UNITED STATES
SECURITIES AND EXCHANGE COMMISSION
Washington, D.C. 20549
FORM N-CSR
CERTIFIED SHAREHOLDER REPORT OF REGISTERED MANAGEMENT
INVESTMENT COMPANIES
Investment Company Act file number: 811-22375
PIMCO Equity Series
(Exact name of registrant as specified in charter)
650 Newport Center Drive, Newport Beach, CA 92660
(Address of principal executive office)
Trent W. Walker
Treasurer (Principal Financial & Accounting Officer)
PIMCO Equity Series
650 Newport Center Drive
Newport Beach, CA 92660
(Name and address of agent for service)
Copies to:
Brendan C. Fox
Dechert LLP
1900 K Street, N.W.
Washington, D.C. 20006
Registrant’s telephone number, including area code: (888) 877-4626
Date of fiscal year end: June 30
Date of reporting period: December 31, 2016
Form N-CSR is to be used by management investment companies to file reports with the Commission not later than 10 days after the transmission to stockholders of any report that is required to be transmitted to stockholders under Rule 30e-1 under the Investment Company Act of 1940 (17 CFR 270.30e-1). The Commission may use the information provided on Form N-CSR in its regulatory, disclosure review, inspection, and policymaking roles.
A registrant is required to disclose the information specified by Form N-CSR, and the Commission will make this information public. A registrant is not required to respond to the collection of information contained in Form N-CSR unless the Form displays a currently valid Office of Management and Budget (“OMB”) control number. Please direct comments concerning the accuracy of the information collection burden estimate and any suggestions for reducing the burden to Secretary, Securities and Exchange Commission, 450 Fifth Street, NW, Washington, DC 20549-0609. The OMB has reviewed this collection of information under the clearance requirements of 44 U.S.C. § 3507.
| Item 1. | Reports to Shareholders. |
The following is a copy of the report transmitted to shareholders pursuant to Rule 30e-1 under the Investment Company Act of 1940, as amended (the “1940 Act”) (17 CFR 270.30e-1).
| | • | | PIMCO Equity Series Funds |
| | • | | PIMCO Equity Series RAE Fundamental Funds |
| | • | | PIMCO Equity Series RealPath® Blend Funds |

PIMCO Equity Series®
Semiannual Report
December 31, 2016

PIMCO Dividend and Income Fund
PIMCO EqS® Long/Short Fund
Share Classes

Table of Contents
* Prior to June 16, 2016, the PIMCO Dividend and Income Fund was named the PIMCO Dividend and Income Builder Fund.
This material is authorized for use only when preceded or accompanied by the current PIMCO Equity Series prospectus. The Shareholder Reports for the other series of the PIMCO Equity Series are printed separately.
Chairman’s Letter
Dear Shareholder,
Please find enclosed the Semiannual Report for the PIMCO Equity Series covering the six-month reporting period ended December 31, 2016. The following pages contain specific details about the investment performance of each fund and a discussion of the factors that most affected performance during the reporting period.
In June 2016, the unexpected outcome of the U.K. “Brexit” referendum dominated headlines and market movements. Volatility rose as a result and sovereign yields rallied significantly, while risk assets generally underperformed. Steadier commodity prices and fiscal stimulus in China helped bolster market sentiment, even as central banks remained on hold ahead of the Brexit referendum. Softer-than-expected employment data in the U.S. pushed market expectations for the next Federal Reserve (“Fed”) interest rate hike further out into the future, with the Fed continuing to hold rates steady through the end of November.
Leading up to the November 8th U.S. presidential election, investors generally shook off the surprising result of the Brexit referendum, along with a host of political developments including new leadership in the U.K. and Brazil, and a coup attempt in Turkey. In this environment, volatility generally remained low and risk assets rallied. Central banks featured prominently in the headlines as monetary policy concerns (in particular, the longevity of central bank support) lingered beneath the seemingly benign market environment. The Bank of Japan’s “comprehensive review,” inaction by the European Central Bank (“ECB”), and the Fed’s solidifying path towards a potential interest rate increase in December 2016 all contributed to sovereign yields generally rising during this period. Still, equities moved higher (U.S. stock indices set record highs), credit spreads tightened, and emerging market assets continued to gain.
In the wake of the not expected result of the U.S. election, volatility fell, equities rallied, credit spreads tightened and the U.S. dollar strengthened. In contrast, interest rates rose dramatically as most markets focused on the pro-growth and inflationary potential of fiscal expansion, tax cuts, and deregulation. Part of the rise in interest rates was also due to a sharp increase in inflation expectations. Despite the generally positive risk sentiment towards the end of the reporting period, emerging markets weakened as protectionist rhetoric from the incoming administration weighed on the asset class.
Finally, the ECB at its December 8th meeting opted to leave its main policy rate unchanged, and announced an expansion of its Quantitative Easing program to exceed $2.4 trillion by the end of 2017. And on December 14th, the Fed raised its key lending rate, the Federal Funds Rate, by 0.25% to a range of 0.50%-0.75%, representing their second rate increase in ten years.
Highlights of the financial markets during the six-month reporting period include:
| | ∎ | | Global developed market equities experienced strong performance amid a period marked by unconventional central bank policy, the continued recovery in commodity prices and higher sovereign yields. U.S. equities, as represented by the S&P 500 Index, returned 7.82% over the reporting period. International equity markets (developed ex-U.S.), as represented by the MSCI EAFE Index returned 5.67%, and 14.06% on a USD-hedged basis over the reporting period. Japanese equities, as represented by the Nikkei 225 Index in JPY, returned 23.83% over the reporting period, and European equities, as represented by the MSCI Europe Index in EUR, returned 10.58% over the reporting period. Following the surprise outcome of the U.K.’s referendum to leave the European Union and accompanying market volatility in June, developed market equities posted strong gains. Global central banks continued down the path of unconventional monetary policy, as the Bank of Japan adopted a yield-curve targeting framework and the ECB extended its asset purchase program. The rally in developed market equities was further supported by the result of the U.S. presidential election, and the possibility of a new paradigm of stronger growth, higher inflation and higher natural interest rates. |
| | ∎ | | Emerging market equities, as represented by the MSCI Emerging Markets Index, returned 4.49% over the reporting period. Benefits from improving internal and external conditions for many emerging markets economies and the continued recovery in commodity prices offset negative implications of the potential for fiscal stimulus in the U.S., a more hawkish Fed and protectionist trade policies. |
| | ∎ | | U.S. Treasuries, as represented by the Bloomberg Barclays U.S. Treasury Index, declined 4.11% for the reporting period. Yields rose across the U.S. Treasury yield curve in reaction to the Fed’s interest rate increase, rising concern over inflation and strong investor risk appetite. The benchmark ten-year U.S. Treasury note yielded 2.45% at the end of the reporting period, up from 1.49% on June 30, 2016. The Bloomberg Barclays U.S. Aggregate Index, a widely used index of U.S. investment-grade bonds, declined 2.53% for the reporting period. |
If you have any questions regarding the PIMCO Equity Series, please contact your account manager or financial adviser, or call one of our shareholder associates at 888.87.PIMCO (888.877.4626). We also invite you to visit our website at www.pimco.com to learn more about our views and global thought leadership.
Thank you again for the trust you have placed in us. We value your commitment and will continue to work diligently to meet your broad investment and investment solution needs.
| | |
 | | Sincerely, 
Brent R. Harris Chairman of the Board,
PIMCO Equity Series February 21, 2017 |
Past performance is no guarantee of future results. Unless otherwise noted, index returns reflect the reinvestment of income dividends and capital gains, if any, but do not reflect fees, brokerage commissions or other expenses of investing. It is not possible to invest directly in an unmanaged index.
| | | | | | |
| | SEMIANNUAL REPORT | | DECEMBER 31, 2016 | | 3 |
Important Information About the Funds
We believe that equity funds have an important role to play in a well-diversified investment portfolio. It is important to note, however, that equity funds are subject to notable risks. Among other things, equity and equity-related securities may decline in value due to both real and perceived general market, economic, and industry conditions.
The values of equity securities, such as common stocks and preferred stocks, have historically risen and fallen in periodic cycles and may decline due to general market conditions, which are not specifically related to a particular company, such as real or perceived adverse economic conditions, changes in the general outlook for corporate earnings, changes in interest or currency rates or adverse investor sentiment generally. Equity securities may also decline due to factors that affect a particular industry or industries, such as labor shortages, increased production costs and competitive conditions within an industry. In addition, the value of an equity security may decline for a number of reasons that directly relate to the issuer, such as management performance, financial leverage and reduced demand for the issuer’s goods or services, as well as the historical and prospective earnings of the issuer and the value of its assets. Different types of equity securities may react differently to these developments and a change in the financial condition of a single issuer may affect securities markets as a whole.
During a general downturn in the securities markets, multiple asset classes, including equity securities, may decline in value simultaneously. The market price of equity securities owned by a Fund may go up or down, sometimes rapidly or unpredictably. Equity securities generally have greater price volatility than fixed income securities and common stocks generally have the greatest appreciation and depreciation potential of all equity securities.
The Funds may be subject to various risks as described in the Funds’ prospectus. Some of these risks may include, but are not limited to, the following: equity risk, dividend-oriented stocks risk, value investing risk, foreign (non-U.S.) investment risk, emerging markets risk, sovereign debt risk, market risk, issuer risk, interest rate risk, call risk, credit risk, high yield and distressed company risk, cash holdings risk, currency risk, real estate risk, liquidity risk, leveraging risk, issuer non-diversification risk, management risk, small-cap and mid-cap company risk, derivatives risk, mortgage-related and other asset-backed securities risk, short sale risk, convertible securities risk and model risk. A complete description of these and other risks is contained in the Funds’ prospectus.
The Funds may use derivative instruments for hedging purposes or as part of an investment strategy. Use of these instruments may involve certain costs and risks such as liquidity risk, interest rate risk, market risk, credit risk, leverage risk, management risk and the risk that a Fund
may not be able to close out a position when it would be most advantageous to do so. Changes in regulation relating to a mutual fund’s use of derivatives and related instruments could potentially limit or impact a Fund’s ability to invest in derivatives, limit a Fund’s ability to employ certain strategies that use derivatives and/or adversely affect the value or performance of derivatives and a Fund. Certain derivative transactions may have a leveraging effect on a Fund. For example, a small investment in a derivative instrument may have a significant impact on a Fund’s exposure to interest rates, currency exchange rates or other investments. As a result, a relatively small price movement in an asset, instrument or component of the index underlying a derivative instrument may cause an immediate and substantial loss or gain, which translates into heightened volatility for the Funds. A Fund may engage in such transactions regardless of whether the Fund owns the asset, instrument or components of the index underlying the derivative instrument. A Fund may invest a significant portion of its assets in these types of instruments. If it does, the Fund’s investment exposure could far exceed the value of its portfolio securities and its investment performance could be primarily dependent upon securities it does not own. Investing in foreign (non-U.S.) securities may entail risk due to foreign (non-U.S.) economic and political developments; this risk may be increased when investing in emerging markets.
The value of an equity security of an issuer that has paid dividends in the past may decrease if the issuer reduces or eliminates future payments to its shareholders. If the dividends or distributions received by a Fund decrease, the Fund may have less income to distribute to the Fund’s shareholders. In addition, during certain market conditions, the equity securities of issuers that have paid regular dividends or distributions may not be widely available or may be highly concentrated in particular sectors of the market. A Fund may invest a significant portion of its assets in value stocks. Value stocks may perform differently from other types of stocks and the market as a whole. A value stock may decrease in price or may not increase in price as anticipated by PIMCO if it continues to be undervalued by the market or the factors that the portfolio manager believes will cause the stock price to increase do not occur.
The geographical classification of foreign (non-U.S.) securities in this report are classified by the country of incorporation of a holding. In certain instances, a security’s country of incorporation may be different from its country of economic exposure.
On each individual Fund Summary page in this Shareholder Report, the Average Annual Total Return table and Cumulative Returns chart measure performance assuming that any dividend and capital gain distributions were reinvested. Returns do not reflect the deduction of taxes that a shareholder would pay on (i) Fund distributions or (ii) the redemption of Fund shares. The Cumulative Returns chart and Average
Annual Total Return table reflect any sales load that would have applied at the time of purchase or any Contingent Deferred Sales Charge (“CDSC”) that would have applied if a full redemption occurred on the last business day of the period shown in the Cumulative Returns chart. Class A shares are subject to an initial sales charge. A CDSC may be imposed in certain circumstances on Class A shares that are purchased without an initial sales charge and then redeemed during the first (i) 18 months after purchase for purchases made prior to August 10, 2015 and (ii) 12 months after purchase for purchases made on or after August 10, 2015. The Cumulative Returns chart reflects only Institutional Class performance. Performance for Class P, Administrative Class, Class D, Class A, Class C and Class R shares, if applicable, are
typically lower than Institutional Class performance due to the lower expenses paid by Institutional Class shares. Performance shown is net of fees and expenses. The minimum initial investment amount for Institutional Class, Class P and Administrative Class shares is $1,000,000. The minimum initial investment amount for Class A, Class C and Class D shares is $1,000. There is no minimum initial investment for Class R shares. Each Fund measures its performance against a broad-based securities market index (“benchmark index”). The benchmark index does not take into account fees, expenses, or taxes. A Fund’s past performance, before and after taxes, is not necessarily an indication of how the Fund will perform in the future.
The following table discloses the inception dates of each Fund and its respective share classes along with each Fund’s diversification status as of period end:
| | | | | | | | | | | | | | | | | | | | | | | | | | | | | | |
| Fund Name | | | | | Fund
Inception | | | Institutional
Class | | | Class P | | | Class D | | | Class A | | | Class C | | | Diversification
Status |
PIMCO Dividend and Income Fund | | | | | | | 12/14/11 | | | | 12/14/11 | | | | 12/14/11 | | | | 12/14/11 | | | | 12/14/11 | | | | 12/14/11 | | | Diversified |
PIMCO EqS® Long/Short Fund | | | | | | | 04/20/12 | | | | 04/20/12 | | | | 04/30/12 | | | | 04/30/12 | | | | 04/30/12 | | | | 04/30/12 | | | Non-diversified |
An investment in a Fund is not a bank deposit and is not guaranteed or insured by the Federal Deposit Insurance Corporation (“FDIC”) or any other government agency. It is possible to lose money on investments in a Fund.
The Trustees are responsible generally for overseeing the management of the Trust. The Trustees authorize the Trust to enter into service agreements with the Adviser, the Distributor, the Administrator and other service providers in order to provide, and in some cases authorize service providers to procure through other parties, necessary or desirable services on behalf of the Trust and the Funds. Shareholders are not parties to or third-party beneficiaries of such service agreements. Neither a Fund’s prospectus nor a Fund’s summary prospectus, the Trust’s Statement of Additional Information (“SAI”), any contracts filed as exhibits to the Trust’s registration statement, nor any other communications, disclosure documents or regulatory filings (including this report) from or on behalf of the Trust or a Fund creates a contract between or among any shareholder of a Fund, on the one hand, and the Trust, a Fund, a service provider to the Trust or a Fund, and/or the Trustees or officers of the Trust, on the other hand. The Trustees (or the Trust and its officers, service providers or other delegates acting under authority of the Trustees) may amend the most recent prospectus or use a new prospectus, summary prospectus or SAI with respect to a Fund or the Trust, and/or amend, file and/or issue any other communications, disclosure documents or regulatory filings, and may amend or enter into any contracts to which the Trust or a Fund is a party, and interpret the investment objective(s), policies, restrictions and contractual provisions applicable to any Fund, without shareholder
input or approval, except in circumstances in which shareholder approval is specifically required by law (such as changes to fundamental investment policies) or where a shareholder approval requirement is specifically disclosed in the Trust’s then-current prospectus or SAI.
PIMCO has adopted written proxy voting policies and procedures (“Proxy Policy”) as required by Rule 206(4)-6 under the Investment Advisers Act of 1940, as amended. The Proxy Policy has been adopted by PIMCO Equity Series as the policies and procedures that PIMCO will use when voting proxies on behalf of a Fund. A description of the policies and procedures that PIMCO uses to vote proxies relating to portfolio securities of a Fund, and information about how the Fund voted proxies relating to portfolio securities held during the most recent twelve-month period ended June 30th, are available without charge, upon request, by calling the Trust at (888) 87-PIMCO, on the Fund’s website at www.pimco.com, and on the Securities and Exchange Commission’s (“SEC”) website at www.sec.gov.
PIMCO Equity Series files a complete schedule of each Fund’s portfolio holdings with the SEC for the first and third quarters of each fiscal year on Form N-Q. A copy of a Fund’s Form N-Q is available on the SEC’s website at www.sec.gov and may be reviewed and copied at the SEC’s Public Reference Room in Washington, D.C. A Fund’s Form N-Q will also be available without charge, upon request, by calling the Trust at (888) 87-PIMCO and on the Fund’s website at www.pimco.com. Information on the operation of the Public Reference Room may be obtained by calling 1-800-SEC-0330.
| | | | | | |
| | SEMIANNUAL REPORT | | DECEMBER 31, 2016 | | 5 |
PIMCO Dividend and Income Fund
Cumulative Returns Through December 31, 2016
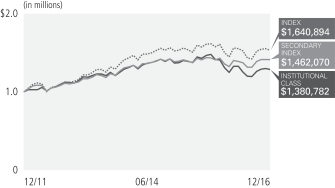
$1,000,000 invested at the end of the month when the Fund’s Institutional Class commenced operations.
Investment Objective and Strategy Overview
PIMCO Dividend and Income Fund (formerly, PIMCO Dividend and Income Builder Fund) (the “Fund”) seeks to provide current income that exceeds the average yield on global stocks by investing under normal circumstances at least 80% of its assets in a diversified portfolio of income-producing investments, and will typically invest between 60-80% of its assets in equity and equity-related securities (such portion of the Fund’s portfolio, the “Equity Sleeve”) providing exposure to a portfolio of stocks (the “RAE Income Global Portfolio”). The stocks for the Equity Sleeve are selected by the Fund’s sub-adviser, Research Affiliates, LLC from a broad universe of global equities. Fund strategies may change from time to time. Please refer to the Fund’s current prospectus for more information regarding the Fund’s strategy.
All Fund returns are net of fees and expenses.
* Cumulative return.
ª Prior to June 16, 2016, The Fund’s primary benchmark was the MSCI All Country World Index. The MSCI All Country World Index is a free float-adjusted market capitalization weighted index that is designed to measure the equity market performance of developed and emerging markets. The Index consists of 46 country indices comprising 23 developed and 23 emerging market country indices.
± The MSCI World Index is a free float-adjusted market capitalization weighted index that is designed to measure the equity market performance of developed markets. The MSCI World Index consists of 23 developed market country indices.
ªª Prior to June 16, 2016, The Fund’s secondary benchmark was the 75% MSCI All Country World Index/25% Bloomberg Barclays Global Aggregate USD Unhedged. The benchmark is a blend of 75% MSCI World Index/25% Bloomberg Barclays Global Aggregate USD Unhedged. The MSCI World Index is a free float-adjusted market capitalization weighted index that is designed to measure the equity market performance of developed markets. The MSCI World Index consists of 23 developed market country indices. Bloomberg Barclays Global Aggregate (USD Unhedged) Index provides a broad-based measure of the global investment-grade fixed income markets. The three major components of this index are the U.S. Aggregate, the Pan-European Aggregate, and the Asian-Pacific Aggregate Indices. The index also includes Eurodollar and Euro-Yen corporate bonds, Canadian Government securities, and USD investment grade 144A securities.
±± The benchmark is a blend of 75% MSCI World Index/25% Bloomberg Barclays Global Aggregate USD Unhedged. The MSCI World Index is a free float-adjusted market capitalization weighted index that is designed to measure the equity market performance of developed markets. The MSCI World Index consists of 23 developed market country indices. Bloomberg Barclays Global Aggregate (USD Unhedged) Index provides a broad-based measure of the global investment-grade fixed income markets. The three major components of this index are the U.S. Aggregate, the Pan-European Aggregate, and the Asian-Pacific Aggregate Indices. The index also includes Eurodollar and Euro-Yen corporate bonds, Canadian Government securities, and USD investment grade 144A securities.
It is not possible to invest directly in an unmanaged index.
Performance quoted represents past performance. Past performance is not a guarantee or a reliable indicator of future results. Current performance may be lower or higher than performance shown. Investment return and the principal value of an investment will fluctuate. Shares may be worth more or less than original cost when redeemed. Returns shown do not reflect the deduction of taxes that a shareholder would pay on fund distributions or the redemption of fund shares. Differences in the Fund’s performance versus the index and related attribution information with respect to particular categories of securities or individual positions may be attributable, in part, to differences in the pricing methodologies used by the Fund and the index. The adjusted returns take into account the maximum sales charge of 5.50% on Class A shares and 1.00% CDSC on Class C shares. For performance current to the most recent month-end, visit www.pimco.com or call (888) 87-PIMCO.
The Fund’s total annual operating expense ratio as stated in the Fund’s current prospectus, which includes the Acquired Fund Fees and Expenses, as supplemented, is 0.83% for the Institutional Class shares, 0.93% for the Class P shares, 1.18% for the Class D shares, 1.18% for the Class A shares, and 1.93% for the Class C shares. Details regarding any Fund’s operating expenses can be found in the Fund’s prospectus.
| | | | | | | | |
| Institutional Class - PQIIX | | Class P - PQIPX | | Class D - PQIDX | | Class A - PQIZX | | Class C - PQICX |
Top 10 Holdings as of 12/31/20161§
| | | | | | | | |
Exxon Mobil Corp. | | | | | | | 2.2% | |
International Business Machines Corp. | | | | | | | 1.8% | |
AT&T, Inc. | | | | | | | 1.8% | |
Royal Dutch Shell PLC ‘A’ | | | | | | | 1.7% | |
HSBC Holdings PLC | | | | | | | 1.7% | |
Pfizer, Inc. | | | | | | | 1.7% | |
Chevron Corp. | | | | | | | 1.7% | |
Structured Asset Investment Loan Trust | | | | | | | 1.6% | |
Banco Santander S.A. | | | | | | | 1.3% | |
Fannie Mae, TBA | | | | | | | 1.3% | |
Geographic Breakdown as of 12/31/20161§
| | | | | | | | |
United States | | | | | | | 51.4% | |
United Kingdom | | | | | | | 10.1% | |
Japan | | | | | | | 8.5% | |
France | | | | | | | 5.9% | |
Germany | | | | | | | 3.6% | |
Netherlands | | | | | | | 2.7% | |
Spain | | | | | | | 2.3% | |
Canada | | | | | | | 2.3% | |
Switzerland | | | | | | | 1.9% | |
Cayman Islands | | | | | | | 1.5% | |
Italy | | | | | | | 1.4% | |
Australia | | | | | | | 1.4% | |
Denmark | | | | | | | 1.1% | |
Luxembourg | | | | | | | 1.0% | |
Other | | | | | | | 3.9% | |
Sector Breakdown as of 12/31/20161§
| | | | | | | | |
Financials | | | | | | | 18.2% | |
Energy | | | | | | | 14.0% | |
Industrials | | | | | | | 8.9% | |
Utilities | | | | | | | 7.0% | |
Asset-Backed Securities | | | | | | | 7.0% | |
Health Care | | | | | | | 6.5% | |
Information Technology | | | | | | | 6.3% | |
Telecommunication Services | | | | | | | 5.6% | |
Materials | | | | | | | 4.8% | |
Consumer Discretionary | | | | | | | 4.5% | |
Consumer Staples | | | | | | | 4.3% | |
Non-Agency Mortgage-Backed Securities | | | | | | | 3.9% | |
U.S. Government Agencies | | | | | | | 3.7% | |
U.S. Treasury Obligations | | | | | | | 2.1% | |
Other | | | | | | | 2.2% | |
1 % of Investments, at value.
§ Top 10 Holdings, Geographic and Sector Breakdown and % of Investments exclude securities sold short, financial derivative instruments and short-term instruments, if any.
Fund Insights
The following impacted performance during the reporting period:
| » | | Overweight exposure to and security selection in the materials sector contributed to relative returns. |
| » | | Underweight exposure to and security selection in the consumer staples sector contributed to relative returns. |
| » | | Overweight exposure to and security selection in the financials sector contributed to relative returns. |
| » | | Overweight exposure to and security selection in the utilities sector detracted from relative returns. |
| » | | Overweight exposure to and security selection in the telecommunication services sector detracted from relative returns. |
| » | | Exposure to non-agency MBS contributed to absolute returns. The Markit iBoxx Broad US Non-Agency RMBS USD Index increased 11.66%. |
| » | | Exposure to U.S. duration detracted from returns, as U.S. Treasury yields increased. |
| | | | | | |
| | SEMIANNUAL REPORT | | DECEMBER 31, 2016 | | 7 |
PIMCO EqS® Long/Short Fund
Cumulative Returns Through December 31, 2016
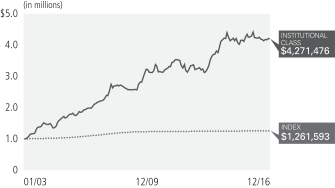
$1,000,000 invested at the end of the month when the Fund’s Institutional Class commenced operations.
Investment Objective and Strategy Overview
PIMCO EqS® Long/Short Fund seeks long-term capital appreciation by investing under normal circumstances in long and short positions of equity and equity-related securities, including common and preferred stock (and securities convertible into, or that PIMCO expects to be exchanged for, common or preferred stock), utilizing a fundamental investing style that integrates bottom-up and top-down research. The Fund will normally invest a substantial portion of its assets in equity and equity-related securities. The Fund may also invest in fixed income securities of varying maturities, cash and cash equivalents. Fund strategies may change from time to time. Please refer to the Fund’s current prospectus for more information regarding the Fund’s strategy.
| | | | | | | | | | | | | | | | | | | | | | |
Average Annual Total Return for the period ended December 31, 2016§ | |
| | | | | 6 Months* | | | 1 Year | | | 5 Year | | | 10 Year | | | Fund Inception
(01/01/03) | |
 | | PIMCO EqS® Long/Short Fund Institutional Class | | | 1.74% | | | | 2.00% | | | | 6.43% | | | | 7.22% | | | | 11.03% | |
| | PIMCO EqS® Long/Short Fund Class P | | | 1.68% | | | | 1.86% | | | | 6.34% | | | | 7.18% | | | | 11.00% | |
| | PIMCO EqS® Long/Short Fund Class D | | | 1.55% | | | | 1.64% | | | | 6.07% | | | | 7.04% | | | | 10.89% | |
| | PIMCO EqS® Long/Short Fund Class A | | | 1.49% | | | | 1.57% | | | | 6.06% | | | | 7.03% | | | | 10.89% | |
| | PIMCO EqS® Long/Short Fund Class A (adjusted) | | | (4.09)% | | | | (4.01)% | | | | 4.86% | | | | 6.43% | | | | 10.44% | |
| | PIMCO EqS® Long/Short Fund Class C | | | 1.11% | | | | 0.93% | | | | 5.33% | | | | 6.67% | | | | 10.62% | |
| | PIMCO EqS® Long/Short Fund Class C (adjusted) | | | 0.15% | | | | (0.03)% | | | | 5.33% | | | | 6.67% | | | | 10.62% | |
 | | 3 Month USD LIBOR Index± | | | 0.37% | | | | 0.68% | | | | 0.39% | | | | 1.24% | | | | 1.68% | |
All Fund returns are net of fees and expenses.
* Cumulative return.
± The 3 Month USD LIBOR (London Interbank Offered Rate) Index is an average interest rate, determined by the ICE Benchmark Administration, that banks charge one another for the use of short-term money (3 months) in England’s Eurodollar market.
It is not possible to invest directly in an unmanaged index.
§ For periods prior to April 20, 2012, the Fund’s performance reflects the performance when the Fund was a partnership, net of actual fees and expenses charged to individual partnership accounts in the aggregate. If the performance had been restated to reflect the applicable fees and expenses of each share class, the performance may have been higher or lower. The Fund began operations as a partnership on January 1, 2003 and, on April 20, 2012, was reorganized into a newly-formed fund that was registered as an investment company under the Investment Company Act of 1940. Prior to the reorganization, the Fund had an investment objective, investment strategies, investment guidelines, and restrictions that were substantially similar to those currently applicable to the Fund; however, the Fund was not registered as an investment company under the Investment Company Act of 1940 and was not subject to its requirements or requirements imposed by the Internal Revenue Code of 1986 which, if applicable, may have adversely affected its performance. The performance of Class P, D, A and C shares for the period from April 20, 2012 to April 30, 2012 is based on the performance of the Institutional Class shares of the Fund. The performance of each class of shares will differ as a result of the different levels of fees and expenses applicable to each class of shares.
Performance quoted represents past performance. Past performance is not a guarantee or a reliable indicator of future results. Current performance may be lower or higher than performance shown. Investment return and the principal value of an investment will fluctuate. Shares may be worth more or less than original cost when redeemed. Returns shown do not reflect the deduction of taxes that a shareholder would pay on fund distributions or the redemption of fund shares. Differences in the Fund’s performance versus the index and related attribution information with respect to particular categories of securities or individual positions may be attributable, in part, to differences in the pricing methodologies used by the Fund and the index. The adjusted returns take into account the maximum sales charge of 5.50% on Class A shares and 1.00% CDSC on Class C shares. For performance current to the most recent month-end, visit www.pimco.com or call (888) 87-PIMCO.
The Fund’s total annual operating expense ratio as stated in the Fund’s current prospectus, as supplemented, is 2.44% for the Institutional Class shares, 2.54% for the Class P shares, 2.79% for the Class D shares, 2.79% for the Class A shares, and 3.54% for the Class C shares. Details regarding any Fund’s operating expenses can be found in the Fund’s prospectus.
| | | | | | | | |
| Institutional Class - PMHIX | | Class P - PMHBX | | Class D - PMHDX | | Class A - PMHAX | | Class C - PMHCX |
Top 10 Holdings as of 12/31/20161§
| | | | | | | | |
IHS Markit Ltd. | | | | | | | 3.7% | |
First Data Corp. ‘A’ | | | | | | | 3.5% | |
Williams Partners LP | | | | | | | 3.3% | |
Energy Transfer Partners LP | | | | | | | 3.0% | |
Enterprise Products Partners LP | | | | | | | 3.0% | |
Nestle S.A. | | | | | | | 2.9% | |
NVR, Inc. | | | | | | | 2.9% | |
CSX Corp. | | | | | | | 2.5% | |
Bank of the Ozarks, Inc. | | | | | | | 2.3% | |
KAR Auction Services, Inc. | | | | | | | 2.2% | |
Sector Breakdown as of 12/31/20162§
| | | | | | | | |
Energy | | | | | | | 11.4% | |
Consumer Discretionary | | | | | | | 10.2% | |
Industrials | | | | | | | 10.2% | |
Information Technology | | | | | | | 8.7% | |
Materials | | | | | | | 4.5% | |
Consumer Staples | | | | | | | 4.4% | |
Financials | | | | | | | 2.6% | |
Real Estate | | | | | | | 1.7% | |
Utilities | | | | | | | 1.5% | |
Health Care | | | | | | | 1.3% | |
U.S. Treasury Floating Rate Notes | | | | | | | 0.6% | |
1 % of Investments, at value.
2 % of net exposure (Investments, at value less Securities Sold Short). Financial derivative instruments and short-term instruments are not taken into consideration.
§ Top 10 Holdings, Sector Breakdown, and % of investments exclude securities sold short, financial derivative instruments, and short-term instruments, if any.
Fund Insights
The following impacted performance during the reporting period:
| » | | Long equity positions contributed to absolute returns, as the prices of these securities generally rose. |
| » | | A long position in First Data Corporation contributed to absolute returns, as the price of this security rose. |
| » | | A long position in Bank of the Ozarks contributed to absolute returns, as the price of this security rose. |
| » | | The Fund’s cash holdings contributed to absolute returns, as the prices of these holdings generally rose. |
| » | | Short equity positions detracted from absolute returns, as the prices of these securities generally rose. |
| » | | A long position in Nestlé detracted from absolute returns, as the price of this security declined. |
| | | | | | |
| | SEMIANNUAL REPORT | | DECEMBER 31, 2016 | | 9 |
Expense Examples
Example
As a shareholder of a Fund, you incur two types of costs: (1) transaction costs, including sales charges (loads) on purchase payments and exchange fees and (2) ongoing costs, including management fees, distribution and/or service (12b-1) fees, and other Fund expenses. The Example is intended to help you understand your ongoing costs (in dollars) of investing in a Fund and to compare these costs with the ongoing costs of investing in other mutual funds.
The Example is based on an investment of $1,000 invested at the beginning of the period and held for the entire period indicated, which for all Funds and share classes is from July 1, 2016 to December 31, 2016 unless noted otherwise in the table and footnotes below.
Actual Expenses
The information in the table under the heading “Actual” provides information about actual account values and actual expenses. You may use the information in these columns, together with the amount you invested, to estimate the expenses that you paid over the period. Simply divide your account value by $1,000 (for example, an $8,600 account value divided by $1,000 = 8.60), then multiply the result by the number in the appropriate row for your share class, in the column entitled “Expenses Paid During Period” to estimate the expenses you paid on your account during this period.
Hypothetical Example for Comparison Purposes
The information in the table under the heading “Hypothetical (5% return before expenses)” provides information about hypothetical account values and hypothetical expenses based on a Fund’s actual expense ratio and an assumed rate of return of 5% per year before expenses, which is not the Fund’s actual return. The hypothetical account values and expenses may not be used to estimate the actual ending account balance or expenses you paid for the period. You may use this information to compare the ongoing costs of investing in a Fund and other funds. To do so, compare this 5% hypothetical example with the 5% hypothetical examples that appear in the shareholder reports of the other funds.
Please note that the expenses shown in the table are meant to highlight your ongoing costs only and do not reflect any transactional costs, such as sales charges (loads) on purchase payments and exchange fees. Therefore, the information under the heading “Hypothetical (5% return before expenses)” is useful in comparing ongoing costs only, and will not help you determine the relative total costs of owning different funds. In addition, if these transactional costs were included, your costs would have been higher.
Expense ratios may vary from period to period because of various factors such as an increase in expenses that are not covered by the management fees, such as fees and expenses of the independent trustees and their counsel, extraordinary expenses and interest expense.
| | | | | | | | | | | | | | | | | | | | | | | | | | | | | | | | | | | | | | | | |
| | | | | | Actual | | | | | | Hypothetical
(5% return before expenses) | | | | | | | |
| | | | | | Beginning
Account Value
(07/01/16) | | | Ending
Account Value
(12/31/16) | | | Expenses Paid
During Period* | | | | | | Beginning
Account Value
(07/01/16) | | | Ending
Account Value
(12/31/16) | | | Expenses Paid
During Period* | | | | | | Net Annualized
Expense Ratio** | |
PIMCO Dividend and Income Fund | | | | | | | | | | | | | | | | | | | | | | | | | | | | | | | | | | | | | | | | |
| Institutional Class | | | | | | $ | 1,000.00 | | | $ | 1,072.30 | | | $ | 4.17 | | | | | | | $ | 1,000.00 | | | $ | 1,021.45 | | | $ | 4.07 | | | | | | | | 0.79 | % |
| Class P | | | | | | | 1,000.00 | | | | 1,071.40 | | | | 4.70 | | | | | | | | 1,000.00 | | | | 1,020.94 | | | | 4.58 | | | | | | | | 0.89 | |
| Class D | | | | | | | 1,000.00 | | | | 1,070.10 | | | | 6.01 | | | | | | | | 1,000.00 | | | | 1,019.67 | | | | 5.87 | | | | | | | | 1.14 | |
| Class A | | | | | | | 1,000.00 | | | | 1,070.40 | | | | 6.01 | | | | | | | | 1,000.00 | | | | 1,019.67 | | | | 5.87 | | | | | | | | 1.14 | |
| Class C | | | | | | | 1,000.00 | | | | 1,066.30 | | | | 9.95 | | | | | | | | 1,000.00 | | | | 1,015.85 | | | | 9.71 | | | | | | | | 1.89 | |
PIMCO EqS® Long/Short Fund | | | | | | | | | | | | | | | | | | | | | | | | | | | | | | | | | | | | | | | | |
| Institutional Class | | | | | | $ | 1,000.00 | | | $ | 1,017.40 | | | $ | 9.15 | | | | | | | $ | 1,000.00 | | | $ | 1,016.41 | | | $ | 9.15 | | | | | | | | 1.78 | % |
| Class P | | | | | | | 1,000.00 | | | | 1,016.80 | | | | 9.66 | | | | | | | | 1,000.00 | | | | 1,015.90 | | | | 9.66 | | | | | | | | 1.88 | |
| Class D | | | | | | | 1,000.00 | | | | 1,015.50 | | | | 10.94 | | | | | | | | 1,000.00 | | | | 1,014.63 | | | | 10.93 | | | | | | | | 2.13 | |
| Class A | | | | | | | 1,000.00 | | | | 1,014.90 | | | | 10.94 | | | | | | | | 1,000.00 | | | | 1,014.63 | | | | 10.93 | | | | | | | | 2.13 | |
| Class C | | | | | | | 1,000.00 | | | | 1,011.10 | | | | 14.76 | | | | | | | | 1,000.00 | | | | 1,010.80 | | | | 14.76 | | | | | | | | 2.88 | |
* Expenses Paid During Period are equal to the net annualized expense ratio for the class, multiplied by the average account value over the period, multiplied by 186/365 (to reflect the one-half year period).
** Net Annualized Expense Ratio is reflective of any applicable contractual fee waivers and/or expense reimbursements or voluntary fee waivers. Details regarding fee waivers can be found in Note 8 in the Notes to Financial Statements.
(THIS PAGE INTENTIONALLY LEFT BLANK)
| | | | | | |
| | SEMIANNUAL REPORT | | DECEMBER 31, 2016 | | 11 |
Financial Highlights
| | | | | | | | | | | | | | | | | | | | | | | | | | | | | | | | |
| | | | | | Investment Operations | | | | | | Less Distributions(b) | |
| | | | | | | | | | | | | | | | | | | | | | | | | |
| Selected Per Share Data for the Year or Period Ended: | |
Net Asset Value
Beginning of
Year or
Period | | | Net Investment
Income (Loss)(a) | | | Net Realized/
Unrealized
Gain (Loss) | | | Total | | | | | | From Net
Investment
Income | | | From Net
Realized
Capital Gains | | | Total | |
| | | | | | | | |
PIMCO Dividend and Income Fund | | | | | | | | | | | | | | | | | | | | | | | | | | | | | | | | |
| Institutional Class | | | | | | | | | | | | | | | | | | | | | | | | | | | | | | | | |
07/01/2016 - 12/31/2016+ | | $ | 9.94 | | | $ | 0.14 | | | $ | 0.58 | | | $ | 0.72 | | | | | | | $ | (0.14 | ) | | $ | 0.00 | | | $ | (0.14 | ) |
06/30/2016 | | | 12.29 | | | | 0.43 | | | | (1.58 | ) | | | (1.15 | ) | | | | | | | (0.44 | ) | | | (0.76 | ) | | | (1.20 | ) |
06/30/2015 | | | 13.12 | | | | 0.47 | | | | (0.50 | ) | | | (0.03 | ) | | | | | | | (0.46 | ) | | | (0.34 | ) | | | (0.80 | ) |
06/30/2014 | | | 11.60 | | | | 0.44 | | | | 1.54 | | | | 1.98 | | | | | | | | (0.46 | ) | | | 0.00 | | | | (0.46 | ) |
06/30/2013 | | | 10.47 | | | | 0.54 | | | | 1.03 | | | | 1.57 | | | | | | | | (0.42 | ) | | | (0.02 | ) | | | (0.44 | ) |
12/14/2011 - 06/30/2012 | | | 10.00 | | | | 0.25 | | | | 0.47 | | | | 0.72 | | | | | | | | (0.25 | ) | | | 0.00 | | | | (0.25 | ) |
| Class P | | | | | | | | | | | | | | | | | | | | | | | | | | | | | | | | |
07/01/2016 - 12/31/2016+ | | | 9.96 | | | | 0.13 | | | | 0.58 | | | | 0.71 | | | | | | | | (0.13 | ) | | | 0.00 | | | | (0.13 | ) |
06/30/2016 | | | 12.30 | | | | 0.39 | | | | (1.54 | ) | | | (1.15 | ) | | | | | | | (0.43 | ) | | | (0.76 | ) | | | (1.19 | ) |
06/30/2015 | | | 13.13 | | | | 0.46 | | | | (0.50 | ) | | | (0.04 | ) | | | | | | | (0.45 | ) | | | (0.34 | ) | | | (0.79 | ) |
06/30/2014 | | | 11.62 | | | | 0.44 | | | | 1.52 | | | | 1.96 | | | | | | | | (0.45 | ) | | | 0.00 | | | | (0.45 | ) |
06/30/2013 | | | 10.48 | | | | 0.54 | | | | 1.03 | | | | 1.57 | | | | | | | | (0.41 | ) | | | (0.02 | ) | | | (0.43 | ) |
12/14/2011 - 06/30/2012 | | | 10.00 | | | | 0.30 | | | | 0.42 | | | | 0.72 | | | | | | | | (0.24 | ) | | | 0.00 | | | | (0.24 | ) |
| Class D | | | | | | | | | | | | | | | | | | | | | | | | | | | | | | | | |
07/01/2016 - 12/31/2016+ | | | 9.94 | | | | 0.12 | | | | 0.58 | | | | 0.70 | | | | | | | | (0.12 | ) | | | 0.00 | | | | (0.12 | ) |
06/30/2016 | | | 12.29 | | | | 0.36 | | | | (1.54 | ) | | | (1.18 | ) | | | | | | | (0.41 | ) | | | (0.76 | ) | | | (1.17 | ) |
06/30/2015 | | | 13.12 | | | | 0.46 | | | | (0.53 | ) | | | (0.07 | ) | | | | | | | (0.42 | ) | | | (0.34 | ) | | | (0.76 | ) |
06/30/2014 | | | 11.61 | | | | 0.40 | | | | 1.53 | | | | 1.93 | | | | | | | | (0.42 | ) | | | 0.00 | | | | (0.42 | ) |
06/30/2013 | | | 10.47 | | | | 0.46 | | | | 1.09 | | | | 1.55 | | | | | | | | (0.39 | ) | | | (0.02 | ) | | | (0.41 | ) |
12/14/2011 - 06/30/2012 | | | 10.00 | | | | 0.26 | | | | 0.44 | | | | 0.70 | | | | | | | | (0.23 | ) | | | 0.00 | | | | (0.23 | ) |
| Class A | | | | | | | | | | | | | | | | | | | | | | | | | | | | | | | | |
07/01/2016 - 12/31/2016+ | | | 9.94 | | | | 0.12 | | | | 0.58 | | | | 0.70 | | | | | | | | (0.12 | ) | | | 0.00 | | | | (0.12 | ) |
06/30/2016 | | | 12.29 | | | | 0.39 | | | | (1.57 | ) | | | (1.18 | ) | | | | | | | (0.41 | ) | | | (0.76 | ) | | | (1.17 | ) |
06/30/2015 | | | 13.12 | | | | 0.43 | | | | (0.50 | ) | | | (0.07 | ) | | | | | | | (0.42 | ) | | | (0.34 | ) | | | (0.76 | ) |
06/30/2014 | | | 11.61 | | | | 0.42 | | | | 1.51 | | | | 1.93 | | | | | | | | (0.42 | ) | | | 0.00 | | | | (0.42 | ) |
06/30/2013 | | | 10.47 | | | | 0.48 | | | | 1.07 | | | | 1.55 | | | | | | | | (0.39 | ) | | | (0.02 | ) | | | (0.41 | ) |
12/14/2011 - 06/30/2012 | | | 10.00 | | | | 0.26 | | | | 0.44 | | | | 0.70 | | | | | | | | (0.23 | ) | | | 0.00 | | | | (0.23 | ) |
| Class C | | | | | | | | | | | | | | | | | | | | | | | | | | | | | | | | |
07/01/2016 - 12/31/2016+ | | | 9.92 | | | | 0.08 | | | | 0.58 | | | | 0.66 | | | | | | | | (0.08 | ) | | | 0.00 | | | | (0.08 | ) |
06/30/2016 | | | 12.27 | | | | 0.31 | | | | (1.57 | ) | | | (1.26 | ) | | | | | | | (0.33 | ) | | | (0.76 | ) | | | (1.09 | ) |
06/30/2015 | | | 13.10 | | | | 0.34 | | | | (0.51 | ) | | | (0.17 | ) | | | | | | | (0.32 | ) | | | (0.34 | ) | | | (0.66 | ) |
06/30/2014 | | | 11.59 | | | | 0.33 | | | | 1.51 | | | | 1.84 | | | | | | | | (0.33 | ) | | | 0.00 | | | | (0.33 | ) |
06/30/2013 | | | 10.46 | | | | 0.40 | | | | 1.06 | | | | 1.46 | | | | | | | | (0.31 | ) | | | (0.02 | ) | | | (0.33 | ) |
12/14/2011 - 06/30/2012 | | | 10.00 | | | | 0.24 | | | | 0.41 | | | | 0.65 | | | | | | | | (0.19 | ) | | | 0.00 | | | | (0.19 | ) |
| | | | | | | | |
PIMCO EqS® Long/Short Fund | | | | | | | | | | | | | | | | | | | | | | | | | | | | | | | | |
| Institutional Class | | | | | | | | | | | | | | | | | | | | | | | | | | | | | | | | |
07/01/2016 - 12/31/2016+ | | $ | 11.69 | | | $ | (0.04 | ) | | $ | 0.24 | | | $ | 0.20 | | | | | | | $ | (0.36 | ) | | $ | (0.23 | ) | | $ | (0.59 | ) |
06/30/2016 | | | 12.07 | | | | (0.17 | ) | | | (0.07 | ) | | | (0.24 | ) | | | | | | | 0.00 | | | | (0.14 | ) | | | (0.14 | ) |
06/30/2015 | | | 11.92 | | | | 0.02 | | | | 0.18 | | | | 0.20 | | | | | | | | 0.00 | | | | (0.05 | ) | | | (0.05 | ) |
06/30/2014 | | | 11.09 | | | | (0.10 | ) | | | 1.60 | | | | 1.50 | | | | | | | | (0.06 | ) | | | (0.61 | ) | | | (0.67 | ) |
06/30/2013 | | | 9.71 | | | | 0.15 | | | | 1.27 | | | | 1.42 | | | | | | | | (0.04 | ) | | | 0.00 | | | | (0.04 | ) |
04/20/2012 - 06/30/2012 | | | 10.00 | | | | (0.02 | ) | | | (0.27 | ) | | | (0.29 | ) | | | | | | | 0.00 | | | | 0.00 | | | | 0.00 | |
| Class P | | | | | | | | | | | | | | | | | | | | | | | | | | | | | | | | |
07/01/2016 - 12/31/2016+ | | | 11.63 | | | | (0.04 | ) | | | 0.23 | | | | 0.19 | | | | | | | | (0.35 | ) | | | (0.23 | ) | | | (0.58 | ) |
06/30/2016 | | | 12.02 | | | | (0.18 | ) | | | (0.07 | ) | | | (0.25 | ) | | | | | | | 0.00 | | | | (0.14 | ) | | | (0.14 | ) |
06/30/2015 | | | 11.88 | | | | 0.02 | | | | 0.17 | | | | 0.19 | | | | | | | | 0.00 | | | | (0.05 | ) | | | (0.05 | ) |
06/30/2014 | | | 11.08 | | | | (0.08 | ) | | | 1.56 | | | | 1.48 | | | | | | | | (0.07 | ) | | | (0.61 | ) | | | (0.68 | ) |
06/30/2013 | | | 9.70 | | | | (0.05 | ) | | | 1.47 | | | | 1.42 | | | | | | | | (0.04 | ) | | | 0.00 | | | | (0.04 | ) |
04/30/2012 - 06/30/2012 | | | 10.00 | | | | (0.02 | ) | | | (0.28 | ) | | | (0.30 | ) | | | | | | | 0.00 | | | | 0.00 | | | | 0.00 | |
| | | | | | | | |
| 12 | | PIMCO EQUITY SERIES | | | | | See Accompanying Notes | |
| | | | | | | | | | | | | | | | | | | | | | | | | | | | | | | | | | |
| | | | | | | Ratios/Supplemental Data | |
| | | | | | | | | | Ratios to Average Net Assets | | | | |
Net Asset
Value End of
Year or
Period | | | Total Return | | | Net Assets
End of Year or
Period (000s) | | | Expenses | | | Expenses
Excluding
Waivers | | | Expenses
Excluding
Interest
Expense and
Dividends on
Securities
Sold Short | | | Expenses
Excluding
Interest
Expense and
Dividends on
Securities
Sold Short
and Waivers | | | Expenses
Net Investment
Income (Loss) | | | Portfolio
Turnover
Rate | |
| | | | | | | | |
| | | | | | | | | | | | | | | | | | | | | | | | | | | | | | | | | | |
| | | | | | | | | | | | | | | | | | | | | | | | | | | | | | | | | | |
| $ | 10.52 | | | | 7.23 | % | | $ | 24,326 | | | | 0.79 | %* | | | 0.81 | %* | | | 0.79 | %* | | | 0.81 | %* | | | 2.61 | %* | | | 49 | % |
| | 9.94 | | | | (9.06 | ) | | | 31,840 | | | | 0.83 | (c) | | | 1.00 | (c) | | | 0.83 | (c) | | | 1.00 | (c) | | | 4.02 | | | | 114 | |
| | 12.29 | | | | (0.12 | ) | | | 68,607 | | | | 0.83 | | | | 1.00 | | | | 0.83 | | | | 1.00 | | | | 3.70 | | | | 98 | |
| | 13.12 | | | | 17.23 | | | | 90,408 | | | | 0.84 | | | | 1.00 | | | | 0.84 | | | | 1.00 | | | | 3.56 | | | | 79 | |
| | 11.60 | | | | 15.17 | | | | 69,203 | | | | 0.83 | | | | 1.00 | | | | 0.83 | | | | 1.00 | | | | 4.66 | | | | 75 | |
| | 10.47 | | | | 7.17 | | | | 11,170 | | | | 0.83 | * | | | 1.57 | * | | | 0.83 | * | | | 1.57 | * | | | 4.35 | * | | | 28 | |
| | | | | | | | | | | | | | | | | | | | | | | | | | | | | | | | | | |
| | 10.54 | | | | 7.14 | | | | 22,113 | | | | 0.89 | * | | | 0.91 | * | | | 0.89 | * | | | 0.91 | * | | | 2.49 | * | | | 49 | |
| | 9.96 | | | | (9.05 | ) | | | 34,120 | | | | 0.93 | (c) | | | 1.10 | (c) | | | 0.93 | (c) | | | 1.10 | (c) | | | 3.52 | | | | 114 | |
| | 12.30 | | | | (0.22 | ) | | | 169,790 | | | | 0.93 | | | | 1.10 | | | | 0.93 | | | | 1.10 | | | | 3.64 | | | | 98 | |
| | 13.13 | | | | 17.05 | | | | 158,122 | | | | 0.94 | | | | 1.10 | | | | 0.94 | | | | 1.10 | | | | 3.53 | | | | 79 | |
| | 11.62 | | | | 15.15 | | | | 85,724 | | | | 0.93 | | | | 1.10 | | | | 0.93 | | | | 1.10 | | | | 4.62 | | | | 75 | |
| | 10.48 | | | | 7.21 | | | | 8,207 | | | | 0.93 | * | | | 2.47 | * | | | 0.93 | * | | | 2.47 | * | | | 5.28 | * | | | 28 | |
| | | | | | | | | | | | | | | | | | | | | | | | | | | | | | | | | | |
| | 10.52 | | | | 7.01 | | | | 8,807 | | | | 1.14 | * | | | 1.16 | * | | | 1.14 | * | | | 1.16 | * | | | 2.24 | * | | | 49 | |
| | 9.94 | | | | (9.38 | ) | | | 10,623 | | | | 1.18 | (c) | | | 1.35 | (c) | | | 1.18 | (c) | | | 1.35 | (c) | | | 3.36 | | | | 114 | |
| | 12.29 | | | | (0.47 | ) | | | 41,094 | | | | 1.18 | | | | 1.35 | | | | 1.18 | | | | 1.35 | | | | 3.59 | | | | 98 | |
| | 13.12 | | | | 16.78 | | | | 32,523 | | | | 1.19 | | | | 1.35 | | | | 1.19 | | | | 1.35 | | | | 3.19 | | | | 79 | |
| | 11.61 | | | | 14.91 | | | | 23,204 | | | | 1.18 | | | | 1.35 | | | | 1.18 | | | | 1.35 | | | | 4.00 | | | | 75 | |
| | 10.47 | | | | 6.98 | | | | 2,306 | | | | 1.18 | * | | | 2.26 | * | | | 1.18 | * | | | 2.26 | * | | | 4.52 | * | | | 28 | |
| | | | | | | | | | | | | | | | | | | | | | | | | | | | | | | | | | |
| | 10.52 | | | | 7.04 | | | | 142,081 | | | | 1.14 | * | | | 1.16 | * | | | 1.14 | * | | | 1.16 | * | | | 2.24 | * | | | 49 | |
| | 9.94 | | | | (9.38 | ) | | | 167,857 | | | | 1.18 | (c) | | | 1.35 | (c) | | | 1.18 | (c) | | | 1.35 | (c) | | | 3.66 | | | | 114 | |
| | 12.29 | | | | (0.49 | ) | | | 296,317 | | | | 1.18 | | | | 1.35 | | | | 1.18 | | | | 1.35 | | | | 3.39 | | | | 98 | |
| | 13.12 | | | | 16.78 | | | | 320,719 | | | | 1.19 | | | | 1.35 | | | | 1.19 | | | | 1.35 | | | | 3.34 | | | | 79 | |
| | 11.61 | | | | 14.91 | | | | 117,579 | | | | 1.18 | | | | 1.35 | | | | 1.18 | | | | 1.35 | | | | 4.18 | | | | 75 | |
| | 10.47 | | | | 6.98 | | | | 13,314 | | | | 1.18 | * | | | 2.43 | * | | | 1.18 | * | | | 2.43 | * | | | 4.62 | * | | | 28 | |
| | | | | | | | | | | | | | | | | | | | | | | | | | | | | | | | | | |
| | 10.50 | | | | 6.63 | | | | 164,552 | | | | 1.89 | * | | | 1.91 | * | | | 1.89 | * | | | 1.91 | * | | | 1.49 | * | | | 49 | |
| | 9.92 | | | | (10.07 | ) | | | 195,393 | | | | 1.93 | (c) | | | 2.10 | (c) | | | 1.93 | (c) | | | 2.10 | (c) | | | 2.90 | | | | 114 | |
| | 12.27 | | | | (1.23 | ) | | | 358,171 | | | | 1.93 | | | | 2.10 | | | | 1.93 | | | | 2.10 | | | | 2.67 | | | | 98 | |
| | 13.10 | | | | 15.97 | | | | 353,287 | | | | 1.94 | | | | 2.10 | | | | 1.94 | | | | 2.10 | | | | 2.67 | | | | 79 | |
| | 11.59 | | | | 14.08 | | | | 86,879 | | | | 1.93 | | | | 2.10 | | | | 1.93 | | | | 2.10 | | | | 3.42 | | | | 75 | |
| | 10.46 | | | | 6.46 | | | | 8,000 | | | | 1.93 | * | | | 3.46 | * | | | 1.93 | * | | | 3.46 | * | | | 4.27 | * | | | 28 | |
| | | | | | | | |
| | | | | | | | | | | | | | | | | | | | | | | | | | | | | | | | | | |
| | | | | | | | | | | | | | | | | | | | | | | | | | | | | | | | | | |
| $ | 11.30 | | | | 1.74 | % | | $ | 160,553 | | | | 1.78 | %* | | | 1.80 | %* | | | 1.49 | %* | | | 1.51 | %* | | | (0.61 | )%* | | | 117 | % |
| | 11.69 | | | | (2.02 | ) | | | 243,341 | | | | 2.42 | | | | 2.43 | | | | 1.50 | | | | 1.51 | | | | (1.45 | ) | | | 672 | |
| | 12.07 | | | | 1.74 | | | | 299,808 | | | | 1.91 | | | | 1.92 | | | | 1.49 | | | | 1.50 | | | | 0.20 | | | | 450 | (d) |
| | 11.92 | | | | 13.59 | | | | 545,346 | | | | 2.02 | | | | 2.04 | | | | 1.48 | | | | 1.50 | | | | (0.82 | ) | | | 522 | |
| | 11.09 | | | | 14.66 | | | | 329,610 | | | | 2.65 | | | | 2.75 | | | | 1.40 | | | | 1.50 | | | | 1.45 | | | | 528 | |
| | 9.71 | | | | (2.90 | ) | | | 212,229 | | | | 1.52 | * | | | 2.41 | * | | | 1.40 | * | | | 2.29 | * | | | (1.30 | )* | | | 113 | |
| | | | | | | | | | | | | | | | | | | | | | | | | | | | | | | | | | |
| | 11.24 | | | | 1.68 | | | | 153,785 | | | | 1.88 | * | | | 1.90 | * | | | 1.59 | * | | | 1.61 | * | | | (0.73 | )* | | | 117 | |
| | 11.63 | | | | (2.11 | ) | | | 249,973 | | | | 2.53 | | | | 2.54 | | | | 1.60 | | | | 1.61 | | | | (1.50 | ) | | | 672 | |
| | 12.02 | | | | 1.66 | | | | 207,511 | | | | 2.01 | | | | 2.02 | | | | 1.59 | | | | 1.60 | | | | 0.16 | | | | 450 | (d) |
| | 11.88 | | | | 13.40 | | | | 277,661 | | | | 2.00 | | | | 2.02 | | | | 1.58 | | | | 1.60 | | | | (0.71 | ) | | | 522 | |
| | 11.08 | | | | 14.77 | | | | 15,664 | | | | 3.94 | | | | 4.04 | | | | 1.50 | | | | 1.60 | | | | (0.48 | ) | | | 528 | |
| | 9.70 | | | | (3.00 | ) | | | 10 | | | | 1.62 | * | | | 2.40 | * | | | 1.50 | * | | | 2.28 | * | | | (1.34 | )* | | | 113 | |
| | | | | | |
| | SEMIANNUAL REPORT | | DECEMBER 31, 2016 | | 13 |
Financial Highlights (Cont.)
| | | | | | | | | | | | | | | | | | | | | | | | | | | | | | | | |
| | | | | | Investment Operations | | | | | | Less Distributions(b) | |
| | | | | | | | | | | | | | | | | | | | | | | | | |
| Selected Per Share Data for the Year or Period Ended: | |
Net Asset Value
Beginning of
Year or
Period | | | Net Investment
Income (Loss)(a) | | | Net Realized/
Unrealized
Gain (Loss) | | | Total | | | | | | From Net
Investment
Income | | | From Net
Realized
Capital Gains | | | Total | |
| | | | | | | | |
PIMCO EqS® Long/Short Fund (Cont.) | | | | | | | | | | | | | | | | | | | | | | | | | | | | | | | | |
| Class D | | | | | | | | | | | | | | | | | | | | | | | | | | | | | | | | |
07/01/2016 - 12/31/2016+ | | $ | 11.53 | | | $ | (0.06 | ) | | $ | 0.24 | | | $ | 0.18 | | | | | | | $ | (0.33 | ) | | $ | (0.23 | ) | | $ | (0.56 | ) |
06/30/2016 | | | 11.95 | | | | (0.20 | ) | | | (0.08 | ) | | | (0.28 | ) | | | | | | | 0.00 | | | | (0.14 | ) | | | (0.14 | ) |
06/30/2015 | | | 11.84 | | | | (0.02 | ) | | | 0.18 | | | | 0.16 | | | | | | | | 0.00 | | | | (0.05 | ) | | | (0.05 | ) |
06/30/2014 | | | 11.06 | | | | (0.12 | ) | | | 1.57 | | | | 1.45 | | | | | | | | (0.06 | ) | | | (0.61 | ) | | | (0.67 | ) |
06/30/2013 | | | 9.70 | | | | (0.10 | ) | | | 1.48 | | | | 1.38 | | | | | | | | (0.02 | ) | | | 0.00 | | | | (0.02 | ) |
04/30/2012 - 06/30/2012 | | | 10.00 | | | | (0.03 | ) | | | (0.27 | ) | | | (0.30 | ) | | | | | | | 0.00 | | | | 0.00 | | | | 0.00 | |
| Class A | | | | | | | | | | | | | | | | | | | | | | | | | | | | | | | | |
07/01/2016 - 12/31/2016+ | | | 11.52 | | | | (0.06 | ) | | | 0.23 | | | | 0.17 | | | | | | | | (0.34 | ) | | | (0.23 | ) | | | (0.57 | ) |
06/30/2016 | | | 11.94 | | | | (0.21 | ) | | | (0.07 | ) | | | (0.28 | ) | | | | | | | 0.00 | | | | (0.14 | ) | | | (0.14 | ) |
06/30/2015 | | | 11.83 | | | | (0.02 | ) | | | 0.18 | | | | 0.16 | | | | | | | | 0.00 | | | | (0.05 | ) | | | (0.05 | ) |
06/30/2014 | | | 11.05 | | | | (0.12 | ) | | | 1.57 | | | | 1.45 | | | | | | | | (0.06 | ) | | | (0.61 | ) | | | (0.67 | ) |
06/30/2013 | | | 9.70 | | | | (0.00 | )^ | | | 1.38 | | | | 1.38 | | | | | | | | (0.03 | ) | | | 0.00 | | | | (0.03 | ) |
04/30/2012 - 06/30/2012 | | | 10.00 | | | | (0.03 | ) | | | (0.27 | ) | | | (0.30 | ) | | | | | | | 0.00 | | | | 0.00 | | | | 0.00 | |
| Class C | | | | | | | | | | | | | | | | | | | | | | | | | | | | | | | | |
07/01/2016 - 12/31/2016+ | | | 11.20 | | | | (0.10 | ) | | | 0.22 | | | | 0.12 | | | | | | | | (0.29 | ) | | | (0.23 | ) | | | (0.52 | ) |
06/30/2016 | | | 11.69 | | | | (0.29 | ) | | | (0.06 | ) | | | (0.35 | ) | | | | | | | 0.00 | | | | (0.14 | ) | | | (0.14 | ) |
06/30/2015 | | | 11.67 | | | | (0.11 | ) | | | 0.18 | | | | 0.07 | | | | | | | | 0.00 | | | | (0.05 | ) | | | (0.05 | ) |
06/30/2014 | | | 10.98 | | | | (0.20 | ) | | | 1.55 | | | | 1.35 | | | | | | | | (0.05 | ) | | | (0.61 | ) | | | (0.66 | ) |
06/30/2013 | | | 9.69 | | | | 0.01 | | | | 1.29 | | | | 1.30 | | | | | | | | (0.01 | ) | | | 0.00 | | | | (0.01 | ) |
04/30/2012 - 06/30/2012 | | | 10.00 | | | | (0.04 | ) | | | (0.27 | ) | | | (0.31 | ) | | | | | | | 0.00 | | | | 0.00 | | | | 0.00 | |
| ^ | Reflects an amount rounding to less than one cent. |
| (a) | Per share amounts based on average number of shares outstanding during the year or period. |
| (b) | The tax characterization of distributions is determined in accordance with federal income tax regulations. The actual tax characterization of distributions paid is determined at the end of the fiscal year. See Note 2 in the Notes to Financial Statements for more information. |
| (c) | Effective June 16, 2016, the Fund’s advisory fee wad decreased by 0.20% to an annual rate of 0.49% |
| (d) | The amount previously reported as 763% in the Fund’s annual report has been restated, as above. |
| | | | | | | | |
| 14 | | PIMCO EQUITY SERIES | | | | | See Accompanying Notes | |
| | | | | | | | | | | | | | | | | | | | | | | | | | | | | | | | | | |
| | | | | | | Ratios/Supplemental Data | |
| | | | | | | | | | Ratios to Average Net Assets | | | | |
Net Asset
Value End of
Year or
Period | | | Total Return | | | Net Assets
End of Year or
Period (000s) | | | Expenses | | | Expenses
Excluding
Waivers | | | Expenses
Excluding
Interest
Expense and
Dividends on
Securities
Sold Short | | | Expenses
Excluding
Interest
Expense and
Dividends on
Securities
Sold Short
and Waivers | | | Expenses
Net Investment
Income (Loss) | | | Portfolio
Turnover
Rate | |
| | | | | | | | |
| | | | | | | | | | | | | | | | | | | | | | | | | | | | | | | | | | |
| | | | | | | | | | | | | | | | | | | | | | | | | | | | | | | | | | |
| $ | 11.15 | | | | 1.55 | % | | $ | 36,606 | | | | 2.13 | % * | | | 2.15 | % * | | | 1.84 | % * | | | 1.86 | % * | | | (0.94 | ) % * | | | 117 | % |
| | 11.53 | | | | (2.37 | ) | | | 62,130 | | | | 2.77 | | | | 2.78 | | | | 1.85 | | | | 1.86 | | | | (1.73 | ) | | | 672 | |
| | 11.95 | | | | 1.41 | | | | 44,227 | | | | 2.26 | | | | 2.27 | | | | 1.84 | | | | 1.85 | | | | (0.19 | ) | | | 450 | (d) |
| | 11.84 | | | | 13.13 | | | | 77,934 | | | | 2.31 | | | | 2.33 | | | | 1.83 | | | | 1.85 | | | | (1.01 | ) | | | 522 | |
| | 11.06 | | | | 14.31 | | | | 12,421 | | | | 3.95 | | | | 4.05 | | | | 1.75 | | | | 1.85 | | | | (0.97 | ) | | | 528 | |
| | 9.70 | | | | (3.00 | ) | | | 111 | | | | 1.87 | * | | | 3.97 | * | | | 1.77 | * | | | 3.87 | * | | | (1.72 | )* | | | 113 | |
| | | | | | | | | | | | | | | | | | | | | | | | | | | | | | | | | | |
| | 11.12 | | | | 1.49 | | | | 105,993 | | | | 2.13 | * | | | 2.15 | * | | | 1.84 | * | | | 1.86 | * | | | (0.95 | )* | | | 117 | |
| | 11.52 | | | | (2.38 | ) | | | 147,582 | | | | 2.79 | | | | 2.80 | | | | 1.85 | | | | 1.86 | | | | (1.79 | ) | | | 672 | |
| | 11.94 | | | | 1.41 | | | | 172,843 | | | | 2.26 | | | | 2.27 | | | | 1.84 | | | | 1.85 | | | | (0.18 | ) | | | 450 | (d) |
| | 11.83 | | | | 13.17 | | | | 382,160 | | | | 2.27 | | | | 2.29 | | | | 1.83 | | | | 1.85 | | | | (0.98 | ) | | | 522 | |
| | 11.05 | | | | 14.27 | | | | 24,759 | | | | 3.62 | | | | 3.72 | | | | 1.75 | | | | 1.85 | | | | (0.03 | ) | | | 528 | |
| | 9.70 | | | | (3.00 | ) | | | 1,219 | | | | 1.87 | * | | | 3.17 | * | | | 1.74 | * | | | 3.04 | * | | | (1.70 | )* | | | 113 | |
| | | | | | | | | | | | | | | | | | | | | | | | | | | | | | | | | | |
| | 10.80 | | | | 1.11 | | | | 109,816 | | | | 2.88 | * | | | 2.90 | * | | | 2.59 | * | | | 2.61 | * | | | (1.69 | )* | | | 117 | |
| | 11.20 | | | | (3.03 | ) | | | 145,358 | | | | 3.54 | | | | 3.55 | | | | 2.60 | | | | 2.61 | | | | (2.51 | ) | | | 672 | |
| | 11.69 | | | | 0.66 | | | | 140,719 | | | | 3.01 | | | | 3.02 | | | | 2.59 | | | | 2.60 | | | | (0.95 | ) | | | 450 | (d) |
| | 11.67 | | | | 12.26 | | | | 214,485 | | | | 3.00 | | | | 3.02 | | | | 2.58 | | | | 2.60 | | | | (1.71 | ) | | | 522 | |
| | 10.98 | | | | 13.41 | | | | 9,530 | | | | 4.04 | | | | 4.14 | | | | 2.50 | | | | 2.60 | | | | 0.13 | | | | 528 | |
| | 9.69 | | | | (3.10 | ) | | | 53 | | | | 2.62 | * | | | 4.50 | * | | | 2.52 | * | | | 4.40 | * | | | (2.46 | )* | | | 113 | |
| | | | | | |
| | SEMIANNUAL REPORT | | DECEMBER 31, 2016 | | 15 |
Statements of Assets and Liabilities
| | | | | | | | |
| (Amounts in thousands†, except per share amounts) | | PIMCO
Dividend and
Income
Fund | | | PIMCO
EqS®
Long/Short
Fund | |
| | |
Assets: | | | | | | | | |
Investments, at value | | | | | | | | |
Investments in securities* | | $ | 372,211 | | | $ | 549,623 | |
Investments in Affiliates | | | 1,485 | | | | 24,585 | |
Financial Derivative Instruments | | | | | | | | |
Exchange-traded or centrally cleared | | | 75 | | | | 167 | |
Over the counter | | | 979 | | | | 705 | |
Cash | | | 499 | | | | 1 | |
Deposits with counterparty | | | 1,043 | | | | 72,633 | |
Foreign currency, at value | | | 551 | | | | 481 | |
Receivable for investments sold | | | 10,401 | | | | 20,975 | |
Receivable for TBA investments sold | | | 17,899 | | | | 0 | |
Receivable for Fund shares sold | | | 156 | | | | 804 | |
Interest and/or dividends receivable | | | 1,935 | | | | 293 | |
Dividends receivable from Affiliates | | | 1 | | | | 53 | |
Reimbursement receivable from PIMCO | | | 215 | | | | 289 | |
Other assets | | | 1 | | | | 1 | |
Total Assets | | | 407,451 | | | | 670,610 | |
| | |
Liabilities: | | | | | | | | |
Borrowings & Other Financing Transactions | | | | | | | | |
Payable for reverse repurchase agreements | | $ | 1,563 | | | $ | 0 | |
Payable for short sales | | | 97 | | | | 74,472 | |
Financial Derivative Instruments | | | | | | | | |
Exchange-traded or centrally cleared | | | 80 | | | | 44 | |
Over the counter | | | 558 | | | | 206 | |
Payable for investments purchased | | | 10,865 | | | | 21,549 | |
Payable for investments in Affiliates purchased | | | 1 | | | | 53 | |
Payable for TBA investments purchased | | | 29,990 | | | | 0 | |
Deposits from counterparty | | | 580 | | | | 540 | |
Payable for Fund shares redeemed | | | 1,108 | | | | 5,787 | |
Accrued investment advisory fees | | | 163 | | | | 560 | |
Accrued supervisory and administrative fees | | | 131 | | | | 281 | |
Accrued distribution fees | | | 115 | | | | 87 | |
Accrued servicing fees | | | 70 | | | | 51 | |
Other liabilities | | | 251 | | | | 227 | |
Total Liabilities | | | 45,572 | | | | 103,857 | |
| | |
Net Assets | | $ | 361,879 | | | $ | 566,753 | |
| | |
Net Assets Consist of: | | | | | | | | |
Paid in capital | | $ | 476,378 | | | $ | 560,053 | |
(Overdistributed) net investment income | | | (980 | ) | | | (19,683 | ) |
Accumulated undistributed net realized gain (loss) | | | (126,629 | ) | | | 5,920 | |
Net unrealized appreciation | | | 13,110 | | | | 20,463 | |
| | |
Net Assets | | $ | 361,879 | | | $ | 566,753 | |
| | |
Cost of investments in securities | | $ | 359,982 | | | $ | 530,924 | |
Cost of investments in Affiliates | | $ | 1,485 | | | $ | 24,580 | |
Cost of foreign currency held | | $ | 550 | | | $ | 484 | |
Proceeds received on short sales | | $ | 96 | | | $ | 75,127 | |
Cost or premiums of financial derivative instruments, net | | $ | (454 | ) | | $ | 0 | |
| | |
* Includes repurchase agreements of: | | $ | 0 | | | $ | 2,840 | |
| † | A zero balance may reflect actual amounts rounding to less than one thousand. |
| | | | | | | | |
| 16 | | PIMCO EQUITY SERIES | | | | | See Accompanying Notes | |
December 31, 2016 (Unaudited)
| | | | | | | | |
| | | PIMCO
Dividend and
Income
Fund | | | PIMCO
EqS®
Long/Short
Fund | |
| | |
Net Assets: | | | | | | | | |
Institutional Class | | $ | 24,326 | | | $ | 160,553 | |
Class P | | | 22,113 | | | | 153,785 | |
Class D | | | 8,807 | | | | 36,606 | |
Class A | | | 142,081 | | | | 105,993 | |
Class C | | | 164,552 | | | | 109,816 | |
| | |
Shares Issued and Outstanding: | | | | | | | | |
Institutional Class | | | 2,311 | | | | 14,210 | |
Class P | | | 2,097 | | | | 13,683 | |
Class D | | | 837 | | | | 3,284 | |
Class A | | | 13,507 | | | | 9,527 | |
Class C | | | 15,673 | | | | 10,169 | |
| | |
Net Asset Value Per Share Outstanding: | | | | | | | | |
Institutional Class | | $ | 10.52 | | | $ | 11.30 | |
Class P | | | 10.54 | | | | 11.24 | |
Class D | | | 10.52 | | | | 11.15 | |
Class A | | | 10.52 | | | | 11.12 | |
Class C | | | 10.50 | | | | 10.80 | |
| | | | | | |
| | SEMIANNUAL REPORT | | DECEMBER 31, 2016 | | 17 |
Statements of Operations
(Unaudited)
| | | | | | | | |
| Six Months Ended December 31, 2016 | | | | | | |
| (Amounts in thousands†) | | PIMCO
Dividend and
Income
Fund | | | PIMCO
EqS®
Long/Short
Fund | |
| | |
Investment Income: | | | | | | | | |
Interest | | $ | 2,031 | | | $ | 494 | |
Dividends, net of foreign taxes* | | | 4,807 | | | | 3,006 | |
Dividends from Investments in Affiliates | | | 12 | | | | 750 | |
Total Income | | | 6,850 | | | | 4,250 | |
| | |
Expenses: | | | | | | | | |
Investment advisory fees | | | 991 | | | | 3,768 | |
Supervisory and administrative fees | | | 795 | | | | 1,891 | |
Distribution and/or servicing fees - Class D | | | 13 | | | | 68 | |
Distribution fees - Class C | | | 683 | | | | 505 | |
Servicing fees - Class A | | | 195 | | | | 164 | |
Servicing fees - Class C | | | 228 | | | | 168 | |
Dividends on short sales | | | 0 | | | | 813 | |
Trustee fees | | | 35 | | | | 63 | |
Interest expense | | | 4 | | | | 219 | |
Miscellaneous expense | | | 10 | | | | 18 | |
Total Expenses | | | 2,954 | | | | 7,677 | |
Waiver and/or Reimbursement by PIMCO | | | (35 | ) | | | (63 | ) |
Net Expenses | | | 2,919 | | | | 7,614 | |
| | |
Net Investment Income (Loss) | | | 3,931 | | | | (3,364 | ) |
| | |
Net Realized Gain (Loss): | | | | | | | | |
Investments in securities | | | 2,834 | | | | 41,436 | |
Investments in Affiliates | | | (1 | ) | | | 69 | |
Exchange-traded or centrally cleared financial derivative instruments | | | 859 | | | | (3,194 | ) |
Over the counter financial derivative instruments | | | 815 | | | | 1,753 | |
Short sales | | | 0 | | | | (3,855 | ) |
Foreign currency | | | (43 | ) | | | (103 | ) |
| | |
Net Realized Gain | | | 4,464 | | | | 36,106 | |
| | |
Net Change in Unrealized Appreciation (Depreciation): | | | | | | | | |
Investments in securities | | | 18,174 | | | | (23,165 | ) |
Investments in Affiliates | | | (1 | ) | | | (27 | ) |
Exchange-traded or centrally cleared financial derivative instruments | | | (426 | ) | | | 620 | |
Over the counter financial derivative instruments | | | 474 | | | | 1,228 | |
Short sales | | | 0 | | | | 2,211 | |
Foreign currency assets and liabilities | | | 6 | | | | (110 | ) |
| | |
Net Change in Unrealized Appreciation (Depreciation) | | | 18,227 | | | | (19,243 | ) |
| | |
Net Increase in Net Assets Resulting from Operations | | $ | 26,622 | | | $ | 13,499 | |
| | |
* Foreign tax withholdings - Dividends | | $ | 197 | | | $ | 41 | |
| † | A zero balance may reflect actual amounts rounding to less than one thousand. |
| | | | | | | | |
| 18 | | PIMCO EQUITY SERIES | | | | | See Accompanying Notes | |
Statements of Changes in Net Assets
| | | | | | | | | | | | | | | | |
| | | PIMCO
Dividend and Income Fund | | | PIMCO
EqS® Long/Short Fund | |
| | | | |
| (Amounts in thousands†) | | Six Months Ended
December 31, 2016
(Unaudited) | | | Year Ended
June 30, 2016 | | | Six Months Ended
December 31, 2016
(Unaudited) | | | Year Ended
June 30, 2016 | |
| | | | |
(Decrease) in Net Assets from: | | | | | | | | | | | | | | | | |
| | | | |
Operations: | | | | | | | | | | | | | | | | |
Net investment income (loss) | | $ | 3,931 | | | $ | 21,611 | | | $ | (3,364 | ) | | $ | (15,129 | ) |
Net realized gain (loss) | | | 4,464 | | | | (132,213 | ) | | | 36,106 | | | | 4,258 | |
Net change in unrealized appreciation (depreciation) | | | 18,227 | | | | 12,518 | | | | (19,243 | ) | | | (10,199 | ) |
| | | | |
Net Increase (Decrease) in Net Assets Resulting from Operations | | | 26,622 | | | | (98,084 | ) | | | 13,499 | | | | (21,070 | ) |
| | | | |
Distributions to Shareholders: | | | | | | | | | | | | | | | | |
From net investment income | | | | | | | | | | | | | | | | |
Institutional Class | | | (318 | ) | | | (1,746 | ) | | | (5,009 | ) | | | 0 | |
Class P | | | (275 | ) | | | (3,101 | ) | | | (4,771 | ) | | | 0 | |
Class D | | | (98 | ) | | | (848 | ) | | | (1,056 | ) | | | 0 | |
Class A | | | (1,604 | ) | | | (8,671 | ) | | | (3,239 | ) | | | 0 | |
Class C | | | (1,206 | ) | | | (8,146 | ) | | | (2,934 | ) | | | 0 | |
Class R | | | NA | | | | (4 | )^ | | | NA | | | | NA | |
From net realized capital gains | | | | | | | | | | | | | | | | |
Institutional Class | | | 0 | | | | (2,576 | ) | | | (3,352 | ) | | | (2,579 | ) |
Class P | | | 0 | | | | (5,302 | ) | | | (3,145 | ) | | | (3,075 | ) |
Class D | | | 0 | | | | (1,876 | ) | | | (852 | ) | | | (641 | ) |
Class A | | | 0 | | | | (16,603 | ) | | | (2,245 | ) | | | (1,768 | ) |
Class C | | | 0 | | | | (19,121 | ) | | | (2,370 | ) | | | (1,826 | ) |
Class R | | | NA | | | | (18 | )^ | | | NA | | | | NA | |
| | | | |
Total Distributions(a) | | | (3,501 | ) | | | (68,012 | ) | | | (28,973 | ) | | | (9,889 | ) |
| | | | |
Portfolio Share Transactions: | | | | | | | | | | | | | | | | |
Net increase (decrease) resulting from Fund share transactions** | | | (101,075 | ) | | | (328,333 | ) | | | (266,157 | ) | | | 14,235 | |
| | | | |
Total (Decrease) in Net Assets | | | (77,954 | ) | | | (494,429 | ) | | | (281,631 | ) | | | (16,724 | ) |
| | | | |
Net Assets: | | | | | | | | | | | | | | | | |
Beginning of year or period | | | 439,833 | | | | 934,262 | | | | 848,384 | | | | 865,108 | |
End of year or period* | | $ | 361,879 | | | $ | 439,833 | | | $ | 566,753 | | | $ | 848,384 | |
| | | | |
* Including undistributed (overdistributed) net investment income of: | | $ | (980 | ) | | $ | (1,410 | ) | | $ | (19,683 | ) | | $ | 690 | |
| † | A zero balance may reflect actual amounts rounding to less than one thousand. |
| ^ | Class R Shares liquidated at the close of business on January 22, 2016. |
| ** | See Note 12 in the Notes to Financial Statements. |
| (a) | The tax characterization of distributions is determined in accordance with federal income tax regulations. The actual tax characterization of distributions paid is determined at the end of the fiscal year. See Note 2 in the Notes to Financial Statements for more information. |
| | | | | | |
| | SEMIANNUAL REPORT | | DECEMBER 31, 2016 | | 19 |
Statement of Cash Flows
| | | | |
| Six Months Ended December 31,2016 (Unaudited) | | | |
| (Amounts in thousands) | | PIMCO
EqS® Long/Short
Fund | |
| |
Cash Flows Provided by Operating Activities: | | | | |
| |
Net increase in net assets resulting from operations | | $ | 13,499 | |
| |
Adjustments to Reconcile Net Increase in Net Assets from Operations to Net Cash Provided by Operating Activities: | | | | |
Purchases of long-term securities | | | (468,097 | ) |
Proceeds from sales of long-term securities | | | 708,524 | |
Proceeds from sales of short-term portfolio investments, net | | | 110,154 | |
(Increase) in deposits with counterparty | | | (8,295 | ) |
Decrease in receivable for investments sold | | | 4,029 | |
Decrease in interest and/or dividends receivable | | | 336 | |
Decrease in dividends receivable from Affiliates | | | 144 | |
Payments on exchange-traded or centrally cleared financial derivative instruments | | | (2,697 | ) |
Proceeds from over the counter financial derivative instruments | | | 1,752 | |
(Increase) in other assets | | | (1 | ) |
(Decrease) in payable for investments purchased | | | (56,730 | ) |
Increase in deposits from counterparty | | | 120 | |
(Decrease) in accrued investment advisory fees | | | (185 | ) |
(Decrease) in accrued supervisory and administrative fees | | | (92 | ) |
(Decrease) in accrued distribution fees | | | (17 | ) |
(Decrease) in accrued servicing fees | | | (10 | ) |
(Increase) in reimbursement receivable from PIMCO | | | (138 | ) |
Payments on short sales transactions, net | | | 7,426 | |
Payments on foreign currency transactions | | | (213 | ) |
(Decrease) in other liabilities | | | (3 | ) |
Net Realized (Gain) Loss | | | | |
Investments in securities | | | (41,436 | ) |
Investments in Affiliates | | | (69 | ) |
Exchange-traded or centrally cleared financial derivative instruments | | | 3,194 | |
Over the counter financial derivative instruments | | | (1,753 | ) |
Short sales | | | 3,855 | |
Foreign currency | | | 103 | |
Net Change in Unrealized (Appreciation) Depreciation | | | | |
Investments in securities | | | 23,165 | |
Investments in Affiliates | | | 27 | |
Exchange-traded or centrally cleared financial derivative instruments | | | (620 | ) |
Over the counter financial derivative instruments | | | (1,228 | ) |
Short sales | | | (2,211 | ) |
Foreign currency assets and liabilities | | | 110 | |
Net amortization (accretion) on investments | | | (392 | ) |
| |
Net Cash Provided by Operating Activities | | | 292,251 | |
| |
Cash Flows (Used for) Financing Activities: | | | | |
Proceeds from shares sold | | | 66,978 | |
Payments on shares redeemed | | | (358,683 | ) |
Cash distributions paid* | | | (66 | ) |
| |
Net Cash (Used for) Financing Activities | | | (291,771 | ) |
| |
Net Increase in Cash and Foreign Currency | | | 480 | |
| |
Cash and Foreign Currency: | | | | |
Beginning of period | | | 2 | |
End of period | | $ | 482 | |
| |
* Reinvestment of distributions | | $ | 28,907 | |
| |
Supplemental Disclosure of Cash Flow Information: | | | | |
Interest expense paid during the period | | $ | 15 | |
| | | | | | | | |
| 20 | | PIMCO EQUITY SERIES | | | | | See Accompanying Notes | |
Schedule of Investments PIMCO Dividend and Income Fund
December 31, 2016 (Unaudited)
| | | | | | | | | | | | |
| | | | | PRINCIPAL
AMOUNT
(000S) | | | | | MARKET
VALUE
(000S) | |
| INVESTMENTS IN SECURITIES 102.9% | |
| | | | | | | | | | | | |
| ASSET-BACKED SECURITIES 7.2% | |
| | | | | | | | | | | | |
| CAYMAN ISLANDS 1.5% | |
ACAS CLO Ltd. | |
2.332% due 10/25/2025 | | $ | | | 750 | | | $ | | | 750 | |
Mariner CLO LLC | |
2.221% due 07/23/2026 | | | | | 700 | | | | | | 702 | |
NewMark Capital Funding CLO Ltd. | |
2.054% due 06/02/2025 | | | | | 1,100 | | | | | | 1,096 | |
OZLM Ltd. | |
2.430% due 04/17/2026 | | | | | 1,000 | | | | | | 1,001 | |
Palmer Square CLO Ltd. | |
2.280% due 10/17/2025 | | | | | 700 | | | | | | 699 | |
TICP CLO Ltd. | |
2.384% due 04/26/2026 | | | | | 1,100 | | | | | | 1,099 | |
Trainer Wortham First Republic CBO Ltd. | |
2.081% due 11/06/2038 | | | | | 63 | | | | | | 63 | |
| | | | | | | | | | | | |
Total Cayman Islands | | | | | | | | | | | 5,410 | |
| | | | | | | | | | | | |
| | | | | | | | | | | | |
| UNITED STATES 5.7% | |
Conseco Financial Corp. | |
6.280% due 09/01/2030 | | | | | 586 | | | | | | 621 | |
Credit Suisse First Boston Mortgage Securities Corp. | |
1.376% due 01/25/2032 | | | | | 1,545 | | | | | | 1,371 | |
EMC Mortgage Loan Trust | |
1.884% due 02/25/2041 | | | | | 39 | | | | | | 39 | |
HSI Asset Securitization Corp. Trust | |
0.926% due 12/25/2036 | | | | | 5,494 | | | | | | 2,312 | |
Morgan Stanley Home Equity Loan Trust | |
0.856% due 12/25/2036 | | | | | 2,081 | | | | | | 1,176 | |
1.176% due 12/25/2035 | | | | | 3,600 | | | | | | 3,174 | |
Progress Residential Trust | |
2.236% due 09/17/2033 | | | | | 998 | | | | | | 1,008 | |
Residential Asset Securities Corp. Trust | |
1.469% due 01/25/2034 | | | | | 2,097 | | | | | | 1,924 | |
Structured Asset Investment Loan Trust | |
0.906% due 09/25/2036 | | | | | 6,696 | | | | | | 5,893 | |
VOLT LLC | |
3.500% due 07/25/2046 | | | | | 3,143 | | | | | | 3,139 | |
| | | | | | | | | | | | |
Total United States | | | | | | | | | | | 20,657 | |
| | | | | | | | | | | | |
Total Asset-Backed Securities (Cost $25,453) | | | 26,067 | |
| | | | | | | | | | | | |
| | | | | | | | | | | | |
| BANK LOAN OBLIGATIONS 0.9% | |
| | | | | | | | | | | | |
| UNITED STATES 0.9% | |
Diamond Resorts Corp. | |
7.000% due 08/11/2023 | | | | | 100 | | | | | | 99 | |
Energy Future Intermediate Holding Co. LLC | |
4.250% due 06/30/2017 | | | | | 1,988 | | | | | | 2,003 | |
Hilton Worldwide Finance LLC | |
3.256% due 10/25/2023 | | | | | 272 | | | | | | 276 | |
3.500% due 10/26/2020 | | | | | 20 | | | | | | 20 | |
iHeartCommunications, Inc. | |
7.520% due 01/30/2019 | | | | | 300 | | | | | | 245 | |
Las Vegas Sands LLC | |
3.020% due 12/19/2020 | | | | | 398 | | | | | | 401 | |
OGX | |
13.000% due 04/10/2049 ^ | | | | | 15 | | | | | | 7 | |
TEX Operations Co. LLC | |
5.000% due 08/04/2023 | | | | | 29 | | | | | | 29 | |
| | | | | | | | | | | | |
Total Bank Loan Obligations (Cost $3,117) | | | 3,080 | |
| | | | | | | | | | | | |
| |
| | | | | SHARES | | | | | | |
| COMMON STOCKS 74.7% | |
| | | | | | | | | | | | |
| AUSTRALIA 1.3% | |
| | | | | | | | | | | | |
| CONSUMER DISCRETIONARY 0.1% | |
Myer Holdings Ltd. | | | | | 281,645 | | | | | | 280 | |
| | | | | | | | | | | | |
| | | | | | | | | | | | |
| | | | | SHARES | | | | | MARKET
VALUE
(000S) | |
| CONSUMER STAPLES 0.1% | |
Coca-Cola Amatil Ltd. | | | | | 29,460 | | | $ | | | 215 | |
Metcash Ltd. (a) | | | | | 192,964 | | | | | | 317 | |
| | | | | | | | | | | | |
| | | | | | | | | | | 532 | |
| | | | | | | | | | | | |
| | | | | | | | | | | | |
| ENERGY 0.3% | |
Woodside Petroleum Ltd. | | | | | 20,949 | | | | | | 469 | |
WorleyParsons Ltd. | | | | | 96,551 | | | | | | 672 | |
| | | | | | | | | | | | |
| | | | | | | | | | | 1,141 | |
| | | | | | | | | | | | |
| | | | | | | | | | | | |
| FINANCIALS 0.3% | |
AMP Ltd. | | | | | 49,686 | | | | | | 180 | |
Australia & New Zealand Banking Group Ltd. | | | | | 27,691 | | | | | | 606 | |
Genworth Mortgage Insurance Australia Ltd. | | | | | 74,034 | | | | | | 175 | |
| | | | | | | | | | | | |
| | | | | | | | | | | 961 | |
| | | | | | | | | | | | |
| | | | | | | | | | | | |
| HEALTH CARE 0.1% | |
Primary Health Care Ltd. | | | | | 71,068 | | | | | | 209 | |
| | | | | | | | | | | | |
| | | | | | | | | | | | |
| MATERIALS 0.4% | |
CSR Ltd. | | | | | 86,598 | | | | | | 288 | |
Fortescue Metals Group Ltd. | | | | | 164,104 | | | | | | 686 | |
Mineral Resources Ltd. | | | | | 7,109 | | | | | | 62 | |
Orica Ltd. | | | | | 22,774 | | | | | | 289 | |
OZ Minerals Ltd. | | | | | 53,509 | | | | | | 302 | |
| | | | | | | | | | | | |
| | | | | | | | | | | 1,627 | |
| | | | | | | | | | | | |
Total Australia | | | | | | | | | | | 4,750 | |
| | | | | | | | | | | | |
| | | | | | | | | | | | |
| AUSTRIA 0.4% | |
| | | | | | | | | | | | |
| ENERGY 0.2% | |
OMV AG | | | | | 18,086 | | | | | | 638 | |
| | | | | | | | | | | | |
| | | | | | | | | | | | |
| FINANCIALS 0.1% | |
Raiffeisen Bank International AG | | | | | 34,067 | | | | | | 621 | |
| | | | | | | | | | | | |
| | | | | | | | | | | | |
| MATERIALS 0.1% | |
voestalpine AG | | | | | 8,316 | | | | | | 325 | |
| | | | | | | | | | | | |
Total Austria | | | | | | | | | | | 1,584 | |
| | | | | | | | | | | | |
| | | | | | | | | | | | |
| BELGIUM 0.1% | |
| | | | | | | | | | | | |
| CONSUMER DISCRETIONARY 0.0% | |
D’ieteren S.A. | | | | | 2,093 | | | | | | 93 | |
| | | | | | | | | | | | |
| | | | | | | | | | | | |
| TELECOMMUNICATION SERVICES 0.1% | |
Proximus S.A. | | | | | 9,512 | | | | | | 273 | |
| | | | | | | | | | | | |
Total Belgium | | | | | | | | | | | 366 | |
| | | | | | | | | | | | |
| | | | | | | | | | | | |
| BRAZIL 0.0% | |
| | | | | | | | | | | | |
| ENERGY 0.0% | |
OGX Petroleo e Gas S.A. SP - ADR | | | | | 6,334 | | | | | | 0 | |
| | | | | | | | | | | | |
Total Brazil | | | | | | | | | | | 0 | |
| | | | | | | | | | | | |
| |
| CANADA 2.3% | |
| | | | | | | | | | | | |
| ENERGY 0.6% | |
Baytex Energy Corp. (a) | | | | | 43,503 | | | | | | 213 | |
Bonavista Energy Corp. | | | | | 77,676 | | | | | | 278 | |
Encana Corp. | | | | | 16,407 | | | | | | 193 | |
| | | | | | | | | | | | |
| | | | | SHARES | | | | | MARKET
VALUE
(000S) | |
Enerplus Corp. | | | | | 70,052 | | | $ | | | 665 | |
Husky Energy, Inc. (a) | | | | | 40,809 | | | | | | 495 | |
Pengrowth Energy Corp. | | | | | 44,043 | | | | | | 63 | |
Penn West Petroleum Ltd. (a) | | | | | 86,645 | | | | | | 153 | |
| | | | | | | | | | | | |
| | | | | | | | | | | 2,060 | |
| | | | | | | | | | | | |
| | | | | | | | | | | | |
| FINANCIALS 0.7% | |
Canadian Imperial Bank of Commerce | | | | | 16,944 | | | | | | 1,383 | |
Genworth MI Canada, Inc. | | | | | 5,796 | | | | | | 145 | |
IGM Financial, Inc. | | | | | 5,938 | | | | | | 169 | |
National Bank of Canada | | | | | 11,992 | | | | | | 487 | |
Power Corp. of Canada | | | | | 15,599 | | | | | | 349 | |
Power Financial Corp. | | | | | 6,854 | | | | | | 171 | |
| | | | | | | | | | | | |
| | | | | | | | | | | 2,704 | |
| | | | | | | | | | | | |
| | | | | | | | | | | | |
| INDUSTRIALS 0.1% | |
Bombardier, Inc. ‘B’ (a) | | | | | 60,937 | | | | | | 106 | |
Russel Metals, Inc. | | | | | 6,424 | | | | | | 122 | |
| | | | | | | | | | | | |
| | | | | | | | | | | 228 | |
| | | | | | | | | | | | |
| | | | | | | | | | | | |
| MATERIALS 0.6% | |
IAMGOLD Corp. (a) | | | | | 46,790 | | | | | | 180 | |
Teck Resources Ltd. ‘B’ | | | | | 111,489 | | | | | | 2,231 | |
| | | | | | | | | | | | |
| | | | | | | | | | | 2,411 | |
| | | | | | | | | | | | |
| | | | | | | | | | | | |
| TELECOMMUNICATION SERVICES 0.1% | |
Manitoba Telecom Services, Inc. | | | | | 7,513 | | | | | | 213 | |
| | | | | | | | | | | | |
| | | | | | | | | | | | |
| UTILITIES 0.2% | |
Atco Ltd. ‘I’ | | | | | 10,020 | | | | | | 333 | |
TransAlta Corp. | | | | | 68,446 | | | | | | 379 | |
| | | | | | | | | | | | |
| | | | | | | | | | | 712 | |
| | | | | | | | | | | | |
Total Canada | | | | | | | | | | | 8,328 | |
| | | | | | | | | | | | |
| | | | | | | | | | | | |
| DENMARK 0.4% | |
| | | | | | | | | | | | |
| INDUSTRIALS 0.3% | |
AP Moller - Maersk A/S | | | | | 774 | | | | | | 1,234 | |
| | | | | | | | | | | | |
| | | | | | | | | | | | |
| TELECOMMUNICATION SERVICES 0.1% | |
TDC A/S | | | | | 66,750 | | | | | | 342 | |
| | | | | | | | | | | | |
Total Denmark | | | | | | | | | | | 1,576 | |
| | | | | | | | | | | | |
| | | | | | | | | | | | |
| FINLAND 0.3% | |
| | | | | | | | | | | | |
| INDUSTRIALS 0.0% | |
Metso OYJ | | | | | 2,106 | | | | | | 60 | |
| | | | | | | | | | | | |
| | | | | | | | | | | | |
| MATERIALS 0.1% | |
Stora Enso OYJ ‘R’ | | | | | 36,657 | | | | | | 392 | |
| | | | | | | | | | | | |
| | | | | | | | | | | | |
| UTILITIES 0.2% | |
Fortum OYJ | | | | | 33,941 | | | | | | 519 | |
| | | | | | | | | | | | |
Total Finland | | | | | | | | | | | 971 | |
| | | | | | | | | | | | |
| | | | | | | | | | | | |
| FRANCE 5.4% | |
| | | | | | | | | | | | |
| CONSUMER DISCRETIONARY 0.8% | |
Cie Generale des Etablissements Michelin | | | | | 7,874 | | | | | | 875 | |
Lagardere S.C.A. | | | | | 23,997 | | | | | | 666 | |
| | | | | | |
| See Accompanying Notes | | SEMIANNUAL REPORT | | DECEMBER 31, 2016 | | 21 |
Schedule of Investments PIMCO Dividend and Income Fund (Cont.)
| | | | | | | | | | | | |
| | | | | SHARES | | | | | MARKET
VALUE
(000S) | |
Television Francaise 1 | | | | | 3,069 | | | $ | | | 31 | |
Vivendi S.A. | | | | | 65,443 | | | | | | 1,241 | |
| | | | | | | | | | | | |
| | | | | | | | | | | 2,813 | |
| | | | | | | | | | | | |
| | | | | | | | | | | | |
| CONSUMER STAPLES 0.1% | |
Casino Guichard Perrachon S.A. | | | | | 9,413 | | | | | | 451 | |
| | | | | | | | | | | | |
| | | | | | | | | | | | |
| ENERGY 0.9% | |
Total S.A. | | | | | 60,976 | | | | | | 3,127 | |
Vallourec S.A. | | | | | 29,230 | | | | | | 201 | |
| | | | | | | | | | | | |
| | | | | | | | | | | 3,328 | |
| | | | | | | | | | | | |
| | | | | | | | | | | | |
| FINANCIALS 0.9% | |
CNP Assurances | | | | | 9,413 | | | | | | 174 | |
Societe Generale S.A. | | | | | 60,296 | | | | | | 2,966 | |
| | | | | | | | | | | | |
| | | | | | | | | | | 3,140 | |
| | | | | | | | | | | | |
| | | | | | | | | | | | |
| HEALTH CARE 1.0% | |
Sanofi | | | | | 44,655 | | | | | | 3,611 | |
| | | | | | | | | | | | |
| | | | | | | | | | | | |
| INDUSTRIALS 0.6% | |
Bouygues S.A. | | | | | 22,890 | | | | | | 819 | |
Rexel S.A. | | | | | 8,267 | | | | | | 136 | |
Vinci S.A. | | | | | 17,149 | | | | | | 1,167 | |
| | | | | | | | | | | | |
| | | | | | | | | | | 2,122 | |
| | | | | | | | | | | | |
| | | | | | | | | | | | |
| TELECOMMUNICATION SERVICES 0.4% | |
Orange S.A. | | | | | 108,006 | | | | | | 1,638 | |
| | | | | | | | | | | | |
| | | | | | | | | | | | |
| UTILITIES 0.7% | |
Electricite de France S.A. | | | | | 73,337 | | | | | | 746 | |
Engie S.A. | | | | | 137,793 | | | | | | 1,754 | |
| | | | | | | | | | | | |
| | | | | | | | | | | 2,500 | |
| | | | | | | | | | | | |
Total France | | | | | | | | | | | 19,603 | |
| | | | | | | | | | | | |
| | | | | | | | | | | | |
| GERMANY 3.2% | |
| | | | | | | | | | | | |
| CONSUMER DISCRETIONARY 0.4% | |
Bayerische Motoren Werke AG | | | | | 13,637 | | | | | | 1,270 | |
| | | | | | | | | | | | |
| | | | | | | | | | | | |
| CONSUMER STAPLES 0.4% | |
METRO AG | | | | | 30,887 | | | | | | 1,027 | |
Suedzucker AG | | | | | 10,499 | | | | | | 250 | |
| | | | | | | | | | | | |
| | | | | | | | | | | 1,277 | |
| | | | | | | | | | | | |
| | | | | | | | | | | | |
| FINANCIALS 0.3% | |
Muenchener Rueckversicherungs-Gesellschaft AG in Muenchen | | | | | 6,367 | | | | | | 1,203 | |
| | | | | | | | | | | | |
| | | | | | | | | | | | |
| HEALTH CARE 0.0% | |
Rhoen Klinikum AG | | | | | 5,465 | | | | | | 147 | |
| | | | | | | | | | | | |
| | | | | | | | | | | | |
| INDUSTRIALS 0.5% | |
Bilfinger SE | | | | | 7,729 | | | | | | 298 | |
Deutsche Lufthansa AG | | | | | 104,259 | | | | | | 1,344 | |
Deutsche Post AG | | | | | 6,390 | | | | | | 209 | |
| | | | | | | | | | | | |
| | | | | | | | | | | 1,851 | |
| | | | | | | | | | | | |
| | | | | | | | | | | | |
| | | | | | | | | | | | |
| | | | | SHARES | | | | | MARKET
VALUE
(000S) | |
| MATERIALS 0.6% | |
BASF SE | | | | | 18,912 | | | $ | | | 1,753 | |
Evonik Industries AG | | | | | 5,379 | | | | | | 160 | |
K+S AG | | | | | 11,711 | | | | | | 279 | |
| | | | | | | | | | | | |
| | | | | | | | | | | 2,192 | |
| | | | | | | | | | | | |
| | | | | | | | | | | | |
| UTILITIES 1.0% | |
E.ON SE | | | | | 263,260 | | | | | | 1,852 | |
RWE AG | | | | | 122,194 | | | | | | 1,516 | |
Uniper SE (a) | | | | | 6,736 | | | | | | 93 | |
| | | | | | | | | | | | |
| | | | | | | | | | | 3,461 | |
| | | | | | | | | | | | |
Total Germany | | | | | | | | | | | 11,401 | |
| | | | | | | | | | | | |
| | | | | | | | | | | | |
| HONG KONG 0.5% | |
| | | | | | | | | | | | |
| CONSUMER DISCRETIONARY 0.1% | |
SJM Holdings Ltd. | | | | | 369,000 | | | | | | 288 | |
| | | | | | | | | | | | |
| | | | | | | | | | | | |
| INDUSTRIALS 0.1% | |
Noble Group Ltd. | | | | | 1,984,000 | | | | | | 231 | |
| | | | | | | | | | | | |
| | | | | | | | | | | | |
| INFORMATION TECHNOLOGY 0.1% | |
Kingboard Chemical Holdings Ltd. | | | | | 84,000 | | | | | | 254 | |
| | | | | | | | | | | | |
| | | | | | | | | | | | |
| REAL ESTATE 0.2% | |
Kerry Properties Ltd. | | | | | 70,000 | | | | | | 189 | |
Shimao Property Holdings Ltd. | | | | | 191,000 | | | | | | 249 | |
Swire Pacific Ltd. ‘A’ | | | | | 39,500 | | | | | | 376 | |
Wheelock & Co. Ltd. | | | | | 43,000 | | | | | | 241 | |
| | | | | | | | | | | | |
| | | | | | | | | | | 1,055 | |
| | | | | | | | | | | | |
Total Hong Kong | | | | | | | | | | | 1,828 | |
| | | | | | | | | | | | |
| | | | | | | | | | | | |
| ISRAEL 0.3% | |
| | | | | | | | | | | | |
| FINANCIALS 0.1% | |
Bank Leumi Le-Israel BM (a) | | | | | 117,738 | | | | | | 484 | |
| | | | | | | | | | | | |
| | | | | | | | | | | | |
| MATERIALS 0.1% | |
Israel Chemicals Ltd. | | | | | 65,432 | | | | | | 267 | |
| | | | | | | | | | | | |
| | | | | | | | | | | | |
| TELECOMMUNICATION SERVICES 0.1% | |
Bezeq The Israeli Telecommunication Corp. Ltd. | | | | | 217,650 | | | | | | 413 | |
| | | | | | | | | | | | |
Total Israel | | | | | | | | | | | 1,164 | |
| | | | | | | | | | | | |
| | | | | | | | | | | | |
| ITALY 1.4% | |
| | | | | | | | | | | | |
| ENERGY 0.7% | |
Eni SpA | | | | | 149,407 | | | | | | 2,422 | |
Snam SpA | | | | | 42,566 | | | | | | 175 | |
| | | | | | | | | | | | |
| | | | | | | | | | | 2,597 | |
| | | | | | | | | | | | |
| | | | | | | | | | | | |
| FINANCIALS 0.2% | |
Poste Italiane SpA | | | | | 77,417 | | | | | | 514 | |
| | | | | | | | | | | | |
| | | | | | | | | | | | |
| UTILITIES 0.5% | |
Enel SpA | | | | | 417,597 | | | | | | 1,836 | |
| | | | | | | | | | | | |
Total Italy | | | | | | | | | | | 4,947 | |
| | | | | | | | | | | | |
| | | | | | | | | | | | |
| | | | | SHARES | | | | | MARKET
VALUE
(000S) | |
| JAPAN 8.7% | |
| | | | | | | | | | | | |
| CONSUMER DISCRETIONARY 0.9% | |
Aisin Seiki Co. Ltd. | | | | | 7,400 | | | $ | | | 320 | |
Benesse Holdings, Inc. | | | | | 11,600 | | | | | | 319 | |
DCM Holdings Co. Ltd. | | | | | 3,500 | | | | | | 31 | |
EDION Corp. | | | | | 3,600 | | | | | | 34 | |
Fuji Media Holdings, Inc. | | | | | 20,700 | | | | | | 289 | |
Isuzu Motors Ltd. | | | | | 4,900 | | | | | | 62 | |
Nikon Corp. | | | | | 27,500 | | | | | | 427 | |
Nissan Motor Co. Ltd. | | | | | 100,300 | | | | | | 1,006 | |
Onward Holdings Co. Ltd. | | | | | 22,000 | | | | | | 154 | |
Sega Sammy Holdings, Inc. | | | | | 4,100 | | | | | | 61 | |
Sumitomo Rubber Industries Ltd. | | | | | 16,500 | | | | | | 261 | |
Yamada Denki Co. Ltd. | | | | | 31,400 | | | | | | 169 | |
Yokohama Rubber Co. Ltd. | | | | | 1,600 | | | | | | 29 | |
| | | | | | | | | | | | |
| | | | | | | | | | | 3,162 | |
| | | | | | | | | | | | |
| | | | | | | | | | | | |
| CONSUMER STAPLES 0.1% | |
Coca-Cola West Co. Ltd. | | | | | 9,500 | | | | | | 280 | |
Kirin Holdings Co. Ltd. | | | | | 15,400 | | | | | | 250 | |
| | | | | | | | | | | | |
| | | | | | | | | | | 530 | |
| | | | | | | | | | | | |
| | | | | | | | | | | | |
| ENERGY 0.2% | |
Idemitsu Kosan Co. Ltd. | | | | | 11,600 | | | | | | 308 | |
JX Holdings, Inc. | | | | | 137,300 | | | | | | 580 | |
| | | | | | | | | | | | |
| | | | | | | | | | | 888 | |
| | | | | | | | | | | | |
| | | | | | | | | | | | |
| FINANCIALS 1.8% | |
Mitsubishi UFJ Financial Group, Inc. | | | | | 370,000 | | | | | | 2,282 | |
Mizuho Financial Group, Inc. | | | | | 716,000 | | | | | | 1,285 | |
Nishi-Nippon Financial Holdings, Inc. (a) | | | | | 15,500 | | | | | | 162 | |
North Pacific Bank Ltd. | | | | | 15,500 | | | | | | 64 | |
Resona Holdings, Inc. | | | | | 124,100 | | | | | | 636 | |
Sumitomo Mitsui Financial Group, Inc. | | | | | 39,800 | | | | | | 1,516 | |
Sumitomo Mitsui Trust Holdings, Inc. | | | | | 13,500 | | | | | | 483 | |
| | | | | | | | | | | | |
| | | | | | | | | | | 6,428 | |
| | | | | | | | | | | | |
| | | | | | | | | | | | |
| HEALTH CARE 0.4% | |
Daiichi Sankyo Co. Ltd. | | | | | 22,300 | | | | | | 455 | |
Hoya Corp. | | | | | 3,700 | | | | | | 155 | |
Takeda Pharmaceutical Co. Ltd. | | | | | 15,800 | | | | | | 656 | |
| | | | | | | | | | | | |
| | | | | | | | | | | 1,266 | |
| | | | | | | | | | | | |
| | | | | | | | | | | | |
| INDUSTRIALS 2.1% | |
Asahi Glass Co. Ltd. | | | | | 84,000 | | | | | | 570 | |
Dai Nippon Printing Co. Ltd. | | | | | 7,000 | | | | | | 69 | |
Hitachi Construction Machinery Co. Ltd. | | | | | 15,700 | | | | | | 339 | |
ITOCHU Corp. | | | | | 42,200 | | | | | | 559 | |
Japan Airlines Co. Ltd. | | | | | 12,700 | | | | | | 371 | |
Komatsu Ltd. | | | | | 32,800 | | | | | | 743 | |
Marubeni Corp. | | | | | 144,300 | | | | | | 816 | |
Mitsubishi Corp. | | | | | 39,700 | | | | | | 843 | |
Mitsui & Co. Ltd. | | | | | 81,200 | | | | | | 1,113 | |
Mitsui Engineering & Shipbuilding Co. Ltd. | | | | | 55,000 | | | | | | 85 | |
Nippon Yusen KK | | | | | 226,000 | | | | | | 418 | |
Sumitomo Corp. | | | | | 72,500 | | | | | | 851 | |
Sumitomo Heavy Industries Ltd. | | | | | 6,000 | | | | | | 39 | |
Toshiba Corp. | | | | | 297,000 | | | | | | 717 | |
| | | | | | | | |
| 22 | | PIMCO EQUITY SERIES | | | | | See Accompanying Notes | |
December 31, 2016 (Unaudited)
| | | | | | | | | | | | |
| | | | | SHARES | | | | | MARKET
VALUE
(000S) | |
West Japan Railway Co. | | | | | 3,100 | | | $ | | | 190 | |
| | | | | | | | | | | | |
| | | | | | | | | | | 7,723 | |
| | | | | | | | | | | | |
| | | | | | | | | | | | |
| INFORMATION TECHNOLOGY 1.8% | |
Brother Industries Ltd. | | | | | 9,900 | | | | | | 178 | |
Canon, Inc. | | | | | 54,800 | | | | | | 1,543 | |
DeNA Co. Ltd. | | | | | 900 | | | | | | 20 | |
Fujitsu Ltd. | | | | | 220,000 | | | | | | 1,218 | |
Gree, Inc. | | | | | 10,800 | | | | | | 57 | |
Hitachi Ltd. | | | | | 421,000 | | | | | | 2,270 | |
Ibiden Co. Ltd. | | | | | 18,000 | | | | | | 241 | |
Nippon Electric Glass Co. Ltd. | | | | | 64,000 | | | | | | 345 | |
Ricoh Co. Ltd. | | | | | 95,000 | | | | | | 803 | |
| | | | | | | | | | | | |
| | | | | | | | | | | 6,675 | |
| | | | | | | | | | | | |
| | | | | | | | | | | | |
| MATERIALS 0.7% | |
Asahi Kasei Corp. | | | | | 16,000 | | | | | | 139 | |
Denka Co. Ltd. | | | | | 32,000 | | | | | | 141 | |
DIC Corp. | | | | | 8,600 | | | | | | 261 | |
Kobe Steel Ltd. | | | | | 25,900 | | | | | | 246 | |
Mitsubishi Chemical Holdings Corp. | | | | | 72,900 | | | | | | 471 | |
Mitsui Mining & Smelting Co. Ltd. | | | | | 100,000 | | | | | | 252 | |
Nippon Light Metal Holdings Co. Ltd. | | | | | 14,300 | | | | | | 30 | |
Rengo Co. Ltd. | | | | | 29,000 | | | | | | 158 | |
Showa Denko KK | | | | | 27,300 | | | | | | 390 | |
Sumitomo Metal Mining Co. Ltd. | | | | | 15,000 | | | | | | 191 | |
Ube Industries Ltd. | | | | | 88,000 | | | | | | 184 | |
| | | | | | | | | | | | |
| | | | | | | | | | | 2,463 | |
| | | | | | | | | | | | |
| | | | | | | | | | | | |
| REAL ESTATE 0.1% | |
Daito Trust Construction Co. Ltd. | | | | | 1,300 | | | | | | 195 | |
| | | | | | | | | | | | |
| | | | | | | | | | | | |
| TELECOMMUNICATION SERVICES 0.5% | |
Nippon Telegraph & Telephone Corp. | | | | | 29,000 | | | | | | 1,221 | |
NTT DOCOMO, Inc. | | | | | 30,100 | | | | | | 684 | |
| | | | | | | | | | | | |
| | | | | | | | | | | 1,905 | |
| | | | | | | | | | | | |
| | | | | | | | | | | | |
| UTILITIES 0.1% | |
Chugoku Electric Power Co., Inc. | | | | | 18,300 | | | | | | 214 | |
Hokuriku Electric Power Co. | | | | | 18,600 | | | | | | 208 | |
| | | | | | | | | | | | |
| | | | | | | | | | | 422 | |
| | | | | | | | | | | | |
Total Japan | | | | | | | | | | | 31,657 | |
| | | | | | | | | | | | |
| | | | | | | | | | | | |
| LUXEMBOURG 0.5% | |
| | | | | | | | | | | | |
| CONSUMER DISCRETIONARY 0.0% | |
RTL Group S.A. | | | | | 1,850 | | | | | | 136 | |
| | | | | | | | | | | | |
| | | | | | | | | | | | |
| MATERIALS 0.5% | |
ArcelorMittal | | | | | 230,178 | | | | | | 1,691 | |
| | | | | | | | | | | | |
Total Luxembourg | | | | | | | | | | | 1,827 | |
| | | | | | | | | | | | |
| | | | | | | | | | | | |
| MACAU 0.0% | |
| | | | | | | | | | | | |
| CONSUMER DISCRETIONARY 0.0% | |
Wynn Macau Ltd. | | | | | 19,200 | | | | | | 30 | |
| | | | | | | | | | | | |
Total Macau | | | | | | | | | | | 30 | |
| | | | | | | | | | | | |
| | | | | | | | | | | | |
| | | | | | | | | | | | |
| | | | | SHARES | | | | | MARKET
VALUE
(000S) | |
| MEXICO 0.0% | |
| | | | | | | | | | | | |
| CONSUMER DISCRETIONARY 0.0% | |
Desarrolladora Homex S.A.B. de C.V. (a) | | | | | 41,996 | | | $ | | | 2 | |
| | | | | | | | | | | | |
Total Mexico | | | | | | | | | | | 2 | |
| | | | | | | | | | | | |
| | | | | | | | | | | | |
| NETHERLANDS 2.7% | |
| | | | | | | | | | | | |
| CONSUMER STAPLES 0.3% | |
Koninklijke Ahold Delhaize NV | | | | | 55,347 | | | | | | 1,166 | |
| | | | | | | | | | | | |
| | | | | | | | | | | | |
| ENERGY 1.8% | |
Fugro NV | | | | | 13,142 | | | | | | 201 | |
Royal Dutch Shell PLC ‘A’ | | | | | 237,003 | | | | | | 6,464 | |
| | | | | | | | | | | | |
| | | | | | | | | | | 6,665 | |
| | | | | | | | | | | | |
| | | | | | | | | | | | |
| FINANCIALS 0.1% | |
Aegon NV | | | | | 30,256 | | | | | | 166 | |
Delta Lloyd NV | | | | | 32,149 | | | | | | 180 | |
| | | | | | | | | | | | |
| | | | | | | | | | | 346 | |
| | | | | | | | | | | | |
| | | | | | | | | | | | |
| INDUSTRIALS 0.4% | |
Koninklijke Philips NV | | | | | 43,254 | | | | | | 1,322 | |
| | | | | | | | | | | | |
| | | | | | | | | | | | |
| TELECOMMUNICATION SERVICES 0.1% | |
Koninklijke KPN NV | | | | | 60,259 | | | | | | 178 | |
VimpelCom Ltd. SP - ADR | | | | | 39,936 | | | | | | 154 | |
| | | | | | | | | | | | |
| | | | | | | | | | | 332 | |
| | | | | | | | | | | | |
Total Netherlands | | | | | | | | | | | 9,831 | |
| | | | | | | | | | | | |
| | | | | | | | | | | | |
| NEW ZEALAND 0.1% | |
| | | | | | | | | | | | |
| TELECOMMUNICATION SERVICES 0.1% | |
Spark New Zealand Ltd. | | | | | 90,106 | | | | | | 213 | |
| | | | | | | | | | | | |
Total New Zealand | | | | | | | | | | | 213 | |
| | | | | | | | | | | | |
| | | | | | | | | | | | |
| NORWAY 0.7% | |
| | | | | | | | | | | | |
| CONSUMER STAPLES 0.1% | |
Marine Harvest ASA | | | | | 18,920 | | | | | | 342 | |
| | | | | | | | | | | | |
| | | | | | | | | | | | |
| ENERGY 0.6% | |
Aker Solutions ASA | | | | | 13,572 | | | | | | 65 | |
Statoil ASA | | | | | 114,885 | | | | | | 2,097 | |
| | | | | | | | | | | | |
| | | | | | | | | | | 2,162 | |
| | | | | | | | | | | | |
| | | | | | | | | | | | |
| FINANCIALS 0.0% | |
Gjensidige Forsikring ASA | | | | | 9,451 | | | | | | 150 | |
| | | | | | | | | | | | |
Total Norway | | | | | | | | | | | 2,654 | |
| | | | | | | | | | | | |
| | | | | | | | | | | | |
| PORTUGAL 0.1% | |
| | | | | | | | | | | | |
| UTILITIES 0.1% | |
EDP - Energias de Portugal S.A. | | | | | 113,258 | | | | | | 345 | |
| | | | | | | | | | | | |
Total Portugal | | | | | | | | | | | 345 | |
| | | | | | | | | | | | |
| | | | | | | | | | | | |
| SINGAPORE 0.1% | |
| | | | | | | | | | | | |
| INDUSTRIALS 0.1% | |
Keppel Corp. Ltd. | | | | | 86,900 | | | | | | 346 | |
| | | | | | | | | | | | |
Total Singapore | | | | | | | | | | | 346 | |
| | | | | | | | | | | | |
| | | | | | | | | | | | |
| | | | | | | | | | | | |
| | | | | SHARES | | | | | MARKET
VALUE
(000S) | |
| SPAIN 2.4% | |
| | | | | | | | | | | | |
| CONSUMER STAPLES 0.1% | |
Distribuidora Internacional de Alimentacion S.A. | | | | | 39,565 | | | $ | | | 194 | |
| | | | | | | | | | | | |
| | | | | | | | | | | | |
| FINANCIALS 1.4% | |
Banco Santander S.A. | | | | | 944,033 | | | | | | 4,911 | |
Mapfre S.A. | | | | | 86,120 | | | | | | 263 | |
| | | | | | | | | | | | |
| | | | | | | | | | | 5,174 | |
| | | | | | | | | | | | |
| | | | | | | | | | | | |
| INDUSTRIALS 0.3% | |
Abertis Infraestructuras S.A. | | | | | 12,961 | | | | | | 181 | |
ACS Actividades de Construccion y Servicios S.A. | | | | | 19,001 | | | | | | 600 | |
Obrascon Huarte Lain S.A. | | | | | 62,178 | | | | | | 215 | |
| | | | | | | | | | | | |
| | | | | | | | | | | 996 | |
| | | | | | | | | | | | |
| | | | | | | | | | | | |
| TELECOMMUNICATION SERVICES 0.3% | |
Telefonica S.A. | | | | | 101,831 | | | | | | 940 | |
| | | | | | | | | | | | |
| | | | | | | | | | | | |
| UTILITIES 0.3% | |
Endesa S.A. | | | | | 60,110 | | | | | | 1,271 | |
| | | | | | | | | | | | |
Total Spain | | | | | | | | | | | 8,575 | |
| | | | | | | | | | | | |
| | | | | | | | | | | | |
| SWEDEN 0.4% | |
| | | | | | | | | | | | |
| FINANCIALS 0.0% | |
Ratos AB ‘B’ | | | | | 35,288 | | | | | | 167 | |
| | | | | | | | | | | | |
| | | | | | | | | | | | |
| HEALTH CARE 0.0% | |
Getinge AB ‘B’ | | | | | 8,880 | | | | | | 142 | |
| | | | | | | | | | | | |
| | | | | | | | | | | | |
| INDUSTRIALS 0.1% | |
Skanska AB ‘B’ | | | | | 8,609 | | | | | | 203 | |
| | | | | | | | | | | | |
| | | | | | | | | | | | |
| TELECOMMUNICATION SERVICES 0.3% | |
Tele2 AB ‘B’ | | | | | 75,467 | | | | | | 603 | |
Telia Co. AB | | | | | 109,707 | | | | | | 441 | |
| | | | | | | | | | | | |
| | | | | | | | | | | 1,044 | |
| | | | | | | | | | | | |
Total Sweden | | | | | | | | | | | 1,556 | |
| | | | | | | | | | | | |
| | | | | | | | | | | | |
| SWITZERLAND 2.0% | |
| | | | | | | | | | | | |
| CONSUMER DISCRETIONARY 0.1% | |
Garmin Ltd. | | | | | 4,370 | | | | | | 212 | |
| | | | | | | | | | | | |
| | | | | | | | | | | | |
| ENERGY 0.0% | |
Transocean Ltd. | | | | | 10,721 | | | | | | 158 | |
| | | | | | | | | | | | |
| | | | | | | | | | | | |
| FINANCIALS 1.2% | |
Baloise Holding AG | | | | | 1,502 | | | | | | 189 | |
Swiss Life Holding AG | | | | | 2,935 | | | | | | 829 | |
Swiss Re AG | | | | | 14,742 | | | | | | 1,395 | |
Zurich Insurance Group AG | | | | | 7,060 | | | | | | 1,940 | |
| | | | | | | | | | | | |
| | | | | | | | | | | 4,353 | |
| | | | | | | | | | | | |
| | | | | | | | | | | | |
| HEALTH CARE 0.6% | |
Novartis AG | | | | | 9,043 | | | | | | 658 | |
Roche Holding AG | | | | | 6,859 | | | | | | 1,563 | |
| | | | | | | | | | | | |
| | | | | | | | | | | 2,221 | |
| | | | | | | | | | | | |
| | | | | | |
| See Accompanying Notes | | SEMIANNUAL REPORT | | DECEMBER 31, 2016 | | 23 |
Schedule of Investments PIMCO Dividend and Income Fund (Cont.)
| | | | | | | | | | | | |
| | | | | SHARES | | | | | MARKET
VALUE
(000S) | |
| TELECOMMUNICATION SERVICES 0.1% | |
Swisscom AG | | | | | 683 | | | $ | | | 305 | |
| | | | | | | | | | | | |
Total Switzerland | | | | | | | | | | | 7,249 | |
| | | | | | | | | | | | |
| | | | | | | | | | | | |
| UNITED KINGDOM 7.7% | |
| | | | | | | | | | | | |
| CONSUMER DISCRETIONARY 0.3% | |
Kingfisher PLC | | | | | 114,278 | | | | | | 492 | |
Marks & Spencer Group PLC | | | | | 112,113 | | | | | | 483 | |
Pearson PLC | | | | | 19,915 | | | | | | 200 | |
| | | | | | | | | | | | |
| | | | | | | | | | | 1,175 | |
| | | | | | | | | | | | |
| | | | | | | | | | | | |
| CONSUMER STAPLES 0.7% | |
British American Tobacco PLC | | | | | 21,539 | | | | | | 1,221 | |
J Sainsbury PLC | | | | | 147,206 | | | | | | 452 | |
Tate & Lyle PLC | | | | | 18,638 | | | | | | 162 | |
WM Morrison Supermarkets PLC | | | | | 263,674 | | | | | | 749 | |
| | | | | | | | | | | | |
| | | | | | | | | | | 2,584 | |
| | | | | | | | | | | | |
| | | | | | | | | | | | |
| ENERGY 1.4% | |
BP PLC | | | | | 760,627 | | | | | | 4,764 | |
Subsea 7 S.A. | | | | | 9,755 | | | | | | 123 | |
| | | | | | | | | | | | |
| | | | | | | | | | | 4,887 | |
| | | | | | | | | | | | |
| | | | | | | | | | | | |
| FINANCIALS 3.1% | |
Barclays PLC | | | | | 1,085,878 | | | | | | 2,980 | |
HSBC Holdings PLC | | | | | 794,179 | | | | | | 6,408 | |
Old Mutual PLC | | | | | 128,765 | | | | | | 328 | |
Standard Chartered PLC | | | | | 190,022 | | | | | | 1,550 | |
| | | | | | | | | | | | |
| | | | | | | | | | | 11,266 | |
| | | | | | | | | | | | |
| | | | | | | | | | | | |
| HEALTH CARE 0.5% | |
GlaxoSmithKline PLC | | | | | 103,237 | | | | | | 1,983 | |
| | | | | | | | | | | | |
| | | | | | | | | | | | |
| INDUSTRIALS 0.4% | |
Aggreko PLC | | | | | 5,168 | | | | | | 58 | |
BAE Systems PLC | | | | | 128,721 | | | | | | 936 | |
Firstgroup PLC (a) | | | | | 126,140 | | | | | | 161 | |
IMI PLC | | | | | 2,363 | | | | | | 30 | |
Smiths Group PLC | | | | | 1,709 | | | | | | 30 | |
Stagecoach Group PLC | | | | | 44,625 | | | | | | 119 | |
| | | | | | | | | | | | |
| | | | | | | | | | | 1,334 | |
| | | | | | | | | | | | |
| | | | | | | | | | | | |
| MATERIALS 0.3% | |
Anglo American PLC (a) | | | | | 40,932 | | | | | | 579 | |
Rio Tinto PLC | | | | | 12,207 | | | | | | 466 | |
| | | | | | | | | | | | |
| | | | | | | | | | | 1,045 | |
| | | | | | | | | | | | |
| | | | | | | | | | | | |
| TELECOMMUNICATION SERVICES 0.4% | |
Vodafone Group PLC | | | | | 577,630 | | | | | | 1,422 | |
| | | | | | | | | | | | |
| | | | | | | | | | | | |
| UTILITIES 0.6% | |
Centrica PLC | | | | | 296,148 | | | | | | 853 | |
Drax Group PLC | | | | | 58,086 | | | | | | 270 | |
National Grid PLC | | | | | 65,874 | | | | | | 770 | |
Severn Trent PLC | | | | | 5,765 | | | | | | 157 | |
| | | | | | | | | | | | |
| | | | | | | | | | | 2,050 | |
| | | | | | | | | | | | |
Total United Kingdom | | | | | | | | | | | 27,746 | |
| | | | | | | | | | | | |
| | | | | | | | | | | | |
| | | | | | | | | | | | |
| | | | | SHARES | | | | | MARKET
VALUE
(000S) | |
| UNITED STATES 33.7% | |
| | | | | | | | | | | | |
| CONSUMER DISCRETIONARY 2.0% | |
Abercrombie & Fitch Co. ‘A’ | | | | | 23,530 | | | $ | | | 282 | |
Coach, Inc. | | | | | 4,938 | | | | | | 173 | |
Dillard’s, Inc. ‘A’ | | | | | 6,029 | | | | | | 378 | |
Ford Motor Co. | | | | | 51,448 | | | | | | 624 | |
Gap, Inc. | | | | | 32,080 | | | | | | 720 | |
Goodyear Tire & Rubber Co. | | | | | 4,337 | | | | | | 134 | |
Guess?, Inc. | | | | | 14,432 | | | | | | 175 | |
Kohl’s Corp. | | | | | 26,642 | | | | | | 1,315 | |
Macy’s, Inc. | | | | | 17,368 | | | | | | 622 | |
Mattel, Inc. | | | | | 7,980 | | | | | | 220 | |
Regal Entertainment Group ‘A’ | | | | | 7,282 | | | | | | 150 | |
Rent-A-Center, Inc. | | | | | 14,971 | | | | | | 168 | |
Staples, Inc. | | | | | 22,236 | | | | | | 201 | |
Time, Inc. | | | | | 16,461 | | | | | | 294 | |
Tupperware Brands Corp. | | | | | 3,967 | | | | | | 209 | |
Viacom, Inc. ‘B’ | | | | | 29,232 | | | | | | 1,026 | |
Weight Watchers International, Inc. (a) | | | | | 18,666 | | | | | | 214 | |
Wynn Resorts Ltd. | | | | | 3,612 | | | | | | 312 | |
| | | | | | | | | | | | |
| | | | | | | | | | | 7,217 | |
| | | | | | | | | | | | |
| | | | | | | | | | | | |
| CONSUMER STAPLES 2.5% | |
Altria Group, Inc. | | | | | 9,902 | | | | | | 670 | |
Avon Products, Inc. | | | | | 152,506 | | | | | | 769 | |
Bunge Ltd. | | | | | 3,745 | | | | | | 270 | |
Herbalife Ltd. (a) | | | | | 8,374 | | | | | | 403 | |
Kimberly-Clark Corp. | | | | | 1,977 | | | | | | 226 | |
PepsiCo, Inc. | | | | | 3,796 | | | | | | 397 | |
Philip Morris International, Inc. | | | | | 28,672 | | | | | | 2,623 | |
Procter & Gamble Co. | | | | | 9,393 | | | | | | 790 | |
Wal-Mart Stores, Inc. | | | | | 42,713 | | | | | | 2,952 | |
| | | | | | | | | | | | |
| | | | | | | | | | | 9,100 | |
| | | | | | | | | | | | |
| | | | | | | | | | | | |
| ENERGY 7.7% | |
Apache Corp. | | | | | 15,485 | | | | | | 983 | |
California Resources Corp. (a) | | | | | 26,123 | | | | | | 556 | |
Chesapeake Energy Corp. (a) | | | | | 268,191 | | | | | | 1,883 | |
Chevron Corp. | | | | | 53,168 | | | | | | 6,258 | |
ConocoPhillips | | | | | 55,043 | | | | | | 2,760 | |
CONSOL Energy, Inc. | | | | | 6,172 | | | | | | 113 | |
Denbury Resources, Inc. (a) | | | | | 98,194 | | | | | | 361 | |
Devon Energy Corp. | | | | | 1,703 | | | | | | 78 | |
Diamond Offshore Drilling, Inc. | | | | | 12,225 | | | | | | 216 | |
Exxon Mobil Corp. | | | | | 90,025 | | | | | | 8,126 | |
Hess Corp. | | | | | 15,700 | | | | | | 978 | |
HollyFrontier Corp. | | | | | 13,899 | | | | | | 455 | |
Marathon Oil Corp. | | | | | 61,723 | | | | | | 1,069 | |
Marathon Petroleum Corp. | | | | | 12,675 | | | | | | 638 | |
Murphy Oil Corp. | | | | | 23,440 | | | | | | 730 | |
National Oilwell Varco, Inc. | | | | | 20,997 | | | | | | 786 | |
Occidental Petroleum Corp. | | | | | 15,051 | | | | | | 1,072 | |
ONEOK, Inc. | | | | | 520 | | | | | | 30 | |
Patterson-UTI Energy, Inc. | | | | | 1,121 | | | | | | 30 | |
Spectra Energy Corp. | | | | | 8,014 | | | | | | 329 | |
Superior Energy Services, Inc. | | | | | 4,288 | | | | | | 72 | |
Valero Energy Corp. | | | | | 6,957 | | | | | | 475 | |
| | | | | | | | | | | | |
| | | | | | | | | | | 27,998 | |
| | | | | | | | | | | | |
| | | | | | | | | | | | |
| FINANCIALS 3.6% | |
Aflac, Inc. | | | | | 6,119 | | | | | | 426 | |
American International Group, Inc. | | | | | 44,999 | | | | | | 2,939 | |
| | | | | | | | | | | | |
| | | | | SHARES | | | | | MARKET
VALUE
(000S) | |
American National Insurance Co. | | | | | 662 | | | $ | | | 82 | |
Assurant, Inc. | | | | | 5,024 | | | | | | 466 | |
Capital One Financial Corp. | | | | | 9,712 | | | | | | 847 | |
Discover Financial Services | | | | | 8,665 | | | | | | 625 | |
Donnelley Financial Solutions, Inc. (a) | | | | | 1,921 | | | | | | 44 | |
Fifth Third Bancorp | | | | | 5,942 | | | | | | 160 | |
Franklin Resources, Inc. | | | | | 1,319 | | | | | | 52 | |
Goldman Sachs Group, Inc. | | | | | 1,180 | | | | | | 283 | |
JPMorgan Chase & Co. | | | | | 28,202 | | | | | | 2,434 | |
Loews Corp. | | | | | 9,070 | | | | | | 425 | |
Navient Corp. | | | | | 45,686 | | | | | | 751 | |
People’s United Financial, Inc. | | | | | 11,231 | | | | | | 217 | |
Progressive Corp. | | | | | 3,959 | | | | | | 140 | |
Reinsurance Group of America, Inc. | | | | | 1,118 | | | | | | 141 | |
Santander Consumer USA Holdings, Inc. (a) | | | | | 17,830 | | | | | | 241 | |
SLM Corp. (a) | | | | | 55,119 | | | | | | 607 | |
Travelers Cos., Inc. | | | | | 16,923 | | | | | | 2,072 | |
| | | | | | | | | | | | |
| | | | | | | | | | | 12,952 | |
| | | | | | | | | | | | |
| | | | | | | | | | | | |
| HEALTH CARE 4.0% | |
Anthem, Inc. | | | | | 16,606 | | | | | | 2,387 | |
Baxter International, Inc. | | | | | 9,850 | | | | | | 437 | |
HCA Holdings, Inc. (a) | | | | | 20,954 | | | | | | 1,551 | |
Johnson & Johnson | | | | | 15,944 | | | | | | 1,837 | |
Merck & Co., Inc. | | | | | 25,848 | | | | | | 1,522 | |
Pfizer, Inc. | | | | | 195,380 | | | | | | 6,346 | |
Quest Diagnostics, Inc. | | | | | 5,779 | | | | | | 531 | |
| | | | | | | | | | | | |
| | | | | | | | | | | 14,611 | |
| | | | | | | | | | | | |
| | | | | | | | | | | | |
| INDUSTRIALS 2.0% | |
AGCO Corp. | | | | | 517 | | | | | | 30 | |
Armstrong World Industries, Inc. (a) | | | | | 7,645 | | | | | | 320 | |
Caterpillar, Inc. | | | | | 14,827 | | | | | | 1,375 | |
Deere & Co. | | | | | 14,511 | | | | | | 1,495 | |
Dun & Bradstreet Corp. | | | | | 1,025 | | | | | | 124 | |
Emerson Electric Co. | | | | | 17,208 | | | | | | 959 | |
Joy Global, Inc. | | | | | 17,288 | | | | | | 484 | |
L3 Technologies, Inc. | | | | | 4,064 | | | | | | 618 | |
LSC Communications, Inc. | | | | | 1,921 | | | | | | 57 | |
Norfolk Southern Corp. | | | | | 6,613 | | | | | | 715 | |
Oshkosh Corp. | | | | | 455 | | | | | | 29 | |
Pitney Bowes, Inc. | | | | | 18,136 | | | | | | 275 | |
RR Donnelley & Sons Co. | | | | | 5,123 | | | | | | 84 | |
Ryder System, Inc. | | | | | 399 | | | | | | 30 | |
Waste Management, Inc. | | | | | 6,933 | | | | | | 492 | |
| | | | | | | | | | | | |
| | | | | | | | | | | 7,087 | |
| | | | | | | | | | | | |
| | | | | | | | | | | | |
| INFORMATION TECHNOLOGY 4.6% | |
Booz Allen Hamilton Holding Corp. | | | | | 12,574 | | | | | | 454 | |
CA, Inc. | | | | | 12,948 | | | | | | 411 | |
Corning, Inc. | | | | | 35,517 | | | | | | 862 | |
HP, Inc. | | | | | 58,806 | | | | | | 873 | |
Intel Corp. | | | | | 126,580 | | | | | | 4,591 | |
International Business Machines Corp. | | | | | 41,172 | | | | | | 6,834 | |
Jabil Circuit, Inc. | | | | | 6,162 | | | | | | 146 | |
Seagate Technology PLC | | | | | 35,978 | | | | | | 1,373 | |
Western Union Co. | | | | | 20,403 | | | | | | 443 | |
Xerox Corp. | | | | | 68,575 | | | | | | 599 | |
| | | | | | | | | | | | |
| | | | | | | | | | | 16,586 | |
| | | | | | | | | | | | |
| | | | | | | | |
| 24 | | PIMCO EQUITY SERIES | | | | | See Accompanying Notes | |
December 31, 2016 (Unaudited)
| | | | | | | | | | | | |
| | | | | SHARES | | | | | MARKET
VALUE
(000S) | |
| MATERIALS 1.5% | |
CF Industries Holdings, Inc. | | | | | 14,070 | | | $ | | | 443 | |
Domtar Corp. | | | | | 9,896 | | | | | | 386 | |
Freeport-McMoRan, Inc. (a) | | | | | 160,757 | | | | | | 2,120 | |
Huntsman Corp. | | | | | 6,757 | | | | | | 129 | |
LyondellBasell Industries NV ‘A’ | | | | | 10,229 | | | | | | 877 | |
Mosaic Co. | | | | | 31,191 | | | | | | 915 | |
Newmont Mining Corp. | | | | | 13,994 | | | | | | 477 | |
Reliance Steel & Aluminum Co. | | | | | 1,719 | | | | | | 137 | |
| | | | | | | | | | | | |
| | | | | | | | | | | 5,484 | |
| | | | | | | | | | | | |
| | | | | | | | | | | | |
| TELECOMMUNICATION SERVICES 3.3% | |
AT&T, Inc. | | | | | 159,578 | | | | | | 6,787 | |
CenturyLink, Inc. | | | | | 47,764 | | | | | | 1,136 | |
Frontier Communications Corp. | | | | | 74,639 | | | | | | 252 | |
Telephone & Data Systems, Inc. | | | | | 3,029 | | | | | | 88 | |
Verizon Communications, Inc. | | | | | 67,014 | | | | | | 3,577 | |
| | | | | | | | | | | | |
| | | | | | | | | | | 11,840 | |
| | | | | | | | | | | | |
| | | | | | | | | | | | |
| UTILITIES 2.5% | |
Ameren Corp. | | | | | 6,211 | | | | | | 326 | |
American Electric Power Co., Inc. | | | | | 14,300 | | | | | | 900 | |
CenterPoint Energy, Inc. | | | | | 19,261 | | | | | | 475 | |
Consolidated Edison, Inc. | | | | | 11,277 | | | | | | 831 | |
Entergy Corp. | | | | | 18,578 | | | | | | 1,365 | |
Exelon Corp. | | | | | 35,243 | | | | | | 1,251 | |
FirstEnergy Corp. | | | | | 34,130 | | | | | | 1,057 | |
Great Plains Energy, Inc. | | | | | 6,903 | | | | | | 189 | |
Pinnacle West Capital Corp. | | | | | 4,205 | | | | | | 328 | |
PPL Corp. | | | | | 15,981 | | | | | | 544 | |
Public Service Enterprise Group, Inc. | | | | | 15,726 | | | | | | 690 | |
Southern Co. | | | | | 12,956 | | | | | | 637 | |
Vectren Corp. | | | | | 2,808 | | | | | | 146 | |
Xcel Energy, Inc. | | | | | 6,140 | | | | | | 250 | |
| | | | | | | | | | | | |
| | | | | | | | | | | 8,989 | |
| | | | | | | | | | | | |
Total United States | | | | | | | | | | | 121,864 | |
| | | | | | | | | | | | |
Total Common Stocks (Cost $255,604) | | | | | | 270,413 | |
| | | | | | | | | | | | |
| |
| | | | | PRINCIPAL
AMOUNT
(000S) | | | | | | |
| CORPORATE BONDS & NOTES 7.9% | |
| | | | | | | | | | | | |
| AUSTRALIA 0.1% | |
| | | | | | | | | | | | |
| BANKING & FINANCE 0.1% | |
National Australia Bank Ltd. | |
1.375% due 07/12/2019 | | $ | | | 400 | | | | | | 393 | |
| | | | | | | | | | | | |
Total Australia | | | | | | | | | | | 393 | |
| | | | | | | | | | | | |
| | | | | | | | | | | | |
| AUSTRIA 0.0% | |
| | | | | | | | | | | | |
| INDUSTRIALS 0.0% | |
OGX Austria GmbH | |
8.375% due 04/01/2022 ^ | | | | | 200 | | | | | | 0 | |
8.500% due 06/01/2018 ^ | | | | | 200 | | | | | | 0 | |
| | | | | | | | | | | | |
| | | | | | | | | | | 0 | |
| | | | | | | | | | | | |
Total Austria | | | | | | | | | | | 0 | |
| | | | | | | | | | | | |
| | | | | | | | | | | | |
| BRAZIL 0.4% | |
| | | | | | | | | | | | |
| UTILITIES 0.4% | |
Petrobras Global Finance BV | |
5.375% due 01/27/2021 | | | | | 483 | | | | | | 473 | |
| | | | | | | | | | | | |
| | | | | PRINCIPAL
AMOUNT
(000S) | | | | | MARKET
VALUE
(000S) | |
4.375% due 05/20/2023 | | $ | | | 57 | | | $ | | | 50 | |
4.875% due 03/17/2020 | | | | | 273 | | | | | | 271 | |
3.873% due 03/17/2020 | | | | | 37 | | | | | | 36 | |
6.250% due 12/14/2026 | | GBP | | | 100 | | | | | | 116 | |
6.850% due 06/05/2115 | | $ | | | 108 | | | | | | 88 | |
6.875% due 01/20/2040 | | | | | 2 | | | | | | 2 | |
8.375% due 05/23/2021 | | | | | 485 | | | | | | 524 | |
| | | | | | | | | | | | |
| | | | | | | | | | | 1,560 | |
| | | | | | | | | | | | |
Total Brazil | | | | | | | | | | | 1,560 | |
| | | | | | | | | | | | |
| | | | | | | | | | | | |
| CAYMAN ISLANDS 0.0% | |
| | | | | | | | | | | | |
| UTILITIES 0.0% | |
Odebrecht Drilling Norbe Ltd. | |
6.350% due 06/30/2022 | | | | | 143 | | | | | | 65 | |
| | | | | | | | | | | | |
Total Cayman Islands | | | | | | | | | | | 65 | |
| | | | | | | | | | | | |
| | | | | | | | | | | | |
| DENMARK 0.7% | |
| | | | | | | | | | | | |
| BANKING & FINANCE 0.7% | |
Nykredit Realkredit A/S | |
3.000% due 10/01/2047 | | DKK | | | 9,529 | | | | | | 1,403 | |
Realkredit Danmark A/S | |
2.000% due 04/01/2017 | | | | | 8,800 | | | | | | 1,254 | |
| | | | | | | | | | | | |
| | | | | | | | | | | 2,657 | |
| | | | | | | | | | | | |
Total Denmark | | | | | | | | | | | 2,657 | |
| | | | | | | | | | | | |
| | | | | | | | | | | | |
| FRANCE 0.7% | |
| | | | | | | | | | | | |
| BANKING & FINANCE 0.4% | |
BPCE S.A. | |
12.500% due 09/30/2019 (f) | | $ | | | 100 | | | | | | 122 | |
Credit Agricole S.A. | |
7.875% due 01/23/2024 (f) | | | | | 500 | | | | | | 507 | |
RCI Banque S.A. | | | | | | | | | | | | |
3.500% due 04/03/2018 | | | | | 1,000 | | | | | | 1,019 | |
| | | | | | | | | | | | |
| | | | | | | | | | | 1,648 | |
| | | | | | | | | | | | |
| | | | | | | | | | | | |
| INDUSTRIALS 0.3% | |
SFR Group S.A. | | | | | | | | | | | | |
7.375% due 05/01/2026 | | | | | 1,000 | | | | | | 1,025 | |
| | | | | | | | | | | | |
Total France | | | | | | | | | | | 2,673 | |
| | | | | | | | | | | | |
| | | | | | | | | | | | |
| GERMANY 0.2% | |
| | | | | | | | | | | | |
| BANKING & FINANCE 0.2% | |
Deutsche Bank AG | | | | | | | | | | | | |
4.250% due 10/14/2021 | | | | | 590 | | | | | | 592 | |
| | | | | | | | | | | | |
Total Germany | | | | | | | | | | | 592 | |
| | | | | | | | | | | | |
| | | | | | | | | | | | |
| IRELAND 0.2% | |
| | | | | | | | | | | | |
| BANKING & FINANCE 0.1% | |
Vnesheconombank Via VEB Finance PLC | |
6.902% due 07/09/2020 | | | | | 100 | | | | | | 108 | |
| | | | | | | | | | | | |
| | | | | | | | | | | | |
| INDUSTRIALS 0.1% | |
Russian Railways via RZD Capital PLC | |
7.487% due 03/25/2031 | | GBP | | | 300 | | | | | | 420 | |
| | | | | | | | | | | | |
Total Ireland | | | | | | | | | | | 528 | |
| | | | | | | | | | | | |
| | | | | | | | | | | | |
| ITALY 0.1% | |
| | | | | | | | | | | | |
| UTILITIES 0.1% | |
Telecom Italia SpA | | | | | | | | | | | | |
7.375% due 12/15/2017 | | | | | 250 | | | | | | 325 | |
| | | | | | | | | | | | |
Total Italy | | | | | | | | | | | 325 | |
| | | | | | | | | | | | |
| | | | | | | | | | | | |
| | | | | PRINCIPAL
AMOUNT
(000S) | | | | | MARKET
VALUE
(000S) | |
| LUXEMBOURG 0.6% | |
| | | | | | | | | | | | |
| BANKING & FINANCE 0.2% | |
Sberbank of Russia Via SB Capital S.A. | |
3.352% due 11/15/2019 | | EUR | | | 200 | | | $ | | | 222 | |
6.125% due 02/07/2022 | | $ | | | 400 | | | | | | 436 | |
| | | | | | | | | | | | |
| | | | | | | | | | | 658 | |
| | | | | | | | | | | | |
| | | | | | | | | | | | |
| UTILITIES 0.4% | |
Gazprom Neft OAO Via GPN Capital S.A. | |
4.375% due 09/19/2022 | | | | | 300 | | | | | | 298 | |
6.000% due 11/27/2023 | | | | | 300 | | | | | | 319 | |
Gazprom OAO Via Gaz Capital S.A. | |
9.250% due 04/23/2019 | | | | | 600 | | | | | | 681 | |
5.999% due 01/23/2021 | | | | | 30 | | | | | | 32 | |
6.605% due 02/13/2018 | | EUR | | | 50 | | | | | | 56 | |
| | | | | | | | | | | | |
| | | | | | | | | | | 1,386 | |
| | | | | | | | | | | | |
Total Luxembourg | | | | | | | | | | | 2,044 | |
| | | | | | | | | | | | |
| | | | | | | | | | | | |
| MEXICO 0.0% | |
| | | | | | | | | | | | |
| INDUSTRIALS 0.0% | |
Corp. GEO S.A.B. de C.V. | | | | | | | | | | | | |
8.875% due 03/27/2022 ^ | | $ | | | 300 | | | | | | 0 | |
9.250% due 06/30/2020 ^ | | | | | 100 | | | | | | 0 | |
Petroleos Mexicanos | | | | | | | | | | | | |
4.607% due 03/11/2022 | | | | | 20 | | | | | | 21 | |
5.375% due 03/13/2022 | | | | | 10 | | | | | | 10 | |
6.500% due 03/13/2027 | | | | | 40 | | | | | | 41 | |
| | | | | | | | | | | | |
| | | | | | | | | | | 72 | |
| | | | | | | | | | | | |
Total Mexico | | | | | | | | | | | 72 | |
| | | | | | | | | | | | |
| | | | | | | | | | | | |
| NETHERLANDS 0.1% | |
| | | | | | | | | | | | |
| BANKING & FINANCE 0.1% | |
Cooperatieve Rabobank UA | | | | | | | | | | | | |
6.625% due 06/29/2021 (f) | | EUR | | | 200 | | | | | | 226 | |
| | | | | | | | | | | | |
Total Netherlands | | | | | | | | | | | 226 | |
| | | | | | | | | | | | |
| | | | | | | | | | | | |
| UNITED KINGDOM 2.0% | |
| | | | | | | | | | | | |
| BANKING & FINANCE 1.7% | |
Barclays Bank PLC | | | | | | | | | | | | |
14.000% due 06/15/2019 (f) | | GBP | | | 300 | | | | | | 455 | |
7.625% due 11/21/2022 | | $ | | | 830 | | | | | | 912 | |
HSBC Holdings PLC | | | | | | | | | | | | |
3.600% due 05/25/2023 | | | | | 200 | | | | | | 201 | |
6.000% due 09/29/2023 (f) | | EUR | | | 520 | | | | | | 567 | |
Lloyds Banking Group PLC | | | | | | | | | | | | |
7.875% due 06/27/2029 (f) | | GBP | | | 400 | | | | | | 523 | |
7.625% due 06/27/2023 (f) | | | | | 200 | | | | | | 259 | |
Royal Bank of Scotland Group PLC | |
7.500% due 08/10/2020 (f) | | $ | | | 360 | | | | | | 342 | |
8.000% due 08/10/2025 (f) | | | | | 450 | | | | | | 432 | |
2.500% due 03/22/2023 | | EUR | | | 350 | | | | | | 376 | |
Royal Bank of Scotland PLC | | | | | | | | | | | | |
9.500% due 03/16/2022 | | $ | | | 200 | | | | | | 203 | |
Santander UK Group Holdings PLC | |
4.750% due 09/15/2025 | | | | | 760 | | | | | | 746 | |
Santander UK PLC | | | | | | | | | | | | |
5.000% due 11/07/2023 | | | | | 200 | | | | | | 204 | |
Tesco Property Finance PLC | | | | | | | | | | | | |
6.052% due 10/13/2039 | | GBP | | | 778 | | | | | | 996 | |
TIG FinCo PLC | | | | | | | | | | | | |
8.500% due 03/02/2020 | | | | | 60 | | | | | | 76 | |
| | | | | | | | | | | | |
| | | | | | | | | | | 6,292 | |
| | | | | | | | | | | | |
| |
| INDUSTRIALS 0.3% | |
Enterprise Inns PLC | | | | | | | | | | | | |
6.875% due 02/15/2021 | | | | | 200 | | | | | | 269 | |
| | | | | | |
| See Accompanying Notes | | SEMIANNUAL REPORT | | DECEMBER 31, 2016 | | 25 |
Schedule of Investments PIMCO Dividend and Income Fund (Cont.)
| | | | | | | | | | | | |
| | | | | PRINCIPAL
AMOUNT
(000S) | | | | | MARKET
VALUE
(000S) | |
Marstons Issuer PLC | | | | | | | | | | | | |
5.641% due 07/15/2035 | | GBP | | | 200 | | | $ | | | 224 | |
Mitchells & Butlers Finance PLC | | | | | | | | | | | | |
0.823% due 12/15/2030 | | | | | 149 | | | | | | 160 | |
Spirit Issuer PLC | | | | | | | | | | | | |
6.582% due 12/28/2027 | | | | | 200 | | | | | | 270 | |
3.067% due 12/28/2031 | | | | | 22 | | | | | | 25 | |
Unique Pub Finance Co. PLC | | | | | | | | | | | | |
5.659% due 06/30/2027 | | | | | 48 | | | | | | 63 | |
| | | | | | | | | | | | |
| | | | | | | | | | | 1,011 | |
| | | | | | | | | | | | |
Total United Kingdom | | | | | | | | | | | 7,303 | |
| | | | | | | | | | | | |
| | | | | | | | | | | | |
| UNITED STATES 2.8% | |
| | | | | | | | | | | | |
| BANKING & FINANCE 1.3% | |
Blackstone CQP Holdco LP | | | | | | | | | | | | |
9.296% due 03/19/2019 | | $ | | | 321 | | | | | | 324 | |
Cantor Fitzgerald LP | | | | | | | | | | | | |
7.875% due 10/15/2019 | | | | | 280 | | | | | | 311 | |
CIT Group, Inc. | | | | | | | | | | | | |
3.875% due 02/19/2019 | | | | | 378 | | | | | | 387 | |
International Lease Finance Corp. | |
7.125% due 09/01/2018 | | | | | 325 | | | | | | 351 | |
6.250% due 05/15/2019 | | | | | 1,110 | | | | | | 1,196 | |
Navient Corp. | | | | | | | | | | | | |
8.000% due 03/25/2020 | | | | | 600 | | | | | | 667 | |
Springleaf Finance Corp. | | | | | | | | | | | | |
6.900% due 12/15/2017 | | | | | 200 | | | | | | 209 | |
8.250% due 12/15/2020 | | | | | 980 | | | | | | 1,068 | |
| | | | | | | | | | | | |
| | | | | | | | | | | 4,513 | |
| | | | | | | | | | | | |
| | | | | | | | | | | | |
| INDUSTRIALS 1.3% | |
Anheuser-Busch InBev Finance, Inc. | |
4.900% due 02/01/2046 | | | | | 17 | | | | | | 18 | |
Caesars Entertainment Operating Co., Inc. | |
8.500% due 02/15/2020 ^(g) | | | | | 286 | | | | | | 300 | |
9.000% due 02/15/2020 ^(g) | | | | | 240 | | | | | | 250 | |
11.250% due 06/01/2017 ^(g) | | | | | 304 | | | | | | 311 | |
CVS Pass-Through Trust | | | | | | | | | | | | |
8.353% due 07/10/2031 | | | | | 696 | | | | | | 898 | |
Diamond Resorts International, Inc. | |
7.750% due 09/01/2023 | | | | | 103 | | | | | | 105 | |
iHeartCommunications, Inc. | | | | | | | | | | | | |
9.000% due 03/01/2021 | | | | | 3 | | | | | | 2 | |
9.000% due 12/15/2019 | | | | | 54 | | | | | | 44 | |
9.000% due 09/15/2022 | | | | | 697 | | | | | | 515 | |
Time Warner Cable LLC | | | | | | | | | | | | |
6.750% due 07/01/2018 | | | | | 500 | | | | | | 534 | |
5.000% due 02/01/2020 | | | | | 600 | | | | | | 637 | |
Time Warner, Inc. | | | | | | | | | | | | |
3.800% due 02/15/2027 | | | | | 14 | | | | | | 14 | |
Tyson Foods, Inc. | | | | | | | | | | | | |
4.875% due 08/15/2034 | | | | | 500 | | | | | | 510 | |
Viacom, Inc. | | | | | | | | | | | | |
2.200% due 04/01/2019 | | | | | 450 | | | | | | 446 | |
| | | | | | | | | | | | |
| | | | | | | | | | | 4,584 | |
| | | | | | | | | | | | |
| | | | | | | | | | | | |
| UTILITIES 0.2% | |
AT&T, Inc. | | | | | | | | | | | | |
5.650% due 02/15/2047 | | | | | 8 | | | | | | 9 | |
Kinder Morgan Finance Co. LLC | | | | | | | | | | | | |
6.000% due 01/15/2018 | | | | | 800 | | | | | | 833 | |
| | | | | | | | | | | | |
| | | | | | | | | | | 842 | |
| | | | | | | | | | | | |
Total United States | | | | | | | | | | | 9,939 | |
| | | | | | | | | | | | |
| |
| | | | | | | | | | | | |
| | | | | PRINCIPAL
AMOUNT
(000S) | | | | | MARKET
VALUE
(000S) | |
| VENEZUELA 0.0% | |
| | | | | | | | | | | | |
| INDUSTRIALS 0.0% | |
Petroleos de Venezuela S.A. | | | | | | | | | | | | |
8.500% due 11/02/2017 | | $ | | | 200 | | | $ | | | 159 | |
| | | | | | | | | | | | |
Total Venezuela | | | | | | | | | | | 159 | |
| | | | | | | | | | | | |
Total Corporate Bonds & Notes (Cost $29,444) | | | 28,536 | |
| | | | | | | | | | | | |
| | | | | | | | | | | | |
| NON-AGENCY MORTGAGE-BACKED SECURITIES 4.0% | |
| | | | | | | | | | | | |
| UNITED KINGDOM 0.7% | |
Eurosail PLC | | | | | | | | | | | | |
1.325% due 06/13/2045 | | GBP | | | 1,241 | | | | | | 1,398 | |
Grifonas Finance PLC | | | | | | | | | | | | |
0.088% due 08/28/2039 | | EUR | | | 445 | | | | | | 355 | |
Juno Eclipse Ltd. | | | | | | | | | | | | |
0.000% due 11/20/2022 | | | | | 453 | | | | | | 473 | |
RMAC PLC | | | | | | | | | | | | |
0.616% due 06/12/2036 | | GBP | | | 322 | | | | | | 365 | |
| | | | | | | | | | | | |
Total United Kingdom | | | | | | | | | | | 2,591 | |
| | | | | | | | | | | | |
| | | | | | | | | | | | |
| UNITED STATES 3.3% | |
Banc of America Alternative Loan Trust | |
6.000% due 04/25/2036 ^ | | $ | | | 63 | | | | | | 55 | |
6.000% due 07/25/2046 ^ | | | | | 132 | | | | | | 116 | |
Banc of America Funding Trust | | | | | | | | | | | | |
3.096% due 05/20/2036 ^ | | | | | 30 | | | | | | 27 | |
Banc of America Mortgage Trust | |
3.439% due 11/20/2046 ^ | | | | | 12 | | | | | | 10 | |
6.000% due 10/25/2036 ^ | | | | | 36 | | | | | | 31 | |
Bear Stearns Mortgage Funding Trust | |
7.500% due 08/25/2036 | | | | | 168 | | | | | | 162 | |
Chase Mortgage Finance Trust | | | | | | | | | | | | |
3.210% due 09/25/2036 ^ | | | | | 74 | | | | | | 66 | |
Countrywide Alternative Loan Trust | |
1.456% due 10/25/2037 ^ | | | | | 6,097 | | | | | | 1,872 | |
5.500% due 09/25/2035 | | | | | 2,028 | | | | | | 1,911 | |
6.000% due 06/25/2036 ^ | | | | | 191 | | | | | | 158 | |
6.000% due 02/25/2037 ^ | | | | | 89 | | | | | | 61 | |
6.000% due 06/25/2037 ^ | | | | | 595 | | | | | | 456 | |
6.250% due 12/25/2036 ^ | | | | | 37 | | | | | | 27 | |
Countrywide Home Loan Mortgage Pass-Through Trust | |
1.256% due 07/25/2037 ^ | | | | | 31 | | | | | | 19 | |
Credit Suisse First Boston Mortgage Securities Corp. | |
6.000% due 11/25/2035 ^ | | | | | 23 | | | | | | 13 | |
6.000% due 01/25/2036 | | | | | 53 | | | | | | 41 | |
Credit Suisse Mortgage Capital Certificates | |
2.448% due 12/29/2037 | | | | | 202 | | | | | | 140 | |
Credit Suisse Mortgage Capital Mortgage-Backed Trust | |
5.000% due 03/25/2037 ^ | | | | | 3 | | | | | | 3 | |
First Horizon Alternative Mortgage Securities Trust | |
3.129% due 06/25/2036 | | | | | 593 | | | | | | 486 | |
HSI Asset Loan Obligation Trust | |
6.000% due 06/25/2037 ^ | | | | | 16 | | | | | | 14 | |
JPMorgan Alternative Loan Trust | |
1.852% due 05/26/2037 | | | | | 118 | | | | | | 104 | |
JPMorgan Mortgage Trust | | | | | | | | | | | | |
6.500% due 07/25/2036 ^ | | | | | 133 | | | | | | 108 | |
Merrill Lynch Mortgage Investors Trust | |
3.243% due 03/25/2036 ^ | | | | | 20 | | | | | | 14 | |
Residential Accredit Loans, Inc. Trust | |
1.156% due 10/25/2045 | | | | | 144 | | | | | | 110 | |
5.500% due 03/25/2037 | | | | | 696 | | | | | | 559 | |
6.250% due 03/25/2037 ^ | | | | | 51 | | | | | | 41 | |
Structured Adjustable Rate Mortgage Loan Trust | |
3.086% due 10/25/2036 ^ | | | | | 3,334 | | | | | | 2,465 | |
Wells Fargo Alternative Loan Trust | |
3.139% due 07/25/2037 ^ | | | | | 2,039 | | | | | | 1,737 | |
| | | | | | | | | | | | |
| | | | | PRINCIPAL
AMOUNT
(000S) | | | | | MARKET
VALUE
(000S) | |
Wells Fargo Commercial Mortgage Trust | |
3.412% due 09/15/2058 | | $ | | | 1,156 | | | $ | | | 1,190 | |
| | | | | | | | | | | | |
Total United States | | | | | | | | | | | 11,996 | |
| | | | | | | | | | | | |
Total Non-Agency Mortgage-Backed Securities (Cost $16,177) | | | 14,587 | |
| | | | | | | | | | | | |
| | | | | | | | | | | | |
| MUNICIPAL BONDS & NOTES 0.5% | |
| | | | | | | | | | | | |
| CALIFORNIA 0.2% | |
California State Public Works Board Revenue Notes, Series 2011 | |
5.786% due 12/01/2021 | | | | | 750 | | | | | | 813 | |
| | | | | | | | | | | | |
Total California | | | | | | | | | | | 813 | |
| | | | | | | | | | | | |
| | | | | | | | | | | | |
| ILLINOIS 0.0% | |
Illinois State General Obligation Bonds, (BABs), Series 2010 | |
6.630% due 02/01/2035 | | | | | 15 | | | | | | 16 | |
Illinois State General Obligation Bonds, Series 2003 | |
5.100% due 06/01/2033 | | | | | 120 | | | | | | 106 | |
| | | | | | | | | | | | |
Total Illinois | | | | | | | | | | | 122 | |
| | | | | | | | | | | | |
| | | | | | | | | | | | |
| MICHIGAN 0.1% | |
Michigan Tobacco Settlement Finance Authority Revenue Bonds, Series 2006 | |
7.309% due 06/01/2034 | | | | | 220 | | | | | | 203 | |
| | | | | | | | | | | | |
Total Michigan | | | | | | | | | | | 203 | |
| | | | | | | | | | | | |
| | | | | | | | | | | | |
| VIRGINIA 0.1% | |
Tobacco Settlement Financing Corp., Virginia Revenue Bonds, Series 2007 | |
6.706% due 06/01/2046 | | | | | 385 | | | | | | 308 | |
| | | | | | | | | | | | |
Total Virginia | | | | | | | | | | | 308 | |
| | | | | | | | | | | | |
| | | | | | | | | | | | |
| WEST VIRGINIA 0.1% | |
Tobacco Settlement Finance Authority, West Virginia Revenue Bonds, Series 2007 | |
7.467% due 06/01/2047 | | | | | 365 | | | | | | 330 | |
| | | | | | | | | | | | |
Total West Virginia | | | | | | | | | | | 330 | |
| | | | | | | | | | | | |
Total Municipal Bonds & Notes (Cost $1,752) | | | 1,776 | |
| | | | | | | | | | | | |
| |
| | | | | SHARES | | | | | | |
| PREFERRED STOCKS 0.4% | |
| | | | | | | | | | | | |
| GERMANY 0.4% | |
| | | | | | | | | | | | |
| INDUSTRIALS 0.4% | |
Volkswagen AG | | | | | 9,979 | | | | | | 1,396 | |
| | | | | | | | | | | | |
Total Preferred Stocks (Cost $1,366) | | | 1,396 | |
| | | | | | | | | | | | |
| | | | | | | | | | | | |
| REAL ESTATE INVESTMENT TRUSTS 0.3% | |
| | | | | | | | | | | | |
| CANADA 0.1% | |
| | | | | | | | | | | | |
| REAL ESTATE 0.1% | |
Dream Office Real Estate Investment Trust | | | | | 14,726 | | | | | | 214 | |
| | | | | | | | | | | | |
Total Canada | | | | | | | | | | | 214 | |
| | | | | | | | | | | | |
| | | | | | | | | | | | |
| UNITED STATES 0.2% | |
| | | | | | | | | | | | |
| FINANCIALS 0.1% | |
Annaly Capital Management, Inc. | | | | | 38,864 | | | | | | 387 | |
Chimera Investment Corp. | | | | | 7,095 | | | | | | 121 | |
| | | | | | | | | | | | |
| | | | | | | | | | | 508 | |
| | | | | | | | | | | | |
| | | | | | | | | | | | |
| | | | | | | | |
| 26 | | PIMCO EQUITY SERIES | | | | | See Accompanying Notes | |
December 31, 2016 (Unaudited)
| | | | | | | | | | | | |
| | | | | SHARES | | | | | MARKET
VALUE
(000S) | |
| REAL ESTATE 0.1% | |
Hospitality Properties Trust | | | | | 4,299 | | | $ | | | 137 | |
Iron Mountain, Inc. | | | | | 7,604 | | | | | | 247 | |
| | | | | | | | | | | | |
| | | | | | | | | | | 384 | |
| | | | | | | | | | | | |
Total United States | | | | | | | | | | | 892 | |
| | | | | | | | | | | | |
Total Real Estate Investment Trusts (Cost $1,145) | | | 1,106 | |
| | | | | | | | | | | | |
| |
| | | | | PRINCIPAL
AMOUNT
(000S) | | | | | | |
| SOVEREIGN ISSUES 0.4% | |
| | | | | | | | | | | | |
| BRAZIL 0.1% | |
Brazil Notas do Tesouro Nacional | |
6.000% due 05/15/2045 (e) | | BRL | | | 1,477 | | | | | | 469 | |
| | | | | | | | | | | | |
Total Brazil | | | | | | | | | | | 469 | |
| | | | | | | | | | | | |
| |
| GREECE 0.1% | |
Republic of Greece Government International Bond | |
3.800% due 08/08/2017 | | JPY | | | 39,000 | | | | | | 327 | |
4.500% due 07/03/2017 | | | | | 10,000 | | | | | | 85 | |
4.750% due 04/17/2019 | | EUR | | | 100 | | | | | | 100 | |
| | | | | | | | | | | | |
Total Greece | | | | | | | | | | | 512 | |
| | | | | | | | | | | | |
| |
| SAUDI ARABIA 0.1% | |
Saudi Government International Bond | |
4.500% due 10/26/2046 | | $ | | | 200 | | | | | | 192 | |
| | | | | | | | | | | | |
Total Saudi Arabia | | | | | | | | | | | 192 | |
| | | | | | | | | | | | |
| | | | | | | | | | | | |
| SPAIN 0.0% | |
Autonomous Community of Catalonia | |
4.900% due 09/15/2021 | | EUR | | | 50 | | | | | | 57 | |
| | | | | | | | | | | | |
Total Spain | | | | | | | | | | | 57 | |
| | | | | | | | | | | | |
| | | | | | | | | | | | |
| | | | | PRINCIPAL
AMOUNT
(000S) | | | | | MARKET
VALUE
(000S) | |
| VENEZUELA 0.1% | |
Venezuela Government International Bond | |
7.650% due 04/21/2025 | | $ | | | 100 | | | $ | | | 46 | |
7.750% due 10/13/2019 | | | | | 200 | | | | | | 112 | |
| | | | | | | | | | | | |
Total Venezuela | | | | | | | | | | | 158 | |
| | | | | | | | | | | | |
Total Sovereign Issues (Cost $1,713) | | | 1,388 | |
| | | | | | | | | | | | |
| | | | | | | | | | | | |
| U.S. GOVERNMENT AGENCIES 3.8% | |
| | | | | | | | | | | | |
| UNITED STATES 3.8% | |
Fannie Mae | | | | | | | | | | | | |
3.000% due 11/01/2029 | | | | | 35 | | | | | | 36 | |
3.500% due 02/01/2046 (h) | | | | | 1,766 | | | | | | 1,811 | |
Fannie Mae, TBA | | | | | | | | | | | | |
2.500% due 02/01/2032 | | | | | 1,000 | | | | | | 1,000 | |
3.000% due 02/01/2047 | | | | | 4,900 | | | | | | 4,857 | |
3.500% due 02/01/2047 | | | | | 4,000 | | | | | | 4,092 | |
Freddie Mac, TBA | | | | | | | | | | | | |
3.000% due 01/01/2047 | | | | | 2,000 | | | | | | 1,985 | |
| | | | | | | | | | | | |
Total U.S. Government Agencies
(Cost $13,826) | | | | | | 13,781 | |
| | | | | | | | | | | | |
| | | | | | | | | | | | |
| U.S. TREASURY OBLIGATIONS 2.2% | |
| | | | | | | | | | | | |
| UNITED STATES 2.2% | |
U.S. Treasury Bonds | | | | | | | | | | | | |
2.875% due 11/15/2046 | | | | | 1,000 | | | | | | 963 | |
U.S. Treasury Notes | | | | | | | | | | | | |
1.125% due 06/30/2021 | | | | | 1,100 | | | | | | 1,064 | |
1.750% due 11/30/2021 | | | | | 900 | | | | | | 893 | |
2.000% due 11/15/2026 (h) | | | | | 700 | | | | | | 672 | |
2.125% due 11/30/2023 | | | | | 1,400 | | | | | | 1,389 | |
2.250% due 12/31/2023 | | | | | 3,000 | | | | | | 2,998 | |
| | | | | | | | | | | | |
Total U.S. Treasury Obligations (Cost $8,027) | | | 7,979 | |
| | | | | | | | | | | | |
| | | | | | | | | | | | |
| | | | | PRINCIPAL
AMOUNT
(000S) | | | | | MARKET
VALUE
(000S) | |
| SHORT-TERM INSTRUMENTS 0.6% | |
| | | | | | | | | | | | |
| JAPAN TREASURY BILLS 0.6% | |
(0.255)% due 01/30/2017 (b)(c) | | JPY | | | 240,000 | | | $ | | | 2,054 | |
| | | | | | | | | | | | |
| | | | | | | | | | | | |
| MEXICO TREASURY BILLS 0.0% | |
5.789% due 02/02/2017 (c)(d) | | MXN | | | 1,000 | | | | | | 48 | |
| | | | | | | | | | | | |
Total Short-Term Instruments
(Cost $2,358) | | | | | | 2,102 | |
| | | | | | | | | | | | |
| | | | | | | | | | | | |
Total Investments in Securities
(Cost $359,982) | | | | | | 372,211 | |
| | | | | | | | | | | | |
| |
| | | | | SHARES | | | | | | |
| INVESTMENTS IN AFFILIATES 0.4% | |
| | | | | | | | | | | | |
| SHORT-TERM INSTRUMENTS 0.4% | |
| | | | | | | | | | | | |
| CENTRAL FUNDS USED FOR CASH MANAGEMENT PURPOSES 0.4% | |
PIMCO Short-Term Floating NAV Portfolio III | | | | | 150,182 | | | | | | 1,485 | |
| | | | | | | | | | | | |
Total Short-Term Instruments
(Cost $1,485) | | | | | | 1,485 | |
| | | | | | | | | | | | |
| | | | | | | | | | | | |
Total Investments in Affiliates
(Cost $1,485) | | | | | | 1,485 | |
| | | | | | | | | | | | |
Total Investments 103.3%
(Cost $361,467) | | | $ | | | 373,696 | |
| |
Financial Derivative
Instruments (i)(j) 0.1% (Cost or Premiums, net $(454)) | | | 416 | |
| |
| Other Assets and Liabilities, net (3.4)% | | | | | | (12,233 | ) |
| | | | | | | | | | | | |
| Net Assets 100.0% | | | | | | | | $ | | | 361,879 | |
| | | | | | | | | | | | |
NOTES TO SCHEDULE OF INVESTMENTS (AMOUNTS IN THOUSANDS*, EXCEPT NUMBER OF CONTRACTS):
| * | A zero balance may reflect actual amounts rounding to less than one thousand. |
| (a) | Security did not produce income within the last twelve months. |
| (b) | Coupon represents a weighted average yield to maturity. |
| (d) | Coupon represents a yield to maturity. |
| (e) | Principal amount of security is adjusted for inflation. |
| (f) | Perpetual maturity; date shown, if applicable, represents next contractual call date. |
| (g) | Security is subject to a forbearance agreement entered into by the Fund which forbears the Fund from taking action to, among other things, accelerate and collect payments on the subject note with respect to specified events of default. |
BORROWINGS AND OTHER FINANCING TRANSACTIONS
REVERSE REPURCHASE AGREEMENTS:
| | | | | | | | | | | | | | | | | | | | |
| Counterparty | | Borrowing
Rate(1) | | | Borrowing
Date | | | Maturity
Date | | | Amount
Borrowed(1) | | | Payable for
Reverse
Repurchase
Agreements | |
BOS | | | (0.400 | )% | | | 01/03/2017 | | | | 01/09/2017 | | | $ | (674 | ) | | $ | (674 | ) |
| | | 1.030 | | | | 12/14/2016 | | | | 01/18/2017 | | | | (889 | ) | | | (889 | ) |
| | | | | | | | | | | | | | | | | | | | |
Total Reverse Repurchase Agreements | | | | | | | | | | | $ | (1,563 | ) |
| | | | | | | | | | | | | | | | | | | | |
| (1) | The average amount of borrowings outstanding during the period ended December 31, 2016 was $(319) at a weighted average interest rate of 0.725%. Average borrowings includes sale-buyback transactions, of which there were none open at period end. |
| | | | | | |
| See Accompanying Notes | | SEMIANNUAL REPORT | | DECEMBER 31, 2016 | | 27 |
Schedule of Investments PIMCO Dividend and Income Fund (Cont.)
SHORT SALES
| | | | | | | | | | | | | | | | | | | | |
| Description | | Coupon | | | Maturity
Date | | | Principal
Amount | | | Proceeds | | | Payable for
Short Sales | |
U.S. Treasury Notes | | | 1.125% | | | | 09/30/2021 | | | | $ 100 | | | $ | (96 | ) | | $ | (97 | ) |
| | | | | | | | | | | | | | | | | | | | |
Total Short Sales | | | | | | | | | | | | | | $ | (96 | ) | | $ | (97 | ) |
| | | | | | | | | | | | | | | | | | | | |
BORROWINGS AND OTHER FINANCING TRANSACTIONS SUMMARY
The following is a summary by counterparty of the market value of Borrowings and Other Financing Transactions and collateral pledged/(received) as of December 31, 2016:
| (h) | Securities with an aggregate market value of $1,592 have been pledged as collateral under the terms of the following master agreements as of December 31, 2016. |
| | | | | | | | | | | | | | | | | | | | | | | | | | | | |
| Counterparty | | Repurchase
Agreement
Proceeds
to be
Received | | | Payable for
Reverse
Repurchase
Agreements | | | Payable for
Sale-Buyback
Transactions | | | Payable for
Short Sales | | | Total
Borrowings and
Other Financing
Transactions | | | Collateral
Pledged/(Received) | | | Net Exposure(2) | |
Global/Master Repurchase Agreement | |
BOS | | $ | 0 | | | $ | (1,563 | ) | | $ | 0 | | | $ | 0 | | | $ | (1,563 | ) | | $ | 1,592 | | | $ | 29 | |
|
Master Securities Forward Transaction Agreement | |
BPS | | | 0 | | | | 0 | | | | 0 | | | | (97 | ) | | | (97 | ) | | | 0 | | | | (97 | ) |
| | | | | | | | | | | | | | | | | | | | | | | | | | | | |
Total Borrowings and Other Financing Transactions | | $ | 0 | | | $ | (1,563 | ) | | $ | 0 | | | $ | (97 | ) | | | | | | | | | | | | |
| | | | | | | | | | | | | | | | | | | | | | | | | | | | |
| (2) | Net Exposure represents the net receivable/(payable) that would be due from/to the counterparty in the event of default. Exposure from borrowings and other financing transactions can only be netted across transactions governed under the same master agreement with the same legal entity. See Note 7, Principal Risks, in the Notes to Financial Statements for more information regarding master netting arrangements. |
CERTAIN TRANSFERS ACCOUNTED FOR AS SECURED BORROWINGS
Remaining Contractual Maturity of the Agreements
| | | | | | | | | | | | | | | | | | | | |
| | | Overnight and
Continuous | | | Up to 30 days | | | 31-90 days | | | Greater Than 90 days | | | Total | |
Reverse Repurchase Agreements | |
U.S. Government Agencies | | $ | 0 | | | $ | (889 | ) | | $ | 0 | | | $ | 0 | | | $ | (889 | ) |
| | | | | | | | | | | | | | | | | | | | |
Total Borrowings | | $ | 0 | | | $ | (889 | ) | | $ | 0 | | | $ | 0 | | | $ | (889 | ) |
| | | | | | | | | | | | | | | | | | | | |
Gross amount of recognized liabilities for reverse repurchase agreements(3) | | | $ | (889 | ) |
| | | | | | | | | | | | | | | | | | | | |
| (3) | Unsettled reverse repurchase agreements liability of $(674) is outstanding at period end. |
(i) FINANCIAL DERIVATIVE INSTRUMENTS: EXCHANGE-TRADED OR CENTRALLY CLEARED
FUTURES CONTRACTS:
| | | | | | | | | | | | | | | | | | | | | | |
| Description | | Type | | Expiration
Month | | | # of
Contracts | | | Unrealized
Appreciation/
(Depreciation) | | | Variation Margin | |
| | | | | | Asset | | | Liability | |
British pound currency March Futures | | Short | | | 03/2017 | | | | 56 | | | $ | 134 | | | $ | 0 | | | $ | (30 | ) |
Euro currency March Futures | | Short | | | 03/2017 | | | | 11 | | | | 18 | | | | 0 | | | | (7 | ) |
Japanese yen currency March Futures | | Short | | | 03/2017 | | | | 3 | | | | 5 | | | | 0 | | | | 0 | |
U.S. Treasury 10-Year Note March Futures | | Long | | | 03/2017 | | | | 16 | | | | (10 | ) | | | 6 | | | | 0 | |
| | | | | | | | | | | | | | | | | | | | | | |
Total Futures Contracts | | | $ | 147 | | | $ | 6 | | | $ | (37 | ) |
| | | | | | | | | | | | | | | | | | | | | | |
SWAP AGREEMENTS:
CREDIT DEFAULT SWAPS ON CREDIT INDICES - SELL PROTECTION(1)
| | | | | | | | | | | | | | | | | | | | | | | | | | | | |
| Index/Tranches | | Fixed
Receive Rate | | | Maturity
Date | | | Notional
Amount(2) | | | Market
Value(3) | | | Unrealized
(Depreciation) | | | Variation Margin | |
| | | | | | | Asset | | | Liability | |
CDX.HY-26 5-Year Index | | | 0.000 | % | | | 06/20/2021 | | | $ | 600 | | | $ | (43 | ) | | $ | (1 | ) | | $ | 0 | | | $ | (1 | ) |
| | | | | | | | | | | | | | | | | | | | | | | | | | | | |
| (1) | If the Fund is a seller of protection and a credit event occurs, as defined under the terms of that particular swap agreement, the Fund will either (i) pay to the buyer of protection an amount equal to the notional amount of the swap and take delivery of the referenced obligation or underlying securities comprising the referenced index or (ii) pay a net settlement amount in the form of cash, securities or other deliverable obligations equal to the notional amount of the swap less the recovery value of the referenced obligation or underlying securities comprising the referenced index. |
| | | | | | | | |
| 28 | | PIMCO EQUITY SERIES | | | | | See Accompanying Notes | |
December 31, 2016 (Unaudited)
| (2) | The maximum potential amount the Fund could be required to pay as a seller of credit protection or receive as a buyer of credit protection if a credit event occurs as defined under the terms of that particular swap agreement. |
| (3) | The prices and resulting values for credit default swap agreements on credit indices serve as an indicator of the current status of the payment/performance risk and represent the likelihood of an expected liability (or profit) for the credit derivative should the notional amount of the swap agreement be closed/sold as of the period end. Increasing market values, in absolute terms when compared to the notional amount of the swap, represent a deterioration of the referenced indices’ credit soundness and a greater likelihood or risk of default or other credit event occurring as defined under the terms of the agreement. |
INTEREST RATE SWAPS
| | | | | | | | | | | | | | | | | | | | | | | | | | | | | | | | | | |
Pay/Receive
Floating Rate | | Floating Rate Index | | Fixed Rate | | | Maturity
Date | | | Notional
Amount | | | Market
Value | | | Unrealized
Appreciation/
(Depreciation) | | | Variation Margin | |
| | | | | | | | Asset | | | Liability | |
Pay | | 3-Month USD-LIBOR | | | 1.750 | % | | | 12/21/2023 | | | | $ | | | | 1,700 | | | $ | 47 | | | $ | 4 | | | $ | 0 | | | $ | (3 | ) |
Receive | | 3-Month USD-LIBOR | | | 1.750 | | | | 12/21/2026 | | | | | | | | 7,200 | | | | 385 | | | | 475 | | | | 0 | | | | (24 | ) |
Receive | | 3-Month USD-LIBOR | | | 1.500 | | | | 06/21/2027 | | | | | | | | 200 | | | | 17 | | | | (1 | ) | | | 0 | | | | (1 | ) |
Receive | | 3-Month USD-LIBOR | | | 2.250 | | | | 12/21/2046 | | | | | | | | 600 | | | | 49 | | | | 127 | | | | 0 | | | | (5 | ) |
Pay | | 3-Month ZAR-JIBAR | | | 8.250 | | | | 03/15/2022 | | | | ZAR | | | | 31,900 | | | | 37 | | | | 32 | | | | 6 | | | | 0 | |
Pay | | 6-Month AUD-BBR-BBSW | | | 2.750 | | | | 06/17/2026 | | | | AUD | | | | 9,300 | | | | (121 | ) | | | (469 | ) | | | 48 | | | | 0 | |
Pay | | 6-Month JPY-LIBOR | | | 0.000 | | | | 09/20/2026 | | | | JPY | | | | 20,000 | | | | 3 | | | | 0 | | | | 0 | | | | 0 | |
Receive | | 6-Month JPY-LIBOR | | | 0.500 | | | | 09/20/2046 | | | | | | | | 80,000 | | | | 63 | | | | 20 | | | | 0 | | | | (9 | ) |
Pay | | 28-Day MXN-TIIE | | | 5.610 | | | | 07/07/2021 | | | | MXN | | | | 700 | | | | (3 | ) | | | (1 | ) | | | 0 | | | | 0 | |
Pay | | 28-Day MXN-TIIE | | | 6.750 | | | | 08/31/2021 | | | | | | | | 2,000 | | | | (3 | ) | | | (2 | ) | | | 0 | | | | 0 | |
Pay | | 28-Day MXN-TIIE | | | 5.797 | | | | 09/06/2021 | | | | | | | | 1,200 | | | | (4 | ) | | | (1 | ) | | | 0 | | | | 0 | |
Pay | | 28-Day MXN-TIIE | | | 7.030 | | | | 11/10/2021 | | | | | | | | 2,400 | | | | (3 | ) | | | (2 | ) | | | 0 | | | | 0 | |
Pay | | 28-Day MXN-TIIE | | | 7.350 | | | | 11/17/2021 | | | | | | | | 600 | | | | 0 | | | | 0 | | | | 0 | | | | 0 | |
Pay | | 28-Day MXN-TIIE | | | 7.387 | | | | 11/17/2021 | | | | | | | | 500 | | | | 0 | | | | 0 | | | | 0 | | | | 0 | |
Pay | | 28-Day MXN-TIIE | | | 7.199 | | | | 12/03/2021 | | | | | | | | 500 | | | | 0 | | | | 0 | | | | 0 | | | | 0 | |
Pay | | 28-Day MXN-TIIE | | | 5.990 | | | | 01/30/2026 | | | | | | | | 4,300 | | | | (27 | ) | | | (23 | ) | | | 1 | | | | 0 | |
Pay | | 28-Day MXN-TIIE | | | 6.080 | | | | 03/10/2026 | | | | | | | | 14,100 | | | | (84 | ) | | | (77 | ) | | | 4 | | | | 0 | |
Pay | | 28-Day MXN-TIIE | | | 6.490 | | | | 09/08/2026 | | | | | | | | 30,000 | | | | (145 | ) | | | (158 | ) | | | 10 | | | | 0 | |
Pay | | 28-Day MXN-TIIE | | | 7.380 | | | | 11/04/2026 | | | | | | | | 100 | | | | 0 | | | | 0 | | | | 0 | | | | 0 | |
| | | | | | | | | | | | | | | | | | | | | | | | | | | | | | | | | | |
| | | | | | | | | | | | | | | | | | | | $ | 211 | | | $ | (76 | ) | | $ | 69 | | | $ | (42 | ) |
| | | | | | | | | | | | | | | | | | | | | | | | | | | | | | | | | | |
Total Swap Agreements | | | | | | | | | | | | | | | | | | | | $ | 168 | | | $ | (77 | ) | | $ | 69 | | | $ | (43 | ) |
| | | | | | | | | | | | | | | | | | | | | | | | | | | | | | | | | | |
FINANCIAL DERIVATIVE INSTRUMENTS: EXCHANGE-TRADED OR CENTRALLY CLEARED SUMMARY
The following is a summary of the market value and variation margin of Exchange-Traded or Centrally Cleared Financial Derivative Instruments as of December 31, 2016:
Cash of $1,007 has been pledged as collateral for exchange-traded and centrally cleared financial derivative instruments as of December 31, 2016.
| | | | | | | | | | | | | | | | | | | | | | | | | | | | | | | | | | | | |
| | | Financial Derivative Assets | | | | | | Financial Derivative Liabilities | |
| | | Market Value | | | Variation Margin
Asset | | | | | | | | | Market Value | | | Variation Margin
Liability | | | | |
| | | Purchased
Options | | | Futures | | | Swap
Agreements | | | Total | | | | | | Written
Options | | | Futures | | | Swap
Agreements | | | Total | |
Total Exchange-Traded or Centrally Cleared | | $ | 0 | | | $ | 6 | | | $ | 69 | | | $ | 75 | | | | | | | $ | 0 | | | $ | (37) | | | $ | | (43) | | $ | (80) | |
| | | | | | | | | | | | | | | | | | | | | | | | | | | | | | | | | | | | |
(j) FINANCIAL DERIVATIVE INSTRUMENTS: OVER THE COUNTER
FORWARD FOREIGN CURRENCY CONTRACTS:
| | | | | | | | | | | | | | | | | | | | | | | | |
Counterparty | | Settlement
Month | | | Currency to
be Delivered | | | Currency to
be Received | | | Unrealized Appreciation/
(Depreciation) | |
| | | | | Asset | | | Liability | |
AZD | | | 01/2017 | | | AUD | | | 86 | | | $ | | | 62 | | | $ | 0 | | | $ | 0 | |
| | | 02/2017 | | | $ | | | 1,142 | | | GBP | | | 924 | | | | 0 | | | | (2 | ) |
BOA | | | 01/2017 | | | DKK | | | 10,500 | | | $ | | | 1,587 | | | | 100 | | | | 0 | |
| | | 01/2017 | | | JPY | | | 48,365 | | | | | | 420 | | | | 6 | | | | 0 | |
| | | 01/2017 | | | $ | | | 1,954 | | | EUR | | | 1,879 | | | | 24 | | | | 0 | |
| | | 02/2017 | | | EUR | | | 1,879 | | | $ | | | 1,957 | | | | 0 | | | | (24 | ) |
| | | 02/2017 | | | $ | | | 967 | | | MXN | | | 18,552 | | | | 0 | | | | (77 | ) |
| | | 04/2017 | | | DKK | | | 8,976 | | | $ | | | 1,362 | | | | 85 | | | | 0 | |
BPS | | | 01/2017 | | | BRL | | | 5,071 | | | | | | 1,467 | | | | 0 | | | | (91 | ) |
| | | 01/2017 | | | EUR | | | 2,835 | | | | | | 3,007 | | | | 22 | | | | 0 | |
| | | 01/2017 | | | $ | | | 1,544 | | | BRL | | | 5,071 | | | | 14 | | | | 0 | |
| | | 02/2017 | | | GBP | | | 2,373 | | | $ | | | 2,961 | | | | 33 | | | | 0 | |
| | | 02/2017 | | | $ | | | 106 | | | MXN | | | 2,174 | | | | 0 | | | | (2 | ) |
| | | | | | |
| See Accompanying Notes | | SEMIANNUAL REPORT | | DECEMBER 31, 2016 | | 29 |
Schedule of Investments PIMCO Dividend and Income Fund (Cont.)
| | | | | | | | | | | | | | | | | | | | | | | | |
Counterparty | | Settlement
Month | | | Currency to
be Delivered | | | Currency to
be Received | | | Unrealized Appreciation/
(Depreciation) | |
| | | | | Asset | | | Liability | |
CBK | | | 01/2017 | | | AUD | | | 139 | | | $ | | | 103 | | | $ | 3 | | | $ | 0 | |
| | | 01/2017 | | | JPY | | | 240,000 | | | | | | 2,326 | | | | 269 | | | | 0 | |
| | | 01/2017 | | | $ | | | 112 | | | EUR | | | 107 | | | | 1 | | | | 0 | |
DUB | | | 01/2017 | | | BRL | | | 3,976 | | | $ | | | 1,208 | | | | 0 | | | | (13 | ) |
| | | 01/2017 | | | $ | | | 1,167 | | | BRL | | | 3,976 | | | | 54 | | | | 0 | |
| | | 02/2017 | | | BRL | | | 2,948 | | | $ | | | 860 | | | | 0 | | | | (39 | ) |
| | | 02/2017 | | | $ | | | 414 | | | BRL | | | 1,398 | | | | 13 | | | | 0 | |
GLM | | | 01/2017 | | | BRL | | | 205 | | | $ | | | 63 | | | | 0 | | | | 0 | |
| | | 01/2017 | | | EUR | | | 17 | | | | | | 18 | | | | 0 | | | | 0 | |
| | | 01/2017 | | | $ | | | 169 | | | AUD | | | 226 | | | | 0 | | | | (6 | ) |
| | | 01/2017 | | | | | | 60 | | | BRL | | | 205 | | | | 3 | | | | 0 | |
| | | 01/2017 | | | | | | 117 | | | DKK | | | 780 | | | | 0 | | | | (7 | ) |
| | | 01/2017 | | | | | | 2,564 | | | JPY | | | 293,300 | | | | 0 | | | | (54 | ) |
| | | 02/2017 | | | ZAR | | | 415 | | | $ | | | 30 | | | | 0 | | | | 0 | |
HUS | | | 01/2017 | | | AUD | | | 1,269 | | | | | | 945 | | | | 29 | | | | 0 | |
IND | | | 02/2017 | | | JPY | | | 104,219 | | | | | | 991 | | | | 97 | | | | 0 | |
JPM | | | 01/2017 | | | BRL | | | 68 | | | | | | 21 | | | | 0 | | | | 0 | |
| | | 01/2017 | | | $ | | | 20 | | | BRL | | | 68 | | | | 1 | | | | 0 | |
| | | 01/2017 | | | | | | 1,442 | | | JPY | | | 169,473 | | | | 9 | | | | 0 | |
| | | 02/2017 | | | JPY | | | 169,473 | | | $ | | | 1,443 | | | | 0 | | | | (9 | ) |
| | | 02/2017 | | | $ | | | 543 | | | RUB | | | 35,977 | | | | 37 | | | | 0 | |
MSB | | | 01/2017 | | | | | | 70 | | | AUD | | | 94 | | | | 0 | | | | (2 | ) |
SCX | | | 01/2017 | | | BRL | | | 1,398 | | | $ | | | 429 | | | | 0 | | | | (1 | ) |
| | | 01/2017 | | | JPY | | | 414,408 | | | | | | 3,709 | | | | 163 | | | | 0 | |
| | | 01/2017 | | | $ | | | 414 | | | BRL | | | 1,398 | | | | 15 | | | | 0 | |
| | | 01/2017 | | | | | | 924 | | | EUR | | | 866 | | | | 0 | | | | (12 | ) |
| | | 02/2017 | | | MXN | | | 992 | | | $ | | | 48 | | | | 1 | | | | 0 | |
| | | | | | | | | | | | | | | | | | | | | | | | |
Total Forward Foreign Currency Contracts | | | | | | | | | | | | | | | $ | 979 | | | $ | (339 | ) |
| | | | | | | | | | | | | | | | | | | | | | | | |
SWAP AGREEMENTS:
CREDIT DEFAULT SWAPS ON CORPORATE ISSUES - SELL PROTECTION(1)
| | | | | | | | | | | | | | | | | | | | | | | | | | | | | | | | | | |
| Counterparty | | Reference Entity | | Fixed
Receive Rate | | | Maturity
Date | | | Implied
Credit Spread at
December 31, 2016(2) | | | Notional
Amount(3) | | | Premiums
(Received) | | | Unrealized
Appreciation | | | Swap Agreements,
at Value | |
| | | | | | | | | Asset | | | Liability | |
| GST | | Petrobras Global Finance BV | | | 1.000% | | | | 12/20/2021 | | | | 4.729% | | | | $ 200 | | | $ | (37 | ) | | $ | 5 | | | $ | 0 | | | $ | (32 | ) |
| | | | | | | | | | | | | | | | | | | | | | | | | | | | | | | | | | |
CREDIT DEFAULT SWAPS ON CREDIT INDICES - SELL PROTECTION(1)
| | | | | | | | | | | | | | | | | | | | | | | | | | | | | | |
| Counterparty | | Index/Tranches | | Fixed
Receive Rate | | | Maturity
Date | | | Notional
Amount(3) | | | Premiums
(Received) | | | Unrealized
Appreciation | | | Swap Agreements,
at Value(4) | |
| | | | | | | | Asset | | | Liability | |
| DUB | | CMBX.NA.AAA.9 Index | | | 0.500 | % | | | 09/17/2058 | | | $ | 2,300 | | | | $ (128 | ) | | $ | 78 | | | $ | 0 | | | $ | (50 | ) |
| FBF | | CMBX.NA.AAA.9 Index | | | 0.500 | | | | 09/17/2058 | | | | 600 | | | | (24 | ) | | | 11 | | | | 0 | | | | (13 | ) |
| GST | | CMBX.NA.AAA.9 Index | | | 0.500 | | | | 09/17/2058 | | | | 3,200 | | | | (132 | ) | | | 62 | | | | 0 | | | | (70 | ) |
| MYC | | CMBX.NA.AAA.9 Index | | | 0.500 | | | | 09/17/2058 | | | | 2,400 | | | | (133 | ) | | | 81 | | | | 0 | | | | (52 | ) |
| | | | | | | | | | | | | | | | | | | | | | | | | | | | | | |
| | | | | | | | | | | | | | | $ (417 | ) | | $ | 232 | | | $ | 0 | | | $ | (185 | ) |
| | | | | | | | | | | | | | | | | | | | | | | | | | | | | | |
| (1) | If the Fund is a seller of protection and a credit event occurs, as defined under the terms of that particular swap agreement, the Fund will either (i) pay to the buyer of protection an amount equal to the notional amount of the swap and take delivery of the referenced obligation or underlying securities comprising the referenced index or (ii) pay a net settlement amount in the form of cash, securities or other deliverable obligations equal to the notional amount of the swap less the recovery value of the referenced obligation or underlying securities comprising the referenced index. |
| (2) | Implied credit spreads, represented in absolute terms, utilized in determining the market value of credit default swap agreements on corporate issues as of period end serve as an indicator of the current status of the payment/performance risk and represent the likelihood or risk of default for the credit derivative. The implied credit spread of a particular referenced entity reflects the cost of buying/selling protection and may include upfront payments required to be made to enter into the agreement. Wider credit spreads represent a deterioration of the referenced entity’s credit soundness and a greater likelihood or risk of default or other credit event occurring as defined under the terms of the agreement. |
| (3) | The maximum potential amount the Fund could be required to pay as a seller of credit protection or receive as a buyer of credit protection if a credit event occurs as defined under the terms of that particular swap agreement. |
| (4) | The prices and resulting values for credit default swap agreements on credit indices serve as an indicator of the current status of the payment/performance risk and represent the likelihood of an expected liability (or profit) for the credit derivative should the notional amount of the swap agreement be closed/sold as of the period end. Increasing market values, in absolute terms when compared to the notional amount of the swap, represent a deterioration of the referenced indices’ credit soundness and a greater likelihood or risk of default or other credit event occurring as defined under the terms of the agreement. |
| | | | | | | | |
| 30 | | PIMCO EQUITY SERIES | | | | | See Accompanying Notes | |
December 31, 2016 (Unaudited)
INTEREST RATE SWAPS
| | | | | | | | | | | | | | | | | | | | | | | | | | | | | | | | | | |
Counterparty | | Pay/Receive Floating Rate | | Floating Rate Index | | Fixed Rate | | | Maturity Date | | | Notional
Amount | | | Premiums
Paid/(Received) | | | Unrealized
Appreciation/
(Depreciation) | | | Swap Agreements, at Value | |
| | | | | | | | | Asset | | | Liability | |
| DUB | | Pay | | 3-Month USD-LIBOR | | | 2.100 | % | | | 02/21/2022 | | | $ | | | 4,500 | | | $ | 0 | | | $ | (2 | ) | | $ | 0 | | | $ | (2 | ) |
| GLM | | Pay | | 3-Month USD-LIBOR | | | 2.100 | | | | 02/21/2022 | | | | | | 40 | | | | 0 | | | | 0 | | | | 0 | | | | 0 | |
| | | | | | | | | | | | | | | | | | | | | | | | | | | | | | | | | | |
| | | | | | | | | $ | 0 | | | $ | (2 | ) | | $ | 0 | | | $ | (2 | ) |
| | | | | | | | | | | | | | | | | | | | | | | | | | | | | | | | | | |
Total Swap Agreements | | | | | | $ | (454 | ) | | $ | 235 | | | $ | 0 | | | $ | (219 | ) |
| | | | | | | | | | | | | | | | | | | | | | | | | | | | | | | | | | |
FINANCIAL DERIVATIVE INSTRUMENTS: OVER THE COUNTER SUMMARY
The following is a summary by counterparty of the market value of OTC financial derivative instruments and collateral pledged/(received) as of December 31, 2016:
| | | | | | | | | | | | | | | | | | | | | | | | | | | | | | | | | | | | | | | | | | | | | | | | |
| | | Financial Derivative Assets | | | | | | Financial Derivative Liabilities | | | | | | | | | | |
| Counterparty | | Forward
Foreign
Currency
Contracts | | | Purchased
Options | | | Swap
Agreements | | | Total
Over the
Counter | | | | | | Forward
Foreign
Currency
Contracts | | | Written
Options | | | Swap
Agreements | | | Total
Over the
Counter | | | Net Market
Value of OTC
Derivatives | | | Collateral
Pledged/
(Received) | | | Net
Exposure(5) | |
AZD | | $ | 0 | | | $ | 0 | | | $ | 0 | | | $ | 0 | | | | | | | $ | (2 | ) | | $ | 0 | | | $ | 0 | | | $ | (2 | ) | | $ | (2 | ) | | $ | 0 | | | $ | (2 | ) |
BOA | | | 215 | | | | 0 | | | | 0 | | | | 215 | | | | | | | | (101 | ) | | | 0 | | | | 0 | | | | (101 | ) | | | 114 | | | | 0 | | | | 114 | |
BPS | | | 69 | | | | 0 | | | | 0 | | | | 69 | | | | | | | | (93 | ) | | | 0 | | | | 0 | | | | (93 | ) | | | (24 | ) | | | 0 | | | | (24 | ) |
CBK | | | 273 | | | | 0 | | | | 0 | | | | 273 | | | | | | | | 0 | | | | 0 | | | | 0 | | | | 0 | | | | 273 | | | | (300 | ) | | | (27 | ) |
DUB | | | 67 | | | | 0 | | | | 0 | | | | 67 | | | | | | | | (52 | ) | | | 0 | | | | (52 | ) | | | (104 | ) | | | (37 | ) | | | 0 | | | | (37 | ) |
FBF | | | 0 | | | | 0 | | | | 0 | | | | 0 | | | | | | | | 0 | | | | 0 | | | | (13 | ) | | | (13 | ) | | | (13 | ) | | | 0 | | | | (13 | ) |
GLM | | | 3 | | | | 0 | | | | 0 | | | | 3 | | | | | | | | (67 | ) | | | 0 | | | | 0 | | | | (67 | ) | | | (64 | ) | | | 0 | | | | (64 | ) |
GST | | | 0 | | | | 0 | | | | 0 | | | | 0 | | | | | | | | 0 | | | | 0 | | | | (102 | ) | | | (102 | ) | | | (102 | ) | | | 0 | | | | (102 | ) |
HUS | | | 29 | | | | 0 | | | | 0 | | | | 29 | | | | | | | | 0 | | | | 0 | | | | 0 | | | | 0 | | | | 29 | | | | 0 | | | | 29 | |
IND | | | 97 | | | | 0 | | | | 0 | | | | 97 | | | | | | | | 0 | | | | 0 | | | | 0 | | | | 0 | | | | 97 | | | | 0 | | | | 97 | |
JPM | | | 47 | | | | 0 | | | | 0 | | | | 47 | | | | | | | | (9 | ) | | | 0 | | | | 0 | | | | (9 | ) | | | 38 | | | | 0 | | | | 38 | |
MSB | | | 0 | | | | 0 | | | | 0 | | | | 0 | | | | | | | | (2 | ) | | | 0 | | | | 0 | | | | (2 | ) | | | (2 | ) | | | 0 | | | | (2 | ) |
MYC | | | 0 | | | | 0 | | | | 0 | | | | 0 | | | | | | | | 0 | | | | 0 | | | | (52 | ) | | | (52 | ) | | | (52 | ) | | | 0 | | | | (52 | ) |
SCX | | | 179 | | | | 0 | | | | 0 | | | | 179 | | | | | | | | (13 | ) | | | 0 | | | | 0 | | | | (13 | ) | | | 166 | | | | (280 | ) | | | (114 | ) |
| | | | | | | | | | | | | | | | | | | | | | | | | | | | | | | | | | | | | | | | | | | | | | | | |
Total Over the Counter | | $ | 979 | | | $ | 0 | | | $ | 0 | | | $ | 979 | | | | | | | $ | (339 | ) | | $ | 0 | | | $ | (219 | ) | | $ | (558 | ) | | | | | | | | | | | | |
| | | | | | | | | | | | | | | | | | | | | | | | | | | | | | | | | | | | | | | | | | | | | | | | |
| (5) | Net Exposure represents the net receivable/(payable) that would be due from/to the counterparty in the event of default. Exposure from OTC financial derivative instruments can only be netted across transactions governed under the same master agreement with the same legal entity. See Note 7, Principal Risks, in the Notes to Financial Statements for more information regarding master netting arrangements. |
FAIR VALUE OF FINANCIAL DERIVATIVE INSTRUMENTS
The following is a summary of the fair valuation of the Fund’s derivative instruments categorized by risk exposure. See Note 7, Principal Risks, in the Notes to Financial Statements on risks of the Fund.
Fair Values of Financial Derivative Instruments on the Statements of Assets and Liabilities as of December 31, 2016:
| | | | | | | | | | | | | | | | | | | | | | | | |
| | | Derivatives not accounted for as hedging instruments | |
| | | Commodity
Contracts | | | Credit
Contracts | | | Equity
Contracts | | | Foreign
Exchange
Contracts | | | Interest
Rate Contracts | | | Total | |
Financial Derivative Instruments - Assets | | | | | | | | | | | | | | | | | | | | | | | | |
Exchange-traded or centrally cleared | | | | | | | | | | | | | | | | | | | | | | | | |
Futures | | $ | 0 | | | $ | 0 | | | $ | 0 | | | $ | 0 | | | $ | 6 | | | $ | 6 | |
Swap Agreements | | | 0 | | | | 0 | | | | 0 | | | | 0 | | | | 69 | | | | 69 | |
| | | | | | | | | | | | | | | | | | | | | | | | |
| | $ | 0 | | | $ | 0 | | | $ | 0 | | | $ | 0 | | | $ | 75 | | | $ | 75 | |
| | | | | | | | | | | | | | | | | | | | | | | | |
Over the counter | | | | | | | | | | | | | | | | | | | | | | | | |
Forward Foreign Currency Contracts | | $ | 0 | | | $ | 0 | | | $ | 0 | | | $ | 979 | | | $ | 0 | | | $ | 979 | |
| | | | | | | | | | | | | | | | | | | | | | | | |
| | $ | 0 | | | $ | 0 | | | $ | 0 | | | $ | 979 | | | $ | 75 | | | $ | 1,054 | |
| | | | | | | | | | | | | | | | | | | | | | | | |
| | | | | | |
Financial Derivative Instruments - Liabilities | | | | | | | | | | | | | | | | | | | | | | | | |
Exchange-traded or centrally cleared | | | | | | | | | | | | | | | | | | | | | | | | |
Futures | | $ | 0 | | | $ | 0 | | | $ | 0 | | | $ | 37 | | | $ | 0 | | | $ | 37 | |
Swap Agreements | | | 0 | | | | 1 | | | | 0 | | | | 0 | | | | 42 | | | | 43 | |
| | | | | | | | | | | | | | | | | | | | | | | | |
| | $ | 0 | | | $ | 1 | | | $ | 0 | | | $ | 37 | | | $ | 42 | | | $ | 80 | |
| | | | | | | | | | | | | | | | | | | | | | | | |
Over the counter | | | | | | | | | | | | | | | | | | | | | | | | |
Forward Foreign Currency Contracts | | $ | 0 | | | $ | 0 | | | $ | 0 | | | $ | 339 | | | $ | 0 | | | $ | 339 | |
Swap Agreements | | | 0 | | | | 217 | | | | 0 | | | | 0 | | | | 2 | | | | 219 | |
| | | | | | | | | | | | | | | | | | | | | | | | |
| | $ | 0 | | | $ | 217 | | | $ | 0 | | | $ | 339 | | | $ | 2 | | | $ | 558 | |
| | | | | | | | | | | | | | | | | | | | | | | | |
| | $ | 0 | | | $ | 218 | | | $ | 0 | | | $ | 376 | | | $ | 44 | | | $ | 638 | |
| | | | | | | | | | | | | | | | | | | | | | | | |
| | | | | | |
| See Accompanying Notes | | SEMIANNUAL REPORT | | DECEMBER 31, 2016 | | 31 |
Schedule of Investments PIMCO Dividend and Income Fund (Cont.)
The effect of Financial Derivative Instruments on the Statements of Operations for the period ended December 31, 2016:
| | | | | | | | | | | | | | | | | | | | | | | | |
| | | Derivatives not accounted for as hedging instruments | |
| | | Commodity
Contracts | | | Credit
Contracts | | | Equity
Contracts | | | Foreign
Exchange
Contracts | | | Interest
Rate Contracts | | | Total | |
Net Realized Gain (Loss) on Financial Derivative Instruments | | | | | | | | | | | | | | | | | | | | | |
Exchange-traded or centrally cleared | | | | | | | | | | | | | | | | | | | | | | | | |
Futures | | $ | 0 | | | $ | 0 | | | $ | 0 | | | $ | (36 | ) | | $ | 783 | | | $ | 747 | |
Swap Agreements | | | 0 | | | | 62 | | | | 0 | | | | 0 | | | | 50 | | | | 112 | |
| | | | | | | | | | | | | | | | | | | | | | | | |
| | $ | 0 | | | $ | 62 | | | $ | 0 | | | $ | (36 | ) | | $ | 833 | | | $ | 859 | |
| | | | | | | | | | | | | | | | | | | | | | | | |
Over the counter | | | | | | | | | | | | | | | | | | | | | | | | |
Forward Foreign Currency Contracts | | $ | 0 | | | $ | 0 | | | $ | 0 | | | $ | 794 | | | $ | 0 | | | $ | 794 | |
Swap Agreements | | | 0 | | | | 21 | | | | 0 | | | | 0 | | | | 0 | | | | 21 | |
| | | | | | | | | | | | | | | | | | | | | | | | |
| | $ | 0 | | | $ | 21 | | | $ | 0 | | | $ | 794 | | | $ | 0 | | | $ | 815 | |
| | | | | | | | | | | | | | | | | | | | | | | | |
| | $ | 0 | | | $ | 83 | | | $ | 0 | | | $ | 758 | | | $ | 833 | | | $ | 1,674 | |
| | | | | | | | | | | | | | | | | | | | | | | | |
| | | |
Net Change in Unrealized Appreciation (Depreciation) on Financial Derivative Instruments | | | | | | | | | | | | | |
Exchange-traded or centrally cleared | | | | | | | | | | | | | | | | | | | | | | | | |
Futures | | $ | 0 | | | $ | 0 | | | $ | 0 | | | $ | (326 | ) | | $ | (10 | ) | | $ | (336 | ) |
Swap Agreements | | | 0 | | | | (14 | ) | | | 0 | | | | 0 | | | | (76 | ) | | | (90 | ) |
| | | | | | | | | | | | | | | | | | | | | | | | |
| | $ | 0 | | | $ | (14 | ) | | $ | 0 | | | $ | (326 | ) | | $ | (86 | ) | | $ | (426 | ) |
| | | | | | | | | | | | | | | | | | | | | | | | |
Over the counter | | | | | | | | | | | | | | | | | | | | | | | | |
Forward Foreign Currency Contracts | | $ | 0 | | | $ | 0 | | | $ | 0 | | | $ | 261 | | | $ | 0 | | | $ | 261 | |
Swap Agreements | | | 0 | | | | 215 | | | | 0 | | | | 0 | | | | (2 | ) | | | 213 | |
| | | | | | | | | | | | | | | | | | | | | | | | |
| | $ | 0 | | | $ | 215 | | | $ | 0 | | | $ | 261 | | | $ | (2 | ) | | $ | 474 | |
| | | | | | | | | | | | | | | | | | | | | | | | |
| | $ | 0 | | | $ | 201 | | | $ | 0 | | | $ | (65 | ) | | $ | (88 | ) | | $ | 48 | |
| | | | | | | | | | | | | | | | | | | | | | | | |
FAIR VALUE MEASUREMENTS
The following is a summary of the fair valuations according to the inputs used as of December 31, 2016 in valuing the Fund’s assets and liabilities:
| | | | | | | | | | | | | | | | |
| Category and Subcategory | | Level 1 | | | Level 2 | | | Level 3 | | | Fair
Value at
12/31/2016 | |
Investments in Securities, at Value | |
Asset-Backed Securities | |
Cayman Islands | | $ | 0 | | | $ | 5,410 | | | $ | 0 | | | $ | 5,410 | |
United States | | | 0 | | | | 20,657 | | | | 0 | | | | 20,657 | |
Bank Loan Obligations | |
United States | | | 0 | | | | 3,073 | | | | 7 | | | | 3,080 | |
Common Stocks | |
Australia | | | | | | | | | | | | | | | | |
Consumer Discretionary | | | 0 | | | | 280 | | | | 0 | | | | 280 | |
Consumer Staples | | | 0 | | | | 532 | | | | 0 | | | | 532 | |
Energy | | | 0 | | | | 1,141 | | | | 0 | | | | 1,141 | |
Financials | | | 0 | | | | 961 | | | | 0 | | | | 961 | |
Health Care | | | 0 | | | | 209 | | | | 0 | | | | 209 | |
Materials | | | 0 | | | | 1,627 | | | | 0 | | | | 1,627 | |
Austria | |
Energy | | | 0 | | | | 638 | | | | 0 | | | | 638 | |
Financials | | | 0 | | | | 621 | | | | 0 | | | | 621 | |
Materials | | | 0 | | | | 325 | | | | 0 | | | | 325 | |
Belgium | |
Consumer Discretionary | | | 0 | | | | 93 | | | | 0 | | | | 93 | |
Telecommunication Services | | | 0 | | | | 273 | | | | 0 | | | | 273 | |
Canada | |
Energy | | | 2,060 | | | | 0 | | | | 0 | | | | 2,060 | |
Financials | | | 2,704 | | | | 0 | | | | 0 | | | | 2,704 | |
Industrials | | | 228 | | | | 0 | | | | 0 | | | | 228 | |
Materials | | | 2,411 | | | | 0 | | | | 0 | | | | 2,411 | |
Telecommunication Services | | | 213 | | | | 0 | | | | 0 | | | | 213 | |
Utilities | | | 712 | | | | 0 | | | | 0 | | | | 712 | |
Denmark | |
Industrials | | | 0 | | | | 1,234 | | | | 0 | | | | 1,234 | |
Telecommunication Services | | | 0 | | | | 342 | | | | 0 | | | | 342 | |
Finland | |
Industrials | | | 0 | | | | 60 | | | | 0 | | | | 60 | |
Materials | | | 0 | | | | 392 | | | | 0 | | | | 392 | |
Utilities | | | 0 | | | | 519 | | | | 0 | | | | 519 | |
| | | | | | | | | | | | | | | | |
| Category and Subcategory | | Level 1 | | | Level 2 | | | Level 3 | | | Fair
Value at
12/31/2016 | |
France | |
Consumer Discretionary | | $ | 0 | | | $ | 2,813 | | | $ | 0 | | | $ | 2,813 | |
Consumer Staples | | | 0 | | | | 451 | | | | 0 | | | | 451 | |
Energy | | | 0 | | | | 3,328 | | | | 0 | | | | 3,328 | |
Financials | | | 0 | | | | 3,140 | | | | 0 | | | | 3,140 | |
Health Care | | | 0 | | | | 3,611 | | | | 0 | | | | 3,611 | |
Industrials | | | 0 | | | | 2,122 | | | | 0 | | | | 2,122 | |
Telecommunication Services | | | 0 | | | | 1,638 | | | | 0 | | | | 1,638 | |
Utilities | | | 0 | | | | 2,500 | | | | 0 | | | | 2,500 | |
Germany | |
Consumer Discretionary | | | 0 | | | | 1,270 | | | | 0 | | | | 1,270 | |
Consumer Staples | | | 0 | | | | 1,277 | | | | 0 | | | | 1,277 | |
Financials | | | 0 | | | | 1,203 | | | | 0 | | | | 1,203 | |
Health Care | | | 0 | | | | 147 | | | | 0 | | | | 147 | |
Industrials | | | 0 | | | | 1,851 | | | | 0 | | | | 1,851 | |
Materials | | | 0 | | | | 2,192 | | | | 0 | | | | 2,192 | |
Utilities | | | 0 | | | | 3,461 | | | | 0 | | | | 3,461 | |
Hong Kong | |
Consumer Discretionary | | | 0 | | | | 288 | | | | 0 | | | | 288 | |
Industrials | | | 0 | | | | 231 | | | | 0 | | | | 231 | |
Information Technology | | | 0 | | | | 254 | | | | 0 | | | | 254 | |
Real Estate | | | 0 | | | | 1,055 | | | | 0 | | | | 1,055 | |
Israel | |
Financials | | | 0 | | | | 484 | | | | 0 | | | | 484 | |
Materials | | | 0 | | | | 267 | | | | 0 | | | | 267 | |
Telecommunication Services | | | 0 | | | | 413 | | | | 0 | | | | 413 | |
Italy | |
Energy | | | 0 | | | | 2,597 | | | | 0 | | | | 2,597 | |
Financials | | | 514 | | | | 0 | | | | 0 | | | | 514 | |
Utilities | | | 0 | | | | 1,836 | | | | 0 | | | | 1,836 | |
Japan | |
Consumer Discretionary | | | 0 | | | | 3,162 | | | | 0 | | | | 3,162 | |
Consumer Staples | | | 0 | | | | 530 | | | | 0 | | | | 530 | |
Energy | | | 0 | | | | 888 | | | | 0 | | | | 888 | |
Financials | | | 162 | | | | 6,266 | | | | 0 | | | | 6,428 | |
| | | | | | | | |
| 32 | | PIMCO EQUITY SERIES | | | | | See Accompanying Notes | |
December 31, 2016 (Unaudited)
| | | | | | | | | | | | | | | | |
| Category and Subcategory | | Level 1 | | | Level 2 | | | Level 3 | | | Fair
Value at
12/31/2016 | |
Health Care | | $ | 0 | | | $ | 1,266 | | | $ | 0 | | | $ | 1,266 | |
Industrials | | | 0 | | | | 7,723 | | | | 0 | | | | 7,723 | |
Information Technology | | | 0 | | | | 6,675 | | | | 0 | | | | 6,675 | |
Materials | | | 0 | | | | 2,463 | | | | 0 | | | | 2,463 | |
Real Estate | | | 0 | | | | 195 | | | | 0 | | | | 195 | |
Telecommunication Services | | | 0 | | | | 1,905 | | | | 0 | | | | 1,905 | |
Utilities | | | 0 | | | | 422 | | | | 0 | | | | 422 | |
Luxembourg | |
Consumer Discretionary | | | 0 | | | | 136 | | | | 0 | | | | 136 | |
Materials | | | 0 | | | | 1,691 | | | | 0 | | | | 1,691 | |
Macau | |
Consumer Discretionary | | | 0 | | | | 30 | | | | 0 | | | | 30 | |
Mexico | |
Consumer Discretionary | | | 2 | | | | 0 | | | | 0 | | | | 2 | |
Netherlands | |
Consumer Staples | | | 0 | | | | 1,166 | | | | 0 | | | | 1,166 | |
Energy | | | 0 | | | | 6,665 | | | | 0 | | | | 6,665 | |
Financials | | | 0 | | | | 346 | | | | 0 | | | | 346 | |
Industrials | | | 0 | | | | 1,322 | | | | 0 | | | | 1,322 | |
Telecommunication Services | | | 154 | | | | 178 | | | | 0 | | | | 332 | |
New Zealand | |
Telecommunication Services | | | 0 | | | | 213 | | | | 0 | | | | 213 | |
Norway | |
Consumer Staples | | | 0 | | | | 342 | | | | 0 | | | | 342 | |
Energy | | | 0 | | | | 2,162 | | | | 0 | | | | 2,162 | |
Financials | | | 0 | | | | 150 | | | | 0 | | | | 150 | |
Portugal | |
Utilities | | | 0 | | | | 345 | | | | 0 | | | | 345 | |
Singapore | |
Industrials | | | 0 | | | | 346 | | | | 0 | | | | 346 | |
Spain | |
Consumer Staples | | | 0 | | | | 194 | | | | 0 | | | | 194 | |
Financials | | | 0 | | | | 5,174 | | | | 0 | | | | 5,174 | |
Industrials | | | 0 | | | | 996 | | | | 0 | | | | 996 | |
Telecommunication Services | | | 0 | | | | 940 | | | | 0 | | | | 940 | |
Utilities | | | 0 | | | | 1,271 | | | | 0 | | | | 1,271 | |
Sweden | |
Financials | | | 0 | | | | 167 | | | | 0 | | | | 167 | |
Health Care | | | 0 | | | | 142 | | | | 0 | | | | 142 | |
Industrials | | | 0 | | | | 203 | | | | 0 | | | | 203 | |
Telecommunication Services | | | 0 | | | | 1,044 | | | | 0 | | | | 1,044 | |
Switzerland | |
Consumer Discretionary | | | 212 | | | | 0 | | | | 0 | | | | 212 | |
Energy | | | 158 | | | | 0 | | | | 0 | | | | 158 | |
Financials | | | 0 | | | | 4,353 | | | | 0 | | | | 4,353 | |
Health Care | | | 0 | | | | 2,221 | | | | 0 | | | | 2,221 | |
Telecommunication Services | | | 0 | | | | 305 | | | | 0 | | | | 305 | |
United Kingdom | |
Consumer Discretionary | | | 0 | | | | 1,175 | | | | 0 | | | | 1,175 | |
Consumer Staples | | | 0 | | | | 2,584 | | | | 0 | | | | 2,584 | |
Energy | | | 0 | | | | 4,887 | | | | 0 | | | | 4,887 | |
Financials | | | 0 | | | | 11,266 | | | | 0 | | | | 11,266 | |
Health Care | | | 0 | | | | 1,983 | | | | 0 | | | | 1,983 | |
Industrials | | | 0 | | | | 1,334 | | | | 0 | | | | 1,334 | |
Materials | | | 0 | | | | 1,045 | | | | 0 | | | | 1,045 | |
Telecommunication Services | | | 0 | | | | 1,422 | | | | 0 | | | | 1,422 | |
Utilities | | | 0 | | | | 2,050 | | | | 0 | | | | 2,050 | |
United States | |
Consumer Discretionary | | | 7,217 | | | | 0 | | | | 0 | | | | 7,217 | |
Consumer Staples | | | 9,100 | | | | 0 | | | | 0 | | | | 9,100 | |
Energy | | | 27,998 | | | | 0 | | | | 0 | | | | 27,998 | |
Financials | | | 12,952 | | | | 0 | | | | 0 | | | | 12,952 | |
Health Care | | | 14,611 | | | | 0 | | | | 0 | | | | 14,611 | |
Industrials | | | 7,087 | | | | 0 | | | | 0 | | | | 7,087 | |
Information Technology | | | 16,586 | | | | 0 | | | | 0 | | | | 16,586 | |
Materials | | | 5,484 | | | | 0 | | | | 0 | | | | 5,484 | |
Telecommunication Services | | | 11,840 | | | | 0 | | | | 0 | | | | 11,840 | |
Utilities | | | 8,989 | | | | 0 | | | | 0 | | | | 8,989 | |
Corporate Bonds & Notes | |
Australia | |
Banking & Finance | | | 0 | | | | 393 | | | | 0 | | | | 393 | |
Brazil | |
Utilities | | | 0 | | | | 1,560 | | | | 0 | | | | 1,560 | |
| | | | | | | | | | | | | | | | |
| Category and Subcategory | | Level 1 | | | Level 2 | | | Level 3 | | | Fair
Value at
12/31/2016 | |
Cayman Islands | |
Utilities | | $ | 0 | | | $ | 65 | | | $ | 0 | | | $ | 65 | |
Denmark | |
Banking & Finance | | | 0 | | | | 2,657 | | | | 0 | | | | 2,657 | |
France | |
Banking & Finance | | | 0 | | | | 1,648 | | | | 0 | | | | 1,648 | |
Industrials | | | 0 | | | | 1,025 | | | | 0 | | | | 1,025 | |
Germany | |
Banking & Finance | | | 0 | | | | 592 | | | | 0 | | | | 592 | |
Ireland | |
Banking & Finance | | | 0 | | | | 108 | | | | 0 | | | | 108 | |
Industrials | | | 0 | | | | 420 | | | | 0 | | | | 420 | |
Italy | |
Utilities | | | 0 | | | | 325 | | | | 0 | | | | 325 | |
Luxembourg | |
Banking & Finance | | | 0 | | | | 658 | | | | 0 | | | | 658 | |
Utilities | | | 0 | | | | 1,386 | | | | 0 | | | | 1,386 | |
Mexico | |
Industrials | | | 0 | | | | 72 | | | | 0 | | | | 72 | |
Netherlands | |
Banking & Finance | | | 0 | | | | 226 | | | | 0 | | | | 226 | |
United Kingdom | |
Banking & Finance | | | 0 | | | | 6,292 | | | | 0 | | | | 6,292 | |
Industrials | | | 0 | | | | 1,011 | | | | 0 | | | | 1,011 | |
United States | |
Banking & Finance | | | 0 | | | | 4,513 | | | | 0 | | | | 4,513 | |
Industrials | | | 0 | | | | 4,584 | | | | 0 | | | | 4,584 | |
Utilities | | | 0 | | | | 842 | | | | 0 | | | | 842 | |
Venezuela | |
Industrials | | | 0 | | | | 159 | | | | 0 | | | | 159 | |
Non-Agency Mortgage-Backed Securities | |
United Kingdom | | | 0 | | | | 2,591 | | | | 0 | | | | 2,591 | |
United States | | | 0 | | | | 11,996 | | | | 0 | | | | 11,996 | |
Municipal Bonds & Notes | |
California | | | 0 | | | | 813 | | | | 0 | | | | 813 | |
Illinois | | | 0 | | | | 122 | | | | 0 | | | | 122 | |
Michigan | | | 0 | | | | 203 | | | | 0 | | | | 203 | |
Virginia | | | 0 | | | | 308 | | | | 0 | | | | 308 | |
West Virginia | | | 0 | | | | 330 | | | | 0 | | | | 330 | |
Preferred Stocks | |
Germany | |
Industrials | | | 0 | | | | 1,396 | | | | 0 | | | | 1,396 | |
Real Estate Investment Trusts | |
Canada | |
Real Estate | | | 214 | | | | 0 | | | | 0 | | | | 214 | |
United States | |
Financials | | | 508 | | | | 0 | | | | 0 | | | | 508 | |
Real Estate | | | 384 | | | | 0 | | | | 0 | | | | 384 | |
Sovereign Issues | |
Brazil | | | 0 | | | | 469 | | | | 0 | | | | 469 | |
Greece | | | 0 | | | | 512 | | | | 0 | | | | 512 | |
Saudi Arabia | | | 0 | | | | 192 | | | | 0 | | | | 192 | |
Spain | | | 0 | | | | 57 | | | | 0 | | | | 57 | |
Venezuela | | | 0 | | | | 158 | | | | 0 | | | | 158 | |
U.S. Government Agencies | |
United States | | | 0 | | | | 13,781 | | | | 0 | | | | 13,781 | |
U.S. Treasury Obligations | |
United States | | | 0 | | | | 7,979 | | | | 0 | | | | 7,979 | |
Short-Term Instruments | |
Japan Treasury Bills | | | 0 | | | | 2,054 | | | | 0 | | | | 2,054 | |
Mexico Treasury Bills | | | 0 | | | | 48 | | | | 0 | | | | 48 | |
| | | | | | | | | | | | | | | | |
| | $ | 132,500 | | | $ | 239,704 | | | $ | 7 | | | $ | 372,211 | |
| | | | | | | | | | | | | | | | |
|
Investments in Affiliates, at Value | |
Short-Term Instruments | |
Central Funds Used for Cash Management Purposes | | $ | 1,485 | | | $ | 0 | | | $ | 0 | | | $ | 1,485 | |
| | | | | | | | | | | | | | | | |
| | | | |
Total Investments | | $ | 133,985 | | | $ | 239,704 | | | $ | 7 | | | $ | 373,696 | |
| | | | | | | | | | | | | | | | |
| | | | | | |
| See Accompanying Notes | | SEMIANNUAL REPORT | | DECEMBER 31, 2016 | | 33 |
Schedule of Investments PIMCO Dividend and Income Fund (Cont.)
December 31, 2016 (Unaudited)
| | | | | | | | | | | | | | | | |
| Category and Subcategory | | Level 1 | | | Level 2 | | | Level 3 | | | Fair
Value at
12/31/2016 | |
Short Sales, at Value - Liabilities | |
U.S. Treasury Obligations | | $ | 0 | | | $ | (97 | ) | | $ | 0 | | | $ | (97 | ) |
| | | | | | | | | | | | | | | | |
| | $ | 0 | | | $ | (97 | ) | | $ | 0 | | | $ | (97 | ) |
| | | | | | | | | | | | | | | | |
|
Financial Derivative Instruments - Assets | |
Exchange-traded or centrally cleared | | | 6 | | | | 69 | | | | 0 | | | | 75 | |
Over the counter | | | 0 | | | | 979 | | | | 0 | | | | 979 | |
| | | | | | | | | | | | | | | | |
| | $ | 6 | | | $ | 1,048 | | | $ | 0 | | | $ | 1,054 | |
| | | | | | | | | | | | | | | | |
| | | | | | | | | | | | | | | | |
| Category and Subcategory | | Level 1 | | | Level 2 | | | Level 3 | | | Fair
Value at
12/31/2016 | |
Financial Derivative Instruments - Liabilities | |
Exchange-traded or centrally cleared | | $ | (37 | ) | | $ | (43 | ) | | $ | 0 | | | $ | (80 | ) |
Over the counter | | | 0 | | | | (558 | ) | | | 0 | | | | (558 | ) |
| | | | | | | | | | | | | | | | |
| | $ | (37 | ) | | $ | (601 | ) | | $ | 0 | | | $ | (638 | ) |
| | | | | | | | | | | | | | | | |
Total Financial Derivative Instruments | | $ | (31 | ) | | $ | 447 | | | $ | 0 | | | $ | 416 | |
| | | | | | | | | | | | | | | | |
| | | | |
Totals | | $ | 133,954 | | | $ | 240,054 | | | $ | 7 | | | $ | 374,015 | |
| | | | | | | | | | | | | | | | |
There were assets and liabilities valued at $1,452 transferred from Level 1 to Level 2 during the period ended December 31, 2016. There were no significant assets and liabilities transferred from Level 2 to Level 1 during the period ended December 31, 2016. There were no significant transfers between Levels 2 and 3 during the period ended December 31, 2016.
| | | | | | | | |
| 34 | | PIMCO EQUITY SERIES | | | | | See Accompanying Notes | |
Schedule of Investments PIMCO EqS® Long/Short Fund
December 31, 2016 (Unaudited)
| | | | | | | | | | | | |
| | | | | SHARES | | | | | MARKET
VALUE
(000S) | |
| INVESTMENTS IN SECURITIES 97.0% | |
| |
| COMMON STOCKS 59.2% | |
| |
| AUSTRALIA 2.2% | |
| | | | | | | | | | | | |
| MATERIALS 2.2% | |
BHP Billiton Ltd. ADR | | | | | 347,000 | | | $ | | | 12,416 | |
| | | | | | | | | | | | |
Total Australia | | | | | | | | | | | 12,416 | |
| | | | | | | | | | | | |
| | | | | | | | | | | | |
| CANADA 1.7% | |
| | | | | | | | | | | | |
| ENERGY 0.4% | |
Enbridge, Inc. | | | | | 50,000 | | | | | | 2,104 | |
| | | | | | | | | | | | |
| | | | | | | | | | | | |
| UTILITIES 1.3% | |
Fortis, Inc. | | | | | 250,000 | | | | | | 7,720 | |
| | | | | | | | | | | | |
Total Canada | | | | | | | | | | | 9,824 | |
| | | | | | | | | | | | |
| | | | | | | | | | | | |
| SWITZERLAND 3.0% | |
| | | | | | | | | | | | |
| CONSUMER STAPLES 3.0% | |
Nestle S.A. | | | | | 235,000 | | | | | | 16,835 | |
| | | | | | | | | | | | |
Total Switzerland | | | | | | | | | | | 16,835 | |
| | | | | | | | | | | | |
| | | | | | | | | | | | |
| UNITED KINGDOM 5.4% | |
| | | | | | | | | | | | |
| CONSUMER DISCRETIONARY 1.6% | |
Delphi Automotive PLC | | | | | 135,000 | | | | | | 9,092 | |
| | | | | | | | | | | | |
| | | | | | | | | | | | |
| INDUSTRIALS 3.8% | |
IHS Markit Ltd. (a) | | | | | 600,000 | | | | | | 21,246 | |
| | | | | | | | | | | | |
Total United Kingdom | | | | | | | | | | | 30,338 | |
| | | | | | | | | | | | |
| | | | | | | | | | | | |
| UNITED STATES 46.9% | |
| | | | | | | | | | | | |
| CONSUMER DISCRETIONARY 7.9% | |
Carnival Corp. | | | | | 180,000 | | | | | | 9,371 | |
DR Horton, Inc. | | | | | 200,000 | | | | | | 5,466 | |
Lowe’s Cos., Inc. | | | | | 85,000 | | | | | | 6,045 | |
NVR, Inc. (a)(g) | | | | | 10,000 | | | | | | 16,690 | |
Royal Caribbean Cruises Ltd. | | | | | 90,000 | | | | | | 7,384 | |
| | | | | | | | | | | | |
| | | | | | | | | | | 44,956 | |
| | | | | | | | | | | | |
| | | | | | | | | | | | |
| CONSUMER STAPLES 3.1% | |
Kroger Co. | | | | | 350,000 | | | | | | 12,079 | |
Sanderson Farms, Inc. (g) | | | | | 60,000 | | | | | | 5,654 | |
| | | | | | | | | | | | |
| | | | | | | | | | | 17,733 | |
| | | | | | | | | | | | |
| | | | | | | | | | | | |
| | | | | SHARES | | | | | MARKET
VALUE
(000S) | |
| ENERGY 13.0% | |
Arch Coal, Inc. (a)(g) | | | | | 35,000 | | | $ | | | 2,732 | |
Enable Midstream Partners LP (g) | | | | | 311,000 | | | | | | 4,892 | |
Energy Transfer Partners LP | | | | | 490,000 | | | | | | 17,547 | |
Enterprise Products Partners LP | | | | | 630,000 | | | | | | 17,035 | |
Plains All American Pipeline LP | | | | | 390,000 | | | | | | 12,593 | |
Williams Partners LP | | | | | 500,000 | | | | | | 19,015 | |
| | | | | | | | | | | | |
| | | | | | | | | | | 73,814 | |
| | | | | | | | | | | | |
| | | | | | | | | | | | |
| FINANCIALS 2.3% | |
Bank of the Ozarks, Inc. (g) | | | | | 250,000 | | | | | | 13,147 | |
| | | | | | | | | | | | |
| | | | | | | | | | | | |
| HEALTH CARE 2.3% | |
Laboratory Corp. of America Holdings (a) | | | | | 78,000 | | | | | | 10,014 | |
Merck & Co., Inc. | | | | | 50,000 | | | | | | 2,943 | |
| | | | | | | | | | | | |
| | | | | | | | | | | 12,957 | |
| | | | | | | | | | | | |
| | | | | | | | | | | | |
| INDUSTRIALS 8.8% | |
CSX Corp. (g) | | | | | 395,000 | | | | | | 14,192 | |
KAR Auction Services, Inc. | | | | | 300,000 | | | | | | 12,786 | |
Norfolk Southern Corp. | | | | | 106,000 | | | | | | 11,456 | |
Union Pacific Corp. | | | | | 110,000 | | | | | | 11,405 | |
| | | | | | | | | | | | |
| | | | | | | | | | | 49,839 | |
| | | | | | | | | | | | |
| | | | | | | | | | | | |
| INFORMATION TECHNOLOGY 7.7% | |
DST Systems, Inc. | | | | | 110,000 | | | | | | 11,786 | |
eBay, Inc. (a) | | | | | 400,000 | | | | | | 11,876 | |
First Data Corp. ‘A’ (a) | | | | | 1,400,000 | | | | | | 19,866 | |
| | | | | | | | | | | | |
| | | | | | | | | | | 43,528 | |
| | | | | | | | | | | | |
| | | | | | | | | | | | |
| MATERIALS 1.8% | |
Sealed Air Corp. | | | | | 220,000 | | | | | | 9,975 | |
| | | | | | | | | | | | |
Total United States | | | | | | | | | | | 265,949 | |
| | | | | | | | | | | | |
Total Common Stocks (Cost $317,431) | | | 335,362 | |
| | | | | | | | | | | | |
| | | | | | | | | | | | |
| REAL ESTATE INVESTMENT TRUSTS 1.4% | |
| | | | | | | | | | | | |
| UNITED STATES 1.4% | |
| | | | | | | | | | | | |
| REAL ESTATE 1.4% | |
Iron Mountain, Inc. | | | | | 255,000 | | | | | | 8,282 | |
| | | | | | | | | | | | |
Total Real Estate Investment Trusts
(Cost $7,519) | | | 8,282 | |
| | | | | | | | | | | | |
| | | | | | | | | | | | |
| | | | | PRINCIPAL
AMOUNT
(000S) | | | | | MARKET
VALUE
(000S) | |
| U.S. TREASURY OBLIGATIONS 0.6% | |
| | | | | | | | | | | | |
| UNITED STATES 0.6% | |
U.S. Treasury Floating Rate Notes | |
0.730% due 07/31/2018 | | $ | | | 3,200 | | | $ | | | 3,203 | |
| | | | | | | | | | | | |
Total U.S. Treasury Obligations (Cost $3,200) | | | 3,203 | |
| | | | | | | | | | | | |
| | | | | | | | | | | | |
| SHORT-TERM INSTRUMENTS 35.8% | |
| |
| REPURCHASE AGREEMENTS (d) 0.5% | |
| | | | | | | | | | | 2,840 | |
| | | | | | | | | | | | |
| | | | | | | | | | | | |
| U.S. TREASURY BILLS 35.3% | |
0.488% due 03/02/2017 - 03/16/2017 (b)(c)(h) | | | | | 200,100 | | | | | | 199,936 | |
| | | | | | | | | | | | |
| Total Short-Term Instruments (Cost $202,774) | | | | | | | | | 202,776 | |
| | | | | | | | | | | | |
| | | | | | | | | | | | |
| Total Investments in Securities (Cost $530,924) | | | | | | | | | 549,623 | |
| | | | | | | | | | | | |
| |
| | | | | SHARES | | | | | | |
| INVESTMENTS IN AFFILIATES 4.3% | |
| | | | | | | | | | | | |
| SHORT-TERM INSTRUMENTS 4.3% | |
| | | | | | | | | | | | |
| CENTRAL FUNDS USED FOR CASH MANAGEMENT PURPOSES 4.3% | |
PIMCO Short-Term Floating NAV Portfolio III | | | 2,487,075 | | | | | | 24,585 | |
| | | | | | | | | | | | |
| Total Short-Term Instruments (Cost $24,580) | | | | | | | | | 24,585 | |
| | | | | | | | | | | | |
| |
| Total Investments in Affiliates (Cost $24,580) | | | | | | | | | 24,585 | |
| | | | | | | | | | | | |
| Total Investments 101.3% (Cost $555,504) | | | | | | $ | | | 574,208 | |
| |
| Securities Sold Short (e) (13.1)% (Proceeds $75,127) | | | (74,472 | ) |
| |
Financial Derivative
Instruments (f)(i) 0.1% (Cost or Premiums, net $0) | | | 622 | |
| |
| Other Assets and Liabilities, net 11.7% | | | 66,395 | |
| | | | | | | | | | | | |
| Net Assets 100.0% | | | | | | | | $ | | | 566,753 | |
| | | | | | | | | | | | |
NOTES TO SCHEDULE OF INVESTMENTS (AMOUNTS IN THOUSANDS*, EXCEPT NUMBER OF CONTRACTS AND SHARES):
| * | A zero balance may reflect actual amounts rounding to less than one thousand. |
| (a) | Security did not produce income within the last twelve months. |
| (b) | Coupon represents a weighted average yield to maturity. |
| | | | | | |
| See Accompanying Notes | | SEMIANNUAL REPORT | | DECEMBER 31, 2016 | | 35 |
Schedule of Investments PIMCO EqS® Long/Short Fund (Cont.)
BORROWINGS AND OTHER FINANCING TRANSACTIONS
(d) REPURCHASE AGREEMENTS:
| | | | | | | | | | | | | | | | | | | | | | | | | | | | | | |
| Counterparty | | Lending
Rate | | | Settlement
Date | | | Maturity
Date | | | Principal
Amount | | | Collateralized By | | Collateral
(Received) | | | Repurchase
Agreements,
at Value | | | Repurchase
Agreement
Proceeds
to be
Received(1) | |
| SSB | | | 0.010 | % | | | 12/30/2016 | | | | 01/03/2017 | | | $ | 2,840 | | | U.S. Treasury Notes 1.000% due 05/15/2018(2) | | $ | (2,897 | ) | | $ | 2,840 | | | $ | 2,840 | |
| | | | | | | | | | | | | | | | | | | | | | | | | | | | | | |
Total Repurchase Agreements | | | | | $ | (5,794 | ) | | $ | 2,840 | | | $ | 2,840 | |
| | | | | | | | | | | | | | | | | | | | | | | | | | | | | | |
| (1) | Includes accrued interest. |
| (2) | Collateral is held in custody by the counterparty. |
(e) SECURITIES SOLD SHORT:
| | | | | | | | | | | | | | |
| Counterparty | | Description | | Shares | | | Proceeds | | | Payable for
Short Sales(3) | |
| | Common Stocks | | | | | | | | | | | | |
| | Canada | | | | | | | | | | | | |
| | Energy | | | | | | | | | | | | |
GSC | | TransCanada Corp. | | | 75,000 | | | $ | (3,287 | ) | | $ | (3,413 | ) |
| | Industrials | | | | | | | | | | | | |
FOB | | Canadian Pacific Railway Ltd. | | | 41,000 | | | | (3,036 | ) | | | (5,864 | ) |
GSC | | Canadian Pacific Railway Ltd. | | | 20,000 | | | | (5,942 | ) | | | (2,861 | ) |
| | United Kingdom | | | | | | | | | | | | |
| | Industrials | | | | | | | | | | | | |
GSC | | Rolls-Royce Holdings PLC | | | 14,250,000 | | | | (4,134 | ) | | | (3,713 | ) |
| | United States | | | | | | | | | | | | |
| | Consumer Discretionary | | | | | | | | | | | | |
FOB | | Buckle, Inc. | | | 130,430 | | | | (4,040 | ) | | | (2,974 | ) |
| | Consumer Staples | | | | | | | | | | | | |
GSC | | Mead Johnson Nutrition Co. | | | 60,000 | | | | (4,706 | ) | | | (4,266 | ) |
FOB | | Procter & Gamble Co. | | | 100,000 | | | | (8,356 | ) | | | (8,408 | ) |
| | Energy | | | | | | | | | | | | |
GSC | | Exxon Mobil Corp. | | | 170,000 | | | | (14,826 | ) | | | (15,344 | ) |
| | Health Care | | | | | | | | | | | | |
FOB | | Merck & Co., Inc. | | | 50,000 | | | | (3,184 | ) | | | (2,967 | ) |
| | Quest Diagnostics, Inc. | | | 40,000 | | | | (3,082 | ) | | | (3,676 | ) |
| | Industrials | | | | | | | | | | | | |
GSC | | Swift Transportation Co. | | | 100,000 | | | | (2,435 | ) | | | (2,436 | ) |
FOB | | Emerson Electric Co. | | | 60,000 | | | | (3,397 | ) | | | (3,345 | ) |
GSC | | JB Hunt Transport Services, Inc. | | | 20,000 | | | | (1,945 | ) | | | (1,942 | ) |
| | Exchange-Traded Funds | | | | | | | | | | | | |
| | United States | | | | | | | | | | | | |
FOB | | Consumer Staples Select Sector SPDR Fund | | | 71,000 | | | | (3,687 | ) | | | (3,672 | ) |
GSC | | Technology Select Sector SPDR Fund | | | 65,000 | | | | (3,036 | ) | | | (3,143 | ) |
FOB | | VanEck Vectors Semiconductor ETF | | | 90,000 | | | | (6,034 | ) | | | (6,448 | ) |
| | | | | | | | | | | | | | |
Total Short Sales | | | | | | $ | (75,127 | ) | | $ | (74,472 | ) |
| | | | | | | | | | | | | | |
| (3) | Payable for short sales includes $92 of dividends payable. |
BORROWINGS AND OTHER FINANCING TRANSACTIONS SUMMARY
The following is a summary by counterparty of the market value of Borrowings and Other Financing Transactions and collateral pledged/(received) as of December 31, 2016:
| | | | | | | | | | | | | | | | | | | | | | | | | | | | |
| Counterparty | | Repurchase
Agreement
Proceeds
to be
Received | | | Payable for
Reverse
Repurchase
Agreements | | | Payable for
Sale-Buyback
Transactions | | | Payable for
Short Sales | | | Total
Borrowings and
Other Financing
Transactions | | | Collateral
Pledged/(Received) | | | Net Exposure(4) | |
Global/Master Repurchase Agreement | |
SSB | | $ | 2,840 | | | $ | 0 | | | $ | 0 | | | $ | 0 | | | $ | 2,840 | | | $ | (2,897 | ) | | $ | (57 | ) |
| | | | | | | | |
| 36 | | PIMCO EQUITY SERIES | | | | | See Accompanying Notes | |
December 31, 2016 (Unaudited)
| | | | | | | | | | | | | | | | | | | | | | | | | | | | |
| Counterparty | | Repurchase
Agreement
Proceeds
to be
Received | | | Payable for
Reverse
Repurchase
Agreements | | | Payable for
Sale-Buyback
Transactions | | | Payable for
Short Sales | | | Total
Borrowings and
Other Financing
Transactions | | | Collateral
Pledged/(Received) | | | Net Exposure(4) | |
Prime Brokerage Agreement | |
FOB | | $ | 0 | | | $ | 0 | | | $ | 0 | | | $ | (37,354 | ) | | $ | (37,354 | ) | | $ | 44,968 | | | $ | 7,614 | |
GSC | | | 0 | | | | 0 | | | | 0 | | | | (37,118 | ) | | | (37,118 | ) | | | 54,050 | | | | 16,932 | |
| | | | | | | | | | | | | | | | | | | | | | | | | | | | |
Total Borrowings and Other Financing Transactions | | $ | 2,840 | | | $ | 0 | | | $ | 0 | | | $ | (74,472 | ) | | | | | | | | | | | | |
| | | | | | | | | | | | | | | | | | | | | | | | | | | | |
| (4) | Net Exposure represents the net receivable/(payable) that would be due from/to the counterparty in the event of default. Exposure from borrowings and other financing transactions can only be netted across transactions governed under the same master agreement with the same legal entity. See Note 7, Principal Risks, in the Notes to Financial Statements for more information regarding master netting arrangements. |
(f) FINANCIAL DERIVATIVE INSTRUMENTS: EXCHANGE-TRADED OR CENTRALLY CLEARED
FUTURES CONTRACTS:
| | | | | | | | | | | | | | | | | | | | | | |
| Description | | Type | | Expiration
Month | | | # of
Contracts | | | Unrealized
Appreciation | | | Variation Margin | |
| | | | | | Asset | | | Liability | |
Euro STOXX 50 March Futures | | Long | | | 03/2017 | | | | 593 | | | $ | 346 | | | $ | 100 | | | $ | (44 | ) |
Russell 2000 Mini Index March Futures | | Short | | | 03/2017 | | | | 234 | | | | 274 | | | | 67 | | | | 0 | |
| | | | | | | | | | | | | | | | | | | | | | |
Total Futures Contracts | | | $ | 620 | | | $ | 167 | | | $ | (44 | ) |
| | | | | | | | | | | | | | | | | | | | | | |
FINANCIAL DERIVATIVE INSTRUMENTS: EXCHANGE-TRADED OR CENTRALLY CLEARED SUMMARY
The following is a summary of the market value and variation margin of Exchange-Traded or Centrally Cleared Financial Derivative Instruments as of December 31, 2016:
| (g) | Securities with an aggregate market value of $23,703 and cash of $75,315 have been pledged as collateral as of December 31, 2016 for equity short sales and equity options as governed by prime brokerage agreements and agreements governing listed equity option transactions. |
| (h) | Securities with an aggregate market value of $1,920 and cash of $734 have been pledged as collateral for exchange-traded and centrally cleared financial derivative instruments as of December 31, 2016. See Note 7, Principal Risks, in the Notes to Financial Statements for more information regarding master netting arrangements. |
| | | | | | | | | | | | | | | | | | | | | | | | | | | | | | | | | | | | |
| | | Financial Derivative Assets | | | | | | Financial Derivative Liabilities | |
| | | Market Value | | | Variation Margin
Asset | | | | | | | | | Market Value | | | Variation Margin
Liability | | | | |
| | | Purchased
Options | | | Futures | | | Swap
Agreements | | | Total | | | | | | Written
Options | | | Futures | | | Swap
Agreements | | | Total | |
Total Exchange-Traded or Centrally Cleared | | $ | 0 | | | $ | 167 | | | $ | 0 | | | $ | 167 | | | | | | | $ | 0 | | | $ | (44) | | | $ | 0 | | | $ | (44) | |
| | | | | | | | | | | | | | | | | | | | | | | | | | | | | | | | | | | | |
(i) FINANCIAL DERIVATIVE INSTRUMENTS: OVER THE COUNTER
FORWARD FOREIGN CURRENCY CONTRACTS:
| | | | | | | | | | | | | | | | | | | | | | | | |
| Counterparty | | Settlement
Month | | | Currency to
be Delivered | | | Currency to
be Received | | | Unrealized Appreciation/
(Depreciation) | |
| | | | | Asset | | | Liability | |
AZD | | | 01/2017 | | | $ | | | 11,847 | | | AUD | | | 16,458 | | | $ | 30 | | | $ | 0 | |
| | | 02/2017 | | | AUD | | | 16,458 | | | $ | | | 11,839 | | | | 0 | | | | (29 | ) |
BOA | | | 01/2017 | | | $ | | | 15,645 | | | CHF | | | 16,010 | | | | 80 | | | | 0 | |
| | | 02/2017 | | | CHF | | | 16,011 | | | $ | | | 15,671 | | | | 0 | | | | (84 | ) |
CBK | | | 01/2017 | | | | | | 16,010 | | | | | | 15,836 | | | | 111 | | | | 0 | |
GLM | | | 01/2017 | | | AUD | | | 1,937 | | | | | | 1,445 | | | | 47 | | | | 0 | |
| | | 01/2017 | | | CAD | | | 22,162 | | | | | | 16,478 | | | | 0 | | | | (30 | ) |
HUS | | | 01/2017 | | | AUD | | | 12,864 | | | | | | 9,577 | | | | 294 | | | | 0 | |
JPM | | | 01/2017 | | | GBP | | | 1,128 | | | | | | 1,429 | | | | 38 | | | | 0 | |
TOR | | | 01/2017 | | | AUD | | | 1,657 | | | | | | 1,236 | | | | 41 | | | | 0 | |
| | | 01/2017 | | | $ | | | 16,443 | | | CAD | | | 22,162 | | | | 64 | | | | 0 | |
| | | 02/2017 | | | CAD | | | 22,162 | | | $ | | | 16,449 | | | | 0 | | | | (63 | ) |
| | | | | | | | | | | | | | | | | | | | | | | | |
Total Forward Foreign Currency Contracts | | | $ | 705 | | | $ | (206 | ) |
| | | | | | | | | | | | | | | | | | | | | | | | |
| | | | | | |
| See Accompanying Notes | | SEMIANNUAL REPORT | | DECEMBER 31, 2016 | | 37 |
Schedule of Investments PIMCO EqS® Long/Short Fund (Cont.)
FINANCIAL DERIVATIVE INSTRUMENTS: OVER THE COUNTER SUMMARY
The following is a summary by counterparty of the market value of OTC financial derivative instruments and collateral (received) as of December 31, 2016:
| | | | | | | | | | | | | | | | | | | | | | | | | | | | | | | | | | | | | | | | | | | | | | | | |
| | | Financial Derivative Assets | | | | | | Financial Derivative Liabilities | | | | | | | | | | |
| Counterparty | | Forward
Foreign
Currency
Contracts | | | Purchased
Options | | | Swap
Agreements | | | Total
Over the
Counter | | | | | | Forward
Foreign
Currency
Contracts | | | Written
Options | | | Swap
Agreements | | | Total
Over the
Counter | | | Net Market
Value of OTC
Derivatives | | | Collateral
(Received) | | | Net
Exposure(1) | |
AZD | | $ | 30 | | | $ | 0 | | | $ | 0 | | | $ | 30 | | | | | | | $ | (29 | ) | | $ | 0 | | | $ | 0 | | | $ | (29 | ) | | $ | 1 | | | $ | 0 | | | $ | 1 | |
BOA | | | 80 | | | | 0 | | | | 0 | | | | 80 | | | | | | | | (84 | ) | | | 0 | | | | 0 | | | | (84 | ) | | | (4 | ) | | | 0 | | | | (4 | ) |
CBK | | | 111 | | | | 0 | | | | 0 | | | | 111 | | | | | | | | 0 | | | | 0 | | | | 0 | | | | 0 | | | | 111 | | | | (280 | ) | | | (169 | ) |
GLM | | | 47 | | | | 0 | | | | 0 | | | | 47 | | | | | | | | (30 | ) | | | 0 | | | | 0 | | | | (30 | ) | | | 17 | | | | 0 | | | | 17 | |
HUS | | | 294 | | | | 0 | | | | 0 | | | | 294 | | | | | | | | 0 | | | | 0 | | | | 0 | | | | 0 | | | | 294 | | | | (260 | ) | | | 34 | |
JPM | | | 38 | | | | 0 | | | | 0 | | | | 38 | | | | | | | | 0 | | | | 0 | | | | 0 | | | | 0 | | | | 38 | | | | 0 | | | | 38 | |
TOR | | | 105 | | | | 0 | | | | 0 | | | | 105 | | | | | | | | (63 | ) | | | 0 | | | | 0 | | | | (63 | ) | | | 42 | | | | 0 | | | | 42 | |
| | | | | | | | | | | | | | | | | | | | | | | | | | | | | | | | | | | | | | | | | | | | | | | | |
Total Over the Counter | | $ | 705 | | | $ | 0 | | | $ | 0 | | | $ | 705 | | | | | | | $ | (206 | ) | | $ | 0 | | | $ | 0 | | | $ | (206 | ) | | | | | | | | | | | | |
| | | | | | | | | | | | | | | | | | | | | | | | | | | | | | | | | | | | | | | | | | | | | | | | |
| (1) | Net Exposure represents the net receivable/(payable) that would be due from/to the counterparty in the event of default. Exposure from OTC financial derivative instruments can only be netted across transactions governed under the same master agreement with the same legal entity. See Note 7, Principal Risks, in the Notes to Financial Statements for more information regarding master netting arrangements. |
FAIR VALUE OF FINANCIAL DERIVATIVE INSTRUMENTS
The following is a summary of the fair valuation of the Fund’s derivative instruments categorized by risk exposure. See Note 7, Principal Risks, in the Notes to Financial Statements on risks of the Fund.
Fair Values of Financial Derivative Instruments on the Statements of Assets and Liabilities as of December 31, 2016:
| | | | | | | | | | | | | | | | | | | | | | | | |
| | | Derivatives not accounted for as hedging instruments | |
| | | Commodity
Contracts | | | Credit
Contracts | | | Equity
Contracts | | | Foreign
Exchange
Contracts | | | Interest
Rate Contracts | | | Total | |
Financial Derivative Instruments - Assets | | | | | | | | | | | | | | | | | | | | | | | | |
Exchange-traded or centrally cleared | | | | | | | | | | | | | | | | | | | | | | | | |
Futures | | $ | 0 | | | $ | 0 | | | $ | 167 | | | $ | 0 | | | $ | 0 | | | $ | 167 | |
| | | | | | | | | | | | | | | | | | | | | | | | |
Over the counter | |
Forward Foreign Currency Contracts | | $ | 0 | | | $ | 0 | | | $ | 0 | | | $ | 705 | | | $ | 0 | | | $ | 705 | |
| | | | | | | | | | | | | | | | | | | | | | | | |
| | $ | 0 | | | $ | 0 | | | $ | 167 | | | $ | 705 | | | $ | 0 | | | $ | 872 | |
| | | | | | | | | | | | | | | | | | | | | | | | |
| | | | | | |
Financial Derivative Instruments - Liabilities | | | | | | | | | | | | | | | | | | | | | | | | |
Exchange-traded or centrally cleared | | | | | | | | | | | | | | | | | | | | | | | | |
Futures | | $ | 0 | | | $ | 0 | | | $ | 44 | | | $ | 0 | | | $ | 0 | | | $ | 44 | |
| | | | | | | | | | | | | | | | | | | | | | | | |
Over the counter | |
Forward Foreign Currency Contracts | | $ | 0 | | | $ | 0 | | | $ | 0 | | | $ | 206 | | | $ | 0 | | | $ | 206 | |
| | | | | | | | | | | | | | | | | | | | | | | | |
| | $ | 0 | | | $ | 0 | | | $ | 44 | | | $ | 206 | | | $ | 0 | | | $ | 250 | |
| | | | | | | | | | | | | | | | | | | | | | | | |
The effect of Financial Derivative Instruments on the Statements of Operations for the period ended December 31, 2016:
| | | | | | | | | | | | | | | | | | | | | | | | |
| | | Derivatives not accounted for as hedging instruments | |
| | | Commodity
Contracts | | | Credit
Contracts | | | Equity
Contracts | | | Foreign
Exchange
Contracts | | | Interest
Rate Contracts | | | Total | |
Net Realized Gain (Loss) on Financial Derivative Instruments | |
Exchange-traded or centrally cleared | | | | | | | | | | | | | | | | | | | | | | | | |
Futures | | $ | 0 | | | $ | 0 | | | $ | (3,194 | ) | | $ | 0 | | | $ | 0 | | | $ | (3,194 | ) |
| | | | | | | | | | | | | | | | | | | | | | | | |
Over the counter | |
Forward Foreign Currency Contracts | | $ | 0 | | | $ | 0 | | | $ | 0 | | | $ | 1,753 | | | $ | 0 | | | $ | 1,753 | |
| | | | | | | | | | | | | | | | | | | | | | | | |
| | $ | 0 | | | $ | 0 | | | $ | (3,194 | ) | | $ | 1,753 | | | $ | 0 | | | $ | (1,441 | ) |
| | | | | | | | | | | | | | | | | | | | | | | | |
|
Net Change in Unrealized Appreciation on Financial Derivative Instruments | |
Exchange-traded or centrally cleared | | | | | | | | | | | | | | | | | | | | | | | | |
Futures | | $ | 0 | | | $ | 0 | | | $ | 620 | | | $ | 0 | | | $ | 0 | | | $ | 620 | |
| | | | | | | | | | | | | | | | | | | | | | | | |
Over the counter | |
Forward Foreign Currency Contracts | | $ | 0 | | | $ | 0 | | | $ | 0 | | | $ | 1,228 | | | $ | 0 | | | $ | 1,228 | |
| | | | | | | | | | | | | | | | | | | | | | | | |
| | $ | 0 | | | $ | 0 | | | $ | 620 | | | $ | 1,228 | | | $ | 0 | | | $ | 1,848 | |
| | | | | | | | | | | | | | | | | | | | | | | | |
| | | | | | | | |
| 38 | | PIMCO EQUITY SERIES | | | | | See Accompanying Notes | |
December 31, 2016 (Unaudited)
FAIR VALUE MEASUREMENTS
The following is a summary of the fair valuations according to the inputs used as of December 31, 2016 in valuing the Fund’s assets and liabilities:
| | | | | | | | | | | | | | | | |
| Category and Subcategory | | Level 1 | | | Level 2 | | | Level 3 | | | Fair
Value at
12/31/2016 | |
Investments in Securities, at Value | |
Common Stocks | | | | | | | | | | | | | | | | |
Australia | | | | | | | | | | | | | | | | |
Materials | | $ | 12,416 | | | $ | 0 | | | $ | 0 | | | $ | 12,416 | |
Canada | | | | | | | | | | | | | | | | |
Energy | | | 2,104 | | | | 0 | | | | 0 | | | | 2,104 | |
Utilities | | | 7,720 | | | | 0 | | | | 0 | | | | 7,720 | |
Switzerland | | | | | | | | | | | | | | | | |
Consumer Staples | | | 0 | | | | 16,835 | | | | 0 | | | | 16,835 | |
United Kingdom | | | | | | | | | | | | | | | | |
Consumer Discretionary | | | 9,092 | | | | 0 | | | | 0 | | | | 9,092 | |
Industrials | | | 21,246 | | | | 0 | | | | 0 | | | | 21,246 | |
United States | | | | | | | | | | | | | | | | |
Consumer Discretionary | | | 44,956 | | | | 0 | | | | 0 | | | | 44,956 | |
Consumer Staples | | | 17,733 | | | | 0 | | | | 0 | | | | 17,733 | |
Energy | | | 73,814 | | | | 0 | | | | 0 | | | | 73,814 | |
Financials | | | 13,147 | | | | 0 | | | | 0 | | | | 13,147 | |
Health Care | | | 12,957 | | | | 0 | | | | 0 | | | | 12,957 | |
Industrials | | | 49,839 | | | | 0 | | | | 0 | | | | 49,839 | |
Information Technology | | | 43,528 | | | | 0 | | | | 0 | | | | 43,528 | |
Materials | | | 9,975 | | | | 0 | | | | 0 | | | | 9,975 | |
Real Estate Investment Trusts | | | | | | | | | | | | | | | | |
United States | | | | | | | | | | | | | | | | |
Real Estate | | | 8,282 | | | | 0 | | | | 0 | | | | 8,282 | |
U.S. Treasury Obligations | | | | | | | | | | | | | | | | |
United States | | | 0 | | | | 3,203 | | | | 0 | | | | 3,203 | |
Short-Term Instruments | | | | | | | | | | | | | | | | |
Repurchase Agreements | | | 0 | | | | 2,840 | | | | 0 | | | | 2,840 | |
U.S. Treasury Bills | | | 0 | | | | 199,936 | | | | 0 | | | | 199,936 | |
| | | | | | | | | | | | | | | | |
| | $ | 326,809 | | | $ | 222,814 | | | $ | 0 | | | $ | 549,623 | |
| | | | | | | | | | | | | | | | |
|
Investments in Affiliates, at Value | |
Short-Term Instruments | | | | | | | | | | | | | | | | |
Central Funds Used for Cash Management Purposes | | $ | 24,585 | | | $ | 0 | | | $ | 0 | | | $ | 24,585 | |
| | | | | | | | | | | | | | | | |
| | | | |
Total Investments | | $ | 351,394 | | | $ | 222,814 | | | $ | 0 | | | $ | 574,208 | |
| | | | | | | | | | | | | | | | |
| | | | | | | | | | | | | | | | |
| Category and Subcategory | | Level 1 | | | Level 2 | | | Level 3 | | | Fair
Value at
12/31/2016 | |
Short Sales, at Value - Liabilities | |
Common Stocks | | | | | | | | | | | | | | | | |
Canada | | | | | | | | | | | | | | | | |
Energy | | $ | (3,413 | ) | | $ | 0 | | | $ | 0 | | | $ | (3,413 | ) |
Industrials | | | (8,725 | ) | | | 0 | | | | 0 | | | | (8,725 | ) |
United Kingdom | | | | | | | | | | | | | | | | |
Industrials | | | (17 | ) | | | (3,696 | ) | | | 0 | | | | (3,713 | ) |
United States | | | | | | | | | | | | | | | | |
Consumer Discretionary | | | (2,974 | ) | | | 0 | | | | 0 | | | | (2,974 | ) |
Consumer Staples | | | (12,674 | ) | | | 0 | | | | 0 | | | | (12,674 | ) |
Energy | | | (15,344 | ) | | | 0 | | | | 0 | | | | (15,344 | ) |
Health Care | | | (6,643 | ) | | | 0 | | | | 0 | | | | (6,643 | ) |
Industrials | | | (7,723 | ) | | | 0 | | | | 0 | | | | (7,723 | ) |
Exchange-Traded Funds | | | | | | | | | | | | | | | | |
United States | | | (13,263 | ) | | | 0 | | | | 0 | | | | (13,263 | ) |
| | | | | | | | | | | | | | | | |
| | $ | (70,776 | ) | | $ | (3,696 | ) | | $ | 0 | | | $ | (74,472 | ) |
| | | | | | | | | | | | | | | | |
|
Financial Derivative Instruments - Assets | |
Exchange-traded or centrally cleared | | | 167 | | | | 0 | | | | 0 | | | | 167 | |
Over the counter | | | 0 | | | | 705 | �� | | | 0 | | | | 705 | |
| | | | | | | | | | | | | | | | |
| | $ | 167 | | | $ | 705 | | | $ | 0 | | | $ | 872 | |
| | | | | | | | | | | | | | | | |
|
Financial Derivative Instruments - Liabilities | |
Exchange-traded or centrally cleared | | | (44 | ) | | | 0 | | | | 0 | | | | (44 | ) |
Over the counter | | | 0 | | | | (206 | ) | | | 0 | | | | (206 | ) |
| | | | | | | | | | | | | | | | |
| | $ | (44 | ) | | $ | (206 | ) | | $ | 0 | | | $ | (250 | ) |
| | | | | | | | | | | | | | | | |
Total Financial Derivative Instruments | | $ | 123 | | | $ | 499 | | | $ | 0 | | | $ | 622 | |
| | | | | | | | | | | | | | | | |
| | | | |
Totals | | $ | 280,741 | | | $ | 219,617 | | | $ | 0 | | | $ | 500,358 | |
| | | | | | | | | | | | | | | | |
There were no significant transfers between Levels 1, 2, or 3 during the period ended December 31, 2016.
| | | | | | |
| See Accompanying Notes | | SEMIANNUAL REPORT | | DECEMBER 31, 2016 | | 39 |
Notes to Financial Statements
1. ORGANIZATION
PIMCO Equity Series® (the “Trust”) was established as a Delaware statutory trust on December 28, 2009. The Trust is registered under the Investment Company Act of 1940, as amended (the “Act”), as an open-end management investment company. Information presented in these financial statements pertains to the Institutional Class, Class P, Class D, Class A, Class C and Class R shares of the funds (each a “Fund” and collectively the “Funds”) indicated on the cover of this report. Pacific Investment Management Company LLC (“PIMCO”) serves as the investment adviser (the “Adviser”) for the Funds. Effective June 16, 2016, Research Affiliates, LLC (“Research Affiliates”) serves as the interim sub-adviser with respect to the equity portion of the PIMCO Dividend and Income Fund. Effective June 16, 2016, PIMCO and Research Affiliates have also engaged Parametric Portfolio Associates, LLC (“Parametric”) on an interim basis to implement the equity portion of the PIMCO Dividend and Income Fund’s investment strategies. On August 26, 2016, the Fund’s shareholders approved definitive agreements retaining Research Affiliates and Parametric as sub-adviser and portfolio implementer, respectively.
2. SIGNIFICANT ACCOUNTING POLICIES
The following is a summary of significant accounting policies consistently followed by the Trust in the preparation of its financial statements in conformity with accounting principles generally accepted in the United States of America (“U.S. GAAP”). Each Fund is treated as an investment company under the reporting requirements of U.S. GAAP. The preparation of financial statements in accordance with U.S. GAAP requires management to make estimates and assumptions that affect the reported amounts of assets and liabilities and disclosure of contingent assets and liabilities at the date of the financial statements and the reported amounts of increases and decreases in net assets from operations during the reporting period. Actual results could differ from those estimates.
(a) Securities Transactions and Investment Income Securities transactions are recorded as of the trade date for financial reporting purposes. Realized gains (losses) from securities sold are recorded on the identified cost basis. Dividend income is recorded on the ex-dividend date, except certain dividends from foreign securities where the ex-dividend date may have passed, which are recorded as soon as a Fund is informed of the ex-dividend date. Interest income, adjusted for the accretion of discounts and amortization of premiums, is recorded on the accrual basis from settlement date, Estimated tax liabilities on certain foreign securities are recorded on an accrual basis and are reflected as components of interest income or net change in unrealized appreciation (depreciation) on investments on the Statements of Operations, as appropriate. Tax liabilities realized as a result of such security sales are reflected as a component of net realized gain (loss)
on investments on the Statements of Operations. Paydown gains (losses) on mortgage-related and other asset-backed securities are recorded as components of interest income on the Statements of Operations. Income or short-term capital gain distributions received from registered investment companies are recorded as dividend income. Long-term capital gain distributions received from registered investment companies are recorded as realized gains.
Debt obligations may be placed on non-accrual status and related interest income may be reduced by ceasing current accruals and writing off interest receivable when the collection of all or a portion of interest has become doubtful based on consistently applied procedures. A debt obligation is removed from non-accrual status when the issuer resumes interest payments or when collectability of interest is probable.
(b) Cash and Foreign Currency The functional and reporting currency for the Funds is the U.S. dollar. The market values of foreign securities, currency holdings and other assets and liabilities denominated in foreign currencies are translated into U.S. dollars based on the current exchange rates each business day. Purchases and sales of securities and income and expense items denominated in foreign currencies, if any, are translated into U.S. dollars at the exchange rate in effect on the transaction date. The Funds do not separately report the effects of changes in foreign exchange rates from changes in market prices on securities held. Such changes are included in net realized gain (loss) and net change in unrealized appreciation (depreciation) from investments on the Statements of Operations. The Funds may invest in foreign currency-denominated securities and may engage in foreign currency transactions either on a spot (cash) basis at the rate prevailing in the currency exchange market at the time or through a forward foreign currency contract. Realized foreign exchange gains (losses) arising from sales of spot foreign currencies, currency gains (losses) realized between the trade and settlement dates on securities transactions and the difference between the recorded amounts of dividends, interest, and foreign withholding taxes and the U.S. dollar equivalent of the amounts actually received or paid are included in net realized gain (loss) on foreign currency transactions on the Statements of Operations. Net unrealized foreign exchange gains (losses) arising from changes in foreign exchange rates on foreign denominated assets and liabilities other than investments in securities held at the end of the reporting period are included in net change in unrealized appreciation (depreciation) on foreign currency assets and liabilities on the Statements of Operations.
(c) Multiclass Operations Each class offered by the Trust has equal rights as to assets and voting privileges (except that shareholders of a class have exclusive voting rights regarding any matter relating solely to that class of shares). Income and non-class specific expenses are allocated daily to each class on the basis of the relative net assets.
December 31, 2016 (Unaudited)
Realized and unrealized capital gains (losses) are allocated daily based on the relative net assets of each class of the respective Fund. Class specific expenses, where applicable, currently include supervisory and administrative and distribution and servicing fees. Under certain circumstances, the per share net asset value (“NAV”) of a class of the respective Fund’s shares may be different from the per share NAV of another class of shares as a result of the different daily expense accruals applicable to each class of shares.
(d) Distributions to Shareholders The following table shows the anticipated frequency of distributions from net investment income, if any, for each Fund.
| | | | | | | | | | | | |
| | | | | | Distribution Frequency | |
| Fund Name | | | | | Declared | | | Distributed | |
PIMCO Dividend and Income Fund | | | | | | | Quarterly | | | | Quarterly | |
PIMCO EqS® Long/Short Fund | | | | | | | Annually | | | | Annually | |
Net realized capital gains earned by each Fund, if any, will be distributed no less frequently than once each year.
Income distributions and capital gain distributions are determined in accordance with income tax regulations which may differ from U.S. GAAP. Differences between tax regulations and U.S. GAAP may cause timing differences between income and capital gain recognition. Further, the character of investment income and capital gains may be different for certain transactions under the two methods of accounting. As a result, income distributions and capital gain distributions declared during a fiscal period may differ significantly from the net investment income (loss) and realized gains (losses) reported on the Fund’s annual financial statements presented under U.S. GAAP.
If a Fund estimates that a portion of one of its dividend distributions may be comprised of amounts from sources other than net investment income, the Fund will notify shareholders of record of the estimated composition of such distribution through a Section 19 Notice. To determine the sources of a Fund’s distributions during the reporting period, the Fund references its internal accounting records at the time the distribution is paid and generally bases its projections of the final tax character of those distributions on the tax characteristics of the distribution reflected in its internal accounting records at the time of such payment. If, based on such records, a particular distribution does not include capital gains or paid-in surplus or other capital sources, a Section 19 Notice generally would not be issued. It is important to note that differences exist between a Fund’s daily internal accounting records, the Fund’s financial statements presented in accordance with U.S. GAAP, and recordkeeping practices under income tax regulations. Examples of such differences may include, among others, the treatment of paydowns on mortgage-backed securities purchased at a discount and periodic payments under interest rate swap contracts.
Notwithstanding a Fund’s estimates and projections, it is possible that a Fund may not issue a Section 19 Notice in situations where the Fund’s financial statements prepared later and in accordance with U.S. GAAP or the final tax character of those distributions might later report that the sources of those distributions included capital gains and/or a return of capital. Additionally, given differences in tax and U.S. GAAP treatment of certain distributions, a Fund may not issue a Section 19 Notice in situations where the Fund’s financial statements prepared later and in accordance with U.S. GAAP might report that the sources of these distributions included capital gains and/or a return of capital. Please visit www.pimco.com for the most recent Section 19 Notice, if applicable, for additional information regarding the composition of distributions. Final determination of a distribution’s tax character will be reported on Form 1099 DIV sent to shareholders each January.
Distributions classified as a tax basis return of capital, if any, are reflected on the Statements of Changes in Net Assets and have been recorded to paid in capital. In addition, other amounts have been reclassified between undistributed (overdistributed) net investment income (loss), accumulated undistributed (overdistributed) net realized gain (loss) and/or paid in capital to more appropriately conform U.S. GAAP to tax characterizations of distributions.
(e) Statement of Cash Flows U.S. GAAP requires entities providing financial statements that report both financial position and results of operations to also provide a statement of cash flows for each period for which results of operations are provided, but exempts investment companies meeting certain conditions. One of the conditions is that substantially all of the enterprise’s investments were carried at fair value during the period and classified as Level 1 or Level 2 in the fair value hierarchy in accordance with the requirements of U.S. GAAP. Another condition is that the enterprise had little or no debt, based on the average debt outstanding during the period, in relation to average total assets. Funds with certain degrees of borrowing activity, typically through the use of reverse repurchase agreements or sale-buyback transactions, have been determined to be at a level requiring a Statement of Cash Flows. Statements of Cash Flows, as applicable, have been prepared using the indirect method which requires net change in net assets resulting from operations to be adjusted to reconcile to net cash flows from operating activities.
(f) New Accounting Pronouncements In August 2014, the Financial Accounting Standards Board (“FASB”) issued an Accounting Standards Update (“ASU”), ASU 2014-15 requiring management to evaluate whether there are conditions or events, considered in the aggregate, that raise substantial doubt about the entity’s ability to continue as a going concern. The ASU is effective prospectively for annual periods ending after December 15, 2016, and interim periods thereafter. The
| | | | | | |
| | SEMIANNUAL REPORT | | DECEMBER 31, 2016 | | 41 |
Notes to Financial Statements (Cont.)
Funds have adopted the ASU. The implementation of the ASU did not have an impact on the Funds’ financial statements.
In May 2015, the FASB issued ASU 2015-07 which removes the requirement to categorize within the fair value hierarchy all investments for which fair value is measured using the NAV per share practical expedient. The ASU also removes the requirement to make certain disclosures for all investments that are eligible to be measured at fair value using the NAV per share practical expedient. The ASU is effective for annual periods beginning after December 15, 2015 and interim periods within those annual periods. The ASU did not have an impact on the Funds’ financial statements.
In August 2016, the FASB issued ASU 2016-15 which amends ASC 230 to clarify guidance on the classification of certain cash receipts and cash payments in the statement of cash flows. The ASU is effective for annual periods beginning after December 15, 2017, and interim periods within those annual periods. At this time, management is evaluating the implications of these changes on the financial statements.
In October 2016, the U.S. Securities and Exchange Commission (“SEC”) adopted new rules and forms, and amendments to certain current rules and forms, to modernize reporting and disclosure of information by registered investment companies. The amendments to Regulation S-X will require standardized, enhanced disclosure about derivatives in investment company financial statements, and will also change the rules governing the form and content of such financial statements. The amendments to Regulation S-X take effect on August 1, 2017. At this time, management is assessing the anticipated impact of these regulatory developments.
In November 2016, the FASB issued ASU 2016-18 which amends ASC 230 to provide guidance on the classification and presentation of changes in restricted cash and restricted cash equivalents on the statement of cash flows. The ASU is effective for annual periods beginning after December 15, 2017, and interim periods within those annual periods. At this time, management is evaluating the implications of these changes on the financial statements.
3. INVESTMENT VALUATION AND FAIR VALUE MEASUREMENTS
(a) Investment Valuation Policies The price of a Fund’s shares is based on the Fund’s NAV. The NAV of a Fund, or each of its share classes, as applicable, is determined by dividing the total value of portfolio investments and other assets, less any liabilities attributable to that Fund or class, by the total number of shares outstanding of that Fund or class.
On each day that the New York Stock Exchange (“NYSE”) is open, Fund shares are ordinarily valued as of the close of regular trading
(“NYSE Close”). Information that becomes known to the Funds or their agents after the time as of which NAV has been calculated on a particular day will not generally be used to retroactively adjust the price of a security or the NAV determined earlier that day. Each Fund reserves the right to change the time its respective NAV is calculated if the Fund closes earlier, or as permitted by the SEC.
For purposes of calculating NAV, portfolio securities and other assets for which market quotes are readily available are valued at market value. Market value is generally determined on the basis of official closing prices or the last reported sales prices, or if no sales are reported, based on quotes obtained from established market makers or prices (including evaluated prices) supplied by the Funds’ approved pricing services, quotation reporting systems and other third-party sources (together, “Pricing Services”). The Funds will normally use pricing data for domestic equity securities received shortly after the NYSE Close and do not normally take into account trading, clearances or settlements that take place after the NYSE Close. A foreign (non-U.S.) equity security traded on a foreign exchange or on more than one exchange is typically valued using pricing information from the exchange considered by the Adviser to be the primary exchange. A foreign (non-U.S.) equity security will be valued as of the close of trading on the foreign exchange, or the NYSE Close, if the NYSE Close occurs before the end of trading on the foreign exchange. Domestic and foreign (non-U.S.) fixed income securities, non-exchange traded derivatives, and equity options are normally valued on the basis of quotes obtained from brokers and dealers or Pricing Services using data reflecting the earlier closing of the principal markets for those securities. Prices obtained from Pricing Services may be based on, among other things, information provided by market makers or estimates of market values obtained from yield data relating to investments or securities with similar characteristics. Certain fixed income securities purchased on a delayed-delivery basis are marked to market daily until settlement at the forward settlement date. Exchange-traded options, except equity options, futures and options on futures are valued at the settlement price determined by the relevant exchange. Swap agreements are valued on the basis of bid quotes obtained from brokers and dealers or market-based prices supplied by Pricing Services or other pricing sources. The Funds’ investments in open-end management investment companies, other than exchange-traded funds (“ETFs”), are valued at the NAVs of such investments.
If a foreign (non-U.S.) equity security’s value has materially changed after the close of the security’s primary exchange or principal market but before the NYSE Close, the security may be valued at fair value based on procedures established and approved by the Board of Trustees of the Trust (the “Board”). Foreign (non-U.S.) equity securities that do not trade when the NYSE is open are also valued at fair value. With respect to foreign (non-U.S.) equity securities, the Fund may
December 31, 2016 (Unaudited)
determine the fair value of investments based on information provided by Pricing Services and other third-party vendors, which may recommend fair value or adjustments with reference to other securities, indices or assets. In considering whether fair valuation is required and in determining fair values, the Fund may, among other things, consider significant events (which may be considered to include changes in the value of U.S. securities or securities indices) that occur after the close of the relevant market and before the NYSE Close. A Fund may utilize modeling tools provided by third-party vendors to determine fair values of non-U.S. securities. Foreign exchanges may permit trading in foreign (non-U.S.) equity securities on days when the Trust is not open for business, which may result in a Fund’s portfolio investments being affected when shareholders are unable to buy or sell shares.
Senior secured floating rate loans for which an active secondary market exists to a reliable degree will be valued at the mean of the last available bid/ask prices in the market for such loans, as provided by a Pricing Service. Senior secured floating rate loans for which an active secondary market does not exist to a reliable degree will be valued at fair value, which is intended to approximate market value. In valuing a senior secured floating rate loan at fair value, the factors considered may include, but are not limited to, the following: (a) the creditworthiness of the borrower and any intermediate participants, (b) the terms of the loan, (c) recent prices in the market for similar loans, if any, and (d) recent prices in the market for instruments of similar quality, rate, period until next interest rate reset and maturity.
Investments valued in currencies other than the U.S. dollar are converted to the U.S. dollar using exchange rates obtained from Pricing Services. As a result, the value of such investments and, in turn, the NAV of a Fund’s shares may be affected by changes in the value of currencies in relation to the U.S. dollar. The value of investments traded in markets outside the United States or denominated in currencies other than the U.S. dollar may be affected significantly on a day that the Trust is not open for business. As a result, to the extent that a Fund holds foreign (non-U.S.) investments, the value of those investments may change at times when shareholders are unable to buy or sell shares and the value of such investments will be reflected in the Fund’s next calculated NAV.
Investments for which market quotes or market based valuations are not readily available are valued at fair value as determined in good faith by the Board or persons acting at their direction. The Board has adopted methods for valuing securities and other assets in circumstances where market quotes are not readily available, and has delegated to the Adviser the responsibility for applying the fair valuation methods. In the event that market quotes or market based valuations are not readily available, and the security or asset cannot be valued pursuant to a Board approved valuation method, the value of
the security or asset will be determined in good faith by the Valuation Oversight Committee of the Board (“Valuation Oversight Committee”), generally based on recommendations provided by the Adviser. The Adviser may consult with the Sub-Adviser or Parametric in providing such recommendations or otherwise with respect to valuation of the PIMCO Dividend and Income Fund’s portfolio securities or other assets. Market quotes are considered not readily available in circumstances where there is an absence of current or reliable market-based data (e.g., trade information, bid/ask information, indicative market quotations (“Broker Quotes”), Pricing Services’ prices), including where events occur after the close of the relevant market, but prior to the NYSE Close, that materially affect the values of a Fund’s securities or assets. In addition, market quotes are considered not readily available when, due to extraordinary circumstances, the exchanges or markets on which the securities trade do not open for trading for the entire day and no other market prices are available. The Board has delegated to the Adviser the responsibility for monitoring significant events that may materially affect the values of the Fund’s securities or assets and for determining whether the value of the applicable securities or assets should be reevaluated in light of such significant events.
When a Fund uses fair valuation to determine the value of a portfolio security or other asset for purposes of calculating its NAV, such investments will not be priced on the basis of quotes from the primary market in which they are traded, but rather may be priced by another method that the Board or persons acting at their direction believe reflects fair value. Fair valuation may require subjective determinations about the value of a security. While the Trust’s policy is intended to result in a calculation of the Fund’s NAV that fairly reflects security values as of the time of pricing, the Trust cannot ensure that fair values determined by the Board or persons acting at their direction would accurately reflect the price that a Fund could obtain for a security if it were to dispose of that security as of the time of pricing (for instance, in a forced or distressed sale). The prices used by a Fund may differ from the value that would be realized if the securities were sold. The Funds’ use of fair valuation may also help to deter “stale price arbitrage” as discussed under the “Abusive Trading Practices” section in each Fund’s prospectus.
(b) Fair Value Hierarchy U.S. GAAP describes fair value as the price that a Fund would receive to sell an asset or pay to transfer a liability in an orderly transaction between market participants at the measurement date. It establishes a fair value hierarchy that prioritizes inputs to valuation methods and requires disclosure of the fair value hierarchy, separately for each major category of assets and liabilities, that segregates fair value measurements into levels (Level 1, 2, or 3). The inputs or methodology used for valuing securities are not necessarily an indication of the risks associated with investing in those
| | | | | | |
| | SEMIANNUAL REPORT | | DECEMBER 31, 2016 | | 43 |
Notes to Financial Statements (Cont.)
securities. Levels 1, 2, and 3 of the fair value hierarchy are defined as follows:
| ∎ | | Level 1 — Quoted prices in active markets or exchanges for identical assets and liabilities. |
| ∎ | | Level 2 — Significant other observable inputs, which may include, but are not limited to, quoted prices for similar assets or liabilities in markets that are active, quoted prices for identical or similar assets or liabilities in markets that are not active, inputs other than quoted prices that are observable for the assets or liabilities (such as interest rates, yield curves, volatilities, prepayment speeds, loss severities, credit risks and default rates) or other market corroborated inputs. |
| ∎ | | Level 3 — Significant unobservable inputs based on the best information available in the circumstances, to the extent observable inputs are not available, which may include assumptions made by the Board or persons acting at their direction that are used in determining the fair value of investments. |
In accordance with the requirements of U.S. GAAP, the amounts of transfers between Levels 1 and 2 and transfers into and out of Level 3, if material, are disclosed in the Notes to Schedule of Investments for each respective Fund.
For fair valuations using significant unobservable inputs, U.S. GAAP requires a reconciliation of the beginning to ending balances for reported fair values that presents changes attributable to realized gain (loss), unrealized appreciation (depreciation), purchases and sales, accrued discounts (premiums), and transfers into and out of the Level 3 category during the period. The end of period value is used for the transfers between Levels of a Fund’s assets and liabilities. Additionally, U.S. GAAP requires quantitative information regarding the significant unobservable inputs used in the determination of fair value of assets or liabilities categorized as Level 3 in the fair value hierarchy. In accordance with the requirements of U.S. GAAP, a fair value hierarchy, and if material, a Level 3 reconciliation and details of significant unobservable inputs, have been included in the Notes to Schedule of Investments for each respective Fund.
(c) Valuation Techniques and the Fair Value Hierarchy Level 1 and Level 2 trading assets and trading liabilities, at fair value The valuation methods (or “techniques”) and significant inputs used in determining the fair values of portfolio securities or other assets and liabilities categorized as Level 1 and Level 2 of the fair value hierarchy are as follows:
Fixed income securities including corporate, convertible and municipal bonds and notes, U.S. government agencies, U.S. treasury obligations, sovereign issues, bank loans, convertible preferred securities and non-U.S. bonds are normally valued on the basis of quotes obtained
from brokers and dealers or Pricing Services that use broker-dealer quotations, reported trades or valuation estimates from their internal pricing models. The Pricing Services’ internal models use inputs that are observable such as issuer details, interest rates, yield curves, prepayment speeds, credit risks/spreads, default rates and quoted prices for similar assets. Securities that use similar valuation techniques and inputs as described above are categorized as Level 2 of the fair value hierarchy.
Fixed income securities purchased on a delayed-delivery basis or as a repurchase commitment in a sale-buyback transaction are marked to market daily until settlement at the forward settlement date and are categorized as Level 2 of the fair value hierarchy.
Mortgage-related and asset-backed securities are usually issued as separate tranches, or classes, of securities within each deal. These securities are also normally valued by Pricing Services that use broker-dealer quotations, reported trades or valuation estimates from their internal pricing models. The pricing models for these securities usually consider tranche-level attributes, current market data, estimated cash flows and market-based yield spreads for each tranche, and incorporate deal collateral performance, as available. Mortgage-related and asset-backed securities that use similar valuation techniques and inputs as described above are categorized as Level 2 of the fair value hierarchy.
Common stocks, ETFs, exchange-traded notes and financial derivative instruments, such as futures contracts, rights and warrants, or options on futures that are traded on a national securities exchange, are stated at the last reported sale or settlement price on the day of valuation. To the extent these securities are actively traded and valuation adjustments are not applied, they are categorized as Level 1 of the fair value hierarchy.
Valuation adjustments may be applied to certain securities that are solely traded on a foreign exchange to account for the market movement between the close of the foreign market and the NYSE Close. These securities are valued using Pricing Services that consider the correlation of the trading patterns of the foreign security to the intraday trading in the U.S. markets for investments. Securities using these valuation adjustments are categorized as Level 2 of the fair value hierarchy. Preferred securities and other equities traded on inactive markets or valued by reference to similar instruments are also categorized as Level 2 of the fair value hierarchy.
Equity-linked securities are valued by referencing the last reported sale or settlement price of the linked referenced equity on the day of valuation. Foreign exchange adjustments are applied to the last reported price to convert the linked equity’s trading currency to the contract’s settling currency. These investments are categorized as Level 2 of the fair value hierarchy.
December 31, 2016 (Unaudited)
Investments in registered open-end investment companies (other than ETFs) will be valued based upon the NAVs of such investments and are categorized as Level 1 of the fair value hierarchy. Investments in unregistered open-end investment companies will be calculated based upon the NAVs of such investments and are considered Level 1 provided that the NAVs are observable, calculated daily and are the value at which both purchases and sales will be conducted.
Short-term debt instruments (such as commercial paper) having a remaining maturity of 60 days or less may be valued at amortized cost, so long as the amortized cost of such short-term debt instrument is approximately the same as the fair value of the instrument as determined without the use of amortized cost valuation.
Equity exchange-traded options and over the counter financial derivative instruments, such as forward foreign currency contracts and options contracts derive their value from underlying asset prices, indices, reference rates, and other inputs or a combination of these factors. These contracts are normally valued on the basis of quotes obtained from a quotation reporting system, established market makers or Pricing Services (normally determined as of the NYSE Close).
Depending on the product and the terms of the transaction, financial derivative instruments can be valued by Pricing Services using a series of techniques, including simulation pricing models. The pricing models use inputs that are observed from actively quoted markets such as quoted prices, issuer details, indices, bid/ask spreads, interest rates, implied volatilities, yield curves, dividends and exchange rates. Financial derivative instruments that use similar valuation techniques and inputs as described above are categorized as Level 2 of the fair value hierarchy.
Centrally cleared swaps and over the counter swaps derive their value from underlying asset prices, indices, reference rates, and other inputs or a combination of these factors. They are valued using a broker-dealer bid quotation or on market-based prices provided by Pricing Services or other pricing sources (normally determined as of the NYSE close). Centrally cleared swaps and over the counter swaps can be valued by Pricing Services using a series of techniques, including simulation pricing models. The pricing models may use inputs that are observed from actively quoted markets such as the overnight index swap rate (“OIS”), London Interbank Offered Rate (“LIBOR”) forward rate, interest rates, yield curves and credit spreads. These securities are categorized as Level 2 of the fair value hierarchy.
Level 3 trading assets and trading liabilities, at fair value When a fair valuation method is applied by the Adviser that uses significant unobservable inputs, investments will be priced by a method that the Board or persons acting at their direction believe reflects fair value and are categorized as Level 3 of the fair value hierarchy.
The validity of the fair value is reviewed by the Adviser on a periodic basis and may be amended in accordance with the Trust’s valuation procedures.
4. SECURITIES AND OTHER INVESTMENTS
(a) Investments in Affiliates
Each Fund may invest in the PIMCO Short-Term Floating NAV Portfolio III (“Central Fund”) to the extent permitted by the Act and rules thereunder. The Central Fund is a registered investment company created for use solely by the series of the Trust and other series of registered investment companies advised by the Adviser, in connection with their cash management activities. The main investments of the Central Fund are money market and short maturity fixed income instruments. The Central Fund may incur expenses related to its investment activities, but does not pay Investment Advisory Fees or Supervisory and Administrative Fees to the Adviser. The Central Fund is considered to be affiliated with the Funds. The table below shows the Funds’ transactions in and earnings from investments in an affiliated Fund for the period ended December 31, 2016 (amounts in thousands†):
| | | | | | | | | | | | | | | | | | | | | | | | | | | | | | | | | | | | |
| Investments in PIMCO Short-Term Floating NAV Portfolio III | | | | | | | | | | | | | | | | |
| Fund Name | | | | | Market Value
06/30/2016 | | | Purchases
at Cost | | | Proceeds
from Sales | | | Net
Realized
Gain (Loss) | | | Change in
Unrealized
Appreciation
(Depreciation) | | | Market Value
12/31/2016 | | | Dividend
Income(1) | | | Realized Net
Capital Gain
Distributions(1) | |
PIMCO Dividend and Income Fund | | | | | | $ | 7,674 | | | $ | 61,013 | | | $ | (67,200 | ) | | $ | (1 | ) | | $ | (1 | ) | | $ | 1,485 | | | $ | 12 | | | $ | 0 | |
PIMCO EqS® Long/Short Fund | | | | | | | 252,193 | | | | 241,151 | | | | (468,801 | ) | | | 69 | | | | (27 | ) | | | 24,585 | | | | 750 | | | | 0 | |
| † | A zero balance may reflect actual amounts rounding to less than one thousand. |
| (1) | The tax characterization of distributions is determined in accordance with Federal income tax regulations. The actual tax characterization of distributions paid are determined at the end of the fiscal year. See Note 2 in the Notes to Financial Statements for more information. |
| | | | | | |
| | SEMIANNUAL REPORT | | DECEMBER 31, 2016 | | 45 |
Notes to Financial Statements (Cont.)
(b) Investments in Securities
Loan Participations, Assignments and Originations Certain Funds may invest in direct debt instruments which are interests in amounts owed to lenders or lending syndicates by corporate, governmental, or other borrowers. A Fund’s investments in loans may be in the form of participations in loans or assignments of all or a portion of loans from third parties or investments in or originations of loans by the Fund or Funds. A loan is often administered by a bank or other financial institution (the “agent”) that acts as agent for all holders. The agent administers the terms of the loan, as specified in the loan agreement. A Fund may invest in multiple series or tranches of a loan, which may have varying terms and carry different associated risks. When a Fund purchases assignments from agents it acquires direct rights against the borrowers of the loans. These loans may include participations in bridge loans, which are loans taken out by borrowers for a short period (typically less than one year) pending arrangement of more permanent financing through, for example, the issuance of bonds, frequently high yield bonds issued for the purpose of acquisitions.
The types of loans and related investments in which the Funds may invest include, among others, senior loans, subordinated loans (including second lien loans, B-Notes and mezzanine loans), whole loans, commercial real estate and other commercial loans and structured loans. The Funds may originate loans or acquire direct interests in loans through primary loan distributions and/or in private transactions. In the case of subordinated loans, there may be significant indebtedness ranking ahead of the borrower’s obligation to the holder of such a loan, including in the event of the borrower’s insolvency. Mezzanine loans are typically secured by a pledge of an equity interest in the mortgage borrower that owns the real estate rather than an interest in a mortgage.
Investments in loans may include unfunded loan commitments, which are contractual obligations for funding. Unfunded loan commitments may include revolving credit facilities, which may obligate a Fund to supply additional cash to the borrower on demand. Unfunded loan commitments represent a future obligation in full, even though a percentage of the committed amount may not be utilized by the borrower. When investing in a loan participation, a Fund has the right to receive payments of principal, interest and any fees to which it is entitled only from the agent selling the loan agreement and only upon receipt of payments by the agent from the borrower. A Fund may receive a commitment fee based on the undrawn portion of the underlying line of credit portion of a loan. In certain circumstances, a Fund may receive a penalty fee upon the prepayment of a loan by a borrower. Fees earned or paid are recorded as a component of interest
income or interest expense, respectively, on the Statements of Operations. As of December 31, 2016, the Funds had no unfunded loan commitments outstanding.
Mortgage-Related and Other Asset-Backed Securities Certain Funds may invest in mortgage-related and other asset-backed securities that directly or indirectly represent a participation in, or are secured by and payable from, loans on real property. Mortgage-related securities are created from pools of residential or commercial mortgage loans, including mortgage loans made by savings and loan institutions, mortgage bankers, commercial banks and others. These securities provide a monthly payment which consists of both interest and principal. Interest may be determined by fixed or adjustable rates. The rate of prepayments on underlying mortgages will affect the price and volatility of a mortgage-related security, and may have the effect of shortening or extending the effective duration of the security relative to what was anticipated at the time of purchase. The timely payment of principal and interest of certain mortgage-related securities is guaranteed with the full faith and credit of the U.S. Government. Pools created and guaranteed by non-governmental issuers, including government-sponsored corporations, may be supported by various forms of insurance or guarantees, but there can be no assurance that private insurers or guarantors can meet their obligations under the insurance policies or guarantee arrangements. Many of the risks of investing in mortgage-related securities secured by commercial mortgage loans reflect the effects of local and other economic conditions on real estate markets, the ability of tenants to make lease payments, and the ability of a property to attract and retain tenants. These securities may be less liquid and may exhibit greater price volatility than other types of mortgage-related or other asset-backed securities. Other asset-backed securities are created from many types of assets, including auto loans, credit card receivables, home equity loans, and student loans.
Collateralized Debt Obligations (“CDOs”) include Collateralized Bond Obligations (“CBOs”), Collateralized Loan Obligations (“CLOs”) and other similarly structured securities. CBOs and CLOs are types of asset-backed securities. A CBO is a trust which is backed by a diversified pool of high risk, below investment grade fixed income securities. A CLO is a trust typically collateralized by a pool of loans, which may include, among others, domestic and foreign senior secured loans, senior unsecured loans, and subordinate corporate loans, including loans that may be rated below investment grade or equivalent unrated loans. The risks of an investment in a CDO depend largely on the type of the collateral securities and the class of the CDO in which a Fund invests. In addition to the normal risks associated with fixed income securities discussed elsewhere in this report and each Fund’s prospectus and statement of additional information (e.g., prepayment risk, credit risk, liquidity risk, market risk, structural risk, legal risk and interest rate risk (which may be exacerbated if the interest rate payable on a structured financing changes based on multiples of changes in interest rates or inversely to changes in interest rates)), CBOs, CLOs and other CDOs
December 31, 2016 (Unaudited)
carry additional risks including, but not limited to, (i) the possibility that distributions from collateral securities will not be adequate to make interest or other payments, (ii) the quality of the collateral may decline in value or default, (iii) a Fund may invest in CBOs, CLOs, or other CDOs that are subordinate to other classes, and (iv) the complex structure of the security may not be fully understood at the time of investment and may produce disputes with the issuer or unexpected investment results.
Collateralized Mortgage Obligations (“CMOs”) are debt obligations of a legal entity that are collateralized by whole mortgage loans or private mortgage bonds and divided into classes. CMOs are structured into multiple classes, often referred to as “tranches”, with each class bearing a different stated maturity and entitled to a different schedule for payments of principal and interest, including prepayments. CMOs may be less liquid and may exhibit greater price volatility than other types of mortgage-related or asset-backed securities.
Real Estate Investment Trusts (“REITs”) Certain Funds may invest in REITs, which are pooled investment vehicles that own, and typically operate, income-producing real estate. If a REIT meets certain requirements, including distributing to shareholders substantially all of its taxable income (other than net capital gains), then it is not taxed on the income distributed to shareholders. Distributions received from REITs may be characterized as income, capital gain or a return of capital. A return of capital is recorded by a Fund as a reduction to the cost basis of its investment in the REIT. REITs are subject to management fees and other expenses, and so the Funds that invest in REITs will bear their proportionate share of the costs of the REITs’ operations.
U.S. Government Agencies or Government-Sponsored Enterprises Certain Funds may invest in securities of U.S. Government agencies or government-sponsored enterprises. U.S. Government securities are obligations of and, in certain cases, guaranteed by, the U.S. Government, its agencies or instrumentalities. Some U.S. Government securities, such as Treasury bills, notes and bonds, and securities guaranteed by the Government National Mortgage Association (“GNMA” or “Ginnie Mae”), are supported by the full faith and credit of the U.S. Government; others, such as those of the Federal Home Loan Banks, are supported by the right of the issuer to borrow from the U.S. Department of the Treasury (the “U.S. Treasury”); and others, such as those of the Federal National Mortgage Association (“FNMA” or “Fannie Mae”), are supported by the discretionary authority of the U.S. Government to purchase the agency’s obligations. U.S. Government securities may include zero coupon securities. Zero coupon securities do not distribute interest on a current basis and tend to be subject to a greater risk than interest-paying securities.
Government-related guarantors (i.e., not backed by the full faith and credit of the U.S. Government) include FNMA and the Federal Home Loan Mortgage Corporation (“FHLMC” or “Freddie Mac”). FNMA is a government-sponsored corporation. FNMA purchases conventional (i.e., not insured or guaranteed by any government agency) residential mortgages from a list of approved seller/servicers which include state and federally chartered savings and loan associations, mutual savings banks, commercial banks and credit unions and mortgage bankers. Pass-through securities issued by FNMA are guaranteed as to timely payment of principal and interest by FNMA, but are not backed by the full faith and credit of the U.S. Government. FHLMC issues Participation Certificates (“PCs”), which are pass-through securities, each representing an undivided interest in a pool of residential mortgages. FHLMC guarantees the timely payment of interest and ultimate collection of principal, but PCs are not backed by the full faith and credit of the U.S. Government.
Certain Funds may engage in strategies where they seek to extend the expiration or maturity of a position, such as a To Be Announced (“TBA”) security on an underlying asset, by closing out the position before expiration and opening a new position with respect to the same underlying asset with a later expiration date. TBA securities purchased or sold are reflected on the Statements of Assets and Liabilities as an asset or liability, respectively.
5. BORROWINGS AND OTHER FINANCING TRANSACTIONS
The following disclosures contain information on a Fund’s ability to lend or borrow cash or securities to the extent permitted under the Act, which may be viewed as borrowing or financing transactions by a Fund. The location of these instruments in each Fund’s financial statements is described below. For a detailed description of credit and counterparty risks that can be associated with borrowings and other financing transactions, please see Note 7 Principal Risks.
(a) Repurchase Agreements Certain Funds may engage in repurchase agreements. Under the terms of a typical repurchase agreement, a Fund purchases an underlying debt obligation (collateral) subject to an obligation of the seller to repurchase, and a Fund to resell, the obligation at an agreed-upon price and time. The underlying securities for all repurchase agreements are held by a Fund’s custodian or designated subcustodians under tri-party repurchase agreements and in certain instances will remain in custody with the counterparty. The market value of the collateral must be equal to or exceed the total amount of the repurchase obligations, including interest. Repurchase agreements, if any, including accrued interest, are included on the Statements of Assets and Liabilities. Interest earned is recorded as a component of interest income on the Statements of Operations. In
| | | | | | |
| | SEMIANNUAL REPORT | | DECEMBER 31, 2016 | | 47 |
Notes to Financial Statements (Cont.)
periods of increased demand for collateral, a Fund may pay a fee for the receipt of collateral, which may result in interest expense to the Fund.
(b) Reverse Repurchase Agreements Certain Funds may enter into reverse repurchase agreements. In a reverse repurchase agreement, the Fund delivers a security in exchange for cash to a financial institution, the counterparty, with a simultaneous agreement to repurchase the same or substantially the same security at an agreed upon price and date. The Fund is entitled to receive principal and interest payments, if any, made on the security delivered to the counterparty during the term of the agreement. Cash received in exchange for securities delivered plus accrued interest payments to be made by the Fund to counterparties are reflected as a liability on the Consolidated Statement of Assets and Liabilities. Interest payments made by the Fund to counterparties are recorded as a component of interest expense on the Consolidated Statement of Operations. In periods of increased demand for the security, the Fund may receive a fee for use of the security by the counterparty, which may result in interest income to the Fund. The Fund will segregate assets determined to be liquid by the Adviser or will otherwise cover its obligations under reverse repurchase agreements.
(c) Sale-Buybacks Certain Funds may enter into financing transactions referred to as ‘sale-buybacks’. A sale-buyback transaction consists of a sale of a security by the Fund to a financial institution, the counterparty, with a simultaneous agreement to repurchase the same or substantially the same security at an agreed-upon price and date. The Fund is not entitled to receive principal and interest payments, if any, made on the security sold to the counterparty during the term of the agreement. The agreed-upon proceeds for securities to be repurchased by the Fund are reflected as a liability on the Consolidated Statement of Assets and Liabilities. The Fund will recognize net income represented by the price differential between the price received for the transferred security and the agreed-upon repurchase price. This is commonly referred to as the ‘price drop’. A price drop consists of (i) the foregone interest and inflationary income adjustments, if any, the Fund would have otherwise received had the security not been sold and (ii) the negotiated financing terms between the Fund and counterparty. Foregone interest and inflationary income adjustments, if any, are recorded as components of interest income on the Consolidated Statement of Operations. Interest payments based upon negotiated financing terms made by the Fund to counterparties are recorded as a component of interest expense on the Consolidated Statement of Operations. In periods of increased demand for the security, the Fund may receive a fee for use of the security by the counterparty, which may result in interest income to the Fund. The Fund will segregate assets determined to be liquid by the Adviser or will otherwise cover its obligations under sale-buyback transactions.
(d) Short Sales Certain Funds may enter into short sales transactions. Short sales are transactions in which a Fund sells a security that it may not own. A Fund may make short sales of securities to (i) offset potential declines in long positions in similar securities, (ii) to increase the flexibility of the Fund, (iii) for investment return, (iv) as part of a risk arbitrage strategy, and (v) as part of its overall portfolio management strategies involving the use of derivative instruments. When a Fund engages in a short sale, it may borrow the security sold short and deliver it to the counterparty. A Fund will ordinarily have to pay a fee or premium to borrow a security and be obligated to repay the lender of the security any dividend or interest that accrues on the security during the period of the loan. Securities sold in short sale transactions and the dividend or interest payable on such securities, if any, are reflected as payable for short sales on the Statements of Assets and Liabilities. Short sales expose a Fund to the risk that it will be required to cover its short position at a time when the security or other asset has appreciated in value, thus resulting in losses to the Fund. A short sale is “against the box” if a Fund holds in its portfolio or has the right to acquire the security sold short at no additional cost. A Fund will be subject to additional risks to the extent that it engages in short sales that are not “against the box.” A Fund’s loss on a short sale could theoretically be unlimited in cases where the Fund is unable, for whatever reason, to close out its short position.
6. FINANCIAL DERIVATIVE INSTRUMENTS
The following disclosures contain information on how and why the Funds use financial derivative instruments, and how financial derivative instruments affect the Funds’ financial position, results of operations and cash flows. The location and fair value amounts of these instruments on the Statements of Assets and Liabilities and the net realized gain (loss) and net change in unrealized appreciation (depreciation) on the Statements of Operations, each categorized by type of financial derivative contract and related risk exposure, are included in a table in the Notes to Schedules of Investments. The financial derivative instruments outstanding as of period end and the amounts of net realized gain (loss) and net change in unrealized appreciation (depreciation) on financial derivative instruments during the period, as disclosed in the Notes to Schedules of Investments, serve as indicators of the volume of financial derivative activity for the Funds.
(a) Forward Foreign Currency Contracts Certain Funds may enter into forward foreign currency contracts in connection with settling planned purchases or sales of securities, to hedge the currency exposure associated with some or all of a Fund’s securities or as a part of an investment strategy. A forward foreign currency contract is an agreement between two parties to buy and sell a currency at a set price on a future date. The market value of a forward foreign currency contract fluctuates with changes in foreign currency exchange rates.
December 31, 2016 (Unaudited)
Forward foreign currency contracts are marked to market daily, and the change in value is recorded by a Fund as an unrealized gain (loss). Realized gains (losses) are equal to the difference between the value of the contract at the time it was opened and the value at the time it was closed and are recorded upon delivery or receipt of the currency. These contracts may involve market risk in excess of the unrealized gain (loss) reflected on the Statements of Assets and Liabilities. In addition, a Fund could be exposed to risk if the counterparties are unable to meet the terms of the contracts or if the value of the currency changes unfavorably to the U.S. dollar. To mitigate such risk, cash or securities may be exchanged as collateral pursuant to the terms of the underlying contracts.
(b) Futures Contracts Certain Funds may enter into futures contracts. A Fund may use futures contracts to manage its exposure to the securities markets or to movements in interest rates and currency values. The primary risks associated with the use of futures contracts are the imperfect correlation between the change in market value of the securities held by a Fund and the prices of futures contracts and the possibility of an illiquid market. Futures contracts are valued based upon their quoted daily settlement prices. Upon entering into a futures contract, a Fund is required to deposit with its futures broker an amount of cash, U.S. Government and Agency Obligations, or select sovereign debt, in accordance with the initial margin requirements of the broker or exchange. Futures contracts are marked to market daily and based on such movements in the price of the contracts,
an appropriate payable or receivable for the change in value may be posted or collected by the Fund (“Futures Variation Margin”). Gains (losses) are recognized but not considered realized until the contracts expire or close. Futures contracts involve, to varying degrees, risk of loss in excess of the Futures Variation Margin included within exchange traded or centrally cleared financial derivative instruments on the Statements of Assets and Liabilities.
(c) Swap Agreements Certain Funds may invest in swap agreements. Swap agreements are bilaterally negotiated agreements between a Fund and a counterparty to exchange or swap investment cash flows, assets, foreign currencies or market-linked returns at specified, future intervals. Swap agreements may be privately negotiated in the over the counter market (“OTC swaps”) or may be cleared through a third party, known as a central counterparty or derivatives clearing organization (“Centrally Cleared Swaps”). A Fund may enter into asset, credit default, cross-currency, interest rate, total return, variance and other forms of swap agreements to manage its exposure to credit, currency, interest rate, commodity, equity and inflation risk. In connection with these agreements, securities or cash may be identified as collateral or margin in accordance with the terms of the respective swap agreements to provide assets of value and recourse in the event of default or bankruptcy/insolvency.
Centrally Cleared Swaps are marked to market daily based upon valuations as determined from the underlying contract or in accordance with the requirements of the central counterparty or derivatives clearing organization. Changes in market value, if any, are reflected as a component of net change in unrealized appreciation (depreciation) on the Statements of Operations. Daily changes in valuation of centrally cleared swaps (“Swap Variation Margin”), if any, are disclosed within centrally cleared financial derivative instruments on the Statements of Assets and Liabilities. OTC swap payments received or paid at the beginning of the measurement period are included on the Statements of Assets and Liabilities and represent premiums paid or received upon entering into the swap agreement to compensate for differences between the stated terms of the swap agreement and prevailing market conditions (credit spreads, currency exchange rates, interest rates, and other relevant factors). Upfront premiums received (paid) are initially recorded as liabilities (assets) and subsequently marked to market to reflect the current value of the swap. These upfront premiums are recorded as realized gain (loss) on the Statements of Operations upon termination or maturity of the swap. A liquidation payment received or made at the termination of the swap is recorded as realized gain (loss) on the Statements of Operations. Net periodic payments received or paid by a Fund are included as part of realized gain (loss) on the Statements of Operations.
For purposes of applying a Fund’s investment policies and restrictions, swap agreements are generally valued by a Fund at market value. In the case of a credit default swap, in applying certain of a Fund’s investment policies and restrictions, the Funds will value the credit default swap at its notional value or its full exposure value (i.e., the sum of the notional amount for the contract plus the market value), but may value the credit default swap at market value for purposes of applying certain of a Fund’s other investment policies and restrictions. For example, a Fund may value credit default swaps at full exposure value for purposes of a Fund’s credit quality guidelines (if any) because such value reflects a Fund’s actual economic exposure during the term of the credit default swap agreement. In this context, both the notional amount and the market value may be positive or negative depending on whether a Fund is selling or buying protection through the credit default swap. The manner in which certain securities or other instruments are valued by a Fund for purposes of applying investment policies and restrictions may differ from the manner in which those investments are valued by other types of investors.
Entering into swap agreements involves, to varying degrees, elements of interest, credit, market and documentation risk in excess of the amounts recognized on the Statements of Assets and Liabilities. Such risks involve the possibility that there will be no liquid market for these agreements, that the counterparty to the agreements may default on its obligation to perform or disagree as to the meaning of contractual
| | | | | | |
| | SEMIANNUAL REPORT | | DECEMBER 31, 2016 | | 49 |
Notes to Financial Statements (Cont.)
terms in the agreements and that there may be unfavorable changes in interest rates.
A Fund’s maximum risk of loss from counterparty credit risk is the discounted net value of the cash flows to be received from the counterparty over the contract’s remaining life, to the extent that amount is positive. The risk may be mitigated by having a master netting arrangement between a Fund and the counterparty and by the posting of collateral to a Fund to cover a Fund’s exposure to the counterparty.
Credit Default Swap Agreements Certain Funds may use credit default swaps on corporate, loan, sovereign, U.S. municipal or U.S. Treasury issues to provide a measure of protection against defaults of the issuers (i.e., to reduce risk where a Fund owns or has exposure to the referenced obligation) or to take an active long or short position with respect to the likelihood of a particular issuer’s default. Credit default swap agreements involve one party making a stream of payments (referred to as the buyer of protection) to another party (the seller of protection) in exchange for the right to receive a specified return in the event that the referenced entity, obligation or index, as specified in the swap agreement, undergoes a certain credit event. As a seller of protection on credit default swap agreements, a Fund will generally receive from the buyer of protection a fixed rate of income throughout the term of the swap provided that there is no credit event. As the seller, a Fund would effectively add leverage to its portfolio because, in addition to its total net assets, a Fund would be subject to investment exposure on the notional amount of the swap.
If a Fund is a seller of protection and a credit event occurs, as defined under the terms of that particular swap agreement, a Fund will either (i) pay to the buyer of protection an amount equal to the notional amount of the swap and take delivery of the referenced obligation, other deliverable obligations or underlying securities comprising the referenced index or (ii) pay a net settlement amount in the form of cash or securities equal to the notional amount of the swap less the recovery value of the referenced obligation or underlying securities comprising the referenced index. If a Fund is a buyer of protection and a credit event occurs, as defined under the terms of that particular swap agreement, a Fund will either (i) receive from the seller of protection an amount equal to the notional amount of the swap and deliver the referenced obligation, other deliverable obligations or underlying securities comprising the referenced index or (ii) receive a net settlement amount in the form of cash or securities equal to the notional amount of the swap less the recovery value of the referenced obligation or underlying securities comprising the referenced index. Recovery values are estimated by market makers considering either industry standard recovery rates or entity specific factors and considerations until a credit event occurs. If a credit event has occurred,
the recovery value is determined by a facilitated auction whereby a minimum number of allowable broker bids, together with a specified valuation method, are used to calculate the settlement value. The ability to deliver other obligations may result in a cheapest-to-deliver option (the buyer of protection’s right to choose the deliverable obligation with the lowest value following a credit event).
Credit default swap agreements on credit indices involve one party making a stream of payments to another party in exchange for the right to receive a specified return in the event of a write-down, principal shortfall, interest shortfall or default of all or part of the referenced entities comprising the credit index. A credit index is a basket of credit instruments or exposures designed to be representative of some part of the credit market as a whole. These indices are made up of reference credits that are judged by a poll of dealers to be the most liquid entities in the credit default swap market based on the sector of the index. Components of the indices may include, but are not limited to, investment grade securities, high yield securities, asset-backed securities, emerging markets, and/or various credit ratings within each sector. Credit indices are traded using credit default swaps with standardized terms including a fixed spread and standard maturity dates. An index credit default swap references all the names in the index, and if there is a default, the credit event is settled based on that name’s weight in the index. The composition of the indices changes periodically, usually every six months, and for most indices, each name has an equal weight in the index. A Fund may use credit default swaps on credit indices to hedge a portfolio of credit default swaps or bonds, which is less expensive than it would be to buy many credit default swaps to achieve a similar effect. Credit default swaps on indices are instruments for protecting investors owning bonds against default, and traders use them to speculate on changes in credit quality.
Implied credit spreads, represented in absolute terms, utilized in determining the market value of credit default swap agreements on corporate, loan, sovereign, U.S. municipal or U.S. Treasury issues as of period end, if any, are disclosed in the Notes to Schedules of Investments. They serve as an indicator of the current status of payment/performance risk and represent the likelihood or risk of default for the reference entity. The implied credit spread of a particular referenced entity reflects the cost of buying/selling protection and may include upfront payments required to be made to enter into the agreement. Wider credit spreads represent a deterioration of the referenced entity’s credit soundness and a greater likelihood or risk of default or other credit event occurring as defined under the terms of the agreement. For credit default swap agreements on asset-backed securities and credit indices, the quoted market prices and resulting values serve as the indicator of the current status of the payment/performance risk. Increasing market values, in absolute terms when
December 31, 2016 (Unaudited)
compared to the notional amount of the swap, represent a deterioration of the referenced entity’s credit soundness and a greater likelihood or risk of default or other credit event occurring as defined under the terms of the agreement.
The maximum potential amount of future payments (undiscounted) that a Fund as a seller of protection could be required to make under a credit default swap agreement equals the notional amount of the agreement. Notional amounts of each individual credit default swap agreement outstanding as of period end for which a Fund is the seller of protection are disclosed in the Notes to Schedules of Investments. These potential amounts would be partially offset by any recovery values of the respective referenced obligations, upfront payments received upon entering into the agreement, or net amounts received from the settlement of buy protection credit default swap agreements entered into by a Fund for the same referenced entity or entities.
Interest Rate Swap Agreements Certain Fund is subject to interest rate risk exposure in the normal course of pursuing its investment objectives. Because the Fund holds fixed rate bonds, the value of these bonds may decrease if interest rates rise. To help hedge against this risk and to maintain its ability to generate income at prevailing market rates, the Fund may enter into interest rate swap agreements. Interest rate swap agreements involve the exchange by the Fund with another party for their respective commitment to pay or receive interest on the notional amount of principal. Certain forms of interest rate swap agreements may include: (i) interest rate caps, under which, in return for a premium, one party agrees to make payments to the other to the extent that interest rates exceed a specified rate, or “cap”, (ii) interest rate floors, under which, in return for a premium, one party agrees to make payments to the other to the extent that interest rates fall below a specified rate, or “floor”, (iii) interest rate collars, under which a party sells a cap and purchases a floor or vice versa in an attempt to protect itself against interest rate movements exceeding given minimum or maximum levels, (iv) callable interest rate swaps, under which the buyer pays an upfront fee in consideration for the right to early terminate the swap transaction in whole, at zero cost and at a predetermined date and time prior to the maturity date, (v) spreadlocks, which allow the interest rate swap users to lock in the forward differential (or spread) between the interest rate swap rate and a specified benchmark, or (vi) basis swaps, under which two parties can exchange variable interest rates based on different segments of money markets.
7. PRINCIPAL RISKS
In the normal course of business, the Funds trade financial instruments and enter into financial transactions where risk of potential loss exists due to such things as changes in the market (market risk) or failure or inability of the other party to a transaction to perform (credit and
counterparty risk). See below for a detailed description of select principal risks. For a more comprehensive list of potential risks the Funds may be subject to, please see the Important Information About the Funds.
Market Risks A Fund’s investments in financial derivative instruments and other financial instruments expose the Fund to various risks such as, but not limited to, interest rate, foreign (non-U.S.) currency, equity and commodity risks.
The market values of equities, such as common stocks and preferred securities or equity related investments such as futures and options, have historically risen and fallen in periodic cycles and may decline due to general market conditions which are not specifically related to a particular company, such as real or perceived adverse economic conditions, changes in the general outlook for corporate earnings, changes in interest or currency rates or adverse investor sentiment generally. They may also decline due to factors which affect a particular industry or industries, such as labor shortages or increased production costs and competitive conditions within an industry. Different types of equity securities may react differently to these developments. Equity securities and equity related investments generally have greater market price volatility than fixed income securities.
Issuers that have paid regular dividends or distributions to shareholders may not continue to do so in the future. An issuer may reduce or eliminate future dividends or distributions at any time and for any reason. Moreover, a Fund may use a dividend capture strategy (i.e., purchasing an equity security shortly before the issuer pays a dividend and selling it shortly thereafter), which may expose the Fund to higher portfolio turnover, increased trading costs and the potential for capital loss or gain, particularly in the event of significant short-term price movements of stocks subject to dividend capture trading. Also, securities purchased to capture a dividend often decline in value at the time of sale (i.e., shortly following the dividend) and the resulting realized loss to the Fund may exceed the amount of the dividend received, thereby negatively impacting the Fund’s net asset value.
Interest rate risk is the risk that fixed income securities and other instruments held by a Fund will decline in value because of an increase in interest rates. As nominal interest rates rise, the value of certain fixed income securities held by a Fund is likely to decrease. A nominal interest rate can be described as the sum of a real interest rate and an expected inflation rate. Interest rate changes can be sudden and unpredictable, and a Fund may lose money if these changes are not anticipated by the Fund’s management. A Fund may not be able to hedge against changes in interest rates or may choose not to do so for cost or other reasons. In addition, any hedges may not work as intended.
| | | | | | |
| | SEMIANNUAL REPORT | | DECEMBER 31, 2016 | | 51 |
Notes to Financial Statements (Cont.)
Duration is a measure used to determine the sensitivity of a security’s price to changes in interest rates that incorporates a security’s yield, coupon, final maturity and call features, among other characteristics. Convexity is an additional measure of interest rate sensitivity that measures the rate of change of duration in response to changes in interest rates. Fixed income securities with longer durations tend to be more sensitive to changes in interest rates, usually making them more volatile than securities with shorter durations. A wide variety of factors can cause interest rates to rise (e.g., central bank monetary policies, inflation rates, general economic conditions, etc.). At present, the U.S. and many parts of the world, including certain European countries, are at or near historically low interest rates. The Funds may be subject to heightened interest rate risk because the Fed has ended its quantitative easing program and has begun, and may continue, to raise interest rates. To the extent that the Fed continues to raise interest rates, there is a risk that rates across the financial system may rise. Further, while bond markets have steadily grown over the past three decades, dealer “market making” ability has not kept pace and in some cases has decreased. Given the importance of intermediary “market making” in creating a robust and active market, fixed income securities are currently facing increased volatility and liquidity risks. All of these factors, collectively and/or individually, could cause a Fund to lose value. If a Fund lost enough value, the Fund could face increased shareholder redemptions, which could force the Fund to liquidate investments at disadvantageous times or prices, thereby adversely affecting the Fund. Also, the Fund may be adversely affected when a large shareholder purchases or redeems large amounts of shares, which can occur at any time and may impact the Fund in the same manner as a high volume of redemption requests. Large shareholder transactions may impact the Fund’s liquidity and net asset value. Such transactions may also increase the Fund’s transaction costs or otherwise cause the Fund to perform differently than intended. Moreover, the Fund is subject to the risk that other shareholders may make investment decisions based on the choices of a large shareholder.
To the extent that a Fund may invest in securities and instruments that are economically tied to Russia, the Fund is subject to various risks such as, but not limited to political, economic, legal, market and currency risks. The risks include uncertain political and economic policies, short-term market volatility, poor accounting standards, corruption and crime, an inadequate regulatory system, and unpredictable taxation. Investments in Russia are particularly subject to the risk that further economic sanctions may be imposed by the United States and/or other countries. Such sanctions — which may impact companies in many sectors, including energy, financial services and defense, among others — may negatively impact a Fund’s performance and/or ability to achieve its investment objective. The Russian securities market, as compared to U.S. markets, has significant price volatility, less liquidity,
a smaller market capitalization and a smaller number of traded securities. Adverse currency exchange rates are a risk and there may be a lack of available currency hedging instruments. Investments in Russia may be subject to the risk of nationalization or expropriation of assets. Oil, natural gas, metals, and timber account for a significant portion of Russia’s exports, leaving the country vulnerable to swings in world prices.
If a Fund invests directly in foreign (non-U.S.) currencies or in securities that trade in, and receive revenues in, foreign (non-U.S.) currencies, or in financial derivative instruments that provide exposure to foreign (non-U.S.) currencies, it will be subject to the risk that those currencies will decline in value relative to the base currency of the Fund, or, in the case of hedging positions, that the Fund’s base currency will decline in value relative to the currency being hedged. Currency rates in foreign countries may fluctuate significantly over short periods of time for a number of reasons, including changes in interest rates, intervention (or the failure to intervene) by U.S. or foreign governments, central banks or supranational entities such as the International Monetary Fund, or by the imposition of currency controls or other political developments in the United States or abroad. As a result, a Fund’s investments in foreign currency-denominated securities may reduce the Fund’s returns.
Credit and Counterparty Risks A Fund will be exposed to credit risk to parties with whom it trades and will also bear the risk of settlement default. A Fund minimizes concentrations of credit risk by undertaking transactions with a large number of customers and counterparties on recognized and reputable exchanges, where applicable. Over the counter (“OTC”) derivative transactions are subject to the risk that a counterparty to the transaction will not fulfill its contractual obligations to the other party, as many of the protections afforded to centrally cleared derivative transactions might not be available for OTC derivative transactions. For derivatives traded on an exchange or through a central counterparty, credit risk resides with the Fund’s clearing broker, or the clearinghouse itself, rather than with a counterparty in an OTC derivative transaction. A Fund could lose money if the issuer or guarantor of a fixed income security, or the counterparty to a financial derivative instruments contract, repurchase agreement or a loan of portfolio securities, is unable or unwilling to make timely principal and/or interest payments, or to otherwise honor its obligations. Securities and financial derivative instruments are subject to varying degrees of credit risk, which may be reflected in credit ratings.
Similar to credit risk, a Fund may be exposed to counterparty risk, or the risk that an institution or other entity with which the Fund has unsettled or open transactions will default. PIMCO, as the Adviser, minimizes counterparty risks to the Funds through a number of ways. Prior to entering into transactions with a new counterparty, the PIMCO Counterparty Risk Committee conducts an extensive credit review of
December 31, 2016 (Unaudited)
such counterparty and must approve the use of such counterparty. Furthermore, pursuant to the terms of the underlying contract, to the extent that unpaid amounts owed to a Fund exceed a predetermined threshold, such counterparty shall advance collateral to the Fund in the form of cash or securities equal in value to the unpaid amount owed to the Fund. A Fund may invest such collateral in securities or other instruments and will typically pay interest to the counterparty on the collateral received. If the unpaid amount owed to a Fund subsequently decreases, the Fund would be required to return to the counterparty all or a portion of the collateral previously advanced. PIMCO’s attempts to minimize counterparty risk may, however, be unsuccessful.
All transactions in listed securities are settled/paid for upon delivery using approved counterparties. The risk of default is considered minimal, as delivery of securities sold is only made once a Fund has received payment. Payment is made on a purchase once the securities have been delivered by the counterparty. The trade will fail if either party fails to meet its obligation.
Model Risk In making investment allocation decisions, Research Affiliates LLC (the “Sub-Adviser”) may utilize quantitative models that may be proprietary or developed by third-parties. These models are used by the Sub-Adviser to help determine a Fund’s investment allocation decisions. Investment models used in making investment allocation decisions may not adequately take into account certain factors and may result in a decline in the value of your investment. Models rely on accurate financial and market data inputs. If inaccurate data is entered into a model, the resulting information will be incorrect. In addition, the models used may be predictive in nature and such models may result in an incorrect assessment of future events. The models evaluate securities or securities markets based on certain assumptions concerning the interplay of market factors. The markets or the prices of individual securities may be affected by factors not foreseen in developing the models.
Master Netting Arrangements A Fund may be subject to various netting arrangements (“Master Agreements”) with select counterparties. Master Agreements govern the terms of certain transactions, and reduce the counterparty risk associated with relevant transactions by specifying credit protection mechanisms and providing standardization that improves legal certainty. Each type of Master Agreement governs certain types of transactions. Different types of transactions may be traded out of different legal entities or affiliates of a particular organization, resulting in the need for multiple agreements with a single counterparty. As the Master Agreements are specific to unique operations of different asset types, they allow a Fund to close out and net its total exposure to a counterparty in the event of a default with respect to all the transactions governed under a single Master Agreement with a counterparty. For financial reporting purposes the Statements of Assets and Liabilities
generally present derivative assets and liabilities on a gross basis, which reflects the full risks and exposures prior to netting.
Master Agreements can also help limit counterparty risk by specifying collateral posting arrangements at pre-arranged exposure levels. Under most Master Agreements, collateral is routinely transferred if the total net exposure to certain transactions (net of existing collateral already in place) governed under the relevant Master Agreement with a counterparty in a given account exceeds a specified threshold, which typically ranges from zero to $250,000 depending on the counterparty and the type of Master Agreement. United States Treasury Bills and U.S. dollar cash are generally the preferred forms of collateral, although other forms of AAA rated paper or sovereign securities may be used depending on the terms outlined in the applicable Master Agreement. Securities and cash pledged as collateral are reflected as assets on the Statements of Assets and Liabilities as either a component of Investments at value (securities) or Deposits with counterparty. Cash collateral received is not typically held in a segregated account and as such is reflected as a liability on the Statements of Assets and Liabilities as Deposits from counterparty. The market value of any securities received as collateral is not reflected as a component of NAV. A Fund’s overall exposure to counterparty risk can change substantially within a short period, as it is affected by each transaction subject to the relevant Master Agreement.
Master Repurchase Agreements and Global Master Repurchase Agreements (individually and collectively “Master Repo Agreements”) govern repurchase, reverse repurchase, and sale-buyback transactions between a Fund and select counterparties. Master Repo Agreements maintain provisions for, among other things, initiation, income payments, events of default, and maintenance of collateral. The market value of transactions under the Master Repo Agreement, collateral pledged or received, and the net exposure by counterparty as of period end are disclosed in the Notes to Schedules of Investments.
Master Securities Forward Transaction Agreements (“Master Forward Agreements”) govern certain forward settling transactions, such as TBA securities, delayed-delivery or sale-buyback transactions by and between a Fund and select counterparties. The Master Forward Agreements maintain provisions for, among other things, transaction initiation and confirmation, payment and transfer, events of default, termination, and maintenance of collateral. The market value of forward settling transactions, collateral pledged or received, and the net exposure by counterparty as of period end is disclosed in the Notes to Schedules of Investments.
Customer Account Agreements and related addenda govern cleared derivatives transactions such as futures, options on futures, and cleared OTC derivatives. Such transactions require posting of initial margin as
| | | | | | |
| | SEMIANNUAL REPORT | | DECEMBER 31, 2016 | | 53 |
Notes to Financial Statements (Cont.)
determined by each relevant clearing agency which is segregated in an account at a futures commission merchant (“FCM”) registered with the Commodity Futures Trading Commission (“CFTC”). In the United States, counterparty risk may be reduced as creditors of an FCM cannot have a claim to Fund assets in the segregated account. Portability of exposure reduces risk to the Funds. Variation margin, or changes in market value, are exchanged daily, but may not be netted between futures and cleared OTC derivatives unless the parties have agreed to a separate arrangement in respect of portfolio margining. The market value or accumulated unrealized appreciation (depreciation), initial margin posted, and any unsettled variation margin as of period end is disclosed in the Notes to Schedules of Investments.
Prime Broker Arrangements may be entered into to facilitate execution and/or clearing of listed equity option transactions or short sales of equity securities between a Fund and selected counterparties. The arrangements provide guidelines surrounding the rights, obligations, and other events, including, but not limited to, margin, execution, and settlement. These agreements maintain provisions for, among other things, payments, maintenance of collateral, events of default, and termination. Margin and other assets delivered as collateral are typically in the possession of the prime broker and would offset any
obligations due to the prime broker. The market values of listed options and securities sold short and related collateral are disclosed in the Notes to Schedules of Investments.
International Swaps and Derivatives Association, Inc. Master Agreements and Credit Support Annexes (“ISDA Master Agreements”) govern bilateral OTC derivative transactions entered into by a Fund with select counterparties. ISDA Master Agreements maintain provisions for general obligations, representations, agreements, collateral posting and events of default or termination. Events of termination include conditions that may entitle counterparties to elect to terminate early and cause settlement of all outstanding transactions under the applicable ISDA Master Agreement. Any election to terminate early could be material to the financial statements. In limited circumstances, the ISDA Master Agreement may contain additional provisions that add counterparty protection beyond coverage of existing daily exposure if the counterparty has a decline in credit quality below a predefined level. These amounts, if any, may be segregated with a third-party custodian. The market value of OTC financial derivative instruments, collateral received or pledged, and net exposure by counterparty as of period end are disclosed in the Notes to Schedules of Investments.
8. FEES AND EXPENSES
(a) Investment Advisory Fee PIMCO is a majority-owned subsidiary of Allianz Asset Management of America L.P. (“Allianz Asset Management”) and serves as the Adviser to the Trust, pursuant to an investment advisory contract. The Adviser receives a monthly fee from each Fund at an annual rate based on average daily net assets (the “Investment Advisory Fee”). The Investment Advisory Fee for all classes is charged at an annual rate as noted in the table in note (b) below.
(b) Supervisory and Administrative Fee PIMCO serves as administrator (the “Administrator”) and provides supervisory and administrative services to the Trust for which it receives a monthly supervisory and administrative fee based on each share class’s average daily net assets (the “Supervisory and Administrative Fee”). As the Administrator, PIMCO bears the costs of various third-party services, including audit, custodial, portfolio accounting, legal, transfer agency and printing costs.
Investment Advisory Fees and Supervisory and Administrative Fees for all classes, as applicable, are charged at an annual rate as noted in the following table (calculated as a percentage of each Fund’s average daily net assets attributable to each class):
| | | | | | | | | | | | | | | | | | | | | | | | | | | | | | | | | | |
| | | | | | Investment Advisory Fee | | | | | Supervisory and Administrative Fee |
| Fund Name | | | | | All Classes | | | | | Institutional
Class | | | Class P | | | Administrative
Class | | Class D | | | Class A | | | Class C | | | Class R |
PIMCO Dividend and Income Fund | | | | | | 0.49% | | | | | | | 0.30% | | | | 0.40% | | | N/A | | | 0.40% | | | | 0.40% | | | | 0.40% | | | N/A |
PIMCO EqS® Long/Short Fund | | | | | | 1.04% | | | | | | | 0.45% | | | | 0.55% | | | N/A | | | 0.55% | | | | 0.55% | | | | 0.55% | | | N/A |
(c) Distribution and Servicing Fees PIMCO Investments LLC (“PI”), a wholly-owned subsidiary of PIMCO, serves as the distributor (“Distributor”) of the Trust’s shares.
The Trust has adopted separate Distribution and Servicing Plans with respect to the Class A, Class C and Class R shares of the Trust pursuant to Rule 12b-1 under the Act. In connection with the distribution of Class C and Class R shares of the Trust, the Distributor receives
distribution fees from the Trust of up to 0.75% for Class C shares and 0.25% for Class R shares, and in connection with personal services rendered to Class A, Class C and Class R shareholders and the maintenance of such shareholder accounts, the Distributor receives servicing fees from the Trust of up to 0.25% for each of Class A, Class C and Class R shares (percentages reflect annual rates of the average daily net assets attributable to the applicable class).
December 31, 2016 (Unaudited)
The Trust has adopted a Distribution and Servicing Plan with respect to the Class D shares of each Fund pursuant to Rule 12b-1 under the Act (the “Class D Plan”). Under the terms of the Class D Plan, a Fund is permitted to compensate the Distributor out of the assets attributable to the Class D shares of the Fund, in an amount up to 0.25% on an annual basis of the average daily net assets of the Fund’s Class D shares for providing, or procuring through financial intermediaries, distribution, shareholder services, and/or maintenance of shareholder accounts with respect to Class D shareholders of the Fund, some of which may be deemed to be primarily intended to result in the sale of Class D shares.
The Trust has adopted a Distribution and Servicing Plan with respect to the Administrative Class shares of each Fund pursuant to Rule 12b-1 under the Act (the “Administrative Class Plan”). Under the terms of the Administrative Class Plan, a Fund may compensate the Distributor for providing, or procuring through financial intermediaries, distribution, administrative, recordkeeping, shareholder and/or related services with respect to Administrative Class shares. The Administrative Class Plan permits a Fund to make total payments at an annual rate of up to 0.25% of the average daily net assets attributable to the Administrative Class shares.
The Trust paid distribution and servicing fees at effective rates as noted in the following table (calculated as a percentage of each Fund’s average daily net assets attributable to each class):
| | | | | | | | | | | | |
| | | | | | Distribution Fee | | | Servicing Fee | |
Administrative Class | | | | | | | — | | | | 0.25% | |
Class D | | | | | | | — | | | | 0.25% | |
Class A | | | | | | | — | | | | 0.25% | |
Class C | | | | | | | 0.75% | | | | 0.25% | |
Class R | | | | | | | 0.25% | | | | 0.25% | |
The Distributor also received the proceeds of the initial sales charges paid by the shareholders upon the purchase of Class A shares and the contingent deferred sales charges paid by the shareholders upon certain redemptions of Class A and Class C shares. For the period ended December 31, 2016, the Distributor retained $44,078 representing commissions (sales charges) and contingent deferred sales charges from the Trust.
(d) Fund Expenses PIMCO provides or procures supervisory and administrative services for shareholders and also bears the costs of various third-party services required by the Funds, including audit, custodial, portfolio accounting, legal, transfer agency and printing costs. The Trust is responsible for the following expenses: (i) taxes and governmental fees; (ii) brokerage fees and commissions and other portfolio transaction expenses; (iii) the costs of borrowing money, including interest expense; (iv) fees and expenses of the Trustees who are not “interested persons” of PIMCO or the Trust, and any counsel retained exclusively for their benefit; (v) extraordinary expense,
including costs of litigation and indemnification expenses; (vi) organizational expenses; and (vii) any expenses allocated or allocable to a specific class of shares, which include service fees payable with respect to the Administrative Class Shares, and may include certain other expenses as permitted by the Trust’s Multi-Class Plan adopted pursuant to Rule 18f-3 under the Act and subject to review and approval by the Trustees. The ratio of expenses to average net assets per share class, as disclosed on the Financial Highlights, may differ from the annual funds operating expenses per share class.
Each Trustee, other than those affiliated with PIMCO or its affiliates, receives an annual retainer of $62,000, plus $6,250 for each Board meeting attended in person, $375 ($750 in the case of the audit committee chair with respect to audit committee meetings) for each committee meeting attended and $750 for each Board meeting attended telephonically, plus reimbursement of related expenses. In addition, the audit committee chair receives an additional annual retainer of $9,000, the valuation oversight committee lead receives an additional annual retainer of $2,000 (to the extent there are co-leads of the valuation oversight committee, the annual retainer will be split evenly between the co-leads, so that each co-lead individually receives an additional retainer of $1,000) and the governance committee chair receives an additional annual retainer of $750.
These expenses are allocated on a pro rata basis to each Fund of the Trust according to its respective net assets. The Trust pays no compensation directly to any Trustee or any other officer who is affiliated with the Administrator, all of whom receive remuneration for their services to the Trust from the Administrator or its affiliates.
(e) Expense Limitation Pursuant to the Expense Limitation Agreement, PIMCO has agreed to waive a portion of the Funds’ Supervisory and Administrative Fee, or reimburse the Funds, to the extent that the payment of each Fund’s organizational expenses and pro rata share of Trustee Fees exceed 0.0049%, the “Expense Limit” (calculated as a percentage of each Fund’s average daily net assets attributable to each class). The Expense Limitation Agreement will automatically renew for one-year terms unless PIMCO provides written notice to the Trust at least 30 days prior to the end of the then current term.
Pursuant to the Fee Waiver Agreement, PIMCO contractually agreed to reduce its Advisory Fee for the PIMCO Dividend and Income Fund. Effective June 16, 2016, this contractual agreement has been terminated. PIMCO may be reimbursed for these waived amounts in future periods, not to exceed thirty-six months after the waiver. The waiver is reflected in the Statement of Operations as a component of Waiver and/or Reimbursement by PIMCO.
| | | | | | |
| | SEMIANNUAL REPORT | | DECEMBER 31, 2016 | | 55 |
Notes to Financial Statements (Cont.)
Amounts waived (under the Expense Limitation Agreement and Fee Waiver Agreement) may be reimbursed to PIMCO, provided that (1) the Fund’s annualized organizational expenses and pro rata share of Trustee Fees plus the amount reimbursed does not exceed the Expense Limit; (2) such amount paid to PIMCO will not exceed the total Reimbursement Amount, which is the portion of the Supervisory and Administrative Fee or Advisory Fee that was waived, reduced or reimbursed by PIMCO; and (3) such amount will not include any amounts previously reimbursed to PIMCO. The recoverable amounts to PIMCO at December 31, 2016, were as follows (amounts in thousands):
| | | | | | | | | | | | | | | | | | | | |
| | | | | | Expiring within | |
| Fund Name | | | | | 12 months | | | 13 - 24 months | | | 25 - 36 months | | | Total | |
PIMCO Dividend and Income Fund | | | | | | $ | 1,981 | | | $ | 1,407 | | | $ | 427 | | | $ | 3,815 | |
PIMCO EqS® Long/Short Fund | | | | | | | 71 | | | | 68 | | | | 114 | | | | 253 | |
9. RELATED PARTY TRANSACTIONS
The Adviser, Administrator, and Distributor are related parties. Fees payable to these parties are disclosed in Note 8 Fees and Expenses, and the accrued related party fee amounts are disclosed on the Statements of Assets and Liabilities.
Certain Funds are permitted to purchase or sell securities from or to certain related affiliated funds under specified conditions outlined in procedures adopted by the Board. The procedures have been designed to ensure that any purchase or sale of securities by the Funds from or to another fund or portfolio that are, or could be, considered an affiliate, or an affiliate of an affiliate, by virtue of having a common investment adviser (or affiliated investment advisers), common Trustees and/or common officers complies with Rule 17a-7 under the Act. Further, as defined under the procedures, each transaction is effected at the current market price. During the period ended December 31, 2016, the Funds below engaged in purchases and sales of securities pursuant to Rule 17a-7 under the Act (amounts in thousands†):
| | | | | | | | | | | | |
| Fund Name | | | | | Purchases | | | Sales | |
PIMCO Dividend and Income Fund | | | | | | $ | 1,760 | | | $ | 6,240 | |
| † | A zero balance may reflect actual amounts rounding to less than one thousand. |
10. GUARANTEES AND INDEMNIFICATIONS
Under the Trust’s organizational documents, each Trustee or officer of the Trust is indemnified and each employee or other agent of the Trust
(including the Trust’s investment manager) may be indemnified, to the extent permitted by the Act, against certain liabilities that may arise out of performance of their duties to the Funds. Additionally, in the normal course of business, the Funds enter into contracts that contain a variety of indemnification clauses. The Funds’ maximum exposure under these arrangements is unknown as this would involve future claims that may be made against the Funds that have not yet occurred. However, the Funds have not had prior claims or losses pursuant to these contracts.
11. PURCHASES AND SALES OF SECURITIES
The length of time a Fund has held a particular security is not generally a consideration in investment decisions. A change in the securities held by a Fund is known as “portfolio turnover.” Each Fund may engage in frequent and active trading of portfolio securities to achieve its investment objective, particularly during periods of volatile market movements. High portfolio turnover may involve correspondingly greater transaction costs to a Fund, including brokerage commissions or dealer mark-ups and other transaction costs on the sale of securities and reinvestments in other securities. Such sales may also result in realization of taxable capital gains, including short-term capital gains (which are generally taxed at ordinary income tax rates). The transaction costs and tax effects associated with portfolio turnover may adversely affect a Fund’s performance. The portfolio turnover rates are reported in the Financial Highlights.
Purchases and sales of securities (excluding short-term investments) for the period ended December 31, 2016, were as follows (amounts in thousands):
| | | | | | | | | | | | | | | | | | | | |
| | | | | | U.S. Government/Agency | | | All Other | |
| Fund Name | | | | | Purchases | | | Sales | | | Purchases | | | Sales | |
PIMCO Dividend and Income Fund | | | | | | $ | 135,770 | | | $ | 112,317 | | | $ | 56,436 | | | $ | 147,927 | |
PIMCO EqS® Long/Short Fund | | | | | | | 3,200 | | | | 3,203 | | | | 647,193 | | | | 894,911 | |
December 31, 2016 (Unaudited)
12. SHARES OF BENEFICIAL INTEREST
The Funds may issue an unlimited number of shares of beneficial interest with a $0.001 par value. Changes in shares of beneficial interest were as follows (shares and amounts in thousands†):
| | | | | | | | | | | | | | | | | | | | | | | | | | | | | | | | | | |
| | | | | PIMCO
Dividend and Income Fund | | | PIMCO
EqS® Long/Short Fund | |
| | | | | Six Months Ended
12/31/2016 | | | Year Ended
06/30/2016 | | | Six Months Ended
12/31/2016 | | | Year Ended
06/30/2016 | |
| | | | | Shares | | | Amount | | | Shares | | | Amount | | | Shares | | | Amount | | | Shares | | | Amount | |
Receipts for shares sold | | | | | | | | | | | | | | | | | | | | | | | | | | | | | | | | | | |
Institutional Class | | | | | 245 | | | $ | 2,519 | | | | 1,999 | | | $ | 19,199 | | | | 1,977 | | | $ | 23,367 | | | | 18,899 | | | $ | 220,296 | |
Class P | | | | | 425 | | | | 4,387 | | | | 2,499 | | | | 27,174 | | | | 2,142 | | | | 25,217 | | | | 20,667 | | | | 242,511 | |
Class D | | | | | 188 | | | | 1,958 | | | | 702 | | | | 7,868 | | | | 573 | | | | 6,718 | | | | 3,190 | | | | 37,157 | |
Class A | | | | | 702 | | | | 7,226 | | | | 4,205 | | | | 46,505 | | | | 527 | | | | 6,153 | | | | 5,433 | | | | 63,329 | |
Class C | | | | | 647 | | | | 6,697 | | | | 4,077 | | | | 44,242 | | | | 423 | | | | 4,792 | | | | 4,981 | | | | 56,809 | |
Class R | | | | | 0 | | | | 0 | | | | 2 | ^ | | | 15 | ^ | | | 0 | | | | 0 | | | | 0 | | | | 0 | |
Issued as reinvestment of distributions | | | | | | | | | | | | | | | | | | | | | | | | | | | | | | | | | | |
Institutional Class | | | | | 30 | | | | 318 | | | | 426 | | | | 4,233 | | | | 729 | | | | 8,346 | | | | 218 | | | | 2,550 | |
Class P | | | | | 17 | | | | 183 | | | | 564 | | | | 5,610 | | | | 694 | | | | 7,896 | | | | 263 | | | | 3,072 | |
Class D | | | | | 9 | | | | 95 | | | | 271 | | | | 2,689 | | | | 169 | | | | 1,907 | | | | 55 | | | | 640 | |
Class A | | | | | 128 | | | | 1,348 | | | | 2,181 | | | | 21,595 | | | | 485 | | | | 5,471 | | | | 152 | | | | 1,763 | |
Class C | | | | | 94 | | | | 984 | | | | 2,223 | | | | 21,928 | | | | 484 | | | | 5,287 | | | | 161 | | | | 1,820 | |
Class R | | | | | 0 | | | | 0 | | | | 2 | ^ | | | 22 | ^ | | | 0 | | | | 0 | | | | 0 | | | | 0 | |
Cost of shares redeemed | | | | | | | | | | | | | | | | | | | | | | | | | | | | | | | | | | |
Institutional Class | | | | | (1,167 | ) | | | (11,979 | ) | | | (4,804 | ) | | | (50,731 | ) | | | (9,310 | ) | | | (110,540 | ) | | | (23,144 | ) | | | (271,801 | ) |
Class P | | | | | (1,771 | ) | | | (18,210 | ) | | | (13,443 | ) | | | (141,787 | ) | | | (10,642 | ) | | | (125,690 | ) | | | (16,702 | ) | | | (193,796 | ) |
Class D | | | | | (429 | ) | | | (4,473 | ) | | | (3,248 | ) | | | (33,913 | ) | | | (2,847 | ) | | | (33,103 | ) | | | (1,558 | ) | | | (18,122 | ) |
Class A | | | | | (4,216 | ) | | | (43,266 | ) | | | (13,604 | ) | | | (140,011 | ) | | | (4,296 | ) | | | (49,993 | ) | | | (7,254 | ) | | | (84,522 | ) |
Class C | | | | | (4,773 | ) | | | (48,862 | ) | | | (15,791 | ) | | | (162,722 | ) | | | (3,721 | ) | | | (41,985 | ) | | | (4,195 | ) | | | (47,471 | ) |
Class R | | | | | 0 | | | | 0 | | | | (27 | )^ | | | (249 | )^ | | | 0 | | | | 0 | | | | 0 | | | | 0 | |
Net increase (decrease) resulting from Fund share transactions | | | | | (9,871 | ) | | $ | (101,075 | ) | | | (31,766 | ) | | $ | (328,333 | ) | | | (22,613 | ) | | $ | (266,157 | ) | | | 1,166 | | | $ | 14,235 | |
| † | A zero balance may reflect actual amounts rounding to less than one thousand. |
| ^ | Class R Shares liquidated at the close of business on January 22, 2016. |
13. REGULATORY AND LITIGATION MATTERS
The Funds are not named as defendants in any material litigation or arbitration proceedings and are not aware of any material litigation or claim pending or threatened against them.
PIMCO, the investment manager of the PIMCO Total Return Active Exchange-Traded Fund (“BOND”), has entered into a settlement agreement with the SEC that relates to BOND.
The settlement relates to disclosures regarding BOND’s performance attribution during the first four months of its existence in 2012 and the valuation of 43 smaller-sized positions of non-agency mortgage-backed securities using third-party vendor prices, as well as PIMCO’s policies and procedures related to these matters.
The settlement resolves the SEC’s investigation of BOND.
The foregoing speaks only as of the date of this report.
14. FEDERAL INCOME TAX MATTERS
Each Fund intends to qualify as a regulated investment company under Subchapter M of the Internal Revenue Code (the “Code”) and
distribute all of its taxable income and net realized gains, if applicable, to shareholders. Accordingly, no provision for Federal income taxes has been made.
A Fund may be subject to local withholding taxes, including those imposed on realized capital gains. Any applicable foreign capital gains tax is accrued daily based upon net unrealized gains, and may be payable following the sale of any applicable investments.
In accordance with U.S. GAAP, the Adviser has reviewed the Funds’ tax positions for all open tax years. As of December 31, 2016, the Funds have recorded no liability for net unrecognized tax benefits relating to uncertain income tax positions they have taken or expect to take in future tax returns.
The Funds file U.S. tax returns. While the statute of limitations remains open to examine the Funds’ U.S. tax returns filed for the fiscal years ending in 2013-2015, no examinations are in progress or anticipated at this time. The Funds are not aware of any tax positions for which it is reasonably possible that the total amounts of unrecognized tax benefits will significantly change in the next twelve months.
| | | | | | |
| | SEMIANNUAL REPORT | | DECEMBER 31, 2016 | | 57 |
Notes to Financial Statements (Cont.)
December 31, 2016 (Unaudited)
Under the Regulated Investment Company Modernization Act of 2010, a fund is permitted to carry forward any new capital losses for an unlimited period. Additionally, such capital losses that are carried
forward will retain their character as either short-term or long-term capital losses rather than being considered all short-term under previous law.
As of their last fiscal year ended June 30, 2016, the Funds had the following post-effective capital losses with no expiration (amounts in thousands):
| | | | | | | | | | | | |
| | | | | | Short-Term | | | Long-Term | |
PIMCO Dividend and Income Fund | | | | | | $ | 73,130 | | | $ | 55,301 | |
PIMCO EqS® Long/Short Fund | | | | | | | 6,058 | | | | 1,758 | |
As of December 31, 2016, the aggregate cost and the net unrealized appreciation (depreciation) of investments for Federal income tax purposes are as follows (amounts in thousands†):
| | | | | | | | | | | | | | | | | | | | |
| | | | | | Federal Tax
Cost | | | Aggregate
Gross
Unrealized
Appreciation | | | Aggregate
Gross
Unrealized
(Depreciation) | | | Net
Unrealized
Appreciation/
(Depreciation) | |
PIMCO Dividend and Income Fund | | | | | | $ | 361,583 | | | $ | 25,700 | | | $ | (13,587 | ) | | $ | 12,113 | |
PIMCO EqS® Long/Short Fund | | | | | | | 558,390 | | | | 20,065 | | | | (4,247 | ) | | | 15,818 | |
| (1) | Primary differences, if any, between book and tax net unrealized appreciation (depreciation) are attributable to wash sale loss deferrals for Federal income tax purposes. |
Glossary: (abbreviations that may be used in the preceding statements)
(Unaudited)
| | | | | | | | | | |
| | | | |
Counterparty Abbreviations: | | | | | | | | |
| AZD | | Australia and New Zealand Banking Group | | FOB | | Credit Suisse Securities (USA) LLC | | JPM | | JPMorgan Chase Bank N.A. |
| BOA | | Bank of America N.A. | | GLM | | Goldman Sachs Bank USA | | MSB | | Morgan Stanley Bank, N.A |
| BOS | | Banc of America Securities LLC | | GSC | | Goldman Sachs & Co. | | MYC | | Morgan Stanley Capital Services, Inc. |
| BPS | | BNP Paribas S.A. | | GST | | Goldman Sachs International | | SCX | | Standard Chartered Bank |
| CBK | | Citibank N.A. | | HUS | | HSBC Bank USA N.A. | | SSB | | State Street Bank and Trust Co. |
| DUB | | Deutsche Bank AG | | IND | | Crédit Agricole Corporate and Investment Bank S.A. | | TOR | | Toronto Dominion Bank |
| FBF | | Credit Suisse International | | | | | | | | |
| | | | |
Currency Abbreviations: | | | | | | | | |
| AUD | | Australian Dollar | | DKK | | Danish Krone | | MXN | | Mexican Peso |
| BRL | | Brazilian Real | | EUR | | Euro | | RUB | | Russian Ruble |
| CAD | | Canadian Dollar | | GBP | | British Pound | | USD (or $) | | United States Dollar |
| CHF | | Swiss Franc | | JPY | | Japanese Yen | | ZAR | | South African Rand |
| | | | |
Index/Spread Abbreviations: | | | | | | | | |
| CDX.HY | | Credit Derivatives Index - High Yield | | CMBX | | Commercial Mortgage-Backed Index | | | | |
| | | | |
Other Abbreviations: | | | | | | | | |
| ADR | | American Depositary Receipt | | CBO | | Collateralized Bond Obligation | | SP - ADR | | Sponsored American Depositary Receipt |
| BABs | | Build America Bonds | | CLO | | Collateralized Loan Obligation | | SPDR | | Standard & Poor’s Depositary Receipts |
| BBR | | Bank Bill Rate | | JIBAR | | Johannesburg Interbank Agreed Rate | | TBA | | To-Be-Announced |
| BBSW | | Bank Bill Swap Reference Rate | | LIBOR | | London Interbank Offered Rate | | TIIE | | Tasa de Interés Interbancaria de Equilibrio “Equilibrium Interbank Interest Rate” |
| | | | | | |
| | SEMIANNUAL REPORT | | DECEMBER 31, 2016 | | 59 |
Approval of Investment Advisory Contract and Other Agreements
Approval of Renewal of the Investment Advisory Contract, Sub-Advisory Agreement, Portfolio Implementation Agreement and Second Amended and Restated Supervision and Administration Agreement
At a meeting held on August 17, 2016, the Board of Trustees (the “Board”) of PIMCO Equity Series (the “Trust”), including the Trustees who are not “interested persons” of the Trust under the Investment Company Act of 1940, as amended (the “Independent Trustees”), considered and unanimously approved the renewal of the Investment Advisory Contract (the “Investment Advisory Contract”) between the Trust, on behalf of each of the Trust’s series (the “Funds”), and Pacific Investment Management Company LLC (“PIMCO”) for an additional one-year term through August 31, 2017. The Board also considered and unanimously approved the renewal of the Second Amended and Restated Supervision and Administration Agreement (the “Supervision and Administration Agreement” and together with the Investment Advisory Contract, the “Agreements”) between the Trust, on behalf of the Funds, and PIMCO for an additional one-year term through August 31, 2017. In addition, the Board considered and unanimously approved the renewal of the: (i) Sub-Advisory Agreement (the “Sub-Advisory Agreement”) between PIMCO, on behalf of PIMCO RAE Fundamental Emerging Markets Fund, PIMCO RAE Fundamental Global ex-US Fund, PIMCO RAE Fundamental Global Fund, PIMCO RAE Fundamental International Fund, PIMCO RAE Fundamental US Fund and PIMCO RAE Fundamental US Small Fund (the “RAE Fundamental Funds”), each a series of the Trust, and Research Affiliates, LLC (“Research Affiliates”); and (ii) Portfolio Implementation Agreement (the “Portfolio Implementation Agreement”) between PIMCO, on behalf of the RAE Fundamental Funds, each a series of the Trust, Research Affiliates and Parametric Portfolio Associates LLC (“Parametric”), each for an additional one-year term through August 31, 2017.
The information, material factors and conclusions that formed the basis for the Board’s approvals are summarized below.
1. INFORMATION RECEIVED
(a) Materials Reviewed: During the course of the past year, the Trustees received a wide variety of materials relating to the services provided by PIMCO, Research Affiliates and Parametric to the Trust. At each of its quarterly meetings, the Board reviewed the Funds’ investment performance and a significant amount of information relating to Fund operations, including shareholder services, valuation and custody, the Funds’ compliance program and other information relating to the nature, extent and quality of services provided by PIMCO, Research Affiliates and Parametric to the Trust and each of the Funds, as applicable. In considering whether to approve the renewal of the Agreements, the Sub-Advisory Agreement, and the Portfolio
Implementation Agreement, the Board reviewed additional information, including, but not limited to, comparative industry data with regard to investment performance, advisory and supervisory and administrative fees and expenses, financial information for PIMCO and, where relevant, Research Affiliates and Parametric, information regarding the profitability to PIMCO of its relationship with the Funds, information about the personnel providing investment management services, other advisory services and supervisory and administrative services to the Funds, and information about the fees charged and services provided to other clients with similar investment mandates as the Funds, where applicable. In addition, the Board reviewed materials provided by counsel to the Trust and the Independent Trustees, which included, among other things, memoranda outlining legal duties of the Board in considering the renewal of the Agreements, the Sub-Advisory Agreement, and the Portfolio Implementation Agreement.
(b) Review Process: In connection with considering the renewal of the Agreements, the Sub-Advisory Agreement, and the Portfolio Implementation Agreement, the Board reviewed written materials prepared by PIMCO and, where applicable, Research Affiliates and Parametric in response to requests from counsel to the Trust and the Independent Trustees encompassing a wide variety of topics. The Board requested and received assistance and advice regarding, among other things, applicable legal standards from counsel to the Trust and the Independent Trustees, and reviewed comparative fee and performance data prepared at the Board’s request by Lipper, Inc. (“Lipper”), an independent provider of investment company performance information and fee and expense data. The Board received presentations on matters related to the Agreements, the Sub-Advisory Agreement, and the Portfolio Implementation Agreement and met both as a full Board and in a separate session of the Independent Trustees, without management present, at the August 17, 2016 meeting.
The approval determinations were made on the basis of each Trustee’s business judgment after consideration and evaluation of all the information presented. Individual Trustees may have given different weights to certain factors and assigned various degrees of materiality to information received in connection with the approval process. In deciding to approve the renewal of the Agreements, the Sub-Advisory Agreement, and the Portfolio Implementation Agreement, the Board did not identify any single factor or particular information that, in isolation, was controlling. The discussion below is intended to summarize the broad factors and information that figured prominently in the Board’s consideration of the renewal of the Agreements, the Sub-Advisory Agreement, and the Portfolio Implementation Agreement, but is not intended to summarize all of the factors considered by the Board.
(Unaudited)
2. NATURE, EXTENT AND QUALITY OF SERVICES
(a) PIMCO, Research Affiliates, Parametric, their Personnel, and Resources: The Board considered the depth and quality of PIMCO’s investment management process, including: the experience, capability and integrity of its senior management and other personnel; the overall financial strength and stability of its organization; and the ability of its organizational structure to address changes in the Funds’ asset levels. The Board also considered the various services in addition to portfolio management that PIMCO provides under the Investment Advisory Contract. The Board noted that PIMCO makes available to its investment professionals a variety of resources and systems relating to investment management, compliance, trading, performance and portfolio accounting. The Board also noted PIMCO’s commitment to investing in information technology and infrastructure supporting investment management and compliance, as well as PIMCO’s continuing efforts to attract, retain and promote qualified personnel, including personnel with relevant equities experience, and to maintain and enhance its resources and systems. The Board considered PIMCO’s policies, procedures and systems reasonably designed to assure compliance with applicable laws and regulations and its commitment to further developing and strengthening these programs, its oversight of matters that may involve conflicts of interest between the Funds’ investments and those of other accounts managed by PIMCO, and its efforts to keep the Trustees informed about matters relevant to the Funds and their shareholders. The Board also considered PIMCO’s continuous investment in new disciplines and talented personnel, which has enhanced PIMCO’s services to the Funds and has allowed PIMCO to introduce innovative new funds over time.
The Trustees considered information they had received about the steps that PIMCO has taken with respect to active management of counterparty risk, such as implementing procedures requiring daily collateral adjustments and frequent communication between credit analysts and the Counterparty Risk Committee, which oversees counterparty risk on a firm-wide basis, continually evaluating requests to add or remove approved counterparties as market needs and conditions warrant. The Trustees also considered that PIMCO has continued to strengthen the process it uses to assess the financial stability of counterparties with which the Funds do business, to manage collateral and to protect the Funds from an unforeseen deterioration in the creditworthiness of trading counterparties. The Trustees noted that, consistent with its fiduciary duty, PIMCO executes transactions through a competitive best execution process and uses only those counterparties that meet its stringent and monitored criteria. The Trustees considered that PIMCO’s collateral management team utilizes a counterparty risk system to analyze portfolio level exposure and collateral being exchanged with counterparties.
In addition, the Trustees considered new services and service enhancements that PIMCO has implemented since the Board renewed the Agreements in 2015, including, but not limited to: continuing enhancement of analytics and technology systems; enhancing data processing and security and development tools and applications; continuing investment in its enterprise risk management function, including PIMCO’s cybersecurity program; building specialized talent in the PIMCO Global Advisory Board and continuing to hire new portfolio managers; continuing to expand the Funds Business Group global operating model; developing a website monitoring application to ensure accurate data content; engaging a third-party to perform an independent assessment of the application utilized for income servicing and enhancing the application to provide portfolio managers with more timely and high quality quarterly reporting; establishing a Fund Treasurer’s Office to provide, among other things, guidance with respect to industry and regulatory initiatives; advancing technology developers in global tax management application; conducting an end-to-end review of State Street IMS, custodian and pricing vendor connectivity in connection with the pricing function; continuing development of Pricing Portal to improve identification and feedback to vendors regarding valuations; continuing extensive pricing vendor due diligence; and partnering with Boston Financial Data Services, Inc. to establish secondary call center and other call center enhancements.
Similarly, the Board considered the sub-advisory services provided by Research Affiliates to the RAE Fundamental Funds. The Board also considered Research Affiliates’ supervisory responsibilities with respect to Parametric’s provision of portfolio implementation services to the RAE Fundamental Funds. The Board further considered the depth and quality of Research Affiliates’ investment management and research capabilities, the experience and capabilities of its portfolio management personnel and, in particular, the experience and capabilities of Robert Arnott, Research Affiliates’ principal, and the overall financial strength of the organization.
In addition, the Board considered the portfolio implementation and other operational services provided by Parametric to the RAE Fundamental Funds by, among other things, effecting portfolio transactions on behalf of the RAE Fundamental Funds. The Board also considered information about Parametric’s personnel responsible for providing services under the Portfolio Implementation Agreement. The Board also considered the nature and quality of Parametric’s trading, risk management, and compliance capabilities and resources, including Parametric’s policies and procedures regarding trade aggregation and allocation, which are integral parts of its role as portfolio implementer.
Ultimately, the Board concluded that the nature, extent and quality of services provided by PIMCO under the Agreements, by Research Affiliates under the Sub-Advisory Agreement, and by Parametric under
| | | | | | |
| | SEMIANNUAL REPORT | | DECEMBER 31, 2016 | | 61 |
Approval of Investment Advisory Contract and Other Agreements (Cont.)
the Portfolio Implementation Agreement are likely to continue to benefit the Funds and their shareholders, as applicable.
(b) Other Services: The Board also considered the nature, extent and quality of supervisory and administrative services provided by PIMCO to the Funds under the Supervision and Administration Agreement. The Board considered the terms of the Supervision and Administration Agreement, under which the Trust pays for the supervisory and administrative services provided pursuant to that agreement under what is essentially an all-in fee structure (the “unified fee”). In return, PIMCO provides or procures certain supervisory and administrative services and bears the costs of various third party services required by the Funds, including audit, custodial, portfolio accounting, legal, transfer agency, sub-accounting and printing costs. The Board noted that the scope and complexity, as well as the costs, of the supervisory and administrative services provided by PIMCO under the Supervision and Administration Agreement continue to increase. The Board considered PIMCO’s provision of supervisory and administrative services and its supervision of the Trust’s third party service providers to assure that these service providers continue to provide a high level of service relative to alternatives available in the market.
Ultimately, the Board concluded that the nature, extent and quality of the services provided by PIMCO has benefited, and will likely continue to benefit, the Funds and their shareholders.
3. INVESTMENT PERFORMANCE
The Board reviewed information from PIMCO concerning the Funds’ performance, as available, over short- and long-term periods ended May 31, 2016 and other performance data, as available, over short- and long-term periods ended June 30, 2016 (the “PIMCO Report”) and from Lipper concerning the Funds’ performance, as available, over short- and long-term periods ended May 31, 2016 (the “Lipper Report”). The Board considered information regarding both the short- and long-term investment performance of each Fund relative to its peer group and relevant benchmark index as provided to the Board in advance of each of its quarterly meetings throughout the year, including the PIMCO Report and Lipper Report, which were provided in advance of the August 17, 2016 meeting.
The Board noted that, according to Lipper, certain Funds had underperformed in comparison to their respective peer groups or benchmark indexes, or both, over short- and long-term periods. The Board discussed with PIMCO the reasons for the underperformance of certain Funds over short- and long-term periods. The Board also discussed actions that have been taken by PIMCO to attempt to improve performance and took note of PIMCO’s plans to monitor performance going forward.
The Board ultimately concluded, within the context of all of its considerations in connection with the Agreements, that PIMCO’s performance record and process in managing the Funds indicates that its continued management is likely to benefit the Funds and their shareholders, and merits the approval of the renewal of the Agreements.
4. ADVISORY FEES, SUPERVISORY AND ADMINISTRATIVE FEES AND TOTAL EXPENSES
The Board considered that PIMCO seeks to price funds to scale at the outset with reference to the total expense ratios of the respective Lipper median, if available, while providing a premium for innovative investment offerings. PIMCO reported to the Board that, in proposing fees for any Fund or class of shares, it considers a number of factors, including, but not limited to, the type and complexity of the services provided, the cost of providing services, the risk assumed by PIMCO in the development of products and the provision of services, the impact on potential returns from different levels of fees, the competitive marketplace for financial products, and the attractiveness of potential Fund returns to current and potential investors. Fees charged to or proposed for different Funds for advisory services and supervisory and administrative services may vary in light of these various factors. The Board also considered that PIMCO reviews the Funds’ fee levels and carefully considers reductions where appropriate.
The Board reviewed the advisory fees, supervisory and administrative fees and total expenses of the Funds (each as a percentage of average net assets) and compared such amounts with the average and median fee and expense levels of other similar funds. The Board also reviewed information relating to the sub-advisory fees paid to Research Affiliates with respect to applicable Funds, taking into account that PIMCO compensates Research Affiliates from the advisory fees paid by such Funds to PIMCO. With respect to advisory fees, the Board reviewed data from Lipper that compared the average and median advisory fees of other funds in a “Peer Group” of comparable funds, as well as the universe of other similar funds. The Board noted that PIMCO had contractually agreed, through October 31, 2016, to reduce its advisory fee by amounts shown in the table below:
| | | | |
PIMCO Dividend and Income Fund | | | 0.16% | |
PIMCO RAE Fundamental Emerging Markets Fund | | | 0.20% | |
PIMCO RAE Fundamental Global Fund | | | 0.20% | |
PIMCO RAE Fundamental Global ex-US Fund | | | 0.20% | |
PIMCO RAE Fundamental International Fund | | | 0.10% | |
PIMCO RAE Fundamental US Fund | | | 0.10% | |
PIMCO RAE Fundamental US Small Fund | | | 0.10% | |
The Board further noted that the PIMCO Global Dividend Fund, PIMCO Balanced Income Fund, PIMCO U.S. Dividend Fund and PIMCO International Dividend Fund are expected to liquidate on August 26, 2016.
(Unaudited)
The Board also reviewed data comparing the Funds’ advisory fees to the standard and negotiated fee rates PIMCO charges to separate accounts and to other sub-advised clients with similar investment strategies, including differences in advisory services provided. The Board discussed comparisons of fees for Funds with fees for separate accounts and/or PIMCO private/alternative funds with similar investment strategies, noting that for certain Funds, there were no appropriate comparisons because PIMCO did not manage comparable separate accounts at the time that the Board considered the Agreements. The Board noted that the advisory fees (or management fees, where applicable) for most Funds were similar to the fee rates charged to other investment companies with the same investment strategies as the Funds.
Regarding advisory fees charged by PIMCO in its capacity as sub-adviser to third-party/unaffiliated funds, the Trustees took into account that such fees may be lower than the fees charged by PIMCO to serve as adviser to the Funds. The Trustees also took into account that there are various reasons for any such differences in fees, including, but not limited to, the fact that PIMCO may be subject to varying levels of entrepreneurial risk and regulatory requirements, differing legal liabilities on a contract-by-contract basis and different servicing requirements when PIMCO does not serve as the sponsor of a fund and is not principally responsible for all aspects of a fund’s investment program and operations as compared to when PIMCO serves as investment adviser and sponsor. In considering the fees paid by the Funds, the Board noted that retail investors in the Funds receive the benefit of PIMCO’s advisory services at the same advisory fee rates as institutional investors in the Funds.
The Board considered the Funds’ supervisory and administrative fees, comparing them to similar funds in the report supplied by Lipper. The Board also considered that as the Funds’ business has become increasingly complex and the number of Funds has grown over time, PIMCO has provided an increasingly broad array of fund supervisory and administrative functions. In addition, the Board considered the Trust’s unified fee structure, under which the Trust pays for the supervisory and administrative services it requires for one set fee. In return for this unified fee, PIMCO provides or procures supervisory and administrative services and bears the costs of various third party services required by the Funds, including audit, custodial, portfolio accounting, legal, transfer agency, sub-accounting and printing costs. The Board further considered that many other funds pay for comparable services separately, and thus it is difficult to directly compare the Trust’s unified supervisory and administrative fees with the fees paid by other funds for administrative services alone. The Board also considered that the unified supervisory and administrative fee leads to Fund fees that are fixed, rather than variable. The Board noted that, although the unified fee structure does not have
breakpoints, it implicitly reflects economies of scale by fixing the absolute level of Fund fees at competitive levels even if the Funds’ operating costs rise when assets remain flat or decrease. The Board considered that the Funds’ unified fee structure meant that fees were not impacted by recent outflows in certain Funds, unlike funds without a unified fee structure, which may see increased expense ratios when fixed costs are passed through to a smaller asset base. The Board concluded that the Funds’ supervisory and administrative fees were reasonable in relation to the value of the services provided, including the services provided to different classes of shareholders, and that the expenses assumed contractually by PIMCO under the Supervision and Administration Agreement represent, in effect, a cap on overall Fund fees, which is beneficial to the Funds and their shareholders.
The Board noted that the Funds’ total expenses continued to be generally in line with those of competitor funds. The Board discussed with PIMCO those Funds and/or classes of Funds that had above median total expenses. Upon comparing the Funds’ total expenses to other funds in the “Peer Groups” provided by Lipper, the Board found total expenses of each Fund to be reasonable.
The Trustees also considered the advisory fees charged to the Funds that operate as funds of funds (the “Funds of Funds”) and the advisory services provided in exchange for such fees. The Trustees determined that such services were in addition to the advisory services provided to the underlying funds in which the Funds of Funds may invest and, therefore, such services were not duplicative of the advisory services provided to the underlying funds. The Board also considered the various fee waiver agreements in place for the Funds of Funds.
Based on the information presented by PIMCO, Research Affiliates, Parametric and Lipper, members of the Board determined, in the exercise of their business judgment, that the level of the advisory fees and supervisory and administrative fees charged by PIMCO under the Agreements, as well as the total expenses of each Fund, are reasonable.
5. ADVISER COSTS, LEVEL OF PROFITS AND ECONOMIES OF SCALE
The Board reviewed information regarding PIMCO’s costs of providing services to the Funds as a whole and considered that PIMCO did not derive any profit from the Funds during the calendar year ended December 31, 2015, and does not expect to derive any profit from the Funds during the calendar year ended December 31, 2016. The Board noted that it had received information regarding the structure and manner in which PIMCO’s investment professionals were compensated, and PIMCO’s view of the relationship of such compensation to the attraction and retention of quality personnel. The Board considered PIMCO’s need to invest in technology, cyber security, information security, shareholder privacy, business continuity planning, infrastructure and staff to reinforce and offer new services and to accommodate changing regulatory requirements.
| | | | | | |
| | SEMIANNUAL REPORT | | DECEMBER 31, 2016 | | 63 |
Approval of Investment Advisory Contract and Other Agreements (Cont.)
(Unaudited)
With respect to potential economies of scale, the Board noted that PIMCO shares the benefits of economies of scale with the Funds and their shareholders in a number of ways, including through the pricing of Funds to scale from inception and the enhancement of services provided to the Funds in return for fees paid. In considering the advisory fees paid by the Funds, the Board also noted that retail investors in the Funds receive the benefit of PIMCO’s advisory services at the same advisory fee rates as institutional investors in the Funds. The Board considered that the Funds’ unified fee rates had been set competitively and/or priced to scale from inception and continued to be competitive compared with peers. The Board also considered that the unified fee is a transparent means of informing a Fund’s shareholders of the fees associated with the Fund, and that the Fund bears certain expenses that are not covered by the advisory fee or the unified fee. The Board further considered the challenges that arise when managing large funds, which can result in certain “diseconomies” of scale.
The Trustees considered that the unified fee has provided inherent economies of scale because a Fund maintains competitive fixed unified fees even if the particular Fund’s assets decline and/or operating costs rise. The Trustees further considered that, in contrast, breakpoints may be a proxy for charging higher fees on lower asset levels and that when a fund’s assets decline, breakpoints may reverse, which causes expense ratios to increase. The Trustees also considered that, unlike the Funds’ unified fee structure, funds with “pass through” administrative fee structures may experience increased expense ratios when fixed dollar fees are charged against declining fund assets. The Trustees also considered that the unified fee protects shareholders from a rise in operating costs that may result from, among other things, PIMCO’s investments in various business enhancements and infrastructure, including those referenced above. The Trustees noted that PIMCO’s investments in these areas are extensive.
The Board concluded that the Funds’ cost structures were reasonable and that the unified fee structure inherently involves the sharing of economies of scale between PIMCO and each of the Funds, to the benefit of their respective shareholders.
6. ANCILLARY BENEFITS
The Board considered other benefits realized by PIMCO and its affiliates as a result of PIMCO’s relationship with the Trust, including possible ancillary benefits to PIMCO’s institutional investment management business due to the reputation and market penetration of the Trust. The Board also considered that affiliates of PIMCO provide distribution and shareholder services to the Funds and their shareholders, for which they may be compensated through distribution and servicing fees paid pursuant to the Funds’ Rule 12b-1 plans or otherwise. The Board reviewed PIMCO’s soft dollar policies and procedures, noting that while PIMCO has the authority to receive the benefit of research provided by
broker-dealers executing portfolio transactions on behalf of the Funds, it has adopted a policy not to enter into contractual soft dollar arrangements.
7. CONCLUSIONS
Based on their review, including their comprehensive consideration and evaluation of each of the broad factors and information summarized above, the Independent Trustees and the Board as a whole concluded that the nature, extent and quality of the services rendered to the Funds by PIMCO, Research Affiliates and Parametric supported the renewal of the Agreements, the Sub-Advisory Agreement, and the Portfolio Implementation Agreement. The Independent Trustees and the Board as a whole concluded that the Agreements, the Sub-Advisory Agreement, and the Portfolio Implementation Agreement continued to be fair and reasonable to the Funds and their shareholders, that the Funds’ shareholders received reasonable value in return for the fees paid to PIMCO by the Funds under the Agreements, the fees paid to Research Affiliates by PIMCO under the Sub-Advisory Agreement, and the fees paid to Parametric by PIMCO under the Portfolio Implementation Agreement, and that the renewal of the Agreements, the Sub-Advisory Agreement, and the Portfolio Implementation Agreement was in the best interests of the Funds and their shareholders.
Results of Proxy Voting
(Unaudited)
At a special meeting of shareholders held on August 26, 2016, PIMCO sought approval from shareholders of the PIMCO Dividend and Income Fund to enter into a sub-advisory agreement with Research Affiliates, LLC and a portfolio implementation agreement with Research Affiliates, LLC and Parametric Portfolio Associations, LLC.
The results of the proxy solicitation on the preceding matters were as follows:
PIMCO Equity Series
Proposal 1: To approve a sub-advisory agreement for the Fund
| | | | | | | | |
| For* | | Against* | | | Abstain* | |
| 15,360,763 | | | 855,024 | | | | 944,023 | |
Proposal 2: To approve a portfolio implementation agreement for the Fund
| | | | | | | | |
| For* | | Against* | | | Abstain* | |
| 15,324,472 | | | 909,160 | | | | 956,177 | |
| * | Certain series of the Trust’s shares were held by PIMCO-advised funds or accounts for which PIMCO had discretionary authority to vote proxies. Accordingly, PIMCO voted such shares in proportion to the votes of all other Trust shareholders voting on the proposal. |
| | | | | | |
| | SEMIANNUAL REPORT | | DECEMBER 31, 2016 | | 65 |
General Information
Investment Adviser and Administrator
Pacific Investment Management Company LLC
650 Newport Center Drive
Newport Beach, CA 92660
Investment Sub-Adviser
Research Affiliates, LLC
620 Newport Center Drive, Suite 900
Newport Beach, CA 92660
Distributor
PIMCO Investments LLC
1633 Broadway
New York, NY 10019
Custodian
State Street Bank and Trust Company
801 Pennsylvania Avenue
Kansas City, MO 64105
Transfer Agent
Boston Financial Data Services
Institutional Class, Class P, Administrative Class, Class D
330 W. 9th Street, 5th Floor
Kansas City, MO 64105
Boston Financial Data Services
Class A, Class C, Class R
P.O. Box 55060
Boston, MA 02205-5060
Legal Counsel
Dechert LLP
1900 K Street, N.W.
Washington, D.C. 20006
Independent Registered Public Accounting Firm
PricewaterhouseCoopers LLP
1100 Walnut Street, Suite 1300
Kansas City, MO 64106
This report is submitted for the general information of the shareholders of the PIMCO Equity Series.

PES4001SAR_123116

PIMCO Equity Series®
Semiannual Report
December 31, 2016

PIMCO RAE Fundamental Emerging Markets Fund
PIMCO RAE Fundamental Global Fund
PIMCO RAE Fundamental Global ex-US Fund
PIMCO RAE Fundamental International Fund
PIMCO RAE Fundamental US Fund
PIMCO RAE Fundamental US Small Fund
Share Classes

Table of Contents
This material is authorized for use only when preceded or accompanied by the current PIMCO Equity Series prospectus. The Shareholder Reports for the other series of the PIMCO Equity Series are printed separately.
Chairman’s Letter
Dear Shareholder,
Please find enclosed the Semiannual Report for the PIMCO Equity Series covering the six-month reporting period ended December 31, 2016. The following pages contain specific details about the investment performance of each fund and a discussion of the factors that most affected performance during the reporting period.
In June 2016, the unexpected outcome of the U.K. “Brexit” referendum dominated headlines and market movements. Volatility rose as a result and sovereign yields rallied significantly, while risk assets generally underperformed. Steadier commodity prices and fiscal stimulus in China helped bolster market sentiment, even as central banks remained on hold ahead of the Brexit referendum. Softer-than-expected employment data in the U.S. pushed market expectations for the next Federal Reserve (“Fed”) interest rate hike further out into the future, with the Fed continuing to hold rates steady through the end of November.
Leading up to the November 8th U.S. presidential election, investors generally shook off the surprising result of the Brexit referendum, along with a host of political developments including new leadership in the U.K. and Brazil, and a coup attempt in Turkey. In this environment, volatility generally remained low and risk assets rallied. Central banks featured prominently in the headlines as monetary policy concerns (in particular, the longevity of central bank support) lingered beneath the seemingly benign market environment. The Bank of Japan’s “comprehensive review,” inaction by the European Central Bank (“ECB”), and the Fed’s solidifying path towards a potential interest rate increase in December 2016 all contributed to sovereign yields generally rising during this period. Still, equities moved higher (U.S. stock indices set record highs), credit spreads tightened, and emerging market assets continued to gain.
In the wake of the not expected result of the U.S. election, volatility fell, equities rallied, credit spreads tightened and the U.S. dollar strengthened. In contrast, interest rates rose dramatically as most markets focused on the pro-growth and inflationary potential of fiscal expansion, tax cuts, and deregulation. Part of the rise in interest rates was also due to a sharp increase in inflation expectations. Despite the generally positive risk sentiment towards the end of the reporting period, emerging markets weakened as protectionist rhetoric from the incoming administration weighed on the asset class.
Finally, the ECB at its December 8th meeting opted to leave its main policy rate unchanged, and announced an expansion of its Quantitative Easing program to exceed $2.4 trillion by the end of 2017. And on December 14th, the Fed raised its key lending rate, the Federal Funds Rate, by 0.25% to a range of 0.50%-0.75%, representing their second rate increase in ten years.
Highlights of the financial markets during the six-month reporting period include:
| | ∎ | | Global developed market equities experienced strong performance amid a period marked by unconventional central bank policy, the continued recovery in commodity prices and higher sovereign yields. U.S. equities, as represented by the S&P 500 Index, returned 7.82% over the reporting period. International equity markets (developed ex-U.S.), as represented by the MSCI EAFE Index returned 5.67%, and 14.06% on a USD-hedged basis over the reporting period. Japanese equities, as represented by the Nikkei 225 Index in JPY, returned 23.83% over the reporting period, and European equities, as represented by the MSCI Europe Index in EUR, returned 10.58% over the reporting period. Following the surprise outcome of the U.K.’s referendum to leave the European Union and accompanying market volatility in June, developed market equities posted strong gains. Global central banks continued down the path of unconventional monetary policy, as the Bank of Japan adopted a yield-curve targeting framework and the ECB extended its asset purchase program. The rally in developed market equities was further supported by the result of the U.S. presidential election, and the possibility of a new paradigm of stronger growth, higher inflation and higher natural interest rates. |
| | ∎ | | Emerging market equities, as represented by the MSCI Emerging Markets Index, returned 4.49% over the reporting period. Benefits from improving internal and external conditions for many emerging markets economies and the continued recovery in commodity prices offset negative implications of the potential for fiscal stimulus in the U.S., a more hawkish Fed and protectionist trade policies. |
| | ∎ | | U.S. Treasuries, as represented by the Bloomberg Barclays U.S. Treasury Index, declined 4.11% for the reporting period. Yields rose across the U.S. Treasury yield curve in reaction to the Fed’s interest rate increase, rising concern over inflation and strong investor risk appetite. The benchmark ten-year U.S. Treasury note yielded 2.45% at the end of the reporting period, up from 1.49% on June 30, 2016. The Bloomberg Barclays U.S. Aggregate Index, a widely used index of U.S. investment-grade bonds, declined 2.53% for the reporting period. |
If you have any questions regarding the PIMCO Equity Series, please contact your account manager or financial adviser, or call one of our shareholder associates at 888.87.PIMCO (888.877.4626). We also invite you to visit our website at www.pimco.com to learn more about our views and global thought leadership.
Thank you again for the trust you have placed in us. We value your commitment and will continue to work diligently to meet your broad investment and investment solution needs.
| | |
 | | Sincerely, 
Brent R. Harris Chairman of the Board,
PIMCO Equity Series February 21, 2017 |
Past performance is no guarantee of future results. Unless otherwise noted, index returns reflect the reinvestment of income dividends and capital gains, if any, but do not reflect fees, brokerage commissions or other expenses of investing. It is not possible to invest directly in an unmanaged index.
| | | | | | |
| | SEMIANNUAL REPORT | | DECEMBER 31, 2016 | | 3 |
Important Information About the Funds
We believe that equity funds have an important role to play in a well-diversified investment portfolio. It is important to note, however, that equity funds are subject to notable risks. Among other things, equity and equity-related securities may decline in value due to both real and perceived general market, economic, and industry conditions.
The PIMCO RAE Fundamental Global Fund and PIMCO RAE Fundamental Global ex-US Fund are each “fund of funds,” which is a term used to describe mutual funds that pursue their investment objective by investing in other mutual funds instead of investing directly in stocks or bonds of other issuers. Under normal circumstances, the PIMCO RAE Fundamental Global Fund invests substantially all of its assets in Institutional Class shares of the PIMCO RAE Fundamental US Fund, PIMCO RAE Fundamental International Fund (“International Fund”) and PIMCO RAE Fundamental Emerging Markets Fund (“Emerging Markets Fund”) (collectively, “Underlying Funds”), and equity securities that are eligible investments for the Underlying Funds. Under normal circumstances, the PIMCO RAE Fundamental Global ex-US Fund invests substantially all of its assets in Institutional Class shares of the International Fund and Emerging Markets Fund, equity securities of small companies economically tied to non-U.S. countries, and securities that are eligible investments for the International Fund and Emerging Markets Fund. The PIMCO RAE Fundamental Global Fund and PIMCO RAE Fundamental Global ex-US Fund may invest in other affiliated funds and unaffiliated funds, which may or may not be registered under the Investment Company Act of 1940 (together with the Underlying Funds, “Acquired Funds”). The cost of investing in these Funds will generally be higher than the cost of investing in a mutual fund that invests directly in individual stocks and bonds.
The values of equity securities, such as common stocks and preferred stocks, have historically risen and fallen in periodic cycles and may decline due to general market conditions, which are not specifically related to a particular company, such as real or perceived adverse economic conditions, changes in the general outlook for corporate earnings, changes in interest or currency rates or adverse investor sentiment generally. Equity securities may also decline due to factors that affect a particular industry or industries, such as labor shortages, increased production costs and competitive conditions within an industry. In addition, the value of an equity security may decline for a number of reasons that directly relate to the issuer, such as management performance, financial leverage and reduced demand for the issuer’s goods or services, as well as the historical and prospective earnings of the issuer and the value of its assets. Different types of equity securities may react differently to these developments and a change in the financial condition of a single issuer may affect securities markets as a whole.
During a general downturn in the securities markets, multiple asset classes, including equity securities, may decline in value simultaneously. The market price of equity securities owned by a Fund may go up or down, sometimes rapidly or unpredictably. Equity securities generally have greater price volatility than fixed income securities and common stocks generally have the greatest appreciation and depreciation potential of all corporate securities.
The Funds may be subject to various risks as described in the Funds’ prospectus. Some of these risks may include, but are not limited to, the following: new/small fund risk, allocation risk, Acquired Fund risk, equity risk, value investing risk, foreign (non-U.S.) investment risk, emerging markets risk, issuer non-diversification risk, market risk, issuer risk, credit risk, distressed company risk, currency risk, liquidity risk, leveraging risk, management risk, small company risk, arbitrage risk, derivatives risk and model risk. A complete description of these and other risks is contained in the Funds’ prospectus.
The Funds may use derivative instruments for hedging purposes or as part of an investment strategy. Use of these instruments may involve certain costs and risks such as liquidity risk, interest rate risk, market risk, credit risk, leverage risk, management risk and the risk that a Fund may not be able to close out a position when it would be most advantageous to do so. Changes in regulation relating to a mutual fund’s use of derivatives and related instruments could potentially limit or impact a Fund’s ability to invest in derivatives, limit a Fund’s ability to employ certain strategies that use derivatives and/or adversely affect the value or performance of derivatives and a Fund. Certain derivative transactions may have a leveraging effect on a Fund. For example, a small investment in a derivative instrument may have a significant impact on a Fund’s exposure to interest rates, currency exchange rates or other investments. As a result, a relatively small price movement in an asset, instrument or component of the index underlying a derivative instrument may cause an immediate and substantial loss or gain, which translates into heightened volatility for the Funds. A Fund may engage in such transactions regardless of whether the Fund owns the asset, instrument or components of the index underlying the derivative instrument. A Fund may invest a significant portion of its assets in these types of instruments. If it does, the Fund’s investment exposure could far exceed the value of its portfolio securities and its investment performance could be primarily dependent upon securities it does not own. Investing in foreign (non-U.S.) securities may entail risk due to foreign (non-U.S.) economic and political developments; this risk may be increased when investing in emerging markets. For example, if an Underlying Fund invests in emerging market debt, it may face increased exposure to interest rate, liquidity, volatility, and redemption risk due to the specific economic, political, geographical, or legal background of the foreign (non-U.S.) issuer.
The value of an equity security of an issuer that has paid dividends in the past may decrease if the issuer reduces or eliminates future payments to its shareholders. If the dividends or distributions received by a Fund decrease, the Fund may have less income to distribute to the Fund’s shareholders. In addition, during certain market conditions, the equity securities of issuers that have paid regular dividends or distributions may not be widely available or may be highly concentrated in particular sectors of the market. A Fund may invest a significant portion of its assets in value stocks. Value stocks may perform differently from other types of stocks and the market as a whole. A value stock may decrease in price or may not increase in price as anticipated by PIMCO if it continues to be undervalued by the market or the factors that the portfolio manager believes will cause the stock price to increase do not occur.
The geographical classification of foreign (non-U.S.) securities in this report are classified by the country of incorporation of a holding. In certain instances, a security’s country of incorporation may be different from its country of economic exposure.
On each individual Fund Summary page in this Shareholder Report, the Average Annual Total Return table and Cumulative Returns chart measure performance assuming that any dividend and capital gain distributions were reinvested. Returns do not reflect the deduction of taxes that a shareholder would pay on (i) Fund distributions or (ii) the
redemption of Fund shares. The Cumulative Returns chart and Average Annual Total Return table reflect any sales load that would have applied at the time of purchase or any Contingent Deferred Sales Charge (“CDSC”) that would have applied if a full redemption occurred on the last business day of the period shown in the Cumulative Returns chart. Class A shares are subject to an initial sales charge. A CDSC may be imposed in certain circumstances on Class A shares that are purchased without an initial sales charge and then redeemed during the first (i) 18 months after purchase for purchases made prior to August 10, 2015 and (ii) 12 months after purchase for purchases made on or after August 10, 2015. The Cumulative Returns chart reflects only Institutional Class performance. Performance for Class P, Administrative Class, Class D, Class A, Class C and Class R shares, if applicable, are typically lower than Institutional Class performance due to the lower expenses paid by Institutional Class shares. Performance shown is net of fees and expenses. The minimum initial investment amount for Institutional Class, Class P and Administrative Class shares is $1,000,000. The minimum initial investment amount for Class A, Class C and Class D shares is $1,000. There is no minimum initial investment for Class R shares. Each Fund measures its performance against a broad-based securities market index (“benchmark index”). The benchmark index does not take into account fees, expenses, or taxes. A Fund’s past performance, before and after taxes, is not necessarily an indication of how the Fund will perform in the future.
The following table discloses the inception dates of each Fund and its respective share classes along with the Fund’s diversification status as of period end:
| | | | | | | | | | | | | | | | | | | | | | | | | | | | | | | | | | | | | | | | |
| Fund Name | | | | | Fund
Inception | | | Institutional
Class | | | Class P | | | Administrative
Class | | | Class D | | | Class A | | | Class C | | | Class R | | | Diversification
Status | |
PIMCO RAE Fundamental Emerging Markets Fund | | | | | | | 06/05/15 | | | | 06/05/15 | | | | 06/05/15 | | | | — | | | | — | | | | 06/05/15 | | | | 06/05/15 | | | | — | | | | Non-diversified | |
PIMCO RAE Fundamental Global Fund | | | | | | | 06/05/15 | | | | 06/05/15 | | | | 06/05/15 | | | | — | | | | — | | | | 06/05/15 | | | | 06/05/15 | | | | — | | | | Non-diversified | |
PIMCO RAE Fundamental Global ex-US Fund | | | | | | | 06/05/15 | | | | 06/05/15 | | | | 06/05/15 | | | | — | | | | — | | | | 06/05/15 | | | | 06/05/15 | | | | — | | | | Non-diversified | |
PIMCO RAE Fundamental International Fund | | | | | | | 06/05/15 | | | | 06/05/15 | | | | 06/05/15 | | | | — | | | | — | | | | 06/05/15 | | | | 06/05/15 | | | | — | | | | Non-diversified | |
PIMCO RAE Fundamental US Fund | | | | | | | 06/05/15 | | | | 06/05/15 | | | | 06/05/15 | | | | — | | | | — | | | | 06/05/15 | | | | 06/05/15 | | | | — | | | | Non-diversified | |
PIMCO RAE Fundamental US Small Fund | | | | | | | 06/05/15 | | | | 06/05/15 | | | | 06/05/15 | | | | — | | | | — | | | | 06/05/15 | | | | 06/05/15 | | | | — | | | | Non-diversified | |
An investment in a Fund is not a bank deposit and is not guaranteed or insured by the Federal Deposit Insurance Corporation (“FDIC”) or any other government agency. It is possible to lose money on investments in a Fund.
The Trustees are responsible generally for overseeing the management of the Trust. The Trustees authorize the Trust to enter into service agreements with the Adviser, the Distributor, the Administrator and other service providers in order to provide, and in some cases authorize service providers to procure through other parties, necessary or desirable services on behalf of the Trust and the Funds. Shareholders are not parties to or third-party beneficiaries of such service agreements. Neither a Fund’s prospectus nor a Fund’s summary
prospectus, the Trust’s Statement of Additional Information (“SAI”), any contracts filed as exhibits to the Trust’s registration statement, nor any other communications, disclosure documents or regulatory filings (including this report) from or on behalf of the Trust or a Fund creates a contract between or among any shareholder of a Fund, on the one hand, and the Trust, a Fund, a service provider to the Trust or a Fund, and/or the Trustees or officers of the Trust, on the other hand. The Trustees (or the Trust and its officers, service providers or other delegates acting under authority of the Trustees) may amend the most recent prospectus or use a new prospectus, summary prospectus or SAI with respect to a Fund or the Trust, and/or amend, file and/or issue any other communications, disclosure documents or regulatory filings, and may amend or enter into any contracts to which the Trust or a Fund is a
| | | | | | |
| | SEMIANNUAL REPORT | | DECEMBER 31, 2016 | | 5 |
Important Information About the Funds (Cont.)
party, and interpret the investment objective(s), policies, restrictions and contractual provisions applicable to any Fund, without shareholder
input or approval, except in circumstances in which shareholder approval is specifically required by law (such as changes to fundamental investment policies) or where a shareholder approval requirement is specifically disclosed in the Trust’s then-current prospectus or SAI.
PIMCO has adopted written proxy voting policies and procedures (“Proxy Policy”) as required by Rule 206(4)-6 under the Investment Advisers Act of 1940, as amended. The Proxy Policy has been adopted by PIMCO Equity Series as the policies and procedures that PIMCO will use when voting proxies on behalf of a Fund. A description of the policies and procedures that PIMCO uses to vote proxies relating to portfolio securities of a Fund, and information about how the Fund
voted proxies relating to portfolio securities held during the most recent twelve-month period ended June 30th, are available without charge, upon request, by calling the Trust at (888) 87-PIMCO, on the Fund’s website at www.pimco.com, and on the Securities and Exchange Commission’s (“SEC”) website at www.sec.gov.
PIMCO Equity Series files a complete schedule of each Fund’s portfolio holdings with the SEC for the first and third quarters of each fiscal year on Form N-Q. A copy of a Fund’s Form N-Q is available on the SEC’s website at www.sec.gov and may be reviewed and copied at the SEC’s Public Reference Room in Washington, D.C. A Fund’s Form N-Q will also be available without charge, upon request, by calling the Trust at (888) 87-PIMCO and on the Fund’s website at www.pimco.com. Information on the operation of the Public Reference Room may be obtained by calling 1-800-SEC-0330.
(THIS PAGE INTENTIONALLY LEFT BLANK)
| | | | | | |
| | SEMIANNUAL REPORT | | DECEMBER 31, 2016 | | 7 |
PIMCO RAE Fundamental Emerging Markets Fund
Cumulative Returns Through December 31, 2016
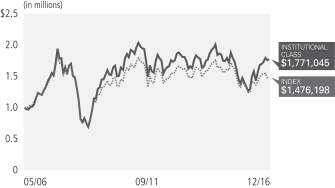
$1,000,000 invested at the end of the month when the Fund’s Institutional Class commenced operations.
Investment Objective and Strategy Overview
PIMCO RAE Fundamental Emerging Markets Fund seeks long-term capital appreciation by investing under normal circumstances at least 80% of its assets in investments that are economically tied to emerging market countries. Specifically, under normal circumstances, the Fund will obtain exposure to a portfolio of stocks economically tied to emerging market countries (“RAE Fundamental Emerging Markets Portfolio”). The stocks are selected by the Fund’s sub-adviser, Research Affiliates, LLC, from a broad universe of companies which satisfy certain liquidity and capacity requirements. Fund strategies may change from time to time. Please refer to the Fund’s current prospectus for more information regarding the Fund’s strategy.
| | | | | | | | | | | | | | | | | | | | | | |
| Average Annual Total Return for the period ended December 31, 2016§ | |
| | | | | 6 Months* | | | 1 Year | | | 5 Year | | | 10 Year | | | Fund Inception
(05/31/06) | |
 | | PIMCO RAE Fundamental Emerging Markets Fund Institutional Class | | | 13.98% | | | | 32.50% | | | | 2.64% | | | | 3.67% | | | | 5.55% | |
| | PIMCO RAE Fundamental Emerging Markets Fund Class P | | | 13.99% | | | | 32.40% | | | | 2.61% | | | | 3.65% | | | | 5.53% | |
| | PIMCO RAE Fundamental Emerging Markets Fund Class A | | | 13.77% | | | | 32.08% | | | | 2.55% | | | | 3.63% | | | | 5.51% | |
| | PIMCO RAE Fundamental Emerging Markets Fund Class A (adjusted) | | | 9.51% | | | | 27.18% | | | | 1.77% | | | | 3.23% | | | | 5.13% | |
| | PIMCO RAE Fundamental Emerging Markets Fund Class C | | | 13.35% | | | | 31.03% | | | | 2.29% | | | | 3.49% | | | | 5.38% | |
| | PIMCO RAE Fundamental Emerging Markets Fund Class C (adjusted) | | | 12.35% | | | | 30.03% | | | | 2.29% | | | | 3.49% | | | | 5.38% | |
 | | MSCI Emerging Markets Index± | | | 4.49% | | | | 11.19% | | | | 1.28% | | | | 1.84% | | | | 3.74% | |
All Fund returns are net of fees and expenses.
* Cumulative return.
± The MSCI Emerging Markets Index is a free float-adjusted market capitalization index that is designed to measure equity market performance of emerging markets.
It is not possible to invest directly in an unmanaged index.
§ For periods prior to June 5, 2015, the Fund’s performance reflects the performance when the Fund was a partnership, net of actual fees and expenses charged to individual partnership accounts in the aggregate. If the performance had been restated to reflect the applicable fees and expenses of each share class, the performance may have been higher or lower. The Fund began operations as a partnership on May 31, 2006 and, on June 5, 2015, was reorganized into a newly-formed fund that was registered as an investment company under the Investment Company Act of 1940. Prior to the reorganization, the Fund had an investment objective, investment strategies, investment guidelines, and restrictions that were substantially similar to those currently applicable to the Fund; however, the Fund was not registered as an investment company under the Investment Company Act of 1940 and was not subject to its requirements or requirements imposed by the Internal Revenue Code of 1986 which, if applicable, may have adversely affected its performance. The performance of each class of shares will differ as a result of the different levels of fees and expenses applicable to each class of shares.
Performance quoted represents past performance. Past performance is not a guarantee or a reliable indicator of future results. Current performance may be lower or higher than performance shown. Investment return and the principal value of an investment will fluctuate. Shares may be worth more or less than original cost when redeemed. Returns shown do not reflect the deduction of taxes that a shareholder would pay on fund distributions or the redemption of fund shares. Differences in the Fund’s performance versus the index and related attribution information with respect to particular categories of securities or individual positions may be attributable, in part, to differences in the pricing methodologies used by the Fund and the index. The adjusted returns take into account the maximum sales charge of 3.75% on Class A shares and 1.00% CDSC on Class C shares. For performance current to the most recent month-end, visit www.pimco.com or call (888) 87-PIMCO.
The Fund’s total annual operating expense ratio as stated in the Fund’s current prospectus, as supplemented, is 0.95% for the Institutional Class shares, 1.05% for the Class P shares, 1.30% for the Class A shares and 2.05% for the Class C shares. Details regarding any Fund’s operating expenses can be found in the Fund’s prospectus.
| | | | | | |
| Institutional Class - PEIFX | | Class P - PEPFX | | Class A - PEAFX | | Class C - PECFX |
Top 10 Holdings as of 12/31/20161§
| | | | | | | | |
Petroleo Brasileiro S.A. SP — ADR | | | | | | | 3.4% | |
Vale S.A. | | | | | | | 3.3% | |
Samsung Electronics Co. Ltd. | | | | | | | 3.2% | |
China Construction Bank Corp. ‘H’ | | | | | | | 3.1% | |
Gazprom PJSC SP — ADR | | | | | | | 2.7% | |
Lukoil PJSC SP — ADR | | | | | | | 2.6% | |
Itau Unibanco Holding S.A. SP — ADR ‘H’ | | | | | | | 2.2% | |
Industrial & Commercial Bank of China Ltd. ‘H’ | | | | | | | 1.9% | |
Banco do Brasil S.A. | | | | | | | 1.9% | |
Banco Bradesco S.A. ADR | | | | | | | 1.6% | |
Geographic Breakdown as of 12/31/20161§
| | | | | | | | |
Brazil | | | | | | | 22.6% | |
China | | | | | | | 15.9% | |
Russia | | | | | | | 14.0% | |
South Korea | | | | | | | 13.7% | |
South Africa | | | | | | | 7.5% | |
Taiwan | | | | | | | 7.2% | |
India | | | | | | | 5.4% | |
Hong Kong | | | | | | | 2.9% | |
Thailand | | | | | | | 2.6% | |
Poland | | | | | | | 2.5% | |
Indonesia | | | | | | | 1.5% | |
Mexico | | | | | | | 1.3% | |
Greece | | | | | | | 1.2% | |
Turkey | | | | | | | 1.1% | |
Other | | | | | | | 0.6% | |
1 % of Investments, at value.
§ Top 10 Holdings, Geographic Breakdown and % of Investments exclude securities sold short, financial derivative instruments and short-term instruments, if any.
Fund Insights
The following impacted performance during the reporting period:
| » | | Overweight exposure to and positioning in the metals & mining industry positively contributed to relative performance, as the industry outperformed the MSCI Emerging Markets Index. |
| » | | Overweight exposure to and positioning in the banking industry positively contributed to relative performance, as the industry outperformed the MSCI Emerging Markets Index. |
| » | | Overweight exposure to and positioning in the oil gas & consumable fuels industry positively contributed to relative performance, as the industry outperformed the MSCI Emerging Markets Index. |
| » | | Positioning in the electric utilities industry positively contributed to relative performance, as portfolio holdings in this industry outperformed the MSCI Emerging Markets Index. |
| » | | Underweight exposure to and positioning in the consumer staples sector positively contributed to relative performance, as the sector underperformed the MSCI Emerging Markets Index. |
| » | | Underweight exposure to and positioning in the industrials sector positively contributed to relative performance, as the sector underperformed the MSCI Emerging Markets Index. |
| » | | Underweight exposure to the information technology sector detracted from relative performance, as the sector outperformed the MSCI Emerging Markets Index. |
| | | | | | |
| | SEMIANNUAL REPORT | | DECEMBER 31, 2016 | | 9 |
PIMCO RAE Fundamental Global Fund
Cumulative Returns Through December 31, 2016

$1,000,000 invested at the end of the month when the Fund’s Institutional Class commenced operations.
Investment Objective and Strategy Overview
PIMCO RAE Fundamental Global Fund seeks long-term capital appreciation by investing under normal circumstances substantially all of its assets in (i) Institutional Class shares of the PIMCO RAE Fundamental US Fund (“US Fund”), the PIMCO RAE Fundamental International Fund (“International Fund”), and the PIMCO RAE Fundamental Emerging Markets Fund (“Emerging Markets Fund”) (together, the US Fund, the International Fund and the Emerging Markets Fund are referred to as the “Underlying Funds”) and (ii) equity securities that are eligible investments for the Underlying Funds. Under normal circumstances, each of the Underlying Funds obtains exposure to a portfolio of stocks (each, a “RAE Fundamental Portfolio”). The stocks are selected by the Fund’s sub-adviser, Research Affiliates, LLC, from a broad universe of companies which satisfy certain liquidity and capacity requirements. Fund strategies may change from time to time. Please refer to the Fund’s current prospectus for more information regarding the Fund’s strategy.
| | | | | | | | | | | | | | |
| Average Annual Total Return for the period ended December 31, 2016 | |
| | | | | 6 Months* | | | 1 Year | | | Fund Inception
(06/05/15) | |
| | PIMCO RAE Fundamental Global Fund Institutional Class | | | 9.62% | | | | 14.40% | | | | 2.12% | |
| | PIMCO RAE Fundamental Global Fund Class P | | | 9.49% | | | | 14.15% | | | | 1.94% | |
| | PIMCO RAE Fundamental Global Fund Class A | | | 9.40% | | | | 13.93% | | | | 1.76% | |
| | PIMCO RAE Fundamental Global Fund Class A (adjusted) | | | 5.31% | | | | 9.63% | | | | (0.68)% | |
| | PIMCO RAE Fundamental Global Fund Class C | | | 9.03% | | | | 13.08% | | | | 1.02% | |
| | PIMCO RAE Fundamental Global Fund Class C (adjusted) | | | 8.03% | | | | 12.08% | | | | 1.02% | |
| | MSCI All Country World Index± | | | 6.55% | | | | 7.86% | | | | 0.84% | |
All Fund returns are net of fees and expenses.
* Cumulative return.
± The MSCI All Country World Index is a free float-adjusted market capitalization weighted index that is designed to measure the equity market performance of developed and emerging markets. The Index consists of 46 country indices comprising 23 developed and 23 emerging market country indices.
It is not possible to invest directly in an unmanaged index.
Performance quoted represents past performance. Past performance is not a guarantee or a reliable indicator of future results. Current performance may be lower or higher than performance shown. Investment return and the principal value of an investment will fluctuate. Shares may be worth more or less than original cost when redeemed. Returns shown do not reflect the deduction of taxes that a shareholder would pay on fund distributions or the redemption of fund shares. Differences in the Fund’s performance versus the index and related attribution information with respect to particular categories of securities or individual positions may be attributable, in part, to differences in the pricing methodologies used by the Fund and the index. The adjusted returns take into account the maximum sales charge of 3.75% on Class A shares and 1.00% CDSC on Class C shares. For performance current to the most recent month-end, visit www.pimco.com or call (888) 87-PIMCO.
The Fund’s total annual operating expense ratio as stated in the Fund’s current prospectus, which includes the Acquired Fund Fees and Expenses (Underlying Fund Expenses), as supplemented, is 1.16% for the Institutional Class shares, 1.26% for the Class P shares, 1.51% for the Class A shares and 2.26% for the Class C shares. Details regarding any Fund’s operating expenses can be found in the Fund’s prospectus.
| | | | | | |
| Institutional Class - PFQIX | | Class P - PFQPX | | Class A - PFQAX | | Class C - PFQCX |
Top Holdings as of 12/31/20161§
| | | | | | | | |
PIMCO RAE Fundamental International Fund | | | | | | | 45.9% | |
PIMCO RAE Fundamental U.S. Fund | | | | | | | 41.2% | |
PIMCO RAE Fundamental Emerging Markets Fund | | | | | | | 12.9% | |
1 % of Investments, at value.
§ Top Holdings and % of Investments exclude securities sold short, financial derivative instruments and short-term instruments, if any.
Fund Insights
The following impacted performance during the reporting period:
| » | | Overweight exposure to and positioning in the financials sector positively contributed to relative performance, as the sector outperformed the MSCI All Country World Index. |
| » | | Overweight exposure to and positioning in the materials sector positively contributed to relative performance, as the sector outperformed the MSCI All Country World Index. |
| » | | Overweight exposure to and positioning in the oil gas & consumable fuels industry positively contributed to relative performance, as the industry outperformed the MSCI All Country World Index. |
| » | | Positioning in the industrials sector positively contributed to relative performance, as portfolio holdings outperformed the MSCI All Country World Index. |
| » | | Overweight exposure to and positioning in the telecommunication services sector detracted from relative performance, as the sector underperformed the MSCI All Country World Index. |
| » | | Positioning in the information technology sector detracted from relative performance, as portfolio holdings underperformed the MSCI All Country World Index. |
| | | | | | |
| | SEMIANNUAL REPORT | | DECEMBER 31, 2016 | | 11 |
PIMCO RAE Fundamental Global ex-US Fund
Cumulative Returns Through December 31, 2016
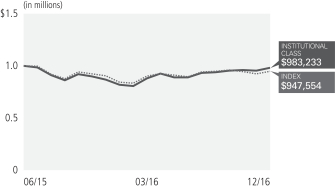
$1,000,000 invested at the end of the month when the Fund’s Institutional Class commenced operations.
Investment Objective and Strategy Overview
PIMCO RAE Fundamental Global ex-US Fund seeks long-term capital appreciation by investing under normal circumstances substantially all of its assets in (i) Institutional Class shares of the PIMCO RAE Fundamental International Fund (“International Fund”) and the PIMCO RAE Fundamental Emerging Markets Fund (“Emerging Markets Fund”) (together, the International Fund and the Emerging Markets Fund are referred to as the “Underlying Funds”), (ii) securities that are eligible investments for the Underlying Funds. Under normal circumstances, each of the Underlying Funds obtains exposure to a portfolio of stocks (each, a “RAE Fundamental Portfolio”). The stocks are selected by the Fund’s sub-adviser, Research Affiliates, LLC, from a broad universe of companies which satisfy certain liquidity and capacity requirements. Fund strategies may change from time to time. Please refer to the Fund’s current prospectus for more information regarding the Fund’s strategy.
| | | | | | | | | | | | | | |
| Average Annual Total Return for the period ended December 31, 2016 | |
| | | | | 6 Months* | | | 1 Year | | | Fund Inception
(06/05/15) | |
| | PIMCO RAE Fundamental Global ex-US Fund Institutional Class | | | 10.39% | | | | 12.99% | | | | (1.95)% | |
| | PIMCO RAE Fundamental Global ex-US Fund Class P | | | 10.38% | | | | 12.85% | | | | (2.06)% | |
| | PIMCO RAE Fundamental Global ex-US Fund Class A | | | 10.27% | | | | 12.61% | | | | (2.27)% | |
| | PIMCO RAE Fundamental Global ex-US Fund Class A (adjusted) | | | 6.10% | | | | 8.39% | | | | (4.62)% | |
| | PIMCO RAE Fundamental Global ex-US Fund Class C | | | 9.74% | | | | 11.69% | | | | (3.06)% | |
| | PIMCO RAE Fundamental Global ex-US Fund Class C (adjusted) | | | 8.74% | | | | 10.69% | | | | (3.06)% | |
| | MSCI All Country World ex US Index± | | | 5.57% | | | | 4.50% | | | | (4.05)% | |
All Fund returns are net of fees and expenses.
* Cumulative return.
± The MSCI All Country World ex US Index is a free float-adjusted market capitalization weighted index that is designed to measure the equity market performance of developed and emerging markets. The Index consists of 45 country indices comprising 22 developed and 23 emerging market country indices.
It is not possible to invest directly in an unmanaged index.
Performance quoted represents past performance. Past performance is not a guarantee or a reliable indicator of future results. Current performance may be lower or higher than performance shown. Investment return and the principal value of an investment will fluctuate. Shares may be worth more or less than original cost when redeemed. Returns shown do not reflect the deduction of taxes that a shareholder would pay on fund distributions or the redemption of fund shares. Differences in the Fund’s performance versus the index and related attribution information with respect to particular categories of securities or individual positions may be attributable, in part, to differences in the pricing methodologies used by the Fund and the index. The adjusted returns take into account the maximum sales charge of 3.75% on Class A shares and 1.00% CDSC on Class C shares. For performance current to the most recent month-end, visit www.pimco.com or call (888) 87-PIMCO.
The Fund’s total annual operating expense ratio as stated in the Fund’s current prospectus, which includes the Acquired Fund Fees and Expenses (Underlying Fund Expenses), as supplemented, is 1.31% for the Institutional Class shares, 1.41% for the Class P shares, 1.66% for the Class A shares and 2.41% for the Class C shares. Details regarding any Fund’s operating expenses can be found in the Fund’s prospectus.
| | | | | | |
| Institutional Class - PZRIX | | Class P - PZRPX | | Class A - PZRAX | | Class C - PZRCX |
Top Holdings as of 12/31/20161§
| | | | | | | | |
PIMCO RAE Fundamental International Fund | | | | | | | 78.0% | |
PIMCO RAE Fundamental Emerging Markets Fund | | | | | | | 22.0% | |
1 % of Investments, at value.
§ Top Holdings and % of Investments exclude securities sold short, financial derivative instruments and short-term instruments, if any.
Fund Insights
The following impacted performance during the reporting period:
| » | | Overweight exposure to and positioning in the banking industry positively contributed to relative performance, as the industry outperformed the MSCI All Country World ex-USA Index. |
| » | | Positioning in the industrials sector positively contributed to relative performance, as portfolio holdings outperformed the MSCI All Country World ex-USA Index. |
| » | | Positioning in the consumer discretionary sector positively contributed to relative performance, as portfolio holdings outperformed the MSCI All Country World ex-USA Index. |
| » | | Overweight exposure to and positioning in the telecommunication services sector detracted from relative performance, as the sector underperformed the MSCI All Country World ex-USA Index. |
| » | | Positioning in the consumer staples sector detracted from relative performance, as portfolio holdings underperformed the MSCI All Country World ex-USA Index. |
| » | | Positioning in the oil gas & consumable fuels industry detracted from relative performance, as portfolio holdings underperformed the MSCI All Country World ex-USA Index. |
| | | | | | |
| | SEMIANNUAL REPORT | | DECEMBER 31, 2016 | | 13 |
PIMCO RAE Fundamental International Fund
Cumulative Returns Through December 31, 2016
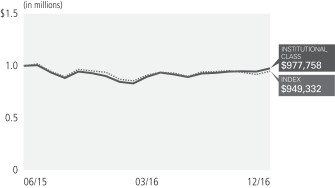
$1,000,000 invested at the end of the month when the Fund’s Institutional Class commenced operations.
Investment Objective and Strategy Overview
PIMCO RAE Fundamental International Fund seeks long-term capital appreciation by obtaining under normal circumstances exposure to a portfolio of stocks economically tied to at least three foreign (non-U.S.) countries (“RAE Fundamental International Portfolio”). The stocks are selected by the Fund’s sub-adviser, Research Affiliates, LLC, from a broad universe of companies which satisfy certain liquidity and capacity requirements. Fund strategies may change from time to time. Please refer to the Fund’s current prospectus for more information regarding the Fund’s strategy.
| | | | | | | | | | | | | | |
| Average Annual Total Return for the period ended December 31, 2016 | |
| | | | | 6 Months* | | | 1 Year | | | Fund Inception
(06/05/15) | |
| | PIMCO RAE Fundamental International Fund Institutional Class | | | 9.37% | | | | 8.23% | | | | (2.49)% | |
| | PIMCO RAE Fundamental International Fund Class P | | | 9.37% | | | | 8.11% | | | | (2.56)% | |
| | PIMCO RAE Fundamental International Fund Class A | | | 9.20% | | | | 7.81% | | | | (2.83)% | |
| | PIMCO RAE Fundamental International Fund Class A (adjusted) | | | 5.14% | | | | 3.74% | | | | (5.17)% | |
| | PIMCO RAE Fundamental International Fund Class C | | | 8.77% | | | | 7.00% | | | | (3.59)% | |
| | PIMCO RAE Fundamental International Fund Class C (adjusted) | | | 7.77% | | | | 6.00% | | | | (3.59)% | |
| | MSCI EAFE Index± | | | 5.67% | | | | 1.00% | | | | (3.95)% | |
All Fund returns are net of fees and expenses.
* Cumulative return.
± MSCI EAFE Index is an unmanaged index designed to represent the performance of large and mid-cap securities across 21 developed markets, including countries in Europe, Australasia and the Far East, excluding the U.S. and Canada. It is not possible to invest directly in the index.
It is not possible to invest directly in an unmanaged index.
Performance quoted represents past performance. Past performance is not a guarantee or a reliable indicator of future results. Current performance may be lower or higher than performance shown. Investment return and the principal value of an investment will fluctuate. Shares may be worth more or less than original cost when redeemed. Returns shown do not reflect the deduction of taxes that a shareholder would pay on fund distributions or the redemption of fund shares. Differences in the Fund’s performance versus the index and related attribution information with respect to particular categories of securities or individual positions may be attributable, in part, to differences in the pricing methodologies used by the Fund and the index. The adjusted returns take into account the maximum sales charge of 3.75% on Class A shares and 1.00% CDSC on Class C shares. For performance current to the most recent month-end, visit www.pimco.com or call (888) 87-PIMCO.
The Fund’s total annual operating expense ratio as stated in the Fund’s current prospectus, as supplemented, is 0.60% for the Institutional Class shares, 0.70% for the Class P shares, 0.95% for the Class A shares and 1.70% for the Class C shares. Details regarding any Fund’s operating expenses can be found in the Fund’s prospectus.
| | | | | | |
| Institutional Class - PPYIX | | Class P - PPYPX | | Class A - PPYAX | | Class C - PPYCX |
Top 10 Holdings as of 12/31/20161§
| | | | | | | | |
HSBC Holdings PLC | | | | | | | 2.3% | |
Royal Dutch Shell PLC ‘A’ | | | | | | | 2.1% | |
BP PLC | | | | | | | 1.6% | |
BHP Billiton Ltd. | | | | | | | 1.6% | |
Banco Santander S.A. | | | | | | | 1.5% | |
Total S.A. | | | | | | | 1.1% | |
Barclays PLC | | | | | | | 1.1% | |
BNP Paribas S.A. | | | | | | | 1.1% | |
Societe Generale S.A. | | | | | | | 1.0% | |
Eni SpA | | | | | | | 1.0% | |
Geographic Breakdown as of 12/31/20161§
| | | | | | | | |
Japan | | | | | | | 18.2% | |
United Kingdom | | | | | | | 15.9% | |
France | | | | | | | 11.7% | |
Canada | | | | | | | 10.6% | |
Germany | | | | | | | 9.6% | |
Australia | | | | | | | 6.8% | |
Switzerland | | | | | | | 5.5% | |
Netherlands | | | | | | | 4.4% | |
Spain | | | | | | | 3.8% | |
Italy | | | | | | | 3.2% | |
Sweden | | | | | | | 2.0% | |
Norway | | | | | | | 1.3% | |
Hong Kong | | | | | | | 1.0% | |
Other | | | | | | | 6.0% | |
1 % of Investments, at value.
§ Top 10 Holdings, Geographic Breakdown and % of Investments exclude securities sold short, financial derivative instruments and short-term instruments, if any.
Fund Insights
The following impacted performance during the reporting period:
| » | | Overweight exposure to and positioning in the banking industry positively contributed to relative performance, as the industry outperformed the MSCI EAFE Index. |
| » | | Overweight exposure to the metals & mining industry positively contributed to relative performance, as the industry outperformed the MSCI EAFE Index. |
| » | | Underweight exposure to the health care sector positively contributed to relative performance, as the sector underperformed the MSCI EAFE Index. |
| » | | Overweight exposure to the utilities sector detracted from relative performance, as the sector underperformed the MSCI EAFE Index. |
| » | | Overweight exposure to the telecommunications services sector detracted from relative performance, as the sector underperformed the MSCI EAFE Index. |
| | | | | | |
| | SEMIANNUAL REPORT | | DECEMBER 31, 2016 | | 15 |
PIMCO RAE Fundamental US Fund
Cumulative Returns Through December 31, 2016
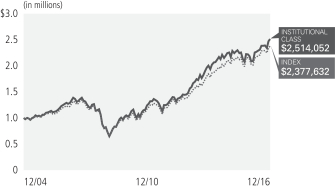
$1,000,000 invested at the end of the month when the Fund’s Institutional Class commenced operations.
Investment Objective and Strategy Overview
PIMCO RAE Fundamental US Fund seeks long-term capital appreciation by investing under normal circumstances at least 80% of its assets in securities of U.S. companies. Specifically, under normal circumstances, the Fund will obtain exposure to a portfolio of stocks of U.S. companies (“RAE Fundamental US Portfolio”). The stocks are selected by the Fund’s sub-adviser, Research Affiliates, LLC, from a broad universe of companies which satisfy certain liquidity and capacity requirements. Fund strategies may change from time to time. Please refer to the Fund’s current prospectus for more information regarding the Fund’s strategy.
| | | | | | | | | | | | | | | | | | | | | | |
| Average Annual Total Return for the period ended December 31, 2016§ | |
| | | | | 6 Months* | | | 1 Year | | | 5 Year | | | 10 Year | | | Fund Inception
(12/22/04) | |
| | PIMCO RAE Fundamental US Fund Institutional Class | | | 8.82% | | | | 15.41% | | | | 14.76% | | | | 7.08% | | | | 7.96% | |
| | PIMCO RAE Fundamental US Fund Class P | | | 8.74% | | | | 15.33% | | | | 14.73% | | | | 7.06% | | | | 7.95% | |
| | PIMCO RAE Fundamental US Fund Class A | | | 8.53% | | | | 14.87% | | | | 14.61% | | | | 7.01% | | | | 7.90% | |
| | PIMCO RAE Fundamental US Fund Class A (adjusted) | | | 4.48% | | | | 10.57% | | | | 13.74% | | | | 6.60% | | | | 7.56% | |
| | PIMCO RAE Fundamental US Fund Class C | | | 8.15% | | | | 14.14% | | | | 14.33% | | | | 6.88% | | | | 7.79% | |
| | PIMCO RAE Fundamental US Fund Class C (adjusted) | | | 7.15% | | | | 13.14% | | | | 14.33% | | | | 6.88% | | | | 7.79% | |
| | S&P 500 Index± | | | 7.82% | | | | 11.96% | | | | 14.66% | | | | 6.95% | | | | 7.48% | ¨ |
All Fund returns are net of fees and expenses.
* Cumulative return.
¨ Average annual total return since 12/31/2004.
± S&P 500 Index is an unmanaged market index generally considered representative of the stock market as a whole. The Index focuses on the large-cap segment of the U.S. equities market.
It is not possible to invest directly in an unmanaged index.
§ For periods prior to June 5, 2015, the Fund’s performance reflects the performance when the Fund was a partnership, net of actual fees and expenses charged to individual partnership accounts in the aggregate. If the performance had been restated to reflect the applicable fees and expenses of each share class, the performance may have been higher or lower. The Fund began operations as a partnership on December 22, 2004 and, on June 5, 2015, was reorganized into a newly-formed fund that was registered as an investment company under the Investment Company Act of 1940. Prior to the reorganization, the Fund had an investment objective, investment strategies, investment guidelines, and restrictions that were substantially similar to those currently applicable to the Fund; however, the Fund was not registered as an investment company under the Investment Company Act of 1940 and was not subject to its requirements or requirements imposed by the Internal Revenue Code of 1986 which, if applicable, may have adversely affected its performance. The performance of each class of shares will differ as a result of the different levels of fees and expenses applicable to each class of shares.
Performance quoted represents past performance. Past performance is not a guarantee or a reliable indicator of future results. Current performance may be lower or higher than performance shown. Investment return and the principal value of an investment will fluctuate. Shares may be worth more or less than original cost when redeemed. Returns shown do not reflect the deduction of taxes that a shareholder would pay on fund distributions or the redemption of fund shares. Differences in the Fund’s performance versus the index and related attribution information with respect to particular categories of securities or individual positions may be attributable, in part, to differences in the pricing methodologies used by the Fund and the index. The adjusted returns take into account the maximum sales charge of 3.75% on Class A shares and 1.00% CDSC on Class C shares. For performance current to the most recent month-end, visit www.pimco.com or call (888) 87-PIMCO.
The Fund’s total annual operating expense ratio as stated in the Fund’s current prospectus, as supplemented, is 0.50% for the Institutional Class shares, 0.60% for the Class P shares, 0.90% for the Class A shares and 1.65% for the Class C shares. Details regarding any Fund’s operating expenses can be found in the Fund’s prospectus.
| | | | | | |
| Institutional Class - PKAIX | | Class P - PKAPX | | Class A - PKAAX | | Class C - PKACX |
Top 10 Holdings as of 12/31/20161§
| | | | | | | | |
Exxon Mobil Corp. | | | | | | | 3.0% | |
AT&T, Inc. | | | | | | | 2.8% | |
Chevron Corp. | | | | | | | 2.6% | |
International Business Machines Corp. | | | | | | | 2.5% | |
Pfizer, Inc. | | | | | | | 2.2% | |
JPMorgan Chase & Co. | | | | | | | 1.9% | |
Apple, Inc. | | | | | | | 1.8% | |
Intel Corp. | | | | | | | 1.8% | |
Microsoft Corp. | | | | | | | 1.7% | |
General Electric Co. | | | | | | | 1.5% | |
Sector Breakdown as of 12/31/20161§
| | | | | | | | |
Information Technology | | | | | | | 18.5% | |
Financials | | | | | | | 14.1% | |
Energy | | | | | | | 13.3% | |
Consumer Discretionary | | | | | | | 10.8% | |
Health Care | | | | | | | 10.6% | |
Industrials | | | | | | | 9.2% | |
Consumer Staples | | | | | | | 8.1% | |
Utilities | | | | | | | 6.1% | |
Telecommunication Services | | | | | | | 4.7% | |
Materials | | | | | | | 4.1% | |
Other | | | | | | | 0.5% | |
1 % of Investments, at value.
§ Top 10 Holdings, Sector Breakdown and % of Investments exclude securities sold short, financial derivative instruments and short-term instruments, if any.
Fund Insights
The following impacted performance during the reporting period:
| » | | Underweight exposure and positioning in the information technology sector positively contributed to relative performance, as portfolio holdings outperformed the S&P 500 Index holdings. |
| » | | Overweight exposure to and positioning in the oil gas & consumable fuels industry contributed to relative performance, as portfolio holdings outperformed the S&P 500 Index holdings. |
| » | | Underweight exposure to the healthcare sector positively contributed to relative performance, as the sector underperformed the S&P 500 Index. |
| » | | Underweight exposure to the real estate sector positively contributed to relative performance, as the sector underperformed the S&P 500 Index. |
| » | | Overweight exposure and positioning in the diversified telecommunication services industry detracted from relative performance, as the industry underperformed the S&P 500 Index. |
| » | | Overweight exposure to the utilities sector detracted from relative performance, as the sector underperformed the S&P 500 Index. |
| | | | | | |
| | SEMIANNUAL REPORT | | DECEMBER 31, 2016 | | 17 |
PIMCO RAE Fundamental US Small Fund
Cumulative Returns Through December 31, 2016
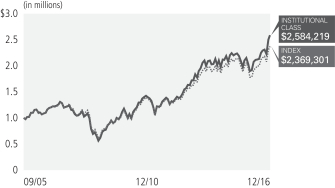
$1,000,000 invested at the end of the month when the Fund’s Institutional Class commenced operations.
Investment Objective and Strategy Overview
PIMCO RAE Fundamental US Small Fund seeks long-term capital appreciation by investing under normal circumstances at least 80% of its assets in securities of U.S. small companies. Specifically, under normal circumstances, the Fund will obtain exposure to a portfolio of stocks of U.S. small companies (“RAE Fundamental US Small Portfolio”). The stocks are selected by the Fund’s sub-adviser, Research Affiliates, LLC, from a broad universe of companies which satisfy certain liquidity and capacity requirements. Fund strategies may change from time to time. Please refer to the Fund’s current prospectus for more information regarding the Fund’s strategy.
| | | | | | | | | | | | | | | | | | | | | | |
Average Annual Total Return for the period ended December 31, 2016§ | |
| | | | | 6 Months* | | | 1 Year | | | 5 Year | | | 10 Year | | | Fund Inception
(09/29/05) | |
| | PIMCO RAE Fundamental US Small Fund Institutional Class | | | 21.13% | | | | 27.14% | | | | 16.09% | | | | 7.97% | | | | 8.83% | |
| | PIMCO RAE Fundamental US Small Fund Class P | | | 21.14% | | | | 27.02% | | | | 16.04% | | | | 7.95% | | | | 8.81% | |
| | PIMCO RAE Fundamental US Small Fund Class A | | | 20.97% | | | | 26.70% | | | | 15.93% | | | | 7.89% | | | | 8.76% | |
| | PIMCO RAE Fundamental US Small Fund Class A (adjusted) | | | 16.46% | | | | 21.89% | | | | 15.05% | | | | 7.48% | | | | 8.39% | |
| | PIMCO RAE Fundamental US Small Fund Class C | | | 20.47% | | | | 25.66% | | | | 15.67% | | | | 7.77% | | | | 8.65% | |
| | PIMCO RAE Fundamental US Small Fund Class C (adjusted) | | | 19.47% | | | | 24.66% | | | | 15.67% | | | | 7.77% | | | | 8.65% | |
| | Russell 2000® Index± | | | 18.68% | | | | 21.31% | | | | 14.46% | | | | 7.07% | | | | 7.96% ¨ | |
All Fund returns are net of fees and expenses.
* Cumulative return.
¨ Average annual total return since 9/30/2005
± Russell 2000® Index is composed of 2,000 of the smallest companies in the Russell 3000 Index and is considered to be representative of the small cap market in general.
It is not possible to invest directly in an unmanaged index.
§ For periods prior to June 5, 2015, the Fund’s performance reflects the performance when the Fund was a partnership, net of actual fees and expenses charged to individual partnership accounts in the aggregate. If the performance had been restated to reflect the applicable fees and expenses of each share class, the performance may have been higher or lower. The Fund began operations as a partnership on September 29, 2005 and, on June 5, 2015, was reorganized into a newly-formed fund that was registered as an investment company under the Investment Company Act of 1940. Prior to the reorganization, the Fund had an investment objective, investment strategies, investment guidelines, and restrictions that were substantially similar to those currently applicable to the Fund; however, the Fund was not registered as an investment company under the Investment Company Act of 1940 and was not subject to its requirements or requirements imposed by the Internal Revenue Code of 1986 which, if applicable, may have adversely affected its performance. The performance of each class of shares will differ as a result of the different levels of fees and expenses applicable to each class of shares.
Performance quoted represents past performance. Past performance is not a guarantee or a reliable indicator of future results. Current performance may be lower or higher than performance shown. Investment return and the principal value of an investment will fluctuate. Shares may be worth more or less than original cost when redeemed. Returns shown do not reflect the deduction of taxes that a shareholder would pay on fund distributions or the redemption of fund shares. Differences in the Fund’s performance versus the index and related attribution information with respect to particular categories of securities or individual positions may be attributable, in part, to differences in the pricing methodologies used by the Fund and the index. The adjusted returns take into account the maximum sales charge of 3.75% on Class A shares and 1.00% CDSC on Class C shares. For performance current to the most recent month-end, visit www.pimco.com or call (888) 87-PIMCO.
The Fund’s total annual operating expense ratio as stated in the Fund’s current prospectus, as supplemented, is 0.60% for the Institutional Class shares, 0.70% for the Class P shares, 1.00% for the Class A shares and 1.75% for the Class C shares. Details regarding any Fund’s operating expenses can be found in the Fund’s prospectus.
| | | | | | |
| Institutional Class - PMJIX | | Class P - PMJPX | | Class A - PMJAX | | Class C - PMJCX |
Top 10 Holdings as of 12/31/20161§
| | | | | | | | |
Unit Corp. | | | | | | | 0.5% | |
SkyWest, Inc. | | | | | | | 0.5% | |
Cliffs Natural Resources, Inc. | | | | | | | 0.4% | |
Tronox Ltd. ‘A’ | | | | | | | 0.4% | |
World Acceptance Corp. | | | | | | | 0.4% | |
PNM Resources, Inc. | | | | | | | 0.4% | |
American Equity Investment Life Holding Co. | | | | | | | 0.4% | |
Central Garden & Pet Co. ‘A’ | | | | | | | 0.4% | |
Unisys Corp. | | | | | | | 0.3% | |
DeVry Education Group, Inc. | | | | | | | 0.3% | |
Pier 1 Imports, Inc. | | | | | | | 0.3% | |
Sector Breakdown as of 12/31/20161§
| | | | | | | | |
Industrials | | | | | | | 19.1% | |
Financials | | | | | | | 17.5% | |
Consumer Discretionary | | | | | | | 16.6% | |
Information Technology | | | | | | | 13.6% | |
Materials | | | | | | | 6.9% | |
Energy | | | | | | | 6.5% | |
Real Estate | | | | | | | 6.3% | |
Health Care | | | | | | | 5.7% | |
Consumer Staples | | | | | | | 3.2% | |
Utilities | | | | | | | 2.9% | |
Telecommunication Services | | | | | | | 1.7% | |
1 % of Investments, at value.
§ Top 10 Holdings, Sector Breakdown and % of Investments exclude securities sold short, financial derivative instruments and short-term instruments, if any.
Fund Insights
The following impacted performance during the reporting period:
| » | | Positioning within the information technology sector positively contributed to relative performance, as portfolio holdings outperformed the Russell 2000 Index. |
| » | | Overweight exposure to and positioning in the industrials sector positively contributed to relative performance, as the sector and portfolio holdings outperformed the Russell 2000 Index. |
| » | | Underweight exposure to and positioning in the Equity Real Estate Investment Trusts industry positively contributed to relative performance, as the industry underperformed the Russell 2000 Index. |
| » | | Underweight exposure to the banking industry detracted from relative performance, as the industry outperformed the Russell 2000 Index. |
| » | | Overweight exposure to the telecommunication services sector detracted from relative performance, as the sector underperformed the Russell 2000 Index. |
| | | | | | |
| | SEMIANNUAL REPORT | | DECEMBER 31, 2016 | | 19 |
Expense Examples
Example
As a shareholder of a Fund, you incur two types of costs: (1) transaction costs, including sales charges (loads) on purchase payments and exchange fees and (2) ongoing costs, including management fees, distribution and/or service (12b-1) fees, and other Fund expenses. The Example is intended to help you understand your ongoing costs (in dollars) of investing in a Fund and to compare these costs with the ongoing costs of investing in other mutual funds.
The Example is based on an investment of $1,000 invested at the beginning of the period and held for the entire period indicated, which for all Funds and share classes is from July 1, 2016 to December 31, 2016 unless noted otherwise in the table and footnotes below.
Actual Expenses
The information in the table under the heading “Actual” provides information about actual account values and actual expenses. You may use the information in these columns, together with the amount you invested, to estimate the expenses that you paid over the period. Simply divide your account value by $1,000 (for example, an $8,600 account value divided by $1,000 = 8.60), then multiply the result by the number in the appropriate row for your share class, in the column entitled “Expenses Paid During Period” to estimate the expenses you paid on your account during this period.
Hypothetical Example for Comparison Purposes
The information in the table under the heading “Hypothetical (5% return before expenses)” provides information about hypothetical account values and hypothetical expenses based on a Fund’s actual expense ratio and an assumed rate of return of 5% per year before expenses, which is not the Fund’s actual return. The hypothetical account values and expenses may not be used to estimate the actual ending account balance or expenses you paid for the period. You may use this information to compare the ongoing costs of investing in a Fund and other funds. To do so, compare this 5% hypothetical example with the 5% hypothetical examples that appear in the shareholder reports of the other funds.
Please note that the expenses shown in the table are meant to highlight your ongoing costs only and do not reflect any transactional costs, such as sales charges (loads) on purchase payments and exchange fees. Therefore, the information under the heading “Hypothetical (5% return before expenses)” is useful in comparing ongoing costs only, and will not help you determine the relative total costs of owning different funds. In addition, if these transactional costs were included, your costs would have been higher.
Expense ratios may vary from period to period because of various factors such as an increase in expenses that are not covered by the management fees, such as fees and expenses of the independent trustees and their counsel, extraordinary expenses and interest expense.
| | | | | | | | | | | | | | | | | | | | | | | | | | | | | | | | | | | | | | | | |
| | | | | | Actual | | | | | | Hypothetical
(5% return before expenses) | | | | | | | |
| | | | | | Beginning
Account Value
(07/01/16) | | | Ending
Account Value
(12/31/16) | | | Expenses Paid
During Period* | | | | | | Beginning
Account Value
(07/01/16) | | | Ending
Account Value
(12/31/16) | | | Expenses Paid
During Period* | | | | | | Net Annualized
Expense Ratio** | |
PIMCO RAE Fundamental Emerging Markets Fund | | | | | | | | | | | | | | | | | | | | | | | | | | | | | | | | | | | | | | | | |
| Institutional Class | | | | | | $ | 1,000.00 | | | $ | 1,139.80 | | | $ | 4.09 | | | | | | | $ | 1,000.00 | | | $ | 1,021.66 | | | $ | 3.86 | | | | | | | | 0.75 | % |
| Class P | | | | | | | 1,000.00 | | | | 1,139.90 | | | | 4.63 | | | | | | | | 1,000.00 | | | | 1,021.15 | | | | 4.38 | | | | | | | | 0.85 | |
| Class A | | | | | | | 1,000.00 | | | | 1,137.70 | | | | 5.99 | | | | | | | | 1,000.00 | | | | 1,019.87 | | | | 5.66 | | | | | | | | 1.10 | |
| Class C | | | | | | | 1,000.00 | | | | 1,133.50 | | | | 10.06 | | | | | | | | 1,000.00 | | | | 1,016.05 | | | | 9.50 | | | | | | | | 1.85 | |
PIMCO RAE Fundamental Global Fund | | | | | | | | | | | | | | | | | | | | | | | | | | | | | | | | | | | | | | | | |
| Institutional Class | | | | | | $ | 1,000.00 | | | $ | 1,096.20 | | | $ | 0.11 | | | | | | | $ | 1,000.00 | | | $ | 1,025.38 | | | $ | 0.10 | | | | | | | | 0.02 | % |
| Class P | | | | | | | 1,000.00 | | | | 1,094.90 | | | | 0.64 | | | | | | | | 1,000.00 | | | | 1,024.87 | | | | 0.62 | | | | | | | | 0.12 | |
| Class A | | | | | | | 1,000.00 | | | | 1,094.00 | | | | 1.97 | | | | | | | | 1,000.00 | | | | 1,023.59 | | | | 1.91 | | | | | | | | 0.37 | |
| Class C | | | | | | | 1,000.00 | | | | 1,090.30 | | | | 5.97 | | | | | | | | 1,000.00 | | | | 1,019.77 | | | | 5.76 | | | | | | | | 1.12 | |
PIMCO RAE Fundamental Global ex-US Fund | | | | | | | | | | | | | | | | | | | | | | | | | | | | | | | | | | | | | | | | |
| Institutional Class | | | | | | $ | 1,000.00 | | | $ | 1,103.90 | | | $ | 0.00 | | | | | | | $ | 1,000.00 | | | $ | 1,025.48 | | | $ | 0.00 | | | | | | | | 0.00 | % |
| Class P | | | | | | | 1,000.00 | | | | 1,103.80 | | | | 0.54 | | | | | | | | 1,000.00 | | | | 1,024.97 | | | | 0.52 | | | | | | | | 0.10 | |
| Class A | | | | | | | 1,000.00 | | | | 1,102.70 | | | | 1.88 | | | | | | | | 1,000.00 | | | | 1,023.70 | | | | 1.80 | | | | | | | | 0.35 | |
| Class C | | | | | | | 1,000.00 | | | | 1,097.40 | | | | 5.88 | | | | | | | | 1,000.00 | | | | 1,019.87 | | | | 5.66 | | | | | | | | 1.10 | |
| | | | | | | | | | | | | | | | | | | | | | | | | | | | | | | | | | | | | | | | |
| | | | | | Actual | | | | | | Hypothetical
(5% return before expenses) | | | | | | | |
| | | | | | Beginning
Account Value
(07/01/16) | | | Ending
Account Value
(12/31/16) | | | Expenses Paid
During Period* | | | | | | Beginning
Account Value
(07/01/16) | | | Ending
Account Value
(12/31/16) | | | Expenses Paid
During Period* | | | | | | Net Annualized
Expense Ratio** | |
PIMCO RAE Fundamental International Fund | | | | | | | | | | | | | | | | | | | | | | | | | | | | | | | | | | | | | | | | |
| Institutional Class | | | | | | $ | 1,000.00 | | | $ | 1,093.70 | | | $ | 2.67 | | | | | | | $ | 1,000.00 | | | $ | 1,022.93 | | | $ | 2.58 | | | | | | | | 0.50 | % |
| Class P | | | | | | | 1,000.00 | | | | 1,093.70 | | | | 3.20 | | | | | | | | 1,000.00 | | | | 1,022.42 | | | | 3.09 | | | | | | | | 0.60 | |
| Class A | | | | | | | 1,000.00 | | | | 1,092.00 | | | | 4.53 | | | | | | | | 1,000.00 | | | | 1,021.15 | | | | 4.38 | | | | | | | | 0.85 | |
| Class C | | | | | | | 1,000.00 | | | | 1,087.70 | | | | 8.51 | | | | | | | | 1,000.00 | | | | 1,017.33 | | | | 8.22 | | | | | | | | 1.60 | |
PIMCO RAE Fundamental US Fund | | | | | | | | | | | | | | | | | | | | | | | | | | | | | | | | | | | | | | | | |
| Institutional Class | | | | | | $ | 1,000.00 | | | $ | 1,088.20 | | | $ | 2.13 | | | | | | | $ | 1,000.00 | | | $ | 1,023.44 | | | $ | 2.06 | | | | | | | | 0.40 | % |
| Class P | | | | | | | 1,000.00 | | | | 1,087.40 | | | | 2.66 | | | | | | | | 1,000.00 | | | | 1,022.93 | | | | 2.58 | | | | | | | | 0.50 | |
| Class A | | | | | | | 1,000.00 | | | | 1,085.30 | | | | 4.25 | | | | | | | | 1,000.00 | | | | 1,021.40 | | | | 4.12 | | | | | | | | 0.80 | |
| Class C | | | | | | | 1,000.00 | | | | 1,081.50 | | | | 8.22 | | | | | | | | 1,000.00 | | | | 1,017.58 | | | | 7.97 | | | | | | | | 1.55 | |
PIMCO RAE Fundamental US Small Fund | | | | | | | | | | | | | | | | | | | | | | | | | | | | | | | | | | | | | | | | |
| Institutional Class | | | | | | $ | 1,000.00 | | | $ | 1,211.30 | | | $ | 2.82 | | | | | | | $ | 1,000.00 | | | $ | 1,022.93 | | | $ | 2.58 | | | | | | | | 0.50 | % |
| Class P | | | | | | | 1,000.00 | | | | 1,211.40 | | | | 3.38 | | | | | | | | 1,000.00 | | | | 1,022.42 | | | | 3.09 | | | | | | | | 0.60 | |
| Class A | | | | | | | 1,000.00 | | | | 1,209.70 | | | | 5.07 | | | | | | | | 1,000.00 | | | | 1,020.89 | | | | 4.63 | | | | | | | | 0.90 | |
| Class C | | | | | | | 1,000.00 | | | | 1,204.70 | | | | 9.27 | | | | | | | | 1,000.00 | | | | 1,017.07 | | | | 8.48 | | | | | | | | 1.65 | |
* Expenses Paid During Period are equal to the net annualized expense ratio for the class, multiplied by the average account value over the period, multiplied by 186/365 (to reflect the one-half year period).
** Net Annualized Expense Ratio is reflective of any applicable contractual fee waivers and/or expense reimbursements or voluntary fee waivers. Details regarding fee waivers can be found in Note 7 in the Notes to Financial Statements.
| | | | | | |
| | SEMIANNUAL REPORT | | DECEMBER 31, 2016 | | 21 |
Financial Highlights
| | | | | | | | | | | | | | | | | | | | | | | | | | | | | | | | | | | | |
| | | | | | Investment Operations | | | | | | Less Distributions(b) | |
| | | | | | | | | | | | | | | | | | | | | | | | | | | | |
| Selected Per Share Data for the Year or Period Ended: | | Net Asset Value
Beginning of
Year or
Period | | | Net Investment
Income (Loss)(a) | | | Net Realized/
Unrealized
Gain (Loss) | | | Total | | | | | | From Net
Investment
Income | | | From Net
Realized
Capital Gains | | | Tax Basis
Return of
Capital | | | Total | |
| | | | | | | | | |
PIMCO RAE Fundamental Emerging Markets Fund | | | | | | | | | | | | | | | | | | | | | | | | | | | | | | | | | | | | |
| Institutional Class | | | | | | | | | | | | | | | | | | | | | | | | | | | | | | | | | | | | |
07/01/2016 - 12/31/2016+ | | $ | 8.73 | | | $ | 0.10 | | | $ | 1.12 | | | $ | 1.22 | | | | | | | $ | (0.27 | ) | | $ | 0.00 | | | $ | 0.00 | | | $ | (0.27 | ) |
06/30/2016 | | | 9.95 | | | | 0.32 | | | | (1.37 | ) | | | (1.05 | ) | | | | | | | (0.17 | ) | | | 0.00 | | | | 0.00 | | | | (0.17 | ) |
06/05/2015 - 06/30/2015 | | | 10.00 | | | | 0.06 | | | | (0.11 | ) | | | (0.05 | ) | | | | | | | 0.00 | | | | 0.00 | | | | 0.00 | | | | 0.00 | |
| Class P | | | | | | | | | | | | | | | | | | | | | | | | | | | | | | | | | | | | |
07/01/2016 - 12/31/2016+ | | | 8.70 | | | | 0.08 | | | | 1.13 | | | | 1.21 | | | | | | | | (0.26 | ) | | | 0.00 | | | | 0.00 | | | | (0.26 | ) |
06/30/2016 | | | 9.96 | | | | 0.25 | | | | (1.33 | ) | | | (1.08 | ) | | | | | | | (0.18 | ) | | | 0.00 | | | | 0.00 | | | | (0.18 | ) |
06/05/2015 - 06/30/2015 | | | 10.00 | | | | 0.06 | | | | (0.10 | ) | | | (0.04 | ) | | | | | | | 0.00 | | | | 0.00 | | | | 0.00 | | | | 0.00 | |
| Class A | | | | | | | | | | | | | | | | | | | | | | | | | | | | | | | | | | | | |
07/01/2016 - 12/31/2016+ | | | 8.73 | | | | 0.06 | | | | 1.14 | | | | 1.20 | | | | | | | | (0.25 | ) | | | 0.00 | | | | 0.00 | | | | (0.25 | ) |
06/30/2016 | | | 9.96 | | | | 0.22 | | | | (1.30 | ) | | | (1.08 | ) | | | | | | | (0.15 | ) | | | 0.00 | | | | 0.00 | | | | (0.15 | ) |
06/05/2015 - 06/30/2015 | | | 10.00 | | | | 0.08 | | | | (0.12 | ) | | | (0.04 | ) | | | | | | | 0.00 | | | | 0.00 | | | | 0.00 | | | | 0.00 | |
| Class C | | | | | | | | | | | | | | | | | | | | | | | | | | | | | | | | | | | | |
07/01/2016 - 12/31/2016+ | | | 8.67 | | | | 0.04 | | | | 1.12 | | | | 1.16 | | | | | | | | (0.25 | ) | | | 0.00 | | | | 0.00 | | | | (0.25 | ) |
06/30/2016 | | | 9.95 | | | | 0.21 | | | | (1.36 | ) | | | (1.15 | ) | | | | | | | (0.13 | ) | | | 0.00 | | | | 0.00 | | | | (0.13 | ) |
06/05/2015 - 06/30/2015 | | | 10.00 | | | | 0.06 | | | | (0.11 | ) | | | (0.05 | ) | | | | | | | 0.00 | | | | 0.00 | | | | 0.00 | | | | 0.00 | |
| | | | | | | | | |
PIMCO RAE Fundamental Global Fund | | | | | | | | | | | | | | | | | | | | | | | | | | | | | | | | | | | | |
| Institutional Class | | | | | | | | | | | | | | | | | | | | | | | | | | | | | | | | | | | | |
07/01/2016 - 12/31/2016+ | | $ | 9.32 | | | $ | 0.25 | | | $ | 0.64 | | | $ | 0.89 | | | | | | | $ | (0.24 | ) | | $ | (0.09 | ) | | $ | 0.00 | | | $ | (0.33 | ) |
06/30/2016 | | | 9.86 | | | | 0.14 | | | | (0.58 | ) | | | (0.44 | ) | | | | | | | (0.10 | ) | | | 0.00 | | | | 0.00 | | | | (0.10 | ) |
06/05/2015 - 06/30/2015 | | | 10.00 | | | | (0.00 | )^ | | | (0.14 | ) | | | (0.14 | ) | | | | | | | 0.00 | | | | 0.00 | | | | 0.00 | | | | 0.00 | |
| Class P | | | | | | | | | | | | | | | | | | | | | | | | | | | | | | | | | | | | |
07/01/2016 - 12/31/2016+ | | | 9.31 | | | | 0.42 | | | | 0.46 | | | | 0.88 | | | | | | | | (0.24 | ) | | | (0.09 | ) | | | 0.00 | | | | (0.33 | ) |
06/30/2016 | | | 9.85 | | | | 0.08 | | | | (0.52 | ) | | | (0.44 | ) | | | | | | | (0.10 | ) | | | 0.00 | | | | 0.00 | | | | (0.10 | ) |
06/05/2015 - 06/30/2015 | | | 10.00 | | | | (0.00 | )^ | | | (0.15 | ) | | | (0.15 | ) | | | | | | | 0.00 | | | | 0.00 | | | | 0.00 | | | | 0.00 | |
| Class A | | | | | | | | | | | | | | | | | | | | | | | | | | | | | | | | | | | | |
07/01/2016 - 12/31/2016+ | | | 9.29 | | | | 0.27 | | | | 0.60 | | | | 0.87 | | | | | | | | (0.23 | ) | | | (0.09 | ) | | | 0.00 | | | | (0.32 | ) |
06/30/2016 | | | 9.85 | | | | 0.02 | | | | (0.48 | ) | | | (0.46 | ) | | | | | | | (0.10 | ) | | | 0.00 | | | | 0.00 | | | | (0.10 | ) |
06/05/2015 - 06/30/2015 | | | 10.00 | | | | (0.00 | )^ | | | (0.15 | ) | | | (0.15 | ) | | | | | | | 0.00 | | | | 0.00 | | | | 0.00 | | | | 0.00 | |
| Class C | | | | | | | | | | | | | | | | | | | | | | | | | | | | | | | | | | | | |
07/01/2016 - 12/31/2016+ | | | 9.22 | | | | 0.22 | | | | 0.61 | | | | 0.83 | | | | | | | | (0.20 | ) | | | (0.09 | ) | | | 0.00 | | | | (0.29 | ) |
06/30/2016 | | | 9.84 | | | | (0.00 | ) | | | (0.52 | ) | | | (0.52 | ) | | | | | | | (0.10 | ) | | | 0.00 | | | | 0.00 | | | | (0.10 | ) |
06/05/2015 - 06/30/2015 | | | 10.00 | | | | (0.01 | ) | | | (0.15 | ) | | | (0.16 | ) | | | | | | | 0.00 | | | | 0.00 | | | | 0.00 | | | | 0.00 | |
| | | | | | | | | |
PIMCO RAE Fundamental Global ex-US Fund | | | | | | | | | | | | | | | | | | | | | | | | | | | | | | | | | | | | |
| Institutional Class | | | | | | | | | | | | | | | | | | | | | | | | | | | | | | | | | | | | |
07/01/2016 - 12/31/2016+ | | $ | 8.68 | | | $ | 0.22 | | | $ | 0.68 | | | $ | 0.90 | | | | | | | $ | (0.24 | ) | | $ | 0.00 | | | $ | 0.00 | | | $ | (0.24 | ) |
06/30/2016 | | | 9.86 | | | | 0.10 | | | | (1.18 | ) | | | (1.08 | ) | | | | | | | (0.10 | ) | | | 0.00 | | | | (0.00 | )^ | | | (0.10 | ) |
06/05/2015 - 06/30/2015 | | | 10.00 | | | | (0.00 | )^ | | | (0.14 | ) | | | (0.14 | ) | | | | | | | 0.00 | | | | 0.00 | | | | 0.00 | | | | 0.00 | |
| Class P | | | | | | | | | | | | | | | | | | | | | | | | | | | | | | | | | | | | |
07/01/2016 - 12/31/2016+ | | | 8.67 | | | | 0.63 | | | | 0.27 | | | | 0.90 | | | | | | | | (0.24 | ) | | | 0.00 | | | | 0.00 | | | | (0.24 | ) |
06/30/2016 | | | 9.86 | | | | 0.09 | | | | (1.18 | ) | | | (1.09 | ) | | | | | | | (0.10 | ) | | | 0.00 | | | | (0.00 | )^ | | | (0.10 | ) |
06/05/2015 - 06/30/2015 | | | 10.00 | | | | (0.00 | )^ | | | (0.14 | ) | | | (0.14 | ) | | | | | | | 0.00 | | | | 0.00 | | | | 0.00 | | | | 0.00 | |
| Class A | | | | | | | | | | | | | | | | | | | | | | | | | | | | | | | | | | | | |
07/01/2016 - 12/31/2016+ | | | 8.66 | | | | 1.23 | | | | (0.34 | ) | | | 0.89 | | | | | | | | (0.24 | ) | | | 0.00 | | | | 0.00 | | | | (0.24 | ) |
06/30/2016 | | | 9.86 | | | | (0.00 | ) | | | (1.11 | ) | | | (1.11 | ) | | | | | | | (0.09 | ) | | | 0.00 | | | | (0.00 | )^ | | | (0.09 | ) |
06/05/2015 - 06/30/2015 | | | 10.00 | | | | (0.00 | )^ | | | (0.14 | ) | | | (0.14 | ) | | | | | | | 0.00 | | | | 0.00 | | | | 0.00 | | | | 0.00 | |
| Class C | | | | | | | | | | | | | | | | | | | | | | | | | | | | | | | | | | | | |
07/01/2016 - 12/31/2016+ | | | 8.61 | | | | 0.21 | | | | 0.63 | | | | 0.84 | | | | | | | | (0.20 | ) | | | 0.00 | | | | 0.00 | | | | (0.20 | ) |
06/30/2016 | | | 9.85 | | | | (0.06 | ) | | | (1.11 | ) | | | (1.17 | ) | | | | | | | (0.07 | ) | | | 0.00 | | | | (0.00 | )^ | | | (0.07 | ) |
06/05/2015 - 06/30/2015 | | | 10.00 | | | | (0.01 | ) | | | (0.14 | ) | | | (0.15 | ) | | | | | | | 0.00 | | | | 0.00 | | | | 0.00 | | | | 0.00 | |
| | | | | | | | | |
PIMCO RAE Fundamental International Fund | | | | | | | | | | | | | | | | | | | | | | | | | | | | | | | | | | | | |
| Institutional Class | | | | | | | | | | | | | | | | | | | | | | | | | | | | | | | | | | | | |
07/01/2016 - 12/31/2016+ | | $ | 8.56 | | | $ | 0.09 | | | $ | 0.71 | | | $ | 0.80 | | | | | | | $ | (0.21 | ) | | $ | 0.00 | | | $ | 0.00 | | | $ | (0.21 | ) |
06/30/2016 | | | 9.83 | | | | 0.28 | | | | (1.32 | ) | | | (1.04 | ) | | | | | | | (0.08 | ) | | | (0.15 | ) | | | 0.00 | | | | (0.23 | ) |
06/05/2015 - 06/30/2015 | | | 10.00 | | | | 0.02 | | | | (0.19 | ) | | | (0.17 | ) | | | | | | | 0.00 | | | | 0.00 | | | | 0.00 | | | | 0.00 | |
| | | | | | | | |
| 22 | | PIMCO EQUITY SERIES | | | | | See Accompanying Notes | |
| | | | | | | | | | | | | | | | | | | | | | | | | | |
| | | | | | | Ratios/Supplemental Data | | | | |
| | | | | | | | | | Ratios to Average Net Assets | | | | |
Net Asset
Value End of
Year or
Period | | | Total Return | | | Net Assets
End of Year or
Period (000s) | | | Expenses | | | Expenses
Excluding
Waivers | | | Net
Investment
Income (Loss) | | | Portfolio
Turnover
Rate | |
| | | | | | |
| | | | | | | | | | | | | | | | | | | | | | | | | | |
| | | | | | | | | | | | | | | | | | | | | | | | | | |
| $ | 9.68 | | | | 13.98 | % | | $ | 1,495,546 | | | | 0.75 | %* | | | 0.96 | %* | | | 2.09 | %* | | | 18 | % |
| | 8.73 | | | | (10.32 | ) | | | 1,379,204 | | | | 0.76 | | | | 0.96 | | | | 3.92 | | | | 30 | |
| | 9.95 | | | | (0.50 | ) | | | 199,378 | | | | 0.75 | * | | | 0.98 | * | | | 10.11 | * | | | 7 | |
| | | | | | | | | | | | | | | | | | | | | | | | | | |
| | 9.65 | | | | 13.99 | | | | 3,278 | | | | 0.85 | * | | | 1.06 | * | | | 1.63 | * | | | 18 | |
| | 8.70 | | | | (10.54 | ) | | | 1,827 | | | | 0.86 | | | | 1.06 | | | | 3.25 | | | | 30 | |
| | 9.96 | | | | (0.40 | ) | | | 10 | | | | 0.85 | * | | | 1.08 | * | | | 10.09 | * | | | 7 | |
| | | | | | | | | | | | | | | | | | | | | | | | | | |
| | 9.68 | | | | 13.77 | | | | 1,516 | | | | 1.10 | * | | | 1.31 | * | | | 1.21 | * | | | 18 | |
| | 8.73 | | | | (10.61 | ) | | | 146 | | | | 1.11 | | | | 1.31 | | | | 2.64 | | | | 30 | |
| | 9.96 | | | | (0.40 | ) | | | 19 | | | | 1.10 | * | | | 1.33 | * | | | 13.46 | * | | | 7 | |
| | | | | | | | | | | | | | | | | | | | | | | | | | |
| | 9.58 | | | | 13.35 | | | | 361 | | | | 1.85 | * | | | 2.06 | * | | | 0.79 | * | | | 18 | |
| | 8.67 | | | | (11.33 | ) | | | 95 | | | | 1.86 | | | | 2.06 | | | | 2.56 | | | | 30 | |
| | 9.95 | | | | (0.50 | ) | | | 10 | | | | 1.85 | * | | | 2.08 | * | | | 9.08 | * | | | 7 | |
| | | | | | |
| | | | | | | | | | | | | | | | | | | | | | | | | | |
| | | | | | | | | | | | | | | | | | | | | | | | | | |
| $ | 9.88 | | | | 9.62 | % | | $ | 381,930 | | | | 0.02 | %* | | | 0.71 | %* | | | 5.01 | %* | | | 12 | % |
| | 9.32 | | | | (4.38 | ) | | | 282,274 | | | | 0.04 | | | | 0.71 | | | | 1.59 | | | | 13 | |
| | 9.86 | | | | (1.40 | ) | | | 38,160 | | | | 0.04 | * | | | 0.86 | * | | | (0.04 | )* | | | 2 | |
| | | | | | | | | | | | | | | | | | | | | | | | | | |
| | 9.86 | | | | 9.49 | | | | 158 | | | | 0.12 | * | | | 0.81 | * | | | 8.46 | * | | | 12 | |
| | 9.31 | | | | (4.44 | ) | | | 57 | | | | 0.14 | | | | 0.81 | | | | 0.92 | | | | 13 | |
| | 9.85 | | | | (1.50 | ) | | | 10 | | | | 0.14 | * | | | 0.96 | * | | | (0.14 | )* | | | 2 | |
| | | | | | | | | | | | | | | | | | | | | | | | | | |
| | 9.84 | | | | 9.40 | | | | 504 | | | | 0.37 | * | | | 1.06 | * | | | 5.45 | * | | | 12 | |
| | 9.29 | | | | (4.61 | ) | | | 286 | | | | 0.39 | | | | 1.06 | | | | 0.23 | | | | 13 | |
| | 9.85 | | | | (1.50 | ) | | | 10 | | | | 0.39 | * | | | 1.21 | * | | | (0.40 | )* | | | 2 | |
| | | | | | | | | | | | | | | | | | | | | | | | | | |
| | 9.76 | | | | 9.03 | | | | 1,067 | | | | 1.12 | * | | | 1.81 | * | | | 4.45 | * | | | 12 | |
| | 9.22 | | | | (5.29 | ) | | | 667 | | | | 1.14 | | | | 1.81 | | | | (0.04 | ) | | | 13 | |
| | 9.84 | | | | (1.60 | ) | | | 17 | | | | 1.14 | * | | | 1.96 | * | | | (1.06 | )* | | | 2 | |
| | | | | | |
| | | | | | | | | | | | | | | | | | | | | | | | | | |
| | | | | | | | | | | | | | | | | | | | | | | | | | |
| $ | 9.34 | | | | 10.39 | % | | $ | 67,631 | | | | 0.00 | %*† | | | 0.76 | %* | | | 4.75 | %* | | | 5 | % |
| | 8.68 | | | | (10.93 | ) | | | 62,809 | | | | 0.00 | † | | | 0.76 | | | | 1.10 | | | | 8 | |
| | 9.86 | | | | (1.40 | ) | | | 70,077 | | | | 0.01 | * | | | 0.84 | * | | | (0.02 | )* | | | 2 | |
| | | | | | | | | | | | | | | | | | | | | | | | | | |
| | 9.33 | | | | 10.38 | | | | 38 | | | | 0.10 | * | | | 0.86 | * | | | 13.22 | * | | | 5 | |
| | 8.67 | | | | (11.07 | ) | | | 9 | | | | 0.10 | | | | 0.86 | | | | 1.01 | | | | 8 | |
| | 9.86 | | | | (1.40 | ) | | | 10 | | | | 0.11 | * | | | 0.94 | * | | | (0.11 | )* | | | 2 | |
| | | | | | | | | | | | | | | | | | | | | | | | | | |
| | 9.31 | | | | 10.27 | | | | 187 | | | | 0.35 | * | | | 1.11 | * | | | 25.99 | * | | | 5 | |
| | 8.66 | | | | (11.29 | ) | | | 9 | | | | 0.35 | | | | 1.11 | | | | (0.02 | ) | | | 8 | |
| | 9.86 | | | | (1.40 | ) | | | 10 | | | | 0.36 | * | | | 1.19 | * | | | (0.37 | )* | | | 2 | |
| | | | | | | | | | | | | | | | | | | | | | | | | | |
| | 9.25 | | | | 9.74 | | | | 560 | | | | 1.10 | * | | | 1.86 | * | | | 4.40 | * | | | 5 | |
| | 8.61 | | | | (11.90 | ) | | | 354 | | | | 1.10 | | | | 1.86 | | | | (0.67 | ) | | | 8 | |
| | 9.85 | | | | (1.50 | ) | | | 10 | | | | 1.11 | * | | | 1.94 | * | | | (1.12 | )* | | | 2 | |
| | | | | | |
| | | | | | | | | | | | | | | | | | | | | | | | | | |
| | | | | | | | | | | | | | | | | | | | | | | | | | |
| $ | 9.15 | | | | 9.37 | % | | $ | 329,255 | | | | 0.50 | %* | | | 0.61 | %* | | | 1.99 | %* | | | 9 | % |
| | 8.56 | | | | (10.60 | ) | | | 247,182 | | | | 0.50 | | | | 0.61 | | | | 3.25 | | | | 39 | |
| | 9.83 | | | | (1.70 | ) | | | 151,532 | | | | 0.50 | * | | | 0.64 | * | | | 2.68 | * | | | 7 | |
| | | | | | |
| | SEMIANNUAL REPORT | | DECEMBER 31, 2016 | | 23 |
Financial Highlights (Cont.)
| | | | | | | | | | | | | | | | | | | | | | | | | | | | | | | | | | | | |
| | | | | | Investment Operations | | | | | | Less Distributions(b) | |
| | | | | | | | | | | | | | | | | | | | | | | | | | | | |
| Selected Per Share Data for the Year or Period Ended: | | Net Asset Value
Beginning of
Year or
Period | | | Net Investment
Income (Loss)(a) | | | Net Realized/
Unrealized
Gain (Loss) | | | Total | | | | | | From Net
Investment
Income | | | From Net
Realized
Capital Gains | | | Tax Basis
Return of
Capital | | | Total | |
| | | | | | | | | |
PIMCO RAE Fundamental International Fund (Cont.) | | | | | | | | | | | | | | | | | | | | | | | | | | | | | | | | | | | | |
| Class P | | | | | | | | | | | | | | | | | | | | | | | | | | | | | | | | | | | | |
07/01/2016 - 12/31/2016+ | | $ | 8.55 | | | $ | 0.09 | | | $ | 0.71 | | | $ | 0.80 | | | | | | | $ | (0.22 | ) | | $ | 0.00 | | | $ | 0.00 | | | $ | (0.22 | ) |
06/30/2016 | | | 9.83 | | | | 0.28 | | | | (1.33 | ) | | | (1.05 | ) | | | | | | | (0.08 | ) | | | (0.15 | ) | | | 0.00 | | | | (0.23 | ) |
06/05/2015 - 06/30/2015 | | | 10.00 | | | | 0.02 | | | | (0.19 | ) | | | (0.17 | ) | | | | | | | 0.00 | | | | 0.00 | | | | 0.00 | | | | 0.00 | |
| Class A | | | | | | | | | | | | | | | | | | | | | | | | | | | | | | | | | | | | |
07/01/2016 - 12/31/2016+ | | | 8.55 | | | | 0.08 | | | | 0.71 | | | | 0.79 | | | | | | | | (0.20 | ) | | | 0.00 | | | | 0.00 | | | | (0.20 | ) |
06/30/2016 | | | 9.83 | | | | 0.34 | | | | (1.42 | ) | | | (1.08 | ) | | | | | | | (0.05 | ) | | | (0.15 | ) | | | 0.00 | | | | (0.20 | ) |
06/05/2015 - 06/30/2015 | | | 10.00 | | | | 0.01 | | | | (0.18 | ) | | | (0.17 | ) | | | | | | | 0.00 | | | | 0.00 | | | | 0.00 | | | | 0.00 | |
| Class C | | | | | | | | | | | | | | | | | | | | | | | | | | | | | | | | | | | | |
07/01/2016 - 12/31/2016+ | | | 8.45 | | | | 0.04 | | | | 0.70 | | | | 0.74 | | | | | | | | (0.17 | ) | | | 0.00 | | | | 0.00 | | | | (0.17 | ) |
06/30/2016 | | | 9.83 | | | | 0.28 | | | | (1.43 | ) | | | (1.15 | ) | | | | | | | (0.08 | ) | | | (0.15 | ) | | | 0.00 | | | | (0.23 | ) |
06/05/2015 - 06/30/2015 | | | 10.00 | | | | 0.01 | | | | (0.18 | ) | | | (0.17 | ) | | | | | | | 0.00 | | | | 0.00 | | | | 0.00 | | | | 0.00 | |
| | | | | | | | | |
PIMCO RAE Fundamental US Fund | | | | | | | | | | | | | | | | | | | | | | | | | | | | | | | | | | | | |
| Institutional Class | | | | | | | | | | | | | | | | | | | | | | | | | | | | | | | | | | | | |
07/01/2016 - 12/31/2016+ | | $ | 9.82 | | | $ | 0.11 | | | $ | 0.76 | | | $ | 0.87 | | | | | | | $ | (0.22 | ) | | $ | (0.32 | ) | | $ | 0.00 | | | $ | (0.54 | ) |
06/30/2016 | | | 9.85 | | | | 0.22 | | | | 0.08 | | | | 0.30 | | | | | | | | (0.11 | ) | | | (0.22 | ) | | | 0.00 | | | | (0.33 | ) |
06/05/2015 - 06/30/2015 | | | 10.00 | | | | 0.01 | | | | (0.16 | ) | | | (0.15 | ) | | | | | | | 0.00 | | | | 0.00 | | | | 0.00 | | | | 0.00 | |
| Class P | | | | | | | | | | | | | | | | | | | | | | | | | | | | | | | | | | | | |
07/01/2016 - 12/31/2016+ | | | 9.81 | | | | 0.11 | | | | 0.75 | | | | 0.86 | | | | | | | | (0.22 | ) | | | (0.32 | ) | | | 0.00 | | | | (0.54 | ) |
06/30/2016 | | | 9.85 | | | | 0.21 | | | | 0.08 | | | | 0.29 | | | | | | | | (0.11 | ) | | | (0.22 | ) | | | 0.00 | | | | (0.33 | ) |
06/05/2015 - 06/30/2015 | | | 10.00 | | | | 0.01 | | | | (0.16 | ) | | | (0.15 | ) | | | | | | | 0.00 | | | | 0.00 | | | | 0.00 | | | | 0.00 | |
| Class A | | | | | | | | | | | | | | | | | | | | | | | | | | | | | | | | | | | | |
07/01/2016 - 12/31/2016+ | | | 9.79 | | | | 0.09 | | | | 0.75 | | | | 0.84 | | | | | | | | (0.21 | ) | | | (0.32 | ) | | | 0.00 | | | | (0.53 | ) |
06/30/2016 | | | 9.86 | | | | 0.18 | | | | 0.07 | | | | 0.25 | | | | | | | | (0.10 | ) | | | (0.22 | ) | | | 0.00 | | | | (0.32 | ) |
06/05/2015 - 06/30/2015 | | | 10.00 | | | | 0.01 | | | | (0.15 | ) | | | (0.14 | ) | | | | | | | 0.00 | | | | 0.00 | | | | 0.00 | | | | 0.00 | |
| Class C | | | | | | | | | | | | | | | | | | | | | | | | | | | | | | | | | | | | |
07/01/2016 - 12/31/2016+ | | | 9.71 | | | | 0.05 | | | | 0.75 | | | | 0.80 | | | | | | | | (0.20 | ) | | | (0.32 | ) | | | 0.00 | | | | (0.52 | ) |
06/30/2016 | | | 9.85 | | | | 0.11 | | | | 0.06 | | | | 0.17 | | | | | | | | (0.09 | ) | | | (0.22 | ) | | | 0.00 | | | | (0.31 | ) |
06/05/2015 - 06/30/2015 | | | 10.00 | | | | 0.01 | | | | (0.16 | ) | | | (0.15 | ) | | | | | | | 0.00 | | | | 0.00 | | | | 0.00 | | | | 0.00 | |
| | | | | | | | | |
PIMCO RAE Fundamental US Small Fund | | | | | | | | | | | | | | | | | | | | | | | | | | | | | | | | | | | | |
| Institutional Class | | | | | | | | | | | | | | | | | | | | | | | | | | | | | | | | | | | | |
07/01/2016 - 12/31/2016+ | | $ | 9.31 | | | $ | 0.07 | | | $ | 1.90 | | | $ | 1.97 | | | | | | | $ | (0.14 | ) | | $ | 0.00 | | | $ | 0.00 | | | $ | (0.14 | ) |
06/30/2016 | | | 9.93 | | | | 0.10 | | | | (0.57 | ) | | | (0.47 | ) | | | | | | | (0.04 | ) | | | (0.11 | ) | | | 0.00 | | | | (0.15 | ) |
06/05/2015 - 06/30/2015 | | | 10.00 | | | | 0.01 | | | | (0.08 | ) | | | (0.07 | ) | | | | | | | 0.00 | | | | 0.00 | | | | 0.00 | | | | 0.00 | |
| Class P | | | | | | | | | | | | | | | | | | | | | | | | | | | | | | | | | | | | |
07/01/2016 - 12/31/2016+ | | | 9.29 | | | | 0.06 | | | | 1.90 | | | | 1.96 | | | | | | | | (0.13 | ) | | | 0.00 | | | | 0.00 | | | | (0.13 | ) |
06/30/2016 | | | 9.92 | | | | 0.11 | | | | (0.59 | ) | | | (0.48 | ) | | | | | | | (0.04 | ) | | | (0.11 | ) | | | 0.00 | | | | (0.15 | ) |
06/05/2015 - 06/30/2015 | | | 10.00 | | | | 0.01 | | | | (0.09 | ) | | | (0.08 | ) | | | | | | | 0.00 | | | | 0.00 | | | | 0.00 | | | | 0.00 | |
| Class A | | | | | | | | | | | | | | | | | | | | | | | | | | | | | | | | | | | | |
07/01/2016 - 12/31/2016+ | | | 9.29 | | | | 0.05 | | | | 1.90 | | | | 1.95 | | | | | | | | (0.13 | ) | | | 0.00 | | | | 0.00 | | | | (0.13 | ) |
06/30/2016 | | | 9.92 | | | | 0.08 | | | | (0.60 | ) | | | (0.52 | ) | | | | | | | (0.00 | )^ | | | (0.11 | ) | | | 0.00 | | | | (0.11 | ) |
06/05/2015 - 06/30/2015 | | | 10.00 | | | | 0.01 | | | | (0.09 | ) | | | (0.08 | ) | | | | | | | 0.00 | | | | 0.00 | | | | 0.00 | | | | 0.00 | |
| Class C | | | | | | | | | | | | | | | | | | | | | | | | | | | | | | | | | | | | |
07/01/2016 - 12/31/2016+ | | | 9.19 | | | | 0.01 | | | | 1.87 | | | | 1.88 | | | | | | | | (0.10 | ) | | | 0.00 | | | | 0.00 | | | | (0.10 | ) |
06/30/2016 | | | 9.91 | | | | 0.01 | | | | (0.58 | ) | | | (0.57 | ) | | | | | | | (0.04 | ) | | | (0.11 | ) | | | 0.00 | | | | (0.15 | ) |
06/05/2015 - 06/30/2015 | | | 10.00 | | | | 0.00 | ^ | | | (0.09 | ) | | | (0.09 | ) | | | | | | | 0.00 | | | | 0.00 | | | | 0.00 | | | | 0.00 | |
| ^ | Reflects an amount rounding to less than one cent. |
| (a) | Per share amounts based on average number of shares outstanding during the year or period. |
| (b) | The tax characterization of distributions is determined in accordance with federal income tax regulations. The actual tax characterization of distributions paid is determined at the end of the fiscal year. See Note 2 in the Notes to Financial Statements for more information. |
| | | | | | | | |
| 24 | | PIMCO EQUITY SERIES | | | | | See Accompanying Notes | |
| | | | | | | | | | | | | | | | | | | | | | | | | | |
| | | | | | | Ratios/Supplemental Data | | | | |
| | | | | | | | | | Ratios to Average Net Assets | | | | |
Net Asset
Value End of
Year or
Period | | | Total Return | | | Net Assets
End of Year or
Period (000s) | | | Expenses | | | Expenses
Excluding
Waivers | | | Net
Investment
Income (Loss) | | | Portfolio
Turnover
Rate | |
| | | | | | |
| | | | | | | | | | | | | | | | | | | | | | | | | | |
| | | | | | | | | | | | | | | | | | | | | | | | | | |
| $ | 9.13 | | | | 9.37 | % | | $ | 6,450 | | | | 0.60 | %* | | | 0.71 | %* | | | 1.98 | %* | | | 9 | % |
| | 8.55 | | | | (10.70 | ) | | | 1,041 | | | | 0.60 | | | | 0.71 | | | | 3.24 | | | | 39 | |
| | 9.83 | | | | (1.70 | ) | | | 10 | | | | 0.60 | * | | | 0.74 | * | | | 2.57 | * | | | 7 | |
| | | | | | | | | | | | | | | | | | | | | | | | | | |
| | 9.14 | | | | 9.20 | | | | 191 | | | | 0.85 | * | | | 0.96 | * | | | 1.68 | * | | | 9 | |
| | 8.55 | | | | (10.95 | ) | | | 46 | | | | 0.85 | | | | 0.96 | | | | 3.94 | | | | 39 | |
| | 9.83 | | | | (1.70 | ) | | | 10 | | | | 0.85 | * | | | 0.99 | * | | | 2.32 | * | | | 7 | |
| | | | | | | | | | | | | | | | | | | | | | | | | | |
| | 9.02 | | | | 8.77 | | | | 460 | | | | 1.60 | * | | | 1.71 | * | | | 0.86 | * | | | 9 | |
| | 8.45 | | | | (11.69 | ) | | | 300 | | | | 1.60 | | | | 1.71 | | | | 3.28 | | | | 39 | |
| | 9.83 | | | | (1.70 | ) | | | 10 | | | | 1.60 | * | | | 1.74 | * | | | 1.56 | * | | | 7 | |
| | | | | | |
| | | | | | | | | | | | | | | | | | | | | | | | | | |
| | | | | | | | | | | | | | | | | | | | | | | | | | |
| $ | 10.15 | | | | 8.82 | % | | $ | 558,501 | | | | 0.40 | %* | | | 0.51 | %* | | | 2.17 | %* | | | 17 | % |
| | 9.82 | | | | 3.16 | | | | 511,838 | | | | 0.40 | | | | 0.51 | | | | 2.29 | | | | 42 | |
| | 9.85 | | | | (1.50 | ) | | | 447,755 | | | | 0.40 | * | | | 0.51 | * | | | 2.03 | * | | | 5 | |
| | | | | | | | | | | | | | | | | | | | | | | | | | |
| | 10.13 | | | | 8.74 | | | | 6,289 | | | | 0.50 | * | | | 0.61 | * | | | 2.05 | * | | | 17 | |
| | 9.81 | | | | 3.09 | | | | 3,372 | | | | 0.50 | | | | 0.61 | | | | 2.22 | | | | 42 | |
| | 9.85 | | | | (1.50 | ) | | | 10 | | | | 0.50 | * | | | 0.61 | * | | | 1.92 | * | | | 5 | |
| | | | | | | | | | | | | | | | | | | | | | | | | | |
| | 10.10 | | | | 8.53 | | | | 5,139 | | | | 0.80 | * | | | 0.91 | * | | | 1.76 | * | | | 17 | |
| | 9.79 | | | | 2.67 | | | | 2,982 | | | | 0.80 | | | | 0.91 | | | | 1.88 | | | | 42 | |
| | 9.86 | | | | (1.40 | ) | | | 14 | | | | 0.80 | * | | | 0.91 | * | | | 1.67 | * | | | 5 | |
| | | | | | | | | | | | | | | | | | | | | | | | | | |
| | 9.99 | | | | 8.15 | | | | 4,840 | | | | 1.55 | * | | | 1.66 | * | | | 0.99 | * | | | 17 | |
| | 9.71 | | | | 1.89 | | | | 1,765 | | | | 1.55 | | | | 1.66 | | | | 1.15 | | | | 42 | |
| | 9.85 | | | | (1.50 | ) | | | 10 | | | | 1.55 | * | | | 1.66 | * | | | 0.86 | * | | | 5 | |
| | | | | | |
| | | | | | | | | | | | | | | | | | | | | | | | | | |
| | | | | | | | | | | | | | | | | | | | | | | | | | |
| $ | 11.14 | | | | 21.13 | % | | $ | 96,624 | | | | 0.50 | %* | | | 0.61 | %* | | | 1.32 | %* | | | 26 | % |
| | 9.31 | | | | (4.68 | ) | | | 81,226 | | | | 0.50 | | | | 0.61 | | | | 1.10 | | | | 85 | |
| | 9.93 | | | | (0.70 | ) | | | 46,426 | | | | 0.50 | * | | | 0.73 | * | | | 1.44 | * | | | 9 | |
| | | | | | | | | | | | | | | | | | | | | | | | | | |
| | 11.12 | | | | 21.14 | | | | 1,918 | | | | 0.60 | * | | | 0.71 | * | | | 1.23 | * | | | 26 | |
| | 9.29 | | | | (4.79 | ) | | | 1,456 | | | | 0.60 | | | | 0.71 | | | | 1.26 | | | | 85 | |
| | 9.92 | | | | (0.80 | ) | | | 10 | | | | 0.60 | * | | | 0.83 | * | | | 1.33 | * | | | 9 | |
| | | | | | | | | | | | | | | | | | | | | | | | | | |
| | 11.11 | | | | 20.97 | | | | 4,536 | | | | 0.90 | * | | | 1.01 | * | | | 1.00 | * | | | 26 | |
| | 9.29 | | | | (5.11 | ) | | | 1,699 | | | | 0.90 | | | | 1.01 | | | | 0.85 | | | | 85 | |
| | 9.92 | | | | (0.80 | ) | | | 10 | | | | 0.90 | * | | | 1.13 | * | | | 1.04 | * | | | 9 | |
| | | | | | | | | | | | | | | | | | | | | | | | | | |
| | 10.97 | | | | 20.47 | | | | 453 | | | | 1.65 | * | | | 1.76 | * | | | 0.25 | * | | | 26 | |
| | 9.19 | | | | (5.69 | ) | | | 247 | | | | 1.65 | | | | 1.76 | | | | 0.08 | | | | 85 | |
| | 9.91 | | | | (0.90 | ) | | | 10 | | | | 1.65 | * | | | 1.88 | * | | | 0.28 | * | | | 9 | |
| | | | | | |
| | SEMIANNUAL REPORT | | DECEMBER 31, 2016 | | 25 |
Statements of Assets and Liabilities
| | | | | | | | | | | | | | | | | | | | | | | | |
| (Amounts in thousands†, except per share amounts) | | PIMCO
RAE
Fundamental
Emerging
Markets Fund | | | PIMCO
RAE
Fundamental
Global Fund | | | PIMCO
RAE
Fundamental
Global ex-US
Fund | | | PIMCO
RAE
Fundamental
International
Fund | | | PIMCO
RAE
Fundamental
US Fund | | | PIMCO
RAE
Fundamental
US Small Fund | |
| | | | | | |
Assets: | | | | | | | | | | | | | | | | | | | | | | | | |
Investments, at value | | | | | | | | | | | | | | | | | | | | | | | | |
Investments in securities | | $ | 1,492,598 | | | $ | 0 | | | $ | 0 | | | $ | 335,380 | | | $ | 572,356 | | | $ | 101,919 | |
Investments in Affiliates | | | 0 | | | | 383,109 | | | | 67,522 | | | | 0 | | | | 0 | | | | 0 | |
Cash | | | 0 | | | | 563 | | | | 246 | | | | 735 | | | | 7,101 | | | | 640 | |
Foreign currency, at value | | | 295 | | | | 0 | | | | 0 | | | | 156 | | | | 0 | | | | 0 | |
Receivable for investments sold | | | 22,111 | | | | 0 | | | | 0 | | | | 4 | | | | 1 | | | | 1 | |
Receivable for investments in Affiliates sold | | | 0 | | | | 0 | | | | 0 | | | | 0 | | | | 0 | | | | 0 | |
Receivable for Fund shares sold | | | 75 | | | | 0 | | | | 830 | | | | 436 | | | | 150 | | | | 1,166 | |
Interest and/or dividends receivable | | | 7,642 | | | | 0 | | | | 0 | | | | 578 | | | | 854 | | | | 174 | |
Reimbursement receivable from PIMCO | | | 72 | | | | 24 | | | | 10 | | | | 27 | | | | 70 | | | | 12 | |
Other assets | | | 0 | | | | 0 | | | | 0 | | | | 13 | | | | 0 | | | | 0 | |
Total Assets | | | 1,522,793 | | | | 383,696 | | | | 68,608 | | | | 337,329 | | | | 580,532 | | | | 103,912 | |
| | | | | | |
Liabilities: | | | | | | | | | | | | | | | | | | | | | | | | |
Payable for investments purchased | | $ | 0 | | | $ | 0 | | | $ | 0 | | | $ | 0 | | | $ | 0 | | | $ | 317 | |
Payable for investments in Affiliates purchased | | | 0 | | | | 0 | | | | 180 | | | | 0 | | | | 0 | | | | 0 | |
Payable for Fund shares redeemed | | | 527 | | | | 0 | | | | 0 | | | | 744 | | | | 5,461 | | | | 1 | |
Overdraft due to custodian | | | 18,718 | | | | 0 | | | | 0 | | | | 0 | | | | 0 | | | | 0 | |
Accrued investment advisory fees | | | 415 | | | | 0 | | | | 0 | | | | 60 | | | | 78 | | | | 23 | |
Accrued supervisory and administrative fees | | | 622 | | | | 2 | | | | 0 | | | | 91 | | | | 132 | | | | 24 | |
Accrued distribution fees | | | 0 | | | | 1 | | | | 1 | | | | 0 | | | | 3 | | | | 0 | |
Accrued servicing fees | | | 0 | | | | 0 | | | | 0 | | | | 0 | | | | 2 | | | | 1 | |
Accrued taxes payable | | | 680 | | | | 0 | | | | 0 | | | | 0 | | | | 0 | | | | 0 | |
Other liabilities | | | 1,130 | | | | 34 | | | | 11 | | | | 78 | | | | 87 | | | | 15 | |
Total Liabilities | | | 22,092 | | | | 37 | | | | 192 | | | | 973 | | | | 5,763 | | | | 381 | |
| | | | | | |
Net Assets | | $ | 1,500,701 | | | $ | 383,659 | | | $ | 68,416 | | | $ | 336,356 | | | $ | 574,769 | | | $ | 103,531 | |
| | | | | | |
Net Assets Consist of: | | | | | | | | | | | | | | | | | | | | | | | | |
Paid in capital | | $ | 1,275,221 | | | $ | 365,523 | | | $ | 73,085 | | | $ | 317,884 | | | $ | 451,005 | | | $ | 83,924 | |
(Overdistributed) net investment income | | | (11,565 | ) | | | (382 | ) | | | (124 | ) | | | (608 | ) | | | (865 | ) | | | (195 | ) |
Accumulated undistributed net realized gain (loss) | | | (23,275 | ) | | | 3,855 | | | | (795 | ) | | | (15,864 | ) | | | 2,026 | | | | (3,856 | ) |
Net unrealized appreciation (depreciation) | | | 260,320 | | | | 14,663 | | | | (3,750 | ) | | | 34,944 | | | | 122,603 | | | | 23,658 | |
| | | | | | |
Net Assets | | $ | 1,500,701 | | | $ | 383,659 | | | $ | 68,416 | | | $ | 336,356 | | | $ | 574,769 | | | $ | 103,531 | |
| | | | | | |
Cost of investments in securities | | $ | 1,231,615 | | | $ | 0 | | | $ | 0 | | | $ | 300,426 | | | $ | 449,753 | | | $ | 78,261 | |
Cost of investments in Affiliates | | $ | 0 | | | $ | 368,446 | | | $ | 71,272 | | | $ | 0 | | | $ | 0 | | | $ | 0 | |
Cost of foreign currency held | | $ | 294 | | | $ | 0 | | | $ | 0 | | | $ | 156 | | | $ | 0 | | | $ | 0 | |
| † | A zero balance may reflect actual amounts rounding to less than one thousand. |
| | | | | | | | |
| 26 | | PIMCO EQUITY SERIES | | | | | See Accompanying Notes | |
December 31, 2016 (Unaudited)
| | | | | | | | | | | | | | | | | | | | | | | | |
| | | PIMCO
RAE
Fundamental
Emerging
Markets Fund | | | PIMCO
RAE
Fundamental
Global Fund | | | PIMCO
RAE
Fundamental
Global ex-US
Fund | | | PIMCO
RAE
Fundamental
International
Fund | | | PIMCO
RAE
Fundamental
US Fund | | | PIMCO
RAE
Fundamental
US Small Fund | |
| | | | | | |
Net Assets: | | | | | | | | | | | | | | | | | | | | | | | | |
Institutional Class | | $ | 1,495,546 | | | $ | 381,930 | | | $ | 67,631 | | | $ | 329,255 | | | $ | 558,501 | | | $ | 96,624 | |
Class P | | | 3,278 | | | | 158 | | | | 38 | | | | 6,450 | | | | 6,289 | | | | 1,918 | |
Class A | | | 1,516 | | | | 504 | | | | 187 | | | | 191 | | | | 5,139 | | | | 4,536 | |
Class C | | | 361 | | | | 1,067 | | | | 560 | | | | 460 | | | | 4,840 | | | | 453 | |
| | | | | | |
Shares Issued and Outstanding: | | | | | | | | | | | | | | | | | | | | | | | | |
Institutional Class | | | 154,419 | | | | 38,657 | | | | 7,241 | | | | 35,985 | | | | 55,028 | | | | 8,674 | |
Class P | | | 340 | | | | 16 | | | | 4 | | | | 707 | | | | 621 | | | | 173 | |
Class A | | | 157 | | | | 51 | | | | 20 | | | | 21 | | | | 509 | | | | 408 | |
Class C | | | 38 | | | | 109 | | | | 61 | | | | 51 | | | | 485 | | | | 41 | |
| | | | | | |
Net Asset Value Per Share Outstanding: | | | | | | | | | | | | | | | | | | | | | | | | |
Institutional Class | | $ | 9.68 | | | $ | 9.88 | | | $ | 9.34 | | | $ | 9.15 | | | $ | 10.15 | | | $ | 11.14 | |
Class P | | | 9.65 | | | | 9.86 | | | | 9.33 | | | | 9.13 | | | | 10.13 | | | | 11.12 | |
Class A | | | 9.68 | | | | 9.84 | | | | 9.31 | | | | 9.14 | | | | 10.10 | | | | 11.11 | |
Class C | | | 9.58 | | | | 9.76 | | | | 9.25 | | | | 9.02 | | | | 9.99 | | | | 10.97 | |
| | | | | | |
| | SEMIANNUAL REPORT | | DECEMBER 31, 2016 | | 27 |
Statements of Operations
(Unaudited)
| | | | | | | | | | | | | | | | | | | | | | | | |
| Six Months Ended December 31, 2016 | | | | | | | | | | | | | | | | | | |
| (Amounts in thousands†) | | PIMCO
RAE
Fundamental
Emerging
Markets Fund | | | PIMCO
RAE
Fundamental
Global Fund | | | PIMCO
RAE
Fundamental
Global ex-US
Fund | | | PIMCO
RAE
Fundamental
International
Fund | | | PIMCO
RAE
Fundamental
US Fund | | | PIMCO
RAE
Fundamental
US Small Fund | |
| | | | | | |
Investment Income: | | | | | | | | | | | | | | | | | | | | | | | | |
Dividends, net of foreign taxes* | | $ | 22,522 | | | $ | 0 | | | $ | 0 | | | $ | 3,732 | | | $ | 7,272 | | | $ | 857 | |
Dividends from Investments in Affiliates | | | 0 | | | | 9,109 | | | | 1,584 | | | | 0 | | | | 0 | | | | 0 | |
Total Income | | | 22,522 | | | | 9,109 | | | | 1,584 | | | | 3,732 | | | | 7,272 | | | | 857 | |
| | | | | | |
Expenses: | | | | | | | | | | | | | | | | | | | | | | | | |
Investment advisory fees | | | 3,955 | | | | 722 | | | | 133 | | | | 448 | | | | 704 | | | | 164 | |
Supervisory and administrative fees | | | 3,563 | | | | 542 | | | | 116 | | | | 448 | | | | 711 | | | | 120 | |
Distribution fees - Class C | | | 1 | | | | 3 | | | | 2 | | | | 1 | | | | 10 | | | | 1 | |
Servicing fees - Class A | | | 2 | | | | 1 | | | | 0 | | | | 0 | | | | 5 | | | | 3 | |
Servicing fees - Class C | | | 0 | | | | 1 | | | | 1 | | | | 1 | | | | 3 | | | | 1 | |
Trustee fees | | | 91 | | | | 22 | | | | 5 | | | | 19 | | | | 41 | | | | 7 | |
Interest expense | | | 4 | | | | 0 | | | | 0 | | | | 2 | | | | 0 | | | | 0 | |
Miscellaneous expense | | | 39 | | | | 9 | | | | 2 | | | | 7 | | | | 14 | | | | 2 | |
Total Expenses | | | 7,655 | | | | 1,300 | | | | 259 | | | | 926 | | | | 1,488 | | | | 298 | |
Waiver and/or Reimbursement by PIMCO | | | (1,673 | ) | | | (1,257 | ) | | | (254 | ) | | | (168 | ) | | | (322 | ) | | | (54 | ) |
Net Expenses | | | 5,982 | | | | 43 | | | | 5 | | | | 758 | | | | 1,166 | | | | 244 | |
| | | | | | |
Net Investment Income | | | 16,540 | | | | 9,066 | | | | 1,579 | | | | 2,974 | | | | 6,106 | | | | 613 | |
| | | | | | |
Net Realized Gain (Loss): | | | | | | | | | | | | | | | | | | | | | | | | |
Investments in securities | | | 17,089 | | | | 0 | | | | 0 | | | | 426 | | | | 11,753 | | | | 4,036 | |
Investments in Affiliates | | | 0 | | | | 655 | | | | (392 | ) | | | 0 | | | | 0 | | | | 0 | |
Net capital gain distributions received from Affiliate investments | | | 0 | | | | 4,600 | | | | 0 | | | | 0 | | | | 0 | | | | 0 | |
Over the counter financial derivative instruments | | | 521 | | | | 0 | | | | 0 | | | | (7 | ) | | | 0 | | | | 0 | |
Foreign currency | | | (1,201 | ) | | | 0 | | | | 0 | | | | (193 | ) | | | 0 | | | | 0 | |
| | | | | | |
Net Realized Gain (Loss) | | | 16,409 | | | | 5,255 | | | | (392 | ) | | | 226 | | | | 11,753 | | | | 4,036 | |
| | | | | | |
Net Change in Unrealized Appreciation (Depreciation): | | | | | | | | | | | | | | | | | | | | | | | | |
Investments in securities | | | 165,424 | | | | 0 | | | | 0 | | | | 22,869 | | | | 29,169 | | | | 13,097 | |
Investments in Affiliates | | | 0 | | | | 17,429 | | | | 5,217 | | | | 0 | | | | 0 | | | | 0 | |
Over the counter financial derivative instruments | | | (408 | ) | | | 0 | | | | 0 | | | | 0 | | | | 0 | | | | 0 | |
Foreign currency assets and liabilities | | | 538 | | | | 0 | | | | 0 | | | | 37 | | | | 0 | | | | 0 | |
| | | | | | |
Net Change in Unrealized Appreciation | | | 165,554 | | | | 17,429 | | | | 5,217 | | | | 22,906 | | | | 29,169 | | | | 13,097 | |
| | | | | | |
Net Increase in Net Assets Resulting from Operations | | $ | 198,503 | | | $ | 31,750 | | | $ | 6,404 | | | $ | 26,106 | | | $ | 47,028 | | | $ | 17,746 | |
| | | | | | |
* Foreign tax withholdings - Dividends | | $ | 3,313 | | | $ | 0 | | | $ | 0 | | | $ | 285 | | | $ | 0 | | | $ | 0 | |
| † | A zero balance may reflect actual amounts rounding to less than one thousand. |
| | | | | | | | |
| 28 | | PIMCO EQUITY SERIES | | | | | See Accompanying Notes | |
Statements of Changes in Net Assets
| | | | | | | | | | | | | | | | | | | | | | | | |
| | | PIMCO
RAE Fundamental Emerging Markets Fund | | | PIMCO
RAE Fundamental Global Fund | | | PIMCO
RAE Fundamental Global ex-US Fund | |
| | | | | | |
| (Amount in thousands†) | | Six Months Ended
December 31, 2016
(Unaudited) | | | Year Ended
June 30, 2016 | | | Six Months Ended
December 31, 2016
(Unaudited) | | | Year Ended
June 30, 2016 | | | Six Months Ended
December 31, 2016
(Unaudited) | | | Year Ended
June 30, 2016 | |
| | | | | | |
Increase (Decrease) in Net Assets from: | | | | | | | | | | | | | | | | | | | | | | | | |
| | | | | | |
Operations: | | | | | | | | | | | | | | | | | | | | | | | | |
Net investment income | | $ | 16,540 | | | $ | 16,472 | | | $ | 9,066 | | | $ | 2,268 | | | $ | 1,579 | | | $ | 689 | |
Net realized gain (loss) | | | 16,409 | | | | (37,135 | ) | | | 5,255 | | | | 2,243 | | | | (392 | ) | | | (381 | ) |
Net change in unrealized appreciation (depreciation) | | | 165,554 | | | | 100,046 | | | | 17,429 | | | | (2,222 | ) | | | 5,217 | | | | (8,010 | ) |
| | | | | | |
Net Increase (Decrease) in Net Assets Resulting from Operations | | | 198,503 | | | | 79,383 | | | | 31,750 | | | | 2,289 | | | | 6,404 | | | | (7,702 | ) |
| | | | | | |
Distributions to Shareholders: | | | | | | | | | | | | | | | | | | | | | | | | |
From net investment income | | | | | | | | | | | | | | | | | | | | | | | | |
Institutional Class | | | (40,860 | ) | | | (3,853 | ) | | | (9,363 | ) | | | (2,395 | ) | | | (1,683 | ) | | | (692 | ) |
Class P | | | (92 | ) | | | (61 | ) | | | (4 | ) | | | (0 | ) | | | (1 | ) | | | 0 | |
Class A | | | (40 | ) | | | (1 | ) | | | (12 | ) | | | (2 | ) | | | (4 | ) | | | 0 | |
Class C | | | (9 | ) | | | (0 | ) | | | (21 | ) | | | (3 | ) | | | (12 | ) | | | 0 | |
From net realized capital gains | | | | | | | | | | | | | | | | | | | | | | | | |
Institutional Class | | | 0 | | | | 0 | | | | (3,530 | ) | | | 0 | | | | 0 | | | | 0 | |
Class P | | | 0 | | | | 0 | | | | (1 | ) | | | 0 | | | | 0 | | | | 0 | |
Class A | | | 0 | | | | 0 | | | | (5 | ) | | | 0 | | | | 0 | | | | 0 | |
Class C | | | 0 | | | | 0 | | | | (10 | ) | | | 0 | | | | 0 | | | | 0 | |
Tax basis return of capital | | | | | | | | | | | | | | | | | | | | | | | | |
Institutional Class | | | 0 | | | | 0 | | | | 0 | | | | 0 | | | | 0 | | | | (28 | ) |
Class P | | | 0 | | | | 0 | | | | 0 | | | | 0 | | | | 0 | | | | (0 | ) |
Class A | | | 0 | | | | 0 | | | | 0 | | | | 0 | | | | 0 | | | | (0 | ) |
Class C | | | 0 | | | | 0 | | | | 0 | | | | 0 | | | | 0 | | | | (0 | ) |
| | | | | | |
Total Distributions(a) | | | (41,001 | ) | | | (3,915 | ) | | | (12,946 | ) | | | (2,400 | ) | | | (1,700 | ) | | | (720 | ) |
| | | | | | |
Portfolio Share Transactions: | | | | | | | | | | | | | | | | | | | | | | | | |
Net increase (decrease) resulting from Fund share transactions** | | | (38,073 | ) | | | 1,106,387 | | | | 81,571 | | | | 245,198 | | | | 531 | | | | 1,496 | |
| | | | | | |
Total Increase (Decrease) in Net Assets | | | 119,429 | | | | 1,181,855 | | | | 100,375 | | | | 245,087 | | | | 5,235 | | | | (6,926 | ) |
| | | | | | |
Net Assets: | | | | | | | | | | | | | | | | | | | | | | | | |
Beginning of year or period | | | 1,381,272 | | | | 199,417 | | | | 283,284 | | | | 38,197 | | | | 63,181 | | | | 70,107 | |
End of year or period* | | $ | 1,500,701 | | | $ | 1,381,272 | | | $ | 383,659 | | | $ | 283,284 | | | $ | 68,416 | | | $ | 63,181 | |
| | | | | | |
* Including undistributed (overdistributed) net investment income of: | | $ | (11,565 | ) | | $ | 12,896 | | | $ | (382 | ) | | $ | (48 | ) | | $ | (124 | ) | | $ | (3 | ) |
| † | A zero balance may reflect actual amounts rounding to less than one thousand. |
| ** | See Note 11 in the Notes to Financial Statements. |
| (a) | The tax characterization of distributions is determined in accordance with federal income tax regulations. The actual tax characterization of distributions paid is determined at the end of the fiscal year. See Note 2 in the Notes to Financial Statements for more information. |
| | | | | | |
| | SEMIANNUAL REPORT | | DECEMBER 31, 2016 | | 29 |
Statements of Changes in Net Assets (Cont.)
| | | | | | | | | | | | | | | | | | | | | | | | |
| | | PIMCO
RAE Fundamental International Fund | | | PIMCO
RAE Fundamental US Fund | | | PIMCO
RAE Fundamental US Small Fund | |
| | | | | | |
| (Amount in thousands†) | | Six Months Ended
December 31, 2016
(Unaudited) | | | Year Ended
June 30, 2016 | | | Six Months Ended
December 31, 2016
(Unaudited) | | | Year Ended
June 30, 2016 | | | Six Months Ended
December 31, 2016
(Unaudited) | | | Year Ended
June 30, 2016 | |
| | | | | | |
Increase in Net Assets from: | | | | | | | | | | | | | | | | | | | | | | | | |
| | | | | | |
Operations: | | | | | | | | | | | | | | | | | | | | | | | | |
Net investment income | | $ | 2,974 | | | $ | 5,793 | | | $ | 6,106 | | | $ | 10,617 | | | $ | 613 | | | $ | 934 | |
Net realized gain (loss) | | | 226 | | | | (14,145 | ) | | | 11,753 | | | | 15,976 | | | | 4,036 | | | | (7,337 | ) |
Net change in unrealized appreciation (depreciation) | | | 22,906 | | | | (10,831 | ) | | | 29,169 | | | | (13,066 | ) | | | 13,097 | | | | 3,050 | |
| | | | | | |
Net Increase (Decrease) in Net Assets Resulting from Operations | | | 26,106 | | | | (19,183 | ) | | | 47,028 | | | | 13,527 | | | | 17,746 | | | | (3,353 | ) |
| | | | | | |
Distributions to Shareholders: | | | | | | | | | | | | | | | | | | | | | | | | |
From net investment income | | | | | | | | | | | | | | | | | | | | | | | | |
Institutional Class | | | (7,439 | ) | | | (1,748 | ) | | | (12,165 | ) | | | (5,444 | ) | | | (1,184 | ) | | | (518 | ) |
Class P | | | (152 | ) | | | (9 | ) | | | (138 | ) | | | (21 | ) | | | (22 | ) | | | (1 | ) |
Class A | | | (1 | ) | | | (0 | ) | | | (103 | ) | | | (15 | ) | | | (39 | ) | | | (0 | ) |
Class C | | | (9 | ) | | | (2 | ) | | | (94 | ) | | | (3 | ) | | | (4 | ) | | | (1 | ) |
From net realized capital gains | | | | | | | | | | | | | | | | | | | | | | | | |
Institutional Class | | | 0 | | | | (3,508 | ) | | | (16,709 | ) | | | (11,342 | ) | | | 0 | | | | (1,268 | ) |
Class P | | | 0 | | | | (17 | ) | | | (167 | ) | | | (43 | ) | | | 0 | | | | (2 | ) |
Class A | | | 0 | | | | (0 | ) | | | (137 | ) | | | (32 | ) | | | 0 | | | | (5 | ) |
Class C | | | 0 | | | | (1 | ) | | | (133 | ) | | | (6 | ) | | | 0 | | | | (0 | ) |
| | | | | | |
Total Distributions(a) | | | (7,601 | ) | | | (5,285 | ) | | | (29,646 | ) | | | (16,906 | ) | | | (1,249 | ) | | | (1,795 | ) |
| | | | | | |
Portfolio Share Transactions: | | | | | | | | | | | | | | | | | | | | | | | | |
Net increase resulting from Fund share transactions** | | | 69,282 | | | | 121,475 | | | | 37,430 | | | | 75,547 | | | | 2,406 | | | | 43,320 | |
| | | | | | |
Total Increase in Net Assets | | | 87,787 | | | | 97,007 | | | | 54,812 | | | | 72,168 | | | | 18,903 | | | | 38,172 | |
| | | | | | |
Net Assets: | | | | | | | | | | | | | | | | | | | | | | | | |
Beginning of year or period | | | 248,569 | | | | 151,562 | | | | 519,957 | | | | 447,789 | | | | 84,628 | | | | 46,456 | |
End of year or period* | | $ | 336,356 | | | $ | 248,569 | | | $ | 574,769 | | | $ | 519,957 | | | $ | 103,531 | | | $ | 84,628 | |
| | | | | | |
* Including undistributed (overdistributed) net investment income of: | | $ | (608 | ) | | $ | 4,019 | | | $ | (865 | ) | | $ | 5,529 | | | $ | (195 | ) | | $ | 441 | |
| † | A zero balance may reflect actual amounts rounding to less than one thousand. |
| ** | See Note 11 in the Notes to Financial Statements. |
| (a) | The tax characterization of distributions is determined in accordance with federal income tax regulations. The actual tax characterization of distributions paid is determined at the end of the fiscal year. See Note 2 in the Notes to Financial Statements for more information. |
| | | | | | | | |
| 30 | | PIMCO EQUITY SERIES | | | | | See Accompanying Notes | |
Schedule of Investments PIMCO RAE Fundamental Emerging Markets Fund
December 31, 2016 (Unaudited)
| | | | | | | | | | | | |
| | | | | SHARES | | | | | MARKET
VALUE
(000S) | |
| INVESTMENTS IN SECURITIES 99.5% | |
| |
| COMMON STOCKS 92.0% | |
| |
| BRAZIL 15.4% | |
| |
| CONSUMER DISCRETIONARY 0.4% | |
Cyrela Brazil Realty S.A. Empreendimentos e Participacoes | | | | | 558,200 | | | $ | | | 1,755 | |
Grendene S.A. | | | | | 28,300 | | | | | | 153 | |
Lojas Renner S.A. | | | | | 57,700 | | | | | | 410 | |
MRV Engenharia e Participacoes S.A. | | | | | 394,300 | | | | | | 1,322 | |
Via Varejo S.A. | | | | | 629,300 | | | | | | 2,074 | |
| | | | | | | | | | | | |
| | | | | | | | | | | 5,714 | |
| | | | | | | | | | | | |
| |
| CONSUMER STAPLES 0.8% | |
Ambev S.A. ADR | | | | | 405,357 | | | | | | 1,990 | |
BRF S.A. | | | | | 50,800 | | | | | | 752 | |
JBS S.A. | | | | | 836,000 | | | | | | 2,924 | |
Marfrig Global Foods S.A. (a) | | | | | 1,638,900 | | | | | | 3,323 | |
Natura Cosmeticos S.A. | | | | | 522,400 | | | | | | 3,690 | |
| | | | | | | | | | | | |
| | | | | | | | | | | 12,679 | |
| | | | | | | | | | | | |
| |
| ENERGY 3.5% | |
Cosan S.A. Industria e Comercio | | | | | 142,100 | | | | | | 1,662 | |
Petroleo Brasileiro S.A. SP - ADR (a) | | | | | 5,043,794 | | | | | | 50,993 | |
| | | | | | | | | | | | |
| | | | | | | | | | | 52,655 | |
| | | | | | | | | | | | |
| |
| FINANCIALS 6.2% | |
Banco Bradesco S.A. ADR | | | | | 2,834,008 | | | | | | 24,684 | |
Banco do Brasil S.A. | | | | | 3,325,600 | | | | | | 28,632 | |
BM&FBovespa S.A. - Bolsa de Valores Mercadorias e Futuros | | | | | 760,200 | | | | | | 3,846 | |
Grupo BTG Pactual | | | | | 87,886 | | | | | | 393 | |
Itau Unibanco Holding S.A. SP - ADR ‘H’ | | | | | 3,184,394 | | | | | | 32,736 | |
Porto Seguro S.A. | | | | | 18,800 | | | | | | 155 | |
Sul America S.A. | | | | | 440,859 | | | | | | 2,436 | |
| | | | | | | | | | | | |
| | | | | | | | | | | 92,882 | |
| | | | | | | | | | | | |
| |
| HEALTH CARE 0.0% | |
Hypermarcas S.A. | | | | | 67,200 | | | | | | 538 | |
| | | | | | | | | | | | |
| |
| INDUSTRIALS 0.2% | |
CCR S.A. | | | | | 175,300 | | | | | | 857 | |
EcoRodovias Infraestrutura e Logistica S.A. | | | | | 544,600 | | | | | | 1,377 | |
Embraer S.A. SP - ADR | | | | | 24,676 | | | | | | 475 | |
Localiza Rent a Car S.A. | | | | | 14,900 | | | | | | 156 | |
| | | | | | | | | | | | |
| | | | | | | | | | | 2,865 | |
| | | | | | | | | | | | |
| |
| MATERIALS 1.3% | |
Cia Siderurgica Nacional S.A. SP - ADR (a) | | | | | 2,432,015 | | | | | | 7,856 | |
Duratex S.A. (a) | | | | | 478,000 | | | | | | 998 | |
Fibria Celulose S.A. SP - ADR | | | | | 150,984 | | | | | | 1,451 | |
Gerdau S.A. SP - ADR | | | | | 3,023,015 | | | | | | 9,492 | |
| | | | | | | | | | | | |
| | | | | | | | | | | 19,797 | |
| | | | | | | | | | | | |
| |
| REAL ESTATE 0.2% | |
BR Malls Participacoes S.A. (a) | | | | | 442,020 | | | | | | 1,621 | |
| | | | | | | | | | | | |
| | | | | SHARES | | | | | MARKET
VALUE
(000S) | |
BR Properties S.A. | | | | | 307,000 | | | $ | | | 706 | |
| | | | | | | | | | | | |
| | | | | | | | | | | 2,327 | |
| | | | | | | | | | | | |
| |
| TELECOMMUNICATION SERVICES 0.5% | |
Telefonica Brasil S.A. ADR | | | | | 373,238 | | | | | | 4,994 | |
TIM Participacoes S.A. ADR | | | | | 261,486 | | | | | | 3,086 | |
| | | | | | | | | | | | |
| | | | | | | | | | | 8,080 | |
| | | | | | | | | | | | |
| |
| UTILITIES 2.3% | |
AES Tiete Energia S.A. | | | | | 339,700 | | | | | | 1,461 | |
Alupar Investimento S.A. | | | | | 66,625 | | | | | | 350 | |
Cia de Saneamento Basico do Estado de Sao Paulo ADR | | | | | 567,601 | | | | | | 4,927 | |
Cia de Saneamento de Minas Gerais-COPASA | | | | | 107,400 | | | | | | 1,203 | |
Cia Energetica de Minas Gerais SP - ADR | | | | | 5,027,184 | | | | | | 11,462 | |
CPFL Energia S.A. ADR | | | | | 298,002 | | | | | | 4,589 | |
EDP - Energias do Brasil S.A. | | | | | 899,300 | | | | | | 3,695 | |
Engie Brasil Energia S.A. | | | | | 178,800 | | | | | | 1,918 | |
Light S.A. | | | | | 611,400 | | | | | | 3,256 | |
Transmissora Alianca de Energia Eletrica S.A. | | | | | 159,200 | | | | | | 1,014 | |
| | | | | | | | | | | | |
| | | | | | | | | | | 33,875 | |
| | | | | | | | | | | | |
Total Brazil | | | | | | | | | | | 231,412 | |
| | | | | | | | | | | | |
| |
| CHILE 0.6% | |
| |
| CONSUMER STAPLES 0.1% | |
Cencosud S.A. | | | | | 741,840 | | | | | | 2,082 | |
| | | | | | | | | | | | |
| |
| ENERGY 0.0% | |
Empresas COPEC S.A. | | | | | 16,750 | | | | | | 161 | |
| | | | | | | | | | | | |
| |
| FINANCIALS 0.1% | |
Banco de Chile | | | | | 2,707,060 | | | | | | 315 | |
Banco de Credito e Inversiones | | | | | 6,430 | | | | | | 325 | |
Banco Santander Chile ADR | | | | | 14,439 | | | | | | 316 | |
Sociedad Matriz del Banco de Chile S.A. | | | | | 628,000 | | | | | | 205 | |
| | | | | | | | | | | | |
| | | | | | | | | | | 1,161 | |
| | | | | | | | | | | | |
| |
| INDUSTRIALS 0.1% | |
Latam Airlines Group S.A. SP - ADR (a) | | | | | 123,006 | | | | | | 1,006 | |
| | | | | | | | | | | | |
| |
| MATERIALS 0.2% | |
Antofagasta PLC | | | | | 222,343 | | | | | | 1,841 | |
CAP S.A. | | | | | 151,380 | | | | | | 1,080 | |
Sociedad Quimica y Minera de Chile S.A. SP - ADR | | | | | 16,317 | | | | | | 468 | |
| | | | | | | | | | | | |
| | | | | | | | | | | 3,389 | |
| | | | | | | | | | | | |
| |
| TELECOMMUNICATION SERVICES 0.0% | |
Empresa Nacional de Telecomunicaciones S.A. (a) | | | | | 43,850 | | | | | | 466 | |
| | | | | | | | | | | | |
| |
| UTILITIES 0.1% | |
Colbun S.A. | | | | | 859,160 | | | | | | 169 | |
Enel Generacion Chile S.A. ADR | | | | | 8,362 | | | | | | 163 | |
Enersis Americas S.A. | | | | | 121,453 | | | | | | 997 | |
| | | | | | | | | | | | |
| | | | | SHARES | | | | | MARKET
VALUE
(000S) | |
Inversiones Aguas Metropolitanas S.A. | | | | | 78,867 | | | $ | | | 114 | |
| | | | | | | | | | | | |
| | | | | | | | | | | 1,443 | |
| | | | | | | | | | | | |
Total Chile | | | | | | | | | | | 9,708 | |
| | | | | | | | | | | | |
| |
| CHINA 15.8% | |
| |
| CONSUMER DISCRETIONARY 0.3% | |
Belle International Holdings Ltd. | | | | | 5,274,000 | | | | | | 2,954 | |
Dongfeng Motor Group Co. Ltd. ‘H’ | | | | | 270,000 | | | | | | 262 | |
GOME Electrical Appliances Holding Ltd. | | | | | 5,771,000 | | | | | | 698 | |
Zhongsheng Group Holdings Ltd. | | | | | 736,500 | | | | | | 656 | |
| | | | | | | | | | | | |
| | | | | | | | | | | 4,570 | |
| | | | | | | | | | | | |
| |
| CONSUMER STAPLES 0.1% | |
Tingyi Cayman Islands Holding Corp. | | | | | 784,000 | | | | | | 950 | |
| | | | | | | | | | | | |
| |
| ENERGY 3.4% | |
China Coal Energy Co. Ltd. ‘H’ | | | | | 907,000 | | | | | | 428 | |
China Oilfield Services Ltd.‘H’ | | | | | 164,000 | | | | | | 151 | |
China Petroleum & Chemical Corp. ‘H’ | | | | | 22,018,400 | | | | | | 15,507 | |
China Shenhua Energy Co. Ltd. ‘H’ | | | | | 3,734,000 | | | | | | 6,980 | |
CNOOC Ltd. | | | | | 15,309,000 | | | | | | 19,025 | |
Inner Mongolia Yitai Coal Co. Ltd. ‘B’ | | | | | 2,229,194 | | | | | | 2,066 | |
PetroChina Co. Ltd. ‘H’ | | | | | 8,802,000 | | | | | | 6,537 | |
Yanzhou Coal Mining Co. Ltd. ‘H’ | | | | | 684,000 | | | | | | 464 | |
| | | | | | | | | | | | |
| | | | | | | | | | | 51,158 | |
| | | | | | | | | | | | |
| |
| FINANCIALS 8.6% | |
Agricultural Bank of China Ltd. ‘H’ | | | | | 29,160,000 | | | | | | 11,901 | |
Bank of China Ltd. ‘H’ | | | | | 53,087,000 | | | | | | 23,407 | |
Bank of Communications Co. Ltd. ‘H’ | | | | | 8,397,000 | | | | | | 6,039 | |
China CITIC Bank Corp. Ltd. ‘H’ | | | | | 4,126,000 | | | | | | 2,611 | |
China Construction Bank Corp. ‘H’ | | | | | 59,799,000 | | | | | | 45,796 | |
China Everbright Bank Co. Ltd. ‘H’ | | | | | 2,600,000 | | | | | | 1,180 | |
China Huarong Asset Management Co. Ltd. (a) | | | | | 388,000 | | | | | | 139 | |
China Life Insurance Co. Ltd. ‘H’ | | | | | 155,000 | | | | | | 401 | |
China Merchants Bank Co. Ltd. ‘H’ | | | | | 1,377,000 | | | | | | 3,211 | |
China Minsheng Banking Corp. Ltd. ‘H’ | | | | | 2,098,600 | | | | | | 2,233 | |
Chongqing Rural Commercial Bank Co. Ltd. ‘H’ | | | | | 2,970,000 | | | | | | 1,737 | |
Industrial & Commercial Bank of China Ltd. ‘H’ | | | | | 48,521,000 | | | | | | 28,930 | |
People’s Insurance Co. Group of China Ltd. ‘H’ | | | | | 1,163,000 | | | | | | 456 | |
PICC Property & Casualty Co. Ltd. ‘H’ | | | | | 108,000 | | | | | | 167 | |
Ping An Insurance Group Co. of China Ltd. ‘H’ | | | | | 356,000 | | | | | | 1,769 | |
| | | | | | | | | | | | |
| | | | | | | | | | | 129,977 | |
| | | | | | | | | | | | |
| |
| | | | | | |
| See Accompanying Notes | | SEMIANNUAL REPORT | | DECEMBER 31, 2016 | | 31 |
Schedule of Investments PIMCO RAE Fundamental Emerging Markets Fund (Cont.)
| | | | | | | | | | | | |
| | | | | SHARES | | | | | MARKET
VALUE
(000S) | |
| INDUSTRIALS 0.3% | |
Air China Ltd. ‘H’ | | | | | 206,000 | | | $ | | | 131 | |
Beijing Capital International Airport Co. Ltd. ‘H’ | | | | | 604,000 | | | | | | 609 | |
China Communications Construction Co. Ltd. ‘H’ | | | | | 147,000 | | | | | | 168 | |
China Energy Engineering Corp. Ltd. | | | | | 1,058,000 | | | | | | 188 | |
China Railway Construction Corp. Ltd. ‘H’ | | | | | 228,000 | | | | | | 292 | |
China Railway Group Ltd. ‘H’ | | | | | 176,000 | | | | | | 144 | |
Guangshen Railway Co. Ltd. ‘H’ | | | | | 628,000 | | | | | | 378 | |
Harbin Electric Co. Ltd. ‘H’ | | | | | 378,000 | | | | | | 175 | |
Shenzhen Expressway Co. Ltd. ‘H’ | | | | | 146,000 | | | | | | 124 | |
Sinopec Engineering Group Co. Ltd. ‘H’ | | | | | 681,500 | | | | | | 567 | |
Sinotruk Hong Kong Ltd. | | | | | 236,500 | | | | | | 168 | |
Weichai Power Co. Ltd. ‘H’ | | | | | 217,000 | | | | | | 333 | |
Yangzijiang Shipbuilding Holdings Ltd. | | | | | 720,000 | | | | | | 404 | |
Zhejiang Expressway Co. Ltd. ‘H’ | | | | | 756,000 | | | | | | 720 | |
| | | | | | | | | | | | |
| | | | | | | | | | | 4,401 | |
| | | | | | | | | | | | |
| |
| INFORMATION TECHNOLOGY 0.4% | |
China Railway Signal & Communication Corp. Ltd. ‘H’ | | | | | 258,000 | | | | | | 185 | |
Legend Holdings Corp. ‘H’ | | | | | 464,000 | | | | | | 1,027 | |
Lenovo Group Ltd. | | | | | 582,000 | | | | | | 351 | |
NetEase, Inc. ADR | | | | | 5,100 | | | | | | 1,098 | |
Sohu.com, Inc. (a) | | | | | 4,896 | | | | | | 166 | |
Tencent Holdings Ltd. | | | | | 150,000 | | | | | | 3,637 | |
| | | | | | | | | | | | |
| | | | | | | | | | | 6,464 | |
| | | | | | | | | | | | |
| |
| MATERIALS 0.7% | |
Angang Steel Co. Ltd. ‘H’ | | | | | 580,000 | | | | | | 343 | |
Anhui Conch Cement Co. Ltd. ‘H’ | | | | | 362,500 | | | | | | 981 | |
China BlueChemical Ltd. ‘H’ | | | | | 1,142,000 | | | | | | 315 | |
China Hongqiao Group Ltd. | | | | | 896,000 | | | | | | 787 | |
China National Building Material Co. Ltd. ‘H’ | | | | | 14,438,000 | | | | | | 6,992 | |
China National Materials Co. Ltd. ‘H’ | | | | | 1,261,000 | | | | | | 293 | |
China Zhongwang Holdings Ltd. | | | | | 316,800 | | | | | | 134 | |
Jiangxi Copper Co. Ltd. ‘H’ | | | | | 135,000 | | | | | | 187 | |
Shandong Chenming Paper Holdings Ltd. ‘B’ | | | | | 194,800 | | | | | | 193 | |
| | | | | | | | | | | | |
| | | | | | | | | | | 10,225 | |
| | | | | | | | | | | | |
| |
| REAL ESTATE 1.4% | |
Agile Property Holdings Ltd. | | | | | 4,108,000 | | | | | | 2,086 | |
China Evergrande Group | | | | | 4,440,000 | | | | | | 2,752 | |
CIFI Holdings Group Co. Ltd. | | | | | 1,326,000 | | | | | | 356 | |
Country Garden Holdings Co. Ltd. | | | | | 7,524,000 | | | | | | 4,194 | |
Greentown China Holdings Ltd. (a) | | | | | 1,369,500 | | | | | | 1,104 | |
Guangzhou R&F Properties Co. Ltd. ‘H’ | | | | | 3,045,800 | | | | | | 3,668 | |
KWG Property Holding Ltd. | | | | | 1,429,000 | | | | | | 808 | |
Longfor Properties Co. Ltd. | | | | | 119,000 | | | | | | 150 | |
Red Star Macalline Group Corp. Ltd. ‘H’ | | | | | 346,800 | | | | | | 357 | |
Shui On Land Ltd. | | | | | 2,991,000 | | | | | | 643 | |
| | | | | | | | | | | | |
| | | | | SHARES | | | | | MARKET
VALUE
(000S) | |
Sino-Ocean Land Holdings Ltd. | | | | | 3,807,000 | | | $ | | | 1,696 | |
SOHO China Ltd. | | | | | 4,805,000 | | | | | | 2,359 | |
Sunac China Holdings Ltd. | | | | | 492,000 | | | | | | 408 | |
| | | | | | | | | | | | |
| | | | | | | | | | | 20,581 | |
| | | | | | | | | | | | |
| |
| TELECOMMUNICATION SERVICES 0.5% | |
China Communications Services Corp. Ltd. ‘H’ | | | | | 2,140,000 | | | | | | 1,360 | |
China Telecom Corp. Ltd. ‘H’ | | | | | 12,400,000 | | | | | | 5,688 | |
| | | | | | | | | | | | |
| | | | | | | | | | | 7,048 | |
| | | | | | | | | | | | |
| |
| UTILITIES 0.1% | |
CGN Power Co. Ltd. ‘H’ | | | | | 440,000 | | | | | | 120 | |
Datang International Power Generation Co. Ltd. ‘H’ | | | | | 2,942,000 | | | | | | 768 | |
Huaneng Power International, Inc. ‘H’ | | | | | 1,244,000 | | | | | | 821 | |
| | | | | | | | | | | | |
| | | | | | | | | | | 1,709 | |
| | | | | | | | | | | | |
Total China | | | | | | | | | | | 237,083 | |
| | | | | | | | | | | | |
| |
| GREECE 1.2% | |
| |
| CONSUMER DISCRETIONARY 0.2% | |
FF Group (a) | | | | | 20,220 | | | | | | 409 | |
OPAP S.A. | | | | | 302,405 | | | | | | 2,673 | |
| | | | | | | | | | | | |
| | | | | | | | | | | 3,082 | |
| | | | | | | | | | | | |
| |
| FINANCIALS 0.8% | |
Alpha Bank AE (a) | | | | | 2,352,197 | | | | | | 4,695 | |
Eurobank Ergasias S.A. (a) | | | | | 706,769 | | | | | | 479 | |
National Bank of Greece S.A. (a) | | | | | 17,618,201 | | | | | | 4,598 | |
Piraeus Bank S.A. (a) | | | | | 12,919,343 | | | | | | 2,834 | |
| | | | | | | | | | | | |
| | | | | | | | | | | 12,606 | |
| | | | | | | | | | | | |
| |
| TELECOMMUNICATION SERVICES 0.2% | |
Hellenic Telecommunications Organization S.A. | | | | | 232,197 | | | | | | 2,181 | |
| | | | | | | | | | | | |
| |
| UTILITIES 0.0% | |
Public Power Corp. S.A. | | | | | 66,634 | | | | | | 203 | |
| | | | | | | | | | | | |
Total Greece | | | | | | | | | | | 18,072 | |
| | | | | | | | | | | | |
| |
| HONG KONG 2.9% | |
| |
| CONSUMER STAPLES 0.4% | |
China Agri-Industries Holdings Ltd. (a) | | | | | 2,123,000 | | | | | | 826 | |
China Resources Beer Holdings Co. Ltd. (a) | | | | | 2,692,000 | | | | | | 5,333 | |
| | | | | | | | | | | | |
| | | | | | | | | | | 6,159 | |
| | | | | | | | | | | | |
| |
| ENERGY 0.1% | |
Kunlun Energy Co. Ltd. | | | | | 1,702,000 | | | | | | 1,268 | |
| | | | | | | | | | | | |
| |
| FINANCIALS 0.3% | |
BOC Hong Kong Holdings Ltd. | | | | | 921,500 | | | | | | 3,282 | |
China Taiping Insurance Holdings Co. Ltd. (a) | | | | | 481,400 | | | | | | 987 | |
| | | | | | | | | | | | |
| | | | | | | | | | | 4,269 | |
| | | | | | | | | | | | |
| |
| | | | | | | | | | | | |
| | | | | SHARES | | | | | MARKET
VALUE
(000S) | |
| INDUSTRIALS 0.2% | |
China Merchants Holdings International Co. Ltd. | | | | | 54,000 | | | $ | | | 133 | |
CITIC Ltd. | | | | | 377,000 | | | | | | 537 | |
COSCO SHIPPING Ports Ltd. | | | | | 702,000 | | | | | | 704 | |
Shanghai Industrial Holdings Ltd. | | | | | 780,000 | | | | | | 2,103 | |
| | | | | | | | | | | | |
| | | | | | | | | | | 3,477 | |
| | | | | | | | | | | | |
| |
| MATERIALS 0.2% | |
China Resources Cement Holdings Ltd. | | | | | 2,826,000 | | | | | | 1,093 | |
Shougang Fushan Resources Group Ltd. | | | | | 5,148,000 | | | | | | 1,003 | |
| | | | | | | | | | | | |
| | | | | | | | | | | 2,096 | |
| | | | | | | | | | | | |
| |
| REAL ESTATE 0.5% | |
China Jinmao Holdings Group Ltd. | | | | | 5,120,000 | | | | | | 1,375 | |
China Overseas Land & Investment Ltd. | | | | | 324,000 | | | | | | 852 | |
China Resources Land Ltd. | | | | | 268,000 | | | | | | 600 | |
Poly Property Group Co. Ltd. | | | | | 8,195,000 | | | | | | 2,702 | |
Yuexiu Property Co. Ltd. | | | | | 9,724,000 | | | | | | 1,325 | |
| | | | | | | | | | | | |
| | | | | | | | | | | 6,854 | |
| | | | | | | | | | | | |
| |
| TELECOMMUNICATION SERVICES 1.0% | |
China Mobile Ltd. | | | | | 696,500 | | | | | | 7,343 | |
China Unicom Hong Kong Ltd. | | | | | 6,718,000 | | | | | | 7,775 | |
| | | | | | | | | | | | |
| | | | | | | | | | | 15,118 | |
| | | | | | | | | | | | |
| |
| UTILITIES 0.2% | |
China Power International Development Ltd. | | | | | 2,734,000 | | | | | | 987 | |
China Resources Power Holdings Co. Ltd. | | | | | 1,632,000 | | | | | | 2,582 | |
| | | | | | | | | | | | |
| | | | | | | | | | | 3,569 | |
| | | | | | | | | | | | |
Total Hong Kong | | | | | | | | | | | 42,810 | |
| | | | | | | | | | | | |
| |
| INDIA 5.4% | |
| |
| CONSUMER DISCRETIONARY 0.2% | |
Tata Motors Ltd. | | | | | 434,249 | | | | | | 2,996 | |
| | | | | | | | | | | | |
| |
| CONSUMER STAPLES 0.1% | |
Hindustan Unilever Ltd. | | | | | 24,484 | | | | | | 298 | |
ITC Ltd. | | | | | 242,760 | | | | | | 859 | |
| | | | | | | | | | | | |
| | | | | | | | | | | 1,157 | |
| | | | | | | | | | | | |
| |
| ENERGY 0.8% | |
Bharat Petroleum Corp. Ltd. | | | | | 44,474 | | | | | | 415 | |
Cairn India Ltd. | | | | | 1,244,377 | | | | | | 4,422 | |
Coal India Ltd. | | | | | 93,874 | | | | | | 414 | |
Hindustan Petroleum Corp. Ltd. | | | | | 176,200 | | | | | | 1,146 | |
Indian Oil Corp. Ltd. | | | | | 251,570 | | | | | | 1,195 | |
Oil & Natural Gas Corp. Ltd. | | | | | 872,304 | | | | | | 2,445 | |
Oil India Ltd. | | | | | 80,480 | | | | | | 535 | |
Reliance Industries Ltd. | | | | | 60,654 | | | | | | 963 | |
Reliance Industries Ltd. SP - GDR | | | | | 3,194 | | | | | | 101 | |
| | | | | | | | | | | | |
| | | | | | | | | | | 11,636 | |
| | | | | | | | | | | | |
| |
| | | | | | | | |
| 32 | | PIMCO EQUITY SERIES | | | | | See Accompanying Notes | |
December 31, 2016 (Unaudited)
| | | | | | | | | | | | |
| | | | | SHARES | | | | | MARKET
VALUE
(000S) | |
| FINANCIALS 1.5% | |
Allahabad Bank (a) | | | | | 1,321,580 | | | $ | | | 1,170 | |
Andhra Bank | | | | | 1,652,432 | | | | | | 1,152 | |
Bank of Baroda (a) | | | | | 609,836 | | | | | | 1,372 | |
Bank of India | | | | | 1,286,370 | | | | | | 2,022 | |
Canara Bank (a) | | | | | 490,500 | | | | | | 1,888 | |
ICICI Bank Ltd. | | | | | 293,753 | | | | | | 1,099 | |
IDBI Bank Ltd. (a) | | | | | 489,630 | | | | | | 500 | |
Indian Bank | | | | | 194,920 | | | | | | 632 | |
Oriental Bank of Commerce | | | | | 997,185 | | | | | | 1,547 | |
Power Finance Corp. Ltd. | | | | | 437,630 | | | | | | 782 | |
Punjab National Bank (a) | | | | | 1,601,286 | | | | | | 2,698 | |
Rural Electrification Corp. Ltd. | | | | | 847,840 | | | | | | 1,550 | |
State Bank of India | | | | | 755,419 | | | | | | 2,772 | |
State Bank of India SP - GDR | | | | | 23,639 | | | | | | 863 | |
Syndicate Bank (a) | | | | | 954,209 | | | | | | 864 | |
UCO Bank (a) | | | | | 542,251 | | | | | | 266 | |
Union Bank of India | | | | | 1,008,550 | | | | | | 1,811 | |
| | | | | | | | | | | | |
| | | | | | | | | | | 22,988 | |
| | | | | | | | | | | | |
| |
| HEALTH CARE 0.0% | |
Piramal Enterprises Ltd. | | | | | 29,603 | | | | | | 705 | |
| | | | | | | | | | | | |
| |
| INDUSTRIALS 0.3% | |
Adani Enterprises Ltd. | | | | | 431,180 | | | | | | 486 | |
Bharat Heavy Electricals Ltd. | | | | | 802,201 | | | | | | 1,424 | |
Jaiprakash Associates Ltd. (a) | | | | | 18,388,364 | | | | | | 2,186 | |
| | | | | | | | | | | | |
| | | | | | | | | | | 4,096 | |
| | | | | | | | | | | | |
| |
| INFORMATION TECHNOLOGY 0.1% | |
Infosys Ltd. SP - ADR | | | | | 72,260 | | | | | | 1,072 | |
Tata Consultancy Services Ltd. | | | | | 10,870 | | | | | | 378 | |
| | | | | | | | | | | | |
| | | | | | | | | | | 1,450 | |
| | | | | | | | | | | | |
| |
| MATERIALS 2.0% | |
Hindalco Industries Ltd. | | | | | 2,351,630 | | | | | | 5,314 | |
Hindustan Zinc Ltd. | | | | | 45,740 | | | | | | 171 | |
Jindal Steel & Power Ltd. | | | | | 2,818,910 | | | | | | 2,836 | |
JSW Steel Ltd. | | | | | 106,360 | | | | | | 2,531 | |
National Aluminium Co. Ltd. | | | | | 457,840 | | | | | | 442 | |
NMDC Ltd. | | | | | 375,570 | | | | | | 680 | |
Steel Authority of India Ltd. (a) | | | | | 2,275,660 | | | | | | 1,634 | |
Tata Chemicals Ltd. | | | | | 79,873 | | | | | | 589 | |
Tata Steel Ltd. | | | | | 1,579,529 | | | | | | 9,051 | |
Vedanta Ltd. | | | | | 825,300 | | | | | | 2,605 | |
Vedanta Resources PLC | | | | | 377,012 | | | | | | 4,046 | |
| | | | | | | | | | | | |
| | | | | | | | | | | 29,899 | |
| | | | | | | | | | | | |
| |
| REAL ESTATE 0.0% | |
DLF Ltd. | | | | | 284,460 | | | | | | 464 | |
| | | | | | | | | | | | |
| |
| TELECOMMUNICATION SERVICES 0.1% | |
Bharti Airtel Ltd. | | | | | 28,520 | | | | | | 128 | |
Reliance Communications Ltd. | | | | | 2,871,312 | | | | | | 1,433 | |
| | | | | | | | | | | | |
| | | | | | | | | | | 1,561 | |
| | | | | | | | | | | | |
| |
| UTILITIES 0.3% | |
Adani Power Ltd. (a) | | | | | 509,410 | | | | | | 224 | |
NHPC Ltd. | | | | | 1,740,670 | | | | | | 679 | |
NTPC Ltd. | | | | | 174,337 | | | | | | 423 | |
Reliance Infrastructure Ltd. | | | | | 153,230 | | | | | | 1,049 | |
| | | | | | | | | | | | |
| | | | | SHARES | | | | | MARKET
VALUE
(000S) | |
Tata Power Co. Ltd. | | | | | 1,510,539 | | | $ | | | 1,681 | |
| | | | | | | | | | | | |
| | | | | | | | | | | 4,056 | |
| | | | | | | | | | | | |
Total India | | | | | | | | | | | 81,008 | |
| | | | | | | | | | | | |
| |
| INDONESIA 1.5% | |
| |
| CONSUMER DISCRETIONARY 0.1% | |
Astra International Tbk PT | | | | | 2,353,900 | | | | | �� | 1,439 | |
| | | | | | | | | | | | |
| |
| CONSUMER STAPLES 0.1% | |
Indofood Sukses Makmur Tbk PT | | | | | 2,463,800 | | | | | | 1,443 | |
| | | | | | | | | | | | |
| |
| ENERGY 0.5% | |
Adaro Energy Tbk PT | | | | | 25,865,700 | | | | | | 3,229 | |
Bumi Resources Tbk PT (a) | | | | | 47,896,000 | | | | | | 988 | |
Indo Tambangraya Megah Tbk PT | | | | | 947,000 | | | | | | 1,181 | |
Tambang Batubara Bukit Asam Persero Tbk PT | | | | | 1,407,000 | | | | | | 1,298 | |
United Tractors Tbk PT | | | | | 982,500 | | | | | | 1,546 | |
| | | | | | | | | | | | |
| | | | | | | | | | | 8,242 | |
| | | | | | | | | | | | |
| |
| FINANCIALS 0.3% | |
Bank Central Asia Tbk PT | | | | | 340,700 | | | | | | 391 | |
Bank Mandiri Persero Tbk PT | | | | | 1,791,100 | | | | | | 1,533 | |
Bank Negara Indonesia Persero Tbk PT | | | | | 3,317,400 | | | | | | 1,354 | |
Bank Rakyat Indonesia Persero Tbk PT | | | | | 1,247,700 | | | | | | 1,078 | |
| | | | | | | | | | | | |
| | | | | | | | | | | 4,356 | |
| | | | | | | | | | | | |
| |
| INDUSTRIALS 0.0% | |
Berlian Laju Tanker Tbk PT (a) | | | | | 707,200 | | | | | | 0 | |
| | | | | | | | | | | | |
| |
| MATERIALS 0.1% | |
Semen Indonesia Persero Tbk PT | | | | | 435,900 | | | | | | 296 | |
Vale Indonesia Tbk PT (a) | | | | | 5,549,000 | | | | | | 1,150 | |
| | | | | | | | | | | | |
| | | | | | | | | | | 1,446 | |
| | | | | | | | | | | | |
| |
| TELECOMMUNICATION SERVICES 0.2% | |
Telekomunikasi Indonesia Persero Tbk PT | | | | | 10,443,000 | | | | | | 3,072 | |
XL Axiata Tbk PT | | | | | 694,000 | | | | | | 119 | |
| | | | | | | | | | | | |
| | | | | | | | | | | 3,191 | |
| | | | | | | | | | | | |
| |
| UTILITIES 0.2% | |
Perusahaan Gas Negara Persero Tbk | | | | | 12,044,000 | | | | | | 2,403 | |
| | | | | | | | | | | | |
Total Indonesia | | | | | | | | | | | 22,520 | |
| | | | | | | | | | | | |
| |
| MEXICO 1.3% | |
| |
| CONSUMER STAPLES 0.3% | |
Coca-Cola Femsa S.A.B. de C.V. SP - ADR | | | | | 7,560 | | | | | | 480 | |
Fomento Economico Mexicano S.A.B. de C.V. SP - ADR | | | | | 14,859 | | | | | | 1,132 | |
Grupo Bimbo S.A.B. de C.V. ‘A’ | | | | | 417,800 | | | | | | 945 | |
Grupo Comercial Chedraui S.A. de C.V. | | | | | 53,000 | | | | | | 95 | |
Kimberly-Clark de Mexico S.A.B. de C.V. ‘A’ | | | | | 419,900 | | | | | | 756 | |
| | | | | | | | | | | | |
| | | | | SHARES | | | | | MARKET
VALUE
(000S) | |
Wal-Mart de Mexico S.A.B. de C.V. | | | | | 389,700 | | | $ | | | 698 | |
| | | | | | | | | | | | |
| | | | | | | | | | | 4,106 | |
| | | | | | | | | | | | |
| |
| FINANCIALS 0.2% | |
Grupo Elektra S.A.B. de C.V. | | | | | 42,290 | | | | | | 531 | |
Grupo Financiero Banorte S.A.B. de C.V. ‘O’ | | | | | 98,700 | | | | | | 486 | |
Grupo Financiero Santander Mexico S.A.B. de C.V. ADR ‘B’ | | | | | 310,646 | | | | | | 2,233 | |
| | | | | | | | | | | | |
| | | | | | | | | | | 3,250 | |
| | | | | | | | | | | | |
| |
| INDUSTRIALS 0.1% | |
Grupo Aeromexico S.A.B. de C.V. (a) | | | | | 302,322 | | | | | | 569 | |
OHL Mexico S.A.B. de C.V. | | | | | 1,438,600 | | | | | | 1,415 | |
| | | | | | | | | | | | |
| | | | | | | | | | | 1,984 | |
| | | | | | | | | | | | |
| |
| MATERIALS 0.5% | |
Cemex S.A.B. de C.V. SP - ADR (a) | | | 542,077 | | | | | | 4,353 | |
Fresnillo PLC | | | | | 23,328 | | | | | | 346 | |
Grupo Mexico S.A.B. de C.V. ‘B’ | | | | | 186,199 | | | | | | 506 | |
Industrias Penoles S.A.B. de C.V. | | | | | 71,080 | | | | | | 1,318 | |
| | | | | | | | | | | | |
| | | | | | | | | | | 6,523 | |
| | | | | | | | | | | | |
| |
| TELECOMMUNICATION SERVICES 0.2% | |
America Movil S.A.B. de C.V. SP - ADR ‘L’ | | | | | 261,107 | | | | | | 3,282 | |
| | | | | | | | | | | | |
Total Mexico | | | | | | | | | | | 19,145 | |
| | | | | | | | | | | | |
| |
| POLAND 2.5% | |
| |
| ENERGY 0.3% | |
Grupa Lotos S.A. (a) | | | | | 108,575 | | | | | | 991 | |
Polski Koncern Naftowy Orlen S.A. | | | | | 122,376 | | | | | | 2,492 | |
Polskie Gornictwo Naftowe i Gazownictwo S.A. | | | | | 912,759 | | | | | | 1,227 | |
| | | | | | | | | | | | |
| | | | | | | | | | | 4,710 | |
| | | | | | | | | | | | |
| |
| FINANCIALS 0.6% | |
Bank Handlowy w Warszawie S.A. | | | | | 8,120 | | | | | | 148 | |
Bank Pekao S.A. | | | | | 49,422 | | | | | | 1,484 | |
Powszechna Kasa Oszczednosci Bank Polski S.A. (a) | | | | | 443,383 | | | | | | 2,979 | |
Powszechny Zaklad Ubezpieczen S.A. | | | | | 487,962 | | | | | | 3,869 | |
| | | | | | | | | | | | |
| | | | | | | | | | | 8,480 | |
| | | | | | | | | | | | |
| |
| INDUSTRIALS 0.0% | |
PKP Cargo S.A. | | | | | 28,606 | | | | | | 321 | |
| | | | | | | | | | | | |
| |
| INFORMATION TECHNOLOGY 0.1% | |
Asseco Poland S.A. | | | | | 82,969 | | | | | | 1,069 | |
| | | | | | | | | | | | |
| |
| MATERIALS 0.8% | |
Jastrzebska Spolka Weglowa S.A. | | | | | 154,580 | | | | | | 2,471 | |
KGHM Polska Miedz S.A. | | | | | 411,912 | | | | | | 9,058 | |
Synthos S.A. | | | | | 297,099 | | | | | | 324 | |
| | | | | | | | | | | | |
| | | | | | | | | | | 11,853 | |
| | | | | | | | | | | | |
| |
| | | | | | |
| See Accompanying Notes | | SEMIANNUAL REPORT | | DECEMBER 31, 2016 | | 33 |
Schedule of Investments PIMCO RAE Fundamental Emerging Markets Fund (Cont.)
| | | | | | | | | | | | |
| | | | | SHARES | | | | | MARKET
VALUE
(000S) | |
| TELECOMMUNICATION SERVICES 0.1% | |
Orange Polska S.A. | | | | | 1,689,928 | | | $ | | | 2,223 | |
| | | | | | | | | | | | |
| |
| UTILITIES 0.6% | |
Enea S.A. | | | | | 412,388 | | | | | | 935 | |
Energa S.A. | | | | | 865,597 | | | | | | 1,881 | |
PGE Polska Grupa Energetyczna S.A. | | | | | 1,710,292 | | | | | | 4,266 | |
Tauron Polska Energia S.A. (a) | | | | | 3,367,869 | | | | | | 2,293 | |
| | | | | | | | | | | | |
| | | | | | | | | | | 9,375 | |
| | | | | | | | | | | | |
Total Poland | | | | | | | | | | | 38,031 | |
| | | | | | | | | | | | |
| |
| RUSSIA 13.5% | |
| |
| CONSUMER STAPLES 0.5% | |
X5 Retail Group NV SP - GDR (a) | | | | | 221,568 | | | | | | 7,190 | |
| | | | | | | | | | | | |
| |
| ENERGY 7.9% | |
Gazprom Neft PJSC SP - ADR | | | 62,665 | | | | | | 1,099 | |
Gazprom PJSC SP - ADR | | | | | 8,103,010 | | | | | | 40,881 | |
Lukoil PJSC SP - ADR | | | | | 684,378 | | | | | | 38,336 | |
Rosneft Oil, Co. PJSC | | | | | 1,921,054 | | | | | | 12,476 | |
Surgutneftegas OJSC SP - ADR | | | | | 4,656,402 | | | | | | 23,475 | |
Tatneft PJSC SP - ADR | | | | | 78,791 | | | | | | 3,242 | |
| | | | | | | | | | | | |
| | | | | | | | | | | 119,509 | |
| | | | | | | | | | | | |
| |
| FINANCIALS 0.6% | |
Sberbank of Russia PJSC SP - ADR | | | | | 632,333 | | | | | | 7,281 | |
VTB Bank PJSC SP - GDR | | | | | 669,046 | | | | | | 1,592 | |
| | | | | | | | | | | | |
| | | | | | | | | | | 8,873 | |
| | | | | | | | | | | | |
| |
| INDUSTRIALS 0.5% | |
Aeroflot PJSC | | | | | 2,939,760 | | | | | | 7,348 | |
| | | | | | | | | | | | |
| |
| INFORMATION TECHNOLOGY 0.0% | |
Mail.Ru Group Ltd. GDR (a) | | | | | 5,120 | | | | | | 94 | |
| | | | | | | | | | | | |
| |
| MATERIALS 1.5% | |
Alrosa PJSC | | | | | 111,221 | | | | | | 176 | |
Evraz PLC (a) | | | | | 1,457,926 | | | | | | 3,985 | |
Magnitogorsk Iron & Steel Works OJSC | | | | | 1,771,000 | | | | | | 955 | |
Mechel PJSC SP - ADR | | | | | 294,903 | | | | | | 1,690 | |
MMC Norilsk Nickel PJSC ADR | | | | | 699,304 | | | | | | 11,639 | |
Novolipetsk Steel PJSC GDR | | | | | 53,070 | | | | | | 987 | |
PhosAgro PJSC SP - GDR | | | | | 140,418 | | | | | | 2,141 | |
Severstal PJSC SP - GDR | | | | | 82,223 | | | | | | 1,239 | |
| | | | | | | | | | | | |
| | | | | | | | | | | 22,812 | |
| | | | | | | | | | | | |
| |
| TELECOMMUNICATION SERVICES 1.4% | |
MegaFon PJSC SP - GDR | | | | | 304,423 | | | | | | 2,877 | |
Mobile TeleSystems PJSC | | | | | 2,761,160 | | | | | | 11,613 | |
Rostelecom PJSC | | | | | 1,781,450 | | | | | | 2,441 | |
Sistema PJSC FC SP - GDR | | | | | 464,854 | | | | | | 4,184 | |
| | | | | | | | | | | | |
| | | | | | | | | | | 21,115 | |
| | | | | | | | | | | | |
| |
| UTILITIES 1.1% | |
Federal Grid Co. Unified Energy System PJSC | | | | | 1,677,080,000 | | | | | | 5,552 | |
| | | | | | | | | | | | |
| | | | | SHARES | | | | | MARKET
VALUE
(000S) | |
Inter RAO UES PJSC | | | | | 49,690,000 | | | $ | | | 3,096 | |
Mosenergo PJSC | | | | | 6,070,000 | | | | | | 246 | |
Rosseti PJSC | | | | | 153,696,000 | | | | | | 2,866 | |
RusHydro PJSC | | | | | 289,167,000 | | | | | | 4,355 | |
| | | | | | | | | | | | |
| | | | | | | | | | | 16,115 | |
| | | | | | | | | | | | |
Total Russia | | | | | | | | | | | 203,056 | |
| | | | | | | | | | | | |
| |
| SOUTH AFRICA 7.4% | |
| |
| CONSUMER DISCRETIONARY 0.2% | |
Imperial Holdings Ltd. | | | | | 229,613 | | | | | | 3,038 | |
Truworths International Ltd. | | | | | 68,000 | | | | | | 394 | |
Tsogo Sun Holdings Ltd. | | | | | 149,481 | | | | | | 300 | |
| | | | | | | | | | | | |
| | | | | | | | | | | 3,732 | |
| | | | | | | | | | | | |
| |
| CONSUMER STAPLES 0.1% | |
Bid Corp. Ltd. | | | | | 50,073 | | | | | | 887 | |
Massmart Holdings Ltd. | | | | | 67,450 | | | | | | 620 | |
Pick n Pay Stores Ltd. | | | | | 32,260 | | | | | | 150 | |
Tiger Brands Ltd. | | | | | 9,241 | | | | | | 267 | |
| | | | | | | | | | | | |
| | | | | | | | | | | 1,924 | |
| | | | | | | | | | | | |
| |
| ENERGY 0.1% | |
Exxaro Resources Ltd. | | | | | 231,410 | | | | | | 1,494 | |
| | | | | | | | | | | | |
| |
| FINANCIALS 2.5% | |
Barclays Africa Group Ltd. | | | | | 561,723 | | | | | | 6,895 | |
FirstRand Ltd. | | | | | 535,910 | | | | | | 2,068 | |
Investec Ltd. | | | | | 88,418 | | | | | | 580 | |
Liberty Holdings Ltd. | | | | | 378,451 | | | | | | 3,037 | |
MMI Holdings Ltd. | | | | | 392,941 | | | | | | 671 | |
Nedbank Group Ltd. | | | | | 327,178 | | | | | | 5,663 | |
Sanlam Ltd. | | | | | 808,874 | | | | | | 3,700 | |
Standard Bank Group Ltd. | | | | | 1,304,750 | | | | | | 14,367 | |
| | | | | | | | | | | | |
| | | | | | | | | | | 36,981 | |
| | | | | | | | | | | | |
| |
| HEALTH CARE 0.1% | |
Life Healthcare Group Holdings Ltd. | | | | | 226,620 | | | | | | 537 | |
Netcare Ltd. | | | | | 238,566 | | | | | | 554 | |
| | | | | | | | | | | | |
| | | | | | | | | | | 1,091 | |
| | | | | | | | | | | | |
| |
| INDUSTRIALS 0.4% | |
Barloworld Ltd. | | | | | 700,846 | | | | | | 5,993 | |
Bidvest Group Ltd. | | | | | 62,798 | | | | | | 827 | |
| | | | | | | | | | | | |
| | | | | | | | | | | 6,820 | |
| | | | | | | | | | | | |
| |
| MATERIALS 2.5% | |
African Rainbow Minerals Ltd. | | | | | 237,920 | | | | | | 1,693 | |
AngloGold Ashanti Ltd. SP - ADR (a) | | | | | 308,440 | | | | | | 3,242 | |
Assore Ltd. | | | | | 11,220 | | | | | | 193 | |
Gold Fields Ltd. SP - ADR | | | | | 1,489,576 | | | | | | 4,484 | |
Harmony Gold Mining Co. Ltd. SP - ADR | | | | | 160,000 | | | | | | 354 | |
Impala Platinum Holdings Ltd. (a) | | | | | 882,181 | | | | | | 2,714 | |
Kumba Iron Ore Ltd. (a) | | | | | 505,497 | | | | | | 5,852 | |
Lonmin PLC (a) | | | | | 742,343 | | | | | | 1,286 | |
Nampak Ltd. | | | | | 1,444,148 | | | | | | 1,943 | |
Sappi Ltd. (a) | | | | | 536,192 | | | | | | 3,498 | |
Sasol Ltd. | | | | | 390,660 | | | | | | 11,212 | |
| | | | | | | | | | | | |
| | | | | SHARES | | | | | MARKET
VALUE
(000S) | |
Sibanye Gold Ltd. | | | | | 497,422 | | | $ | | | 893 | |
| | | | | | | | | | | | |
| | | | | | | | | | | 37,364 | |
| | | | | | | | | | | | |
| |
| TELECOMMUNICATION SERVICES 1.5% | |
MTN Group Ltd. | | | | | 1,784,340 | | | | | | 16,342 | |
Telkom S.A. SOC Ltd. | | | | | 685,847 | | | | | | 3,677 | |
Vodacom Group Ltd. | | | | | 168,588 | | | | | | 1,868 | |
| | | | | | | | | | | | |
| | | | | | | | | | | 21,887 | |
| | | | | | | | | | | | |
Total South Africa | | | | | | | | | | | 111,293 | |
| | | | | | | | | | | | |
| |
| SOUTH KOREA 13.6% | |
| |
| CONSUMER DISCRETIONARY 2.4% | |
CJ O Shopping Co. Ltd. | | | | | 6,798 | | | | | | 914 | |
Hankook Tire Co. Ltd. | | | | | 23,210 | | | | | | 1,116 | |
Hyundai Department Store Co. Ltd. | | | | | 2,732 | | | | | | 247 | |
Hyundai Mobis Co. Ltd. | | | | | 8,468 | | | | | | 1,849 | |
Hyundai Motor Co. | | | | | 121,196 | | | | | | 14,621 | |
Kia Motors Corp. | | | | | 109,733 | | | | | | 3,561 | |
Kumho Tire Co., Inc. (a) | | | | | 278,110 | | | | | | 1,948 | |
LG Electronics, Inc. | | | | | 194,015 | | | | | | 8,283 | |
Lotte Shopping Co. Ltd. | | | | | 16,673 | | | | | | 3,058 | |
Shinsegae Ltd. | | | | | 1,616 | | | | | | 235 | |
| | | | | | | | | | | | |
| | | | | | | | | | | 35,832 | |
| | | | | | | | | | | | |
| |
| CONSUMER STAPLES 0.2% | |
Amorepacific Corp. | | | | | 335 | | | | | | 89 | |
E-MART Inc. | | | | | 8,932 | | | | | | 1,352 | |
Hite Jinro Co. Ltd. | | | | | 29,390 | | | | | | 513 | |
KT&G Corp. | | | | | 10,050 | | | | | | 841 | |
LG Household & Health Care Ltd. | | | | | 146 | | | | | | 104 | |
| | | | | | | | | | | | |
| | | | | | | | | | | 2,899 | |
| | | | | | | | | | | | |
| |
| ENERGY 0.1% | |
GS Holdings Corp. | | | | | 8,640 | | | | | | 386 | |
SK Innovation Co. Ltd. | | | | | 10,776 | | | | | | 1,304 | |
| | | | | | | | | | | | |
| | | | | | | | | | | 1,690 | |
| | | | | | | | | | | | |
| |
| FINANCIALS 3.2% | |
BNK Financial Group, Inc. | | | | | 20,170 | | | | | | 145 | |
DGB Financial Group, Inc. | | | | | 188,903 | | | | | | 1,526 | |
Dongbu Insurance Co. Ltd. | | | | | 14,931 | | | | | | 773 | |
Hana Financial Group, Inc. | | | | | 286,003 | | | | | | 7,382 | |
Hanwha Life Insurance Co. Ltd. | | | | | 400,571 | | | | | | 2,164 | |
Hyundai Marine & Fire Insurance Co. Ltd. | | | | | 63,832 | | | | | | 1,661 | |
Industrial Bank of Korea | | | | | 300,163 | | | | | | 3,150 | |
KB Financial Group, Inc. | | | | | 192,700 | | | | | | 6,810 | |
KB Insurance Co. Ltd. | | | | | 50,240 | | | | | | 1,087 | |
Mirae Asset Life Insurance Co. Ltd. | | | | | 275,343 | | | | | | 1,173 | |
Samsung Card Co. Ltd. | | | | | 17,000 | | | | | | 559 | |
Samsung Fire & Marine Insurance Co. Ltd. | | | | | 1,002 | | | | | | 223 | |
Samsung Life Insurance Co. Ltd. | | | | | 52,206 | | | | | | 4,859 | |
Shinhan Financial Group Co. Ltd. | | | | | 211,849 | | | | | | 7,945 | |
Tongyang Life Insurance Co. Ltd. | | | | | 57,530 | | | | | | 603 | |
Woori Bank | | | | | 693,129 | | | | | | 7,305 | |
| | | | | | | | | | | | |
| | | | | | | | | | | 47,365 | |
| | | | | | | | | | | | |
| | | | | | | | |
| 34 | | PIMCO EQUITY SERIES | | | | | See Accompanying Notes | |
December 31, 2016 (Unaudited)
| | | | | | | | | | | | |
| | | | | SHARES | | | | | MARKET
VALUE
(000S) | |
| INDUSTRIALS 1.4% | |
Asiana Airlines, Inc. (a) | | | | | 251,400 | | | $ | | | 876 | |
CJ Corp. | | | | | 10,817 | | | | | | 1,673 | |
Daewoo Shipbuilding & Marine Engineering Co. Ltd. | | | | | 110,150 | | | | | | 204 | |
Doosan Corp. | | | | | 13,056 | | | | | | 1,132 | |
Doosan Heavy Industries & Construction Co. Ltd. | | | | | 100,631 | | | | | | 2,261 | |
Doosan Infracore Co. Ltd. (a) | | | | | 391,760 | | | | | | 2,847 | |
Hanwha Corp. | | | | | 45,665 | | | | | | 1,323 | |
Hyundai Engineering & Construction Co. Ltd. | | | | | 13,414 | | | | | | 475 | |
Hyundai Heavy Industries Co. Ltd. | | | | | 29,220 | | | | | | 3,510 | |
Korean Air Lines Co. Ltd. (a) | | | | | 68,642 | | | | | | 1,549 | |
LG Corp. | | | | | 5,285 | | | | | | 262 | |
LS Corp. | | | | | 60,266 | | | | | | 2,956 | |
Samsung Heavy Industries Co. Ltd. | | | | | 176,820 | | | | | | 1,350 | |
SK Networks Co. Ltd. | | | | | 211,990 | | | | | | 1,213 | |
| | | | | | | | | | | | |
| | | | | | | | | | | 21,631 | |
| | | | | | | | | | | | |
| |
| INFORMATION TECHNOLOGY 3.3% | |
LG Display Co. Ltd. | | | | | 110,827 | | | | | | 2,875 | |
Samsung Electro-Mechanics Co. Ltd. | | | | | 4,161 | | | | | | 175 | |
Samsung Electronics Co. Ltd. | | | | | 31,662 | | | | | | 47,123 | |
SK Hynix, Inc. | | | | | 4,800 | | | | | | 177 | |
| | | | | | | | | | | | |
| | | | | | | | | | | 50,350 | |
| | | | | | | | | | | | |
| |
| MATERIALS 1.5% | |
Dongkuk Steel Mill Co. Ltd. | | | | | 218,669 | | | | | | 1,994 | |
Hanwha Chemical Corp. | | | | | 49,160 | | | | | | 1,002 | |
Hyosung Corp. | | | | | 3,622 | | | | | | 435 | |
Hyundai Steel Co. | | | | | 38,531 | | | | | | 1,813 | |
Kolon Industries, Inc. | | | | | 10,391 | | | | | | 636 | |
LG Chem Ltd. | | | | | 1,403 | | | | | | 303 | |
OCI Co. Ltd. | | | | | 1,672 | | | | | | 109 | |
POSCO | | | | | 75,886 | | | | | | 16,112 | |
| | | | | | | | | | | | |
| | | | | | | | | | | 22,404 | |
| | | | | | | | | | | | |
| |
| TELECOMMUNICATION SERVICES 1.1% | |
KT Corp. SP - ADR (a) | | | | | 548,263 | | | | | | 7,725 | |
LG Uplus Corp. | | | | | 569,492 | | | | | | 5,398 | |
SK Telecom Co. Ltd. SP - ADR | | | | | 142,881 | | | | | | 2,986 | |
| | | | | | | | | | | | |
| | | | | | | | | | | 16,109 | |
| | | | | | | | | | | | |
| |
| UTILITIES 0.4% | |
Korea Electric Power Corp. | | | | | 102,778 | | | | | | 3,749 | |
Korea Gas Corp. | | | | | 43,487 | | | | | | 1,745 | |
| | | | | | | | | | | | |
| | | | | | | | | | | 5,494 | |
| | | | | | | | | | | | |
Total South Korea | | | | | | | | | | | 203,774 | |
| | | | | | | | | | | | |
| |
| TAIWAN 7.2% | |
| |
| CONSUMER DISCRETIONARY 0.3% | |
Cheng Shin Rubber Industry Co. Ltd. | | | | | 134,000 | | | | | | 252 | |
Far Eastern Department Stores Ltd. | | | | | 383,000 | | | | | | 190 | |
Formosa Taffeta Co. Ltd. | | | | | 360,000 | | | | | | 329 | |
Pou Chen Corp. | | | | | 945,000 | | | | | | 1,174 | |
Ruentex Industries Ltd. | | | | | 929,000 | | | | | | 1,536 | |
| | | | | | | | | | | | |
| | | | | SHARES | | | | | MARKET
VALUE
(000S) | |
Yulon Motor Co. Ltd. | | | | | 665,000 | | | $ | | | 551 | |
| | | | | | | | | | | | |
| | | | | | | | | | | 4,032 | |
| | | | | | | | | | | | |
| |
| CONSUMER STAPLES 0.1% | |
Uni-President Enterprises Corp. | | | | | 1,277,640 | | | | | | 2,107 | |
| | | | | | | | | | | | |
| |
| FINANCIALS 0.9% | |
Cathay Financial Holding Co. Ltd. | | | | | 345,000 | | | | | | 513 | |
China Development Financial Holding Corp. | | | | | 2,507,000 | | | | | | 624 | |
China Life Insurance Co. Ltd. | | | | | 4,426,632 | | | | | | 4,377 | |
Fubon Financial Holding Co. Ltd. | | | | | 114,000 | | | | | | 180 | |
Hua Nan Financial Holdings Co. Ltd. | | | | | 1,203,948 | | | | | | 605 | |
Mega Financial Holding Co. Ltd. | | | | | 2,207,658 | | | | | | 1,570 | |
Mercuries Life Insurance Co. Ltd. (a) | | | | | 877,000 | | | | | | 461 | |
Shanghai Commercial & Savings Bank Ltd. | | | | | 556,446 | | | | | | 466 | |
Shin Kong Financial Holding Co. Ltd. | | | | | 10,074,903 | | | | | | 2,461 | |
SinoPac Financial Holdings Co. Ltd. | | | | | 2,928,601 | | | | | | 823 | |
Taishin Financial Holding Co. Ltd. | | | | | 2,205,772 | | | | | | 806 | |
Taiwan Business Bank | | | | | 2,834,750 | | | | | | 715 | |
Taiwan Cooperative Financial Holding Co. Ltd. | | | | | 698,710 | | | | | | 304 | |
| | | | | | | | | | | | |
| | | | | | | | | | | 13,905 | |
| | | | | | | | | | | | |
| |
| INDUSTRIALS 0.2% | |
Far Eastern New Century Corp. | | | | | 2,987,520 | | | | | | 2,237 | |
Taiwan High Speed Rail Corp. | | | | | 263,000 | | | | | | 150 | |
Teco Electric and Machinery Co. Ltd. | | | | | 689,000 | | | | | | 594 | |
| | | | | | | | | | | | |
| | | | | | | | | | | 2,981 | |
| | | | | | | | | | | | |
| |
| INFORMATION TECHNOLOGY 4.6% | |
Acer, Inc. | | | | | 4,382,000 | | | | | | 1,771 | |
Advanced Semiconductor Engineering, Inc. | | | | | 1,093,000 | | | | | | 1,114 | |
Asustek Computer, Inc. | | | | | 354,000 | | | | | | 2,898 | |
AU Optronics Corp. | | | | | 11,770,000 | | | | | | 4,274 | |
Compal Electronics, Inc. | | | | | 5,171,000 | | | | | | 2,954 | |
Hon Hai Precision Industry Co. Ltd. | | | | | 2,767,145 | | | | | | 7,198 | |
HTC Corp. | | | | | 2,213,000 | | | | | | 5,393 | |
Innolux Corp. | | | | | 13,807,000 | | | | | | 4,943 | |
Inventec Corp. | | | | | 2,101,000 | | | | | | 1,433 | |
Lite-On Technology Corp. | | | | | 2,780,035 | | | | | | 4,181 | |
MediaTek, Inc. | | | | | 147,000 | | | | | | 982 | |
Novatek Microelectronics Corp. | | | | | 125,000 | | | | | | 411 | |
Pegatron Corp. | | | | | 182,000 | | | | | | 433 | |
Powertech Technology, Inc. | | | | | 667,000 | | | | | | 1,790 | |
Quanta Computer, Inc. | | | | | 901,000 | | | | | | 1,679 | |
Siliconware Precision Industries Co. Ltd. | | | | | 284,000 | | | | | | 421 | |
Synnex Technology International Corp. | | | | | 812,650 | | | | | | 817 | |
Taiwan Semiconductor Manufacturing Co. Ltd. SP - ADR | | | | | 464,702 | | | | | | 13,360 | |
TPK Holding Co. Ltd. | | | | | 1,159,000 | | | | | | 2,124 | |
Unimicron Technology Corp. | | | | | 2,268,000 | | | | | | 869 | |
| | | | | | | | | | | | |
| | | | | SHARES | | | | | MARKET
VALUE
(000S) | |
United Microelectronics Corp. | | | | | 12,413,000 | | | $ | | | 4,371 | |
Wistron Corp. | | | | | 5,047,358 | | | | | | 3,890 | |
WPG Holdings Ltd. | | | | | 987,000 | | | | | | 1,160 | |
Yageo Corp. | | | | | 114,036 | | | | | | 207 | |
| | | | | | | | | | | | |
| | | | | | | | | | | 68,673 | |
| | | | | | | | | | | | |
| |
| MATERIALS 0.6% | |
Asia Cement Corp. | | | | | 1,826,000 | | | | | | 1,485 | |
China Steel Corp. | | | | | 3,546,000 | | | | | | 2,696 | |
Formosa Chemicals & Fibre Corp. | | | | | 350,000 | | | | | | 1,042 | |
Formosa Plastics Corp. | | | | | 118,000 | | | | | | 325 | |
Nan Ya Plastics Corp. | | | | | 223,000 | | | | | | 491 | |
Taiwan Cement Corp. | | | | | 2,705,000 | | | | | | 2,940 | |
| | | | | | | | | | | | |
| | | | | | | | | | | 8,979 | |
| | | | | | | | | | | | |
| |
| REAL ESTATE 0.1% | |
Farglory Land Development Co. Ltd. | | | | | 297,000 | | | | | | 340 | |
Highwealth Construction Corp. | | | | | 443,000 | | | | | | 625 | |
| | | | | | | | | | | | |
| | | | | | | | | | | 965 | |
| | | | | | | | | | | | |
| |
| TELECOMMUNICATION SERVICES 0.4% | |
Chunghwa Telecom Co. Ltd. | | | | | 1,347,000 | | | | | | 4,230 | |
Far EasTone Telecommunications Co. Ltd. | | | | | 519,000 | | | | | | 1,167 | |
Taiwan Mobile Co. Ltd. | | | | | 112,000 | | | | | | 360 | |
| | | | | | | | | | | | |
| | | | | | | | | | | 5,757 | |
| | | | | | | | | | | | |
Total Taiwan | | | | | | | | | | | 107,399 | |
| | | | | | | | | | | | |
| |
| THAILAND 2.6% | |
| |
| CONSUMER STAPLES 0.1% | |
Charoen Pokphand Foods PCL | | | | | 943,800 | | | | | | 775 | |
| | | | | | | | | | | | |
| |
| ENERGY 1.2% | |
Banpu Public Co. Ltd. | | | | | 5,764,200 | | | | | | 3,070 | |
PTT Exploration & Production PCL | | | | | 2,358,400 | | | | | | 6,317 | |
PTT PCL | | | | | 767,500 | | | | | | 7,946 | |
| | | | | | | | | | | | |
| | | | | | | | | | | 17,333 | |
| | | | | | | | | | | | |
| |
| FINANCIALS 0.8% | |
Bangkok Bank PCL | | | | | 750,100 | | | | | | 3,330 | |
Kasikornbank PCL | | | | | 437,500 | | | | | | 2,161 | |
Krung Thai Bank PCL | | | | | 4,893,375 | | | | | | 2,411 | |
Siam Commercial Bank PCL | | | | | 662,800 | | | | | | 2,811 | |
Thanachart Capital PCL | | | | | 1,439,600 | | | | | | 1,767 | |
| | | | | | | | | | | | |
| | | | | | | | | | | 12,480 | |
| | | | | | | | | | | | |
| |
| INDUSTRIALS 0.3% | |
Thai Airways International PCL (a) | | | | | 7,325,400 | | | | | | 4,634 | |
| | | | | | | | | | | | |
| |
| MATERIALS 0.1% | |
PTT Global Chemical PCL | | | | | 753,900 | | | | | | 1,322 | |
| | | | | | | | | | | | |
| |
| TELECOMMUNICATION SERVICES 0.1% | |
Advanced Info Service PCL | | | | | 58,500 | | | | | | 239 | |
| | | | | | |
| See Accompanying Notes | | SEMIANNUAL REPORT | | DECEMBER 31, 2016 | | 35 |
Schedule of Investments PIMCO RAE Fundamental Emerging Markets Fund (Cont.)
| | | | | | | | | | | | |
| | | | | SHARES | | | | | MARKET
VALUE
(000S) | |
Total Access Communication PCL | | | | | 1,670,400 | | | $ | | | 1,757 | |
| | | | | | | | | | | | |
| | | | | | | | | | | 1,996 | |
| | | | | | | | | | | | |
Total Thailand | | | | | | | | | | | 38,540 | |
| | | | | | | | | | | | |
| |
| TURKEY 1.1% | |
| |
| CONSUMER DISCRETIONARY 0.0% | |
Arcelik A/S | | | | | 54,550 | | | | | | 328 | |
| | | | | | | | | | | | |
| |
| CONSUMER STAPLES 0.1% | |
Anadolu Efes Biracilik Ve Malt Sanayii A/S | | | | | 70,130 | | | | | | 350 | |
Migros Ticaret A/S | | | | | 138,778 | | | | | | 691 | |
| | | | | | | | | | | | |
| | | | | | | | | | | 1,041 | |
| | | | | | | | | | | | |
| |
| ENERGY 0.0% | |
Tupras Turkiye Petrol Rafinerileri A/S | | | | | 8,010 | | | | | | 160 | |
| | | | | | | | | | | | |
| |
| FINANCIALS 0.8% | |
Akbank TAS | | | | | 341,710 | | | | | | 756 | |
Haci Omer Sabanci Holding A/S | | | | | 1,191,270 | | | | | | 3,084 | |
Turkiye Garanti Bankasi A/S | | | | | 548,420 | | | | | | 1,183 | |
Turkiye Halk Bankasi A/S | | | | | 887,350 | | | | | | 2,345 | |
Turkiye Is Bankasi ‘C’ | | | | | 1,818,390 | | | | | | 2,667 | |
Turkiye Vakiflar Bankasi TAO ‘D’ | | | | | 872,270 | | | | | | 1,073 | |
Yapi ve Kredi Bankasi A/S | | | | | 864,370 | | | | | | 839 | |
| | | | | | | | | | | | |
| | | | | | | | | | | 11,947 | |
| | | | | | | | | | | | |
| |
| INDUSTRIALS 0.1% | |
KOC Holding A/S | | | | | 121,880 | | | | | | 476 | |
Turk Hava Yollari AO (a) | | | | | 410,210 | | | | | | 582 | |
Turkiye Sise ve Cam Fabrikalari A/S | | | | | 449,610 | | | | | | 488 | |
| | | | | | | | | | | | |
| | | | | | | | | | | 1,546 | |
| | | | | | | | | | | | |
| | | | | | | | | | | | |
| | | | | SHARES | | | | | MARKET
VALUE
(000S) | |
| MATERIALS 0.1% | |
Eregli Demir ve Celik Fabrikalari TAS | | | | | 824,600 | | | $ | | | 1,200 | |
| | | | | | | | | | | | |
| |
| TELECOMMUNICATION SERVICES 0.0% | |
Turk Telekomunikasyon A/S | | | | | 282,560 | | | | | | 422 | |
Turkcell Iletisim Hizmetleri A/S (a) | | | | | 99,427 | | | | | | 275 | |
| | | | | | | | | | | | |
| | | | | | | | | | | 697 | |
| | | | | | | | | | | | |
Total Turkey | | | | | | | | | | | 16,919 | |
| | | | | | | | | | �� | | |
Total Common Stocks (Cost $1,173,559) | | | | | | 1,380,770 | |
| | | | | | | | | | | | |
| |
| PREFERRED STOCKS 7.5% | |
| |
| BRAZIL 7.1% | |
| |
| BANKING & FINANCE 0.2% | |
Banco do Estado do Rio Grande do Sul S.A. | | | | | 875,800 | | | | | | 2,774 | |
Itausa - Investimentos Itau S.A. | | | | | 116,700 | | | | | | 296 | |
| | | | | | | | | | | | |
| | | | | | | | | | | 3,070 | |
| | | | | | | | | | | | |
| |
| INDUSTRIALS 5.2% | |
Braskem S.A. | | | | | 470,400 | | | | | | 4,938 | |
Cia Brasileira de Distribuicao | | | | | 487,100 | | | | | | 8,179 | |
Metalurgica Gerdau S.A. | | | | | 8,585,200 | | | | | | 12,570 | |
Usinas Siderurgicas de Minas Gerais S.A. | | | | | 1,987,400 | | | | | | 2,481 | |
Vale S.A. | | | | | 6,882,100 | | | | | | 49,061 | |
| | | | | | | | | | | | |
| | | | | | | | | | | 77,229 | |
| | | | | | | | | | | | |
| |
| UTILITIES 1.7% | |
Centrais Eletricas Brasileiras S.A. | | | | | 1,881,600 | | | | | | 14,943 | |
Cia de Gas de Sao Paulo - COMGAS | | | | | 11,900 | | | | | | 168 | |
| | | | | | | | | | | | |
| | | | | SHARES | | | | | MARKET
VALUE
(000S) | |
Cia de Saneamento do Parana | | | | | 102,400 | | | $ | | | 338 | |
Cia de Transmissao de Energia Eletrica Paulista | | | | | 37,800 | | | | | | 752 | |
Cia Energetica de Sao Paulo | | | | | 782,700 | | | | | | 3,240 | |
Cia Paranaense de Energia | | | | | 426,600 | | | | | | 3,574 | |
Eletropaulo Metropolitana Eletricidade de Sao Paulo S.A. | | | | | 708,022 | | | | | | 2,451 | |
| | | | | | | | | | | | |
| | | | | | | | | | | 25,466 | |
| | | | | | | | | | | | |
Total Brazil | | | | | | | | | | | 105,765 | |
| | | | | | | | | | | | |
| |
| RUSSIA 0.4% | |
| |
| UTILITIES 0.4% | |
Bashneft PJSC | | | | | 43,723 | | | | | | 873 | |
Transneft PJSC | | | | | 1,609 | | | | | | 5,190 | |
| | | | | | | | | | | | |
| | | | | | | | | | | 6,063 | |
| | | | | | | | | | | | |
Total Russia | | | | | | | | | | | 6,063 | |
| | | | | | | | | | | | |
Total Preferred Stocks (Cost $58,056) | | | | | | | | | 111,828 | |
| | | | | | | | | | | | |
| | | | | | | | | | | | |
| Total Investments in Securities (Cost $1,231,615) | | | | | | | | | | | 1,492,598 | |
| | | | | | | | | | | | |
| Total Investments 99.5% (Cost $1,231,615) | | | | | | | | $ | | | 1,492,598 | |
| | | | | | | | | | | | |
| Other Assets and Liabilities, net 0.5% | | | | | | 8,103 | |
| | | | | | | | | | | | |
| Net Assets 100.0% | | | | | | | | $ | | | 1,500,701 | |
| | | | | | | | | | | | |
NOTES TO SCHEDULE OF INVESTMENTS (AMOUNTS IN THOUSANDS*):
| * | A zero balance may reflect actual amounts rounding to less than one thousand. |
| (a) | Security did not produce income within the last twelve months. |
FAIR VALUE OF FINANCIAL DERIVATIVE INSTRUMENTS
The following is a summary of the fair valuation of the Fund’s derivative instruments categorized by risk exposure. See Note 6, Principal Risks, in the Notes to Financial Statements on risks of the Fund.
The effect of Financial Derivative Instruments on the Statements of Operations for the period ended December 31, 2016:
| | | | | | | | | | | | | | | | | | | | | | | | |
| | | Derivatives not accounted for as hedging instruments | |
| | | Commodity
Contracts | | | Credit
Contracts | | | Equity
Contracts | | | Foreign
Exchange
Contracts | | | Interest
Rate Contracts | | | Total | |
Net Realized Gain on Financial Derivative Instruments | | | | | | | | | | | | | | | | | |
Over the counter | | | | | | | | | | | | | | | | | | | | | | | | |
Forward Foreign Currency Contracts | | $ | 0 | | | $ | 0 | | | $ | 0 | | | $ | 521 | | | $ | 0 | | | $ | 521 | |
| | | | | | | | | | | | | | | | | | | | | | | | |
| | | |
Net Change in Unrealized (Depreciation) on Financial Derivative Instruments | | | | | | | | | | | | | |
Over the counter | | | | | | | | | | | | | | | | | | | | | | | | |
Forward Foreign Currency Contracts | | $ | 0 | | | $ | 0 | | | $ | 0 | | | $ | (408 | ) | | $ | 0 | | | $ | (408 | ) |
| | | | | | | | | | | | | | | | | | | | | | | | |
| | | | | | | | |
| 36 | | PIMCO EQUITY SERIES | | | | | See Accompanying Notes | |
December 31, 2016 (Unaudited)
FAIR VALUE MEASUREMENTS
The following is a summary of the fair valuations according to the inputs used as of December 31, 2016 in valuing the Fund’s assets and liabilities:
| | | | | | | | | | | | | | | | |
| Category and Subcategory | | Level 1 | | | Level 2 | | | Level 3 | | | Fair
Value at
12/31/2016 | |
Investments in Securities, at Value | | | | | | | | | | | | | |
Common Stocks | | | | | | | | | | | | | | | | |
Brazil | | | | | | | | | | | | | | | | |
Consumer Discretionary | | $ | 0 | | | $ | 5,714 | | | $ | 0 | | | $ | 5,714 | |
Consumer Staples | | | 1,990 | | | | 10,689 | | | | 0 | | | | 12,679 | |
Energy | | | 50,993 | | | | 1,662 | | | | 0 | | | | 52,655 | |
Financials | | | 57,420 | | | | 35,462 | | | | 0 | | | | 92,882 | |
Health Care | | | 0 | | | | 538 | | | | 0 | | | | 538 | |
Industrials | | | 475 | | | | 2,390 | | | | 0 | | | | 2,865 | |
Materials | | | 18,799 | | | | 998 | | | | 0 | | | | 19,797 | |
Real Estate | | | 0 | | | | 2,327 | | | | 0 | | | | 2,327 | |
Telecommunication Services | | | 8,080 | | | | 0 | | | | 0 | | | | 8,080 | |
Utilities | | | 20,978 | | | | 12,897 | | | | 0 | | | | 33,875 | |
Chile | | | | | | | | | | | | | | | | |
Consumer Staples | | | 2,082 | | | | 0 | | | | 0 | | | | 2,082 | |
Energy | | | 161 | | | | 0 | | | | 0 | | | | 161 | |
Financials | | | 1,161 | | | | 0 | | | | 0 | | | | 1,161 | |
Industrials | | | 1,006 | | | | 0 | | | | 0 | | | | 1,006 | |
Materials | | | 1,548 | | | | 1,841 | | | | 0 | | | | 3,389 | |
Telecommunication Services | | | 466 | | | | 0 | | | | 0 | | | | 466 | |
Utilities | | | 1,443 | | | | 0 | | | | 0 | | | | 1,443 | |
China | | | | | | | | | | | | | | | | |
Consumer Discretionary | | | 0 | | | | 4,570 | | | | 0 | | | | 4,570 | |
Consumer Staples | | | 0 | | | | 950 | | | | 0 | | | | 950 | |
Energy | | | 0 | | | | 51,158 | | | | 0 | | | | 51,158 | |
Financials | | | 0 | | | | 129,977 | | | | 0 | | | | 129,977 | |
Industrials | | | 0 | | | | 4,401 | | | | 0 | | | | 4,401 | |
Information Technology | | | 1,264 | | | | 5,200 | | | | 0 | | | | 6,464 | |
Materials | | | 0 | | | | 10,225 | | | | 0 | | | | 10,225 | |
Real Estate | | | 0 | | | | 20,581 | | | | 0 | | | | 20,581 | |
Telecommunication Services | | | 0 | | | | 7,048 | | | | 0 | | | | 7,048 | |
Utilities | | | 0 | | | | 1,709 | | | | 0 | | | | 1,709 | |
Greece | | | | | | | | | | | | | | | | |
Consumer Discretionary | | | 0 | | | | 3,082 | | | | 0 | | | | 3,082 | |
Financials | | | 0 | | | | 12,606 | | | | 0 | | | | 12,606 | |
Telecommunication Services | | | 0 | | | | 2,181 | | | | 0 | | | | 2,181 | |
Utilities | | | 0 | | | | 203 | | | | 0 | | | | 203 | |
Hong Kong | | | | | | | | | | | | | | | | |
Consumer Staples | | | 0 | | | | 6,159 | | | | 0 | | | | 6,159 | |
Energy | | | 0 | | | | 1,268 | | | | 0 | �� | | | 1,268 | |
Financials | | | 0 | | | | 4,269 | | | | 0 | | | | 4,269 | |
Industrials | | | 0 | | | | 3,477 | | | | 0 | | | | 3,477 | |
Materials | | | 0 | | | | 2,096 | | | | 0 | | | | 2,096 | |
Real Estate | | | 0 | | | | 6,854 | | | | 0 | | | | 6,854 | |
Telecommunication Services | | | 0 | | | | 15,118 | | | | 0 | | | | 15,118 | |
Utilities | | | 0 | | | | 3,569 | | | | 0 | | | | 3,569 | |
India | | | | | | | | | | | | | | | | |
Consumer Discretionary | | | 0 | | | | 2,996 | | | | 0 | | | | 2,996 | |
Consumer Staples | | | 0 | | | | 1,157 | | | | 0 | | | | 1,157 | |
Energy | | | 101 | | | | 11,535 | | | | 0 | | | | 11,636 | |
Financials | | | 0 | | | | 22,988 | | | | 0 | | | | 22,988 | |
Health Care | | | 0 | | | | 705 | | | | 0 | | | | 705 | |
Industrials | | | 0 | | | | 4,096 | | | | 0 | | | | 4,096 | |
Information Technology | | | 1,072 | | | | 378 | | | | 0 | | | | 1,450 | |
Materials | | | 0 | | | | 29,899 | | | | 0 | | | | 29,899 | |
Real Estate | | | 0 | | | | 464 | | | | 0 | | | | 464 | |
Telecommunication Services | | | 0 | | | | 1,561 | | | | 0 | | | | 1,561 | |
Utilities | | | 0 | | | | 4,056 | | | | 0 | | | | 4,056 | |
Indonesia | | | | | | | | | | | | | | | | |
Consumer Discretionary | | | 0 | | | | 1,439 | | | | 0 | | | | 1,439 | |
Consumer Staples | | | 0 | | | | 1,443 | | | | 0 | | | | 1,443 | |
Energy | | | 988 | | | | 7,254 | | | | 0 | | | | 8,242 | |
Financials | | | 0 | | | | 4,356 | | | | 0 | | | | 4,356 | |
Materials | | | 0 | | | | 1,446 | | | | 0 | | | | 1,446 | |
Telecommunication Services | | | 0 | | | | 3,191 | | | | 0 | | | | 3,191 | |
Utilities | | | 0 | | | | 2,403 | | | | 0 | | | | 2,403 | |
| | | | | | | | | | | | | | | | |
| Category and Subcategory | | Level 1 | | | Level 2 | | | Level 3 | | | Fair
Value at
12/31/2016 | |
Mexico | | | | | | | | | | | | | | | | |
Consumer Staples | | $ | 4,106 | | | $ | 0 | | | $ | 0 | | | $ | 4,106 | |
Financials | | | 3,250 | | | | 0 | | | | 0 | | | | 3,250 | |
Industrials | | | 1,984 | | | | 0 | | | | 0 | | | | 1,984 | |
Materials | | | 6,177 | | | | 346 | | | | 0 | | | | 6,523 | |
Telecommunication Services | | | 3,282 | | | | 0 | | | | 0 | | | | 3,282 | |
Poland | | | | | | | | | | | | | | | | |
Energy | | | 0 | | | | 4,710 | | | | 0 | | | | 4,710 | |
Financials | | | 0 | | | | 8,480 | | | | 0 | | | | 8,480 | |
Industrials | | | 321 | | | | 0 | | | | 0 | | | | 321 | |
Information Technology | | | 0 | | | | 1,069 | | | | 0 | | | | 1,069 | |
Materials | | | 2,471 | | | | 9,382 | | | | 0 | | | | 11,853 | |
Telecommunication Services | | | 0 | | | | 2,223 | | | | 0 | | | | 2,223 | |
Utilities | | | 0 | | | | 9,375 | | | | 0 | | | | 9,375 | |
Russia | | | | | | | | | | | | | | | | |
Consumer Staples | | | 7,190 | | | | 0 | | | | 0 | | | | 7,190 | |
Energy | | | 0 | | | | 119,509 | | | | 0 | | | | 119,509 | |
Financials | | | 0 | | | | 8,873 | | | | 0 | | | | 8,873 | |
Industrials | | | 0 | | | | 7,348 | | | | 0 | | | | 7,348 | |
Information Technology | | | 94 | | | | 0 | | | | 0 | | | | 94 | |
Materials | | | 8,803 | | | | 14,009 | | | | 0 | | | | 22,812 | |
Telecommunication Services | | | 7,061 | | | | 14,054 | | | | 0 | | | | 21,115 | |
Utilities | | | 0 | | | | 16,115 | | | | 0 | | | | 16,115 | |
South Africa | | | | | | | | | | | | | | | | |
Consumer Discretionary | | | 394 | | | | 3,338 | | | | 0 | | | | 3,732 | |
Consumer Staples | | | 620 | | | | 1,304 | | | | 0 | | | | 1,924 | |
Energy | | | 0 | | | | 1,494 | | | | 0 | | | | 1,494 | |
Financials | | | 0 | | | | 36,981 | | | | 0 | | | | 36,981 | |
Health Care | | | 0 | | | | 1,091 | | | | 0 | | | | 1,091 | |
Industrials | | | 0 | | | | 6,820 | | | | 0 | | | | 6,820 | |
Materials | | | 14,125 | | | | 23,239 | | | | 0 | | | | 37,364 | |
Telecommunication Services | | | 0 | | | | 21,887 | | | | 0 | | | | 21,887 | |
South Korea | | | | | | | | | | | | | | | | |
Consumer Discretionary | | | 0 | | | | 35,832 | | | | 0 | | | | 35,832 | |
Consumer Staples | | | 0 | | | | 2,899 | | | | 0 | | | | 2,899 | |
Energy | | | 0 | | | | 1,690 | | | | 0 | | | | 1,690 | |
Financials | | | 0 | | | | 47,365 | | | | 0 | | | | 47,365 | |
Industrials | | | 0 | | | | 21,427 | | | | 204 | | | | 21,631 | |
Information Technology | | | 0 | | | | 50,350 | | | | 0 | | | | 50,350 | |
Materials | | | 0 | | | | 22,404 | | | | 0 | | | | 22,404 | |
Telecommunication Services | | | 10,711 | | | | 5,398 | | | | 0 | | | | 16,109 | |
Utilities | | | 0 | | | | 5,494 | | | | 0 | | | | 5,494 | |
Taiwan | | | | | | | | | | | | | | | | |
Consumer Discretionary | | | 0 | | | | 4,032 | | | | 0 | | | | 4,032 | |
Consumer Staples | | | 0 | | | | 2,107 | | | | 0 | | | | 2,107 | |
Financials | | | 466 | | | | 13,439 | | | | 0 | | | | 13,905 | |
Industrials | | | 0 | | | | 2,981 | | | | 0 | | | | 2,981 | |
Information Technology | | | 13,567 | | | | 55,106 | | | | 0 | | | | 68,673 | |
Materials | | | 0 | | | | 8,979 | | | | 0 | | | | 8,979 | |
Real Estate | | | 0 | | | | 965 | | | | 0 | | | | 965 | |
Telecommunication Services | | | 0 | | | | 5,757 | | | | 0 | | | | 5,757 | |
Thailand | | | | | | | | | | | | | | | | |
Consumer Staples | | | 0 | | | | 775 | | | | 0 | | | | 775 | |
Energy | | | 0 | | | | 17,333 | | | | 0 | | | | 17,333 | |
Financials | | | 0 | | | | 12,480 | | | | 0 | | | | 12,480 | |
Industrials | | | 0 | | | | 4,634 | | | | 0 | | | | 4,634 | |
Materials | | | 0 | | | | 1,322 | | | | 0 | | | | 1,322 | |
Telecommunication Services | | | 0 | | | | 1,996 | | | | 0 | | | | 1,996 | |
Turkey | | | | | | | | | | | | | | | | |
Consumer Discretionary | | | 0 | | | | 328 | | | | 0 | | | | 328 | |
Consumer Staples | | | 350 | | | | 691 | | | | 0 | | | | 1,041 | |
Energy | | | 0 | | | | 160 | | | | 0 | | | | 160 | |
Financials | | | 0 | | | | 11,947 | | | | 0 | | | | 11,947 | |
Industrials | | | 0 | | | | 1,546 | | | | 0 | | | | 1,546 | |
Materials | | | 0 | | | | 1,200 | | | | 0 | | | | 1,200 | |
Telecommunication Services | | | 0 | | | | 697 | | | | 0 | | | | 697 | |
| | | | | | |
| See Accompanying Notes | | SEMIANNUAL REPORT | | DECEMBER 31, 2016 | | 37 |
Schedule of Investments PIMCO RAE Fundamental Emerging Markets Fund (Cont.)
December 31, 2016 (Unaudited)
| | | | | | | | | | | | | | | | |
| Category and Subcategory | | Level 1 | | | Level 2 | | | Level 3 | | | Fair
Value at
12/31/2016 | |
Preferred Stocks | | | | | | | | | | | | | | | | |
Brazil | | | | | | | | | | | | | | | | |
Banking & Finance | | $ | 0 | | | $ | 3,070 | | | $ | 0 | | | $ | 3,070 | |
Industrials | | | 0 | | | | 77,229 | | | | 0 | | | | 77,229 | |
Utilities | | | 168 | | | | 25,298 | | | | 0 | | | | 25,466 | |
Russia | | | | | | | | | | | | | | | | |
Utilities | | | 0 | | | | 6,063 | | | | 0 | | | | 6,063 | |
| | | | | | | | | | | | | | | | |
| | | | |
Total Investments | | $ | 255,167 | | | $ | 1,237,227 | | | $ | 204 | | | $ | 1,492,598 | |
| | | | | | | | | | | | | | | | |
There were assets and liabilities valued at $177,930 transferred from Level 1 to Level 2 during the period ended December 31, 2016. There were assets and liabilities valued at $24,384 transferred from Level 2 to Level 1 during the period ended December 31, 2016. There were no significant transfers between Levels 2 and 3 during the period ended December 31, 2016.
| | | | | | | | |
| 38 | | PIMCO EQUITY SERIES | | | | | See Accompanying Notes | |
Schedule of Investments PIMCO RAE Fundamental Global Fund
December 31, 2016 (Unaudited)
| | | | | | | | | | | | |
| | | | | SHARES | | | | | MARKET
VALUE
(000S) | |
| INVESTMENTS IN AFFILIATES 99.9% | |
| |
| MUTUAL FUNDS (a) 99.9% | |
| |
| UNITED STATES 99.9% | |
PIMCO RAE Fundamental Emerging Markets Fund | | | | | 5,102,263 | | | $ | | | 49,390 | |
PIMCO RAE Fundamental International Fund | | | | | 19,201,561 | | | | | | 175,694 | |
PIMCO RAE Fundamental U.S. Fund | | | | | 15,568,922 | | | | | | 158,025 | |
| | | | | | | | | | | | |
Total Mutual Funds (Cost $368,446) | | | | | | 383,109 | |
| | | | | | | | | | | | |
| | | | | | | | | | | | |
Total Investments in Affiliates
(Cost $368,446) | | | | | | 383,109 | |
| | | | | | | | | | | | |
Total Investments 99.9% (Cost $368,446) | | | $ | | | 383,109 | |
| |
| Other Assets and Liabilities, net 0.1% | | | | | | 550 | |
| | | | | | | | | | | | |
| Net Assets 100.0% | | | | | | | | $ | | | 383,659 | |
| | | | | | | | | | | | |
NOTES TO SCHEDULE OF INVESTMENTS (AMOUNTS IN THOUSANDS*):
| * | A zero balance may reflect actual amounts rounding to less than one thousand. |
| (a) | Institutional Class Shares of each Fund. |
FAIR VALUE MEASUREMENTS
The following is a summary of the fair valuations according to the inputs used as of December 31, 2016 in valuing the Fund’s assets and liabilities:
| | | | | | | | | | | | | | | | |
| Category and Subcategory | | Level 1 | | | Level 2 | | | Level 3 | | | Fair
Value at
12/31/2016 | |
Investments in Affiliates, at Value | | | | | | | | | | | | | | | | |
Mutual Funds | | | | | | | | | | | | | | | | |
United States | | $ | 383,109 | | | $ | 0 | | | $ | 0 | | | $ | 383,109 | |
| | | | | | | | | | | | | | | | |
| | | | |
Totals | | $ | 383,109 | | | $ | 0 | | | $ | 0 | | | $ | 383,109 | |
| | | | | | | | | | | | | | | | |
There were no significant transfers between Levels 1, 2, or 3 during the period ended December 31, 2016.
| | | | | | |
| See Accompanying Notes | | SEMIANNUAL REPORT | | DECEMBER 31, 2016 | | 39 |
Schedule of Investments PIMCO RAE Fundamental Global ex-US Fund
December 31, 2016 (Unaudited)
| | | | | | | | | | | | |
| | | | | SHARES | | | | | MARKET
VALUE
(000S) | |
| INVESTMENTS IN AFFILIATES 98.7% | |
| |
| MUTUAL FUNDS (a) 98.7% | |
| |
| UNITED STATES 98.7% | |
PIMCO RAE Fundamental Emerging Markets Fund | | | | | 1,531,918 | | | $ | | | 14,829 | |
PIMCO RAE Fundamental International Fund | | | | | 5,758,835 | | | | | | 52,693 | |
| | | | | | | | | | | | |
| Total Mutual Funds (Cost $71,272) | | | | | | 67,522 | |
| | | | | | | | | | | | |
| | | | | | | | | | | | |
| Total Investments in Affiliates (Cost $71,272) | | | | | | | | | 67,522 | |
| | | | | | | | | | | | |
| Total Investments 98.7% (Cost $71,272) | | | | | | $ | | | 67,522 | |
| |
| Other Assets and Liabilities, net 1.3% | | | | | | 894 | |
| | | | | | | | | | | | |
| Net Assets 100.0% | | | | | | $ | | | 68,416 | |
| | | | | | | | | | | | |
NOTES TO SCHEDULE OF INVESTMENTS (AMOUNTS IN THOUSANDS*):
| * | A zero balance may reflect actual amounts rounding to less than one thousand. |
| (a) | Institutional Class Shares of each Fund. |
FAIR VALUE MEASUREMENTS
The following is a summary of the fair valuations according to the inputs used as of December 31, 2016 in valuing the Fund’s assets and liabilities:
| | | | | | | | | | | | | | | | |
| Category and Subcategory | | Level 1 | | | Level 2 | | | Level 3 | | | Fair
Value at
12/31/2016 | |
Investments in Affiliates, at Value | | | | | | | | | | | | | | | | |
Mutual Funds | | | | | | | | | | | | | | | | |
United States | | $ | 67,522 | | | $ | 0 | | | $ | 0 | | | $ | 67,522 | |
| | | | | | | | | | | | | | | | |
| | | | |
Totals | | $ | 67,522 | | | $ | 0 | | | $ | 0 | | | $ | 67,522 | |
| | | | | | | | | | | | | | | | |
There were no significant transfers between Levels 1, 2, or 3 during the period ended December 31, 2016.
| | | | | | | | |
| 40 | | PIMCO EQUITY SERIES | | | | | See Accompanying Notes | |
Schedule of Investments PIMCO RAE Fundamental International Fund
December 31, 2016 (Unaudited)
| | | | | | | | | | | | |
| | | | | SHARES | | | | | MARKET
VALUE
(000S) | |
| INVESTMENTS IN SECURITIES 99.7% | |
| |
| COMMON STOCKS 98.7% | |
| |
| AUSTRALIA 6.7% | |
| |
| CONSUMER DISCRETIONARY 0.1% | |
Myer Holdings Ltd. | | | | | 157,408 | | | $ | | | 157 | |
Star Entertainment Grp Ltd. | | | | | 15,758 | | | | | | 59 | |
Tatts Group Ltd. | | | | | 21,537 | | | | | | 69 | |
| | | | | | | | | | | | |
| | | | | | | | | | | 285 | |
| | | | | | | | | | | | |
| |
| CONSUMER STAPLES 0.6% | |
Coca-Cola Amatil Ltd. | | | | | 20,294 | | | | | | 148 | |
Metcash Ltd. (a) | | | | | 151,799 | | | | | | 249 | |
Wesfarmers Ltd. | | | | | 26,188 | | | | | | 795 | |
Woolworths Ltd. | | | | | 44,645 | | | | | | 775 | |
| | | | | | | | | | | | |
| | | | | | | | | | | 1,967 | |
| | | | | | | | | | | | |
| |
| ENERGY 0.5% | |
Origin Energy Ltd. | | | | | 20,511 | | | | | | 97 | |
Santos Ltd. | | | | | 65,532 | | | | | | 189 | |
Whitehaven Coal Ltd. | | | | | 30,759 | | | | | | 57 | |
Woodside Petroleum Ltd. | | | | | 29,407 | | | | | | 659 | |
WorleyParsons Ltd. | | | | | 74,818 | | | | | | 521 | |
| | | | | | | | | | | | |
| | | | | | | | | | | 1,523 | |
| | | | | | | | | | | | |
| |
| FINANCIALS 2.7% | |
AMP Ltd. | | | | | 77,485 | | | | | | 281 | |
Australia & New Zealand Banking Group Ltd. | | | | | 91,418 | | | | | | 2,001 | |
Bank of Queensland Ltd. | | | | | 3,116 | | | | | | 27 | |
Bendigo & Adelaide Bank Ltd. | | | | | 33,835 | | | | | | 310 | |
Commonwealth Bank of Australia | | | | | 24,361 | | | | | | 1,445 | |
Genworth Mortgage Insurance Australia Ltd. | | | | | 40,911 | | | | | | 96 | |
Insurance Australia Group Ltd. | | | | | 25,784 | | | | | | 111 | |
Macquarie Group Ltd. | | | | | 4,902 | | | | | | 307 | |
National Australia Bank Ltd. | | | | | 76,518 | | | | | | 1,690 | |
QBE Insurance Group Ltd. | | | | | 22,352 | | | | | | 200 | |
Suncorp Group Ltd. | | | | | 85,507 | | | | | | 833 | |
Westpac Banking Corp. | | | | | 79,765 | | | | | | 1,872 | |
| | | | | | | | | | | | |
| | | | | | | | | | | 9,173 | |
| | | | | | | | | | | | |
| |
| HEALTH CARE 0.1% | |
CSL Ltd. | | | | | 2,619 | | | | | | 190 | |
Primary Health Care Ltd. | | | | | 49,375 | | | | | | 145 | |
Sonic Healthcare Ltd. | | | | | 2,486 | | | | | | 38 | |
| | | | | | | | | | | | |
| | | | | | | | | | | 373 | |
| | | | | | | | | | | | |
| |
| INDUSTRIALS 0.2% | |
Aurizon Holdings Ltd. | | | | | 37,481 | | | | | | 136 | |
CIMIC Group Ltd. | | | | | 8,498 | | | | | | 214 | |
Cleanaway Waste Management Ltd. | | | | | 81,072 | | | | | | 72 | |
Downer EDI Ltd. | | | | | 64,130 | | | | | | 281 | |
Qantas Airways Ltd. | | | | | 26,082 | | | | | | 62 | |
| | | | | | | | | | | | |
| | | | | | | | | | | 765 | |
| | | | | | | | | | | | |
| |
| MATERIALS 2.3% | |
BHP Billiton Ltd. | | | | | 306,122 | | | | | | 5,250 | |
BlueScope Steel Ltd. | | | | | 16,710 | | | | | | 111 | |
Boral Ltd. | | | | | 34,887 | | | | | | 136 | |
CSR Ltd. | | | | | 94,891 | | | | | | 315 | |
Fortescue Metals Group Ltd. | | | | | 243,066 | | | | | | 1,016 | |
| | | | | | | | | | | | |
| | | | | SHARES | | | | | MARKET
VALUE
(000S) | |
Iluka Resources Ltd. | | | | | 12,800 | | | $ | | | 67 | |
Incitec Pivot Ltd. | | | | | 45,389 | | | | | | 117 | |
Mineral Resources Ltd. | | | | | 17,642 | | | | | | 154 | |
Orica Ltd. | | | | | 28,916 | | | | | | 367 | |
OZ Minerals Ltd. | | | | | 48,947 | | | | | | 276 | |
| | | | | | | | | | | | |
| | | | | | | | | | | 7,809 | |
| | | | | | | | | | | | |
| |
| REAL ESTATE 0.0% | |
Lend Lease Group | | | | | 10,213 | | | | | | 107 | |
| | | | | | | | | | | | |
| |
| TELECOMMUNICATION SERVICES 0.1% | |
Telstra Corp. Ltd. | | | | | 52,109 | | | | | | 192 | |
| | | | | | | | | | | | |
| |
| UTILITIES 0.1% | |
AGL Energy Ltd. | | | | | 7,374 | | | | | | 117 | |
AusNet Services | | | | | 75,497 | | | | | | 86 | |
DUET Group | | | | | 21,277 | | | | | | 42 | |
| | | | | | | | | | | | |
| | | | | | | | | | | 245 | |
| | | | | | | | | | | | |
Total Australia | | | | | | | | | | | 22,439 | |
| | | | | | | | | | | | |
| |
| AUSTRIA 0.7% | |
| |
| ENERGY 0.2% | |
OMV AG | | | | | 20,215 | | | | | | 713 | |
| | | | | | | | | | | | |
| |
| FINANCIALS 0.4% | |
Erste Group Bank AG | | | | | 21,462 | | | | | | 628 | |
Raiffeisen Bank International AG | | | | | 25,917 | | | | | | 472 | |
Vienna Insurance Group AG Wiener Versicherung Gruppe | | | | | 4,484 | | | | | | 100 | |
| | | | | | | | | | | | |
| | | | | | | | | | | 1,200 | |
| | | | | | | | | | | | |
| |
| INDUSTRIALS 0.0% | |
Oesterreichische Post AG | | | | | 2,010 | | | | | | 67 | |
| | | | | | | | | | | | |
| |
| MATERIALS 0.1% | | | | | | | | | | | | |
voestalpine AG | | | | | 9,841 | | | | | | 385 | |
| | | | | | | | | | | | |
| |
| REAL ESTATE 0.0% | |
IMMOFINANZ AG | | | | | 29,881 | | | | | | 58 | |
| | | | | | | | | | | | |
Total Austria | | | | | | | | | | | 2,423 | |
| | | | | | | | | | | | |
| |
| BELGIUM 0.6% | |
| |
| CONSUMER STAPLES 0.2% | |
Anheuser-Busch InBev S.A. | | | | | 5,756 | | | | | | 609 | |
| | | | | | | | | | | | |
| |
| FINANCIALS 0.3% | |
Ageas | | | | | 16,690 | | | | | | 659 | |
KBC Group NV | | | | | 4,156 | | | | | | 257 | |
| | | | | | | | | | | | |
| | | | | | | | | | | 916 | |
| | | | | | | | | | | | |
| |
| HEALTH CARE 0.0% | |
UCB S.A. | | | | | 545 | | | | | | 35 | |
| | | | | | | | | | | | |
| |
| INDUSTRIALS 0.0% | | | | | | | | | | | | |
bpost S.A. | | | | | 2,870 | | | | | | 68 | |
| | | | | | | | | | | | |
| |
| MATERIALS 0.0% | |
Solvay S.A. | | | | | 647 | | | | | | 75 | |
Umicore S.A. | | | | | 1,084 | | | | | | 62 | |
| | | | | | | | | | | | |
| | | | | | | | | | | 137 | |
| | | | | | | | | | | | |
| | | | | | | | | | | | |
| | | | | SHARES | | | | | MARKET
VALUE
(000S) | |
| TELECOMMUNICATION SERVICES 0.1% | |
Proximus S.A. | | | | | 7,954 | | | $ | | | 229 | |
| | | | | | | | | | | | |
Total Belgium | | | | | | | | | | | 1,994 | |
| | | | | | | | | | | | |
| |
| CANADA 10.4% | |
| |
| CONSUMER DISCRETIONARY 0.3% | |
Canadian Tire Corp. Ltd. ‘A’ | | | | | 1,861 | | | | | | 193 | |
Hudson’s Bay Co. | | | | | 6,307 | | | | | | 62 | |
Magna International, Inc. | | | | | 13,637 | | | | | | 592 | |
Quebecor, Inc. ‘B’ | | | | | 6,356 | | | | | | 177 | |
Shaw Communications, Inc. ‘B’ | | | | | 2,784 | | | | | | 56 | |
| | | | | | | | | | | | |
| | | | | | | | | | | 1,080 | |
| | | | | | | | | | | | |
| |
| CONSUMER STAPLES 0.2% | |
Empire Co. Ltd. ‘A’ | | | | | 11,399 | | | | | | 134 | |
George Weston Ltd. | | | | | 3,583 | | | | | | 303 | |
| | | | | | | | | | | | |
| | | | | | | | | | | 437 | |
| | | | | | | | | | | | |
| |
| ENERGY 3.3% | |
ARC Resources Ltd. | | | | | 10,683 | | | | | | 184 | |
Baytex Energy Corp. (a) | | | | | 109,904 | | | | | | 537 | |
Bonavista Energy Corp. | | | | | 54,699 | | | | | | 196 | |
Cameco Corp. | | | | | 3,558 | | | | | | 37 | |
Canadian Natural Resources Ltd. | | | | | 24,466 | | | | | | 780 | |
Cenovus Energy, Inc. | | | | | 79,022 | | | | | | 1,195 | |
Crescent Point Energy Corp. | | | | | 35,997 | | | | | | 489 | |
Enbridge, Inc. | | | | | 3,636 | | | | | | 153 | |
Encana Corp. | | | | | 87,831 | | | | | | 1,031 | |
Enerplus Corp. | | | | | 101,229 | | | | | | 960 | |
Gran Tierra Energy, Inc. (a) | | | | | 22,590 | | | | | | 68 | |
Husky Energy, Inc. (a) | | | | | 52,393 | | | | | | 636 | |
MEG Energy Corp. (a) | | | | | 60,308 | | | | | | 414 | |
Pengrowth Energy Corp. | | | | | 130,604 | | | | | | 185 | |
Penn West Petroleum Ltd. (a) | | | | | 170,963 | | | | | | 302 | |
PrairieSky Royalty Ltd. | | | | | 1,290 | | | | | | 31 | |
Precision Drilling Corp. | | | | | 56,334 | | | | | | 307 | |
ShawCor Ltd. | | | | | 3,629 | | | | | | 97 | |
Suncor Energy, Inc. | | | | | 80,736 | | | | | | 2,640 | |
TransCanada Corp. | | | | | 17,662 | | | | | | 796 | |
Vermilion Energy, Inc. | | | | | 3,457 | | | | | | 145 | |
| | | | | | | | | | | | |
| | | | | | | | | | | 11,183 | |
| | | | | | | | | | | | |
| |
| FINANCIALS 3.3% | |
Bank of Montreal | | | | | 20,748 | | | | | | 1,492 | |
Bank of Nova Scotia | | | | | 33,224 | | | | | | 1,850 | |
Canadian Imperial Bank of Commerce | | | | | 17,851 | | | | | | 1,457 | |
Genworth MI Canada, Inc. | | | | | 4,464 | | | | | | 112 | |
Great-West Lifeco, Inc. (b) | | | | | 6,232 | | | | | | 163 | |
IGM Financial, Inc. | | | | | 6,056 | | | | | | 172 | |
Manulife Financial Corp. | | | | | 21,009 | | | | | | 374 | |
National Bank of Canada | | | | | 12,253 | | | | | | 498 | |
Onex Corp. | | | | | 4,401 | | | | | | 300 | |
Power Corp. of Canada | | | | | 21,353 | | | | | | 478 | |
Power Financial Corp. | | | | | 10,058 | | | | | | 251 | |
Royal Bank of Canada | | | | | 27,951 | | | | | | 1,892 | |
Sun Life Financial, Inc. | | | | | 11,336 | | | | | | 435 | |
Toronto-Dominion Bank | | | | | 33,177 | | | | | | 1,636 | |
| | | | | | | | | | | | |
| | | | | | | | | | | 11,110 | |
| | | | | | | | | | | | |
| |
| INDUSTRIALS 0.8% | |
Air Canada (a) | | | | | 74,275 | | | | | | 756 | |
| | | | | | |
| See Accompanying Notes | | SEMIANNUAL REPORT | | DECEMBER 31, 2016 | | 41 |
Schedule of Investments PIMCO RAE Fundamental International Fund (Cont.)
| | | | | | | | | | | | |
| | | | | SHARES | | | | | MARKET
VALUE
(000S) | |
Bombardier, Inc. ‘B’ (a) | | | | | 245,389 | | | $ | | | 395 | |
Canadian National Railway Co. | | | | | 10,236 | | | | | | 689 | |
Canadian Pacific Railway Ltd. | | | | | 301 | | | | | | 43 | |
Finning International, Inc. | | | | | 16,410 | | | | | | 321 | |
Russel Metals, Inc. | | | | | 3,857 | | | | | | 74 | |
SNC-Lavalin Group, Inc. | | | | | 3,333 | | | | | | 143 | |
WestJet Airlines Ltd. | | | | | 11,867 | | | | | | 204 | |
| | | | | | | | | | | | |
| | | | | | | | | | | 2,625 | |
| | | | | | | | | | | | |
| |
| INFORMATION TECHNOLOGY 0.1% | |
BlackBerry Ltd. (a) | | | | | 50,319 | | | | | | 347 | |
| | | | | | | | | | | | |
| |
| MATERIALS 1.7% | |
Agrium, Inc. | | | | | 3,576 | | | | | | 359 | |
Barrick Gold Corp. | | | | | 29,976 | | | | | | 479 | |
First Quantum Minerals Ltd. | | | | | 31,817 | | | | | | 316 | |
Goldcorp, Inc. | | | | | 2,553 | | | | | | 35 | |
IAMGOLD Corp. (a) | | | | | 80,254 | | | | | | 309 | |
Kinross Gold Corp. (a) | | | | | 72,250 | | | | | | 225 | |
Potash Corp. of Saskatchewan, Inc. | | | | | 49,348 | | | | | | 893 | |
Teck Resources Ltd. ‘B’ | | | | | 134,453 | | | | | | 2,691 | |
Yamana Gold, Inc. | | | | | 137,184 | | | | | | 385 | |
| | | | | | | | | | | | |
| | | | | | | | | | | 5,692 | |
| | | | | | | | | | | | |
| |
| TELECOMMUNICATION SERVICES 0.4% | |
BCE, Inc. | | | | | 6,680 | | | | | | 289 | |
Manitoba Telecom Services, Inc. | | | | | 10,321 | | | | | | 292 | |
Rogers Communications, Inc. ‘B’ | | | | | 13,179 | | | | | | 508 | |
TELUS Corp. | | | | | 10,391 | | | | | | 331 | |
| | | | | | | | | | | | |
| | | | | | | | | | | 1,420 | |
| | | | | | | | | | | | |
| |
| UTILITIES 0.3% | |
Atco Ltd. ‘I’ | | | | | 5,293 | | | | | | 176 | |
Canadian Utilities Ltd. ‘A’ | | | | | 2,452 | | | | | | 66 | |
Capital Power Corp. | | | | | 10,631 | | | | | | 184 | |
Emera, Inc. | | | | | 1,977 | | | | | | 67 | |
Just Energy Group, Inc. | | | | | 4,994 | | | | | | 27 | |
Superior Plus Corp. | | | | | 13,969 | | | | | | 133 | |
TransAlta Corp. | | | | | 59,134 | | | | | | 327 | |
| | | | | | | | | | | | |
| | | | | | | | | | | 980 | |
| | | | | | | | | | | | |
Total Canada | | | | | | | | | | | 34,874 | |
| | | | | | | | | | | | |
| |
| DENMARK 0.9% | |
| |
| CONSUMER DISCRETIONARY 0.0% | |
Pandora A/S | | | | | 562 | | | | | | 73 | |
| | | | | | | | | | | | |
| |
| CONSUMER STAPLES 0.1% | |
Carlsberg A/S ‘B’ | | | | | 3,931 | | | | | | 339 | |
| | | | | | | | | | | | |
| |
| FINANCIALS 0.1% | |
Danske Bank A/S | | | | | 7,031 | | | | | | 213 | |
| | | | | | | | | | | | |
| |
| HEALTH CARE 0.1% | |
Novo Nordisk A/S ‘B’ | | | | | 11,054 | | | | | | 396 | |
| | | | | | | | | | | | |
| |
| INDUSTRIALS 0.5% | |
AP Moller - Maersk A/S | | | | | 721 | | | | | | 1,149 | |
ISS A/S | | | | | 12,460 | | | | | | 420 | |
| | | | | | | | | | | | |
| | | | | SHARES | | | | | MARKET
VALUE
(000S) | |
Vestas Wind Systems A/S | | | | | 450 | | | $ | | | 29 | |
| | | | | | | | | | | | |
| | | | | | | | | | | 1,598 | |
| | | | | | | | | | | | |
| |
| TELECOMMUNICATION SERVICES 0.1% | |
TDC A/S | | | | | 74,064 | | | | | | 380 | |
| | | | | | | | | | | | |
Total Denmark | | | | | | | | | | | 2,999 | |
| | | | | | | | | | | | |
| |
| FINLAND 0.7% | |
| |
| CONSUMER DISCRETIONARY 0.0% | |
Nokian Renkaat OYJ | | | | | 828 | | | | | | 31 | |
| | | | | | | | | | | | |
| |
| CONSUMER STAPLES 0.1% | |
Kesko OYJ ‘B’ | | | | | 5,227 | | | | | | 261 | |
| | | | | | | | | | | | |
| |
| ENERGY 0.0% | |
Neste OYJ | | | | | 2,117 | | | | | | 81 | |
| | | | | | | | | | | | |
| |
| FINANCIALS 0.0% | |
Sampo OYJ ‘A’ | | | | | 2,758 | | | | | | 123 | |
| | | | | | | | | | | | |
| |
| HEALTH CARE 0.0% | |
Orion OYJ ‘B’ | | | | | 2,703 | | | | | | 120 | |
| | | | | | | | | | | | |
| |
| INDUSTRIALS 0.1% | |
Kone OYJ ‘B’ | | | | | 595 | | | | | | 27 | |
Metso OYJ | | | | | 4,303 | | | | | | 122 | |
| | | | | | | | | | | | |
| | | | | | | | | | | 149 | |
| | | | | | | | | | | | |
| |
| INFORMATION TECHNOLOGY 0.0% | |
Tieto OYJ | | | | | 3,471 | | | | | | 94 | |
| | | | | | | | | | | | |
| |
| MATERIALS 0.3% | |
Stora Enso OYJ ‘R’ | | | | | 32,138 | | | | | | 344 | |
UPM-Kymmene OYJ | | | | | 21,458 | | | | | | 525 | |
| | | | | | | | | | | | |
| | | | | | | | | | | 869 | |
| | | | | | | | | | | | |
| |
| TELECOMMUNICATION SERVICES 0.0% | |
Elisa OYJ | | | | | 2,204 | | | | | | 71 | |
| | | | | | | | | | | | |
| |
| UTILITIES 0.2% | |
Fortum OYJ | | | | | 35,367 | | | | | | 541 | |
| | | | | | | | | | | | |
Total Finland | | | | | | | | | | | 2,340 | |
| | | | | | | | | | | | |
| |
| FRANCE 11.6% | |
| |
| CONSUMER DISCRETIONARY 1.5% | |
Accor S.A. | | | | | 2,993 | | | | | | 112 | |
Christian Dior SE | | | | | 1,584 | | | | | | 332 | |
Cie Generale des Etablissements Michelin | | | | | 7,868 | | | | | | 875 | |
Elior Group | | | | | 5,098 | | | | | | 117 | |
Kering | | | | | 1,160 | | | | | | 260 | |
Lagardere S.C.A. | | | | | 15,551 | | | | | | 432 | |
LVMH Moet Hennessy Louis Vuitton SE | | | | | 3,099 | | | | | | 591 | |
Peugeot S.A. (a) | | | | | 15,865 | | | | | | 258 | |
Publicis Groupe S.A. | | | | | 2,164 | | | | | | 149 | |
Renault S.A. | | | | | 5,733 | | | | | | 509 | |
Television Francaise 1 | | | | | 10,115 | | | | | | 100 | |
Valeo S.A. | | | | | 2,565 | | | | | | 147 | |
| | | | | | | | | | | | |
| | | | | SHARES | | | | | MARKET
VALUE
(000S) | |
Vivendi S.A. | | | | | 66,663 | | | $ | | | 1,264 | |
| | | | | | | | | | | | |
| | | | | | | | | | | 5,146 | |
| | | | | | | | | | | | |
| |
| CONSUMER STAPLES 0.7% | |
Carrefour S.A. | | | | | 36,008 | | | | | | 867 | |
Casino Guichard Perrachon S.A. | | | | | 12,108 | | | | | | 580 | |
Danone S.A. | | | | | 7,620 | | | | | | 482 | |
L’Oreal S.A. | | | | | 1,180 | | | | | | 215 | |
Pernod-Ricard S.A. | | | | | 2,053 | | | | | | 222 | |
| | | | | | | | | | | | |
| | | | | | | | | | | 2,366 | |
| | | | | | | | | | | | |
| |
| ENERGY 1.3% | |
CGG S.A. (a) | | | | | 9,233 | | | | | | 133 | |
Technip S.A. | | | | | 3,145 | | | | | | 224 | |
Total S.A. | | | | | 71,431 | | | | | | 3,664 | |
Vallourec S.A. | | | | | 65,768 | | | | | | 452 | |
| | | | | | | | | | | | |
| | | | | | | | | | | 4,473 | |
| | | | | | | | | | | | |
| |
| FINANCIALS 3.0% | |
AXA S.A. | | | | | 66,402 | | | | | | 1,674 | |
BNP Paribas S.A. | | | | | 55,473 | | | | | | 3,530 | |
CNP Assurances | | | | | 13,742 | | | | | | 254 | |
Credit Agricole S.A. | | | | | 63,615 | | | | | | 788 | |
Eurazeo S.A. | | | | | 1,914 | | | | | | 112 | |
Natixis S.A. | | | | | 13,919 | | | | | | 78 | |
SCOR SE | | | | | 6,389 | | | | | | 221 | |
Societe Generale S.A. | | | | | 68,822 | | | | | | 3,385 | |
Wendel S.A. | | | | | 782 | | | | | | 94 | |
| | | | | | | | | | | | |
| | | | | | | | | | | 10,136 | |
| | | | | | | | | | | | |
| |
| HEALTH CARE 1.0% | |
Essilor International S.A. | | | | | 1,195 | | | | | | 135 | |
Sanofi | | | | | 40,481 | | | | | | 3,273 | |
| | | | | | | | | | | | |
| | | | | | | | | | | 3,408 | |
| | | | | | | | | | | | |
| |
| INDUSTRIALS 2.1% | |
Air France-KLM (a) | | | | | 141,318 | | | | | | 769 | |
Airbus Group SE | | | | | 4,878 | | | | | | 322 | |
Alstom S.A. (a) | | | | | 4,873 | | | | | | 134 | |
Bouygues S.A. | | | | | 22,275 | | | | | | 798 | |
Cie de Saint-Gobain | | | | | 25,715 | | | | | | 1,196 | |
Eiffage S.A. | | | | | 7,802 | | | | | | 543 | |
Legrand S.A. | | | | | 525 | | | | | | 30 | |
Rexel S.A. | | | | | 32,482 | | | | | | 534 | |
Safran S.A. | | | | | 3,966 | | | | | | 285 | |
Schneider Electric SE | | | | | 10,080 | | | | | | 700 | |
Teleperformance SE | | | | | 1,325 | | | | | | 133 | |
Thales S.A. | | | | | 1,332 | | | | | | 129 | |
Vinci S.A. | | | | | 19,674 | | | | | | 1,338 | |
| | | | | | | | | | | | |
| | | | | | | | | | | 6,911 | |
| | | | | | | | | | | | |
| |
| INFORMATION TECHNOLOGY 0.2% | |
Atos SE | | | | | 3,411 | | | | | | 360 | |
Capgemini S.A. | | | | | 1,727 | | | | | | 145 | |
Neopost S.A. | | | | | 4,708 | | | | | | 147 | |
| | | | | | | | | | | | |
| | | | | | | | | | | 652 | |
| | | | | | | | | | | | |
| |
| MATERIALS 0.2% | |
Air Liquide S.A. | | | | | 3,225 | | | | | | 359 | |
Arkema S.A. | | | | | 2,292 | | | | | | 224 | |
| | | | | | | | | | | | |
| | | | | | | | | | | 583 | |
| | | | | | | | | | | | |
| | | | | | | | |
| 42 | | PIMCO EQUITY SERIES | | | | | See Accompanying Notes | |
December 31, 2016 (Unaudited)
| | | | | | | | | | | | |
| | | | | SHARES | | | | | MARKET
VALUE
(000S) | |
| REAL ESTATE 0.0% | |
Nexity S.A. | | | | | 1,613 | | | $ | | | 75 | |
| | | | | | | | | | | | |
| |
| TELECOMMUNICATION SERVICES 0.6% | |
Orange S.A. | | | | | 134,319 | | | | | | 2,037 | |
| | | | | | | | | | | | |
| |
| UTILITIES 1.0% | |
Electricite de France S.A. | | | | | 70,362 | | | | | | 716 | |
Engie S.A. | | | | | 145,184 | | | | | | 1,848 | |
Suez | | | | | 18,973 | | | | | | 280 | |
Veolia Environnement S.A. | | | | | 25,569 | | | | | | 434 | |
| | | | | | | | | | | | |
| | | | | | | | | | | 3,278 | |
| | | | | | | | | | | | |
Total France | | | | | | | | | | | 39,065 | |
| | | | | | | | | | | | |
| |
| GERMANY 9.0% | |
| |
| CONSUMER DISCRETIONARY 1.3% | |
adidas AG | | | | | 5,554 | | | | | | 876 | |
Bayerische Motoren Werke AG | | | | | 14,569 | | | | | | 1,357 | |
Continental AG | | | | | 1,704 | | | | | | 328 | |
Daimler AG | | | | | 22,631 | | | | | | 1,680 | |
Fielmann AG | | | | | 1,069 | | | | | | 71 | |
ProSiebenSat.1 Media SE | | | | | 3,881 | | | | | | 149 | |
| | | | | | | | | | | | |
| | | | | | | | | | | 4,461 | |
| | | | | | | | | | | | |
| |
| CONSUMER STAPLES 0.4% | |
METRO AG | | | | | 29,500 | | | | | | 981 | |
Suedzucker AG | | | | | 15,991 | | | | | | 381 | |
| | | | | | | | | | | | |
| | | | | | | | | | | 1,362 | |
| | | | | | | | | | | | |
| |
| FINANCIALS 2.0% | |
Commerzbank AG | | | | | 213,994 | | | | | | 1,629 | |
Deutsche Bank AG | | | | | 172,311 | | | | | | 3,126 | |
Deutsche Boerse AG | | | | | 1,859 | | | | | | 149 | |
Hannover Rueck SE | | | | | 2,080 | | | | | | 225 | |
Muenchener Rueckversicherungs-Gesellschaft AG in Muenchen | | | | | 6,879 | | | | | | 1,299 | |
Talanx AG (a) | | | | | 9,333 | | | | | | 312 | |
| | | | | | | | | | | | |
| | | | | | | | | | | 6,740 | |
| | | | | | | | | | | | |
| |
| HEALTH CARE 0.5% | |
Bayer AG | | | | | 9,511 | | | | | | 991 | |
Fresenius Medical Care AG & Co. KGaA | | | | | 1,471 | | | | | | 124 | |
Fresenius SE & Co. KGaA | | | | | 4,428 | | | | | | 346 | |
Rhoen Klinikum AG | | | | | 3,842 | | | | | | 104 | |
STADA Arzneimittel AG | | | | | 2,600 | | | | | | 134 | |
| | | | | | | | | | | | |
| | | | | | | | | | | 1,699 | |
| | | | | | | | | | | | |
| |
| INDUSTRIALS 1.8% | |
Bilfinger SE | | | | | 7,015 | | | | | | 270 | |
Brenntag AG | | | | | 1,832 | | | | | | 101 | |
Deutsche Lufthansa AG | | | | | 101,568 | | | | | | 1,309 | |
Deutsche Post AG | | | | | 46,729 | | | | | | 1,532 | |
Fraport AG Frankfurt Airport Services Worldwide | | | | | 1,874 | | | | | | 111 | |
GEA Group AG | | | | | 1,600 | | | | | | 64 | |
HOCHTIEF AG | | | | | 2,955 | | | | | | 413 | |
OSRAM Licht AG | | | | | 2,427 | | | | | | 127 | |
Rheinmetall AG | | | | | 3,811 | | | | | | 256 | |
Siemens AG | | | | | 14,209 | | | | | | 1,740 | |
| | | | | | | | | | | | |
| | | | | | | | | | | 5,923 | |
| | | | | | | | | | | | |
| | | | | | | | | | | | |
| | | | | SHARES | | | | | MARKET
VALUE
(000S) | |
| INFORMATION TECHNOLOGY 0.3% | |
Infineon Technologies AG | | | | | 7,758 | | | $ | | | 134 | |
SAP SE | | | | | 8,082 | | | | | | 699 | |
| | | | | | | | | | | | |
| | | | | | | | | | | 833 | |
| | | | | | | | | | | | |
| |
| MATERIALS 1.2% | |
Aurubis AG | | | | | 2,430 | | | | | | 140 | |
BASF SE | | | | | 20,670 | | | | | | 1,916 | |
Evonik Industries AG | | | | | 5,754 | | | | | | 171 | |
HeidelbergCement AG | | | | | 5,429 | | | | | | 505 | |
K+S AG | | | | | 18,436 | | | | | | 439 | |
Lanxess AG | | | | | 4,376 | | | | | | 287 | |
Linde AG | | | | | 1,530 | | | | | | 251 | |
Salzgitter AG | | | | | 10,783 | | | | | | 378 | |
ThyssenKrupp AG | | | | | 2,804 | | | | | | 67 | |
| | | | | | | | | | | | |
| | | | | | | | | | | 4,154 | |
| | | | | | | | | | | | |
| |
| TELECOMMUNICATION SERVICES 0.5% | |
Deutsche Telekom AG | | | | | 83,426 | | | | | | 1,431 | |
Freenet AG | | | | | 5,302 | | | | | | 149 | |
| | | | | | | | | | | | |
| | | | | | | | | | | 1,580 | |
| | | | | | | | | | | | |
| |
| UTILITIES 1.0% | |
E.ON SE | | | | | 249,781 | | | | | | 1,757 | |
RWE AG | | | | | 132,046 | | | | | | 1,639 | |
| | | | | | | | | | | | |
| | | | | | | | | | | 3,396 | |
| | | | | | | | | | | | |
Total Germany | | | | | | | | | | | 30,148 | |
| | | | | | | | | | | | |
| |
| HONG KONG 1.1% | |
| |
| CONSUMER DISCRETIONARY 0.1% | |
Li & Fung Ltd. | | | | | 152,000 | | | | | | 66 | |
SJM Holdings Ltd. | | | | | 197,000 | | | | | | 154 | |
| | | | | | | | | | | | |
| | | | | | | | | | | 220 | |
| | | | | | | | | | | | |
| |
| FINANCIALS 0.2% | |
AIA Group Ltd. | | | | | 49,600 | | | | | | 278 | |
Bank of East Asia Ltd. | | | | | 17,600 | | | | | | 67 | |
First Pacific Co. Ltd. | | | | | 58,000 | | | | | | 40 | |
Hang Seng Bank Ltd. | | | | | 8,900 | | | | | | 165 | |
| | | | | | | | | | | | |
| | | | | | | | | | | 550 | |
| | | | | | | | | | | | |
| |
| INDUSTRIALS 0.1% | |
Cathay Pacific Airways Ltd. | | | | | 55,000 | | | | | | 72 | |
MTR Corp. Ltd. | | | | | 22,500 | | | | | | 109 | |
Noble Group Ltd. | | | | | 1,884,800 | | | | | | 220 | |
| | | | | | | | | | | | |
| | | | | | | | | | | 401 | |
| | | | | | | | | | | | |
| |
| INFORMATION TECHNOLOGY 0.0% | |
Kingboard Chemical Holdings Ltd. | | | | | 37,000 | | | | | | 112 | |
| | | | | | | | | | | | |
| |
| REAL ESTATE 0.6% | |
Hang Lung Group Ltd. | | | | | 40,000 | | | | | | 139 | |
Hang Lung Properties Ltd. | | | | | 22,000 | | | | | | 46 | |
Hongkong Land Holdings Ltd. | | | | | 17,300 | | | | | | 109 | |
Hysan Development Co. Ltd. | | | | | 14,000 | | | | | | 58 | |
Kerry Properties Ltd. | | | | | 49,500 | | | | | | 134 | |
New World Development Co. Ltd. | | | | | 291,000 | | | | | | 307 | |
Shimao Property Holdings Ltd. | | | | | 105,500 | | | | | | 137 | |
Sino Land Co. Ltd. | | | | | 18,000 | | | | | | 27 | |
| | | | | | | | | | | | |
| | | | | SHARES | | | | | MARKET
VALUE
(000S) | |
Sun Hung Kai Properties Ltd. | | | | | 16,000 | | | $ | | | 201 | |
Swire Pacific Ltd. ‘A’ | | | | | 36,500 | | | | | | 347 | |
Wharf Holdings Ltd. | | | | | 35,000 | | | | | | 232 | |
Wheelock & Co. Ltd. | | | | | 28,000 | | | | | | 157 | |
| | | | | | | | | | | | |
| | | | | | | | | | | 1,894 | |
| | | | | | | | | | | | |
| |
| TELECOMMUNICATION SERVICES 0.0% | |
PCCW Ltd. | | | | | 90,000 | | | | | | 49 | |
| | | | | | | | | | | | |
| |
| UTILITIES 0.1% | |
CLP Holdings Ltd. | | | | | 30,500 | | | | | | 280 | |
| | | | | | | | | | | | |
Total Hong Kong | | | | | | | | | | | 3,506 | |
| | | | | | | | | | | | |
| |
| IRELAND 0.3% | |
| |
| CONSUMER STAPLES 0.0% | |
Kerry Group PLC ‘A’ | | | | | 347 | | | | | | 25 | |
| | | | | | | | | | | | |
| |
| HEALTH CARE 0.1% | |
Medtronic PLC | | | | | 2,671 | | | | | | 190 | |
| | | | | | | | | | | | |
| |
| INDUSTRIALS 0.1% | |
Experian PLC | | | | | 10,165 | | | | | | 197 | |
| | | | | | | | | | | | |
| |
| MATERIALS 0.1% | |
CRH PLC | | | | | 14,414 | | | | | | 497 | |
Smurfit Kappa Group PLC | | | | | 8,973 | | | | | | 206 | |
| | | | | | | | | | | | |
| | | | | | | | | | | 703 | |
| | | | | | | | | | | | |
Total Ireland | | | | | | | | | | | 1,115 | |
| | | | | | | | | | | | |
| |
| ISRAEL 0.7% | |
| |
| FINANCIALS 0.3% | |
Bank Hapoalim BM | | | | | 57,946 | | | | | | 344 | |
Bank Leumi Le-Israel BM (a) | | | | | 93,776 | | | | | | 385 | |
Israel Discount Bank Ltd.‘A’ (a) | | | | | 68,376 | | | | | | 142 | |
| | | | | | | | | | | | |
| | | | | | | | | | | 871 | |
| | | | | | | | | | | | |
| |
| HEALTH CARE 0.2% | |
Teva Pharmaceutical Industries Ltd. SP - ADR | | | | | 22,977 | | | | | | 833 | |
| | | | | | | | | | | | |
| |
| MATERIALS 0.1% | |
Israel Chemicals Ltd. | | | | | 46,811 | | | | | | 191 | |
| | | | | | | | | | | | |
| |
| TELECOMMUNICATION SERVICES 0.1% | |
Bezeq The Israeli Telecommunication Corp. Ltd. | | | | | 182,753 | | | | | | 347 | |
| | | | | | | | | | | | |
Total Israel | | | | | | | | | | | 2,242 | |
| | | | | | | | | | | | |
| |
| ITALY 3.2% | |
| |
| CONSUMER DISCRETIONARY 0.1% | |
Mediaset SpA | | | | | 67,489 | | | | | | 291 | |
| | | | | | | | | | | | |
| |
| ENERGY 1.0% | |
Eni SpA | | | | | 202,758 | | | | | | 3,287 | |
Saipem SpA (a) | | | | | 55,219 | | | | | | 31 | |
Snam SpA | | | | | 44,425 | | | | | | 183 | |
| | | | | | | | | | | | |
| | | | | | | | | | | 3,501 | |
| | | | | | | | | | | | |
| |
| | | | | | |
| See Accompanying Notes | | SEMIANNUAL REPORT | | DECEMBER 31, 2016 | | 43 |
Schedule of Investments PIMCO RAE Fundamental International Fund (Cont.)
| | | | | | | | | | | | |
| | | | | SHARES | | | | | MARKET
VALUE
(000S) | |
| FINANCIALS 1.1% | |
Assicurazioni Generali SpA | | | | | 34,509 | | | $ | | | 512 | |
Banca Popolare dell’Emilia Romagna SC | | | | | 22,070 | | | | | | 117 | |
Intesa Sanpaolo SpA | | | | | 172,870 | | | | | | 438 | |
Poste Italiane SpA | | | | | 74,953 | | | | | | 497 | |
UniCredit SpA | | | | | 522,285 | | | | | | 1,500 | |
Unione di Banche Italiane SpA | | | | | 127,838 | | | | | | 350 | |
Unipol Gruppo Finanziario SpA | | | | | 46,825 | | | | | | 168 | |
| | | | | | | | | | | | |
| | | | | | | | | | | 3,582 | |
| | | | | | | | | | | | |
| |
| INDUSTRIALS 0.1% | |
Atlantia SpA | | | | | 5,767 | | | | | | 135 | |
Italmobiliare SpA | | | | | 1,241 | | | | | | 58 | |
| | | | | | | | | | | | |
| | | | | | | | | | | 193 | |
| | | | | | | | | | | | |
| |
| TELECOMMUNICATION SERVICES 0.2% | |
Telecom Italia SpA (a) | | | | | 779,679 | | | | | | 688 | |
| | | | | | | | | | | | |
| |
| UTILITIES 0.7% | |
A2A SpA | | | | | 100,720 | | | | | | 130 | |
Enel SpA | | | | | 504,064 | | | | | | 2,216 | |
Hera SpA | | | | | 35,558 | | | | | | 82 | |
Terna Rete Elettrica Nazionale SpA | | | | | 10,054 | | | | | | 46 | |
| | | | | | | | | | | | |
| | | | | | | | | | | 2,474 | |
| | | | | | | | | | | | |
Total Italy | | | | | | | | | | | 10,729 | |
| | | | | | | | | | | | |
| |
| JAPAN 18.1% | |
| |
| CONSUMER DISCRETIONARY 3.3% | |
Aisin Seiki Co. Ltd. | | | | | 7,200 | | | | | | 312 | |
Aoyama Trading Co. Ltd. | | | | | 2,100 | | | | | | 73 | |
Asatsu-DK, Inc. | | | | | 1,800 | | | | | | 44 | |
Bandai Namco Holdings, Inc. | | | | | 1,700 | | | | | | 47 | |
Benesse Holdings, Inc. | | | | | 7,800 | | | | | | 214 | |
Bridgestone Corp. | | | | | 12,600 | | | | | | 453 | |
DCM Holdings Co. Ltd. | | | | | 14,400 | | | | | | 128 | |
Denso Corp. | | | | | 3,300 | | | | | | 143 | |
EDION Corp. | | | | | 11,600 | | | | | | 109 | |
Fuji Heavy Industries Ltd. | | | | | 2,000 | | | | | | 81 | |
Fuji Media Holdings, Inc. | | | | | 15,700 | | | | | | 220 | |
Geo Holdings Corp. | | | | | 2,100 | | | | | | 24 | |
Honda Motor Co. Ltd. | | | | | 39,800 | | | | | | 1,162 | |
Isetan Mitsukoshi Holdings Ltd. ‘L’ | | | | | 13,700 | | | | | | 148 | |
Isuzu Motors Ltd. | | | | | 9,400 | | | | | | 119 | |
JVC Kenwood Corp. | | | | | 41,600 | | | | | | 113 | |
KYB Corp. | | | | | 14,000 | | | | | | 68 | |
Mazda Motor Corp. | | | | | 11,300 | | | | | | 184 | |
Mitsubishi Motors Corp. | | | | | 35,300 | | | | | | 201 | |
Nikon Corp. | | | | | 22,000 | | | | | | 342 | |
Nissan Motor Co. Ltd. | | | | | 100,000 | | | | | | 1,003 | |
Onward Holdings Co. Ltd. | | | | | 14,000 | | | | | | 98 | |
Panasonic Corp. | | | | | 90,500 | | | | | | 918 | |
Pioneer Corp. (a) | | | | | 78,900 | | | | | | 159 | |
Sega Sammy Holdings, Inc. | | | | | 8,900 | | | | | | 132 | |
Seiko Holdings Corp. | | | | | 34,000 | | | | | | 120 | |
Sekisui Chemical Co. Ltd. | | | | | 14,600 | | | | | | 232 | |
Sekisui House Ltd. | | | | | 10,800 | | | | | | 179 | |
Sharp Corp. (a) | | | | | 202,000 | | | | | | 467 | |
Skylark Co. Ltd. | | | | | 7,500 | | | | | | 99 | |
Sony Corp. | | | | | 16,300 | | | | | | 455 | |
Sumitomo Electric Industries Ltd. | | | | | 21,600 | | | | | | 311 | |
Sumitomo Forestry Co. Ltd. | | | | | 7,400 | | | | | | 98 | |
| | | | | | | | | | | | |
| | | | | SHARES | | | | | MARKET
VALUE
(000S) | |
Sumitomo Rubber Industries Ltd. | | | | | 16,400 | | | $ | | | 259 | |
Suzuki Motor Corp. | | | | | 2,000 | | | | | | 70 | |
Takashimaya Co. Ltd. | | | | | 16,000 | | | | | | 132 | |
Takata Corp. | | | | | 9,600 | | | | | | 70 | |
Toyo Tire & Rubber Co. Ltd. | | | | | 5,600 | | | | | | 70 | |
Toyota Motor Corp. | | | | | 24,600 | | | | | | 1,442 | |
Yamada Denki Co. Ltd. | | | | | 52,000 | | | | | | 280 | |
Yokohama Rubber Co. Ltd. | | | | | 8,100 | | | | | | 145 | |
Yoshinoya Holdings Co. Ltd. | | | | | 7,600 | | | | | | 104 | |
Zensho Holdings Co. Ltd. | | | | | 8,800 | | | | | | 145 | |
| | | | | | | | | | | | |
| | | | | | | | | | | 11,173 | |
| | | | | | | | | | | | |
| |
| CONSUMER STAPLES 1.1% | |
Aeon Co. Ltd. | | | | | 54,447 | | | | | | 769 | |
Asahi Group Holdings Ltd. | | | | | 2,300 | | | | | | 72 | |
Coca-Cola West Co. Ltd. | | | | | 6,000 | | | | | | 177 | |
cocokara fine, Inc. | | | | | 700 | | | | | | 26 | |
Ito En Ltd. | | | | | 900 | | | | | | 30 | |
Japan Tobacco, Inc. | | | | | 7,556 | | | | | | 248 | |
Kao Corp. | | | | | 2,800 | | | | | | 133 | |
Kirin Holdings Co. Ltd. | | | | | 44,700 | | | | | | 726 | |
Lion Corp. | | | | | 4,000 | | | | | | 66 | |
Megmilk Snow Brand Co. Ltd. | | | | | 1,300 | | | | | | 36 | |
MEIJI Holdings Co. Ltd. | | | | | 1,500 | | | | | | 117 | |
Morinaga Milk Industry Co. Ltd. | | | | | 18,000 | | | | | | 129 | |
NH Foods Ltd. | | | | | 4,000 | | | | | | 108 | |
Nichirei Corp. | | | | | 3,700 | | | | | | 76 | |
Nippon Suisan Kaisha Ltd. | | | | | 24,400 | | | | | | 117 | |
Sapporo Holdings Ltd. | | | | | 4,700 | | | | | | 121 | |
Seven & i Holdings Co. Ltd. | | | | | 6,500 | | | | | | 247 | |
Shiseido Co. Ltd. | | | | | 10,700 | | | | | | 270 | |
Yamazaki Baking Co. Ltd. | | | | | 11,000 | | | | | | 212 | |
| | | | | | | | | | | | |
| | | | | | | | | | | 3,680 | |
| | | | | | | | | | | | |
| |
| ENERGY 0.4% | |
Idemitsu Kosan Co. Ltd. | | | | | 12,300 | | | | | | 326 | |
Inpex Corp. | | | | | 27,700 | | | | | | 277 | |
JX Holdings, Inc. | | | | | 155,300 | | | | | | 656 | |
| | | | | | | | | | | | |
| | | | | | | | | | | 1,259 | |
| | | | | | | | | | | | |
| |
| FINANCIALS 3.0% | |
Aozora Bank Ltd. | | | | | 24,000 | | | | | | 85 | |
Chiba Bank Ltd. | | | | | 22,000 | | | | | | 135 | |
Credit Saison Co. Ltd. | | | | | 1,800 | | | | | | 32 | |
Dai-ichi Life Insurance Co. Ltd. | | | | | 36,600 | | | | | | 609 | |
Daiwa Securities Group, Inc. | | | | | 31,000 | | | | | | 191 | |
Fukuoka Financial Group, Inc. | | | | | 21,000 | | | | | | 93 | |
Hokuhoku Financial Group, Inc. | | | | | 9,400 | | | | | | 162 | |
Japan Post Bank Co. Ltd. | | | | | 21,800 | | | | | | 261 | |
Japan Post Holdings Co. Ltd. | | | | | 12,300 | | | | | | 153 | |
Mebuki Financial Group, Inc. | | | | | 12,800 | | | | | | 47 | |
Mitsubishi UFJ Financial Group, Inc. | | | | | 357,800 | | | | | | 2,207 | |
Mizuho Financial Group, Inc. | | | | | 687,100 | | | | | | 1,233 | |
MS&AD Insurance Group Holdings, Inc. | | | | | 3,000 | | | | | | 93 | |
Nishi-Nippon Financial Holdings, Inc. (a) | | | | | 7,200 | | | | | | 75 | |
Nomura Holdings, Inc. | | | | | 113,000 | | | | | | 668 | |
North Pacific Bank Ltd. | | | | | 30,600 | | | | | | 126 | |
ORIX Corp. | | | | | 25,800 | | | | | | 402 | |
Resona Holdings, Inc. | | | | | 113,700 | | | | | | 583 | |
SBI Holdings, Inc. | | | | | 16,200 | | | | | | 206 | |
Senshu Ikeda Holdings, Inc. | | | | | 14,100 | | | | | | 65 | |
| | | | | | | | | | | | |
| | | | | SHARES | | | | | MARKET
VALUE
(000S) | |
Sony Financial Holdings, Inc. | | | | | 12,200 | | | $ | | | 190 | |
Sumitomo Mitsui Financial Group, Inc. | | | | | 37,100 | | | | | | 1,413 | |
Sumitomo Mitsui Trust Holdings, Inc. | | | | | 12,500 | | | | | | 447 | |
T&D Holdings, Inc. | | | | | 27,200 | | | | | | 359 | |
Tokio Marine Holdings, Inc. | | | | | 2,600 | | | | | | 106 | |
Yamaguchi Financial Group, Inc. | | | | | 7,000 | | | | | | 76 | |
| | | | | | | | | | | | |
| | | | | | | | | | | 10,017 | |
| | | | | | | | | | | | |
| |
| HEALTH CARE 0.5% | |
Astellas Pharma, Inc. | | | | | 16,300 | | | | | | 226 | |
Daiichi Sankyo Co. Ltd. | | | | | 21,816 | | | | | | 446 | |
Hoya Corp. | | | | | 3,100 | | | | | | 130 | |
Medipal Holdings Corp. | | | | | 5,000 | | | | | | 79 | |
Mitsubishi Tanabe Pharma Corp. | | | | | 1,600 | | | | | | 31 | |
Nipro Corp. | | | | | 2,300 | | | | | | 25 | |
Otsuka Holdings Co. Ltd. | | | | | 5,728 | | | | | | 250 | |
Sumitomo Dainippon Pharma Co. Ltd. | | | | | 4,200 | | | | | | 72 | |
Suzuken Co. Ltd. | | | | | 3,400 | | | | | | 111 | |
Takeda Pharmaceutical Co. Ltd. | | | | | 10,100 | | | | | | 419 | |
Tsumura & Co. | | | | | 1,100 | | | | | | 30 | |
| | | | | | | | | | | | |
| | | | | | | | | | | 1,819 | |
| | | | | | | | | | | | |
| |
| INDUSTRIALS 3.7% | |
ANA Holdings, Inc. | | | | | 68,000 | | | | | | 183 | |
Asahi Glass Co. Ltd. | | | | | 86,000 | | | | | | 584 | |
Central Japan Railway Co. | | | | | 1,000 | | | | | | 164 | |
Dai Nippon Printing Co. Ltd. | | | | | 27,000 | | | | | | 266 | |
East Japan Railway Co. | | | | | 5,100 | | | | | | 440 | |
Ebara Corp. | | | | | 2,300 | | | | | | 65 | |
Fujikura Ltd. | | | | | 20,700 | | | | | | 112 | |
Furukawa Electric Co. Ltd. | | | | | 7,200 | | | | | | 210 | |
GS Yuasa Corp. | | | | | 8,000 | | | | | | 33 | |
Hankyu Hanshin Holdings, Inc. | | | | | 800 | | | | | | 26 | |
Hitachi Construction Machinery Co. Ltd. | | | | | 12,400 | | | | | | 268 | |
IHI Corp. (a) | | | | | 46,000 | | | | | | 119 | |
ITOCHU Corp. | | | | | 35,200 | | | | | | 466 | |
Iwatani Corp. | | | | | 6,000 | | | | | | 32 | |
Japan Airlines Co. Ltd. | | | | | 12,500 | | | | | | 365 | |
JTEKT Corp. | | | | | 3,800 | | | | | | 61 | |
Kanematsu Corp. | | | | | 37,000 | | | | | | 62 | |
Kawasaki Heavy Industries Ltd. | | | | | 50,000 | | | | | | 157 | |
Kawasaki Kisen Kaisha Ltd. | | | | | 45,000 | | | | | | 102 | |
Kokuyo Co. Ltd. | | | | | 2,700 | | | | | | 31 | |
Komatsu Ltd. | | | | | 31,400 | | | | | | 711 | |
LIXIL Group Corp. | | | | | 8,000 | | | | | | 181 | |
Marubeni Corp. | | | | | 120,100 | | | | | | 679 | |
Mitsubishi Corp. | | | | | 35,500 | | | | | | 754 | |
Mitsubishi Electric Corp. | | | | | 48,200 | | | | | | 670 | |
Mitsubishi Heavy Industries Ltd. | | | | | 105,000 | | | | | | 477 | |
Mitsui & Co. Ltd. | | | | | 68,000 | | | | | | 932 | |
Mitsui Engineering & Shipbuilding Co. Ltd. | | | | | 94,000 | | | | | | 145 | |
Mitsui OSK Lines Ltd. | | | | | 90,000 | | | | | | 248 | |
Nippon Express Co. Ltd. | | | | | 20,000 | | | | | | 107 | |
Nippon Sheet Glass Co. Ltd. (a) | | | | | 27,600 | | | | | | 200 | |
Nippon Yusen KK | | | | | 158,000 | | | | | | 293 | |
NSK Ltd. | | | | | 2,900 | | | | | | 34 | |
NTN Corp. | | | | | 31,000 | | | | | | 125 | |
Obayashi Corp. | | | | | 2,700 | | | | | | 26 | |
Sojitz Corp. | | | | | 142,500 | | | | | | 345 | |
| | | | | | | | |
| 44 | | PIMCO EQUITY SERIES | | | | | See Accompanying Notes | |
December 31, 2016 (Unaudited)
| | | | | | | | | | | | |
| | | | | SHARES | | | | | MARKET
VALUE
(000S) | |
Sumitomo Corp. | | | | | 69,000 | | | $ | | | 810 | |
Sumitomo Heavy Industries Ltd. | | | | | 29,000 | | | | | | 186 | |
Tokyu Corp. | | | | | 5,000 | | | | | | 37 | |
Toppan Printing Co. Ltd. | | | | | 30,000 | | | | | | 286 | |
Toshiba Corp. | | | | | 392,000 | | | | | | 947 | |
Toyota Tsusho Corp. | | | | | 8,600 | | | | | | 224 | |
West Japan Railway Co. | | | | | 3,800 | | | | | | 233 | |
| | | | | | | | | | | | |
| | | | | | | | | | | 12,396 | |
| | | | | | | | | | | | |
| |
| INFORMATION TECHNOLOGY 2.5% | |
Brother Industries Ltd. | | | | | 15,800 | | | | | | 284 | |
Canon, Inc. | | | | | 50,050 | | | | | | 1,410 | |
Citizen Holdings Co. Ltd. | | | | | 16,000 | | | | | | 95 | |
DeNA Co. Ltd. | | | | | 8,600 | | | | | | 188 | |
FUJIFILM Holdings Corp. | | | | | 8,000 | | | | | | 303 | |
Fujitsu Ltd. | | | | | 210,000 | | | | | | 1,163 | |
Gree, Inc. | | | | | 17,000 | | | | | | 89 | |
Hitachi Ltd. | | | | | 339,000 | | | | | | 1,828 | |
Ibiden Co. Ltd. | | | | | 12,900 | | | | | | 173 | |
Japan Display, Inc. (a) | | | | | 111,400 | | | | | | 316 | |
Konica Minolta, Inc. | | | | | 39,500 | | | | | | 392 | |
Kyocera Corp. | | | | | 3,300 | | | | | | 164 | |
NEC Corp. | | | | | 296,000 | | | | | | 783 | |
Nippon Electric Glass Co. Ltd. | | | | | 49,000 | | | | | | 264 | |
Omron Corp. | | | | | 2,600 | | | | | | 99 | |
Ricoh Co. Ltd. | | | | | 83,500 | | | | | | 705 | |
Seiko Epson Corp. | | | | | 8,800 | | | | | | 186 | |
Tokyo Electron Ltd. | | | | | 1,400 | | | | | | 132 | |
Toshiba TEC Corp. (a) | | | | | 9,000 | | | | | | 43 | |
Yokogawa Electric Corp. | | | | | 2,300 | | | | | | 33 | |
| | | | | | | | | | | | |
| | | | | | | | | | | 8,650 | |
| | | | | | | | | | | | |
| |
| MATERIALS 1.7% | |
Asahi Kasei Corp. | | | | | 40,000 | | | | | | 348 | |
Denka Co. Ltd. | | | | | 24,000 | | | | | | 106 | |
DIC Corp. | | | | | 5,700 | | | | | | 173 | |
JFE Holdings, Inc. | | | | | 24,500 | | | | | | 370 | |
JSR Corp. | | | | | 2,100 | | | | | | 33 | |
Kaneka Corp. | | | | | 12,000 | | | | | | 98 | |
Kobe Steel Ltd. | | | | | 43,000 | | | | | | 409 | |
Kuraray Co. Ltd. | | | | | 6,400 | | | | | | 96 | |
Mitsubishi Chemical Holdings Corp. | | | | | 111,900 | | | | | | 724 | |
Mitsubishi Materials Corp. | | | | | 4,200 | | | | | | 128 | |
Mitsui Chemicals, Inc. | | | | | 39,000 | | | | | | 175 | |
Mitsui Mining & Smelting Co. Ltd. | | | | | 69,000 | | | | | | 173 | |
Nippon Kayaku Co. Ltd. | | | | | 4,000 | | | | | | 49 | |
Nippon Light Metal Holdings Co. Ltd. | | | | | 51,400 | | | | | | 108 | |
Nippon Paper Industries Co. Ltd. | | | | | 15,418 | | | | | | 260 | |
Nippon Steel & Sumitomo Metal Corp. | | | | | 11,900 | | | | | | 264 | |
Nisshin Steel Co. Ltd. | | | | | 7,200 | | | | | | 88 | |
Oji Holdings Corp. | | | | | 35,000 | | | | | | 142 | |
Rengo Co. Ltd. | | | | | 16,700 | | | | | | 91 | |
Shin-Etsu Chemical Co. Ltd. | | | | | 2,100 | | | | | | 163 | |
Showa Denko KK | | | | | 21,700 | | | | | | 310 | |
Sumitomo Chemical Co. Ltd. | | | | | 91,000 | | | | | | 431 | |
Sumitomo Metal Mining Co. Ltd. | | | | | 7,000 | | | | | | 89 | |
Taiheiyo Cement Corp. | | | | | 26,000 | | | | | | 82 | |
Teijin Ltd. | | | | | 10,600 | | | | | | 214 | |
Tokuyama Corp. (a) | | | | | 58,000 | | | | | | 220 | |
Toyo Seikan Group Holdings Ltd. ‘L’ | | | | | 4,900 | | | | | | 91 | |
| | | | | | | | | | | | |
| | | | | SHARES | | | | | MARKET
VALUE
(000S) | |
Ube Industries Ltd. | | | | | 96,000 | | | $ | | | 201 | |
| | | | | | | | | | | | |
| | | | | | | | | | | 5,636 | |
| | | | | | | | | | | | |
| |
| REAL ESTATE 0.1% | |
Daito Trust Construction Co. Ltd. | | | | | 1,000 | | | | | | 150 | |
Daiwa House Industry Co. Ltd. | | | | | 6,200 | | | | | | 169 | |
Nomura Real Estate Holdings, Inc. | | | | | 3,600 | | | | | | 61 | |
| | | | | | | | | | | | |
| | | | | | | | | | | 380 | |
| | | | | | | | | | | | |
| |
| TELECOMMUNICATION SERVICES 0.9% | |
KDDI Corp. | | | | | 14,100 | | | | | | 356 | |
Nippon Telegraph & Telephone Corp. | | | | | 36,500 | | | | | | 1,537 | |
NTT DOCOMO, Inc. | | | | | 30,900 | | | | | | 703 | |
SoftBank Group Corp. | | | | | 7,000 | | | | | | 463 | |
| | | | | | | | | | | | |
| | | | | | | | | | | 3,059 | |
| | | | | | | | | | | | |
| |
| UTILITIES 0.9% | |
Chubu Electric Power Co., Inc. | | | | | 53,800 | | | | | | 749 | |
Chugoku Electric Power Co., Inc. | | | | | 16,200 | | | | | | 189 | |
Hokkaido Electric Power Co., Inc. | | | | | 12,200 | | | | | | 95 | |
Hokuriku Electric Power Co. | | | | | 17,988 | | | | | | 201 | |
Kansai Electric Power Co., Inc. (a) | | | | | 47,400 | | | | | | 517 | |
Kyushu Electric Power Co., Inc. | | | | | 3,200 | | | | | | 35 | |
Osaka Gas Co. Ltd. | | | | | 20,000 | | | | | | 77 | |
Shikoku Electric Power Co., Inc. (a) | | | | | 7,100 | | | | | | 72 | |
Tohoku Electric Power Co., Inc. | | | | | 35,900 | | | | | | 452 | |
Tokyo Electric Power Co. Holdings, Inc. (a) | | | | | 126,900 | | | | | | 511 | |
Tokyo Gas Co. Ltd. | | | | | 10,000 | | | | | | 45 | |
| | | | | | | | | | | | |
| | | | | | | | | | | 2,943 | |
| | | | | | | | | | | | |
Total Japan | | | | | | | | | | | 61,012 | |
| | | | | | | | | | | | |
| |
| LUXEMBOURG 0.5% | |
| |
| CONSUMER DISCRETIONARY 0.1% | |
RTL Group S.A. | | | | | 1,991 | | | | | | 146 | |
| | | | | | | | | | | | |
| |
| ENERGY 0.0% | |
Tenaris S.A. | | | | | 6,538 | | | | | | 117 | |
| | | | | | | | | | | | |
| |
| MATERIALS 0.4% | |
ArcelorMittal | | | | | 202,260 | | | | | | 1,486 | |
| | | | | | | | | | | | |
Total Luxembourg | | | | | | | | | | | 1,749 | |
| | | | | | | | | | | | |
| |
| MACAU 0.0% | |
| |
| CONSUMER DISCRETIONARY 0.0% | |
Sands China Ltd. | | | | | 9,600 | | | | | | 42 | |
Wynn Macau Ltd. | | | | | 59,600 | | | | | | 94 | |
| | | | | | | | | | | | |
| | | | | | | | | | | 136 | |
| | | | | | | | | | | | |
Total Macau | | | | | | | | | | | 136 | |
| | | | | | | | | | | | |
| |
| NETHERLANDS 4.4% | |
| |
| CONSUMER STAPLES 0.6% | |
Heineken Holding NV | | | | | 5,294 | | | | | | 368 | |
Heineken NV | | | | | 3,282 | | | | | | 246 | |
Koninklijke Ahold Delhaize NV | | | | | 70,774 | | | | | | 1,491 | |
| | | | | | | | | | | | |
| | | | | | | | | | | 2,105 | |
| | | | | | | | | | | | |
| |
| | | | | | | | | | | | |
| | | | | SHARES | | | | | MARKET
VALUE
(000S) | |
| ENERGY 2.2% | |
Fugro NV | | | | | 13,670 | | | $ | | | 209 | |
Royal Dutch Shell PLC ‘A’ | | | | | 264,063 | | | | | | 7,202 | |
| | | | | | | | | | | | |
| | | | | | | | | | | 7,411 | |
| | | | | | | | | | | | |
| |
| FINANCIALS 0.8% | |
ABN AMRO Group NV | | | | | 18,250 | | | | | | 404 | |
Aegon NV | | | | | 102,671 | | | | | | 564 | |
Delta Lloyd NV | | | | | 56,954 | | | | | | 318 | |
ING Groep NV | | | | | 67,098 | | | | | | 945 | |
NN Group NV | | | | | 15,097 | | | | | | 511 | |
| | | | | | | | | | | | |
| | | | | | | | | | | 2,742 | |
| | | | | | | | | | | | |
| |
| INDUSTRIALS 0.5% | |
Boskalis Westminster | | | | | 1,109 | | | | | | 38 | |
Koninklijke Philips NV | | | | | 36,662 | | | | | | 1,121 | |
PostNL NV (a) | | | | | 36,685 | | | | | | 158 | |
Randstad Holding NV | | | | | 2,124 | | | | | | 115 | |
Wolters Kluwer NV | | | | | 5,089 | | | | | | 184 | |
| | | | | | | | | | | | |
| | | | | | | | | | | 1,616 | |
| | | | | | | | | | | | |
| |
| INFORMATION TECHNOLOGY 0.0% | |
NXP Semiconductor NV (a) | | | | | 785 | | | | | | 77 | |
| | | | | | | | | | | | |
| |
| MATERIALS 0.1% | |
Akzo Nobel NV | | | | | 4,063 | | | | | | 254 | |
Koninklijke DSM NV | | | | | 2,250 | | | | | | 135 | |
| | | | | | | | | | | | |
| | | | | | | | | | | 389 | |
| | | | | | | | | | | | |
| |
| TELECOMMUNICATION SERVICES 0.2% | |
Koninklijke KPN NV | | | | | 102,161 | | | | | | 302 | |
VimpelCom Ltd. SP - ADR | | | | | 66,134 | | | | | | 255 | |
| | | | | | | | | | | | |
| | | | | | | | | | | 557 | |
| | | | | | | | | | | | |
Total Netherlands | | | | | | | | | | | 14,897 | |
| | | | | | | | | | | | |
| |
| NEW ZEALAND 0.1% | |
| |
| MATERIALS 0.0% | |
Fletcher Building Ltd. | | | | | 21,047 | | | | | | 155 | |
| | | | | | | | | | | | |
| |
| TELECOMMUNICATION SERVICES 0.1% | |
Spark New Zealand Ltd. | | | | | 126,345 | | | | | | 299 | |
| | | | | | | | | | | | |
Total New Zealand | | | | | | | | | | | 454 | |
| | | | | | | | | | | | |
| |
| NORWAY 1.3% | |
| |
| CONSUMER STAPLES 0.1% | |
Marine Harvest ASA | | | | | 18,944 | | | | | | 342 | |
Orkla ASA | | | | | 26,042 | | | | | | 236 | |
| | | | | | | | | | | | |
| | | | | | | | | | | 578 | |
| | | | | | | | | | | | |
| |
| ENERGY 0.8% | |
Aker Solutions ASA | | | | | 14,586 | | | | | | 70 | |
Statoil ASA | | | | | 139,144 | | | | | | 2,540 | |
TGS Nopec Geophysical Co. ASA | | | | | 3,523 | | | | | | 78 | |
| | | | | | | | | | | | |
| | | | | | | | | | | 2,688 | |
| | | | | | | | | | | | |
| |
| FINANCIALS 0.2% | |
DNB ASA | | | | | 23,749 | | | | | | 352 | |
Gjensidige Forsikring ASA | | | | | 15,061 | | | | | | 239 | |
| | | | | | | | | | | | |
| | | | | | | | | | | 591 | |
| | | | | | | | | | | | |
| | | | | | |
| See Accompanying Notes | | SEMIANNUAL REPORT | | DECEMBER 31, 2016 | | 45 |
Schedule of Investments PIMCO RAE Fundamental International Fund (Cont.)
| | | | | | | | | | | | |
| | | | | SHARES | | | | | MARKET
VALUE
(000S) | |
| MATERIALS 0.1% | |
Norsk Hydro ASA | | | | | 27,466 | | | $ | | | 131 | |
Yara International ASA | | | | | 5,571 | | | | | | 219 | |
| | | | | | | | | | | | |
| | | | | | | | | | | 350 | |
| | | | | | | | | | | | |
| |
| TELECOMMUNICATION SERVICES 0.1% | |
Telenor ASA | | | | | 15,546 | | | | | | 232 | |
| | | | | | | | | | | | |
Total Norway | | | | | | | | | | | 4,439 | |
| | | | | | | | | | | | |
| |
| PORTUGAL 0.2% | |
| |
| CONSUMER STAPLES 0.1% | |
Jeronimo Martins SGPS S.A. | | | | | 2,611 | | | | | | 41 | |
Sonae SGPS S.A. | | | | | 94,053 | | | | | | 86 | |
| | | | | | | | | | | | |
| | | | | | | | | | | 127 | |
| | | | | | | | | | | | |
| |
| ENERGY 0.0% | |
Galp Energia SGPS S.A. | | | | | 3,057 | | | | | | 45 | |
| | | | | | | | | | | | |
| |
| FINANCIALS 0.0% | |
Banco Espirito Santo S.A. | | | | | 59,573 | | | | | | 1 | |
| | | | | | | | | | | | |
| |
| UTILITIES 0.1% | |
EDP - Energias de Portugal S.A. | | | | | 146,918 | | | | | | 447 | |
| | | | | | | | | | | | |
Total Portugal | | | | | | | | | | | 620 | |
| | | | | | | | | | | | |
| |
| SINGAPORE 0.9% | |
| |
| CONSUMER DISCRETIONARY 0.1% | |
Jardine Cycle & Carriage Ltd. | | | | | 3,300 | | | | | | 94 | |
Singapore Press Holdings Ltd. | | | | | 22,900 | | | | | | 55 | |
| | | | | | | | | | | | |
| | | | | | | | | | | 149 | |
| | | | | | | | | | | | |
| |
| CONSUMER STAPLES 0.0% | |
Wilmar International Ltd. | | | | | 47,900 | | | | | | 118 | |
| | | | | | | | | | | | |
| |
| FINANCIALS 0.3% | |
DBS Group Holdings Ltd. | | | | | 33,310 | | | | | | 397 | |
Oversea-Chinese Banking Corp. Ltd. | | | | | 52,100 | | | | | | 320 | |
United Overseas Bank Ltd. | | | | | 27,200 | | | | | | 382 | |
| | | | | | | | | | | | |
| | | | | | | | | | | 1,099 | |
| | | | | | | | | | | | |
| |
| INDUSTRIALS 0.3% | |
Hutchison Port Holdings Trust | | | | | 220,700 | | | | | | 96 | |
Keppel Corp. Ltd. | | | | | 112,000 | | | | | | 446 | |
Sembcorp Industries Ltd. | | | | | 46,000 | | | | | | 90 | |
Singapore Airlines Ltd. | | | | | 50,467 | | | | | | 336 | |
| | | | | | | | | | | | |
| | | | | | | | | | | 968 | |
| | | | | | | | | | | | |
| |
| INFORMATION TECHNOLOGY 0.1% | |
Broadcom Ltd. | | | | | 946 | | | | | | 167 | |
Venture Corp. Ltd. | | | | | 9,800 | | | | | | 67 | |
| | | | | | | | | | | | |
| | | | | | | | | | | 234 | |
| | | | | | | | | | | | |
| |
| REAL ESTATE 0.0% | |
CapitaLand Ltd. | | | | | 61,900 | | | | | | 129 | |
| | | | | | | | | | | | |
| |
| | | | | | | | | | | | |
| | | | | SHARES | | | | | MARKET
VALUE
(000S) | |
| TELECOMMUNICATION SERVICES 0.1% | |
Singapore Telecommunications Ltd. | | | | | 105,900 | | | $ | | | 266 | |
| | | | | | | | | | | | |
Total Singapore | | | | | | | | | | | 2,963 | |
| | | | | | | | | | | | |
| |
| SOUTH AFRICA 0.1% | |
| |
| FINANCIALS 0.0% | |
Investec PLC | | | | | 18,040 | | | | | | 118 | |
| | | | | | | | | | | | |
| |
| MATERIALS 0.1% | |
Mondi PLC | | | | | 6,306 | | | | | | 129 | |
| | | | | | | | | | | | |
Total South Africa | | | | | | | | | | | 247 | |
| | | | | | | | | | | | |
| |
| SPAIN 3.8% | |
| |
| CONSUMER DISCRETIONARY 0.1% | |
Industria de Diseno Textil S.A. | | | | | 8,386 | | | | | | 286 | |
| | | | | | | | | | | | |
| |
| CONSUMER STAPLES 0.1% | |
Distribuidora Internacional de Alimentacion S.A. | | | | | 44,195 | | | | | | 217 | |
| | | | | | | | | | | | |
| |
| ENERGY 0.2% | |
Repsol S.A. | | | | | 44,852 | | | | | | 630 | |
| | | | | | | | | | | | |
| |
| FINANCIALS 1.9% | |
Banco Bilbao Vizcaya Argentaria S.A. | | | | | 94,395 | | | | | | 636 | |
Banco de Sabadell S.A. | | | | | 52,690 | | | | | | 73 | |
Banco Santander S.A. | | | | | 972,218 | | | | | | 5,058 | |
CaixaBank S.A. | | | | | 60,747 | | | | | | 200 | |
Mapfre S.A. | | | | | 101,293 | | | | | | 309 | |
| | | | | | | | | | | | |
| | | | | | | | | | | 6,276 | |
| | | | | | | | | | | | |
| |
| INDUSTRIALS 0.3% | |
Abengoa S.A. ‘B’ (a) | | | | | 226,011 | | | | | | 45 | |
Abertis Infraestructuras S.A. | | | | | 6,666 | | | | | | 93 | |
ACS Actividades de Construccion y Servicios S.A. | | | | | 18,992 | | | | | | 599 | |
Ferrovial S.A. | | | | | 8,028 | | | | | | 143 | |
Obrascon Huarte Lain S.A. | | | | | 47,746 | | | | | | 165 | |
| | | | | | | | | | | | |
| | | | | | | | | | | 1,045 | |
| | | | | | | | | | | | |
| |
| INFORMATION TECHNOLOGY 0.0% | |
Amadeus IT Holding S.A. | | | | | 1,359 | | | | | | 62 | |
Indra Sistemas S.A. (a) | | | | | 8,686 | | | | | | 95 | |
| | | | | | | | | | | | |
| | | | | | | | | | | 157 | |
| | | | | | | | | | | | |
| |
| TELECOMMUNICATION SERVICES 0.5% | |
Telefonica S.A. | | | | | 185,833 | | | | | | 1,716 | |
| | | | | | | | | | | | |
| |
| UTILITIES 0.7% | |
Acciona S.A. | | | | | 2,989 | | | | | | 219 | |
Endesa S.A. | | | | | 63,504 | | | | | | 1,343 | |
Gas Natural SDG S.A. | | | | | 8,284 | | | | | | 156 | |
Iberdrola S.A. | | | | | 83,703 | | | | | | 548 | |
| | | | | | | | | | | | |
| | | | | | | | | | | 2,266 | |
| | | | | | | | | | | | |
Total Spain | | | | | | | | | | | 12,593 | |
| | | | | | | | | | | | |
| |
| | | | | | | | | | | | |
| | | | | SHARES | | | | | MARKET
VALUE
(000S) | |
| SWEDEN 2.0% | |
| |
| CONSUMER DISCRETIONARY 0.1% | |
Bonava AB ‘B’ (a) | | | | | 2,591 | | | $ | | | 40 | |
Electrolux AB ‘B’ | | | | | 3,746 | | | | | | 93 | |
Hennes & Mauritz AB ‘B’ | | | | | 4,947 | | | | | | 137 | |
| | | | | | | | | | | | |
| | | | | | | | | | | 270 | |
| | | | | | | | | | | | |
| |
| CONSUMER STAPLES 0.2% | |
Svenska Cellulosa AB S.C.A. ‘B’ | | | | | 12,024 | | | | | | 338 | |
Swedish Match AB | | | | | 5,384 | | | | | | 171 | |
| | | | | | | | | | | | |
| | | | | | | | | | | 509 | |
| | | | | | | | | | | | |
| |
| FINANCIALS 0.6% | |
Nordea Bank AB | | | | | 73,845 | | | | | | 819 | |
Ratos AB ‘B’ | | | | | 29,811 | | | | | | 141 | |
Skandinaviska Enskilda Banken AB ‘A’ | | | | | 38,680 | | | | | | 404 | |
Svenska Handelsbanken AB ‘A’ | | | | | 25,204 | | | | | | 349 | |
Swedbank AB ‘A’ | | | | | 18,847 | | | | | | 454 | |
| | | | | | | | | | | | |
| | | | | | | | | | | 2,167 | |
| | | | | | | | | | | | |
| |
| HEALTH CARE 0.0% | |
Getinge AB ‘B’ | | | | | 3,504 | | | | | | 56 | |
| | | | | | | | | | | | |
| |
| INDUSTRIALS 0.5% | |
Assa Abloy AB ‘B’ | | | | | 6,134 | | | | | | 114 | |
Atlas Copco AB ‘A’ | | | | | 7,740 | | | | | | 235 | |
Sandvik AB | | | | | 31,227 | | | | | | 385 | |
Securitas AB ‘B’ | | | | | 9,344 | | | | | | 147 | |
Skanska AB ‘B’ | | | | | 7,347 | | | | | | 173 | |
SKF AB ‘B’ | | | | | 6,787 | | | | | | 124 | |
Volvo AB ‘B’ | | | | | 57,663 | | | | | | 671 | |
| | | | | | | | | | | | |
| | | | | | | | | | | 1,849 | |
| | | | | | | | | | | | |
| |
| INFORMATION TECHNOLOGY 0.2% | |
Telefonaktiebolaget LM Ericsson ‘B’ | | | | | 107,258 | | | | | | 629 | |
| | | | | | | | | | | | |
| |
| MATERIALS 0.1% | |
Boliden AB | | | | | 9,275 | | | | | | 241 | |
SSAB AB ‘A’ (a) | | | | | 25,450 | | | | | | 96 | |
| | | | | | | | | | | | |
| | | | | | | | | | | 337 | |
| | | | | | | | | | | | |
| |
| TELECOMMUNICATION SERVICES 0.3% | |
Tele2 AB ‘B’ | | | | | 69,896 | | | | | | 559 | |
Telia Co. AB | | | | | 112,373 | | | | | | 451 | |
| | | | | | | | | | | | |
| | | | | | | | | | | 1,010 | |
| | | | | | | | | | | | |
Total Sweden | | | | | | | | | | | 6,827 | |
| | | | | | | | | | | | |
| |
| SWITZERLAND 5.5% | |
| |
| CONSUMER DISCRETIONARY 0.1% | |
Cie Financiere Richemont S.A. | | | | | 4,745 | | | | | | 314 | |
Garmin Ltd. | | | | | 2,628 | | | | | | 127 | |
Swatch Group AG | | | | | 387 | | | | | | 120 | |
| | | | | | | | | | | | |
| | | | | | | | | | | 561 | |
| | | | | | | | | | | | |
| |
| CONSUMER STAPLES 0.5% | |
Coca-Cola HBC AG | | | | | 3,772 | | | | | | 82 | |
Nestle S.A. | | | | | 22,564 | | | | | | 1,617 | |
| | | | | | | | | | | | |
| | | | | | | | | | | 1,699 | |
| | | | | | | | | | | | |
| | | | | | | | |
| 46 | | PIMCO EQUITY SERIES | | | | | See Accompanying Notes | |
December 31, 2016 (Unaudited)
| | | | | | | | | | | | |
| | | | | SHARES | | | | | MARKET
VALUE
(000S) | |
| ENERGY 0.3% | |
Transocean Ltd. | | | | | 48,555 | | | $ | | | 716 | |
Weatherford International PLC (a) | | | | | 48,195 | | | | | | 240 | |
| | | | | | | | | | | | |
| | | | | | | | | | | 956 | |
| | | | | | | | | | | | |
| |
| FINANCIALS 1.9% | |
Baloise Holding AG | | | | | 1,416 | | | | | | 178 | |
Credit Suisse Group AG | | | | | 77,469 | | | | | | 1,107 | |
Helvetia Holding AG | | | | | 123 | | | | | | 66 | |
Swiss Life Holding AG | | | | | 3,114 | | | | | | 880 | |
Swiss Re AG | | | | | 16,349 | | | | | | 1,547 | |
UBS Group AG | | | | | 36,806 | | | | | | 576 | |
Zurich Insurance Group AG | | | | | 7,188 | | | | | | 1,975 | |
| | | | | | | | | | | | |
| | | | | | | | | | | 6,329 | |
| | | | | | | | | | | | |
| |
| HEALTH CARE 1.3% | |
Actelion Ltd. | | | | | 246 | | | | | | 53 | |
Lonza Group AG | | | | | 245 | | | | | | 42 | |
Novartis AG | | | | | 32,892 | | | | | | 2,392 | |
Roche Holding AG | | | | | 7,790 | | | | | | 1,776 | |
| | | | | | | | | | | | |
| | | | | | | | | | | 4,263 | |
| | | | | | | | | | | | |
| |
| INDUSTRIALS 0.4% | |
ABB Ltd. | | | | | 30,701 | | | | | | 646 | |
Adecco Group AG | | | | | 4,211 | | | | | | 275 | |
Schindler Holding AG | | | | | 749 | | | | | | 132 | |
SGS S.A. | | | | | 31 | | | | | | 63 | |
Wolseley PLC | | | | | 3,808 | | | | | | 232 | |
| | | | | | | | | | | | |
| | | | | | | | | | | 1,348 | |
| | | | | | | | | | | | |
| |
| INFORMATION TECHNOLOGY 0.2% | |
STMicroelectronics NV | | | | | 34,398 | | | | | | 390 | |
TE Connectivity Ltd. | | | | | 3,762 | | | | | | 261 | |
| | | | | | | | | | | | |
| | | | | | | | | | | 651 | |
| | | | | | | | | | | | |
| |
| MATERIALS 0.8% | |
Clariant AG | | | | | 5,018 | | | | | | 86 | |
Givaudan S.A. | | | | | 49 | | | | | | 90 | |
Glencore PLC | | | | | 590,963 | | | | | | 1,997 | |
LafargeHolcim Ltd. | | | | | 1,212 | | | | | | 64 | |
Syngenta AG (a) | | | | | 906 | | | | | | 359 | |
| | | | | | | | | | | | |
| | | | | | | | | | | 2,596 | |
| | | | | | | | | | | | |
| |
| TELECOMMUNICATION SERVICES 0.0% | |
Swisscom AG | | | | | 143 | | | | | | 64 | |
| | | | | | | | | | | | |
Total Switzerland | | | | | | | | | | | 18,467 | |
| | | | | | | | | | | | |
| |
| UNITED KINGDOM 15.8% | |
| |
| CONSUMER DISCRETIONARY 1.5% | |
Berkeley Group Holdings PLC | | | | | 2,066 | | | | | | 71 | |
Compass Group PLC | | | | | 26,073 | | | | | | 482 | |
Fiat Chrysler Automobiles NV | | | | | 181,581 | | | | | | 1,656 | |
GKN PLC | | | | | 40,337 | | | | | | 164 | |
Inchcape PLC | | | | | 4,252 | | | | | | 37 | |
Informa PLC | | | | | 7,438 | | | | | | 62 | |
InterContinental Hotels Group PLC | | | | | 1,812 | | | | | | 81 | |
ITV PLC | | | | | 33,713 | | | | | | 86 | |
Kingfisher PLC | | | | | 113,856 | | | | | | 490 | |
Marks & Spencer Group PLC | | | | | 115,791 | | | | | | 499 | |
Mitchells & Butlers PLC | | | | | 9,591 | | | | | | 30 | |
Next PLC | | | | | 2,536 | | | | | | 156 | |
| | | | | | | | | | | | |
| | | | | SHARES | | | | | MARKET
VALUE
(000S) | |
Pearson PLC | | | | | 33,514 | | | $ | | | 336 | |
Persimmon PLC | | | | | 1,218 | | | | | | 27 | |
Sky PLC | | | | | 11,575 | | | | | | 141 | |
Thomas Cook Group PLC (a) | | | | | 184,550 | | | | | | 198 | |
William Hill PLC | | | | | 22,682 | | | | | | 81 | |
WPP PLC | | | | | 27,858 | | | | | | 620 | |
| | | | | | | | | | | | |
| | | | | | | | | | | 5,217 | |
| | | | | | | | | | | | |
| |
| CONSUMER STAPLES 2.2% | |
Associated British Foods PLC | | | | | 1,939 | | | | | | 66 | |
British American Tobacco PLC | | | | | 33,994 | | | | | | 1,927 | |
Diageo PLC | | | | | 18,045 | | | | | | 468 | |
Imperial Brands PLC | | | | | 20,039 | | | | | | 873 | |
J Sainsbury PLC | | | | | 191,279 | | | | | | 588 | |
Reckitt Benckiser Group PLC | | | | | 5,186 | | | | | | 439 | |
Tate & Lyle PLC | | | | | 11,481 | | | | | | 100 | |
Tesco PLC (a) | | | | | 296,636 | | | | | | 756 | |
Unilever NV - Dutch Certificate | | | | | 18,624 | | | | | | 765 | |
Unilever PLC | | | | | 11,847 | | | | | | 479 | |
WM Morrison Supermarkets PLC | | | | | 273,074 | | | | | | 776 | |
| | | | | | | | | | | | |
| | | | | | | | | | | 7,237 | |
| | | | | | | | | | | | |
| |
| ENERGY 1.8% | |
BP PLC | | | | | 882,040 | | | | | | 5,525 | |
John Wood Group PLC | | | | | 6,771 | | | | | | 73 | |
Petrofac Ltd. | | | | | 15,873 | | | | | | 170 | |
Subsea 7 S.A. | | | | | 19,354 | | | | | | 244 | |
Tullow Oil PLC (a) | | | | | 44,290 | | | | | | 171 | |
| | | | | | | | | | | | |
| | | | | | | | | | | 6,183 | |
| | | | | | | | | | | | |
| |
| FINANCIALS 5.5% | |
Aberdeen Asset Management PLC | | | | | 7,721 | | | | | | 24 | |
Aviva PLC | | | | | 100,206 | | | | | | 597 | |
Barclays PLC | | | | | 1,312,365 | | | | | | 3,602 | |
Direct Line Insurance Group PLC | | | | | 58,601 | | | | | | 267 | |
HSBC Holdings PLC | | | | | 976,096 | | | | | | 7,876 | |
Lancashire Holdings Ltd. | | | | | 12,283 | | | | | | 105 | |
Lloyds Banking Group PLC | | | | | 1,814,280 | | | | | | 1,393 | |
Man Group PLC | | | | | 90,067 | | | | | | 131 | |
NEX Group PLC | | | | | 13,351 | | | | | | 77 | |
Old Mutual PLC | | | | | 389,516 | | | | | | 993 | |
Prudential PLC | | | | | 7,114 | | | | | | 142 | |
Royal Bank of Scotland Group PLC (a) | | | | | 435,161 | | | | | | 1,202 | |
Standard Chartered PLC | | | | | 223,448 | | | | | | 1,822 | |
Standard Life PLC | | | | | 39,658 | | | | | | 182 | |
Tullett Prebon PLC | | | | | 10,910 | | | | | | 58 | |
| | | | | | | | | | | | |
| | | | | | | | | | | 18,471 | |
| | | | | | | | | | | | |
| |
| HEALTH CARE 0.9% | |
AstraZeneca PLC | | | | | 23,043 | | | | | | 1,258 | |
GlaxoSmithKline PLC | | | | | 84,551 | | | | | | 1,624 | |
Smith & Nephew PLC | | | | | 3,925 | | | | | | 59 | |
| | | | | | | | | | | | |
| | | | | | | | | | | 2,941 | |
| | | | | | | | | | | | |
| |
| INDUSTRIALS 1.1% | |
Aggreko PLC | | | | | 8,973 | | | | | | 101 | |
BAE Systems PLC | | | | | 108,285 | | | | | | 788 | |
Capita PLC | | | | | 5,233 | | | | | | 34 | |
Carillion PLC | | | | | 15,236 | | | | | | 44 | |
CNH Industrial NV | | | | | 57,589 | | | | | | 500 | |
Firstgroup PLC (a) | | | | | 83,131 | | | | | | 106 | |
| | | | | | | | | | | | |
| | | | | SHARES | | | | | MARKET
VALUE
(000S) | |
G4S PLC | | | | | 42,020 | | | $ | | | 121 | |
IMI PLC | | | | | 7,645 | | | | | | 98 | |
International Consolidated Airlines Group S.A. | | | | | 38,556 | | | | | | 209 | |
National Express Group PLC | | | | | 21,148 | | | | | | 92 | |
RELX NV | | | | | 7,379 | | | | | | 124 | |
RELX PLC | | | | | 4,366 | | | | | | 78 | |
Rentokil Initial PLC | | | | | 44,234 | | | | | | 121 | |
Rolls-Royce Holdings PLC | | | | | 47,738 | | | | | | 392 | |
Royal Mail PLC | | | | | 110,931 | | | | | | 631 | |
Smiths Group PLC | | | | | 9,143 | | | | | | 159 | |
Stagecoach Group PLC | | | | | 45,158 | | | | | | 120 | |
Weir Group PLC | | | | | 2,443 | | | | | | 57 | |
| | | | | | | | | | | | |
| | | | | | | | | | | 3,775 | |
| | | | | | | | | | | | |
| |
| INFORMATION TECHNOLOGY 0.0% | |
Sage Group PLC | | | | | 16,703 | | | | | | 135 | |
| | | | | | | | | | | | |
| |
| MATERIALS 1.4% | |
Anglo American PLC (a) | | | | | 109,926 | | | | | | 1,553 | |
Croda International PLC | | | | | 689 | | | | | | 27 | |
DS Smith PLC | | | | | 13,520 | | | | | | 68 | |
KAZ Minerals PLC (a) | | | | | 43,258 | | | | | | 191 | |
Rio Tinto Ltd. | | | | | 26,029 | | | | | | 1,115 | |
Rio Tinto PLC | | | | | 43,733 | | | | | | 1,670 | |
| | | | | | | | | | | | |
| | | | | | | | | | | 4,624 | |
| | | | | | | | | | | | |
| |
| TELECOMMUNICATION SERVICES 0.7% | |
BT Group PLC | | | | | 91,254 | | | | | | 412 | |
Vodafone Group PLC | | | | | 741,854 | | | | | | 1,825 | |
| | | | | | | | | | | | |
| | | | | | | | | | | 2,237 | |
| | | | | | | | | | | | |
| |
| UTILITIES 0.7% | |
Centrica PLC | | | | | 322,444 | | | | | | 928 | |
Drax Group PLC | | | | | 49,259 | | | | | | 229 | |
National Grid PLC | | | | | 58,623 | | | | | | 685 | |
Severn Trent PLC | | | | | 4,489 | | | | | | 123 | |
SSE PLC | | | | | 17,978 | | | | | | 343 | |
United Utilities Group PLC | | | | | 6,207 | | | | | | 69 | |
| | | | | | | | | | | | |
| | | | | | | | | | | 2,377 | |
| | | | | | | | | | | | |
Total United Kingdom | | | | | | | | | | | 53,197 | |
| | | | | | | | | | | | |
| |
| UNITED STATES 0.1% | |
| |
| CONSUMER DISCRETIONARY 0.0% | |
Carnival PLC | | | | | 3,211 | | | | | | 163 | |
| | | | | | | | | | | | |
| |
| FINANCIALS 0.1% | |
Thomson Reuters Corp. | | | | | 6,475 | | | | | | 283 | |
| | | | | | | | | | | | |
Total United States | | | | | | | | | | | 446 | |
| | | | | | | | | | | | |
Total Common Stocks (Cost $297,207) | | | 331,921 | |
| | | | | | | | | | | | |
| |
| PREFERRED STOCKS 0.6% | |
| |
| GERMANY 0.6% | |
| |
| INDUSTRIALS 0.6% | |
Fuchs Petrolub SE | | | | | 1,007 | | | | | | 42 | |
Henkel AG & Co. KGaA | | | | | 1,888 | | | | | | 225 | |
Volkswagen AG | | | | | 11,896 | | | | | | 1,664 | |
| | | | | | | | | | | | |
| | | | | | | | | | | 1,931 | |
| | | | | | | | | | | | |
Total Preferred Stocks (Cost $1,703) | | | 1,931 | |
| | | | | | | | | | | | |
| | | | | | |
| See Accompanying Notes | | SEMIANNUAL REPORT | | DECEMBER 31, 2016 | | 47 |
Schedule of Investments PIMCO RAE Fundamental International Fund (Cont.)
| | | | | | | | | | | | |
| | | | | SHARES | | | | | MARKET
VALUE
(000S) | |
| REAL ESTATE INVESTMENT TRUSTS 0.4% | |
| |
| AUSTRALIA 0.1% | |
| |
| REAL ESTATE 0.1% | |
Dexus Property Group | | | | | 11,084 | | | $ | | | 77 | |
Mirvac Group | | | | | 53,739 | | | | | | 83 | |
Scentre Group | | | | | 40,307 | | | | | | 135 | |
Stockland | | | | | 42,168 | | | | | | 139 | |
| | | | | | | | | | | | |
| | | | | | | | | | | 434 | |
| | | | | | | | | | | | |
Total Australia | | | | | | | | | | | 434 | |
| | | | | | | | | | | | |
| |
| CANADA 0.2% | |
| |
| REAL ESTATE 0.2% | |
Artis Real Estate Investment Trust | | | | | 12,044 | | | | | | 114 | |
Cominar Real Estate Investment Trust | | | | | 4,913 | | | | | | 54 | |
Dream Office Real Estate Investment Trust | | | | | 12,283 | | | | | | 179 | |
H&R Real Estate Investment Trust | | | | | 11,861 | | | | | | 197 | |
| | | | | | | | | | | | |
| | | | | SHARES | | | | | MARKET
VALUE
(000S) | |
RioCan Real Estate Investment Trust | | | | | 4,382 | | | $ | | | 87 | |
Smart Real Estate Investment Trust | | | | | 1,264 | | | | | | 30 | |
| | | | | | | | | | | | |
| | | | | | | | | | | 661 | |
| | | | | | | | | | | | |
Total Canada | | | | | | | | | | | 661 | |
| | | | | | | | | | | | |
| |
| FRANCE 0.1% | |
| |
| REAL ESTATE 0.1% | |
Unibail-Rodamco SE | | | | | 1,138 | | | | | | 271 | |
| | | | | | | | | | | | |
Total France | | | | | | | | | | | 271 | |
| | | | | | | | | | | | |
| |
| UNITED KINGDOM 0.0% | |
| |
| REAL ESTATE 0.0% | |
Land Securities Group PLC | | | | | 12,071 | | | | | | 159 | |
| | | | | | | | | | | | |
Total United Kingdom | | | | | | | | | | | 159 | |
| | | | | | | | | | | | |
Total Real Estate Investment Trusts (Cost $1,516) | | | | | | | | | | | 1,525 | |
| | | | | | | | | | | | |
| |
| | | | | | | | | | | | |
| | | | | SHARES | | | | | MARKET
VALUE
(000S) | |
| RIGHTS 0.0% | |
| |
| NORWAY 0.0% | |
| |
| ENERGY 0.0% | |
Petroleum Geo Services ASA Rights - Exp. 01/05/2017 | | | | | 3,496 | | | $ | | | 3 | |
| | | | | | | | | | | | |
| Total Rights (Cost $0) | | | | | | | | | | | 3 | |
| | | | | | | | | | | | |
| | | | | | | | | | | | |
| Total Investments in Securities (Cost $300,426) | | | | | | | | | | | 335,380 | |
| | | | | | | | | | | | |
| Total Investments 99.7% (Cost $300,426) | | | | | | | | $ | | | 335,380 | |
| |
| Other Assets and Liabilities, net 0.3% | | | | | | 976 | |
| | | | | | | | | | | | |
| Net Assets 100.0% | | | | | | | | $ | | | 336,356 | |
| | | | | | | | | | | | |
NOTES TO SCHEDULE OF INVESTMENTS (AMOUNTS IN THOUSANDS*):
| * | A zero balance may reflect actual amounts rounding to less than one thousand. |
| (a) | Security did not produce income within the last twelve months. |
(b) RESTRICTED SECURITIES:
| | | | | | | | | | | | | | | | |
| Issuer Description | | Acquisition
Date | | | Cost | | | Market
Value | | | Market Value
as Percentage
of Net Assets | |
Great-West Lifeco, Inc. | | | 12/18/2008 - 08/04/2016 | | | $ | 157 | | | $ | 163 | | | | 0.05% | |
| | | | | | | | |
FAIR VALUE OF FINANCIAL DERIVATIVE INSTRUMENTS
The following is a summary of the fair valuation of the Fund’s derivative instruments categorized by risk exposure. See Note 6, Principal Risks, in the Notes to Financial Statements on risks of the Fund.
The effect of Financial Derivative Instruments on the Statements of Operations for the period ended December 31, 2016:
| | | | | | | | | | | | | | | | | | | | | | | | |
| | | Derivatives not accounted for as hedging instruments | |
| | | Commodity
Contracts | | | Credit
Contracts | | | Equity
Contracts | | | Foreign
Exchange
Contracts | | | Interest
Rate Contracts | | | Total | |
Net Realized (Loss) on Financial Derivative Instruments | | | | | | | | | | | | | |
Over the counter | | | | | | | | | | | | | | | | | | | | | | | | |
Forward Foreign Currency Contracts | | $ | 0 | | | $ | 0 | | | $ | 0 | | | $ | (7 | ) | | $ | 0 | | | $ | (7 | ) |
| | | | | | | | | | | | | | | | | | | | | | | | |
FAIR VALUE MEASUREMENTS
The following is a summary of the fair valuations according to the inputs used as of December 31, 2016 in valuing the Fund’s assets and liabilities:
| | | | | | | | | | | | | | | | |
| Category and Subcategory | | Level 1 | | | Level 2 | | | Level 3 | | | Fair
Value at
12/31/2016 | |
Investments in Securities, at Value | |
Common Stocks | |
Australia | |
Consumer Discretionary | | $ | 0 | | | $ | 285 | | | $ | 0 | | | $ | 285 | |
Consumer Staples | | | 0 | | | | 1,967 | | | | 0 | | | | 1,967 | |
Energy | | | 0 | | | | 1,523 | | | | 0 | | | | 1,523 | |
Financials | | | 0 | | | | 9,173 | | | | 0 | | | | 9,173 | |
Health Care | | | 0 | | | | 373 | | | | 0 | | | | 373 | |
Industrials | | | 0 | | | | 765 | | | | 0 | | | | 765 | |
Materials | | | 0 | | | | 7,809 | | | | 0 | | | | 7,809 | |
Real Estate | | | 0 | | | | 107 | | | | 0 | | | | 107 | |
Telecommunication Services | | | 0 | | | | 192 | | | | 0 | | | | 192 | |
Utilities | | | 0 | | | | 245 | | | | 0 | | | | 245 | |
| | | | | | | | | | | | | | | | |
| Category and Subcategory | | Level 1 | | | Level 2 | | | Level 3 | | | Fair
Value at
12/31/2016 | |
Austria | |
Energy | | $ | 0 | | | $ | 713 | | | $ | 0 | | | $ | 713 | |
Financials | | | 0 | | | | 1,200 | | | | 0 | | | | 1,200 | |
Industrials | | | 0 | | | | 67 | | | | 0 | | | | 67 | |
Materials | | | 0 | | | | 385 | | | | 0 | | | | 385 | |
Real Estate | | | 0 | | | | 58 | | | | 0 | | | | 58 | |
Belgium | |
Consumer Staples | | | 609 | | | | 0 | | | | 0 | | | | 609 | |
Financials | | | 0 | | | | 916 | | | | 0 | | | | 916 | |
Health Care | | | 0 | | | | 35 | | | | 0 | | | | 35 | |
Industrials | | | 0 | | | | 68 | | | | 0 | | | | 68 | |
Materials | | | 0 | | | | 137 | | | | 0 | | | | 137 | |
Telecommunication Services | | | 0 | | | | 229 | | | | 0 | | | | 229 | |
| | | | | | | | |
| 48 | | PIMCO EQUITY SERIES | | | | | See Accompanying Notes | |
December 31, 2016 (Unaudited)
| | | | | | | | | | | | | | | | |
| Category and Subcategory | | Level 1 | | | Level 2 | | | Level 3 | | | Fair
Value at
12/31/2016 | |
Canada | |
Consumer Discretionary | | $ | 1,080 | | | $ | 0 | | | $ | 0 | | | $ | 1,080 | |
Consumer Staples | | | 437 | | | | 0 | | | | 0 | | | | 437 | |
Energy | | | 11,183 | | | | 0 | | | | 0 | | | | 11,183 | |
Financials | | | 11,110 | | | | 0 | | | | 0 | | | | 11,110 | |
Industrials | | | 2,625 | | | | 0 | | | | 0 | | | | 2,625 | |
Information Technology | | | 347 | | | | 0 | | | | 0 | | | | 347 | |
Materials | | | 5,692 | | | | 0 | | | | 0 | | | | 5,692 | |
Telecommunication Services | | | 1,420 | | | | 0 | | | | 0 | | | | 1,420 | |
Utilities | | | 980 | | | | 0 | | | | 0 | | | | 980 | |
Denmark | |
Consumer Discretionary | | | 0 | | | | 73 | | | | 0 | | | | 73 | |
Consumer Staples | | | 0 | | | | 339 | | | | 0 | | | | 339 | |
Financials | | | 0 | | | | 213 | | | | 0 | | | | 213 | |
Health Care | | | 0 | | | | 396 | | | | 0 | | | | 396 | |
Industrials | | | 0 | | | | 1,598 | | | | 0 | | | | 1,598 | |
Telecommunication Services | | | 0 | | | | 380 | | | | 0 | | | | 380 | |
Finland | |
Consumer Discretionary | | | 0 | | | | 31 | | | | 0 | | | | 31 | |
Consumer Staples | | | 0 | | | | 261 | | | | 0 | | | | 261 | |
Energy | | | 0 | | | | 81 | | | | 0 | | | | 81 | |
Financials | | | 0 | | | | 123 | | | | 0 | | | | 123 | |
Health Care | | | 0 | | | | 120 | | | | 0 | | | | 120 | |
Industrials | | | 0 | | | | 149 | | | | 0 | | | | 149 | |
Information Technology | | | 0 | | | | 94 | | | | 0 | | | | 94 | |
Materials | | | 0 | | | | 869 | | | | 0 | | | | 869 | |
Telecommunication Services | | | 0 | | | | 71 | | | | 0 | | | | 71 | |
Utilities | | | 0 | | | | 541 | | | | 0 | | | | 541 | |
France | |
Consumer Discretionary | | | 0 | | | | 5,146 | | | | 0 | | | | 5,146 | |
Consumer Staples | | | 0 | | | | 2,366 | | | | 0 | | | | 2,366 | |
Energy | | | 0 | | | | 4,473 | | | | 0 | | | | 4,473 | |
Financials | | | 0 | | | | 10,136 | | | | 0 | | | | 10,136 | |
Health Care | | | 0 | | | | 3,408 | | | | 0 | | | | 3,408 | |
Industrials | | | 0 | | | | 6,911 | | | | 0 | | | | 6,911 | |
Information Technology | | | 0 | | | | 652 | | | | 0 | | | | 652 | |
Materials | | | 0 | | | | 583 | | | | 0 | | | | 583 | |
Real Estate | | | 0 | | | | 75 | | | | 0 | | | | 75 | |
Telecommunication Services | | | 0 | | | | 2,037 | | | | 0 | | | | 2,037 | |
Utilities | | | 0 | | | | 3,278 | | | | 0 | | | | 3,278 | |
Germany | |
Consumer Discretionary | | | 0 | | | | 4,461 | | | | 0 | | | | 4,461 | |
Consumer Staples | | | 0 | | | | 1,362 | | | | 0 | | | | 1,362 | |
Financials | | | 0 | | | | 6,740 | | | | 0 | | | | 6,740 | |
Health Care | | | 0 | | | | 1,699 | | | | 0 | | | | 1,699 | |
Industrials | | | 0 | | | | 5,923 | | | | 0 | | | | 5,923 | |
Information Technology | | | 0 | | | | 833 | | | | 0 | | | | 833 | |
Materials | | | 0 | | | | 4,154 | | | | 0 | | | | 4,154 | |
Telecommunication Services | | | 0 | | | | 1,580 | | | | 0 | | | | 1,580 | |
Utilities | | | 0 | | | | 3,396 | | | | 0 | | | | 3,396 | |
Hong Kong | |
Consumer Discretionary | | | 0 | | | | 220 | | | | 0 | | | | 220 | |
Financials | | | 0 | | | | 550 | | | | 0 | | | | 550 | |
Industrials | | | 0 | | | | 401 | | | | 0 | | | | 401 | |
Information Technology | | | 0 | | | | 112 | | | | 0 | | | | 112 | |
Real Estate | | | 0 | | | | 1,894 | | | | 0 | | | | 1,894 | |
Telecommunication Services | | | 0 | | | | 49 | | | | 0 | | | | 49 | |
Utilities | | | 0 | | | | 280 | | | | 0 | | | | 280 | |
Ireland | |
Consumer Staples | | | 25 | | | | 0 | | | | 0 | | | | 25 | |
Health Care | | | 190 | | | | 0 | | | | 0 | | | | 190 | |
Industrials | | | 0 | | | | 197 | | | | 0 | | | | 197 | |
Materials | | | 0 | | | | 703 | | | | 0 | | | | 703 | |
Israel | |
Financials | | | 0 | | | | 871 | | | | 0 | | | | 871 | |
Health Care | | | 833 | | | | 0 | | | | 0 | | | | 833 | |
Materials | | | 0 | | | | 191 | | | | 0 | | | | 191 | |
Telecommunication Services | | | 0 | | | | 347 | | | | 0 | | | | 347 | |
Italy | |
Consumer Discretionary | | | 0 | | | | 291 | | | | 0 | | | | 291 | |
Energy | | | 0 | | | | 3,501 | | | | 0 | | | | 3,501 | |
| | | | | | | | | | | | | | | | |
| Category and Subcategory | | Level 1 | | | Level 2 | | | Level 3 | | | Fair
Value at
12/31/2016 | |
Financials | | $ | 497 | | | $ | 3,085 | | | $ | 0 | | | $ | 3,582 | |
Industrials | | | 58 | | | | 135 | | | | 0 | | | | 193 | |
Telecommunication Services | | | 0 | | | | 688 | | | | 0 | | | | 688 | |
Utilities | | | 0 | | | | 2,474 | | | | 0 | | | | 2,474 | |
Japan | |
Consumer Discretionary | | | 0 | | | | 11,173 | | | | 0 | | | | 11,173 | |
Consumer Staples | | | 0 | | | | 3,680 | | | | 0 | | | | 3,680 | |
Energy | | | 0 | | | | 1,259 | | | | 0 | | | | 1,259 | |
Financials | | | 75 | | | | 9,942 | | | | 0 | | | | 10,017 | |
Health Care | | | 0 | | | | 1,819 | | | | 0 | | | | 1,819 | |
Industrials | | | 0 | | | | 12,396 | | | | 0 | | | | 12,396 | |
Information Technology | | | 0 | | | | 8,650 | | | | 0 | | | | 8,650 | |
Materials | | | 0 | | | | 5,636 | | | | 0 | | | | 5,636 | |
Real Estate | | | 0 | | | | 380 | | | | 0 | | | | 380 | |
Telecommunication Services | | | 0 | | | | 3,059 | | | | 0 | | | | 3,059 | |
Utilities | | | 0 | | | | 2,943 | | | | 0 | | | | 2,943 | |
Luxembourg | |
Consumer Discretionary | | | 0 | | | | 146 | | | | 0 | | | | 146 | |
Energy | | | 0 | | | | 117 | | | | 0 | | | | 117 | |
Materials | | | 0 | | | | 1,486 | | | | 0 | | | | 1,486 | |
Macau | |
Consumer Discretionary | | | 0 | | | | 136 | | | | 0 | | | | 136 | |
Netherlands | |
Consumer Staples | | | 0 | | | | 2,105 | | | | 0 | | | | 2,105 | |
Energy | | | 0 | | | | 7,411 | | | | 0 | | | | 7,411 | |
Financials | | | 0 | | | | 2,742 | | | | 0 | | | | 2,742 | |
Industrials | | | 0 | | | | 1,616 | | | | 0 | | | | 1,616 | |
Information Technology | | | 77 | | | | 0 | | | | 0 | | | | 77 | |
Materials | | | 0 | | | | 389 | | | | 0 | | | | 389 | |
Telecommunication Services | | | 255 | | | | 302 | | | | 0 | | | | 557 | |
New Zealand | |
Materials | | | 0 | | | | 155 | | | | 0 | | | | 155 | |
Telecommunication Services | | | 0 | | | | 299 | | | | 0 | | | | 299 | |
Norway | |
Consumer Staples | | | 0 | | | | 578 | | | | 0 | | | | 578 | |
Energy | | | 0 | | | | 2,688 | | | | 0 | | | | 2,688 | |
Financials | | | 0 | | | | 591 | | | | 0 | | | | 591 | |
Materials | | | 0 | | | | 350 | | | | 0 | | | | 350 | |
Telecommunication Services | | | 0 | | | | 232 | | | | 0 | | | | 232 | |
Portugal | |
Consumer Staples | | | 0 | | | | 127 | | | | 0 | | | | 127 | |
Energy | | | 0 | | | | 45 | | | | 0 | | | | 45 | |
Financials | | | 0 | | | | 0 | | | | 1 | | | | 1 | |
Utilities | | | 0 | | | | 447 | | | | 0 | | | | 447 | |
Singapore | |
Consumer Discretionary | | | 0 | | | | 149 | | | | 0 | | | | 149 | |
Consumer Staples | | | 0 | | | | 118 | | | | 0 | | | | 118 | |
Financials | | | 0 | | | | 1,099 | | | | 0 | | | | 1,099 | |
Industrials | | | 0 | | | | 968 | | | | 0 | | | | 968 | |
Information Technology | | | 167 | | | | 67 | | | | 0 | | | | 234 | |
Real Estate | | | 0 | | | | 129 | | | | 0 | | | | 129 | |
Telecommunication Services | | | 0 | | | | 266 | | | | 0 | | | | 266 | |
South Africa | |
Financials | | | 0 | | | | 118 | | | | 0 | | | | 118 | |
Materials | | | 0 | | | | 129 | | | | 0 | | | | 129 | |
Spain | |
Consumer Discretionary | | | 0 | | | | 286 | | | | 0 | | | | 286 | |
Consumer Staples | | | 0 | | | | 217 | | | | 0 | | | | 217 | |
Energy | | | 0 | | | | 630 | | | | 0 | | | | 630 | |
Financials | | | 0 | | | | 6,276 | | | | 0 | | | | 6,276 | |
Industrials | | | 45 | | | | 1,000 | | | | 0 | | | | 1,045 | |
Information Technology | | | 0 | | | | 157 | | | | 0 | | | | 157 | |
Telecommunication Services | | | 0 | | | | 1,716 | | | | 0 | | | | 1,716 | |
Utilities | | | 0 | | | | 2,266 | | | | 0 | | | | 2,266 | |
Sweden | |
Consumer Discretionary | | | 0 | | | | 270 | | | | 0 | | | | 270 | |
Consumer Staples | | | 0 | | | | 509 | | | | 0 | | | | 509 | |
Financials | | | 0 | | | | 2,167 | | | | 0 | | | | 2,167 | |
Health Care | | | 0 | | | | 56 | | | | 0 | | | | 56 | |
Industrials | | | 0 | | | | 1,849 | | | | 0 | | | | 1,849 | |
Information Technology | | | 0 | | | | 629 | | | | 0 | | | | 629 | |
| | | | | | |
| See Accompanying Notes | | SEMIANNUAL REPORT | | DECEMBER 31, 2016 | | 49 |
Schedule of Investments PIMCO RAE Fundamental International Fund (Cont.)
December 31, 2016 (Unaudited)
| | | | | | | | | | | | | | | | |
| Category and Subcategory | | Level 1 | | | Level 2 | | | Level 3 | | | Fair
Value at
12/31/2016 | |
Materials | | $ | 0 | | | $ | 337 | | | $ | 0 | | | $ | 337 | |
Telecommunication Services | | | 0 | | | | 1,010 | | | | 0 | | | | 1,010 | |
Switzerland | |
Consumer Discretionary | | | 127 | | | | 434 | | | | 0 | | | | 561 | |
Consumer Staples | | | 0 | | | | 1,699 | | | | 0 | | | | 1,699 | |
Energy | | | 956 | | | | 0 | | | | 0 | | | | 956 | |
Financials | | | 0 | | | | 6,329 | | | | 0 | | | | 6,329 | |
Health Care | | | 0 | | | | 4,263 | | | | 0 | | | | 4,263 | |
Industrials | | | 0 | | | | 1,348 | | | | 0 | | | | 1,348 | |
Information Technology | | | 261 | | | | 390 | | | | 0 | | | | 651 | |
Materials | | | 359 | | | | 2,237 | | | | 0 | | | | 2,596 | |
Telecommunication Services | | | 0 | | | | 64 | | | | 0 | | | | 64 | |
United Kingdom | |
Consumer Discretionary | | | 1,686 | | | | 3,531 | | | | 0 | | | | 5,217 | |
Consumer Staples | | | 0 | | | | 7,237 | | | | 0 | | | | 7,237 | |
Energy | | | 0 | | | | 6,183 | | | | 0 | | | | 6,183 | |
Financials | | | 135 | | | | 18,336 | | | | 0 | | | | 18,471 | |
Health Care | | | 0 | | | | 2,941 | | | | 0 | | | | 2,941 | |
Industrials | | | 0 | | | | 3,775 | | | | 0 | | | | 3,775 | |
Information Technology | | | 0 | | | | 135 | | | | 0 | | | | 135 | |
Materials | | | 0 | | | | 4,624 | | | | 0 | | | | 4,624 | |
Telecommunication Services | | | 0 | | | | 2,237 | | | | 0 | | | | 2,237 | |
| | | | | | | | | | | | | | | | |
| Category and Subcategory | | Level 1 | | | Level 2 | | | Level 3 | | | Fair
Value at
12/31/2016 | |
Utilities | | $ | 0 | | | $ | 2,377 | | | $ | 0 | | | $ | 2,377 | |
United States | |
Consumer Discretionary | | | 0 | | | | 163 | | | | 0 | | | | 163 | |
Financials | | | 283 | | | | 0 | | | | 0 | | | | 283 | |
Preferred Stocks | |
Germany | |
Industrials | | | 0 | | | | 1,931 | | | | 0 | | | | 1,931 | |
Real Estate Investment Trusts | |
Australia | |
Real Estate | | | 0 | | | | 434 | | | | 0 | | | | 434 | |
Canada | |
Real Estate | | | 661 | | | | 0 | | | | 0 | | | | 661 | |
France | |
Real Estate | | | 0 | | | | 271 | | | | 0 | | | | 271 | |
United Kingdom | |
Real Estate | | | 0 | | | | 159 | | | | 0 | | | | 159 | |
Rights | |
Norway | |
Energy | | | 0 | | | | 3 | | | | 0 | | | | 3 | |
| | | | | | | | | | | | | | | | |
| | | | |
Total Investments | | $ | 42,173 | | | $ | 293,206 | | | $ | 1 | | | $ | 335,380 | |
| | | | | | | | | | | | | | | | |
There were no significant transfers between Levels 1, 2, or 3 during the period ended December 31, 2016.
| | | | | | | | |
| 50 | | PIMCO EQUITY SERIES | | | | | See Accompanying Notes | |
Schedule of Investments PIMCO RAE Fundamental US Fund
December 31, 2016 (Unaudited)
| | | | | | | | | | | | |
| | | | | SHARES | | | | | MARKET
VALUE
(000S) | |
| INVESTMENTS IN SECURITIES 99.6% | |
| | | | | | | | | | | | |
| COMMON STOCKS 98.8% | |
| | | | | | | | | | | | |
| BERMUDA 0.0% | |
| | | | | | | | | | | | |
| FINANCIALS 0.0% | |
XL Group Ltd. | | | | | 4,259 | | | $ | | | 159 | |
| | | | | | | | | | | | |
Total Bermuda | | | | | | | | | | | 159 | |
| | | | | | | | | | | | |
| | | | | | | | | | | | |
| IRELAND 0.2% | |
| | | | | | | | | | | | |
| CONSUMER DISCRETIONARY 0.0% | |
Adient PLC (a) | | | | | 405 | | | | | | 24 | |
| | | | | | | | | | | | |
| | | | | | | | | | | | |
| INFORMATION TECHNOLOGY 0.2% | |
Accenture PLC ‘A’ | | | | | 10,966 | | | | | | 1,284 | |
| | | | | | | | | | | | |
Total Ireland | | | | | | | | | | | 1,308 | |
| | | | | | | | | | | | |
| | | | | | | | | | | | |
| UNITED KINGDOM 0.1% | |
| | | | | | | | | | | | |
| CONSUMER STAPLES 0.1% | |
Coca-Cola European Partners PLC | | | | | 8,990 | | | | | | 282 | |
| | | | | | | | | | | | |
Total United Kingdom | | | | | | | | | | | 282 | |
| | | | | | | | | | | | |
| | | | | | | | | | | | |
| UNITED STATES 98.5% | |
| | | | | | | | | | | | |
| CONSUMER DISCRETIONARY 10.8% | |
Aaron’s, Inc. | | | | | 4,595 | | | | | | 147 | |
Abercrombie & Fitch Co. ‘A’ | | | | | 42,864 | | | | | | 514 | |
Amazon.com, Inc. (a) | | | | | 1,491 | | | | | | 1,118 | |
American Eagle Outfitters, Inc. | | | | | 18,598 | | | | | | 282 | |
Apollo Education Group, Inc. (a) | | | | | 30,769 | | | | | | 305 | |
AutoNation, Inc. (a) | | | | | 4,781 | | | | | | 233 | |
AutoZone, Inc. (a) | | | | | 279 | | | | | | 220 | |
Bed Bath & Beyond, Inc. | | | | | 40,563 | | | | | | 1,648 | |
Best Buy Co., Inc. | | | | | 30,086 | | | | | | 1,284 | |
Big Lots, Inc. | | | | | 16,449 | | | | | | 826 | |
Brinker International, Inc. | | | | | 4,477 | | | | | | 222 | |
Caesars Entertainment Corp. (a) | | | | | 21,689 | | | | | | 184 | |
Carnival Corp. | | | | | 9,488 | | | | | | 494 | |
Carter’s, Inc. | | | | | 539 | | | | | | 47 | |
CBS Corp. ‘B’ | | | | | 25,909 | | | | | | 1,648 | |
Charter Communications, Inc. ‘A’ (a) | | | | | 281 | | | | | | 81 | |
Chico’s FAS, Inc. | | | | | 22,141 | | | | | | 319 | |
Cinemark Holdings, Inc. | | | | | 2,659 | | | | | | 102 | |
Coach, Inc. | | | | | 21,439 | | | | | | 751 | |
Comcast Corp. ‘A’ | | | | | 46,988 | | | | | | 3,245 | |
Dana, Inc. | | | | | 9,003 | | | | | | 171 | |
DeVry Education Group, Inc. | | | | | 3,229 | | | | | | 101 | |
Dick’s Sporting Goods, Inc. | | | | | 2,125 | | | | | | 113 | |
Dillard’s, Inc. ‘A’ | | | | | 10,681 | | | | | | 670 | |
Discovery Communications, Inc. ‘A’ (a) | | | | | 12,000 | | | | | | 329 | |
Dollar General Corp. | | | | | 2,440 | | | | | | 181 | |
Dollar Tree, Inc. (a) | | | | | 1,325 | | | | | | 102 | |
Expedia, Inc. | | | | | 557 | | | | | | 63 | |
Foot Locker, Inc. | | | | | 1,321 | | | | | | 94 | |
Ford Motor Co. | | | | | 104,389 | | | | | | 1,266 | |
Fossil Group, Inc. (a) | | | | | 27,544 | | | | | | 712 | |
GameStop Corp. ‘A’ | | | | | 32,184 | | | | | | 813 | |
Gannett Co., Inc. | | | | | 6,562 | | | | | | 64 | |
Gap, Inc. | | | | | 56,832 | | | | | | 1,275 | |
General Motors Co. | | | | | 37,018 | | | | | | 1,290 | |
Genesco, Inc. (a) | | | | | 2,165 | | | | | | 134 | |
Genuine Parts Co. | | | | | 2,058 | | | | | | 197 | |
GNC Holdings, Inc. ‘A’ | | | | | 31,437 | | | | | | 347 | |
| | | | | | | | | | | | |
| | | | | SHARES | | | | | MARKET
VALUE
(000S) | |
Goodyear Tire & Rubber Co. | | | | | 10,458 | | | $ | | | 323 | |
Graham Holdings Co. ‘B’ | | | | | 423 | | | | | | 217 | |
Guess?, Inc. | | | | | 27,381 | | | | | | 331 | |
Harley-Davidson, Inc. | | | | | 6,141 | | | | | | 358 | |
Hasbro, Inc. | | | | | 3,396 | | | | | | 264 | |
Home Depot, Inc. | | | | | 25,540 | | | | | | 3,424 | |
International Game Technology PLC | | | | | 23,592 | | | | | | 602 | |
Interpublic Group of Cos., Inc. | | | | | 22,767 | | | | | | 533 | |
JC Penney Co., Inc. (a) | | | | | 58,751 | | | | | | 488 | |
Kohl’s Corp. | | | | | 56,146 | | | | | | 2,772 | |
L Brands, Inc. | | | | | 4,004 | | | | | | 264 | |
Las Vegas Sands Corp. | | | | | 9,477 | | | | | | 506 | |
Liberty Interactive Corp. ‘A’ (a) | | | | | 15,862 | | | | | | 317 | |
Lowe’s Cos., Inc. | | | | | 33,411 | | | | | | 2,376 | |
Macy’s, Inc. | | | | | 36,299 | | | | | | 1,300 | |
Mattel, Inc. | | | | | 23,120 | | | | | | 637 | |
McDonald’s Corp. | | | | | 29,503 | | | | | | 3,591 | |
MGM Resorts International (a) | | | | | 9,350 | | | | | | 270 | |
News Corp. ‘A’ | | | | | 7,912 | | | | | | 91 | |
NIKE, Inc. ‘B’ | | | | | 11,169 | | | | | | 568 | |
Nordstrom, Inc. | | | | | 11,453 | | | | | | 549 | |
O’Reilly Automotive, Inc. (a) | | | | | 690 | | | | | | 192 | |
Office Depot, Inc. | | | | | 76,476 | | | | | | 346 | |
Omnicom Group, Inc. | | | | | 15,327 | | | | | | 1,304 | |
Panera Bread Co. ‘A’ (a) | | | | | 371 | | | | | | 76 | |
Pier 1 Imports, Inc. | | | | | 9,192 | | | | | | 79 | |
Ralph Lauren Corp. | | | | | 5,654 | | | | | | 511 | |
Regal Entertainment Group ‘A’ | | | | | 16,476 | | | | | | 339 | |
Rent-A-Center, Inc. | | | | | 26,866 | | | | | | 302 | |
Ross Stores, Inc. | | | | | 1,189 | | | | | | 78 | |
Royal Caribbean Cruises Ltd. | | | | | 1,174 | | | | | | 96 | |
Sally Beauty Holdings, Inc. (a) | | | | | 5,416 | | | | | | 143 | |
Scripps Networks Interactive, Inc. ‘A’ | | | | | 3,264 | | | | | | 233 | |
Sears Holdings Corp. (a) | | | | | 16,695 | | | | | | 155 | |
SeaWorld Entertainment, Inc. | | | | | 5,323 | | | | | | 101 | |
Sotheby’s | | | | | 2,039 | | | | | | 81 | |
Staples, Inc. | | | | | 128,256 | | | | | | 1,161 | |
Starbucks Corp. | | | | | 7,745 | | | | | | 430 | |
Target Corp. | | | | | 28,494 | | | | | | 2,058 | |
Tenneco, Inc. (a) | | | | | 2,303 | | | | | | 144 | |
Time Warner, Inc. | | | | | 41,192 | | | | | | 3,976 | |
Time, Inc. | | | | | 29,036 | | | | | | 518 | |
TJX Cos., Inc. | | | | | 6,151 | | | | | | 462 | |
Tractor Supply Co. | | | | | 756 | | | | | | 57 | |
Tribune Media Co. ‘A’ | | | | | 10,205 | | | | | | 357 | |
Tupperware Brands Corp. | | | | | 9,203 | | | | | | 484 | |
Urban Outfitters, Inc. (a) | | | | | 8,430 | | | | | | 240 | |
Viacom, Inc. ‘B’ | | | | | 73,078 | | | | | | 2,565 | |
Visteon Corp. | | | | | 4,158 | | | | | | 334 | |
Walt Disney Co. | | | | | 11,748 | | | | | | 1,224 | |
Weight Watchers International, Inc. (a) | | | | | 43,479 | | | | | | 498 | |
Wendy’s Co. | | | | | 7,188 | | | | | | 97 | |
Wyndham Worldwide Corp. | | | | | 11,121 | | | | | | 849 | |
Wynn Resorts Ltd. | | | | | 10,398 | | | | | | 900 | |
Yum! Brands, Inc. | | | | | 2,656 | | | | | | 168 | |
| | | | | | | | | | | | |
| | | | | | | | | | | 61,931 | |
| | | | | | | | | | | | |
| | | | | | | | | | | | |
| CONSUMER STAPLES 8.0% | |
Altria Group, Inc. | | | | | 32,486 | | | | | | 2,197 | |
Archer-Daniels-Midland Co. | | | | | 5,525 | | | | | | 252 | |
Avon Products, Inc. | | | | | 203,072 | | | | | | 1,023 | |
Brown-Forman Corp. ‘B’ | | | | | 2,044 | | | | | | 92 | |
| | | | | | | | | | | | |
| | | | | SHARES | | | | | MARKET
VALUE
(000S) | |
Bunge Ltd. | | | | | 9,160 | | | $ | | | 662 | |
Campbell Soup Co. | | | | | 969 | | | | | | 59 | |
Casey’s General Stores, Inc. | | | | | 513 | | | | | | 61 | |
Coca-Cola Co. | | | | | 77,833 | | | | | | 3,227 | |
Colgate-Palmolive Co. | | | | | 14,024 | | | | | | 918 | |
ConAgra Foods, Inc. | | | | | 5,008 | | | | | | 198 | |
Costco Wholesale Corp. | | | | | 1,950 | | | | | | 312 | |
CVS Health Corp. | | | | | 22,037 | | | | | | 1,739 | |
Dr Pepper Snapple Group, Inc. | | | | | 7,055 | | | | | | 640 | |
Energizer Holdings, Inc. | | | | | 2,098 | | | | | | 94 | |
Estee Lauder Cos., Inc. ‘A’ | | | | | 2,521 | | | | | | 193 | |
General Mills, Inc. | | | | | 14,945 | | | | | | 923 | |
Herbalife Ltd. (a) | | | | | 18,695 | | | | | | 900 | |
HRG Group, Inc. (a) | | | | | 14,237 | | | | | | 221 | |
Ingredion, Inc. | | | | | 1,223 | | | | | | 153 | |
Kellogg Co. | | | | | 5,422 | | | | | | 400 | |
Kimberly-Clark Corp. | | | | | 3,252 | | | | | | 371 | |
Kraft Heinz Co. | | | | | 3,685 | | | | | | 322 | |
Kroger Co. | | | | | 50,871 | | | | | | 1,755 | |
Lamb Weston Holdings, Inc. (a) | | | | | 1,920 | | | | | | 73 | |
McCormick & Co., Inc. | | | | | 736 | | | | | | 69 | |
Molson Coors Brewing Co. ‘B’ | | | | | 877 | | | | | | 85 | |
Mondelez International, Inc. ‘A’ | | | | | 21,838 | | | | | | 968 | |
Nu Skin Enterprises, Inc. ‘A’ | | | | | 8,168 | | | | | | 390 | |
PepsiCo, Inc. | | | | | 42,441 | | | | | | 4,441 | |
Philip Morris International, Inc. | | | | | 61,171 | | | | | | 5,596 | |
Procter & Gamble Co. | | | | | 84,756 | | | | | | 7,126 | |
Reynolds American, Inc. | | | | | 5,316 | | | | | | 298 | |
Rite Aid Corp. (a) | | | | | 89,326 | | | | | | 736 | |
Safeway Casa Ley CVR | | | | | 38,866 | | | | | | 5 | |
Safeway PDC LLC CVR | | | | | 38,866 | | | | | | 1 | |
SUPERVALU, Inc. (a) | | | | | 86,872 | | | | | | 406 | |
Sysco Corp. | | | | | 19,697 | | | | | | 1,091 | |
Universal Corp. | | | | | 1,559 | | | | | | 99 | |
Wal-Mart Stores, Inc. | | | | | 104,743 | | | | | | 7,240 | |
Walgreens Boots Alliance, Inc. | | | | | 3,569 | | | | | | 295 | |
Whole Foods Market, Inc. | | | | | 12,036 | | | | | | 370 | |
| | | | | | | | | | | | |
| | | | | | | | | | | 46,001 | |
| | | | | | | | | | | | |
| | | | | | | | | | | | |
| ENERGY 13.2% | |
Anadarko Petroleum Corp. | | | | | 18,110 | | | | | | 1,263 | |
Apache Corp. | | | | | 30,407 | | | | | | 1,930 | |
Baker Hughes, Inc. | | | | | 11,136 | | | | | | 724 | |
Bristow Group, Inc. | | | | | 4,117 | | | | | | 84 | |
California Resources Corp. (a) | | | | | 71,470 | | | | | | 1,522 | |
Chesapeake Energy Corp. (a) | | | | | 494,298 | | | | | | 3,470 | |
Chevron Corp. | | | | | 125,737 | | | | | | 14,799 | |
ConocoPhillips | | | | | 131,989 | | | | | | 6,618 | |
CONSOL Energy, Inc. | | | | | 28,875 | | | | | | 526 | |
Continental Resources, Inc. (a) | | | | | 1,478 | | | | | | 76 | |
CVR Energy, Inc. | | | | | 13,740 | | | | | | 349 | |
Denbury Resources, Inc. (a) | | | | | 243,182 | | | | | | 895 | |
Devon Energy Corp. | | | | | 1,325 | | | | | | 61 | |
Diamond Offshore Drilling, Inc. | | | | | 25,265 | | | | | | 447 | |
Energen Corp. | | | | | 3,515 | | | | | | 203 | |
EOG Resources, Inc. | | | | | 2,287 | | | | | | 231 | |
EP Energy Corp. ‘A’ (a) | | | | | 54,343 | | | | | | 356 | |
Exxon Mobil Corp. | | | | | 192,352 | | | | | | 17,362 | |
Halliburton Co. | | | | | 28,896 | | | | | | 1,563 | |
Helmerich & Payne, Inc. | | | | | 1,487 | | | | | | 115 | |
Hess Corp. | | | | | 42,154 | | | | | | 2,626 | |
HollyFrontier Corp. | | | | | 26,115 | | | | | | 856 | |
Kinder Morgan, Inc. | | | | | 26,819 | | | | | | 555 | |
Marathon Oil Corp. | | | | | 164,422 | | | | | | 2,846 | |
Marathon Petroleum Corp. | | | | | 31,882 | | | | | | 1,605 | |
| | | | | | |
| See Accompanying Notes | | SEMIANNUAL REPORT | | DECEMBER 31, 2016 | | 51 |
Schedule of Investments PIMCO RAE Fundamental US Fund (Cont.)
| | | | | | | | | | | | |
| | | | | SHARES | | | | | MARKET
VALUE
(000S) | |
Murphy Oil Corp. | | | | | 57,927 | | | $ | | | 1,803 | |
Nabors Industries Ltd. | | | | | 42,019 | | | | | | 689 | |
National Oilwell Varco, Inc. | | | | | 48,535 | | | | | | 1,817 | |
Newfield Exploration Co. (a) | | | | | 1,893 | | | | | | 77 | |
Noble Energy, Inc. | | | | | 2,974 | | | | | | 113 | |
Oasis Petroleum, Inc. (a) | | | | | 14,908 | | | | | | 226 | |
Occidental Petroleum Corp. | | | | | 33,792 | | | | | | 2,407 | |
Oceaneering International, Inc. | | | | | 3,082 | | | | | | 87 | |
ONEOK, Inc. | | | | | 3,036 | | | | | | 174 | |
Patterson-UTI Energy, Inc. | | | | | 12,083 | | | | | | 325 | |
PBF Energy, Inc. ‘A’ | | | | | 3,036 | | | | | | 85 | |
Phillips 66 | | | | | 11,513 | | | | | | 995 | |
Schlumberger Ltd. | | | | | 19,780 | | | | | | 1,661 | |
SEACOR Holdings, Inc. (a) | | | | | 804 | | | | | | 57 | |
Southwestern Energy Co. (a) | | | | | 22,909 | | | | | | 248 | |
Spectra Energy Corp. | | | | | 16,034 | | | | | | 659 | |
Superior Energy Services, Inc. | | | | | 28,157 | | | | | | 475 | |
Targa Resources Corp. | | | | | 3,964 | | | | | | 222 | |
Tesoro Corp. | | | | | 1,477 | | | | | | 129 | |
Unit Corp. (a) | | | | | 4,022 | | | | | | 108 | |
Valero Energy Corp. | | | | | 24,268 | | | | | | 1,658 | |
Western Refining, Inc. | | | | | 4,656 | | | | | | 176 | |
Whiting Petroleum Corp. (a) | | | | | 19,834 | | | | | | 238 | |
WPX Energy, Inc. (a) | | | | | 34,818 | | | | | | 507 | |
| | | | | | | | | | | | |
| | | | | | | | | | | 76,018 | |
| | | | | | | | | | | | |
| | | | | | | | | | | | |
| FINANCIALS 13.7% | |
Aflac, Inc. | | | | | 9,409 | | | | | | 655 | |
Allstate Corp. | | | | | 18,827 | | | | | | 1,395 | |
Ally Financial, Inc. | | | | | 96,993 | | | | | | 1,845 | |
Ambac Financial Group, Inc. (a) | | | | | 2,539 | | | | | | 57 | |
American Equity Investment Life Holding Co. | | | | | 2,572 | | | | | | 58 | |
American Express Co. | | | | | 39,448 | | | | | | 2,922 | |
American Financial Group, Inc. | | | | | 4,410 | | | | | | 389 | |
American International Group, Inc. | | | | | 90,028 | | | | | | 5,880 | |
Ameriprise Financial, Inc. | | | | | 6,813 | | | | | | 756 | |
Assurant, Inc. | | | | | 9,966 | | | | | | 925 | |
Bank of America Corp. | | | | | 198,214 | | | | | | 4,381 | |
Bank of New York Mellon Corp. | | | | | 13,663 | | | | | | 647 | |
BB&T Corp. | | | | | 13,967 | | | | | | 657 | |
Berkshire Hathaway, Inc. ‘B’ (a) | | | | | 11,996 | | | | | | 1,955 | |
BlackRock, Inc. | | | | | 591 | | | | | | 225 | |
Capital One Financial Corp. | | | | | 26,818 | | | | | | 2,340 | |
Cincinnati Financial Corp. | | | | | 1,474 | | | | | | 112 | |
CIT Group, Inc. | | | | | 7,580 | | | | | | 324 | |
Citigroup, Inc. | | | | | 107,897 | | | | | | 6,412 | |
Citizens Financial Group, Inc. | | | | | 21,100 | | | | | | 752 | |
CME Group, Inc. | | | | | 2,934 | | | | | | 338 | |
CNO Financial Group, Inc. | | | | | 10,064 | | | | | | 193 | |
Comerica, Inc. | | | | | 2,208 | | | | | | 150 | |
Discover Financial Services | | | | | 17,335 | | | | | | 1,250 | |
Donnelley Financial Solutions, Inc. (a) | | | | | 3,420 | | | | | | 79 | |
E*TRADE Financial Corp. (a) | | | | | 6,063 | | | | | | 210 | |
Fifth Third Bancorp | | | | | 27,968 | | | | | | 754 | |
First Horizon National Corp. | | | | | 11,718 | | | | | | 234 | |
Franklin Resources, Inc. | | | | | 11,803 | | | | | | 467 | |
Genworth Financial, Inc. ‘A’ (a) | | | | | 215,866 | | | | | | 822 | |
Goldman Sachs Group, Inc. | | | | | 14,104 | | | | | | 3,377 | |
Great Western Bancorp, Inc. | | | | | 3,075 | | | | | | 134 | |
Hartford Financial Services Group, Inc. | | | | | 15,897 | | | | | | 758 | |
JPMorgan Chase & Co. | | | | | 123,867 | | | | | | 10,688 | |
Kemper Corp. | | | | | 1,845 | | | | | | 82 | |
| | | | | | | | | | | | |
| | | | | SHARES | | | | | MARKET
VALUE
(000S) | |
KeyCorp | | | | | 14,297 | | | $ | | | 261 | |
Legg Mason, Inc. | | | | | 20,302 | | | | | | 607 | |
Leucadia National Corp. | | | | | 11,446 | | | | | | 266 | |
Lincoln National Corp. | | | | | 8,662 | | | | | | 574 | |
Loews Corp. | | | | | 18,388 | | | | | | 861 | |
Marsh & McLennan Cos., Inc. | | | | | 1,679 | | | | | | 114 | |
MetLife, Inc. | | | | | 30,746 | | | | | | 1,657 | |
NASDAQ, Inc. | | | | | 2,908 | | | | | | 195 | |
Navient Corp. | | | | | 98,888 | | | | | | 1,625 | |
New York Community Bancorp, Inc. | | | | | 10,947 | | | | | | 174 | |
OneMain Holdings, Inc. (a) | | | | | 3,675 | | | | | | 81 | |
People’s United Financial, Inc. | | | | | 27,991 | | | | | | 542 | |
PHH Corp. (a) | | | | | 17,761 | | | | | | 269 | |
PNC Financial Services Group, Inc. | | | | | 8,142 | | | | | | 952 | |
Primerica, Inc. | | | | | 823 | | | | | | 57 | |
Progressive Corp. | | | | | 11,718 | | | | | | 416 | |
Prudential Financial, Inc. | | | | | 1,330 | | | | | | 138 | |
Regions Financial Corp. | | | | | 51,296 | | | | | | 737 | |
Reinsurance Group of America, Inc. | | | | | 4,165 | | | | | | 524 | |
Santander Consumer USA Holdings, Inc. (a) | | | | | 47,987 | | | | | | 648 | |
SLM Corp. (a) | | | | | 100,988 | | | | | | 1,113 | |
State Street Corp. | | | | | 5,323 | | | | | | 414 | |
SunTrust Banks, Inc. | | | | | 13,011 | | | | | | 714 | |
Synchrony Financial | | | | | 38,565 | | | | | | 1,399 | |
Travelers Cos., Inc. | | | | | 34,864 | | | | | | 4,268 | |
U.S. Bancorp | | | | | 16,539 | | | | | | 850 | |
Voya Financial, Inc. | | | | | 43,405 | | | | | | 1,702 | |
Wells Fargo & Co. | | | | | 85,119 | | | | | | 4,691 | |
White Mountains Insurance Group Ltd. | | | | | 316 | | | | | | 264 | |
WR Berkley Corp. | | | | | 1,263 | | | | | | 84 | |
Zions Bancorporation | | | | | 2,178 | | | | | | 94 | |
| | | | | | | | | | | | |
| | | | | | | | | | | 78,514 | |
| | | | | | | | | | | | |
| | | | | | | | | | | | |
| HEALTH CARE 10.6% | |
Abbott Laboratories | | | | | 20,427 | | | | | | 785 | |
AbbVie, Inc. | | | | | 13,785 | | | | | | 863 | |
Aetna, Inc. | | | | | 15,388 | | | | | | 1,908 | |
AmerisourceBergen Corp. | | | | | 725 | | | | | | 57 | |
Amgen, Inc. | | | | | 20,842 | | | | | | 3,047 | |
Anthem, Inc. | | | | | 33,559 | | | | | | 4,825 | |
Baxter International, Inc. | | | | | 15,817 | | | | | | 701 | |
Becton Dickinson and Co. | | | | | 4,808 | | | | | | 796 | |
Bio-Rad Laboratories, Inc. ‘A’ (a) | | | | | 552 | | | | | | 101 | |
Biogen, Inc. (a) | | | | | 568 | | | | | | 161 | |
Boston Scientific Corp. (a) | | | | | 6,113 | | | | | | 132 | |
Bristol-Myers Squibb Co. | | | | | 15,299 | | | | | | 894 | |
Cardinal Health, Inc. | | | | | 3,826 | | | | | | 275 | |
Celgene Corp. (a) | | | | | 2,317 | | | | | | 268 | |
Cerner Corp. (a) | | | | | 1,342 | | | | | | 64 | |
Community Health Systems, Inc. (a) | | | | | 91,743 | | | | | | 513 | |
CR Bard, Inc. | | | | | 1,950 | | | | | | 438 | |
Danaher Corp. | | | | | 5,351 | | | | | | 417 | |
Edwards Lifesciences Corp. (a) | | | | | 1,137 | | | | | | 107 | |
Eli Lilly & Co. | | | | | 14,212 | | | | | | 1,045 | |
Envision Healthcare Corp. (a) | | | | | 6,304 | | | | | | 399 | |
Express Scripts Holding Co. (a) | | | | | 10,694 | | | | | | 736 | |
Gilead Sciences, Inc. | | | | | 5,334 | | | | | | 382 | |
HCA Holdings, Inc. (a) | | | | | 41,319 | | | | | | 3,059 | |
Henry Schein, Inc. (a) | | | | | 865 | | | | | | 131 | |
Hologic, Inc. (a) | | | | | 1,793 | | | | | | 72 | |
| | | | | | | | | | | | |
| | | | | SHARES | | | | | MARKET
VALUE
(000S) | |
Humana, Inc. | | | | | 3,988 | | | $ | | | 814 | |
Illumina, Inc. (a) | | | | | 384 | | | | | | 49 | |
Intuitive Surgical, Inc. (a) | | | | | 163 | | | | | | 103 | |
Johnson & Johnson | | | | | 61,109 | | | | | | 7,040 | |
Kindred Healthcare, Inc. | | | | | 13,767 | | | | | | 108 | |
LifePoint Health, Inc. (a) | | | | | 7,825 | | | | | | 445 | |
Magellan Health, Inc. (a) | | | | | 1,310 | | | | | | 99 | |
McKesson Corp. | | | | | 4,183 | | | | | | 588 | |
Merck & Co., Inc. | | | | | 130,248 | | | | | | 7,668 | |
Mettler-Toledo International, Inc. (a) | | | | | 235 | | | | | | 98 | |
Mylan NV (a) | | | | | 1,444 | | | | | | 55 | |
Owens & Minor, Inc. | | | | | 2,734 | | | | | | 97 | |
Patterson Cos., Inc. | | | | | 4,792 | | | | | | 197 | |
Pfizer, Inc. | | | | | 382,369 | | | | | | 12,419 | |
Quest Diagnostics, Inc. | | | | | 13,776 | | | | | | 1,266 | |
Regeneron Pharmaceuticals, Inc. (a) | | | | | 153 | | | | | | 56 | |
Select Medical Holdings Corp. (a) | | | | | 7,502 | | | | | | 99 | |
St Jude Medical, Inc. | | | | | 9,954 | | | | | | 798 | |
Stryker Corp. | | | | | 1,283 | | | | | | 154 | |
Tenet Healthcare Corp. (a) | | | | | 40,302 | | | | | | 598 | |
Thermo Fisher Scientific, Inc. | | | | | 2,282 | | | | | | 322 | |
UnitedHealth Group, Inc. | | | | | 27,727 | | | | | | 4,437 | |
Universal Health Services, Inc. ‘B’ | | | | | 696 | | | | | | 74 | |
Valeant Pharmaceuticals International, Inc. (a) | | | | | 14,901 | | | | | | 216 | |
Varian Medical Systems, Inc. (a) | | | | | 2,488 | | | | | | 223 | |
WellCare Health Plans, Inc. (a) | | | | | 601 | | | | | | 82 | |
Zimmer Biomet Holdings, Inc. | | | | | 2,483 | | | | | | 256 | |
Zoetis, Inc. | | | | | 2,510 | | | | | | 134 | |
| | | | | | | | | | | | |
| | | | | | | | | | | 60,671 | |
| | | | | | | | | | | | |
| | | | | | | | | | | | |
| INDUSTRIALS 9.2% | |
3M Co. | | | | | 12,093 | | | | | | 2,159 | |
AGCO Corp. | | | | | 8,617 | | | | | | 499 | |
Alaska Air Group, Inc. | | | | | 1,000 | | | | | | 89 | |
American Airlines Group, Inc. | | | | | 2,692 | | | | | | 126 | |
Armstrong Flooring, Inc. (a) | | | | | 3,732 | | | | | | 74 | |
Armstrong World Industries, Inc. (a) | | | | | 16,246 | | | | | | 679 | |
Avis Budget Group, Inc. (a) | | | | | 35,459 | | | | | | 1,301 | |
Boeing Co. | | | | | 5,492 | | | | | | 855 | |
Caterpillar, Inc. | | | | | 36,485 | | | | | | 3,384 | |
Cintas Corp. | | | | | 851 | | | | | | 98 | |
CSX Corp. | | | | | 53,399 | | | | | | 1,919 | |
Cummins, Inc. | | | | | 6,561 | | | | | | 897 | |
Deere & Co. | | | | | 31,001 | | | | | | 3,194 | |
Delta Air Lines, Inc. | | | | | 1,297 | | | | | | 64 | |
Dover Corp. | | | | | 8,351 | | | | | | 626 | |
Dun & Bradstreet Corp. | | | | | 3,191 | | | | | | 387 | |
Emerson Electric Co. | | | | | 33,724 | | | | | | 1,880 | |
Equifax, Inc. | | | | | 831 | | | | | | 98 | |
FedEx Corp. | | | | | 988 | | | | | | 184 | |
Flowserve Corp. | | | | | 7,628 | | | | | | 367 | |
Fluor Corp. | | | | | 11,874 | | | | | | 624 | |
Fortive Corp. | | | | | 3,727 | | | | | | 200 | |
FTI Consulting, Inc. (a) | | | | | 1,605 | | | | | | 72 | |
GATX Corp. | | | | | 1,630 | | | | | | 100 | |
General Dynamics Corp. | | | | | 4,804 | | | | | | 829 | |
General Electric Co. | | | | | 275,632 | | | | | | 8,710 | |
HD Supply Holdings, Inc. (a) | | | | | 2,680 | | | | | | 114 | |
Herc Holdings, Inc. (a) | | | | | 3,203 | | | | | | 129 | |
Hertz Global Holdings, Inc. (a) | | | | | 5,706 | | | | | | 123 | |
Honeywell International, Inc. | | | | | 8,693 | | | | | | 1,007 | |
| | | | | | | | |
| 52 | | PIMCO EQUITY SERIES | | | | | See Accompanying Notes | |
December 31, 2016 (Unaudited)
| | | | | | | | | | | | |
| | | | | SHARES | | | | | MARKET
VALUE
(000S) | |
Illinois Tool Works, Inc. | | | | | 14,822 | | | $ | | | 1,815 | |
Ingersoll-Rand PLC | | | | | 4,460 | | | | | | 335 | |
Johnson Controls International PLC | | | | | 7,987 | | | | | | 329 | |
Joy Global, Inc. | | | | | 26,753 | | | | | | 749 | |
KBR, Inc. | | | | | 3,410 | | | | | | 57 | |
Kirby Corp. (a) | | | | | 1,434 | | | | | | 95 | |
KLX, Inc. (a) | | | | | 3,575 | | | | | | 161 | |
L3 Technologies, Inc. | | | | | 7,090 | | | | | | 1,079 | |
Lockheed Martin Corp. | | | | | 4,760 | | | | | | 1,190 | |
LSC Communications, Inc. | | | | | 3,420 | | | | | | 102 | |
ManpowerGroup, Inc. | | | | | 4,118 | | | | | | 366 | |
MRC Global, Inc. (a) | | | | | 6,485 | | | | | | 131 | |
Norfolk Southern Corp. | | | | | 14,663 | | | | | | 1,585 | |
Northrop Grumman Corp. | | | | | 10,631 | | | | | | 2,473 | |
NOW, Inc. (a) | | | | | 4,982 | | | | | | 102 | |
Oshkosh Corp. | | | | | 2,080 | | | | | | 134 | |
Owens Corning | | | | | 2,888 | | | | | | 149 | |
PACCAR, Inc. | | | | | 3,132 | | | | | | 200 | |
Parker-Hannifin Corp. | | | | | 2,737 | | | | | | 383 | |
Pitney Bowes, Inc. | | | | | 29,248 | | | | | | 444 | |
Quanta Services, Inc. (a) | | | | | 4,406 | | | | | | 154 | |
Raytheon Co. | | | | | 9,727 | | | | | | 1,381 | |
Republic Services, Inc. | | | | | 11,868 | | | | | | 677 | |
Rexnord Corp. (a) | | | | | 3,930 | | | | | | 77 | |
Rockwell Collins, Inc. | | | | | 1,497 | | | | | | 139 | |
RR Donnelley & Sons Co. | | | | | 15,803 | | | | | | 258 | |
Ryder System, Inc. | | | | | 3,092 | | | | | | 230 | |
Snap-on, Inc. | | | | | 465 | | | | | | 80 | |
SPX FLOW, Inc. (a) | | | | | 3,164 | | | | | | 101 | |
Stanley Black & Decker, Inc. | | | | | 1,890 | | | | | | 217 | |
Textron, Inc. | | | | | 2,596 | | | | | | 126 | |
Timken Co. | | | | | 6,558 | | | | | | 260 | |
TransDigm Group, Inc. | | | | | 295 | | | | | | 73 | |
Trinity Industries, Inc. | | | | | 3,139 | | | | | | 87 | |
Triumph Group, Inc. | | | | | 1,718 | | | | | | 46 | |
Union Pacific Corp. | | | | | 26,557 | | | | | | 2,753 | |
United Continental Holdings, Inc. (a) | | | | | 1,896 | | | | | | 138 | |
United Rentals, Inc. (a) | | | | | 547 | | | | | | 58 | |
United Technologies Corp. | | | | | 15,199 | | | | | | 1,666 | |
Waste Management, Inc. | | | | | 17,812 | | | | | | 1,263 | |
WW Grainger, Inc. | | | | | 1,285 | | | | | | 298 | |
| | | | | | | | | | | | |
| | | | | | | | | | | 52,749 | |
| | | | | | | | | | | | |
| | | | | | | | | | | | |
| INFORMATION TECHNOLOGY 18.2% | |
Activision Blizzard, Inc. | | | | | 30,588 | | | | | | 1,105 | |
Advanced Micro Devices, Inc. (a) | | | | | 61,233 | | | | | | 694 | |
Alphabet, Inc. ‘C’ (a) | | | | | 7,296 | | | | | | 5,631 | |
Amdocs Ltd. | | | | | 4,910 | | | | | | 286 | |
Anixter International, Inc. (a) | | | | | 3,994 | | | | | | 324 | |
Apple, Inc. | | | | | 89,804 | | | | | | 10,401 | |
Applied Materials, Inc. | | | | | 28,057 | | | | | | 905 | |
Arrow Electronics, Inc. (a) | | | | | 12,909 | | | | | | 920 | |
Automatic Data Processing, Inc. | | | | | 2,374 | | | | | | 244 | |
Avnet, Inc. | | | | | 14,712 | | | | | | 700 | |
Booz Allen Hamilton Holding Corp. | | | | | 23,263 | | | | | | 839 | |
Brocade Communications Systems, Inc. | | | | | 17,745 | | | | | | 222 | |
CA, Inc. | | | | | 34,077 | | | | | | 1,083 | |
CACI International, Inc. ‘A’ (a) | | | | | 870 | | | | | | 108 | |
Cisco Systems, Inc. | | | | | 149,342 | | | | | | 4,513 | |
Citrix Systems, Inc. (a) | | | | | 3,056 | | | | | | 273 | |
Computer Sciences Corp. | | | | | 3,816 | | | | | | 227 | |
Convergys Corp. | | | | | 2,578 | | | | | | 63 | |
CoreLogic, Inc. (a) | | | | | 1,936 | | | | | | 71 | |
| | | | | | | | | | | | |
| | | | | SHARES | | | | | MARKET
VALUE
(000S) | |
Corning, Inc. | | | | | 84,145 | | | $ | | | 2,042 | |
Dell Technologies, Inc. ‘V’ (a) | | | | | 7,562 | | | | | | 416 | |
eBay, Inc. (a) | | | | | 3,958 | | | | | | 118 | |
EchoStar Corp. ‘A’ (a) | | | | | 1,256 | | | | | | 65 | |
Electronic Arts, Inc. (a) | | | | | 1,225 | | | | | | 96 | |
Facebook, Inc. ‘A’ (a) | | | | | 1,791 | | | | | | 206 | |
Fidelity National Information Services, Inc. | | | | | 3,680 | | | | | | 278 | |
Fiserv, Inc. (a) | | | | | 2,499 | | | | | | 266 | |
Flex Ltd. (a) | | | | | 10,327 | | | | | | 148 | |
FLIR Systems, Inc. | | | | | 1,818 | | | | | | 66 | |
Global Payments, Inc. | | | | | 1,758 | | | | | | 122 | |
Harris Corp. | | | | | 1,194 | | | | | | 122 | |
Hewlett Packard Enterprise Co. | | | | | 330,559 | | | | | | 7,649 | |
HP, Inc. | | | | | 232,516 | | | | | | 3,451 | |
Intel Corp. | | | | | 278,800 | | | | | | 10,112 | |
InterActiveCorp | | | | | 8,477 | | | | | | 549 | |
International Business Machines Corp. | | | | | 85,570 | | | | | | 14,204 | |
Intuit, Inc. | | | | | 1,799 | | | | | | 206 | |
Jabil Circuit, Inc. | | | | | 22,127 | | | | | | 524 | |
Juniper Networks, Inc. | | | | | 22,705 | | | | | | 642 | |
Keysight Technologies, Inc. (a) | | | | | 8,260 | | | | | | 302 | |
KLA-Tencor Corp. | | | | | 5,548 | | | | | | 437 | |
Leidos Holdings, Inc. | | | | | 6,962 | | | | | | 356 | |
Mastercard, Inc. ‘A’ | | | | | 4,203 | | | | | | 434 | |
Maxim Integrated Products, Inc. | | | | | 3,615 | | | | | | 139 | |
Micron Technology, Inc. (a) | | | | | 86,797 | | | | | | 1,903 | |
Microsoft Corp. | | | | | 156,130 | | | | | | 9,702 | |
Motorola Solutions, Inc. | | | | | 17,873 | | | | | | 1,481 | |
NCR Corp. (a) | | | | | 11,876 | | | | | | 482 | |
NetApp, Inc. | | | | | 32,863 | | | | | | 1,159 | |
NeuStar, Inc. ‘A’ (a) | | | | | 4,276 | | | | | | 143 | |
Nuance Communications, Inc. (a) | | | | | 5,222 | | | | | | 78 | |
NVIDIA Corp. | | | | | 6,354 | | | | | | 678 | |
Oracle Corp. | | | | | 72,213 | | | | | | 2,777 | |
Paychex, Inc. | | | | | 1,409 | | | | | | 86 | |
Qorvo, Inc. (a) | | | | | 1,760 | | | | | | 93 | |
QUALCOMM, Inc. | | | | | 44,560 | | | | | | 2,905 | |
Seagate Technology PLC | | | | | 76,025 | | | | | | 2,902 | |
Symantec Corp. | | | | | 80,174 | | | | | | 1,915 | |
Tech Data Corp. (a) | | | | | 7,561 | | | | | | 640 | |
Teradata Corp. (a) | | | | | 22,240 | | | | | | 604 | |
Texas Instruments, Inc. | | | | | 19,784 | | | | | | 1,444 | |
TiVo Corp. (a) | | | | | 4,644 | | | | | | 97 | |
VeriSign, Inc. (a) | | | | | 1,120 | | | | | | 85 | |
Versum Materials, Inc. (a) | | | | | 899 | | | | | | 25 | |
Visa, Inc. ‘A’ | | | | | 9,551 | | | | | | 745 | |
Vishay Intertechnology, Inc. | | | | | 9,670 | | | | | | 157 | |
Western Digital Corp. | | | | | 3,066 | | | | | | 208 | |
Western Union Co. | | | | | 52,437 | | | | | | 1,139 | |
Xerox Corp. | | | | | 132,982 | | | | | | 1,161 | |
Xilinx, Inc. | | | | | 3,770 | | | | | | 228 | |
Yahoo!, Inc. (a) | | | | | 12,542 | | | | | | 485 | |
| | | | | | | | | | | | |
| | | | | | | | | | | 104,881 | |
| | | | | | | | | | | | |
| | | | | | | | | | | | |
| MATERIALS 4.0% | |
AdvanSix, Inc. (a) | | | | | 387 | | | | | | 9 | |
Air Products & Chemicals, Inc. | | | | | 1,401 | | | | | | 201 | |
Alcoa Corp. | | | | | 2,489 | | | | | | 70 | |
AptarGroup, Inc. | | | | | 1,286 | | | | | | 94 | |
Ashland Global Holdings, Inc. | | | | | 1,557 | | | | | | 170 | |
Avery Dennison Corp. | | | | | 2,730 | | | | | | 192 | |
Ball Corp. | | | | | 3,547 | | | | | | 266 | |
Bemis Co., Inc. | | | | | 4,594 | | | | | | 220 | |
| | | | | | | | | | | | |
| | | | | SHARES | | | | | MARKET
VALUE
(000S) | |
Celanese Corp. ‘A’ | | | | | 1,531 | | | $ | | | 121 | |
CF Industries Holdings, Inc. | | | | | 31,742 | | | | | | 999 | |
Chemours Co. | | | | | 94,647 | | | | | | 2,091 | |
Chemtura Corp. (a) | | | | | 3,567 | | | | | | 118 | |
Commercial Metals Co. | | | | | 3,881 | | | | | | 84 | |
Domtar Corp. | | | | | 19,099 | | | | | | 745 | |
Dow Chemical Co. | | | | | 31,688 | | | | | | 1,813 | |
E.I. du Pont de Nemours & Co. | | | | | 19,509 | | | | | | 1,432 | |
FMC Corp. | | | | | 2,414 | | | | | | 137 | |
Freeport-McMoRan, Inc. (a) | | | | | 307,553 | | | | | | 4,057 | |
Huntsman Corp. | | | | | 15,466 | | | | | | 295 | |
International Paper Co. | | | | | 15,077 | | | | | | 800 | |
LyondellBasell Industries NV ‘A’ | | | | | 22,674 | | | | | | 1,945 | |
Monsanto Co. | | | | | 12,865 | | | | | | 1,353 | |
Mosaic Co. | | | | | 59,924 | | | | | | 1,758 | |
Newmont Mining Corp. | | | | | 50,415 | | | | | | 1,718 | |
Nucor Corp. | | | | | 1,938 | | | | | | 115 | |
Owens-Illinois, Inc. (a) | | | | | 20,205 | | | | | | 352 | |
PPG Industries, Inc. | | | | | 2,058 | | | | | | 195 | |
Praxair, Inc. | | | | | 4,323 | | | | | | 507 | |
Reliance Steel & Aluminum Co. | | | | | 5,790 | | | | | | 461 | |
Sherwin-Williams Co. | | | | | 540 | | | | | | 145 | |
U.S. Steel Corp. | | | | | 18,484 | | | | | | 610 | |
Valspar Corp. | | | | | 1,070 | | | | | | 111 | |
| | | | | | | | | | | | |
| | | | | | | | | | | 23,184 | |
| | | | | | | | | | | | |
| | | | | | | | | | | | |
| TELECOMMUNICATION SERVICES 4.7% | |
AT&T, Inc. | | | | | 380,547 | | | | | | 16,185 | |
CenturyLink, Inc. | | | | | 100,467 | | | | | | 2,389 | |
Contra Leap Wireless | | | | | 22,373 | | | | | | 45 | |
Frontier Communications Corp. | | | | | 168,469 | | | | | | 569 | |
T-Mobile US, Inc. (a) | | | | | 5,513 | | | | | | 317 | |
Telephone & Data Systems, Inc. | | | | | 13,279 | | | | | | 383 | |
Verizon Communications, Inc. | | | | | 133,116 | | | | | | 7,106 | |
Windstream Holdings, Inc. | | | | | 11,155 | | | | | | 82 | |
| | | | | | | | | | | | |
| | | | | | | | | | | 27,076 | |
| | | | | | | | | | | | |
| | | | | | | | | | | | |
| UTILITIES 6.1% | |
AES Corp. | | | | | 119,788 | | | | | | 1,392 | |
Alliant Energy Corp. | | | | | 2,768 | | | | | | 105 | |
Ameren Corp. | | | | | 24,926 | | | | | | 1,308 | |
American Electric Power Co., Inc. | | | | | 28,401 | | | | | | 1,788 | |
American Water Works Co., Inc. | | | | | 1,484 | | | | | | 107 | |
Atmos Energy Corp. | | | | | 2,288 | | | | | | 170 | |
Avista Corp. | | | | | 3,481 | | | | | | 139 | |
Calpine Corp. (a) | | | | | 93,611 | | | | | | 1,070 | |
CenterPoint Energy, Inc. | | | | | 41,196 | | | | | | 1,015 | |
CMS Energy Corp. | | | | | 8,043 | | | | | | 335 | |
Consolidated Edison, Inc. | | | | | 24,010 | | | | | | 1,769 | |
Dominion Resources, Inc. | | | | | 4,930 | | | | | | 378 | |
DTE Energy Co. | | | | | 11,499 | | | | | | 1,133 | |
Duke Energy Corp. | | | | | 33,412 | | | | | | 2,593 | |
Edison International | | | | | 17,134 | | | | | | 1,233 | |
El Paso Electric Co. | | | | | 2,946 | | | | | | 137 | |
Entergy Corp. | | | | | 34,426 | | | | | | 2,529 | |
Exelon Corp. | | | | | 71,666 | | | | | | 2,543 | |
FirstEnergy Corp. | | | | | 48,417 | | | | | | 1,499 | |
Great Plains Energy, Inc. | | | | | 14,194 | | | | | | 388 | |
Hawaiian Electric Industries, Inc. | | | | | 3,702 | | | | | | 122 | |
MDU Resources Group, Inc. | | | | | 35,386 | | | | | | 1,018 | |
National Fuel Gas Co. | | | | | 3,902 | | | | | | 221 | |
NextEra Energy, Inc. | | | | | 10,388 | | | | | | 1,241 | |
NiSource, Inc. | | | | | 6,648 | | | | | | 147 | |
NRG Energy, Inc. | | | | | 65,762 | | | | | | 806 | |
| | | | | | |
| See Accompanying Notes | | SEMIANNUAL REPORT | | DECEMBER 31, 2016 | | 53 |
Schedule of Investments PIMCO RAE Fundamental US Fund (Cont.)
December 31, 2016 (Unaudited)
| | | | | | | | | | | | |
| | | | | SHARES | | | | | MARKET
VALUE
(000S) | |
ONE Gas, Inc. | | | | | 1,508 | | | $ | | | 96 | |
PG&E Corp. | | | | | 21,753 | | | | | | 1,322 | |
Pinnacle West Capital Corp. | | | | | 9,931 | | | | | | 775 | |
PNM Resources, Inc. | | | | | 5,823 | | | | | | 200 | |
Portland General Electric Co. | | | | | 3,450 | | | | | | 150 | |
PPL Corp. | | | | | 37,024 | | | | | | 1,261 | |
Public Service Enterprise Group, Inc. | | | | | 34,493 | | | | | | 1,514 | |
SCANA Corp. | | | | | 4,758 | | | | | | 349 | |
Sempra Energy | | | | | 2,456 | | | | | | 247 | |
Southern Co. | | | | | 38,090 | | | | | | 1,874 | |
Southwest Gas Corp. | | | | | 1,483 | | | | | | 114 | |
UGI Corp. | | | | | 6,560 | | | | | | 302 | |
Vectren Corp. | | | | | 7,049 | | | | | | 368 | |
Westar Energy, Inc. | | | | | 5,088 | | | | | | 287 | |
WGL Holdings, Inc. | | | | | 1,084 | | | | | | 83 | |
Xcel Energy, Inc. | | | | | 26,275 | | | | | | 1,069 | |
| | | | | | | | | | | | |
| | | | | | | | | | | 35,197 | |
| | | | | | | | | | | | |
Total United States | | | | | | | | | | | 566,222 | |
| | | | | | | | | | | | |
Total Common Stocks (Cost $445,413) | | | | | | 567,971 | |
| | | | | | | | | | | | |
| | | | | | | | | | | | |
| | | | | SHARES | | | | | MARKET
VALUE
(000S) | |
| REAL ESTATE INVESTMENT TRUSTS 0.8% | |
| | | | | | | | | | | | |
| UNITED STATES 0.8% | |
| | | | | | | | | | | | |
| FINANCIALS 0.3% | |
AGNC Investment Corp. | | | | | 18,139 | | | $ | | | 329 | |
Annaly Capital Management, Inc. | | | | | 102,541 | | | | | | 1,022 | |
Chimera Investment Corp. | | | | | 13,299 | | | | | | 226 | |
MFA Financial, Inc. | | | | | 15,120 | | | | | | 116 | |
New Residential Investment Corp. | | | | | 4,782 | | | | | | 75 | |
| | | | | | | | | | | | |
| | | | | | | | | | | 1,768 | |
| | | | | | | | | | | | |
| | | | | | | | | | | | |
| REAL ESTATE 0.5% | |
Columbia Property Trust, Inc. | | | | | 3,819 | | | | | | 83 | |
CoreCivic, Inc. | | | | | 20,486 | | | | | | 501 | |
Digital Realty Trust, Inc. | | | | | 1,472 | | | | | | 145 | |
Equinix, Inc. | | | | | 218 | | | | | | 78 | |
Hospitality Properties Trust | | | | | 7,856 | | | | | | 249 | |
Iron Mountain, Inc. | | | | | 19,411 | | | | | | 630 | |
Mack-Cali Realty Corp. | | | | | 4,960 | | | | | | 144 | |
Outfront Media, Inc. | | | | | 2,301 | | | | | | 57 | |
| | | | | | | | | | | | |
| | | | | SHARES | | | | | MARKET
VALUE
(000S) | |
Piedmont Office Realty Trust, Inc. ‘A’ | | | | | 7,312 | | | $ | | | 153 | |
Public Storage | | | | | 754 | | | | | | 169 | |
Simon Property Group, Inc. | | | | | 1,032 | | | | | | 183 | |
Weyerhaeuser Co. | | | | | 3,460 | | | | | | 104 | |
Xenia Hotels & Resorts, Inc. | | | | | 6,250 | | | | | | 121 | |
| | | | | | | | | | | | |
| | | | | | | | | | | 2,617 | |
| | | | | | | | | | | | |
Total Real Estate Investment Trusts (Cost $4,340) | | | | | | | | | 4,385 | |
| | | | | | | | | | | | |
| | | | | | | | | | | | |
| Total Investments in Securities (Cost $449,753) | | | | | | | | | | | 572,356 | |
| | | | | | | | | | | | |
| Total Investments 99.6% (Cost $449,753) | | | | | | | | $ | | | 572,356 | |
| |
| Other Assets and Liabilities, net 0.4% | | | | | | 2,413 | |
| | | | | | | | | | | | |
| Net Assets 100.0% | | | | | | | | $ | | | 574,769 | |
| | | | | | | | | | | | |
NOTES TO SCHEDULE OF INVESTMENTS (AMOUNTS IN THOUSANDS*):
| * | A zero balance may reflect actual amounts rounding to less than one thousand. |
| (a) | Security did not produce income within the last twelve months. |
FAIR VALUE MEASUREMENTS
The following is a summary of the fair valuations according to the inputs used as of December 31, 2016 in valuing the Fund’s assets and liabilities:
| | | | | | | | | | | | | | | | |
| Category and Subcategory | | Level 1 | | | Level 2 | | | Level 3 | | | Fair
Value at
12/31/2016 | |
Investments in Securities, at Value | |
Common Stocks | |
Bermuda | |
Financials | | $ | 159 | | | $ | 0 | | | $ | 0 | | | $ | 159 | |
Ireland | |
Consumer Discretionary | | | 24 | | | | 0 | | | | 0 | | | | 24 | |
Information Technology | | | 1,284 | | | | 0 | | | | 0 | | | | 1,284 | |
United Kingdom | |
Consumer Staples | | | 282 | | | | 0 | | | | 0 | | | | 282 | |
United States | |
Consumer Discretionary | | | 61,931 | | | | 0 | | | | 0 | | | | 61,931 | |
Consumer Staples | | | 45,995 | | | | 0 | | | | 6 | | | | 46,001 | |
Energy | | | 76,018 | | | | 0 | | | | 0 | | | | 76,018 | |
| | | | | | | | | | | | | | | | |
| Category and Subcategory | | Level 1 | | | Level 2 | | | Level 3 | | | Fair
Value at
12/31/2016 | |
Financials | | $ | 78,514 | | | $ | 0 | | | $ | 0 | | | $ | 78,514 | |
Health Care | | | 60,671 | | | | 0 | | | | 0 | | | | 60,671 | |
Industrials | | | 52,749 | | | | 0 | | | | 0 | | | | 52,749 | |
Information Technology | | | 104,881 | | | | 0 | | | | 0 | | | | 104,881 | |
Materials | | | 23,184 | | | | 0 | | | | 0 | | | | 23,184 | |
Telecommunication Services | | | 27,031 | | | | 0 | | | | 45 | | | | 27,076 | |
Utilities | | | 35,197 | | | | 0 | | | | 0 | | | | 35,197 | |
Real Estate Investment Trusts | |
United States | |
Financials | | | 1,768 | | | | 0 | | | | 0 | | | | 1,768 | |
Real Estate | | | 2,617 | | | | 0 | | | | 0 | | | | 2,617 | |
| | | | | | | | | | | | | | | | |
| | | | |
Total Investments | | $ | 572,305 | | | $ | 0 | | | $ | 51 | | | $ | 572,356 | |
| | | | | | | | | | | | | | | | |
There were no significant transfers between Levels 1, 2, or 3 during the period ended December 31, 2016.
| | | | | | | | |
| 54 | | PIMCO EQUITY SERIES | | | | | See Accompanying Notes | |
Schedule of Investments PIMCO RAE Fundamental US Small Fund
December 31, 2016 (Unaudited)
| | | | | | | | | | | | |
| | | | | SHARES | | | | | MARKET
VALUE
(000S) | |
| INVESTMENTS IN SECURITIES 98.4% | |
| | | | | | | | | | | | |
| COMMON STOCKS 90.0% | |
| | | | | | | | | | | | |
| BERMUDA 0.1% | |
| | | | | | | | | | | | |
| INDUSTRIALS 0.1% | |
Triton International Ltd. | | | | | 9,988 | | | $ | | | 158 | |
| | | | | | | | | | | | |
Total Bermuda | | | | | | | | | | | 158 | |
| | | | | | | | | | | | |
| | | | | | | | | | | | |
| UNITED KINGDOM 0.1% | |
| | | | | | | | | | | | |
| INFORMATION TECHNOLOGY 0.1% | |
Cardtronics PLC ‘A’ (a) | | | | | 1,742 | | | | | | 95 | |
| | | | | | | | | | | | |
Total United Kingdom | | | | | | | | | | | 95 | |
| | | | | | | | | | | | |
| | | | | | | | | | | | |
| UNITED STATES 89.8% | |
| | | | | | | | | | | | |
| CONSUMER DISCRETIONARY 16.3% | |
1-800-Flowers.com, Inc. ‘A’ (a) | | | | | 1,447 | | | | | | 15 | |
Aaron’s, Inc. | | | | | 4,668 | | | | | | 149 | |
AMC Entertainment Holdings, Inc. ‘A’ | | | | | 5,147 | | | | | | 173 | |
America’s Car-Mart, Inc. (a) | | | | | 1,703 | | | | | | 74 | |
American Axle & Manufacturing Holdings, Inc. (a) | | | | | 7,805 | | | | | | 151 | |
American Outdoor Brands Corp. (a) | | | | | 4,497 | | | | | | 95 | |
American Public Education, Inc. (a) | | | | | 3,582 | | | | | | 88 | |
Arctic Cat, Inc. | | | | | 3,456 | | | | | | 52 | |
Asbury Automotive Group, Inc. (a) | | | | | 2,108 | | | | | | 130 | |
Ascena Retail Group, Inc. (a) | | | | | 28,089 | | | | | | 174 | |
Ascent Capital Group, Inc. ‘A’ (a) | | | | | 3,447 | | | | | | 56 | |
Barnes & Noble Education, Inc. (a) | | | | | 7,942 | | | | | | 91 | |
Barnes & Noble, Inc. | | | | | 20,102 | | | | | | 224 | |
Bassett Furniture Industries, Inc. | | | | | 982 | | | | | | 30 | |
Big 5 Sporting Goods Corp. | | | | | 3,343 | | | | | | 58 | |
Biglari Holdings, Inc. (a) | | | | | 120 | | | | | | 57 | |
BJ’s Restaurants, Inc. (a) | | | | | 1,903 | | | | | | 75 | |
Bloomin’ Brands, Inc. | | | | | 6,102 | | | | | | 110 | |
Blue Nile, Inc. | | | | | 689 | | | | | | 28 | |
Bob Evans Farms, Inc. | | | | | 3,691 | | | | | | 196 | |
Boot Barn Holdings, Inc. (a) | | | | | 1,257 | | | | | | 16 | |
Boyd Gaming Corp. (a) | | | | | 12,676 | | | | | | 256 | |
Bridgepoint Education, Inc. (a) | | | | | 3,120 | | | | | | 32 | |
Brinker International, Inc. | | | | | 1,650 | | | | | | 82 | |
Buckle, Inc. | | | | | 8,596 | | | | | | 196 | |
Buffalo Wild Wings, Inc. (a) | | | | | 261 | | | | | | 40 | |
Build-A-Bear Workshop, Inc. (a) | | | | | 735 | | | | | | 10 | |
Cable One, Inc. | | | | | 182 | | | | | | 113 | |
Caesars Acquisition Co. ‘A’ (a) | | | | | 1,669 | | | | | | 23 | |
Caleres, Inc. | | | | | 6,517 | | | | | | 214 | |
Callaway Golf Co. | | | | | 4,407 | | | | | | 48 | |
Capella Education Co. | | | | | 2,321 | | | | | | 204 | |
Career Education Corp. (a) | | | | | 15,095 | | | | | | 152 | |
Carrols Restaurant Group, Inc. (a) | | | | | 7,471 | | | | | | 114 | |
Cato Corp. ‘A’ | | | | | 3,206 | | | | | | 96 | |
Cheesecake Factory, Inc. | | | | | 1,670 | | | | | | 100 | |
Chegg, Inc. (a) | | | | | 2,341 | | | | | | 17 | |
Chico’s FAS, Inc. | | | | | 6,663 | | | | | | 96 | |
Children’s Place, Inc. | | | | | 2,626 | | | | | | 265 | |
Choice Hotels International, Inc. | | | | | 2,894 | | | | | | 162 | |
Churchill Downs, Inc. | | | | | 260 | | | | | | 39 | |
Citi Trends, Inc. | | | | | 2,371 | | | | | | 45 | |
Clear Channel Outdoor Holdings, Inc. ‘A’ | | | | | 6,698 | | | | | | 34 | |
ClubCorp Holdings, Inc. | | | | | 2,766 | | | | | | 40 | |
Columbia Sportswear Co. | | | | | 826 | | | | | | 48 | |
Conn’s, Inc. (a) | | | | | 5,524 | | | | | | 70 | |
| | | | | | | | | | | | |
| | | | | SHARES | | | | | MARKET
VALUE
(000S) | |
Container Store Group, Inc. (a) | | | | | 5,355 | | | $ | | | 34 | |
Cooper Tire & Rubber Co. | | | | | 3,531 | | | | | | 137 | |
Cooper-Standard Holding, Inc. (a) | | | | | 3,116 | | | | | | 322 | |
Core-Mark Holding Co., Inc. | | | | | 2,428 | | | | | | 105 | |
Crocs, Inc. (a) | | | | | 19,164 | | | | | | 131 | |
CSS Industries, Inc. | | | | | 1,334 | | | | | | 36 | |
CST Brands, Inc. | | | | | 550 | | | | | | 26 | |
Dana, Inc. | | | | | 14,215 | | | | | | 270 | |
Dave & Buster’s Entertainment, Inc. (a) | | | | | 3,105 | | | | | | 175 | |
Deckers Outdoor Corp. (a) | | | | | 2,261 | | | | | | 125 | |
Del Frisco’s Restaurant Group, Inc. (a) | | | | | 495 | | | | | | 8 | |
Denny’s Corp. (a) | | | | | 3,503 | | | | | | 45 | |
Destination XL Group, Inc. (a) | | | | | 4,606 | | | | | | 20 | |
DeVry Education Group, Inc. | | | | | 10,991 | | | | | | 343 | |
DineEquity, Inc. | | | | | 1,723 | | | | | | 133 | |
Dorman Products, Inc. (a) | | | | | 458 | | | | | | 33 | |
DSW Inc.‘A’ | | | | | 6,496 | | | | | | 147 | |
Eldorado Resorts, Inc. (a) | | | | | 2,390 | | | | | | 40 | |
Entercom Communications Corp. ‘A’ | | | | | 2,204 | | | | | | 34 | |
Entravision Communications Corp. ‘A’ | | | | | 1,933 | | | | | | 14 | |
Eros International PLC (a) | | | | | 2,717 | | | | | | 35 | |
Ethan Allen Interiors, Inc. | | | | | 3,023 | | | | | | 111 | |
Etsy, Inc. (a) | | | | | 740 | | | | | | 9 | |
EW Scripps Co. ‘A’ (a) | | | | | 1,838 | | | | | | 35 | |
Express, Inc. (a) | | | | | 7,713 | | | | | | 83 | |
Extended Stay America, Inc. | | | | | 3,763 | | | | | | 61 | |
Federal-Mogul Holdings Corp. (a) | | | | | 2,897 | | | | | | 30 | |
Fiesta Restaurant Group, Inc. (a) | | | | | 1,787 | | | | | | 53 | |
Finish Line, Inc. ‘A’ | | | | | 12,327 | | | | | | 232 | |
Five Below, Inc. (a) | | | | | 1,493 | | | | | | 60 | |
Flexsteel Industries, Inc. | | | | | 222 | | | | | | 14 | |
Francesca’s Holdings Corp. (a) | | | | | 3,421 | | | | | | 62 | |
Fred’s, Inc. ‘A’ | | | | | 6,453 | | | | | | 120 | |
FTD Cos., Inc. (a) | | | | | 3,273 | | | | | | 78 | |
G-III Apparel Group Ltd. (a) | | | | | 805 | | | | | | 24 | |
Gannett Co., Inc. | | | | | 23,060 | | | | | | 224 | |
Genesco, Inc. (a) | | | | | 2,751 | | | | | | 171 | |
Gentherm, Inc. (a) | | | | | 283 | | | | | | 10 | |
GoPro, Inc. ‘A’ (a) | | | | | 773 | | | | | | 7 | |
Grand Canyon Education, Inc. (a) | | | | | 1,138 | | | | | | 66 | |
Gray Television, Inc. (a) | | | | | 1,196 | | | | | | 13 | |
Group 1 Automotive, Inc. | | | | | 1,683 | | | | | | 131 | |
Groupon, Inc. (a) | | | | | 55,966 | | | | | | 186 | |
Harte-Hanks, Inc. | | | | | 10,286 | | | | | | 16 | |
Haverty Furniture Cos., Inc. | | | | | 2,674 | | | | | | 63 | |
Helen of Troy Ltd. (a) | | | | | 433 | | | | | | 37 | |
Hibbett Sports, Inc. (a) | | | | | 3,791 | | | | | | 141 | |
Hooker Furniture Corp. | | | | | 716 | | | | | | 27 | |
Horizon Global Corp. (a) | | | | | 500 | | | | | | 12 | |
Houghton Mifflin Harcourt Co. (a) | | | | | 2,960 | | | | | | 32 | |
HSN, Inc. | | | | | 2,811 | | | | | | 96 | |
Hyatt Hotels Corp. ‘A’ (a) | | | | | 2,112 | | | | | | 117 | |
Iconix Brand Group, Inc. (a) | | | | | 22,151 | | | | | | 207 | |
ILG, Inc. | | | | | 2,902 | | | | | | 53 | |
Installed Building Products, Inc. (a) | | | | | 468 | | | | | | 19 | |
International Speedway Corp. ‘A’ | | | | | 3,393 | | | | | | 125 | |
iRobot Corp. (a) | | | | | 849 | | | | | | 50 | |
Isle of Capri Casinos, Inc. (a) | | | | | 4,034 | | | | | | 100 | |
Jack in the Box, Inc. | | | | | 1,584 | | | | | | 177 | |
Jamba, Inc. (a) | | | | | 1,776 | | | | | | 18 | |
Jindal Steel & Power Ltd. (a) | | | | | 12,560 | | | | | | 65 | |
John Wiley & Sons, Inc. ‘A’ | | | | | 1,773 | | | | | | 97 | |
Johnson Outdoors, Inc. ‘A’ | | | | | 189 | | | | | | 7 | |
K12, Inc. (a) | | | | | 5,948 | | | | | | 102 | |
| | | | | | | | | | | | |
| | | | | SHARES | | | | | MARKET
VALUE
(000S) | |
Kate Spade & Co. (a) | | | | | 1,216 | | | $ | | | 23 | |
Kirkland’s, Inc. (a) | | | | | 1,752 | | | | | | 27 | |
La Quinta Holdings, Inc. (a) | | | | | 3,796 | | | | | | 54 | |
La-Z-Boy, Inc. | | | | | 2,220 | | | | | | 69 | |
Lands’ End, Inc. (a) | | | | | 7,351 | | | | | | 111 | |
LCI Industries | | | | | 768 | | | | | | 83 | |
LGI Homes, Inc. (a) | | | | | 645 | | | | | | 19 | |
Libbey, Inc. | | | | | 3,868 | | | | | | 75 | |
Liberty TripAdvisor Holdings, Inc. ‘A’ (a) | | | | | 6,323 | | | | | | 95 | |
LifeLock, Inc. (a) | | | | | 2,629 | | | | | | 63 | |
Lifetime Brands, Inc. | | | | | 380 | | | | | | 7 | |
Lions Gate Entertainment Corp. ‘A’ | | | | | 458 | | | | | | 12 | |
Lions Gate Entertainment Corp. ‘B’ (a) | | | | | 3,031 | | | | | | 74 | |
Loral Space & Communications, Inc. (a) | | | | | 1,474 | | | | | | 60 | |
Lumber Liquidators Holdings, Inc. (a) | | | | | 7,023 | | | | | | 111 | |
M/I Homes, Inc. (a) | | | | | 865 | | | | | | 22 | |
Marcus Corp. | | | | | 1,271 | | | | | | 40 | |
Marriott Vacations Worldwide Corp. | | | | | 2,118 | | | | | | 180 | |
MDC Holdings, Inc. | | | | | 1,766 | | | | | | 45 | |
MDC Partners, Inc. ‘A’ | | | | | 804 | | | | | | 5 | |
Media General, Inc. (a) | | | | | 2,855 | | | | | | 54 | |
Meredith Corp. | | | | | 1,853 | | | | | | 110 | |
Meritage Homes Corp. (a) | | | | | 2,526 | | | | | | 88 | |
Michaels Cos., Inc. (a) | | | | | 3,077 | | | | | | 63 | |
Modine Manufacturing Co. (a) | | | | | 6,440 | | | | | | 96 | |
Monarch Casino & Resort, Inc. (a) | | | | | 718 | | | | | | 18 | |
Monro Muffler Brake, Inc. | | | | | 1,370 | | | | | | 78 | |
Movado Group, Inc. | | | | | 2,568 | | | | | | 74 | |
MSG Networks, Inc. ‘A’ (a) | | | | | 956 | | | | | | 21 | |
Murphy USA, Inc. (a) | | | | | 1,701 | | | | | | 105 | |
NACCO Industries, Inc. ‘A’ | | | | | 558 | | | | | | 50 | |
National CineMedia, Inc. | | | | | 11,067 | | | | | | 163 | |
Nautilus, Inc. (a) | | | | | 364 | | | | | | 7 | |
New York Times Co. ‘A’ | | | | | 3,613 | | | | | | 48 | |
Nexstar Broadcasting Group, Inc. ‘A’ | | | | | 894 | | | | | | 57 | |
Noodles & Co. (a) | | | | | 2,362 | | | | | | 10 | |
Nutrisystem, Inc. | | | | | 2,340 | | | | | | 81 | |
Ollie’s Bargain Outlet Holdings, Inc. (a) | | | | | 365 | | | | | | 10 | |
Oxford Industries, Inc. | | | | | 1,173 | | | | | | 71 | |
Papa John’s International, Inc. | | | | | 944 | | | | | | 81 | |
Papa Murphy’s Holdings, Inc. (a) | | | | | 1,654 | | | | | | 7 | |
Party City Holdco, Inc. (a) | | | | | 2,131 | | | | | | 30 | |
Penn National Gaming, Inc. (a) | | | | | 13,950 | | | | | | 192 | |
Perry Ellis International, Inc. (a) | | | | | 3,276 | | | | | | 82 | |
PetMed Express, Inc. | | | | | 2,449 | | | | | | 56 | |
Pier 1 Imports, Inc. | | | | | 40,202 | | | | | | 343 | |
Pinnacle Entertainment, Inc. (a) | | | | | 1,339 | | | | | | 19 | |
Potbelly Corp. (a) | | | | | 5,591 | | | | | | 72 | |
Red Robin Gourmet Burgers, Inc. (a) | | | | | 949 | | | | | | 53 | |
Regis Corp. (a) | | | | | 10,950 | | | | | | 159 | |
Ruby Tuesday, Inc. (a) | | | | | 12,447 | | | | | | 40 | |
Ruth’s Hospitality Group, Inc. | | | | | 605 | | | | | | 11 | |
Scholastic Corp. | | | | | 5,504 | | | | | | 261 | |
Scientific Games Corp. ‘A’ (a) | | | | | 2,954 | | | | | | 41 | |
Sears Hometown and Outlet Stores, Inc. (a) | | | | | 6,157 | | | | | | 29 | |
SeaWorld Entertainment, Inc. | | | | | 11,605 | | | | | | 220 | |
Select Comfort Corp. (a) | | | | | 4,774 | | | | | | 108 | |
Shoe Carnival, Inc. | | | | | 1,323 | | | | | | 36 | |
Shutterfly, Inc. (a) | | | | | 1,875 | | | | | | 94 | |
Sinclair Broadcast Group, Inc. ‘A’ | | | | | 1,566 | | | | | | 52 | |
Sonic Automotive, Inc. ‘A’ | | | | | 8,488 | | | | | | 194 | |
| | | | | | |
| See Accompanying Notes | | SEMIANNUAL REPORT | | DECEMBER 31, 2016 | | 55 |
Schedule of Investments PIMCO RAE Fundamental US Small Fund (Cont.)
| | | | | | | | | | | | |
| | | | | SHARES | | | | | MARKET
VALUE
(000S) | |
Sonic Corp. | | | | | 1,796 | | | $ | | | 48 | |
Sotheby’s | | | | | 4,380 | | | | | | 175 | |
Speedway Motorsports, Inc. | | | | | 2,331 | | | | | | 50 | |
Sportsman’s Warehouse Holdings, Inc. (a) | | | | | 1,068 | | | | | | 10 | |
Stage Stores, Inc. | | | | | 12,256 | | | | | | 54 | |
Standard Motor Products, Inc. | | | | | 1,518 | | | | | | 81 | |
Stein Mart, Inc. | | | | | 3,966 | | | | | | 22 | |
Steven Madden Ltd. (a) | | | | | 2,675 | | | | | | 96 | |
Stoneridge, Inc. (a) | | | | | 3,052 | | | | | | 54 | |
Strayer Education, Inc. (a) | | | | | 3,728 | | | | | | 301 | |
Sturm Ruger & Co., Inc. | | | | | 1,474 | | | | | | 78 | |
Superior Industries International, Inc. | | | | | 3,494 | | | | | | 92 | |
Texas Roadhouse, Inc. | | | | | 3,229 | | | | | | 156 | |
Tile Shop Holdings, Inc. (a) | | | | | 1,562 | | | | | | 31 | |
TopBuild Corp. (a) | | | | | 717 | | | | | | 25 | |
Tower International, Inc. | | | | | 2,649 | | | | | | 75 | |
Townsquare Media, Inc. ‘A’ (a) | | | | | 506 | | | | | | 5 | |
TravelCenters of America LLC (a) | | | | | 7,525 | | | | | | 53 | |
TRI Pointe Homes, Inc. (a) | | | | | 2,605 | | | | | | 30 | |
tronc, Inc. | | | | | 7,233 | | | | | | 100 | |
Tuesday Morning Corp. (a) | | | | | 6,030 | | | | | | 33 | |
Vera Bradley, Inc. (a) | | | | | 4,461 | | | | | | 52 | |
Vince Holding Corp. (a) | | | | | 3,422 | | | | | | 14 | |
Vista Outdoor, Inc. (a) | | | | | 1,038 | | | | | | 38 | |
Vitamin Shoppe, Inc. (a) | | | | | 4,412 | | | | | | 105 | |
Wendy’s Co. | | | | | 19,758 | | | | | | 267 | |
West Marine, Inc. (a) | | | | | 3,105 | | | | | | 32 | |
Wolverine World Wide, Inc. | | | | | 4,924 | | | | | | 108 | |
World Wrestling Entertainment, Inc. ‘A’ | | | | | 1,142 | | | | | | 21 | |
ZAGG, Inc. (a) | | | | | 1,857 | | | | | | 13 | |
Zumiez, Inc. (a) | | | | | 1,593 | | | | | | 35 | |
| | | | | | | | | | | | |
| | | | | | | | | | | 16,905 | |
| | | | | | | | | | | | |
| | | | | | | | | | | | |
| CONSUMER STAPLES 3.1% | |
Alliance One International, Inc. (a) | | | | | 2,085 | | | | | | 40 | |
Andersons, Inc. | | | | | 1,598 | | | | | | 71 | |
B&G Foods, Inc. | | | | | 2,568 | | | | | | 112 | |
Blue Buffalo Pet Products, Inc. (a) | | | | | 580 | | | | | | 14 | |
Boston Beer Co., Inc. ‘A’ (a) | | | | | 367 | | | | | | 62 | |
Cal-Maine Foods, Inc. | | | | | 1,892 | | | | | | 84 | |
Central Garden & Pet Co. ‘A’ (a) | | | | | 11,675 | | | | | | 361 | |
Coca-Cola Bottling Co. Consolidated | | | | | 472 | | | | | | 84 | |
Coty, Inc. ‘A’ | | | | | 1,642 | | | | | | 30 | |
Darling Ingredients, Inc. (a) | | | | | 7,490 | | | | | | 97 | |
Dean Foods Co. | | | | | 6,093 | | | | | | 133 | |
Energizer Holdings, Inc. | | | | | 3,240 | | | | | | 145 | |
Fresh Del Monte Produce, Inc. | | | | | 3,892 | | | | | | 236 | |
Ingles Markets, Inc. ‘A’ | | | | | 4,422 | | | | | | 213 | |
Inter Parfums, Inc. | | | | | 1,744 | | | | | | 57 | |
J&J Snack Foods Corp. | | | | | 476 | | | | | | 63 | |
John B Sanfilippo & Son, Inc. | | | | | 202 | | | | | | 14 | |
Lancaster Colony Corp. | | | | | 362 | | | | | | 51 | |
Medifast, Inc. | | | | | 1,660 | | | | | | 69 | |
National Beverage Corp. | | | | | 678 | | | | | | 35 | |
Nutraceutical International Corp. | | | | | 481 | | | | | | 17 | |
Omega Protein Corp. (a) | | | | | 2,127 | | | | | | 53 | |
Performance Food Group Co. (a) | | | | | 1,386 | | | | | | 33 | |
PriceSmart, Inc. | | | | | 854 | | | | | | 71 | |
Revlon, Inc. ‘A’ (a) | | | | | 397 | | | | | | 12 | |
Sanderson Farms, Inc. | | | | | 900 | | | | | | 85 | |
Seaboard Corp. (a) | | | | | 11 | | | | | | 43 | |
Seneca Foods Corp. ‘A’ (a) | | | | | 589 | | | | | | 24 | |
| | | | | | | | | | | | |
| | | | | SHARES | | | | | MARKET
VALUE
(000S) | |
Smart & Final Stores, Inc. (a) | | | | | 3,607 | | | $ | | | 51 | |
Snyder’s-Lance, Inc. | | | | | 2,065 | | | | | | 79 | |
SpartanNash Co. | | | | | 3,312 | | | | | | 131 | |
United Natural Foods, Inc. (a) | | | | | 1,812 | | | | | | 86 | |
Universal Corp. | | | | | 2,036 | | | | | | 130 | |
USANA Health Sciences, Inc. (a) | | | | | 854 | | | | | | 52 | |
Vector Group Ltd. | | | | | 8,290 | | | | | | 189 | |
Village Super Market, Inc. ‘A’ | | | | | 646 | | | | | | 20 | |
WD-40 Co. | | | | | 802 | | | | | | 94 | |
Weis Markets, Inc. | | | | | 1,403 | | | | | | 94 | |
| | | | | | | | | | | | |
| | | | | | | | | | | 3,235 | |
| | | | | | | | | | | | |
| | | | | | | | | | | | |
| ENERGY 6.4% | |
Alon USA Energy, Inc. | | | | | 5,077 | | | | | | 58 | |
Archrock, Inc. | | | | | 17,641 | | | | | | 233 | |
Atwood Oceanics, Inc. | | | | | 19,715 | | | | | | 259 | |
Bill Barrett Corp. (a) | | | | | 31,058 | | | | | | 217 | |
Bonanza Creek Energy, Inc. (a) | | | | | 16,663 | | | | | | 17 | |
Bristow Group, Inc. | | | | | 9,939 | | | | | | 204 | |
Callon Petroleum Co. (a) | | | | | 770 | | | | | | 12 | |
CARBO Ceramics, Inc. (a) | | | | | 8,531 | | | | | | 89 | |
Carrizo Oil & Gas, Inc. (a) | | | | | 3,121 | | | | | | 117 | |
Clayton Williams Energy, Inc. (a) | | | | | 1,401 | | | | | | 167 | |
Clean Energy Fuels Corp. (a) | | | | | 5,924 | | | | | | 17 | |
Cloud Peak Energy, Inc. (a) | | | | | 24,323 | | | | | | 136 | |
Cobalt International Energy, Inc. (a) | | | | | 6,000 | | | | | | 7 | |
Contango Oil & Gas Co. (a) | | | | | 2,327 | | | | | | 22 | |
CVR Energy, Inc. | | | | | 2,748 | | | | | | 70 | |
Delek U.S. Holdings, Inc. | | | | | 8,757 | | | | | | 211 | |
Dril-Quip, Inc. (a) | | | | | 815 | | | | | | 49 | |
Eclipse Resources Corp. (a) | | | | | 9,756 | | | | | | 26 | |
Enbridge Energy Management LLC (a) | | | | | 2,306 | | | | | | 60 | |
Enbridge Energy Management LLC | | | | | 58,437 | | | | | | 0 | |
EP Energy Corp. ‘A’ (a) | | | | | 24,952 | | | | | | 163 | |
Era Group, Inc. (a) | | | | | 6,139 | | | | | | 104 | |
EXCO Resources, Inc. (a) | | | | | 22,654 | | | | | | 20 | |
Fairmount Santrol Holdings, Inc. (a) | | | | | 13,406 | | | | | | 158 | |
Forum Energy Technologies, Inc. (a) | | | | | 11,531 | | | | | | 254 | |
Geospace Technologies Corp. (a) | | | | | 3,280 | | | | | | 67 | |
Green Plains, Inc. | | | | | 3,745 | | | | | | 104 | |
Gulfmark Offshore, Inc. ‘A’ (a) | | | | | 7,553 | | | | | | 13 | |
Gulfport Energy Corp. (a) | | | | | 1,652 | | | | | | 36 | |
Helix Energy Solutions Group, Inc. (a) | | | | | 27,823 | | | | | | 245 | |
Hornbeck Offshore Services, Inc. (a) | | | | | 5,349 | | | | | | 39 | |
Kosmos Energy Ltd. (a) | | | | | 7,579 | | | | | | 53 | |
Laredo Petroleum, Inc. (a) | | | | | 10,511 | | | | | | 149 | |
Matador Resources Co. (a) | | | | | 1,788 | | | | | | 46 | |
Matrix Service Co. (a) | | | | | 531 | | | | | | 12 | |
McDermott International, Inc. (a) | | | | | 18,660 | | | | | | 138 | |
Natural Gas Services Group, Inc. (a) | | | | | 886 | | | | | | 29 | |
Newpark Resources, Inc. (a) | | | | | 20,699 | | | | | | 155 | |
Northern Oil and Gas, Inc. (a) | | | | | 20,268 | | | | | | 56 | |
Oasis Petroleum, Inc. (a) | | | | | 11,322 | | | | | | 171 | |
Oil States International, Inc. (a) | | | | | 3,282 | | | | | | 128 | |
Parker Drilling Co. (a) | | | | | 34,043 | | | | | | 89 | |
Parsley Energy, Inc. ‘A’ (a) | | | | | 1,125 | | | | | | 40 | |
PBF Energy, Inc. ‘A’ | | | | | 4,383 | | | | | | 122 | |
PDC Energy, Inc. (a) | | | | | 682 | | | | | | 50 | |
PHI, Inc. (a) | | | | | 1,325 | | | | | | 24 | |
Pioneer Energy Services Corp. (a) | | | | | 12,286 | | | | | | 84 | |
Renewable Energy Group, Inc. (a) | | | | | 4,471 | | | | | | 43 | |
Resolute Energy Corp. (a) | | | | | 343 | | | | | | 14 | |
REX American Resources Corp. (a) | | | | | 541 | | | | | | 53 | |
Rice Energy, Inc. (a) | | | | | 1,589 | | | | | | 34 | |
| | | | | | | | | | | | |
| | | | | SHARES | | | | | MARKET
VALUE
(000S) | |
RigNet, Inc. (a) | | | | | 928 | | | $ | | | 22 | |
Rowan Cos. PLC ‘A’ | | | | | 11,484 | | | | | | 217 | |
RPC, Inc. | | | | | 5,374 | | | | | | 106 | |
RSP Permian, Inc. (a) | | | | | 1,258 | | | | | | 56 | |
Sanchez Energy Corp. (a) | | | | | 7,519 | | | | | | 68 | |
SEACOR Holdings, Inc. (a) | | | | | 2,600 | | | | | | 185 | |
SemGroup Corp. ‘A’ | | | | | 2,248 | | | | | | 94 | |
SM Energy Co. | | | | | 5,163 | | | | | | 178 | |
Synergy Resources Corp. (a) | | | | | 1,593 | | | | | | 14 | |
Tesco Corp. | | | | | 8,840 | | | | | | 73 | |
TETRA Technologies, Inc. (a) | | | | | 7,452 | | | | | | 37 | |
Tidewater, Inc. | | | | | 29,383 | | | | | | 100 | |
U.S. Silica Holdings, Inc. | | | | | 2,912 | | | | | | 165 | |
Unit Corp. (a) | | | | | 18,539 | | | | | | 498 | |
W&T Offshore, Inc. (a) | | | | | 34,491 | | | | | | 96 | |
Westmoreland Coal Co. (a) | | | | | 932 | | | | | | 16 | |
World Fuel Services Corp. | | | | | 228 | | | | | | 10 | |
| | | | | | | | | | | | |
| | | | | | | | | | | 6,599 | |
| | | | | | | | | | | | |
| | | | | | | | | | | | |
| FINANCIALS 14.9% | |
1st Source Corp. | | | | | 1,575 | | | | | | 70 | |
Ambac Financial Group, Inc. (a) | | | | | 7,310 | | | | | | 164 | |
American Equity Investment Life Holding Co. | | | | | 16,100 | | | | | | 363 | |
AMERISAFE, Inc. | | | | | 468 | | | | | | 29 | |
Arrow Financial Corp. | | | | | 790 | | | | | | 32 | |
Artisan Partners Asset Management, Inc. ‘A’ | | | | | 460 | | | | | | 14 | |
Associated Banc-Corp | | | | | 7,004 | | | | | | 173 | |
Astoria Financial Corp. | | | | | 9,834 | | | | | | 183 | |
Baldwin & Lyons, Inc. ‘B’ | | | | | 926 | | | | | | 23 | |
Banc of California, Inc. | | | | | 652 | | | | | | 11 | |
BancFirst Corp. | | | | | 489 | | | | | | 45 | |
Bancorp, Inc. (a) | | | | | 2,611 | | | | | | 21 | |
BancorpSouth, Inc. | | | | | 2,764 | | | | | | 86 | |
Bank of Hawaii Corp. | | | | | 595 | | | | | | 53 | |
BankUnited, Inc. | | | | | 3,619 | | | | | | 136 | |
Beneficial Bancorp, Inc. | | | | | 2,592 | | | | | | 48 | |
Berkshire Hills Bancorp, Inc. | | | | | 2,089 | | | | | | 77 | |
BGC Partners, Inc. ‘A’ | | | | | 5,853 | | | | | | 60 | |
BNC Bancorp | | | | | 710 | | | | | | 23 | |
BOK Financial Corp. | | | | | 2,611 | | | | | | 217 | |
Boston Private Financial Holdings, Inc. | | | | | 678 | | | | | | 11 | |
Brookline Bancorp, Inc. | | | | | 8,677 | | | | | | 142 | |
Bryn Mawr Bank Corp. | | | | | 668 | | | | | | 28 | |
Calamos Asset Management, Inc. ‘A’ | | | | | 3,240 | | | | | | 28 | |
Camden National Corp. | | | | | 1,833 | | | | | | 81 | |
Capital Bank Financial Corp. ‘A’ | | | | | 2,672 | | | | | | 105 | |
Capitol Federal Financial, Inc. | | | | | 10,355 | | | | | | 170 | |
Cathay General Bancorp | | | | | 616 | | | | | | 23 | |
Charter Financial Corp. | | | | | 1,765 | | | | | | 29 | |
Chemical Financial Corp. | | | | | 3,748 | | | | | | 203 | |
Citizens & Northern Corp. | | | | | 745 | | | | | | 20 | |
City Holding Co. | | | | | 1,537 | | | | | | 104 | |
CNA Financial Corp. | | | | | 3,247 | | | | | | 135 | |
Columbia Banking System, Inc. | | | | | 584 | | | | | | 26 | |
Community Bank System, Inc. | | | | | 1,548 | | | | | | 96 | |
Community Trust Bancorp, Inc. | | | | | 2,291 | | | | | | 114 | |
Cowen Group, Inc. ‘A’ (a) | | | | | 2,023 | | | | | | 31 | |
Crawford & Co. ‘B’ | | | | | 1,601 | | | | | | 20 | |
Credit Acceptance Corp. (a) | | | | | 283 | | | | | | 62 | |
Customers Bancorp, Inc. (a) | | | | | 972 | | | | | | 35 | |
Dime Community Bancshares, Inc. | | | | | 4,373 | | | | | | 88 | |
Drive Shack, Inc. | | | | | 2,273 | | | | | | 9 | |
| | | | | | | | |
| 56 | | PIMCO EQUITY SERIES | | | | | See Accompanying Notes | |
December 31, 2016 (Unaudited)
| | | | | | | | | | | | |
| | | | | SHARES | | | | | MARKET
VALUE
(000S) | |
Eagle Bancorp, Inc. (a) | | | | | 560 | | | $ | | | 34 | |
eHealth, Inc. (a) | | | | | 3,823 | | | | | | 41 | |
EMC Insurance Group, Inc. | | | | | 792 | | | | | | 24 | |
Employers Holdings, Inc. | | | | | 3,812 | | | | | | 151 | |
Encore Capital Group, Inc. (a) | | | | | 1,807 | | | | | | 52 | |
Enova International, Inc. (a) | | | | | 10,985 | | | | | | 138 | |
Enterprise Financial Services Corp. | | | | | 1,357 | | | | | | 58 | |
EverBank Financial Corp. | | | | | 2,448 | | | | | | 48 | |
Evercore Partners, Inc. ‘A’ | | | | | 1,206 | | | | | | 83 | |
Ezcorp, Inc. ‘A’ (a) | | | | | 14,431 | | | | | | 154 | |
FBL Financial Group, Inc. ‘A’ | | | | | 1,793 | | | | | | 140 | |
FCB Financial Holdings, Inc. ‘A’ (a) | | | | | 1,364 | | | | | | 65 | |
Federal Agricultural Mortgage Corp. ‘C’ | | | | | 515 | | | | | | 29 | |
Federated Investors, Inc. ‘B’ | | | | | 1,799 | | | | | | 51 | |
Fidelity & Guaranty Life | | | | | 3,305 | | | | | | 78 | |
Fidelity Southern Corp. | | | | | 578 | | | | | | 14 | |
Financial Institutions, Inc. | | | | | 1,679 | | | | | | 57 | |
First Bancorp | | | | | 1,664 | | | | | | 45 | |
First Busey Corp. | | | | | 2,773 | | | | | | 85 | |
First Business Financial Services, Inc. | | | | | 706 | | | | | | 17 | |
First Commonwealth Financial Corp. | | | | | 6,128 | | | | | | 87 | |
First Community Bancshares, Inc. | | | | | 1,399 | | | | | | 42 | |
First Connecticut Bancorp, Inc. | | | | | 1,446 | | | | | | 33 | |
First Defiance Financial Corp. | | | | | 648 | | | | | | 33 | |
First Financial Bancorp | | | | | 8,181 | | | | | | 233 | |
First Financial Bankshares, Inc. | | | | | 580 | | | | | | 26 | |
First Financial Corp. | | | | | 1,856 | | | | | | 98 | |
First Interstate BancSystem, Inc. ‘A’ | | | | | 1,662 | | | | | | 71 | |
First Midwest Bancorp, Inc. | | | | | 1,397 | | | | | | 35 | |
First NBC Bank Holding Co. (a) | | | | | 820 | | | | | | 6 | |
First of Long Island Corp. | | | | | 761 | | | | | | 22 | |
FirstCash, Inc. | | | | | 6,009 | | | | | | 282 | |
Flagstar Bancorp, Inc. (a) | | | | | 2,135 | | | | | | 58 | |
Flushing Financial Corp. | | | | | 3,880 | | | | | | 114 | |
FNB Corp. | | | | | 8,311 | | | | | | 133 | |
Fulton Financial Corp. | | | | | 12,731 | | | | | | 239 | |
GAIN Capital Holdings, Inc. | | | | | 2,094 | | | | | | 14 | |
German American Bancorp, Inc. | | | | | 593 | | | | | | 31 | |
Great Southern Bancorp, Inc. | | | | | 986 | | | | | | 54 | |
Great Western Bancorp, Inc. | | | | | 3,713 | | | | | | 162 | |
Green Dot Corp. ‘A’ (a) | | | | | 1,548 | | | | | | 36 | |
Greenhill & Co., Inc. | | | | | 5,501 | | | | | | 152 | |
Hancock Holding Co. | | | | | 4,999 | | | | | | 215 | |
Heartland Financial USA, Inc. | | | | | 1,265 | | | | | | 61 | |
Heritage Financial Corp. | | | | | 1,285 | | | | | | 33 | |
Heritage Insurance Holdings, Inc. | | | | | 705 | | | | | | 11 | |
Hilltop Holdings, Inc. | | | | | 5,053 | | | | | | 151 | |
HomeStreet, Inc. (a) | | | | | 1,568 | | | | | | 50 | |
HomeTrust Bancshares, Inc. (a) | | | | | 1,522 | | | | | | 39 | |
Hope Bancorp, Inc. | | | | | 863 | | | | | | 19 | |
Horace Mann Educators Corp. | | | | | 694 | | | | | | 30 | |
Horizon Bancorp | | | | | 568 | | | | | | 16 | |
Houlihan Lokey, Inc. | | | | | 968 | | | | | | 30 | |
IBERIABANK Corp. | | | | | 843 | | | | | | 71 | |
Independent Bank Corp. | | | | | 657 | | | | | | 46 | |
Independent Bank Group, Inc. | | | | | 266 | | | | | | 17 | |
Infinity Property & Casualty Corp. | | | | | 1,252 | | | | | | 110 | |
International Bancshares Corp. | | | | | 2,698 | | | | | | 110 | |
INTL. FCStone, Inc. (a) | | | | | 752 | | | | | | 30 | |
Investment Technology Group, Inc. | | | | | 1,984 | | | | | | 39 | |
Janus Capital Group, Inc. | | | | | 8,320 | | | | | | 110 | |
KCG Holdings, Inc. ‘A’ (a) | | | | | 17,736 | | | | | | 235 | |
Kemper Corp. | | | | | 2,997 | | | | | | 133 | |
Lakeland Bancorp, Inc. | | | | | 2,678 | | | | | | 52 | |
| | | | | | | | | | | | |
| | | | | SHARES | | | | | MARKET
VALUE
(000S) | |
Lakeland Financial Corp. | | | | | 495 | | | $ | | | 23 | |
LendingTree, Inc. (a) | | | | | 166 | | | | | | 17 | |
LPL Financial Holdings, Inc. | | | | | 6,482 | | | | | | 228 | |
MainSource Financial Group, Inc. | | | | | 1,478 | | | | | | 51 | |
Marlin Business Services Corp. | | | | | 2,080 | | | | | | 43 | |
MB Financial, Inc. | | | | | 324 | | | | | | 15 | |
MBIA, Inc. (a) | | | | | 30,888 | | | | | | 331 | |
Mercury General Corp. | | | | | 2,343 | | | | | | 141 | |
Meridian Bancorp, Inc. | | | | | 1,763 | | | | | | 33 | |
Meta Financial Group, Inc. | | | | | 451 | | | | | | 46 | |
Morningstar, Inc. | | | | | 1,303 | | | | | | 96 | |
National Bank Holdings Corp. ‘A’ | | | | | 5,986 | | | | | | 191 | |
National Bankshares, Inc. | | | | | 59 | | | | | | 3 | |
National General Holdings Corp. | | | | | 919 | | | | | | 23 | |
National Western Life Group, Inc. ‘A’ | | | | | 212 | | | | | | 66 | |
Nationstar Mortgage Holdings, Inc. (a) | | | | | 4,001 | | | | | | 72 | |
Navigators Group, Inc. | | | | | 932 | | | | | | 110 | |
NBT Bancorp, Inc. | | | | | 5,287 | | | | | | 221 | |
Nelnet, Inc. ‘A’ | | | | | 4,383 | | | | | | 222 | |
NMI Holdings, Inc. ‘A’ (a) | | | | | 2,718 | | | | | | 29 | |
Northfield Bancorp, Inc. | | | | | 6,447 | | | | | | 129 | |
Northrim BanCorp, Inc. | | | | | 1,035 | | | | | | 33 | |
Northwest Bancshares, Inc. | | | | | 13,939 | | | | | | 251 | |
OceanFirst Financial Corp. | | | | | 971 | | | | | | 29 | |
Ocwen Financial Corp. (a) | | | | | 32,688 | | | | | | 176 | |
Old National Bancorp | | | | | 5,737 | | | | | | 104 | |
OneBeacon Insurance Group Ltd. ‘A’ | | | | | 4,942 | | | | | | 79 | |
Oritani Financial Corp. | | | | | 3,506 | | | | | | 66 | |
Pacific Premier Bancorp, Inc. (a) | | | | | 1,307 | | | | | | 46 | |
Park National Corp. | | | | | 1,260 | | | | | | 151 | |
Pinnacle Financial Partners, Inc. | | | | | 1,056 | | | | | | 73 | |
Piper Jaffray Cos. (a) | | | | | 2,061 | | | | | | 149 | |
PRA Group, Inc. (a) | | | | | 1,345 | | | | | | 53 | |
Preferred Bank | | | | | 307 | | | | | | 16 | |
Primerica, Inc. | | | | | 3,727 | | | | | | 258 | |
ProAssurance Corp. | | | | | 2,098 | | | | | | 118 | |
Provident Financial Services, Inc. | | | | | 5,649 | | | | | | 160 | |
Regional Management Corp. (a) | | | | | 3,477 | | | | | | 91 | |
Renasant Corp. | | | | | 1,078 | | | | | | 46 | |
Republic Bancorp, Inc. ‘A’ | | | | | 725 | | | | | | 29 | |
RLI Corp. | | | | | 1,168 | | | | | | 74 | |
S&T Bancorp, Inc. | | | | | 888 | | | | | | 35 | |
Safety Insurance Group, Inc. | | | | | 1,190 | | | | | | 88 | |
Sandy Spring Bancorp, Inc. | | | | | 1,335 | | | | | | 53 | |
Selective Insurance Group, Inc. | | | | | 1,535 | | | | | | 66 | |
ServisFirst Bancshares, Inc. | | | | | 2,050 | | | | | | 77 | |
Simmons First National Corp. ‘A’ | | | | | 426 | | | | | | 26 | |
South State Corp. | | | | | 309 | | | | | | 27 | |
State Bank Financial Corp. | | | | | 1,842 | | | | | | 49 | |
Stewart Information Services Corp. | | | | | 465 | | | | | | 21 | |
Stock Yards Bancorp, Inc. | | | | | 1,059 | | | | | | 50 | |
Stonegate Bank | | | | | 528 | | | | | | 22 | |
Suffolk Bancorp | | | | | 447 | | | | | | 19 | |
TCF Financial Corp. | | | | | 11,437 | | | | | | 224 | |
Territorial Bancorp, Inc. | | | | | 1,546 | | | | | | 51 | |
Tompkins Financial Corp. | | | | | 1,045 | | | | | | 99 | |
Towne Bank | | | | | 1,895 | | | | | | 63 | |
TriCo Bancshares | | | | | 605 | | | | | | 21 | |
TriState Capital Holdings, Inc. (a) | | | | | 1,350 | | | | | | 30 | |
TrustCo Bank Corp. | | | | | 13,385 | | | | | | 117 | |
Trustmark Corp. | | | | | 3,061 | | | | | | 109 | |
UMB Financial Corp. | | | | | 994 | | | | | | 77 | |
Union Bankshares Corp. | | | | | 896 | | | | | | 32 | |
United Bankshares, Inc. | | | | | 904 | | | | | | 42 | |
| | | | | | | | | | | | |
| | | | | SHARES | | | | | MARKET
VALUE
(000S) | |
United Fire Group, Inc. | | | | | 1,227 | | | $ | | | 60 | |
Universal Insurance Holdings, Inc. | | | | | 1,288 | | | | | | 37 | |
Univest Corp. of Pennsylvania | | | | | 1,904 | | | | | | 59 | |
Valley National Bancorp | | | | | 17,948 | | | | | | 209 | |
Waddell & Reed Financial, Inc. ‘A’ | | | | | 16,487 | | | | | | 322 | |
Walker & Dunlop, Inc. (a) | | | | | 985 | | | | | | 31 | |
Walter Investment Management Corp. (a) | | | | | 1,801 | | | | | | 9 | |
Washington Federal, Inc. | | | | | 4,341 | | | | | | 149 | |
Washington Trust Bancorp, Inc. | | | | | 696 | | | | | | 39 | |
Waterstone Financial, Inc. | | | | | 1,055 | | | | | | 19 | |
Westamerica Bancorporation | | | | | 2,371 | | | | | | 149 | |
Westwood Holdings Group, Inc. | | | | | 173 | | | | | | 10 | |
Wintrust Financial Corp. | | | | | 1,140 | | | | | | 83 | |
World Acceptance Corp. (a) | | | | | 6,391 | | | | | | 411 | |
WSFS Financial Corp. | | | | | 847 | | | | | | 39 | |
| | | | | | | | | | | | |
| | | | | | | | | | | 15,437 | |
| | | | | | | | | | | | |
| | | | | | | | | | | | |
| HEALTH CARE 5.6% | |
Abaxis, Inc. | | | | | 691 | | | | | | 37 | |
Acorda Therapeutics, Inc. (a) | | | | | 2,083 | | | | | | 39 | |
Addus HomeCare Corp. (a) | | | | | 594 | | | | | | 21 | |
Adeptus Health, Inc. (a) | | | | | 219 | | | | | | 2 | |
Air Methods Corp. (a) | | | | | 2,598 | | | | | | 83 | |
Allscripts Healthcare Solutions, Inc. (a) | | | | | 6,398 | | | | | | 65 | |
Almost Family, Inc. (a) | | | | | 1,076 | | | | | | 48 | |
Amedisys, Inc. (a) | | | | | 3,308 | | | | | | 141 | |
AMN Healthcare Services, Inc. (a) | | | | | 1,985 | | | | | | 76 | |
Amphastar Pharmaceuticals, Inc. (a) | | | | | 470 | | | | | | 9 | |
Analogic Corp. | | | | | 1,153 | | | | | | 96 | |
AngioDynamics, Inc. (a) | | | | | 4,329 | | | | | | 73 | |
Anika Therapeutics, Inc. (a) | | | | | 291 | | | | | | 14 | |
BioScrip, Inc. (a) | | | | | 12,765 | | | | | | 13 | |
BioTelemetry, Inc. (a) | | | | | 478 | | | | | | 11 | |
Cambrex Corp. (a) | | | | | 1,100 | | | | | | 59 | |
Cantel Medical Corp. | | | | | 1,210 | | | | | | 95 | |
Capital Senior Living Corp. (a) | | | | | 847 | | | | | | 14 | |
Catalent, Inc. (a) | | | | | 488 | | | | | | 13 | |
Chemed Corp. | | | | | 956 | | | | | | 153 | |
Civitas Solutions, Inc. (a) | | | | | 547 | | | | | | 11 | |
Computer Programs & Systems, Inc. | | | | | 587 | | | | | | 14 | |
CONMED Corp. | | | | | 3,471 | | | | | | 153 | |
CorVel Corp. (a) | | | | | 358 | | | | | | 13 | |
Cynosure, Inc. ‘A’ (a) | | | | | 1,341 | | | | | | 61 | |
Depomed, Inc. (a) | | | | | 3,059 | | | | | | 55 | |
Emergent BioSolutions, Inc. (a) | | | | | 3,221 | | | | | | 106 | |
Ensign Group, Inc. | | | | | 1,471 | | | | | | 33 | |
Exactech, Inc. (a) | | | | | 1,393 | | | | | | 38 | |
Genomic Health, Inc. (a) | | | | | 608 | | | | | | 18 | |
Globus Medical, Inc. ‘A’ (a) | | | | | 4,222 | | | | | | 105 | |
Haemonetics Corp. (a) | | | | | 3,213 | | | | | | 129 | |
Halyard Health, Inc. (a) | | | | | 6,250 | | | | | | 231 | |
Healthways, Inc. (a) | | | | | 3,384 | | | | | | 77 | |
HMS Holdings Corp. (a) | | | | | 4,319 | | | | | | 78 | |
ICU Medical, Inc. (a) | | | | | 582 | | | | | | 86 | |
Impax Laboratories, Inc. (a) | | | | | 1,552 | | | | | | 21 | |
INC Research Holdings, Inc. ‘A’ (a) | | | | | 875 | | | | | | 46 | |
Inogen, Inc. (a) | | | | | 299 | | | | | | 20 | |
Inovalon Holdings, Inc. ‘A’ (a) | | | | | 1,498 | | | | | | 15 | |
Insulet Corp. (a) | | | | | 973 | | | | | | 37 | |
Integer Holdings Corp. (a) | | | | | 2,069 | | | | | | 61 | |
Integra LifeSciences Holdings Corp. (a) | | | | | 2,133 | | | | | | 183 | |
Intrexon Corp. (a) | | | | | 396 | | | | | | 10 | |
| | | | | | |
| See Accompanying Notes | | SEMIANNUAL REPORT | | DECEMBER 31, 2016 | | 57 |
Schedule of Investments PIMCO RAE Fundamental US Small Fund (Cont.)
| | | | | | | | | | | | |
| | | | | SHARES | | | | | MARKET
VALUE
(000S) | |
Invacare Corp. | | | | | 8,630 | | | $ | | | 113 | |
K2M Group Holdings, Inc. (a) | | | | | 508 | | | | | | 10 | |
Landauer, Inc. | | | | | 195 | | | | | | 9 | |
Lannett Co., Inc. (a) | | | | | 620 | | | | | | 14 | |
LeMaitre Vascular, Inc. | | | | | 503 | | | | | | 13 | |
LHC Group, Inc. (a) | | | | | 1,272 | | | | | | 58 | |
Ligand Pharmaceuticals, Inc. (a) | | | | | 395 | | | | | | 40 | |
Luminex Corp. (a) | | | | | 1,595 | | | | | | 32 | |
Magellan Health, Inc. (a) | | | | | 3,406 | | | | | | 256 | |
Masimo Corp. (a) | | | | | 3,798 | | | | | | 256 | |
Medicines Co. (a) | | | | | 2,866 | | | | | | 97 | |
Meridian Bioscience, Inc. | | | | | 3,468 | | | | | | 61 | |
Merit Medical Systems, Inc. (a) | | | | | 3,116 | | | | | | 83 | |
Molina Healthcare, Inc. (a) | | | | | 1,016 | | | | | | 55 | |
Myriad Genetics, Inc. (a) | | | | | 5,865 | | | | | | 98 | |
National HealthCare Corp. | | | | | 755 | | | | | | 57 | |
Natus Medical, Inc. (a) | | | | | 1,398 | | | | | | 49 | |
Nektar Therapeutics (a) | | | | | 3,204 | | | | | | 39 | |
Neogen Corp. (a) | | | | | 1,414 | | | | | | 93 | |
NuVasive, Inc. (a) | | | | | 1,650 | | | | | | 111 | |
NxStage Medical, Inc. (a) | | | | | 1,195 | | | | | | 31 | |
Omnicell, Inc. (a) | | | | | 1,662 | | | | | | 56 | |
OraSure Technologies, Inc. (a) | | | | | 2,054 | | | | | | 18 | |
Orthofix International NV (a) | | | | | 762 | | | | | | 28 | |
Owens & Minor, Inc. | | | | | 4,505 | | | | | | 159 | |
PDL BioPharma, Inc. | | | | | 72,713 | | | | | | 154 | |
PharMerica Corp. (a) | | | | | 3,139 | | | | | | 79 | |
Phibro Animal Health Corp. ‘A’ | | | | | 459 | | | | | | 13 | |
PRA Health Sciences, Inc. (a) | | | | | 963 | | | | | | 53 | |
Premier, Inc. ‘A’ (a) | | | | | 1,319 | | | | | | 40 | |
Prestige Brands Holdings, Inc. (a) | | | | | 215 | | | | | | 11 | |
Providence Service Corp. (a) | | | | | 554 | | | | | | 21 | |
Quality Systems, Inc. | | | | | 8,089 | | | | | | 106 | |
Quidel Corp. (a) | | | | | 522 | | | | | | 11 | |
RadNet, Inc. (a) | | | | | 11,419 | | | | | | 74 | |
Repligen Corp. (a) | | | | | 380 | | | | | | 12 | |
RTI Surgical, Inc. (a) | | | | | 6,556 | | | | | | 21 | |
SciClone Pharmaceuticals, Inc. (a) | | | | | 2,936 | | | | | | 32 | |
Select Medical Holdings Corp. (a) | | | | | 18,141 | | | | | | 240 | |
Spectrum Pharmaceuticals, Inc. (a) | | | | | 7,136 | | | | | | 32 | |
Surgery Partners, Inc. (a) | | | | | 1,386 | | | | | | 22 | |
Surgical Care Affiliates, Inc. (a) | | | | | 3,127 | | | | | | 145 | |
SurModics, Inc. (a) | | | | | 390 | | | | | | 10 | |
Team Health Holdings, Inc. (a) | | | | | 238 | | | | | | 10 | |
U.S. Physical Therapy, Inc. | | | | | 394 | | | | | | 28 | |
Universal American Corp. (a) | | | | | 6,632 | | | | | | 66 | |
Vascular Solutions, Inc. (a) | | | | | 286 | | | | | | 16 | |
Veeva Systems, Inc. ‘A’ (a) | | | | | 853 | | | | | | 35 | |
VWR Corp. (a) | | | | | 1,074 | | | | | | 27 | |
Zeltiq Aesthetics, Inc. (a) | | | | | 247 | | | | | | 11 | |
| | | | | | | | | | | | |
| | | | | | | | | | | 5,768 | |
| | | | | | | | | | | | |
| | | | | | | | | | | | |
| INDUSTRIALS 18.7% | |
AAON, Inc. | | | | | 1,042 | | | | | | 34 | |
AAR Corp. | | | | | 5,513 | | | | | | 182 | |
ABM Industries, Inc. | | | | | 6,117 | | | | | | 250 | |
ACCO Brands Corp. (a) | | | | | 15,504 | | | | | | 202 | |
Actuant Corp. ‘A’ | | | | | 10,721 | | | | | | 278 | |
Advanced Drainage Systems, Inc. | | | | | 1,458 | | | | | | 30 | |
Advisory Board Co. (a) | | | | | 526 | | | | | | 17 | |
Aegion Corp. (a) | | | | | 2,204 | | | | | | 52 | |
Aerovironment, Inc. (a) | | | | | 1,798 | | | | | | 48 | |
Air Lease Corp. | | | | | 1,493 | | | | | | 51 | |
Air Transport Services Group, Inc. (a) | | | | | 7,629 | | | | | | 122 | |
| | | | | | | | | | | | |
| | | | | SHARES | | | | | MARKET
VALUE
(000S) | |
Aircastle Ltd. | | | | | 8,410 | | | $ | | | 175 | |
Alamo Group, Inc. | | | | | 153 | | | | | | 12 | |
Albany International Corp. ‘A’ | | | | | 2,660 | | | | | | 123 | |
Allegiant Travel Co. | | | | | 295 | | | | | | 49 | |
Altra Industrial Motion Corp. | | | | | 1,985 | | | | | | 73 | |
Ameresco, Inc. ‘A’ (a) | | | | | 2,000 | | | | | | 11 | |
American Woodmark Corp. (a) | | | | | 195 | | | | | | 15 | |
Apogee Enterprises, Inc. | | | | | 1,154 | | | | | | 62 | |
Applied Industrial Technologies, Inc. | | | | | 4,455 | | | | | | 265 | |
ARC Document Solutions, Inc. (a) | | | | | 6,138 | | | | | | 31 | |
ArcBest Corp. | | | | | 516 | | | | | | 14 | |
Astec Industries, Inc. | | | | | 1,536 | | | | | | 104 | |
Astronics Corp. (a) | | | | | 281 | | | | | | 10 | |
Astronics Corp. ‘B’ (a) | | | | | 42 | | | | | | 1 | |
Atlas Air Worldwide Holdings, Inc. (a) | | | | | 3,224 | | | | | | 168 | |
AZZ, Inc. | | | | | 640 | | | | | | 41 | |
Babcock & Wilcox Enterprises, Inc. (a) | | | | | 3,984 | | | | | | 66 | |
Barnes Group, Inc. | | | | | 3,487 | | | | | | 165 | |
Beacon Roofing Supply, Inc. (a) | | | | | 2,685 | | | | | | 124 | |
BMC Stock Holdings, Inc. (a) | | | | | 820 | | | | | | 16 | |
Brady Corp. ‘A’ | | | | | 7,184 | | | | | | 270 | |
Briggs & Stratton Corp. | | | | | 8,488 | | | | | | 189 | |
Brink’s Co. | | | | | 4,185 | | | | | | 173 | |
CAI International, Inc. (a) | | | | | 5,023 | | | | | | 44 | |
Casella Waste Systems, Inc. ‘A’ (a) | | | | | 4,097 | | | | | | 51 | |
CBIZ, Inc. (a) | | | | | 7,552 | | | | | | 103 | |
CEB, Inc. | | | | | 353 | | | | | | 21 | |
Chart Industries, Inc. (a) | | | | | 8,060 | | | | | | 290 | |
CIRCOR International, Inc. | | | | | 570 | | | | | | 37 | |
Civeo Corp. (a) | | | | | 4,393 | | | | | | 10 | |
CLARCOR, Inc. | | | | | 349 | | | | | | 29 | |
Clean Harbors, Inc. (a) | | | | | 1,914 | | | | | | 107 | |
Columbus McKinnon Corp. | | | | | 1,630 | | | | | | 44 | |
Comfort Systems USA, Inc. | | | | | 1,734 | | | | | | 58 | |
Continental Building Products, Inc. (a) | | | | | 906 | | | | | | 21 | |
Covanta Holding Corp. | | | | | 6,237 | | | | | | 97 | |
Covenant Transportation Group, Inc. ‘A’ (a) | | | | | 448 | | | | | | 9 | |
CRA International, Inc. | | | | | 997 | | | | | | 37 | |
Cubic Corp. | | | | | 2,043 | | | | | | 98 | |
Deluxe Corp. | | | | | 443 | | | | | | 32 | |
DigitalGlobe, Inc. (a) | | | | | 5,786 | | | | | | 166 | |
Douglas Dynamics, Inc. | | | | | 1,153 | | | | | | 39 | |
Ducommun, Inc. (a) | | | | | 1,056 | | | | | | 27 | |
DXP Enterprises, Inc. (a) | | | | | 2,066 | | | | | | 72 | |
Dycom Industries, Inc. (a) | | | | | 1,127 | | | | | | 90 | |
Echo Global Logistics, Inc. (a) | | | | | 1,012 | | | | | | 25 | |
EMCOR Group, Inc. | | | | | 166 | | | | | | 12 | |
Encore Wire Corp. | | | | | 1,218 | | | | | | 53 | |
EnerSys | | | | | 2,246 | | | | | | 175 | |
Ennis, Inc. | | | | | 3,747 | | | | | | 65 | |
EnPro Industries, Inc. | | | | | 2,534 | | | | | | 171 | |
ESCO Technologies, Inc. | | | | | 1,998 | | | | | | 113 | |
Essendant, Inc. | | | | | 4,616 | | | | | | 96 | |
Esterline Technologies Corp. (a) | | | | | 2,544 | | | | | | 227 | |
Exponent, Inc. | | | | | 1,273 | | | | | | 77 | |
Forward Air Corp. | | | | | 510 | | | | | | 24 | |
Franklin Covey Co. (a) | | | | | 758 | | | | | | 15 | |
Franklin Electric Co., Inc. | | | | | 902 | | | | | | 35 | |
FTI Consulting, Inc. (a) | | | | | 2,515 | | | | | | 113 | |
G&K Services, Inc. ‘A’ | | | | | 1,398 | | | | | | 135 | |
GATX Corp. | | | | | 4,612 | | | | | | 284 | |
Generac Holdings, Inc. (a) | | | | | 4,451 | | | | | | 181 | |
General Cable Corp. | | | | | 9,836 | | | | | | 187 | |
Gibraltar Industries, Inc. (a) | | | | | 1,468 | | | | | | 61 | |
| | | | | | | | | | | | |
| | | | | SHARES | | | | | MARKET
VALUE
(000S) | |
Global Brass & Copper Holdings, Inc. | | | | | 5,439 | | | $ | | | 187 | |
Granite Construction, Inc. | | | | | 1,757 | | | | | | 97 | |
Great Lakes Dredge & Dock Corp. (a) | | | | | 6,646 | | | | | | 28 | |
Greenbrier Cos., Inc. | | | | | 2,459 | | | | | | 102 | |
Griffon Corp. | | | | | 6,134 | | | | | | 161 | |
H&E Equipment Services, Inc. | | | | | 7,297 | | | | | | 170 | |
Harsco Corp. | | | | | 23,192 | | | | | | 315 | |
Hawaiian Holdings, Inc. (a) | | | | | 4,361 | | | | | | 249 | |
Healthcare Services Group, Inc. | | | | | 544 | | | | | | 21 | |
Heartland Express, Inc. | | | | | 3,417 | | | | | | 70 | |
Heidrick & Struggles International, Inc. | | | | | 3,147 | | | | | | 76 | |
Herc Holdings, Inc. (a) | | | | | 7,342 | | | | | | 295 | |
Herman Miller, Inc. | | | | | 1,065 | | | | | | 36 | |
Hill International, Inc. (a) | | | | | 10,367 | | | | | | 45 | |
Hillenbrand, Inc. | | | | | 3,689 | | | | | | 141 | |
HNI Corp. | | | | | 2,311 | | | | | | 129 | |
Hub Group, Inc. ‘A’ (a) | | | | | 677 | | | | | | 30 | |
Hurco Cos., Inc. | | | | | 651 | | | | | | 22 | |
Huron Consulting Group, Inc. (a) | | | | | 1,429 | | | | | | 72 | |
Hyster-Yale Materials Handling, Inc. | | | | | 833 | | | | | | 53 | |
ICF International, Inc. (a) | | | | | 1,380 | | | | | | 76 | |
InnerWorkings, Inc. (a) | | | | | 3,729 | | | | | | 37 | |
Insperity, Inc. | | | | | 1,297 | | | | | | 92 | |
Interface, Inc. | | | | | 2,335 | | | | | | 43 | |
John Bean Technologies Corp. | | | | | 1,253 | | | | | | 108 | |
Kadant, Inc. | | | | | 1,201 | | | | | | 74 | |
Kaman Corp. | | | | | 4,489 | | | | | | 220 | |
KBR, Inc. | | | | | 7,020 | | | | | | 117 | |
Kelly Services, Inc. ‘A’ | | | | | 5,991 | | | | | | 137 | |
Kennametal, Inc. | | | | | 6,285 | | | | | | 196 | |
KEYW Holding Corp. (a) | | | | | 1,949 | | | | | | 23 | |
Kforce, Inc. | | | | | 4,766 | | | | | | 110 | |
Kimball International, Inc. ‘B’ | | | | | 2,373 | | | | | | 42 | |
Kirby Corp. (a) | | | | | 1,081 | | | | | | 72 | |
KLX, Inc. (a) | | | | | 4,191 | | | | | | 189 | |
Knight Transportation, Inc. | | | | | 3,172 | | | | | | 105 | |
Knoll, Inc. | | | | | 3,649 | | | | | | 102 | |
Korn/Ferry International | | | | | 5,006 | | | | | | 147 | |
Kratos Defense & Security Solutions, Inc. (a) | | | | | 11,951 | | | | | | 88 | |
Landstar System, Inc. | | | | | 1,204 | | | | | | 103 | |
Layne Christensen Co. (a) | | | | | 1,823 | | | | | | 20 | |
Lindsay Corp. | | | | | 687 | | | | | | 51 | |
LSI Industries, Inc. | | | | | 2,743 | | | | | | 27 | |
Lydall, Inc. (a) | | | | | 310 | | | | | | 19 | |
Manitowoc Co., Inc. | | | | | 3,126 | | | | | | 19 | |
Manitowoc Foodservice, Inc. (a) | | | | | 1,162 | | | | | | 22 | |
Marten Transport Ltd. | | | | | 1,757 | | | | | | 41 | |
Masonite International Corp. (a) | | | | | 199 | | | | | | 13 | |
MasTec, Inc. (a) | | | | | 3,914 | | | | | | 150 | |
Matson, Inc. | | | | | 1,858 | | | | | | 66 | |
Matthews International Corp. ‘A’ | | | | | 1,218 | | | | | | 94 | |
McGrath RentCorp | | | | | 4,131 | | | | | | 162 | |
Mercury Systems, Inc. (a) | | | | | 318 | | | | | | 10 | |
Meritor, Inc. (a) | | | | | 6,782 | | | | | | 84 | |
Milacron Holdings Corp. (a) | | | | | 1,112 | | | | | | 21 | |
Miller Industries, Inc. | | | | | 869 | | | | | | 23 | |
Mistras Group, Inc. (a) | | | | | 800 | | | | | | 21 | |
Mobile Mini, Inc. | | | | | 2,682 | | | | | | 81 | |
Moog, Inc. ‘A’ (a) | | | | | 2,482 | | | | | | 163 | |
MRC Global, Inc. (a) | | | | | 11,424 | | | | | | 231 | |
MSA Safety, Inc. | | | | | 815 | | | | | | 57 | |
Mueller Industries, Inc. | | | | | 4,840 | | | | | | 193 | |
Mueller Water Products, Inc. ‘A’ | | | | | 2,107 | | | | | | 28 | |
| | | | | | | | |
| 58 | | PIMCO EQUITY SERIES | | | | | See Accompanying Notes | |
December 31, 2016 (Unaudited)
| | | | | | | | | | | | |
| | | | | SHARES | | | | | MARKET
VALUE
(000S) | |
Multi-Color Corp. | | | | | 249 | | | $ | | | 19 | |
MYR Group, Inc. (a) | | | | | 852 | | | | | | 32 | |
National Presto Industries, Inc. | | | | | 901 | | | | | | 96 | |
Navigant Consulting, Inc. (a) | | | | | 4,034 | | | | | | 106 | |
Navistar International Corp. (a) | | | | | 8,764 | | | | | | 275 | |
NOW, Inc. (a) | | | | | 5,847 | | | | | | 120 | |
On Assignment, Inc. (a) | | | | | 893 | | | | | | 39 | |
PAM Transportation Services, Inc. (a) | | | | | 410 | | | | | | 11 | |
Ply Gem Holdings, Inc. (a) | | | | | 1,061 | | | | | | 17 | |
Powell Industries, Inc. | | | | | 545 | | | | | | 21 | |
Primoris Services Corp. | | | | | 2,506 | | | | | | 57 | |
Quad/Graphics, Inc. | | | | | 10,907 | | | | | | 293 | |
Quanex Building Products Corp. | | | | | 2,216 | | | | | | 45 | |
Raven Industries, Inc. | | | | | 1,844 | | | | | | 46 | |
RBC Bearings, Inc. (a) | | | | | 1,100 | | | | | | 102 | |
Regal Beloit Corp. | | | | | 2,112 | | | | | | 146 | |
Resources Connection, Inc. | | | | | 5,496 | | | | | | 106 | |
Rexnord Corp. (a) | | | | | 5,005 | | | | | | 98 | |
Roadrunner Transportation Systems, Inc. (a) | | | | | 2,687 | | | | | | 28 | |
RPX Corp. (a) | | | | | 6,117 | | | | | | 66 | |
Rush Enterprises, Inc. ‘A’ (a) | | | | | 5,824 | | | | | | 186 | |
Saia, Inc. (a) | | | | | 3,347 | | | | | | 148 | |
Scorpio Bulkers, Inc. (a) | | | | | 10,740 | | | | | | 54 | |
Simpson Manufacturing Co., Inc. | | | | | 3,002 | | | | | | 131 | |
SkyWest, Inc. | | | | | 12,851 | | | | | | 468 | |
Spirit Airlines, Inc. (a) | | | | | 769 | | | | | | 45 | |
SPX Corp. (a) | | | | | 10,839 | | | | | | 257 | |
SPX FLOW, Inc. (a) | | | | | 7,818 | | | | | | 251 | |
Standex International Corp. | | | | | 255 | | | | | | 22 | |
Steelcase, Inc. ‘A’ | | | | | 10,223 | | | | | | 183 | |
Sun Hydraulics Corp. | | | | | 725 | | | | | | 29 | |
Swift Transportation Co. (a) | | | | | 6,671 | | | | | | 163 | |
TASER International, Inc. (a) | | | | | 995 | | | | | | 24 | |
Team, Inc. (a) | | | | | 757 | | | | | | 30 | |
Tennant Co. | | | | | 559 | | | | | | 40 | |
Terex Corp. | | | | | 7,943 | | | | | | 250 | |
Tetra Tech, Inc. | | | | | 2,677 | | | | | | 116 | |
Textainer Group Holdings Ltd. | | | | | 4,763 | | | | | | 35 | |
Thermon Group Holdings, Inc. (a) | | | | | 2,151 | | | | | | 41 | |
Titan International, Inc. | | | | | 10,306 | | | | | | 116 | |
Titan Machinery, Inc. (a) | | | | | 3,663 | | | | | | 53 | |
TransUnion (a) | | | | | 473 | | | | | | 15 | |
Trex Co., Inc. (a) | | | | | 170 | | | | | | 11 | |
TriMas Corp. (a) | | | | | 2,991 | | | | | | 70 | |
TriNet Group, Inc. (a) | | | | | 1,112 | | | | | | 28 | |
Triumph Group, Inc. | | | | | 9,019 | | | | | | 239 | |
TrueBlue, Inc. (a) | | | | | 925 | | | | | | 23 | |
Tutor Perini Corp. (a) | | | | | 4,338 | | | | | | 121 | |
UniFirst Corp. | | | | | 677 | | | | | | 97 | |
Univar, Inc. (a) | | | | | 6,159 | | | | | | 175 | |
Universal Forest Products, Inc. | | | | | 1,339 | | | | | | 137 | |
USA Truck, Inc. (a) | | | | | 2,081 | | | | | | 18 | |
Valmont Industries, Inc. | | | | | 770 | | | | | | 109 | |
Vectrus, Inc. (a) | | | | | 456 | | | | | | 11 | |
Veritiv Corp. (a) | | | | | 1,342 | | | | | | 72 | |
Viad Corp. | | | | | 581 | | | | | | 26 | |
Wabash National Corp. (a) | | | | | 1,329 | | | | | | 21 | |
Watts Water Technologies, Inc. ‘A” | | | | | 2,510 | | | | | | 164 | |
Werner Enterprises, Inc. | | | | | 7,149 | | | | | | 193 | |
Wesco Aircraft Holdings, Inc. (a) | | | | | 5,362 | | | | | | 80 | |
WESCO International, Inc. (a) | | | | | 3,214 | | | | | | 214 | |
West Corp. | | | | | 7,079 | | | | | | 175 | |
YRC Worldwide, Inc. (a) | | | | | 3,341 | | | | | | 44 | |
| | | | | | | | | | | | |
| | | | | | | | | | | 19,338 | |
| | | | | | | | | | | | |
| | | | | | | | | | | | |
| | | | | SHARES | | | | | MARKET
VALUE
(000S) | |
| INFORMATION TECHNOLOGY 13.3% | |
2U, Inc. (a) | | | | | 357 | | | $ | | | 11 | |
3D Systems Corp. (a) | | | | | 3,635 | | | | | | 48 | |
A10 Networks, Inc. (a) | | | | | 1,471 | | | | | | 12 | |
ACI Worldwide, Inc. (a) | | | | | 1,540 | | | | | | 28 | |
Actua Corp. (a) | | | | | 1,746 | | | | | | 24 | |
Acxiom Corp. (a) | | | | | 4,972 | | | | | | 133 | |
ADTRAN, Inc. | | | | | 10,594 | | | | | | 237 | |
Advanced Energy Industries, Inc. (a) | | | | | 1,888 | | | | | | 103 | |
Alpha & Omega Semiconductor Ltd. (a) | | | | | 2,628 | | | | | | 56 | |
American Software, Inc. ‘A’ | | | | | 1,649 | | | | | | 17 | |
Amkor Technology, Inc. (a) | | | | | 18,603 | | | | | | 196 | |
Applied Micro Circuits Corp. (a) | | | | | 1,380 | | | | | | 11 | |
Avid Technology, Inc. (a) | | | | | 12,678 | | | | | | 56 | |
AVX Corp. | | | | | 4,322 | | | | | | 68 | |
Bankrate, Inc. (a) | | | | | 4,732 | | | | | | 52 | |
Bel Fuse, Inc. ‘B’ | | | | | 562 | | | | | | 17 | |
Belden, Inc. | | | | | 1,422 | | | | | | 106 | |
Benchmark Electronics, Inc. (a) | | | | | 6,938 | | | | | | 212 | |
Black Box Corp. | | | | | 3,082 | | | | | | 47 | |
Blackbaud, Inc. | | | | | 441 | | | | | | 28 | |
Blackhawk Network Holdings, Inc. (a) | | | | | 1,352 | | | | | | 51 | |
Blucora, Inc. (a) | | | | | 6,551 | | | | | | 97 | |
Bottomline Technologies de, Inc. (a) | | | | | 353 | | | | | | 9 | |
Brooks Automation, Inc. | | | | | 5,851 | | | | | | 100 | |
Cabot Microelectronics Corp. | | | | | 3,583 | | | | | | 226 | |
CACI International, Inc. ‘A’ (a) | | | | | 2,224 | | | | | | 276 | |
CalAmp Corp. (a) | | | | | 909 | | | | | | 13 | |
Calix, Inc. (a) | | | | | 2,113 | | | | | | 16 | |
Cass Information Systems, Inc. | | | | | 204 | | | | | | 15 | |
CEVA, Inc. (a) | | | | | 444 | | | | | | 15 | |
Ciber, Inc. (a) | | | | | 11,446 | | | | | | 7 | |
Ciena Corp. (a) | | | | | 2,752 | | | | | | 67 | |
Cirrus Logic, Inc. (a) | | | | | 1,502 | | | | | | 85 | |
Coherent, Inc. (a) | | | | | 1,582 | | | | | | 217 | |
Cohu, Inc. | | | | | 1,543 | | | | | | 21 | |
CommVault Systems, Inc. (a) | | | | | 1,860 | | | | | | 96 | |
comScore, Inc. (a) | | | | | 415 | | | | | | 13 | |
Comtech Telecommunications Corp. | | | | | 7,435 | | | | | | 88 | |
Control4 Corp. (a) | | | | | 810 | | | | | | 8 | |
Convergys Corp. | | | | | 3,795 | | | | | | 93 | |
Cray, Inc. (a) | | | | | 1,118 | | | | | | 23 | |
Cree, Inc. (a) | | | | | 9,089 | | | | | | 240 | |
CSG Systems International, Inc. | | | | | 3,777 | | | | | | 183 | |
CTS Corp. | | | | | 538 | | | | | | 12 | |
Cypress Semiconductor Corp. | | | | | 4,221 | | | | | | 48 | |
Daktronics, Inc. | | | | | 4,828 | | | | | | 52 | |
Datalink Corp. (a) | | | | | 1,821 | | | | | | 21 | |
DHI Group, Inc. (a) | | | | | 10,102 | | | | | | 63 | |
Diebold Nixdorf Inc | | | | | 7,429 | | | | | | 187 | |
Digi International, Inc. (a) | | | | | 695 | | | | | | 10 | |
Diodes, Inc. (a) | | | | | 6,124 | | | | | | 157 | |
Dolby Laboratories, Inc. ‘A’ | | | | | 2,230 | | | | | | 101 | |
EarthLink Holdings Corp. | | | | | 27,764 | | | | | | 157 | |
Eastman Kodak Co. (a) | | | | | 3,742 | | | | | | 58 | |
Ebix, Inc. | | | | | 3,202 | | | | | | 183 | |
Electro Scientific Industries, Inc. (a) | | | | | 1,240 | | | | | | 7 | |
Electronics For Imaging, Inc. (a) | | | | | 3,182 | | | | | | 140 | |
Ellie Mae, Inc. (a) | | | | | 115 | | | | | | 10 | |
EnerNOC, Inc. (a) | | | | | 7,586 | | | | | | 46 | |
Entegris, Inc. (a) | | | | | 5,392 | | | | | | 97 | |
ePlus, Inc. (a) | | | | | 630 | | | | | | 73 | |
ExlService Holdings, Inc. (a) | | | | | 1,821 | | | | | | 92 | |
Extreme Networks, Inc. (a) | | | | | 20,891 | | | | | | 105 | |
| | | | | | | | | | | | |
| | | | | SHARES | | | | | MARKET
VALUE
(000S) | |
FARO Technologies, Inc. (a) | | | | | 1,741 | | | $ | | | 63 | |
Finisar Corp. (a) | | | | | 6,348 | | | | | | 192 | |
FireEye, Inc. (a) | | | | | 1,702 | | | | | | 20 | |
Fitbit, Inc. ‘A’ (a) | | | | | 670 | | | | | | 5 | |
FormFactor, Inc. (a) | | | | | 1,563 | | | | | | 18 | |
Forrester Research, Inc. | | | | | 220 | | | | | | 9 | |
GrubHub, Inc. (a) | | | | | 234 | | | | | | 9 | |
Hackett Group, Inc. | | | | | 1,071 | | | | | | 19 | |
Harmonic, Inc. (a) | | | | | 17,590 | | | | | | 88 | |
II-VI, Inc. (a) | | | | | 2,622 | | | | | | 78 | |
Insight Enterprises, Inc. (a) | | | | | 6,587 | | | | | | 266 | |
Integrated Device Technology, Inc. (a) | | | | | 3,368 | | | | | | 79 | |
InterDigital, Inc. | | | | | 3,402 | | | | | | 311 | |
Internap Corp. (a) | | | | | 6,582 | | | | | | 10 | |
Intersil Corp. ‘A’ | | | | | 13,566 | | | | | | 303 | |
Intralinks Holdings, Inc. (a) | | | | | 6,165 | | | | | | 83 | |
Itron, Inc. (a) | | | | | 3,537 | | | | | | 222 | |
Ixia (a) | | | | | 7,239 | | | | | | 117 | |
IXYS Corp. | | | | | 1,015 | | | | | | 12 | |
Knowles Corp. (a) | | | | | 7,374 | | | | | | 123 | |
Lattice Semiconductor Corp. (a) | | | | | 9,132 | | | | | | 67 | |
Lionbridge Technologies, Inc. (a) | | | | | 2,821 | | | | | | 16 | |
Liquidity Services, Inc. (a) | | | | | 9,531 | | | | | | 93 | |
Littelfuse, Inc. | | | | | 603 | | | | | | 92 | |
LivePerson, Inc. (a) | | | | | 1,138 | | | | | | 9 | |
LogMeIn, Inc. | | | | | 148 | | | | | | 14 | |
Lumentum Holdings, Inc. (a) | | | | | 2,186 | | | | | | 85 | |
ManTech International Corp. ‘A’ | | | | | 4,581 | | | | | | 194 | |
Maxwell Technologies, Inc. (a) | | | | | 2,821 | | | | | | 14 | |
Mentor Graphics Corp. | | | | | 3,100 | | | | | | 114 | |
Methode Electronics, Inc. | | | | | 935 | | | | | | 39 | |
MicroStrategy, Inc. ‘A’ (a) | | | | | 482 | | | | | | 95 | |
MKS Instruments, Inc. | | | | | 4,224 | | | | | | 251 | |
MoneyGram International, Inc. (a) | | | | | 7,372 | | | | | | 87 | |
Monolithic Power Systems, Inc. | | | | | 309 | | | | | | 25 | |
Monotype Imaging Holdings, Inc. | | | | | 1,079 | | | | | | 21 | |
MTS Systems Corp. | | | | | 1,679 | | | | | | 95 | |
Nanometrics, Inc. (a) | | | | | 461 | | | | | | 12 | |
NETGEAR, Inc. (a) | | | | | 3,557 | | | | | | 193 | |
NetScout Systems, Inc. (a) | | | | | 1,766 | | | | | | 56 | |
NeuStar, Inc. ‘A’ (a) | | | | | 5,842 | | | | | | 195 | |
NIC, Inc. | | | | | 2,397 | | | | | | 57 | |
Novanta, Inc. (a) | | | | | 634 | | | | | | 13 | |
OSI Systems, Inc. (a) | | | | | 1,648 | | | | | | 125 | |
Park Electrochemical Corp. | | | | | 2,074 | | | | | | 39 | |
PC Connection, Inc. | | | | | 650 | | | | | | 18 | |
Pegasystems, Inc. | | | | | 1,276 | | | | | | 46 | |
Perficient, Inc. (a) | | | | | 1,053 | | | | | | 18 | |
Photronics, Inc. (a) | | | | | 8,769 | | | | | | 99 | |
Plantronics, Inc. | | | | | 3,108 | | | | | | 170 | |
Plexus Corp. (a) | | | | | 3,899 | | | | | | 211 | |
Power Integrations, Inc. | | | | | 913 | | | | | | 62 | |
Progress Software Corp. | | | | | 9,620 | | | | | | 307 | |
QuinStreet, Inc. (a) | | | | | 4,935 | | | | | | 19 | |
Rambus, Inc. (a) | | | | | 2,346 | | | | | | 32 | |
RealPage, Inc. (a) | | | | | 1,557 | | | | | | 47 | |
RetailMeNot, Inc. (a) | | | | | 8,286 | | | | | | 77 | |
RingCentral, Inc. ‘A’ (a) | | | | | 985 | | | | | | 20 | |
Rogers Corp. (a) | | | | | 1,160 | | | | | | 89 | |
Sanmina Corp. (a) | | | | | 6,022 | | | | | | 221 | |
ScanSource, Inc. (a) | | | | | 3,730 | | | | | | 151 | |
Science Applications International Corp. | | | | | 2,889 | | | | | | 245 | |
Seachange International, Inc. (a) | | | �� | | 7,810 | | | | | | 18 | |
| | | | | | |
| See Accompanying Notes | | SEMIANNUAL REPORT | | DECEMBER 31, 2016 | | 59 |
Schedule of Investments PIMCO RAE Fundamental US Small Fund (Cont.)
| | | | | | | | | | | | |
| | | | | SHARES | | | | | MARKET
VALUE
(000S) | |
Semtech Corp. (a) | | | | | 4,435 | | | $ | | | 140 | |
ShoreTel, Inc. (a) | | | | | 3,168 | | | | | | 23 | |
Sigma Designs, Inc. (a) | | | | | 1,702 | | | | | | 10 | |
Silicon Laboratories, Inc. (a) | | | | | 2,221 | | | | | | 144 | |
Sonus Networks, Inc. (a) | | | | | 9,672 | | | | | | 61 | |
Stamps.com, Inc. (a) | | | | | 187 | | | | | | 21 | |
Stratasys Ltd. (a) | | | | | 4,989 | | | | | | 83 | |
Super Micro Computer, Inc. (a) | | | | | 891 | | | | | | 25 | |
Sykes Enterprises, Inc. (a) | | | | | 6,241 | | | | | | 180 | |
Synaptics, Inc. (a) | | | | | 606 | | | | | | 33 | |
Synchronoss Technologies, Inc. (a) | | | | | 1,558 | | | | | | 60 | |
Syntel, Inc. | | | | | 658 | | | | | | 13 | |
Take-Two Interactive Software, Inc. (a) | | | | | 1,200 | | | | | | 59 | |
Tangoe, Inc. (a) | | | | | 2,310 | | | | | | 18 | |
TeleTech Holdings, Inc. | | | | | 1,104 | | | | | | 34 | |
Tessera Holding Corp. | | | | | 1,298 | | | | | | 57 | |
TiVo Corp. (a) | | | | | 12,475 | | | | | | 261 | |
TTM Technologies, Inc. (a) | | | | | 13,356 | | | | | | 182 | |
Ultra Clean Holdings, Inc. (a) | | | | | 1,314 | | | | | | 13 | |
Unisys Corp. (a) | | | | | 23,243 | | | | | | 348 | |
VASCO Data Security International, Inc. (a) | | | | | 534 | | | | | | 7 | |
Veeco Instruments, Inc. (a) | | | | | 4,565 | | | | | | 133 | |
VeriFone Systems, Inc. (a) | | | | | 2,454 | | | | | | 44 | |
Verint Systems, Inc. (a) | | | | | 1,684 | | | | | | 59 | |
Viavi Solutions, Inc. (a) | | | | | 14,481 | | | | | | 118 | |
Virtusa Corp. (a) | | | | | 398 | | | | | | 10 | |
Vishay Intertechnology, Inc. | | | | | 20,196 | | | | | | 327 | |
Vishay Precision Group, Inc. (a) | | | | | 1,678 | | | | | | 32 | |
Web.com Group, Inc. (a) | | | | | 1,660 | | | | | | 35 | |
WebMD Health Corp. (a) | | | | | 3,574 | | | | | | 177 | |
XO Group, Inc. (a) | | | | | 1,020 | | | | | | 20 | |
Yelp, Inc. (a) | | | | | 520 | | | | | | 20 | |
Zedge, Inc. ‘B’ (a) | | | | | 668 | | | | | | 2 | |
Zix Corp. (a) | | | | | 3,937 | | | | | | 19 | |
Zynga, Inc. ‘A’ (a) | | | | | 23,816 | | | | | | 61 | |
| | | | | | | | | | | | |
| | | | | | | | | | | 13,747 | |
| | | | | | | | | | | | |
| | | | | | | | | | | | |
| MATERIALS 6.8% | |
A Schulman, Inc. | | | | | 3,966 | | | | | | 133 | |
AEP Industries, Inc. | | | | | 438 | | | | | | 51 | |
AK Steel Holding Corp. (a) | | | | | 14,450 | | | | | | 148 | |
Allegheny Technologies, Inc. | | | | | 13,850 | | | | | | 221 | |
Ampco-Pittsburgh Corp. | | | | | 1,614 | | | | | | 27 | |
Boise Cascade Co. (a) | | | | | 2,854 | | | | | | 64 | |
Cabot Corp. | | | | | 1,547 | | | | | | 78 | |
Calgon Carbon Corp. | | | | | 2,913 | | | | | | 50 | |
Carpenter Technology Corp. | | | | | 4,602 | | | | | | 166 | |
Century Aluminum Co. (a) | | | | | 6,374 | | | | | | 55 | |
Chemtura Corp. (a) | | | | | 7,341 | | | | | | 244 | |
Clearwater Paper Corp. (a) | | | | | 2,291 | | | | | | 150 | |
Cliffs Natural Resources, Inc. (a) | | | | | 53,031 | | | | | | 446 | |
Coeur Mining, Inc. (a) | | | | | 6,900 | | | | | | 63 | |
Commercial Metals Co. | | | | | 9,063 | | | | | | 197 | |
Compass Minerals International, Inc. | | | | | 1,302 | | | | | | 102 | |
Ferro Corp. (a) | | | | | 1,418 | | | | | | 20 | |
Flotek Industries, Inc. (a) | | | | | 5,827 | | | | | | 55 | |
FutureFuel Corp. | | | | | 2,947 | | | | | | 41 | |
Gold Resource Corp. | | | | | 5,765 | | | | | | 25 | |
Greif, Inc. ‘A’ | | | | | 6,426 | | | | | | 330 | |
Hawkins, Inc. | | | | | 347 | | | | | | 19 | |
Haynes International, Inc. | | | | | 473 | | | | | | 20 | |
HB Fuller Co. | | | | | 2,991 | | | | | | 144 | |
| | | | | | | | | | | | |
| | | | | SHARES | | | | | MARKET
VALUE
(000S) | |
Headwaters, Inc. (a) | | | | | 1,830 | | | $ | | | 43 | |
Hecla Mining Co. | | | | | 21,509 | | | | | | 113 | |
Innophos Holdings, Inc. | | | | | 4,481 | | | | | | 234 | |
Innospec, Inc. | | | | | 1,537 | | | | | | 105 | |
Intrepid Potash, Inc. (a) | | | | | 5,885 | | | | | | 12 | |
Kaiser Aluminum Corp. | | | | | 2,183 | | | | | | 170 | |
KapStone Paper and Packaging Corp. | | | | | 4,139 | | | | | | 91 | |
Koppers Holdings, Inc. (a) | | | | | 2,619 | | | | | | 106 | |
Kraton Corp. (a) | | | | | 3,846 | | | | | | 110 | |
Kronos Worldwide, Inc. | | | | | 3,393 | | | | | | 40 | |
Louisiana-Pacific Corp. (a) | | | | | 2,344 | | | | | | 44 | |
LSB Industries, Inc. (a) | | | | | 1,949 | | | | | | 16 | |
Materion Corp. | | | | | 2,406 | | | | | | 95 | |
Minerals Technologies, Inc. | | | | | 1,643 | | | | | | 127 | |
Myers Industries, Inc. | | | | | 4,065 | | | | | | 58 | |
Neenah Paper, Inc. | | | | | 1,164 | | | | | | 99 | |
Olympic Steel, Inc. | | | | | 1,184 | | | | | | 29 | |
OMNOVA Solutions, Inc. (a) | | | | | 5,868 | | | | | | 59 | |
PH Glatfelter Co. | | | | | 5,205 | | | | | | 124 | |
Platform Specialty Products Corp. (a) | | | | | 21,153 | | | | | | 207 | |
PolyOne Corp. | | | | | 1,855 | | | | | | 59 | |
Quaker Chemical Corp. | | | | | 446 | | | | | | 57 | |
Rayonier Advanced Materials, Inc. | | | | | 4,460 | | | | | | 69 | |
Royal Gold, Inc. | | | | | 599 | | | | | | 38 | |
Ryerson Holding Corp. (a) | | | | | 6,203 | | | | | | 83 | |
Schnitzer Steel Industries, Inc. ‘A’ | | | | | 5,741 | | | | | | 148 | |
Schweitzer-Mauduit International, Inc. | | | | | 2,989 | | | | | | 136 | |
Silgan Holdings, Inc. | | | | | 1,412 | | | | | | 72 | |
Stepan Co. | | | | | 2,071 | | | | | | 169 | |
Stillwater Mining Co. (a) | | | | | 4,970 | | | | | | 80 | |
Summit Materials, Inc. ‘A’ (a) | | | | | 1,834 | | | | | | 44 | |
SunCoke Energy, Inc. | | | | | 23,754 | | | | | | 269 | |
TimkenSteel Corp. (a) | | | | | 13,833 | | | | | | 214 | |
Tredegar Corp. | | | | | 2,047 | | | | | | 49 | |
Trinseo S.A. | | | | | 2,168 | | | | | | 129 | |
Tronox Ltd. ‘A’ | | | | | 41,670 | | | | | | 430 | |
U.S. Concrete, Inc. (a) | | | | | 417 | | | | | | 27 | |
Westlake Chemical Corp. | | | | | 641 | | | | | | 36 | |
Worthington Industries, Inc. | | | | | 5,244 | | | | | | 249 | |
| | | | | | | | | | | | |
| | | | | | | | | | | 7,089 | |
| | | | | | | | | | | | |
| | | | | | | | | | | | |
| REAL ESTATE 0.2% | |
Alexander & Baldwin, Inc. | | | | | 579 | | | | | | 26 | |
Forestar Group, Inc. (a) | | | | | 3,040 | | | | | | 41 | |
HFF, Inc. ‘A’ | | | | | 1,518 | | | | | | 46 | |
RE/MAX Holdings, Inc. ‘A’ | | | | | 1,203 | | | | | | 67 | |
RMR Group, Inc. ‘A’ | | | | | 355 | | | | | | 14 | |
St Joe Co. (a) | | | | | 526 | | | | | | 10 | |
| | | | | | | | | | | | |
| | | | | | | | | | | 204 | |
| | | | | | | | | | | | |
| | | | | | | | | | | | |
| TELECOMMUNICATION SERVICES 1.6% | |
ATN International, Inc. | | | | | 703 | | | | | | 56 | |
Boingo Wireless, Inc. (a) | | | | | 1,156 | | | | | | 14 | |
Cincinnati Bell, Inc. (a) | | | | | 2,747 | | | | | | 62 | |
Cogent Communications Holdings, Inc. | | | | | 1,653 | | | | | | 69 | |
Consolidated Communications Holdings, Inc. | | | | | 7,077 | | | | | | 190 | |
FairPoint Communications, Inc. (a) | | | | | 4,561 | | | | | | 85 | |
General Communication, Inc. ‘A’ (a) | | | | | 7,466 | | | | | | 145 | |
Hawaiian Telcom Holdco, Inc. (a) | | | | | 1,323 | | | | | | 33 | |
IDT Corp. ‘B’ | | | | | 1,027 | | | | | | 19 | |
Inteliquent, Inc. | | | | | 2,659 | | | | | | 61 | |
Iridium Communications, Inc. (a) | | | | | 24,364 | | | | | | 234 | |
| | | | | | | | | | | | |
| | | | | SHARES | | | | | MARKET
VALUE
(000S) | |
Lumos Networks Corp. (a) | | | | | 2,001 | | | $ | | | 31 | |
Shenandoah Telecommunications Co. | | | | | 2,760 | | | | | | 75 | |
Spok Holdings, Inc. | | | | | 3,081 | | | | | | 64 | |
U.S. Cellular Corp. (a) | | | | | 1,511 | | | | | | 66 | |
Vonage Holdings Corp. (a) | | | | | 23,207 | | | | | | 159 | |
Windstream Holdings, Inc. | | | | | 46,533 | | | | | | 341 | |
| | | | | | | | | | | | |
| | | | | | | | | | | 1,704 | |
| | | | | | | | | | | | |
| | | | | | | | | | | | |
| UTILITIES 2.9% | |
ALLETE, Inc. | | | | | 1,568 | | | | | | 101 | |
American States Water Co. | | | | | 4,156 | | | | | | 189 | |
Artesian Resources Corp. ‘A’ | | | | | 475 | | | | | | 15 | |
Atlantic Power Corp. | | | | | 8,032 | | | | | | 20 | |
Avista Corp. | | | | | 3,659 | | | | | | 146 | |
California Water Service Group | | | | | 6,876 | | | | | | 233 | |
Chesapeake Utilities Corp. | | | | | 971 | | | | | | 65 | |
Connecticut Water Service, Inc. | | | | | 686 | | | | | | 38 | |
Dynegy, Inc. (a) | | | | | 12,064 | | | | | | 102 | |
El Paso Electric Co. | | | | | 2,950 | | | | | | 137 | |
Empire District Electric Co. | | | | | 9,112 | | | | | | 311 | |
MGE Energy, Inc. | | | | | 3,052 | | | | | | 199 | |
Middlesex Water Co. | | | | | 1,391 | | | | | | 60 | |
Northwest Natural Gas Co. | | | | | 5,573 | | | | | | 333 | |
NorthWestern Corp. | | | | | 549 | | | | | | 31 | |
NRG Yield, Inc. ‘C’ | | | | | 1,695 | | | | | | 27 | |
Ormat Technologies, Inc. | | | | | 251 | | | | | | 13 | |
Otter Tail Corp. | | | | | 4,546 | | | | | | 186 | |
Pattern Energy Group, Inc. | | | | | 906 | | | | | | 17 | |
PNM Resources, Inc. | | | | | 10,624 | | | | | | 364 | |
SJW Corp. | | | | | 1,879 | | | | | | 105 | |
South Jersey Industries, Inc. | | | | | 1,297 | | | | | | 44 | |
Spire, Inc. | | | | | 817 | | | | | | 53 | |
TerraForm Global, Inc. ‘A’ | | | | | 4,451 | | | | | | 18 | |
TerraForm Power, Inc. ‘A’ | | | | | 1,408 | | | | | | 18 | |
Unitil Corp. | | | | | 2,548 | | | | | | 116 | |
York Water Co. | | | | | 261 | | | | | | 10 | |
| | | | | | | | | | | | |
| | | | | | | | | | | 2,951 | |
| | | | | | | | | | | | |
Total United States | | | | | | | | | | | 92,977 | |
| | | | | | | | | | | | |
Total Common Stocks (Cost $70,369) | | | 93,230 | |
| | | | | | | | | | | | |
| | | | | | | | | | | | |
| REAL ESTATE INVESTMENT TRUSTS 8.4% | |
| | | | | | | | | | | | |
| UNITED STATES 8.4% | |
| | | | | | | | | | | | |
| FINANCIALS 2.4% | |
AG Mortgage Investment Trust, Inc. | | | | | 5,356 | | | | | | 92 | |
Anworth Mortgage Asset Corp. | | | | | 35,066 | | | | | | 181 | |
Apollo Commercial Real Estate Finance, Inc. | | | | | 5,513 | | | | | | 92 | |
Ares Commercial Real Estate Corp. | | | | | 1,261 | | | | | | 17 | |
ARMOUR Residential REIT, Inc. | | | | | 5,796 | | | | | | 126 | |
Blackstone Mortgage Trust, Inc. ‘A’ | | | | | 1,652 | | | | | | 50 | |
Capstead Mortgage Corp. | | | | | 20,016 | | | | | | 204 | |
Colony Capital, Inc. ‘A’ | | | | | 2,511 | | | | | | 51 | |
CYS Investments, Inc. | | | | | 22,348 | | | | | | 173 | |
Dynex Capital, Inc. | | | | | 14,487 | | | | | | 99 | |
Invesco Mortgage Capital, Inc. | | | | | 12,744 | | | | | | 186 | |
Ladder Capital Corp. | | | | | 1,648 | | | | | | 22 | |
MFA Financial, Inc. | | | | | 32,069 | | | | | | 245 | |
MTGE Investment Corp. | | | | | 10,906 | | | | | | 171 | |
New Residential Investment Corp. | | | | | 8,301 | | | | | | 130 | |
New York Mortgage Trust, Inc. | | | | | 4,947 | | | | | | 33 | |
PennyMac Mortgage Investment Trust | | | | | 9,005 | | | | | | 147 | |
| | | | | | | | |
| 60 | | PIMCO EQUITY SERIES | | | | | See Accompanying Notes | |
December 31, 2016 (Unaudited)
| | | | | | | | | | | | |
| | | | | SHARES | | | | | MARKET
VALUE
(000S) | |
Redwood Trust, Inc. | | | | | 12,843 | | | $ | | | 195 | |
Resource Capital Corp. | | | | | 3,686 | | | | | | 31 | |
Two Harbors Investment Corp. | | | | | 15,263 | | | | | | 133 | |
Western Asset Mortgage Capital Corp. | | | | | 6,237 | | | | | | 63 | |
| | | | | | | | | | | | |
| | | | | | | | | | | 2,441 | |
| | | | | | | | | | | | |
| | | | | | | | | | | | |
| REAL ESTATE 6.0% | |
Agree Realty Corp. | | | | | 1,006 | | | | | | 46 | |
American Assets Trust, Inc. | | | | | 1,120 | | | | | | 48 | |
Armada Hoffler Properties, Inc. | | | | | 1,887 | | | | | | 28 | |
Ashford Hospitality Prime, Inc. | | | | | 898 | | | | | | 12 | |
Ashford Hospitality Trust, Inc. | | | | | 16,203 | | | | | | 126 | |
Brandywine Realty Trust | | | | | 13,995 | | | | | | 231 | |
Care Capital Properties, Inc. | | | | | 4,132 | | | | | | 103 | |
CBL & Associates Properties, Inc. | | | | | 27,264 | | | | | | 314 | |
Cedar Realty Trust, Inc. | | | | | 4,441 | | | | | | 29 | |
Chesapeake Lodging Trust | | | | | 1,429 | | | | | | 37 | |
Colony Starwood Homes | | | | | 1,175 | | | | | | 34 | |
Columbia Property Trust, Inc. | | | | | 11,159 | | | | | | 241 | |
CoreSite Realty Corp. | | | | | 1,350 | | | | | | 107 | |
Corporate Office Properties Trust | | | | | 4,718 | | | | | | 147 | |
Cousins Properties, Inc. | | | | | 8,532 | | | | | | 73 | |
DiamondRock Hospitality Co. | | | | | 11,956 | | | | | | 138 | |
DuPont Fabros Technology, Inc. | | | | | 2,762 | | | | | | 121 | |
EastGroup Properties, Inc. | | | | | 784 | | | | | | 58 | |
Education Realty Trust, Inc. | | | | | 247 | | | | | | 10 | |
Empire State Realty Trust, Inc. ‘A’ | | | | | 2,306 | | | | | | 47 | |
First Potomac Realty Trust | | | | | 5,743 | | | | | | 63 | |
Franklin Street Properties Corp. | | | | | 9,991 | | | | | | 130 | |
GEO Group, Inc. | | | | | 4,684 | | | | | | 168 | |
Getty Realty Corp. | | | | | 1,851 | | | | | | 47 | |
| | | | | | | | | | | | |
| | | | | SHARES | | | | | MARKET
VALUE
(000S) | |
Gladstone Commercial Corp. | | | | | 1,856 | | | $ | | | 37 | |
Global Net Lease, Inc. | | | | | 3,118 | | | | | | 24 | |
Government Properties Income Trust | | | | | 7,139 | | | | | | 136 | |
Hersha Hospitality Trust | | | | | 3,348 | | | | | | 72 | |
Hudson Pacific Properties, Inc. | | | | | 598 | | | | | | 21 | |
Investors Real Estate Trust | | | | | 13,669 | | | | | | 98 | |
iStar Financial, Inc. (a) | | | | | 2,670 | | | | | | 33 | |
Kite Realty Group Trust | | | | | 1,673 | | | | | | 39 | |
LaSalle Hotel Properties | | | | | 5,954 | | | | | | 181 | |
Lexington Realty Trust | | | | | 19,265 | | | | | | 208 | |
LTC Properties, Inc. | | | | | 478 | | | | | | 23 | |
Mack-Cali Realty Corp. | | | | | 9,938 | | | | | | 288 | |
Monmouth Real Estate Investment Corp. | | | | | 2,055 | | | | | | 31 | |
Monogram Residential Trust, Inc. | | | | | 3,420 | | | | | | 37 | |
National Health Investors, Inc. | | | | | 522 | | | | | | 39 | |
National Storage Affiliates Trust | | | | | 915 | | | | | | 20 | |
New Senior Investment Group, Inc. | | | | | 5,917 | | | | | | 58 | |
New York REIT, Inc. | | | | | 1,027 | | | | | | 10 | |
NorthStar Realty Finance Corp. | | | | | 5,683 | | | | | | 86 | |
Outfront Media, Inc. | | | | | 6,270 | | | | | | 156 | |
Parkway, Inc. (a) | | | | | 734 | | | | | | 16 | |
Pebblebrook Hotel Trust | | | | | 1,094 | | | | | | 33 | |
Pennsylvania Real Estate Investment Trust | | | | | 3,990 | | | | | | 76 | |
Piedmont Office Realty Trust, Inc. ‘A’ | | | | | 9,599 | | | | | | 201 | |
Potlatch Corp. | | | | | 1,636 | | | | | | 68 | |
Preferred Apartment Communities, Inc. ‘A’ | | | | | 941 | | | | | | 14 | |
PS Business Parks, Inc. | | | | | 950 | | | | | | 111 | |
QTS Realty Trust, Inc. ‘A’ | | | | | 1,695 | | | | | | 84 | |
RAIT Financial Trust | | | | | 11,440 | | | | | | 38 | |
| | | | | | | | | | | | |
| | | | | SHARES | | | | | MARKET
VALUE
(000S) | |
Ramco-Gershenson Properties Trust | | | | | 838 | | | $ | | | 14 | |
Retail Opportunity Investments Corp. | | | | | 1,439 | | | | | | 30 | |
Rexford Industrial Realty, Inc. | | | | | 1,373 | | | | | | 32 | |
RLJ Lodging Trust | | | | | 6,297 | | | | | | 154 | |
Ryman Hospitality Properties, Inc. | | | | | 4,093 | | | | | | 258 | |
Sabra Health Care REIT, Inc. | | | | | 3,622 | | | | | | 89 | |
Select Income REIT | | | | | 3,415 | | | | | | 86 | |
Seritage Growth Properties ‘A’ | | | | | 629 | | | | | | 27 | |
Silver Bay Realty Trust Corp. | | | | | 1,946 | | | | | | 33 | |
STAG Industrial, Inc. | | | | | 423 | | | | | | 10 | |
STORE Capital Corp. | | | | | 1,884 | | | | | | 47 | |
Summit Hotel Properties, Inc. | | | | | 4,835 | | | | | | 78 | |
Sunstone Hotel Investors, Inc. | | | | | 9,208 | | | | | | 140 | |
Tier REIT, Inc. | | | | | 5,626 | | | | | | 98 | |
Urban Edge Properties | | | | | 688 | | | | | | 19 | |
Urstadt Biddle Properties, Inc. ‘A’ | | | | | 1,199 | | | | | | 29 | |
Washington Prime Group, Inc. | | | | | 15,008 | | | | | | 156 | |
Washington Real Estate Investment Trust | | | | | 4,263 | | | | | | 139 | |
Xenia Hotels & Resorts, Inc. | | | | | 10,940 | | | | | | 213 | |
| | | | | | | | | | | | |
| | | | | | | | | | | 6,248 | |
| | | | | | | | | | | | |
Total Real Estate Investment Trusts (Cost $7,892) | | | | | | 8,689 | |
| | | | | | | | | | | | |
| | | | | | | | | | | | |
| Total Investments in Securities (Cost $78,261) | | | | | | 101,919 | |
| | | | | | | | | | | | |
| Total Investments 98.4% (Cost $78,261) | | | | | | | | $ | | | 101,919 | |
| |
| Other Assets and Liabilities, net 1.6% | | | | | | 1,612 | |
| | | | | | | | | | | | |
| Net Assets 100.0% | | | | | | | | $ | | | 103,531 | |
| | | | | | | | | | | | |
NOTES TO SCHEDULE OF INVESTMENTS (AMOUNTS IN THOUSANDS*):
| * | A zero balance may reflect actual amounts rounding to less than one thousand. |
| (a) | Security did not produce income within the last twelve months. |
FAIR VALUE MEASUREMENTS
The following is a summary of the fair valuations according to the inputs used as of December 31, 2016 in valuing the Fund’s assets and liabilities:
| | | | | | | | | | | | | | | | |
| Category and Subcategory | | Level 1 | | | Level 2 | | | Level 3 | | | Fair
Value at
12/31/2016 | |
Investments in Securities, at Value | |
Common Stocks | |
Bermuda | |
Industrials | | $ | 158 | | | $ | 0 | | | $ | 0 | | | $ | 158 | |
United Kingdom | |
Information Technology | | | 95 | | | | 0 | | | | 0 | | | | 95 | |
United States | |
Consumer Discretionary | | | 16,905 | | | | 0 | | | | 0 | | | | 16,905 | |
Consumer Staples | | | 3,235 | | | | 0 | | | | 0 | | | | 3,235 | |
Energy | | | 6,599 | | | | 0 | | | | 0 | | | | 6,599 | |
Financials | | | 15,437 | | | | 0 | | | | 0 | | | | 15,437 | |
Health Care | | | 5,768 | | | | 0 | | | | 0 | | | | 5,768 | |
| | | | | | | | | | | | | | | | |
| Category and Subcategory | | Level 1 | | | Level 2 | | | Level 3 | | | Fair
Value at
12/31/2016 | |
Industrials | | $ | 19,338 | | | $ | 0 | | | $ | 0 | | | $ | 19,338 | |
Information Technology | | | 13,747 | | | | 0 | | | | 0 | | | | 13,747 | |
Materials | | | 7,089 | | | | 0 | | | | 0 | | | | 7,089 | |
Real Estate | | | 204 | | | | 0 | | | | 0 | | | | 204 | |
Telecommunication Services | | | 1,704 | | | | 0 | | | | 0 | | | | 1,704 | |
Utilities | | | 2,951 | | | | 0 | | | | 0 | | | | 2,951 | |
Real Estate Investment Trusts | |
United States | |
Financials | | | 2,441 | | | | 0 | | | | 0 | | | | 2,441 | |
Real Estate | | | 6,248 | | | | 0 | | | | 0 | | | | 6,248 | |
| | | | | | | | | | | | | | | | |
| | | | |
Total Investments | | $ | 101,919 | | | $ | 0 | | | $ | 0 | | | $ | 101,919 | |
| | | | | | | | | | | | | | | | |
There were no significant transfers between Levels 1, 2, or 3 during the period ended December 31, 2016.
| | | | | | |
| See Accompanying Notes | | SEMIANNUAL REPORT | | DECEMBER 31, 2016 | | 61 |
Notes to Financial Statements
1. ORGANIZATION
PIMCO Equity Series (the “Trust”) was established as a Delaware statutory trust on December 28, 2009. The Trust is registered under the Investment Company Act of 1940, as amended (the “Act”), as an open-end management investment company. Information presented in these financial statements pertains to the Institutional Class, Class P, Class A, and Class C shares of the funds (each a “Fund” and collectively the “Funds”) indicated on the cover of this report. Pacific Investment Management Company LLC (“PIMCO”) serves as the investment adviser (the “Adviser”) for the Funds. Research Affiliates, LLC (“Research Affiliates”) serves as the sub-adviser for the Funds. PIMCO and Research Affiliates have also engaged Parametric Portfolio Associates, LLC (“Parametric”) to implement all or a portion of each Fund’s investment strategies. The PIMCO RAE Fundamental Global Fund may invest substantially all of its assets in Institutional Class shares of the PIMCO RAE Fundamental US Fund, PIMCO RAE Fundamental International Fund (“International Fund”) and PIMCO RAE Fundamental Emerging Markets Fund (“Emerging Markets Fund”) (collectively, “Underlying Funds”), and equity securities that are eligible investments for the Underlying Funds. The PIMCO RAE Fundamental Global ex-US Fund may invest substantially all of its assets in Institutional Class shares of the International Fund and Emerging Markets Fund, equity securities of small companies economically tied to non-U.S. countries, and securities that are eligible investments for the International Fund and Emerging Markets Fund. The PIMCO RAE Fundamental Global Fund and PIMCO RAE Fundamental Global ex-US Fund may invest in other affiliated funds and unaffiliated funds, which may or may not be registered under the Investment Company Act of 1940 (together with the Underlying Funds, “Acquired Funds”).
2. SIGNIFICANT ACCOUNTING POLICIES
The following is a summary of significant accounting policies consistently followed by the Trust in the preparation of its financial statements in conformity with accounting principles generally accepted in the United States of America (“U.S. GAAP”). Each Fund is treated as an investment company under the reporting requirements of U.S. GAAP. The preparation of financial statements in accordance with U.S. GAAP requires management to make estimates and assumptions that affect the reported amounts of assets and liabilities and disclosure of contingent assets and liabilities at the date of the financial statements and the reported amounts of increases and decreases in net assets from operations during the reporting period. Actual results could differ from those estimates.
(a) Securities Transactions and Investment Income Securities transactions are recorded as of the trade date for financial reporting purposes. Realized gains (losses) from securities sold are recorded on the identified cost basis. Dividend income is recorded on the ex-dividend
date, except certain dividends from foreign securities where the ex-dividend date may have passed, which are recorded as soon as a Fund is informed of the ex-dividend date. Interest income, adjusted for the accretion of discounts and amortization of premiums, is recorded on the accrual basis from settlement date. Estimated tax liabilities on certain foreign securities are recorded on an accrual basis and are reflected as components of interest income or net change in unrealized appreciation (depreciation) on investments on the Statements of Operations, as appropriate. Tax liabilities realized as a result of such security sales are reflected as a component of net realized gain (loss) on investments on the Statements of Operations.
(b) Cash and Foreign Currency The functional and reporting currency for the Funds is the U.S. dollar. The market values of foreign securities, currency holdings and other assets and liabilities denominated in foreign currencies are translated into U.S. dollars based on the current exchange rates each business day. Purchases and sales of securities and income and expense items denominated in foreign currencies, if any, are translated into U.S. dollars at the exchange rate in effect on the transaction date. The Funds do not separately report the effects of changes in foreign exchange rates from changes in market prices on securities held. Such changes are included in net realized gain (loss) and net change in unrealized appreciation (depreciation) from investments on the Statements of Operations. The Funds may invest in foreign currency-denominated securities and may engage in foreign currency transactions either on a spot (cash) basis at the rate prevailing in the currency exchange market at the time or through a forward foreign currency contract. Realized foreign exchange gains (losses) arising from sales of spot foreign currencies, currency gains (losses) realized between the trade and settlement dates on securities transactions and the difference between the recorded amounts of dividends, interest, and foreign withholding taxes and the U.S. dollar equivalent of the amounts actually received or paid are included in net realized gain (loss) on foreign currency transactions on the Statements of Operations. Net unrealized foreign exchange gains (losses) arising from changes in foreign exchange rates on foreign denominated assets and liabilities other than investments in securities held at the end of the reporting period are included in net change in unrealized appreciation (depreciation) on foreign currency assets and liabilities on the Statements of Operations.
(c) Multiclass Operations Each class offered by the Trust has equal rights as to assets and voting privileges (except that shareholders of a class have exclusive voting rights regarding any matter relating solely to that class of shares). Income and non-class specific expenses are allocated daily to each class on the basis of the relative net assets. Realized and unrealized capital gains (losses) are allocated daily based on the relative net assets of each class of the respective Fund. Class specific expenses, where applicable, currently include supervisory and
December 31, 2016 (Unaudited)
administrative and distribution and servicing fees. Under certain circumstances, the per share net asset value (“NAV”) of a class of the respective Fund’s shares may be different from the per share NAV of another class of shares as a result of the different daily expense accruals applicable to each class of shares.
(d) Distributions to Shareholders The following table shows the anticipated frequency of distributions from net investment income, if any, for each Fund.
| | | | | | | | | | | | |
| | | | | | Distribution Frequency | |
| Fund Name | | | | | Declared | | | Distributed | |
PIMCO RAE Fundamental Emerging Markets Fund | | | | | | | Annually | | | | Annually | |
PIMCO RAE Fundamental Global Fund | | | | | | | Annually | | | | Annually | |
PIMCO RAE Fundamental Global ex-US Fund | | | | | | | Annually | | | | Annually | |
PIMCO RAE Fundamental International Fund | | | | | | | Annually | | | | Annually | |
PIMCO RAE Fundamental US Fund | | | | | | | Annually | | | | Annually | |
PIMCO RAE Fundamental US Small Fund | | | | | | | Annually | | | | Annually | |
Net realized capital gains earned by each Fund, if any, will be distributed no less frequently than once each year.
Income distributions and capital gain distributions are determined in accordance with income tax regulations which may differ from U.S. GAAP. Differences between tax regulations and U.S. GAAP may cause timing differences between income and capital gain recognition. Further, the character of investment income and capital gains may be different for certain transactions under the two methods of accounting. As a result, income distributions and capital gain distributions declared during a fiscal period may differ significantly from the net investment income (loss) and realized gains (losses) reported on the Fund’s annual financial statements presented under U.S. GAAP.
If a Fund estimates that a portion of one of its dividend distributions may be comprised of amounts from sources other than net investment income, the Fund will notify shareholders of record of the estimated composition of such distribution through a Section 19 Notice. To determine the sources of a Fund’s distributions during the reporting period, the Fund references its internal accounting records at the time the distribution is paid and generally bases its projections of the final tax character of those distributions on the tax characteristics of the distribution reflected in its internal accounting records at the time of such payment. If, based on such records, a particular distribution does not include capital gains or paid-in surplus or other capital sources, a Section 19 Notice generally would not be issued. It is important to note that differences exist between a Fund’s daily internal accounting records, the Fund’s financial statements presented in accordance with U.S. GAAP, and recordkeeping practices under income tax regulations. Examples of such differences may include, among others, the treatment of paydowns on mortgage-backed securities purchased at a discount and periodic payments under interest rate swap contracts.
Notwithstanding a Fund’s estimates and projections, it is possible that a Fund may not issue a Section 19 Notice in situations where the Fund’s financial statements prepared later and in accordance with U.S. GAAP or the final tax character of those distributions might later report that the sources of those distributions included capital gains and/or a return of capital. Additionally, given differences in tax and U.S. GAAP treatment of certain distributions, a Fund may not issue a Section 19 Notice in situations where the Fund’s financial statements prepared later and in accordance with U.S. GAAP might report that the sources of these distributions included capital gains and/or a return of capital. Please visit www.pimco.com for the most recent Section 19 Notice, if applicable, for additional information regarding the composition of distributions. Final determination of a distribution’s tax character will be reported on Form 1099 DIV sent to shareholders each January.
Distributions classified as a tax basis return of capital, if any, are reflected on the Statements of Changes in Net Assets and have been recorded to paid in capital. In addition, other amounts have been reclassified between undistributed (overdistributed) net investment income (loss), accumulated undistributed (overdistributed) net realized gain (loss) and/or paid in capital to more appropriately conform U.S. GAAP to tax characterizations of distributions.
(e) New Accounting Pronouncements In August 2014, the Financial Accounting Standards Board (“FASB”) issued an Accounting Standards Update (“ASU”), ASU 2014-15 requiring management to evaluate whether there are conditions or events, considered in the aggregate, that raise substantial doubt about the entity’s ability to continue as a going concern. The ASU is effective prospectively for annual periods ending after December 15, 2016, and interim periods thereafter. The Funds have adopted the ASU. The implementation of the ASU did not have an impact on the Funds’ financial statements.
In May 2015, the FASB issued ASU 2015-07 which removes the requirement to categorize within the fair value hierarchy all investments for which fair value is measured using the NAV per share practical expedient. The ASU also removes the requirement to make certain disclosures for all investments that are eligible to be measured at fair value using the NAV per share practical expedient. The ASU is effective for annual periods beginning after December 15, 2015 and interim periods within those annual periods. The ASU did not have an impact on the Funds’ financial statements.
In August 2016, the FASB issued ASU 2016-15 which amends ASC 230 to clarify guidance on the classification of certain cash receipts and cash payments in the statement of cash flows. The ASU is effective for annual periods beginning after December 15, 2017, and interim periods within those annual periods. At this time, management is evaluating the implications of these changes on the financial statements.
| | | | | | |
| | SEMIANNUAL REPORT | | DECEMBER 31, 2016 | | 63 |
Notes to Financial Statements (Cont.)
In October 2016, the U.S. Securities and Exchange Commission (“SEC”) adopted new rules and forms, and amendments to certain current rules and forms, to modernize reporting and disclosure of information by registered investment companies. The amendments to Regulation S-X will require standardized, enhanced disclosure about derivatives in investment company financial statements, and will also change the rules governing the form and content of such financial statements. The amendments to Regulation S-X take effect on August 1, 2017. At this time, management is assessing the anticipated impact of these regulatory developments.
In November 2016, the FASB issued ASU 2016-18 which amends ASC 230 to provide guidance on the classification and presentation of changes in restricted cash and restricted cash equivalents on the statement of cash flows. The ASU is effective for annual periods beginning after December 15, 2017, and interim periods within those annual periods. At this time, management is evaluating the implications of these changes on the financial statements.
3. INVESTMENT VALUATION AND FAIR VALUE MEASUREMENTS
(a) Investment Valuation Policies The price of a Fund’s shares is based on the Fund’s NAV. The NAV of a Fund, or each of its share classes, as applicable, is determined by dividing the total value of portfolio investments and other assets, less any liabilities attributable to that Fund or class, by the total number of shares outstanding of that Fund or class.
On each day that the New York Stock Exchange (“NYSE”) is open, Fund shares are ordinarily valued as of the close of regular trading (“NYSE Close”). Information that becomes known to the Funds or their agents after the time as of which NAV has been calculated on a particular day will not generally be used to retroactively adjust the price of a security or the NAV determined earlier that day. Each Fund reserves the right to change the time its respective NAV is calculated if the Fund closes earlier, or as permitted by the SEC.
For purposes of calculating NAV, portfolio securities and other assets for which market quotes are readily available are valued at market value. Market value is generally determined on the basis of official closing prices or the last reported sales prices, or if no sales are reported, based on quotes obtained from established market makers or prices (including evaluated prices) supplied by the Funds’ approved pricing services, quotation reporting systems and other third-party sources (together, “Pricing Services”). The Funds will normally use pricing data for domestic equity securities received shortly after the NYSE Close and do not normally take into account trading, clearances or settlements that take place after the NYSE Close. A foreign (non-U.S.) equity security traded on a foreign exchange or on more
than one exchange is typically valued using pricing information from the exchange considered by the Adviser to be the primary exchange. A foreign (non-U.S.) equity security will be valued as of the close of trading on the foreign exchange, or the NYSE Close, if the NYSE Close occurs before the end of trading on the foreign exchange. Domestic and foreign (non-U.S.) fixed income securities, non-exchange traded derivatives, and equity options are normally valued on the basis of quotes obtained from brokers and dealers or Pricing Services using data reflecting the earlier closing of the principal markets for those securities. Prices obtained from Pricing Services may be based on, among other things, information provided by market makers or estimates of market values obtained from yield data relating to investments or securities with similar characteristics. Certain fixed income securities purchased on a delayed-delivery basis are marked to market daily until settlement at the forward settlement date. Exchange-traded options, except equity options, futures and options on futures are valued at the settlement price determined by the relevant exchange. Swap agreements are valued on the basis of bid quotes obtained from brokers and dealers or market-based prices supplied by Pricing Services or other pricing sources. The Funds’ investments in open-end management investment companies, other than exchange-traded funds (“ETFs”), are valued at the NAVs of such investments.
If a foreign (non-U.S.) equity security’s value has materially changed after the close of the security’s primary exchange or principal market but before the NYSE Close, the security may be valued at fair value based on procedures established and approved by the Board of Trustees of the Trust (the “Board”). Foreign (non-U.S.) equity securities that do not trade when the NYSE is open are also valued at fair value. With respect to foreign (non-U.S.) equity securities, the Fund may determine the fair value of investments based on information provided by Pricing Services and other third-party vendors, which may recommend fair value or adjustments with reference to other securities, indices or assets. In considering whether fair valuation is required and in determining fair values, the Fund may, among other things, consider significant events (which may be considered to include changes in the value of U.S. securities or securities indices) that occur after the close of the relevant market and before the NYSE Close. A Fund may utilize modeling tools provided by third-party vendors to determine fair values of non-U.S. securities. Foreign exchanges may permit trading in foreign (non-U.S.) equity securities on days when the Trust is not open for business, which may result in a Fund’s portfolio investments being affected when shareholders are unable to buy or sell shares.
Senior secured floating rate loans for which an active secondary market exists to a reliable degree will be valued at the mean of the last available bid/ask prices in the market for such loans, as provided by a Pricing Service. Senior secured floating rate loans for which an active secondary market does not exist to a reliable degree will be valued at
December 31, 2016 (Unaudited)
fair value, which is intended to approximate market value. In valuing a senior secured floating rate loan at fair value, the factors considered may include, but are not limited to, the following: (a) the creditworthiness of the borrower and any intermediate participants, (b) the terms of the loan, (c) recent prices in the market for similar loans, if any, and (d) recent prices in the market for instruments of similar quality, rate, period until next interest rate reset and maturity.
Investments valued in currencies other than the U.S. dollar are converted to the U.S. dollar using exchange rates obtained from Pricing Services. As a result, the value of such investments and, in turn, the NAV of a Fund’s shares may be affected by changes in the value of currencies in relation to the U.S. dollar. The value of investments traded in markets outside the United States or denominated in currencies other than the U.S. dollar may be affected significantly on a day that the Trust is not open for business. As a result, to the extent that a Fund holds foreign (non-U.S.) investments, the value of those investments may change at times when shareholders are unable to buy or sell shares and the value of such investments will be reflected in the Fund’s next calculated NAV.
Investments for which market quotes or market based valuations are not readily available are valued at fair value as determined in good faith by the Board or persons acting at their direction. The Board has adopted methods for valuing securities and other assets in circumstances where market quotes are not readily available, and has delegated to the Adviser the responsibility for applying the fair valuation methods. In the event that market quotes or market based valuations are not readily available, and the security or asset cannot be valued pursuant to a Board approved valuation method, the value of the security or asset will be determined in good faith by the Valuation Oversight Committee of the Board (“Valuation Oversight Committee”), generally based on recommendations provided by the Adviser. The Adviser may consult with the Sub-Adviser or Parametric in providing such recommendations or otherwise with respect to valuation of the PIMCO Dividend and Income Fund’s portfolio securities or other assets. Market quotes are considered not readily available in circumstances where there is an absence of current or reliable market-based data (e.g., trade information, bid/ask information, indicative market quotations (“Broker Quotes”), Pricing Services’ prices), including where events occur after the close of the relevant market, but prior to the NYSE Close, that materially affect the values of a Fund’s securities or assets. In addition, market quotes are considered not readily available when, due to extraordinary circumstances, the exchanges or markets on which the securities trade do not open for trading for the entire day and no other market prices are available. The Board has delegated to the Adviser the responsibility for monitoring significant events that may materially affect the values of the Fund’s securities or assets and for
determining whether the value of the applicable securities or assets should be reevaluated in light of such significant events.
When a Fund uses fair valuation to determine the value of a portfolio security or other asset for purposes of calculating its NAV, such investments will not be priced on the basis of quotes from the primary market in which they are traded, but rather may be priced by another method that the Board or persons acting at their direction believe reflects fair value. Fair valuation may require subjective determinations about the value of a security. While the Trust’s policy is intended to result in a calculation of the Fund’s NAV that fairly reflects security values as of the time of pricing, the Trust cannot ensure that fair values determined by the Board or persons acting at their direction would accurately reflect the price that a Fund could obtain for a security if it were to dispose of that security as of the time of pricing (for instance, in a forced or distressed sale). The prices used by a Fund may differ from the value that would be realized if the securities were sold. The Funds’ use of fair valuation may also help to deter “stale price arbitrage” as discussed under the “Abusive Trading Practices” section in each Fund’s prospectus.
(b) Fair Value Hierarchy U.S. GAAP describes fair value as the price that a Fund would receive to sell an asset or pay to transfer a liability in an orderly transaction between market participants at the measurement date. It establishes a fair value hierarchy that prioritizes inputs to valuation methods and requires disclosure of the fair value hierarchy, separately for each major category of assets and liabilities, that segregates fair value measurements into levels (Level 1, 2, or 3). The inputs or methodology used for valuing securities are not necessarily an indication of the risks associated with investing in those securities. Levels 1, 2, and 3 of the fair value hierarchy are defined as follows:
| ∎ | | Level 1 — Quoted prices in active markets or exchanges for identical assets and liabilities. |
| ∎ | | Level 2 — Significant other observable inputs, which may include, but are not limited to, quoted prices for similar assets or liabilities in markets that are active, quoted prices for identical or similar assets or liabilities in markets that are not active, inputs other than quoted prices that are observable for the assets or liabilities (such as interest rates, yield curves, volatilities, prepayment speeds, loss severities, credit risks and default rates) or other market corroborated inputs. |
| ∎ | | Level 3 — Significant unobservable inputs based on the best information available in the circumstances, to the extent observable inputs are not available, which may include assumptions made by the Board or persons acting at their direction that are used in determining the fair value of investments. |
In accordance with the requirements of U.S. GAAP, the amounts of transfers between Levels 1 and 2 and transfers into and out of Level 3,
| | | | | | |
| | SEMIANNUAL REPORT | | DECEMBER 31, 2016 | | 65 |
Notes to Financial Statements (Cont.)
if material, are disclosed in the Notes to Schedule of Investments for each respective Fund.
For fair valuations using significant unobservable inputs, U.S. GAAP requires a reconciliation of the beginning to ending balances for reported fair values that presents changes attributable to realized gain (loss), unrealized appreciation (depreciation), purchases and sales, accrued discounts (premiums), and transfers into and out of the Level 3 category during the period. The end of period value is used for the transfers between Levels of a Fund’s assets and liabilities. Additionally, U.S. GAAP requires quantitative information regarding the significant unobservable inputs used in the determination of fair value of assets or liabilities categorized as Level 3 in the fair value hierarchy. In accordance with the requirements of U.S. GAAP, a fair value hierarchy, and if material, a Level 3 reconciliation and details of significant unobservable inputs, have been included in the Notes to Schedule of Investments for each respective Fund.
(c) Valuation Techniques and the Fair Value Hierarchy Level 1 and Level 2 trading assets and trading liabilities, at fair value The valuation methods (or “techniques”) and significant inputs used in determining the fair values of portfolio securities or other assets and liabilities categorized as Level 1 and Level 2 of the fair value hierarchy are as follows:
Common stocks, ETFs, exchange-traded notes and financial derivative instruments, such as futures contracts, rights and warrants, or options on futures that are traded on a national securities exchange, are stated at the last reported sale or settlement price on the day of valuation. To the extent these securities are actively traded and valuation adjustments are not applied, they are categorized as Level 1 of the fair value hierarchy.
Valuation adjustments may be applied to certain securities that are solely traded on a foreign exchange to account for the market movement between the close of the foreign market and the NYSE Close. These securities are valued using Pricing Services that consider the correlation of the trading patterns of the foreign security to the intraday trading in the U.S. markets for investments. Securities using these valuation adjustments are categorized as Level 2 of the fair value hierarchy. Preferred securities and other equities traded on inactive markets or valued by reference to similar instruments are also categorized as Level 2 of the fair value hierarchy.
Equity-linked securities are valued by referencing the last reported sale or settlement price of the linked referenced equity on the day of valuation. Foreign exchange adjustments are applied to the last reported price to convert the linked equity’s trading currency to the
contract’s settling currency. These investments are categorized as Level 2 of the fair value hierarchy.
Investments in registered open-end investment companies (other than ETFs) will be valued based upon the NAVs of such investments and are categorized as Level 1 of the fair value hierarchy. Investments in unregistered open-end investment companies will be calculated based upon the NAVs of such investments and are considered Level 1 provided that the NAVs are observable, calculated daily and are the value at which both purchases and sales will be conducted. Investments in privately held investment funds with significant restrictions on redemption where the inputs to the NAVs are observable will be valued based upon the NAVs of such investments and are categorized as Level 2 of the fair value hierarchy.
Level 3 trading assets and trading liabilities, at fair value When a fair valuation method is applied by the Adviser that uses significant unobservable inputs, investments will be priced by a method that the Board or persons acting at their direction believe reflects fair value and are categorized as Level 3 of the fair value hierarchy.
The validity of the fair value is reviewed by the Adviser on a periodic basis and may be amended in accordance with the Trust’s valuation procedures.
4. SECURITIES AND OTHER INVESTMENTS
(a) Investments in Affiliates
The PIMCO RAE Fundamental Global Fund may invest substantially all of its assets in Acquired Funds and equity securities that are eligible investments for the Underlying Funds. The PIMCO RAE Fundamental Global ex-US Fund may invest substantially all of its assets in Acquired Funds (except the PIMCO RAE Fundamental US Fund), equity securities of small companies economically tied to non-U.S. countries, and securities that are eligible investments for the International Fund and Emerging Markets Fund. The Underlying Funds are considered to be affiliated with the PIMCO RAE Fundamental Global Fund and PIMCO RAE Fundamental Global ex-US Fund.
Each Fund may invest in the PIMCO Short-Term Floating NAV Portfolio III (“Central Fund”) to the extent permitted by the Act and rules thereunder. The Central Fund is a registered investment company created for use solely by the series of the Trust and other series of registered investment companies advised by the Adviser, in connection with their cash management activities. The main investments of the Central Fund are money market and short maturity fixed income instruments. The Central Fund may incur expenses related to its investment activities, but does not pay Investment Advisory Fees or
December 31, 2016 (Unaudited)
Supervisory and Administrative Fees to the Adviser. The Central Fund is considered to be affiliated with the Funds. The table below shows the Funds’ transactions in and earnings from investments in the affiliated Fund for the period ended December 31, 2016 (amounts in thousands†):
| | | | | | | | | | | | | | | | | | | | | | | | | | | | | | | | | | | | |
| PIMCO RAE Fundamental Global Fund | |
| Underlying PIMCO Funds | | | | | Market Value
06/30/2016 | | | Purchases
at Cost | | | Proceeds
from Sales | | | Net
Realized
Gain (Loss) | | | Change in
Unrealized
Appreciation
(Depreciation) | | | Market Value
12/31/2016 | | | Dividend
Income(1) | | | Realized Net
Capital Gain
Distributions(1) | |
PIMCO RAE Fundamental Emerging Markets Fund | | | | | | $ | 30,974 | | | $ | 15,590 | | | $ | (583 | ) | | $ | (21 | ) | | $ | 3,430 | | | $ | 49,390 | | | $ | 1,345 | | | $ | 0 | |
PIMCO RAE Fundamental International Fund | | | | | | | 106,007 | | | | 61,538 | | | | (744 | ) | | | (69 | ) | | | 8,962 | | | | 175,694 | | | | 3,977 | | | | 0 | |
PIMCO RAE Fundamental U.S. Fund | | | | | | | 145,903 | | | | 46,525 | | | | (40,185 | ) | | | 745 | | | | 5,037 | | | | 158,025 | | | | 3,787 | | | | 4,600 | |
Totals | | | | | | $ | 282,884 | | | $ | 123,653 | | | $ | (41,512 | ) | | $ | 655 | | | $ | 17,429 | | | $ | 383,109 | | | $ | 9,109 | | | $ | 4,600 | |
| | | | | | | | | | | | | | | | | | | | | | | | | | | | | | | | | | | | |
| PIMCO RAE Fundamental Global ex-US Fund | |
| Underlying PIMCO Funds | | | | | Market Value
06/30/2016 | | | Purchases
at Cost | | | Proceeds
from Sales | | | Net
Realized
Gain (Loss) | | | Change in
Unrealized
Appreciation
(Depreciation) | | | Market Value
12/31/2016 | | | Dividend
Income(1) | | | Realized Net
Capital Gain
Distributions(1) | |
PIMCO RAE Fundamental Emerging Markets Fund | | | | | | $ | 14,274 | | | $ | 733 | | | $ | (1,699 | ) | | $ | (88 | ) | | $ | 1,609 | | | $ | 14,829 | | | $ | 400 | | | $ | 0 | |
PIMCO RAE Fundamental International Fund | | | | | | | 48,849 | | | | 2,689 | | | | (2,149 | ) | | | (304 | ) | | | 3,608 | | | | 52,693 | | | | 1,184 | | | | 0 | |
Totals | | | | | | $ | 63,123 | | | $ | 3,422 | | | $ | (3,848 | ) | | $ | (392 | ) | | $ | 5,217 | | | $ | 67,522 | | | $ | 1,584 | | | $ | 0 | |
| † | A zero balance may reflect actual amounts rounding to less than one thousand. |
| (1) | The tax characterization of distributions is determined in accordance with Federal income tax regulations. The actual tax characterization of distributions paid are determined at the end of the fiscal year. See Note 2 in the Notes to Financial Statements for more information. |
(b) Investments in Securities
Real Estate Investment Trusts (“REITs”) Certain Funds may invest in REITs, which are pooled investment vehicles that own, and typically operate, income-producing real estate. If a REIT meets certain requirements, including distributing to shareholders substantially all of its taxable income (other than net capital gains), then it is not taxed on the income distributed to shareholders. Distributions received from REITs may be characterized as income, capital gain or a return of capital. A return of capital is recorded by a Fund as a reduction to the cost basis of its investment in the REIT. REITs are subject to management fees and other expenses, and so the Funds that invest in REITs will bear their proportionate share of the costs of the REITs’ operations.
Restricted Securities Certain Funds may invest in securities that are subject to legal or contractual restrictions on resale. These securities may generally be sold privately, but are required to be registered or exempted from such registration before being sold to the public. Private placement securities are generally considered to be restricted except for those securities traded between qualified institutional investors under the provisions of Rule 144A of the Securities Act of 1933. Disposal of restricted securities may involve time-consuming negotiations and expenses, and prompt sale at an acceptable price may be difficult to achieve. Restricted securities held by the Funds at December 31, 2016 are disclosed in the Notes to Schedules of Investments.
Warrants Certain Funds may receive warrants. Warrants are securities that are usually issued together with a debt security or preferred stock
and that give the holder the right to buy a proportionate amount of common stock at a specified price. Warrants are freely transferable and are often traded on major exchanges. Warrants normally have a life that is measured in years and entitle the holder to buy common stock of a company at a price that is usually higher than the market price at the time the warrant is issued. Warrants may entail greater risks than certain other types of investments. Generally, warrants do not carry the right to receive dividends or exercise voting rights with respect to the underlying securities, and they do not represent any rights in the assets of the issuer. In addition, their value does not necessarily change with the value of the underlying securities, and they cease to have value if they are not exercised on or before their expiration date. If the market price of the underlying stock does not exceed the exercise price during the life of the warrant, the warrant will expire worthless. Warrants may increase the potential profit or loss to be realized from the investment as compared with investing the same amount in the underlying securities. Similarly, the percentage increase or decrease in the value of an equity security warrant may be greater than the percentage increase or decrease in the value of the underlying common stock. Warrants may relate to the purchase of equity or debt securities. Debt obligations with warrants attached to purchase equity securities have many characteristics of convertible securities and their prices may, to some degree, reflect the performance of the underlying stock. Debt obligations also may be issued with warrants attached to purchase additional debt securities at the same coupon rate. A decline in interest rates would permit a Fund to sell such warrants at a profit. If interest rates rise, these warrants would generally expire with no value.
| | | | | | |
| | SEMIANNUAL REPORT | | DECEMBER 31, 2016 | | 67 |
Notes to Financial Statements (Cont.)
5. FINANCIAL DERIVATIVE INSTRUMENTS
The following disclosures contain information on how and why the Funds use financial derivative instruments, and how financial derivative instruments affect the Funds’ financial position, results of operations and cash flows. The location and fair value amounts of these instruments on the Statements of Assets and Liabilities and the net realized gain (loss) and net change in unrealized appreciation (depreciation) on the Statements of Operations, each categorized by type of financial derivative contract and related risk exposure, are included in a table in the Notes to Schedules of Investments. The financial derivative instruments outstanding as of period end and the amounts of net realized gain (loss) and net change in unrealized appreciation (depreciation) on financial derivative instruments during the period, as disclosed in the Notes to Schedules of Investments, serve as indicators of the volume of financial derivative activity for the Funds.
(a) Forward Foreign Currency Contracts Certain Funds may enter into forward foreign currency contracts in connection with settling planned purchases or sales of securities, to hedge the currency exposure associated with some or all of a Fund’s securities or as a part of an investment strategy. A forward foreign currency contract is an agreement between two parties to buy and sell a currency at a set price on a future date. The market value of a forward foreign currency contract fluctuates with changes in foreign currency exchange rates. Forward foreign currency contracts are marked to market daily, and the change in value is recorded by a Fund as an unrealized gain (loss). Realized gains (losses) are equal to the difference between the value of the contract at the time it was opened and the value at the time it was closed and are recorded upon delivery or receipt of the currency. These contracts may involve market risk in excess of the unrealized gain (loss) reflected on the Statements of Assets and Liabilities. In addition, a Fund could be exposed to risk if the counterparties are unable to meet the terms of the contracts or if the value of the currency changes unfavorably to the U.S. dollar. To mitigate such risk, cash or securities may be exchanged as collateral pursuant to the terms of the underlying contracts.
6. PRINCIPAL RISKS
In the normal course of business, the Funds (or Acquired Funds) trade financial instruments and enter into financial transactions where risk of potential loss exists due to such things as changes in the market (market risk) or failure or inability of the other party to a transaction to perform (credit and counterparty risk). See below for a detailed description of select principal risks. For a more comprehensive list of potential risks the Funds may be subject to, please see the Important Information About the Funds.
Investments in Mutual Funds To the extent that certain Funds invest substantially all of their respective assets in Acquired Funds, the risks associated with investing in these Funds will be closely related to the risks associated with the securities and other investments held by the Acquired Funds. The ability of the Funds to achieve their respective investment objectives may depend upon the ability of the Acquired Funds to achieve their respective investment objectives. There can be no assurance that the investment objective of any Acquired Fund will be achieved. The NAV of each Fund will fluctuate in response to changes in the respective NAV of the Acquired Funds in which it invests. The extent to which the investment performance and risks associated with the Funds correlate to those of a particular Acquired Fund will depend upon the extent to which the assets of the Funds are allocated from time to time for investment in the Acquired Funds, which will vary. Investing in Acquired Funds involves certain additional expenses and tax results that would not be present when investing in a mutual fund that invests directly in individual stocks and bonds.
Certain Funds’ investment performance depends upon how each Fund’s assets are allocated and reallocated according to each Fund’s asset allocation targets and ranges. A principal risk of investing in each Fund is that the Funds’ investment adviser will make less than optimal or poor asset allocation decisions. The investment adviser attempts to identify investment allocations for the Acquired Funds that will provide consistent, quality performance for the Funds, but there is no guarantee that such allocation techniques will produce the desired results.
Market Risks A Fund’s (or Acquired Funds’) investments in financial derivative instruments and other financial instruments expose the Fund to various risks such as, but not limited to, interest rate, foreign (non-U.S.) currency, equity and commodity risks.
The market values of equities, such as common stocks and preferred securities or equity related investments such as futures and options, have historically risen and fallen in periodic cycles and may decline due to general market conditions which are not specifically related to a particular company, such as real or perceived adverse economic conditions, changes in the general outlook for corporate earnings, changes in interest or currency rates or adverse investor sentiment generally. They may also decline due to factors which affect a particular industry or industries, such as labor shortages or increased production costs and competitive conditions within an industry. Different types of equity securities may react differently to these developments. Equity securities and equity related investments generally have greater market price volatility than fixed income securities.
Issuers that have paid regular dividends or distributions to shareholders may not continue to do so in the future. An issuer may reduce or
December 31, 2016 (Unaudited)
eliminate future dividends or distributions at any time and for any reason. Moreover, a Fund may use a dividend capture strategy (i.e., purchasing an equity security shortly before the issuer pays a dividend and selling it shortly thereafter), which may expose the Fund to higher portfolio turnover, increased trading costs and the potential for capital loss or gain, particularly in the event of significant short-term price movements of stocks subject to dividend capture trading. Also, securities purchased to capture a dividend often decline in value at the time of sale (i.e., shortly following the dividend) and the resulting realized loss to the Fund may exceed the amount of the dividend received, thereby negatively impacting the Fund’s net asset value.
Interest rate risk is the risk that fixed income securities and other instruments held by a Fund (or Acquired Funds) will decline in value because of an increase in interest rates. As nominal interest rates rise, the value of certain fixed income securities held by a Fund (or Acquired Funds) is likely to decrease. A nominal interest rate can be described as the sum of a real interest rate and an expected inflation rate. Interest rate changes can be sudden and unpredictable, and a Fund (or Acquired Funds) may lose money if these changes are not anticipated by the Fund’s (or Acquired Funds’) management. A Fund (or Acquired Funds) may not be able to hedge against changes in interest rates or may choose not to do so for cost or other reasons. In addition, any hedges may not work as intended.
Duration is a measure used to determine the sensitivity of a security’s price to changes in interest rates that incorporates a security’s yield, coupon, final maturity and call features, among other characteristics. Convexity is an additional measure of interest rate sensitivity that measures the rate of change of duration in response to changes in interest rates. Fixed income securities with longer durations tend to be more sensitive to changes in interest rates, usually making them more volatile than securities with shorter durations. A wide variety of factors can cause interest rates to rise (e.g., central bank monetary policies, inflation rates, general economic conditions, etc.). At present, the U.S. and many parts of the world, including certain European countries, are at or near historically low interest rates. The Funds (or Acquired Funds) may be subject to heightened interest rate risk because the Fed has ended its quantitative easing program and has begun, and may continue, to raise interest rates. To the extent that the Fed continues to raise interest rates, there is a risk that rates across the financial system may rise. Further, while bond markets have steadily grown over the past three decades, dealer “market making” ability has not kept pace and in some cases has decreased. Given the importance of intermediary “market making” in creating a robust and active market, fixed income securities are currently facing increased volatility and liquidity risks. All of these factors, collectively and/or individually, could cause a Fund (or Acquired Funds) to lose value. If a Fund (or Acquired Funds) lost
enough value, the Fund (or Acquired Funds) could face increased shareholder redemptions, which could force the Fund (or Acquired Funds) to liquidate investments at disadvantageous times or prices, thereby adversely affecting the Fund (or Acquired Funds). Also, the Fund (or Acquired Funds) may be adversely affected when a large shareholder purchases or redeems large amounts of shares, which can occur at any time and may impact the Fund (or Acquired Funds) in the same manner as a high volume of redemption requests. Large shareholder transactions may impact the Fund’s (or Acquired Funds’) liquidity and net asset value. Such transactions may also increase the Fund’s (or Acquired Funds’) transaction costs or otherwise cause the Fund (or Acquired Funds) to perform differently than intended. Moreover, the Fund (or Acquired Funds) is subject to the risk that other shareholders may make investment decisions based on the choices of a large shareholder.
To the extent that a Fund (or Acquired Funds) may invest in securities and instruments that are economically tied to Russia, the Fund (or Acquired Funds) is subject to various risks such as, but not limited to political, economic, legal, market and currency risks. The risks include uncertain political and economic policies, short-term market volatility, poor accounting standards, corruption and crime, an inadequate regulatory system, and unpredictable taxation. Investments in Russia are particularly subject to the risk that further economic sanctions may be imposed by the United States and/or other countries. Such sanctions — which may impact companies in many sectors, including energy, financial services and defense, among others — may negatively impact a Fund’s (or Acquired Funds’) performance and/or ability to achieve its investment objective. The Russian securities market, as compared to U.S. markets, has significant price volatility, less liquidity, a smaller market capitalization and a smaller number of traded securities. Adverse currency exchange rates are a risk and there may be a lack of available currency hedging instruments. Investments in Russia may be subject to the risk of nationalization or expropriation of assets. Oil, natural gas, metals, and timber account for a significant portion of Russia’s exports, leaving the country vulnerable to swings in world prices.
If a Fund (or Acquired Funds) invests directly in foreign (non-U.S.) currencies or in securities that trade in, and receive revenues in, foreign (non-U.S.) currencies, or in financial derivative instruments that provide exposure to foreign (non-U.S.) currencies, it will be subject to the risk that those currencies will decline in value relative to the base currency of the Fund (or Acquired Funds), or, in the case of hedging positions, that the Fund’s (or Acquired Funds’) base currency will decline in value relative to the currency being hedged. Currency rates in foreign countries may fluctuate significantly over short periods of time for a number of reasons, including changes in interest rates, intervention (or
| | | | | | |
| | SEMIANNUAL REPORT | | DECEMBER 31, 2016 | | 69 |
Notes to Financial Statements (Cont.)
the failure to intervene) by U.S. or foreign governments, central banks or supranational entities such as the International Monetary Fund, or by the imposition of currency controls or other political developments in the United States or abroad. As a result, a Fund’s (or Acquired Funds’) investments in foreign currency-denominated securities may reduce the Fund’s (or Acquired Funds’) returns.
Credit and Counterparty Risks A Fund (or Acquired Funds) will be exposed to credit risk to parties with whom it trades and will also bear the risk of settlement default. A Fund (or Acquired Funds) minimizes concentrations of credit risk by undertaking transactions with a large number of customers and counterparties on recognized and reputable exchanges, where applicable. Over the counter (“OTC”) derivative transactions are subject to the risk that a counterparty to the transaction will not fulfill its contractual obligations to the other party, as many of the protections afforded to centrally cleared derivative transactions might not be available for OTC derivative transactions. For derivatives traded on an exchange or through a central counterparty, credit risk resides with the Fund’s (or Acquired Funds’) clearing broker, or the clearinghouse itself, rather than with a counterparty in an OTC derivative transaction. A Fund (or Acquired Funds) could lose money if the issuer or guarantor of a fixed income security, or the counterparty to a financial derivative instruments contract, repurchase agreement or a loan of portfolio securities, is unable or unwilling to make timely principal and/or interest payments, or to otherwise honor its obligations. Securities and financial derivative instruments are subject to varying degrees of credit risk, which may be reflected in credit ratings.
Similar to credit risk, a Fund (or Acquired Funds) may be exposed to counterparty risk, or the risk that an institution or other entity with which the Fund (or Acquired Funds) has unsettled or open transactions will default. PIMCO, as the Adviser, minimizes counterparty risks to the Funds (or Acquired Funds) through a number of ways. Prior to entering into transactions with a new counterparty, the PIMCO Counterparty Risk Committee conducts an extensive credit review of such counterparty and must approve the use of such counterparty. Furthermore, pursuant to the terms of the underlying contract, to the extent that unpaid amounts owed to a Fund (or Acquired Funds) exceed a predetermined threshold, such counterparty shall advance collateral to the Fund (or Acquired Funds) in the form of cash or securities equal in value to the unpaid amount owed to the Fund (or Acquired Funds). A Fund (or Acquired Funds) may invest such collateral in securities or other instruments and will typically pay interest to the counterparty on the collateral received. If the unpaid amount owed to a Fund (or Acquired Funds) subsequently decreases, the Fund (or Acquired Funds) would be required to return to the counterparty all or a portion of the collateral previously advanced. PIMCO’s attempts to minimize counterparty risk may, however, be unsuccessful.
All transactions in listed securities are settled/paid for upon delivery using approved counterparties. The risk of default is considered minimal, as delivery of securities sold is only made once a Fund (or Acquired Funds) has received payment. Payment is made on a purchase once the securities have been delivered by the counterparty. The trade will fail if either party fails to meet its obligation.
Model Risk In making investment allocation decisions, Research Affiliates LLC (the “Sub-Adviser”) may utilize quantitative models that may be proprietary or developed by third-parties. These models are used by the Sub-Adviser to help determine a Fund’s investment allocation decisions. Investment models used in making investment allocation decisions may not adequately take into account certain factors and may result in a decline in the value of your investment. Models rely on accurate financial and market data inputs. If inaccurate data is entered into a model, the resulting information will be incorrect. In addition, the models used may be predictive in nature and such models may result in an incorrect assessment of future events. The models evaluate securities or securities markets based on certain assumptions concerning the interplay of market factors. The markets or the prices of individual securities may be affected by factors not foreseen in developing the models.
Master Netting Arrangements A Fund may be subject to various netting arrangements (“Master Agreements”) with select counterparties. Master Agreements govern the terms of certain transactions, and reduce the counterparty risk associated with relevant transactions by specifying credit protection mechanisms and providing standardization that improves legal certainty. Each type of Master Agreement governs certain types of transactions. Different types of transactions may be traded out of different legal entities or affiliates of a particular organization, resulting in the need for multiple agreements with a single counterparty. As the Master Agreements are specific to unique operations of different asset types, they allow a Fund to close out and net its total exposure to a counterparty in the event of a default with respect to all the transactions governed under a single Master Agreement with a counterparty. For financial reporting purposes the Statements of Assets and Liabilities generally present derivative assets and liabilities on a gross basis, which reflects the full risks and exposures prior to netting.
Master Agreements can also help limit counterparty risk by specifying collateral posting arrangements at pre-arranged exposure levels. Under most Master Agreements, collateral is routinely transferred if the total net exposure to certain transactions (net of existing collateral already in place) governed under the relevant Master Agreement with a counterparty in a given account exceeds a specified threshold, which typically ranges from zero to $250,000 depending on the counterparty and the type of Master Agreement. United States Treasury Bills and
December 31, 2016 (Unaudited)
U.S. dollar cash are generally the preferred forms of collateral, although other forms of AAA rated paper or sovereign securities may be used depending on the terms outlined in the applicable Master Agreement. Securities and cash pledged as collateral are reflected as assets on the Statements of Assets and Liabilities as either a component of Investments at value (securities) or Deposits with counterparty. Cash collateral received is not typically held in a segregated account and as such is reflected as a liability on the Statements of Assets and Liabilities as Deposits from counterparty. The market value of any securities received as collateral is not reflected as a component of NAV. A Fund’s overall exposure to counterparty risk can change substantially within a short period, as it is affected by each transaction subject to the relevant Master Agreement.
Master Repurchase Agreements and Global Master Repurchase Agreements (individually and collectively “Master Repo Agreements”) govern repurchase, reverse repurchase, and sale-buyback transactions between a Fund and select counterparties. Master Repo Agreements maintain provisions for, among other things, initiation, income payments, events of default, and maintenance of collateral. The market value of transactions under the Master Repo Agreement, collateral pledged or received, and the net exposure by counterparty as of period end are disclosed in the Notes to Schedules of Investments.
Master Securities Forward Transaction Agreements (“Master Forward Agreements”) govern certain forward settling transactions, such as TBA securities, delayed-delivery or sale-buyback transactions by and between a Fund and select counterparties. The Master Forward Agreements maintain provisions for, among other things, transaction initiation and confirmation, payment and transfer, events of default, termination, and maintenance of collateral. The market value of forward settling transactions, collateral pledged or received, and the net exposure by counterparty as of period end is disclosed in the Notes to Schedules of Investments.
Customer Account Agreements and related addenda govern cleared derivatives transactions such as futures, options on futures, and cleared OTC derivatives. Such transactions require posting of initial margin as determined by each relevant clearing agency which is segregated in an account at a futures commission merchant (“FCM”) registered with the Commodity Futures Trading Commission (“CFTC”). In the United States, counterparty risk may be reduced as creditors of an FCM cannot have a claim to Fund assets in the segregated account. Portability of exposure reduces risk to the Funds. Variation margin, or changes in market value, are exchanged daily, but may not be netted between futures and cleared OTC derivatives unless the parties have agreed to a separate arrangement in respect of portfolio margining. The market value or accumulated unrealized appreciation (depreciation), initial
margin posted, and any unsettled variation margin as of period end is disclosed in the Notes to Schedules of Investments.
International Swaps and Derivatives Association, Inc. Master Agreements and Credit Support Annexes (“ISDA Master Agreements”) govern bilateral OTC derivative transactions entered into by a Fund with select counterparties. ISDA Master Agreements maintain provisions for general obligations, representations, agreements, collateral posting and events of default or termination. Events of termination include conditions that may entitle counterparties to elect to terminate early and cause settlement of all outstanding transactions under the applicable ISDA Master Agreement. Any election to terminate early could be material to the financial statements. In limited circumstances, the ISDA Master Agreement may contain additional provisions that add counterparty protection beyond coverage of existing daily exposure if the counterparty has a decline in credit quality below a predefined level. These amounts, if any, may be segregated with a third-party custodian. The market value of OTC financial derivative instruments, collateral received or pledged, and net exposure by counterparty as of period end are disclosed in the Notes to Schedules of Investments.
7. FEES AND EXPENSES
(a) Investment Advisory Fee PIMCO is a majority-owned subsidiary of Allianz Asset Management of America L.P. (“Allianz Asset Management”) and serves as the Adviser to the Trust, pursuant to an investment advisory contract. The Adviser receives a monthly fee from each Fund at an annual rate based on average daily net assets (the “Investment Advisory Fee”). The Investment Advisory Fee for all classes is charged at an annual rate as noted in the table in note (b) below.
(b) Supervisory and Administrative Fee PIMCO serves as administrator (the “Administrator”) and provides supervisory and administrative services to the Trust for which it receives a monthly supervisory and administrative fee based on each share class’s average daily net assets (the “Supervisory and Administrative Fee”). As the Administrator, PIMCO bears the costs of various third-party services, including audit, custodial, portfolio accounting, legal, transfer agency and printing costs.
| | | | | | |
| | SEMIANNUAL REPORT | | DECEMBER 31, 2016 | | 71 |
Notes to Financial Statements (Cont.)
Investment Advisory Fees and Supervisory and Administrative Fees for all classes, as applicable, are charged at an annual rate as noted in the following table (calculated as a percentage of each Fund’s average daily net assets attributable to each class):
| | | | | | | | | | | | | | | | | | | | | | | | | | | | | | | | | | | | |
| | | | | | Investment Advisory Fee | | | | | | Supervisory and Administrative Fee | |
| Fund Name | | | | | All Classes | | | | | | Institutional
Class | | | Class P | | | Administrative
Class | | | Class A | | | Class C | | | Class R | |
PIMCO RAE Fundamental Emerging Markets Fund | | | | | | | 0.50% | | | | | | | | 0.45% | | | | 0.55% | | | | N/A | | | | 0.55% | | | | 0.55% | | | | N/A | |
PIMCO RAE Fundamental Global Fund | | | | | | | 0.40% | | | | | | | | 0.30% | | | | 0.40% | | | | N/A | | | | 0.40% | | | | 0.40% | | | | N/A | |
PIMCO RAE Fundamental Global ex-US Fund | | | | | | | 0.40% | | | | | | | | 0.35% | | | | 0.45% | | | | N/A | | | | 0.45% | | | | 0.45% | | | | N/A | |
PIMCO RAE Fundamental International Fund | | | | | | | 0.30% | | | | | | | | 0.30% | | | | 0.40% | | | | N/A | | | | 0.40% | | | | 0.40% | | | | N/A | |
PIMCO RAE Fundamental US Fund | | | | | | | 0.25% | | | | | | | | 0.25% | | | | 0.35% | | | | N/A | | | | 0.40% | | | | 0.40% | | | | N/A | |
PIMCO RAE Fundamental US Small Fund | | | | | | | 0.35% | | | | | | | | 0.25% | | | | 0.35% | | | | N/A | | | | 0.40% | | | | 0.40% | | | | N/A | |
(c) Distribution and Servicing Fees PIMCO Investments LLC (“PI”), a wholly-owned subsidiary of PIMCO, serves as the distributor (“Distributor”) of the Trust’s shares.
The Trust has adopted separate Distribution and Servicing Plans with respect to the Class A, Class C and Class R shares of the Trust pursuant to Rule 12b-1 under the Act. In connection with the distribution of Class C and Class R shares of the Trust, the Distributor receives distribution fees from the Trust of up to 0.75% for Class C shares and 0.25% for Class R shares, and in connection with personal services rendered to Class A, Class C and Class R shareholders and the maintenance of such shareholder accounts, the Distributor receives servicing fees from the Trust of up to 0.25% for each of Class A, Class C and Class R shares (percentages reflect annual rates of the average daily net assets attributable to the applicable class).
The Trust has adopted a Distribution and Servicing Plan with respect to the Class D shares of each Fund pursuant to Rule 12b-1 under the Act (the “Class D Plan”). Under the terms of the Class D Plan, a Fund is permitted to compensate the Distributor out of the assets attributable to the Class D shares of the Fund, in an amount up to 0.25% on an annual basis of the average daily net assets of the Fund’s Class D shares for providing, or procuring through financial intermediaries, distribution, shareholder services, and/or maintenance of shareholder accounts with respect to Class D shareholders of the Fund, some of which may be deemed to be primarily intended to result in the sale of Class D shares.
The Trust has adopted a Distribution and Servicing Plan with respect to the Administrative Class shares of each Fund pursuant to Rule 12b-1 under the Act (the “Administrative Class Plan”). Under the terms of the Administrative Class Plan, a Fund may compensate the Distributor for providing, or procuring through financial intermediaries, distribution, administrative, recordkeeping, shareholder and/or related services with respect to Administrative Class shares. The Administrative Class Plan permits a Fund to make total payments at an annual rate of up to 0.25% of the average daily net assets attributable to the Administrative Class shares.
The Trust paid distribution and servicing fees at effective rates as noted in the following table (calculated as a percentage of each Fund’s average daily net assets attributable to each class):
| | | | | | | | | | | | |
| | | | | | Distribution Fee | | | Servicing Fee | |
Administrative Class | | | | | | | — | | | | 0.25% | |
Class D | | | | | | | — | | | | 0.25% | |
Class A | | | | | | | — | | | | 0.25% | |
Class C | | | | | | | 0.75% | | | | 0.25% | |
Class R | | | | | | | 0.25% | | | | 0.25% | |
The Distributor also received the proceeds of the initial sales charges paid by the shareholders upon the purchase of Class A shares and the contingent deferred sales charges paid by the shareholders upon certain redemptions of Class A and Class C shares. For the period ended December 31, 2016, the Distributor retained $44,078 representing commissions (sales charges) and contingent deferred sales charges from the Trust.
(d) Fund Expenses PIMCO provides or procures supervisory and administrative services for shareholders and also bears the costs of various third-party services required by the Funds, including audit, custodial, portfolio accounting, legal, transfer agency and printing costs. The Trust is responsible for the following expenses: (i) taxes and governmental fees; (ii) brokerage fees and commissions and other portfolio transaction expenses; (iii) the costs of borrowing money, including interest expense; (iv) fees and expenses of the Trustees who are not “interested persons” of PIMCO or the Trust, and any counsel retained exclusively for their benefit; (v) extraordinary expense, including costs of litigation and indemnification expenses; (vi) organizational expenses; and (vii) any expenses allocated or allocable to a specific class of shares, which include service fees payable with respect to the Administrative Class Shares, and may include certain other expenses as permitted by the Trust’s Multi-Class Plan adopted pursuant to Rule 18f-3 under the Act and subject to review and approval by the Trustees. The ratio of expenses to average net assets per share class, as disclosed on the Financial Highlights, may differ from the annual funds operating expenses per share class.
December 31, 2016 (Unaudited)
Each Trustee, other than those affiliated with PIMCO or its affiliates, receives an annual retainer of $62,000, plus $6,250 for each Board meeting attended in person, $375 ($750 in the case of the audit committee chair with respect to audit committee meetings) for each committee meeting attended and $750 for each Board meeting attended telephonically, plus reimbursement of related expenses. In addition, the audit committee chair receives an additional annual retainer of $9,000, the valuation oversight committee lead receives an additional annual retainer of $2,000 (to the extent there are co-leads of the valuation oversight committee, the annual retainer will be split evenly between the co-leads, so that each co-lead individually receives an additional retainer of $1,000) and the governance committee chair receives an additional annual retainer of $750.
These expenses are allocated on a pro rata basis to each Fund of the Trust according to its respective net assets. The Trust pays no compensation directly to any Trustee or any other officer who is affiliated with the Administrator, all of whom receive remuneration for their services to the Trust from the Administrator or its affiliates.
(e) Expense Limitation Pursuant to the Expense Limitation Agreement, PIMCO has agreed to waive a portion of the Funds’ Supervisory and Administrative Fee, or reimburse the Funds, to the extent that the payment of each Fund’s organizational expenses and pro rata share of
Trustee Fees exceed 0.0049%, the “Expense Limit” (calculated as a percentage of each Fund’s average daily net assets attributable to each class). The Expense Limitation Agreement will automatically renew for one-year terms unless PIMCO provides written notice to the Trust at least 30 days prior to the end of the then current term.
Pursuant to the Fee Wavier Agreement, PIMCO contractually agreed to waive a portion of the Advisory Fee as set forth in the following table (calculated as a percentage of each Fund’s average daily net assets). The Fee Waiver Agreement will automatically renew for one-year terms unless PIMCO provides written notice to the Trust at least 30 days prior to the end of the then current term. PIMCO may be reimbursed for these waived amounts in future periods, not to exceed thirty-six months after the waiver. The waiver is reflected in the Statements of Operations as a component of Waiver and/or Reimbursement by PIMCO.
| | | | | | | | | | | | |
| Fund Name | | | | | Fee Waiver | | | Expiration
Date | |
PIMCO RAE Fundamental Emerging Markets Fund | | | | | | | 0.20% | | | | 10/31/2017 | |
PIMCO RAE Fundamental Global Fund | | | | | | | 0.20% | | | | 10/31/2017 | |
PIMCO RAE Fundamental Global ex-US Fund | | | | | | | 0.20% | | | | 10/31/2017 | |
PIMCO RAE Fundamental International Fund | | | | | | | 0.10% | | | | 10/31/2017 | |
PIMCO RAE Fundamental US Fund | | | | | | | 0.10% | | | | 10/31/2017 | |
PIMCO RAE Fundamental US Small Fund | | | | | | | 0.10% | | | | 10/31/2017 | |
Amounts waived (under the Expense Limitation Agreement and Fee Waiver Agreement) may be reimbursed to PIMCO, provided that (1) the Fund’s annualized organizational expenses and pro rata share of Trustee Fees plus the amount reimbursed does not exceed the Expense Limit; (2) such amount paid to PIMCO will not exceed the total Reimbursement Amount, which is the portion of the Supervisory and Administrative Fee or Advisory Fee that was waived, reduced or reimbursed by PIMCO; and (3) such amount will not include any amounts previously reimbursed to PIMCO. The recoverable amounts to PIMCO at December 31, 2016, were as follows (amounts in thousands†):
| | | | | | | | | | | | | | | | | | | | |
| | | | | | Expiring within | |
| Fund Name | | | | | 12 months | | | 13-24 months | | | 25-36 months | | | Total | |
PIMCO RAE Fundamental Emerging Markets Fund | | | | | | $ | 0 | | | $ | 215 | | | $ | 2,343 | | | $ | 2,558 | |
PIMCO RAE Fundamental Global Fund | | | | | | | 0 | | | | 115 | | | | 611 | | | | 726 | |
PIMCO RAE Fundamental Global ex-US Fund | | | | | | | 0 | | | | 134 | | | | 134 | | | | 268 | |
PIMCO RAE Fundamental International Fund | | | | | | | 0 | | | | 140 | | | | 278 | | | | 418 | |
PIMCO RAE Fundamental US Fund | | | | | | | 0 | | | | 299 | | | | 586 | | | | 885 | |
PIMCO RAE Fundamental US Small Fund | | | | | | | 0 | | | | 104 | | | | 100 | | | | 204 | |
| † | A zero balance may reflect actual amounts rounding to less than one thousand. |
(f) Acquired Fund Fees and Expenses The Acquired Fund expenses for the Funds are based upon an allocation of a Fund’s assets among the Acquired Funds and upon the total annual operating expenses of the Institutional Class shares of the Underlying PIMCO Funds. Acquired Fund expenses will vary with changes in the expenses of the Acquired Funds, as well as the allocation of the Funds’ assets.
PIMCO has contractually agreed, through October 31, 2017, to waive, first, the Investment Advisory Fee and, second, the Supervisory and Administrative Fees it receives from the PIMCO RAE Fundamental Global Fund in an amount equal to the expenses attributable to the Investment
Advisory Fees and the Supervisory and Administrative Fees of the PIMCO RAE Fundamental US Fund, PIMCO RAE Fundamental International Fund and PIMCO RAE Fundamental Emerging Markets Fund indirectly incurred by the PIMCO RAE Fundamental Global Fund in connection with its investments in such Funds, to the extent the PIMCO RAE Fundamental Global Fund’s Investment Advisory Fee and Supervisory and Administrative Fees are greater than or equal to the Investment Advisory Fee and Supervisory and Administrative Fees of such Funds. This waiver renews annually for a full year unless terminated by PIMCO upon at least 30 days’ notice prior to the end of the contract term.
| | | | | | |
| | SEMIANNUAL REPORT | | DECEMBER 31, 2016 | | 73 |
Notes to Financial Statements (Cont.)
PIMCO has contractually agreed, through October 31, 2017, to waive, first, the Investment Advisory Fee and, second, the Supervisory and Administrative Fees it receives from the PIMCO RAE Fundamental Global ex-US Fund in an amount equal to the expenses attributable to the Investment Advisory Fees and the Supervisory and Administrative Fees of the PIMCO RAE Fundamental International Fund and PIMCO RAE Fundamental Emerging Markets Fund indirectly incurred by the PIMCO RAE Fundamental Global ex-US Fund in connection with its investments in such Funds, to the extent the PIMCO RAE Fundamental Global ex-US Fund’s Investment Advisory Fee and Supervisory and Administrative Fees are greater than or equal to the Investment Advisory Fee and Supervisory and Administrative Fees of such Funds. This waiver renews annually for a full year unless terminated by PIMCO upon at least 30 days’ notice prior to the end of the contract term.
The waivers are reflected on the Statements of Operations as a component of Waiver and/or Reimbursement by PIMCO. During the period ended December 31, 2016, the Funds below waived the following fees (amounts in thousands):
| | | | | | | | |
| Fund Name | | | | | Waived
Fees | |
PIMCO RAE Fundamental Global Fund | | | | | | $ | 874 | |
PIMCO RAE Fundamental Global ex-US Fund | | | | | | | 183 | |
8. RELATED PARTY TRANSACTIONS
The Adviser, Administrator, and Distributor are related parties. Fees payable to these parties are disclosed in Note 7, Fees and Expenses, and the accrued related party fee amounts are disclosed on the Statements of Assets and Liabilities.
9. GUARANTEES AND INDEMNIFICATIONS
Under the Trust’s organizational documents, each Trustee or officer of the Trust is indemnified and each employee or other agent of the Trust (including the Trust’s investment manager) may be indemnified, to the extent permitted by the Act, against certain liabilities that may arise out of performance of their duties to the Funds. Additionally, in the normal course of business, the Funds enter into contracts that contain a variety of indemnification clauses. The Funds’ maximum exposure under these arrangements is unknown as this would involve future claims that may be made against the Funds that have not yet occurred. However, the Funds have not had prior claims or losses pursuant to these contracts.
10. PURCHASES AND SALES OF SECURITIES
The length of time a Fund has held a particular security is not generally a consideration in investment decisions. A change in the securities held by a Fund is known as “portfolio turnover.” Each Fund may engage in frequent and active trading of portfolio securities to achieve its investment objective, particularly during periods of volatile market movements. High portfolio turnover may involve correspondingly greater transaction costs to a Fund, including brokerage commissions or dealer mark-ups and other transaction costs on the sale of securities and reinvestments in other securities. Such sales may also result in realization of taxable capital gains, including short-term capital gains (which are generally taxed at ordinary income tax rates). The transaction costs and tax effects associated with portfolio turnover may adversely affect a Fund’s performance. The portfolio turnover rates are reported in the Financial Highlights.
Purchases and sales of securities (excluding short-term investments) for the period ended December 31, 2016, were as follows (amounts in thousands†):
| | | | | | | | | | | | | | | | | | | | |
| | | | | | U.S. Government/Agency | | | All Other | |
| Fund Name | | | | | Purchases | | | Sales | | | Purchases | | | Sales | |
PIMCO RAE Fundamental Emerging Markets Fund | | | | | | $ | 0 | | | $ | 0 | | | $ | 280,986 | | | $ | 338,561 | |
PIMCO RAE Fundamental Global Fund | | | | | | | 0 | | | | 0 | | | | 123,653 | | | | 41,512 | |
PIMCO RAE Fundamental Global ex-US Fund | | | | | | | 0 | | | | 0 | | | | 3,422 | | | | 3,848 | |
PIMCO RAE Fundamental International Fund | | | | | | | 0 | | | | 0 | | | | 122,048 | | | | 24,060 | |
PIMCO RAE Fundamental US Fund | | | | | | | 0 | | | | 0 | | | | 108,698 | | | | 91,724 | |
PIMCO RAE Fundamental US Small Fund | | | | | | | 0 | | | | 0 | | | | 24,424 | | | | 23,487 | |
| | | | | | | | | | | | | | | | | | | | |
| † | A zero balance may reflect actual amounts rounding to less than one thousand. |
December 31, 2016 (Unaudited)
11. SHARES OF BENEFICIAL INTEREST
The Funds may issue an unlimited number of shares of beneficial interest with a $0.001 par value. Changes in shares of beneficial interest were as follows (shares and amounts in thousands†):
| | | | | | | | | | | | | | | | | | | | | | | | | | | | | | | | | | | | | | | | | | | | | | | | | | |
| | | | | PIMCO
RAE Fundamental Emerging Markets Fund | | | PIMCO
RAE Fundamental Global Fund | | | PIMCO
RAE Fundamental Global ex-US Fund | |
| | | | | Six Months Ended
12/31/2016 | | | Year Ended
06/30/2016 | | | Six Months Ended
12/31/2016 | | | Year Ended
06/30/2016 | | | Six Months Ended
12/31/2016 | | | Year Ended
06/30/2016 | |
| | | | | Shares | | | Amount | | | Shares | | | Amount | | | Shares | | | Amount | | | Shares | | | Amount | | | Shares | | | Amount | | | Shares | | | Amount | |
Receipts for shares sold | | | | | | | | | | | | | | | | | | | | | | | | | | | | | | | | | | | | | | | | | | | | | | | | | | |
Institutional Class | | | | | 8,459 | | | $ | 78,821 | | | | 145,199 | | | $ | 1,158,870 | | | | 7,820 | | | $ | 75,411 | | | | 26,449 | | | $ | 244,485 | | | | 109 | | | $ | 1,026 | | | | 91 | | | $ | 769 | |
Class P | | | | | 461 | | | | 4,493 | | | | 544 | | | | 4,321 | | | | 9 | | | | 98 | | | | 5 | | | | 49 | | | | 3 | | | | 29 | | | | 0 | | | | 0 | |
Class A | | | | | 368 | | | | 3,564 | | | | 76 | | | | 655 | | | | 24 | | | | 243 | | | | 32 | | | | 295 | | | | 19 | | | | 176 | | | | 9 | | | | 82 | |
Class C | | | | | 37 | | | | 360 | | | | 12 | | | | 100 | | | | 42 | | | | 407 | | | | 75 | | | | 678 | | | | 25 | | | | 218 | | | | 41 | | | | 350 | |
Issued as reinvestment of distributions | | | | | | | | | | | | | | | | | | | | | | | | | | | | | | | | | | | | | | | | | | | | | | | | | | |
Institutional Class | | | | | 4,256 | | | | 40,860 | | | | 422 | | | | 3,228 | | | | 1,225 | | | | 12,217 | | | | 234 | | | | 2,108 | | | | 180 | | | | 1,683 | | | | 84 | | | | 720 | |
Class P | | | | | 10 | | | | 91 | | | | 8 | | | | 60 | | | | 1 | | | | 5 | | | | 0 | | | | 0 | | | | 0 | | | | 1 | | | | 0 | | | | 0 | |
Class A | | | | | 4 | | | | 40 | | | | 0 | | | | 1 | | | | 2 | | | | 17 | | | | 0 | | | | 2 | | | | 0 | | | | 4 | | | | 0 | | | | 0 | |
Class C | | | | | 1 | | | | 9 | | | | 0 | | | | 0 | | | | 3 | | | | 31 | | | | 0 | | | | 3 | | | | 1 | | | | 12 | | | | 0 | | | | 0 | |
Cost of shares redeemed | | | | | | | | | | | | | | | | | | | | | | | | | | | | | | | | | | | | | | | | | | | | | | | | | | |
Institutional Class | | | | | (16,321 | ) | | | (160,646 | ) | | | (7,631 | ) | | | (57,799 | ) | | | (677 | ) | | | (6,707 | ) | | | (265 | ) | | | (2,360 | ) | | | (286 | ) | | | (2,566 | ) | | | (43 | ) | | | (340 | ) |
Class P | | | | | (341 | ) | | | (3,272 | ) | | | (343 | ) | | | (2,532 | ) | | | 0 | | | | (5 | ) | | | 0 | | | | 0 | | | | 0 | | | | 0 | | | | 0 | | | | 0 | |
Class A | | | | | (232 | ) | | | (2,285 | ) | | | (61 | ) | | | (504 | ) | | | (6 | ) | | | (64 | ) | | | (2 | ) | | | (22 | ) | | | 0 | | | | 0 | | | | (9 | ) | | | (81 | ) |
Class C | | | | | (11 | ) | | | (108 | ) | | | (2 | ) | | | (13 | ) | | | (8 | ) | | | (82 | ) | | | (5 | ) | | | (40 | ) | | | (6 | ) | | | (52 | ) | | | (1 | ) | | | (4 | ) |
Net increase (decrease) resulting from Fund share transactions | | | | | (3,309 | ) | | $ | (38,073 | ) | | | 138,224 | | | $ | 1,106,387 | | | | 8,435 | | | $ | 81,571 | | | | 26,523 | | | $ | 245,198 | | | | 45 | | | $ | 531 | | | | 172 | | | $ | 1,496 | |
| | | | | | | | | | | | | | | | | | | | | | | | | | | | | | | | | | | | | | | | | | | | | | | | | | |
| | | | | | | | | | | | | | | | | | | | | | | | | | | | | | | | | | | | | | | | | | | | | | | | | | |
| | | | | PIMCO
RAE Fundamental International Fund | | | PIMCO
RAE Fundamental US Fund | | | PIMCO
RAE Fundamental US Small Fund | |
| | | | | Six Months Ended
12/31/2016 | | | Year Ended
06/30/2016 | | | Six Months Ended
12/31/2016 | | | Year Ended
06/30/2016 | | | Six Months Ended
12/31/2016 | | | Year Ended
06/30/2016 | |
| | | | | Shares | | | Amount | | | Shares | | | Amount | | | Shares | | | Amount | | | Shares | | | Amount | | | Shares | | | Amount | | | Shares | | | Amount | |
Receipts for shares sold | | | | | | | | | | | | | | | | | | | | | | | | | | | | | | | | | | | | | | | | | | | | | | | | | | |
Institutional Class | | | | | 7,672 | | | $ | 68,452 | | | | 17,278 | | | $ | 152,235 | | | | 6,148 | | | $ | 62,109 | | | | 19,612 | | | $ | 190,056 | | | | 221 | | | $ | 2,273 | | | | 10,568 | | | $ | 96,202 | |
Class P | | | | | 644 | | | | 6,039 | | | | 189 | | | | 1,661 | | | | 320 | | | | 3,326 | | | | 403 | | | | 3,819 | | | | 40 | | | | 424 | | | | 171 | | | | 1,524 | |
Class A | | | | | 16 | | | | 140 | | | | 4 | | | | 40 | | | | 221 | | | | 2,289 | | | | 445 | | | | 4,174 | | | | 231 | | | | 2,530 | | | | 216 | | | | 1,945 | |
Class C | | | | | 17 | | | | 159 | | | | 41 | | | | 339 | | | | 307 | | | | 3,132 | | | | 199 | | | | 1,851 | | | | 17 | | | | 179 | | | | 29 | | | | 255 | |
Issued as reinvestment of distributions | | | | | | | | | | | | | | | | | | | | | | | | | | | | | | | | | | | | | | | | | | | | | | | | | | |
Institutional Class | | | | | 815 | | | | 7,429 | | | | 595 | | | | 5,154 | | | | 2,784 | | | | 28,874 | | | | 1,786 | | | | 16,713 | | | | 106 | | | | 1,184 | | | | 200 | | | | 1,786 | |
Class P | | | | | 17 | | | | 152 | | | | 3 | | | | 25 | | | | 29 | | | | 305 | | | | 7 | | | | 64 | | | | 2 | | | | 22 | | | | 0 | | | | 3 | |
Class A | | | | | 0 | | | | 1 | | | | 0 | | | | 0 | | | | 23 | | | | 236 | | | | 5 | | | | 46 | | | | 4 | | | | 39 | | | | 1 | | | | 5 | |
Class C | | | | | 1 | | | | 9 | | | | 0 | | | | 2 | | | | 22 | | | | 226 | | | | 1 | | | | 9 | | | | 0 | | | | 3 | | | | 0 | | | | 0 | |
Cost of shares redeemed | | | | | | | | | | | | | | | | | | | | | | | | | | | | | | | | | | | | | | | | | | | | | | | | | | |
Institutional Class | | | | | (1,382 | ) | | | (12,393 | ) | | | (4,401 | ) | | | (37,347 | ) | | | (6,008 | ) | | | (61,663 | ) | | | (14,734 | ) | | | (138,985 | ) | | | (379 | ) | | | (3,849 | ) | | | (6,719 | ) | | | (57,926 | ) |
Class P | | | | | (76 | ) | | | (677 | ) | | | (71 | ) | | | (585 | ) | | | (72 | ) | | | (735 | ) | | | (67 | ) | | | (636 | ) | | | (26 | ) | | | (266 | ) | | | (15 | ) | | | (136 | ) |
Class A | | | | | 0 | | | | 0 | | | | 0 | | | | (4 | ) | | | (40 | ) | | | (408 | ) | | | (146 | ) | | | (1,397 | ) | | | (10 | ) | | | (106 | ) | | | (35 | ) | | | (310 | ) |
Class C | | | | | (3 | ) | | | (29 | ) | | | (6 | ) | | | (45 | ) | | | (26 | ) | | | (261 | ) | | | (19 | ) | | | (167 | ) | | | (3 | ) | | | (27 | ) | | | (3 | ) | | | (28 | ) |
Net increase (decrease) resulting from Fund share transactions | | | | | 7,721 | | | $ | 69,282 | | | | 13,632 | | | $ | 121,475 | | | | 3,708 | | | $ | 37,430 | | | | 7,492 | | | $ | 75,547 | | | | 203 | | | $ | 2,406 | | | | 4,413 | | | $ | 43,320 | |
| | | | | | | | | | | | | | | | | | | | | | | | | | | | | | | | | | | | | | | | | | | | | | | | | | |
| † | A zero balance may reflect actual amounts rounding to less than one thousand. |
| | | | | | |
| | SEMIANNUAL REPORT | | DECEMBER 31, 2016 | | 75 |
Notes to Financial Statements (Cont.)
The following table discloses the number of shareholders that own 10% or more of the outstanding shares of a Fund along with their respective percent ownership, if any. Some of these shareholders may be considered related parties, which may include, but are not limited to, the investment manager and its affiliates, affiliated broker dealers, fund of funds and directors or employees of the Trust or Adviser.
| | | | | | | | | | | | | | | | | | | | |
| | | | | | Non Related Parties | | | Related Parties | | | Non Related Parties | | | Related Parties | |
PIMCO RAE Fundamental Emerging Markets Fund | | | | | | | 0 | | | | 2 | | | | 0 | % | | | 84 | % |
PIMCO RAE Fundamental Global ex-US Fund | | | | | | | 2 | | | | 0 | | | | 98 | | | | 0 | |
RAE Fundamental Global Fund | | | | | | | 1 | | | | 0 | | | | 18 | | | | 0 | |
PIMCO RAE Fundamental International Fund | | | | | | | 0 | | | | 3 | | | | 0 | | | | 79 | |
PIMCO RAE Fundamental US Fund | | | | | | | 0 | | | | 1 | | | | 0 | | | | 27 | |
PIMCO RAE Fundamental US Small Fund | | | | | | | 2 | | | | 0 | | | | 63 | | | | 0 | |
12. REGULATORY AND LITIGATION MATTERS
The Funds are not named as defendants in any material litigation or arbitration proceedings and are not aware of any material litigation or claim pending or threatened against them.
PIMCO, the investment manager of the PIMCO Total Return Active Exchange-Traded Fund (“BOND”), has entered into a settlement agreement with the SEC that relates to BOND.
The settlement relates to disclosures regarding BOND’s performance attribution during the first four months of its existence in 2012 and the valuation of 43 smaller-sized positions of non-agency mortgage-backed securities using third-party vendor prices, as well as PIMCO’s policies and procedures related to these matters.
The settlement resolves the SEC’s investigation of BOND.
The foregoing speaks only as of the date of this report.
13. FEDERAL INCOME TAX MATTERS
Each Fund intends to qualify as a regulated investment company under Subchapter M of the Internal Revenue Code (the “Code”) and distribute all of its taxable income and net realized gains, if applicable, to shareholders. Accordingly, no provision for Federal income taxes has been made.
A Fund may be subject to local withholding taxes, including those imposed on realized capital gains. Any applicable foreign capital gains tax is accrued daily based upon net unrealized gains, and may be payable following the sale of any applicable investments.
In accordance with U.S. GAAP, the Adviser has reviewed the Funds’ tax positions for all open tax years. As of December 31, 2016, the Funds have recorded no liability for net unrecognized tax benefits relating to uncertain income tax positions they have taken or expect to take in future tax returns.
The Funds file U.S. tax returns. While the statute of limitations remains open to examine the Funds’ U.S. tax returns filed for the fiscal years ending in 2013-2015, no examinations are in progress or anticipated at this time. The Funds are not aware of any tax positions for which it is reasonably possible that the total amounts of unrecognized tax benefits will significantly change in the next twelve months.
Under the Regulated Investment Company Modernization Act of 2010, a fund is permitted to carry forward any new capital losses for an unlimited period. Additionally, such capital losses that are carried forward will retain their character as either short-term or long-term capital losses rather than being considered all short-term under previous law.
As of their last fiscal year ended June 30, 2016, the Funds had the following post-effective capital losses with no expiration (amounts in thousands†)(1):
| | | | | | | | | | | | |
| | | | | | Short-Term | | | Long-Term | |
PIMCO RAE Fundamental Emerging Markets Fund* | | | | | | $ | 3,517 | | | $ | 9,617 | |
PIMCO RAE Fundamental Global Fund | | | | | | | 0 | | | | 0 | |
PIMCO RAE Fundamental Global ex-US Fund | | | | | | | 225 | | | | 0 | |
PIMCO RAE Fundamental International Fund | | | | | | | 0 | | | | 0 | |
PIMCO RAE Fundamental US Fund | | | | | | | 0 | | | | 0 | |
PIMCO RAE Fundamental US Small Fund | | | | | | | 0 | | | | 0 | |
| † | A zero balance may reflect actual amounts rounding to less than one thousand. |
| (1) | *Portion of amount represents realized loss and recognized built-in loss under IRC 382-383, which is carried forward to future years to offset future realized gain subject to certain limitations |
December 31, 2016 (Unaudited)
As of December 31, 2016, the aggregate cost and the net unrealized appreciation (depreciation) of investments for Federal income tax purposes are as follows (amounts in thousands†):
| | | | | | | | | | | | | | | | | | | | |
| | | | | | Federal
Tax Cost | | | Aggregate
Gross
Unrealized
Appreciation | | | Aggregate
Gross
Unrealized
(Depreciation) | | | Net Unrealized
Appreciation/
(Depreciation)(2) | |
PIMCO RAE Fundamental Emerging Markets Fund | | | | | | $ | 1,252,611 | | | $ | 265,232 | | | $ | (25,245 | ) | | $ | 239,987 | |
PIMCO RAE Fundamental Global Fund | | | | | | | 370,029 | | | | 13,080 | | | | 0 | | | | 13,080 | |
PIMCO RAE Fundamental Global ex-US Fund | | | | | | | 71,491 | | | | 44 | | | | (4,013 | ) | | | (3,969 | ) |
PIMCO RAE Fundamental International Fund | | | | | | | 310,268 | | | | 31,780 | | | | (6,668 | ) | | | 25,112 | |
PIMCO RAE Fundamental US Fund | | | | | | | 455,135 | | | | 127,218 | | | | (9,997 | ) | | | 117,221 | |
PIMCO RAE Fundamental US Small Fund | | | | | | | 81,111 | | | | 23,294 | | | | (2,486 | ) | | | 20,808 | |
| † | A zero balance may reflect actual amounts rounding to less than one thousand. |
| (2) | Primary differences, if any, between book and tax net unrealized appreciation (depreciation) are attributable to wash sale loss deferrals for Federal income tax purposes. |
14. SUBSEQUENT EVENTS
On January 24, 2017, the Board approved the automatic conversion of Class C to Class A shares of the same fund after a ten year holding period for all Funds of the PIMCO Equity Series Trust that offer Class C shares. The conversion feature will be effective on April 1, 2017.
There were no other subsequent events identified that require recognition or disclosure.
| | | | | | |
| | SEMIANNUAL REPORT | | DECEMBER 31, 2016 | | 77 |
Glossary: (abbreviations that may be used in the preceding statements)
(Unaudited)
| | | | | | | | | | |
| | | | |
Currency Abbreviations: | | | | | | | | |
| USD (or $) | | United States Dollar | | | | | | | | |
| | | | |
Municipal Bond or Agency Abbreviations: | | | | | | | | |
| GDR | | Global Depositary Receipt | | | | | | | | |
| | | | |
Other Abbreviations: | | | | | | | | |
| ADR | | American Depositary Receipt | | SP - ADR | | Sponsored American Depositary Receipt | | TBA | | To-Be-Announced |
| REIT | | Real Estate Investment Trust | | SP - GDR | | Sponsored Global Depositary Receipt | | | | |
Approval of Investment Advisory Contract and Other Agreements
(Unaudited)
Approval of Renewal of the Investment Advisory Contract, Sub-Advisory Agreement, Portfolio Implementation Agreement and Second Amended and Restated Supervision and Administration Agreement
At a meeting held on August 17, 2016, the Board of Trustees (the “Board”) of PIMCO Equity Series (the “Trust”), including the Trustees who are not “interested persons” of the Trust under the Investment Company Act of 1940, as amended (the “Independent Trustees”), considered and unanimously approved the renewal of the Investment Advisory Contract (the “Investment Advisory Contract”) between the Trust, on behalf of each of the Trust’s series (the “Funds”), and Pacific Investment Management Company LLC (“PIMCO”) for an additional one-year term through August 31, 2017. The Board also considered and unanimously approved the renewal of the Second Amended and Restated Supervision and Administration Agreement (the “Supervision and Administration Agreement” and together with the Investment Advisory Contract, the “Agreements”) between the Trust, on behalf of the Funds, and PIMCO for an additional one-year term through August 31, 2017. In addition, the Board considered and unanimously approved the renewal of the: (i) Sub-Advisory Agreement (the “Sub-Advisory Agreement”) between PIMCO, on behalf of PIMCO RAE Fundamental Emerging Markets Fund, PIMCO RAE Fundamental Global ex-US Fund, PIMCO RAE Fundamental Global Fund, PIMCO RAE Fundamental International Fund, PIMCO RAE Fundamental US Fund and PIMCO RAE Fundamental US Small Fund (the “RAE Fundamental Funds”), each a series of the Trust, and Research Affiliates, LLC (“Research Affiliates”); and (ii) Portfolio Implementation Agreement (the “Portfolio Implementation Agreement”) between PIMCO, on behalf of the RAE Fundamental Funds, each a series of the Trust, Research Affiliates and Parametric Portfolio Associates LLC (“Parametric”), each for an additional one-year term through August 31, 2017.
The information, material factors and conclusions that formed the basis for the Board’s approvals are summarized below.
1. INFORMATION RECEIVED
(a) Materials Reviewed: During the course of the past year, the Trustees received a wide variety of materials relating to the services provided by PIMCO, Research Affiliates and Parametric to the Trust. At each of its quarterly meetings, the Board reviewed the Funds’ investment performance and a significant amount of information relating to Fund operations, including shareholder services, valuation and custody, the Funds’ compliance program and other information relating to the nature, extent and quality of services provided by PIMCO, Research Affiliates and Parametric to the Trust and each of the Funds, as applicable. In considering whether to approve the renewal of the Agreements, the Sub-Advisory Agreement, and the Portfolio
Implementation Agreement, the Board reviewed additional information, including, but not limited to, comparative industry data with regard to investment performance, advisory and supervisory and administrative fees and expenses, financial information for PIMCO and, where relevant, Research Affiliates and Parametric, information regarding the profitability to PIMCO of its relationship with the Funds, information about the personnel providing investment management services, other advisory services and supervisory and administrative services to the Funds, and information about the fees charged and services provided to other clients with similar investment mandates as the Funds, where applicable. In addition, the Board reviewed materials provided by counsel to the Trust and the Independent Trustees, which included, among other things, memoranda outlining legal duties of the Board in considering the renewal of the Agreements, the Sub-Advisory Agreement, and the Portfolio Implementation Agreement.
(b) Review Process: In connection with considering the renewal of the Agreements, the Sub-Advisory Agreement, and the Portfolio Implementation Agreement, the Board reviewed written materials prepared by PIMCO and, where applicable, Research Affiliates and Parametric in response to requests from counsel to the Trust and the Independent Trustees encompassing a wide variety of topics. The Board requested and received assistance and advice regarding, among other things, applicable legal standards from counsel to the Trust and the Independent Trustees, and reviewed comparative fee and performance data prepared at the Board’s request by Lipper, Inc. (“Lipper”), an independent provider of investment company performance information and fee and expense data. The Board received presentations on matters related to the Agreements, the Sub-Advisory Agreement, and the Portfolio Implementation Agreement and met both as a full Board and in a separate session of the Independent Trustees, without management present, at the August 17, 2016 meeting.
The approval determinations were made on the basis of each Trustee’s business judgment after consideration and evaluation of all the information presented. Individual Trustees may have given different weights to certain factors and assigned various degrees of materiality to information received in connection with the approval process. In deciding to approve the renewal of the Agreements, the Sub-Advisory Agreement, and the Portfolio Implementation Agreement, the Board did not identify any single factor or particular information that, in isolation, was controlling. The discussion below is intended to summarize the broad factors and information that figured prominently in the Board’s consideration of the renewal of the Agreements, the Sub-Advisory Agreement, and the Portfolio Implementation Agreement, but is not intended to summarize all of the factors considered by the Board.
| | | | | | |
| | SEMIANNUAL REPORT | | DECEMBER 31, 2016 | | 79 |
Approval of Investment Advisory Contract and Other Agreements (Cont.)
2. NATURE, EXTENT AND QUALITY OF SERVICES
(a) PIMCO, Research Affiliates, Parametric, their Personnel, and Resources: The Board considered the depth and quality of PIMCO’s investment management process, including: the experience, capability and integrity of its senior management and other personnel; the overall financial strength and stability of its organization; and the ability of its organizational structure to address changes in the Funds’ asset levels. The Board also considered the various services in addition to portfolio management that PIMCO provides under the Investment Advisory Contract. The Board noted that PIMCO makes available to its investment professionals a variety of resources and systems relating to investment management, compliance, trading, performance and portfolio accounting. The Board also noted PIMCO’s commitment to investing in information technology and infrastructure supporting investment management and compliance, as well as PIMCO’s continuing efforts to attract, retain and promote qualified personnel, including personnel with relevant equities experience, and to maintain and enhance its resources and systems. The Board considered PIMCO’s policies, procedures and systems reasonably designed to assure compliance with applicable laws and regulations and its commitment to further developing and strengthening these programs, its oversight of matters that may involve conflicts of interest between the Funds’ investments and those of other accounts managed by PIMCO, and its efforts to keep the Trustees informed about matters relevant to the Funds and their shareholders. The Board also considered PIMCO’s continuous investment in new disciplines and talented personnel, which has enhanced PIMCO’s services to the Funds and has allowed PIMCO to introduce innovative new funds over time.
The Trustees considered information they had received about the steps that PIMCO has taken with respect to active management of counterparty risk, such as implementing procedures requiring daily collateral adjustments and frequent communication between credit analysts and the Counterparty Risk Committee, which oversees counterparty risk on a firm-wide basis, continually evaluating requests to add or remove approved counterparties as market needs and conditions warrant. The Trustees also considered that PIMCO has continued to strengthen the process it uses to assess the financial stability of counterparties with which the Funds do business, to manage collateral and to protect the Funds from an unforeseen deterioration in the creditworthiness of trading counterparties. The Trustees noted that, consistent with its fiduciary duty, PIMCO executes transactions through a competitive best execution process and uses only those counterparties that meet its stringent and monitored criteria. The Trustees considered that PIMCO’s collateral management team utilizes a counterparty risk system to analyze portfolio level exposure and collateral being exchanged with counterparties.
In addition, the Trustees considered new services and service enhancements that PIMCO has implemented since the Board renewed the Agreements in 2015, including, but not limited to: continuing enhancement of analytics and technology systems; enhancing data processing and security and development tools and applications; continuing investment in its enterprise risk management function, including PIMCO’s cybersecurity program; building specialized talent in the PIMCO Global Advisory Board and continuing to hire new portfolio managers; continuing to expand the Funds Business Group global operating model; developing a website monitoring application to ensure accurate data content; engaging a third-party to perform an independent assessment of the application utilized for income servicing and enhancing the application to provide portfolio managers with more timely and high quality quarterly reporting; establishing a Fund Treasurer’s Office to provide, among other things, guidance with respect to industry and regulatory initiatives; advancing technology developers in global tax management application; conducting an end-to-end review of State Street IMS, custodian and pricing vendor connectivity in connection with the pricing function; continuing development of Pricing Portal to improve identification and feedback to vendors regarding valuations; continuing extensive pricing vendor due diligence; and partnering with Boston Financial Data Services, Inc. to establish secondary call center and other call center enhancements.
Similarly, the Board considered the sub-advisory services provided by Research Affiliates to the RAE Fundamental Funds. The Board also considered Research Affiliates’ supervisory responsibilities with respect to Parametric’s provision of portfolio implementation services to the RAE Fundamental Funds. The Board further considered the depth and quality of Research Affiliates’ investment management and research capabilities, the experience and capabilities of its portfolio management personnel and, in particular, the experience and capabilities of Robert Arnott, Research Affiliates’ principal, and the overall financial strength of the organization.
In addition, the Board considered the portfolio implementation and other operational services provided by Parametric to the RAE Fundamental Funds by, among other things, effecting portfolio transactions on behalf of the RAE Fundamental Funds. The Board also considered information about Parametric’s personnel responsible for providing services under the Portfolio Implementation Agreement. The Board also considered the nature and quality of Parametric’s trading, risk management, and compliance capabilities and resources, including Parametric’s policies and procedures regarding trade aggregation and allocation, which are integral parts of its role as portfolio implementer.
Ultimately, the Board concluded that the nature, extent and quality of services provided by PIMCO under the Agreements, by Research Affiliates under the Sub-Advisory Agreement, and by Parametric under
(Unaudited)
the Portfolio Implementation Agreement are likely to continue to benefit the Funds and their shareholders, as applicable.
(b) Other Services: The Board also considered the nature, extent and quality of supervisory and administrative services provided by PIMCO to the Funds under the Supervision and Administration Agreement. The Board considered the terms of the Supervision and Administration Agreement, under which the Trust pays for the supervisory and administrative services provided pursuant to that agreement under what is essentially an all-in fee structure (the “unified fee”). In return, PIMCO provides or procures certain supervisory and administrative services and bears the costs of various third party services required by the Funds, including audit, custodial, portfolio accounting, legal, transfer agency, sub-accounting and printing costs. The Board noted that the scope and complexity, as well as the costs, of the supervisory and administrative services provided by PIMCO under the Supervision and Administration Agreement continue to increase. The Board considered PIMCO’s provision of supervisory and administrative services and its supervision of the Trust’s third party service providers to assure that these service providers continue to provide a high level of service relative to alternatives available in the market.
Ultimately, the Board concluded that the nature, extent and quality of the services provided by PIMCO has benefited, and will likely continue to benefit, the Funds and their shareholders.
3. INVESTMENT PERFORMANCE
The Board reviewed information from PIMCO concerning the Funds’ performance, as available, over short- and long-term periods ended May 31, 2016 and other performance data, as available, over short- and long-term periods ended June 30, 2016 (the “PIMCO Report”) and from Lipper concerning the Funds’ performance, as available, over short- and long-term periods ended May 31, 2016 (the “Lipper Report”). The Board considered information regarding both the short- and long-term investment performance of each Fund relative to its peer group and relevant benchmark index as provided to the Board in advance of each of its quarterly meetings throughout the year, including the PIMCO Report and Lipper Report, which were provided in advance of the August 17, 2016 meeting.
The Board noted that, according to Lipper, certain Funds had underperformed in comparison to their respective peer groups or benchmark indexes, or both, over short- and long-term periods. The Board discussed with PIMCO the reasons for the underperformance of certain Funds over short- and long-term periods. The Board also discussed actions that have been taken by PIMCO to attempt to improve performance and took note of PIMCO’s plans to monitor performance going forward.
The Board ultimately concluded, within the context of all of its considerations in connection with the Agreements, that PIMCO’s performance record and process in managing the Funds indicates that its continued management is likely to benefit the Funds and their shareholders, and merits the approval of the renewal of the Agreements.
4. ADVISORY FEES, SUPERVISORY AND ADMINISTRATIVE FEES AND TOTAL EXPENSES
The Board considered that PIMCO seeks to price funds to scale at the outset with reference to the total expense ratios of the respective Lipper median, if available, while providing a premium for innovative investment offerings. PIMCO reported to the Board that, in proposing fees for any Fund or class of shares, it considers a number of factors, including, but not limited to, the type and complexity of the services provided, the cost of providing services, the risk assumed by PIMCO in the development of products and the provision of services, the impact on potential returns from different levels of fees, the competitive marketplace for financial products, and the attractiveness of potential Fund returns to current and potential investors. Fees charged to or proposed for different Funds for advisory services and supervisory and administrative services may vary in light of these various factors. The Board also considered that PIMCO reviews the Funds’ fee levels and carefully considers reductions where appropriate.
The Board reviewed the advisory fees, supervisory and administrative fees and total expenses of the Funds (each as a percentage of average net assets) and compared such amounts with the average and median fee and expense levels of other similar funds. The Board also reviewed information relating to the sub-advisory fees paid to Research Affiliates with respect to applicable Funds, taking into account that PIMCO compensates Research Affiliates from the advisory fees paid by such Funds to PIMCO. With respect to advisory fees, the Board reviewed data from Lipper that compared the average and median advisory fees of other funds in a “Peer Group” of comparable funds, as well as the universe of other similar funds. The Board noted that PIMCO had contractually agreed, through October 31, 2016, to reduce its advisory fee by amounts shown in the table below:
| | | | |
PIMCO Dividend and Income Fund | | | 0.16% | |
PIMCO RAE Fundamental Emerging Markets Fund | | | 0.20% | |
PIMCO RAE Fundamental Global Fund | | | 0.20% | |
PIMCO RAE Fundamental Global ex-US Fund | | | 0.20% | |
PIMCO RAE Fundamental International Fund | | | 0.10% | |
PIMCO RAE Fundamental US Fund | | | 0.10% | |
PIMCO RAE Fundamental US Small Fund | | | 0.10% | |
The Board further noted that the PIMCO Global Dividend Fund, PIMCO Balanced Income Fund, PIMCO U.S. Dividend Fund and PIMCO International Dividend Fund are expected to liquidate on August 26, 2016.
| | | | | | |
| | SEMIANNUAL REPORT | | DECEMBER 31, 2016 | | 81 |
Approval of Investment Advisory Contract and Other Agreements (Cont.)
The Board also reviewed data comparing the Funds’ advisory fees to the standard and negotiated fee rates PIMCO charges to separate accounts and to other sub-advised clients with similar investment strategies, including differences in advisory services provided. The Board discussed comparisons of fees for Funds with fees for separate accounts and/or PIMCO private/alternative funds with similar investment strategies, noting that for certain Funds, there were no appropriate comparisons because PIMCO did not manage comparable separate accounts at the time that the Board considered the Agreements. The Board noted that the advisory fees (or management fees, where applicable) for most Funds were similar to the fee rates charged to other investment companies with the same investment strategies as the Funds.
Regarding advisory fees charged by PIMCO in its capacity as sub-adviser to third-party/unaffiliated funds, the Trustees took into account that such fees may be lower than the fees charged by PIMCO to serve as adviser to the Funds. The Trustees also took into account that there are various reasons for any such differences in fees, including, but not limited to, the fact that PIMCO may be subject to varying levels of entrepreneurial risk and regulatory requirements, differing legal liabilities on a contract-by-contract basis and different servicing requirements when PIMCO does not serve as the sponsor of a fund and is not principally responsible for all aspects of a fund’s investment program and operations as compared to when PIMCO serves as investment adviser and sponsor. In considering the fees paid by the Funds, the Board noted that retail investors in the Funds receive the benefit of PIMCO’s advisory services at the same advisory fee rates as institutional investors in the Funds.
The Board considered the Funds’ supervisory and administrative fees, comparing them to similar funds in the report supplied by Lipper. The Board also considered that as the Funds’ business has become increasingly complex and the number of Funds has grown over time, PIMCO has provided an increasingly broad array of fund supervisory and administrative functions. In addition, the Board considered the Trust’s unified fee structure, under which the Trust pays for the supervisory and administrative services it requires for one set fee. In return for this unified fee, PIMCO provides or procures supervisory and administrative services and bears the costs of various third party services required by the Funds, including audit, custodial, portfolio accounting, legal, transfer agency, sub-accounting and printing costs. The Board further considered that many other funds pay for comparable services separately, and thus it is difficult to directly compare the Trust’s unified supervisory and administrative fees with the fees paid by other funds for administrative services alone. The Board also considered that the unified supervisory and administrative fee leads to Fund fees that are fixed, rather than variable. The Board noted that, although the unified fee structure does not have
breakpoints, it implicitly reflects economies of scale by fixing the absolute level of Fund fees at competitive levels even if the Funds’ operating costs rise when assets remain flat or decrease. The Board considered that the Funds’ unified fee structure meant that fees were not impacted by recent outflows in certain Funds, unlike funds without a unified fee structure, which may see increased expense ratios when fixed costs are passed through to a smaller asset base. The Board concluded that the Funds’ supervisory and administrative fees were reasonable in relation to the value of the services provided, including the services provided to different classes of shareholders, and that the expenses assumed contractually by PIMCO under the Supervision and Administration Agreement represent, in effect, a cap on overall Fund fees, which is beneficial to the Funds and their shareholders.
The Board noted that the Funds’ total expenses continued to be generally in line with those of competitor funds. The Board discussed with PIMCO those Funds and/or classes of Funds that had above median total expenses. Upon comparing the Funds’ total expenses to other funds in the “Peer Groups” provided by Lipper, the Board found total expenses of each Fund to be reasonable.
The Trustees also considered the advisory fees charged to the Funds that operate as funds of funds (the “Funds of Funds”) and the advisory services provided in exchange for such fees. The Trustees determined that such services were in addition to the advisory services provided to the underlying funds in which the Funds of Funds may invest and, therefore, such services were not duplicative of the advisory services provided to the underlying funds. The Board also considered the various fee waiver agreements in place for the Funds of Funds.
Based on the information presented by PIMCO, Research Affiliates, Parametric and Lipper, members of the Board determined, in the exercise of their business judgment, that the level of the advisory fees and supervisory and administrative fees charged by PIMCO under the Agreements, as well as the total expenses of each Fund, are reasonable.
5. ADVISER COSTS, LEVEL OF PROFITS AND ECONOMIES OF SCALE
The Board reviewed information regarding PIMCO’s costs of providing services to the Funds as a whole and considered that PIMCO did not derive any profit from the Funds during the calendar year ended December 31, 2015, and does not expect to derive any profit from the Funds during the calendar year ended December 31, 2016. The Board noted that it had received information regarding the structure and manner in which PIMCO’s investment professionals were compensated, and PIMCO’s view of the relationship of such compensation to the attraction and retention of quality personnel. The Board considered PIMCO’s need to invest in technology, cyber security, information security, shareholder privacy, business continuity planning, infrastructure and staff to reinforce and offer new services and to accommodate changing regulatory requirements.
(Unaudited)
With respect to potential economies of scale, the Board noted that PIMCO shares the benefits of economies of scale with the Funds and their shareholders in a number of ways, including through the pricing of Funds to scale from inception and the enhancement of services provided to the Funds in return for fees paid. In considering the advisory fees paid by the Funds, the Board also noted that retail investors in the Funds receive the benefit of PIMCO’s advisory services at the same advisory fee rates as institutional investors in the Funds. The Board considered that the Funds’ unified fee rates had been set competitively and/or priced to scale from inception and continued to be competitive compared with peers. The Board also considered that the unified fee is a transparent means of informing a Fund’s shareholders of the fees associated with the Fund, and that the Fund bears certain expenses that are not covered by the advisory fee or the unified fee. The Board further considered the challenges that arise when managing large funds, which can result in certain “diseconomies” of scale.
The Trustees considered that the unified fee has provided inherent economies of scale because a Fund maintains competitive fixed unified fees even if the particular Fund’s assets decline and/or operating costs rise. The Trustees further considered that, in contrast, breakpoints may be a proxy for charging higher fees on lower asset levels and that when a fund’s assets decline, breakpoints may reverse, which causes expense ratios to increase. The Trustees also considered that, unlike the Funds’ unified fee structure, funds with “pass through” administrative fee structures may experience increased expense ratios when fixed dollar fees are charged against declining fund assets. The Trustees also considered that the unified fee protects shareholders from a rise in operating costs that may result from, among other things, PIMCO’s investments in various business enhancements and infrastructure, including those referenced above. The Trustees noted that PIMCO’s investments in these areas are extensive.
The Board concluded that the Funds’ cost structures were reasonable and that the unified fee structure inherently involves the sharing of economies of scale between PIMCO and each of the Funds, to the benefit of their respective shareholders.
6. ANCILLARY BENEFITS
The Board considered other benefits realized by PIMCO and its affiliates as a result of PIMCO’s relationship with the Trust, including possible ancillary benefits to PIMCO’s institutional investment management business due to the reputation and market penetration of the Trust. The Board also considered that affiliates of PIMCO provide distribution and shareholder services to the Funds and their shareholders, for which they may be compensated through distribution and servicing fees paid pursuant to the Funds’ Rule 12b-1 plans or otherwise. The Board reviewed PIMCO’s soft dollar policies and procedures, noting that while PIMCO has the authority to receive the benefit of research provided by
broker-dealers executing portfolio transactions on behalf of the Funds, it has adopted a policy not to enter into contractual soft dollar arrangements.
7. CONCLUSIONS
Based on their review, including their comprehensive consideration and evaluation of each of the broad factors and information summarized above, the Independent Trustees and the Board as a whole concluded that the nature, extent and quality of the services rendered to the Funds by PIMCO, Research Affiliates and Parametric supported the renewal of the Agreements, the Sub-Advisory Agreement, and the Portfolio Implementation Agreement. The Independent Trustees and the Board as a whole concluded that the Agreements, the Sub-Advisory Agreement, and the Portfolio Implementation Agreement continued to be fair and reasonable to the Funds and their shareholders, that the Funds’ shareholders received reasonable value in return for the fees paid to PIMCO by the Funds under the Agreements, the fees paid to Research Affiliates by PIMCO under the Sub-Advisory Agreement, and the fees paid to Parametric by PIMCO under the Portfolio Implementation Agreement, and that the renewal of the Agreements, the Sub-Advisory Agreement, and the Portfolio Implementation Agreement was in the best interests of the Funds and their shareholders.
| | | | | | |
| | SEMIANNUAL REPORT | | DECEMBER 31, 2016 | | 83 |
Results of Proxy Voting
(Unaudited)
At a special meeting of shareholders held on August 26, 2016, PIMCO sought approval from shareholders of the PIMCO Dividend and Income Fund to enter into a sub-advisory agreement with Research Affiliates, LLC and a portfolio implementation agreement with Research Affiliates, LLC and Parametric Portfolio Associations, LLC.
The results of the proxy solicitation on the preceding matters were as follows:
PIMCO Equity Series
Proposal 1: To approve a sub-advisory agreement for the Fund
| | | | |
| For* | | Against* | | Abstain* |
| 15,360,763 | | 855,024 | | 944,023 |
Proposal 2: To approve a portfolio implementation agreement for the Fund
| | | | |
| For* | | Against* | | Abstain* |
| 15,324,472 | | 909,160 | | 956,177 |
| * | Certain series of the Trust’s shares were held by PIMCO-advised funds or accounts for which PIMCO had discretionary authority to vote proxies. Accordingly, PIMCO voted such shares in proportion to the votes of all other Trust shareholders voting on the proposal. |
General Information
Investment Adviser and Administrator
Pacific Investment Management Company LLC
650 Newport Center Drive
Newport Beach, CA 92660
Investment Sub-Adviser
Research Affiliates, LLC
620 Newport Center Drive, Suite 900
Newport Beach, CA 92660
Distributor
PIMCO Investments LLC
1633 Broadway
New York, NY 10019
Custodian
State Street Bank and Trust Company
801 Pennsylvania Avenue
Kansas City, MO 64105
Transfer Agent
Boston Financial Data Services
Institutional Class, Class P, Administrative Class, Class D
330 W. 9th Street, 5th Floor
Kansas City, MO 64105
Boston Financial Data Services
Class A, Class C, Class R
P.O. Box 55060
Boston, MA 02205-5060
Legal Counsel
Dechert LLP
1900 K Street, N.W.
Washington, D.C. 20006
Independent Registered Public Accounting Firm
PricewaterhouseCoopers LLP
1100 Walnut Street, Suite 1300
Kansas City, MO 64106
This report is submitted for the general information of the shareholders of the PIMCO Equity Series.

PES4003SAR_123116

PIMCO Equity Series®
Semiannual Report
December 31, 2016

PIMCO REALPATH® Blend 2020 Fund
PIMCO REALPATH® Blend 2025 Fund
PIMCO REALPATH® Blend 2030 Fund
PIMCO REALPATH® Blend 2035 Fund
PIMCO REALPATH® Blend 2040 Fund
PIMCO REALPATH® Blend 2045 Fund
PIMCO REALPATH® Blend 2050 Fund
PIMCO REALPATH® Blend 2055 Fund
PIMCO REALPATH® Blend Income Fund
Share Classes

Table of Contents
This material is authorized for use only when preceded or accompanied by the current PIMCO Equity Series prospectus. The Shareholder Reports for the other series of PIMCO Equity Series are printed separately.
Chairman’s Letter
Dear Shareholder,
Please find enclosed the Semiannual Report for the PIMCO Equity Series covering the six-month reporting period ended December 31, 2016. The following pages contain specific details about the investment performance of each fund and a discussion of the factors that most affected performance during the reporting period.
In June 2016, the unexpected outcome of the U.K. “Brexit” referendum dominated headlines and market movements. Volatility rose as a result and sovereign yields rallied significantly, while risk assets generally underperformed. Steadier commodity prices and fiscal stimulus in China helped bolster market sentiment, even as central banks remained on hold ahead of the Brexit referendum. Softer-than-expected employment data in the U.S. pushed market expectations for the next Federal Reserve (“Fed”) interest rate hike further out into the future, with the Fed continuing to hold rates steady through the end of November.
Leading up to the November 8th U.S. presidential election, investors generally shook off the surprising result of the Brexit referendum, along with a host of political developments including new leadership in the U.K. and Brazil, and a coup attempt in Turkey. In this environment, volatility generally remained low and risk assets rallied. Central banks featured prominently in the headlines as monetary policy concerns (in particular, the longevity of central bank support) lingered beneath the seemingly benign market environment. The Bank of Japan’s “comprehensive review,” inaction by the European Central Bank (“ECB”), and the Fed’s solidifying path towards a potential interest rate increase in December 2016 all contributed to sovereign yields generally rising during this period. Still, equities moved higher (U.S. stock indices set record highs), credit spreads tightened, and emerging market assets continued to gain.
In the wake of the not expected result of the U.S. election, volatility fell, equities rallied, credit spreads tightened and the U.S. dollar strengthened. In contrast, interest rates rose dramatically as most markets focused on the pro-growth and inflationary potential of fiscal expansion, tax cuts, and deregulation. Part of the rise in interest rates was also due to a sharp increase in inflation expectations. Despite the generally positive risk sentiment towards the end of the reporting period, emerging markets weakened as protectionist rhetoric from the incoming administration weighed on the asset class.
Finally, the ECB at its December 8th meeting opted to leave its main policy rate unchanged, and announced an expansion of its Quantitative Easing program to exceed $2.4 trillion by the end of 2017. And on December 14th, the Fed raised its key lending rate, the Federal Funds Rate, by 0.25% to a range of 0.50%-0.75%, representing their second rate increase in ten years.
Highlights of the financial markets during the six-month reporting period include:
| | ∎ | | Global developed market equities experienced strong performance amid a period marked by unconventional central bank policy, the continued recovery in commodity prices and higher sovereign yields. U.S. equities, as represented by the S&P 500 Index, returned 7.82% over the reporting period. International equity markets (developed ex-U.S.), as represented by the MSCI EAFE Index returned 5.67%, and 14.06% on a USD-hedged basis over the reporting period. Japanese equities, as represented by the Nikkei 225 Index in JPY, returned 23.83% over the reporting period, and European equities, as represented by the MSCI Europe Index in EUR, returned 10.58% over the reporting period. Following the surprise outcome of the U.K.’s referendum to leave the European Union and accompanying market volatility in June, developed market equities posted strong gains. Global central banks continued down the path of unconventional monetary policy, as the Bank of Japan adopted a yield-curve targeting framework and the ECB extended its asset purchase program. The rally in developed market equities was further supported by the result of the U.S. presidential election, and the possibility of a new paradigm of stronger growth, higher inflation and higher natural interest rates. |
| | ∎ | | Emerging market equities, as represented by the MSCI Emerging Markets Index, returned 4.49% over the reporting period. Benefits from improving internal and external conditions for many emerging markets economies and the continued recovery in commodity prices offset negative implications of the potential for fiscal stimulus in the U.S., a more hawkish Fed and protectionist trade policies. |
| | ∎ | | U.S. Treasuries, as represented by the Bloomberg Barclays U.S. Treasury Index, declined 4.11% for the reporting period. Yields rose across the U.S. Treasury yield curve in reaction to the Fed’s interest rate increase, rising concern over inflation and strong investor risk appetite. The benchmark ten-year U.S. Treasury note yielded 2.45% at the end of the reporting period, up from 1.49% on June 30, 2016. The Bloomberg Barclays U.S. Aggregate Index, a widely used index of U.S. investment-grade bonds, declined 2.53% for the reporting period. |
If you have any questions regarding the PIMCO Equity Series, please contact your account manager or financial adviser, or call one of our shareholder associates at 888.87.PIMCO (888.877.4626). We also invite you to visit our website at www.pimco.com to learn more about our views and global thought leadership.
Thank you again for the trust you have placed in us. We value your commitment and will continue to work diligently to meet your broad investment and investment solution needs.
| | |
 | | Sincerely, 
Brent R. Harris Chairman of the Board, PIMCO Equity Series February 21, 2017 |
Past performance is no guarantee of future results. Unless otherwise noted, index returns reflect the reinvestment of income dividends and capital gains, if any, but do not reflect fees, brokerage commissions or other expenses of investing. It is not possible to invest directly in an unmanaged index.
| | | | | | |
| | SEMIANNUAL REPORT | | DECEMBER 31, 2016 | | 3 |
Important Information About the Funds
We believe that equity funds have an important role to play in a well-diversified investment portfolio. It is important to note, however, that equity funds are subject to notable risks. Among other things, equity and equity-related securities may decline in value due to both real and perceived general market, economic, and industry conditions.
The Funds are each “fund of funds,” which is a term used to describe mutual funds that pursue their investment objective by investing in other mutual funds instead of investing directly in stocks or bonds of other issuers. Under normal circumstances, the Funds invest in a combination of affiliated and unaffiliated funds that are registered under the Investment Company Act of 1940, as amended, equity securities, fixed income instruments of varying maturities, or related derivatives on any of the preceding securities mentioned. The Funds may invest in Institutional Class or Class M shares of any funds of the PIMCO Equity Series (the “Trust”) and PIMCO Funds, and in other affiliated funds, including funds of PIMCO ETF Trust, except funds of funds (collectively, “Underlying PIMCO Funds”), and unaffiliated funds that are registered under the Investment Company Act of 1940 (collectively, “Acquired Funds”). The risks and strategies associated with an investment in the Fund may result from direct investments and/or indirect exposure through investment in Acquired Funds.
In an environment where interest rates may trend upward, rising rates would negatively impact the performance of certain funds, and fixed-income securities held by a Fund are likely to decrease in value. A number of factors can cause interest rates to rise (e.g., central bank monetary policies, inflation rates, general economic conditions, etc.). In addition, changes in interest rates can be sudden and significant, and there is no guarantee that Fund management will anticipate such movement accurately.
The values of equity securities, such as common stocks and preferred stocks, have historically risen and fallen in periodic cycles and may decline due to general market conditions, which are not specifically related to a particular company, such as real or perceived adverse economic conditions, changes in the general outlook for corporate earnings, changes in interest or currency rates or adverse investor sentiment generally. Equity securities may also decline due to factors that affect a particular industry or industries, such as labor shortages, increased production costs and competitive conditions within an industry. In addition, the value of an equity security may decline for a number of reasons that directly relate to the issuer, such as management performance, financial leverage and reduced demand for the issuer’s goods or services, as well as the historical and prospective earnings of the issuer and the value of its assets. Different types of equity securities may react differently to these developments and a change in the financial condition of a single issuer may affect securities markets as a whole.
During a general downturn in the securities markets, multiple asset classes, including equity securities, may decline in value simultaneously. The market price of equity securities owned by a Fund may go up or down, sometimes rapidly or unpredictably. Equity securities generally have greater price volatility than fixed income securities and common stocks generally have the greatest appreciation and depreciation potential of all equity securities.
Interest rates in the U.S. are near historically low levels. As such, funds that invest in fixed income securities may currently face an increased exposure to the risks associated with a rising interest rate environment. This is especially true as the Fed ended its quantitative easing program in October 2014 and has begun, and may continue, to raise interest rates. To the extent the Fed continues to raise interest rates, there is a risk that rates across the financial system may rise. Further, while the U.S. bond market has steadily grown over the past three decades, dealer inventories of corporate bonds have remained relatively stagnant. As a result, there has been a significant reduction in the ability of dealers to “make markets.”
Bond funds and individual bonds with a longer duration (a measure used to determine the sensitivity of a security’s price to changes in interest rates) tend to be more sensitive to changes in interest rates, usually making them more volatile than securities or funds with shorter durations. All of the factors mentioned above, individually or collectively, could lead to increased volatility and/or lower liquidity in the fixed income markets or negatively impact a Fund’s performance or cause the Fund to incur losses. As a result, a Fund may experience increased shareholder redemptions, which, among other things, could further reduce the net assets of the Fund.
The Funds may be subject to various risks as described in the Funds’ prospectus. Some of these risks may include, but are not limited to, the following: allocation risk, acquired fund risk, new / small fund risk, equity risk, value investing risk, interest rate risk, call risk, credit risk, high yield and distressed company risk, market risk, issuer risk, liquidity risk, derivatives risk, commodity risk, mortgage-related and other asset-backed securities risk, foreign (non-U.S.) investment risk, real estate risk, emerging market risk, sovereign debt risk, currency risk, leveraging risk, small-cap and mid-cap company risk, management risk, short sale risk, tax risk, subsidiary risk, arbitrage risk, and convertible securities risk. A complete description of these risks is contained in the Funds’ prospectus.
The Funds may use derivative instruments for hedging purposes or as part of an investment strategy. Use of these instruments may involve certain costs and risks such as liquidity risk, interest rate risk, market risk, credit risk, leverage risk, management risk and the risk that a Fund may not be able to close out a position when it would be most advantageous to do so. Changes in regulation relating to a mutual
fund’s use of derivatives and related instruments could potentially limit or impact a Fund’s ability to invest in derivatives, limit the Fund’s ability to employ certain strategies that use derivatives and/or adversely affect the value or performance of derivatives and the Fund. Certain derivative transactions may have a leveraging effect on a Fund. For example, a small investment in a derivative instrument may have a significant impact on a Fund’s exposure to interest rates, currency exchange rates or other investments. As a result, a relatively small price movement in an asset, instrument or component of the index underlying a derivative instrument may cause an immediate and substantial loss or gain, which translates into heightened volatility of the Fund. A Fund may engage in such transactions regardless of whether the Fund owns the asset, instrument or components of the index underlying the derivative instrument. A Fund may invest a significant portion of its assets in these types of instruments. If it does, the Fund’s investment exposure could far exceed the value of its portfolio securities and its investment performance could be primarily dependent upon securities it does not own. Investing in foreign (non-U.S.) securities may entail risk due to foreign (non-U.S.) economic and political developments; this risk may be increased when investing in emerging markets.
For example, if a Fund invests in emerging market debt, it may face increased exposure to interest rate, liquidity, volatility, and redemption risk due to the specific economic, political, geographical, or legal background of the foreign (non-U.S.) issuer.
The value of an equity security of an issuer that has paid dividends in the past may decrease if the issuer reduces or eliminates future payments to its shareholders. If the dividends or distributions received by a Fund decrease, the Fund may have less income to distribute to the Fund’s shareholders. In addition, during certain market conditions, the equity securities of issuers that have paid regular dividends or distributions may not be widely available or may be highly concentrated in particular sectors of the market. A Fund may invest a significant portion of its assets in value stocks. Value stocks may perform differently from other types of stocks and the market as a whole. A value stock may decrease in price or may not increase in price as anticipated by PIMCO if it continues to be undervalued by the market or the factors that the portfolio manager believes will cause the stock price to increase do not occur.
The geographical classification of foreign (non-U.S.) securities in this report are classified by the country of incorporation of a holding. In certain instances, a security’s country of incorporation may be different from its country of economic exposure.
The PIMCO REALPATH® Blend Funds are intended for investors who prefer to have their asset allocation decisions made by professional money managers and are designed to offer individual investors comprehensive asset allocation strategies tailored to the time when they
expect to retire or to begin withdrawing assets. Each PIMCO REALPATH® Blend Fund is designed for investors expecting to retire or to begin withdrawing portions of their investments around the year indicated in the Fund’s name. The retirement year included in the REALPATH® Blend Fund’s name does not necessarily represent the specific year you expect to begin withdrawing your assets. It is intended only as a general guide.
The PIMCO REALPATH® Blend Funds are designed to provide investors with a comprehensive retirement solution tailored to the time when they expect to retire or plan to start withdrawing money (the “target date”). Each PIMCO REALPATH® Blend Fund follows a target asset allocation schedule that changes over time to help reduce portfolio risk, increasing its exposure to conservative investments as the target date approaches. The principal value of a Fund is not guaranteed at any time, including the target date. A Fund’s shareholders may experience losses, including losses near, at, or after the target year indicated in the PIMCO REALPATH® Blend Fund’s name.
On each individual Fund Summary page in this Shareholder Report, the Average Annual Total Return table and Cumulative Returns chart measure performance assuming that any dividend and capital gain distributions were reinvested. Returns do not reflect the deduction of taxes that a shareholder would pay on (i) Fund distributions or (ii) the redemption of Fund shares. The Cumulative Returns chart and Average Annual Total Return table reflect any sales load that would have applied at the time of purchase or any Contingent Deferred Sales Charge (“CDSC”) that would have applied if a full redemption occurred on the last business day of the period shown in the Cumulative Returns chart. Class A shares are subject to an initial sales charge. A CDSC may be imposed in certain circumstances on Class A shares that are purchased without an initial sales charge and then redeemed during the first (i) 18 months after purchase for purchases made prior to August 10, 2015 and (ii) 12 months after purchase for purchases made on or after August 10, 2015. The Cumulative Returns chart reflects only Institutional Class performance. Performance for Class P, Administrative Class, Class D, Class A, Class C and Class R shares, if applicable, are typically lower than Institutional Class performance due to the lower expenses paid by Institutional Class shares. Performance shown is net of fees and expenses. The minimum initial investment amount for Institutional Class, Class P and Administrative Class shares is $1,000,000. The minimum initial investment amount for Class A, Class C and Class D shares is $1,000. There is no minimum initial investment for Class R shares. Each Fund measures its performance against at least one broad-based securities market index (“benchmark index”). The benchmark index does not take into account fees, expenses, or taxes. A Fund’s past performance, before and after taxes, is not necessarily an indication of how the Fund will perform in the future.
| | | | | | |
| | SEMIANNUAL REPORT | | DECEMBER 31, 2016 | | 5 |
Important Information About the Funds (Cont.)
The following table discloses the inception dates of each Fund and its respective share classes along with each Fund’s diversification status as of period end:
| | | | | | | | | | | | | | | | | | | | | | | | | | | | | | | | | | | | | | | | |
| Fund Name | | | | | Fund
Inception | | | Institutional
Class | | | Class P | | | Administrative
Class | | | Class D | | | Class A | | | Class C | | | Class R | | | Diversification
Status | |
PIMCO REALPATH® Blend 2020 Fund | | | | | | | 12/31/14 | | | | 12/31/14 | | | | — | | | | 12/31/14 | | | | — | | | | 12/31/14 | | | | — | | | | — | | | | Diversified | |
PIMCO REALPATH® Blend 2025 Fund | | | | | | | 12/31/14 | | | | 12/31/14 | | | | — | | | | 12/31/14 | | | | — | | | | 12/31/14 | | | | — | | | | — | | | | Diversified | |
PIMCO REALPATH® Blend 2030 Fund | | | | | | | 12/31/14 | | | | 12/31/14 | | | | — | | | | 12/31/14 | | | | — | | | | 12/31/14 | | | | — | | | | — | | | | Diversified | |
PIMCO REALPATH® Blend 2035 Fund | | | | | | | 12/31/14 | | | | 12/31/14 | | | | — | | | | 12/31/14 | | | | — | | | | 12/31/14 | | | | — | | | | — | | | | Diversified | |
PIMCO REALPATH® Blend 2040 Fund | | | | | | | 12/31/14 | | | | 12/31/14 | | | | — | | | | 12/31/14 | | | | — | | | | 12/31/14 | | | | — | | | | — | | | | Diversified | |
PIMCO REALPATH® Blend 2045 Fund | | | | | | | 12/31/14 | | | | 12/31/14 | | | | — | | | | 12/31/14 | | | | — | | | | 12/31/14 | | | | — | | | | — | | | | Diversified | |
PIMCO REALPATH® Blend 2050 Fund | | | | | | | 12/31/14 | | | | 12/31/14 | | | | — | | | | 12/31/14 | | | | — | | | | 12/31/14 | | | | — | | | | — | | | | Diversified | |
PIMCO REALPATH® Blend 2055 Fund | | | | | | | 12/31/14 | | | | 12/31/14 | | | | — | | | | 12/31/14 | | | | — | | | | 12/31/14 | | | | — | | | | — | | | | Diversified | |
PIMCO REALPATH® Blend Income Fund | | | | | | | 12/31/14 | | | | 12/31/14 | | | | — | | | | 12/31/14 | | | | — | | | | 12/31/14 | | | | — | | | | — | | | | Diversified | |
An investment in a Fund is not a bank deposit and is not guaranteed or insured by the Federal Deposit Insurance Corporation (“FDIC”) or any other government agency. It is possible to lose money on investments in a Fund.
The Trustees are responsible generally for overseeing the management of the Trust. The Trustees authorize the Trust to enter into service agreements with the Adviser, the Distributor, the Administrator and other service providers in order to provide, and in some cases authorize service providers to procure through other parties, necessary or desirable services on behalf of the Trust and the Funds. Shareholders are not parties to or third-party beneficiaries of such service agreements. Neither a Fund’s prospectus nor a Fund’s summary prospectus, the Trust’s Statement of Additional Information (“SAI”), any contracts filed as exhibits to the Trust’s registration statement, nor any other communications, disclosure documents or regulatory filings (including this report) from or on behalf of the Trust or a Fund creates a contract between or among any shareholder of a Fund, on the one hand, and the Trust, a Fund, a service provider to the Trust or a Fund, and/or the Trustees or officers of the Trust, on the other hand. The Trustees (or the Trust and its officers, service providers or other delegates acting under authority of the Trustees) may amend the most recent prospectus or use a new prospectus, summary prospectus or SAI with respect to a Fund or the Trust, and/or amend, file and/or issue any other communications, disclosure documents or regulatory filings, and may amend or enter into any contracts to which the Trust or a Fund is a party, and interpret the investment objective(s), policies, restrictions and contractual provisions applicable to any Fund, without shareholder
input or approval, except in circumstances in which shareholder approval is specifically required by law (such as changes to fundamental investment policies) or where a shareholder approval requirement is specifically disclosed in the Trust’s then-current prospectus or SAI.
PIMCO has adopted written proxy voting policies and procedures (“Proxy Policy”) as required by Rule 206(4)-6 under the Investment Advisers Act of 1940, as amended. The Proxy Policy has been adopted by the Trust as the policies and procedures that PIMCO will use when voting on behalf of a Fund. A description of the policies and procedures that PIMCO uses to vote proxies relating to portfolio securities of a Fund, and information about how the Fund voted proxies relating to portfolio securities held during the most recent twelve-month period ended June 30th, are available without charge, upon request, by calling the Trust at (888) 87-PIMCO, on the Fund’s website at www.pimco.com, and on the Securities and Exchange Commission’s (“SEC”) website at www.sec.gov.
PIMCO Equity Series files a complete schedule of each Fund’s portfolio holdings with the SEC for the first and third quarters of each fiscal year on Form N-Q. A copy of a Fund’s Form N-Q is available on the SEC’s website at www.sec.gov and may be reviewed and copied at the SEC’s Public Reference Room in Washington, D.C. A Fund’s Form N-Q will also be available without charge, upon request, by calling the Trust at (888) 87-PIMCO and on the Fund’s website at www.pimco.com. Information on the operation of the Public Reference Room may be obtained by calling 1-800-SEC-0330.
(THIS PAGE INTENTIONALLY LEFT BLANK)
| | | | | | |
| | SEMIANNUAL REPORT | | DECEMBER 31, 2016 | | 7 |
PIMCO REALPATH® Blend 2020 Fund
Cumulative Returns Through December 31, 2016
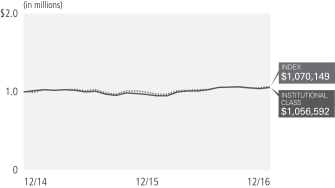
$1,000,000 invested at the end of the month when the Fund’s Institutional Class commenced operations.
Investment Objective and Strategy Overview
PIMCO REALPATH® Blend 2020 Fund seeks to maximize total return, consistent with prudent investment management, by investing under normal circumstances in a combination of affiliated and unaffiliated funds that are registered under the Investment Company Act of 1940, as amended (the “1940 Act”), equity securities, Fixed Income Instruments of varying maturities, or related derivatives on any of the preceding securities mentioned. The Fund may invest in Institutional Class or Class M shares of any funds of the PIMCO Equity Series (the “Trust”) and PIMCO Funds, and in other affiliated funds, including funds of PIMCO ETF Trust, except funds of funds (“Underlying PIMCO Funds”), and unaffiliated funds that are registered under the 1940 Act (collectively, “Acquired Funds”). Under normal circumstances, the Fund seeks to invest substantially all of its equity exposure in index tracking securities, including investments in affiliated or unaffiliated investment companies, which will be registered under the 1940 Act, or related derivatives on such securities or indexes. “Fixed Income Instruments” include bonds, debt securities and other similar instruments issued by various U.S. and non-U.S. public- or private-sector entities. The primary difference between the PIMCO REALPATH® Blend Funds is their asset allocation, which varies depending on the number of years left until the “self-elected” year of retirement indicated in the PIMCO REALPATH® Blend Fund’s name.
The Fund’s long-term asset allocations are based on a “glide path” developed by PIMCO and are based on quantitative and qualitative data relating to various risk metrics, long-term market trends, correlation of asset types and actuarial assumptions of life expectancy and retirement. The glide path changes over time, generally becoming more conservative as the Fund approaches the target date. Fund strategies may change from time to time. Please refer to the Fund’s current prospectus for more information regarding the Fund’s strategy.
| | | | | | | | | | | | | | |
| Average Annual Total Return for the period ended December 31, 2016 | |
| | | | | 6 Months* | | | 1 Year | | | Fund Inception
(12/31/14) | |
 | | PIMCO REALPATH® Blend 2020 Fund Institutional Class | | | 2.62% | | | | 9.22% | | | | 2.79% | |
| | PIMCO REALPATH® Blend 2020 Fund Administrative Class | | | 2.48% | | | | 8.95% | | | | 2.51% | |
| | PIMCO REALPATH® Blend 2020 Fund Class A | | | 2.36% | | | | 8.70% | | | | 2.31% | |
| | PIMCO REALPATH® Blend 2020 Fund Class A (adjusted) | | | (3.30)% | | | | 2.72% | | | | (0.54)% | |
 | | S&P Target Date 2020 Indexª± | | | 3.31% | | | | 7.22% | | | | 3.44% | |
| | | Real Return Target 2020 Index±± | | | 5.95% | | | | 2.68% | | | | 2.10% | |
All Fund returns are net of fees and expenses.
* Cumulative return.
ª As of June 30, 2016, the Fund’s benchmark was changed from the Real Return Target 2020 Index to the S&P Target Date 2020 Index, which more closely aligns with the Fund’s principal investment strategies. The Real Return Target 2020 Index was discontinued as of this date.
± The S&P Target Date Index Series is comprised of eleven multi-asset class indices, each corresponding to a particular target retirement date. Each index provides varying levels of exposure to each asset class. Each target date allocation is created and retired according to a pre-determined schedule related to the respective target date, as indicated in the index name, and is based on market observations through an annual survey of target date fund managers.
±± Real Return Target 2020 Index is a composite of other indices. The sub-indices represent stocks, bonds, TIPs, commodities and real estate securities. The component asset classes are weighted within each index to reflect a targeted level of risk at the beginning and end of the investment horizon. Over time, the weights are adjusted based on predetermined formulas to systematically reduce the level of potential risk as the index’s maturity date approaches.
It is not possible to invest directly in an unmanaged index.
Performance quoted represents past performance. Past performance is not a guarantee or a reliable indicator of future results. Current performance may be lower or higher than performance shown. Investment return and the principal value of an investment will fluctuate. Shares may be worth more or less than original cost when redeemed. Returns shown do not reflect the deduction of taxes that a shareholder would pay on fund distributions or the redemption of fund shares. Differences in the Fund’s performance versus the index and related attribution information with respect to particular categories of securities or individual positions may be attributable, in part, to differences in the pricing methodologies used by the Fund and the index. The adjusted returns take into account the maximum sales charge of 5.50% on Class A shares. For performance current to the most recent month-end, visit www.pimco.com or call (888) 87-PIMCO.
The Fund’s total annual operating expense ratio as stated in the Fund’s current prospectus, which includes the Acquired Fund Fees and Expenses (Underlying PIMCO Fund Expenses), as supplemented, is 0.39% for the Institutional Class shares, 0.64% for the Administrative Class shares and 0.89% for the Class A shares. Details regarding any Fund’s operating expenses can be found in the Fund’s prospectus.
| | | | |
| Institutional Class - PBZNX | | Administrative Class - PBZDX | | Class A - PBZAX |
Top 10 Holdings as of 12/31/20161§
| | | | | | | | |
Vanguard 500 Index Fund ‘Admiral’ | | | | | | | 20.6% | |
PIMCO Income Fund | | | | | | | 13.6% | |
PIMCO Real Return Fund | | | | | | | 10.3% | |
Vanguard Developed Markets Index Fund ‘Admiral’ | | | | | | | 9.4% | |
PIMCO Real Return Asset Fund | | | | | | | 9.1% | |
PIMCO High Yield Fund | | | | | | | 7.7% | |
Vanguard Emerging Markets Stock Index Fund ‘Admiral’ | | | | | | | 6.8% | |
PIMCO Total Return Fund | | | | | | | 5.9% | |
PIMCO Long Duration Total Return Fund | | | | | | | 4.5% | |
PIMCO Long-Term Credit Fund | | | | | | | 4.5% | |
1 % of Investments, at value.
§ Top 10 Holdings and % of Investments exclude securities sold short, financial derivative instruments and short-term instruments, if any.
Fund Insights
The following impacted performance during the reporting period:
| » | | Exposure to U.S. large market capitalization equities benefited absolute performance, as U.S. large market capitalization equities posted positive returns. |
| » | | Exposure to U.S. high yield credit benefited absolute performance, as U.S. high yield credit posted positive returns. |
| » | | Exposure to developed ex-U.S. equities benefited absolute performance, as developed ex-U.S. equities posted positive returns. |
| » | | Exposure to U.S. small market capitalization equities benefited absolute performance, as U.S. small market capitalization equities posted positive returns. |
| » | | Exposure to U.S. long-term Treasuries detracted from absolute performance, as U.S. long-term Treasuries posted negative returns. |
| » | | Exposure to U.S. long-term Treasury Inflation-Protected Securities (TIPS) detracted from absolute performance, as U.S. long-term TIPS posted negative returns. |
| | | | | | |
| | SEMIANNUAL REPORT | | DECEMBER 31, 2016 | | 9 |
PIMCO REALPATH® Blend 2025 Fund
Cumulative Returns Through December 31, 2016
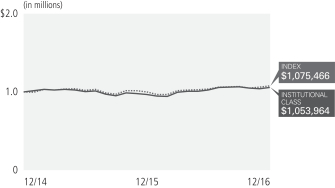
$1,000,000 invested at the end of the month when the Fund’s Institutional Class commenced operations.
Investment Objective and Strategy Overview
PIMCO REALPATH® Blend 2025 Fund seeks to maximize total return, consistent with prudent investment management, by investing under normal circumstances in a combination of affiliated and unaffiliated funds that are registered under the Investment Company Act of 1940, as amended (the “1940 Act”), equity securities, Fixed Income Instruments of varying maturities, or related derivatives on any of the preceding securities mentioned. The Fund may invest in Institutional Class or Class M shares of any funds of the PIMCO Equity Series (the “Trust”) and PIMCO Funds, and in other affiliated funds, including funds of PIMCO ETF Trust, except funds of funds (“Underlying PIMCO Funds”), and unaffiliated funds that are registered under the 1940 Act (collectively, “Acquired Funds”). Under normal circumstances, the Fund seeks to invest substantially all of its equity exposure in index tracking securities, including investments in affiliated or unaffiliated investment companies, which will be registered under the 1940 Act, or related derivatives on such securities or indexes. “Fixed Income Instruments” include bonds, debt securities and other similar instruments issued by various U.S. and non-U.S. public- or private-sector entities. The primary difference between the PIMCO REALPATH® Blend Funds is their asset allocation, which varies depending on the number of years left until the “self-elected” year of retirement indicated in the PIMCO REALPATH® Blend Fund’s name.
The Fund’s long-term asset allocations are based on a “glide path” developed by PIMCO and are based on quantitative and qualitative data relating to various risk metrics, long-term market trends, correlation of asset types and actuarial assumptions of life expectancy and retirement. The glide path changes over time, generally becoming more conservative as the Fund approaches the target date. Fund strategies may change from time to time. Please refer to the Fund’s current prospectus for more information regarding the Fund’s strategy.
| | | | | | | | | | | | | | |
| Average Annual Total Return for the period ended December 31, 2016 | |
| | | | | 6 Months* | | | 1 Year | | | Fund Inception
(12/31/14) | |
| | PIMCO REALPATH® Blend 2025 Fund Institutional Class | | | 2.83% | | | | 9.26% | | | | 2.66% | |
| | PIMCO REALPATH® Blend 2025 Fund Administrative Class | | | 2.70% | | | | 9.00% | | | | 2.40% | |
| | PIMCO REALPATH® Blend 2025 Fund Class A | | | 2.69% | | | | 8.76% | | | | 2.18% | |
| | PIMCO REALPATH® Blend 2025 Fund Class A (adjusted) | | | (2.93)% | | | | 2.76% | | | | (0.66)% | |
| | S&P Target Date 2025 Indexª± | | | 4.00% | | | | 7.82% | | | | 3.70% | |
| | | Real Return Target 2025 Index±± | | | 5.85% | | | | 2.35% | | | | 1.92% | |
All Fund returns are net of fees and expenses.
* Cumulative return.
ª As of June 30, 2016, the Fund’s benchmark was changed from the Real Return Target 2025 Index to the S&P Target Date 2025 Index, which more closely aligns with the Fund’s principal investment strategies. The Real Return Target 2025 Index was discontinued as of this date.
± The S&P Target Date Index Series is comprised of eleven multi-asset class indices, each corresponding to a particular target retirement date. Each index provides varying levels of exposure to each asset class. Each target date allocation is created and retired according to a pre-determined schedule related to the respective target date, as indicated in the index name, and is based on market observations through an annual survey of target date fund managers.
±± Real Return Target 2025 Index is a composite of other indices. The sub-indices represent stocks, bonds, TIPs, commodities and real estate securities. The component asset classes are weighted within each index to reflect a targeted level of risk at the beginning and end of the investment horizon. Over time, the weights are adjusted based on predetermined formulas to systematically reduce the level of potential risk as the index’s maturity date approaches.
It is not possible to invest directly in an unmanaged index.
Performance quoted represents past performance. Past performance is not a guarantee or a reliable indicator of future results. Current performance may be lower or higher than performance shown. Investment return and the principal value of an investment will fluctuate. Shares may be worth more or less than original cost when redeemed. Returns shown do not reflect the deduction of taxes that a shareholder would pay on fund distributions or the redemption of fund shares. Differences in the Fund’s performance versus the index and related attribution information with respect to particular categories of securities or individual positions may be attributable, in part, to differences in the pricing methodologies used by the Fund and the index. The adjusted returns take into account the maximum sales charge of 5.50% on Class A shares. For performance current to the most recent month-end, visit www.pimco.com or call (888) 87-PIMCO.
The Fund’s total annual operating expense ratio as stated in the Fund’s current prospectus, which includes the Acquired Fund Fees and Expenses (Underlying PIMCO Fund Expenses), as supplemented, is 0.35% for the Institutional Class shares, 0.60% for the Administrative Class shares and 0.85% for the Class A shares. Details regarding any Fund’s operating expenses can be found in the Fund’s prospectus.
| | | | |
| Institutional Class - PPZRX | | Administrative Class - PPZDX | | Class A - PPZAX |
Top 10 Holdings as of 12/31/20161§
| | | | | | | | |
Vanguard 500 Index Fund ‘Admiral’ | | | | | | | 24.1% | |
Vanguard Developed Markets Index Fund ‘Admiral’ | | | | | | | 11.6% | |
PIMCO Real Return Asset Fund | | | | | | | 10.4% | |
PIMCO Income Fund | | | | | | | 10.2% | |
Vanguard Emerging Markets Stock Index Fund ‘Admiral’ | | | | | | | 8.5% | |
PIMCO High Yield Fund | | | | | | | 7.7% | |
PIMCO Real Return Fund | | | | | | | 7.2% | |
PIMCO Long-Term Credit Fund | | | | | | | 5.2% | |
PIMCO Long Duration Total Return Fund | | | | | | | 5.1% | |
Vanguard Small-Cap Index Fund ‘Admiral’ | | | | | | | 3.7% | |
1 % of Investments, at value.
§ Top 10 Holdings and % of Investments exclude securities sold short, financial derivative instruments and short-term instruments, if any.
Fund Insights
The following impacted performance during the reporting period:
| » | | Exposure to U.S. large market capitalization equities benefited absolute performance, as U.S. large market capitalization equities posted positive returns. |
| » | | Exposure to U.S. high yield credit benefited absolute performance, as U.S. high yield credit posted positive returns. |
| » | | Exposure to developed ex-U.S. equities benefited absolute performance, as developed ex-U.S. equities posted positive returns. |
| » | | Exposure to U.S. small market capitalization equities benefited absolute performance, as U.S. small market capitalization equities posted positive returns. |
| » | | Exposure to U.S. long-term Treasuries detracted from absolute performance, as U.S. long-term Treasuries posted negative returns. |
| » | | Exposure to U.S. long-term Treasury Inflation-Protected Securities (TIPS) detracted from absolute performance, as U.S. long-term TIPS posted negative returns. |
| | | | | | |
| | SEMIANNUAL REPORT | | DECEMBER 31, 2016 | | 11 |
PIMCO REALPATH® Blend 2030 Fund
Cumulative Returns Through December 31, 2016
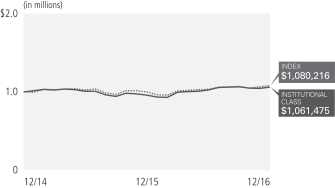
$1,000,000 invested at the end of the month when the Fund’s Institutional Class commenced operations.
Investment Objective and Strategy Overview
PIMCO REALPATH® Blend 2030 Fund seeks to maximize total return, consistent with prudent investment management, by investing under normal circumstances in a combination of affiliated and unaffiliated funds that are registered under the Investment Company Act of 1940, as amended (the “1940 Act”), equity securities, Fixed Income Instruments of varying maturities, or related derivatives on any of the preceding securities mentioned. The Fund may invest in Institutional Class or Class M shares of any funds of the PIMCO Equity Series (the “Trust”) and PIMCO Funds, and in other affiliated funds, including funds of PIMCO ETF Trust, except funds of funds (“Underlying PIMCO Funds”), and unaffiliated funds that are registered under the 1940 Act (collectively, “Acquired Funds”). Under normal circumstances, the Fund seeks to invest substantially all of its equity exposure in index tracking securities, including investments in affiliated or unaffiliated investment companies, which will be registered under the 1940 Act, or related derivatives on such securities or indexes. “Fixed Income Instruments” include bonds, debt securities and other similar instruments issued by various U.S. and non-U.S. public- or private-sector entities. The primary difference between the PIMCO REALPATH® Blend Funds is their asset allocation, which varies depending on the number of years left until the “self-elected” year of retirement indicated in the PIMCO REALPATH® Blend Fund’s name.
The Fund’s long-term asset allocations are based on a “glide path” developed by PIMCO and are based on quantitative and qualitative data relating to various risk metrics, long-term market trends, correlation of asset types and actuarial assumptions of life expectancy and retirement. The glide path changes over time, generally becoming more conservative as the Fund approaches the target date. Fund strategies may change from time to time. Please refer to the Fund’s current prospectus for more information regarding the Fund’s strategy.
| | | | | | | | | | | | | | |
| Average Annual Total Return for the period ended December 31, 2016 | |
| | | | | 6 Months* | | | 1 Year | | | Fund Inception
(12/31/14) | |
| | PIMCO REALPATH® Blend 2030 Fund Institutional Class | | | 3.89% | | | | 10.79% | | | | 3.03% | |
| | PIMCO REALPATH® Blend 2030 Fund Administrative Class | | | 3.68% | | | | 10.58% | | | | 2.79% | |
| | PIMCO REALPATH® Blend 2030 Fund Class A | | | 3.56% | | | | 10.19% | | | | 2.48% | |
| | PIMCO REALPATH® Blend 2030 Fund Class A (adjusted) | | | (2.09)% | | | | 4.16% | | | | (0.37)% | |
| | S&P Target Date 2030 Indexª± | | | 4.61% | | | | 8.35% | | | | 3.93% | |
| | | Real Return Target 2030 Index±± | | | 5.71% | | | | 1.80% | | | | 1.63% | |
All Fund returns are net of fees and expenses.
* Cumulative return.
ª As of June 30, 2016, the Fund’s benchmark was changed from the Real Return Target 2030 Index to the S&P Target Date 2030 Index, which more closely aligns with the Fund’s principal investment strategies. The Real Return Target 2030 Index was discontinued as of this date.
± The S&P Target Date Index Series is comprised of eleven multi-asset class indices, each corresponding to a particular target retirement date. Each index provides varying levels of exposure to each asset class. Each target date allocation is created and retired according to a pre-determined schedule related to the respective target date, as indicated in the index name, and is based on market observations through an annual survey of target date fund managers.
±± Real Return Target 2030 Index is a composite of other indices. The sub-indices represent stocks, bonds, TIPs, commodities and real estate securities. The component asset classes are weighted within each index to reflect a targeted level of risk at the beginning and end of the investment horizon. Over time, the weights are adjusted based on predetermined formulas to systematically reduce the level of potential risk as the index’s maturity date approaches.
It is not possible to invest directly in an unmanaged index.
Performance quoted represents past performance. Past performance is not a guarantee or a reliable indicator of future results. Current performance may be lower or higher than performance shown. Investment return and the principal value of an investment will fluctuate. Shares may be worth more or less than original cost when redeemed. Returns shown do not reflect the deduction of taxes that a shareholder would pay on fund distributions or the redemption of fund shares. Differences in the Fund’s performance versus the index and related attribution information with respect to particular categories of securities or individual positions may be attributable, in part, to differences in the pricing methodologies used by the Fund and the index. The adjusted returns take into account the maximum sales charge of 5.50% on Class A shares. For performance current to the most recent month-end, visit www.pimco.com or call (888) 87-PIMCO.
The Fund’s total annual operating expense ratio as stated in the Fund’s current prospectus, which includes the Acquired Fund Fees and Expenses (Underlying PIMCO Fund Expenses), as supplemented, is 0.32% for the Institutional Class shares, 0.57% for the Administrative Class shares and 0.82% for the Class A shares. Details regarding any Fund’s operating expenses can be found in the Fund’s prospectus.
| | | | |
| Institutional Class - PBPNX | | Administrative Class - PBPRX | | Class A - PBPAX |
Top 10 Holdings as of 12/31/20161§
| | | | | | | | |
Vanguard 500 Index Fund ‘Admiral’ | | | | | | | 28.0% | |
Vanguard Developed Markets Index Fund ‘Admiral’ | | | | | | | 13.3% | |
Vanguard Emerging Markets Stock Index Fund ‘Admiral’ | | | | | | | 9.6% | |
PIMCO Income Fund | | | | | | | 8.8% | |
PIMCO Real Return Asset Fund | | | | | | | 8.3% | |
PIMCO High Yield Fund | | | | | | | 7.5% | |
PIMCO Long-Term Credit Fund | | | | | | | 4.1% | |
PIMCO Long Duration Total Return Fund | | | | | | | 4.1% | |
Vanguard Small-Cap Index Fund ‘Admiral’ | | | | | | | 4.0% | |
PIMCO Real Return Fund | | | | | | | 3.2% | |
1 % of Investments, at value.
§ Top 10 Holdings and % of Investments exclude securities sold short, financial derivative instruments and short-term instruments, if any.
Fund Insights
The following impacted performance during the reporting period:
| » | | Exposure to U.S. large market capitalization equities benefited absolute performance, as U.S. large market capitalization equities posted positive returns. |
| » | | Exposure to U.S. high yield credit benefited absolute performance, as U.S. high yield credit posted positive returns. |
| » | | Exposure to developed ex-U.S. equities benefited absolute performance, as developed ex-U.S. equities posted positive returns. |
| » | | Exposure to U.S. small market capitalization equities benefited absolute performance, as U.S. small market capitalization equities posted positive returns. |
| » | | Exposure to U.S. long-term Treasuries detracted from absolute performance, as U.S. long-term Treasuries posted negative returns. |
| » | | Exposure to U.S. long-term Treasury Inflation-Protected Securities (TIPS) detracted from absolute performance, as U.S. long-term TIPS posted negative returns. |
| | | | | | |
| | SEMIANNUAL REPORT | | DECEMBER 31, 2016 | | 13 |
PIMCO REALPATH® Blend 2035 Fund
Cumulative Returns Through December 31, 2016
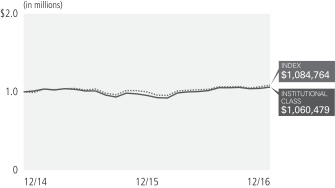
$1,000,000 invested at the end of the month when the Fund’s Institutional Class commenced operations.
Investment Objective and Strategy Overview
PIMCO REALPATH® Blend 2035 Fund seeks to maximize total return, consistent with prudent investment management, by investing under normal circumstances in a combination of affiliated and unaffiliated funds that are registered under the Investment Company Act of 1940, as amended (the “1940 Act”), equity securities, Fixed Income Instruments of varying maturities, or related derivatives on any of the preceding securities mentioned. The Fund may invest in Institutional Class or Class M shares of any funds of the PIMCO Equity Series (the “Trust”) and PIMCO Funds, and in other affiliated funds, including funds of PIMCO ETF Trust, except funds of funds (“Underlying PIMCO Funds”), and unaffiliated funds that are registered under the 1940 Act (collectively, “Acquired Funds”). Under normal circumstances, the Fund seeks to invest substantially all of its equity exposure in index tracking securities, including investments in affiliated or unaffiliated investment companies, which will be registered under the 1940 Act, or related derivatives on such securities or indexes. “Fixed Income Instruments” include bonds, debt securities and other similar instruments issued by various U.S. and non-U.S. public- or private-sector entities. The primary difference between the PIMCO REALPATH® Blend Funds is their asset allocation, which varies depending on the number of years left until the “self-elected” year of retirement indicated in the PIMCO REALPATH® Blend Fund’s name.
The Fund’s long-term asset allocations are based on a “glide path” developed by PIMCO and are based on quantitative and qualitative data relating to various risk metrics, long-term market trends, correlation of asset types and actuarial assumptions of life expectancy and retirement. The glide path changes over time, generally becoming more conservative as the Fund approaches the target date. Fund strategies may change from time to time. Please refer to the Fund’s current prospectus for more information regarding the Fund’s strategy.
| | | | | | | | | | | | | | |
| Average Annual Total Return for the period ended December 31, 2016 | |
| | | | | 6 Months* | | | 1 Year | | | Fund Inception
(12/31/14) | |
| | PIMCO REALPATH® Blend 2035 Fund Institutional Class | | | 4.44% | | | | 11.05% | | | | 2.98% | |
| | PIMCO REALPATH® Blend 2035 Fund Administrative Class | | | 4.22% | | | | 10.68% | | | | 2.65% | |
| | PIMCO REALPATH® Blend 2035 Fund Class A | | | 4.12% | | | | 10.46% | | | | 2.48% | |
| | PIMCO REALPATH® Blend 2035 Fund Class A (adjusted) | | | (1.65)% | | | | 4.44% | | | | (0.37)% | |
| | S&P Target Date 2035 Indexª± | | | 5.23% | | | | 8.85% | | | | 4.15% | |
| | | Real Return Target 2035 Index±± | | | 5.54% | | | | 1.03% | | | | 1.23% | |
All Fund returns are net of fees and expenses.
* Cumulative return.
ª As of June 30, 2016, the Fund’s benchmark was changed from the Real Return Target 2035 Index to the S&P Target Date 2035 Index, which more closely aligns with the Fund’s principal investment strategies. The Real Return Target 2035 Index was discontinued as of this date.
± The S&P Target Date Index Series is comprised of eleven multi-asset class indices, each corresponding to a particular target retirement date. Each index provides varying levels of exposure to each asset class. Each target date allocation is created and retired according to a pre-deter mined schedule related to the respective target date, as indicated in the index name, and is based on market observations through an annual survey of target date fund managers.
±± Real Return Target 2035 Index is a composite of other indices. The sub-indices represent stocks, bonds, TIPs, commodities and real estate securities. The component asset classes are weighted within each index to reflect a targeted level of risk at the beginning and end of the investment horizon. Over time, the weights are adjusted based on predetermined formulas to systematically reduce the level of potential risk as the index’s maturity date approaches.
It is not possible to invest directly in an unmanaged index.
Performance quoted represents past performance. Past performance is not a guarantee or a reliable indicator of future results. Current performance may be lower or higher than performance shown. Investment return and the principal value of an investment will fluctuate. Shares may be worth more or less than original cost when redeemed. Returns shown do not reflect the deduction of taxes that a shareholder would pay on fund distributions or the redemption of fund shares. Differences in the Fund’s performance versus the index and related attribution information with respect to particular categories of securities or individual positions may be attributable, in part, to differences in the pricing methodologies used by the Fund and the index. The adjusted returns take into account the maximum sales charge of 5.50% on Class A shares. For performance current to the most recent month-end, visit www.pimco.com or call (888) 87-PIMCO.
The Fund’s total annual operating expense ratio as stated in the Fund’s current prospectus, which includes the Acquired Fund Fees and Expenses (Underlying PIMCO Fund Expenses), as supplemented, is 0.28% for the Institutional Class shares, 0.53% for the Administrative Class shares and 0.78% for the Class A shares. Details regarding any Fund’s operating expenses can be found in the Fund’s prospectus.
| | | | |
| Institutional Class - PDGZX | | Administrative Class - PDGDX | | Class A - PDGAX |
Top 10 Holdings as of 12/31/20161§
| | | | | | | | |
Vanguard 500 Index Fund ‘Admiral’ | | | | | | | 32.2% | |
Vanguard Developed Markets Index Fund ‘Admiral’ | | | | | | | 15.5% | |
Vanguard Emerging Markets Stock Index Fund ‘Admiral’ | | | | | | | 10.8% | |
PIMCO Income Fund | | | | | | | 8.1% | |
PIMCO High Yield Fund | | | | | | | 7.1% | |
Vanguard Small-Cap Index Fund ‘Admiral’ | | | | | | | 4.7% | |
PIMCO Real Return Asset Fund | | | | | | | 4.1% | |
PIMCO Long Duration Total Return Fund | | | | | | | 2.7% | |
PIMCO Long-Term Credit Fund | | | | | | | 2.7% | |
PIMCO Real Return Fund | | | | | | | 2.0% | |
1 % of Investments, at value.
§ Top 10 Holdings and % of Investments exclude securities sold short, financial derivative instruments and short-term instruments, if any.
Fund Insights
The following impacted performance during the reporting period:
| » | | Exposure to U.S. large market capitalization equities benefited absolute performance, as U.S. large market capitalization equities posted positive returns. |
| » | | Exposure to U.S. high yield credit benefited absolute performance, as U.S. high yield credit posted positive returns. |
| » | | Exposure to developed ex-U.S. equities benefited absolute performance, as developed ex-U.S. equities posted positive returns. |
| » | | Exposure to U.S. small market capitalization equities benefited absolute performance, as U.S. small market capitalization equities posted positive returns. |
| » | | Exposure to U.S. long-term Treasuries detracted from absolute performance, as U.S. long-term Treasuries posted negative returns. |
| » | | Exposure to real estate investment trusts (REITs) detracted from absolute performance, as REITs posted negative returns. |
| | | | | | |
| | SEMIANNUAL REPORT | | DECEMBER 31, 2016 | | 15 |
PIMCO REALPATH® Blend 2040 Fund
Cumulative Returns Through December 31, 2016
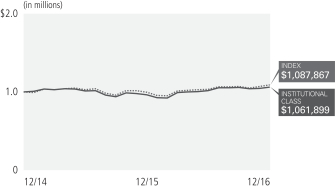
$1,000,000 invested at the end of the month when the Fund’s Institutional Class commenced operations.
Investment Objective and Strategy Overview
PIMCO REALPATH® Blend 2040 Fund seeks to maximize total return, consistent with prudent investment management, by investing under normal circumstances in a combination of affiliated and unaffiliated funds that are registered under the Investment Company Act of 1940, as amended (the “1940 Act”), equity securities, Fixed Income Instruments of varying maturities, or related derivatives on any of the preceding securities mentioned. The Fund may invest in Institutional Class or Class M shares of any funds of the PIMCO Equity Series (the “Trust”) and PIMCO Funds, and in other affiliated funds, including funds of PIMCO ETF Trust, except funds of funds (“Underlying PIMCO Funds”), and unaffiliated funds that are registered under the 1940 Act (collectively, “Acquired Funds”). Under normal circumstances, the Fund seeks to invest substantially all of its equity exposure in index tracking securities, including investments in affiliated or unaffiliated investment companies, which will be registered under the 1940 Act, or related derivatives on such securities or indexes. “Fixed Income Instruments” include bonds, debt securities and other similar instruments issued by various U.S. and non-U.S. public- or private-sector entities. The primary difference between the PIMCO REALPATH® Blend Funds is their asset allocation, which varies depending on the number of years left until the “self-elected” year of retirement indicated in the PIMCO REALPATH® Blend Fund’s name.
The Fund’s long-term asset allocations are based on a “glide path” developed by PIMCO and are based on quantitative and qualitative data relating to various risk metrics, long-term market trends, correlation of asset types and actuarial assumptions of life expectancy and retirement. The glide path changes over time, generally becoming more conservative as the Fund approaches the target date. Fund strategies may change from time to time. Please refer to the Fund’s current prospectus for more information regarding the Fund’s strategy.
| | | | | | | | | | | | | | |
| Average Annual Total Return for the period ended December 31, 2016 | |
| | | | | 6 Months* | | | 1 Year | | | Fund Inception
(12/31/14) | |
| | PIMCO REALPATH® Blend 2040 Fund Institutional Class | | | 4.44% | | | | 10.65% | | | | 3.05% | |
| | PIMCO REALPATH® Blend 2040 Fund Administrative Class | | | 4.42% | | | | 10.39% | | | | 2.81% | |
| | PIMCO REALPATH® Blend 2040 Fund Class A | | | 4.29% | | | | 10.13% | | | | 2.57% | |
| | PIMCO REALPATH® Blend 2040 Fund Class A (adjusted) | | | (1.43)% | | | | 4.04% | | | | (0.28)% | |
| | S&P Target Date 2040 Indexª± | | | 5.68% | | | | 9.23% | | | | 4.29% | |
| | | Real Return Target 2040 Index±± | | | 5.33% | | | | 0.20% | | | | 0.80% | |
All Fund returns are net of fees and expenses.
* Cumulative return.
ª As of June 30, 2016, the Fund’s benchmark was changed from the Real Return Target 2040 Index to the S&P Target Date 2040 Index, which more closely aligns with the Fund’s principal investment strategies. The Real Return Target 2040 Index was discontinued as of this date.
± The S&P Target Date Index Series is comprised of eleven multi-asset class indices, each corresponding to a particular target retirement date. Each index provides varying levels of exposure to each asset class. Each target date allocation is created and retired according to a pre-determined schedule related to the respective target date, as indicated in the index name, and is based on market observations through an annual survey of target date fund managers.
±± Real Return Target 2040 Index is a composite of other indices. The sub-indices represent stocks, bonds, TIPs, commodities and real estate securities. The component asset classes are weighted within each index to reflect a targeted level of risk at the beginning and end of the investment horizon. Over time, the weights are adjusted based on predetermined formulas to systematically reduce the level of potential risk as the index’s maturity date approaches.
It is not possible to invest directly in an unmanaged index.
Performance quoted represents past performance. Past performance is not a guarantee or a reliable indicator of future results. Current performance may be lower or higher than performance shown. Investment return and the principal value of an investment will fluctuate. Shares may be worth more or less than original cost when redeemed. Returns shown do not reflect the deduction of taxes that a shareholder would pay on fund distributions or the redemption of fund shares. Differences in the Fund’s performance versus the index and related attribution information with respect to particular categories of securities or individual positions may be attributable, in part, to differences in the pricing methodologies used by the Fund and the index. The adjusted returns take into account the maximum sales charge of 5.50% on Class A shares. For performance current to the most recent month-end, visit www.pimco.com or call (888) 87-PIMCO.
The Fund’s total annual operating expense ratio as stated in the Fund’s current prospectus, which includes the Acquired Fund Fees and Expenses (Underlying PIMCO Fund Expenses), as supplemented, is 0.25% for the Institutional Class shares, 0.50% for the Administrative Class shares and 0.75% for the Class A shares. Details regarding any Fund’s operating expenses can be found in the Fund’s prospectus.
| | | | |
| Institutional Class - PVPNX | | Administrative Class - PVPRX | | Class A - PVPAX |
Top 10 Holdings as of 12/31/20161§
| | | | | | | | |
Vanguard 500 Index Fund ‘Admiral’ | | | | | | | 35.0% | |
Vanguard Developed Markets Index Fund ‘Admiral’ | | | | | | | 17.1% | |
Vanguard Emerging Markets Stock Index Fund ‘Admiral’ | | | | | | | 11.9% | |
PIMCO Income Fund | | | | | | | 6.5% | |
PIMCO High Yield Fund | | | | | | | 5.5% | |
Vanguard Small-Cap Index Fund ‘Admiral’ | | | | | | | 5.1% | |
PIMCO Real Return Fund | | | | | | | 2.1% | |
PIMCO Real Return Asset Fund | | | | | | | 2.0% | |
PIMCO Long Duration Total Return Fund | | | | | | | 1.8% | |
PIMCO Long-Term Credit Fund | | | | | | | 1.8% | |
1 % of Investments, at value.
§ Top 10 Holdings and % of Investments exclude securities sold short, financial derivative instruments and short-term instruments, if any.
Fund Insights
The following impacted performance during the reporting period:
| » | | Exposure to U.S. large market capitalization equities benefited absolute performance, as U.S. large market capitalization equities posted positive returns. |
| » | | Exposure to U.S. high yield credit benefited absolute performance, as U.S. high yield credit posted positive returns. |
| » | | Exposure to developed ex-U.S. equities benefited absolute performance, as developed ex-U.S. equities posted positive returns. |
| » | | Exposure to U.S. small market capitalization equities benefited absolute performance, as U.S. small market capitalization equities posted positive returns. |
| » | | Exposure to U.S. long-term Treasuries detracted from absolute performance, as U.S. long-term Treasuries posted negative returns. |
| » | | Exposure to real estate investment trusts (REITs) detracted from absolute performance, as REITs posted negative returns. |
| | | | | | |
| | SEMIANNUAL REPORT | | DECEMBER 31, 2016 | | 17 |
PIMCO REALPATH® Blend 2045 Fund
Cumulative Returns Through December 31, 2016

$1,000,000 invested at the end of the month when the Fund’s Institutional Class commenced operations.
Investment Objective and Strategy Overview
PIMCO REALPATH® Blend 2045 Fund seeks to maximize total return, consistent with prudent investment management, by investing under normal circumstances in a combination of affiliated and unaffiliated funds that are registered under the Investment Company Act of 1940, as amended (the “1940 Act”), equity securities, Fixed Income Instruments of varying maturities, or related derivatives on any of the preceding securities mentioned. The Fund may invest in Institutional Class or Class M shares of any funds of the PIMCO Equity Series (the “Trust”) and PIMCO Funds, and in other affiliated funds, including funds of PIMCO ETF Trust, except funds of funds (“Underlying PIMCO Funds”), and unaffiliated funds that are registered under the 1940 Act (collectively, “Acquired Funds”). Under normal circumstances, the Fund seeks to invest substantially all of its equity exposure in index tracking securities, including investments in affiliated or unaffiliated investment companies, which will be registered under the 1940 Act, or related derivatives on such securities or indexes. “Fixed Income Instruments” include bonds, debt securities and other similar instruments issued by various U.S. and non-U.S. public- or private-sector entities. The primary difference between the PIMCO REALPATH® Blend Funds is their asset allocation, which varies depending on the number of years left until the “self-elected” year of retirement indicated in the PIMCO REALPATH® Blend Fund’s name.
The Fund’s long-term asset allocations are based on a “glide path” developed by PIMCO and are based on quantitative and qualitative data relating to various risk metrics, long-term market trends, correlation of asset types and actuarial assumptions of life expectancy and retirement. The glide path changes over time, generally becoming more conservative as the Fund approaches the target date. Fund strategies may change from time to time. Please refer to the Fund’s current prospectus for more information regarding the Fund’s strategy.
| | | | | | | | | | | | | | |
| Average Annual Total Return for the period ended December 31, 2016 | |
| | | | | 6 Months* | | | 1 Year | | | Fund Inception
(12/31/14) | |
| | PIMCO REALPATH® Blend 2045 Fund Institutional Class | | | 4.56% | | | | 10.38% | | | | 2.78% | |
| | PIMCO REALPATH® Blend 2045 Fund Administrative Class | | | 4.35% | | | | 10.04% | | | | 2.50% | |
| | PIMCO REALPATH® Blend 2045 Fund Class A | | | 4.21% | | | | 9.76% | | | | 2.26% | |
| | PIMCO REALPATH® Blend 2045 Fund Class A (adjusted) | | | (1.52)% | | | | 3.68% | | | | (0.59)% | |
| | S&P Target Date 2045 Indexª± | | | 6.06% | | | | 9.54% | | | | 4.41% | |
| | | Real Return Target 2045 Index±± | | | 5.12% | | | | (0.47)% | | | | 0.47% | |
All Fund returns are net of fees and expenses.
* Cumulative return.
ª As of June 30, 2016, the Fund’s benchmark was changed from the Real Return Target 2045 Index to the S&P Target Date 2045 Index, which more closely aligns with the Fund’s principal investment strategies. The Real Return Target 2045 Index was discontinued as of this date.
± The S&P Target Date Index Series is comprised of eleven multi-asset class indices, each corresponding to a particular target retirement date. Each index provides varying levels of exposure to each asset class. Each target date allocation is created and retired according to a pre-determined schedule related to the respective target date, as indicated in the index name, and is based on market observations through an annual survey of target date fund managers.
±± Real Return Target 2045 Index is a composite of other indices. The sub-indices represent stocks, bonds, TIPs, commodities and real estate securities. The component asset classes are weighted within each index to reflect a targeted level of risk at the beginning and end of the investment horizon. Over time, the weights are adjusted based on predetermined formulas to systematically reduce the level of potential risk as the index’s maturity date approaches.
It is not possible to invest directly in an unmanaged index.
Performance quoted represents past performance. Past performance is not a guarantee or a reliable indicator of future results. Current performance may be lower or higher than performance shown. Investment return and the principal value of an investment will fluctuate. Shares may be worth more or less than original cost when redeemed. Returns shown do not reflect the deduction of taxes that a shareholder would pay on fund distributions or the redemption of fund shares. Differences in the Fund’s performance versus the index and related attribution information with respect to particular categories of securities or individual positions may be attributable, in part, to differences in the pricing methodologies used by the Fund and the index. The adjusted returns take into account the maximum sales charge of 5.50% on Class A shares. For performance current to the most recent month-end, visit www.pimco.com or call (888) 87-PIMCO.
The Fund’s total annual operating expense ratio as stated in the Fund’s current prospectus, which includes the Acquired Fund Fees and Expenses (Underlying PIMCO Fund Expenses), as supplemented, is 0.23% for the Institutional Class shares, 0.48% for the Administrative Class shares and 0.73% for the Class A shares. Details regarding any Fund’s operating expenses can be found in the Fund’s prospectus.
| | | | |
| Institutional Class - PVQNX | | Administrative Class - PVQDX | | Class A - PVQAX |
Top 10 Holdings as of 12/31/20161§
| | | | | | | | |
Vanguard 500 Index Fund ‘Admiral’ | | | | | | | 37.0% | |
Vanguard Developed Markets Index Fund ‘Admiral’ | | | | | | | 18.1% | |
Vanguard Emerging Markets Stock Index Fund ‘Admiral’ | | | | | | | 13.0% | |
Vanguard Small-Cap Index Fund ‘Admiral’ | | | | | | | 5.1% | |
PIMCO Income Fund | | | | | | | 4.4% | |
PIMCO High Yield Fund | | | | | | | 3.4% | |
PIMCO Real Return Asset Fund | | | | | | | 2.1% | |
PIMCO Emerging Local Bond Fund | | | | | | | 2.0% | |
PIMCO Real Return Fund | | | | | | | 2.0% | |
PIMCO Long-Term Credit Fund | | | | | | | 1.5% | |
1 % of Investments, at value.
§ Top 10 Holdings and % of Investments exclude securities sold short, financial derivative instruments and short-term instruments, if any.
Fund Insights
The following impacted performance during the reporting period:
| » | | Exposure to U.S. large market capitalization equities benefited absolute performance, as U.S. large market capitalization equities posted positive returns. |
| » | | Exposure to emerging market equities benefited absolute performance, as emerging market equities posted positive returns. |
| » | | Exposure to developed ex-U.S. equities benefited absolute performance, as developed ex-U.S. equities posted positive returns. |
| » | | Exposure to U.S. small market capitalization equities benefited absolute performance, as U.S. small market capitalization equities posted positive returns. |
| » | | Exposure to U.S. long-term Treasuries detracted from absolute performance, as U.S. long-term Treasuries posted negative returns. |
| » | | Exposure to real estate investment trusts (REITs) detracted from absolute performance, as REITs posted negative returns. |
| | | | | | |
| | SEMIANNUAL REPORT | | DECEMBER 31, 2016 | | 19 |
PIMCO REALPATH® Blend 2050 Fund
Cumulative Returns Through December 31, 2016
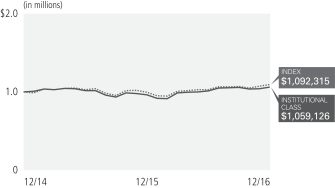
$1,000,000 invested at the end of the month when the Fund’s Institutional Class commenced operations.
Investment Objective and Strategy Overview
PIMCO REALPATH® Blend 2050 Fund seeks to maximize total return, consistent with prudent investment management, by investing under normal circumstances in a combination of affiliated and unaffiliated funds that are registered under the Investment Company Act of 1940, as amended (the “1940 Act”), equity securities, Fixed Income Instruments of varying maturities, or related derivatives on any of the preceding securities mentioned. The Fund may invest in Institutional Class or Class M shares of any funds of the PIMCO Equity Series (the “Trust”) and PIMCO Funds, and in other affiliated funds, including funds of PIMCO ETF Trust, except funds of funds (“Underlying PIMCO Funds”), and unaffiliated funds that are registered under the 1940 Act (collectively, “Acquired Funds”). Under normal circumstances, the Fund seeks to invest substantially all of its equity exposure in index tracking securities, including investments in affiliated or unaffiliated investment companies, which will be registered under the 1940 Act, or related derivatives on such securities or indexes. “Fixed Income Instruments” include bonds, debt securities and other similar instruments issued by various U.S. and non-U.S. public- or private-sector entities. The primary difference between the PIMCO REALPATH® Blend Funds is their asset allocation, which varies depending on the number of years left until the “self-elected” year of retirement indicated in the PIMCO REALPATH® Blend Fund’s name.
The Fund’s long-term asset allocations are based on a “glide path” developed by PIMCO and are based on quantitative and qualitative data relating to various risk metrics, long-term market trends, correlation of asset types and actuarial assumptions of life expectancy and retirement. The glide path changes over time, generally becoming more conservative as the Fund approaches the target date. Fund strategies may change from time to time. Please refer to the Fund’s current prospectus for more information regarding the Fund’s strategy.
| | | | | | | | | | | | | | |
| Average Annual Total Return for the period ended December 31, 2016 | |
| | | | | 6 Months* | | | 1 Year | | | Fund Inception
(12/31/14) | |
| | PIMCO REALPATH® Blend 2050 Fund Institutional Class | | | 4.68% | | | | 10.31% | | | | 2.91% | |
| | PIMCO REALPATH® Blend 2050 Fund Administrative Class | | | 4.55% | | | | 10.04% | | | | 2.65% | |
| | PIMCO REALPATH® Blend 2050 Fund Class A | | | 4.43% | | | | 9.83% | | | | 2.40% | |
| | PIMCO REALPATH® Blend 2050 Fund Class A (adjusted) | | | (1.31)% | | | | 3.74% | | | | (0.45)% | |
| | S&P Target Date 2050 Indexª± | | | 6.40% | | | | 9.74% | | | | 4.51% | |
| | | Real Return Target 2050 Index±± | | | 4.87% | | | | (0.98)% | | | | 0.26% | |
All Fund returns are net of fees and expenses.
* Cumulative return.
ª As of June 30, 2016, the Fund’s benchmark was changed from the Real Return Target 2050 Index to the S&P Target Date 2050 Index, which more closely aligns with the Fund’s principal investment strategies. The Real Return Target 2050 Index was discontinued as of this date.
± The S&P Target Date Index Series is comprised of eleven multi-asset class indices, each corresponding to a particular target retirement date. Each index provides varying levels of exposure to each asset class. Each target date allocation is created and retired according to a pre-determined schedule related to the respective target date, as indicated in the index name, and is based on market observations through an annual survey of target date fund managers.
±± Real Return Target 2050 Index is a composite of other indices. The sub-indices represent stocks, bonds, TIPs, commodities and real estate securities. The component asset classes are weighted within each index to reflect a targeted level of risk at the beginning and end of the investment horizon. Over time, the weights are adjusted based on predetermined formulas to systematically reduce the level of potential risk as the index’s maturity date approaches.
It is not possible to invest directly in an unmanaged index.
Performance quoted represents past performance. Past performance is not a guarantee or a reliable indicator of future results. Current performance may be lower or higher than performance shown. Investment return and the principal value of an investment will fluctuate. Shares may be worth more or less than original cost when redeemed. Returns shown do not reflect the deduction of taxes that a shareholder would pay on fund distributions or the redemption of fund shares. Differences in the Fund’s performance versus the index and related attribution information with respect to particular categories of securities or individual positions may be attributable, in part, to differences in the pricing methodologies used by the Fund and the index. The adjusted returns take into account the maximum sales charge of 5.50% on Class A shares. For performance current to the most recent month-end, visit www.pimco.com or call (888) 87-PIMCO.
The Fund’s total annual operating expense ratio as stated in the Fund’s current prospectus, which includes the Acquired Fund Fees and Expenses (Underlying PIMCO Fund Expenses), as supplemented, is 0.21% for the Institutional Class shares, 0.46% for the Administrative Class shares and 0.71% for the Class A shares. Details regarding any Fund’s operating expenses can be found in the Fund’s prospectus.
| | | | |
| Institutional Class - PPQZX | | Administrative Class - PPQDX | | Class A - PPQAX |
Top 10 Holdings as of 12/31/20161§
| | | | | | | | |
Vanguard 500 Index Fund ‘Admiral’ | | | | | | | 38.9% | |
Vanguard Developed Markets Index Fund ‘Admiral’ | | | | | | | 18.8% | |
Vanguard Emerging Markets Stock Index Fund ‘Admiral’ | | | | | | | 13.5% | |
Vanguard Small-Cap Index Fund ‘Admiral’ | | | | | | | 5.1% | |
PIMCO Income Fund | | | | | | | 3.6% | |
PIMCO High Yield Fund | | | | | | | 2.6% | |
PIMCO Real Return Fund | | | | | | | 2.1% | |
PIMCO Emerging Local Bond Fund | | | | | | | 2.1% | |
PIMCO Long-Term Credit Fund | | | | | | | 1.5% | |
PIMCO Long Duration Total Return Fund | | | | | | | 1.5% | |
1 % of Investments, at value.
§ Top 10 Holdings and % of Investments exclude securities sold short, financial derivative instruments and short-term instruments, if any.
Fund Insights
The following impacted performance during the reporting period:
| » | | Exposure to U.S. large market capitalization equities benefited absolute performance, as U.S. large market capitalization equities posted positive returns. |
| » | | Exposure to emerging market equities benefited absolute performance, as emerging market equities posted positive returns. |
| » | | Exposure to developed ex-U.S. equities benefited absolute performance, as developed ex-U.S. equities posted positive returns. |
| » | | Exposure to U.S. small market capitalization equities benefited absolute performance, as U.S. small market capitalization equities posted positive returns. |
| » | | Exposure to U.S. long-term Treasuries detracted from absolute performance, as U.S. long-term Treasuries posted negative returns. |
| » | | Exposure to real estate investment trusts (REITs) detracted from absolute performance, as REITs posted negative returns. |
| | | | | | |
| | SEMIANNUAL REPORT | | DECEMBER 31, 2016 | | 21 |
PIMCO REALPATH® Blend 2055 Fund
Cumulative Returns Through December 31, 2016
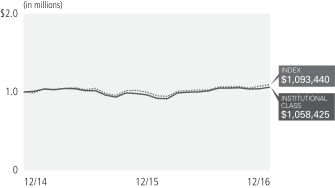
$1,000,000 invested at the end of the month when the Fund’s Institutional Class commenced operations.
Investment Objective and Strategy Overview
PIMCO REALPATH® Blend 2055 Fund seeks to maximize total return, consistent with prudent investment management, by investing under normal circumstances in a combination of affiliated and unaffiliated funds that are registered under the Investment Company Act of 1940, as amended (the “1940 Act”), equity securities, Fixed Income Instruments of varying maturities, or related derivatives on any of the preceding securities mentioned. The Fund may invest in Institutional Class or Class M shares of any funds of the PIMCO Equity Series (the “Trust”) and PIMCO Funds, and in other affiliated funds, including funds of PIMCO ETF Trust, except funds of funds (“Underlying PIMCO Funds”), and unaffiliated funds that are registered under the 1940 Act (collectively, “Acquired Funds”). Under normal circumstances, the Fund seeks to invest substantially all of its equity exposure in index tracking securities, including investments in affiliated or unaffiliated investment companies, which will be registered under the 1940 Act, or related derivatives on such securities or indexes. “Fixed Income Instruments” include bonds, debt securities and other similar instruments issued by various U.S. and non-U.S. public- or private-sector entities. The primary difference between the PIMCO REALPATH® Blend Funds is their asset allocation, which varies depending on the number of years left until the “self-elected” year of retirement indicated in the PIMCO REALPATH® Blend Fund’s name.
The Fund’s long-term asset allocations are based on a “glide path” developed by PIMCO and are based on quantitative and qualitative data relating to various risk metrics, long-term market trends, correlation of asset types and actuarial assumptions of life expectancy and retirement. The glide path changes over time, generally becoming more conservative as the Fund approaches the target date. Fund strategies may change from time to time. Please refer to the Fund’s current prospectus for more information regarding the Fund’s strategy.
| | | | | | | | | | | | | | |
| Average Annual Total Return for the period ended December 31, 2016 | |
| | | | | 6 Months* | | | 1 Year | | | Fund Inception
(12/31/14) | |
| | PIMCO REALPATH® Blend 2055 Fund Institutional Class | | | 4.69% | | | | 10.30% | | | | 2.88% | |
| | PIMCO REALPATH® Blend 2055 Fund Administrative Class | | | 4.59% | | | | 10.07% | | | | 2.62% | |
| | PIMCO REALPATH® Blend 2055 Fund Class A | | | 4.31% | | | | 9.77% | | | | 2.30% | |
| | PIMCO REALPATH® Blend 2055 Fund Class A (adjusted) | | | (1.43)% | | | | 3.69% | | | | (0.54)% | |
| | S&P Target Date 2055+ Indexª± | | | 6.67% | | | | 9.94% | | | | 4.56% | |
| | | Real Return Target 40+ Index±± | | | 4.69% | | | | (1.30)% | | | | 0.11% | |
All Fund returns are net of fees and expenses.
* Cumulative return.
ª As of June 30, 2016, the Fund’s benchmark was changed from the Real Return Target 40+ Index to the S&P Target Date 2055+ Index, which more closely aligns with the Fund’s principal investment strategies. The Real Return Target 40+ Index was discontinued as of this date.
± The S&P Target Date Index Series is comprised of eleven multi-asset class indices, each corresponding to a particular target retirement date. Each index provides varying levels of exposure to e.ach asset class. Each target date allocation is created and retired according to a pre-determined schedule related to the respective target date, as indicated in the index name, and is based on market observations through an annual survey of target date fund managers.
±± Real Return Target 40+ Index is a composite of other indices. The sub-indices represent stocks, bonds, TIPs, commodities and real estate securities. The component asset classes are weighted within each index to reflect a targeted level of risk at the beginning and end of the investment horizon. Over time, the weights are adjusted based on predetermined formulas to systematically reduce the level of potential risk as the index’s maturity date approaches.
t is not possible to invest directly in an unmanaged index.
Performance quoted represents past performance. Past performance is not a guarantee or a reliable indicator of future results. Current performance may be lower or higher than performance shown. Investment return and the principal value of an investment will fluctuate. Shares may be worth more or less than original cost when redeemed. Returns shown do not reflect the deduction of taxes that a shareholder would pay on fund distributions or the redemption of fund shares. Differences in the Fund’s performance versus the index and related attribution information with respect to particular categories of securities or individual positions may be attributable, in part, to differences in the pricing methodologies used by the Fund and the index. The adjusted returns take into account the maximum sales charge of 5.50% on Class A shares. For performance current to the most recent month-end, visit www.pimco.com or call (888) 87-PIMCO.
The Fund’s total annual operating expense ratio as stated in the Fund’s current prospectus, which includes the Acquired Fund Fees and Expenses (Underlying PIMCO Fund Expenses), as supplemented, is 0.21% for the Institutional Class shares, 0.46% for the Administrative Class and 0.71% for the Class A shares. Details regarding any Fund’s operating expenses can be found in the Fund’s prospectus.
| | | | |
| Institutional Class - PRQZX | | Administrative Class - PRQDX | | Class A - PRQAX |
Top 10 Holdings as of 12/31/20161§
| | | | | | | | |
Vanguard 500 Index Fund ‘Admiral’ | | | | | | | 39.9% | |
Vanguard Developed Markets Index Fund ‘Admiral’ | | | | | | | 19.1% | |
Vanguard Emerging Markets Stock Index Fund ‘Admiral’ | | | | | | | 13.7% | |
Vanguard Small-Cap Index Fund ‘Admiral’ | | | | | | | 5.2% | |
PIMCO Income Fund | | | | | | | 3.6% | |
PIMCO High Yield Fund | | | | | | | 2.6% | |
PIMCO Emerging Local Bond Fund | | | | | | | 2.1% | |
PIMCO Real Return Fund | | | | | | | 2.0% | |
PIMCO Long-Term Credit Fund | | | | | | | 1.6% | |
PIMCO Long Duration Total Return Fund | | | | | | | 1.5% | |
1 % of Investments, at value.
§ Top 10 Holdings and % of Investments exclude securities sold short, financial derivative instruments and short-term instruments, if any.
Fund Insights
The following impacted performance during the reporting period:
| » | | Exposure to U.S. large market capitalization equities benefited absolute performance, as U.S. large market capitalization equities posted positive returns. |
| » | | Exposure to emerging market equities benefited absolute performance, as emerging market equities posted positive returns. |
| » | | Exposure to developed ex-U.S. equities benefited absolute performance, as developed ex-U.S. equities posted positive returns. |
| » | | Exposure to U.S. small market capitalization equities benefited absolute performance, as U.S. small market capitalization equities posted positive returns. |
| » | | Exposure to U.S. long-term Treasuries detracted from absolute performance, as U.S. long-term Treasuries posted negative returns. |
| » | | Exposure to real estate investment trusts (REITs) detracted from absolute performance, as REITs posted negative returns. |
| | | | | | |
| | SEMIANNUAL REPORT | | DECEMBER 31, 2016 | | 23 |
PIMCO REALPATH® Blend Income Fund
Cumulative Returns Through December 31, 2016
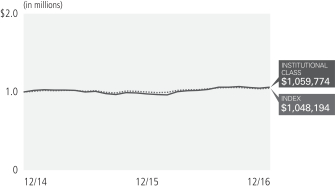
$1,000,000 invested at the end of the month when the Fund’s Institutional Class commenced operations.
Investment Objective and Strategy Overview
PIMCO REALPATH® Blend Income Fund seeks to maximize total return, consistent with prudent investment management, by investing under normal circumstances in a combination of affiliated and unaffiliated funds that are registered under the Investment Company Act of 1940, as amended (the “1940 Act”), equity securities, Fixed Income Instruments of varying maturities, or related derivatives on any of the preceding securities mentioned. The Fund may invest in Institutional Class or Class M shares of any funds of the PIMCO Equity Series (the “Trust”) and PIMCO Funds, and in other affiliated funds, including funds of PIMCO ETF Trust, except funds of funds (“Underlying PIMCO Funds”), and unaffiliated funds that are registered under the 1940 Act (collectively, “Acquired Funds”). Under normal circumstances, the Fund seeks to invest substantially all of its equity exposure in index tracking securities, including investments in affiliated or unaffiliated investment companies, which will be registered under the 1940 Act, or related derivatives on such securities or indexes. “Fixed Income Instruments” include bonds, debt securities and other similar instruments issued by various U.S. and non-U.S. public- or private-sector entities. Unlike the other PIMCO REALPATH® Blend Funds, the Fund does not include a “self-elected” year of retirement in its name because the Fund is managed for shareholders who are retired or about to retire soon and are more focused on preservation of capital and withdrawing portions of their investments.
The Fund’s long-term asset allocations are based on a “glide path” developed by PIMCO and are based on quantitative and qualitative data relating to various risk metrics, long-term market trends, correlation of asset types and actuarial assumptions of life expectancy and retirement. The glide path changes over time, generally becoming more conservative as the Fund approaches its target date, and the Fund’s asset allocation is based on the glide path at its target date. Fund strategies may change from time to time. Please refer to the Fund’s current prospectus for more information regarding the Fund’s strategy.
| | | | | | | | | | | | | | |
| Average Annual Total Return for the period ended December 31, 2016 | |
| | | | | 6 Months* | | | 1 Year | | | Fund Inception
(12/31/14) | |
| | PIMCO REALPATH® Blend Income Fund Institutional Class | | | 2.58% | | | | 8.90% | | | | 2.95% | |
| | PIMCO REALPATH® Blend Income Fund Administrative Class | | | 2.56% | | | | 8.74% | | | | 2.71% | |
| | PIMCO REALPATH® Blend Income Fund Class A | | | 2.44% | | | | 8.40% | | | | 2.48% | |
| | PIMCO REALPATH® Blend Income Fund Class A (adjusted) | | | (3.22)% | | | | 2.47% | | | | (0.37)% | |
| | S&P Target Date Retirement Income Indexª± | | | 0.89% | | | | 5.01% | | | | 2.38% | |
| | | Real Return Target Today Index±± | | | 6.02% | | | | 2.82% | | | | 2.17% | |
All Fund returns are net of fees and expenses.
* Cumulative return.
ª As of June 30, 2016, the Fund’s benchmark was changed from the Real Return Target Today Index to the S&P Target Date Retirement Income Index, which more closely aligns with the Fund’s principal investment strategies. The Real Return Target Today Index was discontinued as of this date.
± The S&P Target Date Index Series is comprised of eleven multi-asset class indices, each corresponding to a particular target retirement date. Each index provides varying levels of exposure to each asset class. Each target date allocation is created and retired according to a pre-determined schedule related to the respective target date, as indicated in the index name, and is based on market observations through an annual survey of target date fund managers.
±± Real Return Target Today Index is a composite of other indices. The sub-indices represent stocks, bonds, TIPs, commodities and real estate securities. The component asset classes are weighted within each index to reflect a targeted level of risk at the beginning and end of the investment horizon. Over time, the weights are adjusted based on predetermined formulas to systematically reduce the level of potential risk as the index’s maturity date approaches.
It is not possible to invest directly in an unmanaged index.
Performance quoted represents past performance. Past performance is not a guarantee or a reliable indicator of future results. Current performance may be lower or higher than performance shown. Investment return and the principal value of an investment will fluctuate. Shares may be worth more or less than original cost when redeemed. Returns shown do not reflect the deduction of taxes that a shareholder would pay on fund distributions or the redemption of fund shares. Differences in the Fund’s performance versus the index and related attribution information with respect to particular categories of securities or individual positions may be attributable, in part, to differences in the pricing methodologies used by the Fund and the index. The adjusted returns take into account the maximum sales charge of 5.50% on Class A shares. For performance current to the most recent month-end, visit www.pimco.com or call (888) 87-PIMCO.
The Fund’s total annual operating expense ratio as stated in the Fund’s current prospectus, which includes the Acquired Fund Fees and Expenses (Underlying PIMCO Fund Expenses), as supplemented, is 0.39% for the Institutional Class shares, 0.64% for the Administrative Class shares and 0.89% for the Class A shares. Details regarding any Fund’s operating expenses can be found in the Fund’s prospectus.
| | | | |
| Institutional Class - PBRNX | | Administrative Class - PBRDX | | Class A - PBRAX |
Top 10 Holdings as of 12/31/20161§
| | | | | | | | |
Vanguard 500 Index Fund ‘Admiral’ | | | | | | | 19.1% | |
PIMCO Income Fund | | | | | | | 16.7% | |
PIMCO Real Return Fund | | | | | | | 10.1% | |
PIMCO Total Return Fund | | | | | | | 9.1% | |
Vanguard Developed Markets Index Fund ‘Admiral’ | | | | | | | 8.2% | |
PIMCO High Yield Fund | | | | | | | 7.7% | |
PIMCO Real Return Asset Fund | | | | | | | 7.1% | |
Vanguard Emerging Markets Stock Index Fund ‘Admiral’ | | | | | | | 6.0% | |
PIMCO Long-Term Credit Fund | | | | | | | 3.5% | |
PIMCO Long Duration Total Return Fund | | | | | | | 3.5% | |
1 % of Investments, at value.
§ Top 10 Holdings and % of Investments exclude securities sold short, financial derivative instruments and short-term instruments, if any.
Fund Insights
The following impacted performance during the reporting period:
| » | | Exposure to U.S. large market capitalization equities benefited absolute performance, as U.S. large market capitalization equities posted positive returns. |
| » | | Exposure to U.S. high yield credit benefited absolute performance, as U.S. high yield credit posted positive returns. |
| » | | Exposure to developed ex-U.S. equities benefited absolute performance, as developed ex-U.S. equities posted positive returns. |
| » | | Exposure to U.S. small market capitalization equities benefited absolute performance, as U.S. small market capitalization equities posted positive returns. |
| » | | Exposure to U.S. long-term Treasuries detracted from absolute performance, as U.S. long-term Treasuries posted negative returns. |
| » | | Exposure to U.S. core fixed income detracted from absolute performance, as U.S. core fixed income posted negative returns. |
| | | | | | |
| | SEMIANNUAL REPORT | | DECEMBER 31, 2016 | | 25 |
Expense Examples
Example
As a shareholder of a Fund, you incur two types of costs: (1) transaction costs, including sales charges (loads) on purchase payments and exchange fees and (2) ongoing costs, including management fees, distribution and/or service (12b-1) fees, and other Fund expenses. The Example is intended to help you understand your ongoing costs (in dollars) of investing in a Fund and to compare these costs with the ongoing costs of investing in other mutual funds.
The Example is based on an investment of $1,000 invested at the beginning of the period and held for the entire period indicated, which for all Funds and share classes is from July 1, 2016 to December 31, 2016 unless noted otherwise in the table and footnotes below.
Actual Expenses
The information in the table under the heading “Actual” provides information about actual account values and actual expenses. You may use the information in these columns, together with the amount you invested, to estimate the expenses that you paid over the period. Simply divide your account value by $1,000 (for example, an $8,600 account value divided by $1,000 = 8.60), then multiply the result by the number in the appropriate row for your share class, in the column entitled “Expenses Paid During Period” to estimate the expenses you paid on your account during this period.
Hypothetical Example for Comparison Purposes
The information in the table under the heading “Hypothetical (5% return before expenses)” provides information about hypothetical account values and hypothetical expenses based on a Fund’s actual expense ratio and an assumed rate of return of 5% per year before expenses, which is not the Fund’s actual return. The hypothetical account values and expenses may not be used to estimate the actual ending account balance or expenses you paid for the period. You may use this information to compare the ongoing costs of investing in a Fund and other funds. To do so, compare this 5% hypothetical example with the 5% hypothetical examples that appear in the shareholder reports of the other funds.
Please note that the expenses shown in the table are meant to highlight your ongoing costs only and do not reflect any transactional costs, such as sales charges (loads) on purchase payments and exchange fees. Therefore, the information under the heading “Hypothetical (5% return before expenses)” is useful in comparing ongoing costs only, and will not help you determine the relative total costs of owning different funds. In addition, if these transactional costs were included, your costs would have been higher.
Expense ratios may vary from period to period because of various factors such as an increase in expenses that are not covered by the management fees, such as fees and expenses of the independent trustees and their counsel, extraordinary expenses and interest expense.
| | | | | | | | | | | | | | | | | | | | | | | | | | | | | | | | | | | | | | | | |
| | | | | | Actual | | | | | | Hypothetical
(5% return before expenses) | | | | | | | |
| | | | | | Beginning
Account Value
(07/01/16) | | | Ending
Account Value
(12/31/16) | | | Expenses Paid
During Period* | | | | | | Beginning
Account Value
(07/01/16) | | | Ending
Account Value
(12/31/16) | | | Expenses Paid
During Period* | | | | | | Net Annualized
Expense Ratio** | |
PIMCO REALPATH® Blend 2020 Fund | | | | | | | | | | | | | | | | | | | | | | | | | | | | | | | | | | | | | | | | |
| Institutional Class | | | | | | $ | 1,000.00 | | | $ | 1,026.20 | | | $ | 0.21 | | | | | | | $ | 1,000.00 | | | $ | 1,025.28 | | | $ | 0.21 | | | | | | | | 0.04 | % |
| Administrative Class | | | | | | | 1,000.00 | | | | 1,024.80 | | | | 1.50 | | | | | | | | 1,000.00 | | | | 1,024.00 | | | | 1.50 | | | | | | | | 0.29 | |
| Class A | | | | | | | 1,000.00 | | | | 1,023.60 | | | | 2.78 | | | | | | | | 1,000.00 | | | | 1,022.73 | | | | 2.78 | | | | | | | | 0.54 | |
PIMCO REALPATH® Blend 2025 Fund | | | | | | | | | | | | | | | | | | | | | | | | | | | | | | | | | | | | | | | | |
| Institutional Class | | | | | | $ | 1,000.00 | | | $ | 1,028.30 | | | $ | 0.21 | | | | | | | $ | 1,000.00 | | | $ | 1,025.28 | | | $ | 0.21 | | | | | | | | 0.04 | % |
| Administrative Class | | | | | | | 1,000.00 | | | | 1,027.00 | | | | 1.50 | | | | | | | | 1,000.00 | | | | 1,024.00 | | | | 1.50 | | | | | | | | 0.29 | |
| Class A | | | | | | | 1,000.00 | | | | 1,026.90 | | | | 2.79 | | | | | | | | 1,000.00 | | | | 1,022.73 | | | | 2.78 | | | | | | | | 0.54 | |
PIMCO REALPATH® Blend 2030 Fund | | | | | | | | | | | | | | | | | | | | | | | | | | | | | | | | | | | | | | | | |
| Institutional Class | | | | | | $ | 1,000.00 | | | $ | 1,038.90 | | | $ | 0.26 | | | | | | | $ | 1,000.00 | | | $ | 1,025.22 | | | $ | 0.26 | | | | | | | | 0.05 | % |
| Administrative Class | | | | | | | 1,000.00 | | | | 1,036.80 | | | | 1.56 | | | | | | | | 1,000.00 | | | | 1,023.95 | | | | 1.55 | | | | | | | | 0.30 | |
| Class A | | | | | | | 1,000.00 | | | | 1,035.60 | | | | 2.85 | | | | | | | | 1,000.00 | | | | 1,022.68 | | | | 2.83 | | | | | | | | 0.55 | |
PIMCO REALPATH® Blend 2035 Fund | | | | | | | | | | | | | | | | | | | | | | | | | | | | | | | | | | | | | | | | |
| Institutional Class | | | | | | $ | 1,000.00 | | | $ | 1,044.40 | | | $ | 0.31 | | | | | | | $ | 1,000.00 | | | $ | 1,025.17 | | | $ | 0.31 | | | | | | | | 0.06 | % |
| Administrative Class | | | | | | | 1,000.00 | | | | 1,042.20 | | | | 1.61 | | | | | | | | 1,000.00 | | | | 1,023.90 | | | | 1.60 | | | | | | | | 0.31 | |
| Class A | | | | | | | 1,000.00 | | | | 1,041.20 | | | | 2.91 | | | | | | | | 1,000.00 | | | | 1,022.63 | | | | 2.89 | | | | | | | | 0.56 | |
| | | | | | | | | | | | | | | | | | | | | | | | | | | | | | | | | | | | | | | | |
| | | | | | Actual | | | | | | Hypothetical
(5% return before expenses) | | | | | | | |
| | | | | | Beginning
Account Value
(07/01/16) | | | Ending
Account Value
(12/31/16) | | | Expenses Paid
During Period* | | | | | | Beginning
Account Value
(07/01/16) | | | Ending
Account Value
(12/31/16) | | | Expenses Paid
During Period* | | | | | | Net Annualized
Expense Ratio** | |
PIMCO REALPATH® Blend 2040 Fund | | | | | | | | | | | | | | | | | | | | | | | | | | | | | | | | | | | | | | | | |
| Institutional Class | | | | | | $ | 1,000.00 | | | $ | 1,044.40 | | | $ | 0.31 | | | | | | | $ | 1,000.00 | | | $ | 1,025.17 | | | $ | 0.31 | | | | | | | | 0.06 | % |
| Administrative Class | | | | | | | 1,000.00 | | | | 1,044.20 | | | | 1.61 | | | | | | | | 1,000.00 | | | | 1,023.90 | | | | 1.60 | | | | | | | | 0.31 | |
| Class A | | | | | | | 1,000.00 | | | | 1,042.90 | | | | 2.91 | | | | | | | | 1,000.00 | | | | 1,022.63 | | | | 2.89 | | | | | | | | 0.56 | |
PIMCO REALPATH® Blend 2045 Fund | | | | | | | | | | | | | | | | | | | | | | | | | | | | | | | | | | | | | | | | |
| Institutional Class | | | | | | $ | 1,000.00 | | | $ | 1,045.60 | | | $ | 0.31 | | | | | | | $ | 1,000.00 | | | $ | 1,025.17 | | | $ | 0.31 | | | | | | | | 0.06 | % |
| Administrative Class | | | | | | | 1,000.00 | | | | 1,043.50 | | | | 1.61 | | | | | | | | 1,000.00 | | | | 1,023.90 | | | | 1.60 | | | | | | | | 0.31 | |
| Class A | | | | | | | 1,000.00 | | | | 1,042.10 | | | | 2.91 | | | | | | | | 1,000.00 | | | | 1,022.63 | | | | 2.89 | | | | | | | | 0.56 | |
PIMCO REALPATH® Blend 2050 Fund | | | | | | | | | | | | | | | | | | | | | | | | | | | | | | | | | | | | | | | | |
| Institutional Class | | | | | | $ | 1,000.00 | | | $ | 1,046.80 | | | $ | 0.31 | | | | | | | $ | 1,000.00 | | | $ | 1,025.17 | | | $ | 0.31 | | | | | | | | 0.06 | % |
| Administrative Class | | | | | | | 1,000.00 | | | | 1,045.50 | | | | 1.62 | | | | | | | | 1,000.00 | | | | 1,023.90 | | | | 1.60 | | | | | | | | 0.31 | |
| Class A | | | | | | | 1,000.00 | | | | 1,044.30 | | | | 2.92 | | | | | | | | 1,000.00 | | | | 1,022.63 | | | | 2.89 | | | | | | | | 0.56 | |
PIMCO REALPATH® Blend 2055 Fund | | | | | | | | | | | | | | | | | | | | | | | | | | | | | | | | | | | | | | | | |
| Institutional Class | | | | | | $ | 1,000.00 | | | $ | 1,046.90 | | | $ | 0.31 | | | | | | | $ | 1,000.00 | | | $ | 1,025.17 | | | $ | 0.31 | | | | | | | | 0.06 | % |
| Administrative Class | | | | | | | 1,000.00 | | | | 1,045.90 | | | | 1.62 | | | | | | | | 1,000.00 | | | | 1,023.90 | | | | 1.60 | | | | | | | | 0.31 | |
| Class A | | | | | | | 1,000.00 | | | | 1,043.10 | | | | 2.92 | | | | | | | | 1,000.00 | | | | 1,022.63 | | | | 2.89 | | | | | | | | 0.56 | |
PIMCO REALPATH® Blend Income Fund | | | | | | | | | | | | | | | | | | | | | | | | | | | | | | | | | | | | | | | | |
| Institutional Class | | | | | | $ | 1,000.00 | | | $ | 1,025.80 | | | $ | 0.21 | | | | | | | $ | 1,000.00 | | | $ | 1,025.28 | | | $ | 0.21 | | | | | | | | 0.04 | % |
| Administrative Class | | | | | | | 1,000.00 | | | | 1,025.60 | | | | 1.50 | | | | | | | | 1,000.00 | | | | 1,024.00 | | | | 1.50 | | | | | | | | 0.29 | |
| Class A | | | | | | | 1,000.00 | | | | 1,024.40 | | | | 2.79 | | | | | | | | 1,000.00 | | | | 1,022.73 | | | | 2.78 | | | | | | | | 0.54 | |
* Expenses Paid During Period are equal to the net annualized expense ratio for the class, multiplied by the average account value over the period, multiplied by 186/365 (to reflect the one-half year period).
** Net Annualized Expense Ratio is reflective of any applicable contractual fee waivers and/or expense reimbursements or voluntary fee waivers. Details regarding fee waivers can be found in Note 7 in the Notes to Financial Statements.
| | | | | | |
| | SEMIANNUAL REPORT | | DECEMBER 31, 2016 | | 27 |
Financial Highlights
| | | | | | | | | | | | | | | | | | | | | | | | | | | | | | | | | | | | |
| | | | | | Investment Operations | | | | | | Less Distributions(b) | |
| | | | | | | | | | | | | | | | | | | | | | | | | | | | |
| Selected Per Share Data for the Year or Period Ended: | | Net Asset Value
Beginning of
Year or
Period | | | Net Investment
Income(a) | | | Net Realized/
Unrealized
Gain (Loss) | | | Total | | | | | | From Net
Investment
Income | | | From Net
Realized
Capital Gains | | | Tax Basis
Return of
Capital | | | Total | |
| | | | | | | | | |
PIMCO REALPATH® Blend 2020 Fund | | | | | | | | | | | | | | | | | | | | | | | | | | | | | | | | | | | | |
| Institutional Class | | | | | | | | | | | | | | | | | | | | | | | | | | | | | | | | | | | | |
07/01/2016 - 12/31/2016+ | | $ | 9.90 | | | $ | 0.16 | | | $ | 0.10 | | | $ | 0.26 | | | | | | | $ | (0.16 | ) | | $ | 0.00 | | | $ | 0.00 | | | $ | (0.16 | ) |
06/30/2016 | | | 9.97 | | | | 0.32 | | | | (0.06 | ) | | | 0.26 | | | | | | | | (0.31 | ) | | | (0.02 | ) | | | 0.00 | | | | (0.33 | ) |
12/31/2014 - 06/30/2015 | | | 10.00 | | | | 0.11 | | | | (0.09 | ) | | | 0.02 | | | | | | | | (0.05 | ) | | | 0.00 | | | | 0.00 | | | | (0.05 | ) |
| Administrative Class | | | | | | | | | | | | | | | | | | | | | | | | | | | | | | | | | | | | |
07/01/2016 - 12/31/2016+ | | | 9.90 | | | | 0.15 | | | | 0.10 | | | | 0.25 | | | | | | | | (0.15 | ) | | | 0.00 | | | | 0.00 | | | | (0.15 | ) |
06/30/2016 | | | 9.97 | | | | 0.29 | | | | (0.06 | ) | | | 0.23 | | | | | | | | (0.28 | ) | | | (0.02 | ) | | | 0.00 | | | | (0.30 | ) |
12/31/2014 - 06/30/2015 | | | 10.00 | | | | 0.10 | | | | (0.09 | ) | | | 0.01 | | | | | | | | (0.04 | ) | | | 0.00 | | | | 0.00 | | | | (0.04 | ) |
| Class A | | | | | | | | | | | | | | | | | | | | | | | | | | | | | | | | | | | | |
07/01/2016 - 12/31/2016+ | | | 9.91 | | | | 0.14 | | | | 0.09 | | | | 0.23 | | | | | | | | (0.13 | ) | | | 0.00 | | | | 0.00 | | | | (0.13 | ) |
06/30/2016 | | | 9.97 | | | | 0.27 | | | | (0.06 | ) | | | 0.21 | | | | | | | | (0.25 | ) | | | (0.02 | ) | | | 0.00 | | | | (0.27 | ) |
12/31/2014 - 06/30/2015 | | | 10.00 | | | | 0.09 | | | | (0.09 | ) | | | 0.00 | | | | | | | | (0.03 | ) | | | 0.00 | | | | 0.00 | | | | (0.03 | ) |
| | | | | | | | | |
PIMCO REALPATH® Blend 2025 Fund | | | | | | | | | | | | | | | | | | | | | | | | | | | | | | | | | | | | |
| Institutional Class | | | | | | | | | | | | | | | | | | | | | | | | | | | | | | | | | | | | |
07/01/2016 - 12/31/2016+ | | $ | 9.85 | | | $ | 0.16 | | | $ | 0.12 | | | $ | 0.28 | | | | | | | $ | (0.16 | ) | | $ | 0.00 | | | $ | 0.00 | | | $ | (0.16 | ) |
06/30/2016 | | | 9.99 | | | | 0.32 | | | | (0.12 | ) | | | 0.20 | | | | | | | | (0.32 | ) | | | (0.02 | ) | | | 0.00 | | | | (0.34 | ) |
12/31/2014 - 06/30/2015 | | | 10.00 | | | | 0.12 | | | | (0.08 | ) | | | 0.04 | | | | | | | | (0.05 | ) | | | 0.00 | | | | 0.00 | | | | (0.05 | ) |
| Administrative Class | | | | | | | | | | | | | | | | | | | | | | | | | | | | | | | | | | | | |
07/01/2016 - 12/31/2016+ | | | 9.85 | | | | 0.15 | | | | 0.12 | | | | 0.27 | | | | | | | | (0.15 | ) | | | 0.00 | | | | 0.00 | | | | (0.15 | ) |
06/30/2016 | | | 9.99 | | | | 0.28 | | | | (0.11 | ) | | | 0.17 | | | | | | | | (0.29 | ) | | | (0.02 | ) | | | 0.00 | | | | (0.31 | ) |
12/31/2014 - 06/30/2015 | | | 10.00 | | | | 0.11 | | | | (0.08 | ) | | | 0.03 | | | | | | | | (0.04 | ) | | | 0.00 | | | | 0.00 | | | | (0.04 | ) |
| Class A | | | | | | | | | | | | | | | | | | | | | | | | | | | | | | | | | | | | |
07/01/2016 - 12/31/2016+ | | | 9.85 | | | | 0.13 | | | | 0.13 | | | | 0.26 | | | | | | | | (0.13 | ) | | | 0.00 | | | | 0.00 | | | | (0.13 | ) |
06/30/2016 | | | 9.99 | | | | 0.24 | | | | (0.10 | ) | | | 0.14 | | | | | | | | (0.26 | ) | | | (0.02 | ) | | | 0.00 | | | | (0.28 | ) |
12/31/2014 - 06/30/2015 | | | 10.00 | | | | 0.10 | | | | (0.08 | ) | | | 0.02 | | | | | | | | (0.03 | ) | | | 0.00 | | | | 0.00 | | | | (0.03 | ) |
| | | | | | | | | |
PIMCO REALPATH® Blend 2030 Fund | | | | | | | | | | | | | | | | | | | | | | | | | | | | | | | | | | | | |
| Institutional Class | | | | | | | | | | | | | | | | | | | | | | | | | | | | | | | | | | | | |
07/01/2016 - 12/31/2016+ | | $ | 9.87 | | | $ | 0.16 | | | $ | 0.22 | | | $ | 0.38 | | | | | | | $ | (0.22 | ) | | $ | 0.00 | | | $ | 0.00 | | | $ | (0.22 | ) |
06/30/2016 | | | 10.00 | | | | 0.31 | | | | (0.16 | ) | | | 0.15 | | | | | | | | (0.25 | ) | | | (0.03 | ) | | | 0.00 | | | | (0.28 | ) |
12/31/2014 - 06/30/2015 | | | 10.00 | | | | 0.13 | | | | (0.08 | ) | | | 0.05 | | | | | | | | (0.05 | ) | | | 0.00 | | | | 0.00 | | | | (0.05 | ) |
| Administrative Class | | | | | | | | | | | | | | | | | | | | | | | | | | | | | | | | | | | | |
07/01/2016 - 12/31/2016+ | | | 9.88 | | | | 0.16 | | | | 0.20 | | | | 0.36 | | | | | | | | (0.21 | ) | | | 0.00 | | | | 0.00 | | | | (0.21 | ) |
06/30/2016 | | | 10.00 | | | | 0.29 | | | | (0.15 | ) | | | 0.14 | | | | | | | | (0.23 | ) | | | (0.03 | ) | | | 0.00 | | | | (0.26 | ) |
12/31/2014 - 06/30/2015 | | | 10.00 | | | | 0.12 | | | | (0.08 | ) | | | 0.04 | | | | | | | | (0.04 | ) | | | 0.00 | | | | 0.00 | | | | (0.04 | ) |
| Class A | | | | | | | | | | | | | | | | | | | | | | | | | | | | | | | | | | | | |
07/01/2016 - 12/31/2016+ | | | 9.87 | | | | 0.15 | | | | 0.20 | | | | 0.35 | | | | | | | | (0.21 | ) | | | 0.00 | | | | 0.00 | | | | (0.21 | ) |
06/30/2016 | | | 10.00 | | | | 0.26 | | | | (0.16 | ) | | | 0.10 | | | | | | | | (0.20 | ) | | | (0.03 | ) | | | 0.00 | | | | (0.23 | ) |
12/31/2014 - 06/30/2015 | | | 10.00 | | | | 0.10 | | | | (0.07 | ) | | | 0.03 | | | | | | | | (0.03 | ) | | | 0.00 | | | | 0.00 | | | | (0.03 | ) |
| | | | | | | | | |
PIMCO REALPATH® Blend 2035 Fund | | | | | | | | | | | | | | | | | | | | | | | | | | | | | | | | | | | | |
| Institutional Class | | | | | | | | | | | | | | | | | | | | | | | | | | | | | | | | | | | | |
07/01/2016 - 12/31/2016+ | | $ | 9.83 | | | $ | 0.15 | | | $ | 0.29 | | | $ | 0.44 | | | | | | | $ | (0.19 | ) | | $ | 0.00 | | | $ | 0.00 | | | $ | (0.19 | ) |
06/30/2016 | | | 10.04 | | | | 0.29 | | | | (0.24 | ) | | | 0.05 | | | | | | | | (0.23 | ) | | | (0.03 | ) | | | 0.00 | | | | (0.26 | ) |
12/31/2014 - 06/30/2015 | | | 10.00 | | | | 0.13 | | | | (0.04 | ) | | | 0.09 | | | | | | | | (0.05 | ) | | | 0.00 | | | | 0.00 | | | | (0.05 | ) |
| Administrative Class | | | | | | | | | | | | | | | | | | | | | | | | | | | | | | | | | | | | |
07/01/2016 - 12/31/2016+ | | | 9.83 | | | | 0.13 | | | | 0.28 | | | | 0.41 | | | | | | | | (0.17 | ) | | | 0.00 | | | | 0.00 | | | | (0.17 | ) |
06/30/2016 | | | 10.04 | | | | 0.26 | | | | (0.24 | ) | | | 0.02 | | | | | | | | (0.20 | ) | | | (0.03 | ) | | | 0.00 | | | | (0.23 | ) |
12/31/2014 - 06/30/2015 | | | 10.00 | | | | 0.11 | | | | (0.03 | ) | | | 0.08 | | | | | | | | (0.04 | ) | | | 0.00 | | | | 0.00 | | | | (0.04 | ) |
| Class A | | | | | | | | | | | | | | | | | | | | | | | | | | | | | | | | | | | | |
07/01/2016 - 12/31/2016+ | | | 9.88 | | | | 0.14 | | | | 0.27 | | | | 0.41 | | | | | | | | (0.17 | ) | | | 0.00 | | | | 0.00 | | | | (0.17 | ) |
06/30/2016 | | | 10.03 | | | | 0.20 | | | | (0.19 | ) | | | 0.01 | | | | | | | | (0.13 | ) | | | (0.03 | ) | | | 0.00 | | | | (0.16 | ) |
12/31/2014 - 06/30/2015 | | | 10.00 | | | | 0.12 | | | | (0.05 | ) | | | 0.07 | | | | | | | | (0.04 | ) | | | 0.00 | | | | 0.00 | | | | (0.04 | ) |
| | | | | | | | |
| 28 | | PIMCO EQUITY SERIES | | | | | See Accompanying Notes | |
| | | | | | | | | | | | | | | | | | | | | | | | | | |
| | | | | | | Ratios/Supplemental Data | |
| | | | | | | | | | Ratios to Average Net Assets | | | | |
Net Asset
Value End of
Year or
Period | | | Total Return | | | Net Assets
End of Year or
Period (000s) | | | Expenses | | | Expenses
Excluding
Waivers | | | Net
Investment
Income | | | Portfolio
Turnover
Rate | |
| | | | | | |
| | | | | | | | | | | | | | | | | | | | | | | | | | |
| | | | | | | | | | | | | | | | | | | | | | | | | | |
| $ | 10.00 | | | | 2.62 | % | | $ | 5,099 | | | | 0.04 | %* | | | 0.05 | %* | | | 3.18 | %* | | | 6 | % |
| | 9.90 | | | | 2.77 | | | | 4,152 | | | | 0.03 | | | | 0.03 | | | | 3.28 | | | | 45 | |
| | 9.97 | | | | 0.19 | | | | 3,007 | | | | 0.03 | * | | | 0.57 | * | | | 2.20 | * | | | 5 | |
| | | | | | | | | | | | | | | | | | | | | | | | | | |
| | 10.00 | | | | 2.48 | | | | 11 | | | | 0.29 | * | | | 0.30 | * | | | 2.87 | * | | | 6 | |
| | 9.90 | | | | 2.45 | | | | 10 | | | | 0.28 | | | | 0.28 | | | | 3.01 | | | | 45 | |
| | 9.97 | | | | 0.08 | | | | 10 | | | | 0.28 | * | | | 0.82 | * | | | 1.92 | * | | | 5 | |
| | | | | | | | | | | | | | | | | | | | | | | | | | |
| | 10.01 | | | | 2.36 | | | | 10 | | | | 0.54 | * | | | 0.55 | * | | | 2.65 | * | | | 6 | |
| | 9.91 | | | | 2.29 | | | | 10 | | | | 0.53 | | | | 0.53 | | | | 2.81 | | | | 45 | |
| | 9.97 | | | | (0.03 | ) | | | 10 | | | | 0.53 | * | | | 1.07 | * | | | 1.70 | * | | | 5 | |
| | | | | | |
| | | | | | | | | | | | | | | | | | | | | | | | | | |
| | | | | | | | | | | | | | | | | | | | | | | | | | |
| $ | 9.97 | | | | 2.83 | % | | $ | 4,102 | | | | 0.04 | %* | | | 0.05 | %* | | | 3.13 | %* | | | 5 | % |
| | 9.85 | | | | 2.10 | | | | 3,395 | | | | 0.03 | | | | 0.03 | | | | 3.32 | | | | 59 | |
| | 9.99 | | | | 0.39 | | | | 3,026 | | | | 0.03 | * | | | 0.57 | * | | | 2.38 | * | | | 5 | |
| | | | | | | | | | | | | | | | | | | | | | | | | | |
| | 9.97 | | | | 2.70 | | | | 16 | | | | 0.29 | * | | | 0.30 | * | | | 2.84 | * | | | 5 | |
| | 9.85 | | | | 1.81 | | | | 16 | | | | 0.28 | | | | 0.28 | | | | 2.96 | | | | 59 | |
| | 9.99 | | | | 0.30 | | | | 15 | | | | 0.28 | * | | | 0.82 | * | | | 2.20 | * | | | 5 | |
| | | | | | | | | | | | | | | | | | | | | | | | | | |
| | 9.98 | | | | 2.69 | | | | 39 | | | | 0.54 | * | | | 0.55 | * | | | 2.63 | * | | | 5 | |
| | 9.85 | | | | 1.50 | | | | 27 | | | | 0.53 | | | | 0.53 | | | | 2.49 | | | | 59 | |
| | 9.99 | | | | 0.17 | | | | 11 | | | | 0.53 | * | | | 1.07 | * | | | 1.92 | * | | | 5 | |
| | | | | | |
| | | | | | | | | | | | | | | | | | | | | | | | | | |
| | | | | | | | | | | | | | | | | | | | | | | | | | |
| $ | 10.03 | | | | 3.89 | % | | $ | 7,278 | | | | 0.05 | %* | | | 0.06 | %* | | | 3.02 | %* | | | 5 | % |
| | 9.87 | | | | 1.67 | | | | 6,409 | | | | 0.04 | | | | 0.04 | | | | 3.22 | | | | 65 | |
| | 10.00 | | | | 0.49 | | | | 3,015 | | | | 0.04 | * | | | 0.58 | * | | | 2.55 | * | | | 6 | |
| | | | | | | | | | | | | | | | | | | | | | | | | | |
| | 10.03 | | | | 3.68 | | | | 34 | | | | 0.30 | * | | | 0.31 | * | | | 3.03 | * | | | 5 | |
| | 9.88 | | | | 1.52 | | | | 23 | | | | 0.29 | | | | 0.29 | | | | 3.05 | | | | 65 | |
| | 10.00 | | | | 0.37 | | | | 10 | | | | 0.29 | * | | | 0.83 | * | | | 2.30 | * | | | 6 | |
| | | | | | | | | | | | | | | | | | | | | | | | | | |
| | 10.01 | | | | 3.56 | | | | 56 | | | | 0.55 | * | | | 0.56 | * | | | 2.84 | * | | | 5 | |
| | 9.87 | | | | 1.15 | | | | 13 | | | | 0.54 | | | | 0.54 | | | | 2.74 | | | | 65 | |
| | 10.00 | | | | 0.27 | | | | 10 | | | | 0.54 | * | | | 1.08 | * | | | 2.04 | * | | | 6 | |
| | | | | | |
| | | | | | | | | | | | | | | | | | | | | | | | | | |
| | | | | | | | | | | | | | | | | | | | | | | | | | |
| $ | 10.08 | | | | 4.44 | % | | $ | 6,472 | | | | 0.06 | %* | | | 0.07 | %* | | | 2.83 | %* | | | 5 | % |
| | 9.83 | | | | 0.64 | | | | 5,958 | | | | 0.05 | | | | 0.05 | | | | 3.05 | | | | 56 | |
| | 10.04 | | | | 0.89 | | | | 3,027 | | | | 0.05 | * | | | 0.58 | * | | | 2.48 | * | | | 6 | |
| | | | | | | | | | | | | | | | | | | | | | | | | | |
| | 10.07 | | | | 4.22 | | | | 21 | | | | 0.31 | * | | | 0.32 | * | | | 2.61 | * | | | 5 | |
| | 9.83 | | | | 0.34 | | | | 10 | | | | 0.30 | | | | 0.30 | | | | 2.69 | | | | 56 | |
| | 10.04 | | | | 0.77 | | | | 10 | | | | 0.30 | * | | | 0.83 | * | | | 2.22 | * | | | 6 | |
| | | | | | | | | | | | | | | | | | | | | | | | | | |
| | 10.12 | | | | 4.12 | | | | 147 | | | | 0.56 | * | | | 0.57 | * | | | 2.61 | * | | | 5 | |
| | 9.88 | | | | 0.21 | | | | 10 | | | | 0.55 | | | | 0.55 | | | | 2.10 | | | | 56 | |
| | 10.03 | | | | 0.65 | | | | 22 | | | | 0.55 | * | | | 1.08 | * | | | 2.33 | * | | | 6 | |
| | | | | | |
| | SEMIANNUAL REPORT | | DECEMBER 31, 2016 | | 29 |
Financial Highlights (Cont.)
| | | | | | | | | | | | | | | | | | | | | | | | | | | | | | | | | | | | |
| | | | | | Investment Operations | | | | | | Less Distributions(b) | |
| | | | | | | | | | | | | | | | | | | | | | | | | | | | |
| Selected Per Share Data for the Year or Period Ended: | | Net Asset Value
Beginning of
Year or
Period | | | Net Investment
Income(a) | | | Net Realized/
Unrealized
Gain (Loss) | | | Total | | | | | | From Net
Investment
Income | | | From Net
Realized
Capital Gains | | | Tax Basis
Return of
Capital | | | Total | |
| | | | | | | | | |
PIMCO REALPATH® Blend 2040 Fund | | | | | | | | | | | | | | | | | | | | | | | | | | | | | | | | | | | | |
| Institutional Class | | | | | | | | | | | | | | | | | | | | | | | | | | | | | | | | | | | | |
07/01/2016 - 12/31/2016+ | | $ | 9.84 | | | $ | 0.14 | | | $ | 0.30 | | | $ | 0.44 | | | | | | | $ | (0.16 | ) | | $ | 0.00 | | | $ | 0.00 | | | $ | (0.16 | ) |
06/30/2016 | | | 10.07 | | | | 0.28 | | | | (0.24 | ) | | | 0.04 | | | | | | | | (0.24 | ) | | | (0.03 | ) | | | 0.00 | | | | (0.27 | ) |
12/31/2014 - 06/30/2015 | | | 10.00 | | | | 0.12 | | | | 0.00 | | | | 0.12 | | | | | | | | (0.05 | ) | | | 0.00 | | | | 0.00 | | | | (0.05 | ) |
| Administrative Class | | | | | | | | | | | | | | | | | | | | | | | | | | | | | | | | | | | | |
07/01/2016 - 12/31/2016+ | | | 9.83 | | | | 0.13 | | | | 0.30 | | | | 0.43 | | | | | | | | (0.14 | ) | | | 0.00 | | | | 0.00 | | | | (0.14 | ) |
06/30/2016 | | | 10.07 | | | | 0.27 | | | | (0.27 | ) | | | 0.00 | | | | | | | | (0.21 | ) | | | (0.03 | ) | | | 0.00 | | | | (0.24 | ) |
12/31/2014 - 06/30/2015 | | | 10.00 | | | | 0.11 | | | | 0.00 | | | | 0.11 | | | | | | | | (0.04 | ) | | | 0.00 | | | | 0.00 | | | | (0.04 | ) |
| Class A | | | | | | | | | | | | | | | | | | | | | | | | | | | | | | | | | | | | |
07/01/2016 - 12/31/2016+ | | | 9.83 | | | | 0.11 | | | | 0.31 | | | | 0.42 | | | | | | | | (0.13 | ) | | | 0.00 | | | | 0.00 | | | | (0.13 | ) |
06/30/2016 | | | 10.07 | | | | 0.25 | | | | (0.27 | ) | | | (0.02 | ) | | | | | | | (0.19 | ) | | | (0.03 | ) | | | 0.00 | | | | (0.22 | ) |
12/31/2014 - 06/30/2015 | | | 10.00 | | | | 0.10 | | | | 0.00 | | | | 0.10 | | | | | | | | (0.03 | ) | | | 0.00 | | | | 0.00 | | | | (0.03 | ) |
| | | | | | | | | |
PIMCO REALPATH® Blend 2045 Fund | | | | | | | | | | | | | | | | | | | | | | | | | | | | | | | | | | | | |
| Institutional Class | | | | | | | | | | | | | | | | | | | | | | | | | | | | | | | | | | | | |
07/01/2016 - 12/31/2016+ | | $ | 9.79 | | | $ | 0.13 | | | $ | 0.32 | | | $ | 0.45 | | | | | | | $ | (0.15 | ) | | $ | 0.00 | | | $ | 0.00 | | | $ | (0.15 | ) |
06/30/2016 | | | 10.10 | | | | 0.27 | | | | (0.32 | ) | | | (0.05 | ) | | | | | | | (0.23 | ) | | | (0.03 | ) | | | 0.00 | | | | (0.26 | ) |
12/31/2014 - 06/30/2015 | | | 10.00 | | | | 0.12 | | | | 0.03 | | | | 0.15 | | | | | | | | (0.05 | ) | | | 0.00 | | | | 0.00 | | | | (0.05 | ) |
| Administrative Class | | | | | | | | | | | | | | | | | | | | | | | | | | | | | | | | | | | | |
07/01/2016 - 12/31/2016+ | | | 9.79 | | | | 0.14 | | | | 0.29 | | | | 0.43 | | | | | | | | (0.14 | ) | | | 0.00 | | | | 0.00 | | | | (0.14 | ) |
06/30/2016 | | | 10.09 | | | | 0.24 | | | | (0.31 | ) | | | (0.07 | ) | | | | | | | (0.20 | ) | | | (0.03 | ) | | | 0.00 | | | | (0.23 | ) |
12/31/2014 - 06/30/2015 | | | 10.00 | | | | 0.14 | | | | (0.01 | ) | | | 0.13 | | | | | | | | (0.04 | ) | | | 0.00 | | | | 0.00 | | | | (0.04 | ) |
| Class A | | | | | | | | | | | | | | | | | | | | | | | | | | | | | | | | | | | | |
07/01/2016 - 12/31/2016+ | | | 9.80 | | | | 0.11 | | | | 0.30 | | | | 0.41 | | | | | | | | (0.12 | ) | | | 0.00 | | | | 0.00 | | | | (0.12 | ) |
06/30/2016 | | | 10.09 | | | | 0.22 | | | | (0.31 | ) | | | (0.09 | ) | | | | | | | (0.17 | ) | | | (0.03 | ) | | | 0.00 | | | | (0.20 | ) |
12/31/2014 - 06/30/2015 | | | 10.00 | | | | 0.09 | | | | 0.03 | | | | 0.12 | | | | | | | | (0.03 | ) | | | 0.00 | | | | 0.00 | | | | (0.03 | ) |
| | | | | | | | | |
PIMCO REALPATH® Blend 2050 Fund | | | | | | | | | | | | | | | | | | | | | | | | | | | | | | | | | | | | |
| Institutional Class | | | | | | | | | | | | | | | | | | | | | | | | | | | | | | | | | | | | |
07/01/2016 - 12/31/2016+ | | $ | 9.82 | | | $ | 0.13 | | | $ | 0.33 | | | $ | 0.46 | | | | | | | $ | (0.16 | ) | | $ | 0.00 | | | $ | 0.00 | | | $ | (0.16 | ) |
06/30/2016 | | | 10.11 | | | | 0.27 | | | | (0.32 | ) | | | (0.05 | ) | | | | | | | (0.21 | ) | | | (0.03 | ) | | | 0.00 | | | | (0.24 | ) |
12/31/2014 - 06/30/2015 | | | 10.00 | | | | 0.12 | | | | 0.04 | | | | 0.16 | | | | | | | | (0.05 | ) | | | 0.00 | | | | 0.00 | | | | (0.05 | ) |
| Administrative Class | | | | | | | | | | | | | | | | | | | | | | | | | | | | | | | | | | | | |
07/01/2016 - 12/31/2016+ | | | 9.82 | | | | 0.12 | | | | 0.33 | | | | 0.45 | | | | | | | | (0.15 | ) | | | 0.00 | | | | 0.00 | | | | (0.15 | ) |
06/30/2016 | | | 10.10 | | | | 0.24 | | | | (0.30 | ) | | | (0.06 | ) | | | | | | | (0.19 | ) | | | (0.03 | ) | | | 0.00 | | | | (0.22 | ) |
12/31/2014 - 06/30/2015 | | | 10.00 | | | | 0.12 | | | | 0.02 | | | | 0.14 | | | | | | | | (0.04 | ) | | | 0.00 | | | | 0.00 | | | | (0.04 | ) |
| Class A | | | | | | | | | | | | | | | | | | | | | | | | | | | | | | | | | | | | |
07/01/2016 - 12/31/2016+ | | | 9.80 | | | | 0.10 | | | | 0.33 | | | | 0.43 | | | | | | | | (0.13 | ) | | | 0.00 | | | | 0.00 | | | | (0.13 | ) |
06/30/2016 | | | 10.10 | | | | 0.23 | | | | (0.32 | ) | | | (0.09 | ) | | | | | | | (0.18 | ) | | | (0.03 | ) | | | 0.00 | | | | (0.21 | ) |
12/31/2014 - 06/30/2015 | | | 10.00 | | | | 0.10 | | | | 0.03 | | | | 0.13 | | | | | | | | (0.03 | ) | | | 0.00 | | | | 0.00 | | | | (0.03 | ) |
| | | | | | | | | |
PIMCO REALPATH® Blend 2055 Fund | | | | | | | | | | | | | | | | | | | | | | | | | | | | | | | | | | | | |
| Institutional Class | | | | | | | | | | | | | | | | | | | | | | | | | | | | | | | | | | | | |
07/01/2016 - 12/31/2016+ | | $ | 9.80 | | | $ | 0.13 | | | $ | 0.33 | | | $ | 0.46 | | | | | | | $ | (0.15 | ) | | $ | 0.00 | | | $ | 0.00 | | | $ | (0.15 | ) |
06/30/2016 | | | 10.11 | | | | 0.27 | | | | (0.33 | ) | | | (0.06 | ) | | | | | | | (0.22 | ) | | | (0.03 | ) | | | 0.00 | | | | (0.25 | ) |
12/31/2014 - 06/30/2015 | | | 10.00 | | | | 0.12 | | | | 0.04 | | | | 0.16 | | | | | | | | (0.05 | ) | | | 0.00 | | | | 0.00 | | | | (0.05 | ) |
| Administrative Class | | | | | | | | | | | | | | | | | | | | | | | | | | | | | | | | | | | | |
07/01/2016 - 12/31/2016+ | | | 9.80 | | | | 0.15 | | | | 0.30 | | | | 0.45 | | | | | | | | (0.14 | ) | | | 0.00 | | | | 0.00 | | | | (0.14 | ) |
06/30/2016 | | | 10.11 | | | | 0.24 | | | | (0.33 | ) | | | (0.09 | ) | | | | | | | (0.19 | ) | | | (0.03 | ) | | | 0.00 | | | | (0.22 | ) |
12/31/2014 - 06/30/2015 | | | 10.00 | | | | 0.11 | | | | 0.04 | | | | 0.15 | | | | | | | | (0.04 | ) | | | 0.00 | | | | 0.00 | | | | (0.04 | ) |
| Class A | | | | | | | | | | | | | | | | | | | | | | | | | | | | | | | | | | | | |
07/01/2016 - 12/31/2016+ | | | 9.79 | | | | 0.08 | | | | 0.34 | | | | 0.42 | | | | | | | | (0.12 | ) | | | 0.00 | | | | 0.00 | | | | (0.12 | ) |
06/30/2016 | | | 10.09 | | | | 0.22 | | | | (0.32 | ) | | | (0.10 | ) | | | | | | | (0.17 | ) | | | (0.03 | ) | | | 0.00 | | | | (0.20 | ) |
12/31/2014 - 06/30/2015 | | | 10.00 | | | | 0.13 | | | | 0.00 | | | | 0.13 | | | | | | | | (0.04 | ) | | | 0.00 | | | | 0.00 | | | | (0.04 | ) |
| | | | | | | | |
| 30 | | PIMCO EQUITY SERIES | | | | | See Accompanying Notes | |
| | | | | | | | | | | | | | | | | | | | | | | | | | |
| | | | | | | Ratios/Supplemental Data | |
| | | | | | | | | | Ratios to Average Net Assets | | | | |
Net Asset
Value End of
Year or
Period | | | Total Return | | | Net Assets
End of Year or
Period (000s) | | | Expenses | | | Expenses
Excluding
Waivers | | | Net
Investment
Income | | | Portfolio
Turnover
Rate | |
| | | | | | |
| | | | | | | | | | | | | | | | | | | | | | | | | | |
| | | | | | | | | | | | | | | | | | | | | | | | | | |
| $ | 10.12 | | | | 4.44 | % | | $ | 3,963 | | | | 0.06 | %* | | | 0.07 | %* | | | 2.69 | %* | | | 4 | % |
| | 9.84 | | | | 0.48 | | | | 3,509 | | | | 0.05 | | | | 0.05 | | | | 2.90 | | | | 43 | |
| | 10.07 | | | | 1.19 | | | | 3,036 | | | | 0.05 | * | | | 0.58 | * | | | 2.39 | * | | | 6 | |
| | | | | | | | | | | | | | | | | | | | | | | | | | |
| | 10.12 | | | | 4.42 | | | | 48 | | | | 0.31 | * | | | 0.32 | * | | | 2.44 | * | | | 4 | |
| | 9.83 | | | | 0.14 | | | | 36 | | | | 0.30 | | | | 0.30 | | | | 2.89 | | | | 43 | |
| | 10.07 | | | | 1.08 | | | | 12 | | | | 0.30 | * | | | 0.83 | * | | | 2.20 | * | | | 6 | |
| | | | | | | | | | | | | | | | | | | | | | | | | | |
| | 10.12 | | | | 4.29 | | | | 31 | | | | 0.56 | * | | | 0.57 | * | | | 2.17 | * | | | 4 | |
| | 9.83 | | | | (0.10 | ) | | | 30 | | | | 0.55 | | | | 0.55 | | | | 2.63 | | | | 43 | |
| | 10.07 | | | | 0.98 | | | | 11 | | | | 0.55 | * | | | 1.08 | * | | | 1.93 | * | | | 6 | |
| | | | | | |
| | | | | | | | | | | | | | | | | | | | | | | | | | |
| | | | | | | | | | | | | | | | | | | | | | | | | | |
| $ | 10.09 | | | | 4.56 | % | | $ | 3,784 | | | | 0.06 | %* | | | 0.07 | %* | | | 2.56 | %* | | | 4 | % |
| | 9.79 | | | | (0.45 | ) | | | 3,415 | | | | 0.05 | | | | 0.05 | | | | 2.84 | | | | 41 | |
| | 10.10 | | | | 1.48 | | | | 3,044 | | | | 0.05 | * | | | 0.58 | * | | | 2.37 | * | | | 6 | |
| | | | | | | | | | | | | | | | | | | | | | | | | | |
| | 10.08 | | | | 4.35 | | | | 80 | | | | 0.31 | * | | | 0.32 | * | | | 2.80 | * | | | 4 | |
| | 9.79 | | | | (0.63 | ) | | | 39 | | | | 0.30 | | | | 0.30 | | | | 2.55 | | | | 41 | |
| | 10.09 | | | | 1.33 | | | | 39 | | | | 0.30 | * | | | 0.83 | * | | | 2.69 | * | | | 6 | |
| | | | | | | | | | | | | | | | | | | | | | | | | | |
| | 10.09 | | | | 4.21 | | | | 16 | | | | 0.56 | * | | | 0.57 | * | | | 2.14 | * | | | 4 | |
| | 9.80 | | | | (0.81 | ) | | | 10 | | | | 0.55 | | | | 0.55 | | | | 2.31 | | | | 41 | |
| | 10.09 | | | | 1.16 | | | | 10 | | | | 0.55 | * | | | 1.08 | * | | | 1.86 | * | | | 6 | |
| | | | | | |
| | | | | | | | | | | | | | | | | | | | | | | | | | |
| | | | | | | | | | | | | | | | | | | | | | | | | | |
| $ | 10.12 | | | | 4.68 | % | | $ | 4,438 | | | | 0.06 | %* | | | 0.07 | %* | | | 2.55 | %* | | | 4 | % |
| | 9.82 | | | | (0.40 | ) | | | 3,934 | | | | 0.05 | | | | 0.05 | | | | 2.86 | | | | 38 | |
| | 10.11 | | | | 1.59 | | | | 3,046 | | | | 0.05 | * | | | 0.58 | * | | | 2.39 | * | | | 6 | |
| | | | | | | | | | | | | | | | | | | | | | | | | | |
| | 10.12 | | | | 4.55 | | | | 14 | | | | 0.31 | * | | | 0.32 | * | | | 2.26 | * | | | 4 | |
| | 9.82 | | | | (0.60 | ) | | | 13 | | | | 0.30 | | | | 0.30 | | | | 2.53 | | | | 38 | |
| | 10.10 | | | | 1.39 | | | | 14 | | | | 0.30 | * | | | 0.83 | * | | | 2.33 | * | | | 6 | |
| | | | | | | | | | | | | | | | | | | | | | | | | | |
| | 10.10 | | | | 4.43 | | | | 114 | | | | 0.56 | * | | | 0.57 | * | | | 2.01 | * | | | 4 | |
| | 9.80 | | | | (0.89 | ) | | | 110 | | | | 0.55 | | | | 0.55 | | | | 2.47 | | | | 38 | |
| | 10.10 | | | | 1.31 | | | | 15 | | | | 0.55 | * | | | 1.08 | * | | | 2.05 | * | | | 6 | |
| | | | | | |
| | | | | | | | | | | | | | | | | | | | | | | | | | |
| | | | | | | | | | | | | | | | | | | | | | | | | | |
| $ | 10.11 | | | | 4.69 | % | | $ | 3,654 | | | | 0.06 | %* | | | 0.07 | %* | | | 2.53 | %* | | | 3 | % |
| | 9.80 | | | | (0.47 | ) | | | 3,388 | | | | 0.05 | | | | 0.05 | | | | 2.83 | | | | 38 | |
| | 10.11 | | | | 1.58 | | | | 3,048 | | | | 0.05 | * | | | 0.58 | * | | | 2.39 | * | | | 5 | |
| | | | | | | | | | | | | | | | | | | | | | | | | | |
| | 10.11 | | | | 4.59 | | | | 63 | | | | 0.31 | * | | | 0.32 | * | | | 2.82 | * | | | 3 | |
| | 9.80 | | | | (0.77 | ) | | | 11 | | | | 0.30 | | | | 0.30 | | | | 2.54 | | | | 38 | |
| | 10.11 | | | | 1.47 | | | | 11 | | | | 0.30 | * | | | 0.83 | * | | | 2.18 | * | | | 5 | |
| | | | | | | | | | | | | | | | | | | | | | | | | | |
| | 10.09 | | | | 4.31 | | | | 22 | | | | 0.56 | * | | | 0.57 | * | | | 1.56 | * | | | 3 | |
| | 9.79 | | | | (0.94 | ) | | | 60 | | | | 0.55 | | | | 0.55 | | | | 2.29 | | | | 38 | |
| | 10.09 | | | | 1.28 | | | | 66 | | | | 0.55 | * | | | 1.08 | * | | | 2.53 | * | | | 5 | |
| | | | | | |
| | SEMIANNUAL REPORT | | DECEMBER 31, 2016 | | 31 |
Financial Highlights (Cont.)
| | | | | | | | | | | | | | | | | | | | | | | | | | | | | | | | | | | | |
| | | | | | Investment Operations | | | | | | Less Distributions(b) | |
| | | | | | | | | | | | | | | | | | | | | | | | | | | | |
| Selected Per Share Data for the Year or Period Ended: | | Net Asset Value
Beginning of
Year or
Period | | | Net Investment
Income(a) | | | Net Realized/
Unrealized
Gain (Loss) | | | Total | | | | | | From Net
Investment
Income | | | From Net
Realized
Capital Gains | | | Tax Basis
Return of
Capital | | | Total | |
| | | | | | | | | |
PIMCO REALPATH® Blend Income Fund | | | | | | | | | | | | | | | | | | | | | | | | | | | | | | | | | | | | |
| Institutional Class | | | | | | | | | | | | | | | | | | | | | | | | | | | | | | | | | | | | |
07/01/2016 - 12/31/2016+ | | $ | 9.92 | | | $ | 0.17 | | | $ | 0.09 | | | $ | 0.26 | | | | | | | $ | (0.17 | ) | | $ | 0.00 | | | $ | 0.00 | | | $ | (0.17 | ) |
06/30/2016 | | | 9.95 | | | | 0.32 | | | | 0.00 | | | | 0.32 | | | | | | | | (0.32 | ) | | | (0.02 | ) | | | (0.01 | ) | | | (0.35 | ) |
12/31/2014 - 06/30/2015 | | | 10.00 | | | | 0.10 | | | | (0.10 | ) | | | 0.00 | | | | | | | | (0.05 | ) | | | 0.00 | | | | 0.00 | | | | (0.05 | ) |
| Administrative Class | | | | | | | | | | | | | | | | | | | | | | | | | | | | | | | | | | | | |
07/01/2016 - 12/31/2016+ | | | 9.92 | | | | 0.15 | | | | 0.10 | | | | 0.25 | | | | | | | | (0.15 | ) | | | 0.00 | | | | 0.00 | | | | (0.15 | ) |
06/30/2016 | | | 9.94 | | | | 0.29 | | | | 0.01 | | | | 0.30 | | | | | | | | (0.29 | ) | | | (0.02 | ) | | | (0.01 | ) | | | (0.32 | ) |
12/31/2014 - 06/30/2015 | | | 10.00 | | | | 0.09 | | | | (0.11 | ) | | | (0.02 | ) | | | | | | | (0.04 | ) | | | 0.00 | | | | 0.00 | | | | (0.04 | ) |
| Class A | | | | | | | | | | | | | | | | | | | | | | | | | | | | | | | | | | | | |
07/01/2016 - 12/31/2016+ | | | 9.91 | | | | 0.14 | | | | 0.10 | | | | 0.24 | | | | | | | | (0.14 | ) | | | 0.00 | | | | 0.00 | | | | (0.14 | ) |
06/30/2016 | | | 9.94 | | | | 0.28 | | | | (0.01 | ) | | | 0.27 | | | | | | | | (0.27 | ) | | | (0.02 | ) | | | (0.01 | ) | | | (0.30 | ) |
12/31/2014 - 06/30/2015 | | | 10.00 | | | | 0.13 | | | | (0.15 | ) | | | (0.02 | ) | | | | | | | (0.04 | ) | | | 0.00 | | | | 0.00 | | | | (0.04 | ) |
| (a) | Per share amounts based on average number of shares outstanding during the year or period. |
| (b) | The tax characterization of distributions is determined in accordance with federal income tax regulations. The actual tax characterization of distributions paid is determined at the end of the fiscal year. See Note 2 in the Notes to Financial Statements for more information. |
| | | | | | | | |
| 32 | | PIMCO EQUITY SERIES | | | | | See Accompanying Notes | |
| | | | | | | | | | | | | | | | | | | | | | | | | | |
| | | | | | | Ratios/Supplemental Data | |
| | | | | | | | | | Ratios to Average Net Assets | | | | |
Net Asset
Value End of
Year or
Period | | | Total Return | | | Net Assets
End of Year or
Period (000s) | | | Expenses | | | Expenses
Excluding
Waivers | | | Net
Investment
Income | | | Portfolio
Turnover
Rate | |
| | | | | | |
| | | | | | | | | | | | | | | | | | | | | | | | | | |
| | | | | | | | | | | | | | | | | | | | | | | | | | |
| $ | 10.01 | | | | 2.58 | % | | $ | 3,596 | | | | 0.04 | %* | | | 0.05 | %* | | | 3.22 | %* | | | 3 | % |
| | 9.92 | | | | 3.33 | | | | 3,317 | | | | 0.03 | | | | 0.03 | | | | 3.34 | | | | 41 | |
| | 9.95 | | | | (0.02 | ) | | | 3,035 | | | | 0.03 | * | | | 0.56 | * | | | 2.03 | * | | | 4 | |
| | | | | | | | | | | | | | | | | | | | | | | | | | |
| | 10.02 | | | | 2.56 | | | | 51 | | | | 0.29 | * | | | 0.30 | * | | | 2.96 | * | | | 3 | |
| | 9.92 | | | | 3.08 | | | | 50 | | | | 0.28 | | | | 0.28 | | | | 2.95 | | | | 41 | |
| | 9.94 | | | | (0.21 | ) | | | 14 | | | | 0.28 | * | | | 0.81 | * | | | 1.84 | * | | | 4 | |
| | | | | | | | | | | | | | | | | | | | | | | | | | |
| | 10.01 | | | | 2.44 | | | | 76 | | | | 0.54 | * | | | 0.55 | * | | | 2.73 | * | | | 3 | |
| | 9.91 | | | | 2.75 | | | | 70 | | | | 0.53 | | | | 0.53 | | | | 2.84 | | | | 41 | |
| | 9.94 | | | | (0.22 | ) | | | 73 | | | | 0.53 | * | | | 1.06 | * | | | 2.61 | * | | | 4 | |
| | | | | | |
| | SEMIANNUAL REPORT | | DECEMBER 31, 2016 | | 33 |
Statements of Assets and Liabilities
| | | | | | | | | | | | | | | | |
| (Amounts in thousands†, except per share amounts) | | PIMCO
REALPATH® Blend
2020
Fund | | | PIMCO
REALPATH® Blend
2025
Fund | | | PIMCO
REALPATH® Blend
2030
Fund | | | PIMCO
REALPATH® Blend
2035
Fund | |
| | | | |
Assets: | | | | | | | | | | | | | | | | |
Investments, at value | | | | | | | | | | | | | | | | |
Investments in securities | | $ | 1,988 | | | $ | 1,920 | | | $ | 4,017 | | | $ | 4,117 | |
Investments in Affiliates | | | 2,996 | | | | 2,095 | | | | 3,312 | | | | 2,402 | |
Financial Derivative Instruments | | | | | | | | | | | | | | | | |
Exchange-traded or centrally cleared | | | 1 | | | | 1 | | | | 0 | | | | 0 | |
Over the counter | | | 7 | | | | 7 | | | | 18 | | | | 22 | |
Cash | | | 148 | | | | 154 | | | | 85 | | | | 186 | |
Receivable for investments sold | | | 72 | | | | 88 | | | | 143 | | | | 96 | |
Receivable for investments in Affiliates sold | | | 44 | | | | 0 | | | | 0 | | | | 10 | |
Receivable for Fund shares sold | | | 1 | | | | 0 | | | | 1 | | | | 0 | |
Interest and/or dividends receivable | | | 0 | | | | 0 | | | | 0 | | | | 0 | |
Dividends receivable from Affiliates | | | 9 | | | | 7 | | | | 10 | | | | 7 | |
Reimbursement receivable from PIMCO | | | 1 | | | | 0 | | | | 0 | | | | 0 | |
Total Assets | | | 5,267 | | | | 4,272 | | | | 7,586 | | | | 6,840 | |
| | | | |
Liabilities: | | | | | | | | | | | | | | | | |
Payable for investments purchased | | $ | 0 | | | $ | 0 | | | $ | 0 | | | $ | 8 | |
Payable for investments in Affiliates purchased | | | 147 | | | | 115 | | | | 217 | | | | 191 | |
Other liabilities | | | 0 | | | | 0 | | | | 1 | | | | 1 | |
Total Liabilities | | | 147 | | | | 115 | | | | 218 | | | | 200 | |
| | | | |
Net Assets | | $ | 5,120 | | | $ | 4,157 | | | $ | 7,368 | | | $ | 6,640 | |
| | | | |
Net Assets Consist of: | | | | | | | | | | | | | | | | |
Paid in capital | | $ | 5,056 | | | $ | 4,179 | | | $ | 7,018 | | | $ | 6,334 | |
Undistributed (overdistributed) net investment income | | | (2 | ) | | | (8 | ) | | | (21 | ) | | | (3 | ) |
Accumulated undistributed net realized (loss) | | | (32 | ) | | | (68 | ) | | | (28 | ) | | | (47 | ) |
Net unrealized appreciation | | | 98 | | | | 54 | | | | 399 | | | | 356 | |
| | | | |
Net Assets | | $ | 5,120 | | | $ | 4,157 | | | $ | 7,368 | | | $ | 6,640 | |
| | | | |
Cost of investments in securities | | $ | 1,886 | | | $ | 1,839 | | | $ | 3,668 | | | $ | 3,812 | |
Cost of investments in Affiliates | | $ | 3,004 | | | $ | 2,126 | | | $ | 3,280 | | | $ | 2,374 | |
Cost or premiums of financial derivative instruments, net | | $ | 4 | | | $ | 4 | | | $ | 0 | | | $ | 0 | |
| † | A zero balance may reflect actual amounts rounding to less than one thousand. |
| | | | | | | | |
| 34 | | PIMCO EQUITY SERIES | | | | | See Accompanying Notes | |
December 31, 2016 (Unaudited)
| | | | | | | | | | | | | | | | | | |
PIMCO
REALPATH® Blend
2040
Fund | | | PIMCO
REALPATH® Blend
2045
Fund | | | PIMCO
REALPATH® Blend
2050
Fund | | | PIMCO
REALPATH® Blend
2055
Fund | | | PIMCO
REALPATH® Blend
Income
Fund | |
| | | | |
| | | | | | | | | | | | | | | | | | |
| | | | | | | | | | | | | | | | | | | |
| $ | 2,714 | | | $ | 2,763 | | | $ | 3,347 | | | $ | 2,763 | | | $ | 1,336 | |
| | 1,211 | | | | 1,010 | | | | 1,039 | | | | 782 | | | | 2,339 | |
| | | | | | | | | | | | | | | | | | | |
| | 0 | | | | 0 | | | | 0 | | | | 0 | | | | 1 | |
| | 15 | | | | 14 | | | | 16 | | | | 13 | | | | 4 | |
| | 122 | | | | 103 | | | | 170 | | | | 191 | | | | 40 | |
| | 33 | | | | 36 | | | | 24 | | | | 8 | | | | 13 | |
| | 8 | | | | 0 | | | | 0 | | | | 0 | | | | 0 | |
| | 1 | | | | 0 | | | | 2 | | | | 0 | | | | 0 | |
| | 0 | | | | 0 | | | | 1 | | | | 0 | | | | 1 | |
| | 4 | | | | 3 | | | | 3 | | | | 2 | | | | 7 | |
| | 0 | | | | 0 | | | | 0 | | | | 1 | | | | 0 | |
| | 4,108 | | | | 3,929 | | | | 4,602 | | | | 3,760 | | | | 3,741 | |
| | | | |
| | | | | | | | | | | | | | | | | | |
| $ | 6 | | | $ | 6 | | | $ | 15 | | | $ | 14 | | | $ | 0 | |
| | 59 | | | | 43 | | | | 21 | | | | 7 | | | | 18 | |
| | 1 | | | | 0 | | | | 0 | | | | 0 | | | | 0 | |
| | 66 | | | | 49 | | | | 36 | | | | 21 | | | | 18 | |
| | | | |
| $ | 4,042 | | | $ | 3,880 | | | $ | 4,566 | | | $ | 3,739 | | | $ | 3,723 | |
| | | | |
| | | | | | | | | | | | | | | | | | |
| $ | 3,962 | | | $ | 3,831 | | | $ | 4,460 | | | $ | 3,686 | | | $ | 3,706 | |
| | 1 | | | | 4 | | | | 4 | | | | 4 | | | | (6 | ) |
| | (35 | ) | | | (45 | ) | | | (42 | ) | | | (41 | ) | | | (14 | ) |
| | 114 | | | | 90 | | | | 144 | | | | 90 | | | | 37 | |
| | | | |
| $ | 4,042 | | | $ | 3,880 | | | $ | 4,566 | | | $ | 3,739 | | | $ | 3,723 | |
| | | | |
| $ | 2,610 | | | $ | 2,675 | | | $ | 3,208 | | | $ | 2,672 | | | $ | 1,282 | |
| $ | 1,216 | | | $ | 1,022 | | | $ | 1,049 | | | $ | 796 | | | $ | 2,357 | |
| $ | 0 | | | $ | 0 | | | $ | 0 | | | $ | 0 | | | $ | 4 | |
| | | | | | |
| | SEMIANNUAL REPORT | | DECEMBER 31, 2016 | | 35 |
Statements of Assets and Liabilities (Cont.)
| | | | | | | | | | | | | | | | |
| | | PIMCO
REALPATH® Blend
2020
Fund | | | PIMCO
REALPATH® Blend
2025
Fund | | | PIMCO
REALPATH® Blend
2030
Fund | | | PIMCO
REALPATH® Blend
2035
Fund | |
| | | | |
Net Assets: | | | | | | | | | | | | | | | | |
Institutional Class | | $ | 5,099 | | | $ | 4,102 | | | $ | 7,278 | | | $ | 6,472 | |
Administrative Class | | | 11 | | | | 16 | | | | 34 | | | | 21 | |
Class A | | | 10 | | | | 39 | | | | 56 | | | | 147 | |
| | | | |
Shares Issued and Outstanding: | | | | | | | | | | | | | | | | |
Institutional Class | | | 510 | | | | 411 | | | | 726 | | | | 642 | |
Administrative Class | | | 1 | | | | 2 | | | | 3 | | | | 2 | |
Class A | | | 1 | | | | 4 | | | | 6 | | | | 15 | |
| | | | |
Net Asset Value Per Share Outstanding: | | | | | | | | | | | | | | | | |
Institutional Class | | $ | 10.00 | | | $ | 9.97 | | | $ | 10.03 | | | $ | 10.08 | |
Administrative Class | | | 10.00 | | | | 9.97 | | | | 10.03 | | | | 10.07 | |
Class A | | | 10.01 | | | | 9.98 | | | | 10.01 | | | | 10.12 | |
| | | | | | | | |
| 36 | | PIMCO EQUITY SERIES | | | | | See Accompanying Notes | |
December 31, 2016 (Unaudited)
| | | | | | | | | | | | | | | | | | |
PIMCO
REALPATH® Blend
2040
Fund | | | PIMCO
REALPATH® Blend
2045
Fund | | | PIMCO
REALPATH® Blend
2050
Fund | | | PIMCO
REALPATH® Blend
2055
Fund | | | PIMCO
REALPATH® Blend
Income
Fund | |
| | | | |
| | | | | | | | | | | | | | | | | | |
| $ | 3,963 | | | $ | 3,784 | | | $ | 4,438 | | | $ | 3,654 | | | $ | 3,596 | |
| | 48 | | | | 80 | | | | 14 | | | | 63 | | | | 51 | |
| | 31 | | | | 16 | | | | 114 | | | | 22 | | | | 76 | |
| | | | |
| | | | | | | | | | | | | | | | | | |
| | 391 | | | | 375 | | | | 439 | | | | 362 | | | | 359 | |
| | 5 | | | | 8 | | | | 1 | | | | 6 | | | | 5 | |
| | 3 | | | | 2 | | | | 11 | | | | 2 | | | | 8 | |
| | | | |
| | | | | | | | | | | | | | | | | | |
| $ | 10.12 | | | $ | 10.09 | | | $ | 10.12 | | | $ | 10.11 | | | $ | 10.01 | |
| | 10.12 | | | | 10.08 | | | | 10.12 | | | | 10.11 | | | | 10.02 | |
| | 10.12 | | | | 10.09 | | | | 10.10 | | | | 10.09 | | | | 10.01 | |
| | | | | | |
| | SEMIANNUAL REPORT | | DECEMBER 31, 2016 | | 37 |
Statements of Operations
| | | | | | | | | | | | | | | | |
| Six Months Ended December 31, 2016 | | | | | | | | | | | | |
| (Amounts in thousands†) | | PIMCO
REALPATH® Blend
2020
Fund | | | PIMCO
REALPATH® Blend
2025
Fund | | | PIMCO
REALPATH® Blend
2030
Fund | | | PIMCO
REALPATH® Blend
2035
Fund | |
| | | | |
Investment Income: | | | | | | | | | | | | | | | | |
Dividends | | $ | 23 | | | $ | 24 | | | $ | 49 | | | $ | 50 | |
Dividends from Investments in Affiliates | | | 53 | | | | 41 | | | | 59 | | | | 44 | |
Total Income | | | 76 | | | | 65 | | | | 108 | | | | 94 | |
| | | | |
Expenses: | | | | | | | | | | | | | | | | |
Investment advisory fees | | | 0 | | | | 0 | | | | 1 | | | | 1 | |
Supervisory and administrative fees | | | 1 | | | | 1 | | | | 1 | | | | 1 | |
Trustee fees | | | 0 | | | | 0 | | | | 0 | | | | 1 | |
Total Expenses | | | 1 | | | | 1 | | | | 2 | | | | 3 | |
Waiver and/or Reimbursement by PIMCO | | | 0 | | | | 0 | | | | (1 | ) | | | 0 | |
Net Expenses | | | 1 | | | | 1 | | | | 1 | | | | 3 | |
| | | | |
Net Investment Income | | | 75 | | | | 64 | | | | 107 | | | | 91 | |
| | | | |
Net Realized Gain (Loss): | | | | | | | | | | | | | | | | |
Investments in securities | | | 2 | | | | 1 | | | | 8 | | | | 4 | |
Investments in Affiliates | | | (4 | ) | | | 0 | | | | 0 | | | | 0 | |
Net capital gain distributions received from Affiliate investments | | | 8 | | | | 7 | | | | 9 | | | | 5 | |
Exchange-traded or centrally cleared financial derivative instruments | | | (8 | ) | | | (9 | ) | | | (4 | ) | | | (5 | ) |
Over the counter financial derivative instruments | | | (5 | ) | | | (7 | ) | | | (13 | ) | | | (14 | ) |
| | | | |
Net Realized Gain (Loss) | | | (7 | ) | | | (8 | ) | | | 0 | | | | (10 | ) |
| | | | |
Net Change in Unrealized Appreciation (Depreciation): | | | | | | | | | | | | | | | | |
Investments in securities | | | 94 | | | | 94 | | | | 194 | | | | 206 | |
Investments in Affiliates | | | (56 | ) | | | (47 | ) | | | (55 | ) | | | (20 | ) |
Exchange-traded or centrally cleared financial derivative instruments | | | 1 | | | | 2 | | | | 4 | | | | 5 | |
Over the counter financial derivative instruments | | | 0 | | | | (1 | ) | | | (4 | ) | | | (6 | ) |
| | | | |
Net Change in Unrealized Appreciation | | | 39 | | | | 48 | | | | 139 | | | | 185 | |
| | | | |
Net Increase in Net Assets Resulting from Operations | | $ | 107 | | | $ | 104 | | | $ | 246 | | | $ | 266 | |
| † | A zero balance may reflect actual amounts rounding to less than one thousand. |
| | | | | | | | |
| 38 | | PIMCO EQUITY SERIES | | | | | See Accompanying Notes | |
(Unaudited)
| | | | | | | | | | | | | | | | | | |
| | | | | | | | | | | | | | |
PIMCO
REALPATH® Blend
2040
Fund | | | PIMCO
REALPATH® Blend
2045
Fund | | | PIMCO
REALPATH® Blend
2050
Fund | | | PIMCO
REALPATH® Blend
2055
Fund | | | PIMCO
REALPATH® Blend
Income
Fund | |
| | | | |
| | | | | | | | | | | | | | | | | | |
| $ | 32 | | | $ | 33 | | | $ | 40 | | | $ | 34 | | | $ | 16 | |
| | 21 | | | | 16 | | | | 18 | | | | 14 | | | | 44 | |
| | 53 | | | | 49 | | | | 58 | | | | 48 | | | | 60 | |
| | | | |
| | | | | | | | | | | | | | | | | | |
| | 1 | | | | 1 | | | | 1 | | | | 1 | | | | 0 | |
| | 0 | | | | 0 | | | | 1 | | | | 1 | | | | 1 | |
| | 0 | | | | 0 | | | | 0 | | | | 0 | | | | 0 | |
| | 1 | | | | 1 | | | | 2 | | | | 2 | | | | 1 | |
| | 0 | | | | 0 | | | | 0 | | | | 0 | | | | 0 | |
| | 1 | | | | 1 | | | | 2 | | | | 2 | | | | 1 | |
| | | | |
| | 52 | | | | 48 | | | | 56 | | | | 46 | | | | 59 | |
| | | | |
| | | | | | | | | | | | | | | | | | |
| | 1 | | | | 0 | | | | (1 | ) | | | 0 | | | | 1 | |
| | 0 | | | | 0 | | | | 0 | | | | 0 | | | | 0 | |
| | 2 | | | | 2 | | | | 3 | | | | 2 | | | | 5 | |
| | (4 | ) | | | (4 | ) | | | (4 | ) | | | (4 | ) | | | (8 | ) |
| | (10 | ) | | | (10 | ) | | | (11 | ) | | | (9 | ) | | | (3 | ) |
| | | | |
| | (11 | ) | | | (12 | ) | | | (13 | ) | | | (11 | ) | | | (5 | ) |
| | | | |
| | | | | | | | | | | | | | | | | | |
| | 134 | | | | 138 | | | | 165 | | | | 139 | | | | 67 | |
| | (11 | ) | | | (13 | ) | | | (14 | ) | | | (12 | ) | | | (32 | ) |
| | 3 | | | | 3 | | | | 3 | | | | 3 | | | | 1 | |
| | (2 | ) | | | (3 | ) | | | (4 | ) | | | (4 | ) | | | 0 | |
| | | | |
| | 124 | | | | 125 | | | | 150 | | | | 126 | | | | 36 | |
| | | | |
| $ | 165 | | | $ | 161 | | | $ | 193 | | | $ | 161 | | | $ | 90 | |
| | | | | | |
| | SEMIANNUAL REPORT | | DECEMBER 31, 2016 | | 39 |
Statements of Changes in Net Assets
| | | | | | | | | | | | | | | | | | | | | | | | | | | | | | | | |
| | | PIMCO
REALPATH® Blend
2020
Fund | | | PIMCO
REALPATH® Blend
2025
Fund | | | PIMCO
REALPATH® Blend
2030
Fund | | | PIMCO
REALPATH® Blend
2035
Fund | |
| | | | | | | | |
| (Amounts in thousands†) | | For the Period
July 1, 2016 -
December 31, 2016
(Unaudited) | | | Year Ended
June 30, 2016 | | | For the Period
July 1, 2016 -
December 31, 2016
(Unaudited) | | | Year Ended
June 30, 2016 | | | For the Period
July 1, 2016 -
December 31, 2016
(Unaudited) | | | Year Ended
June 30, 2016 | | | For the Period
July 1, 2016 -
December 31, 2016
(Unaudited) | | | Year Ended
June 30, 2016 | |
| | | | | | | | |
Increase in Net Assets from: | | | | | | | | | | | | | | | | | | | | | | | | | | | | | | | | |
| | | | | | | | |
Operations: | | | | | | | | | | | | | | | | | | | | | | | | | | | | | | | | |
Net investment income | | $ | 75 | | | $ | 111 | | | $ | 64 | | | $ | 112 | | | $ | 107 | | | $ | 134 | | | $ | 91 | | | $ | 127 | |
Net realized gain (loss) | | | (7 | ) | | | (39 | ) | | | (8 | ) | | | (82 | ) | | | 0 | | | | (41 | ) | | | (10 | ) | | | (55 | ) |
Net change in unrealized appreciation (depreciation) | | | 39 | | | | 89 | | | | 48 | | | | 34 | | | | 139 | | | | 289 | | | | 185 | | | | 189 | |
| | | | | | | | |
Net Increase (Decrease) in Net Assets Resulting from Operations | | | 107 | | | | 161 | | | | 104 | | | | 64 | | | | 246 | | | | 382 | | | | 266 | | | | 261 | |
| | | | | | | | |
Distributions to Shareholders: | | | | | | | | | | | | | | | | | | | | | | | | | | | | | | | | |
From net investment income | | | | | | | | | | | | | | | | | | | | | | | | | | | | | | | | |
Institutional Class | | | (77 | ) | | | (110 | ) | | | (64 | ) | | | (115 | ) | | | (158 | ) | | | (109 | ) | | | (117 | ) | | | (104 | ) |
Administrative Class | | | 0 | | | | 0 | | | | 0 | | | | 0 | | | | (1 | ) | | | 0 | | | | 0 | | | | 0 | |
Class A | | | 0 | | | | 0 | | | | (1 | ) | | | 0 | | | | (1 | ) | | | 0 | | | | (2 | ) | | | 0 | |
From net realized capital gains | | | | | | | | | | | | | | | | | | | | | | | | | | | | | | | | |
Institutional Class | | | 0 | | | | (7 | ) | | | 0 | | | | (7 | ) | | | 0 | | | | (9 | ) | | | 0 | | | | (10 | ) |
Institutional Class | | | 0 | | | | 0 | | | | 0 | | | | 0 | | | | 0 | | | | 0 | | | | 0 | | | | 0 | |
Administrative Class | | | 0 | | | | 0 | | | | 0 | | | | 0 | | | | 0 | | | | 0 | | | | 0 | | | | 0 | |
Class A | | | 0 | | | | 0 | | | | 0 | | | | 0 | | | | 0 | | | | 0 | | | | 0 | | | | 0 | |
| | | | | | | | |
Total Distributions(a) | | | (77 | ) | | | (117 | ) | | | (65 | ) | | | (122 | ) | | | (160 | ) | | | (118 | ) | | | (119 | ) | | | (114 | ) |
| | | | | | | | |
Portfolio Share Transactions: | | | | | | | | | | | | | | | | | | | | | | | | | | | | | | | | |
Net increase resulting from Fund share transactions** | | | 918 | | | | 1,101 | | | | 680 | | | | 444 | | | | 837 | | | | 3,146 | | | | 515 | | | | 2,772 | |
| | | | | | | | |
Total Increase in Net Assets | | | 948 | | | | 1,145 | | | | 719 | | | | 386 | | | | 923 | | | | 3,410 | | | | 662 | | | | 2,919 | |
| | | | | | | | |
Net Assets: | | | | | | | | | | | | | | | | | | | | | | | | | | | | | | | | |
Beginning of year or period | | | 4,172 | | | | 3,027 | | | | 3,438 | | | | 3,052 | | | | 6,445 | | | | 3,035 | | | | 5,978 | | | | 3,059 | |
End of year or period* | | $ | 5,120 | | | $ | 4,172 | | | $ | 4,157 | | | $ | 3,438 | | | $ | 7,368 | | | $ | 6,445 | | | $ | 6,640 | | | $ | 5,978 | |
| | | | | | | | |
* Including undistributed (overdistributed) net investment income of: | | $ | (2 | ) | | $ | 0 | | | $ | (8 | ) | | $ | (7 | ) | | $ | (21 | ) | | $ | 32 | | | $ | (3 | ) | | $ | 25 | |
| † | A zero balance may reflect actual amounts rounding to less than one thousand. |
| ** | See Note 11 in the Notes to Financial Statements. |
| (a) | The tax characterization of distributions is determined in accordance with federal income tax regulations. See Note 2 in the Notes to Financial Statements for more information. |
| | | | | | | | |
| 40 | | PIMCO EQUITY SERIES | | | | | See Accompanying Notes | |
| | | | | | | | | | | | | | | | | | | | | | | | | | | | | | | | | | | | | | |
PIMCO
REALPATH® Blend
2040
Fund | | | PIMCO
REALPATH® Blend
2045
Fund | | | PIMCO
REALPATH® Blend
2050
Fund | | | PIMCO
REALPATH® Blend
2055
Fund | | | PIMCO
REALPATH® Blend
Income
Fund | |
| | | | | | | | | |
For the Period
July 1, 2016 -
December 31, 2016
(Unaudited) | | | Year Ended
June 30, 2016 | | | For the Period
July 1, 2016 -
December 31, 2016
(Unaudited) | | | Year Ended
June 30, 2016 | | | For the Period
July 1, 2016 -
December 31, 2016
(Unaudited) | | | Year Ended
June 30, 2016 | | | For the Period
July 1, 2016 -
December 31, 2016
(Unaudited) | | | Year Ended
June 30, 2016 | | | For the Period
July 1, 2016 -
December 31, 2016
(Unaudited) | | | Year Ended
June 30, 2016 | |
| | | | | | | | | |
| | | | | | | | | | | | | | | | | | | | | | | | | | | | | | | | | | | | | | |
| | | | | | | | | |
| | | | | | | | | | | | | | | | | | | | | | | | | | | | | | | | | | | | | | |
| $ | 52 | | | $ | 90 | | | $ | 48 | | | $ | 87 | | | $ | 56 | | | $ | 91 | | | $ | 46 | | | $ | 85 | | | $ | 59 | | | $ | 105 | |
| | (11 | ) | | | (43 | ) | | | (12 | ) | | | (53 | ) | | | (13 | ) | | | (48 | ) | | | (11 | ) | | | (50 | ) | | | (5 | ) | | | (26 | ) |
| 124 | | | | (4 | ) | | | 125 | | | | (36 | ) | | | 150 | | | | (9 | ) | | | 126 | | | | (39 | ) | | | 36 | | | | 36 | |
| | | | | | | | | |
|
165 |
| | | 43 | | | | 161 | | | | (2 | ) | | | 193 | | | | 34 | | | | 161 | | | | (4 | ) | | | 90 | | | | 115 | |
| | | | | | | | | |
| | | | | | | | | | | | | | | | | | | | | | | | | | | | | | | | | | | | | | |
| | | | | | | | | | | | | | | | | | | | | | | | | | | | | | | | | | | | | | |
| | (60 | ) | | | (77 | ) | | | (54 | ) | | | (73 | ) | | | (68 | ) | | | (72 | ) | | | (53 | ) | | | (71 | ) | | | (58 | ) | | | (103 | ) |
| | (1 | ) | | | (1 | ) | | | (1 | ) | | | (1 | ) | | | 0 | | | | 0 | | | | (1 | ) | | | 0 | | | | (1 | ) | | | 0 | |
| | 0 | | | | (1 | ) | | | 0 | | | | 0 | | | | (1 | ) | | | (2 | ) | | | 0 | | | | (1 | ) | | | (1 | ) | | | (2 | ) |
| | | | | | | | | | | | | | | | | | | | | | | | | | | | | | | | | | | | | | |
| | 0 | | | | (9 | ) | | | 0 | | | | (9 | ) | | | 0 | | | | (8 | ) | | | 0 | | | | (9 | ) | | | 0 | | | | (5 | ) |
| | 0 | | | | 0 | | | | 0 | | | | 0 | | | | 0 | | | | 0 | | | | 0 | | | | 0 | | | | 0 | | | | (3 | ) |
| | 0 | | | | 0 | | | | 0 | | | | 0 | | | | 0 | | | | 0 | | | | 0 | | | | 0 | | | | 0 | | | | 0 | |
| | 0 | | | | 0 | | | | 0 | | | | 0 | | | | 0 | | | | 0 | | | | 0 | | | | 0 | | | | 0 | | | | 0 | |
| | | | | | | | | |
| | (61 | ) | | | (88 | ) | | | (55 | ) | | | (83 | ) | | | (69 | ) | | | (82 | ) | | | (54 | ) | | | (81 | ) | | | (60 | ) | | | (113 | ) |
| | | | | | | | | |
| | | | | | | | | | | | | | | | | | | | | | | | | | | | | | | | | | | | | | |
|
363 |
| | | 561 | | | | 310 | | | | 456 | | | | 385 | | | | 1,030 | | | | 173 | | | | 419 | | | | 256 | | | | 313 | |
| | | | | | | | | |
| | 467 | | | | 516 | | | | 416 | | | | 371 | | | | 509 | | | | 982 | | | | 280 | | | | 334 | | | | 286 | | | | 315 | |
| | | | | | | | | |
| | | | | | | | | | | | | | | | | | | | | | | | | | | | | | | | | | | | | | |
| | 3,575 | | | | 3,059 | | | | 3,464 | | | | 3,093 | | | | 4,057 | | | | 3,075 | | | | 3,459 | | | | 3,125 | | | | 3,437 | | | | 3,122 | |
| $ | 4,042 | | | $ | 3,575 | | | $ | 3,880 | | | $ | 3,464 | | | $ | 4,566 | | | $ | 4,057 | | | $ | 3,739 | | | $ | 3,459 | | | $ | 3,723 | | | $ | 3,437 | |
| | | | | | | | | |
$ | 1 | | | $ | 10 | | | $ | 4 | | | $ | 11 | | | $ | 4 | | | $ | 17 | | | $ | 4 | | | $ | 12 | | | $ | (6 | ) | | $ | (5 | ) |
| | | | | | |
| | SEMIANNUAL REPORT | | DECEMBER 31, 2016 | | 41 |
Schedule of Investments PIMCO REALPATH® Blend 2020 Fund
| | | | | | | | | | | | |
| | | | | SHARES | | | | | MARKET
VALUE
(000S) | |
| INVESTMENTS IN SECURITIES 38.9% | |
| |
| MUTUAL FUNDS 38.9% | |
Vanguard 500 Index Fund ‘Admiral’ | | | | | 4,968 | | | $ | | | 1,026 | |
Vanguard Developed Markets Index Fund ‘Admiral’ | | | | | 40,108 | | | | | | 471 | |
Vanguard Emerging Markets Stock Index Fund ‘Admiral’ | | | | | 11,328 | | | | | | 337 | |
Vanguard Small-Cap Index Fund ‘Admiral’ | | | | | 2,496 | | | | | | 154 | |
| | | | | | | | | | | | |
Total Mutual Funds (Cost $1,886) | | | | | | | | | 1,988 | |
| | | | | | | | | | | | |
| | | | | | | | | | | | |
Total Investments in Securities
(Cost $1,886) | | | | | | 1,988 | |
| | | | | | | | | | | | |
| |
| INVESTMENTS IN AFFILIATES 58.5% | |
| |
| MUTUAL FUNDS (a) 56.5% | |
PIMCO Foreign Bond Fund (U.S. Dollar-Hedged) | | | | | 11,722 | | | | | | 123 | |
PIMCO High Yield Fund | | | | | 43,759 | | | | | | 386 | |
PIMCO Income Fund | | | | | 56,147 | | | | | | 677 | |
PIMCO Long Duration Total Return Fund | | | | | 21,705 | | | | | | 226 | |
PIMCO Long-Term Credit Fund | | | | | 19,806 | | | | | | 226 | |
PIMCO Real Return Asset Fund | | | | | 55,641 | | | | | | 453 | |
| | | | | | | | | | | | |
| | | | | SHARES | | | | | MARKET
VALUE
(000S) | |
PIMCO Real Return Fund | | | | | 46,952 | | | $ | | | 513 | |
PIMCO Total Return Fund | | | | | 29,114 | | | | | | 292 | |
| | | | | | | | | | | | |
Total Mutual Funds (Cost $2,904) | | | | | | | | | 2,896 | |
| | | | | | | | | | | | |
| |
| SHORT-TERM INSTRUMENTS 2.0% | |
| |
| CENTRAL FUNDS USED FOR CASH MANAGEMENT PURPOSES 2.0% | |
PIMCO Short-Term Floating NAV Portfolio III | | | 10,160 | | | | | | 100 | |
| | | | | | | | | | | | |
Total Short-Term Instruments
(Cost $100) | | | | | | 100 | |
| | | | | | | | | | | | |
| | | | | | | | | | | | |
Total Investments in Affiliates
(Cost $3,004) | | | | | | 2,996 | |
| | | | | | | | | | | | |
Total Investments 97.4%
(Cost $4,890) | | | $ | | | 4,984 | |
| |
Financial Derivative
Instruments (b)(c) 0.1% (Cost or Premiums, net $4) | | | 8 | |
| |
| Other Assets and Liabilities, net 2.5% | | | | | | | | | 128 | |
| | | | | | | | | | | | |
| Net Assets 100.0% | | | | | | | | $ | | | 5,120 | |
| | | | | | | | | | | | |
NOTES TO SCHEDULE OF INVESTMENTS (AMOUNTS IN THOUSANDS*, EXCEPT NUMBER OF CONTRACTS AND UNITS):
| * | A zero balance may reflect actual amounts rounding to less than one thousand. |
| (a) | Institutional Class Shares of each Fund. |
(b) FINANCIAL DERIVATIVE INSTRUMENTS: EXCHANGE-TRADED OR CENTRALLY CLEARED
PURCHASED OPTIONS:
OPTIONS ON INDICES
| | | | | | | | | | | | | | | | | | | | |
| Description | | Strike
Value | | | Expiration
Date | | | # of
Contracts | | | Cost | | | Market
Value | |
Put - CBOE S&P 500 Index | | | 1,775.000 | | | | 03/17/2017 | | | | 1 | | | $ | 2 | | | $ | 0 | |
Put - CBOE S&P 500 Index | | | 1,875.000 | | | | 03/17/2017 | | | | 1 | | | | 3 | | | | 1 | |
| | | | | | | | | | | | | | | | | | | | |
| | | | | | | | | | | | | | $ | 5 | | | $ | 1 | |
| | | | | | | | | | | | | | | | | | | | |
Total Purchased Options | | | | | | | | | | | | | | $ | 5 | | | $ | 1 | |
| | | | | | | | | | | | | | | | | | | | |
WRITTEN OPTIONS:
OPTIONS ON INDICES
| | | | | | | | | | | | | | | | | | | | |
| Description | | Strike
Value | | | Expiration
Date | | | # of
Contracts | | | Premiums
(Received) | | | Market
Value | |
Put - CBOE S&P 500 Index | | | 1,600.000 | | | | 03/17/2017 | | | | 1 | | | $ | (1 | ) | | $ | 0 | |
| | | | | | | | | | | | | | | | | | | | |
Total Written Options | | | | | | | | | | | | | | $ | (1 | ) | | $ | 0 | |
| | | | | | | | | | | | | | | | | | | | |
FINANCIAL DERIVATIVE INSTRUMENTS: EXCHANGE-TRADED OR CENTRALLY CLEARED SUMMARY
The following is a summary of the market value and variation margin of Exchange-Traded or Centrally Cleared Financial Derivative Instruments as of December 31, 2016:
| | | | | | | | | | | | | | | | | | | | | | | | | | | | | | | | | | | | |
| | | Financial Derivative Assets | | | | | | Financial Derivative Liabilities | |
| | | Market Value | | | Variation Margin
Asset | | | | | | | | | Market Value | | | Variation Margin
Liability | | | | |
| | | Purchased
Options | | | Futures | | | Swap
Agreements | | | Total | | | | | | Written
Options | | | Futures | | | Swap
Agreements | | | Total | |
Total Exchange-Traded or Centrally Cleared | | $ | 1 | | | $ | 0 | | | $ | 0 | | | $ | 1 | | | | | | | $ | 0 | | | $ | 0 | | | $ | 0 | | | $ | 0 | |
| | | | | | | | | | | | | | | | | | | | | | | | | | | | | | | | | | | | |
| | | | | | | | |
| 42 | | PIMCO EQUITY SERIES | | | | | See Accompanying Notes | |
December 31, 2016 (Unaudited)
(c) FINANCIAL DERIVATIVE INSTRUMENTS: OVER THE COUNTER
WRITTEN OPTIONS:
TRANSACTIONS IN WRITTEN CALL AND PUT OPTIONS FOR THE PERIOD ENDED DECEMBER 31, 2016:
| | | | | | | | | | | | | | | | | | | | | | | | |
| | | Balance at
Beginning of Period | | | Sales | | | Closing Buys | | | Expirations | | | Exercised | | | Balance at
End of Period | |
# of Contracts | | | 2 | | | | 1 | | | | 0 | | | | (2 | ) | | | 0 | | | | 1 | |
Premiums | | $ | (4 | ) | | $ | (1 | ) | | $ | 0 | | | $ | 4 | | | $ | 0 | | | $ | (1 | ) |
SWAP AGREEMENTS:
TOTAL RETURN SWAPS ON COMMODITY AND EQUITY INDICES
| | | | | | | | | | | | | | | | | | | | | | | | | | | | | | | | | | |
Counterparty | | Pay/Receive(1) | | Underlying Reference | | # of Units | | | Financing Rate | | Maturity
Date | | | Notional
Amount | | | Premiums
Paid/(Received) | | | Unrealized
Appreciation/
(Depreciation) | | | Swap Agreements,
at Value | |
| | | | | | | | | | Asset | | | Liability | |
BOA | | Receive | | DWRTFT Index | | | 14 | | | 1-Month USD-LIBOR plus a specified spread | | | 04/06/2017 | | | $ | 126 | | | $ | 0 | | | $ | 6 | | | $ | 6 | | | $ | 0 | |
CBK | | Receive | | BCOMTR Index | | | 368 | | | 3-Month U.S. Treasury Bill rate plus a specified spread | | | 02/15/2017 | | | | 64 | | | | 0 | | | | 1 | | | | 1 | | | | 0 | |
JPM | | Receive | | BCOMTR Index | | | 200 | | | 3-Month U.S. Treasury Bill rate plus a specified spread | | | 02/15/2017 | | | | 35 | | | | 0 | | | | 0 | | | | 0 | | | | 0 | |
| | | | | | | | | | | | | | | | | | | | | | | | | | | | | | | | | | |
| | | | | | | | | | | | | | | | | | | | $ | 0 | | | $ | 7 | | | $ | 7 | | | $ | 0 | |
| | | | | | | | | | | | | | | | | | | | | | | | | | | | | | | | | | |
Total Swap Agreements | | | | | | | | | | | | | | | | $ | 0 | | | $ | 7 | | | $ | 7 | | | $ | 0 | |
| | | | | | | | | | | | | | | | | | | | | | | | | | | | | | | | | | |
| (1) | Receive represents that the Fund receives payments for any positive return on the underlying reference. The Fund makes payments for any negative return on such underlying reference. Pay represents that the Fund receives payments for any negative return on the underlying reference. The Fund makes payments for any positive return on such underlying reference. |
FINANCIAL DERIVATIVE INSTRUMENTS: OVER THE COUNTER SUMMARY
The following is a summary by counterparty of the market value of OTC financial derivative instruments and collateral pledged/(received) as of December 31, 2016:
| | | | | | | | | | | | | | | | | | | | | | | | | | | | | | | | | | | | | | | | | | | | | | | | |
| | | Financial Derivative Assets | | | | | | Financial Derivative Liabilities | | | | | | | | | | |
| Counterparty | | Forward
Foreign
Currency
Contracts | | | Purchased
Options | | | Swap
Agreements | | | Total
Over the
Counter | | | | | | Forward
Foreign
Currency
Contracts | | | Written
Options | | | Swap
Agreements | | | Total
Over the
Counter | | | Net Market
Value of OTC
Derivatives | | | Collateral
Pledged/
(Received) | | | Net
Exposure(2) | |
BOA | | $ | 0 | | | $ | 0 | | | $ | 6 | | | $ | 6 | | | | | | | $ | 0 | | | $ | 0 | | | $ | 0 | | | $ | 0 | | | $ | 6 | | | $ | 0 | | | $ | 6 | |
CBK | | | 0 | | | | 0 | | | | 1 | | | | 1 | | | | | | | | 0 | | | | 0 | | | | 0 | | | | 0 | | | | 1 | | | | 0 | | | | 1 | |
| | | | | | | | | | | | | | | | | | | | | | | | | | | | | | | | | | | | | | | | | | | | | | | | |
Total Over the Counter | | $ | 0 | | | $ | 0 | | | $ | 7 | | | $ | 7 | | | | | | | $ | 0 | | | $ | 0 | | | $ | 0 | | | $ | 0 | | | | | | | | | | | | | |
| | | | | | | | | | | | | | | | | | | | | | | | | | | | | | | | | | | | | | | | | | | | | | | | |
| (2) | Net Exposure represents the net receivable/(payable) that would be due from/to the counterparty in the event of default. Exposure from OTC financial derivative instruments can only be netted across transactions governed under the same master agreement with the same legal entity. See Note 6, Principal Risks, in the Notes to Financial Statements for more information regarding master netting arrangements. |
FAIR VALUE OF FINANCIAL DERIVATIVE INSTRUMENTS
The following is a summary of the fair valuation of the Fund’s derivative instruments categorized by risk exposure. See Note 6, Principal Risks, in the Notes to Financial Statements on risks of the Fund.
Fair Values of Financial Derivative Instruments on the Statements of Assets and Liabilities as of December 31, 2016:
| | | | | | | | | | | | | | | | | | | | | | | | |
| | | Derivatives not accounted for as hedging instruments | |
| | | Commodity
Contracts | | | Credit
Contracts | | | Equity
Contracts | | | Foreign
Exchange
Contracts | | | Interest
Rate Contracts | | | Total | |
Financial Derivative Instruments - Assets | |
Exchange-traded or centrally cleared | |
Purchased Options | | $ | 0 | | | $ | 0 | | | $ | 1 | | | $ | 0 | | | $ | 0 | | | $ | 1 | |
| | | | | | | | | | | | | | | | | | | | | | | | |
Over the counter | |
Swap Agreements | | $ | 1 | | | $ | 0 | | | $ | 6 | | | $ | 0 | | | $ | 0 | | | $ | 7 | |
| | | | | | | | | | | | | | | | | | | | | | | | |
| | $ | 1 | | | $ | 0 | | | $ | 7 | | | $ | 0 | | | $ | 0 | | | $ | 8 | |
| | | | | | | | | | | | | | | | | | | | | | | | |
| | | | | | |
| See Accompanying Notes | | SEMIANNUAL REPORT | | DECEMBER 31, 2016 | | 43 |
Schedule of Investments PIMCO REALPATH® Blend 2020 Fund (Cont.)
December 31, 2016 (Unaudited)
The effect of Financial Derivative Instruments on the Statements of Operations for the period ended December 31, 2016:
| | | | | | | | | | | | | | | | | | | | | | | | |
| | | Derivatives not accounted for as hedging instruments | |
| | | Commodity
Contracts | | | Credit
Contracts | | | Equity
Contracts | | | Foreign
Exchange
Contracts | | | Interest
Rate Contracts | | | Total | |
Net Realized Gain (Loss) on Financial Derivative Instruments | |
Exchange-traded or centrally cleared | |
Purchased Options | | $ | 0 | | | $ | 0 | | | $ | (12 | ) | | $ | 0 | | | $ | 0 | | | $ | (12 | ) |
Written Options | | | 0 | | | | 0 | | | | 4 | | | | 0 | | | | 0 | | | | 4 | |
| | | | | | | | | | | | | | | | | | | | | | | | |
| | $ | 0 | | | $ | 0 | | | $ | (8 | ) | | $ | 0 | | | $ | 0 | | | $ | (8 | ) |
| | | | | | | | | | | | | | | | | | | | | | | | |
Over the counter | |
Swap Agreements | | $ | (2 | ) | | $ | 0 | | | $ | (3 | ) | | $ | 0 | | | $ | 0 | | | $ | (5 | ) |
| | | | | | | | | | | | | | | | | | | | | | | | |
| | $ | (2 | ) | | $ | 0 | | | $ | (11 | ) | | $ | 0 | | | $ | 0 | | | $ | (13 | ) |
| | | | | | | | | | | | | | | | | | | | | | | | |
|
Net Change in Unrealized Appreciation (Depreciation) on Financial Derivative Instruments | |
Exchange-traded or centrally cleared | |
Purchased Options | | $ | 0 | | | $ | 0 | | | $ | 3 | | | $ | 0 | | | $ | 0 | | | $ | 3 | |
Written Options | | | 0 | | | | 0 | | | | (2 | ) | | | 0 | | | | 0 | | | | (2 | ) |
| | | | | | | | | | | | | | | | | | | | | | | | |
| | $ | 0 | | | $ | 0 | | | $ | 1 | | | $ | 0 | | | $ | 0 | | | $ | 1 | |
| | | | | | | | | | | | | | | | | | | | | | | | |
Over the counter | |
Swap Agreements | | $ | 1 | | | $ | 0 | | | $ | (1 | ) | | $ | 0 | | | $ | 0 | | | $ | 0 | |
| | | | | | | | | | | | | | | | | | | | | | | | |
| | $ | 1 | | | $ | 0 | | | $ | 0 | | | $ | 0 | | | $ | 0 | | | $ | 1 | |
| | | | | | | | | | | | | | | | | | | | | | | | |
FAIR VALUE MEASUREMENTS
The following is a summary of the fair valuations according to the inputs used as of December 31, 2016 in valuing the Fund’s assets and liabilities:
| | | | | | | | | | | | | | | | |
| Category and Subcategory | | Level 1 | | | Level 2 | | | Level 3 | | | Fair
Value at
12/31/2016 | |
Investments in Securities, at Value | |
Mutual Funds | | $ | 1,988 | | | $ | 0 | | | $ | 0 | | | $ | 1,988 | |
| | | | | | | | | | | | | | | | |
| | $ | 1,988 | | | $ | 0 | | | $ | 0 | | | $ | 1,988 | |
| | | | | | | | | | | | | | | | |
|
Investments in Affiliates, at Value | |
Mutual Funds | | | 2,896 | | | | 0 | | | | 0 | | | | 2,896 | |
Short-Term Instruments | |
Central Funds Used for Cash Management Purposes | | | 100 | | | | 0 | | | | 0 | | | | 100 | |
| | | | | | | | | | | | | | | | |
| | $ | 2,996 | | | $ | 0 | | | $ | 0 | | | $ | 2,996 | |
| | | | | | | | | | | | | | | | |
| | | | |
Total Investments | | $ | 4,984 | | | $ | 0 | | | $ | 0 | | | $ | 4,984 | |
| | | | | | | | | | | | | | | | |
| | | | | | | | | | | | | | | | |
| Category and Subcategory | | Level 1 | | | Level 2 | | | Level 3 | | | Fair
Value at
12/31/2016 | |
Financial Derivative Instruments - Assets | |
Exchange-traded or centrally cleared | | $ | 0 | | | $ | 1 | | | $ | 0 | | | $ | 1 | |
Over the counter | | | 0 | | | | 7 | | | | 0 | | | | 7 | |
| | | | | | | | | | | | | | | | |
| | $ | 0 | | | $ | 8 | | | $ | 0 | | | $ | 8 | |
| | | | | | | | | | | | | | | | |
Total Financial Derivative Instruments | | $ | 0 | | | $ | 8 | | | $ | 0 | | | $ | 8 | |
| | | | | | | | | | | | | | | | |
| | | | |
Totals | | $ | 4,984 | | | $ | 8 | | | $ | 0 | | | $ | 4,992 | |
| | | | | | | | | | | | | | | | |
There were no significant transfers between Levels 1, 2, or 3 during the period ended December 31, 2016.
| | | | | | | | |
| 44 | | PIMCO EQUITY SERIES | | | | | See Accompanying Notes | |
Schedule of Investments PIMCO REALPATH® Blend 2025 Fund
December 31, 2016 (Unaudited)
| | | | | | | | | | | | |
| | | | | SHARES | | | | | MARKET
VALUE
(000S) | |
| INVESTMENTS IN SECURITIES 46.2% | |
| |
| MUTUAL FUNDS 46.2% | |
Vanguard 500 Index Fund ‘Admiral’ | | | | | 4,675 | | | $ | | | 966 | |
Vanguard Developed Markets Index Fund ‘Admiral’ | | | | | 39,663 | | | | | | 465 | |
Vanguard Emerging Markets Stock Index Fund ‘Admiral’ | | | | | 11,433 | | | | | | 340 | |
Vanguard Small-Cap Index Fund ‘Admiral’ | | | | | 2,407 | | | | | | 149 | |
| | | | | | | | | | | | |
Total Mutual Funds (Cost $1,839) | | | | | | 1,920 | |
| | | | | | | | | | | | |
| |
Total Investments in Securities
(Cost $1,839) | | | | | | 1,920 | |
| | | | | | | | | | | | |
| |
| INVESTMENTS IN AFFILIATES 50.4% | |
| |
| MUTUAL FUNDS (a) 48.0% | |
PIMCO Foreign Bond Fund (U.S. Dollar-Hedged) | | | | | 5,555 | | | | | | 58 | |
PIMCO High Yield Fund | | | | | 35,281 | | | | | | 311 | |
PIMCO Income Fund | | | | | 33,868 | | | | | | 409 | |
PIMCO Long Duration Total Return Fund | | | | | 19,661 | | | | | | 205 | |
PIMCO Long-Term Credit Fund | | | | | 18,107 | | | | | | 207 | |
PIMCO Real Return Asset Fund | | | | | 51,335 | | | | | | 418 | |
| | | | | | | | | | | | |
| | | | | SHARES | | | | | MARKET
VALUE
(000S) | |
PIMCO Real Return Fund | | | | | 26,681 | | | $ | | | 291 | |
PIMCO Total Return Fund | | | | | 9,542 | | | | | | 96 | |
| | | | | | | | | | | | |
Total Mutual Funds (Cost $2,026) | | | | | | | | | 1,995 | |
| | | | | | | | | | | | |
| |
| SHORT-TERM INSTRUMENTS 2.4% | |
| |
| CENTRAL FUNDS USED FOR CASH MANAGEMENT PURPOSES 2.4% | |
PIMCO Short-Term Floating NAV Portfolio III | | | | | 10,160 | | | | | | 100 | |
| | | | | | | | | | | | |
Total Short-Term Instruments
(Cost $100) | | | | | | 100 | |
| | | | | | | | | | | | |
| | | | | | | | | | | | |
Total Investments in Affiliates
(Cost $2,126) | | | | | | 2,095 | |
| | | | | | | | | | | | |
Total Investments 96.6%
(Cost $3,965) | | | $ | | | 4,015 | |
| |
Financial Derivative
Instruments (b)(c) 0.2% (Cost or Premiums, net $4) | | | 8 | |
| |
| Other Assets and Liabilities, net 3.2% | | | | | | | | | 134 | |
| | | | | | | | | | | | |
| Net Assets 100.0% | | | | | | | | $ | | | 4,157 | |
| | | | | | | | | | | | |
NOTES TO SCHEDULE OF INVESTMENTS (AMOUNTS IN THOUSANDS*, EXCEPT NUMBER OF CONTRACTS AND UNITS):
| * | A zero balance may reflect actual amounts rounding to less than one thousand. |
| (a) | Institutional Class Shares of each Fund. |
(b) FINANCIAL DERIVATIVE INSTRUMENTS: EXCHANGE-TRADED OR CENTRALLY CLEARED
PURCHASED OPTIONS:
OPTIONS ON INDICES
| | | | | | | | | | | | | | | | | | | | |
| Description | | Strike
Value | | | Expiration
Date | | | # of
Contracts | | | Cost | | | Market
Value | |
Put - CBOE S&P 500 Index | | | 1,775.000 | | | | 03/17/2017 | | | | 1 | | | $ | 2 | | | $ | 0 | |
Put - CBOE S&P 500 Index | | | 1,875.000 | | | | 03/17/2017 | | | | 1 | | | | 3 | | | | 1 | |
| | | | | | | | | | | | | | | | | | | | |
| | | | | | | | | | | | | | $ | 5 | | | $ | 1 | |
| | | | | | | | | | | | | | | | | | | | |
Total Purchased Options | | | | | | | | | | | | | | $ | 5 | | | $ | 1 | |
| | | | | | | | | | | | | | | | | | | | |
WRITTEN OPTIONS:
OPTIONS ON INDICES
| | | | | | | | | | | | | | | | | | | | |
| Description | | Strike
Value | | | Expiration
Date | | | # of
Contracts | | | Premiums
(Received) | | | Market
Value | |
Put - CBOE S&P 500 Index | | | 1,600.000 | | | | 03/17/2017 | | | | 1 | | | $ | (1 | ) | | $ | 0 | |
| | | | | | | | | | | | | | | | | | | | |
Total Written Options | | | | | | | | | | | | | | $ | (1 | ) | | $ | 0 | |
| | | | | | | | | | | | | | | | | | | | |
FINANCIAL DERIVATIVE INSTRUMENTS: EXCHANGE-TRADED OR CENTRALLY CLEARED SUMMARY
The following is a summary of the market value and variation margin of Exchange-Traded or Centrally Cleared Financial Derivative Instruments as of December 31, 2016:
| | | | | | | | | | | | | | | | | | | | | | | | | | | | | | | | | | | | |
| | | Financial Derivative Assets | | | | | | Financial Derivative Liabilities | |
| | | Market Value | | | Variation Margin
Asset | | | Total | | | | | | Market Value | | | Variation Margin
Liability | | | Total | |
| | | Purchased
Options | | | Futures | | | Swap
Agreements | | | | | | | Written
Options | | | Futures | | | Swap
Agreements | | |
Total Exchange-Traded or Centrally Cleared | | $ | 1 | | | $ | 0 | | | $ | 0 | | | $ | 1 | | | | | | | $ | 0 | | | $ | 0 | | | $ | 0 | | | $ | 0 | |
| | | | | | | | | | | | | | | | | | | | | | | | | | | | | | | | | | | | |
| | | | | | |
| See Accompanying Notes | | SEMIANNUAL REPORT | | DECEMBER 31, 2016 | | 45 |
Schedule of Investments PIMCO REALPATH® Blend 2025 Fund (Cont.)
(c) FINANCIAL DERIVATIVE INSTRUMENTS: OVER THE COUNTER
WRITTEN OPTIONS:
TRANSACTIONS IN WRITTEN CALL AND PUT OPTIONS FOR THE PERIOD ENDED DECEMBER 31, 2016:
| | | | | | | | | | | | | | | | | | | | | | | | |
| | | Balance at
Beginning of Period | | | Sales | | | Closing Buys | | | Expirations | | | Exercised | | | Balance at
End of Period | |
# of Contracts | | | 4 | | | | 1 | | | | 0 | | | | (4 | ) | | | 0 | | | | 1 | |
Premiums | | $ | (10 | ) | | $ | (1 | ) | | $ | 0 | | | $ | 10 | | | $ | 0 | | | $ | (1 | ) |
SWAP AGREEMENTS:
TOTAL RETURN SWAPS ON COMMODITY AND EQUITY INDICES
| | | | | | | | | | | | | | | | | | | | | | | | | | | | | | | | | | |
Counterparty | | Pay/Receive(1) | | Underlying Reference | | # of Units | | | Financing Rate | | Maturity
Date | | | Notional
Amount | | | Premiums
Paid/(Received) | | | Unrealized
Appreciation/
(Depreciation) | | | Swap Agreements,
at Value | |
| | | | | | | | | | Asset | | | Liability | |
BOA | | Receive | | DWRTFT Index | | | 16 | | | 1-Month USD-LIBOR plus a specified spread | | | 04/06/2017 | | | $ | 144 | | | $ | 0 | | | $ | 6 | | | $ | 6 | | | $ | 0 | |
CBK | | Receive | | BCOMTR Index | | | 439 | | | 3-Month U.S. Treasury Bill rate plus a specified spread | | | 02/15/2017 | | | | 77 | | | | 0 | | | | 1 | | | | 1 | | | | 0 | |
JPM | | Receive | | BCOMTR Index | | | 41 | | | 3-Month U.S. Treasury Bill rate plus a specified spread | | | 02/15/2017 | | | | 7 | | | | 0 | | | | 0 | | | | 0 | | | | 0 | |
| | | | | | | | | | | | | | | | | | | | | | | | | | | | | | | | | | |
| | | | | | | | | | | | | | | | | | | | $ | 0 | | | $ | 7 | | | $ | 7 | | | $ | 0 | |
| | | | | | | | | | | | | | | | | | | | | | | | | | | | | | | | | | |
Total Swap Agreements | | | | | | | | | | | | | | | | $ | 0 | | | $ | 7 | | | $ | 7 | | | $ | 0 | |
| | | | | | | | | | | | | | | | | | | | | | | | | | | | | | | | | | |
| (1) | Receive represents that the Fund receives payments for any positive return on the underlying reference. The Fund makes payments for any negative return on such underlying reference. Pay represents that the Fund receives payments for any negative return on the underlying reference. The Fund makes payments for any positive return on such underlying reference. |
FINANCIAL DERIVATIVE INSTRUMENTS: OVER THE COUNTER SUMMARY
The following is a summary by counterparty of the market value of OTC financial derivative instruments and collateral pledged/(received) as of December 31, 2016:
| | | | | | | | | | | | | | | | | | | | | | | | | | | | | | | | | | | | | | | | | | | | | | | | |
| | | Financial Derivative Assets | | | | | | Financial Derivative Liabilities | | | | | | | | | | |
| Counterparty | | Forward
Foreign
Currency
Contracts | | | Purchased
Options | | | Swap
Agreements | | | Total
Over the
Counter | | | | | | Forward
Foreign
Currency
Contracts | | | Written
Options | | | Swap
Agreements | | | Total
Over the
Counter | | | Net Market
Value of OTC
Derivatives | | | Collateral
Pledged/
(Received) | | | Net
Exposure(2) | |
BOA | | $ | 0 | | | $ | 0 | | | $ | 6 | | | $ | 6 | | | | | | | $ | 0 | | | $ | 0 | | | $ | 0 | | | $ | 0 | | | $ | 6 | | | $ | 0 | | | $ | 6 | |
CBK | | | 0 | | | | 0 | | | | 1 | | | | 1 | | | | | | | | 0 | | | | 0 | | | | 0 | | | | 0 | | | | 1 | | | | 0 | | | | 1 | |
| | | | | | | | | | | | | | | | | | | | | | | | | | | | | | | | | | | | | | | | | | | | | | | | |
Total Over the Counter | | $ | 0 | | | $ | 0 | | | $ | 7 | | | $ | 7 | | | | | | | $ | 0 | | | $ | 0 | | | $ | 0 | | | $ | 0 | | | | | | | | | | | | | |
| | | | | | | | | | | | | | | | | | | | | | | | | | | | | | | | | | | | | | | | | | | | | | | | |
| (2) | Net Exposure represents the net receivable/(payable) that would be due from/to the counterparty in the event of default. Exposure from OTC financial derivative instruments can only be netted across transactions governed under the same master agreement with the same legal entity. See Note 6, Principal Risks, in the Notes to Financial Statements for more information regarding master netting arrangements. |
FAIR VALUE OF FINANCIAL DERIVATIVE INSTRUMENTS
The following is a summary of the fair valuation of the Fund’s derivative instruments categorized by risk exposure. See Note 6, Principal Risks, in the Notes to Financial Statements on risks of the Fund.
Fair Values of Financial Derivative Instruments on the Statements of Assets and Liabilities as of December 31, 2016:
| | | | | | | | | | | | | | | | | | | | | | | | |
| | | Derivatives not accounted for as hedging instruments | |
| | | Commodity
Contracts | | | Credit
Contracts | | | Equity
Contracts | | | Foreign
Exchange
Contracts | | | Interest
Rate Contracts | | | Total | |
Financial Derivative Instruments - Assets | |
Exchange-traded or centrally cleared | |
Purchased Options | | $ | 0 | | | $ | 0 | | | $ | 1 | | | $ | 0 | | | $ | 0 | | | $ | 1 | |
| | | | | | | | | | | | | | | | | | | | | | | | |
Over the counter | |
Swap Agreements | | $ | 1 | | | $ | 0 | | | $ | 6 | | | $ | 0 | | | $ | 0 | | | $ | 7 | |
| | | | | | | | | | | | | | | | | | | | | | | | |
| | $ | 1 | | | $ | 0 | | | $ | 7 | | | $ | 0 | | | $ | 0 | | | $ | 8 | |
| | | | | | | | | | | | | | | | | | | | | | | | |
| | | | | | | | |
| 46 | | PIMCO EQUITY SERIES | | | | | See Accompanying Notes | |
December 31, 2016 (Unaudited)
The effect of Financial Derivative Instruments on the Statements of Operations for the period ended December 31, 2016:
| | | | | | | | | | | | | | | | | | | | | | | | |
| | | Derivatives not accounted for as hedging instruments | |
| | | Commodity
Contracts | | | Credit
Contracts | | | Equity
Contracts | | | Foreign
Exchange
Contracts | | | Interest
Rate Contracts | | | Total | |
Net Realized Gain (Loss) on Financial Derivative Instruments | |
Exchange-traded or centrally cleared | |
Purchased Options | | $ | 0 | | | $ | 0 | | | $ | (19 | ) | | $ | 0 | | | $ | 0 | | | $ | (19 | ) |
Written Options | | | 0 | | | | 0 | | | | 10 | | | | 0 | | | | 0 | | | | 10 | |
| | | | | | | | | | | | | | | | | | | | | | | | |
| | $ | 0 | | | $ | 0 | | | $ | (9 | ) | | $ | 0 | | | $ | 0 | | | $ | (9 | ) |
| | | | | | | | | | | | | | | | | | | | | | | | |
Over the counter | |
Swap Agreements | | $ | (1 | ) | | $ | 0 | | | $ | (6 | ) | | $ | 0 | | | $ | 0 | | | $ | (7 | ) |
| | | | | | | | | | | | | | | | | | | | | | | | |
| | $ | (1 | ) | | $ | 0 | | | $ | (15 | ) | | $ | 0 | | | $ | 0 | | | $ | (16 | ) |
| | | | | | | | | | | | | | | | | | | | | | | | |
|
Net Change in Unrealized Appreciation (Depreciation) on Financial Derivative Instruments | |
Exchange-traded or centrally cleared | |
Purchased Options | | $ | 0 | | | $ | 0 | | | $ | 10 | | | $ | 0 | | | $ | 0 | | | $ | 10 | |
Written Options | | | 0 | | | | 0 | | | | (8 | ) | | | 0 | | | | 0 | | | | (8 | ) |
| | | | | | | | | | | | | | | | | | | | | | | | |
| | $ | 0 | | | $ | 0 | | | $ | 2 | | | $ | 0 | | | $ | 0 | | | $ | 2 | |
| | | | | | | | | | | | | | | | | | | | | | | | |
Over the counter | |
Swap Agreements | | $ | 0 | | | $ | 0 | | | $ | (1 | ) | | $ | 0 | | | $ | 0 | | | $ | (1 | ) |
| | | | | | | | | | | | | | | | | | | | | | | | |
| | $ | 0 | | | $ | 0 | | | $ | 1 | | | $ | 0 | | | $ | 0 | | | $ | 1 | |
| | | | | | | | | | | | | | | | | | | | | | | | |
FAIR VALUE MEASUREMENTS
The following is a summary of the fair valuations according to the inputs used as of December 31, 2016 in valuing the Fund’s assets and liabilities:
| | | | | | | | | | | | | | | | |
| Category and Subcategory | | Level 1 | | | Level 2 | | | Level 3 | | | Fair
Value at
12/31/2016 | |
Investments in Securities, at Value | |
Mutual Funds | | $ | 1,920 | | | $ | 0 | | | $ | 0 | | | $ | 1,920 | |
| | | | | | | | | | | | | | | | |
| | $ | 1,920 | | | $ | 0 | | | $ | 0 | | | $ | 1,920 | |
| | | | | | | | | | | | | | | | |
|
Investments in Affiliates, at Value | |
Mutual Funds | | | 1,995 | | | | 0 | | | | 0 | | | | 1,995 | |
Short-Term Instruments | |
Central Funds Used for Cash Management Purposes | | | 100 | | | | 0 | | | | 0 | | | | 100 | |
| | | | | | | | | | | | | | | | |
| | $ | 2,095 | | | $ | 0 | | | $ | 0 | | | $ | 2,095 | |
| | | | | | | | | | | | | | | | |
| | | | |
Total Investments | | $ | 4,015 | | | $ | 0 | | | $ | 0 | | | $ | 4,015 | |
| | | | | | | | | | | | | | | | |
| | | | | | | | | | | | | | | | |
| Category and Subcategory | | Level 1 | | | Level 2 | | | Level 3 | | | Fair
Value at
12/31/2016 | |
Financial Derivative Instruments - Assets | |
Exchange-traded or centrally cleared | | $ | 0 | | | $ | 1 | | | $ | 0 | | | $ | 1 | |
Over The Counter | | | 0 | | | | 7 | | | | 0 | | | | 7 | |
| | | | | | | | | | | | | | | | |
| | $ | 0 | | | $ | 8 | | | $ | 0 | | | $ | 8 | |
| | | | | | | | | | | | | | | | |
Total Financial Derivative Instruments | | $ | 0 | | | $ | 8 | | | $ | 0 | | | $ | 8 | |
| | | | | | | | | | | | | | | | |
| | | | |
Totals | | $ | 4,015 | | | $ | 8 | | | $ | 0 | | | $ | 4,023 | |
| | | | | | | | | | | | | | | | |
There were no significant transfers between Levels 1, 2, or 3 during the period ended December 31, 2016.
| | | | | | |
| See Accompanying Notes | | SEMIANNUAL REPORT | | DECEMBER 31, 2016 | | 47 |
Schedule of Investments PIMCO REALPATH® Blend 2030 Fund
| | | | | | | | | | | | |
| | | | | SHARES | | | | | MARKET
VALUE
(000S) | |
| INVESTMENTS IN SECURITIES 54.5% | |
| |
| MUTUAL FUNDS 54.5% | |
Vanguard 500 Index Fund ‘Admiral’ | | | | | 9,920 | | | $ | | | 2,049 | |
Vanguard Developed Markets Index Fund ‘Admiral’ | | | | | 82,905 | | | | | | 973 | |
Vanguard Emerging Markets Stock Index Fund ‘Admiral’ | | | | | 23,587 | | | | | | 703 | |
Vanguard Small-Cap Index Fund ‘Admiral’ | | | | | 4,721 | | | | | | 292 | |
| | | | | | | | | | | | |
Total Mutual Funds (Cost $3,668) | | | | | | 4,017 | |
| | | | | | | | | | | | |
| | | | | | | | | | | | |
Total Investments in Securities
(Cost $3,668) | | | | | | 4,017 | |
| | | | | | | | | | | | |
| |
| INVESTMENTS IN AFFILIATES 45.0% | |
| |
| MUTUAL FUNDS (a) 38.1% | |
PIMCO Foreign Bond Fund (U.S. Dollar-Hedged) | | | | | 6,907 | | | | | | 72 | |
PIMCO High Yield Fund | | | | | 62,407 | | | | | | 550 | |
PIMCO Income Fund | | | | | 53,331 | | | | | | 643 | |
PIMCO Long Duration Total Return Fund | | | | | 29,108 | | | | | | 303 | |
PIMCO Long-Term Credit Fund | | | | | 26,558 | | | | | | 304 | |
PIMCO Real Return Asset Fund | | | | | 74,607 | | | | | | 607 | |
| | | | | | | | | | | | |
| | | | | SHARES | | | | | MARKET
VALUE
(000S) | |
PIMCO Real Return Fund | | | | | 21,625 | | | $ | | | 236 | |
PIMCO Total Return Fund | | | | | 8,833 | | | | | | 89 | |
| | | | | | | | | | | | |
Total Mutual Funds (Cost $2,772) | | | | | | 2,804 | |
| | | | | | | | | | | | |
| |
| SHORT-TERM INSTRUMENTS 6.9% | |
| | | | | | | | | | | | |
| CENTRAL FUNDS USED FOR CASH MANAGEMENT PURPOSES 6.9% | |
PIMCO Short-Term Floating NAV Portfolio III | | | | | 51,407 | | | | | | 508 | |
| | | | | | | | | | | | |
Total Short-Term Instruments
(Cost $508) | | | | | | 508 | |
| | | | | | | | | | | | |
| | | | | | | | | | | | |
Total Investments in Affiliates
(Cost $3,280) | | | | | | 3,312 | |
| | | | | | | | | | | | |
Total Investments 99.5%
(Cost $6,948) | | | $ | | | 7,329 | |
| |
Financial Derivative
Instruments (b) 0.2% (Cost or Premiums, net $0) | | | 18 | |
| |
| Other Assets and Liabilities, net 0.3% | | | 21 | |
| | | | | | | | | | | | |
| Net Assets 100.0% | | | $ | | | 7,368 | |
| | | | | | | | | | | | |
NOTES TO SCHEDULE OF INVESTMENTS (AMOUNTS IN THOUSANDS*, EXCEPT NUMBER OF UNITS):
| * | A zero balance may reflect actual amounts rounding to less than one thousand. |
| (a) | Institutional Class Shares of each Fund. |
(b) FINANCIAL DERIVATIVE INSTRUMENTS: OVER THE COUNTER
WRITTEN OPTIONS:
TRANSACTIONS IN WRITTEN CALL AND PUT OPTIONS FOR THE PERIOD ENDED DECEMBER 31, 2016:
| | | | | | | | | | | | | | | | | | | | | | | | |
| | | Balance at
Beginning of Period | | | Sales | | | Closing Buys | | | Expirations | | | Exercised | | | Balance at
End of Period | |
# of Contracts | | | 2 | | | | 0 | | | | 0 | | | | (2 | ) | | | 0 | | | | 0 | |
Premiums | | $ | (4 | ) | | $ | 0 | | | $ | 0 | | | $ | 4 | | | $ | 0 | | | $ | 0 | |
As of December 31, 2016 there were no open written options.
SWAP AGREEMENTS:
TOTAL RETURN SWAPS ON COMMODITY AND EQUITY INDICES
| | | | | | | | | | | | | | | | | | | | | | | | | | | | | | | | |
Counterparty | | Pay/Receive(1) | | Underlying Reference | | # of Units | | | Financing Rate | | Maturity
Date | | | Notional
Amount | | Premiums
Paid/(Received) | | | Unrealized
Appreciation/
(Depreciation) | | | Swap Agreements,
at Value | |
| | | | | | | | | | Asset | | | Liability | |
BOA | | Receive | | DWRTFT Index | | | 41 | | | 1-Month USD-LIBOR plus a specified spread | | | 04/06/2017 | | | $ 368 | | $ | 0 | | | $ | 17 | | | $ | 17 | | | $ | 0 | |
CBK | | Receive | | BCOMTR Index | | | 254 | | | 3-Month U.S. Treasury Bill rate plus a specified spread | | | 02/15/2017 | | | 44 | | | 0 | | | | 0 | | | | 0 | | | | 0 | |
JPM | | Receive | | BCOMTR Index | | | 574 | | | 3-Month U.S. Treasury Bill rate plus a specified spread | | | 02/15/2017 | | | 101 | | | 0 | | | | 1 | | | | 1 | | | | 0 | |
| | | | | | | | | | | | | | | | | | | | | | | | | | | | | | | | |
| | | | | | | | | | | | | | | | | | $ | 0 | | | $ | 18 | | | $ | 18 | | | $ | 0 | |
| | | | | | | | | | | | | | | | | | | | | | | | | | | | | | | | |
Total Swap Agreements | | | | | | | | | | | | | | $ | 0 | | | $ | 18 | | | $ | 18 | | | $ | 0 | |
| | | | | | | | | | | | | | | | | | | | | | | | | | | | | | | | |
| (1) | Receive represents that the Fund receives payments for any positive return on the underlying reference. The Fund makes payments for any negative return on such underlying reference. Pay represents that the Fund receives payments for any negative return on the underlying reference. The Fund makes payments for any positive return on such underlying reference. |
| | | | | | | | |
| 48 | | PIMCO EQUITY SERIES | | | | | See Accompanying Notes | |
December 31, 2016 (Unaudited)
FINANCIAL DERIVATIVE INSTRUMENTS: OVER THE COUNTER SUMMARY
The following is a summary by counterparty of the market value of OTC financial derivative instruments and collateral pledged/(received) as of December 31, 2016:
| | | | | | | | | | | | | | | | | | | | | | | | | | | | | | | | | | | | | | | | | | | | | | | | |
| | | Financial Derivative Assets | | | | | | Financial Derivative Liabilities | | | | | | | | | | |
| Counterparty | | Forward
Foreign
Currency
Contracts | | | Purchased
Options | | | Swap
Agreements | | | Total
Over the
Counter | | | | | | Forward
Foreign
Currency
Contracts | | | Written
Options | | | Swap
Agreements | | | Total
Over the
Counter | | | Net Market
Value of OTC
Derivatives | | | Collateral
Pledged/
(Received) | | | Net
Exposure(2) | |
BOA | | $ | 0 | | | $ | 0 | | | $ | 17 | | | $ | 17 | | | | | | | $ | 0 | | | $ | 0 | | | $ | 0 | | | $ | 0 | | | $ | 17 | | | $ | 0 | | | $ | 17 | |
JPM | | | 0 | | | | 0 | | | | 1 | | | | 1 | | | | | | | | 0 | | | | 0 | | | | 0 | | | | 0 | | | | 1 | | | | 0 | | | | 1 | |
| | | | | | | | | | | | | | | | | | | | | | | | | | | | | | | | | | | | | | | | | | | | | | | | |
Total Over the Counter | | $ | 0 | | | $ | 0 | | | $ | 18 | | | $ | 18 | | | | | | | $ | 0 | | | $ | 0 | | | $ | 0 | | | $ | 0 | | | | | | | | | | | | | |
| | | | | | | | | | | | | | | | | | | | | | | | | | | | | | | | | | | | | | | | | | | | | | | | |
| (2) | Net Exposure represents the net receivable/(payable) that would be due from/to the counterparty in the event of default. Exposure from OTC financial derivative instruments can only be netted across transactions governed under the same master agreement with the same legal entity. See Note 6, Principal Risks, in the Notes to Financial Statements for more information regarding master netting arrangements. |
FAIR VALUE OF FINANCIAL DERIVATIVE INSTRUMENTS
The following is a summary of the fair valuation of the Fund’s derivative instruments categorized by risk exposure. See Note 6, Principal Risks, in the Notes to Financial Statements on risks of the Fund.
Fair Values of Financial Derivative Instruments on the Statements of Assets and Liabilities as of December 31, 2016:
| | | | | | | | | | | | | | | | | | | | | | | | |
| | | Derivatives not accounted for as hedging instruments | |
| | | Commodity
Contracts | | | Credit
Contracts | | | Equity
Contracts | | | Foreign
Exchange
Contracts | | | Interest
Rate Contracts | | | Total | |
Financial Derivative Instruments - Assets | | | | | | | | | | | | | | | | | | | | | | | | |
Over the counter | | | | | | | | | | | | | | | | | | | | | | | | |
Swap Agreements | | $ | 1 | | | $ | 0 | | | $ | 17 | | | $ | 0 | | | $ | 0 | | | $ | 18 | |
| | | | | | | | | | | | | | | | | | | | | | | | |
The effect of Financial Derivative Instruments on the Statements of Operations for the period ended December 31, 2016:
| | | | | | | | | | | | | | | | | | | | | | | | |
| | | Derivatives not accounted for as hedging instruments | |
| | | Commodity
Contracts | | | Credit
Contracts | | | Equity
Contracts | | | Foreign
Exchange
Contracts | | | Interest
Rate Contracts | | | Total | |
Net Realized Gain (Loss) on Financial Derivative Instruments | | | | | | | | | | | | | | | | | | | | | | | | |
Exchange-traded or centrally cleared | | | | | | | | | | | | | | | | | | | | | | | | |
Purchased Options | | $ | 0 | | | $ | 0 | | | $ | (8 | ) | | $ | 0 | | | $ | 0 | | | $ | (8 | ) |
Written Options | | | 0 | | | | 0 | | | | 4 | | | | 0 | | | | 0 | | | | 4 | |
| | | | | | | | | | | | | | | | | | | | | | | | |
| | $ | 0 | | | $ | 0 | | | $ | (4 | ) | | $ | 0 | | | $ | 0 | | | $ | (4 | ) |
| | | | | | | | | | | | | | | | | | | | | | | | |
Over the counter | | | | | | | | | | | | | | | | | | | | | | | | |
Swap Agreements | | $ | (2 | ) | | $ | 0 | | | $ | (11 | ) | | $ | 0 | | | $ | 0 | | | $ | (13 | ) |
| | | | | | | | | | | | | | | | | | | | | | | | |
| | $ | (2 | ) | | $ | 0 | | | $ | (15 | ) | | $ | 0 | | | $ | 0 | | | $ | (17 | ) |
| | | | | | | | | | | | | | | | | | | | | | | | |
| | | |
Net Change in Unrealized Appreciation (Depreciation) on Financial Derivative Instruments | | | | | | | | | | | | | |
Exchange-traded or centrally cleared | | | | | | | | | | | | | | | | | | | | | | | | |
Purchased Options | | $ | 0 | | | $ | 0 | | | $ | 8 | | | $ | 0 | | | $ | 0 | | | $ | 8 | |
Written Options | | | 0 | | | | 0 | | | | (4 | ) | | | 0 | | | | 0 | | | | (4 | ) |
| | | | | | | | | | | | | | | | | | | | | | | | |
| | $ | 0 | | | $ | 0 | | | $ | 4 | | | $ | 0 | | | $ | 0 | | | $ | 4 | |
| | | | | | | | | | | | | | | | | | | | | | | | |
Over the counter | | | | | | | | | | | | | | | | | | | | | | | | |
Swap Agreements | | $ | 1 | | | $ | 0 | | | $ | (5 | ) | | $ | 0 | | | $ | 0 | | | $ | (4 | ) |
| | | | | | | | | | | | | | | | | | | | | | | | |
| | $ | 1 | | | $ | 0 | | | $ | (1 | ) | | $ | 0 | | | $ | 0 | | | $ | 0 | |
| | | | | | | | | | | | | | | | | | | | | | | | |
| | | | | | |
| See Accompanying Notes | | SEMIANNUAL REPORT | | DECEMBER 31, 2016 | | 49 |
Schedule of Investments PIMCO REALPATH® Blend 2030 Fund (Cont.)
December 31, 2016 (Unaudited)
FAIR VALUE MEASUREMENTS
The following is a summary of the fair valuations according to the inputs used as of December 31, 2016 in valuing the Fund’s assets and liabilities:
| | | | | | | | | | | | | | | | |
| Category and Subcategory | | Level 1 | | | Level 2 | | | Level 3 | | | Fair
Value at
12/31/2016 | |
Investments in Securities, at Value | |
Mutual Funds | | $ | 4,017 | | | $ | 0 | | | $ | 0 | | | $ | 4,017 | |
| | | | | | | | | | | | | | | | |
| | $ | 4,017 | | | $ | 0 | | | $ | 0 | | | $ | 4,017 | |
| | | | | | | | | | | | | | | | |
|
Investments in Affiliates, at Value | |
Mutual Funds | �� | | 2,804 | | | | 0 | | | | 0 | | | | 2,804 | |
Short-Term Instruments | | | | | | | | | | | | | | | | |
Central Funds Used for Cash Management Purposes | | | 508 | | | | 0 | | | | 0 | | | | 508 | |
| | | | | | | | | | | | | | | | |
| | $ | 3,312 | | | $ | 0 | | | $ | 0 | | | $ | 3,312 | |
| | | | | | | | | | | | | | | | |
| | | | |
Total Investments | | $ | 7,329 | | | $ | 0 | | | $ | 0 | | | $ | 7,329 | |
| | | | | | | | | | | | | | | | |
| | | | | | | | | | | | | | | | |
| Category and Subcategory | | Level 1 | | | Level 2 | | | Level 3 | | | Fair
Value at
12/31/2016 | |
Financial Derivative Instruments - Assets | |
Over the counter | | $ | 0 | | | $ | 18 | | | $ | 0 | | | $ | 18 | |
| | | | | | | | | | | | | | | | |
| | | | |
Totals | | $ | 7,329 | | | $ | 18 | | | $ | 0 | | | $ | 7,347 | |
| | | | | | | | | | | | | | | | |
There were no significant transfers between Levels 1, 2, or 3 during the period ended December 31, 2016.
| | | | | | | | |
| 50 | | PIMCO EQUITY SERIES | | | | | See Accompanying Notes | |
Schedule of Investments PIMCO REALPATH® Blend 2035 Fund
December 31, 2016 (Unaudited)
| | | | | | | | | | | | |
| | | | | SHARES | | | | | MARKET
VALUE
(000S) | |
| INVESTMENTS IN SECURITIES 62.0% | |
| |
| MUTUAL FUNDS 62.0% | |
Vanguard 500 Index Fund ‘Admiral’ | | | | | 10,160 | | | $ | | | 2,099 | |
Vanguard Developed Markets Index Fund ‘Admiral’ | | | | | 86,078 | | | | | | 1,010 | |
Vanguard Emerging Markets Stock Index Fund ‘Admiral’ | | | | | 23,634 | | | | | | 704 | |
Vanguard Small-Cap Index Fund ‘Admiral’ | | | | | 4,919 | | | | | | 304 | |
| | | | | | | | | | | | |
Total Mutual Funds (Cost $3,812) | | | | | | 4,117 | |
| | | | | | | | | | | | |
| | | | | | | | | | | | |
Total Investments in Securities
(Cost $3,812) | | | | | | 4,117 | |
| | | | | | | | | | | | |
| |
| INVESTMENTS IN AFFILIATES 36.2% | |
| |
| MUTUAL FUNDS (a) 28.6% | |
PIMCO Emerging Local Bond Fund | | | | | 5,761 | | | | | | 40 | |
PIMCO Foreign Bond Fund (U.S. Dollar-Hedged) | | | | | 5,788 | | | | | | 60 | |
PIMCO High Yield Fund | | | | | 52,170 | | | | | | 460 | |
PIMCO Income Fund | | | | | 43,661 | | | | | | 527 | |
PIMCO Long Duration Total Return Fund | | | | | 16,639 | | | | | | 173 | |
PIMCO Long-Term Credit Fund | | | | | 15,181 | | | | | | 173 | |
| | | | | | | | | | | | |
| | | | | SHARES | | | | | MARKET
VALUE
(000S) | |
PIMCO Real Return Asset Fund | | | | | 32,767 | | | $ | | | 267 | |
PIMCO Real Return Fund | | | | | 12,196 | | | | | | 133 | |
PIMCO Total Return Fund | | | | | 6,499 | | | | | | 65 | |
| | | | | | | | | | | | |
Total Mutual Funds (Cost $1,870) | | | | | | 1,898 | |
| | | | | | | | | | | | |
| |
| SHORT-TERM INSTRUMENTS 7.6% | |
| | | | | | | | | | | | |
| CENTRAL FUNDS USED FOR CASH MANAGEMENT PURPOSES 7.6% | |
PIMCO Short-Term
Floating NAV Portfolio III | | | | | 50,955 | | | | | | 504 | |
| | | | | | | | | | | | |
Total Short-Term Instruments
(Cost $504) | | | | | | 504 | |
| | | | | | | | | | | | |
| | | | | | | | | | | | |
Total Investments in Affiliates
(Cost $2,374) | | | | | | 2,402 | |
| | | | | | | | | | | | |
Total Investments 98.2%
(Cost $6,186) | | | $ | | | 6,519 | |
| |
Financial Derivative
Instruments (b) 0.3% (Cost or Premiums, net $0) | | | 22 | |
| |
| Other Assets and Liabilities, net 1.5% | | | | | | 99 | |
| | | | | | | | | | | | |
| Net Assets 100.0% | | | $ | | | 6,640 | |
| | | | | | | | | | | | |
NOTES TO SCHEDULE OF INVESTMENTS (AMOUNTS IN THOUSANDS*, EXCEPT NUMBER OF UNITS):
| * | A zero balance may reflect actual amounts rounding to less than one thousand. |
| (a) | Institutional Class Shares of each Fund. |
(b) FINANCIAL DERIVATIVE INSTRUMENTS: OVER THE COUNTER
WRITTEN OPTIONS:
TRANSACTIONS IN WRITTEN CALL AND PUT OPTIONS FOR THE PERIOD ENDED DECEMBER 31, 2016:
| | | | | | | | | | | | | | | | | | | | | | | | |
| | | Balance at
Beginning of Period | | | Sales | | | Closing Buys | | | Expirations | | | Exercised | | | Balance at
End of Period | |
# of Contracts | | | 3 | | | | 0 | | | | 0 | | | | (3 | ) | | | 0 | | | | 0 | |
Premiums | | $ | (12 | ) | | $ | 0 | | | $ | 0 | | | $ | 12 | | | $ | 0 | | | $ | 0 | |
As of December 31, 2016 there were no open written options.
SWAP AGREEMENTS:
TOTAL RETURN SWAPS ON COMMODITY AND EQUITY INDICES
| | | | | | | | | | | | | | | | | | | | | | | | | | | | | | | | |
| Counterparty | | Pay/Receive(1) | | Underlying Reference | | # of Units | | | Financing Rate | | Maturity
Date | | | Notional
Amount | | Premiums
Paid/(Received) | | | Unrealized
Appreciation/
(Depreciation) | | | Swap Agreements,
at Value | |
| | | | | | | | | | Asset | | | Liability | |
BOA | | Receive | | DWRTFT Index | | | 51 | | | 1-Month USD-LIBOR plus a specified spread | | | 04/06/2017 | | | $ 458 | | $ | 0 | | | $ | 21 | | | $ | 21 | | | $ | 0 | |
CBK | | Receive | | BCOMTR Index | | | 402 | | | 3-Month U.S. Treasury Bill rate plus a specified spread | | | 02/15/2017 | | | 71 | | | 0 | | | | 1 | | | | 1 | | | | 0 | |
JPM | | Receive | | BCOMTR Index | | | 334 | | | 3-Month U.S. Treasury Bill rate plus a specified spread | | | 02/15/2017 | | | 59 | | | 0 | | | | 0 | | | | 0 | | | | 0 | |
| | | | | | | | | | | | | | | | | | | | | | | | | | | | | | | | |
| | | | | | | | | | | | | | | | | | $ | 0 | | | $ | 22 | | | $ | 22 | | | $ | 0 | |
| | | | | | | | | | | | | | | | | | | | | | | | | | | | | | | | |
Total Swap Agreements | | | | | $ | 0 | | | $ | 22 | | | $ | 22 | | | $ | 0 | |
| | | | | | | | | | | | | | | | | | | | | | | | | | | | | | | | |
| (1) | Receive represents that the Fund receives payments for any positive return on the underlying reference. The Fund makes payments for any negative return on such underlying reference. Pay represents that the Fund receives payments for any negative return on the underlying reference. The Fund makes payments for any positive return on such underlying reference. |
| | | | | | |
| See Accompanying Notes | | SEMIANNUAL REPORT | | DECEMBER 31, 2016 | | 51 |
Schedule of Investments PIMCO REALPATH® Blend 2035 Fund (Cont.)
FINANCIAL DERIVATIVE INSTRUMENTS: OVER THE COUNTER SUMMARY
The following is a summary by counterparty of the market value of OTC financial derivative instruments and collateral pledged/(received) as of December 31, 2016:
| | | | | | | | | | | | | | | | | | | | | | | | | | | | | | | | | | | | | | | | | | | | | | | | |
| | | Financial Derivative Assets | | | | | | Financial Derivative Liabilities | | | | | | | | | | |
| Counterparty | | Forward
Foreign
Currency
Contracts | | | Purchased
Options | | | Swap
Agreements | | | Total
Over the
Counter | | | | | | Forward
Foreign
Currency
Contracts | | | Written
Options | | | Swap
Agreements | | | Total
Over the
Counter | | | Net Market
Value of OTC
Derivatives | | | Collateral
Pledged/
(Received) | | | Net
Exposure(2) | |
BOA | | $ | 0 | | | $ | 0 | | | $ | 21 | | | $ | 21 | | | | | | | $ | 0 | | | $ | 0 | | | $ | 0 | | | $ | 0 | | | $ | 21 | | | $ | 0 | | | $ | 21 | |
CBK | | | 0 | | | | 0 | | | | 1 | | | | 1 | | | | | | | | 0 | | | | 0 | | | | 0 | | | | 0 | | | | 1 | | | | 0 | | | | 1 | |
| | | | | | | | | | | | | | | | | | | | | | | | | | | | | | | | | | | | | | | | | | | | | | | | |
Total Over the Counter | | $ | 0 | | | $ | 0 | | | $ | 22 | | | $ | 22 | | | | | | | $ | 0 | | | $ | 0 | | | $ | 0 | | | $ | 0 | | | | | | | | | | | | | |
| | | | | | | | | | | | | | | | | | | | | | | | | | | | | | | | | | | | | | | | | | | | | | | | |
| (2) | Net Exposure represents the net receivable/(payable) that would be due from/to the counterparty in the event of default. Exposure from OTC financial derivative instruments can only be netted across transactions governed under the same master agreement with the same legal entity. See Note 6, Principal Risks, in the Notes to Financial Statements for more information regarding master netting arrangements. |
FAIR VALUE OF FINANCIAL DERIVATIVE INSTRUMENTS
The following is a summary of the fair valuation of the Fund’s derivative instruments categorized by risk exposure. See Note 6, Principal Risks, in the Notes to Financial Statements on risks of the Fund.
Fair Values of Financial Derivative Instruments on the Statements of Assets and Liabilities as of December 31, 2016:
| | | | | | | | | | | | | | | | | | | | | | | | |
| | | Derivatives not accounted for as hedging instruments | |
| | | Commodity
Contracts | | | Credit
Contracts | | | Equity
Contracts | | | Foreign
Exchange
Contracts | | | Interest
Rate Contracts | | | Total | |
Financial Derivative Instruments - Assets | |
Over the counter | |
Swap Agreements | | $ | 1 | | | $ | 0 | | | $ | 21 | | | $ | 0 | | | $ | 0 | | | $ | 22 | |
| | | | | | | | | | | | | | | | | | | | | | | | |
The effect of Financial Derivative Instruments on the Statements of Operations for the period ended December 31, 2016:
| | | | | | | | | | | | | | | | | | | | | | | | |
| | | Derivatives not accounted for as hedging instruments | |
| | | Commodity
Contracts | | | Credit
Contracts | | | Equity
Contracts | | | Foreign
Exchange
Contracts | | | Interest
Rate Contracts | | | Total | |
Net Realized Gain (Loss) on Financial Derivative Instruments | |
Exchange-traded or centrally cleared | |
Purchased Options | | $ | 0 | | | $ | 0 | | | $ | (17 | ) | | $ | 0 | | | $ | 0 | | | $ | (17 | ) |
Written Options | | | 0 | | | | 0 | | | | 12 | | | | 0 | | | | 0 | | | | 12 | |
| | | | | | | | | | | | | | | | | | | | | | | | |
| | $ | 0 | | | $ | 0 | | | $ | (5 | ) | | $ | 0 | | | $ | 0 | | | $ | (5 | ) |
| | | | | | | | | | | | | | | | | | | | | | | | |
Over the counter | |
Swap Agreements | | $ | (2 | ) | | $ | 0 | | | $ | (12 | ) | | $ | 0 | | | $ | 0 | | | $ | (14 | ) |
| | | | | | | | | | | | | | | | | | | | | | | | |
| | $ | (2 | ) | | $ | 0 | | | $ | (17 | ) | | $ | 0 | | | $ | 0 | | | $ | (19 | ) |
| | | | | | | | | | | | | | | | | | | | | | | | |
|
Net Change in Unrealized Appreciation (Depreciation) on Financial Derivative Instruments | |
Exchange-traded or centrally cleared | |
Purchased Options | | $ | 0 | | | $ | 0 | | | $ | 16 | | | $ | 0 | | | $ | 0 | | | $ | 16 | |
Written Options | | | 0 | | | | 0 | | | | (11 | ) | | | 0 | | | | 0 | | | | (11 | ) |
| | | | | | | | | | | | | | | | | | | | | | | | |
| | $ | 0 | | | $ | 0 | | | $ | 5 | | | $ | 0 | | | $ | 0 | | | $ | 5 | |
| | | | | | | | | | | | | | | | | | | | | | | | |
Over the counter | |
Swap Agreements | | $ | 1 | | | $ | 0 | | | $ | (7 | ) | | $ | 0 | | | $ | 0 | | | $ | (6 | ) |
| | | | | | | | | | | | | | | | | | | | | | | | |
| | $ | 1 | | | $ | 0 | | | $ | (2 | ) | | $ | 0 | | | $ | 0 | | | $ | (1 | ) |
| | | | | | | | | | | | | | | | | | | | | | | | |
| | | | | | | | |
| 52 | | PIMCO EQUITY SERIES | | | | | See Accompanying Notes | |
December 31, 2016 (Unaudited)
FAIR VALUE MEASUREMENTS
The following is a summary of the fair valuations according to the inputs used as of December 31, 2016 in valuing the Fund’s assets and liabilities:
| | | | | | | | | | | | | | | | |
| Category and Subcategory | | Level 1 | | | Level 2 | | | Level 3 | | | Fair
Value at
12/31/2016 | |
Investments in Securities, at Value | |
Mutual Funds | | $ | 4,117 | | | $ | 0 | | | $ | 0 | | | $ | 4,117 | |
| | | | | | | | | | | | | | | | |
| | $ | 4,117 | | | $ | 0 | | | $ | 0 | | | $ | 4,117 | |
| | | | | | | | | | | | | | | | |
|
Investments in Affiliates, at Value | |
Mutual Funds | | | 1,898 | | | | 0 | | | | 0 | | | | 1,898 | |
Short-Term Instruments | |
Central Funds Used for Cash Management Purposes | | | 504 | | | | 0 | | | | 0 | | | | 504 | |
| | | | | | | | | | | | | | | | |
| | $ | 2,402 | | | $ | 0 | | | $ | 0 | | | $ | 2,402 | |
| | | | | | | | | | | | | | | | |
| | | | |
Total Investments | | $ | 6,519 | | | $ | 0 | | | $ | 0 | | | $ | 6,519 | |
| | | | | | | | | | | | | | | | |
| | | | | | | | | | | | | | | | |
| Category and Subcategory | | Level 1 | | | Level 2 | | | Level 3 | | | Fair
Value at
12/31/2016 | |
Financial Derivative Instruments - Assets | |
Over The Counter | | $ | 0 | | | $ | 22 | | | $ | 0 | | | $ | 22 | |
| | | | | | | | | | | | | | | | |
| | | | |
Totals | | $ | 6,519 | | | $ | 22 | | | $ | 0 | | | $ | 6,541 | |
| | | | | | | | | | | | | | | | |
There were no significant transfers between Levels 1, 2, or 3 during the period ended December 31, 2016.
| | | | | | |
| See Accompanying Notes | | SEMIANNUAL REPORT | | DECEMBER 31, 2016 | | 53 |
Schedule of Investments PIMCO REALPATH® Blend 2040 Fund
| | | | | | | | | | | | |
| | | | | SHARES | | | | | MARKET
VALUE
(000S) | |
| INVESTMENTS IN SECURITIES 67.1% | |
| |
| MUTUAL FUNDS 67.1% | |
Vanguard 500 Index Fund ‘Admiral’ | | | | | 6,652 | | | $ | | | 1,374 | |
Vanguard Developed Markets Index Fund ‘Admiral’ | | | | | 57,222 | | | | | | 672 | |
Vanguard Emerging Markets Stock Index Fund ‘Admiral’ | | | | | 15,744 | | | | | | 469 | |
Vanguard Small-Cap Index Fund ‘Admiral’ | | | | | 3,228 | | | | | | 199 | |
| | | | | | | | | | | | |
Total Mutual Funds (Cost $2,610) | | | | | | 2,714 | |
| | | | | | | | | | | | |
| | | | | | | | | | | | |
Total Investments in Securities
(Cost $2,610) | | | | | | 2,714 | |
| | | | | | | | | | | | |
| |
| INVESTMENTS IN AFFILIATES 30.0% | |
| |
| MUTUAL FUNDS (a) 22.5% | |
PIMCO Emerging Local Bond Fund | | | | | 9,346 | | | | | | 65 | |
PIMCO Foreign Bond Fund (U.S. Dollar-Hedged) | | | | | 3,698 | | | | | | 39 | |
PIMCO High Yield Fund | | | | | 24,389 | | | | | | 215 | |
PIMCO Income Fund | | | | | 21,191 | | | | | | 255 | |
PIMCO Long Duration Total Return Fund | | | | | 6,625 | | | | | | 69 | |
PIMCO Long-Term Credit Fund | | | | | 6,045 | | | | | | 69 | |
| | | | | | | | | | | | |
| | | | | SHARES | | | | | MARKET
VALUE
(000S) | |
PIMCO Real Return Asset Fund | | | | | 9,561 | | | $ | | | 78 | |
PIMCO Real Return Fund | | | | | 7,424 | | | | | | 81 | |
PIMCO Total Return Fund | | | | | 3,800 | | | | | | 38 | |
| | | | | | | | | | | | |
| Total Mutual Funds (Cost $914) | | | | | | | | | 909 | |
| | | | | | | | | | | | |
| |
| SHORT-TERM INSTRUMENTS 7.5% | |
| |
| CENTRAL FUNDS USED FOR CASH MANAGEMENT PURPOSES 7.5% | |
PIMCO Short-Term Floating NAV Portfolio III | | | 30,532 | | | | | | 302 | �� |
| | | | | | | | | | | | |
Total Short-Term Instruments
(Cost $302) | | | | | | 302 | |
| | | | | | | | | | | | |
| |
Total Investments in Affiliates
(Cost $1,216) | | | | | | 1,211 | |
| | | | | | | | | | | | |
Total Investments 97.1%
(Cost $3,826) | | | $ | | | 3,925 | |
| |
Financial Derivative
Instruments (b) 0.4% (Cost or Premiums, net $0) | | | 15 | |
| |
| Other Assets and Liabilities, net 2.5% | | | 102 | |
| | | | | | | | | | | | |
| Net Assets 100.0% | | | $ | | | 4,042 | |
| | | | | | | | | | | | |
NOTES TO SCHEDULE OF INVESTMENTS (AMOUNTS IN THOUSANDS*, EXCEPT NUMBER OF UNITS):
| * | A zero balance may reflect actual amounts rounding to less than one thousand. |
| (a) | Institutional Class Shares of each Fund. |
(b) FINANCIAL DERIVATIVE INSTRUMENTS: OVER THE COUNTER
WRITTEN OPTIONS:
TRANSACTIONS IN WRITTEN CALL AND PUT OPTIONS FOR THE PERIOD ENDED DECEMBER 31, 2016:
| | | | | | | | | | | | | | | | | | | | | | | | |
| | | Balance at
Beginning of Period | | | Sales | | | Closing Buys | | | Expirations | | | Exercised | | | Balance at
End of Period | |
# of Contracts | | | 2 | | | | 0 | | | | 0 | | | | (2 | ) | | | 0 | | | | 0 | |
Premiums | | $ | (6 | ) | | $ | 0 | | | $ | 0 | | | $ | 6 | | | $ | 0 | | | $ | 0 | |
As of December 31, 2016 there were no open written options.
SWAP AGREEMENTS:
TOTAL RETURN SWAPS ON COMMODITY AND EQUITY INDICES
| | | | | | | | | | | | | | | | | | | | | | | | | | | | | | | | |
Counterparty | | Pay/Receive(1) | | Underlying Reference | | # of Units | | | Financing Rate | | Maturity
Date | | | Notional
Amount | | Premiums
Paid/(Received) | | | Unrealized
Appreciation/
(Depreciation) | | | Swap Agreements,
at Value | |
| | | | | | | | | | Asset | | | Liability | |
BOA | | Receive | | DWRTFT Index | | | 35 | | | 1-Month USD-LIBOR plus a specified spread | | | 04/06/2017 | | | $ 314 | | $ | 0 | | | $ | 14 | | | $ | 14 | | | $ | 0 | |
CBK | | Receive | | BCOMTR Index | | | 393 | | | 3-Month U.S. Treasury Bill rate plus a specified spread | | | 02/15/2017 | | | 69 | | | 0 | | | | 1 | | | | 1 | | | | 0 | |
JPM | | Receive | | BCOMTR Index | | | 48 | | | 3-Month U.S. Treasury Bill rate plus a specified spread | | | 02/15/2017 | | | 8 | | | 0 | | | | 0 | | | | 0 | | | | 0 | |
| | | | | | | | | | | | | | | | | | | | | | | | | | | | | | | | |
| | | | | | | | | | | | | | | | | | $ | 0 | | | $ | 15 | | | $ | 15 | | | $ | 0 | |
| | | | | | | | | | | | | | | | | | | | | | | | | | | | | | | | |
Total Swap Agreements | | | | | | | | | | | $ | 0 | | | $ | 15 | | | $ | 15 | | | $ | 0 | |
| | | | | | | | | | | | | | | | | | | | | | | | | | | | | | | | |
| (1) | Receive represents that the Fund receives payments for any positive return on the underlying reference. The Fund makes payments for any negative return on such underlying reference. Pay represents that the Fund receives payments for any negative return on the underlying reference. The Fund makes payments for any positive return on such underlying reference. |
| | | | | | | | |
| 54 | | PIMCO EQUITY SERIES | | | | | See Accompanying Notes | |
December 31, 2016 (Unaudited)
FINANCIAL DERIVATIVE INSTRUMENTS: OVER THE COUNTER SUMMARY
The following is a summary by counterparty of the market value of OTC financial derivative instruments and collateral pledged/(received) as of December 31, 2016:
| | | | | | | | | | | | | | | | | | | | | | | | | | | | | | | | | | | | | | | | | | | | | | | | |
| | | Financial Derivative Assets | | | | | | Financial Derivative Liabilities | | | | | | | | | | |
| Counterparty | | Forward
Foreign
Currency
Contracts | | | Purchased
Options | | | Swap
Agreements | | | Total
Over the
Counter | | | | | | Forward
Foreign
Currency
Contracts | | | Written
Options | | | Swap
Agreements | | | Total
Over the
Counter | | | Net Market
Value of OTC
Derivatives | | | Collateral
Pledged/
(Received) | | | Net
Exposure(2) | |
BOA | | $ | 0 | | | $ | 0 | | | $ | 14 | | | $ | 14 | | | | | | | $ | 0 | | | $ | 0 | | | $ | 0 | | | $ | 0 | | | $ | 14 | | | $ | 0 | | | $ | 14 | |
CBK | | | 0 | | | | 0 | | | | 1 | | | | 1 | | | | | | | | 0 | | | | 0 | | | | 0 | | | | 0 | | | | 1 | | | | 0 | | | | 1 | |
| | | | | | | | | | | | | | | | | | | | | | | | | | | | | | | | | | | | | | | | | | | | | | | | |
Total Over the Counter | | $ | 0 | | | $ | 0 | | | $ | 15 | | | $ | 15 | | | | | | | $ | 0 | | | $ | 0 | | | $ | 0 | | | $ | 0 | | | | | | | | | | | | | |
| | | | | | | | | | | | | | | | | | | | | | | | | | | | | | | | | | | | | | | | | | | | | | | | |
| (2) | Net Exposure represents the net receivable/(payable) that would be due from/to the counterparty in the event of default. Exposure from OTC financial derivative instruments can only be netted across transactions governed under the same master agreement with the same legal entity. See Note 6, Principal Risks, in the Notes to Financial Statements for more information regarding master netting arrangements. |
FAIR VALUE OF FINANCIAL DERIVATIVE INSTRUMENTS
The following is a summary of the fair valuation of the Fund’s derivative instruments categorized by risk exposure. See Note 6, Principal Risks, in the Notes to Financial Statements on risks of the Fund.
Fair Values of Financial Derivative Instruments on the Statements of Assets and Liabilities as of December 31, 2016:
| | | | | | | | | | | | | | | | | | | | | | | | |
| | | Derivatives not accounted for as hedging instruments | |
| | | Commodity
Contracts | | | Credit
Contracts | | | Equity
Contracts | | | Foreign
Exchange
Contracts | | | Interest
Rate Contracts | | | Total | |
Financial Derivative Instruments - Assets | |
Over the counter | |
Swap Agreements | | $ | 1 | | | $ | 0 | | | $ | 14 | | | $ | 0 | | | $ | 0 | | | $ | 15 | |
| | | | | | | | | | | | | | | | | | | | | | | | |
The effect of Financial Derivative Instruments on the Statements of Operations for the period ended December 31, 2016:
| | | | | | | | | | | | | | | | | | | | | | | | |
| | | Derivatives not accounted for as hedging instruments | |
| | | Commodity
Contracts | | | Credit
Contracts | | | Equity
Contracts | | | Foreign
Exchange
Contracts | | | Interest
Rate Contracts | | | Total | |
Net Realized Gain (Loss) on Financial Derivative Instruments | |
Exchange-traded or centrally cleared | |
Purchased Options | | $ | 0 | | | $ | 0 | | | $ | (10 | ) | | $ | 0 | | | $ | 0 | | | $ | (10 | ) |
Written Options | | | 0 | | | | 0 | | | | 6 | | | | 0 | | | | 0 | | | | 6 | |
| | | | | | | | | | | | | | | | | | | | | | | | |
| | $ | 0 | | | $ | 0 | | | $ | (4 | ) | | $ | 0 | | | $ | 0 | | | $ | (4 | ) |
| | | | | | | | | | | | | | | | | | | | | | | | |
Over the counter | |
Swap Agreements | | $ | (1 | ) | | $ | 0 | | | $ | (9 | ) | | $ | 0 | | | $ | 0 | | | $ | (10 | ) |
| | | | | | | | | | | | | | | | | | | | | | | | |
| | $ | (1 | ) | | $ | 0 | | | $ | (13 | ) | | $ | 0 | | | $ | 0 | | | $ | (14 | ) |
| | | | | | | | | | | | | | | | | | | | | | | | |
| |
Net Change in Unrealized Appreciation (Depreciation) on Financial Derivative Instruments | | | | | |
Exchange-traded or centrally cleared | | | | | | | | | | | | | | | | | | | | | | | | |
Purchased Options | | $ | 0 | | | $ | 0 | | | $ | 9 | | | $ | 0 | | | $ | 0 | | | $ | 9 | |
Written Options | | | 0 | | | | 0 | | | | (6 | ) | | | 0 | | | | 0 | | | | (6 | ) |
| | | | | | | | | | | | | | | | | | | | | | | | |
| | $ | 0 | | | $ | 0 | | | $ | 3 | | | $ | 0 | | | $ | 0 | | | $ | 3 | |
| | | | | | | | | | | | | | | | | | | | | | | | |
Over the counter | | | | | | | | | | | | | | | | | | | | | | | | |
Swap Agreements | | $ | 1 | | | $ | 0 | | | $ | (3 | ) | | $ | 0 | | | $ | 0 | | | $ | (2 | ) |
| | | | | | | | | | | | | | | | | | | | | | | | |
| | $ | 1 | | | $ | 0 | | | $ | 0 | | | $ | 0 | | | $ | 0 | | | $ | 1 | |
| | | | | | | | | | | | | | | | | | | | | | | | |
| | | | | | |
| See Accompanying Notes | | SEMIANNUAL REPORT | | DECEMBER 31, 2016 | | 55 |
Schedule of Investments PIMCO REALPATH® Blend 2040 Fund (Cont.)
December 31, 2016 (Unaudited)
FAIR VALUE MEASUREMENTS
The following is a summary of the fair valuations according to the inputs used as of December 31, 2016 in valuing the Fund’s assets and liabilities:
| | | | | | | | | | | | | | | | |
| Category and Subcategory | | Level 1 | | | Level 2 | | | Level 3 | | | Fair
Value at
12/31/2016 | |
Investments in Securities, at Value | |
Mutual Funds | | $ | 2,714 | | | $ | 0 | | | $ | 0 | | | $ | 2,714 | |
| | | | | | | | | | | | | | | | |
| | $ | 2,714 | | | $ | 0 | | | $ | 0 | | | $ | 2,714 | |
| | | | | | | | | | | | | | | | |
|
Investments in Affiliates, at Value | |
Mutual Funds | | | 909 | | | | 0 | | | | 0 | | | | 909 | |
Short-Term Instruments | |
Central Funds Used for Cash Management Purposes | | | 302 | | | | 0 | | | | 0 | | | | 302 | |
| | | | | | | | | | | | | | | | |
| | $ | 1,211 | | | $ | 0 | | | $ | 0 | | | $ | 1,211 | |
| | | | | | | | | | | | | | | | |
| | | | |
Total Investments | | $ | 3,925 | | | $ | 0 | | | $ | 0 | | | $ | 3,925 | |
| | | | | | | | | | | | | | | | |
| | | | | | | | | | | | | | | | |
| Category and Subcategory | | Level 1 | | | Level 2 | | | Level 3 | | | Fair
Value at
12/31/2016 | |
Financial Derivative Instruments - Assets | |
Over the counter | | $ | 0 | | | $ | 15 | | | $ | 0 | | | $ | 15 | |
| | | | | | | | | | | | | | | | |
| | | | |
Totals | | $ | 3,925 | | | $ | 15 | | | $ | 0 | | | $ | 3,940 | |
| | | | | | | | | | | | | | | | |
There were no significant transfers between Levels 1, 2, or 3 during the period ended December 31, 2016.
| | | | | | | | |
| 56 | | PIMCO EQUITY SERIES | | | | | See Accompanying Notes | |
Schedule of Investments PIMCO REALPATH® Blend 2045 Fund
December 31, 2016 (Unaudited)
| | | | | | | | | | | | |
| | | | | SHARES | | | | | MARKET
VALUE
(000S) | |
| INVESTMENTS IN SECURITIES 71.2% | |
| |
| MUTUAL FUNDS 71.2% | |
Vanguard 500 Index Fund ‘Admiral’ | | | | | 6,761 | | | $ | | | 1,396 | |
Vanguard Developed Markets Index Fund ‘Admiral’ | | | | | 58,256 | | | | | | 684 | |
Vanguard Emerging Markets Stock Index Fund ‘Admiral’ | | | | | 16,421 | | | | | | 489 | |
Vanguard Small-Cap Index Fund ‘Admiral’ | | | | | 3,136 | | | | | | 194 | |
| | | | | | | | | | | | |
Total Mutual Funds (Cost $2,675) | | | | | | 2,763 | |
| | | | | | | | | | | | |
| | | | | | | | | | | | |
Total Investments in Securities
(Cost $2,675) | | | | | | 2,763 | |
| | | | | | | | | | | | |
| |
| INVESTMENTS IN AFFILIATES 26.0% | |
| |
| MUTUAL FUNDS (a) 18.2% | |
PIMCO Emerging Local Bond Fund | | | | | 10,935 | | | | | | 76 | |
PIMCO Foreign Bond Fund (U.S. Dollar-Hedged) | | | | | 3,447 | | | | | | 36 | |
PIMCO High Yield Fund | | | | | 14,578 | | | | | | 128 | |
PIMCO Income Fund | | | | | 13,885 | | | | | | 168 | |
PIMCO Long Duration Total Return Fund | | | | | 5,334 | | | | | | 56 | |
PIMCO Long-Term Credit Fund | | | | | 5,000 | | | | | | 57 | |
| | | | | | | | | | | | |
| | | | | SHARES | | | | | MARKET
VALUE
(000S) | |
PIMCO Real Return Asset Fund | | | | | 9,594 | | | $ | | | 78 | |
PIMCO Real Return Fund | | | | | 6,785 | | | | | | 74 | |
PIMCO Total Return Fund | | | | | 3,501 | | | | | | 35 | |
| | | | | | | | | | | | |
Total Mutual Funds (Cost $720) | | | | | | 708 | |
| | | | | | | | | | | | |
| |
| SHORT-TERM INSTRUMENTS 7.8% | |
| | | | | | | | | | | | |
| CENTRAL FUNDS USED FOR CASH MANAGEMENT PURPOSES 7.8% | |
PIMCO Short-Term Floating NAV Portfolio III | | | | | 30,528 | | | | | | 302 | |
| | | | | | | | | | | | |
Total Short-Term Instruments
(Cost $302) | | | | | | 302 | |
| | | | | | | | | | | | |
| | | | | | | | | | | | |
Total Investments in Affiliates
(Cost $1,022) | | | | | | 1,010 | |
| | | | | | | | | | | | |
Total Investments 97.2%
(Cost $3,697) | | | $ | | | 3,773 | |
| |
Financial Derivative
Instruments (b) 0.4% (Cost or Premiums, net $0) | | | 14 | |
| |
| Other Assets and Liabilities, net 2.4% | | | 93 | |
| | | | | | | | | | | | |
| Net Assets 100.0% | | | $ | | | 3,880 | |
| | | | | | | | | | | | |
NOTES TO SCHEDULE OF INVESTMENTS (AMOUNTS IN THOUSANDS*, EXCEPT NUMBER OF UNITS):
| * | A zero balance may reflect actual amounts rounding to less than one thousand. |
| (a) | Institutional Class Shares of each Fund. |
(b) FINANCIAL DERIVATIVE INSTRUMENTS: OVER THE COUNTER
WRITTEN OPTIONS:
TRANSACTIONS IN WRITTEN CALL AND PUT OPTIONS FOR THE PERIOD ENDED DECEMBER 31, 2016:
| | | | | | | | | | | | | | | | | | | | | | | | |
| | | Balance at
Beginning of Period | | | Sales | | | Closing Buys | | | Expirations | | | Exercised | | | Balance at
End of Period | |
# of Contracts | | | 2 | | | | 0 | | | | 0 | | | | (2 | ) | | | 0 | | | | 0 | |
Premiums | | $ | (6 | ) | | $ | 0 | | | $ | 0 | | | $ | 6 | | | $ | 0 | | | $ | 0 | |
As of December 31, 2016 there were no open written options.
SWAP AGREEMENTS:
TOTAL RETURN SWAPS ON COMMODITY AND EQUITY INDICES
| | | | | | | | | | | | | | | | | | | | | | | | | | | | | | | | |
| Counterparty | | Pay/Receive(1) | | Underlying Reference | | # of Units | | | Financing Rate | | Maturity
Date | | | Notional
Amount | | Premiums
Paid/(Received) | | | Unrealized
Appreciation | | | Swap Agreements,
at Value | |
| | | | | | | | | | Asset | | | Liability | |
BOA | | Receive | | DWRTFT Index | | | 33 | | | 1-Month USD-LIBOR plus a specified spread | | | 04/06/2017 | | | $ 297 | | $ | 0 | | | $ | 13 | | | $ | 13 | | | $ | 0 | |
CBK | | Receive | | BCOMTR Index | | | 424 | | | 3-Month U.S. Treasury Bill rate plus a specified spread | | | 02/15/2017 | | | 74 | | | 0 | | | | 1 | | | | 1 | | | | 0 | |
| | | | | | | | | | | | | | | | | | | | | | | | | | | | | | | | |
| | | | | | | | | | | | | | | | | | $ | 0 | | | $ | 14 | | | $ | 14 | | | $ | 0 | |
| | | | | | | | | | | | | | | | | | | | | | | | | | | | | | | | |
Total Swap Agreements | | $ | 0 | | | $ | 14 | | | $ | 14 | | | $ | 0 | |
| | | | | | | | | | | | | | | | | | | | | | | | | | | | | | | | |
| (1) | Receive represents that the Fund receives payments for any positive return on the underlying reference. The Fund makes payments for any negative return on such underlying reference. Pay represents that the Fund receives payments for any negative return on the underlying reference. The Fund makes payments for any positive return on such underlying reference. |
| | | | | | |
| See Accompanying Notes | | SEMIANNUAL REPORT | | DECEMBER 31, 2016 | | 57 |
Schedule of Investments PIMCO REALPATH® Blend 2045 Fund (Cont.)
FINANCIAL DERIVATIVE INSTRUMENTS: OVER THE COUNTER SUMMARY
The following is a summary by counterparty of the market value of OTC financial derivative instruments and collateral pledged/(received) as of December 31, 2016:
| | | | | | | | | | | | | | | | | | | | | | | | | | | | | | | | | | | | | | | | | | | | | | | | |
| | | Financial Derivative Assets | | | | | | Financial Derivative Liabilities | | | | | | | | | | |
| Counterparty | | Forward
Foreign
Currency
Contracts | | | Purchased
Options | | | Swap
Agreements | | | Total
Over the
Counter | | | | | | Forward
Foreign
Currency
Contracts | | | Written
Options | | | Swap
Agreements | | | Total
Over the
Counter | | | Net Market
Value of OTC
Derivatives | | | Collateral
Pledged/
(Received) | | | Net
Exposure(2) | |
BOA | | $ | 0 | | | $ | 0 | | | $ | 13 | | | $ | 13 | | | | | | | $ | 0 | | | $ | 0 | | | $ | 0 | | | $ | 0 | | | $ | 13 | | | $ | 0 | | | $ | 13 | |
CBK | | | 0 | | | | 0 | | | | 1 | | | | 1 | | | | | | | | 0 | | | | 0 | | | | 0 | | | | 0 | | | | 1 | | | | 0 | | | | 1 | |
| | | | | | | | | | | | | | | | | | | | | | | | | | | | | | | | | | | | | | | | | | | | | | | | |
Total Over the Counter | | $ | 0 | | | $ | 0 | | | $ | 14 | | | $ | 14 | | | | | | | $ | 0 | | | $ | 0 | | | $ | 0 | | | $ | 0 | | | | | | | | | | | | | |
| | | | | | | | | | | | | | | | | | | | | | | | | | | | | | | | | | | | | | | | | | | | | | | | |
| (2) | Net Exposure represents the net receivable/(payable) that would be due from/to the counterparty in the event of default. Exposure from OTC financial derivative instruments can only be netted across transactions governed under the same master agreement with the same legal entity. See Note 6, Principal Risks, in the Notes to Financial Statements for more information regarding master netting arrangements. |
FAIR VALUE OF FINANCIAL DERIVATIVE INSTRUMENTS
The following is a summary of the fair valuation of the Fund’s derivative instruments categorized by risk exposure. See Note 6, Principal Risks, in the Notes to Financial Statements on risks of the Fund.
Fair Values of Financial Derivative Instruments on the Statements of Assets and Liabilities as of December 31, 2016:
| | | | | | | | | | | | | | | | | | | | | | | | |
| | | Derivatives not accounted for as hedging instruments | |
| | | Commodity
Contracts | | | Credit
Contracts | | | Equity
Contracts | | | Foreign
Exchange
Contracts | | | Interest
Rate Contracts | | | Total | |
Financial Derivative Instruments - Assets | |
Over the counter | |
Swap Agreements | | $ | 1 | | | $ | 0 | | | $ | 13 | | | $ | 0 | | | $ | 0 | | | $ | 14 | |
| | | | | | | | | | | | | | | | | | | | | | | | |
The effect of Financial Derivative Instruments on the Statements of Operations for the period ended December 31, 2016:
| | | | | | | | | | | | | | | | | | | | | | | | |
| | | Derivatives not accounted for as hedging instruments | |
| | | Commodity
Contracts | | | Credit
Contracts | | | Equity
Contracts | | | Foreign
Exchange
Contracts | | | Interest
Rate Contracts | | | Total | |
Net Realized Gain (Loss) on Financial Derivative Instruments | |
Exchange-traded or centrally cleared | |
Purchased Options | | $ | 0 | | | $ | 0 | | | $ | (10 | ) | | $ | 0 | | | $ | 0 | | | $ | (10 | ) |
Written Options | | | 0 | | | | 0 | | | | 6 | | | | 0 | | | | 0 | | | | 6 | |
| | | | | | | | | | | | | | | | | | | | | | | | |
| | $ | 0 | | | $ | 0 | | | $ | (4 | ) | | $ | 0 | | | $ | 0 | | | $ | (4 | ) |
| | | | | | | | | | | | | | | | | | | | | | | | |
Over the counter | |
Swap Agreements | | $ | (1 | ) | | $ | 0 | | | $ | (9 | ) | | $ | 0 | | | $ | 0 | | | $ | (10 | ) |
| | | | | | | | | | | | | | | | | | | | | | | | |
| | $ | (1 | ) | | $ | 0 | | | $ | (13 | ) | | $ | 0 | | | $ | 0 | | | $ | (14 | ) |
| | | | | | | | | | | | | | | | | | | | | | | | |
|
Net Change in Unrealized Appreciation (Depreciation) on Financial Derivative Instruments | |
Exchange-traded or centrally cleared | |
Purchased Options | | $ | 0 | | | $ | 0 | | | $ | 9 | | | $ | 0 | | | $ | 0 | | | $ | 9 | |
Written Options | | | 0 | | | | 0 | | | | (6 | ) | | | 0 | | | | 0 | | | | (6 | ) |
| | | | | | | | | | | | | | | | | | | | | | | | |
| | $ | 0 | | | $ | 0 | | | $ | 3 | | | $ | 0 | | | $ | 0 | | | $ | 3 | |
| | | | | | | | | | | | | | | | | | | | | | | | |
Over the counter | |
Swap Agreements | | $ | 0 | | | $ | 0 | | | $ | (3 | ) | | $ | 0 | | | $ | 0 | | | $ | (3 | ) |
| | | | | | | | | | | | | | | | | | | | | | | | |
| | $ | 0 | | | $ | 0 | | | $ | 0 | | | $ | 0 | | | $ | 0 | | | $ | 0 | |
| | | | | | | | | | | | | | | | | | | | | | | | |
| | | | | | | | |
| 58 | | PIMCO EQUITY SERIES | | | | | See Accompanying Notes | |
December 31, 2016 (Unaudited)
FAIR VALUE MEASUREMENTS
The following is a summary of the fair valuations according to the inputs used as of December 31, 2016 in valuing the Fund’s assets and liabilities:
| | | | | | | | | | | | | | | | |
| Category and Subcategory | | Level 1 | | | Level 2 | | | Level 3 | | | Fair
Value at
12/31/2016 | |
Investments in Securities, at Value | |
Mutual Funds | | $ | 2,763 | | | $ | 0 | | | $ | 0 | | | $ | 2,763 | |
| | | | | | | | | | | | | | | | |
| | $ | 2,763 | | | $ | 0 | | | $ | 0 | | | $ | 2,763 | |
| | | | | | | | | | | | | | | | |
|
Investments in Affiliates, at Value | |
Mutual Funds | | | 708 | | | | 0 | | | | 0 | | | | 708 | |
Short-Term Instruments | |
Central Funds Used for Cash Management Purposes | | | 302 | | | | 0 | | | | 0 | | | | 302 | |
| | | | | | | | | | | | | | | | |
| | $ | 1,010 | | | $ | 0 | | | $ | 0 | | | $ | 1,010 | |
| | | | | | | | | | | | | | | | |
| | | | |
Total Investments | | $ | 3,773 | | | $ | 0 | | | $ | 0 | | | $ | 3,773 | |
| | | | | | | | | | | | | | | | |
| | | | | | | | | | | | | | | | |
| Category and Subcategory | | Level 1 | | | Level 2 | | | Level 3 | | | Fair
Value at
12/31/2016 | |
Financial Derivative Instruments - Assets | |
Over The Counter | | $ | 0 | | | $ | 14 | | | $ | 0 | | | $ | 14 | |
| | | | | | | | | | | | | | | | |
| | | | |
Totals | | $ | 3,773 | | | $ | 14 | | | $ | 0 | | | $ | 3,787 | |
| | | | | | | | | | | | | | | | |
There were no significant transfers between Levels 1, 2, or 3 during the period ended December 31, 2016.
| | | | | | |
| See Accompanying Notes | | SEMIANNUAL REPORT | | DECEMBER 31, 2016 | | 59 |
Schedule of Investments PIMCO REALPATH® Blend 2050 Fund
| | | | | | | | | | | | |
| | | | | SHARES | | | | | MARKET
VALUE
(000S) | |
| INVESTMENTS IN SECURITIES 73.3% | |
| |
| MUTUAL FUNDS 73.3% | |
Vanguard 500 Index Fund ‘Admiral’ | | | | | 8,263 | | | $ | | | 1,707 | |
Vanguard Developed Markets Index Fund ‘Admiral’ | | | | | 70,108 | | | | | | 823 | |
Vanguard Emerging Markets Stock Index Fund ‘Admiral’ | | | | | 19,936 | | | | | | 593 | |
Vanguard Small-Cap Index Fund ‘Admiral’ | | | | | 3,628 | | | | | | 224 | |
| | | | | | | | | | | | |
Total Mutual Funds (Cost $3,208) | | | | | | | | | | | 3,347 | |
| | | | | | | | | | | | |
| | | | | | | | | | | | |
Total Investments in Securities
(Cost $3,208) | | | 3,347 | |
| | | | | | | | | | | | |
| |
| INVESTMENTS IN AFFILIATES 22.8% | |
| |
| MUTUAL FUNDS (a) 16.2% | |
PIMCO Emerging Local Bond Fund | | | | | 13,032 | | | | | | 91 | |
PIMCO Foreign Bond Fund (U.S. Dollar-Hedged) | | | | | 3,963 | | | | | | 41 | |
PIMCO High Yield Fund | | | | | 12,788 | | | | | | 113 | |
PIMCO Income Fund | | | | | 13,097 | | | | | | 158 | |
PIMCO Long Duration Total Return Fund | | | | | 6,356 | | | | | | 66 | |
PIMCO Long-Term Credit Fund | | | | | 5,852 | | | | | | 67 | |
| | | | | | | | | | | | |
| | | | | SHARES | | | | | MARKET
VALUE
(000S) | |
PIMCO Real Return Asset Fund | | | | | 7,895 | | | $ | | | 64 | |
PIMCO Real Return Fund | | | | | 8,388 | | | | | | 92 | |
PIMCO Total Return Fund | | | | | 4,478 | | | | | | 45 | |
| | | | | | | | | | | | |
Total Mutual Funds (Cost $747) | | | | | | | | | | | 737 | |
| | | | | | | | | | | | |
| |
| SHORT-TERM INSTRUMENTS 6.6% | |
| |
| CENTRAL FUNDS USED FOR CASH MANAGEMENT PURPOSES 6.6% | |
PIMCO Short-Term Floating NAV Portfolio III | | | | | 30,567 | | | | | | 302 | |
| | | | | | | | | | | | |
Total Short-Term Instruments
(Cost $302) | | | | | | | | | 302 | |
| | | | | | | | | | | | |
| | | | | | | | | | | | |
Total Investments in Affiliates
(Cost $1,049) | | | | | | | | | 1,039 | |
| | | | | | | | | | | | |
Total Investments 96.1%
(Cost $4,257) | | | | | | $ | | | 4,386 | |
| |
Financial Derivative
Instruments (b) 0.4% (Cost or Premiums, net $0) | | | | | | | | | | | 16 | |
| |
| Other Assets and Liabilities, net 3.5% | | | | | | | | | 164 | |
| | | | | | | | | | | | |
| Net Assets 100.0% | | | | | | | | $ | | | 4,566 | |
| | | | | | | | | | | | |
NOTES TO SCHEDULE OF INVESTMENTS (AMOUNTS IN THOUSANDS*, EXCEPT NUMBER OF UNITS):
| * | A zero balance may reflect actual amounts rounding to less than one thousand. |
| (a) | Institutional Class Shares of each Fund. |
(b) FINANCIAL DERIVATIVE INSTRUMENTS: OVER THE COUNTER
WRITTEN OPTIONS:
TRANSACTIONS IN WRITTEN CALL AND PUT OPTIONS FOR THE PERIOD ENDED DECEMBER 31, 2016:
| | | | | | | | | | | | | | | | | | | | | | | | |
| | | Balance at
Beginning of Period | | | Sales | | | Closing Buys | | | Expirations | | | Exercised | | | Balance at
End of Period | |
# of Contracts | | | 2 | | | | 0 | | | | 0 | | | | (2 | ) | | | 0 | | | | 0 | |
Premiums | | $ | (6 | ) | | $ | 0 | | | $ | 0 | | | $ | 6 | | | $ | 0 | | | $ | 0 | |
As of December 31, 2016 there were no open written options.
SWAP AGREEMENTS:
TOTAL RETURN SWAPS ON COMMODITY AND EQUITY INDICES
| | | | | | | | | | | | | | | | | | | | | | | | | | | | | | | | |
| Counterparty | | Pay/Receive(1) | | Underlying Reference | | # of Units | | | Financing Rate | | Maturity
Date | | | Notional
Amount | | Premiums
Paid/(Received) | | | Unrealized
Appreciation | | | Swap Agreements,
at Value | |
| | | | | | | | | | Asset | | | Liability | |
BOA | | Receive | | DWRTFT Index | | | 39 | | | 1-Month USD-LIBOR plus a specified spread | | | 04/06/2017 | | | $ 350 | | $ | 0 | | | $ | 15 | | | $ | 15 | | | $ | 0 | |
CBK | | Receive | | BCOMTR Index | | | 497 | | | 3-Month U.S. Treasury Bill rate plus a specified spread | | | 02/15/2017 | | | 87 | | | 0 | | | | 1 | | | | 1 | | | | 0 | |
| | | | | | | | | | | | | | | | | | | | | | | | | | | | | | | | |
| | | | | | | | | | | | | | | | | | $ | 0 | | | $ | 16 | | | $ | 16 | | | $ | 0 | |
| | | | | | | | | | | | | | | | | | | | | | | | | | | | | | | | |
Total Swap Agreements | | $ | 0 | | | $ | 16 | | | $ | 16 | | | $ | 0 | |
| | | | | | | | | | | | | | | | | | | | | | | | | | | | | | | | |
| (1) | Receive represents that the Fund receives payments for any positive return on the underlying reference. The Fund makes payments for any negative return on such underlying reference. Pay represents that the Fund receives payments for any negative return on the underlying reference. The Fund makes payments for any positive return on such underlying reference. |
| | | | | | | | |
| 60 | | PIMCO EQUITY SERIES | | | | | See Accompanying Notes | |
December 31, 2016 (Unaudited)
FINANCIAL DERIVATIVE INSTRUMENTS: OVER THE COUNTER SUMMARY
The following is a summary by counterparty of the market value of OTC financial derivative instruments and collateral pledged/(received) as of December 31, 2016:
| | | | | | | | | | | | | | | | | | | | | | | | | | | | | | | | | | | | | | | | | | | | | | | | |
| | | Financial Derivative Assets | | | | | | Financial Derivative Liabilities | | | | | | | | | | |
| Counterparty | | Forward
Foreign
Currency
Contracts | | | Purchased
Options | | | Swap
Agreements | | | Total
Over the
Counter | | | | | | Forward
Foreign
Currency
Contracts | | | Written
Options | | | Swap
Agreements | | | Total
Over the
Counter | | | Net Market
Value of OTC
Derivatives | | | Collateral
Pledged/
(Received) | | | Net
Exposure(2) | |
BOA | | $ | 0 | | | $ | 0 | | | $ | 15 | | | $ | 15 | | | | | | | $ | 0 | | | $ | 0 | | | $ | 0 | | | $ | 0 | | | $ | 15 | | | $ | 0 | | | $ | 15 | |
CBK | | | 0 | | | | 0 | | | | 1 | | | | 1 | | | | | | | | 0 | | | | 0 | | | | 0 | | | | 0 | | | | 1 | | | | 0 | | | | 1 | |
| | | | | | | | | | | | | | | | | | | | | | | | | | | | | | | | | | | | | | | | | | | | | | | | |
Total Over the Counter | | $ | 0 | | | $ | 0 | | | $ | 16 | | | $ | 16 | | | | | | | $ | 0 | | | $ | 0 | | | $ | 0 | | | $ | 0 | | | | | | | | | | | | | |
| | | | | | | | | | | | | | | | | | | | | | | | | | | | | | | | | | | | | | | | | | | | | | | | |
| (2) | Net Exposure represents the net receivable/(payable) that would be due from/to the counterparty in the event of default. Exposure from OTC financial derivative instruments can only be netted across transactions governed under the same master agreement with the same legal entity. See Note 6, Principal Risks, in the Notes to Financial Statements for more information regarding master netting arrangements. |
FAIR VALUE OF FINANCIAL DERIVATIVE INSTRUMENTS
The following is a summary of the fair valuation of the Fund’s derivative instruments categorized by risk exposure. See Note 6, Principal Risks, in the Notes to Financial Statements on risks of the Fund.
Fair Values of Financial Derivative Instruments on the Statements of Assets and Liabilities as of December 31, 2016:
| | | | | | | | | | | | | | | | | | | | | | | | |
| | | Derivatives not accounted for as hedging instruments | |
| | | Commodity
Contracts | | | Credit
Contracts | | | Equity
Contracts | | | Foreign
Exchange
Contracts | | | Interest
Rate Contracts | | | Total | |
Financial Derivative Instruments - Assets | |
Over the counter | |
Swap Agreements | | $ | 1 | | | $ | 0 | | | $ | 15 | | | $ | 0 | | | $ | 0 | | | $ | 16 | |
| | | | | | | | | | | | | | | | | | | | | | | | |
The effect of Financial Derivative Instruments on the Statements of Operations for the period ended December 31, 2016:
| | | | | | | | | | | | | | | | | | | | | | | | |
| | | Derivatives not accounted for as hedging instruments | |
| | | Commodity
Contracts | | | Credit
Contracts | | | Equity
Contracts | | | Foreign
Exchange
Contracts | | | Interest
Rate Contracts | | | Total | |
Net Realized Gain (Loss) on Financial Derivative Instruments | |
Exchange-traded or centrally cleared | |
Purchased Options | | $ | 0 | | | $ | 0 | | | $ | (10 | ) | | $ | 0 | | | $ | 0 | | | $ | (10 | ) |
Written Options | | | 0 | | | | 0 | | | | 6 | | | | 0 | | | | 0 | | | | 6 | |
| | | | | | | | | | | | | | | | | | | | | | | | |
| | $ | 0 | | | $ | 0 | | | $ | (4 | ) | | $ | 0 | | | $ | 0 | | | $ | (4 | ) |
| | | | | | | | | | | | | | | | | | | | | | | | |
Over the counter | |
Swap Agreements | | $ | (2 | ) | | $ | 0 | | | $ | (9 | ) | | $ | 0 | | | $ | 0 | | | $ | (11 | ) |
| | | | | | | | | | | | | | | | | | | | | | | | |
| | $ | (2 | ) | | $ | 0 | | | $ | (13 | ) | | $ | 0 | | | $ | 0 | | | $ | (15 | ) |
| | | | | | | | | | | | | | | | | | | | | | | | |
|
Net Change in Unrealized Appreciation (Depreciation) on Financial Derivative Instruments | |
Exchange-traded or centrally cleared | |
Purchased Options | | $ | 0 | | | $ | 0 | | | $ | 9 | | | $ | 0 | | | $ | 0 | | | $ | 9 | |
Written Options | | | 0 | | | | 0 | | | | (6 | ) | | | 0 | | | | 0 | | | | (6 | ) |
| | | | | | | | | | | | | | | | | | | | | | | | |
| | $ | 0 | | | $ | 0 | | | $ | 3 | | | $ | 0 | | | $ | 0 | | | $ | 3 | |
| | | | | | | | | | | | | | | | | | | | | | | | |
Over the counter | |
Swap Agreements | | $ | 0 | | | $ | 0 | | | $ | (4 | ) | | $ | 0 | | | $ | 0 | | | $ | (4 | ) |
| | | | | | | | | | | | | | | | | | | | | | | | |
| | $ | 0 | | | $ | 0 | | | $ | (1 | ) | | $ | 0 | | | $ | 0 | | | $ | (1 | ) |
| | | | | | | | | | | | | | | | | | | | | | | | |
| | | | | | |
| See Accompanying Notes | | SEMIANNUAL REPORT | | DECEMBER 31, 2016 | | 61 |
Schedule of Investments PIMCO REALPATH® Blend 2050 Fund (Cont.)
December 31, 2016 (Unaudited)
FAIR VALUE MEASUREMENTS
The following is a summary of the fair valuations according to the inputs used as of December 31, 2016 in valuing the Fund’s assets and liabilities:
| | | | | | | | | | | | | | | | |
| Category and Subcategory | | Level 1 | | | Level 2 | | | Level 3 | | | Fair
Value at
12/31/2016 | |
Investments in Securities, at Value | |
Mutual Funds | | $ | 3,347 | | | $ | 0 | | | $ | 0 | | | $ | 3,347 | |
| | | | | | | | | | | | | | | | |
| | $ | 3,347 | | | $ | 0 | | | $ | 0 | | | $ | 3,347 | |
| | | | | | | | | | | | | | | | |
|
Investments in Affiliates, at Value | |
Mutual Funds | | | 737 | | | | 0 | | | | 0 | | | | 737 | |
Short-Term Instruments | |
Central Funds Used for Cash Management Purposes | | | 302 | | | | 0 | | | | 0 | | | | 302 | |
| | | | | | | | | | | | | | | | |
| | $ | 1,039 | | | $ | 0 | | | $ | 0 | | | $ | 1,039 | |
| | | | | | | | | | | | | | | | |
| | | | |
Total Investments | | $ | 4,386 | | | $ | 0 | | | $ | 0 | | | $ | 4,386 | |
| | | | | | | | | | | | | | | | |
| | | | | | | | | | | | | | | | |
| Category and Subcategory | | Level 1 | | | Level 2 | | | Level 3 | | | Fair
Value at
12/31/2016 | |
Financial Derivative Instruments - Assets | |
Over The Counter | | $ | 0 | | | $ | 16 | | | $ | 0 | | | $ | 16 | |
| | | | | | | | | | | | | | | | |
| | | | |
Totals | | $ | 4,386 | | | $ | 16 | | | $ | 0 | | | $ | 4,402 | |
| | | | | | | | | | | | | | | | |
There were no significant transfers between Levels 1, 2, or 3 during the period ended December 31, 2016.
| | | | | | | | |
| 62 | | PIMCO EQUITY SERIES | | | | | See Accompanying Notes | |
Schedule of Investments PIMCO REALPATH® Blend 2055 Fund
December 31, 2016 (Unaudited)
| | | | | | | | | | | | |
| | | | | SHARES | | | | | MARKET
VALUE
(000S) | |
| INVESTMENTS IN SECURITIES 73.9% | |
| |
| MUTUAL FUNDS 73.9% | |
Vanguard 500 Index Fund ‘Admiral’ | | | | | 6,842 | | | $ | | | 1,414 | |
Vanguard Developed Markets Index Fund ‘Admiral’ | | | | | 57,744 | | | | | | 678 | |
Vanguard Emerging Markets Stock Index Fund ‘Admiral’ | | | | | 16,334 | | | | | | 486 | |
Vanguard Small-Cap Index Fund ‘Admiral’ | | | | | 2,991 | | | | | | 185 | |
| | | | | | | | | | | | |
Total Mutual Funds (Cost $2,672) | | | | | | | | | | | 2,763 | |
| | | | | | | | | | | | |
| | | | | | | | | | | | |
Total Investments in Securities
(Cost $2,672) | | | | | | | | | | | 2,763 | |
| | | | | | | | | | | | |
| |
| INVESTMENTS IN AFFILIATES 20.9% | |
| |
| MUTUAL FUNDS (a) 15.5% | |
PIMCO Emerging Local Bond Fund | | | | | 10,747 | | | | | | 75 | |
PIMCO Foreign Bond Fund (U.S. Dollar-Hedged) | | | | | 3,357 | | | | | | 35 | |
PIMCO High Yield Fund | | | | | 10,296 | | | | | | 91 | |
PIMCO Income Fund | | | | | 10,715 | | | | | | 129 | |
PIMCO Long Duration Total Return Fund | | | | | 5,241 | | | | | | 55 | |
PIMCO Long-Term Credit Fund | | | | | 4,938 | | | | | | 56 | |
| | | | | | | | | | | | |
| | | | | SHARES | | | | | MARKET
VALUE
(000S) | |
PIMCO Real Return Asset Fund | | | | | 4,202 | | | $ | | | 34 | |
PIMCO Real Return Fund | | | | | 6,567 | | | | | | 72 | |
PIMCO Total Return Fund | | | | | 3,394 | | | | | | 34 | |
| | | | | | | | | | | | |
Total Mutual Funds (Cost $595) | | | | | | | | | | | 581 | |
| | | | | | | | | | | | |
| |
| SHORT-TERM INSTRUMENTS 5.4% | |
| |
| CENTRAL FUNDS USED FOR CASH MANAGEMENT PURPOSES 5.4% | |
PIMCO Short-Term Floating NAV Portfolio III | | | | | 20,389 | | | | | | 201 | |
| | | | | | | | | | | | |
Total Short-Term Instruments
(Cost $201) | | | | | | | | | | | 201 | |
| | | | | | | | | | | | |
| |
Total Investments in Affiliates
(Cost $796) | | | | | | | | | | | 782 | |
| |
Total Investments 94.8%
(Cost $3,468) | | | | | | | | $ | | | 3,545 | |
| |
Financial Derivative
Instruments (b) 0.3% (Cost or Premiums, net $0) | | | | | | | | | | | 13 | |
| |
| Other Assets and Liabilities, net 4.9% | | | | | | | | | 181 | |
| | | | | | | | | | | | |
| Net Assets 100.0% | | | | | | | | $ | | | 3,739 | |
| | | | | | | | | | | | |
NOTES TO SCHEDULE OF INVESTMENTS (AMOUNTS IN THOUSANDS*, EXCEPT NUMBER OF UNITS):
| * | A zero balance may reflect actual amounts rounding to less than one thousand. |
| (a) | Institutional Class Shares of each Fund. |
(b) FINANCIAL DERIVATIVE INSTRUMENTS: OVER THE COUNTER
WRITTEN OPTIONS:
TRANSACTIONS IN WRITTEN CALL AND PUT OPTIONS FOR THE PERIOD ENDED DECEMBER 31, 2016:
| | | | | | | | | | | | | | | | | | | | | | | | |
| | | Balance at
Beginning of Period | | | Sales | | | Closing Buys | | | Expirations | | | Exercised | | | Balance at
End of Period | |
# of Contracts | | | 2 | | | | 0 | | | | 0 | | | | (2 | ) | | | 0 | | | | 0 | |
Premiums | | $ | (6 | ) | | $ | 0 | | | $ | 0 | | | $ | 6 | | | $ | 0 | | | $ | 0 | |
As of December 31, 2016 there were no open written options.
SWAP AGREEMENTS:
TOTAL RETURN SWAPS ON COMMODITY AND EQUITY INDICES
| | | | | | | | | | | | | | | | | | | | | | | | | | | | | | | | | | |
Counterparty | | Pay/Receive(1) | | Underlying Reference | | # of Units | | | Financing Rate | | Maturity
Date | | | Notional
Amount | | Premiums
Paid/(Received) | | | Unrealized
Appreciation | | | Swap Agreements,
at Value | |
| | | | | | | | | | Asset | | | Liability | |
BOA | | Receive | | DWRTFT Index | | | 32 | | | 1-Month USD-LIBOR plus a specified spread | | | 04/06/2017 | | | $ | | 287 | | $ | 0 | | | $ | 12 | | | $ | 12 | | | $ | 0 | |
CBK | | Receive | | BCOMTR Index | | | 419 | | | 3-Month U.S. Treasury Bill rate plus a specified spread | | | 02/15/2017 | | | | | 74 | | | 0 | | | | 1 | | | | 1 | | | | 0 | |
| | | | | | | | | | | | | | | | | | | | | | | | | | | | | | | | | | |
| | | | | | | | | | | | | | | | | | | | $ | 0 | | | $ | 13 | | | $ | 13 | | | $ | 0 | |
| | | | | | | | | | | | | | | | | | | | | | | | | | | | | | | | | | |
Total Swap Agreements | | | | | | | $ | 0 | | | $ | 13 | | | $ | 13 | | | $ | 0 | |
| | | | | | | | | | | | | | | | | | | | | | | | | | | | | | | | | | |
| (1) | Receive represents that the Fund receives payments for any positive return on the underlying reference. The Fund makes payments for any negative return on such underlying reference. Pay represents that the Fund receives payments for any negative return on the underlying reference. The Fund makes payments for any positive return on such underlying reference. |
| | | | | | |
| See Accompanying Notes | | SEMIANNUAL REPORT | | DECEMBER 31, 2016 | | 63 |
Schedule of Investments PIMCO REALPATH® Blend 2055 Fund (Cont.)
FINANCIAL DERIVATIVE INSTRUMENTS: OVER THE COUNTER SUMMARY
The following is a summary by counterparty of the market value of OTC financial derivative instruments and collateral pledged/(received) as of December 31, 2016:
| | | | | | | | | | | | | | | | | | | | | | | | | | | | | | | | | | | | | | | | | | | | | | | | |
| | | Financial Derivative Assets | | | | | | Financial Derivative Liabilities | | | | | | | | | | |
| Counterparty | | Forward
Foreign
Currency
Contracts | | | Purchased
Options | | | Swap
Agreements | | | Total
Over the
Counter | | | | | | Forward
Foreign
Currency
Contracts | | | Written
Options | | | Swap
Agreements | | | Total
Over the
Counter | | | Net Market
Value of OTC
Derivatives | | | Collateral
Pledged/
(Received) | | | Net
Exposure(2) | |
BOA | | $ | 0 | | | $ | 0 | | | $ | 12 | | | $ | 12 | | | | | | | $ | 0 | | | $ | 0 | | | $ | 0 | | | $ | 0 | | | $ | 12 | | | $ | 0 | | | $ | 12 | |
CBK | | | 0 | | | | 0 | | | | 1 | | | | 1 | | | | | | | | 0 | | | | 0 | | | | 0 | | | | 0 | | | | 1 | | | | 0 | | | | 1 | |
| | | | | | | | | | | | | | | | | | | | | | | | | | | | | | | | | | | | | | | | | | | | | | | | |
Total Over the Counter | | $ | 0 | | | $ | 0 | | | $ | 13 | | | $ | 13 | | | | | | | $ | 0 | | | $ | 0 | | | $ | 0 | | | $ | 0 | | | | | | | | | | | | | |
| | | | | | | | | | | | | | | | | | | | | | | | | | | | | | | | | | | | | | | | | | | | | | | | |
| (2) | Net Exposure represents the net receivable/(payable) that would be due from/to the counterparty in the event of default. Exposure from OTC financial derivative instruments can only be netted across transactions governed under the same master agreement with the same legal entity. See Note 6, Principal Risks, in the Notes to Financial Statements for more information regarding master netting arrangements. |
FAIR VALUE OF FINANCIAL DERIVATIVE INSTRUMENTS
The following is a summary of the fair valuation of the Fund’s derivative instruments categorized by risk exposure. See Note 6, Principal Risks, in the Notes to Financial Statements on risks of the Fund.
Fair Values of Financial Derivative Instruments on the Statements of Assets and Liabilities as of December 31, 2016:
| | | | | | | | | | | | | | | | | | | | | | | | |
| | | Derivatives not accounted for as hedging instruments | |
| | | Commodity
Contracts | | | Credit
Contracts | | | Equity
Contracts | | | Foreign
Exchange
Contracts | | | Interest
Rate Contracts | | | Total | |
Financial Derivative Instruments - Assets | |
Over the counter | |
Swap Agreements | | $ | 1 | | | $ | 0 | | | $ | 12 | | | $ | 0 | | | $ | 0 | | | $ | 13 | |
| | | | | | | | | | | | | | | | | | | | | | | | |
The effect of Financial Derivative Instruments on the Statements of Operations for the period ended December 31, 2016:
| | | | | | | | | | | | | | | | | | | | | | | | |
| | | Derivatives not accounted for as hedging instruments | |
| | | Commodity
Contracts | | | Credit
Contracts | | | Equity
Contracts | | | Foreign
Exchange
Contracts | | | Interest
Rate Contracts | | | Total | |
Net Realized Gain (Loss) on Financial Derivative Instruments | |
Exchange-traded or centrally cleared | |
Purchased Options | | $ | 0 | | | $ | 0 | | | $ | (10 | ) | | $ | 0 | | | $ | 0 | | | $ | (10 | ) |
Written Options | | | 0 | | | | 0 | | | | 6 | | | | 0 | | | | 0 | | | | 6 | |
| | | | | | | | | | | | | | | | | | | | | | | | |
| | $ | 0 | | | $ | 0 | | | $ | (4 | ) | | $ | 0 | | | $ | 0 | | | $ | (4 | ) |
| | | | | | | | | | | | | | | | | | | | | | | | |
Over the counter | |
Swap Agreements | | $ | (1 | ) | | $ | 0 | | | $ | (8 | ) | | $ | 0 | | | $ | 0 | | | $ | (9 | ) |
| | | | | | | | | | | | | | | | | | | | | | | | |
| | $ | (1 | ) | | $ | 0 | | | $ | (12 | ) | | $ | 0 | | | $ | 0 | | | $ | (13 | ) |
| | | | | | | | | | | | | | | | | | | | | | | | |
|
Net Change in Unrealized Appreciation (Depreciation) on Financial Derivative Instruments | |
Exchange-traded or centrally cleared | |
Purchased Options | | $ | 0 | | | $ | 0 | | | $ | 9 | | | $ | 0 | | | $ | 0 | | | $ | 9 | |
Written Options | | | 0 | | | | 0 | | | | (6 | ) | | | 0 | | | | 0 | | | | (6 | ) |
| | | | | | | | | | | | | | | | | | | | | | | | |
| | $ | 0 | | | $ | 0 | | | $ | 3 | | | $ | 0 | | | $ | 0 | | | $ | 3 | |
| | | | | | | | | | | | | | | | | | | | | | | | |
Over the counter | |
Swap Agreements | | $ | 0 | | | $ | 0 | | | $ | (4 | ) | | $ | 0 | | | $ | 0 | | | $ | (4 | ) |
| | | | | | | | | | | | | | | | | | | | | | | | |
| | $ | 0 | | | $ | 0 | | | $ | (1 | ) | | $ | 0 | | | $ | 0 | | | $ | (1 | ) |
| | | | | | | | | | | | | | | | | | | | | | | | |
| | | | | | | | |
| 64 | | PIMCO EQUITY SERIES | | | | | See Accompanying Notes | |
December 31, 2016 (Unaudited)
FAIR VALUE MEASUREMENTS
The following is a summary of the fair valuations according to the inputs used as of December 31, 2016 in valuing the Fund’s assets and liabilities:
| | | | | | | | | | | | | | | | |
| Category and Subcategory | | Level 1 | | | Level 2 | | | Level 3 | | | Fair
Value at
12/31/2016 | |
Investments in Securities, at Value | |
Mutual Funds | | $ | 2,763 | | | $ | 0 | | | $ | 0 | | | $ | 2,763 | |
| | | | | | | | | | | | | | | | |
| | $ | 2,763 | | | $ | 0 | | | $ | 0 | | | $ | 2,763 | |
| | | | | | | | | | | | | | | | |
|
Investments in Affiliates, at Value | |
Mutual Funds | | | 581 | | | | 0 | | | | 0 | | | | 581 | |
Short-Term Instruments | |
Central Funds Used for Cash Management Purposes | | | 201 | | | | 0 | | | | 0 | | | | 201 | |
| | | | | | | | | | | | | | | | |
| | $ | 782 | | | $ | 0 | | | $ | 0 | | | $ | 782 | |
| | | | | | | | | | | | | | | | |
| | | | |
Total Investments | | $ | 3,545 | | | $ | 0 | | | $ | 0 | | | $ | 3,545 | |
| | | | | | | | | | | | | | | | |
| | | | | | | | | | | | | | | | |
| Category and Subcategory | | Level 1 | | | Level 2 | | | Level 3 | | | Fair
Value at
12/31/2016 | |
Financial Derivative Instruments - Assets | |
Over The Counter | | $ | 0 | | | $ | 13 | | | $ | 0 | | | $ | 13 | |
| | | | | | | | | | | | | | | | |
| | | | |
Totals | | $ | 3,545 | | | $ | 13 | | | $ | 0 | | | $ | 3,558 | |
| | | | | | | | | | | | | | | | |
There were no significant transfers between Levels 1, 2, or 3 during the period ended December 31, 2016.
| | | | | | |
| See Accompanying Notes | | SEMIANNUAL REPORT | | DECEMBER 31, 2016 | | 65 |
Schedule of Investments PIMCO REALPATH® Blend Income Fund
| | | | | | | | | | | | |
| | | | | SHARES | | | | | MARKET
VALUE
(000S) | |
| INVESTMENTS IN SECURITIES 35.9% | |
| |
| MUTUAL FUNDS 35.9% | |
Vanguard 500 Index Fund ‘Admiral’ | | | | | 3,398 | | | $ | | | 702 | |
Vanguard Developed Markets Index Fund ‘Admiral’ | | | | | 25,649 | | | | | | 301 | |
Vanguard Emerging Markets Stock Index Fund ‘Admiral’ | | | | | 7,411 | | | | | | 221 | |
Vanguard Small-Cap Index Fund ‘Admiral’ | | | | | 1,817 | | | | | | 112 | |
| | | | | | | | | | | | |
Total Mutual Funds (Cost $1,282) | | | | | | 1,336 | |
| | | | | | | | | | | | |
| | | | | | | | | | | | |
Total Investments in Securities
(Cost $1,282) | | | | | | 1,336 | |
| | | | | | | | | | | | |
| |
| INVESTMENTS IN AFFILIATES 62.8% | |
| |
| MUTUAL FUNDS (a) 59.9% | |
PIMCO Foreign Bond Fund (U.S. Dollar-Hedged) | | | | | 10,478 | | | | | | 110 | |
PIMCO High Yield Fund | | | | | 31,957 | | | | | | 281 | |
PIMCO Income Fund | | | | | 50,878 | | | | | | 614 | |
PIMCO Long Duration Total Return Fund | | | | | 12,373 | | | | | | 129 | |
PIMCO Long-Term Credit Fund | | | | | 11,397 | | | | | | 130 | |
PIMCO Real Return Asset Fund | | | | | 32,166 | | | | | | 262 | |
| | | | | | | | | | | | |
| | | | | SHARES | | | | | MARKET
VALUE
(000S) | |
PIMCO Real Return Fund | | | | | 34,140 | | | $ | | | 373 | |
PIMCO Total Return Fund | | | | | 33,158 | | | | | | 332 | |
| | | | | | | | | | | | |
Total Mutual Funds (Cost $2,249) | | | | | | 2,231 | |
| | | | | | | | | | | | |
| |
| SHORT-TERM INSTRUMENTS 2.9% | |
| |
| CENTRAL FUNDS USED FOR CASH MANAGEMENT PURPOSES 2.9% | |
PIMCO Short-Term Floating NAV Portfolio III | | | | | 10,897 | | | | | | 108 | |
| | | | | | | | | | | | |
Total Short-Term Instruments
(Cost $108) | | | | | | 108 | |
| | | | | | | | | | | | |
| | | | | | | | | | | | |
Total Investments in Affiliates
(Cost $2,357) | | | | | | 2,339 | |
| | | | | | | | | | | | |
Total Investments 98.7%
(Cost $3,639) | | | $ | | | 3,675 | |
| |
Financial Derivative
Instruments (b)(c) 0.1% (Cost or Premiums, net $4) | | | 5 | |
| |
| Other Assets and Liabilities, net 1.2% | | | 43 | |
| | | | | | | | | | | | |
| Net Assets 100.0% | | | $ | | | 3,723 | |
| | | | | | | | | | | | |
NOTES TO SCHEDULE OF INVESTMENTS (AMOUNTS IN THOUSANDS*, EXCEPT NUMBER OF CONTRACTS AND UNITS):
| * | A zero balance may reflect actual amounts rounding to less than one thousand. |
| (a) | Institutional Class Shares of each Fund. |
(b) FINANCIAL DERIVATIVE INSTRUMENTS: EXCHANGE-TRADED OR CENTRALLY CLEARED
PURCHASED OPTIONS:
OPTIONS ON INDICES
| | | | | | | | | | | | | | | | | | | | |
| Description | | Strike
Value | | | Expiration
Date | | | # of
Contracts | | | Cost | | | Market
Value | |
Put - CBOE S&P 500 Index | | | 1,775.000 | | | | 03/17/2017 | | | | 1 | | | $ | 2 | | | $ | 0 | |
Put - CBOE S&P 500 Index | | | 1,875.000 | | | | 03/17/2017 | | | | 1 | | | | 3 | | | | 1 | |
| | | | | | | | | | | | | | | | | | | | |
| | | | | | | | | | | | | | $ | 5 | | | $ | 1 | |
| | | | | | | | | | | | | | | | | | | | |
Total Purchased Options | | | $ | 5 | | | $ | 1 | |
| | | | | | | | | | | | | | | | | | | | |
WRITTEN OPTIONS:
OPTIONS ON INDICES
| | | | | | | | | | | | | | | | | | | | |
| Description | | Strike
Value | | | Expiration
Date | | | # of
Contracts | | | Premiums
(Received) | | | Market
Value | |
Put - CBOE S&P 500 Index | | | 1,600.000 | | | | 03/17/2017 | | | | 1 | | | $ | (1 | ) | | $ | 0 | |
| | | | | | | | | | | | | | | | | | | | |
Total Written Options | | | $ | (1 | ) | | $ | 0 | |
| | | | | | | | | | | | | | | | | | | | |
FINANCIAL DERIVATIVE INSTRUMENTS: EXCHANGE-TRADED OR CENTRALLY CLEARED SUMMARY
The following is a summary of the market value and variation margin of Exchange-Traded or Centrally Cleared Financial Derivative Instruments as of December 31, 2016:
| | | | | | | | | | | | | | | | | | | | | | | | | | | | | | | | | | | | |
| | | Financial Derivative Assets | | | | | | Financial Derivative Liabilities | |
| | | Market Value | | | Variation Margin
Asset | | | Total | | | | | | Market Value | | | Variation Margin
Liability | | | Total | |
| | | Purchased
Options | | | Futures | | | Swap
Agreements | | | | | | | Written
Options | | | Futures | | | Swap
Agreements | | |
Total Exchange-Traded or Centrally Cleared | | $ | 1 | | | $ | 0 | | | $ | 0 | | | $ | 1 | | | | | | | $ | 0 | | | $ | 0 | | | $ | 0 | | | $ | 0 | |
| | | | | | | | | | | | | | | | | | | | | | | | | | | | | | | | | | | | |
| | | | | | | | |
| 66 | | PIMCO EQUITY SERIES | | | | | See Accompanying Notes | |
December 31, 2016 (Unaudited)
(c) FINANCIAL DERIVATIVE INSTRUMENTS: OVER THE COUNTER
WRITTEN OPTIONS:
TRANSACTIONS IN WRITTEN CALL AND PUT OPTIONS FOR THE PERIOD ENDED DECEMBER 31, 2016:
| | | | | | | | | | | | | | | | | | | | | | | | |
| | | Balance at
Beginning of Period | | | Sales | | | Closing Buys | | | Expirations | | | Exercised | | | Balance at
End of Period | |
# of Contracts | | | 2 | | | | 1 | | | | 0 | | | | (2 | ) | | | 0 | | | | 1 | |
Premiums | | $ | (4 | ) | | $ | (1 | ) | | $ | 0 | | | $ | 4 | | | $ | 0 | | | $ | (1 | ) |
SWAP AGREEMENTS:
TOTAL RETURN SWAPS ON COMMODITY AND EQUITY INDICES
| | | | | | | | | | | | | | | | | | | | | | | | | | | | | | | | |
| Counterparty | | Pay/Receive(1) | | Underlying Reference | | # of Units | | | Financing Rate | | Maturity
Date | | | Notional
Amount | | Premiums
Paid/(Received) | | | Unrealized
Appreciation | | | Swap Agreements,
at Value | |
| | | | | | | | | | Asset | | | Liability | |
BOA | | Receive | | DWRTFT Index | | | 8 | | | 1-Month USD-LIBOR plus a specified spread | | | 04/06/2017 | | | $ 72 | | $ | 0 | | | $ | 3 | | | $ | 3 | | | $ | 0 | |
CBK | | Receive | | BCOMTR Index | | | 413 | | | 3-Month U.S. Treasury Bill rate plus a specified spread | | | 02/15/2017 | | | 72 | | | 0 | | | | 1 | | | | 1 | | | | 0 | |
| | | | | | | | | | | | | | | | | | | | | | | | | | | | | | | | |
| | | | | | | | | | | | | | | | | | $ | 0 | | | $ | 4 | | | $ | 4 | | | $ | 0 | |
| | | | | | | | | | | | | | | | | | | | | | | | | | | | | | | | |
Total Swap Agreements | | $ | 0 | | | $ | 4 | | | $ | 4 | | | $ | 0 | |
| | | | | | | | | | | | | | | | | | | | | | | | | | | | | | | | |
| (1) | Receive represents that the Fund receives payments for any positive return on the underlying reference. The Fund makes payments for any negative return on such underlying reference. Pay represents that the Fund receives payments for any negative return on the underlying reference. The Fund makes payments for any positive return on such underlying reference. |
FINANCIAL DERIVATIVE INSTRUMENTS: OVER THE COUNTER SUMMARY
The following is a summary by counterparty of the market value of OTC financial derivative instruments and collateral pledged/(received) as of December 31, 2016:
| | | | | | | | | | | | | | | | | | | | | | | | | | | | | | | | | | | | | | | | | | | | | | | | |
| | | Financial Derivative Assets | | | | | | Financial Derivative Liabilities | | | | | | | | | | |
| Counterparty | | Forward
Foreign
Currency
Contracts | | | Purchased
Options | | | Swap
Agreements | | | Total
Over the
Counter | | | | | | Forward
Foreign
Currency
Contracts | | | Written
Options | | | Swap
Agreements | | | Total
Over the
Counter | | | Net Market
Value of OTC
Derivatives | | | Collateral
Pledged/
(Received) | | | Net
Exposure(2) | |
BOA | | $ | 0 | | | $ | 0 | | | $ | 3 | | | $ | 3 | | | | | | | $ | 0 | | | $ | 0 | | | $ | 0 | | | $ | 0 | | | $ | 3 | | | $ | 0 | | | $ | 3 | |
CBK | | | 0 | | | | 0 | | | | 1 | | | | 1 | | | | | | | | 0 | | | | 0 | | | | 0 | | | | 0 | | | | 1 | | | | 0 | | | | 1 | |
| | | | | | | | | | | | | | | | | | | | | | | | | | | | | | | | | | | | | | | | | | | | | | | | |
Total Over the Counter | | $ | 0 | | | $ | 0 | | | $ | 4 | | | $ | 4 | | | | | | | $ | 0 | | | $ | 0 | | | $ | 0 | | | $ | 0 | | | | | | | | | | | | | |
| | | | | | | | | | | | | | | | | | | | | | | | | | | | | | | | | | | | | | | | | | | | | | | | |
| (2) | Net Exposure represents the net receivable/(payable) that would be due from/to the counterparty in the event of default. Exposure from OTC financial derivative instruments can only be netted across transactions governed under the same master agreement with the same legal entity. See Note 6, Principal Risks, in the Notes to Financial Statements for more information regarding master netting arrangements. |
FAIR VALUE OF FINANCIAL DERIVATIVE INSTRUMENTS
The following is a summary of the fair valuation of the Fund’s derivative instruments categorized by risk exposure. See Note 6, Principal Risks, in the Notes to Financial Statements on risks of the Fund.
Fair Values of Financial Derivative Instruments on the Statements of Assets and Liabilities as of December 31, 2016:
| | | | | | | | | | | | | | | | | | | | | | | | |
| | | Derivatives not accounted for as hedging instruments | |
| | | Commodity
Contracts | | | Credit
Contracts | | | Equity
Contracts | | | Foreign
Exchange
Contracts | | | Interest
Rate Contracts | | | Total | |
Financial Derivative Instruments - Assets | |
Exchange-traded or centrally cleared | |
Purchased Options | | $ | 0 | | | $ | 0 | | | $ | 1 | | | $ | 0 | | | $ | 0 | | | $ | 1 | |
| | | | | | | | | | | | | | | | | | | | | | | | |
Over the counter | |
Swap Agreements | | $ | 1 | | | $ | 0 | | | $ | 3 | | | $ | 0 | | | $ | 0 | | | $ | 4 | |
| | | | | | | | | | | | | | | | | | | | | | | | |
| | $ | 1 | | | $ | 0 | | | $ | 4 | | | $ | 0 | | | $ | 0 | | | $ | 5 | |
| | | | | | | | | | | | | | | | | | | | | | | | |
| | | | | | |
| See Accompanying Notes | | SEMIANNUAL REPORT | | DECEMBER 31, 2016 | | 67 |
Schedule of Investments PIMCO REALPATH® Blend Income Fund (Cont.)
December 31, 2016 (Unaudited)
The effect of Financial Derivative Instruments on the Statements of Operations for the period ended December 31, 2016:
| | | | | | | | | | | | | | | | | | | | | | | | |
| | | Derivatives not accounted for as hedging instruments | |
| | | Commodity
Contracts | | | Credit
Contracts | | | Equity
Contracts | | | Foreign
Exchange
Contracts | | | Interest
Rate Contracts | | | Total | |
Net Realized Gain (Loss) on Financial Derivative Instruments | |
Exchange-traded or centrally cleared | |
Purchased Options | | $ | 0 | | | $ | 0 | | | $ | (12 | ) | | $ | 0 | | | $ | 0 | | | $ | (12 | ) |
Written Options | | | 0 | | | | 0 | | | | 4 | | | | 0 | | | | 0 | | | | 4 | |
| | | | | | | | | | | | | | | | | | | | | | | | |
| | $ | 0 | | | $ | 0 | | | $ | (8 | ) | | $ | 0 | | | $ | 0 | | | $ | (8 | ) |
| | | | | | | | | | | | | | | | | | | | | | | | |
Over the counter | |
Swap Agreements | | $ | (1 | ) | | $ | 0 | | | $ | (2 | ) | | $ | 0 | | | $ | 0 | | | $ | (3 | ) |
| | | | | | | | | | | | | | | | | | | | | | | | |
| | $ | (1 | ) | | $ | 0 | | | $ | (10 | ) | | $ | 0 | | | $ | 0 | | | $ | (11 | ) |
| | | | | | | | | | | | | | | | | | | | | | | | |
|
Net Change in Unrealized Appreciation (Depreciation) on Financial Derivative Instruments | |
Exchange-traded or centrally cleared | |
Purchased Options | | $ | 0 | | | $ | 0 | | | $ | 3 | | | $ | 0 | | | $ | 0 | | | $ | 3 | |
Written Options | | | 0 | | | | 0 | | | | (2 | ) | | | 0 | | | | 0 | | | | (2 | ) |
| | | | | | | | | | | | | | | | | | | | | | | | |
| | $ | 0 | | | $ | 0 | | | $ | 1 | | | $ | 0 | | | $ | 0 | | | $ | 1 | |
| | | | | | | | | | | | | | | | | | | | | | | | |
Over the counter | |
Swap Agreements | | $ | 1 | | | $ | 0 | | | $ | (1 | ) | | $ | 0 | | | $ | 0 | | | $ | 0 | |
| | | | | | | | | | | | | | | | | | | | | | | | |
| | $ | 1 | | | $ | 0 | | | $ | 0 | | | $ | 0 | | | $ | 0 | | | $ | 1 | |
| | | | | | | | | | | | | | | | | | | | | | | | |
FAIR VALUE MEASUREMENTS
The following is a summary of the fair valuations according to the inputs used as of December 31, 2016 in valuing the Fund’s assets and liabilities:
| | | | | | | | | | | | | | | | |
| Category and Subcategory | | Level 1 | | | Level 2 | | | Level 3 | | | Fair
Value at
12/31/2016 | |
Investments in Securities, at Value | |
Mutual Funds | | $ | 1,336 | | | $ | 0 | | | $ | 0 | | | $ | 1,336 | |
| | | | | | | | | | | | | | | | |
| | $ | 1,336 | | | $ | 0 | | | $ | 0 | | | $ | 1,336 | |
| | | | | | | | | | | | | | | | |
|
Investments in Affiliates, at Value | |
Mutual Funds | | | 2,231 | | | | 0 | | | | 0 | | | | 2,231 | |
Short-Term Instruments | |
Central Funds Used for Cash Management Purposes | | | 108 | | | | 0 | | | | 0 | | | | 108 | |
| | | | | | | | | | | | | | | | |
| | $ | 2,339 | | | $ | 0 | | | $ | 0 | | | $ | 2,339 | |
| | | | | | | | | | | | | | | | |
| | | | |
Total Investments | | $ | 3,675 | | | $ | 0 | | | $ | 0 | | | $ | 3,675 | |
| | | | | | | | | | | | | | | | |
| | | | | | | | | | | | | | | | |
| Category and Subcategory | | Level 1 | | | Level 2 | | | Level 3 | | | Fair
Value at
12/31/2016 | |
Financial Derivative Instruments - Assets | |
Exchange-traded or centrally cleared | | $ | 0 | | | $ | 1 | | | $ | 0 | | | $ | 1 | |
Over The Counter | | | 0 | | | | 4 | | | | 0 | | | | 4 | |
| | | | | | | | | | | | | | | | |
| | $ | 0 | | | $ | 5 | | | $ | 0 | | | $ | 5 | |
| | | | | | | | | | | | | | | | |
Total Financial Derivative Instruments | | $ | 0 | | | $ | 5 | | | $ | 0 | | | $ | 5 | |
| | | | | | | | | | | | | | | | |
| | | | |
Totals | | $ | 3,675 | | | $ | 5 | | | $ | 0 | | | $ | 3,680 | |
| | | | | | | | | | | | | | | | |
There were no significant transfers between Levels 1, 2, or 3 during the period ended December 31, 2016.
| | | | | | | | |
| 68 | | PIMCO EQUITY SERIES | | | | | See Accompanying Notes | |
Notes to Financial Statements
December 31, 2016 (Unaudited)
1. ORGANIZATION
PIMCO Equity Series (the “Trust”) was established as a Delaware statutory trust on December 28, 2009. The Trust is registered under the Investment Company Act of 1940, as amended (the “Act”), as an open-end management investment company. Information presented in these financial statements pertains to the Institutional Class, Administrative Class, and Class A shares of the funds (each a “Fund” and collectively the “Funds”) indicated on the cover of this report. Pacific Investment Management Company LLC (“PIMCO”) serves as the investment adviser (the “Adviser”) for the Funds. Each Fund may invest substantially all of its assets in Institutional Class or Class M shares of any funds of the Trust and PIMCO Funds, and in other affiliated funds, including funds of PIMCO ETF Trust, except funds of funds (“Underlying PIMCO Funds”), and unaffiliated funds that are registered under the Act (collectively, “Acquired Funds”).
2. SIGNIFICANT ACCOUNTING POLICIES
The following is a summary of significant accounting policies consistently followed by the Trust in the preparation of its financial statements in conformity with accounting principles generally accepted in the United States of America (“U.S. GAAP”). Each Fund is treated as an investment company under the reporting requirements of U.S. GAAP. The preparation of financial statements in accordance with U.S. GAAP requires management to make estimates and assumptions that affect the reported amounts of assets and liabilities and disclosure of contingent assets and liabilities at the date of the financial statements and the reported amounts of increases and decreases in net assets from operations during the reporting period. Actual results could differ from those estimates.
(a) Securities Transactions and Investment Income Securities transactions are recorded as of the trade date for financial reporting purposes. Realized gains (losses) from securities sold are recorded on the identified cost basis. Dividend income is recorded on the ex-dividend date, except certain dividends from foreign securities where the ex-dividend date may have passed, which are recorded as soon as a Fund is informed of the ex-dividend date. Interest income, adjusted for the accretion of discounts and amortization of premiums, is recorded on the accrual basis from settlement date. Estimated tax liabilities on certain foreign securities are recorded on an accrual basis and are reflected as components of interest income or net change in unrealized appreciation (depreciation) on investments on the Statements of Operations, as appropriate. Tax liabilities realized as a result of such security sales are reflected as a component of net realized gain (loss) on investments on the Statements of Operations.
(b) Multiclass Operations Each class offered by the Trust has equal rights as to assets and voting privileges (except that shareholders of a
class have exclusive voting rights regarding any matter relating solely to that class of shares). Income and non-class specific expenses are allocated daily to each class on the basis of the relative net assets. Realized and unrealized capital gains (losses) are allocated daily based on the relative net assets of each class of the respective Fund. Class specific expenses, where applicable, currently include supervisory and administrative and distribution and servicing fees. Under certain circumstances, the per share net asset value (“NAV”) of a class of the respective Fund’s shares may be different from the per share NAV of another class of shares as a result of the different daily expense accruals applicable to each class of shares.
(c) Distributions to Shareholders The following table shows the anticipated frequency of distributions from net investment income, if any, for each Fund.
| | | | | | | | | | | | |
| | | | | | Distribution Frequency | |
| Fund Name | | | | | Declared | | | Distributed | |
PIMCO REALPATH® Blend 2020 Fund | | | | | | | Quarterly | | | | Quarterly | |
PIMCO REALPATH® Blend 2025 Fund | | | | | | | Quarterly | | | | Quarterly | |
PIMCO REALPATH® Blend 2030 Fund | | | | | | | Quarterly | | | | Quarterly | |
PIMCO REALPATH® Blend 2035 Fund | | | | | | | Quarterly | | | | Quarterly | |
PIMCO REALPATH® Blend 2040 Fund | | | | | | | Quarterly | | | | Quarterly | |
PIMCO REALPATH® Blend 2045 Fund | | | | | | | Quarterly | | | | Quarterly | |
PIMCO REALPATH® Blend 2050 Fund | | | | | | | Quarterly | | | | Quarterly | |
PIMCO REALPATH® Blend 2055 Fund | | | | | | | Quarterly | | | | Quarterly | |
PIMCO REALPATH® Blend Income Fund | | | | | | | Quarterly | | | | Quarterly | |
Net realized capital gains earned by each Fund, if any, will be distributed no less frequently than once each year.
Income distributions and capital gain distributions are determined in accordance with income tax regulations which may differ from U.S. GAAP. Differences between tax regulations and U.S. GAAP may cause timing differences between income and capital gain recognition. Further, the character of investment income and capital gains may be different for certain transactions under the two methods of accounting. As a result, income distributions and capital gain distributions declared during a fiscal period may differ significantly from the net investment income (loss) and realized gains (losses) reported on the Fund’s annual financial statements presented under U.S. GAAP.
If a Fund estimates that a portion of one of its dividend distributions may be comprised of amounts from sources other than net investment income, the Fund will notify shareholders of record of the estimated composition of such distribution through a Section 19 Notice. To determine the sources of a Fund’s distributions during the reporting period, the Fund references its internal accounting records at the time the distribution is paid and generally bases its projections of the final tax character of those distributions on the tax characteristics of the distribution reflected in its internal accounting records at the time of
| | | | | | |
| | SEMIANNUAL REPORT | | DECEMBER 31, 2016 | | 69 |
Notes to Financial Statements (Cont.)
such payment. If, based on such records, a particular distribution does not include capital gains or paid-in surplus or other capital sources, a Section 19 Notice generally would not be issued. It is important to note that differences exist between a Fund’s daily internal accounting records, the Fund’s financial statements presented in accordance with U.S. GAAP, and recordkeeping practices under income tax regulations. Examples of such differences may include, among others, the treatment of paydowns on mortgage-backed securities purchased at a discount and periodic payments under interest rate swap contracts. Notwithstanding a Fund’s estimates and projections, it is possible that a Fund may not issue a Section 19 Notice in situations where the Fund’s financial statements prepared later and in accordance with U.S. GAAP or the final tax character of those distributions might later report that the sources of those distributions included capital gains and/or a return of capital. Additionally, given differences in tax and U.S. GAAP treatment of certain distributions, a Fund may not issue a Section 19 Notice in situations where the Fund’s financial statements prepared later and in accordance with U.S. GAAP might report that the sources of these distributions included capital gains and/or a return of capital. Please visit www.pimco.com for the most recent Section 19 Notice, if applicable, for additional information regarding the composition of distributions. Final determination of a distribution’s tax character will be reported on Form 1099 DIV sent to shareholders each January.
Distributions classified as a tax basis return of capital, if any, are reflected on the Statements of Changes in Net Assets and have been recorded to paid in capital. In addition, other amounts have been reclassified between undistributed (overdistributed) net investment income (loss), accumulated undistributed (overdistributed) net realized gain (loss) and/or paid in capital to more appropriately conform U.S. GAAP to tax characterizations of distributions.
(d) New Accounting Pronouncements In August 2014, the Financial Accounting Standards Board (“FASB”) issued an Accounting Standards Update (“ASU”), ASU 2014-15 requiring management to evaluate whether there are conditions or events, considered in the aggregate, that raise substantial doubt about the entity’s ability to continue as a going concern. The ASU is effective prospectively for annual periods ending after December 15, 2016, and interim periods thereafter. The Funds have adopted the ASU. The implementation of the ASU did not have an impact on the Funds’ financial statements.
In May 2015, the FASB issued ASU 2015-07 which removes the requirement to categorize within the fair value hierarchy all investments for which fair value is measured using the NAV per share practical expedient. The ASU also removes the requirement to make certain disclosures for all investments that are eligible to be measured at fair value using the NAV per share practical expedient. The ASU is effective for annual periods beginning after December 15, 2015 and interim
periods within those annual periods. The ASU did not have an impact on the Funds’ financial statements.
In August 2016, the FASB issued ASU 2016-15 which amends ASC 230 to clarify guidance on the classification of certain cash receipts and cash payments in the statement of cash flows. The ASU is effective for annual periods beginning after December 15, 2017, and interim periods within those annual periods. At this time, management is evaluating the implications of these changes on the financial statements.
In October 2016, the U.S. Securities and Exchange Commission (“SEC”) adopted new rules and forms, and amendments to certain current rules and forms, to modernize reporting and disclosure of information by registered investment companies. The amendments to Regulation S-X will require standardized, enhanced disclosure about derivatives in investment company financial statements, and will also change the rules governing the form and content of such financial statements. The amendments to Regulation S-X take effect on August 1, 2017. At this time, management is assessing the anticipated impact of these regulatory developments.
In November 2016, the FASB issued ASU 2016-18 which amends ASC 230 to provide guidance on the classification and presentation of changes in restricted cash and restricted cash equivalents on the statement of cash flows. The ASU is effective for annual periods beginning after December 15, 2017, and interim periods within those annual periods. At this time, management is evaluating the implications of these changes on the financial statements.
3. INVESTMENT VALUATION AND FAIR VALUE MEASUREMENTS
(a) Investment Valuation Policies The price of a Fund’s shares is based on the Fund’s NAV. The NAV of a Fund, or each of its share classes, as applicable, is determined by dividing the total value of portfolio investments and other assets, less any liabilities attributable to that Fund or class, by the total number of shares outstanding of that Fund or class.
On each day that the New York Stock Exchange (“NYSE”) is open, Fund shares are ordinarily valued as of the close of regular trading (“NYSE Close”). Information that becomes known to the Funds or their agents after the time as of which NAV has been calculated on a particular day will not generally be used to retroactively adjust the price of a security or the NAV determined earlier that day. Each Fund reserves the right to change the time its respective NAV is calculated if the Fund closes earlier, or as permitted by the SEC.
For purposes of calculating NAV, portfolio securities and other assets for which market quotes are readily available are valued at market value. Market value is generally determined on the basis of official
December 31, 2016 (Unaudited)
closing prices or the last reported sales prices, or if no sales are reported, based on quotes obtained from established market makers or prices (including evaluated prices) supplied by the Funds’ approved pricing services, quotation reporting systems and other third-party sources (together, “Pricing Services”). The Funds will normally use pricing data for domestic equity securities received shortly after the NYSE Close and do not normally take into account trading, clearances or settlements that take place after the NYSE Close. A foreign (non-U.S.) equity security traded on a foreign exchange or on more than one exchange is typically valued using pricing information from the exchange considered by the Adviser to be the primary exchange. A foreign (non-U.S.) equity security will be valued as of the close of trading on the foreign exchange, or the NYSE Close, if the NYSE Close occurs before the end of trading on the foreign exchange. Domestic and foreign (non-U.S.) fixed income securities, non-exchange traded derivatives, and equity options are normally valued on the basis of quotes obtained from brokers and dealers or Pricing Services using data reflecting the earlier closing of the principal markets for those securities. Prices obtained from Pricing Services may be based on, among other things, information provided by market makers or estimates of market values obtained from yield data relating to investments or securities with similar characteristics. Certain fixed income securities purchased on a delayed-delivery basis are marked to market daily until settlement at the forward settlement date. Exchange-traded options, except equity options, futures and options on futures are valued at the settlement price determined by the relevant exchange. Swap agreements are valued on the basis of bid quotes obtained from brokers and dealers or market-based prices supplied by Pricing Services or other pricing sources. The Funds’ investments in open-end management investment companies, other than exchange-traded funds (“ETFs”), are valued at the NAVs of such investments.
If a foreign (non-U.S.) equity security’s value has materially changed after the close of the security’s primary exchange or principal market but before the NYSE Close, the security may be valued at fair value based on procedures established and approved by the Board of Trustees of the Trust (the “Board”). Foreign (non-U.S.) equity securities that do not trade when the NYSE is open are also valued at fair value. With respect to foreign (non-U.S.) equity securities, the Fund may determine the fair value of investments based on information provided by Pricing Services and other third-party vendors, which may recommend fair value or adjustments with reference to other securities, indices or assets. In considering whether fair valuation is required and in determining fair values, the Fund may, among other things, consider significant events (which may be considered to include changes in the value of U.S. securities or securities indices) that occur after the close of the relevant market and before the NYSE Close. A Fund may utilize modeling tools provided by third-party vendors to determine fair values
of non-U.S. securities. Foreign exchanges may permit trading in foreign (non-U.S.) equity securities on days when the Trust is not open for business, which may result in a Fund’s portfolio investments being affected when shareholders are unable to buy or sell shares.
Senior secured floating rate loans for which an active secondary market exists to a reliable degree will be valued at the mean of the last available bid/ask prices in the market for such loans, as provided by a Pricing Service. Senior secured floating rate loans for which an active secondary market does not exist to a reliable degree will be valued at fair value, which is intended to approximate market value. In valuing a senior secured floating rate loan at fair value, the factors considered may include, but are not limited to, the following: (a) the creditworthiness of the borrower and any intermediate participants, (b) the terms of the loan, (c) recent prices in the market for similar loans, if any, and (d) recent prices in the market for instruments of similar quality, rate, period until next interest rate reset and maturity.
Investments valued in currencies other than the U.S. dollar are converted to the U.S. dollar using exchange rates obtained from Pricing Services. As a result, the value of such investments and, in turn, the NAV of a Fund’s shares may be affected by changes in the value of currencies in relation to the U.S. dollar. The value of investments traded in markets outside the United States or denominated in currencies other than the U.S. dollar may be affected significantly on a day that the Trust is not open for business. As a result, to the extent that a Fund holds foreign (non-U.S.) investments, the value of those investments may change at times when shareholders are unable to buy or sell shares and the value of such investments will be reflected in the Fund’s next calculated NAV.
Investments for which market quotes or market based valuations are not readily available are valued at fair value as determined in good faith by the Board or persons acting at their direction. The Board has adopted methods for valuing securities and other assets in circumstances where market quotes are not readily available, and has delegated to the Adviser the responsibility for applying the fair valuation methods. In the event that market quotes or market based valuations are not readily available, and the security or asset cannot be valued pursuant to a Board approved valuation method, the value of the security or asset will be determined in good faith by the Valuation Oversight Committee of the Board (“Valuation Oversight Committee”), generally based on recommendations provided by the Adviser. The Adviser may consult with the Sub-Adviser or Parametric in providing such recommendations or otherwise with respect to valuation of the PIMCO Dividend and Income Fund’s portfolio securities or other assets. Market quotes are considered not readily available in circumstances where there is an absence of current or reliable market-based data (e.g., trade information, bid/ask information, indicative market quotations (“Broker Quotes”), Pricing Services’ prices), including where
| | | | | | |
| | SEMIANNUAL REPORT | | DECEMBER 31, 2016 | | 71 |
Notes to Financial Statements (Cont.)
events occur after the close of the relevant market, but prior to the NYSE Close, that materially affect the values of a Fund’s securities or assets. In addition, market quotes are considered not readily available when, due to extraordinary circumstances, the exchanges or markets on which the securities trade do not open for trading for the entire day and no other market prices are available. The Board has delegated to the Adviser the responsibility for monitoring significant events that may materially affect the values of the Fund’s securities or assets and for determining whether the value of the applicable securities or assets should be reevaluated in light of such significant events.
When a Fund uses fair valuation to determine the value of a portfolio security or other asset for purposes of calculating its NAV, such investments will not be priced on the basis of quotes from the primary market in which they are traded, but rather may be priced by another method that the Board or persons acting at their direction believe reflects fair value. Fair valuation may require subjective determinations about the value of a security. While the Trust’s policy is intended to result in a calculation of the Fund’s NAV that fairly reflects security values as of the time of pricing, the Trust cannot ensure that fair values determined by the Board or persons acting at their direction would accurately reflect the price that a Fund could obtain for a security if it were to dispose of that security as of the time of pricing (for instance, in a forced or distressed sale). The prices used by a Fund may differ from the value that would be realized if the securities were sold. The Funds’ use of fair valuation may also help to deter “stale price arbitrage” as discussed under the “Abusive Trading Practices” section in each Fund’s prospectus.
(b) Fair Value Hierarchy U.S. GAAP describes fair value as the price that a Fund would receive to sell an asset or pay to transfer a liability in an orderly transaction between market participants at the measurement date. It establishes a fair value hierarchy that prioritizes inputs to valuation methods and requires disclosure of the fair value hierarchy, separately for each major category of assets and liabilities, that segregates fair value measurements into levels (Level 1, 2, or 3). The inputs or methodology used for valuing securities are not necessarily an indication of the risks associated with investing in those securities. Levels 1, 2, and 3 of the fair value hierarchy are defined as follows:
| ∎ | | Level 1 — Quoted prices in active markets or exchanges for identical assets and liabilities. |
| ∎ | | Level 2 — Significant other observable inputs, which may include, but are not limited to, quoted prices for similar assets or liabilities in markets that are active, quoted prices for identical or similar assets or liabilities in markets that are not active, inputs other than quoted prices that are observable for the assets or liabilities (such as interest rates, yield curves, volatilities, prepayment speeds, loss severities, credit risks and default rates) or other market corroborated inputs. |
| ∎ | | Level 3 — Significant unobservable inputs based on the best information available in the circumstances, to the extent observable inputs are not available, which may include assumptions made by the Board or persons acting at their direction that are used in determining the fair value of investments. |
In accordance with the requirements of U.S. GAAP, the amounts of transfers between Levels 1 and 2 and transfers into and out of Level 3, if material, are disclosed in the Notes to Schedule of Investments for each respective Fund.
For fair valuations using significant unobservable inputs, U.S. GAAP requires a reconciliation of the beginning to ending balances for reported fair values that presents changes attributable to realized gain (loss), unrealized appreciation (depreciation), purchases and sales, accrued discounts (premiums), and transfers into and out of the Level 3 category during the period. The end of period value is used for the transfers between Levels of a Fund’s assets and liabilities. Additionally, U.S. GAAP requires quantitative information regarding the significant unobservable inputs used in the determination of fair value of assets or liabilities categorized as Level 3 in the fair value hierarchy. In accordance with the requirements of U.S. GAAP, a fair value hierarchy, and if material, a Level 3 reconciliation and details of significant unobservable inputs, have been included in the Notes to Schedule of Investments for each respective Fund.
(c) Valuation Techniques and the Fair Value Hierarchy
Level 1 and Level 2 trading assets and trading liabilities, at fair value The valuation methods (or “techniques”) and significant inputs used in determining the fair values of portfolio securities or other assets and liabilities categorized as Level 1 and Level 2 of the fair value hierarchy are as follows:
Common stocks, ETFs, exchange-traded notes and financial derivative instruments, such as futures contracts, rights and warrants, or options on futures that are traded on a national securities exchange, are stated at the last reported sale or settlement price on the day of valuation. To the extent these securities are actively traded and valuation adjustments are not applied, they are categorized as Level 1 of the fair value hierarchy.
Investments in registered open-end investment companies (other than ETFs) will be valued based upon the NAVs of such investments and are categorized as Level 1 of the fair value hierarchy. Investments in unregistered open-end investment companies will be calculated based upon the NAVs of such investments and are considered Level 1 provided that the NAVs are observable, calculated daily and are the value at which both purchases and sales will be conducted.
Equity exchange-traded options and over the counter financial derivative instruments, such as forward foreign currency contracts and options
December 31, 2016 (Unaudited)
contracts derive their value from underlying asset prices, indices, reference rates, and other inputs or a combination of these factors. These contracts are normally valued on the basis of quotes obtained from a quotation reporting system, established market makers or Pricing Services (normally determined as of the NYSE Close). Depending on the product and the terms of the transaction, financial derivative instruments can be valued by Pricing Services using a series of techniques, including simulation pricing models. The pricing models use inputs that are observed from actively quoted markets such as quoted prices, issuer details, indices, bid/ask spreads, interest rates, implied volatilities, yield curves, dividends and exchange rates. Financial derivative instruments that use similar valuation techniques and inputs as described above are categorized as Level 2 of the fair value hierarchy.
Centrally cleared swaps and over the counter swaps derive their value from underlying asset prices, indices, reference rates, and other inputs or a combination of these factors. They are valued using a broker-dealer bid
quotation or on market-based prices provided by Pricing Services or other pricing sources (normally determined as of the NYSE close). Centrally cleared swaps and over the counter swaps can be valued by Pricing Services using a series of techniques, including simulation pricing models. The pricing models may use inputs that are observed from actively quoted markets such as the overnight index swap rate (“OIS”), London Interbank Offered Rate (“LIBOR”) forward rate, interest rates, yield curves and credit spreads. These securities are categorized as Level 2 of the fair value hierarchy.
Level 3 trading assets and trading liabilities, at fair value When a fair valuation method is applied by the Adviser that uses significant unobservable inputs, investments will be priced by a method that the Board or persons acting at their direction believe reflects fair value and are categorized as Level 3 of the fair value hierarchy.
The validity of the fair value is reviewed by the Adviser on a periodic basis and may be amended in accordance with the Trust’s valuation procedures.
4. SECURITIES AND OTHER INVESTMENTS
(a) Investments in Affiliates
Each Fund may invest substantially all of its assets in Underlying PIMCO Funds and Acquired Funds. The Underlying PIMCO Funds are considered to be affiliated with the Funds. Each Fund may also invest in the PIMCO Short-Term Floating NAV Portfolio III (“Central Fund”) to the extent permitted by the Act and rules thereunder. The Central Fund is a registered investment company created for use solely by the series of the Trust and other series of registered investment companies advised by the Adviser, in connection with their cash management activities. The main investments of the Central Fund are money market and short maturity fixed income instruments. The Central Fund may incur expenses related to its investment activities, but does not pay Investment Advisory Fees or Supervisory and Administrative Fees to the Adviser. The Central Fund is considered to be affiliated with the Funds. The tables below show the Funds’ transactions in and earnings from investments in the affiliated Funds for the period ended December 31, 2016 (amounts in thousands†):
| | | | | | | | | | | | | | | | | | | | | | | | | | | | | | | | | | | | |
| PIMCO REALPATH® Blend 2020 Fund | | | | | | | | | | | | | | | | | | | | | | | | | | | |
| Underlying PIMCO Funds | | | | | Market Value
06/30/2016 | | | Purchases
at Cost | | | Proceeds
from Sales | | | Net
Realized
Gain (Loss) | | | Change in
Unrealized
Appreciation
(Depreciation) | | | Market Value
12/31/2016 | | | Dividend
Income(1) | | | Realized Net
Capital Gain
Distributions(1) | |
PIMCO Foreign Bond Fund (U.S. Dollar-Hedged) | | | | | | $ | 92 | | | $ | 31 | | | $ | 0 | | | $ | 0 | | | $ | 0 | | | $ | 123 | | | $ | 1 | | | $ | 0 | |
PIMCO High Yield Fund | | | | | | | 313 | | | | 74 | | | | (12 | ) | | | 0 | | | | 11 | | | | 386 | | | | 10 | | | | 0 | |
PIMCO Income Fund | | | | | | | 504 | | | | 177 | | | | (11 | ) | | | 0 | | | | 7 | | | | 677 | | | | 16 | | | | 0 | |
PIMCO Long Duration Total Return Fund | | | | | | | 196 | | | | 73 | | | | (12 | ) | | | (2 | ) | | | (29 | ) | | | 226 | | | | 8 | | | | 8 | |
PIMCO Long-Term Credit Fund | | | | | | | 196 | | | | 56 | | | | (14 | ) | | | (1 | ) | | | (11 | ) | | | 226 | | | | 6 | | | | 0 | |
PIMCO Real Return Asset Fund | | | | | | | 392 | | | | 100 | | | | (18 | ) | | | (1 | ) | | | (20 | ) | | | 453 | | | | 6 | | | | 0 | |
PIMCO Real Return Fund | | | | | | | 418 | | | | 108 | | | | (4 | ) | | | 0 | | | | (9 | ) | | | 513 | | | | 3 | | | | 0 | |
PIMCO Short-Term Floating NAV Portfolio III | | | | | | | 0 | | | | 100 | | | | 0 | | | | 0 | | | | 0 | | | | 100 | | | | 0 | | | | 0 | |
PIMCO Total Return Fund | | | | | | | 192 | | | | 105 | | | | 0 | | | | 0 | | | | (5 | ) | | | 292 | | | | 3 | | | | 0 | |
Totals | | | | | | $ | 2,303 | | | $ | 824 | | | $ | (71 | ) | | $ | (4 | ) | | $ | (56 | ) | | $ | 2,996 | | | $ | 53 | | | $ | 8 | |
| † | A zero balance may reflect actual amounts rounding to less than one thousand. |
| (1) | The tax characterization of distributions is determined in accordance with Federal income tax regulations. The actual tax characterization of distributions received from underlying funds are determined at the end of the fiscal year. See Note 2(c) in the Notes to Financial Statements for more information. |
| | | | | | |
| | SEMIANNUAL REPORT | | DECEMBER 31, 2016 | | 73 |
Notes to Financial Statements (Cont.)
| | | | | | | | | | | | | | | | | | | | | | | | | | | | | | | | | | | | |
| PIMCO REALPATH® Blend 2025 Fund | | | | | | | | | | | | | | | | | | | | | | | | | | | |
| Underlying PIMCO Funds | | | | | Market Value
06/30/2016 | | | Purchases
at Cost | | | Proceeds
from Sales | | | Net
Realized
Gain (Loss) | | | Change in
Unrealized
Appreciation
(Depreciation) | | | Market Value
12/31/2016 | | | Dividend
Income(1) | | | Realized Net
Capital Gain
Distributions(1) | |
PIMCO Foreign Bond Fund (U.S. Dollar-Hedged) | | | | | | $ | 41 | | | $ | 17 | | | $ | 0 | | | $ | 0 | | | $ | 0 | | | $ | 58 | | | $ | 0 | | | $ | 0 | |
PIMCO High Yield Fund | | | | | | | 256 | | | | 51 | | | | (5 | ) | | | 0 | | | | 9 | | | | 311 | | | | 8 | | | | 0 | |
PIMCO Income Fund | | | | | | | 321 | | | | 88 | | | | (5 | ) | | | 0 | | | | 5 | | | | 409 | | | | 11 | | | | 0 | |
PIMCO Long Duration Total Return Fund | | | | | | | 171 | | | | 61 | | | | 0 | | | | 0 | | | | (27 | ) | | | 205 | | | | 7 | | | | 7 | |
PIMCO Long-Term Credit Fund | | | | | | | 172 | | | | 46 | | | | 0 | | | | 0 | | | | (11 | ) | | | 207 | | | | 6 | | | | 0 | |
PIMCO Real Return Asset Fund | | | | | | | 343 | | | | 93 | | | | 0 | | | | 0 | | | | (18 | ) | | | 418 | | | | 5 | | | | 0 | |
PIMCO Real Return Fund | | | | | | | 205 | | | | 90 | | | | 0 | | | | 0 | | | | (4 | ) | | | 291 | | | | 2 | | | | 0 | |
PIMCO Short-Term Floating NAV Portfolio III | | | | | | | 0 | | | | 600 | | | | (500 | ) | | | 0 | | | | 0 | | | | 100 | | | | 1 | | | | 0 | |
PIMCO Total Return Fund | | | | | | | 66 | | | | 31 | | | | 0 | | | | 0 | | | | (1 | ) | | | 96 | | | | 1 | | | | 0 | |
Totals | | | | | | $ | 1,575 | | | $ | 1,077 | | | $ | (510 | ) | | $ | 0 | | | $ | (47 | ) | | $ | 2,095 | | | $ | 41 | | | $ | 7 | |
| † | A zero balance may reflect actual amounts rounding to less than one thousand. |
| (1) | The tax characterization of distributions is determined in accordance with Federal income tax regulations. The actual tax characterization of distributions received from underlying funds are determined at the end of the fiscal year. See Note 2(c) in the Notes to Financial Statements for more information. |
| | | | | | | | | | | | | | | | | | | | | | | | | | | | | | | | | | | | |
| PIMCO REALPATH® Blend 2030 Fund | | | | | | | | | | | | | | | | | | | | | | | | | | | |
| Underlying PIMCO Funds | | | | | Market Value
06/30/2016 | | | Purchases
at Cost | | | Proceeds
from Sales | | | Net
Realized
Gain (Loss) | | | Change in
Unrealized
Appreciation
(Depreciation) | | | Market Value
12/31/2016 | | | Dividend
Income(1) | | | Realized Net
Capital Gain
Distributions(1) | |
PIMCO Foreign Bond Fund (U.S. Dollar-Hedged) | | | | | | $ | 64 | | | $ | 8 | | | $ | 0 | | | $ | 0 | | | $ | 0 | | | $ | 72 | | | $ | 0 | | | $ | 0 | |
PIMCO High Yield Fund | | | | | | | 482 | | | | 61 | | | | (9 | ) | | | 0 | | | | 16 | | | | 550 | | | | 15 | | | | 0 | |
PIMCO Income Fund | | | | | | | 553 | | | | 96 | | | | (14 | ) | | | 0 | | | | 8 | | | | 643 | | | | 17 | | | | 0 | |
PIMCO Long Duration Total Return Fund | | | | | | | 244 | | | | 95 | | | | 0 | | | | 0 | | | | (36 | ) | | | 303 | | | | 10 | | | | 10 | |
PIMCO Long-Term Credit Fund | | | | | | | 245 | | | | 73 | | | | 0 | | | | 0 | | | | (14 | ) | | | 304 | | | | 7 | | | | 0 | |
PIMCO Real Return Asset Fund | | | | | | | 489 | | | | 142 | | | | 0 | | | | 0 | | | | (24 | ) | | | 607 | | | | 7 | | | | 0 | |
PIMCO Real Return Fund | | | | | | | 164 | | | | 75 | | | | 0 | | | | 0 | | | | (3 | ) | | | 236 | | | | 1 | | | | 0 | |
PIMCO Short-Term Floating NAV Portfolio III | | | | | | | 406 | | | | 102 | | | | 0 | | | | 0 | | | | 0 | | | | 508 | | | | 2 | | | | 0 | |
PIMCO Total Return Fund | | | | | | | 70 | | | | 21 | | | | 0 | | | | 0 | | | | (2 | ) | | | 89 | | | | 1 | | | | 0 | |
Totals | | | | | | $ | 2,717 | | | $ | 673 | | | $ | (23 | ) | | $ | 0 | | | $ | (55 | ) | | $ | 3,312 | | | $ | 60 | | | $ | 10 | |
| † | A zero balance may reflect actual amounts rounding to less than one thousand. |
| (1) | The tax characterization of distributions is determined in accordance with Federal income tax regulations. The actual tax characterization of distributions received from underlying funds are determined at the end of the fiscal year. See Note 2(c) in the Notes to Financial Statements for more information. |
| | | | | | | | | | | | | | | | | | | | | | | | | | | | | | | | | | | | |
| PIMCO REALPATH® Blend 2035 Fund | | | | | | | | | | | | | | | | | | | | | | | | | | | |
| Underlying PIMCO Funds | | | | | Market Value
06/30/2016 | | | Purchases
at Cost | | | Proceeds
from Sales | | | Net
Realized
Gain (Loss) | | | Change in
Unrealized
Appreciation
(Depreciation) | | | Market Value
12/31/2016 | | | Dividend
Income(1) | | | Realized Net
Capital Gain
Distributions(1) | |
PIMCO Emerging Local Bond Fund | | | | | | $ | 50 | | | $ | 2 | | | $ | (9 | ) | | $ | 0 | | | $ | (3 | ) | | $ | 40 | | | $ | 1 | | | $ | 0 | |
PIMCO Foreign Bond Fund (U.S. Dollar-Hedged) | | | | | | | 60 | | | | 0 | | | | 0 | | | | 0 | | | | 0 | | | | 60 | | | | 0 | | | | 0 | |
PIMCO High Yield Fund | | | | | | | 399 | | | | 66 | | | | (18 | ) | | | 0 | | | | 13 | | | | 460 | | | | 12 | | | | 0 | |
PIMCO Income Fund | | | | | | | 458 | | | | 83 | | | | (21 | ) | | | 0 | | | | 7 | | | | 527 | | | | 14 | | | | 0 | |
PIMCO Long Duration Total Return Fund | | | | | | | 137 | | | | 55 | | | | 0 | | | | 0 | | | | (19 | ) | | | 173 | | | | 5 | | | | 5 | |
PIMCO Long-Term Credit Fund | | | | | | | 137 | | | | 44 | | | | 0 | | | | 0 | | | | (8 | ) | | | 173 | | | | 4 | | | | 0 | |
PIMCO Real Return Asset Fund | | | | | | | 183 | | | | 92 | | | | 0 | | | | 0 | | | | (8 | ) | | | 267 | | | | 2 | | | | 0 | |
PIMCO Real Return Fund | | | | | | | 119 | | | | 16 | | | | 0 | | | | 0 | | | | (2 | ) | | | 133 | | | | 1 | | | | 0 | |
PIMCO Short-Term Floating NAV Portfolio III | | | | | | | 401 | | | | 103 | | | | 0 | | | | 0 | | | | 0 | | | | 504 | | | | 4 | | | | 0 | |
PIMCO Total Return Fund | | | | | | | 60 | | | | 7 | | | | 0 | | | | 0 | | | | (2 | ) | | | 65 | | | | 1 | | | | 0 | |
Totals | | | | | | $ | 2,004 | | | $ | 468 | | | $ | (48 | ) | | $ | 0 | | | $ | (22 | ) | | $ | 2,402 | | | $ | 44 | | | $ | 5 | |
| † | A zero balance may reflect actual amounts rounding to less than one thousand. |
| (1) | The tax characterization of distributions is determined in accordance with Federal income tax regulations. The actual tax characterization of distributions received from underlying funds are determined at the end of the fiscal year. See Note 2(c) in the Notes to Financial Statements for more information. |
December 31, 2016 (Unaudited)
| | | | | | | | | | | | | | | | | | | | | | | | | | | | | | | | | | | | |
| PIMCO REALPATH® Blend 2040 Fund | | | | | | | | | | | | | | | | | | | | | | | | | | | |
| Underlying PIMCO Funds | | | | | Market Value
06/30/2016 | | | Purchases
at Cost | | | Proceeds
from Sales | | | Net
Realized
Gain (Loss) | | | Change in
Unrealized
Appreciation
(Depreciation) | | | Market Value
12/31/2016 | | | Dividend
Income(1) | | | Realized Net
Capital Gain
Distributions(1) | |
PIMCO Emerging Local Bond Fund | | | | | | $ | 67 | | | $ | 11 | | | $ | (8 | ) | | $ | (1 | ) | | $ | (4 | ) | | $ | 65 | | | $ | 2 | | | $ | 0 | |
PIMCO Foreign Bond Fund (U.S. Dollar-Hedged) | | | | | | | 34 | | | | 5 | | | | 0 | | | | 0 | | | | 0 | | | | 39 | | | | 0 | | | | 0 | |
PIMCO High Yield Fund | | | | | | | 174 | | | | 39 | | | | (4 | ) | | | 0 | | | | 6 | | | | 215 | | | | 5 | | | | 0 | |
PIMCO Income Fund | | | | | | | 208 | | | | 50 | | | | (6 | ) | | | 0 | | | | 3 | | | | 255 | | | | 6 | | | | 0 | |
PIMCO Long Duration Total Return Fund | | | | | | | 59 | | | | 18 | | | | 0 | | | | 0 | | | | (8 | ) | | | 69 | | | | 2 | | | | 2 | |
PIMCO Long-Term Credit Fund | | | | | | | 56 | | | | 16 | | | | 0 | | | | 0 | | | | (3 | ) | | | 69 | | | | 2 | | | | 0 | |
PIMCO Real Return Asset Fund | | | | | | | 73 | | | | 8 | | | | 0 | | | | 0 | | | | (3 | ) | | | 78 | | | | 1 | | | | 0 | |
PIMCO Real Return Fund | | | | | | | 71 | | | | 11 | | | | 0 | | | | 0 | | | | (1 | ) | | | 81 | | | | 1 | | | | 0 | |
PIMCO Short-Term Floating NAV Portfolio III | | | | | | | 201 | | | | 101 | | | | 0 | | | | 0 | | | | 0 | | | | 302 | | | | 1 | | | | 0 | |
PIMCO Total Return Fund | | | | | | | 34 | | | | 5 | | | | 0 | | | | 0 | | | | (1 | ) | | | 38 | | | | 1 | | | | 0 | |
Totals | | | | | | $ | 977 | | | $ | 264 | | | $ | (18 | ) | | $ | (1 | ) | | $ | (11 | ) | | $ | 1,211 | | | $ | 21 | | | $ | 2 | |
| † | A zero balance may reflect actual amounts rounding to less than one thousand. |
| (1) | The tax characterization of distributions is determined in accordance with Federal income tax regulations. The actual tax characterization of distributions received from underlying funds are determined at the end of the fiscal year. See Note 2(c) in the Notes to Financial Statements for more information. |
| | | | | | | | | | | | | | | | | | | | | | | | | | | | | | | | | | | | |
| PIMCO REALPATH® Blend 2045 Fund | | | | | | | | | | | | | | | | | | | | | | | | | | | |
| Underlying PIMCO Funds | | | | | Market Value
06/30/2016 | | | Purchases
at Cost | | | Proceeds
from Sales | | | Net
Realized
Gain (Loss) | | | Change in
Unrealized
Appreciation
(Depreciation) | | | Market Value
12/31/2016 | | | Dividend
Income(1) | | | Realized Net
Capital Gain
Distributions(1) | |
PIMCO Emerging Local Bond Fund | | | | | | $ | 69 | | | $ | 11 | | | $ | 0 | | | $ | 0 | | | $ | (4 | ) | | $ | 76 | | | $ | 2 | | | $ | 0 | |
PIMCO Foreign Bond Fund (U.S. Dollar-Hedged) | | | | | | | 32 | | | | 4 | | | | 0 | | | | 0 | | | | 0 | | | | 36 | | | | 0 | | | | 0 | |
PIMCO High Yield Fund | | | | | | | 100 | | | | 25 | | | | 0 | | | | 0 | | | | 3 | | | | 128 | | | | 3 | | | | 0 | |
PIMCO Income Fund | | | | | | | 136 | | | | 30 | | | | 0 | | | | 0 | | | | 2 | | | | 168 | | | | 4 | | | | 0 | |
PIMCO Long Duration Total Return Fund | | | | | | | 52 | | | | 10 | | | | 0 | | | | 0 | | | | (6 | ) | | | 56 | | | | 2 | | | | 2 | |
PIMCO Long-Term Credit Fund | | | | | | | 54 | | | | 6 | | | | 0 | | | | 0 | | | | (3 | ) | | | 57 | | | | 2 | | | | 0 | |
PIMCO Real Return Asset Fund | | | | | | | 70 | | | | 11 | | | | 0 | | | | 0 | | | | (3 | ) | | | 78 | | | | 1 | | | | 0 | |
PIMCO Real Return Fund | | | | | | | 69 | | | | 6 | | | | 0 | | | | 0 | | | | (1 | ) | | | 74 | | | | 0 | | | | 0 | |
PIMCO Short-Term Floating NAV Portfolio III | | | | | | | 201 | | | | 101 | | | | 0 | | | | 0 | | | | 0 | | | | 302 | | | | 1 | | | | 0 | |
PIMCO Total Return Fund | | | | | | | 32 | | | | 4 | | | | 0 | | | | 0 | | | | (1 | ) | | | 35 | | | | 1 | | | | 0 | |
Totals | | | | | | $ | 815 | | | $ | 208 | | | $ | 0 | | | $ | 0 | | | $ | (13 | ) | | $ | 1,010 | | | $ | 16 | | | $ | 2 | |
| † | A zero balance may reflect actual amounts rounding to less than one thousand. |
| (1) | The tax characterization of distributions is determined in accordance with Federal income tax regulations. The actual tax characterization of distributions received from underlying funds are determined at the end of the fiscal year. See Note 2(c) in the Notes to Financial Statements for more information. |
| | | | | | | | | | | | | | | | | | | | | | | | | | | | | | | | | | | | |
| PIMCO REALPATH® Blend 2050 Fund | | | | | | | | | | | | | | | | | | | | | | | | | | | |
| Underlying PIMCO Funds | | | | | Market Value
06/30/2016 | | | Purchases
at Cost | | | Proceeds
from Sales | | | Net
Realized
Gain (Loss) | | | Change in
Unrealized
Appreciation
(Depreciation) | | | Market Value
12/31/2016 | | | Dividend
Income(1) | | | Realized Net
Capital Gain
Distributions(1) | |
PIMCO Emerging Local Bond Fund | | | | | | $ | 81 | | | $ | 15 | | | $ | 0 | | | $ | 0 | | | $ | (5 | ) | | $ | 91 | | | $ | 2 | | | $ | 0 | |
PIMCO Foreign Bond Fund (U.S. Dollar-Hedged) | | | | | | | 41 | | | | 0 | | | | 0 | | | | 0 | | | | 0 | | | | 41 | | | | 0 | | | | 0 | |
PIMCO High Yield Fund | | | | | | | 101 | | | | 9 | | | | 0 | | | | 0 | | | | 3 | | | | 113 | | | | 3 | | | | 0 | |
PIMCO Income Fund | | | | | | | 142 | | | | 14 | | | | 0 | | | | 0 | | | | 2 | | | | 158 | | | | 4 | | | | 0 | |
PIMCO Long Duration Total Return Fund | | | | | | | 63 | | | | 11 | | | | 0 | | | | 0 | | | | (8 | ) | | | 66 | | | | 2 | | | | 2 | |
PIMCO Long-Term Credit Fund | | | | | | | 63 | | | | 7 | | | | 0 | | | | 0 | | | | (3 | ) | | | 67 | | | | 3 | | | | 0 | |
PIMCO Real Return Asset Fund | | | | | | | 49 | | | | 16 | | | | 0 | | | | 0 | | | | (1 | ) | | | 64 | | | | 1 | | | | 0 | |
PIMCO Real Return Fund | | | | | | | 81 | | | | 12 | | | | 0 | | | | 0 | | | | (1 | ) | | | 92 | | | | 1 | | | | 0 | |
PIMCO Short-Term Floating NAV Portfolio III | | | | | | | 301 | | | | 1 | | | | 0 | | | | 0 | | | | 0 | | | | 302 | | | | 1 | | | | 0 | |
PIMCO Total Return Fund | | | | | | | 40 | | | | 6 | | | | 0 | | | | 0 | | | | (1 | ) | | | 45 | | | | 1 | | | | 0 | |
Totals | | | | | | $ | 962 | | | $ | 91 | | | $ | 0 | | | $ | 0 | | | $ | (14 | ) | | $ | 1,039 | | | $ | 18 | | | $ | 2 | |
| † | A zero balance may reflect actual amounts rounding to less than one thousand. |
| (1) | The tax characterization of distributions is determined in accordance with Federal income tax regulations. The actual tax characterization of distributions received from underlying funds are determined at the end of the fiscal year. See Note 2(c) in the Notes to Financial Statements for more information. |
| | | | | | |
| | SEMIANNUAL REPORT | | DECEMBER 31, 2016 | | 75 |
Notes to Financial Statements (Cont.)
| | | | | | | | | | | | | | | | | | | | | | | | | | | | | | | | | | | | |
| PIMCO REALPATH® Blend 2055 Fund | | | | | | | | | | | | | | | | | | | | | | | | | | | |
| Underlying PIMCO Funds | | | | | Market Value
06/30/2016 | | | Purchases
at Cost | | | Proceeds
from Sales | | | Net
Realized
Gain (Loss) | | | Change in
Unrealized
Appreciation
(Depreciation) | | | Market Value
12/31/2016 | | | Dividend
Income(1) | | | Realized Net
Capital Gain
Distributions(1) | |
PIMCO Emerging Local Bond Fund | | | | | | $ | 72 | | | $ | 7 | | | $ | 0 | | | $ | 0 | | | $ | (4 | ) | | $ | 75 | | | $ | 2 | | | $ | 0 | |
PIMCO Foreign Bond Fund (U.S. Dollar-Hedged) | | | | | | | 35 | | | | 0 | | | | 0 | | | | 0 | | | | 0 | | | | 35 | | | | 0 | | | | 0 | |
PIMCO High Yield Fund | | | | | | | 85 | | | | 3 | | | | 0 | | | | 0 | | | | 3 | | | | 91 | | | | 2 | | | | 0 | |
PIMCO Income Fund | | | | | | | 120 | | | | 7 | | | | 0 | | | | 0 | | | | 2 | | | | 129 | | | | 4 | | | | 0 | |
PIMCO Long Duration Total Return Fund | | | | | | | 51 | | | | 11 | | | | 0 | | | | 0 | | | | (7 | ) | | | 55 | | | | 2 | | | | 2 | |
PIMCO Long-Term Credit Fund | | | | | | | 53 | | | | 6 | | | | 0 | | | | 0 | | | | (3 | ) | | | 56 | | | | 2 | | | | 0 | |
PIMCO Real Return Asset Fund | | | | | | | 35 | | | | 0 | | | | 0 | | | | 0 | | | | (1 | ) | | | 34 | | | | 0 | | | | 0 | |
PIMCO Real Return Fund | | | | | | | 69 | | | | 4 | | | | 0 | | | | 0 | | | | (1 | ) | | | 72 | | | | 0 | | | | 0 | |
PIMCO Short-Term Floating NAV Portfolio III | | | | | | | 201 | | | | 0 | | | | 0 | | | | 0 | | | | 0 | | | | 201 | | | | 1 | | | | 0 | |
PIMCO Total Return Fund | | | | | | | 35 | | | | 0 | | | | 0 | | | | 0 | | | | (1 | ) | | | 34 | | | | 1 | | | | 0 | |
Totals | | | | | | $ | 756 | | | $ | 38 | | | $ | 0 | | | $ | 0 | | | $ | (12 | ) | | $ | 782 | | | $ | 14 | | | $ | 2 | |
| † | A zero balance may reflect actual amounts rounding to less than one thousand. |
| (1) | The tax characterization of distributions is determined in accordance with Federal income tax regulations. The actual tax characterization of distributions received from underlying funds are determined at the end of the fiscal year. See Note 2(c) in the Notes to Financial Statements for more information. |
| | | | | | | | | | | | | | | | | | | | | | | | | | | | | | | | | | | | |
| PIMCO REALPATH® Blend Income Fund | | | | | | | | | | | | | | | | | | | | | | | | | | | |
| Underlying PIMCO Funds | | | | | Market Value
06/30/2016 | | | Purchases
at Cost | | | Proceeds
from Sales | | | Net
Realized
Gain (Loss) | | | Change in
Unrealized
Appreciation
(Depreciation) | | | Market Value
12/31/2016 | | | Dividend
Income(1) | | | Realized Net
Capital Gain
Distributions(1) | |
PIMCO Foreign Bond Fund (U.S. Dollar-Hedged) | | | | | | $ | 102 | | | $ | 8 | | | $ | 0 | | | $ | 0 | | | $ | 0 | | | $ | 110 | | | $ | 1 | | | $ | 0 | |
PIMCO High Yield Fund | | | | | | | 256 | | | | 16 | | | | 0 | | | | 0 | | | | 9 | | | | 281 | | | | 8 | | | | 0 | |
PIMCO Income Fund | | | | | | | 567 | | | | 50 | | | | (11 | ) | | | 0 | | | | 8 | | | | 614 | | | | 16 | | | | 0 | |
PIMCO Long Duration Total Return Fund | | | | | | | 120 | | | | 26 | | | | 0 | | | | 0 | | | | (17 | ) | | | 129 | | | | 5 | | | | 4 | |
PIMCO Long-Term Credit Fund | | | | | | | 123 | | | | 18 | | | | (4 | ) | | | 0 | | | | (7 | ) | | | 130 | | | | 3 | | | | 0 | |
PIMCO Real Return Asset Fund | | | | | | | 240 | | | | 33 | | | | 0 | | | | 0 | | | | (11 | ) | | | 262 | | | | 3 | | | | 0 | |
PIMCO Real Return Fund | | | | | | | 343 | | | | 36 | | | | 0 | | | | 0 | | | | (6 | ) | | | 373 | | | | 2 | | | | 0 | |
PIMCO Short-Term Floating NAV Portfolio III | | | | | | | 107 | | | | 1 | | | | 0 | | | | 0 | | | | 0 | | | | 108 | | | | 1 | | | | 0 | |
PIMCO Total Return Fund | | | | | | | 309 | | | | 31 | | | | 0 | | | | 0 | | | | (8 | ) | | | 332 | | | | 5 | | | | 0 | |
Totals | | | | | | $ | 2,167 | | | $ | 219 | | | $ | (15 | ) | | $ | 0 | | | $ | (32 | ) | | $ | 2,339 | | | $ | 44 | | | $ | 4 | |
| † | A zero balance may reflect actual amounts rounding to less than one thousand. |
| (1) | The tax characterization of distributions is determined in accordance with Federal income tax regulations. The actual tax characterization of distributions received from underlying funds are determined at the end of the fiscal year. See Note 2(c) in the Notes to Financial Statements for more information. |
5. FINANCIAL DERIVATIVE INSTRUMENTS
The following disclosures contain information on how and why the Funds use financial derivative instruments, and how financial derivative instruments affect the Funds’ financial position, results of operations and cash flows. The location and fair value amounts of these instruments on the Statements of Assets and Liabilities and the net realized gain (loss) and net change in unrealized appreciation (depreciation) on the Statements of Operations, each categorized by type of financial derivative contract and related risk exposure, are included in a table in the Notes to Schedules of Investments. The financial derivative instruments outstanding as of period end and the amounts of net realized gain (loss) and net change in unrealized appreciation (depreciation) on financial derivative instruments during the period, as disclosed in the Notes to Schedules of Investments, serve as indicators of the volume of financial derivative activity for the Funds.
(a) Options Contracts Certain Funds may write or purchase options to enhance returns or to hedge an existing position or future investment. A Fund may write call and put options on securities and financial derivative instruments it owns or in which it may invest. Writing put options tends to increase a Fund’s exposure to the underlying instrument. Writing call options tends to decrease a Fund’s exposure to the underlying instrument. When a Fund writes a call or put, an amount equal to the premium received is recorded as a liability and subsequently marked to market to reflect the current value of the option written. These liabilities are included on the Statements of Assets and Liabilities. Premiums received from writing options which expire are treated as realized gains. Premiums received from writing options which are exercised or closed are added to the proceeds or offset against amounts paid on the underlying futures, swap, security or currency transaction to determine the realized gain (loss). Certain options may be written with premiums to be determined on a future
December 31, 2016 (Unaudited)
date. The premiums for these options are based upon implied volatility parameters at specified terms. A Fund as a writer of an option has no control over whether the underlying instrument may be sold (“call”) or purchased (“put”) and as a result bears the market risk of an unfavorable change in the price of the instrument underlying the written option. There is the risk a Fund may not be able to enter into a closing transaction because of an illiquid market.
Certain Funds may also purchase put and call options. Purchasing call options tends to increase a Fund’s exposure to the underlying instrument. Purchasing put options tends to decrease a Fund’s exposure to the underlying instrument. A Fund pays a premium which is included as an asset on the Statements of Assets and Liabilities and subsequently marked to market to reflect the current value of the option. Premiums paid for purchasing options which expire are treated as realized losses. Certain options may be purchased with premiums to be determined on a future date. The premiums for these options are based upon implied volatility parameters at specified terms. The risk associated with purchasing put and call options is limited to the premium paid. Premiums paid for purchasing options which are exercised or closed are added to the amounts paid or offset against the proceeds on the underlying investment transaction to determine the realized gain (loss) when the underlying transaction is executed.
Options on Indices Certain Funds may write or purchase options on indices (“Index Option”). An Index Option uses a specified index as the underlying instrument for the option contract. The exercise for an Index Option will not include physical delivery of the underlying index but will result in a cash transfer of the amount of the difference between the settlement price of the underlying index and the strike price.
(b) Swap Agreements Certain Funds may invest in swap agreements. Swap agreements are bilaterally negotiated agreements between a Fund and a counterparty to exchange or swap investment cash flows, assets, foreign currencies or market-linked returns at specified, future intervals. Swap agreements may be privately negotiated in the over the counter market (“OTC swaps”) or may be cleared through a third party, known as a central counterparty or derivatives clearing organization (“Centrally Cleared Swaps”). A Fund may enter into asset, credit default, cross-currency, interest rate, total return, variance and other forms of swap agreements to manage its exposure to credit, currency, interest rate, commodity, equity and inflation risk. In connection with these agreements, securities or cash may be identified as collateral or margin in accordance with the terms of the respective swap agreements to provide assets of value and recourse in the event of default or bankruptcy/insolvency.
Centrally Cleared Swaps are marked to market daily based upon valuations as determined from the underlying contract or in accordance
with the requirements of the central counterparty or derivatives clearing organization. Changes in market value, if any, are reflected as a component of net change in unrealized appreciation (depreciation) on the Statements of Operations. Daily changes in valuation of centrally cleared swaps (“Swap Variation Margin”), if any, are disclosed within centrally cleared financial derivative instruments on the Statements of Assets and Liabilities. OTC swap payments received or paid at the beginning of the measurement period are included on the Statements of Assets and Liabilities and represent premiums paid or received upon entering into the swap agreement to compensate for differences between the stated terms of the swap agreement and prevailing market conditions (credit spreads, currency exchange rates, interest rates, and other relevant factors). Upfront premiums received (paid) are initially recorded as liabilities (assets) and subsequently marked to market to reflect the current value of the swap. These upfront premiums are recorded as realized gains (losses) on the Statements of Operations upon termination or maturity of the swap. A liquidation payment received or made at the termination of the swap is recorded as realized gain (loss) on the Statements of Operations. Net periodic payments received or paid by a Fund are included as part of realized gain (loss) on the Statements of Operations.
For purposes of applying a Fund’s investment policies and restrictions, swap agreements are generally valued by a Fund at market value. In the case of a credit default swap, in applying certain of a Fund’s investment policies and restrictions, the Funds will value the credit default swap at its notional value or its full exposure value (i.e., the sum of the notional amount for the contract plus the market value), but may value the credit default swap at market value for purposes of applying certain of a Fund’s other investment policies and restrictions. For example, a Fund may value credit default swaps at full exposure value for purposes of a Fund’s credit quality guidelines (if any) because such value reflects a Fund’s actual economic exposure during the term of the credit default swap agreement. In this context, both the notional amount and the market value may be positive or negative depending on whether a Fund is selling or buying protection through the credit default swap. The manner in which certain securities or other instruments are valued by a Fund for purposes of applying investment policies and restrictions may differ from the manner in which those investments are valued by other types of investors.
Entering into swap agreements involves, to varying degrees, elements of interest, credit, market and documentation risk in excess of the amounts recognized on the Statements of Assets and Liabilities. Such risks involve the possibility that there will be no liquid market for these agreements, that the counterparty to the agreements may default on its obligation to perform or disagree as to the meaning of contractual terms in the agreements and that there may be unfavorable changes in interest rates.
| | | | | | |
| | SEMIANNUAL REPORT | | DECEMBER 31, 2016 | | 77 |
Notes to Financial Statements (Cont.)
A Fund’s maximum risk of loss from counterparty credit risk is the discounted net value of the cash flows to be received from the counterparty over the contract’s remaining life, to the extent that amount is positive. The risk may be mitigated by having a master netting arrangement between a Fund and the counterparty and by the posting of collateral to a Fund to cover a Fund’s exposure to the counterparty.
Total Return Swap Agreements Certain Funds may enter into total return swap agreements to gain or mitigate exposure to the underlying reference asset. Total return swap agreements involve commitments where single or multiple cash flows are exchanged based on the price of an underlying reference asset and on a fixed or variable interest rate. Total return swap agreements may involve commitments to pay interest in exchange for a market-linked return. One counterparty pays out the total return of a specific reference asset, which may include an underlying equity, index, or bond, and in return receives a fixed or variable rate. At the maturity date, a net cash flow is exchanged where the total return is equivalent to the return of the underlying reference less a financing rate, if any. As a receiver, a Fund would receive payments based on any net positive total return and would owe payments in the event of a net negative total return. As the payer, a Fund would owe payments on any net positive total return, and would receive payments in the event of a net negative total return.
6. PRINCIPAL RISKS
In the normal course of business, the Funds (or Acquired Funds) trade financial instruments and enter into financial transactions where risk of potential loss exists due to such things as changes in the market (market risk) or failure or inability of the other party to a transaction to perform (credit and counterparty risk). See below for a detailed description of select principal risks. For a more comprehensive list of potential risks the Funds may be subject to, please see the Important Information About the Funds.
Investments in Mutual Funds To the extent that certain Funds invest substantially all of their respective assets in Acquired Funds, the risks associated with investing in these Funds will be closely related to the risks associated with the securities and other investments held by the Acquired Funds. The ability of the Funds to achieve their respective investment objectives may depend upon the ability of the Acquired Funds to achieve their respective investment objectives. There can be no assurance that the investment objective of any Acquired Fund will be achieved. The NAV of each Fund will fluctuate in response to changes in the respective NAV of the Acquired Funds in which it invests. The extent to which the investment performance and risks associated with the Funds correlate to those of a particular Acquired Fund will depend upon the extent to which the assets of the Funds are allocated from time to time for investment in the Acquired Funds,
which will vary. Investing in Acquired Funds involves certain additional expenses and tax results that would not be present in a direct investment in the Acquired Funds.
Certain Funds’ investment performance depends upon how each Fund’s assets are allocated and reallocated according to each Fund’s asset allocation targets and ranges. A principal risk of investing in each Fund is that the Funds’ asset allocation sub-adviser will make less than optimal or poor asset allocation decisions. The asset allocation sub-adviser attempts to identify investment allocations for the Acquired Funds that will provide consistent, quality performance for the Funds, but there is no guarantee that such allocation techniques will produce the desired results.
Market Risks A Fund’s (or Acquired Funds’) investments in financial derivative instruments and other financial instruments expose the Fund to various risks such as, but not limited to, interest rate, foreign (non-U.S.) currency, equity and commodity risks.
The market values of equities, such as common stocks and preferred securities or equity related investments such as futures and options, have historically risen and fallen in periodic cycles and may decline due to general market conditions which are not specifically related to a particular company, such as real or perceived adverse economic conditions, changes in the general outlook for corporate earnings, changes in interest or currency rates or adverse investor sentiment generally. They may also decline due to factors which affect a particular industry or industries, such as labor shortages or increased production costs and competitive conditions within an industry. Different types of equity securities may react differently to these developments. Equity securities and equity related investments generally have greater market price volatility than fixed income securities.
Issuers that have paid regular dividends or distributions to shareholders may not continue to do so in the future. An issuer may reduce or eliminate future dividends or distributions at any time and for any reason. Moreover, a Fund may use a dividend capture strategy (i.e., purchasing an equity security shortly before the issuer pays a dividend and selling it shortly thereafter), which may expose the Fund to higher portfolio turnover, increased trading costs and the potential for capital loss or gain, particularly in the event of significant short-term price movements of stocks subject to dividend capture trading. Also, securities purchased to capture a dividend often decline in value at the time of sale (i.e., shortly following the dividend) and the resulting realized loss to the Fund may exceed the amount of the dividend received, thereby negatively impacting the Fund’s net asset value.
Interest rate risk is the risk that fixed income securities and other instruments held by a Fund (or Acquired Funds) will decline in value
December 31, 2016 (Unaudited)
because of an increase in interest rates. As nominal interest rates rise, the value of certain fixed income securities held by a Fund (or Acquired Funds) is likely to decrease. A nominal interest rate can be described as the sum of a real interest rate and an expected inflation rate. Interest rate changes can be sudden and unpredictable, and a Fund (or Acquired Funds) may lose money if these changes are not anticipated by the Fund’s (or Acquired Funds’) management. A Fund (or Acquired Funds) may not be able to hedge against changes in interest rates or may choose not to do so for cost or other reasons. In addition, any hedges may not work as intended.
Duration is a measure used to determine the sensitivity of a security’s price to changes in interest rates that incorporates a security’s yield, coupon, final maturity and call features, among other characteristics. Convexity is an additional measure of interest rate sensitivity that measures the rate of change of duration in response to changes in interest rates. Fixed income securities with longer durations tend to be more sensitive to changes in interest rates, usually making them more volatile than securities with shorter durations. A wide variety of factors can cause interest rates to rise (e.g., central bank monetary policies, inflation rates, general economic conditions, etc.). At present, the U.S. and many parts of the world, including certain European countries, are at or near historically low interest rates. The Funds may be subject to heightened interest rate risk because the Fed has ended its quantitative easing program and has begun, and may continue, to raise interest rates. To the extent that the Fed continues to raise interest rates, there is a risk that rates across the financial system may rise. Further, while bond markets have steadily grown over the past three decades, dealer “market making” ability has not kept pace and in some cases has decreased. Given the importance of intermediary “market making” in creating a robust and active market, fixed income securities are currently facing increased volatility and liquidity risks. All of these factors, collectively and/or individually, could cause a Fund (or Acquired Funds) to lose value. If a Fund (or Acquired Funds) lost enough value, the Fund (or Acquired Funds) could face increased shareholder redemptions, which could force the Fund to liquidate investments at disadvantageous times or prices, thereby adversely affecting the Fund.
To the extent that a Fund (or Acquired Funds) may invest in securities and instruments that are economically tied to Russia, the Fund (or Acquired Funds) is subject to various risks such as, but not limited to political, economic, legal, market and currency risks. The risks include uncertain political and economic policies, short-term market volatility, poor accounting standards, corruption and crime, an inadequate regulatory system, and unpredictable taxation. Investments in Russia are particularly subject to the risk that further economic sanctions may be imposed by the United States and/or other countries. Such sanctions — which may impact companies in many sectors, including energy,
financial services and defense, among others — may negatively impact a Fund’s (or Acquired Funds’) performance and/or ability to achieve its investment objective. The Russian securities market, as compared to U.S. markets, has significant price volatility, less liquidity, a smaller market capitalization and a smaller number of traded securities. Adverse currency exchange rates are a risk and there may be a lack of available currency hedging instruments. Investments in Russia may be subject to the risk of nationalization or expropriation of assets. Oil, natural gas, metals, and timber account for a significant portion of Russia’s exports, leaving the country vulnerable to swings in world prices.
If a Fund (or Acquired Funds) invests directly in foreign (non-U.S.) currencies or in securities that trade in, and receive revenues in, foreign (non-U.S.) currencies, or in financial derivative instruments that provide exposure to foreign (non-U.S.) currencies, it will be subject to the risk that those currencies will decline in value relative to the base currency of the Fund (or Acquired Funds), or, in the case of hedging positions, that the Fund’s (or Acquired Funds’) base currency will decline in value relative to the currency being hedged. Currency rates in foreign countries may fluctuate significantly over short periods of time for a number of reasons, including changes in interest rates, intervention (or the failure to intervene) by U.S. or foreign governments, central banks or supranational entities such as the International Monetary Fund, or by the imposition of currency controls or other political developments in the United States or abroad. As a result, a Fund’s (or Acquired Funds’) investments in foreign currency-denominated securities may reduce the Fund’s (or Acquired Funds’) returns.
Credit and Counterparty Risks A Fund (or Acquired Funds) will be exposed to credit risk to parties with whom it trades and will also bear the risk of settlement default. A Fund (or Acquired Funds) minimizes concentrations of credit risk by undertaking transactions with a large number of customers and counterparties on recognized and reputable exchanges, where applicable. Over the counter (“OTC”) derivative transactions are subject to the risk that a counterparty to the transaction will not fulfill its contractual obligations to the other party, as many of the protections afforded to centrally cleared derivative transactions might not be available for OTC derivative transactions. For derivatives traded on an exchange or through a central counterparty, credit risk resides with the Fund’s (or Acquired Funds’) clearing broker, or the clearinghouse itself, rather than with a counterparty in an OTC derivative transaction. A Fund (or Acquired Funds) could lose money if the issuer or guarantor of a fixed income security, or the counterparty to a financial derivative instruments contract, repurchase agreement or a loan of portfolio securities, is unable or unwilling to make timely principal and/or interest payments, or to otherwise honor its obligations. Securities and financial derivative instruments are subject to varying degrees of credit risk, which may be reflected in credit ratings.
| | | | | | |
| | SEMIANNUAL REPORT | | DECEMBER 31, 2016 | | 79 |
Notes to Financial Statements (Cont.)
Similar to credit risk, a Fund (or Acquired Funds) may be exposed to counterparty risk, or the risk that an institution or other entity with which the Fund (or Acquired Funds) has unsettled or open transactions will default. PIMCO, as the Adviser, minimizes counterparty risks to the Funds (or Acquired Funds) through a number of ways. Prior to entering into transactions with a new counterparty, the PIMCO Counterparty Risk Committee conducts an extensive credit review of such counterparty and must approve the use of such counterparty. Furthermore, pursuant to the terms of the underlying contract, to the extent that unpaid amounts owed to a Fund (or Acquired Funds) exceed a predetermined threshold, such counterparty shall advance collateral to the Fund (or Acquired Funds) in the form of cash or securities equal in value to the unpaid amount owed to the Fund (or Acquired Funds). A Fund (or Acquired Funds) may invest such collateral in securities or other instruments and will typically pay interest to the counterparty on the collateral received. If the unpaid amount owed to a Fund (or Acquired Funds) subsequently decreases, the Fund (or Acquired Funds) would be required to return to the counterparty all or a portion of the collateral previously advanced. PIMCO’s attempts to minimize counterparty risk may, however, be unsuccessful.
All transactions in listed securities are settled/paid for upon delivery using approved counterparties. The risk of default is considered minimal, as delivery of securities sold is only made once a Fund (or Acquired Funds) has received payment. Payment is made on a purchase once the securities have been delivered by the counterparty. The trade will fail if either party fails to meet its obligation.
Master Netting Arrangements A Fund may be subject to various netting arrangements (“Master Agreements”) with select counterparties. Master Agreements govern the terms of certain transactions, and reduce the counterparty risk associated with relevant transactions by specifying credit protection mechanisms and providing standardization that improves legal certainty. Each type of Master Agreement governs certain types of transactions. Different types of transactions may be traded out of different legal entities or affiliates of a particular organization, resulting in the need for multiple agreements with a single counterparty. As the Master Agreements are specific to unique operations of different asset types, they allow a Fund to close out and net its total exposure to a counterparty in the event of a default with respect to all the transactions governed under a single Master Agreement with a counterparty. For financial reporting purposes the Statements of Assets and Liabilities generally present derivative assets and liabilities on a gross basis, which reflects the full risks and exposures prior to netting.
Master Agreements can also help limit counterparty risk by specifying collateral posting arrangements at pre-arranged exposure levels. Under most Master Agreements, collateral is routinely transferred if the total
net exposure to certain transactions (net of existing collateral already in place) governed under the relevant Master Agreement with a counterparty in a given account exceeds a specified threshold, which typically ranges from zero to $250,000 depending on the counterparty and the type of Master Agreement. United States Treasury Bills and U.S. dollar cash are generally the preferred forms of collateral, although other forms of AAA rated paper or sovereign securities may be used depending on the terms outlined in the applicable Master Agreement. Securities and cash pledged as collateral are reflected as assets on the Statements of Assets and Liabilities as either a component of Investments at value (securities) or Deposits with counterparty. Cash collateral received is not typically held in a segregated account and as such is reflected as a liability on the Statements of Assets and Liabilities as Deposits from counterparty. The market value of any securities received as collateral is not reflected as a component of NAV. A Fund’s overall exposure to counterparty risk can change substantially within a short period, as it is affected by each transaction subject to the relevant Master Agreement.
Master Repurchase Agreements and Global Master Repurchase Agreements (individually and collectively “Master Repo Agreements”) govern repurchase, reverse repurchase, and sale-buyback transactions between a Fund and select counterparties. Master Repo Agreements maintain provisions for, among other things, initiation, income payments, events of default, and maintenance of collateral. The market value of transactions under the Master Repo Agreement, collateral pledged or received, and the net exposure by counterparty as of period end are disclosed in the Notes to Schedules of Investments.
Master Securities Forward Transaction Agreements (“Master Forward Agreements”) govern certain forward settling transactions, such as TBA securities, delayed-delivery or sale-buyback transactions by and between a Fund and select counterparties. The Master Forward Agreements maintain provisions for, among other things, transaction initiation and confirmation, payment and transfer, events of default, termination, and maintenance of collateral. The market value of forward settling transactions, collateral pledged or received, and the net exposure by counterparty as of period end is disclosed in the Notes to Schedules of Investments.
Customer Account Agreements and related addenda govern cleared derivatives transactions such as futures, options on futures, and cleared OTC derivatives. Such transactions require posting of initial margin as determined by each relevant clearing agency which is segregated in an account at a futures commission merchant (“FCM”) registered with the Commodity Futures Trading Commission (“CFTC”). In the United States, counterparty risk may be reduced as creditors of an FCM cannot have a claim to Fund assets in the segregated account. Portability of exposure reduces risk to the Funds. Variation margin, or changes in market value, are exchanged daily, but may not be netted between
December 31, 2016 (Unaudited)
futures and cleared OTC derivatives unless the parties have agreed to a separate arrangement in respect of portfolio margining. The market value or accumulated unrealized appreciation (depreciation), initial margin posted, and any unsettled variation margin as of period end is disclosed in the Notes to Schedules of Investments.
International Swaps and Derivatives Association, Inc. Master Agreements and Credit Support Annexes (“ISDA Master Agreements”) govern bilateral OTC derivative transactions entered into by a Fund with select counterparties. ISDA Master Agreements maintain provisions for general obligations, representations, agreements, collateral posting and events of default or termination. Events of termination include conditions that may entitle counterparties to elect to terminate early and cause settlement of all outstanding transactions under the applicable ISDA Master Agreement. Any election to terminate early could be material to the financial statements. In limited circumstances, the ISDA Master Agreement may contain additional provisions that add counterparty protection beyond coverage of existing daily exposure if the counterparty has a decline in credit quality below a predefined level. These amounts, if any, may be segregated with a third-party custodian. The market value of OTC financial derivative instruments, collateral
received or pledged, and net exposure by counterparty as of period end are disclosed in the Notes to Schedules of Investments.
7. FEES AND EXPENSES
(a) Investment Advisory Fee PIMCO is a majority-owned subsidiary of Allianz Asset Management of America L.P. (“Allianz Asset Management”) and serves as the Adviser to the Trust, pursuant to an investment advisory contract. The Adviser receives a monthly fee from each Fund at an annual rate based on average daily net assets (the “Investment Advisory Fee”). The Investment Advisory Fee for all classes is charged at an annual rate as noted in the table in note (b) below.
(b) Supervisory and Administrative Fee PIMCO serves as administrator (the “Administrator”) and provides supervisory and administrative services to the Trust for which it receives a monthly supervisory and administrative fee based on each share class’s average daily net assets (the “Supervisory and Administrative Fee”). As the Administrator, PIMCO bears the costs of various third-party services, including audit, custodial, portfolio accounting, legal, transfer agency and printing costs.
Investment Advisory Fees and Supervisory and Administrative Fees for all classes, as applicable, are charged at an annual rate as noted in the following table (calculated as a percentage of each Fund’s average daily net assets attributable to each class):
| | | | | | | | | | | | | | | | | | | | | | | | | | | | | | | | | | | | | | | | |
| | | | | | Investment Advisory Fee | | | | | | Supervisory and Administrative Fee | |
| Fund Name | | | | | All Classes | | | | | | Inst Class | | | Class P | | | Admin Class | | | Class D | | | Class A | | | Class C | | | Class R | |
PIMCO REALPATH® Blend 2020 Fund | | | | | | | 0.01% | | | | | | | | 0.02% | | | | N/A | | | | 0.02% | | | | N/A | | | | 0.27% | | | | N/A | | | | N/A | |
PIMCO REALPATH® Blend 2025 Fund | | | | | | | 0.01% | | | | | | | | 0.02% | | | | N/A | | | | 0.02% | | | | N/A | | | | 0.27% | | | | N/A | | | | N/A | |
PIMCO REALPATH® Blend 2030 Fund | | | | | | | 0.02% | | | | | | | | 0.02% | | | | N/A | | | | 0.02% | | | | N/A | | | | 0.27% | | | | N/A | | | | N/A | |
PIMCO REALPATH® Blend 2035 Fund | | | | | | | 0.03% | | | | | | | | 0.02% | | | | N/A | | | | 0.02% | | | | N/A | | | | 0.27% | | | | N/A | | | | N/A | |
PIMCO REALPATH® Blend 2040 Fund | | | | | | | 0.03% | | | | | | | | 0.02% | | | | N/A | | | | 0.02% | | | | N/A | | | | 0.27% | | | | N/A | | | | N/A | |
PIMCO REALPATH® Blend 2045 Fund | | | | | | | 0.03% | | | | | | | | 0.02% | | | | N/A | | | | 0.02% | | | | N/A | | | | 0.27% | | | | N/A | | | | N/A | |
PIMCO REALPATH® Blend 2050 Fund | | | | | | | 0.03% | | | | | | | | 0.02% | | | | N/A | | | | 0.02% | | | | N/A | | | | 0.27% | | | | N/A | | | | N/A | |
PIMCO REALPATH® Blend 2055 Fund | | | | | | | 0.03% | | | | | | | | 0.02% | | | | N/A | | | | 0.02% | | | | N/A | | | | 0.27% | | | | N/A | | | | N/A | |
PIMCO REALPATH® Blend Income Fund | | | | | | | 0.01% | | | | | | | | 0.02% | | | | N/A | | | | 0.02% | | | | N/A | | | | 0.27% | | | | N/A | | | | N/A | |
(c) Distribution and Servicing Fees PIMCO Investments LLC (“PI”), a wholly-owned subsidiary of PIMCO, serves as the distributor (“Distributor”) of the Trust’s shares.
The Trust has adopted separate Distribution and Servicing Plans with respect to the Class A, Class C and Class R shares of the Trust pursuant to Rule 12b-1 under the Act. In connection with the distribution of Class C and Class R shares of the Trust, the Distributor receives distribution fees from the Trust of up to 0.75% for Class C shares and 0.25% for Class R shares, and in connection with personal services rendered to Class A, Class C and Class R shareholders and the maintenance of such shareholder accounts, the Distributor receives servicing fees from the Trust of up to 0.25% for each of Class A, Class C and Class R shares (percentages reflect annual rates of the average daily net assets attributable to the applicable class).
The Trust has adopted a Distribution and Servicing Plan with respect to the Class D shares of each Fund pursuant to Rule 12b-1 under the Act (the “Class D Plan”). Under the terms of the Class D Plan, a Fund is permitted to compensate the Distributor out of the assets attributable to the Class D shares of the Fund, in an amount up to 0.25% on an annual basis of the average daily net assets of the Fund’s Class D shares for providing, or procuring through financial intermediaries, distribution, shareholder services, and/or maintenance of shareholder accounts with respect to Class D shareholders of the Fund, some of which may be deemed to be primarily intended to result in the sale of Class D shares.
The Trust has adopted a Distribution and Servicing Plan with respect to the Administrative Class shares of each Fund pursuant to Rule 12b-1 under the Act (the “Administrative Class Plan”). Under the terms of the
| | | | | | |
| | SEMIANNUAL REPORT | | DECEMBER 31, 2016 | | 81 |
Notes to Financial Statements (Cont.)
Administrative Class Plan, a Fund may compensate the Distributor for providing, or procuring through financial intermediaries, distribution, administrative, recordkeeping, shareholder and/or related services with respect to Administrative Class shares. The Administrative Class Plan permits a Fund to make total payments at an annual rate of up to 0.25% of the average daily net assets attributable to the Administrative Class shares.
The Trust paid distribution and servicing fees at effective rates as noted in the following table (calculated as a percentage of each Fund’s average daily net assets attributable to each class):
| | | | | | | | | | | | |
| | | | | | Distribution Fee | | | Servicing Fee | |
Administrative Class | | | | | | | — | | | | 0.25% | |
Class D | | | | | | | — | | | | 0.25% | |
Class A | | | | | | | — | | | | 0.25% | |
Class C | | | | | | | 0.75% | | | | 0.25% | |
Class R | | | | | | | 0.25% | | | | 0.25% | |
The Distributor also received the proceeds of the initial sales charges paid by the shareholders upon the purchase of Class A shares and the contingent deferred sales charges paid by the shareholders upon certain redemptions of Class A and Class C shares. For the period ended December 31, 2016, the Distributor retained $44,078 representing commissions (sales charges) and contingent deferred sales charges from the Trust.
(d) Fund Expenses PIMCO provides or procures supervisory and administrative services for shareholders and also bears the costs of various third-party services required by the Funds, including audit, custodial, portfolio accounting, legal, transfer agency and printing costs. The Trust is responsible for the following expenses: (i) taxes and governmental fees; (ii) brokerage fees and commissions and other portfolio transaction expenses; (iii) the costs of borrowing money, including interest expense; (iv) fees and expenses of the Trustees who are not “interested persons” of PIMCO or the Trust, and any counsel retained exclusively for their benefit; (v) extraordinary expense, including costs of litigation and indemnification expenses; (vi) organizational expenses; and (vii) any expenses allocated or
allocable to a specific class of shares, which include service fees payable with respect to the Administrative Class Shares, and may include certain other expenses as permitted by the Trust’s Multi-Class Plan adopted pursuant to Rule 18f-3 under the Act and subject to review and approval by the Trustees. The ratio of expenses to average net assets per share class, as disclosed on the Financial Highlights, may differ from the annual funds operating expenses per share class.
Each Trustee, other than those affiliated with PIMCO or its affiliates, receives an annual retainer of $62,000, plus $6,250 for each Board meeting attended in person, $375 ($750 in the case of the audit committee chair with respect to audit committee meetings) for each committee meeting attended and $750 for each Board meeting attended telephonically, plus reimbursement of related expenses. In addition, the audit committee chair receives an additional annual retainer of $9,000, the valuation oversight committee lead receives an additional annual retainer of $2,000 (to the extent there are co-leads of the valuation oversight committee, the annual retainer will be split evenly between the co-leads, so that each co-lead individually receives an additional retainer of $1,000) and the governance committee chair receives an additional annual retainer of $750.
These expenses are allocated on a pro rata basis to each Fund of the Trust according to its respective net assets. The Trust pays no compensation directly to any Trustee or any other officer who is affiliated with the Administrator, all of whom receive remuneration for their services to the Trust from the Administrator or its affiliates.
(e) Expense Limitation Pursuant to the Expense Limitation Agreement, PIMCO has agreed to waive a portion of the Funds’ Supervisory and Administrative Fee, or reimburse the Funds, to the extent that the payment of each Fund’s organizational expenses and pro rata share of Trustee Fees exceed 0.0049%, the “Expense Limit” (calculated as a percentage of each Fund’s average daily net assets attributable to each class). The Expense Limitation Agreement will automatically renew for one-year terms unless PIMCO provides written notice to the Trust at least 30 days prior to the end of the then current term.
PIMCO may be reimbursed for these waived amounts in future periods, not to exceed thirty-six months after the waiver. Expenses that have been waived may still be reimbursed to PIMCO, provided that (1) the Fund’s annualized organizational expenses and pro rata share of Trustee Fees plus the amount reimbursed does not exceed the Expense Limit; (2) such amount paid to PIMCO will not exceed the Reimbursement Amount, which is
December 31, 2016 (Unaudited)
the portion of the Supervisory and Administrative Fee that was waived, reduced or reimbursed by PIMCO; and (3) such amount will not include any amounts previously reimbursed to PIMCO. The recoverable amounts to PIMCO at December 31, 2016, were as follows (amounts in thousands†):
| | | | | | | | | | | | | | | | | | | | |
| | | | | | Expiring within | |
| Fund Name | | | | | 12 months | | | 13-24 months | | | 25-36 months | | | Total | |
PIMCO REALPATH® Blend 2020 Fund | | | | | | $ | 0 | | | $ | 16 | | | $ | 0 | | | $ | 16 | |
PIMCO REALPATH® Blend 2025 Fund | | | | | | | 0 | | | | 16 | | | | 0 | | | | 16 | |
PIMCO REALPATH® Blend 2030 Fund | | | | | | | 0 | | | | 16 | | | | 1 | | | | 17 | |
PIMCO REALPATH® Blend 2035 Fund | | | | | | | 0 | | | | 16 | | | | 1 | | | | 17 | |
PIMCO REALPATH® Blend 2040 Fund | | | | | | | 0 | | | | 16 | | | | 0 | | | | 16 | |
PIMCO REALPATH® Blend 2045 Fund | | | | | | | 0 | | | | 16 | | | | 0 | | | | 16 | |
PIMCO REALPATH® Blend 2050 Fund | | | | | | | 0 | | | | 16 | | | | 0 | | | | 16 | |
PIMCO REALPATH® Blend 2055 Fund | | | | | | | 0 | | | | 16 | | | | 0 | | | | 16 | |
PIMCO REALPATH® Blend Income Fund | | | | | | | 0 | | | | 16 | | | | 0 | | | | 16 | |
| † | A zero balance may reflect actual amounts rounding to less than one thousand. |
(f) Acquired Fund Fees and Expenses The Underlying PIMCO Fund expenses for the Funds are based upon an allocation of a Fund’s assets among the Underlying PIMCO Funds and upon the total annual operating expenses of the Institutional Class or Class M shares, as applicable, of the Underlying PIMCO Funds. The Underlying PIMCO Fund expenses incurred by a Fund will vary with changes in the expenses of the Underlying PIMCO Funds, as well as the allocation of the Fund’s assets.
The expenses associated with investing in a fund of funds are generally higher than those for mutual funds that do not invest in other mutual funds. The cost of investing in a fund of funds will generally be higher than the cost of investing in a mutual fund that invests directly in individual stocks and bonds. By investing in a fund of funds, an investor will indirectly bear fees and expenses charged by Acquired Funds in addition to each Fund’s direct fees and expenses. In addition, the use of a fund of funds structure could affect the timing, amount and character of distributions to the shareholders and may therefore increase the amount of taxes payable by shareholders.
8. RELATED PARTY TRANSACTIONS
The Adviser, Administrator, and Distributor are related parties. Fees payable to these parties are disclosed in Note 7, Fees and Expenses, and the accrued related party fee amounts are disclosed on the Statements of Assets and Liabilities.
9. GUARANTEES AND INDEMNIFICATIONS
Under the Trust’s organizational documents, each Trustee or officer of the Trust is indemnified and each employee or other agent of the Trust
(including the Trust’s investment manager) may be indemnified, to the extent permitted by the Act, against certain liabilities that may arise out of performance of their duties to the Funds. Additionally, in the normal course of business, the Funds enter into contracts that contain a variety of indemnification clauses. The Funds’ maximum exposure under these arrangements is unknown as this would involve future claims that may be made against the Funds that have not yet occurred. However, the Funds have not had prior claims or losses pursuant to these contracts.
10. PURCHASES AND SALES OF SECURITIES
The length of time a Fund has held a particular security is not generally a consideration in investment decisions. A change in the securities held by a Fund is known as “portfolio turnover.” Each Fund may engage in frequent and active trading of portfolio securities to achieve its investment objective, particularly during periods of volatile market movements. High portfolio turnover may involve correspondingly greater transaction costs to a Fund, including brokerage commissions or dealer mark-ups and other transaction costs on the sale of securities and reinvestments in other securities. Such sales may also result in realization of taxable capital gains, including short-term capital gains (which are generally taxed at ordinary income tax rates). The transaction costs and tax effects associated with portfolio turnover may adversely affect a Fund’s performance. The portfolio turnover rates are reported in the Financial Highlights.
| | | | | | |
| | SEMIANNUAL REPORT | | DECEMBER 31, 2016 | | 83 |
Notes to Financial Statements (Cont.)
December 31, 2016 (Unaudited)
Purchases and sales of securities (excluding short-term investments) for the period ended December 31, 2016, were as follows (amounts in thousands†):
| | | | | | | | | | | | | | | | | | | | |
| | | | | | U.S. Government/Agency | | | All Other | |
| Fund Name | | | | | Purchases | | | Sales | | | Purchases | | | Sales | |
PIMCO REALPATH® Blend 2020 Fund | | | | | | $ | 0 | | | $ | 0 | | | $ | 1,123 | | | $ | 253 | |
PIMCO REALPATH® Blend 2025 Fund | | | | | | | 0 | | | | 0 | | | | 824 | | | | 192 | |
PIMCO REALPATH® Blend 2030 Fund | | | | | | | 0 | | | | 0 | | | | 1,011 | | | | 292 | |
PIMCO REALPATH® Blend 2035 Fund | | | | | | | 0 | | | | 0 | | | | 707 | | | | 290 | |
PIMCO REALPATH® Blend 2040 Fund | | | | | | | 0 | | | | 0 | | | | 426 | | | | 143 | |
PIMCO REALPATH® Blend 2045 Fund | | | | | | | 0 | | | | 0 | | | | 366 | | | | 130 | |
PIMCO REALPATH® Blend 2050 Fund | | | | | | | 0 | | | | 0 | | | | 426 | | | | 144 | |
PIMCO REALPATH® Blend 2055 Fund | | | | | | | 0 | | | | 0 | | | | 210 | | | | 104 | |
PIMCO REALPATH® Blend Income Fund | | | | | | | 0 | | | | 0 | | | | 325 | | | | 97 | |
| † | A zero balance may reflect actual amounts rounding to less than one thousand. |
(THIS PAGE INTENTIONALLY LEFT BLANK)
| | | | | | |
| | SEMIANNUAL REPORT | | DECEMBER 31, 2016 | | 85 |
Notes to Financial Statements (Cont.)
11. SHARES OF BENEFICIAL INTEREST
The Funds may issue an unlimited number of shares of beneficial interest with a $0.001 par value. Changes in shares of beneficial interest were as follows (shares and amounts in thousands†):
| | | | | | | | | | | | | | | | | | | | | | | | | | | | | | | | | | |
| | | | | PIMCO REALPATH® Blend 2020 Fund | | | PIMCO REALPATH® Blend 2025 Fund | |
| | | | | Six Months Ended
12/31/2016 | | | Year Ended
06/30/2016 | | | Six Months Ended
12/31/2016 | | | Year Ended
06/30/2016 | |
| | | | | Shares | | | Amount | | | Shares | | | Amount | | | Shares | | | Amount | | | Shares | | | Amount | |
Receipts for shares sold | | | | | | | | | | | | | | | | | | | | | | | | | | | | | | | | | | |
Institutional Class | | | | | 90 | | | $ | 907 | | | | 106 | | | $ | 988 | | | | 62 | | | $ | 611 | | | | 109 | | | $ | 1,070 | |
Administrative Class | | | | | 0 | | | | 0 | | | | 0 | | | | 0 | | | | 0 | | | | 0 | | | | 1 | | | | 0 | |
Class A | | | | | 0 | | | | 0 | | | | 0 | | | | 0 | | | | 1 | | | | 12 | | | | 2 | | | | 15 | |
Issued as reinvestment of distributions | | | | | | | | | | | | | | | | | | | | | | | | | | | | | | | | | | |
Institutional Class | | | | | 8 | | | | 77 | | | | 12 | | | | 117 | | | | 6 | | | | 64 | | | | 13 | | | | 122 | |
Administrative Class | | | | | 0 | | | | 0 | | | | 0 | | | | 0 | | | | 0 | | | | 0 | | | | 0 | | | | 0 | |
Class A | | | | | 0 | | | | 0 | | | | 0 | | | | 0 | | | | 0 | | | | 1 | | | | 0 | | | | 0 | |
Cost of shares redeemed | | | | | | | | | | | | | | | | | | | | | | | | | | | | | | | | | | |
Institutional Class | | | | | (7 | ) | | | (66 | ) | | | 0 | | | | (4 | ) | | | (1 | ) | | | (8 | ) | | | (81 | ) | | | (762 | ) |
Administrative Class | | | | | 0 | | | | 0 | | | | 0 | | | | 0 | | | | 0 | | | | 0 | | | | 0 | | | | 0 | |
Class A | | | | | 0 | | | | 0 | | | | 0 | | | | 0 | | | | 0 | | | | 0 | | | | 0 | | | | (1 | ) |
Net increase (decrease) resulting from Fund share transactions | | | | | 91 | | | $ | 918 | | | | 118 | | | $ | 1,101 | | | | 68 | | | $ | 680 | | | | 44 | | | $ | 444 | |
| | | | | | | | | | | | | | | | | | | | | | | | | | | | | | | | | | |
| | | | | | | | | | | | | | | | | | | | | | | | | | | | | | | | | | |
| | | | | PIMCO REALPATH® Blend 2045 Fund | | | PIMCO REALPATH® Blend 2050 Fund | |
| | | | | Six Months Ended
12/31/2016 | | | Year Ended
06/30/2016 | | | Six Months Ended
12/31/2016 | | | Year Ended
06/30/2016 | |
| | | | | Shares | | | Amount | | | Shares | | | Amount | | | Shares | | | Amount | | | Shares | | | Amount | |
Receipts for shares sold | | | | | | | | | | | | | | | | | | | | | | | | | | | | | | | | | | |
Institutional Class | | | | | 24 | | | $ | 243 | | | | 44 | | | $ | 422 | | | | 38 | | | $ | 388 | | | | 95 | | | $ | 900 | |
Administrative Class | | | | | 5 | | | | 51 | | | | 0 | | | | 0 | | | | 0 | | | | 0 | | | | 0 | | | | 0 | |
Class A | | | | | 1 | | | | 5 | | | | 0 | | | | 0 | | | | 0 | | | | 0 | | | | 11 | | | | 99 | |
Issued as reinvestment of distributions | | | | | | | | | | | | | | | | | | | | | | | | | | | | | | | | | | |
Institutional Class | | | | | 5 | | | | 54 | | | | 9 | | | | 82 | | | | 7 | | | | 68 | | | | 8 | | | | 80 | |
Administrative Class | | | | | 0 | | | | 1 | | | | 0 | | | | 1 | | | | 0 | | | | 0 | | | | 0 | | | | 0 | |
Class A | | | | | 0 | | | | 0 | | | | 0 | | | | 0 | | | | 0 | | | | 1 | | | | 0 | | | | 2 | |
Cost of shares redeemed | | | | | | | | | | | | | | | | | | | | | | | | | | | | | | | | | | |
Institutional Class | | | | | (3 | ) | | | (31 | ) | | | (5 | ) | | | (49 | ) | | | (7 | ) | | | (71 | ) | | | (4 | ) | | | (42 | ) |
Administrative Class | | | | | (1 | ) | | | (13 | ) | | | 0 | | | | 0 | | | | 0 | | | | 0 | | | | 0 | | | | 0 | |
Class A | | | | | 0 | | | | 0 | | | | 0 | | | | 0 | | | | 0 | | | | (1 | ) | | | (1 | ) | | | (9 | ) |
Net increase (decrease) resulting from Fund share transactions | | | | | 31 | | | $ | 310 | | | | 48 | | | $ | 456 | | | | 38 | | | $ | 385 | | | | 109 | | | $ | 1,030 | |
| | | | | | | | | | | | | | | | | | | | | | | | | | | | | | | | | | |
December 31, 2016 (Unaudited)
| | | | | | | | | | | | | | | | | | | | | | | | | | | | | | | | | | | | | | | | | | | | | | |
| PIMCO REALPATH® Blend 2030 Fund | | | PIMCO REALPATH® Blend 2035 Fund | | | PIMCO REALPATH® Blend 2040 Fund | |
Six Months Ended
12/31/2016 | | | Year Ended
06/30/2016 | | | Six Months Ended
12/31/2016 | | | Year Ended
06/30/2016 | | | Six Months Ended
12/31/2016 | | | Year Ended
06/30/2016 | |
| Shares | | | Amount | | | Shares | | | Amount | | | Shares | | | Amount | | | Shares | | | Amount | | | Shares | | | Amount | | | Shares | | | Amount | |
| | | | | | | | | | | | | | | | | | | | | | | | | | | | | | | | | | | | | | | | | | | | | | |
| | 61 | | | $ | 637 | | | | 403 | | | $ | 3,640 | | | | 26 | | | $ | 269 | | | | 297 | | | $ | 2,716 | | | | 35 | | | $ | 346 | | | | 45 | | | $ | 433 | |
| | 1 | | | | 10 | | | | 1 | | | | 12 | | | | 1 | | | | 10 | | | | 0 | | | | 0 | | | | 1 | | | | 11 | | | | 3 | | | | 23 | |
| | 5 | | | | 43 | | | | 0 | | | | 3 | | | | 14 | | | | 134 | | | | 2 | | | | 16 | | | | 0 | | | | 0 | | | | 2 | | | | 20 | |
| | | | | | | | | | | | | | | | | | | | | | | | | | | | | | | | | | | | | | | | | | | | | | |
| | 16 | | | | 158 | | | | 12 | | | | 118 | | | | 12 | | | | 117 | | | | 12 | | | | 114 | | | | 6 | | | | 60 | | | | 9 | | | | 86 | |
| | 0 | | | | 1 | | | | 0 | | | | 0 | | | | 0 | | | | 0 | | | | 0 | | | | 0 | | | | 0 | | | | 1 | | | | 0 | | | | 1 | |
| | 0 | | | | 1 | | | | 0 | | | | 0 | | | | 0 | | | | 2 | | | | 0 | | | | 0 | | | | 0 | | | | 0 | | | | 0 | | | | 1 | |
| | | | | | | | | | | | | | | | | | | | | | | | | | | | | | | | | | | | | | | | | | | | | | |
| | (1 | ) | | | (13 | ) | | | (66 | ) | | | (627 | ) | | | (2 | ) | | | (17 | ) | | | (5 | ) | | | (47 | ) | | | (6 | ) | | | (55 | ) | | | 0 | | | | 0 | |
| | 0 | | | | 0 | | | | 0 | | | | 0 | | | | 0 | | | | 0 | | | | 0 | | | | 0 | | | | 0 | | | | 0 | | | | 0 | | | | 0 | |
| | 0 | | | | 0 | | | | 0 | | | | 0 | | | | 0 | | | | 0 | | | | (3 | ) | | | (27 | ) | | | 0 | | | | 0 | | | | 0 | | | | (3 | ) |
| | 82 | | | $ | 837 | | | | 350 | | | $ | 3,146 | | | | 51 | | | $ | 515 | | | | 303 | | | $ | 2,772 | | | | 36 | | | $ | 363 | | | | 59 | | | $ | 561 | |
| | | | | | | | | | | | | | | | | | | | | | | | | | | | | | | | | | | | | | | | | | | | | | |
| | | | | | | | | | | | | | | | | | | | | | | | | | | | | | | | | | | | | | | | | | | | | | |
| | | | | | | | | | | | | | | | | | | | | | | | | | | | | | |
| PIMCO REALPATH® Blend 2055 Fund | | | PIMCO REALPATH® Blend Income Fund | |
Six Months Ended
12/31/2016 | | | Year Ended
06/30/2016 | | | Six Months Ended
12/31/2016 | | | Year Ended
06/30/2016 | |
| Shares | | | Amount | | | Shares | | | Amount | | | Shares | | | Amount | | | Shares | | | Amount | |
| | | | | | | | | | | | | | | | | | | | | | | | | | | | | | |
| | 17 | | | $ | 170 | | | | 39 | | | $ | 358 | | | | 19 | | | $ | 205 | | | | 24 | | | $ | 231 | |
| | 5 | | | | 51 | | | | 0 | | | | 0 | | | | 0 | | | | 0 | | | | 3 | | | | 39 | |
| | 0 | | | | 0 | | | | 0 | | | | 5 | | | | 1 | | | | 6 | | | | 2 | | | | 12 | |
| | | | | | | | | | | | | | | | | | | | | | | | | | | | | | |
| | 5 | | | | 53 | | | | 8 | | | | 79 | | | | 6 | | | | 58 | | | | 12 | | | | 111 | |
| | 0 | | | | 1 | | | | 0 | | | | 0 | | | | 0 | | | | 1 | | | | 0 | | | | 0 | |
| | 0 | | | | 0 | | | | 0 | | | | 1 | | | | 0 | | | | 1 | | | | 0 | | | | 2 | |
| | | | | | | | | | | | | | | | | | | | | | | | | | | | | | |
| | (6 | ) | | | (62 | ) | | | (2 | ) | | | (15 | ) | | | (1 | ) | | | (14 | ) | | | (6 | ) | | | (61 | ) |
| | 0 | | | | 0 | | | | 0 | | | | 0 | | | | 0 | | | | 0 | | | | 0 | | | | (4 | ) |
| | (4 | ) | | | (40 | ) | | | (1 | ) | | | (9 | ) | | | 0 | | | | (1 | ) | | | (2 | ) | | | (17 | ) |
| | 17 | | | $ | 173 | | | | 44 | | | $ | 419 | | | | 25 | | | $ | 256 | | | | 33 | | | $ | 313 | |
| | | | | | | | | | | | | | | | | | | | | | | | | | | | | | |
| † | A zero balance may reflect actual amounts rounding to less than one thousand. |
The following table discloses the number of shareholders that own 10% or more of the outstanding shares of a fund/portfolio along with their respective percent ownership, if any. Some of these shareholders may be considered related parties, which may include, but are not limited to, the investment manager and its affiliates, affiliated broker dealers, fund of funds and directors or employees of the Trust or Adviser.
| | | | | | | | | | | | | | | | | | | | |
| | | | | | Non Related Parties | | | Related Parties | | | Non Related Parties | | | Related Parties | |
PIMCO REALPATH® Blend 2020 Fund | | | | | | | 0 | | | | 1 | | | | 0 | | | | 62% | |
PIMCO REALPATH® Blend 2025 Fund | | | | | | | 0 | | | | 1 | | | | 0 | | | | 76% | |
PIMCO REALPATH® Blend 2030 Fund | | | | | | | 0 | | | | 1 | | | | 0 | | | | 43% | |
PIMCO REALPATH® Blend 2035 Fund | | | | | | | 0 | | | | 1 | | | | 0 | | | | 48% | |
PIMCO REALPATH® Blend 2040 Fund | | | | | | | 0 | | | | 1 | | | | 0 | | | | 79% | |
PIMCO REALPATH® Blend 2045 Fund | | | | | | | 0 | | | | 1 | | | | 0 | | | | 82% | |
PIMCO REALPATH® Blend 2050 Fund | | | | | | | 1 | | | | 1 | | | | 15 | % | | | 70% | |
PIMCO REALPATH® Blend 2055 Fund | | | | | | | 1 | | | | 1 | | | | 12 | % | | | 85% | |
PIMCO REALPATH® Blend Income Fund | | | | | | | 0 | | | | 1 | | | | 0 | | | | 85% | |
| | | | | | |
| | SEMIANNUAL REPORT | | DECEMBER 31, 2016 | | 87 |
Notes to Financial Statements (Cont.)
12. REGULATORY AND LITIGATION MATTERS
The Funds are not named as defendants in any material litigation or arbitration proceedings and are not aware of any material litigation or claim pending or threatened against them.
PIMCO, the investment manager of the PIMCO Total Return Active Exchange-Traded Fund (“BOND”), has entered into a settlement agreement with the SEC that relates to BOND.
The settlement relates to disclosures regarding BOND’s performance attribution during the first four months of its existence in 2012 and the valuation of 43 smaller-sized positions of non-agency mortgage-backed securities using third-party vendor prices, as well as PIMCO’s policies and procedures related to these matters.
The settlement resolves the SEC’s investigation of BOND.
The foregoing speaks only as of the date of this report.
13. FEDERAL INCOME TAX MATTERS
Each Fund intends to qualify as a regulated investment company under Subchapter M of the Internal Revenue Code (the “Code”) and distribute all of its taxable income and net realized gains, if applicable, to shareholders. Accordingly, no provision for Federal income taxes has been made.
A Fund may be subject to local withholding taxes, including those imposed on realized capital gains. Any applicable foreign capital gains tax is accrued daily based upon net unrealized gains, and may be payable following the sale of any applicable investments.
In accordance with U.S. GAAP, the Adviser has reviewed the Funds’ tax positions for all open tax years. As of December 31, 2016, the Funds have recorded no liability for net unrecognized tax benefits relating to uncertain income tax positions they have taken or expect to take in future tax returns.
The Funds file U.S. tax returns. While the statute of limitations remains open to examine the Funds’ U.S. tax returns filed for the fiscal years ending in 2013-2015, no examinations are in progress or anticipated at this time. The Funds are not aware of any tax positions for which it is reasonably possible that the total amounts of unrecognized tax benefits will significantly change in the next twelve months.
The Funds may gain exposure to the commodities markets primarily through index-linked notes, and may invest in other commodity-linked derivative investments, including commodity swap agreements, options, futures contracts, options on futures contracts and foreign funds investing in similar commodity-linked derivatives. The Fund may also gain exposure indirectly to commodity markets by investing in the
Commodity Subsidiary, which invests primarily in commodity-linked derivative instruments backed by a portfolio of inflation-indexed securities and/or other fixed income instruments.
One of the requirements for favorable tax treatment as a regulated investment company under the Code is that a Fund must derive at least 90% of its gross income from certain qualifying sources of income. The IRS has issued a revenue ruling which holds that income derived from commodity index-linked swaps is not qualifying income under Subchapter M of the Code. The IRS has also issued private letter rulings in which the IRS specifically concluded that income from certain commodity index- linked notes is qualifying income. The IRS has also issued private rulings in which the IRS specifically concluded that income derived from investment in a subsidiary, which invests primarily in commodity-linked swaps, will also be qualifying income. Based on the reasoning in such rulings, each Fund will continue to seek to gain exposure to the commodity markets primarily through investments in commodity-linked notes and through investments in the Commodity Subsidiary.
It should be noted, however, that the IRS currently has suspended the issuance of such rulings pending further review. In addition, the IRS also recently issued a revenue procedure, which states that the IRS will not in the future issue private letter rulings that would require a determination of whether an asset (such as a commodity index-linked note) is a “security” under the 1940 Act.
There can be no assurance that the IRS will not change its position that income derived from commodity-linked notes and wholly-owned subsidiaries is qualifying income. Furthermore, the tax treatment of commodity-linked notes, other commodity-linked derivatives, and a Fund’s investments in the Commodity Subsidiary may otherwise be adversely affected by future legislation, court decisions, Treasury Regulations and/or guidance issued by the IRS. Such developments could affect the character, timing and/or amount of the Fund’s taxable income or any distributions made by the Fund or result in the inability of the Fund to operate as described in its Prospectus.
The IRS recently issued proposed regulations that, if finalized, would generally treat a Fund’s income inclusion with respect to a subsidiary as qualifying income only if there is a distribution out of the earnings and profits of the subsidiary that are attributable to such income inclusion. The proposed regulations, if adopted, would apply to taxable years beginning on or after 90 days after the regulations are published as final.
The IRS also recently issued a revenue procedure, which states that the IRS will not in the future issue private letter rulings that would require a determination of whether an asset (such as a commodity index-linked note) is a “security” under the 1940 Act.
December 31, 2016 (Unaudited)
Under the Regulated Investment Company Modernization Act of 2010, a fund is permitted to carry forward any new capital losses for an unlimited period. Additionally, such capital losses that are carried forward will retain their character as either short-term or long-term capital losses rather than being considered all short-term under previous law.
As of their last fiscal year ended June 30, 2016, the Funds had the following post-effective capital losses with no expiration (amounts in thousands):
| | | | | | | | | | | | |
| | | | | | Short-Term | | | Long-Term | |
PIMCO REALPATH® Blend 2020 Fund | | | | | | $ | 0 | | | $ | 20 | |
PIMCO REALPATH® Blend 2025 Fund | | | | | | | 37 | | | | 14 | |
PIMCO REALPATH® Blend 2030 Fund | | | | | | | 0 | | | | 6 | |
PIMCO REALPATH® Blend 2035 Fund | | | | | | | 0 | | | | 29 | |
PIMCO REALPATH® Blend 2040 Fund | | | | | | | 2 | | | | 18 | |
PIMCO REALPATH® Blend 2045 Fund | | | | | | | 7 | | | | 19 | |
PIMCO REALPATH® Blend 2050 Fund | | | | | | | 6 | | | | 21 | |
PIMCO REALPATH® Blend 2055 Fund | | | | | | | 10 | | | | 20 | |
PIMCO REALPATH® Blend Income Fund | | | | | | | 0 | | | | 10 | |
| † | A zero balance may reflect actual amounts rounding to less than one thousand. |
As of December 31, 2016, the aggregate cost and the net unrealized appreciation (depreciation) of investments for Federal income tax purposes are as follows (amounts in thousands†):
| | | | | | | | | | | | | | | | | | | | |
| | | | | | Federal
Tax Cost | | | Aggregate
Gross
Unrealized
Appreciation | | | Aggregate
Gross
Unrealized
(Depreciation) | | | Net
Unrealized
Appreciation/
(Depreciation) | |
PIMCO REALPATH® Blend 2020 Fund | | | | | | $ | 4,908 | | | $ | 115 | | | $ | (39 | ) | | $ | 76 | |
PIMCO REALPATH® Blend 2025 Fund | | | | | | | 3,983 | | | | 88 | | | | (56 | ) | | | 32 | |
PIMCO REALPATH® Blend 2030 Fund | | | | | | | 6,979 | | | | 367 | | | | (17 | ) | | | 350 | |
PIMCO REALPATH® Blend 2035 Fund | | | | | | | 6,204 | | | | 324 | | | | (9 | ) | | | 315 | |
PIMCO REALPATH® Blend 2040 Fund | | | | | | | 3,836 | | | | 133 | | | | (44 | ) | | | 89 | |
PIMCO REALPATH® Blend 2045 Fund | | | | | | | 3,710 | | | | 123 | | | | (60 | ) | | | 63 | |
PIMCO REALPATH® Blend 2050 Fund | | | | | | | 4,266 | | | | 164 | | | | (44 | ) | | | 120 | |
PIMCO REALPATH® Blend 2055 Fund | | | | | | | 3,473 | | | | 134 | | | | (62 | ) | | | 72 | |
PIMCO REALPATH® Blend Income Fund | | | | | | | 3,645 | | | | 86 | | | | (56 | ) | | | 30 | |
| † | A zero balance may reflect actual amounts rounding to less than one thousand. |
| (1) | Primary differences, if any, between book and tax net unrealized appreciation (depreciation) are attributable to wash sale loss deferrals for Federal income tax purposes. |
| | | | | | |
| | SEMIANNUAL REPORT | | DECEMBER 31, 2016 | | 89 |
Glossary: (abbreviations that may be used in the preceding statements)
(Unaudited)
| | | | | | | | | | |
| | | | |
Counterparty Abbreviations: | | | | | | | | |
| BOA | | Bank of America N.A. | | CBK | | Citibank N.A. | | JPM | | JPMorgan Chase Bank N.A. |
| | | | |
Currency Abbreviations: | | | | | | | | |
| USD (or $) | | United States Dollar | | | | | | | | |
| | | | |
Exchange Abbreviations: | | | | | | | | |
| CBOE | | Chicago Board Options Exchange | | | | | | | | |
| | | | |
Index/Spread Abbreviations: | | | | | | | | |
| BCOMTR | | Bloomberg Commodity Index Total Return | | DWRTFT | | Dow Jones Wilshire REIT Total Return Index | | S&P 500 | | Standard & Poor’s 500 Index |
| | | | |
Other Abbreviations: | | | | | | | | |
| LIBOR | | London Interbank Offered Rate | | TBA | | To-Be-Announced | | | | |
Approval of Investment Advisory Contract and Other Agreements
(Unaudited)
Approval of Renewal of the Investment Advisory Contract, Sub-Advisory Agreement, Portfolio Implementation Agreement and Second Amended and Restated Supervision and Administration Agreement
At a meeting held on August 17, 2016, the Board of Trustees (the “Board”) of PIMCO Equity Series (the “Trust”), including the Trustees who are not “interested persons” of the Trust under the Investment Company Act of 1940, as amended (the “Independent Trustees”), considered and unanimously approved the renewal of the Investment Advisory Contract (the “Investment Advisory Contract”) between the Trust, on behalf of each of the Trust’s series (the “Funds”), and Pacific Investment Management Company LLC (“PIMCO”) for an additional one-year term through August 31, 2017. The Board also considered and unanimously approved the renewal of the Second Amended and Restated Supervision and Administration Agreement (the “Supervision and Administration Agreement” and together with the Investment Advisory Contract, the “Agreements”) between the Trust, on behalf of the Funds, and PIMCO for an additional one-year term through August 31, 2017. In addition, the Board considered and unanimously approved the renewal of the: (i) Sub-Advisory Agreement (the “Sub-Advisory Agreement”) between PIMCO, on behalf of PIMCO RAE Fundamental Emerging Markets Fund, PIMCO RAE Fundamental Global ex-US Fund, PIMCO RAE Fundamental Global Fund, PIMCO RAE Fundamental International Fund, PIMCO RAE Fundamental US Fund and PIMCO RAE Fundamental US Small Fund (the “RAE Fundamental Funds”), each a series of the Trust, and Research Affiliates, LLC (“Research Affiliates”); and (ii) Portfolio Implementation Agreement (the “Portfolio Implementation Agreement”) between PIMCO, on behalf of the RAE Fundamental Funds, each a series of the Trust, Research Affiliates and Parametric Portfolio Associates LLC (“Parametric”), each for an additional one-year term through August 31, 2017.
The information, material factors and conclusions that formed the basis for the Board’s approvals are summarized below.
1. INFORMATION RECEIVED
(a) Materials Reviewed: During the course of the past year, the Trustees received a wide variety of materials relating to the services provided by PIMCO, Research Affiliates and Parametric to the Trust. At each of its quarterly meetings, the Board reviewed the Funds’ investment performance and a significant amount of information relating to Fund operations, including shareholder services, valuation and custody, the Funds’ compliance program and other information relating to the nature, extent and quality of services provided by PIMCO, Research Affiliates and Parametric to the Trust and each of the Funds, as applicable. In considering whether to approve the renewal of the Agreements, the Sub-Advisory Agreement, and the Portfolio
Implementation Agreement, the Board reviewed additional information, including, but not limited to, comparative industry data with regard to investment performance, advisory and supervisory and administrative fees and expenses, financial information for PIMCO and, where relevant, Research Affiliates and Parametric, information regarding the profitability to PIMCO of its relationship with the Funds, information about the personnel providing investment management services, other advisory services and supervisory and administrative services to the Funds, and information about the fees charged and services provided to other clients with similar investment mandates as the Funds, where applicable. In addition, the Board reviewed materials provided by counsel to the Trust and the Independent Trustees, which included, among other things, memoranda outlining legal duties of the Board in considering the renewal of the Agreements, the Sub-Advisory Agreement, and the Portfolio Implementation Agreement.
(b) Review Process: In connection with considering the renewal of the Agreements, the Sub-Advisory Agreement, and the Portfolio Implementation Agreement, the Board reviewed written materials prepared by PIMCO and, where applicable, Research Affiliates and Parametric in response to requests from counsel to the Trust and the Independent Trustees encompassing a wide variety of topics. The Board requested and received assistance and advice regarding, among other things, applicable legal standards from counsel to the Trust and the Independent Trustees, and reviewed comparative fee and performance data prepared at the Board’s request by Lipper, Inc. (“Lipper”), an independent provider of investment company performance information and fee and expense data. The Board received presentations on matters related to the Agreements, the Sub-Advisory Agreement, and the Portfolio Implementation Agreement and met both as a full Board and in a separate session of the Independent Trustees, without management present, at the August 17, 2016 meeting.
The approval determinations were made on the basis of each Trustee’s business judgment after consideration and evaluation of all the information presented. Individual Trustees may have given different weights to certain factors and assigned various degrees of materiality to information received in connection with the approval process. In deciding to approve the renewal of the Agreements, the Sub-Advisory Agreement, and the Portfolio Implementation Agreement, the Board did not identify any single factor or particular information that, in isolation, was controlling. The discussion below is intended to summarize the broad factors and information that figured prominently in the Board’s consideration of the renewal of the Agreements, the Sub-Advisory Agreement, and the Portfolio Implementation Agreement, but is not intended to summarize all of the factors considered by the Board.
| | | | | | |
| | SEMIANNUAL REPORT | | DECEMBER 31, 2016 | | 91 |
Approval of Investment Advisory Contract and Other Agreements (Cont.)
2. NATURE, EXTENT AND QUALITY OF SERVICES
(a) PIMCO, Research Affiliates, Parametric, their Personnel, and Resources: The Board considered the depth and quality of PIMCO’s investment management process, including: the experience, capability and integrity of its senior management and other personnel; the overall financial strength and stability of its organization; and the ability of its organizational structure to address changes in the Funds’ asset levels. The Board also considered the various services in addition to portfolio management that PIMCO provides under the Investment Advisory Contract. The Board noted that PIMCO makes available to its investment professionals a variety of resources and systems relating to investment management, compliance, trading, performance and portfolio accounting. The Board also noted PIMCO’s commitment to investing in information technology and infrastructure supporting investment management and compliance, as well as PIMCO’s continuing efforts to attract, retain and promote qualified personnel, including personnel with relevant equities experience, and to maintain and enhance its resources and systems. The Board considered PIMCO’s policies, procedures and systems reasonably designed to assure compliance with applicable laws and regulations and its commitment to further developing and strengthening these programs, its oversight of matters that may involve conflicts of interest between the Funds’ investments and those of other accounts managed by PIMCO, and its efforts to keep the Trustees informed about matters relevant to the Funds and their shareholders. The Board also considered PIMCO’s continuous investment in new disciplines and talented personnel, which has enhanced PIMCO’s services to the Funds and has allowed PIMCO to introduce innovative new funds over time.
The Trustees considered information they had received about the steps that PIMCO has taken with respect to active management of counterparty risk, such as implementing procedures requiring daily collateral adjustments and frequent communication between credit analysts and the Counterparty Risk Committee, which oversees counterparty risk on a firm-wide basis, continually evaluating requests to add or remove approved counterparties as market needs and conditions warrant. The Trustees also considered that PIMCO has continued to strengthen the process it uses to assess the financial stability of counterparties with which the Funds do business, to manage collateral and to protect the Funds from an unforeseen deterioration in the creditworthiness of trading counterparties. The Trustees noted that, consistent with its fiduciary duty, PIMCO executes transactions through a competitive best execution process and uses only those counterparties that meet its stringent and monitored criteria. The Trustees considered that PIMCO’s collateral management team utilizes a counterparty risk system to analyze portfolio level exposure and collateral being exchanged with counterparties.
In addition, the Trustees considered new services and service enhancements that PIMCO has implemented since the Board renewed the Agreements in 2015, including, but not limited to: continuing enhancement of analytics and technology systems; enhancing data processing and security and development tools and applications; continuing investment in its enterprise risk management function, including PIMCO’s cybersecurity program; building specialized talent in the PIMCO Global Advisory Board and continuing to hire new portfolio managers; continuing to expand the Funds Business Group global operating model; developing a website monitoring application to ensure accurate data content; engaging a third-party to perform an independent assessment of the application utilized for income servicing and enhancing the application to provide portfolio managers with more timely and high quality quarterly reporting; establishing a Fund Treasurer’s Office to provide, among other things, guidance with respect to industry and regulatory initiatives; advancing technology developers in global tax management application; conducting an end-to-end review of State Street IMS, custodian and pricing vendor connectivity in connection with the pricing function; continuing development of Pricing Portal to improve identification and feedback to vendors regarding valuations; continuing extensive pricing vendor due diligence; and partnering with Boston Financial Data Services, Inc. to establish secondary call center and other call center enhancements.
Similarly, the Board considered the sub-advisory services provided by Research Affiliates to the RAE Fundamental Funds. The Board also considered Research Affiliates’ supervisory responsibilities with respect to Parametric’s provision of portfolio implementation services to the RAE Fundamental Funds. The Board further considered the depth and quality of Research Affiliates’ investment management and research capabilities, the experience and capabilities of its portfolio management personnel and, in particular, the experience and capabilities of Robert Arnott, Research Affiliates’ principal, and the overall financial strength of the organization.
In addition, the Board considered the portfolio implementation and other operational services provided by Parametric to the RAE Fundamental Funds by, among other things, effecting portfolio transactions on behalf of the RAE Fundamental Funds. The Board also considered information about Parametric’s personnel responsible for providing services under the Portfolio Implementation Agreement. The Board also considered the nature and quality of Parametric’s trading, risk management, and compliance capabilities and resources, including Parametric’s policies and procedures regarding trade aggregation and allocation, which are integral parts of its role as portfolio implementer.
Ultimately, the Board concluded that the nature, extent and quality of services provided by PIMCO under the Agreements, by Research Affiliates under the Sub-Advisory Agreement, and by Parametric under
(Unaudited)
the Portfolio Implementation Agreement are likely to continue to benefit the Funds and their shareholders, as applicable.
(b) Other Services: The Board also considered the nature, extent and quality of supervisory and administrative services provided by PIMCO to the Funds under the Supervision and Administration Agreement. The Board considered the terms of the Supervision and Administration Agreement, under which the Trust pays for the supervisory and administrative services provided pursuant to that agreement under what is essentially an all-in fee structure (the “unified fee”). In return, PIMCO provides or procures certain supervisory and administrative services and bears the costs of various third party services required by the Funds, including audit, custodial, portfolio accounting, legal, transfer agency, sub-accounting and printing costs. The Board noted that the scope and complexity, as well as the costs, of the supervisory and administrative services provided by PIMCO under the Supervision and Administration Agreement continue to increase. The Board considered PIMCO’s provision of supervisory and administrative services and its supervision of the Trust’s third party service providers to assure that these service providers continue to provide a high level of service relative to alternatives available in the market.
Ultimately, the Board concluded that the nature, extent and quality of the services provided by PIMCO has benefited, and will likely continue to benefit, the Funds and their shareholders.
3. INVESTMENT PERFORMANCE
The Board reviewed information from PIMCO concerning the Funds’ performance, as available, over short- and long-term periods ended May 31, 2016 and other performance data, as available, over short- and long-term periods ended June 30, 2016 (the “PIMCO Report”) and from Lipper concerning the Funds’ performance, as available, over short- and long-term periods ended May 31, 2016 (the “Lipper Report”). The Board considered information regarding both the short- and long-term investment performance of each Fund relative to its peer group and relevant benchmark index as provided to the Board in advance of each of its quarterly meetings throughout the year, including the PIMCO Report and Lipper Report, which were provided in advance of the August 17, 2016 meeting.
The Board noted that, according to Lipper, certain Funds had underperformed in comparison to their respective peer groups or benchmark indexes, or both, over short- and long-term periods. The Board discussed with PIMCO the reasons for the underperformance of certain Funds over short- and long-term periods. The Board also discussed actions that have been taken by PIMCO to attempt to improve performance and took note of PIMCO’s plans to monitor performance going forward.
The Board ultimately concluded, within the context of all of its considerations in connection with the Agreements, that PIMCO’s performance record and process in managing the Funds indicates that its continued management is likely to benefit the Funds and their shareholders, and merits the approval of the renewal of the Agreements.
4. ADVISORY FEES, SUPERVISORY AND ADMINISTRATIVE FEES AND TOTAL EXPENSES
The Board considered that PIMCO seeks to price funds to scale at the outset with reference to the total expense ratios of the respective Lipper median, if available, while providing a premium for innovative investment offerings. PIMCO reported to the Board that, in proposing fees for any Fund or class of shares, it considers a number of factors, including, but not limited to, the type and complexity of the services provided, the cost of providing services, the risk assumed by PIMCO in the development of products and the provision of services, the impact on potential returns from different levels of fees, the competitive marketplace for financial products, and the attractiveness of potential Fund returns to current and potential investors. Fees charged to or proposed for different Funds for advisory services and supervisory and administrative services may vary in light of these various factors. The Board also considered that PIMCO reviews the Funds’ fee levels and carefully considers reductions where appropriate.
The Board reviewed the advisory fees, supervisory and administrative fees and total expenses of the Funds (each as a percentage of average net assets) and compared such amounts with the average and median fee and expense levels of other similar funds. The Board also reviewed information relating to the sub-advisory fees paid to Research Affiliates with respect to applicable Funds, taking into account that PIMCO compensates Research Affiliates from the advisory fees paid by such Funds to PIMCO. With respect to advisory fees, the Board reviewed data from Lipper that compared the average and median advisory fees of other funds in a “Peer Group” of comparable funds, as well as the universe of other similar funds. The Board noted that PIMCO had contractually agreed, through October 31, 2016, to reduce its advisory fee by amounts shown in the table below:
| | | | |
PIMCO Dividend and Income Fund | | | 0.16% | |
PIMCO RAE Fundamental Emerging Markets Fund | | | 0.20% | |
PIMCO RAE Fundamental Global Fund | | | 0.20% | |
PIMCO RAE Fundamental Global ex-US Fund | | | 0.20% | |
PIMCO RAE Fundamental International Fund | | | 0.10% | |
PIMCO RAE Fundamental US Fund | | | 0.10% | |
PIMCO RAE Fundamental US Small Fund | | | 0.10% | |
The Board further noted that the PIMCO Global Dividend Fund, PIMCO Balanced Income Fund, PIMCO U.S. Dividend Fund and PIMCO International Dividend Fund are expected to liquidate on August 26, 2016.
| | | | | | |
| | SEMIANNUAL REPORT | | DECEMBER 31, 2016 | | 93 |
Approval of Investment Advisory Contract and Other Agreements (Cont.)
The Board also reviewed data comparing the Funds’ advisory fees to the standard and negotiated fee rates PIMCO charges to separate accounts and to other sub-advised clients with similar investment strategies, including differences in advisory services provided. The Board discussed comparisons of fees for Funds with fees for separate accounts and/or PIMCO private/alternative funds with similar investment strategies, noting that for certain Funds, there were no appropriate comparisons because PIMCO did not manage comparable separate accounts at the time that the Board considered the Agreements. The Board noted that the advisory fees (or management fees, where applicable) for most Funds were similar to the fee rates charged to other investment companies with the same investment strategies as the Funds.
Regarding advisory fees charged by PIMCO in its capacity as sub-adviser to third-party/unaffiliated funds, the Trustees took into account that such fees may be lower than the fees charged by PIMCO to serve as adviser to the Funds. The Trustees also took into account that there are various reasons for any such differences in fees, including, but not limited to, the fact that PIMCO may be subject to varying levels of entrepreneurial risk and regulatory requirements, differing legal liabilities on a contract-by-contract basis and different servicing requirements when PIMCO does not serve as the sponsor of a fund and is not principally responsible for all aspects of a fund’s investment program and operations as compared to when PIMCO serves as investment adviser and sponsor. In considering the fees paid by the Funds, the Board noted that retail investors in the Funds receive the benefit of PIMCO’s advisory services at the same advisory fee rates as institutional investors in the Funds.
The Board considered the Funds’ supervisory and administrative fees, comparing them to similar funds in the report supplied by Lipper. The Board also considered that as the Funds’ business has become increasingly complex and the number of Funds has grown over time, PIMCO has provided an increasingly broad array of fund supervisory and administrative functions. In addition, the Board considered the Trust’s unified fee structure, under which the Trust pays for the supervisory and administrative services it requires for one set fee. In return for this unified fee, PIMCO provides or procures supervisory and administrative services and bears the costs of various third party services required by the Funds, including audit, custodial, portfolio accounting, legal, transfer agency, sub-accounting and printing costs. The Board further considered that many other funds pay for comparable services separately, and thus it is difficult to directly compare the Trust’s unified supervisory and administrative fees with the fees paid by other funds for administrative services alone. The Board also considered that the unified supervisory and administrative fee leads to Fund fees that are fixed, rather than variable. The Board noted that, although the unified fee structure does not have
breakpoints, it implicitly reflects economies of scale by fixing the absolute level of Fund fees at competitive levels even if the Funds’ operating costs rise when assets remain flat or decrease. The Board considered that the Funds’ unified fee structure meant that fees were not impacted by recent outflows in certain Funds, unlike funds without a unified fee structure, which may see increased expense ratios when fixed costs are passed through to a smaller asset base. The Board concluded that the Funds’ supervisory and administrative fees were reasonable in relation to the value of the services provided, including the services provided to different classes of shareholders, and that the expenses assumed contractually by PIMCO under the Supervision and Administration Agreement represent, in effect, a cap on overall Fund fees, which is beneficial to the Funds and their shareholders.
The Board noted that the Funds’ total expenses continued to be generally in line with those of competitor funds. The Board discussed with PIMCO those Funds and/or classes of Funds that had above median total expenses. Upon comparing the Funds’ total expenses to other funds in the “Peer Groups” provided by Lipper, the Board found total expenses of each Fund to be reasonable.
The Trustees also considered the advisory fees charged to the Funds that operate as funds of funds (the “Funds of Funds”) and the advisory services provided in exchange for such fees. The Trustees determined that such services were in addition to the advisory services provided to the underlying funds in which the Funds of Funds may invest and, therefore, such services were not duplicative of the advisory services provided to the underlying funds. The Board also considered the various fee waiver agreements in place for the Funds of Funds.
Based on the information presented by PIMCO, Research Affiliates, Parametric and Lipper, members of the Board determined, in the exercise of their business judgment, that the level of the advisory fees and supervisory and administrative fees charged by PIMCO under the Agreements, as well as the total expenses of each Fund, are reasonable.
5. ADVISER COSTS, LEVEL OF PROFITS AND ECONOMIES OF SCALE
The Board reviewed information regarding PIMCO’s costs of providing services to the Funds as a whole and considered that PIMCO did not derive any profit from the Funds during the calendar year ended December 31, 2015, and does not expect to derive any profit from the Funds during the calendar year ended December 31, 2016. The Board noted that it had received information regarding the structure and manner in which PIMCO’s investment professionals were compensated, and PIMCO’s view of the relationship of such compensation to the attraction and retention of quality personnel. The Board considered PIMCO’s need to invest in technology, cyber security, information security, shareholder privacy, business continuity planning, infrastructure and staff to reinforce and offer new services and to accommodate changing regulatory requirements.
(Unaudited)
With respect to potential economies of scale, the Board noted that PIMCO shares the benefits of economies of scale with the Funds and their shareholders in a number of ways, including through the pricing of Funds to scale from inception and the enhancement of services provided to the Funds in return for fees paid. In considering the advisory fees paid by the Funds, the Board also noted that retail investors in the Funds receive the benefit of PIMCO’s advisory services at the same advisory fee rates as institutional investors in the Funds. The Board considered that the Funds’ unified fee rates had been set competitively and/or priced to scale from inception and continued to be competitive compared with peers. The Board also considered that the unified fee is a transparent means of informing a Fund’s shareholders of the fees associated with the Fund, and that the Fund bears certain expenses that are not covered by the advisory fee or the unified fee. The Board further considered the challenges that arise when managing large funds, which can result in certain “diseconomies” of scale.
The Trustees considered that the unified fee has provided inherent economies of scale because a Fund maintains competitive fixed unified fees even if the particular Fund’s assets decline and/or operating costs rise. The Trustees further considered that, in contrast, breakpoints may be a proxy for charging higher fees on lower asset levels and that when a fund’s assets decline, breakpoints may reverse, which causes expense ratios to increase. The Trustees also considered that, unlike the Funds’ unified fee structure, funds with “pass through” administrative fee structures may experience increased expense ratios when fixed dollar fees are charged against declining fund assets. The Trustees also considered that the unified fee protects shareholders from a rise in operating costs that may result from, among other things, PIMCO’s investments in various business enhancements and infrastructure, including those referenced above. The Trustees noted that PIMCO’s investments in these areas are extensive.
The Board concluded that the Funds’ cost structures were reasonable and that the unified fee structure inherently involves the sharing of economies of scale between PIMCO and each of the Funds, to the benefit of their respective shareholders.
6. ANCILLARY BENEFITS
The Board considered other benefits realized by PIMCO and its affiliates as a result of PIMCO’s relationship with the Trust, including possible ancillary benefits to PIMCO’s institutional investment management business due to the reputation and market penetration of the Trust. The Board also considered that affiliates of PIMCO provide distribution and shareholder services to the Funds and their shareholders, for which they may be compensated through distribution and servicing fees paid pursuant to the Funds’ Rule 12b-1 plans or otherwise. The Board reviewed PIMCO’s soft dollar policies and procedures, noting that while PIMCO has the authority to receive the benefit of research provided by
broker-dealers executing portfolio transactions on behalf of the Funds, it has adopted a policy not to enter into contractual soft dollar arrangements.
7. CONCLUSIONS
Based on their review, including their comprehensive consideration and evaluation of each of the broad factors and information summarized above, the Independent Trustees and the Board as a whole concluded that the nature, extent and quality of the services rendered to the Funds by PIMCO, Research Affiliates and Parametric supported the renewal of the Agreements, the Sub-Advisory Agreement, and the Portfolio Implementation Agreement. The Independent Trustees and the Board as a whole concluded that the Agreements, the Sub-Advisory Agreement, and the Portfolio Implementation Agreement continued to be fair and reasonable to the Funds and their shareholders, that the Funds’ shareholders received reasonable value in return for the fees paid to PIMCO by the Funds under the Agreements, the fees paid to Research Affiliates by PIMCO under the Sub-Advisory Agreement, and the fees paid to Parametric by PIMCO under the Portfolio Implementation Agreement, and that the renewal of the Agreements, the Sub-Advisory Agreement, and the Portfolio Implementation Agreement was in the best interests of the Funds and their shareholders.
| | | | | | |
| | SEMIANNUAL REPORT | | DECEMBER 31, 2016 | | 95 |
Results of Proxy Voting
(Unaudited)
At a special meeting of shareholders held on August 26, 2016, PIMCO sought approval from shareholders of the PIMCO Dividend and Income Fund to enter into a sub-advisory agreement with Research Affiliates, LLC and a portfolio implementation agreement with Research Affiliates, LLC and Parametric Portfolio Associations, LLC.
The results of the proxy solicitation on the preceding matters were as follows:
PIMCO Equity Series
Proposal 1: To approve a sub-advisory agreement for the Fund
| | | | |
| For* | | Against* | | Abstain* |
| 15,360,763 | | 855,024 | | 944,023 |
Proposal 2: To approve a portfolio implementation agreement for the Fund
| | | | |
| For* | | Against* | | Abstain* |
| 15,324,472 | | 909,160 | | 956,177 |
| * | Certain series of the Trust’s shares were held by PIMCO-advised funds or accounts for which PIMCO had discretionary authority to vote proxies. Accordingly, PIMCO voted such shares in proportion to the votes of all other Trust shareholders voting on the proposal. |
General Information
Investment Adviser and Administrator
Pacific Investment Management Company LLC
650 Newport Center Drive
Newport Beach, CA 92660
Distributor
PIMCO Investments LLC
1633 Broadway
New York, NY 10019
Custodian
State Street Bank and Trust Company
801 Pennsylvania Avenue
Kansas City, MO 64105
Transfer Agent
Boston Financial Data Services
Institutional Class, Class P, Administrative Class, Class D
330 W. 9th Street, 5th Floor
Kansas City, MO 64105
Boston Financial Data Services
Class A, Class C, Class R
P.O. Box 55060
Boston, MA 02205-5060
Legal Counsel
Dechert LLP
1900 K Street, N.W.
Washington, D.C. 20006
Independent Registered Public Accounting Firm
PricewaterhouseCoopers LLP
1100 Walnut Street, Suite 1300
Kansas City, MO 64106
This report is submitted for the general information of the shareholders of the PIMCO Equity Series.

PES4002SAR_123116
The information required by this Item 2 is only required in an annual report on this Form N-CSR.
| Item 3. | Audit Committee Financial Expert. |
The information required by this Item 3 is only required in an annual report on this Form N-CSR.
| Item 4. | Principal Accountant Fees and Services. |
The information required by this Item 4 is only required in an annual report on this Form N-CSR.
| Item 5. | Audit Committee of Listed Registrants. |
The information required by this Item 5 is only required in an annual report on this Form N-CSR.
| Item 6. | Schedule of Investments. |
The Schedule of Investments is included as part of the reports to shareholders under Item 1.
| Item 7. | Disclosure of Proxy Voting Policies and Procedures for Closed-End Management Investment Companies. |
Not applicable.
| Item 8. | Portfolio Managers of Closed-End Management Investment Companies. |
Not applicable.
| Item 9. | Purchases of Equity Securities by Closed-End Management Investment Company and Affiliated Purchasers. |
Not applicable.
| Item 10. | Submission of Matters to a Vote of Security Holders. |
There have been no material changes to the procedures by which shareholders may recommend nominees to the Trust’s Board of Trustees since the Trust last provided disclosure in response to this item.
| Item 11. | Controls and Procedures. |
(a) The principal executive officer and principal financial & accounting officer have concluded that the Registrant’s disclosure controls and procedures (as defined in Rule 30a-3(c) under the Investment Company Act of 1940, as amended (the “1940 Act”) (17 CFR 270.30a-3(c))), are effective based on their evaluation of these controls and procedures as of a date within 90 days of the filing date of this report.
(b) There were no changes in the Registrant’s internal control over financial reporting (as defined in Rule 30a-3(d) under the 1940 Act (17 CFR 270.30a-3(d))) that occurred during the last fiscal quarter of the period covered by this report that have materially affected, or are reasonably likely to materially affect, the Registrant’s internal control over financial reporting.
| | |
| (a)(1) | | Exhibit 99.CODE—Code of Ethics is not applicable for semiannual reports. |
| |
| (a)(2) | | Exhibit 99.CERT—Certifications pursuant to Section 302 of the Sarbanes-Oxley Act of 2002. |
| |
| (b) | | Exhibit 99.906CERT—Certifications pursuant to Section 906 of the Sarbanes-Oxley Act of 2002. |
Signatures
Pursuant to the requirements of the Securities Exchange Act of 1934 and the Investment Company Act of 1940, the registrant has duly caused this report to be signed on its behalf by the undersigned, thereunto duly authorized.
| | |
| PIMCO Equity Series |
| |
| By: | | /s/ Peter G. Strelow |
| | Peter G. Strelow |
| | President (Principal Executive Officer) |
| |
| Date: | | February 24, 2017 |
Pursuant to the requirements of the Securities Exchange Act of 1934 and the Investment Company Act of 1940, this report has been signed below by the following persons on behalf of the registrant and in the capacities and on the dates indicated.
| | |
By: | | /s/ Peter G. Strelow |
| | Peter G. Strelow |
| | President (Principal Executive Officer) |
| |
| Date: | | February 24, 2017 |
| |
By: | | /s/ Trent W. Walker |
| | Trent W. Walker |
| | Treasurer (Principal Financial & Accounting Officer) |
| |
| Date: | | February 24, 2017 |
