0001479360pimco:PIMCOINDEXMSCIEmergingMarketsValueIndex22504AdditionalIndexMember2017-03-310001479360pimco:PIMCOINDEXMSCIAllCountryWorldexUSValueIndex22513AdditionalIndexMember2020-07-310001479360pimco:PIMCOINDEXMSCIEAFEValueIndex22518AdditionalIndexMember2016-05-310001479360pimco:PIMCOINDEXRussell2000ValueIndex22526AdditionalIndexMember2014-11-300001479360pimco:PIMCOINDEXSP500Index22525BroadBasedIndexMember2022-07-310001479360pimco:PIMCOINDEXSP500Index22475BroadBasedIndexMember2021-08-310001479360pimco:C000150075Member2019-07-310001479360pimco:C000150089Member2017-05-310001479360pimco:PIMCOINDEXSPTargetDateRetirementIncomeIndex22490AdditionalIndexMember2019-04-30
UNITED STATES
SECURITIES AND EXCHANGE COMMISSION
Washington, D.C. 20549
FORM N-CSR
CERTIFIED SHAREHOLDER REPORT OF REGISTERED MANAGEMENT
INVESTMENT COMPANIES
Investment Company Act file number: 811-22375
PIMCO Equity Series
(Exact name of registrant as specified in charter)
650 Newport Center Drive, Newport Beach, CA 92660
(Address of principal executive office)
Bijal Y. Parikh
Treasurer (Principal Financial & Accounting Officer)
PIMCO Equity Series
650 Newport Center Drive, Newport Beach, CA 92660
(Name and address of agent for service)
Copies to:
Adam T. Teufel
Dechert LLP
1900 K Street, N.W.
Washington, D.C. 20006
Registrant’s telephone number, including area code: (888) 877-4626
Date of fiscal year end: June 30
Date of reporting period: June 30, 2024
Form N-CSR is to be used by management investment companies to file reports with the Commission not later than 10 days after the transmission to stockholders of any report that is required to be transmitted to stockholders under Rule 30e-1 under the Investment Company Act of 1940 (17 CFR 270.30e-1). The Commission may use the information provided on Form N-CSR in its regulatory, disclosure review, inspection, and policymaking roles.
A registrant is required to disclose the information specified by Form N-CSR, and the Commission will make this information public. A registrant is not required to respond to the collection of information contained in Form N-CSR unless the Form displays a currently valid Office of Management and Budget (“OMB”) control number. Please direct comments concerning the accuracy of the information collection burden estimate and any suggestions for reducing the burden to Secretary, Securities and Exchange Commission, 100 F Street, NE, Washington, DC 20549-1090. The OMB has reviewed this collection of information under the clearance requirements of 44 U.S.C. § 3507.
| Item 1. | Reports to Stockholders. |
| | (a) | The following is a copy of the reports transmitted to shareholders pursuant to Rule 30e-1 under the Investment Company Act of 1940, as amended (the “Act”) (17 CFR 270.30e-1). |
| | • | | PIMCO Dividend and Income Fund Class A |
| | • | | PIMCO Dividend and Income Fund Class C |
| | • | | PIMCO Dividend and Income Fund Institutional Class |
| | • | | PIMCO Dividend and Income Fund I-2 |
| | • | | PIMCO REALPATH® Blend Income Fund Class A |
| | • | | PIMCO REALPATH® Blend Income Fund Institutional Class |
| | • | | PIMCO REALPATH® Blend 2025 Fund Class A |
| | • | | PIMCO REALPATH® Blend 2025 Fund Institutional Class |
| | • | | PIMCO REALPATH® Blend 2030 Fund Class A |
| | • | | PIMCO REALPATH® Blend 2030 Fund Institutional Class |
| | • | | PIMCO REALPATH® Blend 2035 Fund Class A |
| | • | | PIMCO REALPATH® Blend 2035 Fund Institutional Class |
| | • | | PIMCO REALPATH® Blend 2040 Fund Class A |
| | • | | PIMCO REALPATH® Blend 2040 Fund Institutional Class |
| | • | | PIMCO REALPATH® Blend 2045 Fund Class A |
| | • | | PIMCO REALPATH® Blend 2045 Fund Institutional Class |
| | • | | PIMCO REALPATH® Blend 2050 Fund Class A |
| | • | | PIMCO REALPATH® Blend 2050 Fund Institutional Class |
| | • | | PIMCO REALPATH® Blend 2055 Fund Class A |
| | • | | PIMCO REALPATH® Blend 2055 Fund Institutional Class |
| | • | | PIMCO REALPATH® Blend 2060 Fund Class A |
| | • | | PIMCO REALPATH® Blend 2060 Fund Institutional Class |
| | • | | PIMCO REALPATH Blend 2065 Fund Class A |
| | • | | PIMCO REALPATH Blend 2065 Fund Institutional Class |
| | • | | PIMCO RAE US Fund Class A |
| | • | | PIMCO RAE US Fund Institutional Class |
| | • | | PIMCO RAE US Small Fund Class A |
| | • | | PIMCO RAE US Small Fund I-2 |
| | • | | PIMCO RAE US Small Fund Institutional Class |
| | • | | PIMCO RAE Emerging Markets Fund Class A |
| | • | | PIMCO RAE Emerging Markets Fund I-2 |
| | • | | PIMCO RAE Emerging Markets Fund Institutional Class |
| | • | | PIMCO RAE International Fund Class A |
| | • | | PIMCO RAE International Fund I-2 |
| | • | | PIMCO RAE International Fund Institutional Class |
| | • | | PIMCO RAE Global ex-US Fund Class A |
| | • | | PIMCO RAE Global ex-US Fund I-2 |
| | • | | PIMCO RAE Global ex-US Fund Institutional Class |
| | • | | PIMCO RAFI Dynamic Multi-Factor U.S. Equity ETF |
| | • | | PIMCO RAFI Dynamic Multi-Factor Emerging Markets Equity ETF |
| | • | | PIMCO RAFI Dynamic Multi-Factor International Equity ETF |
| | • | | PIMCO RAFI ESG U.S. ETF |
| | (b) | Not applicable to the Registrant. |
PIMCO Dividend and Income Fund
Annual Shareholder Report | June 30, 2024
This annual shareholder report contains important information about the PIMCO Dividend and Income Fund (the "Fund") for the period of July 1, 2023 to June 30, 2024 (the "reporting period"). You can find additional information about the Fund at www.pimco.com/literature. You can also request this information by contacting us at 888.87.PIMCO (888.877.4626).
This report describes changes to the Fund that occurred during the reporting period.
What were the Fund costs for the last year?
(based on a hypothetical $10,000 investment)
| Class Name | Cost of a $10,000 investment | Costs paid as a percentage of a $10,000 investment |
|---|
| Class A | $124 | 1.17% |
How did the Fund perform during the reporting period and what affected its performance?
The following affected performance (on a gross basis) during the reporting period:
• Long exposure to U.S. equities contributed to returns, as prices rose.
• Long exposure to eurozone equities contributed to returns, as prices rose.
• Long exposure to Taiwanese equities contributed to returns, as prices rose.
• Long exposure to U.S. duration detracted from returns, as U.S. yields rose.
• Long exposure to the Japanese yen ("JPY") detracted from returns, as the JPY depreciated against the U.S. dollar ("USD").
• Long exposure to the Brazilian real ("BRL") detracted from performance, as the BRL depreciated against the USD.
In addition to the Fund's performance, the tables in this section include performance of: (i) a broad-based securities market index (i.e., a regulatory index) and (ii) one or more supplemental index(es). Effective July 24, 2024, the Fund's regulatory index is the Bloomberg U.S. Aggregate Index. The Fund's regulatory index is shown in connection with certain regulatory requirements to provide a broad measure of market performance.
The table below illustrates cumulative returns for the 10-year period ended June 30, 2024 or the life of the Fund, if shorter. Cumulative returns are based on a hypothetical initial investment equal to the greater of either $10,000 or the investment minimum applicable to the share class.
Cumulative Returns Based on $10,000 Investment
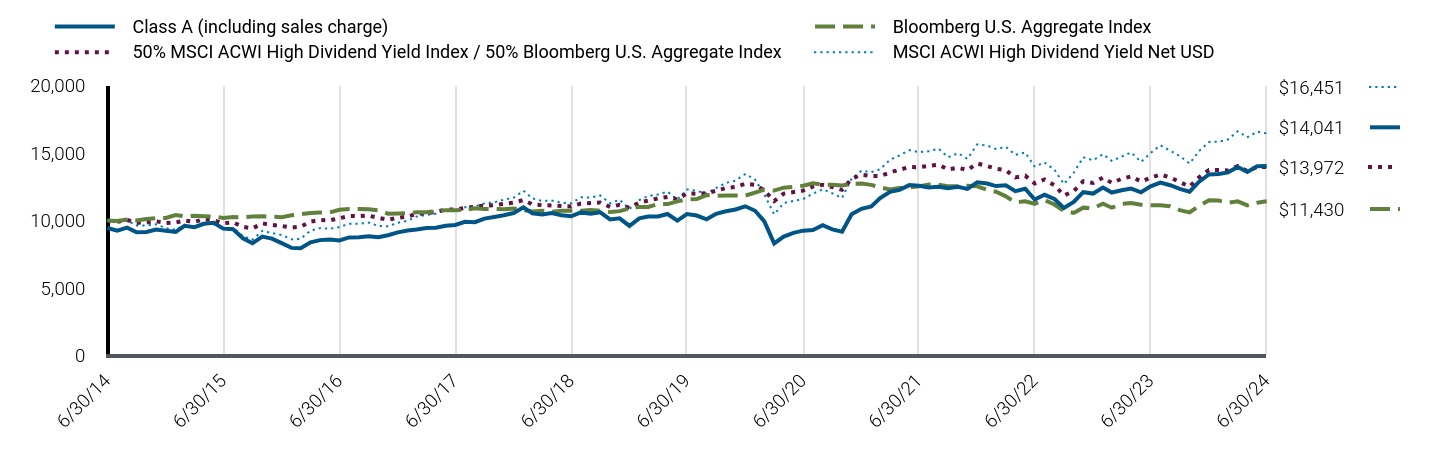
| Class A (including sales charge) | Bloomberg U.S. Aggregate Index | 50% MSCI ACWI High Dividend Yield Index / 50% Bloomberg U.S. Aggregate Index | MSCI ACWI High Dividend Yield Net USD |
|---|
| 6/30/14 | $9,452 | $10,000 | $10,000 | $10,000 |
| 7/31/14 | $9,262 | $9,975 | $9,912 | $9,848 |
| 8/31/14 | $9,476 | $10,085 | $10,046 | $10,007 |
| 9/30/14 | $9,134 | $10,017 | $9,830 | $9,645 |
| 10/31/14 | $9,152 | $10,115 | $9,879 | $9,646 |
| 11/30/14 | $9,333 | $10,187 | $9,954 | $9,724 |
| 12/31/14 | $9,250 | $10,196 | $9,815 | $9,443 |
| 1/31/15 | $9,165 | $10,410 | $9,853 | $9,318 |
| 2/28/15 | $9,610 | $10,312 | $10,006 | $9,696 |
| 3/31/15 | $9,517 | $10,360 | $9,901 | $9,447 |
| 4/30/15 | $9,761 | $10,323 | $10,104 | $9,868 |
| 5/31/15 | $9,842 | $10,298 | $10,022 | $9,732 |
| 6/30/15 | $9,408 | $10,186 | $9,800 | $9,407 |
| 7/31/15 | $9,363 | $10,257 | $9,866 | $9,469 |
| 8/31/15 | $8,693 | $10,242 | $9,538 | $8,851 |
| 9/30/15 | $8,321 | $10,311 | $9,427 | $8,585 |
| 10/31/15 | $8,818 | $10,313 | $9,785 | $9,236 |
| 11/30/15 | $8,665 | $10,286 | $9,688 | $9,078 |
| 12/31/15 | $8,329 | $10,252 | $9,597 | $8,937 |
| 1/31/16 | $7,981 | $10,393 | $9,486 | $8,608 |
| 2/29/16 | $7,952 | $10,467 | $9,545 | $8,652 |
| 3/31/16 | $8,387 | $10,563 | $9,927 | $9,266 |
| 4/30/16 | $8,555 | $10,604 | $10,043 | $9,447 |
| 5/31/16 | $8,606 | $10,607 | $10,017 | $9,395 |
| 6/30/16 | $8,526 | $10,797 | $10,172 | $9,518 |
| 7/31/16 | $8,757 | $10,865 | $10,341 | $9,773 |
| 8/31/16 | $8,774 | $10,853 | $10,330 | $9,764 |
| 9/30/16 | $8,843 | $10,847 | $10,371 | $9,847 |
| 10/31/16 | $8,774 | $10,764 | $10,200 | $9,598 |
| 11/30/16 | $8,920 | $10,509 | $10,067 | $9,574 |
| 12/31/16 | $9,126 | $10,524 | $10,211 | $9,835 |
| 1/31/17 | $9,265 | $10,544 | $10,303 | $9,994 |
| 2/28/17 | $9,334 | $10,615 | $10,493 | $10,294 |
| 3/31/17 | $9,444 | $10,610 | $10,558 | $10,428 |
| 4/30/17 | $9,470 | $10,692 | $10,640 | $10,509 |
| 5/31/17 | $9,618 | $10,774 | $10,821 | $10,786 |
| 6/30/17 | $9,680 | $10,763 | $10,812 | $10,778 |
| 7/31/17 | $9,907 | $10,809 | $10,942 | $10,992 |
| 8/31/17 | $9,881 | $10,906 | $11,022 | $11,053 |
| 9/30/17 | $10,149 | $10,854 | $11,104 | $11,271 |
| 10/31/17 | $10,272 | $10,861 | $11,149 | $11,355 |
| 11/30/17 | $10,395 | $10,847 | $11,236 | $11,547 |
| 12/31/17 | $10,562 | $10,897 | $11,331 | $11,690 |
| 1/31/18 | $10,980 | $10,771 | $11,519 | $12,212 |
| 2/28/18 | $10,535 | $10,669 | $11,195 | $11,642 |
| 3/31/18 | $10,451 | $10,737 | $11,141 | $11,454 |
| 4/30/18 | $10,567 | $10,658 | $11,115 | $11,485 |
| 5/31/18 | $10,389 | $10,734 | $11,073 | $11,317 |
| 6/30/18 | $10,318 | $10,720 | $11,047 | $11,277 |
| 7/31/18 | $10,605 | $10,723 | $11,265 | $11,720 |
| 8/31/18 | $10,506 | $10,792 | $11,299 | $11,716 |
| 9/30/18 | $10,609 | $10,722 | $11,333 | $11,861 |
| 10/31/18 | $10,086 | $10,638 | $11,013 | $11,285 |
| 11/30/18 | $10,168 | $10,701 | $11,173 | $11,545 |
| 12/31/18 | $9,606 | $10,898 | $10,943 | $10,858 |
| 1/31/19 | $10,168 | $11,014 | $11,335 | $11,520 |
| 2/28/19 | $10,306 | $11,007 | $11,479 | $11,821 |
| 3/31/19 | $10,302 | $11,219 | $11,641 | $11,926 |
| 4/30/19 | $10,486 | $11,221 | $11,747 | $12,141 |
| 5/31/19 | $9,998 | $11,421 | $11,570 | $11,560 |
| 6/30/19 | $10,485 | $11,564 | $12,019 | $12,311 |
| 7/31/19 | $10,373 | $11,589 | $11,982 | $12,209 |
| 8/31/19 | $10,094 | $11,890 | $12,033 | $11,997 |
| 9/30/19 | $10,504 | $11,826 | $12,208 | $12,410 |
| 10/31/19 | $10,690 | $11,862 | $12,414 | $12,791 |
| 11/30/19 | $10,821 | $11,856 | $12,490 | $12,955 |
| 12/31/19 | $11,060 | $11,848 | $12,726 | $13,452 |
| 1/31/20 | $10,726 | $12,076 | $12,648 | $13,028 |
| 2/29/20 | $9,945 | $12,293 | $12,228 | $11,929 |
| 3/31/20 | $8,315 | $12,221 | $11,441 | $10,464 |
| 4/30/20 | $8,821 | $12,438 | $11,999 | $11,298 |
| 5/31/20 | $9,097 | $12,496 | $12,110 | $11,455 |
| 6/30/20 | $9,256 | $12,575 | $12,219 | $11,589 |
| 7/31/20 | $9,304 | $12,762 | $12,523 | $11,992 |
| 8/31/20 | $9,657 | $12,659 | $12,642 | $12,317 |
| 9/30/20 | $9,354 | $12,652 | $12,488 | $12,023 |
| 10/31/20 | $9,172 | $12,596 | $12,277 | $11,670 |
| 11/30/20 | $10,465 | $12,720 | $13,094 | $13,111 |
| 12/31/20 | $10,871 | $12,737 | $13,390 | $13,685 |
| 1/31/21 | $11,047 | $12,646 | $13,294 | $13,587 |
| 2/28/21 | $11,663 | $12,463 | $13,301 | $13,797 |
| 3/31/21 | $12,127 | $12,308 | $13,561 | $14,508 |
| 4/30/21 | $12,274 | $12,405 | $13,762 | $14,825 |
| 5/31/21 | $12,627 | $12,445 | $13,966 | $15,215 |
| 6/30/21 | $12,578 | $12,533 | $13,948 | $15,069 |
| 7/31/21 | $12,450 | $12,673 | $14,053 | $15,127 |
| 8/31/21 | $12,509 | $12,649 | $14,132 | $15,326 |
| 9/30/21 | $12,393 | $12,539 | $13,777 | $14,689 |
| 10/31/21 | $12,503 | $12,536 | $13,915 | $14,987 |
| 11/30/21 | $12,343 | $12,573 | $13,743 | $14,573 |
| 12/31/21 | $12,837 | $12,541 | $14,228 | $15,638 |
| 1/31/22 | $12,746 | $12,271 | $14,037 | $15,555 |
| 2/28/22 | $12,553 | $12,134 | $13,840 | $15,293 |
| 3/31/22 | $12,618 | $11,797 | $13,724 | $15,460 |
| 4/30/22 | $12,181 | $11,349 | $13,198 | $14,863 |
| 5/31/22 | $12,354 | $11,422 | $13,323 | $15,047 |
| 6/30/22 | $11,552 | $11,243 | $12,750 | $13,991 |
| 7/31/22 | $11,909 | $11,518 | $13,047 | $14,301 |
| 8/31/22 | $11,603 | $11,192 | $12,621 | $13,771 |
| 9/30/22 | $10,938 | $10,709 | $11,860 | $12,704 |
| 10/31/22 | $11,381 | $10,570 | $12,175 | $13,543 |
| 11/30/22 | $12,102 | $10,959 | $12,912 | $14,686 |
| 12/31/22 | $12,001 | $10,909 | $12,787 | $14,466 |
| 1/31/23 | $12,450 | $11,245 | $13,180 | $14,912 |
| 2/28/23 | $12,076 | $10,954 | $12,792 | $14,419 |
| 3/31/23 | $12,248 | $11,232 | $13,091 | $14,728 |
| 4/30/23 | $12,367 | $11,300 | $13,271 | $15,043 |
| 5/31/23 | $12,097 | $11,177 | $12,888 | $14,339 |
| 6/30/23 | $12,530 | $11,137 | $13,163 | $15,002 |
| 7/31/23 | $12,812 | $11,130 | $13,409 | $15,573 |
| 8/31/23 | $12,617 | $11,059 | $13,193 | $15,170 |
| 9/30/23 | $12,350 | $10,778 | $12,856 | $14,781 |
| 10/31/23 | $12,142 | $10,607 | $12,512 | $14,224 |
| 11/30/23 | $12,876 | $11,088 | $13,203 | $15,150 |
| 12/31/23 | $13,412 | $11,512 | $13,746 | $15,815 |
| 1/31/24 | $13,446 | $11,481 | $13,739 | $15,843 |
| 2/29/24 | $13,569 | $11,318 | $13,710 | $15,999 |
| 3/31/24 | $13,973 | $11,423 | $14,035 | $16,612 |
| 4/30/24 | $13,600 | $11,134 | $13,669 | $16,164 |
| 5/31/24 | $14,029 | $11,323 | $13,961 | $16,581 |
| 6/30/24 | $14,041 | $11,430 | $13,972 | $16,451 |
The table below shows the average annual total returns of the Fund, a regulatory index, and one or more supplemental index(es) for certain periods ended June 30, 2024.
Average Annual Total Returns (%)
| Class/Index Name | 1 Year | 5 Years | 10 Years |
|---|
| Class A (excluding sales charge) | 12.06% | 6.02% | 4.04% |
| Class A (including sales charge) | 5.91% | 4.82% | 3.45% |
| Bloomberg U.S. Aggregate Index | 2.63% | (0.23%) | 1.35% |
| 50% MSCI ACWI High Dividend Yield Index / 50% Bloomberg U.S. Aggregate Index | 6.15% | 3.06% | 3.40% |
| MSCI ACWI High Dividend Yield Net USD | 9.66% | 5.97% | 5.10% |
All Fund returns are net of fees and expenses and include applicable fee waivers and/or expense limitations. Absent any applicable fee waivers and/or expense limitations, performance would have been lower and there can be no assurance that any such waivers or limitations will continue in the future.
Performance quoted represents past performance. Past performance is not a guarantee or a reliable indicator of future results.Current performance may be lower or higher than performance shown. Investment return and the principal value of an investment will fluctuate. Shares may be worth more or less than original cost when redeemed. Returns shown do not reflect the deduction of taxes that a shareholder would pay on Fund distributions or the redemption of Fund shares.Differences in the Fund’s performance versus an index and related attribution information with respect to particular categories of securities or individual positions may be attributable, in part, to differences in the pricing methodologies used by the Fund and the index. The Cumulative Returns chart and Average Annual Total Returns table reflect any sales load that would have applied at the time of purchase or any Contingent Deferred Sales Charge (“CDSC”) that would have applied if a full redemption occurred on the last business day of the period shown in the Cumulative Returns chart. Class A shares are subject to an initial sales charge. A CDSC may be imposed in certain circumstances on Class A shares that are purchased without an initial sales charge and then redeemed during the first 12 months after purchase. For performance current to the most recent month-end, visit www.pimco.com/literature or via 888.87.PIMCO (888.877.4626).
Key Fund StatisticsFootnote Reference* (as of the end of the reporting period)
| Total Net Assets | $171,410 |
| # of Portfolio Holdings | 1,002 |
| Portfolio Turnover Rate | 408% |
| Total Net Advisory Fees Paid During the Reporting Period | $747 |
| Footnote | Description |
Footnote* | Dollar amounts displayed in 000's |
What did the Fund invest in?
Sector Allocation (% of Net Assets)Footnote Reference*
| U.S. Government Agencies | 29.6% |
| Asset-Backed Securities | 14.1% |
| U.S. Treasury Obligations | 10.8% |
| Consumer Staples | 9.8% |
| Non-Agency Mortgage-Backed Securities | 9.7% |
| Financials | 9.1% |
| Industrials | 7.1% |
| Health Care | 6.7% |
| Information Technology | 5.7% |
| Real Estate | 5.2% |
| Energy | 4.1% |
| Materials | 3.8% |
| Short-Term Instruments | 3.4% |
| Banking & Finance | 3.3% |
| Other | 6.0% |
| Other Investments | 1.8% |
| Other Assets and Liabilities, Net | (30.2%) |
| Total | 100.0% |
| Footnote | Description |
Footnote* | % of Net Assets includes derivatives instruments, if any, valued at the value used for determining the Fund’s net asset value. The notional exposure of such derivatives investments therefore may be greater than what is depicted. |
This is a summary of certain changes and planned changes of the Fund since the beginning of the reporting period. For more information, you may refer to the Fund's next prospectus, which we expect to be available by October 31, 2024 or upon request at 888.87.PIMCO (888.877.4626).
Changes to Total Annual Fund Operating Expenses. Annual fund operating expenses increased during the year by 0.07% as a result of higher expenses related to interest.
For additional information about the Fund, including the Fund's prospectus, financial information, holdings and proxy voting information, please visit www.pimco.com/literature or contact 888.87.PIMCO (888.877.4626). For tax information about the Fund, please visit: https://www.pimco.com/tax.
PIMCO Dividend and Income Fund
Annual Shareholder Report |
June 30, 2024
PIMCO Dividend and Income Fund
Annual Shareholder Report | June 30, 2024
This annual shareholder report contains important information about the PIMCO Dividend and Income Fund (the "Fund") for the period of July 1, 2023 to June 30, 2024 (the "reporting period"). You can find additional information about the Fund at www.pimco.com/literature. You can also request this information by contacting us at 888.87.PIMCO (888.877.4626).
This report describes changes to the Fund that occurred during the reporting period.
What were the Fund costs for the last year?
(based on a hypothetical $10,000 investment)
| Class Name | Cost of a $10,000 investment | Costs paid as a percentage of a $10,000 investment |
|---|
| Class C | $203 | 1.92% |
How did the Fund perform during the reporting period and what affected its performance?
The following affected performance (on a gross basis) during the reporting period:
• Long exposure to U.S. equities contributed to returns, as prices rose.
• Long exposure to eurozone equities contributed to returns, as prices rose.
• Long exposure to Taiwanese equities contributed to returns, as prices rose.
• Long exposure to U.S. duration detracted from returns, as U.S. yields rose.
• Long exposure to the Japanese yen ("JPY") detracted from returns, as the JPY depreciated against the U.S. dollar ("USD").
• Long exposure to the Brazilian real ("BRL") detracted from performance, as the BRL depreciated against the USD.
In addition to the Fund's performance, the tables in this section include performance of: (i) a broad-based securities market index (i.e., a regulatory index) and (ii) one or more supplemental index(es). Effective July 24, 2024, the Fund's regulatory index is the Bloomberg U.S. Aggregate Index. The Fund's regulatory index is shown in connection with certain regulatory requirements to provide a broad measure of market performance.
The table below illustrates cumulative returns for the 10-year period ended June 30, 2024 or the life of the Fund, if shorter. Cumulative returns are based on a hypothetical initial investment equal to the greater of either $10,000 or the investment minimum applicable to the share class.
Cumulative Returns Based on $10,000 Investment
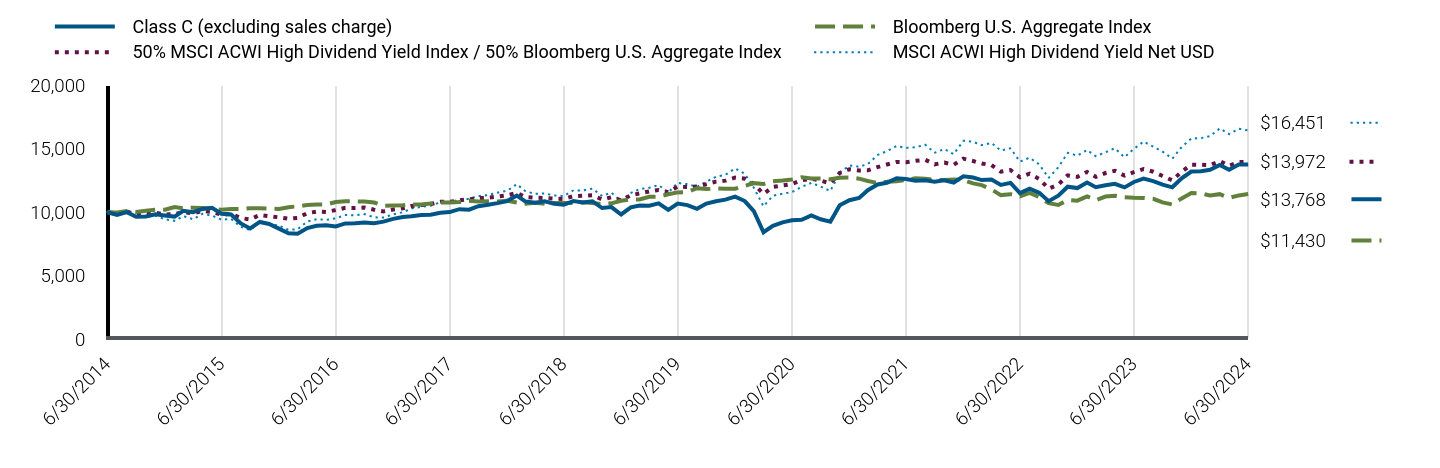
| Class C (excluding sales charge) | Bloomberg U.S. Aggregate Index | 50% MSCI ACWI High Dividend Yield Index / 50% Bloomberg U.S. Aggregate Index | MSCI ACWI High Dividend Yield Net USD |
|---|
| 6/30/2014 | $10,000 | $10,000 | $10,000 | $10,000 |
| 7/31/2014 | $9,792 | $9,975 | $9,912 | $9,848 |
| 8/31/2014 | $10,005 | $10,085 | $10,046 | $10,007 |
| 9/30/2014 | $9,643 | $10,017 | $9,830 | $9,645 |
| 10/31/2014 | $9,656 | $10,115 | $9,879 | $9,646 |
| 11/30/2014 | $9,842 | $10,187 | $9,954 | $9,724 |
| 12/31/2014 | $9,748 | $10,196 | $9,815 | $9,443 |
| 1/31/2015 | $9,652 | $10,410 | $9,853 | $9,318 |
| 2/28/2015 | $10,116 | $10,312 | $10,006 | $9,696 |
| 3/31/2015 | $10,004 | $10,360 | $9,901 | $9,447 |
| 4/30/2015 | $10,254 | $10,323 | $10,104 | $9,868 |
| 5/31/2015 | $10,341 | $10,298 | $10,022 | $9,732 |
| 6/30/2015 | $9,877 | $10,186 | $9,800 | $9,407 |
| 7/31/2015 | $9,823 | $10,257 | $9,866 | $9,469 |
| 8/31/2015 | $9,112 | $10,242 | $9,538 | $8,851 |
| 9/30/2015 | $8,716 | $10,311 | $9,427 | $8,585 |
| 10/31/2015 | $9,231 | $10,313 | $9,785 | $9,236 |
| 11/30/2015 | $9,074 | $10,286 | $9,688 | $9,078 |
| 12/31/2015 | $8,707 | $10,252 | $9,597 | $8,937 |
| 1/31/2016 | $8,337 | $10,393 | $9,486 | $8,608 |
| 2/29/2016 | $8,301 | $10,467 | $9,545 | $8,652 |
| 3/31/2016 | $8,751 | $10,563 | $9,927 | $9,266 |
| 4/30/2016 | $8,930 | $10,604 | $10,043 | $9,447 |
| 5/31/2016 | $8,969 | $10,607 | $10,017 | $9,395 |
| 6/30/2016 | $8,882 | $10,797 | $10,172 | $9,518 |
| 7/31/2016 | $9,115 | $10,865 | $10,341 | $9,773 |
| 8/31/2016 | $9,133 | $10,853 | $10,330 | $9,764 |
| 9/30/2016 | $9,196 | $10,847 | $10,371 | $9,847 |
| 10/31/2016 | $9,124 | $10,764 | $10,200 | $9,598 |
| 11/30/2016 | $9,258 | $10,509 | $10,067 | $9,574 |
| 12/31/2016 | $9,471 | $10,524 | $10,211 | $9,835 |
| 1/31/2017 | $9,615 | $10,544 | $10,303 | $9,994 |
| 2/28/2017 | $9,678 | $10,615 | $10,493 | $10,294 |
| 3/31/2017 | $9,787 | $10,610 | $10,558 | $10,428 |
| 4/30/2017 | $9,805 | $10,692 | $10,640 | $10,509 |
| 5/31/2017 | $9,950 | $10,774 | $10,821 | $10,786 |
| 6/30/2017 | $10,011 | $10,763 | $10,812 | $10,778 |
| 7/31/2017 | $10,237 | $10,809 | $10,942 | $10,992 |
| 8/31/2017 | $10,201 | $10,906 | $11,022 | $11,053 |
| 9/30/2017 | $10,472 | $10,854 | $11,104 | $11,271 |
| 10/31/2017 | $10,590 | $10,861 | $11,149 | $11,355 |
| 11/30/2017 | $10,717 | $10,847 | $11,236 | $11,547 |
| 12/31/2017 | $10,877 | $10,897 | $11,331 | $11,690 |
| 1/31/2018 | $11,308 | $10,771 | $11,519 | $12,212 |
| 2/28/2018 | $10,840 | $10,669 | $11,195 | $11,642 |
| 3/31/2018 | $10,748 | $10,737 | $11,141 | $11,454 |
| 4/30/2018 | $10,858 | $10,658 | $11,115 | $11,485 |
| 5/31/2018 | $10,665 | $10,734 | $11,073 | $11,317 |
| 6/30/2018 | $10,583 | $10,720 | $11,047 | $11,277 |
| 7/31/2018 | $10,878 | $10,723 | $11,265 | $11,720 |
| 8/31/2018 | $10,768 | $10,792 | $11,299 | $11,716 |
| 9/30/2018 | $10,867 | $10,722 | $11,333 | $11,861 |
| 10/31/2018 | $10,330 | $10,638 | $11,013 | $11,285 |
| 11/30/2018 | $10,404 | $10,701 | $11,173 | $11,545 |
| 12/31/2018 | $9,821 | $10,898 | $10,943 | $10,858 |
| 1/31/2019 | $10,387 | $11,014 | $11,335 | $11,520 |
| 2/28/2019 | $10,529 | $11,007 | $11,479 | $11,821 |
| 3/31/2019 | $10,510 | $11,219 | $11,641 | $11,926 |
| 4/30/2019 | $10,699 | $11,221 | $11,747 | $12,141 |
| 5/31/2019 | $10,189 | $11,421 | $11,570 | $11,560 |
| 6/30/2019 | $10,676 | $11,564 | $12,019 | $12,311 |
| 7/31/2019 | $10,562 | $11,589 | $11,982 | $12,209 |
| 8/31/2019 | $10,269 | $11,890 | $12,033 | $11,997 |
| 9/30/2019 | $10,679 | $11,826 | $12,208 | $12,410 |
| 10/31/2019 | $10,860 | $11,862 | $12,414 | $12,791 |
| 11/30/2019 | $10,992 | $11,856 | $12,490 | $12,955 |
| 12/31/2019 | $11,227 | $11,848 | $12,726 | $13,452 |
| 1/31/2020 | $10,880 | $12,076 | $12,648 | $13,028 |
| 2/29/2020 | $10,079 | $12,293 | $12,228 | $11,929 |
| 3/31/2020 | $8,420 | $12,221 | $11,441 | $10,464 |
| 4/30/2020 | $8,922 | $12,438 | $11,999 | $11,298 |
| 5/31/2020 | $9,202 | $12,496 | $12,110 | $11,455 |
| 6/30/2020 | $9,356 | $12,575 | $12,219 | $11,589 |
| 7/31/2020 | $9,404 | $12,762 | $12,523 | $11,992 |
| 8/31/2020 | $9,742 | $12,659 | $12,642 | $12,317 |
| 9/30/2020 | $9,439 | $12,652 | $12,488 | $12,023 |
| 10/31/2020 | $9,246 | $12,596 | $12,277 | $11,670 |
| 11/30/2020 | $10,551 | $12,720 | $13,094 | $13,111 |
| 12/31/2020 | $10,946 | $12,737 | $13,390 | $13,685 |
| 1/31/2021 | $11,123 | $12,646 | $13,294 | $13,587 |
| 2/28/2021 | $11,733 | $12,463 | $13,301 | $13,797 |
| 3/31/2021 | $12,186 | $12,308 | $13,561 | $14,508 |
| 4/30/2021 | $12,324 | $12,405 | $13,762 | $14,825 |
| 5/31/2021 | $12,678 | $12,445 | $13,966 | $15,215 |
| 6/30/2021 | $12,614 | $12,533 | $13,948 | $15,069 |
| 7/31/2021 | $12,475 | $12,673 | $14,053 | $15,127 |
| 8/31/2021 | $12,525 | $12,649 | $14,132 | $15,326 |
| 9/30/2021 | $12,412 | $12,539 | $13,777 | $14,689 |
| 10/31/2021 | $12,511 | $12,536 | $13,915 | $14,987 |
| 11/30/2021 | $12,342 | $12,573 | $13,743 | $14,573 |
| 12/31/2021 | $12,827 | $12,541 | $14,228 | $15,638 |
| 1/31/2022 | $12,736 | $12,271 | $14,037 | $15,555 |
| 2/28/2022 | $12,533 | $12,134 | $13,840 | $15,293 |
| 3/31/2022 | $12,584 | $11,797 | $13,724 | $15,460 |
| 4/30/2022 | $12,148 | $11,349 | $13,198 | $14,863 |
| 5/31/2022 | $12,311 | $11,422 | $13,323 | $15,047 |
| 6/30/2022 | $11,508 | $11,243 | $12,750 | $13,991 |
| 7/31/2022 | $11,854 | $11,518 | $13,047 | $14,301 |
| 8/31/2022 | $11,529 | $11,192 | $12,621 | $13,771 |
| 9/30/2022 | $10,873 | $10,709 | $11,860 | $12,704 |
| 10/31/2022 | $11,304 | $10,570 | $12,175 | $13,543 |
| 11/30/2022 | $12,011 | $10,959 | $12,912 | $14,686 |
| 12/31/2022 | $11,904 | $10,909 | $12,787 | $14,466 |
| 1/31/2023 | $12,339 | $11,245 | $13,180 | $14,912 |
| 2/28/2023 | $11,968 | $10,954 | $12,792 | $14,419 |
| 3/31/2023 | $12,131 | $11,232 | $13,091 | $14,728 |
| 4/30/2023 | $12,238 | $11,300 | $13,271 | $15,043 |
| 5/31/2023 | $11,960 | $11,177 | $12,888 | $14,339 |
| 6/30/2023 | $12,386 | $11,137 | $13,163 | $15,002 |
| 7/31/2023 | $12,655 | $11,130 | $13,409 | $15,573 |
| 8/31/2023 | $12,451 | $11,059 | $13,193 | $15,170 |
| 9/30/2023 | $12,180 | $10,778 | $12,856 | $14,781 |
| 10/31/2023 | $11,964 | $10,607 | $12,512 | $14,224 |
| 11/30/2023 | $12,678 | $11,088 | $13,203 | $15,150 |
| 12/31/2023 | $13,211 | $11,512 | $13,746 | $15,815 |
| 1/31/2024 | $13,233 | $11,481 | $13,739 | $15,843 |
| 2/29/2024 | $13,343 | $11,318 | $13,710 | $15,999 |
| 3/31/2024 | $13,729 | $11,423 | $14,035 | $16,612 |
| 4/30/2024 | $13,352 | $11,134 | $13,669 | $16,164 |
| 5/31/2024 | $13,762 | $11,323 | $13,961 | $16,581 |
| 6/30/2024 | $13,768 | $11,430 | $13,972 | $16,451 |
The table below shows the average annual total returns of the Fund, a regulatory index, and one or more supplemental index(es) for certain periods ended June 30, 2024.
Average Annual Total Returns (%)
| Class/Index Name | 1 Year | 5 Years | 10 Years |
|---|
| Class C (excluding sales charge) | 11.16% | 5.22% | 3.25% |
| Class C (including sales charge) | 10.16% | 5.22% | 3.25% |
| Bloomberg U.S. Aggregate Index | 2.63% | (0.23%) | 1.35% |
| 50% MSCI ACWI High Dividend Yield Index / 50% Bloomberg U.S. Aggregate Index | 6.15% | 3.06% | 3.40% |
| MSCI ACWI High Dividend Yield Net USD | 9.66% | 5.97% | 5.10% |
All Fund returns are net of fees and expenses and include applicable fee waivers and/or expense limitations. Absent any applicable fee waivers and/or expense limitations, performance would have been lower and there can be no assurance that any such waivers or limitations will continue in the future.
Performance quoted represents past performance. Past performance is not a guarantee or a reliable indicator of future results.Current performance may be lower or higher than performance shown. Investment return and the principal value of an investment will fluctuate. Shares may be worth more or less than original cost when redeemed. Returns shown do not reflect the deduction of taxes that a shareholder would pay on Fund distributions or the redemption of Fund shares.Differences in the Fund’s performance versus an index and related attribution information with respect to particular categories of securities or individual positions may be attributable, in part, to differences in the pricing methodologies used by the Fund and the index. The Cumulative Returns chart and Average Annual Total Returns table reflect any Contingent Deferred Sales Charge (“CDSC”) that would have applied if a full redemption occurred on the last business day of the period shown in the Cumulative Returns chart. Class C shares are subject to a CDSC, which may apply if the shares are redeemed in the first year. For performance current to the most recent month-end, visit www.pimco.com/literature or via 888.87.PIMCO (888.877.4626).
Key Fund StatisticsFootnote Reference* (as of the end of the reporting period)
| Total Net Assets | $171,410 |
| # of Portfolio Holdings | 1,002 |
| Portfolio Turnover Rate | 408% |
| Total Net Advisory Fees Paid During the Reporting Period | $747 |
| Footnote | Description |
Footnote* | Dollar amounts displayed in 000's |
What did the Fund invest in?
Sector Allocation (% of Net Assets)Footnote Reference*
| U.S. Government Agencies | 29.6% |
| Asset-Backed Securities | 14.1% |
| U.S. Treasury Obligations | 10.8% |
| Consumer Staples | 9.8% |
| Non-Agency Mortgage-Backed Securities | 9.7% |
| Financials | 9.1% |
| Industrials | 7.1% |
| Health Care | 6.7% |
| Information Technology | 5.7% |
| Real Estate | 5.2% |
| Energy | 4.1% |
| Materials | 3.8% |
| Short-Term Instruments | 3.4% |
| Banking & Finance | 3.3% |
| Other | 6.0% |
| Other Investments | 1.8% |
| Other Assets and Liabilities, Net | (30.2%) |
| Total | 100.0% |
| Footnote | Description |
Footnote* | % of Net Assets includes derivatives instruments, if any, valued at the value used for determining the Fund’s net asset value. The notional exposure of such derivatives investments therefore may be greater than what is depicted. |
This is a summary of certain changes and planned changes of the Fund since the beginning of the reporting period. For more information, you may refer to the Fund's next prospectus, which we expect to be available by October 31, 2024 or upon request at 888.87.PIMCO (888.877.4626).
Changes to Total Annual Fund Operating Expenses. Annual fund operating expenses increased during the year by 0.07% as a result of higher expenses related to interest.
For additional information about the Fund, including the Fund's prospectus, financial information, holdings and proxy voting information, please visit www.pimco.com/literature or contact 888.87.PIMCO (888.877.4626). For tax information about the Fund, please visit: https://www.pimco.com/tax.
PIMCO Dividend and Income Fund
Annual Shareholder Report |
June 30, 2024
Institutional Class: PQIIX
PIMCO Dividend and Income Fund
Annual Shareholder Report | June 30, 2024
This annual shareholder report contains important information about the PIMCO Dividend and Income Fund (the "Fund") for the period of July 1, 2023 to June 30, 2024 (the "reporting period"). You can find additional information about the Fund at www.pimco.com/literature. You can also request this information by contacting us at 888.87.PIMCO (888.877.4626).
This report describes changes to the Fund that occurred during the reporting period.
What were the Fund costs for the last year?
(based on a hypothetical $10,000 investment)
| Class Name | Cost of a $10,000 investment | Costs paid as a percentage of a $10,000 investment |
|---|
| Institutional Class | $87 | 0.82% |
How did the Fund perform during the reporting period and what affected its performance?
The following affected performance (on a gross basis) during the reporting period:
• Long exposure to U.S. equities contributed to returns, as prices rose.
• Long exposure to eurozone equities contributed to returns, as prices rose.
• Long exposure to Taiwanese equities contributed to returns, as prices rose.
• Long exposure to U.S. duration detracted from returns, as U.S. yields rose.
• Long exposure to the Japanese yen ("JPY") detracted from returns, as the JPY depreciated against the U.S. dollar ("USD").
• Long exposure to the Brazilian real ("BRL") detracted from performance, as the BRL depreciated against the USD.
In addition to the Fund's performance, the tables in this section include performance of: (i) a broad-based securities market index (i.e., a regulatory index) and (ii) one or more supplemental index(es). Effective July 24, 2024, the Fund's regulatory index is the Bloomberg U.S. Aggregate Index. The Fund's regulatory index is shown in connection with certain regulatory requirements to provide a broad measure of market performance.
The table below illustrates cumulative returns for the 10-year period ended June 30, 2024 or the life of the Fund, if shorter. Cumulative returns are based on a hypothetical initial investment equal to the greater of either $10,000 or the investment minimum applicable to the share class.
Cumulative Returns Based on $1,000,000 Investment
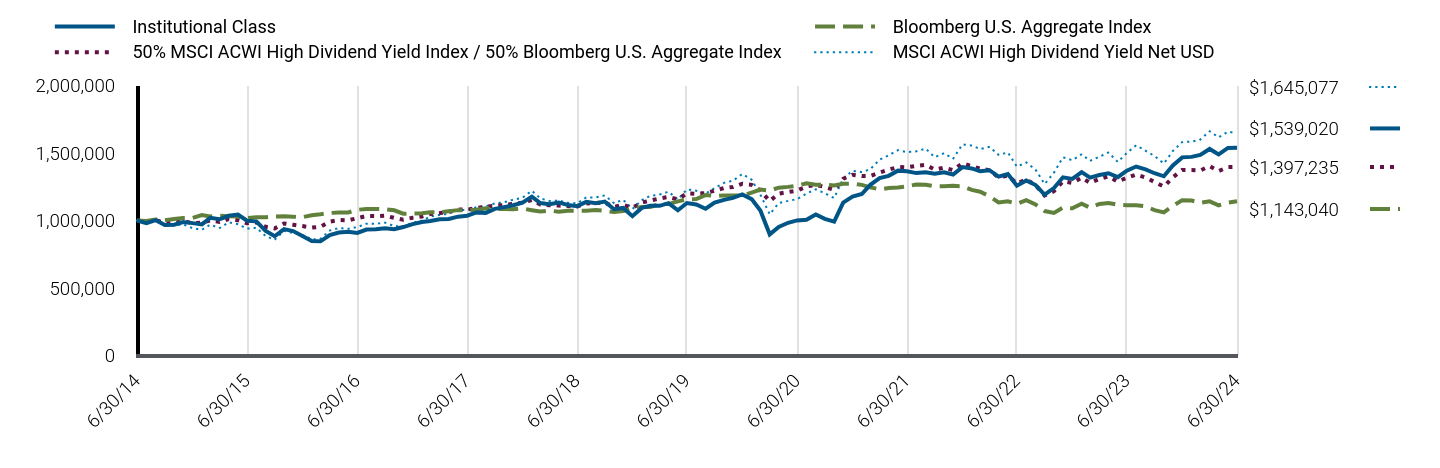
| Institutional Class | Bloomberg U.S. Aggregate Index | 50% MSCI ACWI High Dividend Yield Index / 50% Bloomberg U.S. Aggregate Index | MSCI ACWI High Dividend Yield Net USD |
|---|
| 6/30/14 | $1,000,000 | $1,000,000 | $1,000,000 | $1,000,000 |
| 7/31/14 | $980,951 | $997,491 | $991,153 | $984,814 |
| 8/31/14 | $1,003,134 | $1,008,504 | $1,004,637 | $1,000,737 |
| 9/30/14 | $967,168 | $1,001,660 | $983,043 | $964,513 |
| 10/31/14 | $969,457 | $1,011,503 | $987,935 | $964,632 |
| 11/30/14 | $988,970 | $1,018,679 | $995,425 | $972,414 |
| 12/31/14 | $981,285 | $1,019,632 | $981,505 | $944,306 |
| 1/31/15 | $971,753 | $1,041,013 | $985,296 | $931,802 |
| 2/28/15 | $1,020,044 | $1,031,225 | $1,000,625 | $969,555 |
| 3/31/15 | $1,009,651 | $1,036,013 | $990,130 | $944,717 |
| 4/30/15 | $1,035,749 | $1,032,296 | $1,010,398 | $986,783 |
| 5/31/15 | $1,044,713 | $1,029,810 | $1,002,214 | $973,174 |
| 6/30/15 | $998,946 | $1,018,581 | $980,019 | $940,684 |
| 7/31/15 | $994,514 | $1,025,661 | $986,641 | $946,854 |
| 8/31/15 | $923,580 | $1,024,189 | $953,774 | $885,133 |
| 9/30/15 | $884,424 | $1,031,116 | $942,667 | $858,530 |
| 10/31/15 | $937,503 | $1,031,288 | $978,468 | $923,595 |
| 11/30/15 | $922,340 | $1,028,563 | $968,790 | $907,767 |
| 12/31/15 | $885,782 | $1,025,239 | $959,716 | $893,693 |
| 1/31/16 | $849,336 | $1,039,348 | $948,641 | $860,773 |
| 2/29/16 | $846,548 | $1,046,721 | $954,458 | $865,221 |
| 3/31/16 | $893,061 | $1,056,324 | $992,664 | $926,554 |
| 4/30/16 | $911,249 | $1,060,379 | $1,004,310 | $944,735 |
| 5/31/16 | $916,867 | $1,060,651 | $1,001,681 | $939,546 |
| 6/30/16 | $908,473 | $1,079,709 | $1,017,201 | $951,781 |
| 7/31/16 | $934,064 | $1,086,535 | $1,034,077 | $977,344 |
| 8/31/16 | $936,806 | $1,085,292 | $1,032,968 | $976,363 |
| 9/30/16 | $944,118 | $1,084,656 | $1,037,072 | $984,696 |
| 10/31/16 | $936,806 | $1,076,360 | $1,019,972 | $959,756 |
| 11/30/16 | $952,343 | $1,050,900 | $1,006,667 | $957,416 |
| 12/31/16 | $974,137 | $1,052,382 | $1,021,085 | $983,492 |
| 1/31/17 | $989,878 | $1,054,447 | $1,030,344 | $999,397 |
| 2/28/17 | $997,286 | $1,061,534 | $1,049,288 | $1,029,432 |
| 3/31/17 | $1,009,715 | $1,060,978 | $1,055,836 | $1,042,821 |
| 4/30/17 | $1,012,504 | $1,069,165 | $1,064,024 | $1,050,947 |
| 5/31/17 | $1,029,240 | $1,077,395 | $1,082,094 | $1,078,555 |
| 6/30/17 | $1,035,782 | $1,076,310 | $1,081,192 | $1,077,838 |
| 7/31/17 | $1,060,066 | $1,080,942 | $1,094,213 | $1,099,161 |
| 8/31/17 | $1,057,264 | $1,090,638 | $1,102,153 | $1,105,258 |
| 9/30/17 | $1,086,727 | $1,085,443 | $1,110,439 | $1,127,138 |
| 10/31/17 | $1,099,889 | $1,086,072 | $1,114,903 | $1,135,548 |
| 11/30/17 | $1,113,990 | $1,084,678 | $1,123,582 | $1,154,686 |
| 12/31/17 | $1,131,953 | $1,089,656 | $1,133,123 | $1,168,997 |
| 1/31/18 | $1,177,688 | $1,077,107 | $1,151,891 | $1,221,186 |
| 2/28/18 | $1,130,047 | $1,066,896 | $1,119,535 | $1,164,153 |
| 3/31/18 | $1,121,018 | $1,073,738 | $1,114,116 | $1,145,417 |
| 4/30/18 | $1,134,364 | $1,065,752 | $1,111,477 | $1,148,511 |
| 5/31/18 | $1,115,299 | $1,073,358 | $1,107,305 | $1,131,694 |
| 6/30/18 | $1,107,100 | $1,072,038 | $1,104,655 | $1,127,670 |
| 7/31/18 | $1,138,759 | $1,072,293 | $1,126,488 | $1,171,978 |
| 8/31/18 | $1,129,165 | $1,079,193 | $1,129,936 | $1,171,609 |
| 9/30/18 | $1,140,937 | $1,072,243 | $1,133,307 | $1,186,144 |
| 10/31/18 | $1,083,890 | $1,063,770 | $1,101,284 | $1,128,483 |
| 11/30/18 | $1,093,559 | $1,070,120 | $1,117,260 | $1,154,490 |
| 12/31/18 | $1,032,522 | $1,089,780 | $1,094,282 | $1,085,794 |
| 1/31/19 | $1,093,782 | $1,101,353 | $1,133,457 | $1,152,003 |
| 2/28/19 | $1,109,591 | $1,100,714 | $1,147,927 | $1,182,084 |
| 3/31/19 | $1,109,381 | $1,121,850 | $1,164,073 | $1,192,641 |
| 4/30/19 | $1,129,156 | $1,122,137 | $1,174,711 | $1,214,135 |
| 5/31/19 | $1,076,752 | $1,142,057 | $1,157,009 | $1,155,988 |
| 6/30/19 | $1,129,882 | $1,156,399 | $1,201,865 | $1,231,108 |
| 7/31/19 | $1,118,854 | $1,158,943 | $1,198,184 | $1,220,856 |
| 8/31/19 | $1,087,774 | $1,188,973 | $1,203,342 | $1,199,731 |
| 9/30/19 | $1,132,601 | $1,182,641 | $1,220,814 | $1,240,958 |
| 10/31/19 | $1,153,762 | $1,186,203 | $1,241,430 | $1,279,134 |
| 11/30/19 | $1,167,869 | $1,185,599 | $1,249,048 | $1,295,486 |
| 12/31/19 | $1,193,834 | $1,184,773 | $1,272,566 | $1,345,173 |
| 1/31/20 | $1,158,873 | $1,207,573 | $1,264,760 | $1,302,781 |
| 2/29/20 | $1,074,554 | $1,229,308 | $1,222,798 | $1,192,886 |
| 3/31/20 | $898,210 | $1,222,073 | $1,144,109 | $1,046,380 |
| 4/30/20 | $952,803 | $1,243,797 | $1,199,882 | $1,129,796 |
| 5/31/20 | $983,705 | $1,249,588 | $1,211,009 | $1,145,491 |
| 6/30/20 | $1,001,280 | $1,257,460 | $1,221,930 | $1,158,933 |
| 7/31/20 | $1,006,436 | $1,276,242 | $1,252,280 | $1,199,195 |
| 8/31/20 | $1,044,590 | $1,265,941 | $1,264,179 | $1,231,665 |
| 9/30/20 | $1,012,415 | $1,265,247 | $1,248,767 | $1,202,307 |
| 10/31/20 | $992,726 | $1,259,597 | $1,227,663 | $1,167,038 |
| 11/30/20 | $1,133,656 | $1,271,956 | $1,309,447 | $1,311,078 |
| 12/31/20 | $1,177,663 | $1,273,709 | $1,339,001 | $1,368,455 |
| 1/31/21 | $1,196,709 | $1,264,577 | $1,329,444 | $1,358,732 |
| 2/28/21 | $1,264,427 | $1,246,316 | $1,330,084 | $1,379,658 |
| 3/31/21 | $1,314,346 | $1,230,753 | $1,356,056 | $1,450,767 |
| 4/30/21 | $1,331,332 | $1,240,476 | $1,376,229 | $1,482,470 |
| 5/31/21 | $1,369,552 | $1,244,529 | $1,396,612 | $1,521,540 |
| 6/30/21 | $1,364,429 | $1,253,273 | $1,394,793 | $1,506,888 |
| 7/31/21 | $1,351,558 | $1,267,286 | $1,405,267 | $1,512,668 |
| 8/31/21 | $1,357,994 | $1,264,873 | $1,413,208 | $1,532,648 |
| 9/30/21 | $1,346,293 | $1,253,922 | $1,377,695 | $1,468,891 |
| 10/31/21 | $1,358,169 | $1,253,576 | $1,391,487 | $1,498,706 |
| 11/30/21 | $1,340,895 | $1,257,285 | $1,374,305 | $1,457,257 |
| 12/31/21 | $1,395,722 | $1,254,068 | $1,422,806 | $1,563,840 |
| 1/31/22 | $1,385,807 | $1,227,050 | $1,403,700 | $1,555,533 |
| 2/28/22 | $1,365,979 | $1,213,361 | $1,384,021 | $1,529,273 |
| 3/31/22 | $1,372,644 | $1,179,651 | $1,372,363 | $1,545,998 |
| 4/30/22 | $1,325,236 | $1,134,886 | $1,319,813 | $1,486,270 |
| 5/31/22 | $1,345,081 | $1,142,203 | $1,332,268 | $1,504,740 |
| 6/30/22 | $1,258,595 | $1,124,284 | $1,275,040 | $1,399,073 |
| 7/31/22 | $1,297,406 | $1,151,756 | $1,304,743 | $1,430,071 |
| 8/31/22 | $1,263,030 | $1,119,211 | $1,262,141 | $1,377,086 |
| 9/30/22 | $1,191,531 | $1,070,854 | $1,185,994 | $1,270,426 |
| 10/31/22 | $1,240,805 | $1,056,984 | $1,217,484 | $1,354,345 |
| 11/30/22 | $1,320,315 | $1,095,855 | $1,291,241 | $1,468,634 |
| 12/31/22 | $1,308,527 | $1,090,912 | $1,278,665 | $1,446,650 |
| 1/31/23 | $1,358,541 | $1,124,473 | $1,318,002 | $1,491,153 |
| 2/28/23 | $1,317,832 | $1,095,399 | $1,279,200 | $1,441,908 |
| 3/31/23 | $1,337,540 | $1,123,225 | $1,309,129 | $1,472,757 |
| 4/30/23 | $1,350,446 | $1,130,033 | $1,327,121 | $1,504,307 |
| 5/31/23 | $1,321,114 | $1,117,728 | $1,288,822 | $1,433,864 |
| 6/30/23 | $1,369,425 | $1,113,742 | $1,316,332 | $1,500,192 |
| 7/31/23 | $1,400,198 | $1,112,965 | $1,340,939 | $1,557,321 |
| 8/31/23 | $1,378,893 | $1,105,856 | $1,319,305 | $1,517,016 |
| 9/30/23 | $1,350,554 | $1,077,755 | $1,285,607 | $1,478,076 |
| 10/31/23 | $1,327,845 | $1,060,746 | $1,251,236 | $1,422,367 |
| 11/30/23 | $1,407,923 | $1,108,784 | $1,320,316 | $1,515,011 |
| 12/31/23 | $1,467,909 | $1,151,227 | $1,374,564 | $1,581,512 |
| 1/31/24 | $1,471,567 | $1,148,065 | $1,373,875 | $1,584,273 |
| 2/29/24 | $1,486,197 | $1,131,845 | $1,370,952 | $1,599,912 |
| 3/31/24 | $1,530,237 | $1,142,297 | $1,403,543 | $1,661,205 |
| 4/30/24 | $1,489,579 | $1,113,444 | $1,366,886 | $1,616,396 |
| 5/31/24 | $1,537,629 | $1,132,320 | $1,396,114 | $1,658,119 |
| 6/30/24 | $1,539,020 | $1,143,040 | $1,397,235 | $1,645,077 |
The table below shows the average annual total returns of the Fund, a regulatory index, and one or more supplemental index(es) for certain periods ended June 30, 2024.
Average Annual Total Returns (%)
| Class/Index Name | 1 Year | 5 Years | 10 Years |
|---|
| Institutional Class | 12.38% | 6.38% | 4.41% |
| Bloomberg U.S. Aggregate Index | 2.63% | (0.23%) | 1.35% |
| 50% MSCI ACWI High Dividend Yield Index / 50% Bloomberg U.S. Aggregate Index | 6.15% | 3.06% | 3.40% |
| MSCI ACWI High Dividend Yield Net USD | 9.66% | 5.97% | 5.10% |
All Fund returns are net of fees and expenses and include applicable fee waivers and/or expense limitations. Absent any applicable fee waivers and/or expense limitations, performance would have been lower and there can be no assurance that any such waivers or limitations will continue in the future.
Performance quoted represents past performance. Past performance is not a guarantee or a reliable indicator of future results.Current performance may be lower or higher than performance shown. Investment return and the principal value of an investment will fluctuate. Shares may be worth more or less than original cost when redeemed. Returns shown do not reflect the deduction of taxes that a shareholder would pay on Fund distributions or the redemption of Fund shares.Differences in the Fund’s performance versus an index and related attribution information with respect to particular categories of securities or individual positions may be attributable, in part, to differences in the pricing methodologies used by the Fund and the index. For performance current to the most recent month-end, visit www.pimco.com/literature or via 888.87.PIMCO (888.877.4626).
Key Fund StatisticsFootnote Reference* (as of the end of the reporting period)
| Total Net Assets | $171,410 |
| # of Portfolio Holdings | 1,002 |
| Portfolio Turnover Rate | 408% |
| Total Net Advisory Fees Paid During the Reporting Period | $747 |
| Footnote | Description |
Footnote* | Dollar amounts displayed in 000's |
What did the Fund invest in?
Sector Allocation (% of Net Assets)Footnote Reference*
| U.S. Government Agencies | 29.6% |
| Asset-Backed Securities | 14.1% |
| U.S. Treasury Obligations | 10.8% |
| Consumer Staples | 9.8% |
| Non-Agency Mortgage-Backed Securities | 9.7% |
| Financials | 9.1% |
| Industrials | 7.1% |
| Health Care | 6.7% |
| Information Technology | 5.7% |
| Real Estate | 5.2% |
| Energy | 4.1% |
| Materials | 3.8% |
| Short-Term Instruments | 3.4% |
| Banking & Finance | 3.3% |
| Other | 6.0% |
| Other Investments | 1.8% |
| Other Assets and Liabilities, Net | (30.2%) |
| Total | 100.0% |
| Footnote | Description |
Footnote* | % of Net Assets includes derivatives instruments, if any, valued at the value used for determining the Fund’s net asset value. The notional exposure of such derivatives investments therefore may be greater than what is depicted. |
This is a summary of certain changes and planned changes of the Fund since the beginning of the reporting period. For more information, you may refer to the Fund's next prospectus, which we expect to be available by October 31, 2024 or upon request at 888.87.PIMCO (888.877.4626).
Changes to Total Annual Fund Operating Expenses. Annual fund operating expenses increased during the year by 0.07% as a result of higher expenses related to interest.
For additional information about the Fund, including the Fund's prospectus, financial information, holdings and proxy voting information, please visit www.pimco.com/literature or contact 888.87.PIMCO (888.877.4626). For tax information about the Fund, please visit: https://www.pimco.com/tax.
Institutional Class: PQIIX
PIMCO Dividend and Income Fund
Annual Shareholder Report |
June 30, 2024
PIMCO Dividend and Income Fund
Annual Shareholder Report | June 30, 2024
This annual shareholder report contains important information about the PIMCO Dividend and Income Fund (the "Fund") for the period of July 1, 2023 to June 30, 2024 (the "reporting period"). You can find additional information about the Fund at www.pimco.com/literature. You can also request this information by contacting us at 888.87.PIMCO (888.877.4626).
This report describes changes to the Fund that occurred during the reporting period.
What were the Fund costs for the last year?
(based on a hypothetical $10,000 investment)
| Class Name | Cost of a $10,000 investment | Costs paid as a percentage of a $10,000 investment |
|---|
| I-2 | $98 | 0.92% |
How did the Fund perform during the reporting period and what affected its performance?
The following affected performance (on a gross basis) during the reporting period:
• Long exposure to U.S. equities contributed to returns, as prices rose.
• Long exposure to eurozone equities contributed to returns, as prices rose.
• Long exposure to Taiwanese equities contributed to returns, as prices rose.
• Long exposure to U.S. duration detracted from returns, as U.S. yields rose.
• Long exposure to the Japanese yen ("JPY") detracted from returns, as the JPY depreciated against the U.S. dollar ("USD").
• Long exposure to the Brazilian real ("BRL") detracted from performance, as the BRL depreciated against the USD.
In addition to the Fund's performance, the tables in this section include performance of: (i) a broad-based securities market index (i.e., a regulatory index) and (ii) one or more supplemental index(es). Effective July 24, 2024, the Fund's regulatory index is the Bloomberg U.S. Aggregate Index. The Fund's regulatory index is shown in connection with certain regulatory requirements to provide a broad measure of market performance.
The table below illustrates cumulative returns for the 10-year period ended June 30, 2024 or the life of the Fund, if shorter. Cumulative returns are based on a hypothetical initial investment equal to the greater of either $10,000 or the investment minimum applicable to the share class.
Cumulative Returns Based on $1,000,000 Investment
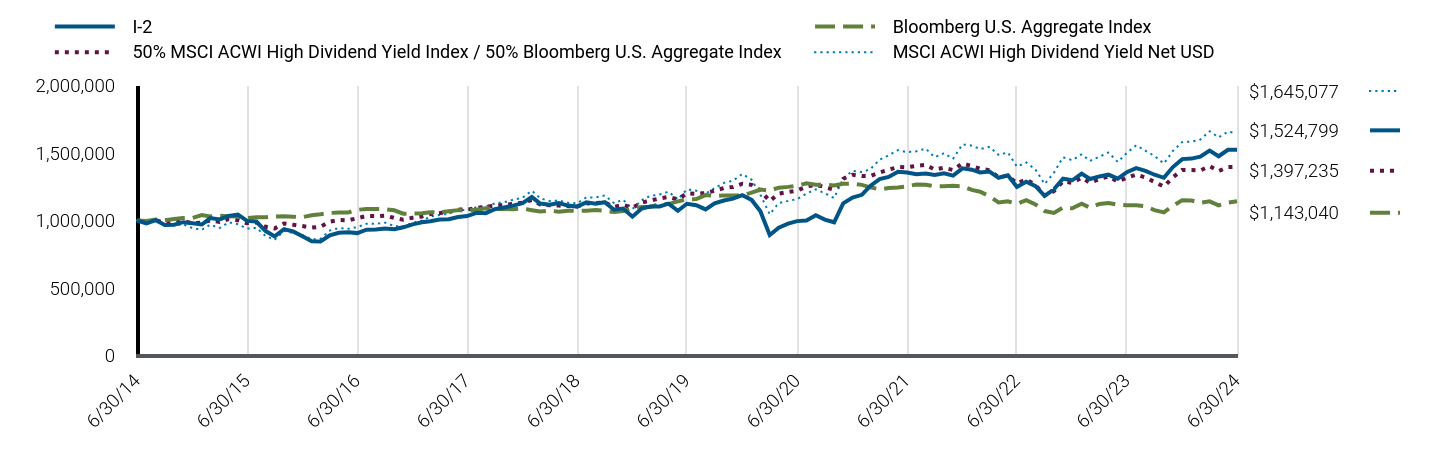
| I-2 | Bloomberg U.S. Aggregate Index | 50% MSCI ACWI High Dividend Yield Index / 50% Bloomberg U.S. Aggregate Index | MSCI ACWI High Dividend Yield Net USD |
|---|
| 6/30/14 | $1,000,000 | $1,000,000 | $1,000,000 | $1,000,000 |
| 7/31/14 | $980,119 | $997,491 | $991,153 | $984,814 |
| 8/31/14 | $1,002,959 | $1,008,504 | $1,004,637 | $1,000,737 |
| 9/30/14 | $966,942 | $1,001,660 | $983,043 | $964,513 |
| 10/31/14 | $969,056 | $1,011,503 | $987,935 | $964,632 |
| 11/30/14 | $988,384 | $1,018,679 | $995,425 | $972,414 |
| 12/31/14 | $979,876 | $1,019,632 | $981,505 | $944,306 |
| 1/31/15 | $971,068 | $1,041,013 | $985,296 | $931,802 |
| 2/28/15 | $1,018,420 | $1,031,225 | $1,000,625 | $969,555 |
| 3/31/15 | $1,008,756 | $1,036,013 | $990,130 | $944,717 |
| 4/30/15 | $1,034,729 | $1,032,296 | $1,010,398 | $986,783 |
| 5/31/15 | $1,043,593 | $1,029,810 | $1,002,214 | $973,174 |
| 6/30/15 | $997,820 | $1,018,581 | $980,019 | $940,684 |
| 7/31/15 | $993,308 | $1,025,661 | $986,641 | $946,854 |
| 8/31/15 | $922,436 | $1,024,189 | $953,774 | $885,133 |
| 9/30/15 | $883,276 | $1,031,116 | $942,667 | $858,530 |
| 10/31/15 | $936,161 | $1,031,288 | $978,468 | $923,595 |
| 11/30/15 | $920,147 | $1,028,563 | $968,790 | $907,767 |
| 12/31/15 | $883,832 | $1,025,239 | $959,716 | $893,693 |
| 1/31/16 | $847,041 | $1,039,348 | $948,641 | $860,773 |
| 2/29/16 | $845,079 | $1,046,721 | $954,458 | $865,221 |
| 3/31/16 | $891,413 | $1,056,324 | $992,664 | $926,554 |
| 4/30/16 | $909,473 | $1,060,379 | $1,004,310 | $944,735 |
| 5/31/16 | $914,104 | $1,060,651 | $1,001,681 | $939,546 |
| 6/30/16 | $907,499 | $1,079,709 | $1,017,201 | $951,781 |
| 7/31/16 | $933,011 | $1,086,535 | $1,034,077 | $977,344 |
| 8/31/16 | $934,834 | $1,085,292 | $1,032,968 | $976,363 |
| 9/30/16 | $942,123 | $1,084,656 | $1,037,072 | $984,696 |
| 10/31/16 | $935,745 | $1,076,360 | $1,019,972 | $959,756 |
| 11/30/16 | $950,323 | $1,050,900 | $1,006,667 | $957,416 |
| 12/31/16 | $972,280 | $1,052,382 | $1,021,085 | $983,492 |
| 1/31/17 | $987,962 | $1,054,447 | $1,030,344 | $999,397 |
| 2/28/17 | $995,342 | $1,061,534 | $1,049,288 | $1,029,432 |
| 3/31/17 | $1,007,531 | $1,060,978 | $1,055,836 | $1,042,821 |
| 4/30/17 | $1,010,309 | $1,069,165 | $1,064,024 | $1,050,947 |
| 5/31/17 | $1,026,978 | $1,077,395 | $1,082,094 | $1,078,555 |
| 6/30/17 | $1,033,300 | $1,076,310 | $1,081,192 | $1,077,838 |
| 7/31/17 | $1,057,482 | $1,080,942 | $1,094,213 | $1,099,161 |
| 8/31/17 | $1,054,691 | $1,090,638 | $1,102,153 | $1,105,258 |
| 9/30/17 | $1,083,846 | $1,085,443 | $1,110,439 | $1,127,138 |
| 10/31/17 | $1,096,949 | $1,086,072 | $1,114,903 | $1,135,548 |
| 11/30/17 | $1,110,989 | $1,084,678 | $1,123,582 | $1,154,686 |
| 12/31/17 | $1,128,578 | $1,089,656 | $1,133,123 | $1,168,997 |
| 1/31/18 | $1,174,101 | $1,077,107 | $1,151,891 | $1,221,186 |
| 2/28/18 | $1,126,682 | $1,066,896 | $1,119,535 | $1,164,153 |
| 3/31/18 | $1,117,713 | $1,073,738 | $1,114,116 | $1,145,417 |
| 4/30/18 | $1,130,047 | $1,065,752 | $1,111,477 | $1,148,511 |
| 5/31/18 | $1,111,071 | $1,073,358 | $1,107,305 | $1,131,694 |
| 6/30/18 | $1,103,593 | $1,072,038 | $1,104,655 | $1,127,670 |
| 7/31/18 | $1,135,097 | $1,072,293 | $1,126,488 | $1,171,978 |
| 8/31/18 | $1,124,595 | $1,079,193 | $1,129,936 | $1,171,609 |
| 9/30/18 | $1,136,086 | $1,072,243 | $1,133,307 | $1,186,144 |
| 10/31/18 | $1,080,292 | $1,063,770 | $1,101,284 | $1,128,483 |
| 11/30/18 | $1,088,950 | $1,070,120 | $1,117,260 | $1,154,490 |
| 12/31/18 | $1,028,912 | $1,089,780 | $1,094,282 | $1,085,794 |
| 1/31/19 | $1,089,840 | $1,101,353 | $1,133,457 | $1,152,003 |
| 2/28/19 | $1,104,581 | $1,100,714 | $1,147,927 | $1,182,084 |
| 3/31/19 | $1,104,323 | $1,121,850 | $1,164,073 | $1,192,641 |
| 4/30/19 | $1,124,974 | $1,122,137 | $1,174,711 | $1,214,135 |
| 5/31/19 | $1,072,856 | $1,142,057 | $1,157,009 | $1,155,988 |
| 6/30/19 | $1,124,661 | $1,156,399 | $1,201,865 | $1,231,108 |
| 7/31/19 | $1,113,703 | $1,158,943 | $1,198,184 | $1,220,856 |
| 8/31/19 | $1,082,822 | $1,188,973 | $1,203,342 | $1,199,731 |
| 9/30/19 | $1,127,227 | $1,182,641 | $1,220,814 | $1,240,958 |
| 10/31/19 | $1,148,250 | $1,186,203 | $1,241,430 | $1,279,134 |
| 11/30/19 | $1,162,265 | $1,185,599 | $1,249,048 | $1,295,486 |
| 12/31/19 | $1,188,669 | $1,184,773 | $1,272,566 | $1,345,173 |
| 1/31/20 | $1,152,927 | $1,207,573 | $1,264,760 | $1,302,781 |
| 2/29/20 | $1,069,189 | $1,229,308 | $1,222,798 | $1,192,886 |
| 3/31/20 | $893,890 | $1,222,073 | $1,144,109 | $1,046,380 |
| 4/30/20 | $948,096 | $1,243,797 | $1,199,882 | $1,129,796 |
| 5/31/20 | $977,756 | $1,249,588 | $1,211,009 | $1,145,491 |
| 6/30/20 | $996,087 | $1,257,460 | $1,221,930 | $1,158,933 |
| 7/31/20 | $1,001,206 | $1,276,242 | $1,252,280 | $1,199,195 |
| 8/31/20 | $1,039,084 | $1,265,941 | $1,264,179 | $1,231,665 |
| 9/30/20 | $1,006,963 | $1,265,247 | $1,248,767 | $1,202,307 |
| 10/31/20 | $987,420 | $1,259,597 | $1,227,663 | $1,167,038 |
| 11/30/20 | $1,127,305 | $1,271,956 | $1,309,447 | $1,311,078 |
| 12/31/20 | $1,170,594 | $1,273,709 | $1,339,001 | $1,368,455 |
| 1/31/21 | $1,190,541 | $1,264,577 | $1,329,444 | $1,358,732 |
| 2/28/21 | $1,256,682 | $1,246,316 | $1,330,084 | $1,379,658 |
| 3/31/21 | $1,306,993 | $1,230,753 | $1,356,056 | $1,450,767 |
| 4/30/21 | $1,322,791 | $1,240,476 | $1,376,229 | $1,482,470 |
| 5/31/21 | $1,361,759 | $1,244,529 | $1,396,612 | $1,521,540 |
| 6/30/21 | $1,356,254 | $1,253,273 | $1,394,793 | $1,506,888 |
| 7/31/21 | $1,342,426 | $1,267,286 | $1,405,267 | $1,512,668 |
| 8/31/21 | $1,348,808 | $1,264,873 | $1,413,208 | $1,532,648 |
| 9/30/21 | $1,336,939 | $1,253,922 | $1,377,695 | $1,468,891 |
| 10/31/21 | $1,349,784 | $1,253,576 | $1,391,487 | $1,498,706 |
| 11/30/21 | $1,332,658 | $1,257,285 | $1,374,305 | $1,457,257 |
| 12/31/21 | $1,386,642 | $1,254,068 | $1,422,806 | $1,563,840 |
| 1/31/22 | $1,376,815 | $1,227,050 | $1,403,700 | $1,555,533 |
| 2/28/22 | $1,356,070 | $1,213,361 | $1,384,021 | $1,529,273 |
| 3/31/22 | $1,362,605 | $1,179,651 | $1,372,363 | $1,545,998 |
| 4/30/22 | $1,316,711 | $1,134,886 | $1,319,813 | $1,486,270 |
| 5/31/22 | $1,335,287 | $1,142,203 | $1,332,268 | $1,504,740 |
| 6/30/22 | $1,248,661 | $1,124,284 | $1,275,040 | $1,399,073 |
| 7/31/22 | $1,287,132 | $1,151,756 | $1,304,743 | $1,430,071 |
| 8/31/22 | $1,254,156 | $1,119,211 | $1,262,141 | $1,377,086 |
| 9/30/22 | $1,183,070 | $1,070,854 | $1,185,994 | $1,270,426 |
| 10/31/22 | $1,231,902 | $1,056,984 | $1,217,484 | $1,354,345 |
| 11/30/22 | $1,309,590 | $1,095,855 | $1,291,241 | $1,468,634 |
| 12/31/22 | $1,298,502 | $1,090,912 | $1,278,665 | $1,446,650 |
| 1/31/23 | $1,348,046 | $1,124,473 | $1,318,002 | $1,491,153 |
| 2/28/23 | $1,307,719 | $1,095,399 | $1,279,200 | $1,441,908 |
| 3/31/23 | $1,326,937 | $1,123,225 | $1,309,129 | $1,472,757 |
| 4/30/23 | $1,339,718 | $1,130,033 | $1,327,121 | $1,504,307 |
| 5/31/23 | $1,310,670 | $1,117,728 | $1,288,822 | $1,433,864 |
| 6/30/23 | $1,358,182 | $1,113,742 | $1,316,332 | $1,500,192 |
| 7/31/23 | $1,388,650 | $1,112,965 | $1,340,939 | $1,557,321 |
| 8/31/23 | $1,367,557 | $1,105,856 | $1,319,305 | $1,517,016 |
| 9/30/23 | $1,339,351 | $1,077,755 | $1,285,607 | $1,478,076 |
| 10/31/23 | $1,316,871 | $1,060,746 | $1,251,236 | $1,422,367 |
| 11/30/23 | $1,396,143 | $1,108,784 | $1,320,316 | $1,515,011 |
| 12/31/23 | $1,455,056 | $1,151,227 | $1,374,564 | $1,581,512 |
| 1/31/24 | $1,458,675 | $1,148,065 | $1,373,875 | $1,584,273 |
| 2/29/24 | $1,473,154 | $1,131,845 | $1,370,952 | $1,599,912 |
| 3/31/24 | $1,517,647 | $1,142,297 | $1,403,543 | $1,661,205 |
| 4/30/24 | $1,476,201 | $1,113,444 | $1,366,886 | $1,616,396 |
| 5/31/24 | $1,523,741 | $1,132,320 | $1,396,114 | $1,658,119 |
| 6/30/24 | $1,524,799 | $1,143,040 | $1,397,235 | $1,645,077 |
The table below shows the average annual total returns of the Fund, a regulatory index, and one or more supplemental index(es) for certain periods ended June 30, 2024.
Average Annual Total Returns (%)
| Class/Index Name | 1 Year | 5 Years | 10 Years |
|---|
| I-2 | 12.27% | 6.28% | 4.31% |
| Bloomberg U.S. Aggregate Index | 2.63% | (0.23%) | 1.35% |
| 50% MSCI ACWI High Dividend Yield Index / 50% Bloomberg U.S. Aggregate Index | 6.15% | 3.06% | 3.40% |
| MSCI ACWI High Dividend Yield Net USD | 9.66% | 5.97% | 5.10% |
All Fund returns are net of fees and expenses and include applicable fee waivers and/or expense limitations. Absent any applicable fee waivers and/or expense limitations, performance would have been lower and there can be no assurance that any such waivers or limitations will continue in the future.
Performance quoted represents past performance. Past performance is not a guarantee or a reliable indicator of future results.Current performance may be lower or higher than performance shown. Investment return and the principal value of an investment will fluctuate. Shares may be worth more or less than original cost when redeemed. Returns shown do not reflect the deduction of taxes that a shareholder would pay on Fund distributions or the redemption of Fund shares.Differences in the Fund’s performance versus an index and related attribution information with respect to particular categories of securities or individual positions may be attributable, in part, to differences in the pricing methodologies used by the Fund and the index. For performance current to the most recent month-end, visit www.pimco.com/literature or via 888.87.PIMCO (888.877.4626).
Key Fund StatisticsFootnote Reference* (as of the end of the reporting period)
| Total Net Assets | $171,410 |
| # of Portfolio Holdings | 1,002 |
| Portfolio Turnover Rate | 408% |
| Total Net Advisory Fees Paid During the Reporting Period | $747 |
| Footnote | Description |
Footnote* | Dollar amounts displayed in 000's |
What did the Fund invest in?
Sector Allocation (% of Net Assets)Footnote Reference*
| U.S. Government Agencies | 29.6% |
| Asset-Backed Securities | 14.1% |
| U.S. Treasury Obligations | 10.8% |
| Consumer Staples | 9.8% |
| Non-Agency Mortgage-Backed Securities | 9.7% |
| Financials | 9.1% |
| Industrials | 7.1% |
| Health Care | 6.7% |
| Information Technology | 5.7% |
| Real Estate | 5.2% |
| Energy | 4.1% |
| Materials | 3.8% |
| Short-Term Instruments | 3.4% |
| Banking & Finance | 3.3% |
| Other | 6.0% |
| Other Investments | 1.8% |
| Other Assets and Liabilities, Net | (30.2%) |
| Total | 100.0% |
| Footnote | Description |
Footnote* | % of Net Assets includes derivatives instruments, if any, valued at the value used for determining the Fund’s net asset value. The notional exposure of such derivatives investments therefore may be greater than what is depicted. |
This is a summary of certain changes and planned changes of the Fund since the beginning of the reporting period. For more information, you may refer to the Fund's next prospectus, which we expect to be available by October 31, 2024 or upon request at 888.87.PIMCO (888.877.4626).
Changes to Total Annual Fund Operating Expenses. Annual fund operating expenses increased during the year by 0.07% as a result of higher expenses related to interest.
For additional information about the Fund, including the Fund's prospectus, financial information, holdings and proxy voting information, please visit www.pimco.com/literature or contact 888.87.PIMCO (888.877.4626). For tax information about the Fund, please visit: https://www.pimco.com/tax.
PIMCO Dividend and Income Fund
Annual Shareholder Report |
June 30, 2024
PIMCO RAE Emerging Markets Fund
Annual Shareholder Report | June 30, 2024
This annual shareholder report contains important information about the PIMCO RAE Emerging Markets Fund (the "Fund") for the period of July 1, 2023 to June 30, 2024 (the "reporting period"). You can find additional information about the Fund at www.pimco.com/literature. You can also request this information by contacting us at 888.87.PIMCO (888.877.4626).
What were the Fund costs for the last year?
(based on a hypothetical $10,000 investment)
| Class Name | Cost of a $10,000 investment | Costs paid as a percentage of a $10,000 investment |
|---|
| Class A | $124 | 1.12% |
How did the Fund perform during the reporting period and what affected its performance?
The following affected performance (on a gross basis) during the reporting period:
• Security selection in the financials sector contributed to relative returns, as the Fund’s holdings outperformed the MSCI Emerging
Markets Value Index.
• Security selection in the industrials sector contributed to relative returns, as the Fund’s holdings outperformed the MSCI Emerging
Markets Value Index.
• Overweight exposure to, and security selection in, the energy sector contributed to relative returns, as the sector and the Fund’s
holdings outperformed the MSCI Emerging Markets Value Index.
• Underweight exposure to the information technology sector detracted from relative returns, as the sector outperformed the MSCI
Emerging Markets Value Index.
• Security selection in the consumer discretionary sector detracted from relative returns, as the Fund’s holdings underperformed the
MSCI Emerging Markets Value Index.
In addition to the Fund's performance, the tables in this section include performance of: (i) a broad-based securities market index (i.e., a regulatory index) and (ii) one or more supplemental index(es). Effective July 24, 2024, the Fund's regulatory index is the MSCI Emerging Markets Index. The Fund's regulatory index is shown in connection with certain regulatory requirements to provide a broad measure of market performance.
The table below illustrates cumulative returns for the 10-year period ended June 30, 2024 or the life of the Fund, if shorter. Cumulative returns are based on a hypothetical initial investment equal to the greater of either $10,000 or the investment minimum applicable to the share class.
Cumulative Returns Based on $10,000 Investment
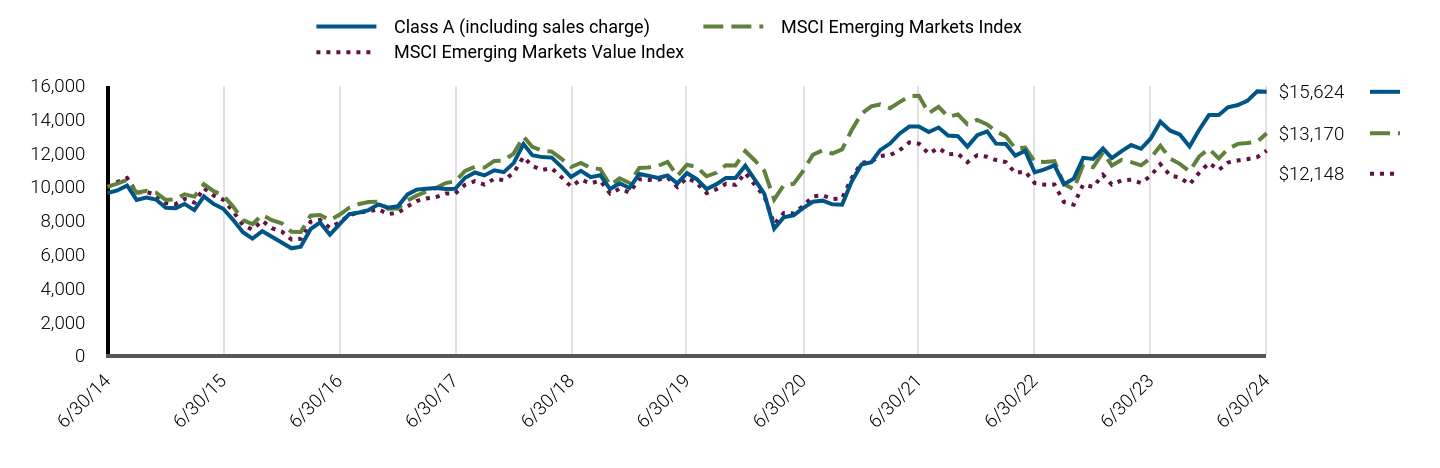
| Class A (including sales charge) | MSCI Emerging Markets Index | MSCI Emerging Markets Value Index |
|---|
| 6/30/14 | $9,624 | $10,000 | $10,000 |
| 7/31/14 | $9,782 | $10,193 | $10,279 |
| 8/31/14 | $10,079 | $10,423 | $10,521 |
| 9/30/14 | $9,223 | $9,651 | $9,658 |
| 10/31/14 | $9,362 | $9,764 | $9,697 |
| 11/30/14 | $9,249 | $9,661 | $9,522 |
| 12/31/14 | $8,760 | $9,216 | $9,036 |
| 1/31/15 | $8,734 | $9,271 | $8,978 |
| 2/28/15 | $8,987 | $9,558 | $9,282 |
| 3/31/15 | $8,620 | $9,422 | $9,070 |
| 4/30/15 | $9,432 | $10,147 | $9,925 |
| 5/31/15 | $8,978 | $9,741 | $9,479 |
| 6/30/15 | $8,699 | $9,488 | $9,233 |
| 7/31/15 | $8,044 | $8,830 | $8,557 |
| 8/31/15 | $7,310 | $8,031 | $7,738 |
| 9/30/15 | $6,934 | $7,790 | $7,465 |
| 10/31/15 | $7,380 | $8,345 | $7,988 |
| 11/30/15 | $7,039 | $8,020 | $7,555 |
| 12/31/15 | $6,698 | $7,841 | $7,357 |
| 1/31/16 | $6,360 | $7,332 | $6,881 |
| 2/29/16 | $6,458 | $7,320 | $6,918 |
| 3/31/16 | $7,491 | $8,289 | $7,931 |
| 4/30/16 | $7,892 | $8,334 | $8,037 |
| 5/31/16 | $7,161 | $8,023 | $7,576 |
| 6/30/16 | $7,776 | $8,344 | $7,903 |
| 7/31/16 | $8,381 | $8,764 | $8,327 |
| 8/31/16 | $8,479 | $8,982 | $8,483 |
| 9/30/16 | $8,622 | $9,097 | $8,548 |
| 10/31/16 | $8,960 | $9,119 | $8,674 |
| 11/30/16 | $8,764 | $8,699 | $8,389 |
| 12/31/16 | $8,847 | $8,718 | $8,454 |
| 1/31/17 | $9,551 | $9,195 | $8,840 |
| 2/28/17 | $9,834 | $9,477 | $9,161 |
| 3/31/17 | $9,889 | $9,716 | $9,313 |
| 4/30/17 | $9,934 | $9,929 | $9,390 |
| 5/31/17 | $9,870 | $10,222 | $9,598 |
| 6/30/17 | $9,880 | $10,325 | $9,608 |
| 7/31/17 | $10,538 | $10,941 | $10,116 |
| 8/31/17 | $10,848 | $11,185 | $10,333 |
| 9/30/17 | $10,675 | $11,140 | $10,134 |
| 10/31/17 | $10,976 | $11,531 | $10,470 |
| 11/30/17 | $10,867 | $11,554 | $10,390 |
| 12/31/17 | $11,402 | $11,969 | $10,827 |
| 1/31/18 | $12,531 | $12,966 | $11,771 |
| 2/28/18 | $11,867 | $12,368 | $11,222 |
| 3/31/18 | $11,758 | $12,138 | $11,002 |
| 4/30/18 | $11,729 | $12,084 | $11,099 |
| 5/31/18 | $11,184 | $11,656 | $10,565 |
| 6/30/18 | $10,580 | $11,172 | $10,019 |
| 7/31/18 | $10,946 | $11,417 | $10,424 |
| 8/31/18 | $10,570 | $11,109 | $10,204 |
| 9/30/18 | $10,688 | $11,050 | $10,363 |
| 10/31/18 | $9,866 | $10,087 | $9,604 |
| 11/30/18 | $10,213 | $10,503 | $9,887 |
| 12/31/18 | $9,934 | $10,225 | $9,664 |
| 1/31/19 | $10,759 | $11,120 | $10,447 |
| 2/28/19 | $10,660 | $11,145 | $10,410 |
| 3/31/19 | $10,528 | $11,239 | $10,423 |
| 4/30/19 | $10,671 | $11,475 | $10,545 |
| 5/31/19 | $10,198 | $10,643 | $9,990 |
| 6/30/19 | $10,814 | $11,307 | $10,523 |
| 7/31/19 | $10,451 | $11,169 | $10,240 |
| 8/31/19 | $9,869 | $10,624 | $9,629 |
| 9/30/19 | $10,143 | $10,827 | $9,842 |
| 10/31/19 | $10,528 | $11,283 | $10,181 |
| 11/30/19 | $10,528 | $11,268 | $10,108 |
| 12/31/19 | $11,254 | $12,109 | $10,820 |
| 1/31/20 | $10,397 | $11,544 | $10,091 |
| 2/29/20 | $9,586 | $10,935 | $9,446 |
| 3/31/20 | $7,525 | $9,251 | $7,790 |
| 4/30/20 | $8,189 | $10,098 | $8,450 |
| 5/31/20 | $8,313 | $10,176 | $8,420 |
| 6/30/20 | $8,741 | $10,924 | $8,867 |
| 7/31/20 | $9,113 | $11,900 | $9,431 |
| 8/31/20 | $9,181 | $12,163 | $9,501 |
| 9/30/20 | $8,967 | $11,968 | $9,280 |
| 10/31/20 | $8,944 | $12,214 | $9,318 |
| 11/30/20 | $10,307 | $13,344 | $10,515 |
| 12/31/20 | $11,315 | $14,325 | $11,413 |
| 1/31/21 | $11,452 | $14,764 | $11,500 |
| 2/28/21 | $12,173 | $14,877 | $11,819 |
| 3/31/21 | $12,562 | $14,653 | $11,882 |
| 4/30/21 | $13,145 | $15,017 | $12,155 |
| 5/31/21 | $13,568 | $15,366 | $12,628 |
| 6/30/21 | $13,568 | $15,392 | $12,556 |
| 7/31/21 | $13,248 | $14,356 | $11,959 |
| 8/31/21 | $13,511 | $14,732 | $12,289 |
| 9/30/21 | $13,031 | $14,147 | $11,918 |
| 10/31/21 | $12,996 | $14,286 | $11,957 |
| 11/30/21 | $12,379 | $13,704 | $11,463 |
| 12/31/21 | $13,055 | $13,961 | $11,870 |
| 1/31/22 | $13,280 | $13,697 | $11,782 |
| 2/28/22 | $12,556 | $13,287 | $11,587 |
| 3/31/22 | $12,531 | $12,987 | $11,463 |
| 4/30/22 | $11,844 | $12,265 | $10,817 |
| 5/31/22 | $12,131 | $12,319 | $10,910 |
| 6/30/22 | $10,858 | $11,500 | $10,221 |
| 7/31/22 | $11,033 | $11,472 | $10,129 |
| 8/31/22 | $11,270 | $11,520 | $10,140 |
| 9/30/22 | $10,159 | $10,169 | $9,102 |
| 10/31/22 | $10,484 | $9,854 | $8,942 |
| 11/30/22 | $11,719 | $11,315 | $10,145 |
| 12/31/22 | $11,653 | $11,156 | $9,991 |
| 1/31/23 | $12,266 | $12,037 | $10,711 |
| 2/28/23 | $11,695 | $11,256 | $10,133 |
| 3/31/23 | $12,112 | $11,597 | $10,381 |
| 4/30/23 | $12,474 | $11,466 | $10,423 |
| 5/31/23 | $12,252 | $11,273 | $10,228 |
| 6/30/23 | $12,850 | $11,701 | $10,643 |
| 7/31/23 | $13,853 | $12,430 | $11,338 |
| 8/31/23 | $13,324 | $11,664 | $10,669 |
| 9/30/23 | $13,101 | $11,359 | $10,560 |
| 10/31/23 | $12,391 | $10,918 | $10,143 |
| 11/30/23 | $13,365 | $11,792 | $10,828 |
| 12/31/23 | $14,247 | $12,252 | $11,411 |
| 1/31/24 | $14,247 | $11,684 | $10,997 |
| 2/29/24 | $14,711 | $12,239 | $11,440 |
| 3/31/24 | $14,842 | $12,543 | $11,561 |
| 4/30/24 | $15,088 | $12,599 | $11,637 |
| 5/31/24 | $15,653 | $12,670 | $11,756 |
| 6/30/24 | $15,624 | $13,170 | $12,148 |
The table below shows the average annual total returns of the Fund, a regulatory index, and one or more supplemental index(es) for certain periods ended June 30, 2024.
Average Annual Total Returns (%)
| Class/Index Name | 1 Year | 5 Years | 10 Years |
|---|
| Class A (excluding sales charge) | 21.59% | 7.64% | 4.96% |
| Class A (including sales charge) | 17.02% | 6.83% | 4.56% |
| MSCI Emerging Markets Index | 12.55% | 3.10% | 2.79% |
| MSCI Emerging Markets Value Index | 14.13% | 2.91% | 1.96% |
All Fund returns are net of fees and expenses and include applicable fee waivers and/or expense limitations. Absent any applicable fee waivers and/or expense limitations, performance would have been lower and there can be no assurance that any such waivers or limitations will continue in the future.
Performance quoted represents past performance. Past performance is not a guarantee or a reliable indicator of future results.Current performance may be lower or higher than performance shown. Investment return and the principal value of an investment will fluctuate. Shares may be worth more or less than original cost when redeemed. Returns shown do not reflect the deduction of taxes that a shareholder would pay on Fund distributions or the redemption of Fund shares.Differences in the Fund’s performance versus an index and related attribution information with respect to particular categories of securities or individual positions may be attributable, in part, to differences in the pricing methodologies used by the Fund and the index. The Cumulative Returns chart and Average Annual Total Returns table reflect any sales load that would have applied at the time of purchase or any Contingent Deferred Sales Charge (“CDSC”) that would have applied if a full redemption occurred on the last business day of the period shown in the Cumulative Returns chart. Class A shares are subject to an initial sales charge. A CDSC may be imposed in certain circumstances on Class A shares that are purchased without an initial sales charge and then redeemed during the first 12 months after purchase. For performance current to the most recent month-end, visit www.pimco.com/literature or via 888.87.PIMCO (888.877.4626).
Key Fund StatisticsFootnote Reference* (as of the end of the reporting period)
| Total Net Assets | $1,845,167 |
| # of Portfolio Holdings | 356 |
| Portfolio Turnover Rate | 67% |
| Total Net Advisory Fees Paid During the Reporting Period | $7,848 |
| Footnote | Description |
Footnote* | Dollar amounts displayed in 000's |
What did the Fund invest in?
Geographic Breakdown (% of Net Assets)Footnote Reference*
| China | 28.4% |
| India | 21.2% |
| South Korea | 12.1% |
| Taiwan | 11.6% |
| Brazil | 9.9% |
| Thailand | 3.4% |
| South Africa | 2.8% |
| Mexico | 1.9% |
| Malaysia | 1.9% |
| Indonesia | 1.6% |
| Hong Kong | 1.4% |
| United States | 1.0% |
| Turkey | 1.0% |
| Chile | 0.7% |
| Other Countries | 1.7% |
| Other Assets and Liabilities, Net | (0.6%) |
| Total | 100.0% |
| Footnote | Description |
Footnote* | % of Net Assets includes derivatives instruments, if any, valued at the value used for determining the Fund's net asset value. The notional exposure of such derivatives investments therefore may be greater than what is depicted. |
For additional information about the Fund, including the Fund's prospectus, financial information, holdings and proxy voting information, please visit www.pimco.com/literature or contact 888.87.PIMCO (888.877.4626). For tax information about the Fund, please visit: https://www.pimco.com/tax.
PIMCO RAE Emerging Markets Fund
Annual Shareholder Report |
June 30, 2024
Institutional Class: PEIFX
PIMCO RAE Emerging Markets Fund
Annual Shareholder Report | June 30, 2024
This annual shareholder report contains important information about the PIMCO RAE Emerging Markets Fund (the "Fund") for the period of July 1, 2023 to June 30, 2024 (the "reporting period"). You can find additional information about the Fund at www.pimco.com/literature. You can also request this information by contacting us at 888.87.PIMCO (888.877.4626).
What were the Fund costs for the last year?
(based on a hypothetical $10,000 investment)
| Class Name | Cost of a $10,000 investment | Costs paid as a percentage of a $10,000 investment |
|---|
| Institutional Class | $85 | 0.77% |
How did the Fund perform during the reporting period and what affected its performance?
The following affected performance (on a gross basis) during the reporting period:
• Security selection in the financials sector contributed to relative returns, as the Fund’s holdings outperformed the MSCI Emerging
Markets Value Index.
• Security selection in the industrials sector contributed to relative returns, as the Fund’s holdings outperformed the MSCI Emerging
Markets Value Index.
• Overweight exposure to, and security selection in, the energy sector contributed to relative returns, as the sector and the Fund’s
holdings outperformed the MSCI Emerging Markets Value Index.
• Underweight exposure to the information technology sector detracted from relative returns, as the sector outperformed the MSCI
Emerging Markets Value Index.
• Security selection in the consumer discretionary sector detracted from relative returns, as the Fund’s holdings underperformed the
MSCI Emerging Markets Value Index.
In addition to the Fund's performance, the tables in this section include performance of: (i) a broad-based securities market index (i.e., a regulatory index) and (ii) one or more supplemental index(es). Effective July 24, 2024, the Fund's regulatory index is the MSCI Emerging Markets Index. The Fund's regulatory index is shown in connection with certain regulatory requirements to provide a broad measure of market performance.
The table below illustrates cumulative returns for the 10-year period ended June 30, 2024 or the life of the Fund, if shorter. Cumulative returns are based on a hypothetical initial investment equal to the greater of either $10,000 or the investment minimum applicable to the share class.
Cumulative Returns Based on $1,000,000 Investment
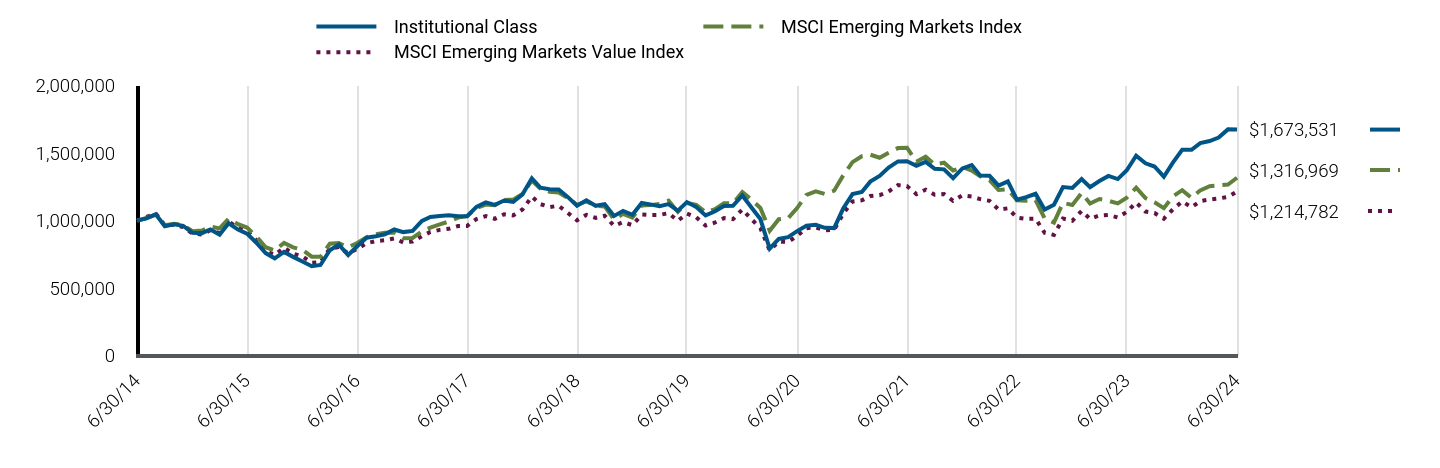
| Institutional Class | MSCI Emerging Markets Index | MSCI Emerging Markets Value Index |
|---|
| 6/30/14 | $1,000,000 | $1,000,000 | $1,000,000 |
| 7/31/14 | $1,016,375 | $1,019,337 | $1,027,941 |
| 8/31/14 | $1,047,508 | $1,042,308 | $1,052,054 |
| 9/30/14 | $958,727 | $965,051 | $965,770 |
| 10/31/14 | $972,660 | $976,428 | $969,685 |
| 11/30/14 | $961,632 | $966,102 | $952,237 |
| 12/31/14 | $910,093 | $921,577 | $903,580 |
| 1/31/15 | $907,307 | $927,102 | $897,826 |
| 2/28/15 | $934,129 | $955,808 | $928,207 |
| 3/31/15 | $896,179 | $942,216 | $907,031 |
| 4/30/15 | $980,185 | $1,014,685 | $992,458 |
| 5/31/15 | $933,330 | $974,050 | $947,853 |
| 6/30/15 | $903,150 | $948,755 | $923,308 |
| 7/31/15 | $835,981 | $882,988 | $855,651 |
| 8/31/15 | $759,735 | $803,123 | $773,795 |
| 9/30/15 | $720,704 | $778,964 | $746,539 |
| 10/31/15 | $767,904 | $834,529 | $798,780 |
| 11/30/15 | $731,597 | $801,976 | $755,476 |
| 12/31/15 | $696,770 | $784,098 | $735,743 |
| 1/31/16 | $662,442 | $733,232 | $688,111 |
| 2/29/16 | $671,720 | $732,031 | $691,806 |
| 3/31/16 | $780,272 | $828,899 | $793,065 |
| 4/30/16 | $822,022 | $833,404 | $803,745 |
| 5/31/16 | $745,015 | $802,316 | $757,609 |
| 6/30/16 | $809,961 | $834,383 | $790,297 |
| 7/31/16 | $873,051 | $876,370 | $832,711 |
| 8/31/16 | $884,184 | $898,150 | $848,327 |
| 9/30/16 | $899,029 | $909,699 | $854,784 |
| 10/31/16 | $934,285 | $911,868 | $867,439 |
| 11/30/16 | $914,801 | $869,894 | $838,888 |
| 12/31/16 | $923,230 | $871,815 | $845,397 |
| 1/31/17 | $997,622 | $919,523 | $884,007 |
| 2/28/17 | $1,027,189 | $947,671 | $916,081 |
| 3/31/17 | $1,033,865 | $971,594 | $931,266 |
| 4/30/17 | $1,038,634 | $992,864 | $938,989 |
| 5/31/17 | $1,031,957 | $1,022,218 | $959,784 |
| 6/30/17 | $1,032,911 | $1,032,509 | $960,767 |
| 7/31/17 | $1,101,581 | $1,094,056 | $1,011,609 |
| 8/31/17 | $1,134,962 | $1,118,460 | $1,033,278 |
| 9/30/17 | $1,116,841 | $1,114,013 | $1,013,363 |
| 10/31/17 | $1,148,315 | $1,153,065 | $1,047,001 |
| 11/30/17 | $1,137,824 | $1,155,380 | $1,038,971 |
| 12/31/17 | $1,194,081 | $1,196,855 | $1,082,680 |
| 1/31/18 | $1,312,972 | $1,296,608 | $1,177,143 |
| 2/28/18 | $1,243,705 | $1,236,809 | $1,122,170 |
| 3/31/18 | $1,232,333 | $1,213,812 | $1,100,200 |
| 4/30/18 | $1,230,265 | $1,208,442 | $1,109,909 |
| 5/31/18 | $1,173,404 | $1,165,622 | $1,056,492 |
| 6/30/18 | $1,110,340 | $1,117,194 | $1,001,855 |
| 7/31/18 | $1,149,626 | $1,141,736 | $1,042,401 |
| 8/31/18 | $1,109,306 | $1,110,863 | $1,020,357 |
| 9/30/18 | $1,121,712 | $1,104,969 | $1,036,324 |
| 10/31/18 | $1,034,870 | $1,008,745 | $960,435 |
| 11/30/18 | $1,072,088 | $1,050,316 | $988,729 |
| 12/31/18 | $1,043,022 | $1,022,491 | $966,421 |
| 1/31/19 | $1,130,131 | $1,112,018 | $1,044,709 |
| 2/28/19 | $1,119,815 | $1,114,517 | $1,041,046 |
| 3/31/19 | $1,106,061 | $1,123,870 | $1,042,268 |
| 4/30/19 | $1,122,108 | $1,147,532 | $1,054,491 |
| 5/31/19 | $1,072,822 | $1,064,264 | $998,967 |
| 6/30/19 | $1,137,008 | $1,130,687 | $1,052,349 |
| 7/31/19 | $1,100,330 | $1,116,861 | $1,024,013 |
| 8/31/19 | $1,038,437 | $1,062,407 | $962,864 |
| 9/30/19 | $1,067,091 | $1,082,687 | $984,174 |
| 10/31/19 | $1,108,354 | $1,128,342 | $1,018,079 |
| 11/30/19 | $1,109,500 | $1,126,788 | $1,010,848 |
| 12/31/19 | $1,185,799 | $1,210,852 | $1,082,039 |
| 1/31/20 | $1,095,128 | $1,154,408 | $1,009,065 |
| 2/29/20 | $1,011,521 | $1,093,532 | $944,593 |
| 3/31/20 | $792,495 | $925,105 | $779,028 |
| 4/30/20 | $864,326 | $1,009,819 | $845,034 |
| 5/31/20 | $877,280 | $1,017,577 | $841,971 |
| 6/30/20 | $922,027 | $1,092,378 | $886,746 |
| 7/31/20 | $962,064 | $1,189,993 | $943,120 |
| 8/31/20 | $969,129 | $1,216,299 | $950,127 |
| 9/30/20 | $946,755 | $1,196,789 | $928,039 |
| 10/31/20 | $944,400 | $1,221,447 | $931,845 |
| 11/30/20 | $1,089,240 | $1,334,415 | $1,051,493 |
| 12/31/20 | $1,196,119 | $1,432,513 | $1,141,282 |
| 1/31/21 | $1,211,684 | $1,476,432 | $1,149,970 |
| 2/28/21 | $1,288,312 | $1,487,724 | $1,181,899 |
| 3/31/21 | $1,330,218 | $1,465,254 | $1,188,227 |
| 4/30/21 | $1,392,478 | $1,501,736 | $1,215,482 |
| 5/31/21 | $1,437,976 | $1,536,562 | $1,262,752 |
| 6/30/21 | $1,439,174 | $1,539,210 | $1,255,569 |
| 7/31/21 | $1,405,649 | $1,435,623 | $1,195,931 |
| 8/31/21 | $1,434,384 | $1,473,202 | $1,228,902 |
| 9/30/21 | $1,382,900 | $1,414,656 | $1,191,840 |
| 10/31/21 | $1,379,308 | $1,428,608 | $1,195,668 |
| 11/30/21 | $1,314,653 | $1,370,390 | $1,146,297 |
| 12/31/21 | $1,386,448 | $1,396,101 | $1,186,955 |
| 1/31/22 | $1,409,947 | $1,369,674 | $1,178,174 |
| 2/28/22 | $1,334,228 | $1,328,734 | $1,158,724 |
| 3/31/22 | $1,331,617 | $1,298,725 | $1,146,318 |
| 4/30/22 | $1,258,508 | $1,226,480 | $1,081,713 |
| 5/31/22 | $1,289,840 | $1,231,881 | $1,091,036 |
| 6/30/22 | $1,155,373 | $1,150,022 | $1,022,139 |
| 7/31/22 | $1,173,650 | $1,147,197 | $1,012,856 |
| 8/31/22 | $1,198,455 | $1,151,987 | $1,013,998 |
| 9/30/22 | $1,082,265 | $1,016,936 | $910,166 |
| 10/31/22 | $1,117,513 | $985,363 | $894,181 |
| 11/30/22 | $1,248,064 | $1,131,509 | $1,014,468 |
| 12/31/22 | $1,241,708 | $1,115,605 | $999,075 |
| 1/31/23 | $1,307,214 | $1,203,696 | $1,071,093 |
| 2/28/23 | $1,247,531 | $1,125,645 | $1,013,265 |
| 3/31/23 | $1,292,658 | $1,159,738 | $1,038,125 |
| 4/30/23 | $1,330,506 | $1,146,595 | $1,042,308 |
| 5/31/23 | $1,307,214 | $1,127,336 | $1,022,768 |
| 6/30/23 | $1,372,721 | $1,170,140 | $1,064,342 |
| 7/31/23 | $1,480,442 | $1,242,983 | $1,133,754 |
| 8/31/23 | $1,423,670 | $1,166,415 | $1,066,887 |
| 9/30/23 | $1,400,379 | $1,135,911 | $1,056,027 |
| 10/31/23 | $1,324,683 | $1,091,776 | $1,014,271 |
| 11/30/23 | $1,429,493 | $1,179,151 | $1,082,817 |
| 12/31/23 | $1,523,459 | $1,225,248 | $1,141,070 |
| 1/31/24 | $1,523,459 | $1,168,356 | $1,099,707 |
| 2/29/24 | $1,573,483 | $1,223,937 | $1,144,011 |
| 3/31/24 | $1,588,642 | $1,254,266 | $1,156,066 |
| 4/30/24 | $1,614,412 | $1,259,878 | $1,163,656 |
| 5/31/24 | $1,675,047 | $1,266,993 | $1,175,620 |
| 6/30/24 | $1,673,531 | $1,316,969 | $1,214,782 |
The table below shows the average annual total returns of the Fund, a regulatory index, and one or more supplemental index(es) for certain periods ended June 30, 2024.
Average Annual Total Returns (%)
| Class/Index Name | 1 Year | 5 Years | 10 Years |
|---|
| Institutional Class | 21.91% | 8.04% | 5.28% |
| MSCI Emerging Markets Index | 12.55% | 3.10% | 2.79% |
| MSCI Emerging Markets Value Index | 14.13% | 2.91% | 1.96% |
All Fund returns are net of fees and expenses and include applicable fee waivers and/or expense limitations. Absent any applicable fee waivers and/or expense limitations, performance would have been lower and there can be no assurance that any such waivers or limitations will continue in the future.
Performance quoted represents past performance. Past performance is not a guarantee or a reliable indicator of future results.Current performance may be lower or higher than performance shown. Investment return and the principal value of an investment will fluctuate. Shares may be worth more or less than original cost when redeemed. Returns shown do not reflect the deduction of taxes that a shareholder would pay on Fund distributions or the redemption of Fund shares.Differences in the Fund’s performance versus an index and related attribution information with respect to particular categories of securities or individual positions may be attributable, in part, to differences in the pricing methodologies used by the Fund and the index. For performance current to the most recent month-end, visit www.pimco.com/literature or via 888.87.PIMCO (888.877.4626).
Key Fund StatisticsFootnote Reference* (as of the end of the reporting period)
| Total Net Assets | $1,845,167 |
| # of Portfolio Holdings | 356 |
| Portfolio Turnover Rate | 67% |
| Total Net Advisory Fees Paid During the Reporting Period | $7,848 |
| Footnote | Description |
Footnote* | Dollar amounts displayed in 000's |
What did the Fund invest in?
Geographic Breakdown (% of Net Assets)Footnote Reference*
| China | 28.4% |
| India | 21.2% |
| South Korea | 12.1% |
| Taiwan | 11.6% |
| Brazil | 9.9% |
| Thailand | 3.4% |
| South Africa | 2.8% |
| Mexico | 1.9% |
| Malaysia | 1.9% |
| Indonesia | 1.6% |
| Hong Kong | 1.4% |
| United States | 1.0% |
| Turkey | 1.0% |
| Chile | 0.7% |
| Other Countries | 1.7% |
| Other Assets and Liabilities, Net | (0.6%) |
| Total | 100.0% |
| Footnote | Description |
Footnote* | % of Net Assets includes derivatives instruments, if any, valued at the value used for determining the Fund's net asset value. The notional exposure of such derivatives investments therefore may be greater than what is depicted. |
For additional information about the Fund, including the Fund's prospectus, financial information, holdings and proxy voting information, please visit www.pimco.com/literature or contact 888.87.PIMCO (888.877.4626). For tax information about the Fund, please visit: https://www.pimco.com/tax.
Institutional Class: PEIFX
PIMCO RAE Emerging Markets Fund
Annual Shareholder Report |
June 30, 2024
PIMCO RAE Emerging Markets Fund
Annual Shareholder Report | June 30, 2024
This annual shareholder report contains important information about the PIMCO RAE Emerging Markets Fund (the "Fund") for the period of July 1, 2023 to June 30, 2024 (the "reporting period"). You can find additional information about the Fund at www.pimco.com/literature. You can also request this information by contacting us at 888.87.PIMCO (888.877.4626).
What were the Fund costs for the last year?
(based on a hypothetical $10,000 investment)
| Class Name | Cost of a $10,000 investment | Costs paid as a percentage of a $10,000 investment |
|---|
| I-2 | $96 | 0.87% |
How did the Fund perform during the reporting period and what affected its performance?
The following affected performance (on a gross basis) during the reporting period:
• Security selection in the financials sector contributed to relative returns, as the Fund’s holdings outperformed the MSCI Emerging
Markets Value Index.
• Security selection in the industrials sector contributed to relative returns, as the Fund’s holdings outperformed the MSCI Emerging
Markets Value Index.
• Overweight exposure to, and security selection in, the energy sector contributed to relative returns, as the sector and the Fund’s
holdings outperformed the MSCI Emerging Markets Value Index.
• Underweight exposure to the information technology sector detracted from relative returns, as the sector outperformed the MSCI
Emerging Markets Value Index.
• Security selection in the consumer discretionary sector detracted from relative returns, as the Fund’s holdings underperformed the
MSCI Emerging Markets Value Index.
In addition to the Fund's performance, the tables in this section include performance of: (i) a broad-based securities market index (i.e., a regulatory index) and (ii) one or more supplemental index(es). Effective July 24, 2024, the Fund's regulatory index is the MSCI Emerging Markets Index. The Fund's regulatory index is shown in connection with certain regulatory requirements to provide a broad measure of market performance.
The table below illustrates cumulative returns for the 10-year period ended June 30, 2024 or the life of the Fund, if shorter. Cumulative returns are based on a hypothetical initial investment equal to the greater of either $10,000 or the investment minimum applicable to the share class.
Cumulative Returns Based on $1,000,000 Investment
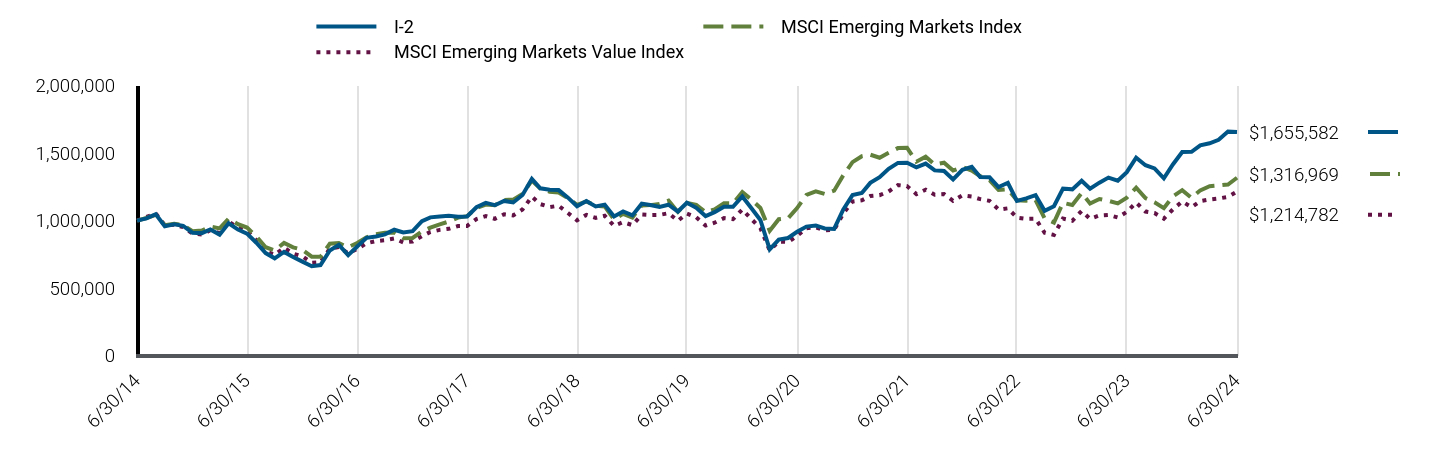
| I-2 | MSCI Emerging Markets Index | MSCI Emerging Markets Value Index |
|---|
| 6/30/14 | $1,000,000 | $1,000,000 | $1,000,000 |
| 7/31/14 | $1,016,375 | $1,019,337 | $1,027,941 |
| 8/31/14 | $1,047,508 | $1,042,308 | $1,052,054 |
| 9/30/14 | $958,727 | $965,051 | $965,770 |
| 10/31/14 | $972,660 | $976,428 | $969,685 |
| 11/30/14 | $961,632 | $966,102 | $952,237 |
| 12/31/14 | $910,093 | $921,577 | $903,580 |
| 1/31/15 | $907,307 | $927,102 | $897,826 |
| 2/28/15 | $934,129 | $955,808 | $928,207 |
| 3/31/15 | $896,179 | $942,216 | $907,031 |
| 4/30/15 | $980,185 | $1,014,685 | $992,458 |
| 5/31/15 | $933,330 | $974,050 | $947,853 |
| 6/30/15 | $904,057 | $948,755 | $923,308 |
| 7/31/15 | $835,981 | $882,988 | $855,651 |
| 8/31/15 | $759,735 | $803,123 | $773,795 |
| 9/30/15 | $720,704 | $778,964 | $746,539 |
| 10/31/15 | $767,904 | $834,529 | $798,780 |
| 11/30/15 | $730,689 | $801,976 | $755,476 |
| 12/31/15 | $696,279 | $784,098 | $735,743 |
| 1/31/16 | $661,884 | $733,232 | $688,111 |
| 2/29/16 | $671,180 | $732,031 | $691,806 |
| 3/31/16 | $779,015 | $828,899 | $793,065 |
| 4/30/16 | $820,847 | $833,404 | $803,745 |
| 5/31/16 | $744,619 | $802,316 | $757,609 |
| 6/30/16 | $808,762 | $834,383 | $790,297 |
| 7/31/16 | $871,976 | $876,370 | $832,711 |
| 8/31/16 | $882,202 | $898,150 | $848,327 |
| 9/30/16 | $898,005 | $909,699 | $854,784 |
| 10/31/16 | $932,401 | $911,868 | $867,439 |
| 11/30/16 | $912,879 | $869,894 | $838,888 |
| 12/31/16 | $921,902 | $871,815 | $845,397 |
| 1/31/17 | $995,463 | $919,523 | $884,007 |
| 2/28/17 | $1,024,123 | $947,671 | $916,081 |
| 3/31/17 | $1,030,810 | $971,594 | $931,266 |
| 4/30/17 | $1,035,587 | $992,864 | $938,989 |
| 5/31/17 | $1,028,900 | $1,022,218 | $959,784 |
| 6/30/17 | $1,030,810 | $1,032,509 | $960,767 |
| 7/31/17 | $1,098,639 | $1,094,056 | $1,011,609 |
| 8/31/17 | $1,131,121 | $1,118,460 | $1,033,278 |
| 9/30/17 | $1,113,925 | $1,114,013 | $1,013,363 |
| 10/31/17 | $1,145,451 | $1,153,065 | $1,047,001 |
| 11/30/17 | $1,133,987 | $1,155,380 | $1,038,971 |
| 12/31/17 | $1,189,540 | $1,196,855 | $1,082,680 |
| 1/31/18 | $1,308,598 | $1,296,608 | $1,177,143 |
| 2/28/18 | $1,239,234 | $1,236,809 | $1,122,170 |
| 3/31/18 | $1,227,846 | $1,213,812 | $1,100,200 |
| 4/30/18 | $1,225,775 | $1,208,442 | $1,109,909 |
| 5/31/18 | $1,169,870 | $1,165,622 | $1,056,492 |
| 6/30/18 | $1,105,682 | $1,117,194 | $1,001,855 |
| 7/31/18 | $1,145,023 | $1,141,736 | $1,042,401 |
| 8/31/18 | $1,104,647 | $1,110,863 | $1,020,357 |
| 9/30/18 | $1,117,071 | $1,104,969 | $1,036,324 |
| 10/31/18 | $1,031,142 | $1,008,745 | $960,435 |
| 11/30/18 | $1,067,377 | $1,050,316 | $988,729 |
| 12/31/18 | $1,038,231 | $1,022,491 | $966,421 |
| 1/31/19 | $1,125,516 | $1,112,018 | $1,044,709 |
| 2/28/19 | $1,115,180 | $1,114,517 | $1,041,046 |
| 3/31/19 | $1,101,398 | $1,123,870 | $1,042,268 |
| 4/30/19 | $1,117,477 | $1,147,532 | $1,054,491 |
| 5/31/19 | $1,066,943 | $1,064,264 | $998,967 |
| 6/30/19 | $1,132,407 | $1,130,687 | $1,052,349 |
| 7/31/19 | $1,094,507 | $1,116,861 | $1,024,013 |
| 8/31/19 | $1,033,637 | $1,062,407 | $962,864 |
| 9/30/19 | $1,062,349 | $1,082,687 | $984,174 |
| 10/31/19 | $1,102,546 | $1,128,342 | $1,018,079 |
| 11/30/19 | $1,102,546 | $1,126,788 | $1,010,848 |
| 12/31/19 | $1,178,808 | $1,210,852 | $1,082,039 |
| 1/31/20 | $1,089,575 | $1,154,408 | $1,009,065 |
| 2/29/20 | $1,005,039 | $1,093,532 | $944,593 |
| 3/31/20 | $787,829 | $925,105 | $779,028 |
| 4/30/20 | $859,450 | $1,009,819 | $845,034 |
| 5/31/20 | $871,191 | $1,017,577 | $841,971 |
| 6/30/20 | $916,981 | $1,092,378 | $886,746 |
| 7/31/20 | $955,727 | $1,189,993 | $943,120 |
| 8/31/20 | $962,771 | $1,216,299 | $950,127 |
| 9/30/20 | $941,637 | $1,196,789 | $928,039 |
| 10/31/20 | $938,115 | $1,221,447 | $931,845 |
| 11/30/20 | $1,081,357 | $1,334,415 | $1,051,493 |
| 12/31/20 | $1,188,346 | $1,432,513 | $1,141,282 |
| 1/31/21 | $1,203,856 | $1,476,432 | $1,149,970 |
| 2/28/21 | $1,279,023 | $1,487,724 | $1,181,899 |
| 3/31/21 | $1,320,782 | $1,465,254 | $1,188,227 |
| 4/30/21 | $1,382,824 | $1,501,736 | $1,215,482 |
| 5/31/21 | $1,426,969 | $1,536,562 | $1,262,752 |
| 6/30/21 | $1,428,162 | $1,539,210 | $1,255,569 |
| 7/31/21 | $1,394,755 | $1,435,623 | $1,195,931 |
| 8/31/21 | $1,422,197 | $1,473,202 | $1,228,902 |
| 9/30/21 | $1,372,086 | $1,414,656 | $1,191,840 |
| 10/31/21 | $1,367,313 | $1,428,608 | $1,195,668 |
| 11/30/21 | $1,304,078 | $1,370,390 | $1,146,297 |
| 12/31/21 | $1,376,095 | $1,396,101 | $1,186,955 |
| 1/31/22 | $1,398,227 | $1,369,674 | $1,178,174 |
| 2/28/22 | $1,322,717 | $1,328,734 | $1,158,724 |
| 3/31/22 | $1,320,113 | $1,298,725 | $1,146,318 |
| 4/30/22 | $1,248,510 | $1,226,480 | $1,081,713 |
| 5/31/22 | $1,279,755 | $1,231,881 | $1,091,036 |
| 6/30/22 | $1,145,661 | $1,150,022 | $1,022,139 |
| 7/31/22 | $1,163,887 | $1,147,197 | $1,012,856 |
| 8/31/22 | $1,188,623 | $1,151,987 | $1,013,998 |
| 9/30/22 | $1,072,755 | $1,016,936 | $910,166 |
| 10/31/22 | $1,106,604 | $985,363 | $894,181 |
| 11/30/22 | $1,236,793 | $1,131,509 | $1,014,468 |
| 12/31/22 | $1,231,176 | $1,115,605 | $999,075 |
| 1/31/23 | $1,295,058 | $1,203,696 | $1,071,093 |
| 2/28/23 | $1,235,532 | $1,125,645 | $1,013,265 |
| 3/31/23 | $1,280,539 | $1,159,738 | $1,038,125 |
| 4/30/23 | $1,318,287 | $1,146,595 | $1,042,308 |
| 5/31/23 | $1,295,058 | $1,127,336 | $1,022,768 |
| 6/30/23 | $1,358,940 | $1,170,140 | $1,064,342 |
| 7/31/23 | $1,464,925 | $1,242,983 | $1,133,754 |
| 8/31/23 | $1,409,755 | $1,166,415 | $1,066,887 |
| 9/30/23 | $1,386,525 | $1,135,911 | $1,056,027 |
| 10/31/23 | $1,312,480 | $1,091,776 | $1,014,271 |
| 11/30/23 | $1,415,562 | $1,179,151 | $1,082,817 |
| 12/31/23 | $1,507,411 | $1,225,248 | $1,141,070 |
| 1/31/24 | $1,508,923 | $1,168,356 | $1,099,707 |
| 2/29/24 | $1,557,305 | $1,223,937 | $1,144,011 |
| 3/31/24 | $1,572,425 | $1,254,266 | $1,156,066 |
| 4/30/24 | $1,598,128 | $1,259,878 | $1,163,656 |
| 5/31/24 | $1,658,606 | $1,266,993 | $1,175,620 |
| 6/30/24 | $1,655,582 | $1,316,969 | $1,214,782 |
The table below shows the average annual total returns of the Fund, a regulatory index, and one or more supplemental index(es) for certain periods ended June 30, 2024.
Average Annual Total Returns (%)
| Class/Index Name | 1 Year | 5 Years | 10 Years |
|---|
| I-2 | 21.83% | 7.89% | 5.17% |
| MSCI Emerging Markets Index | 12.55% | 3.10% | 2.79% |
| MSCI Emerging Markets Value Index | 14.13% | 2.91% | 1.96% |
All Fund returns are net of fees and expenses and include applicable fee waivers and/or expense limitations. Absent any applicable fee waivers and/or expense limitations, performance would have been lower and there can be no assurance that any such waivers or limitations will continue in the future.
Performance quoted represents past performance. Past performance is not a guarantee or a reliable indicator of future results.Current performance may be lower or higher than performance shown. Investment return and the principal value of an investment will fluctuate. Shares may be worth more or less than original cost when redeemed. Returns shown do not reflect the deduction of taxes that a shareholder would pay on Fund distributions or the redemption of Fund shares.Differences in the Fund’s performance versus an index and related attribution information with respect to particular categories of securities or individual positions may be attributable, in part, to differences in the pricing methodologies used by the Fund and the index. For performance current to the most recent month-end, visit www.pimco.com/literature or via 888.87.PIMCO (888.877.4626).
Key Fund StatisticsFootnote Reference* (as of the end of the reporting period)
| Total Net Assets | $1,845,167 |
| # of Portfolio Holdings | 356 |
| Portfolio Turnover Rate | 67% |
| Total Net Advisory Fees Paid During the Reporting Period | $7,848 |
| Footnote | Description |
Footnote* | Dollar amounts displayed in 000's |
What did the Fund invest in?
Geographic Breakdown (% of Net Assets)Footnote Reference*
| China | 28.4% |
| India | 21.2% |
| South Korea | 12.1% |
| Taiwan | 11.6% |
| Brazil | 9.9% |
| Thailand | 3.4% |
| South Africa | 2.8% |
| Mexico | 1.9% |
| Malaysia | 1.9% |
| Indonesia | 1.6% |
| Hong Kong | 1.4% |
| United States | 1.0% |
| Turkey | 1.0% |
| Chile | 0.7% |
| Other Countries | 1.7% |
| Other Assets and Liabilities, Net | (0.6%) |
| Total | 100.0% |
| Footnote | Description |
Footnote* | % of Net Assets includes derivatives instruments, if any, valued at the value used for determining the Fund's net asset value. The notional exposure of such derivatives investments therefore may be greater than what is depicted. |
For additional information about the Fund, including the Fund's prospectus, financial information, holdings and proxy voting information, please visit www.pimco.com/literature or contact 888.87.PIMCO (888.877.4626). For tax information about the Fund, please visit: https://www.pimco.com/tax.
PIMCO RAE Emerging Markets Fund
Annual Shareholder Report |
June 30, 2024
PIMCO RAE Global ex-US Fund
Annual Shareholder Report | June 30, 2024
This annual shareholder report contains important information about the PIMCO RAE Global ex-US Fund for the period of July 1, 2023 to June 30, 2024 (the "reporting period"). You can find additional information about the Fund at www.pimco.com/literature. You can also request this information by contacting us at 888.87.PIMCO (888.877.4626).
What were the Fund costs for the last year?
(based on a hypothetical $10,000 investment)
| Class Name | Cost of a $10,000 investment | Costs paid as a percentage of a $10,000 investment |
|---|
| Class A | $37 | 0.35% |
How did the Fund perform during the reporting period and what affected its performance?
The following affected performance (on a gross basis) during the reporting period:
• Underweight exposure to, and security selection in, healthcare contributed to relative returns, as the sector underperformed the MSCI
All Country World ex US Value Index ("MGCUWXUN") and the Fund’s holdings outperformed the MGCUWXUN.
• Overweight exposure to, and security selection in, information technology contributed to relative returns, as the sector and the Fund’s
holdings outperformed the MGCUWXUN.
• Security selection in industrials contributed to relative returns, as the Fund’s holdings outperformed the MGCUWXUN.
• Overweight exposure to, and security selection in, consumer discretionary detracted from relative returns, as the sector and the Fund’s
holdings underperformed the MGCUWXUN.
• Overweight exposure to, and security selection in, materials detracted from relative returns, as the sector and the Fund’s holdings
underperformed the MGCUWXUN.
• Overweight exposure to, and security selection in, communication services detracted from relative returns, as the sector and the
Fund’s holdings underperformed the MGCUWXUN.
In addition to the Fund's performance, the tables in this section include performance of: (i) a broad-based securities market index (i.e., a regulatory index) and (ii) one or more supplemental index(es). Effective July 24, 2024, the Fund's regulatory index is the MSCI All Country World Index. The Fund's regulatory index is shown in connection with certain regulatory requirements to provide a broad measure of market performance.
The table below illustrates cumulative returns for the 10-year period ended June 30, 2024 or the life of the Fund, if shorter. Cumulative returns are based on a hypothetical initial investment equal to the greater of either $10,000 or the investment minimum applicable to the share class.
Cumulative Returns Based on $10,000 Investment
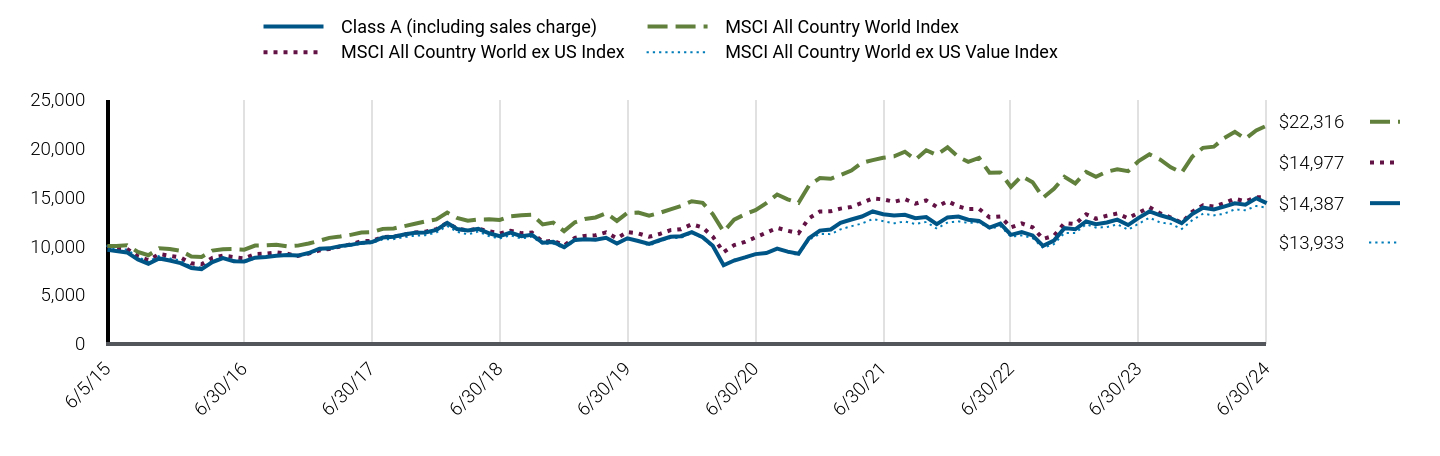
| Class A (including sales charge) | MSCI All Country World Index | MSCI All Country World ex US Index | MSCI All Country World ex US Value Index |
|---|
| 6/5/15 | $9,625 | $10,000 | $10,000 | $10,000 |
| 6/30/15 | $9,490 | $10,000 | $9,733 | $9,714 |
| 7/31/15 | $9,346 | $10,087 | $9,706 | $9,633 |
| 8/31/15 | $8,633 | $9,395 | $8,964 | $8,884 |
| 9/30/15 | $8,171 | $9,055 | $8,548 | $8,393 |
| 10/31/15 | $8,730 | $9,766 | $9,185 | $9,006 |
| 11/30/15 | $8,518 | $9,685 | $8,995 | $8,730 |
| 12/31/15 | $8,244 | $9,510 | $8,826 | $8,513 |
| 1/31/16 | $7,758 | $8,937 | $8,225 | $7,879 |
| 2/29/16 | $7,641 | $8,875 | $8,131 | $7,798 |
| 3/31/16 | $8,351 | $9,533 | $8,792 | $8,478 |
| 4/30/16 | $8,759 | $9,674 | $9,024 | $8,798 |
| 5/31/16 | $8,438 | $9,686 | $8,871 | $8,557 |
| 6/30/16 | $8,419 | $9,627 | $8,736 | $8,328 |
| 7/31/16 | $8,807 | $10,042 | $9,168 | $8,752 |
| 8/31/16 | $8,875 | $10,076 | $9,226 | $8,896 |
| 9/30/16 | $9,002 | $10,138 | $9,340 | $8,977 |
| 10/31/16 | $9,089 | $9,966 | $9,205 | $9,027 |
| 11/30/16 | $9,021 | $10,041 | $8,992 | $8,950 |
| 12/31/16 | $9,283 | $10,258 | $9,222 | $9,272 |
| 1/31/17 | $9,722 | $10,539 | $9,549 | $9,559 |
| 2/28/17 | $9,761 | $10,834 | $9,701 | $9,674 |
| 3/31/17 | $9,991 | $10,967 | $9,947 | $9,891 |
| 4/30/17 | $10,120 | $11,138 | $10,160 | $10,031 |
| 5/31/17 | $10,320 | $11,384 | $10,490 | $10,239 |
| 6/30/17 | $10,409 | $11,436 | $10,522 | $10,295 |
| 7/31/17 | $10,868 | $11,755 | $10,910 | $10,698 |
| 8/31/17 | $10,948 | $11,800 | $10,967 | $10,702 |
| 9/30/17 | $11,177 | $12,028 | $11,171 | $10,912 |
| 10/31/17 | $11,357 | $12,278 | $11,381 | $11,059 |
| 11/30/17 | $11,387 | $12,516 | $11,474 | $11,116 |
| 12/31/17 | $11,655 | $12,717 | $11,730 | $11,374 |
| 1/31/18 | $12,370 | $13,435 | $12,383 | $12,049 |
| 2/28/18 | $11,738 | $12,871 | $11,799 | $11,451 |
| 3/31/18 | $11,582 | $12,595 | $11,591 | $11,203 |
| 4/30/18 | $11,759 | $12,715 | $11,776 | $11,479 |
| 5/31/18 | $11,302 | $12,731 | $11,504 | $11,012 |
| 6/30/18 | $11,002 | $12,662 | $11,288 | $10,773 |
| 7/31/18 | $11,375 | $13,044 | $11,558 | $11,106 |
| 8/31/18 | $11,002 | $13,147 | $11,316 | $10,763 |
| 9/30/18 | $11,147 | $13,204 | $11,368 | $10,958 |
| 10/31/18 | $10,328 | $12,214 | $10,443 | $10,205 |
| 11/30/18 | $10,421 | $12,393 | $10,542 | $10,244 |
| 12/31/18 | $9,888 | $11,520 | $10,065 | $9,785 |
| 1/31/19 | $10,622 | $12,430 | $10,825 | $10,519 |
| 2/28/19 | $10,697 | $12,762 | $11,037 | $10,647 |
| 3/31/19 | $10,633 | $12,923 | $11,103 | $10,599 |
| 4/30/19 | $10,846 | $13,359 | $11,396 | $10,824 |
| 5/31/19 | $10,250 | $12,567 | $10,784 | $10,216 |
| 6/30/19 | $10,793 | $13,390 | $11,434 | $10,765 |
| 7/31/19 | $10,516 | $13,429 | $11,295 | $10,521 |
| 8/31/19 | $10,207 | $13,110 | $10,946 | $10,050 |
| 9/30/19 | $10,591 | $13,386 | $11,228 | $10,464 |
| 10/31/19 | $10,942 | $13,752 | $11,620 | $10,812 |
| 11/30/19 | $11,006 | $14,088 | $11,722 | $10,833 |
| 12/31/19 | $11,415 | $14,584 | $12,230 | $11,322 |
| 1/31/20 | $10,894 | $14,423 | $11,901 | $10,820 |
| 2/29/20 | $10,022 | $13,258 | $10,961 | $9,896 |
| 3/31/20 | $8,029 | $11,468 | $9,374 | $8,090 |
| 4/30/20 | $8,516 | $12,697 | $10,084 | $8,604 |
| 5/31/20 | $8,833 | $13,249 | $10,414 | $8,774 |
| 6/30/20 | $9,173 | $13,672 | $10,885 | $9,122 |
| 7/31/20 | $9,286 | $14,395 | $11,370 | $9,315 |
| 8/31/20 | $9,739 | $15,277 | $11,857 | $9,733 |
| 9/30/20 | $9,422 | $14,784 | $11,565 | $9,330 |
| 10/31/20 | $9,207 | $14,425 | $11,317 | $9,089 |
| 11/30/20 | $10,803 | $16,203 | $12,839 | $10,644 |
| 12/31/20 | $11,575 | $16,955 | $13,533 | $11,235 |
| 1/31/21 | $11,690 | $16,878 | $13,562 | $11,215 |
| 2/28/21 | $12,371 | $17,269 | $13,831 | $11,702 |
| 3/31/21 | $12,717 | $17,730 | $14,006 | $12,028 |
| 4/30/21 | $13,017 | $18,505 | $14,418 | $12,298 |
| 5/31/21 | $13,536 | $18,793 | $14,869 | $12,765 |
| 6/30/21 | $13,248 | $19,041 | $14,772 | $12,548 |
| 7/31/21 | $13,133 | $19,172 | $14,529 | $12,325 |
| 8/31/21 | $13,190 | $19,652 | $14,805 | $12,513 |
| 9/30/21 | $12,844 | $18,840 | $14,331 | $12,258 |
| 10/31/21 | $12,959 | $19,802 | $14,673 | $12,460 |
| 11/30/21 | $12,232 | $19,325 | $14,012 | $11,782 |
| 12/31/21 | $12,930 | $20,098 | $14,592 | $12,409 |
| 1/31/22 | $13,020 | $19,111 | $14,054 | $12,520 |
| 2/28/22 | $12,697 | $18,617 | $13,776 | $12,369 |
| 3/31/22 | $12,568 | $19,020 | $13,798 | $12,426 |
| 4/30/22 | $11,882 | $17,498 | $12,931 | $11,781 |
| 5/31/22 | $12,296 | $17,519 | $13,024 | $12,037 |
| 6/30/22 | $11,145 | $16,042 | $11,904 | $10,947 |
| 7/31/22 | $11,417 | $17,162 | $12,311 | $11,092 |
| 8/31/22 | $11,081 | $16,530 | $11,915 | $10,815 |
| 9/30/22 | $10,020 | $14,948 | $10,724 | $9,804 |
| 10/31/22 | $10,551 | $15,850 | $11,045 | $10,200 |
| 11/30/22 | $11,831 | $17,079 | $12,349 | $11,340 |
| 12/31/22 | $11,712 | $16,407 | $12,256 | $11,343 |
| 1/31/23 | $12,514 | $17,583 | $13,251 | $12,225 |
| 2/28/23 | $12,233 | $17,079 | $12,785 | $11,889 |
| 3/31/23 | $12,402 | $17,606 | $13,098 | $11,929 |
| 4/30/23 | $12,697 | $17,859 | $13,326 | $12,224 |
| 5/31/23 | $12,148 | $17,668 | $12,841 | $11,673 |
| 6/30/23 | $12,880 | $18,693 | $13,417 | $12,281 |
| 7/31/23 | $13,542 | $19,378 | $13,963 | $12,901 |
| 8/31/23 | $13,148 | $18,836 | $13,332 | $12,395 |
| 9/30/23 | $12,838 | $18,057 | $12,911 | $12,272 |
| 10/31/23 | $12,331 | $17,514 | $12,378 | $11,738 |
| 11/30/23 | $13,274 | $19,131 | $13,493 | $12,639 |
| 12/31/23 | $13,925 | $20,050 | $14,170 | $13,306 |
| 1/31/24 | $13,740 | $20,167 | $14,030 | $13,142 |
| 2/29/24 | $14,033 | $21,033 | $14,385 | $13,295 |
| 3/31/24 | $14,372 | $21,693 | $14,834 | $13,759 |
| 4/30/24 | $14,233 | $20,977 | $14,568 | $13,657 |
| 5/31/24 | $14,896 | $21,829 | $14,991 | $14,093 |
| 6/30/24 | $14,387 | $22,316 | $14,977 | $13,933 |
The table below shows the average annual total returns of the Fund, a regulatory index, and one or more supplemental index(es) for certain periods ended June 30, 2024.
Average Annual Total Returns (%)
| Class/Index Name | 1 Year | 5 Years | Since Inception 6/5/15 |
|---|
| Class A (excluding sales charge) | 11.70% | 5.92% | 4.53% |
| Class A (including sales charge) | 7.47% | 5.10% | 4.09% |
MSCI All Country World IndexFootnote Reference* | 19.38% | 10.76% | 9.33% |
| MSCI All Country World ex US Index | 11.62% | 5.55% | 4.55% |
| MSCI All Country World ex US Value Index | 13.45% | 5.29% | 3.72% |
| Footnote | Description |
Footnote* | Since Inception Average Annual Return since 6/30/2015 |
All Fund returns are net of fees and expenses and include applicable fee waivers and/or expense limitations. Absent any applicable fee waivers and/or expense limitations, performance would have been lower and there can be no assurance that any such waivers or limitations will continue in the future.
Performance quoted represents past performance. Past performance is not a guarantee or a reliable indicator of future results.Current performance may be lower or higher than performance shown. Investment return and the principal value of an investment will fluctuate. Shares may be worth more or less than original cost when redeemed. Returns shown do not reflect the deduction of taxes that a shareholder would pay on Fund distributions or the redemption of Fund shares.Differences in the Fund’s performance versus an index and related attribution information with respect to particular categories of securities or individual positions may be attributable, in part, to differences in the pricing methodologies used by the Fund and the index. The Cumulative Returns chart and Average Annual Total Returns table reflect any sales load that would have applied at the time of purchase or any Contingent Deferred Sales Charge (“CDSC”) that would have applied if a full redemption occurred on the last business day of the period shown in the Cumulative Returns chart. Class A shares are subject to an initial sales charge. A CDSC may be imposed in certain circumstances on Class A shares that are purchased without an initial sales charge and then redeemed during the first 12 months after purchase. For performance current to the most recent month-end, visit www.pimco.com/literature or via 888.87.PIMCO (888.877.4626).
Key Fund StatisticsFootnote Reference* (as of the end of the reporting period)
| Total Net Assets | $107,271 |
| # of Portfolio Holdings | 3 |
| Portfolio Turnover Rate | 10% |
| Total Net Advisory Fees Paid During the Reporting Period | $0 |
| Footnote | Description |
Footnote* | Dollar amounts displayed in 000's |
What did the Fund invest in?
Geographic Breakdown (% of Net Assets)Footnote Reference*
| United States | 99.9% |
| Other Assets and Liabilities, Net | 0.1% |
| Total | 100.0% |
| Footnote | Description |
Footnote* | % of Net Assets includes derivatives instruments, if any, valued at the value used for determining the Fund's net asset value. The notional exposure of such derivatives investments therefore may be greater than what is depicted. |
Top Holdings (% of Net Assets)
| PIMCO RAE International Fund | 74.1% |
| PIMCO RAE Emerging Markets Fund | 25.7% |
For additional information about the Fund, including the Fund's prospectus, financial information, holdings and proxy voting information, please visit www.pimco.com/literature or contact 888.87.PIMCO (888.877.4626). For tax information about the Fund, please visit: https://www.pimco.com/tax.
PIMCO RAE Global ex-US Fund
Annual Shareholder Report |
June 30, 2024
Institutional Class: PZRIX
PIMCO RAE Global ex-US Fund
Annual Shareholder Report | June 30, 2024
This annual shareholder report contains important information about the PIMCO RAE Global ex-US Fund for the period of July 1, 2023 to June 30, 2024 (the "reporting period"). You can find additional information about the Fund at www.pimco.com/literature. You can also request this information by contacting us at 888.87.PIMCO (888.877.4626).
What were the Fund costs for the last year?
(based on a hypothetical $10,000 investment)
| Class Name | Cost of a $10,000 investment | Costs paid as a percentage of a $10,000 investment |
|---|
| Institutional Class | $0 | 0.00% |
How did the Fund perform during the reporting period and what affected its performance?
The following affected performance (on a gross basis) during the reporting period:
• Underweight exposure to, and security selection in, healthcare contributed to relative returns, as the sector underperformed the MSCI
All Country World ex US Value Index ("MGCUWXUN") and the Fund’s holdings outperformed the MGCUWXUN.
• Overweight exposure to, and security selection in, information technology contributed to relative returns, as the sector and the Fund’s
holdings outperformed the MGCUWXUN.
• Security selection in industrials contributed to relative returns, as the Fund’s holdings outperformed the MGCUWXUN.
• Overweight exposure to, and security selection in, consumer discretionary detracted from relative returns, as the sector and the Fund’s
holdings underperformed the MGCUWXUN.
• Overweight exposure to, and security selection in, materials detracted from relative returns, as the sector and the Fund’s holdings
underperformed the MGCUWXUN.
• Overweight exposure to, and security selection in, communication services detracted from relative returns, as the sector and the
Fund’s holdings underperformed the MGCUWXUN.
In addition to the Fund's performance, the tables in this section include performance of: (i) a broad-based securities market index (i.e., a regulatory index) and (ii) one or more supplemental index(es). Effective July 24, 2024, the Fund's regulatory index is the MSCI All Country World Index. The Fund's regulatory index is shown in connection with certain regulatory requirements to provide a broad measure of market performance.
The table below illustrates cumulative returns for the 10-year period ended June 30, 2024 or the life of the Fund, if shorter. Cumulative returns are based on a hypothetical initial investment equal to the greater of either $10,000 or the investment minimum applicable to the share class.
Cumulative Returns Based on $1,000,000 Investment
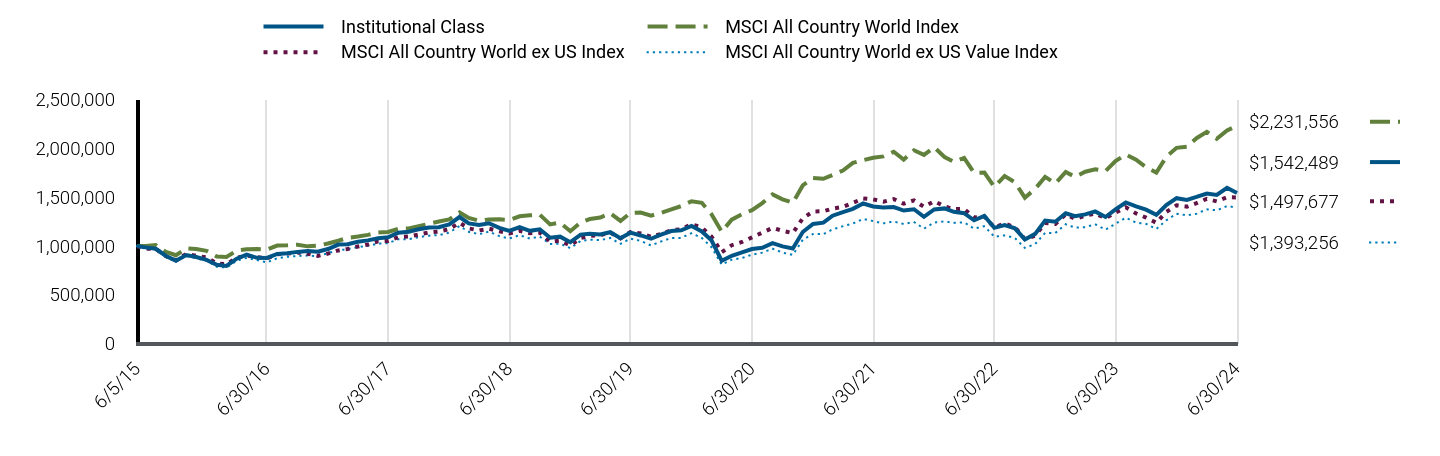
| Institutional Class | MSCI All Country World Index | MSCI All Country World ex US Index | MSCI All Country World ex US Value Index |
|---|
| 6/5/15 | $1,000,000 | $1,000,000 | $1,000,000 | $1,000,000 |
| 6/30/15 | $986,000 | $1,000,000 | $973,276 | $971,350 |
| 7/31/15 | $972,000 | $1,008,685 | $970,572 | $963,325 |
| 8/31/15 | $898,000 | $939,539 | $896,388 | $888,400 |
| 9/30/15 | $850,000 | $905,501 | $854,825 | $839,283 |
| 10/31/15 | $908,000 | $976,566 | $918,460 | $900,592 |
| 11/30/15 | $887,000 | $968,503 | $899,502 | $872,997 |
| 12/31/15 | $858,011 | $951,038 | $882,560 | $851,304 |
| 1/31/16 | $807,421 | $893,681 | $822,527 | $787,859 |
| 2/29/16 | $796,291 | $887,529 | $813,126 | $779,784 |
| 3/31/16 | $870,153 | $953,303 | $879,241 | $847,751 |
| 4/30/16 | $912,649 | $967,375 | $902,377 | $879,824 |
| 5/31/16 | $879,259 | $968,598 | $887,148 | $855,719 |
| 6/30/16 | $878,247 | $962,730 | $873,575 | $832,806 |
| 7/31/16 | $918,720 | $1,004,221 | $916,776 | $875,156 |
| 8/31/16 | $925,802 | $1,007,598 | $922,574 | $889,645 |
| 9/30/16 | $939,967 | $1,013,772 | $933,951 | $897,704 |
| 10/31/16 | $948,062 | $996,566 | $920,522 | $902,674 |
| 11/30/16 | $940,979 | $1,004,139 | $899,230 | $895,007 |
| 12/31/16 | $969,467 | $1,025,831 | $922,232 | $927,236 |
| 1/31/17 | $1,015,138 | $1,053,880 | $954,902 | $955,888 |
| 2/28/17 | $1,019,290 | $1,083,443 | $970,129 | $967,357 |
| 3/31/17 | $1,044,202 | $1,096,697 | $994,723 | $989,147 |
| 4/30/17 | $1,057,695 | $1,113,789 | $1,016,018 | $1,003,073 |
| 5/31/17 | $1,079,493 | $1,138,385 | $1,048,987 | $1,023,919 |
| 6/30/17 | $1,088,834 | $1,143,561 | $1,052,244 | $1,029,514 |
| 7/31/17 | $1,136,581 | $1,175,520 | $1,091,028 | $1,069,758 |
| 8/31/17 | $1,145,923 | $1,180,024 | $1,096,737 | $1,070,204 |
| 9/30/17 | $1,170,834 | $1,202,822 | $1,117,096 | $1,091,193 |
| 10/31/17 | $1,189,518 | $1,227,798 | $1,138,113 | $1,105,932 |
| 11/30/17 | $1,192,632 | $1,251,566 | $1,147,358 | $1,111,649 |
| 12/31/17 | $1,221,283 | $1,271,744 | $1,173,002 | $1,137,367 |
| 1/31/18 | $1,296,937 | $1,343,491 | $1,238,333 | $1,204,858 |
| 2/28/18 | $1,231,010 | $1,287,067 | $1,179,943 | $1,145,124 |
| 3/31/18 | $1,214,798 | $1,259,515 | $1,159,133 | $1,120,328 |
| 4/30/18 | $1,233,171 | $1,271,543 | $1,177,638 | $1,147,918 |
| 5/31/18 | $1,185,617 | $1,273,131 | $1,150,447 | $1,101,193 |
| 6/30/18 | $1,154,274 | $1,266,236 | $1,128,823 | $1,077,279 |
| 7/31/18 | $1,194,263 | $1,304,421 | $1,155,821 | $1,110,631 |
| 8/31/18 | $1,155,355 | $1,314,670 | $1,131,630 | $1,076,318 |
| 9/30/18 | $1,171,567 | $1,320,391 | $1,136,785 | $1,095,764 |
| 10/31/18 | $1,085,104 | $1,221,443 | $1,044,322 | $1,020,495 |
| 11/30/18 | $1,095,912 | $1,239,307 | $1,054,206 | $1,024,362 |
| 12/31/18 | $1,039,134 | $1,152,017 | $1,006,460 | $978,451 |
| 1/31/19 | $1,116,930 | $1,242,980 | $1,082,538 | $1,051,947 |
| 2/28/19 | $1,125,821 | $1,276,226 | $1,103,690 | $1,064,685 |
| 3/31/19 | $1,119,153 | $1,292,276 | $1,110,264 | $1,059,912 |
| 4/30/19 | $1,141,380 | $1,335,910 | $1,139,595 | $1,082,360 |
| 5/31/19 | $1,079,143 | $1,256,665 | $1,078,432 | $1,021,566 |
| 6/30/19 | $1,136,935 | $1,338,951 | $1,143,369 | $1,076,508 |
| 7/31/19 | $1,108,039 | $1,342,875 | $1,129,531 | $1,052,063 |
| 8/31/19 | $1,074,698 | $1,311,018 | $1,094,645 | $1,004,988 |
| 9/30/19 | $1,116,930 | $1,338,605 | $1,122,814 | $1,046,358 |
| 10/31/19 | $1,153,605 | $1,375,240 | $1,161,993 | $1,081,196 |
| 11/30/19 | $1,161,385 | $1,408,812 | $1,172,237 | $1,083,285 |
| 12/31/19 | $1,204,720 | $1,458,424 | $1,223,000 | $1,132,215 |
| 1/31/20 | $1,149,154 | $1,442,314 | $1,190,145 | $1,082,022 |
| 2/29/20 | $1,058,120 | $1,325,818 | $1,096,071 | $989,598 |
| 3/31/20 | $847,679 | $1,146,828 | $937,365 | $808,975 |
| 4/30/20 | $899,698 | $1,269,682 | $1,008,401 | $860,354 |
| 5/31/20 | $933,983 | $1,324,902 | $1,041,402 | $877,448 |
| 6/30/20 | $969,451 | $1,367,236 | $1,088,466 | $912,225 |
| 7/31/20 | $981,274 | $1,439,545 | $1,136,995 | $931,455 |
| 8/31/20 | $1,029,746 | $1,527,653 | $1,185,664 | $973,303 |
| 9/30/20 | $996,643 | $1,478,396 | $1,156,519 | $932,984 |
| 10/31/20 | $975,362 | $1,442,459 | $1,131,655 | $908,856 |
| 11/30/20 | $1,143,243 | $1,620,261 | $1,283,878 | $1,064,361 |
| 12/31/20 | $1,225,619 | $1,695,488 | $1,353,273 | $1,123,473 |
| 1/31/21 | $1,238,888 | $1,687,777 | $1,356,217 | $1,121,543 |
| 2/28/21 | $1,310,061 | $1,726,872 | $1,383,063 | $1,170,158 |
| 3/31/21 | $1,347,457 | $1,772,996 | $1,400,552 | $1,202,812 |
| 4/30/21 | $1,380,028 | $1,850,515 | $1,441,778 | $1,229,793 |
| 5/31/21 | $1,435,518 | $1,879,314 | $1,486,875 | $1,276,470 |
| 6/30/21 | $1,405,360 | $1,904,081 | $1,477,250 | $1,254,850 |
| 7/31/21 | $1,393,297 | $1,917,199 | $1,452,897 | $1,232,512 |
| 8/31/21 | $1,399,329 | $1,965,185 | $1,480,515 | $1,251,310 |
| 9/30/21 | $1,363,139 | $1,884,004 | $1,433,109 | $1,225,776 |
| 10/31/21 | $1,376,409 | $1,980,170 | $1,467,316 | $1,245,985 |
| 11/30/21 | $1,299,204 | $1,932,487 | $1,401,245 | $1,178,211 |
| 12/31/21 | $1,374,205 | $2,009,787 | $1,459,155 | $1,240,940 |
| 1/31/22 | $1,385,015 | $1,911,082 | $1,405,384 | $1,251,964 |
| 2/28/22 | $1,349,883 | $1,861,723 | $1,377,567 | $1,236,904 |
| 3/31/22 | $1,336,370 | $1,902,046 | $1,379,763 | $1,242,576 |
| 4/30/22 | $1,263,404 | $1,749,803 | $1,293,123 | $1,178,121 |
| 5/31/22 | $1,307,995 | $1,751,851 | $1,302,401 | $1,203,655 |
| 6/30/22 | $1,186,384 | $1,604,176 | $1,190,360 | $1,094,652 |
| 7/31/22 | $1,214,759 | $1,716,200 | $1,231,112 | $1,109,234 |
| 8/31/22 | $1,180,979 | $1,653,018 | $1,191,517 | $1,081,513 |
| 9/30/22 | $1,067,475 | $1,494,776 | $1,072,446 | $980,395 |
| 10/31/22 | $1,124,227 | $1,584,981 | $1,104,496 | $1,020,042 |
| 11/30/22 | $1,260,701 | $1,707,917 | $1,234,876 | $1,134,006 |
| 12/31/22 | $1,248,535 | $1,640,709 | $1,225,646 | $1,134,340 |
| 1/31/23 | $1,335,300 | $1,758,310 | $1,325,055 | $1,222,457 |
| 2/28/23 | $1,305,888 | $1,707,917 | $1,278,543 | $1,188,897 |
| 3/31/23 | $1,323,536 | $1,760,577 | $1,309,797 | $1,192,852 |
| 4/30/23 | $1,354,418 | $1,785,881 | $1,332,553 | $1,222,421 |
| 5/31/23 | $1,297,065 | $1,766,753 | $1,284,102 | $1,167,264 |
| 6/30/23 | $1,375,006 | $1,869,332 | $1,341,719 | $1,228,076 |
| 7/31/23 | $1,445,595 | $1,937,765 | $1,396,266 | $1,290,119 |
| 8/31/23 | $1,405,889 | $1,883,616 | $1,333,207 | $1,239,533 |
| 9/30/23 | $1,372,065 | $1,805,727 | $1,291,097 | $1,227,187 |
| 10/31/23 | $1,319,124 | $1,751,435 | $1,237,829 | $1,173,752 |
| 11/30/23 | $1,419,124 | $1,913,085 | $1,349,251 | $1,263,858 |
| 12/31/23 | $1,489,411 | $2,004,978 | $1,417,041 | $1,330,600 |
| 1/31/24 | $1,471,718 | $2,016,732 | $1,402,963 | $1,314,174 |
| 2/29/24 | $1,502,278 | $2,103,276 | $1,438,483 | $1,329,518 |
| 3/31/24 | $1,537,664 | $2,169,312 | $1,483,448 | $1,375,878 |
| 4/30/24 | $1,523,188 | $2,097,740 | $1,456,812 | $1,365,706 |
| 5/31/24 | $1,595,567 | $2,182,937 | $1,499,102 | $1,409,262 |
| 6/30/24 | $1,542,489 | $2,231,556 | $1,497,677 | $1,393,256 |
The table below shows the average annual total returns of the Fund, a regulatory index, and one or more supplemental index(es) for certain periods ended June 30, 2024.
Average Annual Total Returns (%)
| Class/Index Name | 1 Year | 5 Years | Since Inception 6/5/15 |
|---|
| Institutional Class | 12.18% | 6.29% | 4.90% |
MSCI All Country World IndexFootnote Reference* | 19.38% | 10.76% | 9.33% |
| MSCI All Country World ex US Index | 11.62% | 5.55% | 4.55% |
| MSCI All Country World ex US Value Index | 13.45% | 5.29% | 3.72% |
| Footnote | Description |
Footnote* | Since Inception Average Annual Return since 6/30/2015 |
All Fund returns are net of fees and expenses and include applicable fee waivers and/or expense limitations. Absent any applicable fee waivers and/or expense limitations, performance would have been lower and there can be no assurance that any such waivers or limitations will continue in the future.
Performance quoted represents past performance. Past performance is not a guarantee or a reliable indicator of future results.Current performance may be lower or higher than performance shown. Investment return and the principal value of an investment will fluctuate. Shares may be worth more or less than original cost when redeemed. Returns shown do not reflect the deduction of taxes that a shareholder would pay on Fund distributions or the redemption of Fund shares.Differences in the Fund’s performance versus an index and related attribution information with respect to particular categories of securities or individual positions may be attributable, in part, to differences in the pricing methodologies used by the Fund and the index. For performance current to the most recent month-end, visit www.pimco.com/literature or via 888.87.PIMCO (888.877.4626).
Key Fund StatisticsFootnote Reference* (as of the end of the reporting period)
| Total Net Assets | $107,271 |
| # of Portfolio Holdings | 3 |
| Portfolio Turnover Rate | 10% |
| Total Net Advisory Fees Paid During the Reporting Period | $0 |
| Footnote | Description |
Footnote* | Dollar amounts displayed in 000's |
What did the Fund invest in?
Geographic Breakdown (% of Net Assets)Footnote Reference*
| United States | 99.9% |
| Other Assets and Liabilities, Net | 0.1% |
| Total | 100.0% |
| Footnote | Description |
Footnote* | % of Net Assets includes derivatives instruments, if any, valued at the value used for determining the Fund's net asset value. The notional exposure of such derivatives investments therefore may be greater than what is depicted. |
Top Holdings (% of Net Assets)
| PIMCO RAE International Fund | 74.1% |
| PIMCO RAE Emerging Markets Fund | 25.7% |
For additional information about the Fund, including the Fund's prospectus, financial information, holdings and proxy voting information, please visit www.pimco.com/literature or contact 888.87.PIMCO (888.877.4626). For tax information about the Fund, please visit: https://www.pimco.com/tax.
Institutional Class: PZRIX
PIMCO RAE Global ex-US Fund
Annual Shareholder Report |
June 30, 2024
PIMCO RAE Global ex-US Fund
Annual Shareholder Report | June 30, 2024
This annual shareholder report contains important information about the PIMCO RAE Global ex-US Fund for the period of July 1, 2023 to June 30, 2024 (the "reporting period"). You can find additional information about the Fund at www.pimco.com/literature. You can also request this information by contacting us at 888.87.PIMCO (888.877.4626).
What were the Fund costs for the last year?
(based on a hypothetical $10,000 investment)
| Class Name | Cost of a $10,000 investment | Costs paid as a percentage of a $10,000 investment |
|---|
| I-2 | $11 | 0.10% |
How did the Fund perform during the reporting period and what affected its performance?
The following affected performance (on a gross basis) during the reporting period:
• Underweight exposure to, and security selection in, healthcare contributed to relative returns, as the sector underperformed the MSCI
All Country World ex US Value Index ("MGCUWXUN") and the Fund’s holdings outperformed the MGCUWXUN.
• Overweight exposure to, and security selection in, information technology contributed to relative returns, as the sector and the Fund’s
holdings outperformed the MGCUWXUN.
• Security selection in industrials contributed to relative returns, as the Fund’s holdings outperformed the MGCUWXUN.
• Overweight exposure to, and security selection in, consumer discretionary detracted from relative returns, as the sector and the Fund’s
holdings underperformed the MGCUWXUN.
• Overweight exposure to, and security selection in, materials detracted from relative returns, as the sector and the Fund’s holdings
underperformed the MGCUWXUN.
• Overweight exposure to, and security selection in, communication services detracted from relative returns, as the sector and the
Fund’s holdings underperformed the MGCUWXUN.
In addition to the Fund's performance, the tables in this section include performance of: (i) a broad-based securities market index (i.e., a regulatory index) and (ii) one or more supplemental index(es). Effective July 24, 2024, the Fund's regulatory index is the MSCI All Country World Index. The Fund's regulatory index is shown in connection with certain regulatory requirements to provide a broad measure of market performance.
The table below illustrates cumulative returns for the 10-year period ended June 30, 2024 or the life of the Fund, if shorter. Cumulative returns are based on a hypothetical initial investment equal to the greater of either $10,000 or the investment minimum applicable to the share class.
Cumulative Returns Based on $1,000,000 Investment
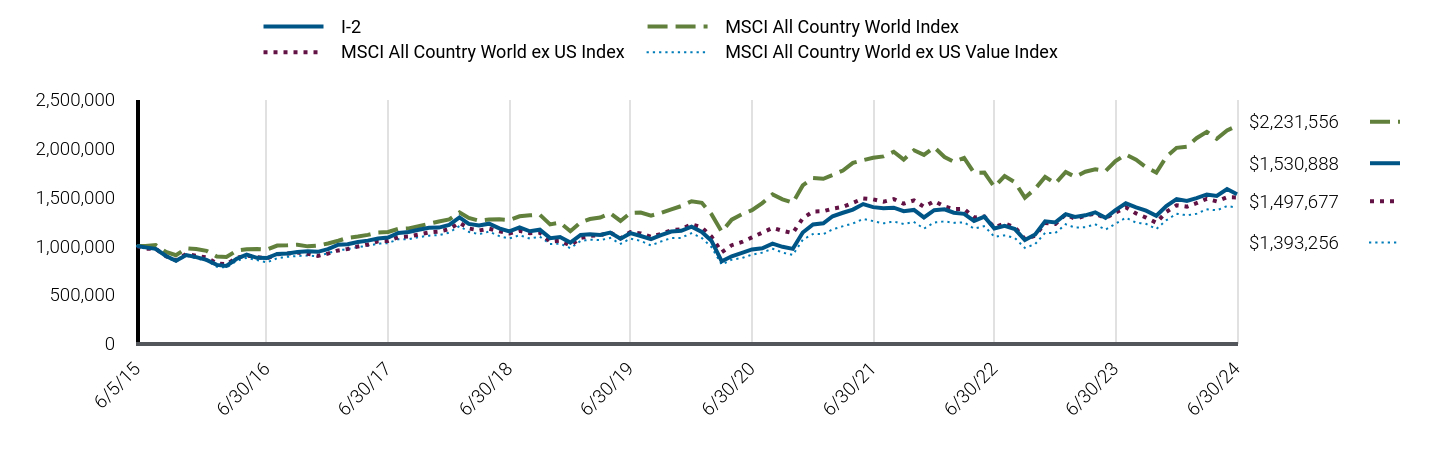
| I-2 | MSCI All Country World Index | MSCI All Country World ex US Index | MSCI All Country World ex US Value Index |
|---|
| 6/5/15 | $1,000,000 | $1,000,000 | $1,000,000 | $1,000,000 |
| 6/30/15 | $986,000 | $1,000,000 | $973,276 | $971,350 |
| 7/31/15 | $971,000 | $1,008,685 | $970,572 | $963,325 |
| 8/31/15 | $898,000 | $939,539 | $896,388 | $888,400 |
| 9/30/15 | $849,000 | $905,501 | $854,825 | $839,283 |
| 10/31/15 | $908,000 | $976,566 | $918,460 | $900,592 |
| 11/30/15 | $886,000 | $968,503 | $899,502 | $872,997 |
| 12/31/15 | $857,593 | $951,038 | $882,560 | $851,304 |
| 1/31/16 | $807,027 | $893,681 | $822,527 | $787,859 |
| 2/29/16 | $795,903 | $887,529 | $813,126 | $779,784 |
| 3/31/16 | $869,729 | $953,303 | $879,241 | $847,751 |
| 4/30/16 | $912,204 | $967,375 | $902,377 | $879,824 |
| 5/31/16 | $878,831 | $968,598 | $887,148 | $855,719 |
| 6/30/16 | $876,808 | $962,730 | $873,575 | $832,806 |
| 7/31/16 | $918,272 | $1,004,221 | $916,776 | $875,156 |
| 8/31/16 | $924,340 | $1,007,598 | $922,574 | $889,645 |
| 9/30/16 | $938,498 | $1,013,772 | $933,951 | $897,704 |
| 10/31/16 | $946,589 | $996,566 | $920,522 | $902,674 |
| 11/30/16 | $940,521 | $1,004,139 | $899,230 | $895,007 |
| 12/31/16 | $967,827 | $1,025,831 | $922,232 | $927,236 |
| 1/31/17 | $1,013,469 | $1,053,880 | $954,902 | $955,888 |
| 2/28/17 | $1,017,619 | $1,083,443 | $970,129 | $967,357 |
| 3/31/17 | $1,041,477 | $1,096,697 | $994,723 | $989,147 |
| 4/30/17 | $1,054,962 | $1,113,789 | $1,016,018 | $1,003,073 |
| 5/31/17 | $1,076,746 | $1,138,385 | $1,048,987 | $1,023,919 |
| 6/30/17 | $1,086,082 | $1,143,561 | $1,052,244 | $1,029,514 |
| 7/31/17 | $1,133,799 | $1,175,520 | $1,091,028 | $1,069,758 |
| 8/31/17 | $1,143,135 | $1,180,024 | $1,096,737 | $1,070,204 |
| 9/30/17 | $1,166,994 | $1,202,822 | $1,117,096 | $1,091,193 |
| 10/31/17 | $1,186,703 | $1,227,798 | $1,138,113 | $1,105,932 |
| 11/30/17 | $1,188,778 | $1,251,566 | $1,147,358 | $1,111,649 |
| 12/31/17 | $1,216,935 | $1,271,744 | $1,173,002 | $1,137,367 |
| 1/31/18 | $1,292,521 | $1,343,491 | $1,238,333 | $1,204,858 |
| 2/28/18 | $1,226,653 | $1,287,067 | $1,179,943 | $1,145,124 |
| 3/31/18 | $1,210,456 | $1,259,515 | $1,159,133 | $1,120,328 |
| 4/30/18 | $1,228,813 | $1,271,543 | $1,177,638 | $1,147,918 |
| 5/31/18 | $1,181,302 | $1,273,131 | $1,150,447 | $1,101,193 |
| 6/30/18 | $1,149,987 | $1,266,236 | $1,128,823 | $1,077,279 |
| 7/31/18 | $1,189,940 | $1,304,421 | $1,155,821 | $1,110,631 |
| 8/31/18 | $1,151,067 | $1,314,670 | $1,131,630 | $1,076,318 |
| 9/30/18 | $1,167,264 | $1,320,391 | $1,136,785 | $1,095,764 |
| 10/31/18 | $1,080,880 | $1,221,443 | $1,044,322 | $1,020,495 |
| 11/30/18 | $1,091,678 | $1,239,307 | $1,054,206 | $1,024,362 |
| 12/31/18 | $1,035,095 | $1,152,017 | $1,006,460 | $978,451 |
| 1/31/19 | $1,112,755 | $1,242,980 | $1,082,538 | $1,051,947 |
| 2/28/19 | $1,120,521 | $1,276,226 | $1,103,690 | $1,064,685 |
| 3/31/19 | $1,113,865 | $1,292,276 | $1,110,264 | $1,059,912 |
| 4/30/19 | $1,137,163 | $1,335,910 | $1,139,595 | $1,082,360 |
| 5/31/19 | $1,075,035 | $1,256,665 | $1,078,432 | $1,021,566 |
| 6/30/19 | $1,131,616 | $1,338,951 | $1,143,369 | $1,076,508 |
| 7/31/19 | $1,102,770 | $1,342,875 | $1,129,531 | $1,052,063 |
| 8/31/19 | $1,070,597 | $1,311,018 | $1,094,645 | $1,004,988 |
| 9/30/19 | $1,111,646 | $1,338,605 | $1,122,814 | $1,046,358 |
| 10/31/19 | $1,148,257 | $1,375,240 | $1,161,993 | $1,081,196 |
| 11/30/19 | $1,156,023 | $1,408,812 | $1,172,237 | $1,083,285 |
| 12/31/19 | $1,198,296 | $1,458,424 | $1,223,000 | $1,132,215 |
| 1/31/20 | $1,144,042 | $1,442,314 | $1,190,145 | $1,082,022 |
| 2/29/20 | $1,053,227 | $1,325,818 | $1,096,071 | $989,598 |
| 3/31/20 | $843,289 | $1,146,828 | $937,365 | $808,975 |
| 4/30/20 | $895,184 | $1,269,682 | $1,008,401 | $860,354 |
| 5/31/20 | $929,387 | $1,324,902 | $1,041,402 | $877,448 |
| 6/30/20 | $964,770 | $1,367,236 | $1,088,466 | $912,225 |
| 7/31/20 | $976,564 | $1,439,545 | $1,136,995 | $931,455 |
| 8/31/20 | $1,023,741 | $1,527,653 | $1,185,664 | $973,303 |
| 9/30/20 | $991,897 | $1,478,396 | $1,156,519 | $932,984 |
| 10/31/20 | $970,667 | $1,442,459 | $1,131,655 | $908,856 |
| 11/30/20 | $1,138,145 | $1,620,261 | $1,283,878 | $1,064,361 |
| 12/31/20 | $1,220,690 | $1,695,488 | $1,353,273 | $1,123,473 |
| 1/31/21 | $1,232,670 | $1,687,777 | $1,356,217 | $1,121,543 |
| 2/28/21 | $1,304,546 | $1,726,872 | $1,383,063 | $1,170,158 |
| 3/31/21 | $1,340,483 | $1,772,996 | $1,400,552 | $1,202,812 |
| 4/30/21 | $1,372,828 | $1,850,515 | $1,441,778 | $1,229,793 |
| 5/31/21 | $1,429,130 | $1,879,314 | $1,486,875 | $1,276,470 |
| 6/30/21 | $1,397,984 | $1,904,081 | $1,477,250 | $1,254,850 |
| 7/31/21 | $1,386,005 | $1,917,199 | $1,452,897 | $1,232,512 |
| 8/31/21 | $1,391,994 | $1,965,185 | $1,480,515 | $1,251,310 |
| 9/30/21 | $1,356,057 | $1,884,004 | $1,433,109 | $1,225,776 |
| 10/31/21 | $1,369,234 | $1,980,170 | $1,467,316 | $1,245,985 |
| 11/30/21 | $1,292,566 | $1,932,487 | $1,401,245 | $1,178,211 |
| 12/31/21 | $1,366,735 | $2,009,787 | $1,459,155 | $1,240,940 |
| 1/31/22 | $1,376,124 | $1,911,082 | $1,405,384 | $1,251,964 |
| 2/28/22 | $1,341,251 | $1,861,723 | $1,377,567 | $1,236,904 |
| 3/31/22 | $1,329,180 | $1,902,046 | $1,379,763 | $1,242,576 |
| 4/30/22 | $1,256,753 | $1,749,803 | $1,293,123 | $1,178,121 |
| 5/31/22 | $1,301,014 | $1,751,851 | $1,302,401 | $1,203,655 |
| 6/30/22 | $1,180,301 | $1,604,176 | $1,190,360 | $1,094,652 |
| 7/31/22 | $1,207,126 | $1,716,200 | $1,231,112 | $1,109,234 |
| 8/31/22 | $1,173,595 | $1,653,018 | $1,191,517 | $1,081,513 |
| 9/30/22 | $1,060,930 | $1,494,776 | $1,072,446 | $980,395 |
| 10/31/22 | $1,117,262 | $1,584,981 | $1,104,496 | $1,020,042 |
| 11/30/22 | $1,252,729 | $1,707,917 | $1,234,876 | $1,134,006 |
| 12/31/22 | $1,241,512 | $1,640,709 | $1,225,646 | $1,134,340 |
| 1/31/23 | $1,326,127 | $1,758,310 | $1,325,055 | $1,222,457 |
| 2/28/23 | $1,296,950 | $1,707,917 | $1,278,543 | $1,188,897 |
| 3/31/23 | $1,314,456 | $1,760,577 | $1,309,797 | $1,192,852 |
| 4/30/23 | $1,345,093 | $1,785,881 | $1,332,553 | $1,222,421 |
| 5/31/23 | $1,288,196 | $1,766,753 | $1,284,102 | $1,167,264 |
| 6/30/23 | $1,366,976 | $1,869,332 | $1,341,719 | $1,228,076 |
| 7/31/23 | $1,437,003 | $1,937,765 | $1,396,266 | $1,290,119 |
| 8/31/23 | $1,396,154 | $1,883,616 | $1,333,207 | $1,239,533 |
| 9/30/23 | $1,362,600 | $1,805,727 | $1,291,097 | $1,227,187 |
| 10/31/23 | $1,310,080 | $1,751,435 | $1,237,829 | $1,173,752 |
| 11/30/23 | $1,409,284 | $1,913,085 | $1,349,251 | $1,263,858 |
| 12/31/23 | $1,479,858 | $2,004,978 | $1,417,041 | $1,330,600 |
| 1/31/24 | $1,460,722 | $2,016,732 | $1,402,963 | $1,314,174 |
| 2/29/24 | $1,491,021 | $2,103,276 | $1,438,483 | $1,329,518 |
| 3/31/24 | $1,527,699 | $2,169,312 | $1,483,448 | $1,375,878 |
| 4/30/24 | $1,513,347 | $2,097,740 | $1,456,812 | $1,365,706 |
| 5/31/24 | $1,583,512 | $2,182,937 | $1,499,102 | $1,409,262 |
| 6/30/24 | $1,530,888 | $2,231,556 | $1,497,677 | $1,393,256 |
The table below shows the average annual total returns of the Fund, a regulatory index, and one or more supplemental index(es) for certain periods ended June 30, 2024.
Average Annual Total Returns (%)
| Class/Index Name | 1 Year | 5 Years | Since Inception 6/5/15 |
|---|
| I-2 | 11.99% | 6.23% | 4.81% |
MSCI All Country World IndexFootnote Reference* | 19.38% | 10.76% | 9.33% |
| MSCI All Country World ex US Index | 11.62% | 5.55% | 4.55% |
| MSCI All Country World ex US Value Index | 13.45% | 5.29% | 3.72% |
| Footnote | Description |
Footnote* | Since Inception Average Annual Return since 6/30/2015 |
All Fund returns are net of fees and expenses and include applicable fee waivers and/or expense limitations. Absent any applicable fee waivers and/or expense limitations, performance would have been lower and there can be no assurance that any such waivers or limitations will continue in the future.
Performance quoted represents past performance. Past performance is not a guarantee or a reliable indicator of future results.Current performance may be lower or higher than performance shown. Investment return and the principal value of an investment will fluctuate. Shares may be worth more or less than original cost when redeemed. Returns shown do not reflect the deduction of taxes that a shareholder would pay on Fund distributions or the redemption of Fund shares.Differences in the Fund’s performance versus an index and related attribution information with respect to particular categories of securities or individual positions may be attributable, in part, to differences in the pricing methodologies used by the Fund and the index. For performance current to the most recent month-end, visit www.pimco.com/literature or via 888.87.PIMCO (888.877.4626).
Key Fund StatisticsFootnote Reference* (as of the end of the reporting period)
| Total Net Assets | $107,271 |
| # of Portfolio Holdings | 3 |
| Portfolio Turnover Rate | 10% |
| Total Net Advisory Fees Paid During the Reporting Period | $0 |
| Footnote | Description |
Footnote* | Dollar amounts displayed in 000's |
What did the Fund invest in?
Geographic Breakdown (% of Net Assets)Footnote Reference*
| United States | 99.9% |
| Other Assets and Liabilities, Net | 0.1% |
| Total | 100.0% |
| Footnote | Description |
Footnote* | % of Net Assets includes derivatives instruments, if any, valued at the value used for determining the Fund's net asset value. The notional exposure of such derivatives investments therefore may be greater than what is depicted. |
Top Holdings (% of Net Assets)
| PIMCO RAE International Fund | 74.1% |
| PIMCO RAE Emerging Markets Fund | 25.7% |
For additional information about the Fund, including the Fund's prospectus, financial information, holdings and proxy voting information, please visit www.pimco.com/literature or contact 888.87.PIMCO (888.877.4626). For tax information about the Fund, please visit: https://www.pimco.com/tax.
PIMCO RAE Global ex-US Fund
Annual Shareholder Report |
June 30, 2024
PIMCO RAE International Fund
Annual Shareholder Report | June 30, 2024
This annual shareholder report contains important information about the PIMCO RAE International Fund (the "Fund") for the period of July 1, 2023 to June 30, 2024 (the "reporting period"). You can find additional information about the Fund at www.pimco.com/literature. You can also request this information by contacting us at 888.87.PIMCO (888.877.4626).
What were the Fund costs for the last year?
(based on a hypothetical $10,000 investment)
| Class Name | Cost of a $10,000 investment | Costs paid as a percentage of a $10,000 investment |
|---|
| Class A | $90 | 0.86% |
How did the Fund perform during the reporting period and what affected its performance?
The following affected performance (on a gross basis) during the reporting period:
• Security selection in, the healthcare sector contributed to relative returns, as the Fund’s holdings outperformed the MSCI EAFE Value
Index.
• Underweight exposure to, and security selection in, the energy sector contributed to relative returns, as the sector underperformed the
MSCI EAFE Value Index and the Fund’s holdings outperformed the MSCI EAFE Value Index.
• Security selection in utilities contributed to relative returns, as the Fund’s holdings outperformed the MSCI EAFE Value Index.
• Overweight exposure to, and security selection in, the consumer discretionary sector detracted from relative returns, as the sector and
the Fund’s holdings underperformed the MSCI EAFE Value Index.
• Underweight exposure to the financials sector detracted from relative returns, as the sector outperformed the MSCI EAFE Value Index.
• Overweight exposure to, and security selection in, the consumer staples sector detracted from relative returns, as the sector and the
Fund’s holdings underperformed the MSCI EAFE Value Index.
In addition to the Fund's performance, the tables in this section include performance of: (i) a broad-based securities market index (i.e., a regulatory index) and (ii) one or more supplemental index(es). Effective July 24, 2024, the Fund's regulatory index is the MSCI EAFE Index. The Fund's regulatory index is shown in connection with certain regulatory requirements to provide a broad measure of market performance.
The table below illustrates cumulative returns for the 10-year period ended June 30, 2024 or the life of the Fund, if shorter. Cumulative returns are based on a hypothetical initial investment equal to the greater of either $10,000 or the investment minimum applicable to the share class.
Cumulative Returns Based on $10,000 Investment
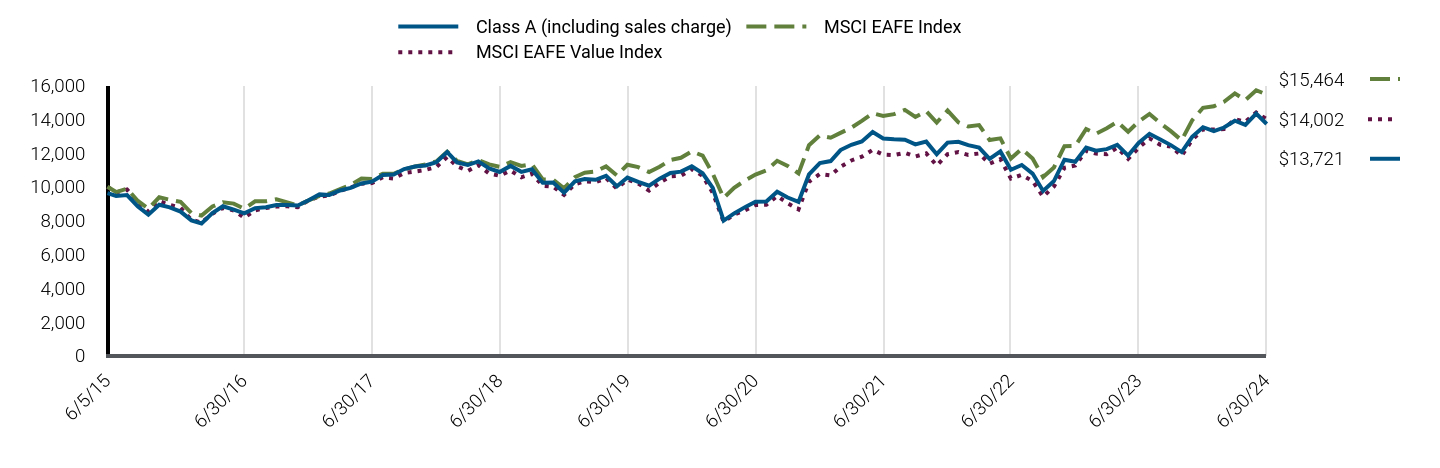
| Class A (including sales charge) | MSCI EAFE Index | MSCI EAFE Value Index |
|---|
| 6/5/15 | $9,625 | $10,000 | $10,000 |
| 6/30/15 | $9,461 | $9,690 | $9,666 |
| 7/31/15 | $9,509 | $9,891 | $9,834 |
| 8/31/15 | $8,835 | $9,163 | $9,095 |
| 9/30/15 | $8,354 | $8,698 | $8,528 |
| 10/31/15 | $8,941 | $9,378 | $9,156 |
| 11/30/15 | $8,787 | $9,232 | $8,929 |
| 12/31/15 | $8,533 | $9,108 | $8,757 |
| 1/31/16 | $8,011 | $8,449 | $8,045 |
| 2/29/16 | $7,834 | $8,294 | $7,889 |
| 3/31/16 | $8,445 | $8,834 | $8,409 |
| 4/30/16 | $8,849 | $9,090 | $8,741 |
| 5/31/16 | $8,652 | $9,007 | $8,602 |
| 6/30/16 | $8,425 | $8,705 | $8,175 |
| 7/31/16 | $8,740 | $9,146 | $8,605 |
| 8/31/16 | $8,790 | $9,152 | $8,744 |
| 9/30/16 | $8,918 | $9,265 | $8,828 |
| 10/31/16 | $8,918 | $9,075 | $8,849 |
| 11/30/16 | $8,888 | $8,895 | $8,794 |
| 12/31/16 | $9,200 | $9,199 | $9,197 |
| 1/31/17 | $9,552 | $9,466 | $9,423 |
| 2/28/17 | $9,522 | $9,601 | $9,488 |
| 3/31/17 | $9,784 | $9,865 | $9,753 |
| 4/30/17 | $9,935 | $10,116 | $9,958 |
| 5/31/17 | $10,196 | $10,488 | $10,188 |
| 6/30/17 | $10,307 | $10,469 | $10,219 |
| 7/31/17 | $10,700 | $10,771 | $10,561 |
| 8/31/17 | $10,730 | $10,767 | $10,495 |
| 9/30/17 | $11,052 | $11,035 | $10,819 |
| 10/31/17 | $11,203 | $11,202 | $10,903 |
| 11/30/17 | $11,263 | $11,320 | $11,000 |
| 12/31/17 | $11,455 | $11,502 | $11,169 |
| 1/31/18 | $12,054 | $12,078 | $11,772 |
| 2/28/18 | $11,445 | $11,533 | $11,213 |
| 3/31/18 | $11,290 | $11,325 | $10,942 |
| 4/30/18 | $11,507 | $11,584 | $11,280 |
| 5/31/18 | $11,083 | $11,324 | $10,791 |
| 6/30/18 | $10,877 | $11,185 | $10,654 |
| 7/31/18 | $11,238 | $11,461 | $10,960 |
| 8/31/18 | $10,887 | $11,239 | $10,561 |
| 9/30/18 | $11,042 | $11,337 | $10,779 |
| 10/31/18 | $10,236 | $10,435 | $10,064 |
| 11/30/18 | $10,257 | $10,421 | $10,008 |
| 12/31/18 | $9,650 | $9,915 | $9,518 |
| 1/31/19 | $10,328 | $10,567 | $10,155 |
| 2/28/19 | $10,459 | $10,836 | $10,324 |
| 3/31/19 | $10,416 | $10,905 | $10,272 |
| 4/30/19 | $10,645 | $11,211 | $10,511 |
| 5/31/19 | $10,033 | $10,673 | $9,903 |
| 6/30/19 | $10,547 | $11,306 | $10,430 |
| 7/31/19 | $10,295 | $11,163 | $10,196 |
| 8/31/19 | $10,066 | $10,873 | $9,777 |
| 9/30/19 | $10,481 | $11,185 | $10,249 |
| 10/31/19 | $10,821 | $11,587 | $10,618 |
| 11/30/19 | $10,897 | $11,717 | $10,660 |
| 12/31/19 | $11,210 | $12,098 | $11,050 |
| 1/31/20 | $10,800 | $11,846 | $10,650 |
| 2/29/20 | $9,935 | $10,775 | $9,642 |
| 3/31/20 | $8,001 | $9,337 | $7,934 |
| 4/30/20 | $8,422 | $9,940 | $8,359 |
| 5/31/20 | $8,797 | $10,373 | $8,613 |
| 6/30/20 | $9,116 | $10,726 | $8,920 |
| 7/31/20 | $9,127 | $10,976 | $8,937 |
| 8/31/20 | $9,708 | $11,540 | $9,460 |
| 9/30/20 | $9,366 | $11,240 | $9,026 |
| 10/31/20 | $9,105 | $10,792 | $8,663 |
| 11/30/20 | $10,732 | $12,464 | $10,303 |
| 12/31/20 | $11,409 | $13,044 | $10,759 |
| 1/31/21 | $11,525 | $12,905 | $10,676 |
| 2/28/21 | $12,176 | $13,194 | $11,184 |
| 3/31/21 | $12,490 | $13,498 | $11,560 |
| 4/30/21 | $12,688 | $13,904 | $11,781 |
| 5/31/21 | $13,246 | $14,357 | $12,189 |
| 6/30/21 | $12,862 | $14,196 | $11,908 |
| 7/31/21 | $12,816 | $14,303 | $11,879 |
| 8/31/21 | $12,793 | $14,555 | $12,014 |
| 9/30/21 | $12,513 | $14,132 | $11,793 |
| 10/31/21 | $12,676 | $14,480 | $11,981 |
| 11/30/21 | $11,932 | $13,806 | $11,261 |
| 12/31/21 | $12,618 | $14,513 | $11,931 |
| 1/31/22 | $12,662 | $13,812 | $12,056 |
| 2/28/22 | $12,469 | $13,568 | $11,892 |
| 3/31/22 | $12,320 | $13,655 | $11,971 |
| 4/30/22 | $11,649 | $12,771 | $11,365 |
| 5/31/22 | $12,096 | $12,867 | $11,645 |
| 6/30/22 | $11,009 | $11,673 | $10,486 |
| 7/31/22 | $11,292 | $12,255 | $10,704 |
| 8/31/22 | $10,785 | $11,673 | $10,343 |
| 9/30/22 | $9,757 | $10,581 | $9,416 |
| 10/31/22 | $10,338 | $11,150 | $10,023 |
| 11/30/22 | $11,605 | $12,406 | $11,125 |
| 12/31/22 | $11,480 | $12,416 | $11,265 |
| 1/31/23 | $12,325 | $13,421 | $12,135 |
| 2/28/23 | $12,134 | $13,141 | $11,965 |
| 3/31/23 | $12,230 | $13,467 | $11,934 |
| 4/30/23 | $12,485 | $13,847 | $12,318 |
| 5/31/23 | $11,847 | $13,261 | $11,655 |
| 6/30/23 | $12,596 | $13,864 | $12,310 |
| 7/31/23 | $13,138 | $14,313 | $12,870 |
| 8/31/23 | $12,804 | $13,765 | $12,488 |
| 9/30/23 | $12,469 | $13,294 | $12,382 |
| 10/31/23 | $12,054 | $12,756 | $11,838 |
| 11/30/23 | $12,963 | $13,939 | $12,776 |
| 12/31/23 | $13,528 | $14,680 | $13,400 |
| 1/31/24 | $13,299 | $14,765 | $13,391 |
| 2/29/24 | $13,510 | $15,035 | $13,415 |
| 3/31/24 | $13,915 | $15,529 | $14,000 |
| 4/30/24 | $13,668 | $15,132 | $13,857 |
| 5/31/24 | $14,337 | $15,718 | $14,403 |
| 6/30/24 | $13,721 | $15,464 | $14,002 |
The table below shows the average annual total returns of the Fund, a regulatory index, and one or more supplemental index(es) for certain periods ended June 30, 2024.
Average Annual Total Returns (%)
| Class/Index Name | 1 Year | 5 Years | Since Inception 6/5/15 |
|---|
| Class A (excluding sales charge) | 8.93% | 5.40% | 3.99% |
| Class A (including sales charge) | 4.82% | 4.59% | 3.55% |
| MSCI EAFE Index | 11.54% | 6.46% | 4.92% |
| MSCI EAFE Value Index | 13.75% | 6.07% | 3.78% |
All Fund returns are net of fees and expenses and include applicable fee waivers and/or expense limitations. Absent any applicable fee waivers and/or expense limitations, performance would have been lower and there can be no assurance that any such waivers or limitations will continue in the future.
Performance quoted represents past performance. Past performance is not a guarantee or a reliable indicator of future results.Current performance may be lower or higher than performance shown. Investment return and the principal value of an investment will fluctuate. Shares may be worth more or less than original cost when redeemed. Returns shown do not reflect the deduction of taxes that a shareholder would pay on Fund distributions or the redemption of Fund shares.Differences in the Fund’s performance versus an index and related attribution information with respect to particular categories of securities or individual positions may be attributable, in part, to differences in the pricing methodologies used by the Fund and the index. The Cumulative Returns chart and Average Annual Total Returns table reflect any sales load that would have applied at the time of purchase or any Contingent Deferred Sales Charge (“CDSC”) that would have applied if a full redemption occurred on the last business day of the period shown in the Cumulative Returns chart. Class A shares are subject to an initial sales charge. A CDSC may be imposed in certain circumstances on Class A shares that are purchased without an initial sales charge and then redeemed during the first 12 months after purchase. For performance current to the most recent month-end, visit www.pimco.com/literature or via 888.87.PIMCO (888.877.4626).
Key Fund StatisticsFootnote Reference* (as of the end of the reporting period)
| Total Net Assets | $487,820 |
| # of Portfolio Holdings | 285 |
| Portfolio Turnover Rate | 49% |
| Total Net Advisory Fees Paid During the Reporting Period | $1,485 |
| Footnote | Description |
Footnote* | Dollar amounts displayed in 000's |
What did the Fund invest in?
Geographic Breakdown (% of Net Assets)Footnote Reference*
| Japan | 21.9% |
| United Kingdom | 14.3% |
| Germany | 9.8% |
| Switzerland | 8.0% |
| Canada | 7.8% |
| Netherlands | 6.9% |
| France | 5.1% |
| Australia | 5.1% |
| United States | 4.0% |
| Spain | 3.6% |
| Sweden | 3.3% |
| Hong Kong | 2.3% |
| Luxembourg | 1.7% |
| Italy | 1.6% |
| Other Countries | 7.0% |
| Other Assets and Liabilities, Net | (2.4%) |
| Total | 100.0% |
| Footnote | Description |
Footnote* | % of Net Assets includes derivatives instruments, if any, valued at the value used for determining the Fund's net asset value. The notional exposure of such derivatives investments therefore may be greater than what is depicted. |
For additional information about the Fund, including the Fund's prospectus, financial information, holdings and proxy voting information, please visit www.pimco.com/literature or contact 888.87.PIMCO (888.877.4626). For tax information about the Fund, please visit: https://www.pimco.com/tax.
PIMCO RAE International Fund
Annual Shareholder Report |
June 30, 2024
Institutional Class: PPYIX
PIMCO RAE International Fund
Annual Shareholder Report | June 30, 2024
This annual shareholder report contains important information about the PIMCO RAE International Fund (the "Fund") for the period of July 1, 2023 to June 30, 2024 (the "reporting period"). You can find additional information about the Fund at www.pimco.com/literature. You can also request this information by contacting us at 888.87.PIMCO (888.877.4626).
What were the Fund costs for the last year?
(based on a hypothetical $10,000 investment)
| Class Name | Cost of a $10,000 investment | Costs paid as a percentage of a $10,000 investment |
|---|
| Institutional Class | $53 | 0.51% |
How did the Fund perform during the reporting period and what affected its performance?
The following affected performance (on a gross basis) during the reporting period:
• Security selection in, the healthcare sector contributed to relative returns, as the Fund’s holdings outperformed the MSCI EAFE Value
Index.
• Underweight exposure to, and security selection in, the energy sector contributed to relative returns, as the sector underperformed the
MSCI EAFE Value Index and the Fund’s holdings outperformed the MSCI EAFE Value Index.
• Security selection in utilities contributed to relative returns, as the Fund’s holdings outperformed the MSCI EAFE Value Index.
• Overweight exposure to, and security selection in, the consumer discretionary sector detracted from relative returns, as the sector and
the Fund’s holdings underperformed the MSCI EAFE Value Index.
• Underweight exposure to the financials sector detracted from relative returns, as the sector outperformed the MSCI EAFE Value Index.
• Overweight exposure to, and security selection in, the consumer staples sector detracted from relative returns, as the sector and the
Fund’s holdings underperformed the MSCI EAFE Value Index.
In addition to the Fund's performance, the tables in this section include performance of: (i) a broad-based securities market index (i.e., a regulatory index) and (ii) one or more supplemental index(es). Effective July 24, 2024, the Fund's regulatory index is the MSCI EAFE Index. The Fund's regulatory index is shown in connection with certain regulatory requirements to provide a broad measure of market performance.
The table below illustrates cumulative returns for the 10-year period ended June 30, 2024 or the life of the Fund, if shorter. Cumulative returns are based on a hypothetical initial investment equal to the greater of either $10,000 or the investment minimum applicable to the share class.
Cumulative Returns Based on $1,000,000 Investment
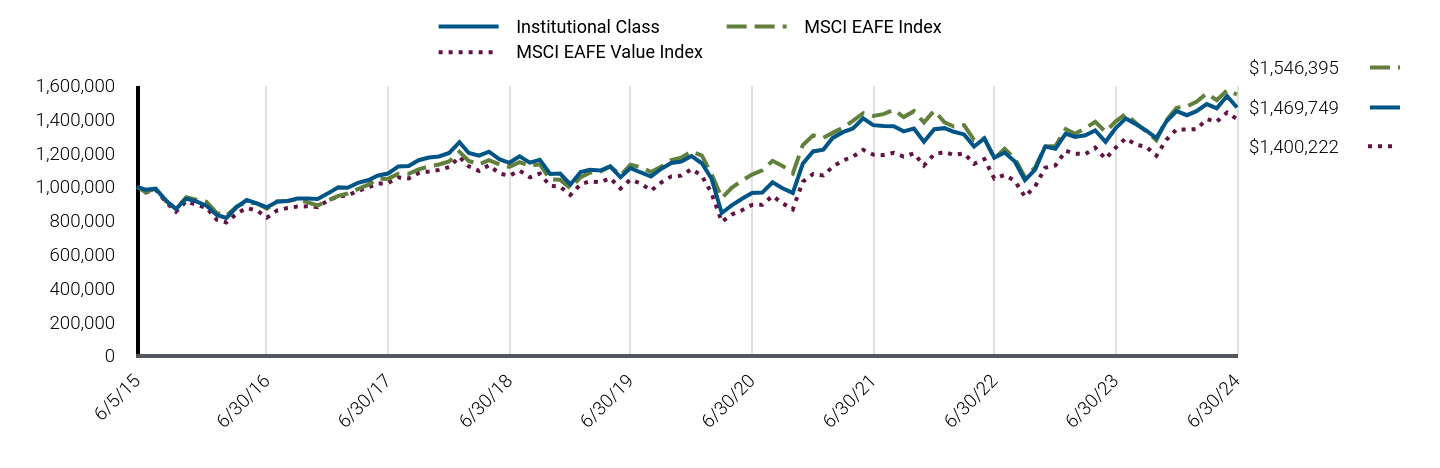
| Institutional Class | MSCI EAFE Index | MSCI EAFE Value Index |
|---|
| 6/5/15 | $1,000,000 | $1,000,000 | $1,000,000 |
| 6/30/15 | $983,000 | $968,967 | $966,625 |
| 7/31/15 | $989,000 | $989,086 | $983,443 |
| 8/31/15 | $919,000 | $916,326 | $909,513 |
| 9/30/15 | $869,000 | $869,799 | $852,841 |
| 10/31/15 | $930,000 | $937,791 | $915,610 |
| 11/30/15 | $914,000 | $923,202 | $892,893 |
| 12/31/15 | $888,046 | $910,762 | $875,694 |
| 1/31/16 | $833,634 | $844,901 | $804,459 |
| 2/29/16 | $816,181 | $829,422 | $788,906 |
| 3/31/16 | $879,833 | $883,391 | $840,938 |
| 4/30/16 | $921,925 | $908,966 | $874,097 |
| 5/31/16 | $901,392 | $900,709 | $860,198 |
| 6/30/16 | $878,806 | $870,474 | $817,497 |
| 7/31/16 | $911,659 | $914,590 | $860,457 |
| 8/31/16 | $916,792 | $915,240 | $874,383 |
| 9/30/16 | $930,138 | $926,483 | $882,837 |
| 10/31/16 | $931,165 | $907,532 | $884,897 |
| 11/30/16 | $928,085 | $889,457 | $879,435 |
| 12/31/16 | $961,137 | $919,872 | $919,694 |
| 1/31/17 | $997,901 | $946,555 | $942,339 |
| 2/28/17 | $994,750 | $960,090 | $948,782 |
| 3/31/17 | $1,023,111 | $986,520 | $975,318 |
| 4/30/17 | $1,038,868 | $1,011,622 | $995,781 |
| 5/31/17 | $1,067,229 | $1,048,753 | $1,018,842 |
| 6/30/17 | $1,078,784 | $1,046,898 | $1,021,919 |
| 7/31/17 | $1,120,801 | $1,077,097 | $1,056,102 |
| 8/31/17 | $1,122,902 | $1,076,691 | $1,049,513 |
| 9/30/17 | $1,157,566 | $1,103,479 | $1,081,881 |
| 10/31/17 | $1,173,322 | $1,120,235 | $1,090,260 |
| 11/30/17 | $1,179,624 | $1,131,986 | $1,100,032 |
| 12/31/17 | $1,200,395 | $1,150,156 | $1,116,895 |
| 1/31/18 | $1,263,971 | $1,207,847 | $1,177,201 |
| 2/28/18 | $1,200,395 | $1,153,329 | $1,121,261 |
| 3/31/18 | $1,184,232 | $1,132,542 | $1,094,246 |
| 4/30/18 | $1,207,938 | $1,158,401 | $1,127,956 |
| 5/31/18 | $1,163,759 | $1,132,363 | $1,079,070 |
| 6/30/18 | $1,142,207 | $1,118,528 | $1,065,386 |
| 7/31/18 | $1,180,999 | $1,146,061 | $1,095,971 |
| 8/31/18 | $1,143,285 | $1,123,928 | $1,056,106 |
| 9/30/18 | $1,160,526 | $1,133,682 | $1,077,940 |
| 10/31/18 | $1,076,477 | $1,043,450 | $1,006,369 |
| 11/30/18 | $1,078,632 | $1,042,135 | $1,000,769 |
| 12/31/18 | $1,014,154 | $991,546 | $951,839 |
| 1/31/19 | $1,087,164 | $1,056,711 | $1,015,545 |
| 2/28/19 | $1,100,853 | $1,083,647 | $1,032,434 |
| 3/31/19 | $1,096,290 | $1,090,481 | $1,027,185 |
| 4/30/19 | $1,121,387 | $1,121,140 | $1,051,117 |
| 5/31/19 | $1,056,363 | $1,067,296 | $990,272 |
| 6/30/19 | $1,111,120 | $1,130,614 | $1,043,032 |
| 7/31/19 | $1,084,882 | $1,116,259 | $1,019,575 |
| 8/31/19 | $1,060,926 | $1,087,341 | $977,691 |
| 9/30/19 | $1,105,416 | $1,118,500 | $1,024,870 |
| 10/31/19 | $1,140,780 | $1,158,687 | $1,061,846 |
| 11/30/19 | $1,149,907 | $1,171,749 | $1,066,047 |
| 12/31/19 | $1,182,352 | $1,209,830 | $1,104,976 |
| 1/31/20 | $1,139,574 | $1,184,560 | $1,065,020 |
| 2/29/20 | $1,049,263 | $1,077,478 | $964,232 |
| 3/31/20 | $844,877 | $933,669 | $793,395 |
| 4/30/20 | $890,032 | $993,986 | $835,860 |
| 5/31/20 | $929,246 | $1,037,269 | $861,286 |
| 6/30/20 | $963,706 | $1,072,588 | $891,995 |
| 7/31/20 | $966,083 | $1,097,589 | $893,727 |
| 8/31/20 | $1,026,686 | $1,154,017 | $946,046 |
| 9/30/20 | $991,037 | $1,124,032 | $902,604 |
| 10/31/20 | $963,706 | $1,079,150 | $866,258 |
| 11/30/20 | $1,136,009 | $1,246,433 | $1,030,305 |
| 12/31/20 | $1,209,386 | $1,304,387 | $1,075,944 |
| 1/31/21 | $1,220,326 | $1,290,490 | $1,067,554 |
| 2/28/21 | $1,289,607 | $1,319,435 | $1,118,411 |
| 3/31/21 | $1,323,640 | $1,349,773 | $1,156,047 |
| 4/30/21 | $1,345,518 | $1,390,387 | $1,178,120 |
| 5/31/21 | $1,405,076 | $1,435,729 | $1,218,921 |
| 6/30/21 | $1,364,966 | $1,419,572 | $1,190,841 |
| 7/31/21 | $1,360,104 | $1,430,260 | $1,187,933 |
| 8/31/21 | $1,358,889 | $1,455,489 | $1,201,388 |
| 9/30/21 | $1,328,502 | $1,413,249 | $1,179,336 |
| 10/31/21 | $1,345,518 | $1,448,009 | $1,198,144 |
| 11/30/21 | $1,266,513 | $1,380,613 | $1,126,058 |
| 12/31/21 | $1,341,159 | $1,451,306 | $1,193,128 |
| 1/31/22 | $1,347,368 | $1,381,173 | $1,205,562 |
| 2/28/22 | $1,325,636 | $1,356,752 | $1,189,177 |
| 3/31/22 | $1,310,114 | $1,365,472 | $1,197,110 |
| 4/30/22 | $1,238,709 | $1,277,133 | $1,136,546 |
| 5/31/22 | $1,286,830 | $1,286,708 | $1,164,525 |
| 6/30/22 | $1,171,962 | $1,167,317 | $1,048,573 |
| 7/31/22 | $1,203,007 | $1,225,485 | $1,070,411 |
| 8/31/22 | $1,150,230 | $1,167,281 | $1,034,294 |
| 9/30/22 | $1,040,019 | $1,058,085 | $941,566 |
| 10/31/22 | $1,102,110 | $1,114,983 | $1,002,297 |
| 11/30/22 | $1,238,709 | $1,240,570 | $1,112,462 |
| 12/31/22 | $1,225,197 | $1,241,567 | $1,126,515 |
| 1/31/23 | $1,315,089 | $1,342,106 | $1,213,471 |
| 2/28/23 | $1,295,113 | $1,314,100 | $1,196,467 |
| 3/31/23 | $1,305,101 | $1,346,669 | $1,193,370 |
| 4/30/23 | $1,333,401 | $1,384,689 | $1,231,825 |
| 5/31/23 | $1,266,814 | $1,326,092 | $1,165,490 |
| 6/30/23 | $1,346,718 | $1,386,442 | $1,231,014 |
| 7/31/23 | $1,404,981 | $1,431,302 | $1,286,991 |
| 8/31/23 | $1,370,023 | $1,376,466 | $1,248,834 |
| 9/30/23 | $1,333,401 | $1,329,449 | $1,238,237 |
| 10/31/23 | $1,288,455 | $1,275,551 | $1,183,776 |
| 11/30/23 | $1,386,670 | $1,393,944 | $1,277,585 |
| 12/31/23 | $1,447,731 | $1,468,003 | $1,339,995 |
| 1/31/24 | $1,423,877 | $1,476,451 | $1,339,095 |
| 2/29/24 | $1,447,731 | $1,503,477 | $1,341,529 |
| 3/31/24 | $1,489,933 | $1,552,926 | $1,400,037 |
| 4/30/24 | $1,464,245 | $1,513,157 | $1,385,720 |
| 5/31/24 | $1,537,640 | $1,571,770 | $1,440,319 |
| 6/30/24 | $1,469,749 | $1,546,395 | $1,400,222 |
The table below shows the average annual total returns of the Fund, a regulatory index, and one or more supplemental index(es) for certain periods ended June 30, 2024.
Average Annual Total Returns (%)
| Class/Index Name | 1 Year | 5 Years | Since Inception 6/5/15 |
|---|
| Institutional Class | 9.14% | 5.75% | 4.34% |
| MSCI EAFE Index | 11.54% | 6.46% | 4.92% |
| MSCI EAFE Value Index | 13.75% | 6.07% | 3.78% |
All Fund returns are net of fees and expenses and include applicable fee waivers and/or expense limitations. Absent any applicable fee waivers and/or expense limitations, performance would have been lower and there can be no assurance that any such waivers or limitations will continue in the future.
Performance quoted represents past performance. Past performance is not a guarantee or a reliable indicator of future results.Current performance may be lower or higher than performance shown. Investment return and the principal value of an investment will fluctuate. Shares may be worth more or less than original cost when redeemed. Returns shown do not reflect the deduction of taxes that a shareholder would pay on Fund distributions or the redemption of Fund shares.Differences in the Fund’s performance versus an index and related attribution information with respect to particular categories of securities or individual positions may be attributable, in part, to differences in the pricing methodologies used by the Fund and the index. For performance current to the most recent month-end, visit www.pimco.com/literature or via 888.87.PIMCO (888.877.4626).
Key Fund StatisticsFootnote Reference* (as of the end of the reporting period)
| Total Net Assets | $487,820 |
| # of Portfolio Holdings | 285 |
| Portfolio Turnover Rate | 49% |
| Total Net Advisory Fees Paid During the Reporting Period | $1,485 |
| Footnote | Description |
Footnote* | Dollar amounts displayed in 000's |
What did the Fund invest in?
Geographic Breakdown (% of Net Assets)Footnote Reference*
| Japan | 21.9% |
| United Kingdom | 14.3% |
| Germany | 9.8% |
| Switzerland | 8.0% |
| Canada | 7.8% |
| Netherlands | 6.9% |
| France | 5.1% |
| Australia | 5.1% |
| United States | 4.0% |
| Spain | 3.6% |
| Sweden | 3.3% |
| Hong Kong | 2.3% |
| Luxembourg | 1.7% |
| Italy | 1.6% |
| Other Countries | 7.0% |
| Other Assets and Liabilities, Net | (2.4%) |
| Total | 100.0% |
| Footnote | Description |
Footnote* | % of Net Assets includes derivatives instruments, if any, valued at the value used for determining the Fund's net asset value. The notional exposure of such derivatives investments therefore may be greater than what is depicted. |
For additional information about the Fund, including the Fund's prospectus, financial information, holdings and proxy voting information, please visit www.pimco.com/literature or contact 888.87.PIMCO (888.877.4626). For tax information about the Fund, please visit: https://www.pimco.com/tax.
Institutional Class: PPYIX
PIMCO RAE International Fund
Annual Shareholder Report |
June 30, 2024
PIMCO RAE International Fund
Annual Shareholder Report | June 30, 2024
This annual shareholder report contains important information about the PIMCO RAE International Fund (the "Fund") for the period of July 1, 2023 to June 30, 2024 (the "reporting period"). You can find additional information about the Fund at www.pimco.com/literature. You can also request this information by contacting us at 888.87.PIMCO (888.877.4626).
What were the Fund costs for the last year?
(based on a hypothetical $10,000 investment)
| Class Name | Cost of a $10,000 investment | Costs paid as a percentage of a $10,000 investment |
|---|
| I-2 | $64 | 0.61% |
How did the Fund perform during the reporting period and what affected its performance?
The following affected performance (on a gross basis) during the reporting period:
• Security selection in, the healthcare sector contributed to relative returns, as the Fund’s holdings outperformed the MSCI EAFE Value
Index.
• Underweight exposure to, and security selection in, the energy sector contributed to relative returns, as the sector underperformed the
MSCI EAFE Value Index and the Fund’s holdings outperformed the MSCI EAFE Value Index.
• Security selection in utilities contributed to relative returns, as the Fund’s holdings outperformed the MSCI EAFE Value Index.
• Overweight exposure to, and security selection in, the consumer discretionary sector detracted from relative returns, as the sector and
the Fund’s holdings underperformed the MSCI EAFE Value Index.
• Underweight exposure to the financials sector detracted from relative returns, as the sector outperformed the MSCI EAFE Value Index.
• Overweight exposure to, and security selection in, the consumer staples sector detracted from relative returns, as the sector and the
Fund’s holdings underperformed the MSCI EAFE Value Index.
In addition to the Fund's performance, the tables in this section include performance of: (i) a broad-based securities market index (i.e., a regulatory index) and (ii) one or more supplemental index(es). Effective July 24, 2024, the Fund's regulatory index is the MSCI EAFE Index. The Fund's regulatory index is shown in connection with certain regulatory requirements to provide a broad measure of market performance.
The table below illustrates cumulative returns for the 10-year period ended June 30, 2024 or the life of the Fund, if shorter. Cumulative returns are based on a hypothetical initial investment equal to the greater of either $10,000 or the investment minimum applicable to the share class.
Cumulative Returns Based on $1,000,000 Investment
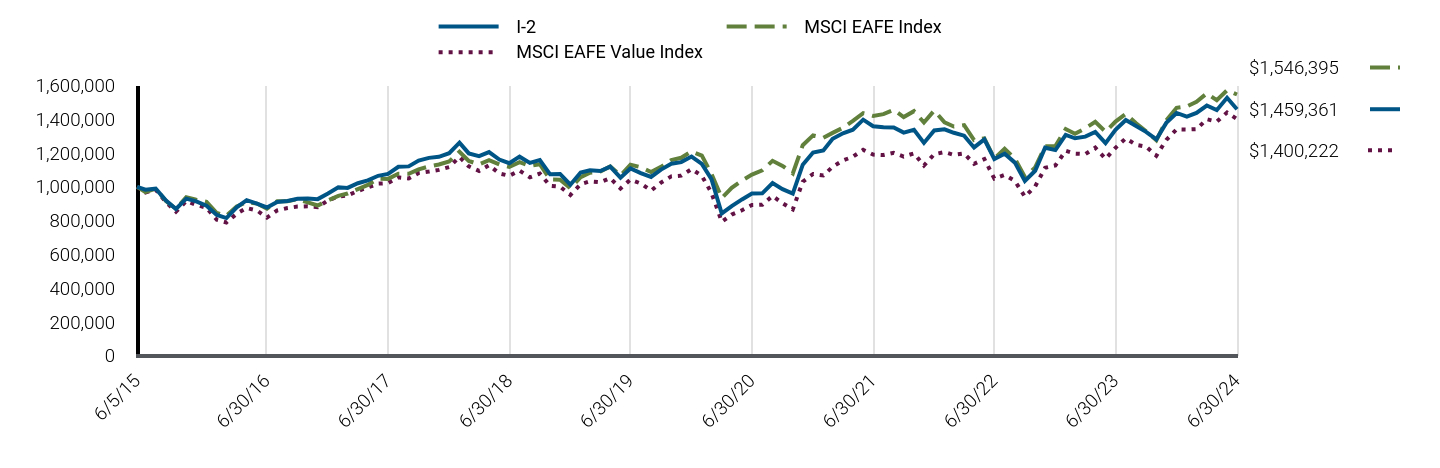
| I-2 | MSCI EAFE Index | MSCI EAFE Value Index |
|---|
| 6/5/15 | $1,000,000 | $1,000,000 | $1,000,000 |
| 6/30/15 | $983,000 | $968,967 | $966,625 |
| 7/31/15 | $989,000 | $989,086 | $983,443 |
| 8/31/15 | $919,000 | $916,326 | $909,513 |
| 9/30/15 | $869,000 | $869,799 | $852,841 |
| 10/31/15 | $930,000 | $937,791 | $915,610 |
| 11/30/15 | $914,000 | $923,202 | $892,893 |
| 12/31/15 | $888,097 | $910,762 | $875,694 |
| 1/31/16 | $833,682 | $844,901 | $804,459 |
| 2/29/16 | $815,201 | $829,422 | $788,906 |
| 3/31/16 | $878,856 | $883,391 | $840,938 |
| 4/30/16 | $920,951 | $908,966 | $874,097 |
| 5/31/16 | $900,417 | $900,709 | $860,198 |
| 6/30/16 | $877,830 | $870,474 | $817,497 |
| 7/31/16 | $910,684 | $914,590 | $860,457 |
| 8/31/16 | $915,818 | $915,240 | $874,383 |
| 9/30/16 | $929,165 | $926,483 | $882,837 |
| 10/31/16 | $930,191 | $907,532 | $884,897 |
| 11/30/16 | $927,111 | $889,457 | $879,435 |
| 12/31/16 | $960,083 | $919,872 | $919,694 |
| 1/31/17 | $996,888 | $946,555 | $942,339 |
| 2/28/17 | $993,733 | $960,090 | $948,782 |
| 3/31/17 | $1,021,074 | $986,520 | $975,318 |
| 4/30/17 | $1,037,899 | $1,011,622 | $995,781 |
| 5/31/17 | $1,065,240 | $1,048,753 | $1,018,842 |
| 6/30/17 | $1,076,807 | $1,046,898 | $1,021,919 |
| 7/31/17 | $1,118,870 | $1,077,097 | $1,056,102 |
| 8/31/17 | $1,120,973 | $1,076,691 | $1,049,513 |
| 9/30/17 | $1,155,675 | $1,103,479 | $1,081,881 |
| 10/31/17 | $1,171,448 | $1,120,235 | $1,090,260 |
| 11/30/17 | $1,177,758 | $1,131,986 | $1,100,032 |
| 12/31/17 | $1,198,951 | $1,150,156 | $1,116,895 |
| 1/31/18 | $1,261,487 | $1,207,847 | $1,177,201 |
| 2/28/18 | $1,197,873 | $1,153,329 | $1,121,261 |
| 3/31/18 | $1,181,700 | $1,132,542 | $1,094,246 |
| 4/30/18 | $1,205,420 | $1,158,401 | $1,127,956 |
| 5/31/18 | $1,161,215 | $1,132,363 | $1,079,070 |
| 6/30/18 | $1,139,651 | $1,118,528 | $1,065,386 |
| 7/31/18 | $1,178,466 | $1,146,061 | $1,095,971 |
| 8/31/18 | $1,141,807 | $1,123,928 | $1,056,106 |
| 9/30/18 | $1,157,980 | $1,133,682 | $1,077,940 |
| 10/31/18 | $1,073,881 | $1,043,450 | $1,006,369 |
| 11/30/18 | $1,076,037 | $1,042,135 | $1,000,769 |
| 12/31/18 | $1,012,660 | $991,546 | $951,839 |
| 1/31/19 | $1,084,586 | $1,056,711 | $1,015,545 |
| 2/28/19 | $1,098,286 | $1,083,647 | $1,032,434 |
| 3/31/19 | $1,093,719 | $1,090,481 | $1,027,185 |
| 4/30/19 | $1,118,836 | $1,121,140 | $1,051,117 |
| 5/31/19 | $1,053,761 | $1,067,296 | $990,272 |
| 6/30/19 | $1,108,561 | $1,130,614 | $1,043,032 |
| 7/31/19 | $1,081,161 | $1,116,259 | $1,019,575 |
| 8/31/19 | $1,058,327 | $1,087,341 | $977,691 |
| 9/30/19 | $1,101,711 | $1,118,500 | $1,024,870 |
| 10/31/19 | $1,137,102 | $1,158,687 | $1,061,846 |
| 11/30/19 | $1,146,236 | $1,171,749 | $1,066,047 |
| 12/31/19 | $1,178,875 | $1,209,830 | $1,104,976 |
| 1/31/20 | $1,136,050 | $1,184,560 | $1,065,020 |
| 2/29/20 | $1,045,642 | $1,077,478 | $964,232 |
| 3/31/20 | $842,223 | $933,669 | $793,395 |
| 4/30/20 | $886,238 | $993,986 | $835,860 |
| 5/31/20 | $925,494 | $1,037,269 | $861,286 |
| 6/30/20 | $959,992 | $1,072,588 | $891,995 |
| 7/31/20 | $961,182 | $1,097,589 | $893,727 |
| 8/31/20 | $1,021,850 | $1,154,017 | $946,046 |
| 9/30/20 | $986,163 | $1,124,032 | $902,604 |
| 10/31/20 | $959,992 | $1,079,150 | $866,258 |
| 11/30/20 | $1,131,292 | $1,246,433 | $1,030,305 |
| 12/31/20 | $1,202,836 | $1,304,387 | $1,075,944 |
| 1/31/21 | $1,214,999 | $1,290,490 | $1,067,554 |
| 2/28/21 | $1,284,323 | $1,319,435 | $1,118,411 |
| 3/31/21 | $1,317,161 | $1,349,773 | $1,156,047 |
| 4/30/21 | $1,337,836 | $1,390,387 | $1,178,120 |
| 5/31/21 | $1,397,431 | $1,435,729 | $1,218,921 |
| 6/30/21 | $1,358,512 | $1,419,572 | $1,190,841 |
| 7/31/21 | $1,352,431 | $1,430,260 | $1,187,933 |
| 8/31/21 | $1,351,215 | $1,455,489 | $1,201,388 |
| 9/30/21 | $1,320,809 | $1,413,249 | $1,179,336 |
| 10/31/21 | $1,337,836 | $1,448,009 | $1,198,144 |
| 11/30/21 | $1,259,998 | $1,380,613 | $1,126,058 |
| 12/31/21 | $1,334,001 | $1,451,306 | $1,193,128 |
| 1/31/22 | $1,340,206 | $1,381,173 | $1,205,562 |
| 2/28/22 | $1,320,041 | $1,356,752 | $1,189,177 |
| 3/31/22 | $1,302,978 | $1,365,472 | $1,197,110 |
| 4/30/22 | $1,233,175 | $1,277,133 | $1,136,546 |
| 5/31/22 | $1,281,262 | $1,286,708 | $1,164,525 |
| 6/30/22 | $1,164,924 | $1,167,317 | $1,048,573 |
| 7/31/22 | $1,195,947 | $1,225,485 | $1,070,411 |
| 8/31/22 | $1,143,208 | $1,167,281 | $1,034,294 |
| 9/30/22 | $1,034,626 | $1,058,085 | $941,566 |
| 10/31/22 | $1,095,122 | $1,114,983 | $1,002,297 |
| 11/30/22 | $1,231,624 | $1,240,570 | $1,112,462 |
| 12/31/22 | $1,217,347 | $1,241,567 | $1,126,515 |
| 1/31/23 | $1,307,151 | $1,342,106 | $1,213,471 |
| 2/28/23 | $1,287,195 | $1,314,100 | $1,196,467 |
| 3/31/23 | $1,297,173 | $1,346,669 | $1,193,370 |
| 4/30/23 | $1,325,445 | $1,384,689 | $1,231,825 |
| 5/31/23 | $1,258,923 | $1,326,092 | $1,165,490 |
| 6/30/23 | $1,337,086 | $1,386,442 | $1,231,014 |
| 7/31/23 | $1,395,292 | $1,431,302 | $1,286,991 |
| 8/31/23 | $1,360,368 | $1,376,466 | $1,248,834 |
| 9/30/23 | $1,325,445 | $1,329,449 | $1,238,237 |
| 10/31/23 | $1,280,542 | $1,275,551 | $1,183,776 |
| 11/30/23 | $1,378,662 | $1,393,944 | $1,277,585 |
| 12/31/23 | $1,437,361 | $1,468,003 | $1,339,995 |
| 1/31/24 | $1,415,360 | $1,476,451 | $1,339,095 |
| 2/29/24 | $1,437,361 | $1,503,477 | $1,341,529 |
| 3/31/24 | $1,481,362 | $1,552,926 | $1,400,037 |
| 4/30/24 | $1,453,861 | $1,513,157 | $1,385,720 |
| 5/31/24 | $1,527,196 | $1,571,770 | $1,440,319 |
| 6/30/24 | $1,459,361 | $1,546,395 | $1,400,222 |
The table below shows the average annual total returns of the Fund, a regulatory index, and one or more supplemental index(es) for certain periods ended June 30, 2024.
Average Annual Total Returns (%)
| Class/Index Name | 1 Year | 5 Years | Since Inception 6/5/15 |
|---|
| I-2 | 9.14% | 5.65% | 4.26% |
| MSCI EAFE Index | 11.54% | 6.46% | 4.92% |
| MSCI EAFE Value Index | 13.75% | 6.07% | 3.78% |
All Fund returns are net of fees and expenses and include applicable fee waivers and/or expense limitations. Absent any applicable fee waivers and/or expense limitations, performance would have been lower and there can be no assurance that any such waivers or limitations will continue in the future.
Performance quoted represents past performance. Past performance is not a guarantee or a reliable indicator of future results.Current performance may be lower or higher than performance shown. Investment return and the principal value of an investment will fluctuate. Shares may be worth more or less than original cost when redeemed. Returns shown do not reflect the deduction of taxes that a shareholder would pay on Fund distributions or the redemption of Fund shares.Differences in the Fund’s performance versus an index and related attribution information with respect to particular categories of securities or individual positions may be attributable, in part, to differences in the pricing methodologies used by the Fund and the index. For performance current to the most recent month-end, visit www.pimco.com/literature or via 888.87.PIMCO (888.877.4626).
Key Fund StatisticsFootnote Reference* (as of the end of the reporting period)
| Total Net Assets | $487,820 |
| # of Portfolio Holdings | 285 |
| Portfolio Turnover Rate | 49% |
| Total Net Advisory Fees Paid During the Reporting Period | $1,485 |
| Footnote | Description |
Footnote* | Dollar amounts displayed in 000's |
What did the Fund invest in?
Geographic Breakdown (% of Net Assets)Footnote Reference*
| Japan | 21.9% |
| United Kingdom | 14.3% |
| Germany | 9.8% |
| Switzerland | 8.0% |
| Canada | 7.8% |
| Netherlands | 6.9% |
| France | 5.1% |
| Australia | 5.1% |
| United States | 4.0% |
| Spain | 3.6% |
| Sweden | 3.3% |
| Hong Kong | 2.3% |
| Luxembourg | 1.7% |
| Italy | 1.6% |
| Other Countries | 7.0% |
| Other Assets and Liabilities, Net | (2.4%) |
| Total | 100.0% |
| Footnote | Description |
Footnote* | % of Net Assets includes derivatives instruments, if any, valued at the value used for determining the Fund's net asset value. The notional exposure of such derivatives investments therefore may be greater than what is depicted. |
For additional information about the Fund, including the Fund's prospectus, financial information, holdings and proxy voting information, please visit www.pimco.com/literature or contact 888.87.PIMCO (888.877.4626). For tax information about the Fund, please visit: https://www.pimco.com/tax.
PIMCO RAE International Fund
Annual Shareholder Report |
June 30, 2024
Annual Shareholder Report | June 30, 2024
This annual shareholder report contains important information about the PIMCO RAE US Fund (the "Fund") for the period of July 1, 2023 to June 30, 2024 (the "reporting period"). You can find additional information about the Fund at www.pimco.com/literature. You can also request this information by contacting us at 888.87.PIMCO (888.877.4626).
What were the Fund costs for the last year?
(based on a hypothetical $10,000 investment)
| Class Name | Cost of a $10,000 investment | Costs paid as a percentage of a $10,000 investment |
|---|
| Class A | $89 | 0.80% |
How did the Fund perform during the reporting period and what affected its performance?
The following affected performance (on a gross basis) during the reporting period:
• Overweight exposure to, and security selection in, information technology contributed to relative returns, as the sector and the Fund’s
holdings outperformed the Russell 1000® Value Index ("RVL Index").
• Overweight exposure to, and security selection in, energy contributed to relative returns, as the sector and the Fund’s holdings
outperformed the RVL Index.
• Underweight exposure to, and security selection in, utilities contributed to relative returns, as the sector underperformed the RVL Index
and the Fund’s holdings outperformed the RVL Index.
• Underweight exposure to financials detracted from relative returns, as the sector outperformed the RVL Index.
• Underweight exposure to, and security selection in, industrials detracted from relative returns, as the sector outperformed the RVL
Index and the Fund’s holdings underperformed the RVL Index.
• Security selection in consumer staples detracted from relative returns, as the Fund’s holdings underperformed the RVL Index.
In addition to the Fund's performance, the tables in this section include performance of: (i) a broad-based securities market index (i.e., a regulatory index) and (ii) one or more supplemental index(es). Effective July 24, 2024, the Fund's regulatory index is the S&P 500 Index. The Fund's regulatory index is shown in connection with certain regulatory requirements to provide a broad measure of market performance.
The table below illustrates cumulative returns for the 10-year period ended June 30, 2024 or the life of the Fund, if shorter. Cumulative returns are based on a hypothetical initial investment equal to the greater of either $10,000 or the investment minimum applicable to the share class.
Cumulative Returns Based on $10,000 Investment
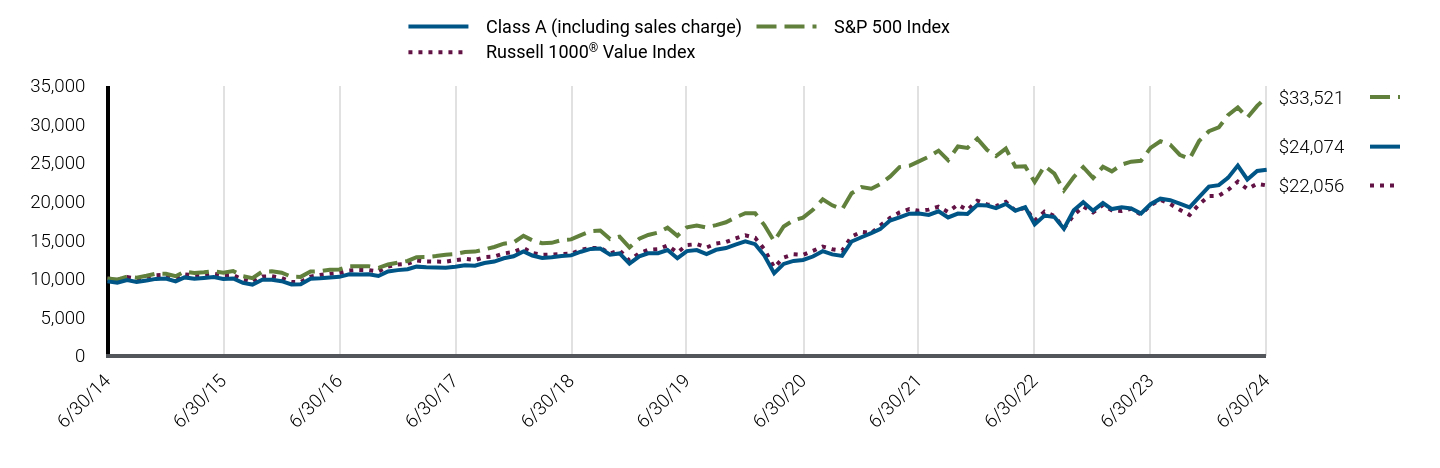
| Class A (including sales charge) | S&P 500 Index | Russell 1000® Value Index |
|---|
| 6/30/14 | $9,627 | $10,000 | $10,000 |
| 7/31/14 | $9,445 | $9,862 | $9,830 |
| 8/31/14 | $9,798 | $10,257 | $10,191 |
| 9/30/14 | $9,546 | $10,113 | $9,981 |
| 10/31/14 | $9,748 | $10,360 | $10,205 |
| 11/30/14 | $9,950 | $10,638 | $10,414 |
| 12/31/14 | $9,990 | $10,612 | $10,478 |
| 1/31/15 | $9,627 | $10,293 | $10,059 |
| 2/28/15 | $10,141 | $10,885 | $10,546 |
| 3/31/15 | $9,960 | $10,712 | $10,402 |
| 4/30/15 | $10,071 | $10,815 | $10,499 |
| 5/31/15 | $10,192 | $10,954 | $10,625 |
| 6/30/15 | $9,950 | $10,742 | $10,413 |
| 7/31/15 | $10,000 | $10,967 | $10,459 |
| 8/31/15 | $9,435 | $10,306 | $9,836 |
| 9/30/15 | $9,213 | $10,051 | $9,539 |
| 10/31/15 | $9,849 | $10,898 | $10,259 |
| 11/30/15 | $9,839 | $10,931 | $10,298 |
| 12/31/15 | $9,652 | $10,758 | $10,077 |
| 1/31/16 | $9,235 | $10,225 | $9,556 |
| 2/29/16 | $9,266 | $10,211 | $9,554 |
| 3/31/16 | $9,965 | $10,903 | $10,242 |
| 4/30/16 | $10,038 | $10,946 | $10,457 |
| 5/31/16 | $10,143 | $11,142 | $10,619 |
| 6/30/16 | $10,216 | $11,171 | $10,711 |
| 7/31/16 | $10,539 | $11,583 | $11,022 |
| 8/31/16 | $10,529 | $11,599 | $11,107 |
| 9/30/16 | $10,560 | $11,602 | $11,084 |
| 10/31/16 | $10,320 | $11,390 | $10,913 |
| 11/30/16 | $10,904 | $11,812 | $11,536 |
| 12/31/16 | $11,087 | $12,045 | $11,824 |
| 1/31/17 | $11,197 | $12,274 | $11,908 |
| 2/28/17 | $11,538 | $12,761 | $12,336 |
| 3/31/17 | $11,472 | $12,776 | $12,210 |
| 4/30/17 | $11,439 | $12,907 | $12,188 |
| 5/31/17 | $11,395 | $13,089 | $12,176 |
| 6/30/17 | $11,527 | $13,170 | $12,375 |
| 7/31/17 | $11,724 | $13,441 | $12,539 |
| 8/31/17 | $11,647 | $13,482 | $12,393 |
| 9/30/17 | $12,010 | $13,760 | $12,760 |
| 10/31/17 | $12,196 | $14,082 | $12,853 |
| 11/30/17 | $12,624 | $14,513 | $13,246 |
| 12/31/17 | $12,877 | $14,675 | $13,440 |
| 1/31/18 | $13,505 | $15,515 | $13,959 |
| 2/28/18 | $12,982 | $14,943 | $13,293 |
| 3/31/18 | $12,668 | $14,563 | $13,059 |
| 4/30/18 | $12,750 | $14,619 | $13,102 |
| 5/31/18 | $12,924 | $14,971 | $13,180 |
| 6/30/18 | $12,994 | $15,064 | $13,213 |
| 7/31/18 | $13,470 | $15,624 | $13,735 |
| 8/31/18 | $13,830 | $16,133 | $13,938 |
| 9/30/18 | $13,888 | $16,225 | $13,966 |
| 10/31/18 | $13,086 | $15,116 | $13,243 |
| 11/30/18 | $13,249 | $15,424 | $13,638 |
| 12/31/18 | $11,921 | $14,031 | $12,329 |
| 1/31/19 | $12,875 | $15,156 | $13,288 |
| 2/28/19 | $13,260 | $15,642 | $13,713 |
| 3/31/19 | $13,272 | $15,946 | $13,800 |
| 4/30/19 | $13,681 | $16,592 | $14,289 |
| 5/31/19 | $12,615 | $15,538 | $13,371 |
| 6/30/19 | $13,545 | $16,633 | $14,330 |
| 7/31/19 | $13,681 | $16,872 | $14,449 |
| 8/31/19 | $13,173 | $16,605 | $14,024 |
| 9/30/19 | $13,718 | $16,915 | $14,525 |
| 10/31/19 | $13,941 | $17,282 | $14,728 |
| 11/30/19 | $14,400 | $17,909 | $15,183 |
| 12/31/19 | $14,822 | $18,449 | $15,601 |
| 1/31/20 | $14,445 | $18,442 | $15,265 |
| 2/29/20 | $12,964 | $16,924 | $13,787 |
| 3/31/20 | $10,678 | $14,834 | $11,431 |
| 4/30/20 | $11,886 | $16,735 | $12,716 |
| 5/31/20 | $12,276 | $17,532 | $13,152 |
| 6/30/20 | $12,406 | $17,881 | $13,064 |
| 7/31/20 | $12,847 | $18,889 | $13,581 |
| 8/31/20 | $13,536 | $20,247 | $14,142 |
| 9/30/20 | $13,120 | $19,478 | $13,795 |
| 10/31/20 | $12,925 | $18,960 | $13,614 |
| 11/30/20 | $14,796 | $21,035 | $15,445 |
| 12/31/20 | $15,348 | $21,844 | $16,037 |
| 1/31/21 | $15,870 | $21,623 | $15,890 |
| 2/28/21 | $16,393 | $22,220 | $16,850 |
| 3/31/21 | $17,504 | $23,193 | $17,842 |
| 4/30/21 | $17,906 | $24,431 | $18,555 |
| 5/31/21 | $18,401 | $24,601 | $18,988 |
| 6/30/21 | $18,415 | $25,175 | $18,771 |
| 7/31/21 | $18,241 | $25,773 | $18,921 |
| 8/31/21 | $18,709 | $26,557 | $19,296 |
| 9/30/21 | $17,906 | $25,322 | $18,624 |
| 10/31/21 | $18,415 | $27,096 | $19,570 |
| 11/30/21 | $18,361 | $26,908 | $18,880 |
| 12/31/21 | $19,524 | $28,114 | $20,072 |
| 1/31/22 | $19,450 | $26,659 | $19,604 |
| 2/28/22 | $19,110 | $25,861 | $19,377 |
| 3/31/22 | $19,657 | $26,821 | $19,924 |
| 4/30/22 | $18,785 | $24,483 | $18,800 |
| 5/31/22 | $19,243 | $24,527 | $19,165 |
| 6/30/22 | $17,026 | $22,503 | $17,491 |
| 7/31/22 | $18,149 | $24,578 | $18,651 |
| 8/31/22 | $17,957 | $23,575 | $18,095 |
| 9/30/22 | $16,450 | $21,404 | $16,508 |
| 10/31/22 | $18,829 | $23,137 | $18,201 |
| 11/30/22 | $19,893 | $24,430 | $19,338 |
| 12/31/22 | $18,789 | $23,023 | $18,559 |
| 1/31/23 | $19,779 | $24,469 | $19,520 |
| 2/28/23 | $18,997 | $23,872 | $18,832 |
| 3/31/23 | $19,236 | $24,749 | $18,745 |
| 4/30/23 | $19,077 | $25,135 | $19,028 |
| 5/31/23 | $18,422 | $25,244 | $18,294 |
| 6/30/23 | $19,619 | $26,912 | $19,509 |
| 7/31/23 | $20,338 | $27,777 | $20,195 |
| 8/31/23 | $20,146 | $27,334 | $19,650 |
| 9/30/23 | $19,699 | $26,031 | $18,892 |
| 10/31/23 | $19,220 | $25,484 | $18,225 |
| 11/30/23 | $20,529 | $27,811 | $19,600 |
| 12/31/23 | $21,904 | $29,075 | $20,686 |
| 1/31/24 | $22,092 | $29,563 | $20,707 |
| 2/29/24 | $23,032 | $31,142 | $21,471 |
| 3/31/24 | $24,621 | $32,144 | $22,545 |
| 4/30/24 | $22,827 | $30,831 | $21,581 |
| 5/31/24 | $23,920 | $32,360 | $22,266 |
| 6/30/24 | $24,074 | $33,521 | $22,056 |
The table below shows the average annual total returns of the Fund, a regulatory index, and one or more supplemental index(es) for certain periods ended June 30, 2024.
Average Annual Total Returns (%)
| Class/Index Name | 1 Year | 5 Years | 10 Years |
|---|
| Class A (excluding sales charge) | 22.70% | 12.19% | 9.60% |
| Class A (including sales charge) | 18.09% | 11.33% | 9.18% |
| S&P 500 Index | 24.56% | 15.05% | 12.86% |
Russell 1000® Value Index | 13.05% | 9.01% | 8.23% |
All Fund returns are net of fees and expenses and include applicable fee waivers and/or expense limitations. Absent any applicable fee waivers and/or expense limitations, performance would have been lower and there can be no assurance that any such waivers or limitations will continue in the future.
Performance quoted represents past performance. Past performance is not a guarantee or a reliable indicator of future results.Current performance may be lower or higher than performance shown. Investment return and the principal value of an investment will fluctuate. Shares may be worth more or less than original cost when redeemed. Returns shown do not reflect the deduction of taxes that a shareholder would pay on Fund distributions or the redemption of Fund shares.Differences in the Fund’s performance versus an index and related attribution information with respect to particular categories of securities or individual positions may be attributable, in part, to differences in the pricing methodologies used by the Fund and the index. The Cumulative Returns chart and Average Annual Total Returns table reflect any sales load that would have applied at the time of purchase or any Contingent Deferred Sales Charge (“CDSC”) that would have applied if a full redemption occurred on the last business day of the period shown in the Cumulative Returns chart. Class A shares are subject to an initial sales charge. A CDSC may be imposed in certain circumstances on Class A shares that are purchased without an initial sales charge and then redeemed during the first 12 months after purchase. For performance current to the most recent month-end, visit www.pimco.com/literature or via 888.87.PIMCO (888.877.4626).
Key Fund StatisticsFootnote Reference* (as of the end of the reporting period)
| Total Net Assets | $1,459,971 |
| # of Portfolio Holdings | 148 |
| Portfolio Turnover Rate | 73% |
| Total Net Advisory Fees Paid During the Reporting Period | $3,128 |
| Footnote | Description |
Footnote* | Dollar amounts displayed in 000's |
What did the Fund invest in?
Sector Allocation (% of Net Assets)Footnote Reference*
| Information Technology | 31.4% |
| Consumer Staples | 16.9% |
| Health Care | 15.1% |
| Energy | 10.2% |
| Financials | 8.6% |
| Industrials | 5.5% |
| Utilities | 3.8% |
| Communication Services | 3.2% |
| Consumer Discretionary | 1.9% |
| Materials | 1.9% |
| Real Estate | 1.2% |
| Short-Term Instruments | 0.2% |
| Other Assets and Liabilities, Net | 0.1% |
| Total | 100.0% |
| Footnote | Description |
Footnote* | % of Net Assets includes derivatives instruments, if any, valued at the value used for determining the Fund’s net asset value. The notional exposure of such derivatives investments therefore may be greater than what is depicted. |
For additional information about the Fund, including the Fund's prospectus, financial information, holdings and proxy voting information, please visit www.pimco.com/literature or contact 888.87.PIMCO (888.877.4626). For tax information about the Fund, please visit: https://www.pimco.com/tax.
Annual Shareholder Report |
June 30, 2024
Institutional Class: PKAIX
Annual Shareholder Report | June 30, 2024
This annual shareholder report contains important information about the PIMCO RAE US Fund (the "Fund") for the period of July 1, 2023 to June 30, 2024 (the "reporting period"). You can find additional information about the Fund at www.pimco.com/literature. You can also request this information by contacting us at 888.87.PIMCO (888.877.4626).
What were the Fund costs for the last year?
(based on a hypothetical $10,000 investment)
| Class Name | Cost of a $10,000 investment | Costs paid as a percentage of a $10,000 investment |
|---|
| Institutional Class | $45 | 0.40% |
How did the Fund perform during the reporting period and what affected its performance?
The following affected performance (on a gross basis) during the reporting period:
• Overweight exposure to, and security selection in, information technology contributed to relative returns, as the sector and the Fund’s
holdings outperformed the Russell 1000® Value Index ("RVL Index").
• Overweight exposure to, and security selection in, energy contributed to relative returns, as the sector and the Fund’s holdings
outperformed the RVL Index.
• Underweight exposure to, and security selection in, utilities contributed to relative returns, as the sector underperformed the RVL Index
and the Fund’s holdings outperformed the RVL Index.
• Underweight exposure to financials detracted from relative returns, as the sector outperformed the RVL Index.
• Underweight exposure to, and security selection in, industrials detracted from relative returns, as the sector outperformed the RVL
Index and the Fund’s holdings underperformed the RVL Index.
• Security selection in consumer staples detracted from relative returns, as the Fund’s holdings underperformed the RVL Index.
In addition to the Fund's performance, the tables in this section include performance of: (i) a broad-based securities market index (i.e., a regulatory index) and (ii) one or more supplemental index(es). Effective July 24, 2024, the Fund's regulatory index is the S&P 500 Index. The Fund's regulatory index is shown in connection with certain regulatory requirements to provide a broad measure of market performance.
The table below illustrates cumulative returns for the 10-year period ended June 30, 2024 or the life of the Fund, if shorter. Cumulative returns are based on a hypothetical initial investment equal to the greater of either $10,000 or the investment minimum applicable to the share class.
Cumulative Returns Based on $1,000,000 Investment
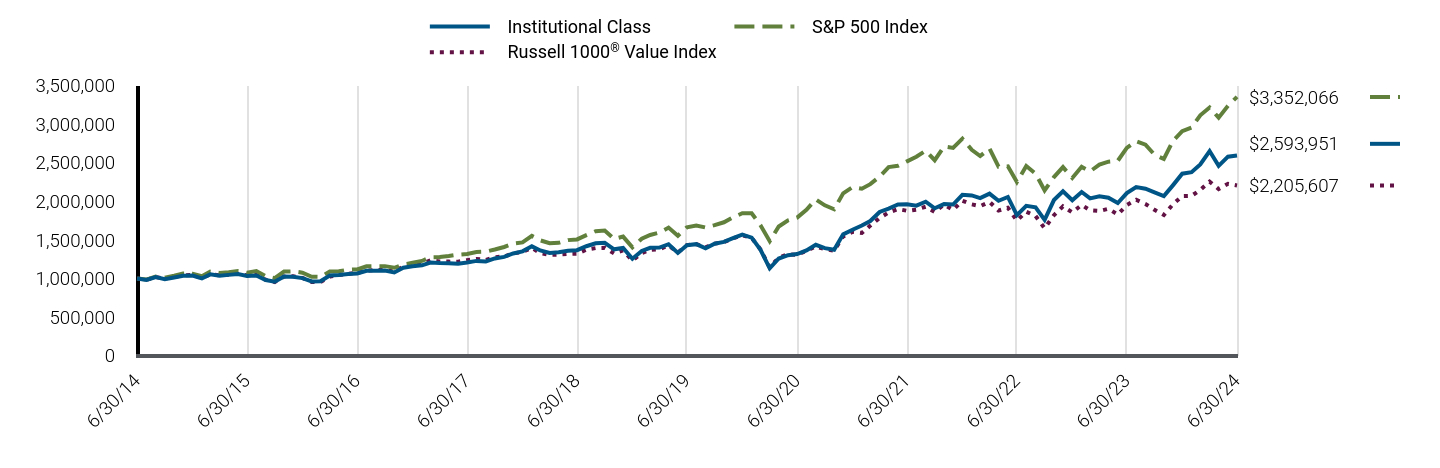
| Institutional Class | S&P 500 Index | Russell 1000® Value Index |
|---|
| 6/30/14 | $1,000,000 | $1,000,000 | $1,000,000 |
| 7/31/14 | $981,021 | $986,209 | $982,959 |
| 8/31/14 | $1,018,371 | $1,025,662 | $1,019,087 |
| 9/30/14 | $992,136 | $1,011,279 | $998,066 |
| 10/31/14 | $1,012,583 | $1,035,980 | $1,020,488 |
| 11/30/14 | $1,034,194 | $1,063,842 | $1,041,383 |
| 12/31/14 | $1,038,503 | $1,061,162 | $1,047,771 |
| 1/31/15 | $1,000,482 | $1,029,306 | $1,005,888 |
| 2/28/15 | $1,053,686 | $1,088,463 | $1,054,562 |
| 3/31/15 | $1,035,085 | $1,071,249 | $1,040,207 |
| 4/30/15 | $1,046,923 | $1,081,526 | $1,049,932 |
| 5/31/15 | $1,058,604 | $1,095,433 | $1,062,550 |
| 6/30/15 | $1,032,830 | $1,074,228 | $1,041,334 |
| 7/31/15 | $1,039,122 | $1,096,734 | $1,045,899 |
| 8/31/15 | $980,402 | $1,030,564 | $983,609 |
| 9/30/15 | $958,383 | $1,005,064 | $953,914 |
| 10/31/15 | $1,024,442 | $1,089,846 | $1,025,887 |
| 11/30/15 | $1,023,393 | $1,093,087 | $1,029,816 |
| 12/31/15 | $1,004,751 | $1,075,847 | $1,007,665 |
| 1/31/16 | $961,349 | $1,022,459 | $955,599 |
| 2/29/16 | $965,689 | $1,021,079 | $955,360 |
| 3/31/16 | $1,038,387 | $1,090,347 | $1,024,184 |
| 4/30/16 | $1,045,982 | $1,094,574 | $1,045,702 |
| 5/31/16 | $1,057,918 | $1,114,231 | $1,061,942 |
| 6/30/16 | $1,065,513 | $1,117,118 | $1,071,127 |
| 7/31/16 | $1,100,234 | $1,158,304 | $1,102,233 |
| 8/31/16 | $1,099,149 | $1,159,931 | $1,110,731 |
| 9/30/16 | $1,102,404 | $1,160,150 | $1,108,421 |
| 10/31/16 | $1,078,534 | $1,138,988 | $1,091,263 |
| 11/30/16 | $1,139,296 | $1,181,170 | $1,153,585 |
| 12/31/16 | $1,159,534 | $1,204,517 | $1,182,413 |
| 1/31/17 | $1,170,958 | $1,227,363 | $1,190,831 |
| 2/28/17 | $1,207,514 | $1,276,096 | $1,233,618 |
| 3/31/17 | $1,200,660 | $1,277,585 | $1,221,047 |
| 4/30/17 | $1,197,233 | $1,290,705 | $1,218,752 |
| 5/31/17 | $1,192,663 | $1,308,869 | $1,217,557 |
| 6/30/17 | $1,207,514 | $1,317,038 | $1,237,465 |
| 7/31/17 | $1,228,077 | $1,344,120 | $1,253,910 |
| 8/31/17 | $1,220,081 | $1,348,235 | $1,239,302 |
| 9/30/17 | $1,260,065 | $1,376,046 | $1,276,011 |
| 10/31/17 | $1,279,485 | $1,408,157 | $1,285,274 |
| 11/30/17 | $1,324,039 | $1,451,345 | $1,324,629 |
| 12/31/17 | $1,351,376 | $1,467,482 | $1,343,969 |
| 1/31/18 | $1,416,706 | $1,551,501 | $1,395,927 |
| 2/28/18 | $1,363,474 | $1,494,317 | $1,329,271 |
| 3/31/18 | $1,330,809 | $1,456,342 | $1,305,890 |
| 4/30/18 | $1,339,278 | $1,461,930 | $1,310,199 |
| 5/31/18 | $1,358,635 | $1,497,136 | $1,317,982 |
| 6/30/18 | $1,367,104 | $1,506,351 | $1,321,250 |
| 7/31/18 | $1,417,916 | $1,562,408 | $1,373,545 |
| 8/31/18 | $1,455,421 | $1,613,319 | $1,393,846 |
| 9/30/18 | $1,462,680 | $1,622,502 | $1,396,606 |
| 10/31/18 | $1,377,992 | $1,511,604 | $1,324,290 |
| 11/30/18 | $1,396,139 | $1,542,408 | $1,363,833 |
| 12/31/18 | $1,256,643 | $1,403,142 | $1,232,864 |
| 1/31/19 | $1,357,277 | $1,515,584 | $1,328,818 |
| 2/28/19 | $1,397,273 | $1,564,247 | $1,371,274 |
| 3/31/19 | $1,399,853 | $1,594,643 | $1,379,995 |
| 4/30/19 | $1,443,720 | $1,659,210 | $1,428,943 |
| 5/31/19 | $1,331,473 | $1,553,770 | $1,337,062 |
| 6/30/19 | $1,430,818 | $1,663,274 | $1,433,037 |
| 7/31/19 | $1,445,010 | $1,687,179 | $1,444,917 |
| 8/31/19 | $1,392,112 | $1,660,453 | $1,402,422 |
| 9/30/19 | $1,450,171 | $1,691,521 | $1,452,460 |
| 10/31/19 | $1,474,684 | $1,728,159 | $1,472,765 |
| 11/30/19 | $1,523,711 | $1,790,889 | $1,518,303 |
| 12/31/19 | $1,569,165 | $1,844,942 | $1,560,072 |
| 1/31/20 | $1,529,903 | $1,844,219 | $1,526,515 |
| 2/29/20 | $1,374,204 | $1,692,404 | $1,378,672 |
| 3/31/20 | $1,131,857 | $1,483,370 | $1,143,071 |
| 4/30/20 | $1,259,123 | $1,673,529 | $1,271,574 |
| 5/31/20 | $1,302,448 | $1,753,236 | $1,315,151 |
| 6/30/20 | $1,315,987 | $1,788,103 | $1,306,419 |
| 7/31/20 | $1,363,373 | $1,888,925 | $1,358,061 |
| 8/31/20 | $1,436,484 | $2,024,702 | $1,414,217 |
| 9/30/20 | $1,393,159 | $1,947,770 | $1,379,484 |
| 10/31/20 | $1,372,851 | $1,895,972 | $1,361,358 |
| 11/30/20 | $1,571,873 | $2,103,512 | $1,544,474 |
| 12/31/20 | $1,630,890 | $2,184,389 | $1,603,689 |
| 1/31/21 | $1,686,791 | $2,162,335 | $1,588,999 |
| 2/28/21 | $1,744,089 | $2,221,962 | $1,685,023 |
| 3/31/21 | $1,861,479 | $2,319,274 | $1,784,169 |
| 4/30/21 | $1,904,802 | $2,443,050 | $1,855,518 |
| 5/31/21 | $1,957,907 | $2,460,114 | $1,898,826 |
| 6/30/21 | $1,960,702 | $2,517,545 | $1,877,084 |
| 7/31/21 | $1,943,932 | $2,577,349 | $1,892,082 |
| 8/31/21 | $1,994,242 | $2,655,715 | $1,929,602 |
| 9/30/21 | $1,908,994 | $2,532,198 | $1,862,433 |
| 10/31/21 | $1,963,497 | $2,709,608 | $1,957,007 |
| 11/30/21 | $1,957,907 | $2,690,834 | $1,888,042 |
| 12/31/21 | $2,083,878 | $2,811,426 | $2,007,159 |
| 1/31/22 | $2,076,172 | $2,665,943 | $1,960,412 |
| 2/28/22 | $2,040,721 | $2,586,121 | $1,937,671 |
| 3/31/22 | $2,099,292 | $2,682,143 | $1,992,372 |
| 4/30/22 | $2,006,812 | $2,448,255 | $1,880,002 |
| 5/31/22 | $2,056,134 | $2,452,747 | $1,916,549 |
| 6/30/22 | $1,820,311 | $2,250,288 | $1,749,100 |
| 7/31/22 | $1,940,535 | $2,457,774 | $1,865,083 |
| 8/31/22 | $1,922,039 | $2,357,541 | $1,809,504 |
| 9/30/22 | $1,760,199 | $2,140,415 | $1,650,828 |
| 10/31/22 | $2,016,060 | $2,313,706 | $1,820,088 |
| 11/30/22 | $2,130,118 | $2,443,005 | $1,933,825 |
| 12/31/22 | $2,013,530 | $2,302,253 | $1,855,873 |
| 1/31/23 | $2,120,031 | $2,446,912 | $1,952,044 |
| 2/28/23 | $2,036,827 | $2,387,210 | $1,883,215 |
| 3/31/23 | $2,063,452 | $2,474,855 | $1,874,533 |
| 4/30/23 | $2,046,812 | $2,513,484 | $1,902,782 |
| 5/31/23 | $1,976,921 | $2,524,409 | $1,829,392 |
| 6/30/23 | $2,106,718 | $2,691,210 | $1,950,919 |
| 7/31/23 | $2,183,266 | $2,777,665 | $2,019,513 |
| 8/31/23 | $2,163,297 | $2,733,440 | $1,964,986 |
| 9/30/23 | $2,116,703 | $2,603,115 | $1,889,157 |
| 10/31/23 | $2,066,781 | $2,548,381 | $1,822,508 |
| 11/30/23 | $2,206,563 | $2,781,113 | $1,960,016 |
| 12/31/23 | $2,357,166 | $2,907,461 | $2,068,581 |
| 1/31/24 | $2,376,750 | $2,956,318 | $2,070,733 |
| 2/29/24 | $2,478,229 | $3,114,172 | $2,147,122 |
| 3/31/24 | $2,650,922 | $3,214,370 | $2,254,457 |
| 4/30/24 | $2,458,646 | $3,083,080 | $2,158,146 |
| 5/31/24 | $2,577,928 | $3,235,954 | $2,226,559 |
| 6/30/24 | $2,593,951 | $3,352,066 | $2,205,607 |
The table below shows the average annual total returns of the Fund, a regulatory index, and one or more supplemental index(es) for certain periods ended June 30, 2024.
Average Annual Total Returns (%)
| Class/Index Name | 1 Year | 5 Years | 10 Years |
|---|
| Institutional Class | 23.13% | 12.64% | 10.00% |
| S&P 500 Index | 24.56% | 15.05% | 12.86% |
Russell 1000® Value Index | 13.05% | 9.01% | 8.23% |
All Fund returns are net of fees and expenses and include applicable fee waivers and/or expense limitations. Absent any applicable fee waivers and/or expense limitations, performance would have been lower and there can be no assurance that any such waivers or limitations will continue in the future.
Performance quoted represents past performance. Past performance is not a guarantee or a reliable indicator of future results.Current performance may be lower or higher than performance shown. Investment return and the principal value of an investment will fluctuate. Shares may be worth more or less than original cost when redeemed. Returns shown do not reflect the deduction of taxes that a shareholder would pay on Fund distributions or the redemption of Fund shares.Differences in the Fund’s performance versus an index and related attribution information with respect to particular categories of securities or individual positions may be attributable, in part, to differences in the pricing methodologies used by the Fund and the index. For performance current to the most recent month-end, visit www.pimco.com/literature or via 888.87.PIMCO (888.877.4626).
Key Fund StatisticsFootnote Reference* (as of the end of the reporting period)
| Total Net Assets | $1,459,971 |
| # of Portfolio Holdings | 148 |
| Portfolio Turnover Rate | 73% |
| Total Net Advisory Fees Paid During the Reporting Period | $3,128 |
| Footnote | Description |
Footnote* | Dollar amounts displayed in 000's |
What did the Fund invest in?
Sector Allocation (% of Net Assets)Footnote Reference*
| Information Technology | 31.4% |
| Consumer Staples | 16.9% |
| Health Care | 15.1% |
| Energy | 10.2% |
| Financials | 8.6% |
| Industrials | 5.5% |
| Utilities | 3.8% |
| Communication Services | 3.2% |
| Consumer Discretionary | 1.9% |
| Materials | 1.9% |
| Real Estate | 1.2% |
| Short-Term Instruments | 0.2% |
| Other Assets and Liabilities, Net | 0.1% |
| Total | 100.0% |
| Footnote | Description |
Footnote* | % of Net Assets includes derivatives instruments, if any, valued at the value used for determining the Fund’s net asset value. The notional exposure of such derivatives investments therefore may be greater than what is depicted. |
For additional information about the Fund, including the Fund's prospectus, financial information, holdings and proxy voting information, please visit www.pimco.com/literature or contact 888.87.PIMCO (888.877.4626). For tax information about the Fund, please visit: https://www.pimco.com/tax.
Institutional Class: PKAIX
Annual Shareholder Report |
June 30, 2024
Annual Shareholder Report | June 30, 2024
This annual shareholder report contains important information about the PIMCO RAE US Fund (the "Fund") for the period of July 1, 2023 to June 30, 2024 (the "reporting period"). You can find additional information about the Fund at www.pimco.com/literature. You can also request this information by contacting us at 888.87.PIMCO (888.877.4626).
What were the Fund costs for the last year?
(based on a hypothetical $10,000 investment)
| Class Name | Cost of a $10,000 investment | Costs paid as a percentage of a $10,000 investment |
|---|
| I-2 | $56 | 0.50% |
How did the Fund perform during the reporting period and what affected its performance?
The following affected performance (on a gross basis) during the reporting period:
• Overweight exposure to, and security selection in, information technology contributed to relative returns, as the sector and the Fund’s
holdings outperformed the Russell 1000® Value Index ("RVL Index").
• Overweight exposure to, and security selection in, energy contributed to relative returns, as the sector and the Fund’s holdings
outperformed the RVL Index.
• Underweight exposure to, and security selection in, utilities contributed to relative returns, as the sector underperformed the RVL Index
and the Fund’s holdings outperformed the RVL Index.
• Underweight exposure to financials detracted from relative returns, as the sector outperformed the RVL Index.
• Underweight exposure to, and security selection in, industrials detracted from relative returns, as the sector outperformed the RVL
Index and the Fund’s holdings underperformed the RVL Index.
• Security selection in consumer staples detracted from relative returns, as the Fund’s holdings underperformed the RVL Index.
In addition to the Fund's performance, the tables in this section include performance of: (i) a broad-based securities market index (i.e., a regulatory index) and (ii) one or more supplemental index(es). Effective July 24, 2024, the Fund's regulatory index is the S&P 500 Index. The Fund's regulatory index is shown in connection with certain regulatory requirements to provide a broad measure of market performance.
The table below illustrates cumulative returns for the 10-year period ended June 30, 2024 or the life of the Fund, if shorter. Cumulative returns are based on a hypothetical initial investment equal to the greater of either $10,000 or the investment minimum applicable to the share class.
Cumulative Returns Based on $1,000,000 Investment
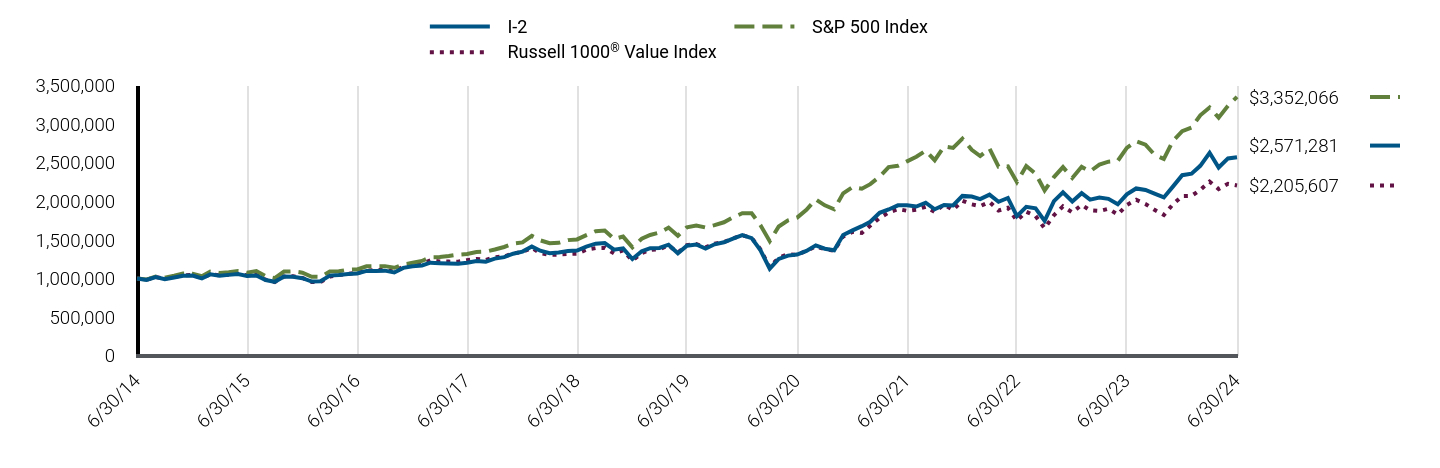
| I-2 | S&P 500 Index | Russell 1000® Value Index |
|---|
| 6/30/14 | $1,000,000 | $1,000,000 | $1,000,000 |
| 7/31/14 | $981,021 | $986,209 | $982,959 |
| 8/31/14 | $1,018,371 | $1,025,662 | $1,019,087 |
| 9/30/14 | $992,136 | $1,011,279 | $998,066 |
| 10/31/14 | $1,012,583 | $1,035,980 | $1,020,488 |
| 11/30/14 | $1,034,194 | $1,063,842 | $1,041,383 |
| 12/31/14 | $1,038,503 | $1,061,162 | $1,047,771 |
| 1/31/15 | $1,000,482 | $1,029,306 | $1,005,888 |
| 2/28/15 | $1,053,686 | $1,088,463 | $1,054,562 |
| 3/31/15 | $1,035,085 | $1,071,249 | $1,040,207 |
| 4/30/15 | $1,046,923 | $1,081,526 | $1,049,932 |
| 5/31/15 | $1,058,604 | $1,095,433 | $1,062,550 |
| 6/30/15 | $1,032,830 | $1,074,228 | $1,041,334 |
| 7/31/15 | $1,039,122 | $1,096,734 | $1,045,899 |
| 8/31/15 | $980,402 | $1,030,564 | $983,609 |
| 9/30/15 | $957,334 | $1,005,064 | $953,914 |
| 10/31/15 | $1,024,442 | $1,089,846 | $1,025,887 |
| 11/30/15 | $1,023,393 | $1,093,087 | $1,029,816 |
| 12/31/15 | $1,003,971 | $1,075,847 | $1,007,665 |
| 1/31/16 | $960,556 | $1,022,459 | $955,599 |
| 2/29/16 | $964,897 | $1,021,079 | $955,360 |
| 3/31/16 | $1,037,617 | $1,090,347 | $1,024,184 |
| 4/30/16 | $1,045,215 | $1,094,574 | $1,045,702 |
| 5/31/16 | $1,057,154 | $1,114,231 | $1,061,942 |
| 6/30/16 | $1,064,752 | $1,117,118 | $1,071,127 |
| 7/31/16 | $1,098,398 | $1,158,304 | $1,102,233 |
| 8/31/16 | $1,098,398 | $1,159,931 | $1,110,731 |
| 9/30/16 | $1,101,654 | $1,160,150 | $1,108,421 |
| 10/31/16 | $1,077,776 | $1,138,988 | $1,091,263 |
| 11/30/16 | $1,137,472 | $1,181,170 | $1,153,585 |
| 12/31/16 | $1,157,858 | $1,204,517 | $1,182,413 |
| 1/31/17 | $1,169,288 | $1,227,363 | $1,190,831 |
| 2/28/17 | $1,204,721 | $1,276,096 | $1,233,618 |
| 3/31/17 | $1,199,006 | $1,277,585 | $1,221,047 |
| 4/30/17 | $1,195,577 | $1,290,705 | $1,218,752 |
| 5/31/17 | $1,191,005 | $1,308,869 | $1,217,557 |
| 6/30/17 | $1,204,721 | $1,317,038 | $1,237,465 |
| 7/31/17 | $1,226,438 | $1,344,120 | $1,253,910 |
| 8/31/17 | $1,218,437 | $1,348,235 | $1,239,302 |
| 9/30/17 | $1,257,299 | $1,376,046 | $1,276,011 |
| 10/31/17 | $1,276,730 | $1,408,157 | $1,285,274 |
| 11/30/17 | $1,321,307 | $1,451,345 | $1,324,629 |
| 12/31/17 | $1,348,069 | $1,467,482 | $1,343,969 |
| 1/31/18 | $1,413,415 | $1,551,501 | $1,395,927 |
| 2/28/18 | $1,360,170 | $1,494,317 | $1,329,271 |
| 3/31/18 | $1,327,497 | $1,456,342 | $1,305,890 |
| 4/30/18 | $1,335,968 | $1,461,930 | $1,310,199 |
| 5/31/18 | $1,355,329 | $1,497,136 | $1,317,982 |
| 6/30/18 | $1,362,590 | $1,506,351 | $1,321,250 |
| 7/31/18 | $1,413,415 | $1,562,408 | $1,373,545 |
| 8/31/18 | $1,450,929 | $1,613,319 | $1,393,846 |
| 9/30/18 | $1,458,189 | $1,622,502 | $1,396,606 |
| 10/31/18 | $1,373,481 | $1,511,604 | $1,324,290 |
| 11/30/18 | $1,390,423 | $1,542,408 | $1,363,833 |
| 12/31/18 | $1,252,065 | $1,403,142 | $1,232,864 |
| 1/31/19 | $1,352,747 | $1,515,584 | $1,328,818 |
| 2/28/19 | $1,392,761 | $1,564,247 | $1,371,274 |
| 3/31/19 | $1,395,343 | $1,594,643 | $1,379,995 |
| 4/30/19 | $1,437,939 | $1,659,210 | $1,428,943 |
| 5/31/19 | $1,326,931 | $1,553,770 | $1,337,062 |
| 6/30/19 | $1,425,031 | $1,663,274 | $1,433,037 |
| 7/31/19 | $1,440,520 | $1,687,179 | $1,444,917 |
| 8/31/19 | $1,387,598 | $1,660,453 | $1,402,422 |
| 9/30/19 | $1,443,102 | $1,691,521 | $1,452,460 |
| 10/31/19 | $1,468,917 | $1,728,159 | $1,472,765 |
| 11/30/19 | $1,516,677 | $1,790,889 | $1,518,303 |
| 12/31/19 | $1,561,816 | $1,844,942 | $1,560,072 |
| 1/31/20 | $1,522,533 | $1,844,219 | $1,526,515 |
| 2/29/20 | $1,368,113 | $1,692,404 | $1,378,672 |
| 3/31/20 | $1,127,000 | $1,483,370 | $1,143,071 |
| 4/30/20 | $1,252,975 | $1,673,529 | $1,271,574 |
| 5/31/20 | $1,296,321 | $1,753,236 | $1,315,151 |
| 6/30/20 | $1,309,866 | $1,788,103 | $1,306,419 |
| 7/31/20 | $1,357,276 | $1,888,925 | $1,358,061 |
| 8/31/20 | $1,429,068 | $2,024,702 | $1,414,217 |
| 9/30/20 | $1,385,722 | $1,947,770 | $1,379,484 |
| 10/31/20 | $1,365,404 | $1,895,972 | $1,361,358 |
| 11/30/20 | $1,563,170 | $2,103,512 | $1,544,474 |
| 12/31/20 | $1,622,938 | $2,184,389 | $1,603,689 |
| 1/31/21 | $1,677,456 | $2,162,335 | $1,588,999 |
| 2/28/21 | $1,734,769 | $2,221,962 | $1,685,023 |
| 3/31/21 | $1,850,793 | $2,319,274 | $1,784,169 |
| 4/30/21 | $1,894,127 | $2,443,050 | $1,855,518 |
| 5/31/21 | $1,947,247 | $2,460,114 | $1,898,826 |
| 6/30/21 | $1,948,644 | $2,517,545 | $1,877,084 |
| 7/31/21 | $1,931,870 | $2,577,349 | $1,892,082 |
| 8/31/21 | $1,982,194 | $2,655,715 | $1,929,602 |
| 9/30/21 | $1,896,923 | $2,532,198 | $1,862,433 |
| 10/31/21 | $1,951,440 | $2,709,608 | $1,957,007 |
| 11/30/21 | $1,945,849 | $2,690,834 | $1,888,042 |
| 12/31/21 | $2,069,503 | $2,811,426 | $2,007,159 |
| 1/31/22 | $2,061,793 | $2,665,943 | $1,960,412 |
| 2/28/22 | $2,027,867 | $2,586,121 | $1,937,671 |
| 3/31/22 | $2,086,467 | $2,682,143 | $1,992,372 |
| 4/30/22 | $1,993,940 | $2,448,255 | $1,880,002 |
| 5/31/22 | $2,043,288 | $2,452,747 | $1,916,549 |
| 6/30/22 | $1,807,346 | $2,250,288 | $1,749,100 |
| 7/31/22 | $1,927,630 | $2,457,774 | $1,865,083 |
| 8/31/22 | $1,909,125 | $2,357,541 | $1,809,504 |
| 9/30/22 | $1,747,204 | $2,140,415 | $1,650,828 |
| 10/31/22 | $2,001,651 | $2,313,706 | $1,820,088 |
| 11/30/22 | $2,115,767 | $2,443,005 | $1,933,825 |
| 12/31/22 | $1,998,253 | $2,302,253 | $1,855,873 |
| 1/31/23 | $2,104,827 | $2,446,912 | $1,952,044 |
| 2/28/23 | $2,021,566 | $2,387,210 | $1,883,215 |
| 3/31/23 | $2,048,209 | $2,474,855 | $1,874,533 |
| 4/30/23 | $2,031,557 | $2,513,484 | $1,902,782 |
| 5/31/23 | $1,961,618 | $2,524,409 | $1,829,392 |
| 6/30/23 | $2,089,840 | $2,691,210 | $1,950,919 |
| 7/31/23 | $2,166,439 | $2,777,665 | $2,019,513 |
| 8/31/23 | $2,146,457 | $2,733,440 | $1,964,986 |
| 9/30/23 | $2,099,831 | $2,603,115 | $1,889,157 |
| 10/31/23 | $2,049,875 | $2,548,381 | $1,822,508 |
| 11/30/23 | $2,189,752 | $2,781,113 | $1,960,016 |
| 12/31/23 | $2,337,852 | $2,907,461 | $2,068,581 |
| 1/31/24 | $2,357,453 | $2,956,318 | $2,070,733 |
| 2/29/24 | $2,459,021 | $3,114,172 | $2,147,122 |
| 3/31/24 | $2,628,302 | $3,214,370 | $2,254,457 |
| 4/30/24 | $2,437,639 | $3,083,080 | $2,158,146 |
| 5/31/24 | $2,555,244 | $3,235,954 | $2,226,559 |
| 6/30/24 | $2,571,281 | $3,352,066 | $2,205,607 |
The table below shows the average annual total returns of the Fund, a regulatory index, and one or more supplemental index(es) for certain periods ended June 30, 2024.
Average Annual Total Returns (%)
| Class/Index Name | 1 Year | 5 Years | 10 Years |
|---|
| I-2 | 23.04% | 12.53% | 9.90% |
| S&P 500 Index | 24.56% | 15.05% | 12.86% |
Russell 1000® Value Index | 13.05% | 9.01% | 8.23% |
All Fund returns are net of fees and expenses and include applicable fee waivers and/or expense limitations. Absent any applicable fee waivers and/or expense limitations, performance would have been lower and there can be no assurance that any such waivers or limitations will continue in the future.
Performance quoted represents past performance. Past performance is not a guarantee or a reliable indicator of future results.Current performance may be lower or higher than performance shown. Investment return and the principal value of an investment will fluctuate. Shares may be worth more or less than original cost when redeemed. Returns shown do not reflect the deduction of taxes that a shareholder would pay on Fund distributions or the redemption of Fund shares.Differences in the Fund’s performance versus an index and related attribution information with respect to particular categories of securities or individual positions may be attributable, in part, to differences in the pricing methodologies used by the Fund and the index. For performance current to the most recent month-end, visit www.pimco.com/literature or via 888.87.PIMCO (888.877.4626).
Key Fund StatisticsFootnote Reference* (as of the end of the reporting period)
| Total Net Assets | $1,459,971 |
| # of Portfolio Holdings | 148 |
| Portfolio Turnover Rate | 73% |
| Total Net Advisory Fees Paid During the Reporting Period | $3,128 |
| Footnote | Description |
Footnote* | Dollar amounts displayed in 000's |
What did the Fund invest in?
Sector Allocation (% of Net Assets)Footnote Reference*
| Information Technology | 31.4% |
| Consumer Staples | 16.9% |
| Health Care | 15.1% |
| Energy | 10.2% |
| Financials | 8.6% |
| Industrials | 5.5% |
| Utilities | 3.8% |
| Communication Services | 3.2% |
| Consumer Discretionary | 1.9% |
| Materials | 1.9% |
| Real Estate | 1.2% |
| Short-Term Instruments | 0.2% |
| Other Assets and Liabilities, Net | 0.1% |
| Total | 100.0% |
| Footnote | Description |
Footnote* | % of Net Assets includes derivatives instruments, if any, valued at the value used for determining the Fund’s net asset value. The notional exposure of such derivatives investments therefore may be greater than what is depicted. |
For additional information about the Fund, including the Fund's prospectus, financial information, holdings and proxy voting information, please visit www.pimco.com/literature or contact 888.87.PIMCO (888.877.4626). For tax information about the Fund, please visit: https://www.pimco.com/tax.
Annual Shareholder Report |
June 30, 2024
Annual Shareholder Report | June 30, 2024
This annual shareholder report contains important information about the PIMCO RAE US Small Fund (the "Fund") for the period of July 1, 2023 to June 30, 2024 (the "reporting period"). You can find additional information about the Fund at www.pimco.com/literature. You can also request this information by contacting us at 888.87.PIMCO (888.877.4626).
What were the Fund costs for the last year?
(based on a hypothetical $10,000 investment)
| Class Name | Cost of a $10,000 investment | Costs paid as a percentage of a $10,000 investment |
|---|
| Class A | $101 | 0.90% |
How did the Fund perform during the reporting period and what affected its performance?
The following affected performance (on a gross basis) during the reporting period:
• Overweight exposure to, and security selection in, the consumer discretionary sector contributed to relative returns, as the sector and
the Fund’s holdings outperformed the Russell 2000® Value Index ("RUJ").
• Overweight exposure to, and security selection in, the industrials sector contributed to relative returns, as the sector and the Fund’s
holdings outperformed the RUJ.
• Security selection in the materials sector contributed to relative returns, as the Fund’s holdings outperformed the RUJ.
• Underweight exposure to the financials sector detracted from relative returns, as the sector outperformed the RUJ.
• Security selection in the healthcare sector detracted from relative returns, as the Fund’s holdings underperformed the RUJ.
• Overweight exposure to, and security selection in, the information technology sector detracted from relative returns, as the sector and
the Fund’s holdings underperformed the RUJ.
In addition to the Fund's performance, the tables in this section include performance of: (i) a broad-based securities market index (i.e., a regulatory index) and (ii) one or more supplemental index(es). Effective July 24, 2024, the Fund's regulatory index is the S&P 500 Index. The Fund's regulatory index is shown in connection with certain regulatory requirements to provide a broad measure of market performance.
The table below illustrates cumulative returns for the 10-year period ended June 30, 2024 or the life of the Fund, if shorter. Cumulative returns are based on a hypothetical initial investment equal to the greater of either $10,000 or the investment minimum applicable to the share class.
Cumulative Returns Based on $10,000 Investment
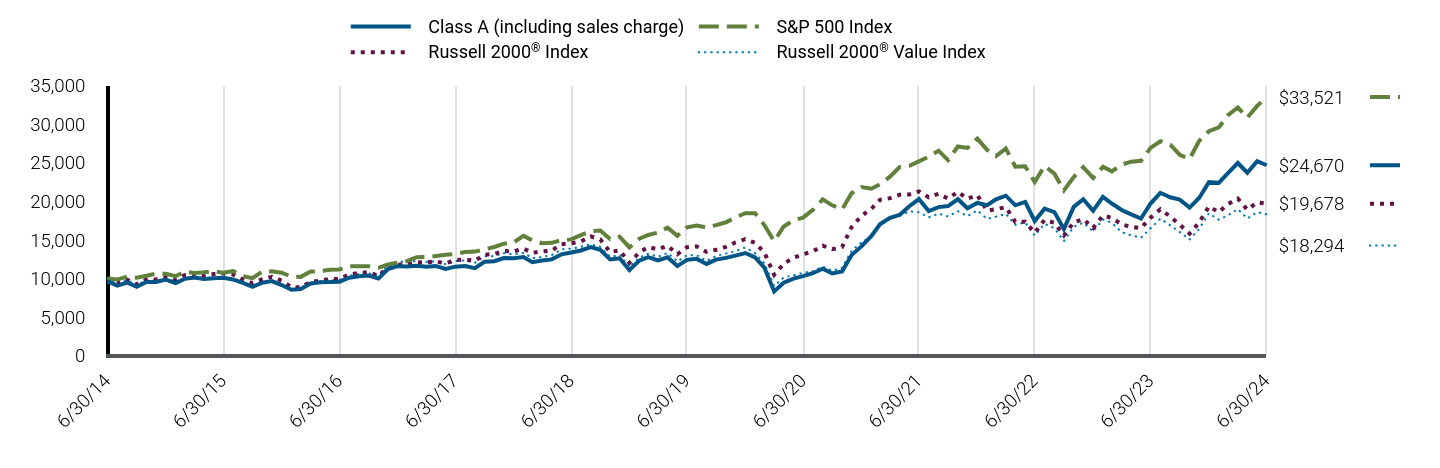
| Class A (including sales charge) | S&P 500 Index | Russell 2000® Index | Russell 2000® Value Index |
|---|
| 6/30/14 | $9,623 | $10,000 | $10,000 | $10,000 |
| 7/31/14 | $9,073 | $9,862 | $9,395 | $9,395 |
| 8/31/14 | $9,481 | $10,257 | $9,861 | $9,804 |
| 9/30/14 | $8,941 | $10,113 | $9,264 | $9,142 |
| 10/31/14 | $9,562 | $10,360 | $9,875 | $9,781 |
| 11/30/14 | $9,552 | $10,638 | $9,884 | $9,735 |
| 12/31/14 | $9,868 | $10,612 | $10,165 | $10,001 |
| 1/31/15 | $9,409 | $10,293 | $9,838 | $9,585 |
| 2/28/15 | $9,959 | $10,885 | $10,422 | $10,030 |
| 3/31/15 | $10,122 | $10,712 | $10,604 | $10,200 |
| 4/30/15 | $9,929 | $10,815 | $10,334 | $9,982 |
| 5/31/15 | $10,031 | $10,954 | $10,570 | $10,064 |
| 6/30/15 | $10,102 | $10,742 | $10,649 | $10,078 |
| 7/31/15 | $9,878 | $10,967 | $10,525 | $9,800 |
| 8/31/15 | $9,430 | $10,306 | $9,864 | $9,318 |
| 9/30/15 | $8,931 | $10,051 | $9,380 | $8,996 |
| 10/31/15 | $9,460 | $10,898 | $9,908 | $9,499 |
| 11/30/15 | $9,674 | $10,931 | $10,230 | $9,769 |
| 12/31/15 | $9,152 | $10,758 | $9,717 | $9,254 |
| 1/31/16 | $8,533 | $10,225 | $8,862 | $8,633 |
| 2/29/16 | $8,636 | $10,211 | $8,862 | $8,692 |
| 3/31/16 | $9,348 | $10,903 | $9,569 | $9,412 |
| 4/30/16 | $9,524 | $10,946 | $9,719 | $9,611 |
| 5/31/16 | $9,534 | $11,142 | $9,938 | $9,788 |
| 6/30/16 | $9,586 | $11,171 | $9,932 | $9,817 |
| 7/31/16 | $10,101 | $11,583 | $10,525 | $10,347 |
| 8/31/16 | $10,287 | $11,599 | $10,711 | $10,604 |
| 9/30/16 | $10,380 | $11,602 | $10,830 | $10,688 |
| 10/31/16 | $9,988 | $11,390 | $10,316 | $10,336 |
| 11/30/16 | $11,226 | $11,812 | $11,466 | $11,708 |
| 12/31/16 | $11,596 | $12,045 | $11,787 | $12,192 |
| 1/31/17 | $11,564 | $12,274 | $11,834 | $12,105 |
| 2/28/17 | $11,637 | $12,761 | $12,062 | $12,280 |
| 3/31/17 | $11,533 | $12,776 | $12,078 | $12,176 |
| 4/30/17 | $11,606 | $12,907 | $12,210 | $12,224 |
| 5/31/17 | $11,241 | $13,089 | $11,962 | $11,843 |
| 6/30/17 | $11,533 | $13,170 | $12,375 | $12,257 |
| 7/31/17 | $11,617 | $13,441 | $12,467 | $12,335 |
| 8/31/17 | $11,335 | $13,482 | $12,309 | $12,032 |
| 9/30/17 | $12,159 | $13,760 | $13,077 | $12,884 |
| 10/31/17 | $12,232 | $14,082 | $13,188 | $12,901 |
| 11/30/17 | $12,639 | $14,513 | $13,569 | $13,274 |
| 12/31/17 | $12,617 | $14,675 | $13,514 | $13,147 |
| 1/31/18 | $12,770 | $15,515 | $13,867 | $13,309 |
| 2/28/18 | $12,115 | $14,943 | $13,330 | $12,644 |
| 3/31/18 | $12,333 | $14,563 | $13,502 | $12,800 |
| 4/30/18 | $12,475 | $14,619 | $13,619 | $13,022 |
| 5/31/18 | $13,130 | $14,971 | $14,446 | $13,780 |
| 6/30/18 | $13,359 | $15,064 | $14,549 | $13,863 |
| 7/31/18 | $13,632 | $15,624 | $14,803 | $14,108 |
| 8/31/18 | $14,058 | $16,133 | $15,441 | $14,444 |
| 9/30/18 | $13,708 | $16,225 | $15,070 | $14,086 |
| 10/31/18 | $12,475 | $15,116 | $13,433 | $12,824 |
| 11/30/18 | $12,617 | $15,424 | $13,646 | $13,031 |
| 12/31/18 | $11,105 | $14,031 | $12,025 | $11,456 |
| 1/31/19 | $12,312 | $15,156 | $13,378 | $12,709 |
| 2/28/19 | $12,769 | $15,642 | $14,074 | $13,203 |
| 3/31/19 | $12,359 | $15,946 | $13,779 | $12,822 |
| 4/30/19 | $12,745 | $16,592 | $14,247 | $13,307 |
| 5/31/19 | $11,609 | $15,538 | $13,139 | $12,220 |
| 6/30/19 | $12,417 | $16,633 | $14,068 | $12,999 |
| 7/31/19 | $12,546 | $16,872 | $14,149 | $13,020 |
| 8/31/19 | $11,890 | $16,605 | $13,450 | $12,293 |
| 9/30/19 | $12,453 | $16,915 | $13,730 | $12,924 |
| 10/31/19 | $12,675 | $17,282 | $14,092 | $13,237 |
| 11/30/19 | $12,968 | $17,909 | $14,672 | $13,547 |
| 12/31/19 | $13,300 | $18,449 | $15,095 | $14,021 |
| 1/31/20 | $12,742 | $18,442 | $14,611 | $13,265 |
| 2/29/20 | $11,412 | $16,924 | $13,381 | $11,976 |
| 3/31/20 | $8,324 | $14,834 | $10,474 | $9,021 |
| 4/30/20 | $9,452 | $16,735 | $11,912 | $10,134 |
| 5/31/20 | $9,987 | $17,532 | $12,687 | $10,425 |
| 6/30/20 | $10,307 | $17,881 | $13,136 | $10,727 |
| 7/31/20 | $10,687 | $18,889 | $13,500 | $10,948 |
| 8/31/20 | $11,269 | $20,247 | $14,260 | $11,538 |
| 9/30/20 | $10,652 | $19,478 | $13,784 | $11,001 |
| 10/31/20 | $10,901 | $18,960 | $14,072 | $11,395 |
| 11/30/20 | $13,050 | $21,035 | $16,666 | $13,595 |
| 12/31/20 | $14,157 | $21,844 | $18,108 | $14,671 |
| 1/31/21 | $15,482 | $21,623 | $19,019 | $15,443 |
| 2/28/21 | $17,053 | $22,220 | $20,205 | $16,894 |
| 3/31/21 | $17,858 | $23,193 | $20,407 | $17,777 |
| 4/30/21 | $18,222 | $24,431 | $20,836 | $18,137 |
| 5/31/21 | $19,365 | $24,601 | $20,879 | $18,701 |
| 6/30/21 | $20,287 | $25,175 | $21,283 | $18,588 |
| 7/31/21 | $18,728 | $25,773 | $20,515 | $17,923 |
| 8/31/21 | $19,248 | $26,557 | $20,974 | $18,403 |
| 9/30/21 | $19,378 | $25,322 | $20,355 | $18,034 |
| 10/31/21 | $20,274 | $27,096 | $21,221 | $18,722 |
| 11/30/21 | $19,105 | $26,908 | $20,337 | $18,082 |
| 12/31/21 | $19,785 | $28,114 | $20,791 | $18,819 |
| 1/31/22 | $19,501 | $26,659 | $18,790 | $17,722 |
| 2/28/22 | $20,243 | $25,861 | $18,990 | $18,016 |
| 3/31/22 | $20,723 | $26,821 | $19,227 | $18,368 |
| 4/30/22 | $19,479 | $24,483 | $17,321 | $16,943 |
| 5/31/22 | $19,915 | $24,527 | $17,347 | $17,268 |
| 6/30/22 | $17,451 | $22,503 | $15,921 | $15,562 |
| 7/31/22 | $19,043 | $24,578 | $17,583 | $17,069 |
| 8/31/22 | $18,607 | $23,575 | $17,223 | $16,529 |
| 9/30/22 | $16,404 | $21,404 | $15,572 | $14,845 |
| 10/31/22 | $19,283 | $23,137 | $17,287 | $16,713 |
| 11/30/22 | $20,264 | $24,430 | $17,691 | $17,224 |
| 12/31/22 | $18,777 | $23,023 | $16,542 | $16,094 |
| 1/31/23 | $20,573 | $24,469 | $18,155 | $17,630 |
| 2/28/23 | $19,711 | $23,872 | $17,848 | $17,223 |
| 3/31/23 | $18,873 | $24,749 | $16,995 | $15,988 |
| 4/30/23 | $18,298 | $25,135 | $16,690 | $15,589 |
| 5/31/23 | $17,771 | $25,244 | $16,536 | $15,283 |
| 6/30/23 | $19,711 | $26,912 | $17,880 | $16,497 |
| 7/31/23 | $21,100 | $27,777 | $18,973 | $17,742 |
| 8/31/23 | $20,525 | $27,334 | $18,024 | $16,888 |
| 9/30/23 | $20,214 | $26,031 | $16,963 | $16,009 |
| 10/31/23 | $19,184 | $25,484 | $15,806 | $15,054 |
| 11/30/23 | $20,430 | $27,811 | $17,237 | $16,409 |
| 12/31/23 | $22,484 | $29,075 | $19,343 | $18,451 |
| 1/31/24 | $22,387 | $29,563 | $18,590 | $17,613 |
| 2/29/24 | $23,650 | $31,142 | $19,642 | $18,189 |
| 3/31/24 | $24,961 | $32,144 | $20,345 | $18,986 |
| 4/30/24 | $23,698 | $30,831 | $18,913 | $17,776 |
| 5/31/24 | $25,204 | $32,360 | $19,862 | $18,608 |
| 6/30/24 | $24,670 | $33,521 | $19,678 | $18,294 |
The table below shows the average annual total returns of the Fund, a regulatory index, and one or more supplemental index(es) for certain periods ended June 30, 2024.
Average Annual Total Returns (%)
| Class/Index Name | 1 Year | 5 Years | 10 Years |
|---|
| Class A (excluding sales charge) | 25.16% | 14.72% | 9.87% |
| Class A (including sales charge) | 20.47% | 13.85% | 9.45% |
| S&P 500 Index | 24.56% | 15.05% | 12.86% |
Russell 2000® Index | 10.06% | 6.94% | 7.00% |
Russell 2000® Value Index | 10.90% | 7.07% | 6.23% |
All Fund returns are net of fees and expenses and include applicable fee waivers and/or expense limitations. Absent any applicable fee waivers and/or expense limitations, performance would have been lower and there can be no assurance that any such waivers or limitations will continue in the future.
Performance quoted represents past performance. Past performance is not a guarantee or a reliable indicator of future results.Current performance may be lower or higher than performance shown. Investment return and the principal value of an investment will fluctuate. Shares may be worth more or less than original cost when redeemed. Returns shown do not reflect the deduction of taxes that a shareholder would pay on Fund distributions or the redemption of Fund shares.Differences in the Fund’s performance versus an index and related attribution information with respect to particular categories of securities or individual positions may be attributable, in part, to differences in the pricing methodologies used by the Fund and the index. The Cumulative Returns chart and Average Annual Total Returns table reflect any sales load that would have applied at the time of purchase or any Contingent Deferred Sales Charge (“CDSC”) that would have applied if a full redemption occurred on the last business day of the period shown in the Cumulative Returns chart. Class A shares are subject to an initial sales charge. A CDSC may be imposed in certain circumstances on Class A shares that are purchased without an initial sales charge and then redeemed during the first 12 months after purchase. For performance current to the most recent month-end, visit www.pimco.com/literature or via 888.87.PIMCO (888.877.4626).
Key Fund StatisticsFootnote Reference* (as of the end of the reporting period)
| Total Net Assets | $1,186,677 |
| # of Portfolio Holdings | 189 |
| Portfolio Turnover Rate | 62% |
| Total Net Advisory Fees Paid During the Reporting Period | $2,893 |
| Footnote | Description |
Footnote* | Dollar amounts displayed in 000's |
What did the Fund invest in?
Sector Allocation (% of Net Assets)Footnote Reference*
| Consumer Staples | 24.4% |
| Industrials | 17.4% |
| Financials | 14.8% |
| Information Technology | 8.2% |
| Materials | 7.8% |
| Real Estate | 6.9% |
| Consumer Discretionary | 6.5% |
| Energy | 5.6% |
| Health Care | 4.5% |
| Communication Services | 2.8% |
| Short-Term Instruments | 1.5% |
| Utilities | 0.2% |
| Other Assets and Liabilities, Net | (0.6%) |
| Total | 100.0% |
| Footnote | Description |
Footnote* | % of Net Assets includes derivatives instruments, if any, valued at the value used for determining the Fund’s net asset value. The notional exposure of such derivatives investments therefore may be greater than what is depicted. |
For additional information about the Fund, including the Fund's prospectus, financial information, holdings and proxy voting information, please visit www.pimco.com/literature or contact 888.87.PIMCO (888.877.4626). For tax information about the Fund, please visit: https://www.pimco.com/tax.
Annual Shareholder Report |
June 30, 2024
Institutional Class: PMJIX
Annual Shareholder Report | June 30, 2024
This annual shareholder report contains important information about the PIMCO RAE US Small Fund (the "Fund") for the period of July 1, 2023 to June 30, 2024 (the "reporting period"). You can find additional information about the Fund at www.pimco.com/literature. You can also request this information by contacting us at 888.87.PIMCO (888.877.4626).
What were the Fund costs for the last year?
(based on a hypothetical $10,000 investment)
| Class Name | Cost of a $10,000 investment | Costs paid as a percentage of a $10,000 investment |
|---|
| Institutional Class | $56 | 0.50% |
How did the Fund perform during the reporting period and what affected its performance?
The following affected performance (on a gross basis) during the reporting period:
• Overweight exposure to, and security selection in, the consumer discretionary sector contributed to relative returns, as the sector and
the Fund’s holdings outperformed the Russell 2000® Value Index ("RUJ").
• Overweight exposure to, and security selection in, the industrials sector contributed to relative returns, as the sector and the Fund’s
holdings outperformed the RUJ.
• Security selection in the materials sector contributed to relative returns, as the Fund’s holdings outperformed the RUJ.
• Underweight exposure to the financials sector detracted from relative returns, as the sector outperformed the RUJ.
• Security selection in the healthcare sector detracted from relative returns, as the Fund’s holdings underperformed the RUJ.
• Overweight exposure to, and security selection in, the information technology sector detracted from relative returns, as the sector and
the Fund’s holdings underperformed the RUJ.
In addition to the Fund's performance, the tables in this section include performance of: (i) a broad-based securities market index (i.e., a regulatory index) and (ii) one or more supplemental index(es). Effective July 24, 2024, the Fund's regulatory index is the S&P 500 Index. The Fund's regulatory index is shown in connection with certain regulatory requirements to provide a broad measure of market performance.
The table below illustrates cumulative returns for the 10-year period ended June 30, 2024 or the life of the Fund, if shorter. Cumulative returns are based on a hypothetical initial investment equal to the greater of either $10,000 or the investment minimum applicable to the share class.
Cumulative Returns Based on $1,000,000 Investment
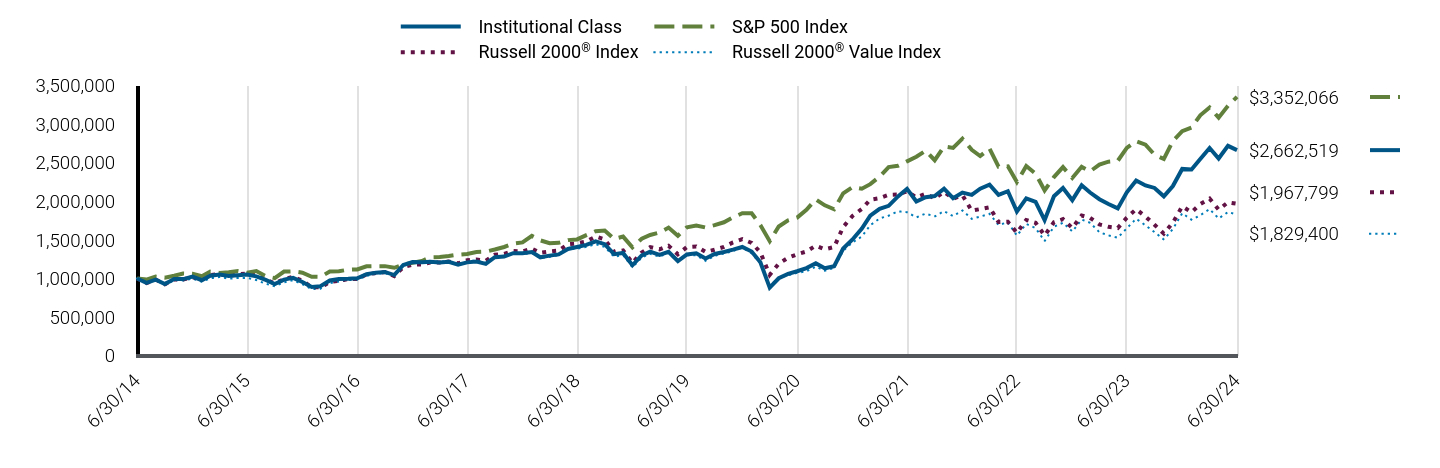
| Institutional Class | S&P 500 Index | Russell 2000® Index | Russell 2000® Value Index |
|---|
| 6/30/14 | $1,000,000 | $1,000,000 | $1,000,000 | $1,000,000 |
| 7/31/14 | $943,522 | $986,209 | $939,470 | $939,500 |
| 8/31/14 | $985,404 | $1,025,662 | $986,058 | $980,400 |
| 9/30/14 | $928,968 | $1,011,279 | $926,412 | $914,200 |
| 10/31/14 | $993,586 | $1,035,980 | $987,481 | $978,100 |
| 11/30/14 | $992,400 | $1,063,842 | $988,369 | $973,500 |
| 12/31/14 | $1,025,477 | $1,061,162 | $1,016,538 | $1,000,100 |
| 1/31/15 | $978,217 | $1,029,306 | $983,836 | $958,500 |
| 2/28/15 | $1,035,087 | $1,088,463 | $1,042,246 | $1,003,000 |
| 3/31/15 | $1,051,588 | $1,071,249 | $1,060,402 | $1,020,000 |
| 4/30/15 | $1,032,494 | $1,081,526 | $1,033,362 | $998,200 |
| 5/31/15 | $1,043,025 | $1,095,433 | $1,056,954 | $1,006,400 |
| 6/30/15 | $1,051,027 | $1,074,228 | $1,064,870 | $1,007,800 |
| 7/31/15 | $1,027,742 | $1,096,734 | $1,052,496 | $980,000 |
| 8/31/15 | $981,170 | $1,030,564 | $986,358 | $931,800 |
| 9/30/15 | $929,307 | $1,005,064 | $937,967 | $899,600 |
| 10/31/15 | $985,404 | $1,089,846 | $990,812 | $949,900 |
| 11/30/15 | $1,008,690 | $1,093,087 | $1,023,043 | $976,900 |
| 12/31/15 | $954,475 | $1,075,847 | $971,676 | $925,400 |
| 1/31/16 | $889,911 | $1,022,459 | $886,237 | $863,300 |
| 2/29/16 | $900,672 | $1,021,079 | $886,201 | $869,200 |
| 3/31/16 | $974,921 | $1,090,347 | $956,929 | $941,200 |
| 4/30/16 | $993,214 | $1,094,574 | $971,943 | $961,100 |
| 5/31/16 | $995,366 | $1,114,231 | $993,831 | $978,800 |
| 6/30/16 | $1,001,823 | $1,117,118 | $993,205 | $981,700 |
| 7/31/16 | $1,055,626 | $1,158,304 | $1,052,509 | $1,034,700 |
| 8/31/16 | $1,076,071 | $1,159,931 | $1,071,118 | $1,060,400 |
| 9/30/16 | $1,084,680 | $1,160,150 | $1,083,050 | $1,068,800 |
| 10/31/16 | $1,044,865 | $1,138,988 | $1,031,562 | $1,033,600 |
| 11/30/16 | $1,175,070 | $1,181,170 | $1,146,591 | $1,170,800 |
| 12/31/16 | $1,213,536 | $1,204,517 | $1,178,719 | $1,219,200 |
| 1/31/17 | $1,210,268 | $1,227,363 | $1,183,363 | $1,210,500 |
| 2/28/17 | $1,217,894 | $1,276,096 | $1,206,202 | $1,228,000 |
| 3/31/17 | $1,208,090 | $1,277,585 | $1,207,782 | $1,217,600 |
| 4/30/17 | $1,215,715 | $1,290,705 | $1,221,031 | $1,222,400 |
| 5/31/17 | $1,178,677 | $1,308,869 | $1,196,195 | $1,184,300 |
| 6/30/17 | $1,209,179 | $1,317,038 | $1,237,548 | $1,225,700 |
| 7/31/17 | $1,218,983 | $1,344,120 | $1,246,743 | $1,233,500 |
| 8/31/17 | $1,189,571 | $1,348,235 | $1,230,884 | $1,203,200 |
| 9/30/17 | $1,276,719 | $1,376,046 | $1,307,704 | $1,288,400 |
| 10/31/17 | $1,284,344 | $1,408,157 | $1,318,845 | $1,290,100 |
| 11/30/17 | $1,327,918 | $1,451,345 | $1,356,855 | $1,327,400 |
| 12/31/17 | $1,326,043 | $1,467,482 | $1,351,373 | $1,314,700 |
| 1/31/18 | $1,342,020 | $1,551,501 | $1,386,684 | $1,330,900 |
| 2/28/18 | $1,274,691 | $1,494,317 | $1,332,992 | $1,264,400 |
| 3/31/18 | $1,296,373 | $1,456,342 | $1,350,227 | $1,280,000 |
| 4/30/18 | $1,312,349 | $1,461,930 | $1,361,907 | $1,302,200 |
| 5/31/18 | $1,381,961 | $1,497,136 | $1,444,575 | $1,378,000 |
| 6/30/18 | $1,407,067 | $1,506,351 | $1,454,932 | $1,386,300 |
| 7/31/18 | $1,435,596 | $1,562,408 | $1,480,292 | $1,410,800 |
| 8/31/18 | $1,481,243 | $1,613,319 | $1,544,107 | $1,444,400 |
| 9/30/18 | $1,444,725 | $1,622,502 | $1,506,971 | $1,408,600 |
| 10/31/18 | $1,314,632 | $1,511,604 | $1,343,284 | $1,282,400 |
| 11/30/18 | $1,330,608 | $1,542,408 | $1,364,629 | $1,303,100 |
| 12/31/18 | $1,171,403 | $1,403,142 | $1,202,525 | $1,145,600 |
| 1/31/19 | $1,298,703 | $1,515,584 | $1,337,809 | $1,270,900 |
| 2/28/19 | $1,347,665 | $1,564,247 | $1,407,361 | $1,320,300 |
| 3/31/19 | $1,304,823 | $1,594,643 | $1,377,905 | $1,282,200 |
| 4/30/19 | $1,346,441 | $1,659,210 | $1,424,713 | $1,330,700 |
| 5/31/19 | $1,226,485 | $1,553,770 | $1,313,913 | $1,222,000 |
| 6/30/19 | $1,312,168 | $1,663,274 | $1,406,780 | $1,299,900 |
| 7/31/19 | $1,326,856 | $1,687,179 | $1,414,883 | $1,302,000 |
| 8/31/19 | $1,258,310 | $1,660,453 | $1,345,030 | $1,229,300 |
| 9/30/19 | $1,318,288 | $1,691,521 | $1,373,020 | $1,292,400 |
| 10/31/19 | $1,342,769 | $1,728,159 | $1,409,186 | $1,323,700 |
| 11/30/19 | $1,373,370 | $1,790,889 | $1,467,188 | $1,354,700 |
| 12/31/19 | $1,408,277 | $1,844,942 | $1,509,487 | $1,402,100 |
| 1/31/20 | $1,349,857 | $1,844,219 | $1,461,078 | $1,326,500 |
| 2/29/20 | $1,209,403 | $1,692,404 | $1,338,084 | $1,197,600 |
| 3/31/20 | $882,504 | $1,483,370 | $1,047,372 | $902,100 |
| 4/30/20 | $1,003,071 | $1,673,529 | $1,191,229 | $1,013,400 |
| 5/31/20 | $1,059,004 | $1,753,236 | $1,268,742 | $1,042,500 |
| 6/30/20 | $1,093,807 | $1,788,103 | $1,313,592 | $1,072,700 |
| 7/31/20 | $1,134,825 | $1,888,925 | $1,349,952 | $1,094,800 |
| 8/31/20 | $1,196,973 | $2,024,702 | $1,426,008 | $1,153,800 |
| 9/30/20 | $1,132,339 | $1,947,770 | $1,378,380 | $1,100,100 |
| 10/31/20 | $1,159,684 | $1,895,972 | $1,407,243 | $1,139,500 |
| 11/30/20 | $1,388,389 | $2,103,512 | $1,666,626 | $1,359,500 |
| 12/31/20 | $1,505,175 | $2,184,389 | $1,810,789 | $1,467,100 |
| 1/31/21 | $1,647,943 | $2,162,335 | $1,901,908 | $1,544,300 |
| 2/28/21 | $1,815,184 | $2,221,962 | $2,020,454 | $1,689,400 |
| 3/31/21 | $1,902,205 | $2,319,274 | $2,040,739 | $1,777,700 |
| 4/30/21 | $1,941,636 | $2,443,050 | $2,083,595 | $1,813,700 |
| 5/31/21 | $2,064,008 | $2,460,114 | $2,087,887 | $1,870,100 |
| 6/30/21 | $2,161,905 | $2,517,545 | $2,128,329 | $1,858,800 |
| 7/31/21 | $1,997,383 | $2,577,349 | $2,051,475 | $1,792,300 |
| 8/31/21 | $2,053,130 | $2,655,715 | $2,097,367 | $1,840,300 |
| 9/30/21 | $2,068,087 | $2,532,198 | $2,035,537 | $1,803,400 |
| 10/31/21 | $2,163,265 | $2,709,608 | $2,122,128 | $1,872,200 |
| 11/30/21 | $2,039,533 | $2,690,834 | $2,033,699 | $1,808,200 |
| 12/31/21 | $2,112,771 | $2,811,426 | $2,079,132 | $1,881,900 |
| 1/31/22 | $2,083,427 | $2,665,943 | $1,878,974 | $1,772,200 |
| 2/28/22 | $2,162,430 | $2,586,121 | $1,899,023 | $1,801,600 |
| 3/31/22 | $2,214,346 | $2,682,143 | $1,922,665 | $1,836,800 |
| 4/30/22 | $2,083,427 | $2,448,255 | $1,732,110 | $1,694,300 |
| 5/31/22 | $2,130,829 | $2,452,747 | $1,734,726 | $1,726,800 |
| 6/30/22 | $1,866,732 | $2,250,288 | $1,592,062 | $1,556,200 |
| 7/31/22 | $2,038,282 | $2,457,774 | $1,758,273 | $1,706,900 |
| 8/31/22 | $1,993,137 | $2,357,541 | $1,722,299 | $1,652,900 |
| 9/30/22 | $1,756,128 | $2,140,415 | $1,557,234 | $1,484,500 |
| 10/31/22 | $2,065,369 | $2,313,706 | $1,728,669 | $1,671,300 |
| 11/30/22 | $2,171,459 | $2,443,005 | $1,769,051 | $1,722,400 |
| 12/31/22 | $2,014,662 | $2,302,253 | $1,654,240 | $1,609,400 |
| 1/31/23 | $2,207,713 | $2,446,912 | $1,815,479 | $1,763,000 |
| 2/28/23 | $2,113,662 | $2,387,210 | $1,784,815 | $1,722,300 |
| 3/31/23 | $2,027,037 | $2,474,855 | $1,699,537 | $1,598,800 |
| 4/30/23 | $1,965,161 | $2,513,484 | $1,668,979 | $1,558,900 |
| 5/31/23 | $1,908,236 | $2,524,409 | $1,653,558 | $1,528,300 |
| 6/30/23 | $2,116,137 | $2,691,210 | $1,787,992 | $1,649,700 |
| 7/31/23 | $2,269,588 | $2,777,665 | $1,897,328 | $1,774,200 |
| 8/31/23 | $2,205,238 | $2,733,440 | $1,802,404 | $1,688,800 |
| 9/30/23 | $2,173,063 | $2,603,115 | $1,696,297 | $1,600,900 |
| 10/31/23 | $2,064,162 | $2,548,381 | $1,580,609 | $1,505,400 |
| 11/30/23 | $2,197,813 | $2,781,113 | $1,723,670 | $1,640,900 |
| 12/31/23 | $2,418,873 | $2,907,461 | $1,934,268 | $1,845,100 |
| 1/31/24 | $2,411,338 | $2,956,318 | $1,859,045 | $1,761,300 |
| 2/29/24 | $2,546,976 | $3,114,172 | $1,964,155 | $1,818,900 |
| 3/31/24 | $2,690,149 | $3,214,370 | $2,034,472 | $1,898,600 |
| 4/30/24 | $2,554,511 | $3,083,080 | $1,891,286 | $1,777,600 |
| 5/31/24 | $2,717,779 | $3,235,954 | $1,986,171 | $1,860,800 |
| 6/30/24 | $2,662,519 | $3,352,066 | $1,967,799 | $1,829,400 |
The table below shows the average annual total returns of the Fund, a regulatory index, and one or more supplemental index(es) for certain periods ended June 30, 2024.
Average Annual Total Returns (%)
| Class/Index Name | 1 Year | 5 Years | 10 Years |
|---|
| Institutional Class | 25.82% | 15.20% | 10.29% |
| S&P 500 Index | 24.56% | 15.05% | 12.86% |
Russell 2000® Index | 10.06% | 6.94% | 7.00% |
Russell 2000® Value Index | 10.90% | 7.07% | 6.23% |
All Fund returns are net of fees and expenses and include applicable fee waivers and/or expense limitations. Absent any applicable fee waivers and/or expense limitations, performance would have been lower and there can be no assurance that any such waivers or limitations will continue in the future.
Performance quoted represents past performance. Past performance is not a guarantee or a reliable indicator of future results.Current performance may be lower or higher than performance shown. Investment return and the principal value of an investment will fluctuate. Shares may be worth more or less than original cost when redeemed. Returns shown do not reflect the deduction of taxes that a shareholder would pay on Fund distributions or the redemption of Fund shares.Differences in the Fund’s performance versus an index and related attribution information with respect to particular categories of securities or individual positions may be attributable, in part, to differences in the pricing methodologies used by the Fund and the index. For performance current to the most recent month-end, visit www.pimco.com/literature or via 888.87.PIMCO (888.877.4626).
Key Fund StatisticsFootnote Reference* (as of the end of the reporting period)
| Total Net Assets | $1,186,677 |
| # of Portfolio Holdings | 189 |
| Portfolio Turnover Rate | 62% |
| Total Net Advisory Fees Paid During the Reporting Period | $2,893 |
| Footnote | Description |
Footnote* | Dollar amounts displayed in 000's |
What did the Fund invest in?
Sector Allocation (% of Net Assets)Footnote Reference*
| Consumer Staples | 24.4% |
| Industrials | 17.4% |
| Financials | 14.8% |
| Information Technology | 8.2% |
| Materials | 7.8% |
| Real Estate | 6.9% |
| Consumer Discretionary | 6.5% |
| Energy | 5.6% |
| Health Care | 4.5% |
| Communication Services | 2.8% |
| Short-Term Instruments | 1.5% |
| Utilities | 0.2% |
| Other Assets and Liabilities, Net | (0.6%) |
| Total | 100.0% |
| Footnote | Description |
Footnote* | % of Net Assets includes derivatives instruments, if any, valued at the value used for determining the Fund’s net asset value. The notional exposure of such derivatives investments therefore may be greater than what is depicted. |
For additional information about the Fund, including the Fund's prospectus, financial information, holdings and proxy voting information, please visit www.pimco.com/literature or contact 888.87.PIMCO (888.877.4626). For tax information about the Fund, please visit: https://www.pimco.com/tax.
Institutional Class: PMJIX
Annual Shareholder Report |
June 30, 2024
Annual Shareholder Report | June 30, 2024
This annual shareholder report contains important information about the PIMCO RAE US Small Fund (the "Fund") for the period of July 1, 2023 to June 30, 2024 (the "reporting period"). You can find additional information about the Fund at www.pimco.com/literature. You can also request this information by contacting us at 888.87.PIMCO (888.877.4626).
What were the Fund costs for the last year?
(based on a hypothetical $10,000 investment)
| Class Name | Cost of a $10,000 investment | Costs paid as a percentage of a $10,000 investment |
|---|
| I-2 | $68 | 0.60% |
How did the Fund perform during the reporting period and what affected its performance?
The following affected performance (on a gross basis) during the reporting period:
• Overweight exposure to, and security selection in, the consumer discretionary sector contributed to relative returns, as the sector and
the Fund’s holdings outperformed the Russell 2000® Value Index ("RUJ").
• Overweight exposure to, and security selection in, the industrials sector contributed to relative returns, as the sector and the Fund’s
holdings outperformed the RUJ.
• Security selection in the materials sector contributed to relative returns, as the Fund’s holdings outperformed the RUJ.
• Underweight exposure to the financials sector detracted from relative returns, as the sector outperformed the RUJ.
• Security selection in the healthcare sector detracted from relative returns, as the Fund’s holdings underperformed the RUJ.
• Overweight exposure to, and security selection in, the information technology sector detracted from relative returns, as the sector and
the Fund’s holdings underperformed the RUJ.
In addition to the Fund's performance, the tables in this section include performance of: (i) a broad-based securities market index (i.e., a regulatory index) and (ii) one or more supplemental index(es). Effective July 24, 2024, the Fund's regulatory index is the S&P 500 Index. The Fund's regulatory index is shown in connection with certain regulatory requirements to provide a broad measure of market performance.
The table below illustrates cumulative returns for the 10-year period ended June 30, 2024 or the life of the Fund, if shorter. Cumulative returns are based on a hypothetical initial investment equal to the greater of either $10,000 or the investment minimum applicable to the share class.
Cumulative Returns Based on $1,000,000 Investment
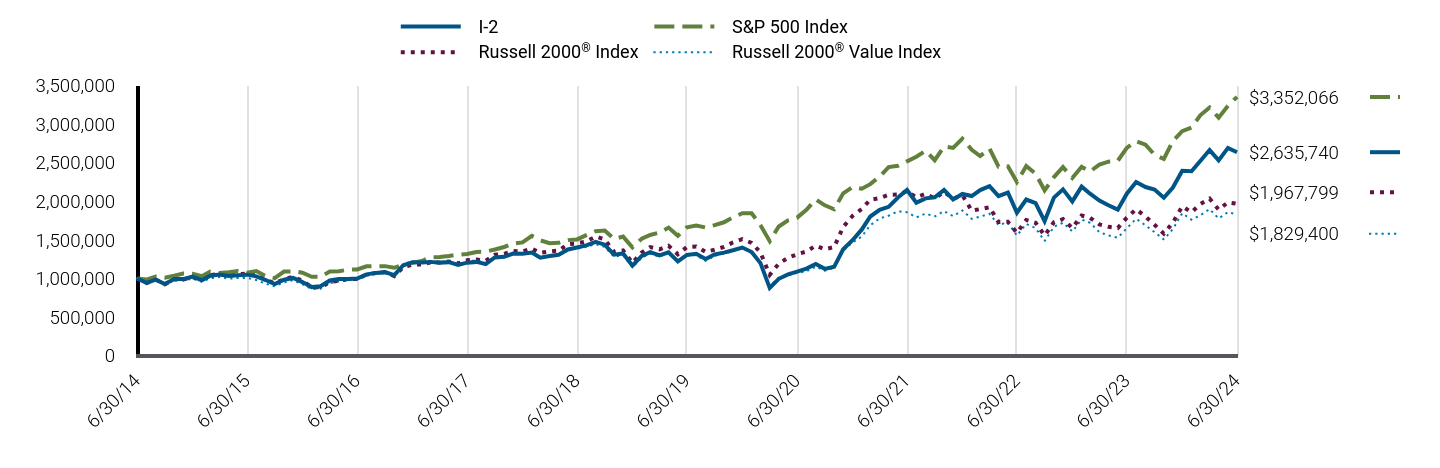
| I-2 | S&P 500 Index | Russell 2000® Index | Russell 2000® Value Index |
|---|
| 6/30/14 | $1,000,000 | $1,000,000 | $1,000,000 | $1,000,000 |
| 7/31/14 | $943,522 | $986,209 | $939,470 | $939,500 |
| 8/31/14 | $985,404 | $1,025,662 | $986,058 | $980,400 |
| 9/30/14 | $928,968 | $1,011,279 | $926,412 | $914,200 |
| 10/31/14 | $993,586 | $1,035,980 | $987,481 | $978,100 |
| 11/30/14 | $992,400 | $1,063,842 | $988,369 | $973,500 |
| 12/31/14 | $1,025,477 | $1,061,162 | $1,016,538 | $1,000,100 |
| 1/31/15 | $978,217 | $1,029,306 | $983,836 | $958,500 |
| 2/28/15 | $1,035,087 | $1,088,463 | $1,042,246 | $1,003,000 |
| 3/31/15 | $1,051,588 | $1,071,249 | $1,060,402 | $1,020,000 |
| 4/30/15 | $1,032,494 | $1,081,526 | $1,033,362 | $998,200 |
| 5/31/15 | $1,043,025 | $1,095,433 | $1,056,954 | $1,006,400 |
| 6/30/15 | $1,049,969 | $1,074,228 | $1,064,870 | $1,007,800 |
| 7/31/15 | $1,027,742 | $1,096,734 | $1,052,496 | $980,000 |
| 8/31/15 | $980,112 | $1,030,564 | $986,358 | $931,800 |
| 9/30/15 | $928,249 | $1,005,064 | $937,967 | $899,600 |
| 10/31/15 | $984,346 | $1,089,846 | $990,812 | $949,900 |
| 11/30/15 | $1,007,631 | $1,093,087 | $1,023,043 | $976,900 |
| 12/31/15 | $953,367 | $1,075,847 | $971,676 | $925,400 |
| 1/31/16 | $888,805 | $1,022,459 | $886,237 | $863,300 |
| 2/29/16 | $899,565 | $1,021,079 | $886,201 | $869,200 |
| 3/31/16 | $973,811 | $1,090,347 | $956,929 | $941,200 |
| 4/30/16 | $992,104 | $1,094,574 | $971,943 | $961,100 |
| 5/31/16 | $993,180 | $1,114,231 | $993,831 | $978,800 |
| 6/30/16 | $999,636 | $1,117,118 | $993,205 | $981,700 |
| 7/31/16 | $1,053,438 | $1,158,304 | $1,052,509 | $1,034,700 |
| 8/31/16 | $1,072,806 | $1,159,931 | $1,071,118 | $1,060,400 |
| 9/30/16 | $1,082,491 | $1,160,150 | $1,083,050 | $1,068,800 |
| 10/31/16 | $1,042,677 | $1,138,988 | $1,031,562 | $1,033,600 |
| 11/30/16 | $1,171,802 | $1,181,170 | $1,146,591 | $1,170,800 |
| 12/31/16 | $1,210,944 | $1,204,517 | $1,178,719 | $1,219,200 |
| 1/31/17 | $1,207,677 | $1,227,363 | $1,183,363 | $1,210,500 |
| 2/28/17 | $1,215,300 | $1,276,096 | $1,206,202 | $1,228,000 |
| 3/31/17 | $1,204,411 | $1,277,585 | $1,207,782 | $1,217,600 |
| 4/30/17 | $1,212,033 | $1,290,705 | $1,221,031 | $1,222,400 |
| 5/31/17 | $1,175,008 | $1,308,869 | $1,196,195 | $1,184,300 |
| 6/30/17 | $1,205,499 | $1,317,038 | $1,237,548 | $1,225,700 |
| 7/31/17 | $1,215,300 | $1,344,120 | $1,246,743 | $1,233,500 |
| 8/31/17 | $1,185,898 | $1,348,235 | $1,230,884 | $1,203,200 |
| 9/30/17 | $1,271,927 | $1,376,046 | $1,307,704 | $1,288,400 |
| 10/31/17 | $1,280,639 | $1,408,157 | $1,318,845 | $1,290,100 |
| 11/30/17 | $1,323,109 | $1,451,345 | $1,356,855 | $1,327,400 |
| 12/31/17 | $1,320,677 | $1,467,482 | $1,351,373 | $1,314,700 |
| 1/31/18 | $1,336,643 | $1,551,501 | $1,386,684 | $1,330,900 |
| 2/28/18 | $1,269,355 | $1,494,317 | $1,332,992 | $1,264,400 |
| 3/31/18 | $1,292,165 | $1,456,342 | $1,350,227 | $1,280,000 |
| 4/30/18 | $1,306,991 | $1,461,930 | $1,361,907 | $1,302,200 |
| 5/31/18 | $1,376,560 | $1,497,136 | $1,444,575 | $1,378,000 |
| 6/30/18 | $1,401,651 | $1,506,351 | $1,454,932 | $1,386,300 |
| 7/31/18 | $1,429,022 | $1,562,408 | $1,480,292 | $1,410,800 |
| 8/31/18 | $1,474,642 | $1,613,319 | $1,544,107 | $1,444,400 |
| 9/30/18 | $1,438,146 | $1,622,502 | $1,506,971 | $1,408,600 |
| 10/31/18 | $1,309,272 | $1,511,604 | $1,343,284 | $1,282,400 |
| 11/30/18 | $1,324,098 | $1,542,408 | $1,364,629 | $1,303,100 |
| 12/31/18 | $1,166,182 | $1,403,142 | $1,202,525 | $1,145,600 |
| 1/31/19 | $1,293,446 | $1,515,584 | $1,337,809 | $1,270,900 |
| 2/28/19 | $1,341,171 | $1,564,247 | $1,407,361 | $1,320,300 |
| 3/31/19 | $1,298,341 | $1,594,643 | $1,377,905 | $1,282,200 |
| 4/30/19 | $1,339,947 | $1,659,210 | $1,424,713 | $1,330,700 |
| 5/31/19 | $1,221,248 | $1,553,770 | $1,313,913 | $1,222,000 |
| 6/30/19 | $1,305,683 | $1,663,274 | $1,406,780 | $1,299,900 |
| 7/31/19 | $1,320,368 | $1,687,179 | $1,414,883 | $1,302,000 |
| 8/31/19 | $1,251,841 | $1,660,453 | $1,345,030 | $1,229,300 |
| 9/30/19 | $1,310,578 | $1,691,521 | $1,373,020 | $1,292,400 |
| 10/31/19 | $1,335,052 | $1,728,159 | $1,409,186 | $1,323,700 |
| 11/30/19 | $1,365,644 | $1,790,889 | $1,467,188 | $1,354,700 |
| 12/31/19 | $1,400,941 | $1,844,942 | $1,509,487 | $1,402,100 |
| 1/31/20 | $1,342,568 | $1,844,219 | $1,461,078 | $1,326,500 |
| 2/29/20 | $1,202,226 | $1,692,404 | $1,338,084 | $1,197,600 |
| 3/31/20 | $878,072 | $1,483,370 | $1,047,372 | $902,100 |
| 4/30/20 | $996,059 | $1,673,529 | $1,191,229 | $1,013,400 |
| 5/31/20 | $1,053,190 | $1,753,236 | $1,268,742 | $1,042,500 |
| 6/30/20 | $1,087,965 | $1,788,103 | $1,313,592 | $1,072,700 |
| 7/31/20 | $1,127,708 | $1,888,925 | $1,349,952 | $1,094,800 |
| 8/31/20 | $1,188,564 | $2,024,702 | $1,426,008 | $1,153,800 |
| 9/30/20 | $1,125,224 | $1,947,770 | $1,378,380 | $1,100,100 |
| 10/31/20 | $1,151,305 | $1,895,972 | $1,407,243 | $1,139,500 |
| 11/30/20 | $1,378,585 | $2,103,512 | $1,666,626 | $1,359,500 |
| 12/31/20 | $1,495,799 | $2,184,389 | $1,810,789 | $1,467,100 |
| 1/31/21 | $1,635,733 | $2,162,335 | $1,901,908 | $1,544,300 |
| 2/28/21 | $1,802,838 | $2,221,962 | $2,020,454 | $1,689,400 |
| 3/31/21 | $1,888,429 | $2,319,274 | $2,040,739 | $1,777,700 |
| 4/30/21 | $1,927,828 | $2,443,050 | $2,083,595 | $1,813,700 |
| 5/31/21 | $2,048,741 | $2,460,114 | $2,087,887 | $1,870,100 |
| 6/30/21 | $2,146,559 | $2,517,545 | $2,128,329 | $1,858,800 |
| 7/31/21 | $1,982,171 | $2,577,349 | $2,051,475 | $1,792,300 |
| 8/31/21 | $2,037,873 | $2,655,715 | $2,097,367 | $1,840,300 |
| 9/30/21 | $2,052,817 | $2,532,198 | $2,035,537 | $1,803,400 |
| 10/31/21 | $2,147,918 | $2,709,608 | $2,122,128 | $1,872,200 |
| 11/30/21 | $2,024,287 | $2,690,834 | $2,033,699 | $1,808,200 |
| 12/31/21 | $2,095,343 | $2,811,426 | $2,079,132 | $1,881,900 |
| 1/31/22 | $2,068,160 | $2,665,943 | $1,878,974 | $1,772,200 |
| 2/28/22 | $2,145,178 | $2,586,121 | $1,899,023 | $1,801,600 |
| 3/31/22 | $2,197,279 | $2,682,143 | $1,922,665 | $1,836,800 |
| 4/30/22 | $2,068,160 | $2,448,255 | $1,732,110 | $1,694,300 |
| 5/31/22 | $2,113,465 | $2,452,747 | $1,734,726 | $1,726,800 |
| 6/30/22 | $1,852,963 | $2,250,288 | $1,592,062 | $1,556,200 |
| 7/31/22 | $2,022,856 | $2,457,774 | $1,758,273 | $1,706,900 |
| 8/31/22 | $1,975,286 | $2,357,541 | $1,722,299 | $1,652,900 |
| 9/30/22 | $1,741,966 | $2,140,415 | $1,557,234 | $1,484,500 |
| 10/31/22 | $2,047,773 | $2,313,706 | $1,728,669 | $1,671,300 |
| 11/30/22 | $2,154,239 | $2,443,005 | $1,769,051 | $1,722,400 |
| 12/31/22 | $1,998,526 | $2,302,253 | $1,654,240 | $1,609,400 |
| 1/31/23 | $2,189,927 | $2,446,912 | $1,815,479 | $1,763,000 |
| 2/28/23 | $2,097,955 | $2,387,210 | $1,784,815 | $1,722,300 |
| 3/31/23 | $2,008,469 | $2,474,855 | $1,699,537 | $1,598,800 |
| 4/30/23 | $1,948,812 | $2,513,484 | $1,668,979 | $1,558,900 |
| 5/31/23 | $1,891,640 | $2,524,409 | $1,653,558 | $1,528,300 |
| 6/30/23 | $2,097,955 | $2,691,210 | $1,787,992 | $1,649,700 |
| 7/31/23 | $2,249,585 | $2,777,665 | $1,897,328 | $1,774,200 |
| 8/31/23 | $2,184,956 | $2,733,440 | $1,802,404 | $1,688,800 |
| 9/30/23 | $2,152,641 | $2,603,115 | $1,696,297 | $1,600,900 |
| 10/31/23 | $2,045,755 | $2,548,381 | $1,580,609 | $1,505,400 |
| 11/30/23 | $2,177,499 | $2,781,113 | $1,723,670 | $1,640,900 |
| 12/31/23 | $2,396,127 | $2,907,461 | $1,934,268 | $1,845,100 |
| 1/31/24 | $2,388,560 | $2,956,318 | $1,859,045 | $1,761,300 |
| 2/29/24 | $2,522,239 | $3,114,172 | $1,964,155 | $1,818,900 |
| 3/31/24 | $2,663,484 | $3,214,370 | $2,034,472 | $1,898,600 |
| 4/30/24 | $2,529,806 | $3,083,080 | $1,891,286 | $1,777,600 |
| 5/31/24 | $2,691,229 | $3,235,954 | $1,986,171 | $1,860,800 |
| 6/30/24 | $2,635,740 | $3,352,066 | $1,967,799 | $1,829,400 |
The table below shows the average annual total returns of the Fund, a regulatory index, and one or more supplemental index(es) for certain periods ended June 30, 2024.
Average Annual Total Returns (%)
| Class/Index Name | 1 Year | 5 Years | 10 Years |
|---|
| I-2 | 25.63% | 15.08% | 10.18% |
| S&P 500 Index | 24.56% | 15.05% | 12.86% |
Russell 2000® Index | 10.06% | 6.94% | 7.00% |
Russell 2000® Value Index | 10.90% | 7.07% | 6.23% |
All Fund returns are net of fees and expenses and include applicable fee waivers and/or expense limitations. Absent any applicable fee waivers and/or expense limitations, performance would have been lower and there can be no assurance that any such waivers or limitations will continue in the future.
Performance quoted represents past performance. Past performance is not a guarantee or a reliable indicator of future results.Current performance may be lower or higher than performance shown. Investment return and the principal value of an investment will fluctuate. Shares may be worth more or less than original cost when redeemed. Returns shown do not reflect the deduction of taxes that a shareholder would pay on Fund distributions or the redemption of Fund shares.Differences in the Fund’s performance versus an index and related attribution information with respect to particular categories of securities or individual positions may be attributable, in part, to differences in the pricing methodologies used by the Fund and the index. For performance current to the most recent month-end, visit www.pimco.com/literature or via 888.87.PIMCO (888.877.4626).
Key Fund StatisticsFootnote Reference* (as of the end of the reporting period)
| Total Net Assets | $1,186,677 |
| # of Portfolio Holdings | 189 |
| Portfolio Turnover Rate | 62% |
| Total Net Advisory Fees Paid During the Reporting Period | $2,893 |
| Footnote | Description |
Footnote* | Dollar amounts displayed in 000's |
What did the Fund invest in?
Sector Allocation (% of Net Assets)Footnote Reference*
| Consumer Staples | 24.4% |
| Industrials | 17.4% |
| Financials | 14.8% |
| Information Technology | 8.2% |
| Materials | 7.8% |
| Real Estate | 6.9% |
| Consumer Discretionary | 6.5% |
| Energy | 5.6% |
| Health Care | 4.5% |
| Communication Services | 2.8% |
| Short-Term Instruments | 1.5% |
| Utilities | 0.2% |
| Other Assets and Liabilities, Net | (0.6%) |
| Total | 100.0% |
| Footnote | Description |
Footnote* | % of Net Assets includes derivatives instruments, if any, valued at the value used for determining the Fund’s net asset value. The notional exposure of such derivatives investments therefore may be greater than what is depicted. |
For additional information about the Fund, including the Fund's prospectus, financial information, holdings and proxy voting information, please visit www.pimco.com/literature or contact 888.87.PIMCO (888.877.4626). For tax information about the Fund, please visit: https://www.pimco.com/tax.
Annual Shareholder Report |
June 30, 2024
PIMCO RAFI Dynamic Multi-Factor Emerging Markets Equity ETF
MFEM | Principal Listing Exchange: NYSE Arca
Annual Shareholder Report | June 30, 2024
This annual shareholder report contains important information about the PIMCO RAFI Dynamic Multi-Factor Emerging Markets Equity ETF (the "Fund") for the period of July 1, 2023 to June 30, 2024 (the "reporting period"). You can find additional information about the Fund at www.pimco.com/literature. You can also request this information by contacting us at 888.400.4ETF (888.400.4383).
What were the Fund costs for the last year?
(based on a hypothetical $10,000 investment)
| Fund Name | Cost of a $10,000 investment | Costs paid as a percentage of a $10,000 investment |
|---|
| PIMCO RAFI Dynamic Multi-Factor Emerging Markets Equity ETF | $50 | 0.50% |
How did the Fund perform during the reporting period and what affected its performance?
The following affected performance (on a gross basis) during the reporting period:
• Security selection in financials contributed to relative returns, as the Fund’s holdings outperformed the MSCI Emerging Markets Index.
• Underweight exposure to, and security selection in, consumer discretionary contributed to relative returns, as the sector
underperformed the MSCI Emerging Markets Index and the Fund’s holdings outperformed the MSCI Emerging Markets Index.
• Overweight exposure to, and security selection in, utilities contributed to relative returns, as the sector and the Fund’s holdings
outperformed the MSCI Emerging Markets Index.
• Overweight exposure to, and security selection in, real estate detracted from relative returns, as the sector and Fund’s holdings
underperformed the MSCI Emerging Markets Index.
• Underweight exposure to, and security selection in, information technology detracted from relative returns, as the sector outperformed
the MSCI Emerging Markets Index and the Fund’s holdings underperformed the MSCI Emerging Markets Index.
In addition to the Fund's performance, the tables in this section include performance of: (i) a broad-based securities market index (i.e., a regulatory index) and (ii) one or more supplemental index(es). Effective July 24, 2024, the Fund's regulatory index is the MSCI Emerging Markets Index. The Fund's regulatory index is shown in connection with certain regulatory requirements to provide a broad measure of market performance.
The table below illustrates cumulative returns for the 10-year period ended June 30, 2024 or the life of the Fund, if shorter. Cumulative returns are based on a hypothetical initial investment equal to the greater of either $10,000 or the investment minimum applicable to the share class.
Cumulative Returns Based on $10,000 Investment
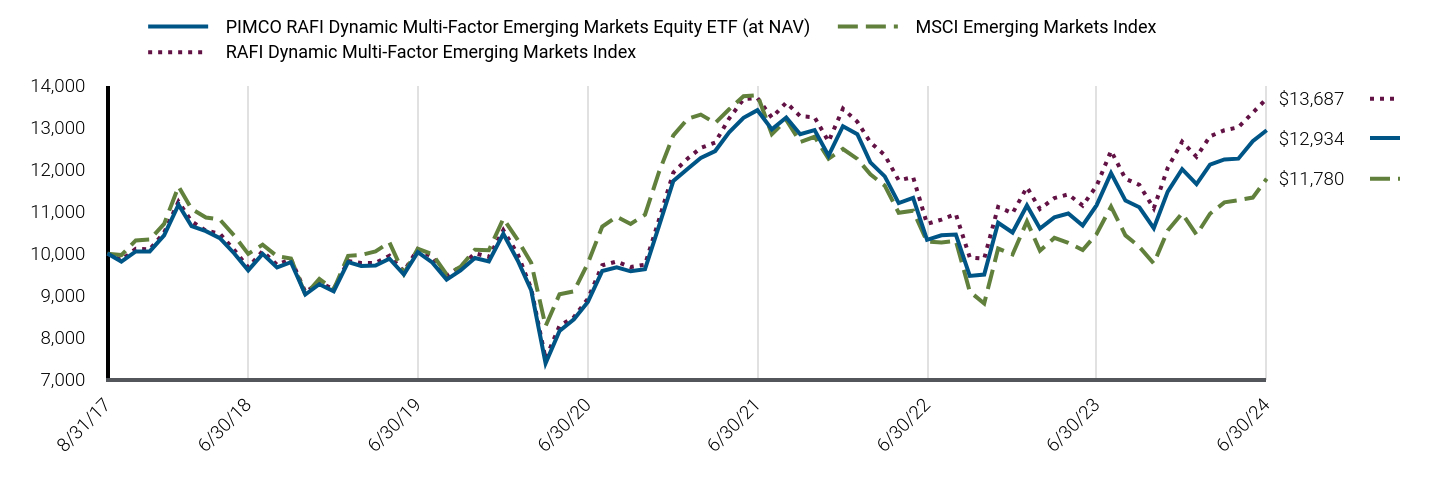
| PIMCO RAFI Dynamic Multi-Factor Emerging Markets Equity ETF (at NAV) | MSCI Emerging Markets Index | RAFI Dynamic Multi-Factor Emerging Markets Index |
|---|
| 8/31/17 | $10,000 | $10,000 | $10,000 |
| 9/30/17 | $9,812 | $9,965 | $9,847 |
| 10/31/17 | $10,052 | $10,314 | $10,116 |
| 11/30/17 | $10,052 | $10,335 | $10,099 |
| 12/31/17 | $10,434 | $10,706 | $10,502 |
| 1/31/18 | $11,163 | $11,598 | $11,235 |
| 2/28/18 | $10,654 | $11,063 | $10,767 |
| 3/31/18 | $10,534 | $10,858 | $10,547 |
| 4/30/18 | $10,367 | $10,810 | $10,476 |
| 5/31/18 | $10,003 | $10,427 | $10,085 |
| 6/30/18 | $9,601 | $9,993 | $9,673 |
| 7/31/18 | $9,993 | $10,213 | $10,059 |
| 8/31/18 | $9,670 | $9,937 | $9,735 |
| 9/30/18 | $9,795 | $9,884 | $9,870 |
| 10/31/18 | $9,027 | $9,023 | $9,083 |
| 11/30/18 | $9,271 | $9,395 | $9,315 |
| 12/31/18 | $9,105 | $9,146 | $9,156 |
| 1/31/19 | $9,798 | $9,947 | $9,824 |
| 2/28/19 | $9,707 | $9,969 | $9,775 |
| 3/31/19 | $9,716 | $10,053 | $9,778 |
| 4/30/19 | $9,879 | $10,265 | $9,950 |
| 5/31/19 | $9,502 | $9,520 | $9,578 |
| 6/30/19 | $10,036 | $10,114 | $10,107 |
| 7/31/19 | $9,790 | $9,990 | $9,922 |
| 8/31/19 | $9,382 | $9,503 | $9,472 |
| 9/30/19 | $9,598 | $9,685 | $9,689 |
| 10/31/19 | $9,897 | $10,093 | $10,006 |
| 11/30/19 | $9,814 | $10,079 | $9,921 |
| 12/31/19 | $10,470 | $10,831 | $10,559 |
| 1/31/20 | $9,836 | $10,326 | $9,990 |
| 2/29/20 | $9,130 | $9,782 | $9,167 |
| 3/31/20 | $7,393 | $8,275 | $7,497 |
| 4/30/20 | $8,158 | $9,033 | $8,281 |
| 5/31/20 | $8,438 | $9,102 | $8,489 |
| 6/30/20 | $8,850 | $9,771 | $8,926 |
| 7/31/20 | $9,587 | $10,645 | $9,723 |
| 8/31/20 | $9,673 | $10,880 | $9,812 |
| 9/30/20 | $9,579 | $10,705 | $9,680 |
| 10/31/20 | $9,630 | $10,926 | $9,738 |
| 11/30/20 | $10,654 | $11,936 | $10,803 |
| 12/31/20 | $11,728 | $12,814 | $11,929 |
| 1/31/21 | $12,017 | $13,207 | $12,264 |
| 2/28/21 | $12,276 | $13,308 | $12,514 |
| 3/31/21 | $12,440 | $13,107 | $12,643 |
| 4/30/21 | $12,885 | $13,433 | $13,213 |
| 5/31/21 | $13,230 | $13,745 | $13,675 |
| 6/30/21 | $13,412 | $13,768 | $13,699 |
| 7/31/21 | $12,956 | $12,842 | $13,235 |
| 8/31/21 | $13,238 | $13,178 | $13,594 |
| 9/30/21 | $12,839 | $12,654 | $13,269 |
| 10/31/21 | $12,940 | $12,779 | $13,243 |
| 11/30/21 | $12,332 | $12,258 | $12,667 |
| 12/31/21 | $13,032 | $12,488 | $13,447 |
| 1/31/22 | $12,842 | $12,252 | $13,135 |
| 2/28/22 | $12,169 | $11,886 | $12,649 |
| 3/31/22 | $11,838 | $11,617 | $12,341 |
| 4/30/22 | $11,201 | $10,971 | $11,744 |
| 5/31/22 | $11,325 | $11,019 | $11,821 |
| 6/30/22 | $10,327 | $10,287 | $10,705 |
| 7/31/22 | $10,436 | $10,262 | $10,810 |
| 8/31/22 | $10,453 | $10,305 | $10,942 |
| 9/30/22 | $9,468 | $9,097 | $9,907 |
| 10/31/22 | $9,501 | $8,814 | $9,880 |
| 11/30/22 | $10,734 | $10,121 | $11,111 |
| 12/31/22 | $10,502 | $9,979 | $10,961 |
| 1/31/23 | $11,145 | $10,767 | $11,578 |
| 2/28/23 | $10,598 | $10,069 | $11,061 |
| 3/31/23 | $10,863 | $10,374 | $11,321 |
| 4/30/23 | $10,953 | $10,256 | $11,410 |
| 5/31/23 | $10,669 | $10,084 | $11,142 |
| 6/30/23 | $11,152 | $10,467 | $11,613 |
| 7/31/23 | $11,916 | $11,119 | $12,445 |
| 8/31/23 | $11,261 | $10,434 | $11,781 |
| 9/30/23 | $11,102 | $10,161 | $11,634 |
| 10/31/23 | $10,605 | $9,766 | $11,077 |
| 11/30/23 | $11,475 | $10,548 | $12,042 |
| 12/31/23 | $12,009 | $10,960 | $12,662 |
| 1/31/24 | $11,652 | $10,451 | $12,305 |
| 2/29/24 | $12,115 | $10,948 | $12,791 |
| 3/31/24 | $12,240 | $11,219 | $12,934 |
| 4/30/24 | $12,259 | $11,270 | $13,006 |
| 5/31/24 | $12,675 | $11,333 | $13,351 |
| 6/30/24 | $12,934 | $11,780 | $13,687 |
The table below shows the average annual total returns of the Fund, a regulatory index, and one or more supplemental index(es) for certain periods ended June 30, 2024.
Average Annual Total Returns (%)
| Fund/Index Name | 1 Year | 5 Years | Since Inception 8/31/17 |
|---|
| PIMCO RAFI Dynamic Multi-Factor Emerging Markets Equity ETF (at NAV) | 15.97% | 5.20% | 3.84% |
| PIMCO RAFI Dynamic Multi-Factor Emerging Markets Equity ETF (at Market Price) | 14.75% | 5.23% | 3.79% |
| MSCI Emerging Markets Index | 12.55% | 3.10% | 2.43% |
| RAFI Dynamic Multi-Factor Emerging Markets Index | 17.86% | 6.25% | 4.70% |
All Fund returns are net of fees and expenses and include applicable fee waivers and/or expense limitations. Absent any applicable fee waivers and/or expense limitations, performance would have been lower and there can be no assurance that any such waivers or limitations will continue in the future.
Performance quoted represents past performance. Past performance is not a guarantee or a reliable indicator of future results.Current performance may be lower or higher than performance shown. Investment return and the principal value of an investment will fluctuate. Shares may be worth more or less than original cost when redeemed. Returns shown do not reflect the deduction of taxes that a shareholder would pay on Fund distributions or the redemption of Fund shares.Differences in the Fund’s performance versus an index and related attribution information with respect to particular categories of securities or individual positions may be attributable, in part, to differences in the pricing methodologies used by the Fund and the index. For performance current to the most recent month-end, visit www.pimco.com/literature or via 888.400.4ETF (888.400.4383).
Key Fund StatisticsFootnote Reference* (as of the end of the reporting period)
| Total Net Assets | $105,002 |
| # of Portfolio Holdings | 776 |
| Portfolio Turnover Rate | 39% |
| Total Net Management Fees Paid During the Reporting Period | $450 |
| Footnote | Description |
Footnote* | Dollar amounts displayed in 000's |
What did the Fund invest in?
Geographic Breakdown (% of Net Assets)Footnote Reference*
| Footnote | Description |
Footnote* | % of Net Assets includes derivatives instruments, if any, valued at the value used for determining the Fund's net asset value. The notional exposure of such derivatives investments therefore may be greater than what is depicted. |
| China | 25.0% |
| Taiwan | 20.7% |
| India | 16.8% |
| South Korea | 13.1% |
| Brazil | 5.4% |
| South Africa | 2.8% |
| Thailand | 2.3% |
| Saudi Arabia | 2.0% |
| Malaysia | 1.8% |
| Hong Kong | 1.8% |
| Mexico | 1.6% |
| Turkey | 1.5% |
| Indonesia | 0.9% |
| Poland | 0.8% |
| Other Countries | 3.5% |
| Other Assets and Liabilities, Net | 0.0% |
| Total | 100.0% |
For additional information about the Fund, including the Fund's prospectus, financial information, holdings and proxy voting information, please visit www.pimco.com/literature or contact 888.400.4ETF (888.400.4383). For tax information about the Fund, please visit: https://www.pimco.com/tax.
PIMCO RAFI Dynamic Multi-Factor Emerging Markets Equity ETF
Annual Shareholder Report |
June 30, 2024
MFEM | Principal Listing Exchange: NYSE Arca
PIMCO RAFI Dynamic Multi-Factor International Equity ETF
MFDX | Principal Listing Exchange: NYSE Arca
Annual Shareholder Report | June 30, 2024
This annual shareholder report contains important information about the PIMCO RAFI Dynamic Multi-Factor International Equity ETF (the "Fund") for the period of July 1, 2023 to June 30, 2024 (the "reporting period"). You can find additional information about the Fund at www.pimco.com/literature. You can also request this information by contacting us at 888.400.4ETF (888.400.4383).
What were the Fund costs for the last year?
(based on a hypothetical $10,000 investment)
| Fund Name | Cost of a $10,000 investment | Costs paid as a percentage of a $10,000 investment |
|---|
| PIMCO RAFI Dynamic Multi-Factor International Equity ETF | $39 | 0.39% |
How did the Fund perform during the reporting period and what affected its performance?
The following affected performance (on a gross basis) during the reporting period:
• Security selection in consumer staples contributed to relative returns, as the Fund’s holdings outperformed the MSCI EAFE Index.
• Overweight exposure to, and security selection in, industrials contributed to relative returns, as the sector and the Fund’s holdings
outperformed the MSCI EAFE Index.
• Security selection in consumer discretionary contributed to relative returns, as the Fund’s holdings outperformed the MSCI EAFE
Index.
• Overweight exposure to, and security selection in, materials detracted from relative returns, as the sector and the Fund’s holdings
underperformed the MSCI EAFE Index.
• Security selection in communication services detracted from relative returns, as the Fund’s holdings underperformed the MSCI EAFE
Index.
• Underweight exposure to financials detracted from relative returns, as the sector outperformed the MSCI EAFE Index.
In addition to the Fund's performance, the tables in this section include performance of: (i) a broad-based securities market index (i.e., a regulatory index) and (ii) one or more supplemental index(es). Effective July 24, 2024, the Fund's regulatory index is the MSCI EAFE Index. The Fund's regulatory index is shown in connection with certain regulatory requirements to provide a broad measure of market performance.
The table below illustrates cumulative returns for the 10-year period ended June 30, 2024 or the life of the Fund, if shorter. Cumulative returns are based on a hypothetical initial investment equal to the greater of either $10,000 or the investment minimum applicable to the share class.
Cumulative Returns Based on $10,000 Investment
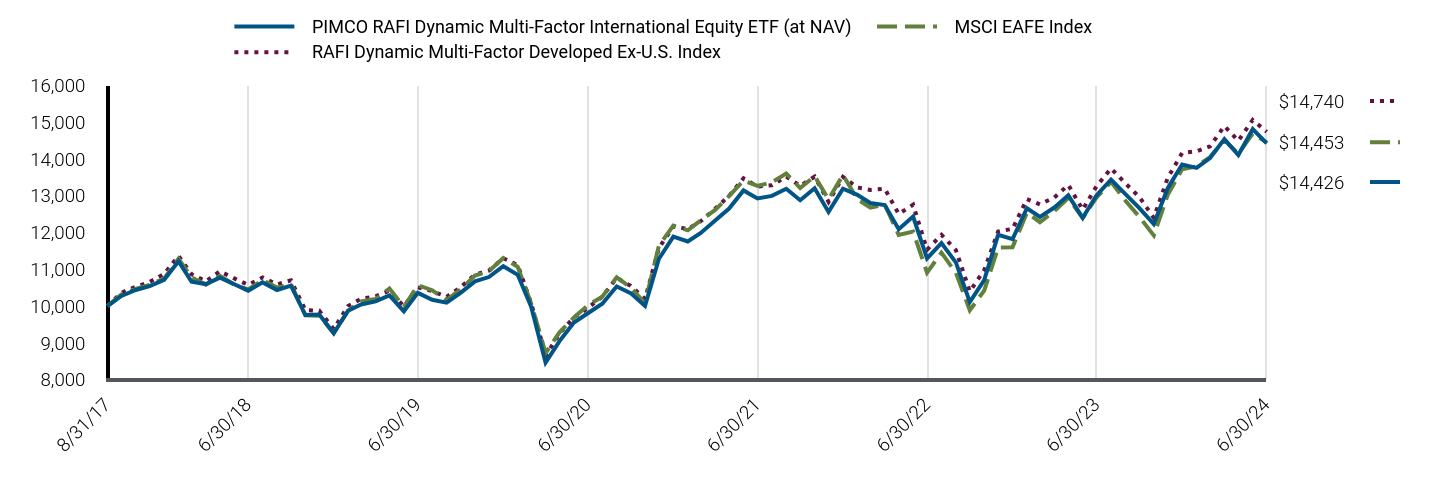
| PIMCO RAFI Dynamic Multi-Factor International Equity ETF (at NAV) | MSCI EAFE Index | RAFI Dynamic Multi-Factor Developed Ex-U.S. Index |
|---|
| 8/31/17 | $10,000 | $10,000 | $10,000 |
| 9/30/17 | $10,276 | $10,314 | $10,364 |
| 10/31/17 | $10,440 | $10,470 | $10,528 |
| 11/30/17 | $10,544 | $10,580 | $10,659 |
| 12/31/17 | $10,716 | $10,750 | $10,873 |
| 1/31/18 | $11,220 | $11,289 | $11,368 |
| 2/28/18 | $10,664 | $10,779 | $10,867 |
| 3/31/18 | $10,600 | $10,585 | $10,674 |
| 4/30/18 | $10,777 | $10,827 | $10,950 |
| 5/31/18 | $10,596 | $10,584 | $10,754 |
| 6/30/18 | $10,422 | $10,454 | $10,580 |
| 7/31/18 | $10,647 | $10,712 | $10,781 |
| 8/31/18 | $10,440 | $10,505 | $10,591 |
| 9/30/18 | $10,558 | $10,596 | $10,702 |
| 10/31/18 | $9,759 | $9,753 | $9,892 |
| 11/30/18 | $9,772 | $9,740 | $9,874 |
| 12/31/18 | $9,263 | $9,267 | $9,380 |
| 1/31/19 | $9,876 | $9,876 | $10,005 |
| 2/28/19 | $10,045 | $10,128 | $10,199 |
| 3/31/19 | $10,128 | $10,192 | $10,267 |
| 4/30/19 | $10,294 | $10,479 | $10,419 |
| 5/31/19 | $9,858 | $9,975 | $9,997 |
| 6/30/19 | $10,361 | $10,567 | $10,513 |
| 7/31/19 | $10,172 | $10,433 | $10,409 |
| 8/31/19 | $10,096 | $10,163 | $10,253 |
| 9/30/19 | $10,360 | $10,454 | $10,514 |
| 10/31/19 | $10,673 | $10,830 | $10,858 |
| 11/30/19 | $10,791 | $10,952 | $10,966 |
| 12/31/19 | $11,087 | $11,308 | $11,303 |
| 1/31/20 | $10,852 | $11,071 | $11,115 |
| 2/29/20 | $9,982 | $10,071 | $10,082 |
| 3/31/20 | $8,468 | $8,726 | $8,646 |
| 4/30/20 | $9,049 | $9,290 | $9,260 |
| 5/31/20 | $9,555 | $9,695 | $9,695 |
| 6/30/20 | $9,808 | $10,025 | $9,951 |
| 7/31/20 | $10,067 | $10,259 | $10,256 |
| 8/31/20 | $10,533 | $10,786 | $10,766 |
| 9/30/20 | $10,356 | $10,506 | $10,554 |
| 10/31/20 | $10,006 | $10,086 | $10,196 |
| 11/30/20 | $11,289 | $11,650 | $11,583 |
| 12/31/20 | $11,889 | $12,191 | $12,166 |
| 1/31/21 | $11,758 | $12,061 | $12,097 |
| 2/28/21 | $11,989 | $12,332 | $12,309 |
| 3/31/21 | $12,327 | $12,616 | $12,650 |
| 4/30/21 | $12,654 | $12,995 | $12,999 |
| 5/31/21 | $13,146 | $13,419 | $13,478 |
| 6/30/21 | $12,928 | $13,268 | $13,251 |
| 7/31/21 | $12,998 | $13,368 | $13,287 |
| 8/31/21 | $13,192 | $13,604 | $13,523 |
| 9/30/21 | $12,880 | $13,209 | $13,271 |
| 10/31/21 | $13,206 | $13,534 | $13,520 |
| 11/30/21 | $12,562 | $12,904 | $12,836 |
| 12/31/21 | $13,193 | $13,565 | $13,515 |
| 1/31/22 | $13,028 | $12,909 | $13,226 |
| 2/28/22 | $12,804 | $12,681 | $13,161 |
| 3/31/22 | $12,750 | $12,762 | $13,194 |
| 4/30/22 | $12,094 | $11,937 | $12,506 |
| 5/31/22 | $12,436 | $12,026 | $12,758 |
| 6/30/22 | $11,299 | $10,910 | $11,538 |
| 7/31/22 | $11,713 | $11,454 | $11,939 |
| 8/31/22 | $11,190 | $10,910 | $11,528 |
| 9/30/22 | $10,113 | $9,889 | $10,400 |
| 10/31/22 | $10,710 | $10,421 | $10,979 |
| 11/30/22 | $11,939 | $11,595 | $12,032 |
| 12/31/22 | $11,824 | $11,604 | $12,100 |
| 1/31/23 | $12,663 | $12,544 | $12,912 |
| 2/28/23 | $12,428 | $12,282 | $12,768 |
| 3/31/23 | $12,681 | $12,587 | $12,955 |
| 4/30/23 | $13,014 | $12,942 | $13,294 |
| 5/31/23 | $12,402 | $12,394 | $12,624 |
| 6/30/23 | $13,019 | $12,958 | $13,264 |
| 7/31/23 | $13,441 | $13,378 | $13,745 |
| 8/31/23 | $13,047 | $12,865 | $13,338 |
| 9/30/23 | $12,667 | $12,426 | $12,966 |
| 10/31/23 | $12,233 | $11,922 | $12,401 |
| 11/30/23 | $13,207 | $13,028 | $13,487 |
| 12/31/23 | $13,851 | $13,721 | $14,163 |
| 1/31/24 | $13,760 | $13,800 | $14,210 |
| 2/29/24 | $14,027 | $14,052 | $14,343 |
| 3/31/24 | $14,541 | $14,514 | $14,897 |
| 4/30/24 | $14,111 | $14,143 | $14,498 |
| 5/31/24 | $14,814 | $14,690 | $15,062 |
| 6/30/24 | $14,426 | $14,453 | $14,740 |
The table below shows the average annual total returns of the Fund, a regulatory index, and one or more supplemental index(es) for certain periods ended June 30, 2024.
Average Annual Total Returns (%)
| Fund/Index Name | 1 Year | 5 Years | Since Inception 8/31/17 |
|---|
| PIMCO RAFI Dynamic Multi-Factor International Equity ETF (at NAV) | 10.81% | 6.85% | 5.51% |
| PIMCO RAFI Dynamic Multi-Factor International Equity ETF (at Market Price) | 10.82% | 6.90% | 5.47% |
| MSCI EAFE Index | 11.54% | 6.46% | 5.54% |
| RAFI Dynamic Multi-Factor Developed Ex-U.S. Index | 11.13% | 6.99% | 5.84% |
All Fund returns are net of fees and expenses and include applicable fee waivers and/or expense limitations. Absent any applicable fee waivers and/or expense limitations, performance would have been lower and there can be no assurance that any such waivers or limitations will continue in the future.
Performance quoted represents past performance. Past performance is not a guarantee or a reliable indicator of future results.Current performance may be lower or higher than performance shown. Investment return and the principal value of an investment will fluctuate. Shares may be worth more or less than original cost when redeemed. Returns shown do not reflect the deduction of taxes that a shareholder would pay on Fund distributions or the redemption of Fund shares.Differences in the Fund’s performance versus an index and related attribution information with respect to particular categories of securities or individual positions may be attributable, in part, to differences in the pricing methodologies used by the Fund and the index. For performance current to the most recent month-end, visit www.pimco.com/literature or via 888.400.4ETF (888.400.4383).
Key Fund StatisticsFootnote Reference* (as of the end of the reporting period)
| Total Net Assets | $253,544 |
| # of Portfolio Holdings | 1,185 |
| Portfolio Turnover Rate | 29% |
| Total Net Management Fees Paid During the Reporting Period | $779 |
| Footnote | Description |
Footnote* | Dollar amounts displayed in 000's |
What did the Fund invest in?
Geographic Breakdown (% of Net Assets)Footnote Reference*
| Footnote | Description |
Footnote* | % of Net Assets includes derivatives instruments, if any, valued at the value used for determining the Fund's net asset value. The notional exposure of such derivatives investments therefore may be greater than what is depicted. |
| Japan | 23.7% |
| United Kingdom | 14.7% |
| Canada | 8.0% |
| France | 7.7% |
| Switzerland | 7.3% |
| Germany | 6.6% |
| Australia | 5.1% |
| Netherlands | 4.6% |
| Spain | 3.8% |
| Italy | 3.2% |
| Sweden | 2.8% |
| Denmark | 2.6% |
| Singapore | 1.5% |
| Ireland | 1.3% |
| Other Countries | 6.6% |
| Other Assets and Liabilities, Net | 0.5% |
| Total | 100.0% |
For additional information about the Fund, including the Fund's prospectus, financial information, holdings and proxy voting information, please visit www.pimco.com/literature or contact 888.400.4ETF (888.400.4383). For tax information about the Fund, please visit: https://www.pimco.com/tax.
PIMCO RAFI Dynamic Multi-Factor International Equity ETF
Annual Shareholder Report |
June 30, 2024
MFDX | Principal Listing Exchange: NYSE Arca
PIMCO RAFI Dynamic Multi-Factor U.S. Equity ETF
MFUS | Principal Listing Exchange: NYSE Arca
Annual Shareholder Report | June 30, 2024
This annual shareholder report contains important information about the PIMCO RAFI Dynamic Multi-Factor U.S. Equity ETF (the "Fund") for the period of July 1, 2023 to June 30, 2024 (the "reporting period"). You can find additional information about the Fund at www.pimco.com/literature. You can also request this information by contacting us at 888.400.4ETF (888.400.4383).
What were the Fund costs for the last year?
(based on a hypothetical $10,000 investment)
| Fund Name | Cost of a $10,000 investment | Costs paid as a percentage of a $10,000 investment |
|---|
| PIMCO RAFI Dynamic Multi-Factor U.S. Equity ETF | $29 | 0.29% |
How did the Fund perform during the reporting period and what affected its performance?
The following affected performance (on a gross basis) during the reporting period:
• Security selection in healthcare contributed to relative returns, as the Fund’s holdings outperformed the S&P 500 Index ("S&P 500").
• Overweight exposure to, and security selection in, energy contributed to relative returns, as the sector and the Fund’s holdings
outperformed the S&P 500.
• Underweight exposure to, and security selection in, utilities contributed to relative returns, as the sector underperformed the S&P 500
and the Fund’s holdings outperformed the S&P 500.
• Underweight exposure to, and security selection in, information technology detracted from relative returns, as the sector outperformed
the S&P 500 and the Fund’s holdings underperformed the S&P 500.
• Overweight exposure to consumer staples detracted from relative returns, as the sector underperformed the S&P 500.
• Underweight exposure to, and security selection in, communication services detracted from relative returns, as the sector
outperformed the S&P 500 and the Fund’s holdings underperformed the S&P 500.
In addition to the Fund's performance, the tables in this section include performance of: (i) a broad-based securities market index (i.e., a regulatory index) and (ii) one or more supplemental index(es). Effective July 24, 2024, the Fund's regulatory index is the S&P 500 Index. The Fund's regulatory index is shown in connection with certain regulatory requirements to provide a broad measure of market performance.
The table below illustrates cumulative returns for the 10-year period ended June 30, 2024 or the life of the Fund, if shorter. Cumulative returns are based on a hypothetical initial investment equal to the greater of either $10,000 or the investment minimum applicable to the share class.
Cumulative Returns Based on $10,000 Investment
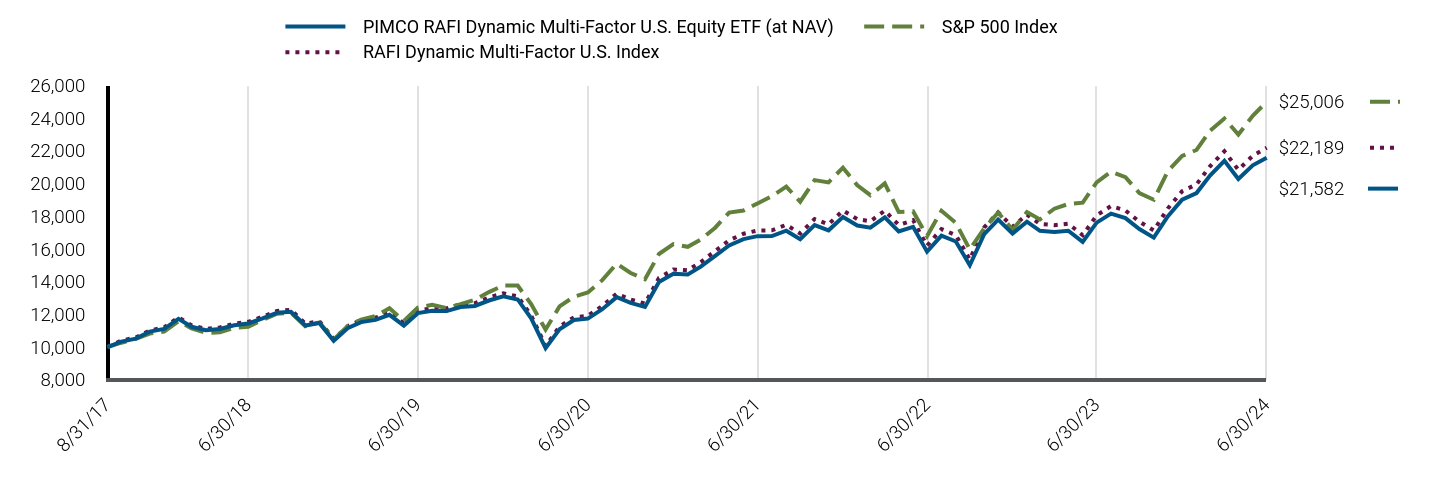
| PIMCO RAFI Dynamic Multi-Factor U.S. Equity ETF (at NAV) | S&P 500 Index | RAFI Dynamic Multi-Factor U.S. Index |
|---|
| 8/31/17 | $10,000 | $10,000 | $10,000 |
| 9/30/17 | $10,332 | $10,265 | $10,392 |
| 10/31/17 | $10,516 | $10,505 | $10,580 |
| 11/30/17 | $10,940 | $10,827 | $11,013 |
| 12/31/17 | $11,111 | $10,947 | $11,194 |
| 1/31/18 | $11,721 | $11,574 | $11,810 |
| 2/28/18 | $11,240 | $11,147 | $11,328 |
| 3/31/18 | $11,030 | $10,864 | $11,114 |
| 4/30/18 | $11,103 | $10,906 | $11,196 |
| 5/31/18 | $11,334 | $11,168 | $11,431 |
| 6/30/18 | $11,443 | $11,237 | $11,544 |
| 7/31/18 | $11,746 | $11,655 | $11,855 |
| 8/31/18 | $12,092 | $12,035 | $12,209 |
| 9/30/18 | $12,153 | $12,104 | $12,274 |
| 10/31/18 | $11,317 | $11,276 | $11,428 |
| 11/30/18 | $11,472 | $11,506 | $11,587 |
| 12/31/18 | $10,379 | $10,467 | $10,487 |
| 1/31/19 | $11,174 | $11,306 | $11,293 |
| 2/28/19 | $11,524 | $11,669 | $11,649 |
| 3/31/19 | $11,660 | $11,896 | $11,795 |
| 4/30/19 | $11,969 | $12,377 | $12,111 |
| 5/31/19 | $11,312 | $11,591 | $11,449 |
| 6/30/19 | $12,073 | $12,408 | $12,225 |
| 7/31/19 | $12,222 | $12,586 | $12,380 |
| 8/31/19 | $12,201 | $12,387 | $12,360 |
| 9/30/19 | $12,450 | $12,619 | $12,618 |
| 10/31/19 | $12,513 | $12,892 | $12,683 |
| 11/30/19 | $12,845 | $13,360 | $13,027 |
| 12/31/19 | $13,103 | $13,763 | $13,291 |
| 1/31/20 | $12,910 | $13,758 | $13,099 |
| 2/29/20 | $11,756 | $12,625 | $11,928 |
| 3/31/20 | $9,929 | $11,066 | $10,062 |
| 4/30/20 | $11,083 | $12,484 | $11,246 |
| 5/31/20 | $11,650 | $13,079 | $11,820 |
| 6/30/20 | $11,739 | $13,339 | $11,913 |
| 7/31/20 | $12,314 | $14,091 | $12,506 |
| 8/31/20 | $13,051 | $15,104 | $13,264 |
| 9/30/20 | $12,698 | $14,530 | $12,905 |
| 10/31/20 | $12,450 | $14,144 | $12,660 |
| 11/30/20 | $13,982 | $15,692 | $14,225 |
| 12/31/20 | $14,485 | $16,295 | $14,747 |
| 1/31/21 | $14,434 | $16,131 | $14,697 |
| 2/28/21 | $14,918 | $16,576 | $15,197 |
| 3/31/21 | $15,579 | $17,301 | $15,875 |
| 4/30/21 | $16,211 | $18,225 | $16,526 |
| 5/31/21 | $16,598 | $18,352 | $16,928 |
| 6/30/21 | $16,783 | $18,781 | $17,124 |
| 7/31/21 | $16,791 | $19,227 | $17,137 |
| 8/31/21 | $17,115 | $19,811 | $17,476 |
| 9/30/21 | $16,597 | $18,890 | $16,946 |
| 10/31/21 | $17,454 | $20,213 | $17,829 |
| 11/30/21 | $17,138 | $20,073 | $17,507 |
| 12/31/21 | $17,953 | $20,973 | $18,352 |
| 1/31/22 | $17,435 | $19,888 | $17,822 |
| 2/28/22 | $17,305 | $19,292 | $17,693 |
| 3/31/22 | $17,931 | $20,008 | $18,343 |
| 4/30/22 | $17,066 | $18,264 | $17,464 |
| 5/31/22 | $17,350 | $18,297 | $17,761 |
| 6/30/22 | $15,834 | $16,787 | $16,199 |
| 7/31/22 | $16,816 | $18,335 | $17,215 |
| 8/31/22 | $16,456 | $17,587 | $16,847 |
| 9/30/22 | $15,003 | $15,967 | $15,355 |
| 10/31/22 | $16,904 | $17,260 | $17,318 |
| 11/30/22 | $17,796 | $18,224 | $18,235 |
| 12/31/22 | $16,943 | $17,174 | $17,360 |
| 1/31/23 | $17,668 | $18,254 | $18,101 |
| 2/28/23 | $17,108 | $17,808 | $17,535 |
| 3/31/23 | $17,032 | $18,462 | $17,457 |
| 4/30/23 | $17,116 | $18,750 | $17,545 |
| 5/31/23 | $16,429 | $18,832 | $16,841 |
| 6/30/23 | $17,608 | $20,076 | $18,055 |
| 7/31/23 | $18,164 | $20,721 | $18,626 |
| 8/31/23 | $17,886 | $20,391 | $18,354 |
| 9/30/23 | $17,221 | $19,419 | $17,671 |
| 10/31/23 | $16,694 | $19,011 | $17,133 |
| 11/30/23 | $17,989 | $20,747 | $18,469 |
| 12/31/23 | $19,014 | $21,689 | $19,531 |
| 1/31/24 | $19,418 | $22,054 | $19,951 |
| 2/29/24 | $20,493 | $23,231 | $21,056 |
| 3/31/24 | $21,386 | $23,979 | $21,976 |
| 4/30/24 | $20,276 | $22,999 | $20,840 |
| 5/31/24 | $21,113 | $24,140 | $21,702 |
| 6/30/24 | $21,582 | $25,006 | $22,189 |
The table below shows the average annual total returns of the Fund, a regulatory index, and one or more supplemental index(es) for certain periods ended June 30, 2024.
Average Annual Total Returns (%)
| Fund/Index Name | 1 Year | 5 Years | Since Inception 8/31/17 |
|---|
| PIMCO RAFI Dynamic Multi-Factor U.S. Equity ETF (at NAV) | 22.57% | 12.32% | 11.92% |
| PIMCO RAFI Dynamic Multi-Factor U.S. Equity ETF (at Market Price) | 22.39% | 12.31% | 11.91% |
| S&P 500 Index | 24.56% | 15.05% | 14.35% |
| RAFI Dynamic Multi-Factor U.S. Index | 22.90% | 12.66% | 12.37% |
All Fund returns are net of fees and expenses and include applicable fee waivers and/or expense limitations. Absent any applicable fee waivers and/or expense limitations, performance would have been lower and there can be no assurance that any such waivers or limitations will continue in the future.
Performance quoted represents past performance. Past performance is not a guarantee or a reliable indicator of future results.Current performance may be lower or higher than performance shown. Investment return and the principal value of an investment will fluctuate. Shares may be worth more or less than original cost when redeemed. Returns shown do not reflect the deduction of taxes that a shareholder would pay on Fund distributions or the redemption of Fund shares.Differences in the Fund’s performance versus an index and related attribution information with respect to particular categories of securities or individual positions may be attributable, in part, to differences in the pricing methodologies used by the Fund and the index. For performance current to the most recent month-end, visit www.pimco.com/literature or via 888.400.4ETF (888.400.4383).
Key Fund StatisticsFootnote Reference* (as of the end of the reporting period)
| Total Net Assets | $147,940 |
| # of Portfolio Holdings | 813 |
| Portfolio Turnover Rate | 41% |
| Total Net Management Fees Paid During the Reporting Period | $380 |
| Footnote | Description |
Footnote* | Dollar amounts displayed in 000's |
What did the Fund invest in?
Allocation Breakdown (% of Net Assets)Footnote Reference*
| Footnote | Description |
Footnote* | % of Net Assets includes derivatives instruments, if any, valued at the value used for determining the Fund’s net asset value. The notional exposure of such derivatives investments therefore may be greater than what is depicted. |
| Consumer Staples | 17.7% |
| Financials | 17.6% |
| Information Technology | 16.2% |
| Health Care | 13.6% |
| Industrials | 11.9% |
| Communication Services | 7.7% |
| Energy | 6.1% |
| Materials | 3.5% |
| Consumer Discretionary | 2.6% |
| Real Estate | 1.7% |
| Utilities | 0.9% |
| Short-Term Instruments | 0.5% |
| Other Assets and Liabilities, Net | 0.0% |
| Total | 100.0% |
For additional information about the Fund, including the Fund's prospectus, financial information, holdings and proxy voting information, please visit www.pimco.com/literature or contact 888.400.4ETF (888.400.4383). For tax information about the Fund, please visit: https://www.pimco.com/tax.
PIMCO RAFI Dynamic Multi-Factor U.S. Equity ETF
Annual Shareholder Report |
June 30, 2024
MFUS | Principal Listing Exchange: NYSE Arca
RAFE | Principal Listing Exchange: NYSE Arca
Annual Shareholder Report | June 30, 2024
This annual shareholder report contains important information about the PIMCO RAFI ESG U.S. ETF (the "Fund") for the period of July 1, 2023 to June 30, 2024 (the "reporting period"). You can find additional information about the Fund at www.pimco.com/literature. You can also request this information by contacting us at 888.400.4ETF (888.400.4383).
What were the Fund costs for the last year?
(based on a hypothetical $10,000 investment)
| Fund Name | Cost of a $10,000 investment | Costs paid as a percentage of a $10,000 investment |
|---|
| PIMCO RAFI ESG U.S. ETF | $29 | 0.29% |
How did the Fund perform during the reporting period and what affected its performance?
The following affected performance (on a gross basis) during the reporting period:
• Security selection in financials contributed to relative returns, as the Fund’s holdings outperformed the S&P 500 Index.
• Underweight exposure to the utilities sector contributed to relative returns, as the sector underperformed the S&P 500 Index.
• No exposure to the energy sector contributed to relative returns, as the sector underperformed the S&P 500 Index.
• Security selection in the information technology sector detracted from relative returns, as the Fund’s holdings underperformed the S&P
500 Index.
• Overweight exposure to, and security selection in, the healthcare sector detracted from relative returns, as the sector and the Fund’s
holdings underperformed the S&P 500 Index.
• Security selection in the communication services sector detracted from relative returns, as the Fund’s holdings underperformed the
S&P 500 Index.
In addition to the Fund's performance, the tables in this section include performance of: (i) a broad-based securities market index (i.e., a regulatory index) and (ii) one or more supplemental index(es). Effective July 24, 2024, the Fund's regulatory index is the S&P 500 Index. The Fund's regulatory index is shown in connection with certain regulatory requirements to provide a broad measure of market performance.
The table below illustrates cumulative returns for the 10-year period ended June 30, 2024 or the life of the Fund, if shorter. Cumulative returns are based on a hypothetical initial investment equal to the greater of either $10,000 or the investment minimum applicable to the share class.
Cumulative Returns Based on $10,000 Investment
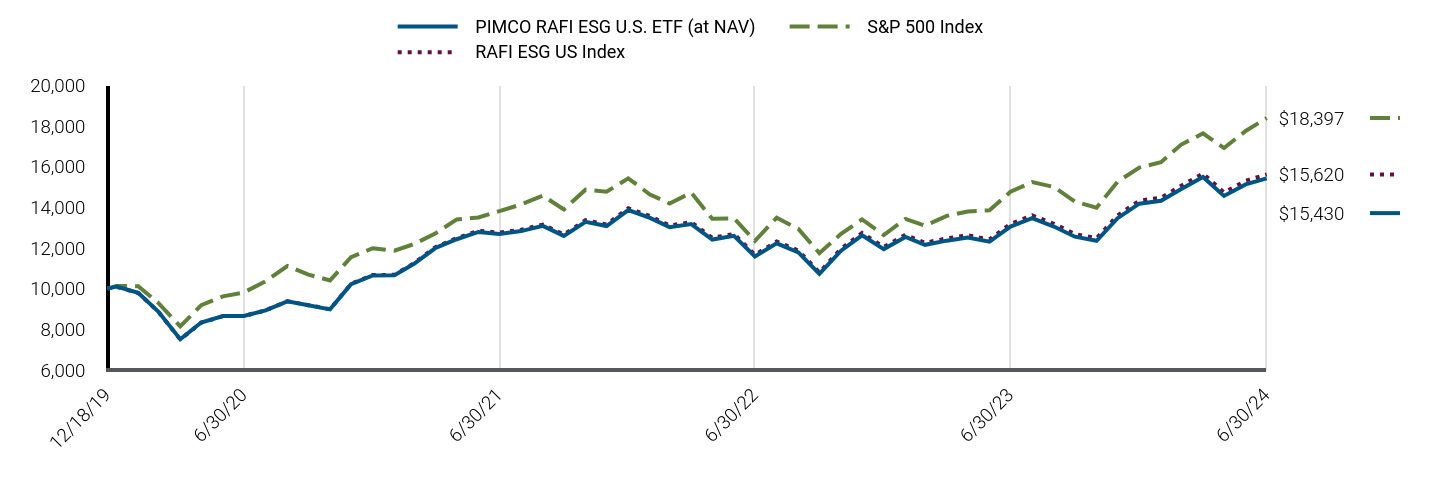
| PIMCO RAFI ESG U.S. ETF (at NAV) | S&P 500 Index | RAFI ESG US Index |
|---|
| 12/18/19 | $10,000 | $10,000 | $10,000 |
| 12/31/19 | $10,100 | $10,126 | $10,087 |
| 1/31/20 | $9,796 | $10,122 | $9,787 |
| 2/29/20 | $8,859 | $9,288 | $8,850 |
| 3/31/20 | $7,510 | $8,141 | $7,499 |
| 4/30/20 | $8,335 | $9,185 | $8,325 |
| 5/31/20 | $8,650 | $9,622 | $8,647 |
| 6/30/20 | $8,658 | $9,814 | $8,656 |
| 7/31/20 | $8,931 | $10,367 | $8,932 |
| 8/31/20 | $9,375 | $11,112 | $9,381 |
| 9/30/20 | $9,180 | $10,690 | $9,186 |
| 10/31/20 | $8,979 | $10,406 | $8,987 |
| 11/30/20 | $10,216 | $11,545 | $10,234 |
| 12/31/20 | $10,647 | $11,989 | $10,670 |
| 1/31/21 | $10,655 | $11,868 | $10,681 |
| 2/28/21 | $11,223 | $12,195 | $11,256 |
| 3/31/21 | $12,010 | $12,729 | $12,055 |
| 4/30/21 | $12,432 | $13,408 | $12,483 |
| 5/31/21 | $12,791 | $13,502 | $12,848 |
| 6/30/21 | $12,696 | $13,817 | $12,755 |
| 7/31/21 | $12,833 | $14,145 | $12,896 |
| 8/31/21 | $13,090 | $14,575 | $13,156 |
| 9/30/21 | $12,596 | $13,898 | $12,663 |
| 10/31/21 | $13,291 | $14,871 | $13,368 |
| 11/30/21 | $13,083 | $14,768 | $13,158 |
| 12/31/21 | $13,866 | $15,430 | $13,956 |
| 1/31/22 | $13,481 | $14,632 | $13,570 |
| 2/28/22 | $13,025 | $14,193 | $13,109 |
| 3/31/22 | $13,180 | $14,720 | $13,273 |
| 4/30/22 | $12,415 | $13,437 | $12,500 |
| 5/31/22 | $12,600 | $13,461 | $12,693 |
| 6/30/22 | $11,588 | $12,350 | $11,668 |
| 7/31/22 | $12,229 | $13,489 | $12,319 |
| 8/31/22 | $11,786 | $12,939 | $11,873 |
| 9/30/22 | $10,725 | $11,747 | $10,800 |
| 10/31/22 | $11,870 | $12,698 | $11,966 |
| 11/30/22 | $12,626 | $13,408 | $12,736 |
| 12/31/22 | $11,947 | $12,636 | $12,050 |
| 1/31/23 | $12,545 | $13,429 | $12,650 |
| 2/28/23 | $12,156 | $13,102 | $12,256 |
| 3/31/23 | $12,362 | $13,583 | $12,473 |
| 4/30/23 | $12,512 | $13,795 | $12,627 |
| 5/31/23 | $12,310 | $13,855 | $12,424 |
| 6/30/23 | $13,058 | $14,770 | $13,187 |
| 7/31/23 | $13,468 | $15,245 | $13,604 |
| 8/31/23 | $13,057 | $15,002 | $13,193 |
| 9/30/23 | $12,557 | $14,287 | $12,688 |
| 10/31/23 | $12,353 | $13,986 | $12,485 |
| 11/30/23 | $13,468 | $15,264 | $13,603 |
| 12/31/23 | $14,183 | $15,957 | $14,331 |
| 1/31/24 | $14,323 | $16,225 | $14,476 |
| 2/29/24 | $14,903 | $17,092 | $15,062 |
| 3/31/24 | $15,496 | $17,642 | $15,668 |
| 4/30/24 | $14,563 | $16,921 | $14,728 |
| 5/31/24 | $15,132 | $17,760 | $15,312 |
| 6/30/24 | $15,430 | $18,397 | $15,620 |
The table below shows the average annual total returns of the Fund, a regulatory index, and one or more supplemental index(es) for certain periods ended June 30, 2024.
Average Annual Total Returns (%)
| Fund/Index Name | 1 Year | Since Inception 12/18/19 |
|---|
| PIMCO RAFI ESG U.S. ETF (at NAV) | 18.17% | 10.04% |
| PIMCO RAFI ESG U.S. ETF (at Market Price) | 18.13% | 9.95% |
| S&P 500 Index | 24.56% | 14.38% |
| RAFI ESG US Index | 18.44% | 10.33% |
All Fund returns are net of fees and expenses and include applicable fee waivers and/or expense limitations. Absent any applicable fee waivers and/or expense limitations, performance would have been lower and there can be no assurance that any such waivers or limitations will continue in the future.
Performance quoted represents past performance. Past performance is not a guarantee or a reliable indicator of future results.Current performance may be lower or higher than performance shown. Investment return and the principal value of an investment will fluctuate. Shares may be worth more or less than original cost when redeemed. Returns shown do not reflect the deduction of taxes that a shareholder would pay on Fund distributions or the redemption of Fund shares.Differences in the Fund’s performance versus an index and related attribution information with respect to particular categories of securities or individual positions may be attributable, in part, to differences in the pricing methodologies used by the Fund and the index. For performance current to the most recent month-end, visit www.pimco.com/literature or via 888.400.4ETF (888.400.4383).
Key Fund StatisticsFootnote Reference* (as of the end of the reporting period)
| Total Net Assets | $52,835 |
| # of Portfolio Holdings | 246 |
| Portfolio Turnover Rate | 18% |
| Total Net Management Fees Paid During the Reporting Period | $124 |
| Footnote | Description |
Footnote* | Dollar amounts displayed in 000's |
What did the Fund invest in?
Allocation Breakdown (% of Net Assets)Footnote Reference*
| Footnote | Description |
Footnote* | % of Net Assets includes derivatives instruments, if any, valued at the value used for determining the Fund’s net asset value. The notional exposure of such derivatives investments therefore may be greater than what is depicted. |
| Information Technology | 31.0% |
| Health Care | 18.8% |
| Financials | 15.6% |
| Consumer Staples | 14.1% |
| Communication Services | 7.9% |
| Industrials | 4.7% |
| Materials | 4.2% |
| Real Estate | 2.2% |
| Consumer Discretionary | 0.6% |
| Short-Term Instruments | 0.6% |
| Utilities | 0.3% |
| Other Assets and Liabilities, Net | 0.0% |
| Total | 100.0% |
For additional information about the Fund, including the Fund's prospectus, financial information, holdings and proxy voting information, please visit www.pimco.com/literature or contact 888.400.4ETF (888.400.4383). For tax information about the Fund, please visit: https://www.pimco.com/tax.
Annual Shareholder Report |
June 30, 2024
RAFE | Principal Listing Exchange: NYSE Arca
PIMCO REALPATH® Blend 2025 Fund
Annual Shareholder Report | June 30, 2024
This annual shareholder report contains important information about the PIMCO REALPATH® Blend 2025 Fund for the period of July 1, 2023 to June 30, 2024 (the "reporting period"). You can find additional information about the Fund at www.pimco.com/literature. You can also request this information by contacting us at 888.87.PIMCO (888.877.4626).
This report describes changes to the Fund that occurred during the reporting period.
What were the Fund costs for the last year?
(based on a hypothetical $10,000 investment)
| Class Name | Cost of a $10,000 investment | Costs paid as a percentage of a $10,000 investment |
|---|
| Class A | $50 | 0.48% |
How did the Fund perform during the reporting period and what affected its performance?
The following affected performance (on a gross basis) during the reporting period:
• Exposure to U.S. large cap equities contributed to absolute performance, as U.S. large cap equities posted positive returns.
• Exposure to global equities contributed to absolute performance, as global equities posted positive returns.
• Exposure to emerging market equities contributed to absolute performance, as emerging market equities posted positive returns.
• Exposure to U.S. core bonds contributed to absolute performance, as U.S. core bonds posted positive returns.
• Exposure to long-term Treasury Inflation-Protected Securities ("TIPS") detracted from absolute performance, as long-term TIPS posted
negative returns.
• Exposure to long-term treasuries detracted from absolute performance, as long-term treasuries posted negative returns.
• Exposure to global bonds detracted from absolute performance, as global bonds posted negative returns.
• There were no other material detractors for this Fund.
In addition to the Fund's performance, the tables in this section include performance of: (i) a broad-based securities market index (i.e., a regulatory index) and (ii) one or more supplemental index(es). Effective July 24, 2024, the Fund's regulatory index is the S&P 500 Index. The Fund's regulatory index is shown in connection with certain regulatory requirements to provide a broad measure of market performance.
The table below illustrates cumulative returns for the 10-year period ended June 30, 2024 or the life of the Fund, if shorter. Cumulative returns are based on a hypothetical initial investment equal to the greater of either $10,000 or the investment minimum applicable to the share class.
Cumulative Returns Based on $10,000 Investment
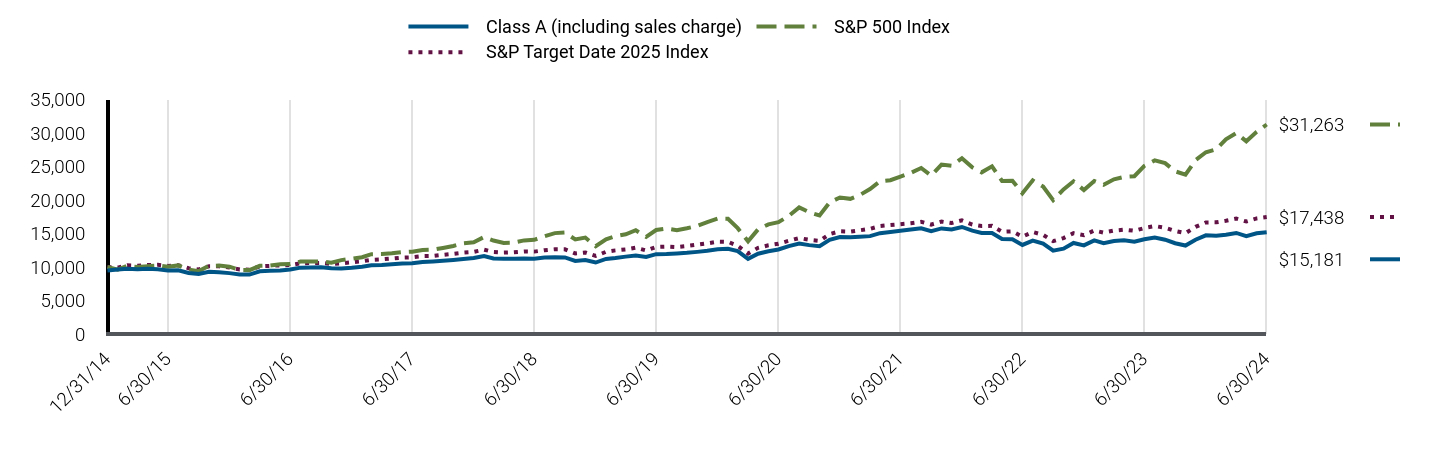
| Class A (including sales charge) | S&P 500 Index | S&P Target Date 2025 Index |
|---|
| 12/31/14 | $9,452 | $10,000 | $10,000 |
| 1/31/15 | $9,603 | $9,600 | $9,902 |
| 2/28/15 | $9,745 | $10,152 | $10,243 |
| 3/31/15 | $9,669 | $9,991 | $10,188 |
| 4/30/15 | $9,745 | $10,087 | $10,276 |
| 5/31/15 | $9,669 | $10,217 | $10,318 |
| 6/30/15 | $9,468 | $10,019 | $10,146 |
| 7/31/15 | $9,506 | $10,229 | $10,256 |
| 8/31/15 | $9,108 | $9,612 | $9,813 |
| 9/30/15 | $8,943 | $9,374 | $9,627 |
| 10/31/15 | $9,285 | $10,164 | $10,087 |
| 11/30/15 | $9,209 | $10,195 | $10,086 |
| 12/31/15 | $9,074 | $10,034 | $9,920 |
| 1/31/16 | $8,862 | $9,536 | $9,611 |
| 2/29/16 | $8,852 | $9,523 | $9,593 |
| 3/31/16 | $9,340 | $10,169 | $10,082 |
| 4/30/16 | $9,446 | $10,209 | $10,157 |
| 5/31/16 | $9,456 | $10,392 | $10,230 |
| 6/30/16 | $9,610 | $10,419 | $10,284 |
| 7/31/16 | $9,893 | $10,803 | $10,553 |
| 8/31/16 | $9,923 | $10,818 | $10,572 |
| 9/30/16 | $9,957 | $10,820 | $10,604 |
| 10/31/16 | $9,811 | $10,623 | $10,434 |
| 11/30/16 | $9,752 | $11,016 | $10,532 |
| 12/31/16 | $9,869 | $11,234 | $10,695 |
| 1/31/17 | $10,037 | $11,447 | $10,855 |
| 2/28/17 | $10,245 | $11,902 | $11,065 |
| 3/31/17 | $10,283 | $11,915 | $11,132 |
| 4/30/17 | $10,392 | $12,038 | $11,255 |
| 5/31/17 | $10,511 | $12,207 | $11,391 |
| 6/30/17 | $10,557 | $12,283 | $11,443 |
| 7/31/17 | $10,735 | $12,536 | $11,620 |
| 8/31/17 | $10,815 | $12,574 | $11,644 |
| 9/30/17 | $10,914 | $12,834 | $11,811 |
| 10/31/17 | $11,044 | $13,133 | $11,960 |
| 11/30/17 | $11,183 | $13,536 | $12,139 |
| 12/31/17 | $11,337 | $13,687 | $12,251 |
| 1/31/18 | $11,629 | $14,470 | $12,578 |
| 2/28/18 | $11,267 | $13,937 | $12,227 |
| 3/31/18 | $11,226 | $13,583 | $12,137 |
| 4/30/18 | $11,216 | $13,635 | $12,179 |
| 5/31/18 | $11,246 | $13,963 | $12,301 |
| 6/30/18 | $11,228 | $14,049 | $12,287 |
| 7/31/18 | $11,390 | $14,572 | $12,498 |
| 8/31/18 | $11,450 | $15,047 | $12,636 |
| 9/30/18 | $11,418 | $15,132 | $12,622 |
| 10/31/18 | $10,902 | $14,098 | $12,008 |
| 11/30/18 | $11,023 | $14,385 | $12,155 |
| 12/31/18 | $10,656 | $13,086 | $11,636 |
| 1/31/19 | $11,198 | $14,135 | $12,253 |
| 2/28/19 | $11,334 | $14,589 | $12,471 |
| 3/31/19 | $11,540 | $14,872 | $12,610 |
| 4/30/19 | $11,718 | $15,475 | $12,872 |
| 5/31/19 | $11,487 | $14,491 | $12,467 |
| 6/30/19 | $11,906 | $15,513 | $12,988 |
| 7/31/19 | $11,937 | $15,736 | $13,039 |
| 8/31/19 | $12,011 | $15,486 | $12,970 |
| 9/30/19 | $12,100 | $15,776 | $13,122 |
| 10/31/19 | $12,248 | $16,118 | $13,322 |
| 11/30/19 | $12,407 | $16,703 | $13,519 |
| 12/31/19 | $12,625 | $17,207 | $13,774 |
| 1/31/20 | $12,722 | $17,200 | $13,755 |
| 2/29/20 | $12,356 | $15,784 | $13,156 |
| 3/31/20 | $11,212 | $13,835 | $11,994 |
| 4/30/20 | $11,978 | $15,608 | $12,850 |
| 5/31/20 | $12,334 | $16,352 | $13,230 |
| 6/30/20 | $12,606 | $16,677 | $13,462 |
| 7/31/20 | $13,113 | $17,617 | $13,907 |
| 8/31/20 | $13,491 | $18,883 | $14,303 |
| 9/30/20 | $13,254 | $18,166 | $14,054 |
| 10/31/20 | $13,092 | $17,683 | $13,890 |
| 11/30/20 | $14,042 | $19,618 | $14,907 |
| 12/31/20 | $14,457 | $20,373 | $15,320 |
| 1/31/21 | $14,423 | $20,167 | $15,277 |
| 2/28/21 | $14,491 | $20,723 | $15,467 |
| 3/31/21 | $14,598 | $21,631 | $15,684 |
| 4/30/21 | $15,041 | $22,785 | $16,107 |
| 5/31/21 | $15,211 | $22,944 | $16,256 |
| 6/30/21 | $15,402 | $23,480 | $16,380 |
| 7/31/21 | $15,573 | $24,038 | $16,509 |
| 8/31/21 | $15,768 | $24,769 | $16,728 |
| 9/30/21 | $15,322 | $23,617 | $16,325 |
| 10/31/21 | $15,746 | $25,271 | $16,769 |
| 11/30/21 | $15,597 | $25,096 | $16,552 |
| 12/31/21 | $15,965 | $26,221 | $16,954 |
| 1/31/22 | $15,412 | $24,864 | $16,326 |
| 2/28/22 | $15,082 | $24,120 | $16,102 |
| 3/31/22 | $15,065 | $25,015 | $16,135 |
| 4/30/22 | $14,170 | $22,834 | $15,251 |
| 5/31/22 | $14,123 | $22,876 | $15,311 |
| 6/30/22 | $13,287 | $20,987 | $14,513 |
| 7/31/22 | $13,937 | $22,922 | $15,211 |
| 8/31/22 | $13,476 | $21,988 | $14,788 |
| 9/30/22 | $12,416 | $19,963 | $13,850 |
| 10/31/22 | $12,724 | $21,579 | $14,310 |
| 11/30/22 | $13,578 | $22,785 | $15,034 |
| 12/31/22 | $13,212 | $21,472 | $14,728 |
| 1/31/23 | $13,968 | $22,821 | $15,438 |
| 2/28/23 | $13,541 | $22,264 | $15,128 |
| 3/31/23 | $13,872 | $23,082 | $15,423 |
| 4/30/23 | $13,970 | $23,442 | $15,568 |
| 5/31/23 | $13,761 | $23,544 | $15,395 |
| 6/30/23 | $14,139 | $25,100 | $15,812 |
| 7/31/23 | $14,385 | $25,906 | $16,095 |
| 8/31/23 | $14,066 | $25,493 | $15,846 |
| 9/30/23 | $13,537 | $24,278 | $15,369 |
| 10/31/23 | $13,191 | $23,768 | $15,039 |
| 11/30/23 | $14,068 | $25,938 | $15,976 |
| 12/31/23 | $14,713 | $27,116 | $16,641 |
| 1/31/24 | $14,663 | $27,572 | $16,657 |
| 2/29/24 | $14,801 | $29,044 | $16,888 |
| 3/31/24 | $15,071 | $29,979 | $17,213 |
| 4/30/24 | $14,578 | $28,754 | $16,779 |
| 5/31/24 | $15,021 | $30,180 | $17,238 |
| 6/30/24 | $15,181 | $31,263 | $17,438 |
The table below shows the average annual total returns of the Fund, a regulatory index, and one or more supplemental index(es) for certain periods ended June 30, 2024.
Average Annual Total Returns (%)
| Class/Index Name | 1 Year | 5 Years | Since Inception 12/31/14 |
|---|
| Class A (excluding sales charge) | 7.36% | 4.98% | 5.12% |
| Class A (including sales charge) | 1.45% | 3.80% | 4.49% |
| S&P 500 Index | 24.56% | 15.05% | 12.75% |
| S&P Target Date 2025 Index | 10.29% | 6.07% | 6.03% |
All Fund returns are net of fees and expenses and include applicable fee waivers and/or expense limitations. Absent any applicable fee waivers and/or expense limitations, performance would have been lower and there can be no assurance that any such waivers or limitations will continue in the future.
Performance quoted represents past performance. Past performance is not a guarantee or a reliable indicator of future results.Current performance may be lower or higher than performance shown. Investment return and the principal value of an investment will fluctuate. Shares may be worth more or less than original cost when redeemed. Returns shown do not reflect the deduction of taxes that a shareholder would pay on Fund distributions or the redemption of Fund shares.Differences in the Fund’s performance versus an index and related attribution information with respect to particular categories of securities or individual positions may be attributable, in part, to differences in the pricing methodologies used by the Fund and the index. The Cumulative Returns chart and Average Annual Total Returns table reflect any sales load that would have applied at the time of purchase or any Contingent Deferred Sales Charge (“CDSC”) that would have applied if a full redemption occurred on the last business day of the period shown in the Cumulative Returns chart. Class A shares are subject to an initial sales charge. A CDSC may be imposed in certain circumstances on Class A shares that are purchased without an initial sales charge and then redeemed during the first 12 months after purchase. For performance current to the most recent month-end, visit www.pimco.com/literature or via 888.87.PIMCO (888.877.4626).
Key Fund StatisticsFootnote Reference* (as of the end of the reporting period)
| Total Net Assets | $463,549 |
| # of Portfolio Holdings | 23 |
| Portfolio Turnover Rate | 27% |
| Total Net Advisory Fees Paid During the Reporting Period | $44 |
| Footnote | Description |
Footnote* | Dollar amounts displayed in 000's |
What did the Fund invest in?
Allocation Breakdown (% of Net Assets)Footnote Reference*
| Affiliated Investments | 61.8% |
| Mutual Funds | 37.5% |
| Short-Term Instruments | 0.1% |
| Other Investments | 0.2% |
| Other Assets and Liabilities, Net | 0.4% |
| Total | 100.0% |
| Footnote | Description |
Footnote* | % of Net Assets includes derivatives instruments, if any, valued at the value used for determining the Fund’s net asset value. The notional exposure of such derivatives investments therefore may be greater than what is depicted. |
Top Holdings (% of Net Assets)
| Vanguard Institutional Index Fund 'Institutional' | 21.4% |
| PIMCO Total Return Fund | 17.2% |
| Vanguard Developed Markets Index Fund 'Institutional' | 10.8% |
| PIMCO Income Fund | 10.8% |
| PIMCO Long-Term Real Return Fund | 9.1% |
| PIMCO Long-Term U.S. Government Fund | 8.1% |
| PIMCO Real Return Fund | 4.9% |
| Vanguard Emerging Markets Stock Index Fund 'Institutional' | 4.3% |
| PIMCO Emerging Markets Local Currency and Bond Fund | 3.2% |
| PIMCO International Bond Fund (U.S. Dollar-Hedged) | 2.8% |
This is a summary of certain changes and planned changes of the Fund since the beginning of the reporting period. For more information, you may refer to the Fund's next prospectus, which we expect to be available by October 31, 2024 or upon request at 888.87.PIMCO (888.877.4626).
Changes to Total Annual Fund Operating Expenses. Annual fund operating expenses increased during the year by 0.21% as a result of the Fund’s exposure to fees and expenses related to the Fund’s investment in underlying funds.
Change to REALPATH® Blend Glide Path. Effective February 28, 2024, the Fund’s REALPATH® Blend Glide Path, which forms the basis of the Fund’s long-term asset allocations, was changed based on data relating to risk metrics, long-term market trends, correlation of asset types and actuarial assumptions of life expectancy and retirement.
For additional information about the Fund, including the Fund's prospectus, financial information, holdings and proxy voting information, please visit www.pimco.com/literature or contact 888.87.PIMCO (888.877.4626). For tax information about the Fund, please visit: https://www.pimco.com/tax.
PIMCO REALPATH® Blend 2025 Fund
Annual Shareholder Report |
June 30, 2024
Institutional Class: PPZRX
PIMCO REALPATH® Blend 2025 Fund
Annual Shareholder Report | June 30, 2024
This annual shareholder report contains important information about the PIMCO REALPATH® Blend 2025 Fund for the period of July 1, 2023 to June 30, 2024 (the "reporting period"). You can find additional information about the Fund at www.pimco.com/literature. You can also request this information by contacting us at 888.87.PIMCO (888.877.4626).
This report describes changes to the Fund that occurred during the reporting period.
What were the Fund costs for the last year?
(based on a hypothetical $10,000 investment)
| Class Name | Cost of a $10,000 investment | Costs paid as a percentage of a $10,000 investment |
|---|
| Institutional Class | $3 | 0.03% |
How did the Fund perform during the reporting period and what affected its performance?
The following affected performance (on a gross basis) during the reporting period:
• Exposure to U.S. large cap equities contributed to absolute performance, as U.S. large cap equities posted positive returns.
• Exposure to global equities contributed to absolute performance, as global equities posted positive returns.
• Exposure to emerging market equities contributed to absolute performance, as emerging market equities posted positive returns.
• Exposure to U.S. core bonds contributed to absolute performance, as U.S. core bonds posted positive returns.
• Exposure to long-term Treasury Inflation-Protected Securities ("TIPS") detracted from absolute performance, as long-term TIPS posted
negative returns.
• Exposure to long-term treasuries detracted from absolute performance, as long-term treasuries posted negative returns.
• Exposure to global bonds detracted from absolute performance, as global bonds posted negative returns.
• There were no other material detractors for this Fund.
In addition to the Fund's performance, the tables in this section include performance of: (i) a broad-based securities market index (i.e., a regulatory index) and (ii) one or more supplemental index(es). Effective July 24, 2024, the Fund's regulatory index is the S&P 500 Index. The Fund's regulatory index is shown in connection with certain regulatory requirements to provide a broad measure of market performance.
The table below illustrates cumulative returns for the 10-year period ended June 30, 2024 or the life of the Fund, if shorter. Cumulative returns are based on a hypothetical initial investment equal to the greater of either $10,000 or the investment minimum applicable to the share class.
Cumulative Returns Based on $1,000,000 Investment
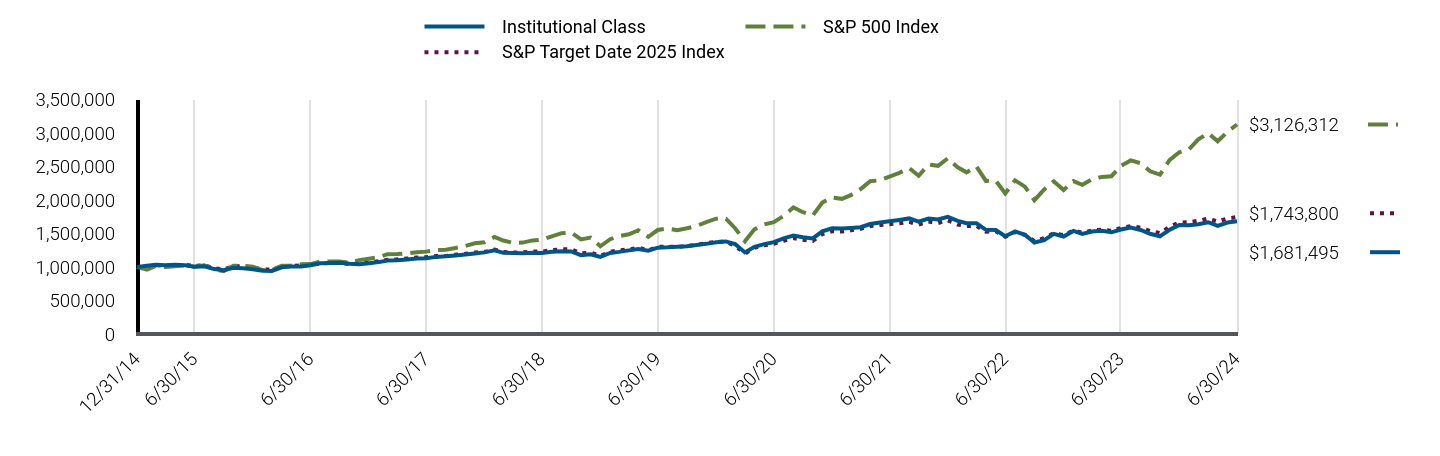
| Institutional Class | S&P 500 Index | S&P Target Date 2025 Index |
|---|
| 12/31/14 | $1,000,000 | $1,000,000 | $1,000,000 |
| 1/31/15 | $1,016,000 | $959,985 | $990,161 |
| 2/28/15 | $1,031,000 | $1,015,157 | $1,024,302 |
| 3/31/15 | $1,024,000 | $999,103 | $1,018,763 |
| 4/30/15 | $1,033,000 | $1,008,687 | $1,027,618 |
| 5/31/15 | $1,025,000 | $1,021,658 | $1,031,762 |
| 6/30/15 | $1,003,885 | $1,001,881 | $1,014,626 |
| 7/31/15 | $1,008,910 | $1,022,872 | $1,025,640 |
| 8/31/15 | $967,709 | $961,158 | $981,319 |
| 9/30/15 | $950,161 | $937,375 | $962,729 |
| 10/31/15 | $986,396 | $1,016,447 | $1,008,724 |
| 11/30/15 | $979,350 | $1,019,470 | $1,008,634 |
| 12/31/15 | $964,647 | $1,003,391 | $991,978 |
| 1/31/16 | $943,119 | $953,598 | $961,096 |
| 2/29/16 | $941,069 | $952,312 | $959,298 |
| 3/31/16 | $994,859 | $1,016,915 | $1,008,222 |
| 4/30/16 | $1,006,152 | $1,020,857 | $1,015,704 |
| 5/31/16 | $1,007,179 | $1,039,190 | $1,023,032 |
| 6/30/16 | $1,024,938 | $1,041,882 | $1,028,438 |
| 7/31/16 | $1,055,113 | $1,080,295 | $1,055,307 |
| 8/31/16 | $1,058,235 | $1,081,812 | $1,057,207 |
| 9/30/16 | $1,062,950 | $1,082,016 | $1,060,353 |
| 10/31/16 | $1,047,303 | $1,062,279 | $1,043,402 |
| 11/30/16 | $1,041,044 | $1,101,621 | $1,053,179 |
| 12/31/16 | $1,053,964 | $1,123,395 | $1,069,530 |
| 1/31/17 | $1,071,936 | $1,144,702 | $1,085,541 |
| 2/28/17 | $1,095,193 | $1,190,154 | $1,106,486 |
| 3/31/17 | $1,099,315 | $1,191,542 | $1,113,213 |
| 4/30/17 | $1,110,964 | $1,203,779 | $1,125,468 |
| 5/31/17 | $1,125,791 | $1,220,720 | $1,139,142 |
| 6/30/17 | $1,130,804 | $1,228,339 | $1,144,278 |
| 7/31/17 | $1,149,952 | $1,253,597 | $1,161,958 |
| 8/31/17 | $1,158,462 | $1,257,434 | $1,164,429 |
| 9/30/17 | $1,170,199 | $1,283,373 | $1,181,129 |
| 10/31/17 | $1,184,079 | $1,313,321 | $1,196,026 |
| 11/30/17 | $1,200,094 | $1,353,600 | $1,213,934 |
| 12/31/17 | $1,216,942 | $1,368,650 | $1,225,148 |
| 1/31/18 | $1,248,257 | $1,447,011 | $1,257,845 |
| 2/28/18 | $1,210,464 | $1,393,678 | $1,222,739 |
| 3/31/18 | $1,207,224 | $1,358,260 | $1,213,724 |
| 4/30/18 | $1,205,065 | $1,363,472 | $1,217,885 |
| 5/31/18 | $1,210,464 | $1,396,307 | $1,230,123 |
| 6/30/18 | $1,209,091 | $1,404,901 | $1,228,724 |
| 7/31/18 | $1,226,441 | $1,457,183 | $1,249,783 |
| 8/31/18 | $1,232,947 | $1,504,666 | $1,263,590 |
| 9/30/18 | $1,230,578 | $1,513,230 | $1,262,189 |
| 10/31/18 | $1,176,128 | $1,409,800 | $1,200,801 |
| 11/30/18 | $1,189,196 | $1,438,530 | $1,215,478 |
| 12/31/18 | $1,149,317 | $1,308,644 | $1,163,622 |
| 1/31/19 | $1,208,862 | $1,413,513 | $1,225,290 |
| 2/28/19 | $1,224,590 | $1,458,898 | $1,247,066 |
| 3/31/19 | $1,246,939 | $1,487,247 | $1,261,030 |
| 4/30/19 | $1,267,270 | $1,547,466 | $1,287,232 |
| 5/31/19 | $1,242,422 | $1,449,127 | $1,246,678 |
| 6/30/19 | $1,288,010 | $1,551,256 | $1,298,821 |
| 7/31/19 | $1,292,557 | $1,573,551 | $1,303,926 |
| 8/31/19 | $1,300,515 | $1,548,625 | $1,296,958 |
| 9/30/19 | $1,310,124 | $1,577,601 | $1,312,216 |
| 10/31/19 | $1,327,272 | $1,611,771 | $1,332,239 |
| 11/30/19 | $1,344,421 | $1,670,277 | $1,351,904 |
| 12/31/19 | $1,368,881 | $1,720,689 | $1,377,442 |
| 1/31/20 | $1,380,561 | $1,720,014 | $1,375,462 |
| 2/29/20 | $1,340,849 | $1,578,424 | $1,315,555 |
| 3/31/20 | $1,216,777 | $1,383,468 | $1,199,353 |
| 4/30/20 | $1,300,934 | $1,560,821 | $1,284,967 |
| 5/31/20 | $1,340,676 | $1,635,159 | $1,322,972 |
| 6/30/20 | $1,370,565 | $1,667,678 | $1,346,224 |
| 7/31/20 | $1,425,575 | $1,761,710 | $1,390,654 |
| 8/31/20 | $1,467,710 | $1,888,343 | $1,430,282 |
| 9/30/20 | $1,442,051 | $1,816,592 | $1,405,363 |
| 10/31/20 | $1,425,638 | $1,768,282 | $1,389,040 |
| 11/30/20 | $1,529,981 | $1,961,845 | $1,490,689 |
| 12/31/20 | $1,576,020 | $2,037,275 | $1,531,954 |
| 1/31/21 | $1,572,369 | $2,016,707 | $1,527,659 |
| 2/28/21 | $1,580,888 | $2,072,317 | $1,546,692 |
| 3/31/21 | $1,592,782 | $2,163,076 | $1,568,416 |
| 4/30/21 | $1,640,899 | $2,278,516 | $1,610,714 |
| 5/31/21 | $1,661,873 | $2,294,430 | $1,625,647 |
| 6/30/21 | $1,682,119 | $2,347,993 | $1,637,970 |
| 7/31/21 | $1,702,055 | $2,403,770 | $1,650,859 |
| 8/31/21 | $1,724,483 | $2,476,858 | $1,672,828 |
| 9/30/21 | $1,676,140 | $2,361,660 | $1,632,541 |
| 10/31/21 | $1,722,422 | $2,527,122 | $1,676,947 |
| 11/30/21 | $1,707,412 | $2,509,612 | $1,655,230 |
| 12/31/21 | $1,748,465 | $2,622,083 | $1,695,377 |
| 1/31/22 | $1,688,129 | $2,486,398 | $1,632,647 |
| 2/28/22 | $1,653,468 | $2,411,951 | $1,610,243 |
| 3/31/22 | $1,652,212 | $2,501,506 | $1,613,529 |
| 4/30/22 | $1,553,131 | $2,283,370 | $1,525,135 |
| 5/31/22 | $1,550,557 | $2,287,559 | $1,531,079 |
| 6/30/22 | $1,457,344 | $2,098,736 | $1,451,295 |
| 7/31/22 | $1,530,986 | $2,292,248 | $1,521,109 |
| 8/31/22 | $1,480,599 | $2,198,766 | $1,478,772 |
| 9/30/22 | $1,364,324 | $1,996,263 | $1,384,975 |
| 10/31/22 | $1,399,373 | $2,157,883 | $1,431,042 |
| 11/30/22 | $1,492,838 | $2,278,474 | $1,503,369 |
| 12/31/22 | $1,454,002 | $2,147,201 | $1,472,795 |
| 1/31/23 | $1,536,934 | $2,282,118 | $1,543,807 |
| 2/28/23 | $1,491,455 | $2,226,437 | $1,512,761 |
| 3/31/23 | $1,527,673 | $2,308,179 | $1,542,346 |
| 4/30/23 | $1,539,786 | $2,344,206 | $1,556,845 |
| 5/31/23 | $1,516,905 | $2,354,395 | $1,539,518 |
| 6/30/23 | $1,558,780 | $2,509,962 | $1,581,163 |
| 7/31/23 | $1,587,146 | $2,590,595 | $1,609,499 |
| 8/31/23 | $1,552,027 | $2,549,349 | $1,584,607 |
| 9/30/23 | $1,495,156 | $2,427,801 | $1,536,922 |
| 10/31/23 | $1,457,097 | $2,376,753 | $1,503,910 |
| 11/30/23 | $1,553,603 | $2,593,811 | $1,597,557 |
| 12/31/23 | $1,626,586 | $2,711,650 | $1,664,095 |
| 1/31/24 | $1,621,062 | $2,757,216 | $1,665,661 |
| 2/29/24 | $1,636,251 | $2,904,440 | $1,688,779 |
| 3/31/24 | $1,667,579 | $2,997,889 | $1,721,289 |
| 4/30/24 | $1,613,247 | $2,875,441 | $1,677,853 |
| 5/31/24 | $1,663,399 | $3,018,019 | $1,723,839 |
| 6/30/24 | $1,681,495 | $3,126,312 | $1,743,800 |
The table below shows the average annual total returns of the Fund, a regulatory index, and one or more supplemental index(es) for certain periods ended June 30, 2024.
Average Annual Total Returns (%)
| Class/Index Name | 1 Year | 5 Years | Since Inception 12/31/14 |
|---|
| Institutional Class | 7.87% | 5.48% | 5.63% |
| S&P 500 Index | 24.56% | 15.05% | 12.75% |
| S&P Target Date 2025 Index | 10.29% | 6.07% | 6.03% |
All Fund returns are net of fees and expenses and include applicable fee waivers and/or expense limitations. Absent any applicable fee waivers and/or expense limitations, performance would have been lower and there can be no assurance that any such waivers or limitations will continue in the future.
Performance quoted represents past performance. Past performance is not a guarantee or a reliable indicator of future results.Current performance may be lower or higher than performance shown. Investment return and the principal value of an investment will fluctuate. Shares may be worth more or less than original cost when redeemed. Returns shown do not reflect the deduction of taxes that a shareholder would pay on Fund distributions or the redemption of Fund shares.Differences in the Fund’s performance versus an index and related attribution information with respect to particular categories of securities or individual positions may be attributable, in part, to differences in the pricing methodologies used by the Fund and the index. For performance current to the most recent month-end, visit www.pimco.com/literature or via 888.87.PIMCO (888.877.4626).
Key Fund StatisticsFootnote Reference* (as of the end of the reporting period)
| Total Net Assets | $463,549 |
| # of Portfolio Holdings | 23 |
| Portfolio Turnover Rate | 27% |
| Total Net Advisory Fees Paid During the Reporting Period | $44 |
| Footnote | Description |
Footnote* | Dollar amounts displayed in 000's |
What did the Fund invest in?
Allocation Breakdown (% of Net Assets)Footnote Reference*
| Affiliated Investments | 61.8% |
| Mutual Funds | 37.5% |
| Short-Term Instruments | 0.1% |
| Other Investments | 0.2% |
| Other Assets and Liabilities, Net | 0.4% |
| Total | 100.0% |
| Footnote | Description |
Footnote* | % of Net Assets includes derivatives instruments, if any, valued at the value used for determining the Fund’s net asset value. The notional exposure of such derivatives investments therefore may be greater than what is depicted. |
Top Holdings (% of Net Assets)
| Vanguard Institutional Index Fund 'Institutional' | 21.4% |
| PIMCO Total Return Fund | 17.2% |
| Vanguard Developed Markets Index Fund 'Institutional' | 10.8% |
| PIMCO Income Fund | 10.8% |
| PIMCO Long-Term Real Return Fund | 9.1% |
| PIMCO Long-Term U.S. Government Fund | 8.1% |
| PIMCO Real Return Fund | 4.9% |
| Vanguard Emerging Markets Stock Index Fund 'Institutional' | 4.3% |
| PIMCO Emerging Markets Local Currency and Bond Fund | 3.2% |
| PIMCO International Bond Fund (U.S. Dollar-Hedged) | 2.8% |
This is a summary of certain changes and planned changes of the Fund since the beginning of the reporting period. For more information, you may refer to the Fund's next prospectus, which we expect to be available by October 31, 2024 or upon request at 888.87.PIMCO (888.877.4626).
Changes to Total Annual Fund Operating Expenses. Annual fund operating expenses increased during the year by 0.21% as a result of the Fund’s exposure to fees and expenses related to the Fund’s investment in underlying funds.
Change to REALPATH® Blend Glide Path. Effective February 28, 2024, the Fund’s REALPATH® Blend Glide Path, which forms the basis of the Fund’s long-term asset allocations, was changed based on data relating to risk metrics, long-term market trends, correlation of asset types and actuarial assumptions of life expectancy and retirement.
For additional information about the Fund, including the Fund's prospectus, financial information, holdings and proxy voting information, please visit www.pimco.com/literature or contact 888.87.PIMCO (888.877.4626). For tax information about the Fund, please visit: https://www.pimco.com/tax.
Institutional Class: PPZRX
PIMCO REALPATH® Blend 2025 Fund
Annual Shareholder Report |
June 30, 2024
PIMCO REALPATH® Blend 2030 Fund
Annual Shareholder Report | June 30, 2024
This annual shareholder report contains important information about the PIMCO REALPATH® Blend 2030 Fund for the period of July 1, 2023 to June 30, 2024 (the "reporting period"). You can find additional information about the Fund at www.pimco.com/literature. You can also request this information by contacting us at 888.87.PIMCO (888.877.4626).
This report describes changes to the Fund that occurred during the reporting period.
What were the Fund costs for the last year?
(based on a hypothetical $10,000 investment)
| Class Name | Cost of a $10,000 investment | Costs paid as a percentage of a $10,000 investment |
|---|
| Class A | $50 | 0.48% |
How did the Fund perform during the reporting period and what affected its performance?
The following affected performance (on a gross basis) during the reporting period:
• Exposure to U.S. large cap equities contributed to absolute performance, as U.S. large cap equities posted positive returns.
• Exposure to global equities contributed to absolute performance, as global equities posted positive returns.
• Exposure to emerging market equities contributed to absolute performance, as emerging market equities posted positive returns.
• Exposure to U.S. core bonds contributed to absolute performance, as U.S. core bonds posted positive returns.
• Exposure to long-term Treasury Inflation-Protected Securities ("TIPS") detracted from absolute performance, as long-term TIPS posted
negative returns.
• Exposure to long-term treasuries detracted from absolute performance, as long-term treasuries posted negative returns.
• There were no other material detractors for this Fund.
In addition to the Fund's performance, the tables in this section include performance of: (i) a broad-based securities market index (i.e., a regulatory index) and (ii) one or more supplemental index(es). Effective July 24, 2024, the Fund's regulatory index is the S&P 500 Index. The Fund's regulatory index is shown in connection with certain regulatory requirements to provide a broad measure of market performance.
The table below illustrates cumulative returns for the 10-year period ended June 30, 2024 or the life of the Fund, if shorter. Cumulative returns are based on a hypothetical initial investment equal to the greater of either $10,000 or the investment minimum applicable to the share class.
Cumulative Returns Based on $10,000 Investment
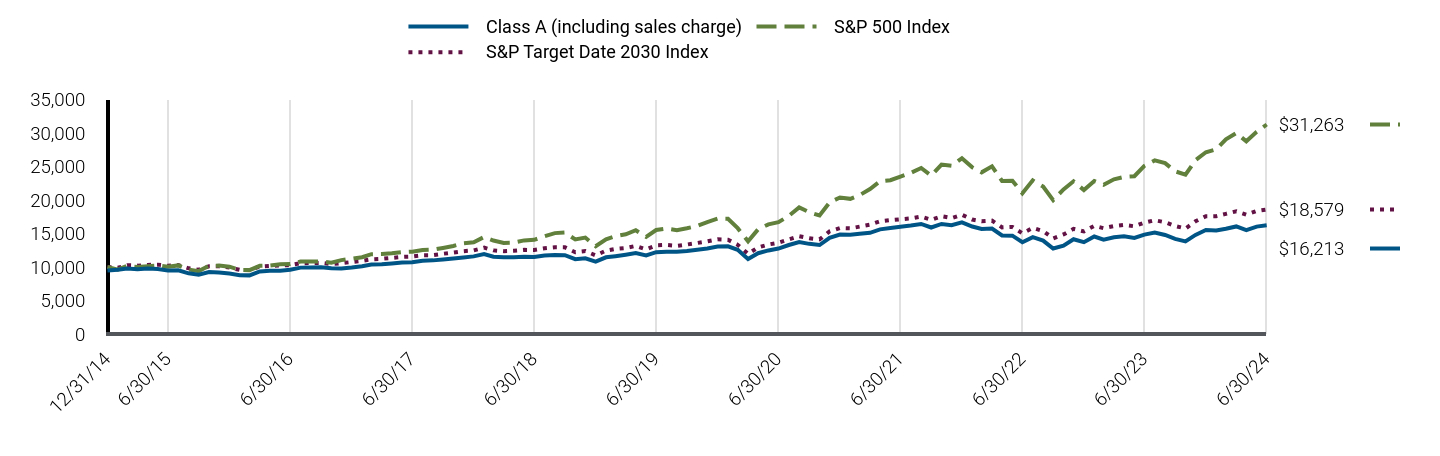
| Class A (including sales charge) | S&P 500 Index | S&P Target Date 2030 Index |
|---|
| 12/31/14 | $9,452 | $10,000 | $10,000 |
| 1/31/15 | $9,584 | $9,600 | $9,876 |
| 2/28/15 | $9,754 | $10,152 | $10,257 |
| 3/31/15 | $9,669 | $9,991 | $10,195 |
| 4/30/15 | $9,773 | $10,087 | $10,294 |
| 5/31/15 | $9,698 | $10,217 | $10,343 |
| 6/30/15 | $9,477 | $10,019 | $10,163 |
| 7/31/15 | $9,496 | $10,229 | $10,278 |
| 8/31/15 | $9,041 | $9,612 | $9,792 |
| 9/30/15 | $8,851 | $9,374 | $9,585 |
| 10/31/15 | $9,250 | $10,164 | $10,087 |
| 11/30/15 | $9,155 | $10,195 | $10,090 |
| 12/31/15 | $9,009 | $10,034 | $9,909 |
| 1/31/16 | $8,768 | $9,536 | $9,560 |
| 2/29/16 | $8,739 | $9,523 | $9,532 |
| 3/31/16 | $9,323 | $10,169 | $10,060 |
| 4/30/16 | $9,420 | $10,209 | $10,139 |
| 5/31/16 | $9,439 | $10,392 | $10,220 |
| 6/30/16 | $9,585 | $10,419 | $10,263 |
| 7/31/16 | $9,896 | $10,803 | $10,555 |
| 8/31/16 | $9,925 | $10,818 | $10,577 |
| 9/30/16 | $9,965 | $10,820 | $10,610 |
| 10/31/16 | $9,800 | $10,623 | $10,429 |
| 11/30/16 | $9,781 | $11,016 | $10,558 |
| 12/31/16 | $9,927 | $11,234 | $10,736 |
| 1/31/17 | $10,115 | $11,447 | $10,911 |
| 2/28/17 | $10,353 | $11,902 | $11,138 |
| 3/31/17 | $10,393 | $11,915 | $11,214 |
| 4/30/17 | $10,512 | $12,038 | $11,343 |
| 5/31/17 | $10,651 | $12,207 | $11,490 |
| 6/30/17 | $10,701 | $12,283 | $11,551 |
| 7/31/17 | $10,909 | $12,536 | $11,750 |
| 8/31/17 | $10,979 | $12,574 | $11,768 |
| 9/30/17 | $11,106 | $12,834 | $11,967 |
| 10/31/17 | $11,256 | $13,133 | $12,141 |
| 11/30/17 | $11,415 | $13,536 | $12,350 |
| 12/31/17 | $11,575 | $13,687 | $12,474 |
| 1/31/18 | $11,928 | $14,470 | $12,871 |
| 2/28/18 | $11,514 | $13,937 | $12,470 |
| 3/31/18 | $11,454 | $13,583 | $12,356 |
| 4/30/18 | $11,454 | $13,635 | $12,412 |
| 5/31/18 | $11,514 | $13,963 | $12,548 |
| 6/30/18 | $11,488 | $14,049 | $12,529 |
| 7/31/18 | $11,701 | $14,572 | $12,778 |
| 8/31/18 | $11,781 | $15,047 | $12,932 |
| 9/30/18 | $11,759 | $15,132 | $12,924 |
| 10/31/18 | $11,150 | $14,098 | $12,200 |
| 11/30/18 | $11,292 | $14,385 | $12,366 |
| 12/31/18 | $10,799 | $13,086 | $11,727 |
| 1/31/19 | $11,440 | $14,135 | $12,435 |
| 2/28/19 | $11,608 | $14,589 | $12,692 |
| 3/31/19 | $11,827 | $14,872 | $12,828 |
| 4/30/19 | $12,060 | $15,475 | $13,138 |
| 5/31/19 | $11,711 | $14,491 | $12,627 |
| 6/30/19 | $12,209 | $15,513 | $13,226 |
| 7/31/19 | $12,252 | $15,736 | $13,280 |
| 8/31/19 | $12,252 | $15,486 | $13,149 |
| 9/30/19 | $12,381 | $15,776 | $13,341 |
| 10/31/19 | $12,573 | $16,118 | $13,575 |
| 11/30/19 | $12,766 | $16,703 | $13,809 |
| 12/31/19 | $13,039 | $17,207 | $14,116 |
| 1/31/20 | $13,082 | $17,200 | $14,053 |
| 2/29/20 | $12,560 | $15,784 | $13,305 |
| 3/31/20 | $11,188 | $13,835 | $11,945 |
| 4/30/20 | $12,048 | $15,608 | $12,911 |
| 5/31/20 | $12,462 | $16,352 | $13,348 |
| 6/30/20 | $12,747 | $16,677 | $13,611 |
| 7/31/20 | $13,270 | $17,617 | $14,105 |
| 8/31/20 | $13,727 | $18,883 | $14,593 |
| 9/30/20 | $13,445 | $18,166 | $14,294 |
| 10/31/20 | $13,270 | $17,683 | $14,105 |
| 11/30/20 | $14,349 | $19,618 | $15,303 |
| 12/31/20 | $14,826 | $20,373 | $15,797 |
| 1/31/21 | $14,793 | $20,167 | $15,755 |
| 2/28/21 | $14,938 | $20,723 | $16,019 |
| 3/31/21 | $15,095 | $21,631 | $16,309 |
| 4/30/21 | $15,605 | $22,785 | $16,807 |
| 5/31/21 | $15,797 | $22,944 | $16,984 |
| 6/30/21 | $16,002 | $23,480 | $17,110 |
| 7/31/21 | $16,173 | $24,038 | $17,238 |
| 8/31/21 | $16,413 | $24,769 | $17,507 |
| 9/30/21 | $15,885 | $23,617 | $17,032 |
| 10/31/21 | $16,412 | $25,271 | $17,570 |
| 11/30/21 | $16,217 | $25,096 | $17,293 |
| 12/31/21 | $16,662 | $26,221 | $17,789 |
| 1/31/22 | $16,028 | $24,864 | $17,067 |
| 2/28/22 | $15,664 | $24,120 | $16,817 |
| 3/31/22 | $15,721 | $25,015 | $16,912 |
| 4/30/22 | $14,698 | $22,834 | $15,905 |
| 5/31/22 | $14,663 | $22,876 | $15,969 |
| 6/30/22 | $13,694 | $20,987 | $15,015 |
| 7/31/22 | $14,449 | $22,922 | $15,833 |
| 8/31/22 | $13,930 | $21,988 | $15,350 |
| 9/30/22 | $12,758 | $19,963 | $14,267 |
| 10/31/22 | $13,184 | $21,579 | $14,848 |
| 11/30/22 | $14,130 | $22,785 | $15,683 |
| 12/31/22 | $13,695 | $21,472 | $15,305 |
| 1/31/23 | $14,544 | $22,821 | $16,129 |
| 2/28/23 | $14,083 | $22,264 | $15,781 |
| 3/31/23 | $14,427 | $23,082 | $16,097 |
| 4/30/23 | $14,561 | $23,442 | $16,264 |
| 5/31/23 | $14,329 | $23,544 | $16,065 |
| 6/30/23 | $14,831 | $25,100 | $16,611 |
| 7/31/23 | $15,149 | $25,906 | $16,971 |
| 8/31/23 | $14,770 | $25,493 | $16,672 |
| 9/30/23 | $14,195 | $24,278 | $16,116 |
| 10/31/23 | $13,803 | $23,768 | $15,731 |
| 11/30/23 | $14,783 | $25,938 | $16,812 |
| 12/31/23 | $15,506 | $27,116 | $17,569 |
| 1/31/24 | $15,443 | $27,572 | $17,583 |
| 2/29/24 | $15,705 | $29,044 | $17,927 |
| 3/31/24 | $16,047 | $29,979 | $18,318 |
| 4/30/24 | $15,497 | $28,754 | $17,805 |
| 5/31/24 | $16,022 | $30,180 | $18,352 |
| 6/30/24 | $16,213 | $31,263 | $18,579 |
The table below shows the average annual total returns of the Fund, a regulatory index, and one or more supplemental index(es) for certain periods ended June 30, 2024.
Average Annual Total Returns (%)
| Class/Index Name | 1 Year | 5 Years | Since Inception 12/31/14 |
|---|
| Class A (excluding sales charge) | 9.31% | 5.84% | 5.85% |
| Class A (including sales charge) | 3.28% | 4.64% | 5.22% |
| S&P 500 Index | 24.56% | 15.05% | 12.75% |
| S&P Target Date 2030 Index | 11.85% | 7.03% | 6.74% |
All Fund returns are net of fees and expenses and include applicable fee waivers and/or expense limitations. Absent any applicable fee waivers and/or expense limitations, performance would have been lower and there can be no assurance that any such waivers or limitations will continue in the future.
Performance quoted represents past performance. Past performance is not a guarantee or a reliable indicator of future results.Current performance may be lower or higher than performance shown. Investment return and the principal value of an investment will fluctuate. Shares may be worth more or less than original cost when redeemed. Returns shown do not reflect the deduction of taxes that a shareholder would pay on Fund distributions or the redemption of Fund shares.Differences in the Fund’s performance versus an index and related attribution information with respect to particular categories of securities or individual positions may be attributable, in part, to differences in the pricing methodologies used by the Fund and the index. The Cumulative Returns chart and Average Annual Total Returns table reflect any sales load that would have applied at the time of purchase or any Contingent Deferred Sales Charge (“CDSC”) that would have applied if a full redemption occurred on the last business day of the period shown in the Cumulative Returns chart. Class A shares are subject to an initial sales charge. A CDSC may be imposed in certain circumstances on Class A shares that are purchased without an initial sales charge and then redeemed during the first 12 months after purchase. For performance current to the most recent month-end, visit www.pimco.com/literature or via 888.87.PIMCO (888.877.4626).
Key Fund StatisticsFootnote Reference* (as of the end of the reporting period)
| Total Net Assets | $619,096 |
| # of Portfolio Holdings | 24 |
| Portfolio Turnover Rate | 22% |
| Total Net Advisory Fees Paid During the Reporting Period | $57 |
| Footnote | Description |
Footnote* | Dollar amounts displayed in 000's |
What did the Fund invest in?
Allocation Breakdown (% of Net Assets)Footnote Reference*
| Mutual Funds | 51.1% |
| Affiliated Investments | 48.4% |
| Short-Term Instruments | 0.2% |
| Other Investments | 0.2% |
| Other Assets and Liabilities, Net | 0.1% |
| Total | 100.0% |
| Footnote | Description |
Footnote* | % of Net Assets includes derivatives instruments, if any, valued at the value used for determining the Fund’s net asset value. The notional exposure of such derivatives investments therefore may be greater than what is depicted. |
Top Holdings (% of Net Assets)
| Vanguard Institutional Index Fund 'Institutional' | 29.2% |
| Vanguard Developed Markets Index Fund 'Institutional' | 14.6% |
| PIMCO Total Return Fund | 11.0% |
| PIMCO Long-Term Real Return Fund | 8.4% |
| PIMCO Long-Term U.S. Government Fund | 7.6% |
| PIMCO Income Fund | 7.4% |
| Vanguard Emerging Markets Stock Index Fund 'Institutional' | 5.5% |
| PIMCO Real Return Fund | 3.9% |
| PIMCO Emerging Markets Local Currency and Bond Fund | 2.6% |
| PIMCO International Bond Fund (U.S. Dollar-Hedged) | 1.8% |
This is a summary of certain changes and planned changes of the Fund since the beginning of the reporting period. For more information, you may refer to the Fund's next prospectus, which we expect to be available by October 31, 2024 or upon request at 888.87.PIMCO (888.877.4626).
Changes to Total Annual Fund Operating Expenses. Annual fund operating expenses increased during the year by 0.18% as a result of the Fund’s exposure to fees and expenses related to the Fund’s investment in underlying funds.
Change to REALPATH® Blend Glide Path. Effective February 28, 2024, the Fund’s REALPATH® Blend Glide Path, which forms the basis of the Fund’s long-term asset allocations, was changed based on data relating to risk metrics, long-term market trends, correlation of asset types and actuarial assumptions of life expectancy and retirement.
For additional information about the Fund, including the Fund's prospectus, financial information, holdings and proxy voting information, please visit www.pimco.com/literature or contact 888.87.PIMCO (888.877.4626). For tax information about the Fund, please visit: https://www.pimco.com/tax.
PIMCO REALPATH® Blend 2030 Fund
Annual Shareholder Report |
June 30, 2024
Institutional Class: PBPNX
PIMCO REALPATH® Blend 2030 Fund
Annual Shareholder Report | June 30, 2024
This annual shareholder report contains important information about the PIMCO REALPATH® Blend 2030 Fund for the period of July 1, 2023 to June 30, 2024 (the "reporting period"). You can find additional information about the Fund at www.pimco.com/literature. You can also request this information by contacting us at 888.87.PIMCO (888.877.4626).
This report describes changes to the Fund that occurred during the reporting period.
What were the Fund costs for the last year?
(based on a hypothetical $10,000 investment)
| Class Name | Cost of a $10,000 investment | Costs paid as a percentage of a $10,000 investment |
|---|
| Institutional Class | $3 | 0.03% |
How did the Fund perform during the reporting period and what affected its performance?
The following affected performance (on a gross basis) during the reporting period:
• Exposure to U.S. large cap equities contributed to absolute performance, as U.S. large cap equities posted positive returns.
• Exposure to global equities contributed to absolute performance, as global equities posted positive returns.
• Exposure to emerging market equities contributed to absolute performance, as emerging market equities posted positive returns.
• Exposure to U.S. core bonds contributed to absolute performance, as U.S. core bonds posted positive returns.
• Exposure to long-term Treasury Inflation-Protected Securities ("TIPS") detracted from absolute performance, as long-term TIPS posted
negative returns.
• Exposure to long-term treasuries detracted from absolute performance, as long-term treasuries posted negative returns.
• There were no other material detractors for this Fund.
In addition to the Fund's performance, the tables in this section include performance of: (i) a broad-based securities market index (i.e., a regulatory index) and (ii) one or more supplemental index(es). Effective July 24, 2024, the Fund's regulatory index is the S&P 500 Index. The Fund's regulatory index is shown in connection with certain regulatory requirements to provide a broad measure of market performance.
The table below illustrates cumulative returns for the 10-year period ended June 30, 2024 or the life of the Fund, if shorter. Cumulative returns are based on a hypothetical initial investment equal to the greater of either $10,000 or the investment minimum applicable to the share class.
Cumulative Returns Based on $1,000,000 Investment
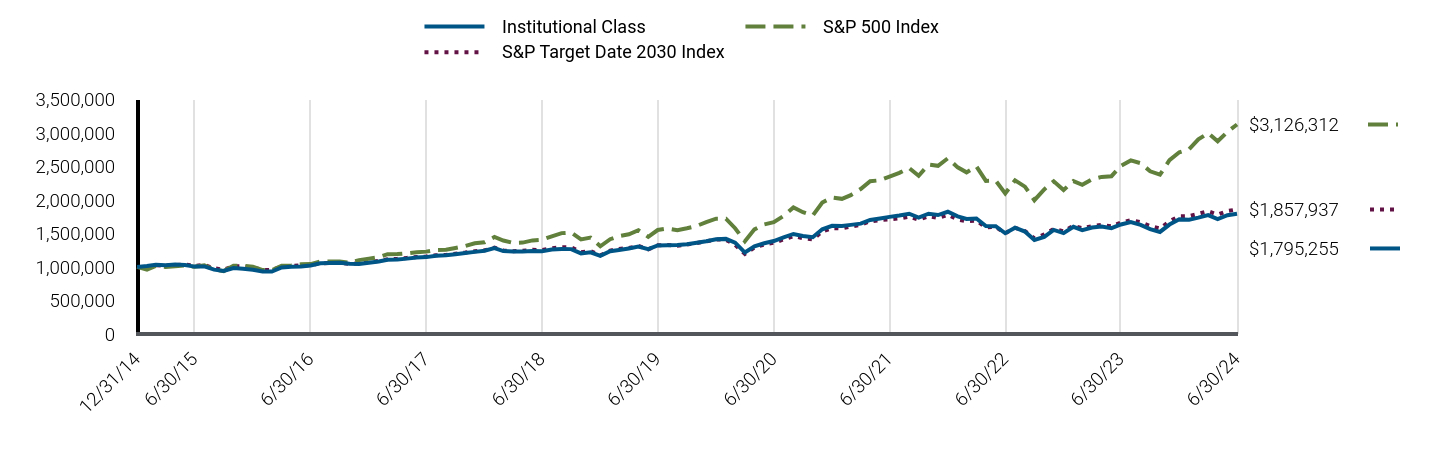
| Institutional Class | S&P 500 Index | S&P Target Date 2030 Index |
|---|
| 12/31/14 | $1,000,000 | $1,000,000 | $1,000,000 |
| 1/31/15 | $1,014,000 | $959,985 | $987,556 |
| 2/28/15 | $1,033,000 | $1,015,157 | $1,025,720 |
| 3/31/15 | $1,024,000 | $999,103 | $1,019,492 |
| 4/30/15 | $1,036,000 | $1,008,687 | $1,029,416 |
| 5/31/15 | $1,028,000 | $1,021,658 | $1,034,308 |
| 6/30/15 | $1,004,901 | $1,001,881 | $1,016,275 |
| 7/31/15 | $1,007,915 | $1,022,872 | $1,027,756 |
| 8/31/15 | $959,680 | $961,158 | $979,249 |
| 9/30/15 | $940,423 | $937,375 | $958,519 |
| 10/31/15 | $982,712 | $1,016,447 | $1,008,733 |
| 11/30/15 | $973,650 | $1,019,470 | $1,008,974 |
| 12/31/15 | $958,130 | $1,003,391 | $990,920 |
| 1/31/16 | $932,484 | $953,598 | $956,011 |
| 2/29/16 | $930,432 | $952,312 | $953,227 |
| 3/31/16 | $992,559 | $1,016,915 | $1,005,974 |
| 4/30/16 | $1,003,861 | $1,020,857 | $1,013,909 |
| 5/31/16 | $1,005,916 | $1,039,190 | $1,021,957 |
| 6/30/16 | $1,021,727 | $1,041,882 | $1,026,277 |
| 7/31/16 | $1,055,888 | $1,080,295 | $1,055,464 |
| 8/31/16 | $1,058,994 | $1,081,812 | $1,057,703 |
| 9/30/16 | $1,062,649 | $1,082,016 | $1,061,034 |
| 10/31/16 | $1,047,098 | $1,062,279 | $1,042,942 |
| 11/30/16 | $1,045,024 | $1,101,621 | $1,055,772 |
| 12/31/16 | $1,061,475 | $1,123,395 | $1,073,623 |
| 1/31/17 | $1,081,583 | $1,144,702 | $1,091,146 |
| 2/28/17 | $1,106,982 | $1,190,154 | $1,113,793 |
| 3/31/17 | $1,111,215 | $1,191,542 | $1,121,392 |
| 4/30/17 | $1,123,914 | $1,203,779 | $1,134,289 |
| 5/31/17 | $1,139,789 | $1,220,720 | $1,148,971 |
| 6/30/17 | $1,146,405 | $1,228,339 | $1,155,098 |
| 7/31/17 | $1,167,615 | $1,253,597 | $1,175,032 |
| 8/31/17 | $1,176,099 | $1,257,434 | $1,176,794 |
| 9/30/17 | $1,189,780 | $1,283,373 | $1,196,712 |
| 10/31/17 | $1,206,823 | $1,313,321 | $1,214,052 |
| 11/30/17 | $1,224,931 | $1,353,600 | $1,235,009 |
| 12/31/17 | $1,242,470 | $1,368,650 | $1,247,429 |
| 1/31/18 | $1,280,318 | $1,447,011 | $1,287,105 |
| 2/28/18 | $1,237,064 | $1,393,678 | $1,246,998 |
| 3/31/18 | $1,230,576 | $1,358,260 | $1,235,621 |
| 4/30/18 | $1,231,657 | $1,363,472 | $1,241,227 |
| 5/31/18 | $1,238,145 | $1,396,307 | $1,254,821 |
| 6/30/18 | $1,235,893 | $1,404,901 | $1,252,915 |
| 7/31/18 | $1,259,765 | $1,457,183 | $1,277,848 |
| 8/31/18 | $1,268,445 | $1,504,666 | $1,293,168 |
| 9/30/18 | $1,265,867 | $1,513,230 | $1,292,363 |
| 10/31/18 | $1,201,593 | $1,409,800 | $1,220,023 |
| 11/30/18 | $1,217,934 | $1,438,530 | $1,236,593 |
| 12/31/18 | $1,164,581 | $1,308,644 | $1,172,683 |
| 1/31/19 | $1,233,551 | $1,413,513 | $1,243,504 |
| 2/28/19 | $1,252,772 | $1,458,898 | $1,269,206 |
| 3/31/19 | $1,276,529 | $1,487,247 | $1,282,805 |
| 4/30/19 | $1,302,673 | $1,547,466 | $1,313,782 |
| 5/31/19 | $1,265,161 | $1,449,127 | $1,262,676 |
| 6/30/19 | $1,320,369 | $1,551,256 | $1,322,579 |
| 7/31/19 | $1,324,946 | $1,573,551 | $1,328,002 |
| 8/31/19 | $1,326,090 | $1,548,625 | $1,314,921 |
| 9/30/19 | $1,340,070 | $1,577,601 | $1,334,113 |
| 10/31/19 | $1,361,944 | $1,611,771 | $1,357,516 |
| 11/30/19 | $1,382,667 | $1,670,277 | $1,380,947 |
| 12/31/19 | $1,412,796 | $1,720,689 | $1,411,627 |
| 1/31/20 | $1,418,673 | $1,720,014 | $1,405,281 |
| 2/29/20 | $1,363,430 | $1,578,424 | $1,330,545 |
| 3/31/20 | $1,214,866 | $1,383,468 | $1,194,518 |
| 4/30/20 | $1,308,950 | $1,560,821 | $1,291,110 |
| 5/31/20 | $1,353,641 | $1,635,159 | $1,334,776 |
| 6/30/20 | $1,386,164 | $1,667,678 | $1,361,060 |
| 7/31/20 | $1,442,694 | $1,761,710 | $1,410,473 |
| 8/31/20 | $1,492,157 | $1,888,343 | $1,459,255 |
| 9/30/20 | $1,462,870 | $1,816,592 | $1,429,356 |
| 10/31/20 | $1,443,994 | $1,768,282 | $1,410,528 |
| 11/30/20 | $1,561,968 | $1,961,845 | $1,530,312 |
| 12/31/20 | $1,614,610 | $2,037,275 | $1,579,734 |
| 1/31/21 | $1,612,182 | $2,016,707 | $1,575,517 |
| 2/28/21 | $1,627,964 | $2,072,317 | $1,601,880 |
| 3/31/21 | $1,646,611 | $2,163,076 | $1,630,855 |
| 4/30/21 | $1,701,907 | $2,278,516 | $1,680,717 |
| 5/31/21 | $1,724,026 | $2,294,430 | $1,698,372 |
| 6/30/21 | $1,747,017 | $2,347,993 | $1,711,030 |
| 7/31/21 | $1,766,855 | $2,403,770 | $1,723,764 |
| 8/31/21 | $1,794,133 | $2,476,858 | $1,750,744 |
| 9/30/21 | $1,737,049 | $2,361,660 | $1,703,215 |
| 10/31/21 | $1,794,287 | $2,527,122 | $1,757,043 |
| 11/30/21 | $1,774,378 | $2,509,612 | $1,729,263 |
| 12/31/21 | $1,823,840 | $2,622,083 | $1,778,869 |
| 1/31/22 | $1,754,823 | $2,486,398 | $1,706,694 |
| 2/28/22 | $1,715,202 | $2,411,951 | $1,681,739 |
| 3/31/22 | $1,723,157 | $2,501,506 | $1,691,171 |
| 4/30/22 | $1,610,415 | $2,283,370 | $1,590,459 |
| 5/31/22 | $1,607,852 | $2,287,559 | $1,596,940 |
| 6/30/22 | $1,502,921 | $2,098,736 | $1,501,520 |
| 7/31/22 | $1,585,203 | $2,292,248 | $1,583,279 |
| 8/31/22 | $1,528,634 | $2,198,766 | $1,535,042 |
| 9/30/22 | $1,401,844 | $1,996,263 | $1,426,746 |
| 10/31/22 | $1,448,314 | $2,157,883 | $1,484,839 |
| 11/30/22 | $1,552,871 | $2,278,474 | $1,568,316 |
| 12/31/22 | $1,504,999 | $2,147,201 | $1,530,454 |
| 1/31/23 | $1,599,145 | $2,282,118 | $1,612,944 |
| 2/28/23 | $1,548,757 | $2,226,437 | $1,578,125 |
| 3/31/23 | $1,587,729 | $2,308,179 | $1,609,717 |
| 4/30/23 | $1,602,393 | $2,344,206 | $1,626,386 |
| 5/31/23 | $1,578,397 | $2,354,395 | $1,606,511 |
| 6/30/23 | $1,633,772 | $2,509,962 | $1,661,147 |
| 7/31/23 | $1,669,870 | $2,590,595 | $1,697,128 |
| 8/31/23 | $1,628,424 | $2,549,349 | $1,667,202 |
| 9/30/23 | $1,565,411 | $2,427,801 | $1,611,626 |
| 10/31/23 | $1,522,413 | $2,376,753 | $1,573,140 |
| 11/30/23 | $1,632,596 | $2,593,811 | $1,681,246 |
| 12/31/23 | $1,711,254 | $2,711,650 | $1,756,918 |
| 1/31/24 | $1,705,796 | $2,757,216 | $1,758,280 |
| 2/29/24 | $1,735,818 | $2,904,440 | $1,792,725 |
| 3/31/24 | $1,773,687 | $2,997,889 | $1,831,784 |
| 4/30/24 | $1,713,236 | $2,875,441 | $1,780,523 |
| 5/31/24 | $1,772,313 | $3,018,019 | $1,835,222 |
| 6/30/24 | $1,795,255 | $3,126,312 | $1,857,937 |
The table below shows the average annual total returns of the Fund, a regulatory index, and one or more supplemental index(es) for certain periods ended June 30, 2024.
Average Annual Total Returns (%)
| Class/Index Name | 1 Year | 5 Years | Since Inception 12/31/14 |
|---|
| Institutional Class | 9.88% | 6.34% | 6.36% |
| S&P 500 Index | 24.56% | 15.05% | 12.75% |
| S&P Target Date 2030 Index | 11.85% | 7.03% | 6.74% |
All Fund returns are net of fees and expenses and include applicable fee waivers and/or expense limitations. Absent any applicable fee waivers and/or expense limitations, performance would have been lower and there can be no assurance that any such waivers or limitations will continue in the future.
Performance quoted represents past performance. Past performance is not a guarantee or a reliable indicator of future results.Current performance may be lower or higher than performance shown. Investment return and the principal value of an investment will fluctuate. Shares may be worth more or less than original cost when redeemed. Returns shown do not reflect the deduction of taxes that a shareholder would pay on Fund distributions or the redemption of Fund shares.Differences in the Fund’s performance versus an index and related attribution information with respect to particular categories of securities or individual positions may be attributable, in part, to differences in the pricing methodologies used by the Fund and the index. For performance current to the most recent month-end, visit www.pimco.com/literature or via 888.87.PIMCO (888.877.4626).
Key Fund StatisticsFootnote Reference* (as of the end of the reporting period)
| Total Net Assets | $619,096 |
| # of Portfolio Holdings | 24 |
| Portfolio Turnover Rate | 22% |
| Total Net Advisory Fees Paid During the Reporting Period | $57 |
| Footnote | Description |
Footnote* | Dollar amounts displayed in 000's |
What did the Fund invest in?
Allocation Breakdown (% of Net Assets)Footnote Reference*
| Mutual Funds | 51.1% |
| Affiliated Investments | 48.4% |
| Short-Term Instruments | 0.2% |
| Other Investments | 0.2% |
| Other Assets and Liabilities, Net | 0.1% |
| Total | 100.0% |
| Footnote | Description |
Footnote* | % of Net Assets includes derivatives instruments, if any, valued at the value used for determining the Fund’s net asset value. The notional exposure of such derivatives investments therefore may be greater than what is depicted. |
Top Holdings (% of Net Assets)
| Vanguard Institutional Index Fund 'Institutional' | 29.2% |
| Vanguard Developed Markets Index Fund 'Institutional' | 14.6% |
| PIMCO Total Return Fund | 11.0% |
| PIMCO Long-Term Real Return Fund | 8.4% |
| PIMCO Long-Term U.S. Government Fund | 7.6% |
| PIMCO Income Fund | 7.4% |
| Vanguard Emerging Markets Stock Index Fund 'Institutional' | 5.5% |
| PIMCO Real Return Fund | 3.9% |
| PIMCO Emerging Markets Local Currency and Bond Fund | 2.6% |
| PIMCO International Bond Fund (U.S. Dollar-Hedged) | 1.8% |
This is a summary of certain changes and planned changes of the Fund since the beginning of the reporting period. For more information, you may refer to the Fund's next prospectus, which we expect to be available by October 31, 2024 or upon request at 888.87.PIMCO (888.877.4626).
Changes to Total Annual Fund Operating Expenses. Annual fund operating expenses increased during the year by 0.18% as a result of the Fund’s exposure to fees and expenses related to the Fund’s investment in underlying funds.
Change to REALPATH® Blend Glide Path. Effective February 28, 2024, the Fund’s REALPATH® Blend Glide Path, which forms the basis of the Fund’s long-term asset allocations, was changed based on data relating to risk metrics, long-term market trends, correlation of asset types and actuarial assumptions of life expectancy and retirement.
For additional information about the Fund, including the Fund's prospectus, financial information, holdings and proxy voting information, please visit www.pimco.com/literature or contact 888.87.PIMCO (888.877.4626). For tax information about the Fund, please visit: https://www.pimco.com/tax.
Institutional Class: PBPNX
PIMCO REALPATH® Blend 2030 Fund
Annual Shareholder Report |
June 30, 2024
PIMCO REALPATH® Blend 2035 Fund
Annual Shareholder Report | June 30, 2024
This annual shareholder report contains important information about the PIMCO REALPATH® Blend 2035 Fund for the period of July 1, 2023 to June 30, 2024 (the "reporting period"). You can find additional information about the Fund at www.pimco.com/literature. You can also request this information by contacting us at 888.87.PIMCO (888.877.4626).
This report describes changes to the Fund that occurred during the reporting period.
What were the Fund costs for the last year?
(based on a hypothetical $10,000 investment)
| Class Name | Cost of a $10,000 investment | Costs paid as a percentage of a $10,000 investment |
|---|
| Class A | $52 | 0.49% |
How did the Fund perform during the reporting period and what affected its performance?
The following affected performance (on a gross basis) during the reporting period:
• Exposure to U.S. large cap equities contributed to absolute performance, as U.S. large cap equities posted positive returns.
• Exposure to global equities contributed to absolute performance, as global equities posted positive returns.
• Exposure to emerging market equities contributed to absolute performance, as emerging market equities posted positive returns.
• Exposure to U.S. small cap equities contributed to absolute performance, as U.S. small cap equities posted positive returns.
• Exposure to long-term Treasury Inflation-Protected Securities ("TIPS") detracted from absolute performance, as long-term TIPS posted
negative returns.
• Exposure to long-term treasuries detracted from absolute performance, as long-term treasuries posted negative returns.
• There were no other material detractors for this Fund.
In addition to the Fund's performance, the tables in this section include performance of: (i) a broad-based securities market index (i.e., a regulatory index) and (ii) one or more supplemental index(es). Effective July 24, 2024, the Fund's regulatory index is the S&P 500 Index. The Fund's regulatory index is shown in connection with certain regulatory requirements to provide a broad measure of market performance.
The table below illustrates cumulative returns for the 10-year period ended June 30, 2024 or the life of the Fund, if shorter. Cumulative returns are based on a hypothetical initial investment equal to the greater of either $10,000 or the investment minimum applicable to the share class.
Cumulative Returns Based on $10,000 Investment
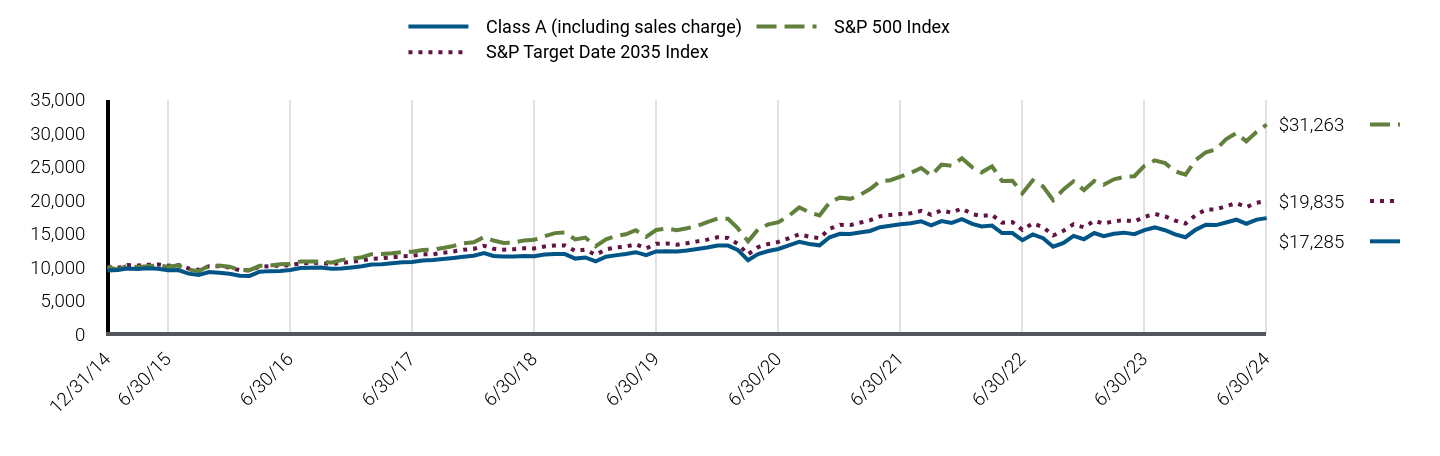
| Class A (including sales charge) | S&P 500 Index | S&P Target Date 2035 Index |
|---|
| 12/31/14 | $9,452 | $10,000 | $10,000 |
| 1/31/15 | $9,546 | $9,600 | $9,850 |
| 2/28/15 | $9,773 | $10,152 | $10,269 |
| 3/31/15 | $9,679 | $9,991 | $10,201 |
| 4/30/15 | $9,811 | $10,087 | $10,310 |
| 5/31/15 | $9,735 | $10,217 | $10,366 |
| 6/30/15 | $9,513 | $10,019 | $10,178 |
| 7/31/15 | $9,523 | $10,229 | $10,297 |
| 8/31/15 | $9,001 | $9,612 | $9,773 |
| 9/30/15 | $8,790 | $9,374 | $9,546 |
| 10/31/15 | $9,236 | $10,164 | $10,087 |
| 11/30/15 | $9,141 | $10,195 | $10,092 |
| 12/31/15 | $8,986 | $10,034 | $9,899 |
| 1/31/16 | $8,679 | $9,536 | $9,512 |
| 2/29/16 | $8,650 | $9,523 | $9,475 |
| 3/31/16 | $9,287 | $10,169 | $10,037 |
| 4/30/16 | $9,373 | $10,209 | $10,121 |
| 5/31/16 | $9,402 | $10,392 | $10,208 |
| 6/30/16 | $9,533 | $10,419 | $10,240 |
| 7/31/16 | $9,842 | $10,803 | $10,554 |
| 8/31/16 | $9,861 | $10,818 | $10,580 |
| 9/30/16 | $9,899 | $10,820 | $10,615 |
| 10/31/16 | $9,735 | $10,623 | $10,423 |
| 11/30/16 | $9,755 | $11,016 | $10,582 |
| 12/31/16 | $9,926 | $11,234 | $10,775 |
| 1/31/17 | $10,112 | $11,447 | $10,965 |
| 2/28/17 | $10,367 | $11,902 | $11,209 |
| 3/31/17 | $10,416 | $11,915 | $11,293 |
| 4/30/17 | $10,534 | $12,038 | $11,429 |
| 5/31/17 | $10,681 | $12,207 | $11,586 |
| 6/30/17 | $10,740 | $12,283 | $11,657 |
| 7/31/17 | $10,956 | $12,536 | $11,880 |
| 8/31/17 | $11,025 | $12,574 | $11,891 |
| 9/30/17 | $11,167 | $12,834 | $12,121 |
| 10/31/17 | $11,334 | $13,133 | $12,317 |
| 11/30/17 | $11,511 | $13,536 | $12,554 |
| 12/31/17 | $11,669 | $13,687 | $12,691 |
| 1/31/18 | $12,069 | $14,470 | $13,159 |
| 2/28/18 | $11,639 | $13,937 | $12,710 |
| 3/31/18 | $11,549 | $13,583 | $12,571 |
| 4/30/18 | $11,569 | $13,635 | $12,642 |
| 5/31/18 | $11,639 | $13,963 | $12,786 |
| 6/30/18 | $11,606 | $14,049 | $12,762 |
| 7/31/18 | $11,846 | $14,572 | $13,047 |
| 8/31/18 | $11,936 | $15,047 | $13,214 |
| 9/30/18 | $11,916 | $15,132 | $13,211 |
| 10/31/18 | $11,244 | $14,098 | $12,385 |
| 11/30/18 | $11,414 | $14,385 | $12,568 |
| 12/31/18 | $10,822 | $13,086 | $11,818 |
| 1/31/19 | $11,526 | $14,135 | $12,608 |
| 2/28/19 | $11,725 | $14,589 | $12,902 |
| 3/31/19 | $11,926 | $14,872 | $13,031 |
| 4/30/19 | $12,201 | $15,475 | $13,385 |
| 5/31/19 | $11,757 | $14,491 | $12,774 |
| 6/30/19 | $12,320 | $15,513 | $13,446 |
| 7/31/19 | $12,352 | $15,736 | $13,503 |
| 8/31/19 | $12,288 | $15,486 | $13,313 |
| 9/30/19 | $12,445 | $15,776 | $13,543 |
| 10/31/19 | $12,669 | $16,118 | $13,812 |
| 11/30/19 | $12,893 | $16,703 | $14,080 |
| 12/31/19 | $13,210 | $17,207 | $14,438 |
| 1/31/20 | $13,188 | $17,200 | $14,331 |
| 2/29/20 | $12,547 | $15,784 | $13,437 |
| 3/31/20 | $11,016 | $13,835 | $11,883 |
| 4/30/20 | $11,928 | $15,608 | $12,949 |
| 5/31/20 | $12,374 | $16,352 | $13,435 |
| 6/30/20 | $12,683 | $16,677 | $13,731 |
| 7/31/20 | $13,215 | $17,617 | $14,280 |
| 8/31/20 | $13,737 | $18,883 | $14,870 |
| 9/30/20 | $13,432 | $18,166 | $14,514 |
| 10/31/20 | $13,226 | $17,683 | $14,300 |
| 11/30/20 | $14,422 | $19,618 | $15,699 |
| 12/31/20 | $14,948 | $20,373 | $16,285 |
| 1/31/21 | $14,903 | $20,167 | $16,245 |
| 2/28/21 | $15,125 | $20,723 | $16,598 |
| 3/31/21 | $15,372 | $21,631 | $16,973 |
| 4/30/21 | $15,930 | $22,785 | $17,558 |
| 5/31/21 | $16,153 | $22,944 | $17,764 |
| 6/30/21 | $16,357 | $23,480 | $17,898 |
| 7/31/21 | $16,514 | $24,038 | $18,022 |
| 8/31/21 | $16,807 | $24,769 | $18,358 |
| 9/30/21 | $16,220 | $23,617 | $17,789 |
| 10/31/21 | $16,840 | $25,271 | $18,451 |
| 11/30/21 | $16,580 | $25,096 | $18,100 |
| 12/31/21 | $17,121 | $26,221 | $18,716 |
| 1/31/22 | $16,438 | $24,864 | $17,881 |
| 2/28/22 | $16,034 | $24,120 | $17,592 |
| 3/31/22 | $16,172 | $25,015 | $17,775 |
| 4/30/22 | $15,062 | $22,834 | $16,615 |
| 5/31/22 | $15,062 | $22,876 | $16,686 |
| 6/30/22 | $13,991 | $20,987 | $15,545 |
| 7/31/22 | $14,848 | $22,922 | $16,501 |
| 8/31/22 | $14,292 | $21,988 | $15,947 |
| 9/30/22 | $13,024 | $19,963 | $14,690 |
| 10/31/22 | $13,581 | $21,579 | $15,406 |
| 11/30/22 | $14,626 | $22,785 | $16,377 |
| 12/31/22 | $14,138 | $21,472 | $15,911 |
| 1/31/23 | $15,066 | $22,821 | $16,877 |
| 2/28/23 | $14,590 | $22,264 | $16,479 |
| 3/31/23 | $14,963 | $23,082 | $16,815 |
| 4/30/23 | $15,118 | $23,442 | $17,009 |
| 5/31/23 | $14,892 | $23,544 | $16,778 |
| 6/30/23 | $15,501 | $25,100 | $17,468 |
| 7/31/23 | $15,895 | $25,906 | $17,917 |
| 8/31/23 | $15,478 | $25,493 | $17,556 |
| 9/30/23 | $14,855 | $24,278 | $16,920 |
| 10/31/23 | $14,436 | $23,768 | $16,476 |
| 11/30/23 | $15,537 | $25,938 | $17,714 |
| 12/31/23 | $16,299 | $27,116 | $18,557 |
| 1/31/24 | $16,250 | $27,572 | $18,581 |
| 2/29/24 | $16,639 | $29,044 | $19,059 |
| 3/31/24 | $17,047 | $29,979 | $19,527 |
| 4/30/24 | $16,449 | $28,754 | $18,941 |
| 5/31/24 | $17,059 | $30,180 | $19,586 |
| 6/30/24 | $17,285 | $31,263 | $19,835 |
The table below shows the average annual total returns of the Fund, a regulatory index, and one or more supplemental index(es) for certain periods ended June 30, 2024.
Average Annual Total Returns (%)
| Class/Index Name | 1 Year | 5 Years | Since Inception 12/31/14 |
|---|
| Class A (excluding sales charge) | 11.51% | 7.01% | 6.56% |
| Class A (including sales charge) | 5.35% | 5.80% | 5.93% |
| S&P 500 Index | 24.56% | 15.05% | 12.75% |
| S&P Target Date 2035 Index | 13.55% | 8.09% | 7.48% |
All Fund returns are net of fees and expenses and include applicable fee waivers and/or expense limitations. Absent any applicable fee waivers and/or expense limitations, performance would have been lower and there can be no assurance that any such waivers or limitations will continue in the future.
Performance quoted represents past performance. Past performance is not a guarantee or a reliable indicator of future results.Current performance may be lower or higher than performance shown. Investment return and the principal value of an investment will fluctuate. Shares may be worth more or less than original cost when redeemed. Returns shown do not reflect the deduction of taxes that a shareholder would pay on Fund distributions or the redemption of Fund shares.Differences in the Fund’s performance versus an index and related attribution information with respect to particular categories of securities or individual positions may be attributable, in part, to differences in the pricing methodologies used by the Fund and the index. The Cumulative Returns chart and Average Annual Total Returns table reflect any sales load that would have applied at the time of purchase or any Contingent Deferred Sales Charge (“CDSC”) that would have applied if a full redemption occurred on the last business day of the period shown in the Cumulative Returns chart. Class A shares are subject to an initial sales charge. A CDSC may be imposed in certain circumstances on Class A shares that are purchased without an initial sales charge and then redeemed during the first 12 months after purchase. For performance current to the most recent month-end, visit www.pimco.com/literature or via 888.87.PIMCO (888.877.4626).
Key Fund StatisticsFootnote Reference* (as of the end of the reporting period)
| Total Net Assets | $648,938 |
| # of Portfolio Holdings | 18 |
| Portfolio Turnover Rate | 14% |
| Total Net Advisory Fees Paid During the Reporting Period | $116 |
| Footnote | Description |
Footnote* | Dollar amounts displayed in 000's |
What did the Fund invest in?
Allocation Breakdown (% of Net Assets)Footnote Reference*
| Mutual Funds | 62.6% |
| Affiliated Investments | 37.2% |
| Other Investments | 0.0% |
| Other Assets and Liabilities, Net | 0.2% |
| Total | 100.0% |
| Footnote | Description |
Footnote* | % of Net Assets includes derivatives instruments, if any, valued at the value used for determining the Fund’s net asset value. The notional exposure of such derivatives investments therefore may be greater than what is depicted. |
Top Holdings (% of Net Assets)
| Vanguard Institutional Index Fund 'Institutional' | 35.2% |
| Vanguard Developed Markets Index Fund 'Institutional' | 17.6% |
| PIMCO Total Return Fund | 8.4% |
| Vanguard Emerging Markets Stock Index Fund 'Institutional' | 7.0% |
| PIMCO Long-Term Real Return Fund | 6.3% |
| PIMCO Income Fund | 5.5% |
| PIMCO Long-Term U.S. Government Fund | 5.3% |
| PIMCO Real Return Fund | 2.9% |
| Vanguard Small-Cap Index Fund 'Institutional' | 2.8% |
| PIMCO Emerging Markets Local Currency and Bond Fund | 2.0% |
This is a summary of certain changes and planned changes of the Fund since the beginning of the reporting period. For more information, you may refer to the Fund's next prospectus, which we expect to be available by October 31, 2024 or upon request at 888.87.PIMCO (888.877.4626).
Changes to Total Annual Fund Operating Expenses. Annual fund operating expenses increased during the year by 0.13% as a result of the Fund’s exposure to fees and expenses related to the Fund’s investment in underlying funds.
Change to REALPATH® Blend Glide Path. Effective February 28, 2024, the Fund’s REALPATH® Blend Glide Path, which forms the basis of the Fund’s long-term asset allocations, was changed based on data relating to risk metrics, long-term market trends, correlation of asset types and actuarial assumptions of life expectancy and retirement.
For additional information about the Fund, including the Fund's prospectus, financial information, holdings and proxy voting information, please visit www.pimco.com/literature or contact 888.87.PIMCO (888.877.4626). For tax information about the Fund, please visit: https://www.pimco.com/tax.
PIMCO REALPATH® Blend 2035 Fund
Annual Shareholder Report |
June 30, 2024
Institutional Class: PDGZX
PIMCO REALPATH® Blend 2035 Fund
Annual Shareholder Report | June 30, 2024
This annual shareholder report contains important information about the PIMCO REALPATH® Blend 2035 Fund for the period of July 1, 2023 to June 30, 2024 (the "reporting period"). You can find additional information about the Fund at www.pimco.com/literature. You can also request this information by contacting us at 888.87.PIMCO (888.877.4626).
This report describes changes to the Fund that occurred during the reporting period.
What were the Fund costs for the last year?
(based on a hypothetical $10,000 investment)
| Class Name | Cost of a $10,000 investment | Costs paid as a percentage of a $10,000 investment |
|---|
| Institutional Class | $4 | 0.04% |
How did the Fund perform during the reporting period and what affected its performance?
The following affected performance (on a gross basis) during the reporting period:
• Exposure to U.S. large cap equities contributed to absolute performance, as U.S. large cap equities posted positive returns.
• Exposure to global equities contributed to absolute performance, as global equities posted positive returns.
• Exposure to emerging market equities contributed to absolute performance, as emerging market equities posted positive returns.
• Exposure to U.S. small cap equities contributed to absolute performance, as U.S. small cap equities posted positive returns.
• Exposure to long-term Treasury Inflation-Protected Securities ("TIPS") detracted from absolute performance, as long-term TIPS posted
negative returns.
• Exposure to long-term treasuries detracted from absolute performance, as long-term treasuries posted negative returns.
• There were no other material detractors for this Fund.
In addition to the Fund's performance, the tables in this section include performance of: (i) a broad-based securities market index (i.e., a regulatory index) and (ii) one or more supplemental index(es). Effective July 24, 2024, the Fund's regulatory index is the S&P 500 Index. The Fund's regulatory index is shown in connection with certain regulatory requirements to provide a broad measure of market performance.
The table below illustrates cumulative returns for the 10-year period ended June 30, 2024 or the life of the Fund, if shorter. Cumulative returns are based on a hypothetical initial investment equal to the greater of either $10,000 or the investment minimum applicable to the share class.
Cumulative Returns Based on $1,000,000 Investment

| Institutional Class | S&P 500 Index | S&P Target Date 2035 Index |
|---|
| 12/31/14 | $1,000,000 | $1,000,000 | $1,000,000 |
| 1/31/15 | $1,011,000 | $959,985 | $985,036 |
| 2/28/15 | $1,035,000 | $1,015,157 | $1,026,942 |
| 3/31/15 | $1,025,000 | $999,103 | $1,020,112 |
| 4/30/15 | $1,040,000 | $1,008,687 | $1,030,995 |
| 5/31/15 | $1,033,000 | $1,021,658 | $1,036,612 |
| 6/30/15 | $1,008,878 | $1,001,881 | $1,017,760 |
| 7/31/15 | $1,010,888 | $1,022,872 | $1,029,656 |
| 8/31/15 | $955,621 | $961,158 | $977,284 |
| 9/30/15 | $934,192 | $937,375 | $954,615 |
| 10/31/15 | $981,505 | $1,016,447 | $1,008,704 |
| 11/30/15 | $972,445 | $1,019,470 | $1,009,244 |
| 12/31/15 | $954,983 | $1,003,391 | $989,920 |
| 1/31/16 | $923,253 | $953,598 | $951,248 |
| 2/29/16 | $920,182 | $952,312 | $947,531 |
| 3/31/16 | $988,094 | $1,016,915 | $1,003,729 |
| 4/30/16 | $998,343 | $1,020,857 | $1,012,083 |
| 5/31/16 | $1,001,418 | $1,039,190 | $1,020,810 |
| 6/30/16 | $1,015,366 | $1,041,882 | $1,023,958 |
| 7/31/16 | $1,050,485 | $1,080,295 | $1,055,406 |
| 8/31/16 | $1,052,551 | $1,081,812 | $1,058,014 |
| 9/30/16 | $1,057,347 | $1,082,016 | $1,061,468 |
| 10/31/16 | $1,039,759 | $1,062,279 | $1,042,274 |
| 11/30/16 | $1,041,828 | $1,101,621 | $1,058,198 |
| 12/31/16 | $1,060,479 | $1,123,395 | $1,077,549 |
| 1/31/17 | $1,081,520 | $1,144,702 | $1,096,514 |
| 2/28/17 | $1,108,874 | $1,190,154 | $1,120,870 |
| 3/31/17 | $1,114,134 | $1,191,542 | $1,129,338 |
| 4/30/17 | $1,126,759 | $1,203,779 | $1,142,885 |
| 5/31/17 | $1,143,592 | $1,220,720 | $1,158,617 |
| 6/30/17 | $1,150,264 | $1,228,339 | $1,165,733 |
| 7/31/17 | $1,174,513 | $1,253,597 | $1,187,978 |
| 8/31/17 | $1,181,893 | $1,257,434 | $1,189,085 |
| 9/30/17 | $1,197,179 | $1,283,373 | $1,212,055 |
| 10/31/17 | $1,215,174 | $1,313,321 | $1,231,738 |
| 11/30/17 | $1,235,285 | $1,353,600 | $1,255,427 |
| 12/31/17 | $1,252,727 | $1,368,650 | $1,269,087 |
| 1/31/18 | $1,296,814 | $1,447,011 | $1,315,851 |
| 2/28/18 | $1,250,576 | $1,393,678 | $1,270,967 |
| 3/31/18 | $1,241,974 | $1,358,260 | $1,257,095 |
| 4/30/18 | $1,244,124 | $1,363,472 | $1,264,241 |
| 5/31/18 | $1,251,651 | $1,396,307 | $1,278,642 |
| 6/30/18 | $1,248,680 | $1,404,901 | $1,276,183 |
| 7/31/18 | $1,275,638 | $1,457,183 | $1,304,719 |
| 8/31/18 | $1,285,343 | $1,504,666 | $1,321,358 |
| 9/30/18 | $1,284,292 | $1,513,230 | $1,321,077 |
| 10/31/18 | $1,212,822 | $1,409,800 | $1,238,522 |
| 11/30/18 | $1,231,231 | $1,438,530 | $1,256,836 |
| 12/31/18 | $1,167,995 | $1,308,644 | $1,181,766 |
| 1/31/19 | $1,244,119 | $1,413,513 | $1,260,838 |
| 2/28/19 | $1,266,842 | $1,458,898 | $1,290,164 |
| 3/31/19 | $1,288,762 | $1,487,247 | $1,303,134 |
| 4/30/19 | $1,318,494 | $1,547,466 | $1,338,477 |
| 5/31/19 | $1,271,609 | $1,449,127 | $1,277,410 |
| 6/30/19 | $1,331,987 | $1,551,256 | $1,344,614 |
| 7/31/19 | $1,336,588 | $1,573,551 | $1,350,271 |
| 8/31/19 | $1,329,686 | $1,548,625 | $1,331,324 |
| 9/30/19 | $1,347,860 | $1,577,601 | $1,354,345 |
| 10/31/19 | $1,373,313 | $1,611,771 | $1,381,193 |
| 11/30/19 | $1,397,609 | $1,670,277 | $1,408,034 |
| 12/31/19 | $1,432,816 | $1,720,689 | $1,443,835 |
| 1/31/20 | $1,430,455 | $1,720,014 | $1,433,131 |
| 2/29/20 | $1,362,001 | $1,578,424 | $1,343,744 |
| 3/31/20 | $1,195,308 | $1,383,468 | $1,188,349 |
| 4/30/20 | $1,295,704 | $1,560,821 | $1,294,918 |
| 5/31/20 | $1,344,131 | $1,635,159 | $1,343,500 |
| 6/30/20 | $1,378,217 | $1,667,678 | $1,373,110 |
| 7/31/20 | $1,436,185 | $1,761,710 | $1,427,965 |
| 8/31/20 | $1,494,153 | $1,888,343 | $1,487,005 |
| 9/30/20 | $1,462,271 | $1,816,592 | $1,451,428 |
| 10/31/20 | $1,439,757 | $1,768,282 | $1,430,037 |
| 11/30/20 | $1,570,105 | $1,961,845 | $1,569,854 |
| 12/31/20 | $1,629,565 | $2,037,275 | $1,628,492 |
| 1/31/21 | $1,624,740 | $2,016,707 | $1,624,502 |
| 2/28/21 | $1,650,070 | $2,072,317 | $1,659,756 |
| 3/31/21 | $1,677,689 | $2,163,076 | $1,697,295 |
| 4/30/21 | $1,739,826 | $2,278,516 | $1,755,803 |
| 5/31/21 | $1,762,975 | $2,294,430 | $1,776,421 |
| 6/30/21 | $1,787,313 | $2,347,993 | $1,789,807 |
| 7/31/21 | $1,805,752 | $2,403,770 | $1,802,199 |
| 8/31/21 | $1,837,712 | $2,476,858 | $1,835,774 |
| 9/30/21 | $1,775,005 | $2,361,660 | $1,778,895 |
| 10/31/21 | $1,842,847 | $2,527,122 | $1,845,090 |
| 11/30/21 | $1,815,710 | $2,509,612 | $1,809,979 |
| 12/31/21 | $1,874,883 | $2,622,083 | $1,871,550 |
| 1/31/22 | $1,800,091 | $2,486,398 | $1,788,084 |
| 2/28/22 | $1,756,990 | $2,411,951 | $1,759,215 |
| 3/31/22 | $1,772,757 | $2,501,506 | $1,777,529 |
| 4/30/22 | $1,652,204 | $2,283,370 | $1,661,491 |
| 5/31/22 | $1,653,473 | $2,287,559 | $1,668,589 |
| 6/30/22 | $1,536,592 | $2,098,736 | $1,554,455 |
| 7/31/22 | $1,629,449 | $2,292,248 | $1,650,094 |
| 8/31/22 | $1,569,665 | $2,198,766 | $1,594,685 |
| 9/30/22 | $1,431,383 | $1,996,263 | $1,469,000 |
| 10/31/22 | $1,492,619 | $2,157,883 | $1,540,576 |
| 11/30/22 | $1,608,711 | $2,278,474 | $1,637,703 |
| 12/31/22 | $1,554,803 | $2,147,201 | $1,591,088 |
| 1/31/23 | $1,658,194 | $2,282,118 | $1,687,735 |
| 2/28/23 | $1,605,844 | $2,226,437 | $1,647,865 |
| 3/31/23 | $1,647,118 | $2,308,179 | $1,681,504 |
| 4/30/23 | $1,665,492 | $2,344,206 | $1,700,903 |
| 5/31/23 | $1,640,556 | $2,354,395 | $1,677,847 |
| 6/30/23 | $1,709,570 | $2,509,962 | $1,746,792 |
| 7/31/23 | $1,752,967 | $2,590,595 | $1,791,664 |
| 8/31/23 | $1,708,255 | $2,549,349 | $1,755,614 |
| 9/30/23 | $1,639,676 | $2,427,801 | $1,691,987 |
| 10/31/23 | $1,594,753 | $2,376,753 | $1,647,575 |
| 11/30/23 | $1,716,308 | $2,593,811 | $1,771,431 |
| 12/31/23 | $1,801,399 | $2,711,650 | $1,855,708 |
| 1/31/24 | $1,796,029 | $2,757,216 | $1,858,105 |
| 2/29/24 | $1,840,326 | $2,904,440 | $1,905,859 |
| 3/31/24 | $1,885,800 | $2,997,889 | $1,952,741 |
| 4/30/24 | $1,821,052 | $2,875,441 | $1,894,145 |
| 5/31/24 | $1,888,498 | $3,018,019 | $1,958,572 |
| 6/30/24 | $1,914,197 | $3,126,312 | $1,983,534 |
The table below shows the average annual total returns of the Fund, a regulatory index, and one or more supplemental index(es) for certain periods ended June 30, 2024.
Average Annual Total Returns (%)
| Class/Index Name | 1 Year | 5 Years | Since Inception 12/31/14 |
|---|
| Institutional Class | 11.97% | 7.52% | 7.08% |
| S&P 500 Index | 24.56% | 15.05% | 12.75% |
| S&P Target Date 2035 Index | 13.55% | 8.09% | 7.48% |
All Fund returns are net of fees and expenses and include applicable fee waivers and/or expense limitations. Absent any applicable fee waivers and/or expense limitations, performance would have been lower and there can be no assurance that any such waivers or limitations will continue in the future.
Performance quoted represents past performance. Past performance is not a guarantee or a reliable indicator of future results.Current performance may be lower or higher than performance shown. Investment return and the principal value of an investment will fluctuate. Shares may be worth more or less than original cost when redeemed. Returns shown do not reflect the deduction of taxes that a shareholder would pay on Fund distributions or the redemption of Fund shares.Differences in the Fund’s performance versus an index and related attribution information with respect to particular categories of securities or individual positions may be attributable, in part, to differences in the pricing methodologies used by the Fund and the index. For performance current to the most recent month-end, visit www.pimco.com/literature or via 888.87.PIMCO (888.877.4626).
Key Fund StatisticsFootnote Reference* (as of the end of the reporting period)
| Total Net Assets | $648,938 |
| # of Portfolio Holdings | 18 |
| Portfolio Turnover Rate | 14% |
| Total Net Advisory Fees Paid During the Reporting Period | $116 |
| Footnote | Description |
Footnote* | Dollar amounts displayed in 000's |
What did the Fund invest in?
Allocation Breakdown (% of Net Assets)Footnote Reference*
| Mutual Funds | 62.6% |
| Affiliated Investments | 37.2% |
| Other Investments | 0.0% |
| Other Assets and Liabilities, Net | 0.2% |
| Total | 100.0% |
| Footnote | Description |
Footnote* | % of Net Assets includes derivatives instruments, if any, valued at the value used for determining the Fund’s net asset value. The notional exposure of such derivatives investments therefore may be greater than what is depicted. |
Top Holdings (% of Net Assets)
| Vanguard Institutional Index Fund 'Institutional' | 35.2% |
| Vanguard Developed Markets Index Fund 'Institutional' | 17.6% |
| PIMCO Total Return Fund | 8.4% |
| Vanguard Emerging Markets Stock Index Fund 'Institutional' | 7.0% |
| PIMCO Long-Term Real Return Fund | 6.3% |
| PIMCO Income Fund | 5.5% |
| PIMCO Long-Term U.S. Government Fund | 5.3% |
| PIMCO Real Return Fund | 2.9% |
| Vanguard Small-Cap Index Fund 'Institutional' | 2.8% |
| PIMCO Emerging Markets Local Currency and Bond Fund | 2.0% |
This is a summary of certain changes and planned changes of the Fund since the beginning of the reporting period. For more information, you may refer to the Fund's next prospectus, which we expect to be available by October 31, 2024 or upon request at 888.87.PIMCO (888.877.4626).
Changes to Total Annual Fund Operating Expenses. Annual fund operating expenses increased during the year by 0.13% as a result of the Fund’s exposure to fees and expenses related to the Fund’s investment in underlying funds.
Change to REALPATH® Blend Glide Path. Effective February 28, 2024, the Fund’s REALPATH® Blend Glide Path, which forms the basis of the Fund’s long-term asset allocations, was changed based on data relating to risk metrics, long-term market trends, correlation of asset types and actuarial assumptions of life expectancy and retirement.
For additional information about the Fund, including the Fund's prospectus, financial information, holdings and proxy voting information, please visit www.pimco.com/literature or contact 888.87.PIMCO (888.877.4626). For tax information about the Fund, please visit: https://www.pimco.com/tax.
Institutional Class: PDGZX
PIMCO REALPATH® Blend 2035 Fund
Annual Shareholder Report |
June 30, 2024
PIMCO REALPATH® Blend 2040 Fund
Annual Shareholder Report | June 30, 2024
This annual shareholder report contains important information about the PIMCO REALPATH® Blend 2040 Fund for the period of July 1, 2023 to June 30, 2024 (the "reporting period"). You can find additional information about the Fund at www.pimco.com/literature. You can also request this information by contacting us at 888.87.PIMCO (888.877.4626).
This report describes changes to the Fund that occurred during the reporting period.
What were the Fund costs for the last year?
(based on a hypothetical $10,000 investment)
| Class Name | Cost of a $10,000 investment | Costs paid as a percentage of a $10,000 investment |
|---|
| Class A | $54 | 0.51% |
How did the Fund perform during the reporting period and what affected its performance?
The following affected performance (on a gross basis) during the reporting period:
• Exposure to U.S. large cap equities contributed to absolute performance, as U.S. large cap equities posted positive returns.
• Exposure to global equities contributed to absolute performance, as global equities posted positive returns.
• Exposure to emerging market equities contributed to absolute performance, as emerging market equities posted positive returns.
• Exposure to U.S. small cap equities contributed to absolute performance, as U.S. small cap equities posted positive returns.
• Exposure to long-term Treasury Inflation-Protected Securities ("TIPS") detracted from absolute performance, as long-term TIPS posted
negative returns.
• Exposure to long-term treasuries detracted from absolute performance, as long-term treasuries posted negative returns.
• There were no other material detractors for this Fund.
In addition to the Fund's performance, the tables in this section include performance of: (i) a broad-based securities market index (i.e., a regulatory index) and (ii) one or more supplemental index(es). Effective July 24, 2024, the Fund's regulatory index is the S&P 500 Index. The Fund's regulatory index is shown in connection with certain regulatory requirements to provide a broad measure of market performance.
The table below illustrates cumulative returns for the 10-year period ended June 30, 2024 or the life of the Fund, if shorter. Cumulative returns are based on a hypothetical initial investment equal to the greater of either $10,000 or the investment minimum applicable to the share class.
Cumulative Returns Based on $10,000 Investment

| Class A (including sales charge) | S&P 500 Index | S&P Target Date 2040 Index |
|---|
| 12/31/14 | $9,452 | $10,000 | $10,000 |
| 1/31/15 | $9,527 | $9,600 | $9,834 |
| 2/28/15 | $9,783 | $10,152 | $10,279 |
| 3/31/15 | $9,698 | $9,991 | $10,206 |
| 4/30/15 | $9,820 | $10,087 | $10,323 |
| 5/31/15 | $9,773 | $10,217 | $10,383 |
| 6/30/15 | $9,545 | $10,019 | $10,189 |
| 7/31/15 | $9,554 | $10,229 | $10,310 |
| 8/31/15 | $9,023 | $9,612 | $9,758 |
| 9/30/15 | $8,815 | $9,374 | $9,517 |
| 10/31/15 | $9,270 | $10,164 | $10,085 |
| 11/30/15 | $9,194 | $10,195 | $10,093 |
| 12/31/15 | $9,029 | $10,034 | $9,890 |
| 1/31/16 | $8,683 | $9,536 | $9,477 |
| 2/29/16 | $8,654 | $9,523 | $9,433 |
| 3/31/16 | $9,291 | $10,169 | $10,020 |
| 4/30/16 | $9,378 | $10,209 | $10,107 |
| 5/31/16 | $9,407 | $10,392 | $10,198 |
| 6/30/16 | $9,535 | $10,419 | $10,222 |
| 7/31/16 | $9,855 | $10,803 | $10,552 |
| 8/31/16 | $9,874 | $10,818 | $10,581 |
| 9/30/16 | $9,910 | $10,820 | $10,617 |
| 10/31/16 | $9,735 | $10,623 | $10,418 |
| 11/30/16 | $9,774 | $11,016 | $10,599 |
| 12/31/16 | $9,944 | $11,234 | $10,802 |
| 1/31/17 | $10,140 | $11,447 | $11,003 |
| 2/28/17 | $10,406 | $11,902 | $11,259 |
| 3/31/17 | $10,455 | $11,915 | $11,350 |
| 4/30/17 | $10,573 | $12,038 | $11,489 |
| 5/31/17 | $10,730 | $12,207 | $11,653 |
| 6/30/17 | $10,797 | $12,283 | $11,731 |
| 7/31/17 | $11,023 | $12,536 | $11,968 |
| 8/31/17 | $11,082 | $12,574 | $11,973 |
| 9/30/17 | $11,239 | $12,834 | $12,225 |
| 10/31/17 | $11,407 | $13,133 | $12,438 |
| 11/30/17 | $11,604 | $13,536 | $12,696 |
| 12/31/17 | $11,759 | $13,687 | $12,840 |
| 1/31/18 | $12,210 | $14,470 | $13,355 |
| 2/28/18 | $11,748 | $13,937 | $12,872 |
| 3/31/18 | $11,648 | $13,583 | $12,719 |
| 4/30/18 | $11,678 | $13,635 | $12,800 |
| 5/31/18 | $11,759 | $13,963 | $12,956 |
| 6/30/18 | $11,716 | $14,049 | $12,927 |
| 7/31/18 | $11,987 | $14,572 | $13,235 |
| 8/31/18 | $12,077 | $15,047 | $13,408 |
| 9/30/18 | $12,072 | $15,132 | $13,408 |
| 10/31/18 | $11,336 | $14,098 | $12,516 |
| 11/30/18 | $11,528 | $14,385 | $12,710 |
| 12/31/18 | $10,862 | $13,086 | $11,889 |
| 1/31/19 | $11,611 | $14,135 | $12,733 |
| 2/28/19 | $11,842 | $14,589 | $13,049 |
| 3/31/19 | $12,024 | $14,872 | $13,176 |
| 4/30/19 | $12,331 | $15,475 | $13,557 |
| 5/31/19 | $11,802 | $14,491 | $12,884 |
| 6/30/19 | $12,417 | $15,513 | $13,607 |
| 7/31/19 | $12,449 | $15,736 | $13,665 |
| 8/31/19 | $12,332 | $15,486 | $13,432 |
| 9/30/19 | $12,516 | $15,776 | $13,688 |
| 10/31/19 | $12,773 | $16,118 | $13,979 |
| 11/30/19 | $13,019 | $16,703 | $14,273 |
| 12/31/19 | $13,378 | $17,207 | $14,667 |
| 1/31/20 | $13,291 | $17,200 | $14,528 |
| 2/29/20 | $12,538 | $15,784 | $13,532 |
| 3/31/20 | $10,934 | $13,835 | $11,846 |
| 4/30/20 | $11,905 | $15,608 | $12,979 |
| 5/31/20 | $12,374 | $16,352 | $13,501 |
| 6/30/20 | $12,687 | $16,677 | $13,819 |
| 7/31/20 | $13,244 | $17,617 | $14,403 |
| 8/31/20 | $13,833 | $18,883 | $15,062 |
| 9/30/20 | $13,494 | $18,166 | $14,668 |
| 10/31/20 | $13,264 | $17,683 | $14,440 |
| 11/30/20 | $14,564 | $19,618 | $15,974 |
| 12/31/20 | $15,146 | $20,373 | $16,628 |
| 1/31/21 | $15,090 | $20,167 | $16,595 |
| 2/28/21 | $15,378 | $20,723 | $17,011 |
| 3/31/21 | $15,699 | $21,631 | $17,448 |
| 4/30/21 | $16,291 | $22,785 | $18,092 |
| 5/31/21 | $16,536 | $22,944 | $18,322 |
| 6/30/21 | $16,735 | $23,480 | $18,458 |
| 7/31/21 | $16,892 | $24,038 | $18,581 |
| 8/31/21 | $17,219 | $24,769 | $18,964 |
| 9/30/21 | $16,586 | $23,617 | $18,329 |
| 10/31/21 | $17,275 | $25,271 | $19,081 |
| 11/30/21 | $16,947 | $25,096 | $18,674 |
| 12/31/21 | $17,561 | $26,221 | $19,379 |
| 1/31/22 | $16,830 | $24,864 | $18,463 |
| 2/28/22 | $16,413 | $24,120 | $18,154 |
| 3/31/22 | $16,598 | $25,015 | $18,404 |
| 4/30/22 | $15,427 | $22,834 | $17,138 |
| 5/31/22 | $15,450 | $22,876 | $17,210 |
| 6/30/22 | $14,295 | $20,987 | $15,919 |
| 7/31/22 | $15,200 | $22,922 | $16,978 |
| 8/31/22 | $14,620 | $21,988 | $16,377 |
| 9/30/22 | $13,270 | $19,963 | $14,991 |
| 10/31/22 | $13,910 | $21,579 | $15,819 |
| 11/30/22 | $15,037 | $22,785 | $16,894 |
| 12/31/22 | $14,489 | $21,472 | $16,365 |
| 1/31/23 | $15,487 | $22,821 | $17,431 |
| 2/28/23 | $14,988 | $22,264 | $17,004 |
| 3/31/23 | $15,367 | $23,082 | $17,359 |
| 4/30/23 | $15,545 | $23,442 | $17,572 |
| 5/31/23 | $15,319 | $23,544 | $17,316 |
| 6/30/23 | $16,010 | $25,100 | $18,135 |
| 7/31/23 | $16,475 | $25,906 | $18,668 |
| 8/31/23 | $16,022 | $25,493 | $18,249 |
| 9/30/23 | $15,360 | $24,278 | $17,548 |
| 10/31/23 | $14,930 | $23,768 | $17,050 |
| 11/30/23 | $16,113 | $25,938 | $18,419 |
| 12/31/23 | $16,912 | $27,116 | $19,337 |
| 1/31/24 | $16,863 | $27,572 | $19,363 |
| 2/29/24 | $17,348 | $29,044 | $19,963 |
| 3/31/24 | $17,813 | $29,979 | $20,502 |
| 4/30/24 | $17,192 | $28,754 | $19,858 |
| 5/31/24 | $17,873 | $30,180 | $20,585 |
| 6/30/24 | $18,125 | $31,263 | $20,864 |
The table below shows the average annual total returns of the Fund, a regulatory index, and one or more supplemental index(es) for certain periods ended June 30, 2024.
Average Annual Total Returns (%)
| Class/Index Name | 1 Year | 5 Years | Since Inception 12/31/14 |
|---|
| Class A (excluding sales charge) | 13.21% | 7.86% | 7.10% |
| Class A (including sales charge) | 7.00% | 6.64% | 6.46% |
| S&P 500 Index | 24.56% | 15.05% | 12.75% |
| S&P Target Date 2040 Index | 15.05% | 8.92% | 8.05% |
All Fund returns are net of fees and expenses and include applicable fee waivers and/or expense limitations. Absent any applicable fee waivers and/or expense limitations, performance would have been lower and there can be no assurance that any such waivers or limitations will continue in the future.
Performance quoted represents past performance. Past performance is not a guarantee or a reliable indicator of future results.Current performance may be lower or higher than performance shown. Investment return and the principal value of an investment will fluctuate. Shares may be worth more or less than original cost when redeemed. Returns shown do not reflect the deduction of taxes that a shareholder would pay on Fund distributions or the redemption of Fund shares.Differences in the Fund’s performance versus an index and related attribution information with respect to particular categories of securities or individual positions may be attributable, in part, to differences in the pricing methodologies used by the Fund and the index. The Cumulative Returns chart and Average Annual Total Returns table reflect any sales load that would have applied at the time of purchase or any Contingent Deferred Sales Charge (“CDSC”) that would have applied if a full redemption occurred on the last business day of the period shown in the Cumulative Returns chart. Class A shares are subject to an initial sales charge. A CDSC may be imposed in certain circumstances on Class A shares that are purchased without an initial sales charge and then redeemed during the first 12 months after purchase. For performance current to the most recent month-end, visit www.pimco.com/literature or via 888.87.PIMCO (888.877.4626).
Key Fund StatisticsFootnote Reference* (as of the end of the reporting period)
| Total Net Assets | $574,639 |
| # of Portfolio Holdings | 18 |
| Portfolio Turnover Rate | 19% |
| Total Net Advisory Fees Paid During the Reporting Period | $157 |
| Footnote | Description |
Footnote* | Dollar amounts displayed in 000's |
What did the Fund invest in?
Allocation Breakdown (% of Net Assets)Footnote Reference*
| Mutual Funds | 73.1% |
| Affiliated Investments | 26.6% |
| Other Investments | 0.0% |
| Other Assets and Liabilities, Net | 0.3% |
| Total | 100.0% |
| Footnote | Description |
Footnote* | % of Net Assets includes derivatives instruments, if any, valued at the value used for determining the Fund’s net asset value. The notional exposure of such derivatives investments therefore may be greater than what is depicted. |
Top Holdings (% of Net Assets)
| Vanguard Institutional Index Fund 'Institutional' | 41.5% |
| Vanguard Developed Markets Index Fund 'Institutional' | 20.4% |
| Vanguard Emerging Markets Stock Index Fund 'Institutional' | 8.2% |
| PIMCO Total Return Fund | 5.7% |
| PIMCO Long-Term Real Return Fund | 4.3% |
| PIMCO Income Fund | 3.4% |
| PIMCO Long-Term U.S. Government Fund | 3.2% |
| Vanguard Small-Cap Index Fund 'Institutional' | 3.0% |
| PIMCO Real Return Fund | 2.0% |
| PIMCO Emerging Markets Local Currency and Bond Fund | 1.7% |
This is a summary of certain changes and planned changes of the Fund since the beginning of the reporting period. For more information, you may refer to the Fund's next prospectus, which we expect to be available by October 31, 2024 or upon request at 888.87.PIMCO (888.877.4626).
Changes to Total Annual Fund Operating Expenses. Annual fund operating expenses increased during the year by 0.09% as a result of the Fund’s exposure to fees and expenses related to the Fund’s investment in underlying funds.
Change to REALPATH® Blend Glide Path. Effective February 28, 2024, the Fund’s REALPATH® Blend Glide Path, which forms the basis of the Fund’s long-term asset allocations, was changed based on data relating to risk metrics, long-term market trends, correlation of asset types and actuarial assumptions of life expectancy and retirement.
For additional information about the Fund, including the Fund's prospectus, financial information, holdings and proxy voting information, please visit www.pimco.com/literature or contact 888.87.PIMCO (888.877.4626). For tax information about the Fund, please visit: https://www.pimco.com/tax.
PIMCO REALPATH® Blend 2040 Fund
Annual Shareholder Report |
June 30, 2024
Institutional Class: PVPNX
PIMCO REALPATH® Blend 2040 Fund
Annual Shareholder Report | June 30, 2024
This annual shareholder report contains important information about the PIMCO REALPATH® Blend 2040 Fund for the period of July 1, 2023 to June 30, 2024 (the "reporting period"). You can find additional information about the Fund at www.pimco.com/literature. You can also request this information by contacting us at 888.87.PIMCO (888.877.4626).
This report describes changes to the Fund that occurred during the reporting period.
What were the Fund costs for the last year?
(based on a hypothetical $10,000 investment)
| Class Name | Cost of a $10,000 investment | Costs paid as a percentage of a $10,000 investment |
|---|
| Institutional Class | $6 | 0.06% |
How did the Fund perform during the reporting period and what affected its performance?
The following affected performance (on a gross basis) during the reporting period:
• Exposure to U.S. large cap equities contributed to absolute performance, as U.S. large cap equities posted positive returns.
• Exposure to global equities contributed to absolute performance, as global equities posted positive returns.
• Exposure to emerging market equities contributed to absolute performance, as emerging market equities posted positive returns.
• Exposure to U.S. small cap equities contributed to absolute performance, as U.S. small cap equities posted positive returns.
• Exposure to long-term Treasury Inflation-Protected Securities ("TIPS") detracted from absolute performance, as long-term TIPS posted
negative returns.
• Exposure to long-term treasuries detracted from absolute performance, as long-term treasuries posted negative returns.
• There were no other material detractors for this Fund.
In addition to the Fund's performance, the tables in this section include performance of: (i) a broad-based securities market index (i.e., a regulatory index) and (ii) one or more supplemental index(es). Effective July 24, 2024, the Fund's regulatory index is the S&P 500 Index. The Fund's regulatory index is shown in connection with certain regulatory requirements to provide a broad measure of market performance.
The table below illustrates cumulative returns for the 10-year period ended June 30, 2024 or the life of the Fund, if shorter. Cumulative returns are based on a hypothetical initial investment equal to the greater of either $10,000 or the investment minimum applicable to the share class.
Cumulative Returns Based on $1,000,000 Investment

| Institutional Class | S&P 500 Index | S&P Target Date 2040 Index |
|---|
| 12/31/14 | $1,000,000 | $1,000,000 | $1,000,000 |
| 1/31/15 | $1,008,000 | $959,985 | $983,379 |
| 2/28/15 | $1,036,000 | $1,015,157 | $1,027,919 |
| 3/31/15 | $1,027,000 | $999,103 | $1,020,601 |
| 4/30/15 | $1,041,000 | $1,008,687 | $1,032,274 |
| 5/31/15 | $1,036,000 | $1,021,658 | $1,038,341 |
| 6/30/15 | $1,011,883 | $1,001,881 | $1,018,894 |
| 7/31/15 | $1,013,893 | $1,022,872 | $1,031,040 |
| 8/31/15 | $957,621 | $961,158 | $975,829 |
| 9/30/15 | $936,432 | $937,375 | $951,678 |
| 10/31/15 | $984,764 | $1,016,447 | $1,008,518 |
| 11/30/15 | $976,709 | $1,019,470 | $1,009,287 |
| 12/31/15 | $959,717 | $1,003,391 | $988,976 |
| 1/31/16 | $923,945 | $953,598 | $947,690 |
| 2/29/16 | $920,879 | $952,312 | $943,330 |
| 3/31/16 | $989,607 | $1,016,915 | $1,002,029 |
| 4/30/16 | $998,827 | $1,020,857 | $1,010,676 |
| 5/31/16 | $1,001,900 | $1,039,190 | $1,019,792 |
| 6/30/16 | $1,016,763 | $1,041,882 | $1,022,171 |
| 7/31/16 | $1,050,862 | $1,080,295 | $1,055,209 |
| 8/31/16 | $1,052,928 | $1,081,812 | $1,058,059 |
| 9/30/16 | $1,057,763 | $1,082,016 | $1,061,687 |
| 10/31/16 | $1,040,168 | $1,062,279 | $1,041,767 |
| 11/30/16 | $1,043,273 | $1,101,621 | $1,059,887 |
| 12/31/16 | $1,061,899 | $1,123,395 | $1,080,230 |
| 1/31/17 | $1,083,934 | $1,144,702 | $1,100,311 |
| 2/28/17 | $1,112,266 | $1,190,154 | $1,125,851 |
| 3/31/17 | $1,118,562 | $1,191,542 | $1,134,954 |
| 4/30/17 | $1,132,203 | $1,203,779 | $1,148,917 |
| 5/31/17 | $1,148,991 | $1,220,720 | $1,165,306 |
| 6/30/17 | $1,156,391 | $1,228,339 | $1,173,106 |
| 7/31/17 | $1,181,622 | $1,253,597 | $1,196,750 |
| 8/31/17 | $1,188,980 | $1,257,434 | $1,197,314 |
| 9/30/17 | $1,205,888 | $1,283,373 | $1,222,491 |
| 10/31/17 | $1,224,878 | $1,313,321 | $1,243,792 |
| 11/30/17 | $1,245,978 | $1,353,600 | $1,269,616 |
| 12/31/17 | $1,263,070 | $1,368,650 | $1,284,022 |
| 1/31/18 | $1,312,517 | $1,447,011 | $1,335,460 |
| 2/28/18 | $1,263,070 | $1,393,678 | $1,287,216 |
| 3/31/18 | $1,253,395 | $1,358,260 | $1,271,905 |
| 4/30/18 | $1,256,620 | $1,363,472 | $1,280,032 |
| 5/31/18 | $1,265,219 | $1,396,307 | $1,295,569 |
| 6/30/18 | $1,262,389 | $1,404,901 | $1,292,727 |
| 7/31/18 | $1,291,496 | $1,457,183 | $1,323,494 |
| 8/31/18 | $1,302,276 | $1,504,666 | $1,340,778 |
| 9/30/18 | $1,301,713 | $1,513,230 | $1,340,814 |
| 10/31/18 | $1,223,676 | $1,409,800 | $1,251,570 |
| 11/30/18 | $1,244,269 | $1,438,530 | $1,271,022 |
| 12/31/18 | $1,172,385 | $1,308,644 | $1,188,923 |
| 1/31/19 | $1,254,021 | $1,413,513 | $1,273,304 |
| 2/28/19 | $1,278,966 | $1,458,898 | $1,304,853 |
| 3/31/19 | $1,299,835 | $1,487,247 | $1,317,591 |
| 4/30/19 | $1,334,041 | $1,547,466 | $1,355,697 |
| 5/31/19 | $1,277,031 | $1,449,127 | $1,288,381 |
| 6/30/19 | $1,343,724 | $1,551,256 | $1,360,727 |
| 7/31/19 | $1,348,314 | $1,573,551 | $1,366,536 |
| 8/31/19 | $1,335,691 | $1,548,625 | $1,343,174 |
| 9/30/19 | $1,356,677 | $1,577,601 | $1,368,812 |
| 10/31/19 | $1,384,388 | $1,611,771 | $1,397,888 |
| 11/30/19 | $1,412,099 | $1,670,277 | $1,427,286 |
| 12/31/19 | $1,450,499 | $1,720,689 | $1,466,746 |
| 1/31/20 | $1,443,423 | $1,720,014 | $1,452,823 |
| 2/29/20 | $1,362,054 | $1,578,424 | $1,353,195 |
| 3/31/20 | $1,187,134 | $1,383,468 | $1,184,557 |
| 4/30/20 | $1,293,339 | $1,560,821 | $1,297,905 |
| 5/31/20 | $1,345,262 | $1,635,159 | $1,350,143 |
| 6/30/20 | $1,380,804 | $1,667,678 | $1,381,936 |
| 7/31/20 | $1,441,096 | $1,761,710 | $1,440,265 |
| 8/31/20 | $1,504,934 | $1,888,343 | $1,506,171 |
| 9/30/20 | $1,469,441 | $1,816,592 | $1,466,817 |
| 10/31/20 | $1,445,759 | $1,768,282 | $1,444,029 |
| 11/30/20 | $1,587,848 | $1,961,845 | $1,597,448 |
| 12/31/20 | $1,650,731 | $2,037,275 | $1,662,782 |
| 1/31/21 | $1,647,127 | $2,016,707 | $1,659,515 |
| 2/28/21 | $1,678,363 | $2,072,317 | $1,701,105 |
| 3/31/21 | $1,713,703 | $2,163,076 | $1,744,784 |
| 4/30/21 | $1,780,407 | $2,278,516 | $1,809,203 |
| 5/31/21 | $1,807,089 | $2,294,430 | $1,832,167 |
| 6/30/21 | $1,829,617 | $2,347,993 | $1,845,769 |
| 7/31/21 | $1,847,962 | $2,403,770 | $1,858,060 |
| 8/31/21 | $1,883,429 | $2,476,858 | $1,896,389 |
| 9/30/21 | $1,814,945 | $2,361,660 | $1,832,900 |
| 10/31/21 | $1,891,080 | $2,527,122 | $1,908,124 |
| 11/30/21 | $1,856,697 | $2,509,612 | $1,867,419 |
| 12/31/21 | $1,924,751 | $2,622,083 | $1,937,937 |
| 1/31/22 | $1,845,132 | $2,486,398 | $1,846,259 |
| 2/28/22 | $1,799,636 | $2,411,951 | $1,815,401 |
| 3/31/22 | $1,821,494 | $2,501,506 | $1,840,397 |
| 4/30/22 | $1,693,825 | $2,283,370 | $1,713,786 |
| 5/31/22 | $1,696,353 | $2,287,559 | $1,721,018 |
| 6/30/22 | $1,569,873 | $2,098,736 | $1,591,861 |
| 7/31/22 | $1,669,889 | $2,292,248 | $1,697,800 |
| 8/31/22 | $1,606,588 | $2,198,766 | $1,637,742 |
| 9/30/22 | $1,459,177 | $1,996,263 | $1,499,055 |
| 10/31/22 | $1,530,233 | $2,157,883 | $1,581,875 |
| 11/30/22 | $1,654,580 | $2,278,474 | $1,689,390 |
| 12/31/22 | $1,594,428 | $2,147,201 | $1,636,472 |
| 1/31/23 | $1,704,882 | $2,282,118 | $1,743,149 |
| 2/28/23 | $1,651,604 | $2,226,437 | $1,700,448 |
| 3/31/23 | $1,693,221 | $2,308,179 | $1,735,900 |
| 4/30/23 | $1,714,076 | $2,344,206 | $1,757,239 |
| 5/31/23 | $1,689,310 | $2,354,395 | $1,731,625 |
| 6/30/23 | $1,766,884 | $2,509,962 | $1,813,474 |
| 7/31/23 | $1,817,777 | $2,590,595 | $1,866,774 |
| 8/31/23 | $1,769,494 | $2,549,349 | $1,824,929 |
| 9/30/23 | $1,697,002 | $2,427,801 | $1,754,817 |
| 10/31/23 | $1,649,827 | $2,376,753 | $1,704,976 |
| 11/30/23 | $1,782,180 | $2,593,811 | $1,841,877 |
| 12/31/23 | $1,869,494 | $2,711,650 | $1,933,712 |
| 1/31/24 | $1,865,502 | $2,757,216 | $1,936,314 |
| 2/29/24 | $1,920,057 | $2,904,440 | $1,996,288 |
| 3/31/24 | $1,971,496 | $2,997,889 | $2,050,185 |
| 4/30/24 | $1,904,666 | $2,875,441 | $1,985,840 |
| 5/31/24 | $1,979,516 | $3,018,019 | $2,058,477 |
| 6/30/24 | $2,009,320 | $3,126,312 | $2,086,438 |
The table below shows the average annual total returns of the Fund, a regulatory index, and one or more supplemental index(es) for certain periods ended June 30, 2024.
Average Annual Total Returns (%)
| Class/Index Name | 1 Year | 5 Years | Since Inception 12/31/14 |
|---|
| Institutional Class | 13.72% | 8.38% | 7.63% |
| S&P 500 Index | 24.56% | 15.05% | 12.75% |
| S&P Target Date 2040 Index | 15.05% | 8.92% | 8.05% |
All Fund returns are net of fees and expenses and include applicable fee waivers and/or expense limitations. Absent any applicable fee waivers and/or expense limitations, performance would have been lower and there can be no assurance that any such waivers or limitations will continue in the future.
Performance quoted represents past performance. Past performance is not a guarantee or a reliable indicator of future results.Current performance may be lower or higher than performance shown. Investment return and the principal value of an investment will fluctuate. Shares may be worth more or less than original cost when redeemed. Returns shown do not reflect the deduction of taxes that a shareholder would pay on Fund distributions or the redemption of Fund shares.Differences in the Fund’s performance versus an index and related attribution information with respect to particular categories of securities or individual positions may be attributable, in part, to differences in the pricing methodologies used by the Fund and the index. For performance current to the most recent month-end, visit www.pimco.com/literature or via 888.87.PIMCO (888.877.4626).
Key Fund StatisticsFootnote Reference* (as of the end of the reporting period)
| Total Net Assets | $574,639 |
| # of Portfolio Holdings | 18 |
| Portfolio Turnover Rate | 19% |
| Total Net Advisory Fees Paid During the Reporting Period | $157 |
| Footnote | Description |
Footnote* | Dollar amounts displayed in 000's |
What did the Fund invest in?
Allocation Breakdown (% of Net Assets)Footnote Reference*
| Mutual Funds | 73.1% |
| Affiliated Investments | 26.6% |
| Other Investments | 0.0% |
| Other Assets and Liabilities, Net | 0.3% |
| Total | 100.0% |
| Footnote | Description |
Footnote* | % of Net Assets includes derivatives instruments, if any, valued at the value used for determining the Fund’s net asset value. The notional exposure of such derivatives investments therefore may be greater than what is depicted. |
Top Holdings (% of Net Assets)
| Vanguard Institutional Index Fund 'Institutional' | 41.5% |
| Vanguard Developed Markets Index Fund 'Institutional' | 20.4% |
| Vanguard Emerging Markets Stock Index Fund 'Institutional' | 8.2% |
| PIMCO Total Return Fund | 5.7% |
| PIMCO Long-Term Real Return Fund | 4.3% |
| PIMCO Income Fund | 3.4% |
| PIMCO Long-Term U.S. Government Fund | 3.2% |
| Vanguard Small-Cap Index Fund 'Institutional' | 3.0% |
| PIMCO Real Return Fund | 2.0% |
| PIMCO Emerging Markets Local Currency and Bond Fund | 1.7% |
This is a summary of certain changes and planned changes of the Fund since the beginning of the reporting period. For more information, you may refer to the Fund's next prospectus, which we expect to be available by October 31, 2024 or upon request at 888.87.PIMCO (888.877.4626).
Changes to Total Annual Fund Operating Expenses. Annual fund operating expenses increased during the year by 0.09% as a result of the Fund’s exposure to fees and expenses related to the Fund’s investment in underlying funds.
Change to REALPATH® Blend Glide Path. Effective February 28, 2024, the Fund’s REALPATH® Blend Glide Path, which forms the basis of the Fund’s long-term asset allocations, was changed based on data relating to risk metrics, long-term market trends, correlation of asset types and actuarial assumptions of life expectancy and retirement.
For additional information about the Fund, including the Fund's prospectus, financial information, holdings and proxy voting information, please visit www.pimco.com/literature or contact 888.87.PIMCO (888.877.4626). For tax information about the Fund, please visit: https://www.pimco.com/tax.
Institutional Class: PVPNX
PIMCO REALPATH® Blend 2040 Fund
Annual Shareholder Report |
June 30, 2024
PIMCO REALPATH® Blend 2045 Fund
Annual Shareholder Report | June 30, 2024
This annual shareholder report contains important information about the PIMCO REALPATH® Blend 2045 Fund for the period of July 1, 2023 to June 30, 2024 (the "reporting period"). You can find additional information about the Fund at www.pimco.com/literature. You can also request this information by contacting us at 888.87.PIMCO (888.877.4626).
This report describes changes to the Fund that occurred during the reporting period.
What were the Fund costs for the last year?
(based on a hypothetical $10,000 investment)
| Class Name | Cost of a $10,000 investment | Costs paid as a percentage of a $10,000 investment |
|---|
| Class A | $54 | 0.50% |
How did the Fund perform during the reporting period and what affected its performance?
The following affected performance (on a gross basis) during the reporting period:
• Exposure to U.S. large cap equities contributed to absolute performance, as U.S. large cap equities posted positive returns.
• Exposure to global equities contributed to absolute performance, as global equities posted positive returns.
• Exposure to emerging market equities contributed to absolute performance, as emerging market equities posted positive returns.
• Exposure to U.S. small cap equities contributed to absolute performance, as U.S. small cap equities posted positive returns.
• Exposure to long-term Treasury Inflation-Protected Securities ("TIPS") detracted from absolute performance, as long-term TIPS posted
negative returns.
• Exposure to long-term treasuries detracted from absolute performance, as long-term treasuries posted negative returns.
• There were no other material detractors for this Fund.
In addition to the Fund's performance, the tables in this section include performance of: (i) a broad-based securities market index (i.e., a regulatory index) and (ii) one or more supplemental index(es). Effective July 24, 2024, the Fund's regulatory index is the S&P 500 Index. The Fund's regulatory index is shown in connection with certain regulatory requirements to provide a broad measure of market performance.
The table below illustrates cumulative returns for the 10-year period ended June 30, 2024 or the life of the Fund, if shorter. Cumulative returns are based on a hypothetical initial investment equal to the greater of either $10,000 or the investment minimum applicable to the share class.
Cumulative Returns Based on $10,000 Investment
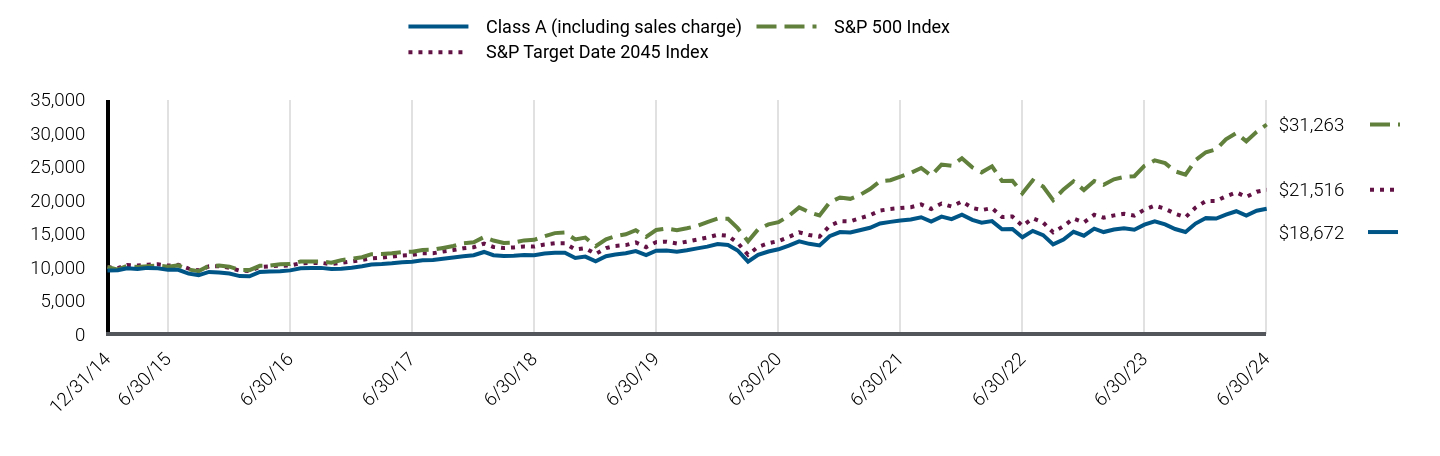
| Class A (including sales charge) | S&P 500 Index | S&P Target Date 2045 Index |
|---|
| 12/31/14 | $9,452 | $10,000 | $10,000 |
| 1/31/15 | $9,509 | $9,600 | $9,820 |
| 2/28/15 | $9,792 | $10,152 | $10,287 |
| 3/31/15 | $9,698 | $9,991 | $10,210 |
| 4/30/15 | $9,858 | $10,087 | $10,333 |
| 5/31/15 | $9,802 | $10,217 | $10,397 |
| 6/30/15 | $9,561 | $10,019 | $10,198 |
| 7/31/15 | $9,561 | $10,229 | $10,321 |
| 8/31/15 | $8,993 | $9,612 | $9,746 |
| 9/30/15 | $8,781 | $9,374 | $9,492 |
| 10/31/15 | $9,255 | $10,164 | $10,083 |
| 11/30/15 | $9,170 | $10,195 | $10,092 |
| 12/31/15 | $9,005 | $10,034 | $9,881 |
| 1/31/16 | $8,630 | $9,536 | $9,447 |
| 2/29/16 | $8,592 | $9,523 | $9,397 |
| 3/31/16 | $9,247 | $10,169 | $10,005 |
| 4/30/16 | $9,333 | $10,209 | $10,094 |
| 5/31/16 | $9,353 | $10,392 | $10,188 |
| 6/30/16 | $9,484 | $10,419 | $10,205 |
| 7/31/16 | $9,813 | $10,803 | $10,548 |
| 8/31/16 | $9,822 | $10,818 | $10,579 |
| 9/30/16 | $9,857 | $10,820 | $10,617 |
| 10/31/16 | $9,683 | $10,623 | $10,412 |
| 11/30/16 | $9,712 | $11,016 | $10,612 |
| 12/31/16 | $9,883 | $11,234 | $10,823 |
| 1/31/17 | $10,098 | $11,447 | $11,034 |
| 2/28/17 | $10,363 | $11,902 | $11,299 |
| 3/31/17 | $10,422 | $11,915 | $11,395 |
| 4/30/17 | $10,539 | $12,038 | $11,538 |
| 5/31/17 | $10,696 | $12,207 | $11,708 |
| 6/30/17 | $10,764 | $12,283 | $11,788 |
| 7/31/17 | $11,000 | $12,536 | $12,034 |
| 8/31/17 | $11,049 | $12,574 | $12,038 |
| 9/30/17 | $11,212 | $12,834 | $12,301 |
| 10/31/17 | $11,398 | $13,133 | $12,523 |
| 11/30/17 | $11,594 | $13,536 | $12,791 |
| 12/31/17 | $11,754 | $13,687 | $12,941 |
| 1/31/18 | $12,233 | $14,470 | $13,483 |
| 2/28/18 | $11,754 | $13,937 | $12,982 |
| 3/31/18 | $11,645 | $13,583 | $12,819 |
| 4/30/18 | $11,675 | $13,635 | $12,908 |
| 5/31/18 | $11,774 | $13,963 | $13,063 |
| 6/30/18 | $11,734 | $14,049 | $13,032 |
| 7/31/18 | $12,014 | $14,572 | $13,352 |
| 8/31/18 | $12,113 | $15,047 | $13,527 |
| 9/30/18 | $12,113 | $15,132 | $13,529 |
| 10/31/18 | $11,342 | $14,098 | $12,597 |
| 11/30/18 | $11,542 | $14,385 | $12,798 |
| 12/31/18 | $10,826 | $13,086 | $11,939 |
| 1/31/19 | $11,608 | $14,135 | $12,811 |
| 2/28/19 | $11,850 | $14,589 | $13,139 |
| 3/31/19 | $12,036 | $14,872 | $13,263 |
| 4/30/19 | $12,366 | $15,475 | $13,659 |
| 5/31/19 | $11,781 | $14,491 | $12,951 |
| 6/30/19 | $12,424 | $15,513 | $13,703 |
| 7/31/19 | $12,456 | $15,736 | $13,761 |
| 8/31/19 | $12,286 | $15,486 | $13,504 |
| 9/30/19 | $12,500 | $15,776 | $13,776 |
| 10/31/19 | $12,769 | $16,118 | $14,082 |
| 11/30/19 | $13,026 | $16,703 | $14,389 |
| 12/31/19 | $13,409 | $17,207 | $14,807 |
| 1/31/20 | $13,288 | $17,200 | $14,649 |
| 2/29/20 | $12,457 | $15,784 | $13,590 |
| 3/31/20 | $10,784 | $13,835 | $11,822 |
| 4/30/20 | $11,801 | $15,608 | $12,994 |
| 5/31/20 | $12,304 | $16,352 | $13,534 |
| 6/30/20 | $12,628 | $16,677 | $13,867 |
| 7/31/20 | $13,197 | $17,617 | $14,473 |
| 8/31/20 | $13,810 | $18,883 | $15,177 |
| 9/30/20 | $13,449 | $18,166 | $14,759 |
| 10/31/20 | $13,219 | $17,683 | $14,521 |
| 11/30/20 | $14,587 | $19,618 | $16,136 |
| 12/31/20 | $15,198 | $20,373 | $16,829 |
| 1/31/21 | $15,142 | $20,167 | $16,800 |
| 2/28/21 | $15,474 | $20,723 | $17,252 |
| 3/31/21 | $15,844 | $21,631 | $17,727 |
| 4/30/21 | $16,480 | $22,785 | $18,409 |
| 5/31/21 | $16,726 | $22,944 | $18,653 |
| 6/30/21 | $16,926 | $23,480 | $18,791 |
| 7/31/21 | $17,083 | $24,038 | $18,913 |
| 8/31/21 | $17,420 | $24,769 | $19,325 |
| 9/30/21 | $16,761 | $23,617 | $18,650 |
| 10/31/21 | $17,505 | $25,271 | $19,458 |
| 11/30/21 | $17,144 | $25,096 | $19,020 |
| 12/31/21 | $17,800 | $26,221 | $19,777 |
| 1/31/22 | $17,024 | $24,864 | $18,814 |
| 2/28/22 | $16,606 | $24,120 | $18,492 |
| 3/31/22 | $16,838 | $25,015 | $18,783 |
| 4/30/22 | $15,621 | $22,834 | $17,455 |
| 5/31/22 | $15,656 | $22,876 | $17,527 |
| 6/30/22 | $14,439 | $20,987 | $16,132 |
| 7/31/22 | $15,378 | $22,922 | $17,257 |
| 8/31/22 | $14,752 | $21,988 | $16,632 |
| 9/30/22 | $13,367 | $19,963 | $15,163 |
| 10/31/22 | $14,075 | $21,579 | $16,080 |
| 11/30/22 | $15,247 | $22,785 | $17,219 |
| 12/31/22 | $14,662 | $21,472 | $16,644 |
| 1/31/23 | $15,705 | $22,821 | $17,777 |
| 2/28/23 | $15,207 | $22,264 | $17,340 |
| 3/31/23 | $15,587 | $23,082 | $17,697 |
| 4/30/23 | $15,789 | $23,442 | $17,924 |
| 5/31/23 | $15,551 | $23,544 | $17,654 |
| 6/30/23 | $16,312 | $25,100 | $18,558 |
| 7/31/23 | $16,822 | $25,906 | $19,149 |
| 8/31/23 | $16,347 | $25,493 | $18,688 |
| 9/30/23 | $15,659 | $24,278 | $17,941 |
| 10/31/23 | $15,218 | $23,768 | $17,406 |
| 11/30/23 | $16,470 | $25,938 | $18,862 |
| 12/31/23 | $17,290 | $27,116 | $19,830 |
| 1/31/24 | $17,230 | $27,572 | $19,858 |
| 2/29/24 | $17,809 | $29,044 | $20,543 |
| 3/31/24 | $18,313 | $29,979 | $21,130 |
| 4/30/24 | $17,671 | $28,754 | $20,447 |
| 5/31/24 | $18,398 | $30,180 | $21,230 |
| 6/30/24 | $18,672 | $31,263 | $21,516 |
The table below shows the average annual total returns of the Fund, a regulatory index, and one or more supplemental index(es) for certain periods ended June 30, 2024.
Average Annual Total Returns (%)
| Class/Index Name | 1 Year | 5 Years | Since Inception 12/31/14 |
|---|
| Class A (excluding sales charge) | 14.47% | 8.49% | 7.43% |
| Class A (including sales charge) | 8.17% | 7.26% | 6.80% |
| S&P 500 Index | 24.56% | 15.05% | 12.75% |
| S&P Target Date 2045 Index | 15.94% | 9.44% | 8.40% |
All Fund returns are net of fees and expenses and include applicable fee waivers and/or expense limitations. Absent any applicable fee waivers and/or expense limitations, performance would have been lower and there can be no assurance that any such waivers or limitations will continue in the future.
Performance quoted represents past performance. Past performance is not a guarantee or a reliable indicator of future results.Current performance may be lower or higher than performance shown. Investment return and the principal value of an investment will fluctuate. Shares may be worth more or less than original cost when redeemed. Returns shown do not reflect the deduction of taxes that a shareholder would pay on Fund distributions or the redemption of Fund shares.Differences in the Fund’s performance versus an index and related attribution information with respect to particular categories of securities or individual positions may be attributable, in part, to differences in the pricing methodologies used by the Fund and the index. The Cumulative Returns chart and Average Annual Total Returns table reflect any sales load that would have applied at the time of purchase or any Contingent Deferred Sales Charge (“CDSC”) that would have applied if a full redemption occurred on the last business day of the period shown in the Cumulative Returns chart. Class A shares are subject to an initial sales charge. A CDSC may be imposed in certain circumstances on Class A shares that are purchased without an initial sales charge and then redeemed during the first 12 months after purchase. For performance current to the most recent month-end, visit www.pimco.com/literature or via 888.87.PIMCO (888.877.4626).
Key Fund StatisticsFootnote Reference* (as of the end of the reporting period)
| Total Net Assets | $534,519 |
| # of Portfolio Holdings | 18 |
| Portfolio Turnover Rate | 20% |
| Total Net Advisory Fees Paid During the Reporting Period | $150 |
| Footnote | Description |
Footnote* | Dollar amounts displayed in 000's |
What did the Fund invest in?
Allocation Breakdown (% of Net Assets)Footnote Reference*
| Mutual Funds | 81.2% |
| Affiliated Investments | 18.1% |
| Other Investments | 0.0% |
| Other Assets and Liabilities, Net | 0.7% |
| Total | 100.0% |
| Footnote | Description |
Footnote* | % of Net Assets includes derivatives instruments, if any, valued at the value used for determining the Fund’s net asset value. The notional exposure of such derivatives investments therefore may be greater than what is depicted. |
Top Holdings (% of Net Assets)
| Vanguard Institutional Index Fund 'Institutional' | 45.9% |
| Vanguard Developed Markets Index Fund 'Institutional' | 23.8% |
| Vanguard Emerging Markets Stock Index Fund 'Institutional' | 8.4% |
| PIMCO Total Return Fund | 3.6% |
| Vanguard Small-Cap Index Fund 'Institutional' | 3.1% |
| PIMCO Long-Term U.S. Government Fund | 2.4% |
| PIMCO Long-Term Real Return Fund | 2.3% |
| PIMCO Income Fund | 1.6% |
| PIMCO Real Return Fund | 1.6% |
| PIMCO Emerging Markets Local Currency and Bond Fund | 1.2% |
This is a summary of certain changes and planned changes of the Fund since the beginning of the reporting period. For more information, you may refer to the Fund's next prospectus, which we expect to be available by October 31, 2024 or upon request at 888.87.PIMCO (888.877.4626).
Changes to Total Annual Fund Operating Expenses. Annual fund operating expenses increased during the year by 0.05% as a result of the Fund’s exposure to fees and expenses related to the Fund’s investment in underlying funds.
Change to REALPATH® Blend Glide Path. Effective February 28, 2024, the Fund’s REALPATH® Blend Glide Path, which forms the basis of the Fund’s long-term asset allocations, was changed based on data relating to risk metrics, long-term market trends, correlation of asset types and actuarial assumptions of life expectancy and retirement.
For additional information about the Fund, including the Fund's prospectus, financial information, holdings and proxy voting information, please visit www.pimco.com/literature or contact 888.87.PIMCO (888.877.4626). For tax information about the Fund, please visit: https://www.pimco.com/tax.
PIMCO REALPATH® Blend 2045 Fund
Annual Shareholder Report |
June 30, 2024
Institutional Class: PVQNX
PIMCO REALPATH® Blend 2045 Fund
Annual Shareholder Report | June 30, 2024
This annual shareholder report contains important information about the PIMCO REALPATH® Blend 2045 Fund for the period of July 1, 2023 to June 30, 2024 (the "reporting period"). You can find additional information about the Fund at www.pimco.com/literature. You can also request this information by contacting us at 888.87.PIMCO (888.877.4626).
This report describes changes to the Fund that occurred during the reporting period.
What were the Fund costs for the last year?
(based on a hypothetical $10,000 investment)
| Class Name | Cost of a $10,000 investment | Costs paid as a percentage of a $10,000 investment |
|---|
| Institutional Class | $5 | 0.05% |
How did the Fund perform during the reporting period and what affected its performance?
The following affected performance (on a gross basis) during the reporting period:
• Exposure to U.S. large cap equities contributed to absolute performance, as U.S. large cap equities posted positive returns.
• Exposure to global equities contributed to absolute performance, as global equities posted positive returns.
• Exposure to emerging market equities contributed to absolute performance, as emerging market equities posted positive returns.
• Exposure to U.S. small cap equities contributed to absolute performance, as U.S. small cap equities posted positive returns.
• Exposure to long-term Treasury Inflation-Protected Securities ("TIPS") detracted from absolute performance, as long-term TIPS posted
negative returns.
• Exposure to long-term treasuries detracted from absolute performance, as long-term treasuries posted negative returns.
• There were no other material detractors for this Fund.
In addition to the Fund's performance, the tables in this section include performance of: (i) a broad-based securities market index (i.e., a regulatory index) and (ii) one or more supplemental index(es). Effective July 24, 2024, the Fund's regulatory index is the S&P 500 Index. The Fund's regulatory index is shown in connection with certain regulatory requirements to provide a broad measure of market performance.
The table below illustrates cumulative returns for the 10-year period ended June 30, 2024 or the life of the Fund, if shorter. Cumulative returns are based on a hypothetical initial investment equal to the greater of either $10,000 or the investment minimum applicable to the share class.
Cumulative Returns Based on $1,000,000 Investment
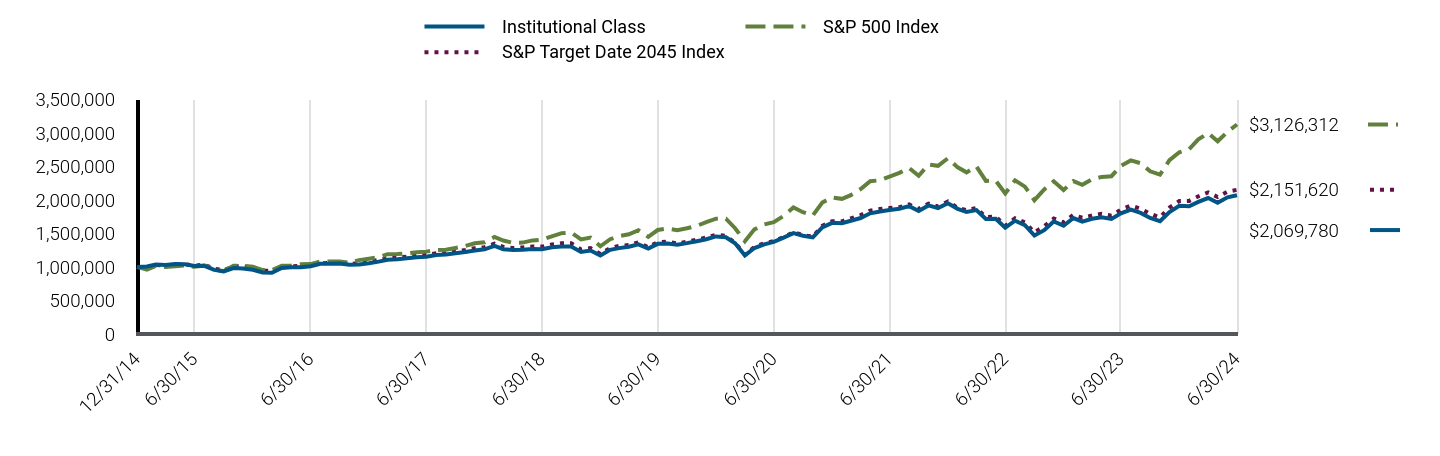
| Institutional Class | S&P 500 Index | S&P Target Date 2045 Index |
|---|
| 12/31/14 | $1,000,000 | $1,000,000 | $1,000,000 |
| 1/31/15 | $1,007,000 | $959,985 | $982,026 |
| 2/28/15 | $1,037,000 | $1,015,157 | $1,028,691 |
| 3/31/15 | $1,028,000 | $999,103 | $1,020,984 |
| 4/30/15 | $1,044,000 | $1,008,687 | $1,033,312 |
| 5/31/15 | $1,039,000 | $1,021,658 | $1,039,735 |
| 6/30/15 | $1,014,844 | $1,001,881 | $1,019,808 |
| 7/31/15 | $1,013,839 | $1,022,872 | $1,032,127 |
| 8/31/15 | $955,561 | $961,158 | $974,562 |
| 9/30/15 | $933,000 | $937,375 | $949,178 |
| 10/31/15 | $983,324 | $1,016,447 | $1,008,273 |
| 11/30/15 | $975,272 | $1,019,470 | $1,009,230 |
| 12/31/15 | $957,024 | $1,003,391 | $988,097 |
| 1/31/16 | $918,212 | $953,598 | $944,652 |
| 2/29/16 | $914,126 | $952,312 | $939,747 |
| 3/31/16 | $984,811 | $1,016,915 | $1,000,471 |
| 4/30/16 | $994,025 | $1,020,857 | $1,009,360 |
| 5/31/16 | $996,072 | $1,039,190 | $1,018,775 |
| 6/30/16 | $1,010,280 | $1,041,882 | $1,020,467 |
| 7/31/16 | $1,046,398 | $1,080,295 | $1,054,817 |
| 8/31/16 | $1,047,430 | $1,081,812 | $1,057,884 |
| 9/30/16 | $1,052,004 | $1,082,016 | $1,061,660 |
| 10/31/16 | $1,033,402 | $1,062,279 | $1,041,172 |
| 11/30/16 | $1,037,536 | $1,101,621 | $1,061,194 |
| 12/31/16 | $1,056,341 | $1,123,395 | $1,082,343 |
| 1/31/17 | $1,079,373 | $1,144,702 | $1,103,367 |
| 2/28/17 | $1,107,640 | $1,190,154 | $1,129,898 |
| 3/31/17 | $1,114,968 | $1,191,542 | $1,139,542 |
| 4/30/17 | $1,128,578 | $1,203,779 | $1,153,837 |
| 5/31/17 | $1,145,329 | $1,220,720 | $1,170,766 |
| 6/30/17 | $1,152,881 | $1,228,339 | $1,178,830 |
| 7/31/17 | $1,179,083 | $1,253,597 | $1,203,430 |
| 8/31/17 | $1,185,372 | $1,257,434 | $1,203,846 |
| 9/30/17 | $1,202,913 | $1,283,373 | $1,230,105 |
| 10/31/17 | $1,223,943 | $1,313,321 | $1,252,311 |
| 11/30/17 | $1,246,024 | $1,353,600 | $1,279,077 |
| 12/31/17 | $1,263,711 | $1,368,650 | $1,294,075 |
| 1/31/18 | $1,315,030 | $1,447,011 | $1,348,300 |
| 2/28/18 | $1,264,781 | $1,393,678 | $1,298,202 |
| 3/31/18 | $1,253,020 | $1,358,260 | $1,281,942 |
| 4/30/18 | $1,257,297 | $1,363,472 | $1,290,750 |
| 5/31/18 | $1,266,919 | $1,396,307 | $1,306,338 |
| 6/30/18 | $1,263,197 | $1,404,901 | $1,303,189 |
| 7/31/18 | $1,294,268 | $1,457,183 | $1,335,179 |
| 8/31/18 | $1,306,054 | $1,504,666 | $1,352,740 |
| 9/30/18 | $1,306,069 | $1,513,230 | $1,352,860 |
| 10/31/18 | $1,224,238 | $1,409,800 | $1,259,724 |
| 11/30/18 | $1,245,773 | $1,438,530 | $1,279,792 |
| 12/31/18 | $1,169,480 | $1,308,644 | $1,193,859 |
| 1/31/19 | $1,254,802 | $1,413,513 | $1,281,121 |
| 2/28/19 | $1,280,968 | $1,458,898 | $1,313,887 |
| 3/31/19 | $1,301,185 | $1,487,247 | $1,326,322 |
| 4/30/19 | $1,337,838 | $1,547,466 | $1,365,938 |
| 5/31/19 | $1,274,840 | $1,449,127 | $1,295,073 |
| 6/30/19 | $1,344,630 | $1,551,256 | $1,370,332 |
| 7/31/19 | $1,349,239 | $1,573,551 | $1,376,117 |
| 8/31/19 | $1,330,803 | $1,548,625 | $1,350,393 |
| 9/30/19 | $1,355,127 | $1,577,601 | $1,377,597 |
| 10/31/19 | $1,384,107 | $1,611,771 | $1,408,229 |
| 11/30/19 | $1,413,088 | $1,670,277 | $1,438,920 |
| 12/31/19 | $1,455,251 | $1,720,689 | $1,480,654 |
| 1/31/20 | $1,443,420 | $1,720,014 | $1,464,916 |
| 2/29/20 | $1,353,502 | $1,578,424 | $1,358,960 |
| 3/31/20 | $1,172,079 | $1,383,468 | $1,182,238 |
| 4/30/20 | $1,282,183 | $1,560,821 | $1,299,359 |
| 5/31/20 | $1,337,828 | $1,635,159 | $1,353,404 |
| 6/30/20 | $1,373,619 | $1,667,678 | $1,386,706 |
| 7/31/20 | $1,436,487 | $1,761,710 | $1,447,297 |
| 8/31/20 | $1,504,101 | $1,888,343 | $1,517,653 |
| 9/30/20 | $1,464,956 | $1,816,592 | $1,475,948 |
| 10/31/20 | $1,440,046 | $1,768,282 | $1,452,069 |
| 11/30/20 | $1,590,693 | $1,961,845 | $1,613,552 |
| 12/31/20 | $1,658,138 | $2,037,275 | $1,682,908 |
| 1/31/21 | $1,652,134 | $2,016,707 | $1,679,971 |
| 2/28/21 | $1,689,355 | $2,072,317 | $1,725,247 |
| 3/31/21 | $1,730,140 | $2,163,076 | $1,772,678 |
| 4/30/21 | $1,800,511 | $2,278,516 | $1,840,873 |
| 5/31/21 | $1,828,416 | $2,294,430 | $1,865,348 |
| 6/30/21 | $1,849,868 | $2,347,993 | $1,879,096 |
| 7/31/21 | $1,869,456 | $2,403,770 | $1,891,341 |
| 8/31/21 | $1,907,408 | $2,476,858 | $1,932,549 |
| 9/30/21 | $1,834,656 | $2,361,660 | $1,864,997 |
| 10/31/21 | $1,918,161 | $2,527,122 | $1,945,792 |
| 11/30/21 | $1,878,864 | $2,509,612 | $1,901,978 |
| 12/31/21 | $1,951,758 | $2,622,083 | $1,977,666 |
| 1/31/22 | $1,867,063 | $2,486,398 | $1,881,379 |
| 2/28/22 | $1,821,556 | $2,411,951 | $1,849,204 |
| 3/31/22 | $1,848,102 | $2,501,506 | $1,878,350 |
| 4/30/22 | $1,715,372 | $2,283,370 | $1,745,467 |
| 5/31/22 | $1,720,429 | $2,287,559 | $1,752,702 |
| 6/30/22 | $1,586,605 | $2,098,736 | $1,613,153 |
| 7/31/22 | $1,690,355 | $2,292,248 | $1,725,732 |
| 8/31/22 | $1,622,032 | $2,198,766 | $1,663,166 |
| 9/30/22 | $1,469,349 | $1,996,263 | $1,516,262 |
| 10/31/22 | $1,547,951 | $2,157,883 | $1,607,955 |
| 11/30/22 | $1,678,531 | $2,278,474 | $1,721,942 |
| 12/31/22 | $1,614,383 | $2,147,201 | $1,664,436 |
| 1/31/23 | $1,729,788 | $2,282,118 | $1,777,705 |
| 2/28/23 | $1,675,327 | $2,226,437 | $1,734,010 |
| 3/31/23 | $1,718,355 | $2,308,179 | $1,769,734 |
| 4/30/23 | $1,741,769 | $2,344,206 | $1,792,418 |
| 5/31/23 | $1,715,753 | $2,354,395 | $1,765,362 |
| 6/30/23 | $1,800,524 | $2,509,962 | $1,855,844 |
| 7/31/23 | $1,856,465 | $2,590,595 | $1,914,883 |
| 8/31/23 | $1,805,728 | $2,549,349 | $1,868,799 |
| 9/30/23 | $1,730,410 | $2,427,801 | $1,794,096 |
| 10/31/23 | $1,682,089 | $2,376,753 | $1,740,590 |
| 11/30/23 | $1,820,522 | $2,593,811 | $1,886,225 |
| 12/31/23 | $1,911,518 | $2,711,650 | $1,982,962 |
| 1/31/24 | $1,906,219 | $2,757,216 | $1,985,759 |
| 2/29/24 | $1,971,129 | $2,904,440 | $2,054,340 |
| 3/31/24 | $2,028,183 | $2,997,889 | $2,112,959 |
| 4/30/24 | $1,957,649 | $2,875,441 | $2,044,650 |
| 5/31/24 | $2,038,829 | $3,018,019 | $2,123,021 |
| 6/30/24 | $2,069,780 | $3,126,312 | $2,151,620 |
The table below shows the average annual total returns of the Fund, a regulatory index, and one or more supplemental index(es) for certain periods ended June 30, 2024.
Average Annual Total Returns (%)
| Class/Index Name | 1 Year | 5 Years | Since Inception 12/31/14 |
|---|
| Institutional Class | 14.95% | 9.01% | 7.96% |
| S&P 500 Index | 24.56% | 15.05% | 12.75% |
| S&P Target Date 2045 Index | 15.94% | 9.44% | 8.40% |
All Fund returns are net of fees and expenses and include applicable fee waivers and/or expense limitations. Absent any applicable fee waivers and/or expense limitations, performance would have been lower and there can be no assurance that any such waivers or limitations will continue in the future.
Performance quoted represents past performance. Past performance is not a guarantee or a reliable indicator of future results.Current performance may be lower or higher than performance shown. Investment return and the principal value of an investment will fluctuate. Shares may be worth more or less than original cost when redeemed. Returns shown do not reflect the deduction of taxes that a shareholder would pay on Fund distributions or the redemption of Fund shares.Differences in the Fund’s performance versus an index and related attribution information with respect to particular categories of securities or individual positions may be attributable, in part, to differences in the pricing methodologies used by the Fund and the index. For performance current to the most recent month-end, visit www.pimco.com/literature or via 888.87.PIMCO (888.877.4626).
Key Fund StatisticsFootnote Reference* (as of the end of the reporting period)
| Total Net Assets | $534,519 |
| # of Portfolio Holdings | 18 |
| Portfolio Turnover Rate | 20% |
| Total Net Advisory Fees Paid During the Reporting Period | $150 |
| Footnote | Description |
Footnote* | Dollar amounts displayed in 000's |
What did the Fund invest in?
Allocation Breakdown (% of Net Assets)Footnote Reference*
| Mutual Funds | 81.2% |
| Affiliated Investments | 18.1% |
| Other Investments | 0.0% |
| Other Assets and Liabilities, Net | 0.7% |
| Total | 100.0% |
| Footnote | Description |
Footnote* | % of Net Assets includes derivatives instruments, if any, valued at the value used for determining the Fund’s net asset value. The notional exposure of such derivatives investments therefore may be greater than what is depicted. |
Top Holdings (% of Net Assets)
| Vanguard Institutional Index Fund 'Institutional' | 45.9% |
| Vanguard Developed Markets Index Fund 'Institutional' | 23.8% |
| Vanguard Emerging Markets Stock Index Fund 'Institutional' | 8.4% |
| PIMCO Total Return Fund | 3.6% |
| Vanguard Small-Cap Index Fund 'Institutional' | 3.1% |
| PIMCO Long-Term U.S. Government Fund | 2.4% |
| PIMCO Long-Term Real Return Fund | 2.3% |
| PIMCO Income Fund | 1.6% |
| PIMCO Real Return Fund | 1.6% |
| PIMCO Emerging Markets Local Currency and Bond Fund | 1.2% |
This is a summary of certain changes and planned changes of the Fund since the beginning of the reporting period. For more information, you may refer to the Fund's next prospectus, which we expect to be available by October 31, 2024 or upon request at 888.87.PIMCO (888.877.4626).
Changes to Total Annual Fund Operating Expenses. Annual fund operating expenses increased during the year by 0.05% as a result of the Fund’s exposure to fees and expenses related to the Fund’s investment in underlying funds.
Change to REALPATH® Blend Glide Path. Effective February 28, 2024, the Fund’s REALPATH® Blend Glide Path, which forms the basis of the Fund’s long-term asset allocations, was changed based on data relating to risk metrics, long-term market trends, correlation of asset types and actuarial assumptions of life expectancy and retirement.
For additional information about the Fund, including the Fund's prospectus, financial information, holdings and proxy voting information, please visit www.pimco.com/literature or contact 888.87.PIMCO (888.877.4626). For tax information about the Fund, please visit: https://www.pimco.com/tax.
Institutional Class: PVQNX
PIMCO REALPATH® Blend 2045 Fund
Annual Shareholder Report |
June 30, 2024
PIMCO REALPATH® Blend 2050 Fund
Annual Shareholder Report | June 30, 2024
This annual shareholder report contains important information about the PIMCO REALPATH® Blend 2050 Fund for the period of July 1, 2023 to June 30, 2024 (the "reporting period"). You can find additional information about the Fund at www.pimco.com/literature. You can also request this information by contacting us at 888.87.PIMCO (888.877.4626).
This report describes changes to the Fund that occurred during the reporting period.
What were the Fund costs for the last year?
(based on a hypothetical $10,000 investment)
| Class Name | Cost of a $10,000 investment | Costs paid as a percentage of a $10,000 investment |
|---|
| Class A | $54 | 0.50% |
How did the Fund perform during the reporting period and what affected its performance?
The following affected performance (on a gross basis) during the reporting period:
• Exposure to U.S. large cap equities contributed to absolute performance, as U.S. large cap equities posted positive returns.
• Exposure to global equities contributed to absolute performance, as global equities posted positive returns.
• Exposure to emerging market equities contributed to absolute performance, as emerging market equities posted positive returns.
• Exposure to U.S. small cap equities contributed to absolute performance, as U.S. small cap equities posted positive returns.
• Exposure to long-term Treasury Inflation-Protected Securities ("TIPS") detracted from absolute performance, as long-term TIPS posted
negative returns.
• Exposure to long-term U.S. treasuries detracted from absolute performance, as long-term treasuries posted negative returns.
• There were no other material detractors for this Fund.
In addition to the Fund's performance, the tables in this section include performance of: (i) a broad-based securities market index (i.e., a regulatory index) and (ii) one or more supplemental index(es). Effective July 24, 2024, the Fund's regulatory index is the S&P 500 Index. The Fund's regulatory index is shown in connection with certain regulatory requirements to provide a broad measure of market performance.
The table below illustrates cumulative returns for the 10-year period ended June 30, 2024 or the life of the Fund, if shorter. Cumulative returns are based on a hypothetical initial investment equal to the greater of either $10,000 or the investment minimum applicable to the share class.
Cumulative Returns Based on $10,000 Investment
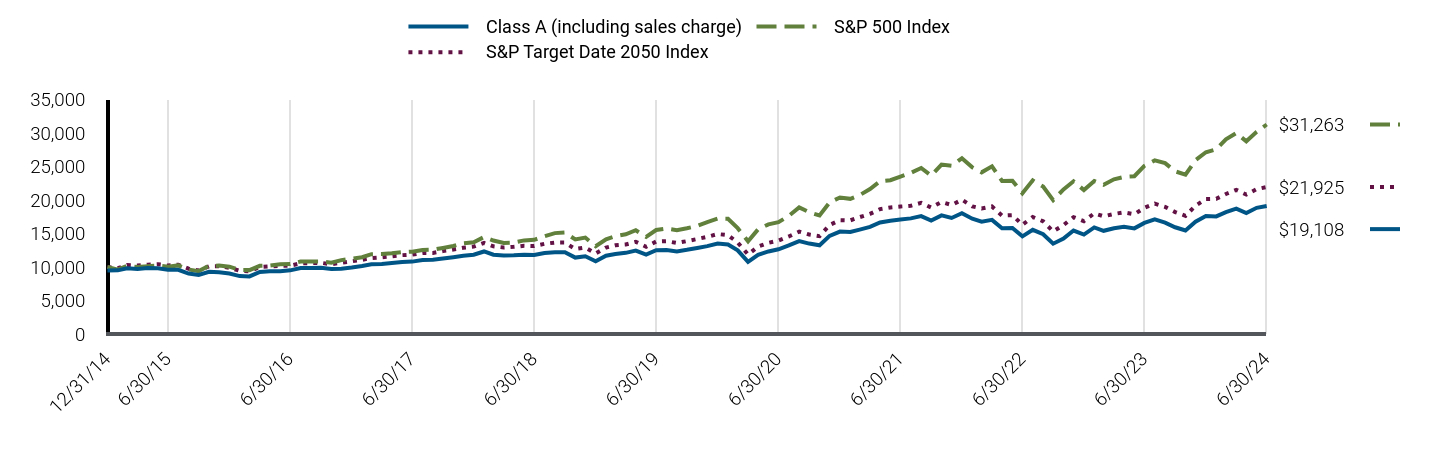
| Class A (including sales charge) | S&P 500 Index | S&P Target Date 2050 Index |
|---|
| 12/31/14 | $9,452 | $10,000 | $10,000 |
| 1/31/15 | $9,490 | $9,600 | $9,807 |
| 2/28/15 | $9,792 | $10,152 | $10,293 |
| 3/31/15 | $9,698 | $9,991 | $10,213 |
| 4/30/15 | $9,849 | $10,087 | $10,343 |
| 5/31/15 | $9,811 | $10,217 | $10,410 |
| 6/30/15 | $9,576 | $10,019 | $10,207 |
| 7/31/15 | $9,566 | $10,229 | $10,333 |
| 8/31/15 | $9,007 | $9,612 | $9,733 |
| 9/30/15 | $8,793 | $9,374 | $9,469 |
| 10/31/15 | $9,277 | $10,164 | $10,082 |
| 11/30/15 | $9,192 | $10,195 | $10,096 |
| 12/31/15 | $9,024 | $10,034 | $9,878 |
| 1/31/16 | $8,629 | $9,536 | $9,422 |
| 2/29/16 | $8,581 | $9,523 | $9,366 |
| 3/31/16 | $9,254 | $10,169 | $9,994 |
| 4/30/16 | $9,341 | $10,209 | $10,082 |
| 5/31/16 | $9,360 | $10,392 | $10,180 |
| 6/30/16 | $9,490 | $10,419 | $10,188 |
| 7/31/16 | $9,829 | $10,803 | $10,545 |
| 8/31/16 | $9,839 | $10,818 | $10,575 |
| 9/30/16 | $9,880 | $10,820 | $10,613 |
| 10/31/16 | $9,696 | $10,623 | $10,403 |
| 11/30/16 | $9,735 | $11,016 | $10,622 |
| 12/31/16 | $9,911 | $11,234 | $10,840 |
| 1/31/17 | $10,126 | $11,447 | $11,060 |
| 2/28/17 | $10,391 | $11,902 | $11,335 |
| 3/31/17 | $10,450 | $11,915 | $11,438 |
| 4/30/17 | $10,578 | $12,038 | $11,584 |
| 5/31/17 | $10,725 | $12,207 | $11,759 |
| 6/30/17 | $10,794 | $12,283 | $11,842 |
| 7/31/17 | $11,039 | $12,536 | $12,093 |
| 8/31/17 | $11,088 | $12,574 | $12,096 |
| 9/30/17 | $11,260 | $12,834 | $12,368 |
| 10/31/17 | $11,446 | $13,133 | $12,597 |
| 11/30/17 | $11,653 | $13,536 | $12,875 |
| 12/31/17 | $11,817 | $13,687 | $13,027 |
| 1/31/18 | $12,307 | $14,470 | $13,589 |
| 2/28/18 | $11,817 | $13,937 | $13,073 |
| 3/31/18 | $11,697 | $13,583 | $12,906 |
| 4/30/18 | $11,737 | $13,635 | $12,997 |
| 5/31/18 | $11,827 | $13,963 | $13,161 |
| 6/30/18 | $11,787 | $14,049 | $13,128 |
| 7/31/18 | $12,087 | $14,572 | $13,456 |
| 8/31/18 | $12,197 | $15,047 | $13,635 |
| 9/30/18 | $12,185 | $15,132 | $13,636 |
| 10/31/18 | $11,393 | $14,098 | $12,675 |
| 11/30/18 | $11,594 | $14,385 | $12,882 |
| 12/31/18 | $10,851 | $13,086 | $11,993 |
| 1/31/19 | $11,667 | $14,135 | $12,887 |
| 2/28/19 | $11,922 | $14,589 | $13,223 |
| 3/31/19 | $12,103 | $14,872 | $13,346 |
| 4/30/19 | $12,444 | $15,475 | $13,753 |
| 5/31/19 | $11,826 | $14,491 | $13,018 |
| 6/30/19 | $12,494 | $15,513 | $13,789 |
| 7/31/19 | $12,526 | $15,736 | $13,847 |
| 8/31/19 | $12,322 | $15,486 | $13,573 |
| 9/30/19 | $12,552 | $15,776 | $13,853 |
| 10/31/19 | $12,831 | $16,118 | $14,167 |
| 11/30/19 | $13,101 | $16,703 | $14,483 |
| 12/31/19 | $13,506 | $17,207 | $14,913 |
| 1/31/20 | $13,352 | $17,200 | $14,744 |
| 2/29/20 | $12,475 | $15,784 | $13,652 |
| 3/31/20 | $10,752 | $13,835 | $11,847 |
| 4/30/20 | $11,794 | $15,608 | $13,040 |
| 5/31/20 | $12,310 | $16,352 | $13,593 |
| 6/30/20 | $12,638 | $16,677 | $13,933 |
| 7/31/20 | $13,220 | $17,617 | $14,546 |
| 8/31/20 | $13,857 | $18,883 | $15,272 |
| 9/30/20 | $13,483 | $18,166 | $14,843 |
| 10/31/20 | $13,231 | $17,683 | $14,599 |
| 11/30/20 | $14,636 | $19,618 | $16,263 |
| 12/31/20 | $15,272 | $20,373 | $16,981 |
| 1/31/21 | $15,217 | $20,167 | $16,955 |
| 2/28/21 | $15,571 | $20,723 | $17,430 |
| 3/31/21 | $15,982 | $21,631 | $17,927 |
| 4/30/21 | $16,630 | $22,785 | $18,629 |
| 5/31/21 | $16,898 | $22,944 | $18,883 |
| 6/30/21 | $17,076 | $23,480 | $19,018 |
| 7/31/21 | $17,245 | $24,038 | $19,139 |
| 8/31/21 | $17,594 | $24,769 | $19,567 |
| 9/30/21 | $16,911 | $23,617 | $18,867 |
| 10/31/21 | $17,690 | $25,271 | $19,708 |
| 11/30/21 | $17,306 | $25,096 | $19,249 |
| 12/31/21 | $18,006 | $26,221 | $20,036 |
| 1/31/22 | $17,203 | $24,864 | $19,045 |
| 2/28/22 | $16,761 | $24,120 | $18,717 |
| 3/31/22 | $17,028 | $25,015 | $19,032 |
| 4/30/22 | $15,783 | $22,834 | $17,665 |
| 5/31/22 | $15,818 | $22,876 | $17,737 |
| 6/30/22 | $14,561 | $20,987 | $16,293 |
| 7/31/22 | $15,539 | $22,922 | $17,450 |
| 8/31/22 | $14,887 | $21,988 | $16,812 |
| 9/30/22 | $13,467 | $19,963 | $15,304 |
| 10/31/22 | $14,224 | $21,579 | $16,258 |
| 11/30/22 | $15,436 | $22,785 | $17,429 |
| 12/31/22 | $14,834 | $21,472 | $16,836 |
| 1/31/23 | $15,905 | $22,821 | $18,002 |
| 2/28/23 | $15,393 | $22,264 | $17,558 |
| 3/31/23 | $15,781 | $23,082 | $17,914 |
| 4/30/23 | $15,995 | $23,442 | $18,146 |
| 5/31/23 | $15,757 | $23,544 | $17,866 |
| 6/30/23 | $16,568 | $25,100 | $18,820 |
| 7/31/23 | $17,092 | $25,906 | $19,444 |
| 8/31/23 | $16,615 | $25,493 | $18,958 |
| 9/30/23 | $15,921 | $24,278 | $18,187 |
| 10/31/23 | $15,443 | $23,768 | $17,631 |
| 11/30/23 | $16,746 | $25,938 | $19,136 |
| 12/31/23 | $17,590 | $27,116 | $20,133 |
| 1/31/24 | $17,542 | $27,572 | $20,160 |
| 2/29/24 | $18,172 | $29,044 | $20,893 |
| 3/31/24 | $18,702 | $29,979 | $21,506 |
| 4/30/24 | $18,046 | $28,754 | $20,802 |
| 5/31/24 | $18,824 | $30,180 | $21,617 |
| 6/30/24 | $19,108 | $31,263 | $21,925 |
The table below shows the average annual total returns of the Fund, a regulatory index, and one or more supplemental index(es) for certain periods ended June 30, 2024.
Average Annual Total Returns (%)
| Class/Index Name | 1 Year | 5 Years | Since Inception 12/31/14 |
|---|
| Class A (excluding sales charge) | 15.33% | 8.87% | 7.69% |
| Class A (including sales charge) | 8.98% | 7.64% | 7.06% |
| S&P 500 Index | 24.56% | 15.05% | 12.75% |
| S&P Target Date 2050 Index | 16.50% | 9.72% | 8.62% |
All Fund returns are net of fees and expenses and include applicable fee waivers and/or expense limitations. Absent any applicable fee waivers and/or expense limitations, performance would have been lower and there can be no assurance that any such waivers or limitations will continue in the future.
Performance quoted represents past performance. Past performance is not a guarantee or a reliable indicator of future results.Current performance may be lower or higher than performance shown. Investment return and the principal value of an investment will fluctuate. Shares may be worth more or less than original cost when redeemed. Returns shown do not reflect the deduction of taxes that a shareholder would pay on Fund distributions or the redemption of Fund shares.Differences in the Fund’s performance versus an index and related attribution information with respect to particular categories of securities or individual positions may be attributable, in part, to differences in the pricing methodologies used by the Fund and the index. The Cumulative Returns chart and Average Annual Total Returns table reflect any sales load that would have applied at the time of purchase or any Contingent Deferred Sales Charge (“CDSC”) that would have applied if a full redemption occurred on the last business day of the period shown in the Cumulative Returns chart. Class A shares are subject to an initial sales charge. A CDSC may be imposed in certain circumstances on Class A shares that are purchased without an initial sales charge and then redeemed during the first 12 months after purchase. For performance current to the most recent month-end, visit www.pimco.com/literature or via 888.87.PIMCO (888.877.4626).
Key Fund StatisticsFootnote Reference* (as of the end of the reporting period)
| Total Net Assets | $480,539 |
| # of Portfolio Holdings | 17 |
| Portfolio Turnover Rate | 29% |
| Total Net Advisory Fees Paid During the Reporting Period | $141 |
| Footnote | Description |
Footnote* | Dollar amounts displayed in 000's |
What did the Fund invest in?
Allocation Breakdown (% of Net Assets)Footnote Reference*
| Mutual Funds | 86.2% |
| Affiliated Investments | 12.8% |
| Short-Term Instruments | 0.1% |
| Other Investments | 0.0% |
| Other Assets and Liabilities, Net | 0.9% |
| Total | 100.0% |
| Footnote | Description |
Footnote* | % of Net Assets includes derivatives instruments, if any, valued at the value used for determining the Fund’s net asset value. The notional exposure of such derivatives investments therefore may be greater than what is depicted. |
Top Holdings (% of Net Assets)
| Vanguard Institutional Index Fund 'Institutional' | 48.3% |
| Vanguard Developed Markets Index Fund 'Institutional' | 25.6% |
| Vanguard Emerging Markets Stock Index Fund 'Institutional' | 8.7% |
| Vanguard Small-Cap Index Fund 'Institutional' | 3.6% |
| PIMCO Total Return Fund | 2.5% |
| PIMCO Long-Term U.S. Government Fund | 1.5% |
| PIMCO Long-Term Real Return Fund | 1.4% |
| PIMCO Income Fund | 1.1% |
| PIMCO Real Return Fund | 1.0% |
| PIMCO Emerging Markets Local Currency and Bond Fund | 0.5% |
This is a summary of certain changes and planned changes of the Fund since the beginning of the reporting period. For more information, you may refer to the Fund's next prospectus, which we expect to be available by October 31, 2024 or upon request at 888.87.PIMCO (888.877.4626).
Change to REALPATH® Blend Glide Path. Effective February 28, 2024, the Fund’s REALPATH® Blend Glide Path, which forms the basis of the Fund’s long-term asset allocations, was changed based on data relating to risk metrics, long-term market trends, correlation of asset types and actuarial assumptions of life expectancy and retirement.
For additional information about the Fund, including the Fund's prospectus, financial information, holdings and proxy voting information, please visit www.pimco.com/literature or contact 888.87.PIMCO (888.877.4626). For tax information about the Fund, please visit: https://www.pimco.com/tax.
PIMCO REALPATH® Blend 2050 Fund
Annual Shareholder Report |
June 30, 2024
Institutional Class: PPQZX
PIMCO REALPATH® Blend 2050 Fund
Annual Shareholder Report | June 30, 2024
This annual shareholder report contains important information about the PIMCO REALPATH® Blend 2050 Fund for the period of July 1, 2023 to June 30, 2024 (the "reporting period"). You can find additional information about the Fund at www.pimco.com/literature. You can also request this information by contacting us at 888.87.PIMCO (888.877.4626).
This report describes changes to the Fund that occurred during the reporting period.
What were the Fund costs for the last year?
(based on a hypothetical $10,000 investment)
| Class Name | Cost of a $10,000 investment | Costs paid as a percentage of a $10,000 investment |
|---|
| Institutional Class | $5 | 0.05% |
How did the Fund perform during the reporting period and what affected its performance?
The following affected performance (on a gross basis) during the reporting period:
• Exposure to U.S. large cap equities contributed to absolute performance, as U.S. large cap equities posted positive returns.
• Exposure to global equities contributed to absolute performance, as global equities posted positive returns.
• Exposure to emerging market equities contributed to absolute performance, as emerging market equities posted positive returns.
• Exposure to U.S. small cap equities contributed to absolute performance, as U.S. small cap equities posted positive returns.
• Exposure to long-term Treasury Inflation-Protected Securities ("TIPS") detracted from absolute performance, as long-term TIPS posted
negative returns.
• Exposure to long-term U.S. treasuries detracted from absolute performance, as long-term treasuries posted negative returns.
• There were no other material detractors for this Fund.
In addition to the Fund's performance, the tables in this section include performance of: (i) a broad-based securities market index (i.e., a regulatory index) and (ii) one or more supplemental index(es). Effective July 24, 2024, the Fund's regulatory index is the S&P 500 Index. The Fund's regulatory index is shown in connection with certain regulatory requirements to provide a broad measure of market performance.
The table below illustrates cumulative returns for the 10-year period ended June 30, 2024 or the life of the Fund, if shorter. Cumulative returns are based on a hypothetical initial investment equal to the greater of either $10,000 or the investment minimum applicable to the share class.
Cumulative Returns Based on $1,000,000 Investment
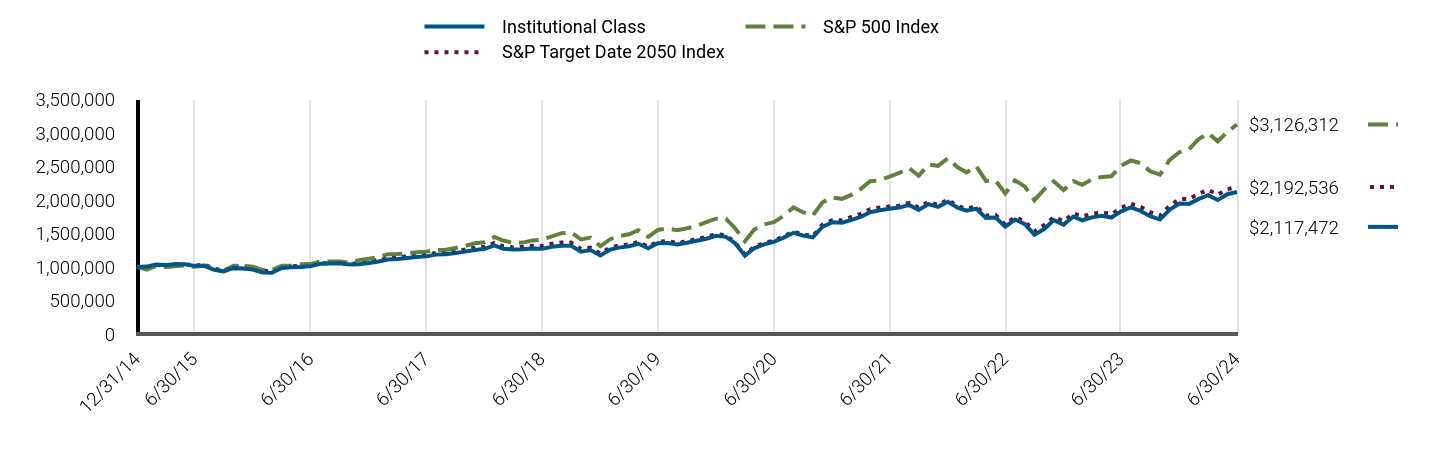
| Institutional Class | S&P 500 Index | S&P Target Date 2050 Index |
|---|
| 12/31/14 | $1,000,000 | $1,000,000 | $1,000,000 |
| 1/31/15 | $1,005,000 | $959,985 | $980,688 |
| 2/28/15 | $1,037,000 | $1,015,157 | $1,029,293 |
| 3/31/15 | $1,027,000 | $999,103 | $1,021,337 |
| 4/30/15 | $1,044,000 | $1,008,687 | $1,034,283 |
| 5/31/15 | $1,040,000 | $1,021,658 | $1,041,010 |
| 6/30/15 | $1,015,871 | $1,001,881 | $1,020,686 |
| 7/31/15 | $1,014,866 | $1,022,872 | $1,033,343 |
| 8/31/15 | $955,582 | $961,158 | $973,311 |
| 9/30/15 | $933,352 | $937,375 | $946,911 |
| 10/31/15 | $985,709 | $1,016,447 | $1,008,173 |
| 11/30/15 | $976,647 | $1,019,470 | $1,009,620 |
| 12/31/15 | $960,162 | $1,003,391 | $987,849 |
| 1/31/16 | $918,282 | $953,598 | $942,211 |
| 2/29/16 | $914,197 | $952,312 | $936,633 |
| 3/31/16 | $985,474 | $1,016,915 | $999,441 |
| 4/30/16 | $994,684 | $1,020,857 | $1,008,243 |
| 5/31/16 | $997,754 | $1,039,190 | $1,017,973 |
| 6/30/16 | $1,011,789 | $1,041,882 | $1,018,800 |
| 7/31/16 | $1,047,851 | $1,080,295 | $1,054,530 |
| 8/31/16 | $1,049,911 | $1,081,812 | $1,057,526 |
| 9/30/16 | $1,054,282 | $1,082,016 | $1,061,312 |
| 10/31/16 | $1,035,713 | $1,062,279 | $1,040,253 |
| 11/30/16 | $1,039,840 | $1,101,621 | $1,062,214 |
| 12/31/16 | $1,059,126 | $1,123,395 | $1,084,020 |
| 1/31/17 | $1,082,151 | $1,144,702 | $1,106,005 |
| 2/28/17 | $1,111,455 | $1,190,154 | $1,133,503 |
| 3/31/17 | $1,118,781 | $1,191,542 | $1,143,778 |
| 4/30/17 | $1,132,386 | $1,203,779 | $1,158,413 |
| 5/31/17 | $1,149,131 | $1,220,720 | $1,175,860 |
| 6/30/17 | $1,157,531 | $1,228,339 | $1,184,242 |
| 7/31/17 | $1,183,719 | $1,253,597 | $1,209,347 |
| 8/31/17 | $1,190,004 | $1,257,434 | $1,209,567 |
| 9/30/17 | $1,208,450 | $1,283,373 | $1,236,751 |
| 10/31/17 | $1,228,416 | $1,313,321 | $1,259,651 |
| 11/30/17 | $1,251,534 | $1,353,600 | $1,287,479 |
| 12/31/17 | $1,269,641 | $1,368,650 | $1,302,748 |
| 1/31/18 | $1,323,077 | $1,447,011 | $1,358,883 |
| 2/28/18 | $1,270,710 | $1,393,678 | $1,307,296 |
| 3/31/18 | $1,258,954 | $1,358,260 | $1,290,553 |
| 4/30/18 | $1,263,229 | $1,363,472 | $1,299,716 |
| 5/31/18 | $1,273,916 | $1,396,307 | $1,316,066 |
| 6/30/18 | $1,269,741 | $1,404,901 | $1,312,772 |
| 7/31/18 | $1,301,859 | $1,457,183 | $1,345,648 |
| 8/31/18 | $1,314,707 | $1,504,666 | $1,363,463 |
| 9/30/18 | $1,314,601 | $1,513,230 | $1,363,607 |
| 10/31/18 | $1,228,539 | $1,409,800 | $1,267,486 |
| 11/30/18 | $1,251,130 | $1,438,530 | $1,288,201 |
| 12/31/18 | $1,171,128 | $1,308,644 | $1,199,276 |
| 1/31/19 | $1,259,901 | $1,413,513 | $1,288,675 |
| 2/28/19 | $1,288,354 | $1,458,898 | $1,322,302 |
| 3/31/19 | $1,308,052 | $1,487,247 | $1,334,599 |
| 4/30/19 | $1,345,851 | $1,547,466 | $1,375,317 |
| 5/31/19 | $1,279,417 | $1,449,127 | $1,301,787 |
| 6/30/19 | $1,352,777 | $1,551,256 | $1,378,879 |
| 7/31/19 | $1,356,234 | $1,573,551 | $1,384,694 |
| 8/31/19 | $1,335,493 | $1,548,625 | $1,357,270 |
| 9/30/19 | $1,360,156 | $1,577,601 | $1,385,332 |
| 10/31/19 | $1,391,464 | $1,611,771 | $1,416,665 |
| 11/30/19 | $1,420,453 | $1,670,277 | $1,448,286 |
| 12/31/19 | $1,464,975 | $1,720,689 | $1,491,321 |
| 1/31/20 | $1,449,592 | $1,720,014 | $1,474,396 |
| 2/29/20 | $1,354,924 | $1,578,424 | $1,365,182 |
| 3/31/20 | $1,168,660 | $1,383,468 | $1,184,725 |
| 4/30/20 | $1,282,329 | $1,560,821 | $1,303,992 |
| 5/31/20 | $1,337,980 | $1,635,159 | $1,359,323 |
| 6/30/20 | $1,375,187 | $1,667,678 | $1,393,317 |
| 7/31/20 | $1,438,073 | $1,761,710 | $1,454,579 |
| 8/31/20 | $1,509,265 | $1,888,343 | $1,527,196 |
| 9/30/20 | $1,468,923 | $1,816,592 | $1,484,305 |
| 10/31/20 | $1,441,633 | $1,768,282 | $1,459,931 |
| 11/30/20 | $1,595,882 | $1,961,845 | $1,626,284 |
| 12/31/20 | $1,665,974 | $2,037,275 | $1,698,105 |
| 1/31/21 | $1,659,977 | $2,016,707 | $1,695,502 |
| 2/28/21 | $1,699,557 | $2,072,317 | $1,743,020 |
| 3/31/21 | $1,745,791 | $2,163,076 | $1,792,709 |
| 4/30/21 | $1,817,270 | $2,278,516 | $1,862,940 |
| 5/31/21 | $1,846,346 | $2,294,430 | $1,888,327 |
| 6/30/21 | $1,867,770 | $2,347,993 | $1,901,779 |
| 7/31/21 | $1,886,105 | $2,403,770 | $1,913,858 |
| 8/31/21 | $1,926,443 | $2,476,858 | $1,956,748 |
| 9/30/21 | $1,851,360 | $2,361,660 | $1,886,663 |
| 10/31/21 | $1,938,410 | $2,527,122 | $1,970,780 |
| 11/30/21 | $1,896,724 | $2,509,612 | $1,924,852 |
| 12/31/21 | $1,974,163 | $2,622,083 | $2,003,616 |
| 1/31/22 | $1,885,579 | $2,486,398 | $1,904,456 |
| 2/28/22 | $1,838,756 | $2,411,951 | $1,871,692 |
| 3/31/22 | $1,869,128 | $2,501,506 | $1,903,154 |
| 4/30/22 | $1,732,455 | $2,283,370 | $1,766,455 |
| 5/31/22 | $1,737,517 | $2,287,559 | $1,773,688 |
| 6/30/22 | $1,600,844 | $2,098,736 | $1,629,322 |
| 7/31/22 | $1,707,145 | $2,292,248 | $1,744,974 |
| 8/31/22 | $1,637,543 | $2,198,766 | $1,681,181 |
| 9/30/22 | $1,481,742 | $1,996,263 | $1,530,378 |
| 10/31/22 | $1,565,399 | $2,157,883 | $1,625,778 |
| 11/30/22 | $1,699,757 | $2,278,474 | $1,742,948 |
| 12/31/22 | $1,632,754 | $2,147,201 | $1,683,567 |
| 1/31/23 | $1,751,971 | $2,282,118 | $1,800,159 |
| 2/28/23 | $1,696,250 | $2,226,437 | $1,755,750 |
| 3/31/23 | $1,740,006 | $2,308,179 | $1,791,408 |
| 4/30/23 | $1,764,696 | $2,344,206 | $1,814,553 |
| 5/31/23 | $1,737,407 | $2,354,395 | $1,786,562 |
| 6/30/23 | $1,828,609 | $2,509,962 | $1,881,962 |
| 7/31/23 | $1,888,393 | $2,590,595 | $1,944,380 |
| 8/31/23 | $1,835,107 | $2,549,349 | $1,895,849 |
| 9/30/23 | $1,758,174 | $2,427,801 | $1,818,748 |
| 10/31/23 | $1,707,307 | $2,376,753 | $1,763,056 |
| 11/30/23 | $1,852,083 | $2,593,811 | $1,913,569 |
| 12/31/23 | $1,945,110 | $2,711,650 | $2,013,309 |
| 1/31/24 | $1,941,141 | $2,757,216 | $2,015,984 |
| 2/29/24 | $2,012,594 | $2,904,440 | $2,089,252 |
| 3/31/24 | $2,072,224 | $2,997,889 | $2,150,586 |
| 4/30/24 | $1,999,165 | $2,875,441 | $2,080,211 |
| 5/31/24 | $2,085,507 | $3,018,019 | $2,161,725 |
| 6/30/24 | $2,117,472 | $3,126,312 | $2,192,536 |
The table below shows the average annual total returns of the Fund, a regulatory index, and one or more supplemental index(es) for certain periods ended June 30, 2024.
Average Annual Total Returns (%)
| Class/Index Name | 1 Year | 5 Years | Since Inception 12/31/14 |
|---|
| Institutional Class | 15.80% | 9.38% | 8.22% |
| S&P 500 Index | 24.56% | 15.05% | 12.75% |
| S&P Target Date 2050 Index | 16.50% | 9.72% | 8.62% |
All Fund returns are net of fees and expenses and include applicable fee waivers and/or expense limitations. Absent any applicable fee waivers and/or expense limitations, performance would have been lower and there can be no assurance that any such waivers or limitations will continue in the future.
Performance quoted represents past performance. Past performance is not a guarantee or a reliable indicator of future results.Current performance may be lower or higher than performance shown. Investment return and the principal value of an investment will fluctuate. Shares may be worth more or less than original cost when redeemed. Returns shown do not reflect the deduction of taxes that a shareholder would pay on Fund distributions or the redemption of Fund shares.Differences in the Fund’s performance versus an index and related attribution information with respect to particular categories of securities or individual positions may be attributable, in part, to differences in the pricing methodologies used by the Fund and the index. For performance current to the most recent month-end, visit www.pimco.com/literature or via 888.87.PIMCO (888.877.4626).
Key Fund StatisticsFootnote Reference* (as of the end of the reporting period)
| Total Net Assets | $480,539 |
| # of Portfolio Holdings | 17 |
| Portfolio Turnover Rate | 29% |
| Total Net Advisory Fees Paid During the Reporting Period | $141 |
| Footnote | Description |
Footnote* | Dollar amounts displayed in 000's |
What did the Fund invest in?
Allocation Breakdown (% of Net Assets)Footnote Reference*
| Mutual Funds | 86.2% |
| Affiliated Investments | 12.8% |
| Short-Term Instruments | 0.1% |
| Other Investments | 0.0% |
| Other Assets and Liabilities, Net | 0.9% |
| Total | 100.0% |
| Footnote | Description |
Footnote* | % of Net Assets includes derivatives instruments, if any, valued at the value used for determining the Fund’s net asset value. The notional exposure of such derivatives investments therefore may be greater than what is depicted. |
Top Holdings (% of Net Assets)
| Vanguard Institutional Index Fund 'Institutional' | 48.3% |
| Vanguard Developed Markets Index Fund 'Institutional' | 25.6% |
| Vanguard Emerging Markets Stock Index Fund 'Institutional' | 8.7% |
| Vanguard Small-Cap Index Fund 'Institutional' | 3.6% |
| PIMCO Total Return Fund | 2.5% |
| PIMCO Long-Term U.S. Government Fund | 1.5% |
| PIMCO Long-Term Real Return Fund | 1.4% |
| PIMCO Income Fund | 1.1% |
| PIMCO Real Return Fund | 1.0% |
| PIMCO Emerging Markets Local Currency and Bond Fund | 0.5% |
This is a summary of certain changes and planned changes of the Fund since the beginning of the reporting period. For more information, you may refer to the Fund's next prospectus, which we expect to be available by October 31, 2024 or upon request at 888.87.PIMCO (888.877.4626).
Change to REALPATH® Blend Glide Path. Effective February 28, 2024, the Fund’s REALPATH® Blend Glide Path, which forms the basis of the Fund’s long-term asset allocations, was changed based on data relating to risk metrics, long-term market trends, correlation of asset types and actuarial assumptions of life expectancy and retirement.
For additional information about the Fund, including the Fund's prospectus, financial information, holdings and proxy voting information, please visit www.pimco.com/literature or contact 888.87.PIMCO (888.877.4626). For tax information about the Fund, please visit: https://www.pimco.com/tax.
Institutional Class: PPQZX
PIMCO REALPATH® Blend 2050 Fund
Annual Shareholder Report |
June 30, 2024
PIMCO REALPATH® Blend 2055 Fund
Annual Shareholder Report | June 30, 2024
This annual shareholder report contains important information about the PIMCO REALPATH® Blend 2055 Fund for the period of July 1, 2023 to June 30, 2024 (the "reporting period"). You can find additional information about the Fund at www.pimco.com/literature. You can also request this information by contacting us at 888.87.PIMCO (888.877.4626).
This report describes changes to the Fund that occurred during the reporting period.
What were the Fund costs for the last year?
(based on a hypothetical $10,000 investment)
| Class Name | Cost of a $10,000 investment | Costs paid as a percentage of a $10,000 investment |
|---|
| Class A | $54 | 0.50% |
How did the Fund perform during the reporting period and what affected its performance?
The following affected performance (on a gross basis) during the reporting period:
• Exposure to U.S. large cap equities contributed to absolute performance, as U.S. large cap equities posted positive returns.
• Exposure to global equities contributed to absolute performance, as global equities posted positive returns.
• Exposure to emerging market equities contributed to absolute performance, as emerging market equities posted positive returns.
• Exposure to U.S. small cap equities contributed to absolute performance, as U.S. small cap equities posted positive returns.
• Exposure to U.S. long-term Treasury Inflation-Protected Securities ("TIPS") detracted from absolute performance, as long-term TIPS
posted negative returns.
• Exposure to long-term treasuries detracted from absolute performance, as long-term treasuries posted negative returns.
• There were no other material detractors for this Fund.
In addition to the Fund's performance, the tables in this section include performance of: (i) a broad-based securities market index (i.e., a regulatory index) and (ii) one or more supplemental index(es). Effective July 24, 2024, the Fund's regulatory index is the S&P 500 Index. The Fund's regulatory index is shown in connection with certain regulatory requirements to provide a broad measure of market performance.
The table below illustrates cumulative returns for the 10-year period ended June 30, 2024 or the life of the Fund, if shorter. Cumulative returns are based on a hypothetical initial investment equal to the greater of either $10,000 or the investment minimum applicable to the share class.
Cumulative Returns Based on $10,000 Investment
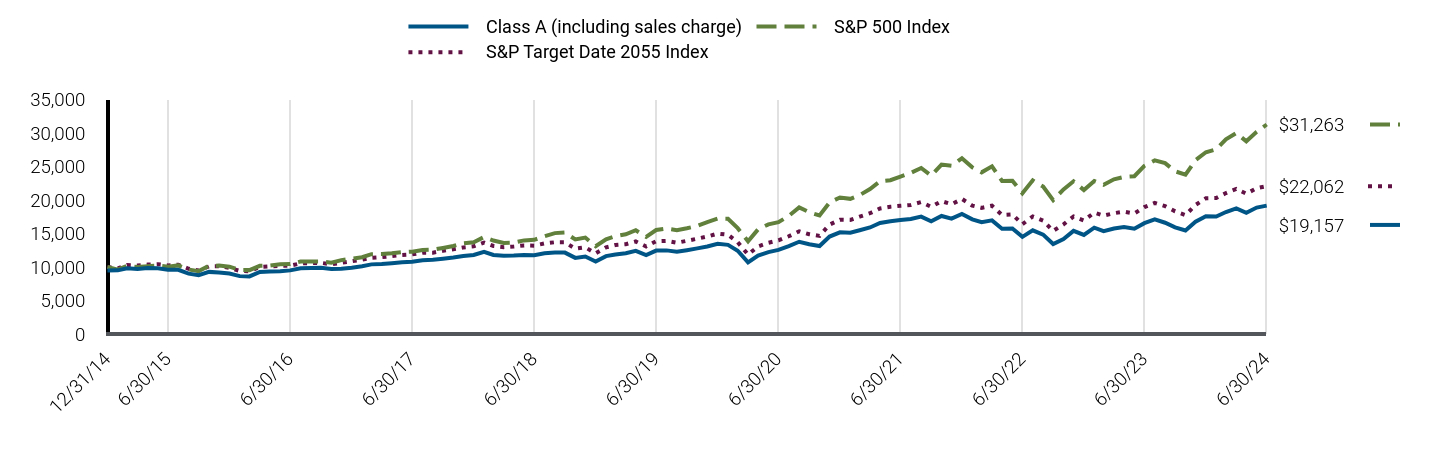
| Class A (including sales charge) | S&P 500 Index | S&P Target Date 2055 Index |
|---|
| 12/31/14 | $9,452 | $10,000 | $10,000 |
| 1/31/15 | $9,490 | $9,600 | $9,800 |
| 2/28/15 | $9,792 | $10,152 | $10,297 |
| 3/31/15 | $9,698 | $9,991 | $10,215 |
| 4/30/15 | $9,849 | $10,087 | $10,348 |
| 5/31/15 | $9,802 | $10,217 | $10,417 |
| 6/30/15 | $9,573 | $10,019 | $10,211 |
| 7/31/15 | $9,563 | $10,229 | $10,338 |
| 8/31/15 | $8,994 | $9,612 | $9,724 |
| 9/30/15 | $8,776 | $9,374 | $9,453 |
| 10/31/15 | $9,260 | $10,164 | $10,078 |
| 11/30/15 | $9,184 | $10,195 | $10,093 |
| 12/31/15 | $9,011 | $10,034 | $9,869 |
| 1/31/16 | $8,627 | $9,536 | $9,402 |
| 2/29/16 | $8,578 | $9,523 | $9,342 |
| 3/31/16 | $9,250 | $10,169 | $9,981 |
| 4/30/16 | $9,327 | $10,209 | $10,071 |
| 5/31/16 | $9,356 | $10,392 | $10,169 |
| 6/30/16 | $9,483 | $10,419 | $10,172 |
| 7/31/16 | $9,812 | $10,803 | $10,537 |
| 8/31/16 | $9,822 | $10,818 | $10,569 |
| 9/30/16 | $9,861 | $10,820 | $10,608 |
| 10/31/16 | $9,677 | $10,623 | $10,395 |
| 11/30/16 | $9,716 | $11,016 | $10,628 |
| 12/31/16 | $9,892 | $11,234 | $10,850 |
| 1/31/17 | $10,108 | $11,447 | $11,076 |
| 2/28/17 | $10,382 | $11,902 | $11,357 |
| 3/31/17 | $10,431 | $11,915 | $11,463 |
| 4/30/17 | $10,559 | $12,038 | $11,611 |
| 5/31/17 | $10,706 | $12,207 | $11,789 |
| 6/30/17 | $10,775 | $12,283 | $11,873 |
| 7/31/17 | $11,010 | $12,536 | $12,127 |
| 8/31/17 | $11,059 | $12,574 | $12,129 |
| 9/30/17 | $11,235 | $12,834 | $12,405 |
| 10/31/17 | $11,412 | $13,133 | $12,638 |
| 11/30/17 | $11,619 | $13,536 | $12,917 |
| 12/31/17 | $11,779 | $13,687 | $13,072 |
| 1/31/18 | $12,262 | $14,470 | $13,644 |
| 2/28/18 | $11,779 | $13,937 | $13,125 |
| 3/31/18 | $11,669 | $13,583 | $12,954 |
| 4/30/18 | $11,699 | $13,635 | $13,047 |
| 5/31/18 | $11,789 | $13,963 | $13,208 |
| 6/30/18 | $11,749 | $14,049 | $13,174 |
| 7/31/18 | $12,041 | $14,572 | $13,506 |
| 8/31/18 | $12,141 | $15,047 | $13,684 |
| 9/30/18 | $12,139 | $15,132 | $13,685 |
| 10/31/18 | $11,353 | $14,098 | $12,717 |
| 11/30/18 | $11,555 | $14,385 | $12,925 |
| 12/31/18 | $10,815 | $13,086 | $12,030 |
| 1/31/19 | $11,616 | $14,135 | $12,929 |
| 2/28/19 | $11,869 | $14,589 | $13,267 |
| 3/31/19 | $12,050 | $14,872 | $13,390 |
| 4/30/19 | $12,399 | $15,475 | $13,800 |
| 5/31/19 | $11,776 | $14,491 | $13,058 |
| 6/30/19 | $12,438 | $15,513 | $13,837 |
| 7/31/19 | $12,470 | $15,736 | $13,894 |
| 8/31/19 | $12,268 | $15,486 | $13,615 |
| 9/30/19 | $12,504 | $15,776 | $13,901 |
| 10/31/19 | $12,770 | $16,118 | $14,220 |
| 11/30/19 | $13,047 | $16,703 | $14,538 |
| 12/31/19 | $13,448 | $17,207 | $14,975 |
| 1/31/20 | $13,295 | $17,200 | $14,801 |
| 2/29/20 | $12,415 | $15,784 | $13,688 |
| 3/31/20 | $10,686 | $13,835 | $11,854 |
| 4/30/20 | $11,708 | $15,608 | $13,058 |
| 5/31/20 | $12,208 | $16,352 | $13,614 |
| 6/30/20 | $12,544 | $16,677 | $13,959 |
| 7/31/20 | $13,120 | $17,617 | $14,580 |
| 8/31/20 | $13,762 | $18,883 | $15,320 |
| 9/30/20 | $13,382 | $18,166 | $14,884 |
| 10/31/20 | $13,120 | $17,683 | $14,634 |
| 11/30/20 | $14,535 | $19,618 | $16,321 |
| 12/31/20 | $15,171 | $20,373 | $17,050 |
| 1/31/21 | $15,105 | $20,167 | $17,024 |
| 2/28/21 | $15,467 | $20,723 | $17,509 |
| 3/31/21 | $15,890 | $21,631 | $18,017 |
| 4/30/21 | $16,552 | $22,785 | $18,732 |
| 5/31/21 | $16,817 | $22,944 | $18,991 |
| 6/30/21 | $16,992 | $23,480 | $19,126 |
| 7/31/21 | $17,148 | $24,038 | $19,246 |
| 8/31/21 | $17,505 | $24,769 | $19,679 |
| 9/30/21 | $16,826 | $23,617 | $18,971 |
| 10/31/21 | $17,608 | $25,271 | $19,820 |
| 11/30/21 | $17,206 | $25,096 | $19,355 |
| 12/31/21 | $17,917 | $26,221 | $20,151 |
| 1/31/22 | $17,103 | $24,864 | $19,152 |
| 2/28/22 | $16,667 | $24,120 | $18,822 |
| 3/31/22 | $16,954 | $25,015 | $19,141 |
| 4/30/22 | $15,705 | $22,834 | $17,764 |
| 5/31/22 | $15,750 | $22,876 | $17,837 |
| 6/30/22 | $14,489 | $20,987 | $16,372 |
| 7/31/22 | $15,464 | $22,922 | $17,540 |
| 8/31/22 | $14,822 | $21,988 | $16,900 |
| 9/30/22 | $13,414 | $19,963 | $15,378 |
| 10/31/22 | $14,172 | $21,579 | $16,348 |
| 11/30/22 | $15,388 | $22,785 | $17,533 |
| 12/31/22 | $14,777 | $21,472 | $16,934 |
| 1/31/23 | $15,853 | $22,821 | $18,112 |
| 2/28/23 | $15,350 | $22,264 | $17,667 |
| 3/31/23 | $15,742 | $23,082 | $18,021 |
| 4/30/23 | $15,953 | $23,442 | $18,254 |
| 5/31/23 | $15,707 | $23,544 | $17,970 |
| 6/30/23 | $16,539 | $25,100 | $18,932 |
| 7/31/23 | $17,089 | $25,906 | $19,561 |
| 8/31/23 | $16,597 | $25,493 | $19,073 |
| 9/30/23 | $15,908 | $24,278 | $18,295 |
| 10/31/23 | $15,438 | $23,768 | $17,735 |
| 11/30/23 | $16,742 | $25,938 | $19,252 |
| 12/31/23 | $17,582 | $27,116 | $20,255 |
| 1/31/24 | $17,535 | $27,572 | $20,283 |
| 2/29/24 | $18,202 | $29,044 | $21,023 |
| 3/31/24 | $18,745 | $29,979 | $21,641 |
| 4/30/24 | $18,088 | $28,754 | $20,932 |
| 5/31/24 | $18,865 | $30,180 | $21,754 |
| 6/30/24 | $19,157 | $31,263 | $22,062 |
The table below shows the average annual total returns of the Fund, a regulatory index, and one or more supplemental index(es) for certain periods ended June 30, 2024.
Average Annual Total Returns (%)
| Class/Index Name | 1 Year | 5 Years | Since Inception 12/31/14 |
|---|
| Class A (excluding sales charge) | 15.83% | 9.02% | 7.72% |
| Class A (including sales charge) | 9.47% | 7.80% | 7.09% |
| S&P 500 Index | 24.56% | 15.05% | 12.75% |
| S&P Target Date 2055 Index | 16.53% | 9.78% | 8.69% |
All Fund returns are net of fees and expenses and include applicable fee waivers and/or expense limitations. Absent any applicable fee waivers and/or expense limitations, performance would have been lower and there can be no assurance that any such waivers or limitations will continue in the future.
Performance quoted represents past performance. Past performance is not a guarantee or a reliable indicator of future results.Current performance may be lower or higher than performance shown. Investment return and the principal value of an investment will fluctuate. Shares may be worth more or less than original cost when redeemed. Returns shown do not reflect the deduction of taxes that a shareholder would pay on Fund distributions or the redemption of Fund shares.Differences in the Fund’s performance versus an index and related attribution information with respect to particular categories of securities or individual positions may be attributable, in part, to differences in the pricing methodologies used by the Fund and the index. The Cumulative Returns chart and Average Annual Total Returns table reflect any sales load that would have applied at the time of purchase or any Contingent Deferred Sales Charge (“CDSC”) that would have applied if a full redemption occurred on the last business day of the period shown in the Cumulative Returns chart. Class A shares are subject to an initial sales charge. A CDSC may be imposed in certain circumstances on Class A shares that are purchased without an initial sales charge and then redeemed during the first 12 months after purchase. For performance current to the most recent month-end, visit www.pimco.com/literature or via 888.87.PIMCO (888.877.4626).
Key Fund StatisticsFootnote Reference* (as of the end of the reporting period)
| Total Net Assets | $408,637 |
| # of Portfolio Holdings | 20 |
| Portfolio Turnover Rate | 21% |
| Total Net Advisory Fees Paid During the Reporting Period | $110 |
| Footnote | Description |
Footnote* | Dollar amounts displayed in 000's |
What did the Fund invest in?
Allocation Breakdown (% of Net Assets)Footnote Reference*
| Mutual Funds | 88.7% |
| Affiliated Investments | 10.3% |
| Short-Term Instruments | 0.5% |
| Other Investments | 0.0% |
| Other Assets and Liabilities, Net | 0.5% |
| Total | 100.0% |
| Footnote | Description |
Footnote* | % of Net Assets includes derivatives instruments, if any, valued at the value used for determining the Fund’s net asset value. The notional exposure of such derivatives investments therefore may be greater than what is depicted. |
Top Holdings (% of Net Assets)
| Vanguard Institutional Index Fund 'Institutional' | 49.8% |
| Vanguard Developed Markets Index Fund 'Institutional' | 25.8% |
| Vanguard Emerging Markets Stock Index Fund 'Institutional' | 9.0% |
| Vanguard Small-Cap Index Fund 'Institutional' | 4.1% |
| PIMCO Total Return Fund | 1.9% |
| PIMCO Long-Term Real Return Fund | 1.0% |
| PIMCO Long-Term U.S. Government Fund | 0.9% |
| PIMCO Income Fund | 0.8% |
| PIMCO Real Return Fund | 0.8% |
| PIMCO Emerging Markets Local Currency and Bond Fund | 0.3% |
This is a summary of certain changes and planned changes of the Fund since the beginning of the reporting period. For more information, you may refer to the Fund's next prospectus, which we expect to be available by October 31, 2024 or upon request at 888.87.PIMCO (888.877.4626).
Change to REALPATH® Blend Glide Path. Effective February 28, 2024, the Fund’s REALPATH® Blend Glide Path, which forms the basis of the Fund’s long-term asset allocations, was changed based on data relating to risk metrics, long-term market trends, correlation of asset types and actuarial assumptions of life expectancy and retirement.
For additional information about the Fund, including the Fund's prospectus, financial information, holdings and proxy voting information, please visit www.pimco.com/literature or contact 888.87.PIMCO (888.877.4626). For tax information about the Fund, please visit: https://www.pimco.com/tax.
PIMCO REALPATH® Blend 2055 Fund
Annual Shareholder Report |
June 30, 2024
Institutional Class: PRQZX
PIMCO REALPATH® Blend 2055 Fund
Annual Shareholder Report | June 30, 2024
This annual shareholder report contains important information about the PIMCO REALPATH® Blend 2055 Fund for the period of July 1, 2023 to June 30, 2024 (the "reporting period"). You can find additional information about the Fund at www.pimco.com/literature. You can also request this information by contacting us at 888.87.PIMCO (888.877.4626).
This report describes changes to the Fund that occurred during the reporting period.
What were the Fund costs for the last year?
(based on a hypothetical $10,000 investment)
| Class Name | Cost of a $10,000 investment | Costs paid as a percentage of a $10,000 investment |
|---|
| Institutional Class | $5 | 0.05% |
How did the Fund perform during the reporting period and what affected its performance?
The following affected performance (on a gross basis) during the reporting period:
• Exposure to U.S. large cap equities contributed to absolute performance, as U.S. large cap equities posted positive returns.
• Exposure to global equities contributed to absolute performance, as global equities posted positive returns.
• Exposure to emerging market equities contributed to absolute performance, as emerging market equities posted positive returns.
• Exposure to U.S. small cap equities contributed to absolute performance, as U.S. small cap equities posted positive returns.
• Exposure to U.S. long-term Treasury Inflation-Protected Securities ("TIPS") detracted from absolute performance, as long-term TIPS
posted negative returns.
• Exposure to long-term treasuries detracted from absolute performance, as long-term treasuries posted negative returns.
• There were no other material detractors for this Fund.
In addition to the Fund's performance, the tables in this section include performance of: (i) a broad-based securities market index (i.e., a regulatory index) and (ii) one or more supplemental index(es). Effective July 24, 2024, the Fund's regulatory index is the S&P 500 Index. The Fund's regulatory index is shown in connection with certain regulatory requirements to provide a broad measure of market performance.
The table below illustrates cumulative returns for the 10-year period ended June 30, 2024 or the life of the Fund, if shorter. Cumulative returns are based on a hypothetical initial investment equal to the greater of either $10,000 or the investment minimum applicable to the share class.
Cumulative Returns Based on $1,000,000 Investment
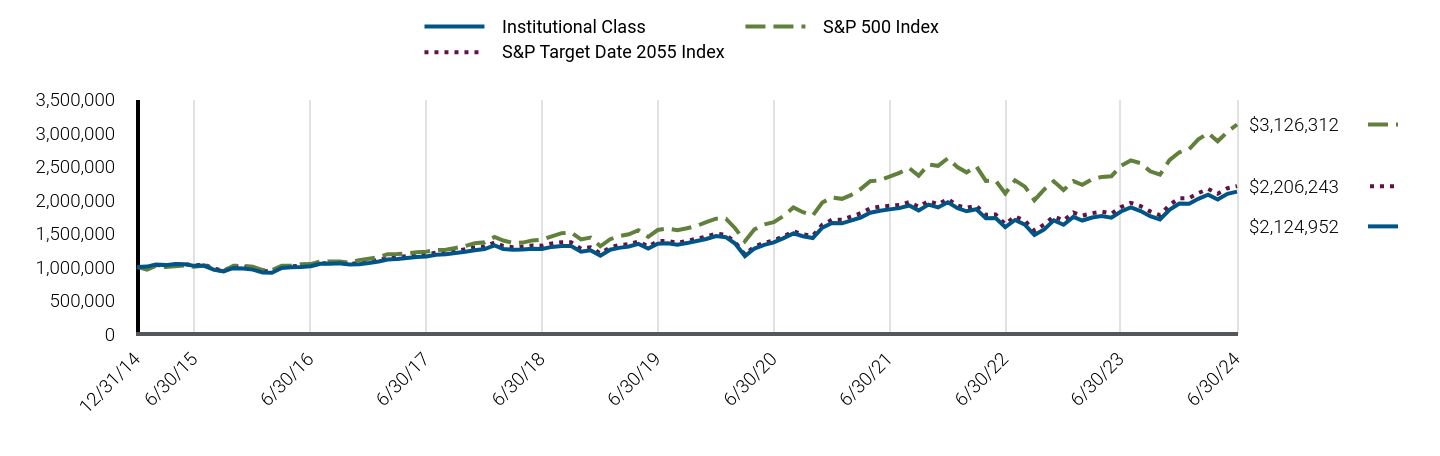
| Institutional Class | S&P 500 Index | S&P Target Date 2055 Index |
|---|
| 12/31/14 | $1,000,000 | $1,000,000 | $1,000,000 |
| 1/31/15 | $1,005,000 | $959,985 | $979,985 |
| 2/28/15 | $1,037,000 | $1,015,157 | $1,029,691 |
| 3/31/15 | $1,027,000 | $999,103 | $1,021,539 |
| 4/30/15 | $1,044,000 | $1,008,687 | $1,034,793 |
| 5/31/15 | $1,040,000 | $1,021,658 | $1,041,686 |
| 6/30/15 | $1,015,807 | $1,001,881 | $1,021,141 |
| 7/31/15 | $1,015,807 | $1,022,872 | $1,033,799 |
| 8/31/15 | $955,522 | $961,158 | $972,364 |
| 9/30/15 | $933,311 | $937,375 | $945,258 |
| 10/31/15 | $984,658 | $1,016,447 | $1,007,821 |
| 11/30/15 | $976,604 | $1,019,470 | $1,009,278 |
| 12/31/15 | $959,614 | $1,003,391 | $986,944 |
| 1/31/16 | $917,714 | $953,598 | $940,155 |
| 2/29/16 | $913,626 | $952,312 | $934,188 |
| 3/31/16 | $985,105 | $1,016,915 | $998,073 |
| 4/30/16 | $994,321 | $1,020,857 | $1,007,070 |
| 5/31/16 | $997,393 | $1,039,190 | $1,016,905 |
| 6/30/16 | $1,011,055 | $1,041,882 | $1,017,215 |
| 7/31/16 | $1,047,164 | $1,080,295 | $1,053,703 |
| 8/31/16 | $1,049,227 | $1,081,812 | $1,056,896 |
| 9/30/16 | $1,053,508 | $1,082,016 | $1,060,792 |
| 10/31/16 | $1,034,916 | $1,062,279 | $1,039,489 |
| 11/30/16 | $1,039,048 | $1,101,621 | $1,062,778 |
| 12/31/16 | $1,058,425 | $1,123,395 | $1,085,033 |
| 1/31/17 | $1,081,457 | $1,144,702 | $1,107,615 |
| 2/28/17 | $1,110,770 | $1,190,154 | $1,135,717 |
| 3/31/17 | $1,118,099 | $1,191,542 | $1,146,335 |
| 4/30/17 | $1,131,709 | $1,203,779 | $1,161,133 |
| 5/31/17 | $1,148,459 | $1,220,720 | $1,178,884 |
| 6/30/17 | $1,156,091 | $1,228,339 | $1,187,294 |
| 7/31/17 | $1,182,318 | $1,253,597 | $1,212,722 |
| 8/31/17 | $1,188,613 | $1,257,434 | $1,212,910 |
| 9/30/17 | $1,206,444 | $1,283,373 | $1,240,518 |
| 10/31/17 | $1,227,499 | $1,313,321 | $1,263,753 |
| 11/30/17 | $1,249,607 | $1,353,600 | $1,291,714 |
| 12/31/17 | $1,266,371 | $1,368,650 | $1,307,200 |
| 1/31/18 | $1,320,213 | $1,447,011 | $1,364,372 |
| 2/28/18 | $1,268,525 | $1,393,678 | $1,312,475 |
| 3/31/18 | $1,256,679 | $1,358,260 | $1,295,351 |
| 4/30/18 | $1,259,910 | $1,363,472 | $1,304,656 |
| 5/31/18 | $1,270,678 | $1,396,307 | $1,320,832 |
| 6/30/18 | $1,266,609 | $1,404,901 | $1,317,437 |
| 7/31/18 | $1,298,975 | $1,457,183 | $1,350,556 |
| 8/31/18 | $1,310,843 | $1,504,666 | $1,368,400 |
| 9/30/18 | $1,310,654 | $1,513,230 | $1,368,519 |
| 10/31/18 | $1,226,236 | $1,409,800 | $1,271,675 |
| 11/30/18 | $1,248,964 | $1,438,530 | $1,292,498 |
| 12/31/18 | $1,169,102 | $1,308,644 | $1,202,961 |
| 1/31/19 | $1,256,416 | $1,413,513 | $1,292,894 |
| 2/28/19 | $1,284,765 | $1,458,898 | $1,326,737 |
| 3/31/19 | $1,304,426 | $1,487,247 | $1,338,964 |
| 4/30/19 | $1,343,126 | $1,547,466 | $1,379,954 |
| 5/31/19 | $1,274,832 | $1,449,127 | $1,305,791 |
| 6/30/19 | $1,347,758 | $1,551,256 | $1,383,670 |
| 7/31/19 | $1,352,331 | $1,573,551 | $1,389,431 |
| 8/31/19 | $1,330,611 | $1,548,625 | $1,361,477 |
| 9/30/19 | $1,355,997 | $1,577,601 | $1,390,056 |
| 10/31/19 | $1,387,024 | $1,611,771 | $1,421,959 |
| 11/30/19 | $1,416,902 | $1,670,277 | $1,453,841 |
| 12/31/19 | $1,461,012 | $1,720,689 | $1,497,515 |
| 1/31/20 | $1,444,569 | $1,720,014 | $1,480,085 |
| 2/29/20 | $1,349,439 | $1,578,424 | $1,368,812 |
| 3/31/20 | $1,161,822 | $1,383,468 | $1,185,433 |
| 4/30/20 | $1,274,712 | $1,560,821 | $1,305,786 |
| 5/31/20 | $1,328,805 | $1,635,159 | $1,361,389 |
| 6/30/20 | $1,365,742 | $1,667,678 | $1,395,918 |
| 7/31/20 | $1,429,375 | $1,761,710 | $1,458,016 |
| 8/31/20 | $1,500,078 | $1,888,343 | $1,531,977 |
| 9/30/20 | $1,458,835 | $1,816,592 | $1,488,369 |
| 10/31/20 | $1,431,732 | $1,768,282 | $1,463,450 |
| 11/30/20 | $1,586,100 | $1,961,845 | $1,632,116 |
| 12/31/20 | $1,655,349 | $2,037,275 | $1,705,017 |
| 1/31/21 | $1,650,596 | $2,016,707 | $1,702,432 |
| 2/28/21 | $1,690,999 | $2,072,317 | $1,750,944 |
| 3/31/21 | $1,737,499 | $2,163,076 | $1,801,710 |
| 4/30/21 | $1,809,446 | $2,278,516 | $1,873,219 |
| 5/31/21 | $1,839,423 | $2,294,430 | $1,899,065 |
| 6/30/21 | $1,859,452 | $2,347,993 | $1,912,585 |
| 7/31/21 | $1,877,646 | $2,403,770 | $1,924,580 |
| 8/31/21 | $1,917,674 | $2,476,858 | $1,967,858 |
| 9/30/21 | $1,844,092 | $2,361,660 | $1,897,144 |
| 10/31/21 | $1,930,457 | $2,527,122 | $1,982,040 |
| 11/30/21 | $1,887,883 | $2,509,612 | $1,935,516 |
| 12/31/21 | $1,965,453 | $2,622,083 | $2,015,110 |
| 1/31/22 | $1,877,989 | $2,486,398 | $1,915,170 |
| 2/28/22 | $1,830,508 | $2,411,951 | $1,882,166 |
| 3/31/22 | $1,861,745 | $2,501,506 | $1,914,110 |
| 4/30/22 | $1,725,551 | $2,283,370 | $1,776,393 |
| 5/31/22 | $1,730,549 | $2,287,559 | $1,783,684 |
| 6/30/22 | $1,593,104 | $2,098,736 | $1,637,219 |
| 7/31/22 | $1,700,561 | $2,292,248 | $1,753,993 |
| 8/31/22 | $1,630,589 | $2,198,766 | $1,690,039 |
| 9/30/22 | $1,475,736 | $1,996,263 | $1,537,809 |
| 10/31/22 | $1,560,851 | $2,157,883 | $1,634,833 |
| 11/30/22 | $1,694,781 | $2,278,474 | $1,753,330 |
| 12/31/22 | $1,629,041 | $2,147,201 | $1,693,353 |
| 1/31/23 | $1,747,865 | $2,282,118 | $1,811,187 |
| 2/28/23 | $1,692,925 | $2,226,437 | $1,766,651 |
| 3/31/23 | $1,737,302 | $2,308,179 | $1,802,107 |
| 4/30/23 | $1,761,627 | $2,344,206 | $1,825,436 |
| 5/31/23 | $1,734,742 | $2,354,395 | $1,797,005 |
| 6/30/23 | $1,827,052 | $2,509,962 | $1,893,233 |
| 7/31/23 | $1,888,508 | $2,590,595 | $1,956,127 |
| 8/31/23 | $1,834,734 | $2,549,349 | $1,907,284 |
| 9/30/23 | $1,758,203 | $2,427,801 | $1,829,545 |
| 10/31/23 | $1,708,079 | $2,376,753 | $1,773,477 |
| 11/30/23 | $1,853,311 | $2,593,811 | $1,925,177 |
| 12/31/23 | $1,947,466 | $2,711,650 | $2,025,515 |
| 1/31/24 | $1,942,245 | $2,757,216 | $2,028,298 |
| 2/29/24 | $2,016,646 | $2,904,440 | $2,102,260 |
| 3/31/24 | $2,077,736 | $2,997,889 | $2,164,093 |
| 4/30/24 | $2,005,684 | $2,875,441 | $2,093,180 |
| 5/31/24 | $2,092,147 | $3,018,019 | $2,175,360 |
| 6/30/24 | $2,124,952 | $3,126,312 | $2,206,243 |
The table below shows the average annual total returns of the Fund, a regulatory index, and one or more supplemental index(es) for certain periods ended June 30, 2024.
Average Annual Total Returns (%)
| Class/Index Name | 1 Year | 5 Years | Since Inception 12/31/14 |
|---|
| Institutional Class | 16.30% | 9.53% | 8.26% |
| S&P 500 Index | 24.56% | 15.05% | 12.75% |
| S&P Target Date 2055 Index | 16.53% | 9.78% | 8.69% |
All Fund returns are net of fees and expenses and include applicable fee waivers and/or expense limitations. Absent any applicable fee waivers and/or expense limitations, performance would have been lower and there can be no assurance that any such waivers or limitations will continue in the future.
Performance quoted represents past performance. Past performance is not a guarantee or a reliable indicator of future results.Current performance may be lower or higher than performance shown. Investment return and the principal value of an investment will fluctuate. Shares may be worth more or less than original cost when redeemed. Returns shown do not reflect the deduction of taxes that a shareholder would pay on Fund distributions or the redemption of Fund shares.Differences in the Fund’s performance versus an index and related attribution information with respect to particular categories of securities or individual positions may be attributable, in part, to differences in the pricing methodologies used by the Fund and the index. For performance current to the most recent month-end, visit www.pimco.com/literature or via 888.87.PIMCO (888.877.4626).
Key Fund StatisticsFootnote Reference* (as of the end of the reporting period)
| Total Net Assets | $408,637 |
| # of Portfolio Holdings | 20 |
| Portfolio Turnover Rate | 21% |
| Total Net Advisory Fees Paid During the Reporting Period | $110 |
| Footnote | Description |
Footnote* | Dollar amounts displayed in 000's |
What did the Fund invest in?
Allocation Breakdown (% of Net Assets)Footnote Reference*
| Mutual Funds | 88.7% |
| Affiliated Investments | 10.3% |
| Short-Term Instruments | 0.5% |
| Other Investments | 0.0% |
| Other Assets and Liabilities, Net | 0.5% |
| Total | 100.0% |
| Footnote | Description |
Footnote* | % of Net Assets includes derivatives instruments, if any, valued at the value used for determining the Fund’s net asset value. The notional exposure of such derivatives investments therefore may be greater than what is depicted. |
Top Holdings (% of Net Assets)
| Vanguard Institutional Index Fund 'Institutional' | 49.8% |
| Vanguard Developed Markets Index Fund 'Institutional' | 25.8% |
| Vanguard Emerging Markets Stock Index Fund 'Institutional' | 9.0% |
| Vanguard Small-Cap Index Fund 'Institutional' | 4.1% |
| PIMCO Total Return Fund | 1.9% |
| PIMCO Long-Term Real Return Fund | 1.0% |
| PIMCO Long-Term U.S. Government Fund | 0.9% |
| PIMCO Income Fund | 0.8% |
| PIMCO Real Return Fund | 0.8% |
| PIMCO Emerging Markets Local Currency and Bond Fund | 0.3% |
This is a summary of certain changes and planned changes of the Fund since the beginning of the reporting period. For more information, you may refer to the Fund's next prospectus, which we expect to be available by October 31, 2024 or upon request at 888.87.PIMCO (888.877.4626).
Change to REALPATH® Blend Glide Path. Effective February 28, 2024, the Fund’s REALPATH® Blend Glide Path, which forms the basis of the Fund’s long-term asset allocations, was changed based on data relating to risk metrics, long-term market trends, correlation of asset types and actuarial assumptions of life expectancy and retirement.
For additional information about the Fund, including the Fund's prospectus, financial information, holdings and proxy voting information, please visit www.pimco.com/literature or contact 888.87.PIMCO (888.877.4626). For tax information about the Fund, please visit: https://www.pimco.com/tax.
Institutional Class: PRQZX
PIMCO REALPATH® Blend 2055 Fund
Annual Shareholder Report |
June 30, 2024
PIMCO REALPATH® Blend 2060 Fund
Annual Shareholder Report | June 30, 2024
This annual shareholder report contains important information about the PIMCO REALPATH® Blend 2060 Fund for the period of July 1, 2023 to June 30, 2024 (the "reporting period"). You can find additional information about the Fund at www.pimco.com/literature. You can also request this information by contacting us at 888.87.PIMCO (888.877.4626).
This report describes changes to the Fund that occurred during the reporting period.
What were the Fund costs for the last year?
(based on a hypothetical $10,000 investment)
| Class Name | Cost of a $10,000 investment | Costs paid as a percentage of a $10,000 investment |
|---|
| Class A | $54 | 0.50% |
How did the Fund perform during the reporting period and what affected its performance?
The following affected performance (on a gross basis) during the reporting period:
• Exposure to U.S. large cap equities contributed to absolute performance, as U.S. large cap equities posted positive returns.
• Exposure to global equities contributed to absolute performance, as global equities posted positive returns.
• Exposure to emerging market equities contributed to absolute performance, as emerging market equities posted positive returns.
• Exposure to U.S. small cap equities contributed to absolute performance, as U.S. small cap equities posted positive returns.
• Exposure to long-term Treasury Inflation-Protected Securities ("TIPS") detracted from absolute performance, as long-term TIPS posted
negative returns.
• Exposure to long-term treasuries detracted from absolute performance, as long-term treasuries posted negative returns.
• There were no other material detractors for this Fund.
In addition to the Fund's performance, the tables in this section include performance of: (i) a broad-based securities market index (i.e., a regulatory index) and (ii) one or more supplemental index(es). Effective July 24, 2024, the Fund's regulatory index is the S&P 500 Index. The Fund's regulatory index is shown in connection with certain regulatory requirements to provide a broad measure of market performance.
The table below illustrates cumulative returns for the 10-year period ended June 30, 2024 or the life of the Fund, if shorter. Cumulative returns are based on a hypothetical initial investment equal to the greater of either $10,000 or the investment minimum applicable to the share class.
Cumulative Returns Based on $10,000 Investment
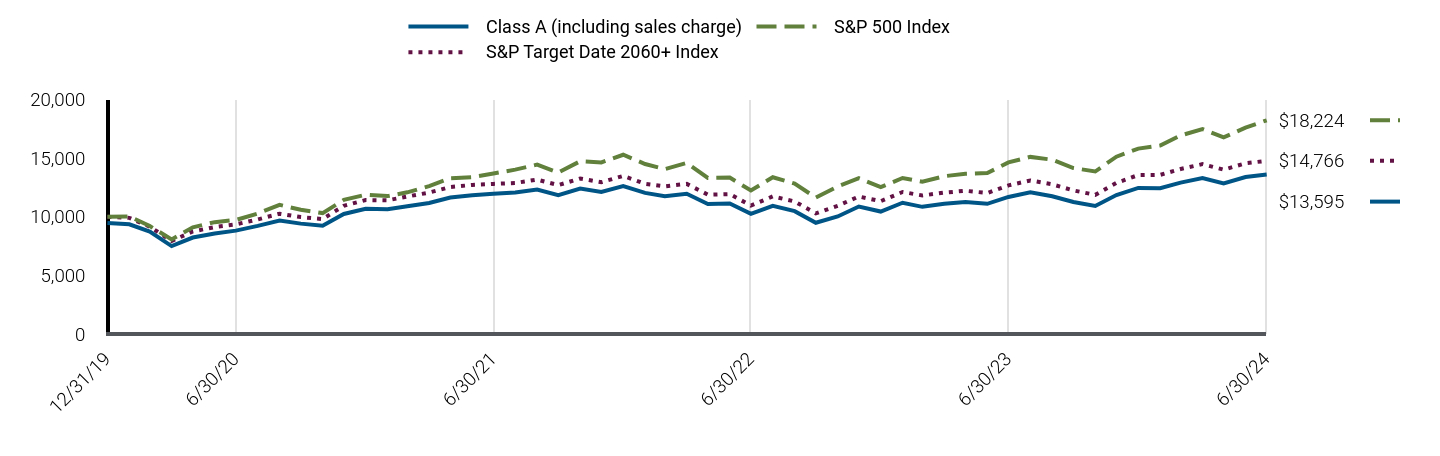
| Class A (including sales charge) | S&P 500 Index | S&P Target Date 2060+ Index |
|---|
| 12/31/19 | $9,452 | $10,000 | $10,000 |
| 1/31/20 | $9,348 | $10,026 | $9,900 |
| 2/29/20 | $8,724 | $9,201 | $9,152 |
| 3/31/20 | $7,495 | $8,064 | $7,927 |
| 4/30/20 | $8,223 | $9,098 | $8,739 |
| 5/31/20 | $8,573 | $9,532 | $9,116 |
| 6/30/20 | $8,809 | $9,721 | $9,349 |
| 7/31/20 | $9,216 | $10,269 | $9,763 |
| 8/31/20 | $9,669 | $11,007 | $10,257 |
| 9/30/20 | $9,409 | $10,589 | $9,967 |
| 10/31/20 | $9,230 | $10,308 | $9,800 |
| 11/30/20 | $10,232 | $11,436 | $10,929 |
| 12/31/20 | $10,675 | $11,876 | $11,418 |
| 1/31/21 | $10,627 | $11,756 | $11,400 |
| 2/28/21 | $10,884 | $12,080 | $11,722 |
| 3/31/21 | $11,173 | $12,609 | $12,058 |
| 4/30/21 | $11,632 | $13,282 | $12,533 |
| 5/31/21 | $11,823 | $13,374 | $12,708 |
| 6/30/21 | $11,954 | $13,687 | $12,797 |
| 7/31/21 | $12,069 | $14,012 | $12,874 |
| 8/31/21 | $12,319 | $14,438 | $13,164 |
| 9/30/21 | $11,834 | $13,766 | $12,691 |
| 10/31/21 | $12,393 | $14,731 | $13,258 |
| 11/30/21 | $12,104 | $14,629 | $12,943 |
| 12/31/21 | $12,609 | $15,284 | $13,478 |
| 1/31/22 | $12,033 | $14,493 | $12,807 |
| 2/28/22 | $11,740 | $14,060 | $12,588 |
| 3/31/22 | $11,960 | $14,582 | $12,801 |
| 4/30/22 | $11,080 | $13,310 | $11,879 |
| 5/31/22 | $11,133 | $13,334 | $11,928 |
| 6/30/22 | $10,243 | $12,234 | $10,947 |
| 7/31/22 | $10,923 | $13,362 | $11,729 |
| 8/31/22 | $10,473 | $12,817 | $11,300 |
| 9/30/22 | $9,483 | $11,636 | $10,280 |
| 10/31/22 | $10,017 | $12,579 | $10,930 |
| 11/30/22 | $10,866 | $13,281 | $11,723 |
| 12/31/22 | $10,437 | $12,516 | $11,321 |
| 1/31/23 | $11,190 | $13,303 | $12,108 |
| 2/28/23 | $10,840 | $12,978 | $11,810 |
| 3/31/23 | $11,111 | $13,455 | $12,052 |
| 4/30/23 | $11,260 | $13,665 | $12,210 |
| 5/31/23 | $11,101 | $13,724 | $12,022 |
| 6/30/23 | $11,685 | $14,631 | $12,669 |
| 7/31/23 | $12,079 | $15,101 | $13,093 |
| 8/31/23 | $11,739 | $14,860 | $12,763 |
| 9/30/23 | $11,250 | $14,152 | $12,242 |
| 10/31/23 | $10,920 | $13,854 | $11,864 |
| 11/30/23 | $11,846 | $15,120 | $12,880 |
| 12/31/23 | $12,456 | $15,807 | $13,555 |
| 1/31/24 | $12,424 | $16,072 | $13,570 |
| 2/29/24 | $12,908 | $16,930 | $14,067 |
| 3/31/24 | $13,300 | $17,475 | $14,483 |
| 4/30/24 | $12,836 | $16,761 | $14,008 |
| 5/31/24 | $13,387 | $17,592 | $14,558 |
| 6/30/24 | $13,595 | $18,224 | $14,766 |
The table below shows the average annual total returns of the Fund, a regulatory index, and one or more supplemental index(es) for certain periods ended June 30, 2024.
Average Annual Total Returns (%)
| Class/Index Name | 1 Year | Since Inception 12/31/19 |
|---|
| Class A (excluding sales charge) | 16.35% | 8.42% |
| Class A (including sales charge) | 9.94% | 7.07% |
| S&P 500 Index | 24.56% | 14.26% |
| S&P Target Date 2060+ Index | 16.55% | 9.04% |
All Fund returns are net of fees and expenses and include applicable fee waivers and/or expense limitations. Absent any applicable fee waivers and/or expense limitations, performance would have been lower and there can be no assurance that any such waivers or limitations will continue in the future.
Performance quoted represents past performance. Past performance is not a guarantee or a reliable indicator of future results.Current performance may be lower or higher than performance shown. Investment return and the principal value of an investment will fluctuate. Shares may be worth more or less than original cost when redeemed. Returns shown do not reflect the deduction of taxes that a shareholder would pay on Fund distributions or the redemption of Fund shares.Differences in the Fund’s performance versus an index and related attribution information with respect to particular categories of securities or individual positions may be attributable, in part, to differences in the pricing methodologies used by the Fund and the index. The Cumulative Returns chart and Average Annual Total Returns table reflect any sales load that would have applied at the time of purchase or any Contingent Deferred Sales Charge (“CDSC”) that would have applied if a full redemption occurred on the last business day of the period shown in the Cumulative Returns chart. Class A shares are subject to an initial sales charge. A CDSC may be imposed in certain circumstances on Class A shares that are purchased without an initial sales charge and then redeemed during the first 12 months after purchase. For performance current to the most recent month-end, visit www.pimco.com/literature or via 888.87.PIMCO (888.877.4626).
Key Fund StatisticsFootnote Reference* (as of the end of the reporting period)
| Total Net Assets | $159,478 |
| # of Portfolio Holdings | 18 |
| Portfolio Turnover Rate | 12% |
| Total Net Advisory Fees Paid During the Reporting Period | $36 |
| Footnote | Description |
Footnote* | Dollar amounts displayed in 000's |
What did the Fund invest in?
Allocation Breakdown (% of Net Assets)Footnote Reference*
| Mutual Funds | 90.0% |
| Affiliated Investments | 10.0% |
| Short-Term Instruments | 0.4% |
| Other Investments | 0.0% |
| Other Assets and Liabilities, Net | (0.4%) |
| Total | 100.0% |
| Footnote | Description |
Footnote* | % of Net Assets includes derivatives instruments, if any, valued at the value used for determining the Fund’s net asset value. The notional exposure of such derivatives investments therefore may be greater than what is depicted. |
Top Holdings (% of Net Assets)
| Vanguard Institutional Index Fund 'Institutional' | 50.9% |
| Vanguard Developed Markets Index Fund 'Institutional' | 25.8% |
| Vanguard Emerging Markets Stock Index Fund 'Institutional' | 9.0% |
| Vanguard Small-Cap Index Fund 'Institutional' | 4.3% |
| PIMCO Total Return Fund | 1.4% |
| PIMCO Long-Term Real Return Fund | 0.8% |
| PIMCO Long-Term U.S. Government Fund | 0.7% |
| PIMCO Real Return Fund | 0.7% |
| PIMCO Income Fund | 0.6% |
| PIMCO Emerging Markets Local Currency and Bond Fund | 0.3% |
This is a summary of certain changes and planned changes of the Fund since the beginning of the reporting period. For more information, you may refer to the Fund's next prospectus, which we expect to be available by October 31, 2024 or upon request at 888.87.PIMCO (888.877.4626).
Change to REALPATH® Blend Glide Path. Effective February 28, 2024, the Fund’s REALPATH® Blend Glide Path, which forms the basis of the Fund’s long-term asset allocations, was changed based on data relating to risk metrics, long-term market trends, correlation of asset types and actuarial assumptions of life expectancy and retirement.
For additional information about the Fund, including the Fund's prospectus, financial information, holdings and proxy voting information, please visit www.pimco.com/literature or contact 888.87.PIMCO (888.877.4626). For tax information about the Fund, please visit: https://www.pimco.com/tax.
PIMCO REALPATH® Blend 2060 Fund
Annual Shareholder Report |
June 30, 2024
Institutional Class: PRBMX
PIMCO REALPATH® Blend 2060 Fund
Annual Shareholder Report | June 30, 2024
This annual shareholder report contains important information about the PIMCO REALPATH® Blend 2060 Fund for the period of July 1, 2023 to June 30, 2024 (the "reporting period"). You can find additional information about the Fund at www.pimco.com/literature. You can also request this information by contacting us at 888.87.PIMCO (888.877.4626).
This report describes changes to the Fund that occurred during the reporting period.
What were the Fund costs for the last year?
(based on a hypothetical $10,000 investment)
| Class Name | Cost of a $10,000 investment | Costs paid as a percentage of a $10,000 investment |
|---|
| Institutional Class | $5 | 0.05% |
How did the Fund perform during the reporting period and what affected its performance?
The following affected performance (on a gross basis) during the reporting period:
• Exposure to U.S. large cap equities contributed to absolute performance, as U.S. large cap equities posted positive returns.
• Exposure to global equities contributed to absolute performance, as global equities posted positive returns.
• Exposure to emerging market equities contributed to absolute performance, as emerging market equities posted positive returns.
• Exposure to U.S. small cap equities contributed to absolute performance, as U.S. small cap equities posted positive returns.
• Exposure to long-term Treasury Inflation-Protected Securities ("TIPS") detracted from absolute performance, as long-term TIPS posted
negative returns.
• Exposure to long-term treasuries detracted from absolute performance, as long-term treasuries posted negative returns.
• There were no other material detractors for this Fund.
In addition to the Fund's performance, the tables in this section include performance of: (i) a broad-based securities market index (i.e., a regulatory index) and (ii) one or more supplemental index(es). Effective July 24, 2024, the Fund's regulatory index is the S&P 500 Index. The Fund's regulatory index is shown in connection with certain regulatory requirements to provide a broad measure of market performance.
The table below illustrates cumulative returns for the 10-year period ended June 30, 2024 or the life of the Fund, if shorter. Cumulative returns are based on a hypothetical initial investment equal to the greater of either $10,000 or the investment minimum applicable to the share class.
Cumulative Returns Based on $1,000,000 Investment
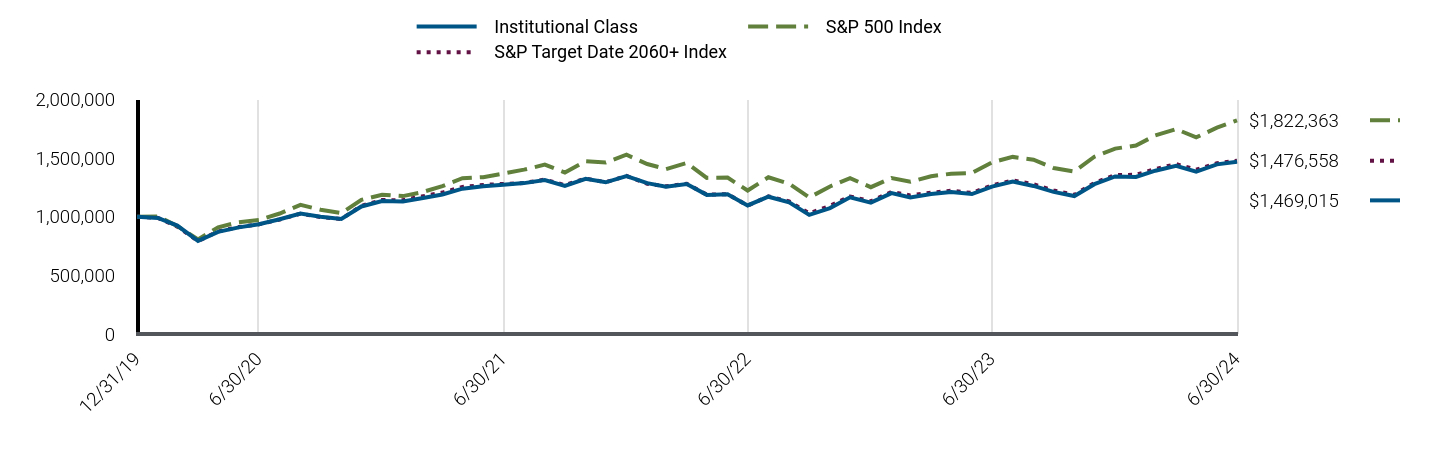
| Institutional Class | S&P 500 Index | S&P Target Date 2060+ Index |
|---|
| 12/31/19 | $1,000,000 | $1,000,000 | $1,000,000 |
| 1/31/20 | $989,000 | $1,002,616 | $990,039 |
| 2/29/20 | $924,000 | $920,082 | $915,250 |
| 3/31/20 | $794,000 | $806,440 | $792,745 |
| 4/30/20 | $871,000 | $909,820 | $873,915 |
| 5/31/20 | $909,000 | $953,153 | $911,552 |
| 6/30/20 | $935,000 | $972,109 | $934,853 |
| 7/31/20 | $978,000 | $1,026,921 | $976,291 |
| 8/31/20 | $1,026,000 | $1,100,737 | $1,025,721 |
| 9/30/20 | $999,240 | $1,058,912 | $996,684 |
| 10/31/20 | $980,217 | $1,030,752 | $979,974 |
| 11/30/20 | $1,087,350 | $1,143,582 | $1,092,907 |
| 12/31/20 | $1,134,171 | $1,187,551 | $1,141,775 |
| 1/31/21 | $1,130,135 | $1,175,561 | $1,140,041 |
| 2/28/21 | $1,157,380 | $1,207,977 | $1,172,247 |
| 3/31/21 | $1,189,119 | $1,260,882 | $1,205,806 |
| 4/30/21 | $1,238,835 | $1,328,173 | $1,253,314 |
| 5/31/21 | $1,260,142 | $1,337,450 | $1,270,849 |
| 6/30/21 | $1,273,249 | $1,368,672 | $1,279,652 |
| 7/31/21 | $1,286,523 | $1,401,185 | $1,287,420 |
| 8/31/21 | $1,313,070 | $1,443,789 | $1,316,429 |
| 9/30/21 | $1,262,576 | $1,376,639 | $1,269,081 |
| 10/31/21 | $1,323,040 | $1,473,088 | $1,325,821 |
| 11/30/21 | $1,293,321 | $1,462,881 | $1,294,329 |
| 12/31/21 | $1,346,436 | $1,528,442 | $1,347,831 |
| 1/31/22 | $1,286,298 | $1,449,350 | $1,280,699 |
| 2/28/22 | $1,255,115 | $1,405,954 | $1,258,815 |
| 3/31/22 | $1,278,502 | $1,458,157 | $1,280,131 |
| 4/30/22 | $1,186,067 | $1,331,002 | $1,187,903 |
| 5/31/22 | $1,191,635 | $1,333,444 | $1,192,800 |
| 6/30/22 | $1,095,859 | $1,223,377 | $1,094,732 |
| 7/31/22 | $1,170,475 | $1,336,178 | $1,172,864 |
| 8/31/22 | $1,122,587 | $1,281,686 | $1,129,955 |
| 9/30/22 | $1,015,860 | $1,163,644 | $1,028,031 |
| 10/31/22 | $1,073,846 | $1,257,855 | $1,092,956 |
| 11/30/22 | $1,165,284 | $1,328,149 | $1,172,296 |
| 12/31/22 | $1,119,976 | $1,251,628 | $1,132,084 |
| 1/31/23 | $1,201,429 | $1,330,273 | $1,210,814 |
| 2/28/23 | $1,164,096 | $1,297,815 | $1,181,001 |
| 3/31/23 | $1,193,993 | $1,345,464 | $1,205,181 |
| 4/30/23 | $1,211,001 | $1,366,464 | $1,220,990 |
| 5/31/23 | $1,192,859 | $1,372,404 | $1,202,205 |
| 6/30/23 | $1,256,830 | $1,463,086 | $1,266,930 |
| 7/31/23 | $1,299,935 | $1,510,087 | $1,309,299 |
| 8/31/23 | $1,262,502 | $1,486,044 | $1,276,301 |
| 9/30/23 | $1,211,340 | $1,415,193 | $1,224,236 |
| 10/31/23 | $1,176,080 | $1,385,436 | $1,186,370 |
| 11/30/23 | $1,277,309 | $1,511,962 | $1,287,961 |
| 12/31/23 | $1,343,071 | $1,580,652 | $1,355,509 |
| 1/31/24 | $1,339,621 | $1,607,213 | $1,357,028 |
| 2/29/24 | $1,392,516 | $1,693,031 | $1,406,700 |
| 3/31/24 | $1,434,719 | $1,747,504 | $1,448,347 |
| 4/30/24 | $1,385,007 | $1,676,128 | $1,400,770 |
| 5/31/24 | $1,446,280 | $1,759,238 | $1,455,762 |
| 6/30/24 | $1,469,015 | $1,822,363 | $1,476,558 |
The table below shows the average annual total returns of the Fund, a regulatory index, and one or more supplemental index(es) for certain periods ended June 30, 2024.
Average Annual Total Returns (%)
| Class/Index Name | 1 Year | Since Inception 12/31/19 |
|---|
| Institutional Class | 16.88% | 8.93% |
| S&P 500 Index | 24.56% | 14.26% |
| S&P Target Date 2060+ Index | 16.55% | 9.04% |
All Fund returns are net of fees and expenses and include applicable fee waivers and/or expense limitations. Absent any applicable fee waivers and/or expense limitations, performance would have been lower and there can be no assurance that any such waivers or limitations will continue in the future.
Performance quoted represents past performance. Past performance is not a guarantee or a reliable indicator of future results.Current performance may be lower or higher than performance shown. Investment return and the principal value of an investment will fluctuate. Shares may be worth more or less than original cost when redeemed. Returns shown do not reflect the deduction of taxes that a shareholder would pay on Fund distributions or the redemption of Fund shares.Differences in the Fund’s performance versus an index and related attribution information with respect to particular categories of securities or individual positions may be attributable, in part, to differences in the pricing methodologies used by the Fund and the index. For performance current to the most recent month-end, visit www.pimco.com/literature or via 888.87.PIMCO (888.877.4626).
Key Fund StatisticsFootnote Reference* (as of the end of the reporting period)
| Total Net Assets | $159,478 |
| # of Portfolio Holdings | 18 |
| Portfolio Turnover Rate | 12% |
| Total Net Advisory Fees Paid During the Reporting Period | $36 |
| Footnote | Description |
Footnote* | Dollar amounts displayed in 000's |
What did the Fund invest in?
Allocation Breakdown (% of Net Assets)Footnote Reference*
| Mutual Funds | 90.0% |
| Affiliated Investments | 10.0% |
| Short-Term Instruments | 0.4% |
| Other Investments | 0.0% |
| Other Assets and Liabilities, Net | (0.4%) |
| Total | 100.0% |
| Footnote | Description |
Footnote* | % of Net Assets includes derivatives instruments, if any, valued at the value used for determining the Fund’s net asset value. The notional exposure of such derivatives investments therefore may be greater than what is depicted. |
Top Holdings (% of Net Assets)
| Vanguard Institutional Index Fund 'Institutional' | 50.9% |
| Vanguard Developed Markets Index Fund 'Institutional' | 25.8% |
| Vanguard Emerging Markets Stock Index Fund 'Institutional' | 9.0% |
| Vanguard Small-Cap Index Fund 'Institutional' | 4.3% |
| PIMCO Total Return Fund | 1.4% |
| PIMCO Long-Term Real Return Fund | 0.8% |
| PIMCO Long-Term U.S. Government Fund | 0.7% |
| PIMCO Real Return Fund | 0.7% |
| PIMCO Income Fund | 0.6% |
| PIMCO Emerging Markets Local Currency and Bond Fund | 0.3% |
This is a summary of certain changes and planned changes of the Fund since the beginning of the reporting period. For more information, you may refer to the Fund's next prospectus, which we expect to be available by October 31, 2024 or upon request at 888.87.PIMCO (888.877.4626).
Change to REALPATH® Blend Glide Path. Effective February 28, 2024, the Fund’s REALPATH® Blend Glide Path, which forms the basis of the Fund’s long-term asset allocations, was changed based on data relating to risk metrics, long-term market trends, correlation of asset types and actuarial assumptions of life expectancy and retirement.
For additional information about the Fund, including the Fund's prospectus, financial information, holdings and proxy voting information, please visit www.pimco.com/literature or contact 888.87.PIMCO (888.877.4626). For tax information about the Fund, please visit: https://www.pimco.com/tax.
Institutional Class: PRBMX
PIMCO REALPATH® Blend 2060 Fund
Annual Shareholder Report |
June 30, 2024
PIMCO REALPATH® Blend 2065 Fund
Annual Shareholder Report | June 30, 2024
This annual shareholder report contains important information about the PIMCO REALPATH® Blend 2065 Fund for the period of July 1, 2023 to June 30, 2024 (the "reporting period"). You can find additional information about the Fund at www.pimco.com/literature. You can also request this information by contacting us at 888.87.PIMCO (888.877.4626).
This report describes changes to the Fund that occurred during the reporting period.
What were the Fund costs for the last year?
(based on a hypothetical $10,000 investment)
| Class Name | Cost of a $10,000 investment | Costs paid as a percentage of a $10,000 investment |
|---|
| Class A | $54 | 0.50% |
How did the Fund perform during the reporting period and what affected its performance?
The following affected performance (on a gross basis) during the reporting period:
• Exposure to U.S. large cap equities contributed to absolute performance, as U.S. large cap equities posted positive returns.
• Exposure to global equities contributed to absolute performance, as global equities posted positive returns.
• Exposure to emerging market equities contributed to absolute performance, as emerging market equities posted positive returns.
• Exposure to U.S. small cap equities contributed to absolute performance, as U.S. small cap equities posted positive returns.
• Exposure to long-term U.S. Treasury Inflation-Protected Securities ("TIPS") detracted from absolute performance, as long-term TIPS
posted negative returns.
• Exposure to long-term U.S. treasuries detracted from absolute performance, as long-term U.S. treasuries posted negative returns.
• There were no other material detractors for this Fund.
In addition to the Fund's performance, the tables in this section include performance of: (i) a broad-based securities market index (i.e., a regulatory index) and (ii) one or more supplemental index(es). Effective July 24, 2024, the Fund's regulatory index is the S&P 500 Index. The Fund's regulatory index is shown in connection with certain regulatory requirements to provide a broad measure of market performance.
The table below illustrates cumulative returns for the 10-year period ended June 30, 2024 or the life of the Fund, if shorter. Cumulative returns are based on a hypothetical initial investment equal to the greater of either $10,000 or the investment minimum applicable to the share class.
Cumulative Returns Based on $10,000 Investment
| Class A (including sales charge) | S&P 500 Index | S&P Target Date 2065 Index |
|---|
| 12/30/22 | $9,452 | $10,000 | $10,000 |
| 12/31/22 | $9,452 | $9,975 | $9,969 |
| 1/31/23 | $10,142 | $10,602 | $10,660 |
| 2/28/23 | $9,811 | $10,343 | $10,397 |
| 3/31/23 | $10,056 | $10,723 | $10,608 |
| 4/30/23 | $10,198 | $10,890 | $10,743 |
| 5/31/23 | $10,046 | $10,938 | $10,580 |
| 6/30/23 | $10,585 | $11,660 | $11,157 |
| 7/31/23 | $10,935 | $12,035 | $11,534 |
| 8/31/23 | $10,623 | $11,843 | $11,245 |
| 9/30/23 | $10,176 | $11,279 | $10,782 |
| 10/31/23 | $9,873 | $11,042 | $10,451 |
| 11/30/23 | $10,716 | $12,050 | $11,352 |
| 12/31/23 | $11,255 | $12,597 | $11,946 |
| 1/31/24 | $11,226 | $12,809 | $11,965 |
| 2/29/24 | $11,676 | $13,493 | $12,414 |
| 3/31/24 | $12,021 | $13,927 | $12,783 |
| 4/30/24 | $11,590 | $13,358 | $12,361 |
| 5/31/24 | $12,098 | $14,021 | $12,852 |
| 6/30/24 | $12,289 | $14,524 | $13,047 |
The table below shows the average annual total returns of the Fund, a regulatory index, and one or more supplemental index(es) for certain periods ended June 30, 2024.
Average Annual Total Returns (%)
| Class/Index Name | 1 Year | Since Inception 12/30/22 |
|---|
| Class A (excluding sales charge) | 16.09% | 19.14% |
| Class A (including sales charge) | 9.72% | 14.74% |
| S&P 500 Index | 24.56% | 28.22% |
| S&P Target Date 2065 Index | 16.93% | 19.38% |
All Fund returns are net of fees and expenses and include applicable fee waivers and/or expense limitations. Absent any applicable fee waivers and/or expense limitations, performance would have been lower and there can be no assurance that any such waivers or limitations will continue in the future.
Performance quoted represents past performance. Past performance is not a guarantee or a reliable indicator of future results.Current performance may be lower or higher than performance shown. Investment return and the principal value of an investment will fluctuate. Shares may be worth more or less than original cost when redeemed. Returns shown do not reflect the deduction of taxes that a shareholder would pay on Fund distributions or the redemption of Fund shares.Differences in the Fund’s performance versus an index and related attribution information with respect to particular categories of securities or individual positions may be attributable, in part, to differences in the pricing methodologies used by the Fund and the index. The Cumulative Returns chart and Average Annual Total Returns table reflect any sales load that would have applied at the time of purchase or any Contingent Deferred Sales Charge (“CDSC”) that would have applied if a full redemption occurred on the last business day of the period shown in the Cumulative Returns chart. Class A shares are subject to an initial sales charge. A CDSC may be imposed in certain circumstances on Class A shares that are purchased without an initial sales charge and then redeemed during the first 12 months after purchase. For performance current to the most recent month-end, visit www.pimco.com/literature or via 888.87.PIMCO (888.877.4626).
Key Fund StatisticsFootnote Reference* (as of the end of the reporting period)
| Total Net Assets | $19,152 |
| # of Portfolio Holdings | 17 |
| Portfolio Turnover Rate | 16% |
| Total Net Advisory Fees Paid During the Reporting Period | $3 |
| Footnote | Description |
Footnote* | Dollar amounts displayed in 000's |
What did the Fund invest in?
Allocation Breakdown (% of Net Assets)Footnote Reference*
| Mutual Funds | 90.3% |
| Affiliated Investments | 9.2% |
| Short-Term Instruments | 1.1% |
| Other Investments | 0.0% |
| Other Assets and Liabilities, Net | (0.6%) |
| Total | 100.0% |
| Footnote | Description |
Footnote* | % of Net Assets includes derivatives instruments, if any, valued at the value used for determining the Fund’s net asset value. The notional exposure of such derivatives investments therefore may be greater than what is depicted. |
Top Holdings (% of Net Assets)
| Vanguard Institutional Index Fund 'Institutional' | 51.2% |
| Vanguard Developed Markets Index Fund 'Admiral' | 25.6% |
| Vanguard Emerging Markets Stock Index Fund 'Admiral' | 9.0% |
| Vanguard Small-Cap Index Fund 'Admiral' | 4.5% |
| PIMCO Total Return Fund | 0.9% |
| PIMCO Long-Term Real Return Fund | 0.7% |
| PIMCO Real Return Fund | 0.7% |
| PIMCO Long-Term U.S. Government Fund | 0.7% |
| PIMCO Income Fund | 0.4% |
| PIMCO Emerging Markets Local Currency and Bond Fund | 0.3% |
This is a summary of certain changes and planned changes of the Fund since the beginning of the reporting period. For more information, you may refer to the Fund's next prospectus, which we expect to be available by October 31, 2024 or upon request at 888.87.PIMCO (888.877.4626).
Change to REALPATH® Blend Glide Path. Effective February 28, 2024, the Fund’s REALPATH® Blend Glide Path, which forms the basis of the Fund’s long-term asset allocations, was changed based on data relating to risk metrics, long-term market trends, correlation of asset types and actuarial assumptions of life expectancy and retirement.
For additional information about the Fund, including the Fund's prospectus, financial information, holdings and proxy voting information, please visit www.pimco.com/literature or contact 888.87.PIMCO (888.877.4626). For tax information about the Fund, please visit: https://www.pimco.com/tax.
PIMCO REALPATH® Blend 2065 Fund
Annual Shareholder Report |
June 30, 2024
Institutional Class: PBLIX
PIMCO REALPATH® Blend 2065 Fund
Annual Shareholder Report | June 30, 2024
This annual shareholder report contains important information about the PIMCO REALPATH® Blend 2065 Fund for the period of July 1, 2023 to June 30, 2024 (the "reporting period"). You can find additional information about the Fund at www.pimco.com/literature. You can also request this information by contacting us at 888.87.PIMCO (888.877.4626).
This report describes changes to the Fund that occurred during the reporting period.
What were the Fund costs for the last year?
(based on a hypothetical $10,000 investment)
| Class Name | Cost of a $10,000 investment | Costs paid as a percentage of a $10,000 investment |
|---|
| Institutional Class | $5 | 0.05% |
How did the Fund perform during the reporting period and what affected its performance?
The following affected performance (on a gross basis) during the reporting period:
• Exposure to U.S. large cap equities contributed to absolute performance, as U.S. large cap equities posted positive returns.
• Exposure to global equities contributed to absolute performance, as global equities posted positive returns.
• Exposure to emerging market equities contributed to absolute performance, as emerging market equities posted positive returns.
• Exposure to U.S. small cap equities contributed to absolute performance, as U.S. small cap equities posted positive returns.
• Exposure to long-term U.S. Treasury Inflation-Protected Securities ("TIPS") detracted from absolute performance, as long-term TIPS
posted negative returns.
• Exposure to long-term U.S. treasuries detracted from absolute performance, as long-term U.S. treasuries posted negative returns.
• There were no other material detractors for this Fund.
In addition to the Fund's performance, the tables in this section include performance of: (i) a broad-based securities market index (i.e., a regulatory index) and (ii) one or more supplemental index(es). Effective July 24, 2024, the Fund's regulatory index is the S&P 500 Index. The Fund's regulatory index is shown in connection with certain regulatory requirements to provide a broad measure of market performance.
The table below illustrates cumulative returns for the 10-year period ended June 30, 2024 or the life of the Fund, if shorter. Cumulative returns are based on a hypothetical initial investment equal to the greater of either $10,000 or the investment minimum applicable to the share class.
Cumulative Returns Based on $1,000,000 Investment
| Institutional Class | S&P 500 Index | S&P Target Date 2065 Index |
|---|
| 12/30/2022 | $1,000,000 | $1,000,000 | $1,000,000 |
| 12/31/2022 | $1,000,000 | $997,520 | $996,872 |
| 1/31/2023 | $1,074,000 | $1,060,198 | $1,066,026 |
| 2/28/2023 | $1,039,000 | $1,034,330 | $1,039,660 |
| 3/31/2023 | $1,065,771 | $1,072,305 | $1,060,775 |
| 4/30/2023 | $1,079,794 | $1,089,042 | $1,074,293 |
| 5/31/2023 | $1,064,769 | $1,093,775 | $1,057,982 |
| 6/30/2023 | $1,122,866 | $1,166,047 | $1,115,741 |
| 7/31/2023 | $1,159,927 | $1,203,506 | $1,153,391 |
| 8/31/2023 | $1,127,874 | $1,184,344 | $1,124,455 |
| 9/30/2023 | $1,080,337 | $1,127,877 | $1,078,204 |
| 10/31/2023 | $1,048,208 | $1,104,162 | $1,045,135 |
| 11/30/2023 | $1,138,571 | $1,205,000 | $1,135,180 |
| 12/31/2023 | $1,195,719 | $1,259,744 | $1,194,615 |
| 1/31/2024 | $1,192,674 | $1,280,913 | $1,196,514 |
| 2/29/2024 | $1,241,396 | $1,349,308 | $1,241,426 |
| 3/31/2024 | $1,279,266 | $1,392,722 | $1,278,293 |
| 4/30/2024 | $1,233,432 | $1,335,837 | $1,236,063 |
| 5/31/2024 | $1,287,414 | $1,402,073 | $1,285,219 |
| 6/30/2024 | $1,308,033 | $1,452,383 | $1,304,659 |
The table below shows the average annual total returns of the Fund, a regulatory index, and one or more supplemental index(es) for certain periods ended June 30, 2024.
Average Annual Total Returns (%)
| Class/Index Name | 1 Year | Since Inception 12/30/22 |
|---|
| Institutional Class | 16.49% | 19.62% |
| S&P 500 Index | 24.56% | 28.22% |
| S&P Target Date 2065 Index | 16.93% | 19.38% |
All Fund returns are net of fees and expenses and include applicable fee waivers and/or expense limitations. Absent any applicable fee waivers and/or expense limitations, performance would have been lower and there can be no assurance that any such waivers or limitations will continue in the future.
Performance quoted represents past performance. Past performance is not a guarantee or a reliable indicator of future results.Current performance may be lower or higher than performance shown. Investment return and the principal value of an investment will fluctuate. Shares may be worth more or less than original cost when redeemed. Returns shown do not reflect the deduction of taxes that a shareholder would pay on Fund distributions or the redemption of Fund shares.Differences in the Fund’s performance versus an index and related attribution information with respect to particular categories of securities or individual positions may be attributable, in part, to differences in the pricing methodologies used by the Fund and the index. For performance current to the most recent month-end, visit www.pimco.com/literature or via 888.87.PIMCO (888.877.4626).
Key Fund StatisticsFootnote Reference* (as of the end of the reporting period)
| Total Net Assets | $19,152 |
| # of Portfolio Holdings | 17 |
| Portfolio Turnover Rate | 16% |
| Total Net Advisory Fees Paid During the Reporting Period | $3 |
| Footnote | Description |
Footnote* | Dollar amounts displayed in 000's |
What did the Fund invest in?
Allocation Breakdown (% of Net Assets)Footnote Reference*
| Mutual Funds | 90.3% |
| Affiliated Investments | 9.2% |
| Short-Term Instruments | 1.1% |
| Other Investments | 0.0% |
| Other Assets and Liabilities, Net | (0.6%) |
| Total | 100.0% |
| Footnote | Description |
Footnote* | % of Net Assets includes derivatives instruments, if any, valued at the value used for determining the Fund’s net asset value. The notional exposure of such derivatives investments therefore may be greater than what is depicted. |
Top Holdings (% of Net Assets)
| Vanguard Institutional Index Fund 'Institutional' | 51.2% |
| Vanguard Developed Markets Index Fund 'Admiral' | 25.6% |
| Vanguard Emerging Markets Stock Index Fund 'Admiral' | 9.0% |
| Vanguard Small-Cap Index Fund 'Admiral' | 4.5% |
| PIMCO Total Return Fund | 0.9% |
| PIMCO Long-Term Real Return Fund | 0.7% |
| PIMCO Real Return Fund | 0.7% |
| PIMCO Long-Term U.S. Government Fund | 0.7% |
| PIMCO Income Fund | 0.4% |
| PIMCO Emerging Markets Local Currency and Bond Fund | 0.3% |
This is a summary of certain changes and planned changes of the Fund since the beginning of the reporting period. For more information, you may refer to the Fund's next prospectus, which we expect to be available by October 31, 2024 or upon request at 888.87.PIMCO (888.877.4626).
Change to REALPATH® Blend Glide Path. Effective February 28, 2024, the Fund’s REALPATH® Blend Glide Path, which forms the basis of the Fund’s long-term asset allocations, was changed based on data relating to risk metrics, long-term market trends, correlation of asset types and actuarial assumptions of life expectancy and retirement.
For additional information about the Fund, including the Fund's prospectus, financial information, holdings and proxy voting information, please visit www.pimco.com/literature or contact 888.87.PIMCO (888.877.4626). For tax information about the Fund, please visit: https://www.pimco.com/tax.
Institutional Class: PBLIX
PIMCO REALPATH® Blend 2065 Fund
Annual Shareholder Report |
June 30, 2024
PIMCO REALPATH® Blend Income Fund
Annual Shareholder Report | June 30, 2024
This annual shareholder report contains important information about the PIMCO REALPATH® Blend Income Fund for the period of July 1, 2023 to June 30, 2024 (the "reporting period"). You can find additional information about the Fund at www.pimco.com/literature. You can also request this information by contacting us at 888.87.PIMCO (888.877.4626).
This report describes changes to the Fund that occurred during the reporting period.
What were the Fund costs for the last year?
(based on a hypothetical $10,000 investment)
| Class Name | Cost of a $10,000 investment | Costs paid as a percentage of a $10,000 investment |
|---|
| Class A | $50 | 0.48% |
How did the Fund perform during the reporting period and what affected its performance?
The following affected performance (on a gross basis) during the reporting period:
• Exposure to U.S. large cap equities contributed to absolute performance, as U.S. large cap equities posted positive returns.
• Exposure to global equities contributed to absolute performance, as global equities posted positive returns.
• Exposure to emerging market equities contributed to absolute performance, as emerging market equities posted positive returns.
• Exposure to U.S. core bonds contributed to absolute performance, as U.S. core bonds posted positive returns.
• Exposure to long-term Treasury Inflation-Protected Securities ("TIPS") detracted from absolute performance, as long-term TIPS posted
negative returns.
• Exposure to long-term treasuries detracted from absolute performance, as long-term treasuries posted negative returns.
• Exposure to global bonds detracted from absolute performance, as global bonds posted negative returns.
• There were no other material detractors for this Fund.
In addition to the Fund's performance, the tables in this section include performance of: (i) a broad-based securities market index (i.e., a regulatory index) and (ii) one or more supplemental index(es). Effective July 24, 2024, the Fund's regulatory index is the S&P 500 Index. The Fund's regulatory index is shown in connection with certain regulatory requirements to provide a broad measure of market performance.
The table below illustrates cumulative returns for the 10-year period ended June 30, 2024 or the life of the Fund, if shorter. Cumulative returns are based on a hypothetical initial investment equal to the greater of either $10,000 or the investment minimum applicable to the share class.
Cumulative Returns Based on $10,000 Investment
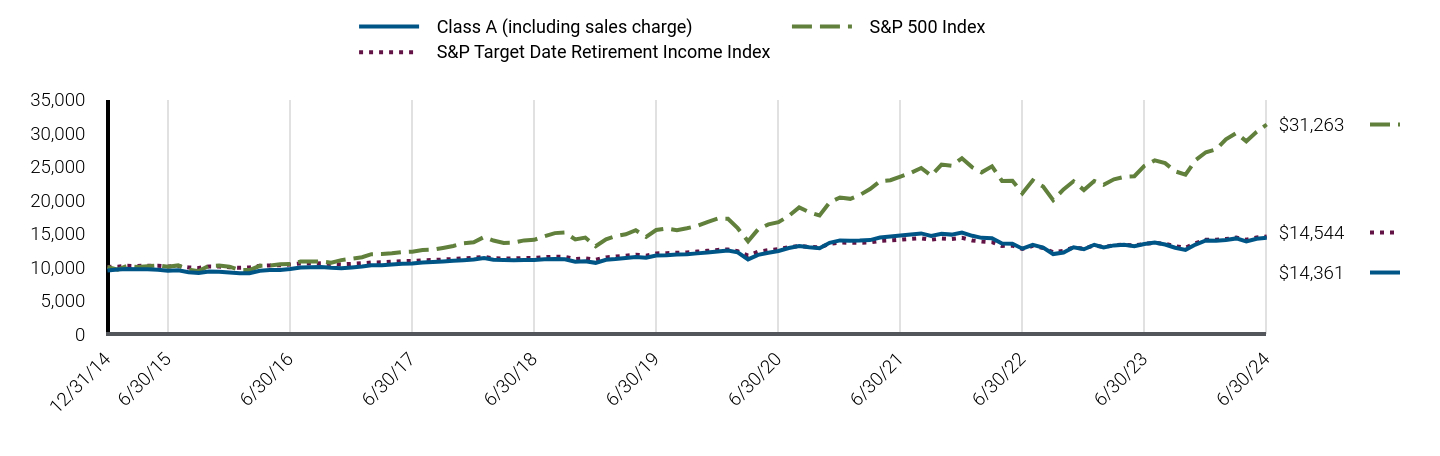
| Class A (including sales charge) | S&P 500 Index | S&P Target Date Retirement Income Index |
|---|
| 12/31/14 | $9,452 | $10,000 | $10,000 |
| 1/31/15 | $9,631 | $9,600 | $10,044 |
| 2/28/15 | $9,688 | $10,152 | $10,164 |
| 3/31/15 | $9,641 | $9,991 | $10,146 |
| 4/30/15 | $9,669 | $10,087 | $10,179 |
| 5/31/15 | $9,594 | $10,217 | $10,180 |
| 6/30/15 | $9,431 | $10,019 | $10,058 |
| 7/31/15 | $9,488 | $10,229 | $10,138 |
| 8/31/15 | $9,203 | $9,612 | $9,919 |
| 9/30/15 | $9,083 | $9,374 | $9,847 |
| 10/31/15 | $9,320 | $10,164 | $10,073 |
| 11/30/15 | $9,263 | $10,195 | $10,055 |
| 12/31/15 | $9,157 | $10,034 | $9,960 |
| 1/31/16 | $9,060 | $9,536 | $9,870 |
| 2/29/16 | $9,051 | $9,523 | $9,907 |
| 3/31/16 | $9,435 | $10,169 | $10,177 |
| 4/30/16 | $9,532 | $10,209 | $10,229 |
| 5/31/16 | $9,551 | $10,392 | $10,260 |
| 6/30/16 | $9,690 | $10,419 | $10,367 |
| 7/31/16 | $9,925 | $10,803 | $10,512 |
| 8/31/16 | $9,944 | $10,818 | $10,515 |
| 9/30/16 | $9,994 | $10,820 | $10,538 |
| 10/31/16 | $9,886 | $10,623 | $10,433 |
| 11/30/16 | $9,817 | $11,016 | $10,376 |
| 12/31/16 | $9,927 | $11,234 | $10,459 |
| 1/31/17 | $10,055 | $11,447 | $10,543 |
| 2/28/17 | $10,244 | $11,902 | $10,664 |
| 3/31/17 | $10,268 | $11,915 | $10,689 |
| 4/30/17 | $10,367 | $12,038 | $10,778 |
| 5/31/17 | $10,477 | $12,207 | $10,863 |
| 6/30/17 | $10,503 | $12,283 | $10,880 |
| 7/31/17 | $10,652 | $12,536 | $10,988 |
| 8/31/17 | $10,732 | $12,574 | $11,034 |
| 9/30/17 | $10,806 | $12,834 | $11,104 |
| 10/31/17 | $10,906 | $13,133 | $11,184 |
| 11/30/17 | $11,006 | $13,536 | $11,274 |
| 12/31/17 | $11,119 | $13,687 | $11,352 |
| 1/31/18 | $11,332 | $14,470 | $11,488 |
| 2/28/18 | $11,059 | $13,937 | $11,287 |
| 3/31/18 | $11,039 | $13,583 | $11,261 |
| 4/30/18 | $11,008 | $13,635 | $11,262 |
| 5/31/18 | $11,028 | $13,963 | $11,343 |
| 6/30/18 | $11,018 | $14,049 | $11,340 |
| 7/31/18 | $11,140 | $14,572 | $11,449 |
| 8/31/18 | $11,170 | $15,047 | $11,540 |
| 9/30/18 | $11,145 | $15,132 | $11,515 |
| 10/31/18 | $10,768 | $14,098 | $11,179 |
| 11/30/18 | $10,860 | $14,385 | $11,272 |
| 12/31/18 | $10,609 | $13,086 | $11,064 |
| 1/31/19 | $11,062 | $14,135 | $11,425 |
| 2/28/19 | $11,176 | $14,589 | $11,538 |
| 3/31/19 | $11,348 | $14,872 | $11,680 |
| 4/30/19 | $11,483 | $15,475 | $11,820 |
| 5/31/19 | $11,369 | $14,491 | $11,678 |
| 6/30/19 | $11,707 | $15,513 | $12,011 |
| 7/31/19 | $11,738 | $15,736 | $12,052 |
| 8/31/19 | $11,863 | $15,486 | $12,107 |
| 9/30/19 | $11,908 | $15,776 | $12,167 |
| 10/31/19 | $12,023 | $16,118 | $12,286 |
| 11/30/19 | $12,138 | $16,703 | $12,399 |
| 12/31/19 | $12,311 | $17,207 | $12,538 |
| 1/31/20 | $12,440 | $17,200 | $12,608 |
| 2/29/20 | $12,182 | $15,784 | $12,351 |
| 3/31/20 | $11,131 | $13,835 | $11,700 |
| 4/30/20 | $11,796 | $15,608 | $12,264 |
| 5/31/20 | $12,118 | $16,352 | $12,503 |
| 6/30/20 | $12,376 | $16,677 | $12,657 |
| 7/31/20 | $12,816 | $17,617 | $12,957 |
| 8/31/20 | $13,116 | $18,883 | $13,119 |
| 9/30/20 | $12,923 | $18,166 | $13,003 |
| 10/31/20 | $12,794 | $17,683 | $12,905 |
| 11/30/20 | $13,600 | $19,618 | $13,436 |
| 12/31/20 | $13,957 | $20,373 | $13,643 |
| 1/31/21 | $13,923 | $20,167 | $13,602 |
| 2/28/21 | $13,945 | $20,723 | $13,609 |
| 3/31/21 | $14,006 | $21,631 | $13,647 |
| 4/30/21 | $14,380 | $22,785 | $13,877 |
| 5/31/21 | $14,550 | $22,944 | $13,964 |
| 6/30/21 | $14,692 | $23,480 | $14,065 |
| 7/31/21 | $14,852 | $24,038 | $14,182 |
| 8/31/21 | $15,001 | $24,769 | $14,278 |
| 9/30/21 | $14,641 | $23,617 | $14,061 |
| 10/31/21 | $14,951 | $25,271 | $14,258 |
| 11/30/21 | $14,825 | $25,096 | $14,170 |
| 12/31/21 | $15,132 | $26,221 | $14,340 |
| 1/31/22 | $14,648 | $24,864 | $13,957 |
| 2/28/22 | $14,341 | $24,120 | $13,808 |
| 3/31/22 | $14,294 | $25,015 | $13,692 |
| 4/30/22 | $13,502 | $22,834 | $13,133 |
| 5/31/22 | $13,467 | $22,876 | $13,178 |
| 6/30/22 | $12,722 | $20,987 | $12,694 |
| 7/31/22 | $13,291 | $22,922 | $13,139 |
| 8/31/22 | $12,876 | $21,988 | $12,834 |
| 9/30/22 | $11,923 | $19,963 | $12,190 |
| 10/31/22 | $12,161 | $21,579 | $12,396 |
| 11/30/22 | $12,924 | $22,785 | $12,895 |
| 12/31/22 | $12,636 | $21,472 | $12,738 |
| 1/31/23 | $13,307 | $22,821 | $13,212 |
| 2/28/23 | $12,917 | $22,264 | $12,976 |
| 3/31/23 | $13,215 | $23,082 | $13,229 |
| 4/30/23 | $13,314 | $23,442 | $13,331 |
| 5/31/23 | $13,105 | $23,544 | $13,203 |
| 6/30/23 | $13,433 | $25,100 | $13,439 |
| 7/31/23 | $13,642 | $25,906 | $13,606 |
| 8/31/23 | $13,347 | $25,493 | $13,443 |
| 9/30/23 | $12,869 | $24,278 | $13,089 |
| 10/31/23 | $12,547 | $23,768 | $12,855 |
| 11/30/23 | $13,339 | $25,938 | $13,551 |
| 12/31/23 | $13,950 | $27,116 | $14,056 |
| 1/31/24 | $13,899 | $27,572 | $14,072 |
| 2/29/24 | $14,013 | $29,044 | $14,162 |
| 3/31/24 | $14,257 | $29,979 | $14,383 |
| 4/30/24 | $13,802 | $28,754 | $14,058 |
| 5/31/24 | $14,207 | $30,180 | $14,387 |
| 6/30/24 | $14,361 | $31,263 | $14,544 |
The table below shows the average annual total returns of the Fund, a regulatory index, and one or more supplemental index(es) for certain periods ended June 30, 2024.
Average Annual Total Returns (%)
| Class/Index Name | 1 Year | 5 Years | Since Inception 12/31/14 |
|---|
| Class A (excluding sales charge) | 6.90% | 4.17% | 4.50% |
| Class A (including sales charge) | 0.99% | 3.01% | 3.88% |
| S&P 500 Index | 24.56% | 15.05% | 12.75% |
| S&P Target Date Retirement Income Index | 8.22% | 3.90% | 4.02% |
All Fund returns are net of fees and expenses and include applicable fee waivers and/or expense limitations. Absent any applicable fee waivers and/or expense limitations, performance would have been lower and there can be no assurance that any such waivers or limitations will continue in the future.
Performance quoted represents past performance. Past performance is not a guarantee or a reliable indicator of future results.Current performance may be lower or higher than performance shown. Investment return and the principal value of an investment will fluctuate. Shares may be worth more or less than original cost when redeemed. Returns shown do not reflect the deduction of taxes that a shareholder would pay on Fund distributions or the redemption of Fund shares.Differences in the Fund’s performance versus an index and related attribution information with respect to particular categories of securities or individual positions may be attributable, in part, to differences in the pricing methodologies used by the Fund and the index. The Cumulative Returns chart and Average Annual Total Returns table reflect any sales load that would have applied at the time of purchase or any Contingent Deferred Sales Charge (“CDSC”) that would have applied if a full redemption occurred on the last business day of the period shown in the Cumulative Returns chart. Class A shares are subject to an initial sales charge. A CDSC may be imposed in certain circumstances on Class A shares that are purchased without an initial sales charge and then redeemed during the first 12 months after purchase. For performance current to the most recent month-end, visit www.pimco.com/literature or via 888.87.PIMCO (888.877.4626).
Key Fund StatisticsFootnote Reference* (as of the end of the reporting period)
| Total Net Assets | $335,002 |
| # of Portfolio Holdings | 21 |
| Portfolio Turnover Rate | 27% |
| Total Net Advisory Fees Paid During the Reporting Period | $34 |
| Footnote | Description |
Footnote* | Dollar amounts displayed in 000's |
What did the Fund invest in?
Allocation Breakdown (% of Net Assets)Footnote Reference*
| Affiliated Investments | 65.1% |
| Mutual Funds | 34.5% |
| Short-Term Instruments | 0.2% |
| Other Investments | 0.2% |
| Other Assets and Liabilities, Net | 0.0% |
| Total | 100.0% |
| Footnote | Description |
Footnote* | % of Net Assets includes derivatives instruments, if any, valued at the value used for determining the Fund’s net asset value. The notional exposure of such derivatives investments therefore may be greater than what is depicted. |
Top Holdings (% of Net Assets)
| Vanguard Institutional Index Fund 'Institutional' | 19.7% |
| PIMCO Total Return Fund | 18.7% |
| PIMCO Income Fund | 11.7% |
| Vanguard Developed Markets Index Fund 'Institutional' | 10.0% |
| PIMCO Long-Term Real Return Fund | 9.2% |
| PIMCO Long-Term U.S. Government Fund | 8.1% |
| PIMCO Real Return Fund | 5.1% |
| Vanguard Emerging Markets Stock Index Fund 'Institutional' | 4.0% |
| PIMCO Emerging Markets Local Currency and Bond Fund | 3.3% |
| PIMCO International Bond Fund (U.S. Dollar-Hedged) | 3.0% |
This is a summary of certain changes and planned changes of the Fund since the beginning of the reporting period. For more information, you may refer to the Fund's next prospectus, which we expect to be available by October 31, 2024 or upon request at 888.87.PIMCO (888.877.4626).
Changes to Total Annual Fund Operating Expenses. Annual fund operating expenses increased during the year by 0.20% as a result of the Fund’s exposure to fees and expenses related to the Fund’s investment in underlying funds.
Change to REALPATH® Blend Glide Path. Effective February 28, 2024, the Fund’s REALPATH® Blend Glide Path, which forms the basis of the Fund’s long-term asset allocations, was changed based on data relating to risk metrics, long-term market trends, correlation of asset types and actuarial assumptions of life expectancy and retirement.
For additional information about the Fund, including the Fund's prospectus, financial information, holdings and proxy voting information, please visit www.pimco.com/literature or contact 888.87.PIMCO (888.877.4626). For tax information about the Fund, please visit: https://www.pimco.com/tax.
PIMCO REALPATH® Blend Income Fund
Annual Shareholder Report |
June 30, 2024
Institutional Class: PBRNX
PIMCO REALPATH® Blend Income Fund
Annual Shareholder Report | June 30, 2024
This annual shareholder report contains important information about the PIMCO REALPATH® Blend Income Fund for the period of July 1, 2023 to June 30, 2024 (the "reporting period"). You can find additional information about the Fund at www.pimco.com/literature. You can also request this information by contacting us at 888.87.PIMCO (888.877.4626).
This report describes changes to the Fund that occurred during the reporting period.
What were the Fund costs for the last year?
(based on a hypothetical $10,000 investment)
| Class Name | Cost of a $10,000 investment | Costs paid as a percentage of a $10,000 investment |
|---|
| Institutional Class | $3 | 0.03% |
How did the Fund perform during the reporting period and what affected its performance?
The following affected performance (on a gross basis) during the reporting period:
• Exposure to U.S. large cap equities contributed to absolute performance, as U.S. large cap equities posted positive returns.
• Exposure to global equities contributed to absolute performance, as global equities posted positive returns.
• Exposure to emerging market equities contributed to absolute performance, as emerging market equities posted positive returns.
• Exposure to U.S. core bonds contributed to absolute performance, as U.S. core bonds posted positive returns.
• Exposure to long-term Treasury Inflation-Protected Securities ("TIPS") detracted from absolute performance, as long-term TIPS posted
negative returns.
• Exposure to long-term treasuries detracted from absolute performance, as long-term treasuries posted negative returns.
• Exposure to global bonds detracted from absolute performance, as global bonds posted negative returns.
• There were no other material detractors for this Fund.
In addition to the Fund's performance, the tables in this section include performance of: (i) a broad-based securities market index (i.e., a regulatory index) and (ii) one or more supplemental index(es). Effective July 24, 2024, the Fund's regulatory index is the S&P 500 Index. The Fund's regulatory index is shown in connection with certain regulatory requirements to provide a broad measure of market performance.
The table below illustrates cumulative returns for the 10-year period ended June 30, 2024 or the life of the Fund, if shorter. Cumulative returns are based on a hypothetical initial investment equal to the greater of either $10,000 or the investment minimum applicable to the share class.
Cumulative Returns Based on $1,000,000 Investment
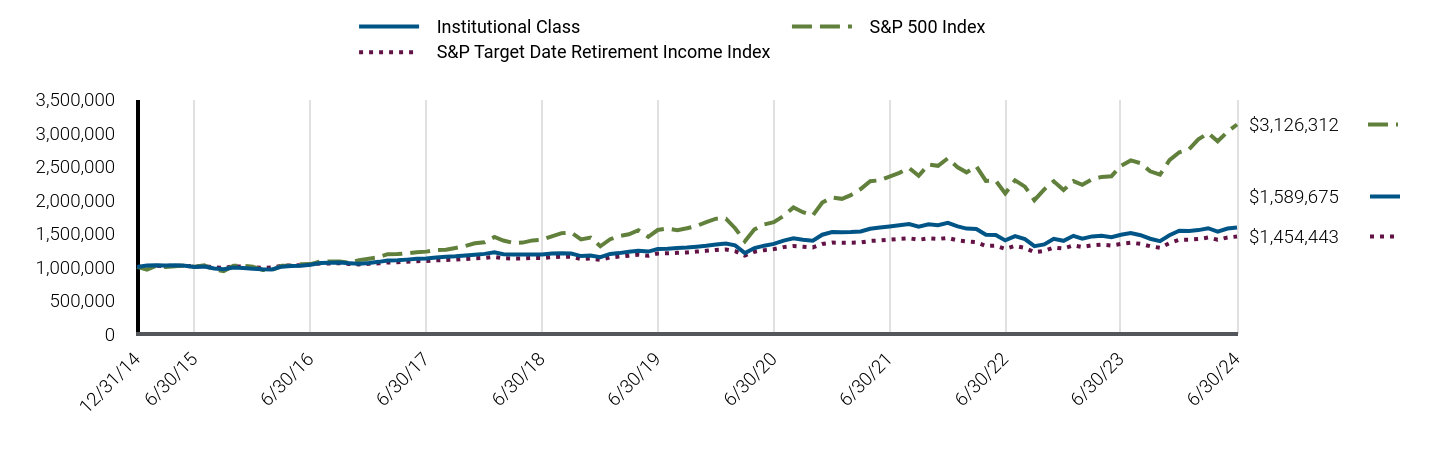
| Institutional Class | S&P 500 Index | S&P Target Date Retirement Income Index |
|---|
| 12/31/14 | $1,000,000 | $1,000,000 | $1,000,000 |
| 1/31/15 | $1,020,000 | $959,985 | $1,004,399 |
| 2/28/15 | $1,026,000 | $1,015,157 | $1,016,422 |
| 3/31/15 | $1,021,000 | $999,103 | $1,014,625 |
| 4/30/15 | $1,025,000 | $1,008,687 | $1,017,922 |
| 5/31/15 | $1,017,000 | $1,021,658 | $1,017,978 |
| 6/30/15 | $999,841 | $1,001,881 | $1,005,804 |
| 7/31/15 | $1,006,875 | $1,022,872 | $1,013,826 |
| 8/31/15 | $976,729 | $961,158 | $991,921 |
| 9/30/15 | $964,934 | $937,375 | $984,740 |
| 10/31/15 | $990,089 | $1,016,447 | $1,007,318 |
| 11/30/15 | $985,058 | $1,019,470 | $1,005,466 |
| 12/31/15 | $973,207 | $1,003,391 | $995,976 |
| 1/31/16 | $963,977 | $953,598 | $986,970 |
| 2/29/16 | $962,952 | $952,312 | $990,658 |
| 3/31/16 | $1,003,787 | $1,016,915 | $1,017,727 |
| 4/30/16 | $1,015,089 | $1,020,857 | $1,022,918 |
| 5/31/16 | $1,017,144 | $1,039,190 | $1,026,004 |
| 6/30/16 | $1,033,091 | $1,041,882 | $1,036,667 |
| 7/31/16 | $1,058,085 | $1,080,295 | $1,051,170 |
| 8/31/16 | $1,061,209 | $1,081,812 | $1,051,521 |
| 9/30/16 | $1,066,364 | $1,082,016 | $1,053,827 |
| 10/31/16 | $1,055,920 | $1,062,279 | $1,043,302 |
| 11/30/16 | $1,048,609 | $1,101,621 | $1,037,640 |
| 12/31/16 | $1,059,774 | $1,123,395 | $1,045,860 |
| 1/31/17 | $1,075,655 | $1,144,702 | $1,054,260 |
| 2/28/17 | $1,094,712 | $1,190,154 | $1,066,404 |
| 3/31/17 | $1,098,355 | $1,191,542 | $1,068,887 |
| 4/30/17 | $1,108,967 | $1,203,779 | $1,077,784 |
| 5/31/17 | $1,121,701 | $1,220,720 | $1,086,255 |
| 6/30/17 | $1,124,552 | $1,228,339 | $1,087,973 |
| 7/31/17 | $1,141,623 | $1,253,597 | $1,098,759 |
| 8/31/17 | $1,150,159 | $1,257,434 | $1,103,379 |
| 9/30/17 | $1,158,216 | $1,283,373 | $1,110,378 |
| 10/31/17 | $1,170,002 | $1,313,321 | $1,118,392 |
| 11/30/17 | $1,181,788 | $1,353,600 | $1,127,437 |
| 12/31/17 | $1,194,842 | $1,368,650 | $1,135,196 |
| 1/31/18 | $1,217,570 | $1,447,011 | $1,148,768 |
| 2/28/18 | $1,188,349 | $1,393,678 | $1,128,730 |
| 3/31/18 | $1,187,266 | $1,358,260 | $1,126,111 |
| 4/30/18 | $1,184,020 | $1,363,472 | $1,126,207 |
| 5/31/18 | $1,187,266 | $1,396,307 | $1,134,324 |
| 6/30/18 | $1,186,608 | $1,404,901 | $1,133,957 |
| 7/31/18 | $1,199,648 | $1,457,183 | $1,144,892 |
| 8/31/18 | $1,202,908 | $1,504,666 | $1,153,987 |
| 9/30/18 | $1,201,065 | $1,513,230 | $1,151,523 |
| 10/31/18 | $1,161,721 | $1,409,800 | $1,117,922 |
| 11/30/18 | $1,171,557 | $1,438,530 | $1,127,213 |
| 12/31/18 | $1,145,309 | $1,308,644 | $1,106,364 |
| 1/31/19 | $1,194,092 | $1,413,513 | $1,142,495 |
| 2/28/19 | $1,206,288 | $1,458,898 | $1,153,792 |
| 3/31/19 | $1,226,054 | $1,487,247 | $1,168,009 |
| 4/30/19 | $1,241,644 | $1,547,466 | $1,181,986 |
| 5/31/19 | $1,229,395 | $1,449,127 | $1,167,783 |
| 6/30/19 | $1,266,103 | $1,551,256 | $1,201,051 |
| 7/31/19 | $1,270,593 | $1,573,551 | $1,205,188 |
| 8/31/19 | $1,284,062 | $1,548,625 | $1,210,748 |
| 9/30/19 | $1,289,801 | $1,577,601 | $1,216,731 |
| 10/31/19 | $1,302,236 | $1,611,771 | $1,228,584 |
| 11/30/19 | $1,315,801 | $1,670,277 | $1,239,894 |
| 12/31/19 | $1,334,032 | $1,720,689 | $1,253,847 |
| 1/31/20 | $1,349,099 | $1,720,014 | $1,260,817 |
| 2/29/20 | $1,321,283 | $1,578,424 | $1,235,061 |
| 3/31/20 | $1,207,230 | $1,383,468 | $1,170,004 |
| 4/30/20 | $1,281,450 | $1,560,821 | $1,226,376 |
| 5/31/20 | $1,317,400 | $1,635,159 | $1,250,291 |
| 6/30/20 | $1,344,086 | $1,667,678 | $1,265,737 |
| 7/31/20 | $1,392,835 | $1,761,710 | $1,295,730 |
| 8/31/20 | $1,426,495 | $1,888,343 | $1,311,886 |
| 9/30/20 | $1,406,660 | $1,816,592 | $1,300,252 |
| 10/31/20 | $1,392,698 | $1,768,282 | $1,290,471 |
| 11/30/20 | $1,481,123 | $1,961,845 | $1,343,559 |
| 12/31/20 | $1,520,292 | $2,037,275 | $1,364,319 |
| 1/31/21 | $1,517,872 | $2,016,707 | $1,360,237 |
| 2/28/21 | $1,520,292 | $2,072,317 | $1,360,927 |
| 3/31/21 | $1,528,342 | $2,163,076 | $1,364,746 |
| 4/30/21 | $1,570,147 | $2,278,516 | $1,387,692 |
| 5/31/21 | $1,588,590 | $2,294,430 | $1,396,420 |
| 6/30/21 | $1,604,501 | $2,347,993 | $1,406,508 |
| 7/31/21 | $1,623,129 | $2,403,770 | $1,418,250 |
| 8/31/21 | $1,640,515 | $2,476,858 | $1,427,784 |
| 9/30/21 | $1,601,529 | $2,361,660 | $1,406,113 |
| 10/31/21 | $1,636,481 | $2,527,122 | $1,425,834 |
| 11/30/21 | $1,622,750 | $2,509,612 | $1,417,039 |
| 12/31/21 | $1,656,934 | $2,622,083 | $1,434,030 |
| 1/31/22 | $1,604,272 | $2,486,398 | $1,395,654 |
| 2/28/22 | $1,572,161 | $2,411,951 | $1,380,766 |
| 3/31/22 | $1,566,895 | $2,501,506 | $1,369,163 |
| 4/30/22 | $1,479,488 | $2,283,370 | $1,313,252 |
| 5/31/22 | $1,476,918 | $2,287,559 | $1,317,821 |
| 6/30/22 | $1,396,282 | $2,098,736 | $1,269,399 |
| 7/31/22 | $1,459,573 | $2,292,248 | $1,313,927 |
| 8/31/22 | $1,414,365 | $2,198,766 | $1,283,446 |
| 9/30/22 | $1,310,245 | $1,996,263 | $1,218,960 |
| 10/31/22 | $1,336,216 | $2,157,883 | $1,239,583 |
| 11/30/22 | $1,420,622 | $2,278,474 | $1,289,492 |
| 12/31/22 | $1,390,160 | $2,147,201 | $1,273,805 |
| 1/31/23 | $1,464,657 | $2,282,118 | $1,321,239 |
| 2/28/23 | $1,422,088 | $2,226,437 | $1,297,637 |
| 3/31/23 | $1,456,007 | $2,308,179 | $1,322,883 |
| 4/30/23 | $1,466,733 | $2,344,206 | $1,333,150 |
| 5/31/23 | $1,443,941 | $2,354,395 | $1,320,333 |
| 6/30/23 | $1,480,136 | $2,509,962 | $1,343,913 |
| 7/31/23 | $1,504,356 | $2,590,595 | $1,360,640 |
| 8/31/23 | $1,473,408 | $2,549,349 | $1,344,319 |
| 9/30/23 | $1,420,946 | $2,427,801 | $1,308,873 |
| 10/31/23 | $1,385,727 | $2,376,753 | $1,285,516 |
| 11/30/23 | $1,473,774 | $2,593,811 | $1,355,057 |
| 12/31/23 | $1,541,336 | $2,711,650 | $1,405,584 |
| 1/31/24 | $1,537,203 | $2,757,216 | $1,407,175 |
| 2/29/24 | $1,549,600 | $2,904,440 | $1,416,178 |
| 3/31/24 | $1,577,932 | $2,997,889 | $1,438,291 |
| 4/30/24 | $1,526,584 | $2,875,441 | $1,405,779 |
| 5/31/24 | $1,573,769 | $3,018,019 | $1,438,679 |
| 6/30/24 | $1,589,675 | $3,126,312 | $1,454,443 |
The table below shows the average annual total returns of the Fund, a regulatory index, and one or more supplemental index(es) for certain periods ended June 30, 2024.
Average Annual Total Returns (%)
| Class/Index Name | 1 Year | 5 Years | Since Inception 12/31/14 |
|---|
| Institutional Class | 7.40% | 4.66% | 5.00% |
| S&P 500 Index | 24.56% | 15.05% | 12.75% |
| S&P Target Date Retirement Income Index | 8.22% | 3.90% | 4.02% |
All Fund returns are net of fees and expenses and include applicable fee waivers and/or expense limitations. Absent any applicable fee waivers and/or expense limitations, performance would have been lower and there can be no assurance that any such waivers or limitations will continue in the future.
Performance quoted represents past performance. Past performance is not a guarantee or a reliable indicator of future results.Current performance may be lower or higher than performance shown. Investment return and the principal value of an investment will fluctuate. Shares may be worth more or less than original cost when redeemed. Returns shown do not reflect the deduction of taxes that a shareholder would pay on Fund distributions or the redemption of Fund shares.Differences in the Fund’s performance versus an index and related attribution information with respect to particular categories of securities or individual positions may be attributable, in part, to differences in the pricing methodologies used by the Fund and the index. For performance current to the most recent month-end, visit www.pimco.com/literature or via 888.87.PIMCO (888.877.4626).
Key Fund StatisticsFootnote Reference* (as of the end of the reporting period)
| Total Net Assets | $335,002 |
| # of Portfolio Holdings | 21 |
| Portfolio Turnover Rate | 27% |
| Total Net Advisory Fees Paid During the Reporting Period | $34 |
| Footnote | Description |
Footnote* | Dollar amounts displayed in 000's |
What did the Fund invest in?
Allocation Breakdown (% of Net Assets)Footnote Reference*
| Affiliated Investments | 65.1% |
| Mutual Funds | 34.5% |
| Short-Term Instruments | 0.2% |
| Other Investments | 0.2% |
| Other Assets and Liabilities, Net | 0.0% |
| Total | 100.0% |
| Footnote | Description |
Footnote* | % of Net Assets includes derivatives instruments, if any, valued at the value used for determining the Fund’s net asset value. The notional exposure of such derivatives investments therefore may be greater than what is depicted. |
Top Holdings (% of Net Assets)
| Vanguard Institutional Index Fund 'Institutional' | 19.7% |
| PIMCO Total Return Fund | 18.7% |
| PIMCO Income Fund | 11.7% |
| Vanguard Developed Markets Index Fund 'Institutional' | 10.0% |
| PIMCO Long-Term Real Return Fund | 9.2% |
| PIMCO Long-Term U.S. Government Fund | 8.1% |
| PIMCO Real Return Fund | 5.1% |
| Vanguard Emerging Markets Stock Index Fund 'Institutional' | 4.0% |
| PIMCO Emerging Markets Local Currency and Bond Fund | 3.3% |
| PIMCO International Bond Fund (U.S. Dollar-Hedged) | 3.0% |
This is a summary of certain changes and planned changes of the Fund since the beginning of the reporting period. For more information, you may refer to the Fund's next prospectus, which we expect to be available by October 31, 2024 or upon request at 888.87.PIMCO (888.877.4626).
Changes to Total Annual Fund Operating Expenses. Annual fund operating expenses increased during the year by 0.20% as a result of the Fund’s exposure to fees and expenses related to the Fund’s investment in underlying funds.
Change to REALPATH® Blend Glide Path. Effective February 28, 2024, the Fund’s REALPATH® Blend Glide Path, which forms the basis of the Fund’s long-term asset allocations, was changed based on data relating to risk metrics, long-term market trends, correlation of asset types and actuarial assumptions of life expectancy and retirement.
For additional information about the Fund, including the Fund's prospectus, financial information, holdings and proxy voting information, please visit www.pimco.com/literature or contact 888.87.PIMCO (888.877.4626). For tax information about the Fund, please visit: https://www.pimco.com/tax.
Institutional Class: PBRNX
PIMCO REALPATH® Blend Income Fund
Annual Shareholder Report |
June 30, 2024
As of the end of the period covered by this report, the Registrant has adopted a code of ethics (the “Code”) that applies to the Registrant’s principal executive officer and principal financial officer. The Registrant did not grant any waivers, including implicit waivers, from any provisions of the Code to the principal executive officer or principal financial officer during the period covered by this report.
A copy of the Code is included as an exhibit to this report.
| Item 3. | Audit Committee Financial Expert. |
The Board of Trustees has determined that Peter B. McCarthy, who serves on the Board’s Audit Committee, qualifies as an “audit committee financial expert” as such term is defined in the instructions to this Item 3. The Board has also determined that Mr. McCarthy is “independent” as such term is interpreted under this Item 3.
| Item 4. | Principal Accountant Fees and Services. |
| | | | | | | | | | |
| | (a) | | Fiscal Year Ended | | Audit Fees | | | | |
| | | | June 30, 2024 | | $ 778,309 | | | | |
| | | | June 30, 2023 | | $ 676,297 | | | | |
| | | | | |
| | (b) | | Fiscal Year Ended | | Audit-Related Fees(1) | | | | |
| | | | June 30, 2024 | | $ — | | | | |
| | | | June 30, 2023 | | $ — | | | | |
| | | | | |
| | (c) | | Fiscal Year Ended | | Tax Fees | | | | |
| | | | June 30, 2024 | | $ 85,225 | | | | |
| | | | June 30, 2023 | | $ 93,875 | | | | |
| | | | | |
| | (d) | | Fiscal Year Ended | | All Other Fees(2) | | | | |
| | | | June 30, 2024 | | $ — | | | | |
| | | | June 30, 2023 | | $ — | | | | |
“Audit Fees” represents aggregate fees billed for each of the last two fiscal years for professional services rendered for the audit of the PIMCO Equity Series (the “Trust” or “Registrant”) annual financial statements or services that are normally provided by the accountant in connection with statutory or regulatory filings or engagements for those fiscal years.
“Audit-Related Fees” represents aggregate fees billed for each of the last two fiscal years for assurance and related services reasonably related to the performance of the audit of the Trust’s annual financial statements for those years.
“Tax Fees” represents aggregate fees billed for each of the last two fiscal years for professional services related to tax compliance, tax advice and tax planning, including review of federal and state income tax returns, review of excise tax distribution requirements and preparation of excise tax returns.
“All Other Fees” represents aggregate fees, if any, billed for other products and services rendered by the principal accountant to the Trust for the last two fiscal years.
| | | | |
| | (1) | | There were no “Audit-Related Fees” for the last two fiscal years. |
| | (2) | | There were no “All Other Fees” for the last two fiscal years. |
| | (e) | Pre-approval policies and procedures |
(1) The Registrant’s Audit Committee has adopted pre-approval policies and procedures (the “Procedures”) to govern the Audit Committee’s pre-approval of (i) all audit services and permissible non-audit services to be provided to the Registrant by its independent accountant, and (ii) all permissible non-audit services to be provided by such independent accountant to the Registrant’s investment adviser and to any entity controlling, controlled by, or under common control with the investment adviser that provides ongoing services to the Registrant (collectively, the “Service Affiliates”) if the services provided directly relate to the Registrant’s operations and financial reporting. In accordance with the Procedures, the Audit Committee is responsible for the engagement of the independent accountant to certify the Registrant’s financial statements for each fiscal year. With respect to the pre-approval of non-audit services provided to the Registrant and its Service Affiliates, the Procedures provide that the Audit Committee may annually pre-approve a list of types or categories of non-audit services that may be provided to the Registrant or its Service Affiliates, or the Audit Committee may pre-approve such services on a project-by-project basis as they arise. Unless a type of service has received general pre-approval, it will require specific pre-approval by the Audit Committee if it is to be provided by the independent accountant. The Procedures also permit the Audit Committee to delegate authority to one or more of its members to pre-approve any proposed non-audit services that have not been previously pre-approved by the Audit Committee, subject to the ratification by the full Audit Committee no later than its next scheduled meeting.
(2) With respect to the services described in paragraphs (b) through (d) of this Item 4, no amount was approved by the Audit Committee pursuant to paragraph (c)(7)(i)(C) of Rule 2-01 of Regulation S-X.
| | | | | | | | | | | | |
| | | | | | | Aggregate Non-Audit Fees Billed to Entity |
| | | | Entity | | June 30, 2024 | | | | | June 30, 2023 |
| | | | PIMCO Equity Series | | $ | 85,225 | | | | | $93,875 |
| | | | Pacific Investment Management Company LLC (“PIMCO”) | | | 12,040,579 | | | | | 37,330,351 |
| | | | Totals | | $ | 12,125,804 | | | | | $37,424,226 |
| | | | | | | | | | | | |
| | (h) | The Registrant’s Audit Committee has considered whether the provision of non-audit services that were rendered to the Registrant’s investment adviser, and any entity controlling, controlled by, or under common control with the investment adviser that provides ongoing services to the Registrant which were not pre-approved (not requiring pre-approval) is compatible with maintaining the principal accountant’s independence. |
| Item 5. | Audit Committee of Listed Registrants. |
The Registrant has a separately-designated standing audit committee (known as the Audit Oversight Committee) established in accordance with Section 3(a)(58)(A) of the Securities Exchange Act of 1934, as amended. The Audit Oversight Committee is comprised of:
George E. Borst
Jennifer Holden Dunbar
Kym M. Hubbard
Gary F. Kennedy
Peter B. McCarthy (Chair)
Ronald C. Parker
| Item 6. | Schedule of Investments. |
The information required by this Item 6 is included as part of the annual Financial Statements and Financial Highlights filed under Item 7(a) of this Form N-CSR.
| Item 7. | Financial Statements and Financial Highlights for Open-End Management Investment Companies. |
| | (a) | The following is a copy of the report(s) of the Funds’ Financial Statements and Financial Highlights. |
PIMCO Equity Series
REALPATH ® Blend Funds
Equity Exchange-Traded Funds

PIMCO EQUITY SERIES®
Annual Financial and Other Information
June 30, 2024
REALPATH® Blend Funds
PIMCO REALPATH® Blend 2025 Fund
PIMCO REALPATH® Blend 2030 Fund
PIMCO REALPATH® Blend 2035 Fund
PIMCO REALPATH® Blend 2040 Fund
PIMCO REALPATH® Blend 2045 Fund
PIMCO REALPATH® Blend 2050 Fund
PIMCO REALPATH® Blend 2055 Fund
PIMCO REALPATH® Blend 2060 Fund
PIMCO REALPATH® Blend 2065 Fund
PIMCO REALPATH® Blend Income Fund
Table of Contents
This material is authorized for use only when preceded or accompanied by the current PIMCO Equity Series prospectus.
| | | | |
| Important Information About the Funds | | | | |
PIMCO Equity Series (the “Trust”) is an open-end management investment company that includes PIMCO REALPATH® Blend 2025 Fund, PIMCO REALPATH® Blend 2030 Fund, PIMCO REALPATH® Blend 2035 Fund, PIMCO REALPATH® Blend 2040 Fund, PIMCO REALPATH® Blend 2045 Fund, PIMCO REALPATH® Blend 2050 Fund, PIMCO REALPATH® Blend 2055 Fund, PIMCO REALPATH® Blend 2060 Fund, PIMCO REALPATH® Blend 2065 Fund and PIMCO REALPATH® Blend Income Fund (each, a “Fund” and collectively, the “Funds”).
The Funds are each “fund of funds,” which is a term used to describe mutual funds that pursue their investment objective by investing in other mutual funds instead of investing directly in stocks or bonds of other issuers. Under normal circumstances, the Funds invest in a combination of affiliated and unaffiliated funds that are registered under the Investment Company Act of 1940, as amended (the “Act”), equity securities, fixed income instruments of varying maturities, or related derivatives on any of the preceding securities mentioned. The Funds may invest in Institutional Class or Class M shares of any funds of the Trust and PIMCO Funds, and in other affiliated funds, including funds of PIMCO ETF Trust, except funds of funds and PIMCO California Municipal Intermediate Value Fund, PIMCO California Municipal Opportunistic Value Fund, PIMCO National Municipal Intermediate Value Fund and PIMCO National Municipal Opportunistic Value Fund (collectively, “Underlying PIMCO Funds”), and unaffiliated funds that are registered under the Act (collectively, “Acquired Funds”). The risks and strategies associated with an investment in the Fund may result from direct investments and/or indirect exposure through investment in Acquired Funds.
We believe that equity funds and bond funds have an important role to play in a well-diversified investment portfolio. It is important to note, however, that equity funds and bond funds are subject to notable risks.
Among other things, equity and equity-related securities may decline in value due to both real and perceived general market, economic and industry conditions. The values of equity securities, such as common stocks and preferred securities, have historically risen and fallen in periodic cycles and may decline due to general market conditions, which are not specifically related to a particular company, such as real or perceived adverse economic conditions, changes in the general outlook for corporate earnings, changes in interest or currency rates or adverse investor sentiment generally. Equity securities may also decline due to factors that affect a particular industry or industries, such as labor shortages, increased production costs and competitive conditions within an industry. In addition, the value of an equity security may decline for a number of reasons that directly relate to the issuer, such as management performance, financial leverage and reduced demand for the issuer’s goods or services, as well as the historical and prospective earnings of
the issuer and the value of its assets. Different types of equity securities may react differently to these developments and a change in the financial condition of a single issuer may affect securities markets as a whole.
During a general downturn in the securities markets, multiple asset classes, including equity securities, may decline in value simultaneously. The market price of equity securities owned by a Fund may go up or down, sometimes rapidly or unpredictably. Equity securities generally have greater price volatility than fixed income securities and common stocks generally have the greatest appreciation and depreciation potential of all equity securities.
Bond funds and fixed income securities are subject to a variety of risks, including interest rate risk, liquidity risk and market risk. In an environment where interest rates may trend upward, rising rates would negatively impact the performance of most bond funds, and fixed income securities and other instruments held by a Fund (and/or Underlying PIMCO Funds or Acquired Funds, as applicable) are likely to decrease in value. A wide variety of factors can cause interest rates to rise (e.g., central bank monetary policies, inflation rates, general economic conditions, etc.). In addition, changes in interest rates can be sudden and unpredictable, and there is no guarantee that Fund management will anticipate such movement accurately. A Fund may lose money as a result of movements in interest rates.
As of the date of this report, interest rates in the United States and many parts of the world, including certain European countries, remain high. In efforts to combat inflation, the U.S. Federal Reserve (the “Fed”) raised interest rates multiple times in 2022 and 2023. In the second half of 2023 and the beginning of 2024, however, the Fed paused the rate hikes, keeping interest rates steady. It is uncertain whether rates will remain steady, increase or decrease in the future. As such, the Funds may face a heightened level of risk associated with rising interest rates and/or bond yields. This could be driven by a variety of factors, including but not limited to central bank monetary policies, changing inflation or real growth rates, general economic conditions, increasing bond issuances or reduced market demand for low yielding investments. Further, while bond markets have steadily grown over the past three decades, dealer inventories of corporate bonds are near historic lows in relation to market size. As a result, there has been a significant reduction in the ability of dealers to “make markets”.
Bond funds and individual bonds with a longer duration (a measure used to determine the sensitivity of a security’s price to changes in interest rates) tend to be more sensitive to changes in interest rates, usually making them more volatile than securities or funds with shorter durations. All of the factors mentioned above, individually or collectively, could lead to increased volatility and/or lower liquidity in the fixed income markets, or negatively impact a Fund’s performance or cause a Fund to incur losses. As a result, a Fund may experience
increased shareholder redemptions, which, among other things, could further reduce the net assets of the Fund.
The Funds may be subject to various risks as described in each Fund’s prospectus and in the Principal and Other Risks in the Notes to Financial Statements.
Classifications of the Funds’ portfolio holdings in this report are made according to financial reporting standards. The classification of a particular portfolio holding as shown in the Schedule of Investments sections of this report may differ from the classification used for the Funds’ compliance calculations, including those used in the Funds’ prospectus, investment objectives, regulatory and other investment limitations and policies, which may be based on different asset class, sector or geographical classifications. The Funds are separately monitored for compliance with respect to prospectus and regulatory requirements.
The geographical classification of foreign (non-U.S.) securities in this report, if any, are classified by the country of incorporation of a holding. In certain instances, a security’s country of incorporation may be different from its country of economic exposure.
In February 2022, Russia launched an invasion of Ukraine. As a result, Russia and other countries, persons and entities that provided material aid to Russia’s aggression against Ukraine, have been the subject of economic sanctions and import and export controls imposed by countries throughout the world, including the United States. Such measures have had and may continue to have an adverse effect on the Russian, Belarusian and other securities and economies, which may, in turn, negatively impact a Fund. The extent, duration and impact of Russia’s military action in Ukraine, related sanctions and retaliatory actions are difficult to ascertain, but could be significant and have severe adverse effects on the region, including significant adverse effects on the regional, European and global economies and the markets for certain securities and commodities, such as oil and natural gas, as well as other sectors. Further, a Fund may have investments in securities and instruments that are economically tied to the region and may have been negatively impacted by the sanctions and counter-sanctions by Russia, including declines in value and reductions in liquidity. The sanctions may cause a Fund to sell portfolio holdings at a disadvantageous time or price or to continue to hold investments that a Fund may no longer seek to hold. PIMCO will continue to actively manage these positions in the best interests of a Fund and its shareholders.
The United States’ enforcement of restrictions on U.S. investments in certain issuers and tariffs on goods from certain other countries has contributed to and may continue to contribute to international trade
tensions and may impact portfolio securities (and/or portfolio securities of Underlying PIMCO Funds or Acquired Funds, as applicable). The United States’ enforcement of sanctions or other similar measures on various Russian entities and persons, and the Russian government’s response, may also negatively impact securities and instruments that are economically tied to Russia.
A Fund may invest in certain instruments that rely in some fashion upon the London Interbank Offered Rate (“LIBOR”). LIBOR was traditionally an average interest rate, determined by the ICE Benchmark Administration, that banks charge one another for the use of short-term money. The United Kingdom’s Financial Conduct Authority, which regulates LIBOR, announced plans to ultimately phase out the use of LIBOR. Although the transition process away from LIBOR for many instruments has been completed, some LIBOR use is continuing and there are potential effects related to the transition away from LIBOR or continued use of LIBOR on a Fund, or on certain instruments in which a Fund invests, which can be difficult to ascertain, and may vary depending on factors that include, but are not limited to: (i) existing fallback or termination provisions in individual contracts and (ii) whether, how and when industry participants adopt new reference rates for affected instruments. The transition of investments from LIBOR to a replacement rate as a result of amendment, application of existing fallbacks, statutory requirements or otherwise may also result in a reduction in the value of certain instruments held by a Fund or a reduction in the effectiveness of related Fund transactions such as hedges. In addition, an instrument’s transition to a replacement rate could result in variations in the reported yields of a Fund that holds such instrument. Any such effects of the transition away from LIBOR, as well as other unforeseen effects, could result in losses to a Fund.
The PIMCO REALPATH® Blend Funds are intended for investors who prefer to have their asset allocation decisions made by professional
money managers and are designed to offer individual investors comprehensive asset allocation strategies tailored to the time when they expect to retire or to begin withdrawing assets. Each PIMCO REALPATH® Blend Fund is designed for investors expecting to retire or to begin withdrawing portions of their investments around the year indicated in the Fund’s name. The retirement year included in the REALPATH® Blend Fund’s name does not necessarily represent the specific year you expect to begin withdrawing your assets. It is intended only as a general guide.
The PIMCO REALPATH® Blend Funds are designed to provide investors with a comprehensive retirement solution tailored to the time when they expect to retire or plan to start withdrawing money (the “target date”). Each PIMCO REALPATH® Blend Fund follows a target asset allocation schedule that changes over time to help reduce portfolio risk, increasing its exposure to conservative investments as the target date approaches. The principal value of a Fund is not guaranteed at any
| | | | | | | | | | | | |
| | | | ANNUAL FINANCIAL AND OTHER INFORMATION | | | | | | | JUNE 30, 2024 | | | 3 |
| | | | |
| Important Information About the Funds | | (Cont.) | | |
time, including the target date. A Fund’s shareholders may experience losses, including losses near, at or after the target year indicated in the PIMCO REALPATH® Blend Fund’s name.
U.S. and global markets have experienced increased volatility, including as a result of the failures of certain U.S. and non-U.S. banks in 2023, which could be harmful to the Funds and issuers in which they invest. For example, if a bank at which a Fund or issuer has an account fails, any cash or other assets in bank or custody accounts, which may be substantial in size, could be temporarily inaccessible or permanently lost by the Fund or issuer. If a bank that provides a subscription line credit facility, asset-based facility, other credit facility and/or other services to an issuer or to a fund fails, the issuer or fund could be unable to draw funds under its credit facilities or obtain replacement credit facilities or other services from other lending institutions with similar terms.
Issuers in which a Fund may invest can be affected by volatility in the banking sector. Even if banks used by issuers in which the Funds invest
remain solvent, continued volatility in the banking sector could contribute to, cause or intensify an economic recession, increase the costs of capital and banking services or result in the issuers being unable to obtain or refinance indebtedness at all or on as favorable terms as could otherwise have been obtained. Potential impacts to the Funds and issuers resulting from changes in the banking sector, market conditions and potential legislative or regulatory responses are uncertain. Such conditions and responses, as well as a changing interest rate environment, can contribute to decreased market liquidity and erode the value of certain holdings, including those of U.S. and non-U.S. banks. Continued market volatility and uncertainty and/or a downturn in market and economic and financial conditions, as a result of developments in the banking sector or otherwise (including as a result of delayed access to cash or credit facilities), could have an adverse impact on the Funds and issuers in which they invest.
The following table discloses the inception dates of each Fund and its respective share classes along with each Fund’s diversification status as of period end:
| | | | | | | | | | | | | | | | | | | | | | | | | | | | |
| Fund Name | | | | | Fund
Inception | | | Institutional
Class | | | Administrative
Class | | | Class A | | | Class R | | | Diversification
Status | |
PIMCO REALPATH® Blend 2025 Fund | | | | | | | 12/31/14 | | | | 12/31/14 | | | | 12/31/14 | | | | 12/31/14 | | | | — | | | | Diversified | |
PIMCO REALPATH® Blend 2030 Fund | | | | | | | 12/31/14 | | | | 12/31/14 | | | | 12/31/14 | | | | 12/31/14 | | | | — | | | | Diversified | |
PIMCO REALPATH® Blend 2035 Fund | | | | | | | 12/31/14 | | | | 12/31/14 | | | | 12/31/14 | | | | 12/31/14 | | | | — | | | | Diversified | |
PIMCO REALPATH® Blend 2040 Fund | | | | | | | 12/31/14 | | | | 12/31/14 | | | | 12/31/14 | | | | 12/31/14 | | | | — | | | | Diversified | |
PIMCO REALPATH® Blend 2045 Fund | | | | | | | 12/31/14 | | | | 12/31/14 | | | | 12/31/14 | | | | 12/31/14 | | | | — | | | | Diversified | |
PIMCO REALPATH® Blend 2050 Fund | | | | | | | 12/31/14 | | | | 12/31/14 | | | | 12/31/14 | | | | 12/31/14 | | | | — | | | | Diversified | |
PIMCO REALPATH® Blend 2055 Fund | | | | | | | 12/31/14 | | | | 12/31/14 | | | | 12/31/14 | | | | 12/31/14 | | | | — | | | | Diversified | |
PIMCO REALPATH® Blend 2060 Fund | | | | | | | 12/31/19 | | | | 12/31/19 | | | | 12/31/19 | | | | 12/31/19 | | | | — | | | | Diversified | |
PIMCO REALPATH® Blend 2065 Fund | | | | | | | 12/30/22 | | | | 12/30/22 | | | | 12/30/22 | | | | 12/30/22 | | | | — | | | | Diversified | |
PIMCO REALPATH® Blend Income Fund | | | | | | | 12/31/14 | | | | 12/31/14 | | | | 12/31/14 | | | | 12/31/14 | | | | — | | | | Diversified | |
An investment in a Fund is not a bank deposit and is not guaranteed or insured by the Federal Deposit Insurance Corporation or any other government agency. It is possible to lose money on investments in a Fund.
The Trustees are responsible generally for overseeing the management of the Trust. The Trustees authorize the Trust to enter into service agreements with the Adviser, the Distributor, the Administrator and other service providers in order to provide, and in some cases authorize service providers to procure through other parties, necessary or desirable services on behalf of the Trust and the Funds. Shareholders are not parties to or third-party beneficiaries of such service agreements. Neither a Fund’s prospectus nor a Fund’s summary prospectus, the Trust’s Statement of Additional Information (“SAI”), any contracts filed as exhibits to the Trust’s registration statement, nor any other communications, disclosure
documents or regulatory filings (including this report) from or on behalf of the Trust or a Fund creates a contract between or among any shareholder of a Fund, on the one hand, and the Trust, a Fund, a service provider to the Trust or a Fund, and/or the Trustees or officers of the Trust, on the other hand. The Trustees (or the Trust and its officers, service providers or other delegates acting under authority of the Trustees) may amend the most recent prospectus or use a new prospectus, summary prospectus or SAI with respect to a Fund or the Trust, and/or amend, file and/or issue any other communications, disclosure documents or regulatory filings, and may amend or enter into any contracts to which the Trust or a Fund is a party, and interpret the investment objective(s), policies, restrictions and contractual provisions applicable to any Fund, without shareholder input or approval, except in circumstances in which shareholder approval is specifically required by
law (such as changes to fundamental investment policies) or where a shareholder approval requirement is specifically disclosed in the Trust’s then-current prospectus or SAI.
PIMCO has adopted written proxy voting policies and procedures (“Proxy Policy”) as required by Rule 206(4)-6 under the Investment Advisers Act of 1940, as amended. The Proxy Policy has been adopted by the Trust as the policies and procedures that PIMCO will use when voting proxies on behalf of the Funds. A description of the policies and procedures that PIMCO uses to vote proxies relating to portfolio securities of each Fund, and information about how each Fund voted proxies relating to portfolio securities held during the most recent twelve-month period ended June 30, are available without charge, upon request, by calling the Trust at (888) 87-PIMCO, on the Funds’ website at www.pimco.com, and on the Securities and Exchange Commission’s (“SEC”) website at www.sec.gov.
The Funds file portfolio holdings information with the SEC on Form N-PORT within 60 days of the end of each fiscal quarter. The Funds’ complete schedules of securities holdings as of the end of each fiscal quarter will be made available to the public on the SEC’s website at www.sec.gov and on PIMCO’s website at www.pimco.com, and will be made available, upon request, by calling PIMCO at (888) 87-PIMCO.
Paper copies of the Funds’ shareholder reports are required to be provided free of charge by the Fund or financial intermediary upon request.
In October 2022, the SEC adopted changes to the mutual fund and exchange-traded fund (“ETF”) shareholder report and registration statement disclosure requirements and the registered fund advertising rules, which impact the disclosures provided to shareholders. The rule amendments were effective as of January 2023, and compliance with the rule amendments was required as of July 2024. As such, the Funds have made significant updates to the content of their shareholder reports. In addition, shareholder reports are now mailed to shareholders who have not opted to receive shareholder report documents electronically.
In September 2023, the SEC adopted amendments to Rule 35d-1 under the Investment Company Act of 1940, as amended, the rule governing fund naming conventions (the “Names Rule”). In general, the Names Rule requires funds with certain types of names to adopt a policy to invest at least 80% of their assets in the type of investment suggested by the name. The amendments expand the scope of the current rule to include any term used in a fund name that suggests the fund makes investments that have, or whose issuers have, particular characteristics. Additionally, the amendments modify the circumstances under which a fund may deviate from its 80% investment policy and address the
calculation methodology of derivatives instruments for purposes of the rule. The amendments became effective December 11, 2023, and fund groups with $1 billion or more in net assets will have 24 months to comply with the amendments (fund groups with net assets of less than $1 billion have 30 months to comply).
On February 16, 2024, a supplement was filed to provide notification of the liquidation of the Administrative Class of PIMCO REALPATH® Blend Income Fund, PIMCO REALPATH® Blend 2025 Fund, PIMCO REALPATH® Blend 2030 Fund, PIMCO REALPATH® Blend 2035 Fund, PIMCO REALPATH® Blend 2040 Fund, PIMCO REALPATH® Blend 2045 Fund, PIMCO REALPATH® Blend 2050 Fund, PIMCO REALPATH® Blend 2055 Fund, PIMCO REALPATH® Blend 2060 Fund and PIMCO REALPATH® Blend 2065 Fund. Effective May 17, 2024, the Funds no longer sold Administrative Class shares to new investors or existing shareholders (except through reinvested dividends), including through exchanges into Administrative Class shares of a Fund from other funds in the Trust or funds of PIMCO Funds. The Administrative Class of the Funds liquidated on June 21, 2024.
| | | | | | | | | | | | |
| | | | ANNUAL FINANCIAL AND OTHER INFORMATION | | | | | | | JUNE 30, 2024 | | | 5 |
| | | | | | | | | | | | | | | | | | | | | | | | | | | | |
| | | | | | Investment Operations | | | Less Distributions(c) | |
| | | | | | | | | | | | | | | | | | | | | | |
| Selected Per Share Data for the Year or Period Ended^: | | Net Asset
Value
Beginning of
Year or
Period(a) | | | Net
Investment
Income
(Loss)(b) | | | Net Realized/
Unrealized
Gain (Loss) | | | Total | | | From Net
Investment
Income | | | From Net
Realized
Capital
Gains | | | Total | |
| | | | | | | |
PIMCO REALPATH® Blend 2025 Fund | | | | | | | | | | | | | | | | | | | | | | | | | | | | |
| Institutional Class | | | | | | | | | | | | | | | | | | | | | | | | | | | | |
| | | | | | | |
06/30/2024 | | $ | 11.54 | | | $ | 0.42 | | | $ | 0.47 | | | $ | 0.89 | | | $ | (0.49 | ) | | $ | 0.00 | | | $ | (0.49 | ) |
| | | | | | | |
06/30/2023 | | | 11.29 | | | | 0.44 | | | | 0.31 | | | | 0.75 | | | | (0.31 | ) | | | (0.19 | ) | | | (0.50 | ) |
| | | | | | | |
06/30/2022 | | | 13.50 | | | | 0.44 | | | | (2.16 | ) | | | (1.72 | ) | | | (0.37 | ) | | | (0.12 | ) | | | (0.49 | ) |
| | | | | | | |
06/30/2021 | | | 11.71 | | | | 0.36 | | | | 2.25 | | | | 2.61 | | | | (0.65 | ) | | | (0.17 | ) | | | (0.82 | ) |
| | | | | | | |
06/30/2020 | | | 11.33 | | | | 0.36 | | | | 0.36 | | | | 0.72 | | | | (0.34 | ) | | | 0.00 | | | | (0.34 | ) |
| Class A | | | | | | | | | | | | | | | | | | | | | | | | | | | | |
| | | | | | | |
06/30/2024 | | | 11.50 | | | | 0.37 | | | | 0.46 | | | | 0.83 | | | | (0.44 | ) | | | 0.00 | | | | (0.44 | ) |
| | | | | | | |
06/30/2023 | | | 11.25 | | | | 0.38 | | | | 0.32 | | | | 0.70 | | | | (0.26 | ) | | | (0.19 | ) | | | (0.45 | ) |
| | | | | | | |
06/30/2022 | | | 13.46 | | | | 0.37 | | | | (2.15 | ) | | | (1.78 | ) | | | (0.31 | ) | | | (0.12 | ) | | | (0.43 | ) |
| | | | | | | |
06/30/2021 | | | 11.68 | | | | 0.28 | | | | 2.27 | | | | 2.55 | | | | (0.60 | ) | | | (0.17 | ) | | | (0.77 | ) |
| | | | | | | |
06/30/2020 | | | 11.31 | | | | 0.31 | | | | 0.35 | | | | 0.66 | | | | (0.29 | ) | | | 0.00 | | | | (0.29 | ) |
| | | | | | | |
PIMCO REALPATH® Blend 2030 Fund | | | | | | | | | | | | | | | | | | | | | | | | | | | | |
| Institutional Class | | | | | | | | | | | | | | | | | | | | | | | | | | | | |
| | | | | | | |
06/30/2024 | | $ | 12.22 | | | $ | 0.41 | | | $ | 0.78 | | | $ | 1.19 | | | $ | (0.47 | ) | | $ | 0.00 | | | $ | (0.47 | ) |
| | | | | | | |
06/30/2023 | | | 11.69 | | | | 0.41 | | | | 0.58 | | | | 0.99 | | | | (0.28 | ) | | | (0.18 | ) | | | (0.46 | ) |
| | | | | | | |
06/30/2022 | | | 14.09 | | | | 0.41 | | | | (2.30 | ) | | | (1.89 | ) | | | (0.34 | ) | | | (0.17 | ) | | | (0.51 | ) |
| | | | | | | |
06/30/2021 | | | 11.76 | | | | 0.34 | | | | 2.69 | | | | 3.03 | | | | (0.55 | ) | | | (0.15 | ) | | | (0.70 | ) |
| | | | | | | |
06/30/2020 | | | 11.54 | | | | 0.35 | | | | 0.22 | | | | 0.57 | | | | (0.33 | ) | | | (0.02 | ) | | | (0.35 | ) |
| Class A | | | | | | | | | | | | | | | | | | | | | | | | | | | | |
| | | | | | | |
06/30/2024 | | | 12.15 | | | | 0.36 | | | | 0.76 | | | | 1.12 | | | | (0.42 | ) | | | 0.00 | | | | (0.42 | ) |
| | | | | | | |
06/30/2023 | | | 11.62 | | | | 0.36 | | | | 0.58 | | | | 0.94 | | | | (0.23 | ) | | | (0.18 | ) | | | (0.41 | ) |
| | | | | | | |
06/30/2022 | | | 14.02 | | | | 0.35 | | | | (2.30 | ) | | | (1.95 | ) | | | (0.28 | ) | | | (0.17 | ) | | | (0.45 | ) |
| | | | | | | |
06/30/2021 | | | 11.71 | | | | 0.27 | | | | 2.68 | | | | 2.95 | | | | (0.49 | ) | | | (0.15 | ) | | | (0.64 | ) |
| | | | | | | |
06/30/2020 | | | 11.50 | | | | 0.29 | | | | 0.22 | | | | 0.51 | | | | (0.28 | ) | | | (0.02 | ) | | | (0.30 | ) |
| | | | | | | |
PIMCO REALPATH® Blend 2035 Fund | | | | | | | | | | | | | | | | | | | | | | | | | | | | |
| Institutional Class | | | | | | | | | | | | | | | | | | | | | | | | | | | | |
| | | | | | | |
06/30/2024 | | $ | 13.00 | | | $ | 0.42 | | | $ | 1.11 | | | $ | 1.53 | | | $ | (0.46 | ) | | $ | 0.00 | | | $ | (0.46 | ) |
| | | | | | | |
06/30/2023 | | | 12.08 | | | | 0.39 | | | | 0.94 | | | | 1.33 | | | | (0.25 | ) | | | (0.16 | ) | | | (0.41 | ) |
| | | | | | | |
06/30/2022 | | | 14.54 | | | | 0.39 | | | | (2.34 | ) | | | (1.95 | ) | | | (0.34 | ) | | | (0.17 | ) | | | (0.51 | ) |
| | | | | | | |
06/30/2021 | | | 11.65 | | | | 0.31 | | | | 3.11 | | | | 3.42 | | | | (0.44 | ) | | | (0.09 | ) | | | (0.53 | ) |
| | | | | | | |
06/30/2020 | | | 11.58 | | | | 0.33 | | | | 0.08 | | | | 0.41 | | | | (0.32 | ) | | | (0.02 | ) | | | (0.34 | ) |
| Class A | | | | | | | | | | | | | | | | | | | | | | | | | | | | |
| | | | | | | |
06/30/2024 | | | 13.00 | | | | 0.35 | | | | 1.13 | | | | 1.48 | | | | (0.41 | ) | | | 0.00 | | | | (0.41 | ) |
| | | | | | | |
06/30/2023 | | | 12.08 | | | | 0.33 | | | | 0.95 | | | | 1.28 | | | | (0.20 | ) | | | (0.16 | ) | | | (0.36 | ) |
| | | | | | | |
06/30/2022 | | | 14.55 | | | | 0.32 | | | | (2.34 | ) | | | (2.02 | ) | | | (0.28 | ) | | | (0.17 | ) | | | (0.45 | ) |
| | | | | | | |
06/30/2021 | | | 11.67 | | | | 0.24 | | | | 3.11 | | | | 3.35 | | | | (0.38 | ) | | | (0.09 | ) | | | (0.47 | ) |
| | | | | | | |
06/30/2020 | | | 11.61 | | | | 0.27 | | | | 0.08 | | | | 0.35 | | | | (0.27 | ) | | | (0.02 | ) | | | (0.29 | ) |
| | | | | | | |
PIMCO REALPATH® Blend 2040 Fund | | | | | | | | | | | | | | | | | | | | | | | | | | | | |
| Institutional Class | | | | | | | | | | | | | | | | | | | | | | | | | | | | |
| | | | | | | |
06/30/2024 | | $ | 13.54 | | | $ | 0.40 | | | $ | 1.43 | | | $ | 1.83 | | | $ | (0.45 | ) | | $ | 0.00 | | | $ | (0.45 | ) |
| | | | | | | |
06/30/2023 | | | 12.40 | | | | 0.37 | | | | 1.15 | | | | 1.52 | | | | (0.22 | ) | | | (0.16 | ) | | | (0.38 | ) |
| | | | | | | |
06/30/2022 | | | 14.96 | | | | 0.38 | | | | (2.42 | ) | | | (2.04 | ) | | | (0.35 | ) | | | (0.17 | ) | | | (0.52 | ) |
| | | | | | | |
06/30/2021 | | | 11.68 | | | | 0.30 | | | | 3.46 | | | | 3.76 | | | | (0.41 | ) | | | (0.07 | ) | | | (0.48 | ) |
| | | | | | | |
06/30/2020 | | | 11.71 | | | | 0.31 | | | | 0.02 | | | | 0.33 | | | | (0.34 | ) | | | (0.02 | ) | | | (0.36 | ) |
| Class A | | | | | | | | | | | | | | | | | | | | | | | | | | | | |
| | | | | | | |
06/30/2024 | | | 13.44 | | | | 0.34 | | | | 1.41 | | | | 1.75 | | | | (0.39 | ) | | | 0.00 | | | | (0.39 | ) |
| | | | | | | |
06/30/2023 | | | 12.32 | | | | 0.31 | | | | 1.14 | | | | 1.45 | | | | (0.17 | ) | | | (0.16 | ) | | | (0.33 | ) |
| | | | | | | |
06/30/2022 | | | 14.88 | | | | 0.30 | | | | (2.39 | ) | | | (2.09 | ) | | | (0.30 | ) | | | (0.17 | ) | | | (0.47 | ) |
| | | | | | | |
06/30/2021 | | | 11.62 | | | | 0.22 | | | | 3.45 | | | | 3.67 | | | | (0.34 | ) | | | (0.07 | ) | | | (0.41 | ) |
| | | | | | | |
06/30/2020 | | | 11.67 | | | | 0.26 | | | | 0.00 | | | | 0.26 | | | | (0.29 | ) | | | (0.02 | ) | | | (0.31 | ) |
| | | | | | | |
PIMCO REALPATH® Blend 2045 Fund | | | | | | | | | | | | | | | | | | | | | | | | | | | | |
| Institutional Class | | | | | | | | | | | | | | | | | | | | | | | | | | | | |
| | | | | | | |
06/30/2024 | | $ | 13.84 | | | $ | 0.39 | | | $ | 1.65 | | | $ | 2.04 | | | $ | (0.43 | ) | | $ | 0.00 | | | $ | (0.43 | ) |
| | | | | | | |
06/30/2023 | | | 12.54 | | | | 0.35 | | | | 1.31 | | | | 1.66 | | | | (0.20 | ) | | | (0.16 | ) | | | (0.36 | ) |
| | | | | | | |
06/30/2022 | | | 15.11 | | | | 0.36 | | | | (2.42 | ) | | | (2.06 | ) | | | (0.32 | ) | | | (0.19 | ) | | | (0.51 | ) |
| | | | | | | |
06/30/2021 | | | 11.58 | | | | 0.29 | | | | 3.69 | | | | 3.98 | | | | (0.38 | ) | | | (0.07 | ) | | | (0.45 | ) |
| | | | | | | |
06/30/2020 | | | 11.67 | | | | 0.30 | | | | (0.04 | ) | | | 0.26 | | | | (0.33 | ) | | | (0.02 | ) | | | (0.35 | ) |
| | | | | | |
| 6 | | PIMCO EQUITY SERIES | | | See Accompanying Notes | |
| | | | | | | | | | | | | | | | | | | | | | | | | | | | | | | | | | |
| | | | | | | Ratios/Supplemental Data | |
| | | | | | | | | | Ratios to Average Net Assets(e) | | | | |
Net Asset
Value End of
Year or
Period(a) | | | Total Return(d) | | | Net Assets
End of Year or
Period (000s) | | | Expenses | | | Expenses
Excluding
Waivers | | | Expenses
Excluding
Interest
Expense | | | Expenses
Excluding
Interest
Expense and Waivers | | | Net
Investment
Income (Loss) | | | Portfolio
Turnover
Rate | |
| | | | | | | | |
| | | | | | | | | | | | | | | | | | | | | | | | | | | | | | | | | | |
| | | | | | | | | | | | | | | | | | | | | | | | | | | | | | | | | | |
| | | | | | | | |
| $ | 11.94 | | | | 7.87 | % | | $ | 457,575 | | | | 0.03 | % | | | 0.04 | % | | | 0.03 | % | | | 0.04 | % | | | 3.66 | % | | | 27 | % |
| | | | | | | | |
| | 11.54 | | | | 6.87 | | | | 403,689 | | | | 0.03 | | | | 0.03 | | | | 0.03 | | | | 0.03 | | | | 3.89 | | | | 23 | |
| | | | | | | | |
| | 11.29 | | | | (13.29 | ) | | | 211,435 | | | | 0.04 | | | | 0.04 | | | | 0.04 | | | | 0.04 | | | | 3.35 | | | | 21 | |
| | | | | | | | |
| | 13.50 | | | | 22.73 | | | | 220,130 | | | | 0.04 | | | | 0.04 | | | | 0.04 | | | | 0.04 | | | | 2.78 | | | | 20 | |
| | | | | | | | |
| | 11.71 | | | | 6.41 | | | | 80,067 | | | | 0.04 | | | | 0.05 | | | | 0.04 | | | | 0.05 | | | | 3.18 | | | | 39 | |
| | | | | | | | | | | | | | | | | | | | | | | | | | | | | | | | | | | |
| | | | | | | | |
| | 11.89 | | | | 7.36 | | | | 5,974 | | | | 0.48 | | | | 0.49 | | | | 0.48 | | | | 0.49 | | | | 3.21 | | | | 27 | |
| | | | | | | | |
| | 11.50 | | | | 6.41 | | | | 5,844 | | | | 0.48 | | | | 0.48 | | | | 0.48 | | | | 0.48 | | | | 3.40 | | | | 23 | |
| | | | | | | | |
| | 11.25 | | | | (13.73 | ) | | | 6,905 | | | | 0.51 | (f) | | | 0.51 | (f) | | | 0.51 | (f) | | | 0.51 | (f) | | | 2.85 | | | | 21 | |
| | | | | | | | |
| | 13.46 | | | | 22.18 | | | | 10,114 | | | | 0.54 | | | | 0.54 | | | | 0.54 | | | | 0.54 | | | | 2.21 | | | | 20 | |
| | | | | | | | |
| | 11.68 | | | | 5.88 | | | | 6,420 | | | | 0.54 | | | | 0.55 | | | | 0.54 | | | | 0.55 | | | | 2.68 | | | | 39 | |
| | | | | | | | |
| | | | | | | | | | | | | | | | | | | | | | | | | | | | | | | | | | |
| | | | | | | | | | | | | | | | | | | | | | | | | | | | | | | | | | |
| | | | | | | | |
| $ | 12.94 | | | | 9.88 | % | | $ | 610,590 | | | | 0.03 | % | | | 0.04 | % | | | 0.03 | % | | | 0.04 | % | | | 3.36 | % | | | 22 | % |
| | | | | | | | |
| | 12.22 | | | | 8.71 | | | | 510,421 | | | | 0.03 | | | | 0.03 | | | | 0.03 | | | | 0.03 | | | | 3.46 | | | | 18 | |
| | | | | | | | |
| | 11.69 | | | | (13.97 | ) | | | 239,698 | | | | 0.04 | | | | 0.04 | | | | 0.04 | | | | 0.04 | | | | 3.04 | | | | 22 | |
| | | | | | | | |
| | 14.09 | | | | 26.14 | | | | 239,041 | | | | 0.04 | | | | 0.04 | | | | 0.04 | | | | 0.04 | | | | 2.59 | | | | 26 | |
| | | | | | | | |
| | 11.76 | | | | 4.89 | | | | 105,414 | | | | 0.05 | | | | 0.06 | | | | 0.05 | | | | 0.06 | | | | 3.00 | | | | 28 | |
| | | | | | | | | | | | | | | | | | | | | | | | | | | | | | | | | | |
| | | | | | | | |
| | 12.85 | | | | 9.31 | | | | 8,506 | | | | 0.48 | | | | 0.49 | | | | 0.48 | | | | 0.49 | | | | 2.91 | | | | 22 | |
| | | | | | | | |
| | 12.15 | | | | 8.30 | | | | 8,479 | | | | 0.48 | | | | 0.48 | | | | 0.48 | | | | 0.48 | | | | 3.02 | | | | 18 | |
| | | | | | | | |
| | 11.62 | | | | (14.42 | ) | | | 7,847 | | | | 0.51 | (f) | | | 0.51 | (f) | | | 0.51 | (f) | | | 0.51 | (f) | | | 2.56 | | | | 22 | |
| | | | | | | | |
| | 14.02 | | | | 25.53 | | | | 9,243 | | | | 0.54 | | | | 0.54 | | | | 0.54 | | | | 0.54 | | | | 2.04 | | | | 26 | |
| | | | | | | | |
| | 11.71 | | | | 4.41 | | | | 6,494 | | | | 0.55 | | | | 0.56 | | | | 0.55 | | | | 0.56 | | | | 2.50 | | | | 28 | |
| | | | | | | | |
| | | | | | | | | | | | | | | | | | | | | | | | | | | | | | | | | | |
| | | | | | | | | | | | | | | | | | | | | | | | | | | | | | | | | | |
| | | | | | | | |
| $ | 14.07 | | | | 11.97 | % | | $ | 640,041 | | | | 0.04 | % | | | 0.05 | % | | | 0.04 | % | | | 0.05 | % | | | 3.14 | % | | | 14 | % |
| | | | | | | | |
| | 13.00 | | | | 11.26 | | | | 488,420 | | | | 0.04 | | | | 0.04 | | | | 0.04 | | | | 0.04 | | | | 3.16 | | | | 18 | |
| | | | | | | | |
| | 12.08 | | | | (14.03 | ) | | | 215,450 | | | | 0.05 | | | | 0.05 | | | | 0.05 | | | | 0.05 | | | | 2.78 | | | | 17 | |
| | | | | | | | |
| | 14.54 | | | | 29.68 | | | | 193,069 | | | | 0.04 | | | | 0.05 | | | | 0.04 | | | | 0.05 | | | | 2.32 | | | | 21 | |
| | | | | | | | |
| | 11.65 | | | | 3.47 | | | | 76,525 | | | | 0.06 | | | | 0.07 | | | | 0.06 | | | | 0.07 | | | | 2.85 | | | | 34 | |
| | | | | | | | | | | | | | | | | | | | | | | | | | | | | | | | | | |
| | | | | | | | |
| | 14.07 | | | | 11.51 | | | | 8,897 | | | | 0.49 | | | | 0.50 | | | | 0.49 | | | | 0.50 | | | | 2.68 | | | | 14 | |
| | | | | | | | |
| | 13.00 | | | | 10.79 | | | | 8,308 | | | | 0.49 | | | | 0.49 | | | | 0.49 | | | | 0.49 | | | | 2.69 | | | | 18 | |
| | | | | | | | |
| | 12.08 | | | | (14.46 | ) | | | 6,983 | | | | 0.52 | (f) | | | 0.52 | (f) | | | 0.52 | (f) | | | 0.52 | (f) | | | 2.29 | | | | 17 | |
| | | | | | | | |
| | 14.55 | | | | 28.97 | | | | 7,914 | | | | 0.54 | | | | 0.55 | | | | 0.54 | | | | 0.55 | | | | 1.80 | | | | 21 | |
| | | | | | | | |
| | 11.67 | | | | 2.95 | | | | 6,109 | | | | 0.56 | | | | 0.57 | | | | 0.56 | | | | 0.57 | | | | 2.36 | | | | 34 | |
| | | | | | | | |
| | | | | | | | | | | | | | | | | | | | | | | | | | | | | | | | | | |
| | | | | | | | | | | | | | | | | | | | | | | | | | | | | | | | | | |
| | | | | | | | |
| $ | 14.92 | | | | 13.72 | % | | $ | 565,112 | | | | 0.06 | % | | | 0.07 | % | | | 0.05 | % | | | 0.06 | % | | | 2.91 | % | | | 19 | % |
| | | | | | | | |
| | 13.54 | | | | 12.55 | | | | 452,132 | | | | 0.05 | | | | 0.05 | | | | 0.05 | | | | 0.05 | | | | 2.89 | | | | 16 | |
| | | | | | | | |
| | 12.40 | | | | (14.20 | ) | | | 224,639 | | | | 0.06 | | | | 0.06 | | | | 0.06 | | | | 0.06 | | | | 2.59 | | | | 17 | |
| | | | | | | | |
| | 14.96 | | | | 32.50 | | | | 212,568 | | | | 0.05 | | | | 0.06 | | | | 0.05 | | | | 0.06 | | | | 2.20 | | | | 26 | |
| | | | | | | | |
| | 11.68 | | | | 2.76 | | | | 92,728 | | | | 0.06 | | | | 0.07 | | | | 0.06 | | | | 0.07 | | | | 2.70 | | | | 21 | |
| | | | | | | | | | | | | | | | | | | | | | | | | | | | | | | | | | |
| | | | | | | | |
| | 14.80 | | | | 13.21 | | | | 9,527 | | | | 0.51 | | | | 0.52 | | | | 0.50 | | | | 0.51 | | | | 2.47 | | | | 19 | |
| | | | | | | | |
| | 13.44 | | | | 12.00 | | | | 8,655 | | | | 0.50 | | | | 0.50 | | | | 0.50 | | | | 0.50 | | | | 2.40 | | | | 16 | |
| | | | | | | | |
| | 12.32 | | | | (14.58 | ) | | | 7,441 | | | | 0.53 | (f) | | | 0.53 | (f) | | | 0.53 | (f) | | | 0.53 | (f) | | | 2.08 | | | | 17 | |
| | | | | | | | |
| | 14.88 | | | | 31.91 | | | | 9,024 | | | | 0.55 | | | | 0.56 | | | | 0.55 | | | | 0.56 | | | | 1.66 | | | | 26 | |
| | | | | | | | |
| | 11.62 | | | | 2.17 | | | | 7,914 | | | | 0.56 | | | | 0.57 | | | | 0.56 | | | | 0.57 | | | | 2.22 | | | | 21 | |
| | | | | | | | |
| | | | | | | | | | | | | | | | | | | | | | | | | | | | | | | | | | |
| | | | | | | | | | | | | | | | | | | | | | | | | | | | | | | | | | |
| | | | | | | | |
| $ | 15.45 | | | | 14.95 | % | | $ | 527,937 | | | | 0.05 | % | | | 0.06 | % | | | 0.05 | % | | | 0.06 | % | | | 2.74 | % | | | 20 | % |
| | | | | | | | |
| | 13.84 | | | | 13.48 | | | | 426,393 | | | | 0.05 | | | | 0.05 | | | | 0.05 | | | | 0.05 | | | | 2.68 | | | | 11 | |
| | | | | | | | |
| | 12.54 | | | | (14.23 | ) | | | 207,869 | | | | 0.06 | | | | 0.06 | | | | 0.06 | | | | 0.06 | | | | 2.47 | | | | 13 | |
| | | | | | | | |
| | 15.11 | | | | 34.67 | | | | 200,184 | | | | 0.05 | | | | 0.06 | | | | 0.05 | | | | 0.06 | | | | 2.13 | | | | 22 | |
| | | | | | | | |
| | 11.58 | | | | 2.16 | | | | 91,173 | | | | 0.06 | | | | 0.07 | | | | 0.06 | | | | 0.07 | | | | 2.59 | | | | 16 | |
| | | | | | | | | | | | |
| | | | ANNUAL FINANCIAL AND OTHER INFORMATION | | | | | | | JUNE 30, 2024 | | | 7 |
| | | | |
| Financial Highlights | | (Cont.) | | |
| | | | | | | | | | | | | | | | | | | | | | | | | | | | |
| | | | | | Investment Operations | | | Less Distributions(c) | |
| | | | | | | | | | | | | | | | | | | | | | |
| Selected Per Share Data for the Year or Period Ended^: | | Net Asset
Value
Beginning of
Year or
Period(a) | | | Net
Investment
Income
(Loss)(b) | | | Net Realized/
Unrealized
Gain (Loss) | | | Total | | | From Net
Investment
Income | | | From Net
Realized
Capital
Gains | | | Total | |
| | | | | | | |
PIMCO REALPATH® Blend 2045 Fund (Cont.) | | | | | | | | | | | | | | | | | | | | | | | | | | | | |
| Class A | | | | | | | | | | | | | | | | | | | | | | | | | | | | |
| | | | | | | |
06/30/2024 | | $ | 13.73 | | | $ | 0.33 | | | $ | 1.63 | | | $ | 1.96 | | | $ | (0.37 | ) | | $ | 0.00 | | | $ | (0.37 | ) |
| | | | | | | |
06/30/2023 | | | 12.46 | | | | 0.28 | | | | 1.31 | | | | 1.59 | | | | (0.16 | ) | | | (0.16 | ) | | | (0.32 | ) |
| | | | | | | |
06/30/2022 | | | 15.05 | | | | 0.29 | | | | (2.42 | ) | | | (2.13 | ) | | | (0.27 | ) | | | (0.19 | ) | | | (0.46 | ) |
| | | | | | | |
06/30/2021 | | | 11.54 | | | | 0.21 | | | | 3.69 | | | | 3.90 | | | | (0.32 | ) | | | (0.07 | ) | | | (0.39 | ) |
| | | | | | | |
06/30/2020 | | | 11.64 | | | | 0.24 | | | | (0.04 | ) | | | 0.20 | | | | (0.28 | ) | | | (0.02 | ) | | | (0.30 | ) |
| | | | | | | |
PIMCO REALPATH® Blend 2050 Fund | | | | | | | | | | | | | | | | | | | | | | | | | | | | |
| Institutional Class | | | | | | | | | | | | | | | | | | | | | | | | | | | | |
| | | | | | | |
06/30/2024 | | $ | 14.07 | | | $ | 0.38 | | | $ | 1.81 | | | $ | 2.19 | | | $ | (0.42 | ) | | $ | 0.00 | | | $ | (0.42 | ) |
| | | | | | | |
06/30/2023 | | | 12.65 | | | | 0.34 | | | | 1.43 | | | | 1.77 | | | | (0.19 | ) | | | (0.16 | ) | | | (0.35 | ) |
| | | | | | | |
06/30/2022 | | | 15.28 | | | | 0.36 | | | | (2.44 | ) | | | (2.08 | ) | | | (0.34 | ) | | | (0.21 | ) | | | (0.55 | ) |
| | | | | | | |
06/30/2021 | | | 11.59 | | | | 0.29 | | | | 3.83 | | | | 4.12 | | | | (0.36 | ) | | | (0.07 | ) | | | (0.43 | ) |
| | | | | | | |
06/30/2020 | | | 11.74 | | | | 0.29 | | | | (0.08 | ) | | | 0.21 | | | | (0.34 | ) | | | (0.02 | ) | | | (0.36 | ) |
| Class A | | | | | | | | | | | | | | | | | | | | | | | | | | | | |
| | | | | | | |
06/30/2024 | | | 13.90 | | | | 0.32 | | | | 1.79 | | | | 2.11 | | | | (0.37 | ) | | | 0.00 | | | | (0.37 | ) |
| | | | | | | |
06/30/2023 | | | 12.51 | | | | 0.27 | | | | 1.43 | | | | 1.70 | | | | (0.15 | ) | | | (0.16 | ) | | | (0.31 | ) |
| | | | | | | |
06/30/2022 | | | 15.16 | | | | 0.29 | | | | (2.43 | ) | | | (2.14 | ) | | | (0.30 | ) | | | (0.21 | ) | | | (0.51 | ) |
| | | | | | | |
06/30/2021 | | | 11.51 | | | | 0.21 | | | | 3.81 | | | | 4.02 | | | | (0.30 | ) | | | (0.07 | ) | | | (0.37 | ) |
| | | | | | | |
06/30/2020 | | | 11.67 | | | | 0.23 | | | | (0.08 | ) | | | 0.15 | | | | (0.29 | ) | | | (0.02 | ) | | | (0.31 | ) |
| | | | | | | |
PIMCO REALPATH® Blend 2055 Fund | | | | | | | | | | | | | | | | | | | | | | | | | | | | |
| Institutional Class | | | | | | | | | | | | | | | | | | | | | | | | | | | | |
| | | | | | | |
06/30/2024 | | $ | 14.27 | | | $ | 0.39 | | | $ | 1.90 | | | $ | 2.29 | | | $ | (0.40 | ) | | $ | (0.02 | ) | | $ | (0.42 | ) |
| | | | | | | |
06/30/2023 | | | 12.75 | | | | 0.34 | | | | 1.50 | | | | 1.84 | | | | (0.19 | ) | | | (0.13 | ) | | | (0.32 | ) |
| | | | | | | |
06/30/2022 | | | 15.33 | | | | 0.37 | | | | (2.48 | ) | | | (2.11 | ) | | | (0.30 | ) | | | (0.17 | ) | | | (0.47 | ) |
| | | | | | | |
06/30/2021 | | | 11.59 | | | | 0.29 | | | | 3.87 | | | | 4.16 | | | | (0.38 | ) | | | (0.04 | ) | | | (0.42 | ) |
| | | | | | | |
06/30/2020 | | | 11.79 | | | | 0.29 | | | | (0.12 | ) | | | 0.17 | | | | (0.36 | ) | | | (0.01 | ) | | | (0.37 | ) |
| Class A | | | | | | | | | | | | | | | | | | | | | | | | | | | | |
| | | | | | | |
06/30/2024 | | | 14.12 | | | | 0.33 | | | | 1.87 | | | | 2.20 | | | | (0.34 | ) | | | (0.02 | ) | | | (0.36 | ) |
| | | | | | | |
06/30/2023 | | | 12.64 | | | | 0.26 | | | | 1.50 | | | | 1.76 | | | | (0.15 | ) | | | (0.13 | ) | | | (0.28 | ) |
| | | | | | | |
06/30/2022 | | | 15.24 | | | | 0.29 | | | | (2.45 | ) | | | (2.16 | ) | | | (0.27 | ) | | | (0.17 | ) | | | (0.44 | ) |
| | | | | | | |
06/30/2021 | | | 11.53 | | | | 0.21 | | | | 3.86 | | | | 4.07 | | | | (0.32 | ) | | | (0.04 | ) | | | (0.36 | ) |
| | | | | | | |
06/30/2020 | | | 11.73 | | | | 0.23 | | | | (0.12 | ) | | | 0.11 | | | | (0.30 | ) | | | (0.01 | ) | | | (0.31 | ) |
| | | | | | | |
PIMCO REALPATH® Blend 2060 Fund | | | | | | | | | | | | | | | | | | | | | | | | | | | | |
| Institutional Class | | | | | | | | | | | | | | | | | | | | | | | | | | | | |
| | | | | | | |
06/30/2024 | | $ | 11.08 | | | $ | 0.30 | | | $ | 1.55 | | | $ | 1.85 | | | $ | (0.28 | ) | | $ | 0.00 | | | $ | (0.28 | ) |
| | | | | | | |
06/30/2023 | | | 9.84 | | | | 0.26 | | | | 1.16 | | | | 1.42 | | | | (0.12 | ) | | | (0.06 | ) | | | (0.18 | ) |
| | | | | | | |
06/30/2022 | | | 12.47 | | | | 0.30 | | | | (1.85 | ) | | | (1.55 | ) | | | (0.27 | ) | | | (0.81 | ) | | | (1.08 | ) |
| | | | | | | |
06/30/2021 | | | 9.35 | | | | 0.24 | | | | 3.12 | | | | 3.36 | | | | (0.24 | ) | | | 0.00 | | | | (0.24 | ) |
| | | | | | | |
12/31/2019 - 06/30/2020 | | | 10.00 | | | | 0.09 | | | | (0.74 | ) | | | (0.65 | ) | | | 0.00 | | | | 0.00 | | | | 0.00 | |
| Class A | | | | | | | | | | | | | | | | | | | | | | | | | | | | |
| | | | | | | |
06/30/2024 | | | 10.99 | | | | 0.24 | | | | 1.54 | | | | 1.78 | | | | (0.23 | ) | | | 0.00 | | | | (0.23 | ) |
| | | | | | | |
06/30/2023 | | | 9.78 | | | | 0.20 | | | | 1.16 | | | | 1.36 | | | | (0.09 | ) | | | (0.06 | ) | | | (0.15 | ) |
| | | | | | | |
06/30/2022 | | | 12.43 | | | | 0.24 | | | | (1.84 | ) | | | (1.60 | ) | | | (0.24 | ) | | | (0.81 | ) | | | (1.05 | ) |
| | | | | | | |
06/30/2021 | | | 9.32 | | | | 0.20 | | | | 3.11 | | | | 3.31 | | | | (0.20 | ) | | | 0.00 | | | | (0.20 | ) |
| | | | | | | |
12/31/2019 - 06/30/2020 | | | 10.00 | | | | 0.08 | | | | (0.76 | ) | | | (0.68 | ) | | | 0.00 | | | | 0.00 | | | | 0.00 | |
| | | | | | | |
PIMCO REALPATH® Blend 2065 Fund | | | | | | | | | | | | | | | | | | | | | | | | | | | | |
| Institutional Class | | | | | | | | | | | | | | | | | | | | | | | | | | | | |
| | | | | | | |
06/30/2024 | | $ | 11.21 | | | $ | 0.31 | | | $ | 1.52 | | | $ | 1.83 | | | $ | (0.23 | ) | | $ | (0.02 | ) | | $ | (0.25 | ) |
| | | | | | | |
12/30/2022 - 06/30/2023 | | | 10.00 | | | | 0.12 | | | | 1.11 | | | | 1.23 | | | | (0.02 | ) | | | 0.00 | | | | (0.02 | ) |
| Class A | | | | | | | | | | | | | | | | | | | | | | | | | | | | |
| | | | | | | |
06/30/2024 | | | 11.19 | | | | 0.23 | | | | 1.55 | | | | 1.78 | | | | (0.18 | ) | | | (0.02 | ) | | | (0.20 | ) |
| | | | | | | |
12/30/2022 - 06/30/2023 | | | 10.00 | | | | 0.08 | | | | 1.12 | | | | 1.20 | | | | (0.01 | ) | | | 0.00 | | | | (0.01 | ) |
| | | | | | |
| 8 | | PIMCO EQUITY SERIES | | | See Accompanying Notes | |
| | | | | | | | | | | | | | | | | | | | | | | | | | | | | | | | | | |
| | | | | | | Ratios/Supplemental Data | |
| | | | | | | | | | Ratios to Average Net Assets(e) | | | | |
Net Asset
Value End of
Year or
Period(a) | | | Total Return(d) | | | Net Assets
End of Year or
Period (000s) | | | Expenses | | | Expenses
Excluding
Waivers | | | Expenses
Excluding
Interest
Expense | | | Expenses
Excluding
Interest
Expense and Waivers | | | Net
Investment
Income (Loss) | | | Portfolio
Turnover
Rate | |
| | | | | | | | |
|
|
| | | | | | | | | | | | | | | | | | | | | | | | | | | | | | | | |
| | | | | | | | | | | | | | | | | | | | | | | | | | | | | | | | | | |
| | | | | | | | |
| $ | 15.32 | | | | 14.47 | % | | $ | 6,582 | | | | 0.50 | % | | | 0.51 | % | | | 0.50 | % | | | 0.51 | % | | | 2.34 | % | | | 20 | % |
| | | | | | | | |
| | 13.73 | | | | 12.97 | | | | 4,749 | | | | 0.50 | | | | 0.50 | | | | 0.50 | | | | 0.50 | | | | 2.19 | | | | 11 | |
| | | | | | | | |
| | 12.46 | | | | (14.69 | ) | | | 3,967 | | | | 0.53 | (f) | | | 0.53 | (f) | | | 0.53 | (f) | | | 0.53 | (f) | | | 1.97 | | | | 13 | |
| | | | | | | | |
| | 15.05 | | | | 34.03 | | | | 4,593 | | | | 0.55 | | | | 0.56 | | | | 0.55 | | | | 0.56 | | | | 1.57 | | | | 22 | |
| | | | | | | | |
| | 11.54 | | | | 1.64 | | | | 3,658 | | | | 0.56 | | | | 0.57 | | | | 0.56 | | | | 0.57 | | | | 2.08 | | | | 16 | |
| | | | | | | | |
| | | | | | | | | | | | | | | | | | | | | | | | | | | | | | | | | | | |
| | | | | | | | | | | | | | | | | | | | | | | | | | | | | | | | | | |
| | | | | | | | |
| $ | 15.84 | | | | 15.80 | % | | $ | 470,653 | | | | 0.05 | % | | | 0.06 | % | | | 0.05 | % | | | 0.06 | % | | | 2.61 | % | | | 29 | % |
| | | | | | | | |
| | 14.07 | | | | 14.23 | | | | 397,754 | | | | 0.05 | | | | 0.05 | | | | 0.05 | | | | 0.05 | | | | 2.55 | | | | 9 | |
| | | | | | | | |
| | 12.65 | | | | (14.29 | ) | | | 206,038 | | | | 0.06 | | | | 0.06 | | | | 0.06 | | | | 0.06 | | | | 2.43 | | | | 9 | |
| | | | | | | | |
| | 15.28 | | | | 35.82 | | | | 200,851 | | | | 0.05 | | | | 0.06 | | | | 0.05 | | | | 0.06 | | | | 2.08 | | | | 19 | |
| | | | | | | | |
| | 11.59 | | | | 1.66 | | | | 103,972 | | | | 0.06 | | | | 0.07 | | | | 0.06 | | | | 0.07 | | | | 2.53 | | | | 20 | |
| | | | | | | | | | | | | | | | | | | | | | | | | | | | | | | | | | |
| | | | | | | | |
| | 15.64 | | | | 15.33 | | | | 9,886 | | | | 0.50 | | | | 0.51 | | | | 0.50 | | | | 0.51 | | | | 2.23 | | | | 29 | |
| | | | | | | | |
| | 13.90 | | | | 13.78 | | | | 4,854 | | | | 0.50 | | | | 0.50 | | | | 0.50 | | | | 0.50 | | | | 2.08 | | | | 9 | |
| | | | | | | | |
| | 12.51 | | | | (14.73 | ) | | | 3,704 | | | | 0.53 | (f) | | | 0.53 | (f) | | | 0.53 | (f) | | | 0.53 | (f) | | | 1.93 | | | | 9 | |
| | | | | | | | |
| | 15.16 | | | | 35.11 | | | | 4,896 | | | | 0.55 | | | | 0.56 | | | | 0.55 | | | | 0.56 | | | | 1.51 | | | | 19 | |
| | | | | | | | |
| | 11.51 | | | | 1.16 | | | | 4,101 | | | | 0.56 | | | | 0.57 | | | | 0.56 | | | | 0.57 | | | | 2.03 | | | | 20 | |
| | | | | | | | |
| | | | | | | | | | | | | | | | | | | | | | | | | | | | | | | | | | | |
| | | | | | | | | | | | | | | | | | | | | | | | | | | | | | | | | | |
| | | | | | | | |
| $ | 16.14 | | | | 16.30 | % | | $ | 401,820 | | | | 0.05 | % | | | 0.06 | % | | | 0.05 | % | | | 0.06 | % | | | 2.60 | % | | | 21 | % |
| | | | | | | | |
| | 14.27 | | | | 14.69 | | | | 289,834 | | | | 0.05 | | | | 0.05 | | | | 0.05 | | | | 0.05 | | | | 2.51 | | | | 8 | |
| | | | | | | | |
| | 12.75 | | | | (14.32 | ) | | | 145,097 | | | | 0.06 | | | | 0.06 | | | | 0.06 | | | | 0.06 | | | | 2.47 | | | | 9 | |
| | | | | | | | |
| | 15.33 | | | | 36.15 | | | | 122,612 | | | | 0.06 | | | | 0.06 | | | | 0.06 | | | | 0.06 | | | | 2.11 | | | | 14 | |
| | | | | | | | |
| | 11.59 | | | | 1.33 | | | | 51,061 | | | | 0.07 | | | | 0.07 | | | | 0.06 | | | | 0.06 | | | | 2.49 | | | | 28 | |
| | | | | | | | | | | | | | | | | | | | | | | | | | | | | | | | | | |
| | | | | | | | |
| | 15.96 | | | | 15.83 | | | | 6,817 | | | | 0.50 | | | | 0.51 | | | | 0.50 | | | | 0.51 | | | | 2.22 | | | | 21 | |
| | | | | | | | |
| | 14.12 | | | | 14.14 | | | | 3,320 | | | | 0.50 | | | | 0.50 | | | | 0.50 | | | | 0.50 | | | | 1.99 | | | | 8 | |
| | | | | | | | |
| | 12.64 | | | | (14.73 | ) | | | 2,622 | | | | 0.53 | (f) | | | 0.53 | (f) | | | 0.53 | (f) | | | 0.53 | (f) | | | 1.92 | | | | 9 | |
| | | | | | | | |
| | 15.24 | | | | 35.46 | | | | 3,159 | | | | 0.56 | | | | 0.56 | | | | 0.56 | | | | 0.56 | | | | 1.52 | | | | 14 | |
| | | | | | | | |
| | 11.53 | | | | 0.85 | | | | 2,684 | | | | 0.57 | | | | 0.57 | | | | 0.56 | | | | 0.56 | | | | 1.98 | | | | 28 | |
| | | | | | | | |
| | | | | | | | | | | | | | | | | | | | | | | | | | | | | | | | | | |
| | | | | | | | | | | | | | | | | | | | | | | | | | | | | | | | | | |
| | | | | | | | |
| $ | 12.65 | | | | 16.88 | % | | $ | 158,655 | | | | 0.05 | % | | | 0.06 | % | | | 0.05 | % | | | 0.06 | % | | | 2.61 | % | | | 12 | % |
| | | | | | | | |
| | 11.08 | | | | 14.69 | | | | 84,966 | | | | 0.05 | | | | 0.05 | | | | 0.05 | | | | 0.05 | | | | 2.52 | | | | 11 | |
| | | | | | | | |
| | 9.84 | | | | (13.93 | ) | | | 22,421 | | | | 0.06 | | | | 0.06 | | | | 0.06 | | | | 0.06 | | | | 2.60 | | | | 50 | |
| | | | | | | | |
| | 12.47 | | | | 36.18 | | | | 11,451 | | | | 0.06 | | | | 0.07 | | | | 0.06 | | | | 0.07 | | | | 2.10 | | | | 20 | |
| | | | | | | | |
| | 9.35 | | | | (6.50 | ) | | | 2,817 | | | | 0.05 | * | | | 2.52 | * | | | 0.05 | * | | | 2.52 | * | | | 1.95 | * | | | 12 | |
| | | | | | | | | | | | | | | | | | | | | | | | | | | | | | | | | | |
| | | | | | | | |
| | 12.54 | | | | 16.35 | | | | 823 | | | | 0.50 | | | | 0.51 | | | | 0.50 | | | | 0.51 | | | | 2.10 | | | | 12 | |
| | | | | | | | |
| | 10.99 | | | | 14.09 | | | | 802 | | | | 0.50 | | | | 0.50 | | | | 0.50 | | | | 0.50 | | | | 1.99 | | | | 11 | |
| | | | | | | | |
| | 9.78 | | | | (14.32 | ) | | | 536 | | | | 0.53 | (f) | | | 0.53 | (f) | | | 0.53 | (f) | | | 0.53 | (f) | | | 2.05 | | | | 50 | |
| | | | | | | | |
| | 12.43 | | | | 35.70 | | | | 834 | | | | 0.56 | | | | 0.57 | | | | 0.56 | | | | 0.57 | | | | 1.72 | | | | 20 | |
| | | | | | | | |
| | 9.32 | | | | (6.80 | ) | | | 29 | | | | 0.55 | * | | | 3.02 | * | | | 0.55 | * | | | 3.02 | * | | | 1.70 | * | | | 12 | |
| | | | | | | | |
| | | | | | | | | | | | | | | | | | | | | | | | | | | | | | | | | | |
| | | | | | | | | | | | | | | | | | | | | | | | | | | | | | | | | | |
| | | | | | | | |
| $ | 12.79 | | | | 16.49 | % | | $ | 18,944 | | | | 0.05 | % | | | 0.05 | % | | | 0.05 | % | | | 0.05 | % | | | 2.59 | % | | | 16 | % |
| | | | | | | | |
| | 11.21 | | | | 12.29 | | | | 4,889 | | | | 0.05 | * | | | 3.49 | * | | | 0.05 | * | | | 3.49 | * | | | 2.21 | * | | | 8 | |
| | | | | | | | | | | | | | | | | | | | | | | | | | | | | | | | | | |
| | | | | | | | |
| | 12.77 | | | | 16.09 | | | | 208 | | | | 0.50 | | | | 0.50 | | | | 0.50 | | | | 0.50 | | | | 1.96 | | | | 16 | |
| | | | | | | | |
| | 11.19 | | | | 11.99 | | | | 112 | | | | 0.50 | * | | | 3.94 | * | | | 0.50 | * | | | 3.94 | * | | | 1.48 | * | | | 8 | |
| | | | | | | | | | | | |
| | | | ANNUAL FINANCIAL AND OTHER INFORMATION | | | | | | | JUNE 30, 2024 | | | 9 |
| | | | |
| Financial Highlights | | (Cont.) | | |
| | | | | | | | | | | | | | | | | | | | | | | | | | | | |
| | | | | | Investment Operations | | | Less Distributions(c) | |
| | | | | | | | | | | | | | | | | | | | | | |
| Selected Per Share Data for the Year or Period Ended^: | | Net Asset
Value
Beginning of
Year or
Period(a) | | | Net
Investment
Income
(Loss)(b) | | | Net Realized/
Unrealized
Gain (Loss) | | | Total | | | From Net
Investment
Income | | | From Net
Realized
Capital
Gains | | | Total | |
| | | | | | | |
PIMCO REALPATH® Blend Income Fund | | | | | | | | | | | | | | | | | | | | | | | | | | | | |
| Institutional Class | | | | | | | | | | | | | | | | | | | | | | | | | | | | |
| | | | | | | |
06/30/2024 | | $ | 11.00 | | | $ | 0.41 | | | $ | 0.39 | | | $ | 0.80 | | | $ | (0.50 | ) | | $ | 0.00 | | | $ | (0.50 | ) |
| | | | | | | |
06/30/2023 | | | 10.81 | | | | 0.45 | | | | 0.18 | | | | 0.63 | | | | (0.34 | ) | | | (0.10 | ) | | | (0.44 | ) |
| | | | | | | |
06/30/2022 | | | 12.92 | | | | 0.43 | | | | (2.04 | ) | | | (1.61 | ) | | | (0.37 | ) | | | (0.13 | ) | | | (0.50 | ) |
| | | | | | | |
06/30/2021 | | | 11.58 | | | | 0.36 | | | | 1.84 | | | | 2.20 | | | | (0.68 | ) | | | (0.18 | ) | | | (0.86 | ) |
| | | | | | | |
06/30/2020 | | | 11.28 | | | | 0.35 | | | | 0.34 | | | | 0.69 | | | | (0.39 | ) | | | 0.00 | | | | (0.39 | ) |
| Class A | | | | | | | | | | | | | | | | | | | | | | | | | | | | |
| | | | | | | |
06/30/2024 | | | 10.92 | | | | 0.36 | | | | 0.38 | | | | 0.74 | | | | (0.45 | ) | | | 0.00 | | | | (0.45 | ) |
| | | | | | | |
06/30/2023 | | | 10.73 | | | | 0.40 | | | | 0.18 | | | | 0.58 | | | | (0.29 | ) | | | (0.10 | ) | | | (0.39 | ) |
| | | | | | | |
06/30/2022 | | | 12.84 | | | | 0.37 | | | | (2.03 | ) | | | (1.66 | ) | | | (0.32 | ) | | | (0.13 | ) | | | (0.45 | ) |
| | | | | | | |
06/30/2021 | | | 11.53 | | | | 0.30 | | | | 1.82 | | | | 2.12 | | | | (0.63 | ) | | | (0.18 | ) | | | (0.81 | ) |
| | | | | | | |
06/30/2020 | | | 11.24 | | | | 0.32 | | | | 0.32 | | | | 0.64 | | | | (0.35 | ) | | | 0.00 | | | | (0.35 | ) |
| ^ | A zero balance may reflect actual amounts rounding to less than $0.01 or 0.01%. |
| * | Annualized, except for organizational expense, if any. |
| (a) | Includes adjustments required by U.S. GAAP and may differ from net asset values and performance reported elsewhere by the Funds. |
| (b) | Per share amounts based on average number of shares outstanding during the year or period. |
| (c) | The tax characterization of distributions is determined in accordance with Federal income tax regulations. See Note 2, Distributions to Shareholders, in the Notes to Financial Statements for more information. |
| (d) | Includes adjustments required by U.S. GAAP and may differ from net asset values and performance reported elsewhere by the Funds. Additionally, excludes initial sales charges and contingent deferred sales charges. |
| (e) | Ratios shown do not include expenses of the investment companies in which a Fund may invest. See Note 9, Fees and Expenses, in the Notes to Financial Statements for more information regarding the expenses and any applicable fee waivers associated with these investments. |
| (f) | Effective November 1, 2021, the Class’s Supervisory and Administrative fees was decreased by 0.05% to an annual rate of 0.22%. |
| | | | | | |
| 10 | | PIMCO EQUITY SERIES | | | See Accompanying Notes | |
| | | | | | | | | | | | | | | | | | | | | | | | | | | | | | | | | | |
| | | | | | | Ratios/Supplemental Data | |
| | | | | | | | | | Ratios to Average Net Assets(e) | | | | |
Net Asset
Value End of
Year or
Period(a) | | | Total Return(d) | | | Net Assets
End of Year or
Period (000s) | | | Expenses | | | Expenses
Excluding
Waivers | | | Expenses
Excluding
Interest
Expense | | | Expenses
Excluding
Interest
Expense and Waivers | | | Net
Investment
Income (Loss) | | | Portfolio
Turnover
Rate | |
| | | | | | | | |
|
|
| | | | | | | | | | | | | | | | | | | | | | | | | | | | | | | | |
| | | | | | | | | | | | | | | | | | | | | | | | | | | | | | | | | | |
| | | | | | | | |
| $ | 11.30 | | | | 7.40 | % | | $ | 317,089 | | | | 0.03 | % | | | 0.04 | % | | | 0.03 | % | | | 0.04 | % | | | 3.75 | % | | | 27 | % |
| | | | | | | | |
| | 11.00 | | | | 6.01 | | | | 297,254 | | | | 0.03 | | | | 0.03 | | | | 0.03 | | | | 0.03 | | | | 4.14 | | | | 29 | |
| | | | | | | | |
| | 10.81 | | | | (12.98 | ) | | | 170,997 | | | | 0.03 | | | | 0.04 | | | | 0.03 | | | | 0.04 | | | | 3.49 | | | | 18 | |
| | | | | | | | |
| | 12.92 | | | | 19.37 | | | | 191,873 | | | | 0.03 | | | | 0.04 | | | | 0.03 | | | | 0.04 | | | | 2.88 | | | | 17 | |
| | | | | | | | |
| | 11.58 | | | | 6.16 | | | | 106,005 | | | | 0.04 | | | | 0.05 | | | | 0.04 | | | | 0.05 | | | | 3.08 | | | | 52 | |
| | | | | | | | | | | | | | | | | | | | | | | | | | | | | | | | | | |
| | | | | | | | |
| | 11.21 | | | | 6.90 | | | | 17,913 | | | | 0.48 | | | | 0.49 | | | | 0.48 | | | | 0.49 | | | | 3.30 | | | | 27 | |
| | | | | | | | |
| | 10.92 | | | | 5.59 | | | | 21,344 | | | | 0.48 | | | | 0.48 | | | | 0.48 | | | | 0.48 | | | | 3.70 | | | | 29 | |
| | | | | | | | |
| | 10.73 | | | | (13.41 | ) | | | 28,738 | | | | 0.50 | (f) | | | 0.51 | (f) | | | 0.50 | (f) | | | 0.51 | (f) | | | 3.03 | | | | 18 | |
| | | | | | | | |
| | 12.84 | | | | 18.71 | | | | 30,699 | | | | 0.53 | | | | 0.54 | | | | 0.53 | | | | 0.54 | | | | 2.39 | | | | 17 | |
| | | | | | | | |
| | 11.53 | | | | 5.71 | | | | 16,501 | | | | 0.54 | | | | 0.55 | | | | 0.54 | | | | 0.55 | | | | 2.82 | | | | 52 | |
| | | | | | | | | | | | |
| | | | ANNUAL FINANCIAL AND OTHER INFORMATION | | | | | | | JUNE 30, 2024 | | | 11 |
| | | | |
| Statements of Assets and Liabilities | | | | |
| | | | | | | | | | | | | | | | |
| (Amounts in thousands†, except per share amounts) | | PIMCO REALPATH® Blend 2025 Fund | | | PIMCO REALPATH® Blend 2030 Fund | | | PIMCO REALPATH® Blend 2035 Fund | | | PIMCO REALPATH® Blend 2040 Fund | |
| | | | |
Assets: | | | | | | | | | | | | | | | | |
| | | | |
Investments, at value | | | | | | | | | | | | | | | | |
Investments in securities* | | $ | 174,354 | | | $ | 317,710 | | | $ | 406,501 | | | $ | 420,161 | |
Investments in Affiliates | | | 286,506 | | | | 299,351 | | | | 241,878 | | | | 153,066 | |
Financial Derivative Instruments | | | | | | | | | | | | | | | | |
Exchange-traded or centrally cleared | | | 992 | | | | 1,302 | | | | 0 | | | | 0 | |
Cash | | | 1 | | | | 0 | | | | 0 | | | | 0 | |
Receivable for investments sold | | | 3,417 | | | | 4,777 | | | | 6,066 | | | | 5,998 | |
Receivable for investments in Affiliates sold | | | 1,284 | | | | 957 | | | | 462 | | | | 0 | |
Receivable for Fund shares sold | | | 214 | | | | 1,025 | | | | 296 | | | | 1,278 | |
Interest and/or dividends receivable | | | 381 | | | | 709 | | | | 913 | | | | 946 | |
Dividends receivable from Affiliates | | | 1,087 | | | | 1,128 | | | | 914 | | | | 580 | |
Reimbursement receivable from PIMCO | | | 3 | | | | 4 | | | | 4 | | | | 4 | |
Total Assets | | | 468,239 | | | | 626,963 | | | | 657,034 | | | | 582,033 | |
| | | | |
Liabilities: | | | | | | | | | | | | | | | | |
| | | | |
Financial Derivative Instruments | | | | | | | | | | | | | | | | |
Over the counter | | $ | 85 | | | $ | 113 | | | $ | 116 | | | $ | 102 | |
Payable for investments purchased | | | 2,385 | | | | 4,582 | | | | 5,160 | | | | 5,555 | |
Payable for investments in Affiliates purchased | | | 1,830 | | | | 2,773 | | | | 2,339 | | | | 1,348 | |
Deposits from counterparty | | | 101 | | | | 126 | | | | 130 | | | | 121 | |
Payable for Fund shares redeemed | | | 276 | | | | 256 | | | | 328 | | | | 243 | |
Accrued investment advisory fees | | | 4 | | | | 5 | | | | 10 | | | | 13 | |
Accrued supervisory and administrative fees | | | 8 | | | | 11 | | | | 11 | | | | 10 | |
Accrued servicing fees | | | 1 | | | | 1 | | | | 2 | | | | 2 | |
Total Liabilities | | | 4,690 | | | | 7,867 | | | | 8,096 | | | | 7,394 | |
| | | | |
Commitments and Contingent Liabilities^ | | | | | | | | | | | | | | | | |
| | | | |
Net Assets | | $ | 463,549 | | | $ | 619,096 | | | $ | 648,938 | | | $ | 574,639 | |
| | | | |
Net Assets Consist of: | | | | | | | | | | | | | | | | |
| | | | |
Paid in capital | | $ | 456,018 | | | $ | 578,527 | | | $ | 579,232 | | | $ | 490,863 | |
Distributable earnings (accumulated loss) | | | 7,531 | | | | 40,569 | | | | 69,706 | | | | 83,776 | |
| | | | |
Net Assets | | $ | 463,549 | | | $ | 619,096 | | | $ | 648,938 | | | $ | 574,639 | |
| | | | |
Cost of investments in securities | | $ | 130,232 | | | $ | 241,045 | | | $ | 317,199 | | | $ | 324,386 | |
Cost of investments in Affiliates | | $ | 313,442 | | | $ | 326,402 | | | $ | 259,139 | | | $ | 163,962 | |
Cost or premiums of financial derivative instruments, net | | $ | 2,268 | | | $ | 2,916 | | | $ | 0 | | | $ | 0 | |
| | | | |
* Includes repurchase agreements of: | | $ | 544 | | | $ | 548 | | | $ | 449 | | | $ | 360 | |
| † | A zero balance may reflect actual amounts rounding to less than one thousand. |
| ^ | See Note 9, Fees and Expenses, in the Notes to Financial Statements for more information. |
| | | | | | |
| 12 | | PIMCO EQUITY SERIES | | | See Accompanying Notes | |
| | | | | | | | | | | | | | | | | | | | | | |
PIMCO REALPATH® Blend 2045 Fund | | | PIMCO REALPATH® Blend 2050 Fund | | | PIMCO REALPATH® Blend 2055 Fund | | | PIMCO REALPATH® Blend 2060 Fund | | | PIMCO REALPATH® Blend 2065 Fund | | | PIMCO REALPATH® Blend Income Fund | |
| | | | | |
| | | | | | | | | | | | | | | | | | | | | | |
| | | | | |
| | | | | | | | | | | | | | | | | | | | | | | |
| $ | 434,444 | | | $ | 415,053 | | | $ | 364,464 | | | $ | 144,190 | | | $ | 17,504 | | | $ | 116,528 | |
| | 97,076 | | | | 61,448 | | | | 42,107 | | | | 15,895 | | | | 1,766 | | | | 217,827 | |
| | | | | | | | | | | | | | | | | | | | | | | |
| | 0 | | | | 0 | | | | 0 | | | | 0 | | | | 0 | | | | 729 | |
| | 1 | | | | 1 | | | | 1 | | | | 0 | | | | 1 | | | | 0 | |
| | 7,089 | | | | 7,672 | | | | 5,498 | | | | 1,370 | | | | 71 | | | | 2,022 | |
| | 0 | | | | 0 | | | | 0 | | | | 0 | | | | 0 | | | | 713 | |
| | 631 | | | | 603 | | | | 839 | | | | 433 | | | | 146 | | | | 121 | |
| | 970 | | | | 927 | | | | 815 | | | | 319 | | | | 38 | | | | 253 | |
| | 361 | | | | 226 | | | | 156 | | | | 55 | | | | 5 | | | | 820 | |
| | 4 | | | | 4 | | | | 3 | | | | 1 | | | | 0 | | | | 3 | |
| | 540,576 | | | | 485,934 | | | | 413,883 | | | | 162,263 | | | | 19,531 | | | | 339,016 | |
| | | | | |
| | | | | | | | | | | | | | | | | | | | | | |
| | | | | |
| | | | | | | | | | | | | | | | | | | | | | | |
| $ | 96 | | | $ | 88 | | | $ | 76 | | | $ | 29 | | | $ | 3 | | | $ | 61 | |
| | 5,404 | | | | 4,914 | | | | 4,785 | | | | 2,412 | | | | 358 | | | | 1,761 | |
| | 404 | | | | 253 | | | | 174 | | | | 230 | | | | 16 | | | | 2,133 | |
| | 109 | | | | 99 | | | | 101 | | | | 0 | | | | 0 | | | | 0 | |
| | 22 | | | | 19 | | | | 93 | | | | 108 | | | | 0 | | | | 45 | |
| | 12 | | | | 11 | | | | 9 | | | | 4 | | | | 1 | | | | 3 | |
| | 9 | | | | 9 | | | | 7 | | | | 2 | | | | 1 | | | | 8 | |
| | 1 | | | | 2 | | | | 1 | | | | 0 | | | | 0 | | | | 3 | |
| | 6,057 | | | | 5,395 | | | | 5,246 | | | | 2,785 | | | | 379 | | | | 4,014 | |
| | | | | |
| | | | | | | | | | | | | | | | | | | | | | |
| | | | | |
| $ | 534,519 | | | $ | 480,539 | | | $ | 408,637 | | | $ | 159,478 | | | $ | 19,152 | | | $ | 335,002 | |
| | | | | |
| | | | | | | | | | | | | | | | | | | | | | |
| | | | | |
| $ | 440,235 | | | $ | 378,617 | | | $ | 334,893 | | | $ | 137,097 | | | $ | 16,867 | | | $ | 338,186 | |
| | 94,284 | | | | 101,922 | | | | 73,744 | | | | 22,381 | | | | 2,285 | | | | (3,184 | ) |
| | | | | |
| $ | 534,519 | | | $ | 480,539 | | | $ | 408,637 | | | $ | 159,478 | | | $ | 19,152 | | | $ | 335,002 | |
| | | | | |
| $ | 336,502 | | | $ | 315,310 | | | $ | 292,049 | | | $ | 122,876 | | | $ | 15,400 | | | $ | 83,286 | |
| $ | 103,892 | | | $ | 65,618 | | | $ | 44,260 | | | $ | 16,139 | | | $ | 1,769 | | | $ | 240,774 | |
| $ | 0 | | | $ | 0 | | | $ | 0 | | | $ | 0 | | | $ | 0 | | | $ | 1,694 | |
| | | | | |
| $ | 371 | | | $ | 559 | | | $ | 1,106 | | | $ | 310 | | | $ | 217 | | | $ | 536 | |
| | | | | | | | | | | | |
| | | | ANNUAL FINANCIAL AND OTHER INFORMATION | | | | | | | JUNE 30, 2024 | | | 13 |
| | | | |
| Statements of Assets and Liabilities | | (Cont.) | | |
| | | | | | | | | | | | | | | | |
| | | PIMCO REALPATH® Blend
2025 Fund | | | PIMCO REALPATH® Blend
2030 Fund | | | PIMCO REALPATH® Blend
2035 Fund | | | PIMCO REALPATH® Blend
2040 Fund | |
| | | | |
Net Assets: | | | | | | | | | | | | | | | | |
| | | | |
Institutional Class | | $ | 457,575 | | | $ | 610,590 | | | $ | 640,041 | | | $ | 565,112 | |
Class A | | | 5,974 | | | | 8,506 | | | | 8,897 | | | | 9,527 | |
| | | | |
Shares Issued and Outstanding: | | | | | | | | | | | | | | | | |
| | | | |
Institutional Class | | | 38,322 | | | | 47,195 | | | | 45,481 | | | | 37,880 | |
Class A | | | 502 | | | | 662 | | | | 632 | | | | 644 | |
| | | | |
Net Asset Value Per Share Outstanding(a): | | | | | | | | | | | | | | | | |
| | | | |
Institutional Class | | $ | 11.94 | | | $ | 12.94 | | | $ | 14.07 | | | $ | 14.92 | |
Class A | | | 11.89 | | | | 12.85 | | | | 14.07 | | | | 14.80 | |
| (a) | Includes adjustments required by U.S. GAAP and may differ from net asset values and performance reported elsewhere by the Funds. |
| | | | | | |
| 14 | | PIMCO EQUITY SERIES | | | See Accompanying Notes | |
| | | | | | | | | | | | | | | | | | | | | | |
PIMCO REALPATH® Blend 2045 Fund | | | PIMCO REALPATH® Blend 2050 Fund | | | PIMCO REALPATH® Blend 2055 Fund | | | PIMCO REALPATH® Blend
2060 Fund | | | PIMCO REALPATH® Blend
2065 Fund | | | PIMCO REALPATH® Blend Income Fund | |
| | | | | |
| | | | | | | | | | | | | | | | | | | | | | |
| | | | | |
| $ | 527,937 | | | $ | 470,653 | | | $ | 401,820 | | | $ | 158,655 | | | $ | 18,944 | | | $ | 317,089 | |
| | 6,582 | | | | 9,886 | | | | 6,817 | | | | 823 | | | | 208 | | | | 17,913 | |
| | | | | |
| | | | | | | | | | | | | | | | | | | | | | |
| | | | | |
| | 34,166 | | | | 29,706 | | | | 24,890 | | | | 12,540 | | | | 1,481 | | | | 28,053 | |
| | 430 | | | | 632 | | | | 427 | | | | 66 | | | | 16 | | | | 1,598 | |
| | | | | |
| | | | | | | | | | | | | | | | | | | | | | |
| | | | | |
| $ | 15.45 | | | $ | 15.84 | | | $ | 16.14 | | | $ | 12.65 | | | $ | 12.79 | | | $ | 11.30 | |
| | 15.32 | | | | 15.64 | | | | 15.96 | | | | 12.54 | | | | 12.77 | | | | 11.21 | |
| | | | | | | | | | | | |
| | | | ANNUAL FINANCIAL AND OTHER INFORMATION | | | | | | | JUNE 30, 2024 | | | 15 |
| | | | | | | | | | | | | | | | |
| Year Ended June 30, 2024 | |
| (Amounts in thousands†) | | PIMCO REALPATH® Blend 2025 Fund | | | PIMCO REALPATH® Blend 2030 Fund | | | PIMCO REALPATH® Blend 2035 Fund | | | PIMCO REALPATH® Blend 2040 Fund | |
| | | | |
Investment Income: | | | | | | | | | | | | | | | | |
| | | | |
Interest | | $ | 56 | | | $ | 77 | | | $ | 68 | | | $ | 73 | |
Dividends | | | 4,530 | | | | 7,518 | | | | 8,996 | | | | 9,199 | |
Dividends from Investments in Affiliates | | | 11,780 | | | | 11,698 | | | | 9,340 | | | | 6,270 | |
Total Income | | | 16,366 | | | | 19,293 | | | | 18,404 | | | | 15,542 | |
| | | | |
Expenses: | | | | | | | | | | | | | | | | |
| | | | |
Investment advisory fees | | | 44 | | | | 57 | | | | 116 | | | | 157 | |
Supervisory and administrative fees | | | 100 | | | | 130 | | | | 132 | | | | 122 | |
Distribution and/or servicing fees - Administrative Class | | | 19 | (a) | | | 19 | (a) | | | 22 | (a) | | | 14 | (a) |
Distribution and/or servicing fees - Class A | | | 14 | | | | 21 | | | | 20 | | | | 21 | |
Trustee fees | | | 25 | | | | 31 | | | | 31 | | | | 28 | |
Interest expense | | | 17 | | | | 26 | | | | 26 | | | | 26 | |
Expense reimbursements recouped | | | 22 | | | | 28 | | | | 28 | | | | 26 | |
Organizational expense reimbursements recouped | | | 0 | | | | 0 | | | | 0 | | | | 0 | |
Total Expenses | | | 241 | | | | 312 | | | | 375 | | | | 394 | |
Waiver and/or Reimbursement by PIMCO | | | (25 | ) | | | (31 | ) | | | (31 | ) | | | (28 | ) |
Net Expenses | | | 216 | | | | 281 | | | | 344 | | | | 366 | |
| | | | |
Net Investment Income (Loss) | | | 16,150 | | | | 19,012 | | | | 18,060 | | | | 15,176 | |
| | | | |
Net Realized Gain (Loss): | | | | | | | | | | | | | | | | |
| | | | |
Investments in securities | | | 3,368 | | | | 2,563 | | | | 549 | | | | 814 | |
Investments in Affiliates | | | (3,248 | ) | | | (2,470 | ) | | | (1,130 | ) | | | (1,102 | ) |
Net capital gain distributions received from investments | | | 1,252 | | | | 2,250 | | | | 2,780 | | | | 2,879 | |
Exchange-traded or centrally cleared financial derivative instruments | | | (1,721 | ) | | | (2,070 | ) | | | 0 | | | | 0 | |
Over the counter financial derivative instruments | | | 293 | | | | 409 | | | | 477 | | | | 491 | |
| | | | |
Net Realized Gain (Loss) | | | (56 | ) | | | 682 | | | | 2,676 | | | | 3,082 | |
| | | | |
Net Change in Unrealized Appreciation (Depreciation): | | | | | | | | | | | | | | | | |
| | | | |
Investments in securities | | | 20,014 | | | | 39,269 | | | | 51,127 | | | | 53,418 | |
Investments in Affiliates | | | (2,105 | ) | | | (4,127 | ) | | | (3,657 | ) | | | (1,720 | ) |
Exchange-traded or centrally cleared financial derivative instruments | | | (231 | ) | | | (376 | ) | | | 0 | | | | 0 | |
Over the counter financial derivative instruments | | | 146 | | | | 148 | | | | 128 | | | | 117 | |
| | | | |
Net Change in Unrealized Appreciation (Depreciation) | | | 17,824 | | | | 34,914 | | | | 47,598 | | | | 51,815 | |
| | | | |
Net Increase (Decrease) in Net Assets Resulting from Operations | | $ | 33,918 | | | $ | 54,608 | | | $ | 68,334 | | | $ | 70,073 | |
| † | A zero balance may reflect actual amounts rounding to less than one thousand. |
| (a) | Administrative Class Shares liquidated at the close of business on June 21, 2024. |
| | | | | | |
| 16 | | PIMCO EQUITY SERIES | | | See Accompanying Notes | |
| | | | | | | | | | | | | | | | | | | | | | |
| | | | | | | | | | | | | | | | | |
PIMCO REALPATH® Blend 2045 Fund | | | PIMCO REALPATH® Blend 2050 Fund | | | PIMCO REALPATH® Blend 2055 Fund | | | PIMCO REALPATH® Blend 2060 Fund | | | PIMCO REALPATH® Blend 2065 Fund | | | PIMCO REALPATH® Blend Income Fund | |
| | | | | |
| | | | | | | | | | | | | | | | | | | | | | |
| | | | | |
| $ | 67 | | | $ | 59 | | | $ | 54 | | | $ | 25 | | | $ | 4 | | | $ | 39 | |
| | 9,712 | | | | 9,605 | | | | 7,764 | | | | 2,637 | | | | 252 | | | | 3,075 | |
| | 4,231 | | | | 2,922 | | | | 1,967 | | | | 556 | | | | 44 | | | | 9,556 | |
| | 14,010 | | | | 12,586 | | | | 9,785 | | | | 3,218 | | | | 300 | | | | 12,670 | |
| | | | | |
| | | | | | | | | | | | | | | | | | | | | | |
| | | | | |
| | 150 | | | | 141 | | | | 110 | | | | 36 | | | | 3 | | | | 34 | |
| | 112 | | | | 109 | | | | 83 | | | | 26 | | | | 3 | | | | 104 | |
| | 18 | (a) | | | 12 | (a) | | | 11 | (a) | | | 1 | (a) | | | 0 | (a) | | | 19 | (a) |
| | 14 | | | | 18 | | | | 12 | | | | 2 | | | | 0 | | | | 47 | |
| | 26 | | | | 25 | | | | 19 | | | | 6 | | | | 0 | | | | 19 | |
| | 23 | | | | 20 | | | | 14 | | | | 3 | | | | 0 | | | | 12 | |
| | 25 | | | | 23 | | | | 18 | | | | 6 | | | | 0 | | | | 17 | |
| | 0 | | | | 0 | | | | 0 | | | | 0 | | | | 1 | | | | 0 | |
| | 368 | | | | 348 | | | | 267 | | | | 80 | | | | 7 | | | | 252 | |
| | (27 | ) | | | (25 | ) | | | (19 | ) | | | (6 | ) | | | 0 | | | | (19 | ) |
| | 341 | | | | 323 | | | | 248 | | | | 74 | | | | 7 | | | | 233 | |
| | | | | |
| | 13,669 | | | | 12,263 | | | | 9,537 | | | | 3,144 | | | | 293 | | | | 12,437 | |
| | | | | |
| | | | | | | | | | | | | | | | | | | | | | |
| | | | | |
| | 1,286 | | | | 2,868 | | | | (4 | ) | | | 4 | | | | (5 | ) | | | 2,496 | |
| | (577 | ) | | | (533 | ) | | | (216 | ) | | | (20 | ) | | | 0 | | | | (5,335 | ) |
| | 3,039 | | | | 3,037 | | | | 2,449 | | | | 821 | | | | 76 | | | | 783 | |
| | 0 | | | | 0 | | | | 0 | | | | 0 | | | | 0 | | | | (1,416 | ) |
| | 417 | | | | 408 | | | | 424 | | | | 210 | | | | 20 | | | | 185 | |
| | | | | |
| | 4,165 | | | | 5,780 | | | | 2,653 | | | | 1,015 | | | | 91 | | | | (3,287 | ) |
| | | | | |
| | | | | | | | | | | | | | | | | | | | | | |
| | | | | |
| | 56,177 | | | | 55,182 | | | | 47,855 | | | | 16,934 | | | | 1,739 | | | | 13,190 | |
| | (1,057 | ) | | | (228 | ) | | | (174 | ) | | | (45 | ) | | | (5 | ) | | | 1,350 | |
| | 0 | | | | 0 | | | | 0 | | | | 0 | | | | 0 | | | | (86 | ) |
| | 106 | | | | 84 | | | | 44 | | | | 1 | | | | (2 | ) | | | 123 | |
| | | | | |
| | 55,226 | | | | 55,038 | | | | 47,725 | | | | 16,890 | | | | 1,732 | | | | 14,577 | |
| | | | | |
| $ | 73,060 | | | $ | 73,081 | | | $ | 59,915 | | | $ | 21,049 | | | $ | 2,116 | | | $ | 23,727 | |
| | | | | | | | | | | | |
| | | | ANNUAL FINANCIAL AND OTHER INFORMATION | | | | | | | JUNE 30, 2024 | | | 17 |
| | | | |
| Statements of Changes in Net Assets | | | | |
| | | | | | | | | | | | | | | | | | | | | | | | | | | | | | | | |
| | | PIMCO REALPATH® Blend 2025 Fund | | | PIMCO REALPATH® Blend 2030 Fund | | | PIMCO REALPATH® Blend 2035 Fund | | | PIMCO REALPATH® Blend 2040 Fund | |
| | | | | | | | |
| (Amounts in thousands†) | | Year Ended
June 30, 2024 | | | Year Ended
June 30, 2023 | | | Year Ended
June 30, 2024 | | | Year Ended
June 30, 2023 | | | Year Ended
June 30, 2024 | | | Year Ended
June 30, 2023 | | | Year Ended
June 30, 2024 | | | Year Ended
June 30, 2023 | |
| | | | | | | | |
Increase (Decrease) in Net Assets from: | | | | | | | | | | | | | | | | | | | | | | | | | | | | | | | | |
| | | | | | | | |
Operations: | | | | | | | | | | | | | | | | | | | | | | | | | | | | | | | | |
| | | | | | | | |
Net investment income (loss) | | $ | 16,150 | | | $ | 12,840 | | | $ | 19,012 | | | $ | 13,592 | | | $ | 18,060 | | | $ | 11,790 | | | $ | 15,176 | | | $ | 10,135 | |
Net realized gain (loss) | | | (56 | ) | | | (7,208 | ) | | | 682 | | | | (6,806 | ) | | | 2,676 | | | | (5,212 | ) | | | 3,082 | | | | (4,114 | ) |
Net change in unrealized appreciation (depreciation) | | | 17,824 | | | | 17,865 | | | | 34,914 | | | | 29,228 | | | | 47,598 | | | | 36,766 | | | | 51,815 | | | | 39,043 | |
| | | | | | | | |
Net Increase (Decrease) in Net Assets Resulting from Operations | | | 33,918 | | | | 23,497 | | | | 54,608 | | | | 36,014 | | | | 68,334 | | | | 43,344 | | | | 70,073 | | | | 45,064 | |
| | | | | | | | |
Distributions to Shareholders: | | | | | | | | | | | | | | | | | | | | | | | | | | | | | | | | |
| | | | | | | | |
From net investment income and/or net realized capital gains | | | | | | | | | | | | | | | | | | | | | | | | | | | | | | | | |
Institutional Class | | | (18,361 | ) | | | (12,215 | ) | | | (21,140 | ) | | | (12,793 | ) | | | (19,763 | ) | | | (10,255 | ) | | | (16,476 | ) | | | (9,073 | ) |
Administrative Class | | | (170 | )(b) | | | (1,131 | ) | | | (128 | )(b) | | | (1,130 | ) | | | (141 | )(b) | | | (873 | ) | | | (80 | )(b) | | | (546 | ) |
Class A | | | (221 | ) | | | (230 | ) | | | (282 | ) | | | (287 | ) | | | (247 | ) | | | (222 | ) | | | (245 | ) | | | (211 | ) |
| | | | | | | | |
Total Distributions(c) | | | (18,752 | ) | | | (13,576 | ) | | | (21,550 | ) | | | (14,210 | ) | | | (20,151 | ) | | | (11,350 | ) | | | (16,801 | ) | | | (9,830 | ) |
| | | | | | | | |
Fund Share Transactions: | | | | | | | | | | | | | | | | | | | | | | | | | | | | | | | | |
Net increase (decrease) resulting from Fund share transactions* | | | 10,502 | | | | 183,825 | | | | 41,237 | | | | 245,358 | | | | 70,854 | | | | 249,537 | | | | 40,064 | | | | 194,975 | |
| | | | | | | | |
Total Increase (Decrease) in Net Assets | | | 25,668 | | | | 193,746 | | | | 74,295 | | | | 267,162 | | | | 119,037 | | | | 281,531 | | | | 93,336 | | | | 230,209 | |
| | | | | | | | |
Net Assets: | | | | | | | | | | | | | | | | | | | | | | | | | | | | | | | | |
| | | | | | | | |
Beginning of year | | | 437,881 | | | | 244,135 | | | | 544,801 | | | | 277,639 | | | | 529,901 | | | | 248,370 | | | | 481,303 | | | | 251,094 | |
End of year | | $ | 463,549 | | | $ | 437,881 | | | $ | 619,096 | | | $ | 544,801 | | | $ | 648,938 | | | $ | 529,901 | | | $ | 574,639 | | | $ | 481,303 | |
| † | A zero balance may reflect actual amounts rounding to less than one thousand. |
| * | See Note 13, Shares of Beneficial Interest, in the Notes to Financial Statements. |
| (a) | Inception date of the Fund was December 30, 2022. |
| (b) | Administrative Class Shares liquidated at the close of business on June 21, 2024. |
| (c) | The tax characterization of distributions is determined in accordance with Federal income tax regulations. See Note 2, Distributions to Shareholders, in the Notes to Financial Statements for more information. |
| | | | | | |
| 18 | | PIMCO EQUITY SERIES | | | See Accompanying Notes | |
| | | | | | | | | | | | | | | | | | | | | | | | | | | | | | | | | | | | | | | | | | | | | | |
PIMCO REALPATH® Blend 2045 Fund | | | PIMCO REALPATH® Blend 2050 Fund | | | PIMCO REALPATH® Blend 2055 Fund | | | PIMCO REALPATH® Blend 2060 Fund | | | PIMCO REALPATH® Blend 2065 Fund | | | PIMCO REALPATH® Blend Income Fund | |
| | | | | | | | | | | |
Year Ended
June 30, 2024 | | | Year Ended
June 30, 2023 | | | Year Ended
June 30, 2024 | | | Year Ended
June 30, 2023 | | | Year Ended
June 30, 2024 | | | Year Ended
June 30, 2023 | | | Year Ended
June 30, 2024 | | | Year Ended
June 30, 2023 | | | Year Ended
June 30, 2024 | | | Inception date
through
June 30, 2023(a) | | | Year Ended
June 30, 2024 | | | Year Ended
June 30, 2023 | |
| | | | | | | | | | | |
| | | | | | | | | | | | | | | | | | | | | | | | | | | | | | | | | | | | | | | | | | | | | | |
| | | | | | | | | | | |
| | | | | | | | | | | | | | | | | | | | | | | | | | | | | | | | | | | | | | | | | | | | | | |
| | | | | | | | | | | |
| $ | 13,669 | | | $ | 8,796 | | | $ | 12,263 | | | $ | 7,997 | | | $ | 9,537 | | | $ | 5,540 | | | $ | 3,144 | | | $ | 1,282 | | | $ | 293 | | | $ | 40 | | | $ | 12,437 | | | $ | 11,365 | |
| | 4,165 | | | | (2,216 | ) | | | 5,780 | | | | (1,573 | ) | | | 2,653 | | | | (739 | ) | | | 1,015 | | | | (364 | ) | | | 91 | | | | 23 | | | | (3,287 | ) | | | (6,684 | ) |
| | | | | | | | | | | |
| | 55,226 | | | | 39,012 | | | | 55,038 | | | | 38,957 | | | | 47,725 | | | | 28,345 | | | | 16,890 | | | | 7,186 | | | | 1,732 | | | | 364 | | | | 14,577 | | | | 11,804 | |
| | | | | | | | | | | |
| 73,060 | | | | 45,592 | | | | 73,081 | | | | 45,381 | | | | 59,915 | | | | 33,146 | | | | 21,049 | | | | 8,104 | | | | 2,116 | | | | 427 | | | | 23,727 | | | | 16,485 | |
| | | | | | | | | | | |
| | | | | | | | | | | | | | | | | | | | | | | | | | | | | | | | | | | | | | | | | | | | | | |
| | | | | | | | | | | |
|
|
| | | | | | | | | | | | | | | | | | | | | | | | | | | | | | | | | | | | | | | | | | | | |
| | (14,675 | ) | | | (7,723 | ) | | | (13,155 | ) | | | (7,070 | ) | | | (10,264 | ) | | | (4,594 | ) | | | (3,006 | ) | | | (783 | ) | | | (248 | ) | | | (5 | ) | | | (13,906 | ) | | | (8,780 | ) |
| | (99 | )(b) | | | (518 | ) | | | (57 | )(b) | | | (534 | ) | | | (53 | )(b) | | | (230 | ) | | | (4 | )(b) | | | (12 | ) | | | (2 | )(b) | | | 0 | | | | (189 | )(b) | | | (936 | ) |
| | (151 | ) | | | (109 | ) | | | (189 | ) | | | (97 | ) | | | (119 | ) | | | (67 | ) | | | (15 | ) | | | (10 | ) | | | (3 | ) | | | 0 | | | | (756 | ) | | | (874 | ) |
| | | | | | | | | | | |
| | (14,925 | ) | | | (8,350 | ) | | | (13,401 | ) | | | (7,701 | ) | | | (10,436 | ) | | | (4,891 | ) | | | (3,025 | ) | | | (805 | ) | | | (253 | ) | | | (5 | ) | | | (14,851 | ) | | | (10,590 | ) |
| | | | | | | | | | | |
| | | | | | | | | | | | | | | | | | | | | | | | | | | | | | | | | | | | | | | | | | | | | | |
| 19,341 | | | | 189,263 | | | | 145 | | | | 153,762 | | | | 50,680 | | | | 124,095 | | | | 54,477 | | | | 56,357 | | | | 12,176 | | | | 4,691 | | | | (19,960 | ) | | | 115,358 | |
| | | | | | | | | | | |
| | 77,476 | | | | 226,505 | | | | 59,825 | | | | 191,442 | | | | 100,159 | | | | 152,350 | | | | 72,501 | | | | 63,656 | | | | 14,039 | | | | 5,113 | | | | (11,084 | ) | | | 121,253 | |
| | | | | | | | | | | |
| | | | | | | | | | | | | | | | | | | | | | | | | | | | | | | | | | | | | | | | | | | | | | |
| | | | | | | | | | | |
| | 457,043 | | | | 230,538 | | | | 420,714 | | | | 229,272 | | | | 308,478 | | | | 156,128 | | | | 86,977 | | | | 23,321 | | | | 5,113 | | | | 0 | | | | 346,086 | | | | 224,833 | |
| $ | 534,519 | | | $ | 457,043 | | | $ | 480,539 | | | $ | 420,714 | | | $ | 408,637 | | | $ | 308,478 | | | $ | 159,478 | | | $ | 86,977 | | | $ | 19,152 | | | $ | 5,113 | | | $ | 335,002 | | | $ | 346,086 | |
| | | | | | | | | | | | |
| | | | ANNUAL FINANCIAL AND OTHER INFORMATION | | | | | | | JUNE 30, 2024 | | | 19 |
| | | | | | |
| Schedule of Investments | | PIMCO REALPATH® Blend 2025 Fund | | | | |
(Amounts in thousands*, except number of shares, contracts, units and ounces, if any)
| | | | | | | | | | | | |
| | | | | SHARES | | | | | MARKET
VALUE
(000S) | |
| INVESTMENTS IN SECURITIES 37.6% | |
| |
| MUTUAL FUNDS 37.5% | |
| | | | |
Vanguard Developed Markets Index Fund ‘Institutional’ | | | | | 3,168,761 | | | $ | | | 50,257 | |
| | | |
Vanguard Emerging Markets Stock Index Fund ‘Institutional’ | | | 715,723 | | | | | | 19,868 | |
| | | | |
Vanguard Institutional Index Fund ‘Institutional’ | | | | | 220,833 | | | | | | 99,207 | |
| | | | |
Vanguard Small-Cap Index Fund ‘Institutional’ | | | | | 42,810 | | | | | | 4,478 | |
| | | | | | | | | | | | |
Total Mutual Funds (Cost $129,689) | | | | | | 173,810 | |
| | | | | | | | | | | | |
| |
| SHORT-TERM INSTRUMENTS 0.1% | |
| |
| REPURCHASE AGREEMENTS (b) 0.1% | |
| | | | | | | | | | | 544 | |
| | | | | | | | | | | | |
Total Short-Term Instruments
(Cost $544) | | | | | | 544 | |
| | | | | | | | | | | | |
| | | | |
| | | | | | | | | | | | |
Total Investments in Securities
(Cost $130,232) | | | | | | 174,354 | |
| | | | | | | | | | | | |
| | | | | | | | | | | | |
| | | | | SHARES | | | | | MARKET
VALUE
(000S) | |
| INVESTMENTS IN AFFILIATES 61.8% | |
| |
| MUTUAL FUNDS (a) 57.0% | |
| | | | |
PIMCO Emerging Markets Local Currency and Bond Fund | | | | | 2,626,298 | | | $ | | | 14,865 | |
| | | | |
PIMCO High Yield Fund | | | | | 506,026 | | | | | | 4,013 | |
| | | | |
PIMCO Income Fund | | | | | 4,793,185 | | | | | | 50,233 | |
| | | | |
PIMCO International Bond Fund (U.S. Dollar-Hedged) | | | | | 1,325,071 | | | | | | 12,999 | |
| | | | |
PIMCO Long-Term Real Return Fund | | | | | 3,523,778 | | | | | | 42,250 | |
| | | | |
PIMCO Long-Term U.S. Government Fund | | | | | 2,655,083 | | | | | | 37,410 | |
| | | | |
PIMCO Real Return Fund | | | | | 2,282,932 | | | | | | 22,715 | |
| | | | |
PIMCO Total Return Fund | | | | | 9,398,393 | | | | | | 79,792 | |
| | | | | | | | | | | | |
| Total Mutual Funds (Cost $291,228) | | | | | | 264,277 | |
| | | | | | | | | | | | |
| | | | | | | | | | | | |
| | | | | SHARES | | | | | MARKET
VALUE
(000S) | |
| SHORT-TERM INSTRUMENTS 4.8% | |
| |
| CENTRAL FUNDS USED FOR CASH MANAGEMENT PURPOSES 4.8% | |
| | | | |
PIMCO Short-Term Floating NAV Portfolio III | | | | | 2,284,864 | | | $ | | | 22,229 | |
| | | | | | | | | | | | |
| Total Short-Term Instruments (Cost $22,214) | | | | | | | | | | | 22,229 | |
| | | | | | | | | | | | |
| | | | |
| | | | | | | | | | | | |
| Total Investments in Affiliates (Cost $313,442) | | | | | | | | | | | 286,506 | |
| | | | |
| | | | | | | | | | | | |
Total Investments 99.4%
(Cost $443,674) | | | | | | | | $ | | | 460,860 | |
| |
Financial Derivative
Instruments (c)(d) 0.2% (Cost or Premiums, net $2,268) | | | | | | 907 | |
| |
| Other Assets and Liabilities, net 0.4% | | | | | | 1,782 | |
| | | | | | | | | | | | |
| Net Assets 100.0% | | | | | | | | $ | | | 463,549 | |
| | | | | | | | | | | | |
NOTES TO SCHEDULE OF INVESTMENTS:
| * | A zero balance may reflect actual amounts rounding to less than one thousand. |
| (a) | Institutional Class Shares of each Fund. |
BORROWINGS AND OTHER FINANCING TRANSACTIONS
(b) REPURCHASE AGREEMENTS:
| | | | | | | | | | | | | | | | | | | | | | | | | | | | | | |
| Counterparty | | Lending
Rate | | | Settlement
Date | | | Maturity
Date | | | Principal
Amount | | | Collateralized By | | Collateral
(Received) | | | Repurchase
Agreements,
at Value | | | Repurchase
Agreement
Proceeds
to be
Received(1) | |
| FICC | | | 2.600 | % | | | 06/28/2024 | | | | 07/01/2024 | | | $ | 544 | | | U.S. Treasury Inflation Protected Securities 0.625% due 01/15/2026 | | $ | (555 | ) | | $ | 544 | | | $ | 544 | |
| | | | | | | | | | | | | | | | | | | | | | | | | | | | | | |
Total Repurchase Agreements | | | | | $ | (555 | ) | | $ | 544 | | | $ | 544 | |
| | | | | | | | | | | | | | | |
BORROWINGS AND OTHER FINANCING TRANSACTIONS SUMMARY
The following is a summary by counterparty of the market value of Borrowings and Other Financing Transactions and collateral pledged/(received) as of June 30, 2024:
| | | | | | | | | | | | | | | | | | | | | | | | |
| Counterparty | | Repurchase
Agreement
Proceeds
to be
Received(1) | | | Payable for
Reverse
Repurchase
Agreements | | | Payable for
Sale-Buyback
Transactions | | | Total
Borrowings and
Other Financing
Transactions | | | Collateral
Pledged/(Received) | | | Net Exposure(2) | |
Global/Master Repurchase Agreement | |
FICC | | $ | 544 | | | $ | 0 | | | $ | 0 | | | $ | 544 | | | $ | (555 | ) | | $ | (11 | ) |
| | | | | | | | | | | | | | | | | | | | | | | | |
Total Borrowings and Other Financing Transactions | | $ | 544 | | | $ | 0 | | | $ | 0 | | | | | | | | | | | | | |
| | | | | | | | | | | | | | | | | | | | | | | | |
| (1) | Includes accrued interest. |
| (2) | Net Exposure represents the net receivable/(payable) that would be due from/to the counterparty in the event of default. Exposure from borrowings and other financing transactions can only be netted across transactions governed under the same master agreement with the same legal entity. See Note 8, Master Netting Arrangements, in the Notes to Financial Statements for more information. |
| | | | | | |
| 20 | | PIMCO EQUITY SERIES | | | See Accompanying Notes | |
(c) FINANCIAL DERIVATIVE INSTRUMENTS: EXCHANGE-TRADED OR CENTRALLY CLEARED
PURCHASED OPTIONS:
OPTIONS ON INDICES
| | | | | | | | | | | | | | | | | | | | | | | | |
| Description | | Strike
Value | | | Expiration
Date | | | # of
Contracts | | | Notional
Amount | | | Cost | | | Market
Value | |
Put - CBOE S&P 500 | | | 3,600.000 | | | | 06/28/2024 | | | | 85 | | | $ | 0 | | | $ | 0 | | | $ | 0 | |
Put - CBOE S&P 500 | | | 3,575.000 | | | | 09/20/2024 | | | | 93 | | | | 9 | | | | 555 | | | | 21 | |
Put - CBOE S&P 500 | | | 3,775.000 | | | | 12/20/2024 | | | | 97 | | | | 10 | | | | 564 | | | | 105 | |
Put - CBOE S&P 500 | | | 4,075.000 | | | | 03/21/2025 | | | | 87 | | | | 9 | | | | 554 | | | | 245 | |
Put - CBOE S&P 500 | | | 4,500.000 | | | | 06/20/2025 | | | | 95 | | | | 10 | | | | 595 | | | | 621 | |
| | | | | | | | | | | | | | | | | | | | | | | | |
Total Purchased Options | | | | | | | $ | 2,268 | | | $ | 992 | |
| | | | | | | | | |
FINANCIAL DERIVATIVE INSTRUMENTS: EXCHANGE-TRADED OR CENTRALLY CLEARED SUMMARY
The following is a summary of the market value and variation margin of Exchange-Traded or Centrally Cleared Financial Derivative Instruments as of June 30, 2024:
| | | | | | | | | | | | | | | | | | | | | | | | | | | | | | | | | | | | |
| | | Financial Derivative Assets | | | | | | Financial Derivative Liabilities | |
| | | Market Value | | | Variation Margin
Asset | | | Total | | | | | | Market Value | | | Variation Margin
Liability | | | Total | |
| | | Purchased
Options | | | Futures | | | Swap
Agreements | | | | | | Written
Options | | | Futures | | | Swap
Agreements | |
Total Exchange-Traded or Centrally Cleared | | $ | 992 | | | $ | 0 | | | $ | 0 | | | $ | 992 | | | | | | | $ | 0 | | | $ | 0 | | | $ | 0 | | | $ | 0 | |
| | | | | | | | | | | | | | | | | | | | | | | | | | | | | | | | | | | | |
(d) FINANCIAL DERIVATIVE INSTRUMENTS: OVER THE COUNTER
SWAP AGREEMENTS:
TOTAL RETURN SWAPS ON COMMODITY AND EQUITY INDICES
| | | | | | | | | | | | | | | | | | | | | | | | | | | | | | | | | | |
| Counterparty | | Pay/Receive(1) | | Underlying
Reference | | # of Units | | | Financing Rate | | Payment
Frequency | | Maturity
Date | | Notional
Amount | | | Premiums
Paid/(Received) | | | Unrealized
Appreciation/
(Depreciation) | | | Swap Agreements,
at Value | |
| | Asset | | | Liability | |
GST | | Receive | | BERYTR Index | | | 18,902 | | | 5.400% (3-Month U.S. Treasury Bill rate plus a specified spread) | | Monthly | | 02/18/2025 | | $ | 9,067 | | | $ | 0 | | | $ | (13 | ) | | $ | 0 | | | $ | (13 | ) |
| | | | | | | | | | | |
MYI | | Receive | | FNRETR Index | | | 545 | | | 5.670% (1-Month USD-LIBOR plus a specified spread) | | Monthly | | 09/11/2024 | | | 12,435 | | | | 0 | | | | (51 | ) | | | 0 | | | | (51 | ) |
| | Receive | | FNRETR Index | | | 187 | | | 5.730% (1-Month USD-LIBOR plus a specified spread) | | Monthly | | 04/02/2025 | | | 4,267 | | | | 0 | | | | (18 | ) | | | 0 | | | | (18 | ) |
| | Receive | | FNRETR Index | | | 30 | | | 5.740% (1-Month USD-LIBOR plus a specified spread) | | Monthly | | 04/02/2025 | | | 685 | | | | 0 | | | | (3 | ) | | | 0 | | | | (3 | ) |
| | | | | | | | | | | | | | | | | | | | | | | | |
Total Swap Agreements | | | $ | 0 | | | $ | (85 | ) | | $ | 0 | | | $ | (85 | ) |
| | | | | | | | | | | | | | | | | |
FINANCIAL DERIVATIVE INSTRUMENTS: OVER THE COUNTER SUMMARY
The following is a summary by counterparty of the market value of OTC financial derivative instruments and collateral pledged/(received) as of June 30, 2024:
| | | | | | | | | | | | | | | | | | | | | | | | | | | | | | | | | | | | | | | | | | | | | | | | |
| | | Financial Derivative Assets | | | | | | Financial Derivative Liabilities | | | | | | | | | | |
| Counterparty | | Forward
Foreign
Currency
Contracts | | | Purchased
Options | | | Swap
Agreements | | | Total
Over the
Counter | | | | | | Forward
Foreign
Currency
Contracts | | | Written
Options | | | Swap
Agreements | | | Total
Over the
Counter | | | Net Market
Value of OTC
Derivatives | | | Collateral
Pledged/
(Received) | | | Net
Exposure(2) | |
GST | | $ | 0 | | | $ | 0 | | | $ | 0 | | | $ | 0 | | | | | | | $ | 0 | | | $ | 0 | | | $ | (13 | ) | | $ | (13 | ) | | $ | (13 | ) | | $ | 0 | | | $ | (13 | ) |
MYI | | | 0 | | | | 0 | | | | 0 | | | | 0 | | | | | | | | 0 | | | | 0 | | | | (72 | ) | | | (72 | ) | | | (72 | ) | | | (100 | ) | | | (172 | ) |
| | | | | | | | | | | | | | | | | | | | | | | | | | | | | | | | | | | | | | | | | | | | | | | | |
Total Over the Counter | | $ | 0 | | | $ | 0 | | | $ | 0 | | | $ | 0 | | | | | | | $ | 0 | | | $ | 0 | | | $ | (85 | ) | | $ | (85 | ) | | | | | | | | | | | | |
| | | | | | | | | | | | | | | | | | | | | | | | | | | | | | | | | | | | | | | | | | | | | | | | |
| (1) | Receive represents that the Fund receives payments for any positive net return on the underlying reference. The Fund makes payments for any negative net return on such underlying reference. Pay represents that the Fund receives payments for any negative net return on the underlying reference. The Fund makes payments for any positive net return on such underlying reference. |
| (2) | Net Exposure represents the net receivable/(payable) that would be due from/to the counterparty in the event of default. Exposure from OTC financial derivative instruments can only be netted across transactions governed under the same master agreement with the same legal entity. See Note 8, Master Netting Arrangements, in the Notes to Financial Statements for more information. |
| | | | | | | | | | | | |
| See Accompanying Notes | | | ANNUAL FINANCIAL AND OTHER INFORMATION | | | | | | | JUNE 30, 2024 | | | 21 |
| | | | | | |
| Schedule of Investments | | PIMCO REALPATH® Blend 2025 Fund | | (Cont.) | | June 30, 2024 |
FAIR VALUE OF FINANCIAL DERIVATIVE INSTRUMENTS
The following is a summary of the fair valuation of the Fund’s derivative instruments categorized by risk exposure. See Note 7, Principal and Other Risks, in the Notes to Financial Statements on risks of the Fund.
Fair Values of Financial Derivative Instruments on the Statements of Assets and Liabilities as of June 30, 2024:
| | | | | | | | | | | | | | | | | | | | | | | | |
| | | Derivatives not accounted for as hedging instruments | |
| | | Commodity
Contracts | | | Credit
Contracts | | | Equity
Contracts | | | Foreign
Exchange
Contracts | | | Interest
Rate Contracts | | | Total | |
Financial Derivative Instruments - Assets | |
Exchange-traded or centrally cleared | |
Purchased Options | | $ | 0 | | | $ | 0 | | | $ | 992 | | | $ | 0 | | | $ | 0 | | | $ | 992 | |
| | | | | | | | | | | | | | | | | | | | | | | | |
|
Financial Derivative Instruments - Liabilities | |
Over the counter | |
Swap Agreements | | $ | 13 | | | $ | 0 | | | $ | 72 | | | $ | 0 | | | $ | 0 | | | $ | 85 | |
| | | | | | | | | | | | | | | | | | | | | | | | |
The effect of Financial Derivative Instruments on the Statements of Operations for the period ended June 30, 2024:
| | | | | | | | | | | | | | | | | | | | | | | | |
| | | Derivatives not accounted for as hedging instruments | |
| | | Commodity
Contracts | | | Credit
Contracts | | | Equity
Contracts | | | Foreign
Exchange
Contracts | | | Interest
Rate Contracts | | | Total | |
Net Realized Gain (Loss) on Financial Derivative Instruments | |
Exchange-traded or centrally cleared | |
Purchased Options | | $ | 0 | | | $ | 0 | | | $ | (2,322 | ) | | $ | 0 | | | $ | 0 | | | $ | (2,322 | ) |
Written Options | | | 0 | | | | 0 | | | | 601 | | | | 0 | | | | 0 | | | | 601 | |
| | | | | | | | | | | | | | | | | | | | | | | | |
| | $ | 0 | | | $ | 0 | | | $ | (1,721 | ) | | $ | 0 | | | $ | 0 | | | $ | (1,721 | ) |
| | | | | | | | | | | | | | | | | | | | | | | | |
Over the counter | |
Swap Agreements | | $ | (154 | ) | | $ | 0 | | | $ | 447 | | | $ | 0 | | | $ | 0 | | | $ | 293 | |
| | | | | | | | | | | | | | | | | | | | | | | | |
| | $ | (154 | ) | | $ | 0 | | | $ | (1,274 | ) | | $ | 0 | | | $ | 0 | | | $ | (1,428 | ) |
| | | | | | | | | | | | | | | | | | | | | | | | |
|
Net Change in Unrealized Appreciation (Depreciation) on Financial Derivative Instruments | |
Exchange-traded or centrally cleared | |
Purchased Options | | $ | 0 | | | $ | 0 | | | $ | 290 | | | $ | 0 | | | $ | 0 | | | $ | 290 | |
Written Options | | | 0 | | | | 0 | | | | (521 | ) | | | 0 | | | | 0 | | | | (521 | ) |
| | | | | | | | | | | | | | | | | | | | | | | | |
| | $ | 0 | | | $ | 0 | | | $ | (231 | ) | | $ | 0 | | | $ | 0 | | | $ | (231 | ) |
| | | | | | | | | | | | | | | | | | | | | | | | |
Over the counter | |
Swap Agreements | | $ | 156 | | | $ | 0 | | | $ | (10 | ) | | $ | 0 | | | $ | 0 | | | $ | 146 | |
| | | | | | | | | | | | | | | | | | | | | | | | |
| | $ | 156 | | | $ | 0 | | | $ | (241 | ) | | $ | 0 | | | $ | 0 | | | $ | (85 | ) |
| | | | | | | | | | | | | | | | | | | | | | | | |
FAIR VALUE MEASUREMENTS
The following is a summary of the fair valuations according to the inputs used as of June 30, 2024 in valuing the Fund’s assets and liabilities:
| | | | | | | | | | | | | | | | |
| Category and Subcategory | | Level 1 | | | Level 2 | | | Level 3 | | | Fair
Value at
06/30/2024 | |
Investments in Securities, at Value | |
Mutual Funds | | $ | 173,810 | | | $ | 0 | | | $ | 0 | | | $ | 173,810 | |
Short-Term Instruments | |
Repurchase Agreements | | | 0 | | | | 544 | | | | 0 | | | | 544 | |
| | | | | | | | | | | | | | | | |
| | $ | 173,810 | | | $ | 544 | | | $ | 0 | | | $ | 174,354 | |
| | | | | | | | | | | | | | | | |
|
Investments in Affiliates, at Value | |
Mutual Funds | | | 264,277 | | | | 0 | | | | 0 | | | | 264,277 | |
Short-Term Instruments | |
Central Funds Used for Cash Management Purposes | | | 22,229 | | | | 0 | | | | 0 | | | | 22,229 | |
| | | | | | | | | | | | | | | | |
| | $ | 286,506 | | | $ | 0 | | | $ | 0 | | | $ | 286,506 | |
| | | | | | | | | | | | | | | | |
| | | | |
Total Investments | | $ | 460,316 | | | $ | 544 | | | $ | 0 | | | $ | 460,860 | |
| | | | | | | | | | | | | | | | |
| | | | | | | | | | | | | | | | |
| Category and Subcategory | | Level 1 | | | Level 2 | | | Level 3 | | | Fair
Value at
06/30/2024 | |
Financial Derivative Instruments - Assets | |
Exchange-traded or centrally cleared | | $ | 0 | | | $ | 992 | | | $ | 0 | | | $ | 992 | |
| | | | | | | | | | | | | | | | |
|
Financial Derivative Instruments - Liabilities | |
Over the counter | | $ | 0 | | | $ | (85 | ) | | $ | 0 | | | $ | (85 | ) |
| | | | | | | | | | | | | | | | |
| | | | |
Total Financial Derivative Instruments | | $ | 0 | | | $ | 907 | | | $ | 0 | | | $ | 907 | |
| | | | | | | | | | | | | | | | |
| | | | |
Totals | | $ | 460,316 | | | $ | 1,451 | | | $ | 0 | | | $ | 461,767 | |
| | | | | | | | | | | | | | | | |
There were no significant transfers into or out of Level 3 during the period ended June 30, 2024.
| | | | | | |
| 22 | | PIMCO EQUITY SERIES | | | See Accompanying Notes | |
| | | | | | |
| Schedule of Investments | | PIMCO REALPATH® Blend 2030 Fund | | | | June 30, 2024 |
(Amounts in thousands*, except number of shares, contracts, units and ounces, if any)
| | | | | | | | | | | | |
| | | | | SHARES | | | | | MARKET
VALUE
(000S) | |
| INVESTMENTS IN SECURITIES 51.3% | |
| |
| MUTUAL FUNDS 51.1% | |
| | | | |
Vanguard Developed Markets Index Fund ‘Institutional’ | | | | | 3,654,980 | | | $ | | | 90,607 | |
| | | | |
Vanguard Emerging Markets Stock Index Fund ‘Institutional’ | | | | | 1,231,990 | | | | | | 34,200 | |
| | | | |
Vanguard Institutional Index Fund ‘Institutional’ | | | | | 402,294 | | | | | | 180,723 | |
| | | | |
Vanguard Small-Cap Index Fund ‘Institutional’ | | | | | 106,492 | | | | | | 11,138 | |
| | | | | | | | | | | | |
Total Mutual Funds (Cost $240,003) | | | | | | 316,668 | |
| | | | | | | | | | | | |
| |
| | | | | PRINCIPAL
AMOUNT
(000S) | | | | | | |
| SHORT-TERM INSTRUMENTS 0.2% | |
| |
| REPURCHASE AGREEMENTS (d) 0.1% | |
| | | | | | | | | | | 548 | |
| | | | | | | | | | | | |
| |
| U.S. TREASURY BILLS 0.1% | |
5.376% due 07/11/2024 (a)(b)(e) | | $ | | | 495 | | | | | | 494 | |
| | | | | | | | | | | | |
Total Short-Term Instruments
(Cost $1,042) | | | 1,042 | |
| | | | | | | | | | | | |
| | | | |
| | | | | | | | | | | | |
| Total Investments in Securities (Cost $241,045) | | | 317,710 | |
| | | | | | | | | | | | |
| | | | | | | | | | | | |
| | | | | SHARES | | | | | MARKET
VALUE
(000S) | |
| INVESTMENTS IN AFFILIATES 48.4% | |
| |
| MUTUAL FUNDS (c) 43.4% | |
| | | | |
PIMCO Emerging Markets Local Currency and Bond Fund | | | | | 2,842,851 | | | $ | | | 16,090 | |
| | | | |
PIMCO High Yield Fund | | | | | 517,296 | | | | | | 4,102 | |
| | | | |
PIMCO Income Fund | | | | | 4,381,880 | | | | | | 45,922 | |
| | | | |
PIMCO International Bond Fund (U.S. Dollar-Hedged) | | | | | 1,144,075 | | | | | | 11,223 | |
| | | | |
PIMCO Long-Term Real Return Fund | | | | | 4,317,669 | | | | | | 51,769 | |
| | | | |
PIMCO Long-Term U.S. Government Fund | | | | | 3,326,382 | | | | | | 46,869 | |
| | | | |
PIMCO Real Return Fund | | | | | 2,438,825 | | | | | | 24,266 | |
| | | | |
PIMCO Total Return Fund | | | | | 8,004,322 | | | | | | 67,957 | |
| | | | | | | | | | | | |
| Total Mutual Funds (Cost $295,261) | | | 268,198 | |
| | | | | | | | | | | | |
| |
| | | | | | | | | | | | |
| | | | | SHARES | | | | | MARKET
VALUE
(000S) | |
| SHORT-TERM INSTRUMENTS 5.0% | |
| |
| CENTRAL FUNDS USED FOR CASH MANAGEMENT PURPOSES 5.0% | |
| | | | |
PIMCO Short-Term Floating NAV Portfolio III | | | | | 3,202,039 | | | $ | | | 31,153 | |
| | | | | | | | | | | | |
| Total Short-Term Instruments (Cost $31,141) | | | | | | | | | | | 31,153 | |
| | | | | | | | | | | | |
| | | | |
| | | | | | | | | | | | |
| Total Investments in Affiliates (Cost $326,402) | | | | | | 299,351 | |
| | | | |
| | | | | | | | | | | | |
Total Investments 99.7%
(Cost $567,447) | | | $ | | | 617,061 | |
| |
Financial Derivative
Instruments (f)(g) 0.2% (Cost or Premiums, net $2,916) | | | | | | 1,189 | |
| |
| Other Assets and Liabilities, net 0.1% | | | | | | 846 | |
| | | | | | | | | | | | |
| Net Assets 100.0% | | | | | | | | $ | | | 619,096 | |
| | | | | | | | | | | | |
NOTES TO SCHEDULE OF INVESTMENTS:
| * | A zero balance may reflect actual amounts rounding to less than one thousand. |
| (a) | Coupon represents a weighted average yield to maturity. |
| (c) | Institutional Class Shares of each Fund. |
BORROWINGS AND OTHER FINANCING TRANSACTIONS
(d) REPURCHASE AGREEMENTS:
| | | | | | | | | | | | | | | | | | | | | | | | | | | | | | |
| Counterparty | | Lending
Rate | | | Settlement
Date | | | Maturity
Date | | | Principal
Amount | | | Collateralized By | | Collateral
(Received) | | | Repurchase
Agreements,
at Value | | | Repurchase
Agreement
Proceeds
to be
Received(1) | |
| FICC | | | 2.600 | % | | | 06/28/2024 | | | | 07/01/2024 | | | $ | 548 | | | U.S. Treasury Inflation Protected Securities 0.625% due 01/15/2026 | | $ | (559 | ) | | $ | 548 | | | $ | 548 | |
| | | | | | | | | | | | | | | | | | | | | | | | | | | | | | |
Total Repurchase Agreements | | | | | $ | (559 | ) | | $ | 548 | | | $ | 548 | |
| | | | | | | | | | | | | | | |
BORROWINGS AND OTHER FINANCING TRANSACTIONS SUMMARY
The following is a summary by counterparty of the market value of Borrowings and Other Financing Transactions and collateral pledged/(received) as of June 30, 2024:
| | | | | | | | | | | | | | | | | | | | | | | | |
| Counterparty | | Repurchase
Agreement
Proceeds
to be
Received(1) | | | Payable for
Reverse
Repurchase
Agreements | | | Payable for
Sale-Buyback
Transactions | | | Total
Borrowings and
Other Financing
Transactions | | | Collateral
Pledged/(Received) | | | Net Exposure(2) | |
Global/Master Repurchase Agreement | |
FICC | | $ | 548 | | | $ | 0 | | | $ | 0 | | | $ | 548 | | | $ | (559 | ) | | $ | (11 | ) |
| | | | | | | | | | | | | | | | | | | | | | | | |
Total Borrowings and Other Financing Transactions | | $ | 548 | | | $ | 0 | | | $ | 0 | | | | | | | | | | | | | |
| | | | | | | | | | | | | | | | | | | | | | | | |
| (e) | Securities with an aggregate market value of $138 have been pledged as collateral as of June 30, 2024 for equity short sales and equity options as governed by prime brokerage agreements and agreements governing listed equity option transactions. |
| (1) | Includes accrued interest. |
| (2) | Net Exposure represents the net receivable/(payable) that would be due from/to the counterparty in the event of default. Exposure from borrowings and other financing transactions can only be netted across transactions governed under the same master agreement with the same legal entity. See Note 8, Master Netting Arrangements, in the Notes to Financial Statements for more information. |
| | | | | | | | | | | | |
| See Accompanying Notes | | | ANNUAL FINANCIAL AND OTHER INFORMATION | | | | | | | JUNE 30, 2024 | | | 23 |
| | | | | | |
| Schedule of Investments | | PIMCO REALPATH® Blend 2030 Fund | | (Cont.) | | |
(f) FINANCIAL DERIVATIVE INSTRUMENTS: EXCHANGE-TRADED OR CENTRALLY CLEARED
PURCHASED OPTIONS:
OPTIONS ON INDICES
| | | | | | | | | | | | | | | | | | | | | | | | |
| Description | | Strike
Value | | | Expiration
Date | | | # of
Contracts | | | Notional
Amount | | | Cost | | | Market
Value | |
Put - CBOE S&P 500 | | | 3,575.000 | | | | 09/20/2024 | | | | 116 | | | $ | 12 | | | $ | 692 | | | $ | 26 | |
Put - CBOE S&P 500 | | | 3,775.000 | | | | 12/20/2024 | | | | 122 | | | | 12 | | | | 709 | | | | 132 | |
Put - CBOE S&P 500 | | | 4,075.000 | | | | 03/21/2025 | | | | 114 | | | | 11 | | | | 726 | | | | 320 | |
Put - CBOE S&P 500 | | | 4,500.000 | | | | 06/20/2025 | | | | 126 | | | | 13 | | | | 789 | | | | 824 | |
| | | | | | | | | | | | | | | | | | | | | | | | |
Total Purchased Options | | | $ | 2,916 | | | $ | 1,302 | |
| | | | | | | | | | | | | |
FINANCIAL DERIVATIVE INSTRUMENTS: EXCHANGE-TRADED OR CENTRALLY CLEARED SUMMARY
The following is a summary of the market value and variation margin of Exchange-Traded or Centrally Cleared Financial Derivative Instruments as of June 30, 2024:
| | | | | | | | | | | | | | | | | | | | | | | | | | | | | | | | | | | | |
| | | Financial Derivative Assets | | | | | | Financial Derivative Liabilities | |
| | | Market Value | | | Variation Margin
Asset | | | Total | | | | | | Market Value | | | Variation Margin
Liability | | | Total | |
| | | Purchased
Options | | | Futures | | | Swap
Agreements | | | | | | Written
Options | | | Futures | | | Swap
Agreements | |
Total Exchange-Traded or Centrally Cleared | | $ | 1,302 | | | $ | 0 | | | $ | 0 | | | $ | 1,302 | | | | | | | $ | 0 | | | $ | 0 | | | $ | 0 | | | $ | 0 | |
| | | | | | | | | | | | | | | | | | | | | | | | | | | | | | | | | | | | |
(g) FINANCIAL DERIVATIVE INSTRUMENTS: OVER THE COUNTER
SWAP AGREEMENTS:
TOTAL RETURN SWAPS ON COMMODITY AND EQUITY INDICES
| | | | | | | | | | | | | | | | | | | | | | | | | | | | | | | | | | |
| Counterparty | | Pay/Receive(1) | | Underlying
Reference | | # of Units | | | Financing Rate | | Payment
Frequency | | Maturity
Date | | Notional
Amount | | | Premiums
Paid/(Received) | | | Unrealized
Appreciation/
(Depreciation) | | | Swap Agreements,
at Value | |
| | Asset | | | Liability | |
GST | | Receive | | BERYTR Index | | | 22,255 | | | 5.400% (3-Month U.S. Treasury Bill rate plus a specified spread) | | Monthly | | 02/18/2025 | | $ | 10,676 | | | $ | 0 | | | $ | (16 | ) | | $ | 0 | | | $ | (16 | ) |
| | | | | | | | | | | |
MYI | | Receive | | FNRETR Index | | | 756 | | | 5.670% (1-Month USD-LIBOR plus a specified spread) | | Monthly | | 09/11/2024 | | | 17,250 | | | | 0 | | | | (71 | ) | | | 0 | | | | (71 | ) |
| | Receive | | FNRETR Index | | | 254 | | | 5.730% (1-Month USD-LIBOR plus a specified spread) | | Monthly | | 04/02/2025 | | | 5,795 | | | | 0 | | | | (24 | ) | | | 0 | | | | (24 | ) |
| | Receive | | FNRETR Index | | | 16 | | | 5.740% (1-Month USD-LIBOR plus a specified spread) | | Monthly | | 04/02/2025 | | | 365 | | | | 0 | | | | (2 | ) | | | 0 | | | | (2 | ) |
| | | | | | | | | | | | | | | | | | | | | | | | |
Total Swap Agreements | | | $ | 0 | | | $ | (113 | ) | | $ | 0 | | | $ | (113 | ) |
| | | | | | | | | | | | | | | | | |
FINANCIAL DERIVATIVE INSTRUMENTS: OVER THE COUNTER SUMMARY
The following is a summary by counterparty of the market value of OTC financial derivative instruments and collateral pledged/(received) as of June 30, 2024:
| | | | | | | | | | | | | | | | | | | | | | | | | | | | | | | | | | | | | | | | | | | | | | | | |
| | | Financial Derivative Assets | | | | | | Financial Derivative Liabilities | | | | | | | | | | |
| Counterparty | | Forward
Foreign
Currency
Contracts | | | Purchased
Options | | | Swap
Agreements | | | Total
Over the
Counter | | | | | | Forward
Foreign
Currency
Contracts | | | Written
Options | | | Swap
Agreements | | | Total
Over the
Counter | | | Net Market
Value of OTC
Derivatives | | | Collateral
Pledged/
(Received) | | | Net
Exposure(2) | |
GST | | $ | 0 | | | $ | 0 | | | $ | 0 | | | $ | 0 | | | | | | | $ | 0 | | | $ | 0 | | | $ | (16 | ) | | $ | (16 | ) | | $ | (16 | ) | | $ | 0 | | | $ | (16 | ) |
MYI | | | 0 | | | | 0 | | | | 0 | | | | 0 | | | | | | | | 0 | | | | 0 | | | | (97 | ) | | | (97 | ) | | | (97 | ) | | | (126 | ) | | | (223 | ) |
| | | | | | | | | | | | | | | | | | | | | | | | | | | | | | | | | | | | | | | | | | | | | | | | |
Total Over the Counter | | $ | 0 | | | $ | 0 | | | $ | 0 | | | $ | 0 | | | | | | | $ | 0 | | | $ | 0 | | | $ | (113 | ) | | $ | (113 | ) | | | | | | | | | | | | |
| | | | | | | | | | | | | | | | | | | | | | | | | | | | | | | | | | | | | | | | | | | | | | | | |
| (1) | Receive represents that the Fund receives payments for any positive net return on the underlying reference. The Fund makes payments for any negative net return on such underlying reference. Pay represents that the Fund receives payments for any negative net return on the underlying reference. The Fund makes payments for any positive net return on such underlying reference. |
| (2) | Net Exposure represents the net receivable/(payable) that would be due from/to the counterparty in the event of default. Exposure from OTC financial derivative instruments can only be netted across transactions governed under the same master agreement with the same legal entity. See Note 8, Master Netting Arrangements, in the Notes to Financial Statements for more information. |
| | | | | | |
| 24 | | PIMCO EQUITY SERIES | | | See Accompanying Notes | |
FAIR VALUE OF FINANCIAL DERIVATIVE INSTRUMENTS
The following is a summary of the fair valuation of the Fund’s derivative instruments categorized by risk exposure. See Note 7, Principal and Other Risks, in the Notes to Financial Statements on risks of the Fund.
Fair Values of Financial Derivative Instruments on the Statements of Assets and Liabilities as of June 30, 2024:
| | | | | | | | | | | | | | | | | | | | | | | | |
| | | Derivatives not accounted for as hedging instruments | |
| | | Commodity
Contracts | | | Credit
Contracts | | | Equity
Contracts | | | Foreign
Exchange
Contracts | | | Interest
Rate Contracts | | | Total | |
Financial Derivative Instruments - Assets | |
Exchange-traded or centrally cleared | |
Purchased Options | | $ | 0 | | | $ | 0 | | | $ | 1,302 | | | $ | 0 | | | $ | 0 | | | $ | 1,302 | |
| | | | | | | | | | | | | | | | | | | | | | | | |
|
Financial Derivative Instruments - Liabilities | |
Over the counter | |
Swap Agreements | | $ | 16 | | | $ | 0 | | | $ | 97 | | | $ | 0 | | | $ | 0 | | | $ | 113 | |
| | | | | | | | | | | | | | | | | | | | | | | | |
The effect of Financial Derivative Instruments on the Statements of Operations for the period ended June 30, 2024:
| | | | | | | | | | | | | | | | | | | | | | | | |
| | | Derivatives not accounted for as hedging instruments | |
| | | Commodity
Contracts | | | Credit
Contracts | | | Equity
Contracts | | | Foreign
Exchange
Contracts | | | Interest
Rate Contracts | | | Total | |
Net Realized Gain (Loss) on Financial Derivative Instruments | |
Exchange-traded or centrally cleared | |
Purchased Options | | $ | 0 | | | $ | 0 | | | $ | (2,779 | ) | | $ | 0 | | | $ | 0 | | | $ | (2,779 | ) |
Written Options | | | 0 | | | | 0 | | | | 709 | | | | 0 | | | | 0 | | | | 709 | |
| | | | | | | | | | | | | | | | | | | | | | | | |
| | $ | 0 | | | $ | 0 | | | $ | (2,070 | ) | | $ | 0 | | | $ | 0 | | | $ | (2,070 | ) |
| | | | | | | | | | | | | | | | | | | | | | | | |
Over the counter | |
Swap Agreements | | $ | (151 | ) | | $ | 0 | | | $ | 560 | | | $ | 0 | | | $ | 0 | | | $ | 409 | |
| | | | | | | | | | | | | | | | | | | | | | | | |
| | $ | (151 | ) | | $ | 0 | | | $ | (1,510 | ) | | $ | 0 | | | $ | 0 | | | $ | (1,661 | ) |
| | | | | | | | | | | | | | | | | | | | | | | | |
|
Net Change in Unrealized Appreciation (Depreciation) on Financial Derivative Instruments | |
Exchange-traded or centrally cleared | |
Purchased Options | | $ | 0 | | | $ | 0 | | | $ | 238 | | | $ | 0 | | | $ | 0 | | | $ | 238 | |
Written Options | | | 0 | | | | 0 | | | | (614 | ) | | | 0 | | | | 0 | | | | (614 | ) |
| | | | | | | | | | | | | | | | | | | | | | | | |
| | $ | 0 | | | $ | 0 | | | $ | (376 | ) | | $ | 0 | | | $ | 0 | | | $ | (376 | ) |
| | | | | | | | | | | | | | | | | | | | | | | | |
Over the counter | |
Swap Agreements | | $ | 167 | | | $ | 0 | | | $ | (19 | ) | | $ | 0 | | | $ | 0 | | | $ | 148 | |
| | | | | | | | | | | | | | | | | | | | | | | | |
| | $ | 167 | | | $ | 0 | | | $ | (395 | ) | | $ | 0 | | | $ | 0 | | | $ | (228 | ) |
| | | | | | | | | | | | | | | | | | | | | | | | |
FAIR VALUE MEASUREMENTS
The following is a summary of the fair valuations according to the inputs used as of June 30, 2024 in valuing the Fund’s assets and liabilities:
| | | | | | | | | | | | | | | | |
| Category and Subcategory | | Level 1 | | | Level 2 | | | Level 3 | | | Fair
Value at
06/30/2024 | |
Investments in Securities, at Value | |
Mutual Funds | | $ | 316,668 | | | $ | 0 | | | $ | 0 | | | $ | 316,668 | |
Short-Term Instruments | |
Repurchase Agreements | | | 0 | | | | 548 | | | | 0 | | | | 548 | |
U.S. Treasury Bills | | | 0 | | | | 494 | | | | 0 | | | | 494 | |
| | | | | | | | | | | | | | | | |
| | $ | 316,668 | | | $ | 1,042 | | | $ | 0 | | | $ | 317,710 | |
| | | | | | | | | | | | | | | | |
|
Investments in Affiliates, at Value | |
Mutual Funds | | | 268,198 | | | | 0 | | | | 0 | | | | 268,198 | |
Short-Term Instruments | |
Central Funds Used for Cash Management Purposes | | | 31,153 | | | | 0 | | | | 0 | | | | 31,153 | |
| | | | | | | | | | | | | | | | |
| | $ | 299,351 | | | $ | 0 | | | $ | 0 | | | $ | 299,351 | |
| | | | | | | | | | | | | | | | |
| | | | |
Total Investments | | $ | 616,019 | | | $ | 1,042 | | | $ | 0 | | | $ | 617,061 | |
| | | | | | | | | | | | | | | | |
| | | | | | | | | | | | | | | | |
| Category and Subcategory | | Level 1 | | | Level 2 | | | Level 3 | | | Fair
Value at
06/30/2024 | |
Financial Derivative Instruments - Assets | |
Exchange-traded or centrally cleared | | $ | 0 | | | $ | 1,302 | | | $ | 0 | | | $ | 1,302 | |
| | | | | | | | | | | | | | | | |
|
Financial Derivative Instruments - Liabilities | |
Over the counter | | $ | 0 | | | $ | (113 | ) | | $ | 0 | | | $ | (113 | ) |
| | | | | | | | | | | | | | | | |
| | | | |
Total Financial Derivative Instruments | | $ | 0 | | | $ | 1,189 | | | $ | 0 | | | $ | 1,189 | |
| | | | | | | | | | | | | | | | |
| | | | |
Totals | | $ | 616,019 | | | $ | 2,231 | | | $ | 0 | | | $ | 618,250 | |
| | | | | | | | | | | | | | | | |
There were no significant transfers into or out of Level 3 during the period ended June 30, 2024.
| | | | | | | | | | | | |
| See Accompanying Notes | | | ANNUAL FINANCIAL AND OTHER INFORMATION | | | | | | | JUNE 30, 2024 | | | 25 |
| | | | | | |
| Schedule of Investments | | PIMCO REALPATH® Blend 2035 Fund | | | | |
(Amounts in thousands*, except number of shares, contracts, units and ounces, if any)
| | | | | | | | | | | | |
| | | | | SHARES | | | | | MARKET
VALUE
(000S) | |
| INVESTMENTS IN SECURITIES 62.7% | |
| |
| MUTUAL FUNDS 62.6% | |
| | | | |
Vanguard Developed Markets Index Fund ‘Institutional’ | | | | | 4,596,391 | | | $ | | | 113,945 | |
| | | | |
Vanguard Emerging Markets Stock Index Fund ‘Institutional’ | | | | | 1,630,780 | | | | | | 45,271 | |
| | | | |
Vanguard Institutional Index Fund ‘Institutional’ | | | | | 509,301 | | | | | | 228,793 | |
| | | | |
Vanguard Small-Cap Index Fund ‘Institutional’ | | | | | 172,513 | | | | | | 18,043 | |
| | | | | | | | | | | | |
Total Mutual Funds (Cost $316,750) | | | | | | 406,052 | |
| | | | | | | | | | | | |
| |
| SHORT-TERM INSTRUMENTS 0.1% | |
| |
| REPURCHASE AGREEMENTS (b) 0.1% | |
| | | | | | | | | | | 449 | |
| | | | | | | | | | | | |
Total Short-Term Instruments
(Cost $449) | | | | | | 449 | |
| | | | | | | | | | | | |
| | | | |
| | | | | | | | | | | | |
| Total Investments in Securities (Cost $317,199) | | | | | | 406,501 | |
| | | | | | | | | | | | |
| | | | | | | | | | | | |
| | | | | SHARES | | | | | MARKET
VALUE
(000S) | |
| INVESTMENTS IN AFFILIATES 37.2% | |
| |
| MUTUAL FUNDS (a) 32.2% | |
| | | | |
PIMCO Emerging Markets Local Currency and Bond Fund | | | | | 2,343,664 | | | $ | | | 13,265 | |
| | | | |
PIMCO High Yield Fund | | | | | 373,748 | | | | | | 2,964 | |
| | | | |
PIMCO Income Fund | | | | | 3,412,695 | | | | | | 35,765 | |
| | | | |
PIMCO International Bond Fund (U.S. Dollar-Hedged) | | | | | 852,158 | | | | | | 8,359 | |
| | | | |
PIMCO Long-Term Real Return Fund | | | | | 3,399,643 | | | | | | 40,762 | |
| | | | |
PIMCO Long-Term U.S. Government Fund | | | | | 2,438,350 | | | | | | 34,356 | |
| | | | |
PIMCO Real Return Fund | | | | | 1,907,615 | | | | | | 18,981 | |
| | | | |
PIMCO Total Return Fund | | | | | 6,425,189 | | | | | | 54,550 | |
| | | | | | | | | | | | |
| Total Mutual Funds (Cost $226,295) | | | | | | 209,002 | |
| | | | | | | | | | | | |
| | | | | | | | | | | | |
| | | | | SHARES | | | | | MARKET
VALUE
(000S) | |
| SHORT-TERM INSTRUMENTS 5.0% | |
| |
| CENTRAL FUNDS USED FOR CASH MANAGEMENT PURPOSES 5.0% | |
| | | | |
PIMCO Short-Term Floating NAV Portfolio III | | | | | 3,379,160 | | | $ | | | 32,876 | |
| | | | | | | | | | | | |
| Total Short-Term Instruments (Cost $32,844) | | | | | | | | | | | 32,876 | |
| | | | | | | | | | | | |
| | | | |
| | | | | | | | | | | | |
| Total Investments in Affiliates (Cost $259,139) | | | | | | | | | | | 241,878 | |
| | | | |
| | | | | | | | | | | | |
Total Investments 99.9%
(Cost $576,338) | | | | | | | | $ | | | 648,379 | |
| |
Financial Derivative
Instruments (c) (0.0)% (Cost or Premiums, net $0) | | | | | | | | | (116 | ) |
| |
| Other Assets and Liabilities, net 0.1% | | | | | | 675 | |
| | | | | | | | | | | | |
| Net Assets 100.0% | | | | | | | | $ | | | 648,938 | |
| | | | | | | | | | | | |
NOTES TO SCHEDULE OF INVESTMENTS:
| * | A zero balance may reflect actual amounts rounding to less than one thousand. |
| (a) | Institutional Class Shares of each Fund. |
BORROWINGS AND OTHER FINANCING TRANSACTIONS
(b) REPURCHASE AGREEMENTS:
| | | | | | | | | | | | | | | | | | | | | | | | | | | | | | |
| Counterparty | | Lending
Rate | | | Settlement
Date | | | Maturity
Date | | | Principal
Amount | | | Collateralized By | | Collateral
(Received) | | | Repurchase
Agreements,
at Value | | | Repurchase
Agreement
Proceeds
to be
Received(1) | |
| FICC | | | 2.600 | % | | | 06/28/2024 | | | | 07/01/2024 | | | $ | 449 | | | U.S. Treasury Inflation Protected Securities 0.625% due 01/15/2026 | | $ | (458 | ) | | $ | 449 | | | $ | 449 | |
| | | | | | | | | | | | | | | | | | | | | | | | | | | | | | |
Total Repurchase Agreements | | | | | $ | (458 | ) | | $ | 449 | | | $ | 449 | |
| | | | | | | | | | | | | | | |
BORROWINGS AND OTHER FINANCING TRANSACTIONS SUMMARY
The following is a summary by counterparty of the market value of Borrowings and Other Financing Transactions and collateral pledged/(received) as of June 30, 2024:
| | | | | | | | | | | | | | | | | | | | | | | | |
| Counterparty | | Repurchase
Agreement
Proceeds
to be
Received(1) | | | Payable for
Reverse
Repurchase
Agreements | | | Payable for
Sale-Buyback
Transactions | | | Total
Borrowings and
Other Financing
Transactions | | | Collateral
Pledged/(Received) | | | Net Exposure(2) | |
Global/Master Repurchase Agreement | |
FICC | | $ | 449 | | | $ | 0 | | | $ | 0 | | | $ | 449 | | | $ | (458 | ) | | $ | (9 | ) |
| | | | | | | | | | | | | | | | | | | | | | | | |
Total Borrowings and Other Financing Transactions | | $ | 449 | | | $ | 0 | | | $ | 0 | | | | | | | | | | | | | |
| | | | | | | | | | | | | | | | | | | | | | | | |
| (1) | Includes accrued interest. |
| (2) | Net Exposure represents the net receivable/(payable) that would be due from/to the counterparty in the event of default. Exposure from borrowings and other financing transactions can only be netted across transactions governed under the same master agreement with the same legal entity. See Note 8, Master Netting Arrangements, in the Notes to Financial Statements for more information. |
| | | | | | |
| 26 | | PIMCO EQUITY SERIES | | | See Accompanying Notes | |
(c) FINANCIAL DERIVATIVE INSTRUMENTS: OVER THE COUNTER
SWAP AGREEMENTS:
TOTAL RETURN SWAPS ON COMMODITY AND EQUITY INDICES
| | | | | | | | | | | | | | | | | | | | | | | | | | | | | | | | | | |
| Counterparty | | Pay/Receive(1) | | Underlying
Reference | | # of Units | | | Financing Rate | | Payment
Frequency | | Maturity
Date | | Notional
Amount | | | Premiums
Paid/(Received) | | | Unrealized
Appreciation/
(Depreciation) | | | Swap Agreements,
at Value | |
| | Asset | | | Liability | |
GST | | Receive | | BERYTR Index | | | 21,365 | | | 5.400% (3-Month U.S. Treasury Bill rate plus a specified spread) | | Monthly | | 02/18/2025 | | $ | 10,249 | | | $ | 0 | | | $ | (14 | ) | | $ | 0 | | | $ | (14 | ) |
| | | | | | | | | | | |
MYI | | Receive | | FNRETR Index | | | 813 | | | 5.670% (1-Month USD-LIBOR plus a specified spread) | | Monthly | | 09/11/2024 | | | 18,550 | | | | 0 | | | | (77 | ) | | | 0 | | | | (77 | ) |
| | Receive | | FNRETR Index | | | 191 | | | 5.730% (1-Month USD-LIBOR plus a specified spread) | | Monthly | | 04/02/2025 | | | 4,358 | | | | 0 | | | | (18 | ) | | | 0 | | | | (18 | ) |
| | Receive | | FNRETR Index | | | 67 | | | 5.740% (1-Month USD-LIBOR plus a specified spread) | | Monthly | | 04/02/2025 | | | 1,529 | | | | 0 | | | | (7 | ) | | | 0 | | | | (7 | ) |
| | | | | | | | | | | | | | | | | | | | | | | | |
Total Swap Agreements | | | $ | 0 | | | $ | (116 | ) | | $ | 0 | | | $ | (116 | ) |
| | | | | | | | | | | | | | | | | |
FINANCIAL DERIVATIVE INSTRUMENTS: OVER THE COUNTER SUMMARY
The following is a summary by counterparty of the market value of OTC financial derivative instruments and collateral pledged/(received) as of June 30, 2024:
| | | | | | | | | | | | | | | | | | | | | | | | | | | | | | | | | | | | | | | | | | | | | | | | |
| | | Financial Derivative Assets | | | | | | Financial Derivative Liabilities | | | | | | | | | | |
| Counterparty | | Forward
Foreign
Currency
Contracts | | | Purchased
Options | | | Swap
Agreements | | | Total
Over the
Counter | | | | | | Forward
Foreign
Currency
Contracts | | | Written
Options | | | Swap
Agreements | | | Total
Over the
Counter | | | Net Market
Value of OTC
Derivatives | | | Collateral
Pledged/
(Received) | | | Net
Exposure(2) | |
GST | | $ | 0 | | | $ | 0 | | | $ | 0 | | | $ | 0 | | | | | | | $ | 0 | | | $ | 0 | | | $ | (14 | ) | | $ | (14 | ) | | $ | (14 | ) | | $ | 0 | | | $ | (14 | ) |
MYI | | | 0 | | | | 0 | | | | 0 | | | | 0 | | | | | | | | 0 | | | | 0 | | | | (102 | ) | | | (102 | ) | | | (102 | ) | | | (130 | ) | | | (232 | ) |
| | | | | | | | | | | | | | | | | | | | | | | | | | | | | | | | | | | | | | | | | | | | | | | | |
Total Over the Counter | | $ | 0 | | | $ | 0 | | | $ | 0 | | | $ | 0 | | | | | | | $ | 0 | | | $ | 0 | | | $ | (116 | ) | | $ | (116 | ) | | | | | | | | | | | | |
| | | | | | | | | | | | | | | | | | | | | | | | | | | | | | | | | | | | | | | | | | | | | | | | |
| (1) | Receive represents that the Fund receives payments for any positive net return on the underlying reference. The Fund makes payments for any negative net return on such underlying reference. Pay represents that the Fund receives payments for any negative net return on the underlying reference. The Fund makes payments for any positive net return on such underlying reference. |
| (2) | Net Exposure represents the net receivable/(payable) that would be due from/to the counterparty in the event of default. Exposure from OTC financial derivative instruments can only be netted across transactions governed under the same master agreement with the same legal entity. See Note 8, Master Netting Arrangements, in the Notes to Financial Statements for more information. |
FAIR VALUE OF FINANCIAL DERIVATIVE INSTRUMENTS
The following is a summary of the fair valuation of the Fund’s derivative instruments categorized by risk exposure. See Note 7, Principal and Other Risks, in the Notes to Financial Statements on risks of the Fund.
Fair Values of Financial Derivative Instruments on the Statements of Assets and Liabilities as of June 30, 2024:
| | | | | | | | | | | | | | | | | | | | | | | | |
| | | Derivatives not accounted for as hedging instruments | |
| | | Commodity
Contracts | | | Credit
Contracts | | | Equity
Contracts | | | Foreign
Exchange
Contracts | | | Interest
Rate Contracts | | | Total | |
Financial Derivative Instruments - Liabilities | |
Over the counter | |
Swap Agreements | | $ | 14 | | | $ | 0 | | | $ | 102 | | | $ | 0 | | | $ | 0 | | | $ | 116 | |
| | | | | | | | | | | | | | | | | | | | | | | | |
The effect of Financial Derivative Instruments on the Statements of Operations for the period ended June 30, 2024:
| | | | | | | | | | | | | | | | | | | | | | | | |
| | | Derivatives not accounted for as hedging instruments | |
| | | Commodity
Contracts | | | Credit
Contracts | | | Equity
Contracts | | | Foreign
Exchange
Contracts | | | Interest
Rate Contracts | | | Total | |
Net Realized Gain (Loss) on Financial Derivative Instruments | |
Over the counter | |
Swap Agreements | | $ | (127 | ) | | $ | 0 | | | $ | 604 | | | $ | 0 | | | $ | 0 | | | $ | 477 | |
| | | | | | | | | | | | | | | | | | | | | | | | |
|
Net Change in Unrealized Appreciation (Depreciation) on Financial Derivative Instruments | |
Over the counter | |
Swap Agreements | | $ | 151 | | | $ | 0 | | | $ | (23 | ) | | $ | 0 | | | $ | 0 | | | $ | 128 | |
| | | | | | | | | | | | | | | | | | | | | | | | |
| | | | | | | | | | | | |
| See Accompanying Notes | | | ANNUAL FINANCIAL AND OTHER INFORMATION | | | | | | | JUNE 30, 2024 | | | 27 |
| | | | | | |
| Schedule of Investments | | PIMCO REALPATH® Blend 2035 Fund | | (Cont.) | | June 30, 2024 |
FAIR VALUE MEASUREMENTS
The following is a summary of the fair valuations according to the inputs used as of June 30, 2024 in valuing the Fund’s assets and liabilities:
| | | | | | | | | | | | | | | | |
| Category and Subcategory | | Level 1 | | | Level 2 | | | Level 3 | | | Fair
Value at
06/30/2024 | |
Investments in Securities, at Value | |
Mutual Funds | | $ | 406,052 | | | $ | 0 | | | $ | 0 | | | $ | 406,052 | |
Short-Term Instruments | |
Repurchase Agreements | | | 0 | | | | 449 | | | | 0 | | | | 449 | |
| | | | | | | | | | | | | | | | |
| | $ | 406,052 | | | $ | 449 | | | $ | 0 | | | $ | 406,501 | |
| | | | | | | | | | | | | | | | |
|
Investments in Affiliates, at Value | |
Mutual Funds | | | 209,002 | | | | 0 | | | | 0 | | | | 209,002 | |
Short-Term Instruments | |
Central Funds Used for Cash Management Purposes | | | 32,876 | | | | 0 | | | | 0 | | | | 32,876 | |
| | | | | | | | | | | | | | | | |
| | $ | 241,878 | | | $ | 0 | | | $ | 0 | | | $ | 241,878 | |
| | | | | | | | | | | | | | | | |
| | | | |
Total Investments | | $ | 647,930 | | | $ | 449 | | | $ | 0 | | | $ | 648,379 | |
| | | | | | | | | | | | | | | | |
| | | | | | | | | | | | | | | | |
| Category and Subcategory | | Level 1 | | | Level 2 | | | Level 3 | | | Fair
Value at
06/30/2024 | |
Financial Derivative Instruments - Liabilities | |
Over the counter | | $ | 0 | | | $ | (116 | ) | | $ | 0 | | | $ | (116 | ) |
| | | | | | | | | | | | | | | | |
| | | | |
Total Financial Derivative Instruments | | $ | 0 | | | $ | (116 | ) | | $ | 0 | | | $ | (116 | ) |
| | | | | | | | | | | | | | | | |
| | | | |
Totals | | $ | 647,930 | | | $ | 333 | | | $ | 0 | | | $ | 648,263 | |
| | | | | | | | | | | | | | | | |
There were no significant transfers into or out of Level 3 during the period ended June 30, 2024.
| | | | | | |
| 28 | | PIMCO EQUITY SERIES | | | See Accompanying Notes | |
| | | | | | |
| Schedule of Investments | | PIMCO REALPATH® Blend 2040 Fund | | | | June 30, 2024 |
(Amounts in thousands*, except number of shares, contracts, units and ounces, if any)
| | | | | | | | | | | | |
| | | | | SHARES | | | | | MARKET
VALUE
(000S) | |
| INVESTMENTS IN SECURITIES 73.2% | |
| |
| MUTUAL FUNDS 73.1% | |
| | | | |
Vanguard Developed Markets Index Fund ‘Institutional’ | | | | | 4,719,032 | | | $ | | | 116,985 | |
| | | | |
Vanguard Emerging Markets Stock Index Fund ‘Institutional’ | | | | | 1,689,183 | | | | | | 46,892 | |
| | | | |
Vanguard Institutional Index Fund ‘Institutional’ | | | | | 531,576 | | | | | | 238,800 | |
| | | | |
Vanguard Small-Cap Index Fund ‘Institutional’ | | | | | 163,726 | | | | | | 17,124 | |
| | | | | | | | | | | | |
Total Mutual Funds (Cost $324,026) | | | 419,801 | |
| | | | |
| | | | | | | | | | | | |
| SHORT-TERM INSTRUMENTS 0.1% | |
| | | | | | | | | | | | |
| REPURCHASE AGREEMENTS (b) 0.1% | | | | |
| | | | | | | | | | | 360 | |
| | | | | | | | | | | | |
Total Short-Term Instruments
(Cost $360) | | | | | | | | | 360 | |
| | | | |
| | | | |
| | | | | | | | | | | | |
| Total Investments in Securities (Cost $324,386) | | | | | | | | | 420,161 | |
| | | | |
| | | | | | | | | | | | |
| | | | | SHARES | | | | | MARKET
VALUE
(000S) | |
| INVESTMENTS IN AFFILIATES 26.6% | |
| |
| MUTUAL FUNDS (a) 21.6% | |
| | | | |
PIMCO Emerging Markets Local Currency and Bond Fund | | | | | 1,702,030 | | | $ | | | 9,633 | |
| | | | |
PIMCO High Yield Fund | | | | | 176,814 | | | | | | 1,402 | |
| | | | |
PIMCO Income Fund | | | | | 1,884,560 | | | | | | 19,750 | |
| | | | |
PIMCO International Bond Fund (U.S. Dollar-Hedged) | | | | | 645,708 | | | | | | 6,334 | |
| | | | |
PIMCO Long-Term Real Return Fund | | | | | 2,055,050 | | | | | | 24,640 | |
| | | | |
PIMCO Long-Term U.S. Government Fund | | | | | 1,314,615 | | | | | | 18,523 | |
| | | | |
PIMCO Real Return Fund | | | | | 1,156,761 | | | | | | 11,510 | |
| | | | |
PIMCO Total Return Fund | | | | | 3,830,577 | | | | | | 32,522 | |
| | | | | | | | | | | | |
| Total Mutual Funds (Cost $135,235) | | | 124,314 | |
| | | | |
| | | | | | | | | | | | |
| | | | | SHARES | | | | | MARKET
VALUE
(000S) | |
| SHORT-TERM INSTRUMENTS 5.0% | |
| |
| CENTRAL FUNDS USED FOR CASH MANAGEMENT PURPOSES 5.0% | |
| | | | |
PIMCO Short-Term Floating NAV Portfolio III | | | | | 2,955,242 | | | $ | | | 28,752 | |
| | | | | | | | | | | | |
Total Short-Term Instruments
(Cost $28,727) | | | | | | | | | 28,752 | |
| | | | |
| | | | |
| | | | | | | | | | | | |
Total Investments in Affiliates
(Cost $163,962) | | | | | | | | | 153,066 | |
| |
| | | | |
Total Investments 99.8%
(Cost $488,348) | | | | | | $ | | | 573,227 | |
| |
Financial Derivative
Instruments (c) (0.0)% (Cost or Premiums, net $0) | | | | | | | | | | | (102 | ) |
| |
| Other Assets and Liabilities, net 0.2% | | | 1,514 | |
| | | | |
| Net Assets 100.0% | | | $ | | | 574,639 | |
| | | | | | | |
NOTES TO SCHEDULE OF INVESTMENTS:
| * | A zero balance may reflect actual amounts rounding to less than one thousand. |
| (a) | Institutional Class Shares of each Fund. |
BORROWINGS AND OTHER FINANCING TRANSACTIONS
(b) REPURCHASE AGREEMENTS:
| | | | | | | | | | | | | | | | | | | | | | | | | | | | | | |
| Counterparty | | Lending
Rate | | | Settlement
Date | | | Maturity
Date | | | Principal
Amount | | | Collateralized By | | Collateral
(Received) | | | Repurchase
Agreements,
at Value | | | Repurchase
Agreement
Proceeds
to be
Received(1) | |
| FICC | | | 2.600 | % | | | 06/28/2024 | | | | 07/01/2024 | | | $ | 360 | | | U.S. Treasury Inflation Protected Securities 0.625% due 01/15/2026 | | $ | (367 | ) | | $ | 360 | | | $ | 360 | |
| | | | | | | | | | | | | | | | | | | | | | | | | | | | | | |
Total Repurchase Agreements | | | | | $ | (367 | ) | | $ | 360 | | | $ | 360 | |
| | | | | | | | | | | | | | | |
BORROWINGS AND OTHER FINANCING TRANSACTIONS SUMMARY
The following is a summary by counterparty of the market value of Borrowings and Other Financing Transactions and collateral pledged/(received) as of June 30, 2024:
| | | | | | | | | | | | | | | | | | | | | | | | |
| Counterparty | | Repurchase
Agreement
Proceeds
to be
Received(1) | | | Payable for
Reverse
Repurchase
Agreements | | | Payable for
Sale-Buyback
Transactions | | | Total
Borrowings and
Other Financing
Transactions | | | Collateral
Pledged/(Received) | | | Net Exposure(2) | |
Global/Master Repurchase Agreement | |
FICC | | $ | 360 | | | $ | 0 | | | $ | 0 | | | $ | 360 | | | $ | (367 | ) | | $ | (7 | ) |
| | | | | | | | | | | | | | | | | | | | | | | | |
Total Borrowings and Other Financing Transactions | | $ | 360 | | | $ | 0 | | | $ | 0 | | | | | | | | | | | | | |
| | | | | | | | | | | | | | | | | | | | | | | | |
| (1) | Includes accrued interest. |
| (2) | Net Exposure represents the net receivable/(payable) that would be due from/to the counterparty in the event of default. Exposure from borrowings and other financing transactions can only be netted across transactions governed under the same master agreement with the same legal entity. See Note 8, Master Netting Arrangements, in the Notes to Financial Statements for more information. |
| | | | | | | | | | | | |
| See Accompanying Notes | | | ANNUAL FINANCIAL AND OTHER INFORMATION | | | | | | | JUNE 30, 2024 | | | 29 |
| | | | | | |
| Schedule of Investments | | PIMCO REALPATH® Blend 2040 Fund | | (Cont.) | | |
(c) FINANCIAL DERIVATIVE INSTRUMENTS: OVER THE COUNTER
SWAP AGREEMENTS:
TOTAL RETURN SWAPS ON COMMODITY AND EQUITY INDICES
| | | | | | | | | | | | | | | | | | | | | | | | | | | | | | | | | | | | |
Counterparty | | Pay/Receive(1) | | Underlying
Reference | | # of Units | | | Financing Rate | | Payment
Frequency | | Maturity
Date | | | Notional
Amount | | | Premiums
Paid/(Received) | | | Unrealized
Appreciation/
(Depreciation) | | | Swap Agreements,
at Value | |
| | Asset | | | Liability | |
GST | | Receive | | BERYTR Index | | | 17,270 | | | 5.400% (3-Month U.S. Treasury Bill rate plus a specified spread) | | Monthly | | | 02/18/2025 | | | $ | 8,284 | | | $ | 0 | | | $ | (12 | ) | | $ | 0 | | | $ | (12 | ) |
| | | | | | | | | | | |
MYI | | Receive | | FNRETR Index | | | 664 | | | 5.670% (1-Month USD-LIBOR plus a specified spread) | | Monthly | | | 09/11/2024 | | | | 15,151 | | | | 0 | | | | (63 | ) | | | 0 | | | | (63 | ) |
| | Receive | | FNRETR Index | | | 264 | | | 5.730% (1-Month USD-LIBOR plus a specified spread) | | Monthly | | | 04/02/2025 | | | | 6,024 | | | | 0 | | | | (25 | ) | | | 0 | | | | (25 | ) |
| | Receive | | FNRETR Index | | | 26 | | | 5.740% (1-Month USD-LIBOR plus a specified spread) | | Monthly | | | 04/02/2025 | | | | 593 | | | | 0 | | | | (2 | ) | | | 0 | | | | (2 | ) |
| | | | | | | | | | | | | | | | | | | | | | | | | | |
Total Swap Agreements | | | $ | 0 | | | $ | (102 | ) | | $ | 0 | | | $ | (102 | ) |
| | | | | | | | | | | | | | | | | |
FINANCIAL DERIVATIVE INSTRUMENTS: OVER THE COUNTER SUMMARY
The following is a summary by counterparty of the market value of OTC financial derivative instruments and collateral pledged/(received) as of June 30, 2024:
| | | | | | | | | | | | | | | | | | | | | | | | | | | | | | | | | | | | | | | | | | | | | | | | |
| | | Financial Derivative Assets | | | | | | Financial Derivative Liabilities | | | | | | | | | | |
| Counterparty | | Forward
Foreign
Currency
Contracts | | | Purchased
Options | | | Swap
Agreements | | | Total
Over the
Counter | | | | | | Forward
Foreign
Currency
Contracts | | | Written
Options | | | Swap
Agreements | | | Total
Over the
Counter | | | Net Market
Value of OTC
Derivatives | | | Collateral
Pledged/
(Received) | | | Net
Exposure(2) | |
GST | | $ | 0 | | | $ | 0 | | | $ | 0 | | | $ | 0 | | | | | | | $ | 0 | | | $ | 0 | | | $ | (12 | ) | | $ | (12 | ) | | $ | (12 | ) | | $ | 0 | | | $ | (12 | ) |
MYI | | | 0 | | | | 0 | | | | 0 | | | | 0 | | | | | | | | 0 | | | | 0 | | | | (90 | ) | | | (90 | ) | | | (90 | ) | | | (120 | ) | | | (210 | ) |
| | | | | | | | | | | | | | | | | | | | | | | | | | | | | | | | | | | | | | | | | | | | | | | | |
Total Over the Counter | | $ | 0 | | | $ | 0 | | | $ | 0 | | | $ | 0 | | | | | | | $ | 0 | | | $ | 0 | | | $ | (102 | ) | | $ | (102 | ) | | | | | | | | | | | | |
| | | | | | | | | | | | | | | | | | | | | | | | | | | | | | | | | | | | | | | | | | | | | | | | |
| (1) | Receive represents that the Fund receives payments for any positive net return on the underlying reference. The Fund makes payments for any negative net return on such underlying reference. Pay represents that the Fund receives payments for any negative net return on the underlying reference. The Fund makes payments for any positive net return on such underlying reference. |
| (2) | Net Exposure represents the net receivable/(payable) that would be due from/to the counterparty in the event of default. Exposure from OTC financial derivative instruments can only be netted across transactions governed under the same master agreement with the same legal entity. See Note 8, Master Netting Arrangements, in the Notes to Financial Statements for more information. |
FAIR VALUE OF FINANCIAL DERIVATIVE INSTRUMENTS
The following is a summary of the fair valuation of the Fund’s derivative instruments categorized by risk exposure. See Note 7, Principal and Other Risks, in the Notes to Financial Statements on risks of the Fund.
Fair Values of Financial Derivative Instruments on the Statements of Assets and Liabilities as of June 30, 2024:
| | | | | | | | | | | | | | | | | | | | | | | | |
| | | Derivatives not accounted for as hedging instruments | |
| | | Commodity
Contracts | | | Credit
Contracts | | | Equity
Contracts | | | Foreign
Exchange
Contracts | | | Interest
Rate Contracts | | | Total | |
Financial Derivative Instruments - Liabilities | |
Over the counter | |
Swap Agreements | | $ | 12 | | | $ | 0 | | | $ | 90 | | | $ | 0 | | | $ | 0 | | | $ | 102 | |
| | | | | | | | | | | | | | | | | | | | | | | | |
The effect of Financial Derivative Instruments on the Statements of Operations for the period ended June 30, 2024:
| | | | | | | | | | | | | | | | | | | | | | | | |
| | | Derivatives not accounted for as hedging instruments | |
| | | Commodity
Contracts | | | Credit
Contracts | | | Equity
Contracts | | | Foreign
Exchange
Contracts | | | Interest
Rate Contracts | | | Total | |
Net Realized Gain (Loss) on Financial Derivative Instruments | |
Over the counter | |
Swap Agreements | | $ | (123 | ) | | $ | 0 | | | $ | 614 | | | $ | 0 | | | $ | 0 | | | $ | 491 | |
| | | | | | | | | | | | | | | | | | | | | | | | |
|
Net Change in Unrealized Appreciation (Depreciation) on Financial Derivative Instruments | |
Over the counter | |
Swap Agreements | | $ | 129 | | | $ | 0 | | | $ | (12 | ) | | $ | 0 | | | $ | 0 | | | $ | 117 | |
| | | | | | | | | | | | | | | | | | | | | | | | |
| | | | | | |
| 30 | | PIMCO EQUITY SERIES | | | See Accompanying Notes | |
FAIR VALUE MEASUREMENTS
The following is a summary of the fair valuations according to the inputs used as of June 30, 2024 in valuing the Fund’s assets and liabilities:
| | | | | | | | | | | | | | | | |
| Category and Subcategory | | Level 1 | | | Level 2 | | | Level 3 | | | Fair
Value at
06/30/2024 | |
Investments in Securities, at Value | |
Mutual Funds | | $ | 419,801 | | | $ | 0 | | | $ | 0 | | | $ | 419,801 | |
Short-Term Instruments | |
Repurchase Agreements | | | 0 | | | | 360 | | | | 0 | | | | 360 | |
| | | | | | | | | | | | | | | | |
| | $ | 419,801 | | | $ | 360 | | | $ | 0 | | | $ | 420,161 | |
| | | | | | | | | | | | | | | | |
|
Investments in Affiliates, at Value | |
Mutual Funds | | | 124,314 | | | | 0 | | | | 0 | | | | 124,314 | |
Short-Term Instruments | |
Central Funds Used for Cash Management Purposes | | | 28,752 | | | | 0 | | | | 0 | | | | 28,752 | |
| | | | | | | | | | | | | | | | |
| | $ | 153,066 | | | $ | 0 | | | $ | 0 | | | $ | 153,066 | |
| | | | | | | | | | | | | | | | |
| | | | |
Total Investments | | $ | 572,867 | | | $ | 360 | | | $ | 0 | | | $ | 573,227 | |
| | | | | | | | | | | | | | | | |
| | | | | | | | | | | | | | | | |
| Category and Subcategory | | Level 1 | | | Level 2 | | | Level 3 | | | Fair
Value at
06/30/2024 | |
|
Financial Derivative Instruments - Liabilities | |
Over the counter | | $ | 0 | | | $ | (102 | ) | | $ | 0 | | | $ | (102 | ) |
| | | | | | | | | | | | | | | | |
| | | | |
Total Financial Derivative Instruments | | $ | 0 | | | $ | (102 | ) | | $ | 0 | | | $ | (102 | ) |
| | | | | | | | | | | | | | | | |
| | | | |
Totals | | $ | 572,867 | | | $ | 258 | | | $ | 0 | | | $ | 573,125 | |
| | | | | | | | | | | | | | | | |
There were no significant transfers into or out of Level 3 during the period ended June 30, 2024.
| | | | | | | | | | | | |
| See Accompanying Notes | | | ANNUAL FINANCIAL AND OTHER INFORMATION | | | | | | | JUNE 30, 2024 | | | 31 |
| | | | | | |
| Schedule of Investments | | PIMCO REALPATH® Blend 2045 Fund | | | | |
(Amounts in thousands*, except number of shares, contracts, units and ounces, if any)
| | | | | | | | | | | | |
| | | | | SHARES | | | | | MARKET
VALUE
(000S) | |
| INVESTMENTS IN SECURITIES 81.3% | |
| |
| MUTUAL FUNDS 81.2% | |
| | | | |
Vanguard Developed Markets Index Fund ‘Institutional’ | | | | | 5,139,727 | | | $ | | | 127,414 | |
| | | | |
Vanguard Emerging Markets Stock Index Fund ‘Institutional’ | | | | | 1,616,827 | | | | | | 44,883 | |
| | | | |
Vanguard Institutional Index Fund ‘Institutional’ | | | | | 545,680 | | | | | | 245,136 | |
| | | | |
Vanguard Small-Cap Index Fund ‘Institutional’ | | | | | 159,093 | | | | | | 16,640 | |
| | | | | | | | | | | | |
Total Mutual Funds (Cost $336,131) | | | 434,073 | |
| | | | |
| |
| SHORT-TERM INSTRUMENTS 0.1% | |
| |
| REPURCHASE AGREEMENTS (b) 0.1% | |
| | | | | | | | | | | 371 | |
| | | | | | | | | | | | |
Total Short-Term Instruments (Cost $371) | | | 371 | |
| | | | |
| | | | |
| | | | | | | | | | | | |
Total Investments in Securities (Cost $336,502) | | | 434,444 | |
| | | | |
| | | | | | | | | | | | |
| | | | | SHARES | | | | | MARKET
VALUE
(000S) | |
| INVESTMENTS IN AFFILIATES 18.1% | |
| |
| MUTUAL FUNDS (a) 13.5% | |
| | | | |
PIMCO Emerging Markets Local Currency and Bond Fund | | | | | 1,158,122 | | | $ | | | 6,555 | |
| | | | |
PIMCO High Yield Fund | | | | | 19,159 | | | | | | 152 | |
| | | | |
PIMCO Income Fund | | | | | 827,985 | | | | | | 8,677 | |
| | | | |
PIMCO International Bond Fund (U.S. Dollar-Hedged) | | | | | 404,288 | | | | | | 3,966 | |
| | | | |
PIMCO Long-Term Real Return Fund | | | | | 1,028,388 | | | | | | 12,330 | |
| | | | |
PIMCO Long-Term U.S. Government Fund | | | | | 897,579 | | | | | | 12,647 | |
| | | | |
PIMCO Real Return Fund | | | | | 850,392 | | | | | | 8,461 | |
| | | | |
PIMCO Total Return Fund | | | | | 2,288,198 | | | | | | 19,427 | |
| | | | | | | | | | | | |
| Total Mutual Funds (Cost $79,057) | | | 72,215 | |
| | | | |
| |
| | | | | | | | | | | | |
| | | | | SHARES | | | | | MARKET
VALUE
(000S) | |
| SHORT-TERM INSTRUMENTS 4.6% | |
| |
| CENTRAL FUNDS USED FOR CASH MANAGEMENT PURPOSES 4.6% | |
| | | | |
PIMCO Short-Term Floating NAV Portfolio III | | | | | 2,555,305 | | | $ | | | 24,861 | |
| | | | | | | | | | | | |
Total Short-Term Instruments
(Cost $24,835) | | | 24,861 | |
| | | | |
| | | | |
| | | | | | | | | | | | |
| Total Investments in Affiliates (Cost $103,892) | | | 97,076 | |
| |
| | | | |
Total Investments 99.4%
(Cost $440,394) | | | $ | | | 531,520 | |
| |
Financial Derivative Instruments (c) (0.0)% (Cost or Premiums, net $0) | | | | | | | | | | | (96 | ) |
| |
| Other Assets and Liabilities, net 0.6% | | | 3,095 | |
| | | | |
| Net Assets 100.0% | | | $ | | | 534,519 | |
| | | | | | | |
NOTES TO SCHEDULE OF INVESTMENTS:
| * | A zero balance may reflect actual amounts rounding to less than one thousand. |
| (a) | Institutional Class Shares of each Fund. |
BORROWINGS AND OTHER FINANCING TRANSACTIONS
(b) REPURCHASE AGREEMENTS:
| | | | | | | | | | | | | | | | | | | | | | | | | | | | | | |
| Counterparty | | Lending
Rate | | | Settlement
Date | | | Maturity
Date | | | Principal
Amount | | | Collateralized By | | Collateral
(Received) | | | Repurchase
Agreements,
at Value | | | Repurchase
Agreement
Proceeds
to be
Received(1) | |
| FICC | | | 2.600 | % | | | 06/28/2024 | | | | 07/01/2024 | | | $ | 371 | | | U.S. Treasury Inflation Protected Securities 0.625% due 01/15/2026 | | $ | (378 | ) | | $ | 371 | | | $ | 371 | |
| | | | | | | | | | | | | | | | | | | | | | | | | | | | | | |
Total Repurchase Agreements | | | | | $ | (378 | ) | | $ | 371 | | | $ | 371 | |
| | | | | | | | | | | | | | | |
BORROWINGS AND OTHER FINANCING TRANSACTIONS SUMMARY
The following is a summary by counterparty of the market value of Borrowings and Other Financing Transactions and collateral pledged/(received) as of June 30, 2024:
| | | | | | | | | | | | | | | | | | | | | | | | |
| Counterparty | | Repurchase
Agreement
Proceeds
to be
Received(1) | | | Payable for
Reverse
Repurchase
Agreements | | | Payable for
Sale-Buyback
Transactions | | | Total
Borrowings and
Other Financing
Transactions | | | Collateral
Pledged/(Received) | | | Net Exposure(2) | |
Global/Master Repurchase Agreement | |
FICC | | $ | 371 | | | $ | 0 | | | $ | 0 | | | $ | 371 | | | $ | (378 | ) | | $ | (7 | ) |
| | | | | | | | | | | | | | | | | | | | | | | | |
Total Borrowings and Other Financing Transactions | | $ | 371 | | | $ | 0 | | | $ | 0 | | | | | | | | | | | | | |
| | | | | | | | | | | | | | | | | | | | | | | | |
| (1) | Includes accrued interest. |
| (2) | Net Exposure represents the net receivable/(payable) that would be due from/to the counterparty in the event of default. Exposure from borrowings and other financing transactions can only be netted across transactions governed under the same master agreement with the same legal entity. See Note 8, Master Netting Arrangements, in the Notes to Financial Statements for more information. |
| | | | | | |
| 32 | | PIMCO EQUITY SERIES | | | See Accompanying Notes | |
(c) FINANCIAL DERIVATIVE INSTRUMENTS: OVER THE COUNTER
SWAP AGREEMENTS:
TOTAL RETURN SWAPS ON COMMODITY AND EQUITY INDICES
| | | | | | | | | | | | | | | | | | | | | | | | | | | | | | | | | | | | |
| Counterparty | | Pay/Receive(1) | | Underlying
Reference | | # of Units | | | Financing Rate | | Payment
Frequency | | Maturity
Date | | | Notional
Amount | | | Premiums
Paid/(Received) | | | Unrealized
Appreciation/
(Depreciation) | | | Swap Agreements,
at Value | |
| | Asset | | | Liability | |
GST | | Receive | | BERYTR Index | | | 15,126 | | | 5.400% (3-Month U.S. Treasury Bill rate plus a specified spread) | | Monthly | | | 02/18/2025 | | | $ | 7,256 | | | $ | 0 | | | $ | (10 | ) | | $ | 0 | | | $ | (10 | ) |
| | | | | | | | | | | |
MYI | | Receive | | FNRETR Index | | | 606 | | | 5.670% (1-Month USD-LIBOR plus a specified spread) | | Monthly | | | 09/11/2024 | | | | 13,827 | | | | 0 | | | | (57 | ) | | | 0 | | | | (57 | ) |
| | Receive | | FNRETR Index | | | 254 | | | 5.730% (1-Month USD-LIBOR plus a specified spread) | | Monthly | | | 04/02/2025 | | | | 5,796 | | | | 0 | | | | (24 | ) | | | 0 | | | | (24 | ) |
| | Receive | | FNRETR Index | | | 48 | | | 5.740% (1-Month USD-LIBOR plus a specified spread) | | Monthly | | | 04/02/2025 | | | | 1,095 | | | | 0 | | | | (5 | ) | | | 0 | | | | (5 | ) |
| | | | | | | | | | | | | | | | | | | | | | | | | | |
Total Swap Agreements | | | $ | 0 | | | $ | (96 | ) | | $ | 0 | | | $ | (96 | ) |
| | | | | | | | | | | | | | | | | |
FINANCIAL DERIVATIVE INSTRUMENTS: OVER THE COUNTER SUMMARY
The following is a summary by counterparty of the market value of OTC financial derivative instruments and collateral pledged/(received) as of June 30, 2024:
| | | | | | | | | | | | | | | | | | | | | | | | | | | | | | | | | | | | | | | | | | | | | | | | |
| | | Financial Derivative Assets | | | | | | Financial Derivative Liabilities | | | | | | | | | | |
| Counterparty | | Forward
Foreign
Currency
Contracts | | | Purchased
Options | | | Swap
Agreements | | | Total
Over the
Counter | | | | | | Forward
Foreign
Currency
Contracts | | | Written
Options | | | Swap
Agreements | | | Total
Over the
Counter | | | Net Market
Value of OTC
Derivatives | | | Collateral
Pledged/
(Received) | | | Net
Exposure(2) | |
GST | | $ | 0 | | | $ | 0 | | | $ | 0 | | | $ | 0 | | | | | | | $ | 0 | | | $ | 0 | | | $ | (10 | ) | | $ | (10 | ) | | $ | (10 | ) | | $ | 0 | | | $ | (10 | ) |
MYI | | | 0 | | | | 0 | | | | 0 | | | | 0 | | | | | | | | 0 | | | | 0 | | | | (86 | ) | | | (86 | ) | | | (86 | ) | | | (108 | ) | | | (194 | ) |
| | | | | | | | | | | | | | | | | | | | | | | | | | | | | | | | | | | | | | | | | | | | | | | | |
Total Over the Counter | | $ | 0 | | | $ | 0 | | | $ | 0 | | | $ | 0 | | | | | | | $ | 0 | | | $ | 0 | | | $ | (96 | ) | | $ | (96 | ) | | | | | | | | | | | | |
| | | | | | | | | | | | | | | | | | | | | | | | | | | | | | | | | | | | | | | | | | | | | | | | |
| (1) | Receive represents that the Fund receives payments for any positive net return on the underlying reference. The Fund makes payments for any negative net return on such underlying reference. Pay represents that the Fund receives payments for any negative net return on the underlying reference. The Fund makes payments for any positive net return on such underlying reference. |
| (2) | Net Exposure represents the net receivable/(payable) that would be due from/to the counterparty in the event of default. Exposure from OTC financial derivative instruments can only be netted across transactions governed under the same master agreement with the same legal entity. See Note 8, Master Netting Arrangements, in the Notes to Financial Statements for more information. |
FAIR VALUE OF FINANCIAL DERIVATIVE INSTRUMENTS
The following is a summary of the fair valuation of the Fund’s derivative instruments categorized by risk exposure. See Note 7, Principal and Other Risks, in the Notes to Financial Statements on risks of the Fund.
Fair Values of Financial Derivative Instruments on the Statements of Assets and Liabilities as of June 30, 2024:
| | | | | | | | | | | | | | | | | | | | | | | | |
| | | Derivatives not accounted for as hedging instruments | |
| | | Commodity
Contracts | | | Credit
Contracts | | | Equity
Contracts | | | Foreign
Exchange
Contracts | | | Interest
Rate Contracts | | | Total | |
Financial Derivative Instruments - Liabilities | |
Over the counter | |
Swap Agreements | | $ | 10 | | | $ | 0 | | | $ | 86 | | | $ | 0 | | | $ | 0 | | | $ | 96 | |
| | | | | | | | | | | | | | | | | | | | | | | | |
The effect of Financial Derivative Instruments on the Statements of Operations for the period ended June 30, 2024:
| | | | | | | | | | | | | | | | | | | | | | | | |
| | | Derivatives not accounted for as hedging instruments | |
| | | Commodity
Contracts | | | Credit
Contracts | | | Equity
Contracts | | | Foreign
Exchange
Contracts | | | Interest
Rate Contracts | | | Total | |
Net Realized Gain (Loss) on Financial Derivative Instruments | |
Over the counter | |
Swap Agreements | | $ | (106 | ) | | $ | 0 | | | $ | 523 | | | $ | 0 | | | $ | 0 | | | $ | 417 | |
| | | | | | | | | | | | | | | | | | | | | | | | |
|
Net Change in Unrealized Appreciation (Depreciation) on Financial Derivative Instruments | |
Over the counter | |
Swap Agreements | | $ | 113 | | | $ | 0 | | | $ | (7 | ) | | $ | 0 | | | $ | 0 | | | $ | 106 | |
| | | | | | | | | | | | | | | | | | | | | | | | |
| | | | | | | | | | | | |
| See Accompanying Notes | | | ANNUAL FINANCIAL AND OTHER INFORMATION | | | | | | | JUNE 30, 2024 | | | 33 |
| | | | | | |
| Schedule of Investments | | PIMCO REALPATH® Blend 2045 Fund | | (Cont.) | | June 30, 2024 |
FAIR VALUE MEASUREMENTS
The following is a summary of the fair valuations according to the inputs used as of June 30, 2024 in valuing the Fund’s assets and liabilities:
| | | | | | | | | | | | | | | | |
| Category and Subcategory | | Level 1 | | | Level 2 | | | Level 3 | | | Fair
Value at
06/30/2024 | |
Investments in Securities, at Value | |
Mutual Funds | | $ | 434,073 | | | $ | 0 | | | $ | 0 | | | $ | 434,073 | |
Short-Term Instruments | |
Repurchase Agreements | | | 0 | | | | 371 | | | | 0 | | | | 371 | |
| | | | | | | | | | | | | | | | |
| | $ | 434,073 | | | $ | 371 | | | $ | 0 | | | $ | 434,444 | |
| | | | | | | | | | | | | | | | |
|
Investments in Affiliates, at Value | |
Mutual Funds | | | 72,215 | | | | 0 | | | | 0 | | | | 72,215 | |
Short-Term Instruments | |
Central Funds Used for Cash Management Purposes | | | 24,861 | | | | 0 | | | | 0 | | | | 24,861 | |
| | | | | | | | | | | | | | | | |
| | $ | 97,076 | | | $ | 0 | | | $ | 0 | | | $ | 97,076 | |
| | | | | | | | | | | | | | | | |
| | | | |
Total Investments | | $ | 531,149 | | | $ | 371 | | | $ | 0 | | | $ | 531,520 | |
| | | | | | | | | | | | | | | | |
| | | | | | | | | | | | | | | | |
| Category and Subcategory | | Level 1 | | | Level 2 | | | Level 3 | | | Fair
Value at
06/30/2024 | |
|
Financial Derivative Instruments - Liabilities | |
Over the counter | | $ | 0 | | | $ | (96 | ) | | $ | 0 | | | $ | (96 | ) |
| | | | | | | | | | | | | | | | |
| | | | |
Total Financial Derivative Instruments | | $ | 0 | | | $ | (96 | ) | | $ | 0 | | | $ | (96 | ) |
| | | | | | | | | | | | | | | | |
| | | | |
Totals | | $ | 531,149 | | | $ | 275 | | | $ | 0 | | | $ | 531,424 | |
| | | | | | | | | | | | | | | | |
There were no significant transfers into or out of Level 3 during the period ended June 30, 2024.
| | | | | | |
| 34 | | PIMCO EQUITY SERIES | | | See Accompanying Notes | |
| | | | | | |
| Schedule of Investments | | PIMCO REALPATH® Blend 2050 Fund | | | | June 30, 2024 |
(Amounts in thousands*, except number of shares, contracts, units and ounces, if any)
| | | | | | | | | | | | |
| | | | | SHARES | | | | | MARKET
VALUE
(000S) | |
| INVESTMENTS IN SECURITIES 86.3% | |
| |
| MUTUAL FUNDS 86.2% | |
| | | | |
Vanguard Developed Markets Index Fund ‘Institutional’ | | | | | 4,972,308 | | | $ | | | 123,264 | |
| | | | |
Vanguard Emerging Markets Stock Index Fund ‘Institutional’ | | | | | 1,509,306 | | | | | | 41,898 | |
| | | | |
Vanguard Institutional Index Fund ‘Institutional’ | | | | | 516,354 | | | | | | 231,962 | |
| | | | |
Vanguard Small-Cap Index Fund ‘Institutional’ | | | | | 166,076 | | | | | | 17,370 | |
| | | | | | | | | | | | |
Total Mutual Funds (Cost $314,751) | | | 414,494 | |
| | | | |
| |
| SHORT-TERM INSTRUMENTS 0.1% | |
| |
| REPURCHASE AGREEMENTS (b) 0.1% | |
| | | | | | | | | | | 559 | |
| | | | | | | | | | | | |
Total Short-Term Instruments (Cost $559) | | | 559 | |
| | | | |
| | | | |
| | | | | | | | | | | | |
Total Investments in Securities (Cost $315,310) | | | 415,053 | |
| | | | |
| | | | | | | | | | | | |
| | | | | SHARES | | | | | MARKET
VALUE
(000S) | |
| INVESTMENTS IN AFFILIATES 12.9% | |
| |
| MUTUAL FUNDS (a) 8.5% | |
| | | | |
PIMCO Emerging Markets Local Currency and Bond Fund | | | | | 426,124 | | | $ | | | 2,412 | |
| | | | |
PIMCO Income Fund | | | | | 489,894 | | | | | | 5,134 | |
| | | | |
PIMCO International Bond Fund (U.S. Dollar-Hedged) | | | | | 231,348 | | | | | | 2,269 | |
| | | | |
PIMCO Long-Term Real Return Fund | | | | | 553,604 | | | | | | 6,638 | |
| | | | |
PIMCO Long-Term U.S. Government Fund | | | | | 517,272 | | | | | | 7,288 | |
| | | | |
PIMCO Real Return Fund | | | | | 473,627 | | | | | | 4,712 | |
| | | | |
PIMCO Total Return Fund | | | | | 1,416,944 | | | | | | 12,030 | |
| | | | | | | | | | | | |
| Total Mutual Funds (Cost $44,674) | | | 40,483 | |
| | | | |
| |
| | | | | | | | | | | | |
| | | | | SHARES | | | | | MARKET
VALUE
(000S) | |
| SHORT-TERM INSTRUMENTS 4.4% | |
| |
| CENTRAL FUNDS USED FOR CASH MANAGEMENT PURPOSES 4.4% | |
| | | | |
PIMCO Short-Term Floating NAV Portfolio III | | | | | 2,154,843 | | | $ | | | 20,965 | |
| | | | | | | | | | | | |
| Total Short-Term Instruments (Cost $20,944) | | | | | | | | | | | 20,965 | |
| | | | | | | | | | | | |
| | | | |
| | | | | | | | | | | | |
| Total Investments in Affiliates (Cost $65,618) | | | | | | | | | | | 61,448 | |
| | | | |
| | | | | | | | | | | | |
| Total Investments 99.2% (Cost $380,928) | | | | | | | | $ | | | 476,501 | |
| |
Financial Derivative
Instruments (c) (0.0)% (Cost or Premiums, net $0) | | | | | | | | | | | (88 | ) |
| |
| Other Assets and Liabilities, net 0.8% | | | 4,126 | |
| | | | |
| Net Assets 100.0% | | | $ | | | 480,539 | |
| | | | | | | |
NOTES TO SCHEDULE OF INVESTMENTS:
| * | A zero balance may reflect actual amounts rounding to less than one thousand. |
| (a) | Institutional Class Shares of each Fund. |
BORROWINGS AND OTHER FINANCING TRANSACTIONS
(b) REPURCHASE AGREEMENTS:
| | | | | | | | | | | | | | | | | | | | | | | | | | | | | | |
| Counterparty | | Lending
Rate | | | Settlement
Date | | | Maturity
Date | | | Principal
Amount | | | Collateralized By | | Collateral
(Received) | | | Repurchase
Agreements,
at Value | | | Repurchase
Agreement
Proceeds
to be
Received(1) | |
| FICC | | | 2.600 | % | | | 06/28/2024 | | | | 07/01/2024 | | | $ | 559 | | | U.S. Treasury Inflation Protected Securities 0.625% due 01/15/2026 | | $ | (570 | ) | | $ | 559 | | | $ | 559 | |
| | | | | | | | | | | | | | | | | | | | | | | | | | | | | | |
Total Repurchase Agreements | | | | | $ | (570 | ) | | $ | 559 | | | $ | 559 | |
| | | | | | | | | | | | | | | |
BORROWINGS AND OTHER FINANCING TRANSACTIONS SUMMARY
The following is a summary by counterparty of the market value of Borrowings and Other Financing Transactions and collateral pledged/(received) as of June 30, 2024:
| | | | | | | | | | | | | | | | | | | | | | | | |
| Counterparty | | Repurchase
Agreement
Proceeds
to be
Received(1) | | | Payable for
Reverse
Repurchase
Agreements | | | Payable for
Sale-Buyback
Transactions | | | Total
Borrowings and
Other Financing
Transactions | | | Collateral
Pledged/(Received) | | | Net Exposure(2) | |
Global/Master Repurchase Agreement | |
FICC | | $ | 559 | | | $ | 0 | | | $ | 0 | | | $ | 559 | | | $ | (570 | ) | | $ | (11 | ) |
| | | | | | | | | | | | | | | | | | | | | | | | |
Total Borrowings and Other Financing Transactions | | $ | 559 | | | $ | 0 | | | $ | 0 | | | | | | | | | | | | | |
| | | | | | | | | | | | | | | | | | | | | | | | |
| (1) | Includes accrued interest. |
| (2) | Net Exposure represents the net receivable/(payable) that would be due from/to the counterparty in the event of default. Exposure from borrowings and other financing transactions can only be netted across transactions governed under the same master agreement with the same legal entity. See Note 8, Master Netting Arrangements, in the Notes to Financial Statements for more information. |
| | | | | | | | | | | | |
| See Accompanying Notes | | | ANNUAL FINANCIAL AND OTHER INFORMATION | | | | | | | JUNE 30, 2024 | | | 35 |
| | | | | | |
| Schedule of Investments | | PIMCO REALPATH® Blend 2050 Fund | | (Cont.) | | |
(c) FINANCIAL DERIVATIVE INSTRUMENTS: OVER THE COUNTER
SWAP AGREEMENTS:
TOTAL RETURN SWAPS ON COMMODITY AND EQUITY INDICES
| | | | | | | | | | | | | | | | | | | | | | | | | | | | | | | | | | | | |
| Counterparty | | Pay/Receive(1) | | Underlying
Reference | | # of Units | | | Financing Rate | | Payment
Frequency | | Maturity
Date | | | Notional
Amount | | | Premiums
Paid/(Received) | | | Unrealized
Appreciation/
(Depreciation) | | | Swap Agreements,
at Value | |
| | Asset | | | Liability | |
GST | | Receive | | BERYTR Index | | | 12,651 | | | 5.400% (3-Month U.S. Treasury Bill rate plus a specified spread) | | Monthly | | | 02/18/2025 | | | $ | 6,069 | | | $ | 0 | | | $ | (9 | ) | | $ | 0 | | | $ | (9 | ) |
| | | | | | | | | | | |
MYI | | Receive | | FNRETR Index | | | 650 | | | 5.670% (1-Month USD-LIBOR plus a specified spread) | | Monthly | | | 09/11/2024 | | | | 14,831 | | | | 0 | | | | (61 | ) | | | 0 | | | | (61 | ) |
| | Receive | | FNRETR Index | | | 166 | | | 5.730% (1-Month USD-LIBOR plus a specified spread) | | Monthly | | | 04/02/2025 | | | | 3,788 | | | | 0 | | | | (16 | ) | | | 0 | | | | (16 | ) |
| | Receive | | FNRETR Index | | | 24 | | | 5.740% (1-Month USD-LIBOR plus a specified spread) | | Monthly | | | 04/02/2025 | | | | 547 | | | | 0 | | | | (2 | ) | | | 0 | | | | (2 | ) |
| | | | | | | | | | | | | | | | | | | | | | | | | | |
Total Swap Agreements | | | $ | 0 | | | $ | (88 | ) | | $ | 0 | | | $ | (88 | ) |
| | | | | | | | | | | | | | | | | |
FINANCIAL DERIVATIVE INSTRUMENTS: OVER THE COUNTER SUMMARY
The following is a summary by counterparty of the market value of OTC financial derivative instruments and collateral pledged/(received) as of June 30, 2024:
| | | | | | | | | | | | | | | | | | | | | | | | | | | | | | | | | | | | | | | | | | | | | | | | |
| | | Financial Derivative Assets | | | | | | Financial Derivative Liabilities | | | | | | | | | | |
| Counterparty | | Forward
Foreign
Currency
Contracts | | | Purchased
Options | | | Swap
Agreements | | | Total
Over the
Counter | | | | | | Forward
Foreign
Currency
Contracts | | | Written
Options | | | Swap
Agreements | | | Total
Over the
Counter | | | Net Market
Value of OTC
Derivatives | | | Collateral
Pledged/
(Received) | | | Net
Exposure(2) | |
GST | | $ | 0 | | | $ | 0 | | | $ | 0 | | | $ | 0 | | | | | | | $ | 0 | | | $ | 0 | | | $ | (9 | ) | | $ | (9 | ) | | $ | (9 | ) | | $ | 0 | | | $ | (9 | ) |
MYI | | | 0 | | | | 0 | | | | 0 | | | | 0 | | | | | | | | 0 | | | | 0 | | | | (79 | ) | | | (79 | ) | | | (79 | ) | | | (99 | ) | | | (178 | ) |
| | | | | | | | | | | | | | | | | | | | | | | | | | | | | | | | | | | | | | | | | | | | | | | | |
Total Over the Counter | | $ | 0 | | | $ | 0 | | | $ | 0 | | | $ | 0 | | | | | | | $ | 0 | | | $ | 0 | | | $ | (88 | ) | | $ | (88 | ) | | | | | | | | | | | | |
| | | | | | | | | | | | | | | | | | | | | | | | | | | | | | | | | | | | | | | | | | | | | | | | |
| (1) | Receive represents that the Fund receives payments for any positive net return on the underlying reference. The Fund makes payments for any negative net return on such underlying reference. Pay represents that the Fund receives payments for any negative net return on the underlying reference. The Fund makes payments for any positive net return on such underlying reference. |
| (2) | Net Exposure represents the net receivable/(payable) that would be due from/to the counterparty in the event of default. Exposure from OTC financial derivative instruments can only be netted across transactions governed under the same master agreement with the same legal entity. See Note 8, Master Netting Arrangements, in the Notes to Financial Statements for more information. |
FAIR VALUE OF FINANCIAL DERIVATIVE INSTRUMENTS
The following is a summary of the fair valuation of the Fund’s derivative instruments categorized by risk exposure. See Note 7, Principal and Other Risks, in the Notes to Financial Statements on risks of the Fund.
Fair Values of Financial Derivative Instruments on the Statements of Assets and Liabilities as of June 30, 2024:
| | | | | | | | | | | | | | | | | | | | | | | | |
| | | Derivatives not accounted for as hedging instruments | |
| | | Commodity
Contracts | | | Credit
Contracts | | | Equity
Contracts | | | Foreign
Exchange
Contracts | | | Interest
Rate Contracts | | | Total | |
Financial Derivative Instruments - Liabilities | |
Over the counter | |
Swap Agreements | | $ | 9 | | | $ | 0 | | | $ | 79 | | | $ | 0 | | | $ | 0 | | | $ | 88 | |
| | | | | | | | | | | | | | | | | | | | | | | | |
The effect of Financial Derivative Instruments on the Statements of Operations for the period ended June 30, 2024:
| | | | | | | | | | | | | | | | | | | | | | | | |
| | | Derivatives not accounted for as hedging instruments | |
| | | Commodity
Contracts | | | Credit
Contracts | | | Equity
Contracts | | | Foreign
Exchange
Contracts | | | Interest
Rate Contracts | | | Total | |
Net Realized Gain (Loss) on Financial Derivative Instruments | |
Over the counter | |
Swap Agreements | | $ | (87 | ) | | $ | 0 | | | $ | 495 | | | $ | 0 | | | $ | 0 | | | $ | 408 | |
| | | | | | | | | | | | | | | | | | | | | | | | |
|
Net Change in Unrealized Appreciation (Depreciation) on Financial Derivative Instruments | |
Over the counter | |
Swap Agreements | | $ | 97 | | | $ | 0 | | | $ | (13 | ) | | $ | 0 | | | $ | 0 | | | $ | 84 | |
| | | | | | | | | | | | | | | | | | | | | | | | |
| | | | | | |
| 36 | | PIMCO EQUITY SERIES | | | See Accompanying Notes | |
FAIR VALUE MEASUREMENTS
The following is a summary of the fair valuations according to the inputs used as of June 30, 2024 in valuing the Fund’s assets and liabilities:
| | | | | | | | | | | | | | | | |
| Category and Subcategory | | Level 1 | | | Level 2 | | | Level 3 | | | Fair
Value at
06/30/2024 | |
Investments in Securities, at Value | |
Mutual Funds | | $ | 414,494 | | | $ | 0 | | | $ | 0 | | | $ | 414,494 | |
Short-Term Instruments | |
Repurchase Agreements | | | 0 | | | | 559 | | | | 0 | | | | 559 | |
| | | | | | | | | | | | | | | | |
| | $ | 414,494 | | | $ | 559 | | | $ | 0 | | | $ | 415,053 | |
| | | | | | | | | | | | | | | | |
|
Investments in Affiliates, at Value | |
Mutual Funds | | | 40,483 | | | | 0 | | | | 0 | | | | 40,483 | |
Short-Term Instruments | |
Central Funds Used for Cash Management Purposes | | | 20,965 | | | | 0 | | | | 0 | | | | 20,965 | |
| | | | | | | | | | | | | | | | |
| | $ | 61,448 | | | $ | 0 | | | $ | 0 | | | $ | 61,448 | |
| | | | | | | | | | | | | | | | |
| | | | |
Total Investments | | $ | 475,942 | | | $ | 559 | | | $ | 0 | | | $ | 476,501 | |
| | | | | | | | | | | | | | | | |
| | | | | | | | | | | | | | | | |
| Category and Subcategory | | Level 1 | | | Level 2 | | | Level 3 | | | Fair
Value at
06/30/2024 | |
|
Financial Derivative Instruments - Liabilities | |
Over the counter | | $ | 0 | | | $ | (88 | ) | | $ | 0 | | | $ | (88 | ) |
| | | | | | | | | | | | | | | | |
| | | | |
Total Financial Derivative Instruments | | $ | 0 | | | $ | (88 | ) | | $ | 0 | | | $ | (88 | ) |
| | | | | | | | | | | | | | | | |
| | | | |
Totals | | $ | 475,942 | | | $ | 471 | | | $ | 0 | | | $ | 476,413 | |
| | | | | | | | | | | | | | | | |
There were no significant transfers into or out of Level 3 during the period ended June 30, 2024.
| | | | | | | | | | | | |
| See Accompanying Notes | | | ANNUAL FINANCIAL AND OTHER INFORMATION | | | | | | | JUNE 30, 2024 | | | 37 |
| | | | | | |
| Schedule of Investments | | PIMCO REALPATH® Blend 2055 Fund | | | | |
(Amounts in thousands*, except number of shares, contracts, units and ounces, if any)
| | | | | | | | | | | | |
| | | | | SHARES | | | | | MARKET
VALUE
(000S) | |
| INVESTMENTS IN SECURITIES 89.2% | |
| |
| MUTUAL FUNDS 88.7% | |
| | | | |
Vanguard Developed Markets Index Fund ‘Institutional’ | | | | | 4,248,616 | | | $ | | | 105,323 | |
| | | | |
Vanguard Emerging Markets Stock Index Fund ‘Institutional’ | | | | | 1,332,743 | | | | | | 36,997 | |
| | | | |
Vanguard Institutional Index Fund ‘Institutional’ | | | | | 453,152 | | | | | | 203,570 | |
| | | | |
Vanguard Small-Cap Index Fund ‘Institutional’ | | | | | 158,839 | | | | | | 16,613 | |
| | | | | | | | | | | | |
Total Mutual Funds (Cost $290,088) | | | 362,503 | |
| | | | |
| |
| SHORT-TERM INSTRUMENTS 0.5% | |
| |
| REPURCHASE AGREEMENTS (d) 0.3% | |
| | | | | | | | | | | 1,106 | |
| | | | | | | | | | | | |
| |
| U.S. TREASURY BILLS 0.2% | |
5.383% due 07/11/2024 - 07/18/2024 (a)(b) | | $ | | | 857 | | | | | | 855 | |
| | | | | | | | | | | | |
Total Short-Term Instruments (Cost $1,961) | | | 1,961 | |
| | | | |
| | | | |
| | | | | | | | | | | | |
Total Investments in Securities (Cost $292,049) | | | 364,464 | |
| | | | |
| | | | | | | | | | | | |
| | | | | SHARES | | | | | MARKET
VALUE
(000S) | |
| INVESTMENTS IN AFFILIATES 10.3% | |
| |
| MUTUAL FUNDS (c) 5.9% | |
| | | | |
PIMCO Emerging Markets Local Currency and Bond Fund | | | | | 222,923 | | | $ | | | 1,262 | |
| | | | |
PIMCO Income Fund | | | | | 322,163 | | | | | | 3,376 | |
| | | | |
PIMCO International Bond Fund (U.S. Dollar-Hedged) | | | | | 106,641 | | | | | | 1,046 | |
| | | | |
PIMCO Long-Term Real Return Fund | | | | | 329,727 | | | | | | 3,953 | |
| | | | |
PIMCO Long-Term U.S. Government Fund | | | | | 263,206 | | | | | | 3,709 | |
| | | | |
PIMCO Real Return Fund | | | | | 327,578 | | | | | | 3,259 | |
| | | | |
PIMCO Total Return Fund | | | | | 903,920 | | | | | | 7,674 | |
| | | | | | | | | | | | |
| Total Mutual Funds (Cost $26,451) | | | 24,279 | |
| | | | |
| |
| |
| | | | | | | | | | | | |
| | | | | SHARES | | | | | MARKET
VALUE
(000S) | |
| SHORT-TERM INSTRUMENTS 4.4% | |
| |
| CENTRAL FUNDS USED FOR CASH MANAGEMENT PURPOSES 4.4% | |
| | | | |
PIMCO Short-Term Floating NAV Portfolio III | | | | | 1,832,425 | | | $ | | | 17,828 | |
| | | | | | | | | | | | |
Total Short-Term Instruments
(Cost $17,809) | | | 17,828 | |
| | | | |
| | | | |
| | | | | | | | | | | | |
Total Investments in Affiliates
(Cost $44,260) | | | 42,107 | |
| | | | |
| | | | | | | | | | | | |
Total Investments 99.5%
(Cost $336,309) | | | $ | | | 406,571 | |
| |
Financial Derivative Instruments (e) (0.0)% (Cost or Premiums, net $0) | | | | | | | | | | | (76 | ) |
| |
| Other Assets and Liabilities, net 0.5% | | | 2,142 | |
| | | | |
| Net Assets 100.0% | | | $ | | | 408,637 | |
| | | | | | | |
NOTES TO SCHEDULE OF INVESTMENTS:
| * | A zero balance may reflect actual amounts rounding to less than one thousand. |
| (a) | Coupon represents a weighted average yield to maturity. |
| (c) | Institutional Class Shares of each Fund. |
BORROWINGS AND OTHER FINANCING TRANSACTIONS
(d) REPURCHASE AGREEMENTS:
| | | | | | | | | | | | | | | | | | | | | | | | | | | | | | |
| Counterparty | | Lending
Rate | | | Settlement
Date | | | Maturity
Date | | | Principal
Amount | | | Collateralized By | | Collateral
(Received) | | | Repurchase
Agreements,
at Value | | | Repurchase
Agreement
Proceeds
to be
Received(1) | |
| FICC | | | 2.600 | % | | | 06/28/2024 | | | | 07/01/2024 | | | $ | 1,106 | | | U.S. Treasury Inflation Protected Securities 0.625% due 01/15/2026 | | $ | (1,128 | ) | | $ | 1,106 | | | $ | 1,106 | |
| | | | | | | | | | | | | | | | | | | | | | | | | | | | | | |
Total Repurchase Agreements | | | | | $ | (1,128 | ) | | $ | 1,106 | | | $ | 1,106 | |
| | | | | | | | | | | | | | | |
BORROWINGS AND OTHER FINANCING TRANSACTIONS SUMMARY
The following is a summary by counterparty of the market value of Borrowings and Other Financing Transactions and collateral pledged/(received) as of June 30, 2024:
| | | | | | | | | | | | | | | | | | | | | | | | |
| Counterparty | | Repurchase
Agreement
Proceeds
to be
Received(1) | | | Payable for
Reverse
Repurchase
Agreements | | | Payable for
Sale-Buyback
Transactions | | | Total
Borrowings and
Other Financing
Transactions | | | Collateral
Pledged/(Received) | | | Net Exposure(2) | |
Global/Master Repurchase Agreement | |
FICC | | $ | 1,106 | | | $ | 0 | | | $ | 0 | | | $ | 1,106 | | | $ | (1,128 | ) | | $ | (22 | ) |
| | | | | | | | | | | | | | | | | | | | | | | | |
Total Borrowings and Other Financing Transactions | | $ | 1,106 | | | $ | 0 | | | $ | 0 | | | | | | | | | | | | | |
| | | | | | | | | | | | | | | | | | | | | | | | |
| (1) | Includes accrued interest. |
| (2) | Net Exposure represents the net receivable/(payable) that would be due from/to the counterparty in the event of default. Exposure from borrowings and other financing transactions can only be netted across transactions governed under the same master agreement with the same legal entity. See Note 8, Master Netting Arrangements, in the Notes to Financial Statements for more information. |
| | | | | | |
| 38 | | PIMCO EQUITY SERIES | | | See Accompanying Notes | |
(e) FINANCIAL DERIVATIVE INSTRUMENTS: OVER THE COUNTER
SWAP AGREEMENTS:
TOTAL RETURN SWAPS ON COMMODITY AND EQUITY INDICES
| | | | | | | | | | | | | | | | | | | | | | | | | | | | | | | | | | | | |
Counterparty | | Pay/Receive(1) | | Underlying
Reference | | # of Units | | | Financing Rate | | Payment
Frequency | | Maturity
Date | | | Notional
Amount | | | Premiums
Paid/(Received) | | | Unrealized
Appreciation/
(Depreciation) | | | Swap Agreements,
at Value | |
| | Asset | | | Liability | |
GST | | Receive | | BERYTR Index | | | 9,871 | | | 5.400% (3-Month U.S. Treasury Bill rate plus a specified spread) | | Monthly | | | 02/18/2025 | | | $ | 4,735 | | | $ | 0 | | | $ | (7 | ) | | $ | 0 | | | $ | (7 | ) |
| | | | | | | | | | | |
MYI | | Receive | | FNRETR Index | | | 577 | | | 5.670% (1-Month USD-LIBOR plus a specified spread) | | Monthly | | | 09/11/2024 | | | | 13,166 | | | | 0 | | | | (55 | ) | | | 0 | | | | (55 | ) |
| | Receive | | FNRETR Index | | | 98 | | | 5.730% (1-Month USD-LIBOR plus a specified spread) | | Monthly | | | 04/02/2025 | | | | 2,236 | | | | 0 | | | | (9 | ) | | | 0 | | | | (9 | ) |
| | Receive | | FNRETR Index | | | 54 | | | 5.740% (1-Month USD-LIBOR plus a specified spread) | | Monthly | | | 04/02/2025 | | | | 1,232 | | | | 0 | | | | (5 | ) | | | 0 | | | | (5 | ) |
| | | | | | | | | | | | | | | | | | | | | | | | | | |
Total Swap Agreements | | | $ | 0 | | | $ | (76 | ) | | $ | 0 | | | $ | (76 | ) |
| | | | | | | | | | | | | | | | | |
FINANCIAL DERIVATIVE INSTRUMENTS: OVER THE COUNTER SUMMARY
The following is a summary by counterparty of the market value of OTC financial derivative instruments and collateral pledged/(received) as of June 30, 2024:
| | | | | | | | | | | | | | | | | | | | | | | | | | | | | | | | | | | | | | | | | | | | | | | | |
| | | Financial Derivative Assets | | | | | | Financial Derivative Liabilities | | | | | | | | | | |
| Counterparty | | Forward
Foreign
Currency
Contracts | | | Purchased
Options | | | Swap
Agreements | | | Total
Over the
Counter | | | | | | Forward
Foreign
Currency
Contracts | | | Written
Options | | | Swap
Agreements | | | Total
Over the
Counter | | | Net Market
Value of OTC
Derivatives | | | Collateral
Pledged/
(Received) | | | Net
Exposure(2) | |
GST | | $ | 0 | | | $ | 0 | | | $ | 0 | | | $ | 0 | | | | | | | $ | 0 | | | $ | 0 | | | $ | (7 | ) | | $ | (7 | ) | | $ | (7 | ) | | $ | 0 | | | $ | (7 | ) |
MYI | | | 0 | | | | 0 | | | | 0 | | | | 0 | | | | | | | | 0 | | | | 0 | | | | (69 | ) | | | (69 | ) | | | (69 | ) | | | (100 | ) | | | (169 | ) |
| | | | | | | | | | | | | | | | | | | | | | | | | | | | | | | | | | | | | | | | | | | | | | | | |
Total Over the Counter | | $ | 0 | | | $ | 0 | | | $ | 0 | | | $ | 0 | | | | | | | $ | 0 | | | $ | 0 | | | $ | (76 | ) | | $ | (76 | ) | | | | | | | | | | | | |
| | | | | | | | | | | | | | | | | | | | | | | | | | | | | | | | | | | | | | | | | | | | | | | | |
| (1) | Receive represents that the Fund receives payments for any positive net return on the underlying reference. The Fund makes payments for any negative net return on such underlying reference. Pay represents that the Fund receives payments for any negative net return on the underlying reference. The Fund makes payments for any positive net return on such underlying reference. |
| (2) | Net Exposure represents the net receivable/(payable) that would be due from/to the counterparty in the event of default. Exposure from OTC financial derivative instruments can only be netted across transactions governed under the same master agreement with the same legal entity. See Note 8, Master Netting Arrangements, in the Notes to Financial Statements for more information. |
FAIR VALUE OF FINANCIAL DERIVATIVE INSTRUMENTS
The following is a summary of the fair valuation of the Fund’s derivative instruments categorized by risk exposure. See Note 7, Principal and Other Risks, in the Notes to Financial Statements on risks of the Fund.
Fair Values of Financial Derivative Instruments on the Statements of Assets and Liabilities as of June 30, 2024:
| | | | | | | | | | | | | | | | | | | | | | | | |
| | | Derivatives not accounted for as hedging instruments | |
| | | Commodity
Contracts | | | Credit
Contracts | | | Equity
Contracts | | | Foreign
Exchange
Contracts | | | Interest
Rate Contracts | | | Total | |
Financial Derivative Instruments - Liabilities | |
Over the counter | |
Swap Agreements | | $ | 7 | | | $ | 0 | | | $ | 69 | | | $ | 0 | | | $ | 0 | | | $ | 76 | |
| | | | | | | | | | | | | | | | | | | | | | | | |
The effect of Financial Derivative Instruments on the Statements of Operations for the period ended June 30, 2024:
| | | | | | | | | | | | | | | | | | | | | | | | |
| | | Derivatives not accounted for as hedging instruments | |
| | | Commodity
Contracts | | | Credit
Contracts | | | Equity
Contracts | | | Foreign
Exchange
Contracts | | | Interest
Rate Contracts | | | Total | |
Net Realized Gain (Loss) on Financial Derivative Instruments | |
Over the counter | |
Swap Agreements | | $ | (50 | ) | | $ | 0 | | | $ | 474 | | | $ | 0 | | | $ | 0 | | | $ | 424 | |
| | | | | | | | | | | | | | | | | | | | | | | | |
|
Net Change in Unrealized Appreciation (Depreciation) on Financial Derivative Instruments | |
Over the counter | |
Swap Agreements | | $ | 64 | | | $ | 0 | | | $ | (20 | ) | | $ | 0 | | | $ | 0 | | | $ | 44 | |
| | | | | | | | | | | | | | | | | | | | | | | | |
| | | | | | | | | | | | |
| See Accompanying Notes | | | ANNUAL FINANCIAL AND OTHER INFORMATION | | | | | | | JUNE 30, 2024 | | | 39 |
| | | | | | |
| Schedule of Investments | | PIMCO REALPATH® Blend 2055 Fund | | (Cont.) | | June 30, 2024 |
FAIR VALUE MEASUREMENTS
The following is a summary of the fair valuations according to the inputs used as of June 30, 2024 in valuing the Fund’s assets and liabilities:
| | | | | | | | | | | | | | | | |
| Category and Subcategory | | Level 1 | | | Level 2 | | | Level 3 | | | Fair Value at 06/30/2024 | |
Investments in Securities, at Value | | | | | | | | | |
Mutual Funds | | $ | 362,503 | | | $ | 0 | | | $ | 0 | | | $ | 362,503 | |
Short-Term Instruments | |
Repurchase Agreements | | | 0 | | | | 1,106 | | | | 0 | | | | 1,106 | |
U.S. Treasury Bills | | | 0 | | | | 855 | | | | 0 | | | | 855 | |
| | | | | | | | | | | | | | | | |
| | $ | 362,503 | | | $ | 1,961 | | | $ | 0 | | | $ | 364,464 | |
| | | | | | | | | | | | | | | | |
| | |
Investments in Affiliates, at Value | | | | | | | | | |
Mutual Funds | | | 24,279 | | | | 0 | | | | 0 | | | | 24,279 | |
Short-Term Instruments | |
Central Funds Used for Cash Management Purposes | | | 17,828 | | | | 0 | | | | 0 | | | | 17,828 | |
| | | | | | | | | | | | | | | | |
| | $ | 42,107 | | | $ | 0 | | | $ | 0 | | | $ | 42,107 | |
| | | | | | | | | | | | | | | | |
| | | | |
Total Investments | | $ | 404,610 | | | $ | 1,961 | | | $ | 0 | | | $ | 406,571 | |
| | | | | | | | | | | | | | | | |
| | | | | | | | | | | | | | | | |
| Category and Subcategory | | Level 1 | | | Level 2 | | | Level 3 | | | Fair Value at 06/30/2024 | |
|
Financial Derivative Instruments - Liabilities | |
Over the counter | | $ | 0 | | | $ | (76 | ) | | $ | 0 | | | $ | (76 | ) |
| | | | | | | | | | | | | | | | |
| | | | |
Total Financial Derivative Instruments | | $ | 0 | | | $ | (76 | ) | | $ | 0 | | | $ | (76 | ) |
| | | | | | | | | | | | | | | | |
| | | | |
Totals | | $ | 404,610 | | | $ | 1,885 | | | $ | 0 | | | $ | 406,495 | |
| | | | | | | | | | | | | | | | |
There were no significant transfers into or out of Level 3 during the period ended June 30, 2024.
| | | | | | |
| 40 | | PIMCO EQUITY SERIES | | | See Accompanying Notes | |
| | | | | | |
| Schedule of Investments | | PIMCO REALPATH® Blend 2060 Fund | | | | June 30, 2024 |
(Amounts in thousands*, except number of shares, contracts, units and ounces, if any)
| | | | | | | | | | | | |
| | | | | SHARES | | | | | MARKET
VALUE
(000S) | |
| INVESTMENTS IN SECURITIES 90.4% | |
| |
| MUTUAL FUNDS 90.0% | |
| | | | |
Vanguard Developed Markets Index Fund ‘Institutional’ | | | | | 2,592,359 | | | $ | | | 41,115 | |
| | | | |
Vanguard Emerging Markets Stock Index Fund ‘Institutional’ | | | | | 518,346 | | | | | | 14,389 | |
| | | | |
Vanguard Institutional Index Fund ‘Institutional’ | | | | | 180,658 | | | | | | 81,159 | |
| | | | |
Vanguard Small-Cap Index Fund ‘Institutional’ | | | | | 65,795 | | | | | | 6,881 | |
| | | | | | | | | | | | |
Total Mutual Funds (Cost $122,230) | | | 143,544 | |
| | | | | | | | | | | | |
| |
| SHORT-TERM INSTRUMENTS 0.4% | |
| |
REPURCHASE AGREEMENTS (d) 0.2%
| |
| | | | | | | | | | | 310 | |
| | | | | | | | | | | | |
| |
| U.S. TREASURY BILLS 0.2% | |
5.376% due 07/11/2024 (a)(b) | | | | $ | 336 | | | | | | 336 | |
| | | | | | | | | | | | |
| Total Short-Term Instruments (Cost $ ) | | | | | | | | | | | 646 | |
| | | | | | | | | | | | |
| | | | |
| | | | | | | | | | | | |
| Total Investments in Securities (Cost $122,876) | | | 144,190 | |
| | | | | | | | | | | | |
| | | | | | | | | | | | |
| | | | | SHARES | | | | | MARKET
VALUE
(000S) | |
| INVESTMENTS IN AFFILIATES 10.0% | |
| |
| MUTUAL FUNDS 4.6% (c) | |
| | | | |
PIMCO Emerging Markets Local Currency and Bond Fund | | | | | 85,114 | | | $ | | | 482 | |
| | | | |
PIMCO Income Fund | | | | | 87,704 | | | | | | 919 | |
| | | | |
PIMCO International Bond Fund (U.S. Dollar-Hedged) | | | | | 23,989 | | | | | | 235 | |
| | | | |
PIMCO Long-Term Real Return Fund | | | | | 100,567 | | | | | | 1,206 | |
| | | | |
PIMCO Long-Term U.S. Government Fund | | | | | 83,323 | | | | | | 1,174 | |
| | | | |
PIMCO Real Return Fund | | | | | 112,027 | | | | | | 1,115 | |
| | | | |
PIMCO Total Return Fund | | | | | 262,693 | | | | | | 2,230 | |
| | | | | | | | | | | | |
| Total Mutual Funds (Cost $7,609) | | | | | | | | | | | 7,361 | |
| | | | | | | | | | | | |
| |
| | | | | | | | | | | | |
| | | | | SHARES | | | | | MARKET
VALUE
(000S) | |
| SHORT-TERM INSTRUMENTS 5.4% | |
| |
| CENTRAL FUNDS USED FOR CASH MANAGEMENT PURPOSES 5.4% | |
| | | | |
PIMCO Short-Term Floating NAV Portfolio III | | | | | 877,134 | | | $ | | | 8,534 | |
| | | | | | | | | | | | |
| Total Short-Term Instruments (Cost $8,530) | | | | | | | | | | | 8,534 | |
| | | | | | | | | | | | |
| | | | |
| | | | | | | | | | | | |
| Total Investments in Affiliates (Cost $16,139) | | | | | | | | | | | 15,895 | |
| | | | |
| | | | | | | | | | | | |
Total Investments 100.4%
(Cost $139,015) | | | | | | | | $ | | | 160,085 | |
| |
Financial Derivative Instruments (e) (0.0)% (Cost or Premiums, net $0) | | | | | | | | | | | (29 | ) |
| |
| Other Assets and Liabilities, net (0.4)% | | | | | | (578 | ) |
| | | | | | | | | | | | |
| Net Assets 100.0% | | | | | | | | $ | | | 159,478 | |
| | | | | | | | | | | | |
NOTES TO SCHEDULE OF INVESTMENTS:
| * | A zero balance may reflect actual amounts rounding to less than one thousand. |
| (b) | Coupon represents a yield to maturity. |
| (c) | Institutional Class Shares of each Fund. |
BORROWINGS AND OTHER FINANCING TRANSACTIONS
(d) REPURCHASE AGREEMENTS:
| | | | | | | | | | | | | | | | | | | | | | | | | | | | | | |
| Counterparty | | Lending
Rate | | | Settlement
Date | | | Maturity
Date | | | Principal
Amount | | | Collateralized By | | Collateral
(Received) | | | Repurchase
Agreements,
at Value | | | Repurchase
Agreement
Proceeds
to be
Received(1) | |
| FICC | | | 2.600 | % | | | 06/28/2024 | | | | 07/01/2024 | | | $ | 310 | | | U.S. Treasury Inflation Protected Securities 0.625% due 01/15/2026 | | $ | (316 | ) | | $ | 310 | | | $ | 310 | |
| | | | | | | | | | | | | | | | | | | | | | | | | | | | | | |
Total Repurchase Agreements | | | | | $ | (316 | ) | | $ | 310 | | | $ | 310 | |
| | | | | | | | | | | | | | | |
BORROWINGS AND OTHER FINANCING TRANSACTIONS SUMMARY
The following is a summary by counterparty of the market value of Borrowings and Other Financing Transactions and collateral pledged/(received) as of June 30, 2024:
| | | | | | | | | | | | | | | | | | | | | | | | |
| Counterparty | | Repurchase
Agreement
Proceeds
to be
Received(1) | | | Payable for
Reverse
Repurchase
Agreements | | | Payable for
Sale-Buyback
Transactions | | | Total
Borrowings and
Other Financing
Transactions | | | Collateral
Pledged/(Received) | | | Net Exposure(2) | |
Global/Master Repurchase Agreement | |
FICC | | $ | 310 | | | $ | 0 | | | $ | 0 | | | $ | 310 | | | $ | (316 | ) | | $ | (6 | ) |
| | | | | | | | | | | | | | | | | | | | | | | | |
Total Borrowings and Other Financing Transactions | | $ | 310 | | | $ | 0 | | | $ | 0 | | | | | | | | | | | | | |
| | | | | | | | | | | | | | | | | | | | | | | | |
| (1) | Includes accrued interest. |
| (2) | Net Exposure represents the net receivable/(payable) that would be due from/to the counterparty in the event of default. Exposure from borrowings and other financing transactions can only be netted across transactions governed under the same master agreement with the same legal entity. See Note 8, Master Netting Arrangements, in the Notes to Financial Statements for more information. |
| | | | | | | | | | | | |
| See Accompanying Notes | | | ANNUAL FINANCIAL AND OTHER INFORMATION | | | | | | | JUNE 30, 2024 | | | 41 |
| | | | | | |
| Schedule of Investments | | PIMCO REALPATH® Blend 2060 Fund | | (Cont.) | | |
(e) FINANCIAL DERIVATIVE INSTRUMENTS: OVER THE COUNTER
SWAP AGREEMENTS:
TOTAL RETURN SWAPS ON COMMODITY AND EQUITY INDICES
| | | | | | | | | | | | | | | | | | | | | | | | | | | | | | | | | | | | |
| Counterparty | | Pay/Receive(1) | | Underlying
Reference | | # of Units | | | Financing Rate | | Payment
Frequency | | Maturity
Date | | | Notional
Amount | | | Premiums
Paid/(Received) | | | Unrealized
Appreciation/
(Depreciation) | | | Swap Agreements,
at Value | |
| | Asset | | | Liability | |
GST | | Receive | | BERYTR Index | | | 3,465 | | | 5.400% (3-Month U.S. Treasury Bill rate plus a specified spread) | | Monthly | | | 02/18/2025 | | | $ | 1,662 | | | $ | 0 | | | $ | (2 | ) | | $ | 0 | | | $ | (2 | ) |
| | | | | | | | | | | |
MYI | | Receive | | FNRETR Index | | | 203 | | | 5.670% (1-Month USD-LIBOR plus a specified spread) | | Monthly | | | 09/11/2024 | | | | 4,632 | | | | 0 | | | | (19 | ) | | | 0 | | | | (19 | ) |
| | Receive | | FNRETR Index | | | 19 | | | 5.730% (1-Month USD-LIBOR plus a specified spread) | | Monthly | | | 04/02/2025 | | | | 434 | | | | 0 | | | | (2 | ) | | | 0 | | | | (2 | ) |
| | Receive | | FNRETR Index | | | 60 | | | 5.740% (1-Month USD-LIBOR plus a specified spread) | | Monthly | | | 04/02/2025 | | | | 1,369 | | | | 0 | | | | (6 | ) | | | 0 | | | | (6 | ) |
| | | | | | | | | | | | | | | | | | | | | | | | | | |
Total Swap Agreements | | | $ | 0 | | | $ | (29 | ) | | $ | 0 | | | $ | (29 | ) |
| | | | | | | | | | | | | | | | | |
FINANCIAL DERIVATIVE INSTRUMENTS: OVER THE COUNTER SUMMARY
The following is a summary by counterparty of the market value of OTC financial derivative instruments and collateral pledged/(received) as of June 30, 2024:
| | | | | | | | | | | | | | | | | | | | | | | | | | | | | | | | | | | | | | | | | | | | | | | | |
| | | Financial Derivative Assets | | | | | | Financial Derivative Liabilities | | | | | | | | | | |
| Counterparty | | Forward
Foreign
Currency
Contracts | | | Purchased
Options | | | Swap
Agreements | | | Total
Over the
Counter | | | | | | Forward
Foreign
Currency
Contracts | | | Written
Options | | | Swap
Agreements | | | Total
Over the
Counter | | | Net Market
Value of OTC
Derivatives | | | Collateral
Pledged/
(Received) | | | Net
Exposure(2) | |
GST | | $ | 0 | | | $ | 0 | | | $ | 0 | | | $ | 0 | | | | | | | $ | 0 | | | $ | 0 | | | $ | (2 | ) | | $ | (2 | ) | | $ | (2 | ) | | $ | 0 | | | $ | (2 | ) |
MYI | | | 0 | | | | 0 | | | | 0 | | | | 0 | | | | | | | | 0 | | | | 0 | | | | (27 | ) | | | (27 | ) | | | (27 | ) | | | 0 | | | | (27 | ) |
| | | | | | | | | | | | | | | | | | | | | | | | | | | | | | | | | | | | | | | | | | | | | | | | |
Total Over the Counter | | $ | 0 | | | $ | 0 | | | $ | 0 | | | $ | 0 | | | | | | | $ | 0 | | | $ | 0 | | | $ | (29 | ) | | $ | (29 | ) | | | | | | | | | | | | |
| | | | | | | | | | | | | | | | | | | | | | | | | | | | | | | | | | | | | | | | | | | | | | | | |
| (1) | Receive represents that the Fund receives payments for any positive net return on the underlying reference. The Fund makes payments for any negative net return on such underlying reference. Pay represents that the Fund receives payments for any negative net return on the underlying reference. The Fund makes payments for any positive net return on such underlying reference. |
| (2) | Net Exposure represents the net receivable/(payable) that would be due from/to the counterparty in the event of default. Exposure from OTC financial derivative instruments can only be netted across transactions governed under the same master agreement with the same legal entity. See Note 8, Master Netting Arrangements, in the Notes to Financial Statements for more information. |
FAIR VALUE OF FINANCIAL DERIVATIVE INSTRUMENTS
The following is a summary of the fair valuation of the Fund’s derivative instruments categorized by risk exposure. See Note 7, Principal and Other Risks, in the Notes to Financial Statements on risks of the Fund.
Fair Values of Financial Derivative Instruments on the Statements of Assets and Liabilities as of June 30, 2024:
| | | | | | | | | | | | | | | | | | | | | | | | |
| | | Derivatives not accounted for as hedging instruments | |
| | | Commodity
Contracts | | | Credit
Contracts | | | Equity
Contracts | | | Foreign
Exchange
Contracts | | | Interest
Rate Contracts | | | Total | |
Financial Derivative Instruments - Liabilities | |
Over the counter | |
Swap Agreements | | $ | 2 | | | $ | 0 | | | $ | 27 | | | $ | 0 | | | $ | 0 | | | $ | 29 | |
| | | | | | | | | | | | | | | | | | | | | | | | |
The effect of Financial Derivative Instruments on the Statements of Operations for the period ended June 30, 2024:
| | | | | | | | | | | | | | | | | | | | | | | | |
| | | Derivatives not accounted for as hedging instruments | |
| | | Commodity
Contracts | | | Credit
Contracts | | | Equity
Contracts | | | Foreign
Exchange
Contracts | | | Interest
Rate Contracts | | | Total | |
Net Realized Gain (Loss) on Financial Derivative Instruments | |
Over the counter | |
Swap Agreements | | $ | (14 | ) | | $ | 0 | | | $ | 224 | | | $ | 0 | | | $ | 0 | | | $ | 210 | |
| | | | | | | | | | | | | | | | | | | | | | | | |
|
Net Change in Unrealized Appreciation (Depreciation) on Financial Derivative Instruments | |
Over the counter | |
Swap Agreements | | $ | 15 | | | $ | 0 | | | $ | (14 | ) | | $ | 0 | | | $ | 0 | | | $ | 1 | |
| | | | | | | | | | | | | | | | | | | | | | | | |
| | | | | | |
| 42 | | PIMCO EQUITY SERIES | | | See Accompanying Notes | |
FAIR VALUE MEASUREMENTS
The following is a summary of the fair valuations according to the inputs used as of June 30, 2024 in valuing the Fund’s assets and liabilities:
| | | | | | | | | | | | | | | | |
| Category and Subcategory | | Level 1 | | | Level 2 | | | Level 3 | | | Fair
Value at
06/30/2024 | |
Investments in Securities, at Value | |
Mutual Funds | | $ | 143,544 | | | $ | 0 | | | $ | 0 | | | $ | 143,544 | |
Short-Term Instruments | |
Repurchase Agreements | | | 0 | | | | 310 | | | | 0 | | | | 310 | |
U.S. Treasury Bills | | | 0 | | | | 336 | | | | 0 | | | | 336 | |
| | | | | | | | | | | | | | | | |
| | $ | 143,544 | | | $ | 646 | | | $ | 0 | | | $ | 144,190 | |
| | | | | | | | | | | | | | | | |
|
Investments in Affiliates, at Value | |
Mutual Funds | | | 7,361 | | | | 0 | | | | 0 | | | | 7,361 | |
Short-Term Instruments | |
Central Funds Used for Cash Management Purposes | | | 8,534 | | | | 0 | | | | 0 | | | | 8,534 | |
| | | | | | | | | | | | | | | | |
| | $ | 15,895 | | | $ | 0 | | | $ | 0 | | | $ | 15,895 | |
| | | | | | | | | | | | | | | | |
| | | | |
Total Investments | | $ | 159,439 | | | $ | 646 | | | $ | 0 | | | $ | 160,085 | |
| | | | | | | | | | | | | | | | |
| | | | | | | | | | | | | | | | |
| Category and Subcategory | | Level 1 | | | Level 2 | | | Level 3 | | | Fair
Value at
06/30/2024 | |
|
Financial Derivative Instruments - Liabilities | |
Over the counter | | $ | 0 | | | $ | (29 | ) | | $ | 0 | | | $ | (29 | ) |
| | | | | | | | | | | | | | | | |
| | | | |
Total Financial Derivative Instruments | | $ | 0 | | | $ | (29 | ) | | $ | 0 | | | $ | (29 | ) |
| | | | | | | | | | | | | | | | |
| | | | |
Totals | | $ | 159,439 | | | $ | 617 | | | $ | 0 | | | $ | 160,056 | |
| | | | | | | | | | | | | | | | |
There were no significant transfers into or out of Level 3 during the period ended June 30, 2024.
| | | | | | | | | | | | |
| See Accompanying Notes | | | ANNUAL FINANCIAL AND OTHER INFORMATION | | | | | | | JUNE 30, 2024 | | | 43 |
| | | | | | |
| Schedule of Investments | | PIMCO REALPATH® Blend 2065 Fund | | | | |
(Amounts in thousands*, except number of shares, contracts, units and ounces, if any)
| | | | | | | | | | | | |
| | | | | SHARES | | | | | MARKET
VALUE
(000S) | |
| INVESTMENTS IN SECURITIES 91.4% | |
| |
| MUTUAL FUNDS 90.3% | |
| | | | |
Vanguard Developed Markets Index Fund ‘Admiral’ | | | | | 309,958 | | | $ | | | 4,910 | |
| | | |
Vanguard Emerging Markets Stock Index Fund ‘Admiral’ | | | 47,056 | | | | | | 1,718 | |
| | | | |
Vanguard Institutional Index Fund ‘Institutional’ | | | | | 21,814 | | | | | | 9,799 | |
| | | | |
Vanguard Small-Cap Index Fund ‘Admiral’ | | | | | 8,222 | | | | | | 860 | |
| | | | | | | | | | | | |
Total Mutual Funds (Cost $15,183) | | | 17,287 | |
| | | | |
| |
| SHORT-TERM INSTRUMENTS 1.1% | |
| |
| REPURCHASE AGREEMENTS (b) 1.1% | |
| | | | | | | | | | | 217 | |
| | | | | | | | | | | | |
Total Short-Term Instruments (Cost $217) | | | 217 | |
| | | | |
| | | | |
| | | | | | | | | | | | |
Total Investments in Securities (Cost $15,400) | | | 17,504 | |
| | | | |
| |
| | | | | | | | | | | | |
| | | | | SHARES | | | | | MARKET
VALUE
(000S) | |
| INVESTMENTS IN AFFILIATES 9.2% | |
| |
| MUTUAL FUNDS (a) 3.8% | |
| | | | |
PIMCO Emerging Markets Local Currency and Bond Fund | | | | | 9,447 | | | $ | | | 54 | |
| | | | |
PIMCO Income Fund | | | | | 7,381 | | | | | | 77 | |
| | | | |
PIMCO International Bond Fund (U.S. Dollar-Hedged) | | | | | 2,157 | | | | | | 21 | |
| | | | |
PIMCO Long-Term Real Return Fund | | | | | 11,428 | | | | | | 137 | |
| | | | |
PIMCO Long-Term U.S. Government Fund | | | | | 9,145 | | | | | | 129 | |
| | | | |
PIMCO Real Return Fund | | | | | 13,697 | | | | | | 136 | |
| | | | |
PIMCO Total Return Fund | | | | | 20,418 | | | | | | 174 | |
| | | | | | | | | | | | |
| Total Mutual Funds (Cost $731) | | | 728 | |
| | | | |
| |
| | | | | | | | | | | | |
| | | | | SHARES | | | | | MARKET
VALUE
(000S) | |
| SHORT-TERM INSTRUMENTS 5.4% | |
| |
| CENTRAL FUNDS USED FOR CASH MANAGEMENT PURPOSES 5.4% | |
| | | | |
PIMCO Short-Term Floating NAV Portfolio III | | | | | 106,724 | | | $ | | | 1,038 | |
| | | | | | | | | | | | |
| Total Short-Term Instruments (Cost $1,038) | | | | | | | | | | | 1,038 | |
| | | | | | | | | | | | |
| | | | |
| | | | | | | | | | | | |
| Total Investments in Affiliates (Cost $1,769) | | | | | | | | | | | 1,766 | |
| | | | |
| | | | | | | | | | | | |
| Total Investments 100.6% (Cost $17,169) | | | | | | | | $ | | | 19,270 | |
| | | | | | | | | | | | |
Financial Derivative
Instruments (c) (0.0)% (Cost or Premiums, net $0) | | | | | | | | | | | (3 | ) |
| |
| Other Assets and Liabilities, net (0.6)% | | | (115 | ) |
| | | | |
| Net Assets 100.0% | | | $ | | | 19,152 | |
| | | | | | | |
| | | | | | | | | | | | |
NOTES TO SCHEDULE OF INVESTMENTS:
| * | A zero balance may reflect actual amounts rounding to less than one thousand. |
| (a) | Institutional Class Shares of each Fund. |
BORROWINGS AND OTHER FINANCING TRANSACTIONS
(b) REPURCHASE AGREEMENTS:
| | | | | | | | | | | | | | | | | | | | | | | | | | | | | | |
| Counterparty | | Lending
Rate | | | Settlement
Date | | | Maturity
Date | | | Principal
Amount | | | Collateralized By | | Collateral
(Received) | | | Repurchase
Agreements,
at Value | | | Repurchase
Agreement
Proceeds
to be
Received(1) | |
| FICC | | | 2.600 | % | | | 06/28/2024 | | | | 07/01/2024 | | | $ | 217 | | | U.S. Treasury Inflation Protected Securities 0.625% due 01/15/2026 | | $ | (222 | ) | | $ | 217 | | | $ | 217 | |
| | | | | | | | | | | | | | | | | | | | | | | | | | | | | | |
Total Repurchase Agreements | | | | | $ | (222 | ) | | $ | 217 | | | $ | 217 | |
| | | | | | | | | | | | | | | |
BORROWINGS AND OTHER FINANCING TRANSACTIONS SUMMARY
The following is a summary by counterparty of the market value of Borrowings and Other Financing Transactions and collateral pledged/(received) as of June 30, 2024:
| | | | | | | | | | | | | | | | | | | | | | | | |
| Counterparty | | Repurchase
Agreement
Proceeds
to be
Received(1) | | | Payable for
Reverse
Repurchase
Agreements | | | Payable for
Sale-Buyback
Transactions | | | Total
Borrowings and
Other Financing
Transactions | | | Collateral
Pledged/(Received) | | | Net Exposure(2) | |
Global/Master Repurchase Agreement | |
FICC | | $ | 217 | | | $ | 0 | | | $ | 0 | | | $ | 217 | | | $ | (222 | ) | | $ | (5 | ) |
| | | | | | | | | | | | | | | | | | | | | | | | |
Total Borrowings and Other Financing Transactions | | $ | 217 | | | $ | 0 | | | $ | 0 | | | | | | | | | | | | | |
| | | | | | | | | | | | | | | | | | | | | | | | |
| (1) | Includes accrued interest. |
| (2) | Net Exposure represents the net receivable/(payable) that would be due from/to the counterparty in the event of default. Exposure from borrowings and other financing transactions can only be netted across transactions governed under the same master agreement with the same legal entity. See Note 8, Master Netting Arrangements, in the Notes to Financial Statements for more information. |
| | | | | | |
| 44 | | PIMCO EQUITY SERIES | | | See Accompanying Notes | |
(c) FINANCIAL DERIVATIVE INSTRUMENTS: OVER THE COUNTER
SWAP AGREEMENTS:
TOTAL RETURN SWAPS ON COMMODITY AND EQUITY INDICES
| | | | | | | | | | | | | | | | | | | | | | | | | | | | | | | | | | | | |
| Counterparty | | Pay/Receive(1) | | Underlying
Reference | | # of Units | | | Financing Rate | | Payment
Frequency | | Maturity
Date | | | Notional
Amount | | | Premiums
Paid/(Received) | | | Unrealized
Appreciation/
(Depreciation) | | | Swap Agreements,
at Value | |
| | Asset | | | Liability | |
GST | | Receive | | BERYTR Index | | | 400 | | | 5.400% (3-Month U.S. Treasury Bill rate plus a specified spread) | | Monthly | | | 02/18/2025 | | | $ | 192 | | | $ | 0 | | | $ | 0 | | | $ | 0 | | | $ | 0 | |
| | | | | | | | | | | |
JPM | | Receive | | FNRETR Index | | | 2 | | | 5.700% (1-Month USD-LIBOR plus a specified spread) | | Monthly | | | 07/10/2024 | | | | 46 | | | | 0 | | | | 0 | | | | 0 | | | | 0 | |
| | | | | | | | | | | |
MYI | | Receive | | FNRETR Index | | | 18 | | | 5.670% (1-Month USD-LIBOR plus a specified spread) | | Monthly | | | 09/11/2024 | | | | 411 | | | | 0 | | | | (2 | ) | | | 0 | | | | (2 | ) |
| | Receive | | FNRETR Index | | | 14 | | | 5.740% (1-Month USD-LIBOR plus a specified spread) | | Monthly | | | 04/02/2025 | | | | 319 | | | | 0 | | | | (1 | ) | | | 0 | | | | (1 | ) |
| | | | | | | | | | | | | | | | | | | | | | | | | | |
Total Swap Agreements | | | $ | 0 | | | $ | (3 | ) | | $ | 0 | | | $ | (3 | ) |
| | | | | | | | | | | | | | | | | |
FINANCIAL DERIVATIVE INSTRUMENTS: OVER THE COUNTER SUMMARY
The following is a summary by counterparty of the market value of OTC financial derivative instruments and collateral pledged/(received) as of June 30, 2024:
| | | | | | | | | | | | | | | | | | | | | | | | | | | | | | | | | | | | | | | | | | | | | | | | |
| | | Financial Derivative Assets | | | | | | Financial Derivative Liabilities | | | | | | | | | | |
| Counterparty | | Forward
Foreign
Currency
Contracts | | | Purchased
Options | | | Swap
Agreements | | | Total
Over the
Counter | | | | | | Forward
Foreign
Currency
Contracts | | | Written
Options | | | Swap
Agreements | | | Total
Over the
Counter | | | Net Market
Value of OTC
Derivatives | | | Collateral
Pledged/
(Received) | | | Net
Exposure(2) | |
MYI | | $ | 0 | | | $ | 0 | | | $ | 0 | | | $ | 0 | | | | | | | $ | 0 | | | $ | 0 | | | $ | (3 | ) | | $ | (3 | ) | | $ | (3 | ) | | $ | 0 | | | $ | (3 | ) |
| | | | | | | | | | | | | | | | | | | | | | | | | | | | | | | | | | | | | | | | | | | | | | | | |
| (1) | Receive represents that the Fund receives payments for any positive net return on the underlying reference. The Fund makes payments for any negative net return on such underlying reference. Pay represents that the Fund receives payments for any negative net return on the underlying reference. The Fund makes payments for any positive net return on such underlying reference. |
| (2) | Net Exposure represents the net receivable/(payable) that would be due from/to the counterparty in the event of default. Exposure from OTC financial derivative instruments can only be netted across transactions governed under the same master agreement with the same legal entity. See Note 8, Master Netting Arrangements, in the Notes to Financial Statements for more information. |
FAIR VALUE OF FINANCIAL DERIVATIVE INSTRUMENTS
The following is a summary of the fair valuation of the Fund’s derivative instruments categorized by risk exposure. See Note 7, Principal and Other Risks, in the Notes to Financial Statements on risks of the Fund.
Fair Values of Financial Derivative Instruments on the Statements of Assets and Liabilities as of June 30, 2024:
| | | | | | | | | | | | | | | | | | | | | | | | |
| | | Derivatives not accounted for as hedging instruments | |
| | | Commodity
Contracts | | | Credit
Contracts | | | Equity
Contracts | | | Foreign
Exchange
Contracts | | | Interest
Rate Contracts | | | Total | |
Financial Derivative Instruments - Liabilities | |
Over the counter | |
Swap Agreements | | $ | 0 | | | $ | 0 | | | $ | 3 | | | $ | 0 | | | $ | 0 | | | $ | 3 | |
| | | | | | | | | | | | | | | | | | | | | | | | |
The effect of Financial Derivative Instruments on the Statements of Operations for the period ended June 30, 2024:
| | | | | | | | | | | | | | | | | | | | | | | | |
| | | Derivatives not accounted for as hedging instruments | |
| | | Commodity
Contracts | | | Credit
Contracts | | | Equity
Contracts | | | Foreign
Exchange
Contracts | | | Interest
Rate Contracts | | | Total | |
Net Realized Gain (Loss) on Financial Derivative Instruments | |
Over the counter | |
Swap Agreements | | $ | 0 | | | $ | 0 | | | $ | 20 | | | $ | 0 | | | $ | 0 | | | $ | 20 | |
| | | | | | | | | | | | | | | | | | | | | | | | |
|
Net Change in Unrealized Appreciation (Depreciation) on Financial Derivative Instruments | |
Over the counter | |
Swap Agreements | | $ | 1 | | | $ | 0 | | | $ | (3 | ) | | $ | 0 | | | $ | 0 | | | $ | (2 | ) |
| | | | | | | | | | | | | | | | | | | | | | | | |
| | | | | | | | | | | | |
| See Accompanying Notes | | | ANNUAL FINANCIAL AND OTHER INFORMATION | | | | | | | JUNE 30, 2024 | | | 45 |
| | | | | | |
| Schedule of Investments | | PIMCO REALPATH® Blend 2065 Fund | | (Cont.) | | June 30, 2024 |
FAIR VALUE MEASUREMENTS
The following is a summary of the fair valuations according to the inputs used as of June 30, 2024 in valuing the Fund’s assets and liabilities:
| | | | | | | | | | | | | | | | |
| Category and Subcategory | | Level 1 | | | Level 2 | | | Level 3 | | | Fair Value at
06/30/2024 | |
Investments in Securities, at Value | |
Mutual Funds | | $ | 17,287 | | | $ | 0 | | | $ | 0 | | | $ | 17,287 | |
Short-Term Instruments | |
Repurchase Agreements | | | 0 | | | | 217 | | | | 0 | | | | 217 | |
| | | | | | | | | | | | | | | | |
| | $ | 17,287 | | | $ | 217 | | | $ | 0 | | | $ | 17,504 | |
| | | | | | | | | | | | | | | | |
|
Investments in Affiliates, at Value | |
Mutual Funds | | | 728 | | | | 0 | | | | 0 | | | | 728 | |
Short-Term Instruments | |
Central Funds Used for Cash Management Purposes | | | 1,038 | | | | 0 | | | | 0 | | | | 1,038 | |
| | | | | | | | | | | | | | | | |
| | $ | 1,766 | | | $ | 0 | | | $ | 0 | | | $ | 1,766 | |
| | | | | | | | | | | | | | | | |
| | | | |
Total Investments | | $ | 19,053 | | | $ | 217 | | | $ | 0 | | | $ | 19,270 | |
| | | | | | | | | | | | | | | | |
| | | | | | | | | | | | | | | | |
| Category and Subcategory | | Level 1 | | | Level 2 | | | Level 3 | | | Fair Value at
06/30/2024 | |
|
Financial Derivative Instruments - Liabilities | |
Over the counter | | $ | 0 | | | $ | (3 | ) | | $ | 0 | | | $ | (3 | ) |
| | | | | | | | | | | | | | | | |
| | | | |
Total Financial Derivative Instruments | | $ | 0 | | | $ | (3 | ) | | $ | 0 | | | $ | (3 | ) |
| | | | | | | | | | | | | | | | |
| | | | |
Totals | | $ | 19,053 | | | $ | 214 | | | $ | 0 | | | $ | 19,267 | |
| | | | | | | | | | | | | | | | |
There were no significant transfers into or out of Level 3 during the period ended June 30, 2024.
| | | | | | |
| 46 | | PIMCO EQUITY SERIES | | | See Accompanying Notes | |
| | | | | | |
| Schedule of Investments | | PIMCO REALPATH® Blend Income Fund | | | | June 30, 2024 |
(Amounts in thousands*, except number of shares, contracts, units and ounces, if any)
| | | | | | | | | | | | |
| | | | | SHARES | | | | | MARKET
VALUE
(000S) | |
| INVESTMENTS IN SECURITIES 34.7% | |
| |
| MUTUAL FUNDS 34.5% | |
| | | | |
Vanguard Developed Markets Index Fund ‘Institutional’ | | | | | 2,119,316 | | | $ | | | 33,612 | |
| | | |
Vanguard Emerging Markets Stock Index Fund ‘Institutional’ | | | 484,792 | | | | | | 13,458 | |
| | | | |
Vanguard Institutional Index Fund ‘Institutional’ | | | | | 147,119 | | | | | | 66,091 | |
| | | | |
Vanguard Small-Cap Index Fund ‘Admiral’ | | | | | 27,062 | | | | | | 2,831 | |
| | | | | | | | | | | | |
Total Mutual Funds (Cost $82,750) | | | | | | 115,992 | |
| | | | | | | | | | | | |
| |
| SHORT-TERM INSTRUMENTS 0.2% | |
| |
| REPURCHASE AGREEMENTS (b) 0.2% | |
| | | | |
| | | | | | | | | | | 536 | |
| | | | | | | | | | | | |
Total Short-Term Instruments
(Cost $536) | | | | | | | | | | | 536 | |
| | | | | | | | | | | | |
| | | | |
| | | | | | | | | | | | |
| Total Investments in Securities (Cost $83,286) | | | | | | | | | | | 116,528 | |
| | | | | | | | | | | | |
| | | | | | | | | | | | |
| | | | | SHARES | | | | | MARKET
VALUE
(000S) | |
| INVESTMENTS IN AFFILIATES 65.1% | |
| |
| MUTUAL FUNDS (a) 60.0% | |
| | | | |
PIMCO Emerging Markets Local Currency and Bond Fund | | | | | 1,968,589 | | | $ | | | 11,142 | |
| | | | |
PIMCO High Yield Fund | | | | | 394,877 | | | | | | 3,131 | |
| | | | |
PIMCO Income Fund | | | | | 3,723,155 | | | | | | 39,019 | |
| | | | |
PIMCO International Bond Fund (U.S. Dollar-Hedged) | | | | | 1,018,156 | | | | | | 9,988 | |
| | | | |
PIMCO Long-Term Real Return Fund | | | | | 2,566,840 | | | | | | 30,777 | |
| | | | |
PIMCO Long-Term U.S. Government Fund | | | | | 1,920,497 | | | | | | 27,060 | |
| | | | |
PIMCO Real Return Fund | | | | | 1,705,415 | | | | | | 16,969 | |
| | | | |
PIMCO Total Return Fund | | | | | 7,361,158 | | | | | | 62,496 | |
| | | | | | | | | | | | |
| Total Mutual Funds (Cost $223,538) | | | | | | 200,582 | |
| | | | | | | | | | | | |
| |
| | | | | | | | | | | | |
| | | | | SHARES | | | | | MARKET
VALUE
(000S) | |
| SHORT-TERM INSTRUMENTS 5.1% | |
| |
| CENTRAL FUNDS USED FOR CASH MANAGEMENT PURPOSES 5.1% | |
| | | | |
PIMCO Short-Term Floating NAV Portfolio III | | | | | 1,772,544 | | | $ | | | 17,245 | |
| | | | | | | | | | | | |
| Total Short-Term Instruments (Cost $17,236) | | | | | | | | | | | 17,245 | |
| | | | | | | | | | | | |
| | | | |
| | | | | | | | | | | | |
| Total Investments in Affiliates (Cost $240,774) | | | | | | | | | | | 217,827 | |
| | | | |
| | | | | | | | | | | | |
| Total Investments 99.8% (Cost $324,060) | | | | | | | | $ | | | 334,355 | |
| |
Financial Derivative Instruments (c)(d) 0.2% (Cost or Premiums, net $1,694) | | | | | | | | | | | 668 | |
| |
| Other Assets and Liabilities, net 0.0% | | | | | | (21 | ) |
| | | | | | | | | | | | |
| Net Assets 100.0% | | | | | | | | $ | | | 335,002 | |
| | | | | | | | | | | | |
NOTES TO SCHEDULE OF INVESTMENTS:
| * | A zero balance may reflect actual amounts rounding to less than one thousand. |
| (a) | Institutional Class Shares of each Fund. |
BORROWINGS AND OTHER FINANCING TRANSACTIONS
(b) REPURCHASE AGREEMENTS:
| | | | | | | | | | | | | | | | | | | | | | | | | | | | | | |
| Counterparty | | Lending
Rate | | | Settlement
Date | | | Maturity
Date | | | Principal
Amount | | | Collateralized By | | Collateral
(Received) | | | Repurchase
Agreements,
at Value | | | Repurchase
Agreement
Proceeds
to be
Received(1) | |
| FICC | | | 2.600 | % | | | 06/28/2024 | | | | 07/01/2024 | | | $ | 536 | | | U.S. Treasury Inflation Protected Securities 0.625% due 01/15/2026 | | $ | (547 | ) | | $ | 536 | | | $ | 536 | |
| | | | | | | | | | | | | | | | | | | | | | | | | | | | | | |
Total Repurchase Agreements | | | | | $ | (547 | ) | | $ | 536 | | | $ | 536 | |
| | | | | | | | | | | | | | | |
BORROWINGS AND OTHER FINANCING TRANSACTIONS SUMMARY
The following is a summary by counterparty of the market value of Borrowings and Other Financing Transactions and collateral pledged/(received) as of June 30, 2024:
| | | | | | | | | | | | | | | | | | | | | | | | |
| Counterparty | | Repurchase
Agreement
Proceeds
to be
Received(1) | | | Payable for
Reverse
Repurchase
Agreements | | | Payable for
Sale-Buyback
Transactions | | | Total
Borrowings and
Other Financing
Transactions | | | Collateral
Pledged/(Received) | | | Net Exposure(2) | |
Global/Master Repurchase Agreement | |
FICC | | $ | 536 | | | $ | 0 | | | $ | 0 | | | $ | 536 | | | $ | (547 | ) | | $ | (11 | ) |
| | | | | | | | | | | | | | | | | | | | | | | | |
Total Borrowings and Other Financing Transactions | | $ | 536 | | | $ | 0 | | | $ | 0 | | | | | | | | | | | | | |
| | | | | | | | | | | | | | | | | | | | | | | | |
| (1) | Includes accrued interest. |
| (2) | Net Exposure represents the net receivable/(payable) that would be due from/to the counterparty in the event of default. Exposure from borrowings and other financing transactions can only be netted across transactions governed under the same master agreement with the same legal entity. See Note 8, Master Netting Arrangements, in the Notes to Financial Statements for more information. |
| | | | | | | | | | | | |
| See Accompanying Notes | | | ANNUAL FINANCIAL AND OTHER INFORMATION | | | | | | | JUNE 30, 2024 | | | 47 |
| | | | | | |
| Schedule of Investments | | PIMCO REALPATH® Blend Income Fund | | (Cont.) | | |
(c) FINANCIAL DERIVATIVE INSTRUMENTS: EXCHANGE-TRADED OR CENTRALLY CLEARED
PURCHASED OPTIONS:
OPTIONS ON INDICES
| | | | | | | | | | | | | | | | | | | | | | | | |
| Description | | Strike
Value | | | Expiration
Date | | | # of
Contracts | | | Notional Amount | | | Cost | | | Market
Value | |
Put - CBOE S&P 500 | | | 3,575.000 | | | | 09/20/2024 | | | | 71 | | | $ | 7 | | | $ | 424 | | | $ | 16 | |
Put - CBOE S&P 500 | | | 3,775.000 | | | | 12/20/2024 | | | | 73 | | | | 7 | | | | 424 | | | | 79 | |
Put - CBOE S&P 500 | | | 4,075.000 | | | | 03/21/2025 | | | | 65 | | | | 7 | | | | 414 | | | | 183 | |
Put - CBOE S&P 500 | | | 4,500.000 | | | | 06/20/2025 | | | | 69 | | | | 7 | | | | 432 | | | | 451 | |
| | | | | | | | | | | | | | | | | | | | | | | | |
Total Purchased Options | | | $ | 1,694 | | | $ | 729 | |
| | | | | | | | | |
FINANCIAL DERIVATIVE INSTRUMENTS: EXCHANGE-TRADED OR CENTRALLY CLEARED SUMMARY
The following is a summary of the market value and variation margin of Exchange-Traded or Centrally Cleared Financial Derivative Instruments as of June 30, 2024:
| | | | | | | | | | | | | | | | | | | | | | | | | | | | | | | | | | | | |
| | | Financial Derivative Assets | | | | | | Financial Derivative Liabilities | |
| | | Market Value | | | Variation Margin
Asset | | | | | | | | | Market Value | | | Variation Margin
Liability | | | | |
| | | Purchased
Options | | | Futures | | | Swap
Agreements | | | Total | | | | | | Written
Options | | | Futures | | | Swap
Agreements | | | Total | |
Total Exchange-Traded or Centrally Cleared | | $ | 729 | | | $ | 0 | | | $ | 0 | | | $ | 729 | | | | | | | $ | 0 | | | $ | 0 | | | $ | 0 | | | $ | 0 | |
| | | | | | | | | | | | | | | | | | | | | | | | | | | | | | | | | | | | |
(d) FINANCIAL DERIVATIVE INSTRUMENTS: OVER THE COUNTER
SWAP AGREEMENTS:
TOTAL RETURN SWAPS ON COMMODITY AND EQUITY INDICES
| | | | | | | | | | | | | | | | | | | | | | | | | | | | | | | | | | | | |
| Counterparty | | Pay/Receive(1) | | Underlying
Reference | | # of Units | | | Financing Rate | | Payment
Frequency | | Maturity
Date | | | Notional
Amount | | | Premiums
Paid/(Received) | | | Unrealized
Appreciation/
(Depreciation) | | | Swap Agreements,
at Value | |
| | Asset | | | Liability | |
GST | | Receive | | BERYTR Index | | | 13,963 | | | 5.400% (3-Month U.S. Treasury Bill rate plus a specified spread) | | Monthly | | | 02/18/2025 | | | $ | 6,698 | | | $ | 0 | | | $ | (9 | ) | | $ | 0 | | | $ | (9 | ) |
| | | | | | | | | | | |
MYI | | Receive | | FNRETR Index | | | 398 | | | 5.670% (1-Month USD-LIBOR plus a specified spread) | | Monthly | | | 09/11/2024 | | | | 9,082 | | | | 0 | | | | (38 | ) | | | 0 | | | | (38 | ) |
| | Receive | | FNRETR Index | | | 148 | | | 5.730% (1-Month USD-LIBOR plus a specified spread) | | Monthly | | | 04/02/2025 | | | | 3,377 | | | | 0 | | | | (14 | ) | | | 0 | | | | (14 | ) |
| | | | | | | | | | | | | | | | | | | | | | | | | | |
Total Swap Agreements | | | $ | 0 | | | $ | (61 | ) | | $ | 0 | | | $ | (61 | ) |
| | | | | | | | | | | | | | | | | |
FINANCIAL DERIVATIVE INSTRUMENTS: OVER THE COUNTER SUMMARY
The following is a summary by counterparty of the market value of OTC financial derivative instruments and collateral pledged/(received) as of June 30, 2024:
| | | | | | | | | | | | | | | | | | | | | | | | | | | | | | | | | | | | | | | | | | | | | | | | |
| | | Financial Derivative Assets | | | | | | Financial Derivative Liabilities | | | | | | | | | | |
| Counterparty | | Forward
Foreign
Currency
Contracts | | | Purchased
Options | | | Swap
Agreements | | | Total
Over the
Counter | | | | | | Forward
Foreign
Currency
Contracts | | | Written
Options | | | Swap
Agreements | | | Total
Over the
Counter | | | Net Market
Value of OTC
Derivatives | | | Collateral
Pledged/
(Received) | | | Net
Exposure(2) | |
GST | | $ | 0 | | | $ | 0 | | | $ | 0 | | | $ | 0 | | | | | | | $ | 0 | | | $ | 0 | | | $ | (9 | ) | | $ | (9 | ) | | $ | (9 | ) | | $ | 0 | | | $ | (9 | ) |
MYI | | | 0 | | | | 0 | | | | 0 | | | | 0 | | | | | | | | 0 | | | | 0 | | | | (52 | ) | | | (52 | ) | | | (52 | ) | | | 0 | | | | (52 | ) |
| | | | | | | | | | | | | | | | | | | | | | | | | | | | | | | | | | | | | | | | | | | | | | | | |
Total Over the Counter | | $ | 0 | | | $ | 0 | | | $ | 0 | | | $ | 0 | | | | | | | $ | 0 | | | $ | 0 | | | $ | (61 | ) | | $ | (61 | ) | | | | | | | | | | | | |
| | | | | | | | | | | | | | | | | | | | | | | | | | | | | | | | | | | | | | | | | | | | | | | | |
| (1) | Receive represents that the Fund receives payments for any positive net return on the underlying reference. The Fund makes payments for any negative net return on such underlying reference. Pay represents that the Fund receives payments for any negative net return on the underlying reference. The Fund makes payments for any positive net return on such underlying reference. |
| (2) | Net Exposure represents the net receivable/(payable) that would be due from/to the counterparty in the event of default. Exposure from OTC financial derivative instruments can only be netted across transactions governed under the same master agreement with the same legal entity. See Note 8, Master Netting Arrangements, in the Notes to Financial Statements for more information. |
| | | | | | |
| 48 | | PIMCO EQUITY SERIES | | | See Accompanying Notes | |
FAIR VALUE OF FINANCIAL DERIVATIVE INSTRUMENTS
The following is a summary of the fair valuation of the Fund’s derivative instruments categorized by risk exposure. See Note 7, Principal and Other Risks, in the Notes to Financial Statements on risks of the Fund.
Fair Values of Financial Derivative Instruments on the Statements of Assets and Liabilities as of June 30, 2024:
| | | | | | | | | | | | | | | | | | | | | | | | |
| | | Derivatives not accounted for as hedging instruments | |
| | | Commodity
Contracts | | | Credit
Contracts | | | Equity
Contracts | | | Foreign
Exchange
Contracts | | | Interest
Rate Contracts | | | Total | |
Financial Derivative Instruments - Assets | |
Exchange-traded or centrally cleared | |
Purchased Options | | $ | 0 | | | $ | 0 | | | $ | 729 | | | $ | 0 | | | $ | 0 | | | $ | 729 | |
| | | | | | | | | | | | | | | | | | | | | | | | |
|
Financial Derivative Instruments - Liabilities | |
Over the counter | |
Swap Agreements | | $ | 9 | | | $ | 0 | | | $ | 52 | | | $ | 0 | | | $ | 0 | | | $ | 61 | |
| | | | | | | | | | | | | | | | | | | | | | | | |
The effect of Financial Derivative Instruments on the Statements of Operations for the period ended June 30, 2024:
| | | | | | | | | | | | | | | | | | | | | | | | |
| | | Derivatives not accounted for as hedging instruments | |
| | | Commodity
Contracts | | | Credit
Contracts | | | Equity
Contracts | | | Foreign
Exchange
Contracts | | | Interest
Rate Contracts | | | Total | |
Net Realized Gain (Loss) on Financial Derivative Instruments | |
Exchange-traded or centrally cleared | |
Purchased Options | | $ | 0 | | | $ | 0 | | | $ | (1,920 | ) | | $ | 0 | | | $ | 0 | | | $ | (1,920 | ) |
Written Options | | | 0 | | | | 0 | | | | 504 | | | | 0 | | | | 0 | | | | 504 | |
| | | | | | | | | | | | | | | | | | | | | | | | |
| | $ | 0 | | | $ | 0 | | | $ | (1,416 | ) | | $ | 0 | | | $ | 0 | | | $ | (1,416 | ) |
| | | | | | | | | | | | | | | | | | | | | | | | |
Over the counter | |
Swap Agreements | | $ | (124 | ) | | $ | 0 | | | $ | 309 | | | $ | 0 | | | $ | 0 | | | $ | 185 | |
| | | | | | | | | | | | | | | | | | | | | | | | |
| | $ | (124 | ) | | $ | 0 | | | $ | (1,107 | ) | | $ | 0 | | | $ | 0 | | | $ | (1,231 | ) |
| | | | | | | | | | | | | | | | | | | | | | | | |
|
Net Change in Unrealized Appreciation (Depreciation) on Financial Derivative Instruments | |
Exchange-traded or centrally cleared | |
Purchased Options | | $ | 0 | | | $ | 0 | | | $ | 352 | | | $ | 0 | | | $ | 0 | | | $ | 352 | |
Written Options | | | 0 | | | | 0 | | | | (438 | ) | | | 0 | | | | 0 | | | | (438 | ) |
| | | | | | | | | | | | | | | | | | | | | | | | |
| | $ | 0 | | | $ | 0 | | | $ | (86 | ) | | $ | 0 | | | $ | 0 | | | $ | (86 | ) |
| | | | | | | | | | | | | | | | | | | | | | | | |
Over the counter | |
Swap Agreements | | $ | 127 | | | $ | 0 | | | $ | (4 | ) | | $ | 0 | | | $ | 0 | | | $ | 123 | |
| | | | | | | | | | | | | | | | | | | | | | | | |
| | $ | 127 | | | $ | 0 | | | $ | (90 | ) | | $ | 0 | | | $ | 0 | | | $ | 37 | |
| | | | | | | | | | | | | | | | | | | | | | | | |
FAIR VALUE MEASUREMENTS
The following is a summary of the fair valuations according to the inputs used as of June 30, 2024 in valuing the Fund’s assets and liabilities:
| | | | | | | | | | | | | | | | |
| Category and Subcategory | | Level 1 | | | Level 2 | | | Level 3 | | | Fair Value at
06/30/2024 | |
Investments in Securities, at Value | |
Mutual Funds | | $ | 115,992 | | | $ | 0 | | | $ | 0 | | | $ | 115,992 | |
Short-Term Instruments | |
Repurchase Agreements | | | 0 | | | | 536 | | | | 0 | | | | 536 | |
| | | | | | | | | | | | | | | | |
| | $ | 115,992 | | | $ | 536 | | | $ | 0 | | | $ | 116,528 | |
| | | | | | | | | | | | | | | | |
|
Investments in Affiliates, at Value | |
Mutual Funds | | | 200,582 | | | | 0 | | | | 0 | | | | 200,582 | |
Short-Term Instruments | |
Central Funds Used for Cash Management Purposes | | | 17,245 | | | | 0 | | | | 0 | | | | 17,245 | |
| | | | | | | | | | | | | | | | |
| | $ | 217,827 | | | $ | 0 | | | $ | 0 | | | $ | 217,827 | |
| | | | | | | | | | | | | | | | |
| | | | |
Total Investments | | $ | 333,819 | | | $ | 536 | | | $ | 0 | | | $ | 334,355 | |
| | | | | | | | | | | | | | | | |
| | | | | | | | | | | | | | | | |
| Category and Subcategory | | Level 1 | | | Level 2 | | | Level 3 | | | Fair Value at
06/30/2024 | |
|
Financial Derivative Instruments - Assets | |
Exchange-traded or centrally cleared | | $ | 0 | | | $ | 729 | | | $ | 0 | | | $ | 729 | |
| | | | | | | | | | | | | | | | |
|
Financial Derivative Instruments - Liabilities | |
Over the counter | | $ | 0 | | | $ | (61 | ) | | $ | 0 | | | $ | (61 | ) |
| | | | | | | | | | | | | | | | |
| | | | |
Total Financial Derivative Instruments | | $ | 0 | | | $ | 668 | | | $ | 0 | | | $ | 668 | |
| | | | | | | | | | | | | | | | |
| | | | |
Totals | | $ | 333,819 | | | $ | 1,204 | | | $ | 0 | | | $ | 335,023 | |
| | | | | | | | | | | | | | | | |
There were no significant transfers into or out of Level 3 during the period ended June 30, 2024.
| | | | | | | | | | | | |
| See Accompanying Notes | | | ANNUAL FINANCIAL AND OTHER INFORMATION | | | | | | | JUNE 30, 2024 | | | 49 |
| | | | |
| Notes to Financial Statements | | | | |
1. ORGANIZATION
PIMCO Equity Series (the “Trust”) was established as a Delaware statutory trust on March 30, 2010. The Trust is registered under the Investment Company Act of 1940, as amended (the “Act”), as an open-end management investment company. Information presented in these financial statements pertains to the Institutional Class, Administrative Class, and Class A shares of the funds (each, a “Fund” and collectively, the “Funds”) indicated on the cover of this report. Pacific Investment Management Company LLC (“PIMCO”) serves as the investment adviser (the “Adviser”) for the Funds. Each Fund may invest substantially all of its assets in Institutional Class or Class M shares of any funds of the Trust and PIMCO Funds, and in other affiliated funds, including funds of PIMCO ETF Trust, except funds of funds and PIMCO California Municipal Intermediate Value Fund, PIMCO California Municipal Opportunistic Value Fund, PIMCO National Municipal Intermediate Value Fund and PIMCO National Municipal Opportunistic Value Fund (collectively, the “Underlying PIMCO Funds”), and unaffiliated funds that are registered under the Act (collectively, the “Acquired Funds”).
Hereinafter, the Board of Trustees of the Funds shall be collectively referred to as the “Board.”
2. SIGNIFICANT ACCOUNTING POLICIES
The following is a summary of significant accounting policies consistently followed by the Trust in the preparation of its financial statements in conformity with accounting principles generally accepted in the United States of America (“U.S. GAAP”). Each Fund is treated as an investment company under the reporting requirements of U.S. GAAP. The functional and reporting currency for the Funds is the U.S. dollar. The preparation of financial statements in accordance with U.S. GAAP requires management to make estimates and assumptions that affect the reported amounts of assets and liabilities and disclosure of contingent assets and liabilities at the date of the financial statements and the reported amounts of increases and decreases in net assets from operations during the reporting period. Actual results could differ from those estimates.
(a) Securities Transactions and Investment Income Securities transactions are recorded as of the trade date for financial reporting purposes. Securities purchased or sold on a when-issued or delayed-delivery basis may be settled beyond a standard settlement period for the security after the trade date. Realized gains (losses) from securities sold are recorded on the identified cost basis. Dividend income is recorded on the ex-dividend date, except certain dividends from foreign securities where the ex-dividend date may have passed, which are recorded as soon as a Fund is informed of the ex-dividend date. Interest income, adjusted for the accretion of discounts and
amortization of premiums, is recorded on the accrual basis from settlement date, with the exception of securities with a forward starting effective date, where interest income is recorded on the accrual basis from effective date. For convertible securities, premiums attributable to the conversion feature are not amortized. Estimated tax liabilities on certain foreign securities are recorded on an accrual basis and are reflected as components of interest income or net change in unrealized appreciation (depreciation) on investments on the Statements of Operations, as appropriate. Tax liabilities realized as a result of such security sales are reflected as a component of net realized gain (loss) on investments on the Statements of Operations. Paydown gains (losses) on mortgage-related and other asset-backed securities, if any, are recorded as components of interest income on the Statements of Operations. Income or short-term capital gain distributions received from registered investment companies, if any, are recorded as dividend income. Long-term capital gain distributions received from registered investment companies, if any, are recorded as realized gains.
Debt obligations may be placed on non-accrual status and related interest income may be reduced by ceasing current accruals and writing off interest receivable when the collection of all or a portion of interest has become doubtful based on consistently applied procedures. A debt obligation is removed from non-accrual status when the issuer resumes interest payments or when collectability of interest is probable. A debt obligation may be granted, in certain situations, a contractual or non-contractual forbearance for interest payments that are expected to be paid after agreed upon pay dates.
(b) Multi-Class Operations Each class offered by the Trust has equal rights as to assets and voting privileges (except that shareholders of a class have exclusive voting rights regarding any matter relating solely to that class of shares). Income and non-class specific expenses are allocated daily to each class on the basis of the relative net assets. Realized and unrealized capital gains (losses) are allocated daily based on the relative net assets of each class of the respective Fund. Class specific expenses, where applicable, currently include supervisory and administrative and distribution and servicing fees. Under certain circumstances, the per share net asset value (“NAV”) of a class of the respective Fund’s shares may be different from the per share NAV of another class of shares as a result of the different daily expense accruals applicable to each class of shares.
(c) Distributions to Shareholders The following table shows the anticipated frequency of distributions from net investment income, if any, for each Fund.
| | | | | | | | | | | | |
| | | | Distribution Frequency | |
| | | |
| Fund Name | | | | | Declared | | | Distributed | |
| | | |
PIMCO REALPATH® Blend 2025 Fund | | | | | | | Quarterly | | | | Quarterly | |
| | | |
PIMCO REALPATH® Blend 2030 Fund | | | | | | | Quarterly | | | | Quarterly | |
| | | | | | | | | | | | |
| | | |
| Fund Name | | | | | Declared | | | Distributed | |
| | | |
PIMCO REALPATH® Blend 2035 Fund | | | | | | | Quarterly | | | | Quarterly | |
| | | |
PIMCO REALPATH® Blend 2040 Fund | | | | | | | Quarterly | | | | Quarterly | |
| | | |
PIMCO REALPATH® Blend 2045 Fund | | | | | | | Quarterly | | | | Quarterly | |
| | | |
PIMCO REALPATH® Blend 2050 Fund | | | | | | | Quarterly | | | | Quarterly | |
| | | |
PIMCO REALPATH® Blend 2055 Fund | | | | | | | Quarterly | | | | Quarterly | |
| | | |
PIMCO REALPATH® Blend 2060 Fund | | | | | | | Quarterly | | | | Quarterly | |
| | | |
PIMCO REALPATH® Blend 2065 Fund | | | | | | | Quarterly | | | | Quarterly | |
| | | |
PIMCO REALPATH® Blend Income Fund | | | | | | | Quarterly | | | | Quarterly | |
In addition, each Fund distributes any net capital gains it earns from the sale of portfolio securities to shareholders no less frequently than annually. Net short-term capital gains may be paid more frequently. A Fund may revise its distribution policy or postpone the payment of distributions at any time.
Income distributions and capital gain distributions are determined in accordance with income tax regulations which may differ from U.S. GAAP. Differences between tax regulations and U.S. GAAP may cause timing differences between income and capital gain recognition. Further, the character of investment income and capital gains may be different for certain transactions under the two methods of accounting. As a result, income distributions and capital gain distributions declared during a fiscal period may differ significantly from the net investment income (loss) and realized gains (losses) reported on each Fund’s annual financial statements presented under U.S. GAAP.
Separately, if a Fund determines or estimates, as applicable, that a portion of a distribution may be comprised of amounts from sources other than net investment income in accordance with its policies, accounting records (if applicable) and accounting practices, the Fund will notify shareholders of the estimated composition of such distribution through a Section 19 Notice. For these purposes, a Fund determines or estimates, as applicable, the source or sources from which a distribution is paid, to the close of the period as of which it is paid, in reference to its internal accounting records and related accounting practices. If, based on such accounting records and practices, it is determined or estimated, as applicable, that a particular distribution does not include capital gains or paid-in surplus or other capital sources, a Section 19 Notice generally would not be issued. It is important to note that differences exist between a Fund’s daily internal accounting records and practices, a Fund’s financial statements presented in accordance with U.S. GAAP, and recordkeeping practices under income tax regulations. For instance, a Fund’s internal accounting records and practices may take into account, among other factors, tax-related characteristics of certain sources of distributions that differ from treatment under U.S. GAAP. Examples of such differences may include but are not limited to, for certain Funds, the treatment of periodic payments under interest rate swap contracts. Accordingly, among other consequences, it is possible that a Fund may
not issue a Section 19 Notice in situations where the Fund’s financial statements prepared later and in accordance with U.S. GAAP and/or the final tax character of those distributions might later report that the sources of those distributions included capital gains and/or a return of capital. Please visit www.pimco.com for the most recent Section 19 Notice, if applicable, for additional information regarding the estimated composition of distributions. Final determination of a distribution’s tax character will be provided to shareholders when such information is available.
Distributions classified as a tax basis return of capital at a Fund’s fiscal year end, if any, are reflected on the Statements of Changes in Net Assets and have been recorded to paid in capital on the Statements of Assets and Liabilities. In addition, other amounts have been reclassified between distributable earnings (accumulated loss) and paid in capital on the Statements of Assets and Liabilities to more appropriately conform U.S. GAAP to tax characterizations of distributions.
(d) New Accounting Pronouncements and Regulatory Updates In March 2020, the Financial Accounting Standards Board (“FASB”) issued an Accounting Standards Update (“ASU”), ASU 2020-04, Reference Rate Reform (Topic 848), which provides optional guidance to ease the potential accounting burden associated with transitioning away from the London Interbank Offered Rate and other reference rates that are expected to be discontinued. ASU 2020-04 is effective for certain reference rate-related contract modifications that occurred or will occur during the period March 12, 2020 through December 31, 2024. In January 2021 and December 2022, FASB issued ASU 2021-01 and ASU 2022-06, which include additional amendments to Topic 848. Management is continuously evaluating the potential effect a discontinuation of LIBOR could have on the Funds’ investments and has determined that it is unlikely the ASU’s adoption will have a material impact on the Funds’ financial statements.
In June 2022, the FASB issued ASU 2022-03, Fair Value Measurement (Topic 820), which affects all entities that have investments in equity securities measured at fair value that are subject to a contractual sale restriction. The amendments in ASU 2022-03 clarify that a contractual restriction on the sale of an equity security is not considered part of the unit of account of the equity security and, therefore, is not considered in measuring the fair value. The amendments also require additional disclosures for equity securities subject to contractual sale restrictions that are measured at fair value in accordance with Topic 820. The effective date for the amendments in ASU 2022-03 is for fiscal years beginning after December 15, 2023 and interim periods within those fiscal years. Management has implemented changes in connection with the amendments and has determined that there was no material impact to the Funds’ financial statements.
| | | | | | | | | | | | |
| | | | ANNUAL FINANCIAL AND OTHER INFORMATION | | | | | | | JUNE 30, 2024 | | | 51 |
| | | | |
| Notes to Financial Statements | | (Cont.) | | |
In October 2022, the U.S. Securities and Exchange Commission (“SEC”) adopted changes to the mutual fund and exchange-traded fund (“ETF”) shareholder report and registration statement disclosure requirements and the registered fund advertising rules, which change the disclosures provided to shareholders. The rule amendments were effective as of January 2023, and compliance with the rule amendments was required as of July 2024. As such, the Funds have made significant updates to the content of their shareholder reports. In addition, shareholder reports are now mailed to shareholders who have not opted to receive shareholder report documents electronically. Management has implemented format and content changes to the Funds’ annual and semiannual financial and other information in connection with the rule amendments and has determined that there was no material impact to the Funds’ financial statements.
The SEC made a final ruling on February 15, 2023 to adopt proposed amendments to the Settlement Cycle Rule (Rule 15c6-1) and other related rules under the Securities Exchange Act of 1934, as amended, to shorten the standard settlement cycle for most broker-dealer transactions from two business days after the trade date (T+2) to one business day after the trade date (T+1). The effective date was May 5, 2023, and compliance with the amendments was required as of May 28, 2024. Management has implemented changes in connection with the rule and has determined that there was no material impact to the Funds’ financial statements.
In September 2023, the SEC adopted amendments to Rule 35d-1 under the Act, the rule governing fund naming conventions (the “Names Rule”). In general, the Names Rule requires funds with certain types of names to adopt a policy to invest at least 80% of their assets in the type of investment suggested by the name. The amendments expand the scope of the current rule to include any term used in a fund name that suggests the fund makes investments that have, or whose issuers have, particular characteristics. Additionally, the amendments modify the circumstances under which a fund may deviate from its 80% investment policy and address the calculation methodology of derivatives instruments for purposes of the rule. The amendments became effective December 11, 2023, and fund groups with $1 billion or more in net assets will have 24 months to comply with the amendments (fund groups with net assets of less than $1 billion have 30 months to comply). At this time, management is evaluating the implications of these changes on the financial statements.
3. INVESTMENT VALUATION AND FAIR VALUE MEASUREMENTS
(a) Investment Valuation Policies The NAV of a Fund’s shares, or each of their respective share classes, as applicable, is determined by dividing the total value of portfolio investments and other assets
attributable to the Fund or class, less any liabilities, as applicable, by the total number of shares outstanding.
On each day that the New York Stock Exchange (“NYSE”) is open, each Fund’s shares are ordinarily valued as of the close of regular trading (normally 4:00 p.m., Eastern time) (“NYSE Close”). Information that becomes known to the Funds or their agents after the time as of which NAV has been calculated on a particular day will not generally be used to retroactively adjust the price of a security or the NAV determined earlier that day. If regular trading on the NYSE closes earlier than scheduled, each Fund may calculate its NAV as of the earlier closing time or calculate its NAV as of the NYSE Close for that day. Each Fund generally does not calculate its NAV on days on which the NYSE is not open for business. If the NYSE is closed on a day it would normally be open for business, each Fund may calculate its NAV as of the NYSE Close for such day or such other time that each Fund may determine.
For purposes of calculating NAV, portfolio securities and other assets for which market quotations are readily available are valued at market value. A market quotation is readily available only when that quotation is a quoted price (unadjusted) in active markets for identical investments that a Fund can access at the measurement date, provided that a quotation will not be readily available if it is not reliable. Market value is generally determined on the basis of official closing prices or the last reported sales prices. The Funds will normally use pricing data for domestic equity securities received shortly after the NYSE Close and do not normally take into account trading, clearances or settlements that take place after the NYSE Close. A foreign (non-U.S.) equity security traded on a foreign exchange or on more than one exchange is typically valued using pricing information from the exchange considered by PIMCO to be the primary exchange. If market value pricing is used, a foreign (non-U.S.) equity security will be valued as of the close of trading on the foreign exchange or the NYSE Close if the NYSE Close occurs before the end of trading on the foreign exchange.
Investments for which market quotations are not readily available are valued at fair value as determined in good faith pursuant to Rule 2a-5 under the Act. As a general principle, the fair value of a security or other asset is the price that would be received to sell an asset or paid to transfer a liability in an orderly transaction between market participants at the measurement date. Pursuant to Rule 2a-5, the Board has designated PIMCO as the valuation designee (“Valuation Designee”) for each Fund to perform the fair value determination relating to all Fund investments. PIMCO may carry out its designated responsibilities as Valuation Designee through various teams and committees. The Valuation Designee’s policies and procedures govern the Valuation Designee’s selection and application of methodologies for determining and calculating the fair value of Fund portfolio
investments. The Valuation Designee may value Fund portfolio securities for which market quotations are not readily available and other Fund assets utilizing inputs from pricing services, quotation reporting systems, valuation agents and other third-party sources (together, “Pricing Sources”).
Domestic and foreign (non-U.S.) fixed income securities, non-exchange traded derivatives and equity options are normally valued on the basis of quotes obtained from brokers and dealers or Pricing Sources using data reflecting the earlier closing of the principal markets for those securities. Prices obtained from Pricing Sources may be based on, among other things, information provided by market makers or estimates of market values obtained from yield data relating to investments or securities with similar characteristics. Certain fixed income securities purchased on a delayed-delivery basis are marked to market daily until settlement at the forward settlement date. Common stocks, ETFs, exchange-traded notes and financial derivative instruments, such as futures contracts, rights and warrants, or options on futures that are traded on a national securities exchange, are stated at the last reported sale or settlement price on the day of valuation. Exchange-traded options, except equity options, futures and options on futures are valued at the settlement price determined by the relevant exchange. Swap agreements are valued on the basis of bid quotes obtained from brokers and dealers or market-based prices supplied by Pricing Sources. With respect to any portion of a Fund’s assets that are invested in one or more open-end management investment companies (other than ETFs), a Fund’s NAV will be calculated based on the NAVs of such investments. Open-end management investment companies may include affiliated funds.
If a foreign (non-U.S.) equity security’s value has materially changed after the close of the security’s primary exchange or principal market but before the NYSE Close, the security may be valued at fair value. Foreign (non-U.S.) equity securities that do not trade when the NYSE is open are also valued at fair value. With respect to foreign (non-U.S.) equity securities, a Fund may determine the fair value of investments based on information provided by Pricing Sources, which may recommend fair value or adjustments with reference to other securities, indexes or assets. In considering whether fair valuation is required and in determining fair values, the Valuation Designee may, among other things, consider significant events (which may be considered to include changes in the value of U.S. securities or securities indexes) that occur after the close of the relevant market and before the NYSE Close. A Fund may utilize modeling tools provided by third-party vendors to determine fair values of foreign (non-U.S.) securities. For these purposes, unless otherwise determined by the Valuation Designee, any movement in the applicable reference index or instrument (“zero trigger”) between the earlier close of the applicable foreign market and the NYSE Close may be deemed to be a significant event, prompting
the application of the pricing model (effectively resulting in daily fair valuations). Foreign exchanges may permit trading in foreign (non-U.S.) equity securities on days when the Trust is not open for business, which may result in a Fund’s portfolio investments being affected when shareholders are unable to buy or sell shares.
Investments valued in currencies other than the U.S. dollar are converted to the U.S. dollar using exchange rates obtained from Pricing Sources. As a result, the value of such investments and, in turn, the NAV of a Fund’s shares may be affected by changes in the value of currencies in relation to the U.S. dollar. The value of investments traded in markets outside the United States or denominated in currencies other than the U.S. dollar may be affected significantly on a day that the Trust is not open for business. As a result, to the extent that a Fund holds foreign (non-U.S.) investments, the value of those investments may change at times when shareholders are unable to buy or sell shares and the value of such investments will be reflected in each Fund’s next calculated NAV.
Fair valuation may require subjective determinations about the value of a security. While the Trust’s and Valuation Designee’s policies and procedures are intended to result in a calculation of a Fund’s NAV that fairly reflects security values as of the time of pricing, the Trust cannot ensure that fair values accurately reflect the price that a Fund could obtain for a security if it were to dispose of that security as of the time of pricing (for instance, in a forced or distressed sale). The prices used by a Fund may differ from the value that would be realized if the securities were sold. The Funds’ use of fair valuation may also help to deter “stale price arbitrage” as discussed under the “Abusive Trading Practices” section in each Fund’s prospectus.
Under certain circumstances, the per share NAV of a class of a Fund’s shares may be different from the per share NAV of another class of shares as a result of the different daily expense accruals applicable to each class of shares.
(b) Fair Value Hierarchy U.S. GAAP describes fair value as the price that a Fund would receive to sell an asset or pay to transfer a liability in an orderly transaction between market participants at the measurement date. It establishes a fair value hierarchy that prioritizes inputs to valuation methods and requires disclosure of the fair value hierarchy, separately for each major category of assets and liabilities, that segregates fair value measurements into levels (Level 1, 2 or 3). The inputs or methodology used for valuing securities are not necessarily an indication of the risks associated with investing in those securities. Levels 1, 2 and 3 of the fair value hierarchy are defined as follows:
| ∎ | | Level 1 — Quoted prices (unadjusted) in active markets or exchanges for identical assets and liabilities. |
| | | | | | | | | | | | |
| | | | ANNUAL FINANCIAL AND OTHER INFORMATION | | | | | | | JUNE 30, 2024 | | | 53 |
| | | | |
| Notes to Financial Statements | | (Cont.) | | |
| ∎ | | Level 2 — Significant other observable inputs, which may include, but are not limited to, quoted prices for similar assets or liabilities in markets that are active, quoted prices for identical or similar assets or liabilities in markets that are not active, inputs other than quoted prices that are observable for the assets or liabilities (such as interest rates, yield curves, volatilities, prepayment speeds, loss severities, credit risks and default rates) or other market corroborated inputs. |
| ∎ | | Level 3 — Significant unobservable inputs based on the best information available in the circumstances, to the extent observable inputs are not available, which may include assumptions made by the Valuation Designee that are used in determining the fair value of investments. |
In accordance with the requirements of U.S. GAAP, the amounts of transfers into and out of Level 3, if material, are disclosed in the Notes to Schedule of Investments for each respective Fund.
For fair valuations using significant unobservable inputs, U.S. GAAP requires a reconciliation of the beginning to ending balances for reported fair values that presents changes attributable to realized gain (loss), unrealized appreciation (depreciation), purchases and sales, accrued discounts (premiums), and transfers into and out of the Level 3 category during the period. The end of period value is used for the transfers between Levels of a Fund’s assets and liabilities. Additionally, U.S. GAAP requires quantitative information regarding the significant unobservable inputs used in the determination of fair value of assets or liabilities categorized as Level 3 in the fair value hierarchy. In accordance with the requirements of U.S. GAAP, a fair value hierarchy and, if material, a Level 3 reconciliation and details of significant unobservable inputs, have been included in the Notes to Schedule of Investments for each respective Fund.
(c) Valuation Techniques and the Fair Value Hierarchy
Level 1, Level 2 and Level 3 trading assets and trading liabilities, at fair value The valuation methods (or “techniques”) and significant inputs used in determining the fair values of portfolio securities or other assets and liabilities categorized as Level 1, Level 2 and Level 3 of the fair value hierarchy are as follows:
Common stocks, ETFs, exchange-traded notes and financial derivative instruments, such as futures contracts, rights and warrants, or options on futures that are traded on a national securities exchange, are stated at the last reported sale or settlement price on the day of valuation. To the extent these securities are actively traded and valuation adjustments are not applied, they are categorized as Level 1 of the fair value hierarchy.
Investments in registered open-end investment companies (other than ETFs) will be valued based upon the NAVs of such investments and are
categorized as Level 1 of the fair value hierarchy. Investments in unregistered open-end investment companies will be calculated based upon the NAVs of such investments and are considered Level 1 provided that the NAVs are observable, calculated daily and are the value at which both purchases and sales will be conducted.
Equity exchange-traded options and over the counter financial derivative instruments, such as forward foreign currency contracts and options contracts derive their value from underlying asset prices, indexes, reference rates and other inputs or a combination of these factors. These contracts are normally valued on the basis of quotes obtained from a quotation reporting system, established market makers or Pricing Sources (normally determined as of the NYSE Close). Depending on the product and the terms of the transaction, financial derivative instruments can be valued by Pricing Sources using a series of techniques, including simulation pricing models. The pricing models use inputs that are observed from actively quoted markets such as quoted prices, issuer details, indexes, bid/ask spreads, interest rates, implied volatilities, yield curves, dividends and exchange rates. Financial derivative instruments that use similar valuation techniques and inputs as described above are categorized as Level 2 of the fair value hierarchy.
Centrally cleared swaps and over the counter swaps derive their value from underlying asset prices, indexes, reference rates and other inputs or a combination of these factors. They are valued using a broker-dealer bid quotation or on market-based prices provided by Pricing Sources (normally determined as of the NYSE Close). Centrally cleared swaps and over the counter swaps can be valued by Pricing Sources using a series of techniques, including simulation pricing models. The pricing models may use inputs that are observed from actively quoted markets such as the overnight index swap rate, LIBOR forward rate, interest rates, yield curves and credit spreads. These securities are categorized as Level 2 of the fair value hierarchy.
Short-term debt instruments (such as commercial paper, time deposits and certificates of deposit) having a remaining maturity of 60 days or less may be valued at amortized cost, so long as the amortized cost value of such short-term debt instruments is approximately the same as the fair value of the instrument as determined without the use of amortized cost valuation. These securities are categorized as Level 2 or Level 3 of the fair value hierarchy depending on the source of the base price.
When a fair valuation method is applied by PIMCO that uses significant unobservable inputs, investments will be priced by a method that the Valuation Designee believes reflects fair value and are categorized as Level 3 of the fair value hierarchy.
4. SECURITIES AND OTHER INVESTMENTS
(a) Investments in Affiliates
Each Fund may invest substantially all or a significant portion of its assets in Underlying PIMCO Funds and Acquired Funds. The Underlying PIMCO Funds are considered to be affiliated with the Funds. Each Fund may also invest in the PIMCO Short Asset Portfolio and the PIMCO Short-Term Floating NAV Portfolio III (“Central Funds”) to the extent permitted by the Act, rules thereunder or exemptive relief therefrom. The Central Funds are registered investment companies created for use solely by the series of the Trust and other series of registered investment companies advised by the Adviser, in connection with their cash management activities. The main investments of the Central Funds are money market and short maturity fixed income instruments. The Central Funds may incur expenses related to their investment activities, but do not pay Investment Advisory Fees or Supervisory and Administrative Fees to the Adviser. The Central Funds are considered to be affiliated with the Funds. A complete schedule of portfolio holdings for each affiliate fund is filed with the SEC for the first and third quarters of each fiscal year on Form N-PORT and is available at the SEC’s website at www.sec.gov. A copy of each Acquired Fund’s shareholder report is also available at the SEC’s website at www.sec.gov, and a copy of each affiliate fund’s shareholder report is available on the Funds’ website at www.pimco.com, or upon request, as applicable. The tables below show the Funds’ transactions in and earnings from investments in the affiliated funds for the period ended June 30, 2024 (amounts in thousands†):
| | | | | | | | | | | | | | | | | | | | | | | | | | | | | | | | | | | | |
| PIMCO REALPATH® Blend 2025 Fund | |
| Underlying PIMCO Funds | | | | | Market Value
06/30/2023 | | | Purchases
at Cost | | | Proceeds
from Sales | | | Net
Realized
Gain (Loss) | | | Change in
Unrealized
Appreciation
(Depreciation) | | | Market Value
06/30/2024 | | | Dividend
Income(1) | | | Realized Net
Capital Gain
Distributions(1) | |
| | | | | | | | | |
PIMCO Emerging Markets Local Currency and Bond Fund | | | | | | $ | 13,201 | | | $ | 2,433 | | | $ | (456 | ) | | $ | (33 | ) | | $ | (280 | ) | | $ | 14,865 | | | $ | 601 | | | $ | 0 | |
| | | | | | | | | |
PIMCO High Yield Fund | | | | | | | 9,008 | | | | 1,255 | | | | (6,517 | ) | | | (448 | ) | | | 715 | | | | 4,013 | | | | 448 | | | | 0 | |
| | | | | | | | | |
PIMCO Income Fund | | | | | | | 58,993 | | | | 12,832 | | | | (21,918 | ) | | | (1,563 | ) | | | 1,889 | | | | 50,233 | | | | 3,606 | | | | 0 | |
| | | | | | | | | |
PIMCO International Bond Fund (U.S. Dollar-Hedged) | | | | | | | 11,162 | | | | 2,563 | | | | (1,079 | ) | | | (19 | ) | | | 372 | | | | 12,999 | | | | 431 | | | | 0 | |
| | | | | | | | | |
PIMCO Long-Term Real Return Fund | | | | | | | 44,631 | | | | 9,240 | | | | (7,147 | ) | | | (706 | ) | | | (3,768 | ) | | | 42,250 | | | | 2,073 | | | | 0 | |
| | | | | | | | | |
PIMCO Long-Term U.S. Government Fund | | | | | | | 23,399 | | | | 19,368 | | | | (3,314 | ) | | | (258 | ) | | | (1,785 | ) | | | 37,410 | | | | 919 | | | | 0 | |
| | | | | | | | | |
PIMCO Real Return Fund | | | | | | | 17,956 | | | | 6,263 | | | | (1,494 | ) | | | (64 | ) | | | 54 | | | | 22,715 | | | | 669 | | | | 0 | |
| | | | | | | | | |
PIMCO Short-Term Floating NAV Portfolio III | | | | | | | 25,404 | | | | 96,715 | | | | (99,900 | ) | | | 4 | | | | 6 | | | | 22,229 | | | | 1,106 | | | | 0 | |
| | | | | | | | | |
PIMCO Total Return Fund | | | | | | | 49,927 | | | | 32,774 | | | | (3,440 | ) | | | (161 | ) | | | 692 | | | | 79,792 | | | | 1,927 | | | | 0 | |
| | | | | | | | | |
Totals | | | | | | $ | 253,681 | | | $ | 183,443 | | | $ | (145,265 | ) | | $ | (3,248 | ) | | $ | (2,105 | ) | | $ | 286,506 | | | $ | 11,780 | | | $ | 0 | |
|
| PIMCO REALPATH® Blend 2030 Fund | |
| Underlying PIMCO Funds | | | | | Market Value
06/30/2023 | | | Purchases
at Cost | | | Proceeds
from Sales | | | Net
Realized
Gain (Loss) | | | Change in
Unrealized
Appreciation
(Depreciation) | | | Market Value
06/30/2024 | | | Dividend
Income(1) | | | Realized Net
Capital Gain
Distributions(1) | |
| | | | | | | | | |
PIMCO Emerging Markets Local Currency and Bond Fund | | | | | | $ | 13,083 | | | $ | 3,781 | | | $ | (422 | ) | | $ | (30 | ) | | $ | (322 | ) | | $ | 16,090 | | | $ | 620 | | | $ | 0 | |
| | | | | | | | | |
PIMCO High Yield Fund | | | | | | | 8,581 | | | | 1,671 | | | | (6,404 | ) | | | (388 | ) | | | 642 | | | | 4,102 | | | | 438 | | | | 0 | |
| | | | | | | | | |
PIMCO Income Fund | | | | | | | 49,107 | | | | 12,910 | | | | (16,370 | ) | | | (936 | ) | | | 1,211 | | | | 45,922 | | | | 3,087 | | | | 0 | |
| | | | | | | | | |
PIMCO International Bond Fund (U.S. Dollar-Hedged) | | | | | | | 9,148 | | | | 2,618 | | | | (835 | ) | | | (11 | ) | | | 303 | | | | 11,223 | | | | 362 | | | | 0 | |
| | | | | | | | | |
PIMCO Long-Term Real Return Fund | | | | | | | 47,594 | | | | 14,433 | | | | (5,299 | ) | | | (617 | ) | | | (4,342 | ) | | | 51,769 | | | | 2,370 | | | | 0 | |
| | | | | | | | | |
PIMCO Long-Term U.S. Government Fund | | | | | | | 28,348 | | | | 23,651 | | | | (2,544 | ) | | | (250 | ) | | | (2,336 | ) | | | 46,869 | | | | 1,140 | | | | 0 | |
| | | | | | | | | |
PIMCO Real Return Fund | | | | | | | 16,816 | | | | 8,726 | | | | (1,272 | ) | | | (49 | ) | | | 45 | | | | 24,266 | | | | 677 | | | | 0 | |
| | | | | | | | | |
PIMCO Short-Term Floating NAV Portfolio III | | | | | | | 27,819 | | | | 100,621 | | | | (97,300 | ) | | | 12 | | | | 1 | | | | 31,153 | | | | 1,407 | | | | 0 | |
| | | | | | | | | |
PIMCO Total Return Fund | | | | | | | 40,483 | | | | 30,433 | | | | (3,429 | ) | | | (201 | ) | | | 671 | | | | 67,957 | | | | 1,597 | | | | 0 | |
| | | | | | | | | |
Totals | | | | | | $ | 240,979 | | | $ | 198,844 | | | $ | (133,875 | ) | | $ | (2,470 | ) | | $ | (4,127 | ) | | $ | 299,351 | | | $ | 11,698 | | | $ | 0 | |
| | | | | | | | | | | | |
| | | | ANNUAL FINANCIAL AND OTHER INFORMATION | | | | | | | JUNE 30, 2024 | | | 55 |
| | | | |
| Notes to Financial Statements | | (Cont.) | | |
| | | | | | | | | | | | | | | | | | | | | | | | | | | | | | | | | | | | |
| PIMCO REALPATH® Blend 2035 Fund | |
| Underlying PIMCO Funds | | | | | Market Value
06/30/2023 | | | Purchases
at Cost | | | Proceeds
from Sales | | | Net
Realized
Gain (Loss) | | | Change in
Unrealized
Appreciation
(Depreciation) | | | Market Value
06/30/2024 | | | Dividend
Income(1) | | | Realized Net
Capital Gain
Distributions(1) | |
| | | | | | | | | |
PIMCO Emerging Markets Local Currency and Bond Fund | | | | | | $ | 10,051 | | | $ | 3,477 | | | $ | 0 | | | $ | 0 | | | $ | (263 | ) | | $ | 13,265 | | | $ | 496 | | | $ | 0 | |
| | | | | | | | | |
PIMCO High Yield Fund | | | | | | | 5,660 | | | | 1,134 | | | | (4,011 | ) | | | (194 | ) | | | 375 | | | | 2,964 | | | | 299 | | | | 0 | |
| | | | | | | | | |
PIMCO Income Fund | | | | | | | 35,294 | | | | 9,315 | | | | (9,059 | ) | | | (613 | ) | | | 828 | | | | 35,765 | | | | 2,306 | | | | 0 | |
| | | | | | | | | |
PIMCO International Bond Fund (U.S. Dollar-Hedged) | | | | | | | 6,615 | | | | 1,512 | | | | 0 | | | | 0 | | | | 232 | | | | 8,359 | | | | 270 | | | | 0 | |
| | | | | | | | | |
PIMCO Long-Term Real Return Fund | | | | | | | 34,247 | | | | 12,443 | | | | (2,246 | ) | | | (228 | ) | | | (3,454 | ) | | | 40,762 | | | | 1,791 | | | | 0 | |
| | | | | | | | | |
PIMCO Long-Term U.S. Government Fund | | | | | | | 19,659 | | | | 17,433 | | | | (864 | ) | | | (61 | ) | | | (1,811 | ) | | | 34,356 | | | | 827 | | | | 0 | |
| | | | | | | | | |
PIMCO Real Return Fund | | | | | | | 11,192 | | | | 8,058 | | | | (267 | ) | | | (15 | ) | | | 13 | | | | 18,981 | | | | 497 | | | | 0 | |
| | | | | | | | | |
PIMCO Short-Term Floating NAV Portfolio III | | | | | | | 23,529 | | | | 85,931 | | | | (76,600 | ) | | | 0 | | | | 16 | | | | 32,876 | | | | 1,616 | | | | 0 | |
| | | | | | | | | |
PIMCO Total Return Fund | | | | | | | 29,600 | | | | 25,305 | | | | (743 | ) | | | (19 | ) | | | 407 | | | | 54,550 | | | | 1,238 | | | | 0 | |
| | | | | | | | | |
Totals | | | | | | $ | 175,847 | | | $ | 164,608 | | | $ | (93,790 | ) | | $ | (1,130 | ) | | $ | (3,657 | ) | | $ | 241,878 | | | $ | 9,340 | | | $ | 0 | |
|
| PIMCO REALPATH® Blend 2040 Fund | |
| Underlying PIMCO Funds | | | | | Market Value
06/30/2023 | | | Purchases
at Cost | | | Proceeds
from Sales | | | Net
Realized
Gain (Loss) | | | Change in
Unrealized
Appreciation
(Depreciation) | | | Market Value
06/30/2024 | | | Dividend
Income(1) | | | Realized Net
Capital Gain
Distributions(1) | |
| | | | | | | | | |
PIMCO Emerging Markets Local Currency and Bond Fund | | | | | | $ | 7,526 | | | $ | 2,813 | | | $ | (363 | ) | | $ | (13 | ) | | $ | (330 | ) | | $ | 9,633 | | | $ | 367 | | | $ | 0 | |
| | | | | | | | | |
PIMCO High Yield Fund | | | | | | | 2,282 | | | | 943 | | | | (1,892 | ) | | | (46 | ) | | | 115 | | | | 1,402 | | | | 129 | | | | 0 | |
| | | | | | | | | |
PIMCO Income Fund | | | | | | | 23,058 | | | | 7,199 | | | | (10,760 | ) | | | (701 | ) | | | 954 | | | | 19,750 | | | | 1,449 | | | | 0 | |
| | | | | | | | | |
PIMCO International Bond Fund (U.S. Dollar-Hedged) | | | | | | | 4,814 | | | | 1,363 | | | | 0 | | | | 0 | | | | 157 | | | | 6,334 | | | | 197 | | | | 0 | |
| | | | | | | | | |
PIMCO Long-Term Real Return Fund | | | | | | | 20,258 | | | | 9,241 | | | | (2,636 | ) | | | (234 | ) | | | (1,989 | ) | | | 24,640 | | | | 1,089 | | | | 0 | |
| | | | | | | | | |
PIMCO Long-Term U.S. Government Fund | | | | | | | 11,243 | | | | 9,252 | | | | (993 | ) | | | (57 | ) | | | (922 | ) | | | 18,523 | | | | 455 | | | | 0 | |
| | | | | | | | | |
PIMCO Real Return Fund | | | | | | | 5,889 | | | | 6,118 | | | | (500 | ) | | | (1 | ) | | | 4 | | | | 11,510 | | | | 291 | | | | 0 | |
| | | | | | | | | |
PIMCO Short-Term Floating NAV Portfolio III | | | | | | | 21,641 | | | | 95,397 | | | | (88,300 | ) | | | 0 | | | | 14 | | | | 28,752 | | | | 1,483 | | | | 0 | |
| | | | | | | | | |
PIMCO Total Return Fund | | | | | | | 20,749 | | | | 13,650 | | | | (2,104 | ) | | | (50 | ) | | | 277 | | | | 32,522 | | | | 810 | | | | 0 | |
| | | | | | | | | |
Totals | | | | | | $ | 117,460 | | | $ | 145,976 | | | $ | (107,548 | ) | | $ | (1,102 | ) | | $ | (1,720 | ) | | $ | 153,066 | | | $ | 6,270 | | | $ | 0 | |
|
| PIMCO REALPATH® Blend 2045 Fund | |
| Underlying PIMCO Funds | | | | | Market Value
06/30/2023 | | | Purchases
at Cost | | | Proceeds
from Sales | | | Net
Realized
Gain (Loss) | | | Change in
Unrealized
Appreciation
(Depreciation) | | | Market Value
06/30/2024 | | | Dividend
Income(1) | | | Realized Net
Capital Gain
Distributions(1) | |
| | | | | | | | | |
PIMCO Emerging Markets Local Currency and Bond Fund | | | | | | $ | 4,793 | | | $ | 2,467 | | | $ | (469 | ) | | $ | (17 | ) | | $ | (219 | ) | | $ | 6,555 | | | $ | 249 | | | $ | 0 | |
| | | | | | | | | |
PIMCO High Yield Fund | | | | | | | 138 | | | | 9 | | | | 0 | | | | 0 | | | | 5 | | | | 152 | | | | 9 | | | | 0 | |
| | | | | | | | | |
PIMCO Income Fund | | | | | | | 12,496 | | | | 3,470 | | | | (7,453 | ) | | | (427 | ) | | | 591 | | | | 8,677 | | | | 546 | | | | 0 | |
| | | | | | | | | |
PIMCO International Bond Fund (U.S. Dollar-Hedged) | | | | | | | 2,969 | | | | 1,161 | | | | (270 | ) | | | (1 | ) | | | 107 | | | | 3,966 | | | | 130 | | | | 0 | |
| | | | | | | | | |
PIMCO Long-Term Real Return Fund | | | | | | | 8,937 | | | | 5,597 | | | | (1,149 | ) | | | (69 | ) | | | (986 | ) | | | 12,330 | | | | 540 | | | | 0 | |
| | | | | | | | | |
PIMCO Long-Term U.S. Government Fund | | | | | | | 8,398 | | | | 6,062 | | | | (1,027 | ) | | | (58 | ) | | | (728 | ) | | | 12,647 | | | | 344 | | | | 0 | |
| | | | | | | | | |
PIMCO Real Return Fund | | | | | | | 3,539 | | | | 5,558 | | | | (637 | ) | | | (1 | ) | | | 2 | | | | 8,461 | | | | 209 | | | | 0 | |
| | | | | | | | | |
PIMCO Short-Term Floating NAV Portfolio III | | | | | | | 24,160 | | | | 84,085 | | | | (83,400 | ) | | | 5 | | | | 11 | | | | 24,861 | | | | 1,473 | | | | 0 | |
| | | | | | | | | |
PIMCO Total Return Fund | | | | | | | 12,085 | | | | 8,513 | | | | (1,322 | ) | | | (9 | ) | | | 160 | | | | 19,427 | | | | 731 | | | | 0 | |
| | | | | | | | | |
Totals | | | | | | $ | 77,515 | | | $ | 116,922 | | | $ | (95,727 | ) | | $ | (577 | ) | | $ | (1,057 | ) | | $ | 97,076 | | | $ | 4,231 | | | $ | 0 | |
| | | | | | | | | | | | | | | | | | | | | | | | | | | | | | | | | | | | |
| PIMCO REALPATH® Blend 2050 Fund | |
| Underlying PIMCO Funds | | | | | Market Value
06/30/2023 | | | Purchases
at Cost | | | Proceeds
from Sales | | | Net
Realized
Gain (Loss) | | | Change in
Unrealized
Appreciation
(Depreciation) | | | Market Value
06/30/2024 | | | Dividend
Income(1) | | | Realized Net
Capital Gain
Distributions(1) | |
| | | | | | | | | |
PIMCO Emerging Markets Local Currency and Bond Fund | | | | | | $ | 1,826 | | | $ | 975 | | | $ | (314 | ) | | $ | (11 | ) | | $ | (64 | ) | | $ | 2,412 | | | $ | 96 | | | $ | 0 | |
| | | | | | | | | |
PIMCO Income Fund | | | | | | | 8,031 | | | | 2,445 | | | | (5,443 | ) | | | (244 | ) | | | 345 | | | | 5,134 | | | | 501 | | | | 0 | |
| | | | | | | | | |
PIMCO International Bond Fund (U.S. Dollar-Hedged) | | | | | | | 1,615 | | | | 913 | | | | (326 | ) | | | (2 | ) | | | 69 | | | | 2,269 | | | | 76 | | | | 0 | |
| | | | | | | | | |
PIMCO Long-Term Real Return Fund | | | | | | | 5,232 | | | | 2,853 | | | | (893 | ) | | | (54 | ) | | | (500 | ) | | | 6,638 | | | | 303 | | | | 0 | |
| | | | | | | | | |
PIMCO Long-Term U.S. Government Fund | | | | | | | 5,123 | | | | 3,690 | | | | (1,084 | ) | | | (57 | ) | | | (384 | ) | | | 7,288 | | | | 210 | | | | 0 | |
| | | | | | | | | |
PIMCO Real Return Fund | | | | | | | 1,674 | | | | 3,748 | | | | (724 | ) | | | (60 | ) | | | 74 | | | | 4,712 | | | | 116 | | | | 0 | |
| | | | | | | | | |
PIMCO Short-Term Floating NAV Portfolio III | | | | | | | 18,149 | | | | 93,304 | | | | (90,500 | ) | | | 5 | | | | 7 | | | | 20,965 | | | | 1,294 | | | | 0 | |
| | | | | | | | | |
PIMCO Total Return Fund | | | | | | | 7,924 | | | | 5,495 | | | | (1,504 | ) | | | (110 | ) | | | 225 | | | | 12,030 | | | | 326 | | | | 0 | |
| | | | | | | | | |
Totals | | | | | | $ | 49,574 | | | $ | 113,423 | | | $ | (100,788 | ) | | $ | (533 | ) | | $ | (228 | ) | | $ | 61,448 | | | $ | 2,922 | | | $ | 0 | |
|
| PIMCO REALPATH® Blend 2055 Fund | |
| Underlying PIMCO Funds | | | | | Market Value
06/30/2023 | | | Purchases
at Cost | | | Proceeds
from Sales | | | Net
Realized
Gain (Loss) | | | Change in
Unrealized
Appreciation
(Depreciation) | | | Market Value
06/30/2024 | | | Dividend
Income(1) | | | Realized Net
Capital Gain
Distributions(1) | |
| | | | | | | | | |
PIMCO Emerging Markets Local Currency and Bond Fund | | | | | | $ | 827 | | | $ | 461 | | | $ | 0 | | | $ | 0 | | | $ | (26 | ) | | $ | 1,262 | | | $ | 45 | | | $ | 0 | |
| | | | | | | | | |
PIMCO Income Fund | | | | | | | 4,342 | | | | 1,688 | | | | (2,696 | ) | | | (124 | ) | | | 166 | | | | 3,376 | | | | 287 | | | | 0 | |
| | | | | | | | | |
PIMCO International Bond Fund (U.S. Dollar-Hedged) | | | | | | | 597 | | | | 421 | | | | 0 | | | | 0 | | | | 28 | | | | 1,046 | | | | 31 | | | | 0 | |
| | | | | | | | | |
PIMCO Long-Term Real Return Fund | | | | | | | 2,661 | | | | 1,861 | | | | (266 | ) | | | (22 | ) | | | (281 | ) | | | 3,953 | | | | 168 | | | | 0 | |
| | | | | | | | | |
PIMCO Long-Term U.S. Government Fund | | | | | | | 2,423 | | | | 1,807 | | | | (308 | ) | | | (21 | ) | | | (192 | ) | | | 3,709 | | | | 105 | | | | 0 | |
| | | | | | | | | |
PIMCO Real Return Fund | | | | | | | 1,062 | | | | 2,473 | | | | (280 | ) | | | (50 | ) | | | 54 | | | | 3,259 | | | | 76 | | | | 0 | |
| | | | | | | | | |
PIMCO Short-Term Floating NAV Portfolio III | | | | | | | 15,042 | | | | 84,574 | | | | (81,800 | ) | | | 4 | | | | 8 | | | | 17,828 | | | | 1,065 | | | | 0 | |
| | | | | | | | | |
PIMCO Total Return Fund | | | | | | | 4,185 | | | | 3,885 | | | | (462 | ) | | | (3 | ) | | | 69 | | | | 7,674 | | | | 190 | | | | 0 | |
| | | | | | | | | |
Totals | | | | | | $ | 31,139 | | | $ | 97,170 | | | $ | (85,812 | ) | | $ | (216 | ) | | $ | (174 | ) | | $ | 42,107 | | | $ | 1,967 | | | $ | 0 | |
|
| PIMCO REALPATH® Blend 2060 Fund | |
| Underlying PIMCO Funds | | | | | Market Value
06/30/2023 | | | Purchases
at Cost | | | Proceeds
from Sales | | | Net
Realized
Gain (Loss) | | | Change in
Unrealized
Appreciation
(Depreciation) | | | Market Value
06/30/2024 | | | Dividend
Income(1) | | | Realized Net
Capital Gain
Distributions(1) | |
| | | | | | | | | |
PIMCO Emerging Markets Local Currency and Bond Fund | | | | | | $ | 256 | | | $ | 234 | | | $ | 0 | | | $ | 0 | | | $ | (8 | ) | | $ | 482 | | | $ | 14 | | | $ | 0 | |
| | | | | | | | | |
PIMCO Income Fund | | | | | | | 840 | | | | 630 | | | | (567 | ) | | | (19 | ) | | | 35 | | | | 919 | | | | 66 | | | | 0 | |
| | | | | | | | | |
PIMCO International Bond Fund (U.S. Dollar-Hedged) | | | | | | | 98 | | | | 132 | | | | 0 | | | | 0 | | | | 5 | | | | 235 | | | | 6 | | | | 0 | |
| | | | | | | | | |
PIMCO Long-Term Real Return Fund | | | | | | | 597 | | | | 673 | | | | 0 | | | | 0 | | | | (64 | ) | | | 1,206 | | | | 45 | | | | 0 | |
| | | | | | | | | |
PIMCO Long-Term U.S. Government Fund | | | | | | | 583 | | | | 636 | | | | 0 | | | | 0 | | | | (45 | ) | | | 1,174 | | | | 28 | | | | 0 | |
| | | | | | | | | |
PIMCO Real Return Fund | | | | | | | 359 | | | | 751 | | | | 0 | | | | 0 | | | | 5 | | | | 1,115 | | | | 25 | | | | 0 | |
| | | | | | | | | |
PIMCO Short-Term Floating NAV Portfolio III | | | | | | | 3,600 | | | | 48,731 | | | | (43,800 | ) | | | (1 | ) | | | 4 | | | | 8,534 | | | | 327 | | | | 0 | |
| | | | | | | | | |
PIMCO Total Return Fund | | | | | | | 829 | | | | 1,378 | | | | 0 | | | | 0 | | | | 23 | | | | 2,230 | | | | 45 | | | | 0 | |
| | | | | | | | | |
Totals | | | | | | $ | 7,162 | | | $ | 53,165 | | | $ | (44,367 | ) | | $ | (20 | ) | | $ | (45 | ) | | $ | 15,895 | | | $ | 556 | | | $ | 0 | |
| | | | | | | | | | | | |
| | | | ANNUAL FINANCIAL AND OTHER INFORMATION | | | | | | | JUNE 30, 2024 | | | 57 |
| | | | |
| Notes to Financial Statements | | (Cont.) | | |
| | | | | | | | | | | | | | | | | | | | | | | | | | | | | | | | | | | | |
| PIMCO REALPATH® Blend 2065 Fund | |
| Underlying PIMCO Funds | | | | | Market Value
06/30/2023 | | | Purchases
at Cost | | | Proceeds
from Sales | | | Net
Realized
Gain (Loss) | | | Change in
Unrealized
Appreciation
(Depreciation) | | | Market Value
06/30/2024 | | | Dividend
Income(1) | | | Realized Net
Capital Gain
Distributions(1) | |
| | | | | | | | | |
PIMCO Emerging Markets Local Currency and Bond Fund | | | | | | $ | 15 | | | $ | 39 | | | $ | 0 | | | $ | 0 | | | $ | 0 | | | $ | 54 | | | $ | 1 | | | $ | 0 | |
| | | | | | | | | |
PIMCO Income Fund | | | | | | | 41 | | | | 85 | | | | (50 | ) | | | 0 | | | | 1 | | | | 77 | | | | 4 | | | | 0 | |
| | | | | | | | | |
PIMCO International Bond Fund (U.S. Dollar-Hedged) | | | | | | | 4 | | | | 17 | | | | 0 | | | | 0 | | | | 0 | | | | 21 | | | | 0 | | | | 0 | |
| | | | | | | | | |
PIMCO Long-Term Real Return Fund | | | | | | | 38 | | | | 104 | | | | 0 | | | | 0 | | | | (5 | ) | | | 137 | | | | 5 | | | | 0 | |
| | | | | | | | | |
PIMCO Long-Term U.S. Government Fund | | | | | | | 34 | | | | 98 | | | | 0 | | | | 0 | | | | (3 | ) | | | 129 | | | | 3 | | | | 0 | |
| | | | | | | | | |
PIMCO Real Return Fund | | | | | | | 22 | | | | 113 | | | | 0 | | | | 0 | | | | 1 | | | | 136 | | | | 3 | | | | 0 | |
| | | | | | | | | |
PIMCO Short-Term Floating NAV Portfolio III | | | | | | | 102 | | | | 6,026 | | | | (5,090 | ) | | | 0 | | | | 0 | | | | 1,038 | | | | 25 | | | | 0 | |
| | | | | | | | | |
PIMCO Total Return Fund | | | | | | | 41 | | | | 132 | | | | 0 | | | | 0 | | | | 1 | | | | 174 | | | | 3 | | | | 0 | |
| | | | | | | | | |
Totals | | | | | | $ | 297 | | | $ | 6,614 | | | $ | (5,140 | ) | | $ | 0 | | | $ | (5 | ) | | $ | 1,766 | | | $ | 44 | | | $ | 0 | |
|
| PIMCO REALPATH® Blend Income Fund | |
| Underlying PIMCO Funds | | | | | Market Value
06/30/2023 | | | Purchases
at Cost | | | Proceeds
from Sales | | | Net
Realized
Gain (Loss) | | | Change in
Unrealized
Appreciation
(Depreciation) | | | Market Value
06/30/2024 | | | Dividend
Income(1) | | | Realized Net
Capital Gain
Distributions(1) | |
| | | | | | | | | |
PIMCO Emerging Markets Local Currency and Bond Fund | | | | | | $ | 11,357 | | | $ | 1,503 | | | $ | (1,240 | ) | | $ | (79 | ) | | $ | (399 | ) | | $ | 11,142 | | | $ | 484 | | | $ | 0 | |
| | | | | | | | | |
PIMCO High Yield Fund | | | | | | | 7,742 | | | | 565 | | | | (5,404 | ) | | | (425 | ) | | | 653 | | | | 3,131 | | | | 366 | | | | 0 | |
| | | | | | | | | |
PIMCO Income Fund | | | | | | | 54,265 | | | | 7,204 | | | | (23,062 | ) | | | (2,137 | ) | | | 2,749 | | | | 39,019 | | | | 3,069 | | | | 0 | |
| | | | | | | | | |
PIMCO International Bond Fund (U.S. Dollar-Hedged) | | | | | | | 10,130 | | | | 1,314 | | | | (1,776 | ) | | | (49 | ) | | | 369 | | | | 9,988 | | | | 363 | | | | 0 | |
| | | | | | | | | |
PIMCO Long-Term Real Return Fund | | | | | | | 36,356 | | | | 6,596 | | | | (8,617 | ) | | | (1,509 | ) | | | (2,049 | ) | | | 30,777 | | | | 1,598 | | | | 0 | |
| | | | | | | | | |
PIMCO Long-Term U.S. Government Fund | | | | | | | 17,877 | | | | 14,617 | | | | (3,865 | ) | | | (350 | ) | | | (1,219 | ) | | | 27,060 | | | | 683 | | | | 0 | |
| | | | | | | | | |
PIMCO Real Return Fund | | | | | | | 15,838 | | | | 3,893 | | | | (2,747 | ) | | | (157 | ) | | | 142 | | | | 16,969 | | | | 540 | | | | 0 | |
| | | | | | | | | |
PIMCO Short-Term Floating NAV Portfolio III | | | | | | | 17,024 | | | | 80,012 | | | | (79,800 | ) | | | 7 | | | | 2 | | | | 17,245 | | | | 804 | | | | 0 | |
| | | | | | | | | |
PIMCO Total Return Fund | | | | | | | 46,431 | | | | 23,428 | | | | (7,829 | ) | | | (636 | ) | | | 1,102 | | | | 62,496 | | | | 1,649 | | | | 0 | |
| | | | | | | | | |
Totals | | | | | | $ | 217,020 | | | $ | 139,132 | | | $ | (134,340 | ) | | $ | (5,335 | ) | | $ | 1,350 | | | $ | 217,827 | | | $ | 9,556 | | | $ | 0 | |
| † | A zero balance may reflect actual amounts rounding to less than one thousand. |
| (1) | The tax characterization of distributions is determined in accordance with Federal income tax regulations and may contain a return of capital. The actual tax characterization of distributions received is determined at the end of the fiscal year of the affiliated fund, unless otherwise advised on IRS Form 1099-DIV. See Note 2, Distributions to Shareholders, in the Notes to Financial Statements for more information. |
(b) Investments in Securities
The Funds (and where applicable, certain Acquired Funds and Underlying PIMCO Funds) may utilize the investments and strategies described below to the extent permitted by each Fund’s respective investment policies.
Securities Issued by U.S. Government Agencies or Government-Sponsored Enterprises are obligations of and, in certain cases, guaranteed by, the U.S. Government, its agencies or instrumentalities. Some U.S. Government securities, such as Treasury bills, notes and bonds, and securities guaranteed by the Government National Mortgage Association, are supported by the full faith and credit of the U.S. Government; others, such as those of the Federal Home Loan Banks, are supported by the right of the issuer to borrow from the U.S. Department of the Treasury (the “U.S. Treasury”); and others, such as those of the Federal National Mortgage Association (“FNMA” or “Fannie Mae”), are supported by the discretionary authority of the U.S. Government to purchase the agency’s obligations. U.S. Government securities may include zero coupon securities which do not distribute
interest on a current basis and tend to be subject to a greater risk than interest-paying securities of similar maturities.
Government-related guarantors (i.e., not backed by the full faith and credit of the U.S. Government) include FNMA and the Federal Home Loan Mortgage Corporation (“FHLMC” or “Freddie Mac”). FNMA is a government-sponsored corporation. FNMA purchases conventional (i.e., not insured or guaranteed by any government agency) residential mortgages from a list of approved seller/servicers which include state and federally chartered savings and loan associations, mutual savings banks, commercial banks and credit unions and mortgage bankers. Pass-through securities issued by FNMA are guaranteed as to timely payment of principal and interest by FNMA, but are not backed by the full faith and credit of the U.S. Government. FHLMC is a government sponsored corporation that issues Participation Certificates (“PCs”), which are pass-through securities, each representing an undivided interest in a pool of residential mortgages. FHLMC guarantees the timely payment of interest and ultimate collection of principal, but PCs are not backed by the full faith and credit of the U.S. Government.
5. BORROWINGS AND OTHER FINANCING TRANSACTIONS
The Funds (and where applicable, certain Acquired Funds and Underlying PIMCO Funds) may enter into the borrowings and other financing transactions described below to the extent permitted by each Fund’s respective investment policies.
The following disclosures contain information on a Fund’s ability to lend or borrow cash or securities to the extent permitted under the Act, which may be viewed as borrowing or financing transactions by a Fund. The location of these instruments in each Fund’s financial statements is described below.
(a) Repurchase Agreements Under the terms of a typical repurchase agreement, a Fund purchases an underlying debt obligation (collateral) subject to an obligation of the seller to repurchase, and a Fund to resell, the obligation at an agreed-upon price and time. In an open maturity repurchase agreement, there is no pre-determined repurchase date and the agreement can be terminated by a Fund or counterparty at any time. The underlying securities for all repurchase agreements are held by a Fund’s custodian or designated subcustodians (in the case of tri-party repurchase agreements) and in certain instances will remain in custody with the counterparty. Traditionally, a Fund has used bilateral repurchase agreements wherein the underlying securities will be held by a Fund’s custodian. The market value of the collateral must be equal to or exceed the total amount of the repurchase obligations, including interest. Repurchase agreements, if any, including accrued interest, are included on the Statements of Assets and Liabilities. Interest earned is recorded as a component of interest income on the Statements of Operations. In periods of increased demand for collateral, a Fund may pay a fee for the receipt of collateral, which may result in interest expense to the Fund.
(b) Interfund Lending In accordance with an exemptive order (the “Order”) from the SEC, the Funds of the Trust may participate in a joint lending and borrowing facility for temporary purposes (the “Interfund Lending Program”), subject to compliance with the terms and conditions of the Order, and to the extent permitted by each Fund’s investment policies and restrictions. The Funds are currently permitted to borrow under the Interfund Lending Program. A lending fund may lend in aggregate up to 15% of its current net assets at the time of the interfund loan, but may not lend more than 5% of its net assets to any one borrowing fund through the Interfund Lending Program. A borrowing fund may not borrow through the Interfund Lending Program or from any other source if its total outstanding borrowings immediately after the borrowing would be more than 33 1/3% of its total assets (or any lower threshold provided for by the fund’s investment restrictions). If a borrowing fund’s total outstanding borrowings exceed 10% of its total assets, each of its outstanding
interfund loans will be subject to collateralization of at least 102% of the outstanding principal value of the loan. All interfund loans are for temporary or emergency purposes and the interfund loan rate to be charged will be the average of the highest current overnight repurchase agreement rate available to a lending fund and the bank loan rate, as calculated according to a formula established by the Board.
During the period ended June 30, 2024, the Funds did not participate in the Interfund Lending Program.
6. FINANCIAL DERIVATIVE INSTRUMENTS
The Funds (and where applicable, certain Acquired Funds and Underlying PIMCO Funds) may enter into the financial derivative instruments described below to the extent permitted by each Fund’s respective investment policies.
The following disclosures contain information on how and why the Funds use financial derivative instruments, and how financial derivative instruments affect the Funds’ financial position, results of operations and cash flows. The location and fair value amounts of these instruments on the Statements of Assets and Liabilities and the net realized gain (loss) and net change in unrealized appreciation (depreciation) on the Statements of Operations, each categorized by type of financial derivative contract and related risk exposure, are included in a table in the Notes to Schedules of Investments. The financial derivative instruments outstanding as of period end and the amounts of net realized gain (loss) and net change in unrealized appreciation (depreciation) on financial derivative instruments during the period, as disclosed in the Notes to Schedules of Investments, serve as indicators of the volume of financial derivative activity for the Funds.
(a) Options Contracts may be written or purchased to enhance returns or to hedge an existing position or future investment. A Fund may write call and put options on securities and financial derivative instruments it owns or in which it may invest. Writing put options tends to increase a Fund’s exposure to the underlying instrument. Writing call options tends to decrease a Fund’s exposure to the underlying instrument. When a Fund writes a call or put, an amount equal to the premium received is recorded and subsequently marked to market to reflect the current value of the option written. These amounts are included on the Statements of Assets and Liabilities. Premiums received from writing options which expire are treated as realized gains. Premiums received from writing options which are exercised or closed are added to the proceeds or offset against amounts paid on the underlying futures, swap, security or currency transaction to determine the realized gain (loss). Certain options may be written with premiums to be determined on a future date. The premiums for these options are based upon implied volatility parameters at specified terms. A Fund as a writer of an option has no control over whether the underlying instrument may
| | | | | | | | | | | | |
| | | | ANNUAL FINANCIAL AND OTHER INFORMATION | | | | | | | JUNE 30, 2024 | | | 59 |
| | | | |
| Notes to Financial Statements | | (Cont.) | | |
be sold (“call”) or purchased (“put”) and as a result bears the market risk of an unfavorable change in the price of the instrument underlying the written option. There is the risk a Fund may not be able to enter into a closing transaction because of an illiquid market.
Purchasing call options tends to increase a Fund’s exposure to the underlying instrument. Purchasing put options tends to decrease a Fund’s exposure to the underlying instrument. A Fund pays a premium which is included as an asset on the Statements of Assets and Liabilities and subsequently marked to market to reflect the current value of the option. Premiums paid for purchasing options which expire are treated as realized losses. Certain options may be purchased with premiums to be determined on a future date. The premiums for these options are based upon implied volatility parameters at specified terms. The risk associated with purchasing put and call options is limited to the premium paid. Premiums paid for purchasing options which are exercised or closed are added to the amounts paid or offset against the proceeds on the underlying investment transaction to determine the realized gain (loss) when the underlying transaction is executed.
Options on Indexes (“Index Option”) use a specified index as the underlying instrument for the option contract. The exercise for an Index Option will not include physical delivery of the underlying index but will result in a cash transfer of the amount of the difference between the settlement price of the underlying index and the strike price.
(b) Swap Agreements are bilaterally negotiated agreements between a Fund and a counterparty to exchange or swap investment cash flows, assets, foreign currencies or market-linked returns at specified, future intervals. Swap agreements may be privately negotiated in the over the counter market (“OTC swaps”) or may be cleared through a third party, known as a central counterparty or derivatives clearing organization (“Centrally Cleared Swaps”). A Fund may enter into asset, credit default, cross-currency, interest rate, total return, variance and other forms of swap agreements to manage its exposure to credit, currency, interest rate, commodity, equity and inflation risk. In connection with these agreements, securities or cash may be identified as collateral or margin in accordance with the terms of the respective swap agreements to provide assets of value and recourse in the event of default or bankruptcy/insolvency.
Centrally Cleared Swaps are marked to market daily based upon valuations as determined from the underlying contract or in accordance with the requirements of the central counterparty or derivatives clearing organization. Changes in market value, if any, are reflected as a component of net change in unrealized appreciation (depreciation) on the Statements of Operations. Daily changes in valuation of centrally cleared swaps (“Swap Variation Margin”), if any, are disclosed within centrally cleared financial derivative instruments on the Statements of
Assets and Liabilities. Centrally Cleared and OTC swap payments received or paid at the beginning of the measurement period are included on the Statements of Assets and Liabilities and represent premiums paid or received upon entering into the swap agreement to compensate for differences between the stated terms of the swap agreement and prevailing market conditions (credit spreads, currency exchange rates, interest rates, and other relevant factors). Upfront premiums received (paid) are initially recorded as liabilities (assets) and subsequently marked to market to reflect the current value of the swap. These upfront premiums are recorded as realized gain (loss) on the Statements of Operations upon termination or maturity of the swap. A liquidation payment received or made at the termination of the swap is recorded as realized gain (loss) on the Statements of Operations. Net periodic payments received or paid by a Fund are included as part of realized gain (loss) on the Statements of Operations.
For purposes of applying certain of a Fund’s investment policies and restrictions, swap agreements, like other derivative instruments, may be valued by a Fund at market value, notional value or full exposure value. In the case of a credit default swap, in applying certain of a Fund’s investment policies and restrictions, the Funds will value the credit default swap at its notional value or its full exposure value (i.e., the sum of the notional amount for the contract plus the market value), but may value the credit default swap at market value for purposes of applying certain of a Fund’s other investment policies and restrictions. For example, a Fund may value credit default swaps at full exposure value for purposes of a Fund’s credit quality guidelines (if any) because such value in general better reflects a Fund’s actual economic exposure during the term of the credit default swap agreement. As a result, a Fund may, at times, have notional exposure to an asset class (before netting) that is greater or lesser than the stated limit or restriction noted in a Fund’s prospectus. In this context, both the notional amount and the market value may be positive or negative depending on whether a Fund is selling or buying protection through the credit default swap. The manner in which certain securities or other instruments are valued by a Fund for purposes of applying investment policies and restrictions may differ from the manner in which those investments are valued by other types of investors.
Entering into swap agreements involves, to varying degrees, elements of interest, credit, market and documentation risk in excess of the amounts recognized on the Statements of Assets and Liabilities. Such risks involve the possibility that there will be no liquid market for these agreements, that the counterparty to the agreements may fail to perform or meet an obligation or disagree as to the meaning of contractual terms in the agreements and that there may be unfavorable changes in interest rates or the values of the asset upon which the swap is based.
A Fund’s maximum risk of loss from counterparty credit risk is the discounted net value of the cash flows to be received from the counterparty over the contract’s remaining life, to the extent that amount is positive. The risk may be mitigated by having a master netting arrangement between a Fund and the counterparty and by the posting of collateral to a Fund to cover a Fund’s exposure to the counterparty.
To the extent a Fund has a policy to limit the net amount owed to or to be received from a single counterparty under existing swap agreements, such limitation only applies to counterparties to OTC swaps and does not apply to centrally cleared swaps where the counterparty is a central counterparty or derivatives clearing organization.
Total Return Swap Agreements are entered into to gain or mitigate exposure to the underlying reference asset. Total return swap
agreements involve commitments where single or multiple cash flows are exchanged based on the price of an underlying reference asset and on a fixed or variable interest rate. Total return swap agreements may involve commitments to pay interest in exchange for a market-linked return. One counterparty pays out the total return of a specific underlying reference asset, which may include a single security, a basket of securities, or an index, and in return receives a fixed or variable rate. At the maturity date, a net cash flow is exchanged where the total return is equivalent to the return of the underlying reference asset less a financing rate, if any. As a receiver, a Fund would receive payments based on any net positive total return and would owe payments in the event of a net negative total return. As the payer, a Fund would owe payments on any net positive total return and would receive payments in the event of a net negative total return.
7. PRINCIPAL AND OTHER RISKS
(a) Principal Risks
The principal risks of investing in a Fund, which could adversely affect its net asset value, yield and total return, are listed below.
| | | | | | | | | | | | | | | | | | | | | | | | |
| Risks | | | | | PIMCO
REALPATH®
Blend 2025
Fund | | PIMCO
REALPATH®
Blend 2030
Fund | | PIMCO
REALPATH®
Blend 2035
Fund | | PIMCO
REALPATH®
Blend 2040
Fund | | PIMCO
REALPATH®
Blend 2045
Fund | | PIMCO
REALPATH®
Blend 2050
Fund | | PIMCO
REALPATH®
Blend 2055
Fund | | PIMCO
REALPATH®
Blend 2060
Fund | | PIMCO
REALPATH®
Blend 2065
Fund | | PIMCO
REALPATH®
Blend Income
Fund |
| | | | | | | | | | | |
Allocation | | | | | | X | | X | | X | | X | | X | | X | | X | | X | | X | | X |
| | | | | | | | | | | |
Acquired Fund | | | | | | X | | X | | X | | X | | X | | X | | X | | X | | X | | X |
| | | | | | | | | | | |
New Fund | | | | | | — | | — | | — | | — | | — | | — | | — | | — | | X | | — |
| | | | | | | | | | | |
Small Fund | | | | | | — | | — | | — | | — | | — | | — | | — | | X | | X | | — |
| | | | | | | | | | | |
Equity | | | | | | X | | X | | X | | X | | X | | X | | X | | X | | X | | X |
| | | | | | | | | | | |
Value Investing | | | | | | X | | X | | X | | X | | X | | X | | X | | X | | X | | X |
| | | | | | | | | | | |
Interest Rate | | | | | | X | | X | | X | | X | | X | | X | | X | | X | | X | | X |
| | | | | | | | | | | |
Call | | | | | | X | | X | | X | | X | | X | | X | | X | | X | | X | | X |
| | | | | | | | | | | |
Credit | | | | | | X | | X | | X | | X | | X | | X | | X | | X | | X | | X |
| | | | | | | | | | | |
High Yield and Distressed Company | | | | | | X | | X | | X | | X | | X | | X | | X | | X | | X | | X |
| | | | | | | | | | | |
Market | | | | | | X | | X | | X | | X | | X | | X | | X | | X | | X | | X |
| | | | | | | | | | | |
Issuer | | | | | | X | | X | | X | | X | | X | | X | | X | | X | | X | | X |
| | | | | | | | | | | |
Liquidity | | | | | | X | | X | | X | | X | | X | | X | | X | | X | | X | | X |
| | | | | | | | | | | |
Derivatives | | | | | | X | | X | | X | | X | | X | | X | | X | | X | | X | | X |
| | | | | | | | | | | |
Commodity | | | | | | X | | X | | X | | X | | X | | X | | X | | X | | X | | X |
| | | | | | | | | | | |
Mortgage-Related and Other Asset Backed Securities | | | | | | X | | X | | X | | X | | X | | X | | X | | X | | X | | X |
| | | | | | | | | | | |
Foreign (Non-U.S.) Investment | | | | | | X | | X | | X | | X | | X | | X | | X | | X | | X | | X |
| | | | | | | | | | | |
Real Estate | | | | | | X | | X | | X | | X | | X | | X | | X | | X | | X | | X |
| | | | | | | | | | | |
Emerging Markets | | | | | | X | | X | | X | | X | | X | | X | | X | | X | | X | | X |
| | | | | | | | | | | |
Sovereign Debt | | | | | | X | | X | | X | | X | | X | | X | | X | | X | | X | | X |
| | | | | | | | | | | |
Currency | | | | | | X | | X | | X | | X | | X | | X | | X | | X | | X | | X |
| | | | | | | | | | | |
Leveraging | | | | | | X | | X | | X | | X | | X | | X | | X | | X | | X | | X |
| | | | | | | | | | | |
Small-Cap and Mid-Cap Company | | | | | | X | | X | | X | | X | | X | | X | | X | | X | | X | | X |
| | | | | | | | | | | |
Management | | | | | | X | | X | | X | | X | | X | | X | | X | | X | | X | | X |
| | | | | | | | | | | |
Short Exposure | | | | | | X | | X | | X | | X | | X | | X | | X | | X | | X | | X |
| | | | | | | | | | | |
Tax | | | | | | X | | X | | X | | X | | X | | X | | X | | X | | X | | X |
| | | | | | | | | | | |
Subsidiary | | | | | | X | | X | | X | | X | | X | | X | | X | | X | | X | | X |
| | | | | | | | | | | |
Convertible Securities | | | | | | X | | X | | X | | X | | X | | X | | X | | X | | X | | X |
| | | | | | | | | | | |
Exchange-Traded Fund | | | | | | X | | X | | X | | X | | X | | X | | X | | X | | X | | X |
| | | | | | | | | | | |
LIBOR Transition | | | | | | X | | X | | X | | X | | X | | X | | X | | X | | X | | X |
| | | | | | | | | | | | |
| | | | ANNUAL FINANCIAL AND OTHER INFORMATION | | | | | | | JUNE 30, 2024 | | | 61 |
| | | | |
| Notes to Financial Statements | | (Cont.) | | |
A Fund is generally subject to a different level and amount of risk relative to its target date and time horizon. The principal risks of investing in a Fund include risks from direct investments and/or for certain Funds that invest in Acquired Funds or Underlying PIMCO Funds, indirect exposure through investment in such Acquired Funds or Underlying PIMCO Funds. Please see “Description of Principal Risks” in a Fund’s prospectus for a more detailed description of the risks of investing in a Fund.
The following risks are principal risks of investing in a Fund.
Allocation Risk is the risk that a Fund could lose money as a result of less than optimal or poor asset allocation decisions. A Fund could miss attractive investment opportunities by underweighting markets that subsequently experience significant returns and could lose value by overweighting markets that subsequently experience
significant declines.
Acquired Fund Risk is the risk that a Fund’s performance is closely related to the risks associated with the securities and other investments held by the Acquired Funds and that the ability of a Fund to achieve its investment objective will depend upon the ability of the Acquired Funds to achieve their investment objectives. In addition, a Fund’s performance will be reduced by the Fund’s proportionate amount of the expenses of any Acquired Funds in which it invests.
The following risks are principal risks of investing in a Fund that include risks from direct investments and/or indirect exposure through investment in Acquired Funds.
New Fund Risk is the risk that a new fund’s performance may not represent how the fund is expected to or may perform in the long term. In addition, new funds have limited operating histories for investors to evaluate and new funds may not attract sufficient assets to achieve investment and trading efficiencies.
Small Fund Risk is the risk that a smaller fund may not achieve investment or trading efficiencies. Additionally, a smaller fund may be more adversely affected by large purchases or redemptions of
fund shares.
Equity Risk is the risk that the value of equity or equity-related securities, such as common stocks and preferred securities, may decline due to general market conditions which are not specifically related to a particular company or to factors affecting a particular industry or industries. Equity or equity-related securities generally have greater price volatility than fixed income securities. In addition, preferred securities may be subject to greater credit risk or other risks, such as risks related to deferred and omitted distributions, limited voting rights, liquidity, interest rates, regulatory changes and special redemption rights.
Value Investing Risk is the risk that a value stock may decrease in price or may not increase in price as anticipated by PIMCO if it continues to be undervalued by the market or the factors that the portfolio manager believes will cause the stock price to increase do not occur.
Interest Rate Risk is the risk that fixed income securities will fluctuate in value because of a change in interest rates; a fund with a longer average portfolio duration will be more sensitive to changes in interest rates than a fund with a shorter average portfolio duration.
Call Risk is the risk that an issuer may exercise its right to redeem a fixed income security earlier than expected (a call). Issuers may call outstanding securities prior to their maturity for a number of reasons (e.g., declining interest rates, changes in credit spreads and improvements in the issuer’s credit quality). If an issuer calls a security that a Fund has invested in, a Fund may not recoup the full amount of its initial investment or may not realize the full anticipated earnings from the investment and may be forced to reinvest in lower-yielding securities, securities with greater credit risks or securities with other, less favorable features.
Credit Risk is the risk that a Fund could lose money if the issuer or guarantor of a fixed income security, or the counterparty to a derivative contract, or the issuer or guarantor of collateral, is unable or unwilling, or is perceived (whether by market participants, rating agencies, pricing services or otherwise) as unable or unwilling, to meet its financial obligations.
High Yield and Distressed Company Risk is the risk that high yield securities and unrated securities of similar credit quality (commonly known as “junk bonds”) and securities of distressed companies may be subject to greater levels of credit, issuer and liquidity risks. Securities of distressed companies include both debt and equity securities. High yield securities and debt securities of distressed companies are considered primarily speculative with respect to the issuer’s continuing ability to make principal and interest payments. Distressed companies may be engaged in restructurings or bankruptcy proceedings.
Market Risk is the risk that the value of securities owned by a Fund may go up or down, sometimes rapidly or unpredictably, due to factors affecting securities markets generally or particular industries.
Issuer Risk is the risk that the value of a security may decline for a reason directly related to the issuer, such as management performance, changes in financial condition or credit rating, financial leverage, reputation or reduced demand for the issuer’s goods or services.
Liquidity Risk is the risk that a particular investment may be difficult to purchase or sell and that a Fund may be unable to sell illiquid
investments at an advantageous time or price or achieve its desired level of exposure to a certain sector. Liquidity risk may result from the lack of an active market, reduced number and capacity of traditional market participants to make a market in fixed income securities, and may be magnified in a rising interest rate environment or other circumstances where investor redemptions from fixed income funds may be higher than normal, causing increased supply in the market due to selling activity.
Derivatives Risk is the risk of investing in derivative instruments (such as forwards, futures, swaps and structured securities) and other similar investments, including leverage, liquidity, interest rate, market, counterparty (including credit), operational, legal and management risks, and valuation complexity. Changes in the value of a derivative or other similar investment may not correlate perfectly with, and may be more sensitive to market events than, the underlying asset, rate or index, and a Fund could lose more than the initial amount invested. Changes in the value of a derivative or other similar instrument may also create margin delivery or settlement payment obligations for the Fund. A Fund’s use of derivatives or other similar investments may result in losses to the Fund, a reduction in a Fund’s returns and/or increased volatility. Non-centrally-cleared over-the-counter (“OTC”) derivatives or other similar investments are also subject to the risk that a counterparty to the transaction will not fulfill its contractual obligations to the other party, as many of the protections afforded to centrally-cleared derivative transactions might not be available for non-centrally-cleared OTC derivatives or other similar investments. The primary credit risk on derivatives or other similar investments that are exchange-traded or traded through a central clearing counterparty resides with a Fund’s clearing broker or the clearinghouse. Changes in regulation relating to a registered fund’s use of derivatives and related instruments could potentially limit or impact a Fund’s ability to invest in derivatives, limit a Fund’s ability to employ certain strategies that use derivatives or other similar investments and/or adversely affect the value of derivatives or other similar investments and a Fund’s performance.
Commodity Risk is the risk that investing in commodity-linked derivative instruments and commodities, either directly or indirectly through a subsidiary, may subject a Fund to greater volatility than investments in traditional securities. The value of commodity-linked derivative instruments or commodities may be affected by changes in overall market movements, foreign currency exchange rates, commodity index volatility, changes in inflation, interest rates, or supply and demand factors affecting a particular industry or commodity market, such as drought, floods, weather, livestock disease, pandemics and public health emergencies, embargoes, taxation, war, terrorism, cyber hacking, economic and political developments, environmental proceedings, tariffs, changes in storage costs, availability of transportation systems, and international economic, political and
regulatory developments. Investments in commodities can also present risks associated with transportation and delivery, custody, storage and maintenance, illiquidity, and the unavailability of accurate market valuations of the commodity.
Mortgage-Related and Other Asset-Backed Securities Risk is the risks of investing in mortgage-related and other asset-backed securities, including interest rate risk, extension risk, prepayment risk and credit risk. A Fund may invest in any tranche of mortgage-related and other asset-backed securities, including junior and/or equity tranches (to the extent consistent with other of the Fund’s guidelines), which generally carry higher levels of the foregoing risks.
Foreign (Non-U.S.) Investment Risk is the risk that investing in foreign (non-U.S.) securities may result in a Fund experiencing more rapid and extreme changes in value than a fund that invests exclusively in securities of U.S. companies, due to smaller markets, differing reporting, accounting and auditing standards, increased risk of delayed settlement of portfolio transactions or loss of certificates of portfolio securities, and the risk of unfavorable foreign government actions, including nationalization, expropriation or confiscatory taxation, currency blockage, political changes, diplomatic developments or the imposition of sanctions and other similar measures. Foreign securities may also be less liquid and more difficult to value than securities of U.S. issuers.
Real Estate Risk is the risk that a Fund’s investments in real estate investment trusts (“REITs”) or real estate-linked derivative instruments will subject a Fund to risks similar to those associated with direct ownership of real estate, including losses from casualty or condemnation, and changes in local and general economic conditions, supply and demand, interest rates, zoning laws, regulatory limitations on rents, property taxes and operating expenses. A Fund’s investments in REITs or real estate-linked derivative instruments subject it to management and tax risks. In addition, privately traded REITs subject a Fund to liquidity and valuation risk.
Emerging Markets Risk is the risk of investing in emerging market securities, primarily increased foreign (non-U.S.) investment risk.
Sovereign Debt Risk is the risk that investments in fixed income instruments issued by sovereign entities may decline in value as a result of default or other adverse credit event resulting from an issuer’s inability or unwillingness to make principal or interest payments in a timely fashion.
Currency Risk is the risk that foreign (non-U.S.) currencies will change in value relative to the U.S. dollar and affect a Fund’s investments in foreign (non-U.S.) currencies or in securities that trade in, and receive revenues in, or in derivatives that provide exposure to, foreign (non-U.S.) currencies.
| | | | | | | | | | | | |
| | | | ANNUAL FINANCIAL AND OTHER INFORMATION | | | | | | | JUNE 30, 2024 | | | 63 |
| | | | |
| Notes to Financial Statements | | (Cont.) | | |
Leveraging Risk is the risk that certain transactions of a Fund, such as reverse repurchase agreements, loans of portfolio securities, and the use of when-issued, delayed delivery or forward commitment transactions, or derivative instruments, may give rise to leverage, magnifying gains and losses and causing a Fund to be more volatile than if it had not been leveraged. This means that leverage entails a heightened risk of loss.
Small-Cap and Mid-Cap Company Risk is the risk that the value of securities issued by small-capitalization and mid-capitalization companies may go up or down, sometimes rapidly and unpredictably, due to narrow markets and limited managerial and financial resources.
Management Risk is the risk that the investment techniques and risk analyses applied by PIMCO will not produce the desired results and that actual or potential conflicts of interest, legislative, regulatory or tax restrictions, policies or developments may affect the investment techniques available to PIMCO and the individual portfolio managers in connection with managing a Fund and may cause PIMCO to restrict or prohibit participation in certain investments. There is no guarantee that the investment objective of a Fund will be achieved.
Short Exposure Risk is the risk of entering into short sales or other short positions, including the potential loss of more money than the actual cost of the investment, and the risk that the third party to the short sale or other short position will not fulfill its contractual obligations, causing a loss to a Fund.
Tax Risk is the risk that the tax treatment of swap agreements and other derivative instruments, such as commodity-linked derivative instruments, including commodity index-linked notes, swap agreements, commodity options, futures, and options on futures, may be affected by future regulatory or legislative changes that could affect whether income from such investments is “qualifying income” under Subchapter M of the Internal Revenue Code, or otherwise affect the character, timing and/or amount of a Fund’s taxable income or gains and distributions.
Subsidiary Risk is the risk that, by investing in certain Underlying PIMCO Funds that invest in a subsidiary (each a “Subsidiary”), a Fund is indirectly exposed to the risks associated with a Subsidiary’s investments. The Subsidiaries are not registered under the Act and may not be subject to all the investor protections of the Act. There is no guarantee that the investment objective of a Subsidiary will be achieved.
Convertible Securities Risk is the risk that arises because convertible securities share both fixed income and equity characteristics. Convertible securities are subject to risks to which fixed income and equity investments are subject. These risks include equity risk, interest rate risk and credit risk.
Exchange-Traded Fund Risk is the risk that an exchange-traded fund may not track the performance of the index it is designed to track, among other reasons, because of exchange rules, market prices of shares of an exchange-traded fund may fluctuate rapidly and materially, or shares of an exchange-traded fund may trade significantly above or below net asset value, any of which may cause losses to a Fund invested in the exchange-traded fund.
LIBOR Transition Risk is the risk related to the discontinuation and replacement of the London Interbank Offered Rate (“LIBOR”). Certain instruments held by a Fund rely or relied in some fashion upon LIBOR. Although the transition process away from LIBOR for most instruments has been completed, some LIBOR use is continuing and there are potential effects related to the transition away from LIBOR or the continued use of LIBOR on a Fund, or on certain instruments in which the Fund invests, which can be difficult to ascertain and could result in losses to a Fund.
(b) Other Risks
In general, a Fund may be subject to additional risks, including, but not limited to, risks related to government regulation and intervention in financial markets, operational risks, risks associated with financial, economic and global market disruptions, and cyber security risks. Please see a Fund’s prospectus and Statement of Additional Information for a more detailed description of the risks of investing in a Fund. Please see the Important Information section of this report for additional discussion of certain regulatory and market developments that may impact a Fund’s performance.
Market Disruptions Risk A Fund is subject to investment and operational risks associated with financial, economic and other global market developments and disruptions, including those arising from war, military conflicts, terrorism, market manipulation, government interventions, defaults and shutdowns, political changes or diplomatic developments, public health emergencies (such as the spread of infectious diseases, pandemics and epidemics), bank failures and natural/environmental disasters, which can all negatively impact the securities markets and cause a Fund to lose value. These events can also impair the technology and other operational systems upon which a Fund’s service providers, including PIMCO as a Fund’s investment adviser, rely, and could otherwise disrupt a Fund’s service providers’ ability to fulfill their obligations to a Fund.
Government Intervention in Financial Markets Federal, state, and other governments, their regulatory agencies, or self-regulatory organizations may take actions that affect the regulation of the instruments in which a Fund invests, or the issuers of such instruments, in ways that are unforeseeable. Legislation or regulation may also change the way in which a Fund itself is regulated. Such legislation or
regulation could limit or preclude a Fund’s ability to achieve its investment objective. Furthermore, volatile financial markets can expose a Fund to greater market and liquidity risk and potential difficulty in valuing portfolio instruments held by the Fund. The value of a Fund’s holdings is also generally subject to the risk of future local, national, or global economic disturbances based on unknown weaknesses in the markets in which a Fund invests. In addition, it is not certain that the U.S. Government will intervene in response to a future market disturbance and the effect of any such future intervention cannot be predicted. It is difficult for issuers to prepare for the impact of future financial downturns, although companies can seek to identify and manage future uncertainties through risk management programs.
Regulatory Risk Financial entities, such as investment companies and investment advisers, are generally subject to extensive government regulation and intervention. Government regulation and/ or intervention may change the way a Fund is regulated, affect the expenses incurred directly by a Fund and the value of its investments, and limit and/or preclude a Fund’s ability to achieve its investment objective. Government regulation may change frequently and may have significant adverse consequences. Moreover, government regulation may have unpredictable and unintended effects.
Operational Risk An investment in a Fund, like any fund, can involve operational risks arising from factors such as processing errors, human errors, inadequate or failed internal or external processes, failures in systems and technology, changes in personnel and errors caused by third-party service providers. The occurrence of any of these failures, errors or breaches could result in a loss of information, regulatory scrutiny, reputational damage or other events, any of which could have a material adverse effect on a Fund. While a Fund seeks to minimize such events through controls and oversight, there may still be failures that could cause losses to the Fund.
Cyber Security Risk As the use of technology, including cloud-based technology, has become more prevalent in the course of business, the Funds have become potentially more susceptible to operational and information security risks resulting from breaches in cyber security. A breach in cyber security refers to both intentional and unintentional cyber events that may, among other things, cause a Fund to lose proprietary information, suffer data corruption and/or destruction or lose operational capacity, result in the unauthorized release or other misuse of confidential information, or otherwise disrupt normal business operations. Cyber security failures or breaches may result in financial losses to a Fund and its shareholders. These failures or breaches may also result in disruptions to business operations, potentially resulting in financial losses; interference with a Fund’s ability to calculate its net asset value, process shareholder transactions or otherwise transact business with shareholders; impediments to trading; violations of applicable
privacy and other laws; regulatory fines; penalties; third-party claims in litigation; reputational damage; reimbursement or other compensation costs; additional compliance and cyber security risk management costs and other adverse consequences. In addition, substantial costs may be incurred in order to prevent any cyber incidents in the future. There is also a risk that cyber security breaches may not be detected. The Funds and their shareholders may suffer losses as a result of a cyber security breach related to the Funds, their service providers, trading counterparties or the issuers in which a Fund invests.
8. MASTER NETTING ARRANGEMENTS
A Fund may be subject to various netting arrangements (“Master Agreements”) with select counterparties. Master Agreements govern the terms of certain transactions, and are intended to reduce the counterparty risk associated with relevant transactions by specifying credit protection mechanisms and providing standardization that is intended to improve legal certainty. Each type of Master Agreement governs certain types of transactions. Different types of transactions may be traded out of different legal entities or affiliates of a particular organization, resulting in the need for multiple agreements with a single counterparty. As the Master Agreements are specific to unique operations of different asset types, they allow a Fund to close out and net its total exposure to a counterparty in the event of a default with respect to all the transactions governed under a single Master Agreement with a counterparty. For financial reporting purposes the Statements of Assets and Liabilities generally present derivative assets and liabilities on a gross basis, which reflects the full risks and exposures prior to netting.
Master Agreements can also help limit counterparty risk by specifying collateral posting arrangements at pre-arranged exposure levels. Under most Master Agreements, collateral is routinely transferred if the total net exposure to certain transactions (net of existing collateral already in place) governed under the relevant Master Agreement with a counterparty in a given account exceeds a specified threshold, which typically ranges from zero to $250,000 depending on the counterparty and the type of Master Agreement. United States Treasury Bills and U.S. dollar cash are generally the preferred forms of collateral, although other securities may be used depending on the terms outlined in the applicable Master Agreement. Securities and cash pledged as collateral are reflected as assets on the Statements of Assets and Liabilities as either a component of Investments at value (securities) or Deposits with counterparty. Cash collateral received is not typically held in a segregated account and as such is reflected as a liability on the Statements of Assets and Liabilities as Deposits from counterparty. The market value of any securities received as collateral is not reflected as a component of NAV. A Fund’s overall exposure to counterparty risk can change substantially within a short period, as it is affected by each transaction subject to the relevant Master Agreement.
| | | | | | | | | | | | |
| | | | ANNUAL FINANCIAL AND OTHER INFORMATION | | | | | | | JUNE 30, 2024 | | | 65 |
| | | | |
| Notes to Financial Statements | | (Cont.) | | |
Master Repurchase Agreements and Global Master Repurchase Agreements (individually and collectively “Master Repo Agreements”) govern repurchase, reverse repurchase and certain sale-buyback transactions between a Fund and select counterparties. Master Repo Agreements maintain provisions for, among other things, initiation, income payments, events of default and maintenance of collateral. The market value of transactions under the Master Repo Agreement, collateral pledged or received, and the net exposure by counterparty as of period end are disclosed in the Notes to Schedules of Investments.
Master Securities Forward Transaction Agreements (“Master Forward Agreements”) govern certain forward settling transactions, such as TBA securities, delayed-delivery or certain sale-buyback transactions by and between a Fund and select counterparties. The Master Forward Agreements maintain provisions for, among other things, transaction initiation and confirmation, payment and transfer, events of default, termination and maintenance of collateral. The market value of forward settling transactions, collateral pledged or received, and the net exposure by counterparty as of period end is disclosed in the Notes to Schedules of Investments.
Customer Account Agreements and related addenda govern cleared derivatives transactions such as futures, options on futures and cleared OTC derivatives. Such transactions require posting of initial margin as determined by each relevant clearing agency which is segregated in an account at a futures commission merchant (“FCM”) registered with the Commodity Futures Trading Commission. In the United States, counterparty risk may be reduced as creditors of an FCM cannot have a claim to Fund assets in the segregated account. FCM customers, such as the Funds, are permitted to transfer their customer account (and cleared derivative transactions held in such customer account) from one FCM to another FCM. Upon completion of the transfer, the customer maintains the same economic position with respect to the outstanding exposure. As such, these transfers are not recognized as dispositions and reacquisitions of the affected derivative positions. Variation margin, which reflects changes in market value, is generally exchanged daily, but may not be netted between futures and cleared OTC derivatives unless the parties have agreed to a separate arrangement in respect of portfolio margining. The porting of exposure between FCMs has no impact on the market value or accumulated unrealized appreciation (depreciation), initial margin posted, and any unsettled variation margin; these values as of period end are disclosed in the Notes to Schedules of Investments.
International Swaps and Derivatives Association, Inc. Master Agreements and Credit Support Annexes (“ISDA Master Agreements”) govern bilateral OTC derivative transactions entered into by a Fund with select counterparties. ISDA Master Agreements maintain provisions for general obligations, representations, agreements,
collateral posting and events of default or termination. Events of termination include conditions that may entitle counterparties to elect to terminate early and cause settlement of all outstanding transactions under the applicable ISDA Master Agreement. Any election to terminate early could be material to the financial statements. The ISDA Master Agreement may contain additional provisions that add counterparty protection beyond coverage of existing daily exposure if the counterparty has a decline in credit quality below a predefined level or as required by regulation. Similarly, if required by regulation, the Funds may be required to post additional collateral beyond coverage of daily exposure. These amounts, if any, may (or if required by law, will) be segregated with a third-party custodian. To the extent the Funds are required by regulation to post additional collateral beyond coverage of daily exposure, they could potentially incur costs, including in procuring eligible assets to meet collateral requirements, associated with such posting. The market value of OTC financial derivative instruments, collateral received or pledged, and net exposure by counterparty as of period end are disclosed in the Notes to Schedules of Investments.
9. FEES AND EXPENSES
(a) Investment Advisory Fee PIMCO is a majority-owned subsidiary of Allianz Asset Management of America LLC (“Allianz Asset Management”) and serves as the Adviser to the Trust, pursuant to an investment advisory contract. The Adviser receives a monthly fee from each Fund at an annual rate based on average daily net assets (the “Investment Advisory Fee”). The Investment Advisory Fee for all classes is charged at an annual rate as noted in the table in note (b) below.
(b) Supervisory and Administrative Fee PIMCO serves as administrator (the “Administrator”) and provides supervisory and administrative services to the Trust for which it receives a monthly supervisory and administrative fee based on each share class’s average daily net assets (the “Supervisory and Administrative Fee”). As the Administrator, PIMCO bears the costs of various third-party services, including audit, custodial, portfolio accounting, legal, transfer agency and printing costs.
The Investment Advisory Fees and Supervisory and Administrative Fees for all classes, as applicable, are charged at the annual rate as noted in the following table (calculated as a percentage of each Fund’s average daily net assets attributable to each class):
| | | | | | | | | | | | | | | | | | | | | | | | | | | | |
| | | | Investment Advisory Fee | | | | | | Supervisory and Administrative Fee | |
| Fund Name | | | | | All Classes | | | | | | Institutional
Class | | | Administrative
Class | | | Class A | | | Class R | |
PIMCO REALPATH® Blend 2025 Fund | | | | | | | 0.01% | | | | | | | | 0.02% | | | | 0.02%~ | | | | 0.22% | | | | 0.27% | * |
PIMCO REALPATH® Blend 2030 Fund | | | | | | | 0.01% | | | | | | | | 0.02% | | | | 0.02%~ | | | | 0.22% | | | | 0.27% | * |
PIMCO REALPATH® Blend 2035 Fund | | | | | | | 0.02% | | | | | | | | 0.02% | | | | 0.02%~ | | | | 0.22% | | | | 0.27% | * |
PIMCO REALPATH® Blend 2040 Fund | | | | | | | 0.03% | | | | | | | | 0.02% | | | | 0.02%~ | | | | 0.22% | | | | 0.27% | * |
PIMCO REALPATH® Blend 2045 Fund | | | | | | | 0.03% | | | | | | | | 0.02% | | | | 0.02%~ | | | | 0.22% | | | | 0.27% | * |
PIMCO REALPATH® Blend 2050 Fund | | | | | | | 0.03% | | | | | | | | 0.02% | | | | 0.02%~ | | | | 0.22% | | | | 0.27% | * |
PIMCO REALPATH® Blend 2055 Fund | | | | | | | 0.03% | | | | | | | | 0.02% | | | | 0.02%~ | | | | 0.22% | | | | 0.27% | * |
PIMCO REALPATH® Blend 2060 Fund | | | | | | | 0.03% | | | | | | | | 0.02% | | | | 0.02%~ | | | | 0.22% | | | | N/A | |
PIMCO REALPATH® Blend 2065 Fund | | | | | | | 0.03% | | | | | | | | 0.02% | | | | 0.02%~ | | | | 0.22% | | | | N/A | |
PIMCO REALPATH® Blend Income Fund | | | | | | | 0.01% | | | | | | | | 0.02% | | | | 0.02%~ | | | | 0.22% | | | | 0.27% | * |
| ~ | This share class was liquidated during the reporting period. |
| * | This particular share class has been registered with the SEC, but was not operational during the fiscal year ended June 30, 2024. |
(c) Distribution and Servicing Fees PIMCO Investments LLC, a wholly-owned subsidiary of PIMCO, serves as the distributor (“Distributor”) of the Trust’s shares.
The Trust has adopted separate Distribution and Servicing Plans with respect to the Class A and Class R shares of the Trust pursuant to Rule 12b-1 under the Act. In connection with the distribution of Class R shares of the Trust, the Distributor receives distribution fees from the Trust of up to 0.25% for Class R shares and in connection with personal services rendered to Class A and Class R shareholders and the maintenance of such shareholder accounts, the Distributor receives servicing fees from the Trust of up to 0.25% for each of Class A and Class R shares (percentages reflect annual rates of the average daily net assets attributable to the applicable class).
The Trust has adopted a Distribution and Servicing Plan with respect to the Administrative Class shares of each Fund pursuant to Rule 12b-1 under the Act (the “Administrative Class Plan”). Under the terms of the Administrative Class Plan, a Fund may compensate the Distributor for providing, or procuring through financial intermediaries, distribution, administrative, recordkeeping, shareholder and/or related services with respect to Administrative Class shares. The Administrative Class Plan permits a Fund to make total payments at an annual rate of up to 0.25% of the average daily net assets attributable to the Administrative Class shares.
The Trust paid distribution and servicing fees at effective rates as noted in the following table (calculated as a percentage of each Fund’s average daily net assets attributable to each class):
| | | | | | | | | | | | |
| | | | | | Distribution Fee | | | Servicing Fee | |
| | | |
Administrative Class~ | | | | | | | 0.25% | ~ | | | — | |
| | | |
Class A | | | | | | | — | | | | 0.25% | |
| | | |
Class R* | | | | | | | 0.25% | * | | | 0.25% | * |
| ~ | This share class was liquidated during the reporting period. |
| * | This particular share class has been registered with the SEC, but was not operational during the fiscal year ended June 30, 2024. |
The Distributor also received the proceeds of the initial sales charges paid by the shareholders upon the purchase of Class A shares and the contingent deferred sales charges paid by the shareholders upon certain redemptions of Class A and Class C shares. For the period ended June 30, 2024, the Distributor retained $29,582 representing commissions (sales charges) and contingent deferred sales charges, net of any commission adjustments payable by the Distributor to broker dealers, from the Trust.
(d) Fund Expenses PIMCO provides or procures supervisory and administrative services for shareholders and also bears the costs of various third-party services required by the Funds, including audit, custodial, portfolio accounting, legal, transfer agency and printing costs. The Trust is responsible for the following expenses: (i) salaries and other compensation of any of the Trust’s executive officers and employees who are not officers, directors, stockholders, or employees of PIMCO or its subsidiaries or affiliates; (ii) taxes and governmental fees; (iii) brokerage fees and commissions and other portfolio transaction expenses; (iv) costs of borrowing money, including interest expenses; (v) fees and expenses of the Trustees who are not “interested persons” of PIMCO or the Trust, and any counsel retained exclusively for their benefit; (vi) extraordinary expenses, including costs of litigation and indemnification expenses; (vii) organizational and offering expenses of the Trust and the Funds, and any other expenses which are capitalized in accordance with generally accepted accounting principles; and (viii) any expenses allocated or allocable to a specific class of shares, which include service fees payable with respect to the Administrative Class Shares, and may include certain other expenses as permitted by the Trust’s Multi-Class Plan adopted pursuant to Rule 18f-3 under the Act and subject to review and approval by the Trustees. The ratio of expenses to average net assets per share class, as disclosed on the Financial Highlights, may differ from the annual fund operating expenses per share class.
| | | | | | | | | | | | |
| | | | ANNUAL FINANCIAL AND OTHER INFORMATION | | | | | | | JUNE 30, 2024 | | | 67 |
| | | | |
| Notes to Financial Statements | | (Cont.) | | |
(e) Remuneration Paid to Directors, Officers and Others (N-CSR Item 10) The Trust pays no compensation directly to any Trustee or any other officer who is affiliated with the Administrator, all of whom receive remuneration for their services to the Trust from the Administrator or its affiliates. The pro rata share of Trustee fees for each Fund is reflected on the Statements of Operations as Trustee fees.
(f) Expense Limitation Pursuant to the Expense Limitation Agreement, PIMCO has contractually agreed, through October 31, 2024, to waive a portion of each Fund’s Supervisory and Administrative Fee, or
reimburse each Fund, to the extent that each Fund’s organizational expenses, pro rata share of expenses related to obtaining or maintaining a Legal Entity Identifier and pro rata share of Trustee fees exceed 0.0049% (the “Expense Limit”) (calculated as a percentage of each Fund’s average daily net assets attributable to each class). The Expense Limitation Agreement will automatically renew for one-year terms unless PIMCO provides written notice to the Trust at least 30 days prior to the end of the then current term. The waiver, if any, is reflected on the Statements of Operations as a component of Waiver and/or Reimbursement by PIMCO.
In any month in which the investment advisory contract or supervision and administration agreement is in effect, PIMCO is entitled to reimbursement by each Fund of any portion of the supervisory and administrative fee waived or reimbursed pursuant to the Expense Limitation Agreement (the “Reimbursement Amount”) within thirty-six months of the time of the waiver, provided that such amount paid to PIMCO will not: i) together with any organizational expenses, pro rata share of expenses related to obtaining or maintaining a Legal Entity Identifier and pro rata Trustee fees, exceed, for such month, the Expense Limit (or the amount of the expense limit in place at the time the amount being recouped was originally waived if lower than the Expense Limit); ii) exceed the total Reimbursement Amount; or iii) include any amounts previously reimbursed to PIMCO. The total recoverable amounts to PIMCO as of June 30, 2024, were as follows (amounts in thousands†):
| | | | | | | | | | | | | | | | | | | | |
| | | | | | Expiring within | | | | |
| | | | | |
| Fund Name | | | | | 12 months | | | 13-24 months | | | 25-36 months | | | Total | |
| | | | | |
PIMCO RealPath® Blend 2025 Fund | | | | | | $ | 0 | | | $ | 0 | | | $ | 20 | | | $ | 20 | |
| | | | | |
PIMCO RealPath® Blend 2030 Fund | | | | | | | 0 | | | | 0 | | | | 23 | | | | 23 | |
| | | | | |
PIMCO RealPath® Blend 2035 Fund | | | | | | | 0 | | | | 0 | | | | 19 | | | | 19 | |
| | | | | |
PIMCO RealPath® Blend 2040 Fund | | | | | | | 0 | | | | 0 | | | | 20 | | | | 20 | |
| | | | | |
PIMCO RealPath® Blend 2045 Fund | | | | | | | 0 | | | | 0 | | | | 21 | | | | 21 | |
| | | | | |
PIMCO RealPath® Blend 2050 Fund | | | | | | | 0 | | | | 0 | | | | 23 | | | | 23 | |
| | | | | |
PIMCO RealPath® Blend 2055 Fund | | | | | | | 0 | | | | 0 | | | | 10 | | | | 10 | |
| | | | | |
PIMCO RealPath® Blend 2060 Fund | | | | | | | 0 | | | | 0 | | | | 1 | | | | 1 | |
| | | | | |
PIMCO RealPath® Blend 2065 Fund | | | | | | | 0 | | | | 120 | | | | 0 | | | | 120 | |
| | | | | |
PIMCO RealPath® Blend Income Fund | | | | | | | 0 | | | | 1 | | | | 19 | | | | 20 | |
| † | A zero balance may reflect actual amounts rounding to less than one thousand. |
(g) Acquired Fund Fees and Expenses Acquired Fund expenses incurred by the Funds, if any, will vary with changes in the expenses of the Acquired Funds, as well as the allocation of the Funds’ assets.
The expenses associated with investing in a fund of funds are generally higher than those for mutual funds that do not invest in other mutual funds. The cost of investing in a fund of funds Fund will generally be higher than the cost of investing in a mutual fund that invests directly in individual stocks and bonds. By investing in a fund of funds Fund, an investor will indirectly bear fees and expenses charged by Acquired Funds (and may indirectly bear a portion of the fees and expenses charged by Underlying PIMCO Funds to the extent such fees and expenses are not waived or reimbursed pursuant to applicable waiver and reimbursement agreements) in addition to each Fund’s direct fees and expenses. In addition, the use of a fund of funds structure could affect the timing, amount and character of distributions to the shareholders and may therefore increase the amount of taxes payable by shareholders.
10. RELATED PARTY TRANSACTIONS
The Adviser, Administrator and Distributor are related parties. Fees paid to these parties are disclosed in Note 9, Fees and Expenses, and the
accrued related party fee amounts are disclosed on the Statements of Assets and Liabilities.
11. GUARANTEES AND INDEMNIFICATIONS
Under the Trust’s organizational documents, each Trustee or officer of the Trust is indemnified and each employee or other agent of the Trust (including the Trust’s investment manager) may be indemnified, to the extent permitted by the Act, against certain liabilities that may arise out of performance of their duties to the Funds. Additionally, in the normal course of business, the Funds enter into contracts that contain a variety of indemnification clauses. The Funds’ maximum exposure under these arrangements is unknown as this would involve future claims that may be made against the Funds that have not yet occurred. However, the Funds have not had prior claims or losses pursuant to these contracts.
12. PURCHASES AND SALES OF SECURITIES
The length of time a Fund has held a particular security is not generally a consideration in investment decisions. A change in the securities held by a Fund is known as “portfolio turnover.” Each Fund may engage in frequent and active trading of portfolio securities to achieve its investment objective(s), particularly during periods of volatile market
movements. High portfolio turnover may involve correspondingly greater transaction costs, including brokerage commissions or dealer mark-ups and other transaction costs on the sale of securities and reinvestments in other securities, which are borne by a Fund. Such sales may also result in realization of taxable capital gains, including short-term capital
gains (which are generally taxed at ordinary income tax rates when distributed to shareholders). The transaction costs associated with portfolio turnover may adversely affect a Fund’s performance. The portfolio turnover rates are reported in the Financial Highlights.
Purchases and sales of securities (excluding short-term investments) for the period ended June 30, 2024, were as follows (amounts in thousands†):
| | | | | | | | | | | | | | | | | | | | |
| | | | U.S. Government/Agency | | | All Other | |
| | | | |
| Fund Name | | | Purchases | | | Sales | | | Purchases | | | Sales | |
| | | | | |
PIMCO REALPATH® Blend 2025 Fund | | | | | | $ | 0 | | | $ | 0 | | | $ | 121,612 | | | $ | 114,711 | |
| | | | | |
PIMCO REALPATH® Blend 2030 Fund | | | | | | | 0 | | | | 0 | | | | 152,855 | | | | 117,585 | |
| | | | | |
PIMCO REALPATH® Blend 2035 Fund | | | | | | | 0 | | | | 0 | | | | 145,045 | | | | 79,701 | |
| | | | | |
PIMCO REALPATH® Blend 2040 Fund | | | | | | | 0 | | | | 0 | | | | 128,868 | | | | 92,758 | |
| | | | | |
PIMCO REALPATH® Blend 2045 Fund | | | | | | | 0 | | | | 0 | | | | 117,339 | | | | 95,712 | |
| | | | | |
PIMCO REALPATH® Blend 2050 Fund | | | | | | | 0 | | | | 0 | | | | 128,317 | | | | 129,932 | |
| | | | | |
PIMCO REALPATH® Blend 2055 Fund | | | | | | | 0 | | | | 0 | | | | 123,187 | | | | 73,390 | |
| | | | | |
PIMCO REALPATH® Blend 2060 Fund | | | | | | | 0 | | | | 0 | | | | 66,109 | | | | 14,199 | |
| | | | | |
PIMCO REALPATH® Blend 2065 Fund | | | | | | | 0 | | | | 0 | | | | 13,213 | | | | 1,740 | |
| | | | | |
PIMCO REALPATH® Blend Income Fund | | | | | | | 0 | | | | 0 | | | | 85,171 | | | | 106,778 | |
| | | | | | | | | | | | | | | | | | | | |
| † | A zero balance may reflect actual amounts rounding to less than one thousand. |
13. SHARES OF BENEFICIAL INTEREST
The Trust may issue an unlimited number of shares of beneficial interest with a $0.001 par value. Changes in shares of beneficial interest were as follows (shares and amounts in thousands†):
| | | | | | | | | | | | | | | | | | | | | | | | | | | | | | | | | | |
| | | | | PIMCO REALPATH® Blend 2025 Fund | | | PIMCO REALPATH® Blend 2030 Fund | |
| | | | | |
| | | | | Year Ended
06/30/2024 | | | Year Ended
06/30/2023 | | | Year Ended
06/30/2024 | | | Year Ended
06/30/2023 | |
| | | | | | | | | |
| | | | | Shares | | | Amount | | | Shares | | | Amount | | | Shares | | | Amount | | | Shares | | | Amount | |
Receipts for shares sold | | | | | | | | | | | | | | | | | | | | | | | | | | | | | | | | | | |
| | | | | | | | | |
Institutional Class | | | | | 11,025 | | | $ | 126,307 | | | | 22,163 | | | $ | 250,170 | | | | 12,783 | | | $ | 157,234 | | | | 24,745 | | | $ | 291,897 | |
| | | | | | | | | |
Administrative Class | | | | | 59 | (b) | | | 675 | (b) | | | 844 | | | | 9,574 | | | | 56 | (b) | | | 694 | (b) | | | 435 | | | | 5,142 | |
| | | | | | | | | |
Class A | | | | | 45 | | | | 525 | | | | 75 | | | | 847 | | | | 70 | | | | 857 | | | | 58 | | | | 674 | |
Issued as reinvestment of distributions | | | | | | | | | | | | | | | | | | | | | | | | | | | | | | | | | | |
| | | | | | | | | |
Institutional Class | | | | | 1,538 | | | | 18,124 | | | | 1,074 | | | | 11,972 | | | | 1,642 | | | | 20,747 | | | | 1,065 | | | | 12,424 | |
| | | | | | | | | |
Administrative Class | | | | | 15 | (b) | | | 170 | (b) | | | 102 | | | | 1,131 | | | | 11 | (b) | | | 128 | (b) | | | 97 | | | | 1,130 | |
| | | | | | | | | |
Class A | | | | | 19 | | | | 221 | | | | 20 | | | | 225 | | | | 23 | | | | 282 | | | | 25 | | | | 286 | |
Cost of shares redeemed | | | | | | | | | | | | | | | | | | | | | | | | | | | | | | | | | | |
| | | | | | | | | |
Institutional Class | | | | | (9,212 | ) | | | (106,982 | ) | | | (7,002 | ) | | | (79,208 | ) | | | (8,988 | ) | | | (111,730 | ) | | | (4,561 | ) | | | (53,971 | ) |
| | | | | | | | | |
Administrative Class | | | | | (2,538 | )(b) | | | (27,734 | )(b) | | | (774 | ) | | | (8,664 | ) | | | (2,192 | )(b) | | | (25,374 | )(b) | | | (988 | ) | | | (11,522 | ) |
| | | | | | | | | |
Class A | | | | | (70 | ) | | | (804 | ) | | | (201 | ) | | | (2,222 | ) | | | (129 | ) | | | (1,601 | ) | | | (60 | ) | | | (702 | ) |
| | | | | | | | | |
Net increase (decrease) resulting from Fund share transactions | | | | | 881 | | | $ | 10,502 | | | | 16,301 | | | $ | 183,825 | | | | 3,276 | | | $ | 41,237 | | | | 20,816 | | | $ | 245,358 | |
| | | | | | | | | | | | | | | | | | | | | | | | | | | | | | | | | | |
| | | |
| | | | | PIMCO REALPATH® Blend 2035 Fund | | | PIMCO REALPATH® Blend 2040 Fund | |
| | | | | |
| | | | | Year Ended
06/30/2024 | | | Year Ended
06/30/2023 | | | Year Ended
06/30/2024 | | | Year Ended
06/30/2023 | |
| | | | | | | | | |
| | | | | Shares | | | Amount | | | Shares | | | Amount | | | Shares | | | Amount | | | Shares | | | Amount | |
Receipts for shares sold | | | | | | | | | | | | | | | | | | | | | | | | | | | | | | | | | | |
| | | | | | | | | |
Institutional Class | | | | | 14,257 | | | $ | 187,968 | | | | 22,896 | | | $ | 283,165 | | | | 12,170 | | | $ | 168,978 | | | | 18,042 | | | $ | 230,160 | |
| | | | | | | | | |
Administrative Class | | | | | 93 | (b) | | | 1,195 | (b) | | | 1,219 | | | | 15,318 | | | | 146 | (b) | | | 1,907 | (b) | | | 443 | | | | 5,695 | |
| | | | | | | | | |
Class A | | | | | 79 | | | | 1,054 | | | | 76 | | | | 943 | | | | 80 | | | | 1,091 | | | | 83 | | | | 1,052 | |
Issued as reinvestment of distributions | | | | | | | | | | | | | | | | | | | | | | | | | | | | | | | | | | |
| | | | | | | | | |
Institutional Class | | | | | 1,418 | | | | 19,260 | | | | 810 | | | | 9,879 | | | | 1,122 | | | | 15,997 | | | | 692 | | | | 8,703 | |
| | | | | | | | | |
Administrative Class | | | | | 11 | (b) | | | 141 | (b) | | | 72 | | | | 873 | | | | 6 | (b) | | | 80 | (b) | | | 44 | | | | 546 | |
| | | | | | | | | |
Class A | | | | | 18 | | | | 247 | | | | 18 | | | | 222 | | | | 17 | | | | 245 | | | | 17 | | | | 211 | |
Cost of shares redeemed | | | | | | | | | | | | | | | | | | | | | | | | | | | | | | | | | | |
| | | | | | | | | |
Institutional Class | | | | | (7,777 | ) | | | (104,854 | ) | | | (3,965 | ) | | | (49,596 | ) | | | (8,804 | ) | | | (125,442 | ) | | | (3,451 | ) | | | (44,280 | ) |
| | | | | | | | | |
Administrative Class | | | | | (2,662 | )(b) | | | (32,821 | )(b) | | | (885 | ) | | | (10,856 | ) | | | (1,673 | )(b) | | | (21,480 | )(b) | | | (504 | ) | | | (6,357 | ) |
| | | | | | | | | |
Class A | | | | | (104 | ) | | | (1,336 | ) | | | (33 | ) | | | (411 | ) | | | (97 | ) | | | (1,312 | ) | | | (60 | ) | | | (755 | ) |
| | | | | | | | | |
Net increase (decrease) resulting from Fund share transactions | | | | | 5,333 | | | $ | 70,854 | | | | 20,208 | | | $ | 249,537 | | | | 2,967 | | | $ | 40,064 | | | | 15,306 | | | $ | 194,975 | |
| | | | | | | | | | | | | | | | | | | | | | | | | | | | | | | | | | |
| | | | | | | | | | | | |
| | | | ANNUAL FINANCIAL AND OTHER INFORMATION | | | | | | | JUNE 30, 2024 | | | 69 |
| | | | |
| Notes to Financial Statements | | (Cont.) | | |
| | | | | | | | | | | | | | | | | | | | | | | | | | | | | | | | | | |
| | | | | PIMCO REALPATH® Blend 2045 Fund | | | PIMCO REALPATH® Blend 2050 Fund | |
| | | | | |
| | | | | Year Ended
06/30/2024 | | | Year Ended
06/30/2023 | | | Year Ended
06/30/2024 | | | Year Ended
06/30/2023 | |
| | | | | | | | | |
| | | | | Shares | | | Amount | | | Shares | | | Amount | | | Shares | | | Amount | | | Shares | | | Amount | |
Receipts for shares sold | | | | | | | | | | | | | | | | | | | | | | | | | | | | | | | | | | |
| | | | | | | | | |
Institutional Class | | | | | 10,806 | | | $ | 153,461 | | | | 16,833 | | | $ | 217,904 | | | | 10,312 | | | $ | 149,304 | | | | 14,375 | | | $ | 188,230 | |
| | | | | | | | | |
Administrative Class | | | | | 54 | (b) | | | 738 | (b) | | | 997 | | | | 13,135 | | | | 39 | (b) | | | 549 | (b) | | | 283 | | | | 3,665 | |
| | | | | | | | | |
Class A | | | | | 95 | | | | 1,322 | | | | 44 | | | | 559 | | | | 308 | | | | 4,435 | | | | 62 | | | | 821 | |
Issued as reinvestment of distributions | | | | | | | | | | | | | | | | | | | | | | | | | | | | | | | | | | |
| | | | | | | | | |
Institutional Class | | | | | 969 | | | | 14,217 | | | | 582 | | | | 7,411 | | | | 861 | | | | 12,870 | | | | 535 | | | | 6,882 | |
| | | | | | | | | |
Administrative Class | | | | | 7 | (b) | | | 99 | (b) | | | 41 | | | | 518 | | | | 4 | (b) | | | 57 | (b) | | | 42 | | | | 534 | |
| | | | | | | | | |
Class A | | | | | 10 | | | | 151 | | | | 9 | | | | 109 | | | | 13 | | | | 189 | | | | 8 | | | | 97 | |
Cost of shares redeemed | | | | | | | | | | | | | | | | | | | | | | | | | | | | | | | | | | |
| | | | | | | | | |
Institutional Class | | | | | (8,426 | ) | | | (124,773 | ) | | | (3,178 | ) | | | (41,625 | ) | | | (9,741 | ) | | | (148,830 | ) | | | (2,930 | ) | | | (38,678 | ) |
| | | | | | | | | |
Administrative Class | | | | | (1,941 | )(b) | | | (25,571 | )(b) | | | (655 | ) | | | (8,436 | ) | | | (1,337 | )(b) | | | (17,866 | )(b) | | | (582 | ) | | | (7,562 | ) |
| | | | | | | | | |
Class A | | | | | (21 | ) | | | (303 | ) | | | (25 | ) | | | (312 | ) | | | (38 | ) | | | (563 | ) | | | (17 | ) | | | (227 | ) |
| | | | | | | | | |
Net increase (decrease) resulting from Fund share transactions | | | | | 1,553 | | | $ | 19,341 | | | | 14,648 | | | $ | 189,263 | | | | 421 | | | $ | 145 | | | | 11,776 | | | $ | 153,762 | |
| | | | | | | | | | | | | | | | | | | | | | | | | | | | | | | | | | |
| | | |
| | | | | PIMCO REALPATH® Blend 2055 Fund | | | PIMCO REALPATH® Blend 2060 Fund | |
| | | | | |
| | | | | Year Ended
06/30/2024 | | | Year Ended
06/30/2023 | | | Year Ended
06/30/2024 | | | Year Ended
06/30/2023 | |
| | | | | | | | | |
| | | | | Shares | | | Amount | | | Shares | | | Amount | | | Shares | | | Amount | | | Shares | | | Amount | |
Receipts for shares sold | | | | | | | | | | | | | | | | | | | | | | | | | | | | | | | | | | |
| | | | | | | | | |
Institutional Class | | | | | 10,569 | | | $ | 154,810 | | | | 11,019 | | | $ | 146,157 | | | | 7,077 | | | $ | 81,707 | | | | 6,324 | | | $ | 65,135 | |
| | | | | | | | | |
Administrative Class | | | | | 75 | (b) | | | 1,069 | (b) | | | 667 | | | | 8,974 | | | | 44 | (b) | | | 483 | (b) | | | 90 | | | | 911 | |
| | | | | | | | | |
Class A | | | | | 228 | | | | 3,403 | | | | 79 | | | | 1,023 | | | | 11 | | | | 125 | | | | 31 | | | | 298 | |
Issued as reinvestment of distributions | | | | | | | | | | | | | | | | | | | | | | | | | | | | | | | | | | |
| | | | | | | | | |
Institutional Class | | | | | 668 | | | | 10,097 | | | | 346 | | | | 4,502 | | | | 241 | | | | 2,884 | | | | 73 | | | | 735 | |
| | | | | | | | | |
Administrative Class | | | | | 4 | (b) | | | 53 | (b) | | | 18 | | | | 230 | | | | 0 | (b) | | | 4 | (b) | | | 1 | | | | 12 | |
| | | | | | | | | |
Class A | | | | | 8 | | | | 116 | | | | 5 | | | | 65 | | | | 1 | | | | 15 | | | | 1 | | | | 10 | |
Cost of shares redeemed | | | | | | | | | | | | | | | | | | | | | | | | | | | | | | | | | | |
| | | | | | | | | |
Institutional Class | | | | | (6,657 | ) | | | (102,552 | ) | | | (2,436 | ) | | | (32,546 | ) | | | (2,443 | ) | | | (28,900 | ) | | | (1,010 | ) | | | (10,421 | ) |
| | | | | | | | | |
Administrative Class | | | | | (1,157 | )(b) | | | (15,657 | )(b) | | | (269 | ) | | | (3,551 | ) | | | (154 | )(b) | | | (1,618 | )(b) | | | (18 | ) | | | (183 | ) |
| | | | | | | | | |
Class A | | | | | (44 | ) | | | (659 | ) | | | (57 | ) | | | (759 | ) | | | (19 | ) | | | (223 | ) | | | (14 | ) | | | (140 | ) |
| | | | | | | | | |
Net increase (decrease) resulting from Fund share transactions | | | | | 3,694 | | | $ | 50,680 | | | | 9,372 | | | $ | 124,095 | | | | 4,758 | | | $ | 54,477 | | | | 5,478 | | | $ | 56,357 | |
| | | | | | | | | | | | | | | | | | | | | | | | | | | | | | | | | | |
| | | |
| | | | | PIMCO REALPATH® Blend 2065 Fund | | | PIMCO REALPATH® Blend Income Fund | |
| | | | | |
| | | | | Year Ended
06/30/2024 | | | Inception date
through
06/30/2023(a) | | | Year Ended
06/30/2024 | | | Year Ended
06/30/2023 | |
| | | | | | | | | |
| | | | | Shares | | | Amount | | | Shares | | | Amount | | | Shares | | | Amount | | | Shares | | | Amount | |
Receipts for shares sold | | | | | | | | | | | | | | | | | | | | | | | | | | | | | | | | | | |
| | | | | | | | | |
Institutional Class | | | | | 1,241 | | | $ | 14,640 | | | | 440 | | | $ | 4,527 | | | | 8,093 | | | $ | 87,848 | | | | 17,590 | | | $ | 190,509 | |
| | | | | | | | | |
Administrative Class | | | | | 0 | (b) | | | 0 | (b) | | | 10 | | | | 100 | | | | 42 | (b) | | | 461 | (b) | | | 524 | | | | 5,695 | |
| | | | | | | | | |
Class A | | | | | 12 | | | | 138 | | | | 10 | | | | 100 | | | | 34 | | | | 375 | | | | 160 | | | | 1,688 | |
Issued as reinvestment of distributions | | | | | | | | | | | | | | | | | | | | | | | | | | | | | | | | | | |
| | | | | | | | | |
Institutional Class | | | | | 21 | | | | 248 | | | | 0 | | | | 5 | | | | 1,231 | | | | 13,773 | | | | 811 | | | | 8,643 | |
| | | | | | | | | |
Administrative Class | | | | | 0 | (b) | | | 2 | (b) | | | 0 | | | | 0 | | | | 17 | (b) | | | 189 | (b) | | | 88 | | | | 936 | |
| | | | | | | | | |
Class A | | | | | 0 | | | | 3 | | | | 0 | | | | 0 | | | | 68 | | | | 753 | | | | 82 | | | | 866 | |
Cost of shares redeemed | | | | | | | | | | | | | | | | | | | | | | | | | | | | | | | | | | |
| | | | | | | | | |
Institutional Class | | | | | (217 | ) | | | (2,659 | ) | | | (4 | ) | | | (41 | ) | | | (8,283 | ) | | | (91,574 | ) | | | (7,213 | ) | | | (77,996 | ) |
| | | | | | | | | |
Administrative Class | | | | | (10 | )(b) | | | (130 | )(b) | | | 0 | | | | 0 | | | | (2,558 | )(b) | | | (26,794 | )(b) | | | (436 | ) | | | (4,645 | ) |
| | | | | | | | | |
Class A | | | | | (6 | ) | | | (66 | ) | | | 0 | | | | 0 | | | | (459 | ) | | | (4,991 | ) | | | (966 | ) | | | (10,338 | ) |
| | | | | | | | | |
Net increase (decrease) resulting from Fund share transactions | | | | | 1,041 | | | $ | 12,176 | | | | 456 | | | $ | 4,691 | | | | (1,815 | ) | | $ | (19,960 | ) | | | 10,640 | | | $ | 115,358 | |
| | | | | | | | | | | | | | | | | | | | | | | | | | | | | | | | | | |
| † | A zero balance may reflect actual amounts rounding to less than one thousand. |
| (a) | Inception date of the Fund was December 30, 2022. |
| (b) | Administrative Class Shares liquidated at the close of business on June 21, 2024. |
The following table discloses the number of persons owned of record or beneficially 10% or more of the outstanding shares of a Fund along with their respective percent ownership, if any, as of June 30, 2024. Some of these shareholders may be considered related parties, which may include, but are not limited to, the investment adviser and its affiliates, affiliated broker dealers, fund of funds and directors or employees of the Trust or Adviser.
| | | | | | | | | | | | | | | | | | | | |
| | | | | | Shareholders that own 10% or more of outstanding shares | | | Total percentage of portfolio held by shareholders that own 10% or more of outstanding shares | |
| | | | | |
| Fund Name | | | | | Non-Related Parties | | | Related Parties | | | Non-Related Parties | | | Related Parties | |
| | | | | |
PIMCO RealPath® Blend 2025 Fund | | | | | | | 2 | | | | 0 | | | | 59% | | | | 0% | |
| | | | | |
PIMCO RealPath® Blend 2030 Fund | | | | | | | 2 | | | | 0 | | | | 56% | | | | 0% | |
| | | | | |
PIMCO RealPath® Blend 2035 Fund | | | | | | | 2 | | | | 0 | | | | 56% | | | | 0% | |
| | | | | |
PIMCO RealPath® Blend 2040 Fund | | | | | | | 3 | | | | 0 | | | | 70% | | | | 0% | |
| | | | | |
PIMCO RealPath® Blend 2045 Fund | | | | | | | 3 | | | | 0 | | | | 67% | | | | 0% | |
| | | | | |
PIMCO RealPath® Blend 2050 Fund | | | | | | | 4 | | | | 0 | | | | 78% | | | | 0% | |
| | | | | |
PIMCO RealPath® Blend 2055 Fund | | | | | | | 4 | | | | 0 | | | | 79% | | | | 0% | |
| | | | | |
PIMCO RealPath® Blend 2060 Fund | | | | | | | 3 | | | | 0 | | | | 73% | | | | 0% | |
| | | | | |
PIMCO RealPath® Blend 2065 Fund | | | | | | | 2 | | | | 1 | | | | 59% | | | | 20% | |
| | | | | |
PIMCO RealPath® Blend Income Fund | | | | | | | 2 | | | | 0 | | | | 56% | | | | 0% | |
| | | | | | | | | | | | | | | | | | | | |
14. REGULATORY AND LITIGATION MATTERS
The Funds are not named as defendants in any material litigation or arbitration proceedings and are not aware of any material litigation or claim pending or threatened against them.
The foregoing speaks only as of the date of this report.
15. FEDERAL INCOME TAX MATTERS
Each Fund intends to qualify as a regulated investment company under Subchapter M of the Internal Revenue Code (the “Code”) and distribute all of its taxable income and net realized gains, if applicable, to shareholders. Accordingly, no provision for Federal income taxes has been made.
A Fund may be subject to local withholding taxes, including those imposed on realized capital gains. Any applicable foreign capital gains
tax is accrued daily based upon net unrealized gains, and may be payable following the sale of any applicable investments.
In accordance with U.S. GAAP, the Adviser has reviewed the Funds’ tax positions for all open tax years. As of June 30, 2024, the Funds have recorded no liability for net unrecognized tax benefits relating to uncertain income tax positions they have taken or expect to take in future tax returns.
The Funds file U.S. federal, state and local tax returns as required. The Funds’ tax returns are subject to examination by relevant tax authorities until expiration of the applicable statute of limitations, which is generally three years after the filing of the tax return but which can be extended to six years in certain circumstances. Tax returns for open years have incorporated no uncertain tax positions that require a provision for income taxes.
As of June 30, 2024, the components of distributable taxable earnings are as follows (amounts in thousands†):
| | | | | | | | | | | | | | | | | | | | | | | | | | | | | | | | | | | | |
| | | | | | Undistributed
Ordinary
Income(1) | | | Undistributed
Long-Term
Capital Gains | | | Net Tax Basis
Unrealized
Appreciation/
(Depreciation)(2) | | | Other
Book-to-Tax
Accounting
Differences(3) | | | Accumulated
Capital
Losses(4) | | | Qualified
Late-Year
Loss
Deferral -
Capital(5) | | | Qualified
Late-Year
Loss
Deferral -
Ordinary(6) | | | Total Components
of Distributable
Earnings | |
| | | | | | | | | |
PIMCO REALPATH® Blend 2025 Fund | | | | | | $ | 1,977 | | | $ | 0 | | | $ | 11,545 | | | $ | 0 | | | $ | (5,991 | ) | | $ | 0 | | | $ | 0 | | | $ | 7,531 | |
| | | | | | | | | |
PIMCO REALPATH® Blend 2030 Fund | | | | | | | 2,819 | | | | 0 | | | | 44,004 | | | | 0 | | | | (6,254 | ) | | | 0 | | | | 0 | | | | 40,569 | |
| | | | | | | | | |
PIMCO REALPATH® Blend 2035 Fund | | | | | | | 3,249 | | | | 0 | | | | 66,955 | | | | 0 | | | | (498 | ) | | | 0 | | | | 0 | | | | 69,706 | |
| | | | | | | | | |
PIMCO REALPATH® Blend 2040 Fund | | | | | | | 3,280 | | | | 30 | | | | 80,466 | | | | 0 | | | | 0 | | | | 0 | | | | 0 | | | | 83,776 | |
| | | | | | | | | |
PIMCO REALPATH® Blend 2045 Fund | | | | | | | 3,359 | | | | 3,098 | | | | 87,827 | | | | 0 | | | | 0 | | | | 0 | | | | 0 | | | | 94,284 | |
| | | | | | | | | |
PIMCO REALPATH® Blend 2050 Fund | | | | | | | 3,662 | | | | 4,671 | | | | 93,589 | | | | 0 | | | | 0 | | | | 0 | | | | 0 | | | | 101,922 | |
| | | | | | | | | |
PIMCO REALPATH® Blend 2055 Fund | | | | | | | 3,965 | | | | 2,274 | | | | 67,505 | | | | 0 | | | | 0 | | | | 0 | | | | 0 | | | | 73,744 | |
| | | | | | | | | |
PIMCO REALPATH® Blend 2060 Fund | | | | | | | 1,034 | | | | 643 | | | | 20,704 | | | | 0 | | | | 0 | | | | 0 | | | | 0 | | | | 22,381 | |
| | | | | | | | | |
PIMCO REALPATH® Blend 2065 Fund | | | | | | | 128 | | | | 76 | | | | 2,081 | | | | 0 | | | | 0 | | | | 0 | | | | 0 | | | | 2,285 | |
| | | | | | | | | |
PIMCO REALPATH® Blend Income Fund | | | | | | | 1,215 | | | | 0 | | | | 3,358 | | | | 0 | | | | (7,757 | ) | | | 0 | | | | 0 | | | | (3,184 | ) |
| † | A zero balance may reflect actual amounts rounding to less than one thousand. |
| (1) | Includes undistributed short-term capital gains, if any. |
| | | | | | | | | | | | |
| | | | ANNUAL FINANCIAL AND OTHER INFORMATION | | | | | | | JUNE 30, 2024 | | | 71 |
| | | | | | |
| Notes to Financial Statements | | (Cont.) | | | | |
| (2) | Adjusted for open wash sale loss deferrals and the accelerated recognition of unrealized gain or loss on certain futures, options, and/or forward contracts for federal income tax purposes. Also adjusted for differences between book and tax realized and unrealized gain (loss) on swap contracts. |
| (3) | Represents differences in income tax regulations and financial accounting principles generally accepted in the United States of America, mainly due to organizational expenditures. |
| (4) | Capital losses available to offset future net capital gains as shown below. |
| (5) | Capital losses realized during the period November 1, 2023 through June 30, 2024 which the Funds elected to defer to the following taxable year pursuant to income tax regulations. |
| (6) | Specified losses realized during the period November 1, 2023 through June 30, 2024 and Ordinary losses realized during the period January 1, 2024 through June 30, 2024 which the Funds elected to defer to the following taxable year pursuant to income tax regulations. |
Under the Regulated Investment Company Modernization Act of 2010, a fund is permitted to carry forward any new capital losses for an unlimited period. Additionally, such capital losses that are carried forward will retain their character as either short-term or long-term capital losses rather than being considered all short-term under previous law.
As of June 30, 2024, the Funds had the following post-effective capital losses with no expiration (amounts in thousands†):
| | | | | | | | | | | | |
| | | | | | Short-Term | | | Long-Term | |
| | | |
PIMCO REALPATH® Blend 2025 Fund | | | | | | $ | 4,337 | | | $ | 1,654 | |
| | | |
PIMCO REALPATH® Blend 2030 Fund | | | | | | | 5,872 | | | | 382 | |
| | | |
PIMCO REALPATH® Blend 2035 Fund | | | | | | | 498 | | | | 0 | |
| | | |
PIMCO REALPATH® Blend 2040 Fund | | | | | | | 0 | | | | 0 | |
| | | |
PIMCO REALPATH® Blend 2045 Fund | | | | | | | 0 | | | | 0 | |
| | | |
PIMCO REALPATH® Blend 2050 Fund | | | | | | | 0 | | | | 0 | |
| | | |
PIMCO REALPATH® Blend 2055 Fund | | | | | | | 0 | | | | 0 | |
| | | |
PIMCO REALPATH® Blend 2060 Fund | | | | | | | 0 | | | | 0 | |
| | | |
PIMCO REALPATH® Blend 2065 Fund | | | | | | | 0 | | | | 0 | |
| | | |
PIMCO REALPATH® Blend Income Fund | | | | | | | 3,663 | | | | 4,094 | |
| † | A zero balance may reflect actual amounts rounding to less than one thousand. |
As of June 30, 2024, the aggregate cost and the net unrealized appreciation/(depreciation) of investments for federal income tax purposes are as follows (amounts in thousands†):
| | | | | | | | | | | | | | | | | | | | |
| | | | | | Federal Tax Cost | | | Unrealized Appreciation | | | Unrealized (Depreciation) | | | Net Unrealized
Appreciation/
(Depreciation)(7) | |
| | | | | |
PIMCO REALPATH® Blend 2025 Fund | | | | | | $ | 450,220 | | | $ | 40,009 | | | $ | (28,462 | ) | | $ | 11,547 | |
| | | | | |
PIMCO REALPATH® Blend 2030 Fund | | | | | | | 574,247 | | | | 72,957 | | | | (28,953 | ) | | | 44,004 | |
| | | | | |
PIMCO REALPATH® Blend 2035 Fund | | | | | | | 581,307 | | | | 84,469 | | | | (17,513 | ) | | | 66,956 | |
| | | | | |
PIMCO REALPATH® Blend 2040 Fund | | | | | | | 492,658 | | | | 91,559 | | | | (11,092 | ) | | | 80,467 | |
| | | | | |
PIMCO REALPATH® Blend 2045 Fund | | | | | | | 443,598 | | | | 94,822 | | | | (6,997 | ) | | | 87,825 | |
| | | | | |
PIMCO REALPATH® Blend 2050 Fund | | | | | | | 382,824 | | | | 97,967 | | | | (4,378 | ) | | | 93,589 | |
| | | | | |
PIMCO REALPATH® Blend 2055 Fund | | | | | | | 338,992 | | | | 69,837 | | | | (2,333 | ) | | | 67,504 | |
| | | | | |
PIMCO REALPATH® Blend 2060 Fund | | | | | | | 139,352 | | | | 21,012 | | | | (308 | ) | | | 20,704 | |
| | | | | |
PIMCO REALPATH® Blend 2065 Fund | | | | | | | 17,186 | | | | 2,092 | | | | (11 | ) | | | 2,081 | |
| | | | | |
PIMCO REALPATH® Blend Income Fund | | | | | | | 331,770 | | | | 27,345 | | | | (24,093 | ) | | | 3,252 | |
| † | A zero balance may reflect actual amounts rounding to less than one thousand. |
| (7) | Adjusted for open wash sale loss deferrals and the accelerated recognition of unrealized gain or loss on certain futures, options, and/or forward contracts for federal income tax purposes. Also adjusted for differences between book and tax realized and unrealized gain (loss) on swap contracts. |
For the fiscal years ended June 30, 2024 and June 30, 2023, respectively, the Funds made the following tax basis distributions (amounts in thousands†):
| | | | | | | | | | | | | | | | | | | | | | | | | | | | |
| | | | | | June 30, 2024 | | | June 30, 2023 | |
| | | | | | | |
| | | | | | Ordinary
Income
Distributions(8) | | | Long-Term
Capital Gain
Distributions | | | Return of
Capital(9) | | | Ordinary
Income
Distributions(8) | | | Long-Term
Capital Gain
Distributions | | | Return of
Capital(9) | |
| | | | | | | |
PIMCO REALPATH® Blend 2025 Fund | | | | | | $ | 18,752 | | | $ | 0 | | | $ | 0 | | | $ | 9,103 | | | $ | 4,473 | | | $ | 0 | |
| | | | | | | |
PIMCO REALPATH® Blend 2030 Fund | | | | | | | 21,550 | | | | 0 | | | | 0 | | | | 9,225 | | | | 4,985 | | | | 0 | |
| | | | | | | |
PIMCO REALPATH® Blend 2035 Fund | | | | | | | 20,151 | | | | 0 | | | | 0 | | | | 7,353 | | | | 3,997 | | | | 0 | |
| | | | | | | |
PIMCO REALPATH® Blend 2040 Fund | | | | | | | 16,801 | | | | 0 | | | | 0 | | | | 6,000 | | | | 3,830 | | | | 0 | |
| | | | | | | |
PIMCO REALPATH® Blend 2045 Fund | | | | | | | 14,925 | | | | 0 | | | | 0 | | | | 4,880 | | | | 3,470 | | | | 0 | |
| | | | | | | | | | | | | | | | | | | | | | | | | | | | |
| | | | | | June 30, 2024 | | | June 30, 2023 | |
| | | | | | | |
| | | | | | Ordinary
Income
Distributions(8) | | | Long-Term
Capital Gain
Distributions | | | Return of
Capital(9) | | | Ordinary
Income
Distributions(8) | | | Long-Term
Capital Gain
Distributions | | | Return of
Capital(9) | |
| | | | | | | |
PIMCO REALPATH® Blend 2050 Fund | | | | | | $ | 13,401 | | | $ | 0 | | | $ | 0 | | | $ | 4,351 | | | $ | 3,350 | | | $ | 0 | |
| | | | | | | |
PIMCO REALPATH® Blend 2055 Fund | | | | | | | 9,851 | | | | 585 | | | | 0 | | | | 2,921 | | | | 1,970 | | | | 0 | |
| | | | | | | |
PIMCO REALPATH® Blend 2060 Fund | | | | | | | 3,025 | | | | 0 | | | | 0 | | | | 573 | | | | 232 | | | | 0 | |
| | | | | | | |
PIMCO REALPATH® Blend 2065 Fund | | | | | | | 247 | | | | 6 | | | | 0 | | | | 5 | | | | 0 | | | | 0 | |
| | | | | | | |
PIMCO REALPATH® Blend Income Fund | | | | | | | 14,851 | | | | 0 | | | | 0 | | | | 8,406 | | | | 2,184 | | | | 0 | |
| † | A zero balance may reflect actual amounts rounding to less than one thousand. |
| (8) | Includes short-term capital gains distributed, if any. |
| (9) | A portion of the distributions made represents a tax return of capital. Return of capital distributions have been reclassified from undistributed net investment income to paid-in capital to more appropriately conform financial accounting to tax accounting. |
16. SUBSEQUENT EVENTS
On August 22, 2024, the Board approved a proposal to reorganize the PIMCO REALPATH® 2025 Fund (the “Target Fund”) with and into the PIMCO REALPATH® Blend Income Fund (the “Acquiring Fund”). Holders of the Institutional Class and Class A shares of the Target Fund will receive Institutional Class and Class A shares, respectively, of the Acquiring Fund (the “Reorganization”). The Reorganization does not require shareholder approval, and the shareholders will not be asked to vote on the Reorganization. The Reorganization is expected to close on or about January 10, 2025. Additionally, on August 22, 2024, the Board approved a proposal to terminate Class R shares of the PIMCO REALPATH® BLEND 2025 Fund during the third quarter of 2024.
| | | | | | | | | | | | |
| | | | ANNUAL FINANCIAL AND OTHER INFORMATION | | | | | | | JUNE 30, 2024 | | | 73 |
Report of Independent Registered Public Accounting Firm
To the Board of Trustees of PIMCO Equity Series® and Shareholders of PIMCO REALPATH® Blend 2025 Fund, PIMCO REALPATH® Blend 2030 Fund, PIMCO REALPATH® Blend 2035 Fund, PIMCO REALPATH® Blend 2040 Fund, PIMCO REALPATH® Blend 2045 Fund, PIMCO REALPATH® Blend 2050 Fund, PIMCO REALPATH® Blend 2055 Fund, PIMCO REALPATH® Blend 2060, PIMCO REALPATH® Blend 2065 Fund and PIMCO REALPATH® Blend Income Fund
Opinions on the Financial Statements
We have audited the accompanying statements of assets and liabilities, including the schedules of investments, of each of the funds listed in the table below (ten of the funds constituting PIMCO Equity Series®, hereafter collectively referred to as the “Funds”) as of June 30, 2024, the related statements of operations and of changes in net assets for each of the periods indicated in the table below, including the related notes, and the financial highlights for each of the periods indicated therein (collectively referred to as the “financial statements”). In our opinion, the financial statements present fairly, in all material respects, the financial position of each of the Funds listed in the table below as of June 30, 2024, the results of each of their operations and the changes in each of their net assets, for the periods indicated in the table below, and each of the financial highlights for each of the periods indicated therein, in conformity with accounting principles generally accepted in the United States of America.
PIMCO REALPATH® Blend 2025 Fund(1)
PIMCO REALPATH® Blend 2030 Fund(1)
PIMCO REALPATH® Blend 2035 Fund(1)
PIMCO REALPATH® Blend 2040 Fund(1)
PIMCO REALPATH® Blend 2045 Fund(1)
PIMCO REALPATH® Blend 2050 Fund(1)
PIMCO REALPATH® Blend 2055 Fund(1)
PIMCO REALPATH® Blend 2060 Fund(1)
PIMCO REALPATH® Blend 2065 Fund(2)
PIMCO REALPATH® Blend Income Fund(1)
| (1) | Statement of operations for the year ended June 30, 2024 and statement of changes in net assets for the years ended June 30, 2024 and 2023 |
| (2) | Statement of operations for the year ended June 30, 2024, and statement of changes in net assets for the year ended June 30, 2024 and the period December 30, 2022 (inception date) through June 30, 2023 |
Basis for Opinions
These financial statements are the responsibility of the Funds’ management. Our responsibility is to express an opinion on the Funds’ financial statements based on our audits. We are a public accounting firm registered with the Public Company Accounting Oversight Board (United States) (PCAOB) and are required to be independent with respect to the Funds in accordance with the U.S. federal securities laws and the applicable rules and regulations of the Securities and Exchange Commission and the PCAOB.
We conducted our audits of these financial statements in accordance with the standards of the PCAOB. Those standards require that we plan and perform the audit to obtain reasonable assurance about whether the financial statements are free of material misstatement, whether due to error or fraud.
Our audits included performing procedures to assess the risks of material misstatement of the financial statements, whether due to error or fraud, and performing procedures that respond to those risks. Such procedures included examining, on a test basis, evidence regarding the amounts and disclosures in the financial statements. Our audits also included evaluating the accounting principles used and significant estimates made by management, as well as evaluating the overall presentation of the financial statements.
Our procedures included confirmation of securities owned as of June 30, 2024, by correspondence with the custodian, transfer agents and brokers. We believe that our audits provide a reasonable basis for our opinions.
/s/ PricewaterhouseCoopers LLP
Kansas City, Missouri
August 27, 2024
We have served as the auditor of one or more investment companies in PIMCO Equity Series® since 2010.
| | | | | | |
| Glossary: | | (abbreviations that may be used in the preceding statements) | | | | (Unaudited) |
| | | | | | | | | | |
| | | | |
Counterparty Abbreviations: | | | | | | | | |
| | | | | |
| FICC | | Fixed Income Clearing Corporation | | JPM | | JP Morgan Chase Bank N.A. | | MYI | | Morgan Stanley & Co. International PLC |
| | | | | |
| GST | | Goldman Sachs International | | | | | | | | |
| | | | |
Currency Abbreviations: | | | | | | | | |
| | | | | |
| USD (or $) | | United States Dollar | | | | | | | | |
| | | | |
Exchange Abbreviations: | | | | | | | | |
| | | | | |
| CBOE | | Chicago Board Options Exchange | | OTC | | Over the Counter | | | | |
| | | | |
Index/Spread Abbreviations: | | | | | | | | |
| | | | | |
| BERYTR | | Bloomberg Enhanced Roll Yield Total Return Index | | FNRETR | | FTSE Nareit Equity REITs Total Return Index | | S&P 500 | | Standard & Poor’s 500 Index |
| | | | |
Other Abbreviations: | | | | | | | | |
| | | | | |
| LIBOR | | London Interbank Offered Rate | | TBA | | To-Be-Announced | | | | |
| | | | | | | | | | | | |
| | | | ANNUAL FINANCIAL AND OTHER INFORMATION | | | | | | | JUNE 30, 2024 | | | 75 |
| | | | |
| Federal Income Tax Information | | | | (Unaudited) |
As required by the Internal Revenue Code (“Code”) and Treasury Regulations, if applicable, shareholders must be notified within 60 days of the Funds’ fiscal year end regarding the status of qualified dividend income and the dividend received deduction.
Dividend Received Deduction. Corporate shareholders are generally entitled to take the dividend received deduction on the portion of a fund’s dividend distribution that qualifies under tax law. The percentage of the following Funds’ fiscal 2024 ordinary income dividend that qualifies for the corporate dividend received deduction is set forth below.
Qualified Dividend Income. Under the Jobs and Growth Tax Relief Reconciliation Act of 2003, the following percentage of ordinary dividends paid during the fiscal year ended June 30, 2024 was designated as ‘‘qualified dividend income’’ as defined in the Jobs and Growth Tax Relief Reconciliation Act of 2003 subject to reduced tax rates in 2024.
Qualified Interest Income and Qualified Short-Term Capital Gain (for non-U.S. resident shareholders only). Under the American Jobs Creation Act of 2004, the following amounts of ordinary dividends paid during the fiscal year ended June 30, 2024 are considered to be derived from “qualified interest income,” as defined in Section 871(k)(1)(E) of the Code, and therefore are designated as interest-related dividends, as defined in Section 871(k)(1)(C) of the Code. Further, the following amounts of ordinary dividends paid during the fiscal year ended June 30, 2024 are considered to be derived from “qualified short-term capital gain,” as defined in Section 871(k)(2)(D) of the Code, and therefore are designated as qualified short-term gain dividends, as defined by Section 871(k)(2)(C) of the Code.
Section 163(j) Interest Dividends. The Funds intend to pass through the maximum amount allowable as Section 163(j) Interest defined in Proposed Treasury Section 1.163(j)-1(b). The 163(j) amount of ordinary income distributions are as follows:
| | | | | | | | | | | | | | | | | | | | | | | | |
| | | | | | Dividend
Received
Deduction
% | | | Qualified
Dividend
Income
% | | | Qualified
Interest
Income
(000s)† | | | Qualified
Short-Term
Capital Gains
(000s)† | | | 163(j)
Interest
Dividends
(000s)† | |
| | | | | | |
PIMCO REALPATH® Blend 2025 Fund | | | | | | | 0% | | | | 10.40% | | | $ | 36 | | | $ | 0 | | | $ | 40 | |
| | | | | | |
PIMCO REALPATH® Blend 2030 Fund | | | | | | | 0% | | | | 14.51% | | | | 39 | | | | 0 | | | | 49 | |
| | | | | | |
PIMCO REALPATH® Blend 2035 Fund | | | | | | | 0% | | | | 15.25% | | | | 103 | | | | 0 | | | | 39 | |
| | | | | | |
PIMCO REALPATH® Blend 2040 Fund | | | | | | | 0% | | | | 22.46% | | | | 77 | | | | 0 | | | | 43 | |
| | | | | | |
PIMCO REALPATH® Blend 2045 Fund | | | | | | | 0% | | | | 26.75% | | | | 652 | | | | 0 | | | | 38 | |
| | | | | | |
PIMCO REALPATH® Blend 2050 Fund | | | | | | | 0% | | | | 29.89% | | | | 694 | | | | 0 | | | | 36 | |
| | | | | | |
PIMCO REALPATH® Blend 2055 Fund | | | | | | | 0% | | | | 26.81% | | | | 2,102 | | | | 0 | | | | 30 | |
| | | | | | |
PIMCO REALPATH® Blend 2060 Fund | | | | | | | 0% | | | | 33.14% | | | | 0 | | | | 0 | | | | 0 | |
| | | | | | |
PIMCO REALPATH® Blend 2065 Fund | | | | | | | 0% | | | | 34.16% | | | | 0 | | | | 13 | | | | 0 | |
| | | | | | |
PIMCO REALPATH® Blend Income Fund | | | | | | | 0% | | | | 8.89% | | | | 31 | | | | 0 | | | | 26 | |
| † | A zero balance may reflect actual amounts rounding to less than one thousand. |
Shareholders are advised to consult their own tax advisor with respect to the tax consequences of their investment in the Trust. In January 2025, you will be advised on IRS Form 1099-DIV as to the federal tax status of the dividends and distributions received by you in calendar year 2024.
Section 199A Dividends. Non-corporate fund shareholders of the funds below meeting certain holding period requirements may be able to deduct up to 20 percent of qualified REIT dividends passed through and reported to the shareholders by the funds as IRC section 199A dividends. The IRC section 199A percentage of ordinary dividends are as follows:
| | | | | | | | |
| | | | | | 199A
Dividends | |
| | |
PIMCO REALPATH® Blend 2025 Fund | | | | | | | 0% | |
| | |
PIMCO REALPATH® Blend 2030 Fund | | | | | | | 0% | |
| | |
PIMCO REALPATH® Blend 2035 Fund | | | | | | | 0% | |
| | |
PIMCO REALPATH® Blend 2040 Fund | | | | | | | 0% | |
| | |
PIMCO REALPATH® Blend 2045 Fund | | | | | | | 0% | |
| | |
PIMCO REALPATH® Blend 2050 Fund | | | | | | | 0% | |
| | |
PIMCO REALPATH® Blend 2055 Fund | | | | | | | 0% | |
| | |
PIMCO REALPATH® Blend 2060 Fund | | | | | | | 0% | |
| | |
PIMCO REALPATH® Blend 2065 Fund | | | | | | | 0% | |
| | |
PIMCO REALPATH® Blend Income Fund | | | | | | | 0% | |
General Information
Investment Adviser and Administrator
Pacific Investment Management Company LLC
650 Newport Center Drive
Newport Beach, CA 92660
Distributor
PIMCO Investments LLC
1633 Broadway
New York, NY 10019
Custodian
State Street Bank and Trust Company
2323 Grand Boulevard, 5th Floor
Kansas City, MO 64108
Transfer Agent
SS&C Global Investor & Distribution Solutions, Inc.
Institutional Class, I-2, I-3, Administrative Class
430 W 7th Street STE 219024
Kansas City, MO 64105-1407
SS&C Global Investor & Distribution Solutions, Inc.
Class A, Class C, Class R
430 W 7th Street STE 219294
Kansas City, MO 64105-1407
Legal Counsel
Dechert LLP
1900 K Street, N.W.
Washington, D.C. 20006
Independent Registered Public Accounting Firm
PricewaterhouseCoopers LLP
1100 Walnut Street, Suite 1300
Kansas City, MO 64106
This report is submitted for the general information of the shareholders of the Funds listed on the Report cover.

PES3002FSAR_063024

PIMCO EQUITY SERIES®
Annual Financial and Other Information
June 30, 2024
PIMCO Equity Series
PIMCO Dividend and Income Fund
PIMCO RAE Emerging Markets Fund
PIMCO RAE Global ex-US Fund
PIMCO RAE International Fund
PIMCO RAE US Fund
PIMCO RAE US Small Fund
Table of Contents
This material is authorized for use only when preceded or accompanied by the current PIMCO Equity Series prospectus.
| | | | |
| Important Information About the Funds | | | | |
PIMCO Equity Series (the “Trust”) is an open-end management investment company that includes PIMCO Dividend and Income Fund, PIMCO RAE Emerging Markets Fund, PIMCO RAE Global ex-US Fund, PIMCO RAE International Fund, PIMCO RAE US Fund and PIMCO RAE US Small Fund (each, a “Fund” and collectively, the “Funds”).
We believe that equity funds have an important role to play in a well-diversified investment portfolio. It is important to note, however, that equity funds are subject to notable risks. Among other things, equity and equity-related securities may decline in value due to both real and perceived general market, economic and industry conditions.
PIMCO RAE Global ex-US Fund is a “fund of funds,” which is a term used to describe mutual funds that pursue their investment objective by investing in other mutual funds instead of investing directly in stocks or bonds of other issuers. Under normal circumstances, the PIMCO RAE Global ex-US Fund invests substantially all of its assets in Institutional Class shares of the International Fund and Emerging Markets Fund, equity securities of small companies economically tied to non-U.S. countries, and securities that are eligible investments for the International Fund and Emerging Markets Fund. The PIMCO RAE Global ex-US Fund may invest in other affiliated funds and unaffiliated funds, which may or may not be registered under the Investment Company Act of 1940, as amended (the “Act”) (together with the Underlying Funds, “Acquired Funds”). The cost of investing in these Funds will generally be higher than the cost of investing in a mutual fund that invests directly in individual stocks and bonds.
The values of equity securities, such as common stocks and preferred securities, have historically risen and fallen in periodic cycles and may decline due to general market conditions, which are not specifically related to a particular company, such as real or perceived adverse economic conditions, changes in the general outlook for corporate earnings, changes in interest or currency rates or adverse investor sentiment generally. Equity securities may also decline due to factors that affect a particular industry or industries, such as labor shortages, increased production costs and competitive conditions within an industry. In addition, the value of an equity security may decline for a number of reasons that directly relate to the issuer, such as management performance, financial leverage and reduced demand for the issuer’s goods or services, as well as the historical and prospective earnings of the issuer and the value of its assets. Different types of equity securities may react differently to these developments and a change in the financial condition of a single issuer may affect securities markets as a whole.
During a general downturn in the securities markets, multiple asset classes, including equity securities, may decline in value simultaneously. The market price of equity securities owned by a Fund may go up or
down, sometimes rapidly or unpredictably. Equity securities generally have greater price volatility than fixed income securities and common stocks generally have the greatest appreciation and depreciation potential of all corporate securities.
The Funds may be subject to various risks as described in each Fund’s prospectus and in the Principal and Other Risks in the Notes to Financial Statements.
Classifications of the Funds’ portfolio holdings in this report are made according to financial reporting standards. The classification of a particular portfolio holding as shown in the Schedule of Investments sections of this report may differ from the classification used for the Funds’ compliance calculations, including those used in the Funds’ prospectus, investment objectives, regulatory and other investment limitations and policies, which may be based on different asset class, sector or geographical classifications. The Funds are separately monitored for compliance with respect to prospectus and regulatory requirements.
The geographical classification of foreign (non-U.S.) securities in this report, if any, are classified by the country of incorporation of a holding. In certain instances, a security’s country of incorporation may be different from its country of economic exposure.
In February 2022, Russia launched an invasion of Ukraine. As a result, Russia and other countries, persons and entities that provided material aid to Russia’s aggression against Ukraine, have been the subject of economic sanctions and import and export controls imposed by countries throughout the world, including the United States. Such measures have had and may continue to have an adverse effect on the Russian, Belarusian and other securities and economies, which may, in turn, negatively impact a Fund. The extent, duration and impact of Russia’s military action in Ukraine, related sanctions and retaliatory actions are difficult to ascertain, but could be significant and have severe adverse effects on the region, including significant adverse effects on the regional, European and global economies and the markets for certain securities and commodities, such as oil and natural gas, as well as other sectors. Further, a Fund may have investments in securities and instruments that are economically tied to the region and may have been negatively impacted by the sanctions and counter-sanctions by Russia, including declines in value and reductions in liquidity. The sanctions may cause a Fund to sell portfolio holdings at a disadvantageous time or price or to continue to hold investments that a Fund may no longer seek to hold. PIMCO will continue to actively manage these positions in the best interests of a Fund and its shareholders.
The United States’ enforcement of restrictions on U.S. investments in certain issuers and tariffs on goods from certain other countries has
contributed to and may continue to contribute to international trade tensions and may impact portfolio securities (and/or portfolio securities of Underlying PIMCO Funds or Acquired Funds, as applicable). The United States’ enforcement of sanctions or other similar measures on various Russian entities and persons, and the Russian government’s response, may also negatively impact securities and instruments that are economically tied to Russia.
A Fund may invest in certain instruments that rely in some fashion upon the London Interbank Offered Rate (“LIBOR”). LIBOR was traditionally an average interest rate, determined by the ICE Benchmark Administration, that banks charge one another for the use of short-term money. The United Kingdom’s Financial Conduct Authority, which regulates LIBOR, announced plans to ultimately phase out the use of LIBOR. Although the transition process away from LIBOR for many instruments has been completed, some LIBOR use is continuing and there are potential effects related to the transition away from LIBOR or continued use of LIBOR on a Fund, or on certain instruments in which a Fund invests, which can be difficult to ascertain, and may vary depending on factors that include, but are not limited to: (i) existing fallback or termination provisions in individual contracts and (ii) whether, how and when industry participants adopt new reference rates for affected instruments. The transition of investments from LIBOR to a replacement rate as a result of amendment, application of existing fallbacks, statutory requirements or otherwise may also result in a reduction in the value of certain instruments held by a Fund or a reduction in the effectiveness of related Fund transactions such as hedges. In addition, an instrument’s transition to a replacement rate could result in variations in the reported yields of a Fund that holds such instrument. Any such effects of the transition away from LIBOR, as well as other unforeseen effects, could result in losses to a Fund.
A Fund may have investments in securities and instruments that are economically tied to Russia. Investments in Russia are subject to various risks such as, but not limited to political, economic, legal, market and currency risks. The risks include uncertain political and economic policies, short-term market volatility, poor accounting standards, corruption and crime, an inadequate regulatory system, regional armed conflict and unpredictable taxation. Investments in Russia are particularly subject to the risk that further economic sanctions, export and import controls and other similar measures may be imposed by the United States and/or other countries. Other similar measures may include, but are not limited to, banning or expanding bans on Russia or certain persons or entities associated with Russia from global payment systems that facilitate cross-border payments, restricting the settlement of securities transactions by certain investors, and freezing Russian assets or those of particular countries, entities or persons with ties to Russia (e.g. Belarus). Such sanctions and other
similar measures — which may impact companies in many sectors, including energy, financial services, technology, accounting, quantum computing, shipping, aviation, metals and mining, and defense, among others — and Russia’s countermeasures may negatively impact a Fund’s performance and/or ability to achieve its investment objective. For example, certain investments may be prohibited and/or existing investments may become illiquid (e.g., in the event that transacting in certain existing investments is prohibited, securities markets close, or market participants cease transacting in certain investments in light of geopolitical events, sanctions or related considerations), which could render any such securities held by a Fund unmarketable for an indefinite period of time and/or cause the Fund to sell other portfolio holdings at a disadvantageous time or price in order to meet shareholder redemptions. In addition, such sanctions or other similar measures, and the Russian government’s response, could result in a downgrade of Russia’s credit rating or of securities of issuers located in or economically tied to Russia, devaluation of Russia’s currency and/or increased volatility with respect to Russian securities and the ruble. Moreover, disruptions caused by Russian military action or other actions (including cyberattacks, espionage or other asymmetric measures) or resulting actual or threatened responses to such activity may impact Russia’s economy and Russian and other issuers of securities in which a Fund is invested. Such resulting actual or threatened responses may include, but are not limited to, purchasing and financing restrictions, withdrawal of financial intermediaries, boycotts or changes in consumer or purchaser preferences, sanctions, tariffs export and import controls, or cyberattacks on the Russian government, Russian companies or Russian individuals, including politicians. Any actions by Russia made in response to such sanctions or retaliatory measures could further impair the value and liquidity of Fund investments. Sanctions and other similar measures have resulted in defaults on debt obligations by certain corporate issuers and the Russian Federation that could lead to cross-defaults or cross-accelerations on other obligations of these issuers. The Russian securities market is characterized by limited volume of trading, resulting in difficulty in obtaining accurate prices and trading. These issues can be magnified as a result of sanctions and other similar measures that may be imposed and the Russian government’s response. The Russian securities market, as compared to U.S. markets, has significant price volatility, less liquidity, a smaller market capitalization and a smaller number of traded securities. There may be little publicly available information about issuers. Settlement, clearing and registration of securities transactions are subject to risks. Prior to the implementation of the National Settlement Depository (“NSD”), a recognized central securities depository, there was no central registration system for equity share registration in Russia, and registration was carried out by either the issuers themselves or by registrars located throughout Russia. Title to Russian equities held through the NSD is now based on the records
| | | | | | | | | | | | |
| | | | ANNUAL FINANCIAL AND OTHER INFORMATION | | | | | | | JUNE 30, 2024 | | | 3 |
| | | | |
| Important Information About the Funds | | (Cont.) | | |
of the NSD and not the registrars. Although the implementation of the NSD has enhanced the efficiency and transparency of the Russian securities market, issues resulting in loss can still occur. In addition, sanctions or Russian countermeasures may prohibit or limit a Fund’s ability to participate in corporate actions, and therefore require the Fund to forego voting on or receiving funds that would otherwise be beneficial to the Fund. Ownership of securities issued by Russian companies that are not held through depositories such as the NSD may be recorded by companies themselves and by registrars. In such cases, the risk is increased that a Fund could lose ownership rights through fraud, negligence or oversight. While applicable Russian regulations impose liability on registrars for losses resulting from their errors, it may be difficult for a Fund to enforce any rights it may have against the registrar or issuer of the securities in the event of loss of share registration. In addition, issuers and registrars are still prominent in the validation and approval of documentation requirements for corporate action processing in Russia. Because the documentation requirements and approval criteria vary between registrars and issuers, there remain unclear and inconsistent market standards in the Russian market with respect to the completion and submission of corporate action elections. In addition, sanctions or Russian countermeasures may prohibit or limit a Fund’s ability to participate in corporate actions, and therefore require the Fund to forego voting on or receiving funds that would otherwise be beneficial to the Fund. To the extent that a Fund suffers a loss relating to title or corporate actions relating to its portfolio securities, it may be difficult for the Fund to enforce its rights or otherwise remedy the loss. Russian securities laws may not recognize foreign nominee accounts held with a custodian bank, and therefore the custodian may be considered the ultimate owner of securities they hold for their clients. Adverse currency exchange rates are a risk and there may be a lack of available currency hedging instruments. Investments in Russia may be subject to the risk of nationalization or expropriation of assets. Oil, natural gas, metals, minerals, and timber account for a significant portion of Russia’s exports, leaving the country vulnerable to swings in world prices, and to sanctions or other actions that may be directed at the Russian economy as a whole or at Russian oil, natural gas, metals, minerals or timber industries.
Russia has attempted, and may attempt in the future, to assert its influence in the region through economic or military measures. For example, in February 2022, Russia launched a large-scale invasion of Ukraine. Such measures may have an adverse effect on the Russian economy, which may, in turn, negatively impact a Fund. Foreign investors also face a high degree of currency risk when investing in Russian securities and a lack of available currency hedging instruments. In addition, there is the risk that the Russian government may impose capital controls on foreign portfolio investments in the event of extreme
financial or political crisis. Such capital controls may prevent the sale of a portfolio of foreign assets and the repatriation of investment income and capital.
Foreign investors also face a high degree of currency risk when investing in Russian securities and a lack of available currency hedging instruments. In addition, there is the risk that the Russian government may impose capital controls on foreign portfolio investments in the event of extreme financial or political crisis. Such capital controls may prevent the sale of a portfolio of foreign assets and the repatriation of investment income and capital.
U.S. and global markets have experienced increased volatility, including as a result of the failures of certain U.S. and non-U.S. banks in 2023, which could be harmful to the Funds and issuers in which they invest. For example, if a bank at which a Fund or issuer has an account fails, any cash or other assets in bank or custody accounts, which may be substantial in size, could be temporarily inaccessible or permanently lost by the Fund or issuer. If a bank that provides a subscription line credit facility, asset-based facility, other credit facility and/or other services to an issuer or to a fund fails, the issuer or fund could be unable to draw funds under its credit facilities or obtain replacement credit facilities or other services from other lending institutions with similar terms.
Issuers in which a Fund may invest can be affected by volatility in the banking sector. Even if banks used by issuers in which the Funds invest remain solvent, volatility in the banking sector could contribute to, cause or intensify an economic recession, increase the costs of capital and banking services or result in the issuers being unable to obtain or refinance indebtedness at all or on as favorable terms as could otherwise have been obtained. Potential impacts to the Funds and issuers resulting from changes in the banking sector, market conditions and potential legislative or regulatory responses are uncertain. Such conditions and responses, as well as a changing interest rate environment, can contribute to decreased market liquidity and erode the value of certain holdings, including those of U.S. and non-U.S. banks. Continued market volatility and uncertainty and/or a downturn in market and economic and financial conditions, as a result of developments in the banking sector or otherwise (including as a result of delayed access to cash or credit facilities), could have an adverse impact on the Funds and issuers in which they invest.
The following table discloses the inception dates of each Fund and its respective share classes along with the Fund’s diversification status as of period end:
| | | | | | | | | | | | | | | | | | | | | | | | | | | | | | | | |
| Fund Name | | | | | Fund
Inception | | | Institutional
Class | | | I-2 | | | I-3 | | | Class A | | | Class C | | | Diversification
Status | |
PIMCO Dividend and Income Fund | | | | | | | 12/14/11 | | | | 12/14/11 | | | | 12/14/11 | | | | — | | | | 12/14/11 | | | | 12/14/11 | | | | Diversified | |
PIMCO RAE Emerging Markets Fund | | | | | | | 06/05/15 | | | | 06/05/15 | | | | 06/05/15 | | | | — | | | | 06/05/15 | | | | — | | | | Diversified | |
PIMCO RAE Global ex-US Fund | | | | | | | 06/05/15 | | | | 06/05/15 | | | | 06/05/15 | | | | — | | | | 06/05/15 | | | | — | | | | Diversified | |
PIMCO RAE International Fund | | | | | | | 06/05/15 | | | | 06/05/15 | | | | 06/05/15 | | | | — | | | | 06/05/15 | | | | — | | | | Diversified | |
PIMCO RAE US Fund | | | | | | | 06/05/15 | | | | 06/05/15 | | | | 06/05/15 | | | | — | | | | 06/05/15 | | | | — | | | | Diversified | |
PIMCO RAE US Small Fund | | | | | | | 06/05/15 | | | | 06/05/15 | | | | 06/05/15 | | | | — | | | | 06/05/15 | | | | — | | | | Diversified | |
An investment in a Fund is not a bank deposit and is not guaranteed or insured by the Federal Deposit Insurance Corporation or any other government agency. It is possible to lose money on investments in a Fund.
The Trustees are responsible generally for overseeing the management of the Trust. The Trustees authorize the Trust to enter into service agreements with the Adviser, the Distributor, the Administrator and other service providers in order to provide, and in some cases authorize
service providers to procure through other parties, necessary or desirable services on behalf of the Trust and the Funds. Shareholders are not parties to or third-party beneficiaries of such service agreements. Neither a Fund’s prospectus nor a Fund’s summary prospectus, the Trust’s Statement of Additional Information (“SAI”),
any contracts filed as exhibits to the Trust’s registration statement, nor any other communications, disclosure documents or regulatory filings (including this report) from or on behalf of the Trust or a Fund creates a contract between or among any shareholder of a Fund, on the one hand, and the Trust, a Fund, a service provider to the Trust or a Fund, and/or the Trustees or officers of the Trust, on the other hand. The Trustees (or the Trust and its officers, service providers or other delegates acting under authority of the Trustees) may amend the most recent prospectus or use a new prospectus, summary prospectus or SAI with respect to a Fund or the Trust, and/or amend, file and/or issue any other communications, disclosure documents or regulatory filings, and may amend or enter into any contracts to which the Trust or a Fund is a party, and interpret the investment objective(s), policies, restrictions and contractual provisions applicable to any Fund, without shareholder input or approval, except in circumstances in which shareholder approval is specifically required by law (such as changes to fundamental investment policies) or where a shareholder approval requirement is specifically disclosed in the Trust’s then-current prospectus or SAI.
PIMCO has adopted written proxy voting policies and procedures (“Proxy Policy”) as required by Rule 206(4)-6 under the Investment Advisers Act of 1940, as amended. The Proxy Policy has been adopted by the Trust as the policies and procedures that PIMCO will use when
voting proxies on behalf of the Funds. A description of the policies and procedures that PIMCO uses to vote proxies relating to portfolio securities of each Fund, and information about how each Fund voted proxies relating to portfolio securities held during the most recent twelve-month period ended June 30, are available without charge, upon request, by calling the Trust at (888) 87-PIMCO, on the Funds’ website at www.pimco.com, and on the Securities and Exchange Commission’s (“SEC”) website at www.sec.gov.
The Funds file portfolio holdings information with the SEC on Form N-PORT within 60 days of the end of each fiscal quarter. The Funds’ complete schedules of securities holdings as of the end of each fiscal quarter will be made available to the public on the SEC’s website at www.sec.gov and on PIMCO’s website at www.pimco.com, and will be made available, upon request, by calling PIMCO at (888) 87-PIMCO.
Paper copies of the Funds’ shareholder reports are required to be provided free of charge by the Fund or financial intermediary upon request.
In October 2022, the SEC adopted changes to the mutual fund and exchange-traded fund (“ETF”) shareholder report and registration statement disclosure requirements and the registered fund advertising rules, which impact the disclosures provided to shareholders. The rule amendments were effective as of January 2023, and compliance with the rule amendments was required as of July 2024. As such, the Funds have made significant updates to the content of their shareholder reports. In addition, shareholder reports are now mailed to shareholders who have not opted to receive shareholder report documents electronically.
In September 2023, the SEC adopted amendments to Rule 35d-1 under the Investment Company Act of 1940, as amended, the rule governing fund naming conventions (the “Names Rule”). In general, the Names Rule requires funds with certain types of names to adopt a policy to invest at least 80% of their assets in the type of investment suggested by the name. The amendments expand the scope of the current rule to include any term used in a fund name that suggests the fund makes
| | | | | | | | | | | | |
| | | | ANNUAL FINANCIAL AND OTHER INFORMATION | | | | | | | JUNE 30, 2024 | | | 5 |
| | | | |
| Important Information About the Funds | | (Cont.) | | |
investments that have, or whose issuers have, particular characteristics. Additionally, the amendments modify the circumstances under which a fund may deviate from its 80% investment policy and address the calculation methodology of derivatives instruments for purposes of the rule. The amendments became effective December 11, 2023, and fund groups with $1 billion or more in net assets will have 24 months to comply with the amendments (fund groups with net assets of less than $1 billion have 30 months to comply).
(THIS PAGE INTENTIONALLY LEFT BLANK)
| | | | | | | | | | | | |
| | | | ANNUAL FINANCIAL AND OTHER INFORMATION | | | | | | | JUNE 30, 2024 | | | 7 |
| | | | | | | | | | | | | | | | | | | | | | | | | | | | | | | | |
| | | | | | Investment Operations | | | Less Distributions(c) | |
| | | | | | | | | | | | | | | | | | | | | | | | | |
| Selected Per Share Data for the Year or Period Ended^: | | Net Asset Value
Beginning of
Year or
Period(a) | | | Net Investment
Income (Loss)(b) | | |
Net Realized/
Unrealized
Gain (Loss) | | | Total | | | From Net
Investment
Income | | | From Net
Realized
Capital Gains | | | Tax Basis
Return of
Capital | | | Total | |
| | | | | | | | |
PIMCO Dividend and Income Fund | | | | | | | | | | | | | | | | | | | | | | | | | | | | | | | | |
| Institutional Class | | | | | | | | | | | | | | | | | | | | | | | | | | | | | | | | |
| | | | | | | | |
06/30/2024 | | $ | 11.57 | | | $ | 0.48 | | | $ | 0.92 | | | $ | 1.40 | | | $ | (0.62 | ) | | $ | 0.00 | | | $ | 0.00 | | | $ | (0.62 | ) |
| | | | | | | | |
06/30/2023 | | | 11.35 | | | | 0.46 | | | | 0.51 | | | | 0.97 | | | | (0.75 | ) | | | 0.00 | | | | 0.00 | | | | (0.75 | ) |
| | | | | | | | |
06/30/2022 | | | 12.72 | | | | 0.47 | | | | (1.42 | ) | | | (0.95 | ) | | | (0.42 | ) | | | 0.00 | | | | 0.00 | | | | (0.42 | ) |
| | | | | | | | |
06/30/2021 | | | 9.71 | | | | 0.44 | | | | 3.03 | | | | 3.47 | | | | (0.46 | ) | | | 0.00 | | | | 0.00 | | | | (0.46 | ) |
| | | | | | | | |
06/30/2020 | | | 11.27 | | | | 0.33 | | | | (1.57 | ) | | | (1.24 | ) | | | (0.32 | ) | | | 0.00 | | | | 0.00 | | | | (0.32 | ) |
| I-2 | | | | | | | | | | | | | | | | | | | | | | | | | | | | | | | | |
| | | | | | | | |
06/30/2024 | | | 11.59 | | | | 0.47 | | | | 0.92 | | | | 1.39 | | | | (0.61 | ) | | | 0.00 | | | | 0.00 | | | | (0.61 | ) |
| | | | | | | | |
06/30/2023 | | | 11.37 | | | | 0.45 | | | | 0.50 | | | | 0.95 | | | | (0.73 | ) | | | 0.00 | | | | 0.00 | | | | (0.73 | ) |
| | | | | | | | |
06/30/2022 | | | 12.74 | | | | 0.48 | | | | (1.44 | ) | | | (0.96 | ) | | | (0.41 | ) | | | 0.00 | | | | 0.00 | | | | (0.41 | ) |
| | | | | | | | |
06/30/2021 | | | 9.72 | | | | 0.41 | | | | 3.06 | | | | 3.47 | | | | (0.45 | ) | | | 0.00 | | | | 0.00 | | | | (0.45 | ) |
| | | | | | | | |
06/30/2020 | | | 11.29 | | | | 0.32 | | | | (1.58 | ) | | | (1.26 | ) | | | (0.31 | ) | | | 0.00 | | | | 0.00 | | | | (0.31 | ) |
| Class A | | | | | | | | | | | | | | | | | | | | | | | | | | | | | | | | |
| | | | | | | | |
06/30/2024 | | | 11.54 | | | | 0.44 | | | | 0.92 | | | | 1.36 | | | | (0.58 | ) | | | 0.00 | | | | 0.00 | | | | (0.58 | ) |
| | | | | | | | |
06/30/2023 | | | 11.33 | | | | 0.42 | | | | 0.50 | | | | 0.92 | | | | (0.71 | ) | | | 0.00 | | | | 0.00 | | | | (0.71 | ) |
| | | | | | | | |
06/30/2022 | | | 12.71 | | | | 0.43 | | | | (1.42 | ) | | | (0.99 | ) | | | (0.39 | ) | | | 0.00 | | | | 0.00 | | | | (0.39 | ) |
| | | | | | | | |
06/30/2021 | | | 9.70 | | | | 0.39 | | | | 3.04 | | | | 3.43 | | | | (0.42 | ) | | | 0.00 | | | | 0.00 | | | | (0.42 | ) |
| | | | | | | | |
06/30/2020 | | | 11.27 | | | | 0.29 | | | | (1.57 | ) | | | (1.28 | ) | | | (0.29 | ) | | | 0.00 | | | | 0.00 | | | | (0.29 | ) |
| Class C | | | | | | | | | | | | | | | | | | | | | | | | | | | | | | | | |
| | | | | | | | |
06/30/2024 | | | 11.53 | | | | 0.35 | | | | 0.91 | | | | 1.26 | | | | (0.49 | ) | | | 0.00 | | | | 0.00 | | | | (0.49 | ) |
| | | | | | | | |
06/30/2023 | | | 11.32 | | | | 0.33 | | | | 0.51 | | | | 0.84 | | | | (0.63 | ) | | | 0.00 | | | | 0.00 | | | | (0.63 | ) |
| | | | | | | | |
06/30/2022 | | | 12.72 | | | | 0.34 | | | | (1.43 | ) | | | (1.09 | ) | | | (0.31 | ) | | | 0.00 | | | | 0.00 | | | | (0.31 | ) |
| | | | | | | | |
06/30/2021 | | | 9.70 | | | | 0.27 | | | | 3.07 | | | | 3.34 | | | | (0.32 | ) | | | 0.00 | | | | 0.00 | | | | (0.32 | ) |
| | | | | | | | |
06/30/2020 | | | 11.29 | | | | 0.21 | | | | (1.57 | ) | | | (1.36 | ) | | | (0.23 | ) | | | 0.00 | | | | 0.00 | | | | (0.23 | ) |
| | | | | | | | |
PIMCO RAE Emerging Markets Fund | | | | | | | | | | | | | | | | | | | | | | | | | | | | | | | | |
| Institutional Class | | | | | | | | | | | | | | | | | | | | | | | | | | | | | | | | |
| | | | | | | | |
06/30/2024 | | $ | 9.43 | | | $ | 0.38 | | | $ | 1.64 | | | $ | 2.02 | | | $ | (0.41 | ) | | $ | 0.00 | | | $ | 0.00 | | | $ | (0.41 | ) |
| | | | | | | | |
06/30/2023 | | | 8.85 | | | | 0.42 | | | | 1.13 | | | | 1.55 | | | | (0.05 | ) | | | (0.92 | ) | | | 0.00 | | | | (0.97 | ) |
| | | | | | | | |
06/30/2022 | | | 12.02 | | | | 0.55 | | | | (2.76 | ) | | | (2.21 | ) | | | (0.96 | ) | | | 0.00 | | | | 0.00 | | | | (0.96 | ) |
| | | | | | | | |
06/30/2021 | | | 7.83 | | | | 0.27 | | | | 4.09 | | | | 4.36 | | | | (0.17 | ) | | | 0.00 | | | | 0.00 | | | | (0.17 | ) |
| | | | | | | | |
06/30/2020 | | | 9.92 | | | | 0.24 | | | | (2.06 | ) | | | (1.82 | ) | | | (0.24 | ) | | | (0.03 | ) | | | 0.00 | | | | (0.27 | ) |
| I-2 | | | | | | | | | | | | | | | | | | | | | | | | | | | | | | | | |
| | | | | | | | |
06/30/2024 | | | 9.36 | | | | 0.37 | | | | 1.62 | | | | 1.99 | | | | (0.40 | ) | | | 0.00 | | | | 0.00 | | | | (0.40 | ) |
| | | | | | | | |
06/30/2023 | | | 8.80 | | | | 0.41 | | | | 1.11 | | | | 1.52 | | | | (0.04 | ) | | | (0.92 | ) | | | 0.00 | | | | (0.96 | ) |
| | | | | | | | |
06/30/2022 | | | 11.97 | | | | 0.50 | | | | (2.71 | ) | | | (2.21 | ) | | | (0.96 | ) | | | 0.00 | | | | 0.00 | | | | (0.96 | ) |
| | | | | | | | |
06/30/2021 | | | 7.80 | | | | 0.30 | | | | 4.03 | | | | 4.33 | | | | (0.16 | ) | | | 0.00 | | | | 0.00 | | | | (0.16 | ) |
| | | | | | | | |
06/30/2020 | | | 9.86 | | | | 0.32 | | | | (2.16 | ) | | | (1.84 | ) | | | (0.19 | ) | | | (0.03 | ) | | | 0.00 | | | | (0.22 | ) |
| Class A | | | | | | | | | | | | | | | | | | | | | | | | | | | | | | | | |
| | | | | | | | |
06/30/2024 | | | 9.23 | | | | 0.33 | | | | 1.61 | | | | 1.94 | | | | (0.39 | ) | | | 0.00 | | | | 0.00 | | | | (0.39 | ) |
| | | | | | | | |
06/30/2023 | | | 8.70 | | | | 0.41 | | | | 1.07 | | | | 1.48 | | | | (0.03 | ) | | | (0.92 | ) | | | 0.00 | | | | (0.95 | ) |
| | | | | | | | |
06/30/2022 | | | 11.86 | | | | 0.47 | | | | (2.68 | ) | | | (2.21 | ) | | | (0.95 | ) | | | 0.00 | | | | 0.00 | | | | (0.95 | ) |
| | | | | | | | |
06/30/2021 | | | 7.75 | | | | 0.23 | | | | 4.03 | | | | 4.26 | | | | (0.15 | ) | | | 0.00 | | | | 0.00 | | | | (0.15 | ) |
| | | | | | | | |
06/30/2020 | | | 9.84 | | | | 0.23 | | | | (2.07 | ) | | | (1.84 | ) | | | (0.22 | ) | | | (0.03 | ) | | | 0.00 | | | | (0.25 | ) |
| | | | | | | | |
PIMCO RAE Global ex-US Fund | | | | | | | | | | | | | | | | | | | | | | | | | | | | | | | | |
| Institutional Class | | | | | | | | | | | | | | | | | | | | | | | | | | | | | | | | |
| | | | | | | | |
06/30/2024 | | $ | 9.35 | | | $ | 0.57 | | | $ | 0.52 | | | $ | 1.09 | | | $ | (0.48 | ) | | $ | (0.37 | ) | | $ | 0.00 | | | $ | (0.85 | ) |
| | | | | | | | |
06/30/2023 | | | 8.78 | | | | 0.17 | | | | 1.15 | | | | 1.32 | | | | (0.15 | ) | | | (0.60 | ) | | | 0.00 | | | | (0.75 | ) |
| | | | | | | | |
06/30/2022 | | | 11.65 | | | | 1.15 | | | | (2.80 | ) | | | (1.65 | ) | | | (1.22 | ) | | | 0.00 | | | | 0.00 | | | | (1.22 | ) |
| | | | | | | | |
06/30/2021 | | | 8.20 | | | | 0.21 | | | | 3.45 | | | | 3.66 | | | | (0.21 | ) | | | 0.00 | | | | 0.00 | | | | (0.21 | ) |
| | | | | | | | |
06/30/2020 | | | 10.23 | | | | 0.38 | | | | (1.76 | ) | | | (1.38 | ) | | | (0.37 | ) | | | (0.28 | ) | | | 0.00 | | | | (0.65 | ) |
| I-2 | | | | | | | | | | | | | | | | | | | | | | | | | | | | | | | | |
| | | | | | | | |
06/30/2024 | | | 9.37 | | | | 0.58 | | | | 0.50 | | | | 1.08 | | | | (0.48 | ) | | | (0.37 | ) | | | 0.00 | | | | (0.85 | ) |
| | | | | | | | |
06/30/2023 | | | 8.80 | | | | 0.16 | | | | 1.16 | | | | 1.32 | | | | (0.15 | ) | | | (0.60 | ) | | | 0.00 | | | | (0.75 | ) |
| | | | | | | | |
06/30/2022 | | | 11.67 | | | | 1.39 | | | | (3.04 | ) | | | (1.65 | ) | | | (1.22 | ) | | | 0.00 | | | | 0.00 | | | | (1.22 | ) |
| | | | | | | | |
06/30/2021 | | | 8.18 | | | | 0.02 | | | | 3.63 | | | | 3.65 | | | | (0.16 | ) | | | 0.00 | | | | 0.00 | | | | (0.16 | ) |
| | | | | | | | |
06/30/2020 | | | 10.20 | | | | 0.30 | | | | (1.68 | ) | | | (1.38 | ) | | | (0.36 | ) | | | (0.28 | ) | | | 0.00 | | | | (0.64 | ) |
| | | | | | |
| 8 | | PIMCO EQUITY SERIES | | | See Accompanying Notes | |
| | | | | | | | | | | | | | | | | | | | | | | | | | | | | | | | | | |
| | | | | | | Ratios/Supplemental Data | |
| | | | | | | | | | Ratios to Average Net Assets(e) | | | | |
Net Asset
Value End of
Year or
Period(a) | | | Total Return(d) | | | Net Assets
End of Year or
Period (000s) | | | Expenses | | | Expenses
Excluding
Waivers | | | Expenses
Excluding
Interest
Expense | | | Expenses
Excluding
Interest
Expense and
Waivers | | | Net
Investment
Income (Loss) | | | Portfolio
Turnover
Rate | |
| | | | | | | | |
| | | | | | | | | | | | | | | | | | | | | | | | | | | | | | | | | | |
| | | | | | | | | | | | | | | | | | | | | | | | | | | | | | | | | | |
| | | | | | | | |
| $ | 12.35 | | | | 12.38 | % | | $ | 14,161 | | | | 0.82 | % | | | 0.83 | % | | | 0.71 | % | | | 0.72 | % | | | 4.02 | % | | | 408 | % |
| | | | | | | | |
| | 11.57 | | | | 8.81 | | | | 18,032 | | | | 0.75 | | | | 0.76 | | | | 0.69 | | | | 0.70 | | | | 4.05 | | | | 344 | |
| | | | | | | | |
| | 11.35 | | | | (7.76 | ) | | | 12,660 | | | | 0.71 | (f)(g) | | | 0.72 | (f)(g) | | | 0.71 | (f)(g) | | | 0.72 | (f)(g) | | | 3.80 | | | | 254 | |
| | | | | | | | |
| | 12.72 | | | | 36.27 | | | | 32,512 | | | | 0.79 | (h) | | | 0.80 | (h) | | | 0.77 | (h) | | | 0.78 | (h) | | | 3.79 | | | | 218 | |
| | | | | | | | |
| | 9.71 | | | | (11.38 | ) | | | 16,438 | | | | 0.83 | | | | 0.84 | | | | 0.80 | | | | 0.81 | | | | 3.05 | | | | 158 | |
| | | | | | | | | | | | | | | | | | | | | | | | | | | | | | | | | | |
| | | | | | | | |
| | 12.37 | | | | 12.27 | | | | 17,267 | | | | 0.92 | | | | 0.93 | | | | 0.81 | | | | 0.82 | | | | 3.97 | | | | 408 | |
| | | | | | | | |
| | 11.59 | | | | 8.68 | | | | 15,876 | | | | 0.85 | | | | 0.86 | | | | 0.79 | | | | 0.80 | | | | 3.88 | | | | 344 | |
| | | | | | | | |
| | 11.37 | | | | (7.78 | ) | | | 17,950 | | | | 0.81 | (f)(i) | | | 0.82 | (f)(i) | | | 0.81 | (f)(i) | | | 0.82 | (f)(i) | | | 3.83 | | | | 254 | |
| | | | | | | | |
| | 12.74 | | | | 36.19 | | | | 19,919 | | | | 0.89 | (h) | | | 0.90 | (h) | | | 0.87 | (h) | | | 0.88 | (h) | | | 3.64 | | | | 218 | |
| | | | | | | | |
| | 9.72 | | | | (11.52 | ) | | | 19,236 | | | | 0.93 | | | | 0.94 | | | | 0.90 | | | | 0.91 | | | | 2.95 | | | | 158 | |
| | | | | | | | | | | | | | | | | | | | | | | | | | | | | | | | | | |
| | | | | | | | |
| | 12.32 | | | | 12.06 | | | | 129,723 | | | | 1.17 | | | | 1.18 | | | | 1.06 | | | | 1.07 | | | | 3.72 | | | | 408 | |
| | | | | | | | |
| | 11.54 | | | | 8.37 | | | | 122,269 | | | | 1.10 | | | | 1.11 | | | | 1.04 | | | | 1.05 | | | | 3.65 | | | | 344 | |
| | | | | | | | |
| | 11.33 | | | | (8.08 | ) | | | 120,215 | | | | 1.06 | (f)(i) | | | 1.07 | (f)(i) | | | 1.06 | (f)(i) | | | 1.07 | (f)(i) | | | 3.47 | | | | 254 | |
| | | | | | | | |
| | 12.71 | | | | 35.89 | | | | 136,346 | | | | 1.14 | (h) | | | 1.15 | (h) | | | 1.12 | (h) | | | 1.13 | (h) | | | 3.41 | | | | 218 | |
| | | | | | | | |
| | 9.70 | | | | (11.72 | ) | | | 96,148 | | | | 1.18 | | | | 1.19 | | | | 1.15 | | | | 1.16 | | | | 2.70 | | | | 158 | |
| | | | | | | | | | | | | | | | | | | | | | | | | | | | | | | | | | |
| | | | | | | | |
| | 12.30 | | | | 11.16 | | | | 10,259 | | | | 1.92 | | | | 1.93 | | | | 1.81 | | | | 1.82 | | | | 2.95 | | | | 408 | |
| | | | | | | | |
| | 11.53 | | | | 7.63 | | | | 13,403 | | | | 1.85 | | | | 1.86 | | | | 1.79 | | | | 1.80 | | | | 2.88 | | | | 344 | |
| | | | | | | | |
| | 11.32 | | | | (8.76 | ) | | | 15,021 | | | | 1.81 | (f)(i) | | | 1.82 | (f)(i) | | | 1.81 | (f)(i) | | | 1.82 | (f)(i) | | | 2.73 | | | | 254 | |
| | | | | | | | |
| | 12.72 | | | | 34.82 | | | | 18,882 | | | | 1.89 | (h) | | | 1.90 | (h) | | | 1.87 | (h) | | | 1.88 | (h) | | | 2.52 | | | | 218 | |
| | | | | | | | |
| | 9.70 | | | | (12.36 | ) | | | 46,644 | | | | 1.93 | | | | 1.94 | | | | 1.90 | | | | 1.91 | | | | 1.92 | | | | 158 | |
| | | | | | | | |
| | | | | | | | | | | | | | | | | | | | | | | | | | | | | | | | | | |
| | | | | | | | | | | | | | | | | | | | | | | | | | | | | | | | | | |
| | | | | | | | |
| $ | 11.04 | | | | 21.91 | % | | $ | 1,626,359 | | | | 0.77 | % | | | 0.78 | % | | | 0.75 | % | | | 0.76 | % | | | 3.77 | % | | | 67 | % |
| | | | | | | | |
| | 9.43 | | | | 18.81 | | | | 1,262,012 | | | | 0.76 | | | | 0.77 | | | | 0.75 | | | | 0.76 | | | | 4.72 | | | | 65 | |
| | | | | | | | |
| | 8.85 | | | | (19.72 | ) | | | 1,247,735 | | | | 0.76 | | | | 0.77 | | | | 0.75 | | | | 0.76 | | | | 5.13 | | | | 109 | |
| | | | | | | | |
| | 12.02 | | | | 56.09 | | | | 1,716,375 | | | | 0.79 | (j) | | | 0.85 | (j) | | | 0.78 | (j) | | | 0.84 | (j) | | | 2.66 | | | | 79 | |
| | | | | | | | |
| | 7.83 | | | | (18.91 | ) | | | 1,184,716 | | | | 0.76 | | | | 0.97 | | | | 0.75 | | | | 0.96 | | | | 2.70 | | | | 56 | |
| | | | | | | | | | | | | | | | | | | | | | | | | | | | | | | | | | |
| | | | | | | | |
| | 10.95 | | | | 21.83 | | | | 189,683 | | | | 0.87 | | | | 0.88 | | | | 0.85 | | | | 0.86 | | | | 3.72 | | | | 67 | |
| | | | | | | | |
| | 9.36 | | | | 18.62 | | | | 95,565 | | | | 0.86 | | | | 0.87 | | | | 0.85 | | | | 0.86 | | | | 4.55 | | | | 65 | |
| | | | | | | | |
| | 8.80 | | | | (19.78 | ) | | | 69,156 | | | | 0.86 | | | | 0.87 | | | | 0.85 | | | | 0.86 | | | | 4.73 | | | | 109 | |
| | | | | | | | |
| | 11.97 | | | | 55.95 | | | | 59,609 | | | | 0.89 | (k) | | | 0.95 | (k) | | | 0.88 | (k) | | | 0.94 | (k) | | | 2.71 | | | | 79 | |
| | | | | | | | |
| | 7.80 | | | | (19.13 | ) | | | 3,070 | | | | 0.86 | | | | 1.07 | | | | 0.85 | | | | 1.06 | | | | 3.58 | | | | 56 | |
| | | | | | | | | | | | | | | | | | | | | | | | | | | | | | | | | | |
| | | | | | | | |
| | 10.78 | | | | 21.59 | | | | 29,125 | | | | 1.12 | | | | 1.13 | | | | 1.10 | | | | 1.11 | | | | 3.34 | | | | 67 | |
| | | | | | | | |
| | 9.23 | | | | 18.35 | | | | 25,955 | | | | 1.11 | | | | 1.12 | | | | 1.10 | | | | 1.11 | | | | 4.63 | | | | 65 | |
| | | | | | | | |
| | 8.70 | | | | (19.97 | ) | | | 12,611 | | | | 1.11 | | | | 1.12 | | | | 1.10 | | | | 1.11 | | | | 4.43 | | | | 109 | |
| | | | | | | | |
| | 11.86 | | | | 55.42 | | | | 15,798 | | | | 1.14 | (k) | | | 1.20 | (k) | | | 1.13 | (k) | | | 1.19 | (k) | | | 2.24 | | | | 79 | |
| | | | | | | | |
| | 7.75 | | | | (19.27 | ) | | | 7,628 | | | | 1.11 | | | | 1.32 | | | | 1.10 | | | | 1.31 | | | | 2.61 | | | | 56 | |
| | | | | | | | |
| | | | | | | | | | | | | | | | | | | | | | | | | | | | | | | | | | |
| | | | | | | | | | | | | | | | | | | | | | | | | | | | | | | | | | |
| | | | | | | | |
| $ | 9.59 | | | | 12.18 | % | | $ | 90,712 | | | | 0.00 | % | | | 0.55 | % | | | 0.00 | % | | | 0.55 | % | | | 6.07 | % | | | 10 | % |
| | | | | | | | |
| | 9.35 | | | | 15.90 | | | | 76,470 | | | | 0.00 | | | | 0.56 | | | | 0.00 | | | | 0.56 | | | | 1.86 | | | | 14 | |
| | | | | | | | |
| | 8.78 | | | | (15.58 | ) | | | 69,094 | | | | 0.00 | | | | 0.56 | | | | 0.00 | | | | 0.56 | | | | 10.87 | | | | 7 | |
| | | | | | | | |
| | 11.65 | | | | 44.96 | | | | 80,502 | | | | 0.02 | (l) | | | 0.63 | (l) | | | 0.02 | (l) | | | 0.63 | (l) | | | 2.08 | | | | 18 | |
| | | | | | | | |
| | 8.20 | | | | (14.73 | ) | | | 53,191 | | | | 0.02 | | | | 0.78 | | | | 0.01 | | | | 0.77 | | | | 4.03 | | | | 34 | |
| | | | | | | | | | | | | | | | | | | | | | | | | | | | | | | | | | |
| | | | | | | | |
| | 9.60 | | | | 11.99 | | | | 114 | | | | 0.10 | | | | 0.65 | | | | 0.10 | | | | 0.65 | | | | 6.19 | | | | 10 | |
| | | | | | | | |
| | 9.37 | | | | 15.82 | | | | 117 | | | | 0.10 | | | | 0.66 | | | | 0.10 | | | | 0.66 | | | | 1.76 | | | | 14 | |
| | | | | | | | |
| | 8.80 | | | | (15.57 | ) | | | 307 | | | | 0.10 | | | | 0.66 | | | | 0.10 | | | | 0.66 | | | | 13.36 | | | | 7 | |
| | | | | | | | |
| | 11.67 | | | | 44.90 | | | | 154 | | | | 0.12 | (j) | | | 0.73 | (j) | | | 0.12 | (j) | | | 0.73 | (j) | | | 0.18 | | | | 18 | |
| | | | | | | | |
| | 8.18 | | | | (14.74 | ) | | | 67 | | | | 0.12 | | | | 0.88 | | | | 0.11 | | | | 0.87 | | | | 3.14 | | | | 34 | |
| | | | | | | | | | | | |
| | | | ANNUAL FINANCIAL AND OTHER INFORMATION | | | | | | | JUNE 30, 2024 | | | 9 |
| | | | |
| Financial Highlights | | (Cont.) | | |
| | | | | | | | | | | | | | | | | | | | | | | | | | | | | | | | |
| | | | | | Investment Operations | | | Less Distributions(c) | |
| | | | | | | | | | | | | | | | | | | | | | | | | |
| Selected Per Share Data for the Year or Period Ended^: | | Net Asset Value
Beginning of
Year or
Period(a) | | | Net Investment
Income (Loss)(b) | | |
Net Realized/
Unrealized
Gain (Loss) | | | Total | | | From Net
Investment
Income | | | From Net
Realized
Capital Gains | | | Tax Basis
Return of
Capital | | | Total | |
| | | | | | | | |
PIMCO RAE Global ex-US Fund (Cont.) | | | | | | | | | | | | | | | | | | | | | | | | | | | | | | | | |
| Class A | | | | | | | | | | | | | | | | | | | | | | | | | | | | | | | | |
| | | | | | | | |
06/30/2024 | | $ | 9.15 | | | $ | 0.50 | | | $ | 0.53 | | | $ | 1.03 | | | $ | (0.47 | ) | | $ | (0.37 | ) | | $ | 0.00 | | | $ | (0.84 | ) |
| | | | | | | | |
06/30/2023 | | | 8.62 | | | | 0.15 | | | | 1.12 | | | | 1.27 | | | | (0.14 | ) | | | (0.60 | ) | | | 0.00 | | | | (0.74 | ) |
| | | | | | | | |
06/30/2022 | | | 11.48 | | | | 1.08 | | | | (2.74 | ) | | | (1.66 | ) | | | (1.20 | ) | | | 0.00 | | | | 0.00 | | | | (1.20 | ) |
| | | | | | | | |
06/30/2021 | | | 8.10 | | | | 0.18 | | | | 3.39 | | | | 3.57 | | | | (0.19 | ) | | | 0.00 | | | | 0.00 | | | | (0.19 | ) |
| | | | | | | | |
06/30/2020 | | | 10.14 | | | | 0.41 | | | | (1.81 | ) | | | (1.40 | ) | | | (0.36 | ) | | | (0.28 | ) | | | 0.00 | | | | (0.64 | ) |
| | | | | | | | |
PIMCO RAE International Fund | | | | | | | | | | | | | | | | | | | | | | | | | | | | | | | | |
| Institutional Class | | | | | | | | | | | | | | | | | | | | | | | | | | | | | | | | |
| | | | | | | | |
06/30/2024 | | $ | 8.09 | | | $ | 0.27 | | | $ | 0.44 | | | $ | 0.71 | | | $ | (0.47 | ) | | $ | (0.32 | ) | | $ | 0.00 | | | $ | (0.79 | ) |
| | | | | | | | |
06/30/2023 | | | 7.55 | | | | 0.25 | | | | 0.82 | | | | 1.07 | | | | (0.17 | ) | | | (0.36 | ) | | | 0.00 | | | | (0.53 | ) |
| | | | | | | | |
06/30/2022 | | | 11.23 | | | | 0.36 | | | | (1.69 | ) | | | (1.33 | ) | | | (0.46 | ) | | | (1.89 | ) | | | 0.00 | | | | (2.35 | ) |
| | | | | | | | |
06/30/2021 | | | 8.11 | | | | 0.27 | | | | 3.08 | | | | 3.35 | | | | (0.23 | ) | | | 0.00 | | | | 0.00 | | | | (0.23 | ) |
| | | | | | | | |
06/30/2020 | | | 9.74 | | | | 0.23 | | | | (1.45 | ) | | | (1.22 | ) | | | (0.41 | ) | | | 0.00 | | | | 0.00 | | | | (0.41 | ) |
| I-2 | | | | | | | | | | | | | | | | | | | | | | | | | | | | | | | | |
| | | | | | | | |
06/30/2024 | | | 8.04 | | | | 0.24 | | | | 0.47 | | | | 0.71 | | | | (0.47 | ) | | | (0.32 | ) | | | 0.00 | | | | (0.79 | ) |
| | | | | | | | |
06/30/2023 | | | 7.51 | | | | 0.26 | | | | 0.80 | | | | 1.06 | | | | (0.17 | ) | | | (0.36 | ) | | | 0.00 | | | | (0.53 | ) |
| | | | | | | | |
06/30/2022 | | | 11.17 | | | | 0.35 | | | | (1.69 | ) | | | (1.34 | ) | | | (0.43 | ) | | | (1.89 | ) | | | 0.00 | | | | (2.32 | ) |
| | | | | | | | |
06/30/2021 | | | 8.07 | | | | 0.40 | | | | 2.92 | | | | 3.32 | | | | (0.22 | ) | | | 0.00 | | | | 0.00 | | | | (0.22 | ) |
| | | | | | | | |
06/30/2020 | | | 9.71 | | | | 0.21 | | | | (1.43 | ) | | | (1.22 | ) | | | (0.42 | ) | | | 0.00 | | | | 0.00 | | | | (0.42 | ) |
| Class A | | | | | | | | | | | | | | | | | | | | | | | | | | | | | | | | |
| | | | | | | | |
06/30/2024 | | | 7.90 | | | | 0.23 | | | | 0.45 | | | | 0.68 | | | | (0.46 | ) | | | (0.32 | ) | | | 0.00 | | | | (0.78 | ) |
| | | | | | | | |
06/30/2023 | | | 7.39 | | | | 0.19 | | | | 0.82 | | | | 1.01 | | | | (0.14 | ) | | | (0.36 | ) | | | 0.00 | | | | (0.50 | ) |
| | | | | | | | |
06/30/2022 | | | 11.06 | | | | 0.32 | | | | (1.66 | ) | | | (1.34 | ) | | | (0.44 | ) | | | (1.89 | ) | | | 0.00 | | | | (2.33 | ) |
| | | | | | | | |
06/30/2021 | | | 8.01 | | | | 0.30 | | | | 2.96 | | | | 3.26 | | | | (0.21 | ) | | | 0.00 | | | | 0.00 | | | | (0.21 | ) |
| | | | | | | | |
06/30/2020 | | | 9.64 | | | | 0.18 | | | | (1.41 | ) | | | (1.23 | ) | | | (0.40 | ) | | | 0.00 | | | | 0.00 | | | | (0.40 | ) |
| | | | | | | | |
PIMCO RAE US Fund | | | | | | | | | | | | | | | | | | | | | | | | | | | | | | | | |
| Institutional Class | | | | | | | | | | | | | | | | | | | | | | | | | | | | | | | | |
| | | | | | | | |
06/30/2024 | | $ | 12.66 | | | $ | 0.25 | | | $ | 2.55 | | | $ | 2.80 | | | $ | (0.40 | ) | | $ | (0.49 | ) | | $ | 0.00 | | | $ | (0.89 | ) |
| | | | | | | | |
06/30/2023 | | | 11.81 | | | | 0.29 | | | | 1.53 | | | | 1.82 | | | | (0.14 | ) | | | (0.83 | ) | | | 0.00 | | | | (0.97 | ) |
| | | | | | | | |
06/30/2022 | | | 14.03 | | | | 0.26 | | | | (1.13 | ) | | | (0.87 | ) | | | (0.17 | ) | | | (1.18 | ) | | | 0.00 | | | | (1.35 | ) |
| | | | | | | | |
06/30/2021 | | | 9.72 | | | | 0.25 | | | | 4.44 | | | | 4.69 | | | | (0.28 | ) | | | (0.10 | ) | | | 0.00 | | | | (0.38 | ) |
| | | | | | | | |
06/30/2020 | | | 11.09 | | | | 0.28 | | | | (1.08 | ) | | | (0.80 | ) | | | (0.32 | ) | | | (0.25 | ) | | | 0.00 | | | | (0.57 | ) |
| I-2 | | | | | | | | | | | | | | | | | | | | | | | | | | | | | | | | |
| | | | | | | | |
06/30/2024 | | | 12.55 | | | | 0.23 | | | | 2.54 | | | | 2.77 | | | | (0.40 | ) | | | (0.49 | ) | | | 0.00 | | | | (0.89 | ) |
| | | | | | | | |
06/30/2023 | | | 11.72 | | | | 0.28 | | | | 1.52 | | | | 1.80 | | | | (0.14 | ) | | | (0.83 | ) | | | 0.00 | | | | (0.97 | ) |
| | | | | | | | |
06/30/2022 | | | 13.94 | | | | 0.25 | | | | (1.13 | ) | | | (0.88 | ) | | | (0.16 | ) | | | (1.18 | ) | | | 0.00 | | | | (1.34 | ) |
| | | | | | | | |
06/30/2021 | | | 9.67 | | | | 0.23 | | | | 4.41 | | | | 4.64 | | | | (0.27 | ) | | | (0.10 | ) | | | 0.00 | | | | (0.37 | ) |
| | | | | | | | |
06/30/2020 | | | 11.04 | | | | 0.27 | | | | (1.08 | ) | | | (0.81 | ) | | | (0.31 | ) | | | (0.25 | ) | | | 0.00 | | | | (0.56 | ) |
| Class A | | | | | | | | | | | | | | | | | | | | | | | | | | | | | | | | |
| | | | | | | | |
06/30/2024 | | | 12.29 | | | | 0.19 | | | | 2.48 | | | | 2.67 | | | | (0.38 | ) | | | (0.49 | ) | | | 0.00 | | | | (0.87 | ) |
| | | | | | | | |
06/30/2023 | | | 11.52 | | | | 0.23 | | | | 1.49 | | | | 1.72 | | | | (0.12 | ) | | | (0.83 | ) | | | 0.00 | | | | (0.95 | ) |
| | | | | | | | |
06/30/2022 | | | 13.75 | | | | 0.21 | | | | (1.11 | ) | | | (0.90 | ) | | | (0.15 | ) | | | (1.18 | ) | | | 0.00 | | | | (1.33 | ) |
| | | | | | | | |
06/30/2021 | | | 9.55 | | | | 0.19 | | | | 4.37 | | | | 4.56 | | | | (0.26 | ) | | | (0.10 | ) | | | 0.00 | | | | (0.36 | ) |
| | | | | | | | |
06/30/2020 | | | 10.93 | | | | 0.23 | | | | (1.07 | ) | | | (0.84 | ) | | | (0.29 | ) | | | (0.25 | ) | | | 0.00 | | | | (0.54 | ) |
| | | | | | | | |
PIMCO RAE US Small Fund | | | | | | | | | | | | | | | | | | | | | | | | | | | | | | | | |
| Institutional Class | | | | | | | | | | | | | | | | | | | | | | | | | | | | | | | | |
| | | | | | | | |
06/30/2024 | | $ | 8.55 | | | $ | 0.12 | | | $ | 2.08 | | | $ | 2.20 | | | $ | (0.15 | ) | | $ | 0.00 | | | $ | 0.00 | | | $ | (0.15 | ) |
| | | | | | | | |
06/30/2023 | | | 8.27 | | | | 0.17 | | | | 0.91 | | | | 1.08 | | | | (0.11 | ) | | | (0.69 | ) | | | 0.00 | | | | (0.80 | ) |
| | | | | | | | |
06/30/2022 | | | 15.90 | | | | 0.15 | | | | (1.62 | ) | | | (1.47 | ) | | | (0.20 | ) | | | (5.96 | ) | | | 0.00 | | | | (6.16 | ) |
| | | | | | | | |
06/30/2021 | | | 8.80 | | | | 0.09 | | | | 8.05 | | | | 8.14 | | | | (0.17 | ) | | | (0.87 | ) | | | 0.00 | | | | (1.04 | ) |
| | | | | | | | |
06/30/2020 | | | 10.72 | | | | 0.14 | | | | (1.88 | ) | | | (1.74 | ) | | | (0.18 | ) | | | 0.00 | | | | 0.00 | | | | (0.18 | ) |
| I-2 | | | | | | | | | | | | | | | | | | | | | | | | | | | | | | | | |
| | | | | | | | |
06/30/2024 | | | 8.44 | | | | 0.10 | | | | 2.05 | | | | 2.15 | | | | (0.14 | ) | | | 0.00 | | | | 0.00 | | | | (0.14 | ) |
| | | | | | | | |
06/30/2023 | | | 8.18 | | | | 0.14 | | | | 0.92 | | | | 1.06 | | | | (0.11 | ) | | | (0.69 | ) | | | 0.00 | | | | (0.80 | ) |
| | | | | | | | |
06/30/2022 | | | 15.80 | | | | 0.15 | | | | (1.61 | ) | | | (1.46 | ) | | | (0.20 | ) | | | (5.96 | ) | | | 0.00 | | | | (6.16 | ) |
| | | | | | | | |
06/30/2021 | | | 8.76 | | | | 0.02 | | | | 8.06 | | | | 8.08 | | | | (0.17 | ) | | | (0.87 | ) | | | 0.00 | | | | (1.04 | ) |
| | | | | | | | |
06/30/2020 | | | 10.67 | | | | 0.16 | | | | (1.90 | ) | | | (1.74 | ) | | | (0.17 | ) | | | 0.00 | | | | 0.00 | | | | (0.17 | ) |
| | | | | | |
| 10 | | PIMCO EQUITY SERIES | | | See Accompanying Notes | |
| | | | | | | | | | | | | | | | | | | | | | | | | | | | | | | | | | |
| | | | | | | Ratios/Supplemental Data | |
| | | | | | | | | | Ratios to Average Net Assets(e) | | | | |
Net Asset
Value End of
Year or
Period(a) | | | Total Return(d) | | | Net Assets
End of Year or
Period (000s) | | | Expenses | | | Expenses
Excluding
Waivers | | | Expenses
Excluding
Interest
Expense | | | Expenses
Excluding
Interest
Expense and
Waivers | | | Net
Investment
Income (Loss) | | | Portfolio
Turnover
Rate | |
| | | | | | | | |
| | | | | | | | | | | | | | | | | | | | | | | | | | | | | | | | | | |
| | | | | | | | | | | | | | | | | | | | | | | | | | | | | | | | | | |
| | | | | | | | |
| $ | 9.34 | | | | 11.70 | % | | $ | 16,445 | | | | 0.35 | % | | | 0.90 | % | | | 0.35 | % | | | 0.90 | % | | | 5.47 | % | | | 10 | % |
| | | | | | | | |
| | 9.15 | | | | 15.57 | | | | 15,625 | | | | 0.35 | | | | 0.91 | | | | 0.35 | | | | 0.91 | | | | 1.72 | | | | 14 | |
| | | | | | | | |
| | 8.62 | | | | (15.87 | ) | | | 9,334 | | | | 0.35 | | | | 0.91 | | | | 0.35 | | | | 0.91 | | | | 10.37 | | | | 7 | |
| | | | | | | | |
| | 11.48 | | | | 44.43 | | | | 11,523 | | | | 0.37 | (j) | | | 0.98 | (j) | | | 0.37 | (j) | | | 0.98 | (j) | | | 1.88 | | | | 18 | |
| | | | | | | | |
| | 8.10 | | | | (15.01 | ) | | | 11,252 | | | | 0.37 | | | | 1.13 | | | | 0.36 | | | | 1.12 | | | | 4.66 | | | | 34 | |
| | | | | | | | |
| | | | | | | | | | | | | | | | | | | | | | | | | | | | | | | | | | |
| | | | | | | | | | | | | | | | | | | | | | | | | | | | | | | | | | |
| | | | | | | | |
| $ | 8.01 | | | | 9.14 | % | | $ | 474,743 | | | | 0.51 | % | | | 0.52 | % | | | 0.50 | % | | | 0.51 | % | | | 3.32 | % | | | 49 | % |
| | | | | | | | |
| | 8.09 | | | | 14.91 | | | | 561,420 | | | | 0.51 | | | | 0.52 | | | | 0.50 | | | | 0.51 | | | | 3.29 | | | | 94 | |
| | | | | | | | |
| | 7.55 | | | | (14.14 | ) | | | 503,685 | | | | 0.51 | | | | 0.52 | | | | 0.50 | | | | 0.51 | | | | 3.77 | | | | 58 | |
| | | | | | | | |
| | 11.23 | | | | 41.64 | | | | 1,025,896 | | | | 0.51 | (m) | | | 0.55 | (m) | | | 0.51 | (m) | | | 0.55 | (m) | | | 2.79 | | | | 87 | |
| | | | | | | | |
| | 8.11 | | | | (13.27 | ) | | | 756,178 | | | | 0.51 | | | | 0.62 | | | | 0.50 | | | | 0.61 | | | | 2.65 | | | | 93 | |
| | | | | | | | | | | | | | | | | | | | | | | | | | | | | | | | | | |
| | | | | | | | |
| | 7.96 | | | | 9.14 | | | | 7,785 | | | | 0.61 | | | | 0.62 | | | | 0.60 | | | | 0.61 | | | | 3.00 | | | | 49 | |
| | | | | | | | |
| | 8.04 | | | | 14.78 | | | | 10,660 | | | | 0.61 | | | | 0.62 | | | | 0.60 | | | | 0.61 | | | | 3.36 | | | | 94 | |
| | | | | | | | |
| | 7.51 | | | | (14.25 | ) | | | 11,264 | | | | 0.61 | | | | 0.62 | | | | 0.60 | | | | 0.61 | | | | 3.44 | | | | 58 | |
| | | | | | | | |
| | 11.17 | | | | 41.51 | | | | 25,494 | | | | 0.61 | (n) | | | 0.65 | (n) | | | 0.61 | (n) | | | 0.65 | (n) | | | 3.66 | | | | 87 | |
| | | | | | | | |
| | 8.07 | | | | (13.40 | ) | | | 841 | | | | 0.61 | | | | 0.72 | | | | 0.60 | | | | 0.71 | | | | 2.39 | | | | 93 | |
| | | | | | | | | | | | | | | | | | | | | | | | | | | | | | | | | | |
| | | | | | | | |
| | 7.80 | | | | 8.93 | | | | 5,292 | | | | 0.86 | | | | 0.87 | | | | 0.85 | | | | 0.86 | | | | 2.98 | | | | 49 | |
| | | | | | | | |
| | 7.90 | | | | 14.42 | | | | 5,285 | | | | 0.86 | | | | 0.87 | | | | 0.85 | | | | 0.86 | | | | 2.51 | | | | 94 | |
| | | | | | | | |
| | 7.39 | | | | (14.41 | ) | | | 21,550 | | | | 0.86 | | | | 0.87 | | | | 0.85 | | | | 0.86 | | | | 3.49 | | | | 58 | |
| | | | | | | | |
| | 11.06 | | | | 41.10 | | | | 25,298 | | | | 0.86 | (n) | | | 0.90 | (n) | | | 0.86 | (n) | | | 0.90 | (n) | | | 2.87 | | | | 87 | |
| | | | | | | | |
| | 8.01 | | | | (13.57 | ) | | | 3,258 | | | | 0.86 | | | | 0.97 | | | | 0.85 | | | | 0.96 | | | | 2.05 | | | | 93 | |
| | | | | | | | |
| | | | | | | | | | | | | | | | | | | | | | | | | | | | | | | | | | |
| | | | | | | | | | | | | | | | | | | | | | | | | | | | | | | | | | |
| | | | | | | | |
| $ | 14.57 | | | | 23.13 | % | | $ | 1,372,233 | | | | 0.40 | % | | | 0.41 | % | | | 0.40 | % | | | 0.41 | % | | | 1.84 | % | | | 73 | % |
| | | | | | | | |
| | 12.66 | | | | 15.73 | | | | 1,091,632 | | | | 0.40 | | | | 0.41 | | | | 0.40 | | | | 0.41 | | | | 2.33 | | | | 77 | |
| | | | | | | | |
| | 11.81 | | | | (7.16 | ) | | | 778,671 | | | | 0.40 | | | | 0.41 | | | | 0.40 | | | | 0.41 | | | | 1.94 | | | | 69 | |
| | | | | | | | |
| | 14.03 | | | | 48.99 | | | | 915,231 | | | | 0.40 | (o) | | | 0.44 | (o) | | | 0.40 | (o) | | | 0.44 | (o) | | | 2.06 | | | | 54 | |
| | | | | | | | |
| | 9.72 | | | | (8.03 | ) | | | 578,588 | | | | 0.41 | | | | 0.52 | | | | 0.40 | | | | 0.51 | | | | 2.60 | | | | 34 | |
| | | | | | | | | | | | | | | | | | | | | | | | | | | | | | | | | | |
| | | | | | | | |
| | 14.43 | | | | 23.04 | | | | 38,700 | | | | 0.50 | | | | 0.51 | | | | 0.50 | | | | 0.51 | | | | 1.76 | | | | 73 | |
| | | | | | | | |
| | 12.55 | | | | 15.63 | | | | 56,292 | | | | 0.50 | | | | 0.51 | | | | 0.50 | | | | 0.51 | | | | 2.23 | | | | 77 | |
| | | | | | | | |
| | 11.72 | | | | (7.25 | ) | | | 44,350 | | | | 0.50 | | | | 0.51 | | | | 0.50 | | | | 0.51 | | | | 1.87 | | | | 69 | |
| | | | | | | | |
| | 13.94 | | | | 48.77 | | | | 39,056 | | | | 0.50 | (p) | | | 0.54 | (p) | | | 0.50 | (p) | | | 0.54 | (p) | | | 1.92 | | | | 54 | |
| | | | | | | | |
| | 9.67 | | | | (8.08 | ) | | | 16,970 | | | | 0.51 | | | | 0.62 | | | | 0.50 | | | | 0.61 | | | | 2.51 | | | | 34 | |
| | | | | | | | | | | | | | | | | | | | | | | | | | | | | | | | | | |
| | | | | | | | |
| | 14.09 | | | | 22.70 | | | | 49,038 | | | | 0.80 | | | | 0.81 | | | | 0.80 | | | | 0.81 | | | | 1.44 | | | | 73 | |
| | | | | | | | |
| | 12.29 | | | | 15.23 | | | | 19,529 | | | | 0.80 | | | | 0.81 | | | | 0.80 | | | | 0.81 | | | | 1.92 | | | | 77 | |
| | | | | | | | |
| | 11.52 | | | | (7.54 | ) | | | 15,623 | | | | 0.80 | | | | 0.81 | | | | 0.80 | | | | 0.81 | | | | 1.57 | | | | 69 | |
| | | | | | | | |
| | 13.75 | | | | 48.44 | | | | 12,212 | | | | 0.80 | (n) | | | 0.84 | (n) | | | 0.80 | (n) | | | 0.84 | (n) | | | 1.65 | | | | 54 | |
| | | | | | | | |
| | 9.55 | | | | (8.41 | ) | | | 7,432 | | | | 0.81 | | | | 0.92 | | | | 0.80 | | | | 0.91 | | | | 2.21 | | | | 34 | |
| | | | | | | | |
| | | | | | | | | | | | | | | | | | | | | | | | | | | | | | | | | | |
| | | | | | | | | | | | | | | | | | | | | | | | | | | | | | | | | | |
| | | | | | | | |
| $ | 10.60 | | | | 25.82 | % | | $ | 837,907 | | | | 0.50 | % | | | 0.51 | % | | | 0.50 | % | | | 0.51 | % | | | 1.27 | % | | | 62 | % |
| | | | | | | | |
| | 8.55 | | | | 13.36 | | | | 440,423 | | | | 0.50 | | | | 0.51 | | | | 0.50 | | | | 0.51 | | | | 1.95 | | | | 92 | |
| | | | | | | | |
| | 8.27 | | | | (13.65 | ) | | | 274,652 | | | | 0.50 | | | | 0.51 | | | | 0.50 | | | | 0.51 | | | | 1.33 | | | | 131 | |
| | | | | | | | |
| | 15.90 | | | | 97.65 | | | | 331,165 | | | | 0.53 | (o) | | | 0.56 | (o) | | | 0.51 | (o) | | | 0.54 | (o) | | | 0.79 | | | | 118 | |
| | | | | | | | |
| | 8.80 | | | | (16.64 | ) | | | 288,592 | | | | 0.53 | | | | 0.63 | | | | 0.52 | | | | 0.62 | | | | 1.50 | | | | 202 | |
| | | | | | | | | | | | | | | | | | | | | | | | | | | | | | | | | | |
| | | | | | | | |
| | 10.45 | | | | 25.63 | | | | 199,705 | | | | 0.60 | | | | 0.61 | | | | 0.60 | | | | 0.61 | | | | 1.10 | | | | 62 | |
| | | | | | | | |
| | 8.44 | | | | 13.22 | | | | 87,529 | | | | 0.60 | | | | 0.61 | | | | 0.60 | | | | 0.61 | | | | 1.72 | | | | 92 | |
| | | | | | | | |
| | 8.18 | | | | (13.68 | ) | | | 47,933 | | | | 0.60 | | | | 0.61 | | | | 0.60 | | | | 0.61 | | | | 1.39 | | | | 131 | |
| | | | | | | | |
| | 15.80 | | | | 97.30 | | | | 6,427 | | | | 0.63 | (p) | | | 0.66 | (p) | | | 0.61 | (p) | | | 0.64 | (p) | | | 0.17 | | | | 118 | |
| | | | | | | | |
| | 8.76 | | | | (16.67 | ) | | | 883 | | | | 0.63 | | | | 0.73 | | | | 0.62 | | | | 0.72 | | | | 1.53 | | | | 202 | |
| | | | | | | | | | | | |
| | | | ANNUAL FINANCIAL AND OTHER INFORMATION | | | | | | | JUNE 30, 2024 | | | 11 |
| | | | |
| Financial Highlights | | (Cont.) | | |
| | | | | | | | | | | | | | | | | | | | | | | | | | | | | | | | |
| | | | | | Investment Operations | | | Less Distributions(c) | |
| | | | | | | | | | | | | | | | | | | | | | | | | |
| Selected Per Share Data for the Year or Period Ended^: | | Net Asset Value
Beginning of
Year or
Period(a) | | | Net Investment
Income (Loss)(b) | | |
Net Realized/
Unrealized
Gain (Loss) | | | Total | | | From Net
Investment
Income | | | From Net
Realized
Capital Gains | | | Tax Basis
Return of
Capital | | | Total | |
| | | | | | | | |
PIMCO RAE US Small Fund (Cont.) | | | | | | | | | | | | | | | | | | | | | | | | | | | | | | | | |
| Class A | | | | | | | | | | | | | | | | | | | | | | | | | | | | | | | | |
| | | | | | | | |
06/30/2024 | | $ | 8.23 | | | $ | 0.08 | | | $ | 1.98 | | | $ | 2.06 | | | $ | (0.13 | ) | | $ | 0.00 | | | $ | 0.00 | | | $ | (0.13 | ) |
| | | | | | | | |
06/30/2023 | | | 8.00 | | | | 0.13 | | | | 0.89 | | | | 1.02 | | | | (0.10 | ) | | | (0.69 | ) | | | 0.00 | | | | (0.79 | ) |
| | | | | | | | |
06/30/2022 | | | 15.62 | | | | 0.12 | | | | (1.60 | ) | | | (1.48 | ) | | | (0.18 | ) | | | (5.96 | ) | | | 0.00 | | | | (6.14 | ) |
| | | | | | | | |
06/30/2021 | | | 8.68 | | | | (0.04 | ) | | | 8.01 | | | | 7.97 | | | | (0.16 | ) | | | (0.87 | ) | | | 0.00 | | | | (1.03 | ) |
| | | | | | | | |
06/30/2020 | | | 10.60 | | | | 0.12 | | | | (1.89 | ) | | | (1.77 | ) | | | (0.15 | ) | | | 0.00 | | | | 0.00 | | | | (0.15 | ) |
| ^ | A zero balance may reflect actual amounts rounding to less than $0.01 or 0.01%. |
| (a) | Includes adjustments required by U.S. GAAP and may differ from net asset values and performance reported elsewhere by the Funds. |
| (b) | Per share amounts based on average number of shares outstanding during the year or period. |
| (c) | The tax characterization of distributions is determined in accordance with Federal income tax regulations. See Note 2, Distributions to Shareholders, in the Notes to Financial Statements for more information. |
| (d) | Includes adjustments required by U.S. GAAP and may differ from net asset values and performance reported elsewhere by the Funds. Additionally, excludes initial sales charges and contingent deferred sales charges. |
| (e) | Ratios shown do not include expenses of the investment companies in which a Fund may invest. See Note 9, Fees and Expenses, in the Notes to Financial Statements for more information regarding the expenses and any applicable fee waivers associated with these investments. |
| (f) | Effective November 1, 2021, the Fund’s Investment advisory fee was decreased by 0.01% to an annual rate of 0.44%. |
| (g) | Effective November 1, 2021, the Class’s Supervisory and Administrative fees was decreased by 0.05% to an annual rate of 0.25%. |
| (h) | Effective October 1, 2020, the Fund’s Investment advisory fee was decreased by 0.04% to an annual rate of 0.45%. |
| (i) | Effective November 1, 2021, the Class’s Supervisory and Administrative fees was decreased by 0.05% to an annual rate of 0.35%. |
| (j) | Effective November 1, 2020, the Class’s Supervisory and Administrative fee was decreased by 0.20% to an annual rate of 0.25%. |
| (k) | Effective November 1, 2020, the Class’s Supervisory and Administrative fee was decreased by 0.20% to an annual rate of 0.35%. |
| (l) | Effective November 1, 2020, the Class’s Supervisory and Administrative fee was decreased by 0.20% to an annual rate of 0.15%. |
| (m) | Effective November 1, 2020, the Class’s Supervisory and Administrative fee was decreased by 0.10% to an annual rate of 0.20%. |
| (n) | Effective November 1, 2020, the Class’s Supervisory and Administrative fee was decreased by 0.10% to an annual rate of 0.30%. |
| (o) | Effective November 1, 2020, the Class’s Supervisory and Administrative fee was decreased by 0.10% to an annual rate of 0.15%. |
| (p) | Effective November 1, 2020, the Class’s Supervisory and Administrative fee was decreased by 0.10% to an annual rate of 0.25%. |
| | | | | | |
| 12 | | PIMCO EQUITY SERIES | | | See Accompanying Notes | |
| | | | | | | | | | | | | | | | | | | | | | | | | | | | | | | | | | |
| | | | | | | Ratios/Supplemental Data | |
| | | | | | | | | | Ratios to Average Net Assets(e) | | | | |
Net Asset
Value End of
Year or
Period(a) | | | Total Return(d) | | | Net Assets
End of Year or
Period (000s) | | | Expenses | | | Expenses
Excluding
Waivers | | | Expenses
Excluding
Interest
Expense | | | Expenses
Excluding
Interest
Expense and
Waivers | | | Net
Investment
Income (Loss) | | | Portfolio
Turnover
Rate | |
| | | | | | | | |
| | | | | | | | | | | | | | | | | | | | | | | | | | | | | | | | | | |
| | | | | | | | | | | | | | | | | | | | | | | | | | | | | | | | | | |
| | | | | | | | |
| $ | 10.16 | | | | 25.16 | % | | $ | 149,065 | | | | 0.90 | % | | | 0.91 | % | | | 0.90 | % | | | 0.91 | % | | | 0.87 | % | | | 62 | % |
| | | | | | | | |
| | 8.23 | | | | 12.95 | | | | 83,456 | | | | 0.90 | | | | 0.91 | | | | 0.90 | | | | 0.91 | | | | 1.53 | | | | 92 | |
| | | | | | | | |
| | 8.00 | | | | (13.98 | ) | | | 73,766 | | | | 0.90 | | | | 0.91 | | | | 0.90 | | | | 0.91 | | | | 1.11 | | | | 131 | |
| | | | | | | | |
| | 15.62 | | | | 96.82 | | | | 46,113 | | | | 0.93 | (n) | | | 0.96 | (n) | | | 0.91 | (n) | | | 0.94 | (n) | | | (0.27 | ) | | | 118 | |
| | | | | | | | |
| | 8.68 | | | | (16.99 | ) | | | 3,900 | | | | 0.93 | | | | 1.03 | | | | 0.92 | | | | 1.02 | | | | 1.22 | | | | 202 | |
| | | | | | | | | | | | |
| | | | ANNUAL FINANCIAL AND OTHER INFORMATION | | | | | | | JUNE 30, 2024 | | | 13 |
| | | | |
| Statements of Assets and Liabilities | | | | |
| | | | | | | | | | | | | | | | | | | | | | | | |
| (Amounts in thousands†, except per share amounts) | | PIMCO
Dividend and
Income Fund | | | PIMCO
RAE Emerging
Markets Fund | | | PIMCO
RAE Global
ex-US Fund | | | PIMCO
RAE
International
Fund | | | PIMCO
RAE US Fund | | | PIMCO
RAE US Small
Fund | |
| | | | | | |
Assets: | | | | | | | | | | | | | | | | | | | | | | | | |
| | | | | | |
Investments, at value | | | | | | | | | | | | | | | | | | | | | | | | |
Investments in securities*^ | | $ | 214,960 | | | $ | 1,851,438 | | | $ | 117 | | | $ | 482,691 | | | $ | 1,458,784 | | | $ | 1,184,514 | |
Investments in Affiliates | | | 5,168 | | | | 5,565 | | | | 107,050 | | | | 16,688 | | | | 327 | | | | 9,797 | |
Financial Derivative Instruments | | | | | | | | | | | | | | | | | | | | | | | | |
Exchange-traded or centrally cleared | | | 258 | | | | 0 | | | | 0 | | | | 0 | | | | 0 | | | | 0 | |
Over the counter | | | 260 | | | | 0 | | | | 0 | | | | 0 | | | | 0 | | | | 0 | |
Cash | | | 88 | | | | 1,907 | | | | 0 | | | | 0 | | | | 1 | | | | 15,066 | |
Deposits with counterparty | | | 1,601 | | | | 0 | | | | 0 | | | | 0 | | | | 0 | | | | 0 | |
Foreign currency, at value | | | 398 | | | | 3,792 | | | | 0 | | | | 337 | | | | 0 | | | | 0 | |
Receivable for investments sold | | | 509 | | | | 5 | | | | 0 | | | | 0 | | | | 0 | | | | 0 | |
Receivable for investments in Affiliates sold | | | 0 | | | | 0 | | | | 43 | | | | 0 | | | | 0 | | | | 0 | |
Receivable for TBA investments sold | | | 42,760 | | | | 0 | | | | 0 | | | | 0 | | | | 0 | | | | 0 | |
Receivable for Fund shares sold | | | 38 | | | | 1,734 | | | | 69 | | | | 760 | | | | 556 | | | | 3,151 | |
Interest and/or dividends receivable | | | 1,189 | | | | 13,771 | | | | 0 | | | | 4,252 | | | | 1,582 | | | | 1,336 | |
Dividends receivable from Affiliates | | | 19 | | | | 0 | | | | 0 | | | | 0 | | | | 0 | | | | 0 | |
Reimbursement receivable from PIMCO | | | 2 | | | | 10 | | | | 46 | | | | 4 | | | | 9 | | | | 5 | |
Other assets | | | 0 | | | | 7 | | | | 0 | | | | 14 | | | | 0 | | | | 0 | |
Total Assets | | | 267,250 | | | | 1,878,229 | | | | 107,325 | | | | 504,746 | | | | 1,461,259 | | | | 1,213,869 | |
| | | | | | |
Liabilities: | | | | | | | | | | | | | | | | | | | | | | | | |
| | | | | | |
Financial Derivative Instruments | | | | | | | | | | | | | | | | | | | | | | | | |
Exchange-traded or centrally cleared | | $ | 149 | | | $ | 0 | | | $ | 0 | | | $ | 0 | | | $ | 0 | | | $ | 0 | |
Over the counter | | | 456 | | | | 0 | | | | 0 | | | | 0 | | | | 0 | | | | 0 | |
Payable for investments purchased | | | 2,000 | | | | 4,259 | | | | 0 | | | | 0 | | | | 0 | | | | 0 | |
Payable for investments in Affiliates purchased | | | 22 | | | | 0 | | | | 0 | | | | 0 | | | | 0 | | | | 0 | |
Payable for TBA investments purchased | | | 92,942 | | | | 0 | | | | 0 | | | | 0 | | | | 0 | | | | 0 | |
Payable upon return of securities loaned | | | 0 | | | | 7,471 | | | | 0 | | | | 16,688 | | | | 306 | | | | 24,862 | |
Deposits from counterparty | | | 50 | | | | 874 | | | | 0 | | | | 0 | | | | 0 | | | | 0 | |
Payable for Fund shares redeemed | | | 85 | | | | 386 | | | | 4 | | | | 46 | | | | 498 | | | | 1,829 | |
Accrued investment advisory fees | | | 58 | | | | 701 | | | | 33 | | | | 114 | | | | 278 | | | | 310 | |
Accrued supervisory and administrative fees | | | 45 | | | | 366 | | | | 14 | | | | 77 | | | | 176 | | | | 163 | |
Accrued distribution fees | | | 6 | | | | 0 | | | | 0 | | | | 0 | | | | 0 | | | | 0 | |
Accrued servicing fees | | | 27 | | | | 6 | | | | 3 | | | | 1 | | | | 9 | | | | 28 | |
Accrued taxes payable | | | 0 | | | | 18,999 | | | | 0 | | | | 0 | | | | 0 | | | | 0 | |
Other liabilities | | | 0 | | | | 0 | | | | 0 | | | | 0 | | | | 21 | | | | 0 | |
Total Liabilities | | | 95,840 | | | | 33,062 | | | | 54 | | | | 16,926 | | | | 1,288 | | | | 27,192 | |
| | | | | | |
Commitments and Contingent Liabilities^^ | | | | | | | | | | | | | | | | | | | | | | | | |
| | | | | | |
Net Assets | | $ | 171,410 | | | $ | 1,845,167 | | | $ | 107,271 | | | $ | 487,820 | | | $ | 1,459,971 | | | $ | 1,186,677 | |
| | | | | | |
Net Assets Consist of: | | | | | | | | | | | | | | | | | | | | | | | | |
| | | | | | |
Paid in capital | | $ | 250,314 | | | $ | 1,780,344 | | | $ | 110,506 | | | $ | 429,932 | | | $ | 1,038,820 | | | $ | 971,170 | |
Distributable earnings (accumulated loss) | | | (78,904 | ) | | | 64,823 | | | | (3,235 | ) | | | 57,888 | | | | 421,151 | | | | 215,507 | |
| | | | | | |
Net Assets | | $ | 171,410 | | | $ | 1,845,167 | | | $ | 107,271 | | | $ | 487,820 | | | $ | 1,459,971 | | | $ | 1,186,677 | |
| | | | | | |
Cost of investments in securities | | $ | 208,967 | | | $ | 1,569,513 | | | $ | 117 | | | $ | 418,101 | | | $ | 1,101,052 | | | $ | 961,622 | |
Cost of investments in Affiliates | | $ | 5,167 | | | $ | 5,565 | | | $ | 106,796 | | | $ | 16,688 | | | $ | 327 | | | $ | 9,797 | |
Cost of foreign currency held | | $ | 402 | | | $ | 3,906 | | | $ | 0 | | | $ | 338 | | | $ | 0 | | | $ | 0 | |
Cost or premiums of financial derivative instruments, net | | $ | (214 | ) | | $ | 0 | | | $ | 0 | | | $ | 0 | | | $ | 0 | | | $ | 0 | |
| | | | | | |
* Includes repurchase agreements of: | | $ | 546 | | | $ | 13,790 | | | $ | 117 | | | $ | 2,737 | | | $ | 3,342 | | | $ | 8,108 | |
| | | | | | |
^ Includes securities on loan of: | | $ | 0 | | | $ | 6,775 | | | $ | 0 | | | $ | 15,733 | | | $ | 298 | | | $ | 24,305 | |
| † | A zero balance may reflect actual amounts rounding to less than one thousand. |
| ^^ | See Note 9, Fees and Expenses, in the Notes to Financial Statements for more information. |
| | | | | | |
| 14 | | PIMCO EQUITY SERIES | | | See Accompanying Notes | |
| | | | | | | | | | | | | | | | | | | | | | | | |
| | | PIMCO
Dividend and
Income Fund | | | PIMCO
RAE Emerging
Markets Fund | | | PIMCO
RAE Global
ex-US Fund | | | PIMCO
RAE
International
Fund | | | PIMCO
RAE US Fund | | | PIMCO
RAE US Small
Fund | |
| | | | | | |
Net Assets: | | | | | | | | | | | | | | | | | | | | | | | | |
| | | | | | |
Institutional Class | | $ | 14,161 | | | $ | 1,626,359 | | | $ | 90,712 | | | $ | 474,743 | | | $ | 1,372,233 | | | $ | 837,907 | |
I-2 | | | 17,267 | | | | 189,683 | | | | 114 | | | | 7,785 | | | | 38,700 | | | | 199,705 | |
Class A | | | 129,723 | | | | 29,125 | | | | 16,445 | | | | 5,292 | | | | 49,038 | | | | 149,065 | |
Class C | | | 10,259 | | | | N/A | | | | N/A | | | | N/A | | | | N/A | | | | N/A | |
| | | | | | |
Shares Issued and Outstanding: | | | | | | | | | | | | | | | | | | | | | | | | |
| | | | | | |
Institutional Class | | | 1,146 | | | | 147,344 | | | | 9,460 | | | | 59,243 | | | | 94,193 | | | | 79,076 | |
I-2 | | | 1,395 | | | | 17,322 | | | | 12 | | | | 977 | | | | 2,682 | | | | 19,117 | |
Class A | | | 10,530 | | | | 2,702 | | | | 1,760 | | | | 679 | | | | 3,482 | | | | 14,671 | |
Class C | | | 834 | | | | N/A | | | | N/A | | | | N/A | | | | N/A | | | | N/A | |
| | | | | | |
Net Asset Value Per Share Outstanding(a): | | | | | | | | | | | | | | | | | | | | | | | | |
| | | | | | |
Institutional Class | | $ | 12.35 | | | $ | 11.04 | | | $ | 9.59 | | | $ | 8.01 | | | $ | 14.57 | | | $ | 10.60 | |
I-2 | | | 12.37 | | | | 10.95 | | | | 9.60 | | | | 7.96 | | | | 14.43 | | | | 10.45 | |
Class A | | | 12.32 | | | | 10.78 | | | | 9.34 | | | | 7.80 | | | | 14.09 | | | | 10.16 | |
Class C | | | 12.30 | | | | N/A | | | | N/A | | | | N/A | | | | N/A | | | | N/A | |
| (a) | Includes adjustments required by U.S. GAAP and may differ from net asset values and performance reported elsewhere by the Funds. |
| | | | | | | | | | | | |
| | | | ANNUAL FINANCIAL AND OTHER INFORMATION | | | | | | | JUNE 30, 2024 | | | 15 |
| | | | | | | | | | | | | | | | | | | | | | | | |
| Year Ended June 30, 2024 | |
| (Amounts in thousands†) | | PIMCO
Dividend and
Income Fund | | | PIMCO
RAE Emerging
Markets Fund | | | PIMCO
RAE Global
ex-US Fund | | | PIMCO
RAE
International
Fund | | | PIMCO
RAE US Fund | | | PIMCO
RAE US Small
Fund | |
| | | | | | |
Investment Income: | | | | | | | | | | | | | | | | | | | | | | | | |
| | | | | | |
Interest | | $ | 4,266 | | | $ | 268 | | | $ | 4 | | | $ | 58 | | | $ | 176 | | | $ | 175 | |
Dividends, net of foreign taxes* | | | 3,672 | | | | 70,783 | | | | 0 | | | | 18,692 | | | | 27,985 | | | | 13,993 | |
Dividends from Investments in Affiliates | | | 345 | | | | 0 | | | | 5,939 | | | | 0 | | | | 0 | | | | 0 | |
Securities lending income | | | 0 | | | | 361 | | | | 0 | | | | 192 | | | | 15 | | | | 428 | |
Total Income | | | 8,283 | | | | 71,412 | | | | 5,943 | | | | 18,942 | | | | 28,176 | | | | 14,596 | |
| | | | | | |
Expenses: | | | | | | | | | | | | | | | | | | | | | | | | |
| | | | | | |
Investment advisory fees | | | 747 | | | | 7,848 | | | | 394 | | | | 1,485 | | | | 3,128 | | | | 2,893 | |
Supervisory and administrative fees | | | 578 | | | | 4,074 | | | | 163 | | | | 1,005 | | | | 1,969 | | | | 1,521 | |
Distribution and/or servicing fees - Class A | | | 315 | | | | 53 | | | | 39 | | | | 13 | | | | 74 | | | | 273 | |
Distribution and/or servicing fees - Class C | | | 116 | | | | N/A | | | | N/A | | | | N/A | | | | N/A | | | | N/A | |
Trustee fees | | | 10 | | | | 82 | | | | 5 | | | | 30 | | | | 66 | | | | 40 | |
Interest expense | | | 183 | | | | 239 | | | | 0 | | | | 30 | | | | 0 | | | | 1 | |
Miscellaneous expense | | | 35 | | | | 77 | | | | 5 | | | | 24 | | | | 61 | | | | 41 | |
Total Expenses | | | 1,984 | | | | 12,373 | | | | 606 | | | | 2,587 | | | | 5,298 | | | | 4,769 | |
Waiver and/or Reimbursement by PIMCO | | | (10 | ) | | | (82 | ) | | | (548 | ) | | | (30 | ) | | | (66 | ) | | | (40 | ) |
Net Expenses | | | 1,974 | | | | 12,291 | | | | 58 | | | | 2,557 | | | | 5,232 | | | | 4,729 | |
| | | | | | |
Net Investment Income (Loss) | | | 6,309 | | | | 59,121 | | | | 5,885 | | | | 16,385 | | | | 22,944 | | | | 9,867 | |
| | | | | | |
Net Realized Gain (Loss): | | | | | | | | | | | | | | | | | | | | | | | | |
| | | | | | |
Investments in securities, net of foreign capital gains tax** | | | 5,252 | | | | 113,141 | | | | 0 | | | | 66,770 | | | | 122,618 | | | | 50,339 | |
Investments in Affiliates | | | 16 | | | | 0 | | | | (1,522 | ) | | | 0 | | | | 0 | | | | 0 | |
Net capital gain distributions received from Affiliate investments | | | 0 | | | | 0 | | | | 2,255 | | | | 0 | | | | 0 | | | | 0 | |
Exchange-traded or centrally cleared financial derivative instruments | | | 383 | | | | 138 | | | | 0 | | | | 0 | | | | 0 | | | | 0 | |
Over the counter financial derivative instruments | | | 436 | | | | 1 | | | | 0 | | | | (19 | ) | | | 0 | | | | 0 | |
Foreign currency | | | (5 | ) | | | (2,925 | ) | | | 0 | | | | (87 | ) | | | 0 | | | | 0 | |
| | | | | | |
Net Realized Gain (Loss) | | | 6,082 | | | | 110,355 | | | | 733 | | | | 66,664 | | | | 122,618 | | | | 50,339 | |
| | | | | | |
Net Change in Unrealized Appreciation (Depreciation): | | | | | | | | | | | | | | | | | | | | | | | | |
| | | | | | |
Investments in securities, net of foreign capital gains tax*** | | | 6,387 | | | | 149,900 | | | | 0 | | | | (37,440 | ) | | | 116,685 | | | | 126,561 | |
Investments in Affiliates | | | (15 | ) | | | 0 | | | | 5,107 | | | | 0 | | | | 0 | | | | 0 | |
Exchange-traded or centrally cleared financial derivative instruments | | | 951 | | | | 0 | | | | 0 | | | | 0 | | | | 0 | | | | 0 | |
Over the counter financial derivative instruments | | | (203 | ) | | | 0 | | | | 0 | | | | 0 | | | | 0 | | | | 0 | |
Foreign currency assets and liabilities | | | (37 | ) | | | (220 | ) | | | 0 | | | | (40 | ) | | | 0 | | | | 0 | |
| | | | | | |
Net Change in Unrealized Appreciation (Depreciation) | | | 7,083 | | | | 149,680 | | | | 5,107 | | | | (37,480 | ) | | | 116,685 | | | | 126,561 | |
| | | | | | |
Net Increase (Decrease) in Net Assets Resulting from Operations | | $ | 19,474 | | | $ | 319,156 | | | $ | 11,725 | | | $ | 45,569 | | | $ | 262,247 | | | $ | 186,767 | |
| | | | | | |
* Foreign tax withholdings - Dividends | | $ | 230 | | | $ | 10,826 | | | $ | 0 | | | $ | 2,282 | | | $ | 0 | | | $ | 0 | |
| | | | | | |
** Foreign capital gains tax | | $ | 0 | | | $ | 6,362 | | | $ | 0 | | | $ | 0 | | | $ | 0 | | | $ | 0 | |
| | | | | | |
*** Foreign capital gains tax | | $ | 0 | | | $ | (16,672 | ) | | $ | 0 | | | $ | 0 | | | $ | 0 | | | $ | 0 | |
| † | A zero balance may reflect actual amounts rounding to less than one thousand. |
| | | | | | |
| 16 | | PIMCO EQUITY SERIES | | | See Accompanying Notes | |
(THIS PAGE INTENTIONALLY LEFT BLANK)
| | | | | | | | | | | | |
| | | | ANNUAL FINANCIAL AND OTHER INFORMATION | | | | | | | JUNE 30, 2024 | | | 17 |
| | | | |
| Statements of Changes in Net Assets | | | | |
| | | | | | | | | | | | | | | | | | | | | | | | |
| | | PIMCO Dividend and Income Fund | | | PIMCO RAE Emerging Markets Fund | | | PIMCO RAE Global ex-US Fund | |
| | | | | | |
| (Amounts in thousands†) | | Year Ended
June 30, 2024 | | | Year Ended
June 30, 2023 | | | Year Ended
June 30, 2024 | | | Year Ended
June 30, 2023 | | | Year Ended
June 30, 2024 | | | Year Ended
June 30, 2023 | |
| | | | | | |
Increase (Decrease) in Net Assets from: | | | | | | | | | | | | | | | | | | | | | | | | |
| | | | | | |
Operations: | | | | | | | | | | | | | | | | | | | | | | | | |
| | | | | | |
Net investment income (loss) | | $ | 6,309 | | | $ | 6,017 | | | $ | 59,121 | | | $ | 58,790 | | | $ | 5,885 | | | $ | 1,616 | |
Net realized gain (loss) | | | 6,082 | | | | (4,038 | ) | | | 110,355 | | | | (43,402 | ) | | | 733 | | | | 1,971 | |
Net change in unrealized appreciation (depreciation) | | | 7,083 | | | | 11,263 | | | | 149,680 | | | | 191,770 | | | | 5,107 | | | | 9,580 | |
| | | | | | |
Net Increase (Decrease) in Net Assets Resulting from Operations | | | 19,474 | | | | 13,242 | | | | 319,156 | | | | 207,158 | | | | 11,725 | | | | 13,167 | |
| | | | | | |
Distributions to Shareholders: | | | | | | | | | | | | | | | | | | | | | | | | |
| | | | | | |
From net investment income and/or net realized capital gains | | | | | | | | | | | | | | | | | | | | | | | | |
Institutional Class | | | (817 | ) | | | (909 | ) | | | (56,778 | ) | | | (110,130 | ) | | | (7,467 | ) | | | (5,937 | ) |
I-2 | | | (837 | ) | | | (1,004 | ) | | | (5,137 | ) | | | (6,797 | ) | | | (11 | ) | | | (24 | ) |
Class A | | | (6,217 | ) | | | (7,378 | ) | | | (837 | ) | | | (1,104 | ) | | | (1,363 | ) | | | (1,373 | ) |
Class C | | | (475 | ) | | | (820 | ) | | | N/A | | | | N/A | | | | N/A | | | | N/A | |
| | | | | | |
Total Distributions(a) | | | (8,346 | ) | | | (10,111 | ) | | | (62,752 | ) | | | (118,031 | ) | | | (8,841 | ) | | | (7,334 | ) |
| | | | | | |
Fund Share Transactions: | | | | | | | | | | | | | | | | | | | | | | | | |
| | | | | | |
Net increase (decrease) resulting from Fund share transactions* | | | (9,298 | ) | | | 603 | | | | 205,231 | | | | (35,097 | ) | | | 12,175 | | | | 7,644 | |
| | | | | | |
Total Increase (Decrease) in Net Assets | | | 1,830 | | | | 3,734 | | | | 461,635 | | | | 54,030 | | | | 15,059 | | | | 13,477 | |
| | | | | | |
Net Assets: | | | | | | | | | | | | | | | | | | | | | | | | |
| | | | | | |
Beginning of year | | | 169,580 | | | | 165,846 | | | | 1,383,532 | | | | 1,329,502 | | | | 92,212 | | | | 78,735 | |
End of year | | $ | 171,410 | | | $ | 169,580 | | | $ | 1,845,167 | | | $ | 1,383,532 | | | $ | 107,271 | | | $ | 92,212 | |
| † | A zero balance may reflect actual amounts rounding to less than one thousand. |
| * | See Note 13, Shares of Beneficial Interest, in the Notes to Financial Statements. |
| (a) | The tax characterization of distributions is determined in accordance with Federal income tax regulations. See Note 2, Distributions to Shareholders, in the Notes to Financial Statements for more information. |
| | | | | | |
| 18 | | PIMCO EQUITY SERIES | | | See Accompanying Notes | |
| | | | | | | | | | | | | | | | | | | | | | |
PIMCO RAE International Fund | | | PIMCO RAE US Fund | | | PIMCO RAE US Small Fund | |
| | | | | |
Year Ended
June 30, 2024 | | | Year Ended
June 30, 2023 | | | Year Ended
June 30, 2024 | | | Year Ended
June 30, 2023 | | | Year Ended
June 30, 2024 | | | Year Ended
June 30, 2023 | |
| | | | | |
| | | | | | | | | | | | | | | | | | | | | | |
| | | | | |
| | | | | | | | | | | | | | | | | | | | | | |
| | | | | |
| $ | 16,385 | | | $ | 21,284 | | | $ | 22,944 | | | $ | 25,182 | | | $ | 9,867 | | | $ | 11,698 | |
| | 66,664 | | | | 44,054 | | | | 122,618 | | | | 16,390 | | | | 50,339 | | | | 1,697 | |
| | (37,480 | ) | | | 48,068 | | | | 116,685 | | | | 91,761 | | | | 126,561 | | | | 59,198 | |
| | | | | |
| | 45,569 | | | | 113,406 | | | | 262,247 | | | | 133,333 | | | | 186,767 | | | | 72,593 | |
| | | | | |
| | | | | | | | | | | | | | | | | | | | | | |
| | | | | |
| | | | | | | | | | | | | | | | | | | | | | |
| | (45,132 | ) | | | (50,236 | ) | | | (71,487 | ) | | | (73,075 | ) | | | (8,806 | ) | | | (47,913 | ) |
| | (1,028 | ) | | | (745 | ) | | | (3,871 | ) | | | (3,996 | ) | | | (1,752 | ) | | | (4,583 | ) |
| | (522 | ) | | | (330 | ) | | | (1,394 | ) | | | (1,379 | ) | | | (1,443 | ) | | | (7,395 | ) |
| | N/A | | | | N/A | | | | N/A | | | | N/A | | | | N/A | | | | N/A | |
| | | | | |
| | (46,682 | ) | | | (51,311 | ) | | | (76,752 | ) | | | (78,450 | ) | | | (12,001 | ) | | | (59,891 | ) |
| | | | | |
| | | | | | | | | | | | | | | | | | | | | | |
| | | | | |
| | (88,432 | ) | | | (21,229 | ) | | | 107,023 | | | | 273,926 | | | | 400,503 | | | | 202,355 | |
| | | | | |
| | (89,545 | ) | | | 40,866 | | | | 292,518 | | | | 328,809 | | | | 575,269 | | | | 215,057 | |
| | | | | |
| | | | | | | | | | | | | | | | | | | | | | |
| | | | | |
| | 577,365 | | | | 536,499 | | | | 1,167,453 | | | | 838,644 | | | | 611,408 | | | | 396,351 | |
| $ | 487,820 | | | $ | 577,365 | | | $ | 1,459,971 | | | $ | 1,167,453 | | | $ | 1,186,677 | | | $ | 611,408 | |
| | | | | | | | | | | | |
| | | | ANNUAL FINANCIAL AND OTHER INFORMATION | | | | | | | JUNE 30, 2024 | | | 19 |
| | | | | | |
| Schedule of Investments | | PIMCO Dividend and Income Fund | | | | |
(Amounts in thousands*, except number of shares, contracts, units and ounces, if any)
| | | | | | | | | | | | |
| | | | | PRINCIPAL
AMOUNT
(000S) | | | | | MARKET
VALUE
(000S) | |
| INVESTMENTS IN SECURITIES 125.4% | |
| | | | | | | | | | | | |
| ASSET-BACKED SECURITIES 14.1% | |
| |
| CAYMAN ISLANDS 3.4% | |
|
AGL CLO Ltd. | |
6.786% due 07/20/2034 • | | $ | | | 400 | | | $ | | | 401 | |
|
Anchorage Capital CLO Ltd. | |
6.432% due 10/15/2031 (a) | | | | | 600 | | | | | | 600 | |
|
Bain Capital Credit CLO Ltd. | |
6.679% due 10/17/2032 • | | | | | 800 | | | | | | 800 | |
|
Ballyrock CLO Ltd. | |
6.716% due 07/20/2034 • | | | | | 400 | | | | | | 400 | |
|
CIFC Funding Ltd. | |
6.730% due 07/15/2036 • | | | | | 400 | | | | | | 401 | |
|
Magnetite Ltd. | |
6.874% due 10/25/2033 • | | | | | 400 | | | | | | 401 | |
|
Newark BSL CLO Ltd. | |
6.555% due 07/25/2030 • | | | | | 300 | | | | | | 300 | |
|
Palmer Square CLO Ltd. | |
6.645% due 04/20/2035 • | | | | | 800 | | | | | | 802 | |
|
TIAA CLO Ltd. | |
0.000% due 01/20/2032 •(a) | | | | | 400 | | | | | | 400 | |
|
Trinitas CLO Ltd. | |
6.706% due 01/20/2032 • | | | | | 317 | | | | | | 317 | |
|
TruPS Financials Note Securitization Ltd. | |
7.164% due 09/20/2039 • | | | | | 203 | | | | | | 201 | |
|
Voya CLO Ltd. | |
6.659% due 10/17/2032 • | | | | | 800 | | | | | | 801 | |
| | | | | | | | | | | | |
Total Cayman Islands | | | | | | | | | | | 5,824 | |
| | | | | | | | | | | | |
| |
| IRELAND 0.2% | |
|
Palmer Square European Loan Funding DAC | |
5.328% due 05/15/2033 • | | EUR | | | 230 | | | | | | 246 | |
| | | | | | | | | | | | |
Total Ireland | | | | | | | | | | | 246 | |
| | | | | | | | | | | | |
| |
| UNITED STATES 10.5% | |
|
Avis Budget Rental Car Funding AESOP LLC | |
3.350% due 09/22/2025 | | $ | | | 200 | | | | | | 199 | |
|
Bear Stearns Asset-Backed Securities Trust | |
6.088% due 12/25/2034 • | | | | | 797 | | | | | | 776 | |
|
Carvana Auto Receivables Trust | |
5.820% due 08/10/2028 | | | | | 400 | | | | | | 402 | |
6.160% due 10/10/2028 | | | | | 400 | | | | | | 404 | |
|
Citigroup Mortgage Loan Trust | |
6.090% due 02/25/2035 • | | | | | 917 | | | | | | 842 | |
|
Credit Suisse First Boston Mortgage Securities Corp. | |
5.099% due 01/25/2032 • | | | | | 386 | | | | | | 371 | |
|
ECMC Group Student Loan Trust | |
6.600% due 11/25/2069 • | | | | | 667 | | | | | | 668 | |
|
EMC Mortgage Loan Trust | |
6.760% due 02/25/2041 «• | | | | | 20 | | | | | | 19 | |
|
Ent Auto Receivables Trust | |
6.240% due 01/16/2029 | | | | | 392 | | | | | | 396 | |
|
FBR Securitization Trust | |
6.165% due 11/25/2035 • | | | | | 645 | | | | | | 630 | |
|
First Investors Auto Owner Trust | |
6.440% due 10/16/2028 | | | | | 283 | | | | | | 285 | |
|
GLS Auto Select Receivables Trust | |
5.590% due 10/15/2029 (a) | | | | | 400 | | | | | | 400 | |
6.370% due 06/15/2028 | | | | | 332 | | | | | | 334 | |
|
Home Equity Asset Trust | |
6.165% due 01/25/2036 • | | | | | 111 | | | | | | 103 | |
|
LCCM Trust | |
6.893% due 11/15/2038 • | | | | | 893 | | | | | | 881 | |
| | | | |
Lendmark Funding Trust | | | | | | | | | | | | |
5.530% due 06/21/2032 | | | | | 200 | | | | | | 201 | |
|
Morgan Stanley Home Equity Loan Trust | |
5.560% due 12/25/2036 • | | | | | 1,296 | | | | | | 619 | |
|
Navient Private Education Refi Loan Trust | |
1.330% due 04/15/2069 | | | | | 187 | | | | | | 169 | |
| | | | | | | | | | | | |
| | | | | PRINCIPAL
AMOUNT
(000S) | | | | | MARKET
VALUE
(000S) | |
|
Navient Student Loan Trust | |
6.350% due 08/26/2069 • | | $ | | | 609 | | | $ | | | 609 | |
6.500% due 12/27/2066 • | | | | | 322 | | | | | | 323 | |
|
Nelnet Student Loan Trust | |
5.900% due 09/27/2066 • | | | | | 319 | | | | | | 319 | |
|
Option One Mortgage Loan Trust | |
5.680% due 04/25/2037 • | | | | | 1,768 | | | | | | 1,216 | |
|
Pagaya AI Debt Selection Trust | |
7.128% due 06/16/2031 | | | | | 192 | | | | | | 193 | |
7.600% due 12/16/2030 | | | | | 169 | | | | | | 170 | |
|
PRET LLC | |
8.232% due 09/25/2053 þ | | | | | 664 | | | | | | 672 | |
|
Reach ABS Trust | |
6.300% due 02/18/2031 | | | | | 141 | | | | | | 141 | |
|
Research-Driven Pagaya Motor Asset Trust | |
7.130% due 01/26/2032 | | | | | 660 | | | | | | 664 | |
|
Residential Asset Mortgage Products Trust | |
6.525% due 05/25/2035 • | | | | | 1,000 | | | | | | 951 | |
|
Residential Asset Securities Corp. Trust | |
6.345% due 01/25/2034 • | | | | | 152 | | | | | | 152 | |
|
SLM Private Credit Student Loan Trust | |
5.931% due 06/15/2039 • | | | | | 661 | | | | | | 648 | |
|
SLM Student Loan Trust | |
6.250% due 03/25/2026 • | | | | | 669 | | | | | | 668 | |
|
SMB Private Education Loan Trust | |
0.000% due 07/05/2053 • | | | | | 800 | | | | | | 796 | |
6.783% due 02/16/2055 • | | | | | 575 | | | | | | 579 | |
|
Soundview Home Loan Trust | |
5.865% due 12/25/2036 • | | | | | 799 | | | | | | 778 | |
6.460% due 09/25/2037 • | | | | | 1,774 | | | | | | 1,217 | |
|
Structured Asset Investment Loan Trust | |
5.610% due 09/25/2036 • | | | | | 266 | | | | | | 259 | |
| | | | | | | | | | | | |
Total United States | | | | | | | | | | | 18,054 | |
| | | | | | | | | | | | |
Total Asset-Backed Securities (Cost $25,024) | | | 24,124 | |
| | | | |
| |
| LOAN PARTICIPATIONS AND ASSIGNMENTS 0.5% | |
| | | | | | | | | | | | |
| FRANCE 0.0% | |
|
Altice France SA | |
10.829% due 08/15/2028 | | | | | 100 | | | | | | 74 | |
| | | | | | | | | | | | |
Total France | | | | | | | | | | | 74 | |
| | | | | | | | | | | | |
| |
| JERSEY, CHANNEL ISLANDS 0.2% | |
|
Softbank Vision Fund II | |
6.000% due 12/23/2025 « | | | | | 282 | | | | | | 270 | |
| | | | | | | | | | | | |
| | | | | | | | | | | | |
Total Jersey, Channel Islands | | | | | | | | | | | 270 | |
| | | | | | | | | | | | |
| |
| NETHERLANDS 0.0% | |
|
Lealand Finance Co. BV | |
8.458% due 06/30/2027 | | | | | 1 | | | | | | 1 | |
|
Lealand Finance Co. BV (6.444 Cash and 3.000% PIK) | |
9.444% due 12/31/2027 (b) | | | | | 3 | | | | | | 1 | |
| | | | | | | | | | | | |
Total Netherlands | | | | | | | | | | | 2 | |
| | | | | | | | | | | | |
| |
| UNITED STATES 0.3% | |
|
Envision Healthcare Corp. | |
11.186% due 11/03/2028 « | | | | | 124 | | | | | | 124 | |
14.311% due 07/20/2026 « | | | | | 464 | | | | | | 464 | |
|
Press Ganey Holdings, Inc. | |
8.844% due 04/30/2031 | | | | | 3 | | | | | | 3 | |
|
Syniverse Holdings, Inc. | |
12.335% due 05/13/2027 | | | | | 8 | | | | | | 8 | |
|
U.S. Renal Care, Inc. | |
10.458% due 06/20/2028 | | | | | 13 | | | | | | 12 | |
|
Westmoreland Mining Holdings LLC | |
8.000% due 03/15/2029 | | | | | 2 | | | | | | 1 | |
| | | | | | | | | | | | |
Total United States | | | | | | | | | | | 612 | |
| | | | | | | | | | | | |
Total Loan Participations and Assignments (Cost $961) | | | 958 | |
| | | | |
| |
| | | | | | | | | | | | |
| | | | | SHARES | | | | | MARKET
VALUE
(000S) | |
| COMMON STOCKS 46.9% | |
| |
| AUSTRALIA 1.2% | |
| |
| CONSUMER STAPLES 0.1% | |
| | | | |
Coles Group Ltd. | | | | | 11,104 | | | $ | | | 126 | |
| | | | | | | | | | | | |
| |
| INDUSTRIALS 0.2% | |
| | | | |
Brambles Ltd. | | | | | 30,731 | | | | | | 297 | |
| | | | | | | | | | | | |
| |
| MATERIALS 0.9% | |
| | | | |
BHP Group Ltd. | | | | | 29,869 | | | | | | 854 | |
| | | | |
BlueScope Steel Ltd. | | | | | 9,624 | | | | | | 130 | |
| | | | |
Fortescue Ltd. | | | | | 37,450 | | | | | | 533 | |
| | | | |
Rio Tinto Ltd. | | | | | 1,829 | | | | | | 145 | |
| | | | | | | | | | | | |
| | | | | | | | | | | 1,662 | |
| | | | | | | | | | | | |
Total Australia | | | | | | | | | | | 2,085 | |
| | | | | | | | | | | | |
| |
| AUSTRIA 0.2% | |
| |
| FINANCIALS 0.2% | |
| | | | |
Erste Group Bank AG | | | | | 7,470 | | | | | | 354 | |
| | | | | | | | | | | | |
Total Austria | | | | | | | | | | | 354 | |
| | | | | | | | | | | | |
| |
| BELGIUM 0.1% | |
| |
| FINANCIALS 0.1% | |
| | | | |
Ageas SA | | | | | 3,446 | | | | | | 157 | |
| | | | | | | | | | | | |
Total Belgium | | | | | | | | | | | 157 | |
| | | | | | | | | | | | |
| |
| BRAZIL 1.0% | |
| |
| CONSUMER STAPLES 0.1% | |
| | | | |
Ambev SA | | | | | 102,600 | | | | | | 209 | |
| | | | | | | | | | | | |
| |
| ENERGY 0.4% | |
| | | | |
Petroleo Brasileiro SA | | | | | 82,100 | | | | | | 593 | |
| | | | | | | | | | | | |
| |
| FINANCIALS 0.1% | |
| | | | |
Banco do Brasil SA | | | | | 37,000 | | | | | | 177 | |
| | | | | | | | | | | | |
| |
| MATERIALS 0.4% | |
| | | | |
Vale SA | | | | | 64,700 | | | | | | 720 | |
| | | | | | | | | | | | |
Total Brazil | | | | | | | | | | | 1,699 | |
| | | | | | | | | | | | |
| |
| CANADA 0.1% | |
| |
| FINANCIALS 0.1% | |
| | | |
Brookfield Asset Management Ltd. ‘A’ | | | 3,418 | | | | | | 130 | |
| | | | | | | | | | | | |
Total Canada | | | | | | | | | | | 130 | |
| | | | | | | | | | | | |
| |
| CHINA 1.3% | |
| |
| ENERGY 0.2% | |
| | | |
China Shenhua Energy Co. Ltd. ‘H’ | | | 74,500 | | | | | | 343 | |
| | | | | | | | | | | | |
| |
| FINANCIALS 0.9% | |
| | | |
China Construction Bank Corp. ‘H’ | | | 2,013,000 | | | | | | 1,488 | |
| | | | |
PICC Property & Casualty Co. Ltd. ‘H’ | | | | | 150,000 | | | | | | 186 | |
| | | | | | | | | | | | |
| | | | | | | | | | | 1,674 | |
| | | | | | | | | | | | |
| |
| HEALTH CARE 0.1% | |
| | | |
CSPC Pharmaceutical Group Ltd. | | | 184,000 | | | | | | 147 | |
| | | | | | | | | | | | |
| |
| | | | | | |
| 20 | | PIMCO EQUITY SERIES | | | See Accompanying Notes | |
| | | | | | | | | | | | |
| | | | | SHARES | | | | | MARKET
VALUE
(000S) | |
| INFORMATION TECHNOLOGY 0.1% | |
| | | | |
Vipshop Holdings Ltd. | | | | | 8,289 | | | $ | | | 108 | |
| | | | | | | | | | | | |
Total China | | | | | | | | | | | 2,272 | |
| | | | | | | | | | | | |
| |
| CZECH REPUBLIC 0.1% | |
| |
| UTILITIES 0.1% | |
| | | | |
CEZ AS | | | | | 3,437 | | | | | | 129 | |
| | | | | | | | | | | | |
Total Czech Republic | | | | | | | | | | | 129 | |
| | | | | | | | | | | | |
| |
| DENMARK 0.1% | |
| |
| INDUSTRIALS 0.1% | |
| | | | |
AP Moller - Maersk AS ‘B’ | | | | | 90 | | | | | | 156 | |
| | | | | | | | | | | | |
Total Denmark | | | | | | | | | | | 156 | |
| | | | | | | | | | | | |
| |
| FINLAND 0.1% | |
| |
| UTILITIES 0.1% | |
| | | | |
Fortum Oyj | | | | | 8,596 | | | | | | 126 | |
| | | | | | | | | | | | |
Total Finland | | | | | | | | | | | 126 | |
| | | | | | | | | | | | |
| |
| FRANCE 1.3% | |
| |
| ENERGY 0.2% | |
| | | |
TotalEnergies SE | | | 5,451 | | | | | | 365 | |
| | | | | | | | | | | | |
| |
| FINANCIALS 0.5% | |
| | | |
AXA SA | | | 26,807 | | | | | | 879 | |
| | | | | | | | | | | | |
| |
| INDUSTRIALS 0.5% | |
| | | |
Cie de Saint-Gobain SA | | | 10,158 | | | | | | 790 | |
| | | | | | | | | | | | |
| |
| UTILITIES 0.1% | |
| | | |
Engie SA | | | 16,218 | | | | | | 232 | |
| | | | | | | | | | | | |
Total France | | | | | | | | | | | 2,266 | |
| | | | | | | | | | | | |
| |
| GERMANY 0.7% | |
| |
| FINANCIALS 0.4% | |
| | | |
Muenchener Rueckversicherungs-Gesellschaft AG in Muenchen | | | 1,448 | | | | | | 724 | |
| | | | | | | | | | | | |
| |
| INDUSTRIALS 0.1% | |
| | | |
GEA Group AG | | | 3,387 | | | | | | 141 | |
| | | | | | | | | | | | |
| |
| MATERIALS 0.2% | |
| | | | |
HeidelbergCement AG | | | | | 2,877 | | | | | | 297 | |
| | | | | | | | | | | | |
Total Germany | | | | | | | | | | | 1,162 | |
| | | | | | | | | | | | |
| |
| HONG KONG 0.2% | |
| |
| UTILITIES 0.2% | |
| | | | |
CLP Holdings Ltd. | | | | | 36,500 | | | | | | 295 | |
| | | | | | | | | | | | |
Total Hong Kong | | | | | | | | | | | 295 | |
| | | | | | | | | | | | |
| |
| INDONESIA 0.2% | |
| |
| COMMUNICATION SERVICES 0.1% | |
| | | | |
Telkom Indonesia Persero Tbk PT | | | | | 1,070,900 | | | | | | 203 | |
| | | | | | | | | | | | |
| |
| FINANCIALS 0.1% | |
| | | | |
Bank Rakyat Indonesia Persero Tbk PT | | | | | 406,200 | | | | | | 114 | |
| | | | | | | | | | | | |
Total Indonesia | | | | | | | | | | | 317 | |
| | | | | | | | | | | | |
| |
| | | | | | | | | | | | |
| | | | | SHARES | | | | | MARKET
VALUE
(000S) | |
| IRELAND 0.1% | |
| |
| FINANCIALS 0.1% | |
| | | |
AIB Group PLC | | | 35,481 | | | $ | | | 187 | |
| | | | | | | | | | | | |
Total Ireland | | | | | | | | | | | 187 | |
| | | | | | | | | | | | |
| |
| ITALY 1.5% | |
| |
| FINANCIALS 0.8% | |
| | | | |
Assicurazioni Generali SpA | | | | | 22,680 | | | | | | 565 | |
| | | | |
Intesa Sanpaolo SpA | | | | | 158,053 | | | | | | 587 | |
| | | | |
Poste Italiane SpA | | | | | 9,979 | | | | | | 127 | |
| | | | | | | | | | | | |
| | | | | | | | | | | 1,279 | |
| | | | | | | | | | | | |
| |
| UTILITIES 0.7% | |
| | | | |
Enel SpA | | | | | 181,417 | | | | | | 1,259 | |
| | | | | | | | | | | | |
Total Italy | | | | | | | | | | | 2,538 | |
| | | | | | | | | | | | |
| | | | | | | | | | | | |
| JAPAN 2.1% | |
| |
| CONSUMER STAPLES 0.6% | |
| | | | |
Bridgestone Corp. | | | | | 6,300 | | | | | | 249 | |
| | | | |
Isuzu Motors Ltd. | | | | | 9,500 | | | | | | 126 | |
| | | | |
Japan Tobacco, Inc. | | | | | 4,500 | | | | | | 122 | |
| | | | |
Mazda Motor Corp. | | | | | 10,800 | | | | | | 104 | |
| | | | |
Sekisui Chemical Co. Ltd. | | | | | 8,500 | | | | | | 118 | |
| | | | |
Subaru Corp. | | | | | 13,200 | | | | | | 281 | |
| | | | | | | | | | | | |
| | | | | | | | | | | 1,000 | |
| | | | | | | | | | | | |
| |
| FINANCIALS 0.2% | |
| | | | |
Sompo Holdings, Inc. | | | | | 19,800 | | | | | | 424 | |
| | | | | | | | | | | | |
| |
| HEALTH CARE 0.1% | |
| | | | |
Ono Pharmaceutical Co. Ltd. | | | | | 8,300 | | | | | | 113 | |
| | | | | | | | | | | | |
| |
| INDUSTRIALS 1.2% | |
| | | | |
Kawasaki Kisen Kaisha Ltd. | | | | | 8,400 | | | | | | 122 | |
| | | | |
Marubeni Corp. | | | | | 31,700 | | | | | | 588 | |
| | | | |
Mitsui & Co. Ltd. | | | | | 24,400 | | | | | | 556 | |
| | | | |
Mitsui OSK Lines Ltd. | | | | | 7,600 | | | | | | 229 | |
| | | | |
Nippon Yusen KK | | | | | 10,100 | | | | | | 295 | |
| | | | |
Toyota Tsusho Corp. | | | | | 14,100 | | | | | | 276 | |
| | | | | | | | | | | | |
| | | | | | | | | | | 2,066 | |
| | | | | | | | | | | | |
Total Japan | | | | | | | | | | | 3,603 | |
| | | | | | | | | | | | |
| | | | | | | | | | | | |
| LUXEMBOURG 0.2% | |
| |
| ENERGY 0.1% | |
| | | | |
Tenaris SA | | | | | 10,163 | | | | | | 156 | |
| | | | | | | | | | | | |
| |
| FINANCIALS 0.1% | |
| | | | |
Intelsat Emergence SA «(h) | | | | | 2,890 | | | | | | 108 | |
| | | | | | | | | | | | |
| |
| INDUSTRIALS 0.0% | |
| | | | |
Forsea Holding SA «(d) | | | | | 2,200 | | | | | | 51 | |
| | | | | | | | | | | | |
Total Luxembourg | | | | | | | | | | | 315 | |
| | | | | | | | | | | | |
| |
| MEXICO 0.4% | |
| |
| CONSUMER DISCRETIONARY 0.0% | |
| | | | |
Desarrolladora Homex SAB de CV (d) | | | | | 41,996 | | | | | | 0 | |
| | | | | | | | | | | | |
| |
| | | | | | | | | | | | |
| | | | | SHARES | | | | | MARKET
VALUE
(000S) | |
| CONSUMER STAPLES 0.2% | |
| | | | |
Wal-Mart de Mexico SAB de CV | | | | | 115,800 | | | $ | | | 394 | |
| | | | | | | | | | | | |
| |
| MATERIALS 0.2% | |
| | | | |
Grupo Mexico SAB de CV ‘B’ | | | | | 69,400 | | | | | | 373 | |
| | | | | | | | | | | | |
Total Mexico | | | | | | | | | | | 767 | |
| | | | | | | | | | | | |
| | | | | | | | | | | | |
| NETHERLANDS 0.4% | |
| |
| CONSUMER STAPLES 0.4% | |
| | | | |
Stellantis NV | | | | | 38,166 | | | | | | 755 | |
| | | | | | | | | | | | |
Total Netherlands | | | | | | | | | | | 755 | |
| | | | | | | | | | | | |
| |
| NORWAY 0.4% | |
| |
| ENERGY 0.4% | |
| | | | |
Aker BP ASA | | | | | 6,954 | | | | | | 178 | |
| | | | |
Equinor ASA | | | | | 19,866 | | | | | | 569 | |
| | | | | | | | | | | | |
| | | | | | | | | | | 747 | |
| | | | | | | | | | | | |
Total Norway | | | | | | | | | | | 747 | |
| | | | | | | | | | | | |
| |
| POLAND 0.3% | |
| |
| ENERGY 0.1% | |
| | | | |
ORLEN SA | | | | | 12,763 | | | | | | 214 | |
| | | | | | | | | | | | |
| |
| FINANCIALS 0.2% | |
| | | | |
Bank Polska Kasa Opieki SA | | | | | 4,001 | | | | | | 167 | |
| | | | |
Powszechny Zaklad Ubezpieczen SA | | | | | 13,177 | | | | | | 168 | |
| | | | | | | | | | | | |
| | | | | | | | | | | 335 | |
| | | | | | | | | | | | |
Total Poland | | | | | | | | | | | 549 | |
| | | | | | | | | | | | |
| |
| PORTUGAL 0.1% | |
| |
| CONSUMER STAPLES 0.1% | |
| | | | |
Jeronimo Martins SGPS SA | | | | | 5,485 | | | | | | 107 | |
| | | | | | | | | | | | |
Total Portugal | | | | | | | | | | | 107 | |
| | | | | | | | | | | | |
| |
| SINGAPORE 0.1% | |
| |
| FINANCIALS 0.1% | |
| | | | |
Singapore Exchange Ltd. | | | | | 18,100 | | | | | | 126 | |
| | | | | | | | | | | | |
Total Singapore | | | | | | | | | | | 126 | |
| | | | | | | | | | | | |
| |
| SOUTH AFRICA 0.8% | |
| |
| FINANCIALS 0.8% | |
| | | | |
Absa Group Ltd. | | | | | 18,265 | | | | | | 159 | |
| | | | |
FirstRand Ltd. | | | | | 112,229 | | | | | | 476 | |
| | | | |
Nedbank Group Ltd. | | | | | 10,340 | | | | | | 146 | |
| | | | |
Sanlam Ltd. | | | | | 37,912 | | | | | | 169 | |
| | | | |
Standard Bank Group Ltd. | | | | | 29,580 | | | | | | 345 | |
| | | | | | | | | | | | |
| | | | | | | | | | | 1,295 | |
| | | | | | | | | | | | |
Total South Africa | | | | | | | | | | | 1,295 | |
| | | | | | | | | | | | |
| |
| SOUTH KOREA 0.5% | |
| |
| CONSUMER STAPLES 0.4% | |
| | | | |
Kia Corp. | | | | | 5,830 | | | | | | 545 | |
| | | | |
KT&G Corp. | | | | | 2,279 | | | | | | 146 | |
| | | | | | | | | | | | |
| | | | | | | | | | | 691 | |
| | | | | | | | | | | | |
| |
| FINANCIALS 0.1% | |
| | | | |
Samsung Fire & Marine Insurance Co. Ltd. | | | | | 659 | | | | | | 186 | |
| | | | | | | | | | | | |
Total South Korea | | | | | | | | | | | 877 | |
| | | | | | | | | | | | |
| | | | | | | | | | | | |
| | | | | | | | | | | | |
| See Accompanying Notes | | | ANNUAL FINANCIAL AND OTHER INFORMATION | | | | | | | JUNE 30, 2024 | | | 21 |
| | | | | | |
| Schedule of Investments | | PIMCO Dividend and Income Fund | | (Cont.) | | |
| | | | | | | | | | | | |
| | | | | SHARES | | | | | MARKET
VALUE
(000S) | |
| SPAIN 1.5% | |
| |
| ENERGY 0.2% | |
| | | | |
Repsol SA | | | | | 27,154 | | | $ | | | 431 | |
| | | | | | | | | | | | |
| |
| FINANCIALS 1.1% | |
| | | | |
Banco Bilbao Vizcaya Argentaria SA | | | | | 130,217 | | | | | | 1,307 | |
| | | | |
Banco Santander SA | | | | | 44,199 | | | | | | 205 | |
| | | | |
CaixaBank SA | | | | | 71,883 | | | | | | 382 | |
| | | | | | | | | | | | |
| | | | | | | | | | | 1,894 | |
| | | | | | | | | | | | |
| |
| INDUSTRIALS 0.1% | |
| | | | |
ACS Actividades de Construccion y Servicios SA | | | | | 4,389 | | | | | | 190 | |
| | | | | | | | | | | | |
| |
| UTILITIES 0.1% | |
| | | | |
Endesa SA | | | | | 6,986 | | | | | | 131 | |
| | | | | | | | | | | | |
Total Spain | | | | | | | | | | | 2,646 | |
| | | | | | | | | | | | |
| |
| SWEDEN 0.1% | |
| | | | | | | | | | | | |
| INDUSTRIALS 0.1% | |
| | | | |
SKF AB ‘B’ | | | | | 7,312 | | | | | | 147 | |
| | | | | | | | | | | | |
Total Sweden | | | | | | | | | | | 147 | |
| | | | | | | | | | | | |
| |
| SWITZERLAND 3.5% | |
| |
| CONSUMER DISCRETIONARY 0.2% | |
| | | | |
Garmin Ltd. | | | | | 1,871 | | | | | | 305 | |
| | | | | | | | | | | | |
| |
| CONSUMER STAPLES 0.2% | |
| | | | |
Nestle SA | | | | | 3,930 | | | | | | 401 | |
| | | | | | | | | | | | |
| |
| FINANCIALS 0.8% | |
| | | | |
Swiss Re AG | | | | | 6,716 | | | | | | 832 | |
| | | | |
Zurich Insurance Group AG | | | | | 942 | | | | | | 502 | |
| | | | | | | | | | | | |
| | | | | | | | | | | 1,334 | |
| | | | | | | | | | | | |
| |
| HEALTH CARE 1.7% | |
| | | | |
Novartis AG | | | | | 16,008 | | | | | | 1,705 | |
| | | | |
Roche Holding AG | | | | | 4,412 | | | | | | 1,222 | |
| | | | | | | | | | | | |
| | | | | | | | | | | 2,927 | |
| | | | | | | | | | | | |
| |
| MATERIALS 0.6% | |
| | | | |
Holcim AG | | | | | 11,633 | | | | | | 1,028 | |
| | | | | | | | | | | | |
Total Switzerland | | | | | | | | | | | 5,995 | |
| | | | | | | | | | | | |
| |
| TAIWAN 2.5% | |
| |
| INFORMATION TECHNOLOGY 2.5% | |
| | | | |
ASE Technology Holding Co. Ltd. | | | | | 69,000 | | | | | | 357 | |
| | | | |
Hon Hai Precision Industry Co. Ltd. | | | | | 179,000 | | | | | | 1,179 | |
| | | | |
MediaTek, Inc. | | | | | 34,000 | | | | | | 1,464 | |
| | | | |
Novatek Microelectronics Corp. | | | | | 12,000 | | | | | | 224 | |
| | | | |
Pegatron Corp. | | | | | 43,000 | | | | | | 138 | |
| | | | |
Quanta Computer, Inc. | | | | | 60,000 | | | | | | 574 | |
| | | | |
Realtek Semiconductor Corp. (d) | | | | | 10,000 | | | | | | 168 | |
| | | | |
United Microelectronics Corp. | | | | | 88,000 | | | | | | 152 | |
| | | | | | | | | | | | |
| | | | | | | | | | | 4,256 | |
| | | | | | | | | | | | |
Total Taiwan | | | | | | | | | | | 4,256 | |
| | | | | | | | | | | | |
| |
| TURKEY 0.1% | |
| |
| ENERGY 0.0% | |
| | | | |
Turkiye Petrol Rafinerileri AS | | | | | 20,553 | | | | | | 104 | |
| | | | | | | | | | | | |
| |
| | | | | | | | | | | | |
| | | | | SHARES | | | | | MARKET
VALUE
(000S) | |
| FINANCIALS 0.1% | |
| | | | |
Akbank TAS | | | | | 65,684 | | | $ | | | 129 | |
| | | | | | | | | | | | |
Total Turkey | | | | | | | | | | | 233 | |
| | | | | | | | | | | | |
| |
| UNITED KINGDOM 3.1% | |
| |
| CONSUMER STAPLES 1.1% | |
| | | | |
British American Tobacco PLC | | | | | 26,513 | | | | | | 814 | |
| | | | |
Imperial Brands PLC | | | | | 18,311 | | | | | | 469 | |
| | | | |
Tesco PLC | | | | | 155,937 | | | | | | 602 | |
| | | | | | | | | | | | |
| | | | | | | | | | | 1,885 | |
| | | | | | | | | | | | |
| |
| FINANCIALS 0.5% | |
| | | | |
3i Group PLC | | | | | 21,651 | | | | | | 835 | |
| | | | | | | | | | | | |
| |
| INDUSTRIALS 0.7% | |
| | | | |
BAE Systems PLC | | | | | 67,506 | | | | | | 1,124 | |
| | | | | | | | | | | | |
| |
| MATERIALS 0.8% | |
| | | | |
Mondi PLC | | | | | 9,608 | | | | | | 185 | |
| | | | |
Rio Tinto PLC | | | | | 19,010 | | | | | | 1,247 | |
| | | | | | | | | | | | |
| | | | | | | | | | | 1,432 | |
| | | | | | | | | | | | |
Total United Kingdom | | | | | | | | | | | 5,276 | |
| | | | | | | | | | | | |
| |
| UNITED STATES 22.6% | |
| | | | | | | | | | | | |
| COMMUNICATION SERVICES 1.3% | |
| | | | |
Clear Channel Outdoor Holdings, Inc. (d) | | | | | 29,821 | | | | | | 42 | |
| | | | |
iHeartMedia, Inc. ‘A’ (d) | | | | | 6,979 | | | | | | 8 | |
| | | | |
iHeartMedia, Inc. ‘B’ «(d) | | | | | 5,486 | | | | | | 5 | |
| | | | |
Meta Platforms, Inc. ‘A’ | | | | | 266 | | | | | | 134 | |
| | | | |
Verizon Communications, Inc. | | | | | 47,940 | | | | | | 1,977 | |
| | | | | | | | | | | | |
| | | | | | | | | | | 2,166 | |
| | | | | | | | | | | | |
| |
| CONSUMER STAPLES 6.5% | |
| | | | |
Altria Group, Inc. | | | | | 38,306 | | | | | | 1,745 | |
| | | | |
Archer-Daniels-Midland Co. | | | | | 3,529 | | | | | | 213 | |
| | | | |
Bunge Global SA | | | | | 3,198 | | | | | | 342 | |
| | | | |
Coca-Cola Co. | | | | | 26,972 | | | | | | 1,717 | |
| | | | |
Dick’s Sporting Goods, Inc. | | | | | 1,313 | | | | | | 282 | |
| | | | |
Home Depot, Inc. | | | | | 5,255 | | | | | | 1,809 | |
| | | | |
Kimberly-Clark Corp. | | | | | 7,514 | | | | | | 1,038 | |
| | | | |
Kroger Co. | | | | | 3,210 | | | | | | 160 | |
| | | | |
Lennar Corp. ‘A’ | | | | | 2,949 | | | | | | 442 | |
| | | | |
Philip Morris International, Inc. | | | | | 15,218 | | | | | | 1,542 | |
| | | | |
Procter & Gamble Co. | | | | | 2,231 | | | | | | 368 | |
| | | | |
Target Corp. | | | | | 10,296 | | | | | | 1,524 | |
| | | | | | | | | | | | |
| | | | | | | | | | | 11,182 | |
| | | | | | | | | | | | |
| |
| ENERGY 2.3% | |
| | | | |
ConocoPhillips | | | | | 4,028 | | | | | | 461 | |
| | | | |
Devon Energy Corp. | | | | | 14,162 | | | | | | 671 | |
| | | | |
EOG Resources, Inc. | | | | | 1,012 | | | | | | 127 | |
| | | | |
HF Sinclair Corp. | | | | | 3,586 | | | | | | 191 | |
| | | | |
Marathon Petroleum Corp. | | | | | 7,936 | | | | | | 1,377 | |
| | | | |
Valero Energy Corp. | | | | | 7,347 | | | | | | 1,152 | |
| | | | | | | | | | | | |
| | | | | | | | | | | 3,979 | |
| | | | | | | | | | | | |
| |
| FINANCIALS 1.8% | |
| | | | |
Ameriprise Financial, Inc. | | | | | 322 | | | | | | 138 | |
| | | | |
BlackRock, Inc. | | | | | 955 | | | | | | 752 | |
| | | | | | | | | | | | |
| | | | | SHARES | | | | | MARKET
VALUE
(000S) | |
| | | | |
CME Group, Inc. | | | | | 595 | | | $ | | | 117 | |
| | | | |
Hartford Financial Services Group, Inc. | | | | | 3,568 | | | | | | 359 | |
| | | | |
Regions Financial Corp. | | | | | 7,877 | | | | | | 158 | |
| | | | |
State Street Corp. | | | | | 6,734 | | | | | | 498 | |
| | | | |
Synchrony Financial | | | | | 9,017 | | | | | | 425 | |
| | | | |
T Rowe Price Group, Inc. | | | | | 4,926 | | | | | | 568 | |
| | | | | | | | | | | | |
| | | | | | | | | | | 3,015 | |
| | | | | | | | | | | | |
| |
| HEALTH CARE 4.9% | |
| | | | |
AbbVie, Inc. | | | | | 16,639 | | | | | | 2,854 | |
| | | | |
Amsurg Equity «(d)(h) | | | | | 4,188 | | | | | | 207 | |
| | | | |
Bristol-Myers Squibb Co. | | | | | 2,727 | | | | | | 113 | |
| | | | |
Gilead Sciences, Inc. | | | | | 11,899 | | | | | | 817 | |
| | | | |
Johnson & Johnson | | | | | 19,077 | | | | | | 2,788 | |
| | | | |
Merck & Co., Inc. | | | | | 5,011 | | | | | | 620 | |
| | | | |
Pfizer, Inc. | | | | | 37,434 | | | | | | 1,048 | |
| | | | | | | | | | | | |
| | | | | | | | | | | 8,447 | |
| | | | | | | | | | | | |
| |
| INDUSTRIALS 2.0% | |
| | | | |
3M Co. | | | | | 3,567 | | | | | | 364 | |
| | | | |
Cummins, Inc. | | | | | 2,761 | | | | | | 765 | |
| | | | |
Lockheed Martin Corp. | | | | | 3,570 | | | | | | 1,668 | |
| | | | |
Masco Corp. | | | | | 2,598 | | | | | | 173 | |
| | | | |
Neiman Marcus Group Ltd. LLC «(d)(h) | | | | | 1,124 | | | | | | 152 | |
| | | | |
Owens Corning | | | | | 1,940 | | | | | | 337 | |
| | | | |
Westmoreland Mining Holdings «(d)(h) | | | | | 52 | | | | | | 0 | |
| | | | |
Westmoreland Mining LLC «(d)(h) | | | | | 53 | | | | | | 0 | |
| | | | | | | | | | | | |
| | | | | | | | | | | 3,459 | |
| | | | | | | | | | | | |
| |
| INFORMATION TECHNOLOGY 3.2% | |
| | | | |
Apple, Inc. | | | | | 3,894 | | | | | | 820 | |
| | | | |
Cisco Systems, Inc. | | | | | 23,656 | | | | | | 1,124 | |
| | | | |
eBay, Inc. | | | | | 11,456 | | | | | | 615 | |
| | | | |
Microsoft Corp. | | | | | 2,049 | | | | | | 916 | |
| | | | |
NetApp, Inc. | | | | | 4,595 | | | | | | 592 | |
| | | | |
NVIDIA Corp. | | | | | 1,390 | | | | | | 172 | |
| | | | |
QUALCOMM, Inc. | | | | | 5,665 | | | | | | 1,128 | |
| | | | |
Skyworks Solutions, Inc. | | | | | 1,600 | | | | | | 171 | |
| | | | | | | | | | | | |
| | | | | | | | | | | 5,538 | |
| | | | | | | | | | | | |
| |
| MATERIALS 0.6% | |
| | | | |
Nucor Corp. | | | | | 3,657 | | | | | | 578 | |
| | | | |
Steel Dynamics, Inc. | | | | | 3,351 | | | | | | 434 | |
| | | | | | | | | | | | |
| | | | | | | | | | | 1,012 | |
| | | | | | | | | | | | |
| |
| UTILITIES 0.0% | |
| | | | |
Windstream Units «(d) | | | | | 40 | | | | | | 1 | |
| | | | | | | | | | | | |
Total United States | | | | | | | | | | | 38,799 | |
| | | | | | | | | | | | |
Total Common Stocks (Cost $70,839) | | | 80,366 | |
| | | | |
| |
| | | | | PRINCIPAL
AMOUNT
(000S) | | | | | | |
| CORPORATE BONDS & NOTES 5.8% | |
| | | | | | | | | | | | |
| BERMUDA 0.1% | |
| | | | | | | | | | | | |
| INDUSTRIALS 0.1% | |
|
Essent Group Ltd. | |
6.250% due 07/01/2029 (a) | | $ | | | 200 | | | | | | 200 | |
| | | | | | | | | | | | |
Total Bermuda | | | | | | | | | | | 200 | |
| | | | | | | | | | | | |
| |
| | | | | | |
| 22 | | PIMCO EQUITY SERIES | | | See Accompanying Notes | |
| | | | | | | | | | | | |
| | | | | PRINCIPAL
AMOUNT
(000S) | | | | | MARKET
VALUE
(000S) | |
| FRANCE 0.4% | |
| | | | | | | | | | | | |
| BANKING & FINANCE 0.4% | |
|
BPCE SA | |
6.714% due 10/19/2029 • | | $ | | | 250 | | | $ | | | 259 | |
| | | | |
Societe Generale SA | | | | | | | | | | | | |
6.691% due 01/10/2034 • | | | | | 400 | | | | | | 413 | |
| | | | | | | | | | | | |
| | | | | | | | | | | 672 | |
| | | | | | | | | | | | |
Total France | | | | | | | | | | | 672 | |
| | | | | | | | | | | | |
| |
| GERMANY 0.1% | |
| | | | | | | | | | | | |
| BANKING & FINANCE 0.1% | |
|
Deutsche Bank AG | |
3.547% due 09/18/2031 • | | | | | 200 | | | | | | 176 | |
| | | | | | | | | | | | |
Total Germany | | | | | | | | | | | 176 | |
| | | | | | | | | | | | |
| |
| IRELAND 0.2% | |
| | | | | | | | | | | | |
| INDUSTRIALS 0.2% | |
|
Russian Railways Via RZD Capital PLC | |
7.487% due 03/25/2031 ^(c) | | GBP | | | 300 | | | | | | 266 | |
| | | | | | | | | | | | |
Total Ireland | | | | | | | | | | | 266 | |
| | | | | | | | | | | | |
| |
| ITALY 0.1% | |
| | | | | | | | | | | | |
| BANKING & FINANCE 0.1% | |
|
Intesa Sanpaolo SpA | |
7.200% due 11/28/2033 | | $ | | | 200 | | | | | | 214 | |
| | | | | | | | | | | | |
Total Italy | | | | | | | | | | | 214 | |
| | | | | | | | | | | | |
| |
| JAPAN 0.7% | |
| | | | | | | | | | | | |
| BANKING & FINANCE 0.2% | |
|
Mizuho Financial Group, Inc. | |
5.594% due 07/10/2035 •(a) | | | | | 200 | | | | | | 199 | |
|
Nomura Holdings, Inc. | |
5.594% due 07/02/2027 (a) | | | | | 200 | | | | | | 200 | |
| | | | | | | | | | | | |
| | | | | | | | | | | 399 | |
| | | | | | | | | | | | |
| |
| INDUSTRIALS 0.5% | |
|
Nissan Motor Co. Ltd. | |
4.810% due 09/17/2030 | | | | | 868 | | | | | | 807 | |
| | | | | | | | | | | | |
Total Japan | | | | | | | | | | | 1,206 | |
| | | | | | | | | | | | |
| |
| LUXEMBOURG 0.1% | |
| | | | | | | | | | | | |
| INDUSTRIALS 0.1% | |
|
Intelsat Jackson Holdings SA | |
6.500% due 03/15/2030 | | | | | 208 | | | | | | 194 | |
| | | | | | | | | | | | |
| |
| UTILITIES 0.0% | |
|
FORESEA Holding SA | |
7.500% due 06/15/2030 | | | | | 27 | | | | | | 26 | |
| | | | | | | | | | | | |
Total Luxembourg | | | | | | | | | | | 220 | |
| | | | | | | | | | | | |
| |
| PERU 0.0% | |
| | | | | | | | | | | | |
| BANKING & FINANCE 0.0% | |
|
Banco de Credito del Peru SA | |
4.650% due 09/17/2024 | | PEN | | | 100 | | | | | | 26 | |
| | | | | | | | | | | | |
Total Peru | | | | | | | | | | | 26 | |
| | | | | | | | | | | | |
| |
| SPAIN 0.3% | |
| | | | | | | | | | | | |
| BANKING & FINANCE 0.3% | |
|
Banco Santander SA | |
6.607% due 11/07/2028 | | $ | | | 400 | | | | | | 420 | |
| | | | | | | | | | | | |
Total Spain | | | | | | | | | | | 420 | |
| | | | | | | | | | | | |
| |
| | | | | | | | | | | | |
| | | | | PRINCIPAL
AMOUNT
(000S) | | | | | MARKET
VALUE
(000S) | |
| SWITZERLAND 0.7% | |
| | | | | | | | | | | | |
| BANKING & FINANCE 0.7% | |
|
UBS Group AG | |
5.959% due 01/12/2034 • | | $ | | | 637 | | | $ | | | 647 | |
3.091% due 05/14/2032 • | | | | | 673 | | | | | | 574 | |
| | | | | | | | | | | | |
| | | | | | | | | | | 1,221 | |
| | | | | | | | | | | | |
Total Switzerland | | | | | | | | | | | 1,221 | |
| | | | | | | | | | | | |
| |
| UNITED KINGDOM 1.2% | |
| | | | | | | | | | | | |
| BANKING & FINANCE 1.0% | |
|
Barclays PLC | |
7.437% due 11/02/2033 • | | | | | 700 | | | | | | 770 | |
|
HSBC Holdings PLC | |
5.402% due 08/11/2033 • | | | | | 800 | | | | | | 792 | |
|
Nationwide Building Society | |
6.557% due 10/18/2027 • | | | | | 200 | | | | | | 204 | |
| | | | | | | | | | | | |
| | | | | | | | | | | 1,766 | |
| | | | | | | | | | | | |
| |
| INDUSTRIALS 0.2% | |
|
Marston’s Issuer PLC | |
7.902% due 07/16/2035 ~ | | GBP | | | 200 | | | | | | 192 | |
|
Mitchells & Butlers Finance PLC | |
5.802% (BP0003M + 0.450%) due 12/15/2030 ~ | | | | | 65 | | | | | | 78 | |
| | | | | | | | | | | | |
| | | | | | | | | | | 270 | |
| | | | | | | | | | | | |
Total United Kingdom | | | | | | | | | | | 2,036 | |
| | | | | | | | | | | | |
| |
| UNITED STATES 1.9% | |
| | | | | | | | | | | | |
| BANKING & FINANCE 0.3% | |
|
Credit Suisse AG AT1 Claim | |
1.000% due 12/31/2060 | | $ | | | 365 | | | | | | 44 | |
|
EPR Properties | |
4.950% due 04/15/2028 | | | | | 2 | | | | | | 2 | |
4.750% due 12/15/2026 | | | | | 2 | | | | | | 2 | |
|
GLP Capital LP | |
5.250% due 06/01/2025 | | | | | 3 | | | | | | 3 | |
5.300% due 01/15/2029 | | | | | 19 | | | | | | 19 | |
|
JPMorgan Chase & Co. | |
6.087% due 10/23/2029 • | | | | | 190 | | | | | | 196 | |
|
VICI Properties LP | |
4.625% due 06/15/2025 | | | | | 237 | | | | | | 234 | |
| | | | | | | | | | | | |
| | | | | | | | | | | 500 | |
| | | | | | | | | | | | |
| |
| INDUSTRIALS 1.1% | |
|
American Airlines Pass-Through Trust | |
3.350% due 04/15/2031 | | | | | 7 | | | | | | 6 | |
|
Carvana Co. (13.000% PIK) | |
13.000% due 06/01/2030 (b) | | | | | 130 | | | | | | 136 | |
|
Carvana Co. (14.000% PIK) | |
14.000% due 06/01/2031 (b) | | | | | 156 | | | | | | 168 | |
|
CVS Pass-Through Trust | |
8.353% due 07/10/2031 | | | | | 334 | | | | | | 360 | |
|
DISH DBS Corp. | |
5.250% due 12/01/2026 | | | | | 490 | | | | | | 387 | |
5.750% due 12/01/2028 | | | | | 200 | | | | | | 139 | |
|
Energy Transfer LP | |
4.950% due 05/15/2028 | | | | | 4 | | | | | | 4 | |
|
Exela Intermediate LLC (11.500% PIK) | |
11.500% due 04/15/2026 (b) | | | | | 10 | | | | | | 2 | |
|
Prime Healthcare Services, Inc. | |
7.250% due 11/01/2025 | | | | | 408 | | | | | | 408 | |
|
Topaz Solar Farms LLC | |
5.750% due 09/30/2039 | | | | | 62 | | | | | | 60 | |
4.875% due 09/30/2039 | | | | | 8 | | | | | | 7 | |
|
U.S. Renal Care, Inc. | |
10.625% due 06/28/2028 | | | | | 2 | | | | | | 2 | |
| | | | | | | | | | | | |
| | | | | PRINCIPAL
AMOUNT
(000S) | | | | | MARKET
VALUE
(000S) | |
|
Venture Global Calcasieu Pass LLC | |
3.875% due 08/15/2029 | | $ | | | 230 | | | $ | | | 210 | |
| | | | | | | | | | | | |
| | | | | | | | | | | 1,889 | |
| | | | | | | | | | | | |
| |
| UTILITIES 0.5% | |
|
Pacific Gas & Electric Co. | |
3.400% due 08/15/2024 | | | | | 35 | | | | | | 35 | |
3.300% due 03/15/2027 | | | | | 20 | | | | | | 19 | |
3.750% due 07/01/2028 | | | | | 110 | | | | | | 104 | |
3.250% due 06/01/2031 | | | | | 559 | | | | | | 481 | |
4.200% due 03/01/2029 | | | | | 200 | | | | | | 189 | |
| | | | | | | | | | | | |
| | | | | | | | | | | 828 | |
| | | | | | | | | | | | |
Total United States | | | | | | | | | | | 3,217 | |
| | | | | | | | | | | | |
| |
| VENEZUELA 0.0% | |
| | | | | | | | | | | | |
| INDUSTRIALS 0.0% | |
|
Petroleos de Venezuela SA | |
6.000% due 11/15/2026 | | | | | 300 | | | | | | 37 | |
9.750% due 05/17/2035 | | | | | 20 | | | | | | 3 | |
| | | | | | | | | | | | |
| | | | | | | | | | | 40 | |
| | | | | | | | | | | | |
Total Venezuela | | | | | | | | | | | 40 | |
| | | | | | | | | | | | |
Total Corporate Bonds & Notes (Cost $10,414) | | | 9,914 | |
| | | | |
| |
| NON-AGENCY MORTGAGE-BACKED SECURITIES 9.7% | |
| |
| IRELAND 0.3% | |
|
Kinbane DAC | |
4.450% due 09/25/2062 ~ | | EUR | | | 494 | | | | | | 526 | |
| | | | | | | | | | | | |
Total Ireland | | | | | | | | | | | 526 | |
| | | | | | | | | | | | |
| |
| UNITED KINGDOM 2.1% | |
|
Avon Finance PLC | |
6.134% due 12/28/2049 • | | GBP | | | 607 | | | | | | 767 | |
|
Bridgegate Funding PLC | |
7.483% due 10/16/2062 • | | | | | 1,330 | | | | | | 1,712 | |
|
Eurosail PLC | |
6.053% due 09/13/2045 • | | | | | 229 | | | | | | 288 | |
6.303% due 06/13/2045 • | | | | | 242 | | | | | | 305 | |
|
Grifonas Finance PLC | |
4.181% due 08/28/2039 • | | EUR | | | 142 | | | | | | 148 | |
|
Towd Point Mortgage Funding | |
0.000% due 07/20/2053 • | | GBP | | | 300 | | | | | | 380 | |
| | | | | | | | | | | | |
Total United Kingdom | | | | | | | | | | | 3,600 | |
| | | | | | | | | | | | |
| |
| UNITED STATES 7.3% | |
|
Banc of America Alternative Loan Trust | |
6.000% due 07/25/2046 | | $ | | | 38 | | | | | | 31 | |
|
Banc of America Funding Trust | |
4.788% due 05/20/2036 «~ | | | | | 5 | | | | | | 4 | |
|
Banc of America Mortgage Trust | |
3.734% due 11/20/2046 ~ | | | | | 3 | | | | | | 2 | |
6.000% due 10/25/2036 « | | | | | 8 | | | | | | 6 | |
|
Bear Stearns Mortgage Funding Trust | |
7.500% due 08/25/2036 «þ | | | | | 3 | | | | | | 3 | |
|
Benchmark Mortgage Trust | |
3.626% due 09/15/2048 ~ | | | | | 865 | | | | | | 811 | |
|
Chase Home Lending Mortgage Trust | |
3.250% due 09/25/2064 ~ | | | | | 900 | | | | | | 789 | |
3.500% due 06/25/2062 ~ | | | | | 1,537 | | | | | | 1,384 | |
|
Chase Mortgage Finance Trust | |
4.333% due 09/25/2036 «~ | | | | | 16 | | | | | | 14 | |
|
CIM Trust | |
5.000% due 05/25/2062 ~ | | | | | 1,393 | | | | | | 1,368 | |
|
Countrywide Alternative Loan Trust | |
6.000% due 06/25/2036 « | | | | | 77 | | | | | | 40 | |
6.000% due 02/25/2037 | | | | | 49 | | | | | | 19 | |
6.250% due 12/25/2036 • | | | | | 20 | | | | | | 8 | |
| | | | | | | | | | | | |
| See Accompanying Notes | | | ANNUAL FINANCIAL AND OTHER INFORMATION | | | | | | | JUNE 30, 2024 | | | 23 |
| | | | | | |
| Schedule of Investments | | PIMCO Dividend and Income Fund | | (Cont.) | | |
| | | | | | | | | | | | |
| | | | | PRINCIPAL
AMOUNT
(000S) | | | | | MARKET
VALUE
(000S) | |
|
Countrywide Home Loan Mortgage Pass-Through Trust | |
5.960% due 07/25/2037 «• | | $ | | | 14 | | | $ | | | 4 | |
|
Credit Suisse First Boston Mortgage Securities Corp. | |
6.000% due 01/25/2036 | | | | | 28 | | | | | | 17 | |
|
Credit Suisse First Boston Mortgage-Backed Pass-Through Certificates | |
6.000% due 11/25/2035 | | | | | 308 | | | | | | 74 | |
|
Credit Suisse Mortgage Capital Certificates | |
3.888% due 12/29/2037 ~ | | | | | 105 | | | | | | 54 | |
|
Credit Suisse Mortgage Capital Mortgage-Backed Trust | |
3.904% due 04/25/2062 ~ | | | | | 1,388 | | | | | | 1,298 | |
|
DBGS Mortgage Trust | |
8.093% due 10/15/2036 • | | | | | 900 | | | | | | 675 | |
|
First Horizon Alternative Mortgage Securities Trust | |
5.660% due 06/25/2036 ~ | | | | | 101 | | | | | | 77 | |
|
HSI Asset Loan Obligation Trust | |
6.000% due 06/25/2037 | | | | | 2 | | | | | | 2 | |
|
JP Morgan Alternative Loan Trust | |
5.843% due 05/26/2037 ~ | | | | | 36 | | | | | | 27 | |
|
JP Morgan Chase Commercial Mortgage Securities Trust | |
7.235% due 10/05/2040 | | | | | 400 | | | | | | 421 | |
7.958% due 11/15/2038 • | | | | | 967 | | | | | | 957 | |
|
JP Morgan Mortgage Trust | |
6.500% due 07/25/2036 | | | | | 78 | | | | | | 27 | |
|
Legacy Mortgage Asset Trust | |
7.208% due 01/28/2070 • | | | | | 31 | | | | | | 31 | |
|
Merrill Lynch Mortgage Investors Trust | |
4.303% due 03/25/2036 ~ | | | | | 7 | | | | | | 4 | |
|
MFA Trust | |
4.400% due 03/25/2068 þ | | | | | 1,391 | | | | | | 1,347 | |
|
Morgan Stanley Capital Trust | |
7.578% due 07/15/2035 • | | | | | 977 | | | | | | 975 | |
|
OBX Trust | |
6.310% due 04/25/2048 • | | | | | 4 | | | | | | 4 | |
|
PRPM LLC | |
6.327% due 06/25/2069 þ | | | | | 400 | | | | | | 401 | |
|
Residential Accredit Loans, Inc. Trust | |
5.500% due 03/25/2037 | | | | | 192 | | | | | | 149 | |
6.250% due 03/25/2037 | | | | | 17 | | | | | | 13 | |
6.260% due 10/25/2045 «• | | | | | 41 | | | | | | 32 | |
|
Structured Adjustable Rate Mortgage Loan Trust | |
4.512% due 10/25/2036 ~ | | | | | 1,097 | | | | | | 536 | |
|
Wells Fargo Alternative Loan Trust | |
6.863% due 07/25/2037 ~ | | | | | 358 | | | | | | 318 | |
|
Wells Fargo Commercial Mortgage Trust | |
3.412% due 09/15/2058 | | | | | 183 | | | | | | 181 | |
|
WSTN Trust | |
6.518% due 07/05/2037 ~ | | | | | 500 | | | | | | 502 | |
| | | | | | | | | | | | |
Total United States | | | | | | | | | | | 12,605 | |
| | | | | | | | | | | | |
Total Non-Agency Mortgage-Backed Securities (Cost $17,380) | | | 16,731 | |
| | | | |
| |
| MUNICIPAL BONDS & NOTES 0.1% | |
| |
| ILLINOIS 0.0% | |
|
Illinois State General Obligation Bonds, (BABs), Series 2010 | |
6.630% due 02/01/2035 | | | | | 13 | | | | | | 13 | |
7.350% due 07/01/2035 | | | | | 4 | | | | | | 5 | |
| | | | | | | | | | | | |
Total Illinois | | | | | | | | | | | 18 | |
| | | | | | | | | | | | |
| |
| PUERTO RICO 0.1% | |
|
Commonwealth of Puerto Rico Bonds, Series 2022 | |
0.000% due 11/01/2043 | | | | | 39 | | | | | | 24 | |
|
Puerto Rico Electric Power Authority Revenue Bonds, (BABs), Series 2010 | |
6.125% due 07/01/2040 ^(c) | | | | | 100 | | | | | | 47 | |
| | | | | | | | | | | | |
Total Puerto Rico | | | | | | | | | | | 71 | |
| | | | | | | | | | | | |
Total Municipal Bonds & Notes (Cost $71) | | | 89 | |
| | | | |
| | | | | | | | | | | | |
| | | | | SHARES | | | | | MARKET
VALUE
(000S) | |
| PREFERRED STOCKS 0.6% | |
| | | | | | | | | | | | |
| BRAZIL 0.4% | |
| | | | | | | | | | | | |
| UTILITIES 0.4% | |
| | | | |
Petroleo Brasileiro SA | | | | | 105,600 | | | $ | | | 719 | |
| | | | | | | | | | | | |
Total Brazil | | | | | | | | | | | 719 | |
| | | | | | | | | | | | |
| |
| REPUBLIC OF KOREA 0.1% | |
| | | | | | | | | | | | |
| INDUSTRIALS 0.1% | |
| | | | |
Samsung Electronics Co. Ltd. | | | | | 2,728 | | | | | | 125 | |
| | | | | | | | | | | | |
Total Republic of Korea | | | | | | | | | | | 125 | |
| | | | | | | | | | | | |
| |
| UNITED KINGDOM 0.1% | |
| | | | | | | | | | | | |
| BANKING & FINANCE 0.1% | |
|
Nationwide Building Society | |
10.250% ~ | | | | | 880 | | | | | | 146 | |
| | | | | | | | | | | | |
Total United Kingdom | | | | | | | | | | | 146 | |
| | | | | | | | | | | | |
Total Preferred Stocks (Cost $865) | | | 990 | |
| | | | |
| |
| REAL ESTATE INVESTMENT TRUSTS 5.2% | |
| | | | | | | | | | | | |
| UNITED STATES 5.2% | |
| | | | | | | | | | | | |
| REAL ESTATE 5.2% | |
| | | | |
Apple Hospitality REIT, Inc. | | | | | 27,974 | | | | | | 407 | |
| | | | |
Boston Properties, Inc. | | | | | 3,502 | | | | | | 216 | |
| | | | |
Camden Property Trust | | | | | 2,770 | | | | | | 302 | |
| | | | |
CareTrust REIT, Inc. | | | | | 6,479 | | | | | | 163 | |
| | | | |
Crown Castle, Inc. | | | | | 4,163 | | | | | | 407 | |
| | | | |
Digital Realty Trust, Inc. | | | | | 4,034 | | | | | | 613 | |
| | | | |
EPR Properties | | | | | 9,315 | | | | | | 391 | |
| | | | |
Equity Residential | | | | | 4,844 | | | | | | 336 | |
| | | | |
Gaming & Leisure Properties, Inc. | | | | | 12,786 | | | | | | 578 | |
| | | | |
Healthcare Realty Trust, Inc. | | | | | 15,386 | | | | | | 253 | |
| | | | |
Healthpeak Properties, Inc. | | | | | 14,073 | | | | | | 276 | |
| | | | |
Highwoods Properties, Inc. | | | | | 18,277 | | | | | | 480 | |
| | | | |
Kilroy Realty Corp. | | | | | 7,143 | | | | | | 223 | |
| | | | |
Mid-America Apartment Communities, Inc. | | | | | 1,704 | | | | | | 243 | |
| | | | |
National Storage Affiliates Trust | | | | | 7,754 | | | | | | 320 | |
| | | | |
Omega Healthcare Investors, Inc. | | | | | 10,393 | | | | | | 356 | |
| | | | |
Park Hotels & Resorts, Inc. | | | | | 36,229 | | | | | | 543 | |
| | | | |
Public Storage | | | | | 842 | | | | | | 242 | |
| | | | |
Realty Income Corp. | | | | | 5,465 | | | | | | 289 | |
| | | | |
Regency Centers Corp. | | | | | 4,123 | | | | | | 256 | |
| | | | |
RLJ Lodging Trust | | | | | 23,688 | | | | | | 228 | |
| | | | |
Simon Property Group, Inc. | | | | | 3,843 | | | | | | 583 | |
| | | | |
Uniti Group, Inc. | | | | | 28 | | | | | | 0 | |
| | | | |
VICI Properties, Inc. | | | | | 33,654 | | | | | | 964 | |
| | | | |
WP Carey, Inc. | | | | | 4,417 | | | | | | 243 | |
| | | | | | | | | | | | |
| | | | | | | | | | | 8,912 | |
| | | | | | | | | | | | |
Total Real Estate Investment Trusts (Cost $8,302) | | | 8,912 | |
| | | | | | | | | | | | |
| |
| | | | | PRINCIPAL
AMOUNT
(000S) | | | | | | |
| SOVEREIGN ISSUES 1.8% | |
| |
| ARGENTINA 0.3% | |
|
Argentina Government International Bond | |
0.750% due 07/09/2030 þ | | $ | | | 299 | | | | | | 167 | |
1.000% due 07/09/2029 | | | | | 31 | | | | | | 18 | |
3.500% due 07/09/2041 þ | | | | | 196 | | | | | | 77 | |
3.625% due 07/09/2035 þ | | | | | 373 | | | | | | 159 | |
4.250% due 01/09/2038 þ | | | | | 269 | | | | | | 124 | |
| | | | | | | | | | | | |
Total Argentina | | | | | | | | | | | 545 | |
| | | | | | | | | | | | |
| |
| | | | | | | | | | | | |
| | | | | PRINCIPAL
AMOUNT
(000S) | | | | | MARKET
VALUE
(000S) | |
| ISRAEL 0.1% | |
|
Israel Government International Bond | |
5.500% due 03/12/2034 | | $ | | | 200 | | | $ | | | 191 | |
| | | | | | | | | | | | |
Total Israel | | | | | | | | | | | 191 | |
| | | | | | | | | | | | |
| |
| MEXICO 0.6% | |
|
Mexico Government International Bond | |
2.750% due 11/27/2031 (g) | | MXN | | | 6,177 | | | | | | 284 | |
3.000% due 12/03/2026 (g) | | | | | 4,389 | | | | | | 222 | |
4.000% due 11/30/2028 (g) | | | | | 488 | | | | | | 25 | |
4.000% due 08/24/2034 (g) | | | | | 163 | | | | | | 8 | |
7.000% due 09/03/2026 | | | | | 3,000 | | | | | | 149 | |
7.500% due 06/03/2027 | | | | | 2,300 | | | | | | 117 | |
7.750% due 05/29/2031 | | | | | 300 | | | | | | 15 | |
8.500% due 03/01/2029 | | | | | 1,600 | | | | | | 82 | |
8.500% due 05/31/2029 | | | | | 1,100 | | | | | | 57 | |
| | | | | | | | | | | | |
Total Mexico | | | | | | | | | | | 959 | |
| | | | | | | | | | | | |
| |
| PERU 0.1% | |
|
Peru Government International Bond | |
6.150% due 08/12/2032 | | PEN | | | 104 | | | | | | 26 | |
6.900% due 08/12/2037 | | | | | 5 | | | | | | 1 | |
6.950% due 08/12/2031 | | | | | 202 | | | | | | 54 | |
| | | | | | | | | | | | |
Total Peru | | | | | | | | | | | 81 | |
| | | | | | | | | | | | |
| |
| ROMANIA 0.2% | |
|
Romania Government International Bond | |
5.500% due 09/18/2028 | | EUR | | | 200 | | | | | | 220 | |
5.625% due 05/30/2037 | | | | | 100 | | | | | | 103 | |
| | | | | | | | | | | | |
Total Romania | | | | | | | | | | | 323 | |
| | | | | | | | | | | | |
| |
| SOUTH AFRICA 0.3% | |
|
South Africa Government International Bond | |
10.500% due 12/21/2026 | | ZAR | | | 9,600 | | | | | | 548 | |
| | | | | | | | | | | | |
Total South Africa | | | | | | | | | | | 548 | |
| | | | | | | | | | | | |
| |
| TURKEY 0.2% | |
|
Turkey Government International Bond | |
4.250% due 03/13/2025 | | $ | | | 200 | | | | | | 197 | |
5.250% due 03/13/2030 | | | | | 200 | | | | | | 183 | |
| | | | | | | | | | | | |
Total Turkey | | | | | | | | | | | 380 | |
| | | | | | | | | | | | |
| |
| VENEZUELA 0.0% | |
|
Venezuela Government International Bond | |
7.000% due 03/31/2038 ^(c) | | | | | 2 | | | | | | 0 | |
7.650% due 04/21/2025 ^(c) | | | | | 3 | | | | | | 1 | |
9.250% due 09/15/2027 ^(c) | | | | | 44 | | | | | | 8 | |
| | | | | | | | | | | | |
Total Venezuela | | | | | | | | | | | 9 | |
| | | | | | | | | | | | |
Total Sovereign Issues (Cost $3,439) | | | 3,036 | |
| | | | |
| |
| U.S. GOVERNMENT AGENCIES 29.6% | |
| |
| UNITED STATES 29.6% | |
|
Ginnie Mae, TBA | |
3.000% due 07/01/2054 | | | | | 200 | | | | | | 174 | |
3.500% due 07/01/2054 | | | | | 100 | | | | | | 90 | |
4.500% due 08/01/2054 | | | | | 600 | | | | | | 571 | |
5.000% due 08/01/2054 | | | | | 300 | | | | | | 292 | |
5.500% due 07/01/2054 | | | | | 100 | | | | | | 99 | |
|
Uniform Mortgage-Backed Security | |
3.000% due 11/01/2029 - 05/01/2052 | | | | | 326 | | | | | | 278 | |
3.500% due 02/01/2050 | | | | | 27 | | | | | | 25 | |
4.000% due 08/01/2042 - 10/01/2042 | | | | | 94 | | | | | | 88 | |
|
Uniform Mortgage-Backed Security, TBA | |
3.000% due 08/01/2054 | | | | | 2,900 | | | | | | 2,470 | |
3.500% due 07/01/2054 | | | | | 1,300 | | | | | | 1,151 | |
4.000% due 07/01/2054 | | | | | 7,700 | | | | | | 7,046 | |
| | | | | | |
| 24 | | PIMCO EQUITY SERIES | | | See Accompanying Notes | |
| | | | | | | | | | | | |
| | | | | PRINCIPAL
AMOUNT
(000S) | | | | | MARKET
VALUE
(000S) | |
4.500% due 08/01/2054 | | $ | | | 4,300 | | | $ | | | 4,055 | |
5.000% due 07/01/2054 - 08/01/2054 | | | | | 8,200 | | | | | | 7,925 | |
5.500% due 08/01/2054 | | | | | 5,000 | | | | | | 4,931 | |
6.000% due 08/01/2054 | | | | | 9,700 | | | | | | 9,724 | |
6.500% due 08/01/2054 | | | | | 10,600 | | | | | | 10,783 | |
7.000% due 08/01/2054 | | | | | 1,000 | | | | | | 1,028 | |
| | | | | | | | | | | | |
Total U.S. Government Agencies (Cost $50,890) | | | 50,730 | |
| | | | | | | | | | | | |
| |
| U.S. TREASURY OBLIGATIONS 10.8% | |
| |
| UNITED STATES 10.8% | |
|
U.S. Treasury Bonds | |
2.875% due 11/15/2046 | | | | | 600 | | | | | | 450 | |
3.000% due 02/15/2049 | | | | | 1,133 | | | | | | 858 | |
4.375% due 08/15/2043 | | | | | 300 | | | | | | 290 | |
|
U.S. Treasury Inflation Protected Securities (g) | |
0.125% due 10/15/2024 (k) | | | | | 1,686 | | | | | | 1,669 | |
0.125% due 04/15/2025 | | | | | 568 | | | | | | 553 | |
0.125% due 07/15/2030 | | | | | 342 | | | | | | 306 | |
0.125% due 07/15/2031 | | | | | 2,491 | | | | | | 2,189 | |
0.125% due 02/15/2051 | | | | | 361 | | | | | | 209 | |
0.250% due 01/15/2025 | | | | | 608 | | | | | | 595 | |
0.250% due 07/15/2029 (k) | | | | | 880 | | | | | | 808 | |
0.375% due 07/15/2025 | | | | | 62 | | | | | | 61 | |
0.375% due 01/15/2027 | | | | | 42 | | | | | | 40 | |
0.375% due 07/15/2027 | | | | | 13 | | | | | | 12 | |
0.625% due 07/15/2032 | | | | | 647 | | | | | | 581 | |
0.750% due 07/15/2028 | | | | | 262 | | | | | | 249 | |
0.875% due 01/15/2029 | | | | | 431 | | | | | | 408 | |
1.000% due 02/15/2048 | | | | | 127 | | | | | | 97 | |
1.000% due 02/15/2049 | | | | | 125 | | | | | | 95 | |
| | | | | | | | | | | | |
| | | | | PRINCIPAL
AMOUNT
(000S) | | | | | MARKET
VALUE
(000S) | |
1.375% due 07/15/2033 | | $ | | | 1,135 | | | $ | | | 1,073 | |
2.375% due 01/15/2025 | | | | | 153 | | | | | | 152 | |
|
U.S. Treasury Notes | |
0.500% due 10/31/2027 (m) | | | | | 100 | | | | | | 88 | |
0.625% due 11/30/2027 (m) | | | | | 550 | | | | | | 484 | |
0.625% due 12/31/2027 | | | | | 220 | | | | | | 193 | |
0.750% due 01/31/2028 (m) | | | | | 110 | | | | | | 96 | |
2.375% due 03/31/2029 | | | | | 2,800 | | | | | | 2,562 | |
4.000% due 10/31/2029 | | | | | 800 | | | | | | 787 | |
4.500% due 03/31/2026 | | | | | 1,800 | | | | | | 1,791 | |
4.500% due 04/15/2027 | | | | | 1,800 | | | | | | 1,797 | |
| | | | | | | | | | | | |
Total U.S. Treasury Obligations
(Cost $20,112) | | | 18,493 | |
| | | | | | | | | | | | |
| |
| | | | | SHARES | | | | | | |
| WARRANTS 0.0% | |
| |
| LUXEMBOURG 0.0% | |
| |
| FINANCIALS 0.0% | |
| |
| | | | |
Intelsat Emergence SA - Exp.
02/17/2027 « | | | | | 132 | | | | | | 0 | |
| | | | | | | | | | | | |
Total Warrants (Cost $53) | | | 0 | |
| | | | | | | | | | | | |
| |
| SHORT-TERM INSTRUMENTS 0.3% | |
| |
| REPURCHASE AGREEMENTS (i) 0.3% | |
| | | | | | | | | | | 546 | |
| | | | | | | | | | | | |
| |
| | | | | | | | | | | | |
| | | | | PRINCIPAL
AMOUNT
(000S) | | | | | MARKET
VALUE
(000S) | |
| U.S. TREASURY BILLS 0.0% | |
5.376% due 07/11/2024 (e)(f)(m) | | $ | | | 71 | | | $ | | | 71 | |
| | | | | | | | | | | | |
Total Short-Term Instruments
(Cost $617) | | | 617 | |
| | | | | | | | | | | | |
| | | | |
| | | | | | | | | | | | |
Total Investments in Securities
(Cost $208,967) | | | 214,960 | |
| | | | | | | | | | | | |
| |
| | | | | SHARES | | | | | | |
| INVESTMENTS IN AFFILIATES 3.0% | |
| |
| SHORT-TERM INSTRUMENTS 3.0% | |
| |
| CENTRAL FUNDS USED FOR CASH MANAGEMENT PURPOSES 3.0% | |
| | | | |
PIMCO Short-Term Floating NAV Portfolio III | | | | | 531,189 | | | | | | 5,168 | |
| | | | | | | | | | | | |
Total Short-Term Instruments
(Cost $5,167) | | | 5,168 | |
| | | | | | | | | | | | |
| | | | |
| | | | | | | | | | | | |
Total Investments in Affiliates
(Cost $5,167) | | | 5,168 | |
| | | | |
| | | | | | | | | | | | |
Total Investments 128.4%
(Cost $214,134) | | | $ | | | 220,128 | |
| | | | | | | | | | | | |
Financial Derivative
Instruments (j)(l) (0.0)% (Cost or Premiums, net $(214)) | | | (87 | ) |
| | | | | | | | | | | | |
| Other Assets and Liabilities, net (28.4)% | | | (48,631 | ) |
| | | | | | | | | | | | |
| Net Assets 100.0% | | | $ | | | 171,410 | |
| | | | | | | | | | | | |
NOTES TO SCHEDULE OF INVESTMENTS:
| * | A zero balance may reflect actual amounts rounding to less than one thousand. |
| « | Security valued using significant unobservable inputs (Level 3). |
| ~ | Variable or Floating rate security. Rate shown is the rate in effect as of period end. Certain variable rate securities are not based on a published reference rate and spread, rather are determined by the issuer or agent and are based on current market conditions. Reference rate is as of reset date, which may vary by security. These securities may not indicate a reference rate and/or spread in their description. |
| • | Rate shown is the rate in effect as of period end. The rate may be based on a fixed rate, a capped rate or a floor rate and may convert to a variable or floating rate in the future. These securities do not indicate a reference rate and spread in their description. |
| þ | Coupon represents a rate which changes periodically based on a predetermined schedule or event. Rate shown is the rate in effect as of period end. |
| (b) | Payment in-kind security. |
| (c) | Security is not accruing income as of the date of this report. |
| (d) | Security did not produce income within the last twelve months. |
| (f) | Coupon represents a yield to maturity. |
| (g) | Principal amount of security is adjusted for inflation. |
(h) RESTRICTED SECURITIES:
| | | | | | | | | | | | | | | | |
| Issuer Description | | Acquisition
Date | | | Cost | | | Market
Value | | | Market Value
as Percentage
of Net Assets | |
Amsurg Equity | | | 11/02/2023 - 11/06/2023 | | | $ | 175 | | | $ | 207 | | | | 0.12 | % |
Intelsat Emergence SA | | | 06/19/2017 - 07/03/2023 | | | | 208 | | | | 108 | | | | 0.06 | |
Neiman Marcus Group Ltd. LLC | | | 09/25/2020 | | | | 36 | | | | 152 | | | | 0.09 | |
Westmoreland Mining Holdings | | | 03/26/2019 | | | | 0 | | | | 0 | | | | 0.00 | |
Westmoreland Mining LLC | | | 06/30/2023 | | | | 0 | | | | 0 | | | | 0.00 | |
| | | | | | | | | | | | | | | | |
| | | $ | 419 | | | $ | 467 | | | | 0.27 | % |
| | | | | | | | | | | | | |
| | | | | | | | | | | | |
| See Accompanying Notes | | | ANNUAL FINANCIAL AND OTHER INFORMATION | | | | | | | JUNE 30, 2024 | | | 25 |
| | | | | | |
| Schedule of Investments | | PIMCO Dividend and Income Fund | | (Cont.) | | |
BORROWINGS AND OTHER FINANCING TRANSACTIONS
(i) REPURCHASE AGREEMENTS:
| | | | | | | | | | | | | | | | | | | | | | | | | | | | | | |
| Counterparty | | Lending
Rate | | | Settlement
Date | | | Maturity
Date | | | Principal
Amount | | | Collateralized By | | Collateral
(Received) | | | Repurchase
Agreements,
at Value | | | Repurchase
Agreement
Proceeds
to be
Received(1) | |
| FICC | | | 2.600 | % | | | 06/28/2024 | | | | 07/01/2024 | | | $ | 546 | | | U.S. Treasury Inflation Protected Securities 0.625% due 01/15/2026 | | $ | (557 | ) | | $ | 546 | | | $ | 546 | |
| | | | | | | | | | | | | | | | | | | | | | | | | | | | | | |
Total Repurchase Agreements | | | | | $ | (557 | ) | | $ | 546 | | | $ | 546 | |
| | | | | | | | | | | | | | | | | | | | | | | | | | | | | | |
BORROWINGS AND OTHER FINANCING TRANSACTIONS SUMMARY
The following is a summary by counterparty of the market value of Borrowings and Other Financing Transactions and collateral pledged/(received) as of June 30, 2024:
| | | | | | | | | | | | | | | | | | | | | | | | |
| Counterparty | | Repurchase
Agreement
Proceeds
to be
Received(1) | | | Payable for
Reverse
Repurchase
Agreements | | | Payable for
Sale-Buyback
Transactions | | | Total
Borrowings and
Other Financing
Transactions | | | Collateral
Pledged/(Received) | | | Net Exposure(2) | |
Global/Master Repurchase Agreement | |
FICC | | $ | 546 | | | $ | 0 | | | $ | 0 | | | $ | 546 | | | $ | (557 | ) | | $ | (11 | ) |
| | | | | | | | | | | | | | | | | | | | | | | | |
Total Borrowings and Other Financing Transactions | | $ | 546 | | | $ | 0 | | | $ | 0 | | | | | | | | | | | | | |
| | | | | | | | | | | | | | | | | | | | | | | | |
| (1) | Includes accrued interest. |
| (2) | Net Exposure represents the net receivable/(payable) that would be due from/to the counterparty in the event of default. Exposure from borrowings and other financing transactions can only be netted across transactions governed under the same master agreement with the same legal entity. See Note 8, Master Netting Arrangements, in the Notes to Financial Statements for more information. |
(j) FINANCIAL DERIVATIVE INSTRUMENTS: EXCHANGE-TRADED OR CENTRALLY CLEARED
FUTURES CONTRACTS:
| | | | | | | | | | | | | | | | | | | | | | | | | | | | |
| LONG FUTURES CONTRACTS | |
| | | | | |
Description | | Expiration
Month | | | # of
Contracts | | | Notional
Amount | | | Unrealized
Appreciation/
(Depreciation) | | | Variation Margin | |
| | Asset | | | Liability | |
U.S. Treasury 2-Year Note September Futures | | | 09/2024 | | | | 1 | | | $ | | | | | 204 | | | $ | 0 | | | $ | 0 | | | $ | 0 | |
U.S. Treasury 5-Year Note September Futures | | | 09/2024 | | | | 23 | | | | | | | | 2,451 | | | | 11 | | | | 0 | | | | (2 | ) |
U.S. Treasury 10-Year Note September Futures | | | 09/2024 | | | | 100 | | | | | | | | 10,998 | | | | 45 | | | | 0 | | | | (27 | ) |
| | | | | | | | | | | | | | | | | | | | | | | | | | | | |
| | | | | | | | | | | | | | | | | | $ | 56 | | | $ | 0 | | | $ | (29 | ) |
| | | | | | | | | | | | | | | | | | | | | | | | | | | | |
| SHORT FUTURES CONTRACTS | |
| | | | | |
Description | | Expiration
Month | | | # of
Contracts | | | Notional
Amount | | | Unrealized
Appreciation/
(Depreciation) | | | Variation Margin | |
| | Asset | | | Liability | |
3-Month SOFR Active Contract December Futures | | | 03/2025 | | | | 1 | | | $ | | | | | (238 | ) | | $ | 7 | | | $ | 0 | | | $ | 0 | |
3-Month SOFR Active Contract December Futures | | | 03/2026 | | | | 1 | | | | | | | | (240 | ) | | | 4 | | | | 0 | | | | 0 | |
3-Month SOFR Active Contract June Futures | | | 09/2024 | | | | 2 | | | | | | | | (473 | ) | | | 15 | | | | 0 | | | | 0 | |
3-Month SOFR Active Contract June Futures | | | 09/2025 | | | | 2 | | | | | | | | (478 | ) | | | 11 | | | | 0 | | | | 0 | |
3-Month SOFR Active Contract March Futures | | | 06/2025 | | | | 1 | | | | | | | | (239 | ) | | | 6 | | | | 0 | | | | 0 | |
3-Month SOFR Active Contract March Futures | | | 06/2026 | | | | 1 | | | | | | | | (240 | ) | | | 4 | | | | 0 | | | | 0 | |
3-Month SOFR Active Contract September Futures | | | 12/2024 | | | | 2 | | | | | | | | (474 | ) | | | 14 | | | | 0 | | | | 0 | |
3-Month SOFR Active Contract September Futures | | | 12/2025 | | | | 1 | | | | | | | | (240 | ) | | | 5 | | | | 0 | | | | 0 | |
Australia Government 10-Year Bond September Futures | | | 09/2024 | | | | 18 | | | | | | | | (1,364 | ) | | | 0 | | | | 10 | | | | (11 | ) |
U.S. Treasury 10-Year Ultra Long-Term Bond September Futures | | | 09/2024 | | | | 14 | | | | | | | | (1,589 | ) | | | (8 | ) | | | 7 | | | | 0 | |
U.S. Treasury Long-Term Bond September Futures | | | 09/2024 | | | | 17 | | | | | | | | (2,011 | ) | | | (19 | ) | | | 17 | | | | 0 | |
U.S. Treasury Ultra Long-Term Bond September Futures | | | 09/2024 | | | | 4 | | | | | | | | (501 | ) | | | (4 | ) | | | 7 | | | | 0 | |
| | | | | | | | | | | | | | | | | | | | | | | | | | | | |
| | | | | | | | | | | | | | | | | | $ | 35 | | | $ | 41 | | | $ | (11 | ) |
| | | | | | | | | | | | | | | | | | | | | | | | | | | | |
Total Futures Contracts | | | $ | 91 | | | $ | 41 | | | $ | (40 | ) |
| | | | | | | | | | | | | | | | | | | | | | | | | | | | |
| | | | | | |
| 26 | | PIMCO EQUITY SERIES | | | See Accompanying Notes | |
SWAP AGREEMENTS:
CREDIT DEFAULT SWAPS ON CORPORATE ISSUES - SELL PROTECTION(1)
| | | | | | | | | | | | | | | | | | | | | | | | | | | | | | | | | | | | | | | | |
| Reference Entity | | Fixed
Receive Rate | | | Payment
Frequency | | | Maturity
Date | | | Implied
Credit Spread at
June 30, 2024(2) | | | Notional
Amount(3) | | | Premiums
Paid/(Received) | | | Unrealized
Appreciation/
(Depreciation) | | | Market
Value(4) | | | Variation Margin | |
| | Asset | | | Liability | |
AT&T, Inc. | | | 1.000 | % | | | Quarterly | | | | 06/20/2028 | | | | 0.564 | % | | $ | 600 | | | $ | (5 | ) | | $ | 15 | | | $ | 10 | | | $ | 1 | | | $ | 0 | |
Ford Motor Co. | | | 5.000 | | | | Quarterly | | | | 06/20/2027 | | | | 0.875 | | | | 200 | | | | 24 | | | | (1 | ) | | | 23 | | | | 0 | | | | 0 | |
Ford Motor Credit Co. LLC | | | 5.000 | | | | Quarterly | | | | 06/20/2026 | | | | 0.602 | | | | 600 | | | | 52 | | | | (1 | ) | | | 51 | | | | 0 | | | | 0 | |
Verizon Communications, Inc. | | | 1.000 | | | | Quarterly | | | | 06/20/2026 | | | | 0.355 | | | | 500 | | | | 11 | | | | (5 | ) | | | 6 | | | | 0 | | | | 0 | |
Verizon Communications, Inc. | | | 1.000 | | | | Quarterly | | | | 06/20/2028 | | | | 0.523 | | | | 250 | | | | 0 | | | | 4 | | | | 4 | | | | 0 | | | | 0 | |
| | | | | | | | | | | | | | | | | | | | | | | | | | | | | | | | | | | | | | | | |
| | | | | | | | | | | | | | | | | | | $ | 82 | | | $ | 12 | | | $ | 94 | | | $ | 1 | | | $ | 0 | |
| | | | | | | | | | | | | | | | | | | | | | | | | | | | | | | | | |
CREDIT DEFAULT SWAPS ON CREDIT INDICES - SELL PROTECTION(1)
| | | | | | | | | | | | | | | | | | | | | | | | | | | | | | | | | | | | |
| Index/Tranches | | Fixed
Receive Rate | | | Payment
Frequency | | | Maturity
Date | | | Notional
Amount(3) | | | Premiums
Paid/(Received) | | | Unrealized
Appreciation/
(Depreciation) | | | Market
Value(4) | | | Variation Margin | |
| | Asset | | | Liability | |
CDX.EM-36 5-Year Index | | | 1.000 | % | | | Quarterly | | | | 12/20/2026 | | | $ | 552 | | | $ | (21 | ) | | $ | 19 | | | $ | (2 | ) | | $ | 0 | | | $ | 0 | |
CDX.EM-40 5-Year Index | | | 1.000 | | | | Quarterly | | | | 12/20/2028 | | | | 200 | | | | (10 | ) | | | 5 | | | | (5 | ) | | | 0 | | | | 0 | |
CDX.EM-41 5-Year Index | | | 1.000 | | | | Quarterly | | | | 06/20/2029 | | | | 400 | | | | (15 | ) | | | 2 | | | | (13 | ) | | | 0 | | | | 0 | |
CDX.HY-41 5-Year Index | | | 5.000 | | | | Quarterly | | | | 12/20/2028 | | | | 2,178 | | | | 1 | | | | 141 | | | | 142 | | | | 0 | | | | (1 | ) |
CDX.HY-42 5-Year Index | | | 5.000 | | | | Quarterly | | | | 06/20/2029 | | | | 3,900 | | | | 265 | | | | (16 | ) | | | 249 | | | | 0 | | | | (3 | ) |
CDX.IG-42 5-Year Index | | | 1.000 | | | | Quarterly | | | | 06/20/2029 | | | | 2,100 | | | | 47 | | | | (3 | ) | | | 44 | | | | 0 | | | | 0 | |
| | | | | | | | | | | | | | | | | | | | | | | | | | | | | | | | | | | | |
| | | | | | | | | | | | | | | $ | 267 | | | $ | 148 | | | $ | 415 | | | $ | 0 | | | $ | (4 | ) |
| | | | | | | | | | | | | | | | | | | | | | | | | | | | | | | | | |
INTEREST RATE SWAPS
| | | | | | | | | | | | | | | | | | | | | | | | | | | | | | | | | | | | | | | | |
Pay/Receive
Floating Rate | | Floating Rate Index | | Fixed Rate | | | Payment
Frequency | | Maturity
Date | | | Notional
Amount | | | Premiums
Paid/(Received) | | | Unrealized
Appreciation/
(Depreciation) | | | Market
Value | | | Variation Margin | |
| | Asset | | | Liability | |
Pay(5) | | 1-Day GBP-SONIO Compounded-OIS | | | 4.000 | % | | Annual | | | 09/18/2029 | | | | GBP | | | | 6,500 | | | $ | 112 | | | $ | (80 | ) | | $ | 32 | | | $ | 0 | | | $ | (8 | ) |
Receive(5) | | 1-Day GBP-SONIO Compounded-OIS | | | 3.750 | | | Annual | | | 09/18/2034 | | | | | | | | 1,300 | | | | (21 | ) | | | 34 | | | | 13 | | | | 6 | | | | 0 | |
Pay | | 1-Day JPY-MUTKCALM Compounded-OIS | | | 0.176 | | | Annual | | | 04/27/2027 | | | | JPY | | | | 30,000 | | | | 0 | | | | (2 | ) | | | (2 | ) | | | 0 | | | | 0 | |
Receive | | 1-Day JPY-MUTKCALM Compounded-OIS | | | 0.020 | | | Semi-Annual | | | 09/20/2028 | | | | | | | | 210,000 | | | | 4 | | | | 35 | | | | 39 | | | | 2 | | | | 0 | |
Receive | | 1-Day JPY-MUTKCALM Compounded-OIS | | | 0.000 | | | Semi-Annual | | | 03/15/2029 | | | | | | | | 641,000 | | | | 46 | | | | 88 | | | | 134 | | | | 6 | | | | 0 | |
Receive(5) | | 1-Day JPY-MUTKCALM Compounded-OIS | | | 0.700 | | | Annual | | | 09/18/2029 | | | | | | | | 58,000 | | | | 1 | | | | (1 | ) | | | 0 | | | | 0 | | | | 0 | |
Receive | | 1-Day JPY-MUTKCALM Compounded-OIS | | | 0.400 | | | Annual | | | 06/15/2032 | | | | | | | | 90,200 | | | | 2 | | | | 19 | | | | 21 | | | | 1 | | | | 0 | |
Receive(5) | | 1-Day JPY-MUTKCALM Compounded-OIS | | | 1.000 | | | Annual | | | 09/18/2034 | | | | | | | | 31,000 | | | | 1 | | | | 0 | | | | 1 | | | | 0 | | | | 0 | |
Receive | | 1-Day JPY-MUTKCALM Compounded-OIS | | | 0.500 | | | Annual | | | 03/15/2042 | | | | | | | | 48,000 | | | | 13 | | | | 31 | | | | 44 | | | | 1 | | | | 0 | |
Receive | | 1-Day JPY-MUTKCALM Compounded-OIS | | | 0.711 | | | Annual | | | 04/27/2042 | | | | | | | | 9,000 | | | | 0 | | | | 7 | | | | 7 | | | | 0 | | | | 0 | |
Receive(5) | | 1-Day USD-SOFR Compounded-OIS | | | 4.060 | | | Annual | | | 07/02/2034 | | | | $ | | | | 100 | | | | 0 | | | | (1 | ) | | | (1 | ) | | | 0 | | | | (1 | ) |
Pay | | 1-Day USD-SOFR Compounded-OIS | | | 2.993 | | | Annual | | | 10/13/2024 | | | | | | | | 100 | | | | (1 | ) | | | (2 | ) | | | (3 | ) | | | 0 | | | | 0 | |
Pay | | 1-Day USD-SOFR Compounded-OIS | | | 2.920 | | | Annual | | | 10/17/2024 | | | | | | | | 300 | | | | (2 | ) | | | (6 | ) | | | (8 | ) | | | 0 | | | | 0 | |
Pay | | 1-Day USD-SOFR Compounded-OIS | | | 3.018 | | | Annual | | | 10/24/2024 | | | | | | | | 100 | | | | (1 | ) | | | (1 | ) | | | (2 | ) | | | 0 | | | | 0 | |
Pay | | 1-Day USD-SOFR Compounded-OIS | | | 3.140 | | | Annual | | | 10/25/2024 | | | | | | | | 100 | | | | (1 | ) | | | (1 | ) | | | (2 | ) | | | 0 | | | | 0 | |
Pay | | 1-Day USD-SOFR Compounded-OIS | | | 3.190 | | | Annual | | | 10/25/2024 | | | | | | | | 100 | | | | (1 | ) | | | (1 | ) | | | (2 | ) | | | 0 | | | | 0 | |
Pay | | 1-Day USD-SOFR Compounded-OIS | | | 3.225 | | | Annual | | | 10/25/2024 | | | | | | | | 100 | | | | (1 | ) | | | (1 | ) | | | (2 | ) | | | 0 | | | | 0 | |
Pay | | 1-Day USD-SOFR Compounded-OIS | | | 2.973 | | | Annual | | | 10/27/2024 | | | | | | | | 100 | | | | (1 | ) | | | (2 | ) | | | (3 | ) | | | 0 | | | | 0 | |
Pay | | 1-Day USD-SOFR Compounded-OIS | | | 2.841 | | | Annual | | | 10/31/2024 | | | | | | | | 100 | | | | (1 | ) | | | (2 | ) | | | (3 | ) | | | 0 | | | | 0 | |
Pay | | 1-Day USD-SOFR Compounded-OIS | | | 3.088 | | | Annual | | | 11/07/2024 | | | | | | | | 100 | | | | (1 | ) | | | (1 | ) | | | (2 | ) | | | 0 | | | | 0 | |
Pay | | 1-Day USD-SOFR Compounded-OIS | | | 3.020 | | | Annual | | | 11/08/2024 | | | | | | | | 200 | | | | (1 | ) | | | (4 | ) | | | (5 | ) | | | 0 | | | | 0 | |
Pay | | 1-Day USD-SOFR Compounded-OIS | | | 2.910 | | | Annual | | | 11/14/2024 | | | | | | | | 100 | | | | (1 | ) | | | (2 | ) | | | (3 | ) | | | 0 | | | | 0 | |
Pay | | 1-Day USD-SOFR Compounded-OIS | | | 2.845 | | | Annual | | | 11/15/2024 | | | | | | | | 200 | | | | (1 | ) | | | (4 | ) | | | (5 | ) | | | 0 | | | | 0 | |
Pay | | 1-Day USD-SOFR Compounded-OIS | | | 3.750 | | | Annual | | | 11/21/2024 | | | | | | | | 200 | | | | (1 | ) | | | (2 | ) | | | (3 | ) | | | 0 | | | | 0 | |
Pay | | 1-Day USD-SOFR Compounded-OIS | | | 3.650 | | | Annual | | | 11/22/2024 | | | | | | | | 200 | | | | (1 | ) | | | (3 | ) | | | (4 | ) | | | 0 | | | | 0 | |
Pay | | 1-Day USD-SOFR Compounded-OIS | | | 3.650 | | | Annual | | | 12/05/2024 | | | | | | | | 200 | | | | (1 | ) | | | (3 | ) | | | (4 | ) | | | 0 | | | | 0 | |
Pay | | 1-Day USD-SOFR Compounded-OIS | | | 3.750 | | | Annual | | | 12/11/2024 | | | | | | | | 200 | | | | (1 | ) | | | (2 | ) | | | (3 | ) | | | 0 | | | | 0 | |
Receive | | 1-Day USD-SOFR Compounded-OIS | | | 2.500 | | | Semi-Annual | | | 12/18/2024 | | | | | | | | 3,100 | | | | (113 | ) | | | 161 | | | | 48 | | | | 1 | | | | 0 | |
Receive | | 1-Day USD-SOFR Compounded-OIS | | | 2.450 | | | Annual | | | 12/20/2024 | | | | | | | | 3,200 | | | | 0 | | | | 95 | | | | 95 | | | | 1 | | | | 0 | |
Receive | | 1-Day USD-SOFR Compounded-OIS | | | 2.350 | | | Annual | | | 01/17/2025 | | | | | | | | 1,600 | | | | 0 | | | | 48 | | | | 48 | | | | 0 | | | | 0 | |
Pay | | 1-Day USD-SOFR Compounded-OIS | | | 2.688 | | | Annual | | | 04/04/2025 | | | | | | | | 100 | | | | (1 | ) | | | (2 | ) | | | (3 | ) | | | 0 | | | | 0 | |
Pay | | 1-Day USD-SOFR Compounded-OIS | | | 2.690 | | | Annual | | | 04/04/2025 | | | | | | | | 100 | | | | (1 | ) | | | (2 | ) | | | (3 | ) | | | 0 | | | | 0 | |
Pay | | 1-Day USD-SOFR Compounded-OIS | | | 2.697 | | | Annual | | | 04/04/2025 | | | | | | | | 200 | | | | (2 | ) | | | (3 | ) | | | (5 | ) | | | 0 | | | | 0 | |
Pay | | 1-Day USD-SOFR Compounded-OIS | | | 2.781 | | | Annual | | | 04/09/2025 | | | | | | | | 200 | | | | (2 | ) | | | (3 | ) | | | (5 | ) | | | 0 | | | | 0 | |
Pay | | 1-Day USD-SOFR Compounded-OIS | | | 2.721 | | | Annual | | | 04/10/2025 | | | | | | | | 100 | | | | (1 | ) | | | (1 | ) | | | (2 | ) | | | 0 | | | | 0 | |
Pay | | 1-Day USD-SOFR Compounded-OIS | | | 2.785 | | | Annual | | | 04/10/2025 | | | | | | | | 100 | | | | (1 | ) | | | (1 | ) | | | (2 | ) | | | 0 | | | | 0 | |
Pay | | 1-Day USD-SOFR Compounded-OIS | | | 2.790 | | | Annual | | | 04/10/2025 | | | | | | | | 100 | | | | (1 | ) | | | (1 | ) | | | (2 | ) | | | 0 | | | | 0 | |
Pay | | 1-Day USD-SOFR Compounded-OIS | | | 2.835 | | | Annual | | | 04/10/2025 | | | | | | | | 100 | | | | (1 | ) | | | (1 | ) | | | (2 | ) | | | 0 | | | | 0 | |
Pay | | 1-Day USD-SOFR Compounded-OIS | | | 4.500 | | | Annual | | | 05/22/2025 | | | | | | | | 14,420 | | | | (42 | ) | | | (49 | ) | | | (91 | ) | | | 0 | | | | (1 | ) |
Pay | | 1-Day USD-SOFR Compounded-OIS | | | 4.900 | | | Annual | | | 06/06/2025 | | | | | | | | 8,480 | | | | 12 | | | | (29 | ) | | | (17 | ) | | | 0 | | | | 0 | |
| | | | | | | | | | | | |
| See Accompanying Notes | | | ANNUAL FINANCIAL AND OTHER INFORMATION | | | | | | | JUNE 30, 2024 | | | 27 |
| | | | | | |
| Schedule of Investments | | PIMCO Dividend and Income Fund | | (Cont.) | | |
| | | | | | | | | | | | | | | | | | | | | | | | | | | | | | | | | | | | | | | | |
Pay/Receive
Floating Rate | | Floating Rate Index | | Fixed Rate | | | Payment
Frequency | | Maturity
Date | | | Notional
Amount | | | Premiums
Paid/(Received) | | | Unrealized
Appreciation/
(Depreciation) | | | Market
Value | | | Variation Margin | |
| | Asset | | | Liability | |
Receive | | 1-Day USD-SOFR Compounded-OIS | | | 1.600 | % | | Annual | | | 01/16/2026 | | | | $ | | | | 1,200 | | | $ | 15 | | | $ | 62 | | | $ | 77 | | | $ | 0 | | | $ | 0 | |
Receive | | 1-Day USD-SOFR Compounded-OIS | | | 2.300 | | | Annual | | | 01/17/2026 | | | | | | | | 1,000 | | | | 0 | | | | 51 | | | | 51 | | | | 0 | | | | 0 | |
Receive | | 1-Day USD-SOFR Compounded-OIS | | | 0.928 | | | Semi-Annual | | | 05/06/2026 | | | | | | | | 100 | | | | 0 | | | | 8 | | | | 8 | | | | 0 | | | | 0 | |
Receive | | 1-Day USD-SOFR Compounded-OIS | | | 0.940 | | | Semi-Annual | | | 06/08/2026 | | | | | | | | 100 | | | | 0 | | | | 8 | | | | 8 | | | | 0 | | | | 0 | |
Receive | | 1-Day USD-SOFR Compounded-OIS | | | 0.500 | | | Semi-Annual | | | 06/16/2026 | | | | | | | | 1,000 | | | | 9 | | | | 74 | | | | 83 | | | | 1 | | | | 0 | |
Receive | | 1-Day USD-SOFR Compounded-OIS | | | 3.000 | | | Semi-Annual | | | 06/19/2026 | | | | | | | | 2,300 | | | | (188 | ) | | | 270 | | | | 82 | | | | 1 | | | | 0 | |
Receive | | 1-Day USD-SOFR Compounded-OIS | | | 3.500 | | | Annual | | | 06/21/2026 | | | | | | | | 170 | | | | 1 | | | | 3 | | | | 4 | | | | 0 | | | | 0 | |
Receive | | 1-Day USD-SOFR Compounded-OIS | | | 1.250 | | | Semi-Annual | | | 12/15/2026 | | | | | | | | 100 | | | | (2 | ) | | | 10 | | | | 8 | | | | 0 | | | | 0 | |
Receive | | 1-Day USD-SOFR Compounded-OIS | | | 1.740 | | | Semi-Annual | | | 12/16/2026 | | | | | | | | 100 | | | | (5 | ) | | | 12 | | | | 7 | | | | 0 | | | | 0 | |
Pay | | 1-Day USD-SOFR Compounded-OIS | | | 1.380 | | | Semi-Annual | | | 01/04/2027 | | | | | | | | 100 | | | | 0 | | | | (9 | ) | | | (9 | ) | | | 0 | | | | 0 | |
Pay | | 1-Day USD-SOFR Compounded-OIS | | | 1.570 | | | Semi-Annual | | | 01/11/2027 | | | | | | | | 200 | | | | 0 | | | | (16 | ) | | | (16 | ) | | | 0 | | | | 0 | |
Pay | | 1-Day USD-SOFR Compounded-OIS | | | 1.425 | | | Semi-Annual | | | 01/18/2027 | | | | | | | | 100 | | | | 0 | | | | (8 | ) | | | (8 | ) | | | 0 | | | | 0 | |
Pay | | 1-Day USD-SOFR Compounded-OIS | | | 1.443 | | | Semi-Annual | | | 01/18/2027 | | | | | | | | 100 | | | | 0 | | | | (8 | ) | | | (8 | ) | | | 0 | | | | 0 | |
Receive | | 1-Day USD-SOFR Compounded-OIS | | | 1.350 | | | Semi-Annual | | | 01/20/2027 | | | | | | | | 500 | | | | 0 | | | | 43 | | | | 43 | | | | 0 | | | | 0 | |
Pay | | 1-Day USD-SOFR Compounded-OIS | | | 1.550 | | | Semi-Annual | | | 01/20/2027 | | | | | | | | 2,400 | | | | (6 | ) | | | (185 | ) | | | (191 | ) | | | 0 | | | | (1 | ) |
Pay | | 1-Day USD-SOFR Compounded-OIS | | | 1.580 | | | Semi-Annual | | | 02/16/2027 | | | | | | | | 200 | | | | 0 | | | | (16 | ) | | | (16 | ) | | | 0 | | | | 0 | |
Receive | | 1-Day USD-SOFR Compounded-OIS | | | 1.450 | | | Semi-Annual | | | 02/17/2027 | | | | | | | | 1,200 | | | | 0 | | | | 98 | | | | 98 | | | | 1 | | | | 0 | |
Pay | | 1-Day USD-SOFR Compounded-OIS | | | 1.700 | | | Semi-Annual | | | 02/17/2027 | | | | | | | | 4,900 | | | | (13 | ) | | | (351 | ) | | | (364 | ) | | | 0 | | | | (3 | ) |
Pay | | 1-Day USD-SOFR Compounded-OIS | | | 1.928 | | | Annual | | | 03/25/2027 | | | | | | | | 200 | | | | 0 | | | | (14 | ) | | | (14 | ) | | | 0 | | | | 0 | |
Receive | | 1-Day USD-SOFR Compounded-OIS | | | 1.000 | | | Annual | | | 06/15/2027 | | | | | | | | 200 | | | | 8 | | | | 11 | | | | 19 | | | | 0 | | | | 0 | |
Pay | | 1-Day USD-SOFR Compounded-OIS | | | 2.850 | | | Annual | | | 08/30/2027 | | | | | | | | 200 | | | | (1 | ) | | | (12 | ) | | | (13 | ) | | | 0 | | | | 0 | |
Pay | | 1-Day USD-SOFR Compounded-OIS | | | 2.900 | | | Annual | | | 10/04/2027 | | | | | | | | 900 | | | | (7 | ) | | | (48 | ) | | | (55 | ) | | | 0 | | | | (1 | ) |
Receive | | 1-Day USD-SOFR Compounded-OIS | | | 2.000 | | | Annual | | | 12/21/2027 | | | | | | | | 200 | | | | 14 | | | | 4 | | | | 18 | | | | 0 | | | | 0 | |
Pay | | 1-Day USD-SOFR Compounded-OIS | | | 3.800 | | | Annual | | | 03/10/2028 | | | | | | | | 100 | | | | 0 | | | | (2 | ) | | | (2 | ) | | | 0 | | | | 0 | |
Pay | | 1-Day USD-SOFR Compounded-OIS | | | 1.280 | | | Semi-Annual | | | 03/24/2028 | | | | | | | | 400 | | | | 0 | | | | (43 | ) | | | (43 | ) | | | 0 | | | | 0 | |
Receive | | 1-Day USD-SOFR Compounded-OIS | | | 1.235 | | | Semi-Annual | | | 05/12/2028 | | | | | | | | 100 | | | | 0 | | | | 12 | | | | 12 | | | | 0 | | | | 0 | |
Pay | | 1-Day USD-SOFR Compounded-OIS | | | 0.500 | | | Semi-Annual | | | 06/16/2028 | | | | | | | | 1,610 | | | | (67 | ) | | | (165 | ) | | | (232 | ) | | | 0 | | | | (2 | ) |
Receive | | 1-Day USD-SOFR Compounded-OIS | | | 2.250 | | | Semi-Annual | | | 06/20/2028 | | | | | | | | 4,900 | | | | (419 | ) | | | 814 | | | | 395 | | | | 6 | | | | 0 | |
Receive | | 1-Day USD-SOFR Compounded-OIS | | | 3.250 | | | Annual | | | 06/21/2028 | | | | | | | | 2,110 | | | | 2 | | | | 69 | | | | 71 | | | | 3 | | | | 0 | |
Pay | | 1-Day USD-SOFR Compounded-OIS | | | 3.800 | | | Annual | | | 09/05/2028 | | | | | | | | 200 | | | | (2 | ) | | | (3 | ) | | | (5 | ) | | | 0 | | | | 0 | |
Pay | | 1-Day USD-SOFR Compounded-OIS | | | 1.265 | | | Semi-Annual | | | 09/28/2028 | | | | | | | | 100 | | | | 0 | | | | (13 | ) | | | (13 | ) | | | 0 | | | | 0 | |
Pay | | 1-Day USD-SOFR Compounded-OIS | | | 1.500 | | | Semi-Annual | | | 12/15/2028 | | | | | | | | 422 | | | | 9 | | | | (59 | ) | | | (50 | ) | | | 0 | | | | (1 | ) |
Receive | | 1-Day USD-SOFR Compounded-OIS | | | 3.750 | | | Annual | | | 12/20/2028 | | | | | | | | 1,690 | | | | 10 | | | | 30 | | | | 40 | | | | 3 | | | | 0 | |
Receive | | 1-Day USD-SOFR Compounded-OIS | | | 1.379 | | | Semi-Annual | | | 12/22/2028 | | | | | | | | 100 | | | | 0 | | | | 12 | | | | 12 | | | | 0 | | | | 0 | |
Receive | | 1-Day USD-SOFR Compounded-OIS | | | 1.500 | | | Semi-Annual | | | 01/12/2029 | | | | | | | | 55 | | | | 0 | | | | 7 | | | | 7 | | | | 0 | | | | 0 | |
Pay | | 1-Day USD-SOFR Compounded-OIS | | | 1.700 | | | Semi-Annual | | | 01/12/2029 | | | | | | | | 200 | | | | (1 | ) | | | (22 | ) | | | (23 | ) | | | 0 | | | | 0 | |
Pay | | 1-Day USD-SOFR Compounded-OIS | | | 3.940 | | | Annual | | | 02/22/2029 | | | | | | | | 200 | | | | (1 | ) | | | (1 | ) | | | (2 | ) | | | 0 | | | | 0 | |
Pay | | 1-Day USD-SOFR Compounded-OIS | | | 3.970 | | | Annual | | | 02/27/2029 | | | | | | | | 100 | | | | 0 | | | | (1 | ) | | | (1 | ) | | | 0 | | | | 0 | |
Receive | | 1-Day USD-SOFR Compounded-OIS | | | 4.250 | | | Annual | | | 03/20/2029 | | | | | | | | 180 | | | | (6 | ) | | | 5 | | | | (1 | ) | | | 0 | | | | 0 | |
Pay | | 1-Day USD-SOFR Compounded-OIS | | | 1.000 | | | Annual | | | 06/15/2029 | | | | | | | | 220 | | | | (9 | ) | | | (21 | ) | | | (30 | ) | | | 0 | | | | 0 | |
Receive | | 1-Day USD-SOFR Compounded-OIS | | | 1.000 | | | Annual | | | 06/15/2029 | | | | | | | | 310 | | | | 18 | | | | 25 | | | | 43 | | | | 1 | | | | 0 | |
Receive | | 1-Day USD-SOFR Compounded-OIS | | | 1.750 | | | Annual | | | 06/15/2029 | | | | | | | | 282 | | | | 16 | | | | 14 | | | | 30 | | | | 1 | | | | 0 | |
Receive | | 1-Day USD-SOFR Compounded-OIS | | | 3.750 | | | Annual | | | 06/20/2029 | | | | | | | | 3,540 | | | | (61 | ) | | | 114 | | | | 53 | | | | 7 | | | | 0 | |
Receive | | 1-Day USD-SOFR Compounded-OIS | | | 2.000 | | | Semi-Annual | | | 12/10/2029 | | | | | | | | 100 | | | | (9 | ) | | | 20 | | | | 11 | | | | 0 | | | | 0 | |
Receive | | 1-Day USD-SOFR Compounded-OIS | | | 1.500 | | | Semi-Annual | | | 12/18/2029 | | | | | | | | 200 | | | | (11 | ) | | | 39 | | | | 28 | | | | 1 | | | | 0 | |
Receive | | 1-Day USD-SOFR Compounded-OIS | | | 2.000 | | | Annual | | | 12/21/2029 | | | | | | | | 1,370 | | | | 120 | | | | 41 | | | | 161 | | | | 3 | | | | 0 | |
Receive | | 1-Day USD-SOFR Compounded-OIS | | | 1.750 | | | Semi-Annual | | | 01/15/2030 | | | | | | | | 300 | | | | (22 | ) | | | 61 | | | | 39 | | | | 1 | | | | 0 | |
Receive | | 1-Day USD-SOFR Compounded-OIS | | | 2.000 | | | Semi-Annual | | | 02/12/2030 | | | | | | | | 200 | | | | (18 | ) | | | 41 | | | | 23 | | | | 1 | | | | 0 | |
Pay | | 1-Day USD-SOFR Compounded-OIS | | | 3.470 | | | Annual | | | 02/22/2030 | | | | | | | | 100 | | | | 0 | | | | (4 | ) | | | (4 | ) | | | 0 | | | | 0 | |
Pay | | 1-Day USD-SOFR Compounded-OIS | | | 3.340 | | | Annual | | | 02/23/2030 | | | | | | | | 200 | | | | (1 | ) | | | (7 | ) | | | (8 | ) | | | 0 | | | | (1 | ) |
Receive | | 1-Day USD-SOFR Compounded-OIS | | | 2.000 | | | Semi-Annual | | | 03/10/2030 | | | | | | | | 100 | | | | (9 | ) | | | 20 | | | | 11 | | | | 0 | | | | 0 | |
Receive | | 1-Day USD-SOFR Compounded-OIS | | | 1.250 | | | Semi-Annual | | | 06/17/2030 | | | | | | | | 2,400 | | | | (96 | ) | | | 483 | | | | 387 | | | | 7 | | | | 0 | |
Receive | | 1-Day USD-SOFR Compounded-OIS | | | 3.000 | | | Annual | | | 06/21/2030 | | | | | | | | 2,460 | | | | 35 | | | | 99 | | | | 134 | | | | 7 | | | | 0 | |
Pay | | 1-Day USD-SOFR Compounded-OIS | | | 3.500 | | | Annual | | | 06/22/2030 | | | | | | | | 200 | | | | (1 | ) | | | (5 | ) | | | (6 | ) | | | 0 | | | | (1 | ) |
Receive | | 1-Day USD-SOFR Compounded-OIS | | | 1.000 | | | Semi-Annual | | | 12/16/2030 | | | | | | | | 127 | | | | 0 | | | | 24 | | | | 24 | | | | 0 | | | | 0 | |
Receive | | 1-Day USD-SOFR Compounded-OIS | | | 3.500 | | | Annual | | | 12/20/2030 | | | | | | | | 2,120 | | | | 46 | | | | 37 | | | | 83 | | | | 7 | | | | 0 | |
Receive | | 1-Day USD-SOFR Compounded-OIS | | | 4.250 | | | Annual | | | 03/20/2031 | | | | | | | | 280 | | | | (13 | ) | | | 10 | | | | (3 | ) | | | 1 | | | | 0 | |
Receive | | 1-Day USD-SOFR Compounded-OIS | | | 0.750 | | | Semi-Annual | | | 06/16/2031 | | | | | | | | 2,600 | | | | 174 | | | | 379 | | | | 553 | | | | 10 | | | | 0 | |
Pay | | 1-Day USD-SOFR Compounded-OIS | | | 0.750 | | | Semi-Annual | | | 06/16/2031 | | | | | | | | 663 | | | | (49 | ) | | | (92 | ) | | | (141 | ) | | | 0 | | | | (2 | ) |
Receive | | 1-Day USD-SOFR Compounded-OIS | | | 3.750 | | | Annual | | | 06/20/2031 | | | | | | | | 1,560 | | | | 32 | | | | (8 | ) | | | 24 | | | | 6 | | | | 0 | |
Receive | | 1-Day USD-SOFR Compounded-OIS | | | 1.450 | | | Semi-Annual | | | 07/16/2031 | | | | | | | | 100 | | | | 0 | | | | 18 | | | | 18 | | | | 0 | | | | 0 | |
Receive | | 1-Day USD-SOFR Compounded-OIS | | | 1.370 | | | Semi-Annual | | | 07/19/2031 | | | | | | | | 100 | | | | 0 | | | | 18 | | | | 18 | | | | 0 | | | | 0 | |
Receive | | 1-Day USD-SOFR Compounded-OIS | | | 1.360 | | | Semi-Annual | | | 07/20/2031 | | | | | | | | 100 | | | | 0 | | | | 18 | | | | 18 | | | | 0 | | | | 0 | |
Receive | | 1-Day USD-SOFR Compounded-OIS | | | 1.405 | | | Semi-Annual | | | 09/07/2031 | | | | | | | | 100 | | | | (1 | ) | | | 19 | | | | 18 | | | | 0 | | | | 0 | |
Pay | | 1-Day USD-SOFR Compounded-OIS | | | 1.500 | | | Semi-Annual | | | 10/05/2031 | | | | | | | | 100 | | | | 0 | | | | (18 | ) | | | (18 | ) | | | 0 | | | | 0 | |
Pay | | 1-Day USD-SOFR Compounded-OIS | | | 1.535 | | | Semi-Annual | | | 10/15/2031 | | | | | | | | 100 | | | | 0 | | | | (18 | ) | | | (18 | ) | | | 0 | | | | 0 | |
Pay | | 1-Day USD-SOFR Compounded-OIS | | | 1.545 | | | Semi-Annual | | | 10/26/2031 | | | | | | | | 100 | | | | 0 | | | | (17 | ) | | | (17 | ) | | | 0 | | | | 0 | |
Pay | | 1-Day USD-SOFR Compounded-OIS | | | 1.768 | | | Semi-Annual | | | 02/02/2032 | | | | | | | | 100 | | | | 0 | | | | (16 | ) | | | (16 | ) | | | 0 | | | | 0 | |
Pay | | 1-Day USD-SOFR Compounded-OIS | | | 2.000 | | | Semi-Annual | | | 02/18/2032 | | | | | | | | 200 | | | | (1 | ) | | | (28 | ) | | | (29 | ) | | | 0 | | | | (1 | ) |
Pay | | 1-Day USD-SOFR Compounded-OIS | | | 1.817 | | | Annual | | | 04/05/2032 | | | | | | | | 400 | | | | (2 | ) | | | (59 | ) | | | (61 | ) | | | 0 | | | | (2 | ) |
Pay | | 1-Day USD-SOFR Compounded-OIS | | | 1.872 | | | Annual | | | 04/06/2032 | | | | | | | | 200 | | | | (1 | ) | | | (28 | ) | | | (29 | ) | | | 0 | | | | (1 | ) |
| | | | | | |
| 28 | | PIMCO EQUITY SERIES | | | See Accompanying Notes | |
| | | | | | | | | | | | | | | | | | | | | | | | | | | | | | | | | | | | | | | | |
Pay/Receive
Floating Rate | | Floating Rate Index | | Fixed Rate | | | Payment
Frequency | | Maturity
Date | | | Notional
Amount | | | Premiums
Paid/(Received) | | | Unrealized
Appreciation/
(Depreciation) | | | Market
Value | | | Variation Margin | |
| | Asset | | | Liability | |
Pay | | 1-Day USD-SOFR Compounded-OIS | | | 1.250 | % | | Annual | | | 06/15/2032 | | | | $ | | | | 210 | | | $ | (21 | ) | | $ | (18 | ) | | $ | (39 | ) | | $ | 0 | | | $ | (1 | ) |
Pay | | 1-Day USD-SOFR Compounded-OIS | | | 1.750 | | | Annual | | | 06/15/2032 | | | | | | | | 280 | | | | (23 | ) | | | (19 | ) | | | (42 | ) | | | 0 | | | | (1 | ) |
Receive | | 1-Day USD-SOFR Compounded-OIS | | | 1.750 | | | Annual | | | 06/15/2032 | | | | | | | | 399 | | | | 35 | | | | 25 | | | | 60 | | | | 2 | | | | 0 | |
Receive | | 1-Day USD-SOFR Compounded-OIS | | | 2.000 | | | Annual | | | 12/21/2032 | | | | | | | | 2,100 | | | | 246 | | | | 87 | | | | 333 | | | | 10 | | | | 0 | |
Pay | | 1-Day USD-SOFR Compounded-OIS | | | 3.430 | | | Annual | | | 02/27/2033 | | | | | | | | 100 | | | | 0 | | | | (5 | ) | | | (5 | ) | | | 0 | | | | (1 | ) |
Pay | | 1-Day USD-SOFR Compounded-OIS | | | 3.370 | | | Annual | | | 03/01/2033 | | | | | | | | 100 | | | | (1 | ) | | | (4 | ) | | | (5 | ) | | | 0 | | | | (1 | ) |
Pay | | 1-Day USD-SOFR Compounded-OIS | | | 3.405 | | | Annual | | | 03/01/2033 | | | | | | | | 100 | | | | 0 | | | | (5 | ) | | | (5 | ) | | | 0 | | | | (1 | ) |
Pay | | 1-Day USD-SOFR Compounded-OIS | | | 3.425 | | | Annual | | | 03/01/2033 | | | | | | | | 100 | | | | 0 | | | | (5 | ) | | | (5 | ) | | | 0 | | | | (1 | ) |
Pay | | 1-Day USD-SOFR Compounded-OIS | | | 3.300 | | | Annual | | | 03/06/2033 | | | | | | | | 100 | | | | 0 | | | | (6 | ) | | | (6 | ) | | | 0 | | | | (1 | ) |
Pay | | 1-Day USD-SOFR Compounded-OIS | | | 3.450 | | | Annual | | | 03/07/2033 | | | | | | | | 100 | | | | 0 | | | | (4 | ) | | | (4 | ) | | | 0 | | | | (1 | ) |
Receive | | 1-Day USD-SOFR Compounded-OIS | | | 3.500 | | | Annual | | | 05/22/2033 | | | | | | | | 6,420 | | | | 63 | | | | 171 | | | | 234 | | | | 34 | | | | 0 | |
Receive | | 1-Day USD-SOFR Compounded-OIS | | | 3.700 | | | Annual | | | 06/06/2033 | | | | | | | | 3,870 | | | | (31 | ) | | | 111 | | | | 80 | | | | 20 | | | | 0 | |
Pay | | 1-Day USD-SOFR Compounded-OIS | | | 3.300 | | | Annual | | | 06/14/2033 | | | | | | | | 200 | | | | (1 | ) | | | (9 | ) | | | (10 | ) | | | 0 | | | | (1 | ) |
Receive | | 1-Day USD-SOFR Compounded-OIS | | | 3.000 | | | Annual | | | 06/21/2033 | | | | | | | | 725 | | | | 10 | | | | 43 | | | | 53 | | | | 4 | | | | 0 | |
Pay | | 1-Day USD-SOFR Compounded-OIS | | | 3.500 | | | Annual | | | 06/21/2033 | | | | | | | | 100 | | | | (1 | ) | | | (3 | ) | | | (4 | ) | | | 0 | | | | (1 | ) |
Pay | | 1-Day USD-SOFR Compounded-OIS | | | 3.650 | | | Annual | | | 07/10/2033 | | | | | | | | 100 | | | | 0 | | | | (4 | ) | | | (4 | ) | | | 0 | | | | (1 | ) |
Pay | | 1-Day USD-SOFR Compounded-OIS | | | 3.750 | | | Annual | | | 07/12/2033 | | | | | | | | 100 | | | | 0 | | | | (3 | ) | | | (3 | ) | | | 0 | | | | (1 | ) |
Pay | | 1-Day USD-SOFR Compounded-OIS | | | 3.760 | | | Annual | | | 08/23/2033 | | | | | | | | 100 | | | | 0 | | | | (3 | ) | | | (3 | ) | | | 0 | | | | (1 | ) |
Pay | | 1-Day USD-SOFR Compounded-OIS | | | 3.800 | | | Annual | | | 08/30/2033 | | | | | | | | 100 | | | | 0 | | | | (3 | ) | | | (3 | ) | | | 0 | | | | (1 | ) |
Pay | | 1-Day USD-SOFR Compounded-OIS | | | 3.900 | | | Annual | | | 08/30/2033 | | | | | | | | 100 | | | | 0 | | | | (2 | ) | | | (2 | ) | | | 0 | | | | (1 | ) |
Pay | | 1-Day USD-SOFR Compounded-OIS | | | 3.950 | | | Annual | | | 09/13/2033 | | | | | | | | 100 | | | | 0 | | | | (1 | ) | | | (1 | ) | | | 0 | | | | (1 | ) |
Pay | | 1-Day USD-SOFR Compounded-OIS | | | 4.165 | | | Annual | | | 09/27/2033 | | | | | | | | 200 | | | | (1 | ) | | | 2 | | | | 1 | | | | 0 | | | | (1 | ) |
Pay | | 1-Day USD-SOFR Compounded-OIS | | | 4.155 | | | Annual | | | 10/02/2033 | | | | | | | | 100 | | | | 0 | | | | 1 | | | | 1 | | | | 0 | | | | (1 | ) |
Pay | | 1-Day USD-SOFR Compounded-OIS | | | 4.170 | | | Annual | | | 10/03/2033 | | | | | | | | 100 | | | | 0 | | | | 1 | | | | 1 | | | | 0 | | | | (1 | ) |
Pay | | 1-Day USD-SOFR Compounded-OIS | | | 4.030 | | | Annual | | | 10/04/2033 | | | | | | | | 100 | | | | 0 | | | | (1 | ) | | | (1 | ) | | | 0 | | | | (1 | ) |
Pay | | 1-Day USD-SOFR Compounded-OIS | | | 4.175 | | | Annual | | | 10/10/2033 | | | | | | | | 100 | | | | 0 | | | | 1 | | | | 1 | | | | 0 | | | | (1 | ) |
Pay | | 1-Day USD-SOFR Compounded-OIS | | | 4.150 | | | Annual | | | 10/12/2033 | | | | | | | | 100 | | | | 0 | | | | 1 | | | | 1 | | | | 0 | | | | (1 | ) |
Pay | | 1-Day USD-SOFR Compounded-OIS | | | 4.220 | | | Annual | | | 10/20/2033 | | | | | | | | 100 | | | | 0 | | | | 1 | | | | 1 | | | | 0 | | | | (1 | ) |
Pay | | 1-Day USD-SOFR Compounded-OIS | | | 4.450 | | | Annual | | | 10/31/2033 | | | | | | | | 100 | | | | 0 | | | | 3 | | | | 3 | | | | 0 | | | | (1 | ) |
Pay | | 1-Day USD-SOFR Compounded-OIS | | | 4.450 | | | Annual | | | 11/01/2033 | | | | | | | | 100 | | | | 0 | | | | 3 | | | | 3 | | | | 0 | | | | (1 | ) |
Receive | | 1-Day USD-SOFR Compounded-OIS | | | 4.250 | | | Annual | | | 11/22/2033 | | | | | | | | 100 | | | | (1 | ) | | | (1 | ) | | | (2 | ) | | | 1 | | | | 0 | |
Receive | | 1-Day USD-SOFR Compounded-OIS | | | 4.030 | | | Annual | | | 12/15/2033 | | | | | | | | 100 | | | | (1 | ) | | | 1 | | | | 0 | | | | 1 | | | | 0 | |
Receive | | 1-Day USD-SOFR Compounded-OIS | | | 3.950 | | | Annual | | | 12/19/2033 | | | | | | | | 100 | | | | 0 | | | | 1 | | | | 1 | | | | 1 | | | | 0 | |
Pay | | 1-Day USD-SOFR Compounded-OIS | | | 3.500 | | | Annual | | | 12/20/2033 | | | | | | | | 40 | | | | 0 | | | | (2 | ) | | | (2 | ) | | | 0 | | | | 0 | |
Receive | | 1-Day USD-SOFR Compounded-OIS | | | 3.684 | | | Annual | | | 01/03/2034 | | | | | | | | 100 | | | | (1 | ) | | | 4 | | | | 3 | | | | 1 | | | | 0 | |
Receive | | 1-Day USD-SOFR Compounded-OIS | | | 3.648 | | | Annual | | | 01/08/2034 | | | | | | | | 100 | | | | (1 | ) | | | 4 | | | | 3 | | | | 1 | | | | 0 | |
Receive | | 1-Day USD-SOFR Compounded-OIS | | | 3.670 | | | Annual | | | 01/08/2034 | | | | | | | | 100 | | | | (1 | ) | | | 4 | | | | 3 | | | | 1 | | | | 0 | |
Receive | | 1-Day USD-SOFR Compounded-OIS | | | 3.594 | | | Annual | | | 01/09/2034 | | | | | | | | 100 | | | | 0 | | | | 4 | | | | 4 | | | | 1 | | | | 0 | |
Pay | | 1-Day USD-SOFR Compounded-OIS | | | 3.665 | | | Annual | | | 01/24/2034 | | | | | | | | 100 | | | | 0 | | | | (3 | ) | | | (3 | ) | | | 0 | | | | (1 | ) |
Pay | | 1-Day USD-SOFR Compounded-OIS | | | 3.685 | | | Annual | | | 01/24/2034 | | | | | | | | 100 | | | | 0 | | | | (3 | ) | | | (3 | ) | | | 0 | | | | (1 | ) |
Pay | | 1-Day USD-SOFR Compounded-OIS | | | 3.725 | | | Annual | | | 02/07/2034 | | | | | | | | 100 | | | | (1 | ) | | | (2 | ) | | | (3 | ) | | | 0 | | | | (1 | ) |
Pay | | 1-Day USD-SOFR Compounded-OIS | | | 3.860 | | | Annual | | | 02/21/2034 | | | | | | | | 200 | | | | (1 | ) | | | (2 | ) | | | (3 | ) | | | 0 | | | | (1 | ) |
Pay | | 1-Day USD-SOFR Compounded-OIS | | | 3.650 | | | Annual | | | 03/05/2034 | | | | | | | | 100 | | | | 0 | | | | (3 | ) | | | (3 | ) | | | 0 | | | | (1 | ) |
Pay | | 1-Day USD-SOFR Compounded-OIS | | | 3.710 | | | Annual | | | 03/05/2034 | | | | | | | | 100 | | | | 0 | | | | (3 | ) | | | (3 | ) | | | 0 | | | | (1 | ) |
Pay | | 1-Day USD-SOFR Compounded-OIS | | | 3.900 | | | Annual | | | 04/10/2034 | | | | | | | | 100 | | | | 0 | | | | (1 | ) | | | (1 | ) | | | 0 | | | | (1 | ) |
Pay | | 1-Day USD-SOFR Compounded-OIS | | | 3.950 | | | Annual | | | 04/16/2034 | | | | | | | | 100 | | | | 0 | | | | 0 | | | | 0 | | | | 0 | | | | (1 | ) |
Pay | | 1-Day USD-SOFR Compounded-OIS | | | 4.080 | | | Annual | | | 04/17/2034 | | | | | | | | 100 | | | | 0 | | | | 1 | | | | 1 | | | | 0 | | | | (1 | ) |
Pay | | 1-Day USD-SOFR Compounded-OIS | | | 4.085 | | | Annual | | | 04/22/2034 | | | | | | | | 100 | | | | 0 | | | | 1 | | | | 1 | | | | 0 | | | | (1 | ) |
Pay | | 1-Day USD-SOFR Compounded-OIS | | | 4.150 | | | Annual | | | 04/22/2034 | | | | | | | | 100 | | | | 0 | | | | 1 | | | | 1 | | | | 0 | | | | (1 | ) |
Pay | | 1-Day USD-SOFR Compounded-OIS | | | 4.105 | | | Annual | | | 04/24/2034 | | | | | | | | 100 | | | | 0 | | | | 1 | | | | 1 | | | | 0 | | | | (1 | ) |
Pay | | 1-Day USD-SOFR Compounded-OIS | | | 4.078 | | | Annual | | | 04/29/2034 | | | | | | | | 100 | | | | 0 | | | | 1 | | | | 1 | | | | 0 | | | | (1 | ) |
Pay | | 1-Day USD-SOFR Compounded-OIS | | | 4.090 | | | Annual | | | 04/30/2034 | | | | | | | | 200 | | | | (1 | ) | | | 3 | | | | 2 | | | | 0 | | | | (1 | ) |
Pay | | 1-Day USD-SOFR Compounded-OIS | | | 4.130 | | | Annual | | | 05/03/2034 | | | | | | | | 100 | | | | 0 | | | | 1 | | | | 1 | | | | 0 | | | | (1 | ) |
Pay | | 1-Day USD-SOFR Compounded-OIS | | | 4.200 | | | Annual | | | 05/06/2034 | | | | | | | | 100 | | | | 0 | | | | 2 | | | | 2 | | | | 0 | | | | (1 | ) |
Receive | | 1-Day USD-SOFR Compounded-OIS | | | 4.080 | | | Annual | | | 06/05/2034 | | | | | | | | 100 | | | | 0 | | | | (1 | ) | | | (1 | ) | | | 1 | | | | 0 | |
Pay | | 1-Day USD-SOFR Compounded-OIS | | | 3.750 | | | Annual | | | 06/20/2034 | | | | | | | | 760 | | | | (20 | ) | | | 7 | | | | (13 | ) | | | 0 | | | | (4 | ) |
Receive(5) | | 1-Day USD-SOFR Compounded-OIS | | | 3.994 | | | Annual | | | 07/02/2034 | | | | | | | | 100 | | | | 0 | | | | 0 | | | | 0 | | | | 0 | | | | 0 | |
Pay(5) | | 1-Day USD-SOFR Compounded-OIS | | | 3.750 | | | Annual | | | 12/18/2034 | | | | | | | | 10 | | | | 0 | | | | 0 | | | | 0 | | | | 0 | | | | 0 | |
Receive | | 1-Day USD-SOFR Compounded-OIS | | | 1.910 | | | Semi-Annual | | | 10/17/2049 | | | | | | | | 100 | | | | (22 | ) | | | 58 | | | | 36 | | | | 1 | | | | 0 | |
Receive | | 1-Day USD-SOFR Compounded-OIS | | | 1.895 | | | Semi-Annual | | | 10/18/2049 | | | | | | | | 100 | | | | (21 | ) | | | 57 | | | | 36 | | | | 1 | | | | 0 | |
Receive | | 1-Day USD-SOFR Compounded-OIS | | | 2.250 | | | Semi-Annual | | | 12/11/2049 | | | | | | | | 900 | | | | (269 | ) | | | 538 | | | | 269 | | | | 12 | | | | 0 | |
Receive | | 1-Day USD-SOFR Compounded-OIS | | | 2.000 | | | Semi-Annual | | | 01/15/2050 | | | | | | | | 100 | | | | (24 | ) | | | 58 | | | | 34 | | | | 1 | | | | 0 | |
Receive | | 1-Day USD-SOFR Compounded-OIS | | | 1.625 | | | Semi-Annual | | | 01/16/2050 | | | | | | | | 100 | | | | (15 | ) | | | 55 | | | | 40 | | | | 1 | | | | 0 | |
Receive | | 1-Day USD-SOFR Compounded-OIS | | | 1.750 | | | Semi-Annual | | | 01/22/2050 | | | | | | | | 500 | | | | (89 | ) | | | 279 | | | | 190 | | | | 6 | | | | 0 | |
Receive | | 1-Day USD-SOFR Compounded-OIS | | | 1.625 | | | Semi-Annual | | | 02/03/2050 | | | | | | | | 300 | | | | (44 | ) | | | 164 | | | | 120 | | | | 4 | | | | 0 | |
Receive | | 1-Day USD-SOFR Compounded-OIS | | | 2.250 | | | Semi-Annual | | | 03/12/2050 | | | | | | | | 600 | | | | (183 | ) | | | 359 | | | | 176 | | | | 8 | | | | 0 | |
Receive | | 1-Day USD-SOFR Compounded-OIS | | | 1.250 | | | Semi-Annual | | | 12/16/2050 | | | | | | | | 400 | | | | 38 | | | | 148 | | | | 186 | | | | 5 | | | | 0 | |
Pay | | 1-Day USD-SOFR Compounded-OIS | | | 1.491 | | | Semi-Annual | | | 01/21/2051 | | | | | | | | 100 | | | | (1 | ) | | | (42 | ) | | | (43 | ) | | | 0 | | | | (1 | ) |
Pay | | 1-Day USD-SOFR Compounded-OIS | | | 1.590 | | | Semi-Annual | | | 02/09/2051 | | | | | | | | 900 | | | | (7 | ) | | | (363 | ) | | | (370 | ) | | | 0 | | | | (11 | ) |
Receive | | 1-Day USD-SOFR Compounded-OIS | | | 1.785 | | | Semi-Annual | | | 08/12/2051 | | | | | | | | 100 | | | | (1 | ) | | | 39 | | | | 38 | | | | 1 | | | | 0 | |
Pay | | 1-Day USD-SOFR Compounded-OIS | | | 3.370 | | | Annual | | | 07/12/2053 | | | | | | | | 100 | | | | (1 | ) | | | (8 | ) | | | (9 | ) | | | 0 | | | | (2 | ) |
| | | | | | | | | | | | |
| See Accompanying Notes | | | ANNUAL FINANCIAL AND OTHER INFORMATION | | | | | | | JUNE 30, 2024 | | | 29 |
| | | | | | |
| Schedule of Investments | | PIMCO Dividend and Income Fund | | (Cont.) | | |
| | | | | | | | | | | | | | | | | | | | | | | | | | | | | | | | | | | | | | | | |
Pay/Receive
Floating Rate | | Floating Rate Index | | Fixed Rate | | | Payment
Frequency | | Maturity
Date | | | Notional
Amount | | | Premiums
Paid/(Received) | | | Unrealized
Appreciation/
(Depreciation) | | | Market
Value | | | Variation Margin | |
| | Asset | | | Liability | |
Pay | | 1-Year BRL-CDI | | | 11.157 | % | | Maturity | | | 01/02/2025 | | | | BRL | | | | 100 | | | $ | 0 | | | $ | (1 | ) | | $ | (1 | ) | | $ | 0 | | | $ | 0 | |
Pay | | 1-Year BRL-CDI | | | 11.177 | | | Maturity | | | 01/02/2025 | | | | | | | | 100 | | | | 0 | | | | 0 | | | | 0 | | | | 0 | | | | 0 | |
Pay | | 1-Year BRL-CDI | | | 11.367 | | | Maturity | | | 01/02/2025 | | | | | | | | 100 | | | | 0 | | | | 0 | | | | 0 | | | | 0 | | | | 0 | |
Pay | | 1-Year BRL-CDI | | | 12.018 | | | Maturity | | | 01/02/2025 | | | | | | | | 200 | | | | 0 | | | | 0 | | | | 0 | | | | 0 | | | | 0 | |
Pay | | 1-Year BRL-CDI | | | 12.098 | | | Maturity | | | 01/02/2025 | | | | | | | | 300 | | | | 0 | | | | 0 | | | | 0 | | | | 0 | | | | 0 | |
Pay | | 1-Year BRL-CDI | | | 12.158 | | | Maturity | | | 01/02/2025 | | | | | | | | 200 | | | | 0 | | | | 0 | | | | 0 | | | | 0 | | | | 0 | |
Pay | | 1-Year BRL-CDI | | | 12.163 | | | Maturity | | | 01/02/2025 | | | | | | | | 200 | | | | 0 | | | | 0 | | | | 0 | | | | 0 | | | | 0 | |
Pay | | 1-Year BRL-CDI | | | 12.178 | | | Maturity | | | 01/02/2025 | | | | | | | | 300 | | | | 0 | | | | 0 | | | | 0 | | | | 0 | | | | 0 | |
Pay | | 1-Year BRL-CDI | | | 9.874 | | | Maturity | | | 01/02/2026 | | | | | | | | 500 | | | | 0 | | | | (3 | ) | | | (3 | ) | | | 0 | | | | 0 | |
Pay | | 1-Year BRL-CDI | | | 9.899 | | | Maturity | | | 01/02/2026 | | | | | | | | 200 | | | | 0 | | | | (1 | ) | | | (1 | ) | | | 0 | | | | 0 | |
Pay | | 1-Year BRL-CDI | | | 9.939 | | | Maturity | | | 01/02/2026 | | | | | | | | 400 | | | | 0 | | | | (2 | ) | | | (2 | ) | | | 0 | | | | 0 | |
Pay | | 1-Year BRL-CDI | | | 10.052 | | | Maturity | | | 01/02/2026 | | | | | | | | 1,000 | | | | 0 | | | | (5 | ) | | | (5 | ) | | | 0 | | | | 0 | |
Pay | | 1-Year BRL-CDI | | | 10.085 | | | Maturity | | | 01/02/2026 | | | | | | | | 900 | | | | 0 | | | | (5 | ) | | | (5 | ) | | | 0 | | | | 0 | |
Pay | | 1-Year BRL-CDI | | | 10.105 | | | Maturity | | | 01/02/2026 | | | | | | | | 900 | | | | 0 | | | | (5 | ) | | | (5 | ) | | | 0 | | | | 0 | |
Pay | | 1-Year BRL-CDI | | | 9.998 | | | Maturity | | | 01/04/2027 | | | | | | | | 700 | | | | 0 | | | | (6 | ) | | | (6 | ) | | | 0 | | | | 0 | |
Pay | | 1-Year BRL-CDI | | | 10.037 | | | Maturity | | | 01/04/2027 | | | | | | | | 200 | | | | 0 | | | | (2 | ) | | | (2 | ) | | | 0 | | | | 0 | |
Pay | | 1-Year BRL-CDI | | | 10.041 | | | Maturity | | | 01/04/2027 | | | | | | | | 800 | | | | 0 | | | | (6 | ) | | | (6 | ) | | | 0 | | | | (1 | ) |
Pay | | 1-Year BRL-CDI | | | 10.072 | | | Maturity | | | 01/04/2027 | | | | | | | | 400 | | | | 0 | | | | (2 | ) | | | (2 | ) | | | 0 | | | | 0 | |
Pay | | 1-Year BRL-CDI | | | 10.090 | | | Maturity | | | 01/04/2027 | | | | | | | | 1,500 | | | | 0 | | | | (11 | ) | | | (11 | ) | | | 0 | | | | (1 | ) |
Pay | | 1-Year BRL-CDI | | | 10.098 | | | Maturity | | | 01/04/2027 | | | | | | | | 1,190 | | | | 0 | | | | (7 | ) | | | (7 | ) | | | 0 | | | | (1 | ) |
Pay | | 1-Year BRL-CDI | | | 10.138 | | | Maturity | | | 01/04/2027 | | | | | | | | 400 | | | | 0 | | | | (3 | ) | | | (3 | ) | | | 0 | | | | 0 | |
Pay | | 1-Year BRL-CDI | | | 10.165 | | | Maturity | | | 01/04/2027 | | | | | | | | 610 | | | | 0 | | | | (3 | ) | | | (3 | ) | | | 0 | | | | 0 | |
Pay | | 1-Year BRL-CDI | | | 10.170 | | | Maturity | | | 01/04/2027 | | | | | | | | 1,010 | | | | 0 | | | | (6 | ) | | | (6 | ) | | | 0 | | | | (1 | ) |
Pay | | 1-Year BRL-CDI | | | 10.183 | | | Maturity | | | 01/04/2027 | | | | | | | | 1,810 | | | | 0 | | | | (10 | ) | | | (10 | ) | | | 0 | | | | (1 | ) |
Pay | | 1-Year BRL-CDI | | | 10.203 | | | Maturity | | | 01/04/2027 | | | | | | | | 1,410 | | | | 0 | | | | (8 | ) | | | (8 | ) | | | 0 | | | | (1 | ) |
Pay | | 1-Year BRL-CDI | | | 10.210 | | | Maturity | | | 01/04/2027 | | | | | | | | 200 | | | | 0 | | | | (1 | ) | | | (1 | ) | | | 0 | | | | 0 | |
Pay | | 1-Year BRL-CDI | | | 10.256 | | | Maturity | | | 01/04/2027 | | | | | | | | 1,410 | | | | 0 | | | | (7 | ) | | | (7 | ) | | | 0 | | | | (1 | ) |
Pay | | 1-Year BRL-CDI | | | 10.328 | | | Maturity | | | 01/04/2027 | | | | | | | | 1,040 | | | | 0 | | | | (5 | ) | | | (5 | ) | | | 0 | | | | (1 | ) |
Pay | | 1-Year BRL-CDI | | | 11.250 | | | Maturity | | | 01/04/2027 | | | | | | | | 100 | | | | 0 | | | | (1 | ) | | | (1 | ) | | | 0 | | | | 0 | |
Pay | | 1-Year BRL-CDI | | | 11.290 | | | Maturity | | | 01/04/2027 | | | | | | | | 100 | | | | 0 | | | | (1 | ) | | | (1 | ) | | | 0 | | | | 0 | |
Pay | | 1-Year BRL-CDI | | | 11.746 | | | Maturity | | | 01/04/2027 | | | | | | | | 100 | | | | 0 | | | | 0 | | | | 0 | | | | 0 | | | | 0 | |
Pay | | 1-Year BRL-CDI | | | 11.901 | | | Maturity | | | 01/04/2027 | | | | | | | | 300 | | | | 0 | | | | (1 | ) | | | (1 | ) | | | 0 | | | | 0 | |
Pay | | 3-Month EUR-EURIBOR | | | 2.770 | | | Annual | | | 04/16/2029 | | | | EUR | | | | 100 | | | | 0 | | | | (1 | ) | | | (1 | ) | | | 0 | | | | 0 | |
Pay | | 3-Month EUR-EURIBOR | | | 2.860 | | | Annual | | | 04/24/2029 | | | | | | | | 100 | | | | 0 | | | | 0 | | | | 0 | | | | 0 | | | | 0 | |
Pay | | 3-Month EUR-EURIBOR | | | 2.780 | | | Annual | | | 05/02/2029 | | | | | | | | 100 | | | | 0 | | | | (1 | ) | | | (1 | ) | | | 0 | | | | 0 | |
Pay | | 3-Month EUR-EURIBOR | | | 2.827 | | | Annual | | | 05/06/2029 | | | | | | | | 100 | | | | 0 | | | | 0 | | | | 0 | | | | 0 | | | | 0 | |
Receive | | 3-Month EUR-EURIBOR | | | 2.818 | | | Annual | | | 06/26/2029 | | | | | | | | 100 | | | | 0 | | | | 0 | | | | 0 | | | | 0 | | | | 0 | |
Pay | | 3-Month NZD-BBR | | | 4.750 | | | Semi-Annual | | | 06/19/2029 | | | | NZD | | | | 300 | | | | 2 | | | | 0 | | | | 2 | | | | 0 | | | | (1 | ) |
Pay | | 3-Month ZAR-JIBAR | | | 8.410 | | | Quarterly | | | 07/31/2028 | | | | ZAR | | | | 400 | | | | 0 | | | | 0 | | | | 0 | | | | 0 | | | | 0 | |
Pay | | 3-Month ZAR-JIBAR | | | 8.415 | | | Quarterly | | | 07/31/2028 | | | | | | | | 400 | | | | 0 | | | | 0 | | | | 0 | | | | 0 | | | | 0 | |
Pay | | 3-Month ZAR-JIBAR | | | 8.420 | | | Quarterly | | | 07/31/2028 | | | | | | | | 1,300 | | | | 0 | | | | 1 | | | | 1 | | | | 0 | | | | 0 | |
Pay | | 3-Month ZAR-JIBAR | | | 8.428 | | | Quarterly | | | 07/31/2028 | | | | | | | | 900 | | | | 0 | | | | 1 | | | | 1 | | | | 0 | | | | 0 | |
Pay | | 3-Month ZAR-JIBAR | | | 8.426 | | | Quarterly | | | 08/01/2028 | | | | | | | | 500 | | | | 0 | | | | 0 | | | | 0 | | | | 0 | | | | 0 | |
Pay | | 3-Month ZAR-JIBAR | | | 8.460 | | | Quarterly | | | 08/01/2028 | | | | | | | | 900 | | | | 0 | | | | 1 | | | | 1 | | | | 0 | | | | 0 | |
Pay | | 3-Month ZAR-JIBAR | | | 8.460 | | | Quarterly | | | 08/02/2028 | | | | | | | | 900 | | | | 0 | | | | 1 | | | | 1 | | | | 0 | | | | 0 | |
Pay | | 3-Month ZAR-JIBAR | | | 8.464 | | | Quarterly | | | 08/02/2028 | | | | | | | | 900 | | | | 0 | | | | 1 | | | | 1 | | | | 0 | | | | 0 | |
Pay | | 3-Month ZAR-JIBAR | | | 8.550 | | | Quarterly | | | 08/03/2028 | | | | | | | | 900 | | | | 0 | | | | 1 | | | | 1 | | | | 0 | | | | 0 | |
Pay | | 3-Month ZAR-JIBAR | | | 8.380 | | | Quarterly | | | 08/04/2028 | | | | | | | | 400 | | | | 0 | | | | 0 | | | | 0 | | | | 0 | | | | 0 | |
Pay | | 3-Month ZAR-JIBAR | | | 8.410 | | | Quarterly | | | 08/04/2028 | | | | | | | | 1,100 | | | | 0 | | | | 1 | | | | 1 | | | | 0 | | | | 0 | |
Pay | | 3-Month ZAR-JIBAR | | | 8.415 | | | Quarterly | | | 08/04/2028 | | | | | | | | 400 | | | | 0 | | | | 0 | | | | 0 | | | | 0 | | | | 0 | |
Pay | | 3-Month ZAR-JIBAR | | | 8.421 | | | Quarterly | | | 08/04/2028 | | | | | | | | 500 | | | | 0 | | | | 0 | | | | 0 | | | | 0 | | | | 0 | |
Pay | | 3-Month ZAR-JIBAR | | | 8.543 | | | Quarterly | | | 08/04/2028 | | | | | | | | 500 | | | | 0 | | | | 1 | | | | 1 | | | | 0 | | | | 0 | |
Pay | | 3-Month ZAR-JIBAR | | | 8.360 | | | Quarterly | | | 08/07/2028 | | | | | | | | 900 | | | | 0 | | | | 1 | | | | 1 | | | | 0 | | | | 0 | |
Pay | | 3-Month ZAR-JIBAR | | | 8.400 | | | Quarterly | | | 08/07/2028 | | | | | | | | 900 | | | | 0 | | | | 1 | | | | 1 | | | | 0 | | | | 0 | |
Pay | | 3-Month ZAR-JIBAR | | | 8.410 | | | Quarterly | | | 08/07/2028 | | | | | | | | 200 | | | | 0 | | | | 0 | | | | 0 | | | | 0 | | | | 0 | |
Pay | | 6-Month AUD-BBR-BBSW | | | 2.750 | | | Semi-Annual | | | 06/17/2026 | | | | AUD | | | | 5,080 | | | | 483 | | | | (596 | ) | | | (113 | ) | | | 0 | | | | (1 | ) |
Receive | | 6-Month AUD-BBR-BBSW | | | 3.000 | | | Semi-Annual | | | 03/21/2027 | | | | | | | | 80 | | | | (9 | ) | | | 11 | | | | 2 | | | | 0 | | | | 0 | |
Pay | | 6-Month AUD-BBR-BBSW | | | 4.500 | | | Semi-Annual | | | 09/20/2033 | | | | | | | | 1,300 | | | | (3 | ) | | | 7 | | | | 4 | | | | 1 | | | | 0 | |
Pay | | 6-Month AUD-BBR-BBSW | | | 4.500 | | | Semi-Annual | | | 03/20/2034 | | | | | | | | 400 | | | | (2 | ) | | | 3 | | | | 1 | | | | 2 | | | | 0 | |
Pay(5) | | 6-Month AUD-BBR-BBSW | | | 4.500 | | | Semi-Annual | | | 09/18/2034 | | | | | | | | 400 | | | | 5 | | | | (4 | ) | | | 1 | | | | 0 | | | | 0 | |
Pay | | 6-Month EUR-EURIBOR | | | 3.370 | | | Annual | | | 10/09/2028 | | | | EUR | | | | 100 | | | | 0 | | | | 4 | | | | 4 | | | | 0 | | | | 0 | |
Pay | | 6-Month EUR-EURIBOR | | | 3.450 | | | Annual | | | 10/20/2028 | | | | | | | | 100 | | | | 0 | | | | 4 | | | | 4 | | | | 0 | | | | 0 | |
Receive | | 6-Month EUR-EURIBOR | | | 3.270 | | | Annual | | | 11/08/2028 | | | | | | | | 100 | | | | 0 | | | | (3 | ) | | | (3 | ) | | | 0 | | | | 0 | |
Receive | | 6-Month EUR-EURIBOR | | | 2.920 | | | Annual | | | 12/13/2028 | | | | | | | | 100 | | | | 0 | | | | (2 | ) | | | (2 | ) | | | 0 | | | | 0 | |
Receive | | 6-Month EUR-EURIBOR | | | 2.880 | | | Annual | | | 12/19/2028 | | | | | | | | 100 | | | | 0 | | | | (1 | ) | | | (1 | ) | | | 0 | | | | 0 | |
Receive | | 6-Month EUR-EURIBOR | | | 2.760 | | | Annual | | | 01/03/2029 | | | | | | | | 100 | | | | 0 | | | | 1 | | | | 1 | | | | 0 | | | | 0 | |
Pay(5) | | 6-Month EUR-EURIBOR | | | 2.750 | | | Annual | | | 09/18/2029 | | | | | | | | 2,700 | | | | 41 | | | | (49 | ) | | | (8 | ) | | | 0 | | | | (2 | ) |
Receive | | 6-Month EUR-EURIBOR | | | 0.150 | | | Annual | | | 03/18/2030 | | | | | | | | 800 | | | | (2 | ) | | | 146 | | | | 144 | | | | 1 | | | | 0 | |
Pay | | 6-Month EUR-EURIBOR | | | 2.000 | | | Annual | | | 09/21/2032 | | | | | | | | 680 | | | | 8 | | | | (48 | ) | | | (40 | ) | | | 0 | | | | (1 | ) |
Pay | | 6-Month EUR-EURIBOR | | | 3.300 | | | Annual | | | 10/03/2033 | | | | | | | | 100 | | | | 0 | | | | 6 | | | | 6 | | | | 0 | | | | 0 | |
Receive | | 6-Month EUR-EURIBOR | | | 2.970 | | | Annual | | | 12/15/2033 | | | | | | | | 100 | | | | 0 | | | | (3 | ) | | | (3 | ) | | | 0 | | | | 0 | |
| | | | | | |
| 30 | | PIMCO EQUITY SERIES | | | See Accompanying Notes | |
| | | | | | | | | | | | | | | | | | | | | | | | | | | | | | | | | | | | | | | | |
Pay/Receive
Floating Rate | | Floating Rate Index | | Fixed Rate | | | Payment
Frequency | | Maturity
Date | | | Notional
Amount | | | Premiums
Paid/(Received) | | | Unrealized
Appreciation/
(Depreciation) | | | Market
Value | | | Variation Margin | |
| | Asset | | | Liability | |
Receive | | 6-Month EUR-EURIBOR | | | 2.890 | % | | Annual | | | 12/22/2033 | | | | EUR | | | | 100 | | | $ | 0 | | | $ | (2 | ) | | $ | (2 | ) | | $ | 0 | | | $ | 0 | |
Pay(5) | | 6-Month EUR-EURIBOR | | | 2.750 | | | Annual | | | 09/18/2034 | | | | | | | | 2,500 | | | | 34 | | | | (44 | ) | | | (10 | ) | | | 0 | | | | (5 | ) |
Receive(5) | | 6-Month EUR-EURIBOR | | | 0.830 | | | Annual | | | 12/09/2052 | | | | | | | | 1,500 | | | | 9 | | | | 86 | | | | 95 | | | | 0 | | | | (1 | ) |
Receive(5) | | 6-Month EUR-EURIBOR | | | 2.500 | | | Annual | | | 09/18/2054 | | | | | | | | 1,700 | | | | (46 | ) | | | 47 | | | | 1 | | | | 4 | | | | 0 | |
Pay | | 28-Day MXN-TIIE | | | 5.990 | | | Lunar | | | 01/30/2026 | | | | MXN | | | | 4,300 | | | | 9 | | | | (25 | ) | | | (16 | ) | | | 0 | | | | 0 | |
Pay | | 28-Day MXN-TIIE | | | 6.080 | | | Lunar | | | 03/10/2026 | | | | | | | | 15,500 | | | | 35 | | | | (96 | ) | | | (61 | ) | | | 1 | | | | 0 | |
Pay | | 28-Day MXN-TIIE | | | 6.490 | | | Lunar | | | 09/08/2026 | | | | | | | | 30,000 | | | | 97 | | | | (221 | ) | | | (124 | ) | | | 2 | | | | 0 | |
Receive | | 28-Day MXN-TIIE | | | 8.410 | | | Lunar | | | 03/31/2027 | | | | | | | | 1,000 | | | | 0 | | | | 2 | | | | 2 | | | | 0 | | | | 0 | |
Receive | | 28-Day MXN-TIIE | | | 8.730 | | | Lunar | | | 04/06/2027 | | | | | | | | 1,500 | | | | 0 | | | | 3 | | | | 3 | | | | 0 | | | | 0 | |
Receive | | 28-Day MXN-TIIE | | | 9.073 | | | Lunar | | | 06/03/2027 | | | | | | | | 700 | | | | 0 | | | | 1 | | | | 1 | | | | 0 | | | | 0 | |
Receive | | 28-Day MXN-TIIE | | | 9.260 | | | Lunar | | | 06/03/2027 | | | | | | | | 400 | | | | 0 | | | | 0 | | | | 0 | | | | 0 | | | | 0 | |
Receive | | 28-Day MXN-TIIE | | | 9.340 | | | Lunar | | | 06/03/2027 | | | | | | | | 900 | | | | 0 | | | | 1 | | | | 1 | | | | 0 | | | | 0 | |
Receive | | 28-Day MXN-TIIE | | | 7.984 | | | Lunar | | | 12/10/2027 | | | | | | | | 2,900 | | | | (22 | ) | | | 30 | | | | 8 | | | | 0 | | | | 0 | |
Receive | | 28-Day MXN-TIIE | | | 8.005 | | | Lunar | | | 12/21/2027 | | | | | | | | 11,400 | | | | (86 | ) | | | 120 | | | | 34 | | | | 0 | | | | (1 | ) |
Receive | | 28-Day MXN-TIIE | | | 7.800 | | | Lunar | | | 12/28/2027 | | | | | | | | 1,200 | | | | (8 | ) | | | 12 | | | | 4 | | | | 0 | | | | 0 | |
Receive | | 28-Day MXN-TIIE | | | 7.910 | | | Lunar | | | 12/30/2027 | | | | | | | | 700 | | | | (5 | ) | | | 7 | | | | 2 | | | | 0 | | | | 0 | |
Receive | | 28-Day MXN-TIIE | | | 8.030 | | | Lunar | | | 01/31/2028 | | | | | | | | 2,000 | | | | (15 | ) | | | 21 | | | | 6 | | | | 0 | | | | 0 | |
Receive | | 28-Day MXN-TIIE | | | 8.050 | | | Lunar | | | 01/31/2028 | | | | | | | | 1,900 | | | | (15 | ) | | | 20 | | | | 5 | | | | 0 | | | | 0 | |
Pay | | 28-Day MXN-TIIE | | | 8.300 | | | Lunar | | | 06/16/2028 | | | | | | | | 1,300 | | | | (1 | ) | | | (2 | ) | | | (3 | ) | | | 0 | | | | 0 | |
Pay | | 28-Day MXN-TIIE | | | 8.512 | | | Lunar | | | 07/24/2028 | | | | | | | | 2,300 | | | | 0 | | | | (5 | ) | | | (5 | ) | | | 0 | | | | 0 | |
Pay | | 28-Day MXN-TIIE | | | 8.444 | | | Lunar | | | 07/25/2028 | | | | | | | | 3,000 | | | | 0 | | | | (7 | ) | | | (7 | ) | | | 0 | | | | 0 | |
Pay | | 28-Day MXN-TIIE | | | 8.471 | | | Lunar | | | 07/26/2028 | | | | | | | | 1,500 | | | | 0 | | | | (3 | ) | | | (3 | ) | | | 0 | | | | 0 | |
Pay | | 28-Day MXN-TIIE | | | 8.550 | | | Lunar | | | 07/27/2028 | | | | | | | | 800 | | | | 0 | | | | (2 | ) | | | (2 | ) | | | 0 | | | | 0 | |
Pay | | 28-Day MXN-TIIE | | | 8.556 | | | Lunar | | | 07/27/2028 | | | | | | | | 4,600 | | | | 0 | | | | (10 | ) | | | (10 | ) | | | 1 | | | | 0 | |
Pay | | 28-Day MXN-TIIE | | | 8.620 | | | Lunar | | | 07/28/2028 | | | | | | | | 800 | | | | 0 | | | | (2 | ) | | | (2 | ) | | | 0 | | | | 0 | |
Pay | | 28-Day MXN-TIIE | | | 8.636 | | | Lunar | | | 07/28/2028 | | | | | | | | 1,600 | | | | 0 | | | | (3 | ) | | | (3 | ) | | | 0 | | | | 0 | |
Pay | | 28-Day MXN-TIIE | | | 8.640 | | | Lunar | | | 07/28/2028 | | | | | | | | 300 | | | | 0 | | | | (1 | ) | | | (1 | ) | | | 0 | | | | 0 | |
Pay | | 28-Day MXN-TIIE | | | 8.650 | | | Lunar | | | 07/28/2028 | | | | | | | | 900 | | | | 0 | | | | (2 | ) | | | (2 | ) | | | 0 | | | | 0 | |
Pay | | 28-Day MXN-TIIE | | | 8.660 | | | Lunar | | | 07/28/2028 | | | | | | | | 800 | | | | 0 | | | | (2 | ) | | | (2 | ) | | | 0 | | | | 0 | |
Pay | | 28-Day MXN-TIIE | | | 8.600 | | | Lunar | | | 07/31/2028 | | | | | | | | 1,300 | | | | 0 | | | | (3 | ) | | | (3 | ) | | | 0 | | | | 0 | |
Receive | | 28-Day MXN-TIIE | | | 8.760 | | | Lunar | | | 03/01/2029 | | | | | | | | 500 | | | | 0 | | | | 1 | | | | 1 | | | | 0 | | | | 0 | |
Receive | | 28-Day MXN-TIIE | | | 8.770 | | | Lunar | | | 03/01/2029 | | | | | | | | 300 | | | | 0 | | | | 1 | | | | 1 | | | | 0 | | | | 0 | |
Receive | | 28-Day MXN-TIIE | | | 8.780 | | | Lunar | | | 03/01/2029 | | | | | | | | 200 | | | | 0 | | | | 0 | | | | 0 | | | | 0 | | | | 0 | |
Receive | | 28-Day MXN-TIIE | | | 8.720 | | | Lunar | | | 03/07/2029 | | | | | | | | 100 | | | | 0 | | | | 0 | | | | 0 | | | | 0 | | | | 0 | |
Receive | | 28-Day MXN-TIIE | | | 8.725 | | | Lunar | | | 03/07/2029 | | | | | | | | 300 | | | | 0 | | | | 1 | | | | 1 | | | | 0 | | | | 0 | |
Receive | | 28-Day MXN-TIIE | | | 8.730 | | | Lunar | | | 03/07/2029 | | | | | | | | 200 | | | | 0 | | | | 0 | | | | 0 | | | | 0 | | | | 0 | |
Receive | | 28-Day MXN-TIIE | | | 8.673 | | | Lunar | | | 05/31/2029 | | | | | | | | 300 | | | | 0 | | | | 1 | | | | 1 | | | | 0 | | | | 0 | |
Receive | | 28-Day MXN-TIIE | | | 8.680 | | | Lunar | | | 05/31/2029 | | | | | | | | 300 | | | | 0 | | | | 1 | | | | 1 | | | | 0 | | | | 0 | |
Receive | | 28-Day MXN-TIIE | | | 8.681 | | | Lunar | | | 05/31/2029 | | | | | | | | 400 | | | | 0 | | | | 1 | | | | 1 | | | | 0 | | | | 0 | |
Receive | | 28-Day MXN-TIIE | | | 8.683 | | | Lunar | | | 05/31/2029 | | | | | | | | 100 | | | | 0 | | | | 0 | | | | 0 | | | | 0 | | | | 0 | |
Receive | | 28-Day MXN-TIIE | | | 8.810 | | | Lunar | | | 05/29/2031 | | | | | | | | 300 | | | | 0 | | | | 1 | | | | 1 | | | | 0 | | | | 0 | |
Receive | | 28-Day MXN-TIIE | | | 7.495 | | | Lunar | | | 01/14/2032 | | | | | | | | 700 | | | | 3 | | | | 1 | | | | 4 | | | | 0 | | | | 0 | |
Receive | | 28-Day MXN-TIIE | | | 7.498 | | | Lunar | | | 01/15/2032 | | | | | | | | 2,900 | | | | 12 | | | | 5 | | | | 17 | | | | 0 | | | | 0 | |
Receive | | 28-Day MXN-TIIE | | | 8.732 | | | Lunar | | | 03/30/2032 | | | | | | | | 700 | | | | 0 | | | | 2 | | | | 2 | | | | 0 | | | | 0 | |
Receive | | 28-Day MXN-TIIE | | | 8.701 | | | Lunar | | | 03/31/2032 | | | | | | | | 1,700 | | | | 0 | | | | 4 | | | | 4 | | | | 0 | | | | 0 | |
Pay | | 28-Day MXN-TIIE | | | 7.165 | | | Lunar | | | 09/06/2032 | | | | | | | | 400 | | | | 2 | | | | (5 | ) | | | (3 | ) | | | 0 | | | | 0 | |
Pay | | 28-Day MXN-TIIE | | | 7.380 | | | Lunar | | | 08/14/2037 | | | | | | | | 100 | | | | 1 | | | | (2 | ) | | | (1 | ) | | | 0 | | | | 0 | |
Pay | | 28-Day MXN-TIIE | | | 7.360 | | | Lunar | | | 08/21/2037 | | | | | | | | 100 | | | | 1 | | | | (2 | ) | | | (1 | ) | | | 0 | | | | 0 | |
Receive | | 28-Day MXN-TIIE | | | 8.103 | | | Lunar | | | 01/04/2038 | | | | | | | | 900 | | | | (9 | ) | | | 14 | | | | 5 | | | | 0 | | | | 0 | |
Pay | | CAONREPO | | | 3.750 | | | Semi-Annual | | | 12/20/2025 | | | | CAD | | | | 1,200 | | | | (20 | ) | | | 15 | | | | (5 | ) | | | 0 | | | | 0 | |
Pay | | UKRPI | | | 4.000 | | | Maturity | | | 09/15/2031 | | | | GBP | | | | 100 | | | | 0 | | | | (16 | ) | | | (16 | ) | | | 0 | | | | 0 | |
Pay | | UKRPI | | | 4.140 | | | Maturity | | | 10/15/2031 | | | | | | | | 100 | | | | 0 | | | | (14 | ) | | | (14 | ) | | | 0 | | | | 0 | |
Pay | | UKRPI | | | 4.250 | | | Maturity | | | 11/15/2031 | | | | | | | | 100 | | | | (1 | ) | | | (11 | ) | | | (12 | ) | | | 0 | | | | 0 | |
| | | | | | | | | | | | | | | | | | | | | | | | | | | | | | | | | | | | | | | | |
| | | | | | | $ | (419 | ) | | $ | 3,103 | | | $ | 2,684 | | | $ | 216 | | | $ | (105 | ) |
| | | | | | | | | | | | | | | | | | | | | | | | | |
Total Swap Agreements | | | | | | | $ | (70 | ) | | $ | 3,263 | | | $ | 3,193 | | | $ | 217 | | | $ | (109 | ) |
| | | | | | | | | | | | | | | | | | | | | | | | | |
FINANCIAL DERIVATIVE INSTRUMENTS: EXCHANGE-TRADED OR CENTRALLY CLEARED SUMMARY
The following is a summary of the market value and variation margin of Exchange-Traded or Centrally Cleared Financial Derivative Instruments as of June 30, 2024:
| | | | | | | | | | | | | | | | | | | | | | | | | | | | | | | | | | | | |
| | | Financial Derivative Assets | | | | | | Financial Derivative Liabilities | |
| | | Market Value | | | Variation Margin
Asset | | | | | | | | | Market Value | | | Variation Margin
Liability | | | | |
| | | Purchased
Options | | | Futures | | | Swap
Agreements | | | Total | | | | | | Written
Options | | | Futures | | | Swap
Agreements | | | Total | |
Total Exchange-Traded or Centrally Cleared | | $ | 0 | | | $ | 41 | | | $ | 217 | | | $ | 258 | | | | | | | $ | 0 | | | | $ (40 | ) | | | $ (109 | ) | | | $ (149 | ) |
| | | | | | | | | | | | | | | | | | | | | | | | | | | | | | | | | | | | |
| | | | | | | | | | | | |
| See Accompanying Notes | | | ANNUAL FINANCIAL AND OTHER INFORMATION | | | | | | | JUNE 30, 2024 | | | 31 |
| | | | | | |
| Schedule of Investments | | PIMCO Dividend and Income Fund | | (Cont.) | | |
| (k) | Securities with an aggregate market value of $923 and cash of $1,601 have been pledged as collateral for exchange-traded and centrally cleared financial derivative instruments as of June 30, 2024. See Note 8, Master Netting Arrangements, in the Notes to Financial Statements for more information. |
| (1) | If the Fund is a seller of protection and a credit event occurs, as defined under the terms of that particular swap agreement, the Fund will either (i) pay to the buyer of protection an amount equal to the notional amount of the swap and take delivery of the referenced obligation or underlying securities comprising the referenced index or (ii) pay a net settlement amount in the form of cash, securities or other deliverable obligations equal to the notional amount of the swap less the recovery value of the referenced obligation or underlying securities comprising the referenced index. |
| (2) | Implied credit spreads, represented in absolute terms, utilized in determining the market value of credit default swap agreements on sovereign issues as of period end serve as indicators of the current status of the payment/performance risk and represent the likelihood or risk of default for the credit derivative. The implied credit spread of a particular referenced entity reflects the cost of buying/selling protection and may include upfront payments required to be made to enter into the agreement. Wider credit spreads represent a deterioration of the referenced entity’s credit soundness and a greater likelihood or risk of default or other credit event occurring as defined under the terms of the agreement. |
| (3) | The maximum potential amount the Fund could be required to pay as a seller of credit protection or receive as a buyer of credit protection if a credit event occurs as defined under the terms of that particular swap agreement. |
| (4) | The prices and resulting values for credit default swap agreements serve as indicators of the current status of the payment/performance risk and represent the likelihood of an expected liability (or profit) for the credit derivative should the notional amount of the swap agreement be closed/sold as of the period end. Increasing market values, in absolute terms when compared to the notional amount of the swap, represent a deterioration of the underlying referenced instrument’s credit soundness and a greater likelihood or risk of default or other credit event occurring as defined under the terms of the agreement. |
| (5) | This instrument has a forward starting effective date. See Note 2, Securities Transactions and Investment Income, in the Notes to Financial Statements for further information. |
(l) FINANCIAL DERIVATIVE INSTRUMENTS: OVER THE COUNTER
FORWARD FOREIGN CURRENCY CONTRACTS:
| | | | | | | | | | | | | | | | | | | | | | | | |
| Counterparty | | Settlement
Month | | | Currency to
be Delivered | | | Currency to
be Received | | | Unrealized Appreciation/
(Depreciation) | |
| | Asset | | | Liability | |
AZD | | | 07/2024 | | | NZD | | | 157 | | | $ | | | 96 | | | $ | 1 | | | $ | 0 | |
| | | 08/2024 | | | $ | | | 96 | | | NZD | | | 158 | | | | 0 | | | | (1 | ) |
| | | 10/2024 | | | | | | 300 | | | CNH | | | 2,146 | | | | 0 | | | | (3 | ) |
| | | | | | | |
BOA | | | 07/2024 | | | KRW | | | 425,805 | | | $ | | | 311 | | | | 2 | | | | 0 | |
| | | 07/2024 | | | $ | | | 71 | | | PLN | | | 282 | | | | 0 | | | | (1 | ) |
| | | 07/2024 | | | | | | 99 | | | SGD | | | 134 | | | | 0 | | | | (1 | ) |
| | | 08/2024 | | | | | | 5 | | | TRY | | | 179 | | | | 0 | | | | 0 | |
| | | | | | | |
BPS | | | 07/2024 | | | AUD | | | 20 | | | $ | | | 13 | | | | 0 | | | | 0 | |
| | | 07/2024 | | | BRL | | | 3,628 | | | | | | 678 | | | | 29 | | | | 0 | |
| | | 07/2024 | | | EUR | | | 132 | | | | | | 142 | | | | 1 | | | | 0 | |
| | | 07/2024 | | | GBP | | | 3,116 | | | | | | 3,980 | | | | 42 | | | | 0 | |
| | | 07/2024 | | | KRW | | | 422,615 | | | | | | 308 | | | | 1 | | | | 0 | |
| | | 07/2024 | | | $ | | | 470 | | | AUD | | | 705 | | | | 1 | | | | 0 | |
| | | 07/2024 | | | | | | 653 | | | BRL | | | 3,628 | | | | 0 | | | | (4 | ) |
| | | 07/2024 | | | | | | 1,478 | | | EUR | | | 1,382 | | | | 2 | | | | 0 | |
| | | 07/2024 | | | | | | 50 | | | IDR | | | 819,320 | | | | 0 | | | | 0 | |
| | | 07/2024 | | | | | | 150 | | | NZD | | | 244 | | | | 0 | | | | (1 | ) |
| | | 07/2024 | | | | | | 159 | | | PLN | | | 629 | | | | 0 | | | | (2 | ) |
| | | 07/2024 | | | | | | 379 | | | SGD | | | 514 | | | | 0 | | | | 0 | |
| | | 08/2024 | | | AUD | | | 705 | | | $ | | | 470 | | | | 0 | | | | (1 | ) |
| | | 08/2024 | | | EUR | | | 1,382 | | | | | | 1,480 | | | | 0 | | | | (2 | ) |
| | | 08/2024 | | | SGD | | | 513 | | | | | | 379 | | | | 0 | | | | 0 | |
| | | 08/2024 | | | $ | | | 4 | | | TRY | | | 123 | | | | 0 | | | | 0 | |
| | | 09/2024 | | | CNH | | | 4,973 | | | $ | | | 694 | | | | 9 | | | | 0 | |
| | | 09/2024 | | | INR | | | 3,269 | | | | | | 39 | | | | 0 | | | | 0 | |
| | | 09/2024 | | | TWD | | | 13,701 | | | | | | 426 | | | | 3 | | | | 0 | |
| | | 09/2024 | | | $ | | | 100 | | | INR | | | 8,401 | | | | 0 | | | | 0 | |
| | | 10/2024 | | | CNH | | | 1,714 | | | $ | | | 239 | | | | 3 | | | | 0 | |
| | | 10/2024 | | | $ | | | 51 | | | CNH | | | 363 | | | | 0 | | | | (1 | ) |
| | | 05/2029 | | | KWD | | | 23 | | | $ | | | 80 | | | | 2 | | | | 0 | |
| | | 07/2029 | | | | | | 3 | | | | | | 10 | | | | 0 | | | | 0 | |
| | | | | | | |
BRC | | | 07/2024 | | | MXN | | | 1,142 | | | | | | 62 | | | | 0 | | | | (1 | ) |
| | | 07/2024 | | | SGD | | | 135 | | | | | | 100 | | | | 0 | | | | 0 | |
| | | 07/2024 | | | $ | | | 30 | | | NOK | | | 316 | | | | 0 | | | | 0 | |
| | | 07/2024 | | | | | | 100 | | | PLN | | | 401 | | | | 0 | | | | (1 | ) |
| | | 07/2024 | | | | | | 198 | | | TRY | | | 6,840 | | | | 8 | | | | 0 | |
| | | 08/2024 | | | | | | 141 | | | EUR | | | 132 | | | | 0 | | | | 0 | |
| | | 08/2024 | | | | | | 147 | | | TRY | | | 5,079 | | | | 1 | | | | 0 | |
| | | 09/2024 | | | MXN | | | 1,451 | | | $ | | | 77 | | | | 0 | | | | (1 | ) |
| | | 09/2024 | | | $ | | | 1 | | | MXN | | | 10 | | | | 0 | | | | 0 | |
| | | 09/2024 | | | | | | 159 | | | TRY | | | 5,897 | | | | 9 | | | | 0 | |
| | | | | | | |
CBK | | | 07/2024 | | | BRL | | | 4,818 | | | $ | | | 867 | | | | 5 | | | | 0 | |
| | | 07/2024 | | | CHF | | | 91 | | | | | | 100 | | | | 0 | | | | (1 | ) |
| | | 07/2024 | | | KRW | | | 20,612 | | | | | | 15 | | | | 0 | | | | 0 | |
| | | 07/2024 | | | $ | | | 884 | | | BRL | | | 4,819 | | | | 0 | | | | (22 | ) |
| | | | | | |
| 32 | | PIMCO EQUITY SERIES | | | See Accompanying Notes | |
| | | | | | | | | | | | | | | | | | | | | | | | |
| Counterparty | | Settlement
Month | | | Currency to
be Delivered | | | Currency to
be Received | | | Unrealized Appreciation/
(Depreciation) | |
| | Asset | | | Liability | |
| | | 07/2024 | | | $ | | | 200 | | | PLN | | | 793 | | | $ | 0 | | | $ | (3 | ) |
| | | 07/2024 | | | | | | 29 | | | TRY | | | 971 | | | | 0 | | | | 0 | |
| | | 07/2024 | | | | | | 43 | | | ZAR | | | 785 | | | | 0 | | | | 0 | |
| | | 08/2024 | | | BRL | | | 4,835 | | | $ | | | 884 | | | | 23 | | | | 0 | |
| | | 09/2024 | | | PEN | | | 310 | | | | | | 83 | | | | 3 | | | | 0 | |
| | | 09/2024 | | | TWD | | | 5,128 | | | | | | 159 | | | | 1 | | | | 0 | |
| | | 09/2024 | | | $ | | | 657 | | | INR | | | 54,928 | | | | 0 | | | | 0 | |
| | | | | | | |
DUB | | | 07/2024 | | | KRW | | | 230,982 | | | $ | | | 168 | | | | 0 | | | | 0 | |
| | | 07/2024 | | | $ | | | 150 | | | PLN | | | 589 | | | | 0 | | | | (4 | ) |
| | | 08/2024 | | | BRL | | | 182 | | | $ | | | 35 | | | | 3 | | | | 0 | |
| | | 03/2025 | | | $ | | | 9 | | | TRY | | | 413 | | | | 1 | | | | 0 | |
| | | | | | | |
FAR | | | 07/2024 | | | AUD | | | 685 | | | $ | | | 456 | | | | 0 | | | | (1 | ) |
| | | 07/2024 | | | NZD | | | 331 | | | | | | 202 | | | | 0 | | | | 0 | |
| | | 07/2024 | | | $ | | | 1,949 | | | JPY | | | 304,302 | | | | 0 | | | | (57 | ) |
| | | 08/2024 | | | | | | 185 | | | NZD | | | 303 | | | | 0 | | | | 0 | |
| | | | | | | |
GLM | | | 07/2024 | | | MXN | | | 912 | | | $ | | | 49 | | | | 0 | | | | (1 | ) |
| | | 07/2024 | | | $ | | | 100 | | | PLN | | | 395 | | | | 0 | | | | (2 | ) |
| | | 07/2024 | | | | | | 37 | | | TRY | | | 1,273 | | | | 1 | | | | 0 | |
| | | 07/2024 | | | | | | 93 | | | ZAR | | | 1,695 | | | | 0 | | | | 0 | |
| | | 08/2024 | | | | | | 2,743 | | | BRL | | | 14,071 | | | | 0 | | | | (235 | ) |
| | | 08/2024 | | | | | | 67 | | | TRY | | | 2,329 | | | | 1 | | | | 0 | |
| | | 09/2024 | | | | | | 84 | | | | | | 3,238 | | | | 8 | | | | 0 | |
| | | | | | | |
JPM | | | 07/2024 | | | BRL | | | 89 | | | $ | | | 18 | | | | 2 | | | | 0 | |
| | | 07/2024 | | | CHF | | | 53 | | | | | | 59 | | | | 0 | | | | 0 | |
| | | 07/2024 | | | KRW | | | 285,066 | | | | | | 207 | | | | 0 | | | | 0 | |
| | | 07/2024 | | | SGD | | | 513 | | | | | | 381 | | | | 3 | | | | 0 | |
| | | 07/2024 | | | $ | | | 16 | | | BRL | | | 89 | | | | 0 | | | | 0 | |
| | | 07/2024 | | | | | | 784 | | | CHF | | | 704 | | | | 0 | | | | (1 | ) |
| | | 07/2024 | | | | | | 29 | | | CNY | | | 208 | | | | 0 | | | | 0 | |
| | | 07/2024 | | | | | | 11 | | | IDR | | | 177,317 | | | | 0 | | | | 0 | |
| | | 07/2024 | | | | | | 50 | | | ILS | | | 184 | | | | 0 | | | | (1 | ) |
| | | 07/2024 | | | | | | 60 | | | PLN | | | 233 | | | | 0 | | | | (2 | ) |
| | | 07/2024 | | | | | | 37 | | | TRY | | | 1,261 | | | | 1 | | | | 0 | |
| | | 07/2024 | | | | | | 174 | | | ZAR | | | 3,210 | | | | 2 | | | | 0 | |
| | | 08/2024 | | | CHF | | | 701 | | | $ | | | 784 | | | | 1 | | | | 0 | |
| | | 08/2024 | | | CNY | | | 208 | | | | | | 29 | | | | 0 | | | | 0 | |
| | | 08/2024 | | | $ | | | 38 | | | TRY | | | 1,289 | | | | 0 | | | | 0 | |
| | | 09/2024 | | | MXN | | | 9,213 | | | $ | | | 509 | | | | 12 | | | | 0 | |
| | | 09/2024 | | | TWD | | | 8,724 | | | | | | 271 | | | | 2 | | | | 0 | |
| | | 09/2024 | | | $ | | | 78 | | | INR | | | 6,499 | | | | 0 | | | | 0 | |
| | | 10/2024 | | | CNH | | | 2,953 | | | $ | | | 413 | | | | 5 | | | | 0 | |
| | | 10/2024 | | | $ | | | 51 | | | CNH | | | 361 | | | | 0 | | | | (1 | ) |
| | | 03/2025 | | | | | | 8 | | | TRY | | | 365 | | | | 1 | | | | 0 | |
| | | | | | | |
MBC | | | 07/2024 | | | CAD | | | 1,190 | | | $ | | | 874 | | | | 4 | | | | 0 | |
| | | 07/2024 | | | EUR | | | 1,095 | | | | | | 1,192 | | | | 19 | | | | 0 | |
| | | 07/2024 | | | JPY | | | 304,320 | | | | | | 1,895 | | | | 4 | | | | 0 | |
| | | 07/2024 | | | NOK | | | 246 | | | | | | 23 | | | | 0 | | | | 0 | |
| | | 07/2024 | | | $ | | | 870 | | | CAD | | | 1,191 | | | | 1 | | | | 0 | |
| | | 08/2024 | | | CAD | | | 1,190 | | | $ | | | 870 | | | | 0 | | | | (1 | ) |
| | | 08/2024 | | | $ | | | 1,895 | | | JPY | | | 302,896 | | | | 0 | | | | (4 | ) |
| | | 08/2024 | | | | | | 23 | | | NOK | | | 246 | | | | 0 | | | | 0 | |
| | | 09/2024 | | | TWD | | | 297 | | | $ | | | 9 | | | | 0 | | | | 0 | |
| | | | | | | |
MYI | | | 07/2024 | | | BRL | | | 1,101 | | | | | | 213 | | | | 16 | | | | 0 | |
| | | 07/2024 | | | $ | | | 198 | | | BRL | | | 1,101 | | | | 0 | | | | (1 | ) |
| | | 07/2024 | | | | | | 84 | | | GBP | | | 66 | | | | 0 | | | | 0 | |
| | | 07/2024 | | | | | | 150 | | | NZD | | | 245 | | | | 0 | | | | (1 | ) |
| | | 09/2024 | | | TWD | | | 3,470 | | | $ | | | 108 | | | | 1 | | | | 0 | |
| | | 09/2024 | | | $ | | | 52 | | | INR | | | 4,338 | | | | 0 | | | | 0 | |
| | | | | | | |
NGF | | | 09/2024 | | | INR | | | 13,998 | | | $ | | | 167 | | | | 0 | | | | 0 | |
| | | 09/2024 | | | TWD | | | 2,774 | | | | | | 86 | | | | 0 | | | | 0 | |
| | | | | | | |
RBC | | | 07/2024 | | | $ | | | 3,868 | | | GBP | | | 3,050 | | | | 0 | | | | (12 | ) |
| | | 08/2024 | | | GBP | | | 3,050 | | | $ | | | 3,868 | | | | 12 | | | | 0 | |
| | | | | | | |
SCX | | | 07/2024 | | | CNY | | | 208 | | | | | | 29 | | | | 0 | | | | 0 | |
| | | 07/2024 | | | EUR | | | 155 | | | | | | 167 | | | | 1 | | | | 0 | |
| | | 07/2024 | | | KRW | | | 214,454 | | | | | | 157 | | | | 2 | | | | 0 | |
| | | 09/2024 | | | CNH | | | 2,041 | | | | | | 284 | | | | 3 | | | | 0 | |
| | | 09/2024 | | | TWD | | | 5,373 | | | | | | 167 | | | | 1 | | | | 0 | |
| | | 09/2024 | | | $ | | | 566 | | | INR | | | 47,337 | | | | 1 | | | | 0 | |
| | | | | | | | | | | | |
| See Accompanying Notes | | | ANNUAL FINANCIAL AND OTHER INFORMATION | | | | | | | JUNE 30, 2024 | | | 33 |
| | | | | | |
| Schedule of Investments | | PIMCO Dividend and Income Fund | | (Cont.) | | |
| | | | | | | | | | | | | | | | | | | | | | | | |
| Counterparty | | Settlement
Month | | | Currency to
be Delivered | | | Currency to
be Received | | | Unrealized Appreciation/
(Depreciation) | |
| | Asset | | | Liability | |
UAG | | | 07/2024 | | | CHF | | | 560 | | | $ | | | 620 | | | $ | 0 | | | $ | (4 | ) |
| | | 07/2024 | | | ILS | | | 448 | | | | | | 121 | | | | 2 | | | | 0 | |
| | | | | | | | | | | | | | | | | | | | | | | | |
Total Forward Foreign Currency Contracts | | | $ | 256 | | | $ | (374 | ) |
| | | | | | | | | |
WRITTEN OPTIONS:
INTEREST RATE SWAPTIONS
| | | | | | | | | | | | | | | | | | | | | | | | | | |
| Counterparty | | Description | | Floating Rate Index | | Pay/Receive
Floating Rate | | Exercise
Rate | | | Expiration
Date | | | Notional
Amount(1) | | | Premiums
(Received) | | | Market
Value | |
| BOA | | Call - OTC 10-Year Interest Rate Swap | | 3-Month USD-LIBOR | | Receive | | | 3.800 | % | | | 07/08/2024 | | | | 100 | | | $ | (1 | ) | | $ | 0 | |
| | Put - OTC 10-Year Interest Rate Swap | | 3-Month USD-LIBOR | | Pay | | | 4.350 | | | | 07/08/2024 | | | | 100 | | | | (1 | ) | | | 0 | |
| | | | | | | | |
| BRC | | Call - OTC 5-Year Interest Rate Swap | | 6-Month EUR-EURIBOR | | Receive | | | 2.700 | | | | 07/04/2024 | | | | 100 | | | | 0 | | | | 0 | |
| | Put - OTC 5-Year Interest Rate Swap | | 6-Month EUR-EURIBOR | | Pay | | | 3.000 | | | | 07/04/2024 | | | | 100 | | | | 0 | | | | 0 | |
| | | | | | | | |
| FAR | | Call - OTC 10-Year Interest Rate Swap | | 3-Month USD-LIBOR | | Receive | | | 3.885 | | | | 07/10/2024 | | | | 100 | | | | 0 | | | | (1 | ) |
| | Put - OTC 10-Year Interest Rate Swap | | 3-Month USD-LIBOR | | Pay | | | 4.235 | | | | 07/10/2024 | | | | 100 | | | | 0 | | | | 0 | |
| | Call - OTC 10-Year Interest Rate Swap | | 3-Month USD-LIBOR | | Receive | | | 3.586 | | | | 07/15/2024 | | | | 100 | | | | (1 | ) | | | 0 | |
| | Put - OTC 10-Year Interest Rate Swap | | 3-Month USD-LIBOR | | Pay | | | 3.986 | | | | 07/15/2024 | | | | 100 | | | | (1 | ) | | | (1 | ) |
| | | | | | | | |
| GLM | | Call - OTC 5-Year Interest Rate Swap | | 3-Month USD-LIBOR | | Receive | | | 3.689 | | | | 07/15/2024 | | | | 100 | | | | 0 | | | | 0 | |
| | Put - OTC 5-Year Interest Rate Swap | | 3-Month USD-LIBOR | | Pay | | | 4.139 | | | | 07/15/2024 | | | | 100 | | | | 0 | | | | 0 | |
| | Call - OTC 10-Year Interest Rate Swap | | 3-Month USD-LIBOR | | Receive | | | 3.844 | | | | 07/03/2024 | | | | 100 | | | | 0 | | | | 0 | |
| | Put - OTC 10-Year Interest Rate Swap | | 3-Month USD-LIBOR | | Pay | | | 4.194 | | | | 07/03/2024 | | | | 100 | | | | 0 | | | | 0 | |
| | Call - OTC 10-Year Interest Rate Swap | | 3-Month USD-LIBOR | | Receive | | | 3.880 | | | | 07/08/2024 | | | | 100 | | | | 0 | | | | 0 | |
| | Put - OTC 10-Year Interest Rate Swap | | 3-Month USD-LIBOR | | Pay | | | 4.230 | | | | 07/08/2024 | | | | 100 | | | | 0 | | | | 0 | |
| | Call - OTC 10-Year Interest Rate Swap | | 3-Month USD-LIBOR | | Receive | | | 3.628 | | | | 07/18/2024 | | | | 100 | | | | (1 | ) | | | 0 | |
| | Put - OTC 10-Year Interest Rate Swap | | 3-Month USD-LIBOR | | Pay | | | 3.978 | | | | 07/18/2024 | | | | 100 | | | | (1 | ) | | | (1 | ) |
| | Call - OTC 10-Year Interest Rate Swap | | 3-Month USD-LIBOR | | Receive | | | 3.680 | | | | 07/22/2024 | | | | 100 | | | | (1 | ) | | | 0 | |
| | Put - OTC 10-Year Interest Rate Swap | | 3-Month USD-LIBOR | | Pay | | | 4.030 | | | | 07/22/2024 | | | | 100 | | | | (1 | ) | | | (1 | ) |
| | Call - OTC 10-Year Interest Rate Swap | | 3-Month USD-LIBOR | | Receive | | | 3.648 | | | | 07/24/2024 | | | | 100 | | | | 0 | | | | 0 | |
| | Put - OTC 10-Year Interest Rate Swap | | 3-Month USD-LIBOR | | Pay | | | 3.998 | | | | 07/24/2024 | | | | 100 | | | | 0 | | | | (1 | ) |
| | Call - OTC 10-Year Interest Rate Swap | | 3-Month USD-LIBOR | | Receive | | | 3.710 | | | | 07/29/2024 | | | | 100 | | | | 0 | | | | 0 | |
| | Put - OTC 10-Year Interest Rate Swap | | 3-Month USD-LIBOR | | Pay | | | 4.110 | | | | 07/29/2024 | | | | 100 | | | | 0 | | | | (1 | ) |
| | | | | | | | |
| JPM | | Call - OTC 5-Year Interest Rate Swap | | 3-Month USD-LIBOR | | Receive | | | 3.850 | | | | 07/05/2024 | | | | 100 | | | | 0 | | | | 0 | |
| | Put - OTC 5-Year Interest Rate Swap | | 3-Month USD-LIBOR | | Pay | | | 4.250 | | | | 07/05/2024 | | | | 100 | | | | 0 | | | | 0 | |
| | Call - OTC 10-Year Interest Rate Swap | | 3-Month USD-LIBOR | | Receive | | | 3.675 | | | | 07/22/2024 | | | | 100 | | | | (1 | ) | | | 0 | |
| | Put - OTC 10-Year Interest Rate Swap | | 3-Month USD-LIBOR | | Pay | | | 4.025 | | | | 07/22/2024 | | | | 100 | | | | (1 | ) | | | (1 | ) |
| | | | | | | | |
| MYC | | Call - OTC 5-Year Interest Rate Swap | | 6-Month EUR-EURIBOR | | Receive | | | 2.820 | | | | 07/11/2024 | | | | 100 | | | | 0 | | | | 0 | |
| | Put - OTC 5-Year Interest Rate Swap | | 6-Month EUR-EURIBOR | | Pay | | | 3.120 | | | | 07/11/2024 | | | | 100 | | | | 0 | | | | 0 | |
| | Call - OTC 10-Year Interest Rate Swap | | 3-Month USD-LIBOR | | Receive | | | 3.765 | | | | 07/22/2024 | | | | 100 | | | | (1 | ) | | | 0 | |
| | Put - OTC 10-Year Interest Rate Swap | | 3-Month USD-LIBOR | | Pay | | | 4.265 | | | | 07/22/2024 | | | | 100 | | | | (1 | ) | | | 0 | |
| | Call - OTC 10-Year Interest Rate Swap | | 3-Month USD-LIBOR | | Receive | | | 3.630 | | | | 07/29/2024 | | | | 100 | | | | 0 | | | | 0 | |
| | Call - OTC 10-Year Interest Rate Swap | | 3-Month USD-LIBOR | | Receive | | | 3.690 | | | | 07/29/2024 | | | | 100 | | | | 0 | | | | 0 | |
| | Put - OTC 10-Year Interest Rate Swap | | 3-Month USD-LIBOR | | Pay | | | 4.040 | | | | 07/29/2024 | | | | 100 | | | | 0 | | | | (1 | ) |
| | Put - OTC 10-Year Interest Rate Swap | | 3-Month USD-LIBOR | | Pay | | | 4.090 | | | | 07/29/2024 | | | | 100 | | | | 0 | | | | (1 | ) |
| | | | | | | | |
| RYL | | Call - OTC 5-Year Interest Rate Swap | | 6-Month EUR-EURIBOR | | Receive | | | 2.740 | | | | 07/15/2024 | | | | 100 | | | | 0 | | | | 0 | |
| | Put - OTC 5-Year Interest Rate Swap | | 6-Month EUR-EURIBOR | | Pay | | | 3.040 | | | | 07/15/2024 | | | | 100 | | | | 0 | | | | 0 | |
| | Call - OTC 5-Year Interest Rate Swap | | 6-Month EUR-EURIBOR | | Receive | | | 2.630 | | | | 07/17/2024 | | | | 100 | | | | 0 | | | | 0 | |
| | Put - OTC 5-Year Interest Rate Swap | | 6-Month EUR-EURIBOR | | Pay | | | 2.970 | | | | 07/17/2024 | | | | 100 | | | | 0 | | | | 0 | |
| | Call - OTC 5-Year Interest Rate Swap | | 6-Month EUR-EURIBOR | | Receive | | | 2.630 | | | | 07/22/2024 | | | | 100 | | | | 0 | | | | 0 | |
| | Put - OTC 5-Year Interest Rate Swap | | 6-Month EUR-EURIBOR | | Pay | | | 2.940 | | | | 07/22/2024 | | | | 100 | | | | 0 | | | | 0 | |
| | | | | | | | | | | | | | | | | | | | | | | | | | |
| | | | | | | | | | | | | | | | | | $ | (12 | ) | | $ | (9 | ) |
| | | | | | | | | | | | | | | | | | | | | | | | |
OPTIONS ON SECURITIES
| | | | | | | | | | | | | | | | | | | | | | |
| Counterparty | | Description | | Strike
Price | | | Expiration
Date | | | Notional
Amount(1) | | | Premiums
(Received) | | | Market
Value | |
| JPM | | Call - OTC Uniform Mortgage-Backed Security, TBA 5.000% due 07/01/2054 | | $ | 97.266 | | | | 07/08/2024 | | | | 100 | | | $ | 0 | | | $ | 0 | |
| | | | | | | | | | | | | | | | | | | | | | |
Total Written Options | | | $ | (12 | ) | | $ | (9 | ) |
| | | | | | | | | |
| | | | | | |
| 34 | | PIMCO EQUITY SERIES | | | See Accompanying Notes | |
SWAP AGREEMENTS:
CREDIT DEFAULT SWAPS ON SOVEREIGN ISSUES - SELL PROTECTION(2)
| | | | | | | | | | | | | | | | | | | | | | | | | | | | | | | | | | | | | | | | |
| Counterparty | | Reference Entity | | Fixed
Receive Rate | | | Payment
Frequency | | Maturity
Date | | | Implied
Credit Spread at
June 30, 2024(3) | | | Notional
Amount(4) | | | Premiums
Paid/(Received) | | | Unrealized
Appreciation/
(Depreciation) | | | Swap Agreements,
at Value(5) | |
| | Asset | | | Liability | |
| CBK | | Brazil Government International Bond | | | 1.000 | % | | Quarterly | | | 12/20/2024 | | | | 0.425 | % | | $ | | | | | 300 | | | $ | (5 | ) | | $ | 6 | | | $ | 1 | | | $ | 0 | |
| | Israel Government International Bond | | | 1.000 | | | Quarterly | | | 06/20/2027 | | | | 1.168 | | | | | | | | 100 | | | | (1 | ) | | | 1 | | | | 0 | | | | 0 | |
| | | | | | | | | | | |
| GST | | Brazil Government International Bond | | | 1.000 | | | Quarterly | | | 12/20/2024 | | | | 0.425 | | | | | | | | 200 | | | | (3 | ) | | | 4 | | | | 1 | | | | 0 | |
| | Colombia Government International Bond | | | 1.000 | | | Quarterly | | | 12/20/2027 | | | | 1.399 | | | | | | | | 100 | | | | (9 | ) | | | 8 | | | | 0 | | | | (1 | ) |
| | Mexico Government International Bond | | | 1.000 | | | Quarterly | | | 12/20/2024 | | | | 0.221 | | | | | | | | 100 | | | | (1 | ) | | | 1 | | | | 0 | | | | 0 | |
| | Turkey Government International Bond | | | 1.000 | | | Quarterly | | | 12/20/2024 | | | | 0.615 | | | | | | | | 100 | | | | (11 | ) | | | 11 | | | | 0 | | | | 0 | |
| | | | | | | | | | | |
| MYC | | Mexico Government International Bond | | | 1.000 | | | Quarterly | | | 12/20/2024 | | | | 0.221 | | | | | | | | 100 | | | | (1 | ) | | | 1 | | | | 0 | | | | 0 | |
| | Mexico Government International Bond | | | 1.000 | | | Quarterly | | | 06/20/2027 | | | | 0.685 | | | | | | | | 100 | | | | 0 | | | | 1 | | | | 1 | | | | 0 | |
| | Mexico Government International Bond | | | 1.000 | | | Quarterly | | | 06/20/2028 | | | | 0.890 | | | | | | | | 100 | | | | (2 | ) | | | 3 | | | | 1 | | | | 0 | |
| | Mexico Government International Bond | | | 1.000 | | | Quarterly | | | 12/20/2028 | | | | 1.011 | | | | | | | | 300 | | | | (3 | ) | | | 3 | | | | 0 | | | | 0 | |
| | South Africa Government International Bond | | | 1.000 | | | Quarterly | | | 12/20/2026 | | | | 1.149 | | | | | | | | 200 | | | | (9 | ) | | | 8 | | | | 0 | | | | (1 | ) |
| | | | | | | | | | | | | | | | | | | | | | | | | | | | | | | | | | | | | | | | |
| | | | | | | | | | | | | | | | $ | (45 | ) | | $ | 47 | | | $ | 4 | | | $ | (2 | ) |
| | | | | | | | | | | | | | | | | | | | | | | | | | | | | | |
CREDIT DEFAULT SWAPS ON CREDIT INDICES - SELL PROTECTION(2)
| | | | | | | | | | | | | | | | | | | | | | | | | | | | | | | | | | | | |
| Counterparty | | Index/Tranches | | Fixed
Receive Rate | | | Payment
Frequency | | Maturity
Date | | | Notional
Amount(4) | | | Premiums
Paid/(Received) | | | Unrealized
Appreciation/
(Depreciation) | | | Swap Agreements,
at Value(5) | |
| | Asset | | | Liability | |
| GST | | CMBX.NA.AAA.10 Index | | | 0.500 | % | | Monthly | | | 11/17/2059 | | | $ | | | | | 4,000 | | | $ | (85 | ) | | $ | 75 | | | $ | 0 | | | $ | (10 | ) |
| | | | | | | | | | |
| MYC | | CMBX.NA.AAA.13 Index | | | 0.500 | | | Monthly | | | 12/16/2072 | | | | | | | | 5,700 | | | | (2 | ) | | | (59 | ) | | | 0 | | | | (61 | ) |
| | | | | | | | | | | | | | | | | | | | | | | | | | | | | | | | | | | | |
| | | | | | | | | | | | | | | | | | | | $ | (87 | ) | | $ | 16 | | | $ | 0 | | | $ | (71 | ) |
| | | | | | | | | | | | | | | | | | | | | | | | | | | | | | | | | | |
Total Swap Agreements | | | $ | (132 | ) | | $ | 63 | | | $ | 4 | | | $ | (73 | ) |
| | | | | | | | | | | | | | | | | |
FINANCIAL DERIVATIVE INSTRUMENTS: OVER THE COUNTER SUMMARY
The following is a summary by counterparty of the market value of OTC financial derivative instruments and collateral pledged/(received) as of June 30, 2024:
| | | | | | | | | | | | | | | | | | | | | | | | | | | | | | | | | | | | | | | | | | | | | | | | |
| | | Financial Derivative Assets | | | | | | Financial Derivative Liabilities | | | | | | | | | | |
| Counterparty | | Forward
Foreign
Currency
Contracts | | | Purchased
Options | | | Swap
Agreements | | | Total
Over the
Counter | | | | | | Forward
Foreign
Currency
Contracts | | | Written
Options | | | Swap
Agreements | | | Total
Over the
Counter | | | Net Market
Value of OTC
Derivatives | | | Collateral
Pledged/
(Received) | | | Net
Exposure(6) | |
AZD | | $ | 1 | | | $ | 0 | | | $ | 0 | | | $ | 1 | | | | | | | $ | (4 | ) | | $ | 0 | | | $ | 0 | | | $ | (4 | ) | | $ | (3 | ) | | $ | 0 | | | $ | (3 | ) |
BOA | | | 2 | | | | 0 | | | | 0 | | | | 2 | | | | | | | | (2 | ) | | | 0 | | | | 0 | | | | (2 | ) | | | 0 | | | | 0 | | | | 0 | |
BPS | | | 93 | | | | 0 | | | | 0 | | | | 93 | | | | | | | | (11 | ) | | | 0 | | | | 0 | | | | (11 | ) | | | 82 | | | | (50 | ) | | | 32 | |
BRC | | | 18 | | | | 0 | | | | 0 | | | | 18 | | | | | | | | (3 | ) | | | 0 | | | | 0 | | | | (3 | ) | | | 15 | | | | 0 | | | | 15 | |
CBK | | | 32 | | | | 0 | | | | 1 | | | | 33 | | | | | | | | (26 | ) | | | 0 | | | | 0 | | | | (26 | ) | | | 7 | | | | 13 | | | | 20 | |
DUB | | | 4 | | | | 0 | | | | 0 | | | | 4 | | | | | | | | (4 | ) | | | 0 | | | | 0 | | | | (4 | ) | | | 0 | | | | 0 | | | | 0 | |
FAR | | | 0 | | | | 0 | | | | 0 | | | | 0 | | | | | | | | (58 | ) | | | (2 | ) | | | 0 | | | | (60 | ) | | | (60 | ) | | | 0 | | | | (60 | ) |
GLM | | | 10 | | | | 0 | | | | 0 | | | | 10 | | | | | | | | (238 | ) | | | (4 | ) | | | 0 | | | | (242 | ) | | | (232 | ) | | | 204 | | | | (28 | ) |
GST | | | 0 | | | | 0 | | | | 1 | | | | 1 | | | | | | | | 0 | | | | 0 | | | | (11 | ) | | | (11 | ) | | | (10 | ) | | | 0 | | | | (10 | ) |
JPM | | | 29 | | | | 0 | | | | 0 | | | | 29 | | | | | | | | (5 | ) | | | (1 | ) | | | 0 | | | | (6 | ) | | | 23 | | | | 0 | | | | 23 | |
MBC | | | 28 | | | | 0 | | | | 0 | | | | 28 | | | | | | | | (5 | ) | | | 0 | | | | 0 | | | | (5 | ) | | | 23 | | | | 0 | | | | 23 | |
MYC | | | 0 | | | | 0 | | | | 2 | | | | 2 | | | | | | | | 0 | | | | (2 | ) | | | (62 | ) | | | (64 | ) | | | (62 | ) | | | 0 | | | | (62 | ) |
MYI | | | 17 | | | | 0 | | | | 0 | | | | 17 | | | | | | | | (2 | ) | | | 0 | | | | 0 | | | | (2 | ) | | | 15 | | | | 0 | | | | 15 | |
RBC | | | 12 | | | | 0 | | | | 0 | | | | 12 | | | | | | | | (12 | ) | | | 0 | | | | 0 | | | | (12 | ) | | | 0 | | | | 0 | | | | 0 | |
SCX | | | 8 | | | | 0 | | | | 0 | | | | 8 | | | | | | | | 0 | | | | 0 | | | | 0 | | | | 0 | | | | 8 | | | | 0 | | | | 8 | |
UAG | | | 2 | | | | 0 | | | | 0 | | | | 2 | | | | | | | | (4 | ) | | | 0 | | | | 0 | | | | (4 | ) | | | (2 | ) | | | 0 | | | | (2 | ) |
| | | | | | | | | | | | | | | | | | | | | | | | | | | | | | | | | | | | | | | | | | | | | | | | |
Total Over the Counter | | $ | 256 | | | $ | 0 | | | $ | 4 | | | $ | 260 | | | | | | | $ | (374 | ) | | $ | (9 | ) | | $ | (73 | ) | | $ | (456 | ) | | | | | | | | | | | | |
| | | | | | | | | | | | | | | | | | | | | | | | | | | | | | | | | | | | | | | | | | | | | | | | |
| (m) | Securities with an aggregate market value of $218 have been pledged as collateral for financial derivative instruments as governed by International Swaps and Derivatives Association, Inc. master agreements as of June 30, 2024. |
| (1) | Notional Amount represents the number of contracts. |
| (2) | If the Fund is a seller of protection and a credit event occurs, as defined under the terms of that particular swap agreement, the Fund will either (i) pay to the buyer of protection an amount equal to the notional amount of the swap and take delivery of the referenced obligation or underlying securities comprising the referenced index or (ii) pay a net settlement amount in the form of cash, securities or other deliverable obligations equal to the notional amount of the swap less the recovery value of the referenced obligation or underlying securities comprising the referenced index. |
| (3) | Implied credit spreads, represented in absolute terms, utilized in determining the market value of credit default swap agreements on sovereign issues as of period end serve as indicators of the current status of the payment/performance risk and represent the likelihood or risk of default for the credit derivative. The implied credit spread of a particular referenced entity reflects the cost of buying/selling protection and may include upfront payments required to be made to enter into the agreement. Wider credit spreads represent a deterioration of the referenced entity’s credit soundness and a greater likelihood or risk of default or other credit event occurring as defined under the terms of the agreement. |
| | | | | | | | | | | | |
| See Accompanying Notes | | | ANNUAL FINANCIAL AND OTHER INFORMATION | | | | | | | JUNE 30, 2024 | | | 35 |
| | | | | | |
| Schedule of Investments | | PIMCO Dividend and Income Fund | | (Cont.) | | |
| (4) | The maximum potential amount the Fund could be required to pay as a seller of credit protection or receive as a buyer of credit protection if a credit event occurs as defined under the terms of that particular swap agreement. |
| (5) | The prices and resulting values for credit default swap agreements serve as indicators of the current status of the payment/performance risk and represent the likelihood of an expected liability (or profit) for the credit derivative should the notional amount of the swap agreement be closed/sold as of the period end. Increasing market values, in absolute terms when compared to the notional amount of the swap, represent a deterioration of the underlying referenced instrument’s credit soundness and a greater likelihood or risk of default or other credit event occurring as defined under the terms of the agreement. |
| (6) | Net Exposure represents the net receivable/(payable) that would be due from/to the counterparty in the event of default. Exposure from OTC financial derivative instruments can only be netted across transactions governed under the same master agreement with the same legal entity. See Note 8, Master Netting Arrangements, in the Notes to Financial Statements for more information. |
FAIR VALUE OF FINANCIAL DERIVATIVE INSTRUMENTS
The following is a summary of the fair valuation of the Fund’s derivative instruments categorized by risk exposure. See Note 7, Principal and Other Risks, in the Notes to Financial Statements on risks of the Fund.
Fair Values of Financial Derivative Instruments on the Statements of Assets and Liabilities as of June 30, 2024:
| | | | | | | | | | | | | | | | | | | | | | | | |
| | | Derivatives not accounted for as hedging instruments | |
| | | Commodity
Contracts | | | Credit
Contracts | | | Equity
Contracts | | | Foreign
Exchange
Contracts | | | Interest
Rate Contracts | | | Total | |
Financial Derivative Instruments - Assets | |
Exchange-traded or centrally cleared | |
Futures | | $ | 0 | | | $ | 0 | | | $ | 0 | | | $ | 0 | | | $ | 41 | | | $ | 41 | |
Swap Agreements | | | 0 | | | | 1 | | | | 0 | | | | 0 | | | | 216 | | | | 217 | |
| | | | | | | | | | | | | | | | | | | | | | | | |
| | $ | 0 | | | $ | 1 | | | $ | 0 | | | $ | 0 | | | $ | 257 | | | $ | 258 | |
| | | | | | | | | | | | | | | | | | | | | | | | |
Over the counter | |
Forward Foreign Currency Contracts | | $ | 0 | | | $ | 0 | | | $ | 0 | | | $ | 256 | | | $ | 0 | | | $ | 256 | |
Swap Agreements | | | 0 | | | | 4 | | | | 0 | | | | 0 | | | | 0 | | | | 4 | |
| | | | | | | | | | | | | | | | | | | | | | | | |
| | $ | 0 | | | $ | 4 | | | $ | 0 | | | $ | 256 | | | $ | 0 | | | $ | 260 | |
| | | | | | | | | | | | | | | | | | | | | | | | |
| | $ | 0 | | | $ | 5 | | | $ | 0 | | | $ | 256 | | | $ | 257 | | | $ | 518 | |
| | | | | | | | | | | | | | | | | | | | | | | | |
|
Financial Derivative Instruments - Liabilities | |
Exchange-traded or centrally cleared | |
Futures | | $ | 0 | | | $ | 0 | | | $ | 0 | | | $ | 0 | | | $ | 40 | | | $ | 40 | |
Swap Agreements | | | 0 | | | | 4 | | | | 0 | | | | 0 | | | | 105 | | | | 109 | |
| | | | | | | | | | | | | | | | | | | | | | | | |
| | $ | 0 | | | $ | 4 | | | $ | 0 | | | $ | 0 | | | $ | 145 | | | $ | 149 | |
| | | | | | | | | | | | | | | | | | | | | | | | |
Over the counter | |
Forward Foreign Currency Contracts | | $ | 0 | | | $ | 0 | | | $ | 0 | | | $ | 374 | | | $ | 0 | | | $ | 374 | |
Written Options | | | 0 | | | | 0 | | | | 0 | | | | 0 | | | | 9 | | | | 9 | |
Swap Agreements | | | 0 | | | | 73 | | | | 0 | | | | 0 | | | | 0 | | | | 73 | |
| | | | | | | | | | | | | | | | | | | | | | | | |
| | $ | 0 | | | $ | 73 | | | $ | 0 | | | $ | 374 | | | $ | 9 | | | $ | 456 | |
| | | | | | | | | | | | | | | | | | | | | | | | |
| | $ | 0 | | | $ | 77 | | | $ | 0 | | | $ | 374 | | | $ | 154 | | | $ | 605 | |
| | | | | | | | | | | | | | | | | | | | | | | | |
The effect of Financial Derivative Instruments on the Statements of Operations for the period ended June 30, 2024:
| | | | | | | | | | | | | | | | | | | | | | | | |
| | | Derivatives not accounted for as hedging instruments | |
| | | Commodity
Contracts | | | Credit
Contracts | | | Equity
Contracts | | | Foreign
Exchange
Contracts | | | Interest
Rate Contracts | | | Total | |
Net Realized Gain (Loss) on Financial Derivative Instruments | |
Exchange-traded or centrally cleared | |
Written Options | | $ | 0 | | | $ | 0 | | | $ | 0 | | | $ | 0 | | | $ | 36 | | | $ | 36 | |
Futures | | | 0 | | | | 0 | | | | 0 | | | | 0 | | | | (422 | ) | | | (422 | ) |
Swap Agreements | | | 0 | | | | 785 | | | | 0 | | | | 0 | | | | (16 | ) | | | 769 | |
| | | | | | | | | | | | | | | | | | | | | | | | |
| | $ | 0 | | | $ | 785 | | | $ | 0 | | | $ | 0 | | | $ | (402 | ) | | $ | 383 | |
| | | | | | | | | | | | | | | | | | | | | | | | |
Over the counter | |
Forward Foreign Currency Contracts | | $ | 0 | | | $ | 0 | | | $ | 0 | | | $ | 373 | | | $ | 0 | | | $ | 373 | |
Written Options | | | 0 | | | | 0 | | | | 0 | | | | 0 | | | | 130 | | | | 130 | |
Swap Agreements | | | 0 | | | | 73 | | | | (140 | ) | | | 0 | | | | 0 | | | | (67 | ) |
| | | | | | | | | | | | | | | | | | | | | | | | |
| | $ | 0 | | | $ | 73 | | | $ | (140 | ) | | $ | 373 | | | $ | 130 | | | $ | 436 | |
| | | | | | | | | | | | | | | | | | | | | | | | |
| | $ | 0 | | | $ | 858 | | | $ | (140 | ) | | $ | 373 | | | $ | (272 | ) | | $ | 819 | |
| | | | | | | | | | | | | | | | | | | | | | | | |
| | | | | | |
| 36 | | PIMCO EQUITY SERIES | | | See Accompanying Notes | |
| | | | | | | | | | | | | | | | | | | | | | | | |
| | | Derivatives not accounted for as hedging instruments | |
| | | Commodity
Contracts | | | Credit
Contracts | | | Equity
Contracts | | | Foreign
Exchange
Contracts | | | Interest
Rate Contracts | | | Total | |
Net Change in Unrealized Appreciation (Depreciation) on Financial Derivative Instruments | |
Exchange-traded or centrally cleared | |
Written Options | | $ | 0 | | | $ | 0 | | | $ | 0 | | | $ | 0 | | | $ | 8 | | | $ | 8 | |
Futures | | | 0 | | | | 0 | | | | 0 | | | | 0 | | | | 166 | | | | 166 | |
Swap Agreements | | | 0 | | | | (107 | ) | | | 0 | | | | 0 | | | | 884 | | | | 777 | |
| | | | | | | | | | | | | | | | | | | | | | | | |
| | $ | 0 | | | $ | (107 | ) | | $ | 0 | | | $ | 0 | | | $ | 1,058 | | | $ | 951 | |
| | | | | | | | | | | | | | | | | | | | | | | | |
Over the counter | |
Forward Foreign Currency Contracts | | $ | 0 | | | $ | 0 | | | $ | 0 | | | $ | (258 | ) | | $ | 0 | | | $ | (258 | ) |
Written Options | | | 0 | | | | 0 | | | | 0 | | | | 0 | | | | 19 | | | | 19 | |
Swap Agreements | | | 0 | | | | 36 | | | | 0 | | | | 0 | | | | 0 | | | | 36 | |
| | | | | | | | | | | | | | | | | | | | | | | | |
| | $ | 0 | | | $ | 36 | | | $ | 0 | | | $ | (258 | ) | | $ | 19 | | | $ | (203 | ) |
| | | | | | | | | | | | | | | | | | | | | | | | |
| | $ | 0 | | | $ | (71 | ) | | $ | 0 | | | $ | (258 | ) | | $ | 1,077 | | | $ | 748 | |
| | | | |
FAIR VALUE MEASUREMENTS
The following is a summary of the fair valuations according to the inputs used as of June 30, 2024 in valuing the Fund’s assets and liabilities:
| | | | | | | | | | | | | | | | |
| Category and Subcategory | | Level 1 | | | Level 2 | | | Level 3 | | | Fair
Value at
06/30/2024 | |
Investments in Securities, at Value | |
Asset-Backed Securities | |
Cayman Islands | | $ | 400 | | | $ | 5,424 | | | $ | 0 | | | $ | 5,824 | |
Ireland | | | 0 | | | | 246 | | | | 0 | | | | 246 | |
United States | | | 0 | | | | 18,035 | | | | 19 | | | | 18,054 | |
Loan Participations and Assignments | |
France | | | 0 | | | | 74 | | | | 0 | | | | 74 | |
Jersey, Channel Islands | | | 0 | | | | 0 | | | | 270 | | | | 270 | |
Netherlands | | | 0 | | | | 2 | | | | 0 | | | | 2 | |
United States | | | 0 | | | | 24 | | | | 588 | | | | 612 | |
Common Stocks | |
Australia | |
Consumer Staples | | | 0 | | | | 126 | | | | 0 | | | | 126 | |
Industrials | | | 0 | | | | 297 | | | | 0 | | | | 297 | |
Materials | | | 0 | | | | 1,662 | | | | 0 | | | | 1,662 | |
Austria | |
Financials | | | 0 | | | | 354 | | | | 0 | | | | 354 | |
Belgium | |
Financials | | | 0 | | | | 157 | | | | 0 | | | | 157 | |
Brazil | |
Consumer Staples | | | 209 | | | | 0 | | | | 0 | | | | 209 | |
Energy | | | 593 | | | | 0 | | | | 0 | | | | 593 | |
Financials | | | 177 | | | | 0 | | | | 0 | | | | 177 | |
Materials | | | 720 | | | | 0 | | | | 0 | | | | 720 | |
Canada | |
Financials | | | 130 | | | | 0 | | | | 0 | | | | 130 | |
China | |
Energy | | | 0 | | | | 343 | | | | 0 | | | | 343 | |
Financials | | | 0 | | | | 1,674 | | | | 0 | | | | 1,674 | |
Health Care | | | 0 | | | | 147 | | | | 0 | | | | 147 | |
Information Technology | | | 108 | | | | 0 | | | | 0 | | | | 108 | |
Czech Republic | |
Utilities | | | 129 | | | | 0 | | | | 0 | | | | 129 | |
Denmark | |
Industrials | | | 0 | | | | 156 | | | | 0 | | | | 156 | |
Finland | |
Utilities | | | 0 | | | | 126 | | | | 0 | | | | 126 | |
France | |
Energy | | | 0 | | | | 365 | | | | 0 | | | | 365 | |
Financials | | | 0 | | | | 879 | | | | 0 | | | | 879 | |
Industrials | | | 0 | | | | 790 | | | | 0 | | | | 790 | |
Utilities | | | 0 | | | | 232 | | | | 0 | | | | 232 | |
Germany | |
Financials | | | 0 | | | | 724 | | | | 0 | | | | 724 | |
Industrials | | | 0 | | | | 141 | | | | 0 | | | | 141 | |
Materials | | | 0 | | | | 297 | | | | 0 | | | | 297 | |
| | | | | | | | | | | | | | | | |
| Category and Subcategory | | Level 1 | | | Level 2 | | | Level 3 | | | Fair
Value at
06/30/2024 | |
Hong Kong | |
Utilities | | $ | 0 | | | $ | 295 | | | $ | 0 | | | $ | 295 | |
Indonesia | |
Communication Services | | | 0 | | | | 203 | | | | 0 | | | | 203 | |
Financials | | | 0 | | | | 114 | | | | 0 | | | | 114 | |
Ireland | |
Financials | | | 0 | | | | 187 | | | | 0 | | | | 187 | |
Italy | |
Financials | | | 0 | | | | 1,279 | | | | 0 | | | | 1,279 | |
Utilities | | | 0 | | | | 1,259 | | | | 0 | | | | 1,259 | |
Japan | |
Consumer Staples | | | 0 | | | | 1,000 | | | | 0 | | | | 1,000 | |
Financials | | | 0 | | | | 424 | | | | 0 | | | | 424 | |
Health Care | | | 0 | | | | 113 | | | | 0 | | | | 113 | |
Industrials | | | 0 | | | | 2,066 | | | | 0 | | | | 2,066 | |
Luxembourg | |
Energy | | | 0 | | | | 156 | | | | 0 | | | | 156 | |
Financials | | | 0 | | | | 0 | | | | 108 | | | | 108 | |
Industrials | | | 0 | | | | 0 | | | | 51 | | | | 51 | |
Mexico | |
Consumer Staples | | | 394 | | | | 0 | | | | 0 | | | | 394 | |
Materials | | | 373 | | | | 0 | | | | 0 | | | | 373 | |
Netherlands | |
Consumer Staples | | | 0 | | | | 755 | | | | 0 | | | | 755 | |
Norway | |
Energy | | | 0 | | | | 747 | | | | 0 | | | | 747 | |
Poland | |
Energy | | | 0 | | | | 214 | | | | 0 | | | | 214 | |
Financials | | | 0 | | | | 335 | | | | 0 | | | | 335 | |
Portugal | |
Consumer Staples | | | 0 | | | | 107 | | | | 0 | | | | 107 | |
Singapore | |
Financials | | | 0 | | | | 126 | | | | 0 | | | | 126 | |
South Africa | |
Financials | | | 328 | | | | 967 | | | | 0 | | | | 1,295 | |
South Korea | |
Consumer Staples | | | 0 | | | | 691 | | | | 0 | | | | 691 | |
Financials | | | 0 | | | | 186 | | | | 0 | | | | 186 | |
Spain | |
Energy | | | 0 | | | | 431 | | | | 0 | | | | 431 | |
Financials | | | 0 | | | | 1,894 | | | | 0 | | | | 1,894 | |
Industrials | | | 0 | | | | 190 | | | | 0 | | | | 190 | |
Utilities | | | 0 | | | | 131 | | | | 0 | | | | 131 | |
Sweden | |
Industrials | | | 0 | | | | 147 | | | | 0 | | | | 147 | |
| | | | | | | | | | | | |
| See Accompanying Notes | | | ANNUAL FINANCIAL AND OTHER INFORMATION | | | | | | | JUNE 30, 2024 | | | 37 |
| | | | | | |
| Schedule of Investments | | PIMCO Dividend and Income Fund | | (Cont.) | | June 30, 2024 |
| | | | | | | | | | | | | | | | |
| Category and Subcategory | | Level 1 | | | Level 2 | | | Level 3 | | | Fair
Value at
06/30/2024 | |
Switzerland | |
Consumer Discretionary | | $ | 305 | | | $ | 0 | | | $ | 0 | | | $ | 305 | |
Consumer Staples | | | 0 | | | | 401 | | | | 0 | | | | 401 | |
Financials | | | 0 | | | | 1,334 | | | | 0 | | | | 1,334 | |
Health Care | | | 0 | | | | 2,927 | | | | 0 | | | | 2,927 | |
Materials | | | 0 | | | | 1,028 | | | | 0 | | | | 1,028 | |
Taiwan | |
Information Technology | | | 0 | | | | 4,256 | | | | 0 | | | | 4,256 | |
Turkey | |
Energy | | | 104 | | | | 0 | | | | 0 | | | | 104 | |
Financials | | | 129 | | | | 0 | | | | 0 | | | | 129 | |
United Kingdom | |
Consumer Staples | | | 0 | | | | 1,885 | | | | 0 | | | | 1,885 | |
Financials | | | 0 | | | | 835 | | | | 0 | | | | 835 | |
Industrials | | | 0 | | | | 1,124 | | | | 0 | | | | 1,124 | |
Materials | | | 185 | | | | 1,247 | | | | 0 | | | | 1,432 | |
United States | |
Communication Services | | | 2,161 | | | | 0 | | | | 5 | | | | 2,166 | |
Consumer Staples | | | 11,182 | | | | 0 | | | | 0 | | | | 11,182 | |
Energy | | | 3,979 | | | | 0 | | | | 0 | | | | 3,979 | |
Financials | | | 3,015 | | | | 0 | | | | 0 | | | | 3,015 | |
Health Care | | | 8,240 | | | | 0 | | | | 207 | | | | 8,447 | |
Industrials | | | 3,307 | | | | 0 | | | | 152 | | | | 3,459 | |
Information Technology | | | 5,538 | | | | 0 | | | | 0 | | | | 5,538 | |
Materials | | | 1,012 | | | | 0 | | | | 0 | | | | 1,012 | |
Utilities | | | 0 | | | | 0 | | | | 1 | | | | 1 | |
Corporate Bonds & Notes | |
Bermuda | |
Industrials | | | 0 | | | | 200 | | | | 0 | | | | 200 | |
France | |
Banking & Finance | | | 0 | | | | 672 | | | | 0 | | | | 672 | |
Germany | |
Banking & Finance | | | 0 | | | | 176 | | | | 0 | | | | 176 | |
Ireland | |
Industrials | | | 0 | | | | 266 | | | | 0 | | | | 266 | |
Italy | |
Banking & Finance | | | 0 | | | | 214 | | | | 0 | | | | 214 | |
Japan | |
Banking & Finance | | | 0 | | | | 399 | | | | 0 | | | | 399 | |
Industrials | | | 0 | | | | 807 | | | | 0 | | | | 807 | |
Luxembourg | |
Industrials | | | 0 | | | | 194 | | | | 0 | | | | 194 | |
Utilities | | | 0 | | | | 26 | | | | 0 | | | | 26 | |
Peru | |
Banking & Finance | | | 0 | | | | 26 | | | | 0 | | | | 26 | |
Spain | |
Banking & Finance | | | 0 | | | | 420 | | | | 0 | | | | 420 | |
Switzerland | |
Banking & Finance | | | 0 | | | | 1,221 | | | | 0 | | | | 1,221 | |
United Kingdom | |
Banking & Finance | | | 0 | | | | 1,766 | | | | 0 | | | | 1,766 | |
Industrials | | | 0 | | | | 270 | | | | 0 | | | | 270 | |
United States | |
Banking & Finance | | | 0 | | | | 500 | | | | 0 | | | | 500 | |
Industrials | | | 0 | | | | 1,889 | | | | 0 | | | | 1,889 | |
Utilities | | | 0 | | | | 828 | | | | 0 | | | | 828 | |
Venezuela | |
Industrials | | | 0 | | | | 40 | | | | 0 | | | | 40 | |
| | | | | | | | | | | | | | | | |
| Category and Subcategory | | Level 1 | | | Level 2 | | | Level 3 | | | Fair
Value at
06/30/2024 | |
Non-Agency Mortgage-Backed Securities | |
Ireland | | $ | 0 | | | $ | 526 | | | $ | 0 | | | $ | 526 | |
United Kingdom | | | 0 | | | | 3,600 | | | | 0 | | | | 3,600 | |
United States | | | 0 | | | | 12,502 | | | | 103 | | | | 12,605 | |
Municipal Bonds & Notes | |
Illinois | | | 0 | | | | 18 | | | | 0 | | | | 18 | |
Puerto Rico | | | 0 | | | | 71 | | | | 0 | | | | 71 | |
Preferred Stocks | |
Brazil | |
Utilities | | | 719 | | | | 0 | | | | 0 | | | | 719 | |
Republic of Korea | |
Industrials | | | 0 | | | | 125 | | | | 0 | | | | 125 | |
United Kingdom | |
Banking & Finance | | | 0 | | | | 146 | | | | 0 | | | | 146 | |
Real Estate Investment Trusts | |
United States | |
Real Estate | | | 8,912 | | | | 0 | | | | 0 | | | | 8,912 | |
Sovereign Issues | |
Argentina | | | 0 | | | | 545 | | | | 0 | | | | 545 | |
Israel | | | 0 | | | | 191 | | | | 0 | | | | 191 | |
Mexico | | | 0 | | | | 959 | | | | 0 | | | | 959 | |
Peru | | | 0 | | | | 81 | | | | 0 | | | | 81 | |
Romania | | | 0 | | | | 323 | | | | 0 | | | | 323 | |
South Africa | | | 0 | | | | 548 | | | | 0 | | | | 548 | |
Turkey | | | 0 | | | | 380 | | | | 0 | | | | 380 | |
Venezuela | | | 0 | | | | 9 | | | | 0 | | | | 9 | |
U.S. Government Agencies | |
United States | | | 0 | | | | 50,730 | | | | 0 | | | | 50,730 | |
U.S. Treasury Obligations | |
United States | | | 0 | | | | 18,493 | | | | 0 | | | | 18,493 | |
Short-Term Instruments | |
Repurchase Agreements | | | 0 | | | | 546 | | | | 0 | | | | 546 | |
U.S. Treasury Bills | | | 0 | | | | 71 | | | | 0 | | | | 71 | |
| | | | | | | | | | | | | | | | |
| | $ | 52,349 | | | $ | 161,107 | | | $ | 1,504 | | | $ | 214,960 | |
| | | | | | | | | | | | | | | | |
|
Investments in Affiliates, at Value | |
Short-Term Instruments | |
Central Funds Used for Cash Management Purposes | | $ | 5,168 | | | $ | 0 | | | $ | 0 | | | $ | 5,168 | |
| | | | | | | | | | | | | | | | |
| | | | |
Total Investments | | $ | 57,517 | | | $ | 161,107 | | | $ | 1,504 | | | $ | 220,128 | |
| | | | | | | | | | | | | | | | |
|
Financial Derivative Instruments - Assets | |
Exchange-traded or centrally cleared | | | 10 | | | | 248 | | | | 0 | | | | 258 | |
Over the counter | | | 0 | | | | 260 | | | | 0 | | | | 260 | |
| | | | | | | | | | | | | | | | |
| | $ | 10 | | | $ | 508 | | | $ | 0 | | | $ | 518 | |
| | | | | | | | | | | | | | | | |
|
Financial Derivative Instruments - Liabilities | |
Exchange-traded or centrally cleared | | | (11 | ) | | | (138 | ) | | | 0 | | | | (149 | ) |
Over the counter | | | 0 | | | | (456 | ) | | | 0 | | | | (456 | ) |
| | | | | | | | | | | | | | | | |
| | $ | (11 | ) | | $ | (594 | ) | | $ | 0 | | | $ | (605 | ) |
| | | | | | | | | | | | | | | | |
| | | | |
Total Financial Derivative Instruments | | $ | (1 | ) | | $ | (86 | ) | | $ | 0 | | | $ | (87 | ) |
| | | | | | | | | | | | | | | | |
| | | | |
Totals | | $ | 57,516 | | | $ | 161,021 | | | $ | 1,504 | | | $ | 220,041 | |
| | | | | | | | | | | | | | | | |
There were no significant transfers into or out of Level 3 during the period ended June 30, 2024.
| | | | | | |
| 38 | | PIMCO EQUITY SERIES | | | See Accompanying Notes | |
| | | | | | |
| Schedule of Investments | | PIMCO RAE Emerging Markets Fund | | | | June 30, 2024 |
(Amounts in thousands*, except number of shares, contracts, units and ounces, if any)
| | | | | | | | | | | | |
| | | | | SHARES | | | | | MARKET
VALUE
(000S) | |
| INVESTMENTS IN SECURITIES 100.3% | |
| |
| COMMON STOCKS 94.7% | |
| |
| BRAZIL 5.2% | |
| |
| CONSUMER DISCRETIONARY 0.3% | |
| | | | |
Vibra Energia SA | | | | | 1,425,100 | | | $ | | | 5,328 | |
| | | | | | | | | | | | |
| |
| CONSUMER STAPLES 0.4% | |
| | | | |
JBS SA (b) | | | | | 962,800 | | | | | | 5,558 | |
| | | | |
Marfrig Global Foods SA (b) | | | | | 527,700 | | | | | | 1,167 | |
| | | | | | | | | | | | |
| | | | | | | | | | | 6,725 | |
| | | | | | | | | | | | |
| |
| ENERGY 0.1% | |
| | | | |
Ultrapar Participacoes SA | | | | | 571,365 | | | | | | 2,208 | |
| | | | | | | | | | | | |
| |
| FINANCIALS 1.2% | |
| | | | |
Banco do Brasil SA | | | | | 652,880 | | | | | | 3,119 | |
| | | | |
Banco Santander Brasil SA | | | | | 404,300 | | | | | | 1,986 | |
| | | | |
Cielo SA | | | | | 16,968,545 | | | | | | 17,090 | |
| | | | | | | | | | | | |
| | | | | | | | | | | 22,195 | |
| | | | | | | | | | | | |
| |
| MATERIALS 3.2% | |
| | | | |
Cia Siderurgica Nacional SA | | | | | 766,700 | | | | | | 1,771 | |
| | | | |
Vale SA | | | | | 5,207,500 | | | | | | 57,961 | |
| | | | | | | | | | | | |
| | | | | | | | | | | 59,732 | |
| | | | | | | | | | | | |
Total Brazil | | | | | | | | | | | 96,188 | |
| | | | | | | | | | | | |
| |
| CHILE 0.7% | |
| |
| CONSUMER STAPLES 0.3% | |
| | | | |
Cencosud SA | | | | | 2,824,859 | | | | | | 5,328 | |
| | | | |
Cia Cervecerias Unidas SA | | | | | 95,988 | | | | | | 549 | |
| | | | | | | | | | | | |
| | | | | | | | | | | 5,877 | |
| | | | | | | | | | | | |
| |
| ENERGY 0.1% | |
| | | | |
Empresas Copec SA | | | | | 65,400 | | | | | | 504 | |
| | | | | | | | | | | | |
| |
| FINANCIALS 0.1% | |
| | | | |
Banco Santander Chile | | | | | 47,406,903 | | | | | | 2,227 | |
| | | | | | | | | | | | |
| |
| MATERIALS 0.0% | |
| | | | |
Empresas CMPC SA | | | | | 116,991 | | | | | | 220 | |
| | | | | | | | | | | | |
| |
| UTILITIES 0.2% | |
| | | | |
Colbun SA | | | | | 8,670,910 | | | | | | 1,122 | |
| | | | |
Enel Chile SA | | | | | 43,137,439 | | | | | | 2,434 | |
| | | | | | | | | | | | |
| | | | | | | | | | | 3,556 | |
| | | | | | | | | | | | |
Total Chile | | | | | | | | | | | 12,384 | |
| | | | | | | | | | | | |
| |
| CHINA 28.4% | |
| |
| COMMUNICATION SERVICES 0.7% | |
| | | | |
China Tower Corp. Ltd. ‘H’ | | | | | 39,552,000 | | | | | | 5,112 | |
| | | | |
China United Network Communications Ltd. ‘A’ | | | | | 10,798,800 | | | | | | 6,968 | |
| | | | | | | | | | | | |
| | | | | | | | | | | 12,080 | |
| | | | | | | | | | | | |
| |
| CONSUMER DISCRETIONARY 0.1% | |
| | | | |
BAIC Motor Corp. Ltd. ‘H’ | | | | | 9,728,000 | | | | | | 2,481 | |
| | | | | | | | | | | | |
| |
| | | | | | | | | | | | |
| | | | | SHARES | | | | | MARKET
VALUE
(000S) | |
| CONSUMER STAPLES 0.5% | |
| | | | |
Dongfeng Motor Group Co. Ltd. ‘H’ | | | | | 3,494,000 | | | $ | | | 996 | |
| | | | |
Henan Shuanghui Investment & Development Co. Ltd. ‘A’ | | | | | 234,800 | | | | | | 768 | |
| | | | |
Hengan International Group Co. Ltd. | | | | | 400,500 | | | | | | 1,220 | |
| | | | |
Huayu Automotive Systems Co. Ltd. ‘A’ | | | | | 448,237 | | | | | | 1,009 | |
| | | | |
SAIC Motor Corp. Ltd. ‘A’ | | | | | 886,100 | | | | | | 1,689 | |
| | | | |
Tingyi Cayman Islands Holding Corp. | | | | | 452,000 | | | | | | 544 | |
| | | | |
Topsports International Holdings Ltd. | | | | | 4,026,000 | | | | | | 2,138 | |
| | | | | | | | | | | | |
| | | | | | | | | | | 8,364 | |
| | | | | | | | | | | | |
| |
| ENERGY 7.8% | |
| | | | |
China Petroleum & Chemical Corp. ‘H’ | | | | | 95,788,400 | | | | | | 61,949 | |
| | | | |
China Shenhua Energy Co. Ltd. ‘H’ | | | | | 3,296,000 | | | | | | 15,192 | |
| | | | |
PetroChina Co. Ltd. ‘H’ | | | | | 63,674,000 | | | | | | 64,295 | |
| | | | |
Shaanxi Coal Industry Co. Ltd. ‘A’ | | | | | 504,700 | | | | | | 1,789 | |
| | | | | | | | | | | | |
| | | | | | | | | | | 143,225 | |
| | | | | | | | | | | | |
| |
| FINANCIALS 11.9% | |
| | | | |
Agricultural Bank of China Ltd. ‘H’ | | | | | 12,197,000 | | | | | | 5,206 | |
| | | | |
Bank of China Ltd. ‘H’ | | | | | 105,414,000 | | | | | | 51,949 | |
| | | | |
Bank of Shanghai Co. Ltd. ‘A’ | | | | | 12,900 | | | | | | 13 | |
| | | | |
China Cinda Asset Management Co. Ltd. ‘H’ | | | | | 31,748,000 | | | | | | 2,639 | |
| | | | |
China Construction Bank Corp. ‘H’ | | | | | 101,798,000 | | | | | | 75,251 | |
| | | | |
China Everbright Bank Co. Ltd. ‘H’ | | | | | 1,717,000 | | | | | | 534 | |
| | | | |
Industrial & Commercial Bank of China Ltd. ‘H’ | | | | | 71,151,000 | | | | | | 42,291 | |
| | | | |
Industrial Bank Co. Ltd. ‘A’ (b) | | | | | 716,100 | | | | | | 1,735 | |
| | | | |
Lufax Holding Ltd. ADR | | | | | 601,195 | | | | | | 1,425 | |
| | | | |
People’s Insurance Co. Group of China Ltd. ‘H’ | | | | | 2,829,000 | | | | | | 969 | |
| | | | |
PICC Property & Casualty Co. Ltd. ‘H’ | | | | | 11,478,000 | | | | | | 14,230 | |
| | | | |
Ping An Insurance Group Co. of China Ltd. ‘H’ | | | | | 5,034,000 | | | | | | 22,807 | |
| | | | |
Shanghai Pudong Development Bank Co. Ltd. ‘A’ | | | | | 878,800 | | | | | | 994 | |
| | | | | | | | | | | | |
| | | | | | | | | | | 220,043 | |
| | | | | | | | | | | | |
| |
| HEALTH CARE 0.8% | |
| | | | |
China Resources Pharmaceutical Group Ltd. | | | | | 5,188,500 | | | | | | 3,835 | |
| | | | |
Sinopharm Group Co. Ltd. ‘H’ | | | | | 4,054,800 | | | | | | 10,784 | |
| | | | | | | | | | | | |
| | | | | | | | | | | 14,619 | |
| | | | | | | | | | | | |
| |
| INDUSTRIALS 1.9% | |
| | | | |
China Communications Services Corp. Ltd. ‘H’ | | | | | 6,720,000 | | | | | | 3,620 | |
| | | | |
China International Marine Containers Group Co. Ltd. ‘H’ | | | | | 1,086,400 | | | | | | 981 | |
| | | | |
China Lesso Group Holdings Ltd. ‘L’ | | | | | 391,000 | | | | | | 156 | |
| | | | | | | | | | | | |
| | | | | SHARES | | | | | MARKET
VALUE
(000S) | |
| | | | |
China State Construction Engineering Corp. Ltd. ‘A’ | | | | | 6,085,000 | | | $ | | | 4,445 | |
| | | | |
CITIC Ltd. | | | | | 3,831,000 | | | | | | 3,482 | |
| | | | |
COSCO SHIPPING Holdings Co. Ltd. ‘H’ | | | | | 2,611,500 | | | | | | 4,558 | |
| | | | |
CRRC Corp. Ltd. ‘H’ | | | | | 8,744,000 | | | | | | 5,640 | |
| | | | |
Daqin Railway Co. Ltd. ‘A’ | | | | | 2,740,800 | | | | | | 2,701 | |
| | | | |
Fosun International Ltd. | | | | | 692,000 | | | | | | 371 | |
| | | | |
Sinopec Engineering Group Co. Ltd. ‘H’ | | | | | 2,894,500 | | | | | | 2,000 | |
| | | | |
Sinotrans Ltd. ‘H’ | | | | | 2,814,000 | | | | | | 1,368 | |
| | | | |
Sinotruk Hong Kong Ltd. | | | | | 1,909,500 | | | | | | 4,957 | |
| | | | |
Xiamen ITG Group Corp. Ltd. ‘A’ | | | | | 1,139,900 | | | | | | 1,125 | |
| | | | | | | | | | | | |
| | | | | | | | | | | 35,404 | |
| | | | | | | | | | | | |
| |
| INFORMATION TECHNOLOGY 3.6% | |
| | | | |
AAC Technologies Holdings, Inc. | | | | | 1,605,000 | | | | | | 6,280 | |
| | | | |
BYD Electronic International Co. Ltd. | | | | | 365,000 | | | | | | 1,816 | |
| | | | |
Lenovo Group Ltd. | | | | | 21,398,000 | | | | | | 30,030 | |
| | | | |
Sunny Optical Technology Group Co. Ltd. | | | | | 402,400 | | | | | | 2,474 | |
| | | | |
Vipshop Holdings Ltd. | | | | | 1,984,530 | | | | | | 25,839 | |
| | | | | | | | | | | | |
| | | | | | | | | | | 66,439 | |
| | | | | | | | | | | | |
| |
| MATERIALS 0.8% | |
| | | | |
Angang Steel Co. Ltd. ‘H’ (b) | | | | | 3,586,000 | | | | | | 558 | |
| | | | |
Anhui Conch Cement Co. Ltd. ‘H’ | | | | | 512,500 | | | | | | 1,219 | |
| | | | |
Baoshan Iron & Steel Co. Ltd. ‘A’ | | | | | 2,423,300 | | | | | | 2,215 | |
| | | | |
China Hongqiao Group Ltd. | | | | | 3,369,000 | | | | | | 5,084 | |
| | | | |
China National Building Material Co. Ltd. ‘H’ | | | | | 1,130,000 | | | | | | 404 | |
| | | | |
Jiangxi Copper Co. Ltd. ‘H’ | | | | | 1,669,000 | | | | | | 3,322 | |
| | | | |
Luxi Chemical Group Co. Ltd. ‘A’ | | | | | 277,600 | | | | | | 443 | |
| | | | |
Sinopec Shanghai Petrochemical Co. Ltd. ‘H’ (b) | | | | | 13,712,000 | | | | | | 1,929 | |
| | | | |
Xinyu Iron & Steel Co. Ltd. ‘A’ | | | | | 548,300 | | | | | | 251 | |
| | | | | | | | | | | | |
| | | | | | | | | | | 15,425 | |
| | | | | | | | | | | | |
| |
| REAL ESTATE 0.2% | |
| | | | |
Agile Group Holdings Ltd. ^(a)(b) | | | | | 6,014,000 | | | | | | 391 | |
| | | | |
Country Garden Holdings Co. Ltd. «(b)(d) | | | | | 6,194,000 | | | | | | 385 | |
| | | | |
Gemdale Corp. | | | | | 1,202,200 | | | | | | 561 | |
| | | | |
Guangzhou R&F Properties Co. Ltd. ‘H’ (b)(d) | | | | | 2,261,400 | | | | | | 254 | |
| | | | |
Longfor Group Holdings Ltd. | | | | | 1,367,000 | | | | | | 1,867 | |
| | | | |
Seazen Group Ltd. (b) | | | | | 2,322,000 | | | | | | 404 | |
| | | | |
Shui On Land Ltd. | | | | | 7,148,000 | | | | | | 604 | |
| | | | | | | | | | | | |
| | | | | | | | | | | 4,466 | |
| | | | | | | | | | | | |
| |
| UTILITIES 0.1% | |
| | | | |
CGN Power Co. Ltd. ‘H’ | | | | | 3,953,000 | | | | | | 1,738 | |
| | | | | | | | | | | | |
Total China | | | | | | | | | | | 524,284 | |
| | | | | | | | | | | | |
| |
| GREECE 0.4% | |
| |
| COMMUNICATION SERVICES 0.2% | |
| | | | |
Hellenic Telecommunications Organization SA (b) | | | | | 203,222 | | | | | | 2,921 | |
| | | | | | | | | | | | |
| |
| | | | | | | | | | | | |
| See Accompanying Notes | | | ANNUAL FINANCIAL AND OTHER INFORMATION | | | | | | | JUNE 30, 2024 | | | 39 |
| | | | | | |
| Schedule of Investments | | PIMCO RAE Emerging Markets Fund | | (Cont.) | | |
| | | | | | | | | | | | |
| | | | | SHARES | | | | | MARKET
VALUE
(000S) | |
| ENERGY 0.1% | |
| | | | |
Helleniq Energy Holdings SA | | | | | 20,664 | | | $ | | | 173 | |
| | | | |
Motor Oil Hellas Corinth Refineries SA | | | | | 73,625 | | | | | | 1,848 | |
| | | | | | | | | | | | |
| | | | | | | | | | | 2,021 | |
| | | | | | | | | | | | |
| |
| INDUSTRIALS 0.1% | |
| | | | |
Star Bulk Carriers Corp. | | | | | 83,465 | | | | | | 2,035 | |
| | | | | | | | | | | | |
Total Greece | | | | | | | | | | | 6,977 | |
| | | | | | | | | | | | |
| |
| HONG KONG 1.4% | |
| |
| FINANCIALS 0.1% | |
| | | | |
China Taiping Insurance Holdings Co. Ltd. | | | | | 768,800 | | | | | | 784 | |
| | | | | | | | | | | | |
| |
| INDUSTRIALS 0.2% | |
| | | | |
China Everbright Environment Group Ltd. | | | | | 2,032,000 | | | | | | 1,017 | |
| | | | |
Orient Overseas International Ltd. | | | | | 62,500 | | | | | | 1,016 | |
| | | | |
Shanghai Industrial Holdings Ltd. | | | | | 713,000 | | | | | | 1,064 | |
| | | | |
Shenzhen International Holdings Ltd. | | | | | 1,271,000 | | | | | | 1,014 | |
| | | | | | | | | | | | |
| | | | | | | | | | | 4,111 | |
| | | | | | | | | | | | |
| |
| REAL ESTATE 0.0% | |
| | | | |
Shenzhen Investment Ltd. | | | | | 1,528,000 | | | | | | 181 | |
| | | | | | | | | | | | |
| |
| UTILITIES 1.1% | |
| | | | |
Beijing Enterprises Holdings Ltd. | | | | | 215,000 | | | | | | 721 | |
| | | | |
Beijing Enterprises Water Group Ltd. | | | | | 2,720,000 | | | | | | 836 | |
| | | | |
China Resources Power Holdings Co. Ltd. | | | | | 2,432,000 | | | | | | 7,451 | |
| | | | |
Kunlun Energy Co. Ltd. | | | | | 10,842,000 | | | | | | 11,218 | |
| | | | | | | | | | | | |
| | | | | | | | | | | 20,226 | |
| | | | | | | | | | | | |
Total Hong Kong | | | | | | | | | | | 25,302 | |
| | | | | | | | | | | | |
| |
| INDIA 21.2% | |
| |
| COMMUNICATION SERVICES 0.5% | |
| | | | |
Indus Towers Ltd. (b) | | | | | 1,857,646 | | | | | | 8,352 | |
| | | | | | | | | | | | |
| |
| CONSUMER DISCRETIONARY 0.1% | |
| | | | |
Apollo Tyres Ltd. | | | | | 189,969 | | | | | | 1,231 | |
| | | | |
Bajaj Auto Ltd. | | | | | 13,069 | | | | | | 1,489 | |
| | | | | | | | | | | | |
| | | | | | | | | | | 2,720 | |
| | | | | | | | | | | | |
| |
| CONSUMER STAPLES 0.8% | |
| | | | |
Hero MotoCorp Ltd. | | | | | 135,808 | | | | | | 9,069 | |
| | | | |
ITC Ltd. | | | | | 811,004 | | | | | | 4,128 | |
| | | | |
Rajesh Exports Ltd. | | | | | 567,707 | | | | | | 1,917 | |
| | | | | | | | | | | | |
| | | | | | | | | | | 15,114 | |
| | | | | | | | | | | | |
| |
| ENERGY 5.6% | |
| | | | |
Bharat Petroleum Corp. Ltd. | | | | | 1,711,064 | | | | | | 6,225 | |
| | | | |
Chennai Petroleum Corp. Ltd. (b) | | | | | 28,659 | | | | | | 337 | |
| | | | |
Coal India Ltd. | | | | | 2,646,806 | | | | | | 14,996 | |
| | | | |
Hindustan Petroleum Corp. Ltd. | | | | | 2,589,706 | | | | | | 10,297 | |
| | | | |
Indian Oil Corp. Ltd. | | | | | 14,510,079 | | | | | | 28,748 | |
| | | | | | | | | | | | |
| | | | | SHARES | | | | | MARKET
VALUE
(000S) | |
| | | | |
Oil & Natural Gas Corp. Ltd. (b) | | | | | 7,867,187 | | | $ | | | 25,817 | |
| | | | |
Oil India Ltd. | | | | | 1,258,674 | | | | | | 10,892 | |
| | | | |
Petronet LNG Ltd. | | | | | 1,562,340 | | | | | | 6,176 | |
| | | | | | | | | | | | |
| | | | | | | | | | | 103,488 | |
| | | | | | | | | | | | |
| |
| FINANCIALS 4.3% | |
| | | | |
General Insurance Corp. of India | | | | | 430,740 | | | | | | 1,952 | |
| | | | |
Housing & Urban Development Corp. Ltd. | | | | | 1,131,680 | | | | | | 3,804 | |
| | | | |
Indiabulls Housing Finance Ltd. ‘L’ | | | | | 8,968,614 | | | | | | 17,855 | |
| | | | |
Power Finance Corp. Ltd. | | | | | 5,565,467 | | | | | | 32,315 | |
| | | | |
RBL Bank Ltd. | | | | | 445,250 | | | | | | 1,399 | |
| | | | |
REC Ltd. | | | | | 3,507,332 | | | | | | 22,061 | |
| | | | | | | | | | | | |
| | | | | | | | | | | 79,386 | |
| | | | | | | | | | | | |
| |
| HEALTH CARE 0.4% | |
| | | | |
Aurobindo Pharma Ltd. | | | | | 236,445 | | | | | | 3,420 | |
| | | | |
Glenmark Pharmaceuticals Ltd. (b) | | | | | 258,071 | | | | | | 3,805 | |
| | | | | | | | | | | | |
| | | | | | | | | | | 7,225 | |
| | | | | | | | | | | | |
| |
| INDUSTRIALS 1.5% | |
| | | | |
Bharat Heavy Electricals Ltd. | | | | | 4,750,838 | | | | | | 17,101 | |
| | | | |
Bharat Petroleum Corp. Ltd. (b) | | | | | 1,711,064 | | | | | | 6,237 | |
| | | | |
Hindustan Petroleum Corp. (b) | | | | | 1,294,853 | | | | | | 5,157 | |
| | | | | | | | | | | | |
| | | | | | | | | | | 28,495 | |
| | | | | | | | | | | | |
| |
| INFORMATION TECHNOLOGY 0.3% | |
| | | | |
Oracle Financial Services Software Ltd. | | | | | 19,818 | | | | | | 2,345 | |
| | | | |
Redington Ltd. | | | | | 892,638 | | | | | | 2,290 | |
| | | | | | | | | | | | |
| | | | | | | | | | | 4,635 | |
| | | | | | | | | | | | |
| |
| MATERIALS 5.1% | |
| | | | |
Gujarat Narmada Valley Fertilizers & Chemicals Ltd. (b) | | | | | 177,756 | | | | | | 1,513 | |
| | | | |
Gujarat State Fertilizers & Chemicals Ltd. | | | | | 335,103 | | | | | | 971 | |
| | | | |
Jindal Saw Ltd. | | | | | 440,562 | | | | | | 2,863 | |
| | | | |
Jindal Steel & Power Ltd. (b) | | | | | 842,404 | | | | | | 10,534 | |
| | | | |
National Aluminium Co. Ltd. | | | | | 9,268,045 | | | | | | 20,766 | |
| | | | |
Steel Authority of India Ltd. (b) | | | | | 4,289,647 | | | | | | 7,626 | |
| | | | |
Tata Steel Ltd. | | | | | 4,574,692 | | | | | | 9,523 | |
| | | | |
Vedanta Ltd. | | | | | 7,290,496 | | | | | | 39,657 | |
| | | | | | | | | | | | |
| | | | | | | | | | | 93,453 | |
| | | | | | | | | | | | |
| |
| UTILITIES 2.6% | |
| | | | |
CESC Ltd. | | | | | 657,798 | | | | | | 1,277 | |
| | | | |
GAIL India Ltd. | | | | | 4,779,457 | | | | | | 12,556 | |
| | | | |
NLC India Ltd. (b) | | | | | 337,699 | | | | | | 969 | |
| | | | |
NTPC Ltd. | | | | | 3,530,278 | | | | | | 16,009 | |
| | | | |
Power Grid Corp. of India Ltd. | | | | | 1,685,056 | | | | | | 6,673 | |
| | | | |
PTC India Ltd. | | | | | 1,649,669 | | | | | | 4,069 | |
| | | | |
Reliance Infrastructure Ltd. (b) | | | | | 1,078,884 | | | | | | 2,584 | |
| | | | |
Reliance Power Ltd. (b) | | | | | 11,074,067 | | | | | | 3,829 | |
| | | | | | | | | | | | |
| | | | | | | | | | | 47,966 | |
| | | | | | | | | | | | |
Total India | | | | | | | | | | | 390,834 | |
| | | | | | | | | | | | |
| |
| | | | | | | | | | | | |
| | | | | SHARES | | | | | MARKET
VALUE
(000S) | |
| INDONESIA 1.5% | |
| |
| COMMUNICATION SERVICES 0.1% | |
| | | | |
Telkom Indonesia Persero Tbk PT | | | | | 10,923,400 | | | $ | | | 2,075 | |
| | | | | | | | | | | | |
| |
| CONSUMER STAPLES 0.1% | |
| | | | |
Gudang Garam Tbk PT | | | | | 624,300 | | | | | | 689 | |
| | | | |
Hanjaya Mandala Sampoerna Tbk PT | | | | | 14,196,100 | | | | | | 616 | |
| | | | | | | | | | | | |
| | | | | | | | | | | 1,305 | |
| | | | | | | | | | | | |
| |
| ENERGY 0.6% | |
| | | | |
Adaro Energy Indonesia Tbk PT | | | | | 24,046,600 | | | | | | 4,097 | |
| | | | |
AKR Corporindo Tbk PT | | | | | 7,933,000 | | | | | | 785 | |
| | | | |
Bukit Asam Tbk PT | | | | | 4,374,800 | | | | | | 654 | |
| | | | |
Indo Tambangraya Megah Tbk PT | | | | | 2,809,500 | | | | | | 4,101 | |
| | | | |
United Tractors Tbk PT | | | | | 1,717,700 | | | | | | 2,303 | |
| | | | | | | | | | | | |
| | | | | | | | | | | 11,940 | |
| | | | | | | | | | | | |
| |
| FINANCIALS 0.3% | |
| | | | |
Bank Mandiri Persero Tbk PT | | | | | 15,903,700 | | | | | | 5,950 | |
| | | | |
Bank Negara Indonesia Persero Tbk PT | | | | | 1,819,400 | | | | | | 516 | |
| | | | | | | | | | | | |
| | | | | | | | | | | 6,466 | |
| | | | | | | | | | | | |
| |
| HEALTH CARE 0.0% | |
| | | | |
Kalbe Farma Tbk PT | | | | | 6,430,500 | | | | | | 599 | |
| | | | | | | | | | | | |
| |
| INDUSTRIALS 0.1% | |
| | | | |
Astra International Tbk PT | | | | | 7,044,100 | | | | | | 1,915 | |
| | | | | | | | | | | | |
| |
| MATERIALS 0.1% | |
| | | | |
Indocement Tunggal Prakarsa Tbk PT | | | | | 2,214,300 | | | | | | 978 | |
| | | | |
Semen Indonesia Persero Tbk PT | | | | | 2,071,778 | | | | | | 472 | |
| | | | | | | | | | | | |
| | | | | | | | | | | 1,450 | |
| | | | | | | | | | | | |
| |
| UTILITIES 0.2% | |
| | | | |
Perusahaan Gas Negara Tbk PT | | | | | 31,279,200 | | | | | | 2,938 | |
| | | | | | | | | | | | |
Total Indonesia | | | | | | | | | | | 28,688 | |
| | | | | | | | | | | | |
| |
| MALAYSIA 1.9% | |
| |
| CONSUMER STAPLES 0.1% | |
| | | | |
Genting Bhd | | | | | 1,461,100 | | | | | | 1,457 | |
| | | | | | | | | | | | |
| |
| ENERGY 0.0% | |
| | | | |
Petronas Dagangan Bhd | | | | | 182,900 | | | | | | 676 | |
| | | | | | | | | | | | |
| |
| FINANCIALS 0.6% | |
| | | | |
Alliance Bank Malaysia Bhd | | | | | 364,100 | | | | | | 292 | |
| | | | |
AMMB Holdings Bhd | | | | | 1,614,000 | | | | | | 1,466 | |
| | | | |
CIMB Group Holdings Bhd | | | | | 867,400 | | | | | | 1,250 | |
| | | | |
Malayan Banking Bhd | | | | | 3,157,700 | | | | | | 6,667 | |
| | | | |
Public Bank Bhd | | | | | 531,700 | | | | | | 453 | |
| | | | |
RHB Bank Bhd | | | | | 846,300 | | | | | | 988 | |
| | | | | | | | | | | | |
| | | | | | | | | | | 11,116 | |
| | | | | | | | | | | | |
| |
| HEALTH CARE 0.3% | |
| | | | |
Hartalega Holdings Bhd (b) | | | | | 2,689,600 | | | | | | 1,870 | |
| | | | | | |
| 40 | | PIMCO EQUITY SERIES | | | See Accompanying Notes | |
| | | | | | | | | | | | |
| | | | | SHARES | | | | | MARKET
VALUE
(000S) | |
| | | | |
Kossan Rubber Industries Bhd | | | | | 1,155,800 | | | $ | | | 576 | |
| | | | |
Supermax Corp. Bhd | | | | | 1,663,000 | | | | | | 309 | |
| | | | |
Top Glove Corp. Bhd (b) | | | | | 13,038,300 | | | | | | 3,040 | |
| | | | | | | | | | | | |
| | | | | | | | | | | 5,795 | |
| | | | | | | | | | | | |
| |
| INDUSTRIALS 0.4% | |
| | | | |
Capital A Bhd (b) | | | | | 18,237,700 | | | | | | 3,325 | |
| | | | |
IJM Corp. Bhd | | | | | 2,343,800 | | | | | | 1,513 | |
| | | | |
MISC Bhd | | | | | 503,900 | | | | | | 908 | |
| | | | |
Sime Darby Bhd | | | | | 1,514,300 | | | | | | 840 | |
| | | | | | | | | | | | |
| | | | | | | | | | | 6,586 | |
| | | | | | | | | | | | |
| |
| REAL ESTATE 0.0% | |
| | | | |
Sime Darby Property Bhd | | | | | 702,700 | | | | | | 199 | |
| | | | | | | | | | | | |
| |
| UTILITIES 0.5% | |
| | | | |
Petronas Gas Bhd | | | | | 105,100 | | | | | | 397 | |
| | | | |
Tenaga Nasional Bhd | | | | | 2,430,000 | | | | | | 7,098 | |
| | | | |
YTL Corp. Bhd | | | | | 2,862,800 | | | | | | 2,088 | |
| | | | | | | | | | | | |
| | | | | | | | | | | 9,583 | |
| | | | | | | | | | | | |
Total Malaysia | | | | | | | | | | | 35,412 | |
| | | | | | | | | | | | |
| |
| MEXICO 1.9% | |
| |
| COMMUNICATION SERVICES 0.0% | |
| | | | |
Megacable Holdings SAB de CV | | | | | 211,739 | | | | | | 532 | |
| | | | | | | | | | | | |
| |
| CONSUMER STAPLES 0.0% | |
| | | | |
Nemak SAB de CV (b) | | | | | 3,123,100 | | | | | | 497 | |
| | | | | | | | | | | | |
| |
| FINANCIALS 0.2% | |
| | | | |
Grupo Financiero Inbursa SAB de CV (b) | | | | | 1,180,998 | | | | | | 2,806 | |
| | | | | | | | | | | | |
| |
| INDUSTRIALS 0.2% | |
| | | | |
Alfa SAB de CV ‘A’ | | | | | 6,613,141 | | | | | | 3,864 | |
| | | | | | | | | | | | |
| |
| MATERIALS 1.5% | |
| | | | |
Alpek SAB de CV (d) | | | | | 1,105,306 | | | | | | 802 | |
| | | | |
Cemex SAB de CV | | | | | 39,247,392 | | | | | | 25,121 | |
| | | | |
Orbia Advance Corp. SAB de CV | | | | | 1,447,000 | | | | | | 2,019 | |
| | | | | | | | | | | | |
| | | | | | | | | | | 27,942 | |
| | | | | | | | | | | | |
Total Mexico | | | | | | | | | | | 35,641 | |
| | | | | | | | | | | | |
| |
| PHILIPPINES 0.3% | |
| |
| COMMUNICATION SERVICES 0.1% | |
| | | | |
PLDT, Inc. | | | | | 79,155 | | | | | | 1,941 | |
| | | | | | | | | | | | |
| |
| ENERGY 0.1% | |
| | | | |
Semirara Mining & Power Corp. | | | | | 2,254,300 | | | | | | 1,296 | |
| | | | | | | | | | | | |
| |
| INDUSTRIALS 0.1% | |
| | | | |
Alliance Global Group, Inc. | | | | | 4,455,700 | | | | | | 658 | |
| | | | |
DMCI Holdings, Inc. | | | | | 6,574,800 | | | | | | 1,250 | |
| | | | | | | | | | | | |
| | | | | | | | | | | 1,908 | |
| | | | | | | | | | | | |
Total Philippines | | | | | | | | | | | 5,145 | |
| | | | | | | | | | | | |
| |
| POLAND 0.7% | |
| |
| COMMUNICATION SERVICES 0.0% | |
| | | | |
Cyfrowy Polsat SA (b) | | | | | 179,209 | | | | | | 538 | |
| | | | | | | | | | | | |
| |
| | | | | | | | | | | | |
| | | | | SHARES | | | | | MARKET
VALUE
(000S) | |
| FINANCIALS 0.5% | |
| | | | |
Bank Polska Kasa Opieki SA | | | | | 37,545 | | | $ | | | 1,562 | |
| | | | |
Powszechny Zaklad Ubezpieczen SA | | | | | 538,428 | | | | | | 6,874 | |
| | | | |
Santander Bank Polska SA | | | | | 8,696 | | | | | | 1,166 | |
| | | | | | | | | | | | |
| | | | | | | | | | | 9,602 | |
| | | | | | | | | | | | |
| |
| UTILITIES 0.2% | |
| | | | |
PGE Polska Grupa Energetyczna SA (b) | | | | | 1,344,061 | | | | | | 2,397 | |
| | | | | | | | | | | | |
Total Poland | | | | | | | | | | | 12,537 | |
| | | | | | | | | | | | |
| |
| QATAR 0.0% | |
| |
| COMMUNICATION SERVICES 0.0% | |
| | | | |
Ooredoo QPSC | | | | | 125,844 | | | | | | 353 | |
| | | | | | | | | | | | |
Total Qatar | | | | | | | | | | | 353 | |
| | | | | | | | | | | | |
| |
| RUSSIA 0.0% | |
| |
| COMMUNICATION SERVICES 0.0% | |
| | | | |
Mobile TeleSystems PJSC «(d) | | | | | 290,070 | | | | | | 0 | |
| | | | |
Rostelecom PJSC «(d) | | | | | 341,490 | | | | | | 0 | |
| | | | |
Sistema AFK PAO « | | | | | 1,963,160 | | | | | | 0 | |
| | | | | | | | | | | | |
| | | | | | | | | | | 0 | |
| | | | | | | | | | | | |
| |
| ENERGY 0.0% | |
| | | | |
Gazprom PJSC «(b) | | | | | 3,725,600 | | | | | | 0 | |
| | | | |
LUKOIL PJSC « | | | | | 254,140 | | | | | | 0 | |
| | | | | | | | | | | | |
| | | | | | | | | | | 0 | |
| | | | | | | | | | | | |
| |
| FINANCIALS 0.0% | |
| | | | |
Sberbank of Russia PJSC « | | | | | 4,916,745 | | | | | | 0 | |
| | | | |
VTB Bank PJSC «(b) | | | | | 23,863,615,853 | | | | | | 28 | |
| | | | | | | | | | | | |
| | | | | | | | | | | 28 | |
| | | | | | | | | | | | |
| |
| MATERIALS 0.0% | |
| | | | |
Alrosa PJSC « | | | | | 2,122,120 | | | | | | 0 | |
| | | | |
Magnitogorsk Iron & Steel Works PJSC « | | | | | 6,974,129 | | | | | | 0 | |
| | | | |
MMC Norilsk Nickel PJSC « | | | | | 379,700 | | | | | | 0 | |
| | | | |
Novolipetsk Steel PJSC « | | | | | 3,113,725 | | | | | | 0 | |
| | | | |
Severstal PAO « | | | | | 339,609 | | | | | | 0 | |
| | | | | | | | | | | | |
| | | | | | | | | | | 0 | |
| | | | | | | | | | | | |
| |
| UTILITIES 0.0% | |
| | | | |
Federal Grid Co. - Rosseti PJSC «(b) | | | | | 591,291,707 | | | | | | 1 | |
| | | | |
Inter RAO UES PJSC « | | | | | 15,264,000 | | | | | | 0 | |
| | | | |
Unipro PJSC « | | | | | 3,938,000 | | | | | | 0 | |
| | | | | | | | | | | | |
| | | | | | | | | | | 1 | |
| | | | | | | | | | | | |
Total Russia | | | | | | | | | | | 29 | |
| | | | | | | | | | | | |
| |
| SAUDI ARABIA 0.3% | |
| |
| COMMUNICATION SERVICES 0.2% | |
| | | | |
Saudi Telecom Co. | | | | | 360,628 | | | | | | 3,605 | |
| | | | | | | | | | | | |
| |
| CONSUMER STAPLES 0.0% | |
| | | | |
Jarir Marketing Co. | | | | | 23,273 | | | | | | 79 | |
| | | | | | | | | | | | |
| |
| | | | | | | | | | | | |
| | | | | SHARES | | | | | MARKET
VALUE
(000S) | |
| MATERIALS 0.0% | |
| | | | |
Yanbu National Petrochemical Co. | | | | | 70,056 | | | $ | | | 683 | |
| | | | | | | | | | | | |
| |
| UTILITIES 0.1% | |
| | | | |
Saudi Electricity Co. | | | | | 160,367 | | | | | | 702 | |
| | | | | | | | | | | | |
Total Saudi Arabia | | | | | | | | | | | 5,069 | |
| | | | | | | | | | | | |
| |
| SOUTH AFRICA 2.6% | |
| |
| COMMUNICATION SERVICES 0.4% | |
| | | | |
MTN Group Ltd. | | | | | 859,715 | | | | | | 4,001 | |
| | | | |
MultiChoice Group (b) | | | | | 201,773 | | | | | | 1,182 | |
| | | | |
Telkom SA SOC Ltd. (b) | | | | | 1,337,598 | | | | | | 1,802 | |
| | | | |
Vodacom Group Ltd. | | | | | 217,717 | | | | | | 1,168 | |
| | | | | | | | | | | | |
| | | | | | | | | | | 8,153 | |
| | | | | | | | | | | | |
| |
| CONSUMER STAPLES 0.4% | |
| | | | |
Motus Holdings Ltd. | | | | | 339,666 | | | | | | 1,725 | |
| | | | |
Shoprite Holdings Ltd. | | | | | 148,264 | | | | | | 2,325 | |
| | | | |
SPAR Group Ltd. (b) | | | | | 128,450 | | | | | | 836 | |
| | | | |
Tiger Brands Ltd. (d) | | | | | 264,214 | | | | | | 2,889 | |
| | | | |
Woolworths Holdings Ltd. | | | | | 120,749 | | | | | | 410 | |
| | | | | | | | | | | | |
| | | | | | | | | | | 8,185 | |
| | | | | | | | | | | | |
| |
| ENERGY 0.1% | |
| | | | |
Exxaro Resources Ltd. | | | | | 101,202 | | | | | | 997 | |
| | | | | | | | | | | | |
| |
| FINANCIALS 1.1% | |
| | | | |
Absa Group Ltd. | | | | | 303,014 | | | | | | 2,639 | |
| | | | |
Momentum Metropolitan Holdings | | | | | 2,211,791 | | | | | | 2,784 | |
| | | | |
Nedbank Group Ltd. | | | | | 606,394 | | | | | | 8,585 | |
| | | | |
Old Mutual Ltd. | | | | | 1,907,558 | | | | | | 1,299 | |
| | | | |
Standard Bank Group Ltd. | | | | | 465,954 | | | | | | 5,425 | |
| | | | | | | | | | | | |
| | | | | | | | | | | 20,732 | |
| | | | | | | | | | | | |
| |
| HEALTH CARE 0.0% | |
| | | | |
Life Healthcare Group Holdings Ltd. | | | | | 963,523 | | | | | | 681 | |
| | | | | | | | | | | | |
| |
| INDUSTRIALS 0.2% | |
| | | | |
Barloworld Ltd. (d) | | | | | 321,486 | | | | | | 1,481 | |
| | | | |
Bidvest Group Ltd. | | | | | 121,953 | | | | | | 1,914 | |
| | | | | | | | | | | | |
| | | | | | | | | | | 3,395 | |
| | | | | | | | | | | | |
| |
| MATERIALS 0.4% | |
| | | | |
Anglo American Platinum Ltd. (d) | | | | | 23,534 | | | | | | 775 | |
| | | | |
Kumba Iron Ore Ltd. | | | | | 84,738 | | | | | | 2,047 | |
| | | | |
Sibanye Stillwater Ltd. (d) | | | | | 3,917,623 | | | | | | 4,235 | |
| | | | | | | | | | | | |
| | | | | | | | | | | 7,057 | |
| | | | | | | | | | | | |
Total South Africa | | | | | | | | | | | 49,200 | |
| | | | | | | | | | | | |
| |
| SOUTH KOREA 12.1% | |
| |
| COMMUNICATION SERVICES 1.5% | |
| | | | |
KT Corp. | | | | | 875,719 | | | | | | 23,733 | |
| | | | |
LG Uplus Corp. | | | | | 391,020 | | | | | | 2,785 | |
| | | | |
SK Telecom Co. Ltd. | | | | | 18,691 | | | | | | 698 | |
| | | | | | | | | | | | |
| | | | | | | | | | | 27,216 | |
| | | | | | | | | | | | |
| |
| | | | | | | | | | | | |
| See Accompanying Notes | | | ANNUAL FINANCIAL AND OTHER INFORMATION | | | | | | | JUNE 30, 2024 | | | 41 |
| | | | | | |
| Schedule of Investments | | PIMCO RAE Emerging Markets Fund | | (Cont.) | | |
| | | | | | | | | | | | |
| | | | | SHARES | | | | | MARKET
VALUE
(000S) | |
| CONSUMER STAPLES 3.6% | |
| | | | |
Amorepacific Group | | | | | 34,289 | | | $ | | | 802 | |
| | | | |
Hankook Tire & Technology Co. Ltd. | | | | | 90,193 | | | | | | 2,947 | |
| | | | |
Hyundai Mobis Co. Ltd. | | | | | 32,507 | | | | | | 5,906 | |
| | | | |
Hyundai Wia Corp. | | | | | 16,010 | | | | | | 670 | |
| | | | |
Kia Corp. | | | | | 221,671 | | | | | | 20,742 | |
| | | | |
KT&G Corp. | | | | | 124,342 | | | | | | 7,945 | |
| | | | |
LG Electronics, Inc. | | | | | 286,033 | | | | | | 22,924 | |
| | | | |
LG H&H Co. Ltd. | | | | | 4,136 | | | | | | 1,033 | |
| | | | |
Lotte Shopping Co. Ltd. | | | | | 45,369 | | | | | | 2,086 | |
| | | | |
Shinsegae, Inc. | | | | | 9,500 | | | | | | 1,080 | |
| | | | | | | | | | | | |
| | | | | | | | | | | 66,135 | |
| | | | | | | | | | | | |
| |
| ENERGY 0.0% | |
| | | | |
S-Oil Corp. | | | | | 9,646 | | | | | | 465 | |
| | | | | | | | | | | | |
| |
| FINANCIALS 1.4% | |
| | | | |
DB Insurance Co. Ltd. | | | | | 59,417 | | | | | | 4,923 | |
| | | | |
Hanwha Life Insurance Co. Ltd. | | | | | 1,695,830 | | | | | | 3,680 | |
| | | | |
Hyundai Marine & Fire Insurance Co. Ltd. | | | | | 163,334 | | | | | | 4,082 | |
| | | | |
Samsung Card Co. Ltd. | | | | | 71,524 | | | | | | 1,984 | |
| | | | |
Samsung Fire & Marine Insurance Co. Ltd. | | | | | 14,076 | | | | | | 3,959 | |
| | | | |
Samsung Life Insurance Co. Ltd. | | | | | 30,644 | | | | | | 1,960 | |
| | | | |
Shinhan Financial Group Co. Ltd. | | | | | 102,499 | | | | | | 3,573 | |
| | | | |
Woori Financial Group, Inc. | | | | | 162,673 | | | | | | 1,736 | |
| | | | | | | | | | | | |
| | | | | | | | | | | 25,897 | |
| | | | | | | | | | | | |
| |
| INDUSTRIALS 2.2% | |
| | | | |
CJ Corp. | | | | | 57,134 | | | | | | 5,017 | |
| | | | |
CJ Logistics Corp. | | | | | 13,482 | | | | | | 929 | |
| | | | |
Daewoo Engineering & Construction Co. Ltd. (b) | | | | | 408,043 | | | | | | 1,098 | |
| | | | |
DL E&C Co. Ltd. | | | | | 44,425 | | | | | | 1,038 | |
| | | | |
Doosan Co. Ltd. | | | | | 51,797 | | | | | | 8,117 | |
| | | | |
GS Engineering & Construction Corp. | | | | | 89,861 | | | | | | 977 | |
| | | | |
GS Holdings Corp. | | | | | 24,598 | | | | | | 835 | |
| | | | |
Hanwha Corp. | | | | | 264,691 | | | | | | 5,138 | |
| | | | |
Hyundai Engineering & Construction Co. Ltd. | | | | | 364,290 | | | | | | 8,443 | |
| | | | |
Hyundai Glovis Co. Ltd. | | | | | 26,259 | | | | | | 4,165 | |
| | | | |
LX International Corp. | | | | | 155,906 | | | | | | 3,443 | |
| | | | |
SK Networks Co. Ltd. | | | | | 447,449 | | | | | | 1,560 | |
| | | | | | | | | | | | |
| | | | | | | | | | | 40,760 | |
| | | | | | | | | | | | |
| |
| INFORMATION TECHNOLOGY 0.5% | |
| | | | |
LG Display Co. Ltd. | | | | | 1,102,257 | | | | | | 9,160 | |
| | | | | | | | | | | | |
| |
| MATERIALS 2.2% | |
| | | | |
Hyundai Steel Co. | | | | | 19,926 | | | | | | 419 | |
| | | | |
Kumho Petrochemical Co. Ltd. | | | | | 3,382 | | | | | | 359 | |
| | | | |
Posco Holdings, Inc. | | | | | 151,208 | | | | | | 39,577 | |
| | | | | | | | | | | | |
| | | | | | | | | | | 40,355 | |
| | | | | | | | | | | | |
| |
| UTILITIES 0.7% | |
| | | | |
Korea Electric Power Corp. (b) | | | | | 819,410 | | | | | | 11,599 | |
| | | | |
Korea Gas Corp. | | | | | 35,577 | | | | | | 1,346 | |
| | | | | | | | | | | | |
| | | | | | | | | | | 12,945 | |
| | | | | | | | | | | | |
Total South Korea | | | | | | | | | | | 222,933 | |
| | | | | | | | | | | | |
| |
| | | | | | | | | | | | |
| | | | | SHARES | | | | | MARKET
VALUE
(000S) | |
| TAIWAN 11.6% | |
| |
| COMMUNICATION SERVICES 0.1% | |
| | | | |
Chunghwa Telecom Co. Ltd. | | | | | 283,000 | | | $ | | | 1,097 | |
| | | | | | | | | | | | |
| |
| CONSUMER STAPLES 0.7% | |
| | | | |
Cheng Shin Rubber Industry Co. Ltd. | | | | | 2,000,000 | | | | | | 3,045 | |
| | | | |
China Motor Corp. | | | | | 1,309,000 | | | | | | 4,995 | |
| | | | |
Pou Chen Corp. | | | | | 2,350,000 | | | | | | 2,531 | |
| | | | |
President Chain Store Corp. | | | | | 27,308 | | | | | | 230 | |
| | | | |
Uni-President Enterprises Corp. | | | | | 1,155,000 | | | | | | 2,894 | |
| | | | | | | | | | | | |
| | | | | | | | | | | 13,695 | |
| | | | | | | | | | | | |
| |
| FINANCIALS 0.1% | |
| | | | |
Cathay Financial Holding Co. Ltd. | | | | | 1,011,000 | | | | | | 1,836 | |
| | | | | | | | | | | | |
| |
| INDUSTRIALS 2.9% | |
| | | | |
Evergreen Marine Corp. Taiwan Ltd. | | | | | 6,066,000 | | | | | | 36,088 | |
| | | | |
Wan Hai Lines Ltd. | | | | | 408,000 | | | | | | 1,114 | |
| | | | |
Yang Ming Marine Transport Corp. | | | | | 7,046,000 | | | | | | 16,202 | |
| | | | | | | | | | | | |
| | | | | | | | | | | 53,404 | |
| | | | | | | | | | | | |
| |
| INFORMATION TECHNOLOGY 7.8% | |
| | | | |
Acer, Inc. | | | | | 884,000 | | | | | | 1,273 | |
| | | | |
Asustek Computer, Inc. | | | | | 506,337 | | | | | | 7,750 | |
| | | | |
AUO Corp. (b) | | | | | 9,268,000 | | | | | | 5,068 | |
| | | | |
Catcher Technology Co. Ltd. | | | | | 1,397,000 | | | | | | 9,980 | |
| | | | |
Cheng Uei Precision Industry Co. Ltd. | | | | | 448,000 | | | | | | 1,089 | |
| | | | |
Chicony Electronics Co. Ltd. | | | | | 778,771 | | | | | | 4,097 | |
| | | | |
ChipMOS Technologies, Inc. | | | | | 212,000 | | | | | | 280 | |
| | | | |
Compal Electronics, Inc. | | | | | 16,762,000 | | | | | | 17,868 | |
| | | | |
Compeq Manufacturing Co. Ltd. | | | | | 402,000 | | | | | | 1,007 | |
| | | | |
FIH Mobile Ltd. (b) | | | | | 10,077,000 | | | | | | 1,128 | |
| | | | |
General Interface Solution Holding Ltd. (b) | | | | | 483,871 | | | | | | 1,012 | |
| | | | |
Innolux Corp. | | | | | 10,635,000 | | | | | | 4,692 | |
| | | | |
Lite-On Technology Corp. | | | | | 584,419 | | | | | | 1,899 | |
| | | | |
Macronix International Co. Ltd. | | | | | 1,657,000 | | | | | | 1,328 | |
| | | | |
MediaTek, Inc. | | | | | 476,000 | | | | | | 20,501 | |
| | | | |
Micro-Star International Co. Ltd. (b) | | | | | 212,000 | | | | | | 1,160 | |
| | | | |
Nanya Technology Corp. | | | | | 1,874,000 | | | | | | 4,020 | |
| | | | |
Novatek Microelectronics Corp. | | | | | 339,000 | | | | | | 6,322 | |
| | | | |
Pegatron Corp. | | | | | 6,454,000 | | | | | | 20,744 | |
| | | | |
Powertech Technology, Inc. | | | | | 1,588,000 | | | | | | 9,182 | |
| | | | |
Primax Electronics Ltd. | | | | | 996,000 | | | | | | 2,887 | |
| | | | |
Quanta Computer, Inc. | | | | | 741,000 | | | | | | 7,084 | |
| | | | |
Radiant Opto-Electronics Corp. | | | | | 889,000 | | | | | | 5,190 | |
| | | | |
Silicon Motion Technology Corp. | | | | | 15,344 | | | | | | 1,243 | |
| | | | |
Supreme Electronics Co. Ltd. | | | | | 546,000 | | | | | | 1,375 | |
| | | | |
TPK Holding Co. Ltd. | | | | | 567,000 | | | | | | 704 | |
| | | | |
Tripod Technology Corp. | | | | | 188,000 | | | | | | 1,262 | |
| | | | |
WPG Holdings Ltd. | | | | | 1,174,320 | | | | | | 3,248 | |
| | | | | | | | | | | | |
| | | | | | | | | | | 143,393 | |
| | | | | | | | | | | | |
| |
| | | | | | | | | | | | |
| | | | | SHARES | | | | | MARKET
VALUE
(000S) | |
| MATERIALS 0.0% | |
| | | | |
Tung Ho Steel Enterprise Corp. | | | | | 87,000 | | | $ | | | 187 | |
| | | | | | | | | | | | |
Total Taiwan | | | | | | | | | | | 213,612 | |
| | | | | | | | | | | | |
| |
| THAILAND 3.4% | |
| |
| COMMUNICATION SERVICES 0.1% | |
| | | | |
Jasmine International PCL | | | | | 18,258,700 | | | | | | 1,500 | |
| | | | | | | | | | | | |
| |
| CONSUMER DISCRETIONARY 0.0% | |
| | | | |
Sri Trang Agro-Industry PCL | | | | | 779,300 | | | | | | 458 | |
| | | | | | | | | | | | |
| |
| ENERGY 0.6% | |
| | | | |
IRPC PCL | | | | | 26,569,300 | | | | | | 1,185 | |
| | | | |
PTT PCL | | | | | 9,751,500 | | | | | | 8,621 | |
| | | | |
Star Petroleum Refining PCL (b) | | | | | 11,058,800 | | | | | | 2,452 | |
| | | | | | | | | | | | |
| | | | | | | | | | | 12,258 | |
| | | | | | | | | | | | |
| |
| FINANCIALS 2.5% | |
| | | | |
Kasikornbank PCL | | | | | 1,760,800 | | | | | | 6,004 | |
| | | | |
SCB PCL | | | | | 9,242,100 | | | | | | 25,906 | |
| | | | |
Thai Life Insurance PCL (b) | | | | | 782,500 | | | | | | 164 | |
| | | | |
Thanachart Capital PCL | | | | | 6,897,904 | | | | | | 8,505 | |
| | | | |
Tisco Financial Group PCL | | | | | 1,925,900 | | | | | | 5,011 | |
| | | | | | | | | | | | |
| | | | | | | | | | | 45,590 | |
| | | | | | | | | | | | |
| |
| INDUSTRIALS 0.0% | |
| | | | |
Regional Container Lines PCL | | | | | 321,300 | | | | | | 249 | |
| | | | | | | | | | | | |
| |
| MATERIALS 0.1% | |
| | | | |
PTT Global Chemical PCL | | | | | 753,600 | | | | | | 624 | |
| | | | |
Siam City Cement PCL | | | | | 126,300 | | | | | | 447 | |
| | | | | | | | | | | | |
| | | | | | | | | | | 1,071 | |
| | | | | | | | | | | | |
| |
| REAL ESTATE 0.1% | |
| | | | |
3BB Internet Infrastructure Fund | | | | | 2,134,600 | | | | | | 320 | |
| | | | |
AP Thailand PCL | | | | | 2,202,700 | | | | | | 476 | |
| | | | |
Pruksa Holding PCL | | | | | 767,800 | | | | | | 183 | |
| | | | |
Supalai PCL | | | | | 738,600 | | | | | | 362 | |
| | | | | | | | | | | | |
| | | | | | | | | | | 1,341 | |
| | | | | | | | | | | | |
Total Thailand | | | | | | | | | | | 62,467 | |
| | | | | | | | | | | | |
| |
| TURKEY 1.0% | |
| |
| ENERGY 0.0% | |
| | | | |
Turkiye Petrol Rafinerileri AS | | | | | 1 | | | | | | 0 | |
| | | | | | | | | | | | |
| |
| FINANCIALS 0.8% | |
| | | | |
Haci Omer Sabanci Holding AS | | | | | 1,976,873 | | | | | | 5,842 | |
| | | | |
Is Yatirim Menkul Degerler AS ‘A’ | | | | | 7,579,891 | | | | | | 9,150 | |
| | | | | | | | | | | | |
| | | | | | | | | | | 14,992 | |
| | | | | | | | | | | | |
| |
| INDUSTRIALS 0.2% | |
| | | | |
AG Anadolu Grubu Holding AS | | | | | 270,248 | | | | | | 3,010 | |
| | | | | | | | | | | | |
Total Turkey | | | | | | | | | | | 18,002 | |
| | | | | | | | | | | | |
| |
| | | | | | |
| 42 | | PIMCO EQUITY SERIES | | | See Accompanying Notes | |
| | | | | | | | | | | | |
| | | | | SHARES | | | | | MARKET
VALUE
(000S) | |
| UNITED ARAB EMIRATES 0.1% | |
| |
| FINANCIALS 0.1% | |
| | | | |
Dubai Islamic Bank PJSC | | | | | 369,482 | | | $ | | | 577 | |
| | | | |
Emirates NBD Bank PJSC | | | | | 388,851 | | | | | | 1,747 | |
| | | | | | | | | | | | |
| | | | | | | | | | | 2,324 | |
| | | | | | | | | | | | |
Total United Arab Emirates | | | | | | | | | | | 2,324 | |
| | | | | | | | | | | | |
Total Common Stocks (Cost $1,456,978) | | | 1,747,381 | |
| | | | |
| |
| PREFERRED STOCKS 4.7% | |
| |
| BRAZIL 4.6% | |
| |
| INDUSTRIALS 0.5% | |
| | | | |
Braskem SA | | | | | 393,300 | | | | | | 1,257 | |
| | | | |
Gerdau SA | | | | | 1,385,200 | | | | | | 4,554 | |
| | | | |
Metalurgica Gerdau SA | | | | | 1,823,600 | | | | | | 3,474 | |
| | | | |
Usinas Siderurgicas de Minas Gerais SA Usiminas ‘A’ | | | | | 888,800 | | | | | | 1,258 | |
| | | | | | | | | | | | |
| | | | | | | | | | | 10,543 | |
| | | | | | | | | | | | |
| |
| UTILITIES 4.1% | |
| | | | |
Cia Energetica de Minas Gerais | | | | | 2,549,370 | | | | | | 4,510 | |
| | | | |
Companhia Paranaense de Energia | | | | | 1,624,900 | | | | | | 2,703 | |
| | | | |
Petroleo Brasileiro SA | | | | | 9,984,100 | | | | | | 67,959 | |
| | | | | | | | | | | | |
| | | | | | | | | | | 75,172 | |
| | | | | | | | | | | | |
Total Brazil | | | | | | | | | | | 85,715 | |
| | | | | | | | | | | | |
| |
| | | | | | | | | | | | |
| | | | | SHARES | | | | | MARKET
VALUE
(000S) | |
| CHILE 0.1% | |
| |
| INDUSTRIALS 0.1% | |
| | | | |
Embotelladora Andina SA | | | | | 422,085 | | | $ | | | 1,195 | |
| | | | | | | | | | | | |
Total Chile | | | | | | | | | | | 1,195 | |
| | | | | | | | | | | | |
| |
| RUSSIA 0.0% | |
| |
| UTILITIES 0.0% | |
| | | | |
Bashneft PJSC « | | | | | 31,237 | | | | | | 0 | |
| | | | |
Transneft PJSC « | | | | | 81,000 | | | | | | 0 | |
| | | | | | | | | | | | |
| | | | | | | | | | | 0 | |
| | | | | | | | | | | | |
Total Russia | | | | | | | | | | | 0 | |
| | | | | | | | | | | | |
Total Preferred Stocks (Cost $95,354) | | | 86,910 | |
| | | | |
| |
| REAL ESTATE INVESTMENT TRUSTS 0.2% | |
| |
| SOUTH AFRICA 0.2% | |
| |
| REAL ESTATE 0.2% | |
| | | | |
Growthpoint Properties Ltd. | | | | | 3,732,643 | | | | | | 2,499 | |
| | | | |
Redefine Properties Ltd. | | | | | 3,894,988 | | | | | | 858 | |
| | | | | | | | | | | | |
| | | | | | | | | | | 3,357 | |
| | | | | | | | | | | | |
Total Real Estate Investment Trusts (Cost $3,391) | | | 3,357 | |
| | | | |
| |
| | | | | | | | | | | | |
| | | | | SHARES | | | | | MARKET
VALUE
(000S) | |
| SHORT-TERM INSTRUMENTS 0.7% | |
| |
| REPURCHASE AGREEMENTS (f) 0.7% | |
| | | | | | | | $ | | | 13,790 | |
| | | | | | | | | | | | |
Total Short-Term Instruments
(Cost $13,790) | | | 13,790 | |
| | | | |
| | | | |
| | | | | | | | | | | | |
| Total Investments in Securities (Cost $1,569,513) | | | 1,851,438 | |
| | | | |
| |
| INVESTMENTS IN AFFILIATES 0.3% | |
| |
| SHORT-TERM INSTRUMENTS 0.3% | |
| |
| MUTUAL FUNDS 0.3% | |
|
PIMCO Government Money Market Fund | |
5.470% (c)(d)(e) | | | | | 5,564,902 | | | | | | 5,565 | |
| | | | | | | | | | | | |
Total Short-Term Instruments
(Cost $5,565) | | | 5,565 | |
| | | | |
| | | | |
| | | | | | | | | | | | |
Total Investments in Affiliates
(Cost $5,565) | | | 5,565 | |
| |
| | | | |
| Total Investments 100.6% (Cost $1,575,078) | | | $ | | | 1,857,003 | |
| |
| Other Assets and Liabilities, net (0.6)% | | | (11,836 | ) |
| | | | |
| Net Assets 100.0% | | | $ | | | 1,845,167 | |
| | | | | | | |
NOTES TO SCHEDULE OF INVESTMENTS:
| * | A zero balance may reflect actual amounts rounding to less than one thousand. |
| « | Security valued using significant unobservable inputs (Level 3). |
| (a) | Security is not accruing income as of the date of this report. |
| (b) | Security did not produce income within the last twelve months. |
| (c) | Institutional Class Shares of each Fund. |
| (d) | Securities with an aggregate market value of $6,775 were out on loan in exchange for $7,471 of cash collateral as of June 30, 2024. The collateral was invested in a cash collateral reinvestment vehicle as described in Note 5 in the Notes to Financial Statements. |
| (e) | Coupon represents a 7-Day Yield. |
BORROWINGS AND OTHER FINANCING TRANSACTIONS
(f) REPURCHASE AGREEMENTS:
| | | | | | | | | | | | | | | | | | | | | | | | | | | | | | |
| Counterparty | | Lending
Rate | | | Settlement
Date | | | Maturity
Date | | | Principal
Amount | | | Collateralized By | | Collateral
(Received) | | | Repurchase
Agreements,
at Value | | | Repurchase
Agreement
Proceeds
to be
Received(1) | |
| FICC | | | 2.600 | % | | | 06/28/2024 | | | | 07/01/2024 | | | $ | 13,790 | | | U.S. Treasury Inflation Protected Securities 0.625% due 01/15/2026 | | $ | (14,066 | ) | | $ | 13,790 | | | $ | 13,793 | |
| | | | | | | | | | | | | | | | | | | | | | | | | | | | | | |
Total Repurchase Agreements | | | | | $ | (14,066 | ) | | $ | 13,790 | | | $ | 13,793 | |
| | | | | | | | | | | | | | | |
| | | | | | | | | | | | |
| See Accompanying Notes | | | ANNUAL FINANCIAL AND OTHER INFORMATION | | | | | | | JUNE 30, 2024 | | | 43 |
| | | | | | |
| Schedule of Investments | | PIMCO RAE Emerging Markets Fund | | (Cont.) | | |
BORROWINGS AND OTHER FINANCING TRANSACTIONS SUMMARY
The following is a summary by counterparty of the market value of Borrowings and Other Financing Transactions and collateral pledged/(received) as of June 30, 2024:
| | | | | | | | | | | | | | | | | | | | | | | | | | | | |
| Counterparty | | Repurchase
Agreement
Proceeds
to be
Received(1) | | | Payable for
Reverse
Repurchase
Agreements | | | Payable for
Sale-Buyback
Transactions | | | Securities Out on Loan | | | Total
Borrowings and
Other Financing
Transactions | | | Collateral
Pledged/(Received) | | | Net Exposure(2) | |
Global/Master Repurchase Agreement | |
FICC | | $ | 13,793 | | | $ | 0 | | | $ | 0 | | | $ | 0 | | | $ | 13,793 | | | $ | (14,066 | ) | | $ | (273 | ) |
|
Master Securities Lending Agreement | |
BMO | | | 0 | | | | 0 | | | | 0 | | | | 639 | | | | 639 | | | | (705 | ) | | | (66 | ) |
BOS | | | 0 | | | | 0 | | | | 0 | | | | 309 | | | | 309 | | | | (442 | ) | | | (133 | ) |
ING | | | 0 | | | | 0 | | | | 0 | | | | 903 | | | | 903 | | | | (949 | ) | | | (46 | ) |
SAL | | | 0 | | | | 0 | | | | 0 | | | | 2,328 | | | | 2,328 | | | | (2,484 | ) | | | (156 | ) |
UBS | | | 0 | | | | 0 | | | | 0 | | | | 2,596 | | | | 2,596 | | | | (2,891 | ) | | | (295 | ) |
| | | | | | | | | | | | | | | | | | | | | | | | | | | | |
Total Borrowings and Other Financing Transactions | | $ | 13,793 | | | $ | 0 | | | $ | 0 | | | $ | 6,775 | | | | | | | | | | | | | |
| | | | | | | | | | | | | | | | | | | | | | | | | | | | |
CERTAIN TRANSFERS ACCOUNTED FOR AS SECURED BORROWINGS
Remaining Contractual Maturity of the Agreements
| | | | | | | | | | | | | | | | | | | | |
| | | Overnight and
Continuous | | | Up to 30 days | | | 31-90 days | | | Greater Than 90 days | | | Total | |
Securities Lending Transactions(3) | |
Common Stocks | | $ | 7,471 | | | $ | 0 | | | $ | 0 | | | $ | 0 | | | $ | 7,471 | |
| | | | | | | | | | | | | | | | | | | | |
Total Borrowings | | $ | 7,471 | | | $ | 0 | | | $ | 0 | | | $ | 0 | | | $ | 7,471 | |
| | | | | | | | | | | | | | | | | | | | |
Payable for securities on loan - cash collateral | | | $ | 7,471 | |
| | | | | |
| (1) | Includes accrued interest. |
| (2) | Net Exposure represents the net receivable/(payable) that would be due from/to the counterparty in the event of default. Exposure from borrowings and other financing transactions can only be netted across transactions governed under the same master agreement with the same legal entity. See Note 8, Master Netting Arrangements, in the Notes to Financial Statements for more information. |
| (3) | Includes cash collateral as described in Note 5 in the Notes to Financial Statements. |
FAIR VALUE OF FINANCIAL DERIVATIVE INSTRUMENTS
The following is a summary of the fair valuation of the Fund’s derivative instruments categorized by risk exposure. See Note 7, Principal and Other Risks, in the Notes to Financial Statements on risks of the Fund.
The effect of Financial Derivative Instruments on the Statements of Operations for the period ended June 30, 2024:
| | | | | | | | | | | | | | | | | | | | | | | | |
| | | Derivatives not accounted for as hedging instruments | |
| | | Commodity
Contracts | | | Credit
Contracts | | | Equity
Contracts | | | Foreign
Exchange
Contracts | | | Interest
Rate Contracts | | | Total | |
Net Realized Gain (Loss) on Financial Derivative Instruments | |
Exchange-traded or centrally cleared | |
Futures | | $ | 0 | | | $ | 0 | | | $ | 138 | | | $ | 0 | | | $ | 0 | | | $ | 138 | |
| | | | | | | | | | | | | | | | | | | | | | | | |
Over the counter | |
Forward Foreign Currency Contracts | | $ | 0 | | | $ | 0 | | | $ | 0 | | | $ | 1 | | | $ | 0 | | | $ | 1 | |
| | | | | | | | | | | | | | | | | | | | | | | | |
| | $ | 0 | | | $ | 0 | | | $ | 138 | | | $ | 1 | | | $ | 0 | | | $ | 139 | |
| | | | | | | | | | | | | | | | | | | | | | | | |
FAIR VALUE MEASUREMENTS
The following is a summary of the fair valuations according to the inputs used as of June 30, 2024 in valuing the Fund’s assets and liabilities:
| | | | | | | | | | | | | | | | |
| Category and Subcategory | | Level 1 | | | Level 2 | | | Level 3 | | | Fair
Value at
06/30/2024 | |
Investments in Securities, at Value | |
Common Stocks | |
Brazil | |
Consumer Discretionary | | $ | 5,328 | | | $ | 0 | | | $ | 0 | | | $ | 5,328 | |
Consumer Staples | | | 6,725 | | | | 0 | | | | 0 | | | | 6,725 | |
Energy | | | 2,208 | | | | 0 | | | | 0 | | | | 2,208 | |
Financials | | | 22,195 | | | | 0 | | | | 0 | | | | 22,195 | |
Materials | | | 59,732 | | | | 0 | | | | 0 | | | | 59,732 | |
| | | | | | | | | | | | | | | | |
| Category and Subcategory | | Level 1 | | | Level 2 | | | Level 3 | | | Fair
Value at
06/30/2024 | |
Chile | |
Consumer Staples | | $ | 5,877 | | | $ | 0 | | | $ | 0 | | | $ | 5,877 | |
Energy | | | 504 | | | | 0 | | | | 0 | | | | 504 | |
Financials | | | 2,227 | | | | 0 | | | | 0 | | | | 2,227 | |
Materials | | | 220 | | | | 0 | | | | 0 | | | | 220 | |
Utilities | | | 3,556 | | | | 0 | | | | 0 | | | | 3,556 | |
China | |
Communication Services | | | 0 | | | | 12,080 | | | | 0 | | | | 12,080 | |
| | | | | | |
| 44 | | PIMCO EQUITY SERIES | | | See Accompanying Notes | |
| | | | | | | | | | | | | | | | |
| Category and Subcategory | | Level 1 | | | Level 2 | | | Level 3 | | | Fair
Value at
06/30/2024 | |
Consumer Discretionary | | $ | 0 | | | $ | 2,481 | | | $ | 0 | | | $ | 2,481 | |
Consumer Staples | | | 768 | | | | 7,596 | | | | 0 | | | | 8,364 | |
Energy | | | 0 | | | | 143,225 | | | | 0 | | | | 143,225 | |
Financials | | | 1,425 | | | | 218,618 | | | | 0 | | | | 220,043 | |
Health Care | | | 0 | | | | 14,619 | | | | 0 | | | | 14,619 | |
Industrials | | | 2,701 | | | | 32,703 | | | | 0 | | | | 35,404 | |
Information Technology | | | 25,839 | | | | 40,600 | | | | 0 | | | | 66,439 | |
Materials | | | 0 | | | | 15,425 | | | | 0 | | | | 15,425 | |
Real Estate | | | 604 | | | | 3,477 | | | | 385 | | | | 4,466 | |
Utilities | | | 0 | | | | 1,738 | | | | 0 | | | | 1,738 | |
Greece | |
Communication Services | | | 0 | | | | 2,921 | | | | 0 | | | | 2,921 | |
Energy | | | 1,848 | | | | 173 | | | | 0 | | | | 2,021 | |
Industrials | | | 2,035 | | | | 0 | | | | 0 | | | | 2,035 | |
Hong Kong | |
Financials | | | 0 | | | | 784 | | | | 0 | | | | 784 | |
Industrials | | | 1,014 | | | | 3,097 | | | | 0 | | | | 4,111 | |
Real Estate | | | 0 | | | | 181 | | | | 0 | | | | 181 | |
Utilities | | | 0 | | | | 20,226 | | | | 0 | | | | 20,226 | |
India | |
Communication Services | | | 0 | | | | 8,352 | | | | 0 | | | | 8,352 | |
Consumer Discretionary | | | 0 | | | | 2,720 | | | | 0 | | | | 2,720 | |
Consumer Staples | | | 0 | | | | 15,114 | | | | 0 | | | | 15,114 | |
Energy | | | 0 | | | | 103,488 | | | | 0 | | | | 103,488 | |
Financials | | | 0 | | | | 79,386 | | | | 0 | | | | 79,386 | |
Health Care | | | 0 | | | | 7,225 | | | | 0 | | | | 7,225 | |
Industrials | | | 0 | | | | 28,495 | | | | 0 | | | | 28,495 | |
Information Technology | | | 0 | | | | 4,635 | | | | 0 | | | | 4,635 | |
Materials | | | 0 | | | | 93,453 | | | | 0 | | | | 93,453 | |
Utilities | | | 0 | | | | 47,966 | | | | 0 | | | | 47,966 | |
Indonesia | |
Communication Services | | | 0 | | | | 2,075 | | | | 0 | | | | 2,075 | |
Consumer Staples | | | 616 | | | | 689 | | | | 0 | | | | 1,305 | |
Energy | | | 9,637 | | | | 2,303 | | | | 0 | | | | 11,940 | |
Financials | | | 0 | | | | 6,466 | | | | 0 | | | | 6,466 | |
Health Care | | | 599 | | | | 0 | | | | 0 | | | | 599 | |
Industrials | | | 0 | | | | 1,915 | | | | 0 | | | | 1,915 | |
Materials | | | 0 | | | | 1,450 | | | | 0 | | | | 1,450 | |
Utilities | | | 0 | | | | 2,938 | | | | 0 | | | | 2,938 | |
Malaysia | |
Consumer Staples | | | 0 | | | | 1,457 | | | | 0 | | | | 1,457 | |
Energy | | | 676 | | | | 0 | | | | 0 | | | | 676 | |
Financials | | | 6,667 | | | | 4,449 | | | | 0 | | | | 11,116 | |
Health Care | | | 5,795 | | | | 0 | | | | 0 | | | | 5,795 | |
Industrials | | | 3,325 | | | | 3,261 | | | | 0 | | | | 6,586 | |
Real Estate | | | 0 | | | | 199 | | | | 0 | | | | 199 | |
Utilities | | | 7,495 | | | | 2,088 | | | | 0 | | | | 9,583 | |
Mexico | |
Communication Services | | | 532 | | | | 0 | | | | 0 | | | | 532 | |
Consumer Staples | | | 497 | | | | 0 | | | | 0 | | | | 497 | |
Financials | | | 2,806 | | | | 0 | | | | 0 | | | | 2,806 | |
Industrials | | | 3,864 | | | | 0 | | | | 0 | | | | 3,864 | |
Materials | | | 27,942 | | | | 0 | | | | 0 | | | | 27,942 | |
Philippines | |
Communication Services | | | 1,941 | | | | 0 | | | | 0 | | | | 1,941 | |
Energy | | | 0 | | | | 1,296 | | | | 0 | | | | 1,296 | |
Industrials | | | 1,908 | | | | 0 | | | | 0 | | | | 1,908 | |
Poland | |
Communication Services | | | 0 | | | | 538 | | | | 0 | | | | 538 | |
Financials | | | 0 | | | | 9,602 | | | | 0 | | | | 9,602 | |
Utilities | | | 0 | | | | 2,397 | | | | 0 | | | | 2,397 | |
Qatar | |
Communication Services | | | 353 | | | | 0 | | | | 0 | | | | 353 | |
| | | | | | | | | | | | | | | | |
| Category and Subcategory | | Level 1 | | | Level 2 | | | Level 3 | | | Fair
Value at
06/30/2024 | |
Russia | |
Financials | | $ | 0 | | | $ | 0 | | | $ | 28 | | | $ | 28 | |
Utilities | | | 0 | | | | 0 | | | | 1 | | | | 1 | |
Saudi Arabia | |
Communication Services | | | 0 | | | | 3,605 | | | | 0 | | | | 3,605 | |
Consumer Staples | | | 0 | | | | 79 | | | | 0 | | | | 79 | |
Materials | | | 0 | | | | 683 | | | | 0 | | | | 683 | |
Utilities | | | 0 | | | | 702 | | | | 0 | | | | 702 | |
South Africa | |
Communication Services | | | 2,984 | | | | 5,169 | | | | 0 | | | | 8,153 | |
Consumer Staples | | | 5,860 | | | | 2,325 | | | | 0 | | | | 8,185 | |
Energy | | | 0 | | | | 997 | | | | 0 | | | | 997 | |
Financials | | | 6,722 | | | | 14,010 | | | | 0 | | | | 20,732 | |
Health Care | | | 681 | | | | 0 | | | | 0 | | | | 681 | |
Industrials | | | 1,481 | | | | 1,914 | | | | 0 | | | | 3,395 | |
Materials | | | 2,047 | | | | 5,010 | | | | 0 | | | | 7,057 | |
South Korea | |
Communication Services | | | 0 | | | | 27,216 | | | | 0 | | | | 27,216 | |
Consumer Staples | | | 0 | | | | 66,135 | | | | 0 | | | | 66,135 | |
Energy | | | 0 | | | | 465 | | | | 0 | | | | 465 | |
Financials | | | 0 | | | | 25,897 | | | | 0 | | | | 25,897 | |
Industrials | | | 0 | | | | 40,760 | | | | 0 | | | | 40,760 | |
Information Technology | | | 0 | | | | 9,160 | | | | 0 | | | | 9,160 | |
Materials | | | 0 | | | | 40,355 | | | | 0 | | | | 40,355 | |
Utilities | | | 0 | | | | 12,945 | | | | 0 | | | | 12,945 | |
Taiwan | |
Communication Services | | | 0 | | | | 1,097 | | | | 0 | | | | 1,097 | |
Consumer Staples | | | 0 | | | | 13,695 | | | | 0 | | | | 13,695 | |
Financials | | | 0 | | | | 1,836 | | | | 0 | | | | 1,836 | |
Industrials | | | 53,404 | | | | 0 | | | | 0 | | | | 53,404 | |
Information Technology | | | 1,243 | | | | 142,150 | | | | 0 | | | | 143,393 | |
Materials | | | 0 | | | | 187 | | | | 0 | | | | 187 | |
Thailand | |
Communication Services | | | 0 | | | | 1,500 | | | | 0 | | | | 1,500 | |
Consumer Discretionary | | | 0 | | | | 458 | | | | 0 | | | | 458 | |
Energy | | | 0 | | | | 12,258 | | | | 0 | | | | 12,258 | |
Financials | | | 0 | | | | 45,590 | | | | 0 | | | | 45,590 | |
Industrials | | | 0 | | | | 249 | | | | 0 | | | | 249 | |
Materials | | | 0 | | | | 1,071 | | | | 0 | | | | 1,071 | |
Real Estate | | | 0 | | | | 1,341 | | | | 0 | | | | 1,341 | |
Turkey | |
Financials | | | 5,842 | | | | 9,150 | | | | 0 | | | | 14,992 | |
Industrials | | | 3,010 | | | | 0 | | | | 0 | | | | 3,010 | |
United Arab Emirates | |
Financials | | | 2,324 | | | | 0 | | | | 0 | | | | 2,324 | |
Preferred Stocks | |
Brazil | |
Industrials | | | 10,543 | | | | 0 | | | | 0 | | | | 10,543 | |
Utilities | | | 75,172 | | | | 0 | | | | 0 | | | | 75,172 | |
Chile | |
Industrials | | | 1,195 | | | | 0 | | | | 0 | | | | 1,195 | |
Real Estate Investment Trusts | |
South Africa | |
Real Estate | | | 2,499 | | | | 858 | | | | 0 | | | | 3,357 | |
Short-Term Instruments | |
Repurchase Agreements | | | 0 | | | | 13,790 | | | | 0 | | | | 13,790 | |
| | | | | | | | | | | | | | | | |
| | $ | 394,466 | | | $ | 1,456,558 | | | $ | 414 | | | $ | 1,851,438 | |
| | | | | | | | | | | | | | | | |
|
Investments in Affiliates, at Value | |
Short-Term Instruments | |
Mutual Funds | | | 5,565 | | | | 0 | | | | 0 | | | | 5,565 | |
| | | | | | | | | | | | | | | | |
| | | | |
Total Investments | | $ | 400,031 | | | $ | 1,456,558 | | | $ | 414 | | | $ | 1,857,003 | |
| | | | | | | | | | | | | | | | |
There were no significant transfers into or out of Level 3 during the period ended June 30, 2024.
| | | | | | | | | | | | |
| See Accompanying Notes | | | ANNUAL FINANCIAL AND OTHER INFORMATION | | | | | | | JUNE 30, 2024 | | | 45 |
| | | | | | |
| Schedule of Investments | | PIMCO RAE Global ex-US Fund | | | | June 30, 2024 |
(Amounts in thousands*, except number of shares, contracts, units and ounces, if any)
| | | | | | | | | | | | |
| | | | | | | | | | MARKET
VALUE
(000S) | |
| INVESTMENTS IN SECURITIES 0.1% | |
| | | | | | | | | | | | |
| SHORT-TERM INSTRUMENTS 0.1% | |
| | | | | | | | | | | | |
| REPURCHASE AGREEMENTS (b) 0.1% | |
| | | | | | | | $ | | | 117 | |
| | | | | | | | | | | | |
Total Short-Term Instruments
(Cost $117) | | | 117 | |
| | | | | | | | | | | | |
| | | | |
| | | | | | | | | | | | |
Total Investments in Securities
(Cost $117) | | | | | | 117 | |
| | | | | | | | | | | | |
| | | | | | | | | | | | |
| | | | | SHARES | | | | | MARKET
VALUE
(000S) | |
| INVESTMENTS IN AFFILIATES 99.8% | |
| | | | | | | | | | | | |
| MUTUAL FUNDS (a) 99.8% | |
| | | | | | | | | | | | |
| UNITED STATES 99.8% | |
| | | | |
PIMCO RAE Emerging Markets Fund | | | | | 2,498,252 | | | $ | | | 27,581 | |
| | | | |
PIMCO RAE International Fund | | | | | 9,921,216 | | | | | | 79,469 | |
| | | | | | | | | | | | |
| Total Mutual Funds (Cost $106,796) | | | | | | 107,050 | |
| | | | | | | | | | | | |
| | | | |
| | | | | | | | | | | | |
Total Investments in Affiliates
(Cost $106,796) | | | | | | | | | | | 107,050 | |
| | | | |
| | | | | | | | | | | | |
Total Investments 99.9%
(Cost $106,913) | | | | | | | | $ | | | 107,167 | |
| |
| Other Assets and Liabilities, net 0.1% | | | | | | 104 | |
| | | | | | | | | | | | |
| Net Assets 100.0% | | | | | | | | $ | | | 107,271 | |
| | | | | | | | | | | | |
NOTES TO SCHEDULE OF INVESTMENTS:
| * | A zero balance may reflect actual amounts rounding to less than one thousand. |
| (a) | Institutional Class Shares of each Fund. |
BORROWINGS AND OTHER FINANCING TRANSACTIONS
(b) REPURCHASE AGREEMENTS:
| | | | | | | | | | | | | | | | | | | | | | | | | | | | | | |
| Counterparty | | Lending
Rate | | | Settlement
Date | | | Maturity
Date | | | Principal
Amount | | | Collateralized By | | Collateral
(Received) | | | Repurchase
Agreements,
at Value | | | Repurchase
Agreement
Proceeds
to be
Received(1) | |
| FICC | | | 2.600 | % | | | 06/28/2024 | | | | 07/01/2024 | | | $ | 117 | | | U.S. Treasury Inflation Protected Securities 0.625% due 01/15/2026 | | $ | (119 | ) | | $ | 117 | | | $ | 117 | |
| | | | | | | | | | | | | | | | | | | | | | | | | | | | | | |
Total Repurchase Agreements | | | | | $ | (119 | ) | | $ | 117 | | | $ | 117 | |
| | | | | | | | | | | | | | | |
BORROWINGS AND OTHER FINANCING TRANSACTIONS SUMMARY
The following is a summary by counterparty of the market value of Borrowings and Other Financing Transactions and collateral pledged/(received) as of June 30, 2024:
| | | | | | | | | | | | | | | | | | | | | | | | |
| Counterparty | | Repurchase
Agreement
Proceeds
to be
Received(1) | | | Payable for
Reverse
Repurchase
Agreements | | | Payable for
Sale-Buyback
Transactions | | | Total
Borrowings and
Other Financing
Transactions | | | Collateral
Pledged/(Received) | | | Net Exposure(2) | |
Global/Master Repurchase Agreement | |
FICC | | $ | 117 | | | $ | 0 | | | $ | 0 | | | $ | 117 | | | $ | (119 | ) | | $ | (2 | ) |
| | | | | | | | | | | | | | | | | | | | | | | | |
Total Borrowings and Other Financing Transactions | | $ | 117 | | | $ | 0 | | | $ | 0 | | | | | | | | | | | | | |
| | | | | | | | | | | | | | | | | | | | | | | | |
| (1) | Includes accrued interest. |
| (2) | Net Exposure represents the net receivable/(payable) that would be due from/to the counterparty in the event of default. Exposure from borrowings and other financing transactions can only be netted across transactions governed under the same master agreement with the same legal entity. See Note 8, Master Netting Arrangements, in the Notes to Financial Statements for more information. |
FAIR VALUE MEASUREMENTS
The following is a summary of the fair valuations according to the inputs used as of June 30, 2024 in valuing the Fund’s assets and liabilities:
| | | | | | | | | | | | | | | | |
| Category and Subcategory | | Level 1 | | | Level 2 | | | Level 3 | | | Fair
Value at
06/30/2024 | |
Investments in Securities, at Value | |
Short-Term Instruments | |
Repurchase Agreements | | $ | 0 | | | $ | 117 | | | $ | 0 | | | $ | 117 | |
| | | | | | | | | | | | | | | | |
| | $ | 0 | | | $ | 117 | | | $ | 0 | | | $ | 117 | |
| | | | | | | | | | | | | | | | |
Investments in Affiliates, at Value | |
Mutual Funds | |
United States | | | 107,050 | | | | 0 | | | | 0 | | | | 107,050 | |
| | | | | | | | | | | | | | | | |
| | | | |
Total Investments | | $ | 107,050 | | | $ | 117 | | | $ | 0 | | | $ | 107,167 | |
| | | | | | | | | | | | | | | | |
There were no significant transfers into or out of Level 3 during the period ended June 30, 2024.
| | | | | | |
| 46 | | PIMCO EQUITY SERIES | | | See Accompanying Notes | |
| | | | | | |
| Schedule of Investments | | PIMCO RAE International Fund | | | | June 30, 2024 |
(Amounts in thousands*, except number of shares, contracts, units and ounces, if any)
| | | | | | | | | | | | |
| | | | | SHARES | | | | | MARKET
VALUE
(000S) | |
| INVESTMENTS IN SECURITIES 99.0% | |
| |
| COMMON STOCKS 95.9% | |
| |
| AUSTRALIA 4.9% | |
| |
| COMMUNICATION SERVICES 0.2% | |
| | | | |
Telstra Group Ltd. | | | | | 447,904 | | | $ | | | 1,081 | |
| | | | | | | | | | | | |
| |
| CONSUMER STAPLES 0.2% | |
| | | | |
JB Hi-Fi Ltd. | | | | | 5,497 | | | | | | 223 | |
| | | | |
Metcash Ltd. | | | | | 256,408 | | | | | | 604 | |
| | | | | | | | | | | | |
| | | | | | | | | | | 827 | |
| | | | | | | | | | | | |
| |
| ENERGY 0.4% | |
| | | | |
Ampol Ltd. | | | | | 47,325 | | | | | | 1,018 | |
| | | | |
Viva Energy Group Ltd. | | | | | 369,833 | | | | | | 773 | |
| | | | | | | | | | | | |
| | | | | | | | | | | 1,791 | |
| | | | | | | | | | | | |
| |
| FINANCIALS 0.9% | |
| | | | |
Medibank Pvt Ltd. | | | | | 301,533 | | | | | | 747 | |
| | | | |
Suncorp Group Ltd. | | | | | 324,148 | | | | | | 3,749 | |
| | | | | | | | | | | | |
| | | | | | | | | | | 4,496 | |
| | | | | | | | | | | | |
| |
| INDUSTRIALS 0.5% | |
| | | | |
Aurizon Holdings Ltd. | | | | | 423,317 | | | | | | 1,028 | |
| | | | |
Brambles Ltd. | | | | | 81,819 | | | | | | 790 | |
| | | | |
Downer EDI Ltd. | | | | | 132,164 | | | | | | 405 | |
| | | | | | | | | | | | |
| | | | | | | | | | | 2,223 | |
| | | | | | | | | | | | |
| |
| MATERIALS 1.4% | |
| | | | |
BlueScope Steel Ltd. | | | | | 101,821 | | | | | | 1,382 | |
| | | | |
Rio Tinto Ltd. | | | | | 67,003 | | | | | | 5,308 | |
| | | | |
Sims Ltd. | | | | | 7,756 | | | | | | 53 | |
| | | | | | | | | | | | |
| | | | | | | | | | | 6,743 | |
| | | | | | | | | | | | |
| |
| REAL ESTATE 0.0% | |
| | | | |
Lendlease Corp. Ltd. | | | | | 63,079 | | | | | | 227 | |
| | | | | | | | | | | | |
| |
| UTILITIES 1.3% | |
| | | | |
AGL Energy Ltd. | | | | | 886,976 | | | | | | 6,391 | |
| | | | | | | | | | | | |
Total Australia | | | | | | | | | | | 23,779 | |
| | | | | | | | | | | | |
| |
| AUSTRIA 0.3% | |
| |
| FINANCIALS 0.1% | |
| | | | |
Vienna Insurance Group AG Wiener Versicherung Gruppe | | | | | 7,538 | | | | | | 246 | |
| | | | | | | | | | | | |
| |
| INDUSTRIALS 0.0% | |
| | | | |
Strabag SE | | | | | 2,287 | | | | | | 96 | |
| | | | | | | | | | | | |
| |
| MATERIALS 0.2% | |
| | | | |
voestalpine AG | | | | | 47,867 | | | | | | 1,294 | |
| | | | | | | | | | | | |
Total Austria | | | | | | | | | | | 1,636 | |
| | | | | | | | | | | | |
| |
| BELGIUM 1.1% | |
| |
| COMMUNICATION SERVICES 0.2% | |
| | | | |
Proximus SADP | | | | | 113,227 | | | | | | 901 | |
| | | | | | | | | | | | |
| |
| CONSUMER STAPLES 0.2% | |
| | | | |
Etablissements Franz Colruyt NV | | | | | 16,085 | | | | | | 768 | |
| | | | | | | | | | | | |
| |
| | | | | | | | | | | | |
| | | | | SHARES | | | | | MARKET
VALUE
(000S) | |
| FINANCIALS 0.3% | |
| | | | |
Ageas SA | | | | | 31,496 | | | $ | | | 1,437 | |
| | | | | | | | | | | | |
| |
| HEALTH CARE 0.4% | |
| | | | |
UCB SA | | | | | 14,867 | | | | | | 2,207 | |
| | | | | | | | | | | | |
| |
| INDUSTRIALS 0.0% | |
| | | | |
bpost SA | | | | | 70,263 | | | | | | 228 | |
| | | | | | | | | | | | |
Total Belgium | | | | | | | | | | | 5,541 | |
| | | | | | | | | | | | |
| |
| CANADA 7.6% | |
| |
| CONSUMER STAPLES 2.3% | |
| | | | |
Canadian Tire Corp. Ltd. ‘A’ | | | | | 2,951 | | | | | | 293 | |
| | | | |
George Weston Ltd. | | | | | 6,361 | | | | | | 915 | |
| | | | |
Gildan Activewear, Inc. | | | | | 19,891 | | | | | | 754 | |
| | | | |
Linamar Corp. | | | | | 8,100 | | | | | | 394 | |
| | | | |
Magna International, Inc. | | | | | 215,167 | | | | | | 9,018 | |
| | | | | | | | | | | | |
| | | | | | | | | | | 11,374 | |
| | | | | | | | | | | | |
| |
| ENERGY 2.9% | |
| | | | |
ARC Resources Ltd. | | | | | 31,100 | | | | | | 555 | |
| | | | |
Imperial Oil Ltd. | | | | | 28,900 | | | | | | 1,970 | |
| | | | |
Suncor Energy, Inc. | | | | | 301,541 | | | | | | 11,495 | |
| | | | | | | | | | | | |
| | | | | | | | | | | 14,020 | |
| | | | | | | | | | | | |
| |
| FINANCIALS 1.0% | |
| | | | |
Bank of Nova Scotia | | | | | 27,500 | | | | | | 1,258 | |
| | | | |
CI Financial Corp. | | | | | 88,051 | | | | | | 927 | |
| | | | |
Manulife Financial Corp. | | | | | 38,200 | | | | | | 1,017 | |
| | | | |
Onex Corp. | | | | | 13,210 | | | | | | 898 | |
| | | | |
Sun Life Financial, Inc. | | | | | 12,653 | | | | | | 621 | |
| | | | | | | | | | | | |
| | | | | | | | | | | 4,721 | |
| | | | | | | | | | | | |
| |
| HEALTH CARE 0.2% | |
| | | | |
Bausch Health Cos., Inc. (a) | | | | | 183,100 | | | | | | 1,277 | |
| | | | | | | | | | | | |
| |
| INDUSTRIALS 0.3% | |
| | | | |
Finning International, Inc. | | | | | 46,400 | | | | | | 1,360 | |
| | | | | | | | | | | | |
| |
| INFORMATION TECHNOLOGY 0.4% | |
| | | | |
CGI, Inc. (a) | | | | | 18,900 | | | | | | 1,887 | |
| | | | |
Open Text Corp. | | | | | 2,600 | | | | | | 78 | |
| | | | | | | | | | | | |
| | | | | | | | | | | 1,965 | |
| | | | | | | | | | | | |
| |
| MATERIALS 0.2% | |
| | | | |
Canfor Corp. (a) | | | | | 8,400 | | | | | | 89 | |
| | | | |
Lundin Mining Corp. | | | | | 19,900 | | | | | | 221 | |
| | | | |
Methanex Corp. | | | | | 1,200 | | | | | | 58 | |
| | | | |
West Fraser Timber Co. Ltd. | | | | | 10,400 | | | | | | 799 | |
| | | | | | | | | | | | |
| | | | | | | | | | | 1,167 | |
| | | | | | | | | | | | |
| |
| UTILITIES 0.3% | |
| | | | |
Atco Ltd. ‘I’ | | | | | 45,381 | | | | | | 1,293 | |
| | | | | | | | | | | | |
Total Canada | | | | | | | | | | | 37,177 | |
| | | | | | | | | | | | |
| |
| DENMARK 1.6% | |
| |
| HEALTH CARE 0.2% | |
| | | | |
H Lundbeck AS | | | | | 144,916 | | | | | | 809 | |
| | | | |
H Lundbeck AS ‘A’ | | | | | 315 | | | | | | 1 | |
| | | | | | | | | | | | |
| | | | | | | | | | | 810 | |
| | | | | | | | | | | | |
| |
| | | | | | | | | | | | |
| | | | | SHARES | | | | | MARKET
VALUE
(000S) | |
| INDUSTRIALS 1.4% | |
| | | | |
AP Moller - Maersk AS ‘B’ | | | | | 3,341 | | | $ | | | 5,794 | |
| | | | |
DS Norden AS | | | | | 5,824 | | | | | | 254 | |
| | | | |
ISS AS | | | | | 51,796 | | | | | | 889 | |
| | | | |
Svitzer AS (a) | | | | | 1,354 | | | | | | 51 | |
| | | | | | | | | | | | |
| | | | | | | | | | | 6,988 | |
| | | | | | | | | | | | |
Total Denmark | | | | | | | | | | | 7,798 | |
| | | | | | | | | | | | |
| |
| FINLAND 1.0% | |
| |
| CONSUMER STAPLES 0.2% | |
| | | | |
Kesko Oyj ‘B’ | | | | | 52,352 | | | | | | 921 | |
| | | | | | | | | | | | |
| |
| FINANCIALS 0.1% | |
| | | | |
Nordea Bank Abp | | | | | 69,362 | | | | | | 827 | |
| | | | | | | | | | | | |
| |
| INDUSTRIALS 0.1% | |
| | | | |
Wartsila Oyj Abp | | | | | 25,738 | | | | | | 499 | |
| | | | | | | | | | | | |
| |
| INFORMATION TECHNOLOGY 0.2% | |
| | | | |
Nokia Oyj | | | | | 220,972 | | | | | | 841 | |
| | | | | | | | | | | | |
| |
| MATERIALS 0.1% | |
| | | | |
Outokumpu Oyj | | | | | 91,558 | | | | | | 330 | |
| | | | | | | | | | | | |
| |
| UTILITIES 0.3% | |
| | | | |
Fortum Oyj | | | | | 97,395 | | | | | | 1,426 | |
| | | | | | | | | | | | |
Total Finland | | | | | | | | | | | 4,844 | |
| | | | | | | | | | | | |
| |
| FRANCE 5.1% | |
| |
| COMMUNICATION SERVICES 0.5% | |
| | | | |
Orange SA (a) | | | | | 263,893 | | | | | | 2,647 | |
| | | | | | | | | | | | |
| |
| CONSUMER STAPLES 1.5% | |
| | | | |
Carrefour SA | | | | | 222,399 | | | | | | 3,151 | |
| | | | |
Renault SA | | | | | 73,008 | | | | | | 3,744 | |
| | | | |
Valeo SE | | | | | 36,725 | | | | | | 393 | |
| | | | | | | | | | | | |
| | | | | | | | | | | 7,288 | |
| | | | | | | | | | | | |
| |
| FINANCIALS 0.4% | |
| | | | |
Amundi SA | | | | | 8,299 | | | | | | 537 | |
| | | | |
AXA SA | | | | | 46,357 | | | | | | 1,519 | |
| | | | | | | | | | | | |
| | | | | | | | | | | 2,056 | |
| | | | | | | | | | | | |
| |
| HEALTH CARE 1.4% | |
| | | | |
Sanofi | | | | | 67,933 | | | | | | 6,552 | |
| | | | | | | | | | | | |
| |
| INDUSTRIALS 1.3% | |
| | | | |
Bouygues SA | | | | | 26,285 | | | | | | 845 | |
| | | | |
Cie de Saint-Gobain SA | | | | | 71,008 | | | | | | 5,523 | |
| | | | | | | | | | | | |
| | | | | | | | | | | 6,368 | |
| | | | | | | | | | | | |
Total France | | | | | | | | | | | 24,911 | |
| | | | | | | | | | | | |
| |
| GERMANY 7.8% | |
| |
| CONSUMER DISCRETIONARY 3.0% | |
| | | | |
Adidas AG | | | | | 29,796 | | | | | | 7,114 | |
| | | | |
Bayerische Motoren Werke AG | | | | | 79,922 | | | | | | 7,560 | |
| | | | | | | | | | | | |
| | | | | | | | | | | 14,674 | |
| | | | | | | | | | | | |
| |
| | | | | | | | | | | | |
| See Accompanying Notes | | | ANNUAL FINANCIAL AND OTHER INFORMATION | | | | | | | JUNE 30, 2024 | | | 47 |
| | | | | | |
| Schedule of Investments | | PIMCO RAE International Fund | | (Cont.) | | |
| | | | | | | | | | | | |
| | | | | SHARES | | | | | MARKET
VALUE
(000S) | |
| CONSUMER STAPLES 0.4% | |
| | | | |
Continental AG | | | | | 30,861 | | | $ | | | 1,748 | |
| | | | | | | | | | | | |
| |
| HEALTH CARE 1.0% | |
| | | | |
Fresenius Medical Care AG & Co. KGaA | | | | | 49,665 | | | | | | 1,898 | |
| | | | |
Fresenius SE & Co. KGaA (a) | | | | | 104,805 | | | | | | 3,131 | |
| | | | | | | | | | | | |
| | | | | | | | | | | 5,029 | |
| | | | | | | | | | | | |
| |
| MATERIALS 3.4% | |
| | | | |
Aurubis AG | | | | | 8,750 | | | | | | 686 | |
| | | | |
BASF SE | | | | | 217,215 | | | | | | 10,501 | |
| | | | |
HeidelbergCement AG | | | | | 49,789 | | | | | | 5,147 | |
| | | | | | | | | | | | |
| | | | | | | | | | | 16,334 | |
| | | | | | | | | | | | |
Total Germany | | | | | | | | | | | 37,785 | |
| | | | | | | | | | | | |
| |
| HONG KONG 2.3% | |
| |
| COMMUNICATION SERVICES 0.0% | |
| | | | |
PCCW Ltd. | | | | | 236,000 | | | | | | 118 | |
| | | | | | | | | | | | |
| |
| CONSUMER STAPLES 0.6% | |
| | | | |
First Pacific Co. Ltd. | | | | | 322,000 | | | | | | 149 | |
| | | | |
Skyworth Group Ltd. | | | | | 1,414,215 | | | | | | 558 | |
| | | | |
WH Group Ltd. | | | | | 2,494,500 | | | | | | 1,642 | |
| | | | |
Yue Yuen Industrial Holdings Ltd. | | | | | 309,000 | | | | | | 595 | |
| | | | | | | | | | | | |
| | | | | | | | | | | 2,944 | |
| | | | | | | | | | | | |
| |
| INDUSTRIALS 0.2% | |
| | | | |
Hutchison Port Holdings Trust | | | | | 2,422,500 | | | | | | 310 | |
| | | | |
Jardine Matheson Holdings Ltd. | | | | | 9,300 | | | | | | 328 | |
| | | | |
SITC International Holdings Co. Ltd. | | | | | 89,000 | | | | | | 242 | |
| | | | | | | | | | | | |
| | | | | | | | | | | 880 | |
| | | | | | | | | | | | |
| |
| INFORMATION TECHNOLOGY 0.2% | |
| | | | |
Kingboard Holdings Ltd. | | | | | 273,500 | | | | | | 643 | |
| | | | |
Kingboard Laminates Holdings Ltd. | | | | | 386,000 | | | | | | 416 | |
| | | | | | | | | | | | |
| | | | | | | | | | | 1,059 | |
| | | | | | | | | | | | |
| |
| REAL ESTATE 1.2% | |
| | | | |
CK Asset Holdings Ltd. | | | | | 212,000 | | | | | | 794 | |
| | | | |
Kerry Properties Ltd. | | | | | 250,500 | | | | | | 436 | |
| | | | |
Sino Land Co. Ltd. | | | | | 46,000 | | | | | | 47 | |
| | | | |
Sun Hung Kai Properties Ltd. | | | | | 228,500 | | | | | | 1,980 | |
| | | | |
Swire Pacific Ltd. ‘A’ | | | | | 217,000 | | | | | | 1,916 | |
| | | | |
Wharf Holdings Ltd. | | | | | 274,000 | | | | | | 770 | |
| | | | | | | | | | | | |
| | | | | | | | | | | 5,943 | |
| | | | | | | | | | | | |
| |
| UTILITIES 0.1% | |
| | | | |
CLP Holdings Ltd. | | | | | 46,000 | | | | | | 372 | |
| | | | | | | | | | | | |
Total Hong Kong | | | | | | | | | | | 11,316 | |
| | | | | | | | | | | | |
| |
| ISRAEL 1.2% | |
| |
| COMMUNICATION SERVICES 0.2% | |
| | | | |
Bezeq The Israeli Telecommunication Corp. Ltd. | | | | | 794,026 | | | | | | 890 | |
| | | | | | | | | | | | |
| |
| ENERGY 0.1% | |
| | | | |
Delek Group Ltd. | | | | | 1,750 | | | | | | 184 | |
| | | | | | | | | | | | |
| | | | | SHARES | | | | | MARKET
VALUE
(000S) | |
| | | | |
Oil Refineries Ltd. | | | | | 1,919,281 | | | $ | | | 443 | |
| | | | |
Paz Oil Co. Ltd. | | | | | 2,651 | | | | | | 240 | |
| | | | | | | | | | | | |
| | | | | | | | | | | 867 | |
| | | | | | | | | | | | |
| |
| FINANCIALS 0.1% | |
| | | | |
Plus500 Ltd. | | | | | 10,910 | | | | | | 314 | |
| | | | | | | | | | | | |
| |
| INDUSTRIALS 0.6% | |
| | | | |
ZIM Integrated Shipping Services Ltd. | | | | | 128,321 | | | | | | 2,845 | |
| | | | | | | | | | | | |
| |
| INFORMATION TECHNOLOGY 0.2% | |
| | | | |
Check Point Software Technologies Ltd. (a) | | | | | 5,339 | | | | | | 881 | |
| | | | | | | | | | | | |
| |
| REAL ESTATE 0.0% | |
| | | | |
G City Ltd. (a) | | | | | 38,061 | | | | | | 89 | |
| | | | | | | | | | | | |
Total Israel | | | | | | | | | | | 5,886 | |
| | | | | | | | | | | | |
| |
| ITALY 1.6% | |
| |
| COMMUNICATION SERVICES 0.2% | |
| | | | |
Telecom Italia SpA (a) | | | | | 3,289,297 | | | | | | 787 | |
| | | | | | | | | | | | |
| |
| FINANCIALS 0.2% | |
| | | | |
Unipol Gruppo SpA | | | | | 89,367 | | | | | | 886 | |
| | | | | | | | | | | | |
| |
| INDUSTRIALS 0.1% | |
| | | | |
Leonardo SpA | | | | | 26,549 | | | | | | 615 | |
| | | | | | | | | | | | |
| |
| UTILITIES 1.1% | |
| | | | |
Enel SpA | | | | | 814,190 | | | | | | 5,650 | |
| | | | | | | | | | | | |
Total Italy | | | | | | | | | | | 7,938 | |
| | | | | | | | | | | | |
| |
| JAPAN 21.9% | |
| |
| COMMUNICATION SERVICES 0.2% | |
| | | | |
Fuji Media Holdings, Inc. | | | | | 16,800 | | | | | | 193 | |
| | | | |
KDDI Corp. | | | | | 5,000 | | | | | | 132 | |
| | | | |
Nippon Telegraph & Telephone Corp. | | | | | 527,200 | | | | | | 499 | |
| | | | |
Nippon Television Holdings, Inc. | | | | | 17,700 | | | | | | 257 | |
| | | | | | | | | | | | |
| | | | | | | | | | | 1,081 | |
| | | | | | | | | | | | |
| |
| CONSUMER STAPLES 4.3% | |
| | | | |
Arcs Co. Ltd. | | | | | 12,500 | | | | | | 226 | |
| | | | |
Bic Camera, Inc. | | | | | 27,000 | | | | | | 258 | |
| | | | |
Bridgestone Corp. | | | | | 15,700 | | | | | | 620 | |
| | | | |
Coca-Cola Bottlers Japan Holdings, Inc. | | | | | 32,500 | | | | | | 407 | |
| | | | |
DCM Holdings Co. Ltd. | | | | | 19,800 | | | | | | 180 | |
| | | | |
EDION Corp. | | | | | 88,100 | | | | | | 891 | |
| | | | |
H2O Retailing Corp. | | | | | 77,200 | | | | | | 1,144 | |
| | | | |
Isuzu Motors Ltd. | | | | | 71,200 | | | | | | 947 | |
| | | | |
Itoham Yonekyu Holdings, Inc. | | | | | 14,280 | | | | | | 382 | |
| | | | |
Izumi Co. Ltd. | | | | | 10,200 | | | | | | 205 | |
| | | | |
JTEKT Corp. | | | | | 14,100 | | | | | | 99 | |
| | | | |
K’s Holdings Corp. | | | | | 75,800 | | | | | | 714 | |
| | | | |
Kao Corp. | | | | | 16,700 | | | | | | 676 | |
| | | | |
Kewpie Corp. | | | | | 19,600 | | | | | | 390 | |
| | | | |
Mazda Motor Corp. | | | | | 317,300 | | | | | | 3,059 | |
| | | | |
MEIJI Holdings Co. Ltd. | | | | | 24,800 | | | | | | 536 | |
| | | | |
Mitsubishi Shokuhin Co. Ltd. | | | | | 6,500 | | | | | | 221 | |
| | | | | | | | | | | | |
| | | | | SHARES | | | | | MARKET
VALUE
(000S) | |
| | | | |
Morinaga Milk Industry Co. Ltd. | | | | | 19,700 | | | $ | | | 415 | |
| | | | |
Nissan Motor Co. Ltd. | | | | | 62,700 | | | | | | 213 | |
| | | | |
Paltac Corp. | | | | | 7,900 | | | | | | 216 | |
| | | | |
Panasonic Holdings Corp. | | | | | 192,600 | | | | | | 1,583 | |
| | | | |
Sekisui Chemical Co. Ltd. | | | | | 52,600 | | | | | | 730 | |
| | | | |
Sekisui House Ltd. | | | | | 46,200 | | | | | | 1,027 | |
| | | | |
Sharp Corp. (a) | | | | | 93,700 | | | | | | 542 | |
| | | | |
Shimamura Co. Ltd. | | | | | 14,000 | | | | | | 637 | |
| | | | |
Subaru Corp. | | | | | 93,100 | | | | | | 1,980 | |
| | | | |
Sugi Holdings Co. Ltd. | | | | | 43,500 | | | | | | 598 | |
| | | | |
Sundrug Co. Ltd. | | | | | 9,000 | | | | | | 227 | |
| | | | |
Tokai Rika Co. Ltd. | | | | | 10,000 | | | | | | 135 | |
| | | | |
Tsuruha Holdings, Inc. | | | | | 8,900 | | | | | | 506 | |
| | | | |
United Super Markets Holdings, Inc. (c) | | | | | 30,500 | | | | | | 166 | |
| | | | |
Yamada Holdings Co. Ltd. | | | | | 392,900 | | | | | | 1,057 | |
| | | | | | | | | | | | |
| | | | | | | | | | | 20,987 | |
| | | | | | | | | | | | |
| |
| FINANCIALS 5.8% | |
| | | | |
Japan Post Holdings Co. Ltd. | | | | | 1,948,100 | | | | | | 19,364 | |
| | | | |
Japan Post Insurance Co. Ltd. | | | | | 48,000 | | | | | | 934 | |
| | | | |
MS&AD Insurance Group Holdings, Inc. | | | | | 332,100 | | | | | | 7,414 | |
| | | | |
Sompo Holdings, Inc. | | | | | 30,300 | | | | | | 649 | |
| | | | | | | | | | | | |
| | | | | | | | | | | 28,361 | |
| | | | | | | | | | | | |
| |
| HEALTH CARE 1.0% | |
| | | | |
Alfresa Holdings Corp. | | | | | 69,000 | | | | | | 948 | |
| | | | |
Astellas Pharma, Inc. | | | | | 62,100 | | | | | | 613 | |
| | | | |
Medipal Holdings Corp. | | | | | 97,600 | | | | | | 1,488 | |
| | | | |
Sumitomo Pharma Co. Ltd. (a) | | | | | 64,200 | | | | | | 162 | |
| | | | |
Suzuken Co. Ltd. | | | | | 44,000 | | | | | | 1,342 | |
| | | | |
Toho Holdings Co. Ltd. | | | | | 5,200 | | | | | | 136 | |
| | | | | | | | | | | | |
| | | | | | | | | | | 4,689 | |
| | | | | | | | | | | | |
| |
| INDUSTRIALS 3.3% | |
| | | | |
AGC, Inc. (c) | | | | | 50,000 | | | | | | 1,627 | |
| | | | |
Amada Co. Ltd. | | | | | 71,800 | | | | | | 798 | |
| | | | |
Dai Nippon Printing Co. Ltd. | | | | | 68,800 | | | | | | 2,321 | |
| | | | |
Ebara Corp. | | | | | 29,000 | | | | | | 463 | |
| | | | |
EXEO Group, Inc. | | | | | 12,200 | | | | | | 122 | |
| | | | |
Hino Motors Ltd. (a) | | | | | 326,500 | | | | | | 852 | |
| | | | |
Inabata & Co. Ltd. | | | | | 19,600 | | | | | | 431 | |
| | | | |
Kajima Corp. | | | | | 15,400 | | | | | | 267 | |
| | | | |
Kamigumi Co. Ltd. | | | | | 9,500 | | | | | | 196 | |
| | | | |
Kandenko Co. Ltd. | | | | | 41,500 | | | | | | 446 | |
| | | | |
Kinden Corp. | | | | | 10,400 | | | | | | 208 | |
| | | | |
Mitsubishi Electric Corp. | | | | | 147,700 | | | | | | 2,367 | |
| | | | |
Nippon Express Holdings, Inc. | | | | | 2,500 | | | | | | 116 | |
| | | | |
Nisshinbo Holdings, Inc. | | | | | 29,400 | | | | | | 197 | |
| | | | |
Persol Holdings Co. Ltd. | | | | | 641,000 | | | | | | 888 | |
| | | | |
Sankyu, Inc. | | | | | 5,000 | | | | | | 171 | |
| | | | |
Secom Co. Ltd. | | | | | 4,500 | | | | | | 266 | |
| | | | |
Seino Holdings Co. Ltd. | | | | | 34,900 | | | | | | 473 | |
| | | | |
Sohgo Security Services Co. Ltd. | | | | | 26,400 | | | | | | 154 | |
| | | | |
Sumitomo Heavy Industries Ltd. | | | | | 15,300 | | | | | | 399 | |
| | | | |
Taisei Corp. | | | | | 11,000 | | | | | | 409 | |
| | | | |
TOPPAN Holdings, Inc. | | | | | 31,800 | | | | | | 882 | |
| | | | |
Yamato Holdings Co. Ltd. | | | | | 172,100 | | | | | | 1,897 | |
| | | | | | | | | | | | |
| | | | | | | | | | | 15,950 | |
| | | | | | | | | | | | |
| |
| INFORMATION TECHNOLOGY 3.3% | |
| | | | |
Alps Alpine Co. Ltd. | | | | | 67,400 | | | | | | 646 | |
| | | | | | |
| 48 | | PIMCO EQUITY SERIES | | | See Accompanying Notes | |
| | | | | | | | | | | | |
| | | | | SHARES | | | | | MARKET
VALUE
(000S) | |
| | | | |
Brother Industries Ltd. | | | | | 20,900 | | | $ | | | 369 | |
| | | | |
Canon Marketing Japan, Inc. | | | | | 11,900 | | | | | | 332 | |
| | | | |
Canon, Inc. (c) | | | | | 238,150 | | | | | | 6,460 | |
| | | | |
Fujitsu Ltd. | | | | | 170,700 | | | | | | 2,677 | |
| | | | |
Konica Minolta, Inc. | | | | | 193,300 | | | | | | 538 | |
| | | | |
NEC Corp. | | | | | 16,800 | | | | | | 1,385 | |
| | | | |
Nippon Electric Glass Co. Ltd. | | | | | 16,500 | | | | | | 377 | |
| | | | |
Otsuka Corp. | | | | | 41,400 | | | | | | 799 | |
| | | | |
Ricoh Co. Ltd. | | | | | 161,900 | | | | | | 1,388 | |
| | | | |
SCREEN Holdings Co. Ltd. | | | | | 9,200 | | | | | | 834 | |
| | | | |
Seiko Epson Corp. | | | | | 28,400 | | | | | | 444 | |
| | | | | | | | | | | | |
| | | | | | | | | | | 16,249 | |
| | | | | | | | | | | | |
| |
| MATERIALS 2.0% | |
| | | | |
Daicel Corp. | | | | | 104,600 | | | | | | 1,007 | |
| | | | |
Denka Co. Ltd. | | | | | 18,200 | | | | | | 245 | |
| | | | |
DIC Corp. | | | | | 16,300 | | | | | | 310 | |
| | | | |
Dowa Holdings Co. Ltd. | | | | | 2,300 | | | | | | 82 | |
| | | | |
JFE Holdings, Inc. | | | | | 24,200 | | | | | | 349 | |
| | | | |
Kaneka Corp. | | | | | 14,600 | | | | | | 385 | |
| | | | |
Kuraray Co. Ltd. (c) | | | | | 68,100 | | | | | | 788 | |
| | | | |
Mitsubishi Chemical Group Corp. | | | | | 160,300 | | | | | | 893 | |
| | | | |
Mitsubishi Materials Corp. | | | | | 13,400 | | | | | | 246 | |
| | | | |
Mitsui Mining & Smelting Co. Ltd. | | | | | 21,000 | | | | | | 673 | |
| | | | |
Nitto Denko Corp. | | | | | 16,900 | | | | | | 1,341 | |
| | | | |
Resonac Holdings Corp. | | | | | 35,900 | | | | | | 793 | |
| | | | |
Taiheiyo Cement Corp. | | | | | 28,700 | | | | | | 722 | |
| | | | |
Tosoh Corp. | | | | | 23,500 | | | | | | 308 | |
| | | | |
Toyo Seikan Group Holdings Ltd. | | | | | 91,100 | | | | | | 1,432 | |
| | | | |
UBE Corp. | | | | | 27,200 | | | | | | 480 | |
| | | | | | | | | | | | |
| | | | | | | | | | | 10,054 | |
| | | | | | | | | | | | |
| |
| REAL ESTATE 0.9% | |
| | | | |
Daito Trust Construction Co. Ltd. | | | | | 41,500 | | | | | | 4,296 | |
| | | | |
Nomura Real Estate Holdings, Inc. | | | | | 3,500 | | | | | | 88 | |
| | | | | | | | | | | | |
| | | | | | | | | | | 4,384 | |
| | | | | | | | | | | | |
| |
| UTILITIES 1.1% | |
| | | | |
Chubu Electric Power Co., Inc. | | | | | 176,100 | | | | | | 2,080 | |
| | | | |
Electric Power Development Co. Ltd. ‘C’ | | | | | 89,100 | | | | | | 1,393 | |
| | | | |
Kansai Electric Power Co., Inc. | | | | | 25,800 | | | | | | 433 | |
| | | | |
Shikoku Electric Power Co., Inc. | | | | | 17,500 | | | | | | 151 | |
| | | | |
Tohoku Electric Power Co., Inc. | | | | | 123,900 | | | | | | 1,120 | |
| | | | | | | | | | | | |
| | | | | | | | | | | 5,177 | |
| | | | | | | | | | | | |
Total Japan | | | | | | | | | | | 106,932 | |
| | | | | | | | | | | | |
| |
| LUXEMBOURG 1.7% | |
| |
| MATERIALS 1.7% | |
| | | | |
ArcelorMittal SA | | | | | 361,364 | | | | | | 8,279 | |
| | | | | | | | | | | | |
Total Luxembourg | | | | | | | | | | | 8,279 | |
| | | | | | | | | | | | |
| |
| NETHERLANDS 6.9% | |
| |
| CONSUMER STAPLES 3.4% | |
| | | | |
Koninklijke Ahold Delhaize NV | | | | | 561,642 | | | | | | 16,527 | |
| | | | | | | | | | | | |
| |
| FINANCIALS 1.2% | |
| | | | |
NN Group NV | | | | | 121,860 | | | | | | 5,664 | |
| | | | | | | | | | | | |
| |
| | | | | | | | | | | | |
| | | | | SHARES | | | | | MARKET
VALUE
(000S) | |
| INDUSTRIALS 0.8% | |
| | | | |
Randstad NV | | | | | 88,862 | | | $ | | | 4,035 | |
| | | | | | | | | | | | |
| |
| INFORMATION TECHNOLOGY 0.5% | |
| | | | |
NXP Semiconductors NV | | | | | 9,214 | | | | | | 2,479 | |
| | | | | | | | | | | | |
| |
| MATERIALS 1.0% | |
| | | | |
Akzo Nobel NV | | | | | 80,313 | | | | | | 4,895 | |
| | | | | | | | | | | | |
Total Netherlands | | | | | | | | | | | 33,600 | |
| | | | | | | | | | | | |
| |
| NEW ZEALAND 0.2% | |
| |
| COMMUNICATION SERVICES 0.0% | |
| | | | |
Spark New Zealand Ltd. | | | | | 101,057 | | | | | | 256 | |
| | | | | | | | | | | | |
| |
| INDUSTRIALS 0.1% | |
| | | | |
Air New Zealand Ltd. | | | | | 322,547 | | | | | | 104 | |
| | | | |
Fletcher Building Ltd. | | | | | 181,609 | | | | | | 313 | |
| | | | | | | | | | | | |
| | | | | | | | | | | 417 | |
| | | | | | | | | | | | |
| |
| UTILITIES 0.1% | |
| | | | |
Contact Energy Ltd. | | | | | 49,990 | | | | | | 274 | |
| | | | | | | | | | | | |
Total New Zealand | | | | | | | | | | | 947 | |
| | | | | | | | | | | | |
| |
| NORWAY 0.9% | |
| |
| COMMUNICATION SERVICES 0.4% | |
| | | | |
Telenor ASA | | | | | 153,639 | | | | | | 1,751 | |
| | | | | | | | | | | | |
| |
| CONSUMER STAPLES 0.1% | |
| | | | |
Mowi ASA | | | | | 25,616 | | | | | | 426 | |
| | | | | | | | | | | | |
| |
| ENERGY 0.0% | |
| | | | |
DNO ASA | | | | | 151,759 | | | | | | 159 | |
| | | | | | | | | | | | |
| |
| INDUSTRIALS 0.1% | |
| | | | |
Golden Ocean Group Ltd. | | | | | 20,979 | | | | | | 291 | |
| | | | | | | | | | | | |
| |
| MATERIALS 0.3% | |
| | | | |
Yara International ASA | | | | | 54,705 | | | | | | 1,576 | |
| | | | | | | | | | | | |
Total Norway | | | | | | | | | | | 4,203 | |
| | | | | | | | | | | | |
| |
| PORTUGAL 0.2% | |
| |
| CONSUMER STAPLES 0.1% | |
| | | | |
Sonae SGPS SA | | | | | 389,923 | | | | | | 365 | |
| | | | | | | | | | | | |
| |
| MATERIALS 0.1% | |
| | | | |
Navigator Co. SA | | | | | 148,137 | | | | | | 616 | |
| | | | | | | | | | | | |
Total Portugal | | | | | | | | | | | 981 | |
| | | | | | | | | | | | |
| |
| RUSSIA 0.0% | |
| |
| MATERIALS 0.0% | |
| | | | |
Evraz PLC «(a) | | | | | 238,175 | | | | | | 0 | |
| | | | | | | | | | | | |
Total Russia | | | | | | | | | | | 0 | |
| | | | | | | | | | | | |
| |
| SINGAPORE 0.4% | |
| |
| COMMUNICATION SERVICES 0.2% | |
| | | | |
JOYY, Inc. ADR | | | | | 27,508 | | | | | | 828 | |
| | | | | | | | | | | | |
| |
| | | | | | | | | | | | |
| | | | | SHARES | | | | | MARKET
VALUE
(000S) | |
| INDUSTRIALS 0.2% | |
| | | | |
ComfortDelGro Corp. Ltd. | | | | | 772,200 | | | $ | | | 763 | |
| | | | |
Jardine Cycle & Carriage Ltd. | | | | | 26,500 | | | | | | 518 | |
| | | | | | | | | | | | |
| | | | | | | | | | | 1,281 | |
| | | | | | | | | | | | |
Total Singapore | | | | | | | | | | | 2,109 | |
| | | | | | | | | | | | |
| |
| SPAIN 3.6% | |
| |
| COMMUNICATION SERVICES 2.2% | |
| | | | |
Telefonica SA (c) | | | | | 2,490,648 | | | | | | 10,551 | |
| | | | | | | | | | | | |
| |
| FINANCIALS 0.4% | |
| | | | |
Mapfre SA | | | | | 800,337 | | | | | | 1,845 | |
| | | | | | | | | | | | |
| |
| INDUSTRIALS 0.2% | |
| | | | |
ACS Actividades de Construccion y Servicios SA | | | | | 28,195 | | | | | | 1,218 | |
| | | | | | | | | | | | |
| |
| UTILITIES 0.8% | |
| | | | |
Endesa SA | | | | | 85,037 | | | | | | 1,598 | |
| | | | |
Naturgy Energy Group SA | | | | | 114,889 | | | | | | 2,497 | |
| | | | | | | | | | | | |
| | | | | | | | | | | 4,095 | |
| | | | | | | | | | | | |
Total Spain | | | | | | | | | | | 17,709 | |
| | | | | | | | | | | | |
| |
| SWEDEN 3.3% | |
| |
| COMMUNICATION SERVICES 0.2% | |
| | | | |
Telia Co. AB | | | | | 370,614 | | | | | | 994 | |
| | | | | | | | | | | | |
| |
| CONSUMER DISCRETIONARY 0.1% | |
| | | | |
Autoliv, Inc. | | | | | 5,202 | | | | | | 556 | |
| | | | | | | | | | | | |
| |
| CONSUMER STAPLES 0.9% | |
| | | | |
Electrolux AB ‘B’ (a) | | | | | 109,284 | | | | | | 903 | |
| | | | |
H & M Hennes & Mauritz AB ‘B’ | | | | | 216,928 | | | | | | 3,436 | |
| | | | | | | | | | | | |
| | | | | | | | | | | 4,339 | |
| | | | | | | | | | | | |
| |
| INDUSTRIALS 2.0% | |
| | | | |
Peab AB ‘B’ | | | | | 37,911 | | | | | | 238 | |
| | | | |
Securitas AB ‘B’ | | | | | 94,552 | | | | | | 937 | |
| | | | |
Skanska AB ‘B’ | | | | | 26,501 | | | | | | 478 | |
| | | | |
Volvo AB ‘B’ | | | | | 302,291 | | | | | | 7,767 | |
| | | | | | | | | | | | |
| | | | | | | | | | | 9,420 | |
| | | | | | | | | | | | |
| |
| REAL ESTATE 0.1% | |
| | | | |
Samhallsbyggnadsbolaget i Norden AB (c) | | | | | 1,248,604 | | | | | | 637 | |
| | | | | | | | | | | | |
Total Sweden | | | | | | | | | | | 15,946 | |
| | | | | | | | | | | | |
| |
| SWITZERLAND 8.0% | |
| |
| CONSUMER STAPLES 0.4% | |
| | | | |
Swatch Group AG | | | | | 8,634 | | | | | | 1,769 | |
| | | | | | | | | | | | |
| |
| FINANCIALS 0.2% | |
| | | | |
Swiss Life Holding AG | | | | | 167 | | | | | | 122 | |
| | | | |
Zurich Insurance Group AG | | | | | 1,854 | | | | | | 988 | |
| | | | | | | | | | | | |
| | | | | | | | | | | 1,110 | |
| | | | | | | | | | | | |
| |
| HEALTH CARE 5.3% | |
| | | | |
Novartis AG | | | | | 101,252 | | | | | | 10,780 | |
| | | | | | | | | | | | |
| See Accompanying Notes | | | ANNUAL FINANCIAL AND OTHER INFORMATION | | | | | | | JUNE 30, 2024 | | | 49 |
| | | | | | |
| Schedule of Investments | | PIMCO RAE International Fund | | (Cont.) | | |
| | | | | | | | | | | | |
| | | | | SHARES | | | | | MARKET
VALUE
(000S) | |
| | | | |
Roche Holding AG | | | | | 54,620 | | | $ | | | 15,133 | |
| | | | | | | | | | | | |
| | | | | | | | | | | 25,913 | |
| | | | | | | | | | | | |
| |
| INDUSTRIALS 0.7% | |
| | | | |
Adecco Group AG | | | | | 95,672 | | | | | | 3,174 | |
| | | | | | | | | | | | |
| |
| MATERIALS 1.4% | |
| | | | |
Glencore PLC | | | | | 1,093,332 | | | | | | 6,222 | |
| | | | |
Holcim AG | | | | | 9,654 | | | | | | 853 | |
| | | | | | | | | | | | |
| | | | | | | | | | | 7,075 | |
| | | | | | | | | | | | |
Total Switzerland | | | | | | | | | | | 39,041 | |
| | | | | | | | | | | | |
| |
| UNITED KINGDOM 14.3% | |
| |
| COMMUNICATION SERVICES 1.9% | |
| | | | |
BT Group PLC | | | | | 928,593 | | | | | | 1,646 | |
| | | | |
Vodafone Group PLC | | | | | 8,864,085 | | | | | | 7,843 | |
| | | | | | | | | | | | |
| | | | | | | | | | | 9,489 | |
| | | | | | | | | | | | |
| |
| CONSUMER DISCRETIONARY 0.4% | |
| | | | |
Barratt Developments PLC | | | | | 303,165 | | | | | | 1,801 | |
| | | | |
Berkeley Group Holdings PLC | | | | | 6,082 | | | | | | 351 | |
| | | | | | | | | | | | |
| | | | | | | | | | | 2,152 | |
| | | | | | | | | | | | |
| |
| CONSUMER STAPLES 3.1% | |
| | | | |
Currys PLC (a) | | | | | 492,800 | | | | | | 449 | |
| | | | |
Imperial Brands PLC | | | | | 151,541 | | | | | | 3,878 | |
| | | | |
Kingfisher PLC | | | | | 751,588 | | | | | | 2,357 | |
| | | | |
Marks & Spencer Group PLC | | | | | 765,090 | | | | | | 2,766 | |
| | | | |
Persimmon PLC | | | | | 195,170 | | | | | | 3,312 | |
| | | | |
Taylor Wimpey PLC | | | | | 1,230,141 | | | | | | 2,203 | |
| | | | | | | | | | | | |
| | | | | | | | | | | 14,965 | |
| | | | | | | | | | | | |
| |
| FINANCIALS 1.5% | |
| | | | |
abrdn PLC | | | | | 532,298 | | | | | | 994 | |
| | | | |
Direct Line Insurance Group PLC | | | | | 840,064 | | | | | | 2,130 | |
| | | | |
M&G PLC | | | | | 1,544,656 | | | | | | 3,971 | |
| | | | | | | | | | | | |
| | | | | | | | | | | 7,095 | |
| | | | | | | | | | | | |
| |
| HEALTH CARE 2.7% | |
| | | | |
GSK PLC | | | | | 679,709 | | | | | | 13,074 | |
| | | | | | | | | | | | |
| |
| | | | | | | | | | | | |
| | | | | SHARES | | | | | MARKET
VALUE
(000S) | |
| INDUSTRIALS 0.6% | |
| | | | |
International Distributions Services PLC (a) | | | | | 722,349 | | | $ | | | 2,916 | |
| | | | | | | | | | | | |
| |
| INFORMATION TECHNOLOGY 0.0% | |
| | | | |
Pearson PLC | | | | | 13,688 | | | | | | 171 | |
| | | | | | | | | | | | |
| |
| MATERIALS 2.4% | |
| | | | |
Johnson Matthey PLC | | | | | 63,778 | | | | | | 1,263 | |
| | | | |
Rio Tinto PLC | | | | | 158,089 | | | | | | 10,374 | |
| | | | | | | | | | | | |
| | | | | | | | | | | 11,637 | |
| | | | | | | | | | | | |
| |
| UTILITIES 1.7% | |
| | | | |
Centrica PLC | | | | | 4,719,691 | | | | | | 8,045 | |
| | | | | | | | | | | | |
Total United Kingdom | | | | | | | | | | | 69,544 | |
| | | | | | | | | | | | |
Total Common Stocks (Cost $402,672) | | | | | | 467,902 | |
| | | | | | | | | | | | |
| |
| PREFERRED STOCKS 2.0% | |
| |
| GERMANY 2.0% | |
| |
| INDUSTRIALS 2.0% | |
| | | | |
Schaeffler AG | | | | | 142,261 | | | | | | 820 | |
| | | | |
Volkswagen AG | | | | | 80,584 | | | | | | 9,099 | |
| | | | | | | | | | | | |
| | | | | | | | | | | 9,919 | |
| | | | | | | | | | | | |
Total Preferred Stocks (Cost $10,785) | | | | | | 9,919 | |
| | | | | | | | | | | | |
| |
| REAL ESTATE INVESTMENT TRUSTS 0.5% | |
| |
| AUSTRALIA 0.3% | |
| |
| REAL ESTATE 0.3% | |
| | | | |
Scentre Group | | | | | 218,361 | | | | | | 453 | |
| | | | |
Stockland | | | | | 241,217 | | | | | | 668 | |
| | | | | | | | | | | | |
| | | | | | | | | | | 1,121 | |
| | | | | | | | | | | | |
Total Australia | | | | | | | | | | | 1,121 | |
| | | | | | | | | | | | |
| |
| CANADA 0.2% | |
| |
| REAL ESTATE 0.2% | |
| | | | |
H&R Real Estate Investment Trust | | | | | 105,286 | | | | | | 689 | |
| | | | | | | | | | | | |
| | | | | SHARES | | | | | MARKET
VALUE
(000S) | |
| | | | |
RioCan Real Estate Investment Trust | | | | | 26,342 | | | $ | | | 323 | |
| | | | | | | | | | | | |
| | | | | | | | | | | 1,012 | |
| | | | | | | | | | | | |
Total Canada | | | | | | | | | | | 1,012 | |
| | | | | | | | | | | | |
Total Real Estate Investment Trusts
(Cost $1,907) | | | 2,133 | |
| | | | | | | | | | | | |
| |
| WARRANTS 0.0% | |
| |
| SPAIN 0.0% | |
| |
| INDUSTRIALS 0.0% | |
| | | | |
Abengoa SA ‘B’ - Exp. 03/31/2025 « | | | | | 226,011 | | | | | | 0 | |
| | | | | | | | | | | | |
Total Warrants (Cost $0) | | | | | | | | | | | 0 | |
| | | | | | | | | | | | |
| |
| SHORT-TERM INSTRUMENTS 0.6% | |
| | | | | | | | | | | | |
| REPURCHASE AGREEMENTS (e) 0.6% | |
| | | | | | | | | | | 2,737 | |
| | | | | | | | | | | | |
Total Short-Term Instruments
(Cost $2,737) | | | | | | 2,737 | |
| | | | | | | | | | | | |
| | | | |
| | | | | | | | | | | | |
Total Investments in Securities
(Cost $418,101) | | | | | | 482,691 | |
| | | | | | | | | | | | |
| |
| INVESTMENTS IN AFFILIATES 3.4% | |
| |
| SHORT-TERM INSTRUMENTS 3.4% | |
| |
| MUTUAL FUNDS 3.4% | |
|
PIMCO Government Money Market Fund | |
5.470% (b)(c)(d) | | | | | 16,687,719 | | | | | | 16,688 | |
| | | | | | | | | | | | |
Total Short-Term Instruments
(Cost $16,688) | | | | | | | | | | | 16,688 | |
| | | | | | | | | | | | |
| | | | |
| | | | | | | | | | | | |
Total Investments in Affiliates
(Cost $16,688) | | | | | | | | | | | 16,688 | |
| | | | |
| | | | | | | | | | | | |
Total Investments 102.4%
(Cost $434,789) | | | | | | | | $ | | | 499,379 | |
| |
| Other Assets and Liabilities, net (2.4)% | | | | | | (11,559 | ) |
| | | | | | | | | | | | |
| Net Assets 100.0% | | | | | | | | $ | | | 487,820 | |
| | | | | | | | | | | | |
NOTES TO SCHEDULE OF INVESTMENTS:
| * | A zero balance may reflect actual amounts rounding to less than one thousand. |
| « | Security valued using significant unobservable inputs (Level 3). |
| (a) | Security did not produce income within the last twelve months. |
| (b) | Institutional Class Shares of each Fund. |
| (c) | Securities with an aggregate market value of $15,733 were out on loan in exchange for $16,688 of cash collateral as of June 30, 2024. The collateral was invested in a cash collateral reinvestment vehicle as described in Note 5 in the Notes to Financial Statements. |
| (d) | Coupon represents a 7-Day Yield. |
BORROWINGS AND OTHER FINANCING TRANSACTIONS
(e) REPURCHASE AGREEMENTS:
| | | | | | | | | | | | | | | | | | | | | | | | | | | | | | |
| Counterparty | | Lending
Rate | | | Settlement
Date | | | Maturity
Date | | | Principal
Amount | | | Collateralized By | | Collateral
(Received) | | | Repurchase
Agreements,
at Value | | | Repurchase
Agreement
Proceeds
to be
Received(1) | |
| FICC | | | 2.600 | % | | | 06/28/2024 | | | | 07/01/2024 | | | $ | 2,737 | | | U.S. Treasury Inflation Protected Securities 0.625% due 01/15/2026 | | $ | (2,792 | ) | | $ | 2,737 | | | $ | 2,738 | |
| | | | | | | | | | | | | | | | | | | | | | | | | | | | | | |
Total Repurchase Agreements | | | | | $ | (2,792 | ) | | $ | 2,737 | | | $ | 2,738 | |
| | | | | | | | | | | | | | | |
| | | | | | |
| 50 | | PIMCO EQUITY SERIES | | | See Accompanying Notes | |
BORROWINGS AND OTHER FINANCING TRANSACTIONS SUMMARY
The following is a summary by counterparty of the market value of Borrowings and Other Financing Transactions and collateral pledged/(received) as of June 30, 2024:
| | | | | | | | | | | | | | | | | | | | | | | | | | | | |
| Counterparty | | Repurchase
Agreement
Proceeds
to be
Received(1) | | | Payable for
Reverse
Repurchase
Agreements | | | Payable for
Sale-Buyback
Transactions | | | Securities
out on loan | | | Total
Borrowings and
Other Financing
Transactions | | | Collateral
Pledged/(Received) | | | Net Exposure(2) | |
Global/Master Repurchase Agreement | |
FICC | | $ | 2,738 | | | $ | 0 | | | $ | 0 | | | $ | 0 | | | $ | 2,738 | | | $ | (2,792 | ) | | $ | (54 | ) |
|
Master Securities Lending Agreement | |
BCY | | | 0 | | | | 0 | | | | 0 | | | | 340 | | | | 340 | | | | (433 | ) | | | (93 | ) |
BSN | | | 0 | | | | 0 | | | | 0 | | | | 267 | | | | 267 | | | | (341 | ) | | | (74 | ) |
GSC | | | 0 | | | | 0 | | | | 0 | | | | 8,322 | | | | 8,322 | | | | (8,740 | ) | | | (418 | ) |
MBC | | | 0 | | | | 0 | | | | 0 | | | | 6,804 | | | | 6,804 | | | | (7,174 | ) | | | (370 | ) |
| | | | | | | | | | | | | | | | | | | | | | | | | | | | |
Total Borrowings and Other Financing Transactions | | $ | 2,738 | | | $ | 0 | | | $ | 0 | | | $ | 15,733 | | | | | | | | | | | | | |
| | | | | | | | | | | | | | | | | | | | | | | | | | | | |
CERTAIN TRANSFERS ACCOUNTED FOR AS SECURED BORROWINGS
Remaining Contractual Maturity of the Agreements
| | | | | | | | | | | | | | | | | | | | |
| | | Overnight and
Continuous | | | Up to 30 days | | | 31-90 days | | | Greater Than 90 days | | | Total | |
Securities Lending Transactions(3) | |
Common Stocks | | $ | 16,688 | | | $ | 0 | | | $ | 0 | | | $ | 0 | | | $ | 16,688 | |
| | | | | | | | | | | | | | | | | | | | |
Total Borrowings | | $ | 16,688 | | | $ | 0 | | | $ | 0 | | | $ | 0 | | | $ | 16,688 | |
| | | | | | | | | | | | | | | | | | | | |
Payable for securities on loan - cash collateral | | | $ | 16,688 | |
| | | | | |
| (1) | Includes accrued interest. |
| (2) | Net Exposure represents the net receivable/(payable) that would be due from/to the counterparty in the event of default. Exposure from borrowings and other financing transactions can only be netted across transactions governed under the same master agreement with the same legal entity. See Note 8, Master Netting Arrangements, in the Notes to Financial Statements for more information. |
| (3) | Includes cash as described in Note 5 in the Notes to Financial Statements. |
FAIR VALUE OF FINANCIAL DERIVATIVE INSTRUMENTS
The following is a summary of the fair valuation of the Fund’s derivative instruments categorized by risk exposure. See Note 7, Principal and Other Risks, in the Notes to Financial Statements on risks of the Fund.
The effect of Financial Derivative Instruments on the Statements of Operations for the period ended June 30, 2024:
| | | | | | | | | | | | | | | | | | | | | | | | |
| | | Derivatives not accounted for as hedging instruments | |
| | | Commodity
Contracts | | | Credit
Contracts | | | Equity
Contracts | | | Foreign
Exchange
Contracts | | | Interest
Rate Contracts | | | Total | |
Net Realized Gain (Loss) on Financial Derivative Instruments | |
Over the counter | |
Forward Foreign Currency Contracts | | $ | 0 | | | $ | 0 | | | $ | 0 | | | $ | (19 | ) | | $ | 0 | | | $ | (19 | ) |
| | | | | | | | | | | | | | | | | | | | | | | | |
FAIR VALUE MEASUREMENTS
The following is a summary of the fair valuations according to the inputs used as of June 30, 2024 in valuing the Fund’s assets and liabilities:
| | | | | | | | | | | | | | | | |
| Category and Subcategory | | Level 1 | | | Level 2 | | | Level 3 | | | Fair
Value at
06/30/2024 | |
Investments in Securities, at Value | |
Common Stocks | |
Australia | |
Communication Services | | $ | 0 | | | $ | 1,081 | | | $ | 0 | | | $ | 1,081 | |
Consumer Staples | | | 0 | | | | 827 | | | | 0 | | | | 827 | |
Energy | | | 0 | | | | 1,791 | | | | 0 | | | | 1,791 | |
Financials | | | 0 | | | | 4,496 | | | | 0 | | | | 4,496 | |
Industrials | | | 0 | | | | 2,223 | | | | 0 | | | | 2,223 | |
Materials | | | 0 | | | | 6,743 | | | | 0 | | | | 6,743 | |
Real Estate | | | 0 | | | | 227 | | | | 0 | | | | 227 | |
Utilities | | | 0 | | | | 6,391 | | | | 0 | | | | 6,391 | |
| | | | | | | | | | | | | | | | |
| Category and Subcategory | | Level 1 | | | Level 2 | | | Level 3 | | | Fair
Value at
06/30/2024 | |
Austria | |
Financials | | $ | 246 | | | $ | 0 | | | $ | 0 | | | $ | 246 | |
Industrials | | | 96 | | | | 0 | | | | 0 | | | | 96 | |
Materials | | | 0 | | | | 1,294 | | | | 0 | | | | 1,294 | |
Belgium | |
Communication Services | | | 0 | | | | 901 | | | | 0 | | | | 901 | |
Consumer Staples | | | 768 | | | | 0 | | | | 0 | | | | 768 | |
Financials | | | 0 | | | | 1,437 | | | | 0 | | | | 1,437 | |
Health Care | | | 0 | | | | 2,207 | | | | 0 | | | | 2,207 | |
Industrials | | | 228 | | | | 0 | | | | 0 | | | | 228 | |
Canada | |
Consumer Staples | | | 11,374 | | | | 0 | | | | 0 | | | | 11,374 | |
| | | | | | | | | | | | |
| See Accompanying Notes | | | ANNUAL FINANCIAL AND OTHER INFORMATION | | | | | | | JUNE 30, 2024 | | | 51 |
| | | | | | |
| Schedule of Investments | | PIMCO RAE International Fund | | (Cont.) | | June 30, 2024 |
| | | | | | | | | | | | | | | | |
| Category and Subcategory | | Level 1 | | | Level 2 | | | Level 3 | | | Fair
Value at
06/30/2024 | |
Energy | | $ | 14,020 | | | $ | 0 | | | $ | 0 | | | $ | 14,020 | |
Financials | | | 4,721 | | | | 0 | | | | 0 | | | | 4,721 | |
Health Care | | | 1,277 | | | | 0 | | | | 0 | | | | 1,277 | |
Industrials | | | 1,360 | | | | 0 | | | | 0 | | | | 1,360 | |
Information Technology | | | 1,965 | | | | 0 | | | | 0 | | | | 1,965 | |
Materials | | | 1,167 | | | | 0 | | | | 0 | | | | 1,167 | |
Utilities | | | 1,293 | | | | 0 | | | | 0 | | | | 1,293 | |
Denmark | |
Health Care | | | 809 | | | | 1 | | | | 0 | | | | 810 | |
Industrials | | | 51 | | | | 6,937 | | | | 0 | | | | 6,988 | |
Finland | |
Consumer Staples | | | 0 | | | | 921 | | | | 0 | | | | 921 | |
Financials | | | 0 | | | | 827 | | | | 0 | | | | 827 | |
Industrials | | | 0 | | | | 499 | | | | 0 | | | | 499 | |
Information Technology | | | 0 | | | | 841 | | | | 0 | | | | 841 | |
Materials | | | 0 | | | | 330 | | | | 0 | | | | 330 | |
Utilities | | | 0 | | | | 1,426 | | | | 0 | | | | 1,426 | |
France | |
Communication Services | | | 0 | | | | 2,647 | | | | 0 | | | | 2,647 | |
Consumer Staples | | | 0 | | | | 7,288 | | | | 0 | | | | 7,288 | |
Financials | | | 0 | | | | 2,056 | | | | 0 | | | | 2,056 | |
Health Care | | | 0 | | | | 6,552 | | | | 0 | | | | 6,552 | |
Industrials | | | 0 | | | | 6,368 | | | | 0 | | | | 6,368 | |
Germany | |
Consumer Discretionary | | | 0 | | | | 14,674 | | | | 0 | | | | 14,674 | |
Consumer Staples | | | 0 | | | | 1,748 | | | | 0 | | | | 1,748 | |
Health Care | | | 0 | | | | 5,029 | | | | 0 | | | | 5,029 | |
Materials | | | 0 | | | | 16,334 | | | | 0 | | | | 16,334 | |
Hong Kong | |
Communication Services | | | 0 | | | | 118 | | | | 0 | | | | 118 | |
Consumer Staples | | | 0 | | | | 2,944 | | | | 0 | | | | 2,944 | |
Industrials | | | 310 | | | | 570 | | | | 0 | | | | 880 | |
Information Technology | | | 0 | | | | 1,059 | | | | 0 | | | | 1,059 | |
Real Estate | | | 0 | | | | 5,943 | | | | 0 | | | | 5,943 | |
Utilities | | | 0 | | | | 372 | | | | 0 | | | | 372 | |
Israel | |
Communication Services | | | 0 | | | | 890 | | | | 0 | | | | 890 | |
Energy | | | 0 | | | | 867 | | | | 0 | | | | 867 | |
Financials | | | 0 | | | | 314 | | | | 0 | | | | 314 | |
Industrials | | | 2,845 | | | | 0 | | | | 0 | | | | 2,845 | |
Information Technology | | | 881 | | | | 0 | | | | 0 | | | | 881 | |
Real Estate | | | 89 | | | | 0 | | | | 0 | | | | 89 | |
Italy | |
Communication Services | | | 0 | | | | 787 | | | | 0 | | | | 787 | |
Financials | | | 0 | | | | 886 | | | | 0 | | | | 886 | |
Industrials | | | 0 | | | | 615 | | | | 0 | | | | 615 | |
Utilities | | | 0 | | | | 5,650 | | | | 0 | | | | 5,650 | |
Japan | |
Communication Services | | | 0 | | | | 1,081 | | | | 0 | | | | 1,081 | |
Consumer Staples | | | 963 | | | | 20,024 | | | | 0 | | | | 20,987 | |
Financials | | | 0 | | | | 28,361 | | | | 0 | | | | 28,361 | |
Health Care | | | 0 | | | | 4,689 | | | | 0 | | | | 4,689 | |
Industrials | | | 0 | | | | 15,950 | | | | 0 | | | | 15,950 | |
Information Technology | | | 0 | | | | 16,249 | | | | 0 | | | | 16,249 | |
Materials | | | 0 | | | | 10,054 | | | | 0 | | | | 10,054 | |
Real Estate | | | 0 | | | | 4,384 | | | | 0 | | | | 4,384 | |
Utilities | | | 0 | | | | 5,177 | | | | 0 | | | | 5,177 | |
Luxembourg | |
Materials | | | 0 | | | | 8,279 | | | | 0 | | | | 8,279 | |
Netherlands | |
Consumer Staples | | | 0 | | | | 16,527 | | | | 0 | | | | 16,527 | |
Financials | | | 0 | | | | 5,664 | | | | 0 | | | | 5,664 | |
Industrials | | | 0 | | | | 4,035 | | | | 0 | | | | 4,035 | |
| | | | | | | | | | | | | | | | |
| Category and Subcategory | | Level 1 | | | Level 2 | | | Level 3 | | | Fair
Value at
06/30/2024 | |
Information Technology | | $ | 2,479 | | | $ | 0 | | | $ | 0 | | | $ | 2,479 | |
Materials | | | 0 | | | | 4,895 | | | | 0 | | | | 4,895 | |
New Zealand | |
Communication Services | | | 256 | | | | 0 | | | | 0 | | | | 256 | |
Industrials | | | 104 | | | | 313 | | | | 0 | | | | 417 | |
Utilities | | | 274 | | | | 0 | | | | 0 | | | | 274 | |
Norway | |
Communication Services | | | 1,751 | | | | 0 | | | | 0 | | | | 1,751 | |
Consumer Staples | | | 0 | | | | 426 | | | | 0 | | | | 426 | |
Energy | | | 0 | | | | 159 | | | | 0 | | | | 159 | |
Industrials | | | 291 | | | | 0 | | | | 0 | | | | 291 | |
Materials | | | 0 | | | | 1,576 | | | | 0 | | | | 1,576 | |
Portugal | |
Consumer Staples | | | 0 | | | | 365 | | | | 0 | | | | 365 | |
Materials | | | 0 | | | | 616 | | | | 0 | | | | 616 | |
Singapore | |
Communication Services | | | 828 | | | | 0 | | | | 0 | | | | 828 | |
Industrials | | | 0 | | | | 1,281 | | | | 0 | | | | 1,281 | |
Spain | |
Communication Services | | | 0 | | | | 10,551 | | | | 0 | | | | 10,551 | |
Financials | | | 0 | | | | 1,845 | | | | 0 | | | | 1,845 | |
Industrials | | | 0 | | | | 1,218 | | | | 0 | | | | 1,218 | |
Utilities | | | 0 | | | | 4,095 | | | | 0 | | | | 4,095 | |
Sweden | |
Communication Services | | | 0 | | | | 994 | | | | 0 | | | | 994 | |
Consumer Discretionary | | | 556 | | | | 0 | | | | 0 | | | | 556 | |
Consumer Staples | | | 0 | | | | 4,339 | | | | 0 | | | | 4,339 | |
Industrials | | | 0 | | | | 9,420 | | | | 0 | | | | 9,420 | |
Real Estate | | | 0 | | | | 637 | | | | 0 | | | | 637 | |
Switzerland | |
Consumer Staples | | | 0 | | | | 1,769 | | | | 0 | | | | 1,769 | |
Financials | | | 0 | | | | 1,110 | | | | 0 | | | | 1,110 | |
Health Care | | | 0 | | | | 25,913 | | | | 0 | | | | 25,913 | |
Industrials | | | 0 | | | | 3,174 | | | | 0 | | | | 3,174 | |
Materials | | | 0 | | | | 7,075 | | | | 0 | | | | 7,075 | |
United Kingdom | |
Communication Services | | | 0 | | | | 9,489 | | | | 0 | | | | 9,489 | |
Consumer Discretionary | | | 0 | | | | 2,152 | | | | 0 | | | | 2,152 | |
Consumer Staples | | | 0 | | | | 14,965 | | | | 0 | | | | 14,965 | |
Financials | | | 0 | | | | 7,095 | | | | 0 | | | | 7,095 | |
Health Care | | | 0 | | | | 13,074 | | | | 0 | | | | 13,074 | |
Industrials | | | 0 | | | | 2,916 | | | | 0 | | | | 2,916 | |
Information Technology | | | 0 | | | | 171 | | | | 0 | | | | 171 | |
Materials | | | 1,263 | | | | 10,374 | | | | 0 | | | | 11,637 | |
Utilities | | | 0 | | | | 8,045 | | | | 0 | | | | 8,045 | |
Preferred Stocks | |
Germany | |
Industrials | | | 0 | | | | 9,919 | | | | 0 | | | | 9,919 | |
Real Estate Investment Trusts | |
Australia | |
Real Estate | | | 0 | | | | 1,121 | | | | 0 | | | | 1,121 | |
Canada | |
Real Estate | | | 1,012 | | | | 0 | | | | 0 | | | | 1,012 | |
Short-Term Instruments | |
Repurchase Agreements | | | 0 | | | | 2,737 | | | | 0 | | | | 2,737 | |
| | | | | | | | | | | | | | | | |
| | $ | 53,277 | | | $ | 429,414 | | | $ | 0 | | | $ | 482,691 | |
| | | | | | | | | | | | | | | | |
|
Investments in Affiliates, at Value | |
Short-Term Instruments | |
Mutual Funds | | | 16,688 | | | | 0 | | | | 0 | | | | 16,688 | |
| | | | | | | | | | | | | | | | |
| | | | |
Total Investments | | $ | 69,965 | | | $ | 429,414 | | | $ | 0 | | | $ | 499,379 | |
| | | | | | | | | | | | | | | | |
There were no significant transfers into or out of Level 3 during the period ended June 30, 2024.
| | | | | | |
| 52 | | PIMCO EQUITY SERIES | | | See Accompanying Notes | |
| | | | | | |
| Schedule of Investments | | PIMCO RAE US Fund | | | | June 30, 2024 |
(Amounts in thousands*, except number of shares, contracts, units and ounces, if any)
| | | | | | | | | | | | |
| | | | | SHARES | | | | | MARKET
VALUE
(000S) | |
| INVESTMENTS IN SECURITIES 99.9% | |
| |
| COMMON STOCKS 98.9% | |
| |
| UNITED STATES 98.9% | |
| |
| COMMUNICATION SERVICES 3.2% | |
| | | | |
Charter Communications, Inc. ‘A’ (a) | | | | | 68,482 | | | $ | | | 20,473 | |
| | | | |
Comcast Corp. ‘A’ | | | | | 519,419 | | | | | | 20,341 | |
| | | | |
Electronic Arts, Inc. | | | | | 23,867 | | | | | | 3,325 | |
| | | | |
Lumen Technologies, Inc. (a) | | | | | 1,121,850 | | | | | | 1,234 | |
| | | | |
Omnicom Group, Inc. | | | | | 9,264 | | | | | | 831 | |
| | | | |
Paramount Global ‘B’ | | | | | 103,772 | | | | | | 1,078 | |
| | | | | | | | | | | | |
| | | | | | | | | | | 47,282 | |
| | | | | | | | | | | | |
| |
| CONSUMER DISCRETIONARY 1.9% | |
| | | | |
Advance Auto Parts, Inc. | | | | | 25,607 | | | | | | 1,622 | |
| | | | |
AutoNation, Inc. (a) | | | | | 30,523 | | | | | | 4,865 | |
| | | | |
Best Buy Co., Inc. | | | | | 243,469 | | | | | | 20,522 | |
| | | | |
Mohawk Industries, Inc. (a) | | | | | 12,336 | | | | | | 1,401 | |
| | | | | | | | | | | | |
| | | | | | | | | | | 28,410 | |
| | | | | | | | | | | | |
| |
| CONSUMER STAPLES 16.8% | |
| | | | |
Altria Group, Inc. | | | | | 386,324 | | | | | | 17,597 | |
| | | | |
Dick’s Sporting Goods, Inc. | | | | | 28,273 | | | | | | 6,074 | |
| | | | |
Dollar General Corp. | | | | | 32,678 | | | | | | 4,321 | |
| | | | |
Foot Locker, Inc. | | | | | 64,999 | | | | | | 1,620 | |
| | | | |
Gap, Inc. | | | | | 395,688 | | | | | | 9,453 | |
| | | | |
Kohl’s Corp. | | | | | 797,098 | | | | | | 18,325 | |
| | | | |
Kroger Co. | | | | | 525,517 | | | | | | 26,239 | |
| | | | |
Lennar Corp. ‘A’ | | | | | 32,839 | | | | | | 4,922 | |
| | | | |
Lowe’s Cos., Inc. | | | | | 71,533 | | | | | | 15,770 | |
| | | | |
Macy’s, Inc. | | | | | 414,547 | | | | | | 7,959 | |
| | | | |
NVR, Inc. (a) | | | | | 922 | | | | | | 6,997 | |
| | | | |
PulteGroup, Inc. | | | | | 150,068 | | | | | | 16,523 | |
| | | | |
PVH Corp. | | | | | 50,671 | | | | | | 5,365 | |
| | | | |
Ralph Lauren Corp. | | | | | 8,474 | | | | | | 1,483 | |
| | | | |
Target Corp. | | | | | 112,237 | | | | | | 16,616 | |
| | | | |
Toll Brothers, Inc. | | | | | 65,735 | | | | | | 7,571 | |
| | | | |
Tyson Foods, Inc. ‘A’ | | | | | 69,896 | | | | | | 3,994 | |
| | | | |
VF Corp. | | | | | 124,887 | | | | | | 1,686 | |
| | | | |
Walgreens Boots Alliance, Inc. | | | | | 960,313 | | | | | | 11,615 | |
| | | | |
Walmart, Inc. | | | | | 840,473 | | | | | | 56,908 | |
| | | | |
Whirlpool Corp. | | | | | 44,552 | | | | | | 4,553 | |
| | | | | | | | | | | | |
| | | | | | | | | | | 245,591 | |
| | | | | | | | | | | | |
| |
| ENERGY 10.2% | |
| | | | |
Marathon Petroleum Corp. | | | | | 305,770 | | | | | | 53,045 | |
| | | | |
PBF Energy, Inc. ‘A’ | | | | | 35,482 | | | | | | 1,633 | |
| | | | |
Phillips 66 | | | | | 336,346 | | | | | | 47,482 | |
| | | | |
Valero Energy Corp. | | | | | 291,235 | | | | | | 45,654 | |
| | | | |
World Kinect Corp. | | | | | 53,372 | | | | | | 1,377 | |
| | | | | | | | | | | | |
| | | | | | | | | | | 149,191 | |
| | | | | | | | | | | | |
| |
| FINANCIALS 8.6% | |
| | | | |
Aflac, Inc. | | | | | 28,558 | | | | | | 2,551 | |
| | | | |
Allstate Corp. | | | | | 65,230 | | | | | | 10,415 | |
| | | | |
Ally Financial, Inc. | | | | | 313,888 | | | | | | 12,452 | |
| | | | |
American Financial Group, Inc. | | | | | 3,210 | | | | | | 395 | |
| | | | |
American International Group, Inc. | | | | | 58,532 | | | | | | 4,345 | |
| | | | |
Ameriprise Financial, Inc. | | | | | 1,768 | | | | | | 755 | |
| | | | |
Capital One Financial Corp. | | | | | 69,415 | | | | | | 9,611 | |
| | | | | | | | | | | | |
| | | | | SHARES | | | | | MARKET
VALUE
(000S) | |
| | | | |
Citigroup, Inc. | | | | | 129,847 | | | $ | | | 8,240 | |
| | | | |
Comerica, Inc. | | | | | 30,297 | | | | | | 1,546 | |
| | | | |
Corebridge Financial, Inc. | | | | | 61,181 | | | | | | 1,782 | |
| | | | |
Discover Financial Services | | | | | 42,965 | | | | | | 5,620 | |
| | | | |
Fidelity National Financial, Inc. | | | | | 22,915 | | | | | | 1,132 | |
| | | | |
First American Financial Corp. | | | | | 11,140 | | | | | | 601 | |
| | | | |
Franklin Resources, Inc. | | | | | 161,588 | | | | | | 3,612 | |
| | | | |
Invesco Ltd. | | | | | 73,793 | | | | | | 1,104 | |
| | | | |
Jefferies Financial Group, Inc. | | | | | 12,161 | | | | | | 605 | |
| | | | |
Old Republic International Corp. | | | | | 23,413 | | | | | | 724 | |
| | | | |
OneMain Holdings, Inc. | | | | | 44,211 | | | | | | 2,144 | |
| | | | |
PayPal Holdings, Inc. (a) | | | | | 33,559 | | | | | | 1,947 | |
| | | | |
Principal Financial Group, Inc. | | | | | 16,302 | | | | | | 1,279 | |
| | | | |
Synchrony Financial | | | | | 650,967 | | | | | | 30,719 | |
| | | | |
T Rowe Price Group, Inc. | | | | | 56,946 | | | | | | 6,566 | |
| | | | |
Travelers Cos., Inc. | | | | | 32,812 | | | | | | 6,672 | |
| | | | |
Unum Group | | | | | 15,040 | | | | | | 769 | |
| | | | |
Wells Fargo & Co. | | | | | 137,081 | | | | | | 8,141 | |
| | | | |
Zions Bancorp NA | | | | | 35,736 | | | | | | 1,550 | |
| | | | | | | | | | | | |
| | | | | | | | | | | 125,277 | |
| | | | | | | | | | | | |
| |
| HEALTH CARE 15.0% | |
| | | | |
Amgen, Inc. | | | | | 127,062 | | | | | | 39,701 | |
| | | | |
Biogen, Inc. (a) | | | | | 111,588 | | | | | | 25,868 | |
| | | | |
Cardinal Health, Inc. | | | | | 274,828 | | | | | | 27,021 | |
| | | | |
Centene Corp. (a) | | | | | 49,098 | | | | | | 3,255 | |
| | | | |
Cigna Group | | | | | 21,846 | | | | | | 7,222 | |
| | | | |
DaVita, Inc. (a) | | | | | 89,238 | | | | | | 12,366 | |
| | | | |
GE Healthcare, Inc. | | | | | 42,347 | | | | | | 3,300 | |
| | | | |
Gilead Sciences, Inc. | | | | | 463,520 | | | | | | 31,802 | |
| | | | |
Humana, Inc. | | | | | 25,403 | | | | | | 9,492 | |
| | | | |
Labcorp Holdings, Inc. | | | | | 15,518 | | | | | | 3,158 | |
| | | | |
McKesson Corp. | | | | | 49,572 | | | | | | 28,952 | |
| | | | |
Organon & Co. | | | | | 175,809 | | | | | | 3,639 | |
| | | | |
Pfizer, Inc. | | | | | 319,569 | | | | | | 8,942 | |
| | | | |
Quest Diagnostics, Inc. | | | | | 27,559 | | | | | | 3,772 | |
| | | | |
Solventum Corp. (a) | | | | | 24,726 | | | | | | 1,307 | |
| | | | |
Universal Health Services, Inc. ‘B’ | | | | | 49,712 | | | | | | 9,193 | |
| | | | | | | | | | | | |
| | | | | | | | | | | 218,990 | |
| | | | | | | | | | | | |
| |
| INDUSTRIALS 5.4% | |
| | | | |
3M Co. | | | | | 172,917 | | | | | | 17,670 | |
| | | | |
AECOM | | | | | 10,731 | | | | | | 946 | |
| | | | |
Builders FirstSource, Inc. (a) | | | | | 19,519 | | | | | | 2,702 | |
| | | | |
Carrier Global Corp. | | | | | 16,576 | | | | | | 1,046 | |
| | | | |
CH Robinson Worldwide, Inc. | | | | | 19,523 | | | | | | 1,720 | |
| | | | |
CSX Corp. | | | | | 316,113 | | | | | | 10,574 | |
| | | | |
Expeditors International of Washington, Inc. | | | | | 15,103 | | | | | | 1,885 | |
| | | | |
FedEx Corp. | | | | | 26,437 | | | | | | 7,927 | |
| | | | |
Hertz Global Holdings, Inc. (a)(c) | | | | | 91,651 | | | | | | 323 | |
| | | | |
Honeywell International, Inc. | | | | | 3,823 | | | | | | 816 | |
| | | | |
Leidos Holdings, Inc. | | | | | 10,243 | | | | | | 1,494 | |
| | | | |
ManpowerGroup, Inc. | | | | | 67,869 | | | | | | 4,737 | |
| | | | |
Masco Corp. | | | | | 21,820 | | | | | | 1,455 | |
| | | | |
Norfolk Southern Corp. | | | | | 29,938 | | | | | | 6,427 | |
| | | | |
Owens Corning | | | | | 25,582 | | | | | | 4,444 | |
| | | | |
Robert Half, Inc. | | | | | 31,365 | | | | | | 2,007 | |
| | | | |
Snap-on, Inc. | | | | | 4,766 | | | | | | 1,246 | |
| | | | |
Union Pacific Corp. | | | | | 48,239 | | | | | | 10,915 | |
| | | | | | | | | | | | |
| | | | | | | | | | | 78,334 | |
| | | | | | | | | | | | |
| |
| | | | | | | | | | | | |
| | | | | SHARES | | | | | MARKET
VALUE
(000S) | |
| INFORMATION TECHNOLOGY 31.5% | |
| | | | |
Amdocs Ltd. | | | | | 27,559 | | | $ | | | 2,175 | |
| | | | |
Apple, Inc. | | | | | 152,031 | | | | | | 32,021 | |
| | | | |
Applied Materials, Inc. | | | | | 169,046 | | | | | | 39,893 | |
| | | | |
Arrow Electronics, Inc. (a) | | | | | 63,911 | | | | | | 7,718 | |
| | | | |
Avnet, Inc. | | | | | 117,645 | | | | | | 6,058 | |
| | | | |
Cisco Systems, Inc. | | | | | 1,216,795 | | | | | | 57,810 | |
| | | | |
Cognizant Technology Solutions Corp. ‘A’ | | | | | 155,928 | | | | | | 10,603 | |
| | | | |
Corning, Inc. | | | | | 68,932 | | | | | | 2,678 | |
| | | | |
DXC Technology Co. (a) | | | | | 66,183 | | | | | | 1,263 | |
| | | | |
eBay, Inc. | | | | | 170,661 | | | | | | 9,168 | |
| | | | |
Gen Digital, Inc. | | | | | 111,082 | | | | | | 2,775 | |
| | | | |
Hewlett Packard Enterprise Co. | | | | | 284,098 | | | | | | 6,014 | |
| | | | |
HP, Inc. | | | | | 467,983 | | | | | | 16,389 | |
| | | | |
Intel Corp. | | | | | 1,604,750 | | | | | | 49,699 | |
| | | | |
Jabil, Inc. | | | | | 29,934 | | | | | | 3,257 | |
| | | | |
Juniper Networks, Inc. | | | | | 277,166 | | | | | | 10,106 | |
| | | | |
Kyndryl Holdings, Inc. (a) | | | | | 152,176 | | | | | | 4,004 | |
| | | | |
Lam Research Corp. | | | | | 28,147 | | | | | | 29,972 | |
| | | | |
Micron Technology, Inc. | | | | | 260,778 | | | | | | 34,300 | |
| | | | |
NetApp, Inc. | | | | | 147,691 | | | | | | 19,023 | |
| | | | |
Oracle Corp. | | | | | 212,372 | | | | | | 29,987 | |
| | | | |
Qorvo, Inc. (a) | | | | | 85,119 | | | | | | 9,877 | |
| | | | |
QUALCOMM, Inc. | | | | | 105,293 | | | | | | 20,972 | |
| | | | |
Seagate Technology Holdings PLC | | | | | 216,298 | | | | | | 22,337 | |
| | | | |
Teradyne, Inc. | | | | | 70,572 | | | | | | 10,465 | |
| | | | |
Western Digital Corp. (a) | | | | | 240,085 | | | | | | 18,191 | |
| | | | |
Xerox Holdings Corp. | | | | | 273,254 | | | | | | 3,175 | |
| | | | | | | | | | | | |
| | | | | | | | | | | 459,930 | |
| | | | | | | | | | | | |
| |
| MATERIALS 1.9% | |
| | | | |
Cleveland-Cliffs, Inc. (a) | | | | | 100,449 | | | | | | 1,546 | |
| | | | |
Eastman Chemical Co. | | | | | 32,947 | | | | | | 3,228 | |
| | | | |
Huntsman Corp. | | | | | 29,035 | | | | | | 661 | |
| | | | |
International Paper Co. | | | | | 110,499 | | | | | | 4,768 | |
| | | | |
LyondellBasell Industries NV ‘A’ | | | | | 54,226 | | | | | | 5,187 | |
| | | | |
Reliance, Inc. | | | | | 22,309 | | | | | | 6,371 | |
| | | | |
Steel Dynamics, Inc. | | | | | 16,341 | | | | | | 2,116 | |
| | | | |
United States Steel Corp. | | | | | 79,699 | | | | | | 3,013 | |
| | | | |
WestRock Co. | | | | | 29,802 | | | | | | 1,498 | |
| | | | | | | | | | | | |
| | | | | | | | | | | 28,388 | |
| | | | | | | | | | | | |
| |
| REAL ESTATE 0.5% | |
| | | | |
CBRE Group, Inc. ‘A’ (a) | | | | | 24,364 | | | | | | 2,171 | |
| | | | |
Jones Lang LaSalle, Inc. (a) | | | | | 21,498 | | | | | | 4,413 | |
| | | | | | | | | | | | |
| | | | | | | | | | | 6,584 | |
| | | | | | | | | | | | |
| |
| UTILITIES 3.9% | |
| | | | |
Evergy, Inc. | | | | | 152,015 | | | | | | 8,052 | |
| | | | |
Exelon Corp. | | | | | 81,224 | | | | | | 2,811 | |
| | | | |
NRG Energy, Inc. | | | | | 58,453 | | | | | | 4,551 | |
| | | | |
PPL Corp. | | | | | 166,368 | | | | | | 4,600 | |
| | | | |
Southern Co. | | | | | 24,058 | | | | | | 1,866 | |
| | | | |
UGI Corp. | | | | | 31,330 | | | | | | 718 | |
| | | | |
Vistra Corp. | | | | | 391,519 | | | | | | 33,663 | |
| | | | | | | | | | | | |
| | | | | | | | | | | 56,261 | |
| | | | | | | | | | | | |
Total Common Stocks (Cost $1,087,235) | | | | | | 1,444,238 | |
| | | | | | | | | | | | |
| |
| | | | | | | | | | | | |
| See Accompanying Notes | | | ANNUAL FINANCIAL AND OTHER INFORMATION | | | | | | | JUNE 30, 2024 | | | 53 |
| | | | | | |
| Schedule of Investments | | PIMCO RAE US Fund | | (Cont.) | | |
| | | | | | | | | | | | |
| | | | | SHARES | | | | | MARKET
VALUE
(000S) | |
| REAL ESTATE INVESTMENT TRUSTS 0.8% | |
| |
| UNITED STATES 0.8% | |
| |
| REAL ESTATE 0.8% | |
| | | | |
Boston Properties, Inc. | | | | | 25,517 | | | $ | | | 1,571 | |
| | | | |
Host Hotels & Resorts, Inc. | | | | | 83,881 | | | | | | 1,508 | |
| | | | |
Iron Mountain, Inc. | | | | | 30,851 | | | | | | 2,765 | |
| | | | |
Weyerhaeuser Co. | | | | | 188,827 | | | | | | 5,360 | |
| | | | | | | | | | | | |
| | | | | | | | | | | 11,204 | |
| | | | | | | | | | | | |
Total Real Estate Investment Trusts
(Cost $10,475) | | | | | | 11,204 | |
| | | | | | | | | | | | |
| |
| | | | | | | | | | | | |
| | | | | | | | | | MARKET
VALUE
(000S) | |
| SHORT-TERM INSTRUMENTS 0.2% | |
| | | | | | | | | | | | |
| REPURCHASE AGREEMENTS (e) 0.2% | |
| | | | | | | | $ | | | 3,342 | |
| | | | | | | | | | | | |
Total Short-Term Instruments
(Cost $3,342) | | | | | | | | | | | 3,342 | |
| | | | | | | | | | | | |
| | | | |
| | | | | | | | | | | | |
Total Investments in Securities
(Cost $1,101,052) | | | | | | | | | | | 1,458,784 | |
| | | | | | | | | | | | |
| |
| | | | | | | | | | | | |
| | | | | SHARES | | | | | MARKET
VALUE
(000S) | |
| INVESTMENTS IN AFFILIATES 0.0% | |
| |
| SHORT-TERM INSTRUMENTS 0.0% | |
| |
| MUTUAL FUNDS 0.0% | |
|
PIMCO Government Money Market Fund | |
5.470% (b)(c)(d) | | | | | 326,880 | | | $ | | | 327 | |
| | | | | | | | | | | | |
Total Short-Term Instruments
(Cost $327) | | | | | | | | | | | 327 | |
| | | | | | | | | | | | |
| | | | |
| | | | | | | | | | | | |
Total Investments in Affiliates
(Cost $327) | | | | | | | | | | | 327 | |
| | | | |
| | | | | | | | | | | | |
Total Investments 99.9%
(Cost $1,101,379) | | | | | | | | $ | | | 1,459,111 | |
| |
| Other Assets and Liabilities, net 0.1% | | | | | | 860 | |
| | | | | | | | | | | | |
| Net Assets 100.0% | | | | | | | | $ | | | 1,459,971 | |
| | | | | | | | | | | | |
NOTES TO SCHEDULE OF INVESTMENTS:
| * | A zero balance may reflect actual amounts rounding to less than one thousand. |
| (a) | Security did not produce income within the last twelve months. |
| (b) | Institutional Class Shares of each Fund. |
| (c) | Securities with an aggregate market value of $298 were out on loan in exchange for $306 of cash collateral as of June 30, 2024. The collateral was invested in a cash collateral reinvestment vehicle as described in Note 5 in the Notes to Financial Statements. |
| (d) | Coupon represents a 7-Day Yield. |
BORROWINGS AND OTHER FINANCING TRANSACTIONS
(e) REPURCHASE AGREEMENTS:
| | | | | | | | | | | | | | | | | | | | | | | | | | | | | | |
| Counterparty | | Lending
Rate | | | Settlement
Date | | | Maturity
Date | | | Principal
Amount | | | Collateralized By | | Collateral
(Received) | | | Repurchase
Agreements,
at Value | | | Repurchase
Agreement
Proceeds
to be
Received(1) | |
| FICC | | | 2.600 | % | | | 06/28/2024 | | | | 07/01/2024 | | | $ | 3,342 | | | U.S. Treasury Inflation Protected Securities 0.625% due 01/15/2026 | | $ | (3,409 | ) | | $ | 3,342 | | | $ | 3,343 | |
| | | | | | | | | | | | | | | | | | | | | | | | | | | | | | |
Total Repurchase Agreements | | | | | $ | (3,409 | ) | | $ | 3,342 | | | $ | 3,343 | |
| | | | | | | | | | | | | | | |
BORROWINGS AND OTHER FINANCING TRANSACTIONS SUMMARY
The following is a summary by counterparty of the market value of Borrowings and Other Financing Transactions and collateral pledged/(received) as of June 30, 2024:
| | | | | | | | | | | | | | | | | | | | | | | | | | | | |
| Counterparty | | Repurchase
Agreement
Proceeds
to be
Received(1) | | | Payable for
Reverse
Repurchase
Agreements | | | Payable for
Sale-Buyback
Transactions | | | Securities Out on Loan | | | Total
Borrowings and
Other Financing
Transactions | | | Collateral
Pledged/(Received) | | | Net Exposure(2) | |
Global/Master Repurchase Agreement | |
FICC | | $ | 3,343 | | | $ | 0 | | | $ | 0 | | | $ | 0 | | | $ | 3,343 | | | $ | (3,409 | ) | | $ | (66 | ) |
|
Master Securities Lending Agreement | |
MSC | | | 0 | | | | 0 | | | | 0 | | | | 298 | | | | 298 | | | | (306 | ) | | | (8 | ) |
| | | | | | | | | | | | | | | | | | | | | | | | | | | | |
Total Borrowings and Other Financing Transactions | | $ | 3,343 | | | $ | 0 | | | $ | 0 | | | $ | 298 | | | | | | | | | | | | | |
| | | | | | | | | | | | | | | | | | | | | | | | | | | | |
CERTAIN TRANSFERS ACCOUNTED FOR AS SECURED BORROWINGS
Remaining Contractual Maturity of the Agreements
| | | | | | | | | | | | | | | | | | | | |
| | | Overnight and
Continuous | | | Up to 30 days | | | 31-90 days | | | Greater Than 90 days | | | Total | |
Securities Lending Transactions(3) | |
Common Stocks | | $ | 306 | | | $ | 0 | | | $ | 0 | | | $ | 0 | | | $ | 306 | |
| | | | | | | | | | | | | | | | | | | | |
Total Borrowings | | $ | 306 | | | $ | 0 | | | $ | 0 | | | $ | 0 | | | $ | 306 | |
| | | | | | | | | | | | | | | | | | | | |
Payable for securities on loan - cash collateral | | | $ | 306 | |
| | | | | |
| | | | | | |
| 54 | | PIMCO EQUITY SERIES | | | See Accompanying Notes | |
| (1) | Includes accrued interest. |
| (2) | Net Exposure represents the net receivable/(payable) that would be due from/to the counterparty in the event of default. Exposure from borrowings and other financing transactions can only be netted across transactions governed under the same master agreement with the same legal entity. See Note 8, Master Netting Arrangements, in the Notes to Financial Statements for more information. |
| (3) | Includes cash collateral as described in Note 5 in the Notes to Financial Statements. |
FAIR VALUE MEASUREMENTS
The following is a summary of the fair valuations according to the inputs used as of June 30, 2024 in valuing the Fund’s assets and liabilities:
| | | | | | | | | | | | | | | | |
| Category and Subcategory | | Level 1 | | | Level 2 | | | Level 3 | | | Fair
Value at
06/30/2024 | |
Investments in Securities, at Value | |
Common Stocks | |
United States | |
Communication Services | | $ | 47,282 | | | $ | 0 | | | $ | 0 | | | $ | 47,282 | |
Consumer Discretionary | | | 28,410 | | | | 0 | | | | 0 | | | | 28,410 | |
Consumer Staples | | | 245,591 | | | | 0 | | | | 0 | | | | 245,591 | |
Energy | | | 149,191 | | | | 0 | | | | 0 | | | | 149,191 | |
Financials | | | 125,277 | | | | 0 | | | | 0 | | | | 125,277 | |
Health Care | | | 218,990 | | | | 0 | | | | 0 | | | | 218,990 | |
Industrials | | | 78,334 | | | | 0 | | | | 0 | | | | 78,334 | |
Information Technology | | | 459,930 | | | | 0 | | | | 0 | | | | 459,930 | |
Materials | | | 28,388 | | | | 0 | | | | 0 | | | | 28,388 | |
Real Estate | | | 6,584 | | | | 0 | | | | 0 | | | | 6,584 | |
Utilities | | | 56,261 | | | | 0 | | | | 0 | | | | 56,261 | |
| | | | | | | | | | | | | | | | |
| Category and Subcategory | | Level 1 | | | Level 2 | | | Level 3 | | | Fair
Value at
06/30/2024 | |
Real Estate Investment Trusts | |
United States | |
Real Estate | | $ | 11,204 | | | $ | 0 | | | $ | 0 | | | $ | 11,204 | |
Short-Term Instruments | |
Repurchase Agreements | | | 0 | | | | 3,342 | | | | 0 | | | | 3,342 | |
| | | | | | | | | | | | | | | | |
| | $ | 1,455,442 | | | $ | 3,342 | | | $ | 0 | | | $ | 1,458,784 | |
| | | | | | | | | | | | | | | | |
|
Investments in Affiliates, at Value | |
Short-Term Instruments | |
Mutual Funds | | | 327 | | | | 0 | | | | 0 | | | | 327 | |
| | | | | | | | | | | | | | | | |
| | | | |
Total Investments | | $ | 1,455,769 | | | $ | 3,342 | | | $ | 0 | | | $ | 1,459,111 | |
| | | | | | | | | | | | | | | | |
There were no significant transfers into or out of Level 3 during the period ended June 30, 2024.
| | | | | | | | | | | | |
| See Accompanying Notes | | | ANNUAL FINANCIAL AND OTHER INFORMATION | | | | | | | JUNE 30, 2024 | | | 55 |
| | | | | | |
| Schedule of Investments | | PIMCO RAE US Small Fund | | | | |
(Amounts in thousands*, except number of shares, contracts, units and ounces, if any)
| | | | | | | | | | | | |
| | | | | SHARES | | | | | MARKET
VALUE
(000S) | |
| INVESTMENTS IN SECURITIES 99.8% | |
| |
| COMMON STOCKS 91.6% | |
| |
| SWITZERLAND 0.3% | |
| |
| CONSUMER STAPLES 0.3% | |
| | | | |
Guess?, Inc. (c) | | | | 175,192 | | | $ | | | | 3,574 | |
| | | | | | | | | | | | |
| Total Switzerland | | | | | | | | | | | 3,574 | |
| | | | | | | | | | | | |
| |
| UNITED KINGDOM 2.8% | |
| |
| CONSUMER STAPLES 0.3% | |
| | | | |
Capri Holdings Ltd. (a) | | | | 101,855 | | | | | | | 3,369 | |
| | | | | | | | | | | | |
| |
| ENERGY 0.6% | |
| | | | |
TechnipFMC PLC | | | | 296,621 | | | | | | | 7,757 | |
| | | | | | | | | | | | |
| |
| FINANCIALS 1.9% | |
| | | | |
Janus Henderson Group PLC | | | | 666,647 | | | | | | | 22,473 | |
| | | | | | | | | | | | |
| Total United Kingdom | | | | | | | | | | | 33,599 | |
| | | | | | | | | | | | |
| |
| UNITED STATES 88.5% | |
| |
| COMMUNICATION SERVICES 2.7% | |
| | | | |
John Wiley & Sons, Inc. ‘A’ | | | | 45,796 | | | | | | | 1,864 | |
| | | | |
Liberty Latin America Ltd. ‘C’ (a) | | | | 433,812 | | | | | | | 4,173 | |
| | | | |
Nexstar Media Group, Inc. | | | | 20,724 | | | | | | | 3,440 | |
| | | | |
NII Holdings, Inc. «(a) | | | | 22,836 | | | | | | | 0 | |
| | | | |
Scholastic Corp. | | | | 82,234 | | | | | | | 2,917 | |
| | | | |
Telephone & Data Systems, Inc. | | | | 293,352 | | | | | | | 6,081 | |
| | | | |
Yelp, Inc. (a) | | | | 314,219 | | | | | | | 11,611 | |
| | | | |
Ziff Davis, Inc. (a) | | | | 29,470 | | | | | | | 1,622 | |
| | | | | | | | | | | | |
| | | | | | | | | | | 31,708 | |
| | | | | | | | | | | | |
| |
| CONSUMER DISCRETIONARY 6.5% | |
| | | | |
Abercrombie & Fitch Co. ‘A’ (a) | | | | 374,348 | | | | | | | 66,574 | |
| | | | |
Academy Sports & Outdoors, Inc. | | | | 15,638 | | | | | | | 833 | |
| | | | |
Adtalem Global Education, Inc. (a) | | | | 137,732 | | | | | | | 9,395 | |
| | | | |
American Eagle Outfitters, Inc. | | | | 38,001 | | | | | | | 758 | |
| | | | | | | | | | | | |
| | | | | | | | | | | 77,560 | |
| | | | | | | | | | | | |
| |
| CONSUMER STAPLES 23.8% | |
| | | | |
Buckle, Inc. | | | | 90,950 | | | | | | | 3,360 | |
| | | | |
Cal-Maine Foods, Inc. | | | | 41,333 | | | | | | | 2,526 | |
| | | | |
Carter’s, Inc. | | | | 237,939 | | | | | | | 14,745 | |
| | | | |
Cracker Barrel Old Country Store, Inc. | | | | 77,503 | | | | | | | 3,268 | |
| | | | |
Dillard’s, Inc. ‘A’ (c) | | | | 118,319 | | | | | | | 52,107 | |
| | | | |
Domino’s Pizza, Inc. | | | | 25,312 | | | | | | | 13,069 | |
| | | | |
Fresh Del Monte Produce, Inc. | | | | 102,656 | | | | | | | 2,243 | |
| | | | |
Gentex Corp. | | | | 126,703 | | | | | | | 4,271 | |
| | | | |
Grand Canyon Education, Inc. (a) | | | | 41,399 | | | | | | | 5,792 | |
| | | | |
Group 1 Automotive, Inc. | | | | 15,623 | | | | | | | 4,644 | |
| | | | |
H&R Block, Inc. | | | | 66,505 | | | | | | | 3,607 | |
| | | | |
Hanesbrands, Inc. (a) | | | | 3,144,279 | | | | | | | 15,501 | |
| | | | |
Helen of Troy Ltd. (a) | | | | 21,034 | | | | | | | 1,951 | |
| | | | |
Ingles Markets, Inc. ‘A’ | | | | 61,496 | | | | | | | 4,219 | |
| | | | |
Jack in the Box, Inc. | | | | 57,606 | | | | | | | 2,934 | |
| | | | |
La-Z-Boy, Inc. | | | | 53,138 | | | | | | | 1,981 | |
| | | | |
Murphy USA, Inc. | | | | 62,805 | | | | | | | 29,484 | |
| | | | |
ODP Corp. (a) | | | | 293,751 | | | | | | | 11,536 | |
| | | | |
Phinia, Inc. | | | | 40,609 | | | | | | | 1,598 | |
| | | | |
Pilgrim’s Pride Corp. (a) | | | | 44,365 | | | | | | | 1,708 | |
| | | | |
Sabre Corp. (a) | | | | 1,097,862 | | | | | | | 2,931 | |
| | | | | | | | | | | | |
| | | | | SHARES | | | | | MARKET
VALUE
(000S) | |
| | | | |
Sally Beauty Holdings, Inc. (a) | | | | 259,132 | | | $ | | | | 2,780 | |
| | | | |
Signet Jewelers Ltd. | | | | 17,131 | | | | | | | 1,535 | |
| | | | |
Six Flags Entertainment Corp. (a) | | | | 110,528 | | | | | | | 3,663 | |
| | | | |
Sonic Automotive, Inc. ‘A’ | | | | 16,410 | | | | | | | 894 | |
| | | | |
Sprouts Farmers Market, Inc. (a) | | | | 458,938 | | | | | | | 38,395 | |
| | | | |
Steven Madden Ltd. | | | | 79,198 | | | | | | | 3,350 | |
| | | | |
Taylor Morrison Home Corp. (a) | | | | 145,350 | | | | | | | 8,058 | |
| | | | |
Travel & Leisure Co. | | | | 128,126 | | | | | | | 5,763 | |
| | | | |
Tri Pointe Homes, Inc. (a) | | | | 453,760 | | | | | | | 16,903 | |
| | | | |
Universal Corp. | | | | 35,757 | | | | | | | 1,723 | |
| | | | |
Urban Outfitters, Inc. (a) | | | | 119,089 | | | | | | | 4,889 | |
| | | | |
Weis Markets, Inc. | | | | 68,132 | | | | | | | 4,277 | |
| | | | |
Williams-Sonoma, Inc. | | | | 24,972 | | | | | | | 7,051 | |
| | | | | | | | | | | | |
| | | | | | | | | | | 282,756 | |
| | | | | | | | | | | | |
| |
| ENERGY 4.9% | |
| | | | |
CNX Resources Corp. (a) | | | | 692,531 | | | | | | | 16,829 | |
| | | | |
CVR Energy, Inc. | | | | 132,165 | | | | | | | 3,538 | |
| | | | |
Delek U.S. Holdings, Inc. | | | | 544,438 | | | | | | | 13,480 | |
| | | | |
Equitrans Midstream Corp. | | | | 474,038 | | | | | | | 6,153 | |
| | | | |
Helmerich & Payne, Inc. | | | | 130,738 | | | | | | | 4,725 | |
| | | | |
Murphy Oil Corp. | | | | 23,541 | | | | | | | 971 | |
| | | | |
Peabody Energy Corp. | | | | 235,362 | | | | | | | 5,206 | |
| | | | |
Southwestern Energy Co. (a) | | | | 990,536 | | | | | | | 6,666 | |
| | | | | | | | | | | | |
| | | | | | | | | | | 57,568 | |
| | | | | | | | | | | | |
| |
| FINANCIALS 11.7% | |
| | | | |
Affiliated Managers Group, Inc. | | | | 72,140 | | | | | | | 11,270 | |
| | | | |
Artisan Partners Asset Management, Inc. ‘A’ | | | | 33,434 | | | | | | | 1,380 | |
| | | | |
BankUnited, Inc. | | | | 96,146 | | | | | | | 2,814 | |
| | | | |
Banner Corp. | | | | 13,923 | | | | | | | 691 | |
| | | | |
Bread Financial Holdings, Inc. | | | | 194,295 | | | | | | | 8,658 | |
| | | | |
CNO Financial Group, Inc. | | | | 349,013 | | | | | | | 9,675 | |
| | | | |
Credit Acceptance Corp. (a) | | | | 12,876 | | | | | | | 6,627 | |
| | | | |
Encore Capital Group, Inc. (a) | | | | 41,899 | | | | | | | 1,749 | |
| | | | |
Evercore, Inc. ‘A’ | | | | 26,086 | | | | | | | 5,437 | |
| | | | |
Federated Hermes, Inc. | | | | 103,443 | | | | | | | 3,401 | |
| | | | |
First Hawaiian, Inc. | | | | 67,296 | | | | | | | 1,397 | |
| | | | |
Genworth Financial, Inc. (a) | | | | 213,772 | | | | | | | 1,291 | |
| | | | |
Jackson Financial, Inc. ‘A’ | | | | 53,127 | | | | | | | 3,945 | |
| | | | |
Mercury General Corp. | | | | 40,197 | | | | | | | 2,136 | |
| | | | |
MGIC Investment Corp. | | | | 580,146 | | | | | | | 12,502 | |
| | | | |
Moelis & Co. ‘A’ | | | | 46,097 | | | | | | | 2,621 | |
| | | | |
Navient Corp. | | | | 59,981 | | | | | | | 873 | |
| | | | |
PennyMac Financial Services, Inc. | | | | 51,592 | | | | | | | 4,881 | |
| | | | |
PROG Holdings, Inc. | | | | 359,417 | | | | | | | 12,465 | |
| | | | |
Radian Group, Inc. | | | | 305,541 | | | | | | | 9,502 | |
| | | | |
SEI Investments Co. | | | | 38,460 | | | | | | | 2,488 | |
| | | | |
SLM Corp. | | | | 1,052,644 | | | | | | | 21,885 | |
| | | | |
Virtu Financial, Inc. ‘A’ | | | | 158,049 | | | | | | | 3,548 | |
| | | | |
Walker & Dunlop, Inc. | | | | 16,840 | | | | | | | 1,654 | |
| | | | |
Washington Federal, Inc. | | | | 43,628 | | | | | | | 1,247 | |
| | | | |
Western Union Co. | | | | 321,640 | | | | | | | 3,930 | |
| | | | |
White Mountains Insurance Group Ltd. | | | | 707 | | | | | | | 1,285 | |
| | | | | | | | | | | | |
| | | | | | | | | | | 139,352 | |
| | | | | | | | | | | | |
| |
| HEALTH CARE 4.5% | |
| | | | |
Amedisys, Inc. (a) | | | | 17,348 | | | | | | | 1,592 | |
| | | | |
AMN Healthcare Services, Inc. (a) | | | | 52,671 | | | | | | | 2,698 | |
| | | | |
Dentsply Sirona, Inc. | | | | 431,207 | | | | | | | 10,741 | |
| | | | |
Elanco Animal Health, Inc. (a) | | | | 321,048 | | | | | | | 4,633 | |
| | | | |
Owens & Minor, Inc. (a) | | | | 456,891 | | | | | | | 6,168 | |
| | | | | | | | | | | | |
| | | | | SHARES | | | | | MARKET
VALUE
(000S) | |
| | | | |
Patterson Cos., Inc. | | | | 532,293 | | | $ | | | | 12,839 | |
| | | | |
Premier, Inc. ‘A’ | | | | 94,846 | | | | | | | 1,771 | |
| | | | |
Teladoc Health, Inc. (a) | | | | 373,005 | | | | | | | 3,648 | |
| | | | |
Tenet Healthcare Corp. (a) | | | | 68,005 | | | | | | | 9,047 | |
| | | | | | | | | | | | |
| | | | | | | | | | | 53,137 | |
| | | | | | | | | | | | |
| |
| INDUSTRIALS 17.5% | |
| | | | |
A O Smith Corp. | | | | 60,781 | | | | | | | 4,971 | |
| | | | |
AAR Corp. (a) | | | | 10,425 | | | | | | | 758 | |
| | | | |
Acuity Brands, Inc. | | | | 78,937 | | | | | | | 19,059 | |
| | | | |
Allison Transmission Holdings, Inc. | | | | 490,603 | | | | | | | 37,237 | |
| | | | |
Apogee Enterprises, Inc. | | | | 89,960 | | | | | | | 5,653 | |
| | | | |
Barnes Group, Inc. | | | | 14,877 | | | | | | | 616 | |
| | | | |
Boise Cascade Co. | | | | 77,002 | | | | | | | 9,180 | |
| | | | |
Brady Corp. ‘A’ | | | | 20,713 | | | | | | | 1,367 | |
| | | | |
CoreCivic, Inc. (a) | | | | 831,368 | | | | | | | 10,791 | |
| | | | |
CSG Systems International, Inc. | | | | 51,162 | | | | | | | 2,106 | |
| | | | |
DNOW, Inc. (a) | | | | 433,843 | | | | | | | 5,957 | |
| | | | |
EMCOR Group, Inc. | | | | 44,651 | | | | | | | 16,301 | |
| | | | |
EnerSys | | | | 9,943 | | | | | | | 1,029 | |
| | | | |
Forward Air Corp. (a) | | | | 71,235 | | | | | | | 1,356 | |
| | | | |
GEO Group, Inc. (a) | | | | 751,083 | | | | | | | 10,786 | |
| | | | |
HNI Corp. | | | | 34,897 | | | | | | | 1,571 | |
| | | | |
JELD-WEN Holding, Inc. (a) | | | | 147,500 | | | | | | | 1,987 | |
| | | | |
JetBlue Airways Corp. (a) | | | | 2,990,698 | | | | | | | 18,213 | |
| | | | |
Landstar System, Inc. | | | | 25,982 | | | | | | | 4,793 | |
| | | | |
Masterbrand, Inc. (a) | | | | 145,774 | | | | | | | 2,140 | |
| | | | |
Matson, Inc. | | | | 19,058 | | | | | | | 2,496 | |
| | | | |
Moog, Inc. ‘A’ | | | | 10,084 | | | | | | | 1,687 | |
| | | | |
MSC Industrial Direct Co., Inc. ‘A’ | | | | 37,846 | | | | | | | 3,002 | |
| | | | |
Oshkosh Corp. | | | | 8,004 | | | | | | | 866 | |
| | | | |
RXO, Inc. (a) | | | | 122,528 | | | | | | | 3,204 | |
| | | | |
Ryder System, Inc. | | | | 94,383 | | | | | | | 11,692 | |
| | | | |
Schneider National, Inc. ‘B’ | | | | 143,097 | | | | | | | 3,457 | |
| | | | |
SkyWest, Inc. (a) | | | | 188,404 | | | | | | | 15,462 | |
| | | | |
Steelcase, Inc. ‘A’ | | | | 346,219 | | | | | | | 4,487 | |
| | | | |
TriNet Group, Inc. | | | | 16,156 | | | | | | | 1,616 | |
| | | | |
Werner Enterprises, Inc. | | | | 103,167 | | | | | | | 3,697 | |
| | | | | | | | | | | | |
| | | | | | | | | | | 207,537 | |
| | | | | | | | | | | | |
| |
| INFORMATION TECHNOLOGY 8.3% | |
| | | | |
ASGN, Inc. (a) | | | | 21,184 | | | | | | | 1,868 | |
| | | | |
Benchmark Electronics, Inc. | | | | 185,594 | | | | | | | 7,323 | |
| | | | |
Cirrus Logic, Inc. (a) | | | | 84,105 | | | | | | | 10,737 | |
| | | | |
CommVault Systems, Inc. (a) | | | | 22,368 | | | | | | | 2,719 | |
| | | | |
Dolby Laboratories, Inc. ‘A’ | | | | 32,534 | | | | | | | 2,578 | |
| | | | |
Dropbox, Inc. ‘A’ (a) | | | | 204,438 | | | | | | | 4,594 | |
| | | | |
Insight Enterprises, Inc. (a) | | | | 7,187 | | | | | | | 1,426 | |
| | | | |
InterDigital, Inc. | | | | 21,169 | | | | | | | 2,467 | |
| | | | |
IPG Photonics Corp. (a) | | | | 10,808 | | | | | | | 912 | |
| | | | |
Knowles Corp. (a) | | | | 7,584 | | | | | | | 131 | |
| | | | |
LiveRamp Holdings, Inc. (a) | | | | 86,570 | | | | | | | 2,678 | |
| | | | |
MKS Instruments, Inc. | | | | 1,423 | | | | | | | 186 | |
| | | | |
NetScout Systems, Inc. (a) | | | | 304,913 | | | | | | | 5,577 | |
| | | | |
PC Connection, Inc. | | | | 28,374 | | | | | | | 1,822 | |
| | | | |
Sanmina Corp. (a) | | | | 355,364 | | | | | | | 23,543 | |
| | | | |
Semtech Corp. (a) | | | | 116,260 | | | | | | | 3,474 | |
| | | | |
Silicon Laboratories, Inc. (a) | | | | 20,847 | | | | | | | 2,306 | |
| | | | |
Teradata Corp. (a) | | | | 408,544 | | | | | | | 14,119 | |
| | | | |
TTM Technologies, Inc. (a) | | | | 65,263 | | | | | | | 1,268 | |
| | | | |
Viavi Solutions, Inc. (a) | | | | 124,833 | | | | | | | 858 | |
| | | | |
Vishay Intertechnology, Inc. | | | | 348,932 | | | | | | | 7,781 | |
| | | | | | | | | | | | |
| | | | | | | | | | | 98,367 | |
| | | | | | | | | | | | |
| |
| | | | | | |
| 56 | | PIMCO EQUITY SERIES | | | See Accompanying Notes | |
| | | | | | | | | | | | |
| | | | | SHARES | | | | | MARKET
VALUE
(000S) | |
| MATERIALS 7.8% | |
| | | | |
Arch Resources, Inc. | | | | 22,598 | | | $ | | | | 3,440 | |
| | | | |
Chemours Co. | | | | 94,799 | | | | | | | 2,140 | |
| | | | |
Eagle Materials, Inc. | | | | 38,430 | | | | | | | 8,357 | |
| | | | |
Greif, Inc. ‘A’ | | | | 14,664 | | | | | | | 843 | |
| | | | |
Louisiana-Pacific Corp. | | | | 147,271 | | | | | | | 12,125 | |
| | | | |
NewMarket Corp. | | | | 4,674 | | | | | | | 2,410 | |
| | | | |
Olin Corp. | | | | 73,655 | | | | | | | 3,473 | |
| | | | |
Ryerson Holding Corp. | | | | 14,268 | | | | | | | 278 | |
| | | | |
Sylvamo Corp. | | | | 190,022 | | | | | | | 13,035 | |
| | | | |
Warrior Met Coal, Inc. | | | | 733,019 | | | | | | | 46,011 | |
| | | | | | | | | | | | |
| | | | | | | | | | | 92,112 | |
| | | | | | | | | | | | |
| |
| REAL ESTATE 0.6% | |
| | | | |
Alexander & Baldwin, Inc. | | | | 172,241 | | | | | | | 2,921 | |
| | | | |
Cushman & Wakefield PLC (a) | | | | 148,070 | | | | | | | 1,540 | |
| | | | |
DigitalBridge Group, Inc. | | | | 78,842 | | | | | | | 1,080 | |
| | | | |
eXp World Holdings, Inc. | | | | 86,508 | | | | | | | 976 | |
| | | | |
New York REIT, Inc. «(a) | | | | 4,082 | | | | | | | 12 | |
| | | | |
Newmark Group, Inc. | | | | 76,368 | | | | | | | 781 | |
| | | | | | | | | | | | |
| | | | | | | | | | | 7,310 | |
| | | | | | | | | | | | |
| |
| UTILITIES 0.2% | |
| | | | |
Hawaiian Electric Industries, Inc. | | | | 30,777 | | | | | | | 277 | |
| | | | |
IDACORP, Inc. | | | | 11,549 | | | | | | | 1,076 | |
| | | | |
Portland General Electric Co. | | | | 35,752 | | | | | | | 1,546 | |
| | | | | | | | | | | | |
| | | | | | | | | | | 2,899 | |
| | | | | | | | | | | | |
Total United States | | | | | | | | | | | 1,050,306 | |
| | | | | | | | | | | | |
| Total Common Stocks (Cost $866,385) | | | | | | | 1,087,479 | |
| | | | | | | | | | | | |
| |
| | | | | | | | | | | | |
| | | | | SHARES | | | | | MARKET
VALUE
(000S) | |
| REAL ESTATE INVESTMENT TRUSTS 7.5% | |
| |
| UNITED STATES 7.5% | |
| |
| FINANCIALS 1.3% | |
| | | | |
Chimera Investment Corp. | | | | 668,034 | | | $ | | | | 8,551 | |
| | | | |
Ladder Capital Corp. | | | | 46,864 | | | | | | | 529 | |
| | | | |
MFA Financial, Inc. | | | | 303,162 | | | | | | | 3,226 | |
| | | | |
Rithm Capital Corp. | | | | 240,811 | | | | | | | 2,627 | |
| | | | | | | | | | | | |
| | | | | | | | | | | 14,933 | |
| | | | | | | | | | | | |
| |
| REAL ESTATE 6.2% | |
| | | | |
Apple Hospitality REIT, Inc. | | | | 283,511 | | | | | | | 4,122 | |
| | | | |
EPR Properties | | | | 98,810 | | | | | | | 4,148 | |
| | | | |
Highwoods Properties, Inc. | | | | 78,054 | | | | | | | 2,051 | |
| | | | |
Hudson Pacific Properties, Inc. | | | | 161,863 | | | | | | | 779 | |
| | | | |
JBG SMITH Properties | | | | 65,619 | | | | | | | 999 | |
| | | | |
Macerich Co. | | | | 313,305 | | | | | | | 4,837 | |
| | | | |
Medical Properties Trust, Inc. (c) | | | | 1,289,017 | | | | | | | 5,556 | |
| | | | |
Park Hotels & Resorts, Inc. | | | | 1,008,600 | | | | | | | 15,109 | |
| | | | |
RLJ Lodging Trust | | | | 700,321 | | | | | | | 6,744 | |
| | | | |
Service Properties Trust | | | | 958,911 | | | | | | | 4,929 | |
| | | | |
SL Green Realty Corp. | | | | 317,662 | | | | | | | 17,992 | |
| | | | |
Vornado Realty Trust | | | | 159,977 | | | | | | | 4,206 | |
| | | | |
Xenia Hotels & Resorts, Inc. | | | | 175,992 | | | | | | | 2,522 | |
| | | | | | | | | | | | |
| | | | | | | | | | | 73,994 | |
| | | | | | | | | | | | |
Total Real Estate Investment Trusts (Cost $87,131) | | | | | | | 88,927 | |
| | | | | | | | | | | | |
| |
| | | | | | | | | | | | |
| | | | | SHARES | | | | | MARKET
VALUE
(000S) | |
| SHORT-TERM INSTRUMENTS 0.7% | |
| |
| REPURCHASE AGREEMENTS (e) 0.7% | |
| | | | | | $ | | | | | 8,108 | |
| | | | | | | | | | | | |
| Total Short-Term Instruments (Cost $8,108) | | | | | | | | | | | 8,108 | |
| | | | | | | | | | | | |
| | | | |
| | | | | | | | | | | | |
| Total Investments in Securities (Cost $961,622) | | | | | | | | | | | 1,184,514 | |
| | | | | | | | | | | | |
| |
| INVESTMENTS IN AFFILIATES 0.8% | |
| |
| SHORT-TERM INSTRUMENTS 0.8% | |
| |
| MUTUAL FUNDS 0.8% | |
|
PIMCO Government Money Market Fund | |
5.470% (b)(c)(d) | | | | 9,797,220 | | | | | | | 9,797 | |
| | | | | | | | | | | | |
Total Short-Term Instruments
(Cost $9,797) | | | | | | | 9,797 | |
| | | | | | | | | | | | |
| | | | |
| | | | | | | | | | | | |
Total Investments in Affiliates
(Cost $9,797) | | | | | | | 9,797 | |
| | | | |
| | | | | | | | | | | | |
Total Investments 100.6%
(Cost $971,419) | | $ | | | | | 1,194,311 | |
| |
| Other Assets and Liabilities, net (0.6)% | | | | | | | (7,634 | ) |
| | | | | | | | | | | | |
| Net Assets 100.0% | | | | | | $ | | | | | 1,186,677 | |
| | | | | | | | | | | | |
NOTES TO SCHEDULE OF INVESTMENTS:
| * | A zero balance may reflect actual amounts rounding to less than one thousand. |
| « | Security valued using significant unobservable inputs (Level 3). |
| (a) | Security did not produce income within the last twelve months. |
| (b) | Institutional Class Shares of each Fund. |
| (c) | Securities with an aggregate market value of $24,305 were out on loan in exchange for $24,862 of cash collateral as of June 30, 2024. The collateral was invested in a cash collateral reinvestment vehicle as described in Note 5 in the Notes to Financial Statements. |
| (d) | Coupon represents a 7-Day Yield. |
BORROWINGS AND OTHER FINANCING TRANSACTIONS
(e) REPURCHASE AGREEMENTS:
| | | | | | | | | | | | | | | | | | | | | | | | | | | | | | |
| Counterparty | | Lending
Rate | | | Settlement
Date | | | Maturity
Date | | | Principal
Amount | | | Collateralized By | | Collateral
(Received) | | | Repurchase
Agreements,
at Value | | | Repurchase
Agreement
Proceeds
to be
Received(1) | |
| FICC | | | 2.600 | % | | | 06/28/2024 | | | | 07/01/2024 | | | $ | 8,108 | | | U.S. Treasury Inflation Protected Securities 0.625% due 01/15/2026 | | $ | (8,270 | ) | | $ | 8,108 | | | $ | 8,110 | |
| | | | | | | | | | | | | | | | | | | | | | | | | | | | | | |
Total Repurchase Agreements | | | | | $ | (8,270 | ) | | $ | 8,108 | | | $ | 8,110 | |
| | | | | | | | | | | | | | | |
| | | | | | | | | | | | |
| See Accompanying Notes | | | ANNUAL FINANCIAL AND OTHER INFORMATION | | | | | | | JUNE 30, 2024 | | | 57 |
| | | | | | |
| Schedule of Investments | | PIMCO RAE US Small Fund | | (Cont.) | | June 30, 2024 |
BORROWINGS AND OTHER FINANCING TRANSACTIONS SUMMARY
The following is a summary by counterparty of the market value of Borrowings and Other Financing Transactions and collateral pledged/(received) as of June 30, 2024:
| | | | | | | | | | | | | | | | | | | | | | | | | | | | |
| Counterparty | | Repurchase
Agreement
Proceeds
to be
Received(1) | | | Payable for
Reverse
Repurchase
Agreements | | | Payable for
Sale-Buyback
Transactions | | | Securities Out on Loan | | | Total
Borrowings and
Other Financing
Transactions | | | Collateral
Pledged/(Received) | | | Net Exposure(2) | |
Global/Master Repurchase Agreement | |
FICC | | $ | 8,110 | | | $ | 0 | | | $ | 0 | | | $ | 0 | | | $ | 8,110 | | | $ | (8,270 | ) | | $ | (160 | ) |
|
Master Securities Lending Agreement | |
BMO | | | 0 | | | | 0 | | | | 0 | | | | 15,365 | | | | 15,365 | | | | (15,680 | ) | | | (315 | ) |
BPG | | | 0 | | | | 0 | | | | 0 | | | | 3,542 | | | | 3,542 | | | | (3,622 | ) | | | (80 | ) |
MSC | | | 0 | | | | 0 | | | | 0 | | | | 4,199 | | | | 4,199 | | | | (4,325 | ) | | | (126 | ) |
MZF | | | 0 | | | | 0 | | | | 0 | | | | 1,199 | | | | 1,199 | | | | (1,235 | ) | | | (36 | ) |
| | | | | | | | | | | | | | | | | | | | | | | | | | | | |
Total Borrowings and Other Financing Transactions | | $ | 8,110 | | | $ | 0 | | | $ | 0 | | | $ | 24,305 | | | | | | | | | | | | | |
| | | | | | | | | | | | | | | | | | | | | | | | | | | | |
CERTAIN TRANSFERS ACCOUNTED FOR AS SECURED BORROWINGS
Remaining Contractual Maturity of the Agreements
| | | | | | | | | | | | | | | | | | | | |
| | | Overnight and
Continuous | | | Up to 30 days | | | 31-90 days | | | Greater Than 90 days | | | Total | |
Securities Lending Transactions(3) | |
Consumer Discretionary | | $ | 18,687 | | | $ | 0 | | | $ | 0 | | | $ | 0 | | | $ | 18,687 | |
Real Estate | | | 6,175 | | | | 0 | | | | 0 | | | | 0 | | | | 6,175 | |
| | | | | | | | | | | | | | | | | | | | |
Total Borrowings | | $ | 24,862 | | | $ | 0 | | | $ | 0 | | | $ | 0 | | | $ | 24,862 | |
| | | | | | | | | | | | | | | | | | | | |
Payable for securities on loan - cash collateral | | | $ | 24,862 | |
| | | | | |
| (1) | Includes accrued interest. |
| (2) | Net Exposure represents the net receivable/(payable) that would be due from/to the counterparty in the event of default. Exposure from borrowings and other financing transactions can only be netted across transactions governed under the same master agreement with the same legal entity. See Note 8, Master Netting Arrangements, in the Notes to Financial Statements for more information. |
| (3) | Includes cash collateral as described in Note 5 in the Notes to Financial Statements. |
FAIR VALUE MEASUREMENTS
The following is a summary of the fair valuations according to the inputs used as of June 30, 2024 in valuing the Fund’s assets and liabilities:
| | | | | | | | | | | | | | | | |
| Category and Subcategory | | Level 1 | | | Level 2 | | | Level 3 | | | Fair
Value at
06/30/2024 | |
Investments in Securities, at Value | |
Common Stocks | |
Switzerland | |
Consumer Staples | | $ | 3,574 | | | $ | 0 | | | $ | 0 | | | $ | 3,574 | |
United Kingdom | |
Consumer Staples | | | 3,369 | | | | 0 | | | | 0 | | | | 3,369 | |
Energy | | | 7,757 | | | | 0 | | | | 0 | | | | 7,757 | |
Financials | | | 22,473 | | | | 0 | | | | 0 | | | | 22,473 | |
United States | |
Communication Services | | | 31,708 | | | | 0 | | | | 0 | | | | 31,708 | |
Consumer Discretionary | | | 77,560 | | | | 0 | | | | 0 | | | | 77,560 | |
Consumer Staples | | | 282,756 | | | | 0 | | | | 0 | | | | 282,756 | |
Energy | | | 57,568 | | | | 0 | | | | 0 | | | | 57,568 | |
Financials | | | 139,352 | | | | 0 | | | | 0 | | | | 139,352 | |
Health Care | | | 53,137 | | | | 0 | | | | 0 | | | | 53,137 | |
Industrials | | | 207,537 | | | | 0 | | | | 0 | | | | 207,537 | |
Information Technology | | | 98,367 | | | | 0 | | | | 0 | | | | 98,367 | |
| | | | | | | | | | | | | | | | |
| Category and Subcategory | | Level 1 | | | Level 2 | | | Level 3 | | | Fair
Value at
06/30/2024 | |
Materials | | $ | 92,112 | | | $ | 0 | | | $ | 0 | | | $ | 92,112 | |
Real Estate | | | 7,298 | | | | 0 | | | | 12 | | | | 7,310 | |
Utilities | | | 2,899 | | | | 0 | | | | 0 | | | | 2,899 | |
Real Estate Investment Trusts | |
United States | |
Financials | | | 14,933 | | | | 0 | | | | 0 | | | | 14,933 | |
Real Estate | | | 73,994 | | | | 0 | | | | 0 | | | | 73,994 | |
Short-Term Instruments | |
Repurchase Agreements | | | 0 | | | | 8,108 | | | | 0 | | | | 8,108 | |
| | | | | | | | | | | | | | | | |
| | $ | 1,176,394 | | | $ | 8,108 | | | $ | 12 | | | $ | 1,184,514 | |
| | | | | | | | | | | | | | | | |
|
Investments in Affiliates, at Value | |
Short-Term Instruments | |
Mutual Funds | | | 9,797 | | | | 0 | | | | 0 | | | | 9,797 | |
| | | | | | | | | | | | | | | | |
| | | | |
Total Investments | | $ | 1,186,191 | | | $ | 8,108 | | | $ | 12 | | | $ | 1,194,311 | |
| | | | | | | | | | | | | | | | |
There were no significant transfers into or out of Level 3 during the period ended June 30, 2024.
| | | | | | |
| 58 | | PIMCO EQUITY SERIES | | | See Accompanying Notes | |
| | | | |
| Notes to Financial Statements | | | | June 30, 2024 |
1. ORGANIZATION
PIMCO Equity Series (the “Trust”) was established as a Delaware statutory trust on March 30, 2010. The Trust is registered under the Investment Company Act of 1940, as amended (the “Act”), as an open-end management investment company. Information presented in these financial statements pertains to the Institutional Class, I-2, Class A and Class C shares of the funds (each, a “Fund” and collectively, the “Funds”) indicated on the cover of this report. Pacific Investment Management Company LLC (“PIMCO”) serves as the investment adviser (the “Adviser”) for the Funds. Research Affiliates, LLC (“Research Affiliates”) serves as the sub-adviser for the PIMCO Emerging Markets Fund, PIMCO RAE Global ex-US Fund, PIMCO RAE International Fund, PIMCO RAE US Fund and PIMCO RAE US Small Fund. The PIMCO RAE Global ex-US Fund may invest substantially all of its assets in Institutional Class shares of the PIMCO RAE International Fund (the “International Fund”) and PIMCO RAE Emerging Markets Fund (the “Emerging Markets Fund”) (together, referred to as the “Underlying Funds”), equity securities of small companies economically tied to non-U.S. countries, and securities that are eligible investments for the International Fund and Emerging Markets Fund. The PIMCO RAE Global ex-US Fund may invest in other affiliated funds and unaffiliated funds, which may or may not be registered under the Act (together with the Underlying Funds, “Acquired Funds”).
Hereinafter, the Board of Trustees of the Funds shall be collectively referred to as the “Board.”
2. SIGNIFICANT ACCOUNTING POLICIES
The following is a summary of significant accounting policies consistently followed by the Trust in the preparation of its financial statements in conformity with accounting principles generally accepted in the United States of America (“U.S. GAAP”). Each Fund is treated as an investment company under the reporting requirements of U.S. GAAP. The functional and reporting currency for the Funds is the U.S. dollar. The preparation of financial statements in accordance with U.S. GAAP requires management to make estimates and assumptions that affect the reported amounts of assets and liabilities and disclosure of contingent assets and liabilities at the date of the financial statements and the reported amounts of increases and decreases in net assets from operations during the reporting period. Actual results could differ from those estimates.
(a) Securities Transactions and Investment Income Securities transactions are recorded as of the trade date for financial reporting purposes. Securities purchased or sold on a when-issued or delayed-delivery basis may be settled beyond a standard settlement period for the security after the trade date. Realized gains (losses) from securities sold are recorded on the identified cost basis. Dividend income is recorded on the ex-dividend date, except certain dividends from foreign securities where the ex-dividend date may have passed, which are recorded as soon as a Fund is
informed of the ex-dividend date. Interest income, adjusted for the accretion of discounts and amortization of premiums, is recorded on the accrual basis from settlement date, with the exception of securities with a forward starting effective date, where interest income is recorded on the accrual basis from effective date. For convertible securities, premiums attributable to the conversion feature are not amortized. Estimated tax liabilities on certain foreign securities are recorded on an accrual basis and are reflected as components of interest income or net change in unrealized appreciation (depreciation) on investments on the Statements of Operations, as appropriate. Tax liabilities realized as a result of such security sales are reflected as a component of net realized gain (loss) on investments on the Statements of Operations. Paydown gains (losses) on mortgage-related and other asset-backed securities, if any, are recorded as components of interest income on the Statements of Operations. Income or short-term capital gain distributions received from registered investment companies, if any, are recorded as dividend income. Long-term capital gain distributions received from registered investment companies, if any, are recorded as realized gains.
Debt obligations may be placed on non-accrual status and related interest income may be reduced by ceasing current accruals and writing off interest receivable when the collection of all or a portion of interest has become doubtful based on consistently applied procedures. A debt obligation is removed from non-accrual status when the issuer resumes interest payments or when collectability of interest is probable. A debt obligation may be granted, in certain situations, a contractual or non-contractual forbearance for interest payments that are expected to be paid after agreed upon pay dates.
(b) Foreign Taxes A Fund may be subject to foreign taxes on income, stock dividends, capital gains on investments, or certain foreign currency transactions. All foreign taxes are recorded in accordance with the applicable foreign tax regulations and rates that exist in the foreign jurisdictions in which each Fund invests. These foreign taxes, if any, are paid by a Fund and are reflected in its Statements of Operations as follows: foreign taxes withheld at source are presented as a reduction of income, foreign taxes on securities lending income are presented as a reduction of securities lending income, foreign taxes on stock dividends are presented as “other foreign taxes”, and foreign taxes on capital gains from sales of investments and foreign taxes on foreign currency transactions are included in their respective net realized gain (loss) categories. Foreign taxes payable as of June 30, 2024, if any, are disclosed in the Statements of Assets and Liabilities.
(c) Foreign Currency Translation The market values of foreign securities, currency holdings and other assets and liabilities denominated in foreign currencies are translated into U.S. dollars based on the current exchange rates each business day. Purchases and sales of securities and income and expense items denominated in foreign currencies, if any, are
| | | | | | | | | | | | |
| | | | ANNUAL FINANCIAL AND OTHER INFORMATION | | | | | | | JUNE 30, 2024 | | | 59 |
| | | | |
| Notes to Financial Statements | | (Cont.) | | |
translated into U.S. dollars at the exchange rate in effect on the transaction date. The Funds do not separately report the effects of changes in foreign exchange rates from changes in market prices on securities held. Such changes are included in net realized gain (loss) and net change in unrealized appreciation (depreciation) from investments on the Statements of Operations. The Funds may invest directly or indirectly through investments in Underlying Funds or Acquired Funds, as applicable, in foreign currency-denominated securities and may engage in foreign currency transactions either on a spot (cash) basis at the rate prevailing in the currency exchange market at the time or through a forward foreign currency contract. Realized foreign exchange gains (losses) arising from sales of spot foreign currencies, currency gains (losses) realized between the trade and settlement dates on securities transactions and the difference between the recorded amounts of dividends, interest and foreign withholding taxes and the U.S. dollar equivalent of the amounts actually received or paid are included in net realized gain (loss) on foreign currency transactions on the Statements of Operations. Net unrealized foreign exchange gains (losses) arising from changes in foreign exchange rates on foreign denominated assets and liabilities other than investments in securities held at the end of the reporting period are included in net change in unrealized appreciation (depreciation) on foreign currency assets and liabilities on the Statements of Operations.
(d) Multi-Class Operations Each class offered by the Trust has equal rights as to assets and voting privileges (except that shareholders of a class have exclusive voting rights regarding any matter relating solely to that class of shares). Income and non-class specific expenses are allocated daily to each class on the basis of the relative net assets. Realized and unrealized capital gains (losses) are allocated daily based on the relative net assets of each class of the respective Fund. Class specific expenses, where applicable, currently include supervisory and administrative and distribution and servicing fees. Under certain circumstances, the per share net asset value (“NAV”) of a class of the respective Fund’s shares may be different from the per share NAV of another class of shares as a result of the different daily expense accruals applicable to each class of shares.
(e) Distributions to Shareholders The following table shows the anticipated frequency of distributions from net investment income, if any, for each Fund.
| | | | | | | | | | | | |
| | | | Distribution Frequency | |
| | | |
| Fund Name | | | | | Declared | | | Distributed | |
| | | |
PIMCO Dividend and Income Fund | | | | | | | Quarterly | | | | Quarterly | |
| | | |
PIMCO RAE Emerging Markets Fund | | | | | | | Annually | | | | Annually | |
| | | |
PIMCO RAE Global ex-US Fund | | | | | | | Annually | | | | Annually | |
| | | |
PIMCO RAE International Fund | | | | | | | Annually | | | | Annually | |
| | | |
PIMCO RAE US Fund | | | | | | | Annually | | | | Annually | |
| | | |
PIMCO RAE US Small Fund | | | | | | | Annually | | | | Annually | |
In addition, each Fund distributes any net capital gains it earns from the sale of portfolio securities to shareholders no less frequently than annually. Net short-term capital gains may be paid more frequently. A Fund may revise its distribution policy or postpone the payment of distributions at any time.
Income distributions and capital gain distributions are determined in accordance with income tax regulations which may differ from U.S. GAAP. Differences between tax regulations and U.S. GAAP may cause timing differences between income and capital gain recognition. Further, the character of investment income and capital gains may be different for certain transactions under the two methods of accounting. As a result, income distributions and capital gain distributions declared during a fiscal period may differ significantly from the net investment income (loss) and realized gains (losses) reported on each Fund’s annual financial statements presented under U.S. GAAP.
Separately, if a Fund determines or estimates, as applicable, that a portion of a distribution may be comprised of amounts from sources other than net investment income in accordance with its policies, accounting records (if applicable) and accounting practices, the Fund will notify shareholders of the estimated composition of such distribution through a Section 19 Notice. For these purposes, a Fund determines or estimates, as applicable, the source or sources from which a distribution is paid, to the close of the period as of which it is paid, in reference to its internal accounting records and related accounting practices. If, based on such accounting records and practices, it is determined or estimated, as applicable, that a particular distribution does not include capital gains or paid-in surplus or other capital sources, a Section 19 Notice generally would not be issued. It is important to note that differences exist between a Fund’s daily internal accounting records and practices, a Fund’s financial statements presented in accordance with U.S. GAAP, and recordkeeping practices under income tax regulations. For instance, a Fund’s internal accounting records and practices may take into account, among other factors, tax-related characteristics of certain sources of distributions that differ from treatment under U.S. GAAP. Examples of such differences may include but are not limited to, for certain Funds, the treatment of periodic payments under interest rate swap contracts. Accordingly, among other consequences, it is possible that a Fund may not issue a Section 19 Notice in situations where the Fund’s financial statements prepared later and in accordance with U.S. GAAP and/or the final tax character of those distributions might later report that the sources of those distributions included capital gains and/or a return of capital. Please visit www.pimco.com for the most recent Section 19 Notice, if applicable, for additional information regarding the estimated composition of distributions. Final determination of a distribution’s tax character will be provided to shareholders when such information is available.
Distributions classified as a tax basis return of capital at a Fund’s fiscal year end, if any, are reflected on the Statements of Changes in Net Assets and have been recorded to paid in capital on the Statements of Assets and Liabilities. In addition, other amounts have been reclassified between distributable earnings (accumulated loss) and paid in capital on the Statements of Assets and Liabilities to more appropriately conform U.S. GAAP to tax characterizations of distributions.
(f) New Accounting Pronouncements and Regulatory Updates In March 2020, the Financial Accounting Standards Board (“FASB”) issued an Accounting Standards Update (“ASU”), ASU 2020-04, Reference Rate Reform (Topic 848), which provides optional guidance to ease the potential accounting burden associated with transitioning away from the London Interbank Offered Rate and other reference rates that are expected to be discontinued. ASU 2020-04 is effective for certain reference rate-related contract modifications that occurred or will occur during the period March 12, 2020 through December 31, 2024. In January 2021 and December 2022, FASB issued ASU 2021-01 and ASU 2022-06, which include additional amendments to Topic 848. Management is continuously evaluating the potential effect a discontinuation of LIBOR could have on the Funds’ investments and has determined that it is unlikely the ASU’s adoption will have a material impact on the Funds’ financial statements.
In June 2022, the FASB issued ASU 2022-03, Fair Value Measurement (Topic 820), which affects all entities that have investments in equity securities measured at fair value that are subject to a contractual sale restriction. The amendments in ASU 2022-03 clarify that a contractual restriction on the sale of an equity security is not considered part of the unit of account of the equity security and, therefore, is not considered in measuring the fair value. The amendments also require additional disclosures for equity securities subject to contractual sale restrictions that are measured at fair value in accordance with Topic 820. The effective date for the amendments in ASU 2022-03 is for fiscal years beginning after December 15, 2023 and interim periods within those fiscal years. Management has implemented changes in connection with the amendments and has determined that there was no material impact to the Funds’ financial statements.
In October 2022, the U.S. Securities and Exchange Commission (“SEC”) adopted changes to the mutual fund and exchange-traded fund (“ETF”) shareholder report and registration statement disclosure requirements and the registered fund advertising rules, which change the disclosures provided to shareholders. The rule amendments were effective as of January 2023, and compliance with the rule amendments was required as of July 2024. As such, the Funds have made significant updates to the content of their shareholder reports. In addition, shareholder reports are now mailed to shareholders who have not opted to receive shareholder report documents electronically.
Management has implemented format and content changes to the Funds’ annual and semiannual financial and other information in connection with the rule amendments and has determined that there was no material impact to the Funds’ financial statements.
The SEC made a final ruling on February 15, 2023 to adopt proposed amendments to the Settlement Cycle Rule (Rule 15c6-1) and other related rules under the Securities Exchange Act of 1934, as amended, to shorten the standard settlement cycle for most broker-dealer transactions from two business days after the trade date (T+2) to one business day after the trade date (T+1). The effective date was May 5, 2023, and compliance with the amendments was required as of May 28, 2024. Management has implemented changes in connection with the rule and has determined that there was no material impact to the Funds’ financial statements.
In September 2023, the SEC adopted amendments to Rule 35d-1 under the Act, the rule governing fund naming conventions (the “Names Rule”). In general, the Names Rule requires funds with certain types of names to adopt a policy to invest at least 80% of their assets in the type of investment suggested by the name. The amendments expand the scope of the current rule to include any term used in a fund name that suggests the fund makes investments that have, or whose issuers have, particular characteristics. Additionally, the amendments modify the circumstances under which a fund may deviate from its 80% investment policy and address the calculation methodology of derivatives instruments for purposes of the rule. The amendments became effective December 11, 2023, and fund groups with $1 billion or more in net assets will have 24 months to comply with the amendments (fund groups with net assets of less than $1 billion have 30 months to comply). At this time, management is evaluating the implications of these changes on the financial statements.
3. INVESTMENT VALUATION AND FAIR VALUE MEASUREMENTS
(a) Investment Valuation Policies The NAV of a Fund’s shares, or each of their respective share classes, as applicable, is determined by dividing the total value of portfolio investments and other assets attributable to the Fund or class, less any liabilities, as applicable, by the total number of shares outstanding.
On each day that the New York Stock Exchange (“NYSE”) is open, each Fund’s shares are ordinarily valued as of the close of regular trading (normally 4:00 p.m., Eastern time) (“NYSE Close”). Information that becomes known to the Funds or their agents after the time as of which NAV has been calculated on a particular day will not generally be used to retroactively adjust the price of a security or the NAV determined earlier that day. If regular trading on the NYSE closes earlier than scheduled, each Fund may calculate its NAV as of the earlier closing time or calculate its NAV as of the NYSE Close for that
| | | | | | | | | | | | |
| | | | ANNUAL FINANCIAL AND OTHER INFORMATION | | | | | | | JUNE 30, 2024 | | | 61 |
| | | | |
| Notes to Financial Statements | | (Cont.) | | |
day. Each Fund generally does not calculate its NAV on days on which the NYSE is not open for business. If the NYSE is closed on a day it would normally be open for business, each Fund may calculate its NAV as of the NYSE Close for such day or such other time that each Fund may determine.
For purposes of calculating NAV, portfolio securities and other assets for which market quotations are readily available are valued at market value. A market quotation is readily available only when that quotation is a quoted price (unadjusted) in active markets for identical investments that a Fund can access at the measurement date, provided that a quotation will not be readily available if it is not reliable. Market value is generally determined on the basis of official closing prices or the last reported sales prices. The Funds will normally use pricing data for domestic equity securities received shortly after the NYSE Close and do not normally take into account trading, clearances or settlements that take place after the NYSE Close. A foreign (non-U.S.) equity security traded on a foreign exchange or on more than one exchange is typically valued using pricing information from the exchange considered by PIMCO to be the primary exchange. If market value pricing is used, a foreign (non-U.S.) equity security will be valued as of the close of trading on the foreign exchange or the NYSE Close if the NYSE Close occurs before the end of trading on the foreign exchange.
Investments for which market quotations are not readily available are valued at fair value as determined in good faith pursuant to Rule 2a-5 under the Act. As a general principle, the fair value of a security or other asset is the price that would be received to sell an asset or paid to transfer a liability in an orderly transaction between market participants at the measurement date. Pursuant to Rule 2a-5, the Board has designated PIMCO as the valuation designee (“Valuation Designee”) for each Fund to perform the fair value determination relating to all Fund investments. PIMCO may carry out its designated responsibilities as Valuation Designee through various teams and committees. The Valuation Designee’s policies and procedures govern the Valuation Designee’s selection and application of methodologies for determining and calculating the fair value of Fund portfolio investments. The Valuation Designee may value Fund portfolio securities for which market quotations are not readily available and other Fund assets utilizing inputs from pricing services, quotation reporting systems, valuation agents and other third-party sources (together, “Pricing Sources”).
Domestic and foreign (non-U.S.) fixed income securities, non-exchange traded derivatives and equity options are normally valued on the basis of quotes obtained from brokers and dealers or Pricing Sources using data reflecting the earlier closing of the principal markets for those securities. Prices obtained from Pricing Sources may be based on, among other things, information provided by market makers or
estimates of market values obtained from yield data relating to investments or securities with similar characteristics. Certain fixed income securities purchased on a delayed-delivery basis are marked to market daily until settlement at the forward settlement date. Common stocks, ETFs, exchange-traded notes and financial derivative instruments, such as futures contracts, rights and warrants, or options on futures that are traded on a national securities exchange, are stated at the last reported sale or settlement price on the day of valuation. Exchange-traded options, except equity options, futures and options on futures are valued at the settlement price determined by the relevant exchange. Swap agreements are valued on the basis of bid quotes obtained from brokers and dealers or market-based prices supplied by Pricing Sources. With respect to any portion of a Fund’s assets that are invested in one or more open-end management investment companies (other than ETFs), a Fund’s NAV will be calculated based on the NAVs of such investments. Open-end management investment companies may include affiliated funds.
If a foreign (non-U.S.) equity security’s value has materially changed after the close of the security’s primary exchange or principal market but before the NYSE Close, the security may be valued at fair value. Foreign (non-U.S.) equity securities that do not trade when the NYSE is open are also valued at fair value. With respect to foreign (non-U.S.) equity securities, a Fund may determine the fair value of investments based on information provided by Pricing Sources, which may recommend fair value or adjustments with reference to other securities, indexes or assets. In considering whether fair valuation is required and in determining fair values, the Valuation Designee may, among other things, consider significant events (which may be considered to include changes in the value of U.S. securities or securities indexes) that occur after the close of the relevant market and before the NYSE Close. A Fund may utilize modeling tools provided by third-party vendors to determine fair values of foreign (non-U.S.) securities. For these purposes, unless otherwise determined by the Valuation Designee, any movement in the applicable reference index or instrument (“zero trigger”) between the earlier close of the applicable foreign market and the NYSE Close may be deemed to be a significant event, prompting the application of the pricing model (effectively resulting in daily fair valuations). Foreign exchanges may permit trading in foreign (non-U.S.) equity securities on days when the Trust is not open for business, which may result in a Fund’s portfolio investments being affected when shareholders are unable to buy or sell shares.
Investments valued in currencies other than the U.S. dollar are converted to the U.S. dollar using exchange rates obtained from Pricing Sources. As a result, the value of such investments and, in turn, the NAV of a Fund’s shares may be affected by changes in the value of currencies in relation to the U.S. dollar. The value of investments traded in markets outside the United States or denominated in currencies
other than the U.S. dollar may be affected significantly on a day that the Trust is not open for business. As a result, to the extent that a Fund holds foreign (non-U.S.) investments, the value of those investments may change at times when shareholders are unable to buy or sell shares and the value of such investments will be reflected in each Fund’s next calculated NAV.
Whole loans may be fair valued using inputs that take into account borrower- or loan-level data (e.g., credit risk of the borrower) that is updated periodically throughout the life of each individual loan; any new borrower- or loan-level data received in any written reports periodically by a Fund normally will be taken into account in calculating the NAV. A Fund’s whole loan investments, including those originated by the Fund or through an alternative lending platform, generally are fair valued in accordance with procedures approved by the Board.
Fair valuation may require subjective determinations about the value of a security. While the Trust’s and Valuation Designee’s policies and procedures are intended to result in a calculation of a Fund’s NAV that fairly reflects security values as of the time of pricing, the Trust cannot ensure that fair values accurately reflect the price that a Fund could obtain for a security if it were to dispose of that security as of the time of pricing (for instance, in a forced or distressed sale). The prices used by a Fund may differ from the value that would be realized if the securities were sold. The Funds’ use of fair valuation may also help to deter “stale price arbitrage” as discussed under the “Abusive Trading Practices” section in each Fund’s prospectus.
Under certain circumstances, the per share NAV of a class of a Fund’s shares may be different from the per share NAV of another class of shares as a result of the different daily expense accruals applicable to each class of shares.
(b) Fair Value Hierarchy U.S. GAAP describes fair value as the price that a Fund would receive to sell an asset or pay to transfer a liability in an orderly transaction between market participants at the measurement date. It establishes a fair value hierarchy that prioritizes inputs to valuation methods and requires disclosure of the fair value hierarchy, separately for each major category of assets and liabilities, that segregates fair value measurements into levels (Level 1, 2 or 3). The inputs or methodology used for valuing securities are not necessarily an indication of the risks associated with investing in those securities. Levels 1, 2 and 3 of the fair value hierarchy are defined as follows:
| ∎ | | Level 1 — Quoted prices (unadjusted) in active markets or exchanges for identical assets and liabilities. |
| ∎ | | Level 2 — Significant other observable inputs, which may include, but are not limited to, quoted prices for similar assets or liabilities in markets that are active, quoted prices for identical or similar assets |
| | | or liabilities in markets that are not active, inputs other than quoted prices that are observable for the assets or liabilities (such as interest rates, yield curves, volatilities, prepayment speeds, loss severities, credit risks and default rates) or other market corroborated inputs. |
| ∎ | | Level 3 — Significant unobservable inputs based on the best information available in the circumstances, to the extent observable inputs are not available, which may include assumptions made by the Valuation Designee that are used in determining the fair value of investments. |
In accordance with the requirements of U.S. GAAP, the amounts of transfers into and out of Level 3, if material, are disclosed in the Notes to Schedule of Investments for each respective Fund.
For fair valuations using significant unobservable inputs, U.S. GAAP requires a reconciliation of the beginning to ending balances for reported fair values that presents changes attributable to realized gain (loss), unrealized appreciation (depreciation), purchases and sales, accrued discounts (premiums), and transfers into and out of the Level 3 category during the period. The end of period value is used for the transfers between Levels of a Fund’s assets and liabilities. Additionally, U.S. GAAP requires quantitative information regarding the significant unobservable inputs used in the determination of fair value of assets or liabilities categorized as Level 3 in the fair value hierarchy. In accordance with the requirements of U.S. GAAP, a fair value hierarchy and, if material, a Level 3 reconciliation and details of significant unobservable inputs, have been included in the Notes to Schedule of Investments for each respective Fund.
(c) Valuation Techniques and the Fair Value Hierarchy
Level 1, Level 2 and Level 3 trading assets and trading liabilities, at fair value The valuation methods (or “techniques”) and significant inputs used in determining the fair values of portfolio securities or other assets and liabilities categorized as Level 1, Level 2 and Level 3 of the fair value hierarchy are as follows:
Common stocks, ETFs, exchange-traded notes and financial derivative instruments, such as futures contracts, rights and warrants, or options on futures that are traded on a national securities exchange, are stated at the last reported sale or settlement price on the day of valuation. To the extent these securities are actively traded and valuation adjustments are not applied, they are categorized as Level 1 of the fair value hierarchy.
Investments in registered open-end investment companies (other than ETFs) will be valued based upon the NAVs of such investments and are categorized as Level 1 of the fair value hierarchy. Investments in unregistered open-end investment companies will be calculated based upon the NAVs of such investments and are considered Level 1 provided that the NAVs are observable, calculated daily and are the value at which both purchases and sales will be conducted.
| | | | | | | | | | | | |
| | | | ANNUAL FINANCIAL AND OTHER INFORMATION | | | | | | | JUNE 30, 2024 | | | 63 |
| | | | |
| Notes to Financial Statements | | (Cont.) | | |
Fixed income securities including corporate, convertible and municipal bonds and notes, U.S. government agencies, U.S. treasury obligations, sovereign issues, bank loans, convertible preferred securities, non-U.S. bonds and short-term debt instruments (such as commercial paper, time deposits and certificates of deposit) are normally valued on the basis of quotes obtained from brokers and dealers or Pricing Sources that use broker-dealer quotations, reported trades or valuation estimates from their internal pricing models. The Pricing Sources’ internal models use inputs that are observable such as issuer details, interest rates, yield curves, prepayment speeds, credit risks/spreads, default rates and quoted prices for similar assets. Securities that use similar valuation techniques and inputs as described above are categorized as Level 2 of the fair value hierarchy.
Fixed income securities purchased on a delayed-delivery basis or as a repurchase commitment in a sale-buyback transaction are marked to market daily until settlement at the forward settlement date and are categorized as Level 2 of the fair value hierarchy.
Mortgage-related and asset-backed securities are usually issued as separate tranches, or classes, of securities within each deal. These securities are also normally valued by Pricing Sources that use broker-dealer quotations, reported trades or valuation estimates from their internal pricing models. The pricing models for these securities usually consider tranche-level attributes, current market data, estimated cash flows and market-based yield spreads for each tranche, and incorporate deal collateral performance, as available. Mortgage-related and asset-backed securities that use similar valuation techniques and inputs as described above are categorized as Level 2 of the fair value hierarchy.
Valuation adjustments may be applied to certain securities that are solely traded on a foreign exchange to account for the market movement between the close of the foreign market and the NYSE Close. These securities are valued using Pricing Sources that consider the correlation of the trading patterns of the foreign security to the intraday trading in the U.S. markets for investments. Securities using these valuation adjustments are categorized as Level 2 of the fair value hierarchy. Preferred securities and other equities traded on inactive markets or valued by reference to similar instruments are also categorized as Level 2 of the fair value hierarchy.
Valuation adjustments may be applied to certain exchange traded futures and options to account for market movement between the exchange settlement and the NYSE Close. These securities are valued using quotes obtained from a quotation reporting system, established market makers or Pricing Sources. Financial derivatives using these valuation adjustments are categorized as Level 2 of the fair value hierarchy.
Equity-linked securities are valued by referencing the last reported sale or settlement price of the linked referenced equity on the day of
valuation. Foreign exchange adjustments are applied to the last reported price to convert the linked equity’s trading currency to the contract’s settling currency. These investments are categorized as Level 2 of the fair value hierarchy.
Equity exchange-traded options and over the counter financial derivative instruments, such as forward foreign currency contracts and options contracts derive their value from underlying asset prices, indexes, reference rates and other inputs or a combination of these factors. These contracts are normally valued on the basis of quotes obtained from a quotation reporting system, established market makers or Pricing Sources (normally determined as of the NYSE Close). Depending on the product and the terms of the transaction, financial derivative instruments can be valued by Pricing Sources using a series of techniques, including simulation pricing models. The pricing models use inputs that are observed from actively quoted markets such as quoted prices, issuer details, indexes, bid/ask spreads, interest rates, implied volatilities, yield curves, dividends and exchange rates. Financial derivative instruments that use similar valuation techniques and inputs as described above are categorized as Level 2 of the fair value hierarchy.
Centrally cleared swaps and over the counter swaps derive their value from underlying asset prices, indexes, reference rates and other inputs or a combination of these factors. They are valued using a broker-dealer bid quotation or on market-based prices provided by Pricing Sources (normally determined as of the NYSE Close). Centrally cleared swaps and over the counter swaps can be valued by Pricing Sources using a series of techniques, including simulation pricing models. The pricing models may use inputs that are observed from actively quoted markets such as the overnight index swap rate, LIBOR forward rate, yield curves and credit spreads. These securities are categorized as Level 2 of the fair value hierarchy.
Short-term debt instruments (such as commercial paper, time deposits and certificates of deposit) having a remaining maturity of 60 days or less may be valued at amortized cost, so long as the amortized cost value of such short-term debt instruments is approximately the same as the fair value of the instrument as determined without the use of amortized cost valuation. These securities are categorized as Level 2 or Level 3 of the fair value hierarchy depending on the source of the base price.
When a fair valuation method is applied by PIMCO that uses significant unobservable inputs, investments will be priced by a method that the Valuation Designee believes reflects fair value and are categorized as Level 3 of the fair value hierarchy.
4. SECURITIES AND OTHER INVESTMENTS
(a) Investments in Affiliates
Each Fund eligible to participate in securities lending may invest the cash collateral received for securities out on loan in the PIMCO Government Money Market Fund under the Securities Lending Agreement. All or a portion of Dividend Income as shown in the table below represents the income earned on the cash collateral invested in PIMCO Government Money Market Fund and is included on the Statements of Operations as a component of Securities Lending Income. PIMCO Government Money Market Fund is considered to be affiliated with the Funds. The table below shows the Funds’ transactions in and earnings from investments in the affiliated funds for the period ended June 30, 2024 (amounts in thousands†):
Investments in PIMCO Government Money Market Fund
| | | | | | | | | | | | | | | | | | | | | | | | | | | | | | | | | | | | |
| Fund Name | | | | | Market Value
06/30/2023 | | | Purchases
at Cost | | | Proceeds
from Sales | | | Net
Realized
Gain (Loss) | | | Change in
Unrealized
Appreciation
(Depreciation) | | | Market Value
06/30/2024 | | | Dividend
Income(1) | | | Realized Net
Capital Gain
Distributions(1) | |
| | | | | | | | | |
PIMCO RAE Emerging Markets Fund | | | | | | $ | 26,933 | | | $ | 250,611 | | | $ | (271,979 | ) | | $ | 0 | | | $ | 0 | | | $ | 5,565 | | | $ | 862 | | | $ | 0 | |
| | | | | | | | | |
PIMCO RAE International Fund | | | | | | | 27,723 | | | | 200,654 | | | | (211,689 | ) | | | 0 | | | | 0 | | | | 16,688 | | | | 498 | | | | 0 | |
| | | | | | | | | |
PIMCO RAE US Fund | | | | | | | 0 | | | | 11,362 | | | | (11,035 | ) | | | 0 | | | | 0 | | | | 327 | | | | 60 | | | | 0 | |
| | | | | | | | | |
PIMCO RAE US Small Fund | | | | | | | 9,797 | | | | 168,176 | | | | (168,176 | ) | | | 0 | | | | 0 | | | | 9,797 | | | | 405 | | | | 0 | |
| † | A zero balance may reflect actual amounts rounding to less than one thousand. |
| (1) | The tax characterization of distributions is determined in accordance with Federal income tax regulations and may contain a return of capital. The actual tax characterization of distributions received is determined at the end of the fiscal year of the affiliated fund. See Note 2, Distributions to Shareholders, in the Notes to Financial Statements for more information. |
The PIMCO RAE Global ex-US Fund may invest substantially all of its assets in Acquired Funds (except the PIMCO RAE US Fund), equity securities of small companies economically tied to non-U.S. countries, and securities that are eligible investments for the International Fund and Emerging Markets Fund. The Underlying Funds are considered to be affiliated with the PIMCO RAE Global ex-US Fund.
Each Fund may invest in the PIMCO Short Asset Portfolio and the PIMCO Short-Term Floating NAV Portfolio III (“Central Funds”) to the extent permitted by the Act, rules thereunder or exemptive relief therefrom. The Central Funds are registered investment companies created for use solely by the series of the Trust and other series of registered investment companies advised by the Adviser, in connection with their cash management activities. The main investments of the Central Funds are money market and short maturity fixed income instruments. The Central Funds may incur expenses related to their investment activities, but do not pay Investment Advisory Fees or Supervisory and Administrative Fees to the Adviser. The Central Funds are considered to be affiliated with the Funds. A complete schedule of portfolio holdings for each affiliate fund is filed with the SEC for the first and third quarters of each fiscal year on Form N-PORT and is available at the SEC’s website at www.sec.gov. A copy of each Acquired Fund’s shareholder report is also available at the SEC’s website at www.sec.gov, and a copy of each affiliate fund’s shareholder report is available on the Funds’ website at www.pimco.com, or upon request, as applicable. The tables below show the Funds’ transactions in and earnings from investments in the affiliated funds for the period ended June 30, 2024 (amounts in thousands†):
Investment in PIMCO Short-Term Floating NAV Portfolio III
| | | | | | | | | | | | | | | | | | | | | | | | | | | | | | | | | | | | |
| Fund Name | | | | | Market Value
06/30/2023 | | | Purchases
at Cost | | | Proceeds
from Sales | | | Net
Realized
Gain (Loss) | | | Change in
Unrealized
Appreciation
(Depreciation) | | | Market Value
06/30/2024 | | | Dividend
Income(1) | | | Realized Net
Capital Gain
Distributions(1) | |
| | | | | | | | | |
PIMCO Dividend and Income Fund | | | | | | $ | 13,363 | | | $ | 29,648 | | | $ | (37,844 | ) | | $ | 16 | | | $ | (15 | ) | | $ | 5,168 | | | $ | 345 | | | $ | 0 | |
| | | | | | | | | | | | | | | | | | | | | | | | | | | | | | | | | | | | |
| PIMCO RAE Global ex-US Fund | |
| Underlying PIMCO Funds | | | | | Market Value
06/30/2023 | | | Purchases
at Cost | | | Proceeds
from Sales | | | Net
Realized
Gain (Loss) | | | Change in
Unrealized
Appreciation
(Depreciation) | | | Market Value
06/30/2024 | | | Dividend
Income(1) | | | Realized Net
Capital Gain
Distributions(1) | |
| | | | | | | | | |
PIMCO RAE Emerging Markets Fund | | | | | | $ | 21,334 | | | $ | 5,023 | | | $ | (2,801 | ) | | $ | 34 | | | $ | 3,991 | | | $ | 27,581 | | | $ | 1,002 | | | $ | 0 | |
| | | | | | | | | |
PIMCO RAE International Fund | | | | | | | 70,733 | | | | 16,330 | | | | (7,154 | ) | | | (1,556 | ) | | | 1,116 | | | | 79,469 | | | | 4,937 | | | | 2,255 | |
| | | | | | | | | |
Totals | | | | | | $ | 92,067 | | | $ | 21,353 | | | $ | (9,955 | ) | | $ | (1,522 | ) | | $ | 5,107 | | | $ | 107,050 | | | $ | 5,939 | | | $ | 2,255 | |
| † | A zero balance may reflect actual amounts rounding to less than one thousand. |
| (1) | The tax characterization of distributions is determined in accordance with Federal income tax regulations and may contain a return of capital. The actual tax characterization of distributions received is determined at the end of the fiscal year of the affiliated fund, unless otherwise advised on IRS Form 1099-DIV. See Note 2, Distributions to Shareholders, in the Notes to Financial Statements for more information. |
| | | | | | | | | | | | |
| | | | ANNUAL FINANCIAL AND OTHER INFORMATION | | | | | | | JUNE 30, 2024 | | | 65 |
| | | | |
| Notes to Financial Statements | | (Cont.) | | |
(b) Investments in Securities
The Funds (and where applicable, certain Acquired Funds and Underlying Funds) may utilize the investments and strategies described below to the extent permitted by each Fund’s respective investment policies.
Inflation-Indexed Bonds are fixed income securities whose principal value is periodically adjusted according to the rate of inflation. The interest rate on these bonds is generally fixed at issuance at a rate lower than typical bonds. Over the life of an inflation-indexed bond, however, interest will be paid based on a principal value which is adjusted for inflation. Any increase or decrease in the principal amount of an inflation-indexed bond will be included as interest income on the Statements of Operations, even though investors do not receive their principal until maturity. Repayment of the original bond principal upon maturity (as adjusted for inflation) is guaranteed in the case of U.S. Treasury Inflation-Protected Securities (“TIPS”). For bonds that do not provide a similar guarantee, the adjusted principal value of the bond repaid at maturity may be less than the original principal.
Loans and Other Indebtedness, Loan Participations and Assignments are direct debt instruments which are interests in amounts owed to lenders or lending syndicates by corporate, governmental or other borrowers. A Fund’s investments in loans may be in the form of participations in loans or assignments of all or a portion of loans from third parties or investments in or originations of loans by the Fund or Funds. A loan is often administered by a bank or other financial institution (the “agent”) that acts as agent for all holders. The agent administers the terms of the loan, as specified in the loan agreement. A Fund may invest in multiple series or tranches of a loan, which may have varying terms and carry different associated risks. When a Fund purchases assignments from agents it acquires direct rights against the borrowers of the loans. These loans may include participations in bridge loans, which are loans taken out by borrowers for a short period (typically less than one year) pending arrangement of more permanent financing through, for example, the issuance of bonds, frequently high yield bonds issued for the purpose of acquisitions.
The types of loans and related investments in which the Funds may invest include, among others, senior loans, subordinated loans (including second lien loans, B-Notes and mezzanine loans), whole loans, commercial real estate and other commercial loans and structured loans. The Funds may originate loans or acquire direct interests in loans through primary loan distributions and/or in private transactions. In the case of subordinated loans, there may be significant indebtedness ranking ahead of the borrower’s obligation to the holder of such a loan, including in the event of the borrower’s insolvency. Mezzanine loans are typically secured by a pledge of an
equity interest in the mortgage borrower that owns the real estate rather than an interest in a mortgage.
Investments in loans may include unfunded loan commitments, which are contractual obligations for funding. Unfunded loan commitments may include revolving credit facilities, which may obligate a Fund to supply additional cash to the borrower on demand. Unfunded loan commitments represent a future obligation in full, even though a percentage of the committed amount may not be utilized by the borrower. When investing in a loan participation, a Fund has the right to receive payments of principal, interest and any fees to which it is entitled only from the agent selling the loan agreement and only upon receipt of payments by the agent from the borrower. A Fund may receive a commitment fee based on the undrawn portion of the underlying line of credit portion of a loan. In certain circumstances, a Fund may receive a penalty fee upon the prepayment of a loan by a borrower. Fees earned or paid are recorded as a component of interest income or interest expense, respectively, on the Statements of Operations. Unfunded loan commitments are reflected as a liability on the Statements of Assets and Liabilities.
Mortgage-Related and Other Asset-Backed Securities directly or indirectly represent a participation in, or are secured by and payable from, loans on real property. Mortgage-related securities are interests in pools of residential or commercial mortgage loans, including mortgage loans made by savings and loan institutions, mortgage bankers, commercial banks and others. These securities provide a monthly payment which consists of both interest and principal payments. Interest may be determined by fixed or adjustable rates. The rate of prepayments on underlying mortgages will affect the price and volatility of a mortgage-related security, and may have the effect of shortening or extending the effective duration of the security relative to what was anticipated at the time of purchase. The timely payment of principal and interest of certain mortgage-related securities is guaranteed with the full faith and credit of the U.S. Government. Pools created and guaranteed by non-governmental issuers, including government-sponsored corporations, may be supported by various forms of insurance or guarantees, but there can be no assurance that private insurers or guarantors can meet their obligations under the insurance policies or guarantee arrangements. Many of the risks of investing in mortgage-related securities secured by commercial mortgage loans reflect the effects of local and other economic conditions on real estate markets, the ability of tenants to make lease payments and the ability of a property to attract and retain tenants. These securities may be less liquid and may exhibit greater price volatility than other types of mortgage-related or other asset-backed securities. Other asset-backed securities are created from many types of assets, including, but not limited to, auto loans, accounts receivable such as credit card receivables and hospital account receivables, home
equity loans, student loans, boat loans, mobile home loans, recreational vehicle loans, manufactured housing loans, aircraft leases, computer leases, syndicated bank loans, peer-to-peer loans and litigation finance loans.
Collateralized Debt Obligations (“CDOs”) include Collateralized Bond Obligations (“CBOs”), Collateralized Loan Obligations (“CLOs”) and other similarly structured securities. CBOs, CLOs and other CDOs are types of asset-backed securities. A CBO is a trust which is backed by a diversified pool of high risk, below investment grade fixed income securities. A CLO is a trust typically collateralized by a pool of loans, which may include, among others, domestic and foreign senior secured loans, senior unsecured loans, and subordinate corporate loans, including loans that may be rated below investment grade or equivalent unrated loans. Other CDOs are trusts backed by other types of assets representing obligations of various parties. The risks of an investment in a CDO depend largely on the type of the collateral securities and the class of the CDO in which a Fund invests. In addition to the normal risks associated with fixed income securities discussed elsewhere in this report and each Fund’s prospectus and statement of additional information (e.g., prepayment risk, credit risk, liquidity risk, market risk, structural risk, legal risk and interest rate risk (which may be exacerbated if the interest rate payable on a structured financing changes based on multiples of changes in interest rates or inversely to changes in interest rates)), CBOs, CLOs and other CDOs carry additional risks including, but not limited to: (i) the possibility that distributions from collateral securities will not be adequate to make interest or other payments, (ii) the quality of the collateral may decline in value or default, (iii) risks related to the capability of the servicer of the securitized assets, (iv) the risk that a Fund may invest in CBOs, CLOs, or other CDOs that are subordinate to other classes, (v) the structure and complexity of the transaction and the legal documents may not be fully understood at the time of investment and could lead to disputes with the issuer or among investors regarding the characterization of proceeds or unexpected investment results, and (vi) the CDO’s manager may perform poorly.
Collateralized Mortgage Obligations (“CMOs”) are debt obligations of a legal entity that are collateralized by whole mortgage loans or private mortgage bonds and divided into classes. CMOs are structured into multiple classes, often referred to as “tranches,” with each class bearing a different stated maturity and entitled to a different schedule for payments of principal and interest, including prepayments. CMOs may be less liquid and may exhibit greater price volatility than other types of mortgage-related or asset-backed securities.
Payment In-Kind Securities may give the issuer the option at each interest payment date of making interest payments in either cash and/or additional debt securities. Those additional debt securities usually
have the same terms, including maturity dates and interest rates, and associated risks as the original bonds. The daily market quotations of the original bonds may include the accrued interest (referred to as a dirty price) and require a pro rata adjustment from the unrealized appreciation (depreciation) on investments to interest receivable on the Statements of Assets and Liabilities.
Perpetual Bonds are fixed income securities with no maturity date but pay a coupon in perpetuity (with no specified ending or maturity date). Unlike typical fixed income securities, there is no obligation for perpetual bonds to repay principal. The coupon payments, however, are mandatory. While perpetual bonds have no maturity date, they may have a callable date in which the perpetuity is eliminated and the issuer may return the principal received on the specified call date. Additionally, a perpetual bond may have additional features, such as interest rate increases at periodic dates or an increase as of a predetermined point in the future.
Restricted Investments are subject to legal or contractual restrictions on resale and may generally be sold privately, but may be required to be registered or exempted from such registration before being sold to the public. Private placement securities are generally considered to be restricted except for those securities traded between qualified institutional investors under the provisions of Rule 144A of the Securities Act of 1933. Disposal of restricted investments may involve time-consuming negotiations and expenses, and prompt sale at an acceptable price may be difficult to achieve. Restricted investments held by the Funds as of June 30, 2024, as applicable, are disclosed in the Notes to Schedules of Investments.
Securities Issued by U.S. Government Agencies or Government-Sponsored Enterprises are obligations of and, in certain cases, guaranteed by, the U.S. Government, its agencies or instrumentalities. Some U.S. Government securities, such as Treasury bills, notes and bonds, and securities guaranteed by the Government National Mortgage Association, are supported by the full faith and credit of the U.S. Government; others, such as those of the Federal Home Loan Banks, are supported by the right of the issuer to borrow from the U.S. Department of the Treasury (the “U.S. Treasury”); and others, such as those of the Federal National Mortgage Association (“FNMA” or “Fannie Mae”), are supported by the discretionary authority of the U.S. Government to purchase the agency’s obligations. U.S. Government securities may include zero coupon securities which do not distribute interest on a current basis and tend to be subject to a greater risk than interest-paying securities of similar maturities.
Government-related guarantors (i.e., not backed by the full faith and credit of the U.S. Government) include FNMA and the Federal Home Loan Mortgage Corporation (“FHLMC” or “Freddie Mac”). FNMA is a government-sponsored corporation. FNMA purchases conventional
| | | | | | | | | | | | |
| | | | ANNUAL FINANCIAL AND OTHER INFORMATION | | | | | | | JUNE 30, 2024 | | | 67 |
| | | | |
| Notes to Financial Statements | | (Cont.) | | |
(i.e., not insured or guaranteed by any government agency) residential mortgages from a list of approved seller/servicers which include state and federally chartered savings and loan associations, mutual savings banks, commercial banks and credit unions and mortgage bankers. Pass-through securities issued by FNMA are guaranteed as to timely payment of principal and interest by FNMA, but are not backed by the full faith and credit of the U.S. Government. FHLMC is a government sponsored corporation that issues Participation Certificates (“PCs”), which are pass-through securities, each representing an undivided interest in a pool of residential mortgages. FHLMC guarantees the timely payment of interest and ultimate collection of principal, but PCs are not backed by the full faith and credit of the U.S. Government.
In June 2019, FNMA and FHLMC started issuing Uniform Mortgage-Backed Securities in place of their current offerings of TBA-eligible securities (the “Single Security Initiative”). The Single Security Initiative seeks to support the overall liquidity of the TBA market and aligns the characteristics of FNMA and FHLMC certificates. The long-term effects that the Single Security Initiative may have on the market for TBA and other mortgage-backed securities are uncertain.
Roll-timing strategies can be used where a Fund seeks to extend the expiration or maturity of a position, such as a TBA security on an underlying asset, by closing out the position before expiration and contemporaneously opening a new position with respect to substantially the same underlying asset with a later expiration date. TBA securities purchased or sold are reflected on the Statements of Assets and Liabilities as an asset or liability, respectively. Recently finalized FINRA rules include mandatory margin requirements for the TBA market that require the Funds to post collateral in connection with their TBA transactions. There is no similar requirement applicable to the Funds’ TBA counterparties. The required collateralization of TBA trades could increase the cost of TBA transactions to the Funds and impose added operational complexity.
Real Estate Investment Trusts (“REITs”) are pooled investment vehicles that own, and typically operate, income-producing real estate. If a REIT meets certain requirements, including distributing to shareholders substantially all of its taxable income (other than net capital gains), then it is not taxed on the income distributed to shareholders. Distributions received from REITs may be characterized as income, capital gain or a return of capital. A return of capital is recorded by a Fund as a reduction to the cost basis of its investment in the REIT. REITs are subject to management fees and other expenses, and so the Funds that invest in REITs will bear their proportionate share of the costs of the REITs’ operations.
Warrants are securities that are usually issued together with a debt security or preferred security and that give the holder the right to buy a proportionate amount of common stock at a specified price. Warrants
normally have a life that is measured in years and entitle the holder to buy common stock of a company at a price that is usually higher than the market price at the time the warrant is issued. Warrants may entail greater risks than certain other types of investments. Generally, warrants do not carry the right to receive dividends or exercise voting rights with respect to the underlying securities, and they do not represent any rights in the assets of the issuer. In addition, their value does not necessarily change with the value of the underlying securities, and they cease to have value if they are not exercised on or before their expiration date. If the market price of the underlying stock does not exceed the exercise price during the life of the warrant, the warrant will expire worthless. Warrants may increase the potential profit or loss to be realized from the investment as compared with investing the same amount in the underlying securities. Similarly, the percentage increase or decrease in the value of an equity security warrant may be greater than the percentage increase or decrease in the value of the underlying common stock. Warrants may relate to the purchase of equity or debt securities. Debt obligations with warrants attached to purchase equity securities have many characteristics of convertible securities and their prices may, to some degree, reflect the performance of the underlying stock. Debt obligations also may be issued with warrants attached to purchase additional debt securities at the same coupon rate. A decline in interest rates would permit a Fund to sell such warrants at a profit. If interest rates rise, these warrants would generally expire with no value.
When-Issued Transactions are purchases or sales made on a when-issued basis. These transactions are made conditionally because a security, although authorized, has not yet been issued in the market. Transactions to purchase or sell securities on a when-issued basis involve a commitment by a Fund to purchase or sell these securities for a predetermined price or yield, with payment and delivery taking place beyond the customary settlement period. A Fund may sell when-issued securities before they are delivered, which may result in a realized gain (loss).
5. BORROWINGS AND OTHER FINANCING TRANSACTIONS
The Funds (and where applicable, certain Acquired Funds and Underlying Funds) may enter into the borrowings and other financing transactions described below to the extent permitted by each Fund’s respective investment policies.
The following disclosures contain information on a Fund’s ability to lend or borrow cash or securities to the extent permitted under the Act, which may be viewed as borrowing or financing transactions by a Fund. The location of these instruments in each Fund’s financial statements is described below.
(a) Repurchase Agreements Under the terms of a typical repurchase agreement, a Fund purchases an underlying debt obligation (collateral)
subject to an obligation of the seller to repurchase, and a Fund to resell, the obligation at an agreed-upon price and time. In an open maturity repurchase agreement, there is no pre-determined repurchase date and the agreement can be terminated by a Fund or counterparty at any time. The underlying securities for all repurchase agreements are held by a Fund’s custodian or designated subcustodians (in the case of tri-party repurchase agreements) and in certain instances will remain in custody with the counterparty. Traditionally, a Fund has used bilateral repurchase agreements wherein the underlying securities will be held by a Fund’s custodian. The market value of the collateral must be equal to or exceed the total amount of the repurchase obligations, including interest. Repurchase agreements, if any, including accrued interest, are included on the Statements of Assets and Liabilities. Interest earned is recorded as a component of interest income on the Statements of Operations. In periods of increased demand for collateral, a Fund may pay a fee for the receipt of collateral, which may result in interest expense to the Fund.
(b) Short Sales Short sales are transactions in which a Fund sells a security that it does not own in anticipation that the market price of that security will decline. A Fund may make short sales of securities to (i) offset potential declines in long positions in similar securities, (ii) to increase the flexibility of a Fund, (iii) for investment return, (iv) as part of a risk arbitrage strategy, and (v) as part of its overall portfolio management strategies involving the use of derivative instruments. When a Fund makes a short sale, it will often borrow the security sold short and deliver it to the counterparty. A Fund will ordinarily have to pay a fee or premium to borrow a security and be obligated to repay the lender of the security any dividend or interest that accrues on the security during the period of the loan. Securities sold in short sale transactions and the dividend or interest payable on such securities, if any, are reflected as payable for short sales on the Statements of Assets and Liabilities. Short sales expose a Fund to the risk that it will be required to cover its short position at a time when the security or other asset has appreciated in value, thus resulting in losses to the Fund. A short sale is “against the box” if a Fund holds in its portfolio or has the right to acquire the security sold short, or securities identical to the security sold short, at no additional cost. A Fund will be subject to additional risks to the extent that it engages in short sales that are not “against the box.” A Fund’s loss on a short sale could theoretically be unlimited in cases where the Fund is unable, for whatever reason, to close out its short position.
(c) Securities Lending The Funds listed below may seek to earn additional income by lending their securities to certain qualified broker-dealers and institutions on a short-term or long-term basis via a lending agent.
|
| Fund Name |
|
PIMCO RAE Emerging Markets Fund |
|
PIMCO RAE Global ex-US Fund |
|
PIMCO RAE International Fund |
|
PIMCO RAE US Fund |
|
PIMCO RAE US Small Fund |
Securities on loan are required to be secured by cash collateral at least equal to 102% of the domestic, or 105% of the foreign security’s market value. If the market value of the collateral at the close of trading on a business day is less than 100% of the market value of the loaned securities at the close of trading on that day, the borrower shall be required to deliver, by the close of business on the following business day, an additional amount of collateral, so that the total amount of posted collateral is equal to at least 100% of the market value of all the loaned securities as of such preceding day. The Funds will then invest the cash collateral received in the PIMCO Government Money Market Fund and record a liability for the return of the collateral during the period the securities are on loan. Each Fund is subject to a lending limit of 33.33% of total assets (including the value of collateral).
The loans are subject to termination at the option of the borrower or a Fund. Upon termination of the loan, the borrower will return to the lender securities identical to the loaned securities. Should the borrower of the securities fail to return loaned securities, a Fund has the right to repurchase the securities using the collateral in the open market.
The borrower pays fees at the Funds’ direction to the lending agent. The lending agent may retain a portion of the fees and interest earned on the cash collateral invested as compensation for its services. Investments made with the cash collateral are disclosed on the Schedules of Investments, if applicable. The lending fees and the Funds’ portion of the interest income earned on cash collateral are included on the Statements of Operations as securities lending income, if applicable.
(d) Interfund Lending In accordance with an exemptive order (the “Order”) from the SEC, the Funds of the Trust may participate in a joint lending and borrowing facility for temporary purposes (the “Interfund Lending Program”), subject to compliance with the terms and conditions of the Order, and to the extent permitted by each Fund’s investment policies and restrictions. The Funds are currently permitted to borrow under the Interfund Lending Program. A lending fund may lend in aggregate up to 15% of its current net assets at the time of the interfund loan, but may not lend more than 5% of its net assets to any one borrowing fund through the Interfund Lending Program. A borrowing fund may not borrow through the Interfund Lending Program or from any other source if its total outstanding borrowings immediately after the borrowing would be more than 33 1/3% of its total assets (or any lower threshold provided for by the fund’s investment restrictions). If a borrowing fund’s total outstanding borrowings exceed 10% of its total assets, each of its outstanding interfund loans will be subject to collateralization of at least 102% of the outstanding principal value of the loan. All interfund loans are for temporary or emergency purposes and the interfund loan rate to be
| | | | | | | | | | | | |
| | | | ANNUAL FINANCIAL AND OTHER INFORMATION | | | | | | | JUNE 30, 2024 | | | 69 |
| | | | |
| Notes to Financial Statements | | (Cont.) | | |
charged will be the average of the highest current overnight repurchase agreement rate available to a lending fund and the bank loan rate, as calculated according to a formula established by the Board.
During the period ended June 30, 2024, the Funds did not participate in the Interfund Lending Program.
6. FINANCIAL DERIVATIVE INSTRUMENTS
The Funds (and where applicable, certain Acquired Funds and Underlying Funds) may enter into the financial derivative instruments described below to the extent permitted by each Fund’s respective investment policies.
The following disclosures contain information on how and why the Funds use financial derivative instruments, and how financial derivative instruments affect the Funds’ financial position, results of operations and cash flows. The location and fair value amounts of these instruments on the Statements of Assets and Liabilities and the net realized gain (loss) and net change in unrealized appreciation (depreciation) on the Statements of Operations, each categorized by type of financial derivative contract and related risk exposure, are included in a table in the Notes to Schedules of Investments. The financial derivative instruments outstanding as of period end and the amounts of net realized gain (loss) and net change in unrealized appreciation (depreciation) on financial derivative instruments during the period, as disclosed in the Notes to Schedules of Investments, serve as indicators of the volume of financial derivative activity for the Funds.
(a) Forward Foreign Currency Contracts may be engaged, in connection with settling planned purchases or sales of securities, to hedge the currency exposure associated with some or all of a Fund’s securities or as part of an investment strategy. A forward foreign currency contract is an agreement between two parties to buy and sell a currency at a set price on a future date. The market value of a forward foreign currency contract fluctuates with changes in foreign currency exchange rates. Forward foreign currency contracts are marked to market daily, and the change in value is recorded by a Fund as an unrealized gain (loss). Realized gains (losses) are equal to the difference between the value of the contract at the time it was opened and the value at the time it was closed and are recorded upon delivery or receipt of the currency. These contracts may involve market risk in excess of the unrealized gain (loss) reflected on the Statements of Assets and Liabilities. In addition, a Fund could be exposed to risk if the counterparties are unable to meet the terms of the contracts or if the value of the currency changes unfavorably to the U.S. dollar. To mitigate such risk, cash or securities may be exchanged as collateral pursuant to the terms of the underlying contracts.
(b) Futures Contracts are agreements to buy or sell a security or other asset for a set price on a future date and are traded on an exchange. A Fund may use futures contracts to manage its exposure to the
securities markets or to movements in interest rates and currency values. The primary risks associated with the use of futures contracts are the imperfect correlation between the change in market value of the securities held by a Fund and the prices of futures contracts and the possibility of an illiquid market. Futures contracts are valued based upon their quoted daily settlement prices. Upon entering into a futures contract, a Fund is required to deposit with its futures broker an amount of cash, U.S. Government and Agency Obligations, or select sovereign debt, in accordance with the initial margin requirements of the broker or exchange. Futures contracts are marked to market daily and based on such movements in the price of the contracts, an appropriate payable or receivable for the change in value may be posted or collected by a Fund (“Futures Variation Margin”). Futures Variation Margins, if any, are disclosed within centrally cleared financial derivative instruments on the Statements of Assets and Liabilities. Gains (losses) are recognized but not considered realized until the contracts expire or close. Futures contracts involve, to varying degrees, risk of loss in excess of the Futures Variation Margin included within exchange traded or centrally cleared financial derivative instruments on the Statements of Assets and Liabilities.
(c) Options Contracts may be written or purchased to enhance returns or to hedge an existing position or future investment. A Fund may write call and put options on securities and financial derivative instruments it owns or in which it may invest. Writing put options tends to increase a Fund’s exposure to the underlying instrument. Writing call options tends to decrease a Fund’s exposure to the underlying instrument. When a Fund writes a call or put, an amount equal to the premium received is recorded and subsequently marked to market to reflect the current value of the option written. These amounts are included on the Statements of Assets and Liabilities. Premiums received from writing options which expire are treated as realized gains. Premiums received from writing options which are exercised or closed are added to the proceeds or offset against amounts paid on the underlying futures, swap, security or currency transaction to determine the realized gain (loss). Certain options may be written with premiums to be determined on a future date. The premiums for these options are based upon implied volatility parameters at specified terms. A Fund as a writer of an option has no control over whether the underlying instrument may be sold (“call”) or purchased (“put”) and as a result bears the market risk of an unfavorable change in the price of the instrument underlying the written option. There is the risk a Fund may not be able to enter into a closing transaction because of an illiquid market.
Purchasing call options tends to increase a Fund’s exposure to the underlying instrument. Purchasing put options tends to decrease a Fund’s exposure to the underlying instrument. A Fund pays a premium which is included as an asset on the Statements of Assets and Liabilities and subsequently marked to market to reflect the current value of the option. Premiums paid for purchasing options which expire
are treated as realized losses. Certain options may be purchased with premiums to be determined on a future date. The premiums for these options are based upon implied volatility parameters at specified terms. The risk associated with purchasing put and call options is limited to the premium paid. Premiums paid for purchasing options which are exercised or closed are added to the amounts paid or offset against the proceeds on the underlying investment transaction to determine the realized gain (loss) when the underlying transaction is executed.
Interest Rate Swaptions may be written or purchased to enter into a pre-defined swap agreement or to shorten, extend, cancel or otherwise modify an existing swap agreement, by some specified date in the future. The writer of the swaption becomes the counterparty to the swap if the buyer exercises. The interest rate swaption agreement will specify whether the buyer of the swaption will be a fixed-rate receiver or a fixed-rate payer upon exercise.
Options on Securities may be written or purchased to enhance returns or to hedge an existing position or future investment. An option on a security uses a specified security as the underlying instrument for the option contract.
(d) Swap Agreements are bilaterally negotiated agreements between a Fund and a counterparty to exchange or swap investment cash flows, assets, foreign currencies or market-linked returns at specified, future intervals. Swap agreements may be privately negotiated in the over the counter market (“OTC swaps”) or may be cleared through a third party, known as a central counterparty or derivatives clearing organization (“Centrally Cleared Swaps”). A Fund may enter into asset, credit default, cross-currency, interest rate, total return, variance and other forms of swap agreements to manage its exposure to credit, currency, interest rate, commodity, equity and inflation risk. In connection with these agreements, securities or cash may be identified as collateral or margin in accordance with the terms of the respective swap agreements to provide assets of value and recourse in the event of default or bankruptcy/insolvency.
Centrally Cleared Swaps are marked to market daily based upon valuations as determined from the underlying contract or in accordance with the requirements of the central counterparty or derivatives clearing organization. Changes in market value, if any, are reflected as a component of net change in unrealized appreciation (depreciation) on the Statements of Operations. Daily changes in valuation of centrally cleared swaps (“Swap Variation Margin”), if any, are disclosed within centrally cleared financial derivative instruments on the Statements of Assets and Liabilities. Centrally Cleared and OTC swap payments received or paid at the beginning of the measurement period are included on the Statements of Assets and Liabilities and represent premiums paid or received upon entering into the swap agreement to compensate for differences between the stated terms of the swap agreement and prevailing market conditions (credit spreads, currency
exchange rates, interest rates, and other relevant factors). Upfront premiums received (paid) are initially recorded as liabilities (assets) and subsequently marked to market to reflect the current value of the swap. These upfront premiums are recorded as realized gain (loss) on the Statements of Operations upon termination or maturity of the swap. A liquidation payment received or made at the termination of the swap is recorded as realized gain (loss) on the Statements of Operations. Net periodic payments received or paid by a Fund are included as part of realized gain (loss) on the Statements of Operations.
For purposes of applying certain of a Fund’s investment policies and restrictions, swap agreements, like other derivative instruments, may be valued by a Fund at market value, notional value or full exposure value. In the case of a credit default swap, in applying certain of a Fund’s investment policies and restrictions, the Funds will value the credit default swap at its notional value or its full exposure value (i.e., the sum of the notional amount for the contract plus the market value), but may value the credit default swap at market value for purposes of applying certain of a Fund’s other investment policies and restrictions. For example, a Fund may value credit default swaps at full exposure value for purposes of a Fund’s credit quality guidelines (if any) because such value in general better reflects a Fund’s actual economic exposure during the term of the credit default swap agreement. As a result, a Fund may, at times, have notional exposure to an asset class (before netting) that is greater or lesser than the stated limit or restriction noted in a Fund’s prospectus. In this context, both the notional amount and the market value may be positive or negative depending on whether a Fund is selling or buying protection through the credit default swap. The manner in which certain securities or other instruments are valued by a Fund for purposes of applying investment policies and restrictions may differ from the manner in which those investments are valued by other types of investors.
Entering into swap agreements involves, to varying degrees, elements of interest, credit, market and documentation risk in excess of the amounts recognized on the Statements of Assets and Liabilities. Such risks involve the possibility that there will be no liquid market for these agreements, that the counterparty to the agreements may fail to perform or meet an obligation or disagree as to the meaning of contractual terms in the agreements and that there may be unfavorable changes in interest rates or the values of the asset upon which the swap is based.
A Fund’s maximum risk of loss from counterparty credit risk is the discounted net value of the cash flows to be received from the counterparty over the contract’s remaining life, to the extent that amount is positive. The risk may be mitigated by having a master netting arrangement between a Fund and the counterparty and by the posting of collateral to a Fund to cover a Fund’s exposure to the counterparty.
| | | | | | | | | | | | |
| | | | ANNUAL FINANCIAL AND OTHER INFORMATION | | | | | | | JUNE 30, 2024 | | | 71 |
| | | | |
| Notes to Financial Statements | | (Cont.) | | |
To the extent a Fund has a policy to limit the net amount owed to or to be received from a single counterparty under existing swap agreements, such limitation only applies to counterparties to OTC swaps and does not apply to centrally cleared swaps where the counterparty is a central counterparty or derivatives clearing organization.
Credit Default Swap Agreements on corporate, loan, sovereign, U.S. municipal or U.S. Treasury issues are entered into to provide a measure of protection against defaults of the issuers (i.e., to reduce risk where a Fund owns or has exposure to the referenced obligation) or to take an active long or short position with respect to the likelihood of a particular issuer’s default. Credit default swap agreements involve one party making a stream of payments (referred to as the buyer of protection) to another party (the seller of protection) in exchange for the right to receive a specified return in the event that the referenced entity, obligation or index, as specified in the swap agreement, undergoes a certain credit event. As a seller of protection on credit default swap agreements, a Fund will generally receive from the buyer of protection a fixed rate of income throughout the term of the swap provided that there is no credit event. As the seller, a Fund would effectively add leverage to its portfolio because, in addition to its total net assets, a Fund would be subject to investment exposure on the notional amount of the swap.
If a Fund is a seller of protection and a credit event occurs, as defined under the terms of that particular swap agreement, a Fund will either (i) pay to the buyer of protection an amount equal to the notional amount of the swap and take delivery of the referenced obligation or underlying securities comprising the referenced index or (ii) pay a net settlement amount in the form of cash, securities or other deliverable obligations equal to the notional amount of the swap less the recovery value of the referenced obligation or underlying securities comprising the referenced index. If a Fund is a buyer of protection and a credit event occurs, as defined under the terms of that particular swap agreement, a Fund will either (i) receive from the seller of protection an amount equal to the notional amount of the swap and deliver the referenced obligation, other deliverable obligations or underlying securities comprising the referenced index or (ii) receive a net settlement amount in the form of cash, securities or other deliverable obligations equal to the notional amount of the swap less the recovery value of the referenced obligation or underlying securities comprising the referenced index. Recovery values are estimated by market makers considering either industry standard recovery rates or entity specific factors and considerations until a credit event occurs. If a credit event has occurred, the recovery value is determined by a facilitated auction whereby a minimum number of allowable broker bids, together with a specified valuation method, are used to calculate the settlement value. The ability to deliver other obligations may result in a cheapest-to-deliver option (the buyer of protection’s right to choose the deliverable obligation with the lowest value following a credit event).
Credit default swap agreements on credit indexes involve one party making a stream of payments to another party in exchange for the right to receive a specified return in the event of a write-down, principal shortfall, interest shortfall or default of all or part of the referenced entities comprising the credit index. A credit index is a basket of credit instruments or exposures designed to be representative of some part of the credit market as a whole. These indexes are made up of reference credits that are judged by a poll of dealers to be the most liquid entities in the credit default swap market based on the sector of the index. Components of the indexes may include, but are not limited to, investment grade securities, high yield securities, asset-backed securities, emerging markets and/or various credit ratings within each sector. Credit indexes are traded using credit default swaps with standardized terms including a fixed spread and standard maturity dates. An index credit default swap references all the names in the index, and if there is a default, the credit event is settled based on that name’s weight in the index. The composition of the indexes changes periodically, usually every six months, and for most indexes, each name has an equal weight in the index. Credit default swaps on credit indexes may be used to hedge a portfolio of credit default swaps or bonds, which is less expensive than it would be to buy many credit default swaps to achieve a similar effect. Credit default swaps on indexes are instruments for protecting investors owning bonds against default, and traders use them to speculate on changes in credit quality.
Implied credit spreads, represented in absolute terms, utilized in determining the market value of credit default swap agreements on corporate, loan, sovereign, U.S. municipal or U.S. Treasury issues as of period end, if any, are disclosed in the Notes to Schedules of Investments. They serve as an indicator of the current status of payment/performance risk and represent the likelihood or risk of default for the reference entity. The implied credit spread of a particular referenced entity reflects the cost of buying/selling protection and may include upfront payments required to be made to enter into the agreement. Wider credit spreads represent a deterioration of the referenced entity’s credit soundness and a greater likelihood or risk of default or other credit event occurring as defined under the terms of the agreement. For credit default swap agreements on asset-backed securities and credit indexes, the quoted market prices and resulting values serve as the indicator of the current status of the payment/performance risk. Increasing market values, in absolute terms when compared to the notional amount of the swap, represent a deterioration of the referenced entity’s credit soundness and a greater likelihood or risk of default or other credit event occurring as defined under the terms of the agreement.
The maximum potential amount of future payments (undiscounted) that a Fund as a seller of protection could be required to make under a credit default swap agreement equals the notional amount of the agreement. Notional amounts of each individual credit default swap
agreement outstanding as of period end for which a Fund is the seller of protection are disclosed in the Notes to Schedules of Investments. These potential amounts would be partially offset by any recovery values of the respective referenced obligations, upfront payments received upon entering into the agreement, or net amounts received from the settlement of buy protection credit default swap agreements entered into by a Fund for the same referenced entity or entities.
Interest Rate Swap Agreements may be entered into to help hedge against interest rate risk exposure and to maintain a Fund’s ability to generate income at prevailing market rates. The value of the fixed rate bonds that the Funds hold may decrease if interest rates rise. To help hedge against this risk and to maintain its ability to generate income at prevailing market rates, a Fund may enter into interest rate swap agreements. Interest rate swap agreements involve the exchange by a Fund with another party for their respective commitment to pay or receive interest on the notional amount of principal. Certain forms of
interest rate swap agreements may include: (i) interest rate caps, under which, in return for a premium, one party agrees to make payments to the other to the extent that interest rates exceed a specified rate, or “cap”, (ii) interest rate floors, under which, in return for a premium, one party agrees to make payments to the other to the extent that interest rates fall below a specified rate, or “floor”, (iii) interest rate collars, under which a party sells a cap and purchases a floor or vice versa in an attempt to protect itself against interest rate movements exceeding given minimum or maximum levels, (iv) callable interest rate swaps, under which the buyer pays an upfront fee in consideration for the right to early terminate the swap transaction in whole, at zero cost and at a predetermined date and time prior to the maturity date, (v) spreadlocks, which allow the interest rate swap users to lock in the forward differential (or spread) between the interest rate swap rate and a specified benchmark, or (vi) basis swaps, under which two parties can exchange variable interest rates based on different segments of money markets.
7. PRINCIPAL AND OTHER RISKS
(a) Principal Risks
The principal risks of investing in a Fund, which could adversely affect its net asset value, yield and total return, are listed below.
| | | | | | | | | | | | | | | | |
| Risks | | | | | PIMCO Dividend and
Income Fund | | PIMCO
RAE Emerging
Markets Fund | | PIMCO
RAE Global
ex-US
Fund | | PIMCO
RAE
International
Fund | | PIMCO
RAE US
Fund | | PIMCO
RAE US Small
Fund |
| | | | | | | |
Allocation | | | | | | X | | — | | X | | — | | — | | — |
| | | | | | | |
Acquired Fund | | | | | | X | | — | | X | | — | | — | | — |
| | | | | | | |
Small Fund | | | | | | — | | — | | X | | — | | — | | — |
| | | | | | | |
Equity | | | | | | X | | X | | X | | X | | X | | X |
| | | | | | | |
Dividend-Oriented Stocks | | | | | | X | | — | | — | | — | | — | | — |
| | | | | | | |
Value Investing | | | | | | X | | X | | X | | X | | X | | X |
| | | | | | | |
Foreign (Non-U.S.) Investment | | | | | | X | | X | | X | | X | | — | | — |
| | | | | | | |
Emerging Markets | | | | | | X | | X | | X | | X | | — | | — |
| | | | | | | |
China | | | | | | — | | X | | — | | — | | — | | — |
| | | | | | | |
Sovereign Debt | | | | | | X | | — | | — | | — | | — | | — |
| | | | | | | |
Market | | | | | | X | | X | | X | | X | | X | | X |
| | | | | | | |
Issuer | | | | | | X | | X | | X | | X | | X | | X |
| | | | | | | |
Interest Rate | | | | | | X | | — | | — | | — | | — | | — |
| | | | | | | |
Call | | | | | | X | | — | | — | | — | | — | | — |
| | | | | | | |
Credit | | | | | | X | | X | | X | | X | | X | | X |
| | | | | | | |
High Yield and Distressed Company | | | | | | X | | — | | — | | — | | — | | — |
| | | | | | | |
Distressed Company | | | | | | — | | — | | X | | — | | — | | X |
| | | | | | | |
Currency | | | | | | X | | X | | X | | X | | — | | — |
| | | | | | | |
Real Estate | | | | | | X | | X | | X | | X | | X | | X |
| | | | | | | |
Liquidity | | | | | | X | | X | | X | | X | | X | | X |
| | | | | | | |
Leveraging | | | | | | X | | X | | X | | X | | X | | X |
| | | | | | | |
Management | | | | | | X | | X | | X | | X | | X | | X |
| | | | | | | |
Small Company | | | | | | — | | — | | X | | — | | — | | X |
| | | | | | | |
Small and Mid-Cap Company | | | | | | X | | — | | — | | — | | — | | — |
| | | | | | | |
Derivatives | | | | | | X | | X | | X | | X | | X | | X |
| | | | | | | |
Model | | | | | | X | | X | | X | | X | | X | | X |
| | | | | | | |
Mortgage-Related and Other Asset-Backed Securities | | | | | | X | | — | | — | | — | | — | | — |
| | | | | | | |
Short Exposure | | | | | | X | | — | | — | | — | | — | | — |
| | | | | | | |
Exchange-Traded Fund | | | | | | X | | — | | — | | — | | — | | — |
| | | | | | | |
Tracking Error | | | | | | X | | — | | — | | — | | — | | — |
| | | | | | | |
Indexing | | | | | | X | | — | | — | | — | | — | | — |
| | | | | | | |
LIBOR Transition | | | | | | X | | — | | — | | — | | — | | — |
| | | | | | | | | | | | |
| | | | ANNUAL FINANCIAL AND OTHER INFORMATION | | | | | | | JUNE 30, 2024 | | | 73 |
| | | | |
| Notes to Financial Statements | | (Cont.) | | |
The principal risks of investing in a Fund include risks from direct investments and/or for certain Funds that invest in Acquired Funds or Underlying PIMCO Funds, indirect exposure through investment in such Acquired Funds or Underlying PIMCO Funds. Please see “Description of Principal Risks” in a Fund’s prospectus for a more detailed description of the risks of investing in a Fund.
Allocation Risk is the risk that a Fund could lose money as a result of less than optimal or poor asset allocation decisions. A Fund could miss attractive investment opportunities by underweighting markets that subsequently experience significant returns and could lose value by overweighting markets that subsequently experience
significant declines.
Acquired Fund Risk is the risk that a Fund’s performance is closely related to the risks associated with the securities and other investments held by the Acquired Funds and that the ability of a Fund to achieve its investment objective will depend upon the ability of the Acquired Funds to achieve their investment objectives. In addition, a Fund’s performance will be reduced by the Fund’s proportionate amount of the expenses of any Acquired Funds in which it invests.
Small Fund Risk is the risk that a smaller fund may not achieve investment or trading efficiencies. Additionally, a smaller fund may be more adversely affected by large purchases or redemptions of fund shares.
Equity Risk is the risk that the value of equity or equity-related securities, such as common stocks and preferred securities, may decline due to general market conditions which are not specifically related to a particular company or to factors affecting a particular industry or industries. Equity or equity-related securities generally have greater price volatility than fixed income securities. In addition, preferred securities may be subject to greater credit risk or other risks, such as risks related to deferred and omitted distributions, limited voting rights, liquidity, interest rates, regulatory changes and special redemption rights.
Dividend-Oriented Stocks Risk is the risk that companies that have paid regular dividends to shareholders may decrease or eliminate dividend payments in the future. A decrease in dividend payments by an issuer may result in a decrease in the value of the security held by a Fund or a Fund receiving less income. In addition, equity securities with higher dividend yields may be sensitive to changes in interest rates, and as interest rates rise, the prices of such securities may fall. A Fund’s use of a dividend capture strategy (i.e., purchasing an equity security shortly before the issuer pays a dividend and selling it shortly thereafter) exposes a Fund to higher portfolio turnover, increased trading costs, the potential for capital loss, particularly in the event of
significant short-term price movements of stocks subject to dividend capture trading and may result in negative tax consequences.
Value Investing Risk is the risk that a value stock may decrease in price or may not increase in price as anticipated by PIMCO or the sub-adviser if it continues to be undervalued by the market or the factors that the portfolio manager believes will cause the stock price to increase do not occur.
Foreign (Non-U.S.) Investment Risk is the risk that investing in foreign (non-U.S.) securities may result in a Fund experiencing more rapid and extreme changes in value than a fund that invests exclusively in securities of U.S. companies, due to smaller markets, differing reporting, accounting and auditing standards, increased risk of delayed settlement of portfolio transactions or loss of certificates of portfolio securities, and the risk of unfavorable foreign government actions, including nationalization, expropriation or confiscatory taxation, currency blockage, political changes, diplomatic developments or the imposition of sanctions and other similar measures. Foreign securities may also be less liquid and more difficult to value than securities of U.S. issuers.
Emerging Markets Risk is the risk of investing in emerging market securities, primarily increased foreign (non-U.S.) investment risk.
China Risk is the risk of investing in securities and instruments economically tied to the People’s Republic of China (excluding Hong Kong, Macau and Taiwan for the purpose of this disclosure) (“PRC”). These investments subject a Fund to the risks of investing in foreign (non-U.S.) securities and emerging market securities, as well as additional risks including, without limitation, inefficiencies resulting from erratic growth, the unavailability of consistently-reliable economic data, dependence on exports and international trade, asset price volatility, potential shortage of liquidity and limited accessibility by foreign (non-U.S.) investors, fluctuations in currency exchange rates, currency devaluation, the relatively small size and absence of operating history of many PRC companies, and the developing nature of the legal and regulatory framework for securities markets, custody arrangements and commerce.
Sovereign Debt Risk is the risk that investments in fixed income instruments issued by sovereign entities may decline in value as a result of default or other adverse credit event resulting from an issuer’s inability or unwillingness to make principal or interest payments in a timely fashion.
Market Risk is the risk that the value of securities owned by a Fund may go up or down, sometimes rapidly or unpredictably, due to factors affecting securities markets generally or particular industries.
Issuer Risk is the risk that the value of a security may decline for a reason directly related to the issuer, such as management performance, changes in financial condition or credit rating, financial leverage, reputation or reduced demand for the issuer’s goods or services.
Interest Rate Risk is the risk that fixed income securities and dividend-paying equity securities will fluctuate in value because of a change in interest rates; a fund with a longer average portfolio duration will be more sensitive to changes in interest rates than a fund with a shorter average portfolio duration.
Call Risk is the risk that an issuer may exercise its right to redeem a fixed income security earlier than expected (a call). Issuers may call outstanding securities prior to their maturity for a number of reasons (e.g., declining interest rates, changes in credit spreads and improvements in the issuer’s credit quality). If an issuer calls a security that the Fund has invested in, a Fund may not recoup the full amount of its initial investment or may not realize the full anticipated earnings from the investment and may be forced to reinvest in lower-yielding securities, securities with greater credit risks or securities with other, less favorable features.
Credit Risk is the risk that a Fund could lose money if the issuer or guarantor of a fixed income security, or the counterparty to a derivative contract, or the issuer or guarantor of collateral, is unable or unwilling, or is perceived (whether by market participants, rating agencies, pricing services or otherwise) as unable or unwilling, to meet its financial obligations.
High Yield and Distressed Company Risk is the risk that high yield securities and unrated securities of similar credit quality (commonly known as “junk bonds”) and securities of distressed companies may be subject to greater levels of credit, issuer and liquidity risks. Securities of distressed companies include both debt and equity securities. High yield securities and debt securities of distressed companies are considered primarily speculative with respect to the issuer’s continuing ability to make principal and interest payments. Distressed companies may be engaged in restructurings or bankruptcy proceedings.
Distressed Company Risk is the risk that securities of distressed companies may be subject to greater levels of market, issuer and liquidity risks. Distressed companies may be engaged in restructurings or bankruptcy proceedings, which may cause the value of their securities to fluctuate rapidly or unpredictably.
Currency Risk is the risk that foreign (non-U.S.) currencies will change in value relative to the U.S. dollar and affect a Fund’s investments in foreign (non-U.S.) currencies or in securities that trade in, and receive revenues in, or in derivatives that provide exposure to, foreign (non-U.S.) currencies.
Real Estate Risk is the risk that a Fund’s investments in real estate investment trusts (“REITs”) or real estate-linked derivative instruments will subject a Fund to risks similar to those associated with direct ownership of real estate, including losses from casualty or condemnation, and changes in local and general economic conditions, supply and demand, interest rates, zoning laws, regulatory limitations on rents, property taxes and operating expenses. A Fund’s investments in REITs or real estate-linked derivative instruments subject it to management and tax risks. In addition, privately traded REITs subject a Fund to liquidity and valuation risk.
Liquidity Risk is the risk that a particular investment may be difficult to purchase or sell and that a Fund may be unable to sell illiquid investments at an advantageous time or price or achieve its desired level of exposure to a certain sector.
Leveraging Risk is the risk that certain transactions of a Fund, such as reverse repurchase agreements, loans of portfolio securities, and the use of when-issued, delayed delivery or forward commitment transactions, or derivative instruments, may give rise to leverage, magnifying gains and losses and causing a Fund to be more volatile than if it had not been leveraged. This means that leverage entails a heightened risk of loss.
Management Risk is the risk that the investment techniques and risk analyses applied by PIMCO or the sub-adviser, including the use of quantitative models or methods, will not produce the desired results and that actual or potential conflicts of interest, legislative, regulatory or tax restrictions, policies or developments may affect the investment techniques available to PIMCO or the sub-adviser and the individual portfolio managers in connection with managing a Fund and may cause PIMCO or the sub-adviser to restrict or prohibit participation in certain investments. There is no guarantee that the investment objective of a Fund will be achieved.
Small Company Risk is the risk that the value of equity securities issued by small companies, ranked by fundamental size as determined by the sub-adviser, may go up or down, sometimes rapidly and unpredictably, due to narrow markets and limited managerial and financial resources.
Small-Cap and Mid-Cap Company Risk is the risk that the value of securities issued by small-capitalization and mid-capitalization companies may go up or down, sometimes rapidly and unpredictably, due to narrow markets and limited managerial and financial resources.
Derivatives Risk is the risk of investing in derivative instruments (such as forwards, futures, swaps and structured securities) and other similar investments, including leverage, liquidity, interest rate, market, counterparty (including credit), operational, legal and management
| | | | | | | | | | | | |
| | | | ANNUAL FINANCIAL AND OTHER INFORMATION | | | | | | | JUNE 30, 2024 | | | 75 |
| | | | |
| Notes to Financial Statements | | (Cont.) | | |
risks, and valuation complexity. Changes in the value of a derivative or other similar investment may not correlate perfectly with, and may be more sensitive to market events than, the underlying asset, rate or index, and a Fund could lose more than the initial amount invested. Changes in the value of a derivative or other similar instrument may also create margin delivery or settlement payment obligations for a Fund. A Fund’s use of derivatives or other similar investments may result in losses to a Fund, a reduction in a Fund’s returns and/or increased volatility. Non-centrally-cleared over-the-counter (“OTC”) derivatives or other similar investments are also subject to the risk that a counterparty to the transaction will not fulfill its contractual obligations to the other party, as many of the protections afforded to centrally-cleared derivative transactions might not be available for non-centrally-cleared OTC derivatives or other similar investments. The primary credit risk on derivatives or other similar investments that are exchange-traded or traded through a central clearing counterparty resides with a Fund’s clearing broker or the clearinghouse. Changes in regulation relating to a registered fund’s use of derivatives and related instruments could potentially limit or impact a Fund’s ability to invest in derivatives, limit a Fund’s ability to employ certain strategies that use derivatives or other similar investments and/or adversely affect the value of derivatives or other similar investments and a Fund’s performance.
Model Risk is the risk that a Fund’s investment models used in making investment allocation decisions may not adequately take into account certain factors or may contain design flaws or faulty assumptions, and may rely on incomplete or inaccurate data inputs, any of which may result in a decline in the value of an investment in a Fund.
Mortgage-Related and Other Asset-Backed Securities Risk is the risk of investing in mortgage-related and other asset-backed securities, including interest rate risk, extension risk, prepayment risk and credit risk. A Fund may invest in any tranche of mortgage-related and other asset-backed securities, including junior and/or equity tranches (to the extent consistent with other of the Fund’s guidelines), which generally carry higher levels of the foregoing risks.
Short Exposure Risk is the risk of entering into short sales or other short positions, including the potential loss of more money than the actual cost of the investment, and the risk that the third party to the short sale or other short position will not fulfill its contractual obligations, causing a loss to a Fund.
Exchange-Traded Fund Risk is the risk that an exchange-traded fund may not track the performance of the index it is designed to track, among other reasons, because of exchange rules, market prices of shares of an exchange-traded fund may fluctuate rapidly and materially, or shares of an exchange-traded fund may trade significantly
above or below net asset value, any of which may cause losses to a Fund invested in the exchange-traded fund.
Tracking Error Risk is the risk that the portfolio of a Fund that seeks to track the investment results of an underlying index may not closely track the underlying index for a number of reasons. A Fund incurs operating expenses, which are not applicable to the underlying index, and the costs of buying and selling securities, especially when rebalancing the Fund’s portfolio to reflect changes in the composition of the underlying index. Performance of a Fund and the underlying index may vary due to asset valuation differences and differences between a Fund’s portfolio and the underlying index due to legal restrictions, cost or liquidity restraints. The risk that performance of a Fund and the underlying index may vary may be heightened during periods of increased market volatility or other unusual market conditions. In addition, a Fund’s use of a representative sampling approach may cause the Fund to be less correlated to the return of the underlying index than if the Fund held all of the securities in the underlying index.
Indexing Risk is the risk that a Fund that seeks to track the investment results of an underlying index is negatively affected by general declines in the asset classes represented by the underlying index.
LIBOR Transition Risk is the risk related to the discontinuation and replacement of the London Interbank Offered Rate (“LIBOR”). Certain instruments held by a Fund rely or relied in some fashion upon LIBOR. Although the transition process away from LIBOR for most instruments has been completed, some LIBOR use is continuing and there are potential effects related to the transition away from LIBOR or the continued use of LIBOR on a Fund, or on certain instruments in which a Fund invests, which can be difficult to ascertain and could result in losses to a Fund.
(b) Other Risks
In general, a Fund may be subject to additional risks, including, but not limited to, risks related to government regulation and intervention in financial markets, operational risks, risks associated with financial, economic and global market disruptions, and cyber security risks. Please see a Fund’s prospectus and Statement of Additional Information for a more detailed description of the risks of investing in a Fund. Please see the Important Information section of this report for additional discussion of certain regulatory and market developments that may impact a Fund’s performance.
Market Disruptions Risk A Fund is subject to investment and operational risks associated with financial, economic and other global market developments and disruptions, including those arising from war, military conflicts, terrorism, market manipulation, government
interventions, defaults and shutdowns, political changes or diplomatic developments, public health emergencies (such as the spread of infectious diseases, pandemics and epidemics), bank failures and natural/environmental disasters, which can all negatively impact the securities markets and cause a Fund to lose value. These events can also impair the technology and other operational systems upon which a Fund’s service providers, including PIMCO as a Fund’s investment adviser, rely, and could otherwise disrupt a Fund’s service providers’ ability to fulfill their obligations to a Fund.
Government Intervention in Financial Markets Federal, state, and other governments, their regulatory agencies, or self-regulatory organizations may take actions that affect the regulation of the instruments in which a Fund invests, or the issuers of such instruments, in ways that are unforeseeable. Legislation or regulation may also change the way in which a Fund itself is regulated. Such legislation or regulation could limit or preclude a Fund’s ability to achieve its investment objective. Furthermore, volatile financial markets can expose a Fund to greater market and liquidity risk and potential difficulty in valuing portfolio instruments held by the Fund. The value of a Fund’s holdings is also generally subject to the risk of future local, national, or global economic disturbances based on unknown weaknesses in the markets in which a Fund invests. In addition, it is not certain that the U.S. Government will intervene in response to a future market disturbance and the effect of any such future intervention cannot be predicted. It is difficult for issuers to prepare for the impact of future financial downturns, although companies can seek to identify and manage future uncertainties through risk management programs.
Regulatory Risk Financial entities, such as investment companies and investment advisers, are generally subject to extensive government regulation and intervention. Government regulation and/or intervention may change the way a Fund is regulated, affect the expenses incurred directly by a Fund and the value of its investments, and limit and/or preclude a Fund’s ability to achieve its investment objective. Government regulation may change frequently and may have significant adverse consequences. Moreover, government regulation may have unpredictable and unintended effects.
Operational Risk An investment in a Fund, like any fund, can involve operational risks arising from factors such as processing errors, human errors, inadequate or failed internal or external processes, failures in systems and technology, changes in personnel and errors caused by third-party service providers. The occurrence of any of these failures, errors or breaches could result in a loss of information, regulatory scrutiny, reputational damage or other events, any of which could have a material adverse effect on a Fund. While a Fund seeks to minimize such events through controls and oversight, there may still be failures that could cause losses to the Fund.
Cyber Security Risk As the use of technology, including cloud-based technology, has become more prevalent in the course of business, the Funds have become potentially more susceptible to operational and information security risks resulting from breaches in cyber security. A breach in cyber security refers to both intentional and unintentional cyber events that may, among other things, cause a Fund to lose proprietary information, suffer data corruption and/or destruction or lose operational capacity, result in the unauthorized release or other misuse of confidential information, or otherwise disrupt normal business operations. Cyber security failures or breaches may result in financial losses to a Fund and its shareholders. These failures or breaches may also result in disruptions to business operations, potentially resulting in financial losses; interference with a Fund’s ability to calculate its net asset value, process shareholder transactions or otherwise transact business with shareholders; impediments to trading; violations of applicable privacy and other laws; regulatory fines; penalties; third-party claims in litigation; reputational damage; reimbursement or other compensation costs; additional compliance and cyber security risk management costs and other adverse consequences. In addition, substantial costs may be incurred in order to prevent any cyber incidents in the future. There is also a risk that cyber security breaches may not be detected. The Funds and their shareholders may suffer losses as a result of a cyber security breach related to the Funds, their service providers, trading counterparties or the issuers in which a Fund invests.
8. MASTER NETTING ARRANGEMENTS
A Fund may be subject to various netting arrangements (“Master Agreements”) with select counterparties. Master Agreements govern the terms of certain transactions, and are intended to reduce the counterparty risk associated with relevant transactions by specifying credit protection mechanisms and providing standardization that is intended to improve legal certainty. Each type of Master Agreement governs certain types of transactions. Different types of transactions may be traded out of different legal entities or affiliates of a particular organization, resulting in the need for multiple agreements with a single counterparty. As the Master Agreements are specific to unique operations of different asset types, they allow a Fund to close out and net its total exposure to a counterparty in the event of a default with respect to all the transactions governed under a single Master Agreement with a counterparty. For financial reporting purposes the Statements of Assets and Liabilities generally present derivative assets and liabilities on a gross basis, which reflects the full risks and exposures prior to netting.
Master Agreements can also help limit counterparty risk by specifying collateral posting arrangements at pre-arranged exposure levels. Under most Master Agreements, collateral is routinely transferred if the total net exposure to certain transactions (net of existing collateral already in
| | | | | | | | | | | | |
| | | | ANNUAL FINANCIAL AND OTHER INFORMATION | | | | | | | JUNE 30, 2024 | | | 77 |
| | | | |
| Notes to Financial Statements | | (Cont.) | | |
place) governed under the relevant Master Agreement with a counterparty in a given account exceeds a specified threshold, which typically ranges from zero to $250,000 depending on the counterparty and the type of Master Agreement. United States Treasury Bills and U.S. dollar cash are generally the preferred forms of collateral, although other securities may be used depending on the terms outlined in the applicable Master Agreement. Securities and cash pledged as collateral are reflected as assets on the Statements of Assets and Liabilities as either a component of Investments at value (securities) or Deposits with counterparty. Cash collateral received is not typically held in a segregated account and as such is reflected as a liability on the Statements of Assets and Liabilities as Deposits from counterparty. The market value of any securities received as collateral is not reflected as a component of NAV. A Fund’s overall exposure to counterparty risk can change substantially within a short period, as it is affected by each transaction subject to the relevant Master Agreement.
The Funds lend their securities through Securities Finance Trust Company (“Securities Lending Agent”), an unaffiliated securities lending agent, and receives collateral in the form of cash or securities with a value at least equal to the value of the securities on loan. The value of the loaned securities is determined at the close of each business day, and any increases or decreases in the required collateral are exchanged between the Fund and the counterparty on the next business day. Cash collateral received is invested in the PIMCO Government Money Market Fund or another cash sweep vehicle agreed by the Fund. The Securities Lending Agent administers the Funds’ securities lending program, providing services that include marketing the Funds’ available securities, soliciting bids from potential borrowers, monitoring the daily value of the loaned securities, and investing cash collateral in accordance with specific instructions provided by the Funds.
Master Repurchase Agreements and Global Master Repurchase Agreements (individually and collectively “Master Repo Agreements”) govern repurchase, reverse repurchase and certain sale-buyback transactions between a Fund and select counterparties. Master Repo Agreements maintain provisions for, among other things, initiation, income payments, events of default and maintenance of collateral. The market value of transactions under the Master Repo Agreement, collateral pledged or received, and the net exposure by counterparty as of period end are disclosed in the Notes to Schedules of Investments.
Master Securities Forward Transaction Agreements (“Master Forward Agreements”) govern certain forward settling transactions, such as TBA securities, delayed-delivery or certain sale-buyback transactions by and between a Fund and select counterparties. The Master Forward Agreements maintain provisions for, among other things, transaction initiation and confirmation, payment and transfer, events of default,
termination and maintenance of collateral. The market value of forward settling transactions, collateral pledged or received, and the net exposure by counterparty as of period end is disclosed in the Notes to Schedules of Investments.
Customer Account Agreements and related addenda govern cleared derivatives transactions such as futures, options on futures and cleared OTC derivatives. Such transactions require posting of initial margin as determined by each relevant clearing agency which is segregated in an account at a futures commission merchant (“FCM”) registered with the Commodity Futures Trading Commission. In the United States, counterparty risk may be reduced as creditors of an FCM cannot have a claim to Fund assets in the segregated account. FCM customers, such as the Funds, are permitted to transfer their customer account (and cleared derivative transactions held in such customer account) from one FCM to another FCM. Upon completion of the transfer, the customer maintains the same economic position with respect to the outstanding exposure. As such, these transfers are not recognized as dispositions and reacquisitions of the affected derivative positions. Variation margin, which reflects changes in market value, is generally exchanged daily, but may not be netted between futures and cleared OTC derivatives unless the parties have agreed to a separate arrangement in respect of portfolio margining. The porting of exposure between FCMs has no impact on the market value or accumulated unrealized appreciation (depreciation), initial margin posted, and any unsettled variation margin; these values as of period end are disclosed in the Notes to Schedules of Investments.
Prime Broker Arrangements may be entered into to facilitate execution and/or clearing of listed equity option transactions or short sales of equity securities between a Fund and selected counterparties. The arrangements provide guidelines surrounding the rights, obligations and other events, including, but not limited to, margin, execution and settlement. These agreements maintain provisions for, among other things, payments, maintenance of collateral, events of default and termination. Margin and other assets delivered as collateral are typically in the possession of the prime broker and would offset any obligations due to the prime broker. The market values of listed options and securities sold short and related collateral are disclosed in the Notes to Schedules of Investments.
International Swaps and Derivatives Association, Inc. Master Agreements and Credit Support Annexes (“ISDA Master Agreements”) govern bilateral OTC derivative transactions entered into by a Fund with select counterparties. ISDA Master Agreements maintain provisions for general obligations, representations, agreements, collateral posting and events of default or termination. Events of termination include conditions that may entitle counterparties to elect
to terminate early and cause settlement of all outstanding transactions under the applicable ISDA Master Agreement. Any election to terminate early could be material to the financial statements. The ISDA Master Agreement may contain additional provisions that add counterparty protection beyond coverage of existing daily exposure if the counterparty has a decline in credit quality below a predefined level or as required by regulation. Similarly, if required by regulation, the Funds may be required to post additional collateral beyond coverage of daily exposure. These amounts, if any, may (or if required by law, will) be segregated with a third-party custodian. To the extent the Funds are required by regulation to post additional collateral beyond coverage of daily exposure, they could potentially incur costs, including in procuring eligible assets to meet collateral requirements, associated with such posting. The market value of OTC financial derivative instruments, collateral received or pledged, and net exposure by counterparty as of period end are disclosed in the Notes to Schedules of Investments.
9. FEES AND EXPENSES
(a) Investment Advisory Fee PIMCO is a majority-owned subsidiary of Allianz Asset Management of America LLC (“Allianz Asset Management”) and serves as the Adviser to the Trust, pursuant to an investment advisory contract. The Adviser receives a monthly fee from each Fund at an annual rate based on average daily net assets (the “Investment Advisory Fee”). The Investment Advisory Fee for all classes is charged at an annual rate as noted in the table in note (b) below.
(b) Supervisory and Administrative Fee PIMCO serves as administrator (the “Administrator”) and provides supervisory and administrative services to the Trust for which it receives a monthly supervisory and administrative fee based on each share class’s average daily net assets (the “Supervisory and Administrative Fee”). As the Administrator, PIMCO bears the costs of various third-party services, including audit, custodial, portfolio accounting, legal, transfer agency and printing costs.
The Investment Advisory Fees and Supervisory and Administrative Fees for all classes, as applicable, are charged at the annual rate as noted in the following table (calculated as a percentage of each Fund’s average daily net assets attributable to each class):
| | | | | | | | | | | | | | | | | | | | | | | | | | | | | | | | |
| | | | Investment Advisory Fee | | | | | | Supervisory and Administrative Fee | |
| Fund Name | | | | | All Classes | | | | | | Institutional
Class | | | I-2 | | | I-3 | | | Class A | | | Class C | |
PIMCO Dividend and Income Fund | | | | | | | 0.44% | | | | | | | | 0.25% | | | | 0.35% | | | | 0.45% | *(1) | | | 0.35% | | | | 0.35% | |
PIMCO RAE Emerging Markets Fund | | | | | | | 0.50% | | | | | | | | 0.25% | | | | 0.35% | | | | N/A | | | | 0.35% | | | | N/A | |
PIMCO RAE Global ex-US Fund | | | | | | | 0.40% | | | | | | | | 0.15% | | | | 0.25% | | | | N/A | | | | 0.25% | | | | N/A | |
PIMCO RAE International Fund | | | | | | | 0.30% | | | | | | | | 0.20% | | | | 0.30% | | | | N/A | | | | 0.30% | | | | N/A | |
PIMCO RAE US Fund | | | | | | | 0.25% | | | | | | | | 0.15% | | | | 0.25% | | | | 0.35% | *(1) | | | 0.30% | | | | N/A | |
PIMCO RAE US Small Fund | | | | | | | 0.35% | | | | | | | | 0.15% | | | | 0.25% | | | | N/A | | | | 0.30% | | | | N/A | |
| (1) | PIMCO has contractually agreed, through October 31, 2024, to waive its supervisory and administrative fee for I-3 shares by 0.05% of the average daily net assets attributable to I-3 shares of the Fund. |
| * | This particular share class has been registered with the SEC, but was not operational during the period ended June 30, 2024. |
(c) Distribution and Servicing Fees PIMCO Investments LLC, a wholly-owned subsidiary of PIMCO, serves as the distributor (“Distributor”) of the Trust’s shares.
The Trust has adopted separate Distribution and Servicing Plans with respect to the Class A and Class C shares of the Trust pursuant to Rule 12b-1 under the Act. In connection with the distribution of Class C shares of the Trust, the Distributor receives distribution fees from the Trust of up to 0.75% for Class C shares, and in connection with personal services rendered to Class A and Class C shareholders and the maintenance of such shareholder accounts, the Distributor receives servicing fees from the Trust of up to 0.25% for each of Class A and Class C shares (percentages reflect annual rates of the average daily net assets attributable to the applicable class).
The Trust paid distribution and servicing fees at effective rates as noted in the following table (calculated as a percentage of each Fund’s average daily net assets attributable to each class):
| | | | | | | | | | | | |
| | | | Allowable Rate | |
| | | |
| | | | | | Distribution Fee | | | Servicing Fee | |
| | | |
Class A | | | | | | | — | | | | 0.25% | |
| | | |
Class C | | | | | | | 0.75% | | | | 0.25% | |
The Distributor also received the proceeds of the initial sales charges paid by the shareholders upon the purchase of Class A shares and the contingent deferred sales charges paid by the shareholders upon certain redemptions of Class A and Class C shares. For the period ended June 30, 2024, the Distributor retained $29,582 representing commissions (sales charges) and contingent deferred sales charges, net of any commission adjustments payable by the Distributor to broker dealers, from the Trust.
| | | | | | | | | | | | |
| | | | ANNUAL FINANCIAL AND OTHER INFORMATION | | | | | | | JUNE 30, 2024 | | | 79 |
| | | | |
| Notes to Financial Statements | | (Cont.) | | |
(d) Fund Expenses PIMCO provides or procures supervisory and administrative services for shareholders and also bears the costs of various third-party services required by the Funds, including audit, custodial, portfolio accounting, legal, transfer agency and printing costs. The Trust is responsible for the following expenses: (i) salaries and other compensation of any of the Trust’s executive officers and employees who are not officers, directors, stockholders, or employees of PIMCO or its subsidiaries or affiliates; (ii) taxes and governmental fees; (iii) brokerage fees and commissions and other portfolio transaction expenses; (iv) costs of borrowing money, including interest expenses; (v) fees and expenses of the Trustees who are not “interested persons” of PIMCO or the Trust, and any counsel retained exclusively for their benefit; (vi) extraordinary expenses, including costs of litigation and indemnification expenses; (vii) organizational and offering expenses of the Trust and the Funds, and any other expenses which are capitalized in accordance with generally accepted accounting principles; and (viii) any expenses allocated or allocable to a specific class of shares, and may include certain other expenses as permitted by the Trust’s Multi-Class Plan adopted pursuant to Rule 18f-3 under the Act and subject to review and approval by the Trustees. The ratio of expenses to average net assets per share class, as disclosed on the Financial Highlights, may differ from the annual fund operating expenses per share class.
(e) Remuneration Paid to Directors, Officers and Others (N-CSR Item 10) The Trust pays no compensation directly to any Trustee or any other officer who is affiliated with the Administrator, all of whom receive remuneration for their services to the Trust from the Administrator or its affiliates. The pro rata share of Trustee fees for each Fund is reflected on the Statements of Operations as Trustee fees.
(f) Expense Limitation Pursuant to the Expense Limitation Agreement, PIMCO has contractually agreed, through October 31, 2024, to waive a portion of each Fund’s Supervisory and Administrative Fee, or reimburse each Fund, to the extent that each Fund’s organizational expenses, pro rata share of expenses related to obtaining or maintaining a Legal Entity Identifier and pro rata share of Trustee fees exceed 0.0049% (the “Expense Limit”) (calculated as a percentage of each Fund’s average daily net assets attributable to each class). The Expense Limitation Agreement will automatically renew for one-year terms unless PIMCO provides written notice to the Trust at least 30 days prior to the end of the then current term. The waiver is reflected on the Statements of Operations as a component of Waiver and/or Reimbursement by PIMCO.
In any month in which the investment advisory contract or supervision and administration agreement is in effect, PIMCO is entitled to reimbursement by each Fund of any portion of the supervisory and administrative fee waived or reimbursed pursuant to the Expense Limitation Agreement (the “Reimbursement Amount”) within thirty-six months of the time of the waiver, provided that such amount paid to PIMCO will not: i) together with any organizational expenses, pro rata share of expenses related to obtaining or maintaining a Legal Entity Identifier and pro rata Trustee fees, exceed, for such month, the Expense Limit (or the amount of the expense limit in place at the time the amount being recouped was originally waived if lower than the Expense Limit); ii) exceed the total Reimbursement Amount; or iii) include any amounts previously reimbursed to PIMCO. In addition, in any month in which the investment advisory contract is in effect, PIMCO is entitled to reimbursement by a Fund of any portion of the advisory fee waived as set forth above (the “RAE Reimbursement Amount”) during the previous thirty-six months from the time of waiver, provided that such amount paid to PIMCO will not: i) together with any recoupment of organizational expenses, pro rata share of expenses related to obtaining or maintaining a Legal Entity Identifier and pro rata Trustee fees or supervisory and administrative fees pursuant to the Expense Limitation Agreement, exceed, for such month, the Expense Limit; ii) exceed the total RAE Reimbursement Amount; or iii) include any amounts previously reimbursed to PIMCO. The total recoverable amounts to PIMCO (from the Fee Waiver Agreement and Expense Limitation Agreement combined) as of June 30, 2024, were as follows (amounts in thousands†):
| | | | | | | | | | | | | | | | | | | | |
| | | | Expiring within | | | | |
| | | | | |
| Fund Name | | | | | 12 months | | | 13-24 months | | | 25-36 months | | | Total | |
| | | | | |
PIMCO Dividend and Income Fund | | | | | | $ | 13 | | | $ | 10 | | | $ | 10 | | | $ | 33 | |
| | | | | |
PIMCO RAE Emerging Markets Fund | | | | | | | 84 | | | | 98 | | | | 82 | | | | 264 | |
| | | | | |
PIMCO RAE Global ex-US Fund | | | | | | | 6 | | | | 6 | | | | 5 | | | | 17 | |
| | | | | |
PIMCO RAE International Fund | | | | | | | 61 | | | | 49 | | | | 30 | | | | 140 | |
| | | | | |
PIMCO RAE US Fund | | | | | | | 60 | | | | 79 | | | | 66 | | | | 205 | |
| | | | | |
PIMCO RAE US Small Fund | | | | | | | 12 | | | | 41 | | | | 40 | | | | 93 | |
| † | A zero balance may reflect actual amounts rounding to less than one thousand. |
Pursuant to a Fee Waiver, PIMCO has contractually agreed, through October 31, 2024, to waive its supervisory and administrative fee for I-3 shares by 0.05% of the average daily net assets attributable to I-3 shares of PIMCO Dividend and Income Fund and PIMCO RAE US Fund. This Fee Waiver Agreement will automatically renew for one-year terms unless PIMCO provides written notice to the Trust at least 30 days prior to the end of the then current term.
Pursuant to the Expense Limitation Agreement and I-3 Fee Waiver Agreement, waiver amounts are reflected on the Statements of Operations as a component of Waiver and/or Reimbursement by PIMCO. For the period ended June 30, 2024, the amounts waived and/or reimbursed were (in thousands†):
| | | | | | | | |
| Fund Name | | | | | Waived Fees | |
| | |
PIMCO Dividend and Income Fund | | | | | | $ | 10 | |
| | |
PIMCO RAE Emerging Markets Fund | | | | | | | 82 | |
| | |
PIMCO RAE Global ex-US Fund | | | | | | | 5 | |
| | |
PIMCO RAE International Fund | | | | | | | 30 | |
| | |
PIMCO RAE US Fund | | | | | | | 66 | |
| | |
PIMCO RAE US Small Fund | | | | | | | 40 | |
| † | A zero balance may reflect actual amounts rounding to less than one thousand. |
(g) Acquired Fund Fees and Expenses Acquired Fund expenses incurred by the Funds, if any, will vary with changes in the expenses of the Acquired Funds, as well as the allocation of the Funds’ assets.
The expenses associated with investing in a fund of funds are generally higher than those for mutual funds that do not invest in other mutual funds. The cost of investing in a fund of funds will generally be higher than the cost of investing in a mutual fund that invests directly in individual stocks and bonds. By investing in a fund of funds, an investor will indirectly bear fees and expenses charged by Acquired Funds in addition to each Fund’s direct fees and expenses. In addition, the use of a fund of funds structure could affect the timing, amount and character of distributions to the shareholders and may therefore increase the amount of taxes payable by shareholders.
PIMCO has contractually agreed, through October 31, 2024, to waive, first, the Investment Advisory Fee and, second, to the extent necessary, the Supervisory and Administrative Fee it receives from the PIMCO Dividend and Income Fund and the PIMCO RAE Global ex-US Fund in an amount equal to the expenses attributable to the advisory fees and the supervisory and administrative fees from the Underlying Funds (“Underlying Fund Fees”) indirectly incurred by each Fund in connection with its investments in Underlying Funds up to a maximum waived amount that is equal to each Fund’s aggregate Investment Advisory Fee and Supervisory and Administrative Fee. This waiver will automatically renew for one-year terms unless PIMCO provides written notice to the Trust at least 30 days prior to the end of the then current term.
The waiver amounts are reflected on the Statements of Operations as a component of Waiver and/or Reimbursement by PIMCO. For the period ended June 30, 2024, the amounts waived and/or reimbursed were (in thousands†):
| | | | | | | | |
| Fund Name | | | | | Waived Fees | |
| | |
PIMCO Dividend and Income Fund | | | | | | $ | 0 | |
| | |
PIMCO RAE Emerging Markets Fund | | | | | | | 0 | |
| | |
PIMCO RAE Global ex-US Fund | | | | | | | 543 | |
| | |
PIMCO RAE International Fund | | | | | | | 0 | |
| | |
PIMCO RAE US Fund | | | | | | | 0 | |
| | |
PIMCO RAE US Small Fund | | | | | | | 0 | |
| † | A zero balance may reflect actual amounts rounding to less than one thousand. |
10. RELATED PARTY TRANSACTIONS
The Adviser, Administrator and Distributor are related parties. Fees paid to these parties are disclosed in Note 9, Fees and Expenses, and the accrued related party fee amounts are disclosed on the Statements of Assets and Liabilities.
11. GUARANTEES AND INDEMNIFICATIONS
Under the Trust’s organizational documents, each Trustee or officer of the Trust is indemnified and each employee or other agent of the Trust (including the Trust’s investment manager) may be indemnified, to the extent permitted by the Act, against certain liabilities that may arise out of performance of their duties to the Funds. Additionally, in the normal course of business, the Funds enter into contracts that contain a variety of indemnification clauses. The Funds’ maximum exposure under these arrangements is unknown as this would involve future claims that may be made against the Funds that have not yet occurred. However, the Funds have not had prior claims or losses pursuant to these contracts.
12. PURCHASES AND SALES OF SECURITIES
The length of time a Fund has held a particular security is not generally a consideration in investment decisions. A change in the securities held by a Fund is known as “portfolio turnover.” Each Fund may engage in frequent and active trading of portfolio securities to achieve its investment objective(s), particularly during periods of volatile market movements. High portfolio turnover may involve correspondingly greater transaction costs, including brokerage commissions or dealer mark-ups and other transaction costs on the sale of securities and reinvestments in other securities, which are borne by a Fund. Such sales may also result in realization of taxable capital gains, including short-term capital gains (which are generally taxed at ordinary income tax rates when distributed to shareholders). The transaction costs associated with portfolio turnover may adversely affect a Fund’s performance. The portfolio turnover rates are reported in the Financial Highlights.
| | | | | | | | | | | | |
| | | | ANNUAL FINANCIAL AND OTHER INFORMATION | | | | | | | JUNE 30, 2024 | | | 81 |
| | | | |
| Notes to Financial Statements | | (Cont.) | | |
Purchases and sales of securities (excluding short-term investments) for the period ended June 30, 2024, were as follows (amounts in thousands†):
| | | | | | | | | | | | | | | | | | | | |
| | | | U.S. Government/Agency | | | All Other | |
| | | | |
| Fund Name | | | Purchases | | | Sales | | | Purchases | | | Sales | |
| | | | | |
PIMCO Dividend and Income Fund | | | | | | $ | 773,146 | | | $ | 760,221 | | | $ | 87,372 | | | $ | 78,093 | |
| | | | | |
PIMCO RAE Emerging Markets Fund | | | | | | | 0 | | | | 0 | | | | 1,237,789 | | | | 1,053,685 | |
| | | | | |
PIMCO RAE Global ex-US Fund | | | | | | | 0 | | | | 0 | | | | 21,352 | | | | 9,954 | |
| | | | | |
PIMCO RAE International Fund | | | | | | | 0 | | | | 0 | | | | 244,579 | | | | 363,800 | |
| | | | | |
PIMCO RAE US Fund | | | | | | | 0 | | | | 0 | | | | 967,581 | | | | 911,297 | |
| | | | | |
PIMCO RAE US Small Fund | | | | | | | 0 | | | | 0 | | | | 912,394 | | | | 516,570 | |
| | | | | | | | | | | | | | | | | | | | |
| † | A zero balance may reflect actual amounts rounding to less than one thousand. |
13. SHARES OF BENEFICIAL INTEREST
The Trust may issue an unlimited number of shares of beneficial interest with a $0.001 par value. Changes in shares of beneficial interest were as follows (shares and amounts in thousands†):
| | | | | | | | | | | | | | | | | | | | | | | | | | | | | | | | | | | | | | | | | | | | | | | | | | |
| | | | | PIMCO Dividend and Income Fund | | | PIMCO RAE Emerging Markets Fund | | | PIMCO RAE Global ex-US Fund | |
| | | | | | | |
| | | | | Year Ended
06/30/2024 | | | Year Ended
06/30/2023 | | | Year Ended
06/30/2024 | | | Year Ended
06/30/2023 | | | Year Ended
06/30/2024 | | | Year Ended
06/30/2023 | |
| | | | | | | | | | | | | |
| | | | | Shares | | | Amount | | | Shares | | | Amount | | | Shares | | | Amount | | | Shares | | | Amount | | | Shares | | | Amount | | | Shares | | | Amount | |
Receipts for shares sold | | | | | | | | | | | | | | | | | | | | | | | | | | | | | | | | | | | | | | | | | | | | | | | | | | |
| | | | | | | | | | | | | |
Institutional Class | | | | | 477 | | | $ | 5,704 | | | | 662 | | | $ | 7,569 | | | | 82,830 | | | $ | 833,296 | | | | 43,144 | | | $ | 387,287 | | | | 1,237 | | | $ | 11,474 | | | | 466 | | | $ | 4,103 | |
| | | | | | | | | | | | | |
I-2 | | | | | 393 | | | | 4,744 | | | | 257 | | | | 2,921 | | | | 9,814 | | | | 99,733 | | | | 5,444 | | | | 47,894 | | | | 0 | | | | 0 | | | | 0 | | | | 0 | |
| | | | | | | | | | | | | |
Class A | | | | | 1,353 | | | | 15,963 | | | | 1,360 | | | | 15,469 | | | | 1,615 | | | | 16,021 | | | | 3,608 | | | | 32,922 | | | | 143 | | | | 1,306 | | | | 989 | | | | 8,646 | |
| | | | | | | | | | | | | |
Class C | | | | | 257 | | | | 3,016 | | | | 330 | | | | 3,756 | | | | N/A | | | | N/A | | | | N/A | | | | N/A | | | | N/A | | | | N/A | | | | N/A | | | | N/A | |
Issued as reinvestment of distributions | | | | | | | | | | | | | | | | | | | | | | | | | | | | | | | | | | | | | | | | | | | | | | | | | | |
| | | | | | | | | | | | | |
Institutional Class | | | | | 68 | | | | 812 | | | | 80 | | | | 905 | | | | 5,439 | | | | 53,467 | | | | 12,425 | | | | 104,542 | | | | 804 | | | | 7,467 | | | | 693 | | | | 5,937 | |
| | | | | | | | | | | | | |
I-2 | | | | | 54 | | | | 648 | | | | 69 | | | | 777 | | | | 426 | | | | 4,155 | | | | 711 | | | | 5,939 | | | | 2 | | | | 11 | | | | 2 | | | | 24 | |
| | | | | | | | | | | | | |
Class A | | | | | 446 | | | | 5,344 | | | | 552 | | | | 6,221 | | | | 82 | | | | 787 | | | | 122 | | | | 1,007 | | | | 150 | | | | 1,363 | | | | 164 | | | | 1,373 | |
| | | | | | | | | | | | | |
Class C | | | | | 36 | | | | 436 | | | | 67 | | | | 755 | | | | N/A | | | | N/A | | | | N/A | | | | N/A | | | | N/A | | | | N/A | | | | N/A | | | | N/A | |
Cost of shares redeemed | | | | | | | | | | | | | | | | | | | | | | | | | | | | | | | | | | | | | | | | | | | | | | | | | | |
| | | | | | | | | | | | | |
Institutional Class | | | | | (958 | ) | | | (11,431 | ) | | | (299 | ) | | | (3,403 | ) | | | (74,820 | ) | | | (753,528 | ) | | | (62,649 | ) | | | (559,064 | ) | | | (757 | ) | | | (7,192 | ) | | | (850 | ) | | | (7,574 | ) |
| | | | | | | | | | | | | |
I-2 | | | | | (422 | ) | | | (5,027 | ) | | | (535 | ) | | | (6,112 | ) | | | (3,128 | ) | | | (31,494 | ) | | | (3,804 | ) | | | (33,994 | ) | | | (2 | ) | | | (16 | ) | | | (25 | ) | | | (231 | ) |
| | | | | | | | | | | | | |
Class A | | | | | (1,863 | ) | | | (22,189 | ) | | | (1,933 | ) | | | (21,881 | ) | | | (1,806 | ) | | | (17,206 | ) | | | (2,368 | ) | | | (21,630 | ) | | | (241 | ) | | | (2,238 | ) | | | (527 | ) | | | (4,634 | ) |
| | | | | | | | | | | | | |
Class C | | | | | (622 | ) | | | (7,318 | ) | | | (561 | ) | | | (6,374 | ) | | | N/A | | | | N/A | | | | N/A | | | | N/A | | | | N/A | | | | N/A | | | | N/A | | | | N/A | |
| | | | | | | | | | | | | |
Net increase (decrease) resulting from Fund share transactions | | | | | (781 | ) | | $ | (9,298 | ) | | | 49 | | | $ | 603 | | | | 20,452 | | | $ | 205,231 | | | | (3,367 | ) | | $ | (35,097 | ) | | | 1,336 | | | $ | 12,175 | | | | 912 | | | $ | 7,644 | |
| | | | |
| | | | | PIMCO RAE International Fund | | | PIMCO RAE US Fund | | | PIMCO RAE US Small Fund | |
| | | | | | | |
| | | | | Year Ended
06/30/2024 | | | Year Ended
06/30/2023 | | | Year Ended
06/30/2024 | | | Year Ended
06/30/2023 | | | Year Ended
06/30/2024 | | | Year Ended
06/30/2023 | |
| | | | | | | | | | | | | |
| | | | | Shares | | | Amount | | | Shares | | | Amount | | | Shares | | | Amount | | | Shares | | | Amount | | | Shares | | | Amount | | | Shares | | | Amount | |
Receipts for shares sold | | | | | | | | | | | | | | | | | | | | | | | | | | | | | | | | | | | | | | | | | | | | | | | | | | |
| | | | | | | | | | | | | |
Institutional Class | | | | | 8,394 | | | $ | 67,062 | | | | 52,136 | | | $ | 376,626 | | | | 35,580 | | | $ | 473,882 | | | | 52,443 | | | $ | 657,879 | | | | 48,663 | | | $ | 469,830 | | | | 53,865 | | | $ | 458,626 | |
| | | | | | | | | | | | | |
I-2 | | | | | 222 | | | | 1,756 | | | | 704 | | | | 5,272 | | | | 1,324 | | | | 17,679 | | | | 2,124 | | | | 26,363 | | | | 13,329 | | | | 130,322 | | | | 9,471 | | | | 78,725 | |
| | | | | | | | | | | | | |
Class A | | | | | 58 | | | | 449 | | | | 91 | | | | 690 | | | | 2,200 | | | | 29,462 | | | | 397 | | | | 4,773 | | | | 7,791 | | | | 72,559 | | | | 4,130 | | | | 34,078 | |
Issued as reinvestment of distributions | | | | | | | | | | | | | | | | | | | | | | | | | | | | | | | | | | | | | | | | | | | | | | | | | | |
| | | | | | | | | | | | | |
Institutional Class | | | | | 5,627 | | | | 44,736 | | | | 6,573 | | | | 49,026 | | | | 5,391 | | | | 70,218 | | | | 5,753 | | | | 71,427 | | | | 887 | | | | 8,668 | | | | 5,605 | | | | 47,413 | |
| | | | | | | | | | | | | |
I-2 | | | | | 94 | | | | 746 | | | | 64 | | | | 475 | | | | 300 | | | | 3,870 | | | | 323 | | | | 3,977 | | | | 157 | | | | 1,516 | | | | 526 | | | | 4,385 | |
| | | | | | | | | | | | | |
Class A | | | | | 65 | | | | 506 | | | | 44 | | | | 320 | | | | 110 | | | | 1,392 | | | | 114 | | | | 1,378 | | | | 148 | | | | 1,394 | | | | 877 | | | | 7,147 | |
Cost of shares redeemed | | | | | | | | | | | | | | | | | | | | | | | | | | | | | | | | | | | | | | | | | | | | | | | | | | |
| | | | | | | | | | | | | |
Institutional Class | | | | | (24,218 | ) | | | (197,540 | ) | | | (56,007 | ) | | | (428,649 | ) | | | (33,019 | ) | | | (438,759 | ) | | | (37,913 | ) | | | (466,662 | ) | | | (21,968 | ) | | | (207,603 | ) | | | (41,178 | ) | | | (347,805 | ) |
| | | | | | | | | | | | | |
I-2 | | | | | (664 | ) | | | (5,265 | ) | | | (942 | ) | | | (7,092 | ) | | | (3,427 | ) | | | (45,218 | ) | | | (1,747 | ) | | | (21,814 | ) | | | (4,740 | ) | | | (44,951 | ) | | | (5,487 | ) | | | (46,846 | ) |
| | | | | | | | | | | | | |
Class A | | | | | (113 | ) | | | (882 | ) | | | (2,383 | ) | | | (17,897 | ) | | | (417 | ) | | | (5,503 | ) | | | (279 | ) | | | (3,395 | ) | | | (3,414 | ) | | | (31,232 | ) | | | (4,083 | ) | | | (33,368 | ) |
| | | | | | | | | | | | | |
Net increase (decrease) resulting from Fund share transactions | | | | | (10,535 | ) | | $ | (88,432 | ) | | | 280 | | | $ | (21,229 | ) | | | 8,042 | | | $ | 107,023 | | | | 21,215 | | | $ | 273,926 | | | | 40,853 | | | $ | 400,503 | | | | 23,726 | | | $ | 202,355 | |
| † | A zero balance may reflect actual amounts rounding to less than one thousand. |
The following table discloses the number of persons owned of record or beneficially 10% or more of the outstanding shares of a Fund along with their respective percent ownership, if any, as of June 30, 2024. Some of these shareholders may be considered related parties, which may include, but are not limited to, the investment adviser and its affiliates, affiliated broker dealers, fund of funds and directors or employees of the Trust or Adviser.
| | | | | | | | | | | | | | | | | | | | |
| | | | | | Shareholders that own 10% or more
of outstanding shares | | | Total percentage of portfolio held by
shareholders that own 10% or more
of outstanding shares | |
| | | | | |
| | | | | | Non-Related Parties | | | Related Parties | | | Non-Related Parties | | | Related Parties | |
| | | | | |
PIMCO Dividend and Income Fund | | | | | | | 2 | | | | 0 | | | | 22 | | | | 0 | |
| | | | | |
PIMCO RAE Emerging Markets Fund | | | | | | | 2 | | | | 1 | | | | 43 | | | | 20 | |
| | | | | |
PIMCO RAE Global ex-US Fund | | | | | | | 4 | | | | 0 | | | | 97 | | | | 0 | |
| | | | | |
PIMCO RAE International Fund | | | | | | | 2 | | | | 2 | | | | 40 | | | | 40 | |
| | | | | |
PIMCO RAE US Fund | | | | | | | 2 | | | | 0 | | | | 56 | | | | 0 | |
| | | | | |
PIMCO RAE US Small Fund | | | | | | | 2 | | | | 0 | | | | 38 | | | | 0 | |
| | | | | | | | | | | | | | | | | | | | |
14. REGULATORY AND LITIGATION MATTERS
The Funds are not named as defendants in any material litigation or arbitration proceedings and are not aware of any material litigation or claim pending or threatened against them.
The foregoing speaks only as of the date of this report.
15. FEDERAL INCOME TAX MATTERS
Each Fund intends to qualify as a regulated investment company under Subchapter M of the Internal Revenue Code (the “Code”) and distribute all of its taxable income and net realized gains, if applicable, to shareholders. Accordingly, no provision for Federal income taxes has been made.
A Fund may be subject to local withholding taxes, including those imposed on realized capital gains. Any applicable foreign capital gains
tax is accrued daily based upon net unrealized gains, and may be payable following the sale of any applicable investments.
In accordance with U.S. GAAP, the Adviser has reviewed the Funds’ tax positions for all open tax years. As of June 30, 2024, the Funds have recorded no liability for net unrecognized tax benefits relating to uncertain income tax positions they have taken or expect to take in future tax returns.
The Funds file U.S. federal, state and local tax returns as required. The Funds’ tax returns are subject to examination by relevant tax authorities until expiration of the applicable statute of limitations, which is generally three years after the filing of the tax return but which can be extended to six years in certain circumstances. Tax returns for open years have incorporated no uncertain tax positions that require a provision for income taxes.
As of June 30, 2024, the components of distributable taxable earnings are as follows (amounts in thousands†):
| | | | | | | | | | | | | | | | | | | | | | | | | | | | | | | | | | | | |
| | | | | | Undistributed
Ordinary
Income(1) | | | Undistributed
Long-Term
Capital Gains | | | Net Tax Basis
Unrealized
Appreciation/
(Depreciation)(2) | | | Other
Book-to-Tax
Accounting
Differences(3) | | | Accumulated
Capital
Losses(4) | | | Qualified
Late-Year
Loss
Deferral -
Capital(5) | | | Qualified
Late-Year
Loss
Deferral -
Ordinary(6) | | | Total
Components
of Distributable
Earnings | |
| | | | | | | | | |
PIMCO Dividend and Income Fund | | | | | | $ | 453 | | | $ | 0 | | | $ | 7,568 | | | $ | (5 | ) | | $ | (86,920 | ) | | $ | 0 | | | $ | 0 | | | $ | (78,904 | ) |
| | | | | | | | | |
PIMCO RAE Emerging Markets Fund | | | | | | | 110,177 | | | | 19,023 | | | | 131,204 | | | | (8 | ) | | | (195,573 | ) | | | 0 | | | | 0 | | | | 64,823 | |
| | | | | | | | | |
PIMCO RAE Global ex-US Fund | | | | | | | 1,215 | | | | 1,265 | | | | (5,714 | ) | | | (1 | ) | | | 0 | | | | 0 | | | | 0 | | | | (3,235 | ) |
| | | | | | | | | |
PIMCO RAE International Fund | | | | | | | 11,257 | | | | 28,343 | | | | 40,286 | | | | (3 | ) | | | (21,995 | ) | | | 0 | | | | 0 | | | | 57,888 | |
| | | | | | | | | |
PIMCO RAE US Fund | | | | | | | 46,884 | | | | 50,958 | | | | 323,317 | | | | (8 | ) | | | 0 | | | | 0 | | | | 0 | | | | 421,151 | |
| | | | | | | | | |
PIMCO RAE US Small Fund | | | | | | | 15,117 | | | | 15,218 | | | | 201,976 | | | | (2 | ) | | | (16,802 | ) | | | 0 | | | | 0 | | | | 215,507 | |
| † | A zero balance may reflect actual amounts rounding to less than one thousand. |
| (1) | Includes undistributed short-term capital gains, if any. |
| (2) | Adjusted for open wash sale loss deferrals and the accelerated recognition of unrealized gain or loss on certain futures, options, and/or forward contracts for federal income tax purposes. Also adjusted for differences between book and tax realized and unrealized gain (loss) on hyperinflationary investments, swap contracts, straddle loss deferrals, passive foreign investment companies (PFICs), interest accrued on defaulted securities, short positions, and other debt adjustments. |
| (3) | Represents differences in income tax regulations and financial accounting principles generally accepted in the United States of America, mainly for distributions payable at fiscal year-end and organizational expenditures. |
| (4) | Capital losses available to offset future net capital gains as shown below. |
| (5) | Capital losses realized during the period November 1, 2023 through June 30, 2024 which the Funds elected to defer to the following taxable year pursuant to income tax regulations. |
| (6) | Specified losses realized during the period November 1, 2023 through June 30, 2024 and Ordinary losses realized during the period January 1, 2024 through June 30, 2024 which the Funds elected to defer to the following taxable year pursuant to income tax regulations. |
| | | | | | | | | | | | |
| | | | ANNUAL FINANCIAL AND OTHER INFORMATION | | | | | | | JUNE 30, 2024 | | | 83 |
| | | | |
| Notes to Financial Statements | | (Cont.) | | June 30, 2024 |
Under the Regulated Investment Company Modernization Act of 2010, a fund is permitted to carry forward any new capital losses for an unlimited period. Additionally, such capital losses that are carried forward will retain their character as either short-term or long-term capital losses rather than being considered all short-term under previous law.
As of June 30, 2024, the Funds had the following post-effective capital losses with no expiration (amounts in thousands†):
| | | | | | | | | | | | |
| | | | | | Short-Term | | | Long-Term | |
| | | |
PIMCO Dividend and Income Fund | | | | | | $ | 67,576 | | | $ | 19,344 | |
| | | |
PIMCO RAE Emerging Markets Fund* | | | | | | | 117,323 | | | | 78,250 | |
| | | |
PIMCO RAE Global ex-US Fund | | | | | | | 0 | | | | 0 | |
| | | |
PIMCO RAE International Fund* | | | | | | | 10,868 | | | | 11,127 | |
| | | |
PIMCO RAE US Fund | | | | | | | 0 | | | | 0 | |
| | | |
PIMCO RAE US Small Fund* | | | | | | | 11,737 | | | | 5,065 | |
| † | A zero balance may reflect actual amounts rounding to less than one thousand. |
| * | Portion of amount represents realized loss and recognized built-in loss under IRC sections 382-83, which is carried forward to future years to offset future realized gain subject to certain limitations. |
As of June 30, 2024, the aggregate cost and the net unrealized appreciation/(depreciation) of investments for federal income tax purposes are as follows (amounts in thousands†):
| | | | | | | | | | | | | | | | | | | | |
| | | | | | Federal
Tax Cost | | | Unrealized
Appreciation | | | Unrealized
(Depreciation) | | | Net Unrealized
Appreciation/
(Depreciation)(7) | |
| | | | | |
PIMCO Dividend and Income Fund | | | | | | $ | 215,632 | | | $ | 19,214 | | | $ | (11,630 | ) | | $ | 7,584 | |
| | | | | |
PIMCO RAE Emerging Markets Fund | | | | | | | 1,706,627 | | | | 313,697 | | | | (163,322 | ) | | | 150,375 | |
| | | | | |
PIMCO RAE Global ex-US Fund | | | | | | | 112,880 | | | | 5,174 | | | | (10,887 | ) | | | (5,713 | ) |
| | | | | |
PIMCO RAE International Fund | | | | | | | 458,998 | | | | 57,167 | | | | (16,786 | ) | | | 40,381 | |
| | | | | |
PIMCO RAE US Fund | | | | | | | 1,135,794 | | | | 358,001 | | | | (34,683 | ) | | | 323,318 | |
| | | | | |
PIMCO RAE US Small Fund | | | | | | | 992,336 | | | | 239,828 | | | | (37,853 | ) | | | 201,975 | |
| † | A zero balance may reflect actual amounts rounding to less than one thousand. |
| (7) | Adjusted for open wash sale loss deferrals and the accelerated recognition of unrealized gain or loss on certain futures, options, and/or forward contracts for federal income tax purposes. Also adjusted for differences between book and tax realized and unrealized gain (loss) on hyperinflationary investments, swap contracts, straddle loss deferrals, passive foreign investment companies (PFICs), interest accrued on defaulted securities, short positions, and other debt adjustments. |
For the fiscal years ended June 30, 2024 and June 30, 2023, respectively, the Funds made the following tax basis distributions (amounts in thousands†):
| | | | | | | | | | | | | | | | | | | | | | | | | | | | |
| | | | | | June 30, 2024 | | | June 30, 2023 | |
| | | | | | | |
| | | | | | Ordinary
Income
Distributions(8) | | | Long-Term
Capital Gain
Distributions | | | Return of
Capital(9) | | | Ordinary
Income
Distributions(8) | | | Long-Term
Capital Gain
Distributions | | | Return of
Capital(9) | |
| | | | | | | |
PIMCO Dividend and Income Fund | | | | | | $ | 8,346 | | | $ | 0 | | | $ | 0 | | | $ | 10,111 | | | $ | 0 | | | $ | 0 | |
| | | | | | | |
PIMCO RAE Emerging Markets Fund | | | | | | | 62,752 | | | | 0 | | | | 0 | | | | 6,007 | | | | 112,024 | | | | 0 | |
| | | | | | | |
PIMCO RAE Global ex-US Fund | | | | | | | 5,101 | | | | 3,740 | | | | 0 | | | | 1,525 | | | | 5,809 | | | | 0 | |
| | | | | | | |
PIMCO RAE International Fund | | | | | | | 31,862 | | | | 14,820 | | | | 0 | | | | 16,275 | | | | 35,036 | | | | 0 | |
| | | | | | | |
PIMCO RAE US Fund | | | | | | | 36,551 | | | | 40,201 | | | | 0 | | | | 12,100 | | | | 66,350 | | | | 0 | |
| | | | | | | |
PIMCO RAE US Small Fund | | | | | | | 12,001 | | | | 0 | | | | 0 | | | | 11,711 | | | | 48,180 | | | | 0 | |
| | | | | | | | | | | | | | | | | | | | | | | | | | | | |
| † | A zero balance may reflect actual amounts rounding to less than one thousand. |
| (8) | Includes short-term capital gains distributed, if any. |
| (9) | A portion of the distributions made represents a tax return of capital. Return of capital distributions have been reclassified from undistributed net investment income to paid-in capital to more appropriately conform financial accounting to tax accounting. |
| | | | |
| Report of Independent Registered Public Accounting Firm | | | | |
To the Board of Trustees of PIMCO Equity Series® and Shareholders of PIMCO Dividend and Income Fund, PIMCO RAE Emerging Markets Fund, PIMCO RAE Global ex-US Fund, PIMCO RAE International Fund, PIMCO RAE US Fund and PIMCO RAE US Small Fund
Opinions on the Financial Statements
We have audited the accompanying statements of assets and liabilities, including the schedules of investments, of PIMCO Dividend and Income Fund, PIMCO RAE Emerging Markets Fund, PIMCO RAE Global ex-US Fund, PIMCO RAE International Fund, PIMCO RAE US Fund and PIMCO RAE US Small Fund (five of the funds constituting PIMCO Equity Series®, hereafter collectively referred to as the “Funds”) as of June 30, 2024, the related statements of operations for the year ended June 30, 2024, the statements of changes in net assets for each of the two years in the period ended June 30, 2024, including the related notes, and the financial highlights for each of the five years in the period ended June 30, 2024 (collectively referred to as the “financial statements”). In our opinion, the financial statements present fairly, in all material respects, the financial position of each of the Funds as of June 30, 2024, the results of each of their operations for the year then ended, the changes in each of their net assets for each of the two years in the period ended June 30, 2024 and each of the financial highlights for each of the five years in the period ended June 30, 2024 in conformity with accounting principles generally accepted in the United States of America.
Basis for Opinions
These financial statements are the responsibility of the Funds’ management. Our responsibility is to express an opinion on the Funds’ financial statements based on our audits. We are a public accounting firm registered with the Public Company Accounting Oversight Board (United States) (PCAOB) and are required to be independent with respect to the Funds in accordance with the U.S. federal securities laws and the applicable rules and regulations of the Securities and Exchange Commission and the PCAOB.
We conducted our audits of these financial statements in accordance with the standards of the PCAOB. Those standards require that we plan and perform the audit to obtain reasonable assurance about whether the financial statements are free of material misstatement, whether due to error or fraud.
Our audits included performing procedures to assess the risks of material misstatement of the financial statements, whether due to error or fraud, and performing procedures that respond to those risks. Such procedures included examining, on a test basis, evidence regarding the amounts and disclosures in the financial statements. Our audits also included evaluating the accounting principles used and significant estimates made by management, as well as evaluating the overall presentation of the financial statements. Our procedures included confirmation of securities owned as of June 30, 2024 by correspondence with the custodian, transfer agent, brokers and agent banks; when replies were not received from brokers or agent banks, we performed other auditing procedures. We believe that our audits provide a reasonable basis for our opinions.
/s/ PricewaterhouseCoopers LLP
Kansas City, Missouri
August 27, 2024
We have served as the auditor of one or more investment companies in PIMCO Equity Series® since 2010.
| | | | | | | | | | | | |
| | | | ANNUAL FINANCIAL AND OTHER INFORMATION | | | | | | | JUNE 30, 2024 | | | 85 |
| | | | | | |
| Glossary: | | (abbreviations that may be used in the preceding statements) | | | | (Unaudited) |
| | | | | | | | | | |
| | | | |
Counterparty Abbreviations: | | | | | | | | |
| | | | | |
| AZD | | Australia and New Zealand Banking Group | | DUB | | Deutsche Bank AG | | MYC | | Morgan Stanley Capital Services LLC |
| | | | | |
| BCY | | Barclays Capital, Inc. | | FAR | | Wells Fargo Bank National Association | | MYI | | Morgan Stanley & Co. International PLC |
| | | | | |
| BMO | | BMO Capital Markets Corporation | | FICC | | Fixed Income Clearing Corporation | | MZF | | Mizuho Securities USA LLC |
| | | | | |
| BOA | | Bank of America N.A. | | GLM | | Goldman Sachs Bank USA | | NGF | | Nomura Global Financial Products, Inc. |
| | | | | |
| BOS | | BofA Securities, Inc. | | GSC | | Goldman Sachs & Co. LLC | | RBC | | Royal Bank of Canada |
| | | | | |
| BPG | | BNP Paribas Securities Corp. | | GST | | Goldman Sachs International | | RYL | | NatWest Markets Plc |
| | | | | |
| BPS | | BNP Paribas S.A. | | ING | | ING Bank NV | | SAL | | Citigroup Global Markets, Inc. |
| | | | | |
| BRC | | Barclays Bank PLC | | JPM | | JP Morgan Chase Bank N.A. | | SCX | | Standard Chartered Bank, London |
| | | | | |
| BSN | | The Bank of Nova Scotia - Toronto | | MBC | | HSBC Bank Plc | | UAG | | UBS AG Stamford |
| | | | | |
| CBK | | Citibank N.A. | | MSC | | Morgan Stanley & Co. LLC. | | UBS | | UBS Securities LLC |
| | | | |
Currency Abbreviations: | | | | | | | | |
| | | | | |
| AUD | | Australian Dollar | | IDR | | Indonesian Rupiah | | NZD | | New Zealand Dollar |
| | | | | |
| BRL | | Brazilian Real | | ILS | | Israeli Shekel | | PEN | | Peruvian New Sol |
| | | | | |
| CAD | | Canadian Dollar | | INR | | Indian Rupee | | PLN | | Polish Zloty |
| | | | | |
| CHF | | Swiss Franc | | JPY | | Japanese Yen | | SGD | | Singapore Dollar |
| | | | | |
| CNH | | Chinese Renminbi (Offshore) | | KRW | | South Korean Won | | TRY | | Turkish New Lira |
| | | | | |
| CNY | | Chinese Renminbi (Mainland) | | KWD | | Kuwaiti Dinar | | TWD | | Taiwanese Dollar |
| | | | | |
| EUR | | Euro | | MXN | | Mexican Peso | | USD (or $) | | United States Dollar |
| | | | | |
| GBP | | British Pound | | NOK | | Norwegian Krone | | ZAR | | South African Rand |
| | | | |
Exchange Abbreviations: | | | | | | | | |
| | | | | |
| OTC | | Over the Counter | | | | | | | | |
| | | | |
Index/Spread Abbreviations: | | | | | | | | |
| | | | | |
| BP0003M | | 3 Month GBP-LIBOR | | CDX.IG | | Credit Derivatives Index - Investment Grade | | SOFR | | Secured Overnight Financing Rate |
| | | | | |
| CAONREPO | | Canadian Overnight Repo Rate Average | | CMBX | | Commercial Mortgage-Backed Index | | SONIO | | Sterling Overnight Interbank Average Rate |
| | | | | |
| CDX.EM | | Credit Derivatives Index - Emerging Markets | | MUTKCALM | | Tokyo Overnight Average Rate | | UKRPI | | United Kingdom Retail Prices Index |
| | | | | |
| CDX.HY | | Credit Derivatives Index - High Yield | | | | | | | | |
| | | | |
Other Abbreviations: | | | | | | | | |
| | | | | |
| ABS | | Asset-Backed Security | | CLO | | Collateralized Loan Obligation | | OIS | | Overnight Index Swap |
| | | | | |
| ADR | | American Depositary Receipt | | DAC | | Designated Activity Company | | PIK | | Payment-in-Kind |
| | | | | |
| BABs | | Build America Bonds | | EURIBOR | | Euro Interbank Offered Rate | | REIT | | Real Estate Investment Trust |
| | | | | |
| BBR | | Bank Bill Rate | | JIBAR | | Johannesburg Interbank Agreed Rate | | TBA | | To-Be-Announced |
| | | | | |
| BBSW | | Bank Bill Swap Reference Rate | | LIBOR | | London Interbank Offered Rate | | TIIE | | Tasa de Interés Interbancaria de Equilibrio “Equilibrium Interbank Interest Rate” |
| | | | | |
| BRL-CDI | | Brazil Interbank Deposit Rate | | Lunar | | Monthly payment based on 28-day periods. One year consists of 13 periods. | | | | |
| | | | |
| Federal Income Tax Information | | | | (Unaudited) |
As required by the Internal Revenue Code (“Code”) and Treasury Regulations, if applicable, shareholders must be notified within 60 days of the Funds’ fiscal year end regarding the status of qualified dividend income and the dividend received deduction.
Dividend Received Deduction. Corporate shareholders are generally entitled to take the dividend received deduction on the portion of a fund’s dividend distribution that qualifies under tax law. The percentage of the following Funds’ fiscal 2024 ordinary income dividend that qualifies for the corporate dividend received deduction is set forth below.
Qualified Dividend Income. Under the Jobs and Growth Tax Relief Reconciliation Act of 2003, the following percentage of ordinary dividends paid during the fiscal year ended June 30, 2024 was designated as “qualified dividend income” as defined in the Jobs and Growth Tax Relief Reconciliation Act of 2003 subject to reduced tax rates in 2024.
Qualified Interest Income and Qualified Short-Term Capital Gain (for non-U.S. resident shareholders only). Under the American Jobs Creation Act of 2004, the following amounts of ordinary dividends paid during the fiscal year ended June 30, 2024 are considered to be derived from “qualified interest income,” as defined in Section 871(k)(1)(E) of the Code, and therefore are designated as interest-related dividends, as defined in Section 871(k)(1)(C) of the Code. Further, the following amounts of ordinary dividends paid during the fiscal year ended June 30, 2024 are considered to be derived from “qualified short-term capital gain,” as defined in Section 871(k)(2)(D) of the Code, and therefore are designated as qualified short-term gain dividends, as defined by Section 871(k)(2)(C) of the Code.
Section 163(j) Interest Dividends. The Funds intend to pass through the maximum amount allowable as Section 163(j) Interest defined in Proposed Treasury Section 1.163(j)-1(b). The 163(j) amount of ordinary income distributions are as follows:
Foreign Taxes. The Funds have made an election under the Internal Revenue Code Section 853 to pass through foreign taxes paid. Shareholders will receive more detailed information along with their Form 1099-DIV.
| | | | | | | | | | | | | | | | | | | | | | | | | | | | | | | | |
| | | | | | Dividend
Received
Deduction % | | | Qualified
Dividend
Income % | | | Qualified
Interest
Income
(000s)† | | | Qualified
Short-Term
Capital Gains
(000s)† | | | 163(j)
Interest
Dividends
(000s)† | | | Foreign
Source
Income
(000s)† | | | Foreign
Taxes Pass
Through
(000s)† | |
| | | | | | | | |
PIMCO Dividend and Income Fund | | | | | | | 15.09% | | | | 35.08% | | | $ | 8,346 | | | $ | 0 | | | $ | 1,799 | | | $ | 0 | | | $ | 0 | |
| | | | | | | | |
PIMCO RAE Emerging Markets Fund | | | | | | | 0.00% | | | | 77.29% | | | | 446 | | | | 0 | | | | 0 | | | | 80,284 | | | | 16,661 | |
| | | | | | | | |
PIMCO RAE Global ex-US Fund | | | | | | | 0.00% | | | | 71.66% | | | | 2 | | | | 0 | | | | 63 | | | | 5,879 | | | | 613 | |
| | | | | | | | |
PIMCO RAE International Fund | | | | | | | 0.00% | | | | 66.48% | | | | 45 | | | | 3,860 | | | | 0 | | | | 16,284 | | | | 1,591 | |
| | | | | | | | |
PIMCO RAE US Fund | | | | | | | 77.15% | | | | 78.67% | | | | 154 | | | | 1,551 | | | | 108 | | | | 0 | | | | 0 | |
| | | | | | | | |
PIMCO RAE US Small Fund | | | | | | | 89.80% | | | | 89.47% | | | | 71 | | | | 0 | | | | 64 | | | | 0 | | | | 0 | |
| † | A zero balance may reflect actual amounts rounding to less than one thousand. |
Shareholders are advised to consult their own tax advisor with respect to the tax consequences of their investment in the Trust. In January 2025, you will be advised on IRS Form 1099-DIV as to the federal tax status of the dividends and distributions received by you in calendar year 2024.
Section 199A Dividends. Non-corporate fund shareholders of the funds below meeting certain holding period requirements may be able to deduct up to 20 percent of qualified REIT dividends passed through and reported to the shareholders by the funds as IRC section 199A dividends. The IRC section 199A percentage of ordinary dividends are as follows:
| | | | | | | | |
| | | | | | 199A Dividends | |
| | |
PIMCO Dividend and Income Fund | | | | | | | 2.98% | |
| | |
PIMCO RAE Emerging Markets Fund | | | | | | | 0.00% | |
| | |
PIMCO RAE Global ex-US Fund | | | | | | | 0.00% | |
| | |
PIMCO RAE International Fund | | | | | | | 0.00% | |
| | |
PIMCO RAE US Fund | | | | | | | 0.00% | |
| | |
PIMCO RAE US Small Fund | | | | | | | 10.53% | |
| | | | | | | | | | | | |
| | | | ANNUAL FINANCIAL AND OTHER INFORMATION | | | | | | | JUNE 30, 2024 | | | 87 |
| | | | |
| Distribution Information | | | | (Unaudited) |
For purposes of Section 19 of the Investment Company Act of 1940 (the “Act”), the PIMCO Dividend and Income Fund estimated the periodic sources of any dividends paid during the period covered by this report in accordance with good accounting practice. Pursuant to Rule 19a-1(e) under the Act, the table below sets forth the actual source information for dividends paid during the six month period ended June 30, 2024 calculated as of each distribution period pursuant to Section 19 of the Act. The information below is not provided for U.S. federal income tax reporting purposes. The tax character of all dividends and distributions is reported on Form 1099-DIV (for shareholders who receive U.S. federal tax reporting) at the end of each calendar year. See the Financial Highlights section of this report for the tax characterization of distributions determined in accordance with federal income tax regulations for the fiscal year.
| | | | | | | | | | | | | | | | | | | | |
| PIMCO Dividend and Income Fund | | | | | | | | | | | | | | | |
| Institutional Class | | | | | Net Investment
Income* | | | Net Realized
Capital Gains* | | | Paid-in Surplus or
Other Capital
Sources** | | | Total (per
common share) | |
| | | | | |
March 2024 | | | | | | $ | 0.1261 | | | $ | 0.0000 | | | $ | 0.0030 | | | $ | 0.1291 | |
| | | | | |
June 2024 | | | | | | $ | 0.1408 | | | $ | 0.0000 | | | $ | 0.0000 | | | $ | 0.1408 | |
| | | | | |
| I-2 | | | | | Net Investment
Income* | | | Net Realized
Capital Gains* | | | Paid-in Surplus or
Other Capital
Sources** | | | Total (per
common share) | |
| | | | | |
March 2024 | | | | | | $ | 0.1237 | | | $ | 0.0000 | | | $ | 0.0029 | | | $ | 0.1266 | |
| | | | | |
June 2024 | | | | | | $ | 0.1382 | | | $ | 0.0000 | | | $ | 0.0000 | | | $ | 0.1382 | |
| | | | | |
| Class A | | | | | Net Investment
Income* | | | Net Realized
Capital Gains* | | | Paid-in Surplus or
Other Capital
Sources** | | | Total (per
common share) | |
| | | | | |
March 2024 | | | | | | $ | 0.1171 | | | $ | 0.0000 | | | $ | 0.0028 | | | $ | 0.1199 | |
| | | | | |
June 2024 | | | | | | $ | 0.1304 | | | $ | 0.0000 | | | $ | 0.0000 | | | $ | 0.1304 | |
| | | | | |
| Class C | | | | | Net Investment
Income* | | | Net Realized
Capital Gains* | | | Paid-in Surplus or
Other Capital
Sources** | | | Total (per
common share) | |
| | | | | |
March 2024 | | | | | | $ | 0.0970 | | | $ | 0.0000 | | | $ | 0.0023 | | | $ | 0.0993 | |
| | | | | |
June 2024 | | | | | | $ | 0.1050 | | | $ | 0.0000 | | | $ | 0.0000 | | | $ | 0.1050 | |
| * | The source of dividends provided in the table differs, in some respects, from information presented in this report prepared in accordance with generally accepted accounting principles, or U.S. GAAP. For example, net earnings from certain interest rate swap contracts are included as a source of net investment income for purposes of Section 19(a). Accordingly, the information in the table may differ from information in the accompanying financial statements that are presented on the basis of U.S. GAAP and may differ from tax information presented in the footnotes. Amounts shown may include accumulated, as well as fiscal period net income and net profits. |
| ** | Occurs when a fund distributes an amount greater than its accumulated net income and net profits. Amounts are not reflective of a fund’s net income, yield, earnings or investment performance. |
General Information
Investment Adviser and Administrator
Pacific Investment Management Company LLC
650 Newport Center Drive
Newport Beach, CA 92660
Investment Sub-Adviser
Research Affiliates, LLC
660 Newport Center Drive, Suite 300
Newport Beach, CA 92660
Distributor
PIMCO Investments LLC
1633 Broadway
New York, NY 10019
Custodian
State Street Bank and Trust Company
2323 Grand Boulevard, 5th Floor
Kansas City, MO 64108
Transfer Agent
SS&C Global Investor & Distribution Solutions, Inc.
Institutional Class, I-2, I-3, Administrative Class
430 W 7th Street STE 219024
Kansas City, MO 64105-1407
SS&C Global Investor & Distribution Solutions, Inc.
Class A, Class C, Class R
430 W 7th Street STE 219294
Kansas City, MO 64105-1407
Legal Counsel
Dechert LLP
1900 K Street, N.W.
Washington, D.C. 20006
Independent Registered Public Accounting Firm
PricewaterhouseCoopers LLP
1100 Walnut Street, Suite 1300
Kansas City, MO 64106
This report is submitted for the general information of the shareholders of the Funds listed on the Report cover.

PES3003FSAR_063024

PIMCO EQUITY SERIES®
Annual Financial and Other Information
June 30, 2024
Equity Exchange-Traded Funds
PIMCO RAFI Dynamic Multi-Factor Emerging Markets Equity ETF | MFEM | NYSE Arca
PIMCO RAFI Dynamic Multi-Factor International Equity ETF | MFDX | NYSE Arca
PIMCO RAFI Dynamic Multi-Factor U.S. Equity ETF | MFUS | NYSE Arca
PIMCO RAFI ESG U.S. ETF | RAFE | NYSE Arca
Table of Contents
This material is authorized for use only when preceded or accompanied by the current PIMCO Equity Series prospectus. The Shareholder Reports for the other series of the PIMCO Equity Series are printed separately.
| | | | |
| Important Information About the Funds | | | | |
PIMCO Equity Series (the “Trust”) is an open-end management investment company that includes PIMCO RAFI Dynamic Multi-Factor Emerging Markets Equity ETF, PIMCO RAFI Dynamic Multi-Factor International Equity ETF, PIMCO RAFI Dynamic Multi-Factor U.S. Equity ETF and PIMCO RAFI ESG U.S. ETF, which are exchange-traded funds (“ETFs”) that seek to provide total return that closely corresponds, before fees and expenses, to the total return of a specified index (each, a “Fund” and collectively, the “Funds”). Each Fund employs a representative sampling strategy in seeking to achieve its investment objective. In using this strategy, PIMCO seeks to invest in a combination of instruments such that the portfolio effectively provides exposure to the underlying index. A Fund may not track its underlying index with the same degree of accuracy as a fund that replicates the composition and weighting of the underlying index. Shares of the Funds are listed and traded at market prices on NYSE Arca, Inc. (“NYSE Arca”) and other secondary markets. The market price for each Fund’s shares may be different from the Fund’s net asset value (“NAV”). Each Fund issues and redeems shares at its NAV only in blocks of a specified number of shares (“Creation Units”). Only certain large institutional investors may purchase or redeem Creation Units directly with the Funds at NAV (“Authorized Participants”). These transactions are in exchange for certain securities similar to a Fund’s portfolio and/or cash. Except when aggregated in Creation Units, shares of a Fund are not redeemable securities. Shareholders who are not Authorized Participants may not redeem shares from the Funds at NAV.
We believe that equity funds have an important role to play in a well-diversified investment portfolio. It is important to note, however, that equity funds are subject to notable risks. Among other things, equity and equity-related securities may decline in value due to both real and perceived general market, economic and industry conditions.
The values of equity securities, such as common stocks and preferred securities, have historically risen and fallen in periodic cycles and may decline due to general market conditions, which are not specifically related to a particular company, such as real or perceived adverse economic conditions, changes in the general outlook for corporate earnings, changes in interest or currency rates or adverse investor sentiment generally. Equity securities may also decline due to factors that affect a particular industry or industries, such as labor shortages, increased production costs and competitive conditions within an industry. In addition, the value of an equity security may decline for a number of reasons that directly relate to the issuer, such as management performance, financial leverage and reduced demand for the issuer’s goods or services, as well as the historical and prospective earnings of the issuer and the value of its assets. Different types of equity securities may react differently to these developments and a change in the financial condition of a single issuer may affect securities markets as a whole.
During a general downturn in the securities markets, multiple asset classes, including equity securities, may decline in value simultaneously. The market price of equity securities owned by a Fund may go up or down, sometimes rapidly or unpredictably. Equity securities generally have greater price volatility than fixed income securities and common stocks generally have the greatest appreciation and depreciation potential of all equity securities.
The Funds may be subject to various risks as described in each Fund’s prospectus and in the Principal and Other Risks in the Notes to Financial Statements.
Classifications of the Funds’ portfolio holdings in this report are made according to financial reporting standards. The classification of a particular portfolio holding as shown in the Schedule of Investments sections of this report may differ from the classification used for the Funds’ compliance calculations, including those used in the Funds’ prospectus, investment objectives, regulatory and other investment limitations and policies, which may be based on different asset class, sector or geographical classifications. The Funds are separately monitored for compliance with respect to prospectus and regulatory requirements.
The geographical classification of foreign (non-U.S.) securities in this report, if any, are classified by the country of incorporation of a holding. In certain instances, a security’s country of incorporation may be different from its country of economic exposure.
In February 2022, Russia launched an invasion of Ukraine. As a result, Russia and other countries, persons and entities that provided material aid to Russia’s aggression against Ukraine, have been the subject of economic sanctions and import and export controls imposed by countries throughout the world, including the United States. Such measures have had and may continue to have an adverse effect on the Russian, Belarusian and other securities and economies, which may, in turn, negatively impact a Fund. The extent, duration and impact of Russia’s military action in Ukraine, related sanctions and retaliatory actions are difficult to ascertain, but could be significant and have severe adverse effects on the region, including significant adverse effects on the regional, European and global economies and the markets for certain securities and commodities, such as oil and natural gas, as well as other sectors. Further, a Fund may have investments in securities and instruments that are economically tied to the region and may have been negatively impacted by the sanctions and counter-sanctions by Russia, including declines in value and reductions in liquidity. The sanctions may cause a Fund to sell portfolio holdings at a disadvantageous time or price or to continue to hold investments that a Fund may no longer seek to hold. PIMCO will continue to actively manage these positions in the best interests of a Fund and its shareholders.
The United States’ enforcement of restrictions on U.S. investments in certain issuers and tariffs on goods from certain other countries has contributed to and may continue to contribute to international trade tensions and may impact portfolio securities. The United States’ enforcement of sanctions or other similar measures on various Russian entities and persons, and the Russian government’s response, may also negatively impact securities and instruments that are economically tied to Russia.
A Fund may invest in certain instruments that rely in some fashion upon the London Interbank Offered Rate (“LIBOR”). LIBOR was traditionally an average interest rate, determined by the ICE Benchmark Administration, that banks charge one another for the use of short-term money. The United Kingdom’s Financial Conduct Authority, which regulates LIBOR, announced plans to ultimately phase out the use of LIBOR. Although the transition process away from LIBOR for many instruments has been completed, some LIBOR use is continuing and there are potential effects related to the transition away from LIBOR or continued use of LIBOR on a Fund, or on certain instruments in which a Fund invests, which can be difficult to ascertain, and may vary depending on factors that include, but are not limited to: (i) existing fallback or termination provisions in individual contracts and (ii) whether, how and when industry participants adopt new reference rates for affected instruments. The transition of investments from LIBOR to a replacement rate as a result of amendment, application of existing fallbacks, statutory requirements or otherwise may also result in a reduction in the value of certain instruments held by a Fund or a reduction in the effectiveness of related Fund transactions such as hedges. In addition, an instrument’s transition to a replacement rate could result in variations in the reported yields of a Fund that holds such instrument. Any such effects of the transition away from LIBOR, as well as other unforeseen effects, could result in losses to a Fund.
Engaging in a responsible investment strategy, which may select or exclude securities of certain issuers for reasons other than performance, carries the risk that a Fund, to the extent a fund engages in a responsible investment strategy, may underperform funds that do not utilize a responsible investment strategy. The application of this strategy may affect a Fund’s exposure to certain sectors or types of investments, which could negatively impact the Fund’s performance. Responsible investing is qualitative and subjective by nature, and there is no guarantee that the criteria utilized or any judgment exercised in pursuing a responsible investment strategy will reflect the beliefs or values of any particular investor. In evaluating a company, the information and data obtained through voluntary or third-party reporting may be incomplete, inaccurate or unavailable, which could cause an incorrect assessment of a company’s business practices with respect to the environment, social responsibility and corporate
governance (“ESG practices”). Socially responsible norms differ by region, and a company’s ESG practices or the assessment of a company’s ESG practices may change over time.
U.S. and global markets have experienced increased volatility, including as a result of the failures of certain U.S. and non-U.S. banks in 2023, which could be harmful to the Funds and issuers in which they invest. For example, if a bank at which a Fund or issuer has an account fails, any cash or other assets in bank or custody accounts, which may be substantial in size, could be temporarily inaccessible or permanently lost by the Fund or issuer. If a bank that provides a subscription line credit facility, asset-based facility, other credit facility and/or other services to an issuer or to a fund fails, the issuer or fund could be unable to draw funds under its credit facilities or obtain replacement credit facilities or other services from other lending institutions with similar terms.
Issuers in which a Fund may invest can be affected by volatility in the banking sector. Even if banks used by issuers in which the Funds invest remain solvent, volatility in the banking sector could contribute to, cause or intensify an economic recession, increase the costs of capital and banking services or result in the issuers being unable to obtain or refinance indebtedness at all or on as favorable terms as could otherwise have been obtained. Potential impacts to the Funds and issuers resulting from changes in the banking sector, market conditions and potential legislative or regulatory responses are uncertain. Such conditions and responses, as well as a changing interest rate environment, can contribute to decreased market liquidity and erode the value of certain holdings, including those of U.S. and non-U.S. banks. Continued market volatility and uncertainty and/or a downturn in market and economic and financial conditions, as a result of developments in the banking sector or otherwise (including as a result of delayed access to cash or credit facilities), could have an adverse impact on the Funds and issuers in which they invest.
The following table discloses the inception dates of each Fund along with each Fund’s diversification status as of period end:
| | | | | | | | | | | | |
| | | |
| Fund Name | | | | | Fund
Inception | | | Diversification
Status | |
PIMCO RAFI Dynamic Multi-Factor Emerging Markets Equity ETF | | | | | | | 08/31/17 | | | | Diversified | |
PIMCO RAFI Dynamic Multi-Factor International Equity ETF | | | | | | | 08/31/17 | | | | Diversified | |
PIMCO RAFI Dynamic Multi-Factor U.S. Equity ETF | | | | | | | 08/31/17 | | | | Diversified | |
PIMCO RAFI ESG U.S. ETF | | | | | | | 12/18/19 | | | | Diversified | |
An investment in a Fund is not a bank deposit and is not guaranteed or insured by the Federal Deposit Insurance Corporation or any other government agency. It is possible to lose money on investments in a Fund.
The Trustees are responsible generally for overseeing the management of the Trust. The Trustees authorize the Trust to enter into service
| | | | | | | | | | | | |
| | | | ANNUAL FINANCIAL AND OTHER INFORMATION | | | | | | | JUNE 30, 2024 | | | 3 |
| | | | |
| Important Information About the Funds | | (Cont.) | | |
agreements with the Adviser, the Distributor, the Administrator and other service providers in order to provide, and in some cases authorize service providers to procure through other parties, necessary or desirable services on behalf of the Trust and the Funds. Shareholders are not parties to or third-party beneficiaries of such service agreements. Neither a Fund’s prospectus nor a Fund’s summary prospectus, the Trust’s Statement of Additional Information (“SAI”), any contracts filed as exhibits to the Trust’s registration statement, nor any other communications, disclosure documents or regulatory filings (including this report) from or on behalf of the Trust or a Fund creates a contract between or among any shareholder of a Fund, on the one hand, and the Trust, a Fund, a service provider to the Trust or a Fund, and/or the Trustees or officers of the Trust, on the other hand. The Trustees (or the Trust and its officers, service providers or other delegates acting under authority of the Trustees) may amend the most recent prospectus or use a new prospectus, summary prospectus or SAI with respect to a Fund or the Trust, and/or amend, file and/or issue any other communications, disclosure documents or regulatory filings, and may amend or enter into any contracts to which the Trust or a Fund is a party, and interpret the investment objective(s), policies, restrictions and contractual provisions applicable to any Fund, without shareholder input or approval, except in circumstances in which shareholder approval is specifically required by law (such as changes to fundamental investment policies) or where a shareholder approval requirement is specifically disclosed in the Trust’s then-current prospectus or SAI.
On each business day, before commencement of trading on NYSE Arca, each Fund will disclose on www.pimcoetfs.com the identities and quantities of each Fund’s portfolio holdings. The frequency at which the daily market prices were at a discount or premium to each Fund’s NAV is disclosed on www.pimcoetfs.com. Please see “Disclosure of Portfolio Holdings” in the SAI for information about the availability of the complete schedule of each Fund’s holdings. Fund fact sheets provide additional information regarding a Fund and may be requested by calling (888) 400-4ETF and are available on the Funds’ website at www.pimcoetfs.com.
PIMCO has adopted written proxy voting policies and procedures (“Proxy Policy”) as required by Rule 206(4)-6 under the Investment Advisers Act of 1940, as amended. The Proxy Policy has been adopted by the Trust as the policies and procedures that PIMCO will use when voting proxies on behalf of the Funds. A description of the policies and procedures that PIMCO uses to vote proxies relating to portfolio securities of each Fund, and information about how each Fund voted
proxies relating to portfolio securities held during the most recent twelve-month period ended June 30, are available without charge, upon request, by calling the Trust at (888) 400-4ETF, on the Funds’ website at www.pimcoetfs.com, and on the Securities and Exchange Commission’s (“SEC”) website at www.sec.gov.
The Funds file portfolio holdings information with the SEC on Form N-PORT within 60 days of the end of each fiscal quarter. The Funds’ complete schedules of securities holdings as of the end of each fiscal quarter will be made available to the public on the SEC’s website at www.sec.gov and on PIMCO’s website at www.pimcoetfs.com, and will be made available, upon request, by calling PIMCO at (888) 400-4ETF.
Paper copies of the Funds’ shareholder reports are required to be provided free of charge by the Fund or financial intermediary upon request.
In October 2022, the SEC adopted changes to the mutual fund and ETF shareholder report and registration statement disclosure requirements and the registered fund advertising rules, which impact the disclosures provided to shareholders. The rule amendments were effective as of January 2023, and compliance with the rule amendments was required as of July 2024. As such, the Funds have made significant updates to the content of their shareholder reports. In addition, shareholder reports are now mailed to shareholders who have not opted to receive shareholder report documents electronically.
In September 2023, the SEC adopted amendments to Rule 35d-1 under the Investment Company Act of 1940, as amended, the rule governing fund naming conventions (the “Names Rule”). In general, the Names Rule requires funds with certain types of names to adopt a policy to invest at least 80% of their assets in the type of investment suggested by the name. The amendments expand the scope of the current rule to include any term used in a fund name that suggests the fund makes investments that have, or whose issuers have, particular characteristics. Additionally, the amendments modify the circumstances under which a fund may deviate from its 80% investment policy and address the calculation methodology of derivatives instruments for purposes of the rule. The amendments became effective December 11, 2023, and fund groups with $1 billion or more in net assets will have 24 months to comply with the amendments (fund groups with net assets of less than $1 billion have 30 months to comply).
(THIS PAGE INTENTIONALLY LEFT BLANK)
| | | | | | | | | | | | |
| | | | ANNUAL FINANCIAL AND OTHER INFORMATION | | | | | | | JUNE 30, 2024 | | | 5 |
| | | | | | | | | | | | | | | | | | | | | | | | | | | | | | | | |
| | | | | | Investment Operations | | | Less Distributions(c) | | | | |
| | | | | | | | | | | | | | | | | | | | | | | | | |
| Selected Per Share Data for the Year or Period Ended^: | |
Net Asset Value
Beginning of
Year or
Period(a) | | | Net Investment Income (Loss)(b) | | | Net Realized/
Unrealized
Gain (Loss) | | | Total | | | From Net
Investment
Income | | | From Net
Realized
Capital Gains | | | Total | | | Net Asset
Value End of
Year or
Period(a) | |
| | | | | | | | |
PIMCO RAFI Dynamic Multi-Factor Emerging Markets Equity ETF | | | | | | | | | | | | | | | | | | | | | | | | | | | | | | | | |
| | | | | | | | |
06/30/2024 | | $ | 18.46 | | | $ | 0.63 | | | $ | 2.22 | | | $ | 2.85 | | | $ | (0.80 | ) | | $ | 0.00 | | | $ | (0.80 | ) | | $ | 20.51 | |
| | | | | | | | |
06/30/2023 | | | 18.33 | | | | 0.75 | | | | 0.61 | | | | 1.36 | | | | (0.64 | ) | | | (0.59 | ) | | | (1.23 | ) | | | 18.46 | |
| | | | | | | | |
06/30/2022 | | | 31.06 | | | | 1.21 | | | | (6.94 | ) | | | (5.73 | ) | | | (2.46 | ) | | | (4.54 | ) | | | (7.00 | ) | | | 18.33 | |
| | | | | | | | |
06/30/2021 | | | 20.84 | | | | 0.50 | | | | 10.14 | | | | 10.64 | | | | (0.42 | ) | | | 0.00 | | | | (0.42 | ) | | | 31.06 | |
| | | | | | | | |
06/30/2020 | | | 24.24 | | | | 0.59 | | | | (3.41 | ) | | | (2.82 | ) | | | (0.58 | ) | | | 0.00 | | | | (0.58 | ) | | | 20.84 | |
| | | | | | | | |
PIMCO RAFI Dynamic Multi-Factor International Equity ETF | | | | | | | | | | | | | | | | | | | | | | | | | | | | | | | | |
| | | | | | | | |
06/30/2024 | | $ | 28.08 | | | $ | 0.87 | | | $ | 2.09 | | | $ | 2.96 | | | $ | (0.86 | ) | | $ | 0.00 | | | $ | (0.86 | ) | | $ | 30.18 | |
| | | | | | | | |
06/30/2023 | | | 25.16 | | | | 0.95 | | | | 2.78 | | | | 3.73 | | | | (0.81 | ) | | | 0.00 | | | | (0.81 | ) | | | 28.08 | |
| | | | | | | | |
06/30/2022 | | | 29.66 | | | | 0.95 | | | | (4.57 | ) | | | (3.62 | ) | | | (0.88 | ) | | | 0.00 | | | | (0.88 | ) | | | 25.16 | |
| | | | | | | | |
06/30/2021 | | | 22.86 | | | | 0.69 | | | | 6.53 | | | | 7.22 | | | | (0.42 | ) | | | 0.00 | | | | (0.42 | ) | | | 29.66 | |
| | | | | | | | |
06/30/2020 | | | 24.94 | | | | 0.53 | | | | (1.84 | ) | | | (1.31 | ) | | | (0.77 | ) | | | 0.00 | | | | (0.77 | ) | | | 22.86 | |
| | | | | | | | |
PIMCO RAFI Dynamic Multi-Factor U.S. Equity ETF | | | | | | | | | | | | | | | | | | | | | | | | | | | | | | | | |
| | | | | | | | |
06/30/2024 | | $ | 39.42 | | | $ | 0.70 | | | $ | 8.07 | | | $ | 8.77 | | | $ | (0.77 | ) | | $ | 0.00 | | | $ | (0.77 | ) | | $ | 47.42 | |
| | | | | | | | |
06/30/2023 | | | 36.24 | | | | 0.87 | | | | 3.13 | | | | 4.00 | | | | (0.82 | ) | | | 0.00 | | | | (0.82 | ) | | | 39.42 | |
| | | | | | | | |
06/30/2022 | | | 39.00 | | | | 0.75 | | | | (2.90 | ) | | | (2.15 | ) | | | (0.61 | ) | | | 0.00 | | | | (0.61 | ) | | | 36.24 | |
| | | | | | | | |
06/30/2021 | | | 27.74 | | | | 0.52 | | | | 11.28 | | | | 11.80 | | | | (0.54 | ) | | | 0.00 | | | | (0.54 | ) | | | 39.00 | |
| | | | | | | | |
06/30/2020 | | | 29.21 | | | | 0.62 | | | | (1.44 | ) | | | (0.82 | ) | | | (0.65 | ) | | | 0.00 | | | | (0.65 | ) | | | 27.74 | |
| | | | | | | | |
PIMCO RAFI ESG U.S. ETF | | | | | | | | | | | | | | | | | | | | | | | | | | | | | | | | |
| | | | | | | | |
06/30/2024 | | $ | 30.38 | | | $ | 0.64 | | | $ | 4.81 | | | $ | 5.45 | | | $ | (0.61 | ) | | $ | 0.00 | | | $ | (0.61 | ) | | $ | 35.22 | |
| | | | | | | | |
06/30/2023 | | | 27.58 | | | | 0.64 | | | | 2.79 | | | | 3.43 | | | | (0.63 | ) | | | 0.00 | | | | (0.63 | ) | | | 30.38 | |
| | | | | | | | |
06/30/2022 | | | 30.72 | | | | 0.60 | | | | (3.22 | ) | | | (2.62 | ) | | | (0.52 | ) | | | 0.00 | | | | (0.52 | ) | | | 27.58 | |
| | | | | | | | |
06/30/2021 | | | 21.40 | | | | 0.51 | | | | 9.32 | | | | 9.83 | | | | (0.51 | ) | | | 0.00 | | | | (0.51 | ) | | | 30.72 | |
| | | | | | | | |
12/18/2019 - 06/30/2020 | | | 25.00 | | | | 0.33 | | | | (3.72 | ) | | | (3.39 | ) | | | (0.21 | ) | | | 0.00 | | | | (0.21 | ) | | | 21.40 | |
| ^ | A zero balance may reflect actual amounts rounding to less than $0.01 or 0.01%. |
| * | Annualized, except for organizational expense, if any. |
| (a) | Includes adjustments required by U.S. GAAP and may differ from net asset values and performance reported elsewhere by the Funds. |
| (b) | Per share amounts based on average number of shares outstanding during the year or period. |
| (c) | The tax characterization of distributions is determined in accordance with Federal income tax regulations. See Note 2, Distributions to Shareholders, in the Notes to Financial Statements for more information. |
| (d) | Includes adjustments required by U.S. GAAP and may differ from net asset values and performance reported elsewhere by the Funds. Additionally, excludes initial sales charges and contingent deferred sales charges. |
| | | | | | |
| 6 | | PIMCO EQUITY SERIES | | | See Accompanying Notes | |
| | | | | | | | | | | | | | | | | | | | | | | | | | | | | | |
| | | | Ratios/Supplemental Data | |
| | | | | | | Ratios to Average Net Assets | | | | |
| Total Return(d) | | | Net Assets
End of Year or
Period (000s) | | | Expenses | | | Expenses Excluding Waivers | | | Expenses
Excluding
Interest
Expense | | | Expenses Excluding Interest Expense and
Waivers | | | Net
Investment
Income (Loss) | | | Portfolio
Turnover Rate | |
| | | | | | | |
| | | | | | | | | | | | | | | | | | | | | | | | | | | | | | |
| | | | | | | |
| | 15.97 | % | | $ | 105,002 | | | | 0.50 | % | | | 0.51 | % | | | 0.49 | % | | | 0.50 | % | | | 3.35 | % | | | 39 | % |
| | | | | | | |
| | 7.99 | | | | 90,844 | | | | 0.50 | | | | 0.51 | | | | 0.49 | | | | 0.50 | | | | 4.15 | | | | 74 | |
| | | | | | | |
| | (23.00 | ) | | | 75,517 | | | | 0.49 | | | | 0.50 | | | | 0.49 | | | | 0.50 | | | | 4.50 | | | | 54 | |
| | | | | | | |
| | 51.62 | | | | 494,452 | | | | 0.50 | | | | 0.51 | | | | 0.50 | | | | 0.51 | | | | 1.91 | | | | 58 | |
| | | | | | | |
| | (11.86 | ) | | | 619,324 | | | | 0.49 | | | | 0.50 | | | | 0.49 | | | | 0.50 | | | | 2.66 | | | | 59 | |
| | | | | | | |
| | | | | | | | | | | | | | | | | | | | | | | | | | | | | | |
| | | | | | | |
| | 10.81 | % | | $ | 253,544 | | | | 0.39 | % | | | 0.40 | % | | | 0.39 | % | | | 0.40 | % | | | 3.02 | % | | | 29 | % |
| | | | | | | |
| | 15.22 | | | | 146,028 | | | | 0.39 | | | | 0.40 | | | | 0.39 | | | | 0.40 | | | | 3.60 | | | | 27 | |
| | | | | | | |
| | (12.60 | ) | | | 85,539 | | | | 0.39 | | | | 0.40 | | | | 0.39 | | | | 0.40 | | | | 3.30 | | | | 39 | |
| | | | | | | |
| | 31.87 | | | | 88,978 | | | | 0.40 | | | | 0.40 | | | | 0.40 | | | | 0.40 | | | | 2.54 | | | | 48 | |
| | | | | | | |
| | (5.37 | ) | | | 24,231 | | | | 0.40 | | | | 0.41 | | | | 0.40 | | | | 0.41 | | | | 2.21 | | | | 35 | |
| | | | | | | |
| | | | | | | | | | | | | | | | | | | | | | | | | | | | | | |
| | | | | | | |
| | 22.57 | % | | $ | 147,940 | | | | 0.29 | % | | | 0.30 | % | | | 0.29 | % | | | 0.30 | % | | | 1.67 | % | | | 41 | % |
| | | | | | | |
| | 11.20 | | | | 126,948 | | | | 0.29 | | | | 0.30 | | | | 0.29 | | | | 0.30 | | | | 2.27 | | | | 45 | |
| | | | | | | |
| | (5.66 | ) | | | 94,954 | | | | 0.29 | | | | 0.30 | | | | 0.29 | | | | 0.30 | | | | 1.88 | | | | 43 | |
| | | | | | | |
| | 43.02 | | | | 82,677 | | | | 0.29 | | | | 0.30 | | | | 0.29 | | | | 0.30 | | | | 1.53 | | | | 63 | |
| | | | | | | |
| | (2.80 | ) | | | 25,525 | | | | 0.30 | | | | 0.31 | | | | 0.30 | | | | 0.31 | | | | 2.12 | | | | 36 | |
| | | | | | | |
| | | | | | | | | | | | | | | | | | | | | | | | | | | | | | |
| | | | | | | |
| | 18.17 | % | | $ | 52,835 | | | | 0.29 | % | | | 0.30 | % | | | 0.29 | % | | | 0.30 | % | | | 1.99 | % | | | 18 | % |
| | | | | | | |
| | 12.69 | | | | 33,419 | | | | 0.29 | | | | 0.30 | | | | 0.29 | | | | 0.30 | | | | 2.25 | | | | 17 | |
| | | | | | | |
| | (8.73 | ) | | | 28,615 | | | | 0.29 | | | | 0.30 | | | | 0.29 | | | | 0.30 | | | | 1.94 | | | | 26 | |
| | | | | | | |
| | 46.63 | | | | 20,584 | | | | 0.30 | | | | 0.31 | | | | 0.30 | | | | 0.31 | | | | 1.91 | | | | 32 | |
| | | | | | | |
| | (13.42 | ) | | | 8,988 | | | | 0.30 | * | | | 0.86 | * | | | 0.30 | * | | | 0.86 | * | | | 2.75 | * | | | 12 | |
| | | | | | | | | | | | |
| | | | ANNUAL FINANCIAL AND OTHER INFORMATION | | | | | | | JUNE 30, 2024 | | | 7 |
| | | | |
| Statements of Assets and Liabilities | | | | June 30, 2024 |
| | | | | | | | | | | | | | | | |
| (Amounts in thousands†, except per share amounts) | | PIMCO
RAFI Dynamic
Multi-Factor
Emerging Markets
Equity ETF | | | PIMCO
RAFI Dynamic
Multi-Factor
International
Equity ETF | | | PIMCO
RAFI Dynamic
Multi-Factor
U.S. Equity ETF | | | PIMCO
RAFI ESG
U.S. ETF | |
| | | | |
Assets: | | | | | | | | | | | | | | | | |
| | | | |
Investments, at value | | | | | | | | | | | | | | | | |
Investments in securities*^ | | $ | 104,966 | | | $ | 252,387 | | | $ | 147,876 | | | $ | 52,812 | |
Investments in Affiliates | | | 8 | | | | 0 | | | | 0 | | | | 0 | |
Cash | | | 1 | | | | 0 | | | | 0 | | | | 0 | |
Foreign currency, at value | | | 73 | | | | 470 | | | | 0 | | | | 0 | |
Receivable for investments sold | | | 0 | | | | 77 | | | | 0 | | | | 0 | |
Interest and/or dividends receivable | | | 605 | | | | 866 | | | | 96 | | | | 35 | |
Reimbursement receivable from PIMCO | | | 1 | | | | 2 | | | | 1 | | | | 0 | |
Total Assets | | | 105,654 | | | | 253,802 | | | | 147,973 | | | | 52,847 | |
| | | | |
Liabilities: | | | | | | | | | | | | | | | | |
Payable for investments purchased | | $ | 0 | | | $ | 181 | | | $ | 0 | | | $ | 0 | |
Payable upon return of securities loaned | | | 8 | | | | 0 | | | | 0 | | | | 0 | |
Accrued management fees | | | 39 | | | | 77 | | | | 33 | | | | 12 | |
Accrued taxes payable | | | 605 | | | | 0 | | | | 0 | | | | 0 | |
Total Liabilities | | | 652 | | | | 258 | | | | 33 | | | | 12 | |
| | | | |
Commitments and Contingent Liabilities^^ | | | | | | | | | | | | | | | | |
| | | | |
Net Assets | | $ | 105,002 | | | $ | 253,544 | | | $ | 147,940 | | | $ | 52,835 | |
| | | | |
Net Assets Consist of: | | | | | | | | | | | | | | | | |
| | | | |
Paid in capital | | $ | 99,024 | | | $ | 239,143 | | | $ | 145,301 | | | $ | 49,526 | |
Distributable earnings (accumulated loss) | | | 5,978 | | | | 14,401 | | | | 2,639 | | | | 3,309 | |
| | | | |
Net Assets | | $ | 105,002 | | | $ | 253,544 | | | $ | 147,940 | | | $ | 52,835 | |
| | | | |
Shares Issued and Outstanding | | | 5,120 | | | | 8,400 | | | | 3,120 | | | | 1,500 | |
| | | | |
Net Asset Value Per Share Outstanding(a): | | $ | 20.51 | | | $ | 30.18 | | | $ | 47.42 | | | $ | 35.22 | |
| | | | |
Cost of investments in securities | | $ | 92,765 | | | $ | 224,604 | | | $ | 122,193 | | | $ | 46,796 | |
Cost of investments in Affiliates | | $ | 8 | | | $ | 0 | | | $ | 0 | | | $ | 0 | |
Cost of foreign currency held | | $ | 120 | | | $ | 470 | | | $ | 0 | | | $ | 0 | |
| | | | |
* Includes repurchase agreements of: | | $ | 632 | | | $ | 1,203 | | | $ | 712 | | | $ | 322 | |
^ Includes securities on loan of: | | $ | 7 | | | $ | 0 | | | $ | 0 | | | $ | 0 | |
| † | A zero balance may reflect actual amounts rounding to less than one thousand. |
| ^^ | See Note 9, Fees and Expenses, in the Notes to Financial Statements for more information. |
| (a) | Includes adjustments required by U.S. GAAP and may differ from net asset values and performance reported elsewhere by the Funds. |
| | | | | | |
| 8 | | PIMCO EQUITY SERIES | | | See Accompanying Notes | |
| | | | | | | | | | | | | | | | |
| Year Ended June 30, 2024 | | | | | | | | | | | | |
| (Amounts in thousands†) | | PIMCO RAFI Dynamic Multi-Factor
Emerging Markets Equity ETF | | | PIMCO RAFI Dynamic
Multi-Factor
International
Equity ETF | | | PIMCO RAFI Dynamic
Multi-Factor U.S. Equity ETF | | | PIMCO RAFI ESG
U.S. ETF | |
| | | | |
Investment Income: | | | | | | | | | | | | | | | | |
| | | | |
Interest | | $ | 13 | | | $ | 23 | | | $ | 14 | | | $ | 6 | |
Dividends, net of foreign taxes* | | | 3,570 | | | | 6,880 | | | | 2,608 | | | | 987 | |
Total Income | | | 3,583 | | | | 6,903 | | | | 2,622 | | | | 993 | |
| | | | |
Expenses: | | | | | | | | | | | | | | | | |
| | | | |
Management fees | | | 455 | | | | 788 | | | | 387 | | | | 126 | |
Trustee fees | | | 5 | | | | 9 | | | | 7 | | | | 2 | |
Interest expense | | | 8 | | | | 5 | | | | 0 | | | | 0 | |
Miscellaneous expense | | | 5 | | | | 11 | | | | 6 | | | | 2 | |
Total Expenses | | | 473 | | | | 813 | | | | 400 | | | | 130 | |
Waiver and/or Reimbursement by PIMCO | | | (5 | ) | | | (9 | ) | | | (7 | ) | | | (2 | ) |
Net Expenses | | | 468 | | | | 804 | | | | 393 | | | | 128 | |
| | | | |
Net Investment Income (Loss) | | | 3,115 | | | | 6,099 | | | | 2,229 | | | | 865 | |
| | | | |
Net Realized Gain (Loss): | | | | | | | | | | | | | | | | |
| | | | |
Investments in securities, net of foreign capital gains tax** | | | 225 | | | | (1,460 | ) | | | (1,965 | ) | | | (413 | ) |
In-kind redemptions | | | 0 | | | | 2,947 | | | | 17,976 | | | | 2,376 | |
Over the counter financial derivative instruments | | | 3 | | | | (5 | ) | | | 0 | | | | 0 | |
Foreign currency | | | (89 | ) | | | (1 | ) | | | 0 | | | | 0 | |
| | | | |
Net Realized Gain (Loss) | | | 139 | | | | 1,481 | | | | 16,011 | | | | 1,963 | |
| | | | |
Net Change in Unrealized Appreciation (Depreciation): | | | | | | | | | | | | | | | | |
| | | | |
Investments in securities, net of foreign capital gains tax*** | | | 10,751 | | | | 15,369 | | | | 8,963 | | | | 5,025 | |
Foreign currency assets and liabilities | | | (27 | ) | | | (5 | ) | | | 0 | | | | 0 | |
| | | | |
Net Change in Unrealized Appreciation (Depreciation) | | | 10,724 | | | | 15,364 | | | | 8,963 | | | | 5,025 | |
| | | | |
Net Increase (Decrease) in Net Assets Resulting from Operations | | $ | 13,978 | | | $ | 22,944 | | | $ | 27,203 | | | $ | 7,853 | |
| | | | |
* Foreign tax withholdings - Dividends | | $ | 487 | | | $ | 762 | | | $ | 0 | | | $ | 0 | |
** Foreign capital gains tax | | $ | 100 | | | | 0 | | | | 0 | | | | 0 | |
*** Foreign capital gains tax | | $ | (504 | ) | | | 0 | | | | 0 | | | | 0 | |
| † | A zero balance may reflect actual amounts rounding to less than one thousand. |
| | | | | | | | | | | | |
| | | | ANNUAL FINANCIAL AND OTHER INFORMATION | | | | | | | JUNE 30, 2024 | | | 9 |
| | | | |
| Statements of Changes in Net Assets | | | | |
| | | | | | | | | | | | | | | | | | | | | | | | | | | | | | | | |
| | | PIMCO
RAFI Dynamic
Multi-Factor
Emerging Markets
Equity ETF | | | PIMCO
RAFI Dynamic
Multi-Factor
International
Equity ETF | | | PIMCO
RAFI Dynamic
Multi-Factor
U.S. Equity ETF | | | PIMCO
RAFI ESG
U.S. ETF | |
| | | | | | | | |
| (Amounts in thousands†) | | Year Ended
June 30, 2024 | | | Year Ended
June 30, 2023 | | | Year Ended
June 30, 2024 | | | Year Ended
June 30, 2023 | | | Year Ended
June 30, 2024 | | | Year Ended
June 30, 2023 | | | Year Ended
June 30, 2024 | | | Year Ended
June 30, 2023 | |
| | | | | | | | |
Increase (Decrease) in Net Assets from: | | | | | | | | | | | | | | | | | | | | | | | | | | | | | | | | |
| | | | | | | | |
Operations: | | | | | | | | | | | | | | | | | | | | | | | | | | | | | | | | |
| | | | | | | | |
Net investment income (loss) | | $ | 3,115 | | | $ | 3,399 | | | $ | 6,099 | | | $ | 4,181 | | | $ | 2,229 | | | $ | 2,610 | | | $ | 865 | | | $ | 667 | |
Net realized gain (loss) | | | 139 | | | | (1,899 | ) | | | 1,481 | | | | (1,280 | ) | | | 16,011 | | | | (3,365 | ) | | | 1,963 | | | | (250 | ) |
Net change in unrealized appreciation (depreciation) | | | 10,724 | | | | 4,076 | | | | 15,364 | | | | 13,989 | | | | 8,963 | | | | 12,671 | | | | 5,025 | | | | 3,022 | |
| | | | | | | | |
Net Increase (Decrease) in Net Assets Resulting from Operations | | | 13,978 | | | | 5,576 | | | | 22,944 | | | | 16,890 | | | | 27,203 | | | | 11,916 | | | | 7,853 | | | | 3,439 | |
| | | | | | | | |
Distributions to Shareholders: | | | | | | | | | | | | | | | | | | | | | | | | | | | | | | | | |
| | | | | | | | |
From net investment income and/or net realized capital gains | | | (3,936 | ) | | | (5,242 | ) | | | (5,382 | ) | | | (3,254 | ) | | | (2,443 | ) | | | (2,406 | ) | | | (807 | ) | | | (651 | ) |
| | | | | | | | |
Total Distributions(a) | | | (3,936 | ) | | | (5,242 | ) | | | (5,382 | ) | | | (3,254 | ) | | | (2,443 | ) | | | (2,406 | ) | | | (807 | ) | | | (651 | ) |
| | | | | | | | |
Fund Share Transactions: | | | | | | | | | | | | | | | | | | | | | | | | | | | | | | | | |
| | | | | | | | |
Receipts for shares sold | | | 4,126 | | | | 32,852 | | | | 95,969 | | | | 46,853 | | | | 40,269 | | | | 26,243 | | | | 17,598 | | | | 8,732 | |
Cost of shares redeemed | | | (10 | ) | | | (17,859 | ) | | | (6,015 | ) | | | 0 | | | | (44,037 | ) | | | (3,759 | ) | | | (5,228 | ) | | | (6,716 | ) |
Net increase (decrease) resulting from Fund share transactions | | | 4,116 | | | | 14,993 | | | | 89,954 | | | | 46,853 | | | | (3,768 | ) | | | 22,484 | | | | 12,370 | | | | 2,016 | |
| | | | | | | | |
Total Increase (Decrease) in Net Assets | | | 14,158 | | | | 15,327 | | | | 107,516 | | | | 60,489 | | | | 20,992 | | | | 31,994 | | | | 19,416 | | | | 4,804 | |
| | | | | | | | |
Net Assets: | | | | | | | | | | | | | | | | | | | | | | | | | | | | | | | | |
| | | | | | | | |
Beginning of year | | | 90,844 | | | | 75,517 | | | | 146,028 | | | | 85,539 | | | | 126,948 | | | | 94,954 | | | | 33,419 | | | | 28,615 | |
End of year | | $ | 105,002 | | | $ | 90,844 | | | $ | 253,544 | | | $ | 146,028 | | | $ | 147,940 | | | $ | 126,948 | | | $ | 52,835 | | | $ | 33,419 | |
| | | | | | | | |
Shares of Beneficial Interest: | | | | | | | | | | | | | | | | | | | | | | | | | | | | | | | | |
| | | | | | | | |
Shares sold | | | 200 | | | | 1,800 | | | | 3,400 | | | | 1,800 | | | | 900 | | | | 700 | | | | 550 | | | | 300 | |
Shares redeemed | | | 0 | | | | (1,000 | ) | | | (200 | ) | | | 0 | | | | (1,000 | ) | | | (100 | ) | | | (150 | ) | | | (238 | ) |
Net increase (decrease) in shares outstanding | | | 200 | | | | 800 | | | | 3,200 | | | | 1,800 | | | | (100 | ) | | | 600 | | | | 400 | | | | 62 | |
| † | A zero balance may reflect actual amounts rounding to less than one thousand. |
| (a) | The tax characterization of distributions is determined in accordance with Federal income tax regulations. See Note 2, Distributions to Shareholders, in the Notes to Financial Statements for more information. |
| | | | | | |
| 10 | | PIMCO EQUITY SERIES | | | See Accompanying Notes | |
| | | | | | |
| Schedule of Investments | | PIMCO RAFI Dynamic Multi-Factor Emerging Markets Equity ETF | | | | June 30, 2024 |
(Amounts in thousands*, except number of shares, contracts, units and ounces, if any)
| | | | | | | | | | | | |
| | | | | SHARES | | | | | MARKET
VALUE
(000S) | |
| INVESTMENTS IN SECURITIES 100.0% | |
| |
| COMMON STOCKS 96.7% | |
| |
| BRAZIL 2.8% | |
| |
| COMMUNICATION SERVICES 0.2% | |
| | | | |
Telefonica Brasil SA | | | | | 14,573 | | | $ | | | 118 | |
| | | | |
TIM SA | | | | | 27,700 | | | | | | 79 | |
| | | | | | | | | | | | |
| | | | | | | | | | | 197 | |
| | | | | | | | | | | | |
| |
| CONSUMER DISCRETIONARY 0.3% | |
| | | | |
Vibra Energia SA | | | | | 89,332 | | | | | | 334 | |
| | | | | | | | | | | | |
| |
| CONSUMER STAPLES 0.9% | |
| | | | |
Atacadao SA | | | | | 21,300 | | | | | | 34 | |
| | | | |
BRF SA (b) | | | | | 33,358 | | | | | | 135 | |
| | | | |
Cogna Educacao SA (b) | | | | | 131,400 | | | | | | 42 | |
| | | | |
JBS SA (b) | | | | | 96,760 | | | | | | 558 | |
| | | | |
Marfrig Global Foods SA (b) | | | | | 61,100 | | | | | | 135 | |
| | | | |
Raia Drogasil SA | | | | | 10,359 | | | | | | 48 | |
| | | | | | | | | | | | |
| | | | | | | | | | | 952 | |
| | | | | | | | | | | | |
| |
| ENERGY 0.2% | |
| | | | |
Ultrapar Participacoes SA | | | | | 47,988 | | | | | | 185 | |
| | | | | | | | | | | | |
| |
| FINANCIALS 0.2% | |
| | | | |
B3 SA - Brasil Bolsa Balcao | | | | | 26,802 | | | | | | 49 | |
| | | | |
Banco Santander Brasil SA | | | | | 12,400 | | | | | | 61 | |
| | | | |
BB Seguridade Participacoes SA | | | | | 5,397 | | | | | | 32 | |
| | | | |
Porto Seguro SA | | | | | 2,300 | | | | | | 12 | |
| | | | | | | | | | | | |
| | | | | | | | | | | 154 | |
| | | | | | | | | | | | |
| |
| INDUSTRIALS 0.0% | |
| | | | |
WEG SA | | | | | 1,281 | | | | | | 10 | |
| | | | | | | | | | | | |
| |
| MATERIALS 0.9% | |
| | | | |
Cia Siderurgica Nacional SA | | | | | 26,577 | | | | | | 61 | |
| | | | |
Klabin SA | | | | | 38,229 | | | | | | 147 | |
| | | | |
Suzano SA | | | | | 15,792 | | | | | | 161 | |
| | | | |
Vale SA | | | | | 55,300 | | | | | | 616 | |
| | | | | | | | | | | | |
| | | | | | | | | | | 985 | |
| | | | | | | | | | | | |
| |
| UTILITIES 0.1% | |
| | | | |
Companhia Paranaense de Energia | | | | | 16,189 | | | | | | 24 | |
| | | | |
CPFL Energia SA | | | | | 3,700 | | | | | | 22 | |
| | | | |
Energisa SA | | | | | 7,300 | | | | | | 59 | |
| | | | |
Engie Brasil Energia SA | | | | | 3,235 | | | | | | 26 | |
| | | | | | | | | | | | |
| | | | | | | | | | | 131 | |
| | | | | | | | | | | | |
Total Brazil | | | | | | | | | | | 2,948 | |
| | | | | | | | | | | | |
| |
| CHILE 0.7% | |
| |
| CONSUMER STAPLES 0.2% | |
| | | | |
Cencosud SA | | | | | 60,565 | | | | | | 114 | |
| | | | |
Cia Cervecerias Unidas SA | | | | | 10,550 | | | | | | 61 | |
| | | | | | | | | | | | |
| | | | | | | | | | | 175 | |
| | | | | | | | | | | | |
| |
| ENERGY 0.1% | |
| | | | |
Empresas Copec SA | | | | | 6,275 | | | | | | 48 | |
| | | | | | | | | | | | |
| |
| FINANCIALS 0.3% | |
| | | | |
Banco de Chile | | | | | 1,388,662 | | | | | | 155 | |
| | | | | | | | | | | | |
| | | | | SHARES | | | | | MARKET
VALUE
(000S) | |
| | | | |
Banco de Credito e Inversiones SA | | | | | 1,126 | | | $ | | | 32 | |
| | | | |
Banco Itau Chile SA | | | | | 900 | | | | | | 10 | |
| | | | |
Banco Santander Chile | | | | | 2,897,759 | | | | | | 136 | |
| | | | | | | | | | | | |
| | | | | | | | | | | 333 | |
| | | | | | | | | | | | |
| |
| MATERIALS 0.0% | |
| | | | |
Empresas CMPC SA | | | | | 18,166 | | | | | | 34 | |
| | | | | | | | | | | | |
| |
| UTILITIES 0.1% | |
| | | | |
Colbun SA | | | | | 399,094 | | | | | | 52 | |
| | | | |
Enel Americas SA | | | | | 357,295 | | | | | | 33 | |
| | | | |
Enel Chile SA | | | | | 699,367 | | | | | | 39 | |
| | | | | | | | | | | | |
| | | | | | | | | | | 124 | |
| | | | | | | | | | | | |
Total Chile | | | | | | | | | | | 714 | |
| | | | | | | | | | | | |
| |
| CHINA 25.0% | |
| |
| COMMUNICATION SERVICES 2.2% | |
| | | | |
China Tower Corp. Ltd. ‘H’ | | | | | 188,000 | | | | | | 24 | |
| | | | |
China United Network Communications Ltd. ‘A’ | | | | | 454,600 | | | | | | 293 | |
| | | | |
Focus Media Information Technology Co. Ltd. ‘A’ | | | | | 73,100 | | | | | | 61 | |
| | | | |
NetEase, Inc. | | | | | 37,615 | | | | | | 718 | |
| | | | |
Tencent Holdings Ltd. | | | | | 12,300 | | | | | | 584 | |
| | | | |
Tencent Music Entertainment Group ADR | | | | | 40,622 | | | | | | 571 | |
| | | | | | | | | | | | |
| | | | | | | | | | | 2,251 | |
| | | | | | | | | | | | |
| |
| CONSUMER DISCRETIONARY 0.2% | |
| | | | |
ANTA Sports Products Ltd. | | | | | 18,200 | | | | | | 174 | |
| | | | |
BAIC Motor Corp. Ltd. ‘H’ | | | | | 123,000 | | | | | | 31 | |
| | | | | | | | | | | | |
| | | | | | | | | | | 205 | |
| | | | | | | | | | | | |
| |
| CONSUMER STAPLES 2.0% | |
| | | | |
China Feihe Ltd. | | | | | 126,000 | | | | | | 58 | |
| | | | |
China Tourism Group Duty Free Corp. Ltd. ‘H’ | | | | | 2,500 | | | | | | 15 | |
| | | | |
China Yongda Automobiles Services Holdings Ltd. | | | | | 49,500 | | | | | | 11 | |
| | | | |
Chongqing Changan Automobile Co. Ltd. ‘A’ | | | | | 13,600 | | | | | | 25 | |
| | | | |
Dongfeng Motor Group Co. Ltd. ‘H’ | | | | | 144,000 | | | | | | 41 | |
| | | | |
Foshan Haitian Flavouring & Food Co. Ltd. ‘A’ | | | | | 3,200 | | | | | | 15 | |
| | | | |
Fuyao Glass Industry Group Co. Ltd. ‘H’ | | | | | 6,000 | | | | | | 35 | |
| | | | |
Great Wall Motor Co. Ltd. ‘H’ | | | | | 25,500 | | | | | | 39 | |
| | | | |
Guangdong Haid Group Co. Ltd. ‘A’ | | | | | 8,900 | | | | | | 58 | |
| | | | |
Haier Smart Home Co. Ltd. | | | | | 33,200 | | | | | | 111 | |
| | | | |
Henan Shuanghui Investment & Development Co. Ltd. ‘A’ | | | | | 30,100 | | | | | | 99 | |
| | | | |
Hengan International Group Co. Ltd. | | | | | 23,000 | | | | | | 70 | |
| | | | |
Huayu Automotive Systems Co. Ltd. ‘A’ | | | | | 28,700 | | | | | | 65 | |
| | | | |
Kweichow Moutai Co. Ltd. ‘A’ | | | | | 1,700 | | | | | | 343 | |
| | | | |
Midea Group Co. Ltd. ‘A’ | | | | | 8,600 | | | | | | 76 | |
| | | | |
Muyuan Foods Co. Ltd. ‘A’ | | | | | 16,200 | | | | | | 97 | |
| | | | |
New Hope Liuhe Co. Ltd. ‘A’ (b) | | | | | 26,500 | | | | | | 33 | |
| | | | |
Nongfu Spring Co. Ltd. ‘H’ | | | | | 18,200 | | | | | | 86 | |
| | | | |
SAIC Motor Corp. Ltd. ‘A’ | | | | | 49,800 | | | | | | 95 | |
| | | | |
Shanghai Yuyuan Tourist Mart Group Co. Ltd. ‘A’ | | | | | 32,400 | | | | | | 23 | |
| | | | | | | | | | | | |
| | | | | SHARES | | | | | MARKET
VALUE
(000S) | |
| | | | |
Shenzhou International Group Holdings Ltd. | | | | | 13,200 | | | $ | | | 129 | |
| | | | |
Tingyi Cayman Islands Holding Corp. | | | | | 94,000 | | | | | | 113 | |
| | | | |
Topsports International Holdings Ltd. | | | | | 77,000 | | | | | | 41 | |
| | | | |
Uni-President China Holdings Ltd. | | | | | 45,000 | | | | | | 41 | |
| | | | |
Wens Foodstuffs Group Co. Ltd. ‘A’ | | | | | 72,700 | | | | | | 198 | |
| | | | |
Wuchan Zhongda Group Co. Ltd. ‘A’ | | | | | 142,500 | | | | | | 85 | |
| | | | |
Wuliangye Yibin Co. Ltd. ‘A’ (b) | | | | | 3,700 | | | | | | 65 | |
| | | | |
Yum China Holdings, Inc. | | | | | 2,064 | | | | | | 64 | |
| | | | | | | | | | | | |
| | | | | | | | | | | 2,131 | |
| | | | | | | | | | | | |
| |
| ENERGY 2.1% | |
| | | | |
China Coal Energy Co. Ltd. ‘H’ | | | | | 29,000 | | | | | | 34 | |
| | | | |
China Merchants Energy Shipping Co. Ltd. (b) | | | | | 13,000 | | | | | | 15 | |
| | | | |
China Petroleum & Chemical Corp. ‘H’ | | | | | 610,000 | | | | | | 394 | |
| | | | |
China Shenhua Energy Co. Ltd. ‘H’ | | | | | 175,500 | | | | | | 809 | |
| | | | |
Guanghui Energy Co. Ltd. ‘A’ | | | | | 10,000 | | | | | | 9 | |
| | | | |
PetroChina Co. Ltd. ‘H’ | | | | | 414,000 | | | | | | 418 | |
| | | | |
Shaanxi Coal Industry Co. Ltd. ‘A’ | | | | | 52,900 | | | | | | 188 | |
| | | | |
Shanxi Coking Coal Energy Group Co. Ltd. ‘A’ (b) | | | | | 25,900 | | | | | | 37 | |
| | | | |
Shanxi Lu’an Environmental Energy Development Co. Ltd. ‘A’ | | | | | 6,600 | | | | | | 16 | |
| | | | |
Yankuang Energy Group Co. Ltd. ‘H’ | | | | | 206,700 | | | | | | 295 | |
| | | | | | | | | | | | |
| | | | | | | | | | | 2,215 | |
| | | | | | | | | | | | |
| |
| FINANCIALS 6.7% | |
| | | | |
Agricultural Bank of China Ltd. ‘H’ | | | | | 1,851,000 | | | | | | 790 | |
| | | | |
Bank of Beijing Co. Ltd. ‘A’ | | | | | 206,400 | | | | | | 166 | |
| | | | |
Bank of Changsha Co. Ltd. ‘A’ | | | | | 44,800 | | | | | | 50 | |
| | | | |
Bank of China Ltd. ‘H’ | | | | | 2,174,000 | | | | | | 1,071 | |
| | | | |
Bank of Chongqing Co. Ltd. ‘H’ | | | | | 36,500 | | | | | | 24 | |
| | | | |
Bank of Communications Co. Ltd. ‘H’ | | | | | 690,000 | | | | | | 541 | |
| | | | |
Bank of Guiyang Co. Ltd. ‘A’ | | | | | 70,600 | | | | | | 51 | |
| | | | |
Bank of Hangzhou Co. Ltd. ‘A’ | | | | | 42,600 | | | | | | 76 | |
| | | | |
Bank of Jiangsu Co. Ltd. ‘A’ | | | | | 348,500 | | | | | | 356 | |
| | | | |
Bank of Nanjing Co. Ltd. ‘A’ | | | | | 76,400 | | | | | | 109 | |
| | | | |
Bank of Shanghai Co. Ltd. ‘A’ | | | | | 98,000 | | | | | | 98 | |
| | | | |
China Cinda Asset Management Co. Ltd. ‘H’ | | | | | 367,000 | | | | | | 31 | |
| | | | |
China CITIC Bank Corp. Ltd. ‘H’ | | | | | 443,000 | | | | | | 284 | |
| | | | |
China Construction Bank Corp. ‘H’ | | | | | 1,394,000 | | | | | | 1,030 | |
| | | | |
China Everbright Bank Co. Ltd. ‘H’ | | | | | 592,000 | | | | | | 184 | |
| | | | |
China Galaxy Securities Co. Ltd. ‘H’ | | | | | 44,000 | | | | | | 23 | |
| | | | |
China Minsheng Banking Corp. Ltd. ‘H’ | | | | | 501,000 | | | | | | 173 | |
| | | | |
China Zheshang Bank Co. Ltd. ‘H’ | | | | | 359,000 | | | | | | 96 | |
| | | | |
Chongqing Rural Commercial Bank Co. Ltd. ‘H’ | | | | | 230,000 | | | | | | 113 | |
| | | | |
CNPC Capital Co. Ltd. ‘A’ | | | | | 27,100 | | | | | | 21 | |
| | | | |
Guosen Securities Co. Ltd. ‘A’ | | | | | 39,200 | | | | | | 47 | |
| | | | |
Huaxia Bank Co. Ltd. ‘A’ | | | | | 114,800 | | | | | | 101 | |
| | | | |
Industrial & Commercial Bank of China Ltd. ‘H’ | | | | | 1,700,000 | | | | | | 1,010 | |
| | | | |
Industrial Bank Co. Ltd. ‘A’ (b) | | | | | 17,300 | | | | | | 42 | |
| | | | |
Lufax Holding Ltd. ADR | | | | | 31,436 | | | | | | 75 | |
| | | | | | | | | | | | |
| See Accompanying Notes | | | ANNUAL FINANCIAL AND OTHER INFORMATION | | | | | | | JUNE 30, 2024 | | | 11 |
| | | | | | |
| Schedule of Investments | | PIMCO RAFI Dynamic Multi-Factor Emerging Markets Equity ETF | | (Cont.) | | |
| | | | | | | | | | | | |
| | | | | SHARES | | | | | MARKET
VALUE
(000S) | |
| | | | |
Ping An Insurance Group Co. of China Ltd. ‘H’ | | | | | 81,000 | | | $ | | | 367 | |
| | | | |
Shanghai Pudong Development Bank Co. Ltd. ‘A’ | | | | | 116,600 | | | | | | 132 | |
| | | | | | | | | | | | |
| | | | | | | | | | | 7,061 | |
| | | | | | | | | | | | |
| |
| HEALTH CARE 0.8% | |
| | | | |
China Resources Pharmaceutical Group Ltd. | | | | | 126,500 | | | | | | 94 | |
| | | | |
CSPC Pharmaceutical Group Ltd. | | | | | 267,680 | | | | | | 213 | |
| | | | |
Jiangsu Hengrui Pharmaceuticals Co. Ltd. ‘A’ (b) | | | | | 7,300 | | | | | | 39 | |
| | | | |
Jointown Pharmaceutical Group Co. Ltd. ‘A’ | | | | | 41,943 | | | | | | 28 | |
| | | | |
Shandong Buchang Pharmaceuticals Co. Ltd. ‘A’ | | | | | 17,000 | | | | | | 35 | |
| | | | |
Shenzhen Mindray Bio-Medical Electronics Co. Ltd. ‘A’ | | | | | 2,400 | | | | | | 96 | |
| | | | |
Sinopharm Group Co. Ltd. ‘H’ | | | | | 75,600 | | | | | | 201 | |
| | | | |
Yunnan Baiyao Group Co. Ltd. ‘A’ | | | | | 10,700 | | | | | | 75 | |
| | | | | | | | | | | | |
| | | | | | | | | | | 781 | |
| | | | | | | | | | | | |
| |
| INDUSTRIALS 3.2% | |
| | | | |
AECC Aviation Power Co. Ltd. ‘A’ | | | | | 11,800 | | | | | | 59 | |
| | | | |
China Communications Services Corp. Ltd. ‘H’ | | | | | 112,000 | | | | | | 60 | |
| | | | |
China CSSC Holdings Ltd. ‘A’ | | | | | 25,600 | | | | | | 143 | |
| | | | |
China International Marine Containers Group Co. Ltd. ‘H’ | | | | | 79,600 | | | | | | 72 | |
| | | | |
China Lesso Group Holdings Ltd. ‘L’ | | | | | 39,000 | | | | | | 16 | |
| | | | |
China Railway Group Ltd. ‘H’ | | | | | 337,000 | | | | | | 186 | |
| | | | |
China State Construction Engineering Corp. Ltd. ‘A’ | | | | | 505,100 | | | | | | 369 | |
| | | | |
CITIC Ltd. | | | | | 165,000 | | | | | | 150 | |
| | | | |
COSCO SHIPPING Holdings Co. Ltd. ‘H’ | | | | | 173,000 | | | | | | 302 | |
| | | | |
Daqin Railway Co. Ltd. ‘A’ | | | | | 247,900 | | | | | | 244 | |
| | | | |
Fosun International Ltd. | | | | | 47,000 | | | | | | 25 | |
| | | | |
Horizon Construction Development Ltd. (b) | | | | | 12,592 | | | | | | 2 | |
| | | | |
Jiangsu Expressway Co. Ltd. ‘H’ | | | | | 90,000 | | | | | | 96 | |
| | | | |
Jiangsu Zhongtian Technology Co. Ltd. ‘A’ | | | | | 52,900 | | | | | | 115 | |
| | | | |
Metallurgical Corp. of China Ltd. ‘H’ | | | | | 478,000 | | | | | | 98 | |
| | | | |
NARI Technology Co. Ltd. ‘A’ | | | | | 34,000 | | | | | | 117 | |
| | | | |
Power Construction Corp. of China Ltd. ‘A’ | | | | | 215,900 | | | | | | 166 | |
| | | | |
Qingdao Port International Co. Ltd. | | | | | 43,000 | | | | | | 33 | |
| | | | |
Sany Heavy Industry Co. Ltd. ‘A’ | | | | | 45,000 | | | | | | 102 | |
| | | | |
Shanghai Construction Group Co. Ltd. ‘A’ | | | | | 125,500 | | | | | | 37 | |
| | | | |
Shanghai International Port Group Co. Ltd. ‘A’ | | | | | 24,100 | | | | | | 19 | |
| | | | |
Shanghai Tunnel Engineering Co. Ltd. ‘A’ | | | | | 86,900 | | | | | | 78 | |
| | | | |
Sichuan Road & Bridge Group Co. Ltd. ‘A’ (b) | | | | | 14,780 | | | | | | 16 | |
| | | | |
Sinopec Engineering Group Co. Ltd. ‘H’ | | | | | 69,000 | | | | | | 48 | |
| | | | |
Sinotrans Ltd. ‘H’ | | | | | 123,000 | | | | | | 60 | |
| | | | |
Sinotruk Hong Kong Ltd. | | | | | 62,000 | | | | | | 161 | |
| | | | |
TBEA Co. Ltd. ‘A’ | | | | | 57,990 | | | | | | 110 | |
| | | | |
Weichai Power Co. Ltd. ‘H’ | | | | | 29,000 | | | | | | 55 | |
| | | | |
Xiamen C & D, Inc. ‘A’ | | | | | 86,000 | | | | | | 106 | |
| | | | |
Xiamen ITG Group Corp. Ltd. ‘A’ | | | | | 67,400 | | | | | | 66 | |
| | | | |
Xiamen Xiangyu Co. Ltd. ‘A’ | | | | | 34,000 | | | | | | 32 | |
| | | | |
Yutong Bus Co Ltd. ‘A’ | | | | | 7,700 | | | | | | 27 | |
| | | | | | | | | | | | |
| | | | | SHARES | | | | | MARKET
VALUE
(000S) | |
| | | | |
Zhejiang Chint Electrics Co. Ltd. ‘A’ | | | | | 15,900 | | | $ | | | 42 | |
| | | | |
Zhejiang Expressway Co. Ltd. ‘H’ | | | | | 58,000 | | | | | | 39 | |
| | | | |
Zoomlion Heavy Industry Science & Technology Co. Ltd. ‘H’ | | | | | 18,800 | | | | | | 12 | |
| | | | |
ZTO Express Cayman, Inc. | | | | | 6,103 | | | | | | 127 | |
| | | | | | | | | | | | |
| | | | | | | | | | | 3,390 | |
| | | | | | | | | | | | |
| |
| INFORMATION TECHNOLOGY 2.3% | |
| | | | |
360 Security Technology, Inc. ‘A’ | | | | | 33,200 | | | | | | 35 | |
| | | | |
AAC Technologies Holdings, Inc. | | | | | 20,000 | | | | | | 78 | |
| | | | |
Avary Holding Shenzhen Co. Ltd. ‘A’ | | | | | 15,100 | | | | | | 82 | |
| | | | |
BYD Electronic International Co. Ltd. | | | | | 11,000 | | | | | | 55 | |
| | | | |
China Railway Signal & Communication Corp. Ltd. ‘H’ | | | | | 258,000 | | | | | | 111 | |
| | | | |
Foxconn Industrial Internet Co. Ltd. ‘A’ | | | | | 70,000 | | | | | | 260 | |
| | | | |
Lenovo Group Ltd. | | | | | 522,000 | | | | | | 733 | |
| | | | |
Luxshare Precision Industry Co. Ltd. ‘A’ (b) | | | | | 6,900 | | | | | | 37 | |
| | | | |
Shenzhen Transsion Holdings Co. Ltd. ‘A’ | | | | | 1,540 | | | | | | 16 | |
| | | | |
Sunny Optical Technology Group Co. Ltd. | | | | | 22,200 | | | | | | 137 | |
| | | | |
TCL Technology Group Corp. ‘A’ | | | | | 18,000 | | | | | | 11 | |
| | | | |
Tianma Microelectronics Co. Ltd. ‘A’ (b) | | | | | 35,300 | | | | | | 35 | |
| | | | |
Trip.com Group Ltd. (b) | | | | | 7,750 | | | | | | 367 | |
| | | | |
Vipshop Holdings Ltd. | | | | | 8,695 | | | | | | 113 | |
| | | | |
Xiaomi Corp. ‘B’ (b) | | | | | 165,000 | | | | | | 347 | |
| | | | | | | | | | | | |
| | | | | | | | | | | 2,417 | |
| | | | | | | | | | | | |
| |
| MATERIALS 2.6% | |
| | | | |
Aluminum Corp. of China Ltd. ‘H’ | | | | | 502,000 | | | | | | 342 | |
| | | | |
Angang Steel Co. Ltd. ‘H’ (b) | | | | | 148,000 | | | | | | 23 | |
| | | | |
Anhui Conch Cement Co. Ltd. ‘H’ | | | | | 139,500 | | | | | | 332 | |
| | | | |
Baoshan Iron & Steel Co. Ltd. ‘A’ | | | | | 205,500 | | | | | | 188 | |
| | | | |
China Hongqiao Group Ltd. | | | | | 415,000 | | | | | | 626 | |
| | | | |
China National Building Material Co. Ltd. ‘H’ | | | | | 344,000 | | | | | | 123 | |
| | | | |
CMOC Group Ltd. ‘H’ | | | | | 93,000 | | | | | | 85 | |
| | | | |
Hengli Petrochemical Co. Ltd. ‘A’ | | | | | 18,000 | | | | | | 34 | |
| | | | |
Hesteel Co. Ltd. ‘A’ | | | | | 146,500 | | | | | | 39 | |
| | | | |
Huaxin Cement Co. Ltd. ‘H’ | | | | | 21,400 | | | | | | 21 | |
| | | | |
Hunan Valin Steel Co. Ltd. ‘A’ | | | | | 75,400 | | | | | | 46 | |
| | | | |
Inner Mongolia Junzheng Energy & Chemical Industry Group Co. Ltd. ‘A’ | | | | | 20,700 | | | | | | 10 | |
| | | | |
Jiangxi Copper Co. Ltd. ‘H’ | | | | | 111,000 | | | | | | 221 | |
| | | | |
Luxi Chemical Group Co. Ltd. ‘A’ | | | | | 16,900 | | | | | | 27 | |
| | | | |
Maanshan Iron & Steel Co. Ltd. ‘H’ | | | | | 84,000 | | | | | | 12 | |
| | | | |
Nanjing Iron & Steel Co. Ltd. ‘A’ | | | | | 72,300 | | | | | | 50 | |
| | | | |
Ningxia Baofeng Energy Group Co. Ltd. ‘A’ (b) | | | | | 29,700 | | | | | | 71 | |
| | | | |
Shandong Chenming Paper Holdings Ltd. ‘H’ (b) | | | | | 28,500 | | | | | | 6 | |
| | | | |
Shandong Gold Mining Co. Ltd. ‘H’ | | | | | 10,500 | | | | | | 21 | |
| | | | |
Shanxi Taigang Stainless Steel Co. Ltd. ‘A’ (b) | | | | | 72,700 | | | | | | 34 | |
| | | | |
Sinopec Shanghai Petrochemical Co. Ltd. ‘H’ (b) | | | | | 188,000 | | | | | | 26 | |
| | | | |
Tongling Nonferrous Metals Group Co. Ltd. ‘A’ | | | | | 99,700 | | | | | | 49 | |
| | | | |
Xinxing Ductile Iron Pipes Co. Ltd. ‘A’ | | | | | 145,900 | | | | | | 70 | |
| | | | |
Xinyu Iron & Steel Co. Ltd. ‘A’ | | | | | 58,800 | | | | | | 27 | |
| | | | |
Zhongjin Gold Corp. Ltd. ‘A’ (b) | | | | | 18,700 | | | | | | 38 | |
| | | | | | | | | | | | |
| | | | | SHARES | | | | | MARKET
VALUE
(000S) | |
| | | | |
Zijin Mining Group Co. Ltd. ‘H’ | | | | | 108,000 | | | $ | | | 228 | |
| | | | | | | | | | | | |
| | | | | | | | | | | 2,749 | |
| | | | | | | | | | | | |
| |
| REAL ESTATE 0.9% | |
| | | | |
Agile Group Holdings Ltd. ^(a)(b) | | | | | 262,000 | | | | | | 17 | |
| | | | |
China Merchants Shekou Industrial Zone Holdings Co. Ltd. ‘A’ (b) | | | | | 31,300 | | | | | | 38 | |
| | | | |
China Vanke Co. Ltd. ‘H’ | | | | | 532,700 | | | | | | 317 | |
| | | | |
Country Garden Holdings Co. Ltd. «(b) | | | | | 3,850,000 | | | | | | 239 | |
| | | | |
Financial Street Holdings Co. Ltd. ‘A’ | | | | | 50,800 | | | | | | 16 | |
| | | | |
Greentown China Holdings Ltd. | | | | | 21,000 | | | | | | 17 | |
| | | | |
Longfor Group Holdings Ltd. | | | | | 116,000 | | | | | | 158 | |
| | | | |
Seazen Group Ltd. (b) | | | | | 584,000 | | | | | | 102 | |
| | | | |
Seazen Holdings Co. Ltd. ‘A’ (b) | | | | | 30,100 | | | | | | 37 | |
| | | | |
Youngor Group Co. Ltd. ‘A’ | | | | | 27,600 | | | | | | 27 | |
| | | | | | | | | | | | |
| | | | | | | | | | | 968 | |
| | | | | | | | | | | | |
| |
| UTILITIES 2.0% | |
| | | | |
CGN Power Co. Ltd. ‘H’ | | | | | 1,386,000 | | | | | | 609 | |
| | | | |
China National Nuclear Power Co. Ltd. ‘A’ | | | | | 219,600 | | | | | | 322 | |
| | | | |
China Yangtze Power Co. Ltd. ‘A’ | | | | | 164,100 | | | | | | 653 | |
| | | | |
ENN Energy Holdings Ltd. | | | | | 30,900 | | | | | | 255 | |
| | | | |
GD Power Development Co. Ltd. ‘A’ | | | | | 271,400 | | | | | | 224 | |
| | | | |
Huadian Power International Corp. Ltd. ‘H’ | | | | | 30,000 | | | | | | 18 | |
| | | | |
Huaneng Lancang River Hydropower, Inc. ‘A’ | | | | | 12,700 | | | | | | 19 | |
| | | | |
SDIC Power Holdings Co. Ltd. ‘A’ (b) | | | | | 9,100 | | | | | | 23 | |
| | | | |
Shenergy Co. Ltd. ‘A’ | | | | | 10,300 | | | | | | 12 | |
| | | | | | | | | | | | |
| | | | | | | | | | | 2,135 | |
| | | | | | | | | | | | |
Total China | | | | | | | | | | | 26,303 | |
| | | | | | | | | | | | |
| |
| GREECE 0.4% | |
| |
| COMMUNICATION SERVICES 0.1% | |
| | | | |
Hellenic Telecommunications Organization SA (b) | | | | | 4,021 | | | | | | 58 | |
| | | | | | | | | | | | |
| |
| CONSUMER STAPLES 0.1% | |
| | | | |
JUMBO SA (b) | | | | | 1,965 | | | | | | 57 | |
| | | | |
OPAP SA | | | | | 3,593 | | | | | | 56 | |
| | | | | | | | | | | | |
| | | | | | | | | | | 113 | |
| | | | | | | | | | | | |
| |
| ENERGY 0.0% | |
| | | | |
Motor Oil Hellas Corinth Refineries SA | | | | | 737 | | | | | | 19 | |
| | | | | | | | | | | | |
| |
| FINANCIALS 0.1% | |
| | | | |
Eurobank Ergasias Services & Holdings SA ‘A’ (b) | | | | | 32,150 | | | | | | 70 | |
| | | | |
National Bank of Greece SA (b) | | | | | 8,469 | | | | | | 70 | |
| | | | | | | | | | | | |
| | | | | | | | | | | 140 | |
| | | | | | | | | | | | |
| |
| INDUSTRIALS 0.1% | |
| | | | |
Mytilineos SA | | | | | 666 | | | | | | 25 | |
| | | | |
Star Bulk Carriers Corp. | | | | | 2,649 | | | | | | 64 | |
| | | | | | | | | | | | |
| | | | | | | | | | | 89 | |
| | | | | | | | | | | | |
Total Greece | | | | | | | | | | | 419 | |
| | | | | | | | | | | | |
| |
| | | | | | |
| 12 | | PIMCO EQUITY SERIES | | | See Accompanying Notes | |
| | | | | | | | | | | | |
| | | | | SHARES | | | | | MARKET
VALUE
(000S) | |
| HONG KONG 1.8% | |
| |
| CONSUMER STAPLES 0.1% | |
| | | | |
Geely Automobile Holdings Ltd. | | | | | 68,000 | | | $ | | | 76 | |
| | | | | | | | | | | | |
| |
| FINANCIALS 0.5% | |
| | | | |
BOC Hong Kong Holdings Ltd. | | | | | 122,000 | | | | | | 377 | |
| | | | |
China Taiping Insurance Holdings Co. Ltd. | | | | | 85,200 | | | | | | 87 | |
| | | | |
Far East Horizon Ltd. | | | | | 68,000 | | | | | | 44 | |
| | | | | | | | | | | | |
| | | | | | | | | | | 508 | |
| | | | | | | | | | | | |
| |
| INDUSTRIALS 0.3% | |
| | | | |
China Everbright Environment Group Ltd. | | | | | 222,000 | | | | | | 111 | |
| | | | |
Orient Overseas International Ltd. | | | | | 7,000 | | | | | | 114 | |
| | | | |
Shanghai Industrial Holdings Ltd. | | | | | 23,000 | | | | | | 34 | |
| | | | |
Shenzhen International Holdings Ltd. | | | | | 60,000 | | | | | | 48 | |
| | | | | | | | | | | | |
| | | | | | | | | | | 307 | |
| | | | | | | | | | | | |
| |
| MATERIALS 0.0% | |
| | | | |
China Resources Cement Holdings Ltd. | | | | | 62,000 | | | | | | 11 | |
| | | | | | | | | | | | |
| |
| REAL ESTATE 0.2% | |
| | | | |
China Jinmao Holdings Group Ltd. | | | | | 306,000 | | | | | | 24 | |
| | | | |
China Overseas Land & Investment Ltd. | | | | | 128,500 | | | | | | 223 | |
| | | | | | | | | | | | |
| | | | | | | | | | | 247 | |
| | | | | | | | | | | | |
| |
| UTILITIES 0.7% | |
| | | | |
Beijing Enterprises Holdings Ltd. | | | | | 28,000 | | | | | | 94 | |
| | | | |
China Power International Development Ltd. | | | | | 48,000 | | | | | | 25 | |
| | | | |
China Resources Gas Group Ltd. | | | | | 51,700 | | | | | | 181 | |
| | | | |
China Resources Power Holdings Co. Ltd. | | | | | 30,000 | | | | | | 92 | |
| | | | |
Guangdong Investment Ltd. | | | | | 182,000 | | | | | | 106 | |
| | | | |
Kunlun Energy Co. Ltd. | | | | | 208,000 | | | | | | 215 | |
| | | | | | | | | | | | |
| | | | | | | | | | | 713 | |
| | | | | | | | | | | | |
Total Hong Kong | | | | | | | | | | | 1,862 | |
| | | | | | | | | | | | |
| |
| INDIA 16.8% | |
| |
| COMMUNICATION SERVICES 0.7% | |
| | | | |
Bharti Airtel Ltd. (b) | | | | | 31,710 | | | | | | 549 | |
| | | | |
Indus Towers Ltd. (b) | | | | | 28,034 | | | | | | 126 | |
| | | | |
Vodafone Idea Ltd. (b) | | | | | 65,354 | | | | | | 14 | |
| | | | | | | | | | | | |
| | | | | | | | | | | 689 | |
| | | | | | | | | | | | |
| |
| CONSUMER DISCRETIONARY 0.4% | |
| | | | |
Bajaj Auto Ltd. | | | | | 2,554 | | | | | | 291 | |
| | | | |
Bharat Forge Ltd. | | | | | 3,280 | | | | | | 66 | |
| | | | |
Exide Industries Ltd. (b) | | | | | 3,281 | | | | | | 22 | |
| | | | | | | | | | | | |
| | | | | | | | | | | 379 | |
| | | | | | | | | | | | |
| |
| CONSUMER STAPLES 2.2% | |
| | | | |
Avenue Supermarts Ltd. (b) | | | | | 1,214 | | | | | | 69 | |
| | | | |
Bosch Ltd. | | | | | 180 | | | | | | 74 | |
| | | | |
Britannia Industries Ltd. (b) | | | | | 927 | | | | | | 61 | |
| | | | |
Colgate-Palmolive India Ltd. | | | | | 1,512 | | | | | | 52 | |
| | | | |
Dabur India Ltd. | | | | | 3,957 | | | | | | 28 | |
| | | | | | | | | | | | |
| | | | | SHARES | | | | | MARKET
VALUE
(000S) | |
| | | | |
Hero MotoCorp Ltd. | | | | | 3,167 | | | $ | | | 212 | |
| | | | |
Hindustan Unilever Ltd. | | | | | 7,001 | | | | | | 207 | |
| | | | |
ITC Ltd. | | | | | 102,142 | | | | | | 520 | |
| | | | |
Mahindra & Mahindra Ltd. | | | | | 6,922 | | | | | | 238 | |
| | | | |
Marico Ltd. | | | | | 4,545 | | | | | | 33 | |
| | | | |
Maruti Suzuki India Ltd. | | | | | 889 | | | | | | 128 | |
| | | | |
Nestle India Ltd. | | | | | 3,452 | | | | | | 106 | |
| | | | |
Rajesh Exports Ltd. | | | | | 14,587 | | | | | | 49 | |
| | | | |
Samvardhana Motherson International Ltd. (b) | | | | | 26,097 | | | | | | 59 | |
| | | | |
Tata Consumer Products Ltd. | | | | | 2,445 | | | | | | 32 | |
| | | | |
Tata Motors Ltd. | | | | | 22,780 | | | | | | 270 | |
| | | | |
TVS Motor Co. Ltd. | | | | | 1,419 | | | | | | 40 | |
| | | | |
Vardhman Textiles Ltd. | | | | | 2,374 | | | | | | 14 | |
| | | | |
Varun Beverages Ltd. | | | | | 4,122 | | | | | | 80 | |
| | | | | | | | | | | | |
| | | | | | | | | | | 2,272 | |
| | | | | | | | | | | | |
| |
| ENERGY 3.1% | |
| | | | |
Bharat Petroleum Corp. Ltd. (b) | | | | | 91,023 | | | | | | 331 | |
| | | | |
Coal India Ltd. | | | | | 52,096 | | | | | | 295 | |
| | | | |
Hindustan Petroleum Corp. Ltd. | | | | | 67,070 | | | | | | 267 | |
| | | | |
Indian Oil Corp. Ltd. | | | | | 237,533 | | | | | | 471 | |
| | | | |
Oil & Natural Gas Corp. Ltd. (b) | | | | | 182,448 | | | | | | 599 | |
| | | | |
Oil India Ltd. | | | | | 17,464 | | | | | | 151 | |
| | | | |
Petronet LNG Ltd. | | | | | 32,010 | | | | | | 126 | |
| | | | |
Reliance Industries Ltd. (b) | | | | | 27,407 | | | | | | 1,027 | |
| | | | | | | | | | | | |
| | | | | | | | | | | 3,267 | |
| | | | | | | | | | | | |
| |
| FINANCIALS 1.8% | |
| | | | |
Bank of Baroda | | | | | 16,252 | | | | | | 54 | |
| | | | |
Bank of India | | | | | 12,588 | | | | | | 18 | |
| | | | |
Canara Bank | | | | | 58,932 | | | | | | 84 | |
| | | | |
Cholamandalam Financial Holdings Ltd. | | | | | 1,644 | | | | | | 29 | |
| | | | |
HDFC Asset Management Co. Ltd. | | | | | 597 | | | | | | 29 | |
| | | | |
ICICI Lombard General Insurance Co. Ltd. | | | | | 754 | | | | | | 16 | |
| | | | |
ICICI Prudential Life Insurance Co. Ltd. | | | | | 2,075 | | | | | | 15 | |
| | | | |
Indiabulls Housing Finance Ltd. ‘L’ | | | | | 72,066 | | | | | | 143 | |
| | | | |
Indian Bank | | | | | 2,571 | | | | | | 17 | |
| | | | |
Indian Railway Finance Corp. Ltd. | | | | | 38,535 | | | | | | 80 | |
| | | | |
LIC Housing Finance Ltd. (b) | | | | | 2,967 | | | | | | 28 | |
| | | | |
Life Insurance Corp. of India (b) | | | | | 2,903 | | | | | | 34 | |
| | | | |
Muthoot Finance Ltd. | | | | | 1,670 | | | | | | 36 | |
| | | | |
Power Finance Corp. Ltd. | | | | | 102,786 | | | | | | 597 | |
| | | | |
Punjab National Bank | | | | | 41,754 | | | | | | 62 | |
| | | | |
RBL Bank Ltd. | | | | | 8,773 | | | | | | 28 | |
| | | | |
REC Ltd. | | | | | 32,586 | | | | | | 205 | |
| | | | |
Shriram Finance Ltd. | | | | | 3,944 | | | | | | 137 | |
| | | | |
State Bank of India | | | | | 24,314 | | | | | | 247 | |
| | | | |
Sundaram Finance Ltd. | | | | | 341 | | | | | | 19 | |
| | | | |
Union Bank of India Ltd. | | | | | 16,139 | | | | | | 26 | |
| | | | | | | | | | | | |
| | | | | | | | | | | 1,904 | |
| | | | | | | | | | | | |
| |
| HEALTH CARE 0.9% | |
| | | | |
Alkem Laboratories Ltd. | | | | | 355 | | | | | | 21 | |
| | | | |
Aurobindo Pharma Ltd. | | | | | 2,691 | | | | | | 39 | |
| | | | |
Cipla Ltd. | | | | | 7,854 | | | | | | 139 | |
| | | | |
Divi’s Laboratories Ltd. | | | | | 1,876 | | | | | | 103 | |
| | | | |
Dr Reddy’s Laboratories Ltd. | | | | | 2,170 | | | | | | 167 | |
| | | | |
Glenmark Pharmaceuticals Ltd. (b) | | | | | 895 | | | | | | 13 | |
| | | | |
Lupin Ltd. (b) | | | | | 5,448 | | | | | | 106 | |
| | | | |
Sun Pharmaceutical Industries Ltd. | | | | | 14,133 | | | | | | 258 | |
| | | | | | | | | | | | |
| | | | | SHARES | | | | | MARKET
VALUE
(000S) | |
| | | | |
Torrent Pharmaceuticals Ltd. | | | | | 1,826 | | | $ | | | 61 | |
| | | | |
Zydus Lifesciences Ltd. | | | | | 3,509 | | | | | | 45 | |
| | | | | | | | | | | | |
| | | | | | | | | | | 952 | |
| | | | | | | | | | | | |
| |
| INDUSTRIALS 1.6% | |
| | | | |
Adani Ports & Special Economic Zone Ltd. | | | | | 6,573 | | | | | | 116 | |
| | | | |
Ashok Leyland Ltd. | | | | | 9,236 | | | | | | 27 | |
| | | | |
Bharat Electronics Ltd. | | | | | 43,255 | | | | | | 158 | |
| | | | |
Bharat Heavy Electricals Ltd. | | | | | 16,379 | | | | | | 59 | |
| | | | |
Bharat Petroleum Corp. Ltd. (b) | | | | | 91,023 | | | | | | 332 | |
| | | | |
Container Corp. Of India Ltd. (b) | | | | | 1,198 | | | | | | 15 | |
| | | | |
Cummins India Ltd. | | | | | 516 | | | | | | 24 | |
| | | | |
Hindustan Aeronautics Ltd. | | | | | 2,443 | | | | | | 154 | |
| | | | |
Hindustan Petroleum Corp. (b) | | | | | 33,535 | | | | | | 134 | |
| | | | |
InterGlobe Aviation Ltd. (b) | | | | | 1,160 | | | | | | 59 | |
| | | | |
Larsen & Toubro Ltd. | | | | | 10,108 | | | | | | 429 | |
| | | | |
NCC Ltd. (b) | | | | | 4,900 | | | | | | 19 | |
| | | | |
Polycab India Ltd. | | | | | 488 | | | | | | 39 | |
| | | | |
Rail Vikas Nigam Ltd. | | | | | 4,227 | | | | | | 21 | |
| | | | |
Siemens Ltd. | | | | | 634 | | | | | | 59 | |
| | | | |
Voltas Ltd. | | | | | 744 | | | | | | 13 | |
| | | | | | | | | | | | |
| | | | | | | | | | | 1,658 | |
| | | | | | | | | | | | |
| |
| INFORMATION TECHNOLOGY 2.3% | |
| | | | |
HCL Technologies Ltd. | | | | | 10,533 | | | | | | 184 | |
| | | | |
Infosys Ltd. | | | | | 29,541 | | | | | | 554 | |
| | | | |
LTIMindtree Ltd. | | | | | 446 | | | | | | 29 | |
| | | | |
Mphasis Ltd. | | | | | 2,455 | | | | | | 72 | |
| | | | |
Oracle Financial Services Software Ltd. | | | | | 616 | | | | | | 73 | |
| | | | |
Redington Ltd. | | | | | 19,323 | | | | | | 49 | |
| | | | |
Tata Consultancy Services Ltd. | | | | | 20,790 | | | | | | 971 | |
| | | | |
Tech Mahindra Ltd. | | | | | 13,380 | | | | | | 229 | |
| | | | |
Wipro Ltd. | | | | | 21,729 | | | | | | 134 | |
| | | | |
Zomato Ltd. (b) | | | | | 60,715 | | | | | | 146 | |
| | | | | | | | | | | | |
| | | | | | | | | | | 2,441 | |
| | | | | | | | | | | | |
| |
| MATERIALS 2.0% | |
| | | | |
Ambuja Cements Ltd. | | | | | 3,753 | | | | | | 30 | |
| | | | |
Asian Paints Ltd. | | | | | 2,672 | | | | | | 93 | |
| | | | |
Coromandel International Ltd. | | | | | 1,681 | | | | | | 32 | |
| | | | |
Grasim Industries Ltd. | | | | | 1,589 | | | | | | 51 | |
| | | | |
Gujarat State Fertilizers & Chemicals Ltd. | | | | | 8,621 | | | | | | 25 | |
| | | | |
Hindalco Industries Ltd. (b) | | | | | 13,451 | | | | | | 111 | |
| | | | |
Jindal Saw Ltd. | | | | | 9,002 | | | | | | 59 | |
| | | | |
Jindal Stainless Ltd. (b) | | | | | 3,650 | | | | | | 36 | |
| | | | |
Jindal Steel & Power Ltd. (b) | | | | | 10,288 | | | | | | 129 | |
| | | | |
National Aluminium Co. Ltd. | | | | | 58,085 | | | | | | 130 | |
| | | | |
NMDC Ltd. (b) | | | | | 35,663 | | | | | | 105 | |
| | | | |
Rain Industries Ltd. (b) | | | | | 5,238 | | | | | | 10 | |
| | | | |
Steel Authority of India Ltd. (b) | | | | | 128,731 | | | | | | 229 | |
| | | | |
Supreme Industries Ltd. | | | | | 2,078 | | | | | | 148 | |
| | | | |
Tata Steel Ltd. | | | | | 225,327 | | | | | | 469 | |
| | | | |
UltraTech Cement Ltd. | | | | | 990 | | | | | | 138 | |
| | | | |
Vedanta Ltd. | | | | | 54,157 | | | | | | 295 | |
| | | | | | | | | | | | |
| | | | | | | | | | | 2,090 | |
| | | | | | | | | | | | |
| |
| REAL ESTATE 0.1% | |
| | | | |
DLF Ltd. | | | | | 8,746 | | | | | | 86 | |
| | | | |
Macrotech Developers Ltd. (b) | | | | | 2,103 | | | | | | 38 | |
| | | | |
Prestige Estates Projects Ltd. (b) | | | | | 783 | | | | | | 18 | |
| | | | | | | | | | | | |
| | | | | | | | | | | 142 | |
| | | | | | | | | | | | |
| |
| | | | | | | | | | | | |
| See Accompanying Notes | | | ANNUAL FINANCIAL AND OTHER INFORMATION | | | | | | | JUNE 30, 2024 | | | 13 |
| | | | | | |
| Schedule of Investments | | PIMCO RAFI Dynamic Multi-Factor Emerging Markets Equity ETF | | (Cont.) | | |
| | | | | | | | | | | | |
| | | | | SHARES | | | | | MARKET
VALUE
(000S) | |
| UTILITIES 1.7% | |
| | | | |
Adani Energy Solutions Ltd. (b) | | | | | 774 | | | $ | | | 9 | |
| | | | |
Adani Power Ltd. (b) | | | | | 9,788 | | | | | | 84 | |
| | | | |
GAIL India Ltd. | | | | | 17,919 | | | | | | 47 | |
| | | | |
Gujarat State Petronet Ltd. | | | | | 4,653 | | | | | | 17 | |
| | | | |
Jaiprakash Power Ventures Ltd. (b) | | | | | 297,614 | | | | | | 70 | |
| | | | |
JSW Energy Ltd. | | | | | 4,824 | | | | | | 42 | |
| | | | |
NHPC Ltd. | | | | | 80,551 | | | | | | 97 | |
| | | | |
NTPC Ltd. | | | | | 121,588 | | | | | | 551 | |
| | | | |
Power Grid Corp. of India Ltd. | | | | | 166,099 | | | | | | 658 | |
| | | | |
PTC India Ltd. | | | | | 16,092 | | | | | | 40 | |
| | | | |
Reliance Infrastructure Ltd. (b) | | | | | 18,746 | | | | | | 45 | |
| | | | |
Reliance Power Ltd. (b) | | | | | 206,423 | | | | | | 71 | |
| | | | |
Tata Power Co. Ltd. | | | | | 17,911 | | | | | | 95 | |
| | | | |
Torrent Power Ltd. | | | | | 908 | | | | | | 16 | |
| | | | | | | | | | | | |
| | | | | | | | | | | 1,842 | |
| | | | | | | | | | | | |
Total India | | | | | | | | | | | 17,636 | |
| | | | | | | | | | | | |
| |
| INDONESIA 0.9% | |
| |
| COMMUNICATION SERVICES 0.2% | |
| | | | |
Telkom Indonesia Persero Tbk PT | | | | | 1,096,700 | | | | | | 208 | |
| | | | | | | | | | | | |
| |
| CONSUMER STAPLES 0.1% | |
| | | | |
Gudang Garam Tbk PT | | | | | 20,300 | | | | | | 22 | |
| | | | |
Indofood CBP Sukses Makmur Tbk PT | | | | | 58,600 | | | | | | 37 | |
| | | | |
Indofood Sukses Makmur Tbk PT | | | | | 28,200 | | | | | | 11 | |
| | | | |
Sumber Alfaria Trijaya Tbk PT | | | | | 302,500 | | | | | | 51 | |
| | | | | | | | | | | | |
| | | | | | | | | | | 121 | |
| | | | | | | | | | | | |
| |
| ENERGY 0.1% | |
| | | | |
Adaro Energy Indonesia Tbk PT | | | | | 639,100 | | | | | | 109 | |
| | | | |
Indo Tambangraya Megah Tbk PT | | | | | 22,500 | | | | | | 33 | |
| | | | |
United Tractors Tbk PT | | | | | 7,900 | | | | | | 10 | |
| | | | | | | | | | | | |
| | | | | | | | | | | 152 | |
| | | | | | | | | | | | |
| |
| FINANCIALS 0.3% | |
| | | | |
Bank Central Asia Tbk PT | | | | | 274,100 | | | | | | 166 | |
| | | | |
Bank Mandiri Persero Tbk PT | | | | | 350,400 | | | | | | 131 | |
| | | | | | | | | | | | |
| | | | | | | | | | | 297 | |
| | | | | | | | | | | | |
| |
| HEALTH CARE 0.0% | |
| | | | |
Kalbe Farma Tbk PT | | | | | 406,200 | | | | | | 38 | |
| | | | | | | | | | | | |
| |
| MATERIALS 0.2% | |
| | | | |
Amman Mineral Internasional PT (b) | | | | | 105,100 | | | | | | 71 | |
| | | | |
Barito Pacific Tbk PT | | | | | 218,849 | | | | | | 13 | |
| | | | |
Chandra Asri Petrochemical Tbk PT | | | | | 86,300 | | | | | | 49 | |
| | | | |
Indocement Tunggal Prakarsa Tbk PT | | | | | 46,100 | | | | | | 20 | |
| | | | | | | | | | | | |
| | | | | | | | | | | 153 | |
| | | | | | | | | | | | |
Total Indonesia | | | | | | | | | | | 969 | |
| | | | | | | | | | | | |
| |
| IRELAND 0.4% | |
| |
| INFORMATION TECHNOLOGY 0.4% | |
| | | | |
PDD Holdings, Inc. ADR (b) | | | | | 2,951 | | | | | | 392 | |
| | | | | | | | | | | | |
Total Ireland | | | | | | | | | | | 392 | |
| | | | | | | | | | | | |
| |
| | | | | | | | | | | | |
| | | | | SHARES | | | | | MARKET
VALUE
(000S) | |
| KUWAIT 0.2% | |
| |
| COMMUNICATION SERVICES 0.0% | |
| | | | |
Mobile Telecommunications Co. KSCP | | | | | 33,058 | | | $ | | | 48 | |
| | | | | | | | | | | | |
| |
| CONSUMER STAPLES 0.0% | |
| | | | |
Humansoft Holding Co. KSC | | | | | 317 | | | | | | 3 | |
| | | | | | | | | | | | |
| |
| FINANCIALS 0.2% | |
| | | | |
Al Ahli Bank of Kuwait KSCP | | | | | 3,970 | | | | | | 4 | |
| | | | |
Boubyan Bank KSCP | | | | | 11,042 | | | | | | 21 | |
| | | | |
Gulf Bank KSCP | | | | | 6,742 | | | | | | 6 | |
| | | | |
Kuwait Finance House KSCP | | | | | 73,809 | | | | | | 171 | |
| | | | | | | | | | | | |
| | | | | | | | | | | 202 | |
| | | | | | | | | | | | |
| |
| INDUSTRIALS 0.0% | |
| | | | |
National Industries Group Holding SAK | | | | | 6,101 | | | | | | 4 | |
| | | | | | | | | | | | |
| |
| REAL ESTATE 0.0% | |
| | | | |
Mabanee Co. KPSC | | | | | 1,640 | | | | | | 4 | |
| | | | | | | | | | | | |
Total Kuwait | | | | | | | | | | | 261 | |
| | | | | | | | | | | | |
| |
| MALAYSIA 1.8% | |
| |
| COMMUNICATION SERVICES 0.1% | |
| | | | |
Axiata Group Bhd | | | | | 45,900 | | | | | | 25 | |
| | | | |
CelecomDigi Bhd | | | | | 27,300 | | | | | | 21 | |
| | | | |
Maxis Bhd | | | | | 37,200 | | | | | | 28 | |
| | | | |
Telekom Malaysia Bhd | | | | | 37,300 | | | | | | 54 | |
| | | | | | | | | | | | |
| | | | | | | | | | | 128 | |
| | | | | | | | | | | | |
| |
| CONSUMER STAPLES 0.2% | |
| | | | |
Genting Bhd | | | | | 48,000 | | | | | | 48 | |
| | | | |
Genting Malaysia Bhd | | | | | 100,500 | | | | | | 54 | |
| | | | |
IOI Corp. Bhd | | | | | 28,800 | | | | | | 23 | |
| | | | |
Kuala Lumpur Kepong Bhd | | | | | 7,300 | | | | | | 32 | |
| | | | |
PPB Group Bhd | | | | | 7,000 | | | | | | 21 | |
| | | | |
SD Guthrie Bhd | | | | | 31,600 | | | | | | 28 | |
| | | | | | | | | | | | |
| | | | | | | | | | | 206 | |
| | | | | | | | | | | | |
| |
| ENERGY 0.0% | |
| | | | |
Petronas Dagangan Bhd | | | | | 3,600 | | | | | | 13 | |
| | | | | | | | | | | | |
| |
| FINANCIALS 0.7% | |
| | | | |
AMMB Holdings Bhd | | | | | 35,700 | | | | | | 32 | |
| | | | |
CIMB Group Holdings Bhd | | | | | 127,800 | | | | | | 184 | |
| | | | |
Hong Leong Bank Bhd | | | | | 11,600 | | | | | | 47 | |
| | | | |
Malayan Banking Bhd | | | | | 111,700 | | | | | | 236 | |
| | | | |
Public Bank Bhd | | | | | 187,400 | | | | | | 160 | |
| | | | |
RHB Bank Bhd | | | | | 40,500 | | | | | | 47 | |
| | | | | | | | | | | | |
| | | | | | | | | | | 706 | |
| | | | | | | | | | | | |
| |
| HEALTH CARE 0.2% | |
| | | | |
Hartalega Holdings Bhd (b) | | | | | 121,800 | | | | | | 85 | |
| | | | |
IHH Healthcare Bhd | | | | | 6,900 | | | | | | 9 | |
| | | | |
Top Glove Corp. Bhd (b) | | | | | 474,800 | | | | | | 111 | |
| | | | | | | | | | | | |
| | | | | | | | | | | 205 | |
| | | | | | | | | | | | |
| |
| INDUSTRIALS 0.2% | |
| | | | |
Capital A Bhd (b) | | | | | 201,300 | | | | | | 37 | |
| | | | | | | | | | | | |
| | | | | SHARES | | | | | MARKET
VALUE
(000S) | |
| | | | |
Gamuda Bhd (b) | | | | | 20,800 | | | $ | | | 29 | |
| | | | |
Malaysia Airports Holdings Bhd | | | | | 21,300 | | | | | | 44 | |
| | | | |
MISC Bhd | | | | | 20,400 | | | | | | 37 | |
| | | | |
Sime Darby Bhd | | | | | 88,800 | | | | | | 49 | |
| | | | | | | | | | | | |
| | | | | | | | | | | 196 | |
| | | | | | | | | | | | |
| |
| MATERIALS 0.1% | |
| | | | |
Petronas Chemicals Group Bhd | | | | | 60,600 | | | | | | 81 | |
| | | | |
Press Metal Aluminium Holdings Bhd | | | | | 21,000 | | | | | | 26 | |
| | | | | | | | | | | | |
| | | | | | | | | | | 107 | |
| | | | | | | | | | | | |
| |
| UTILITIES 0.3% | |
| | | | |
Petronas Gas Bhd | | | | | 5,200 | | | | | | 20 | |
| | | | |
Tenaga Nasional Bhd | | | | | 65,500 | | | | | | 191 | |
| | | | |
YTL Corp. Bhd | | | | | 155,400 | | | | | | 113 | |
| | | | |
YTL Power International Bhd | | | | | 24,200 | | | | | | 25 | |
| | | | | | | | | | | | |
| | | | | | | | | | | 349 | |
| | | | | | | | | | | | |
Total Malaysia | | | | | | | | | | | 1,910 | |
| | | | | | | | | | | | |
| |
| MEXICO 1.6% | |
| |
| COMMUNICATION SERVICES 0.1% | |
| | | | |
Grupo Televisa SAB | | | | | 108,863 | | | | | | 60 | |
| | | | |
Megacable Holdings SAB de CV | | | | | 12,334 | | | | | | 31 | |
| | | | | | | | | | | | |
| | | | | | | | | | | 91 | |
| | | | | | | | | | | | |
| |
| CONSUMER STAPLES 1.0% | |
| | | | |
Arca Continental SAB de CV | | | | | 12,233 | | | | | | 120 | |
| | | | |
Coca-Cola Femsa SAB de CV | | | | | 16,068 | | | | | | 138 | |
| | | | |
Fomento Economico Mexicano SAB de CV | | | | | 14,189 | | | | | | 152 | |
| | | | |
Gruma SAB de CV ‘B’ | | | | | 7,057 | | | | | | 129 | |
| | | | |
Grupo Bimbo SAB de CV ‘A’ | | | | | 14,489 | | | | | | 51 | |
| | | | |
Kimberly-Clark de Mexico SAB de CV ‘A’ | | | | | 46,717 | | | | | | 81 | |
| | | | |
Wal-Mart de Mexico SAB de CV | | | | | 100,290 | | | | | | 341 | |
| | | | | | | | | | | | |
| | | | | | | | | | | 1,012 | |
| | | | | | | | | | | | |
| |
| FINANCIALS 0.0% | |
| | | | |
Grupo Elektra SAB de CV | | | | | 696 | | | | | | 40 | |
| | | | | | | | | | | | |
| |
| INDUSTRIALS 0.1% | |
| | | | |
Alfa SAB de CV ‘A’ | | | | | 99,823 | | | | | | 58 | |
| | | | |
Grupo Aeroportuario del Pacifico SAB de CV ‘B’ | | | | | 1,270 | | | | | | 20 | |
| | | | |
Grupo Aeroportuario del Sureste SAB de CV ‘B’ | | | | | 875 | | | | | | 27 | |
| | | | | | | | | | | | |
| | | | | | | | | | | 105 | |
| | | | | | | | | | | | |
| |
| MATERIALS 0.4% | |
| | | | |
Grupo Mexico SAB de CV ‘B’ | | | | | 75,080 | | | | | | 404 | |
| | | | |
Orbia Advance Corp. SAB de CV | | | | | 34,338 | | | | | | 48 | |
| | | | | | | | | | | | |
| | | | | | | | | | | 452 | |
| | | | | | | | | | | | |
Total Mexico | | | | | | | | | | | 1,700 | |
| | | | | | | | | | | | |
| |
| PHILIPPINES 0.2% | |
| |
| COMMUNICATION SERVICES 0.1% | |
| | | | |
PLDT, Inc. | | | | | 2,295 | | | | | | 56 | |
| | | | | | | | | | | | |
| |
| CONSUMER STAPLES 0.0% | |
| | | | |
Universal Robina Corp. | | | | | 13,850 | | | | | | 26 | |
| | | | | | | | | | | | |
| |
| | | | | | |
| 14 | | PIMCO EQUITY SERIES | | | See Accompanying Notes | |
| | | | | | | | | | | | |
| | | | | SHARES | | | | | MARKET
VALUE
(000S) | |
| INDUSTRIALS 0.1% | |
| | | | |
International Container Terminal Services, Inc. | | | | | 11,920 | | | $ | | | 71 | |
| | | | | | | | | | | | |
| |
| UTILITIES 0.0% | |
| | | | |
Manila Electric Co. | | | | | 3,100 | | | | | | 20 | |
| | | | | | | | | | | | |
Total Philippines | | | | | | | | | | | 173 | |
| | | | | | | | | | | | |
| |
| POLAND 0.8% | |
| |
| COMMUNICATION SERVICES 0.1% | |
| | | | |
Cyfrowy Polsat SA (b) | | | | | 14,377 | | | | | | 43 | |
| | | | |
Orange Polska SA | | | | | 12,926 | | | | | | 25 | |
| | | | | | | | | | | | |
| | | | | | | | | | | 68 | |
| | | | | | | | | | | | |
| |
| FINANCIALS 0.5% | |
| | | | |
Bank Polska Kasa Opieki SA | | | | | 3,418 | | | | | | 142 | |
| | | | |
Powszechna Kasa Oszczednosci Bank Polski SA | | | | | 10,663 | | | | | | 166 | |
| | | | |
Powszechny Zaklad Ubezpieczen SA | | | | | 15,780 | | | | | | 202 | |
| | | | |
Santander Bank Polska SA | | | | | 303 | | | | | | 41 | |
| | | | | | | | | | | | |
| | | | | | | | | | | 551 | |
| | | | | | | | | | | | |
| |
| INFORMATION TECHNOLOGY 0.0% | |
| | | | |
Asseco Poland SA | | | | | 481 | | | | | | 10 | |
| | | | | | | | | | | | |
| |
| MATERIALS 0.1% | |
| | | | |
Jastrzebska Spolka Weglowa SA (b) | | | | | 3,860 | | | | | | 28 | |
| | | | |
KGHM Polska Miedz SA | | | | | 1,768 | | | | | | 66 | |
| | | | | | | | | | | | |
| | | | | | | | | | | 94 | |
| | | | | | | | | | | | |
| |
| UTILITIES 0.1% | |
| | | | |
Enea SA (b) | | | | | 6,451 | | | | | | 17 | |
| | | | |
PGE Polska Grupa Energetyczna SA (b) | | | | | 44,565 | | | | | | 79 | |
| | | | |
Tauron Polska Energia SA (b) | | | | | 68,092 | | | | | | 67 | |
| | | | | | | | | | | | |
| | | | | | | | | | | 163 | |
| | | | | | | | | | | | |
Total Poland | | | | | | | | | | | 886 | |
| | | | | | | | | | | | |
| |
| QATAR 0.5% | |
| |
| COMMUNICATION SERVICES 0.0% | |
| | | | |
Ooredoo QPSC | | | | | 11,948 | | | | | | 33 | |
| | | | | | | | | | | | |
| |
| ENERGY 0.0% | |
| | | | |
Qatar Fuel QSC | | | | | 2,515 | | | | | | 11 | |
| | | | |
Qatar Gas Transport Co. Ltd. | | | | | 23,384 | | | | | | 30 | |
| | | | | | | | | | | | |
| | | | | | | | | | | 41 | |
| | | | | | | | | | | | |
| |
| FINANCIALS 0.3% | |
| | | | |
Commercial Bank PSQC | | | | | 9,852 | | | | | | 12 | |
| | | | |
Doha Bank QPSC | | | | | 67,003 | | | | | | 26 | |
| | | | |
Masraf Al Rayan QSC | | | | | 90,514 | | | | | | 58 | |
| | | | |
Qatar Islamic Bank SAQ | | | | | 11,863 | | | | | | 61 | |
| | | | |
Qatar National Bank QPSC | | | | | 36,549 | | | | | | 147 | |
| | | | | | | | | | | | |
| | | | | | | | | | | 304 | |
| | | | | | | | | | | | |
| |
| INDUSTRIALS 0.1% | |
| | | | |
Industries Qatar QSC | | | | | 26,717 | | | | | | 94 | |
| | | | |
Qatar Navigation QSC | | | | | 4,935 | | | | | | 15 | |
| | | | | | | | | | | | |
| | | | | | | | | | | 109 | |
| | | | | | | | | | | | |
| |
| | | | | | | | | | | | |
| | | | | SHARES | | | | | MARKET
VALUE
(000S) | |
| REAL ESTATE 0.1% | |
| | | | |
Barwa Real Estate Co. | | | | | 55,219 | | | $ | | | 42 | |
| | | | | | | | | | | | |
| |
| UTILITIES 0.0% | |
| | | | |
Qatar Electricity & Water Co. QSC | | | | | 2,341 | | | | | | 10 | |
| | | | | | | | | | | | |
Total Qatar | | | | | | | | | | | 539 | |
| | | | | | | | | | | | |
| |
| RUSSIA 0.0% | |
| |
| ENERGY 0.0% | |
| | | | |
Gazprom Neft PJSC « | | | | | 13,620 | | | | | | 0 | |
| | | | |
Gazprom PJSC «(b) | | | | | 635,130 | | | | | | 0 | |
| | | | |
LUKOIL PJSC « | | | | | 15,703 | | | | | | 0 | |
| | | | |
Novatek PJSC « | | | | | 21,924 | | | | | | 0 | |
| | | | |
Rosneft Oil Co. PJSC « | | | | | 66,050 | | | | | | 0 | |
| | | | |
Surgutneftegas PJSC « | | | | | 701,700 | | | | | | 0 | |
| | | | |
Tatneft PJSC « | | | | | 19,086 | | | | | | 0 | |
| | | | | | | | | | | | |
| | | | | | | | | | | 0 | |
| | | | | | | | | | | | |
| |
| FINANCIALS 0.0% | |
| | | | |
Sberbank of Russia PJSC « | | | | | 117,340 | | | | | | 0 | |
| | | | |
VTB Bank PJSC «(b) | | | | | 598,992,500 | | | | | | 1 | |
| | | | | | | | | | | | |
| | | | | | | | | | | 1 | |
| | | | | | | | | | | | |
| |
| MATERIALS 0.0% | |
| | | | |
Magnitogorsk Iron & Steel Works PJSC « | | | | | 160,600 | | | | | | 0 | |
| | | | |
MMC Norilsk Nickel PJSC « | | | | | 126,900 | | | | | | 0 | |
| | | | |
Novolipetsk Steel PJSC « | | | | | 88,470 | | | | | | 0 | |
| | | | |
Severstal PAO « | | | | | 17,344 | | | | | | 0 | |
| | | | | | | | | | | | |
| | | | | | | | | | | 0 | |
| | | | | | | | | | | | |
| |
| UTILITIES 0.0% | |
| | | | |
Federal Grid Co. - Rosseti PJSC «(b) | | | | | 22,174,692 | | | | | | 0 | |
| | | | |
Inter RAO UES PJSC « | | | | | 1,587,500 | | | | | | 0 | |
| | | | | | | | | | | | |
| | | | | | | | | | | 0 | |
| | | | | | | | | | | | |
Total Russia | | | | | | | | | | | 1 | |
| | | | | | | | | | | | |
| |
| SAUDI ARABIA 2.0% | |
| |
| COMMUNICATION SERVICES 0.5% | |
| | | | |
Saudi Telecom Co. | | | | | 48,088 | | | | | | 481 | |
| | | | | | | | | | | | |
| |
| CONSUMER STAPLES 0.2% | |
| | | | |
Abdullah Al Othaim Markets Co. | | | | | 5,002 | | | | | | 15 | |
| | | | |
Almarai Co. JSC | | | | | 4,192 | | | | | | 64 | |
| | | | |
Jarir Marketing Co. | | | | | 11,272 | | | | | | 38 | |
| | | | |
Savola Group (b) | | | | | 6,124 | | | | | | 76 | |
| | | | | | | | | | | | |
| | | | | | | | | | | 193 | |
| | | | | | | | | | | | |
| |
| ENERGY 0.5% | |
| | | | |
Saudi Arabian Oil Co. | | | | | 74,155 | | | | | | 546 | |
| | | | | | | | | | | | |
| |
| FINANCIALS 0.2% | |
| | | | |
Alinma Bank | | | | | 2,901 | | | | | | 24 | |
| | | | |
Bupa Arabia for Cooperative Insurance Co. | | | | | 1,253 | | | | | | 86 | |
| | | | |
Saudi Investment Bank | | | | | 10,408 | | | | | | 36 | |
| | | | | | | | | | | | |
| | | | | | | | | | | 146 | |
| | | | | | | | | | | | |
| |
| | | | | | | | | | | | |
| | | | | SHARES | | | | | MARKET
VALUE
(000S) | |
| HEALTH CARE 0.0% | |
| | | | |
Dr Sulaiman Al Habib Medical Services Group Co. | | | | | 333 | | | $ | | | 26 | |
| | | | | | | | | | | | |
| |
| MATERIALS 0.4% | |
| | | | |
Advanced Petrochemical Co. (b) | | | | | 2,227 | | | | | | 23 | |
| | | | |
SABIC Agri-Nutrients Co. | | | | | 508 | | | | | | 15 | |
| | | | |
Sahara International Petrochemical Co. | | | | | 5,152 | | | | | | 40 | |
| | | | |
Saudi Basic Industries Corp. | | | | | 13,080 | | | | | | 256 | |
| | | | |
Saudi Cement Co. | | | | | 957 | | | | | | 12 | |
| | | | |
Saudi Kayan Petrochemical Co. (b) | | | | | 14,788 | | | | | | 32 | |
| | | | |
Yanbu National Petrochemical Co. | | | | | 7,401 | | | | | | 72 | |
| | | | | | | | | | | | |
| | | | | | | | | | | 450 | |
| | | | | | | | | | | | |
| |
| REAL ESTATE 0.0% | |
| | | | |
Arabian Centres Co. Ltd. | | | | | 6,404 | | | | | | 34 | |
| | | | | | | | | | | | |
| |
| UTILITIES 0.2% | |
| | | | |
ACWA Power Co. | | | | | 1,535 | | | | | | 145 | |
| | | | |
Saudi Electricity Co. | | | | | 10,854 | | | | | | 47 | |
| | | | | | | | | | | | |
| | | | | | | | | | | 192 | |
| | | | | | | | | | | | |
Total Saudi Arabia | | | | | | | | | | | 2,068 | |
| | | | | | | | | | | | |
| |
| SOUTH AFRICA 2.7% | |
| |
| COMMUNICATION SERVICES 0.3% | |
| | | | |
MTN Group Ltd. | | | | | 39,471 | | | | | | 184 | |
| | | | |
MultiChoice Group (b) | | | | | 13,315 | | | | | | 78 | |
| | | | |
Vodacom Group Ltd. | | | | | 10,420 | | | | | | 56 | |
| | | | | | | | | | | | |
| | | | | | | | | | | 318 | |
| | | | | | | | | | | | |
| |
| CONSUMER STAPLES 0.7% | |
| | | | |
AVI Ltd. | | | | | 7,862 | | | | | | 41 | |
| | | | |
Bid Corp. Ltd. | | | | | 5,239 | | | | | | 122 | |
| | | | |
Foschini Group Ltd. | | | | | 1,711 | | | | | | 12 | |
| | | | |
Motus Holdings Ltd. | | | | | 5,938 | | | | | | 30 | |
| | | | |
Mr Price Group Ltd. | | | | | 5,074 | | | | | | 57 | |
| | | | |
Pick n Pay Stores Ltd. (b) | | | | | 19,885 | | | | | | 28 | |
| | | | |
Shoprite Holdings Ltd. | | | | | 9,605 | | | | | | 151 | |
| | | | |
SPAR Group Ltd. (b) | | | | | 12,832 | | | | | | 84 | |
| | | | |
Tiger Brands Ltd. | | | | | 3,411 | | | | | | 37 | |
| | | | |
Truworths International Ltd. | | | | | 11,684 | | | | | | 60 | |
| | | | |
Woolworths Holdings Ltd. | | | | | 18,704 | | | | | | 64 | |
| | | | | | | | | | | | |
| | | | | | | | | | | 686 | |
| | | | | | | | | | | | |
| |
| ENERGY 0.1% | |
| | | | |
Exxaro Resources Ltd. | | | | | 10,587 | | | | | | 104 | |
| | | | | | | | | | | | |
| |
| FINANCIALS 0.5% | |
| | | | |
Capitec Bank Holdings Ltd. | | | | | 600 | | | | | | 87 | |
| | | | |
FirstRand Ltd. | | | | | 77,190 | | | | | | 327 | |
| | | | |
Sanlam Ltd. | | | | | 11,426 | | | | | | 51 | |
| | | | |
Standard Bank Group Ltd. | | | | | 9,250 | | | | | | 108 | |
| | | | | | | | | | | | |
| | | | | | | | | | | 573 | |
| | | | | | | | | | | | |
| |
| HEALTH CARE 0.1% | |
| | | | |
Aspen Pharmacare Holdings Ltd. | | | | | 8,601 | | | | | | 110 | |
| | | | |
Life Healthcare Group Holdings Ltd. | | | | | 38,291 | | | | | | 27 | |
| | | | | | | | | | | | |
| | | | | | | | | | | 137 | |
| | | | | | | | | | | | |
| |
| | | | | | | | | | | | |
| See Accompanying Notes | | | ANNUAL FINANCIAL AND OTHER INFORMATION | | | | | | | JUNE 30, 2024 | | | 15 |
| | | | | | |
| Schedule of Investments | | PIMCO RAFI Dynamic Multi-Factor Emerging Markets Equity ETF | | (Cont.) | | |
| | | | | | | | | | | | |
| | | | | SHARES | | | | | MARKET
VALUE
(000S) | |
| INDUSTRIALS 0.1% | |
| | | | |
Bidvest Group Ltd. | | | | | 7,530 | | | $ | | | 118 | |
| | | | | | | | | | | | |
| |
| INFORMATION TECHNOLOGY 0.1% | |
| | | | |
Naspers Ltd. ‘N’ | | | | | 748 | | | | | | 147 | |
| | | | | | | | | | | | |
| |
| MATERIALS 0.8% | |
| | | | |
African Rainbow Minerals Ltd. | | | | | 2,643 | | | | | | 33 | |
| | | | |
Anglo American Platinum Ltd. | | | | | 1,058 | | | | | | 35 | |
| | | | |
Gold Fields Ltd. | | | | | 11,221 | | | | | | 168 | |
| | | | |
Harmony Gold Mining Co. Ltd. | | | | | 4,627 | | | | | | 43 | |
| | | | |
Impala Platinum Holdings Ltd. | | | | | 25,906 | | | | | | 129 | |
| | | | |
Kumba Iron Ore Ltd. | | | | | 2,812 | | | | | | 68 | |
| | | | |
Sappi Ltd. | | | | | 27,076 | | | | | | 71 | |
| | | | |
Sasol Ltd. | | | | | 16,248 | | | | | | 123 | |
| | | | |
Sibanye Stillwater Ltd. | | | | | 104,488 | | | | | | 113 | |
| | | | | | | | | | | | |
| | | | | | | | | | | 783 | |
| | | | | | | | | | | | |
Total South Africa | | | | | | | | | | | 2,866 | |
| | | | | | | | | | | | |
| |
| SOUTH KOREA 13.1% | |
| |
| COMMUNICATION SERVICES 0.6% | |
| | | | |
CJ ENM Co. Ltd. (b) | | | | | 467 | | | | | | 28 | |
| | | | |
KT Corp. | | | | | 11,580 | | | | | | 314 | |
| | | | |
LG Uplus Corp. | | | | | 9,348 | | | | | | 67 | |
| | | | |
SK Telecom Co. Ltd. | | | | | 6,764 | | | | | | 253 | |
| | | | | | | | | | | | |
| | | | | | | | | | | 662 | |
| | | | | | | | | | | | |
| |
| CONSUMER STAPLES 4.4% | |
| | | | |
Amorepacific Corp. | | | | | 100 | | | | | | 12 | |
| | | | |
Amorepacific Group | | | | | 1,736 | | | | | | 41 | |
| | | | |
CJ CheilJedang Corp. | | | | | 487 | | | | | | 136 | |
| | | | |
Coway Co. Ltd. | | | | | 1,955 | | | | | | 91 | |
| | | | |
E-MART, Inc. | | | | | 1,666 | | | | | | 68 | |
| | | | |
GS Retail Co. Ltd. | | | | | 886 | | | | | | 13 | |
| | | | |
Hankook Tire & Technology Co. Ltd. | | | | | 3,288 | | | | | | 107 | |
| | | | |
HL Mando Co. Ltd. | | | | | 1,943 | | | | | | 62 | |
| | | | |
Hyundai Department Store Co. Ltd. | | | | | 1,010 | | | | | | 36 | |
| | | | |
Hyundai Mobis Co. Ltd. | | | | | 2,435 | | | | | | 442 | |
| | | | |
Hyundai Motor Co. | | | | | 8,121 | | | | | | 1,732 | |
| | | | |
Hyundai Wia Corp. | | | | | 1,353 | | | | | | 57 | |
| | | | |
Kia Corp. | | | | | 10,241 | | | | | | 958 | |
| | | | |
KT&G Corp. | | | | | 3,091 | | | | | | 198 | |
| | | | |
LG Electronics, Inc. | | | | | 7,011 | | | | | | 562 | |
| | | | |
LG H&H Co. Ltd. | | | | | 302 | | | | | | 75 | |
| | | | |
Lotte Shopping Co. Ltd. | | | | | 794 | | | | | | 36 | |
| | | | |
Shinsegae, Inc. | | | | | 318 | | | | | | 36 | |
| | | | | | | | | | | | |
| | | | | | | | | | | 4,662 | |
| | | | | | | | | | | | |
| |
| ENERGY 0.4% | |
| | | | |
HD Hyundai Co. Ltd. | | | | | 2,234 | | | | | | 120 | |
| | | | |
S-Oil Corp. | | | | | 1,092 | | | | | | 53 | |
| | | | |
SK Innovation Co. Ltd. (b) | | | | | 2,734 | | | | | | 229 | |
| | | | | | | | | | | | |
| | | | | | | | | | | 402 | |
| | | | | | | | | | | | |
| |
| FINANCIALS 2.9% | |
| | | | |
BNK Financial Group, Inc. | | | | | 15,356 | | | | | | 94 | |
| | | | |
DB Insurance Co. Ltd. | | | | | 2,172 | | | | | | 180 | |
| | | | |
DGB Financial Group, Inc. | | | | | 8,295 | | | | | | 48 | |
| | | | |
Hana Financial Group, Inc. | | | | | 12,229 | | | | | | 538 | |
| | | | |
Hanwha Life Insurance Co. Ltd. | | | | | 13,954 | | | | | | 30 | |
| | | | |
Hyundai Marine & Fire Insurance Co. Ltd. | | | | | 4,139 | | | | | | 104 | |
| | | | | | | | | | | | |
| | | | | SHARES | | | | | MARKET
VALUE
(000S) | |
| | | | |
Industrial Bank of Korea | | | | | 13,398 | | | $ | | | 136 | |
| | | | |
KB Financial Group, Inc. | | | | | 6,537 | | | | | | 372 | |
| | | | |
Korea Investment Holdings Co. Ltd. | | | | | 420 | | | | | | 21 | |
| | | | |
Meritz Financial Group, Inc. | | | | | 1,076 | | | | | | 62 | |
| | | | |
Mirae Asset Securities Co. Ltd. | | | | | 1,826 | | | | | | 10 | |
| | | | |
NH Investment & Securities Co. Ltd. ‘C’ | | | | | 1,257 | | | | | | 12 | |
| | | | |
Samsung Card Co. Ltd. | | | | | 693 | | | | | | 19 | |
| | | | |
Samsung Fire & Marine Insurance Co. Ltd. | | | | | 1,102 | | | | | | 310 | |
| | | | |
Samsung Life Insurance Co. Ltd. | | | | | 3,068 | | | | | | 196 | |
| | | | |
Samsung Securities Co. Ltd. | | | | | 405 | | | | | | 12 | |
| | | | |
Shinhan Financial Group Co. Ltd. | | | | | 18,023 | | | | | | 628 | |
| | | | |
Woori Financial Group, Inc. | | | | | 26,243 | | | | | | 280 | |
| | | | | | | | | | | | |
| | | | | | | | | | | 3,052 | |
| | | | | | | | | | | | |
| |
| INDUSTRIALS 2.0% | |
| | | | |
CJ Corp. | | | | | 1,788 | | | | | | 157 | |
| | | | |
CJ Logistics Corp. | | | | | 957 | | | | | | 66 | |
| | | | |
Daewoo Engineering & Construction Co. Ltd. (b) | | | | | 12,774 | | | | | | 34 | |
| | | | |
DL E&C Co. Ltd. | | | | | 2,168 | | | | | | 51 | |
| | | | |
Doosan Co. Ltd. | | | | | 1,407 | | | | | | 221 | |
| | | | |
GS Engineering & Construction Corp. | | | | | 8,168 | | | | | | 89 | |
| | | | |
GS Holdings Corp. | | | | | 2,025 | | | | | | 69 | |
| | | | |
Hanwha Aerospace Co. Ltd. | | | | | 354 | | | | | | 64 | |
| | | | |
Hanwha Corp. | | | | | 3,269 | | | | | | 63 | |
| | | | |
HD Korea Shipbuilding & Offshore Engineering Co. Ltd. (b) | | | | | 673 | | | | | | 77 | |
| | | | |
HDC Hyundai Development Co-Engineering & Construction | | | | | 1,742 | | | | | | 23 | |
| | | | |
Hyundai Engineering & Construction Co. Ltd. | | | | | 5,554 | | | | | | 129 | |
| | | | |
Hyundai Glovis Co. Ltd. | | | | | 1,008 | | | | | | 160 | |
| | | | |
LG Corp. | | | | | 3,015 | | | | | | 175 | |
| | | | |
Lotte Corp. | | | | | 1,389 | | | | | | 25 | |
| | | | |
LS Corp. | | | | | 1,304 | | | | | | 135 | |
| | | | |
LX International Corp. | | | | | 2,971 | | | | | | 66 | |
| | | | |
Posco International Corp. | | | | | 4,173 | | | | | | 197 | |
| | | | |
Samsung C&T Corp. | | | | | 421 | | | | | | 43 | |
| | | | |
SK Networks Co. Ltd. | | | | | 11,193 | | | | | | 39 | |
| | | | |
SK, Inc. | | | | | 1,838 | | | | | | 210 | |
| | | | | | | | | | | | |
| | | | | | | | | | | 2,093 | |
| | | | | | | | | | | | |
| |
| INFORMATION TECHNOLOGY 1.2% | |
| | | | |
LG Display Co. Ltd. | | | | | 19,371 | | | | | | 161 | |
| | | | |
Samsung Electro-Mechanics Co. Ltd. | | | | | 1,489 | | | | | | 170 | |
| | | | |
Samsung SDS Co. Ltd. | | | | | 257 | | | | | | 28 | |
| | | | |
SK Hynix, Inc. | | | | | 5,111 | | | | | | 867 | |
| | | | | | | | | | | | |
| | | | | | | | | | | 1,226 | |
| | | | | | | | | | | | |
| |
| MATERIALS 1.2% | |
| | | | |
Hyundai Steel Co. | | | | | 5,993 | | | | | | 126 | |
| | | | |
KCC Corp. | | | | | 324 | | | | | | 72 | |
| | | | |
Kolon Industries, Inc. | | | | | 1,528 | | | | | | 42 | |
| | | | |
Korea Zinc Co. Ltd. | | | | | 287 | | | | | | 107 | |
| | | | |
Kumho Petrochemical Co. Ltd. | | | | | 471 | | | | | | 50 | |
| | | | |
Lotte Chemical Corp. | | | | | 1,400 | | | | | | 116 | |
| | | | |
Posco Holdings, Inc. | | | | | 2,730 | | | | | | 715 | |
| | | | | | | | | | | | |
| | | | | | | | | | | 1,228 | |
| | | | | | | | | | | | |
| |
| UTILITIES 0.4% | |
| | | | |
Korea Electric Power Corp. (b) | | | | | 19,021 | | | | | | 269 | |
| | | | | | | | | | | | |
| | | | | SHARES | | | | | MARKET
VALUE
(000S) | |
| | | | |
Korea Gas Corp. | | | | | 3,669 | | | $ | | | 139 | |
| | | | | | | | | | | | |
| | | | | | | | | | | 408 | |
| | | | | | | | | | | | |
Total South Korea | | | | | | | | | | | 13,733 | |
| | | | | | | | | | | | |
| |
| TAIWAN 20.7% | |
| |
| COMMUNICATION SERVICES 0.6% | |
| | | | |
Chunghwa Telecom Co. Ltd. | | | | | 107,000 | | | | | | 415 | |
| | | | |
Far EasTone Telecommunications Co. Ltd. | | | | | 47,000 | | | | | | 122 | |
| | | | |
Taiwan Mobile Co. Ltd. | | | | | 44,000 | | | | | | 145 | |
| | | | | | | | | | | | |
| | | | | | | | | | | 682 | |
| | | | | | | | | | | | |
| |
| CONSUMER STAPLES 0.9% | |
| | | | |
Cheng Shin Rubber Industry Co. Ltd. | | | | | 55,000 | | | | | | 84 | |
| | | | |
China Motor Corp. | | | | | 34,000 | | | | | | 130 | |
| | | | |
Eclat Textile Co. Ltd. | | | | | 5,000 | | | | | | 81 | |
| | | | |
Feng TAY Enterprise Co. Ltd. | | | | | 13,560 | | | | | | 65 | |
| | | | |
Giant Manufacturing Co. Ltd. (b) | | | | | 6,000 | | | | | | 39 | |
| | | | |
Great Wall Enterprise Co. Ltd. | | | | | 10,008 | | | | | | 18 | |
| | | | |
Nien Made Enterprise Co. Ltd. | | | | | 2,000 | | | | | | 24 | |
| | | | |
Pou Chen Corp. | | | | | 103,000 | | | | | | 111 | |
| | | | |
President Chain Store Corp. | | | | | 12,000 | | | | | | 101 | |
| | | | |
Ruentex Industries Ltd. (b) | | | | | 17,800 | | | | | | 37 | |
| | | | |
Uni-President Enterprises Corp. | | | | | 81,000 | | | | | | 203 | |
| | | | | | | | | | | | |
| | | | | | | | | | | 893 | |
| | | | | | | | | | | | |
| |
| ENERGY 0.0% | |
| | | | |
Formosa Petrochemical Corp. | | | | | 20,000 | | | | | | 40 | |
| | | | | | | | | | | | |
| |
| FINANCIALS 3.0% | |
| | | | |
Cathay Financial Holding Co. Ltd. | | | | | 243,200 | | | | | | 442 | |
| | | | |
Chang Hwa Commercial Bank Ltd. (b) | | | | | 131,090 | | | | | | 74 | |
| | | | |
China Development Financial Holding Corp. (b) | | | | | 432,096 | | | | | | 201 | |
| | | | |
CTBC Financial Holding Co. Ltd. | | | | | 480,000 | | | | | | 560 | |
| | | | |
E.Sun Financial Holding Co. Ltd. (b) | | | | | 110,239 | | | | | | 97 | |
| | | | |
First Financial Holding Co. Ltd. (b) | | | | | 146,509 | | | | | | 127 | |
| | | | |
Fubon Financial Holding Co. Ltd. (b) | | | | | 170,908 | | | | | | 417 | |
| | | | |
Hua Nan Financial Holdings Co. Ltd. ‘C’ (b) | | | | | 108,503 | | | | | | 88 | |
| | | | |
Mega Financial Holding Co. Ltd. (b) | | | | | 195,646 | | | | | | 244 | |
| | | | |
Shanghai Commercial & Savings Bank Ltd. | | | | | 49,712 | | | | | | 71 | |
| | | | |
Shin Kong Financial Holding Co. Ltd. (b) | | | | | 498,307 | | | | | | 151 | |
| | | | |
SinoPac Financial Holdings Co. Ltd. (b) | | | | | 205,466 | | | | | | 161 | |
| | | | |
Taishin Financial Holding Co. Ltd. (b) | | | | | 236,511 | | | | | | 137 | |
| | | | |
Taiwan Business Bank (b) | | | | | 165,890 | | | | | | 93 | |
| | | | |
Taiwan Cooperative Financial Holding Co. Ltd. | | | | | 117,395 | | | | | | 94 | |
| | | | |
Yuanta Financial Holding Co. Ltd. | | | | | 202,860 | | | | | | 200 | |
| | | | | | | | | | | | |
| | | | | | | | | | | 3,157 | |
| | | | | | | | | | | | |
| |
| INDUSTRIALS 1.1% | |
| | | | |
Evergreen Marine Corp. Taiwan Ltd. | | | | | 86,000 | | | | | | 512 | |
| | | | |
Far Eastern New Century Corp. (b) | | | | | 84,000 | | | | | | 91 | |
| | | | |
Taiwan Glass Industry Corp. (b) | | | | | 14,000 | | | | | | 9 | |
| | | | |
Taiwan High Speed Rail Corp. | | | | | 15,000 | | | | | | 14 | |
| | | | |
Teco Electric & Machinery Co. Ltd. | | | | | 42,000 | | | | | | 69 | |
| | | | | | |
| 16 | | PIMCO EQUITY SERIES | | | See Accompanying Notes | |
| | | | | | | | | | | | |
| | | | | SHARES | | | | | MARKET
VALUE
(000S) | |
| | | | |
Wan Hai Lines Ltd. | | | | | 7,000 | | | $ | | | 19 | |
| | | | |
Yang Ming Marine Transport Corp. | | | | | 190,000 | | | | | | 437 | |
| | | | | | | | | | | | |
| | | | | | | | | | | 1,151 | |
| | | | | | | | | | | | |
| |
| INFORMATION TECHNOLOGY 14.2% | |
| | | | |
Accton Technology Corp. | | | | | 8,000 | | | | | | 136 | |
| | | | |
Acer, Inc. | | | | | 119,000 | | | | | | 171 | |
| | | | |
Advantech Co. Ltd. | | | | | 7,119 | | | | | | 81 | |
| | | | |
ASE Technology Holding Co. Ltd. | | | | | 130,000 | | | | | | 673 | |
| | | | |
Asustek Computer, Inc. | | | | | 49,000 | | | | | | 750 | |
| | | | |
AUO Corp. (b) | | | | | 518,600 | | | | | | 284 | |
| | | | |
Catcher Technology Co. Ltd. | | | | | 23,000 | | | | | | 164 | |
| | | | |
Cheng Uei Precision Industry Co. Ltd. | | | | | 7,000 | | | | | | 17 | |
| | | | |
Chicony Electronics Co. Ltd. | | | | | 29,000 | | | | | | 153 | |
| | | | |
Compal Electronics, Inc. | | | | | 381,000 | | | | | | 406 | |
| | | | |
Compeq Manufacturing Co. Ltd. | | | | | 5,000 | | | | | | 13 | |
| | | | |
Delta Electronics, Inc. | | | | | 23,000 | | | | | | 274 | |
| | | | |
Foxconn Technology Co. Ltd. | | | | | 44,000 | | | | | | 97 | |
| | | | |
General Interface Solution Holding Ltd. (b) | | | | | 18,000 | | | | | | 38 | |
| | | | |
Hon Hai Precision Industry Co. Ltd. | | | | | 466,600 | | | | | | 3,072 | |
| | | | |
Innolux Corp. | | | | | 691,582 | | | | | | 305 | |
| | | | |
Inventec Corp. | | | | | 220,000 | | | | | | 376 | |
| | | | |
King Yuan Electronics Co. Ltd. | | | | | 16,000 | | | | | | 59 | |
| | | | |
Kinpo Electronics | | | | | 61,000 | | | | | | 34 | |
| | | | |
Largan Precision Co. Ltd. | | | | | 1,290 | | | | | | 109 | |
| | | | |
Lite-On Technology Corp. | | | | | 93,000 | | | | | | 302 | |
| | | | |
Macronix International Co. Ltd. | | | | | 53,000 | | | | | | 43 | |
| | | | |
MediaTek, Inc. | | | | | 34,000 | | | | | | 1,464 | |
| | | | |
Micro-Star International Co. Ltd. (b) | | | | | 26,000 | | | | | | 142 | |
| | | | |
Mitac Holdings Corp. | | | | | 72,000 | | | | | | 98 | |
| | | | |
Novatek Microelectronics Corp. | | | | | 8,000 | | | | | | 149 | |
| | | | |
Pegatron Corp. | | | | | 111,000 | | | | | | 357 | |
| | | | |
Powertech Technology, Inc. | | | | | 45,000 | | | | | | 260 | |
| | | | |
Primax Electronics Ltd. | | | | | 18,000 | | | | | | 52 | |
| | | | |
Qisda Corp. (b) | | | | | 78,000 | | | | | | 92 | |
| | | | |
Quanta Computer, Inc. | | | | | 136,000 | | | | | | 1,300 | |
| | | | |
Radiant Opto-Electronics Corp. | | | | | 17,000 | | | | | | 99 | |
| | | | |
Realtek Semiconductor Corp. (b) | | | | | 12,000 | | | | | | 201 | |
| | | | |
Silicon Motion Technology Corp. | | | | | 705 | | | | | | 57 | |
| | | | |
Supreme Electronics Co. Ltd. | | | | | 35,861 | | | | | | 90 | |
| | | | |
Synnex Technology International Corp. | | | | | 52,000 | | | | | | 117 | |
| | | | |
Taiwan Semiconductor Manufacturing Co. Ltd. | | | | | 43,000 | | | | | | 1,274 | |
| | | | |
TPK Holding Co. Ltd. | | | | | 25,000 | | | | | | 31 | |
| | | | |
Tripod Technology Corp. | | | | | 21,000 | | | | | | 141 | |
| | | | |
Unimicron Technology Corp. | | | | | 4,000 | | | | | | 22 | |
| | | | |
Walsin Technology Corp. | | | | | 5,000 | | | | | | 18 | |
| | | | |
Wistron Corp. | | | | | 226,347 | | | | | | 735 | |
| | | | |
Wiwynn Corp. | | | | | 1,000 | | | | | | 81 | |
| | | | |
WPG Holdings Ltd. | | | | | 78,560 | | | | | | 217 | |
| | | | |
WT Microelectronics Co. Ltd. (b) | | | | | 43,880 | | | | | | 167 | |
| | | | |
Yageo Corp. | | | | | 1,000 | | | | | | 23 | |
| | | | |
Zhen Ding Technology Holding Ltd. | | | | | 32,000 | | | | | | 128 | |
| | | | | | | | | | | | |
| | | | | | | | | | | 14,872 | |
| | | | | | | | | | | | |
| |
| MATERIALS 0.8% | |
| | | | |
Asia Cement Corp. | | | | | 46,000 | | | | | | 62 | |
| | | | |
China Steel Corp. (b) | | | | | 266,000 | | | | | | 189 | |
| | | | |
Eternal Materials Co. Ltd. | | | | | 25,300 | | | | | | 24 | |
| | | | |
Formosa Chemicals & Fibre Corp. | | | | | 30,000 | | | | | | 47 | |
| | | | |
Formosa Plastics Corp. | | | | | 92,000 | | | | | | 163 | |
| | | | |
Nan Ya Plastics Corp. | | | | | 49,000 | | | | | | 74 | |
| | | | | | | | | | | | |
| | | | | SHARES | | | | | MARKET
VALUE
(000S) | |
| | | | |
Taiwan Cement Corp. | | | | | 182,553 | | | $ | | | 192 | |
| | | | |
Taiwan Fertilizer Co. Ltd. (b) | | | | | 10,000 | | | | | | 20 | |
| | | | |
Tung Ho Steel Enterprise Corp. | | | | | 21,020 | | | | | | 45 | |
| | | | |
YFY, Inc. | | | | | 42,000 | | | | | | 40 | |
| | | | | | | | | | | | |
| | | | | | | | | | | 856 | |
| | | | | | | | | | | | |
| |
| REAL ESTATE 0.1% | |
| | | | |
Farglory Land Development Co. Ltd. | | | | | 4,000 | | | | | | 10 | |
| | | | |
Highwealth Construction Corp. (b) | | | | | 14,396 | | | | | | 23 | |
| | | | |
Ruentex Development Co. Ltd. | | | | | 26,380 | | | | | | 35 | |
| | | | | | | | | | | | |
| | | | | | | | | | | 68 | |
| | | | | | | | | | | | |
Total Taiwan | | | | | | | | | | | 21,719 | |
| | | | | | | | | | | | |
| |
| THAILAND 2.3% | |
| |
| COMMUNICATION SERVICES 0.2% | |
| | | | |
Advanced Info Service PCL | | | | | 31,200 | | | | | | 177 | |
| | | | |
Digital Telecommunications Infrastructure Fund ‘F’ | | | | | 197,700 | | | | | | 42 | |
| | | | |
Jasmine International PCL | | | | | 381,200 | | | | | | 31 | |
| | | | | | | | | | | | |
| | | | | | | | | | | 250 | |
| | | | | | | | | | | | |
| |
| CONSUMER DISCRETIONARY 0.0% | |
| | | | |
Sri Trang Agro-Industry PCL | | | | | 73,100 | | | | | | 43 | |
| | | | | | | | | | | | |
| |
| CONSUMER STAPLES 0.4% | |
| | | | |
Berli Jucker PCL | | | | | 23,600 | | | | | | 13 | |
| | | | |
Charoen Pokphand Foods PCL (b) | | | | | 224,700 | | | | | | 140 | |
| | | | |
CP ALL PCL | | | | | 60,800 | | | | | | 91 | |
| | | | |
Home Product Center PCL | | | | | 84,100 | | | | | | 21 | |
| | | | |
Thai Beverage PCL | | | | | 244,000 | | | | | | 81 | |
| | | | |
Thai Union Group PCL ‘F’ | | | | | 189,500 | | | | | | 77 | |
| | | | | | | | | | | | |
| | | | | | | | | | | 423 | |
| | | | | | | | | | | | |
| |
| ENERGY 0.9% | |
| | | | |
Bangchak Corp. PCL | | | | | 70,800 | | | | | | 72 | |
| | | | |
IRPC PCL | | | | | 1,042,400 | | | | | | 47 | |
| | | | |
PTT PCL | | | | | 699,200 | | | | | | 618 | |
| | | | |
Star Petroleum Refining PCL (b) | | | | | 154,500 | | | | | | 34 | |
| | | | |
Thai Oil PCL | | | | | 81,800 | | | | | | 118 | |
| | | | | | | | | | | | |
| | | | | | | | | | | 889 | |
| | | | | | | | | | | | |
| |
| FINANCIALS 0.1% | |
| | | | |
Thanachart Capital PCL | | | | | 29,600 | | | | | | 36 | |
| | | | |
Tisco Financial Group PCL | | | | | 25,800 | | | | | | 67 | |
| | | | | | | | | | | | |
| | | | | | | | | | | 103 | |
| | | | | | | | | | | | |
| |
| HEALTH CARE 0.2% | |
| | | | |
Bangkok Dusit Medical Services PCL ‘F’ | | | | | 186,800 | | | | | | 136 | |
| | | | |
Bumrungrad Hospital PCL | | | | | 11,700 | | | | | | 79 | |
| | | | |
Sri Trang Gloves Thailand PCL | | | | | 76,700 | | | | | | 21 | |
| | | | | | | | | | | | |
| | | | | | | | | | | 236 | |
| | | | | | | | | | | | |
| |
| INFORMATION TECHNOLOGY 0.1% | |
| | | | |
Fabrinet (b) | | | | | 314 | | | | | | 77 | |
| | | | | | | | | | | | |
| |
| MATERIALS 0.3% | |
| | | | |
PTT Global Chemical PCL | | | | | 143,400 | | | | | | 119 | |
| | | | |
Siam Cement PCL | | | | | 29,100 | | | | | | 178 | |
| | | | | | | | | | | | |
| | | | | | | | | | | 297 | |
| | | | | | | | | | | | |
| |
| | | | | | | | | | | | |
| | | | | SHARES | | | | | MARKET
VALUE
(000S) | |
| REAL ESTATE 0.1% | |
| | | | |
Land & Houses PCL | | | | | 234,000 | | | $ | | | 38 | |
| | | | |
Supalai PCL | | | | | 67,500 | | | | | | 33 | |
| | | | | | | | | | | | |
| | | | | | | | | | | 71 | |
| | | | | | | | | | | | |
| |
| UTILITIES 0.0% | |
| | | | |
Ratch Group PCL | | | | | 25,550 | | | | | | 18 | |
| | | | | | | | | | | | |
Total Thailand | | | | | | | | | | | 2,407 | |
| | | | | | | | | | | | |
| |
| TURKEY 1.5% | |
| |
| COMMUNICATION SERVICES 0.2% | |
| | | | |
Turk Telekomunikasyon AS (b) | | | | | 17,989 | | | | | | 27 | |
| | | | |
Turkcell Iletisim Hizmetleri AS | | | | | 51,596 | | | | | | 159 | |
| | | | | | | | | | | | |
| | | | | | | | | | | 186 | |
| | | | | | | | | | | | |
| |
| CONSUMER DISCRETIONARY 0.0% | |
| | | | |
Arcelik AS | | | | | 2,941 | | | | | | 16 | |
| | | | | | | | | | | | |
| | | | | | | | | | | | |
| CONSUMER STAPLES 0.6% | |
| | | | |
Anadolu Efes Biracilik Ve Malt Sanayii AS | | | | | 13,830 | | | | | | 105 | |
| | | | |
BIM Birlesik Magazalar AS | | | | | 21,033 | | | | | | 351 | |
| | | | |
Coca-Cola Icecek AS | | | | | 2,118 | | | | | | 53 | |
| | | | |
Ford Otomotiv Sanayi AS | | | | | 2,255 | | | | | | 78 | |
| | | | |
Vestel Elektronik Sanayi ve Ticaret AS (b) | | | | | 14,375 | | | | | | 35 | |
| | | | | | | | | | | | |
| | | | | | | | | | | 622 | |
| | | | | | | | | | | | |
| |
| ENERGY 0.0% | |
| | | | |
Turkiye Petrol Rafinerileri AS | | | | | 6,984 | | | | | | 36 | |
| | | | | | | | | | | | |
| |
| FINANCIALS 0.3% | |
| | | | |
Akbank TAS | | | | | 31,359 | | | | | | 61 | |
| | | | |
Haci Omer Sabanci Holding AS | | | | | 5,592 | | | | | | 17 | |
| | | | |
Is Yatirim Menkul Degerler AS ‘A’ | | | | | 97,172 | | | | | | 117 | |
| | | | |
Turkiye Is Bankasi AS ‘C’ | | | | | 78,651 | | | | | | 38 | |
| | | | |
Yapi ve Kredi Bankasi AS | | | | | 27,804 | | | | | | 29 | |
| | | | | | | | | | | | |
| | | | | | | | | | | 262 | |
| | | | | | | | | | | | |
| |
| INDUSTRIALS 0.3% | |
| | | | |
AG Anadolu Grubu Holding AS | | | | | 6,348 | | | | | | 71 | |
| | | | |
Aselsan Elektronik Sanayi Ve Ticaret AS | | | | | 21,254 | | | | | | 38 | |
| | | | |
Enka Insaat ve Sanayi AS | | | | | 37,219 | | | | | | 47 | |
| | | | |
KOC Holding AS | | | | | 11,038 | | | | | | 77 | |
| | | | |
Tekfen Holding AS (b) | | | | | 26,328 | | | | | | 42 | |
| | | | |
Turkiye Sise ve Cam Fabrikalari AS | | | | | 12,413 | | | | | | 19 | |
| | | | | | | | | | | | |
| | | | | | | | | | | 294 | |
| | | | | | | | | | | | |
| |
| MATERIALS 0.1% | |
| | | | |
Eregli Demir ve Celik Fabrikalari TAS | | | | | 55,568 | | | | | | 91 | |
| | | | |
Petkim Petrokimya Holding AS (b) | | | | | 27,743 | | | | | | 18 | |
| | | | | | | | | | | | |
| | | | | | | | | | | 109 | |
| | | | | | | | | | | | |
| |
| UTILITIES 0.0% | |
| | | | |
Aygaz AS | | | | | 1 | | | | | | 0 | |
| | | | |
Enerjisa Enerji AS | | | | | 12,194 | | | | | | 25 | |
| | | | | | | | | | | | |
| | | | | | | | | | | 25 | |
| | | | | | | | | | | | |
Total Turkey | | | | | | | | | | | 1,550 | |
| | | | | | | | | | | | |
| |
| | | | | | | | | | | | |
| See Accompanying Notes | | | ANNUAL FINANCIAL AND OTHER INFORMATION | | | | | | | JUNE 30, 2024 | | | 17 |
| | | | | | |
| Schedule of Investments | | PIMCO RAFI Dynamic Multi-Factor Emerging Markets Equity ETF | | (Cont.) | | |
| | | | | | | | | | | | |
| | | | | SHARES | | | | | MARKET
VALUE
(000S) | |
| UNITED ARAB EMIRATES 0.5% | |
| |
| CONSUMER DISCRETIONARY 0.1% | |
| | | | |
Abu Dhabi National Oil Co. for Distribution PJSC | | | | | 62,997 | | | $ | | | 58 | |
| | | | | | | | | | | | |
| |
| ENERGY 0.0% | |
| | | | |
ADNOC Drilling Co. PJSC | | | | | 29,618 | | | | | | 33 | |
| | | | | | | | | | | | |
| |
| FINANCIALS 0.3% | |
| | | | |
Abu Dhabi Islamic Bank PJSC | | | | | 13,372 | | | | | | 42 | |
| | | | |
Dubai Islamic Bank PJSC | | | | | 41,157 | | | | | | 64 | |
| | | | |
Emirates NBD Bank PJSC | | | | | 7,644 | | | | | | 35 | |
| | | | |
First Abu Dhabi Bank PJSC | | | | | 37,527 | | | | | | 127 | |
| | | | | | | | | | | | |
| | | | | | | | | | | 268 | |
| | | | | | | | | | | | |
| |
| MATERIALS 0.0% | |
| | | | |
Borouge PLC | | | | | 24,797 | | | | | | 16 | |
| | | | | | | | | | | | |
| |
| REAL ESTATE 0.1% | |
| | | | |
Emaar Development PJSC | | | | | 35,447 | | | | | | 77 | |
| | | | |
Emaar Properties PJSC | | | | | 25,076 | | | | | | 56 | |
| | | | | | | | | | | | |
| | | | | | | | | | | 133 | |
| | | | | | | | | | | | |
Total United Arab Emirates | | | | | | | | | | | 508 | |
| | | | | | | | | | | | |
Total Common Stocks (Cost $89,942) | | | 101,564 | |
| | | | |
| |
| PREFERRED STOCKS 2.6% | |
| | | | | | | | | | | | |
| BRAZIL 2.6% | |
| | | | | | | | | | | | |
| BANKING & FINANCE 0.3% | |
| | | | |
Banco do Estado do Rio Grande do Sul SA | | | | | 22,248 | | | | | | 45 | |
| | | | |
Itau Unibanco Holding SA | | | | | 44,900 | | | | | | 260 | |
| | | | | | | | | | | | |
| | | | | | | | | | | 305 | |
| | | | | | | | | | | | |
| |
| | | | | | | | | | | | |
| | | | | SHARES | | | | | MARKET
VALUE
(000S) | |
| INDUSTRIALS 0.5% | |
| | | | |
Braskem SA | | | | | 25,990 | | | $ | | | 83 | |
| | | | |
Gerdau SA | | | | | 51,414 | | | | | | 169 | |
| | | | |
Metalurgica Gerdau SA | | | | | 96,392 | | | | | | 184 | |
| | | | |
Usinas Siderurgicas de Minas Gerais SA Usiminas ‘A’ | | | | | 85,900 | | | | | | 121 | |
| | | | | | | | | | | | |
| | | | | | | | | | | 557 | |
| | | | | | | | | | | | |
| |
| UTILITIES 1.8% | |
| | | | |
Cia de Transmissao de Energia Eletrica Paulista | | | | | 16,221 | | | | | | 76 | |
| | | | |
Cia Energetica de Minas Gerais | | | | | 79,397 | | | | | | 141 | |
| | | | |
Companhia Paranaense de Energia | | | | | 26,056 | | | | | | 43 | |
| | | | |
Petroleo Brasileiro SA | | | | | 234,298 | | | | | | 1,595 | |
| | | | | | | | | | | | |
| | | | | | | | | | | 1,855 | |
| | | | | | | | | | | | |
Total Brazil | | | | | | | | | | | 2,717 | |
| | | | | | | | | | | | |
| |
| CHILE 0.0% | |
| |
| INDUSTRIALS 0.0% | |
| | | | |
Embotelladora Andina SA | | | | | 8,339 | | | | | | 24 | |
| | | | | | | | | | | | |
Total Chile | | | | | | | | | | | 24 | |
| | | | | | | | | | | | |
| |
| RUSSIA 0.0% | |
| | | | | | | | | | | | |
| UTILITIES 0.0% | |
| | | | |
Bashneft PJSC « | | | | | 2,929 | | | | | | 0 | |
| | | | |
Transneft PJSC «(d) | | | | | 2,200 | | | $ | | | 0 | |
| | | | | | | | | | | | |
| | | | | | | | | | | 0 | |
| | | | | | | | | | | | |
Total Russia | | | | | | | | | | | 0 | |
| | | | |
Total Preferred Stocks (Cost $2,156) | | | 2,741 | |
| | | | |
| | | | | | | | | | | | |
| | | | | | | | | | | | |
| | | | | SHARES | | | | | MARKET
VALUE
(000S) | |
| REAL ESTATE INVESTMENT TRUSTS 0.1% | |
| | | | | | | | | | | | |
| SOUTH AFRICA 0.1% | |
| | | | | | | | | | | | |
| REAL ESTATE 0.1% | |
| | | | |
Growthpoint Properties Ltd. | | | | | 42,265 | | | $ | | | 29 | |
| | | | | | | | | | | | |
Total Real Estate Investment Trusts
(Cost $35) | | | 29 | |
| | | | | | | | | | | | |
| | | | | | | | | | | | |
| SHORT-TERM INSTRUMENTS 0.6% | |
| | | | | | | | | | | | |
| REPURCHASE AGREEMENTS (f) 0.6% | |
| | | | | | | | | | | 632 | |
| | | | | | | | | | | | |
Total Short-Term Instruments
(Cost $632) | | | 632 | |
| | | | |
| | | | |
| | | | | | | | | | | | |
Total Investments in Securities
(Cost $92,765) | | | 104,966 | |
| | | | |
| | | | | | | | | | | | |
| INVESTMENTS IN AFFILIATES 0.0% | |
| | | | | | | | | | | | |
| SHORT-TERM INSTRUMENTS 0.0% | |
| | | | | | | | | | | | |
| MUTUAL FUNDS 0.0% | |
|
PIMCO Government Money Market Fund | |
5.470% (c)(d)(e) | | | | | 8,024 | | | | | | 8 | |
| | | | | | | | | | | | |
| Total Short-Term Instruments (Cost $8) | | | 8 | |
| | | | |
| | | | |
| | | | | | | | | | | | |
| Total Investments in Affiliates (Cost $8) | | | 8 | |
| |
| | | | |
Total Investments 100.0% (Cost $92,773) | | | $ | | | 104,974 | |
| |
| Other Assets and Liabilities, net 0.0% | | | 28 | |
| | | | |
| Net Assets 100.0% | | | $ | | | 105,002 | |
| | | | | | | |
NOTES TO SCHEDULE OF INVESTMENTS:
| * | A zero balance may reflect actual amounts rounding to less than one thousand. |
| « | Security valued using significant unobservable inputs (Level 3). |
| (a) | Security is not accruing income as of the date of this report. |
| (b) | Security did not produce income within the last twelve months. |
| (c) | Institutional Class Shares of each Fund. |
| (d) | Securities with an aggregate market value of $7 were out on loan in exchange for $8 of cash collateral as of June 30, 2024. The collateral was invested in a cash collateral reinvestment vehicle as described in Note 5 in the Notes to Financial Statements. |
| (e) | Coupon represents a 7-Day Yield. |
BORROWINGS AND OTHER FINANCING TRANSACTIONS
(f) REPURCHASE AGREEMENTS:
| | | | | | | | | | | | | | | | | | | | | | | | | | | | | | |
| Counterparty | | Lending
Rate | | | Settlement
Date | | | Maturity
Date | | | Principal
Amount | | | Collateralized By | | Collateral
(Received) | | | Repurchase
Agreements,
at Value | | | Repurchase
Agreement
Proceeds
to be
Received(1) | |
| FICC | | | 2.600 | % | | | 06/28/2024 | | | | 07/01/2024 | | | $ | 632 | | | U.S. Treasury Notes 4.500% due 03/31/2026 | | $ | (645 | ) | | $ | 632 | | | $ | 632 | |
| | | | | | | | | | | | | | | | | | | | | | | | | | | | | | |
Total Repurchase Agreements | | | | | $ | (645 | ) | | $ | 632 | | | $ | 632 | |
| | | | | | | | | | | | | | | | | | | | | | | | | | | | | | |
| | | | | | |
| 18 | | PIMCO EQUITY SERIES | | | See Accompanying Notes | |
BORROWINGS AND OTHER FINANCING TRANSACTIONS SUMMARY
The following is a summary by counterparty of the market value of Borrowings and Other Financing Transactions and collateral pledged/(received) as of June 30, 2024:
| | | | | | | | | | | | | | | | | | | | | | | | | | | | |
| Counterparty | | Repurchase
Agreement
Proceeds
to be
Received(1) | | | Payable for
Reverse
Repurchase
Agreements | | | Payable for
Sale-Buyback
Transactions | | | Securities
Out on loan | | | Total
Borrowings and
Other Financing
Transactions | | | Collateral
Pledged/(Received) | | | Net Exposure(2) | |
Global/Master Repurchase Agreement | | | | | | | | | | | | | | | | | | | | | | | | | | | | |
FICC | | $ | 632 | | | $ | 0 | | | $ | 0 | | | $ | 0 | | | $ | 632 | | | $ | (645 | ) | | $ | (13 | ) |
| | | | | | | |
Master Securities Lending Agreement | | | | | | | | | | | | | | | | | | | | | | | | | | | | |
UBS | | | 0 | | | | 0 | | | | 0 | | | | 7 | | | | 7 | | | | (8 | ) | | | (1 | ) |
| | | | | | | | | | | | | | | | | | | | | | | | | | | | |
Total Borrowings and Other Financing Transactions | | $ | 632 | | | $ | 0 | | | $ | 0 | | | $ | 7 | | | | | | | | | | | | | |
| | | | | | | | | | | | | | | | | | | | | | | | | | | | |
CERTAIN TRANSFERS ACCOUNTED FOR AS SECURED BORROWINGS
Remaining Contractual Maturity of the Agreements
| | | | | | | | | | | | | | | | | | | | |
| | | Overnight and
Continuous | | | Up to 30 days | | | 31-90 days | | | Greater Than 90 days | | | Total | |
Securities Lending Transactions(3) | | | | | | | | | | | | | | | | | | | | |
Preferred Securities | | $ | 8 | | | $ | 0 | | | $ | 0 | | | $ | 0 | | | $ | 8 | |
| | | | | | | | | | | | | | | | | | | | |
Total Borrowings | | $ | 8 | | | $ | 0 | | | $ | 0 | | | $ | 0 | | | $ | 8 | |
| | | | | | | | | | | | | | | | | | | | |
Payable for securities on loan - cash collateral | | | $ | 8 | |
| | | | | | | | | | | | | | | | | | | | |
| (1) | Includes accrued interest. |
| (2) | Net Exposure represents the net receivable/(payable) that would be due from/to the counterparty in the event of default. Exposure from borrowings and other financing transactions can only be netted across transactions governed under the same master agreement with the same legal entity. See Note 8, Master Netting Arrangements, in the Notes to Financial Statements for more information. |
| (3) | Includes cash collateral as described in Note 5 in the Notes to Financial Statements. |
FAIR VALUE OF FINANCIAL DERIVATIVE INSTRUMENTS
The following is a summary of the fair valuation of the Fund’s derivative instruments categorized by risk exposure. See Note 7, Principal and Other Risks, in the Notes to Financial Statements on risks of the Fund.
The effect of Financial Derivative Instruments on the Statements of Operations for the period ended June 30, 2024:
| | | | | | | | | | | | | | | | | | | | | | | | |
| | | Derivatives not accounted for as hedging instruments | |
| | | Commodity
Contracts | | | Credit
Contracts | | | Equity
Contracts | | | Foreign
Exchange
Contracts | | | Interest
Rate Contracts | | | Total | |
Net Realized Gain (Loss) on Financial Derivative Instruments | | | | | | | | | | | | | | | | | | | | | | | | |
Over the counter | | | | | | | | | | | | | | | | | | | | | | | | |
Forward Foreign Currency Contracts | | $ | 0 | | | $ | 0 | | | $ | 0 | | | $ | 3 | | | $ | 0 | | | $ | 3 | |
| | | | | | | | | | | | | | | | | | | | | | | | |
FAIR VALUE MEASUREMENTS
The following is a summary of the fair valuations according to the inputs used as of June 30, 2024 in valuing the Fund’s assets and liabilities:
| | | | | | | | | | | | | | | | |
| Category and Subcategory | | Level 1 | | | Level 2 | | | Level 3 | | | Fair
Value at
06/30/2024 | |
Investments in Securities, at Value | |
Common Stocks | |
Brazil | |
Communication Services | | $ | 197 | | | $ | 0 | | | $ | 0 | | | $ | 197 | |
Consumer Discretionary | | | 334 | | | | 0 | | | | 0 | | | | 334 | |
Consumer Staples | | | 952 | | | | 0 | | | | 0 | | | | 952 | |
Energy | | | 185 | | | | 0 | | | | 0 | | | | 185 | |
Financials | | | 154 | | | | 0 | | | | 0 | | | | 154 | |
Industrials | | | 10 | | | | 0 | | | | 0 | | | | 10 | |
Materials | | | 985 | | | | 0 | | | | 0 | | | | 985 | |
Utilities | | | 131 | | | | 0 | | | | 0 | | | | 131 | |
Chile | |
Consumer Staples | | | 175 | | | | 0 | | | | 0 | | | | 175 | |
Energy | | | 48 | | | | 0 | | | | 0 | | | | 48 | |
Financials | | | 333 | | | | 0 | | | | 0 | | | | 333 | |
| | | | | | | | | | | | | | | | |
| Category and Subcategory | | Level 1 | | | Level 2 | | | Level 3 | | | Fair
Value at
06/30/2024 | |
Materials | | $ | 34 | | | $ | 0 | | | $ | 0 | | | $ | 34 | |
Utilities | | | 124 | | | | 0 | | | | 0 | | | | 124 | |
China | |
Communication Services | | | 571 | | | | 1,680 | | | | 0 | | | | 2,251 | |
Consumer Discretionary | | | 0 | | | | 205 | | | | 0 | | | | 205 | |
Consumer Staples | | | 402 | | | | 1,729 | | | | 0 | | | | 2,131 | |
Energy | | | 52 | | | | 2,163 | | | | 0 | | | | 2,215 | |
Financials | | | 75 | | | | 6,986 | | | | 0 | | | | 7,061 | |
Health Care | | | 0 | | | | 781 | | | | 0 | | | | 781 | |
Industrials | | | 416 | | | | 2,974 | | | | 0 | | | | 3,390 | |
Information Technology | | | 113 | | | | 2,304 | | | | 0 | | | | 2,417 | |
Materials | | | 77 | | | | 2,672 | | | | 0 | | | | 2,749 | |
Real Estate | | | 0 | | | | 729 | | | | 239 | | | | 968 | |
Utilities | | | 937 | | | | 1,198 | | | | 0 | | | | 2,135 | |
| | | | | | | | | | | | |
| See Accompanying Notes | | | ANNUAL FINANCIAL AND OTHER INFORMATION | | | | | | | JUNE 30, 2024 | | | 19 |
| | | | | | |
| Schedule of Investments | | PIMCO RAFI Dynamic Multi-Factor Emerging Markets Equity ETF | | (Cont.) | | |
| | | | | | | | | | | | | | | | |
| Category and Subcategory | | Level 1 | | | Level 2 | | | Level 3 | | | Fair
Value at
06/30/2024 | |
Greece | |
Communication Services | | $ | 0 | | | $ | 58 | | | $ | 0 | | | $ | 58 | |
Consumer Staples | | | 113 | | | | 0 | | | | 0 | | | | 113 | |
Energy | | | 19 | | | | 0 | | | | 0 | | | | 19 | |
Financials | | | 70 | | | | 70 | | | | 0 | | | | 140 | |
Industrials | | | 64 | | | | 25 | | | | 0 | | | | 89 | |
Hong Kong | | | | | | | | | | | | | | | | |
Consumer Staples | | | 0 | | | | 76 | | | | 0 | | | | 76 | |
Financials | | | 44 | | | | 464 | | | | 0 | | | | 508 | |
Industrials | | | 48 | | | | 259 | | | | 0 | | | | 307 | |
Materials | | | 0 | | | | 11 | | | | 0 | | | | 11 | |
Real Estate | | | 0 | | | | 247 | | | | 0 | | | | 247 | |
Utilities | | | 0 | | | | 713 | | | | 0 | | | | 713 | |
India | | | | | | | | | | | | | | | | |
Communication Services | | | 0 | | | | 689 | | | | 0 | | | | 689 | |
Consumer Discretionary | | | 0 | | | | 379 | | | | 0 | | | | 379 | |
Consumer Staples | | | 0 | | | | 2,272 | | | | 0 | | | | 2,272 | |
Energy | | | 0 | | | | 3,267 | | | | 0 | | | | 3,267 | |
Financials | | | 0 | | | | 1,904 | | | | 0 | | | | 1,904 | |
Health Care | | | 0 | | | | 952 | | | | 0 | | | | 952 | |
Industrials | | | 0 | | | | 1,658 | | | | 0 | | | | 1,658 | |
Information Technology | | | 0 | | | | 2,441 | | | | 0 | | | | 2,441 | |
Materials | | | 0 | | | | 2,090 | | | | 0 | | | | 2,090 | |
Real Estate | | | 0 | | | | 142 | | | | 0 | | | | 142 | |
Utilities | | | 0 | | | | 1,842 | | | | 0 | | | | 1,842 | |
Indonesia | | | | | | | | | | | | | | | | |
Communication Services | | | 0 | | | | 208 | | | | 0 | | | | 208 | |
Consumer Staples | | | 99 | | | | 22 | | | | 0 | | | | 121 | |
Energy | | | 142 | | | | 10 | | | | 0 | | | | 152 | |
Financials | | | 0 | | | | 297 | | | | 0 | | | | 297 | |
Health Care | | | 38 | | | | 0 | | | | 0 | | | | 38 | |
Materials | | | 49 | | | | 104 | | | | 0 | | | | 153 | |
Ireland | | | | | | | | | | | | | | | | |
Information Technology | | | 392 | | | | 0 | | | | 0 | | | | 392 | |
Kuwait | | | | | | | | | | | | | | | | |
Communication Services | | | 0 | | | | 48 | | | | 0 | | | | 48 | |
Consumer Staples | | | 3 | | | | 0 | | | | 0 | | | | 3 | |
Financials | | | 0 | | | | 202 | | | | 0 | | | | 202 | |
Industrials | | | 0 | | | | 4 | | | | 0 | | | | 4 | |
Real Estate | | | 4 | | | | 0 | | | | 0 | | | | 4 | |
Malaysia | |
Communication Services | | | 28 | | | | 100 | | | | 0 | | | | 128 | |
Consumer Staples | | | 0 | | | | 206 | | | | 0 | | | | 206 | |
Energy | | | 13 | | | | 0 | | | | 0 | | | | 13 | |
Financials | | | 236 | | | | 470 | | | | 0 | | | | 706 | |
Health Care | | | 205 | | | | 0 | | | | 0 | | | | 205 | |
Industrials | | | 37 | | | | 159 | | | | 0 | | | | 196 | |
Materials | | | 0 | | | | 107 | | | | 0 | | | | 107 | |
Utilities | | | 211 | | | | 138 | | | | 0 | | | | 349 | |
Mexico | |
Communication Services | | | 91 | | | | 0 | | | | 0 | | | | 91 | |
Consumer Staples | | | 1,012 | | | | 0 | | | | 0 | | | | 1,012 | |
Financials | | | 40 | | | | 0 | | | | 0 | | | | 40 | |
Industrials | | | 105 | | | | 0 | | | | 0 | | | | 105 | |
Materials | | | 452 | | | | 0 | | | | 0 | | | | 452 | |
Philippines | |
Communication Services | | | 56 | | | | 0 | | | | 0 | | | | 56 | |
Consumer Staples | | | 26 | | | | 0 | | | | 0 | | | | 26 | |
Industrials | | | 71 | | | | 0 | | | | 0 | | | | 71 | |
Utilities | | | 20 | | | | 0 | | | | 0 | | | | 20 | |
Poland | |
Communication Services | | | 0 | | | | 68 | | | | 0 | | | | 68 | |
Financials | | | 0 | | | | 551 | | | | 0 | | | | 551 | |
Information Technology | | | 0 | | | | 10 | | | | 0 | | | | 10 | |
Materials | | | 0 | | | | 94 | | | | 0 | | | | 94 | |
Utilities | | | 84 | | | | 79 | | | | 0 | | | | 163 | |
Qatar | |
Communication Services | | | 33 | | | | 0 | | | | 0 | | | | 33 | |
Energy | | | 0 | | | | 41 | | | | 0 | | | | 41 | |
Financials | | | 12 | | | | 292 | | | | 0 | | | | 304 | |
Industrials | | | 15 | | | | 94 | | | | 0 | | | | 109 | |
| | | | | | | | | | | | | | | | |
| Category and Subcategory | | Level 1 | | | Level 2 | | | Level 3 | | | Fair
Value at
06/30/2024 | |
Real Estate | | $ | 0 | | | $ | 42 | | | $ | 0 | | | $ | 42 | |
Utilities | | | 0 | | | | 10 | | | | 0 | | | | 10 | |
Russia | |
Financials | | | 0 | | | | 0 | | | | 1 | | | | 1 | |
Saudi Arabia | |
Communication Services | | | 0 | | | | 481 | | | | 0 | | | | 481 | |
Consumer Staples | | | 0 | | | | 193 | | | | 0 | | | | 193 | |
Energy | | | 0 | | | | 546 | | | | 0 | | | | 546 | |
Financials | | | 86 | | | | 60 | | | | 0 | | | | 146 | |
Health Care | | | 0 | | | | 26 | | | | 0 | | | | 26 | |
Materials | | | 308 | | | | 142 | | | | 0 | | | | 450 | |
Real Estate | | | 0 | | | | 34 | | | | 0 | | | | 34 | |
Utilities | | | 145 | | | | 47 | | | | 0 | | | | 192 | |
South Africa | |
Communication Services | | | 78 | | | | 240 | | | | 0 | | | | 318 | |
Consumer Staples | | | 434 | | | | 252 | | | | 0 | | | | 686 | |
Energy | | | 0 | | | | 104 | | | | 0 | | | | 104 | |
Financials | | | 51 | | | | 522 | | | | 0 | | | | 573 | |
Health Care | | | 137 | | | | 0 | | | | 0 | | | | 137 | |
Industrials | | | 0 | | | | 118 | | | | 0 | | | | 118 | |
Information Technology | | | 147 | | | | 0 | | | | 0 | | | | 147 | |
Materials | | | 101 | | | | 682 | | | | 0 | | | | 783 | |
South Korea | |
Communication Services | | | 0 | | | | 662 | | | | 0 | | | | 662 | |
Consumer Staples | | | 0 | | | | 4,662 | | | | 0 | | | | 4,662 | |
Energy | | | 0 | | | | 402 | | | | 0 | | | | 402 | |
Financials | | | 0 | | | | 3,052 | | | | 0 | | | | 3,052 | |
Industrials | | | 0 | | | | 2,093 | | | | 0 | | | | 2,093 | |
Information Technology | | | 0 | | | | 1,226 | | | | 0 | | | | 1,226 | |
Materials | | | 0 | | | | 1,228 | | | | 0 | | | | 1,228 | |
Utilities | | | 0 | | | | 408 | | | | 0 | | | | 408 | |
Taiwan | |
Communication Services | | | 0 | | | | 682 | | | | 0 | | | | 682 | |
Consumer Staples | | | 0 | | | | 893 | | | | 0 | | | | 893 | |
Energy | | | 0 | | | | 40 | | | | 0 | | | | 40 | |
Financials | | | 0 | | | | 3,157 | | | | 0 | | | | 3,157 | |
Industrials | | | 968 | | | | 183 | | | | 0 | | | | 1,151 | |
Information Technology | | | 57 | | | | 14,815 | | | | 0 | | | | 14,872 | |
Materials | | | 0 | | | | 856 | | | | 0 | | | | 856 | |
Real Estate | | | 10 | | | | 58 | | | | 0 | | | | 68 | |
Thailand | |
Communication Services | | | 0 | | | | 250 | | | | 0 | | | | 250 | |
Consumer Discretionary | | | 0 | | | | 43 | | | | 0 | | | | 43 | |
Consumer Staples | | | 0 | | | | 423 | | | | 0 | | | | 423 | |
Energy | | | 0 | | | | 889 | | | | 0 | | | | 889 | |
Financials | | | 0 | | | | 103 | | | | 0 | | | | 103 | |
Health Care | | | 0 | | | | 236 | | | | 0 | | | | 236 | |
Information Technology | | | 77 | | | | 0 | | | | 0 | | | | 77 | |
Materials | | | 0 | | | | 297 | | | | 0 | | | | 297 | |
Real Estate | | | 0 | | | | 71 | | | | 0 | | | | 71 | |
Utilities | | | 0 | | | | 18 | | | | 0 | | | | 18 | |
Turkey | |
Communication Services | | | 186 | | | | 0 | | | | 0 | | | | 186 | |
Consumer Discretionary | | | 16 | | | | 0 | | | | 0 | | | | 16 | |
Consumer Staples | | | 517 | | | | 105 | | | | 0 | | | | 622 | |
Energy | | | 36 | | | | 0 | | | | 0 | | | | 36 | |
Financials | | | 145 | | | | 117 | | | | 0 | | | | 262 | |
Industrials | | | 294 | | | | 0 | | | | 0 | | | | 294 | |
Materials | | | 109 | | | | 0 | | | | 0 | | | | 109 | |
Utilities | | | 0 | | | | 25 | | | | 0 | | | | 25 | |
United Arab Emirates | |
Consumer Discretionary | | | 0 | | | | 58 | | | | 0 | | | | 58 | |
Energy | | | 33 | | | | 0 | | | | 0 | | | | 33 | |
Financials | | | 268 | | | | 0 | | | | 0 | | | | 268 | |
Materials | | | 0 | | | | 16 | | | | 0 | | | | 16 | |
Real Estate | | | 133 | | | | 0 | | | | 0 | | | | 133 | |
Preferred Stocks | |
Brazil | |
Banking & Finance | | | 305 | | | | 0 | | | | 0 | | | | 305 | |
Industrials | | | 557 | | | | 0 | | | | 0 | | | | 557 | |
Utilities | | | 1,855 | | | | 0 | | | | 0 | | | | 1,855 | |
| | | | | | |
| 20 | | PIMCO EQUITY SERIES | | | See Accompanying Notes | |
| | | | | | | | | | | | | | | | |
| Category and Subcategory | | Level 1 | | | Level 2 | | | Level 3 | | | Fair
Value at
06/30/2024 | |
Chile | |
Industrials | | $ | 24 | | | $ | 0 | | | $ | 0 | | | $ | 24 | |
Real Estate Investment Trusts | |
South Africa | |
Real Estate | | | 29 | | | | 0 | | | | 0 | | | | 29 | |
Short-Term Instruments | |
Repurchase Agreements | | | 0 | | | | 632 | | | | 0 | | | | 632 | |
| | | | | | | | | | | | | | | | |
| | $ | 17,243 | | | $ | 87,483 | | | $ | 240 | | | $ | 104,966 | |
| | | | | | | | | | | | | | | | |
| | | | | | | | | | | | | | | | |
| Category and Subcategory | | Level 1 | | | Level 2 | | | Level 3 | | | Fair
Value at
06/30/2024 | |
Investments in Affiliates, at Value | |
Short-Term Instruments | |
Mutual Funds | | $ | 8 | | | $ | 0 | | | $ | 0 | | | $ | 8 | |
| | | | | | | | | | | | | | | | |
| | | | |
Total Investments | | $ | 17,251 | | | $ | 87,483 | | | $ | 240 | | | $ | 104,974 | |
| | | | | | | | | | | | | | | | |
There were no significant transfers into or out of Level 3 during the period ended June 30, 2024.
| | | | | | | | | | | | |
| See Accompanying Notes | | | ANNUAL FINANCIAL AND OTHER INFORMATION | | | | | | | JUNE 30, 2024 | | | 21 |
| | | | | | |
| Schedule of Investments | | PIMCO RAFI Dynamic Multi-Factor International Equity ETF | | | | |
(Amounts in thousands*, except number of shares, contracts, units and ounces, if any)
| | | | | | | | | | | | |
| | | | | SHARES | | | | | MARKET
VALUE
(000S) | |
| INVESTMENTS IN SECURITIES 99.5% | |
| | | | | | | | | | | | |
| COMMON STOCKS 97.3% | |
| | | | | | | | | | | | |
| AUSTRALIA 5.0% | |
| | | | | | | | | | | | |
| COMMUNICATION SERVICES 0.2% | |
| | | | |
CAR Group Ltd. | | | | | 10,954 | | | $ | | | 257 | |
| | | | |
Nine Entertainment Co. Holdings Ltd. | | | | | 12,180 | | | | | | 11 | |
| | | | |
REA Group Ltd. | | | | | 1,472 | | | | | | 192 | |
| | | | |
SEEK Ltd. | | | | | 4,608 | | | | | | 66 | |
| | | | | | | | | | | | |
| | | | | | | | | | | 526 | |
| | | | | | | | | | | | |
| |
| CONSUMER DISCRETIONARY 0.1% | |
| | | | |
Amotiv Ltd. | | | | | 3,007 | | | | | | 21 | |
| | | | |
ARB Corp. Ltd. | | | | | 928 | | | | | | 23 | |
| | | | |
Aristocrat Leisure Ltd. | | | | | 5,941 | | | | | | 197 | |
| | | | | | | | | | | | |
| | | | | | | | | | | 241 | |
| | | | | | | | | | | | |
| |
| CONSUMER STAPLES 0.8% | |
| | | | |
Breville Group Ltd. | | | | | 5,330 | | | | | | 96 | |
| | | | |
Coles Group Ltd. | | | | | 25,440 | | | | | | 288 | |
| | | | |
Domino’s Pizza Enterprises Ltd. | | | | | 2,319 | | | | | | 55 | |
| | | | |
GrainCorp Ltd. ‘A’ | | | | | 18,514 | | | | | | 109 | |
| | | | |
Harvey Norman Holdings Ltd. | | | | | 21,744 | | | | | | 60 | |
| | | | |
JB Hi-Fi Ltd. | | | | | 2,508 | | | | | | 102 | |
| | | | |
Metcash Ltd. | | | | | 49,633 | | | | | | 117 | |
| | | | |
Premier Investments Ltd. | | | | | 1,732 | | | | | | 36 | |
| | | | |
Super Retail Group Ltd. | | | | | 9,682 | | | | | | 89 | |
| | | | |
Wesfarmers Ltd. | | | | | 14,373 | | | | | | 623 | |
| | | | |
Woolworths Group Ltd. | | | | | 22,856 | | | | | | 513 | |
| | | | | | | | | | | | |
| | | | | | | | | | | 2,088 | |
| | | | | | | | | | | | |
| |
| ENERGY 0.2% | |
| | | | |
Ampol Ltd. | | | | | 10,552 | | | | | | 227 | |
| | | | |
New Hope Corp. Ltd. | | | | | 5,421 | | | | | | 18 | |
| | | | |
Santos Ltd. | | | | | 6,500 | | | | | | 33 | |
| | | | |
Viva Energy Group Ltd. | | | | | 41,380 | | | | | | 86 | |
| | | | | | | | | | | | |
| | | | | | | | | | | 364 | |
| | | | | | | | | | | | |
| |
| FINANCIALS 1.4% | |
| | | | |
AMP Ltd. | | | | | 127,776 | | | | | | 93 | |
| | | | |
ANZ Group Holdings Ltd. | | | | | 14,799 | | | | | | 278 | |
| | | | |
ASX Ltd. | | | | | 2,712 | | | | | | 108 | |
| | | | |
Bank of Queensland Ltd. | | | | | 13,009 | | | | | | 50 | |
| | | | |
Bendigo & Adelaide Bank Ltd. | | | | | 11,926 | | | | | | 91 | |
| | | | |
Commonwealth Bank of Australia | | | | | 6,958 | | | | | | 590 | |
| | | | |
Insurance Australia Group Ltd. | | | | | 39,799 | | | | | | 189 | |
| | | | |
Macquarie Group Ltd. | | | | | 1,909 | | | | | | 260 | |
| | | | |
Magellan Financial Group Ltd. | | | | | 3,955 | | | | | | 22 | |
| | | | |
Medibank Pvt Ltd. | | | | | 90,926 | | | | | | 225 | |
| | | | |
National Australia Bank Ltd. | | | | | 22,963 | | | | | | 554 | |
| | | | |
NIB Holdings Ltd. | | | | | 11,665 | | | | | | 57 | |
| | | | |
Perpetual Ltd. | | | | | 5,033 | | | | | | 71 | |
| | | | |
QBE Insurance Group Ltd. | | | | | 20,235 | | | | | | 234 | |
| | | | |
Suncorp Group Ltd. | | | | | 30,386 | | | | | | 351 | |
| | | | |
Westpac Banking Corp. | | | | | 20,279 | | | | | | 367 | |
| | | | | | | | | | | | |
| | | | | | | | | | | 3,540 | |
| | | | | | | | | | | | |
| |
| HEALTH CARE 0.3% | |
| | | | |
Ansell Ltd. | | | | | 6,372 | | | | | | 112 | |
| | | | |
Cochlear Ltd. | | | | | 1,096 | | | | | | 242 | |
| | | | |
CSL Ltd. | | | | | 1,178 | | | | | | 231 | |
| | | | | | | | | | | | |
| | | | | SHARES | | | | | MARKET
VALUE
(000S) | |
| | | | |
Sonic Healthcare Ltd. | | | | | 8,639 | | | $ | | | 151 | |
| | | | | | | | | | | | |
| | | | | | | | | | | 736 | |
| | | | | | | | | | | | |
| |
| INDUSTRIALS 0.5% | |
| | | | |
ALS Ltd. | | | | | 7,870 | | | | | | 73 | |
| | | | |
Aurizon Holdings Ltd. | | | | | 75,340 | | | | | | 183 | |
| | | | |
Brambles Ltd. | | | | | 39,861 | | | | | | 385 | |
| | | | |
Computershare Ltd. | | | | | 3,918 | | | | | | 68 | |
| | | | |
Downer EDI Ltd. | | | | | 19,288 | | | | | | 59 | |
| | | | |
McMillan Shakespeare Ltd. | | | | | 2,418 | | | | | | 28 | |
| | | | |
Monadelphous Group Ltd. | | | | | 5,374 | | | | | | 46 | |
| | | | |
Reece Ltd. | | | | | 6,711 | | | | | | 112 | |
| | | | |
Seven Group Holdings Ltd. | | | | | 5,528 | | | | | | 138 | |
| | | | |
Transurban Group | | | | | 19,121 | | | | | | 158 | |
| | | | |
Worley Ltd. | | | | | 6,805 | | | | | | 68 | |
| | | | | | | | | | | | |
| | | | | | | | | | | 1,318 | |
| | | | | | | | | | | | |
| |
| INFORMATION TECHNOLOGY 0.1% | |
| | | | |
WiseTech Global Ltd. | | | | | 3,622 | | | | | | 241 | |
| | | | | | | | | | | | |
| |
| MATERIALS 1.1% | |
| | | | |
BHP Group Ltd. | | | | | 13,458 | | | | | | 385 | |
| | | | |
BlueScope Steel Ltd. | | | | | 12,873 | | | | | | 175 | |
| | | | |
Champion Iron Ltd. | | | | | 4,863 | | | | | | 20 | |
| | | | |
Evolution Mining Ltd. | | | | | 27,847 | | | | | | 65 | |
| | | | |
Fortescue Ltd. | | | | | 48,961 | | | | | | 697 | |
| | | | |
IGO Ltd. | | | | | 12,745 | | | | | | 48 | |
| | | | |
Iluka Resources Ltd. | | | | | 12,660 | | | | | | 55 | |
| | | | |
Incitec Pivot Ltd. | | | | | 63,972 | | | | | | 123 | |
| | | | |
Northern Star Resources Ltd. | | | | | 22,571 | | | | | | 196 | |
| | | | |
Orica Ltd. | | | | | 8,516 | | | | | | 101 | |
| | | | |
Regis Resources Ltd. (a) | | | | | 22,913 | | | | | | 27 | |
| | | | |
Rio Tinto Ltd. | | | | | 10,173 | | | | | | 806 | |
| | | | |
Sandfire Resources Ltd. (a) | | | | | 5,848 | | | | | | 34 | |
| | | | |
Sims Ltd. | | | | | 10,714 | | | | | | 73 | |
| | | | | | | | | | | | |
| | | | | | | | | | | 2,805 | |
| | | | | | | | | | | | |
| |
| REAL ESTATE 0.0% | |
| | | | |
Lendlease Corp. Ltd. | | | | | 13,910 | | | | | | 50 | |
| | | | | | | | | | | | |
| |
| UTILITIES 0.3% | |
| | | | |
AGL Energy Ltd. | | | | | 35,698 | | | | | | 257 | |
| | | | |
APA Group | | | | | 13,003 | | | | | | 69 | |
| | | | |
Origin Energy Ltd. | | | | | 47,647 | | | | | | 345 | |
| | | | | | | | | | | | |
| | | | | | | | | | | 671 | |
| | | | | | | | | | | | |
Total Australia | | | | | | | | | | | 12,580 | |
| | | | | | | | | | | | |
| |
| AUSTRIA 0.2% | |
| | | | | | | | | | | | |
| ENERGY 0.0% | |
| | | | |
OMV AG | | | | | 1,440 | | | | | | 63 | |
| | | | | | | | | | | | |
| |
| FINANCIALS 0.1% | |
| | | | |
Erste Group Bank AG | | | | | 1,771 | | | | | | 84 | |
| | | | |
UNIQA Insurance Group AG | | | | | 9,083 | | | | | | 77 | |
| | | | | | | | | | | | |
| | | | | | | | | | | 161 | |
| | | | | | | | | | | | |
| |
| INDUSTRIALS 0.0% | |
| | | | |
Andritz AG | | | | | 1,508 | | | | | | 93 | |
| | | | | | | | | | | | |
| | | | | | | | | | | | |
| MATERIALS 0.1% | |
| | | | |
voestalpine AG | | | | | 4,466 | | | | | | 121 | |
| | | | | | | | | | | | |
| |
| | | | | | | | | | | | |
| | | | | SHARES | | | | | MARKET
VALUE
(000S) | |
| REAL ESTATE 0.0% | |
| | | | |
CA Immobilien Anlagen AG | | | | | 2,848 | | | $ | | | 94 | |
| | | | | | | | | | | | |
| |
| UTILITIES 0.0% | |
| | | | |
Verbund AG | | | | | 729 | | | | | | 58 | |
| | | | | | | | | | | | |
Total Austria | | | | | | | | | | | 590 | |
| | | | | | | | | | | | |
| |
| BELGIUM 0.4% | |
| | | | | | | | | | | | |
| COMMUNICATION SERVICES 0.0% | |
| | | | |
Proximus SADP | | | | | 7,196 | | | | | | 57 | |
| | | | | | | | | | | | |
| | | | | | | | | | | | |
| CONSUMER STAPLES 0.1% | |
| | | | |
Etablissements Franz Colruyt NV | | | | | 2,914 | | | | | | 139 | |
| | | | |
Lotus Bakeries NV | | | | | 5 | | | | | | 52 | |
| | | | | | | | | | | | |
| | | | | | | | | | | 191 | |
| | | | | | | | | | | | |
| | | | |
| FINANCIALS 0.1% | |
| | | | |
Ageas SA | | | | | 1,027 | | | | | | 47 | |
| | | | |
Gimv NV | | | | | 997 | | | | | | 47 | |
| | | | | | | | | | | | |
| | | | | | | | | | | 94 | |
| | | | | | | | | | | | |
| | | | |
| HEALTH CARE 0.2% | |
| | | | |
UCB SA | | | | | 2,521 | | | | | | 374 | |
| | | | | | | | | | | | |
| | | | |
| INDUSTRIALS 0.0% | |
| | | | |
Ackermans & Van Haaren NV | | | | | 396 | | | | | | 69 | |
| | | | | | | | | | | | |
| |
| MATERIALS 0.0% | |
| | | | |
Solvay SA | | | | | 1,429 | | | | | | 50 | |
| | | | | | | | | | | | |
| |
| UTILITIES 0.0% | |
| | | | |
Elia Group SA | | | | | 942 | | | | | | 88 | |
| | | | | | | | | | | | |
Total Belgium | | | | | | | | | | | 923 | |
| | | | | | | | | | | | |
| |
| CANADA 7.9% | |
| | | | | | | | | | | | |
| COMMUNICATION SERVICES 0.4% | |
| | | | |
BCE, Inc. | | | | | 17,388 | | | | | | 563 | |
| | | | |
Cogeco Communications, Inc. | | | | | 897 | | | | | | 34 | |
| | | | |
Quebecor, Inc. ‘B’ | | | | | 3,436 | | | | | | 73 | |
| | | | |
TELUS Corp. | | | | | 15,355 | | | | | | 232 | |
| | | | | | | | | | | | |
| | | | | | | | | | | 902 | |
| | | | | | | | | | | | |
| |
| CONSUMER STAPLES 1.6% | |
| | | | |
Alimentation Couche-Tard, Inc. | | | | | 9,632 | | | | | | 540 | |
| | | | |
BRP, Inc. | | | | | 862 | | | | | | 55 | |
| | | | |
Canadian Tire Corp. Ltd. ‘A’ | | | | | 2,153 | | | | | | 214 | |
| | | | |
Dollarama, Inc. | | | | | 4,401 | | | | | | 402 | |
| | | | |
Empire Co. Ltd. ‘A’ | | | | | 8,133 | | | | | | 208 | |
| | | | |
George Weston Ltd. | | | | | 1,945 | | | | | | 280 | |
| | | | |
Gildan Activewear, Inc. | | | | | 4,819 | | | | | | 183 | |
| | | | |
Linamar Corp. | | | | | 1,034 | | | | | | 50 | |
| | | | |
Loblaw Cos., Ltd. | | | | | 3,970 | | | | | | 460 | |
| | | | |
Lululemon Athletica, Inc. (a) | | | | | 672 | | | | | | 201 | |
| | | | |
Magna International, Inc. | | | | | 18,625 | | | | | | 781 | |
| | | | |
Maple Leaf Foods, Inc. | | | | | 2,206 | | | | | | 37 | |
| | | | |
Metro, Inc. | | | | | 4,344 | | | | | | 241 | |
| | | | |
North West Co., Inc. | | | | | 2,291 | | | | | | 69 | |
| | | | |
Premium Brands Holdings Corp. | | | | | 858 | | | | | | 59 | |
| | | | |
Restaurant Brands International, Inc. | | | | | 3,536 | | | | | | 249 | |
| | | | | | |
| 22 | | PIMCO EQUITY SERIES | | | See Accompanying Notes | |
| | | | | | | | | | | | |
| | | | | SHARES | | | | | MARKET
VALUE
(000S) | |
| | | | |
Saputo, Inc. | | | | | 5,161 | | | $ | | | 116 | |
| | | | | | | | | | | | |
| | | | | | | | | | | 4,145 | |
| | | | | | | | | | | | |
| |
| ENERGY 1.4% | |
| | | | |
ARC Resources Ltd. | | | | | 16,157 | | | | | | 288 | |
| | | | |
Birchcliff Energy Ltd. | | | | | 9,805 | | | | | | 43 | |
| | | | |
Cameco Corp. | | | | | 4,348 | | | | | | 214 | |
| | | | |
Canadian Natural Resources Ltd. | | | | | 18,532 | | | | | | 660 | |
| | | | |
Cenovus Energy, Inc. | | | | | 14,694 | | | | | | 289 | |
| | | | |
Gibson Energy, Inc. | | | | | 6,018 | | | | | | 102 | |
| | | | |
Imperial Oil Ltd. | | | | | 7,713 | | | | | | 526 | |
| | | | |
MEG Energy Corp. (a) | | | | | 1,200 | | | | | | 26 | |
| | | | |
Parex Resources, Inc. | | | | | 1,292 | | | | | | 21 | |
| | | | |
Pembina Pipeline Corp. | | | | | 1,100 | | | | | | 41 | |
| | | | |
Peyto Exploration & Development Corp. | | | | | 9,737 | | | | | | 104 | |
| | | | |
Precision Drilling Corp. (a) | | | | | 1,030 | | | | | | 72 | |
| | | | |
Secure Energy Services, Inc. | | | | | 3,000 | | | | | | 26 | |
| | | | |
Suncor Energy, Inc. | | | | | 19,102 | | | | | | 728 | |
| | | | |
Teekay Tankers Ltd. ‘A’ | | | | | 813 | | | | | | 56 | |
| | | | |
Tourmaline Oil Corp. | | | | | 600 | | | | | | 27 | |
| | | | |
Veren, Inc. | | | | | 38,262 | | | | | | 302 | |
| | | | | | | | | | | | |
| | | | | | | | | | | 3,525 | |
| | | | | | | | | | | | |
| | | | | | | | | | | | |
| FINANCIALS 1.6% | |
| | | | |
Brookfield Asset Management Ltd. ‘A’ | | | | | 6,086 | | | | | | 232 | |
| | | | |
Brookfield Corp. | | | | | 11,020 | | | | | | 458 | |
| | | | |
Brookfield Reinsurance Ltd. | | | | | 3,256 | | | | | | 135 | |
| | | | |
Canadian Imperial Bank of Commerce | | | | | 4,370 | | | | | | 208 | |
| | | | |
CI Financial Corp. | | | | | 11,999 | | | | | | 126 | |
| | | | |
Fairfax Financial Holdings Ltd. | | | | | 645 | | | | | | 734 | |
| | | | |
Great-West Lifeco, Inc. | | | | | 3,135 | | | | | | 91 | |
| | | | |
IGM Financial, Inc. | | | | | 2,245 | | | | | | 62 | |
| | | | |
Intact Financial Corp. | | | | | 1,780 | | | | | | 297 | |
| | | | |
Manulife Financial Corp. | | | | | 15,056 | | | | | | 401 | |
| | | | |
National Bank of Canada | | | | | 3,006 | | | | | | 238 | |
| | | | |
Onex Corp. | | | | | 1,202 | | | | | | 82 | |
| | | | |
Power Corp. of Canada | | | | | 9,738 | | | | | | 271 | |
| | | | |
Royal Bank of Canada | | | | | 5,100 | | | | | | 543 | |
| | | | |
TMX Group Ltd. | | | | | 2,752 | | | | | | 77 | |
| | | | | | | | | | | | |
| | | | | | | | | | | 3,955 | |
| | | | | | | | | | | | |
| |
| INDUSTRIALS 1.0% | |
| | | | |
Aecon Group, Inc. | | | | | 5,813 | | | | | | 72 | |
| | | | |
Canadian National Railway Co. | | | | | 3,516 | | | | | | 415 | |
| | | | |
Canadian Pacific Kansas City Ltd. | | | | | 2,587 | | | | | | 204 | |
| | | | |
Finning International, Inc. | | | | | 4,867 | | | | | | 143 | |
| | | | |
GFL Environmental, Inc. | | | | | 3,878 | | | | | | 151 | |
| | | | |
Russel Metals, Inc. | | | | | 2,887 | | | | | | 79 | |
| | | | |
Stantec, Inc. | | | | | 1,329 | | | | | | 111 | |
| | | | |
TFI International, Inc. | | | | | 1,252 | | | | | | 182 | |
| | | | |
Thomson Reuters Corp. | | | | | 3,868 | | | | | | 652 | |
| | | | |
Toromont Industries Ltd. | | | | | 2,068 | | | | | | 183 | |
| | | | |
Waste Connections, Inc. | | | | | 2,136 | | | | | | 375 | |
| | | | |
Westshore Terminals Investment Corp. | | | | | 4,611 | | | | | | 76 | |
| | | | |
WSP Global, Inc. | | | | | 200 | | | | | | 31 | |
| | | | | | | | | | | | |
| | | | | | | | | | | 2,674 | |
| | | | | | | | | | | | |
| |
| INFORMATION TECHNOLOGY 0.5% | |
| | | | |
Canadian Solar, Inc. (a) | | | | | 868 | | | | | | 13 | |
| | | | |
Celestica, Inc. (a) | | | | | 6,371 | | | | | | 365 | |
| | | | | | | | | | | | |
| | | | | SHARES | | | | | MARKET
VALUE
(000S) | |
| | | | |
CGI, Inc. (a) | | | | 6,086 | | | $ | | | | 607 | |
| | | | |
Constellation Software, Inc. | | | | 92 | | | | | | | 265 | |
| | | | |
Descartes Systems Group, Inc. (a) | | | | 336 | | | | | | | 33 | |
| | | | | | | | | | | | |
| | | | | | | | | | | 1,283 | |
| | | | | | | | | | | | |
| |
| MATERIALS 1.0% | |
| | | | |
Agnico Eagle Mines Ltd. | | | | 4,000 | | | | | | | 262 | |
| | | | |
Barrick Gold Corp. | | | | 16,223 | | | | | | | 271 | |
| | | | |
CCL Industries, Inc. ‘B’ | | | | 657 | | | | | | | 34 | |
| | | | |
Centerra Gold, Inc. | | | | 3,700 | | | | | | | 25 | |
| | | | |
Eldorado Gold Corp. (a) | | | | 13,653 | | | | | | | 202 | |
| | | | |
First Quantum Minerals Ltd. | | | | 6,360 | | | | | | | 83 | |
| | | | |
Franco-Nevada Corp. | | | | 1,655 | | | | | | | 196 | |
| | | | |
Hudbay Minerals, Inc. | | | | 3,300 | | | | | | | 30 | |
| | | | |
Interfor Corp. (a) | | | | 3,190 | | | | | | | 38 | |
| | | | |
Ivanhoe Mines Ltd. ‘A’ (a) | | | | 1,900 | | | | | | | 24 | |
| | | | |
Kinross Gold Corp. | | | | 4,064 | | | | | | | 34 | |
| | | | |
Lundin Mining Corp. | | | | 5,453 | | | | | | | 61 | |
| | | | |
Methanex Corp. | | | | 3,319 | | | | | | | 160 | |
| | | | |
Nutrien Ltd. | | | | 1,300 | | | | | | | 66 | |
| | | | |
Pan American Silver Corp. | | | | 1,200 | | | | | | | 24 | |
| | | | |
Stelco Holdings, Inc. | | | | 2,703 | | | | | | | 73 | |
| | | | |
Stella-Jones, Inc. | | | | 657 | | | | | | | 43 | |
| | | | |
Teck Resources Ltd. ‘B’ | | | | 8,384 | | | | | | | 402 | |
| | | | |
Transcontinental, Inc. ‘A’ | | | | 4,596 | | | | | | | 51 | |
| | | | |
West Fraser Timber Co. Ltd. | | | | 2,029 | | | | | | | 156 | |
| | | | |
Wheaton Precious Metals Corp. | | | | 6,633 | | | | | | | 348 | |
| | | | | | | | | | | | |
| | | | | | | | | | | 2,583 | |
| | | | | | | | | | | | |
| |
| REAL ESTATE 0.1% | |
| | | | |
Colliers International Group, Inc. | | | | 654 | | | | | | | 73 | |
| | | | |
FirstService Corp. | | | | 765 | | | | | | | 117 | |
| | | | | | | | | | | | |
| | | | | | | | | | | 190 | |
| | | | | | | | | | | | |
| |
| UTILITIES 0.3% | |
| | | | |
Atco Ltd. ‘I’ | | | | 3,625 | | | | | | | 103 | |
| | | | |
Canadian Utilities Ltd. ‘A’ | | | | 2,463 | | | | | | | 53 | |
| | | | |
Emera, Inc. | | | | 3,881 | | | | | | | 130 | |
| | | | |
Fortis, Inc. | | | | 6,328 | | | | | | | 246 | |
| | | | |
Hydro One Ltd. | | | | 7,110 | | | | | | | 207 | |
| | | | |
Northland Power, Inc. | | | | 3,366 | | | | | | | 58 | |
| | | | |
Superior Plus Corp. | | | | 7,060 | | | | | | | 46 | |
| | | | | | | | | | | | |
| | | | | | | | | | | 843 | |
| | | | | | | | | | | | |
Total Canada | | | | | | | | | | | 20,100 | |
| | | | | | | | | | | | |
| |
| CHILE 0.1% | |
| | | | | | | | | | | | |
| MATERIALS 0.1% | |
| | | | |
Antofagasta PLC | | | | 9,406 | | | | | | | 250 | |
| | | | | | | | | | | | |
Total Chile | | | | | | | | | | | 250 | |
| | | | | | | | | | | | |
| |
| DENMARK 2.6% | |
| | | | | | | | | | | | |
| CONSUMER STAPLES 0.2% | |
| | | | |
Carlsberg AS ‘B’ | | | | 1,280 | | | | | | | 154 | |
| | | | |
Pandora AS | | | | 1,470 | | | | | | | 221 | |
| | | | |
Royal Unibrew AS (a) | | | | 1,033 | | | | | | | 82 | |
| | | | |
Scandinavian Tobacco Group AS ‘A’ | | | | 4,183 | | | | | | | 59 | |
| | | | | | | | | | | | |
| | | | | | | | | | | 516 | |
| | | | | | | | | | | | |
| |
| FINANCIALS 0.2% | |
| | | | |
Danske Bank AS | | | | 7,433 | | | | | | | 221 | |
| | | | |
Sydbank AS | | | | 2,416 | | | | | | | 128 | |
| | | | | | | | | | | | |
| | | | | SHARES | | | | | MARKET
VALUE
(000S) | |
| | | | |
Topdanmark AS | | | | 1,645 | | | $ | | | | 87 | |
| | | | | | | | | | | | |
| | | | | | | | | | | 436 | |
| | | | | | | | | | | | |
| |
| HEALTH CARE 1.8% | |
| | | | |
Ascendis Pharma AS (a) | | | | 167 | | | | | | | 23 | |
| | | | |
Coloplast AS ‘B’ | | | | 887 | | | | | | | 107 | |
| | | | |
Demant AS (a) | | | | 1,894 | | | | | | | 82 | |
| | | | |
Novo Nordisk AS ‘B’ | | | | 29,767 | | | | | | | 4,259 | |
| | | | | | | | | | | | |
| | | | | | | | | | | 4,471 | |
| | | | | | | | | | | | |
| |
| INDUSTRIALS 0.3% | |
| | | | |
AP Moller - Maersk AS ‘B’ | | | | 241 | | | | | | | 418 | |
| | | | |
DSV AS | | | | 937 | | | | | | | 144 | |
| | | | |
ISS AS | | | | 4,098 | | | | | | | 70 | |
| | | | |
Rockwool AS ‘B’ | | | | 141 | | | | | | | 57 | |
| | | | | | | | | | | | |
| | | | | | | | | | | 689 | |
| | | | | | | | | | | | |
| |
| INFORMATION TECHNOLOGY 0.0% | |
| | | | |
GN Store Nord AS (a) | | | | 1,803 | | | | | | | 50 | |
| | | | | | | | | | | | |
| |
| MATERIALS 0.1% | |
| | | | |
Novozymes AS ‘B’ | | | | 5,610 | | | | | | | 343 | |
| | | | | | | | | | | | |
| | | | | | | | | | | | |
| UTILITIES 0.0% | |
| | | | |
Orsted AS (a) | | | | 1,976 | | | | | | | 105 | |
| | | | | | | | | | | | |
Total Denmark | | | | | | | | | | | 6,610 | |
| | | | | | | | | | | | |
| |
| FINLAND 1.0% | |
| | | | | | | | | | | | |
| COMMUNICATION SERVICES 0.0% | |
| | | | |
Elisa Oyj | | | | 2,144 | | | | | | | 98 | |
| | | | | | | | | | | | |
| |
| CONSUMER STAPLES 0.1% | |
| | | | |
Kesko Oyj ‘B’ | | | | 6,470 | | | | | | | 114 | |
| | | | | | | | | | | | |
| |
| ENERGY 0.0% | |
| | | | |
Neste Oyj | | | | 2,894 | | | | | | | 52 | |
| | | | | | | | | | | | |
| |
| FINANCIALS 0.2% | |
| | | | |
Mandatum Oyj | | | | 5,631 | | | | | | | 25 | |
| | | | |
Nordea Bank Abp | | | | 11,713 | | | | | | | 140 | |
| | | | |
Sampo Oyj ‘A’ | | | | 8,142 | | | | | | | 351 | |
| | | | | | | | | | | | |
| | | | | | | | | | | 516 | |
| | | | | | | | | | | | |
| |
| HEALTH CARE 0.1% | |
| | | | |
Orion Oyj ‘B’ | | | | 3,028 | | | | | | | 129 | |
| | | | | | | | | | | | |
| | | | | | | | | | | | |
| INDUSTRIALS 0.3% | |
| | | | |
Cargotec Oyj ‘B’ | | | | 1,618 | | | | | | | 130 | |
| | | | |
Kone Oyj ‘B’ | | | | 6,028 | | | | | | | 299 | |
| | | | |
Konecranes Oyj | | | | 688 | | | | | | | 39 | |
| | | | |
Metso Oyj | | | | 7,564 | | | | | | | 80 | |
| | | | |
Wartsila Oyj Abp | | | | 15,419 | | | | | | | 299 | |
| | | | | | | | | | | | |
| | | | | | | | | | | 847 | |
| | | | | | | | | | | | |
| |
| INFORMATION TECHNOLOGY 0.1% | |
| | | | |
TietoEVRY Oyj | | | | 6,286 | | | | | | | 121 | |
| | | | | | | | | | | | |
| |
| MATERIALS 0.1% | |
| | | | |
Kemira Oyj | | | | 4,774 | | | | | | | 116 | |
| | | | | | | | | | | | |
| See Accompanying Notes | | | ANNUAL FINANCIAL AND OTHER INFORMATION | | | | | | | JUNE 30, 2024 | | | 23 |
| | | | | | |
| Schedule of Investments | | PIMCO RAFI Dynamic Multi-Factor International Equity ETF | | (Cont.) | | |
| | | | | | | | | | | | |
| | | | | SHARES | | | | | MARKET
VALUE
(000S) | |
| | | | |
Outokumpu Oyj | | | | 17,573 | | | $ | | | | 63 | |
| | | | |
Stora Enso Oyj ‘R’ | | | | 9,123 | | | | | | | 125 | |
| | | | |
UPM-Kymmene Oyj | | | | 702 | | | | | | | 25 | |
| | | | | | | | | | | | |
| | | | | | | | | | | 329 | |
| | | | | | | | | | | | |
| |
| REAL ESTATE 0.0% | |
| | | | |
Citycon Oyj | | | | 9,862 | | | | | | | 42 | |
| | | | |
Kojamo Oyj (a) | | | | 4,386 | | | | | | | 45 | |
| | | | | | | | | | | | |
| | | | | | | | | | | 87 | |
| | | | | | | | | | | | |
| |
| UTILITIES 0.1% | |
| | | | |
Fortum Oyj | | | | 10,448 | | | | | | | 153 | |
| | | | | | | | | | | | |
Total Finland | | | | | | | | | | | 2,446 | |
| | | | | | | | | | | | |
| |
| FRANCE 7.6% | |
| | | | | | | | | | | | |
| COMMUNICATION SERVICES 0.8% | |
| | | | |
Eutelsat Communications SA | | | | 13,573 | | | | | | | 54 | |
| | | | |
Metropole Television SA | | | | 3,909 | | | | | | | 49 | |
| | | | |
Orange SA (a) | | | | 116,817 | | | | | | | 1,172 | |
| | | | |
Publicis Groupe SA | | | | 4,597 | | | | | | | 488 | |
| | | | |
Television Francaise SA | | | | 5,548 | | | | | | | 43 | |
| | | | |
Ubisoft Entertainment SA (a) | | | | 3,100 | | | | | | | 68 | |
| | | | |
Vivendi SE | | | | 7,268 | | | | | | | 76 | |
| | | | | | | | | | | | |
| | | | | | | | | | | 1,950 | |
| | | | | | | | | | | | |
| |
| CONSUMER DISCRETIONARY 0.0% | |
| | | | |
Accor SA | | | | 2,799 | | | | | | | 115 | |
| | | | | | | | | | | | |
| |
| CONSUMER STAPLES 1.7% | |
| | | | |
Carrefour SA | | | | 39,400 | | | | | | | 558 | |
| | | | |
Cie Generale des Etablissements Michelin SCA | | | | 6,886 | | | | | | | 266 | |
| | | | |
Danone SA | | | | 12,842 | | | | | | | 787 | |
| | | | |
Forvia SE | | | | 7,264 | | | | | | | 87 | |
| | | | |
Hermes International SCA | | | | 239 | | | | | | | 552 | |
| | | | |
Kering SA | | | | 575 | | | | | | | 209 | |
| | | | |
L’Oreal SA | | | | 629 | | | | | | | 277 | |
| | | | |
LVMH Moet Hennessy Louis Vuitton SE | | | | 396 | | | | | | | 304 | |
| | | | |
Pernod Ricard SA | | | | 816 | | | | | | | 111 | |
| | | | |
Remy Cointreau SA | | | | 258 | | | | | | | 22 | |
| | | | |
Renault SA | | | | 18,099 | | | | | | | 928 | |
| | | | |
SEB SA | | | | 828 | | | | | | | 85 | |
| | | | |
Sodexo SA | | | | 905 | | | | | | | 81 | |
| | | | |
Valeo SE | | | | 9,785 | | | | | | | 105 | |
| | | | | | | | | | | | |
| | | | | | | | | | | 4,372 | |
| | | | | | | | | | | | |
| |
| ENERGY 0.5% | |
| | | | |
Technip Energies NV | | | | 950 | | | | | | | 21 | |
| | | | |
TotalEnergies SE | | | | 20,524 | | | | | | | 1,374 | |
| | | | | | | | | | | | |
| | | | | | | | | | | 1,395 | |
| | | | | | | | | | | | |
| |
| FINANCIALS 0.8% | |
| | | | |
AXA SA | | | | 11,137 | | | | | | | 365 | |
| | | | |
BNP Paribas SA | | | | 5,488 | | | | | | | 351 | |
| | | | |
Credit Agricole SA | | | | 9,197 | | | | | | | 126 | |
| | | | |
SCOR SE | | | | 5,808 | | | | | | | 147 | |
| | | | |
Societe Generale SA | | | | 39,092 | | | | | | | 919 | |
| | | | | | | | | | | | |
| | | | | | | | | | | 1,908 | |
| | | | | | | | | | | | |
| |
| HEALTH CARE 0.6% | |
| | | | |
BioMerieux | | | | 733 | | | | | | | 70 | |
| | | | | | | | | | | | |
| | | | | SHARES | | | | | MARKET
VALUE
(000S) | |
| | | | |
EssilorLuxottica SA | | | | 2,210 | | | $ | | | | 475 | |
| | | | |
Sanofi | | | | 9,419 | | | | | | | 908 | |
| | | | |
Sartorius Stedim Biotech | | | | 258 | | | | | | | 43 | |
| | | | | | | | | | | | |
| | | | | | | | | | | 1,496 | |
| | | | | | | | | | | | |
| |
| INDUSTRIALS 2.4% | |
| | | | |
Air France-KLM (a) | | | | 1,598 | | | | | | | 14 | |
| | | | |
Airbus SE | | | | 5,632 | | | | | | | 773 | |
| | | | |
Alstom SA | | | | 5,163 | | | | | | | 87 | |
| | | | |
Bouygues SA | | | | 10,388 | | | | | | | 334 | |
| | | | |
Bureau Veritas SA | | | | 6,890 | | | | | | | 191 | |
| | | | |
Cie de L’Odet SE | | | | 97 | | | | | | | 136 | |
| | | | |
Cie de Saint-Gobain SA | | | | 6,256 | | | | | | | 487 | |
| | | | |
Dassault Aviation SA | | | | 741 | | | | | | | 134 | |
| | | | |
Elis SA | | | | 4,773 | | | | | | | 104 | |
| | | | |
Legrand SA | | | | 1,085 | | | | | | | 108 | |
| | | | |
Nexans SA | | | | 1,370 | | | | | | | 151 | |
| | | | |
Rexel SA | | | | 15,966 | | | | | | | 413 | |
| | | | |
Safran SA | | | | 5,074 | | | | | | | 1,069 | |
| | | | |
Schneider Electric SE | | | | 4,367 | | | | | | | 1,047 | |
| | | | |
Societe BIC SA | | | | 1,381 | | | | | | | 81 | |
| | | | |
Thales SA | | | | 2,075 | | | | | | | 332 | |
| | | | |
Vinci SA | | | | 6,022 | | | | | | | 635 | |
| | | | | | | | | | | | |
| | | | | | | | | | | 6,096 | |
| | | | | | | | | | | | |
| |
| INFORMATION TECHNOLOGY 0.2% | |
| | | | |
Capgemini SE | | | | 1,602 | | | | | | | 318 | |
| | | | |
Sopra Steria Group | | | | 745 | | | | | | | 145 | |
| | | | | | | | | | | | |
| | | | | | | | | | | 463 | |
| | | | | | | | | | | | |
| |
| MATERIALS 0.3% | |
| | | | |
Air Liquide SA | | | | 3,762 | | | | | | | 649 | |
| | | | |
Eramet SA | | | | 311 | | | | | | | 32 | |
| | | | |
Vicat SACA | | | | 1,987 | | | | | | | 71 | |
| | | | | | | | | | | | |
| | | | | | | | | | | 752 | |
| | | | | | | | | | | | |
| |
| UTILITIES 0.3% | |
| | | | |
Engie SA | | | | 51,878 | | | | | | | 743 | |
| | | | |
Rubis SCA (a) | | | | 1,364 | | | | | | | 38 | |
| | | | | | | | | | | | |
| | | | | | | | | | | 781 | |
| | | | | | | | | | | | |
Total France | | | | | | | | | | | 19,328 | |
| | | | | | | | | | | | |
| |
| GERMANY 6.0% | |
| | | | | | | | | | | | |
| COMMUNICATION SERVICES 0.4% | |
| | | | |
Deutsche Telekom AG | | | | 28,316 | | | | | | | 712 | |
| | | | |
Freenet AG | | | | 5,939 | | | | | | | 158 | |
| | | | |
ProSiebenSat.1 Media SE | | | | 6,579 | | | | | | | 47 | |
| | | | |
Scout24 SE | | | | 1,171 | | | | | | | 89 | |
| | | | | | | | | | | | |
| | | | | | | | | | | 1,006 | |
| | | | | | | | | | | | |
| |
| CONSUMER DISCRETIONARY 0.7% | |
| | | | |
Adidas AG | | | | 3,081 | | | | | | | 736 | |
| | | | |
Bayerische Motoren Werke AG | | | | 10,142 | | | | | | | 959 | |
| | | | | | | | | | | | |
| | | | | | | | | | | 1,695 | |
| | | | | | | | | | | | |
| |
| CONSUMER STAPLES 0.6% | |
| | | | |
Beiersdorf AG | | | | 1,148 | | | | | | | 168 | |
| | | | |
Continental AG | | | | 6,453 | | | | | | | 366 | |
| | | | |
Fielmann Group AG | | | | 1,289 | | | | | | | 59 | |
| | | | |
Hornbach Holding AG & Co. KGaA | | | | 1,036 | | | | | | | 88 | |
| | | | |
Hugo Boss AG | | | | 2,755 | | | | | | | 124 | |
| | | | | | | | | | | | |
| | | | | SHARES | | | | | MARKET
VALUE
(000S) | |
| | | | |
KWS Saat SE & Co KGaA | | | | 1,899 | | | $ | | | | 121 | |
| | | | |
Mercedes-Benz Group AG | | | | 5,272 | | | | | | | 365 | |
| | | | |
Metro AG | | | | 11,102 | | | | | | | 50 | |
| | | | |
Suedzucker AG | | | | 4,609 | | | | | | | 67 | |
| | | | |
TUI AG (a) | | | | 4,087 | | | | | | | 29 | |
| | | | | | | | | | | | |
| | | | | | | | | | | 1,437 | |
| | | | | | | | | | | | |
| |
| FINANCIALS 1.2% | |
| | | | |
Allianz SE (b) | | | | 2,269 | | | | | | | 630 | |
| | | | |
Commerzbank AG | | | | 40,991 | | | | | | | 622 | |
| | | | |
Deutsche Bank AG | | | | 33,633 | | | | | | | 538 | |
| | | | |
Deutsche Boerse AG | | | | 1,425 | | | | | | | 291 | |
| | | | |
Deutsche Pfandbriefbank AG (a) | | | | 10,722 | | | | | | | 58 | |
| | | | |
Hannover Rueck SE | | | | 630 | | | | | | | 160 | |
| | | | |
Muenchener Rueckversicherungs-Gesellschaft AG in Muenchen | | | | 1,161 | | | | | | | 580 | |
| | | | |
Talanx AG | | | | 1,898 | | | | | | | 151 | |
| | | | | | | | | | | | |
| | | | | | | | | | | 3,030 | |
| | | | | | | | | | | | |
| |
| HEALTH CARE 0.3% | |
| | | | |
Fresenius Medical Care AG & Co. KGaA | | | | 6,246 | | | | | | | 239 | |
| | | | |
Fresenius SE & Co. KGaA (a) | | | | 5,637 | | | | | | | 168 | |
| | | | |
Gerresheimer AG | | | | 853 | | | | | | | 92 | |
| | | | |
Merck KGaA | | | | 817 | | | | | | | 135 | |
| | | | |
Siemens Healthineers AG | | | | 2,291 | | | | | | | 132 | |
| | | | | | | | | | | | |
| | | | | | | | | | | 766 | |
| | | | | | | | | | | | |
| |
| INDUSTRIALS 0.8% | |
| | | | |
Bilfinger SE | | | | 2,283 | | | | | | | 120 | |
| | | | |
Daimler Truck Holding AG | | | | 640 | | | | | | | 26 | |
| | | | |
Deutsche Lufthansa AG | | | | 29,213 | | | | | | | 179 | |
| | | | |
Deutsche Post AG | | | | 13,471 | | | | | | | 547 | |
| | | | |
Duerr AG | | | | 700 | | | | | | | 15 | |
| | | | |
Hapag-Lloyd AG | | | | 438 | | | | | | | 81 | |
| | | | |
Hochtief AG | | | | 509 | | | | | | | 58 | |
| | | | |
KION Group AG | | | | 822 | | | | | | | 34 | |
| | | | |
Knorr-Bremse AG | | | | 1,042 | | | | | | | 80 | |
| | | | |
Krones AG | | | | 1,159 | | | | | | | 145 | |
| | | | |
MTU Aero Engines AG | | | | 593 | | | | | | | 151 | |
| | | | |
Nordex SE (a) | | | | 2,057 | | | | | | | 25 | |
| | | | |
Rational AG | | | | 78 | | | | | | | 65 | |
| | | | |
Rheinmetall AG | | | | 454 | | | | | | | 231 | |
| | | | |
Siemens AG | | | | 2,206 | | | | | | | 411 | |
| | | | | | | | | | | | |
| | | | | | | | | | | 2,168 | |
| | | | | | | | | | | | |
| |
| INFORMATION TECHNOLOGY 1.0% | |
| | | | |
SAP SE | | | | 12,207 | | | | | | | 2,452 | |
| | | | | | | | | | | | |
| |
| MATERIALS 0.6% | |
| | | | |
BASF SE | | | | 7,824 | | | | | | | 378 | |
| | | | |
Covestro AG (a) | | | | 10,959 | | | | | | | 642 | |
| | | | |
Evonik Industries AG | | | | 1,627 | | | | | | | 33 | |
| | | | |
HeidelbergCement AG | | | | 982 | | | | | | | 102 | |
| | | | |
K&S AG | | | | 12,010 | | | | | | | 162 | |
| | | | |
Salzgitter AG | | | | 3,917 | | | | | | | 76 | |
| | | | |
Symrise AG | | | | 1,858 | | | | | | | 227 | |
| | | | |
thyssenkrupp AG | | | | 9,050 | | | | | | | 39 | |
| | | | | | | | | | | | |
| | | | | | | | | | | 1,659 | |
| | | | | | | | | | | | |
| |
| REAL ESTATE 0.3% | |
| | | | |
LEG Immobilien SE | | | | 3,104 | | | | | | | 254 | |
| | | | | | |
| 24 | | PIMCO EQUITY SERIES | | | See Accompanying Notes | |
| | | | | | | | | | | | |
| | | | | SHARES | | | | | MARKET
VALUE
(000S) | |
| | | | |
TAG Immobilien AG (a) | | | | 4,824 | | | $ | | | | 70 | |
| | | | |
Vonovia SE | | | | 16,739 | | | | | | | 476 | |
| | | | | | | | | | | | |
| | | | | | | | | | | 800 | |
| | | | | | | | | | | | |
| |
| UTILITIES 0.1% | |
| | | | |
E.ON SE | | | | 16,384 | | | | | | | 215 | |
| | | | | | | | | | | | |
Total Germany | | | | | | | | | | | 15,228 | |
| | | | | | | | | | | | |
| |
| HONG KONG 1.2% | |
| | | | | | | | | | | | |
| COMMUNICATION SERVICES 0.1% | |
| | | | |
HKBN Ltd. | | | | 66,500 | | | | | | | 21 | |
| | | | |
HKT Trust & HKT Ltd. | | | | 92,000 | | | | | | | 103 | |
| | | | |
PCCW Ltd. | | | | 257,295 | | | | | | | 129 | |
| | | | | | | | | | | | |
| | | | | | | | | | | 253 | |
| | | | | | | | | | | | |
| |
| CONSUMER STAPLES 0.1% | |
| | | | |
Bosideng International Holdings Ltd. | | | | 172,000 | | | | | | | 107 | |
| | | | |
Chow Tai Fook Jewellery Group Ltd. | | | | 52,000 | | | | | | | 56 | |
| | | | |
Galaxy Entertainment Group Ltd. | | | | 7,000 | | | | | | | 33 | |
| | | | |
Man Wah Holdings Ltd. | | | | 34,400 | | | | | | | 24 | |
| | | | |
SJM Holdings Ltd. (a) | | | | 42,000 | | | | | | | 14 | |
| | | | |
Skyworth Group Ltd. | | | | 156,000 | | | | | | | 61 | |
| | | | |
WH Group Ltd. | | | | 130,000 | | | | | | | 86 | |
| | | | | | | | | | | | |
| | | | | | | | | | | 381 | |
| | | | | | | | | | | | |
| |
| FINANCIALS 0.2% | |
| | | | |
Futu Holdings Ltd. (a) | | | | 600 | | | | | | | 39 | |
| | | | |
Hong Kong Exchanges & Clearing Ltd. | | | | 6,700 | | | | | | | 214 | |
| | | | |
Prudential PLC | | | | 16,157 | | | | | | | 147 | |
| | | | | | | | | | | | |
| | | | | | | | | | | 400 | |
| | | | | | | | | | | | |
| |
| INDUSTRIALS 0.3% | |
| | | | |
Cathay Pacific Airways Ltd. | | | | 71,000 | | | | | | | 73 | |
| | | | |
CK Hutchison Holdings Ltd. | | | | 39,500 | | | | | | | 188 | |
| | | | |
Jardine Matheson Holdings Ltd. | | | | 3,900 | | | | | | | 138 | |
| | | | |
MTR Corp. Ltd. | | | | 42,000 | | | | | | | 132 | |
| | | | |
Pacific Basin Shipping Ltd. | | | | 136,000 | | | | | | | 43 | |
| | | | |
Techtronic Industries Co. Ltd. | | | | 2,000 | | | | | | | 23 | |
| | | | |
Xinyi Glass Holdings Ltd. | | | | 37,000 | | | | | | | 40 | |
| | | | | | | | | | | | |
| | | | | | | | | | | 637 | |
| | | | | | | | | | | | |
| |
| INFORMATION TECHNOLOGY 0.1% | |
| | | | |
Cowell e Holdings, Inc. (a) | | | | 32,000 | | | | | | | 100 | |
| | | | |
Kingboard Holdings Ltd. | | | | 21,200 | | | | | | | 50 | |
| | | | |
Kingboard Laminates Holdings Ltd. | | | | 45,000 | | | | | | | 49 | |
| | | | | | | | | | | | |
| | | | | | | | | | | 199 | |
| | | | | | | | | | | | |
| |
| REAL ESTATE 0.3% | |
| | | | |
CK Asset Holdings Ltd. | | | | 43,000 | | | | | | | 161 | |
| | | | |
Hongkong Land Holdings Ltd. | | | | 30,300 | | | | | | | 98 | |
| | | | |
New World Development Co. Ltd. | | | | 41,000 | | | | | | | 38 | |
| | | | |
Sino Land Co. Ltd. | | | | 10,000 | | | | | | | 10 | |
| | | | |
Sun Hung Kai Properties Ltd. | | | | 25,500 | | | | | | | 221 | |
| | | | |
Swire Pacific Ltd. ‘A’ | | | | 19,000 | | | | | | | 168 | |
| | | | |
Wharf Holdings Ltd. | | | | 34,000 | | | | | | | 96 | |
| | | | | | | | | | | | |
| | | | | | | | | | | 792 | |
| | | | | | | | | | | | |
| |
| UTILITIES 0.1% | |
| | | | |
China Gas Holdings Ltd. | | | | 17,000 | | | | | | | 15 | |
| | | | | | | | | | | | |
| | | | | SHARES | | | | | MARKET
VALUE
(000S) | |
| | | | |
CLP Holdings Ltd. | | | | 16,100 | | | $ | | | | 130 | |
| | | | |
HK Electric Investments & HK Electric Investments Ltd. | | | | 61,000 | | | | | | | 39 | |
| | | | |
Hong Kong & China Gas Co. Ltd. | | | | 77,972 | | | | | | | 59 | |
| | | | |
Power Assets Holdings Ltd. | | | | 17,000 | | | | | | | 92 | |
| | | | | | | | | | | | |
| | | | | | | | | | | 335 | |
| | | | | | | | | | | | |
Total Hong Kong | | | | | | | | | | | 2,997 | |
| | | | | | | | | | | | |
| |
| IRELAND 1.3% | |
| | | | | | | | | | | | |
| CONSUMER STAPLES 0.1% | |
| | | | |
Glanbia PLC | | | | 8,182 | | | | | | | 160 | |
| | | | |
Kerry Group PLC ‘A’ | | | | 1,816 | | | | | | | 147 | |
| | | | | | | | | | | | |
| | | | | | | | | | | 307 | |
| | | | | | | | | | | | |
| |
| HEALTH CARE 0.4% | |
| | | | |
ICON PLC (a) | | | | 941 | | | | | | | 295 | |
| | | | |
Medtronic PLC | | | | 10,053 | | | | | | | 791 | |
| | | | | | | | | | | | |
| | | | | | | | | | | 1,086 | |
| | | | | | | | | | | | |
| |
| INDUSTRIALS 0.6% | |
| | | | |
Allegion PLC | | | | 917 | | | | | | | 109 | |
| | | | |
Cimpress PLC (a) | | | | 917 | | | | | | | 80 | |
| | | | |
Experian PLC | | | | 9,603 | | | | | | | 446 | |
| | | | |
Grafton Group PLC | | | | 6,011 | | | | | | | 70 | |
| | | | |
Kingspan Group PLC | | | | 1,527 | | | | | | | 130 | |
| | | | |
Trane Technologies PLC | | | | 2,167 | | | | | | | 713 | |
| | | | | | | | | | | | |
| | | | | | | | | | | 1,548 | |
| | | | | | | | | | | | |
| |
| MATERIALS 0.2% | |
| | | | |
James Hardie Industries PLC (a) | | | | 10,788 | | | | | | | 338 | |
| | | | |
Smurfit Kappa Group PLC | | | | 2,615 | | | | | | | 116 | |
| | | | | | | | | | | | |
| | | | | | | | | | | 454 | |
| | | | | | | | | | | | |
Total Ireland | | | | | | | | | | | 3,395 | |
| | | | | | | | | | | | |
| |
| ISRAEL 0.9% | |
| | | | | | | | | | | | |
| COMMUNICATION SERVICES 0.0% | |
| | | | |
Bezeq The Israeli Telecommunication Corp. Ltd. | | | | 60,194 | | | | | | | 68 | |
| | | | | | | | | | | | |
| |
| CONSUMER STAPLES 0.0% | |
| | | | |
Strauss Group Ltd. | | | | 2,323 | | | | | | | 34 | |
| | | | | | | | | | | | |
| |
| ENERGY 0.0% | |
| | | | |
Oil Refineries Ltd. | | | | 200,254 | | | | | | | 46 | |
| | | | |
Paz Oil Co. Ltd. | | | | 269 | | | | | | | 25 | |
| | | | | | | | | | | | |
| | | | | | | | | | | 71 | |
| | | | | | | | | | | | |
| |
| FINANCIALS 0.3% | |
| | | | |
Bank Hapoalim BM | | | | 18,130 | | | | | | | 160 | |
| | | | |
Bank Leumi Le-Israel BM | | | | 25,966 | | | | | | | 212 | |
| | | | |
Harel Insurance Investments & Financial Services Ltd. | | | | 6,719 | | | | | | | 54 | |
| | | | |
Israel Discount Bank Ltd. ‘A’ | | | | 19,842 | | | | | | | 99 | |
| | | | |
Mizrahi Tefahot Bank Ltd. | | | | 2,659 | | | | | | | 90 | |
| | | | |
Plus500 Ltd. | | | | 2,522 | | | | | | | 72 | |
| | | | | | | | | | | | |
| | | | | | | | | | | 687 | |
| | | | | | | | | | | | |
| |
| HEALTH CARE 0.1% | |
| | | | |
Teva Pharmaceutical Industries Ltd. SP ADR (a) | | | | 14,116 | | | | | | | 229 | |
| | | | | | | | | | | | |
| |
| | | | | | | | | | | | |
| | | | | SHARES | | | | | MARKET
VALUE
(000S) | |
| INDUSTRIALS 0.1% | |
| | | | |
Danel Adir Yeoshua Ltd. | | | | 339 | | | $ | | | | 28 | |
| | | | |
Elbit Systems Ltd. | | | | 255 | | | | | | | 44 | |
| | | | |
Hilan Ltd. | | | | 2,032 | | | | | | | 105 | |
| | | | |
ZIM Integrated Shipping Services Ltd. | | | | 4,295 | | | | | | | 95 | |
| | | | | | | | | | | | |
| | | | | | | | | | | 272 | |
| | | | | | | | | | | | |
| |
| INFORMATION TECHNOLOGY 0.2% | |
| | | | |
Check Point Software Technologies Ltd. (a) | | | | 1,064 | | | | | | | 176 | |
| | | | |
Cyberaek Software Ltd. (a) | | | | 185 | | | | | | | 51 | |
| | | | |
JFrog Ltd. (a) | | | | 1,143 | | | | | | | 43 | |
| | | | |
Nice Ltd. (a) | | | | 450 | | | | | | | 77 | |
| | | | |
Wix.com Ltd. (a) | | | | 695 | | | | | | | 110 | |
| | | | | | | | | | | | |
| | | | | | | | | | | 457 | |
| | | | | | | | | | | | |
| |
| MATERIALS 0.1% | |
| | | | |
ICL Group Ltd. | | | | 24,673 | | | | | | | 106 | |
| | | | | | | | | | | | |
| |
| REAL ESTATE 0.1% | |
| | | | |
Azrieli Group Ltd. | | | | 342 | | | | | | | 20 | |
| | | | |
Big Shopping Centers Ltd. (a) | | | | 712 | | | | | | | 68 | |
| | | | |
Melisron Ltd. | | | | 1,297 | | | | | | | 86 | |
| | | | |
YH Dimri Construction & Development Ltd. | | | | 739 | | | | | | | 55 | |
| | | | | | | | | | | | |
| | | | | | | | | | | 229 | |
| | | | | | | | | | | | |
Total Israel | | | | | | | | | | | 2,153 | |
| | | | | | | | | | | | |
| |
| ITALY 3.2% | |
| | | | | | | | | | | | |
| COMMUNICATION SERVICES 0.2% | |
| | | | |
Infrastrutture Wireless Italiane SpA | | | | 7,233 | | | | | | | 75 | |
| | | | |
MFE-MediaForEurope NV ‘A’ | | | | 12,642 | | | | | | | 44 | |
| | | | |
MFE-MediaForEurope NV ‘B’ | | | | 4,435 | | | | | | | 19 | |
| | | | |
Telecom Italia SpA (a) | | | | 1,780,869 | | | | | | | 426 | |
| | | | | | | | | | | | |
| | | | | | | | | | | 564 | |
| | | | | | | | | | | | |
| |
| CONSUMER DISCRETIONARY 0.0% | |
| | | | |
Brembo NV | | | | 6,409 | | | | | | | 70 | |
| | | | | | | | | | | | |
| |
| CONSUMER STAPLES 0.3% | |
| | | | |
Ferrari NV | | | | 1,253 | | | | | | | 511 | |
| | | | |
Moncler SpA | | | | 2,951 | | | | | | | 181 | |
| | | | | | | | | | | | |
| | | | | | | | | | | 692 | |
| | | | | | | | | | | | |
| |
| ENERGY 0.5% | |
| | | | |
Eni SpA | | | | 71,500 | | | | | | | 1,098 | |
| | | | |
Saipem SpA (a) | | | | 41,903 | | | | | | | 107 | |
| | | | |
Saras SpA | | | | 66,351 | | | | | | | 115 | |
| | | | | | | | | | | | |
| | | | | | | | | | | 1,320 | |
| | | | | | | | | | | | |
| |
| FINANCIALS 1.4% | |
| | | | |
Anima Holding SpA | | | | 15,664 | | | | | | | 78 | |
| | | | |
Assicurazioni Generali SpA | | | | 12,499 | | | | | | | 311 | |
| | | | |
Azimut Holding SpA | | | | 5,540 | | | | | | | 131 | |
| | | | |
Banca Generali SpA | | | | 1,721 | | | | | | | 69 | |
| | | | |
Banca IFIS SpA | | | | 5,981 | | | | | | | 124 | |
| | | | |
Banca Mediolanum SpA | | | | 5,773 | | | | | | | 64 | |
| | | | |
Banca Monte dei Paschi di Siena SpA | | | | 16,131 | | | | | | | 76 | |
| | | | |
Banca Popolare di Sondrio SpA | | | | 21,175 | | | | | | | 151 | |
| | | | | | | | | | | | |
| See Accompanying Notes | | | ANNUAL FINANCIAL AND OTHER INFORMATION | | | | | | | JUNE 30, 2024 | | | 25 |
| | | | | | |
| Schedule of Investments | | PIMCO RAFI Dynamic Multi-Factor International Equity ETF | | (Cont.) | | |
| | | | | | | | | | | | |
| | | | | SHARES | | | | | MARKET
VALUE
(000S) | |
| | | | |
Banco BPM SpA | | | | 38,182 | | | $ | | | | 246 | |
| | | | |
BPER Banca | | | | 72,740 | | | | | | | 368 | |
| | | | |
FinecoBank Banca Fineco SpA | | | | 7,265 | | | | | | | 108 | |
| | | | |
Intesa Sanpaolo SpA | | | | 143,418 | | | | | | | 533 | |
| | | | |
Mediobanca SpA | | | | 2,490 | | | | | | | 36 | |
| | | | |
UniCredit SpA | | | | 22,261 | | | | | | | 824 | |
| | | | |
Unipol Gruppo SpA | | | | 31,118 | | | | | | | 309 | |
| | | | | | | | | | | | |
| | | | | | | | | | | 3,428 | |
| | | | | | | | | | | | |
| |
| HEALTH CARE 0.1% | |
| | | | |
Amplifon SpA | | | | 2,281 | | | | | | | 81 | |
| | | | |
DiaSorin SpA | | | | 732 | | | | | | | 73 | |
| | | | |
Recordati Industria Chimica e Farmaceutica SpA | | | | 2,585 | | | | | | | 135 | |
| | | | | | | | | | | | |
| | | | | | | | | | | 289 | |
| | | | | | | | | | | | |
| |
| INDUSTRIALS 0.3% | |
| | | | |
Enav SpA | | | | 12,407 | | | | | | | 49 | |
| | | | |
Iveco Group NV | | | | 9,364 | | | | | | | 105 | |
| | | | |
Leonardo SpA | | | | 28,448 | | | | | | | 659 | |
| | | | |
Prysmian SpA | | | | 787 | | | | | | | 49 | |
| | | | | | | | | | | | |
| | | | | | | | | | | 862 | |
| | | | | | | | | | | | |
| |
| MATERIALS 0.0% | |
| | | | |
Buzzi SpA | | | | 1,319 | | | | | | | 53 | |
| | | | | | | | | | | | |
| |
| UTILITIES 0.4% | |
| | | | |
Enel SpA | | | | 87,529 | | | | | | | 607 | |
| | | | |
Iren SpA | | | | 25,780 | | | | | | | 54 | |
| | | | |
Snam SpA | | | | 20,616 | | | | | | | 91 | |
| | | | |
Terna - Rete Elettrica Nazionale | | | | 20,219 | | | | | | | 156 | |
| | | | | | | | | | | | |
| | | | | | | | | | | 908 | |
| | | | | | | | | | | | |
Total Italy | | | | | | | | | | | 8,186 | |
| | | | | | | | | | | | |
| |
| JAPAN 23.2% | |
| | | | | | | | | | | | |
| COMMUNICATION SERVICES 1.9% | |
| | | | |
Capcom Co. Ltd. | | | | 13,400 | | | | | | | 254 | |
| | | | |
CyberAgent, Inc. | | | | 3,500 | | | | | | | 22 | |
| | | | |
Fuji Media Holdings, Inc. | | | | 8,700 | | | | | | | 100 | |
| | | | |
GungHo Online Entertainment, Inc. | | | | 3,100 | | | | | | | 52 | |
| | | | |
Hakuhodo DY Holdings, Inc. | | | | 3,200 | | | | | | | 24 | |
| | | | |
Internet Initiative Japan, Inc. | | | | 4,400 | | | | | | | 65 | |
| | | | |
KDDI Corp. | | | | 28,400 | | | | | | | 752 | |
| | | | |
Koei Tecmo Holdings Co. Ltd. | | | | 700 | | | | | | | 6 | |
| | | | |
Konami Group Corp. | | | | 400 | | | | | | | 29 | |
| | | | |
Nexon Co. Ltd. | | | | 2,600 | | | | | | | 48 | |
| | | | |
Nintendo Co. Ltd. | | | | 25,300 | | | | | | | 1,351 | |
| | | | |
Nippon Telegraph & Telephone Corp. | | | | 861,000 | | | | | | | 814 | |
| | | | |
Nippon Television Holdings, Inc. | | | | 9,100 | | | | | | | 132 | |
| | | | |
Softbank Corp. | | | | 63,400 | | | | | | | 776 | |
| | | | |
SoftBank Group Corp. | | | | 6,100 | | | | | | | 392 | |
| | | | |
Square Enix Holdings Co. Ltd. | | | | 600 | | | | | | | 18 | |
| | | | |
Toho Co. Ltd. | | | | 900 | | | | | | | 26 | |
| | | | | | | | | | | | |
| | | | | | | | | | | 4,861 | |
| | | | | | | | | | | | |
| |
| CONSUMER DISCRETIONARY 0.3% | |
| | | | |
Adastria Co. Ltd. | | | | 3,200 | | | | | | | 72 | |
| | | | |
Aisin Corp. | | | | 7,400 | | | | | | | 242 | |
| | | | |
Arata Corp. | | | | 200 | | | | | | | 4 | |
| | | | |
Asics Corp. | | | | 15,600 | | | | | | | 240 | |
| | | | |
ASKUL Corp. | | | | 1,100 | | | | | | | 15 | |
| | | | | | | | | | | | |
| | | | | SHARES | | | | | MARKET
VALUE
(000S) | |
| | | | |
Bandai Namco Holdings, Inc. | | | | 3,300 | | | $ | | | | 65 | |
| | | | |
Casio Computer Co. Ltd. | | | | 7,700 | | | | | | | 58 | |
| | | | |
Fujitsu General Ltd. | | | | 1,100 | | | | | | | 14 | |
| | | | |
Nikon Corp. | | | | 12,000 | | | | | | | 122 | |
| | | | |
Rinnai Corp. | | | | 300 | | | | | | | 7 | |
| | | | |
Sega Sammy Holdings, Inc. | | | | 4,900 | | | | | | | 73 | |
| | | | | | | | | | | | |
| | | | | | | | | | | 912 | |
| | | | | | | | | | | | |
| |
| CONSUMER STAPLES 5.5% | |
| | | | |
Aeon Co. Ltd. | | | | 13,100 | | | | | | | 280 | |
| | | | |
Ain Holdings, Inc. | | | | 100 | | | | | | | 4 | |
| | | | |
Ajinomoto Co., Inc. | | | | 11,900 | | | | | | | 419 | |
| | | | |
Belc Co. Ltd. | | | | 1,000 | | | | | | | 47 | |
| | | | |
Bridgestone Corp. | | | | 6,600 | | | | | | | 260 | |
| | | | |
Calbee, Inc. | | | | 3,900 | | | | | | | 75 | |
| | | | |
Coca-Cola Bottlers Japan Holdings, Inc. | | | | 4,400 | | | | | | | 55 | |
| | | | |
DCM Holdings Co. Ltd. | | | | 12,600 | | | | | | | 115 | |
| | | | |
Earth Corp. | | | | 100 | | | | | | | 3 | |
| | | | |
EDION Corp. | | | | 8,200 | | | | | | | 83 | |
| | | | |
Exedy Corp. | | | | 5,000 | | | | | | | 92 | |
| | | | |
Fast Retailing Co. Ltd. | | | | 100 | | | | | | | 25 | |
| | | | |
Food & Life Cos., Ltd. | | | | 1,800 | | | | | | | 29 | |
| | | | |
Fuji Oil Holdings, Inc. | | | | 7,400 | | | | | | | 130 | |
| | | | |
Geo Holdings Corp. | | | | 3,000 | | | | | | | 31 | |
| | | | |
Goldwin, Inc. | | | | 500 | | | | | | | 27 | |
| | | | |
H2O Retailing Corp. | | | | 3,400 | | | | | | | 50 | |
| | | | |
Haseko Corp. | | | | 2,500 | | | | | | | 28 | |
| | | | |
Heiwa Corp. | | | | 700 | | | | | | | 9 | |
| | | | |
Honda Motor Co. Ltd. | | | | 102,600 | | | | | | | 1,103 | |
| | | | |
House Foods Group, Inc. | | | | 3,700 | | | | | | | 66 | |
| | | | |
Iida Group Holdings Co. Ltd. | | | | 4,800 | | | | | | | 63 | |
| | | | |
Isetan Mitsukoshi Holdings Ltd. | | | | 19,800 | | | | | | | 372 | |
| | | | |
Isuzu Motors Ltd. | | | | 19,500 | | | | | | | 259 | |
| | | | |
Itoham Yonekyu Holdings, Inc. | | | | 3,220 | | | | | | | 86 | |
| | | | |
J Front Retailing Co. Ltd. | | | | 9,400 | | | | | | | 98 | |
| | | | |
Japan Tobacco, Inc. | | | | 37,700 | | | | | | | 1,021 | |
| | | | |
JTEKT Corp. | | | | 13,500 | | | | | | | 94 | |
| | | | |
K’s Holdings Corp. | | | | 12,000 | | | | | | | 113 | |
| | | | |
Kagome Co. Ltd. | | | | 3,600 | | | | | | | 73 | |
| | | | |
Kao Corp. | | | | 9,900 | | | | | | | 401 | |
| | | | |
Kewpie Corp. | | | | 5,400 | | | | | | | 107 | |
| | | | |
Kikkoman Corp. | | | | 3,600 | | | | | | | 42 | |
| | | | |
Kirin Holdings Co. Ltd. | | | | 17,400 | | | | | | | 225 | |
| | | | |
Kobe Bussan Co. Ltd. | | | | 3,500 | | | | | | | 78 | |
| | | | |
Kohnan Shoji Co. Ltd. | | | | 4,200 | | | | | | | 109 | |
| | | | |
Koito Manufacturing Co. Ltd. | | | | 4,400 | | | | | | | 61 | |
| | | | |
Kusuri No. Aoki Holdings Co. Ltd. | | | | 900 | | | | | | | 17 | |
| | | | |
Maruha Nichiro Corp. | | | | 4,000 | | | | | | | 79 | |
| | | | |
MatsukiyoCocokara & Co. | | | | 3,100 | | | | | | | 45 | |
| | | | |
Mazda Motor Corp. | | | | 46,000 | | | | | | | 444 | |
| | | | |
McDonald’s Holdings Co. Japan Ltd. | | | | 4,600 | | | | | | | 182 | |
| | | | |
MEIJI Holdings Co. Ltd. | | | | 5,100 | | | | | | | 110 | |
| | | | |
Mitsubishi Motors Corp. | | | | 12,100 | | | | | | | 34 | |
| | | | |
Mitsubishi Shokuhin Co. Ltd. | | | | 3,800 | | | | | | | 129 | |
| | | | |
Mitsui DM Sugar Holdings Co. Ltd. | | | | 4,600 | | | | | | | 97 | |
| | | | |
Morinaga & Co. Ltd. | | | | 7,200 | | | | | | | 112 | |
| | | | |
Morinaga Milk Industry Co. Ltd. | | | | 1,600 | | | | | | | 34 | |
| | | | |
NH Foods Ltd. | | | | 3,800 | | | | | | | 114 | |
| | | | |
NHK Spring Co. Ltd. | | | | 8,400 | | | | | | | 84 | |
| | | | |
Nichirei Corp. | | | | 700 | | | | | | | 15 | |
| | | | |
Nippn Corp. | | | | 5,100 | | | | | | | 74 | |
| | | | |
Nishimatsuya Chain Co. Ltd. | | | | 5,100 | | | | | | | 68 | |
| | | | |
Nissan Motor Co. Ltd. | | | | 128,200 | | | | | | | 435 | |
| | | | | | | | | | | | |
| | | | | SHARES | | | | | MARKET
VALUE
(000S) | |
| | | | |
Nisshin Oillio Group Ltd. | | | | 3,600 | | | $ | | | | 109 | |
| | | | |
Nisshin Seifun Group, Inc. | | | | 5,100 | | | | | | | 59 | |
| | | | |
Nissin Foods Holdings Co. Ltd. | | | | 2,900 | | | | | | | 74 | |
| | | | |
Nitori Holdings Co. Ltd. | | | | 1,500 | | | | | | | 159 | |
| | | | |
NOK Corp. | | | | 8,200 | | | | | | | 109 | |
| | | | |
Paltac Corp. | | | | 100 | | | | | | | 3 | |
| | | | |
Pan Pacific International Holdings Corp. | | | | 5,700 | | | | | | | 133 | |
| | | | |
Pigeon Corp. | | | | 1,200 | | | | | | | 11 | |
| | | | |
Resorttrust, Inc. | | | | 900 | | | | | | | 13 | |
| | | | |
Rohto Pharmaceutical Co. Ltd. | | | | 4,300 | | | | | | | 90 | |
| | | | |
Ryohin Keikaku Co. Ltd. | | | | 3,400 | | | | | | | 57 | |
| | | | |
Saizeriya Co. Ltd. | | | | 3,800 | | | | | | | 130 | |
| | | | |
Sakata Seed Corp. | | | | 200 | | | | | | | 4 | |
| | | | |
Sangetsu Corp. | | | | 900 | | | | | | | 17 | |
| | | | |
Sankyo Co. Ltd. | | | | 17,700 | | | | | | | 193 | |
| | | | |
Sapporo Holdings Ltd. | | | | 1,500 | | | | | | | 53 | |
| | | | |
Sekisui Chemical Co. Ltd. | | | | 3,400 | | | | | | | 47 | |
| | | | |
Sekisui House Ltd. | | | | 6,600 | | | | | | | 147 | |
| | | | |
Seven & i Holdings Co. Ltd. | | | | 33,300 | | | | | | | 407 | |
| | | | |
Shimamura Co. Ltd. | | | | 1,600 | | | | | | | 73 | |
| | | | |
Shimano, Inc. | | | | 500 | | | | | | | 77 | |
| | | | |
Skylark Holdings Co. Ltd. | | | | 4,200 | | | | | | | 56 | |
| | | | |
Stanley Electric Co. Ltd. | | | | 2,800 | | | | | | | 50 | |
| | | | |
Subaru Corp. | | | | 2,500 | | | | | | | 53 | |
| | | | |
Sugi Holdings Co. Ltd. | | | | 600 | | | | | | | 8 | |
| | | | |
Sumitomo Electric Industries Ltd. | | | | 22,800 | | | | | | | 357 | |
| | | | |
Sumitomo Forestry Co. Ltd. | | | | 7,700 | | | | | | | 247 | |
| | | | |
Sumitomo Rubber Industries Ltd. | | | | 12,500 | | | | | | | 125 | |
| | | | |
Sundrug Co. Ltd. | | | | 2,900 | | | | | | | 73 | |
| | | | |
Suntory Beverage & Food Ltd. | | | | 4,100 | | | | | | | 146 | |
| | | | |
Suzuki Motor Corp. | | | | 26,500 | | | | | | | 306 | |
| | | | |
Takashimaya Co. Ltd. | | | | 7,900 | | | | | | | 133 | |
| | | | |
Tokai Rika Co. Ltd. | | | | 4,300 | | | | | | | 58 | |
| | | | |
Tomy Co. Ltd. | | | | 5,000 | | | | | | | 99 | |
| | | | |
Toyo Suisan Kaisha Ltd. | | | | 1,500 | | | | | | | 89 | |
| | | | |
Toyo Tire Corp. | | | | 5,100 | | | | | | | 82 | |
| | | | |
Toyoda Gosei Co. Ltd. | | | | 4,700 | | | | | | | 83 | |
| | | | |
Toyota Boshoku Corp. | | | | 5,400 | | | | | | | 72 | |
| | | | |
Toyota Motor Corp. | | | | 45,000 | | | | | | | 923 | |
| | | | |
TS Tech Co. Ltd. | | | | 4,900 | | | | | | | 58 | |
| | | | |
Tsuruha Holdings, Inc. | | | | 600 | | | | | | | 34 | |
| | | | |
Unicharm Corp. | | | | 2,400 | | | | | | | 77 | |
| | | | |
United Super Markets Holdings, Inc. | | | | 8,600 | | | | | | | 47 | |
| | | | |
USS Co. Ltd. | | | | 9,600 | | | | | | | 81 | |
| | | | |
Yakult Honsha Co. Ltd. | | | | 1,100 | | | | | | | 20 | |
| | | | |
Yamada Holdings Co. Ltd. | | | | 51,100 | | | | | | | 138 | |
| | | | |
Yamaha Corp. | | | | 700 | | | | | | | 16 | |
| | | | |
Yamaha Motor Co. Ltd. | | | | 16,900 | | | | | | | 157 | |
| | | | |
Yamazaki Baking Co. Ltd. | | | | 5,000 | | | | | | | 103 | |
| | | | |
Yokohama Rubber Co. Ltd. | | | | 2,800 | | | | | | | 62 | |
| | | | |
Zensho Holdings Co. Ltd. | | | | 3,400 | | | | | | | 130 | |
| | | | | | | | | | | | |
| | | | | | | | | | | 14,054 | |
| | | | | | | | | | | | |
| |
| ENERGY 0.7% | |
| | | | |
Cosmo Energy Holdings Co. Ltd. | | | | 5,000 | | | | | | | 252 | |
| | | | |
ENEOS Holdings, Inc. | | | | 118,200 | | | | | | | 609 | |
| | | | |
Idemitsu Kosan Co. Ltd. | | | | 48,460 | | | | | | | 315 | |
| | | | |
Inpex Corp. | | | | 34,700 | | | | | | | 510 | |
| | | | |
Iwatani Corp. | | | | 700 | | | | | | | 41 | |
| | | | |
Japan Petroleum Exploration Co. Ltd. | | | | 600 | | | | | | | 24 | |
| | | | | | | | | | | | |
| | | | | | | | | | | 1,751 | |
| | | | | | | | | | | | |
| |
| | | | | | |
| 26 | | PIMCO EQUITY SERIES | | | See Accompanying Notes | |
| | | | | | | | | | | | |
| | | | | SHARES | | | | | MARKET
VALUE
(000S) | |
| FINANCIALS 2.5% | |
| | | | |
Credit Saison Co. Ltd. | | | | 1,000 | | | $ | | | | 21 | |
| | | | |
Dai-ichi Life Holdings, Inc. (a) | | | | 6,100 | | | | | | | 163 | |
| | | | |
Daiwa Securities Group, Inc. | | | | 21,000 | | | | | | | 161 | |
| | | | |
Hirogin Holdings, Inc. | | | | 3,800 | | | | | | | 30 | |
| | | | |
Hokuhoku Financial Group, Inc. | | | | 12,200 | | | | | | | 158 | |
| | | | |
Hyakujushi Bank Ltd. | | | | 5,200 | | | | | | | 110 | |
| | | | |
Iyogin Holdings, Inc. | | | | 3,500 | | | | | | | 33 | |
| | | | |
JAFCO Group Co. Ltd. | | | | 900 | | | | | | | 11 | |
| | | | |
Japan Exchange Group, Inc. | | | | 800 | | | | | | | 19 | |
| | | | |
Japan Post Bank Co. Ltd. | | | | 29,400 | | | | | | | 279 | |
| | | | |
Japan Post Holdings Co. Ltd. | | | | 62,400 | | | | | | | 620 | |
| | | | |
Japan Post Insurance Co. Ltd. | | | | 5,500 | | | | | | | 107 | |
| | | | |
Kyushu Financial Group, Inc. | | | | 4,300 | | | | | | | 25 | |
| | | | |
Mitsubishi HC Capital, Inc. | | | | 13,700 | | | | | | | 91 | |
| | | | |
Mitsubishi UFJ Financial Group, Inc. | | | | 69,100 | | | | | | | 746 | |
| | | | |
Mizuho Financial Group, Inc. | | | | 57,800 | | | | | | | 1,217 | |
| | | | |
MS&AD Insurance Group Holdings, Inc. | | | | 33,200 | | | | | | | 741 | |
| | | | |
Nanto Bank Ltd. | | | | 5,100 | | | | | | | 114 | |
| | | | |
Nishi-Nippon Financial Holdings, Inc. | | | | 14,000 | | | | | | | 177 | |
| | | | |
Nomura Holdings, Inc. | | | | 29,000 | | | | | | | 167 | |
| | | | |
ORIX Corp. (a) | | | | 2,000 | | | | | | | 44 | |
| | | | |
Senshu Ikeda Holdings, Inc. | | | | 60,500 | | | | | | | 151 | |
| | | | |
Seven Bank Ltd. | | | | 42,100 | | | | | | | 71 | |
| | | | |
Sompo Holdings, Inc. | | | | 1,200 | | | | | | | 26 | |
| | | | |
Sumitomo Mitsui Financial Group, Inc. | | | | 6,300 | | | | | | | 423 | |
| | | | |
Tokio Marine Holdings, Inc. | | | | 14,900 | | | | | | | 560 | |
| | | | |
Zenkoku Hosho Co. Ltd. | | | | 200 | | | | | | | 7 | |
| | | | | | | | | | | | |
| | | | | | | | | | | 6,272 | |
| | | | | | | | | | | | |
| |
| HEALTH CARE 1.0% | |
| | | | |
Alfresa Holdings Corp. | | | | 7,500 | | | | | | | 103 | |
| | | | |
Astellas Pharma, Inc. | | | | 15,600 | | | | | | | 154 | |
| | | | |
Chugai Pharmaceutical Co. Ltd. | | | | 8,300 | | | | | | | 295 | |
| | | | |
Eisai Co. Ltd. | | | | 1,500 | | | | | | | 62 | |
| | | | |
Fukuda Denshi Co. Ltd. | | | | 800 | | | | | | | 34 | |
| | | | |
H.U. Group Holdings, Inc. | | | | 3,800 | | | | | | | 55 | |
| | | | |
Hoya Corp. | | | | 1,400 | | | | | | | 164 | |
| | | | |
Kaken Pharmaceutical Co. Ltd. | | | | 3,500 | | | | | | | 84 | |
| | | | |
M3, Inc. | | | | 800 | | | | | | | 8 | |
| | | | |
Medipal Holdings Corp. | | | | 8,100 | | | | | | | 123 | |
| | | | |
Nihon Kohden Corp. | | | | 1,600 | | | | | | | 23 | |
| | | | |
Olympus Corp. | | | | 8,300 | | | | | | | 134 | |
| | | | |
Santen Pharmaceutical Co. Ltd. | | | | 4,600 | | | | | | | 47 | |
| | | | |
Sawai Group Holdings Co. Ltd. | | | | 600 | | | | | | | 24 | |
| | | | |
Shionogi & Co. Ltd. | | | | 3,200 | | | | | | | 125 | |
| | | | |
Suzuken Co. Ltd. | | | | 3,700 | | | | | | | 113 | |
| | | | |
Sysmex Corp. | | | | 1,200 | | | | | | | 19 | |
| | | | |
Takeda Pharmaceutical Co. Ltd. | | | | 22,641 | | | | | | | 587 | |
| | | | |
Terumo Corp. | | | | 9,500 | | | | | | | 158 | |
| | | | |
Toho Holdings Co. Ltd. | | | | 4,700 | | | | | | | 123 | |
| | | | |
Tsumura & Co. | | | | 3,600 | | | | | | | 92 | |
| | | | | | | | | | | | |
| | | | | | | | | | | 2,527 | |
| | | | | | | | | | | | |
| |
| INDUSTRIALS 5.9% | |
| | | | |
AGC, Inc. | | | | 3,900 | | | | | | | 127 | |
| | | | |
ANA Holdings, Inc. | | | | 1,300 | | | | | | | 24 | |
| | | | |
Central Glass Co. Ltd. | | | | 3,900 | | | | | | | 91 | |
| | | | |
Central Japan Railway Co. | | | | 6,400 | | | | | | | 139 | |
| | | | |
COMSYS Holdings Corp. | | | | 4,100 | | | | | | | 79 | |
| | | | |
Dai Nippon Printing Co. Ltd. | | | | 7,300 | | | | | | | 246 | |
| | | | |
Daikin Industries Ltd. | | | | 1,100 | | | | | | | 153 | |
| | | | |
DMG Mori Co. Ltd. | | | | 5,500 | | | | | | | 144 | |
| | | | | | | | | | | | |
| | | | | SHARES | | | | | MARKET
VALUE
(000S) | |
| | | | |
East Japan Railway Co. | | | | 11,000 | | | $ | | | | 183 | |
| | | | |
Ebara Corp. | | | | 3,000 | | | | | | | 48 | |
| | | | |
EXEO Group, Inc. | | | | 8,400 | | | | | | | 84 | |
| | | | |
FANUC Corp. | | | | 5,200 | | | | | | | 143 | |
| | | | |
Fuji Electric Co. Ltd. | | | | 500 | | | | | | | 29 | |
| | | | |
Fujikura Ltd. | | | | 17,400 | | | | | | | 344 | |
| | | | |
Fujitec Co. Ltd. | | | | 3,900 | | | | | | | 105 | |
| | | | |
Furukawa Electric Co. Ltd. | | | | 3,100 | | | | | | | 79 | |
| | | | |
Glory Ltd. | | | | 1,200 | | | | | | | 21 | |
| | | | |
Hanwa Co. Ltd. | | | | 3,600 | | | | | | | 138 | |
| | | | |
Harmonic Drive Systems, Inc. | | | | 500 | | | | | | | 14 | |
| | | | |
Hazama Ando Corp. | | | | 7,900 | | | | | | | 57 | |
| | | | |
Hino Motors Ltd. (a) | | | | 17,900 | | | | | | | 47 | |
| | | | |
Hitachi Ltd. | | | | 81,500 | | | | | | | 1,835 | |
| | | | |
Hitachi Zosen Corp. | | | | 13,800 | | | | | | | 91 | |
| | | | |
Hoshizaki Corp. | | | | 200 | | | | | | | 6 | |
| | | | |
IHI Corp. | | | | 2,400 | | | | | | | 72 | |
| | | | |
ITOCHU Corp. | | | | 8,100 | | | | | | | 398 | |
| | | | |
Kajima Corp. | | | | 6,100 | | | | | | | 106 | |
| | | | |
Kamigumi Co. Ltd. | | | | 3,900 | | | | | | | 81 | |
| | | | |
Kandenko Co. Ltd. | | | | 12,100 | | | | | | | 130 | |
| | | | |
Kawasaki Heavy Industries Ltd. | | | | 8,500 | | | | | | | 325 | |
| | | | |
Kawasaki Kisen Kaisha Ltd. | | | | 2,800 | | | | | | | 41 | |
| | | | |
Keihan Holdings Co. Ltd. | | | | 600 | | | | | | | 11 | |
| | | | |
Keio Corp. | | | | 700 | | | | | | | 16 | |
| | | | |
Kinden Corp. | | | | 5,100 | | | | | | | 102 | |
| | | | |
Kintetsu Group Holdings Co. Ltd. ‘L’ | | | | 3,700 | | | | | | | 81 | |
| | | | |
Kurita Water Industries Ltd. | | | | 800 | | | | | | | 34 | |
| | | | |
Kyushu Railway Co. | | | | 3,000 | | | | | | | 65 | |
| | | | |
Lixil Corp. | | | | 4,200 | | | | | | | 44 | |
| | | | |
Makita Corp. | | | | 1,000 | | | | | | | 27 | |
| | | | |
Marubeni Corp. | | | | 45,300 | | | | | | | 840 | |
| | | | |
MEITEC Group Holdings, Inc. | | | | 3,500 | | | | | | | 71 | |
| | | | |
Minebea Mitsumi, Inc. | | | | 4,800 | | | | | | | 99 | |
| | | | |
MIRAIT ONE Corp. | | | | 4,600 | | | | | | | 60 | |
| | | | |
Mitsubishi Corp. | | | | 26,000 | | | | | | | 511 | |
| | | | |
Mitsubishi Electric Corp. | | | | 9,800 | | | | | | | 157 | |
| | | | |
Mitsubishi Heavy Industries Ltd. | | | | 171,200 | | | | | | | 1,843 | |
| | | | |
Mitsui & Co. Ltd. | | | | 19,600 | | | | | | | 447 | |
| | | | |
Mitsui OSK Lines Ltd. | | | | 10,000 | | | | | | | 301 | |
| | | | |
Nagase & Co. Ltd. | | | | 4,800 | | | | | | | 94 | |
| | | | |
Nagoya Railroad Co. Ltd. | | | | 2,600 | | | | | | | 28 | |
| | | | |
Nankai Electric Railway Co. Ltd. | | | | 4,000 | | | | | | | 66 | |
| | | | |
Nippon Yusen KK | | | | 12,100 | | | | | | | 353 | |
| | | | |
Nisshinbo Holdings, Inc. | | | | 12,400 | | | | | | | 83 | |
| | | | |
NSK Ltd. | | | | 24,400 | | | | | | | 119 | |
| | | | |
NTN Corp. | | | | 34,200 | | | | | | | 68 | |
| | | | |
Obayashi Corp. | | | | 13,700 | | | | | | | 164 | |
| | | | |
Penta-Ocean Construction Co. Ltd. | | | | 9,700 | | | | | | | 40 | |
| | | | |
Persol Holdings Co. Ltd. | | | | 39,700 | | | | | | | 55 | |
| | | | |
Recruit Holdings Co. Ltd. | | | | 10,900 | | | | | | | 587 | |
| | | | |
Sakai Moving Service Co. Ltd. | | | | 4,900 | | | | | | | 78 | |
| | | | |
Sanwa Holdings Corp. | | | | 3,600 | | | | | | | 66 | |
| | | | |
Secom Co. Ltd. | | | | 2,700 | | | | | | | 160 | |
| | | | |
Seino Holdings Co. Ltd. | | | | 3,400 | | | | | | | 46 | |
| | | | |
Senko Group Holdings Co. Ltd. | | | | 9,400 | | | | | | | 66 | |
| | | | |
SG Holdings Co. Ltd. | | | | 3,900 | | | | | | | 36 | |
| | | | |
Shibaura Machine Co. Ltd. | | | | 3,700 | | | | | | | 89 | |
| | | | |
Shinmaywa Industries Ltd. | | | | 8,300 | | | | | | | 74 | |
| | | | |
SHO-BOND Holdings Co. Ltd. | | | | 200 | | | | | | | 7 | |
| | | | |
SMC Corp. | | | | 100 | | | | | | | 48 | |
| | | | |
Sohgo Security Services Co. Ltd. | | | | 12,000 | | | | | | | 70 | |
| | | | |
Sojitz Corp. | | | | 10,540 | | | | | | | 257 | |
| | | | |
Sotetsu Holdings, Inc. | | | | 4,100 | | | | | | | 62 | |
| | | | |
Sumitomo Corp. | | | | 6,200 | | | | | | | 156 | |
| | | | | | | | | | | | |
| | | | | SHARES | | | | | MARKET
VALUE
(000S) | |
| | | | |
Sumitomo Heavy Industries Ltd. | | | | 2,800 | | | $ | | | | 73 | |
| | | | |
Taikisha Ltd. | | | | 3,700 | | | | | | | 123 | |
| | | | |
Taisei Corp. | | | | 5,800 | | | | | | | 216 | |
| | | | |
Takeuchi Manufacturing Co. Ltd. | | | | 4,000 | | | | | | | 140 | |
| | | | |
TechnoPro Holdings, Inc. | | | | 3,400 | | | | | | | 56 | |
| | | | |
Tobu Railway Co. Ltd. | | | | 2,900 | | | | | | | 49 | |
| | | | |
Tokyu Corp. | | | | 12,500 | | | | | | | 138 | |
| | | | |
TOPPAN Holdings, Inc. | | | | 10,100 | | | | | | | 280 | |
| | | | |
TOTO Ltd. | | | | 900 | | | | | | | 21 | |
| | | | |
Toyota Industries Corp. | | | | 800 | | | | | | | 68 | |
| | | | |
Toyota Tsusho Corp. | | | | 25,800 | | | | | | | 504 | |
| | | | |
West Japan Railway Co. | | | | 4,300 | | | | | | | 80 | |
| | | | |
Yamato Holdings Co. Ltd. | | | | 3,200 | | | | | | | 35 | |
| | | | |
Yaskawa Electric Corp. | | | | 3,100 | | | | | | | 112 | |
| | | | |
Yuasa Trading Co. Ltd. | | | | 3,600 | | | | | | | 127 | |
| | | | | | | | | | | | |
| | | | | | | | | | | 14,983 | |
| | | | | | | | | | | | |
| |
| INFORMATION TECHNOLOGY 2.2% | |
| | | | |
Advantest Corp. | | | | 2,600 | | | | | | | 105 | |
| | | | |
Alps Alpine Co. Ltd. | | | | 11,600 | | | | | | | 111 | |
| | | | |
Azbil Corp. | | | | 700 | | | | | | | 20 | |
| | | | |
BIPROGY, Inc. | | | | 3,500 | | | | | | | 97 | |
| | | | |
Brother Industries Ltd. | | | | 4,100 | | | | | | | 72 | |
| | | | |
Canon Marketing Japan, Inc. | | | | 4,100 | | | | | | | 114 | |
| | | | |
Citizen Watch Co. Ltd. | | | | 17,600 | | | | | | | 118 | |
| | | | |
Daiwabo Holdings Co. Ltd. | | | | 4,700 | | | | | | | 84 | |
| | | | |
Dexerials Corp. | | | | 800 | | | | | | | 37 | |
| | | | |
Disco Corp. | | | | 1,300 | | | | | | | 495 | |
| | | | |
DTS Corp. | | | | 4,000 | | | | | | | 105 | |
| | | | |
FUJIFILM Holdings Corp. | | | | 11,300 | | | | | | | 265 | |
| | | | |
Fujitsu Ltd. | | | | 6,100 | | | | | | | 96 | |
| | | | |
Horiba Ltd. | | | | 100 | | | | | | | 8 | |
| | | | |
Hosiden Corp. | | | | 5,200 | | | | | | | 70 | |
| | | | |
Keyence Corp. | | | | 100 | | | | | | | 44 | |
| | | | |
Kokusai Electric Corp. | | | | 2,300 | | | | | | | 68 | |
| | | | |
Konica Minolta, Inc. | | | | 37,400 | | | | | | | 104 | |
| | | | |
Maxell Ltd. | | | | 5,100 | | | | | | | 57 | |
| | | | |
Murata Manufacturing Co. Ltd. | | | | 8,800 | | | | | | | 182 | |
| | | | |
NEC Corp. | | | | 8,100 | | | | | | | 668 | |
| | | | |
NET One Systems Co. Ltd. | | | | 800 | | | | | | | 15 | |
| | | | |
Nippon Electric Glass Co. Ltd. | | | | 5,200 | | | | | | | 119 | |
| | | | |
Nomura Research Institute Ltd. | | | | 4,600 | | | | | | | 130 | |
| | | | |
Obic Co. Ltd. | | | | 300 | | | | | | | 39 | |
| | | | |
Omron Corp. | | | | 2,400 | | | | | | | 83 | |
| | | | |
Otsuka Corp. | | | | 4,900 | | | | | | | 95 | |
| | | | |
Renesas Electronics Corp. | | | | 5,200 | | | | | | | 99 | |
| | | | |
Ricoh Co. Ltd. | | | | 26,400 | | | | | | | 226 | |
| | | | |
Sanken Electric Co. Ltd. | | | | 500 | | | | | | | 21 | |
| | | | |
SCREEN Holdings Co. Ltd. | | | | 1,100 | | | | | | | 100 | |
| | | | |
SCSK Corp. | | | | 1,200 | | | | | | | 24 | |
| | | | |
Seiko Epson Corp. | | | | 4,900 | | | | | | | 77 | |
| | | | |
TDK Corp. | | | | 1,600 | | | | | | | 98 | |
| | | | |
TIS, Inc. | | | | 2,700 | | | | | | | 53 | |
| | | | |
Tokyo Electron Ltd. | | | | 5,800 | | | | | | | 1,270 | |
| | | | |
Tokyo Seimitsu Co. Ltd. | | | | 500 | | | | | | | 38 | |
| | | | |
Topcon Corp. | | | | 1,000 | | | | | | | 11 | |
| | | | |
Toshiba TEC Corp. | | | | 200 | | | | | | | 4 | |
| | | | |
Trend Micro, Inc. | | | | 400 | | | | | | | 16 | |
| | | | |
Ulvac, Inc. | | | | 1,100 | | | | | | | 72 | |
| | | | |
ZOZO, Inc. | | | | 1,100 | | | | | | | 28 | |
| | | | | | | | | | | | |
| | | | | | | | | | | 5,538 | |
| | | | | | | | | | | | |
| |
| MATERIALS 1.7% | |
| | | | |
ARE Holdings, Inc. | | | | 4,100 | | | | | | | 54 | |
| | | | | | | | | | | | |
| See Accompanying Notes | | | ANNUAL FINANCIAL AND OTHER INFORMATION | | | | | | | JUNE 30, 2024 | | | 27 |
| | | | | | |
| Schedule of Investments | | PIMCO RAFI Dynamic Multi-Factor International Equity ETF | | (Cont.) | | |
| | | | | | | | | | | | |
| | | | | SHARES | | | | | MARKET
VALUE
(000S) | |
| | | | |
Daicel Corp. | | | | 14,200 | | | $ | | | | 137 | |
| | | | |
DIC Corp. | | | | 1,000 | | | | | | | 19 | |
| | | | |
Dowa Holdings Co. Ltd. | | | | 200 | | | | | | | 7 | |
| | | | |
FP Corp. | | | | 200 | | | | | | | 3 | |
| | | | |
JFE Holdings, Inc. | | | | 21,800 | | | | | | | 315 | |
| | | | |
Kaneka Corp. | | | | 3,500 | | | | | | | 92 | |
| | | | |
Kobe Steel Ltd. | | | | 33,600 | | | | | | | 418 | |
| | | | |
Kuraray Co. Ltd. | | | | 5,500 | | | | | | | 64 | |
| | | | |
Mitsubishi Chemical Group Corp. | | | | 48,900 | | | | | | | 272 | |
| | | | |
Mitsubishi Materials Corp. | | | | 8,100 | | | | | | | 149 | |
| | | | |
Mitsui Chemicals, Inc. | | | | 5,200 | | | | | | | 144 | |
| | | | |
Mitsui Mining & Smelting Co. Ltd. | | | | 2,900 | | | | | | | 93 | |
| | | | |
Nippon Light Metal Holdings Co. Ltd. | | | | 1,000 | | | | | | | 11 | |
| | | | |
Nippon Paper Industries Co. Ltd. ‘L’ | | | | 21,500 | | | | | | | 128 | |
| | | | |
Nippon Steel Corp. | | | | 33,000 | | | | | | | 699 | |
| | | | |
Nissan Chemical Corp. | | | | 600 | | | | | | | 19 | |
| | | | |
Nitto Denko Corp. | | | | 3,300 | | | | | | | 262 | |
| | | | |
Oji Holdings Corp. | | | | 14,800 | | | | | | | 58 | |
| | | | |
Osaka Soda Co. Ltd. | | | | 400 | | | | | | | 27 | |
| | | | |
Rengo Co. Ltd. | | | | 3,700 | | | | | | | 24 | |
| | | | |
Shin-Etsu Chemical Co. Ltd. | | | | 9,300 | | | | | | | 362 | |
| | | | |
Sumitomo Chemical Co. Ltd. | | | | 65,500 | | | | | | | 141 | |
| | | | |
Sumitomo Osaka Cement Co. Ltd. | | | | 4,000 | | | | | | | 98 | |
| | | | |
Taiheiyo Cement Corp. | | | | 5,200 | | | | | | | 131 | |
| | | | |
Teijin Ltd. | | | | 2,800 | | | | | | | 23 | |
| | | | |
Tokuyama Corp. | | | | 4,700 | | | | | | | 87 | |
| | | | |
Tokyo Ohka Kogyo Co. Ltd. | | | | 3,400 | | | | | | | 93 | |
| | | | |
Tokyo Steel Manufacturing Co. Ltd. | | | | 8,500 | | | | | | | 86 | |
| | | | |
Tosoh Corp. | | | | 4,700 | | | | | | | 61 | |
| | | | |
Toyo Seikan Group Holdings Ltd. | | | | 8,600 | | | | | | | 135 | |
| | | | |
UACJ Corp. | | | | 1,000 | | | | | | | 24 | |
| | | | |
UBE Corp. | | | | 5,200 | | | | | | | 92 | |
| | | | | | | | | | | | |
| | | | | | | | | | | 4,328 | |
| | | | | | | | | | | | |
| |
| REAL ESTATE 0.2% | |
| | | | |
Daito Trust Construction Co. Ltd. | | | | 2,700 | | | | | | | 279 | |
| | | | |
Mitsui Fudosan Co. Ltd. | | | | 8,300 | | | | | | | 76 | |
| | | | |
Relo Group, Inc. | | | | 800 | | | | | | | 9 | |
| | | | |
Tokyu Fudosan Holdings Corp. | | | | 7,600 | | | | | | | 51 | |
| | | | | | | | | | | | |
| | | | | | | | | | | 415 | |
| | | | | | | | | | | | |
| |
| UTILITIES 1.3% | |
| | | | |
Chubu Electric Power Co., Inc. | | | | 28,000 | | | | | | | 331 | |
| | | | |
Chugoku Electric Power Co., Inc. | | | | 21,000 | | | | | | | 138 | |
| | | | |
Electric Power Development Co. Ltd. ‘C’ | | | | 9,200 | | | | | | | 144 | |
| | | | |
Hokkaido Electric Power Co., Inc. | | | | 27,200 | | | | | | | 202 | |
| | | | |
Hokuriku Electric Power Co. | | | | 17,000 | | | | | | | 108 | |
| | | | |
Kansai Electric Power Co., Inc. | | | | 26,300 | | | | | | | 441 | |
| | | | |
Kyushu Electric Power Co., Inc. | | | | 21,200 | | | | | | | 219 | |
| | | | |
Nippon Gas Co. Ltd. | | | | 2,800 | | | | | | | 42 | |
| | | | |
Osaka Gas Co. Ltd. | | | | 11,400 | | | | | | | 252 | |
| | | | |
Shikoku Electric Power Co., Inc. | | | | 12,800 | | | | | | | 110 | |
| | | | |
Toho Gas Co. Ltd. | | | | 3,900 | | | | | | | 95 | |
| | | | |
Tohoku Electric Power Co., Inc. | | | | 21,200 | | | | | | | 192 | |
| | | | |
Tokyo Electric Power Co. Holdings, Inc. (a) | | | | 125,200 | | | | | | | 674 | |
| | | | |
Tokyo Gas Co. Ltd. | | | | 14,900 | | | | | | | 321 | |
| | | | | | | | | | | | |
| | | | | | | | | | | 3,269 | |
| | | | | | | | | | | | |
Total Japan | | | | | | | | | | | 58,910 | |
| | | | | | | | | | | | |
| |
| | | | | | | | | | | | |
| | | | | SHARES | | | | | MARKET
VALUE
(000S) | |
| JORDAN 0.0% | |
| | | | | | | | | | | | |
| HEALTH CARE 0.0% | |
| | | | |
Hikma Pharmaceuticals PLC | | | | 3,645 | | | $ | | | | 87 | |
| | | | | | | | | | | | |
Total Jordan | | | | | | | | | | | 87 | |
| | | | | | | | | | | | |
| |
| LUXEMBOURG 0.4% | |
| | | | | | | | | | | | |
| COMMUNICATION SERVICES 0.1% | |
| | | | |
RTL Group SA | | | | 1,714 | | | | | | | 52 | |
| | | | |
SES SA | | | | 17,724 | | | | | | | 90 | |
| | | | | | | | | | | | |
| | | | | | | | | | | 142 | |
| | | | | | | | | | | | |
| |
| ENERGY 0.0% | |
| | | | |
Tenaris SA | | | | 4,106 | | | | | | | 63 | |
| | | | | | | | | | | | |
| |
| MATERIALS 0.3% | |
| | | | |
APERAM SA | | | | 3,053 | | | | | | | 79 | |
| | | | |
ArcelorMittal SA | | | | 24,047 | | | | | | | 551 | |
| | | | | | | | | | | | |
| | | | | | | | | | | 630 | |
| | | | | | | | | | | | |
| |
| REAL ESTATE 0.0% | |
| | | | |
Aroundtown SA (a) | | | | 12,245 | | | | | | | 26 | |
| | | | | | | | | | | | |
Total Luxembourg | | | | | | | | | | | 861 | |
| | | | | | | | | | | | |
| |
| NETHERLANDS 4.6% | |
| | | | | | | | | | | | |
| COMMUNICATION SERVICES 0.3% | |
| | | | |
Koninklijke KPN NV | | | | 107,900 | | | | | | | 414 | |
| | | | |
Universal Music Group NV | | | | 8,418 | | | | | | | 250 | |
| | | | | | | | | | | | |
| | | | | | | | | | | 664 | |
| | | | | | | | | | | | |
| |
| CONSUMER STAPLES 1.1% | |
| | | | |
Heineken Holding NV | | | | 2,073 | | | | | | | 163 | |
| | | | |
Heineken NV | | | | 2,773 | | | | | | | 268 | |
| | | | |
Koninklijke Ahold Delhaize NV | | | | 46,207 | | | | | | | 1,360 | |
| | | | |
Stellantis NV | | | | 53,515 | | | | | | | 1,058 | |
| | | | | | | | | | | | |
| | | | | | | | | | | 2,849 | |
| | | | | | | | | | | | |
| |
| ENERGY 0.1% | |
| | | | |
Koninklijke Vopak NV | | | | 2,194 | | | | | | | 91 | |
| | | | |
SBM Offshore NV | | | | 2,133 | | | | | | | 33 | |
| | | | | | | | | | | | |
| | | | | | | | | | | 124 | |
| | | | | | | | | | | | |
| |
| FINANCIALS 0.9% | |
| | | | |
ABN AMRO Bank NV | | | | 34,129 | | | | | | | 561 | |
| | | | |
Aegon Ltd. | | | | 83,573 | | | | | | | 517 | |
| | | | |
ASR Nederland NV | | | | 1,260 | | | | | | | 60 | |
| | | | |
Euronext NV | | | | 2,108 | | | | | | | 195 | |
| | | | |
ING Groep NV | | | | 38,779 | | | | | | | 666 | |
| | | | |
NN Group NV | | | | 8,444 | | | | | | | 392 | |
| | | | | | | | | | | | |
| | | | | | | | | | | 2,391 | |
| | | | | | | | | | | | |
| |
| HEALTH CARE 0.1% | |
| | | | |
Koninklijke Philips NV | | | | 4,709 | | | | | | | 118 | |
| | | | |
QIAGEN NV | | | | 2,180 | | | | | | | 90 | |
| | | | | | | | | | | | |
| | | | | | | | | | | 208 | |
| | | | | | | | | | | | |
| |
| INDUSTRIALS 0.5% | |
| | | | |
Arcadis NV | | | | 2,151 | | | | | | | 136 | |
| | | | |
Ferrovial SE | | | | 2,021 | | | | | | | 81 | |
| | | | |
IMCD NV | | | | 953 | | | | | | | 132 | |
| | | | | | | | | | | | |
| | | | | SHARES | | | | | MARKET
VALUE
(000S) | |
| | | | |
Randstad NV | | | | 3,434 | | | $ | | | | 156 | |
| | | | |
TKH Group NV | | | | 894 | | | | | | | 39 | |
| | | | |
Wolters Kluwer NV | | | | 4,616 | | | | | | | 762 | |
| | | | | | | | | | | | |
| | | | | | | | | | | 1,306 | |
| | | | | | | | | | | | |
| |
| INFORMATION TECHNOLOGY 1.4% | |
| | | | |
ASM International NV | | | | 982 | | | | | | | 751 | |
| | | | |
ASML Holding NV | | | | 1,437 | | | | | | | 1,465 | |
| | | | |
BE Semiconductor Industries NV | | | | 2,031 | | | | | | | 339 | |
| | | | |
NXP Semiconductors NV | | | | 3,309 | | | | | | | 890 | |
| | | | | | | | | | | | |
| | | | | | | | | | | 3,445 | |
| | | | | | | | | | | | |
| |
| MATERIALS 0.2% | |
| | | | |
Akzo Nobel NV | | | | 9,694 | | | | | | | 591 | |
| | | | | | | | | | | | |
Total Netherlands | | | | | | | | | | | 11,578 | |
| | | | | | | | | | | | |
| |
| NEW ZEALAND 0.2% | |
| | | | | | | | | | | | |
| COMMUNICATION SERVICES 0.0% | |
| | | | |
Spark New Zealand Ltd. | | | | 35,299 | | | | | | | 89 | |
| | | | | | | | | | | | |
| |
| HEALTH CARE 0.0% | |
| | | | |
Fisher & Paykel Healthcare Corp. Ltd. ‘C’ | | | | 5,378 | | | | | | | 98 | |
| | | | | | | | | | | | |
| |
| INDUSTRIALS 0.1% | |
| | | | |
Auckland International Airport Ltd. | | | | 14,898 | | | | | | | 69 | |
| | | | |
Fletcher Building Ltd. | | | | 22,858 | | | | | | | 40 | |
| | | | | | | | | | | | |
| | | | | | | | | | | 109 | |
| | | | | | | | | | | | |
| |
| UTILITIES 0.1% | |
| | | | |
Contact Energy Ltd. | | | | 13,774 | | | | | | | 75 | |
| | | | |
Meridian Energy Ltd. | | | | 19,455 | | | | | | | 75 | |
| | | | | | | | | | | | |
| | | | | | | | | | | 150 | |
| | | | | | | | | | | | |
Total New Zealand | | | | | | | | | | | 446 | |
| | | | | | | | | | | | |
| |
| NORWAY 1.0% | |
| | | | | | | | | | | | |
| COMMUNICATION SERVICES 0.1% | |
| | | | |
Telenor ASA | | | | 24,535 | | | | | | | 280 | |
| | | | | | | | | | | | |
| |
| CONSUMER STAPLES 0.1% | |
| | | | |
Mowi ASA | | | | 12,878 | | | | | | | 214 | |
| | | | |
Orkla ASA | | | | 5,401 | | | | | | | 44 | |
| | | | |
Salmar ASA | | | | 1,270 | | | | | | | 66 | |
| | | | | | | | | | | | |
| | | | | | | | | | | 324 | |
| | | | | | | | | | | | |
| |
| ENERGY 0.4% | |
| | | | |
Aker BP ASA | | | | 6,281 | | | | | | | 160 | |
| | | | |
Aker Solutions ASA | | | | 39,040 | | | | | | | 162 | |
| | | | |
Equinor ASA | | | | 19,850 | | | | | | | 569 | |
| | | | |
Frontline PLC | | | | 2,896 | | | | | | | 75 | |
| | | | |
SFL Corp. Ltd. | | | | 1,887 | | | | | | | 26 | |
| | | | | | | | | | | | |
| | | | | | | | | | | 992 | |
| | | | | | | | | | | | |
| |
| FINANCIALS 0.1% | |
| | | | |
DNB Bank ASA | | | | 7,725 | | | | | | | 152 | |
| | | | |
Gjensidige Forsikring ASA | | | | 4,342 | | | | | | | 77 | |
| | | | |
SpareBank 1 Nord Norge | | | | 2,890 | | | | | | | 27 | |
| | | | |
Storeband ASA | | | | 2,570 | | | | | | | 26 | |
| | | | | | | | | | | | |
| | | | | | | | | | | 282 | |
| | | | | | | | | | | | |
| |
| | | | | | |
| 28 | | PIMCO EQUITY SERIES | | | See Accompanying Notes | |
| | | | | | | | | | | | |
| | | | | SHARES | | | | | MARKET
VALUE
(000S) | |
| INDUSTRIALS 0.1% | |
| | | | |
Kongsberg Gruppen ASA | | | | 965 | | | $ | | | | 78 | |
| | | | |
Tomra Systems ASA | | | | 6,968 | | | | | | | 83 | |
| | | | |
Wallenius Wilhelmsen ASA | | | | 2,323 | | | | | | | 24 | |
| | | | | | | | | | | | |
| | | | | | | | | | | 185 | |
| | | | | | | | | | | | |
| |
| INFORMATION TECHNOLOGY 0.1% | |
| | | | |
Atea ASA | | | | 9,636 | | | | | | | 138 | |
| | | | | | | | | | | | |
| |
| MATERIALS 0.1% | |
| | | | |
Norsk Hydro ASA | | | | 18,953 | | | | | | | 118 | |
| | | | |
Yara International ASA | | | | 8,594 | | | | | | | 248 | |
| | | | | | | | | | | | |
| | | | | | | | | | | 366 | |
| | | | | | | | | | | | |
Total Norway | | | | | | | | | | | 2,567 | |
| | | | | | | | | | | | |
| |
| PORTUGAL 0.3% | |
| | | | | | | | | | | | |
| CONSUMER STAPLES 0.0% | |
| | | | |
Jeronimo Martins SGPS SA | | | | 4,871 | | | | | | | 95 | |
| | | | | | | | | | | | |
| |
| ENERGY 0.1% | |
| | | | |
Galp Energia SGPS SA | | | | 5,919 | | | | | | | 125 | |
| | | | | | | | | | | | |
| |
| FINANCIALS 0.0% | |
| | | | |
Banco Comercial Portugues SA | | | | 66,643 | | | | | | | 24 | |
| | | | | | | | | | | | |
| |
| UTILITIES 0.2% | |
| | | | |
EDP - Energias de Portugal SA | | | | 118,330 | | | | | | | 444 | |
| | | | |
REN - Redes Energeticas Nacionais SGPS SA | | | | 25,058 | | | | | | | 61 | |
| | | | | | | | | | | | |
| | | | | | | | | | | 505 | |
| | | | | | | | | | | | |
Total Portugal | | | | | | | | | | | 749 | |
| | | | | | | | | | | | |
| |
| SINGAPORE 1.4% | |
| | | | | | | | | | | | |
| COMMUNICATION SERVICES 0.2% | |
| | | | |
JOYY, Inc. ADR | | | | 714 | | | | | | | 21 | |
| | | | |
NetLink NBN Trust | | | | 91,300 | | | | | | | 56 | |
| | | | |
Singapore Telecommunications Ltd. | | | | 237,700 | | | | | | | 481 | |
| | | | | | | | | | | | |
| | | | | | | | | | | 558 | |
| | | | | | | | | | | | |
| |
| CONSUMER STAPLES 0.1% | |
| | | | |
Golden Agri-Resources Ltd. | | | | 658,800 | | | | | | | 131 | |
| | | | |
Wilmar International Ltd. | | | | 84,400 | | | | | | | 193 | |
| | | | | | | | | | | | |
| | | | | | | | | | | 324 | |
| | | | | | | | | | | | |
| |
| FINANCIALS 0.7% | |
| | | | |
DBS Group Holdings Ltd. | | | | 29,370 | | | | | | | 774 | |
| | | | |
Oversea-Chinese Banking Corp. Ltd. | | | | 50,200 | | | | | | | 533 | |
| | | | |
Singapore Exchange Ltd. | | | | 4,600 | | | | | | | 32 | |
| | | | |
United Overseas Bank Ltd. | | | | 18,400 | | | | | | | 424 | |
| | | | | | | | | | | | |
| | | | | | | | | | | 1,763 | |
| | | | | | | | | | | | |
| |
| INDUSTRIALS 0.3% | |
| | | | |
ComfortDelGro Corp. Ltd. | | | | 65,500 | | | | | | | 65 | |
| | | | |
Jardine Cycle & Carriage Ltd. | | | | 4,700 | | | | | | | 92 | |
| | | | |
Keppel Corp. Ltd. | | | | 24,900 | | | | | | | 118 | |
| | | | |
Singapore Airlines Ltd. | | | | 57,100 | | | | | | | 290 | |
| | | | |
Singapore Technologies Engineering Ltd. | | | | 42,400 | | | | | | | 135 | |
| | | | | | | | | | | | |
| | | | | | | | | | | 700 | |
| | | | | | | | | | | | |
| |
| | | | | | | | | | | | |
| | | | | SHARES | | | | | MARKET
VALUE
(000S) | |
| INFORMATION TECHNOLOGY 0.0% | |
| | | | |
Venture Corp. Ltd. | | | | 8,500 | | | $ | | | | 89 | |
| | | | | | | | | | | | |
| |
| UTILITIES 0.1% | |
| | | | |
Sembcorp Industries Ltd. | | | | 53,600 | | | | | | | 190 | |
| | | | | | | | | | | | |
Total Singapore | | | | | | | | | | | 3,624 | |
| | | | | | | | | | | | |
| |
| SOUTH AFRICA 0.0% | |
| | | | | | | | | | | | |
| FINANCIALS 0.0% | |
| | | | |
Investec PLC | | | | 4,997 | | | | | | | 36 | |
| | | | | | | | | | | | |
Total South Africa | | | | | | | | | | | 36 | |
| | | | | | | | | | | | |
| |
| SPAIN 3.8% | |
| | | | | | | | | | | | |
| COMMUNICATION SERVICES 0.6% | |
| | | | |
Cellnex Telecom SA | | | | 5,191 | | | | | | | 169 | |
| | | | |
Telefonica SA | | | | 337,813 | | | | | | | 1,431 | |
| | | | | | | | | | | | |
| | | | | | | | | | | 1,600 | |
| | | | | | | | | | | | |
| |
| CONSUMER STAPLES 0.4% | |
| | | | |
Gestamp Automocion SA | | | | 19,080 | | | | | | | 57 | |
| | | | |
Industria de Diseno Textil SA | | | | 17,391 | | | | | | | 863 | |
| | | | |
Viscofan SA | | | | 1,731 | | | | | | | 113 | |
| | | | | | | | | | | | |
| | | | | | | | | | | 1,033 | |
| | | | | | | | | | | | |
| |
| ENERGY 0.4% | |
| | | | |
Repsol SA | | | | 59,251 | | | | | | | 940 | |
| | | | | | | | | | | | |
| |
| FINANCIALS 1.4% | |
| | | | |
Banco Bilbao Vizcaya Argentaria SA | | | | 76,511 | | | | | | | 768 | |
| | | | |
Banco de Sabadell SA | | | | 478,985 | | | | | | | 925 | |
| | | | |
Banco Santander SA | | | | 304,753 | | | | | | | 1,418 | |
| | | | |
Bankinter SA | | | | 3,006 | | | | | | | 24 | |
| | | | |
CaixaBank SA | | | | 14,093 | | | | | | | 75 | |
| | | | |
Mapfre SA | | | | 101,656 | | | | | | | 234 | |
| | | | |
Unicaja Banco SA | | | | 158,339 | | | | | | | 218 | |
| | | | | | | | | | | | |
| | | | | | | | | | | 3,662 | |
| | | | | | | | | | | | |
| |
| HEALTH CARE 0.1% | |
| | | | |
Almirall SA | | | | 6,200 | | | | | | | 62 | |
| | | | |
Grifols SA (a) | | | | 9,400 | | | | | | | 80 | |
| | | | | | | | | | | | |
| | | | | | | | | | | 142 | |
| | | | | | | | | | | | |
| |
| INDUSTRIALS 0.2% | |
| | | | |
ACS Actividades de Construccion y Servicios SA | | | | 6,304 | | | | | | | 272 | |
| | | | |
Aena SME SA | | | | 565 | | | | | | | 114 | |
| | | | |
Cia de Distribucion Integral Logista Holdings SA | | | | 4,090 | | | | | | | 116 | |
| | | | |
Sacyr SA | | | | 27,962 | | | | | | | 99 | |
| | | | | | | | | | | | |
| | | | | | | | | | | 601 | |
| | | | | | | | | | | | |
| |
| MATERIALS 0.1% | |
| | | | |
Acerinox SA | | | | 10,971 | | | | | | | 114 | |
| | | | | | | | | | | | |
| |
| UTILITIES 0.6% | |
| | | | |
EDP Renovaveis SA | | | | 3,996 | | | | | | | 56 | |
| | | | |
Enagas SA | | | | 2,922 | | | | | | | 44 | |
| | | | |
Endesa SA | | | | 14,859 | | | | | | | 279 | |
| | | | |
Iberdrola SA | | | | 61,652 | | | | | | | 800 | |
| | | | |
Naturgy Energy Group SA | | | | 8,381 | | | | | | | 182 | |
| | | | | | | | | | | | |
| | | | | SHARES | | | | | MARKET
VALUE
(000S) | |
| | | | |
Redeia Corp. SA | | | | 12,928 | | | $ | | | | 226 | |
| | | | | | | | | | | | |
| | | | | | | | | | | 1,587 | |
| | | | | | | | | | | | |
Total Spain | | | | | | | | | | | 9,679 | |
| | | | | | | | | | | | |
| |
| SWEDEN 2.8% | |
| | | | | | | | | | | | |
| COMMUNICATION SERVICES 0.4% | |
| | | | |
Spotify Technology SA (a) | | | | 1,031 | | | | | | | 324 | |
| | | | |
Tele2 AB ‘B’ | | | | 13,983 | | | | | | | 141 | |
| | | | |
Telia Co. AB | | | | 167,462 | | | | | | | 449 | |
| | | | | | | | | | | | |
| | | | | | | | | | | 914 | |
| | | | | | | | | | | | |
| |
| CONSUMER DISCRETIONARY 0.1% | |
| | | | |
Autoliv, Inc. | | | | 1,461 | | | | | | | 157 | |
| | | | |
Betsson AB (a) | | | | 2,838 | | | | | | | 33 | |
| | | | | | | | | | | | |
| | | | | | | | | | | 190 | |
| | | | | | | | | | | | |
| |
| CONSUMER STAPLES 0.3% | |
| | | | |
AAK AB | | | | 3,996 | | | | | | | 117 | |
| | | | |
Axfood AB | | | | 2,797 | | | | | | | 73 | |
| | | | |
Bilia AB ‘A’ | | | | 4,653 | | | | | | | 62 | |
| | | | |
Electrolux AB ‘B’ (a) | | | | 14,365 | | | | | | | 118 | |
| | | | |
Essity AB ‘B’ | | | | 15,168 | | | | | | | 388 | |
| | | | |
Scandic Hotels Group AB (a) | | | | 20,792 | | | | | | | 126 | |
| | | | | | | | | | | | |
| | | | | | | | | | | 884 | |
| | | | | | | | | | | | |
| |
| FINANCIALS 0.4% | |
| | | | |
EQT AB | | | | 5,148 | | | | | | | 151 | |
| | | | |
Skandinaviska Enskilda Banken AB ‘A’ | | | | 9,892 | | | | | | | 146 | |
| | | | |
Svenska Handelsbanken AB ‘A’ | | | | 28,910 | | | | | | | 276 | |
| | | | |
Swedbank AB ‘A’ | | | | 23,616 | | | | | | | 487 | |
| | | | | | | | | | | | |
| | | | | | | | | | | 1,060 | |
| | | | | | | | | | | | |
| |
| HEALTH CARE 0.0% | |
| | | | |
Elekta AB ‘B’ | | | | 3,057 | | | | | | | 19 | |
| | | | |
Getinge AB ‘B’ | | | | 2,249 | | | | | | | 38 | |
| | | | |
Swedish Orphan Biovitrum AB (a) | | | | 1,023 | | | | | | | 28 | |
| | | | | | | | | | | | |
| | | | | | | | | | | 85 | |
| | | | | | | | | | | | |
| |
| INDUSTRIALS 1.3% | |
| | | | |
AddTech AB ‘B’ | | | | 2,766 | | | | | | | 69 | |
| | | | |
Assa Abloy AB ‘B’ | | | | 6,420 | | | | | | | 182 | |
| | | | |
Atlas Copco AB ‘A’ | | | | 45,660 | | | | | | | 857 | |
| | | | |
Beijer Ref AB | | | | 3,403 | | | | | | | 53 | |
| | | | |
Epiroc AB ‘A’ | | | | 8,355 | | | | | | | 167 | |
| | | | |
Indutrade AB | | | | 4,606 | | | | | | | 118 | |
| | | | |
Investment AB Latour ‘B’ | | | | 957 | | | | | | | 26 | |
| | | | |
Lifco AB ‘B’ | | | | 2,043 | | | | | | | 56 | |
| | | | |
Saab AB | | | | 2,353 | | | | | | | 57 | |
| | | | |
Sandvik AB | | | | 11,541 | | | | | | | 232 | |
| | | | |
Securitas AB ‘B’ | | | | 5,595 | | | | | | | 55 | |
| | | | |
Skanska AB ‘B’ | | | | 2,567 | | | | | | | 46 | |
| | | | |
SKF AB ‘B’ | | | | 11,582 | | | | | | | 233 | |
| | | | |
Trelleborg AB ‘B’ | | | | 2,666 | | | | | | | 104 | |
| | | | |
Volvo AB ‘B’ | | | | 43,909 | | | | | | | 1,128 | |
| | | | | | | | | | | | |
| | | | | | | | | | | 3,383 | |
| | | | | | | | | | | | |
| |
| INFORMATION TECHNOLOGY 0.1% | |
| | | | |
Mycronic AB | | | | 741 | | | | | | | 29 | |
| | | | |
Telefonaktiebolaget LM Ericsson ‘B’ | | | | 24,582 | | | | | | | 152 | |
| | | | | | | | | | | | |
| | | | | | | | | | | 181 | |
| | | | | | | | | | | | |
| |
| | | | | | | | | | | | |
| See Accompanying Notes | | | ANNUAL FINANCIAL AND OTHER INFORMATION | | | | | | | JUNE 30, 2024 | | | 29 |
| | | | | | |
| Schedule of Investments | | PIMCO RAFI Dynamic Multi-Factor International Equity ETF | | (Cont.) | | |
| | | | | | | | | | | | |
| | | | | SHARES | | | | | MARKET
VALUE
(000S) | |
| MATERIALS 0.1% | |
| | | | |
Hexpol AB | | | | 4,172 | | | $ | | | | 46 | |
| | | | |
SSAB AB ‘A’ | | | | 48,269 | | | | | | | 266 | |
| | | | | | | | | | | | |
| | | | | | | | | | | 312 | |
| | | | | | | | | | | | |
| |
| REAL ESTATE 0.1% | |
| | | | |
Atrium Ljungberg AB ‘B’ | | | | 4,524 | | | | | | | 88 | |
| | | | |
Castellum AB (a) | | | | 4,025 | | | | | | | 49 | |
| | | | |
Fastighets AB Balder ‘B’ (a) | | | | 3,554 | | | | | | | 24 | |
| | | | | | | | | | | | |
| | | | | | | | | | | 161 | |
| | | | | | | | | | | | |
Total Sweden | | | | | | | | | | | 7,170 | |
| | | | | | | | | | | | |
| |
| SWITZERLAND 7.4% | |
| | | | | | | | | | | | |
| COMMUNICATION SERVICES 0.1% | |
| | | | |
Swisscom AG | | | | 573 | | | | | | | 322 | |
| | | | | | | | | | | | |
| |
| CONSUMER DISCRETIONARY 0.2% | |
| | | | |
Garmin Ltd. | | | | 3,041 | | | | | | | 495 | |
| | | | | | | | | | | | |
| |
| CONSUMER STAPLES 1.1% | |
| | | | |
Barry Callebaut AG | | | | 45 | | | | | | | 73 | |
| | | | |
Chocoladefabriken Lindt & Spruengli AG | | | | 8 | | | | | | | 94 | |
| | | | |
Cie Financiere Richemont SA ‘A’ | | | | 4,157 | | | | | | | 650 | |
| | | | |
Coca-Cola HBC AG | | | | 2,386 | | | | | | | 81 | |
| | | | |
Emmi AG | | | | 50 | | | | | | | 49 | |
| | | | |
Nestle SA | | | | 17,621 | | | | | | | 1,799 | |
| | | | | | | | | | | | |
| | | | | | | | | | | 2,746 | |
| | | | | | | | | | | | |
| |
| FINANCIALS 1.6% | |
| | | | |
Banque Cantonale Vaudoise | | | | 1,042 | | | | | | | 111 | |
| | | | |
Cembra Money Bank AG | | | | 1,110 | | | | | | | 95 | |
| | | | |
Partners Group Holding AG | | | | 341 | | | | | | | 437 | |
| | | | |
St Galler Kantonalbank AG ‘A’ | | | | 129 | | | | | | | 62 | |
| | | | |
Swiss Life Holding AG | | | | 454 | | | | | | | 333 | |
| | | | |
Swiss Re AG | | | | 5,614 | | | | | | | 696 | |
| | | | |
UBS Group AG | | | | 17,005 | | | | | | | 499 | |
| | | | |
Valiant Holding AG | | | | 937 | | | | | | | 106 | |
| | | | |
Zurich Insurance Group AG | | | | 3,407 | | | | | | | 1,815 | |
| | | | | | | | | | | | |
| | | | | | | | | | | 4,154 | |
| | | | | | | | | | | | |
| |
| HEALTH CARE 1.4% | |
| | | | |
Galenica AG | | | | 1,469 | | | | | | | 120 | |
| | | | |
Novartis AG | | | | 13,922 | | | | | | | 1,482 | |
| | | | |
Roche Holding AG | | | | 5,819 | | | | | | | 1,612 | |
| | | | |
Sonova Holding AG | | | | 739 | | | | | | | 228 | |
| | | | |
Straumann Holding AG | | | | 1,352 | | | | | | | 167 | |
| | | | | | | | | | | | |
| | | | | | | | | | | 3,609 | |
| | | | | | | | | | | | |
| |
| INDUSTRIALS 1.5% | |
| | | | |
ABB Ltd. | | | | 29,074 | | | | | | | 1,612 | |
| | | | |
Adecco Group AG | | | | 9,237 | | | | | | | 306 | |
| | | | |
Bucher Industries AG | | | | 171 | | | | | | | 69 | |
| | | | |
Daetwyler Holding AG | | | | 466 | | | | | | | 88 | |
| | | | |
DKSH Holding AG | | | | 1,111 | | | | | | | 75 | |
| | | | |
dormakaba Holding AG | | | | 206 | | | | | | | 106 | |
| | | | |
Flughafen Zurich AG | | | | 383 | | | | | | | 85 | |
| | | | |
Forbo Holding AG | | | | 42 | | | | | | | 49 | |
| | | | |
Geberit AG | | | | 323 | | | | | | | 190 | |
| | | | |
Georg Fischer AG | | | | 719 | | | | | | | 48 | |
| | | | |
Kuehne & Nagel International AG | | | | 1,111 | | | | | | | 320 | |
| | | | | | | | | | | | |
| | | | | SHARES | | | | | MARKET
VALUE
(000S) | |
| | | | |
Schindler Holding AG | | | | 879 | | | $ | | | | 221 | |
| | | | |
SGS SA | | | | 1,776 | | | | | | | 158 | |
| | | | |
Sulzer AG | | | | 1,084 | | | | | | | 150 | |
| | | | |
VAT Group AG | | | | 378 | | | | | | | 213 | |
| | | | | | | | | | | | |
| | | | | | | | | | | 3,690 | |
| | | | | | | | | | | | |
| |
| INFORMATION TECHNOLOGY 0.2% | |
| | | | |
ALSO Holding AG | | | | 118 | | | | | | | 36 | |
| | | | |
Landis & Gyr Group AG | | | | 1,240 | | | | | | | 100 | |
| | | | |
Logitech International SA | | | | 3,584 | | | | | | | 345 | |
| | | | |
Temenos AG | | | | 633 | | | | | | | 44 | |
| | | | | | | | | | | | |
| | | | | | | | | | | 525 | |
| | | | | | | | | | | | |
| |
| MATERIALS 1.0% | |
| | | | |
DSM-Firmenich AG | | | | 930 | | | | | | | 105 | |
| | | | |
EMS-Chemie Holding AG (a) | | | | 87 | | | | | | | 71 | |
| | | | |
Givaudan SA | | | | 126 | | | | | | | 597 | |
| | | | |
Glencore PLC | | | | 192,442 | | | | | | | 1,095 | |
| | | | |
Holcim AG | | | | 4,761 | | | | | | | 421 | |
| | | | |
SIG Group AG | | | | 4,037 | | | | | | | 74 | |
| | | | |
Sika AG | | | | 588 | | | | | | | 168 | |
| | | | | | | | | | | | |
| | | | | | | | | | | 2,531 | |
| | | | | | | | | | | | |
| |
| REAL ESTATE 0.2% | |
| | | | |
Allreal Holding AG | | | | 394 | | | | | | | 68 | |
| | | | |
PSP Swiss Property AG | | | | 1,156 | | | | | | | 148 | |
| | | | |
Swiss Prime Site AG | | | | 2,147 | | | | | | | 203 | |
| | | | | | | | | | | | |
| | | | | | | | | | | 419 | |
| | | | | | | | | | | | |
| |
| UTILITIES 0.1% | |
| | | | |
BKW AG | | | | 740 | | | | | | | 118 | |
| | | | | | | | | | | | |
Total Switzerland | | | | | | | | | | | 18,609 | |
| | | | | | | | | | | | |
| |
| UNITED KINGDOM 14.5% | |
| | | | | | | | | | | | |
| COMMUNICATION SERVICES 0.8% | |
| | | | |
Auto Trader Group PLC | | | | 9,876 | | | | | | | 99 | |
| | | | |
BT Group PLC | | | | 363,221 | | | | | | | 644 | |
| | | | |
Informa PLC | | | | 10,420 | | | | | | | 113 | |
| | | | |
Vodafone Group PLC | | | | 1,031,542 | | | | | | | 913 | |
| | | | |
WPP PLC | | | | 13,240 | | | | | | | 121 | |
| | | | | | | | | | | | |
| | | | | | | | | | | 1,890 | |
| | | | | | | | | | | | |
| |
| CONSUMER DISCRETIONARY 0.2% | |
| | | | |
B&M European Value Retail SA | | | | 45,545 | | | | | | | 251 | |
| | | | |
Barratt Developments PLC | | | | 23,427 | | | | | | | 139 | |
| | | | |
Berkeley Group Holdings PLC | | | | 597 | | | | | | | 34 | |
| | | | | | | | | | | | |
| | | | | | | | | | | 424 | |
| | | | | | | | | | | | |
| |
| CONSUMER STAPLES 3.6% | |
| | | | |
Associated British Foods PLC | | | | 7,796 | | | | | | | 243 | |
| | | | |
Burberry Group PLC | | | | 8,477 | | | | | | | 94 | |
| | | | |
Coca-Cola Europacific Partners PLC | | | | 1,817 | | | | | | | 132 | |
| | | | |
Compass Group PLC | | | | 9,016 | | | | | | | 246 | |
| | | | |
Cranswick PLC | | | | 1,460 | | | | | | | 82 | |
| | | | |
Diageo PLC | | | | 11,162 | | | | | | | 350 | |
| | | | |
Frasers Group PLC (a) | | | | 8,445 | | | | | | | 94 | |
| | | | |
Games Workshop Group PLC | | | | 1,107 | | | | | | | 149 | |
| | | | |
Greggs PLC | | | | 3,267 | | | | | | | 115 | |
| | | | |
Halfords Group PLC | | | | 14,893 | | | | | | | 26 | |
| | | | |
Imperial Brands PLC | | | | 35,686 | | | | | | | 913 | |
| | | | | | | | | | | | |
| | | | | SHARES | | | | | MARKET
VALUE
(000S) | |
| | | | |
Inchcape PLC | | | | 7,789 | | | $ | | | | 73 | |
| | | | |
InterContinental Hotels Group PLC | | | | 3,967 | | | | | | | 417 | |
| | | | |
J Sainsbury PLC | | | | 143,354 | | | | | | | 462 | |
| | | | |
Kingfisher PLC | | | | 106,217 | | | | | | | 333 | |
| | | | |
Marks & Spencer Group PLC | | | | 129,326 | | | | | | | 468 | |
| | | | |
Mitchells & Butlers PLC (a) | | | | 23,466 | | | | | | | 85 | |
| | | | |
Next PLC | | | | 3,413 | | | | | | | 390 | |
| | | | |
Ocado Group PLC (a) | | | | 6,575 | | | | | | | 24 | |
| | | | |
Persimmon PLC | | | | 25,697 | | | | | | | 436 | |
| | | | |
Pets at Home Group PLC | | | | 12,524 | | | | | | | 47 | |
| | | | |
Premier Foods PLC | | | | 49,543 | | | | | | | 99 | |
| | | | |
Reckitt Benckiser Group PLC | | | | 9,660 | | | | | | | 523 | |
| | | | |
Tate & Lyle PLC | | | | 11,834 | | | | | | | 90 | |
| | | | |
Taylor Wimpey PLC | | | | 177,207 | | | | | | | 317 | |
| | | | |
Tesco PLC | | | | 246,622 | | | | | | | 953 | |
| | | | |
Unilever PLC | | | | 37,430 | | | | | | | 2,054 | |
| | | | | | | | | | | | |
| | | | | | | | | | | 9,215 | |
| | | | | | | | | | | | |
| |
| ENERGY 1.1% | |
| | | | |
BP PLC | | | | 152,081 | | | | | | | 916 | |
| | | | |
John Wood Group PLC (a) | | | | 17,924 | | | | | | | 46 | |
| | | | |
Shell PLC | | | | 42,846 | | | | | | | 1,537 | |
| | | | |
Subsea 7 SA | | | | 13,948 | | | | | | | 262 | |
| | | | | | | | | | | | |
| | | | | | | | | | | 2,761 | |
| | | | | | | | | | | | |
| |
| FINANCIALS 2.5% | |
| | | | |
3i Group PLC | | | | 20,304 | | | | | | | 783 | |
| | | | |
abrdn PLC | | | | 135,684 | | | | | | | 253 | |
| | | | |
Admiral Group PLC | | | | 9,172 | | | | | | | 303 | |
| | | | |
Aviva PLC | | | | 53,535 | | | | | | | 322 | |
| | | | |
Barclays PLC | | | | 290,584 | | | | | | | 768 | |
| | | | |
Direct Line Insurance Group PLC | | | | 75,363 | | | | | | | 191 | |
| | | | |
Hargreaves Lansdown PLC | | | | 5,414 | | | | | | | 77 | |
| | | | |
HSBC Holdings PLC | | | | 170,731 | | | | | | | 1,474 | |
| | | | |
IG Group Holdings PLC | | | | 10,968 | | | | | | | 114 | |
| | | | |
Intermediate Capital Group PLC | | | | 3,397 | | | | | | | 93 | |
| | | | |
Legal & General Group PLC | | | | 69,374 | | | | | | | 199 | |
| | | | |
Lloyds Banking Group PLC | | | | 362,097 | | | | | | | 250 | |
| | | | |
London Stock Exchange Group PLC | | | | 2,878 | | | | | | | 341 | |
| | | | |
M&G PLC | | | | 153,829 | | | | | | | 395 | |
| | | | |
Man Group PLC | | | | 43,724 | | | | | | | 134 | |
| | | | |
NatWest Group PLC | | | | 101,460 | | | | | | | 399 | |
| | | | |
Schroders PLC | | | | 17,749 | | | | | | | 81 | |
| | | | |
Virgin Money UK PLC | | | | 11,426 | | | | | | | 31 | |
| | | | | | | | | | | | |
| | | | | | | | | | | 6,208 | |
| | | | | | | | | | | | |
| |
| HEALTH CARE 1.4% | |
| | | | |
AstraZeneca PLC | | | | 9,905 | | | | | | | 1,541 | |
| | | | |
ConvaTec Group PLC | | | | 35,416 | | | | | | | 105 | |
| | | | |
GSK PLC | | | | 96,373 | | | | | | | 1,854 | |
| | | | |
Smith & Nephew PLC | | | | 7,326 | | | | | | | 91 | |
| | | | | | | | | | | | |
| | | | | | | | | | | 3,591 | |
| | | | | | | | | | | | |
| |
| INDUSTRIALS 2.7% | |
| | | | |
Ashtead Group PLC | | | | 4,184 | | | | | | | 279 | |
| | | | |
Babcock International Group PLC | | | | 3,830 | | | | | | | 25 | |
| | | | |
BAE Systems PLC | | | | 79,677 | | | | | | | 1,327 | |
| | | | |
Balfour Beatty PLC | | | | 20,491 | | | | | | | 95 | |
| | | | |
Bunzl PLC | | | | 4,185 | | | | | | | 159 | |
| | | | |
Diploma PLC | | | | 2,327 | | | | | | | 122 | |
| | | | |
Ferguson PLC | | | | 3,039 | | | | | | | 583 | |
| | | | |
Firstgroup PLC | | | | 62,463 | | | | | | | 125 | |
| | | | |
Howden Joinery Group PLC | | | | 23,545 | | | | | | | 260 | |
| | | | |
IMI PLC | | | | 6,765 | | | | | | | 150 | |
| | | | | | |
| 30 | | PIMCO EQUITY SERIES | | | See Accompanying Notes | |
| | | | | | | | | | | | |
| | | | | SHARES | | | | | MARKET
VALUE
(000S) | |
| | | | |
International Consolidated Airlines Group SA (a) | | | | 169,089 | | | $ | | | | 346 | |
| | | | |
International Distributions Services PLC (a) | | | | 55,539 | | | | | | | 224 | |
| | | | |
Intertek Group PLC | | | | 4,018 | | | | | | | 243 | |
| | | | |
Melrose Industries PLC | | | | 6,665 | | | | | | | 46 | |
| | | | |
Morgan Sindall Group PLC | | | | 2,635 | | | | | | | 84 | |
| | | | |
Pagegroup PLC | | | | 9,689 | | | | | | | 52 | |
| | | | |
RELX PLC | | | | 34,194 | | | | | | | 1,567 | |
| | | | |
Rentokil Initial PLC | | | | 44,298 | | | | | | | 257 | |
| | | | |
Rolls-Royce Holdings PLC (a) | | | | 89,072 | | | | | | | 512 | |
| | | | |
Rotork PLC | | | | 7,201 | | | | | | | 31 | |
| | | | |
RS Group PLC | | | | 8,231 | | | | | | | 73 | |
| | | | |
Spirax-Sarco Engineering PLC | | | | 950 | | | | | | | 102 | |
| | | | |
Travis Perkins PLC | | | | 5,075 | | | | | | | 49 | |
| | | | |
Weir Group PLC | | | | 6,114 | | | | | | | 153 | |
| | | | | | | | | | | | |
| | | | | | | | | | | 6,864 | |
| | | | | | | | | | | | |
| |
| INFORMATION TECHNOLOGY 0.3% | |
| | | | |
Computacenter PLC | | | | 2,149 | | | | | | | 78 | |
| | | | |
Halma PLC | | | | 4,233 | | | | | | | 144 | |
| | | | |
Pearson PLC | | | | 26,491 | | | | | | | 331 | |
| | | | |
Sage Group PLC | | | | 19,196 | | | | | | | 263 | |
| | | | | | | | | | | | |
| | | | | | | | | | | 816 | |
| | | | | | | | | | | | |
| |
| MATERIALS 0.9% | |
| | | | |
Anglo American PLC | | | | 17,764 | | | | | | | 561 | |
| | | | |
Croda International PLC | | | | 2,598 | | | | | | | 129 | |
| | | | |
DS Smith PLC | | | | 15,765 | | | | | | | 84 | |
| | | | |
Johnson Matthey PLC | | | | 10,892 | | | | | | | 216 | |
| | | | |
Mondi PLC | | | | 9,556 | | | | | | | 183 | |
| | | | |
Rio Tinto PLC | | | | 17,947 | | | | | | | 1,178 | |
| | | | | | | | | | | | |
| | | | | | | | | | | 2,351 | |
| | | | | | | | | | | | |
| |
| REAL ESTATE 0.0% | |
| | | | |
Grainger PLC | | | | 12,966 | | | | | | | 40 | |
| | | | | | | | | | | | |
| |
| UTILITIES 1.0% | |
| | | | |
Centrica PLC | | | | 438,923 | | | | | | | 748 | |
| | | | |
Drax Group PLC | | | | 17,431 | | | | | | | 109 | |
| | | | |
National Grid PLC | | | | 89,118 | | | | | | | 995 | |
| | | | |
Severn Trent PLC | | | | 5,809 | | | | | | | 175 | |
| | | | |
SSE PLC | | | | 13,604 | | | | | | | 307 | |
| | | | |
United Utilities Group PLC | | | | 15,420 | | | | | | | 191 | |
| | | | | | | | | | | | |
| | | | | | | | | | | 2,525 | |
| | | | | | | | | | | | |
Total United Kingdom | | | | | | | | | | | 36,685 | |
| | | | | | | | | | | | |
| |
| UNITED STATES 0.3% | |
| | | | | | | | | | | | |
| CONSUMER STAPLES 0.1% | |
| | | | |
Carnival PLC (a) | | | | 9,016 | | | | | | | 155 | |
| | | | |
Carnival PLC ADR (a) | | | | 1,689 | | | | | | | 29 | |
| | | | | | | | | | | | |
| | | | | | | | | | | 184 | |
| | | | | | | | | | | | |
| |
| INDUSTRIALS 0.1% | |
| | | | |
RB Global, Inc. | | | | 2,832 | | | | | | | 216 | |
| | | | |
Reliance Worldwide Corp. Ltd. | | | | 6,653 | | | | | | | 20 | |
| | | | | | | | | | | | |
| | | | | | | | | | | 236 | |
| | | | | | | | | | | | |
| |
| MATERIALS 0.1% | |
| | | | |
CRH PLC | | | | 5,453 | | | | | | | 409 | |
| | | | | | | | | | | | |
Total United States | | | | | | | | | | | 829 | |
| | | | | | | | | | | | |
Total Common Stocks (Cost $218,266) | | | | | | | 246,616 | |
| | | | | | | | | | | | |
| |
| | | | | | | | | | | | |
| | | | | SHARES | | | | | MARKET
VALUE
(000S) | |
| PREFERRED STOCKS 0.5% | |
| | | | | | | | | | | | |
| GERMANY 0.5% | |
| | | | | | | | | | | | |
| INDUSTRIALS 0.5% | |
| | | | |
Fuchs SE | | | | 5,165 | | | $ | | | | 236 | |
| | | | |
Henkel AG & Co. KGaA | | | | 2,965 | | | | | | | 264 | |
| | | | |
Sartorius AG | | | | 209 | | | | | | | 49 | |
| | | | |
Schaeffler AG | | | | 9,564 | | | | | | | 56 | |
| | | | |
Volkswagen AG | | | | 6,980 | | | | | | | 788 | |
| | | | | | | | | | | | |
| | | | | | | | | | | 1,393 | |
| | | | | | | | | | | | |
Total Preferred Stocks (Cost $1,370) | | | | | | | | | | | 1,393 | |
| | | | | | | | | | | | |
| |
| REAL ESTATE INVESTMENT TRUSTS 1.2% | |
| | | | | | | | | | | | |
| AUSTRALIA 0.1% | |
| | | | | | | | | | | | |
| REAL ESTATE 0.1% | |
| | | | |
Charter Hall Group | | | | 8,384 | | | | | | | 62 | |
| | | | |
Goodman Group | | | | 11,102 | | | | | | | 256 | |
| | | | |
Stockland | | | | 25,963 | | | | | | | 72 | |
| | | | | | | | | | | | |
| | | | | | | | | | | 390 | |
| | | | | | | | | | | | |
Total Australia | | | | | | | | | | | 390 | |
| | | | | | | | | | | | |
| |
| BELGIUM 0.1% | |
| | | | | | | | | | | | |
| REAL ESTATE 0.1% | |
| | | | |
Cofinimmo SA | | | | 234 | | | | | | | 14 | |
| | | | |
Retail Estates REIT | | | | 1,795 | | | | | | | 119 | |
| | | | |
Warehouses De Pauw CVA | | | | 2,145 | | | | | | | 58 | |
| | | | | | | | | | | | |
| | | | | | | | | | | 191 | |
| | | | | | | | | | | | |
Total Belgium | | | | | | | | | | | 191 | |
| | | | | | | | | | | | |
| |
| CANADA 0.1% | |
| | | | | | | | | | | | |
| REAL ESTATE 0.1% | |
| | | | |
Allied Properties Real Estate Investment Trust | | | | 2,152 | | | | | | | 24 | |
| | | | |
Canadian Apartment Properties REIT | | | | 1,816 | | | | | | | 59 | |
| | | | |
Granite Real Estate Investment Trust | | | | 1,296 | | | | | | | 64 | |
| | | | | | | | | | | | |
| | | | | | | | | | | 147 | |
| | | | | | | | | | | | |
Total Canada | | | | | | | | | | | 147 | |
| | | | | | | | | | | | |
| |
| FRANCE 0.1% | |
| | | | | | | | | | | | |
| REAL ESTATE 0.1% | |
| | | | |
Klepierre SA | | | | 3,484 | | | | | | | 93 | |
| | | | |
Unibail-Rodamco-Westfield | | | | 1,502 | | | | | | | 119 | |
| | | | | | | | | | | | |
| | | | | | | | | | | 212 | |
| | | | | | | | | | | | |
Total France | | | | | | | | | | | 212 | |
| | | | | | | | | | | | |
| |
| HONG KONG 0.1% | |
| | | | | | | | | | | | |
| REAL ESTATE 0.1% | |
| | | | |
Fortune Real Estate Investment Trust | | | | 77,000 | | | | | | | 37 | |
| | | | |
Link REIT | | | | 24,900 | | | | | | | 97 | |
| | | | | | | | | | | | |
| | | | | | | | | | | 134 | |
| | | | | | | | | | | | |
Total Hong Kong | | | | | | | | | | | 134 | |
| | | | | | | | | | | | |
| |
| JAPAN 0.4% | |
| | | | | | | | | | | | |
| REAL ESTATE 0.4% | |
| | | | |
Activia Properties, Inc. | | | | 7 | | | | | | | 16 | |
| | | | |
Advance Residence Investment Corp. | | | | 38 | | | | | | | 77 | |
| | | | |
AEON REIT Investment Corp. | | | | 52 | | | | | | | 43 | |
| | | | |
Daiwa House REIT Investment Corp. | | | | 37 | | | | | | | 57 | |
| | | | |
Daiwa Office Investment Corp. | | | | 4 | | | | | | | 7 | |
| | | | | | | | | | | | |
| | | | | SHARES | | | | | MARKET
VALUE
(000S) | |
| | | | |
Frontier Real Estate Investment Corp. | | | | 2 | | | $ | | | | 5 | |
| | | | |
GLP J-Reit | | | | 50 | | | | | | | 41 | |
| | | | |
Hulic Reit, Inc. | | | | 44 | | | | | | | 40 | |
| | | | |
Industrial & Infrastructure Fund Investment Corp. | | | | 44 | | | | | | | 35 | |
| | | | |
Invincible Investment Corp. | | | | 219 | | | | | | | 89 | |
| | | | |
Japan Excellent, Inc. | | | | 51 | | | | | | | 38 | |
| | | | |
Japan Hotel REIT Investment Corp. | | | | 292 | | | | | | | 141 | |
| | | | |
Japan Metropolitan Fund Invest | | | | 130 | | | | | | | 73 | |
| | | | |
Japan Prime Realty Investment Corp. | | | | 8 | | | | | | | 16 | |
| | | | |
Japan Real Estate Investment Corp. | | | | 7 | | | | | | | 22 | |
| | | | |
KDX Realty Investment Corp. | | | | 53 | | | | | | | 51 | |
| | | | |
LaSalle Logiport REIT | | | | 128 | | | | | | | 118 | |
| | | | |
Mori Hills REIT Investment Corp. | | | | 45 | | | | | | | 37 | |
| | | | |
Nippon Accommodations Fund, Inc. | | | | 3 | | | | | | | 12 | |
| | | | |
Nippon Building Fund, Inc. | | | | 9 | | | | | | | 32 | |
| | | | |
Nippon Prologis REIT, Inc. | | | | 36 | | | | | | | 56 | |
| | | | |
Nomura Real Estate Master Fund, Inc. | | | | 52 | | | | | | | 46 | |
| | | | |
Orix JREIT, Inc. | | | | 49 | | | | | | | 49 | |
| | | | |
Sekisui House Reit, Inc. | | | | 122 | | | | | | | 60 | |
| | | | |
United Urban Investment Corp. | | | | 77 | | | | | | | 68 | |
| | | | | | | | | | | | |
| | | | | | | | | | | 1,229 | |
| | | | | | | | | | | | |
Total Japan | | | | | | | | | | | 1,229 | |
| | | | | | | | | | | | |
| |
| LUXEMBOURG 0.0% | |
| | | | | | | | | | | | |
| REAL ESTATE 0.0% | |
| | | | |
Shurgard Self Storage Ltd. | | | | 2,105 | | | | | | | 81 | |
| | | | | | | | | | | | |
Total Luxembourg | | | | | | | | | | | 81 | |
| | | | | | | | | | | | |
| |
| SINGAPORE 0.1% | |
| | | | | | | | | | | | |
| REAL ESTATE 0.1% | |
| | | | |
CapitaLand Ascendas REIT | | | | 52,300 | | | | | | | 98 | |
| | | | |
CapitaLand Integrated Commercial Trust | | | | 43,300 | | | | | | | 63 | |
| | | | |
Keppel DC REIT | | | | 42,900 | | | | | | | 57 | |
| | | | |
Keppel REIT | | | | 4,720 | | | | | | | 3 | |
| | | | |
Mapletree Industrial Trust | | | | 38,635 | | | | | | | 60 | |
| | | | | | | | | | | | |
| | | | | | | | | | | 281 | |
| | | | | | | | | | | | |
Total Singapore | | | | | | | | | | | 281 | |
| | | | | | | | | | | | |
| |
| SPAIN 0.0% | |
| | | | | | | | | | | | |
| REAL ESTATE 0.0% | |
| | | | |
Inmobiliaria Colonial Socimi SA | | | | 4,436 | | | | | | | 26 | |
| | | | | | | | | | | | |
Total Spain | | | | | | | | | | | 26 | |
| | | | | | | | | | | | |
| |
| UNITED KINGDOM 0.2% | |
| | | | | | | | | | | | |
| REAL ESTATE 0.2% | |
| | | | |
Assura PLC | | | | 48,981 | | | | | | | 25 | |
| | | | |
Big Yellow Group PLC | | | | 3,797 | | | | | | | 56 | |
| | | | |
Great Portland Estates PLC | | | | 6,496 | | | | | | | 28 | |
| | | | |
LondonMetric Property PLC | | | | 23,816 | | | | | | | 58 | |
| | | | |
Segro PLC | | | | 19,577 | | | | | | | 221 | |
| | | | |
Tritax Big Box REIT PLC | | | | 48,856 | | | | | | | 96 | |
| | | | | | | | | | | | |
| | | | | | | | | | | 484 | |
| | | | | | | | | | | | |
Total United Kingdom | | | | | | | | | | | 484 | |
| | | | | | | | | | | | |
Total Real Estate Investment Trusts
(Cost $3,765) | | | | | | | 3,175 | |
| | | | | | | | | | | | |
| |
| | | | | | | | | | | | |
| See Accompanying Notes | | | ANNUAL FINANCIAL AND OTHER INFORMATION | | | | | | | JUNE 30, 2024 | | | 31 |
| | | | | | |
| Schedule of Investments | | PIMCO RAFI Dynamic Multi-Factor International Equity ETF | | (Cont.) | | |
| | | | | | | | | | | | |
| | | | | SHARES | | | | | MARKET
VALUE
(000S) | |
| RIGHTS 0.0% | |
| | | | | | | | | | | | |
| ITALY 0.0% | |
| | | | | | | | | | | | |
| HEALTH CARE 0.0% | |
| | | | |
Amplifon SpA | | | | 2,281 | | | $ | | | | 0 | |
| | | | | | | | | | | | |
Total Rights (Cost $0) | | | | | | | | | | | 0 | |
| | | | | | | | | | | | |
| |
| WARRANTS 0.0% | |
| | | | | | | | | | | | |
| CANADA 0.0% | |
| | | | | | | | | | | | |
| INFORMATION TECHNOLOGY 0.0% | |
| | | | |
Constellation Software, Inc. - Exp. 03/31/2040 « | | | | 58 | | | | | | | 0 | |
| | | | | | | | | | | | |
Total Warrants (Cost $0) | | | | | | | | | | | 0 | |
| | | | | | | | | | | | |
| |
| | | | | | | | | | | | |
| | | | | SHARES | | | | | MARKET
VALUE
(000S) | |
| SHORT-TERM INSTRUMENTS 0.5% | |
| | | | | | | | | | | | |
| REPURCHASE AGREEMENTS (c) 0.5% | |
| | | | | | $ | | | | | 1,203 | |
| | | | | | | | | | | | |
Total Short-Term Instruments
(Cost $1,203) | | | | | | | 1,203 | |
| | | | | | | | | | | | |
| | | | |
| | | | | | | | | | | | |
Total Investments in Securities
(Cost $224,604) | | | | | | | 252,387 | |
| | | | |
| | | | | | | | | | | | |
Total Investments 99.5%
(Cost $224,604) | | $ | | | | | 252,387 | |
| |
| Other Assets and Liabilities, net 0.5% | | | | | | | 1,157 | |
| | | | | | | | | | | | |
| Net Assets 100.0% | | $ | | | | | 253,544 | |
| | | | | | | | | | | | |
NOTES TO SCHEDULE OF INVESTMENTS:
| * | A zero balance may reflect actual amounts rounding to less than one thousand. |
| « | Security valued using significant unobservable inputs (Level 3). |
| (a) | Security did not produce income within the last twelve months. |
| (b) | Institutional Class Shares of each Fund. |
BORROWINGS AND OTHER FINANCING TRANSACTIONS
(c) REPURCHASE AGREEMENTS:
| | | | | | | | | | | | | | | | | | | | | | | | | | | | | | |
| Counterparty | | Lending
Rate | | | Settlement
Date | | | Maturity
Date | | | Principal
Amount | | | Collateralized By | | Collateral
(Received) | | | Repurchase
Agreements,
at Value | | | Repurchase
Agreement
Proceeds
to be
Received(1) | |
| FICC | | | 2.600 | % | | | 06/28/2024 | | | | 07/01/2024 | | | $ | 1,203 | | | U.S. Treasury Notes 4.500% due 03/31/2026 | | $ | (1,228 | ) | | $ | 1,203 | | | $ | 1,204 | |
| | | | | | | | | | | | | | | | | | | | | | | | | | | | | | |
Total Repurchase Agreements | | | | | $ | (1,228 | ) | | $ | 1,203 | | | $ | 1,204 | |
| | | | | | | | | | | | | | | | | | | | | | | | | | | | | | |
BORROWINGS AND OTHER FINANCING TRANSACTIONS SUMMARY
The following is a summary by counterparty of the market value of Borrowings and Other Financing Transactions and collateral pledged/(received) as of June 30, 2024:
| | | | | | | | | | | | | | | | | | | | | | | | |
| Counterparty | | Repurchase
Agreement
Proceeds
to be
Received(1) | | | Payable for
Reverse
Repurchase
Agreements | | | Payable for
Sale-Buyback
Transactions | | | Total
Borrowings and
Other Financing
Transactions | | | Collateral
Pledged/(Received) | | | Net Exposure(2) | |
Global/Master Repurchase Agreement | |
FICC | | $ | 1,204 | | | $ | 0 | | | $ | 0 | | | $ | 1,204 | | | $ | (1,228 | ) | | $ | (24 | ) |
| | | | | | | | | | | | | | | | | | | | | | | | |
Total Borrowings and Other Financing Transactions | | $ | 1,204 | | | $ | 0 | | | $ | 0 | | | | | | | | | | | | | |
| | | | | | | | | | | | | | | | | | | | | | | | |
| (1) | Includes accrued interest. |
| (2) | Net Exposure represents the net receivable/(payable) that would be due from/to the counterparty in the event of default. Exposure from borrowings and other financing transactions can only be netted across transactions governed under the same master agreement with the same legal entity. See Note 8, Master Netting Arrangements, in the Notes to Financial Statements for more information. |
FAIR VALUE OF FINANCIAL DERIVATIVE INSTRUMENTS
The following is a summary of the fair valuation of the Fund’s derivative instruments categorized by risk exposure. See Note 7, Principal and Other Risks, in the Notes to Financial Statements on risks of the Fund.
The effect of Financial Derivative Instruments on the Statements of Operations for the period ended June 30, 2024:
| | | | | | | | | | | | | | | | | | | | | | | | |
| | | Derivatives not accounted for as hedging instruments | |
| | | Commodity
Contracts | | | Credit
Contracts | | | Equity
Contracts | | | Foreign
Exchange
Contracts | | | Interest
Rate
Contracts | | | Total | |
Net Realized Gain (Loss) on Financial Derivative Instruments | |
Over the counter | |
Forward Foreign Currency Contracts | | $ | 0 | | | $ | 0 | | | $ | 0 | | | $ | (5 | ) | | $ | 0 | | | $ | (5 | ) |
| | | | | | | | | | | | | | | | | | | | | | | | |
| | | | | | |
| 32 | | PIMCO EQUITY SERIES | | | See Accompanying Notes | |
FAIR VALUE MEASUREMENTS
The following is a summary of the fair valuations according to the inputs used as of June 30, 2024 in valuing the Fund’s assets and liabilities:
| | | | | | | | | | | | | | | | |
| Category and Subcategory | | Level 1 | | | Level 2 | | | Level 3 | | | Fair
Value at
06/30/2024 | |
Investments in Securities, at Value | |
Common Stocks | |
Australia | |
Communication Services | | $ | 0 | | | $ | 526 | | | $ | 0 | | | $ | 526 | |
Consumer Discretionary | | | 0 | | | | 241 | | | | 0 | | | | 241 | |
Consumer Staples | | | 0 | | | | 2,088 | | | | 0 | | | | 2,088 | |
Energy | | | 0 | | | | 364 | | | | 0 | | | | 364 | |
Financials | | | 0 | | | | 3,540 | | | | 0 | | | | 3,540 | |
Health Care | | | 0 | | | | 736 | | | | 0 | | | | 736 | |
Industrials | | | 0 | | | | 1,318 | | | | 0 | | | | 1,318 | |
Information Technology | | | 0 | | | | 241 | | | | 0 | | | | 241 | |
Materials | | | 0 | | | | 2,805 | | | | 0 | | | | 2,805 | |
Real Estate | | | 0 | | | | 50 | | | | 0 | | | | 50 | |
Utilities | | | 0 | | | | 671 | | | | 0 | | | | 671 | |
Austria | |
Energy | | | 0 | | | | 63 | | | | 0 | | | | 63 | |
Financials | | | 0 | | | | 161 | | | | 0 | | | | 161 | |
Industrials | | | 0 | | | | 93 | | | | 0 | | | | 93 | |
Materials | | | 0 | | | | 121 | | | | 0 | | | | 121 | |
Real Estate | | | 94 | | | | 0 | | | | 0 | | | | 94 | |
Utilities | | | 0 | | | | 58 | | | | 0 | | | | 58 | |
Belgium | |
Communication Services | | | 0 | | | | 57 | | | | 0 | | | | 57 | |
Consumer Staples | | | 191 | | | | 0 | | | | 0 | | | | 191 | |
Financials | | | 0 | | | | 94 | | | | 0 | | | | 94 | |
Health Care | | | 0 | | | | 374 | | | | 0 | | | | 374 | |
Industrials | | | 0 | | | | 69 | | | | 0 | | | | 69 | |
Materials | | | 0 | | | | 50 | | | | 0 | | | | 50 | |
Utilities | | | 0 | | | | 88 | | | | 0 | | | | 88 | |
Canada | |
Communication Services | | | 902 | | | | 0 | | | | 0 | | | | 902 | |
Consumer Staples | | | 4,145 | | | | 0 | | | | 0 | | | | 4,145 | |
Energy | | | 3,525 | | | | 0 | | | | 0 | | | | 3,525 | |
Financials | | | 3,955 | | | | 0 | | | | 0 | | | | 3,955 | |
Industrials | | | 2,674 | | | | 0 | | | | 0 | | | | 2,674 | |
Information Technology | | | 1,283 | | | | 0 | | | | 0 | | | | 1,283 | |
Materials | | | 2,583 | | | | 0 | | | | 0 | | | | 2,583 | |
Real Estate | | | 190 | | | | 0 | | | | 0 | | | | 190 | |
Utilities | | | 843 | | | | 0 | | | | 0 | | | | 843 | |
Chile | |
Materials | | | 0 | | | | 250 | | | | 0 | | | | 250 | |
Denmark | |
Consumer Staples | | | 59 | | | | 457 | | | | 0 | | | | 516 | |
Financials | | | 87 | | | | 349 | | | | 0 | | | | 436 | |
Health Care | | | 23 | | | | 4,448 | | | | 0 | | | | 4,471 | |
Industrials | | | 0 | | | | 689 | | | | 0 | | | | 689 | |
Information Technology | | | 0 | | | | 50 | | | | 0 | | | | 50 | |
Materials | | | 0 | | | | 343 | | | | 0 | | | | 343 | |
Utilities | | | 0 | | | | 105 | | | | 0 | | | | 105 | |
Finland | |
Communication Services | | | 0 | | | | 98 | | | | 0 | | | | 98 | |
Consumer Staples | | | 0 | | | | 114 | | | | 0 | | | | 114 | |
Energy | | | 0 | | | | 52 | | | | 0 | | | | 52 | |
Financials | | | 0 | | | | 516 | | | | 0 | | | | 516 | |
Health Care | | | 0 | | | | 129 | | | | 0 | | | | 129 | |
Industrials | | | 0 | | | | 847 | | | | 0 | | | | 847 | |
Information Technology | | | 0 | | | | 121 | | | | 0 | | | | 121 | |
Materials | | | 0 | | | | 329 | | | | 0 | | | | 329 | |
Real Estate | | | 0 | | | | 87 | | | | 0 | | | | 87 | |
Utilities | | | 0 | | | | 153 | | | | 0 | | | | 153 | |
France | |
Communication Services | | | 0 | | | | 1,950 | | | | 0 | | | | 1,950 | |
Consumer Discretionary | | | 0 | | | | 115 | | | | 0 | | | | 115 | |
Consumer Staples | | | 0 | | | | 4,372 | | | | 0 | | | | 4,372 | |
Energy | | | 0 | | | | 1,395 | | | | 0 | | | | 1,395 | |
Financials | | | 0 | | | | 1,908 | | | | 0 | | | | 1,908 | |
Health Care | | | 0 | | | | 1,496 | | | | 0 | | | | 1,496 | |
| | | | | | | | | | | | | | | | |
| Category and Subcategory | | Level 1 | | | Level 2 | | | Level 3 | | | Fair
Value at
06/30/2024 | |
Industrials | | $ | 0 | | | $ | 6,096 | | | $ | 0 | | | $ | 6,096 | |
Information Technology | | | 0 | | | | 463 | | | | 0 | | | | 463 | |
Materials | | | 0 | | | | 752 | | | | 0 | | | | 752 | |
Utilities | | | 0 | | | | 781 | | | | 0 | | | | 781 | |
Germany | |
Communication Services | | | 0 | | | | 1,006 | | | | 0 | | | | 1,006 | |
Consumer Discretionary | | | 0 | | | | 1,695 | | | | 0 | | | | 1,695 | |
Consumer Staples | | | 0 | | | | 1,437 | | | | 0 | | | | 1,437 | |
Financials | | | 0 | | | | 3,030 | | | | 0 | | | | 3,030 | |
Health Care | | | 0 | | | | 766 | | | | 0 | | | | 766 | |
Industrials | | | 0 | | | | 2,168 | | | | 0 | | | | 2,168 | |
Information Technology | | | 0 | | | | 2,452 | | | | 0 | | | | 2,452 | |
Materials | | | 0 | | | | 1,659 | | | | 0 | | | | 1,659 | |
Real Estate | | | 0 | | | | 800 | | | | 0 | | | | 800 | |
Utilities | | | 0 | | | | 215 | | | | 0 | | | | 215 | |
Hong Kong | |
Communication Services | | | 0 | | | | 253 | | | | 0 | | | | 253 | |
Consumer Staples | | | 0 | | | | 381 | | | | 0 | | | | 381 | |
Financials | | | 39 | | | | 361 | | | | 0 | | | | 400 | |
Industrials | | | 0 | | | | 637 | | | | 0 | | | | 637 | |
Information Technology | | | 0 | | | | 199 | | | | 0 | | | | 199 | |
Real Estate | | | 0 | | | | 792 | | | | 0 | | | | 792 | |
Utilities | | | 0 | | | | 335 | | | | 0 | | | | 335 | |
Ireland | |
Consumer Staples | | | 160 | | | | 147 | | | | 0 | | | | 307 | |
Health Care | | | 1,086 | | | | 0 | | | | 0 | | | | 1,086 | |
Industrials | | | 902 | | | | 646 | | | | 0 | | | | 1,548 | |
Materials | | | 0 | | | | 454 | | | | 0 | | | | 454 | |
Israel | |
Communication Services | | | 0 | | | | 68 | | | | 0 | | | | 68 | |
Consumer Staples | | | 0 | | | | 34 | | | | 0 | | | | 34 | |
Energy | | | 0 | | | | 71 | | | | 0 | | | | 71 | |
Financials | | | 0 | | | | 687 | | | | 0 | | | | 687 | |
Health Care | | | 229 | | | | 0 | | | | 0 | | | | 229 | |
Industrials | | | 123 | | | | 149 | | | | 0 | | | | 272 | |
Information Technology | | | 380 | | | | 77 | | | | 0 | | | | 457 | |
Materials | | | 0 | | | | 106 | | | | 0 | | | | 106 | |
Real Estate | | | 86 | | | | 143 | | | | 0 | | | | 229 | |
Italy | |
Communication Services | | | 19 | | | | 545 | | | | 0 | | | | 564 | |
Consumer Discretionary | | | 0 | | | | 70 | | | | 0 | | | | 70 | |
Consumer Staples | | | 0 | | | | 692 | | | | 0 | | | | 692 | |
Energy | | | 0 | | | | 1,320 | | | | 0 | | | | 1,320 | |
Financials | | | 0 | | | | 3,428 | | | | 0 | | | | 3,428 | |
Health Care | | | 0 | | | | 289 | | | | 0 | | | | 289 | |
Industrials | | | 0 | | | | 862 | | | | 0 | | | | 862 | |
Materials | | | 0 | | | | 53 | | | | 0 | | | | 53 | |
Utilities | | | 0 | | | | 908 | | | | 0 | | | | 908 | |
Japan | |
Communication Services | | | 0 | | | | 4,861 | | | | 0 | | | | 4,861 | |
Consumer Discretionary | | | 0 | | | | 912 | | | | 0 | | | | 912 | |
Consumer Staples | | | 220 | | | | 13,834 | | | | 0 | | | | 14,054 | |
Energy | | | 0 | | | | 1,751 | | | | 0 | | | | 1,751 | |
Financials | | | 0 | | | | 6,272 | | | | 0 | | | | 6,272 | |
Health Care | | | 92 | | | | 2,435 | | | | 0 | | | | 2,527 | |
Industrials | | | 0 | | | | 14,983 | | | | 0 | | | | 14,983 | |
Information Technology | | | 15 | | | | 5,523 | | | | 0 | | | | 5,538 | |
Materials | | | 0 | | | | 4,328 | | | | 0 | | | | 4,328 | |
Real Estate | | | 0 | | | | 415 | | | | 0 | | | | 415 | |
Utilities | | | 0 | | | | 3,269 | | | | 0 | | | | 3,269 | |
Jordan | |
Health Care | | | 0 | | | | 87 | | | | 0 | | | | 87 | |
Luxembourg | |
Communication Services | | | 0 | | | | 142 | | | | 0 | | | | 142 | |
Energy | | | 0 | | | | 63 | | | | 0 | | | | 63 | |
Materials | | | 0 | | | | 630 | | | | 0 | | | | 630 | |
Real Estate | | | 0 | | | | 26 | | | | 0 | | | | 26 | |
| | | | | | | | | | | | |
| See Accompanying Notes | | | ANNUAL FINANCIAL AND OTHER INFORMATION | | | | | | | JUNE 30, 2024 | | | 33 |
| | | | | | |
| Schedule of Investments | | PIMCO RAFI Dynamic Multi-Factor International Equity ETF | | (Cont.) | | June 30, 2024 |
| | | | | | | | | | | | | | | | |
| Category and Subcategory | | Level 1 | | | Level 2 | | | Level 3 | | | Fair
Value at
06/30/2024 | |
Netherlands | |
Communication Services | | $ | 0 | | | $ | 664 | | | $ | 0 | | | $ | 664 | |
Consumer Staples | | | 0 | | | | 2,849 | | | | 0 | | | | 2,849 | |
Energy | | | 0 | | | | 124 | | | | 0 | | | | 124 | |
Financials | | | 0 | | | | 2,391 | | | | 0 | | | | 2,391 | |
Health Care | | | 19 | | | | 189 | | | | 0 | | | | 208 | |
Industrials | | | 81 | | | | 1,225 | | | | 0 | | | | 1,306 | |
Information Technology | | | 890 | | | | 2,555 | | | | 0 | | | | 3,445 | |
Materials | | | 0 | | | | 591 | | | | 0 | | | | 591 | |
New Zealand | |
Communication Services | | | 89 | | | | 0 | | | | 0 | | | | 89 | |
Health Care | | | 0 | | | | 98 | | | | 0 | | | | 98 | |
Industrials | | | 69 | | | | 40 | | | | 0 | | | | 109 | |
Utilities | | | 150 | | | | 0 | | | | 0 | | | | 150 | |
Norway | |
Communication Services | | | 280 | | | | 0 | | | | 0 | | | | 280 | |
Consumer Staples | | | 0 | | | | 324 | | | | 0 | | | | 324 | |
Energy | | | 101 | | | | 891 | | | | 0 | | | | 992 | |
Financials | | | 27 | | | | 255 | | | | 0 | | | | 282 | |
Industrials | | | 0 | | | | 185 | | | | 0 | | | | 185 | |
Information Technology | | | 138 | | | | 0 | | | | 0 | | | | 138 | |
Materials | | | 0 | | | | 366 | | | | 0 | | | | 366 | |
Portugal | |
Consumer Staples | | | 0 | | | | 95 | | | | 0 | | | | 95 | |
Energy | | | 0 | | | | 125 | | | | 0 | | | | 125 | |
Financials | | | 0 | | | | 24 | | | | 0 | | | | 24 | |
Utilities | | | 0 | | | | 505 | | | | 0 | | | | 505 | |
Singapore | |
Communication Services | | | 77 | | | | 481 | | | | 0 | | | | 558 | |
Consumer Staples | | | 131 | | | | 193 | | | | 0 | | | | 324 | |
Financials | | | 0 | | | | 1,763 | | | | 0 | | | | 1,763 | |
Industrials | | | 0 | | | | 700 | | | | 0 | | | | 700 | |
Information Technology | | | 0 | | | | 89 | | | | 0 | | | | 89 | |
Utilities | | | 0 | | | | 190 | | | | 0 | | | | 190 | |
South Africa | |
Financials | | | 0 | | | | 36 | | | | 0 | | | | 36 | |
Spain | |
Communication Services | | | 0 | | | | 1,600 | | | | 0 | | | | 1,600 | |
Consumer Staples | | | 0 | | | | 1,033 | | | | 0 | | | | 1,033 | |
Energy | | | 0 | | | | 940 | | | | 0 | | | | 940 | |
Financials | | | 0 | | | | 3,662 | | | | 0 | | | | 3,662 | |
Health Care | | | 0 | | | | 142 | | | | 0 | | | | 142 | |
Industrials | | | 0 | | | | 601 | | | | 0 | | | | 601 | |
Materials | | | 0 | | | | 114 | | | | 0 | | | | 114 | |
Utilities | | | 0 | | | | 1,587 | | | | 0 | | | | 1,587 | |
Sweden | |
Communication Services | | | 324 | | | | 590 | | | | 0 | | | | 914 | |
Consumer Discretionary | | | 157 | | | | 33 | | | | 0 | | | | 190 | |
Consumer Staples | | | 0 | | | | 884 | | | | 0 | | | | 884 | |
Financials | | | 0 | | | | 1,060 | | | | 0 | | | | 1,060 | |
Health Care | | | 28 | | | | 57 | | | | 0 | | | | 85 | |
Industrials | | | 0 | | | | 3,383 | | | | 0 | | | | 3,383 | |
Information Technology | | | 0 | | | | 181 | | | | 0 | | | | 181 | |
Materials | | | 0 | | | | 312 | | | | 0 | | | | 312 | |
Real Estate | | | 0 | | | | 161 | | | | 0 | | | | 161 | |
| | | | | | | | | | | | | | | | |
| Category and Subcategory | | Level 1 | | | Level 2 | | | Level 3 | | | Fair
Value at
06/30/2024 | |
Switzerland | |
Communication Services | | $ | 0 | | | $ | 322 | | | $ | 0 | | | $ | 322 | |
Consumer Discretionary | | | 495 | | | | 0 | | | | 0 | | | | 495 | |
Consumer Staples | | | 49 | | | | 2,697 | | | | 0 | | | | 2,746 | |
Financials | | | 106 | | | | 4,048 | | | | 0 | | | | 4,154 | |
Health Care | | | 0 | | | | 3,609 | | | | 0 | | | | 3,609 | |
Industrials | | | 163 | | | | 3,527 | | | | 0 | | | | 3,690 | |
Information Technology | | | 0 | | | | 525 | | | | 0 | | | | 525 | |
Materials | | | 0 | | | | 2,531 | | | | 0 | | | | 2,531 | |
Real Estate | | | 0 | | | | 419 | | | | 0 | | | | 419 | |
Utilities | | | 0 | | | | 118 | | | | 0 | | | | 118 | |
United Kingdom | |
Communication Services | | | 0 | | | | 1,890 | | | | 0 | | | | 1,890 | |
Consumer Discretionary | | | 0 | | | | 424 | | | | 0 | | | | 424 | |
Consumer Staples | | | 591 | | | | 8,624 | | | | 0 | | | | 9,215 | |
Energy | | | 0 | | | | 2,761 | | | | 0 | | | | 2,761 | |
Financials | | | 0 | | | | 6,208 | | | | 0 | | | | 6,208 | |
Health Care | | | 0 | | | | 3,591 | | | | 0 | | | | 3,591 | |
Industrials | | | 269 | | | | 6,595 | | | | 0 | | | | 6,864 | |
Information Technology | | | 0 | | | | 816 | | | | 0 | | | | 816 | |
Materials | | | 399 | | | | 1,952 | | | | 0 | | | | 2,351 | |
Real Estate | | | 40 | | | | 0 | | | | 0 | | | | 40 | |
Utilities | | | 0 | | | | 2,525 | | | | 0 | | | | 2,525 | |
United States | |
Consumer Staples | | | 29 | | | | 155 | | | | 0 | | | | 184 | |
Industrials | | | 216 | | | | 20 | | | | 0 | | | | 236 | |
Materials | | | 409 | | | | 0 | | | | 0 | | | | 409 | |
Preferred Stocks | |
Germany | |
Industrials | | | 0 | | | | 1,393 | | | | 0 | | | | 1,393 | |
Real Estate Investment Trusts | |
Australia | |
Real Estate | | | 0 | | | | 390 | | | | 0 | | | | 390 | |
Belgium | |
Real Estate | | | 0 | | | | 191 | | | | 0 | | | | 191 | |
Canada | |
Real Estate | | | 147 | | | | 0 | | | | 0 | | | | 147 | |
France | |
Real Estate | | | 0 | | | | 212 | | | | 0 | | | | 212 | |
Hong Kong | |
Real Estate | | | 0 | | | | 134 | | | | 0 | | | | 134 | |
Japan | |
Real Estate | | | 0 | | | | 1,229 | | | | 0 | | | | 1,229 | |
Luxembourg | |
Real Estate | | | 0 | | | | 81 | | | | 0 | | | | 81 | |
Singapore | |
Real Estate | | | 0 | | | | 281 | | | | 0 | | | | 281 | |
Spain | |
Real Estate | | | 0 | | | | 26 | | | | 0 | | | | 26 | |
United Kingdom | |
Real Estate | | | 0 | | | | 484 | | | | 0 | | | | 484 | |
Short-Term Instruments | |
Repurchase Agreements | | | 0 | | | | 1,203 | | | | 0 | | | | 1,203 | |
| | | | | | | | | | | | | | | | |
| | | | |
Total Investments | | $ | 29,379 | | | $ | 223,008 | | | $ | 0 | | | $ | 252,387 | |
| | | | | | | | | | | | | | | | |
There were no significant transfers into or out of Level 3 during the period ended June 30, 2024.
| | | | | | |
| 34 | | PIMCO EQUITY SERIES | | | See Accompanying Notes | |
| | | | | | |
| Schedule of Investments | | PIMCO RAFI Dynamic Multi-Factor U.S. Equity ETF | | | | June 30, 2024 |
(Amounts in thousands*, except number of shares, contracts, units and ounces, if any)
| | | | | | | | | | | | |
| | | | | SHARES | | | | | MARKET
VALUE
(000S) | |
| INVESTMENTS IN SECURITIES 100.0% | |
| |
| COMMON STOCKS 97.7% | |
| |
| IRELAND 0.2% | |
| |
| INFORMATION TECHNOLOGY 0.2% | |
| | | | |
Accenture PLC ‘A’ | | | | | 823 | | | $ | | | 250 | |
| | | | | | | | | | | | |
Total Ireland | | | | | | | | | | | 250 | |
| | | | | | | | | | | | |
| |
| SWITZERLAND 0.1% | |
| |
| CONSUMER STAPLES 0.0% | |
| | | | |
Guess?, Inc. | | | | | 1,363 | | | | | | 28 | |
| | | | | | | | | | | | |
| |
| FINANCIALS 0.1% | |
| | | | |
Chubb Ltd. | | | | | 819 | | | | | | 209 | |
| | | | | | | | | | | | |
Total Switzerland | | | | | | | | | | | 237 | |
| | | | | | | | | | | | |
| |
| UNITED KINGDOM 0.4% | |
| |
| COMMUNICATION SERVICES 0.0% | |
| | | | |
Liberty Global Ltd. ‘C’ (a) | | | | | 2,679 | | | | | | 48 | |
| | | | | | | | | | | | |
| |
| CONSUMER STAPLES 0.0% | |
| | | | |
Capri Holdings Ltd. (a) | | | | | 471 | | | | | | 15 | |
| | | | |
Nomad Foods Ltd. | | | | | 32 | | | | | | 1 | |
| | | | | | | | | | | | |
| | | | | | | | | | | 16 | |
| | | | | | | | | | | | |
| |
| ENERGY 0.1% | |
| | | | |
TechnipFMC PLC | | | | | 6,614 | | | | | | 173 | |
| | | | | | | | | | | | |
| |
| FINANCIALS 0.1% | |
| | | | |
Janus Henderson Group PLC | | | | | 1,398 | | | | | | 47 | |
| | | | |
Willis Towers Watson PLC | | | | | 245 | | | | | | 64 | |
| | | | | | | | | | | | |
| | | | | | | | | | | 111 | |
| | | | | | | | | | | | |
| |
| INDUSTRIALS 0.1% | |
| | | | |
Nvent Electric PLC | | | | | 592 | | | | | | 45 | |
| | | | |
Pentair PLC | | | | | 1,463 | | | | | | 112 | |
| | | | | | | | | | | | |
| | | | | | | | | | | 157 | |
| | | | | | | | | | | | |
| |
| MATERIALS 0.1% | |
| | | | |
Amcor PLC | | | | | 5,340 | | | | | | 52 | |
| | | | |
Tronox Holdings PLC | | | | | 796 | | | | | | 13 | |
| | | | | | | | | | | | |
| | | | | | | | | | | 65 | |
| | | | | | | | | | | | |
Total United Kingdom | | | | | | | | | | | 570 | |
| | | | | | | | | | | | |
| |
| UNITED STATES 97.0% | |
| |
| COMMUNICATION SERVICES 7.6% | |
| | | | |
Alphabet, Inc. ‘A’ | | | | | 11,788 | | | | | | 2,147 | |
| | | | |
AT&T, Inc. | | | | | 85,290 | | | | | | 1,630 | |
| | | | |
Charter Communications, Inc. ‘A’ (a) | | | | | 1,122 | | | | | | 335 | |
| | | | |
Comcast Corp. ‘A’ | | | | | 9,299 | | | | | | 364 | |
| | | | |
EchoStar Corp. ‘A’ (a) | | | | | 1,039 | | | | | | 19 | |
| | | | |
Electronic Arts, Inc. | | | | | 916 | | | | | | 128 | |
| | | | |
Fox Corp. ‘A’ | | | | | 3,035 | | | | | | 104 | |
| | | | |
Frontier Communications Parent, Inc. (a) | | | | | 590 | | | | | | 15 | |
| | | | |
Interpublic Group of Cos., Inc. | | | | | 3,408 | | | | | | 99 | |
| | | | |
John Wiley & Sons, Inc. ‘A’ | | | | | 456 | | | | | | 19 | |
| | | | |
Liberty Broadband Corp. ‘C’ (a) | | | | | 460 | | | | | | 25 | |
| | | | |
Liberty Latin America Ltd. ‘C’ (a) | | | | | 3,565 | | | | | | 34 | |
| | | | | | | | | | | | |
| | | | | SHARES | | | | | MARKET
VALUE
(000S) | |
| | | | |
Liberty Media Corp.-Liberty SiriusXM (a) | | | | | 2,019 | | | $ | | | 45 | |
| | | | |
Lumen Technologies, Inc. (a) | | | | | 22,643 | | | | | | 25 | |
| | | | |
Meta Platforms, Inc. ‘A’ | | | | | 6,027 | | | | | | 3,039 | |
| | | | |
Netflix, Inc. (a) | | | | | 981 | | | | | | 662 | |
| | | | |
New York Times Co. ‘A’ | | | | | 1,388 | | | | | | 71 | |
| | | | |
News Corp. ‘A’ | | | | | 3,634 | | | | | | 100 | |
| | | | |
Nexstar Media Group, Inc. | | | | | 454 | | | | | | 75 | |
| | | | |
Omnicom Group, Inc. | | | | | 889 | | | | | | 80 | |
| | | | |
Paramount Global ‘B’ | | | | | 2,325 | | | | | | 24 | |
| | | | |
Pinterest, Inc. ‘A’ (a) | | | | | 1,992 | | | | | | 88 | |
| | | | |
Scholastic Corp. | | | | | 334 | | | | | | 12 | |
| | | | |
Snap, Inc. ‘A’ (a) | | | | | 3,013 | | | | | | 50 | |
| | | | |
T-Mobile U.S., Inc. | | | | | 2,410 | | | | | | 425 | |
| | | | |
Take-Two Interactive Software, Inc. (a) | | | | | 704 | | | | | | 110 | |
| | | | |
TEGNA, Inc. | | | | | 3,884 | | | | | | 54 | |
| | | | |
Telephone & Data Systems, Inc. | | | | | 2,159 | | | | | | 45 | |
| | | | |
Verizon Communications, Inc. | | | | | 34,617 | | | | | | 1,428 | |
| | | | |
Yelp, Inc. (a) | | | | | 1,280 | | | | | | 47 | |
| | | | | | | | | | | | |
| | | | | | | | | | | 11,299 | |
| | | | | | | | | | | | |
| |
| CONSUMER DISCRETIONARY 2.7% | |
| | | | |
Abercrombie & Fitch Co. ‘A’ (a) | | | | | 3,055 | | | | | | 543 | |
| | | | |
Academy Sports & Outdoors, Inc. | | | | | 905 | | | | | | 48 | |
| | | | |
Acushnet Holdings Corp. | | | | | 311 | | | | | | 20 | |
| | | | |
Adient PLC (a) | | | | | 1,748 | | | | | | 43 | |
| | | | |
Adtalem Global Education, Inc. (a) | | | | | 978 | | | | | | 67 | |
| | | | |
Advance Auto Parts, Inc. | | | | | 229 | | | | | | 15 | |
| | | | |
Amazon.com, Inc. (a) | | | | | 10,636 | | | | | | 2,055 | |
| | | | |
American Eagle Outfitters, Inc. | | | | | 6,815 | | | | | | 136 | |
| | | | |
Asbury Automotive Group, Inc. (a) | | | | | 454 | | | | | | 103 | |
| | | | |
AutoNation, Inc. (a) | | | | | 782 | | | | | | 125 | |
| | | | |
AutoZone, Inc. (a) | | | | | 141 | | | | | | 418 | |
| | | | |
Bath & Body Works, Inc. | | | | | 969 | | | | | | 38 | |
| | | | |
Best Buy Co., Inc. | | | | | 3,705 | | | | | | 312 | |
| | | | |
Mohawk Industries, Inc. (a) | | | | | 129 | | | | | | 15 | |
| | | | |
TopBuild Corp. (a) | | | | | 131 | | | | | | 50 | |
| | | | |
Worthington Enterprises, Inc. | | | | | 330 | | | | | | 16 | |
| | | | | | | | | | | | |
| | | | | | | | | | | 4,004 | |
| | | | | | | | | | | | |
| |
| CONSUMER STAPLES 17.5% | |
| | | | |
Albertsons Cos., Inc. ‘A’ | | | | | 716 | | | | | | 14 | |
| | | | |
Altria Group, Inc. | | | | | 14,518 | | | | | | 661 | |
| | | | |
Andersons, Inc. | | | | | 542 | | | | | | 27 | |
| | | | |
Archer-Daniels-Midland Co. | | | | | 8,165 | | | | | | 494 | |
| | | | |
BJ’s Wholesale Club Holdings, Inc. (a) | | | | | 582 | | | | | | 51 | |
| | | | |
BorgWarner, Inc. | | | | | 2,193 | | | | | | 71 | |
| | | | |
Boston Beer Co., Inc. ‘A’ (a) | | | | | 100 | | | | | | 31 | |
| | | | |
Bright Horizons Family Solutions, Inc. (a) | | | | | 322 | | | | | | 35 | |
| | | | |
Brown-Forman Corp. ‘B’ | | | | | 2,225 | | | | | | 96 | |
| | | | |
Brunswick Corp. | | | | | 1,175 | | | | | | 86 | |
| | | | |
Buckle, Inc. | | | | | 852 | | | | | | 31 | |
| | | | |
Bunge Global SA | | | | | 810 | | | | | | 86 | |
| | | | |
Burlington Stores, Inc. (a) | | | | | 157 | | | | | | 38 | |
| | | | |
Cal-Maine Foods, Inc. | | | | | 1,435 | | | | | | 88 | |
| | | | |
Campbell Soup Co. | | | | | 345 | | | | | | 16 | |
| | | | |
Carnival Corp. (a) | | | | | 4,241 | | | | | | 79 | |
| | | | |
Carter’s, Inc. | | | | | 1,351 | | | | | | 84 | |
| | | | |
Casey’s General Stores, Inc. | | | | | 591 | | | | | | 225 | |
| | | | |
Central Garden & Pet Co. ‘A’ (a) | | | | | 484 | | | | | | 16 | |
| | | | |
Chipotle Mexican Grill, Inc. (a) | | | | | 6,000 | | | | | | 376 | |
| | | | | | | | | | | | |
| | | | | SHARES | | | | | MARKET
VALUE
(000S) | |
| | | | |
Church & Dwight Co., Inc. | | | | | 922 | | | $ | | | 96 | |
| | | | |
Churchill Downs, Inc. | | | | | 180 | | | | | | 25 | |
| | | | |
Clorox Co. | | | | | 1,350 | | | | | | 184 | |
| | | | |
Coca-Cola Co. | | | | | 12,528 | | | | | | 797 | |
| | | | |
Coca-Cola Consolidated, Inc. | | | | | 30 | | | | | | 33 | |
| | | | |
Colgate-Palmolive Co. | | | | | 4,593 | | | | | | 446 | |
| | | | |
Conagra Brands, Inc. | | | | | 2,075 | | | | | | 59 | |
| | | | |
Constellation Brands, Inc. ‘A’ | | | | | 258 | | | | | | 66 | |
| | | | |
Costco Wholesale Corp. | | | | | 2,040 | | | | | | 1,734 | |
| | | | |
Cracker Barrel Old Country Store, Inc. | | | | | 470 | | | | | | 20 | |
| | | | |
Dana, Inc. | | | | | 2,133 | | | | | | 26 | |
| | | | |
Darden Restaurants, Inc. | | | | | 245 | | | | | | 37 | |
| | | | |
Deckers Outdoor Corp. (a) | | | | | 284 | | | | | | 275 | |
| | | | |
Dick’s Sporting Goods, Inc. | | | | | 682 | | | | | | 147 | |
| | | | |
Dillard’s, Inc. ‘A’ | | | | | 154 | | | | | | 68 | |
| | | | |
Dollar General Corp. | | | | | 992 | | | | | | 131 | |
| | | | |
Dollar Tree, Inc. (a) | | | | | 566 | | | | | | 60 | |
| | | | |
Domino’s Pizza, Inc. | | | | | 650 | | | | | | 336 | |
| | | | |
Dorman Products, Inc. (a) | | | | | 232 | | | | | | 21 | |
| | | | |
Edgewell Personal Care Co. | | | | | 824 | | | | | | 33 | |
| | | | |
Floor & Decor Holdings, Inc. ‘A’ (a) | | | | | 457 | | | | | | 45 | |
| | | | |
Flowers Foods, Inc. | | | | | 2,530 | | | | | | 56 | |
| | | | |
Foot Locker, Inc. | | | | | 3,079 | | | | | | 77 | |
| | | | |
Ford Motor Co. | | | | | 47,619 | | | | | | 597 | |
| | | | |
Gap, Inc. | | | | | 5,336 | | | | | | 127 | |
| | | | |
General Mills, Inc. | | | | | 2,237 | | | | | | 142 | |
| | | | |
General Motors Co. | | | | | 18,858 | | | | | | 876 | |
| | | | |
Gentex Corp. | | | | | 3,224 | | | | | | 109 | |
| | | | |
Genuine Parts Co. | | | | | 206 | | | | | | 28 | |
| | | | |
Goodyear Tire & Rubber Co. (a) | | | | | 6,186 | | | | | | 70 | |
| | | | |
Graham Holdings Co. ‘B’ | | | | | 40 | | | | | | 28 | |
| | | | |
Grand Canyon Education, Inc. (a) | | | | | 518 | | | | | | 72 | |
| | | | |
Group 1 Automotive, Inc. | | | | | 370 | | | | | | 110 | |
| | | | |
H&R Block, Inc. | | | | | 2,163 | | | | | | 117 | |
| | | | |
Hanesbrands, Inc. (a) | | | | | 7,610 | | | | | | 38 | |
| | | | |
Harley-Davidson, Inc. | | | | | 1,035 | | | | | | 35 | |
| | | | |
Helen of Troy Ltd. (a) | | | | | 252 | | | | | | 23 | |
| | | | |
Hershey Co. | | | | | 440 | | | | | | 81 | |
| | | | |
Hilton Worldwide Holdings, Inc. | | | | | 572 | | | | | | 125 | |
| | | | |
Home Depot, Inc. | | | | | 1,596 | | | | | | 549 | |
| | | | |
Hormel Foods Corp. | | | | | 461 | | | | | | 14 | |
| | | | |
Hyatt Hotels Corp. ‘A’ | | | | | 134 | | | | | | 20 | |
| | | | |
Ingredion, Inc. | | | | | 676 | | | | | | 78 | |
| | | | |
International Game Technology PLC | | | | | 1,250 | | | | | | 26 | |
| | | | |
J M Smucker Co. | | | | | 354 | | | | | | 39 | |
| | | | |
Jack in the Box, Inc. | | | | | 758 | | | | | | 39 | |
| | | | |
KB Home | | | | | 772 | | | | | | 54 | |
| | | | |
Kellanova | | | | | 1,838 | | | | | | 106 | |
| | | | |
Keurig Dr Pepper, Inc. | | | | | 2,602 | | | | | | 87 | |
| | | | |
Kimberly-Clark Corp. | | | | | 1,679 | | | | | | 232 | |
| | | | |
Kohl’s Corp. | | | | | 4,313 | | | | | | 99 | |
| | | | |
Kontoor Brands, Inc. | | | | | 1,157 | | | | | | 77 | |
| | | | |
Kraft Heinz Co. | | | | | 6,739 | | | | | | 217 | |
| | | | |
Kroger Co. | | | | | 9,793 | | | | | | 489 | |
| | | | |
La-Z-Boy, Inc. | | | | | 894 | | | | | | 33 | |
| | | | |
Lamb Weston Holdings, Inc. | | | | | 863 | | | | | | 73 | |
| | | | |
Lancaster Colony Corp. | | | | | 361 | | | | | | 68 | |
| | | | |
Las Vegas Sands Corp. | | | | | 399 | | | | | | 18 | |
| | | | |
Laureate Education, Inc. | | | | | 1,286 | | | | | | 19 | |
| | | | |
Lear Corp. | | | | | 447 | | | | | | 51 | |
| | | | |
Leggett & Platt, Inc. | | | | | 1,946 | | | | | | 22 | |
| | | | |
Lennar Corp. ‘A’ | | | | | 690 | | | | | | 103 | |
| | | | |
Light & Wonder, Inc. (a) | | | | | 304 | | | | | | 32 | |
| | | | |
Lithia Motors, Inc. | | | | | 74 | | | | | | 19 | |
| | | | |
Lowe’s Cos., Inc. | | | | | 1,410 | | | | | | 311 | |
| | | | | | | | | | | | |
| See Accompanying Notes | | | ANNUAL FINANCIAL AND OTHER INFORMATION | | | | | | | JUNE 30, 2024 | | | 35 |
| | | | | | |
| Schedule of Investments | | PIMCO RAFI Dynamic Multi-Factor U.S. Equity ETF | | (Cont.) | | |
| | | | | | | | | | | | |
| | | | | SHARES | | | | | MARKET
VALUE
(000S) | |
| | | | |
M/I Homes, Inc. (a) | | | | | 532 | | | $ | | | 65 | |
| | | | |
Macy’s, Inc. | | | | | 4,612 | | | | | | 89 | |
| | | | |
Marriott International, Inc. ‘A’ | | | | | 755 | | | | | | 183 | |
| | | | |
McCormick & Co., Inc. | | | | | 1,387 | | | | | | 98 | |
| | | | |
McDonald’s Corp. | | | | | 2,068 | | | | | | 527 | |
| | | | |
Meritage Homes Corp. | | | | | 621 | | | | | | 101 | |
| | | | |
Molson Coors Beverage Co. ‘B’ | | | | | 2,320 | | | | | | 118 | |
| | | | |
Mondelez International, Inc. ‘A’ | | | | | 4,303 | | | | | | 282 | |
| | | | |
Monster Beverage Corp. (a) | | | | | 1,673 | | | | | | 84 | |
| | | | |
Murphy USA, Inc. | | | | | 492 | | | | | | 231 | |
| | | | |
Newell Brands, Inc. | | | | | 3,402 | | | | | | 22 | |
| | | | |
NIKE, Inc. ‘B’ | | | | | 818 | | | | | | 62 | |
| | | | |
Nordstrom, Inc. | | | | | 2,358 | | | | | | 50 | |
| | | | |
NVR, Inc. (a) | | | | | 12 | | | | | | 91 | |
| | | | |
O’Reilly Automotive, Inc. (a) | | | | | 243 | | | | | | 257 | |
| | | | |
ODP Corp. (a) | | | | | 871 | | | | | | 34 | |
| | | | |
Ollie’s Bargain Outlet Holdings, Inc. (a) | | | | | 218 | | | | | | 21 | |
| | | | |
Penske Automotive Group, Inc. | | | | | 443 | | | | | | 66 | |
| | | | |
PepsiCo, Inc. | | | | | 5,230 | | | | | | 863 | |
| | | | |
Philip Morris International, Inc. | | | | | 6,639 | | | | | | 673 | |
| | | | |
Phinia, Inc. | | | | | 474 | | | | | | 19 | |
| | | | |
Pool Corp. | | | | | 285 | | | | | | 88 | |
| | | | |
Post Holdings, Inc. (a) | | | | | 671 | | | | | | 70 | |
| | | | |
PriceSmart, Inc. | | | | | 234 | | | | | | 19 | |
| | | | |
Procter & Gamble Co. | | | | | 7,399 | | | | | | 1,220 | |
| | | | |
PulteGroup, Inc. | | | | | 1,901 | | | | | | 209 | |
| | | | |
PVH Corp. | | | | | 621 | | | | | | 66 | |
| | | | |
Ralph Lauren Corp. | | | | | 317 | | | | | | 55 | |
| | | | |
Ross Stores, Inc. | | | | | 719 | | | | | | 104 | |
| | | | |
Royal Caribbean Cruises Ltd. (a) | | | | | 762 | | | | | | 121 | |
| | | | |
Sally Beauty Holdings, Inc. (a) | | | | | 3,887 | | | | | | 42 | |
| | | | |
Seaboard Corp. | | | | | 18 | | | | | | 57 | |
| | | | |
Service Corp. International | | | | | 1,163 | | | | | | 83 | |
| | | | |
Signet Jewelers Ltd. | | | | | 852 | | | | | | 76 | |
| | | | |
Skechers USA, Inc. ‘A’ (a) | | | | | 492 | | | | | | 34 | |
| | | | |
Sonic Automotive, Inc. ‘A’ | | | | | 353 | | | | | | 19 | |
| | | | |
Spectrum Brands Holdings, Inc. | | | | | 179 | | | | | | 15 | |
| | | | |
Sprouts Farmers Market, Inc. (a) | | | | | 2,832 | | | | | | 237 | |
| | | | |
Starbucks Corp. | | | | | 916 | | | | | | 71 | |
| | | | |
Steven Madden Ltd. | | | | | 1,020 | | | | | | 43 | |
| | | | |
Strategic Education, Inc. | | | | | 188 | | | | | | 21 | |
| | | | |
Sysco Corp. | | | | | 1,334 | | | | | | 95 | |
| | | | |
Tapestry, Inc. | | | | | 324 | | | | | | 14 | |
| | | | |
Target Corp. | | | | | 6,855 | | | | | | 1,015 | |
| | | | |
Taylor Morrison Home Corp. (a) | | | | | 1,910 | | | | | | 106 | |
| | | | |
Tempur Sealy International, Inc. | | | | | 1,738 | | | | | | 82 | |
| | | | |
Texas Roadhouse, Inc. | | | | | 455 | | | | | | 78 | |
| | | | |
Thor Industries, Inc. | | | | | 965 | | | | | | 90 | |
| | | | |
TJX Cos., Inc. | | | | | 4,339 | | | | | | 478 | |
| | | | |
Toll Brothers, Inc. | | | | | 1,069 | | | | | | 123 | |
| | | | |
Tractor Supply Co. | | | | | 368 | | | | | | 99 | |
| | | | |
TreeHouse Foods, Inc. (a) | | | | | 902 | | | | | | 33 | |
| | | | |
Tri Pointe Homes, Inc. (a) | | | | | 1,972 | | | | | | 73 | |
| | | | |
Tyson Foods, Inc. ‘A’ | | | | | 5,343 | | | | | | 305 | |
| | | | |
U.S. Foods Holding Corp. (a) | | | | | 2,250 | | | | | | 119 | |
| | | | |
Ulta Beauty, Inc. (a) | | | | | 180 | | | | | | 69 | |
| | | | |
Universal Corp. | | | | | 261 | | | | | | 13 | |
| | | | |
Urban Outfitters, Inc. (a) | | | | | 2,269 | | | | | | 93 | |
| | | | |
Vail Resorts, Inc. | | | | | 399 | | | | | | 72 | |
| | | | |
Valvoline, Inc. (a) | | | | | 1,036 | | | | | | 45 | |
| | | | |
VF Corp. | | | | | 1,300 | | | | | | 18 | |
| | | | |
Vista Outdoor, Inc. (a) | | | | | 782 | | | | | | 29 | |
| | | | |
Visteon Corp. (a) | | | | | 588 | | | | | | 63 | |
| | | | |
Walgreens Boots Alliance, Inc. | | | | | 23,930 | | | | | | 289 | |
| | | | | | | | | | | | |
| | | | | SHARES | | | | | MARKET
VALUE
(000S) | |
| | | | |
Walmart, Inc. | | | | | 35,689 | | | $ | | | 2,416 | |
| | | | |
Weis Markets, Inc. | | | | | 239 | | | | | | 15 | |
| | | | |
Wendy’s Co. | | | | | 4,197 | | | | | | 71 | |
| | | | |
Whirlpool Corp. | | | | | 645 | | | | | | 66 | |
| | | | |
Williams-Sonoma, Inc. | | | | | 1,234 | | | | | | 348 | |
| | | | |
Winnebago Industries, Inc. | | | | | 239 | | | | | | 13 | |
| | | | |
Wyndham Hotels & Resorts, Inc. | | | | | 575 | | | | | | 43 | |
| | | | |
Yum! Brands, Inc. | | | | | 1,139 | | | | | | 151 | |
| | | | | | | | | | | | |
| | | | | | | | | | | 25,940 | |
| | | | | | | | | | | | |
| |
| ENERGY 6.0% | |
| | | | |
Antero Resources Corp. (a) | | | | | 2,241 | | | | | | 73 | |
| | | | |
Archrock, Inc. | | | | | 2,782 | | | | | | 56 | |
| | | | |
Baker Hughes Co. | | | | | 7,420 | | | | | | 261 | |
| | | | |
Chevron Corp. | | | | | 8,578 | | | | | | 1,342 | |
| | | | |
Chord Energy Corp. | | | | | 254 | | | | | | 43 | |
| | | | |
CNX Resources Corp. (a) | | | | | 3,571 | | | | | | 87 | |
| | | | |
ConocoPhillips | | | | | 4,392 | | | | | | 502 | |
| | | | |
Coterra Energy, Inc. | | | | | 1,644 | | | | | | 44 | |
| | | | |
CVR Energy, Inc. | | | | | 827 | | | | | | 22 | |
| | | | |
Delek U.S. Holdings, Inc. | | | | | 2,131 | | | | | | 53 | |
| | | | |
Diamondback Energy, Inc. | | | | | 370 | | | | | | 74 | |
| | | | |
DTE Midstream, Inc. | | | | | 214 | | | | | | 15 | |
| | | | |
EOG Resources, Inc. | | | | | 1,326 | | | | | | 167 | |
| | | | |
Equitrans Midstream Corp. | | | | | 3,015 | | | | | | 39 | |
| | | | |
Exxon Mobil Corp. | | | | | 13,393 | | | | | | 1,542 | |
| | | | |
Halliburton Co. | | | | | 1,954 | | | | | | 66 | |
| | | | |
Helmerich & Payne, Inc. | | | | | 1,452 | | | | | | 52 | |
| | | | |
HF Sinclair Corp. | | | | | 1,050 | | | | | | 56 | |
| | | | |
Kinder Morgan, Inc. | | | | | 5,839 | | | | | | 116 | |
| | | | |
Marathon Oil Corp. | | | | | 5,846 | | | | | | 168 | |
| | | | |
Marathon Petroleum Corp. | | | | | 5,921 | | | | | | 1,027 | |
| | | | |
Matador Resources Co. | | | | | 282 | | | | | | 17 | |
| | | | |
Murphy Oil Corp. | | | | | 2,068 | | | | | | 85 | |
| | | | |
NOV, Inc. | | | | | 4,120 | | | | | | 78 | |
| | | | |
ONEOK, Inc. | | | | | 1,304 | | | | | | 106 | |
| | | | |
Ovintiv, Inc. | | | | | 826 | | | | | | 39 | |
| | | | |
Patterson-UTI Energy, Inc. | | | | | 2,613 | | | | | | 27 | |
| | | | |
PBF Energy, Inc. ‘A’ | | | | | 2,906 | | | | | | 134 | |
| | | | |
Peabody Energy Corp. | | | | | 2,973 | | | | | | 66 | |
| | | | |
Permian Resources Corp. | | | | | 4,391 | | | | | | 71 | |
| | | | |
Phillips 66 | | | | | 6,447 | | | | | | 910 | |
| | | | |
Range Resources Corp. | | | | | 2,040 | | | | | | 68 | |
| | | | |
Schlumberger NV | | | | | 3,311 | | | | | | 156 | |
| | | | |
SM Energy Co. | | | | | 1,103 | | | | | | 48 | |
| | | | |
Southwestern Energy Co. (a) | | | | | 2,154 | | | | | | 14 | |
| | | | |
Targa Resources Corp. | | | | | 1,349 | | | | | | 174 | |
| | | | |
Valero Energy Corp. | | | | | 5,988 | | | | | | 939 | |
| | | | |
Williams Cos., Inc. | | | | | 2,656 | | | | | | 113 | |
| | | | |
World Kinect Corp. | | | | | 1,600 | | | | | | 41 | |
| | | | | | | | | | | | |
| | | | | | | | | | | 8,891 | |
| | | | | | | | | | | | |
| |
| FINANCIALS 17.2% | |
| | | | |
Affiliated Managers Group, Inc. | | | | | 411 | | | | | | 64 | |
| | | | |
Aflac, Inc. | | | | | 2,661 | | | | | | 238 | |
| | | | |
Allstate Corp. | | | | | 2,901 | | | | | | 463 | |
| | | | |
Ally Financial, Inc. | | | | | 4,759 | | | | | | 189 | |
| | | | |
American Express Co. | | | | | 1,147 | | | | | | 266 | |
| | | | |
American Financial Group, Inc. | | | | | 118 | | | | | | 14 | |
| | | | |
American International Group, Inc. | | | | | 8,694 | | | | | | 645 | |
| | | | |
Ameriprise Financial, Inc. | | | | | 275 | | | | | | 117 | |
| | | | |
Aon PLC ‘A’ | | | | | 829 | | | | | | 243 | |
| | | | |
Apollo Global Management, Inc. | | | | | 1,449 | | | | | | 171 | |
| | | | |
Ares Management Corp. ‘A’ | | | | | 981 | | | | | | 131 | |
| | | | | | | | | | | | |
| | | | | SHARES | | | | | MARKET
VALUE
(000S) | |
| | | | |
Arthur J Gallagher & Co. | | | | | 459 | | | $ | | | 119 | |
| | | | |
Artisan Partners Asset Management, Inc. ‘A’ | | | | | 839 | | | | | | 35 | |
| | | | |
Assurant, Inc. | | | | | 578 | | | | | | 96 | |
| | | | |
Bank of America Corp. | | | | | 14,880 | | | | | | 592 | |
| | | | |
Bank of New York Mellon Corp. | | | | | 5,904 | | | | | | 354 | |
| | | | |
BankUnited, Inc. | | | | | 1,152 | | | | | | 34 | |
| | | | |
Berkshire Hathaway, Inc. ‘B’ (a) | | | | | 6,592 | | | | | | 2,682 | |
| | | | |
Blackstone, Inc. | | | | | 2,462 | | | | | | 305 | |
| | | | |
Bread Financial Holdings, Inc. | | | | | 1,471 | | | | | | 65 | |
| | | | |
Brighthouse Financial, Inc. (a) | | | | | 1,176 | | | | | | 51 | |
| | | | |
Brown & Brown, Inc. | | | | | 1,883 | | | | | | 168 | |
| | | | |
Cadence Bank | | | | | 543 | | | | | | 15 | |
| | | | |
Capital One Financial Corp. | | | | | 4,592 | | | | | | 636 | |
| | | | |
Carlyle Group, Inc. | | | | | 836 | | | | | | 34 | |
| | | | |
Charles Schwab Corp. | | | | | 3,903 | | | | | | 288 | |
| | | | |
Cincinnati Financial Corp. | | | | | 218 | | | | | | 26 | |
| | | | |
Citigroup, Inc. | | | | | 31,751 | | | | | | 2,015 | |
| | | | |
Citizens Financial Group, Inc. | | | | | 2,349 | | | | | | 85 | |
| | | | |
CME Group, Inc. | | | | | 1,392 | | | | | | 274 | |
| | | | |
CNO Financial Group, Inc. | | | | | 1,716 | | | | | | 48 | |
| | | | |
Coinbase Global, Inc. ‘A’ (a) | | | | | 597 | | | | | | 133 | |
| | | | |
Comerica, Inc. | | | | | 920 | | | | | | 47 | |
| | | | |
Commerce Bancshares, Inc. | | | | | 278 | | | | | | 15 | |
| | | | |
Corebridge Financial, Inc. | | | | | 2,073 | | | | | | 60 | |
| | | | |
Corpay, Inc. (a) | | | | | 252 | | | | | | 67 | |
| | | | |
Credit Acceptance Corp. (a) | | | | | 29 | | | | | | 15 | |
| | | | |
Discover Financial Services | | | | | 877 | | | | | | 115 | |
| | | | |
East West Bancorp, Inc. | | | | | 319 | | | | | | 23 | |
| | | | |
Encore Capital Group, Inc. (a) | | | | | 284 | | | | | | 12 | |
| | | | |
Equitable Holdings, Inc. | | | | | 2,587 | | | | | | 106 | |
| | | | |
Erie Indemnity Co. ‘A’ | | | | | 255 | | | | | | 92 | |
| | | | |
Essent Group Ltd. | | | | | 332 | | | | | | 19 | |
| | | | |
Evercore, Inc. ‘A’ | | | | | 741 | | | | | | 154 | |
| | | | |
FactSet Research Systems, Inc. | | | | | 180 | | | | | | 73 | |
| | | | |
Federated Hermes, Inc. | | | | | 1,599 | | | | | | 53 | |
| | | | |
Fidelity National Financial, Inc. | | | | | 659 | | | | | | 33 | |
| | | | |
Fidelity National Information Services, Inc. | | | | | 1,410 | | | | | | 106 | |
| | | | |
Fifth Third Bancorp | | | | | 1,963 | | | | | | 72 | |
| | | | |
First American Financial Corp. | | | | | 525 | | | | | | 28 | |
| | | | |
First Citizens BancShares, Inc. ‘A’ | | | | | 42 | | | | | | 71 | |
| | | | |
First Horizon Corp. | | | | | 1,029 | | | | | | 16 | |
| | | | |
FirstCash Holdings, Inc. | | | | | 128 | | | | | | 13 | |
| | | | |
Fiserv, Inc. (a) | | | | | 1,393 | | | | | | 208 | |
| | | | |
Franklin Resources, Inc. | | | | | 3,425 | | | | | | 76 | |
| | | | |
Genworth Financial, Inc. (a) | | | | | 8,733 | | | | | | 53 | |
| | | | |
Goldman Sachs Group, Inc. | | | | | 1,450 | | | | | | 656 | |
| | | | |
Hanover Insurance Group, Inc. | | | | | 421 | | | | | | 53 | |
| | | | |
Hartford Financial Services Group, Inc. | | | | | 731 | | | | | | 73 | |
| | | | |
Houlihan Lokey, Inc. | | | | | 754 | | | | | | 102 | |
| | | | |
Huntington Bancshares, Inc. | | | | | 2,784 | | | | | | 37 | |
| | | | |
Interactive Brokers Group, Inc. ‘A’ | | | | | 623 | | | | | | 76 | |
| | | | |
Intercontinental Exchange, Inc. | | | | | 2,699 | | | | | | 369 | |
| | | | |
Invesco Ltd. | | | | | 5,204 | | | | | | 78 | |
| | | | |
Jack Henry & Associates, Inc. | | | | | 874 | | | | | | 145 | |
| | | | |
Jackson Financial, Inc. ‘A’ | | | | | 1,659 | | | | | | 123 | |
| | | | |
Jefferies Financial Group, Inc. | | | | | 861 | | | | | | 43 | |
| | | | |
JPMorgan Chase & Co. | | | | | 6,612 | | | | | | 1,337 | |
| | | | |
Kemper Corp. | | | | | 539 | | | | | | 32 | |
| | | | |
KeyCorp | | | | | 2,024 | | | | | | 29 | |
| | | | |
KKR & Co., Inc. | | | | | 1,597 | | | | | | 168 | |
| | | | |
Lincoln National Corp. | | | | | 2,463 | | | | | | 77 | |
| | | | |
Loews Corp. | | | | | 1,583 | | | | | | 118 | |
| | | | | | |
| 36 | | PIMCO EQUITY SERIES | | | See Accompanying Notes | |
| | | | | | | | | | | | |
| | | | | SHARES | | | | | MARKET
VALUE
(000S) | |
| | | | |
LPL Financial Holdings, Inc. | | | | | 496 | | | $ | | | 138 | |
| | | | |
M&T Bank Corp. | | | | | 263 | | | | | | 40 | |
| | | | |
Markel Group, Inc. (a) | | | | | 31 | | | | | | 49 | |
| | | | |
MarketAxess Holdings, Inc. | | | | | 122 | | | | | | 24 | |
| | | | |
Marsh & McLennan Cos., Inc. | | | | | 1,230 | | | | | | 259 | |
| | | | |
Mastercard, Inc. ‘A’ | | | | | 2,429 | | | | | | 1,072 | |
| | | | |
Mercury General Corp. | | | | | 455 | | | | | | 24 | |
| | | | |
MetLife, Inc. | | | | | 7,286 | | | | | | 511 | |
| | | | |
MGIC Investment Corp. | | | | | 2,410 | | | | | | 52 | |
| | | | |
Moelis & Co. ‘A’ | | | | | 643 | | | | | | 37 | |
| | | | |
Moody’s Corp. | | | | | 95 | | | | | | 40 | |
| | | | |
Morningstar, Inc. | | | | | 147 | | | | | | 43 | |
| | | | |
Mr Cooper Group, Inc. (a) | | | | | 762 | | | | | | 62 | |
| | | | |
MSCI, Inc. | | | | | 199 | | | | | | 96 | |
| | | | |
Nasdaq, Inc. | | | | | 504 | | | | | | 30 | |
| | | | |
Navient Corp. | | | | | 2,735 | | | | | | 40 | |
| | | | |
Nelnet, Inc. ‘A’ | | | | | 173 | | | | | | 17 | |
| | | | |
New York Community Bancorp, Inc. | | | | | 8,774 | | | | | | 28 | |
| | | | |
Northern Trust Corp. | | | | | 399 | | | | | | 33 | |
| | | | |
Old National Bancorp | | | | | 917 | | | | | | 16 | |
| | | | |
OneMain Holdings, Inc. | | | | | 1,161 | | | | | | 56 | |
| | | | |
PennyMac Financial Services, Inc. | | | | | 294 | | | | | | 28 | |
| | | | |
PNC Financial Services Group, Inc. | | | | | 827 | | | | | | 129 | |
| | | | |
Principal Financial Group, Inc. | | | | | 191 | | | | | | 15 | |
| | | | |
PROG Holdings, Inc. | | | | | 916 | | | | | | 32 | |
| | | | |
Progressive Corp. | | | | | 3,015 | | | | | | 626 | |
| | | | |
Prudential Financial, Inc. | | | | | 3,231 | | | | | | 379 | |
| | | | |
Raymond James Financial, Inc. | | | | | 179 | | | | | | 22 | |
| | | | |
Reinsurance Group of America, Inc. | | | | | 339 | | | | | | 70 | |
| | | | |
RLI Corp. | | | | | 268 | | | | | | 38 | |
| | | | |
Robinhood Markets, Inc. ‘A’ (a) | | | | | 1,979 | | | | | | 45 | |
| | | | |
S&P Global, Inc. | | | | | 179 | | | | | | 80 | |
| | | | |
SEI Investments Co. | | | | | 1,532 | | | | | | 99 | |
| | | | |
Selective Insurance Group, Inc. | | | | | 168 | | | | | | 16 | |
| | | | |
SLM Corp. | | | | | 4,471 | | | | | | 93 | |
| | | | |
Stewart Information Services Corp. | | | | | 505 | | | | | | 31 | |
| | | | |
Stifel Financial Corp. | | | | | 206 | | | | | | 17 | |
| | | | |
Synchrony Financial | | | | | 9,500 | | | | | | 448 | |
| | | | |
Synovus Financial Corp. | | | | | 466 | | | | | | 19 | |
| | | | |
T Rowe Price Group, Inc. | | | | | 1,099 | | | | | | 127 | |
| | | | |
Tradeweb Markets, Inc. ‘A’ | | | | | 638 | | | | | | 68 | |
| | | | |
Travelers Cos., Inc. | | | | | 1,992 | | | | | | 405 | |
| | | | |
Truist Financial Corp. | | | | | 3,195 | | | | | | 124 | |
| | | | |
U.S. Bancorp | | | | | 3,626 | | | | | | 144 | |
| | | | |
Unum Group | | | | | 2,903 | | | | | | 148 | |
| | | | |
Virtu Financial, Inc. ‘A’ | | | | | 2,309 | | | | | | 52 | |
| | | | |
Visa, Inc. ‘A’ | | | | | 4,516 | | | | | | 1,185 | |
| | | | |
Washington Federal, Inc. | | | | | 451 | | | | | | 13 | |
| | | | |
Webster Financial Corp. | | | | | 412 | | | | | | 18 | |
| | | | |
Wells Fargo & Co. | | | | | 38,935 | | | | | | 2,312 | |
| | | | |
Western Alliance Bancorp | | | | | 272 | | | | | | 17 | |
| | | | |
Western Union Co. | | | | | 9,650 | | | | | | 118 | |
| | | | |
White Mountains Insurance Group Ltd. | | | | | 31 | | | | | | 56 | |
| | | | |
Wintrust Financial Corp. | | | | | 158 | | | | | | 16 | |
| | | | |
WR Berkley Corp. | | | | | 402 | | | | | | 32 | |
| | | | |
Zions Bancorp NA | | | | | 841 | | | | | | 36 | |
| | | | | | | | | | | | |
| | | | | | | | | | | 25,364 | |
| | | | | | | | | | | | |
| |
| HEALTH CARE 13.7% | |
| | | | |
AbbVie, Inc. | | | | | 10,138 | | | | | | 1,739 | |
| | | | |
Agilent Technologies, Inc. | | | | | 542 | | | | | | 70 | |
| | | | |
Align Technology, Inc. (a) | | | | | 148 | | | | | | 36 | |
| | | | |
Amedisys, Inc. (a) | | | | | 164 | | | | | | 15 | |
| | | | | | | | | | | | |
| | | | | SHARES | | | | | MARKET
VALUE
(000S) | |
| | | | |
Amgen, Inc. | | | | | 4,689 | | | $ | | | 1,465 | |
| | | | |
Avantor, Inc. (a) | | | | | 1,984 | | | | | | 42 | |
| | | | |
Baxter International, Inc. | | | | | 1,412 | | | | | | 47 | |
| | | | |
Becton Dickinson & Co. | | | | | 567 | | | | | | 133 | |
| | | | |
Biogen, Inc. (a) | | | | | 579 | | | | | | 134 | |
| | | | |
BioMarin Pharmaceutical, Inc. (a) | | | | | 311 | | | | | | 26 | |
| | | | |
Boston Scientific Corp. (a) | | | | | 3,378 | | | | | | 260 | |
| | | | |
Bristol-Myers Squibb Co. | | | | | 8,521 | | | | | | 354 | |
| | | | |
Bruker Corp. | | | | | 653 | | | | | | 42 | |
| | | | |
Cardinal Health, Inc. | | | | | 4,558 | | | | | | 448 | |
| | | | |
Catalent, Inc. (a) | | | | | 543 | | | | | | 31 | |
| | | | |
Cencora, Inc. | | | | | 929 | | | | | | 209 | |
| | | | |
Chemed Corp. | | | | | 152 | | | | | | 82 | |
| | | | |
Cigna Group | | | | | 603 | | | | | | 199 | |
| | | | |
Cooper Cos., Inc. (a) | | | | | 1,172 | | | | | | 102 | |
| | | | |
CVS Health Corp. | | | | | 21,249 | | | | | | 1,255 | |
| | | | |
Danaher Corp. | | | | | 1,474 | | | | | | 368 | |
| | | | |
DaVita, Inc. (a) | | | | | 1,736 | | | | | | 241 | |
| | | | |
Dentsply Sirona, Inc. | | | | | 2,260 | | | | | | 56 | |
| | | | |
Elanco Animal Health, Inc. (a) | | | | | 967 | | | | | | 14 | |
| | | | |
Elevance Health, Inc. | | | | | 231 | | | | | | 125 | |
| | | | |
Eli Lilly & Co. | | | | | 4,138 | | | | | | 3,746 | |
| | | | |
Encompass Health Corp. | | | | | 1,319 | | | | | | 113 | |
| | | | |
Exelixis, Inc. (a) | | | | | 1,307 | | | | | | 29 | |
| | | | |
GE Healthcare, Inc. | | | | | 428 | | | | | | 33 | |
| | | | |
Gilead Sciences, Inc. | | | | | 14,374 | | | | | | 986 | |
| | | | |
Globus Medical, Inc. ‘A’ (a) | | | | | 459 | | | | | | 31 | |
| | | | |
Haemonetics Corp. (a) | | | | | 429 | | | | | | 35 | |
| | | | |
HCA Healthcare, Inc. | | | | | 522 | | | | | | 168 | |
| | | | |
Henry Schein, Inc. (a) | | | | | 688 | | | | | | 44 | |
| | | | |
Hologic, Inc. (a) | | | | | 596 | | | | | | 44 | |
| | | | |
IDEXX Laboratories, Inc. (a) | | | | | 174 | | | | | | 85 | |
| | | | |
Incyte Corp. (a) | | | | | 245 | | | | | | 15 | |
| | | | |
Jazz Pharmaceuticals PLC (a) | | | | | 110 | | | | | | 12 | |
| | | | |
Johnson & Johnson | | | | | 9,206 | | | | | | 1,346 | |
| | | | |
Masimo Corp. (a) | | | | | 307 | | | | | | 39 | |
| | | | |
McKesson Corp. | | | | | 1,507 | | | | | | 880 | |
| | | | |
Merck & Co., Inc. | | | | | 11,305 | | | | | | 1,400 | |
| | | | |
Mettler-Toledo International, Inc. (a) | | | | | 81 | | | | | | 113 | |
| | | | |
Molina Healthcare, Inc. (a) | | | | | 124 | | | | | | 37 | |
| | | | |
Neurocrine Biosciences, Inc. (a) | | | | | 483 | | | | | | 67 | |
| | | | |
Organon & Co. | | | | | 5,695 | | | | | | 118 | |
| | | | |
Owens & Minor, Inc. (a) | | | | | 1,314 | | | | | | 18 | |
| | | | |
Patterson Cos., Inc. | | | | | 2,281 | | | | | | 55 | |
| | | | |
Pfizer, Inc. | | | | | 26,806 | | | | | | 750 | |
| | | | |
Premier, Inc. ‘A’ | | | | | 1,735 | | | | | | 32 | |
| | | | |
Quest Diagnostics, Inc. | | | | | 639 | | | | | | 87 | |
| | | | |
Regeneron Pharmaceuticals, Inc. (a) | | | | | 596 | | | | | | 626 | |
| | | | |
ResMed, Inc. | | | | | 751 | | | | | | 144 | |
| | | | |
Royalty Pharma PLC ‘A’ | | | | | 1,650 | | | | | | 44 | |
| | | | |
Select Medical Holdings Corp. | | | | | 1,422 | | | | | | 50 | |
| | | | |
STERIS PLC | | | | | 749 | | | | | | 164 | |
| | | | |
Teleflex, Inc. | | | | | 188 | | | | | | 40 | |
| | | | |
Tenet Healthcare Corp. (a) | | | | | 2,649 | | | | | | 352 | |
| | | | |
United Therapeutics Corp. (a) | | | | | 721 | | | | | | 230 | |
| | | | |
Universal Health Services, Inc. ‘B’ | | | | | 622 | | | | | | 115 | |
| | | | |
Vertex Pharmaceuticals, Inc. (a) | | | | | 680 | | | | | | 319 | |
| | | | |
Viatris, Inc. | | | | | 18,133 | | | | | | 193 | |
| | | | |
Waters Corp. (a) | | | | | 209 | | | | | | 61 | |
| | | | |
West Pharmaceutical Services, Inc. | | | | | 208 | | | | | | 69 | |
| | | | |
Zoetis, Inc. | | | | | 324 | | | | | | 56 | |
| | | | | | | | | | | | |
| | | | | | | | | | | 20,239 | |
| | | | | | | | | | | | |
| |
| INDUSTRIALS 11.7% | |
| | | | |
3M Co. | | | | | 4,740 | | | | | | 484 | |
| | | | | | | | | | | | |
| | | | | SHARES | | | | | MARKET
VALUE
(000S) | |
| | | | |
A O Smith Corp. | | | | | 2,032 | | | $ | | | 166 | |
| | | | |
AAR Corp. (a) | | | | | 504 | | | | | | 37 | |
| | | | |
ABM Industries, Inc. | | | | | 1,168 | | | | | | 59 | |
| | | | |
Acuity Brands, Inc. | | | | | 443 | | | | | | 107 | |
| | | | |
Advanced Drainage Systems, Inc. | | | | | 218 | | | | | | 35 | |
| | | | |
AECOM | | | | | 655 | | | | | | 58 | |
| | | | |
AGCO Corp. | | | | | 320 | | | | | | 31 | |
| | | | |
Allison Transmission Holdings, Inc. | | | | | 1,364 | | | | | | 104 | |
| | | | |
American Woodmark Corp. (a) | | | | | 219 | | | | | | 17 | |
| | | | |
API Group Corp. (a) | | | | | 1,547 | | | | | | 58 | |
| | | | |
Apogee Enterprises, Inc. | | | | | 378 | | | | | | 24 | |
| | | | |
Applied Industrial Technologies, Inc. | | | | | 142 | | | | | | 28 | |
| | | | |
ArcBest Corp. | | | | | 156 | | | | | | 17 | |
| | | | |
Arcosa, Inc. | | | | | 586 | | | | | | 49 | |
| | | | |
Armstrong World Industries, Inc. | | | | | 346 | | | | | | 39 | |
| | | | |
Automatic Data Processing, Inc. | | | | | 467 | | | | | | 111 | |
| | | | |
Beacon Roofing Supply, Inc. (a) | | | | | 177 | | | | | | 16 | |
| | | | |
Boise Cascade Co. | | | | | 718 | | | | | | 86 | |
| | | | |
Booz Allen Hamilton Holding Corp. | | | | | 1,380 | | | | | | 212 | |
| | | | |
Brady Corp. ‘A’ | | | | | 224 | | | | | | 15 | |
| | | | |
Broadridge Financial Solutions, Inc. | | | | | 1,092 | | | | | | 215 | |
| | | | |
Builders FirstSource, Inc. (a) | | | | | 323 | | | | | | 45 | |
| | | | |
BWX Technologies, Inc. | | | | | 1,269 | | | | | | 121 | |
| | | | |
CACI International, Inc. ‘A’ (a) | | | | | 300 | | | | | | 129 | |
| | | | |
Carlisle Cos., Inc. | | | | | 55 | | | | | | 22 | |
| | | | |
Carrier Global Corp. | | | | | 2,541 | | | | | | 160 | |
| | | | |
Caterpillar, Inc. | | | | | 1,860 | | | | | | 620 | |
| | | | |
CH Robinson Worldwide, Inc. | | | | | 1,308 | | | | | | 115 | |
| | | | |
Cintas Corp. | | | | | 323 | | | | | | 226 | |
| | | | |
Clean Harbors, Inc. (a) | | | | | 277 | | | | | | 63 | |
| | | | |
Comfort Systems USA, Inc. | | | | | 245 | | | | | | 75 | |
| | | | |
Copart, Inc. (a) | | | | | 5,808 | | | | | | 315 | |
| | | | |
Core & Main, Inc. ‘A’ (a) | | | | | 383 | | | | | | 19 | |
| | | | |
CoreCivic, Inc. (a) | | | | | 2,504 | | | | | | 33 | |
| | | | |
Crane Co. | | | | | 115 | | | | | | 17 | |
| | | | |
CSG Systems International, Inc. | | | | | 374 | | | | | | 15 | |
| | | | |
CSX Corp. | | | | | 3,766 | | | | | | 126 | |
| | | | |
Cummins, Inc. | | | | | 566 | | | | | | 157 | |
| | | | |
Curtiss-Wright Corp. | | | | | 425 | | | | | | 115 | |
| | | | |
DNOW, Inc. (a) | | | | | 1,831 | | | | | | 25 | |
| | | | |
Donaldson Co., Inc. | | | | | 857 | | | | | | 61 | |
| | | | |
Dover Corp. | | | | | 153 | | | | | | 28 | |
| | | | |
Dycom Industries, Inc. (a) | | | | | 91 | | | | | | 15 | |
| | | | |
Eaton Corp. PLC | | | | | 950 | | | | | | 298 | |
| | | | |
EMCOR Group, Inc. | | | | | 128 | | | | | | 47 | |
| | | | |
Emerson Electric Co. | | | | | 2,228 | | | | | | 245 | |
| | | | |
Encore Wire Corp. | | | | | 305 | | | | | | 88 | |
| | | | |
Equifax, Inc. | | | | | 470 | | | | | | 114 | |
| | | | |
Esab Corp. | | | | | 155 | | | | | | 15 | |
| | | | |
Expeditors International of Washington, Inc. | | | | | 881 | | | | | | 110 | |
| | | | |
Fastenal Co. | | | | | 2,288 | | | | | | 144 | |
| | | | |
Flowserve Corp. | | | | | 682 | | | | | | 33 | |
| | | | |
Fluor Corp. (a) | | | | | 357 | | | | | | 16 | |
| | | | |
Franklin Electric Co., Inc. | | | | | 168 | | | | | | 16 | |
| | | | |
FTI Consulting, Inc. (a) | | | | | 460 | | | | | | 99 | |
| | | | |
GATX Corp. | | | | | 419 | | | | | | 55 | |
| | | | |
Generac Holdings, Inc. (a) | | | | | 454 | | | | | | 60 | |
| | | | |
General Dynamics Corp. | | | | | 855 | | | | | | 248 | |
| | | | |
General Electric Co. | | | | | 9,845 | | | | | | 1,565 | |
| | | | |
Genpact Ltd. | | | | | 2,019 | | | | | | 65 | |
| | | | |
GEO Group, Inc. (a) | | | | | 3,973 | | | | | | 57 | |
| | | | |
GMS, Inc. (a) | | | | | 626 | | | | | | 50 | |
| | | | |
Graco, Inc. | | | | | 750 | | | | | | 59 | |
| | | | |
Granite Construction, Inc. | | | | | 790 | | | | | | 49 | |
| | | | | | | | | | | | |
| See Accompanying Notes | | | ANNUAL FINANCIAL AND OTHER INFORMATION | | | | | | | JUNE 30, 2024 | | | 37 |
| | | | | | |
| Schedule of Investments | | PIMCO RAFI Dynamic Multi-Factor U.S. Equity ETF | | (Cont.) | | |
| | | | | | | | | | | | |
| | | | | SHARES | | | | | MARKET
VALUE
(000S) | |
| | | | |
Greenbrier Cos., Inc. | | | | | 931 | | | $ | | | 46 | |
| | | | |
HEICO Corp. | | | | | 224 | | | | | | 50 | |
| | | | |
Hexcel Corp. | | | | | 1,004 | | | | | | 63 | |
| | | | |
HNI Corp. | | | | | 491 | | | | | | 22 | |
| | | | |
Howmet Aerospace, Inc. | | | | | 1,980 | | | | | | 154 | |
| | | | |
Hub Group, Inc. ‘A’ | | | | | 1,234 | | | | | | 53 | |
| | | | |
Hubbell, Inc. | | | | | 331 | | | | | | 121 | |
| | | | |
Huntington Ingalls Industries, Inc. | | | | | 122 | | | | | | 30 | |
| | | | |
IDEX Corp. | | | | | 629 | | | | | | 127 | |
| | | | |
Illinois Tool Works, Inc. | | | | | 495 | | | | | | 117 | |
| | | | |
Ingersoll Rand, Inc. | | | | | 1,492 | | | | | | 136 | |
| | | | |
Insperity, Inc. | | | | | 345 | | | | | | 31 | |
| | | | |
ITT, Inc. | | | | | 916 | | | | | | 118 | |
| | | | |
JB Hunt Transport Services, Inc. | | | | | 194 | | | | | | 31 | |
| | | | |
JELD-WEN Holding, Inc. (a) | | | | | 1,074 | | | | | | 14 | |
| | | | |
KBR, Inc. | | | | | 489 | | | | | | 31 | |
| | | | |
Kirby Corp. (a) | | | | | 174 | | | | | | 21 | |
| | | | |
Knight-Swift Transportation Holdings, Inc. | | | | | 173 | | | | | | 9 | |
| | | | |
L3Harris Technologies, Inc. | | | | | 1,241 | | | | | | 279 | |
| | | | |
Landstar System, Inc. | | | | | 696 | | | | | | 128 | |
| | | | |
Leidos Holdings, Inc. | | | | | 799 | | | | | | 117 | |
| | | | |
Lennox International, Inc. | | | | | 607 | | | | | | 325 | |
| | | | |
Lincoln Electric Holdings, Inc. | | | | | 663 | | | | | | 125 | |
| | | | |
Lockheed Martin Corp. | | | | | 1,376 | | | | | | 643 | |
| | | | |
Lyft, Inc. ‘A’ (a) | | | | | 1,077 | | | | | | 15 | |
| | | | |
ManpowerGroup, Inc. | | | | | 827 | | | | | | 58 | |
| | | | |
Masco Corp. | | | | | 1,115 | | | | | | 74 | |
| | | | |
Masterbrand, Inc. (a) | | | | | 2,078 | | | | | | 31 | |
| | | | |
Matson, Inc. | | | | | 297 | | | | | | 39 | |
| | | | |
Maximus, Inc. | | | | | 969 | | | | | | 83 | |
| | | | |
MDU Resources Group, Inc. | | | | | 1,711 | | | | | | 43 | |
| | | | |
MillerKnoll, Inc. | | | | | 528 | | | | | | 14 | |
| | | | |
Moog, Inc. ‘A’ | | | | | 323 | | | | | | 54 | |
| | | | |
MSA Safety, Inc. | | | | | 285 | | | | | | 53 | |
| | | | |
MSC Industrial Direct Co., Inc. ‘A’ | | | | | 1,089 | | | | | | 86 | |
| | | | |
Mueller Industries, Inc. | | | | | 1,414 | | | | | | 81 | |
| | | | |
Nordson Corp. | | | | | 256 | | | | | | 59 | |
| | | | |
Northrop Grumman Corp. | | | | | 653 | | | | | | 285 | |
| | | | |
Old Dominion Freight Line, Inc. | | | | | 118 | | | | | | 21 | |
| | | | |
Oshkosh Corp. | | | | | 1,028 | | | | | | 111 | |
| | | | |
Otis Worldwide Corp. | | | | | 1,085 | | | | | | 104 | |
| | | | |
Owens Corning | | | | | 643 | | | | | | 112 | |
| | | | |
PACCAR, Inc. | | | | | 1,254 | | | | | | 129 | |
| | | | |
Parker-Hannifin Corp. | | | | | 340 | | | | | | 172 | |
| | | | |
Parsons Corp. (a) | | | | | 319 | | | | | | 26 | |
| | | | |
Paychex, Inc. | | | | | 388 | | | | | | 46 | |
| | | | |
Primoris Services Corp. | | | | | 853 | | | | | | 43 | |
| | | | |
Quanta Services, Inc. | | | | | 764 | | | | | | 194 | |
| | | | |
RBC Bearings, Inc. (a) | | | | | 68 | | | | | | 18 | |
| | | | |
Republic Services, Inc. | | | | | 918 | | | | | | 178 | |
| | | | |
Resideo Technologies, Inc. (a) | | | | | 1,657 | | | | | | 32 | |
| | | | |
Robert Half, Inc. | | | | | 401 | | | | | | 26 | |
| | | | |
Rollins, Inc. | | | | | 1,366 | | | | | | 67 | |
| | | | |
Rush Enterprises, Inc. ‘A’ | | | | | 934 | | | | | | 39 | |
| | | | |
Ryder System, Inc. | | | | | 643 | | | | | | 80 | |
| | | | |
Saia, Inc. (a) | | | | | 131 | | | | | | 62 | |
| | | | |
Schneider National, Inc. ‘B’ | | | | | 918 | | | | | | 22 | |
| | | | |
Science Applications International Corp. | | | | | 128 | | | | | | 15 | |
| | | | |
Simpson Manufacturing Co., Inc. | | | | | 221 | | | | | | 37 | |
| | | | |
SkyWest, Inc. (a) | | | | | 930 | | | | | | 76 | |
| | | | |
Steelcase, Inc. ‘A’ | | | | | 1,633 | | | | | | 21 | |
| | | | |
Stericycle, Inc. (a) | | | | | 1,008 | | | | | | 59 | |
| | | | |
Terex Corp. | | | | | 1,790 | | | | | | 98 | |
| | | | | | | | | | | | |
| | | | | SHARES | | | | | MARKET
VALUE
(000S) | |
| | | | |
Tetra Tech, Inc. | | | | | 98 | | | $ | | | 20 | |
| | | | |
Textron, Inc. | | | | | 443 | | | | | | 38 | |
| | | | |
Timken Co. | | | | | 889 | | | | | | 71 | |
| | | | |
Toro Co. | | | | | 1,303 | | | | | | 122 | |
| | | | |
TransDigm Group, Inc. | | | | | 176 | | | | | | 225 | |
| | | | |
Trex Co., Inc. (a) | | | | | 291 | | | | | | 22 | |
| | | | |
TriNet Group, Inc. | | | | | 212 | | | | | | 21 | |
| | | | |
Trinity Industries, Inc. | | | | | 1,534 | | | | | | 46 | |
| | | | |
U-Haul Holding Co. | | | | | 767 | | | | | | 46 | |
| | | | |
U-Haul Holding Co. (a) | | | | | 151 | | | | | | 9 | |
| | | | |
Uber Technologies, Inc. (a) | | | | | 4,578 | | | | | | 333 | |
| | | | |
UFP Industries, Inc. | | | | | 856 | | | | | | 96 | |
| | | | |
UniFirst Corp. | | | | | 201 | | | | | | 34 | |
| | | | |
Union Pacific Corp. | | | | | 2,845 | | | | | | 644 | |
| | | | |
United Airlines Holdings, Inc. (a) | | | | | 260 | | | | | | 13 | |
| | | | |
United Parcel Service, Inc. ‘B’ | | | | | 2,145 | | | | | | 294 | |
| | | | |
United Rentals, Inc. | | | | | 198 | | | | | | 128 | |
| | | | |
Verisk Analytics, Inc. | | | | | 1,117 | | | | | | 301 | |
| | | | |
Waste Management, Inc. | | | | | 1,680 | | | | | | 358 | |
| | | | |
Watsco, Inc. | | | | | 668 | | | | | | 309 | |
| | | | |
Watts Water Technologies, Inc. ‘A’ | | | | | 238 | | | | | | 44 | |
| | | | |
Werner Enterprises, Inc. | | | | | 948 | | | | | | 34 | |
| | | | |
WESCO International, Inc. | | | | | 741 | | | | | | 117 | |
| | | | |
Westinghouse Air Brake Technologies Corp. | | | | | 397 | | | | | | 63 | |
| | | | |
Woodward, Inc. | | | | | 114 | | | | | | 20 | |
| | | | |
WW Grainger, Inc. | | | | | 266 | | | | | | 240 | |
| | | | |
XPO, Inc. (a) | | | | | 485 | | | | | | 51 | |
| | | | |
Xylem, Inc. | | | | | 1,254 | | | | | | 170 | |
| | | | | | | | | | | | |
| | | | | | | | | | | 17,326 | |
| | | | | | | | | | | | |
| |
| INFORMATION TECHNOLOGY 16.2% | |
| | | | |
Adobe, Inc. (a) | | | | | 106 | | | | | | 59 | |
| | | | |
Akamai Technologies, Inc. (a) | | | | | 400 | | | | | | 36 | |
| | | | |
Amdocs Ltd. | | | | | 567 | | | | | | 45 | |
| | | | |
Amkor Technology, Inc. | | | | | 1,567 | | | | | | 63 | |
| | | | |
Amphenol Corp. ‘A’ | | | | | 2,493 | | | | | | 168 | |
| | | | |
Ansys, Inc. (a) | | | | | 266 | | | | | | 85 | |
| | | | |
Apple, Inc. | | | | | 4,606 | | | | | | 970 | |
| | | | |
Applied Materials, Inc. | | | | | 3,754 | | | | | | 886 | |
| | | | |
AppLovin Corp. ‘A’ (a) | | | | | 576 | | | | | | 48 | |
| | | | |
Arista Networks, Inc. (a) | | | | | 571 | | | | | | 200 | |
| | | | |
Arrow Electronics, Inc. (a) | | | | | 790 | | | | | | 95 | |
| | | | |
Aspen Technology, Inc. (a) | | | | | 77 | | | | | | 15 | |
| | | | |
Autodesk, Inc. (a) | | | | | 504 | | | | | | 125 | |
| | | | |
Avnet, Inc. | | | | | 1,326 | | | | | | 68 | |
| | | | |
Belden, Inc. | | | | | 637 | | | | | | 60 | |
| | | | |
Benchmark Electronics, Inc. | | | | | 506 | | | | | | 20 | |
| | | | |
Booking Holdings, Inc. | | | | | 186 | | | | | | 737 | |
| | | | |
Broadcom, Inc. | | | | | 1,355 | | | | | | 2,175 | |
| | | | |
CDW Corp. | | | | | 375 | | | | | | 84 | |
| | | | |
Cirrus Logic, Inc. (a) | | | | | 526 | | | | | | 67 | |
| | | | |
Cisco Systems, Inc. | | | | | 12,907 | | | | | | 613 | |
| | | | |
Coherent Corp. (a) | | | | | 463 | | | | | | 33 | |
| | | | |
CommVault Systems, Inc. (a) | | | | | 343 | | | | | | 42 | |
| | | | |
Corning, Inc. | | | | | 7,145 | | | | | | 278 | |
| | | | |
Coupang, Inc. (a) | | | | | 2,258 | | | | | | 47 | |
| | | | |
Dell Technologies, Inc. ‘C’ | | | | | 708 | | | | | | 98 | |
| | | | |
Dolby Laboratories, Inc. ‘A’ | | | | | 664 | | | | | | 53 | |
| | | | |
DoorDash, Inc. ‘A’ (a) | | | | | 1,074 | | | | | | 117 | |
| | | | |
DXC Technology Co. (a) | | | | | 1,393 | | | | | | 27 | |
| | | | |
eBay, Inc. | | | | | 8,518 | | | | | | 458 | |
| | | | |
Entegris, Inc. | | | | | 537 | | | | | | 73 | |
| | | | |
F5, Inc. (a) | | | | | 294 | | | | | | 51 | |
| | | | | | | | | | | | |
| | | | | SHARES | | | | | MARKET
VALUE
(000S) | |
| | | | |
Fair Isaac Corp. (a) | | | | | 188 | | | $ | | | 280 | |
| | | | |
Flex Ltd. (a) | | | | | 2,836 | | | | | | 84 | |
| | | | |
Fortinet, Inc. (a) | | | | | 1,134 | | | | | | 68 | |
| | | | |
Gartner, Inc. (a) | | | | | 467 | | | | | | 210 | |
| | | | |
GCI Liberty, Inc. «(a) | | | | | 221 | | | | | | 0 | |
| | | | |
Gen Digital, Inc. | | | | | 4,617 | | | | | | 115 | |
| | | | |
GoDaddy, Inc. ‘A’ (a) | | | | | 944 | | | | | | 132 | |
| | | | |
Guidewire Software, Inc. (a) | | | | | 163 | | | | | | 22 | |
| | | | |
Hewlett Packard Enterprise Co. | | | | | 18,890 | | | | | | 400 | |
| | | | |
HP, Inc. | | | | | 12,190 | | | | | | 427 | |
| | | | |
Insight Enterprises, Inc. (a) | | | | | 452 | | | | | | 90 | |
| | | | |
Intel Corp. | | | | | 28,765 | | | | | | 891 | |
| | | | |
International Business Machines Corp. | | | | | 9,647 | | | | | | 1,668 | |
| | | | |
Intuit, Inc. | | | | | 616 | | | | | | 405 | |
| | | | |
Jabil, Inc. | | | | | 968 | | | | | | 105 | |
| | | | |
Juniper Networks, Inc. | | | | | 4,977 | | | | | | 181 | |
| | | | |
KLA Corp. | | | | | 492 | | | | | | 406 | |
| | | | |
Knowles Corp. (a) | | | | | 986 | | | | | | 17 | |
| | | | |
Kyndryl Holdings, Inc. (a) | | | | | 3,708 | | | | | | 98 | |
| | | | |
Lam Research Corp. | | | | | 560 | | | | | | 596 | |
| | | | |
Manhattan Associates, Inc. (a) | | | | | 182 | | | | | | 45 | |
| | | | |
Micron Technology, Inc. | | | | | 2,539 | | | | | | 334 | |
| | | | |
MKS Instruments, Inc. | | | | | 124 | | | | | | 16 | |
| | | | |
Monolithic Power Systems, Inc. | | | | | 148 | | | | | | 122 | |
| | | | |
Motorola Solutions, Inc. | | | | | 511 | | | | | | 197 | |
| | | | |
NetApp, Inc. | | | | | 1,082 | | | | | | 139 | |
| | | | |
NetScout Systems, Inc. (a) | | | | | 1,472 | | | | | | 27 | |
| | | | |
NVIDIA Corp. | | | | | 22,290 | | | | | | 2,754 | |
| | | | |
Okta, Inc. (a) | | | | | 540 | | | | | | 51 | |
| | | | |
Oracle Corp. | | | | | 10,882 | | | | | | 1,536 | |
| | | | |
OSI Systems, Inc. (a) | | | | | 184 | | | | | | 25 | |
| | | | |
Palo Alto Networks, Inc. (a) | | | | | 1,095 | | | | | | 371 | |
| | | | |
Plexus Corp. (a) | | | | | 277 | | | | | | 29 | |
| | | | |
PTC, Inc. (a) | | | | | 439 | | | | | | 80 | |
| | | | |
Pure Storage, Inc. ‘A’ (a) | | | | | 1,093 | | | | | | 70 | |
| | | | |
Qorvo, Inc. (a) | | | | | 130 | | | | | | 15 | |
| | | | |
QUALCOMM, Inc. | | | | | 5,803 | | | | | | 1,156 | |
| | | | |
Roper Technologies, Inc. | | | | | 168 | | | | | | 95 | |
| | | | |
Salesforce, Inc. | | | | | 2,112 | | | | | | 543 | |
| | | | |
Sanmina Corp. (a) | | | | | 1,183 | | | | | | 78 | |
| | | | |
Seagate Technology Holdings PLC | | | | | 1,580 | | | | | | 163 | |
| | | | |
ServiceNow, Inc. (a) | | | | | 641 | | | | | | 504 | |
| | | | |
Super Micro Computer, Inc. (a) | | | | | 527 | | | | | | 432 | |
| | | | |
Synaptics, Inc. (a) | | | | | 207 | | | | | | 18 | |
| | | | |
Teradata Corp. (a) | | | | | 1,228 | | | | | | 42 | |
| | | | |
Teradyne, Inc. | | | | | 397 | | | | | | 59 | |
| | | | |
Texas Instruments, Inc. | | | | | 1,554 | | | | | | 302 | |
| | | | |
TTM Technologies, Inc. (a) | | | | | 961 | | | | | | 19 | |
| | | | |
Tyler Technologies, Inc. (a) | | | | | 197 | | | | | | 99 | |
| | | | |
VeriSign, Inc. (a) | | | | | 322 | | | | | | 57 | |
| | | | |
Vishay Intertechnology, Inc. | | | | | 2,784 | | | | | | 62 | |
| | | | |
Vontier Corp. | | | | | 1,096 | | | | | | 42 | |
| | | | |
Western Digital Corp. (a) | | | | | 3,610 | | | | | | 273 | |
| | | | |
Wolfspeed, Inc. (a) | | | | | 443 | | | | | | 10 | |
| | | | |
Xerox Holdings Corp. | | | | | 2,632 | | | | | | 31 | |
| | | | | | | | | | | | |
| | | | | | | | | | | 23,887 | |
| | | | | | | | | | | | |
| |
| MATERIALS 3.4% | |
| | | | |
Alcoa Corp. | | | | | 1,017 | | | | | | 40 | |
| | | | |
AptarGroup, Inc. | | | | | 688 | | | | | | 97 | |
| | | | |
Arch Resources, Inc. | | | | | 96 | | | | | | 15 | |
| | | | |
ATI, Inc. (a) | | | | | 1,247 | | | | | | 69 | |
| | | | |
Avery Dennison Corp. | | | | | 677 | | | | | | 148 | |
| | | | | | |
| 38 | | PIMCO EQUITY SERIES | | | See Accompanying Notes | |
| | | | | | | | | | | | |
| | | | | SHARES | | | | | MARKET
VALUE
(000S) | |
| | | | |
Axalta Coating Systems Ltd. (a) | | | | | 991 | | | $ | | | 34 | |
| | | | |
Ball Corp. | | | | | 1,731 | | | | | | 104 | |
| | | | |
Berry Global Group, Inc. | | | | | 1,288 | | | | | | 76 | |
| | | | |
Cabot Corp. | | | | | 684 | | | | | | 63 | |
| | | | |
Carpenter Technology Corp. | | | | | 1,165 | | | | | | 128 | |
| | | | |
Celanese Corp. | | | | | 836 | | | | | | 113 | |
| | | | |
Chemours Co. | | | | | 1,573 | | | | | | 35 | |
| | | | |
Commercial Metals Co. | | | | | 2,021 | | | | | | 111 | |
| | | | |
Corteva, Inc. | | | | | 950 | | | | | | 51 | |
| | | | |
Crown Holdings, Inc. | | | | | 1,110 | | | | | | 83 | |
| | | | |
Dow, Inc. | | | | | 1,250 | | | | | | 66 | |
| | | | |
DuPont de Nemours, Inc. | | | | | 4,020 | | | | | | 324 | |
| | | | |
Eagle Materials, Inc. | | | | | 327 | | | | | | 71 | |
| | | | |
Eastman Chemical Co. | | | | | 873 | | | | | | 86 | |
| | | | |
Ecolab, Inc. | | | | | 480 | | | | | | 114 | |
| | | | |
Element Solutions, Inc. | | | | | 538 | | | | | | 15 | |
| | | | |
Freeport-McMoRan, Inc. | | | | | 3,366 | | | | | | 164 | |
| | | | |
Graphic Packaging Holding Co. | | | | | 5,029 | | | | | | 132 | |
| | | | |
Greif, Inc. ‘A’ | | | | | 532 | | | | | | 31 | |
| | | | |
Huntsman Corp. | | | | | 649 | | | | | | 15 | |
| | | | |
Innospec, Inc. | | | | | 181 | | | | | | 22 | |
| | | | |
International Flavors & Fragrances, Inc. | | | | | 495 | | | | | | 47 | |
| | | | |
International Paper Co. | | | | | 3,812 | | | | | | 164 | |
| | | | |
Kaiser Aluminum Corp. | | | | | 186 | | | | | | 16 | |
| | | | |
Louisiana-Pacific Corp. | | | | | 1,021 | | | | | | 84 | |
| | | | |
LyondellBasell Industries NV ‘A’ | | | | | 3,390 | | | | | | 324 | |
| | | | |
Martin Marietta Materials, Inc. | | | | | 173 | | | | | | 94 | |
| | | | |
Mosaic Co. | | | | | 2,267 | | | | | | 65 | |
| | | | |
NewMarket Corp. | | | | | 67 | | | | | | 35 | |
| | | | |
Newmont Corp. | | | | | 2,781 | | | | | | 116 | |
| | | | |
Nucor Corp. | | | | | 812 | | | | | | 128 | |
| | | | |
O-I Glass, Inc. (a) | | | | | 4,359 | | | | | | 48 | |
| | | | |
Olin Corp. | | | | | 1,346 | | | | | | 63 | |
| | | | |
Packaging Corp. of America | | | | | 348 | | | | | | 64 | |
| | | | |
PPG Industries, Inc. | | | | | 521 | | | | | | 66 | |
| | | | |
Reliance, Inc. | | | | | 447 | | | | | | 128 | |
| | | | |
Royal Gold, Inc. | | | | | 420 | | | | | | 53 | |
| | | | |
RPM International, Inc. | | | | | 1,413 | | | | | | 152 | |
| | | | |
Scotts Miracle-Gro Co. | | | | | 975 | | | | | | 63 | |
| | | | |
Sealed Air Corp. | | | | | 2,829 | | | | | | 98 | |
| | | | |
Sensient Technologies Corp. | | | | | 396 | | | | | | 29 | |
| | | | |
Sherwin-Williams Co. | | | | | 831 | | | | | | 248 | |
| | | | |
Silgan Holdings, Inc. | | | | | 1,336 | | | | | | 57 | |
| | | | |
Sonoco Products Co. | | | | | 1,028 | | | | | | 52 | |
| | | | |
Southern Copper Corp. | | | | | 136 | | | | | | 15 | |
| | | | |
Steel Dynamics, Inc. | | | | | 570 | | | | | | 74 | |
| | | | |
Stepan Co. | | | | | 151 | | | | | | 13 | |
| | | | |
Sylvamo Corp. | | | | | 649 | | | | | | 45 | |
| | | | |
United States Steel Corp. | | | | | 2,888 | | | | | | 109 | |
| | | | |
Vulcan Materials Co. | | | | | 403 | | | | | | 100 | |
| | | | |
Warrior Met Coal, Inc. | | | | | 1,654 | | | | | | 104 | |
| | | | | | | | | | | | |
| | | | | SHARES | | | | | MARKET
VALUE
(000S) | |
| | | | |
WestRock Co. | | | | | 3,729 | | | $ | | | 187 | |
| | | | | | | | | | | | |
| | | | | | | | | | | 5,048 | |
| | | | | | | | | | | | |
| |
| REAL ESTATE 0.1% | |
| | | | |
DigitalBridge Group, Inc. | | | | | 3,628 | | | | | | 50 | |
| | | | |
Jones Lang LaSalle, Inc. (a) | | | | | 319 | | | | | | 65 | |
| | | | | | | | | | | | |
| | | | | | | | | | | 115 | |
| | | | | | | | | | | | |
| |
| UTILITIES 0.9% | |
| | | | |
AES Corp. | | | | | 3,064 | | | | | | 54 | |
| | | | |
Avista Corp. | | | | | 1,216 | | | | | | 42 | |
| | | | |
Clearway Energy, Inc. ‘C’ | | | | | 728 | | | | | | 18 | |
| | | | |
Constellation Energy Corp. | | | | | 758 | | | | | | 152 | |
| | | | |
Duke Energy Corp. | | | | | 1,724 | | | | | | 173 | |
| | | | |
Evergy, Inc. | | | | | 372 | | | | | | 20 | |
| | | | |
Exelon Corp. | | | | | 4,430 | | | | | | 153 | |
| | | | |
National Fuel Gas Co. | | | | | 1,095 | | | | | | 59 | |
| | | | |
NRG Energy, Inc. | | | | | 1,335 | | | | | | 104 | |
| | | | |
Ormat Technologies, Inc. | | | | | 452 | | | | | | 33 | |
| | | | |
PNM Resources, Inc. | | | | | 820 | | | | | | 30 | |
| | | | |
Public Service Enterprise Group, Inc. | | | | | 1,004 | | | | | | 74 | |
| | | | |
Southwest Gas Holdings, Inc. (a) | | | | | 199 | | | | | | 14 | |
| | | | |
Vistra Corp. | | | | | 5,048 | | | | | | 434 | |
| | | | | | | | | | | | |
| | | | | | | | | | | 1,360 | |
| | | | | | | | | | | | |
Total United States | | | | | | | | | | | 143,473 | |
| | | | | | | | | | | | |
| Total Common Stocks (Cost $118,976) | | | 144,530 | |
| | | | |
| |
| REAL ESTATE INVESTMENT TRUSTS 1.8% | |
| |
| UNITED STATES 1.8% | |
| |
| FINANCIALS 0.2% | |
| | | | |
AGNC Investment Corp. | | | | | 5,740 | | | | | | 55 | |
| | | | |
Annaly Capital Management, Inc. | | | | | 1,281 | | | | | | 24 | |
| | | | |
Chimera Investment Corp. | | | | | 2,695 | | | | | | 35 | |
| | | | |
Ladder Capital Corp. | | | | | 1,632 | | | | | | 18 | |
| | | | |
MFA Financial, Inc. | | | | | 3,210 | | | | | | 34 | |
| | | | |
PennyMac Mortgage Investment Trust | | | | | 2,079 | | | | | | 29 | |
| | | | |
Rithm Capital Corp. | | | | | 8,086 | | | | | | 88 | |
| | | | | | | | | | | | |
| | | | | | | | | | | 283 | |
| | | | | | | | | | | | |
| |
| REAL ESTATE 1.6% | |
| | | | |
American Homes 4 Rent ‘A’ | | | | | 1,423 | | | | | | 53 | |
| | | | |
Americold Realty Trust, Inc. | | | | | 1,903 | | | | | | 49 | |
| | | | |
Apple Hospitality REIT, Inc. | | | | | 3,814 | | | | | | 55 | |
| | | | |
Boston Properties, Inc. | | | | | 324 | | | | | | 20 | |
| | | | |
Camden Property Trust | | | | | 707 | | | | | | 77 | |
| | | | |
COPT Defense Properties | | | | | 1,565 | | | | | | 39 | |
| | | | |
CubeSmart | | | | | 1,239 | | | | | | 56 | |
| | | | | | | | | | | | |
| | | | | SHARES | | | | | MARKET
VALUE
(000S) | |
| | | | |
DiamondRock Hospitality Co. | | | | | 4,145 | | | $ | | | 35 | |
| | | | |
Digital Realty Trust, Inc. | | | | | 803 | | | | | | 122 | |
| | | | |
Douglas Emmett, Inc. | | | | | 1,164 | | | | | | 15 | |
| | | | |
Equinix, Inc. | | | | | 52 | | | | | | 39 | |
| | | | |
Equity LifeStyle Properties, Inc. | | | | | 772 | | | | | | 50 | |
| | | | |
Extra Space Storage, Inc. | | | | | 620 | | | | | | 96 | |
| | | | |
First Industrial Realty Trust, Inc. | | | | | 712 | | | | | | 34 | |
| | | | |
Gaming & Leisure Properties, Inc. | | | | | 1,993 | | | | | | 90 | |
| | | | |
Healthcare Realty Trust, Inc. | | | | | 2,840 | | | | | | 47 | |
| | | | |
Host Hotels & Resorts, Inc. | | | | | 1,521 | | | | | | 27 | |
| | | | |
Hudson Pacific Properties, Inc. | | | | | 3,052 | | | | | | 15 | |
| | | | |
Invitation Homes, Inc. | | | | | 2,524 | | | | | | 91 | |
| | | | |
Iron Mountain, Inc. | | | | | 1,501 | | | | | | 134 | |
| | | | |
JBG SMITH Properties | | | | | 902 | | | | | | 14 | |
| | | | |
Lamar Advertising Co. ‘A’ | | | | | 579 | | | | | | 69 | |
| | | | |
LXP Industrial Trust | | | | | 2,443 | | | | | | 22 | |
| | | | |
Macerich Co. | | | | | 4,355 | | | | | | 67 | |
| | | | |
Park Hotels & Resorts, Inc. | | | | | 6,113 | | | | | | 92 | |
| | | | |
Phillips Edison & Co., Inc. | | | | | 444 | | | | | | 15 | |
| | | | |
Public Storage | | | | | 144 | | | | | | 41 | |
| | | | |
Rayonier, Inc. | | | | | 1,188 | | | | | | 35 | |
| | | | |
RLJ Lodging Trust | | | | | 3,500 | | | | | | 34 | |
| | | | |
SBA Communications Corp. | | | | | 171 | | | | | | 34 | |
| | | | |
Simon Property Group, Inc. | | | | | 1,340 | | | | | | 203 | |
| | | | |
SITE Centers Corp. | | | | | 2,596 | | | | | | 38 | |
| | | | |
SL Green Realty Corp. | | | | | 1,550 | | | | | | 88 | |
| | | | |
Sun Communities, Inc. | | | | | 565 | | | | | | 68 | |
| | | | |
Sunstone Hotel Investors, Inc. | | | | | 3,663 | | | | | | 38 | |
| | | | |
UDR, Inc. | | | | | 956 | | | | | | 39 | |
| | | | |
Vornado Realty Trust | | | | | 2,534 | | | | | | 67 | |
| | | | |
Welltower, Inc. | | | | | 1,384 | | | | | | 144 | |
| | | | |
WP Carey, Inc. | | | | | 1,233 | | | | | | 68 | |
| | | | |
Xenia Hotels & Resorts, Inc. | | | | | 2,132 | | | | | | 31 | |
| | | | | | | | | | | | |
| | | | | | | | | | | 2,351 | |
| | | | | | | | | | | | |
Total Real Estate Investment Trusts (Cost $2,505) | | | 2,634 | |
| | | | |
| |
| SHORT-TERM INSTRUMENTS 0.5% | |
| | | | | | | | | | | | |
| REPURCHASE AGREEMENTS (b) 0.5% | |
| | | | | | | | | | | 712 | |
| | | | | | | | | | | | |
Total Short-Term Instruments
(Cost $712) | | | | | | | | | | | 712 | |
| | | | |
| | | | |
| | | | | | | | | | | | |
Total Investments in Securities
(Cost $122,193) | | | | | | | | | | | 147,876 | |
| |
| | | | |
Total Investments 100.0%
(Cost $122,193) | | | $ | | | 147,876 | |
| |
| Other Assets and Liabilities, net 0.0% | | | 64 | |
| | | | |
| Net Assets 100.0% | | | $ | | | 147,940 | |
| | | | | | | |
NOTES TO SCHEDULE OF INVESTMENTS:
| * | A zero balance may reflect actual amounts rounding to less than one thousand. |
| « | Security valued using significant unobservable inputs (Level 3). |
| (a) | Security did not produce income within the last twelve months. |
| | | | | | | | | | | | |
| See Accompanying Notes | | | ANNUAL FINANCIAL AND OTHER INFORMATION | | | | | | | JUNE 30, 2024 | | | 39 |
| | | | | | |
| Schedule of Investments | | PIMCO RAFI Dynamic Multi-Factor U.S. Equity ETF | | (Cont.) | | June 30, 2024 |
BORROWINGS AND OTHER FINANCING TRANSACTIONS
(b) REPURCHASE AGREEMENTS:
| | | | | | | | | | | | | | | | | | | | | | | | | | | | | | |
| Counterparty | | Lending
Rate | | | Settlement
Date | | | Maturity
Date | | | Principal
Amount | | | Collateralized By | | Collateral
(Received) | | | Repurchase
Agreements,
at Value | | | Repurchase
Agreement
Proceeds
to be
Received(1) | |
| FICC | | | 2.600 | % | | | 06/28/2024 | | | | 07/01/2024 | | | $ | 712 | | | U.S. Treasury Notes 4.500% due 03/31/2026 | | $ | (726 | ) | | $ | 712 | | | $ | 712 | |
| | | | | | | | | | | | | | | | | | | | | | | | | | | | | | |
Total Repurchase Agreements | | | | | $ | (726 | ) | | $ | 712 | | | $ | 712 | |
| | | | | | | | | | | | | | | |
BORROWINGS AND OTHER FINANCING TRANSACTIONS SUMMARY
The following is a summary by counterparty of the market value of Borrowings and Other Financing Transactions and collateral pledged/(received) as of June 30, 2024:
| | | | | | | | | | | | | | | | | | | | | | | | |
| Counterparty | | Repurchase
Agreement
Proceeds
to be
Received(1) | | | Payable for
Reverse
Repurchase
Agreements | | | Payable for
Sale-Buyback
Transactions | | | Total
Borrowings and
Other Financing
Transactions | | | Collateral
Pledged/(Received) | | | Net Exposure(2) | |
Global/Master Repurchase Agreement | |
FICC | | $ | 712 | | | $ | 0 | | | $ | 0 | | | $ | 712 | | | $ | (726 | ) | | $ | (14 | ) |
| | | | | | | | | | | | | | | | | | | | | | | | |
Total Borrowings and Other Financing Transactions | | $ | 712 | | | $ | 0 | | | $ | 0 | | | | | | | | | | | | | |
| | | | | | | | | | | | | | | | | | | | | | | | |
| (1) | Includes accrued interest. |
| (2) | Net Exposure represents the net receivable/(payable) that would be due from/to the counterparty in the event of default. Exposure from borrowings and other financing transactions can only be netted across transactions governed under the same master agreement with the same legal entity. See Note 8, Master Netting Arrangements, in the Notes to Financial Statements for more information. |
FAIR VALUE MEASUREMENTS
The following is a summary of the fair valuations according to the inputs used as of June 30, 2024 in valuing the Fund’s assets and liabilities:
| | | | | | | | | | | | | | | | |
| Category and Subcategory | | Level 1 | | | Level 2 | | | Level 3 | | | Fair
Value at
06/30/2024 | |
Investments in Securities, at Value | |
Common Stocks | |
Ireland | |
Information Technology | | $ | 250 | | | $ | 0 | | | $ | 0 | | | $ | 250 | |
Switzerland | |
Consumer Staples | | | 28 | | | | 0 | | | | 0 | | | | 28 | |
Financials | | | 209 | | | | 0 | | | | 0 | | | | 209 | |
United Kingdom | |
Communication Services | | | 48 | | | | 0 | | | | 0 | | | | 48 | |
Consumer Staples | | | 16 | | | | 0 | | | | 0 | | | | 16 | |
Energy | | | 173 | | | | 0 | | | | 0 | | | | 173 | |
Financials | | | 111 | | | | 0 | | | | 0 | | | | 111 | |
Industrials | | | 157 | | | | 0 | | | | 0 | | | | 157 | |
Materials | | | 65 | | | | 0 | | | | 0 | | | | 65 | |
United States | |
Communication Services | | | 11,299 | | | | 0 | | | | 0 | | | | 11,299 | |
Consumer Discretionary | | | 4,004 | | | | 0 | | | | 0 | | | | 4,004 | |
| | | | | | | | | | | | | | | | |
| Category and Subcategory | | Level 1 | | | Level 2 | | | Level 3 | | | Fair
Value at
06/30/2024 | |
Consumer Staples | | $ | 25,940 | | | $ | 0 | | | $ | 0 | | | $ | 25,940 | |
Energy | | | 8,891 | | | | 0 | | | | 0 | | | | 8,891 | |
Financials | | | 25,364 | | | | 0 | | | | 0 | | | | 25,364 | |
Health Care | | | 20,239 | | | | 0 | | | | 0 | | | | 20,239 | |
Industrials | | | 17,326 | | | | 0 | | | | 0 | | | | 17,326 | |
Information Technology | | | 23,887 | | | | 0 | | | | 0 | | | | 23,887 | |
Materials | | | 5,048 | | | | 0 | | | | 0 | | | | 5,048 | |
Real Estate | | | 115 | | | | 0 | | | | 0 | | | | 115 | |
Utilities | | | 1,360 | | | | 0 | | | | 0 | | | | 1,360 | |
Real Estate Investment Trusts | |
United States | |
Financials | | | 283 | | | | 0 | | | | 0 | | | | 283 | |
Real Estate | | | 2,351 | | | | 0 | | | | 0 | | | | 2,351 | |
Short-Term Instruments | |
Repurchase Agreements | | | 0 | | | | 712 | | | | 0 | | | | 712 | |
| | | | | | | | | | | | | | | | |
| | | | |
Total Investments | | $ | 147,164 | | | $ | 712 | | | $ | 0 | | | $ | 147,876 | |
| | | | | | | | | | | | | | | | |
There were no significant transfers into or out of Level 3 during the period ended June 30, 2024.
| | | | | | |
| 40 | | PIMCO EQUITY SERIES | | | See Accompanying Notes | |
| | | | | | |
| Schedule of Investments | | PIMCO RAFI ESG U.S. ETF | | | | June 30, 2024 |
(Amounts in thousands*, except number of shares, contracts, units and ounces, if any)
| | | | | | | | | | | | |
| | | | | SHARES | | | | | MARKET
VALUE
(000S) | |
| INVESTMENTS IN SECURITIES 100.0% | |
| |
| COMMON STOCKS 97.5% | |
| |
| IRELAND 0.7% | |
| |
| INFORMATION TECHNOLOGY 0.7% | |
| | | | |
Accenture PLC ‘A’ | | | | | 1,167 | | | $ | | | 354 | |
| | | | | | | | | | | | |
Total Ireland | | | | | | | | | | | 354 | |
| | | | | | | | | | | | |
| |
| UNITED KINGDOM 0.3% | |
| |
| COMMUNICATION SERVICES 0.2% | |
| | | | |
Liberty Global Ltd. ‘C’ (a) | | | | | 4,769 | | | | | | 85 | |
| | | | | | | | | | | | |
| |
| MATERIALS 0.1% | |
| | | | |
Amcor PLC | | | | | 6,935 | | | | | | 68 | |
| | | | | | | | | | | | |
Total United Kingdom | | | | | | | | | | | 153 | |
| | | | | | | | | | | | |
| |
| UNITED STATES 96.5% | |
| |
| COMMUNICATION SERVICES 7.8% | |
| | | | |
AT&T, Inc. | | | | | 50,229 | | | | | | 960 | |
| | | | |
Comcast Corp. ‘A’ | | | | | 15,904 | | | | | | 623 | |
| | | | |
Electronic Arts, Inc. | | | | | 800 | | | | | | 111 | |
| | | | |
Fox Corp. ‘A’ | | | | | 1,133 | | | | | | 39 | |
| | | | |
Lumen Technologies, Inc. (a) | | | | | 20,007 | | | | | | 22 | |
| | | | |
Meta Platforms, Inc. ‘A’ | | | | | 2,041 | | | | | | 1,029 | |
| | | | |
Netflix, Inc. (a) | | | | | 96 | | | | | | 65 | |
| | | | |
News Corp. ‘A’ | | | | | 424 | | | | | | 12 | |
| | | | |
Omnicom Group, Inc. | | | | | 617 | | | | | | 55 | |
| | | | |
Paramount Global ‘B’ | | | | | 6,877 | | | | | | 71 | |
| | | | |
T-Mobile U.S., Inc. | | | | | 862 | | | | | | 152 | |
| | | | |
Verizon Communications, Inc. | | | | | 12,146 | | | | | | 501 | |
| | | | |
Walt Disney Co. | | | | | 4,855 | | | | | | 482 | |
| | | | | | | | | | | | |
| | | | | | | | | | | 4,122 | |
| | | | | | | | | | | | |
| |
| CONSUMER DISCRETIONARY 0.5% | |
| | | | |
Advance Auto Parts, Inc. | | | | | 414 | | | | | | 26 | |
| | | | |
Best Buy Co., Inc. | | | | | 2,486 | | | | | | 210 | |
| | | | |
Mohawk Industries, Inc. (a) | | | | | 291 | | | | | | 33 | |
| | | | | | | | | | | | |
| | | | | | | | | | | 269 | |
| | | | | | | | | | | | |
| |
| CONSUMER STAPLES 14.2% | |
| | | | |
Archer-Daniels-Midland Co. | | | | | 1,887 | | | | | | 114 | |
| | | | |
Bunge Global SA | | | | | 125 | | | | | | 13 | |
| | | | |
Campbell Soup Co. | | | | | 520 | | | | | | 23 | |
| | | | |
Church & Dwight Co., Inc. | | | | | 268 | | | | | | 28 | |
| | | | |
Coca-Cola Co. | | | | | 6,999 | | | | | | 445 | |
| | | | |
Colgate-Palmolive Co. | | | | | 2,081 | | | | | | 202 | |
| | | | |
Conagra Brands, Inc. | | | | | 675 | | | | | | 19 | |
| | | | |
Dollar General Corp. | | | | | 845 | | | | | | 112 | |
| | | | |
Estee Lauder Cos., Inc. ‘A’ | | | | | 562 | | | | | | 60 | |
| | | | |
Foot Locker, Inc. | | | | | 993 | | | | | | 25 | |
| | | | |
Ford Motor Co. | | | | | 43,799 | | | | | | 549 | |
| | | | |
Gap, Inc. | | | | | 2,892 | | | | | | 69 | |
| | | | |
General Mills, Inc. | | | | | 2,069 | | | | | | 131 | |
| | | | |
General Motors Co. | | | | | 18,257 | | | | | | 848 | |
| | | | |
Genuine Parts Co. | | | | | 285 | | | | | | 39 | |
| | | | |
Goodyear Tire & Rubber Co. (a) | | | | | 1,649 | | | | | | 19 | |
| | | | |
Hasbro, Inc. | | | | | 538 | | | | | | 31 | |
| | | | |
Hershey Co. | | | | | 124 | | | | | | 23 | |
| | | | |
Hilton Worldwide Holdings, Inc. | | | | | 260 | | | | | | 57 | |
| | | | |
Home Depot, Inc. | | | | | 1,954 | | | | | | 673 | |
| | | | |
Hormel Foods Corp. | | | | | 174 | | | | | | 5 | |
| | | | |
J M Smucker Co. | | | | | 363 | | | | | | 40 | |
| | | | | | | | | | | | |
| | | | | SHARES | | | | | MARKET
VALUE
(000S) | |
| | | | |
Kellanova | | | | | 948 | | | $ | | | 55 | |
| | | | |
Keurig Dr Pepper, Inc. | | | | | 1,728 | | | | | | 58 | |
| | | | |
Kimberly-Clark Corp. | | | | | 1,068 | | | | | | 148 | |
| | | | |
Kohl’s Corp. | | | | | 3,602 | | | | | | 83 | |
| | | | |
Kraft Heinz Co. | | | | | 2,862 | | | | | | 92 | |
| | | | |
Lear Corp. | | | | | 395 | | | | | | 45 | |
| | | | |
LKQ Corp. | | | | | 982 | | | | | | 41 | |
| | | | |
Lowe’s Cos., Inc. | | | | | 1,906 | | | | | | 420 | |
| | | | |
Marriott International, Inc. ‘A’ | | | | | 456 | | | | | | 110 | |
| | | | |
Mondelez International, Inc. ‘A’ | | | | | 1,969 | | | | | | 129 | |
| | | | |
Newell Brands, Inc. | | | | | 2,816 | | | | | | 18 | |
| | | | |
NIKE, Inc. ‘B’ | | | | | 2,570 | | | | | | 194 | |
| | | | |
O’Reilly Automotive, Inc. (a) | | | | | 9 | | | | | | 9 | |
| | | | |
Procter & Gamble Co. | | | | | 7,322 | | | | | | 1,208 | |
| | | | |
PVH Corp. | | | | | 501 | | | | | | 53 | |
| | | | |
Sysco Corp. | | | | | 1,326 | | | | | | 95 | |
| | | | |
Tapestry, Inc. | | | | | 960 | | | | | | 41 | |
| | | | |
Target Corp. | | | | | 3,280 | | | | | | 486 | |
| | | | |
Tesla, Inc. (a) | | | | | 773 | | | | | | 153 | |
| | | | |
TJX Cos., Inc. | | | | | 1,794 | | | | | | 197 | |
| | | | |
Tractor Supply Co. | | | | | 169 | | | | | | 46 | |
| | | | |
Tyson Foods, Inc. ‘A’ | | | | | 1,065 | | | | | | 61 | |
| | | | |
U.S. Foods Holding Corp. (a) | | | | | 613 | | | | | | 32 | |
| | | | |
VF Corp. | | | | | 4,159 | | | | | | 56 | |
| | | | |
Walgreens Boots Alliance, Inc. | | | | | 6,837 | | | | | | 83 | |
| | | | |
Whirlpool Corp. | | | | | 835 | | | | | | 85 | |
| | | | |
WK Kellogg Co. | | | | | 215 | | | | | | 3 | |
| | | | | | | | | | | | |
| | | | | | | | | | | 7,526 | |
| | | | | | | | | | | | |
| |
| FINANCIALS 15.6% | |
| | | | |
Allstate Corp. | | | | | 1,407 | | | | | | 225 | |
| | | | |
American Express Co. | | | | | 1,088 | | | | | | 252 | |
| | | | |
Ameriprise Financial, Inc. | | | | | 258 | | | | | | 110 | |
| | | | |
Bank of America Corp. | | | | | 15,816 | | | | | | 629 | |
| | | | |
Bank of New York Mellon Corp. | | | | | 1,268 | | | | | | 76 | |
| | | | |
BlackRock, Inc. | | | | | 300 | | | | | | 236 | |
| | | | |
Citigroup, Inc. | | | | | 22,093 | | | | | | 1,402 | |
| | | | |
Equitable Holdings, Inc. | | | | | 776 | | | | | | 32 | |
| | | | |
Fidelity National Information Services, Inc. | | | | | 2,094 | | | | | | 158 | |
| | | | |
Fifth Third Bancorp | | | | | 1,222 | | | | | | 45 | |
| | | | |
Fiserv, Inc. (a) | | | | | 542 | | | | | | 81 | |
| | | | |
Goldman Sachs Group, Inc. | | | | | 514 | | | | | | 232 | |
| | | | |
Hartford Financial Services Group, Inc. | | | | | 1,003 | | | | | | 101 | |
| | | | |
JPMorgan Chase & Co. | | | | | 7,859 | | | | | | 1,589 | |
| | | | |
Lincoln National Corp. | | | | | 1,691 | | | | | | 53 | |
| | | | |
Mastercard, Inc. ‘A’ | | | | | 655 | | | | | | 289 | |
| | | | |
MetLife, Inc. | | | | | 4,030 | | | | | | 283 | |
| | | | |
Moody’s Corp. | | | | | 151 | | | | | | 63 | |
| | | | |
Nasdaq, Inc. | | | | | 91 | | | | | | 5 | |
| | | | |
Northern Trust Corp. | | | | | 243 | | | | | | 20 | |
| | | | |
PayPal Holdings, Inc. (a) | | | | | 3,204 | | | | | | 186 | |
| | | | |
Principal Financial Group, Inc. | | | | | 892 | | | | | | 70 | |
| | | | |
Progressive Corp. | | | | | 652 | | | | | | 135 | |
| | | | |
Prudential Financial, Inc. | | | | | 2,084 | | | | | | 244 | |
| | | | |
S&P Global, Inc. | | | | | 168 | | | | | | 75 | |
| | | | |
State Street Corp. | | | | | 1,252 | | | | | | 93 | |
| | | | |
T Rowe Price Group, Inc. | | | | | 194 | | | | | | 22 | |
| | | | |
Visa, Inc. ‘A’ | | | | | 1,588 | | | | | | 417 | |
| | | | |
Wells Fargo & Co. | | | | | 18,573 | | | | | | 1,103 | |
| | | | |
Western Union Co. | | | | | 2,010 | | | | | | 25 | |
| | | | | | | | | | | | |
| | | | | | | | | | | 8,251 | |
| | | | | | | | | | | | |
| |
| | | | | | | | | | | | |
| | | | | SHARES | | | | | MARKET
VALUE
(000S) | |
| HEALTH CARE 18.8% | |
| | | | |
Abbott Laboratories | | | | | 4,322 | | | $ | | | 449 | |
| | | | |
AbbVie, Inc. | | | | | 4,088 | | | | | | 701 | |
| | | | |
Agilent Technologies, Inc. | | | | | 526 | | | | | | 68 | |
| | | | |
Amgen, Inc. | | | | | 1,726 | | | | | | 539 | |
| | | | |
Baxter International, Inc. | | | | | 1,774 | | | | | | 59 | |
| | | | |
Becton Dickinson & Co. | | | | | 605 | | | | | | 141 | |
| | | | |
Biogen, Inc. (a) | | | | | 754 | | | | | | 175 | |
| | | | |
Boston Scientific Corp. (a) | | | | | 913 | | | | | | 70 | |
| | | | |
Bristol-Myers Squibb Co. | | | | | 13,338 | | | | | | 554 | |
| | | | |
Cardinal Health, Inc. | | | | | 1,084 | | | | | | 107 | |
| | | | |
Cencora, Inc. | | | | | 266 | | | | | | 60 | |
| | | | |
Cigna Group | | | | | 1,788 | | | | | | 591 | |
| | | | |
CVS Health Corp. | | | | | 2,016 | | | | | | 119 | |
| | | | |
Danaher Corp. | | | | | 675 | | | | | | 169 | |
| | | | |
DaVita, Inc. (a) | | | | | 546 | | | | | | 76 | |
| | | | |
Edwards Lifesciences Corp. (a) | | | | | 893 | | | | | | 83 | |
| | | | |
Elevance Health, Inc. | | | | | 1,029 | | | | | | 558 | |
| | | | |
Eli Lilly & Co. | | | | | 440 | | | | | | 398 | |
| | | | |
GE Healthcare, Inc. | | | | | 968 | | | | | | 75 | |
| | | | |
Gilead Sciences, Inc. | | | | | 4,691 | | | | | | 322 | |
| | | | |
GRAIL, Inc. (a) | | | | | 16 | | | | | | 0 | |
| | | | |
Henry Schein, Inc. (a) | | | | | 347 | | | | | | 22 | |
| | | | |
Hologic, Inc. (a) | | | | | 518 | | | | | | 38 | |
| | | | |
Humana, Inc. | | | | | 433 | | | | | | 162 | |
| | | | |
Illumina, Inc. (a) | | | | | 93 | | | | | | 10 | |
| | | | |
Intuitive Surgical, Inc. (a) | | | | | 109 | | | | | | 49 | |
| | | | |
Johnson & Johnson | | | | | 9,042 | | | | | | 1,322 | |
| | | | |
Labcorp Holdings, Inc. | | | | | 313 | | | | | | 64 | |
| | | | |
McKesson Corp. | | | | | 306 | | | | | | 179 | |
| | | | |
Merck & Co., Inc. | | | | | 7,522 | | | | | | 931 | |
| | | | |
Organon & Co. | | | | | 1,098 | | | | | | 23 | |
| | | | |
Pfizer, Inc. | | | | | 37,061 | | | | | | 1,037 | |
| | | | |
Quest Diagnostics, Inc. | | | | | 303 | | | | | | 41 | |
| | | | |
Solventum Corp. (a) | | | | | 803 | | | | | | 42 | |
| | | | |
Stryker Corp. | | | | | 242 | | | | | | 82 | |
| | | | |
UnitedHealth Group, Inc. | | | | | 921 | | | | | | 469 | |
| | | | |
Viatris, Inc. | | | | | 4,987 | | | | | | 53 | |
| | | | |
Waters Corp. (a) | | | | | 133 | | | | | | 39 | |
| | | | |
Zoetis, Inc. | | | | | 321 | | | | | | 56 | |
| | | | | | | | | | | | |
| | | | | | | | | | | 9,933 | |
| | | | | | | | | | | | |
| |
| INDUSTRIALS 4.7% | |
| | | | |
3M Co. | | | | | 3,957 | | | | | | 404 | |
| | | | |
AGCO Corp. | | | | | 191 | | | | | | 19 | |
| | | | |
Automatic Data Processing, Inc. | | | | | 639 | | | | | | 153 | |
| | | | |
Carrier Global Corp. | | | | | 2,355 | | | | | | 149 | |
| | | | |
Cummins, Inc. | | | | | 469 | | | | | | 130 | |
| | | | |
Deere & Co. | | | | | 551 | | | | | | 206 | |
| | | | |
Dover Corp. | | | | | 191 | | | | | | 34 | |
| | | | |
Fastenal Co. | | | | | 541 | | | | | | 34 | |
| | | | |
FedEx Corp. | | | | | 855 | | | | | | 256 | |
| | | | |
Fortune Brands Innovations, Inc. | | | | | 160 | | | | | | 10 | |
| | | | |
Illinois Tool Works, Inc. | | | | | 497 | | | | | | 118 | |
| | | | |
Johnson Controls International PLC | | | | | 2,855 | | | | | | 190 | |
| | | | |
ManpowerGroup, Inc. | | | | | 97 | | | | | | 7 | |
| | | | |
NEXTracker, Inc. ‘A’ (a) | | | | | 255 | | | | | | 12 | |
| | | | |
Otis Worldwide Corp. | | | | | 453 | | | | | | 44 | |
| | | | |
Owens Corning | | | | | 489 | | | | | | 85 | |
| | | | |
Paychex, Inc. | | | | | 289 | | | | | | 34 | |
| | | | |
Republic Services, Inc. | | | | | 157 | | | | | | 30 | |
| | | | |
Rockwell Automation, Inc. | | | | | 81 | | | | | | 22 | |
| | | | |
Stanley Black & Decker, Inc. | | | | | 432 | | | | | | 35 | |
| | | | |
United Parcel Service, Inc. ‘B’ | | | | | 1,687 | | | | | | 231 | |
| | | | | | | | | | | | |
| See Accompanying Notes | | | ANNUAL FINANCIAL AND OTHER INFORMATION | | | | | | | JUNE 30, 2024 | | | 41 |
| | | | | | |
| Schedule of Investments | | PIMCO RAFI ESG U.S. ETF | | (Cont.) | | |
| | | | | | | | | | | | |
| | | | | SHARES | | | | | MARKET
VALUE
(000S) | |
| | | | |
Waste Management, Inc. | | | | | 860 | | | $ | | | 183 | |
| | | | |
Westinghouse Air Brake Technologies Corp. | | | | | 34 | | | | | | 5 | |
| | | | |
WW Grainger, Inc. | | | | | 75 | | | | | | 68 | |
| | | | | | | | | | | | |
| | | | | | | | | | | 2,459 | |
| | | | | | | | | | | | |
| |
| INFORMATION TECHNOLOGY 30.2% | |
| | | | |
Adobe, Inc. (a) | | | | | 549 | | | | | | 305 | |
| | | | |
Advanced Micro Devices, Inc. (a) | | | | | 445 | | | | | | 72 | |
| | | | |
Akamai Technologies, Inc. (a) | | | | | 360 | | | | | | 32 | |
| | | | |
Amdocs Ltd. | | | | | 444 | | | | | | 35 | |
| | | | |
Analog Devices, Inc. | | | | | 531 | | | | | | 121 | |
| | | | |
Apple, Inc. | | | | | 13,021 | | | | | | 2,742 | |
| | | | |
Applied Materials, Inc. | | | | | 2,095 | | | | | | 494 | |
| | | | |
Arista Networks, Inc. (a) | | | | | 20 | | | | | | 7 | |
| | | | |
Arrow Electronics, Inc. (a) | | | | | 558 | | | | | | 67 | |
| | | | |
Avnet, Inc. | | | | | 856 | | | | | | 44 | |
| | | | |
Booking Holdings, Inc. | | | | | 8 | | | | | | 32 | |
| | | | |
Broadcom, Inc. | | | | | 351 | | | | | | 564 | |
| | | | |
Cadence Design Systems, Inc. (a) | | | | | 190 | | | | | | 58 | |
| | | | |
CDW Corp. | | | | | 238 | | | | | | 53 | |
| | | | |
Cisco Systems, Inc. | | | | | 21,672 | | | | | | 1,030 | |
| | | | |
Cognizant Technology Solutions Corp. ‘A’ | | | | | 1,146 | | | | | | 78 | |
| | | | |
Dell Technologies, Inc. ‘C’ | | | | | 254 | | | | | | 35 | |
| | | | |
DXC Technology Co. (a) | | | | | 1,187 | | | | | | 23 | |
| | | | |
eBay, Inc. | | | | | 2,100 | | | | | | 113 | |
| | | | |
Flex Ltd. (a) | | | | | 844 | | | | | | 25 | |
| | | | |
Gen Digital, Inc. | | | | | 1,294 | | | | | | 32 | |
| | | | |
Hewlett Packard Enterprise Co. | | | | | 14,062 | | | | | | 298 | |
| | | | |
HP, Inc. | | | | | 8,362 | | | | | | 293 | |
| | | | |
Intel Corp. | | | | | 44,899 | | | | | | 1,391 | |
| | | | |
International Business Machines Corp. | | | | | 4,135 | | | | | | 715 | |
| | | | |
Juniper Networks, Inc. | | | | | 2,302 | | | | | | 84 | |
| | | | |
Keysight Technologies, Inc. (a) | | | | | 151 | | | | | | 21 | |
| | | | |
KLA Corp. | | | | | 111 | | | | | | 92 | |
| | | | |
Kyndryl Holdings, Inc. (a) | | | | | 628 | | | | | | 17 | |
| | | | |
Lam Research Corp. | | | | | 319 | | | | | | 340 | |
| | | | |
Marvell Technology, Inc. | | | | | 429 | | | | | | 30 | |
| | | | |
Microchip Technology, Inc. | | | | | 426 | | | | | | 39 | |
| | | | |
Micron Technology, Inc. | | | | | 4,684 | | | | | | 616 | |
| | | | |
Microsoft Corp. | | | | | 6,319 | | | | | | 2,824 | |
| | | | | | | | | | | | |
| | | | | SHARES | | | | | MARKET
VALUE
(000S) | |
| | | | |
Motorola Solutions, Inc. | | | | | 197 | | | $ | | | 76 | |
| | | | |
NetApp, Inc. | | | | | 1,174 | | | | | | 151 | |
| | | | |
NVIDIA Corp. | | | | | 2,461 | | | | | | 304 | |
| | | | |
ON Semiconductor Corp. (a) | | | | | 641 | | | | | | 44 | |
| | | | |
Oracle Corp. | | | | | 4,197 | | | | | | 593 | |
| | | | |
QUALCOMM, Inc. | | | | | 4,491 | | | | | | 894 | |
| | | | |
Salesforce, Inc. | | | | | 517 | | | | | | 133 | |
| | | | |
Seagate Technology Holdings PLC | | | | | 1,638 | | | | | | 169 | |
| | | | |
Synopsys, Inc. (a) | | | | | 67 | | | | | | 40 | |
| | | | |
TE Connectivity Ltd. | | | | | 1,005 | | | | | | 151 | |
| | | | |
Teradyne, Inc. | | | | | 398 | | | | | | 59 | |
| | | | |
Texas Instruments, Inc. | | | | | 1,940 | | | | | | 377 | |
| | | | |
Western Digital Corp. (a) | | | | | 2,587 | | | | | | 196 | |
| | | | |
Xerox Holdings Corp. | | | | | 2,477 | | | | | | 29 | |
| | | | | | | | | | | | |
| | | | | | | | | | | 15,938 | |
| | | | | | | | | | | | |
| |
| MATERIALS 4.1% | |
| | | | |
Air Products & Chemicals, Inc. | | | | | 539 | | | | | | 139 | |
| | | | |
Ball Corp. | | | | | 1,161 | | | | | | 70 | |
| | | | |
CF Industries Holdings, Inc. | | | | | 720 | | | | | | 53 | |
| | | | |
Corteva, Inc. | | | | | 384 | | | | | | 21 | |
| | | | |
Dow, Inc. | | | | | 4,916 | | | | | | 261 | |
| | | | |
DuPont de Nemours, Inc. | | | | | 3,434 | | | | | | 276 | |
| | | | |
Ecolab, Inc. | | | | | 514 | | | | | | 122 | |
| | | | |
Huntsman Corp. | | | | | 1,079 | | | | | | 25 | |
| | | | |
International Flavors & Fragrances, Inc. | | | | | 401 | | | | | | 38 | |
| | | | |
International Paper Co. | | | | | 3,214 | | | | | | 139 | |
| | | | |
Linde PLC | | | | | 1,248 | | | | | | 548 | |
| | | | |
Mosaic Co. | | | | | 2,531 | | | | | | 73 | |
| | | | |
Newmont Corp. | | | | | 4,624 | | | | | | 194 | |
| | | | |
Packaging Corp. of America | | | | | 291 | | | | | | 53 | |
| | | | |
PPG Industries, Inc. | | | | | 733 | | | | | | 92 | |
| | | | |
Sherwin-Williams Co. | | | | | 205 | | | | | | 61 | |
| | | | | | | | | | | | |
| | | | | | | | | | | 2,165 | |
| | | | | | | | | | | | |
| |
| REAL ESTATE 0.3% | |
| | | | |
CBRE Group, Inc. ‘A’ (a) | | | | | 1,186 | | | | | | 106 | |
| | | | |
Jones Lang LaSalle, Inc. (a) | | | | | 362 | | | | | | 74 | |
| | | | | | | | | | | | |
| | | | | | | | | | | 180 | |
| | | | | | | | | | | | |
| |
| UTILITIES 0.3% | |
| | | | |
American Water Works Co., Inc. | | | | | 425 | | | | | | 55 | |
| | | | | | | | | | | | |
| | | | | SHARES | | | | | MARKET
VALUE
(000S) | |
| | | | |
Edison International | | | | | 1,245 | | | $ | | | 89 | |
| | | | | | | | | | | | |
| | | | | | | | | | | 144 | |
| | | | | | | | | | | | |
Total United States | | | | | | | | | | | 50,987 | |
| | | | | | | | | | | | |
Total Common Stocks
(Cost $45,483) | | | | | | 51,494 | |
| | | | |
| |
| REAL ESTATE INVESTMENT TRUSTS 1.9% | |
| |
| UNITED STATES 1.9% | |
| |
| REAL ESTATE 1.9% | |
| | | | |
American Tower Corp. | | | | | 393 | | | | | | 76 | |
| | | | |
AvalonBay Communities, Inc. | | | | | 303 | | | | | | 63 | |
| | | | |
Crown Castle, Inc. | | | | | 1,171 | | | | | | 114 | |
| | | | |
Equinix, Inc. | | | | | 112 | | | | | | 85 | |
| | | | |
Equity Residential | | | | | 948 | | | | | | 66 | |
| | | | |
Essex Property Trust, Inc. | | | | | 87 | | | | | | 24 | |
| | | | |
Host Hotels & Resorts, Inc. | | | | | 2,962 | | | | | | 53 | |
| | | | |
Iron Mountain, Inc. | | | | | 865 | | | | | | 78 | |
| | | | |
Kimco Realty Corp. | | | | | 290 | | | | | | 6 | |
| | | | |
Mid-America Apartment Communities, Inc. | | | | | 200 | | | | | | 29 | |
| | | | |
Prologis, Inc. | | | | | 550 | | | | | | 62 | |
| | | | |
Realty Income Corp. | | | | | 502 | | | | | | 26 | |
| | | | |
Ventas, Inc. | | | | | 1,570 | | | | | | 80 | |
| | | | |
Vornado Realty Trust | | | | | 492 | | | | | | 13 | |
| | | | |
Welltower, Inc. | | | | | 1,178 | | | | | | 123 | |
| | | | |
Weyerhaeuser Co. | | | | | 3,470 | | | | | | 98 | |
| | | | | | | | | | | | |
| | | | | | | | | | | 996 | |
| | | | | | | | | | | | |
Total Real Estate Investment Trusts
(Cost $991) | | | | | | 996 | |
| | | | |
| |
| SHORT-TERM INSTRUMENTS 0.6% | |
| |
| REPURCHASE AGREEMENTS (b) 0.6% | |
| | | | | | | | | | | 322 | |
| | | | | | | | | | | | |
Total Short-Term Instruments
(Cost $322) | | | | | | | | | | | 322 | |
| | | | |
| | | | |
| | | | | | | | | | | | |
Total Investments in Securities
(Cost $46,796) | | | | | | | | | | | 52,812 | |
| |
| | | | |
Total Investments 100.0%
(Cost $46,796) | | | | | | | | $ | | | 52,812 | |
| |
| Other Assets and Liabilities, net 0.0% | | | 23 | |
| | | | |
| Net Assets 100.0% | | | $ | | | 52,835 | |
| | | | | | | |
NOTES TO SCHEDULE OF INVESTMENTS:
| * | A zero balance may reflect actual amounts rounding to less than one thousand. |
| (a) | Security did not produce income within the last twelve months. |
BORROWINGS AND OTHER FINANCING TRANSACTIONS
(b) REPURCHASE AGREEMENTS:
| | | | | | | | | | | | | | | | | | | | | | | | | | | | | | |
| Counterparty | | Lending
Rate | | | Settlement
Date | | | Maturity
Date | | | Principal
Amount | | | Collateralized By | | Collateral
(Received) | | | Repurchase
Agreements,
at Value | | | Repurchase
Agreement
Proceeds
to be
Received(1) | |
| FICC | | | 2.600 | % | | | 06/28/2024 | | | | 07/01/2024 | | | $ | 322 | | | U.S. Treasury Inflation Protected Securities 0.625% due 01/15/2026 | | $ | (328 | ) | | $ | 322 | | | $ | 322 | |
| | | | | | | | | | | | | | | | | | | | | | | | | | | | | | |
Total Repurchase Agreements | | | | | $ | (328 | ) | | $ | 322 | | | $ | 322 | |
| | | | | | | | | | | | | | | |
| | | | | | |
| 42 | | PIMCO EQUITY SERIES | | | See Accompanying Notes | |
BORROWINGS AND OTHER FINANCING TRANSACTIONS SUMMARY
The following is a summary by counterparty of the market value of Borrowings and Other Financing Transactions and collateral pledged/(received) as of June 30, 2024:
| | | | | | | | | | | | | | | | | | | | | | | | |
| Counterparty | | Repurchase
Agreement
Proceeds
to be
Received(1) | | | Payable for
Reverse
Repurchase
Agreements | | | Payable for
Sale-Buyback
Transactions | | | Total
Borrowings and
Other Financing
Transactions | | | Collateral
Pledged/(Received) | | | Net Exposure(2) | |
Global/Master Repurchase Agreement | |
FICC | | $ | 322 | | | $ | 0 | | | $ | 0 | | | $ | 322 | | | $ | (328 | ) | | $ | (6 | ) |
| | | | | | | | | | | | | | | | | | | | | | | | |
Total Borrowings and Other Financing Transactions | | $ | 322 | | | $ | 0 | | | $ | 0 | | | | | | | | | | | | | |
| | | | | | | | | | | | | | | | | | | | | | | | |
| (1) | Includes accrued interest. |
| (2) | Net Exposure represents the net receivable/(payable) that would be due from/to the counterparty in the event of default. Exposure from borrowings and other financing transactions can only be netted across transactions governed under the same master agreement with the same legal entity. See Note 8, Master Netting Arrangements, in the Notes to Financial Statements for more information. |
FAIR VALUE MEASUREMENTS
The following is a summary of the fair valuations according to the inputs used as of June 30, 2024 in valuing the Fund’s assets and liabilities:
| | | | | | | | | | | | | | | | |
| Category and Subcategory | | Level 1 | | | Level 2 | | | Level 3 | | | Fair
Value at
06/30/2024 | |
Investments in Securities, at Value | |
Common Stocks | |
Ireland | |
Information Technology | | $ | 354 | | | $ | 0 | | | $ | 0 | | | $ | 354 | |
United Kingdom | |
Communication Services | | | 85 | | | | 0 | | | | 0 | | | | 85 | |
Materials | | | 68 | | | | 0 | | | | 0 | | | | 68 | |
United States | |
Communication Services | | | 4,122 | | | | 0 | | | | 0 | | | | 4,122 | |
Consumer Discretionary | | | 269 | | | | 0 | | | | 0 | | | | 269 | |
Consumer Staples | | | 7,526 | | | | 0 | | | | 0 | | | | 7,526 | |
Financials | | | 8,251 | | | | 0 | | | | 0 | | | | 8,251 | |
Health Care | | | 9,933 | | | | 0 | | | | 0 | | | | 9,933 | |
| | | | | | | | | | | | | | | | |
| Category and Subcategory | | Level 1 | | | Level 2 | | | Level 3 | | | Fair
Value at
06/30/2024 | |
Industrials | | $ | 2,459 | | | $ | 0 | | | $ | 0 | | | $ | 2,459 | |
Information Technology | | | 15,938 | | | | 0 | | | | 0 | | | | 15,938 | |
Materials | | | 2,165 | | | | 0 | | | | 0 | | | | 2,165 | |
Real Estate | | | 180 | | | | 0 | | | | 0 | | | | 180 | |
Utilities | | | 144 | | | | 0 | | | | 0 | | | | 144 | |
Real Estate Investment Trusts | |
United States | |
Real Estate | | | 996 | | | | 0 | | | | 0 | | | | 996 | |
Short-Term Instruments | |
Repurchase Agreements | | | 0 | | | | 322 | | | | 0 | | | | 322 | |
| | | | | | | | | | | | | | | | |
| | | | |
Total Investments | | $ | 52,490 | | | $ | 322 | | | $ | 0 | | | $ | 52,812 | |
| | | | | | | | | | | | | | | | |
There were no significant transfers into or out of Level 3 during the period ended June 30, 2024.
| | | | | | | | | | | | |
| See Accompanying Notes | | | ANNUAL FINANCIAL AND OTHER INFORMATION | | | | | | | JUNE 30, 2024 | | | 43 |
| | | | |
| Notes to Financial Statements | | | | |
1. ORGANIZATION
PIMCO Equity Series (the “Trust”) was established as a Delaware statutory trust on March 30, 2010. The Trust is registered under the Investment Company Act of 1940, as amended (the “Act”), as an open-end management investment company. Information presented in these financial statements pertains to the funds (each, a “Fund” and collectively, the “Funds”) indicated on the cover of this report. Pacific Investment Management Company LLC (“PIMCO” or “Manager”) serves as the investment adviser for the Funds. Prior to August 12, 2022, Parametric Portfolio Associates LLC (“Parametric” or “Sub-Adviser”) served as the sub-adviser to each Fund.
Each Fund is an exchange-traded fund (“ETF”). ETFs are funds that trade like other publicly-traded securities and may be designed to track an index or to be actively managed. Unlike shares of a mutual fund, which can be bought from and redeemed by the issuing fund by all shareholders at a price based on net asset value (“NAV”), shares of a Fund may be directly purchased from and redeemed by a Fund at NAV solely by a member or participant of a clearing agency registered with the Securities and Exchange Commission, which has a written agreement with the Fund’s Distributor that allows such member or participant to place orders for the purchase and redemption of Creation Units (“Authorized Participant”). Also, unlike shares of a mutual fund, shares of each Fund are listed on a national securities exchange and trade in the secondary market at market prices that change throughout the day. Each Fund offers and issues shares only in aggregations of a specified number of shares (“Creation Units”).
Hereinafter, the Board of Trustees of the Funds shall be collectively referred to as the “Board.”
2. SIGNIFICANT ACCOUNTING POLICIES
The following is a summary of significant accounting policies consistently followed by the Trust in the preparation of its financial statements in conformity with accounting principles generally accepted in the United States of America (“U.S. GAAP”). Each Fund is treated as an investment company under the reporting requirements of U.S. GAAP. The functional and reporting currency for the Funds is the U.S. dollar. The preparation of financial statements in accordance with U.S. GAAP requires management to make estimates and assumptions that affect the reported amounts of assets and liabilities and disclosure of contingent assets and liabilities at the date of the financial statements and the reported amounts of increases and decreases in net assets from operations during the reporting period. Actual results could differ from those estimates.
(a) Securities Transactions and Investment Income Securities transactions are recorded as of the trade date for financial reporting purposes. Securities
purchased or sold on a when-issued or delayed-delivery basis may be settled beyond a standard settlement period for the security after the trade date. Realized gains (losses) from securities sold are recorded on the identified cost basis. Dividend income is recorded on the ex-dividend date, except certain dividends from foreign securities where the ex-dividend date may have passed, which are recorded as soon as a Fund is informed of the ex-dividend date. Interest income, adjusted for the accretion of discounts and amortization of premiums, is recorded on the accrual basis from settlement date, with the exception of securities with a forward starting effective date, where interest income is recorded on the accrual basis from effective date. For convertible securities, premiums attributable to the conversion feature are not amortized. Estimated tax liabilities on certain foreign securities are recorded on an accrual basis and are reflected as components of interest income or net change in unrealized appreciation (depreciation) on investments on the Statements of Operations, as appropriate. Tax liabilities realized as a result of such security sales are reflected as a component of net realized gain (loss) on investments on the Statements of Operations. Paydown gains (losses) on mortgage-related and other asset-backed securities, if any, are recorded as components of interest income on the Statements of Operations. Income or short-term capital gain distributions received from registered investment companies, if any, are recorded as dividend income. Long-term capital gain distributions received from registered investment companies, if any, are recorded as realized gains.
Debt obligations may be placed on non-accrual status and related interest income may be reduced by ceasing current accruals and writing off interest receivable when the collection of all or a portion of interest has become doubtful based on consistently applied procedures. A debt obligation is removed from non-accrual status when the issuer resumes interest payments or when collectability of interest is probable. A debt obligation may be granted, in certain situations, a contractual or non-contractual forbearance for interest payments that are expected to be paid after agreed upon pay dates.
(b) Foreign Taxes A Fund may be subject to foreign taxes on income, stock dividends, capital gains on investments, or certain foreign currency transactions. All foreign taxes are recorded in accordance with the applicable foreign tax regulations and rates that exist in the foreign jurisdictions in which each Fund invests. These foreign taxes, if any, are paid by a Fund and are reflected in its Statements of Operations as follows: foreign taxes withheld at source are presented as a reduction of income, foreign taxes on securities lending income are presented as a reduction of securities lending income, foreign taxes on stock dividends are presented as “other foreign taxes”, and foreign taxes on capital gains from sales of investments and foreign taxes on foreign currency transactions are included in their respective net realized gain (loss) categories. Foreign taxes payable as of June 30, 2024, if any, are disclosed in the Statements of Assets and Liabilities.
(c) Foreign Currency Translation The market values of foreign securities, currency holdings and other assets and liabilities denominated in foreign currencies are translated into U.S. dollars based on the current exchange rates each business day. Purchases and sales of securities and income and expense items denominated in foreign currencies, if any, are translated into U.S. dollars at the exchange rate in effect on the transaction date. The Funds do not separately report the effects of changes in foreign exchange rates from changes in market prices on securities held. Such changes are included in net realized gain (loss) and net change in unrealized appreciation (depreciation) from investments on the Statements of Operations. The Funds may invest in foreign currency-denominated securities and may engage in foreign currency transactions either on a spot (cash) basis at the rate prevailing in the currency exchange market at the time or through a forward foreign currency contract. Realized foreign exchange gains (losses) arising from sales of spot foreign currencies, currency gains (losses) realized between the trade and settlement dates on securities transactions and the difference between the recorded amounts of dividends, interest and foreign withholding taxes and the U.S. dollar equivalent of the amounts actually received or paid are included in net realized gain (loss) on foreign currency transactions on the Statements of Operations. Net unrealized foreign exchange gains (losses) arising from changes in foreign exchange rates on foreign denominated assets and liabilities other than investments in securities held at the end of the reporting period are included in net change in unrealized appreciation (depreciation) on foreign currency assets and liabilities on the Statements of Operations.
(d) Distributions to Shareholders The following table shows the anticipated frequency of distributions from net investment income, if any, for each Fund.
| | | | | | | | | | | | |
| | | | Distribution Frequency | |
| | | |
| Fund Name | | | | | Declared | | | Distributed | |
| | | |
PIMCO RAFI Dynamic Multi-Factor Emerging Markets Equity ETF | | | | | | | Quarterly | | | | Quarterly | |
| | | |
PIMCO RAFI Dynamic Multi-Factor International Equity ETF | | | | | | | Quarterly | | | | Quarterly | |
| | | |
PIMCO RAFI Dynamic Multi-Factor U.S. Equity ETF | | | | | | | Quarterly | | | | Quarterly | |
| | | |
PIMCO RAFI ESG U.S. ETF | | | | | | | Quarterly | | | | Quarterly | |
In addition, each Fund distributes any net capital gains it earns from the sale of portfolio securities to shareholders no less frequently than annually. Net short-term capital gains may be paid more frequently. The Trust does not provide an automatic dividend and/or distributions reinvestment service. A Fund may revise its distribution policy or postpone the payment of distributions at any time.
Income distributions and capital gain distributions are determined in accordance with income tax regulations which may differ from U.S. GAAP. Differences between tax regulations and U.S. GAAP may cause
timing differences between income and capital gain recognition. Further, the character of investment income and capital gains may be different for certain transactions under the two methods of accounting. As a result, income distributions and capital gain distributions declared during a fiscal period may differ significantly from the net investment income (loss) and realized gains (losses) reported on each Fund’s annual financial statements presented under U.S. GAAP.
Separately, if a Fund determines or estimates, as applicable, that a portion of a distribution may be comprised of amounts from sources other than net investment income in accordance with its policies, accounting records (if applicable) and accounting practices, the Fund will notify shareholders of the estimated composition of such distribution through a Section 19 Notice. For these purposes, a Fund determines or estimates, as applicable, the source or sources from which a distribution is paid, to the close of the period as of which it is paid, in reference to its internal accounting records and related accounting practices. If, based on such accounting records and practices, it is determined or estimated, as applicable, that a particular distribution does not include capital gains or paid-in surplus or other capital sources, a Section 19 Notice generally would not be issued. It is important to note that differences exist between a Fund’s daily internal accounting records and practices, a Fund’s financial statements presented in accordance with U.S. GAAP, and recordkeeping practices under income tax regulations. For instance, a Fund’s internal accounting records and practices may take into account, among other factors, tax-related characteristics of certain sources of distributions that differ from treatment under U.S. GAAP. Examples of such differences may include but are not limited to, for certain Funds, the treatment of periodic payments under interest rate swap contracts. Accordingly, among other consequences, it is possible that a Fund may not issue a Section 19 Notice in situations where a fund’s financial statements prepared later and in accordance with U.S. GAAP and/or the final tax character of those distributions might later report that the sources of those distributions included capital gains and/or a return of capital. Please visit www.pimco.com for the most recent Section 19 Notice, if applicable, for additional information regarding the estimated composition of distributions. Final determination of a distribution’s tax character will be provided to shareholders when such information is available.
Distributions classified as a tax basis return of capital at a Fund’s fiscal year end, if any, are reflected on the Statements of Changes in Net Assets and have been recorded to paid in capital on the Statements of Assets and Liabilities. In addition, other amounts have been reclassified between distributable earnings (accumulated loss) and paid in capital on the Statements of Assets and Liabilities to more appropriately conform U.S. GAAP to tax characterizations of distributions.
| | | | | | | | | | | | |
| | | | ANNUAL FINANCIAL AND OTHER INFORMATION | | | | | | | JUNE 30, 2024 | | | 45 |
| | | | |
| Notes to Financial Statements | | (Cont.) | | |
(e) New Accounting Pronouncements and Regulatory Updates In March 2020, the Financial Accounting Standards Board (“FASB”) issued an Accounting Standards Update (“ASU”), ASU 2020-04, Reference Rate Reform (Topic 848), which provides optional guidance to ease the potential accounting burden associated with transitioning away from the London Interbank Offered Rate and other reference rates that are expected to be discontinued. ASU 2020-04 is effective for certain reference rate-related contract modifications that occurred or will occur during the period March 12, 2020 through December 31, 2024. In January 2021 and December 2022, FASB issued ASU 2021-01 and ASU 2022-06, which include additional amendments to Topic 848. Management is continuously evaluating the potential effect a discontinuation of LIBOR could have on the Funds’ investments and has determined that it is unlikely the ASU’s adoption will have a material impact on the Funds’ financial statements.
In June 2022, the FASB issued ASU 2022-03, Fair Value Measurement (Topic 820), which affects all entities that have investments in equity securities measured at fair value that are subject to a contractual sale restriction. The amendments in ASU 2022-03 clarify that a contractual restriction on the sale of an equity security is not considered part of the unit of account of the equity security and, therefore, is not considered in measuring the fair value. The amendments also require additional disclosures for equity securities subject to contractual sale restrictions that are measured at fair value in accordance with Topic 820. The effective date for the amendments in ASU 2022-03 is for fiscal years beginning after December 15, 2023 and interim periods within those fiscal years. Management has implemented changes in connection with the amendments and has determined that there was no material impact to the Funds’ financial statements.
In October 2022, the U.S. Securities and Exchange Commission (“SEC”) adopted changes to the mutual fund and ETF shareholder report and registration statement disclosure requirements and the registered fund advertising rules, which change the disclosures provided to shareholders. The rule amendments were effective as of January 2023, and compliance with the rule amendments was required as of July 2024. As such, the Funds have made significant updates to the content of their shareholder reports. In addition, shareholder reports are now mailed to shareholders who have not opted to receive shareholder report documents electronically. Management has implemented format and content changes to the Funds’ annual and semiannual financial and other information in connection with the rule amendments and has determined that there was no material impact to the Funds’ financial statements.
The SEC made a final ruling on February 15, 2023 to adopt proposed amendments to the Settlement Cycle Rule (Rule 15c6-1) and other related rules under the Securities Exchange Act of 1934, as amended,
to shorten the standard settlement cycle for most broker-dealer transactions from two business days after the trade date (T+2) to one business day after the trade date (T+1). The effective date was May 5, 2023, and compliance with the amendments was required as of May 28, 2024. Management has implemented changes in connection with the rule and has determined that there was no material impact to the Funds’ financial statements.
In September 2023, the SEC adopted amendments to Rule 35d-1 under the Act, the rule governing fund naming conventions (the “Names Rule”). In general, the Names Rule requires funds with certain types of names to adopt a policy to invest at least 80% of their assets in the type of investment suggested by the name. The amendments expand the scope of the current rule to include any term used in a fund name that suggests the fund makes investments that have, or whose issuers have, particular characteristics. Additionally, the amendments modify the circumstances under which a fund may deviate from its 80% investment policy and address the calculation methodology of derivatives instruments for purposes of the rule. The amendments became effective December 11, 2023, and fund groups with $1 billion or more in net assets will have 24 months to comply with the amendments (fund groups with net assets of less than $1 billion have 30 months to comply). At this time, management is evaluating the implications of these changes on the financial statements.
3. INVESTMENT VALUATION AND FAIR VALUE MEASUREMENTS
(a) Investment Valuation Policies The NAV of a Fund’s shares, or each of their respective share classes, as applicable, is determined by dividing the total value of portfolio investments and other assets attributable to the Fund or class, less any liabilities, as applicable, by the total number of shares outstanding.
On each day that the New York Stock Exchange (“NYSE”) is open, each Fund’s shares are ordinarily valued as of the close of regular trading (normally 4:00 p.m., Eastern time) (“NYSE Close”). Information that becomes known to the Funds or their agents after the time as of which NAV has been calculated on a particular day will not generally be used to retroactively adjust the price of a security or the NAV determined earlier that day. If regular trading on the NYSE closes earlier than scheduled, each Fund may calculate its NAV as of the earlier closing time or calculate its NAV as of the NYSE Close for that day. Each Fund generally does not calculate its NAV on days on which the NYSE is not open for business. If the NYSE is closed on a day it would normally be open for business, each Fund may calculate its NAV as of the NYSE Close for such day or such other time that each Fund may determine.
For purposes of calculating NAV, portfolio securities and other assets for which market quotations are readily available are valued at market value. A market quotation is readily available only when that quotation is a quoted price (unadjusted) in active markets for identical investments that a Fund can access at the measurement date, provided that a quotation will not be readily available if it is not reliable. Market value is generally determined on the basis of official closing prices or the last reported sales prices. The Funds will normally use pricing data for domestic equity securities received shortly after the NYSE Close and do not normally take into account trading, clearances or settlements that take place after the NYSE Close. A foreign (non-U.S.) equity security traded on a foreign exchange or on more than one exchange is typically valued using pricing information from the exchange considered by PIMCO to be the primary exchange. If market value pricing is used, a foreign (non-U.S.) equity security will be valued as of the close of trading on the foreign exchange or the NYSE Close if the NYSE Close occurs before the end of trading on the foreign exchange.
Investments for which market quotations are not readily available are valued at fair value as determined in good faith pursuant to Rule 2a-5 under the Act. As a general principle, the fair value of a security or other asset is the price that would be received to sell an asset or paid to transfer a liability in an orderly transaction between market participants at the measurement date. Pursuant to Rule 2a-5, the Board has designated PIMCO as the valuation designee (“Valuation Designee”) for each Fund to perform the fair value determination relating to all Fund investments. PIMCO may carry out its designated responsibilities as Valuation Designee through various teams and committees. The Valuation Designee’s policies and procedures govern the Valuation Designee’s selection and application of methodologies for determining and calculating the fair value of Fund portfolio investments. The Valuation Designee may value Fund portfolio securities for which market quotations are not readily available and other Fund assets utilizing inputs from pricing services, quotation reporting systems, valuation agents and other third-party sources (together, “Pricing Sources”).
Domestic and foreign (non-U.S.) fixed income securities, non-exchange traded derivatives and equity options are normally valued on the basis of quotes obtained from brokers and dealers or Pricing Sources using data reflecting the earlier closing of the principal markets for those securities. Prices obtained from Pricing Sources may be based on, among other things, information provided by market makers or estimates of market values obtained from yield data relating to investments or securities with similar characteristics. Certain fixed income securities purchased on a delayed-delivery basis are marked to market daily until settlement at the forward settlement date. Common stocks, ETFs, exchange-traded notes and financial derivative instruments, such as futures contracts, rights and warrants, or options
on futures that are traded on a national securities exchange, are stated at the last reported sale or settlement price on the day of valuation. Exchange-traded options, except equity options, futures and options on futures are valued at the settlement price determined by the relevant exchange. Swap agreements are valued on the basis of bid quotes obtained from brokers and dealers or market-based prices supplied by Pricing Sources. With respect to any portion of a Fund’s assets that are invested in one or more open-end management investment companies (other than ETFs), a Fund’s NAV will be calculated based on the NAVs of such investments. Open-end management investment companies may include affiliated funds.
If a foreign (non-U.S.) equity security’s value has materially changed after the close of the security’s primary exchange or principal market but before the NYSE Close, the security may be valued at fair value. Foreign (non-U.S.) equity securities that do not trade when the NYSE is open are also valued at fair value. With respect to foreign (non-U.S.) equity securities, a Fund may determine the fair value of investments based on information provided by Pricing Sources, which may recommend fair value or adjustments with reference to other securities, indexes or assets. In considering whether fair valuation is required and in determining fair values, the Valuation Designee may, among other things, consider significant events (which may be considered to include changes in the value of U.S. securities or securities indexes) that occur after the close of the relevant market and before the NYSE Close. A Fund may utilize modeling tools provided by third-party vendors to determine fair values of foreign (non-U.S.) securities. For these purposes, unless otherwise determined by the Valuation Designee, any movement in the applicable reference index or instrument (“zero trigger”) between the earlier close of the applicable foreign market and the NYSE Close may be deemed to be a significant event, prompting the application of the pricing model (effectively resulting in daily fair valuations). Foreign exchanges may permit trading in foreign (non-U.S.) equity securities on days when the Trust is not open for business, which may result in a Fund’s portfolio investments being affected when shareholders are unable to buy or sell shares.
Investments valued in currencies other than the U.S. dollar are converted to the U.S. dollar using exchange rates obtained from Pricing Sources. As a result, the value of such investments and, in turn, the NAV of a Fund’s shares may be affected by changes in the value of currencies in relation to the U.S. dollar. The value of investments traded in markets outside the United States or denominated in currencies other than the U.S. dollar may be affected significantly on a day that the Trust is not open for business. As a result, to the extent that a Fund holds foreign (non-U.S.) investments, the value of those investments may change at times when shareholders are unable to buy or sell shares and the value of such investments will be reflected in each Fund’s next calculated NAV.
| | | | | | | | | | | | |
| | | | ANNUAL FINANCIAL AND OTHER INFORMATION | | | | | | | JUNE 30, 2024 | | | 47 |
| | | | |
| Notes to Financial Statements | | (Cont.) | | |
Fair valuation may require subjective determinations about the value of a security. While the Trust’s and Valuation Designee’s policies and procedures are intended to result in a calculation of a Fund’s NAV that fairly reflects security values as of the time of pricing, the Trust cannot ensure that fair values accurately reflect the price that a Fund could obtain for a security if it were to dispose of that security as of the time of pricing (for instance, in a forced or distressed sale). The prices used by a Fund may differ from the value that would be realized if the securities were sold.
(b) Fair Value Hierarchy U.S. GAAP describes fair value as the price that a Fund would receive to sell an asset or pay to transfer a liability in an orderly transaction between market participants at the measurement date. It establishes a fair value hierarchy that prioritizes inputs to valuation methods and requires disclosure of the fair value hierarchy, separately for each major category of assets and liabilities, that segregates fair value measurements into levels (Level 1, 2 or 3). The inputs or methodology used for valuing securities are not necessarily an indication of the risks associated with investing in those securities. Levels 1, 2 and 3 of the fair value hierarchy are defined as follows:
| ∎ | | Level 1 — Quoted prices (unadjusted) in active markets or exchanges for identical assets and liabilities. |
| ∎ | | Level 2 — Significant other observable inputs, which may include, but are not limited to, quoted prices for similar assets or liabilities in markets that are active, quoted prices for identical or similar assets or liabilities in markets that are not active, inputs other than quoted prices that are observable for the assets or liabilities (such as interest rates, yield curves, volatilities, prepayment speeds, loss severities, credit risks and default rates) or other market corroborated inputs. |
| ∎ | | Level 3 — Significant unobservable inputs based on the best information available in the circumstances, to the extent observable inputs are not available, which may include assumptions made by the Valuation Designee that are used in determining the fair value of investments. |
In accordance with the requirements of U.S. GAAP, the amounts of transfers into and out of Level 3, if material, are disclosed in the Notes to Schedule of Investments for each respective Fund.
For fair valuations using significant unobservable inputs, U.S. GAAP requires a reconciliation of the beginning to ending balances for reported fair values that presents changes attributable to realized gain (loss), unrealized appreciation (depreciation), purchases and sales, accrued discounts (premiums), and transfers into and out of the Level 3 category during the period. The end of period value is used for the transfers between Levels of a Fund’s assets and liabilities. Additionally, U.S. GAAP requires quantitative information regarding the significant
unobservable inputs used in the determination of fair value of assets or liabilities categorized as Level 3 in the fair value hierarchy. In accordance with the requirements of U.S. GAAP, a fair value hierarchy and, if material, a Level 3 reconciliation and details of significant unobservable inputs, have been included in the Notes to Schedule of Investments for each respective Fund.
(c) Valuation Techniques and the Fair Value Hierarchy
Level 1, Level 2 and Level 3 trading assets and trading liabilities, at fair value The valuation methods (or “techniques”) and significant inputs used in determining the fair values of portfolio securities or other assets and liabilities categorized as Level 1, Level 2 and Level 3 of the fair value hierarchy are as follows:
Common stocks, ETFs, exchange-traded notes and financial derivative instruments, such as futures contracts, rights and warrants, or options on futures that are traded on a national securities exchange, are stated at the last reported sale or settlement price on the day of valuation. To the extent these securities are actively traded and valuation adjustments are not applied, they are categorized as Level 1 of the fair value hierarchy.
Investments in registered open-end investment companies (other than ETFs) will be valued based upon the NAVs of such investments and are categorized as Level 1 of the fair value hierarchy. Investments in unregistered open-end investment companies will be calculated based upon the NAVs of such investments and are considered Level 1 provided that the NAVs are observable, calculated daily and are the value at which both purchases and sales will be conducted.
Fixed income securities including corporate, convertible and municipal bonds and notes, U.S. government agencies, U.S. treasury obligations, sovereign issues, bank loans, convertible preferred securities, non-U.S. bonds and short-term debt instruments (such as commercial paper, time deposits and certificates of deposit) are normally valued on the basis of quotes obtained from brokers and dealers or Pricing Sources that use broker-dealer quotations, reported trades or valuation estimates from their internal pricing models. The Pricing Sources’ internal models use inputs that are observable such as issuer details, interest rates, yield curves, prepayment speeds, credit risks/spreads, default rates and quoted prices for similar assets. Securities that use similar valuation techniques and inputs as described above are categorized as Level 2 of the fair value hierarchy.
Fixed income securities purchased on a delayed-delivery basis or as a repurchase commitment in a sale-buyback transaction are marked to market daily until settlement at the forward settlement date and are categorized as Level 2 of the fair value hierarchy.
Mortgage-related and asset-backed securities are usually issued as separate tranches, or classes, of securities within each deal. These securities are also normally valued by Pricing Sources that use broker-dealer quotations, reported trades or valuation estimates from their internal pricing models. The pricing models for these securities usually consider tranche-level attributes, current market data, estimated cash flows and market-based yield spreads for each tranche, and incorporate deal collateral performance, as available. Mortgage-related and asset-backed securities that use similar valuation techniques and inputs as described above are categorized as Level 2 of the fair value hierarchy.
Valuation adjustments may be applied to certain securities that are solely traded on a foreign exchange to account for the market movement between the close of the foreign market and the NYSE Close. These securities are valued using Pricing Sources that consider the correlation of the trading patterns of the foreign security to the intraday trading in the U.S. markets for investments. Securities using these valuation adjustments are categorized as Level 2 of the fair value hierarchy. Preferred securities and other equities traded on inactive markets or valued by reference to similar instruments are also categorized as Level 2 of the fair value hierarchy.
Valuation adjustments may be applied to certain exchange traded futures and options to account for market movement between the exchange settlement and the NYSE Close. These securities are valued using quotes obtained from a quotation reporting system, established market makers or Pricing Sources. Financial derivatives using these valuation adjustments are categorized as Level 2 of the fair value hierarchy.
Equity-linked securities are valued by referencing the last reported sale or settlement price of the linked referenced equity on the day of valuation. Foreign exchange adjustments are applied to the last reported price to convert the linked equity’s trading currency to the contract’s settling currency. These investments are categorized as Level 2 of the fair value hierarchy.
Equity exchange-traded options and over the counter financial derivative instruments, such as forward foreign currency contracts and options contracts derive their value from underlying asset prices, indexes, reference rates and other inputs or a combination of these factors. These contracts are normally valued on the basis of quotes obtained from a quotation reporting system, established market makers or Pricing Sources (normally determined as of the NYSE Close). Depending on the product and the terms of the transaction, financial derivative instruments can be valued by Pricing Sources using a series of techniques, including simulation pricing models. The pricing models use inputs that are observed from actively quoted markets such as
quoted prices, issuer details, indexes, bid/ask spreads, interest rates, implied volatilities, yield curves, dividends and exchange rates. Financial derivative instruments that use similar valuation techniques and inputs as described above are categorized as Level 2 of the fair value hierarchy.
Centrally cleared swaps and over the counter swaps derive their value from underlying asset prices, indexes, reference rates and other inputs or a combination of these factors. They are valued using a broker-dealer bid quotation or on market-based prices provided by Pricing Sources (normally determined as of the NYSE Close). Centrally cleared swaps and over the counter swaps can be valued by Pricing Sources using a series of techniques, including simulation pricing models. The pricing models may use inputs that are observed from actively quoted markets such as the overnight index swap rate, LIBOR forward rate, interest rates, yield curves and credit spreads. These securities are categorized as Level 2 of the fair value hierarchy.
Short-term debt instruments (such as commercial paper, time deposits and certificates of deposit) having a remaining maturity of 60 days or less may be valued at amortized cost, so long as the amortized cost value of such short-term debt instruments is approximately the same as the fair value of the instrument as determined without the use of amortized cost valuation. These securities are categorized as Level 2 or Level 3 of the fair value hierarchy depending on the source of the base price.
When a fair valuation method is applied by PIMCO that uses significant unobservable inputs, investments will be priced by a method that the Valuation Designee believes reflects fair value and are categorized as Level 3 of the fair value hierarchy.
4. SECURITIES AND OTHER INVESTMENTS
(a) Investments in Affiliates
Each Fund eligible to participate in securities lending may invest the cash collateral received for securities out on loan in the PIMCO Government Money Market Fund under the Securities Lending Agreement. All or a portion of Dividend Income as shown in the table below represents the income earned on the cash collateral invested in PIMCO Government Money Market Fund and is included on the Statements of Operations as a component of Securities Lending Income. PIMCO Government Money Market Fund is considered to be affiliated with the Funds. A complete schedule of portfolio holdings for each affiliate fund is filed with the SEC for the first and third quarters of each fiscal year on Form N-PORT and is available at the SEC’s website at www.sec.gov. A copy of each affiliate fund’s shareholder report is also available at the SEC’s website at www.sec.gov, on the Funds’
| | | | | | | | | | | | |
| | | | ANNUAL FINANCIAL AND OTHER INFORMATION | | | | | | | JUNE 30, 2024 | | | 49 |
| | | | |
| Notes to Financial Statements | | (Cont.) | | |
website at www.pimco.com, or upon request, as applicable. The table below shows the Funds’ transactions in and earnings from investments in the affiliated fund for the period ended June 30, 2024 (amounts in thousands†):
Investments in PIMCO Government Money Market Fund
| | | | | | | | | | | | | | | | | | | | | | | | | | | | | | | | | | | | |
| Fund Name | | | | | Market Value
06/30/2023 | | | Purchases
at Cost | | | Proceeds
from Sales | | | Net
Realized
Gain (Loss) | | | Change in
Unrealized
Appreciation
(Depreciation) | | | Market Value
06/30/2024 | | | Dividend
Income(1) | | | Realized Net
Capital Gain
Distributions(1) | |
| | | | | | | | | |
PIMCO RAFI Dynamic Multi-Factor Emerging Markets Equity ETF | | | | | | $ | 8 | | | $ | 2,999 | | | $ | (2,999 | ) | | $ | 0 | | | $ | 0 | | | $ | 8 | | | $ | 2 | | | $ | 0 | |
| † | A zero balance may reflect actual amounts rounding to less than one thousand. |
| (1) | The tax characterization of distributions is determined in accordance with Federal income tax regulations and may contain a return of capital. The actual tax characterization of distributions received is determined at the end of the fiscal year of the affiliated fund. See Note 2, Distributions to Shareholders, in the Notes to Financial Statements for more information. |
(b) Investments in Securities
The Funds may utilize the investments and strategies described below to the extent permitted by each Fund’s respective investment policies.
Real Estate Investment Trusts (“REITs”) are pooled investment vehicles that own, and typically operate, income-producing real estate. If a REIT meets certain requirements, including distributing to shareholders substantially all of its taxable income (other than net capital gains), then it is not taxed on the income distributed to shareholders. Distributions received from REITs may be characterized as income, capital gain or a return of capital. A return of capital is recorded by a Fund as a reduction to the cost basis of its investment in the REIT. REITs are subject to management fees and other expenses, and so the Funds that invest in REITs will bear their proportionate share of the costs of the REITs’ operations.
Warrants are securities that are usually issued together with a debt security or preferred security and that give the holder the right to buy a proportionate amount of common stock at a specified price. Warrants normally have a life that is measured in years and entitle the holder to buy common stock of a company at a price that is usually higher than the market price at the time the warrant is issued. Warrants may entail greater risks than certain other types of investments. Generally, warrants do not carry the right to receive dividends or exercise voting rights with respect to the underlying securities, and they do not represent any rights in the assets of the issuer. In addition, their value does not necessarily change with the value of the underlying securities, and they cease to have value if they are not exercised on or before their expiration date. If the market price of the underlying stock does not exceed the exercise price during the life of the warrant, the warrant will expire worthless. Warrants may increase the potential profit or loss to be realized from the investment as compared with investing the same amount in the underlying securities. Similarly, the percentage increase or decrease in the value of an equity security warrant may be greater than the percentage increase or decrease in the value of the underlying common stock. Warrants may relate to the purchase of equity or debt
securities. Debt obligations with warrants attached to purchase equity securities have many characteristics of convertible securities and their prices may, to some degree, reflect the performance of the underlying stock. Debt obligations also may be issued with warrants attached to purchase additional debt securities at the same coupon rate. A decline in interest rates would permit a Fund to sell such warrants at a profit. If interest rates rise, these warrants would generally expire with no value.
5. BORROWINGS AND OTHER FINANCING TRANSACTIONS
The Funds may enter into the borrowings and other financing transactions described below to the extent permitted by each Fund’s respective investment policies.
The following disclosures contain information on a Fund’s ability to lend or borrow cash or securities to the extent permitted under the Act, which may be viewed as borrowing or financing transactions by a Fund. The location of these instruments in each Fund’s financial statements is described below.
(a) Repurchase Agreements Under the terms of a typical repurchase agreement, a Fund purchases an underlying debt obligation (collateral) subject to an obligation of the seller to repurchase, and a Fund to resell, the obligation at an agreed-upon price and time. In an open maturity repurchase agreement, there is no pre-determined repurchase date and the agreement can be terminated by a Fund or counterparty at any time. The underlying securities for all repurchase agreements are held by a Fund’s custodian or designated subcustodians (in the case of tri-party repurchase agreements) and in certain instances will remain in custody with the counterparty. Traditionally, a Fund has used bilateral repurchase agreements wherein the underlying securities will be held by a Fund’s custodian. The market value of the collateral must be equal to or exceed the total amount of the repurchase obligations, including interest. Repurchase agreements, if any, including accrued interest, are included on the Statements of Assets and Liabilities. Interest earned is recorded as a component of interest income on the Statements of
Operations. In periods of increased demand for collateral, a Fund may pay a fee for the receipt of collateral, which may result in interest expense to the Fund.
(b) Securities Lending The Funds listed below may seek to earn additional income by lending their securities to certain qualified broker-dealers and institutions on a short-term or long-term basis via a lending agent.
| | | | |
| Fund Name | | | |
| |
PIMCO RAFI Dynamic Multi-Factor Emerging Markets Equity ETF | | | | |
| |
PIMCO RAFI Dynamic Multi-Factor International Equity ETF | | | | |
| |
PIMCO RAFI Dynamic Multi-Factor U.S. Equity ETF | | | | |
| |
PIMCO RAFI ESG U.S. ETF | | | | |
Securities on loan are required to be secured by cash collateral at least equal to 102% of the domestic, or 105% of the foreign security’s market value. If the market value of the collateral at the close of trading on a business day is less than 100% of the market value of the loaned securities at the close of trading on that day, the borrower shall be required to deliver, by the close of business on the following business day, an additional amount of collateral, so that the total amount of posted collateral is equal to at least 100% of the market value of all the loaned securities as of such preceding day. The Funds will then invest the cash collateral received in the PIMCO Government Money Market Fund and record a liability for the return of the collateral during the period the securities are on loan. Each Fund is subject to a lending limit of 33.33% of total assets (including the value of collateral).
The loans are subject to termination at the option of the borrower or a Fund. Upon termination of the loan, the borrower will return to the lender securities identical to the loaned securities. Should the borrower of the securities fail to return loaned securities, a Fund has the right to repurchase the securities using the collateral in the open market.
The borrower pays fees at the Funds’ direction to the lending agent. The lending agent may retain a portion of the fees and interest earned on the cash collateral invested as compensation for its services. Investments made with the cash collateral are disclosed on the Schedules of Investments, if applicable. The lending fees and the Funds’ portion of the interest income earned on cash collateral are included on the Statements of Operations as securities lending income, if applicable.
(c) Interfund Lending In accordance with an exemptive order (the “Order”) from the SEC, the Funds of the Trust may participate in a joint lending and borrowing facility for temporary purposes (the “Interfund Lending Program”), subject to compliance with the terms and conditions of the Order, and to the extent permitted by each Fund’s investment policies and restrictions. The Funds are currently permitted
to borrow under the Interfund Lending Program. A lending fund may lend in aggregate up to 15% of its current net assets at the time of the interfund loan, but may not lend more than 5% of its net assets to any one borrowing fund through the Interfund Lending Program. A borrowing fund may not borrow through the Interfund Lending Program or from any other source if its total outstanding borrowings immediately after the borrowing would be more than 33 1/3% of its total assets (or any lower threshold provided for by the fund’s investment restrictions). If a borrowing fund’s total outstanding borrowings exceed 10% of its total assets, each of its outstanding interfund loans will be subject to collateralization of at least 102% of the outstanding principal value of the loan. All interfund loans are for temporary or emergency purposes and the interfund loan rate to be charged will be the average of the highest current overnight repurchase agreement rate available to a lending fund and the bank loan rate, as calculated according to a formula established by the Board.
During the period ended June 30, 2024, the Funds did not participate in the Interfund Lending Program.
6. FINANCIAL DERIVATIVE INSTRUMENTS
The Funds may enter into the financial derivative instruments described below to the extent permitted by each Fund’s respective investment policies.
The following disclosures contain information on how and why the Funds use financial derivative instruments, and how financial derivative instruments affect the Funds’ financial position, results of operations and cash flows. The location and fair value amounts of these instruments on the Statements of Assets and Liabilities and the net realized gain (loss) and net change in unrealized appreciation (depreciation) on the Statements of Operations, each categorized by type of financial derivative contract and related risk exposure, are included in a table in the Notes to Schedules of Investments. The financial derivative instruments outstanding as of period end and the amounts of net realized gain (loss) and net change in unrealized appreciation (depreciation) on financial derivative instruments during the period, as disclosed in the Notes to Schedules of Investments, serve as indicators of the volume of financial derivative activity for the Funds.
Forward Foreign Currency Contracts may be engaged, in connection with settling planned purchases or sales of securities, to hedge the currency exposure associated with some or all of a Fund’s securities or as part of an investment strategy. A forward foreign currency contract is an agreement between two parties to buy and sell a currency at a set price on a future date. The market value of a forward foreign currency contract fluctuates with changes in foreign currency exchange rates. Forward foreign currency contracts are marked to market daily, and the change in value is recorded by a Fund as an unrealized gain (loss).
| | | | | | | | | | | | |
| | | | ANNUAL FINANCIAL AND OTHER INFORMATION | | | | | | | JUNE 30, 2024 | | | 51 |
| | | | |
| Notes to Financial Statements | | (Cont.) | | |
Realized gains (losses) are equal to the difference between the value of the contract at the time it was opened and the value at the time it was closed and are recorded upon delivery or receipt of the currency. These contracts may involve market risk in excess of the unrealized gain (loss) reflected on the Statements of Assets and Liabilities. In addition, a
Fund could be exposed to risk if the counterparties are unable to meet the terms of the contracts or if the value of the currency changes unfavorably to the U.S. dollar. To mitigate such risk, cash or securities may be exchanged as collateral pursuant to the terms of the underlying contracts.
7. PRINCIPAL AND OTHER RISKS
(a) Principal Risks
The principal risks of investing in a Fund, which could adversely affect its net asset value, yield and total return, are listed below.
| | | | | | | | | | | | |
| Risks | | | | | PIMCO
RAFI Dynamic
Multi-Factor
Emerging Markets
Equity ETF | | PIMCO
RAFI Dynamic
Multi-Factor
International
Equity ETF | | PIMCO
RAFI Dynamic
Multi-Factor
U.S. Equity ETF | | PIMCO
RAFI ESG
U.S. ETF |
| | | | | |
Small Fund | | | | | | X | | — | | — | | X |
| | | | | |
Market Trading | | | | | | X | | X | | X | | X |
| | | | | |
Equity | | | | | | X | | X | | X | | X |
| | | | | |
Credit | | | | | | X | | X | | X | | X |
| | | | | |
Market | | | | | | X | | X | | X | | X |
| | | | | |
Liquidity | | | | | | X | | X | | X | | X |
| | | | | |
Issuer | | | | | | X | | X | | X | | X |
| | | | | |
Derivatives | | | | | | X | | X | | X | | X |
| | | | | |
Foreign (Non-U.S.) Investment | | | | | | X | | X | | — | | — |
| | | | | |
Emerging Markets | | | | | | X | | — | | — | | — |
| | | | | |
China | | | | | | X | | — | | — | | — |
| | | | | |
Currency | | | | | | X | | X | | — | | — |
| | | | | |
Model | | | | | | X | | X | | X | | X |
| | | | | |
Leveraging | | | | | | X | | X | | X | | X |
| | | | | |
Management and Tracking Error | | | | | | X | | X | | X | | X |
| | | | | |
Indexing | | | | | | X | | X | | X | | X |
| | | | | |
Environmental, Social and Governance | | | | | | — | | — | | — | | X |
Please see “Description of Principal Risks” in a Fund’s prospectus for a more detailed description of the risks of investing in a Fund.
Small Fund Risk is the risk that a smaller fund may not achieve investment or trading efficiencies. Additionally, a smaller fund may be more adversely affected by large purchases or redemptions of
fund shares.
Market Trading Risk is the risk that an active secondary trading market for Fund shares does not continue once developed, that a Fund may not continue to meet a listing exchange’s trading or listing requirements, that trading in Fund shares may be halted or become less liquid or that Fund shares trade at prices other than a Fund’s net asset value, and are subject to trading costs, which may be exacerbated if the creation/redemption process becomes less effective, particularly during times of market stress.
Equity Risk is the risk that the value of equity or equity-related securities, such as common stocks and preferred securities, may decline due to general market conditions which are not specifically related to a particular company or to factors affecting a particular industry or
industries. Equity or equity-related securities generally have greater price volatility than fixed income securities. In addition, preferred securities may be subject to greater credit risk or other risks, such as risks related to deferred and omitted distributions, limited voting rights, liquidity, interest rates, regulatory changes and special redemption rights.
Credit Risk is the risk that a Fund could lose money if the counterparty to a derivative contract, or the issuer or guarantor of collateral, is unable or unwilling, or is perceived (whether by market participants, rating agencies, pricing services or otherwise) as unable or unwilling, to meet its financial obligations.
Market Risk is the risk that the value of securities owned by a Fund may go up or down, sometimes rapidly or unpredictably, due to factors affecting securities markets generally or particular industries.
Liquidity Risk is the risk that a particular investment may be difficult to purchase or sell and that a Fund may be unable to sell illiquid investments at an advantageous time or price or achieve its desired level of exposure to a certain sector. The liquidity of a Fund’s shares may be constrained by the liquidity of a Fund’s portfolio holdings.
Issuer Risk is the risk that the value of a security may decline for a reason directly related to the issuer, such as management performance, changes in financial condition or credit rating, financial leverage, reputation or reduced demand for the issuer’s goods or services.
Derivatives Risk is the risk of investing in derivative instruments (such as forwards, futures, swaps and structured securities) and other similar investments, including leverage, liquidity, interest rate, market, counterparty (including credit), operational, legal and management risks, and valuation complexity. Changes in the value of a derivative or other similar investment may not correlate perfectly with, and may be more sensitive to market events than, the underlying asset, rate or index, and a Fund could lose more than the initial amount invested. Changes in the value of a derivative or other similar instrument may also create margin delivery or settlement payment obligations for a Fund. A Fund’s use of derivatives or other similar investments may result in losses to a Fund, a reduction in a Fund’s returns and/or increased volatility. Non-centrally-cleared over-the-counter (“OTC”) derivatives or other similar investments are also subject to the risk that a counterparty to the transaction will not fulfill its contractual obligations to the other party, as many of the protections afforded to centrally-cleared derivative transactions might not be available for non-centrally-cleared OTC derivatives or other similar investments. The primary credit risk on derivatives or other similar investments that are exchange-traded or traded through a central clearing counterparty resides with a Fund’s clearing broker or the clearinghouse. Changes in regulation relating to a registered fund’s use of derivatives and related instruments could potentially limit or impact the Fund’s ability to invest in derivatives, limit a Fund’s ability to employ certain strategies that use derivatives or other similar investments and/or adversely affect the value of derivatives or other similar investments and a Fund’s performance.
Foreign (Non-U.S.) Investment Risk is the risk that investing in foreign (non-U.S.) securities may result in a Fund experiencing more rapid and extreme changes in value than a fund that invests exclusively in securities of U.S. companies, due to smaller markets, differing reporting, accounting and auditing standards, increased risk of delayed settlement of portfolio transactions or loss of certificates of portfolio securities, and the risk of unfavorable foreign government actions, including nationalization, expropriation or confiscatory taxation, currency blockage, political changes, diplomatic developments or the imposition of sanctions and other similar measures. Foreign securities may also be less liquid and more difficult to value than securities of U.S. issuers.
Emerging Markets Risk is the risk of investing in emerging market securities, primarily increased foreign (non-U.S.) investment risk.
Currency Risk is the risk that foreign (non-U.S.) currencies will change in value relative to the U.S. dollar and affect a Fund’s investments in foreign (non-U.S.) currencies or in securities that trade in, and receive revenues in, or in derivatives that provide exposure to, foreign (non-U.S.) currencies.
Model Risk is the risk that a Fund’s investment models used in making investment allocation decisions, including the indexation methodologies used in constructing the underlying index, may not adequately take into account certain factors or may contain design flaws or faulty assumptions, and may rely on incomplete or inaccurate data inputs, any of which may result in a decline in the value of an investment in a Fund.
Leveraging Risk is the risk that certain transactions of a Fund, such as reverse repurchase agreements, loans of portfolio securities, and the use of when-issued, delayed delivery or forward commitment transactions, or derivative instruments, may give rise to leverage, magnifying gains and losses and causing a Fund to be more volatile than if it had not been leveraged. This means that leverage entails a heightened risk of loss.
Management and Tracking Error Risk is the risk that a portfolio manager’s investment decisions may not produce the desired results or that a Fund’s portfolio may not closely track the underlying index for a number of reasons. A Fund incurs operating expenses, which are not applicable to the underlying index, and the costs of buying and selling securities, especially when rebalancing a Fund’s portfolio to reflect changes in the composition of the underlying index. Performance of a Fund and the underlying index may vary due to asset valuation differences and differences between a Fund’s portfolio and the underlying index due to legal restrictions, cost or liquidity restraints. The risk that performance of a Fund and the underlying index may vary may be heightened during periods of increased market volatility or other unusual market conditions. In addition, a Fund’s use of a representative sampling approach may cause a Fund to be less correlated to the return of the underlying index than if a Fund held all of the securities in the underlying index.
Indexing Risk is the risk that a Fund is negatively affected by general declines in the asset classes represented by the underlying index.
Environmental, Social and Governance Risk is the risk that, because the underlying index may select or exclude securities of certain issuers for reasons other than performance, the Fund’s performance will differ from funds that do not utilize an ESG investing strategy. ESG investing is qualitative and subjective by nature, and there is no guarantee that the factors utilized by the index provider or any judgment exercised by the index provider in constructing the underlying index will reflect the opinions of any particular investor.
| | | | | | | | | | | | |
| | | | ANNUAL FINANCIAL AND OTHER INFORMATION | | | | | | | JUNE 30, 2024 | | | 53 |
| | | | |
| Notes to Financial Statements | | (Cont.) | | |
China Risk is the risk of investing in securities and instruments economically tied to the People’s Republic of China (excluding Hong Kong, Macau and Taiwan for the purpose of this disclosure) (“PRC”). These investments subject the Fund to the risks of investing in foreign (non-U.S.) securities and emerging market securities, as well as additional risks including, without limitation, inefficiencies resulting from erratic growth, the unavailability of consistently-reliable economic data, dependence on exports and international trade, asset price volatility, potential shortage of liquidity and limited accessibility by foreign (non-U.S.) investors, fluctuations in currency exchange rates, currency devaluation, the relatively small size and absence of operating history of many PRC companies, and the developing nature of the legal and regulatory framework for securities markets, custody arrangements and commerce.
(b) Other Risks
In general, a Fund may be subject to additional risks, including, but not limited to, risks related to government regulation and intervention in financial markets, operational risks, risks associated with financial, economic and global market disruptions, and cyber security risks.
Please see a Fund’s prospectus and Statement of Additional Information for a more detailed description of the risks of investing in a Fund. Please see the Important Information section of this report for additional discussion of certain regulatory and market developments that may impact a Fund’s performance.
Market Disruptions Risk A Fund is subject to investment and operational risks associated with financial, economic and other global market developments and disruptions, including those arising from war, military conflicts, terrorism, market manipulation, government interventions, defaults and shutdowns, political changes or diplomatic developments, public health emergencies (such as the spread of infectious diseases, pandemics and epidemics), bank failures and natural/environmental disasters, which can all negatively impact the securities markets and cause a Fund to lose value. These events can also impair the technology and other operational systems upon which a Fund’s service providers, including PIMCO as a Fund’s investment adviser, rely, and could otherwise disrupt a Fund’s service providers’ ability to fulfill their obligations to a Fund.
Government Intervention in Financial Markets Federal, state, and other governments, their regulatory agencies, or self-regulatory organizations may take actions that affect the regulation of the instruments in which a Fund invests, or the issuers of such instruments, in ways that are unforeseeable. Legislation or regulation may also change the way in which a Fund itself is regulated. Such legislation or regulation could limit or preclude a Fund’s ability to achieve its investment objective. Furthermore, volatile financial markets can
expose a Fund to greater market and liquidity risk and potential difficulty in valuing portfolio instruments held by the Fund. The value of a Fund’s holdings is also generally subject to the risk of future local, national, or global economic disturbances based on unknown weaknesses in the markets in which a Fund invests. In addition, it is not certain that the U.S. Government will intervene in response to a future market disturbance and the effect of any such future intervention cannot be predicted. It is difficult for issuers to prepare for the impact of future financial downturns, although companies can seek to identify and manage future uncertainties through risk management programs.
Regulatory Risk Financial entities, such as investment companies and investment advisers, are generally subject to extensive government regulation and intervention. Government regulation and/or intervention may change the way a Fund is regulated, affect the expenses incurred directly by a Fund and the value of its investments, and limit and/or preclude a Fund’s ability to achieve its investment objective. Government regulation may change frequently and may have significant adverse consequences. Moreover, government regulation may have unpredictable and unintended effects.
Operational Risk An investment in a Fund, like any fund, can involve operational risks arising from factors such as processing errors, human errors, inadequate or failed internal or external processes, failures in systems and technology, changes in personnel and errors caused by third-party service providers. The occurrence of any of these failures, errors or breaches could result in a loss of information, regulatory scrutiny, reputational damage or other events, any of which could have a material adverse effect on a Fund. While a Fund seeks to minimize such events through controls and oversight, there may still be failures that could cause losses to the Fund.
Cyber Security Risk As the use of technology, including cloud-based technology, has become more prevalent in the course of business, the Funds have become potentially more susceptible to operational and information security risks resulting from breaches in cyber security. A breach in cyber security refers to both intentional and unintentional cyber events that may, among other things, cause a Fund to lose proprietary information, suffer data corruption and/ or destruction or lose operational capacity, result in the unauthorized release or other misuse of confidential information, or otherwise disrupt normal business operations. Cyber security failures or breaches may result in financial losses to a Fund and its shareholders. These failures or breaches may also result in disruptions to business operations, potentially resulting in financial losses; interference with a Fund’s ability to calculate its net asset value, process shareholder transactions or otherwise transact business with shareholders; impediments to trading; violations of applicable privacy and other laws; regulatory fines; penalties; third-party claims in litigation; reputational damage;
reimbursement or other compensation costs; additional compliance and cyber security risk management costs and other adverse consequences. In addition, substantial costs may be incurred in order to prevent any cyber incidents in the future. There is also a risk that cyber security breaches may not be detected. The Funds and their shareholders may suffer losses as a result of a cyber security breach related to the Funds, their service providers, trading counterparties or the issuers in which a Fund invests.
8. MASTER NETTING ARRANGEMENTS
A Fund may be subject to various netting arrangements (“Master Agreements”) with select counterparties. Master Agreements govern the terms of certain transactions, and are intended to reduce the counterparty risk associated with relevant transactions by specifying credit protection mechanisms and providing standardization that is intended to improve legal certainty. Each type of Master Agreement governs certain types of transactions. Different types of transactions may be traded out of different legal entities or affiliates of a particular organization, resulting in the need for multiple agreements with a single counterparty. As the Master Agreements are specific to unique operations of different asset types, they allow a Fund to close out and net its total exposure to a counterparty in the event of a default with respect to all the transactions governed under a single Master Agreement with a counterparty. For financial reporting purposes the Statements of Assets and Liabilities generally present derivative assets and liabilities on a gross basis, which reflects the full risks and exposures prior to netting.
Master Agreements can also help limit counterparty risk by specifying collateral posting arrangements at pre-arranged exposure levels. Under most Master Agreements, collateral is routinely transferred if the total net exposure to certain transactions (net of existing collateral already in place) governed under the relevant Master Agreement with a counterparty in a given account exceeds a specified threshold, which typically ranges from zero to $250,000 depending on the counterparty and the type of Master Agreement. United States Treasury Bills and U.S. dollar cash are generally the preferred forms of collateral, although other securities may be used depending on the terms outlined in the applicable Master Agreement. Securities and cash pledged as collateral are reflected as assets on the Statements of Assets and Liabilities as either a component of Investments at value (securities) or Deposits with counterparty. Cash collateral received is not typically held in a segregated account and as such is reflected as a liability on the Statements of Assets and Liabilities as Deposits from counterparty. The market value of any securities received as collateral is not reflected as a component of NAV. A Fund’s overall exposure to counterparty risk can change substantially within a short period, as it is affected by each transaction subject to the relevant Master Agreement.
The Funds lend their securities through Securities Finance Trust Company (“Securities Lending Agent”), an unaffiliated securities lending agent, and receives collateral in the form of cash or securities with a value at least equal to the value of the securities on loan. The value of the loaned securities is determined at the close of each business day, and any increases or decreases in the required collateral are exchanged between the Fund and the counterparty on the next business day. Cash collateral received is invested in the PIMCO Government Money Market Fund or another cash sweep vehicle agreed by the Fund. The Securities Lending Agent administers the Funds’ securities lending program, providing services that include marketing the Funds’ available securities, soliciting bids from potential borrowers, monitoring the daily value of the loaned securities, and investing cash collateral in accordance with specific instructions provided by the Funds.
Master Repurchase Agreements and Global Master Repurchase Agreements (individually and collectively “Master Repo Agreements”) govern repurchase, reverse repurchase and certain sale-buyback transactions between a Fund and select counterparties. Master Repo Agreements maintain provisions for, among other things, initiation, income payments, events of default and maintenance of collateral. The market value of transactions under the Master Repo Agreement, collateral pledged or received, and the net exposure by counterparty as of period end are disclosed in the Notes to Schedules of Investments.
Master Securities Forward Transaction Agreements (“Master Forward Agreements”) govern certain forward settling transactions, such as TBA securities, delayed-delivery or certain sale-buyback transactions by and between a Fund and select counterparties. The Master Forward Agreements maintain provisions for, among other things, transaction initiation and confirmation, payment and transfer, events of default, termination and maintenance of collateral. The market value of forward settling transactions, collateral pledged or received, and the net exposure by counterparty as of period end is disclosed in the Notes to Schedules of Investments.
Customer Account Agreements and related addenda govern cleared derivatives transactions such as futures, options on futures and cleared OTC derivatives. Such transactions require posting of initial margin as determined by each relevant clearing agency which is segregated in an account at a futures commission merchant (“FCM”) registered with the Commodity Futures Trading Commission. In the United States, counterparty risk may be reduced as creditors of an FCM cannot have a claim to Fund assets in the segregated account. FCM customers, such as the Funds, are permitted to transfer their customer account (and cleared derivative transactions held in such customer account) from one FCM to another FCM. Upon completion of the transfer, the customer maintains the same economic position with respect to the outstanding exposure. As such, these transfers are not recognized as dispositions and reacquisitions of the affected derivative positions. Variation
| | | | | | | | | | | | |
| | | | ANNUAL FINANCIAL AND OTHER INFORMATION | | | | | | | JUNE 30, 2024 | | | 55 |
| | | | |
| Notes to Financial Statements | | (Cont.) | | |
margin, which reflects changes in market value, is generally exchanged daily, but may not be netted between futures and cleared OTC derivatives unless the parties have agreed to a separate arrangement in respect of portfolio margining. The porting of exposure between FCMs has no impact on the market value or accumulated unrealized appreciation (depreciation), initial margin posted, and any unsettled variation margin; these values as of period end are disclosed in the Notes to Schedules of Investments.
International Swaps and Derivatives Association, Inc. Master Agreements and Credit Support Annexes (“ISDA Master Agreements”) govern bilateral OTC derivative transactions entered into by a Fund with select counterparties. ISDA Master Agreements maintain provisions for general obligations, representations, agreements, collateral posting and events of default or termination. Events of termination include conditions that may entitle counterparties to elect to terminate early and cause settlement of all outstanding transactions under the applicable ISDA Master Agreement. Any election to terminate early could be material to the financial statements. The ISDA Master Agreement may contain additional provisions that add counterparty protection beyond coverage of existing daily exposure if the counterparty has a decline in credit quality below a predefined level or as required by regulation. Similarly, if required by regulation, the Funds may be required to post additional collateral beyond coverage of daily exposure. These amounts, if any, may (or if required by law, will) be segregated with a third-party custodian. To the extent the Funds are required by regulation to post additional collateral beyond coverage of daily exposure, they could potentially incur costs, including in procuring eligible assets to meet collateral requirements, associated with such posting. The market value of OTC financial derivative instruments, collateral received or pledged, and net exposure by counterparty as of period end are disclosed in the Notes to Schedules of Investments.
9. FEES AND EXPENSES
(a) Management Fee PIMCO, a majority-owned subsidiary of Allianz Asset Management of America LLC (“Allianz Asset Management”), serves as the Manager to the Trust, pursuant to an investment management agreement. Each Fund pays PIMCO fees in return for providing investment advisory, supervisory and administrative services under an all-in fee structure. Each Fund will pay monthly management fees to PIMCO at an annual rate based on average daily net assets (the “Management Fee”), at an annual rate as noted in the table below.
| | | | | | | | |
| Fund Name | | | | | Management
Fee | |
| | |
PIMCO RAFI Dynamic Multi-Factor Emerging Markets Equity ETF | | | | | | | 0.49% | |
| | |
PIMCO RAFI Dynamic Multi-Factor International Equity ETF | | | | | | | 0.39% | |
| | |
PIMCO RAFI Dynamic Multi-Factor U.S. Equity ETF | | | | | | | 0.29% | |
| | |
PIMCO RAFI ESG U.S. ETF | | | | | | | 0.29% | |
(b) Distribution and Servicing Fees PIMCO Investments LLC, a wholly-owned subsidiary of PIMCO, serves as the distributor (“Distributor”) of each Fund’s Creation Units. The Distributor does not maintain a secondary market in shares of the Funds. During the period ended June 30, 2024, each Fund was permitted to compensate the Distributor at an annual rate of up to 0.25% of a Fund’s average daily net assets (the “12b-1 Plan Fee”). However, the Board of Trustees has determined not to authorize payment of a 12b-1 Plan Fee at this time. The 12b-1 Plan Fee may only be imposed or increased when the Board determines that it is in the best interests of shareholders to do so. Because these fees are paid out of a Fund’s assets on an ongoing basis, to the extent that a fee is authorized, over time it will increase the cost of an investment in the Fund. The 12b-1 Plan Fee may cost an investor more than other types of sales charges.
(c) Fund Expenses PIMCO provides or procures supervisory and administrative services for shareholders and also bears the costs of various third-party services required by the Funds, including audit, custodial, portfolio accounting, legal, transfer agency and printing costs. The Funds bear other expenses which are not covered under the Management Fee which may vary and affect the total level of expenses paid by shareholders, such as (i) salaries and other compensation of any of the Trust’s executive officers and employees who are not officers, directors, shareholders, members, partners or employees of PIMCO or its subsidiaries or affiliates; (ii) taxes and governmental fees; (iii) brokerage fees and commissions and other portfolio transaction expenses; (iv) costs of borrowing money, including interest expenses; (v) securities lending fees and expenses; (vi) fees and expenses of the Trustees who are not “interested persons” of PIMCO or the Trust, and any counsel retained exclusively for their benefit; (vii) extraordinary expenses, including costs of litigation and indemnification expenses; and (viii) organizational and offering expenses of the Trust and the Funds, and any other expenses, which are capitalized in accordance with generally accepted accounting principles. The ratio of expenses to average net assets, as disclosed on the Financial Highlights, may differ from the annual fund operating expenses as disclosed in the prospectus.
(d) Remuneration Paid to Directors, Officers and Others (N-CSR Item 10) The Trust pays no compensation directly to any Trustee or any other officer who is affiliated with the Administrator, all of whom receive remuneration for their services to the Trust from the Administrator or its affiliates. The pro rata share of Trustee fees for each Fund is reflected on the Statements of Operations as Trustee fees.
(e) Expense Limitation Pursuant to the Expense Limitation Agreement, PIMCO has contractually agreed, through October 31, 2024, to waive its Management Fee or reimburse each Fund, to the extent that each Fund’s organizational expenses, pro rata share of expenses related to obtaining or maintaining a Legal Entity Identifier and pro rata share of
Trustee fees exceed 0.0049% (the “Expense Limit”) (calculated as a percentage of each Fund’s average daily net assets). The Expense Limitation Agreement will automatically renew for one-year terms unless PIMCO provides written notice to the Trust at least 30 days prior to the end of the then current term. The waivers, if any, are reflected on the Statements of Operations as a component of Waiver and/or Reimbursement by PIMCO. For the period ended June 30, 2024, the amounts were (in thousands†):
| | | | | | | | |
| Fund Name | | | | | Waived Fees | |
| | |
PIMCO RAFI Dynamic Multi-Factor Emerging Markets Equity ETF | | | | | | $ | 5 | |
| | |
PIMCO RAFI Dynamic Multi-Factor International Equity ETF | | | | | | | 9 | |
| | |
PIMCO RAFI Dynamic Multi-Factor U.S. Equity ETF | | | | | | | 7 | |
| | |
PIMCO RAFI ESG U.S. ETF | | | | | | | 2 | |
| † | A zero balance may reflect actual amounts rounding to less than one thousand. |
In any month in which the investment management agreement is in effect, PIMCO is entitled to reimbursement by each Fund of any portion of the Management Fee and/or other expenses waived or reimbursed pursuant to the Expense Limitation Agreement (the “Reimbursement Amount”) within thirty-six months of the time of the waiver, provided that such amount paid to PIMCO will not: i) together with any organizational expenses, pro rata share of expenses related to obtaining or maintaining a Legal Entity Identifier and pro rata Trustee fees, exceed, for such month, the Expense Limit (or the amount of the expense limit in place at the time the amount being recouped was originally waived if lower than the Expense Limit); ii) exceed the total Reimbursement Amount; or iii) include any amounts previously reimbursed to PIMCO. The total recoverable amounts to PIMCO as of June 30, 2024, were as follows (amounts in thousands†):
| | | | | | | | | | | | | | | | | | | | |
| | | | Expiring within | | | | |
| | | | | |
| Fund Name | | | | | 12 months | | | 13-24 months | | | 25-36 months | | | Total | |
| | | | | |
PIMCO RAFI Dynamic Multi-Factor Emerging Markets Equity ETF | | | | | | $ | 20 | | | $ | 6 | | | $ | 5 | | | $ | 31 | |
| | | | | |
PIMCO RAFI Dynamic Multi-Factor International Equity ETF | | | | | | | 0 | | | | 1 | | | | 9 | | | | 10 | |
| | | | | |
PIMCO RAFI Dynamic Multi-Factor U.S. Equity ETF | | | | | | | 2 | | | | 8 | | | | 7 | | | | 17 | |
| | | | | |
PIMCO RAFI ESG U.S. ETF | | | | | | | 0 | | | | 1 | | | | 2 | | | | 3 | |
| † | A zero balance may reflect actual amounts rounding to less than one thousand. |
10. RELATED PARTY TRANSACTIONS
The Manager and Distributor are related parties. Fees paid to these parties are disclosed in Note 9, Fees and Expenses, and the accrued related party fee amounts are disclosed on the Statements of Assets and Liabilities.
11. GUARANTEES AND INDEMNIFICATIONS
Under the Trust’s organizational documents, each Trustee or officer of the Trust is indemnified and each employee or other agent of the Trust (including the Trust’s investment manager) may be indemnified, to the extent permitted by the Act, against certain liabilities that may arise out of performance of their duties to the Funds. Additionally, in the normal course of business, the Funds enter into contracts that contain a variety of indemnification clauses. The Funds’ maximum exposure under these arrangements is unknown as this would involve future claims that may be made against the Funds that have not yet occurred. However, the Funds have not had prior claims or losses pursuant to these contracts.
12. PURCHASES AND SALES OF SECURITIES
The length of time a Fund has held a particular security is not generally a consideration in investment decisions. A change in the securities held by a Fund is known as “portfolio turnover.” Each Fund may engage in frequent and active trading of portfolio securities to achieve its investment objective(s), particularly during periods of volatile market movements. High portfolio turnover may involve correspondingly greater transaction costs, including brokerage commissions or dealer mark-ups and other transaction costs on the sale of securities and reinvestments in other securities, which are borne by a Fund. Such sales may also result in realization of taxable capital gains, including short-term capital gains (which are generally taxed at ordinary income tax rates when distributed to shareholders). The transaction costs associated with portfolio turnover may adversely affect a Fund’s performance. The portfolio turnover rates are reported in the Financial Highlights.
Purchases and sales of securities (excluding short-term investments) for the period ended June 30, 2024, were as follows (amounts in thousands†):
| | | | | | | | | | | | | | | | | | | | |
| | | | U.S. Government/Agency | | | All Other | |
| | | | |
| Fund Name | | | Purchases | | | Sales | | | Purchases | | | Sales | |
| | | | | |
PIMCO RAFI Dynamic Multi-Factor Emerging Markets Equity ETF | | | | | | $ | 0 | | | $ | 0 | | | $ | 38,857 | | | $ | 36,117 | |
| | | | | |
PIMCO RAFI Dynamic Multi-Factor International Equity ETF | | | | | | | 0 | | | | 0 | | | | 76,205 | | | | 58,686 | |
| | | | | |
PIMCO RAFI Dynamic Multi-Factor U.S. Equity ETF | | | | | | | 0 | | | | 0 | | | | 54,865 | | | | 55,053 | |
| | | | | |
PIMCO RAFI ESG U.S. ETF | | | | | | | 0 | | | | 0 | | | | 8,531 | | | | 7,996 | |
| | | | | | | | | | | | | | | | | | | | |
| † | A zero balance may reflect actual amounts rounding to less than one thousand. |
| | | | | | | | | | | | |
| | | | ANNUAL FINANCIAL AND OTHER INFORMATION | | | | | | | JUNE 30, 2024 | | | 57 |
| | | | |
| Notes to Financial Statements | | (Cont.) | | |
13. CAPITAL SHARE TRANSACTIONS
Capital shares are issued and redeemed by a Fund only in Creation Units. Except when aggregated in Creation Units, shares of a Fund are not redeemable. Transactions in capital shares for a Fund are disclosed in detail on the Statements of Changes in Net Assets.
The consideration for the purchase of Creation Units of a Fund generally consists of a basket of cash and/or securities that a Fund specifies each business day. Authorized Participants may be charged transaction fees as set forth below. To offset transfer and other transaction costs associated with the issuance and redemption of Creation Units, Authorized Participants are subject to standard creation and redemption transaction fees payable directly to State Street Bank and Trust Company, the sub-administrator of the Funds. PIMCO may, from time to time, at its own expense, compensate purchasers of Creation Units who have purchased substantial amounts of Creation Units and other financial institutions for administrative or marketing services. Creations and redemptions for cash (when cash creations and redemptions are available or specified) may be subject to an additional variable charge up to the maximum amount shown in the table below.
| | | | | | | | | | | | | | | | |
| Fund Name | | | | | Standard Creation/
Redemption
Transaction Fee* | | | Maximum
Variable
Charge for
Cash Creations** | | | Maximum
Variable
Charge for
Cash Redemptions** | |
| | | | |
PIMCO RAFI Dynamic Multi-Factor Emerging Markets Equity ETF | | | | | | $ | 2,250 | | | | 3.00% | | | | 2.00% | |
| | | | |
PIMCO RAFI Dynamic Multi-Factor International Equity ETF | | | | | | $ | 5,000 | | | | 3.00% | | | | 2.00% | |
| | | | |
PIMCO RAFI Dynamic Multi-Factor U.S. Equity ETF | | | | | | $ | 2,250 | | | | 3.00% | | | | 2.00% | |
| | | | |
PIMCO RAFI ESG U.S. ETF | | | | | | $ | 500 | | | | 3.00% | | | | 2.00% | |
| * | Applicable to in-kind contributions or redemptions only. |
| ** | As a percentage of the net asset value per Creation Unit purchased or redeemed, inclusive of the standard creation transaction fee (if imposed). |
14. INVESTMENT TRANSACTIONS
For the period ended June 30, 2024, certain Funds had in-kind contributions and in-kind redemptions as follows (amounts in thousands†):
| | | | | | | | | | | | |
| Fund Name | | | | | Contributions | | | Redemptions | |
| | | |
PIMCO RAFI Dynamic Multi-Factor Emerging Markets Equity ETF | | | | | | $ | 464 | | | $ | 0 | |
| | | |
PIMCO RAFI Dynamic Multi-Factor International Equity ETF | | | | | | | 78,797 | | | | 5,991 | |
| | | |
PIMCO RAFI Dynamic Multi-Factor U.S. Equity ETF | | | | | | | 39,253 | | | | 42,831 | |
| | | |
PIMCO RAFI ESG U.S. ETF | | | | | | | 16,780 | | | | 4,996 | |
| † | A zero balance may reflect actual amounts rounding to less than one thousand. |
The in-kind contributions and in-kind redemptions in this table may not agree with the Fund Share Transactions on the Statements of Changes in Net Assets. The table represents the accumulation of each Fund’s daily net shareholder transactions which were executed in kind while the Statements of Changes in Net Assets reflect gross shareholder transactions including any cash component of the transactions.
15. REGULATORY AND LITIGATION MATTERS
The Funds are not named as defendants in any material litigation or arbitration proceedings and are not aware of any material litigation or claim pending or threatened against them.
The foregoing speaks only as of the date of this report.
16. FEDERAL INCOME TAX MATTERS
Each Fund intends to qualify as a regulated investment company under Subchapter M of the Internal Revenue Code (the “Code”) and distribute all of its taxable income and net realized gains, if applicable, to shareholders. Accordingly, no provision for Federal income taxes has been made.
A Fund may be subject to local withholding taxes, including those imposed on realized capital gains. Any applicable foreign capital gains tax is accrued daily based upon net unrealized gains, and may be payable following the sale of any applicable investments.
In accordance with U.S. GAAP, the Manager has reviewed the Funds’ tax positions for all open tax years. As of June 30, 2024, the Funds have recorded no liability for net unrecognized tax benefits relating to uncertain income tax positions they have taken or expect to take in future tax returns.
The Funds file U.S. federal, state and local tax returns as required. The Funds’ tax returns are subject to examination by relevant tax authorities until expiration of the applicable statute of limitations, which is generally three years after the filing of the tax return but which can be extended to six years in certain circumstances. Tax returns for open years have incorporated no uncertain tax positions that require a provision for income taxes.
As of June 30, 2024, the components of distributable taxable earnings are as follows (amounts in thousands†):
| | | | | | | | | | | | | | | | | | | | | | | | | | | | | | | | | | | | |
| | | | | | Undistributed
Ordinary
Income(1) | | | Undistributed
Long-Term
Capital Gains | | | Net Tax Basis
Unrealized
Appreciation/
(Depreciation)(2) | | | Other
Book-to-Tax
Accounting
Differences(3) | | | Accumulated
Capital
Losses(4) | | | Qualified
Late-Year
Loss
Deferral -
Capital(5) | | | Qualified
Late-Year
Loss
Deferral -
Ordinary(6) | | | Total
Components
of
Distributable
Earnings | |
| | | | | | | | | |
PIMCO RAFI Dynamic Multi-Factor Emerging Markets Equity ETF | | | | | | $ | 3,186 | | | $ | 0 | | | $ | 6,607 | | | $ | 0 | | | $ | (3,815 | ) | | $ | 0 | | | $ | 0 | | | $ | 5,978 | |
| | | | | | | | | |
PIMCO RAFI Dynamic Multi-Factor International Equity ETF | | | | | | | 3,854 | | | | 0 | | | | 26,325 | | | | 0 | | | | (15,778 | ) | | | 0 | | | | 0 | | | | 14,401 | |
| | | | | | | | | |
PIMCO RAFI Dynamic Multi-Factor U.S. Equity ETF | | | | | | | 427 | | | | 0 | | | | 25,653 | | | | 0 | | | | (23,441 | ) | | | 0 | | | | 0 | | | | 2,639 | |
| | | | | | | | | |
PIMCO RAFI ESG U.S. ETF | | | | | | | 213 | | | | 0 | | | | 5,779 | | | | 0 | | | | (2,683 | ) | | | 0 | | | | 0 | | | | 3,309 | |
| † | A zero balance may reflect actual amounts rounding to less than one thousand. |
| (1) | Includes undistributed short-term capital gains, if any. |
| (2) | Adjusted for open wash sale loss deferrals. Also adjusted for differences between book and tax realized and unrealized gain (loss) on passive foreign investment companies (PFICs), return of capital distributions from underlying funds, and other debt adjustments. |
| (3) | Represents differences in income tax regulations and financial accounting principles generally accepted in the United States of America. |
| (4) | Capital losses available to offset future net capital gains as shown below. |
| (5) | Capital losses realized during the period November 1, 2023 through June 30, 2024 which the Funds elected to defer to the following taxable year pursuant to income tax regulations. |
| (6) | Specified losses realized during the period November 1, 2023 through June 30, 2024 and Ordinary losses realized during the period January 1, 2024 through June 30, 2024 which the Funds elected to defer to the following taxable year pursuant to income tax regulations. |
Under the Regulated Investment Company Modernization Act of 2010, a fund is permitted to carry forward any new capital losses for an unlimited period. Additionally, such capital losses that are carried forward will retain their character as either short-term or long-term capital losses rather than being considered all short-term under previous law.
As of June 30, 2024, the Funds had the following post-effective capital losses with no expiration (amounts in thousands†):
| | | | | | | | | | | | |
| | | | | | Short-Term | | | Long-Term | |
| | | |
PIMCO RAFI Dynamic Multi-Factor Emerging Markets Equity ETF | | | | | | $ | 3,554 | | | $ | 261 | |
| | | |
PIMCO RAFI Dynamic Multi-Factor International Equity ETF | | | | | | | 10,531 | | | | 5,247 | |
| | | |
PIMCO RAFI Dynamic Multi-Factor U.S. Equity ETF | | | | | | | 17,219 | | | | 6,222 | |
| | | |
PIMCO RAFI ESG U.S. ETF | | | | | | | 1,533 | | | | 1,150 | |
| † | A zero balance may reflect actual amounts rounding to less than one thousand. |
As of June 30, 2024, the aggregate cost and the net unrealized appreciation/(depreciation) of investments for federal income tax purposes are as follows (amounts in thousands†):
| | | | | | | | | | | | | | | | | | | | |
| | | | | | Federal
Tax Cost | | | Unrealized
Appreciation | | | Unrealized
(Depreciation) | | | Net Unrealized
Appreciation/
(Depreciation)(7) | |
| | | | | |
PIMCO RAFI Dynamic Multi-Factor Emerging Markets Equity ETF | | | | | | $ | 97,712 | | | $ | 19,080 | | | $ | (11,818 | ) | | $ | 7,262 | |
| | | | | |
PIMCO RAFI Dynamic Multi-Factor International Equity ETF | | | | | | | 226,054 | | | | 35,646 | | | | (9,313 | ) | | | 26,333 | |
| | | | | |
PIMCO RAFI Dynamic Multi-Factor U.S. Equity ETF | | | | | | | 122,221 | | | | 28,977 | | | | (3,323 | ) | | | 25,654 | |
| | | | | |
PIMCO RAFI ESG U.S. ETF | | | | | | | 47,033 | | | | 8,063 | | | | (2,284 | ) | | | 5,779 | |
| † | A zero balance may reflect actual amounts rounding to less than one thousand. |
| (7) | Adjusted for open wash sale loss deferrals. Also adjusted for differences between book and tax realized and unrealized gain (loss) on passive foreign investment companies (PFICs), return of capital distributions from underlying funds, and other debt adjustments. |
| | | | | | | | | | | | |
| | | | ANNUAL FINANCIAL AND OTHER INFORMATION | | | | | | | JUNE 30, 2024 | | | 59 |
| | | | |
| Notes to Financial Statements | | (Cont.) | | June 30, 2024 |
For the fiscal years ended June 30, 2024 and June 30, 2023, respectively, the Funds made the following tax basis distributions (amounts in thousands†):
| | | | | | | | | | | | | | | | | | | | | | | | | | | | |
| | | | | | June 30, 2024 | | | June 30, 2023 | |
| | | | | | | |
| | | | | | Ordinary
Income
Distributions(8) | | | Long-Term
Capital Gain
Distributions | | | Return of
Capital(9) | | | Ordinary
Income
Distributions(8) | | | Long-Term
Capital Gain
Distributions | | | Return of
Capital(9) | |
| | | | | | | |
PIMCO RAFI Dynamic Multi-Factor Emerging Markets Equity ETF | | | | | | $ | 3,936 | | | $ | 0 | | | $ | 0 | | | $ | 2,819 | | | $ | 2,423 | | | $ | 0 | |
| | | | | | | |
PIMCO RAFI Dynamic Multi-Factor International Equity ETF | | | | | | | 5,382 | | | | 0 | | | | 0 | | | | 3,254 | | | | 0 | | | | 0 | |
| | | | | | | |
PIMCO RAFI Dynamic Multi-Factor U.S. Equity ETF | | | | | | | 2,443 | | | | 0 | | | | 0 | | | | 2,406 | | | | 0 | | | | 0 | |
| | | | | | | |
PIMCO RAFI ESG U.S. ETF | | | | | | | 807 | | | | 0 | | | | 0 | | | | 651 | | | | 0 | | | | 0 | |
| † | A zero balance may reflect actual amounts rounding to less than one thousand. |
| (8) | Includes short-term capital gains distributed, if any. |
| (9) | A portion of the distributions made represents a tax return of capital. Return of capital distributions have been reclassified from undistributed net investment income to paid-in capital to more appropriately conform financial accounting to tax accounting. |
| | | | |
| Report of Independent Registered Public Accounting Firm | | | | |
To the Board of Trustees of PIMCO Equity Series® and Shareholders of PIMCO RAFI Dynamic Multi-Factor Emerging Markets Equity ETF, PIMCO RAFI Dynamic Multi-Factor International Equity ETF, PIMCO RAFI Dynamic Multi-Factor U.S. Equity ETF and PIMCO RAFI ESG U.S. ETF
Opinions on the Financial Statements
We have audited the accompanying statements of assets and liabilities, including the schedules of investments, of PIMCO RAFI Dynamic Multi-Factor Emerging Markets Equity ETF, PIMCO RAFI Dynamic Multi-Factor International Equity ETF, PIMCO RAFI Dynamic Multi-Factor U.S. Equity ETF and PIMCO RAFI ESG U.S. ETF (four of the funds constituting PIMCO Equity Series®, hereafter collectively referred to as the “Funds”) as of June 30, 2024, the related statements of operations for the year ended June 30, 2024, the statements of changes in net assets for each of the two years in the period ended June 30, 2024, including the related notes, and the financial highlights for each of the periods indicated therein (collectively referred to as the “financial statements”). In our opinion, the financial statements present fairly, in all material respects, the financial position of each of the Funds as of June 30, 2024, the results of each of their operations for the year then ended, the changes in each of their net assets for each of the two years in the period ended June 30, 2024 and each of the financial highlights for each of the periods indicated therein in conformity with accounting principles generally accepted in the United States of America.
Basis for Opinions
These financial statements are the responsibility of the Funds’ management. Our responsibility is to express an opinion on the Funds’ financial statements based on our audits. We are a public accounting firm registered with the Public Company Accounting Oversight Board (United States) (PCAOB) and are required to be independent with respect to the Funds in accordance with the U.S. federal securities laws and the applicable rules and regulations of the Securities and Exchange Commission and the PCAOB.
We conducted our audits of these financial statements in accordance with the standards of the PCAOB. Those standards require that we plan and perform the audit to obtain reasonable assurance about whether the financial statements are free of material misstatement, whether due to error or fraud.
Our audits included performing procedures to assess the risks of material misstatement of the financial statements, whether due to error or fraud, and performing procedures that respond to those risks. Such procedures included examining, on a test basis, evidence regarding the amounts and disclosures in the financial statements. Our audits also included evaluating the accounting principles used and significant estimates made by management, as well as evaluating the overall presentation of the financial statements. Our procedures included confirmation of securities owned as of June 30, 2024 by correspondence with the custodian, transfer agent and brokers; when replies were not received from brokers, we performed other auditing procedures. We believe that our audits provide a reasonable basis for our opinions.
/s/ PricewaterhouseCoopers LLP
Kansas City, Missouri
August 27, 2024
We have served as the auditor of one or more investment companies in PIMCO Equity Series® since 2010.
| | | | | | | | | | | | |
| | | | ANNUAL FINANCIAL AND OTHER INFORMATION | | | | | | | JUNE 30, 2024 | | | 61 |
| | | | |
| Glossary: | | (abbreviations that may be used in the preceding statements) | | (Unaudited) |
| | | | | | | | | | |
| | | | |
Counterparty Abbreviations: | | | | | | | | |
| | | | | |
| FICC | | Fixed Income Clearing Corporation | | UBS | | UBS Securities LLC | | | | |
| | | | |
Currency Abbreviations: | | | | | | | | |
| | | | | |
| USD (or $) | | United States Dollar | | | | | | | | |
| | | | |
Other Abbreviations: | | | | | | | | |
| | | | | |
| ADR | | American Depositary Receipt | | REIT | | Real Estate Investment Trust | | TBA | | To-Be-Announced |
| | | | | |
| JSC | | Joint Stock Company | | | | | | | | |
| | | | |
| Federal Income Tax Information | | | | (Unaudited) |
As required by the Internal Revenue Code (“Code”) and Treasury Regulations, if applicable, shareholders must be notified within 60 days of the Funds’ fiscal year end regarding the status of qualified dividend income and the dividend received deduction.
Dividend Received Deduction. Corporate shareholders are generally entitled to take the dividend received deduction on the portion of a fund’s dividend distribution that qualifies under tax law. The percentage of the following Funds’ fiscal 2024 ordinary income dividend that qualifies for the corporate dividend received deduction is set forth below.
Qualified Dividend Income. Under the Jobs and Growth Tax Relief Reconciliation Act of 2003, the following percentage of ordinary dividends paid during the fiscal year ended June 30, 2024 was designated as ‘‘qualified dividend income’’ as defined in the Jobs and Growth Tax Relief Reconciliation Act of 2003 subject to reduced tax rates in 2024.
Qualified Interest Income and Qualified Short-Term Capital Gain (for non-U.S. resident shareholders only). Under the American Jobs Creation Act of 2004, the following amounts of ordinary dividends paid during the fiscal year ended June 30, 2024 are considered to be derived from “qualified interest income,” as defined in Section 871(k)(1)(E) of the Code, and therefore are designated as interest-related dividends, as defined in Section 871(k)(1)(C) of the Code. Further, the following amounts of ordinary dividends paid during the fiscal year ended June 30, 2024 are considered to be derived from “qualified short-term capital gain,” as defined in Section 871(k)(2)(D) of the Code, and therefore are designated as qualified short-term gain dividends, as defined by Section 871(k)(2)(C) of the Code.
Section 163(j) Interest Dividends. The Funds intend to pass through the maximum amount allowable as Section 163(j) Interest defined in Proposed Treasury Section 1.163(j)-1(b). The 163(j) amount of ordinary income distributions are as follows:
Foreign Taxes. The Funds have made an election under the Internal Revenue Code Section 853 to pass through foreign taxes paid. Shareholders will receive more detailed information along with their Form 1099-DIV.
| | | | | | | | | | | | | | | | | | | | | | | | | | | | | | | | |
| | | | | | Dividend Received Deduction % | | | Qualified Dividend Income % | | | Qualified Interest Income (000s)† | | | Qualified Short-Term Capital Gains (000s)† | | | 163(j) Interest Dividends (000s)† | | | Foreign Source Income (000s)† | | | Foreign Taxes Pass Through (000s)† | |
| | | | | | | | |
PIMCO RAFI Dynamic Multi-Factor Emerging Markets Equity ETF | | | | | | | 0.00% | | | | 53.69% | | | $ | 0 | | | $ | 0 | | | $ | 4 | | | $ | 4,075 | | | $ | 572 | |
| | | | | | | | |
PIMCO RAFI Dynamic Multi-Factor International Equity ETF | | | | | | | 0.00% | | | | 100.00% | | | | 0 | | | | 0 | | | | 11 | | | | 7,659 | | | | 752 | |
| | | | | | | | |
PIMCO RAFI Dynamic Multi-Factor U.S. Equity ETF | | | | | | | 99.29% | | | | 100.00% | | | | 0 | | | | 0 | | | | 31 | | | | 0 | | | | 0 | |
| | | | | | | | |
PIMCO RAFI ESG U.S. ETF | | | | | | | 100.00% | | | | 100.00% | | | | 0 | | | | 0 | | | | 0 | | | | 0 | | | | 0 | |
| † | A zero balance may reflect actual amounts rounding to less than one thousand. |
Shareholders are advised to consult their own tax advisor with respect to the tax consequences of their investment in the Trust. In January 2025, you will be advised on IRS Form 1099-DIV as to the federal tax status of the dividends and distributions received by you in calendar year 2024.
Section 199A Dividends. Non-corporate fund shareholders of the funds below meeting certain holding period requirements may be able to deduct up to 20 percent of qualified REIT dividends passed through and reported to the shareholders by the funds as IRC section 199A dividends. The IRC section 199A percentage of ordinary dividends are as follows:
| | | | | | | | |
| | | | | | 199A Dividends | |
| | |
PIMCO RAFI Dynamic Multi-Factor Emerging Markets Equity ETF | | | | | | | 0% | |
| | |
PIMCO RAFI Dynamic Multi-Factor International Equity ETF | | | | | | | 0% | |
| | |
PIMCO RAFI Dynamic Multi-Factor U.S. Equity ETF | | | | | | | 0% | |
| | |
PIMCO RAFI ESG U.S. ETF | | | | | | | 0% | |
| | | | | | | | | | | | |
| | | | ANNUAL FINANCIAL AND OTHER INFORMATION | | | | | | | JUNE 30, 2024 | | | 63 |
General Information
Investment Adviser and Administrator
Pacific Investment Management Company LLC
650 Newport Center Drive
Newport Beach, CA 92660
Distributor
PIMCO Investments LLC
1633 Broadway
New York, NY 10019
Custodian
State Street Bank & Trust Co.
State Street Financial Center
One Congress Street, Suite 1
Boston, MA 02114-2016
Transfer Agent
State Street Bank and Trust Company
1776 Heritage Drive
North Quincy, MA 02171
Legal Counsel
Dechert LLP
1900 K Street, N.W.
Washington, D.C. 20006
Independent Registered Public Accounting Firm
PricewaterhouseCoopers LLP
1100 Walnut Street, Suite 1300
Kansas City, MO 64106
This report is submitted for the general information of the shareholders of the Funds listed on the Report cover.

PES3004FSAR_063024
| Item 8. | Changes in and Disagreements with Accountant for Open-End Management Investment Companies. |
Not applicable.
| Item 9. | Proxy Disclosures for Open-End Management Investment Companies. |
Not applicable .
| Item 10. | Remuneration Paid to Directors, Officers, and Others of Open-End Management Investment Companies. |
The information required by this Item 10 is included as part of the Financial Statements and Financial Highlights filed under Item 7(a) of this Form N-CSR.
| Item 11. | Statement Regarding Basis for Approval of Investment Advisory Contract. |
Not applicable.
| Item 12. | Disclosure of Proxy Voting Policies and Procedures for Closed-End Management Investment Companies. |
Not applicable to open-end investment companies.
| Item 13. | Portfolio Managers of Closed-End Management Investment Companies. |
Not applicable to open-end investment companies.
| Item 14. | Purchases of Equity Securities by Closed-End Management Investment Company and Affiliated Purchasers. |
Not applicable to open-end investment companies.
| Item 15. | Submission of Matters to a Vote of Security Holders. |
There have been no material changes to the procedures by which shareholders may recommend nominees to the Trust’s Board of Trustees since the Trust last provided disclosure in response to this item.
| Item 16. | Controls and Procedures. |
| | (a) | The principal executive officer and principal financial & accounting officer have concluded that the Registrant’s disclosure controls and procedures (as defined in Rule 30a-3(c) under the Act) provide reasonable assurances that material information relating to the Registrant is made known to them by the appropriate persons, based on their evaluation of these controls and procedures as of a date within 90 days of the filing of this report. |
| | (b) | There were no changes in the Registrant’s internal control over financial reporting (as defined in Rule 30a-3(d) under the Act) that occurred during the period covered by this report that have materially affected, or are reasonably likely to materially affect, the Registrant’s internal control over financial reporting. |
| Item 17. | Disclosure of Securities Lending Activities for Closed-End Management Investment Companies. |
Not applicable to open-end investment companies.
| Item 18. | Recovery of Erroneously Awarded Compensation |
| | (a)(4) | Not applicable for open-end investment companies. |
| | (a)(5) | There was no change in the Registrant’s independent public accountant for the period covered by the report. |
Signatures
Pursuant to the requirements of the Securities Exchange Act of 1934 and the Investment Company Act of 1940, the registrant has duly caused this report to be signed on its behalf by the undersigned, thereunto duly authorized.
| | |
| PIMCO Equity Series |
| |
| By: | | /s/ Joshua D. Ratner |
| |
| | Joshua D. Ratner |
| | President (Principal Executive Officer) |
| |
| Date: | | September 4, 2024 |
Pursuant to the requirements of the Securities Exchange Act of 1934 and the Investment Company Act of 1940, this report has been signed below by the following persons on behalf of the registrant and in the capacities and on the dates indicated.
| | |
| |
| By: | | /s/ Joshua D. Ratner |
| |
| | Joshua D. Ratner |
| | President (Principal Executive Officer) |
| |
| Date: | | September 4, 2024 |
| |
| By: | | /s/ Bijal Y. Parikh |
| |
| | Bijal Y. Parikh |
| | Treasurer (Principal Financial & Accounting Officer) |
| |
| Date: | | September 4, 2024 |