UNITED STATES
SECURITIES AND EXCHANGE COMMISSION
Washington, D.C. 20549
FORM N-CSR
CERTIFIED SHAREHOLDER REPORT OF REGISTERED MANAGEMENT
INVESTMENT COMPANIES
Investment Company Act file number: 811-22375
PIMCO Equity Series
(Exact name of registrant as specified in charter)
650 Newport Center Drive, Newport Beach, CA 92660
(Address of principal executive office)
Bijal Y. Parikh
Treasurer (Principal Financial & Accounting Officer)
PIMCO Equity Series
650 Newport Center Drive, Newport Beach, CA 92660
(Name and address of agent for service)
Copies to:
Adam T. Teufel
Dechert LLP
1900 K Street, N.W.
Washington, D.C. 20006
Registrant’s telephone number, including area code: (888) 877-4626
Date of fiscal year end: June 30
Date of reporting period: June 30, 2022
Form N-CSR is to be used by management investment companies to file reports with the Commission not later than 10 days after the transmission to stockholders of any report that is required to be transmitted to stockholders under Rule 30e-1 under the Investment Company Act of 1940 (17 CFR 270.30e-1). The Commission may use the information provided on Form N-CSR in its regulatory, disclosure review, inspection, and policymaking roles.
A registrant is required to disclose the information specified by Form N-CSR, and the Commission will make this information public. A registrant is not required to respond to the collection of information contained in Form N-CSR unless the Form displays a currently valid Office of Management and Budget (“OMB”) control number. Please direct comments concerning the accuracy of the information collection burden estimate and any suggestions for reducing the burden to Secretary, Securities and Exchange Commission, 450 Fifth Street, NW, Washington, DC 20549-0609. The OMB has reviewed this collection of information under the clearance requirements of 44 U.S.C. § 3507.
| Item 1. | Reports to Shareholders. |
| | (a) | The following is a copy of the report transmitted to shareholders pursuant to Rule 30e-1 under the Investment Company Act of 1940, as amended (the “Act”) (17 CFR 270.30e-1). |
| | • | | PIMCO Dividend and Income Fund |
| | • | | PIMCO RAE Emerging Markets Fund |
| | • | | PIMCO RAE Global ex-US Fund |
| | • | | PIMCO RAE International Fund |
| | • | | PIMCO RAE US Small Fund |
| | • | | PIMCO REALPATH® Blend 2025 Fund |
| | • | | PIMCO REALPATH® Blend 2030 Fund |
| | • | | PIMCO REALPATH® Blend 2035 Fund |
| | • | | PIMCO REALPATH® Blend 2040 Fund |
| | • | | PIMCO REALPATH® Blend 2045 Fund |
| | • | | PIMCO REALPATH® Blend 2050 Fund |
| | • | | PIMCO REALPATH® Blend 2055 Fund |
| | • | | PIMCO REALPATH® Blend 2060 Fund |
| | • | | PIMCO REALPATH® Blend Income Fund |
| | • | | PIMCO RAFI Dynamic Multi-Factor Emerging Markets Equity ETF |
| | • | | PIMCO RAFI Dynamic Multi-Factor International Equity ETF |
| | • | | PIMCO RAFI Dynamic Multi-Factor U.S. Equity ETF |
| | • | | PIMCO RAFI ESG U.S. ETF |

PIMCO EQUITY SERIES®
Annual Report
June 30, 2022
PIMCO Dividend and Income Fund
Table of Contents
This material is authorized for use only when preceded or accompanied by the current PIMCO Equity Series prospectus. The Shareholder Reports for the other series of the PIMCO Equity Series are printed separately.
Chairman’s Letter
Dear Shareholder,
We hope that you and your family are remaining safe and healthy during these challenging times. We continue to work tirelessly to navigate markets and manage the assets that you have entrusted with us. Following this letter is the PIMCO Equity Series Annual Report, which covers the 12-month reporting period ended June 30, 2022. On the subsequent pages, you will find specific details regarding investment results and a discussion of the factors that most affected performance during the reporting period.
For the 12-month reporting period ended June 30, 2022
The global economy continued to be affected by the COVID-19 pandemic (“COVID-19”) and its variants. Looking back, third quarter 2021 U.S. annualized gross domestic product (“GDP”) grew 2.3%. Economic activity accelerated during the fourth quarter, as GDP growth was 6.9%. However, the U.S. economy then experienced a setback, as first quarter 2022 GDP growth was -1.6%. Finally, the Commerce Department’s initial estimate for second quarter 2022 GDP growth — released after the reporting period ended — was -0.9%.
In the U.S., the Federal Reserve Board (the “Fed”) took several steps to tighten monetary policy to combat elevated inflation. The Fed reduced the monthly pace of its net asset purchases of Treasury securities and agency mortgage-backed securities in November 2021 and again in December. The Fed ended its monthly asset purchases in mid-March 2022. The Fed then raised the federal funds rate 0.25% to a range between 0.25% and 0.50% in March 2022, its first rate hike since 2018. The central bank then raised rates 0.50% in its May 2022 meeting and 0.75% in its June meeting. Finally, on July 27, 2022 — after the reporting period ended — the Fed raised rates 0.75%, to a range between 2.25% and 2.50%.
Economies outside the U.S. also continued to be impacted by the pandemic. The war in Ukraine and its repercussions also led to increased uncertainties around the world. In its April 2022 World Economic Outlook Update, the International Monetary Fund (“IMF”) said it expects U.S. gross domestic product (“GDP”) growth to be 3.7% in 2022, compared to 5.7% in 2021. Elsewhere, the IMF expects 2022 GDP to grow 2.8% in the eurozone (from 5.3% in 2021), 3.7% in the U.K. (from 7.4% in 2021) and 2.4% in Japan (from 1.6% in 2021).
Several other central banks began tightening monetary policy during the period. In December 2021, the Bank of England (the “BoE”) surprised the market and raised rates for the first time since COVID-19 began. The BoE again raised rates at its meetings in February, March, May and June 2022. The European Central Bank (the “ECB”) indicated that it intended to raise rates at its September 2022 meeting.
Elsewhere, the Bank of Japan (the “BoJ”) maintained its loose monetary policy and appears likely to remain accommodative in the near future given the headwinds facing its economy.
During the reporting period, short- and long-term U.S. Treasury yields moved sharply higher. The yield on the benchmark 10-year U.S. Treasury note was 2.98% on June 30, 2022, versus 1.45% on June 30, 2021. The Bloomberg Global Treasury Index (USD Hedged), which tracks fixed-rate, local currency government debt of investment grade countries, including developed and emerging markets, returned -7.91%. Meanwhile, the Bloomberg Global Aggregate Credit Index (USD Hedged), a widely used index of global investment grade credit bonds, returned -12.75%. Riskier fixed income asset classes, including high yield corporate bonds and emerging market debt, were also weak. The ICE BofAML Developed Markets High Yield Constrained Index (USD Hedged), a widely used index of below-investment-grade bonds, returned -12.85%, whereas emerging market external debt, as represented by the JPMorgan Emerging Markets Bond Index (EMBI) Global (USD Hedged), returned -19.25%. Emerging market local bonds, as represented by the JPMorgan Government Bond Index-Emerging Markets Global Diversified Index (Unhedged), returned -19.28%.
Amid periods of volatility, global equities generally posted weak results during the reporting period as economic and geopolitical concerns weighed on investor sentiment. U.S. equities, as represented by the S&P 500 Index, returned -10.62%. Global equities, as represented by the MSCI World Index, returned -14.34%, while emerging market equities, as measured by the MSCI Emerging Markets Index, returned -25.28%. Meanwhile, Japanese equities, as represented by the Nikkei 225 Index (in JPY), returned -8.33% and European equities, as represented by the MSCI Europe Index (in EUR), returned -6.54%.
Commodity prices were volatile and generated mixed returns. Brent crude oil, which was approximately $75 a barrel at the start of the reporting period, rose to roughly $112 a barrel at the end of June 2022. We believe the oil-price increase was driven by supply shortages and stronger demand due to economic re-openings as COVID-19 restrictions eased. Repercussions from the war in Ukraine also contributed to higher oil prices. In terms of other commodities prices, copper declined, whereas gold rose during the period.
Finally, there were also periods of volatility in the foreign exchange markets. We believe this was due to several factors, including economic growth expectations and changing central bank monetary policies, as well as rising inflation, COVID-19 variants and geopolitical events. The U.S. dollar strengthened against several major currencies. For example, during the reporting period, the U.S. dollar returned 11.59%, 11.95% and 18.13% versus the euro, the British pound and the Japanese yen, respectively.
Thank you for the assets you have placed with us. We deeply value your trust, and we will continue to work diligently to meet your broad investment needs. For any
| | | | | | | | | | |
| | | ANNUAL REPORT | | | | JUNE 30, 2022 | | | 3 | |
Chairman’s Letter (Cont.)
questions regarding the funds, please contact your account manager or financial adviser, or call one of our shareholder associates at (888) 87-PIMCO. We also invite you to visit our website at www.pimco.com to learn more about our global viewpoints.
| | |
 | | Sincerely, 
Peter G. Strelow Chairman of the Board
PIMCO Equity Series |
Past performance is no guarantee of future results. Unless otherwise noted, index returns reflect the reinvestment of income distributions and capital gains, if any, but do not reflect fees, brokerage commissions or other expenses of investing. It is not possible to invest directly in an unmanaged index.
Important Information About the PIMCO Dividend and Income Fund
PIMCO Equity Series (the “Trust”) is an open-end management investment company that includes PIMCO Dividend and Income Fund (the “Fund”).
We believe that equity funds have an important role to play in a well-diversified investment portfolio. It is important to note, however, that equity funds are subject to notable risks. Among other things, equity and equity-related securities may decline in value due to both real and perceived general market, economic, and industry conditions.
The values of equity securities, such as common stocks and preferred securities, have historically risen and fallen in periodic cycles and may decline due to general market conditions, which are not specifically related to a particular company, such as real or perceived adverse economic conditions, changes in the general outlook for corporate earnings, changes in interest or currency rates or adverse investor sentiment generally. Equity securities may also decline due to factors that affect a particular industry or industries, such as labor shortages, increased production costs and competitive conditions within an industry. In addition, the value of an equity security may decline for a number of reasons that directly relate to the issuer, such as management performance, financial leverage and reduced demand for the issuer’s goods or services, as well as the historical and prospective earnings of the issuer and the value of its assets. Different types of equity securities may react differently to these developments and a change in the financial condition of a single issuer may affect securities markets as a whole.
During a general downturn in the securities markets, multiple asset classes, including equity securities, may decline in value simultaneously. The market price of equity securities owned by the Fund may go up or down, sometimes rapidly or unpredictably. Equity securities generally have greater price volatility than fixed income securities and common stocks generally have the greatest appreciation and depreciation potential of all equity securities.
The Fund may be subject to various risks as described in its prospectus and in the Principal and Other Risks in the Notes to Financial Statements.
Classifications of the Fund’s portfolio holdings in this report are made according to financial reporting standards. The classification of a particular portfolio holding as shown in the Allocation Breakdown and Schedule of Investments sections of this report may differ from the classification used for the Fund’s compliance calculations, including those used in the Fund’s prospectus, investment objectives, regulatory, and other investment limitations and policies, which may be based on different asset class, sector or geographical classifications. The Fund is separately monitored for compliance with respect to prospectus and regulatory requirements.
The geographical classification of foreign (non-U.S.) securities in this report, if any, are classified by the country of incorporation of a holding. In certain instances, a security’s country of incorporation may be different from its country of economic exposure.
Beginning in January 2020, global financial markets have experienced and may continue to experience significant volatility resulting from the spread of a novel coronavirus known as COVID-19. The outbreak of COVID-19 has resulted in travel and border restrictions, quarantines, supply chain disruptions, lower consumer demand and general market uncertainty. The effects of COVID-19 have and may continue to adversely affect the global economy, the economies of certain nations and individual issuers, all of which may negatively impact the Fund’s performance. In addition, COVID-19 and governmental responses to COVID-19 may negatively impact the capabilities of the Fund’s service providers and disrupt the Fund’s operations.
| | | | | | | | | | |
| | | ANNUAL REPORT | | | | JUNE 30, 2022 | | | 5 | |
Important Information About the PIMCO Dividend and Income Fund (Cont.)
The United States’ enforcement of restrictions on U.S. investments in certain issuers and tariffs on goods from other countries, each with a focus on China, has contributed to international trade tensions and may impact portfolio securities.
The United Kingdom’s withdrawal from the European Union may impact Fund returns. The withdrawal may cause substantial volatility in foreign exchange markets, lead to weakness in the exchange rate of the British pound, result in a sustained period of market uncertainty, and destabilize some or all of the other European Union member countries and/or the Eurozone.
The Fund may invest in certain instruments that rely in some fashion upon the London Interbank Offered Rate (“LIBOR”). LIBOR is an average interest rate, determined by the ICE Benchmark Administration, that banks charge one another for the use of short-term money. The United Kingdom’s Financial Conduct Authority, which regulates LIBOR, has announced plans to ultimately phase out the use of LIBOR. There remains uncertainty regarding future utilization of LIBOR and the nature of any replacement rate (e.g., the Secured Overnight Financing Rate, which is intended to replace U.S. dollar LIBOR and measures the cost of overnight borrowings through repurchase agreement transactions collateralized with U.S. Treasury securities). Any potential effects of the transition away from LIBOR on the Fund or on certain instruments in which the Fund invests can be difficult to ascertain, and they may vary depending on a variety of factors. The transition may also result in a reduction in the value of certain instruments held by the Fund or a reduction in the effectiveness of related Fund transactions such as hedges. Any such effects of the transition away from LIBOR, as well as other unforeseen effects, could result in losses to the Fund.
On the Fund Summary page in this Shareholder Report, the Average Annual Total Return table and Cumulative Returns chart measure performance assuming that any dividend and capital gain distributions were reinvested. Returns do not reflect the deduction of taxes that a shareholder would pay on (i) Fund distributions or (ii) the redemption of Fund shares. The Cumulative Returns chart and Average Annual Total Return table reflect any sales load that would have applied at the time of purchase or any Contingent Deferred Sales Charge (“CDSC”) that would have applied if a full redemption occurred on the last business day of the period shown in the Cumulative Returns chart. Class A shares are subject to an initial sales charge. A CDSC may be imposed in certain circumstances on Class A shares that are purchased without an initial sales charge and then redeemed during the first 12 months after purchase. Class C shares are subject to a 1% CDSC, which may apply in the first year. The Cumulative Returns chart reflects only Institutional Class performance. Performance may vary by share class based on each class’s expense ratios. Performance shown is net of fees and expenses. The minimum initial investment amount for Institutional Class, I-2 and I-3 shares is $1,000,000. The minimum initial investment amount for Class A and Class C shares is $1,000. The Fund measures its performance against at least one broad-based securities market index (“benchmark index”). The benchmark index does not take into account fees, expenses, or taxes. The Fund’s past performance, before and after taxes, is not necessarily an indication of how the Fund will perform in the future. There is no assurance that the Fund, even if the Fund has experienced high or unusual performance for one or more periods, will experience similar levels of performance in the future. High performance is defined as a significant increase in either 1) the Fund’s total return in excess of that of the Fund’s benchmark between reporting periods or 2) the Fund’s total return in excess of the Fund’s historical returns between reporting periods. Unusual performance is defined as a significant change in the Fund’s performance as compared to one or more previous reporting periods. Historical performance for the Fund or share class may have
been positively impacted by fee waivers or expense limitations in place during some or all of the periods shown, if applicable. Future performance (including total return or yield) and distributions may be negatively impacted by the expiration or reduction of any such fee waivers or expense limitations.
The following table discloses the inception dates of the Fund and its share classes along with the Fund’s diversification status as of period end:
| | | | | | | | | | | | | | | | | | | | | | | | | | | | | | |
| Fund Name | | | | | Fund
Inception | | | Institutional
Class | | | I-2 | | | I-3 | | | Class A | | | Class C | | | Diversification
Status |
| | | | | | | | |
| PIMCO Dividend and Income Fund | | | | | | | 12/14/11 | | | | 12/14/11 | | | | 12/14/11 | | | | — | | | | 12/14/11 | | | | 12/14/11 | | | Diversified |
An investment in the Fund is not a bank deposit and is not guaranteed or insured by the Federal Deposit Insurance Corporation or any other government agency. It is possible to lose money on investments in the Fund.
The Trustees are responsible generally for overseeing the management of the Trust. The Trustees authorize the Trust to enter into service agreements with the Adviser, the Distributor, the Administrator and other service providers in order to provide, and in some cases authorize service providers to procure through other parties, necessary or desirable services on behalf of the Trust and the Fund. Shareholders are not parties to or third-party beneficiaries of such service agreements. Neither the Fund’s prospectus nor the Fund’s summary prospectus, the Trust’s Statement of Additional Information (“SAI”), any contracts filed as exhibits to the Trust’s registration statement, nor any other communications, disclosure documents or regulatory filings (including this report) from or on behalf of the Trust or the Fund creates a contract between or among any shareholder of the Fund, on the one hand, and the Trust, the Fund, a service provider to the Trust or the Fund, and/or the Trustees or officers of the Trust, on the other hand. The Trustees (or the Trust and its officers, service providers or other delegates acting under authority of the Trustees) may amend the most recent prospectus or use a new prospectus, summary prospectus or SAI with respect to the Fund or the Trust, and/or amend, file and/or issue any other communications, disclosure documents or regulatory filings, and may amend or enter into any contracts to which the Trust or the Fund is a party, and interpret the investment objective(s), policies, restrictions and contractual provisions applicable to the Fund, without shareholder input or approval, except in circumstances in which shareholder approval is specifically required by law (such as changes to fundamental investment policies) or where a shareholder approval requirement is specifically disclosed in the Trust’s then-current prospectus or SAI.
PIMCO has adopted written proxy voting policies and procedures (“Proxy Policy”) as required by Rule 206(4)-6 under the Investment Advisers Act of 1940, as amended. The Proxy Policy has been adopted by the Trust as the policies and procedures that PIMCO will use when voting proxies on behalf of the Fund. A description of the policies and procedures that PIMCO uses to vote proxies relating to portfolio securities of the Fund, and information about how the Fund voted proxies relating to portfolio securities held during the most recent twelve-month period ended June 30th, are available without charge, upon request, by calling the Trust at (888) 87-PIMCO, on the Fund’s website at www.pimco.com, and on the Securities and Exchange Commission’s (“SEC”) website at www.sec.gov.
The Fund files portfolio holdings information with the SEC on Form N-PORT within 60 days of the end of each fiscal quarter. The Fund’s complete schedule of securities holdings as of the end of each
| | | | | | | | | | |
| | | ANNUAL REPORT | | | | JUNE 30, 2022 | | | 7 | |
Important Information About the PIMCO Dividend and Income Fund (Cont.)
fiscal quarter will be made available to the public on the SEC’s website at www.sec.gov and on PIMCO’s website at www.pimco.com, and will be made available, upon request, by calling PIMCO at (888) 87-PIMCO.
SEC rules allow the Fund to fulfill its obligation to deliver shareholder reports to investors by providing access to such reports online free of charge and by mailing a notice that the report is electronically available. Investors may elect to receive all future reports in paper free of charge by contacting their financial intermediary or, if invested directly with the Fund, investors can inform the Fund by calling (888) 87-PIMCO. Any election to receive reports in paper will apply to all funds held with the fund complex if invested directly with the Fund or to all funds held in the investor’s account if invested through a financial intermediary.
In August 2020, the SEC proposed changes to the mutual fund and ETF shareholder report and registration statement disclosure requirements and the registered fund advertising rules, which, if adopted, will change the disclosures provided to shareholders.
In October 2020, the SEC adopted a rule related to the use of derivatives, short sales, reverse repurchase agreements and certain other transactions by registered investment companies that rescinds and withdraws the guidance of the SEC and its staff regarding asset segregation and cover transactions that was applicable to the Fund as of the date of this report. Subject to certain exceptions, the rule requires funds that trade derivatives and other transactions that create future payment or delivery obligations to comply with a value-at-risk leverage limit and a certain derivatives risk management program and reporting requirements. These requirements may limit the ability of the Fund to use derivatives and reverse repurchase agreements and similar financing transactions as part of its investment strategies and may increase the cost of the Fund’s investments and cost of doing business, which could adversely affect investors. The rule went into effect on February 19, 2021. The compliance date for the new rule and related reporting requirements is August 19, 2022.
In October 2020, the SEC adopted a rule regarding the ability of a fund to invest in other funds. The rule allows a fund to acquire shares of another fund in excess of certain limitations currently imposed by the Investment Company Act of 1940 (the “Act”) without obtaining individual exemptive relief from the SEC, subject to certain conditions. The rule also includes the rescission of certain exemptive relief from the SEC and guidance from the SEC staff for funds to invest in other funds. The effective date for the rule was January 19, 2021, and the compliance date for the rule was January 19, 2022.
In December 2020, the SEC adopted a rule addressing fair valuation of fund investments. The new rule sets forth requirements for good faith determinations of fair value as well as for the performance of fair value determinations, including related oversight and reporting obligations. The new rule also defines “readily available market quotations” for purposes of the definition of “value” under the Act, and the SEC noted that this definition will apply in all contexts under the Act. The effective date for the rule was March 8, 2021. The compliance date for the new rule and the associated recordkeeping requirements is September 8, 2022.
In May 2022, the SEC proposed amendments to a current rule governing fund naming conventions. In general, the current rule requires funds with certain types of names to adopt a policy to invest at least 80% of their assets in the type of investment suggested by the name. The proposed amendments would expand the scope of the current rule in a number of ways that would result in an
expansion of the types of fund names that would require the fund to adopt an 80% investment policy under the rule. Additionally, the proposed amendments would modify the circumstances under which a fund may deviate from its 80% investment policy and address the use and valuation of derivatives instruments for purposes of the rule. The proposal’s impact on the Fund will not be known unless and until any final rulemaking is adopted.
In May 2022, the SEC proposed a framework that would require certain registered portfolios (such as the Fund) to disclose their environmental, social, and governance (“ESG”) investing practices. Among other things, the proposed requirements would mandate that funds meeting three pre-defined classifications (i.e., integrated, ESG focused and/or impact funds) provide prospectus and shareholder report disclosure related to the ESG factors, criteria and processes used in managing the fund. The proposal’s impact on the Fund will not be known unless and until any final rulemaking is adopted.
| | | | | | | | | | |
| | | ANNUAL REPORT | | | | JUNE 30, 2022 | | | 9 | |
PIMCO Dividend and Income Fund
Cumulative Returns Through June 30, 2022
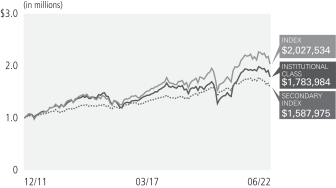
$1,000,000 invested at the end of the month when the Fund’s Institutional Class commenced operations.
| | | | | | | | | | | | | | | | | | |
|
| Average Annual Total Return for the period ended June 30, 2022 | |
| | | | | |
| | | | | 1 Year | | | 5 Years | | | 10 Years | | | Fund
Inception
(12/14/11) | |
 | | PIMCO Dividend and Income Fund Institutional Class | | | (7.76)% | | | | 3.97% | | | | 5.45% | | | | 5.85% | |
| | PIMCO Dividend and Income Fund I-2 | | | (7.93)% | | | | 3.86% | | | | 5.34% | | | | 5.76% | |
| | PIMCO Dividend and Income Fund Class A | | | (8.16)% | | | | 3.60% | | | | 5.07% | | | | 5.48% | |
| | PIMCO Dividend and Income Fund Class A (adjusted) | | | (13.21)% | | | | 2.44% | | | | 4.48% | | | | 4.91% | |
| | PIMCO Dividend and Income Fund Class C | | | (8.76)% | | | | 2.83% | | | | 4.29% | | | | 4.69% | |
| | PIMCO Dividend and Income Fund Class C (adjusted) | | | (9.65)% | | | | 2.83% | | | | 4.29% | | | | 4.69% | |
 | | MSCI ACWI High Dividend Yield Net USD±ª | | | (7.15)% | | | | 5.36% | | | | 6.92% | | | | 7.37% | |
| | MSCI World Index | | | (14.34)% | | | | 7.67% | | | | 9.51% | | | | 9.98% | |
 | | 50% MSCI ACWI High Dividend Yield Index / 50% Bloomberg US Aggregate Index±± | | | (8.59)% | | | | 3.35% | | | | 4.39% | | | | 4.70% | |
All Fund returns are net of fees and expenses and include applicable fee waivers and/or expense limitations. Absent any applicable fee waivers and/or expense limitations, performance would have been lower and there can be no assurance that any such waivers or limitations will continue in the future
ª Effective November 1, 2021, the Fund’s primary benchmark is the MSCI ACWI High Dividend Yield Index. The Fund believes that the new primary benchmark better aligns with the Fund’s investment strategy. Prior to November 1, 2021, the Fund’s primary benchmark was the MSCI World Index.
± MSCI ACWI High Dividend Yield Net USD includes large and mid cap stocks across a group of developed markets and emerging markets countries. The index is designed to include companies with high dividend income and quality characteristics, and that have higher than average dividend yields that are both sustainable and persistent. Securities are screened based on track record of consistent dividend payments with capacity to sustain dividend payouts into the future. Securities are also screened based on certain quality factors such as return on equity, earnings variability, debt to equity, and recent 12-month price performance. Issuer weights are capped at 5%. The index is market cap weighted and rebalanced semi-annually in May and November.
| | | | | | |
| Institutional Class - PQIIX | | I-2 - PQIPX | | | | |
| Class A - PQIZX | | Class C - PQICX | | | | |
±± The MSCI ACWI High Dividend Yield Index includes large and mid cap stocks across a group of developed markets and emerging markets countries. The index is designed to include companies with high dividend income and quality characteristics, and that have higher than average dividend yields that are both sustainable and persistent. Securities are screened based on track record of consistent dividend payments with capacity to sustain dividend payouts into the future. Securities are also screened based on certain quality factors such as return on equity, earnings variability, debt to equity, and recent 12-month price performance. Issuer weights are capped at 5%. The index is market cap weighted and rebalanced semi-annually in May and November. The Bloomberg US Aggregate Index represents securities that are registered with the Securities and Exchange Commission, taxable, and dollar denominated. The index covers the U.S. investment grade fixed rate bond market, with index components for government and corporate securities, mortgage pass-through securities, and asset-backed securities. These major sectors are subdivided into more specific indices that are calculated and reported on a regular basis.
The MSCI World Index is a broad global equity index that represents large and mid-cap equity performance across all 23 developed markets countries. It covers approximately 5% of the free float-adjusted market capitalization in each country.
It is not possible to invest directly in an unmanaged index.
Performance quoted represents past performance. Past performance is not a guarantee or a reliable indicator of future results. Current performance may be lower or higher than performance shown. Investment return and the principal value of an investment will fluctuate. Shares may be worth more or less than original cost when redeemed. Returns shown do not reflect the deduction of taxes that a shareholder would pay on fund distributions or the redemption of fund shares. Differences in the Fund’s performance versus the index and related attribution information with respect to particular categories of securities or individual positions may be attributable, in part, to differences in the pricing methodologies used by the Fund and the index. The adjusted returns take into account the maximum sales charge of 5.50% on Class A shares and 1.00% CDSC on Class C shares. For performance data current to the most recent month-end, visit www.pimco.com or via (888) 87-PIMCO.
The Fund’s total annual operating expense ratio in effect as of period end was 0.73% for Institutional Class shares, 0.83% for I-2 shares, 1.08% for Class A shares, and 1.83% for Class C shares. Details regarding any changes to the Fund’s operating expenses, subsequent to period end, can be found in the Fund’s current prospectus, as supplemented.
| | | | | | | | | | |
| | | ANNUAL REPORT | | | | JUNE 30, 2022 | | | 11 | |
PIMCO Dividend and Income Fund (Cont.)
| | | | |
| |
| Geographic Breakdown as of June 30, 2022†§ | | | |
| |
| United States | | | 62.1 | % |
| Short-Term Instruments‡ | | | 7.1 | % |
| United Kingdom | | | 6.1 | % |
| Switzerland | | | 3.3 | % |
| Japan | | | 2.8 | % |
| China | | | 2.2 | % |
| Australia | | | 2.0 | % |
| Brazil | | | 1.6 | % |
| France | | | 1.5 | % |
| Canada | | | 1.3 | % |
| Other | | | 10.0 | % |
| | | | |
| |
| Sector Breakdown as of June 30, 2022†§ | | | |
| |
| Industrials | | | 11.6 | % |
| Health Care | | | 9.9 | % |
| U.S. Government Agencies | | | 9.3 | % |
| Asset-Backed Securities | | | 7.9 | % |
| Short-Term Instruments‡ | | | 7.1 | % |
| Consumer Staples | | | 6.4 | % |
| Financials | | | 5.9 | % |
| Real Estate | | | 5.3 | % |
| Information Technology | | | 5.2 | % |
| Non-Agency Mortgage-Backed Securities | | | 4.8 | % |
| Materials | | | 4.1 | % |
| U.S. Treasury Notes | | | 3.7 | % |
| Utilities | | | 3.4 | % |
| Loan Participations and Assignments | | | 3.4 | % |
| Banking & Finance | | | 3.0 | % |
| U.S. Treasury Inflation Protected Securities | | | 2.4 | % |
| Energy | | | 1.9 | % |
| Consumer Discretionary | | | 1.3 | % |
| Communication Services | | | 1.3 | % |
| Other | | | 2.1 | % |
| † | | % of Investments, at value. |
| § | | Geographic and Sector Breakdown and % of Investments exclude securities sold short and financial derivative instruments, if any. |
| ‡ | | Includes Central Funds Used for Cash Management Purposes. |
| | | | | | |
| Institutional Class - PQIIX | | I-2 - PQIPX | | | | |
| Class A - PQIZX | | Class C - PQICX | | | | |
Investment Objective and Strategy Overview
PIMCO Dividend and Income Fund seeks to provide current income, and as a secondary objective, seeks to provide long-term capital appreciation, by investing under normal circumstances at least 80% of its assets in a diversified portfolio of income-producing investments, and will typically invest between 35-65% of its assets in equity and equity-related securities (such portion of the Fund’s portfolio, the “Equity Sleeve”) selected in accordance with PIMCO’s systematic equity income strategy. Equity-related securities include securities having an equity component (e.g., hybrids, bank capital, certain real estate investment trusts (“REITs”) and business development companies (“BDCs”)) and equity derivatives. With respect to investments in equity securities, there is no limitation on the market capitalization range of the issuers in which the Fund may invest. The securities for the Equity Sleeve are selected by PIMCO from a broad universe of global equities. The Fund will also typically invest 35-65% of its assets in “Fixed Income Instruments” of varying maturities selected primarily based on their ability to deliver consistent income, subject to prudent risk management. Fixed Income Instruments include bonds, debt securities and other similar instruments issued by various U.S. and non-U.S. public or private-sector entities. Fund strategies may change from time to time. Please refer to the Fund’s current prospectus for more information regarding the Fund’s strategy.
Fund Insights
The following affected performance (on a gross basis) during the reporting period:
Equity Portfolio:
| » | | Overweight exposure to, and security selection in, the energy sector contributed to relative returns, as the sector outperformed the benchmark index and the Fund’s holdings outperformed the benchmark index. |
| » | | Security selection in the materials sector contributed to relative returns, as the Fund’s holdings outperformed the benchmark index. |
| » | | There were no other material contributors for this Fund. |
| » | | Underweight exposure to the utilities sector detracted from relative returns, as the sector outperformed the benchmark index. |
| » | | Overweight exposure to, and security selection in, the industrials sector detracted from relative returns, as the sector and the Fund’s holdings underperformed the benchmark index. |
| » | | Security selection in the consumer discretionary sector detracted from relative returns, as the Fund’s holdings underperformed the benchmark index. |
| » | | Underweight exposure to, and security selection in, the consumer staples sector detracted from relative returns, as the sector outperformed the benchmark index and the Fund’s holdings underperformed the benchmark index. |
Tactical Portfolio:
| » | | Exposure to the real estate sector detracted from returns, as the sector delivered negative returns. |
| » | | There were no material contributors for this Fund. |
| | | | | | | | | | |
| | | ANNUAL REPORT | | | | JUNE 30, 2022 | | | 13 | |
PIMCO Dividend and Income Fund (Cont.)
Fixed Income Portfolio:
| » | | Short exposure to United Kingdom (“U.K.”) duration contributed to performance, as interest rates in the U.K. rose across the yield curve. |
| » | | Exposure to a basket of emerging market currencies, including the Russian ruble, contributed to performance, as these currencies appreciated versus the U.S. dollar. |
| » | | There were no other material contributors for this Fund. |
| » | | Exposure to United States (“U.S.”) duration detracted from performance, as U.S. interest rates rose across the yield curve. |
| » | | Holdings of high yield corporate credit detracted from performance, as spreads on these securities widened. |
| » | | Exposure to emerging market external debt detracted from performance, as these securities posted negative returns. |
| » | | Holdings of investment grade corporate credit detracted from performance, as spreads on these securities widened. |
Expense Example
Example
As a shareholder of a Fund, you incur two types of costs: (1) transaction costs, including sales charges (loads) on purchase payments and exchange fees and (2) ongoing costs, including investment advisory fees, supervisory and administrative fees, distribution and/or service (12b-1) fees, and other Fund expenses. The Example is intended to help you understand your ongoing costs (in dollars) of investing in a Fund and to compare these costs with the ongoing costs of investing in other mutual funds.
The Example is based on an investment of $1,000 invested at the beginning of the period and held for the entire period indicated, which for all Funds and share classes is from January 1, 2022 to June 30, 2022 unless noted otherwise in the table and footnotes below.
Actual Expenses
The information in the table under the heading “Actual” provides information about actual account values and actual expenses. You may use this information, together with the amount you invested, to estimate the expenses that you paid over the period. Simply divide your account value by $1,000 (for example, an $8,600 account value divided by $1,000 = 8.60), then multiply the result by the number in the appropriate row for your share class, in the column entitled “Expenses Paid During Period” to estimate the expenses you paid on your account during this period.
Hypothetical Example for Comparison Purposes
The information in the table under the heading “Hypothetical (5% return before expenses)” provides information about hypothetical account values and hypothetical expenses based on a Fund’s actual expense ratio and an assumed rate of return of 5% per year before expenses, which is not the Fund’s actual return. The hypothetical account values and expenses may not be used to estimate the actual ending account balance or expenses you paid for the period. You may use this information to compare the ongoing costs of investing in a Fund and other funds. To do so, compare this 5% hypothetical example with the 5% hypothetical examples that appear in the shareholder reports of the other funds.
Please note that the expenses shown in the table are meant to highlight your ongoing costs only and do not reflect any transactional costs, such as sales charges (loads) on purchase payments and exchange fees. Therefore, the information under the heading “Hypothetical (5% return before expenses)” is useful in comparing ongoing costs only, and will not help you determine the relative total costs of owning different funds. In addition, if these transactional costs were included, your costs would have been higher.
Expense ratios may vary from period to period because of various factors such as an increase in expenses that are not covered by the investment advisory fees and supervisory and administrative fees, such as fees and expenses of the independent trustees and their counsel, extraordinary expenses and interest expense.
| | | | | | | | | | | | | | | | | | | | | | | | | | | | | | | | | | | | | | | | |
| | | | | | Actual | | | | | | Hypothetical
(5% return before expenses) | | | | | | | |
| | | | | | Beginning
Account Value
(01/01/22) | | | Ending
Account Value
(06/30/22) | | | Expenses Paid
During Period* | | | | | | Beginning
Account Value
(01/01/22) | | | Ending
Account Value
(06/30/22) | | | Expenses Paid
During Period* | | | | | | Net Annualized
Expense Ratio** | |
Institutional Class | | | | | | $ | 1,000.00 | | | $ | 901.80 | | | $ | 3.26 | | | | | | | $ | 1,000.00 | | | $ | 1,021.09 | | | $ | 3.47 | | | | | | | | 0.70 | % |
I-2 | | | | | | | 1,000.00 | | | | 900.50 | | | | 3.73 | | | | | | | | 1,000.00 | | | | 1,020.60 | | | | 3.96 | | | | | | | | 0.80 | |
Class A | | | | | | | 1,000.00 | | | | 899.90 | | | | 4.89 | | | | | | | | 1,000.00 | | | | 1,019.37 | | | | 5.20 | | | | | | | | 1.05 | |
Class C | | | | | | | 1,000.00 | | | | 897.20 | | | | 8.37 | | | | | | | | 1,000.00 | | | | 1,015.69 | | | | 8.90 | | | | | | | | 1.80 | |
* Expenses Paid During Period are equal to the net annualized expense ratio for the class, multiplied by the average account value over the period, multiplied by 179/365 (to reflect the one-half year period).
** Net Annualized Expense Ratio is reflective of any applicable contractual fee waivers and/or expense reimbursements or voluntary fee waivers. Details regarding fee waivers, if any, can be found in Note 9, Fees and Expenses, in the Notes to Financial Statements.
| | | | | | | | | | |
| | | ANNUAL REPORT | | | | JUNE 30, 2022 | | | 15 | |
Financial Highlights PIMCO Dividend and Income Fund
| | | | | | | | | | | | | | | | | | | | | | | | | | | | | | | | | | | | | | | | |
| | | | | Investment Operations | | | | Less Distributions(c) |
| | | | | | | | | | | | | | | | | |
Selected Per Share Data for
the Year Ended^: | | Net Asset Value Beginning of Year(a) | | Net Investment Income (Loss)(b) | | Net Realized/ Unrealized Gain (Loss) | | Total | | | | From Net
Investment
Income | | From Net
Realized
Capital
Gains | | Total |
| | | | | | | | |
Institutional Class | | | | | | | | | | | | | | | | | | | | | | | | | | | | | | | | | | | | | | | | |
| | | | | | | | |
06/30/2022 | | | $ | 12.72 | | | | $ | 0.47 | | | | $ | (1.42 | ) | | | $ | (0.95 | ) | | | | | | | | $ | (0.42 | ) | | | $ | 0.00 | | | | $ | (0.42 | ) |
| | | | | | | | |
06/30/2021 | | | | 9.71 | | | | | 0.44 | | | | | 3.03 | | | | | 3.47 | | | | | | | | | | (0.46 | ) | | | | 0.00 | | | | | (0.46 | ) |
| | | | | | | | |
06/30/2020 | | | | 11.27 | | | | | 0.33 | | | | | (1.57 | ) | | | | (1.24 | ) | | | | | | | | | (0.32 | ) | | | | 0.00 | | | | | (0.32 | ) |
| | | | | | | | |
06/30/2019 | | | | 11.54 | | | | | 0.39 | | | | | (0.18 | ) | | | | 0.21 | | | | | | | | | | (0.48 | ) | | | | 0.00 | | | | | (0.48 | ) |
| | | | | | | | |
06/30/2018 | | | | 11.09 | | | | | 0.36 | | | | | 0.41 | | | | | 0.77 | | | | | | | | | | (0.32 | ) | | | | 0.00 | | | | | (0.32 | ) |
| | | | | | | | |
I-2 | | | | | | | | | | | | | | | | | | | | | | | | | | | | | | | | | | | | | | | | |
| | | | | | | | |
06/30/2022 | | | | 12.74 | | | | | 0.48 | | | | | (1.44 | ) | | | | (0.96 | ) | | | | | | | | | (0.41 | ) | | | | 0.00 | | | | | (0.41 | ) |
| | | | | | | | |
06/30/2021 | | | | 9.72 | | | | | 0.41 | | | | | 3.06 | | | | | 3.47 | | | | | | | | | | (0.45 | ) | | | | 0.00 | | | | | (0.45 | ) |
| | | | | | | | |
06/30/2020 | | | | 11.29 | | | | | 0.32 | | | | | (1.58 | ) | | | | (1.26 | ) | | | | | | | | | (0.31 | ) | | | | 0.00 | | | | | (0.31 | ) |
| | | | | | | | |
06/30/2019 | | | | 11.56 | | | | | 0.38 | | | | | (0.19 | ) | | | | 0.19 | | | | | | | | | | (0.46 | ) | | | | 0.00 | | | | | (0.46 | ) |
| | | | | | | | |
06/30/2018 | | | | 11.11 | | | | | 0.34 | | | | | 0.42 | | | | | 0.76 | | | | | | | | | | (0.31 | ) | | | | 0.00 | | | | | (0.31 | ) |
| | | | | | | | |
Class A | | | | | | | | | | | | | | | | | | | | | | | | | | | | | | | | | | | | | | | | |
| | | | | | | | |
06/30/2022 | | | | 12.71 | | | | | 0.43 | | | | | (1.42 | ) | | | | (0.99 | ) | | | | | | | | | (0.39 | ) | | | | 0.00 | | | | | (0.39 | ) |
| | | | | | | | |
06/30/2021 | | | | 9.70 | | | | | 0.39 | | | | | 3.04 | | | | | 3.43 | | | | | | | | | | (0.42 | ) | | | | 0.00 | | | | | (0.42 | ) |
| | | | | | | | |
06/30/2020 | | | | 11.27 | | | | | 0.29 | | | | | (1.57 | ) | | | | (1.28 | ) | | | | | | | | | (0.29 | ) | | | | 0.00 | | | | | (0.29 | ) |
| | | | | | | | |
06/30/2019 | | | | 11.53 | | | | | 0.35 | | | | | (0.19 | ) | | | | 0.16 | | | | | | | | | | (0.42 | ) | | | | 0.00 | | | | | (0.42 | ) |
| | | | | | | | |
06/30/2018 | | | | 11.08 | | | | | 0.31 | | | | | 0.42 | | | | | 0.73 | | | | | | | | | | (0.28 | ) | | | | 0.00 | | | | | (0.28 | ) |
| | | | | | | | |
Class C | | | | | | | | | | | | | | | | | | | | | | | | | | | | | | | | | | | | | | | | |
| | | | | | | | |
06/30/2022 | | | | 12.72 | | | | | 0.34 | | | | | (1.43 | ) | | | | (1.09 | ) | | | | | | | | | (0.31 | ) | | | | 0.00 | | | | | (0.31 | ) |
| | | | | | | | |
06/30/2021 | | | | 9.70 | | | | | 0.27 | | | | | 3.07 | | | | | 3.34 | | | | | | | | | | (0.32 | ) | | | | 0.00 | | | | | (0.32 | ) |
| | | | | | | | |
06/30/2020 | | | | 11.29 | | | | | 0.21 | | | | | (1.57 | ) | | | | (1.36 | ) | | | | | | | | | (0.23 | ) | | | | 0.00 | | | | | (0.23 | ) |
| | | | | | | | |
06/30/2019 | | | | 11.48 | | | | | 0.26 | | | | | (0.18 | ) | | | | 0.08 | | | | | | | | | | (0.27 | ) | | | | 0.00 | | | | | (0.27 | ) |
| | | | | | | | |
06/30/2018 | | | | 11.06 | | | | | 0.22 | | | | | 0.42 | | | | | 0.64 | | | | | | | | | | (0.22 | ) | | | | 0.00 | | | | | (0.22 | ) |
| ^ | A zero balance may reflect actual amounts rounding to less than $0.01 or 0.01%. |
| (a) | Includes adjustments required by U.S. GAAP and may differ from net asset values and performance reported elsewhere by the Fund. |
| (b) | Per share amounts based on average number of shares outstanding during the year. |
| (c) | The tax characterization of distributions is determined in accordance with Federal income tax regulations. See Note 2, Distributions to Shareholders, in the Notes to Financial Statements for more information. |
| (d) | Includes adjustments required by U.S. GAAP and may differ from net asset values and performance reported elsewhere by the Fund. Additionally, excludes initial sales charges and contingent deferred sales charges. |
| (e) | Effective November 1, 2021, the Fund’s Investment advisory fee was decreased by 0.01% to an annual rate of 0.44%. |
| (f) | Effective November 1, 2021, the Class’s Supervisory and Administrative fees was decreased by 0.05% to an annual rate of 0.25%. |
| (g) | Effective October 1, 2020, the Fund’s Investment advisory fee was decreased by 0.04% to an annual rate of 0.45%. |
| (h) | Effective November 1, 2021, the Class’s Supervisory and Administrative fees was decreased by 0.05% to an annual rate of 0.35%. |
| | | | |
| 16 | | PIMCO EQUITY SERIES | | See Accompanying Notes |
| | | | | | | | | | | | | | | | | | | | | | | | | | | | | | | | | | | | | | | | | | | |
| | | | | Ratios/Supplemental Data |
| | | | | | | Ratios to Average Net Assets | | |
Net Asset Value End of Year(a) | | Total
Return(d) | | Net Assets End of Year
(000s) | | Expenses | | Expenses Excluding Waivers | | Expenses Excluding Interest Expense | | Expenses Excluding Interest Expense and
Waivers | | Net Investment Income (Loss) | | Portfolio
Turnover
Rate |
| | | | | | | | |
| | | | | | | | | | | | | | | | | | | | | | | | | | | | | | | | | | | | | | | | | | | | |
| | | | | | | | |
| | $ | 11.35 | | | | | (7.76 | )% | | | $ | 12,660 | | | | | 0.71 | %(e)(f) | | | | 0.72 | %(e)(f) | | | | 0.71 | %(e)(f) | | | | 0.72 | %(e)(f) | | | | 3.80 | % | | | | 254 | % |
| | | | | | | | |
| | | 12.72 | | | | | 36.27 | | | | | 32,512 | | | | | 0.79 | (g) | | | | 0.80 | (g) | | | | 0.77 | (g) | | | | 0.78 | (g) | | | | 3.79 | | | | | 218 | |
| | | | | | | | |
| | | 9.71 | | | | | (11.38 | ) | | | | 16,438 | | | | | 0.83 | | | | | 0.84 | | | | | 0.80 | | | | | 0.81 | | | | | 3.05 | | | | | 158 | |
| | | | | | | | |
| | | 11.27 | | | | | 2.06 | | | | | 20,685 | | | | | 0.95 | | | | | 0.96 | | | | | 0.80 | | | | | 0.81 | | | | | 3.48 | | | | | 108 | |
| | | | | | | | |
| | | 11.54 | | | | | 6.89 | | | | | 23,027 | | | | | 0.85 | | | | | 0.86 | | | | | 0.80 | | | | | 0.81 | | | | | 3.04 | | | | | 80 | |
| | | | | | | | |
| | | | | | | | | | | | | | | | | | | | | | | | | | | | | | | | | | | | | | | | | | | | |
| | | | | | | | |
| | | 11.37 | | | | | (7.78 | ) | | | | 17,950 | | | | | 0.81 | (e)(h) | | | | 0.82 | (e)(h) | | | | 0.81 | (e)(h) | | | | 0.82 | (e)(h) | | | | 3.83 | | | | | 254 | |
| | | | | | | | |
| | | 12.74 | | | | | 36.19 | | | | | 19,919 | | | | | 0.89 | (g) | | | | 0.90 | (g) | | | | 0.87 | (g) | | | | 0.88 | (g) | | | | 3.64 | | | | | 218 | |
| | | | | | | | |
| | | 9.72 | | | | | (11.52 | ) | | | | 19,236 | | | | | 0.93 | | | | | 0.94 | | | | | 0.90 | | | | | 0.91 | | | | | 2.95 | | | | | 158 | |
| | | | | | | | |
| | | 11.29 | | | | | 1.91 | | | | | 25,573 | | | | | 1.05 | | | | | 1.06 | | | | | 0.90 | | | | | 0.91 | | | | | 3.40 | | | | | 108 | |
| | | | | | | | |
| | | 11.56 | | | | | 6.80 | | | | | 27,286 | | | | | 0.95 | | | | | 0.96 | | | | | 0.90 | | | | | 0.91 | | | | | 2.94 | | | | | 80 | |
| | | | | | | | |
| | | | | | | | | | | | | | | | | | | | | | | | | | | | | | | | | | | | | | | | | | | | |
| | | | | | | | |
| | | 11.33 | | | | | (8.08 | ) | | | | 120,215 | | | | | 1.06 | (e)(h) | | | | 1.07 | (e)(h) | | | | 1.06 | (e)(h) | | | | 1.07 | (e)(h) | | | | 3.47 | | | | | 254 | |
| | | | | | | | |
| | | 12.71 | | | | | 35.89 | | | | | 136,346 | | | | | 1.14 | (g) | | | | 1.15 | (g) | | | | 1.12 | (g) | | | | 1.13 | (g) | | | | 3.41 | | | | | 218 | |
| | | | | | | | |
| | | 9.70 | | | | | (11.72 | ) | | | | 96,148 | | | | | 1.18 | | | | | 1.19 | | | | | 1.15 | | | | | 1.16 | | | | | 2.70 | | | | | 158 | |
| | | | | | | | |
| | | 11.27 | | | | | 1.61 | | | | | 122,533 | | | | | 1.30 | | | | | 1.31 | | | | | 1.15 | | | | | 1.16 | | | | | 3.13 | | | | | 108 | |
| | | | | | | | |
| | | 11.53 | | | | | 6.60 | | | | | 138,561 | | | | | 1.20 | | | | | 1.21 | | | | | 1.15 | | | | | 1.16 | | | | | 2.70 | | | | | 80 | |
| | | | | | | | |
| | | | | | | | | | | | | | | | | | | | | | | | | | | | | | | | | | | | | | | | | | | | |
| | | | | | | | |
| | | 11.32 | | | | | (8.76 | ) | | | | 15,021 | | | | | 1.81 | (e)(h) | | | | 1.82 | (e)(h) | | | | 1.81 | (e)(h) | | | | 1.82 | (e)(h) | | | | 2.73 | | | | | 254 | |
| | | | | | | | |
| | | 12.72 | | | | | 34.82 | | | | | 18,882 | | | | | 1.89 | (g) | | | | 1.90 | (g) | | | | 1.87 | (g) | | | | 1.88 | (g) | | | | 2.52 | | | | | 218 | |
| | | | | | | | |
| | | 9.70 | | | | | (12.36 | ) | | | | 46,644 | | | | | 1.93 | | | | | 1.94 | | | | | 1.90 | | | | | 1.91 | | | | | 1.92 | | | | | 158 | |
| | | | | | | | |
| | | 11.29 | | | | | 0.87 | | | | | 83,059 | | | | | 2.05 | | | | | 2.06 | | | | | 1.90 | | | | | 1.91 | | | | | 2.34 | | | | | 108 | |
| | | | | | | | |
| | | 11.48 | | | | | 5.72 | | | | | 115,183 | | | | | 1.95 | | | | | 1.96 | | | | | 1.90 | | | | | 1.91 | | | | | 1.91 | | | | | 80 | |
| | | | | | | | | | |
| | | ANNUAL REPORT | | | | JUNE 30, 2022 | | | 17 | |
Statement of Assets and Liabilities PIMCO Dividend and Income Fund
| | | | |
| (Amounts in thousands†, except per share amounts) | | | |
| |
Assets: | | | | |
| |
Investments, at value | | | | |
Investments in securities* | | $ | 167,344 | |
Investments in Affiliates | | | 11,603 | |
| |
Financial Derivative Instruments | | | | |
Exchange-traded or centrally cleared | | | 320 | |
Over the counter | | | 345 | |
Cash | | | 55 | |
Deposits with counterparty | | | 1,960 | |
Foreign currency, at value | | | 506 | |
Receivable for investments sold | | | 223 | |
Receivable for investments sold on a delayed-delivery basis | | | 17 | |
Receivable for TBA investments sold | | | 16,702 | |
Receivable for Fund shares sold | | | 281 | |
Interest and/or dividends receivable | | | 1,483 | |
Dividends receivable from Affiliates | | | 10 | |
Reimbursement receivable from PIMCO | | | 3 | |
| |
Total Assets | | | 200,852 | |
| |
Liabilities: | | | | |
| |
Financial Derivative Instruments | | | | |
Exchange-traded or centrally cleared | | $ | 350 | |
Over the counter | | | 688 | |
Payable for investments purchased | | | 173 | |
Payable for investments in Affiliates purchased | | | 10 | |
Payable for TBA investments purchased | | | 33,474 | |
Payable for unfunded loan commitments | | | 15 | |
Payable for Fund shares redeemed | | | 148 | |
Accrued investment advisory fees | | | 61 | |
Accrued supervisory and administrative fees | | | 48 | |
Accrued distribution fees | | | 10 | |
Accrued servicing fees | | | 29 | |
| |
Total Liabilities | | | 35,006 | |
| |
Net Assets | | $ | 165,846 | |
| |
Net Assets Consist of: | | | | |
| |
Paid in capital | | $ | 259,009 | |
Distributable earnings (accumulated loss) | | | (93,163 | ) |
| |
Net Assets | | $ | 165,846 | |
| |
Cost of investments in securities | | $ | 178,437 | |
Cost of investments in Affiliates | | $ | 11,610 | |
Cost of foreign currency held | | $ | 514 | |
Cost or premiums of financial derivative instruments, net | | $ | (1,271 | ) |
| |
* Includes repurchase agreements of: | | $ | 1,002 | |
| † | A zero balance may reflect actual amounts rounding to less than one thousand. |
| | | | |
| 18 | | PIMCO EQUITY SERIES | | See Accompanying Notes |
June 30, 2022
| | | | |
| | | | |
| |
Net Assets: | | | | |
| |
Institutional Class | | $ | 12,660 | |
I-2 | | | 17,950 | |
Class A | | | 120,215 | |
Class C | | | 15,021 | |
| |
Shares Issued and Outstanding: | | | | |
| |
Institutional Class | | | 1,116 | |
I-2 | | | 1,579 | |
Class A | | | 10,615 | |
Class C | | | 1,327 | |
| |
Net Asset Value Per Share Outstanding(a): | | | | |
| |
Institutional Class | | $ | 11.35 | |
I-2 | | | 11.37 | |
Class A | | | 11.33 | |
Class C | | | 11.32 | |
| (a) | Includes adjustments required by U.S. GAAP and may differ from net asset values and performance reported elsewhere by the Fund. |
| | | | | | | | | | |
| | | ANNUAL REPORT | | | | JUNE 30, 2022 | | | 19 | |
Statement of Operations PIMCO Dividend and Income Fund
| | | | |
| Year Ended June 30, 2022 | | | |
| (Amounts in thousands†) | | | |
| |
Investment Income: | | | | |
| |
Interest | | $ | 2,834 | |
Dividends, net of foreign taxes* | | | 5,894 | |
Dividends from Investments in Affiliates | | | 56 | |
Total Income | | | 8,784 | |
| |
Expenses: | | | | |
| |
Investment advisory fees | | | 857 | |
Supervisory and administrative fees | | | 684 | |
Distribution and/or servicing fees - Class A | | | 329 | |
Distribution and/or servicing fees - Class C | | | 168 | |
Trustee fees | | | 13 | |
Interest expense | | | 9 | |
Miscellaneous expense | | | 13 | |
Total Expenses | | | 2,073 | |
Waiver and/or Reimbursement by PIMCO | | | (14 | ) |
Net Expenses | | | 2,059 | |
| |
Net Investment Income (Loss) | | | 6,725 | |
| |
Net Realized Gain (Loss): | | | | |
| |
Investments in securities | | | 18,216 | |
Investments in Affiliates | | | (33 | ) |
Exchange-traded or centrally cleared financial derivative instruments | | | (346 | ) |
Over the counter financial derivative instruments | | | 1,334 | |
Foreign currency | | | 62 | |
| |
Net Realized Gain (Loss) | | | 19,233 | |
| |
Net Change in Unrealized Appreciation (Depreciation): | | | | |
| |
Investments in securities | | | (41,679 | ) |
Investments in Affiliates | | | (7 | ) |
Exchange-traded or centrally cleared financial derivative instruments | | | 1,023 | |
Over the counter financial derivative instruments | | | (523 | ) |
Foreign currency assets and liabilities | | | (21 | ) |
| |
Net Change in Unrealized Appreciation (Depreciation) | | | (41,207 | ) |
| |
Net Increase (Decrease) in Net Assets Resulting from Operations | | $ | (15,249 | ) |
| |
* Foreign tax withholdings - Dividends | | $ | 273 | |
| † | A zero balance may reflect actual amounts rounding to less than one thousand. |
| | | | |
| 20 | | PIMCO EQUITY SERIES | | See Accompanying Notes |
Statements of Changes in Net Assets PIMCO Dividend and Income Fund
| | | | | | | | |
| (Amounts in thousands†) | | Year Ended
June 30, 2022 | | | Year Ended
June 30, 2021 | |
| | |
Increase (Decrease) in Net Assets from: | | | | | | | | |
| | |
Operations: | | | | | | | | |
| | |
Net investment income (loss) | | $ | 6,725 | | | $ | 6,225 | |
Net realized gain (loss) | | | 19,233 | | | | 9,367 | |
Net change in unrealized appreciation (depreciation) | | | (41,207 | ) | | | 40,077 | |
| | |
Net Increase (Decrease) in Net Assets Resulting from Operations | | | (15,249 | ) | | | 55,669 | |
| | |
Distributions to Shareholders: | | | | | | | | |
| | |
From net investment income and/or net realized capital gains | | | | | | | | |
Institutional Class | | | (894 | ) | | | (853 | ) |
I-2 | | | (566 | ) | | | (728 | ) |
Class A | | | (4,051 | ) | | | (4,278 | ) |
Class C | | | (414 | ) | | | (841 | ) |
| | |
Total Distributions(a) | | | (5,925 | ) | | | (6,700 | ) |
| | |
Fund Share Transactions: | | | | | | | | |
| | |
Net increase (decrease) resulting from Fund share transactions* | | | (20,639 | ) | | | (19,776 | ) |
| | |
Total Increase (Decrease) in Net Assets | | | (41,813 | ) | | | 29,193 | |
| | |
Net Assets: | | | | | | | | |
| | |
Beginning of year | | | 207,659 | | | | 178,466 | |
End of year | | $ | 165,846 | | | $ | 207,659 | |
| † | A zero balance may reflect actual amounts rounding to less than one thousand. |
| * | See Note 13, Shares of Beneficial Interest, in the Notes to Financial Statements. |
| (a) | The tax characterization of distributions is determined in accordance with Federal income tax regulations. See Note 2, Distributions to Shareholders, in the Notes to Financial Statements for more information. |
| | | | | | | | | | |
| | | ANNUAL REPORT | | | | JUNE 30, 2022 | | | 21 | |
Schedule of Investments PIMCO Dividend and Income Fund
(Amounts in thousands*, except number of shares, contracts, units and ounces, if any)
| | | | | | | | | | | | |
| | | | | PRINCIPAL
AMOUNT
(000S) | | | | | MARKET
VALUE
(000S) | |
| INVESTMENTS IN SECURITIES 100.9% | |
| |
| ASSET-BACKED SECURITIES 8.5% | |
| |
| CAYMAN ISLANDS 0.2% | |
|
TruPS Financials Note Securitization Ltd. | |
3.666% due 09/20/2039 • | | $ | | | 361 | | | $ | | | 341 | |
| | | | | | | | | | | | |
Total Cayman Islands | | | | | | | | | | | 341 | |
| | | | | | | | | | | | |
| |
| UNITED STATES 8.3% | |
|
Bear Stearns Asset-Backed Securities Trust | |
3.499% due 12/25/2034 • | | | | | 973 | | | | | | 931 | |
|
Citigroup Mortgage Loan Trust, Inc. | |
2.254% due 02/25/2035 • | | | | | 1,093 | | | | | | 1,032 | |
|
Conseco Finance Corp. | |
6.280% due 09/01/2030 | | | | | 66 | | | | | | 67 | |
|
Credit Suisse First Boston Mortgage Securities Corp. | |
2.244% due 01/25/2032 • | | | | | 592 | | | | | | 564 | |
|
EMC Mortgage Loan Trust | |
2.924% due 02/25/2041 • | | | | | 21 | | | | | | 20 | |
|
Home Equity Asset Trust | |
2.329% (US0001M + 0.705%) due 01/25/2036 ~ | | | | | 141 | | | | | | 136 | |
|
LCCM Trust | |
2.774% due 11/15/2038 • | | | | | 1,000 | | | | | | 973 | |
|
Legacy Mortgage Asset Trust | |
3.383% due 01/28/2070 • | | | | | 311 | | | | | | 311 | |
|
Morgan Stanley Home Equity Loan Trust | |
1.724% due 12/25/2036 • | | | | | 1,423 | | | | | | 772 | |
|
Navient Student Loan Trust | |
2.674% (US0001M + 1.050%) due 12/27/2066 ~ | | | | | 436 | | | | | | 430 | |
|
Option One Mortgage Loan Trust | |
1.844% due 04/25/2037 • | | | | | 2,060 | | | | | | 1,541 | |
|
Residential Asset Mortgage Products Trust | |
2.689% (US0001M + 0.710%) due 05/25/2035 ~ | | | | | 1,000 | | | | | | 948 | |
|
Residential Asset Securities Corp. Trust | |
2.509% due 01/25/2034 • | | | | | 401 | | | | | | 396 | |
|
SLM Private Credit Student Loan Trust | |
2.159% due 06/15/2039 • | | | | | 1,040 | | | | | | 991 | |
|
SMB Private Education Loan Trust | |
1.830% due 02/16/2055 • | | | | | 900 | | | | | | 897 | |
|
Soundview Home Loan Trust | |
2.029% due 12/25/2036 • | | | | | 1,000 | | | | | | 965 | |
2.624% (US0001M + 1.000%) due 09/25/2037 ~ | | | | | 1,990 | | | | | | 1,532 | |
|
Structured Asset Investment Loan Trust | |
1.774% due 09/25/2036 • | | | | | 613 | | | | | | 597 | |
| | | | | | | | | | | | |
| | | | | PRINCIPAL
AMOUNT
(000S) | | | | | MARKET
VALUE
(000S) | |
|
Upstart Securitization Trust | |
1.310% due 11/20/2031 | | $ | | | 710 | | | $ | | | 684 | |
| | | | | | | | | | | | |
Total United States | | | | | | | | | | | 13,787 | |
| | | | | | | | | | | | |
Total Asset-Backed Securities (Cost $14,794) | | | 14,128 | |
| | | | |
| |
| LOAN PARTICIPATIONS AND ASSIGNMENTS 3.7% | |
| |
| CANADA 0.4% | |
|
Air Canada | |
4.250% (LIBOR03M + 3.500%) due 08/11/2028 «~ | | | 650 | | | | | | 600 | |
| | | | | | | | | | | | |
Total Canada | | | | | | | | | | | 600 | |
| | | | | | | | | | | | |
| |
| LUXEMBOURG 0.0% | |
|
Intelsat Jackson Holdings SA | |
4.920% due 02/01/2029 | | | | | 59 | | | | | | 54 | |
| | | | | | | | | | | | |
Total Luxembourg | | | | | | | | | | | 54 | |
| | | | | | | | | | | | |
| |
| PANAMA 0.5% | |
|
Carnival Corp. | |
5.877% (LIBOR06M + 3.000%) due 06/30/2025 ~ | | | 397 | | | | | | 371 | |
6.127% (LIBOR06M + 3.250%) due 10/18/2028 ��~ | | | 520 | | | | | | 468 | |
| | | | | | | | | | | | |
Total Panama | | | | | | | | | | | 839 | |
| | | | | | | | | | | | |
| |
| UNITED KINGDOM 0.8% | |
|
Ineos Finance PLC | |
2.500% (EUR003M + 2.000%) due 04/01/2024 ~ | | EUR | | | 837 | | | | | | 839 | |
|
Softbank Vision Fund | |
5.000% due 12/21/2025 « | | $ | | | 378 | | | | | | 378 | |
| | | | | | | | | | | | |
Total United Kingdom | | | 1,217 | |
| | | | | | | | | | | | |
| |
| UNITED STATES 2.0% | |
|
AmSurg Corp. | |
13.000% due 04/30/2028 « | | | | | 141 | | | | | | 131 | |
|
Avolon TLB Borrower 1 (U.S.) LLC | |
3.095% (LIBOR01M + 1.500%) due 02/12/2027 ~ | | | 7 | | | | | | 6 | |
|
Caesars Resort Collection LLC | |
4.416% (LIBOR01M + 2.750%) due 12/23/2024 ~ | | | 1,000 | | | | | | 966 | |
|
Envision Healthcare Corp. | |
TBD% due 04/30/2027 µ | | | | | 15 | | | | | | 15 | |
8.875% due 04/30/2027 | | | | | 85 | | | | | | 83 | |
| | | | |
| 22 | | PIMCO EQUITY SERIES | | See Accompanying Notes |
June 30, 2022
| | | | | | | | | | | | |
| | | | | PRINCIPAL
AMOUNT
(000S) | | | | | MARKET
VALUE
(000S) | |
|
Hilton Worldwide Finance LLC | |
3.374% (LIBOR01M + 1.750%) due 06/22/2026 ~ | | $ | | | 230 | | | $ | | | 221 | |
|
Lealand Finance Co. BV | |
4.666% (LIBOR01M + 3.000%) due 06/28/2024 «~ | | | | | 1 | | | | | | 1 | |
|
Lealand Finance Co. BV (2.666% Cash and 3.000% PIK) | |
5.666% (LIBOR01M + 1.000%) due 06/30/2025 ~(a) | | | | | 3 | | | | | | 1 | |
|
Press Ganey (Azalea Topco) | |
4.739% - 5.166% (LIBOR03M + 3.500%) due 07/24/2026 ~ | | | | | 3 | | | | | | 3 | |
|
PUG LLC | |
5.166% (LIBOR01M + 3.500%) due 02/12/2027 ~ | | | | | 4 | | | | | | 4 | |
|
SkyMiles IP Ltd. | |
4.813% (LIBOR03M + 3.750%) due 10/20/2027 ~ | | | | | 550 | | | | | | 546 | |
|
Sotera Health Holdings LLC | |
4.416% (LIBOR01M + 2.750%) due 12/11/2026 ~ | | | | | 525 | | | | | | 500 | |
|
Syniverse Holdings, Inc. | |
8.286% due 05/13/2027 | | | | | 8 | | | | | | 7 | |
|
Uber Technologies, Inc. | |
5.075% (LIBOR03M + 3.500%) due 02/25/2027 ~ | | | | | 889 | | | | | | 854 | |
|
Westmoreland Mining Holdings LLC (15.000% PIK) | |
15.000% due 03/15/2029 (a) | | | | | 5 | | | | | | 3 | |
| | | | | | | | | | | | |
Total United States | | | | | | | | | | | 3,341 | |
| | | | | | | | | | | | |
Total Loan Participations and Assignments (Cost $6,530) | | | 6,051 | |
| | | | |
| | | | | | | | | | | | |
| | | | | SHARES | | | | | | |
| COMMON STOCKS 44.7% | |
| |
| AUSTRALIA 1.9% | |
| |
| INDUSTRIALS 0.1% | |
| | | | |
Aurizon Holdings Ltd. | | | | | 43,397 | | | | | | 114 | |
| | | | | | | | | | | | |
| |
| MATERIALS 1.8% | |
| | | | |
BHP Group Ltd. | | | | | 63,814 | | | | | | 1,827 | |
| | | | |
Fortescue Metals Group Ltd. | | | | | 44,625 | | | | | | 537 | |
| | | | |
Rio Tinto Ltd. | | | | | 10,065 | | | | | | 718 | |
| | | | | | | | | | | | |
| | | | | | | | | | | 3,082 | |
| | | | | | | | | | | | |
Total Australia | | | | | | | | | | | 3,196 | |
| | | | | | | | | | | | |
| |
| | | | | | | | | | | | |
| | | | | SHARES | | | | | MARKET
VALUE
(000S) | |
| BELGIUM 0.1% | |
| |
| FINANCIALS 0.1% | |
| | | | |
Ageas SA | | | | | 5,217 | | | $ | | | 230 | |
| | | | | | | | | | | | |
Total Belgium | | | | | | | | | | | 230 | |
| | | | | | | | | | | | |
| |
| BRAZIL 1.3% | |
| |
| COMMUNICATION SERVICES 0.1% | |
| | | | |
Telefonica Brasil SA | | | | | 13,200 | | | | | | 119 | |
| | | | | | | | | | | | |
| |
| CONSUMER STAPLES 0.1% | |
| | | | |
Ambev SA | | | | | 50,700 | | | | | | 130 | |
| | | | | | | | | | | | |
| |
| ENERGY 0.3% | |
| | | | |
Petroleo Brasileiro SA | | | | | 100,600 | | | | | | 587 | |
| | | | | | | | | | | | |
| |
| FINANCIALS 0.1% | |
| | | | |
Banco do Brasil SA | | | | | 23,200 | | | | | | 148 | |
| | | | | | | | | | | | |
| |
| MATERIALS 0.7% | |
| | | | |
Vale SA | | | | | 84,300 | | | | | | 1,233 | |
| | | | | | | | | | | | |
Total Brazil | | | | | | | | | | | 2,217 | |
| | | | | | | | | | | | |
| |
| CANADA 0.8% | |
| |
| CONSUMER DISCRETIONARY 0.1% | |
| | | | |
Canadian Tire Corp. Ltd. ‘A’ | | | | | 700 | | | | | | 88 | |
| | | | | | | | | | | | |
| |
| CONSUMER STAPLES 0.3% | |
| | | | |
George Weston Ltd. | | | | | 1,089 | | | | | | 127 | |
| | | | |
Loblaw Cos., Ltd. | | | | | 4,441 | | | | | | 401 | |
| | | | | | | | | | | | |
| | | | | | | | | | | 528 | |
| | | | | | | | | | | | |
| |
| FINANCIALS 0.2% | |
| | | | |
Fairfax Financial Holdings Ltd. | | | | | 660 | | | | | | 350 | |
| | | | | | | | | | | | |
| |
| INDUSTRIALS 0.1% | |
| | | | |
Toromont Industries Ltd. | | | | | 2,191 | | | | | | 177 | |
| | | | | | | | | | | | |
| |
| MATERIALS 0.1% | |
| | | | |
Lundin Mining Corp. | | | | | 17,072 | | | | | | 108 | |
| | | | | | | | | | | | |
Total Canada | | | | | | | | | | | 1,251 | |
| | | | | | | | | | | | |
| |
| | | | | | | | | | |
| See Accompanying Notes | | ANNUAL REPORT | | | | JUNE 30, 2022 | | | 23 | |
Schedule of Investments PIMCO Dividend and Income Fund (Cont.)
| | | | | | | | | | | | |
| | | | | SHARES | | | | | MARKET
VALUE
(000S) | |
| CHINA 2.3% | |
| |
| ENERGY 0.2% | |
| | | | |
China Shenhua Energy Co. Ltd. ‘H’ | | | | | 92,000 | | | $ | | | 264 | |
| | | | |
PetroChina Co. Ltd. ‘H’ | | | | | 452,000 | | | | | | 212 | |
| | | | | | | | | | | | |
| | | | | | | | | | | 476 | |
| | | | | | | | | | | | |
| |
| FINANCIALS 1.8% | |
| | | | |
Agricultural Bank of China Ltd. ‘H’ | | | | | 327,000 | | | | | | 124 | |
| | | | |
China Construction Bank Corp. ‘H’ | | | | | 2,376,000 | | | | | | 1,602 | |
| | | | |
Industrial & Commercial Bank of China Ltd. ‘H’ | | | | | 1,486,000 | | | | | | 887 | |
| | | | |
PICC Property & Casualty Co. Ltd. ‘H’ | | | | | 186,000 | | | | | | 194 | |
| | | | |
Postal Savings Bank of China Co. Ltd. ‘H’ | | | | | 209,000 | | | | | | 166 | |
| | | | | | | | | | | | |
| | | | | | | | | | | 2,973 | |
| | | | | | | | | | | | |
| |
| INDUSTRIALS 0.1% | |
| | | | |
COSCO SHIPPING Holdings Co. Ltd. ‘H’ | | | | | 86,500 | | | | | | 121 | |
| | | | | | | | | | | | |
| |
| INFORMATION TECHNOLOGY 0.1% | |
| | | | |
Lenovo Group Ltd. | | | | | 190,000 | | | | | | 178 | |
| | | | | | | | | | | | |
| |
| UTILITIES 0.1% | |
| | | | |
China Longyuan Power Group Corp. Ltd. ‘H’ | | | | | 70,000 | | | | | | 136 | |
| | | | | | | | | | | | |
Total China | | | | | | | | | | | 3,884 | |
| | | | | | | | | | | | |
| |
| CZECH REPUBLIC 0.1% | |
| |
| UTILITIES 0.1% | |
| | | | |
CEZ AS | | | | | 4,352 | | | | | | 196 | |
| | | | | | | | | | | | |
Total Czech Republic | | | | | | | | | | | 196 | |
| | | | | | | | | | | | |
| |
| DENMARK 0.3% | |
| |
| INDUSTRIALS 0.3% | |
| | | | |
AP Moller - Maersk AS ‘A’ | | | | | 85 | | | | | | 197 | |
| | | | |
AP Moller - Maersk AS ‘B’ | | | | | 145 | | | | | | 341 | |
| | | | | | | | | | | | |
| | | | | | | | | | | 538 | |
| | | | | | | | | | | | |
Total Denmark | | | | | | | | | | | 538 | |
| | | | | | | | | | | | |
| |
| | | | | | | | | | | | |
| | | | | SHARES | | | | | MARKET
VALUE
(000S) | |
| FRANCE 1.4% | |
| |
| COMMUNICATION SERVICES 0.3% | |
| | | | |
Orange SA | | | | | 42,232 | | | $ | | | 498 | |
| | | | | | | | | | | | |
| |
| HEALTH CARE 0.9% | |
| | | | |
Sanofi | | | | | 14,363 | | | | | | 1,448 | |
| | | | | | | | | | | | |
| |
| INDUSTRIALS 0.2% | |
| | | | |
Bouygues SA | | | | | 6,065 | | | | | | 187 | |
| | | | |
Thales SA | | | | | 1,065 | | | | | | 131 | |
| | | | | | | | | | | | |
| | | | | | | | | | | 318 | |
| | | | | | | | | | | | |
Total France | | | | | | | | | | | 2,264 | |
| | | | | | | | | | | | |
| |
| GERMANY 0.3% | |
| |
| UTILITIES 0.3% | |
| | | | |
RWE AG | | | | | 14,749 | | | | | | 546 | |
| | | | | | | | | | | | |
Total Germany | | | | | | | | | | | 546 | |
| | | | | | | | | | | | |
| |
| GREECE 0.1% | |
| |
| CONSUMER DISCRETIONARY 0.1% | |
| | | | |
OPAP SA | | | | | 8,207 | | | | | | 118 | |
| | | | | | | | | | | | |
Total Greece | | | | | | | | | | | 118 | |
| | | | | | | | | | | | |
| |
| HONG KONG 0.2% | |
| |
| INDUSTRIALS 0.1% | |
| | | | |
Orient Overseas International Ltd. | | | | | 4,000 | | | | | | 107 | |
| | | | |
SITC International Holdings Co. Ltd. | | | | | 35,000 | | | | | | 99 | |
| | | | | | | | | | | | |
| | | | | | | | | | | 206 | |
| | | | | | | | | | | | |
| |
| UTILITIES 0.1% | |
| | | | |
CLP Holdings Ltd. | | | | | 13,500 | | | | | | 112 | |
| | | | | | | | | | | | |
Total Hong Kong | | | | | | | | | | | 318 | |
| | | | | | | | | | | | |
| |
| INDONESIA 0.4% | |
| |
| COMMUNICATION SERVICES 0.2% | |
| | | | |
Telkom Indonesia Persero Tbk PT | | | | | 1,334,600 | | | | | | 359 | |
| | | | | | | | | | | | |
| |
| CONSUMER DISCRETIONARY 0.1% | |
| | | | |
Astra International Tbk PT | | | | | 551,700 | | | | | | 246 | |
| | | | | | | | | | | | |
| |
| | | | |
| 24 | | PIMCO EQUITY SERIES | | See Accompanying Notes |
June 30, 2022
| | | | | | | | | | | | |
| | | | | SHARES | | | | | MARKET
VALUE
(000S) | |
| ENERGY 0.1% | |
| | | | |
Adaro Energy Indonesia Tbk PT | | | | | 519,400 | | | $ | | | 100 | |
| | | | | | | | | | | | |
Total Indonesia | | | | | | | | | | | 705 | |
| | | | | | | | | | | | |
| |
| ISRAEL 0.1% | |
| |
| INDUSTRIALS 0.1% | |
| | | | |
ZIM Integrated Shipping Services Ltd. | | | | | 2,283 | | | | | | 108 | |
| | | | | | | | | | | | |
Total Israel | | | | | | | | | | | 108 | |
| | | | | | | | | | | | |
| |
| JAPAN 2.6% | |
| |
| COMMUNICATION SERVICES 0.2% | |
| | | | |
Nippon Telegraph & Telephone Corp. | | | | | 9,800 | | | | | | 282 | |
| | | | | | | | | | | | |
| |
| CONSUMER DISCRETIONARY 0.1% | |
| | | | |
Suzuki Motor Corp. | | | | | 3,400 | | | | | | 107 | |
| | | | | | | | | | | | |
| |
| CONSUMER STAPLES 0.3% | |
| | | | |
Japan Tobacco, Inc. | | | | | 32,600 | | | | | | 565 | |
| | | | | | | | | | | | |
| |
| HEALTH CARE 0.6% | |
| | | | |
Astellas Pharma, Inc. | | | | | 49,100 | | | | | | 766 | |
| | | | |
Eisai Co. Ltd. | | | | | 6,600 | | | | | | 279 | |
| | | | | | | | | | | | |
| | | | | | | | | | | 1,045 | |
| | | | | | | | | | | | |
| |
| INDUSTRIALS 1.1% | |
| | | | |
Dai Nippon Printing Co. Ltd. | | | | | 6,000 | | | | | | 129 | |
| | | | |
Fuji Electric Co. Ltd. | | | | | 2,800 | | | | | | 116 | |
| | | | |
ITOCHU Corp. | | | | | 32,300 | | | | | | 871 | |
| | | | |
Nippon Yusen KK | | | | | 4,300 | | | | | | 295 | |
| | | | |
Sumitomo Corp. | | | | | 12,700 | | | | | | 173 | |
| | | | |
Taisei Corp. | | | | | 4,900 | | | | | | 153 | |
| | | | |
Yamato Holdings Co. Ltd. | | | | | 7,400 | | | | | | 118 | |
| | | | | | | | | | | | |
| | | | | | | | | | | 1,855 | |
| | | | | | | | | | | | |
| |
| INFORMATION TECHNOLOGY 0.1% | |
| | | | |
Disco Corp. | | | | | 700 | | | | | | 166 | |
| | | | | | | | | | | | |
| |
| MATERIALS 0.2% | |
| | | | |
Nitto Denko Corp. | | | | | 3,800 | | | | | | 246 | |
| | | | | | | | | | | | |
Total Japan | | | | | | | | | | | 4,266 | |
| | | | | | | | | | | | |
| |
| | | | | | | | | | | | |
| | | | | SHARES | | | | | MARKET
VALUE
(000S) | |
| LUXEMBOURG 0.0% | |
| |
| FINANCIALS 0.0% | |
| | | | |
Intelsat SA «(c)(i) | | | | | 2,886 | | | $ | | | 81 | |
| | | | | | | | | | | | |
Total Luxembourg | | | | | | | | | | | 81 | |
| | | | | | | | | | | | |
| |
| MALAYSIA 0.1% | |
| |
| MATERIALS 0.1% | |
| | | | |
Petronas Chemicals Group Bhd | | | | | 63,600 | | | | | | 130 | |
| | | | | | | | | | | | |
Total Malaysia | | | | | | | | | | | 130 | |
| | | | | | | | | | | | |
| |
| MEXICO 0.0% | |
| |
| CONSUMER DISCRETIONARY 0.0% | |
| | | | |
Desarrolladora Homex SAB de CV (c) | | | | | 41,996 | | | | | | 0 | |
| | | | | | | | | | | | |
Total Mexico | | | | | | | | | | | 0 | |
| | | | | | | | | | | | |
| |
| NETHERLANDS 0.4% | |
| |
| CONSUMER STAPLES 0.4% | |
| | | | |
Koninklijke Ahold Delhaize NV | | | | | 28,399 | | | | | | 739 | |
| | | | | | | | | | | | |
Total Netherlands | | | | | | | | | | | 739 | |
| | | | | | | | | | | | |
| |
| NORWAY 0.3% | |
| |
| COMMUNICATION SERVICES 0.2% | |
| | | | |
Telenor ASA | | | | | 18,970 | | | | | | 253 | |
| | | | | | | | | | | | |
| |
| ENERGY 0.1% | |
| | | | |
Aker BP ASA | | | | | 3,417 | | | | | | 118 | |
| | | | |
Equinor ASA | | | | | 3,346 | | | | | | 117 | |
| | | | | | | | | | | | |
| | | | | | | | | | | 235 | |
| | | | | | | | | | | | |
Total Norway | | | | | | | | | | | 488 | |
| | | | | | | | | | | | |
| |
| PORTUGAL 0.1% | |
| |
| CONSUMER STAPLES 0.1% | |
| | | | |
Jeronimo Martins SGPS SA | | | | | 6,435 | | | | | | 139 | |
| | | | | | | | | | | | |
Total Portugal | | | | | | | | | | | 139 | |
| | | | | | | | | | | | |
| | | | | | | | | | | | |
| SINGAPORE 0.1% | |
| |
| INDUSTRIALS 0.1% | |
| | | | |
Singapore Technologies Engineering Ltd. | | | | | 42,400 | | | | | | 125 | |
| | | | | | | | | | | | |
Total Singapore | | | | | | | | | | | 125 | |
| | | | | | | | | | | | |
| |
| | | | | | | | | | |
| See Accompanying Notes | | ANNUAL REPORT | | | | JUNE 30, 2022 | | | 25 | |
Schedule of Investments PIMCO Dividend and Income Fund (Cont.)
| | | | | | | | | | | | |
| | | | | SHARES | | | | | MARKET
VALUE
(000S) | |
| SOUTH AFRICA 0.6% | |
| |
| COMMUNICATION SERVICES 0.2% | |
| | | | |
MTN Group Ltd. | | | | | 41,477 | | | $ | | | 338 | |
| | | | | | | | | | | | |
| |
| ENERGY 0.1% | |
| | | | |
Exxaro Resources Ltd. | | | | | 8,717 | | | | | | 106 | |
| | | | | | | | | | | | |
| |
| FINANCIALS 0.3% | |
| | | | |
Absa Group Ltd. | | | | | 21,811 | | | | | | 208 | |
| | | | |
FirstRand Ltd. | | | | | 57,282 | | | | | | 220 | |
| | | | |
Nedbank Group Ltd. | | | | | 12,147 | | | | | | 156 | |
| | | | | | | | | | | | |
| | | | | | | | | | | 584 | |
| | | | | | | | | | | | |
Total South Africa | | | | | | | | | | | 1,028 | |
| | | | | | | | | | | | |
| |
| SOUTH KOREA 0.4% | |
| |
| CONSUMER DISCRETIONARY 0.3% | |
| | | | |
Kia Corp. | | | | | 7,110 | | | | | | 424 | |
| | | | | | | | | | | | |
| |
| CONSUMER STAPLES 0.1% | |
| | | | |
KT&G Corp. | | | | | 2,964 | | | | | | 188 | |
| | | | | | | | | | | | |
Total South Korea | | | | | | | | | | | 612 | |
| | | | | | | | | | | | |
| |
| SPAIN 0.8% | |
| |
| FINANCIALS 0.5% | |
| | | | |
Banco Bilbao Vizcaya Argentaria SA | | | | | 175,705 | | | | | | 798 | |
| | | | | | | | | | | | |
| |
| UTILITIES 0.3% | |
| | | | |
Enagas SA | | | | | 6,559 | | | | | | 145 | |
| | | | |
Endesa SA | | | | | 8,594 | | | | | | 162 | |
| | | | |
Red Electrica Corp. SA | | | | | 11,021 | | | | | | 209 | |
| | | | | | | | | | | | |
| | | | | | | | | | | 516 | |
| | | | | | | | | | | | |
Total Spain | | | | | | | | | | | 1,314 | |
| | | | | | | | | | | | |
| |
| SWEDEN 0.5% | |
| |
| ENERGY 0.1% | |
| | | | |
Lundin Energy AB | | | | | 4,469 | | | | | | 3 | |
| | | | |
Lundin Energy AB (i) | | | | | 4,250 | | | | | | 147 | |
| | | | | | | | | | | | |
| | | | | | | | | | | 150 | |
| | | | | | | | | | | | |
| |
| | | | | | | | | | | | |
| | | | | SHARES | | | | | MARKET
VALUE
(000S) | |
| INFORMATION TECHNOLOGY 0.4% | |
| | | | |
Telefonaktiebolaget LM Ericsson ‘B’ | | | | | 78,945 | | | $ | | | 590 | |
| | | | | | | | | | | | |
Total Sweden | | | | | | | | | | | 740 | |
| | | | | | | | | | | | |
| |
| SWITZERLAND 3.4% | |
| |
| HEALTH CARE 3.1% | |
| | | | |
Novartis AG | | | | | 27,030 | | | | | | 2,292 | |
| | | | |
Roche Holding AG | | | | | 8,233 | | | | | | 2,790 | |
| | | | | | | | | | | | |
| | | | | | | | | | | 5,082 | |
| | | | | | | | | | | | |
| |
| INDUSTRIALS 0.2% | |
| | | | |
Kuehne & Nagel International AG | | | | | 1,475 | | | | | | 351 | |
| | | | | | | | | | | | |
| |
| INFORMATION TECHNOLOGY 0.1% | |
| | | | |
STMicroelectronics NV | | | | | 5,695 | | | | | | 180 | |
| | | | | | | | | | | | |
Total Switzerland | | | | | | | | | | | 5,613 | |
| | | | | | | | | | | | |
| |
| TAIWAN 1.1% | |
| |
| INFORMATION TECHNOLOGY 1.1% | |
| | | | |
MediaTek, Inc. | | | | | 29,000 | | | | | | 636 | |
| | | | |
Novatek Microelectronics Corp. | | | | | 15,000 | | | | | | 152 | |
| | | | |
Realtek Semiconductor Corp. | | | | | 12,000 | | | | | | 147 | |
| | | | |
Taiwan Semiconductor Manufacturing Co. Ltd. | | | | | 24,000 | | | | | | 385 | |
| | | | |
United Microelectronics Corp. | | | | | 323,000 | | | | | | 432 | |
| | | | | | | | | | | | |
| | | | | | | | | | | 1,752 | |
| | | | | | | | | | | | |
Total Taiwan | | | | | | | | | | | 1,752 | |
| | | | | | | | | | | | |
| |
| UNITED KINGDOM 3.1% | |
| |
| CONSUMER STAPLES 0.4% | |
| | | | |
Imperial Brands PLC | | | | | 24,520 | | | | | | 549 | |
| | | | | | | | | | | | |
| |
| HEALTH CARE 0.7% | |
| | | | |
GSK PLC | | | | | 53,769 | | | | | | 1,159 | |
| | | | | | | | | | | | |
| |
| INDUSTRIALS 0.2% | |
| | | | |
BAE Systems PLC | | | | | 37,000 | | | | | | 375 | |
| | | | | | | | | | | | |
| |
| | | | |
| 26 | | PIMCO EQUITY SERIES | | See Accompanying Notes |
June 30, 2022
| | | | | | | | | | | | |
| | | | | SHARES | | | | | MARKET
VALUE
(000S) | |
| MATERIALS 1.4% | |
| | | | |
Anglo American PLC | | | | | 14,171 | | | $ | | | 506 | |
| | | | |
Rio Tinto PLC | | | | | 30,240 | | | | | | 1,808 | |
| | | | | | | | | | | | |
| | | | | | | | | | | 2,314 | |
| | | | | | | | | | | | |
| |
| UTILITIES 0.4% | |
| | | | |
National Grid PLC | | | | | 9,626 | | | | | | 124 | |
| | | | |
SSE PLC | | | | | 28,852 | | | | | | 569 | |
| | | | | | | | | | | | |
| | | | | | | | | | | 693 | |
| | | | | | | | | | | | |
Total United Kingdom | | | | | | | | | | | 5,090 | |
| | | | | | | | | | | | |
| |
| UNITED STATES 21.9% | |
| |
| COMMUNICATION SERVICES 0.2% | |
| | | | |
Clear Channel Outdoor Holdings, Inc. (c) | | | | | 29,821 | | | | | | 32 | |
| | | | |
iHeartMedia, Inc. ‘A’ (c) | | | | | 6,979 | | | | | | 55 | |
| | | | |
iHeartMedia, Inc. ‘B’ «(c) | | | | | 5,486 | | | | | | 39 | |
| | | | |
Interpublic Group of Cos., Inc. | | | | | 10,371 | | | | | | 285 | |
| | | | | | | | | | | | |
| | | | | | | | | | | 411 | |
| | | | | | | | | | | | |
| |
| CONSUMER DISCRETIONARY 0.8% | |
| | | | |
Genuine Parts Co. | | | | | 3,807 | | | | | | 507 | |
| | | | |
LKQ Corp. | | | | | 7,295 | | | | | | 358 | |
| | | | |
McDonald’s Corp. | | | | | 1,058 | | | | | | 261 | |
| | | | |
Target Corp. | | | | | 1,473 | | | | | | 208 | |
| | | | | | | | | | | | |
| | | | | | | | | | | 1,334 | |
| | | | | | | | | | | | |
| |
| CONSUMER STAPLES 5.2% | |
| | | | |
Altria Group, Inc. | | | | | 45,296 | | | | | | 1,892 | |
| | | | |
Archer-Daniels-Midland Co. | | | | | 14,576 | | | | | | 1,131 | |
| | | | |
Coca-Cola Co. | | | | | 7,566 | | | | | | 476 | |
| | | | |
Kroger Co. | | | | | 15,788 | | | | | | 747 | |
| | | | |
Philip Morris International, Inc. | | | | | 25,436 | | | | | | 2,512 | |
| | | | |
Procter & Gamble Co. | | | | | 8,356 | | | | | | 1,201 | |
| | | | |
Tyson Foods, Inc. ‘A’ | | | | | 7,768 | | | | | | 669 | |
| | | | | | | | | | | | |
| | | | | | | | | | | 8,628 | |
| | | | | | | | | | | | |
| |
| ENERGY 0.6% | |
| | | | |
APA Corp. | | | | | 9,445 | | | | | | 330 | |
| | | | |
Marathon Petroleum Corp. | | | | | 2,972 | | | | | | 244 | |
| | | | |
Noble Corp. (c)(i) | | | | | 2,136 | | | | | | 54 | |
| | | | |
Phillips 66 | | | | | 2,599 | | | | | | 213 | |
| | | | | | | | | | | | |
| | | | | SHARES | | | | | MARKET
VALUE
(000S) | |
| | | | |
Valaris Ltd. (c) | | | | | 112 | | | $ | | | 5 | |
| | | | |
Valero Energy Corp. | | | | | 1,646 | | | | | | 175 | |
| | | | | | | | | | | | |
| | | | | | | | | | | 1,021 | |
| | | | | | | | | | | | |
| |
| FINANCIALS 3.3% | |
| | | | |
Aflac, Inc. | | | | | 10,151 | | | | | | 562 | |
| | | | |
Allstate Corp. | | | | | 4,301 | | | | | | 545 | |
| | | | |
Ally Financial, Inc. | | | | | 9,071 | | | | | | 304 | |
| | | | |
American International Group, Inc. | | | | | 1,945 | | | | | | 99 | |
| | | | |
Ameriprise Financial, Inc. | | | | | 457 | | | | | | 109 | |
| | | | |
Capital One Financial Corp. | | | | | 5,459 | | | | | | 569 | |
| | | | |
Discover Financial Services | | | | | 7,756 | | | | | | 734 | |
| | | | |
Fifth Third Bancorp | | | | | 2,895 | | | | | | 97 | |
| | | | |
Hartford Financial Services Group, Inc. | | | | | 9,029 | | | | | | 591 | |
| | | | |
KeyCorp | | | | | 25,258 | | | | | | 435 | |
| | | | |
MetLife, Inc. | | | | | 3,992 | | | | | | 251 | |
| | | | |
Regions Financial Corp. | | | | | 12,821 | | | | | | 240 | |
| | | | |
Synchrony Financial | | | | | 14,191 | | | | | | 392 | |
| | | | |
U.S. Bancorp | | | | | 11,610 | | | | | | 534 | |
| | | | | | | | | | | | |
| | | | | | | | | | | 5,462 | |
| | | | | | | | | | | | |
| |
| HEALTH CARE 5.5% | |
| | | | |
Bristol-Myers Squibb Co. | | | | | 2,808 | | | | | | 216 | |
| | | | |
Elevance Health, Inc. | | | | | 335 | | | | | | 162 | |
| | | | |
Johnson & Johnson | | | | | 17,645 | | | | | | 3,132 | |
| | | | |
Merck & Co., Inc. | | | | | 28,255 | | | | | | 2,576 | |
| | | | |
Pfizer, Inc. | | | | | 54,241 | | | | | | 2,844 | |
| | | | |
Quest Diagnostics, Inc. | | | | | 1,003 | | | | | | 133 | |
| | | | | | | | | | | | |
| | | | | | | | | | | 9,063 | |
| | | | | | | | | | | | |
| |
| INDUSTRIALS 2.2% | |
| | | | |
General Dynamics Corp. | | | | | 6,426 | | | | | | 1,422 | |
| | | | |
Lockheed Martin Corp. | | | | | 3,858 | | | | | | 1,659 | |
| | | | |
Neiman Marcus Group Ltd. LLC «(c)(i) | | | | | 1,124 | | | | | | 194 | |
| | | | |
Textron, Inc. | | | | | 5,843 | | | | | | 357 | |
| | | | |
Westmoreland Mining Holdings «(c)(i) | | | | | 53 | | | | | | 0 | |
| | | | | | | | | | | | |
| | | | | | | | | | | 3,632 | |
| | | | | | | | | | | | |
| |
| INFORMATION TECHNOLOGY 3.9% | |
| | | | |
Apple, Inc. | | | | | 5,236 | | | | | | 716 | |
| | | | | | | | | | |
| See Accompanying Notes | | ANNUAL REPORT | | | | JUNE 30, 2022 | | | 27 | |
Schedule of Investments PIMCO Dividend and Income Fund (Cont.)
| | | | | | | | | | | | |
| | | | | SHARES | | | | | MARKET
VALUE
(000S) | |
| | | | |
Broadcom, Inc. | | | | | 2,763 | | | $ | | | 1,342 | |
| | | | |
Cisco Systems, Inc. | | | | | 36,572 | | | | | | 1,559 | |
| | | | |
Intel Corp. | | | | | 19,736 | | | | | | 738 | |
| | | | |
Microsoft Corp. | | | | | 462 | | | | | | 119 | |
| | | | |
NetApp, Inc. | | | | | 1,623 | | | | | | 106 | |
| | | | |
Seagate Technology Holdings PLC | | | | | 3,371 | | | | | | 241 | |
| | | | |
Texas Instruments, Inc. | | | | | 10,694 | | | | | | 1,643 | |
| | | | | | | | | | | | |
| | | | | | | | | | | 6,464 | |
| | | | | | | | | | | | |
| |
| MATERIALS 0.1% | |
| | | | |
CF Industries Holdings, Inc. | | | | | 1,685 | | | | | | 145 | |
| | | | | | | | | | | | |
| |
| UTILITIES 0.1% | |
| | | | |
NRG Energy, Inc. | | | | | 4,281 | | | | | | 163 | |
| | | | | | | | | | | | |
Total United States | | | | | | | | | | | 36,323 | |
| | | | | | | | | | | | |
Total Common Stocks (Cost $76,056) | | | 74,011 | |
| | | | |
| |
| | | | | PRINCIPAL
AMOUNT
(000S) | | | | | | |
| CORPORATE BONDS & NOTES 12.8% | |
| |
| AUSTRIA 0.4% | |
| |
| BANKING & FINANCE 0.4% | |
|
Erste Group Bank AG | |
6.500% due 04/15/2024 •(g)(h) | | EUR | | | 600 | | | | | | 613 | |
| | | | | | | | | | | | |
Total Austria | | | | | | | | | | | 613 | |
| | | | | | | | | | | | |
| |
| BERMUDA 0.1% | |
| |
| INDUSTRIALS 0.1% | |
|
Valaris Ltd. (8.250% Cash or 12.000% PIK) | |
8.250% due 04/30/2028 (a) | | $ | | | 1 | | | | | | 1 | |
|
Viking Ocean Cruises Ship Ltd. | |
5.625% due 02/15/2029 | | | | | 300 | | | | | | 237 | |
| | | | | | | | | | | | |
| | | | | | | | | | | 238 | |
| | | | | | | | | | | | |
Total Bermuda | | | | | | | | | | | 238 | |
| | | | | | | | | | | | |
| |
| BRAZIL 0.0% | |
| |
| INDUSTRIALS 0.0% | |
|
Odebrecht Oil & Gas Finance Ltd. | |
0.000% due 08/01/2022 (d)(g) | | | 46 | | | | | | 0 | |
| | | | | | | | | | | | |
Total Brazil | | | | | | | | | | | 0 | |
| | | | | | | | | | | | |
| |
| | | | | | | | | | | | |
| | | | | PRINCIPAL
AMOUNT
(000S) | | | | | MARKET
VALUE
(000S) | |
| CANADA 0.3% | |
| |
| INDUSTRIALS 0.3% | |
|
Bombardier, Inc. | |
7.500% due 03/15/2025 | | $ | | | 486 | | | $ | | | 441 | |
| | | | | | | | | | | | |
Total Canada | | | | | | | | | | | 441 | |
| | | | | | | | | | | | |
| |
| CAYMAN ISLANDS 0.3% | |
| |
| BANKING & FINANCE 0.0% | |
|
Park Aerospace Holdings Ltd. | |
4.500% due 03/15/2023 | | | | | 21 | | | | | | 21 | |
5.500% due 02/15/2024 | | | | | 3 | | | | | | 3 | |
| | | | | | | | | | | | |
| | | | | | | | | | | 24 | |
| | | | | | | | | | | | |
| |
| INDUSTRIALS 0.2% | |
|
MGM China Holdings Ltd. | |
4.750% due 02/01/2027 | | | | | 253 | | | | | | 179 | |
5.375% due 05/15/2024 | | | | | 200 | | | | | | 171 | |
|
Noble Corp. PLC (11.000% Cash or 15.000% PIK) | |
11.000% due 02/15/2028 (a) | | | | | 5 | | | | | | 5 | |
|
Transocean, Inc. | |
8.000% due 02/01/2027 | | | | | 10 | | | | | | 7 | |
7.250% due 11/01/2025 | | | | | 16 | | | | | | 12 | |
7.500% due 01/15/2026 | | | | | 10 | | | | | | 7 | |
| | | | | | | | | | | | |
| | | | | | | | | | | 381 | |
| | | | | | | | | | | | |
| |
| UTILITIES 0.1% | |
|
Odebrecht Drilling Norbe Ltd. (6.350% Cash and 1.000% PIK) | |
7.350% due 12/01/2026 ^(a) | | | | | 100 | | | | | | 62 | |
|
Transocean Phoenix 2 Ltd. | |
7.750% due 10/15/2024 | | | | | 2 | | | | | | 2 | |
| | | | | | | | | | | | |
| | | | | | | | | | | 64 | |
| | | | | | | | | | | | |
Total Cayman Islands | | | | | | | | | | | 469 | |
| | | | | | | | | | | | |
| |
| FRANCE 0.2% | |
| |
| BANKING & FINANCE 0.2% | |
|
Societe Generale SA | |
7.375% due 10/04/2023 •(g)(h) | | | | | 400 | | | | | | 385 | |
| | | | | | | | | | | | |
Total France | | | | | | | | | | | 385 | |
| | | | | | | | | | | | |
| |
| HONG KONG 0.1% | |
| |
| BANKING & FINANCE 0.1% | |
|
Huarong Finance Co. Ltd. | |
3.875% due 11/13/2029 | | | | | 265 | | | | | | 212 | |
| | | | | | | | | | | | |
Total Hong Kong | | | | | | | | | | | 212 | |
| | | | | | | | | | | | |
| |
| | | | |
| 28 | | PIMCO EQUITY SERIES | | See Accompanying Notes |
June 30, 2022
| | | | | | | | | | | | |
| | | | | PRINCIPAL
AMOUNT
(000S) | | | | | MARKET
VALUE
(000S) | |
| IRELAND 0.0% | |
| |
| INDUSTRIALS 0.0% | |
|
Russian Railways Via RZD Capital PLC | |
7.487% due 03/25/2031 ^(b) | | GBP | | | 300 | | | $ | | | 36 | |
| | | | | | | | | | | | |
Total Ireland | | | | | | | | | | | 36 | |
| | | | | | | | | | | | |
| |
| ITALY 0.2% | |
| |
| BANKING & FINANCE 0.2% | |
|
UniCredit SpA | |
7.830% due 12/04/2023 | | $ | | | 370 | | | | | | 383 | |
| | | | | | | | | | | | |
Total Italy | | | | | | | | | | | 383 | |
| | | | | | | | | | | | |
| |
| JAPAN 0.5% | |
| |
| INDUSTRIALS 0.5% | |
|
Nissan Motor Co. Ltd. | |
4.810% due 09/17/2030 | | | | | 868 | | | | | | 772 | |
| | | | | | | | | | | | |
Total Japan | | | | | | | | | | | 772 | |
| | | | | | | | | | | | |
| |
| LIBERIA 0.5% | |
| |
| INDUSTRIALS 0.5% | |
|
Royal Caribbean Cruises Ltd. | |
9.125% due 06/15/2023 | | | | | 895 | | | | | | 887 | |
| | | | | | | | | | | | |
Total Liberia | | | | | | | | | | | 887 | |
| | | | | | | | | | | | |
| |
| LUXEMBOURG 0.1% | |
| |
| INDUSTRIALS 0.1% | |
|
Intelsat Jackson Holdings SA | |
6.500% due 03/15/2030 | | | | | 208 | | | | | | 172 | |
| | | | | | | | | | | | |
Total Luxembourg | | | | | | | | | | | 172 | |
| | | | | | | | | | | | |
| |
| MEXICO 0.3% | |
| |
| INDUSTRIALS 0.3% | |
|
Corp. GEO SAB de CV | |
8.875% due 03/27/2049 « | | | | | 300 | | | | | | 0 | |
|
Petroleos Mexicanos | |
6.950% due 01/28/2060 | | | | | 30 | | | | | | 18 | |
7.690% due 01/23/2050 | | | | | 10 | | | | | | 7 | |
6.500% due 06/02/2041 | | | | | 757 | | | | | | 474 | |
6.700% due 02/16/2032 | | | | | 20 | | | | | | 15 | |
| | | | | | | | | | | | |
| | | | | | | | | | | 514 | |
| | | | | | | | | | | | |
Total Mexico | | | | | | | | | | | 514 | |
| | | | | | | | | | | | |
| |
| | | | | | | | | | | | |
| | | | | PRINCIPAL
AMOUNT
(000S) | | | | | MARKET
VALUE
(000S) | |
| MULTINATIONAL 0.1% | |
| |
| INDUSTRIALS 0.1% | |
|
American Airlines, Inc. | |
5.750% due 04/20/2029 | | $ | | | 100 | | | $ | | | 86 | |
| | | | | | | | | | | | |
Total Multinational | | | | | | | | | | | 86 | |
| | | | | | | | | | | | |
| |
| NETHERLANDS 0.2% | |
| |
| INDUSTRIALS 0.2% | |
|
Syngenta Finance NV | |
5.182% due 04/24/2028 | | | | | 300 | | | | | | 304 | |
| | | | | | | | | | | | |
Total Netherlands | | | | | | | | | | | 304 | |
| | | | | | | | | | | | |
| |
| PERU 0.0% | |
| |
| BANKING & FINANCE 0.0% | |
|
Banco de Credito del Peru SA | |
4.650% due 09/17/2024 | | PEN | | | 100 | | | | | | 24 | |
| | | | | | | | | | | | |
Total Peru | | | | | | | | | | | 24 | |
| | | | | | | | | | | | |
| |
| SPAIN 0.1% | |
| |
| INDUSTRIALS 0.1% | |
|
Cellnex Finance Co. SA | |
3.875% due 07/07/2041 | | $ | | | 260 | | | | | | 179 | |
| | | | | | | | | | | | |
Total Spain | | | | | | | | | | | 179 | |
| | | | | | | | | | | | |
| |
| SWITZERLAND 0.2% | |
| |
| BANKING & FINANCE 0.2% | |
|
Credit Suisse Group AG | |
7.500% due 12/11/2023 •(g)(h) | | | 365 | | | | | | 349 | |
| | | | | | | | | | | | |
Total Switzerland | | | | | | | | | | | 349 | |
| | | | | | | | | | | | |
| |
| UNITED KINGDOM 2.0% | |
| |
| BANKING & FINANCE 1.5% | |
|
Barclays Bank PLC | |
7.625% due 11/21/2022 (h) | | | | | 454 | | | | | | 459 | |
|
Barclays PLC | |
7.750% due 09/15/2023 •(g)(h) | | | 600 | | | | | | 591 | |
4.972% due 05/16/2029 • | | | | | 400 | | | | | | 393 | |
7.875% due 09/15/2022 •(g)(h) | | GBP | | | 200 | | | | | | 243 | |
|
HSBC Holdings PLC | |
6.000% due 09/29/2023 •(g)(h) | | EUR | | | 320 | | | | | | 333 | |
|
Lloyds Banking Group PLC | |
7.625% due 06/27/2023 •(g)(h) | | GBP | | | 200 | | | | | | 244 | |
| | | | | | | | | | |
| See Accompanying Notes | | ANNUAL REPORT | | | | JUNE 30, 2022 | | | 29 | |
Schedule of Investments PIMCO Dividend and Income Fund (Cont.)
| | | | | | | | | | | | |
| | | | | PRINCIPAL
AMOUNT
(000S) | | | | | MARKET
VALUE
(000S) | |
7.875% due 06/27/2029 •(g)(h) | | GBP | | | 200 | | | $ | | | 241 | |
| | | | | | | | | | | | |
| | | | | | | | | | | 2,504 | |
| | | | | | | | | | | | |
| |
| INDUSTRIALS 0.5% | |
|
Market Bidco Finco PLC | |
4.750% due 11/04/2027 | | EUR | | | 100 | | | | | | 83 | |
|
Marston’s Issuer PLC | |
3.607% (SONIO/N + 2.669%) due 07/16/2035 ~ | | GBP | | | 200 | | | | | | 195 | |
|
Mitchells & Butlers Finance PLC | |
1.738% (SONIO/N + 0.569%) due 12/15/2030 ~ | | | | | 90 | | | | | | 104 | |
|
Rolls-Royce PLC | |
4.625% due 02/16/2026 | | EUR | | | 375 | | | | | | 370 | |
| | | | | | | | | | | | |
| | | | | | | | | | | 752 | |
| | | | | | | | | | | | |
Total United Kingdom | | | | | | | | | | | 3,256 | |
| | | | | | | | | | | | |
| |
| UNITED STATES 7.0% | |
| |
| BANKING & FINANCE 0.1% | |
|
EPR Properties | |
4.750% due 12/15/2026 | | $ | | | 2 | | | | | | 2 | |
4.950% due 04/15/2028 | | | | | 2 | | | | | | 2 | |
|
GLP Capital LP | |
5.300% due 01/15/2029 | | | | | 19 | | | | | | 18 | |
5.250% due 06/01/2025 | | | | | 3 | | | | | | 3 | |
|
Omega Healthcare Investors, Inc. | |
3.625% due 10/01/2029 | | | | | 8 | | | | | | 6 | |
|
VICI Properties LP | |
4.625% due 06/15/2025 | | | | | 237 | | | | | | 226 | |
| | | | | | | | | | | | |
| | | | | | | | | | | 257 | |
| | | | | | | | | | | | |
| | | | | | | | | | | | |
| INDUSTRIALS 4.6% | |
|
American Airlines Pass-Through Trust | |
3.350% due 04/15/2031 | | | | | 8 | | | | | | 7 | |
2.875% due 01/11/2036 | | | | | 482 | | | | | | 412 | |
|
Boeing Co. | |
6.125% due 02/15/2033 | | | | | 400 | | | | | | 403 | |
|
Broadcom, Inc. | |
3.137% due 11/15/2035 | | | | | 8 | | | | | | 6 | |
3.500% due 02/15/2041 | | | | | 225 | | | | | | 170 | |
3.187% due 11/15/2036 | | | | | 500 | | | | | | 381 | |
3.469% due 04/15/2034 | | | | | 263 | | | | | | 214 | |
4.926% due 05/15/2037 | | | | | 8 | | | | | | 7 | |
|
Carvana Co. | |
10.250% due 05/01/2030 | | | | | 200 | | | | | | 165 | |
5.500% due 04/15/2027 | | | | | 230 | | | | | | 149 | |
|
Charter Communications Operating LLC | |
3.900% due 06/01/2052 | | | | | 100 | | | | | | 70 | |
| | | | | | | | | | | | |
| | | | | PRINCIPAL
AMOUNT
(000S) | | | | | MARKET
VALUE
(000S) | |
4.800% due 03/01/2050 | | $ | | | 16 | | | $ | | | 13 | |
|
Citrix Systems, Inc. | |
3.300% due 03/01/2030 | | | | | 3 | | | | | | 3 | |
|
Community Health Systems, Inc. | |
8.000% due 03/15/2026 | | | | | 184 | | | | | | 168 | |
|
Coty, Inc. | |
3.875% due 04/15/2026 | | EUR | | | 245 | | | | | | 228 | |
|
CVS Pass-Through Trust | |
8.353% due 07/10/2031 | | $ | | | 399 | | | | | | 456 | |
|
DISH DBS Corp. | |
5.250% due 12/01/2026 | | | | | 490 | | | | | | 385 | |
|
Energy Transfer LP | |
4.950% due 05/15/2028 | | | | | 4 | | | | | | 4 | |
|
Exela Intermediate LLC | |
11.500% due 07/15/2026 | | | | | 12 | | | | | | 4 | |
|
Hyatt Hotels Corp. | |
4.850% due 03/15/2026 | | | | | 900 | | | | | | 898 | |
|
Magallanes, Inc. | |
4.279% due 03/15/2032 | | | | | 170 | | | | | | 152 | |
|
Netflix, Inc. | |
5.375% due 11/15/2029 | | | | | 8 | | | | | | 8 | |
|
Oracle Corp. | |
3.950% due 03/25/2051 (i) | | | | | 510 | | | | | | 375 | |
|
Prime Healthcare Services, Inc. | |
7.250% due 11/01/2025 | | | | | 1,208 | | | | | | 1,035 | |
|
RegionalCare Hospital Partners Holdings, Inc. | |
9.750% due 12/01/2026 | | | | | 230 | | | | | | 224 | |
|
Surgery Center Holdings, Inc. | |
10.000% due 04/15/2027 | | | | | 200 | | | | | | 194 | |
|
Topaz Solar Farms LLC | |
4.875% due 09/30/2039 | | | | | 9 | | | | | | 8 | |
5.750% due 09/30/2039 | | | | | 70 | | | | | | 64 | |
|
U.S. Renal Care, Inc. | |
10.625% due 07/15/2027 | | | | | 6 | | | | | | 2 | |
|
Western Midstream Operating LP | |
2.621% (US0003M + 1.850%) due 01/13/2023 ~ | | | 4 | | | | | | 4 | |
|
Wynn Resorts Finance LLC | |
7.750% due 04/15/2025 | | | | | 1,400 | | | | | | 1,364 | |
| | | | | | | | | | | | |
| | | | | | | | | | | 7,573 | |
| | | | | | | | | | | | |
| |
| UTILITIES 2.3% | |
|
Pacific Gas & Electric Co. | |
2.950% due 03/01/2026 | | | | | 53 | | | | | | 48 | |
3.750% due 08/15/2042 | | | | | 2 | | | | | | 1 | |
3.750% due 07/01/2028 | | | | | 110 | | | | | | 97 | |
4.500% due 07/01/2040 | | | | | 131 | | | | | | 102 | |
4.950% due 07/01/2050 | | | | | 805 | | | | | | 643 | |
4.550% due 07/01/2030 | | | | | 127 | | | | | | 113 | |
4.200% due 03/01/2029 | | | | | 200 | | | | | | 179 | |
| | | | |
| 30 | | PIMCO EQUITY SERIES | | See Accompanying Notes |
June 30, 2022
| | | | | | | | | | | | |
| | | | | PRINCIPAL
AMOUNT
(000S) | | | | | MARKET
VALUE
(000S) | |
4.250% due 03/15/2046 | | $ | | | 4 | | | $ | | | 3 | |
3.300% due 03/15/2027 | | | | | 20 | | | | | | 18 | |
4.000% due 12/01/2046 | | | | | 2 | | | | | | 1 | |
3.400% due 08/15/2024 | | | | | 35 | | | | | | 34 | |
3.250% due 06/15/2023 | | | | | 23 | | | | | | 23 | |
4.500% due 12/15/2041 | | | | | 2 | | | | | | 1 | |
4.600% due 06/15/2043 | | | | | 210 | | | | | | 161 | |
4.750% due 02/15/2044 | | | | | 120 | | | | | | 92 | |
3.250% due 06/01/2031 | | | | | 559 | | | | | | 452 | |
|
Southern California Edison Co. | |
4.875% due 03/01/2049 | | | | | 1 | | | | | | 1 | |
|
Sprint Communications, Inc. | |
6.000% due 11/15/2022 | | | | | 900 | | | | | | 907 | |
|
Sprint Corp. | |
7.625% due 03/01/2026 | | | | | 7 | | | | | | 7 | |
7.625% due 02/15/2025 | | | | | 400 | | | | | | 418 | |
7.125% due 06/15/2024 | | | | | 435 | | | | | | 448 | |
| | | | | | | | | | | | |
| | | | | | | | | | | 3,749 | |
| | | | | | | | | | | | |
Total United States | | | | | | | | | | | 11,579 | |
| | | | | | | | | | | | |
| |
| VENEZUELA 0.0% | |
| |
| INDUSTRIALS 0.0% | |
|
Petroleos de Venezuela SA | |
9.750% due 05/17/2035 ^(b) | | | 20 | | | | | | 1 | |
6.000% due 05/16/2024 ^(b) | | | 20 | | | | | | 1 | |
6.000% due 11/15/2026 ^(b) | | | 300 | | | | | | 18 | |
| | | | | | | | | | | | |
| | | | | | | | | | | 20 | |
| | | | | | | | | | | | |
Total Venezuela | | | | | | | | | | | 20 | |
| | | | | | | | | | | | |
| |
| VIRGIN ISLANDS (BRITISH) 0.2% | |
| |
| INDUSTRIALS 0.2% | |
|
Studio City Finance Ltd. | |
5.000% due 01/15/2029 | | | | | 550 | | | | | | 285 | |
| | | | | | | | | | | | |
Total Virgin Islands (British) | | | 285 | |
| | | | | | | | | | | | |
Total Corporate Bonds & Notes (Cost $25,614) | | | 21,204 | |
| | | | |
| |
| NON-AGENCY MORTGAGE-BACKED SECURITIES 5.2% | |
| |
| UNITED KINGDOM 0.8% | |
|
Eurosail PLC | |
2.290% due 09/13/2045 • | | GBP | | | 363 | | | | | | 429 | |
2.540% due 06/13/2045 • | | | | | 235 | | | | | | 283 | |
2.540% (BP0003M + 0.950%) due 06/13/2045 ~ | | | 242 | | | | | | 292 | |
|
Grifonas Finance PLC | |
0.000% (EUR006M + 0.280%) due 08/28/2039 ~ | | EUR | | | 213 | | | | | | 212 | |
| | | | | | | | | | | | |
Total United Kingdom | | | | | | 1,216 | |
| | | | | | | | | | | | |
| |
| | | | | | | | | | | | |
| | | | | PRINCIPAL
AMOUNT
(000S) | | | | | MARKET
VALUE
(000S) | |
| UNITED STATES 4.4% | |
|
Banc of America Alternative Loan Trust | |
6.000% due 07/25/2046 ^ | | $ | | | 49 | | | $ | | | 43 | |
|
Banc of America Funding Trust | |
3.013% due 05/20/2036 ^~ | | | | | 6 | | | | | | 6 | |
|
Banc of America Mortgage Trust | |
3.242% due 11/20/2046 ^~ | | | | | 3 | | | | | | 3 | |
6.000% due 10/25/2036 ^ | | | | | 10 | | | | | | 8 | |
|
Bear Stearns Mortgage Funding Trust | |
7.500% due 08/25/2036 þ | | | | | 16 | | | | | | 16 | |
|
Benchmark Mortgage Trust | |
3.626% due 09/15/2048 ~ | | | | | 865 | | | | | | 811 | |
|
Chase Mortgage Finance Trust | |
3.201% due 09/25/2036 ^~ | | | | | 20 | | | | | | 18 | |
|
Countrywide Alternative Loan Trust | |
6.000% due 06/25/2036 ^ | | | | | 86 | | | | | | 58 | |
6.000% due 02/25/2037 ^ | | | | | 50 | | | | | | 22 | |
6.250% (US0001M + 0.650%) due 12/25/2036 ^~ | | | | | 20 | | | | | | 10 | |
|
Countrywide Home Loan Mortgage Pass-Through Trust | |
2.124% (US0001M + 0.500%) due 07/25/2037 ^~ | | | | | 14 | | | | | | 5 | |
|
Credit Suisse First Boston Mortgage Securities Corp. | |
6.000% due 01/25/2036 ^ | | | | | 30 | | | | | | 21 | |
|
Credit Suisse First Boston Mortgage-Backed Pass-Through Certificates | |
6.000% due 11/25/2035 ^ | | | | | 313 | | | | | | 113 | |
|
Credit Suisse Mortgage Capital Certificates | |
2.476% due 12/29/2037 ~ | | | | | 119 | | | | | | 85 | |
|
Credit Suisse Mortgage Capital Trust | |
3.303% due 07/10/2034 ~ | | | | | 960 | | | | | | 959 | |
|
DBGS Mortgage Trust | |
3.975% (US0001M + 2.650%) due 10/15/2036 ~ | | | | | 900 | | | | | | 859 | |
|
First Horizon Alternative Mortgage Securities Trust | |
3.162% due 06/25/2036 ^~ | | | | | 154 | | | | | | 131 | |
|
HSI Asset Loan Obligation Trust | |
6.000% due 06/25/2037 ^ | | | | | 2 | | | | | | 2 | |
|
JP Morgan Alternative Loan Trust | |
5.843% due 05/26/2037 ~ | | | | | 44 | | | | | | 38 | |
|
JP Morgan Chase Commercial Mortgage Securities Trust | |
3.840% due 11/15/2038 • | | | | | 967 | | | | | | 908 | |
|
JP Morgan Mortgage Trust | |
6.500% due 07/25/2036 ^ | | | | | 81 | | | | | | 42 | |
|
Merrill Lynch Mortgage Investors Trust | |
2.606% due 03/25/2036 ^~ | | | | | 10 | | | | | | 6 | |
|
Morgan Stanley Capital Trust | |
3.274% (US0001M + 1.950%) due 07/15/2035 ~ | | | | | 977 | | | | | | 926 | |
| | | | | | | | | | |
| See Accompanying Notes | | ANNUAL REPORT | | | | JUNE 30, 2022 | | | 31 | |
Schedule of Investments PIMCO Dividend and Income Fund (Cont.)
| | | | | | | | | | | | |
| | | | | PRINCIPAL
AMOUNT
(000S) | | | | | MARKET
VALUE
(000S) | |
|
OBX Trust | |
2.474% (US0001M + 0.850%) due 04/25/2048 ~ | | $ | | | 41 | | | $ | | | 40 | |
|
Residential Accredit Loans, Inc. Trust | |
2.424% due 10/25/2045 • | | | | | 48 | | | | | | 43 | |
5.500% due 03/25/2037 ^ | | | | | 239 | | | | | | 205 | |
6.250% due 03/25/2037 ^ | | | | | 20 | | | | | | 17 | |
|
Structured Adjustable Rate Mortgage Loan Trust | |
3.090% due 10/25/2036 ^~ | | | | | 1,281 | | | | | | 837 | |
|
Wells Fargo Alternative Loan Trust | |
3.411% due 07/25/2037 ^~ | | | | | 473 | | | | | | 424 | |
|
Wells Fargo Commercial Mortgage Trust | |
3.412% due 09/15/2058 | | | | | 703 | | | | | | 696 | |
| | | | | | | | | | | | |
Total United States | | | 7,352 | |
| | | | | | | | | | | | |
Total Non-Agency Mortgage-Backed Securities (Cost $9,099) | | | 8,568 | |
| | | | |
| |
| MUNICIPAL BONDS & NOTES 0.2% | |
| |
| ILLINOIS 0.0% | |
|
Illinois State General Obligation Bonds, (BABs), Series 2010 | |
6.630% due 02/01/2035 | | | | | 15 | | | | | | 16 | |
7.350% due 07/01/2035 | | | | | 5 | | | | | | 5 | |
| | | | | | | | | | | | |
Total Illinois | | | | | | | | | | | 21 | |
| | | | | | | | | | | | |
| |
| PUERTO RICO 0.1% | |
|
Commonwealth of Puerto Rico Bonds, Series 2022 | |
0.000% due 11/01/2043 | | | | | 44 | | | | | | 22 | |
|
Commonwealth of Puerto Rico General Obligation Bonds, Series 2021 | |
0.000% due 07/01/2033 (d) | | | | | 11 | | | | | | 7 | |
4.000% due 07/01/2033 | | | | | 9 | | | | | | 8 | |
4.000% due 07/01/2035 | | | | | 8 | | | | | | 7 | |
4.000% due 07/01/2037 | | | | | 7 | | | | | | 6 | |
4.000% due 07/01/2041 | | | | | 7 | | | | | | 6 | |
|
Commonwealth of Puerto Rico General Obligation Notes, Series 2021 | |
0.000% due 07/01/2024 (d) | | | | | 5 | | | | | | 4 | |
5.250% due 07/01/2023 | | | | | 10 | | | | | | 10 | |
|
Puerto Rico Electric Power Authority Revenue Bonds, (BABs), Series 2010 | |
6.125% due 07/01/2040 ^(b) | | | | | 100 | | | | | | 80 | |
| | | | | | | | | | | | |
Total Puerto Rico | | | | | | | | | | | 150 | |
| | | | | | | | | | | | |
| |
| VIRGINIA 0.1% | |
|
Tobacco Settlement Financing Corp., Virginia Revenue Bonds, Series 2007 | |
6.706% due 06/01/2046 | | | | | 160 | | | | | | 149 | |
| | | | | | | | | | | | |
Total Virginia | | | | | | | | | | | 149 | |
| | | | | | | | | | | | |
Total Municipal Bonds & Notes (Cost $249) | | | 320 | |
| | | | |
| |
| | | | | | | | | | | | |
| | | | | SHARES | | | | | MARKET
VALUE
(000S) | |
| PREFERRED STOCKS 0.9% | |
| |
| BRAZIL 0.4% | |
| |
| ENERGY 0.4% | |
| | | | |
Petroleo Brasileiro SA | | | | | 129,300 | | | $ | | | 690 | |
| | | | | | | | | | | | |
Total Brazil | | | | | | | | | | | 690 | |
| | | | | | | | | | | | |
| |
| NETHERLANDS 0.2% | |
| |
| BANKING & FINANCE 0.2% | |
|
Stichting AK Rabobank Certificaten | |
6.500% due 12/29/2049 þ(g) | | | | | 261,275 | | | | | | 267 | |
| | | | | | | | | | | | |
Total Netherlands | | | | | | | | | | | 267 | |
| | | | | | | | | | | | |
| |
| SPAIN 0.1% | |
| |
| BANKING & FINANCE 0.1% | |
|
CaixaBank SA | |
6.000% due 07/18/2022 •(g)(h) | | | | | 200,000 | | | | | | 210 | |
| | | | | | | | | | | | |
Total Spain | | | | | | | | | | | 210 | |
| | | | | | | | | | | | |
| |
| UNITED KINGDOM 0.1% | |
| |
| BANKING & FINANCE 0.1% | |
|
Nationwide Building Society | |
10.250% ~ | | | | | 1,130 | | | | | | 201 | |
| | | | | | | | | | | | |
Total United Kingdom | | | | | | | | | | | 201 | |
| | | | | | | | | | | | |
| |
| UNITED STATES 0.1% | |
| |
| INDUSTRIALS 0.1% | |
|
General Electric Co. | |
5.159% (US0003M + 3.330%) due 09/15/2022 ~(g) | | | | | 169,000 | | | | | | 149 | |
| | | | | | | | | | | | |
Total United States | | | | | | | | | | | 149 | |
| | | | | | | | | | | | |
Total Preferred Stocks (Cost $1,702) | | | 1,517 | |
| | | | |
| |
| REAL ESTATE INVESTMENT TRUSTS 5.7% | |
| |
| AUSTRALIA 0.2% | |
| |
| REAL ESTATE 0.2% | |
| | | | |
Dexus | | | | | 29,130 | | | | | | 179 | |
| | | | |
Stockland | | | | | 64,652 | | | | | | 162 | |
| | | | | | | | | | | | |
| | | | | | | | | | | 341 | |
| | | | | | | | | | | | |
Total Australia | | | | | | | | | | | 341 | |
| | | | | | | | | | | | |
| | | | | | | | | | | | |
| | | | |
| 32 | | PIMCO EQUITY SERIES | | See Accompanying Notes |
June 30, 2022
| | | | | | | | | | | | |
| | | | | SHARES | | | | | MARKET
VALUE
(000S) | |
| UNITED STATES 5.5% | |
| |
| REAL ESTATE 5.5% | |
| | | | |
Apartment Income REIT Corp. | | | | | 9,999 | | | $ | | | 416 | |
| | | | |
CBL & Associates Properties, Inc. | | | | | 39 | | | | | | 1 | |
| | | | |
Cousins Properties, Inc. | | | | | 8,922 | | | | | | 261 | |
| | | | |
EPR Properties | | | | | 13,675 | | | | | | 642 | |
| | | | |
Equity Residential | | | | | 4,570 | | | | | | 330 | |
| | | | |
Gaming & Leisure Properties, Inc. | | | | | 17,880 | | | | | | 820 | |
| | | | |
Healthcare Realty Trust, Inc. | | | | | 26,039 | | | | | | 708 | |
| | | | |
Highwoods Properties, Inc. | | | | | 5,599 | | | | | | 191 | |
| | | | |
Hudson Pacific Properties, Inc. | | | | | 10,988 | | | | | | 163 | |
| | | | |
Medical Properties Trust, Inc. | | | | | 42,602 | | | | | | 651 | |
| | | | |
Physicians Realty Trust | | | | | 11,765 | | | | | | 205 | |
| | | | |
Simon Property Group, Inc. | | | | | 7,708 | | | | | | 732 | |
| | | | |
SITE Centers Corp. | | | | | 29,050 | | | | | | 391 | |
| | | | |
SL Green Realty Corp. | | | | | 3,740 | | | | | | 173 | |
| | | | |
Spirit Realty Capital, Inc. | | | | | 10,271 | | | | | | 388 | |
| | | | |
Uniti Group, Inc. | | | | | 32 | | | | | | 0 | |
| | | | |
Ventas, Inc. | | | | | 6,174 | | | | | | 317 | |
| | | | |
VICI Properties, Inc. | | | | | 66,978 | | | | | | 1,995 | |
| | | | |
Weyerhaeuser Co. | | | | | 7,475 | | | | | | 248 | |
| | | | |
WP Carey, Inc. | | | | | 5,167 | | | | | | 428 | |
| | | | | | | | | | | | |
| | | | | | | | | | | 9,060 | |
| | | | | | | | | | | | |
Total United States | | | | | | | | | | | 9,060 | |
| | | | | | | | | | | | |
Total Real Estate Investment Trusts (Cost $10,553) | | | 9,401 | |
| | | | |
| |
| RIGHTS 0.0% | |
| |
| LUXEMBOURG 0.0% | |
| |
| FINANCIALS 0.0% | |
| | | | |
Intelsat Jackson Holdings SA Exp - 12/05/2025 «(c) | | | | | 348 | | | | | | 2 | |
| | | | | | | | | | | | |
Total Rights (Cost $0) | | | 2 | |
| | | | |
| | | | | | | | | | | | |
| | | | | PRINCIPAL
AMOUNT
(000S) | | | | | | |
| SOVEREIGN ISSUES 1.0% | |
| |
| ARGENTINA 0.2% | |
|
Argentina Government International Bond | |
0.500% due 07/09/2030 þ | | $ | | | 299 | | | | | | 65 | |
1.000% due 07/09/2029 | | | | | 31 | | | | | | 7 | |
1.125% due 07/09/2035 þ | | | | | 373 | | | | | | 78 | |
2.000% due 01/09/2038 þ | | | | | 269 | | | | | | 79 | |
| | | | | | | | | | | | |
| | | | | PRINCIPAL
AMOUNT
(000S) | | | | | MARKET
VALUE
(000S) | |
2.500% due 07/09/2041 þ | | $ | | | 196 | | | $ | | | 51 | |
15.500% due 10/17/2026 | | ARS | | | 1,226 | | | | | | 2 | |
47.331% (BADLARPP) due 10/04/2022 ~ | | | | | 28 | | | | | | 0 | |
|
Autonomous City of Buenos Aires | |
53.715% (BADLARPP + 3.250%) due 03/29/2024 ~ | | | 3,481 | | | | | | 13 | |
|
Provincia de Buenos Aires | |
49.102% due 04/12/2025 | | | | | 389 | | | | | | 1 | |
| | | | | | | | | | | | |
Total Argentina | | | | | | | | | | | 296 | |
| | | | | | | | | | | | |
| |
| PERU 0.1% | |
|
Peru Government International Bond | |
5.940% due 02/12/2029 | | PEN | | | 238 | | | | | | 57 | |
6.150% due��08/12/2032 | | | | | 250 | | | | | | 57 | |
6.350% due 08/12/2028 | | | | | 266 | | | | | | 65 | |
6.900% due 08/12/2037 | | | | | 7 | | | | | | 2 | |
6.950% due 08/12/2031 | | | | | 87 | | | | | | 22 | |
8.200% due 08/12/2026 | | | | | 189 | | | | | | 52 | |
| | | | | | | | | | | | |
Total Peru | | | | | | | | | | | 255 | |
| | | | | | | | | | | | |
| |
| ROMANIA 0.1% | |
|
Romania Government International Bond | |
2.000% due 04/14/2033 | | EUR | | | 214 | | | | | | 146 | |
| | | | | | | | | | | | |
Total Romania | | | | | | | | | | | 146 | |
| | | | | | | | | | | | |
| |
| SOUTH AFRICA 0.4% | |
|
South Africa Government International Bond | |
8.000% due 01/31/2030 | | ZAR | | | 200 | | | | | | 11 | |
8.250% due 03/31/2032 | | | | | 300 | | | | | | 15 | |
8.750% due 02/28/2048 | | | | | 200 | | | | | | 10 | |
8.875% due 02/28/2035 | | | | | 200 | | | | | | 10 | |
10.500% due 12/21/2026 | | | | | 10,200 | | | | | | 664 | |
| | | | | | | | | | | | |
Total South Africa | | | | | | | | | | | 710 | |
| | | | | | | | | | | | |
| |
| TURKEY 0.2% | |
|
Turkey Government International Bond | |
4.250% due 03/13/2025 | | $ | | | 200 | | | | | | 172 | |
5.250% due 03/13/2030 | | | | | 200 | | | | | | 143 | |
| | | | | | | | | | | | |
Total Turkey | | | | | | | | | | | 315 | |
| | | | | | | | | | | | |
| |
| VENEZUELA 0.0% | |
|
Venezuela Government International Bond | |
6.000% due 12/09/2049 | | | | | 125 | | | | | | 10 | |
7.000% due 03/31/2038 ^(b) | | | | | 2 | | | | | | 0 | |
7.650% due 04/21/2025 ^(b) | | | | | 3 | | | | | | 0 | |
9.250% due 09/15/2027 ^(b) | | | | | 44 | | | | | | 4 | |
| | | | | | | | | | | | |
Total Venezuela | | | | | | | | | | | 14 | |
| | | | | | | | | | | | |
Total Sovereign Issues (Cost $2,487) | | | 1,736 | |
| | | | |
| |
| | | | | | | | | | |
| See Accompanying Notes | | ANNUAL REPORT | | | | JUNE 30, 2022 | | | 33 | |
Schedule of Investments PIMCO Dividend and Income Fund (Cont.)
| | | | | | | | | | | | |
| | | | | PRINCIPAL
AMOUNT
(000S) | | | | | MARKET
VALUE
(000S) | |
| U.S. GOVERNMENT AGENCIES 10.0% | |
| |
| UNITED STATES 10.0% | |
|
Ginnie Mae, TBA | |
3.500% due 07/01/2052 | | $ | | | 100 | | | $ | | | 97 | |
|
Uniform Mortgage-Backed Security | |
3.000% due 11/01/2029 - 03/01/2050 | | | | | 56 | | | | | | 53 | |
3.500% due 02/01/2050 | | | | | 34 | | | | | | 33 | |
|
Uniform Mortgage-Backed Security, TBA | |
2.500% due 08/01/2052 | | | | | 100 | | | | | | 90 | |
3.000% due 08/01/2052 | | | | | 3,400 | | | | | | 3,164 | |
3.500% due 08/01/2052 | | | | | 7,100 | | | | | | 6,822 | |
4.000% due 04/01/2052 | | | | | 6,500 | | | | | | 6,401 | |
| | | | | | | | | | | | |
Total U.S. Government Agencies (Cost $16,692) | | | 16,660 | |
| | | | |
| |
| U.S. TREASURY OBLIGATIONS 7.6% | |
| |
| UNITED STATES 7.6% | |
|
U.S. Treasury Bonds | |
2.875% due 11/15/2046 | | | | | 600 | | | | | | 547 | |
3.000% due 02/15/2049 | | | | | 1,133 | | | | | | 1,080 | |
|
U.S. Treasury Inflation Protected Securities (f) | |
0.125% due 07/15/2030 | | | | | 316 | | | | | | 301 | |
0.125% due 07/15/2031 | | | | | 2,189 | | | | | | 2,084 | |
0.125% due 02/15/2051 | | | | | 333 | | | | | | 257 | |
0.250% due 07/15/2029 (l) | | | | | 811 | | | | | | 787 | |
0.375% due 01/15/2027 | | | | | 38 | | | | | | 38 | |
0.375% due 07/15/2027 | | | | | 12 | | | | | | 12 | |
0.750% due 07/15/2028 | | | | | 242 | | | | | | 244 | |
0.875% due 01/15/2029 | | | | | 397 | | | | | | 401 | |
1.000% due 02/15/2048 | | | | | 117 | | | | | | 112 | |
1.000% due 02/15/2049 | | | | | 115 | | | | | | 111 | |
|
U.S. Treasury Notes | |
0.125% due 04/30/2023 (l)(n) | | | | | 4,000 | | | | | | 3,910 | |
2.375% due 03/31/2029 (n) | | | | | 2,800 | | | | | | 2,681 | |
2.875% due 05/15/2032 | | | | | 100 | | | | | | 99 | |
| | | | | | | | | | | | |
Total U.S. Treasury Obligations (Cost $13,500) | | | 12,664 | |
| | | | |
| | | | | | | | | | | | |
| | | | | SHARES | | | | | | |
| WARRANTS 0.0% | |
| |
| LUXEMBOURG 0.0% | |
| |
| FINANCIALS 0.0% | |
| | | | |
Intelsat Emergence SA - Exp. 02/17/2027 « | | | | | 132 | | | | | | 0 | |
| | | |
Intelsat Jackson Holdings SA-Exp. 12/05/2025 « | | | 296 | | | | | | 2 | |
| | | | | | | | | | | | |
| |
| | | 2 | |
| | | | |
Total Luxembourg | | | | | | | | | | | 2 | |
| | | | |
| |
| | | | | | | | | | | | |
| | | | | SHARES | | | | | MARKET
VALUE
(000S) | |
| UNITED STATES 0.0% | |
| |
| INFORMATION TECHNOLOGY 0.0% | |
| | | |
Windstream Holdings LLC - Exp. 9/21/2055 « | | | 40 | | | $ | | | 1 | |
| | | | | | | | | | | | |
Total United States | | | 1 | |
| | | | |
Total Warrants (Cost $53) | | | 3 | |
| | | | |
| | | | | | | | | | | | |
| | | | | PRINCIPAL
AMOUNT
(000S) | | | | | | |
| SHORT-TERM INSTRUMENTS 0.6% | |
| | | | | | | | | | | | |
| REPURCHASE AGREEMENTS (j) 0.6% | | | | |
| | | | | | | | | | | 1,002 | |
| | | | | | | | | | | | |
| | | | | | | | | | | | |
| ARGENTINA TREASURY BILLS 0.0% | |
51.049% due 09/30/2022 (d)(e) | | ARS | | | 23,000 | | | | | | 77 | |
| | | | | | | | | | | | |
Total Argentina Treasury Bills (Cost $106) | | | 77 | |
| | | | |
Total Short-Term Instruments (Cost $1,108) | | | 1,079 | |
|
| |
| Total Investments in Securities (Cost $178,437) | | | 167,344 | |
| | | | |
| |
| | | | | SHARES | | | | | | |
| INVESTMENTS IN AFFILIATES 7.0% | |
| |
| SHORT-TERM INSTRUMENTS 7.0% | |
| |
| CENTRAL FUNDS USED FOR CASH MANAGEMENT PURPOSES 7.0% | |
| | | | |
PIMCO Short-Term Floating NAV Portfolio III | | | | | 1,195,687 | | | | | | 11,603 | |
| | | | | | | | | | | | |
| Total Short-Term Instruments (Cost $11,610) | | | | | | 11,603 | |
|
| |
| Total Investments in Affiliates (Cost $11,610) | | | 11,603 | |
|
| |
| Total Investments 107.9% (Cost $190,047) | | | $ | | | 178,947 | |
| | | | | | | | | | | | |
Financial Derivative Instruments (k)(m) (0.2)% (Cost or Premiums, net $(1,271)) | | | (373 | ) |
| | | | | | | | | | | | |
| Other Assets and Liabilities, net (7.7)% | | | (12,728 | ) |
| | | | |
| Net Assets 100.0% | | | $ | | | 165,846 | |
| | | | | | | |
| | | | |
| 34 | | PIMCO EQUITY SERIES | | See Accompanying Notes |
June 30, 2022
NOTES TO SCHEDULE OF INVESTMENTS:
| * | A zero balance may reflect actual amounts rounding to less than one thousand. |
| « | Security valued using significant unobservable inputs (Level 3). |
| µ | All or a portion of this amount represents unfunded loan commitments. The interest rate for the unfunded portion will be determined at the time of funding. See Note 4, Securities and Other Investments, in the Notes to Financial Statements for more information regarding unfunded loan commitments. |
| ~ | Variable or Floating rate security. Rate shown is the rate in effect as of period end. Certain variable rate securities are not based on a published reference rate and spread, rather are determined by the issuer or agent and are based on current market conditions. Reference rate is as of reset date, which may vary by security. These securities may not indicate a reference rate and/or spread in their description. |
| • | Rate shown is the rate in effect as of period end. The rate may be based on a fixed rate, a capped rate or a floor rate and may convert to a variable or floating rate in the future. These securities do not indicate a reference rate and spread in their description. |
| þ | Coupon represents a rate which changes periodically based on a predetermined schedule or event. Rate shown is the rate in effect as of period end. |
| (a) | Payment in-kind security. |
| (b) | Security is not accruing income as of the date of this report. |
| (c) | Security did not produce income within the last twelve months. |
| (e) | Coupon represents a yield to maturity. |
| (f) | Principal amount of security is adjusted for inflation. |
| (g) | Perpetual maturity; date shown, if applicable, represents next contractual call date. |
| (h) | Contingent convertible security. |
(i) RESTRICTED SECURITIES:
| | | | | | | | | | | | | | | | |
| Issuer Description | | Acquisition
Date | | | Cost | | | Market
Value | | | Market Value
as Percentage
of Net Assets | |
Intelsat SA | | | 06/19/2017 - 02/23/2022 | | | $ | 208 | | | $ | 81 | | | | 0.05 | % |
Lundin Energy AB | | | 09/30/2021 - 06/08/2022 | | | | 152 | | | | 147 | | | | 0.09 | |
Neiman Marcus Group Ltd. LLC | | | 09/25/2020 | | | | 36 | | | | 194 | | | | 0.12 | |
Noble Corp. | | | 02/05/2021 - 02/27/2021 | | | | 26 | | | | 54 | | | | 0.03 | |
Oracle Corp. 3.950% due 03/25/2051 | | | 03/22/2021 | | | | 509 | | | | 375 | | | | 0.23 | |
Westmoreland Mining Holdings | | | 03/26/2019 | | | | 0 | | | | 0 | | | | 0.00 | |
| | | | | | | | | | | | | | | | |
| | | $ | 931 | | | $ | 851 | | | | 0.52 | % |
| | | | | | | | | | | | | |
BORROWINGS AND OTHER FINANCING TRANSACTIONS
(j) REPURCHASE AGREEMENTS:
| | | | | | | | | | | | | | | | | | | | | | | | | | | | | | |
| Counterparty | | Lending
Rate | | | Settlement
Date | | | Maturity
Date | | | Principal
Amount | | | Collateralized By | | Collateral
(Received) | | | Repurchase
Agreements,
at Value | | | Repurchase
Agreement
Proceeds
to be
Received(1) | |
FICC | | | 0.400 | % | | | 06/30/2022 | | | | 07/01/2022 | | | $ | 1,002 | | | U.S. Treasury Notes
3.000% due 06/30/2024 | | $ | (1,022 | ) | | $ | 1,002 | | | $ | 1,002 | |
| | | | | | | | | | | | | | | | | | | | | | | | | | | | | | |
Total Repurchase Agreements | | | | | $ | (1,022 | ) | | $ | 1,002 | | | $ | 1,002 | |
| | | | | | | | | | | | | | | |
| | | | | | | | | | |
| See Accompanying Notes | | ANNUAL REPORT | | | | JUNE 30, 2022 | | | 35 | |
Schedule of Investments PIMCO Dividend and Income Fund (Cont.)
BORROWINGS AND OTHER FINANCING TRANSACTIONS SUMMARY
The following is a summary by counterparty of the market value of Borrowings and Other Financing Transactions and collateral pledged/(received) as of June 30, 2022:
| | | | | | | | | | | | | | | | | | | | | | | | |
| Counterparty | | Repurchase
Agreement
Proceeds to be
Received(1) | | | Payable for
Reverse
Repurchase
Agreements | | | Payable for
Sale-Buyback
Transactions | | | Total
Borrowings and
Other Financing
Transactions | | | Collateral
Pledged/
(Received) | | | Net Exposure(2) | |
Global/Master Repurchase Agreement | |
FICC | | $ | 1,002 | | | $ | 0 | | | $ | 0 | | | $ | 1,002 | | | $ | (1,022 | ) | | $ | (20 | ) |
| | | | | | | | | | | | | | | | | | | | | | | | |
Total Borrowings and Other Financing Transactions | | $ | 1,002 | | | $ | 0 | | | $ | 0 | | | | | | | | | | | | | |
| | | | | | | | | | | | | | | | | | | | | | | | |
| (1) | Includes accrued interest. |
| (2) | Net Exposure represents the net receivable/(payable) that would be due from/to the counterparty in the event of default. Exposure from borrowings and other financing transactions can only be netted across transactions governed under the same master agreement with the same legal entity. See Note 8, Master Netting Arrangements, in the Notes to Financial Statements for more information. |
The average amount of borrowings outstanding during the period ended June 30, 2022 was $(916) at a weighted average interest rate of 0.071%. Average borrowings may include reverse repurchase agreements and sale-buyback transactions, if held during the period.
(k) FINANCIAL DERIVATIVE INSTRUMENTS: EXCHANGE-TRADED OR CENTRALLY CLEARED
WRITTEN OPTIONS:
OPTIONS ON EXCHANGE-TRADED FUTURES CONTRACTS
| | | | | | | | | | | | | | | | | | | | | | | | |
| Description | | Strike
Price | | | Expiration
Date | | | # of
Contracts | | | Notional
Amount | | | Premiums
(Received) | | | Market
Value | |
Put - CME 3-Month SOFR Active Contract
December 2023 Futures | | $ | 96.500 | | | | 12/15/2023 | | | | 2 | | | $ | 5 | | | $ | (2 | ) | | $ | (2 | ) |
Call - CME 3-Month SOFR Active Contract
December 2023 Futures | | | 98.000 | | | | 12/15/2023 | | | | 2 | | | | 5 | | | | (1 | ) | | | (2 | ) |
| | | | | | | | | | | | | | | | | | | | | | | | |
Total Written Options | | | $ | (3 | ) | | $ | (4 | ) |
| | | | | | | | | | | | | | | | | | | | | | | | |
FUTURES CONTRACTS:
LONG FUTURES CONTRACTS
| | | | | | | | | | | | | | | | | | | | | | | | |
Description | | Expiration
Month | | | # of
Contracts | | | Notional
Amount | | | Unrealized
Appreciation/
(Depreciation) | | | Variation Margin | |
| | Asset | | | Liability | |
Euro-BTP Italy Government Bond September Futures | | | 09/2022 | | | | 7 | | | $ | 903 | | | $ | (22 | ) | | $ | 21 | | | $ | 0 | |
U.S. Treasury 2-Year Note September Futures | | | 09/2022 | | | | 1 | | | | 210 | | | | (1 | ) | | | 1 | | | | 0 | |
U.S. Treasury 10-Year Note September Futures | | | 09/2022 | | | | 176 | | | | 20,862 | | | | (122 | ) | | | 179 | | | | 0 | |
| | | | | | | | | | | | | | | | | | | | | | | | |
| | | | | | | | | | | | | | $ | (145 | ) | | $ | 201 | | | $ | 0 | |
| | | | | | | | | | | | | | | | | | | | | | | | |
| | | | |
| 36 | | PIMCO EQUITY SERIES | | See Accompanying Notes |
June 30, 2022
SHORT FUTURES CONTRACTS
| | | | | | | | | | | | | | | | | | | | | | | | |
Description | | Expiration
Month | | | # of
Contracts | | | Notional
Amount | | | Unrealized
Appreciation/
(Depreciation) | | | Variation Margin | |
| | Asset | | | Liability | |
Australia Government 10-Year Bond September Futures | | | 09/2022 | | | | 18 | | | $ | (1,477 | ) | | $ | 6 | | | $ | 0 | | | $ | (10 | ) |
U.S. Treasury 10-Year Ultra September Futures | | | 09/2022 | | | | 24 | | | | (3,057 | ) | | | 22 | | | | 0 | | | | (32 | ) |
U.S. Treasury 30-Year Bond September Futures | | | 09/2022 | | | | 9 | | | | (1,248 | ) | | | 7 | | | | 0 | | | | (15 | ) |
U.S. Treasury Ultra Long-Term Bond September Futures | | | 09/2022 | | | | 4 | | | | (617 | ) | | | 13 | | | | 0 | | | | (9 | ) |
| | | | | | | | | | | | | | | | | | | | | | | | |
| | | | | | | | | | $ | 48 | | | $ | 0 | | | $ | (66 | ) |
| | | | | | | | | | | | | | | | | | | | |
Total Futures Contracts | | | $ | (97 | ) | | $ | 201 | | | $ | (66 | ) |
| | | | | | | | | | | | | |
SWAP AGREEMENTS:
CREDIT DEFAULT SWAPS ON CORPORATE ISSUES - SELL PROTECTION(1)
| | | | | | | | | | | | | | | | | | | | | | | | | | | | | | | | | | | | | | | | |
Reference Entity | | Fixed
Receive Rate | | | Payment
Frequency | | | Maturity
Date | | | Implied
Credit
Spread at
June 30,
2022(2) | | | Notional
Amount(3) | | | Premiums
Paid/
(Received) | | | Unrealized
Appreciation/
(Depreciation) | | | Market
Value(4) | | | Variation Margin | |
| | Asset | | | Liability | |
AT&T, Inc. | | | 1.000 | % | | | Quarterly | | | | 12/20/2026 | | | | 1.227 | % | | $ | 1,000 | | | $ | 16 | | | $ | (25 | ) | | $ | (9 | ) | | $ | 0 | | | $ | (1 | ) |
Boeing Co. | | | 1.000 | | | | Quarterly | | | | 06/20/2023 | | | | 1.520 | | | | 100 | | | | 0 | | | | 0 | | | | 0 | | | | 0 | | | | 0 | |
Boeing Co. | | | 1.000 | | | | Quarterly | | | | 12/20/2023 | | | | 1.745 | | | | 200 | | | | 2 | | | | (4 | ) | | | (2 | ) | | | 0 | | | | 0 | |
Devon Energy Corp. | | | 1.000 | | | | Quarterly | | | | 12/20/2026 | | | | 1.798 | | | | 500 | | | | (1 | ) | | | (15 | ) | | | (16 | ) | | | 0 | | | | (1 | ) |
Ford Motor Co. | | | 5.000 | | | | Quarterly | | | | 06/20/2027 | | | | 4.446 | | | | 200 | | | | 24 | | | | (19 | ) | | | 5 | | | | 0 | | | | (1 | ) |
Ford Motor Credit Co. LLC | | | 5.000 | | | | Quarterly | | | | 06/20/2026 | | | | 3.931 | | | | 600 | | | | 52 | | | | (29 | ) | | | 23 | | | | 0 | | | | (1 | ) |
General Electric Co. | | | 1.000 | | | | Quarterly | | | | 06/20/2026 | | | | 1.530 | | | | 300 | | | | 1 | | | | (7 | ) | | | (6 | ) | | | 0 | | | | 0 | |
General Motors Co. | | | 5.000 | | | | Quarterly | | | | 12/20/2026 | | | | 2.634 | | | | 900 | | | | 179 | | | | (94 | ) | | | 85 | | | | 0 | | | | (1 | ) |
Hess Corp. | | | 1.000 | | | | Quarterly | | | | 12/20/2026 | | | | 1.797 | | | | 500 | | | | (2 | ) | | | (14 | ) | | | (16 | ) | | | 0 | | | | (1 | ) |
Rolls-Royce PLC | | | 1.000 | | | | Quarterly | | | | 06/20/2027 | | | | 4.406 | | | EUR | 100 | | | | (8 | ) | | | (7 | ) | | | (15 | ) | | | 0 | | | | (1 | ) |
Rolls-Royce PLC | | | 1.000 | | | | Quarterly | | | | 12/20/2025 | | | | 3.940 | | | | 100 | | | | (10 | ) | | | 0 | | | | (10 | ) | | | 0 | | | | (1 | ) |
Rolls-Royce PLC | | | 1.000 | | | | Quarterly | | | | 12/20/2026 | | | | 4.270 | | | | 200 | | | | (9 | ) | | | (18 | ) | | | (27 | ) | | | 0 | | | | (2 | ) |
Verizon Communications, Inc. | | | 1.000 | | | | Quarterly | | | | 06/20/2026 | | | | 1.105 | | | $ | 500 | | | | 11 | | | | (13 | ) | | | (2 | ) | | | 0 | | | | (1 | ) |
| | | | | | | | | | | | | | | | | | | | | | | | | | | | | | | | | | | | | | | | |
| | | | | | | | | | | | | | | | | | | $ | 255 | | | $ | (245 | ) | | $ | 10 | | | $ | 0 | | | $ | (11 | ) |
| | | | | | | | | | | | | | | | | | | | | | | | | | | | | | | | | |
CREDIT DEFAULT SWAPS ON CREDIT INDICES - SELL PROTECTION(1)
| | | | | | | | | | | | | | | | | | | | | | | | | | | | | | | | | | | | |
Index/Tranches | | Fixed
Receive Rate | | | Payment
Frequency | | | Maturity
Date | | | Notional
Amount(3) | | | Premiums
Paid/
(Received) | | | Unrealized
Appreciation/
(Depreciation) | | | Market
Value(4) | | | Variation Margin | |
| | Asset | | | Liability | |
CDX.EM-36 5-Year Index | | | 1.000 | % | | | Quarterly | | | | 12/20/2026 | | | $ | 1,200 | | | $ | (46 | ) | | $ | (110 | ) | | $ | (156 | ) | | $ | 0 | | | $ | (1 | ) |
CDX.HY-38 5-Year Index | | | 5.000 | | | | Quarterly | | | | 06/20/2027 | | | | 6,336 | | | | 147 | | | | (323 | ) | | | (176 | ) | | | 0 | | | | (8 | ) |
CDX.IG-38 5-Year Index | | | 1.000 | | | | Quarterly | | | | 06/20/2027 | | | | 200 | | | | 3 | | | | (3 | ) | | | 0 | | | | 0 | | | | 0 | |
iTraxx Asia Ex-Japan 37 5-Year Index | | | 1.000 | | | | Quarterly | | | | 06/20/2027 | | | | 100 | | | | 0 | | | | (2 | ) | | | (2 | ) | | | 0 | | | | 0 | |
iTraxx Europe Main 34 5-Year Index | | | 1.000 | | | | Quarterly | | | | 12/20/2025 | | | EUR | 800 | | | | 22 | | | | (20 | ) | | | 2 | | | | 0 | | | | (2 | ) |
| | | | | | | | | | | | | | | | | | | | | | | | | | | | | | | | | | | | |
| | | | | | | | | | | | | | | $ | 126 | | | $ | (458 | ) | | $ | (332 | ) | | $ | 0 | | | $ | (11 | ) |
| | | | | | | | | | | | | | | | | | | | | | | | | | | | | | | | | |
| | | | | | | | | | |
| See Accompanying Notes | | ANNUAL REPORT | | | | JUNE 30, 2022 | | | 37 | |
Schedule of Investments PIMCO Dividend and Income Fund (Cont.)
INTEREST RATE SWAPS
| | | | | | | | | | | | | | | | | | | | | | | | | | | | | | | | | | | | | | |
Pay/
Receive
Floating
Rate | | Floating Rate Index | | Fixed Rate | | | Payment
Frequency | | Maturity
Date | | | Notional
Amount | | | Premiums
Paid/
(Received) | | | Unrealized
Appreciation/
(Depreciation) | | | Market
Value | | | Variation Margin | |
| | Asset | | | Liability | |
| Receive(5) | | 1-Day GBP-SONIO Compounded-OIS | | | 0.750 | % | | Annual | | | 09/21/2032 | | | GBP | | | 1,300 | | | $ | 126 | | | $ | 103 | | | $ | 229 | | | $ | 0 | | | $ | (24 | ) |
| Receive | | 1-Day GBP-SONIO Compounded-OIS | | | 0.500 | | | Annual | | | 03/16/2042 | | | | | | 200 | | | | 7 | | | | 62 | | | | 69 | | | | 0 | | | | (5 | ) |
| Receive(5) | | 1-Day GBP-SONIO Compounded-OIS | | | 0.750 | | | Annual | | | 09/21/2052 | | | | | | 950 | | | | 21 | | | | 345 | | | | 366 | | | | 0 | | | | (28 | ) |
| Pay | | 1-Day JPY-MUTKCALM Compounded-OIS | | | 0.176 | | | Annual | | | 04/27/2027 | | | JPY | | | 30,000 | | | | 0 | | | | 0 | | | | 0 | | | | 0 | | | | 0 | |
| Receive | | 1-Day JPY-MUTKCALM Compounded-OIS | | | 0.020 | | | Semi-Annual | | | 09/20/2028 | | | | | | 210,000 | | | | 4 | | | | 32 | | | | 36 | | | | 0 | | | | (2 | ) |
| Receive | | 1-Day JPY-MUTKCALM Compounded-OIS | | | 0.000 | | | Semi-Annual | | | 03/15/2029 | | | | | | 641,000 | | | | 46 | | | | 76 | | | | 122 | | | | 0 | | | | (7 | ) |
| Receive | | 1-Day JPY-MUTKCALM Compounded-OIS | | | 0.400 | | | Annual | | | 06/15/2032 | | | | | | 150,000 | | | | 2 | | | | 9 | | | | 11 | | | | 0 | | | | (2 | ) |
| Receive | | 1-Day JPY-MUTKCALM Compounded-OIS | | | 0.500 | | | Annual | | | 03/15/2042 | | | | | | 90,000 | | | | 26 | | | | 19 | | | | 45 | | | | 0 | | | | (2 | ) |
| Receive | | 1-Day JPY-MUTKCALM Compounded-OIS | | | 0.711 | | | Annual | | | 04/27/2042 | | | | | | 10,000 | | | | 0 | | | | 2 | | | | 2 | | | | 0 | | | | 0 | |
| Pay | | 1-Day USD-SOFR Compounded-OIS | | | 1.928 | | | Annual | | | 03/25/2027 | | | $ | | | 200 | | | | 0 | | | | (7 | ) | | | (7 | ) | | | 1 | | | | 0 | |
| Receive | | 1-Day USD-SOFR Compounded-OIS | | | 1.000 | | | Annual | | | 06/15/2027 | | | | | | 200 | | | | 8 | | | | 9 | | | | 17 | | | | 0 | | | | (1 | ) |
| Receive(5) | | 1-Day USD-SOFR Compounded-OIS | | | 2.450 | | | Annual | | | 10/04/2027 | | | | | | 320 | | | | 0 | | | | 5 | | | | 5 | | | | 0 | | | | (2 | ) |
| Pay | | 1-Day USD-SOFR Compounded-OIS | | | 1.000 | | | Annual | | | 06/15/2029 | | | | | | 220 | | | | (9 | ) | | | (16 | ) | | | (25 | ) | | | 1 | | | | 0 | |
| Receive | | 1-Day USD-SOFR Compounded-OIS | | | 1.000 | | | Annual | | | 06/15/2029 | | | | | | 310 | | | | 18 | | | | 17 | | | | 35 | | | | 0 | | | | (2 | ) |
| Pay | | 1-Day USD-SOFR Compounded-OIS | | | 1.817 | | | Annual | | | 04/05/2032 | | | | | | 400 | | | | (2 | ) | | | (30 | ) | | | (32 | ) | | | 3 | | | | 0 | |
| Pay | | 1-Day USD-SOFR Compounded-OIS | | | 1.872 | | | Annual | | | 04/06/2032 | | | | | | 200 | | | | (1 | ) | | | (14 | ) | | | (15 | ) | | | 1 | | | | 0 | |
| Pay | | 1-Day USD-SOFR Compounded-OIS | | | 1.250 | | | Annual | | | 06/15/2032 | | | | | | 340 | | | | (32 | ) | | | (14 | ) | | | (46 | ) | | | 3 | | | | 0 | |
| Pay | | 1-Day USD-SOFR Compounded-OIS | | | 1.750 | | | Annual | | | 06/15/2032 | | | | | | 500 | | | | (33 | ) | | | (13 | ) | | | (46 | ) | | | 4 | | | | 0 | |
| Pay | | 1-Year BRL-CDI | | | 5.830 | | | Maturity | | | 01/02/2023 | | | BRL | | | 800 | | | | 8 | | | | (11 | ) | | | (3 | ) | | | 0 | | | | 0 | |
| Pay | | 1-Year BRL-CDI | | | 5.836 | | | Maturity | | | 01/02/2023 | | | | | | 600 | | | | 6 | | | | (8 | ) | | | (2 | ) | | | 0 | | | | 0 | |
| Pay | | 1-Year BRL-CDI | | | 5.855 | | | Maturity | | | 01/02/2023 | | | | | | 200 | | | | 2 | | | | (3 | ) | | | (1 | ) | | | 0 | | | | 0 | |
| Pay | | 1-Year BRL-CDI | | | 6.170 | | | Maturity | | | 01/02/2023 | | | | | | 5,200 | | | | (1 | ) | | | (47 | ) | | | (48 | ) | | | 0 | | | | 0 | |
| Receive | | 1-Year BRL-CDI | | | 12.670 | | | Maturity | | | 01/02/2023 | | | | | | 300 | | | | 0 | | | | 0 | | | | 0 | | | | 0 | | | | 0 | |
| Receive | | 1-Year BRL-CDI | | | 12.690 | | | Maturity | | | 01/02/2023 | | | | | | 200 | | | | 0 | | | | 0 | | | | 0 | | | | 0 | | | | 0 | |
| Receive | | 1-Year BRL-CDI | | | 12.740 | | | Maturity | | | 01/02/2023 | | | | | | 500 | | | | 0 | | | | 0 | | | | 0 | | | | 0 | | | | 0 | |
| Receive | | 1-Year BRL-CDI | | | 12.750 | | | Maturity | | | 01/02/2023 | | | | | | 200 | | | | 0 | | | | 0 | | | | 0 | | | | 0 | | | | 0 | |
| Receive | | 1-Year BRL-CDI | | | 12.760 | | | Maturity | | | 01/02/2023 | | | | | | 400 | | | | 0 | | | | 0 | | | | 0 | | | | 0 | | | | 0 | |
| Receive | | 1-Year BRL-CDI | | | 12.900 | | | Maturity | | | 01/02/2023 | | | | | | 900 | | | | 0 | | | | 0 | | | | 0 | | | | 0 | | | | 0 | |
| Receive | | 1-Year BRL-CDI | | | 12.930 | | | Maturity | | | 01/02/2023 | | | | | | 100 | | | | 0 | | | | 0 | | | | 0 | | | | 0 | | | | 0 | |
| Receive | | 1-Year BRL-CDI | | | 12.939 | | | Maturity | | | 01/02/2023 | | | | | | 500 | | | | 0 | | | | 0 | | | | 0 | | | | 0 | | | | 0 | |
| Receive | | 1-Year BRL-CDI | | | 12.946 | | | Maturity | | | 01/02/2023 | | | | | | 1,200 | | | | 0 | | | | 0 | | | | 0 | | | | 0 | | | | 0 | |
| Receive | | 1-Year BRL-CDI | | | 12.960 | | | Maturity | | | 01/02/2023 | | | | | | 900 | | | | 0 | | | | 0 | | | | 0 | | | | 0 | | | | 0 | |
| Receive | | 1-Year BRL-CDI | | | 12.970 | | | Maturity | | | 01/02/2023 | | | | | | 1,600 | | | | 0 | | | | 1 | | | | 1 | | | | 0 | | | | 0 | |
| Pay | | 1-Year BRL-CDI | | | 11.140 | | | Maturity | | | 01/02/2025 | | | | | | 100 | | | | 0 | | | | (1 | ) | | | (1 | ) | | | 0 | | | | 0 | |
| Pay | | 1-Year BRL-CDI | | | 11.160 | | | Maturity | | | 01/02/2025 | | | | | | 100 | | | | 0 | | | | (1 | ) | | | (1 | ) | | | 0 | | | | 0 | |
| Pay | | 1-Year BRL-CDI | | | 11.350 | | | Maturity | | | 01/02/2025 | | | | | | 100 | | | | 0 | | | | (1 | ) | | | (1 | ) | | | 0 | | | | 0 | |
| Pay | | 1-Year BRL-CDI | | | 12.000 | | | Maturity | | | 01/02/2025 | | | | | | 200 | | | | 0 | | | | 0 | | | | 0 | | | | 0 | | | | 0 | |
| Pay | | 1-Year BRL-CDI | | | 12.080 | | | Maturity | | | 01/02/2025 | | | | | | 300 | | | | 0 | | | | (1 | ) | | | (1 | ) | | | 0 | | | | 0 | |
| Pay | | 1-Year BRL-CDI | | | 12.140 | | | Maturity | | | 01/02/2025 | | | | | | 200 | | | | 0 | | | | 0 | | | | 0 | | | | 0 | | | | 0 | |
| Pay | | 1-Year BRL-CDI | | | 12.145 | | | Maturity | | | 01/02/2025 | | | | | | 200 | | | | 0 | | | | 0 | | | | 0 | | | | 0 | | | | 0 | |
| Pay | | 1-Year BRL-CDI | | | 12.160 | | | Maturity | | | 01/02/2025 | | | | | | 300 | | | | 0 | | | | (1 | ) | | | (1 | ) | | | 0 | | | | 0 | |
| Pay | | 1-Year BRL-CDI | | | 11.220 | | | Maturity | | | 01/04/2027 | | | | | | 100 | | | | 0 | | | | (1 | ) | | | (1 | ) | | | 0 | | | | 0 | |
| | | | |
| 38 | | PIMCO EQUITY SERIES | | See Accompanying Notes |
June 30, 2022
| | | | | | | | | | | | | | | | | | | | | | | | | | | | | | | | | | | | | | |
Pay/
Receive
Floating
Rate | | Floating Rate Index | | Fixed Rate | | | Payment
Frequency | | Maturity
Date | | | Notional
Amount | | | Premiums
Paid/
(Received) | | | Unrealized
Appreciation/
(Depreciation) | | | Market
Value | | | Variation Margin | |
| | Asset | | | Liability | |
| Pay | | 1-Year BRL-CDI | | | 11.260 | % | | Maturity | | | 01/04/2027 | | | BAL | | | 100 | | | $ | 0 | | | $ | (1 | ) | | $ | (1 | ) | | $ | 0 | | | $ | 0 | |
| Pay | | 1-Year BRL-CDI | | | 11.715 | | | Maturity | | | 01/04/2027 | | | | | | 100 | | | | 0 | | | | 0 | | | | 0 | | | | 0 | | | | 0 | |
| Pay | | 1-Year BRL-CDI | | | 11.870 | | | Maturity | | | 01/04/2027 | | | | | | 300 | | | | 0 | | | | (1 | ) | | | (1 | ) | | | 0 | | | | 0 | |
| Pay(5) | | 3-Month USD-LIBOR | | | 1.270 | | | Semi-Annual | | | 11/04/2023 | | | $ | | | 2,200 | | | | (41 | ) | | | (9 | ) | | | (50 | ) | | | 3 | | | | 0 | |
| Pay | | 3-Month USD-LIBOR | | | 1.088 | | | Semi-Annual | | | 02/03/2024 | | | | | | 200 | | | | 0 | | | | (6 | ) | | | (6 | ) | | | 0 | | | | 0 | |
| Pay(5) | | 3-Month USD-LIBOR | | | 1.700 | | | Semi-Annual | | | 03/06/2024 | | | | | | 400 | | | | (1 | ) | | | (6 | ) | | | (7 | ) | | | 1 | | | | 0 | |
| Receive | | 3-Month USD-LIBOR | | | 2.500 | | | Semi-Annual | | | 12/18/2024 | | | | | | 3,100 | | | | (293 | ) | | | 344 | | | | 51 | | | | 0 | | | | (9 | ) |
| Receive | | 3-Month USD-LIBOR | | | 0.928 | | | Semi-Annual | | | 05/06/2026 | | | | | | 100 | | | | 0 | | | | 8 | | | | 8 | | | | 0 | | | | (1 | ) |
| Receive | | 3-Month USD-LIBOR | | | 0.940 | | | Semi-Annual | | | 06/08/2026 | | | | | | 100 | | | | 0 | | | | 8 | | | | 8 | | | | 0 | | | | 0 | |
| Receive | | 3-Month USD-LIBOR | | | 0.500 | | | Semi-Annual | | | 06/16/2026 | | | | | | 1,000 | | | | 15 | | | | 81 | | | | 96 | | | | 0 | | | | (4 | ) |
| Receive | | 3-Month USD-LIBOR | | | 3.000 | | | Semi-Annual | | | 06/19/2026 | | | | | | 2,300 | | | | (345 | ) | | | 352 | | | | 7 | | | | 0 | | | | (11 | ) |
| Receive | | 3-Month USD-LIBOR | | | 1.250 | | | Semi-Annual | | | 12/15/2026 | | | | | | 100 | | | | (2 | ) | | | 10 | | | | 8 | | | | 0 | | | | (1 | ) |
| Receive | | 3-Month USD-LIBOR | | | 1.740 | | | Semi-Annual | | | 12/16/2026 | | | | | | 100 | | | | (8 | ) | | | 13 | | | | 5 | | | | 0 | | | | (1 | ) |
| Pay | | 3-Month USD-LIBOR | | | 1.380 | | | Semi-Annual | | | 01/04/2027 | | | | | | 100 | | | | 0 | | | | (7 | ) | | | (7 | ) | | | 1 | | | | 0 | |
| Pay | | 3-Month USD-LIBOR | | | 1.570 | | | Semi-Annual | | | 01/11/2027 | | | | | | 200 | | | | 0 | | | | (12 | ) | | | (12 | ) | | | 1 | | | | 0 | |
| Pay | | 3-Month USD-LIBOR | | | 1.425 | | | Semi-Annual | | | 01/18/2027 | | | | | | 100 | | | | 0 | | | | (7 | ) | | | (7 | ) | | | 1 | | | | 0 | |
| Pay | | 3-Month USD-LIBOR | | | 1.443 | | | Semi-Annual | | | 01/18/2027 | | | | | | 100 | | | | 0 | | | | (6 | ) | | | (6 | ) | | | 1 | | | | 0 | |
| Receive | | 3-Month USD-LIBOR | | | 1.350 | | | Semi-Annual | | | 01/20/2027 | | | | | | 500 | | | | 0 | | | | 34 | | | | 34 | | | | 0 | | | | (3 | ) |
| Pay | | 3-Month USD-LIBOR | | | 1.550 | | | Semi-Annual | | | 01/20/2027 | | | | | | 2,400 | | | | (8 | ) | | | (135 | ) | | | (143 | ) | | | 14 | | | | 0 | |
| Pay | | 3-Month USD-LIBOR | | | 1.580 | | | Semi-Annual | | | 02/16/2027 | | | | | | 200 | | | | (1 | ) | | | (11 | ) | | | (12 | ) | | | 1 | | | | 0 | |
| Receive | | 3-Month USD-LIBOR | | | 1.450 | | | Semi-Annual | | | 02/17/2027 | | | | | | 1,200 | | | | 0 | | | | 79 | | | | 79 | | | | 0 | | | | (7 | ) |
| Pay | | 3-Month USD-LIBOR | | | 1.700 | | | Semi-Annual | | | 02/17/2027 | | | | | | 4,900 | | | | (18 | ) | | | (246 | ) | | | (264 | ) | | | 28 | | | | 0 | |
| Pay | | 3-Month USD-LIBOR | | | 1.280 | | | Semi-Annual | | | 03/24/2028 | | | | | | 400 | | | | (1 | ) | | | (35 | ) | | | (36 | ) | | | 2 | | | | 0 | |
| Receive | | 3-Month USD-LIBOR | | | 1.235 | | | Semi-Annual | | | 05/12/2028 | | | | | | 100 | | | | 0 | | | | 10 | | | | 10 | | | | 0 | | | | (1 | ) |
| Pay | | 3-Month USD-LIBOR | | | 0.500 | | | Semi-Annual | | | 06/16/2028 | | | | | | 1,610 | | | | (91 | ) | | | (134 | ) | | | (225 | ) | | | 10 | | | | 0 | |
| Receive | | 3-Month USD-LIBOR | | | 2.250 | | | Semi-Annual | | | 06/20/2028 | | | | | | 4,900 | | | | (643 | ) | | | 858 | | | | 215 | | | | 0 | | | | (30 | ) |
| Pay | | 3-Month USD-LIBOR | | | 1.265 | | | Semi-Annual | | | 09/28/2028 | | | | | | 100 | | | | 0 | | | | (10 | ) | | | (10 | ) | | | 1 | | | | 0 | |
| Pay | | 3-Month USD-LIBOR | | | 1.500 | | | Semi-Annual | | | 12/15/2028 | | | | | | 422 | | | | 11 | | | | (49 | ) | | | (38 | ) | | | 3 | | | | 0 | |
| Receive | | 3-Month USD-LIBOR | | | 1.379 | | | Semi-Annual | | | 12/22/2028 | | | | | | 100 | | | | 0 | | | | 10 | | | | 10 | | | | 0 | | | | (1 | ) |
| Receive | | 3-Month USD-LIBOR | | | 1.500 | | | Semi-Annual | | | 01/12/2029 | | | | | | 55 | | | | 0 | | | | 5 | | | | 5 | | | | 0 | | | | 0 | |
| Pay | | 3-Month USD-LIBOR | | | 1.700 | | | Semi-Annual | | | 01/12/2029 | | | | | | 200 | | | | (1 | ) | | | (14 | ) | | | (15 | ) | | | 1 | | | | 0 | |
| Receive | | 3-Month USD-LIBOR | | | 2.000 | | | Semi-Annual | | | 12/10/2029 | | | | | | 100 | | | | (12 | ) | | | 19 | | | | 7 | | | | 0 | | | | (1 | ) |
| Receive | | 3-Month USD-LIBOR | | | 1.500 | | | Semi-Annual | | | 12/18/2029 | | | | | | 200 | | | | (15 | ) | | | 36 | | | | 21 | | | | 0 | | | | (1 | ) |
| Receive | | 3-Month USD-LIBOR | | | 1.750 | | | Semi-Annual | | | 01/15/2030 | | | | | | 300 | | | | (30 | ) | | | 55 | | | | 25 | | | | 0 | | | | (2 | ) |
| Receive | | 3-Month USD-LIBOR | | | 2.000 | | | Semi-Annual | | | 02/12/2030 | | | | | | 200 | | | | (25 | ) | | | 38 | | | | 13 | | | | 0 | | | | (2 | ) |
| Receive | | 3-Month USD-LIBOR | | | 2.000 | | | Semi-Annual | | | 03/10/2030 | | | | | | 100 | | | | (13 | ) | | | 20 | | | | 7 | | | | 0 | | | | (1 | ) |
| Receive | | 3-Month USD-LIBOR | | | 1.250 | | | Semi-Annual | | | 06/17/2030 | | | | | | 2,400 | | | | (130 | ) | | | 438 | | | | 308 | | | | 0 | | | | (17 | ) |
| Receive | | 3-Month USD-LIBOR | | | 1.000 | | | Semi-Annual | | | 12/16/2030 | | | | | | 127 | | | | 1 | | | | 19 | | | | 20 | | | | 0 | | | | (1 | ) |
| Receive | | 3-Month USD-LIBOR | | | 0.750 | | | Semi-Annual | | | 06/16/2031 | | | | | | 2,600 | | | | 213 | | | | 261 | | | | 474 | | | | 0 | | | | (17 | ) |
| Pay | | 3-Month USD-LIBOR | | | 0.750 | | | Semi-Annual | | | 06/16/2031 | | | | | | 663 | | | | (60 | ) | | | (61 | ) | | | (121 | ) | | | 5 | | | | 0 | |
| Receive | | 3-Month USD-LIBOR | | | 1.450 | | | Semi-Annual | | | 07/16/2031 | | | | | | 100 | | | | (1 | ) | | | 13 | | | | 12 | | | | 0 | | | | (1 | ) |
| Receive | | 3-Month USD-LIBOR | | | 1.370 | | | Semi-Annual | | | 07/19/2031 | | | | | | 100 | | | | 0 | | | | 13 | | | | 13 | | | | 0 | | | | (1 | ) |
| Receive | | 3-Month USD-LIBOR | | | 1.360 | | | Semi-Annual | | | 07/20/2031 | | | | | | 100 | | | | 0 | | | | 13 | | | | 13 | | | | 0 | | | | (1 | ) |
| Receive | | 3-Month USD-LIBOR | | | 1.405 | | | Semi-Annual | | | 09/07/2031 | | | | | | 100 | | | | (1 | ) | | | 14 | | | | 13 | | | | 0 | | | | (1 | ) |
| Pay | | 3-Month USD-LIBOR | | | 1.500 | | | Semi-Annual | | | 10/05/2031 | | | | | | 100 | | | | 0 | | | | (13 | ) | | | (13 | ) | | | 1 | | | | 0 | |
| Pay | | 3-Month USD-LIBOR | | | 1.535 | | | Semi-Annual | | | 10/15/2031 | | | | | | 100 | | | | 0 | | | | (12 | ) | | | (12 | ) | | | 1 | | | | 0 | |
| Pay | | 3-Month USD-LIBOR | | | 1.545 | | | Semi-Annual | | | 10/26/2031 | | | | | | 100 | | | | 0 | | | | (12 | ) | | | (12 | ) | | | 1 | | | | 0 | |
| Pay | | 3-Month USD-LIBOR | | | 1.768 | | | Semi-Annual | | | 02/02/2032 | | | | | | 100 | | | | 0 | | | | (10 | ) | | | (10 | ) | | | 1 | | | | 0 | |
| Pay | | 3-Month USD-LIBOR | | | 2.000 | | | Semi-Annual | | | 02/18/2032 | | | | | | 200 | | | | (2 | ) | | | (15 | ) | | | (17 | ) | | | 1 | | | | 0 | |
| Receive | | 3-Month USD-LIBOR | | | 1.910 | | | Semi-Annual | | | 10/17/2049 | | | | | | 100 | | | | (23 | ) | | | 43 | | | | 20 | | | | 0 | | | | (1 | ) |
| Receive | | 3-Month USD-LIBOR | | | 1.895 | | | Semi-Annual | | | 10/18/2049 | | | | | | 100 | | | | (23 | ) | | | 44 | | | | 21 | | | | 0 | | | | (1 | ) |
| Receive | | 3-Month USD-LIBOR | | | 2.250 | | | Semi-Annual | | | 12/11/2049 | | | | | | 900 | | | | (292 | ) | | | 418 | | | | 126 | | | | 0 | | | | (8 | ) |
| Receive | | 3-Month USD-LIBOR | | | 2.000 | | | Semi-Annual | | | 01/15/2050 | | | | | | 100 | | | | (26 | ) | | | 44 | | | | 18 | | | | 0 | | | | (1 | ) |
| Receive | | 3-Month USD-LIBOR | | | 1.625 | | | Semi-Annual | | | 01/16/2050 | | | | | | 100 | | | | (16 | ) | | | 41 | | | | 25 | | | | 0 | | | | (1 | ) |
| Receive | | 3-Month USD-LIBOR | | | 1.750 | | | Semi-Annual | | | 01/22/2050 | | | | | | 500 | | | | (97 | ) | | | 212 | | | | 115 | | | | 0 | | | | (4 | ) |
| Receive | | 3-Month USD-LIBOR | | | 1.625 | | | Semi-Annual | | | 02/03/2050 | | | | | | 300 | | | | (48 | ) | | | 124 | | | | 76 | | | | 0 | | | | (2 | ) |
| Receive | | 3-Month USD-LIBOR | | | 2.250 | | | Semi-Annual | | | 03/12/2050 | | | | | | 600 | | | | (196 | ) | | | 276 | | | | 80 | | | | 0 | | | | (5 | ) |
| Receive | | 3-Month USD-LIBOR | | | 1.250 | | | Semi-Annual | | | 12/16/2050 | | | | | | 400 | | | | 41 | | | | 93 | | | | 134 | | | | 0 | | | | (3 | ) |
| Pay | | 3-Month USD-LIBOR | | | 1.491 | | | Semi-Annual | | | 01/21/2051 | | | | | | 100 | | | | (1 | ) | | | (27 | ) | | | (28 | ) | | | 1 | | | | 0 | |
| Pay | | 3-Month USD-LIBOR | | | 1.590 | | | Semi-Annual | | | 02/09/2051 | | | | | | 900 | | | | (7 | ) | | | (231 | ) | | | (238 | ) | | | 7 | | | | 0 | |
| Receive | | 3-Month USD-LIBOR | | | 1.785 | | | Semi-Annual | | | 08/12/2051 | | | | | | 100 | | | | (1 | ) | | | 24 | | | | 23 | | | | 0 | | | | (1 | ) |
| Pay | | 3-Month ZAR-JIBAR | | | 7.250 | | | Quarterly | | | 09/19/2023 | | | ZAR | | | 900 | | | | 5 | | | | (5 | ) | | | 0 | | | | 0 | | | | 0 | |
| Pay | | 3-Month ZAR-JIBAR | | | 4.848 | | | Quarterly | | | 01/11/2026 | | | | | | 900 | | | | 0 | | | | (5 | ) | | | (5 | ) | | | 0 | | | | 0 | |
| | | | | | | | | | |
| See Accompanying Notes | | ANNUAL REPORT | | | | JUNE 30, 2022 | | | 39 | |
Schedule of Investments PIMCO Dividend and Income Fund (Cont.)
| | | | | | | | | | | | | | | | | | | | | | | | | | | | | | | | | | | | | | |
Pay/
Receive
Floating
Rate | | Floating Rate Index | | Fixed Rate | | | Payment
Frequency | | Maturity
Date | | | Notional
Amount | | | Premiums
Paid/
(Received) | | | Unrealized
Appreciation/
(Depreciation) | | | Market
Value | | | Variation Margin | |
| | Asset | | | Liability | |
| Pay | | 3-Month ZAR-JIBAR | | | 4.915 | % | | Quarterly | | | 02/01/2026 | | | ZAR | | | 200 | | | $ | 0 | | | $ | (1 | ) | | $ | (1 | ) | | $ | 0 | | | $ | 0 | |
| Pay | | 3-Month ZAR-JIBAR | | | 5.020 | | | Quarterly | | | 02/11/2026 | | | | | | 400 | | | | 0 | | | | (2 | ) | | | (2 | ) | | | 0 | | | | 0 | |
| Receive | | 3-Month ZAR-JIBAR | | | 8.300 | | | Quarterly | | | 03/15/2027 | | | | | | 600 | | | | (5 | ) | | | 5 | | | | 0 | | | | 0 | | | | 0 | |
| Pay | | 6-Month AUD-BBR-BBSW | | | 2.750 | | | Semi-Annual | | | 06/17/2026 | | | AUD | | | 5,080 | | | | 483 | | | | (635 | ) | | | (152 | ) | | | 8 | | | | 0 | |
| Receive | | 6-Month AUD-BBR-BBSW | | | 3.000 | | | Semi-Annual | | | 03/21/2027 | | | | | | 80 | | | | (9 | ) | | | 11 | | | | 2 | | | | 0 | | | | 0 | |
| Receive | | 6-Month EUR-EURIBOR | | | 0.150 | | | Annual | | | 03/18/2030 | | | EUR | | | 800 | | | | (2 | ) | | | 133 | | | | 131 | | | | 0 | | | | (13 | ) |
| Receive(5) | | 6-Month EUR-EURIBOR | | | 0.250 | | | Annual | | | 09/21/2032 | | | | | | 1,200 | | | | 94 | | | | 137 | | | | 231 | | | | 0 | | | | (21 | ) |
| Pay | | 28-Day MXN-TIIE | | | 7.640 | | | Lunar | | | 01/03/2023 | | | MXN | | | 200 | | | | 1 | | | | (1 | ) | | | 0 | | | | 0 | | | | 0 | |
| Pay | | 28-Day MXN-TIIE | | | 7.645 | | | Lunar | | | 01/03/2023 | | | | | | 2,000 | | | | 6 | | | | (7 | ) | | | (1 | ) | | | 0 | | | | 0 | |
| Pay | | 28-Day MXN-TIIE | | | 7.745 | | | Lunar | | | 01/05/2023 | | | | | | 1,400 | | | | 5 | | | | (5 | ) | | | 0 | | | | 0 | | | | 0 | |
| Pay | | 28-Day MXN-TIIE | | | 7.610 | | | Lunar | | | 01/23/2023 | | | | | | 6,000 | | | | 19 | | | | (21 | ) | | | (2 | ) | | | 0 | | | | 0 | |
| Pay | | 28-Day MXN-TIIE | | | 7.805 | | | Lunar | | | 02/06/2023 | | | | | | 3,400 | | | | 12 | | | | (13 | ) | | | (1 | ) | | | 0 | | | | 0 | |
| Pay | | 28-Day MXN-TIIE | | | 7.820 | | | Lunar | | | 02/06/2023 | | | | | | 3,400 | | | | 12 | | | | (13 | ) | | | (1 | ) | | | 0 | | | | 0 | |
| Receive | | 28-Day MXN-TIIE | | | 8.675 | | | Lunar | | | 04/03/2024 | | | | | | 8,800 | | | | 0 | | | | 6 | | | | 6 | | | | 0 | | | | (1 | ) |
| Receive | | 28-Day MXN-TIIE | | | 8.660 | | | Lunar | | | 04/04/2024 | | | | | | 3,700 | | | | 0 | | | | 3 | | | | 3 | | | | 0 | | | | 0 | |
| Receive | | 28-Day MXN-TIIE | | | 8.750 | | | Lunar | | | 04/05/2024 | | | | | | 3,600 | | | | 0 | | | | 2 | | | | 2 | | | | 0 | | | | 0 | |
| Pay | | 28-Day MXN-TIIE | | | 5.990 | | | Lunar | | | 01/30/2026 | | | | | | 4,300 | | | | 9 | | | | (30 | ) | | | (21 | ) | | | 1 | | | | 0 | |
| Pay | | 28-Day MXN-TIIE | | | 6.080 | | | Lunar | | | 03/10/2026 | | | | | | 15,500 | | | | 35 | | | | (109 | ) | | | (74 | ) | | | 3 | | | | 0 | |
| Pay | | 28-Day MXN-TIIE | | | 6.490 | | | Lunar | | | 09/08/2026 | | | | | | 30,000 | | | | 97 | | | | (231 | ) | | | (134 | ) | | | 6 | | | | 0 | |
| Receive | | 28-Day MXN-TIIE | | | 8.410 | | | Lunar | | | 03/31/2027 | | | | | | 1,000 | | | | 0 | | | | 1 | | | | 1 | | | | 0 | | | | 0 | |
| Receive | | 28-Day MXN-TIIE | | | 8.730 | | | Lunar | | | 04/06/2027 | | | | | | 1,500 | | | | 0 | | | | 1 | | | | 1 | | | | 0 | | | | 0 | |
| Receive | | 28-Day MXN-TIIE | | | 7.984 | | | Lunar | | | 12/10/2027 | | | | | | 2,900 | | | | (22 | ) | | | 28 | | | | 6 | | | | 0 | | | | (1 | ) |
| Receive | | 28-Day MXN-TIIE | | | 8.005 | | | Lunar | | | 12/21/2027 | | | | | | 11,400 | | | | (86 | ) | | | 109 | | | | 23 | | | | 0 | | | | (3 | ) |
| Receive | | 28-Day MXN-TIIE | | | 7.800 | | | Lunar | | | 12/28/2027 | | | | | | 1,200 | | | | (8 | ) | | | 11 | | | | 3 | | | | 0 | | | | 0 | |
| Receive | | 28-Day MXN-TIIE | | | 7.910 | | | Lunar | | | 12/30/2027 | | | | | | 700 | | | | (5 | ) | | | 7 | | | | 2 | | | | 0 | | | | 0 | |
| Receive | | 28-Day MXN-TIIE | | | 8.030 | | | Lunar | | | 01/31/2028 | | | | | | 2,000 | | | | (15 | ) | | | 19 | | | | 4 | | | | 0 | | | | 0 | |
| Receive | | 28-Day MXN-TIIE | | | 8.050 | | | Lunar | | | 01/31/2028 | | | | | | 1,900 | | | | (15 | ) | | | 19 | | | | 4 | | | | 0 | | | | 0 | |
| Receive | | 28-Day MXN-TIIE | | | 7.495 | | | Lunar | | | 01/14/2032 | | | | | | 700 | | | | 3 | | | | 0 | | | | 3 | | | | 0 | | | | 0 | |
| Receive | | 28-Day MXN-TIIE | | | 7.498 | | | Lunar | | | 01/15/2032 | | | | | | 2,900 | | | | 12 | | | | 1 | | | | 13 | | | | 0 | | | | (1 | ) |
| Receive | | 28-Day MXN-TIIE | | | 8.732 | | | Lunar | | | 03/30/2032 | | | | | | 700 | | | | 0 | | | | 0 | | | | 0 | | | | 0 | | | | 0 | |
| Receive | | 28-Day MXN-TIIE | | | 8.701 | | | Lunar | | | 03/31/2032 | | | | | | 1,700 | | | | 0 | | | | 1 | | | | 1 | | | | 0 | | | | (1 | ) |
| Pay | | 28-Day MXN-TIIE | | | 7.165 | | | Lunar | | | 09/06/2032 | | | | | | 400 | | | | 2 | | | | (4 | ) | | | (2 | ) | | | 0 | | | | 0 | |
| Pay | | 28-Day MXN-TIIE | | | 7.380 | | | Lunar | | | 08/14/2037 | | | | | | 100 | | | | 1 | | | | (2 | ) | | | (1 | ) | | | 0 | | | | 0 | |
| Pay | | 28-Day MXN-TIIE | | | 7.360 | | | Lunar | | | 08/21/2037 | | | | | | 100 | | | | 1 | | | | (2 | ) | | | (1 | ) | | | 0 | | | | 0 | |
| Receive | | 28-Day MXN-TIIE | | | 8.103 | | | Lunar | | | 01/04/2038 | | | | | | 900 | | | | (9 | ) | | | 12 | | | | 3 | | | | 0 | | | | 0 | |
| Pay | | UKRPI | | | 4.000 | | | Maturity | | | 09/15/2031 | | | GBP | | | 100 | | | | 0 | | | | (9 | ) | | | (9 | ) | | | 0 | | | | 0 | |
| Pay | | UKRPI | | | 4.140 | | | Maturity | | | 10/15/2031 | | | | | | 100 | | | | 0 | | | | (7 | ) | | | (7 | ) | | | 1 | | | | 0 | |
| Pay | | UKRPI | | | 4.250 | | | Maturity | | | 11/15/2031 | | | | | | 100 | | | | (1 | ) | | | (4 | ) | | | (5 | ) | | | 1 | | | | 0 | |
| | | | | | | | | | | | | | | | | | | | | |
| | | $ | (1,375 | ) | | $ | 2,912 | | | $ | 1,537 | | | $ | 119 | | | $ | (258 | ) |
| | | | | | | | | | | | | | | | | | | | | |
Total Swap Agreements | | | $ | (994 | ) | | $ | 2,209 | | | $ | 1,215 | | | $ | 119 | | | $ | (280 | ) |
| | | | | | | | | | | | | | | | | | | | | |
FINANCIAL DERIVATIVE INSTRUMENTS: EXCHANGE-TRADED OR CENTRALLY CLEARED SUMMARY
The following is a summary of the market value and variation margin of Exchange-Traded or Centrally Cleared Financial Derivative Instruments as of June 30, 2022:
| | | | | | | | | | | | | | | | | | | | | | | | | | | | | | | | | | | | |
| | | Financial Derivative Assets | | | | | | Financial Derivative Liabilities | |
| | | Market Value | | | Variation Margin
Asset | | | | | | | | | Market Value | | | Variation Margin
Liability | | | | |
| | | Purchased
Options | | | Futures | | | Swap
Agreements | | | Total | | | | | | Written
Options | | | Futures | | | Swap
Agreements | | | Total | |
Total Exchange-Traded or Centrally Cleared | | $ | 0 | | | $ | 201 | | | $ | 119 | | | $ | 320 | | | | | | | $ | (4 | ) | | $ | (66 | ) | | $ | (280 | ) | | $ | (350 | ) |
| | | | | | | | | | | | | | | | | | | | | | | | | | | | | | | | | | | | |
| (l) | Securities with an aggregate market value of $852 and cash of $1,960 have been pledged as collateral for exchange-traded and centrally cleared financial derivative instruments as of June 30, 2022. See Note 8, Master Netting Arrangements, in the Notes to Financial Statements for more information. |
| | | | |
| 40 | | PIMCO EQUITY SERIES | | See Accompanying Notes |
June 30, 2022
| (1) | If the Fund is a seller of protection and a credit event occurs, as defined under the terms of that particular swap agreement, the Fund will either (i) pay to the buyer of protection an amount equal to the notional amount of the swap and take delivery of the referenced obligation or underlying securities comprising the referenced index or (ii) pay a net settlement amount in the form of cash, securities or other deliverable obligations equal to the notional amount of the swap less the recovery value of the referenced obligation or underlying securities comprising the referenced index. |
| (2) | Implied credit spreads, represented in absolute terms, utilized in determining the market value of credit default swap agreements on sovereign issues as of period end serve as indicators of the current status of the payment/performance risk and represent the likelihood or risk of default for the credit derivative. The implied credit spread of a particular referenced entity reflects the cost of buying/selling protection and may include upfront payments required to be made to enter into the agreement. Wider credit spreads represent a deterioration of the referenced entity’s credit soundness and a greater likelihood or risk of default or other credit event occurring as defined under the terms of the agreement. |
| (3) | The maximum potential amount the Fund could be required to pay as a seller of credit protection or receive as a buyer of credit protection if a credit event occurs as defined under the terms of that particular swap agreement. |
| (4) | The prices and resulting values for credit default swap agreements serve as indicators of the current status of the payment/performance risk and represent the likelihood of an expected liability (or profit) for the credit derivative should the notional amount of the swap agreement be closed/sold as of the period end. Increasing market values, in absolute terms when compared to the notional amount of the swap, represent a deterioration of the underlying referenced instrument’s credit soundness and a greater likelihood or risk of default or other credit event occurring as defined under the terms of the agreement. |
| (5) | This instrument has a forward starting effective date. See Note 2, Securities Transactions and Investment Income, in the Notes to Financial Statements for further information. |
(m) FINANCIAL DERIVATIVE INSTRUMENTS: OVER THE COUNTER
FORWARD FOREIGN CURRENCY CONTRACTS:
| | | | | | | | | | | | | | | | | | | | | | | | | | | | |
Counterparty | | Settlement
Month | | | Currency to
be Delivered | | | Currency to
be Received | | | Unrealized Appreciation/
(Depreciation) | |
| | Asset | | | Liability | |
AZD | | | 07/2022 | | | | AUD | | | | 14 | | | $ | | | | | 10 | | | $ | 0 | | | $ | 0 | |
BOA | | | 07/2022 | | | | | | | | 35 | | | | | | | | 25 | | | | 1 | | | | 0 | |
| | | 07/2022 | | | | GBP | | | | 1,999 | | | | | | | | 2,527 | | | | 94 | | | | 0 | |
| | | 07/2022 | | | | PEN | | | | 892 | | | | | | | | 222 | | | | 0 | | | | (11 | ) |
| | | 07/2022 | | | $ | | | | | 83 | | | | PEN | | | | 312 | | | | 0 | | | | (1 | ) |
| | | 08/2022 | | | | | | | | 402 | | | | MXN | | | | 8,162 | | | | 1 | | | | 0 | |
| | | 08/2022 | | | | | | | | 150 | | | | NOK | | | | 1,430 | | | | 0 | | | | (5 | ) |
| | | 08/2022 | | | | | | | | 3 | | | | RUB | | | | 525 | | | | 6 | | | | 0 | |
| | | 11/2022 | | | | ZAR | | | | 402 | | | $ | | | | | 25 | | | | 1 | | | | 0 | |
BPS | | | 07/2022 | | | | MXN | | | | 14,153 | | | | | | | | 704 | | | | 0 | | | | 0 | |
| | | 07/2022 | | | $ | | | | | 3,459 | | | | EUR | | | | 3,288 | | | | 0 | | | | (13 | ) |
| | | 07/2022 | | | | | | | | 106 | | | | GBP | | | | 84 | | | | 0 | | | | (4 | ) |
| | | 07/2022 | | | | | | | | 162 | | | | JPY | | | | 21,800 | | | | 0 | | | | (1 | ) |
| | | 07/2022 | | | | | | | | 805 | | | | MXN | | | | 16,833 | | | | 32 | | | | 0 | |
| | | 08/2022 | | | | EUR | | | | 3,237 | | | $ | | | | | 3,411 | | | | 12 | | | | 0 | |
| | | 08/2022 | | | | GBP | | | | 1,934 | | | | | | | | 2,350 | | | | 0 | | | | (5 | ) |
| | | 08/2022 | | | $ | | | | | 116 | | | | CAD | | | | 150 | | | | 1 | | | | 0 | |
| | | 08/2022 | | | | | | | | 84 | | | | IDR | | | | 1,240,172 | | | | 0 | | | | (1 | ) |
| | | 08/2022 | | | | ZAR | | | | 1,561 | | | $ | | | | | 98 | | | | 2 | | | | 0 | |
| | | 09/2022 | | | $ | | | | | 694 | | | | MXN | | | | 14,153 | | | | 1 | | | | 0 | |
| | | 11/2022 | | | | ZAR | | | | 864 | | | $ | | | | | 54 | | | | 2 | | | | 0 | |
BRC | | | 07/2022 | | | $ | | | | | 112 | | | | GBP | | | | 93 | | | | 1 | | | | 0 | |
| | | 08/2022 | | | | | | | | 92 | | | | IDR | | | | 1,364,469 | | | | 0 | | | | (1 | ) |
| | | 08/2022 | | | | | | | | 263 | | | | NOK | | | | 2,573 | | | | 0 | | | | (1 | ) |
| | | 11/2022 | | | | ZAR | | | | 306 | | | $ | | | | | 19 | | | | 1 | | | | 0 | |
CBK | | | 07/2022 | | | | BRL | | | | 5,552 | | | | | | | | 1,077 | | | | 16 | | | | 0 | |
| | | 07/2022 | | | | EUR | | | | 68 | | | | | | | | 73 | | | | 1 | | | | 0 | |
| | | 07/2022 | | | | GBP | | | | 112 | | | | | | | | 141 | | | | 4 | | | | 0 | |
| | | 07/2022 | | | | PEN | | | | 6 | | | | | | | | 2 | | | | 0 | | | | 0 | |
| | | 07/2022 | | | $ | | | | | 1,060 | | | | BRL | | | | 5,552 | | | | 1 | | | | 0 | |
| | | 07/2022 | | | | | | | | 191 | | | | PEN | | | | 739 | | | | 2 | | | | (1 | ) |
| | | 08/2022 | | | | PEN | | | | 101 | | | $ | | | | | 27 | | | | 0 | | | | 0 | |
| | | | | | | | | | |
| See Accompanying Notes | | ANNUAL REPORT | | | | JUNE 30, 2022 | | | 41 | |
Schedule of Investments PIMCO Dividend and Income Fund (Cont.)
| | | | | | | | | | | | | | | | | | | | | | | | | | | | |
Counterparty | | Settlement
Month | | | Currency to
be Delivered | | | Currency to
be Received | | | Unrealized Appreciation/
(Depreciation) | |
| | Asset | | | Liability | |
| | | 08/2022 | | | $ | | | | | 1,068 | | | | BRL | | | | 5,552 | | | $ | 0 | | | $ | (16 | ) |
| | | 08/2022 | | | | | | | | 49 | | | | PEN | | | | 186 | | | | 0 | | | | (1 | ) |
| | | 12/2022 | | | | PEN | | | | 167 | | | $ | | | | | 43 | | | | 0 | | | | 0 | |
| | | 12/2022 | | | $ | | | | | 23 | | | | PEN | | | | 97 | | | | 2 | | | | 0 | |
| | | 02/2023 | | | | PEN | | | | 185 | | | $ | | | | | 47 | | | | 0 | | | | (1 | ) |
| | | 04/2023 | | | | | | | | 572 | | | | | | | | 145 | | | | 0 | | | | (1 | ) |
DUB | | | 07/2022 | | | $ | | | | | 2 | | | | PEN | | | | 8 | | | | 0 | | | | 0 | |
| | | 08/2022 | | | | TWD | | | | 392 | | | $ | | | | | 13 | | | | 0 | | | | 0 | |
| | | 08/2022 | | | $ | | | | | 0 | | | | RUB | | | | 0 | | | | 0 | | | | 0 | |
| | | 10/2022 | | | | | | | | 27 | | | | | | | | 2,576 | | | | 14 | | | | 0 | |
GLM | | | 07/2022 | | | | BRL | | | | 5,552 | | | $ | | | | | 1,060 | | | | 0 | | | | (1 | ) |
| | | 07/2022 | | | | MXN | | | | 2,680 | | | | | | | | 130 | | | | 0 | | | | (4 | ) |
| | | 07/2022 | | | $ | | | | | 1,118 | | | | BRL | | | | 5,552 | | | | 0 | | | | (57 | ) |
| | | 07/2022 | | | | | | | | 16 | | | | PEN | | | | 59 | | | | 0 | | | | 0 | |
| | | 08/2022 | | | | | | | | 33 | | | | | | | | 123 | | | | 0 | | | | (1 | ) |
| | | 10/2022 | | | | | | | | 67 | | | | RUB | | | | 6,359 | | | | 36 | | | | 0 | |
| | | 11/2022 | | | | ZAR | | | | 425 | | | $ | | | | | 26 | | | | 1 | | | | 0 | |
| | | 02/2023 | | | | | | | | 62 | | | | | | | | 4 | | | | 0 | | | | 0 | |
HUS | | | 07/2022 | | | | AUD | | | | 583 | | | | | | | | 403 | | | | 1 | | | | (1 | ) |
| | | 07/2022 | | | | EUR | | | | 3,220 | | | | | | | | 3,472 | | | | 97 | | | | 0 | |
| | | 07/2022 | | | $ | | | | | 440 | | | | AUD | | | | 632 | | | | 0 | | | | (4 | ) |
| | | 07/2022 | | | | | | | | 1,369 | | | | JPY | | | | 181,800 | | | | 0 | | | | (29 | ) |
| | | 08/2022 | | | | MXN | | | | 4,125 | | | $ | | | | | 201 | | | | 0 | | | | (2 | ) |
| | | 08/2022 | | | $ | | | | | 377 | | | | AUD | | | | 548 | | | | 1 | | | | 0 | |
| | | 08/2022 | | | | | | | | 218 | | | | CLP | | | | 182,929 | | | | 0 | | | | (20 | ) |
| | | 08/2022 | | | | | | | | 161 | | | | IDR | | | | 2,358,427 | | | | 0 | | | | (3 | ) |
| | | 05/2023 | | | | CNH | | | | 48 | | | $ | | | | | 7 | | | | 0 | | | | 0 | |
JPM | | | 08/2022 | | | | | | | | 151 | | | | | | | | 22 | | | | 0 | | | | 0 | |
| | | 08/2022 | | | | TWD | | | | 4,571 | | | | | | | | 155 | | | | 1 | | | | 0 | |
| | | 08/2022 | | | $ | | | | | 364 | | | | IDR | | | | 5,361,132 | | | | 0 | | | | (6 | ) |
MYI | | | 08/2022 | | | | TWD | | | | 1,359 | | | $ | | | | | 46 | | | | 0 | | | | 0 | |
| | | 08/2022 | | | $ | | | | | 104 | | | | IDR | | | | 1,534,968 | | | | 0 | | | | (2 | ) |
RBC | | | 08/2022 | | | | | | | | 409 | | | | CAD | | | | 529 | | | | 2 | | | | 0 | |
| | | 08/2022 | | | | | | | | 368 | | | | JPY | | | | 49,948 | | | | 1 | | | | 0 | |
| | | 09/2022 | | | | | | | | 440 | | | | MXN | | | | 9,051 | | | | 5 | | | | 0 | |
SCX | | | 07/2022 | | | | PEN | | | | 6 | | | $ | | | | | 1 | | | | 0 | | | | 0 | |
| | | 07/2022 | | | $ | | | | | 9 | | | | PEN | | | | 34 | | | | 0 | | | | 0 | |
| | | 08/2022 | | | | | | | | 381 | | | | JPY | | | | 51,656 | | | | 1 | | | | 0 | |
| | | 11/2022 | | | | PEN | | | | 29 | | | $ | | | | | 7 | | | | 0 | | | | 0 | |
UAG | | | 07/2022 | | | | MXN | | | | 2,615 | | | | | | | | 126 | | | | 0 | | | | (4 | ) |
| | | 09/2022 | | | $ | | | | | 28 | | | | MXN | | | | 551 | | | | 0 | | | | (1 | ) |
| | | 11/2022 | | | | ZAR | | | | 941 | | | $ | | | | | 60 | | | | 3 | | | | 0 | |
| | | | | | | | | | | | | | | | | | | | | | | | | | | | |
Total Forward Foreign Currency Contracts | | | $ | 344 | | | $ | (198 | ) |
| | | | | | | | | |
WRITTEN OPTIONS:
CREDIT DEFAULT SWAPTIONS ON CREDIT INDICES
| | | | | | | | | | | | | | | | | | | | | | | | | | |
| Counterparty | | Description | | Buy/Sell
Protection | | | Exercise
Rate | | | Expiration
Date | | | Notional
Amount(1) | | | Premiums
(Received) | | | Market
Value | |
BPS | | Put - OTC CDX.IG-37 5-Year Index | | | Sell | | | | 1.200 | % | | | 07/20/2022 | | | | 100 | | | $ | 0 | | | $ | 0 | |
BRC | | Put - OTC iTraxx Europe 37 5-Year Index | | | Sell | | | | 1.600 | | | | 08/17/2022 | | | | 100 | | | | (1 | ) | | | 0 | |
CBK | | Put - OTC CDX.IG-38 5-Year Index | | | Sell | | | | 1.200 | | | | 07/20/2022 | | | | 100 | | | | 0 | | | | 0 | |
DUB | | Put - OTC CDX.IG-38 5-Year Index | | | Sell | | | | 1.400 | | | | 08/17/2022 | | | | 100 | | | | 0 | | | | 0 | |
GST | | Put - OTC CDX.IG-38 5-Year Index | | | Sell | | | | 1.300 | | | | 08/17/2022 | | | | 100 | | | | 0 | | | | 0 | |
MYC | | Put - OTC CDX.IG-38 5-Year Index | | | Sell | | | | 1.250 | | | | 07/20/2022 | | | | 100 | | | | 0 | | | | 0 | |
| | Put - OTC CDX.IG-38 5-Year Index | | | Sell | | | | 1.350 | | | | 08/17/2022 | | | | 200 | | | | (1 | ) | | | (1 | ) |
| | | | | | | | | | | | | | | | | | | | | | | | | | |
| | | | | | | | | | | | | | | | | | $ | (2 | ) | | $ | (1 | ) |
| | | | | | | | | | | | | | | | | | | | | | | | | | |
| | | | |
| 42 | | PIMCO EQUITY SERIES | | See Accompanying Notes |
June 30, 2022
INTEREST RATE SWAPTIONS
| | | | | | | | | | | | | | | | | | | | | | | | | | |
| Counterparty | | Description | | Floating Rate Index | | Pay/
Receive
Floating
Rate | | Exercise
Rate | | | Expiration
Date | | | Notional
Amount(1) | | | Premiums
(Received) | | | Market
Value | |
BOA | | Call - OTC 1-Year Interest Rate Swap | | 3-Month USD-LIBOR | | Receive | | | 2.150 | % | | | 12/01/2023 | | | | 200 | | | $ | (1 | ) | | $ | (1 | ) |
| | Put - OTC 1-Year Interest Rate Swap | | 3-Month USD-LIBOR | | Pay | | | 3.650 | | | | 12/01/2023 | | | | 200 | | | | (1 | ) | | | (1 | ) |
| | Call - OTC 5-Year Interest Rate Swap | | 3-Month USD-LIBOR | | Receive | | | 2.250 | | | | 08/26/2022 | | | | 200 | | | | (1 | ) | | | 0 | |
| | Put - OTC 5-Year Interest Rate Swap | | 3-Month USD-LIBOR | | Pay | | | 2.850 | | | | 08/26/2022 | | | | 200 | | | | (1 | ) | | | (2 | ) |
BPS | | Call - OTC 1-Year Interest Rate Swap | | 6-Month EUR-EURIBOR | | Receive | | | 0.550 | | | | 04/11/2023 | | | | 100 | | | | 1 | | | | 0 | |
| | Put - OTC 1-Year Interest Rate Swap | | 6-Month EUR-EURIBOR | | Pay | | | 2.100 | | | | 04/11/2023 | | | | 100 | | | | 1 | | | | 0 | |
| | Call - OTC 1-Year Interest Rate Swap | | 6-Month EUR-EURIBOR | | Receive | | | 0.700 | | | | 04/28/2023 | | | | 300 | | | | (1 | ) | | | 0 | |
| | Put - OTC 1-Year Interest Rate Swap | | 6-Month EUR-EURIBOR | | Pay | | | 2.250 | | | | 04/28/2023 | | | | 300 | | | | (1 | ) | | | (1 | ) |
CBK | | Call - OTC 1-Year Interest Rate Swap | | 3-Month USD-LIBOR | | Receive | | | 2.690 | | | | 04/02/2024 | | | | 100 | | | | (1 | ) | | | (1 | ) |
| | Put - OTC 1-Year Interest Rate Swap | | 3-Month USD-LIBOR | | Pay | | | 2.690 | | | | 04/02/2024 | | | | 100 | | | | (1 | ) | | | (1 | ) |
| | Call - OTC 5-Year Interest Rate Swap | | 3-Month USD-LIBOR | | Receive | | | 1.755 | | | | 09/30/2022 | | | | 200 | | | | (1 | ) | | | 0 | |
| | Put - OTC 5-Year Interest Rate Swap | | 3-Month USD-LIBOR | | Pay | | | 2.955 | | | | 09/30/2022 | | | | 200 | | | | (1 | ) | | | (2 | ) |
DUB | | Call - OTC 1-Year Interest Rate Swap | | 3-Month USD-LIBOR | | Receive | | | 2.920 | | | | 10/13/2023 | | | | 200 | | | | (1 | ) | | | (1 | ) |
| | Put - OTC 1-Year Interest Rate Swap | | 3-Month USD-LIBOR | | Pay | | | 2.920 | | | | 10/13/2023 | | | | 200 | | | | (1 | ) | | | (1 | ) |
| | Call - OTC 1-Year Interest Rate Swap | | 3-Month USD-LIBOR | | Receive | | | 2.790 | | | | 04/08/2024 | | | | 100 | | | | (1 | ) | | | (1 | ) |
| | Put - OTC 1-Year Interest Rate Swap | | 3-Month USD-LIBOR | | Pay | | | 2.790 | | | | 04/08/2024 | | | | 100 | | | | (1 | ) | | | (1 | ) |
FAR | | Call - OTC 1-Year Interest Rate Swap | | 3-Month USD-LIBOR | | Receive | | | 2.688 | | | | 04/02/2024 | | | | 100 | | | | (1 | ) | | | (1 | ) |
| | Put - OTC 1-Year Interest Rate Swap | | 3-Month USD-LIBOR | | Pay | | | 2.688 | | | | 04/02/2024 | | | | 100 | | | | (1 | ) | | | (1 | ) |
| | Call - OTC 1-Year Interest Rate Swap | | 3-Month USD-LIBOR | | Receive | | | 2.781 | | | | 04/05/2024 | | | | 200 | | | | 0 | | | | (1 | ) |
| | Put - OTC 1-Year Interest Rate Swap | | 3-Month USD-LIBOR | | Pay | | | 2.781 | | | | 04/05/2024 | | | | 200 | | | | 0 | | | | (1 | ) |
GLM | | Call - OTC 1-Year Interest Rate Swap | | 3-Month USD-LIBOR | | Receive | | | 0.870 | | | | 11/02/2022 | | | | 8,100 | | | | (15 | ) | | | 0 | |
| | Put - OTC 1-Year Interest Rate Swap | | 3-Month USD-LIBOR | | Pay | | | 1.270 | | | | 11/02/2022 | | | | 8,100 | | | | (15 | ) | | | (185 | ) |
| | Call - OTC 1-Year Interest Rate Swap | | 3-Month USD-LIBOR | | Receive | | | 2.920 | | | | 10/13/2023 | | | | 100 | | | | (1 | ) | | | (1 | ) |
| | Put - OTC 1-Year Interest Rate Swap | | 3-Month USD-LIBOR | | Pay | | | 2.920 | | | | 10/13/2023 | | | | 100 | | | | (1 | ) | | | (1 | ) |
| | Call - OTC 1-Year Interest Rate Swap | | 3-Month USD-LIBOR | | Receive | | | 3.018 | | | | 10/20/2023 | | | | 100 | | | | (1 | ) | | | (1 | ) |
| | Put - OTC 1-Year Interest Rate Swap | | 3-Month USD-LIBOR | | Pay | | | 3.018 | | | | 10/20/2023 | | | | 100 | | | | (1 | ) | | | (1 | ) |
| | Call - OTC 1-Year Interest Rate Swap | | 3-Month USD-LIBOR | | Receive | | | 3.140 | | | | 10/23/2023 | | | | 100 | | | | (1 | ) | | | (1 | ) |
| | Put - OTC 1-Year Interest Rate Swap | | 3-Month USD-LIBOR | | Pay | | | 3.140 | | | | 10/23/2023 | | | | 100 | | | | (1 | ) | | | 0 | |
| | Call - OTC 1-Year Interest Rate Swap | | 3-Month USD-LIBOR | | Receive | | | 3.190 | | | | 10/23/2023 | | | | 100 | | | | (1 | ) | | | (1 | ) |
| | | | | | | | | | |
| See Accompanying Notes | | ANNUAL REPORT | | | | JUNE 30, 2022 | | | 43 | |
Schedule of Investments PIMCO Dividend and Income Fund (Cont.)
| | | | | | | | | | | | | | | | | | | | | | | | | | |
| Counterparty | | Description | | Floating Rate Index | | Pay/
Receive
Floating
Rate | | Exercise
Rate | | | Expiration
Date | | | Notional
Amount(1) | | | Premiums
(Received) | | | Market
Value | |
| | Put - OTC 1-Year Interest Rate Swap | | 3-Month USD-LIBOR | | Pay | | | 3.190 | % | | | 10/23/2023 | | | | 100 | | | $ | (1 | ) | | $ | 0 | |
| | Call - OTC 1-Year Interest Rate Swap | | 3-Month USD-LIBOR | | Receive | | | 3.225 | | | | 10/23/2023 | | | | 100 | | | | (1 | ) | | | (1 | ) |
| | Put - OTC 1-Year Interest Rate Swap | | 3-Month USD-LIBOR | | Pay | | | 3.225 | | | | 10/23/2023 | | | | 100 | | | | (1 | ) | | | 0 | |
| | Call - OTC 1-Year Interest Rate Swap | | 3-Month USD-LIBOR | | Receive | | | 2.973 | | | | 10/25/2023 | | | | 100 | | | | (1 | ) | | | (1 | ) |
| | Put - OTC 1-Year Interest Rate Swap | | 3-Month USD-LIBOR | | Pay | | | 2.973 | | | | 10/25/2023 | | | | 100 | | | | (1 | ) | | | (1 | ) |
| | Call - OTC 1-Year Interest Rate Swap | | 3-Month USD-LIBOR | | Receive | | | 2.841 | | | | 10/27/2023 | | | | 100 | | | | (1 | ) | | | (1 | ) |
| | Put - OTC 1-Year Interest Rate Swap | | 3-Month USD-LIBOR | | Pay | | | 2.841 | | | | 10/27/2023 | | | | 100 | | | | (1 | ) | | | (1 | ) |
| | Call - OTC 1-Year Interest Rate Swap | | 3-Month USD-LIBOR | | Receive | | | 3.088 | | | | 11/03/2023 | | | | 100 | | | | (1 | ) | | | (1 | ) |
| | Put - OTC 1-Year Interest Rate Swap | | 3-Month USD-LIBOR | | Pay | | | 3.088 | | | | 11/03/2023 | | | | 100 | | | | (1 | ) | | | 0 | |
| | Call - OTC 1-Year Interest Rate Swap | | 3-Month USD-LIBOR | | Receive | | | 2.910 | | | | 11/10/2023 | | | | 100 | | | | (1 | ) | | | (1 | ) |
| | Put - OTC 1-Year Interest Rate Swap | | 3-Month USD-LIBOR | | Pay | | | 2.910 | | | | 11/10/2023 | | | | 100 | | | | (1 | ) | | | (1 | ) |
| | Call - OTC 1-Year Interest Rate Swap | | 3-Month USD-LIBOR | | Receive | | | 2.250 | | | | 11/17/2023 | | | | 200 | | | | (1 | ) | | | (1 | ) |
| | Put - OTC 1-Year Interest Rate Swap | | 3-Month USD-LIBOR | | Pay | | | 3.750 | | | | 11/17/2023 | | | | 200 | | | | (1 | ) | | | (1 | ) |
| | Call - OTC 1-Year Interest Rate Swap | | 3-Month USD-LIBOR | | Receive | | | 2.150 | | | | 11/20/2023 | | | | 200 | | | | (1 | ) | | | (1 | ) |
| | Put - OTC 1-Year Interest Rate Swap | | 3-Month USD-LIBOR | | Pay | | | 3.650 | | | | 11/20/2023 | | | | 200 | | | | (1 | ) | | | (1 | ) |
| | Call - OTC 1-Year Interest Rate Swap | | 3-Month USD-LIBOR | | Receive | | | 2.250 | | | | 12/07/2023 | | | | 200 | | | | (1 | ) | | | (1 | ) |
| | Put - OTC 1-Year Interest Rate Swap | | 3-Month USD-LIBOR | | Pay | | | 3.750 | | | | 12/07/2023 | | | | 200 | | | | (1 | ) | | | (1 | ) |
| | Call - OTC 1-Year Interest Rate Swap | | 3-Month USD-LIBOR | | Receive | | | 2.697 | | | | 04/02/2024 | | | | 200 | | | | 0 | | | | (1 | ) |
| | Put - OTC 1-Year Interest Rate Swap | | 3-Month USD-LIBOR | | Pay | | | 2.697 | | | | 04/02/2024 | | | | 200 | | | | (1 | ) | | | (1 | ) |
| | Call - OTC 1-Year Interest Rate Swap | | 3-Month USD-LIBOR | | Receive | | | 2.721 | | | | 04/08/2024 | | | | 100 | | | | (1 | ) | | | (1 | ) |
| | Put - OTC 1-Year Interest Rate Swap | | 3-Month USD-LIBOR | | Pay | | | 2.721 | | | | 04/08/2024 | | | | 100 | | | | (1 | ) | | | (1 | ) |
| | Call - OTC 1-Year Interest Rate Swap | | 6-Month EUR-EURIBOR | | Receive | | | 0.550 | | | | 04/05/2023 | | | | 300 | | | | (1 | ) | | | 0 | |
| | Put - OTC 1-Year Interest Rate Swap | | 6-Month EUR-EURIBOR | | Pay | | | 2.100 | | | | 04/05/2023 | | | | 300 | | | | (1 | ) | | | (1 | ) |
| | Call - OTC 1-Year Interest Rate Swap | | 6-Month EUR-EURIBOR | | Receive | | | 0.550 | | | | 04/11/2023 | | | | 500 | | | | (1 | ) | | | 0 | |
| | Put - OTC 1-Year Interest Rate Swap | | 6-Month EUR-EURIBOR | | Pay | | | 2.100 | | | | 04/11/2023 | | | | 500 | | | | (1 | ) | | | (1 | ) |
| | Call - OTC 1-Year Interest Rate Swap | | 6-Month EUR-EURIBOR | | Receive | | | 0.700 | | | | 04/24/2023 | | | | 300 | | | | 1 | | | | 0 | |
| | Put - OTC 1-Year Interest Rate Swap | | 6-Month EUR-EURIBOR | | Pay | | | 2.250 | | | | 04/24/2023 | | | | 300 | | | | (1 | ) | | | (1 | ) |
| | Call - OTC 1-Year Interest Rate Swap | | 6-Month EUR-EURIBOR | | Receive | | | 0.700 | | | | 04/26/2023 | | | | 300 | | | | (1 | ) | | | 0 | |
| | Put - OTC 1-Year Interest Rate Swap | | 6-Month EUR-EURIBOR | | Pay | | | 2.250 | | | | 04/26/2023 | | | | 300 | | | | (1 | ) | | | (1 | ) |
| | Call - OTC 1-Year Interest Rate Swap | | 6-Month EUR-EURIBOR | | Receive | | | 0.550 | | | | 05/15/2023 | | | | 300 | | | | (1 | ) | | | 0 | |
| | | | |
| 44 | | PIMCO EQUITY SERIES | | See Accompanying Notes |
June 30, 2022
| | | | | | | | | | | | | | | | | | | | | | | | | | |
| Counterparty | | Description | | Floating Rate Index | | Pay/
Receive
Floating
Rate | | Exercise
Rate | | | Expiration
Date | | | Notional
Amount(1) | | | Premiums
(Received) | | | Market
Value | |
| | Put - OTC 1-Year Interest Rate Swap | | 6-Month EUR-EURIBOR | | Pay | | | 2.100 | % | | | 05/15/2023 | | | | 300 | | | $ | (1 | ) | | $ | (1 | ) |
MYC | | Call - OTC 1-Year Interest Rate Swap | | 3-Month USD-LIBOR | | Receive | | | 2.993 | | | | 10/11/2023 | | | | 100 | | | | (1 | ) | | | (1 | ) |
| | Put - OTC 1-Year Interest Rate Swap | | 3-Month USD-LIBOR | | Pay | | | 2.993 | | | | 10/11/2023 | | | | 100 | | | | (1 | ) | | | (1 | ) |
NGF | | Call - OTC 1-Year Interest Rate Swap | | 3-Month USD-LIBOR | | Receive | | | 3.020 | | | | 11/06/2023 | | | | 200 | | | | (1 | ) | | | (1 | ) |
| | Put - OTC 1-Year Interest Rate Swap | | 3-Month USD-LIBOR | | Pay | | | 3.020 | | | | 11/06/2023 | | | | 200 | | | | (1 | ) | | | (1 | ) |
| | Call - OTC 1-Year Interest Rate Swap | | 3-Month USD-LIBOR | | Receive | | | 2.845 | | | | 11/13/2023 | | | | 200 | | | | (1 | ) | | | (1 | ) |
| | Put - OTC 1-Year Interest Rate Swap | | 3-Month USD-LIBOR | | Pay | | | 2.845 | | | | 11/13/2023 | | | | 200 | | | | (1 | ) | | | (1 | ) |
| | Call - OTC 1-Year Interest Rate Swap | | 3-Month USD-LIBOR | | Receive | | | 2.785 | | | | 04/08/2024 | | | | 100 | | | | (1 | ) | | | (1 | ) |
| | Put - OTC 1-Year Interest Rate Swap | | 3-Month USD-LIBOR | | Pay | | | 2.785 | | | | 04/08/2024 | | | | 100 | | | | (1 | ) | | | (1 | ) |
| | Call - OTC 1-Year Interest Rate Swap | | 3-Month USD-LIBOR | | Receive | | | 2.835 | | | | 04/08/2024 | | | | 100 | | | | (1 | ) | | | (1 | ) |
| | Put - OTC 1-Year Interest Rate Swap | | 3-Month USD-LIBOR | | Pay | | | 2.835 | | | | 04/08/2024 | | | | 100 | | | | (1 | ) | | | (1 | ) |
| | Call - OTC 1-Year Interest Rate Swap | | 6-Month EUR-EURIBOR | | Receive | | | 0.550 | | | | 04/03/2023 | | | | 800 | | | | (1 | ) | | | 0 | |
| | Put - OTC 1-Year Interest Rate Swap | | 6-Month EUR-EURIBOR | | Pay | | | 2.100 | | | | 04/03/2023 | | | | 800 | | | | (1 | ) | | | (3 | ) |
| | Call - OTC 1-Year Interest Rate Swap | | 6-Month EUR-EURIBOR | | Receive | | | 0.550 | | | | 04/04/2023 | | | | 400 | | | | (1 | ) | | | 0 | |
| | Put - OTC 1-Year Interest Rate Swap | | 6-Month EUR-EURIBOR | | Pay | | | 2.100 | | | | 04/04/2023 | | | | 400 | | | | (1 | ) | | | (1 | ) |
| | Call - OTC 1-Year Interest Rate Swap | | 6-Month EUR-EURIBOR | | Receive | | | 0.550 | | | | 05/12/2023 | | | | 400 | | | | 1 | | | | 0 | |
| | Put - OTC 1-Year Interest Rate Swap | | 6-Month EUR-EURIBOR | | Pay | | | 2.100 | | | | 05/12/2023 | | | | 400 | | | | (1 | ) | | | (1 | ) |
| | | | | | | | | | | | | | | | | | | | | | | | | | |
| | | | | | | | | | | | | | | | | | | | $ | (93 | ) | | $ | (246 | ) |
| | | | | | | | | | | | | | | | | | | | | | | | | | |
OPTIONS ON SECURITIES
| | | | | | | | | | | | | | | | | | | | | | |
| Counterparty | | Description | | Strike
Price | | | Expiration
Date | | | Notional
Amount(1) | | | Premiums
(Received) | | | Market
Value | |
BOA | | Call - OTC Uniform Mortgage-Backed Security, TBA 3.000% due 09/01/2052 | | $ | 93.563 | | | | 09/07/2022 | | | | 500 | | | $ | (4 | ) | | $ | (5 | ) |
| | Call - OTC Uniform Mortgage-Backed Security, TBA 3.000% due 09/01/2052 | | | 94.438 | | | | 09/07/2022 | | | | 500 | | | | (3 | ) | | | (3 | ) |
| | Call - OTC Uniform Mortgage-Backed Security, TBA 3.000% due 09/01/2052 | | | 94.703 | | | | 09/07/2022 | | | | 100 | | | | (1 | ) | | | (1 | ) |
| | Put - OTC Uniform Mortgage-Backed Security, TBA 4.000% due 07/01/2052 | | | 98.297 | | | | 07/07/2022 | | | | 500 | | | | (3 | ) | | | (1 | ) |
| | Put - OTC Uniform Mortgage-Backed Security, TBA 4.000% due 07/01/2052 | | | 99.141 | | | | 07/07/2022 | | | | 100 | | | | (1 | ) | | | (1 | ) |
JPM | | Put - OTC Fannie Mae, TBA 4.500% due 09/01/2052 | | | 99.141 | | | | 09/07/2022 | | | | 500 | | | | (2 | ) | | | (3 | ) |
| | Put - OTC Fannie Mae, TBA 4.500% due 09/01/2052 | | | 99.156 | | | | 09/07/2022 | | | | 100 | | | | 0 | | | | (1 | ) |
| | Put - OTC Fannie Mae, TBA 4.500% due 09/01/2052 | | | 99.656 | | | | 09/07/2022 | | | | 500 | | | | (2 | ) | | | (4 | ) |
| | Call - OTC Fannie Mae, TBA 4.500% due 09/01/2052 | | | 101.141 | | | | 09/07/2022 | | | | 500 | | | | (1 | ) | | | (2 | ) |
| | Put - OTC Uniform Mortgage-Backed Security, TBA 3.500% due 08/01/2052 | | | 96.906 | | | | 08/04/2022 | | | | 500 | | | | (2 | ) | | | (6 | ) |
| | | | | | | | | | |
| See Accompanying Notes | | ANNUAL REPORT | | | | JUNE 30, 2022 | | | 45 | |
Schedule of Investments PIMCO Dividend and Income Fund (Cont.)
| | | | | | | | | | | | | | | | | | | | | | |
| Counterparty | | Description | | Strike
Price | | | Expiration
Date | | | Notional
Amount(1) | | | Premiums
(Received) | | | Market
Value | |
SAL | | Put - OTC Fannie Mae, TBA 4.500% due 09/01/2052 | | $ | 98.234 | | | | 09/07/2022 | | | | 500 | | | $ | (3 | ) | | $ | (2 | ) |
| | Put - OTC Fannie Mae, TBA 4.500% due 09/01/2052 | | | 99.406 | | | | 09/07/2022 | | | | 500 | | | | (2 | ) | | | (4 | ) |
| | Put - OTC Fannie Mae, TBA 4.500% due 09/01/2052 | | | 99.656 | | | | 09/07/2022 | | | | 500 | | | | (2 | ) | | | (4 | ) |
| | Call - OTC Fannie Mae, TBA 4.500% due 09/01/2052 | | | 100.234 | | | | 09/07/2022 | | | | 500 | | | | (2 | ) | | | (4 | ) |
| | Put - OTC Uniform Mortgage-Backed Security, TBA 4.500% due 07/01/2052 | | | 99.563 | | | | 07/07/2022 | | | | 500 | | | | (2 | ) | | | 0 | |
| | | | | | | | | | | | | | | | | | | | | | |
| | | | | | | | | | | | | | | | $ | (30 | ) | | $ | (41 | ) |
| | | | | | | | | | | | | | | | | | | | | | |
Total Written Options | | | $ | (125 | ) | | $ | (288 | ) |
| | | | | | | | | | | | | | | | | | | | | | |
SWAP AGREEMENTS:
CREDIT DEFAULT SWAPS ON SOVEREIGN ISSUES - SELL PROTECTION(2)
| | | | | | | | | | | | | | | | | | | | | | | | | | | | | | | | | | | | |
Counterparty | | Reference Entity | | Fixed
Receive
Rate | | | Payment
Frequency | | Maturity
Date | | | Implied Credit
Spread at
June 30,
2022(3) | | | Notional
Amount(4) | | | Premiums
Paid/
(Received) | | | Unrealized
Appreciation/
(Depreciation) | | | Swap
Agreements,
at Value(5) | |
| | Asset | | | Liability | |
BPS | | Mexico Government International Bond | | | 1.000 | % | | Quarterly | | | 06/20/2024 | | | | 1.045 | % | | $ | 40 | | | $ | (1 | ) | | $ | 1 | | | $ | 0 | | | $ | 0 | |
CBK | | Brazil Government International Bond | | | 1.000 | | | Quarterly | | | 12/20/2022 | | | | 0.877 | | | | 245 | | | | (8 | ) | | | 8 | | | | 0 | | | | 0 | |
| | Brazil Government International Bond | | | 1.000 | | | Quarterly | | | 12/20/2024 | | | | 1.870 | | | | 300 | | | | (5 | ) | | | (1 | ) | | | 0 | | | | (6 | ) |
GST | | Brazil Government International Bond | | | 1.000 | | | Quarterly | | | 12/20/2024 | | | | 1.870 | | | | 200 | | | | (3 | ) | | | (1 | ) | | | 0 | | | | (4 | ) |
| | Colombia Government International Bond | | | 1.000 | | | Quarterly | | | 06/20/2027 | | | | 2.912 | | | | 100 | | | | (4 | ) | | | (4 | ) | | | 0 | | | | (8 | ) |
| | Mexico Government International Bond | | | 1.000 | | | Quarterly | | | 06/20/2023 | | | | 0.801 | | | | 100 | | | | (1 | ) | | | 1 | | | | 0 | | | | 0 | |
| | Mexico Government International Bond | | | 1.000 | | | Quarterly | | | 12/20/2024 | | | | 1.183 | | | | 100 | | | | (1 | ) | | | 1 | | | | 0 | | | | 0 | |
| | Turkey Government International Bond | | | 1.000 | | | Quarterly | | | 12/20/2024 | | | | 9.043 | | | | 100 | | | | (11 | ) | | | (6 | ) | | | 0 | | | | (17 | ) |
HUS | | Brazil Government International Bond | | | 1.000 | | | Quarterly | | | 06/20/2024 | | | | 1.608 | | | | 400 | | | | (12 | ) | | | 8 | | | | 0 | | | | (4 | ) |
| | Mexico Government International Bond | | | 1.000 | | | Quarterly | | | 12/20/2023 | | | | 0.965 | | | | 300 | | | | (5 | ) | | | 6 | | | | 1 | | | | 0 | |
MYC | | Mexico Government International Bond | | | 1.000 | | | Quarterly | | | 12/20/2024 | | | | 1.183 | | | | 100 | | | | (1 | ) | | | 1 | | | | 0 | | | | 0 | |
| | Mexico Government International Bond | | | 1.000 | | | Quarterly | | | 06/20/2027 | | | | 1.751 | | | | 500 | | | | (1 | ) | | | (16 | ) | | | 0 | | | | (17 | ) |
| | South Africa Government International Bond | | | 1.000 | | | Quarterly | | | 12/20/2026 | | | | 3.013 | | | | 200 | | | | (9 | ) | | | (7 | ) | | | 0 | | | | (16 | ) |
| | | | | | | | | | | | | | | | | | | | | | | | | | | | | | | | | | | | |
| | | | | | | | | | | | | | | | | | | | | | $ | (62 | ) | | $ | (9 | ) | | $ | 1 | | | $ | (72 | ) |
| | | | | | | | | | | | | | | | | | | | | | | | | | | | | | | | | | | | |
CREDIT DEFAULT SWAPS ON CREDIT INDICES - SELL PROTECTION(2)
| | | | | | | | | | | | | | | | | | | | | | | | | | | | | | | | |
Counterparty | | Index/Tranches | | Fixed
Receive
Rate | | | Payment
Frequency | | Maturity
Date | | | Notional
Amount(4) | | | Premiums
Paid/
(Received) | | | Unrealized
Appreciation/
(Depreciation) | | | Swap
Agreements,
at Value(5) | |
| | Asset | | | Liability | |
GST | | CMBX.NA.AAA.10 Index | | | 0.500 | % | | Monthly | | | 11/17/2059 | | | $ | 4,000 | | | $ | (85 | ) | | $ | 70 | | | $ | 0 | | | $ | (15 | ) |
MYC | | CMBX.NA.AAA.13 Index | | | 0.500 | | | Monthly | | | 12/16/2072 | | | | 5,700 | | | | (2 | ) | | | (99 | ) | | | 0 | | | | (101 | ) |
| | | | | | | | | | | | | | | | | | | | | | | | | | | | | | | | |
| | | | | | | | | | | | | | | | | | $ | (87 | ) | | $ | (29 | ) | | $ | 0 | | | $ | (116 | ) |
| | | | | | | | | | | | | | | | | | | | | | | | | | | | | | | | |
| | | | |
| 46 | | PIMCO EQUITY SERIES | | See Accompanying Notes |
June 30, 2022
INTEREST RATE SWAPS
| | | | | | | | | | | | | | | | | | | | | | | | | | | | | | | | | | |
| Counterparty | | Pay/
Receive
Floating
Rate | | Floating Rate Index | | Fixed
Rate | | | Payment
Frequency | | Maturity
Date | | | Notional
Amount | | | Premiums
Paid/
(Received) | | | Unrealized
Appreciation/
(Depreciation) | | | Swap
Agreements,
at Value | |
| | Asset | | | Liability | |
MYC | | Pay | | 3-Month USD-LIBOR | | | 2.900 | % | | Annual | | | 10/04/2027 | | | $ | 900 | | | $ | 0 | | | $ | (8 | ) | | $ | 0 | | | $ | (8 | ) |
| | | | | | | | | | | | | | | | | | | | | | | | | | | | | | | | |
TOTAL RETURN SWAPS ON SECURITIES
| | | | | | | | | | | | | | | | | | | | | | | | | | | | | | | | | | | | |
Counterparty | | Pay/
Receive(6) | | Underlying
Reference | | # of
Shares | | | Financing Rate | | Payment
Frequency | | Maturity
Date | | | Notional
Amount | | | Premiums
Paid/
(Received) | | | Unrealized
Appreciation/
(Depreciation) | | | Swap
Agreements,
at Value | |
| | Asset | | | Liability | |
| BOA | | Receive | | iBoxx USD Investment Grade Corporate Bond ETF | | | 646 | | | (0.220)% (1-Month USD-LIBOR less a specified spread) | | Monthly | | | 10/17/2022 | | | $ | 48 | | | $ | 0 | | | $ | 0 | | | $ | 0 | | | $ | 0 | |
| | Receive | | iBoxx USD Investment Grade Corporate Bond ETF | | | 324 | | | (0.520)% (1-Month USD-LIBOR less a specified spread) | | Monthly | | | 10/17/2022 | | | | 25 | | | | 0 | | | | (1 | ) | | | 0 | | | | (1 | ) |
| | Receive | | iBoxx USD Investment Grade Corporate Bond ETF | | | 667 | | | 0.280% (1-Month USD-LIBOR less a specified spread) | | Monthly | | | 12/01/2022 | | | | 52 | | | | 0 | | | | (4 | ) | | | 0 | | | | (4 | ) |
| | Receive | | iBoxx USD Investment Grade Corporate Bond ETF | | | 666 | | | (0.420)% (1-Month USD-LIBOR less a specified spread) | | Monthly | | | 12/15/2022 | | | | 50 | | | | 0 | | | | (1 | ) | | | 0 | | | | (1 | ) |
| | | | | | | | | | | | | | | | | | | | | | | | | | | | | | | | | | | | |
| | | | | | | | | | | | | $ | 0 | | | $ | (6 | ) | | $ | 0 | | | $ | (6 | ) |
| | | | | | | | | | | | | | | | | | | | | | | | | | | |
Total Swap Agreements | | | $ | (149 | ) | | $ | (52 | ) | | $ | 1 | | | $ | (202 | ) |
| | | | | | | | | | | | | | | | | |
FINANCIAL DERIVATIVE INSTRUMENTS: OVER THE COUNTER SUMMARY
The following is a summary by counterparty of the market value of OTC financial derivative instruments and collateral pledged/(received) as of June 30, 2022:
| | | | | | | | | | | | | | | | | | | | | | | | | | | | | | | | | | | | | | | | | | | | | | | | |
| | | Financial Derivative Assets | | | | | | Financial Derivative Liabilities | | | | | | | | | | |
| Counterparty | | Forward
Foreign
Currency
Contracts | | | Purchased
Options | | | Swap
Agreements | | | Total
Over the
Counter | | | | | | Forward
Foreign
Currency
Contracts | | | Written
Options | | | Swap
Agreements | | | Total
Over the
Counter | | | Net Market
Value of OTC
Derivatives | | | Collateral
Pledged/
(Received) | | | Net
Exposure(7) | |
BOA | | $ | 103 | | | $ | 0 | | | $ | 0 | | | $ | 103 | | | | | | | $ | (17 | ) | | $ | (15 | ) | | $ | (6 | ) | | $ | (38 | ) | | $ | 65 | | | $ | 0 | | | $ | 65 | |
BPS | | | 50 | | | | 0 | | | | 0 | | | | 50 | | | | | | | | (24 | ) | | | (1 | ) | | | 0 | | | | (25 | ) | | | 25 | | | | 0 | | | | 25 | |
BRC | | | 2 | | | | 0 | | | | 0 | | | | 2 | | | | | | | | (2 | ) | | | 0 | | | | 0 | | | | (2 | ) | | | 0 | | | | 0 | | | | 0 | |
CBK | | | 26 | | | | 0 | | | | 0 | | | | 26 | | | | | | | | (20 | ) | | | (4 | ) | | | (6 | ) | | | (30 | ) | | | (4 | ) | | | 0 | | | | (4 | ) |
DUB | | | 14 | | | | 0 | | | | 0 | | | | 14 | | | | | | | | 0 | | | | (4 | ) | | | 0 | | | | (4 | ) | | | 10 | | | | 0 | | | | 10 | |
FAR | | | 0 | | | | 0 | | | | 0 | | | | 0 | | | | | | | | 0 | | | | (4 | ) | | | 0 | | | | (4 | ) | | | (4 | ) | | | 0 | | | | (4 | ) |
GLM | | | 37 | | | | 0 | | | | 0 | | | | 37 | | | | | | | | (63 | ) | | | (214 | ) | | | 0 | | | | (277 | ) | | | (240 | ) | | | 245 | | | | 5 | |
GST | | | 0 | | | | 0 | | | | 0 | | | | 0 | | | | | | | | 0 | | | | 0 | | | | (44 | ) | | | (44 | ) | | | (44 | ) | | | 0 | | | | (44 | ) |
HUS | | | 99 | | | | 0 | | | | 1 | | | | 100 | | | | | | | | (59 | ) | | | 0 | | | | (4 | ) | | | (63 | ) | | | 37 | | | | 0 | | | | 37 | |
JPM | | | 1 | | | | 0 | | | | 0 | | | | 1 | | | | | | | | (6 | ) | | | (16 | ) | | | 0 | | | | (22 | ) | | | (21 | ) | | | 0 | | | | (21 | ) |
MYC | | | 0 | | | | 0 | | | | 0 | | | | 0 | | | | | | | | 0 | | | | (3 | ) | | | (142 | ) | | | (145 | ) | | | (145 | ) | | | 0 | | | | (145 | ) |
MYI | | | 0 | | | | 0 | | | | 0 | | | | 0 | | | | | | | | (2 | ) | | | 0 | | | | 0 | | | | (2 | ) | | | (2 | ) | | | 0 | | | | (2 | ) |
NGF | | | 0 | | | | 0 | | | | 0 | | | | 0 | | | | | | | | 0 | | | | (13 | ) | | | 0 | | | | (13 | ) | | | (13 | ) | | | 0 | | | | (13 | ) |
RBC | | | 8 | | | | 0 | | | | 0 | | | | 8 | | | | | | | | 0 | | | | 0 | | | | 0 | | | | 0 | | | | 8 | | | | 0 | | | | 8 | |
SAL | | | 0 | | | | 0 | | | | 0 | | | | 0 | | | | | | | | 0 | | | | (14 | ) | | | 0 | | | | (14 | ) | | | (14 | ) | | | 0 | | | | (14 | ) |
SCX | | | 1 | | | | 0 | | | | 0 | | | | 1 | | | | | | | | 0 | | | | 0 | | | | 0 | | | | 0 | | | | 1 | | | | 0 | | | | 1 | |
UAG | | | 3 | | | | 0 | | | | 0 | | | | 3 | | | | | | | | (5 | ) | | | 0 | | | | 0 | | | | (5 | ) | | | (2 | ) | | | 0 | | | | (2 | ) |
| | | | | | | | | | | | | | | | | | | | | | | | | | | | | | | | | | | | | | | | | | | | | | | | |
Total Over the Counter | | $ | 344 | | | $ | 0 | | | $ | 1 | | | $ | 345 | | | | | | | $ | (198 | ) | | $ | (288 | ) | | $ | (202 | ) | | $ | (688 | ) | | | | | | | | | | | | |
| | | | | | | | | | | | | | | | | | | | | | | | | | | | | | | | | | | | | | | | | | | | | | | | |
| | | | | | | | | | |
| See Accompanying Notes | | ANNUAL REPORT | | | | JUNE 30, 2022 | | | 47 | |
Schedule of Investments PIMCO Dividend and Income Fund (Cont.)
| (n) | Securities with an aggregate market value of $245 have been pledged as collateral for financial derivative instruments as governed by International Swaps and Derivatives Association, Inc. master agreements as of June 30, 2022. |
| (1) | Notional Amount represents the number of contracts. |
| (2) | If the Fund is a seller of protection and a credit event occurs, as defined under the terms of that particular swap agreement, the Fund will either (i) pay to the buyer of protection an amount equal to the notional amount of the swap and take delivery of the referenced obligation or underlying securities comprising the referenced index or (ii) pay a net settlement amount in the form of cash, securities or other deliverable obligations equal to the notional amount of the swap less the recovery value of the referenced obligation or underlying securities comprising the referenced index. |
| (3) | Implied credit spreads, represented in absolute terms, utilized in determining the market value of credit default swap agreements on sovereign issues as of period end serve as indicators of the current status of the payment/performance risk and represent the likelihood or risk of default for the credit derivative. The implied credit spread of a particular referenced entity reflects the cost of buying/selling protection and may include upfront payments required to be made to enter into the agreement. Wider credit spreads represent a deterioration of the referenced entity’s credit soundness and a greater likelihood or risk of default or other credit event occurring as defined under the terms of the agreement. |
| (4) | The maximum potential amount the Fund could be required to pay as a seller of credit protection or receive as a buyer of credit protection if a credit event occurs as defined under the terms of that particular swap agreement. |
| (5) | The prices and resulting values for credit default swap agreements serve as indicators of the current status of the payment/performance risk and represent the likelihood of an expected liability (or profit) for the credit derivative should the notional amount of the swap agreement be closed/sold as of the period end. Increasing market values, in absolute terms when compared to the notional amount of the swap, represent a deterioration of the underlying referenced instrument’s credit soundness and a greater likelihood or risk of default or other credit event occurring as defined under the terms of the agreement. |
| (6) | Receive represents that the Fund receives payments for any positive net return on the underlying reference. The Fund makes payments for any negative net return on such underlying reference. Pay represents that the Fund receives payments for any negative net return on the underlying reference. The Fund makes payments for any positive net return on such underlying reference. |
| (7) | Net Exposure represents the net receivable/(payable) that would be due from/to the counterparty in the event of default. Exposure from OTC financial derivative instruments can only be netted across transactions governed under the same master agreement with the same legal entity. See Note 8, Master Netting Arrangements, in the Notes to Financial Statements for more information. |
FAIR VALUE OF FINANCIAL DERIVATIVE INSTRUMENTS
The following is a summary of the fair valuation of the Fund’s derivative instruments categorized by risk exposure. See Note 7, Principal and Other Risks, in the Notes to Financial Statements on risks of the Fund.
Fair Values of Financial Derivative Instruments on the Statement of Assets and Liabilities as of June 30, 2022:
| | | | | | | | | | | | | | | | | | | | | | | | |
| | | Derivatives not accounted for as hedging instruments | |
| | | Commodity
Contracts | | | Credit
Contracts | | | Equity
Contracts | | | Foreign
Exchange
Contracts | | | Interest
Rate Contracts | | | Total | |
Financial Derivative Instruments - Assets | | | | | | | | | | | | | | | | | | | | | | | | |
Exchange-traded or centrally cleared | | | | | | | | | | | | | | | | | | | | | | | | |
Futures | | $ | 0 | | | $ | 0 | | | $ | 0 | | | $ | 0 | | | $ | 201 | | | $ | 201 | |
Swap Agreements | | | 0 | | | | 0 | | | | 0 | | | | 0 | | | | 119 | | | | 119 | |
| | | | | | | | | | | | | | | | | | | | | | | | |
| | $ | 0 | | | $ | 0 | | | $ | 0 | | | $ | 0 | | | $ | 320 | | | $ | 320 | |
| | | | | | | | | | | | | | | | | | | | | | | | |
Over the counter | | | | | | | | | | | | | | | | | | | | | | | | |
Forward Foreign Currency Contracts | | $ | 0 | | | $ | 0 | | | $ | 0 | | | $ | 344 | | | $ | 0 | | | $ | 344 | |
Swap Agreements | | | 0 | | | | 1 | | | | 0 | | | | 0 | | | | 0 | | | | 1 | |
| | | | | | | | | | | | | | | | | | | | | | | | |
| | $ | 0 | | | $ | 1 | | | $ | 0 | | | $ | 344 | | | $ | 0 | | | $ | 345 | |
| | | | | | | | | | | | | | | | | | | | | | | | |
| | $ | 0 | | | $ | 1 | | | $ | 0 | | | $ | 344 | | | $ | 320 | | | $ | 665 | |
| | | | | | | | | | | | | | | | | | | | | | | | |
| | | | |
| 48 | | PIMCO EQUITY SERIES | | See Accompanying Notes |
June 30, 2022
| | | | | | | | | | | | | | | | | | | | | | | | |
| | | Derivatives not accounted for as hedging instruments | |
| | | Commodity
Contracts | | | Credit
Contracts | | | Equity
Contracts | | | Foreign
Exchange
Contracts | | | Interest
Rate Contracts | | | Total | |
| | | | | |
Financial Derivative Instruments - Liabilities | | | | | | | | | | | | | | | | | | | | | |
Exchange-traded or centrally cleared | | | | | | | | | | | | | | | | | | | | | | | | |
Written Options | | $ | 0 | | | $ | 0 | | | $ | 0 | | | $ | 0 | | | $ | 4 | | | $ | 4 | |
Futures | | | 0 | | | | 0 | | | | 0 | | | | 0 | | | | 66 | | | | 66 | |
Swap Agreements | | | 0 | | | | 22 | | | | 0 | | | | 0 | | | | 258 | | | | 280 | |
| | | | | | | | | | | | | | | | | | | | | | | | |
| | $ | 0 | | | $ | 22 | | | $ | 0 | | | $ | 0 | | | $ | 328 | | | $ | 350 | |
| | | | | | | | | | | | | | | | | | | | | | | | |
Over the counter | | | | | | | | | | | | | | | | | | | | | | | | |
Forward Foreign Currency Contracts | | $ | 0 | | | $ | 0 | | | $ | 0 | | | $ | 198 | | | $ | 0 | | | $ | 198 | |
Written Options | | | 0 | | | | 1 | | | | 0 | | | | 0 | | | | 287 | | | | 288 | |
Swap Agreements | | | 0 | | | | 188 | | | | 6 | | | | 0 | | | | 8 | | | | 202 | |
| | | | | | | | | | | | | | | | | | | | | | | | |
| | $ | 0 | | | $ | 189 | | | $ | 6 | | | $ | 198 | | | $ | 295 | | | $ | 688 | |
| | | | | | | | | | | | | | | | | | | | | | | | |
| | $ | 0 | | | $ | 211 | | | $ | 6 | | | $ | 198 | | | $ | 623 | | | $ | 1,038 | |
| | | | | | | | | | | | | | | | | | | | | | | | |
The effect of Financial Derivative Instruments on the Statement of Operations for the period ended June 30, 2022:
| | | | | | | | | | | | | | | | | | | | | | | | |
| | | Derivatives not accounted for as hedging instruments | |
| | | Commodity
Contracts | | | Credit
Contracts | | | Equity
Contracts | | | Foreign
Exchange
Contracts | | | Interest
Rate Contracts | | | Total | |
Net Realized Gain (Loss) on Financial Derivative Instruments | |
Exchange-traded or centrally cleared | | | | | | | | | | | | | | | | | | | | | | | | |
Futures | | $ | 0 | | | $ | 0 | | | $ | (48 | ) | | $ | 0 | | | $ | (246 | ) | | $ | (294 | ) |
Swap Agreements | | | 0 | | | | 4 | | | | 0 | | | | 0 | | | | (56 | ) | | | (52 | ) |
| | | | | | | | | | | | | | | | | | | | | | | | |
| | $ | 0 | | | $ | 4 | | | $ | (48 | ) | | $ | 0 | | | $ | (302 | ) | | $ | (346 | ) |
| | | | | | | | | | | | | | | | | | | | | | | | |
Over the counter | |
Forward Foreign Currency Contracts | | $ | 0 | | | $ | 0 | | | $ | 0 | | | $ | 1,176 | | | $ | 0 | | | $ | 1,176 | |
Purchased Options | | | 0 | | | | (1 | ) | | | 0 | | | | 0 | | | | (1 | ) | | | (2 | ) |
Written Options | | | 0 | | | | 21 | | | | 0 | | | | 2 | | | | 23 | | | | 46 | |
Swap Agreements | | | 0 | | | | 128 | | | | (17 | ) | | | 0 | | | | 3 | | | | 114 | |
| | | | | | | | | | | | | | | | | | | | | | | | |
| | $ | 0 | | | $ | 148 | | | $ | (17 | ) | | $ | 1,178 | | | $ | 25 | | | $ | 1,334 | |
| | | | | | | | | | | | | | | | | | | | | | | | |
| | $ | 0 | | | $ | 152 | | | $ | (65 | ) | | $ | 1,178 | | | $ | (277 | ) | | $ | 988 | |
| | | | | | | | | | | | | | | | | | | | | | | | |
|
Net Change in Unrealized Appreciation (Depreciation) on Financial Derivative Instruments | |
Exchange-traded or centrally cleared | | | | | | | | | | | | | | | | | | | | | | | | |
Written Options | | $ | 0 | | | $ | 0 | | | $ | 0 | | | $ | 0 | | | $ | (1 | ) | | $ | (1 | ) |
Futures | | | 0 | | | | 0 | | | | 0 | | | | 0 | | | | (136 | ) | | | (136 | ) |
Swap Agreements | | | 0 | | | | (736 | ) | | | 0 | | | | 0 | | | | 1,896 | | | | 1,160 | |
| | | | | | | | | | | | | | | | | | | | | | | | |
| | $ | 0 | | | $ | (736 | ) | | $ | 0 | | | $ | 0 | | | $ | 1,759 | | | $ | 1,023 | |
| | | | | | | | | | | | | | | | | | | | | | | | |
Over the counter | | | | | | | | | | | | | | | | | | | | | | | | |
Forward Foreign Currency Contracts | | $ | 0 | | | $ | 0 | | | $ | 0 | | | $ | (75 | ) | | $ | 0 | | | $ | (75 | ) |
Purchased Options | | | 0 | | | | 1 | | | | 0 | | | | 0 | | | | 5 | | | | 6 | |
Written Options | | | 0 | | | | 1 | | | | 0 | | | | (1 | ) | | | (174 | ) | | | (174 | ) |
Swap Agreements | | | 0 | | | | (268 | ) | | | (6 | ) | | | 0 | | | | (6 | ) | | | (280 | ) |
| | | | | | | | | | | | | | | | | | | | | | | | |
| | $ | 0 | | | $ | (266 | ) | | $ | (6 | ) | | $ | (76 | ) | | $ | (175 | ) | | $ | (523 | ) |
| | | | | | | | | | | | | | | | | | | | | | | | |
| | $ | 0 | | | $ | (1,002 | ) | | $ | (6 | ) | | $ | (76 | ) | | $ | 1,584 | | | $ | 500 | |
| | | | | | | | | | | | | | | | | | | | | | | | |
| | | | | | | | | | |
| See Accompanying Notes | | ANNUAL REPORT | | | | JUNE 30, 2022 | | | 49 | |
Schedule of Investments PIMCO Dividend and Income Fund (Cont.)
FAIR VALUE MEASUREMENTS
The following is a summary of the fair valuations according to the inputs used as of June 30, 2022 in valuing the Fund’s assets and liabilities:
| | | | | | | | | | | | | | | | |
| Category and Subcategory | | Level 1 | | | Level 2 | | | Level 3 | | | Fair
Value at
06/30/2022 | |
Investments in Securities, at Value | | | | | | | | | | | | | | | | |
Asset-Backed Securities | | | | | | | | | | | | | | | | |
Cayman Islands | | $ | 0 | | | $ | 341 | | | $ | 0 | | | $ | 341 | |
United States | | | 0 | | | | 13,787 | | | | 0 | | | | 13,787 | |
Loan Participations and Assignments | | | | | | | | | | | | | | | | |
Canada | | | 0 | | | | 0 | | | | 600 | | | | 600 | |
Luxembourg | | | 0 | | | | 54 | | | | 0 | | | | 54 | |
Panama | | | 0 | | | | 371 | | | | 468 | | | | 839 | |
United Kingdom | | | 0 | | | | 839 | | | | 378 | | | | 1,217 | |
United States | | | 0 | | | | 3,209 | | | | 132 | | | | 3,341 | |
Common Stocks | | | | | | | | | | | | | | | | |
Australia | | | | | | | | | | | | | | | | |
Industrials | | | 0 | | | | 114 | | | | 0 | | | | 114 | |
Materials | | | 0 | | | | 3,082 | | | | 0 | | | | 3,082 | |
Belgium | | | | | | | | | | | | | | | | |
Financials | | | 0 | | | | 230 | | | | 0 | | | | 230 | |
Brazil | | | | | | | | | | | | | | | | |
Communication Services | | | 119 | | | | 0 | | | | 0 | | | | 119 | |
Consumer Staples | | | 130 | | | | 0 | | | | 0 | | | | 130 | |
Energy | | | 587 | | | | 0 | | | | 0 | | | | 587 | |
Financials | | | 148 | | | | 0 | | | | 0 | | | | 148 | |
Materials | | | 1,233 | | | | 0 | | | | 0 | | | | 1,233 | |
Canada | | | | | | | | | | | | | | | | |
Consumer Discretionary | | | 88 | | | | 0 | | | | 0 | | | | 88 | |
Consumer Staples | | | 528 | | | | 0 | | | | 0 | | | | 528 | |
Financials | | | 350 | | | | 0 | | | | 0 | | | | 350 | |
Industrials | | | 177 | | | | 0 | | | | 0 | | | | 177 | |
Materials | | | 108 | | | | 0 | | | | 0 | | | | 108 | |
China | | | | | | | | | | | | | | | | |
Energy | | | 0 | | | | 476 | | | | 0 | | | | 476 | |
Financials | | | 0 | | | | 2,973 | | | | 0 | | | | 2,973 | |
Industrials | | | 0 | | | | 121 | | | | 0 | | | | 121 | |
Information Technology | | | 0 | | | | 178 | | | | 0 | | | | 178 | |
Utilities | | | 0 | | | | 136 | | | | 0 | | | | 136 | |
Czech Republic | | | | | | | | | | | | | | | | |
Utilities | | | 0 | | | | 196 | | | | 0 | | | | 196 | |
Denmark | | | | | | | | | | | | | | | | |
Industrials | | | 0 | | | | 538 | | | | 0 | | | | 538 | |
France | | | | | | | | | | | | | | | | |
Communication Services | | | 0 | | | | 498 | | | | 0 | | | | 498 | |
Health Care | | | 0 | | | | 1,448 | | | | 0 | | | | 1,448 | |
Industrials | | | 0 | | | | 318 | | | | 0 | | | | 318 | |
Germany | | | | | | | | | | | | | | | | |
Utilities | | | 0 | | | | 546 | | | | 0 | | | | 546 | |
Greece | | | | | | | | | | | | | | | | |
Consumer Discretionary | | | 0 | | | | 118 | | | | 0 | | | | 118 | |
Hong Kong | | | | | | | | | | | | | | | | |
Industrials | | | 0 | | | | 206 | | | | 0 | | | | 206 | |
Utilities | | | 0 | | | | 112 | | | | 0 | | | | 112 | |
Indonesia | | | | | | | | | | | | | | | | |
Communication Services | | | 0 | | | | 359 | | | | 0 | | | | 359 | |
Consumer Discretionary | | | 0 | | | | 246 | | | | 0 | | | | 246 | |
Energy | | | 0 | | | | 100 | | | | 0 | | | | 100 | |
| | | | |
| 50 | | PIMCO EQUITY SERIES | | See Accompanying Notes |
June 30, 2022
| | | | | | | | | | | | | | | | |
| Category and Subcategory | | Level 1 | | | Level 2 | | | Level 3 | | | Fair
Value at
06/30/2022 | |
Israel | | | | | | | | | | | | | | | | |
Industrials | | $ | 108 | | | $ | 0 | | | $ | 0 | | | $ | 108 | |
Japan | | | | | | | | | | | | | | | | |
Communication Services | | | 0 | | | | 282 | | | | 0 | | | | 282 | |
Consumer Discretionary | | | 0 | | | | 107 | | | | 0 | | | | 107 | |
Consumer Staples | | | 0 | | | | 565 | | | | 0 | | | | 565 | |
Health Care | | | 0 | | | | 1,045 | | | | 0 | | | | 1,045 | |
Industrials | | | 0 | | | | 1,855 | | | | 0 | | | | 1,855 | |
Information Technology | | | 0 | | | | 166 | | | | 0 | | | | 166 | |
Materials | | | 0 | | | | 246 | | | | 0 | | | | 246 | |
Luxembourg | | | | | | | | | | | | | | | | |
Financials | | | 0 | | | | 0 | | | | 81 | | | | 81 | |
Malaysia | | | | | | | | | | | | | | | | |
Materials | | | 0 | | | | 130 | | | | 0 | | | | 130 | |
Netherlands | | | | | | | | | | | | | | | | |
Consumer Staples | | | 0 | | | | 739 | | | | 0 | | | | 739 | |
Norway | | | | | | | | | | | | | | | | |
Communication Services | | | 0 | | | | 253 | | | | 0 | | | | 253 | |
Energy | | | 0 | | | | 235 | | | | 0 | | | | 235 | |
Portugal | | | | | | | | | | | | | | | | |
Consumer Staples | | | 0 | | | | 139 | | | | 0 | | | | 139 | |
Singapore | | | | | | | | | | | | | | | | |
Industrials | | | 0 | | | | 125 | | | | 0 | | | | 125 | |
South Africa | | | | | | | | | | | | | | | | |
Communication Services | | | 0 | | | | 338 | | | | 0 | | | | 338 | |
Energy | | | 0 | | | | 106 | | | | 0 | | | | 106 | |
Financials | | | 0 | | | | 584 | | | | 0 | | | | 584 | |
South Korea | |
Consumer Discretionary | | | 0 | | | | 424 | | | | 0 | | | | 424 | |
Consumer Staples | | | 0 | | | | 188 | | | | 0 | | | | 188 | |
Spain | |
Financials | | | 0 | | | | 798 | | | | 0 | | | | 798 | |
Utilities | | | 0 | | | | 516 | | | | 0 | | | | 516 | |
Sweden | |
Energy | | | 0 | | | | 150 | | | | 0 | | | | 150 | |
Information Technology | | | 0 | | | | 590 | | | | 0 | | | | 590 | |
Switzerland | |
Health Care | | | 0 | | | | 5,082 | | | | 0 | | | | 5,082 | |
Industrials | | | 0 | | | | 351 | | | | 0 | | | | 351 | |
Information Technology | | | 0 | | | | 180 | | | | 0 | | | | 180 | |
Taiwan | |
Information Technology | | | 0 | | | | 1,752 | | | | 0 | | | | 1,752 | |
United Kingdom | |
Consumer Staples | | | 0 | | | | 549 | | | | 0 | | | | 549 | |
Health Care | | | 0 | | | | 1,159 | | | | 0 | | | | 1,159 | |
Industrials | | | 0 | | | | 375 | | | | 0 | | | | 375 | |
Materials | | | 0 | | | | 2,314 | | | | 0 | | | | 2,314 | |
Utilities | | | 0 | | | | 693 | | | | 0 | | | | 693 | |
United States | |
Communication Services | | | 372 | | | | 0 | | | | 39 | | | | 411 | |
Consumer Discretionary | | | 1,334 | | | | 0 | | | | 0 | | | | 1,334 | |
Consumer Staples | | | 8,628 | | | | 0 | | | | 0 | | | | 8,628 | |
Energy | | | 1,021 | | | | 0 | | | | 0 | | | | 1,021 | |
Financials | | | 5,462 | | | | 0 | | | | 0 | | | | 5,462 | |
Health Care | | | 9,063 | | | | 0 | | | | 0 | | | | 9,063 | |
Industrials | | | 3,438 | | | | 0 | | | | 194 | | | | 3,632 | |
Information Technology | | | 6,464 | | | | 0 | | | | 0 | | | | 6,464 | |
Materials | | | 145 | | | | 0 | | | | 0 | | | | 145 | |
Utilities | | | 163 | | | | 0 | | | | 0 | | | | 163 | |
| | | | | | | | | | |
| See Accompanying Notes | | ANNUAL REPORT | | | | JUNE 30, 2022 | | | 51 | |
Schedule of Investments PIMCO Dividend and Income Fund (Cont.)
| | | | | | | | | | | | | | | | |
| Category and Subcategory | | Level 1 | | | Level 2 | | | Level 3 | | | Fair
Value at
06/30/2022 | |
Corporate Bonds & Notes | |
Austria | |
Banking & Finance | | $ | 0 | | | $ | 613 | | | $ | 0 | | | $ | 613 | |
Bermuda | |
Industrials | | | 0 | | | | 238 | | | | 0 | | | | 238 | |
Canada | |
Industrials | | | 0 | | | | 441 | | | | 0 | | | | 441 | |
Cayman Islands | |
Banking & Finance | | | 0 | | | | 24 | | | | 0 | | | | 24 | |
Industrials | | | 0 | | | | 381 | | | | 0 | | | | 381 | |
Utilities | | | 0 | | | | 64 | | | | 0 | | | | 64 | |
France | |
Banking & Finance | | | 0 | | | | 385 | | | | 0 | | | | 385 | |
Hong Kong | |
Banking & Finance | | | 0 | | | | 212 | | | | 0 | | | | 212 | |
Ireland | |
Industrials | | | 0 | | | | 36 | | | | 0 | | | | 36 | |
Italy | |
Banking & Finance | | | 0 | | | | 383 | | | | 0 | | | | 383 | |
Japan | |
Industrials | | | 0 | | | | 772 | | | | 0 | | | | 772 | |
Liberia | |
Industrials | | | 0 | | | | 887 | | | | 0 | | | | 887 | |
Luxembourg | |
Industrials | | | 0 | | | | 172 | | | | 0 | | | | 172 | |
Mexico | |
Industrials | | | 0 | | | | 514 | | | | 0 | | | | 514 | |
Multinational | |
Industrials | | | 0 | | | | 86 | | | | 0 | | | | 86 | |
Netherlands | |
Industrials | | | 0 | | | | 304 | | | | 0 | | | | 304 | |
Peru | |
Banking & Finance | | | 0 | | | | 24 | | | | 0 | | | | 24 | |
Spain | | | | | | | | | | | | | | | | |
Industrials | | | 0 | | | | 179 | | | | 0 | | | | 179 | |
Switzerland | | | | | | | | | | | | | | | | |
Banking & Finance | | | 0 | | | | 349 | | | | 0 | | | | 349 | |
United Kingdom | | | | | | | | | | | | | | | | |
Banking & Finance | | | 0 | | | | 2,504 | | | | 0 | | | | 2,504 | |
Industrials | | | 0 | | | | 752 | | | | 0 | | | | 752 | |
United States | | | | | | | | | | | | | | | | |
Banking & Finance | | | 0 | | | | 257 | | | | 0 | | | | 257 | |
Industrials | | | 0 | | | | 7,573 | | | | 0 | | | | 7,573 | |
Utilities | | | 0 | | | | 3,749 | | | | 0 | | | | 3,749 | |
Venezuela | | | | | | | | | | | | | | | | |
Industrials | | | 0 | | | | 20 | | | | 0 | | | | 20 | |
Virgin Islands (British) | | | | | | | | | | | | | | | | |
Industrials | | | 0 | | | | 285 | | | | 0 | | | | 285 | |
Non-Agency Mortgage-Backed Securities | | | | | | | | | | | | | | | | |
United Kingdom | | | 0 | | | | 1,216 | | | | 0 | | | | 1,216 | |
United States | | | 0 | | | | 7,352 | | | | 0 | | | | 7,352 | |
Municipal Bonds & Notes | | | | | | | | | | | | | | | | |
Illinois | | | 0 | | | | 21 | | | | 0 | | | | 21 | |
Puerto Rico | | | 0 | | | | 150 | | | | 0 | | | | 150 | |
Virginia | | | 0 | | | | 149 | | | | 0 | | | | 149 | |
Preferred Stocks | | | | | | | | | | | | | | | | |
Brazil | | | | | | | | | | | | | | | | |
Energy | | | 690 | | | | 0 | | | | 0 | | | | 690 | |
Netherlands | | | | | | | | | | | | | | | | |
Banking & Finance | | | 0 | | | | 267 | | | | 0 | | | | 267 | |
| | | | |
| 52 | | PIMCO EQUITY SERIES | | See Accompanying Notes |
June 30, 2022
| | | | | | | | | | | | | | | | |
| Category and Subcategory | | Level 1 | | | Level 2 | | | Level 3 | | | Fair
Value at
06/30/2022 | |
Spain | | | | | | | | | | | | | | | | |
Banking & Finance | | $ | 0 | | | $ | 210 | | | $ | 0 | | | $ | 210 | |
United Kingdom | | | | | | | | | | | | | | | | |
Banking & Finance | | | 0 | | | | 201 | | | | 0 | | | | 201 | |
United States | | | | | | | | | | | | | | | | |
Industrials | | | 0 | | | | 149 | | | | 0 | | | | 149 | |
Real Estate Investment Trusts | | | | | | | | | | | | | | | | |
Australia | | | | | | | | | | | | | | | | |
Real Estate | | | 0 | | | | 341 | | | | 0 | | | | 341 | |
United States | | | | | | | | | | | | | | | | |
Real Estate | | | 9,060 | | | | 0 | | | | 0 | | | | 9,060 | |
Rights | | | | | | | | | | | | | | | | |
Luxembourg | | | | | | | | | | | | | | | | |
Financials | | | 0 | | | | 0 | | | | 2 | | | | 2 | |
Sovereign Issues | | | | | | | | | | | | | | | | |
Argentina | | | 0 | | | | 296 | | | | 0 | | | | 296 | |
Peru | | | 0 | | | | 255 | | | | 0 | | | | 255 | |
Romania | | | 0 | | | | 146 | | | | 0 | | | | 146 | |
South Africa | | | 0 | | | | 710 | | | | 0 | | | | 710 | |
Turkey | | | 0 | | | | 315 | | | | 0 | | | | 315 | |
Venezuela | | | 0 | | | | 14 | | | | 0 | | | | 14 | |
U.S. Government Agencies | | | | | | | | | | | | | | | | |
United States | | | 0 | | | | 16,660 | | | | 0 | | | | 16,660 | |
U.S. Treasury Obligations | | | | | | | | | | | | | | | | |
United States | | | 0 | | | | 12,664 | | | | 0 | | | | 12,664 | |
Warrants | | | | | | | | | | | | | | | | |
Luxembourg | | | | | | | | | | | | | | | | |
Financials | | | 0 | | | | 0 | | | | 2 | | | | 2 | |
United States | | | | | | | | | | | | | | | | |
Information Technology | | | 0 | | | | 0 | | | | 1 | | | | 1 | |
Short-Term Instruments | | | | | | | | | | | | | | | | |
Repurchase Agreements | | | 0 | | | | 1,002 | | | | 0 | | | | 1,002 | |
Argentina Treasury Bills | | | 0 | | | | 77 | | | | 0 | | | | 77 | |
| | | | | | | | | | | | | | | | |
| | $ | 49,416 | | | $ | 116,031 | | | $ | 1,897 | | | $ | 167,344 | |
| | | | |
Investments in Affiliates, at Value | | | | | | | | | | | | | | | | |
Short-Term Instruments | | | | | | | | | | | | | | | | |
Central Funds Used for Cash Management Purposes | | $ | 11,603 | | | $ | 0 | | | $ | 0 | | | $ | 11,603 | |
| | | | | | | | | | | | | | | | |
Total Investments | | $ | 61,019 | | | $ | 116,031 | | | $ | 1,897 | | | $ | 178,947 | |
| | | | | | | | | | | | | | | | |
| | | | |
Financial Derivative Instruments - Assets | | | | | | | | | | | | | | | | |
Exchange-traded or centrally cleared | | | 21 | | | | 299 | | | | 0 | | | | 320 | |
Over the counter | | | 0 | | | | 345 | | | | 0 | | | | 345 | |
| | | | | | | | | | | | | | | | |
| | $ | 21 | | | $ | 644 | | | $ | 0 | | | $ | 665 | |
| | | | |
Financial Derivative Instruments - Liabilities | | | | | | | | | | | | | | | | |
Exchange-traded or centrally cleared | | | (10 | ) | | | (340 | ) | | | 0 | | | | (350 | ) |
Over the counter | | | 0 | | | | (688 | ) | | | 0 | | | | (688 | ) |
| | | | | | | | | | | | | | | | |
| | $ | (10 | ) | | $ | (1,028 | ) | | $ | 0 | | | $ | (1,038 | ) |
| | | | | | | | | | | | | | | | |
Total Financial Derivative Instruments | | $ | 11 | | | $ | (384 | ) | | $ | 0 | | | $ | (373 | ) |
| | | | | | | | | | | | | | | | |
Totals | | $ | 61,030 | | | $ | 115,647 | | | $ | 1,897 | | | $ | 178,574 | |
| | | | | | | | | | | | | | | | |
| | | | | | | | | | |
| See Accompanying Notes | | ANNUAL REPORT | | | | JUNE 30, 2022 | | | 53 | |
Schedule of Investments PIMCO Dividend and Income Fund (Cont.)
The following is a reconciliation of the fair valuations using significant unobservable inputs (Level 3) for the Fund during the period ended June 30, 2022:
| | | | | | | | | | | | | | | | | | | | | | | | | | | | | | | | | | | | | | | | |
| Category and Subcategory | | Beginning
Balance at
06/30/2021 | | | Net
Purchases | | | Net Sales/
Settlements | | | Accrued
Discounts/
(Premiums) | | | Realized
Gain/
(Loss) | | | Net Change in
Unrealized
Appreciation/
(Depreciation)(1) | | | Transfers
into
Level 3 | | | Transfers out
of Level 3 | | | Ending
Balance at
06/30/2022 | | | Net Change in
Unrealized
Appreciation/
(Depreciation)
on Investments
Held at
06/30/2022 (1) | |
Investments in Securities, at Value | | | | | | | | | | | | | | | | | | | | | | | | | | | | | | | | | |
Loan Participations and Assignments | | | | | | | | | | | | | | | | | | | | | | | | | | | | | | | | | | | | | | | | |
Canada | | $ | 0 | | | $ | 661 | | | $ | 0 | | | $ | (1 | ) | | $ | 0 | | | $ | (60 | ) | | $ | 0 | | | $ | 0 | | | $ | 600 | | | $ | (60 | ) |
Panama | | | 0 | | | | 522 | | | | (3 | ) | | | 0 | | | | 0 | | | | (51 | ) | | | 0 | | | | 0 | | | | 468 | | | | (51 | ) |
United Kingdom | | | 0 | | | | 400 | | | | (22 | ) | | | 0 | | | | 0 | | | | 0 | | | | 0 | | | | 0 | | | | 378 | | | | 0 | |
United States | | | 2 | | | | 202 | | | | (1 | ) | | | (1 | ) | | | 0 | | | | (67 | ) | | | 0 | | | | (3 | ) | | | 132 | | | | (69 | ) |
Common Stocks | | | | | | | | | | | | | | | | | | | | | | | | | | | | | | | | | | | | | | | | |
Luxembourg | | | | | | | | | | | | | | | | | | | | | | | | | | | | | | | | | | | | | | | | |
Financials | | | 0 | | | | 208 | | | | 0 | | | | 0 | | | | 0 | | | | (127 | ) | | | 0 | | | | 0 | | | | 81 | | | | (127 | ) |
United States | | | | | | | | | | | | | | | | | | | | | | | | | | | | | | | | | | | | | | | | |
Communication Services | | | 133 | | | | 0 | | | | 0 | | | | 0 | | | | 0 | | | | (94 | ) | | | 0 | | | | 0 | | | | 39 | | | | (94 | ) |
Industrials | | | 124 | | | | 0 | | | | 0 | | | | 0 | | | | 0 | | | | 70 | | | | 0 | | | | 0 | | | | 194 | | | | 70 | |
Rights | | | | | | | | | | | | | | | | | | | | | | | | | | | | | | | | | | | | | | | | |
Luxembourg | | | | | | | | | | | | | | | | | | | | | | | | | | | | | | | | | | | | | | | | |
Financials | | | 0 | | | | 0 | | | | 0 | | | | 0 | | | | 0 | | | | 2 | | | | 0 | | | | 0 | | | | 2 | | | | 2 | |
Warrants | | | | | | | | | | | | | | | | | | | | | | | | | | | | | | | | | | | | | | | | |
Luxembourg | | | | | | | | | | | | | | | | | | | | | | | | | | | | | | | | | | | | | | | | |
Financials | | | 0 | | | | 54 | | | | 0 | | | | 0 | | | | (1 | ) | | | (51 | ) | | | 0 | | | | 0 | | | | 2 | | | | (51 | ) |
United States | | | | | | | | | | | | | | | | | | | | | | | | | | | | | | | | | | | | | | | | |
Information Technology | | $ | 1 | | | $ | 0 | | | $ | 0 | | | $ | 0 | | | $ | 0 | | | $ | 0 | | | $ | 0 | | | $ | 0 | | | $ | 1 | | | $ | 0 | |
| | | | | | | | | | | | | | | | | | | | | | | | | | | | | | | | | | | | | | | | |
Totals | | $ | 260 | | | $ | 2,047 | | | $ | (26 | ) | | $ | (2 | ) | | $ | (1 | ) | | $ | (378 | ) | | $ | 0 | | | $ | (3 | ) | | $ | 1,897 | | | $ | (380 | ) |
| | | | | | | | | | | | | | | | | | | | | | | | | | | | | | | | | | | | | | | | |
The following is a summary of significant unobservable inputs used in the fair valuations of assets and liabilities categorized within Level 3 of the fair value hierarchy:
| | | | | | | | | | | | | | | | | | | | | |
| Category and Subcategory | | Ending
Balance
at 06/30/2022 | | Valuation Technique | | Unobservable Inputs | | | | (% Unless Noted Otherwise) |
| | Input Value(s) | | Weighted
Average |
Investments in Securities, at Value | | | | | | | | | | | | | | | | | | | | | |
Loan Participations and Assignments | | | | | | | | | | | | | | | | | | | | | |
Canada | | | $ | 600 | | | Third Party Vendor | | Broker Quote | | | | | | 92.250 | | | | | — | |
Panama | | | | 468 | | | Third Party Vendor | | Broker Quote | | | | | | 90.000 | | | | | — | |
United Kingdom | | | | 378 | | | Discounted Cash Flow | | Discount Rate | | | | | | 5.136 | | | | | — | |
United States | | | | 132 | | | Third Party Vendor | | Broker Quote | | | | | | 62.500-93.000 | | | | | 92.868 | |
Common Stocks | | | | | | | | | | | | | | | | | | | | | |
Luxembourg | | | | | | | | | | | | | | | | | | | | | |
Financials | | | | 81 | | | Indicative Market Quotation | | EBITDA Multiple | | X | | | | 7.000 | | | | | — | |
United States | | | | | | | | | | | | | | | | | | | | | |
Communication Services | | | | 39 | | | Reference Instrument | | Liquidity Discount | | | | | | 10.000 | | | | | — | |
Industrials | | | | 194 | | | Discounted Cash Flow | | Discount Rate | | | | | | 9.500-17.100 | | | | | 9.500 | |
Rights | | | | | | | | | | | | | | | | | | | | | |
Luxembourg | | | | | | | | | | | | | | | | | | | | | |
Financials | | | | 2 | | | Other Valuation Techniques(2) | | — | | | | | | — | | | | | — | |
Warrants | | | | | | | | | | | | | | | | | | | | | |
Luxembourg | | | | | | | | | | | | | | | | | | | | | |
Financials | | | | 1 | | | Indicative Market Quotation | | EBITDA Multiple | | X | | | | 7.000 | | | | | — | |
| | | | |
| 54 | | PIMCO EQUITY SERIES | | See Accompanying Notes |
June 30, 2022
| | | | | | | | | | | | | | | | | | | | | |
| Category and Subcategory | | Ending
Balance
at 06/30/2022 | | Valuation Technique | | Unobservable Inputs | | | | (% Unless Noted Otherwise) |
| | Input Value(s) | | Weighted
Average |
| | | $ | 1 | | | Other Valuation Techniques(2) | | — | | | | | | — | | | | | — | |
United States | | | | | | | | | | | | | | | | | | | | | |
Information Technology | | | | 1 | | | Comparable Companies/Discounted Cash Flow | | EBITDA Multiple | | X | | | | 3.875 | | | | | — | |
| | | | | | | | | | | | | | | | | | | | | |
Total | | | $ | 1,897 | | | | | | | | | | | | | | | | | |
| | | | | | | | | | | | | | | | | | | | | |
| (1) | Any difference between Net Change in Unrealized Appreciation/(Depreciation) and Net Change in Unrealized Appreciation/(Depreciation) on Investments Held at June 30, 2022 may be due to an investment no longer held or categorized as Level 3 at period end. |
| (2) | Includes valuation techniques not defined in the Notes to Financial Statements as securities valued using such techniques are not considered significant to the Fund. |
| | | | | | | | | | |
| See Accompanying Notes | | ANNUAL REPORT | | | | JUNE 30, 2022 | | | 55 | |
Notes to Financial Statements
1. ORGANIZATION
PIMCO Equity Series (the “Trust”) was established as a Delaware statutory trust on March 30, 2010. The Trust is registered under the Investment Company Act of 1940, as amended (the “Act”), as an open-end management investment company. Information presented in these financial statements pertains to the Institutional Class, I-2, Class A and Class C shares of the PIMCO Dividend and Income Fund (the “Fund”). Pacific Investment Management Company LLC (“PIMCO”) serves as the investment adviser (the “Adviser”) for the Fund. Prior to November 1, 2021, PIMCO had engaged Research Affiliates, LLC as the sub-adviser for the equity portion of the Fund and Parametric Portfolio Associates, LLC to implement the investment strategies of the equity portion of the Fund.
The Fund may invest in the least expensive class of shares of any actively managed or smart beta funds (including mutual funds or exchange-traded funds) of the Trust, or PIMCO ETF Trust or PIMCO Funds, each an affiliated open-end investment company, except funds of funds and PIMCO California Municipal Intermediate Value Fund, PIMCO California Municipal Opportunistic Value Fund, PIMCO National Municipal Intermediate Value Fund and PIMCO National Municipal Opportunistic Value Fund (“Underlying PIMCO Funds”), and may also invest in other unaffiliated funds and exchange-traded funds (collectively, “Acquired Funds”).
2. SIGNIFICANT ACCOUNTING POLICIES
The following is a summary of significant accounting policies consistently followed by the Trust in the preparation of its financial statements in conformity with accounting principles generally accepted in the United States of America (“U.S. GAAP”). The Fund is treated as an investment company under the reporting requirements of U.S. GAAP. The functional and reporting currency for the Fund is the U.S. dollar. The preparation of financial statements in accordance with U.S. GAAP requires management to make estimates and assumptions that affect the reported amounts of assets and liabilities and disclosure of contingent assets and liabilities at the date of the financial statements and the reported amounts of increases and decreases in net assets from operations during the reporting period. Actual results could differ from those estimates.
(a) Securities Transactions and Investment Income Securities transactions are recorded as of the trade date for financial reporting purposes. Securities purchased or sold on a when-issued or delayed-delivery basis may be settled beyond a standard settlement period for the security after the trade date. Realized gains (losses) from securities sold are recorded on the identified cost basis. Dividend income is recorded on the ex-dividend date, except certain dividends from foreign securities where the ex-dividend date may have passed, which are recorded as soon as the Fund is informed of the ex-dividend date. Interest income, adjusted for the accretion of discounts and amortization of premiums, is recorded on the accrual basis from settlement date, with the exception of securities with a forward starting effective date, where interest income is recorded on the accrual basis from effective date. For convertible securities, premiums attributable to the conversion feature are not amortized. Estimated tax liabilities on certain foreign securities are recorded on an accrual basis and are reflected as components of interest income or net change in unrealized appreciation (depreciation) on investments on the Statement of Operations, as appropriate. Tax liabilities realized as a result of such security sales are reflected as a component of net realized gain (loss) on investments on the Statement of Operations. Paydown gains (losses) on mortgage-related and other asset-backed securities, if any, are recorded as components of interest income on the Statement of
June 30, 2022
Operations. Income or short-term capital gain distributions received from registered investment companies, if any, are recorded as dividend income. Long-term capital gain distributions received from registered investment companies, if any, are recorded as realized gains.
Debt obligations may be placed on non-accrual status and related interest income may be reduced by ceasing current accruals and writing off interest receivable when the collection of all or a portion of interest has become doubtful based on consistently applied procedures. A debt obligation is removed from non-accrual status when the issuer resumes interest payments or when collectability of interest is probable.
(b) Foreign Currency Translation The market values of foreign securities, currency holdings and other assets and liabilities denominated in foreign currencies are translated into U.S. dollars based on the current exchange rates each business day. Purchases and sales of securities and income and expense items denominated in foreign currencies, if any, are translated into U.S. dollars at the exchange rate in effect on the transaction date. The Fund does not separately report the effects of changes in foreign exchange rates from changes in market prices on securities held. Such changes are included in net realized gain (loss) and net change in unrealized appreciation (depreciation) from investments on the Statement of Operations. The Fund may invest in foreign currency-denominated securities and may engage in foreign currency transactions either on a spot (cash) basis at the rate prevailing in the currency exchange market at the time or through a forward foreign currency contract. Realized foreign exchange gains (losses) arising from sales of spot foreign currencies, currency gains (losses) realized between the trade and settlement dates on securities transactions and the difference between the recorded amounts of dividends, interest, and foreign withholding taxes and the U.S. dollar equivalent of the amounts actually received or paid are included in net realized gain (loss) on foreign currency transactions on the Statement of Operations. Net unrealized foreign exchange gains (losses) arising from changes in foreign exchange rates on foreign denominated assets and liabilities other than investments in securities held at the end of the reporting period are included in net change in unrealized appreciation (depreciation) on foreign currency assets and liabilities on the Statement of Operations.
(c) Multi-Class Operations Each class offered by the Trust has equal rights as to assets and voting privileges (except that shareholders of a class have exclusive voting rights regarding any matter relating solely to that class of shares). Income and non-class specific expenses are allocated daily to each class on the basis of the relative net assets. Realized and unrealized capital gains (losses) are allocated daily based on the relative net assets of each class of the Fund. Class specific expenses, where applicable, currently include supervisory and administrative and distribution and servicing fees. Under certain circumstances, the per share net asset value (“NAV”) of a class of the Fund’s shares may be different from the per share NAV of another class of shares as a result of the different daily expense accruals applicable to each class of shares.
(d) Distributions to Shareholders Distributions from net investment income, if any, are declared and distributed to shareholders quarterly. In addition, the Fund distributes any net capital gains it earns from the sale of portfolio securities to shareholders no less frequently than annually. Net short-term capital gains may be paid more frequently.
Income distributions and capital gain distributions are determined in accordance with income tax regulations which may differ from U.S. GAAP. Differences between tax regulations and U.S. GAAP
| | | | | | | | | | |
| | | ANNUAL REPORT | | | | JUNE 30, 2022 | | | 57 | |
Notes to Financial Statements (Cont.)
may cause timing differences between income and capital gain recognition. Further, the character of investment income and capital gains may be different for certain transactions under the two methods of accounting. As a result, income distributions and capital gain distributions declared during a fiscal period may differ significantly from the net investment income (loss) and realized gains (losses) reported on the Fund’s annual financial statements presented under U.S. GAAP.
Separately, if the Fund determines or estimates, as applicable, that a portion of a distribution may be comprised of amounts from sources other than net investment income in accordance with its policies, accounting records (if applicable), and accounting practices, the Fund will notify shareholders of the estimated composition of such distribution through a Section 19 Notice. For these purposes, the Fund determines or estimates, as applicable, the source or sources from which a distribution is paid, to the close of the period as of which it is paid, in reference to its internal accounting records and related accounting practices. If, based on such accounting records and practices, it is determined or estimated, as applicable, that a particular distribution does not include capital gains or paid-in surplus or other capital sources, a Section 19 Notice generally would not be issued. It is important to note that differences exist between the Fund’s daily internal accounting records and practices, the Fund’s financial statements presented in accordance with U.S. GAAP, and recordkeeping practices under income tax regulations. For instance, the Fund’s internal accounting records and practices may take into account, among other factors, tax-related characteristics of certain sources of distributions that differ from treatment under U.S. GAAP. Examples of such differences may include but are not limited to, for certain Funds, the treatment of periodic payments under interest rate swap contracts. Accordingly, among other consequences, it is possible that the Fund may not issue a Section 19 Notice in situations where the Fund’s financial statements prepared later and in accordance with U.S. GAAP and/or the final tax character of those distributions might later report that the sources of those distributions included capital gains and/or a return of capital. Please visit www.pimco.com for the most recent Section 19 Notice, if applicable, for additional information regarding the estimated composition of distributions. Final determination of a distribution’s tax character will be provided to shareholders when such information is available.
Distributions classified as a tax basis return of capital at the Fund’s fiscal year end, if any, are reflected on the Statements of Changes in Net Assets and have been recorded to paid in capital on the Statement of Assets and Liabilities. In addition, other amounts have been reclassified between distributable earnings (accumulated loss) and paid in capital on the Statement of Assets and Liabilities to more appropriately conform U.S. GAAP to tax characterizations of distributions.
(e) New Accounting Pronouncements and Regulatory Updates In March 2020, the Financial Accounting Standards Board issued an Accounting Standards Update (“ASU”), ASU 2020-04, which provides optional guidance to ease the potential accounting burden associated with transitioning away from the London Interbank Offered Rate and other reference rates that are expected to be discontinued. ASU 2020-04 is effective for certain reference rate-related contract modifications that occur during the period March 12, 2020 through December 31, 2022. In March 2021, the administrator for LIBOR announced the extension of the publication of a majority of the USD LIBOR settings to June 30, 2023. Management is continuously evaluating the potential effect a discontinuation of LIBOR could have on the Fund’s investments and has determined that it is unlikely the ASU’s adoption will have a material impact on the Fund’s financial statements.
June 30, 2022
In October 2020, the U.S. Securities and Exchange Commission (“SEC”) adopted a rule related to the use of derivatives, short sales, reverse repurchase agreements and certain other transactions by registered investment companies that rescinds and withdraws the guidance of the SEC and its staff regarding asset segregation and cover transactions that was applicable to the Fund as of the date of this report. Subject to certain exceptions, the rule requires funds to trade derivatives and other transactions that create future payment or delivery obligations (except reverse repurchase agreements and similar financing transactions) subject to a value-at-risk leverage limit, certain derivatives risk management program and reporting requirements. The rule went into effect on February 19, 2021. The compliance date for the new rule and the related reporting requirements is August 19, 2022. At this time, management is evaluating the implications of these changes on the financial statements.
In October 2020, the SEC adopted a rule regarding the ability of a fund to invest in other funds. The rule allows a fund to acquire shares of another fund in excess of certain limitations currently imposed by the Act without obtaining individual exemptive relief from the SEC, subject to certain conditions. The rule also includes the rescission of certain exemptive relief from the SEC and guidance from the SEC staff for funds to invest in other funds. The effective date for the rule was January 19, 2021, and the compliance date for the rule was January 19, 2022. Management has implemented changes in connection with the rule and has determined that there is no material impact to the Fund’s financial statements.
In December 2020, the SEC adopted a rule addressing fair valuation of fund investments. The new rule sets forth requirements for good faith determinations of fair value as well as for the performance of fair value determinations, including related oversight and reporting obligations. The new rule also defines “readily available market quotations” for purposes of the definition of “value” under the Act, and the SEC noted that this definition would apply in all contexts under the Act. The effective date for the rule was March 8, 2021. The compliance date for the new rule and the associated recordkeeping requirements is September 8, 2022. At this time, management is evaluating the implications of these changes on the financial statements.
3. INVESTMENT VALUATION AND FAIR VALUE MEASUREMENTS
(a) Investment Valuation Policies The price of the Fund’s shares is based on the Fund’s NAV. The NAV of the Fund, or each of its share classes, as applicable, is determined by dividing the total value of portfolio investments and other assets, less any liabilities attributable to the Fund or class, by the total number of shares outstanding of the Fund or class.
On each day that the New York Stock Exchange (“NYSE”) is open, Fund shares are ordinarily valued as of the close of regular trading (normally 4:00 p.m., Eastern time) (“NYSE Close”). Information that becomes known to the Fund or its agents after the time as of which NAV has been calculated on a particular day will not generally be used to retroactively adjust the price of a security or the NAV determined earlier that day. If regular trading on the NYSE closes earlier than scheduled, the Fund reserves the right to either (i) calculate its NAV as of the earlier closing time or (ii) calculate its NAV as of the normally scheduled close of regular trading on the NYSE for that day. The Fund generally does not calculate its NAV on days during which the NYSE is closed. However, if the NYSE is closed on a day it would normally be open for business, the Fund reserves the right to calculate its NAV as of the normally scheduled close of regular trading on the NYSE for that day or such other time that the Fund may determine.
| | | | | | | | | | |
| | | ANNUAL REPORT | | | | JUNE 30, 2022 | | | 59 | |
Notes to Financial Statements (Cont.)
For purposes of calculating NAV, portfolio securities and other assets for which market quotes are readily available are valued at market value. Market value is generally determined on the basis of official closing prices or the last reported sales prices, or if no sales are reported, based on quotes obtained from established market makers or prices (including evaluated prices) supplied by the Fund’s approved pricing services, quotation reporting systems and other third-party sources (together, “Pricing Services”). The Fund will normally use pricing data for domestic equity securities received shortly after the NYSE Close and does not normally take into account trading, clearances or settlements that take place after the NYSE Close. If market value pricing is used, a foreign (non-U.S.) equity security traded on a foreign exchange or on more than one exchange is typically valued using pricing information from the exchange considered by PIMCO to be the primary exchange. A foreign (non-U.S.) equity security will be valued as of the close of trading on the foreign exchange, or the NYSE Close, if the NYSE Close occurs before the end of trading on the foreign exchange. Domestic and foreign (non-U.S.) fixed income securities, non-exchange traded derivatives, and equity options are normally valued on the basis of quotes obtained from brokers and dealers or Pricing Services using such data reflecting the principal markets for those securities. Prices obtained from Pricing Services may be based on, among other things, information provided by market makers or estimates of market values obtained from yield data relating to investments or securities with similar characteristics. Certain fixed income securities purchased on a delayed-delivery basis are marked to market daily until settlement at the forward settlement date. Exchange-traded options, except equity options, futures and options on futures are valued at the settlement price determined by the relevant exchange, quotes obtained from a quotation reporting system, established market makers or pricing services. Swap agreements are valued on the basis of market-based prices supplied by Pricing Services or quotes obtained from brokers and dealers. The Fund’s investments in open-end management investment companies, other than exchange-traded funds (“ETFs”), are valued at the NAVs of such investments. Open-end management investment companies may include affiliated funds.
If a foreign (non-U.S.) equity security’s value has materially changed after the close of the security’s primary exchange or principal market but before the NYSE Close, the security may be valued at fair value based on procedures established and approved by the Board of Trustees of the Trust (the “Board”). Foreign (non-U.S.) equity securities that do not trade when the NYSE is open are also valued at fair value. With respect to foreign (non-U.S.) equity securities, the Fund may determine the fair value of investments based on information provided by Pricing Services and other third-party vendors, which may recommend fair value or adjustments with reference to other securities, indices or assets. In considering whether fair valuation is required and in determining fair values, the Fund may, among other things, consider significant events (which may be considered to include changes in the value of U.S. securities or securities indices) that occur after the close of the relevant market and before the NYSE Close. The Fund may utilize modeling tools provided by third-party vendors to determine fair values of foreign (non-U.S.) securities. For these purposes, any movement in the applicable reference index or instrument (“zero trigger”) between the earlier close of the applicable foreign market and the NYSE Close may be deemed to be a significant event, prompting the application of the pricing model (effectively resulting in daily fair valuations). Foreign exchanges may permit trading in foreign (non-U.S.) equity securities on days when the Trust is not open for business, which may result in the Fund’s portfolio investments being affected when shareholders are unable to buy or sell shares.
June 30, 2022
Senior secured floating rate loans for which an active secondary market exists to a reliable degree are valued at the mean of the last available bid/ask prices in the market for such loans, as provided by a Pricing Service. Senior secured floating rate loans for which an active secondary market does not exist to a reliable degree are valued at fair value, which is intended to approximate market value. In valuing a senior secured floating rate loan at fair value, the factors considered may include, but are not limited to, the following: (a) the creditworthiness of the borrower and any intermediate participants, (b) the terms of the loan, (c) recent prices in the market for similar loans, if any, and (d) recent prices in the market for instruments of similar quality, rate, period until next interest rate reset and maturity.
Investments valued in currencies other than the U.S. dollar are converted to the U.S. dollar using exchange rates obtained from Pricing Services. As a result, the value of such investments and, in turn, the NAV of the Fund’s shares may be affected by changes in the value of currencies in relation to the U.S. dollar. The value of investments traded in markets outside the United States or denominated in currencies other than the U.S. dollar may be affected significantly on a day that the Trust is not open for business. As a result, to the extent that the Fund holds foreign (non-U.S.) investments, the value of those investments may change at times when shareholders are unable to buy or sell shares and the value of such investments will be reflected in the Fund’s next calculated NAV.
Investments for which market quotes or market based valuations are not readily available are valued at fair value as determined in good faith by the Board or persons acting at their direction. The Board has adopted methods for valuing securities and other assets in circumstances where market quotes are not readily available, and has delegated to the Adviser the responsibility for applying the fair valuation methods. In the event that market quotes or market based valuations are not readily available, and the security or asset cannot be valued pursuant to a Board approved valuation method, the value of the security or asset will be determined in good faith by the Board. Market quotes are considered not readily available in circumstances where there is an absence of current or reliable market-based data (e.g., trade information, bid/ask information, indicative market quotations (“Broker Quotes”), Pricing Services’ prices), including where events occur after the close of the relevant market, but prior to the NYSE Close, that materially affect the values of the Fund’s securities or assets. In addition, market quotes are considered not readily available when, due to extraordinary circumstances, the exchanges or markets on which the securities trade do not open for trading for the entire day and no other market prices are available. The Board has delegated, to the Adviser, the responsibility for monitoring significant events that may materially affect the values of the Fund’s securities or assets and for determining whether the value of the applicable securities or assets should be reevaluated in light of such significant events.
When the Fund (or, in each instance in this paragraph, as applicable, an Underlying PIMCO Fund or an Acquired Fund) uses fair valuation to determine the value of a portfolio security or other asset for purposes of calculating its NAV, such investments will not be priced on the basis of quotes from the primary market in which they are traded, but rather may be priced by another method that the Board or persons acting at their direction believe reflects fair value. Fair valuation may require subjective determinations about the value of a security. While the Trust’s policy is intended to result in a calculation of the Fund’s NAV that fairly reflects security values as of the time of pricing, the Trust cannot ensure that fair values determined by the Board or persons acting at their direction would
| | | | | | | | | | |
| | | ANNUAL REPORT | | | | JUNE 30, 2022 | | | 61 | |
Notes to Financial Statements (Cont.)
accurately reflect the price that the Fund could obtain for a security if it were to dispose of that security as of the time of pricing (for instance, in a forced or distressed sale). The prices used by the Fund may differ from the value that would be realized if the securities were sold. The Fund’s use of fair valuation may also help to deter “stale price arbitrage” as discussed under the “Abusive Trading Practices” section in the Fund’s prospectus.
(b) Fair Value Hierarchy U.S. GAAP describes fair value as the price that the Fund would receive to sell an asset or pay to transfer a liability in an orderly transaction between market participants at the measurement date. It establishes a fair value hierarchy that prioritizes inputs to valuation methods and requires disclosure of the fair value hierarchy, separately for each major category of assets and liabilities, that segregates fair value measurements into levels (Level 1, 2, or 3). The inputs or methodology used for valuing securities are not necessarily an indication of the risks associated with investing in those securities. Levels 1, 2, and 3 of the fair value hierarchy are defined as follows:
| ∎ | | Level 1 — Quoted prices in active markets or exchanges for identical assets and liabilities. |
| ∎ | | Level 2 — Significant other observable inputs, which may include, but are not limited to, quoted prices for similar assets or liabilities in markets that are active, quoted prices for identical or similar assets or liabilities in markets that are not active, inputs other than quoted prices that are observable for the assets or liabilities (such as interest rates, yield curves, volatilities, prepayment speeds, loss severities, credit risks and default rates) or other market corroborated inputs. |
| ∎ | | Level 3 — Significant unobservable inputs based on the best information available in the circumstances, to the extent observable inputs are not available, which may include assumptions made by the Board or persons acting at their direction that are used in determining the fair value of investments. |
Assets or liabilities categorized as Level 2 or 3 as of period end have been transferred between Levels 2 and 3 since the prior period due to changes in the method utilized in valuing the investments. Transfers from Level 3 to Level 2 are a result of the availability of current and reliable market-based data provided by Pricing Services or other valuation techniques which utilize significant observable inputs. In accordance with the requirements of U.S. GAAP, the amounts of transfers into and out of Level 3, if material, are disclosed in the Notes to Schedule of Investments for the Fund.
For fair valuations using significant unobservable inputs, U.S. GAAP requires a reconciliation of the beginning to ending balances for reported fair values that presents changes attributable to realized gain (loss), unrealized appreciation (depreciation), purchases and sales, accrued discounts (premiums), and transfers into and out of the Level 3 category during the period. The end of period value is used for the transfers between Levels of the Fund’s assets and liabilities. Additionally, U.S. GAAP requires quantitative information regarding the significant unobservable inputs used in the determination of fair value of assets or liabilities categorized as Level 3 in the fair value hierarchy. In accordance with the requirements of U.S. GAAP, a fair value hierarchy, and if material, a Level 3 reconciliation and details of significant unobservable inputs, have been included in the Notes to Schedule of Investments for the Fund.
June 30, 2022
(c) Valuation Techniques and the Fair Value Hierarchy
Level 1, Level 2 and Level 3 trading assets and trading liabilities, at fair value The valuation methods (or “techniques”) and significant inputs used in determining the fair values of portfolio securities or other assets and liabilities categorized as Level 1, Level 2 and Level 3 of the fair value hierarchy are as follows:
Fixed income securities including corporate, convertible and municipal bonds and notes, U.S. government agencies, U.S. treasury obligations, sovereign issues, bank loans, convertible preferred securities and non-U.S. bonds are normally valued on the basis of quotes obtained from brokers and dealers or Pricing Services that use broker-dealer quotations, reported trades or valuation estimates from their internal pricing models. The Pricing Services’ internal models use inputs that are observable such as issuer details, interest rates, yield curves, prepayment speeds, credit risks/spreads, default rates and quoted prices for similar assets. Securities that use similar valuation techniques and inputs as described above are categorized as Level 2 of the fair value hierarchy.
Fixed income securities purchased on a delayed-delivery basis or as a repurchase commitment in a sale-buyback transaction are marked to market daily until settlement at the forward settlement date and are categorized as Level 2 of the fair value hierarchy.
Mortgage-related and asset-backed securities are usually issued as separate tranches, or classes, of securities within each deal. These securities are also normally valued by Pricing Services that use broker-dealer quotations, reported trades or valuation estimates from their internal pricing models. The pricing models for these securities usually consider tranche-level attributes, current market data, estimated cash flows and market-based yield spreads for each tranche, and incorporate deal collateral performance, as available. Mortgage-related and asset-backed securities that use similar valuation techniques and inputs as described above are categorized as Level 2 of the fair value hierarchy.
Common stocks, ETFs, exchange-traded notes and financial derivative instruments, such as futures contracts, rights and warrants, or options on futures that are traded on a national securities exchange, are stated at the last reported sale or settlement price on the day of valuation. To the extent these securities are actively traded and valuation adjustments are not applied, they are categorized as Level 1 of the fair value hierarchy.
Valuation adjustments may be applied to certain securities that are solely traded on a foreign exchange to account for the market movement between the close of the foreign market and the NYSE Close. These securities are valued using Pricing Services that consider the correlation of the trading patterns of the foreign security to the intraday trading in the U.S. markets for investments. Securities using these valuation adjustments are categorized as Level 2 of the fair value hierarchy. Preferred securities and other equities traded on inactive markets or valued by reference to similar instruments are also categorized as Level 2 of the fair value hierarchy.
Valuation adjustments may be applied to certain exchange traded futures and options to account for market movement between the exchange settlement and the NYSE close. These securities are valued using quotes obtained from a quotation reporting system, established market makers or pricing services. Financial derivatives using these valuation adjustments are categorized as Level 2 of the fair value hierarchy.
| | | | | | | | | | |
| | | ANNUAL REPORT | | | | JUNE 30, 2022 | | | 63 | |
Notes to Financial Statements (Cont.)
Investments in registered open-end investment companies (other than ETFs) will be valued based upon the NAVs of such investments and are categorized as Level 1 of the fair value hierarchy. Investments in unregistered open-end investment companies will be calculated based upon the NAVs of such investments and are considered Level 1 provided that the NAVs are observable, calculated daily and are the value at which both purchases and sales will be conducted.
Equity exchange-traded options and over the counter financial derivative instruments, such as forward foreign currency contracts and options contracts derive their value from underlying asset prices, indices, reference rates, and other inputs or a combination of these factors. These contracts are normally valued on the basis of quotes obtained from a quotation reporting system, established market makers or Pricing Services (normally determined as of the NYSE Close). Depending on the product and the terms of the transaction, financial derivative instruments can be valued by Pricing Services using a series of techniques, including simulation pricing models. The pricing models use inputs that are observed from actively quoted markets such as quoted prices, issuer details, indices, bid/ask spreads, interest rates, implied volatilities, yield curves, dividends and exchange rates. Financial derivative instruments that use similar valuation techniques and inputs as described above are categorized as Level 2 of the fair value hierarchy.
Centrally cleared swaps and over the counter swaps derive their value from underlying asset prices, indices, reference rates, and other inputs or a combination of these factors. They are valued using a broker-dealer bid quotation or on market-based prices provided by Pricing Services (normally determined as of the NYSE Close). Centrally cleared swaps and over the counter swaps can be valued by Pricing Services using a series of techniques, including simulation pricing models. The pricing models may use inputs that are observed from actively quoted markets such as the overnight index swap rate, London Interbank Offered Rate forward rate, interest rates, yield curves and credit spreads. These securities are categorized as Level 2 of the fair value hierarchy.
When a fair valuation method is applied by the Adviser that uses significant unobservable inputs, investments will be priced by a method that the Board or persons acting at their direction believe reflects fair value and are categorized as Level 3 of the fair value hierarchy.
If third-party evaluated vendor pricing is not available or not deemed to be indicative of fair value, the Adviser may elect to obtain Broker Quotes directly from the broker-dealer or passed through from a third-party vendor. In the event that fair value is based upon a single sourced Broker Quote, these securities are categorized as Level 3 of the fair value hierarchy. Broker Quotes are typically received from established market participants. Although independently received, the Adviser does not have the transparency to view the underlying inputs which support the market quotation. Significant changes in the Broker Quote would have direct and proportional changes in the fair value of the security.
Reference instrument valuation estimates fair value by utilizing the correlation of the security to one or more broad-based securities, market indices, and/or other financial instruments, whose pricing information is readily available. Unobservable inputs may include those used in algorithms based on percentage change in the reference instruments and/or weights of each reference instrument. Significant changes in the unobservable inputs would result in direct and proportional changes in the fair value of the security. These securities are categorized as Level 2 or Level 3 of the fair value hierarchy depending on the source or input of the reference instrument.
June 30, 2022
The Discounted Cash Flow model is based on future cash flows generated by the investment and may be normalized based on expected investment performance. Future cash flows are discounted to present value using an appropriate rate of return, typically calibrated to the initial transaction date and adjusted based on Capital Asset Pricing Model and/or other market-based inputs. Significant changes in the unobservable inputs would result in direct and proportional changes in the fair value of the security. These securities are categorized as Level 3 of the fair value hierarchy.
The Comparable Companies model is based on application of valuation multiples from publicly traded comparable companies to the financials of the subject company. Adjustments may be made to the market-derived valuation multiples based on differences between the comparable companies and the subject company. Significant changes in the unobservable inputs would result in direct and proportional changes in the fair value of the security. These securities are categorized as Level 3 of the fair value hierarchy.
Short-term debt instruments (such as commercial paper) having a remaining maturity of 60 days or less may be valued at amortized cost, so long as the amortized cost value of such short-term debt instruments is approximately the same as the fair value of the instrument as determined without the use of amortized cost valuation. These securities are categorized as Level 2 or Level 3 of the fair value hierarchy depending on the source of the base price.
4. SECURITIES AND OTHER INVESTMENTS
(a) Investments in Affiliates
The Fund may invest in the PIMCO Short Asset Portfolio and the PIMCO Short-Term Floating NAV Portfolio III (“Central Funds”) to the extent permitted by the Act and rules thereunder. The Central Funds are registered investment companies created for use solely by the series of the Trust and other series of registered investment companies advised by the Adviser, in connection with their cash management activities. The main investments of the Central Funds are money market and short maturity fixed income instruments. The Central Funds may incur expenses related to their investment activities, but do not pay Investment Advisory Fees or Supervisory and Administrative Fees to the Adviser. The Central Funds are considered to be affiliated with the Fund. A complete schedule of portfolio holdings for each affiliate fund is filed with the SEC for the first and third quarters of each fiscal year on Form N-PORT and is available at the SEC’s website at www.sec.gov. A copy of each affiliate fund’s shareholder report is also available at the SEC’s website at www.sec.gov, on the Fund’s website at www.pimco.com, or upon request, as applicable. The table below shows the Fund’s transactions in and earnings from investments in the affiliated Funds for the period ended June 30, 2022 (amounts in thousands†):
Investment in PIMCO Short-Term Floating NAV Portfolio III
| | | | | | | | | | | | | | | | | | | | | | | | | | | | | | |
Market Value
06/30/2021 | | | Purchases
at Cost | | | Proceeds
from Sales | | | Net
Realized
Gain (Loss) | | | Change in
Unrealized
Appreciation
(Depreciation) | | | Market Value
06/30/2022 | | | Dividend
Income(1) | | | Realized Net
Capital Gain
Distributions(1) | |
| | | | | | | |
| $ | 1,231 | | | $ | 84,057 | | | $ | (73,645) | | | $ | (33) | | | $ | (7) | | | $ | 11,603 | | | $ | 56 | | | $ | 0 | |
| † | A zero balance may reflect actual amounts rounding to less than one thousand. |
| (1) | The tax characterization of distributions is determined in accordance with Federal income tax regulations and may contain a return of capital. The actual tax characterization of distributions received is determined at the end of the fiscal year of the affiliated fund. See Note 2, Distributions to Shareholders, in the Notes to Financial Statements for more information. |
| | | | | | | | | | |
| | | ANNUAL REPORT | | | | JUNE 30, 2022 | | | 65 | |
Notes to Financial Statements (Cont.)
(b) Investments in Securities
The Fund may utilize the investments and strategies described below to the extent permitted by the Fund’s investment policies.
Delayed-Delivery Transactions involve a commitment by the Fund to purchase or sell securities for a predetermined price or yield, with payment and delivery taking place beyond the customary settlement period. When delayed-delivery transactions are outstanding, the Fund will designate or receive as collateral liquid assets in an amount sufficient to meet the purchase price or respective obligations. When purchasing a security on a delayed-delivery basis, the Fund assumes the rights and risks of ownership of the security, including the risk of price and yield fluctuations, and takes such fluctuations into account when determining its NAV. The Fund may dispose of or renegotiate a delayed-delivery transaction after it is entered into, which may result in a realized gain (loss). When the Fund has sold a security on a delayed-delivery basis, the Fund does not participate in future gains (losses) with respect to the security.
Inflation-Indexed Bonds are fixed income securities whose principal value is periodically adjusted by the rate of inflation. The interest rate on these bonds is generally fixed at issuance at a rate lower than typical bonds. Over the life of an inflation-indexed bond, however, interest will be paid based on a principal value which is adjusted for inflation. Any increase or decrease in the principal amount of an inflation-indexed bond will be included as interest income on the Statement of Operations, even though investors do not receive their principal until maturity. Repayment of the original bond principal upon maturity (as adjusted for inflation) is guaranteed in the case of U.S. Treasury Inflation-Protected Securities. For bonds that do not provide a similar guarantee, the adjusted principal value of the bond repaid at maturity may be less than the original principal.
Loans and Other Indebtedness, Loan Participations and Assignments are direct debt instruments which are interests in amounts owed to lenders or lending syndicates by corporate, governmental, or other borrowers. The Fund’s investments in loans may be in the form of participations in loans or assignments of all or a portion of loans from third parties or investments in or originations of loans by the Fund or Funds. A loan is often administered by a bank or other financial institution (the “agent”) that acts as agent for all holders. The agent administers the terms of the loan, as specified in the loan agreement. The Fund may invest in multiple series or tranches of a loan, which may have varying terms and carry different associated risks. When the Fund purchases assignments from agents it acquires direct rights against the borrowers of the loans. These loans may include participations in bridge loans, which are loans taken out by borrowers for a short period (typically less than one year) pending arrangement of more permanent financing through, for example, the issuance of bonds, frequently high yield bonds issued for the purpose of acquisitions.
The types of loans and related investments in which the Fund may invest include, among others, senior loans, subordinated loans (including second lien loans, B-Notes and mezzanine loans), whole loans, commercial real estate and other commercial loans and structured loans. The Fund may originate loans or acquire direct interests in loans through primary loan distributions and/or in private transactions. In the case of subordinated loans, there may be significant indebtedness ranking ahead of the borrower’s obligation to the holder of such a loan, including in the event of the borrower’s insolvency. Mezzanine loans are typically secured by a pledge of an equity interest in the mortgage borrower that owns the real estate rather than an interest in a mortgage.
June 30, 2022
Investments in loans may include unfunded loan commitments, which are contractual obligations for funding. Unfunded loan commitments may include revolving credit facilities, which may obligate the Fund to supply additional cash to the borrower on demand. Unfunded loan commitments represent a future obligation in full, even though a percentage of the committed amount may not be utilized by the borrower. When investing in a loan participation, the Fund has the right to receive payments of principal, interest and any fees to which it is entitled only from the agent selling the loan agreement and only upon receipt of payments by the agent from the borrower. The Fund may receive a commitment fee based on the undrawn portion of the underlying line of credit portion of a loan. In certain circumstances, the Fund may receive a penalty fee upon the prepayment of a loan by a borrower. Fees earned or paid are recorded as a component of interest income or interest expense, respectively, on the Statement of Operations. Unfunded loan commitments are reflected as a liability on the Statement of Assets and Liabilities.
Mortgage-Related and Other Asset-Backed Securities directly or indirectly represent a participation in, or are secured by and payable from, loans on real property. Mortgage-related securities are created from pools of residential or commercial mortgage loans, including mortgage loans made by savings and loan institutions, mortgage bankers, commercial banks and others. These securities provide a monthly payment which consists of both interest and principal. Interest may be determined by fixed or adjustable rates. The rate of prepayments on underlying mortgages will affect the price and volatility of a mortgage-related security, and may have the effect of shortening or extending the effective duration of the security relative to what was anticipated at the time of purchase. The timely payment of principal and interest of certain mortgage-related securities is guaranteed with the full faith and credit of the U.S. Government. Pools created and guaranteed by non-governmental issuers, including government-sponsored corporations, may be supported by various forms of insurance or guarantees, but there can be no assurance that private insurers or guarantors can meet their obligations under the insurance policies or guarantee arrangements. Many of the risks of investing in mortgage-related securities secured by commercial mortgage loans reflect the effects of local and other economic conditions on real estate markets, the ability of tenants to make lease payments, and the ability of a property to attract and retain tenants. These securities may be less liquid and may exhibit greater price volatility than other types of mortgage-related or other asset-backed securities. Other asset-backed securities are created from many types of assets, including, but not limited to, auto loans, accounts receivable, such as credit card receivables and hospital account receivables, home equity loans, student loans, boat loans, mobile home loans, recreational vehicle loans, manufactured housing loans, aircraft leases, computer leases and syndicated bank loans.
Collateralized Debt Obligations (“CDOs”) include Collateralized Bond Obligations (“CBOs”), Collateralized Loan Obligations (“CLOs”) and other similarly structured securities. CBOs and CLOs are types of asset-backed securities. A CBO is a trust which is backed by a diversified pool of high risk, below investment grade fixed income securities. A CLO is a trust typically collateralized by a pool of loans, which may include, among others, domestic and foreign senior secured loans, senior unsecured loans, and subordinate corporate loans, including loans that may be rated below investment grade or equivalent unrated loans. The risks of an investment in a CDO depend largely on the type of the collateral securities and the class of the CDO in which the Fund invests. In addition to the normal risks associated with fixed income securities discussed elsewhere in this report and the Fund’s prospectus and statement of additional information (e.g., prepayment risk, credit risk, liquidity risk, market risk, structural risk, legal risk and interest rate risk (which may be exacerbated if the
| | | | | | | | | | |
| | | ANNUAL REPORT | | | | JUNE 30, 2022 | | | 67 | |
Notes to Financial Statements (Cont.)
interest rate payable on a structured financing changes based on multiples of changes in interest rates or inversely to changes in interest rates)), CBOs, CLOs and other CDOs carry additional risks including, but not limited to, (i) the possibility that distributions from collateral securities will not be adequate to make interest or other payments, (ii) the quality of the collateral may decline in value or default, (iii) the risk that the Fund may invest in CBOs, CLOs, or other CDOs that are subordinate to other classes, and (iv) the complex structure of the security may not be fully understood at the time of investment and may produce disputes with the issuer or unexpected investment results.
Collateralized Mortgage Obligations (“CMOs”) are debt obligations of a legal entity that are collateralized by whole mortgage loans or private mortgage bonds and divided into classes. CMOs are structured into multiple classes, often referred to as “tranches”, with each class bearing a different stated maturity and entitled to a different schedule for payments of principal and interest, including prepayments. CMOs may be less liquid and may exhibit greater price volatility than other types of mortgage-related or asset-backed securities.
Payment In-Kind Securities may give the issuer the option at each interest payment date of making interest payments in either cash and/or additional debt securities. Those additional debt securities usually have the same terms, including maturity dates and interest rates, and associated risks as the original bonds. The daily market quotations of the original bonds may include the accrued interest (referred to as a dirty price) and require a pro rata adjustment from the unrealized appreciation (depreciation) on investments to interest receivable on the Statement of Assets and Liabilities.
Perpetual Bonds are fixed income securities with no maturity date but pay a coupon in perpetuity (with no specified ending or maturity date). Unlike typical fixed income securities, there is no obligation for perpetual bonds to repay principal. The coupon payments, however, are mandatory. While perpetual bonds have no maturity date, they may have a callable date in which the perpetuity is eliminated and the issuer may return the principal received on the specified call date. Additionally, a perpetual bond may have additional features, such as interest rate increases at periodic dates or an increase as of a predetermined point in the future.
Real Estate Investment Trusts (“REITs”) are pooled investment vehicles that own, and typically operate, income-producing real estate. If a REIT meets certain requirements, including distributing to shareholders substantially all of its taxable income (other than net capital gains), then it is not taxed on the income distributed to shareholders. Distributions received from REITs may be characterized as income, capital gain or a return of capital. A return of capital is recorded by the Fund as a reduction to the cost basis of its investment in the REIT. REITs are subject to management fees and other expenses, and so the Fund that invests in REITs will bear its proportionate share of the costs of the REITs’ operations.
Restricted Investments are subject to legal or contractual restrictions on resale and may generally be sold privately, but may be required to be registered or exempted from such registration before being sold to the public. Private placement securities are generally considered to be restricted except for those securities traded between qualified institutional investors under the provisions of Rule 144A of the Securities Act of 1933. Disposal of restricted investments may involve time-consuming negotiations and expenses, and prompt sale at an acceptable price may be difficult to achieve. Restricted investments held by the Fund as of June 30, 2022, as applicable, are disclosed in the Notes to Schedule of Investments.
June 30, 2022
Securities Issued by U.S. Government Agencies or Government-Sponsored Enterprises are obligations of and, in certain cases, guaranteed by, the U.S. Government, its agencies or instrumentalities. Some U.S. Government securities, such as Treasury bills, notes and bonds, and securities guaranteed by the Government National Mortgage Association, are supported by the full faith and credit of the U.S. Government; others, such as those of the Federal Home Loan Banks, are supported by the right of the issuer to borrow from the U.S. Department of the Treasury (the “U.S. Treasury”); and others, such as those of the Federal National Mortgage Association (“FNMA” or “Fannie Mae”), are supported by the discretionary authority of the U.S. Government to purchase the agency’s obligations. U.S. Government securities may include zero coupon securities which do not distribute interest on a current basis and tend to be subject to a greater risk than interest-paying securities of similar maturities.
Government-related guarantors (i.e., not backed by the full faith and credit of the U.S. Government) include FNMA and the Federal Home Loan Mortgage Corporation (“FHLMC” or “Freddie Mac”). FNMA is a government-sponsored corporation. FNMA purchases conventional (i.e., not insured or guaranteed by any government agency) residential mortgages from a list of approved seller/servicers which include state and federally chartered savings and loan associations, mutual savings banks, commercial banks and credit unions and mortgage bankers. Pass-through securities issued by FNMA are guaranteed as to timely payment of principal and interest by FNMA, but are not backed by the full faith and credit of the U.S. Government. FHLMC issues Participation Certificates (“PCs”), which are pass-through securities, each representing an undivided interest in a pool of residential mortgages. FHLMC guarantees the timely payment of interest and ultimate collection of principal, but PCs are not backed by the full faith and credit of the U.S. Government.
In June 2019, FNMA and FHLMC started issuing Uniform Mortgage Backed Securities in place of their current offerings of TBA-eligible securities (the “Single Security Initiative”). The Single Security Initiative seeks to support the overall liquidity of the TBA market and aligns the characteristics of FNMA and FHLMC certificates. The effects that the Single Security Initiative may have on the market for TBA and other mortgage-backed securities are uncertain.
Roll-timing strategies can be used where the Fund seeks to extend the expiration or maturity of a position, such as a TBA security on an underlying asset, by closing out the position before expiration and opening a new position with respect to substantially the same underlying asset with a later expiration date. TBA securities purchased or sold are reflected on the Statement of Assets and Liabilities as an asset or liability, respectively. Recently finalized FINRA rules include mandatory margin requirements for the TBA market that requires the Fund to post collateral in connection with its TBA transactions. There is no similar requirement applicable to the Fund’s TBA counterparties. The required collateralization of TBA trades could increase the cost of TBA transactions to the Fund and impose added operational complexity.
Warrants are securities that are usually issued together with a debt security or preferred security and that give the holder the right to buy a proportionate amount of common stock at a specified price. Warrants normally have a life that is measured in years and entitle the holder to buy common stock of a company at a price that is usually higher than the market price at the time the warrant is issued. Warrants may entail greater risks than certain other types of investments.
| | | | | | | | | | |
| | | ANNUAL REPORT | | | | JUNE 30, 2022 | | | 69 | |
Notes to Financial Statements (Cont.)
Generally, warrants do not carry the right to receive dividends or exercise voting rights with respect to the underlying securities, and they do not represent any rights in the assets of the issuer. In addition, their value does not necessarily change with the value of the underlying securities, and they cease to have value if they are not exercised on or before their expiration date. If the market price of the underlying stock does not exceed the exercise price during the life of the warrant, the warrant will expire worthless. Warrants may increase the potential profit or loss to be realized from the investment as compared with investing the same amount in the underlying securities. Similarly, the percentage increase or decrease in the value of an equity security warrant may be greater than the percentage increase or decrease in the value of the underlying common stock. Warrants may relate to the purchase of equity or debt securities. Debt obligations with warrants attached to purchase equity securities have many characteristics of convertible securities and their prices may, to some degree, reflect the performance of the underlying stock. Debt obligations also may be issued with warrants attached to purchase additional debt securities at the same coupon rate. A decline in interest rates would permit the Fund to sell such warrants at a profit. If interest rates rise, these warrants would generally expire with no value.
When-Issued Transactions are purchases or sales made on a when-issued basis. These transactions are made conditionally because a security, although authorized, has not yet been issued in the market. Transactions to purchase or sell securities on a when-issued basis involve a commitment by the Fund to purchase or sell these securities for a predetermined price or yield, with payment and delivery taking place beyond the customary settlement period. The Fund may sell when-issued securities before they are delivered, which may result in a realized gain (loss).
5. BORROWINGS AND OTHER FINANCING TRANSACTIONS
The Fund may enter into the borrowings and other financing transactions described below to the extent permitted by the Fund’s investment policies.
The following disclosures contain information on the Fund’s ability to lend or borrow cash or securities to the extent permitted under the Act, which may be viewed as borrowing or financing transactions by the Fund. The location of these instruments in the Fund’s financial statements is described below.
(a) Repurchase Agreements Under the terms of a typical repurchase agreement, the Fund purchases an underlying debt obligation (collateral) subject to an obligation of the seller to repurchase, and the Fund to resell, the obligation at an agreed-upon price and time. In an open maturity repurchase agreement, there is no pre-determined repurchase date and the agreement can be terminated by the Fund or counterparty at any time. The underlying securities for all repurchase agreements are held by the Fund’s custodian or designated subcustodians under tri-party repurchase agreements and in certain instances will remain in custody with the counterparty. The market value of the collateral must be equal to or exceed the total amount of the repurchase obligations, including interest. Repurchase agreements, if any, including accrued interest, are included on the Statement of Assets and Liabilities. Interest earned is recorded as a component of interest income on the Statement of Operations. In periods of increased demand for collateral, the Fund may pay a fee for the receipt of collateral, which may result in interest expense to the Fund.
June 30, 2022
(b) Reverse Repurchase Agreements In a reverse repurchase agreement, the Fund delivers a security in exchange for cash to a financial institution, the counterparty, with a simultaneous agreement to repurchase the same or substantially the same security at an agreed upon price and date. In an open maturity reverse repurchase agreement, there is no pre-determined repurchase date and the agreement can be terminated by the Fund or counterparty at any time. The Fund is entitled to receive principal and interest payments, if any, made on the security delivered to the counterparty during the term of the agreement. Cash received in exchange for securities delivered plus accrued interest payments to be made by the Fund to counterparties are reflected as a liability on the Statement of Assets and Liabilities. Interest payments made by the Fund to counterparties are recorded as a component of interest expense on the Statement of Operations. In periods of increased demand for the security, the Fund may receive a fee for use of the security by the counterparty, which may result in interest income to the Fund. The Fund will segregate assets determined to be liquid by the Adviser or will otherwise cover its obligations under reverse repurchase agreements.
(c) Sale-Buybacks A sale-buyback financing transaction consists of a sale of a security by the Fund to a financial institution, the counterparty, with a simultaneous agreement to repurchase the same or substantially the same security at an agreed-upon price and date. The Fund is not entitled to receive principal and interest payments, if any, made on the security sold to the counterparty during the term of the agreement. The agreed-upon proceeds for securities to be repurchased by the Fund are reflected as a liability on the Statement of Assets and Liabilities. The Fund will recognize net income represented by the price differential between the price received for the transferred security and the agreed-upon repurchase price. This is commonly referred to as the ‘price drop.’ A price drop consists of (i) the foregone interest and inflationary income adjustments, if any, the Fund would have otherwise received had the security not been sold and (ii) the negotiated financing terms between the Fund and counterparty. Foregone interest and inflationary income adjustments, if any, are recorded as components of interest income on the Statement of Operations. Interest payments based upon negotiated financing terms made by the Fund to counterparties are recorded as a component of interest expense on the Statement of Operations. In periods of increased demand for the security, the Fund may receive a fee for use of the security by the counterparty, which may result in interest income to the Fund. The Fund will segregate assets determined to be liquid by the Adviser or will otherwise cover its obligations under sale-buyback transactions.
(d) Short Sales Short sales are transactions in which the Fund sells a security that it may not own. The Fund may make short sales of securities to (i) offset potential declines in long positions in similar securities, (ii) to increase the flexibility of the Fund, (iii) for investment return, (iv) as part of a risk arbitrage strategy, and (v) as part of its overall portfolio management strategies involving the use of derivative instruments. When the Fund engages in a short sale, it may borrow the security sold short and deliver it to the counterparty. The Fund will ordinarily have to pay a fee or premium to borrow a security and be obligated to repay the lender of the security any dividend or interest that accrues on the security during the period of the loan. Securities sold in short sale transactions and the dividend or interest payable on such securities, if any, are reflected as payable for short sales on the Statement of Assets and Liabilities. Short sales expose the Fund to the risk that it will be required to cover its short position at a time when the security or other asset has appreciated in value, thus resulting in losses to the Fund. A short sale is “against the box” if the Fund holds in its portfolio or has the right to acquire the security sold short, or securities identical to the security sold short, at no
| | | | | | | | | | |
| | | ANNUAL REPORT | | | | JUNE 30, 2022 | | | 71 | |
Notes to Financial Statements (Cont.)
additional cost. The Fund will be subject to additional risks to the extent that it engages in short sales that are not “against the box.” The Fund’s loss on a short sale could theoretically be unlimited in cases where the Fund is unable, for whatever reason, to close out its short position.
(e) Interfund Lending In accordance with an exemptive order (the “Order”) from the SEC, each Fund of the Trust may participate in a joint lending and borrowing facility for temporary purposes (the “Interfund Lending Program”), subject to compliance with the terms and conditions of the Order, and to the extent permitted by each Fund’s investment policies and restrictions. Each Fund is currently permitted to borrow under the Interfund Lending Program. A lending fund may lend in aggregate up to 15% of its current net assets at the time of the interfund loan, but may not lend more than 5% of its net assets to any one borrowing fund through the Interfund Lending Program. A borrowing fund may not borrow through the Interfund Lending Program or from any other source if its total outstanding borrowings immediately after the borrowing would be more than 33 1/3% of its total assets (or any lower threshold provided for by the funds’ investment restrictions). If a borrowing funds’ total outstanding borrowings exceed 10% of its total assets, each of its outstanding interfund loans will be subject to collateralization of at least 102% of the outstanding principal value of the loan. All interfund loans are for temporary or emergency purposes and the interfund loan rate to be charged will be the average of the highest current overnight repurchase agreement rate available to a lending fund and the bank loan rate, as calculated according to a formula established by the Board.
During the period ended June 30, 2022, the Fund did not participate in the Interfund Lending Program.
6. FINANCIAL DERIVATIVE INSTRUMENTS
The Fund may enter into the financial derivative instruments described below to the extent permitted by the Fund’s investment policies.
The following disclosures contain information on how and why the Fund uses financial derivative instruments, and how financial derivative instruments affect the Fund’s financial position, results of operations and cash flows. The location and fair value amounts of these instruments on the Statement of Assets and Liabilities and the net realized gain (loss) and net change in unrealized appreciation (depreciation) on the Statement of Operations, each categorized by type of financial derivative contract and related risk exposure, are included in a table in the Notes to Schedule of Investments. The financial derivative instruments outstanding as of period end and the amounts of net realized gain (loss) and net change in unrealized appreciation (depreciation) on financial derivative instruments during the period, as disclosed in the Notes to Schedule of Investments, serve as indicators of the volume of financial derivative activity for the Fund.
(a) Forward Foreign Currency Contracts may be engaged, in connection with settling planned purchases or sales of securities, to hedge the currency exposure associated with some or all of the Fund’s securities or as part of an investment strategy. A forward foreign currency contract is an agreement between two parties to buy and sell a currency at a set price on a future date. The market value of a forward foreign currency contract fluctuates with changes in foreign currency exchange rates. Forward foreign currency contracts are marked to market daily, and the change in value is recorded by the Fund as an unrealized gain (loss). Realized gains (losses) are equal to the difference between the value of the contract at the time it was opened and the value at the time it was closed
June 30, 2022
and are recorded upon delivery or receipt of the currency. These contracts may involve market risk in excess of the unrealized gain (loss) reflected on the Statement of Assets and Liabilities. In addition, the Fund could be exposed to risk if the counterparties are unable to meet the terms of the contracts or if the value of the currency changes unfavorably to the U.S. dollar. To mitigate such risk, cash or securities may be exchanged as collateral pursuant to the terms of the underlying contracts.
(b) Futures Contracts are agreements to buy or sell a security or other asset for a set price on a future date and are traded on an exchange. The Fund may use futures contracts to manage its exposure to the securities markets or to movements in interest rates and currency values. The primary risks associated with the use of futures contracts are the imperfect correlation between the change in market value of the securities held by the Fund and the prices of futures contracts and the possibility of an illiquid market. Futures contracts are valued based upon their quoted daily settlement prices. Upon entering into a futures contract, the Fund is required to deposit with its futures broker an amount of cash, U.S. Government and Agency Obligations, or select sovereign debt, in accordance with the initial margin requirements of the broker or exchange. Futures contracts are marked to market daily and based on such movements in the price of the contracts, an appropriate payable or receivable for the change in value may be posted or collected by the Fund (“Futures Variation Margin”). Futures Variation Margins, if any, are disclosed within centrally cleared financial derivative instruments on the Statement of Assets and Liabilities. Gains (losses) are recognized but not considered realized until the contracts expire or close. Futures contracts involve, to varying degrees, risk of loss in excess of the Futures Variation Margin included within exchange traded or centrally cleared financial derivative instruments on the Statement of Assets and Liabilities.
(c) Options Contracts may be written or purchased to enhance returns or to hedge an existing position or future investment. The Fund may write call and put options on securities and financial derivative instruments it owns or in which it may invest. Writing put options tends to increase the Fund’s exposure to the underlying instrument. Writing call options tends to decrease the Fund’s exposure to the underlying instrument. When the Fund writes a call or put, an amount equal to the premium received is recorded and subsequently marked to market to reflect the current value of the option written. These amounts are included on the Statement of Assets and Liabilities. Premiums received from writing options which expire are treated as realized gains. Premiums received from writing options which are exercised or closed are added to the proceeds or offset against amounts paid on the underlying futures, swap, security or currency transaction to determine the realized gain (loss). Certain options may be written with premiums to be determined on a future date. The premiums for these options are based upon implied volatility parameters at specified terms. The Fund as a writer of an option has no control over whether the underlying instrument may be sold (“call”) or purchased (“put”) and as a result bears the market risk of an unfavorable change in the price of the instrument underlying the written option. There is the risk the Fund may not be able to enter into a closing transaction because of an illiquid market.
Purchasing call options tends to increase the Fund’s exposure to the underlying instrument. Purchasing put options tends to decrease the Fund’s exposure to the underlying instrument. The Fund pays a premium which is included as an asset on the Statement of Assets and Liabilities and subsequently marked to market to reflect the current value of the option. Premiums paid for purchasing options which expire are treated as realized losses. Certain options may be purchased with premiums to be determined on a future date. The premiums for these options are based upon
| | | | | | | | | | |
| | | ANNUAL REPORT | | | | JUNE 30, 2022 | | | 73 | |
Notes to Financial Statements (Cont.)
implied volatility parameters at specified terms. The risk associated with purchasing put and call options is limited to the premium paid. Premiums paid for purchasing options which are exercised or closed are added to the amounts paid or offset against the proceeds on the underlying investment transaction to determine the realized gain (loss) when the underlying transaction is executed.
Credit Default Swaptions may be written or purchased to hedge exposure to the credit risk of an investment without making a commitment to the underlying instrument. A credit default swaption is an option to sell or buy credit protection on a specific reference by entering into a pre-defined swap agreement by some specified date in the future.
Foreign Currency Options may be written or purchased to be used as a short or long hedge against possible variations in foreign exchange rates or to gain exposure to foreign currencies.
Interest Rate Swaptions may be written or purchased to enter into a pre-defined swap agreement or to shorten, extend, cancel or otherwise modify an existing swap agreement, by some specified date in the future. The writer of the swaption becomes the counterparty to the swap if the buyer exercises. The interest rate swaption agreement will specify whether the buyer of the swaption will be a fixed-rate receiver or a fixed-rate payer upon exercise.
Options on Exchange-Traded Futures Contracts (“Futures Option”) may be written or purchased to hedge an existing position or future investment, for speculative purposes or to manage exposure to market movements. A Futures Option is an option contract in which the underlying instrument is a single futures contract.
Options on Securities may be written or purchased to enhance returns or to hedge an existing position or future investment. An option on a security uses a specified security as the underlying instrument for the option contract.
(d) Swap Agreements are bilaterally negotiated agreements between the Fund and a counterparty to exchange or swap investment cash flows, assets, foreign currencies or market-linked returns at specified, future intervals. Swap agreements may be privately negotiated in the over the counter market (“OTC swaps”) or may be cleared through a third party, known as a central counterparty or derivatives clearing organization (“Centrally Cleared Swaps”). The Fund may enter into asset, credit default, cross-currency, interest rate, total return, variance and other forms of swap agreements to manage its exposure to credit, currency, interest rate, commodity, equity and inflation risk. In connection with these agreements, securities or cash may be identified as collateral or margin in accordance with the terms of the respective swap agreements to provide assets of value and recourse in the event of default or bankruptcy/insolvency.
Centrally Cleared Swaps are marked to market daily based upon valuations as determined from the underlying contract or in accordance with the requirements of the central counterparty or derivatives clearing organization. Changes in market value, if any, are reflected as a component of net change in unrealized appreciation (depreciation) on the Statement of Operations. Daily changes in valuation of centrally cleared swaps (“Swap Variation Margin”), if any, are disclosed within centrally cleared financial derivative instruments on the Statement of Assets and Liabilities. Centrally Cleared and OTC swap payments received or paid at the beginning of the measurement period are included on the
June 30, 2022
Statement of Assets and Liabilities and represent premiums paid or received upon entering into the swap agreement to compensate for differences between the stated terms of the swap agreement and prevailing market conditions (credit spreads, currency exchange rates, interest rates, and other relevant factors). Upfront premiums received (paid) are initially recorded as liabilities (assets) and subsequently marked to market to reflect the current value of the swap. These upfront premiums are recorded as realized gain (loss) on the Statement of Operations upon termination or maturity of the swap. A liquidation payment received or made at the termination of the swap is recorded as realized gain (loss) on the Statement of Operations. Net periodic payments received or paid by the Fund are included as part of realized gain (loss) on the Statement of Operations.
For purposes of applying certain of the Fund’s investment policies and restrictions, swap agreements, like other derivative instruments, may be valued by the Fund at market value, notional value or full exposure value. In the case of a credit default swap, in applying certain of the Fund’s investment policies and restrictions, the Fund will value the credit default swap at its notional value or its full exposure value (i.e., the sum of the notional amount for the contract plus the market value), but may value the credit default swap at market value for purposes of applying certain of the Fund’s other investment policies and restrictions. For example, the Fund may value credit default swaps at full exposure value for purposes of the Fund’s credit quality guidelines (if any) because such value in general better reflects the Fund’s actual economic exposure during the term of the credit default swap agreement. As a result, the Fund may, at times, have notional exposure to an asset class (before netting) that is greater or lesser than the stated limit or restriction noted in the Fund’s prospectus. In this context, both the notional amount and the market value may be positive or negative depending on whether the Fund is selling or buying protection through the credit default swap. The manner in which certain securities or other instruments are valued by the Fund for purposes of applying investment policies and restrictions may differ from the manner in which those investments are valued by other types of investors.
Entering into swap agreements involves, to varying degrees, elements of interest, credit, market and documentation risk in excess of the amounts recognized on the Statement of Assets and Liabilities. Such risks involve the possibility that there will be no liquid market for these agreements, that the counterparty to the agreements may default on its obligation to perform or disagree as to the meaning of contractual terms in the agreements and that there may be unfavorable changes in interest rates or the values of the asset upon which the swap is based.
The Fund’s maximum risk of loss from counterparty credit risk is the discounted net value of the cash flows to be received from the counterparty over the contract’s remaining life, to the extent that amount is positive. The risk may be mitigated by having a master netting arrangement between the Fund and the counterparty and by the posting of collateral to the Fund to cover the Fund’s exposure to the counterparty.
To the extent the Fund has a policy to limit the net amount owed to or to be received from a single counterparty under existing swap agreements, such limitation only applies to counterparties to OTC swaps and does not apply to centrally cleared swaps where the counterparty is a central counterparty or derivatives clearing organization.
| | | | | | | | | | |
| | | ANNUAL REPORT | | | | JUNE 30, 2022 | | | 75 | |
Notes to Financial Statements (Cont.)
Credit Default Swap Agreements on corporate, loan, sovereign, U.S. municipal or U.S. Treasury issues are entered into to provide a measure of protection against defaults of the issuers (i.e., to reduce risk where the Fund owns or has exposure to the referenced obligation) or to take an active long or short position with respect to the likelihood of a particular issuer’s default. Credit default swap agreements involve one party making a stream of payments (referred to as the buyer of protection) to another party (the seller of protection) in exchange for the right to receive a specified return in the event that the referenced entity, obligation or index, as specified in the swap agreement, undergoes a certain credit event. As a seller of protection on credit default swap agreements, the Fund will generally receive from the buyer of protection a fixed rate of income throughout the term of the swap provided that there is no credit event. As the seller, the Fund would effectively add leverage to its portfolio because, in addition to its total net assets, the Fund would be subject to investment exposure on the notional amount of the swap.
If the Fund is a seller of protection and a credit event occurs, as defined under the terms of that particular swap agreement, the Fund will either (i) pay to the buyer of protection an amount equal to the notional amount of the swap and take delivery of the referenced obligation or underlying securities comprising the referenced index or (ii) pay a net settlement amount in the form of cash, securities or other deliverable obligations equal to the notional amount of the swap less the recovery value of the referenced obligation or underlying securities comprising the referenced index. If the Fund is a buyer of protection and a credit event occurs, as defined under the terms of that particular swap agreement, the Fund will either (i) receive from the seller of protection an amount equal to the notional amount of the swap and deliver the referenced obligation, other deliverable obligations or underlying securities comprising the referenced index or (ii) receive a net settlement amount in the form of cash or securities equal to the notional amount of the swap less the recovery value of the referenced obligation or underlying securities comprising the referenced index. Recovery values are estimated by market makers considering either industry standard recovery rates or entity specific factors and considerations until a credit event occurs. If a credit event has occurred, the recovery value is determined by a facilitated auction whereby a minimum number of allowable broker bids, together with a specified valuation method, are used to calculate the settlement value. The ability to deliver other obligations may result in a cheapest-to-deliver option (the buyer of protection’s right to choose the deliverable obligation with the lowest value following a credit event).
Credit default swap agreements on credit indices involve one party making a stream of payments to another party in exchange for the right to receive a specified return in the event of a write-down, principal shortfall, interest shortfall or default of all or part of the referenced entities comprising the credit index. A credit index is a basket of credit instruments or exposures designed to be representative of some part of the credit market as a whole. These indices are made up of reference credits that are judged by a poll of dealers to be the most liquid entities in the credit default swap market based on the sector of the index. Components of the indices may include, but are not limited to, investment grade securities, high yield securities, asset-backed securities, emerging markets, and/or various credit ratings within each sector. Credit indices are traded using credit default swaps with standardized terms including a fixed spread and standard maturity dates. An index credit default swap references all the names in the index, and if there is a default, the credit event is settled based on that name’s weight in the index. The composition of the indices changes periodically, usually every six months, and for most indices, each name has an equal weight in the index. Credit default swaps on credit indices may be used to hedge a portfolio of credit default swaps or bonds, which is
June 30, 2022
less expensive than it would be to buy many credit default swaps to achieve a similar effect. Credit default swaps on indices are instruments for protecting investors owning bonds against default, and traders use them to speculate on changes in credit quality.
Implied credit spreads, represented in absolute terms, utilized in determining the market value of credit default swap agreements on corporate, loan, sovereign, U.S. municipal or U.S. Treasury issues as of period end, if any, are disclosed in the Notes to Schedule of Investments. They serve as an indicator of the current status of payment/performance risk and represent the likelihood or risk of default for the reference entity. The implied credit spread of a particular referenced entity reflects the cost of buying/selling protection and may include upfront payments required to be made to enter into the agreement. Wider credit spreads represent a deterioration of the referenced entity’s credit soundness and a greater likelihood or risk of default or other credit event occurring as defined under the terms of the agreement. For credit default swap agreements on asset-backed securities and credit indices, the quoted market prices and resulting values serve as the indicator of the current status of the payment/performance risk. Increasing market values, in absolute terms when compared to the notional amount of the swap, represent a deterioration of the referenced entity’s credit soundness and a greater likelihood or risk of default or other credit event occurring as defined under the terms of the agreement.
The maximum potential amount of future payments (undiscounted) that the Fund as a seller of protection could be required to make under a credit default swap agreement equals the notional amount of the agreement. Notional amounts of each individual credit default swap agreement outstanding as of period end for which the Fund is the seller of protection are disclosed in the Notes to Schedule of Investments. These potential amounts would be partially offset by any recovery values of the respective referenced obligations, upfront payments received upon entering into the agreement, or net amounts received from the settlement of buy protection credit default swap agreements entered into by the Fund for the same referenced entity or entities.
Interest Rate Swap Agreements may be entered into to help hedge against interest rate risk exposure and to maintain the Fund’s ability to generate income at prevailing market rates. The value of the fixed rate bonds that the Fund holds may decrease if interest rates rise. To help hedge against this risk and to maintain its ability to generate income at prevailing market rates, the Fund may enter into interest rate swap agreements. Interest rate swap agreements involve the exchange by the Fund with another party for their respective commitment to pay or receive interest on the notional amount of principal. Certain forms of interest rate swap agreements may include: (i) interest rate caps, under which, in return for a premium, one party agrees to make payments to the other to the extent that interest rates exceed a specified rate, or ‘cap,’ (ii) interest rate floors, under which, in return for a premium, one party agrees to make payments to the other to the extent that interest rates fall below a specified rate, or ‘floor,’ (iii) interest rate collars, under which a party sells a cap and purchases a floor or vice versa in an attempt to protect itself against interest rate movements exceeding given minimum or maximum levels, (iv) callable interest rate swaps, under which the buyer pays an upfront fee in consideration for the right to early terminate the swap transaction in whole, at zero cost and at a predetermined date and time prior to the maturity date, (v) spreadlocks, which allow the interest rate swap users to lock in the forward differential (or spread) between the interest rate swap rate and a specified benchmark, or (vi) basis swaps, under which two parties can exchange variable interest rates based on different segments of money markets.
| | | | | | | | | | |
| | | ANNUAL REPORT | | | | JUNE 30, 2022 | | | 77 | |
Notes to Financial Statements (Cont.)
Total Return Swap Agreements are entered into to gain or mitigate exposure to the underlying reference asset. Total return swap agreements involve commitments where single or multiple cash flows are exchanged based on the price of an underlying reference asset and on a fixed or variable interest rate. Total return swap agreements may involve commitments to pay interest in exchange for a market-linked return. One counterparty pays out the total return of a specific underlying reference asset, which may include a single security, a basket of securities, or an index, and in return receives a fixed or variable rate. At the maturity date, a net cash flow is exchanged where the total return is equivalent to the return of the underlying reference asset less a financing rate, if any. As a receiver, the Fund would receive payments based on any net positive total return and would owe payments in the event of a net negative total return. As the payer, the Fund would owe payments on any net positive total return, and would receive payments in the event of a net negative total return.
7. PRINCIPAL AND OTHER RISKS
(a) Principal Risks
The principal risks of investing in the Fund, which could adversely affect its net asset value, yield and total return, are listed below. Please see “Description of Principal Risks” in the Fund’s prospectus for a more detailed description of the risks of investing in the Fund.
Allocation Risk is the risk that the Fund could lose money as a result of less than optimal or poor asset allocation decisions. The Fund could miss attractive investment opportunities by underweighting markets that subsequently experience significant returns and could lose value by overweighting markets that subsequently experience significant declines.
Acquired Fund Risk is the risk that the Fund’s performance is closely related to the risks associated with the securities and other investments held by the Acquired Funds and that the ability of the Fund to achieve its investment objective will depend upon the ability of the Acquired Funds to achieve their investment objectives.
Equity Risk is the risk that the value of equity securities, such as common stocks and preferred securities, may decline due to general market conditions which are not specifically related to a particular company or to factors affecting a particular industry or industries. Equity securities generally have greater price volatility than fixed income securities.
Dividend-Oriented Stocks Risk is the risk that companies that have paid regular dividends to shareholders may decrease or eliminate dividend payments in the future. A decrease in dividend payments by an issuer may result in a decrease in the value of the security held by the Fund or the Fund receiving less income. In addition, equity securities with higher dividend yields may be sensitive to changes in interest rates, and as interest rates rise, the prices of such securities may fall. The Fund’s use of a dividend capture strategy (i.e., purchasing an equity security shortly before the issuer pays a dividend and selling it shortly thereafter) exposes the Fund to higher portfolio turnover, increased trading costs, the potential for capital loss, particularly in the event of significant short-term price movements of stocks subject to dividend capture trading and may result in negative tax consequences.
June 30, 2022
Value Investing Risk is the risk that a value stock may decrease in price or may not increase in price as anticipated by PIMCO if it continues to be undervalued by the market or the factors that the portfolio manager believes will cause the stock price to increase do not occur.
Foreign (Non-U.S.) Investment Risk is the risk that investing in foreign (non-U.S.) securities may result in the Fund experiencing more rapid and extreme changes in value than a fund that invests exclusively in securities of U.S. companies, due to smaller markets, differing reporting, accounting and auditing standards, increased risk of delayed settlement of portfolio transactions or loss of certificates of portfolio securities, and the risk of unfavorable foreign government actions, including nationalization, expropriation or confiscatory taxation, currency blockage, or political changes or diplomatic developments. Foreign securities may also be less liquid and more difficult to value than securities of U.S. issuers.
Emerging Markets Risk is the risk of investing in emerging market securities, primarily increased foreign (non-U.S.) investment risk.
Sovereign Debt Risk is the risk that investments in fixed income instruments issued by sovereign entities may decline in value as a result of default or other adverse credit event resulting from an issuer’s inability or unwillingness to make principal or interest payments in a timely fashion.
Market Risk is the risk that the value of securities owned by the Fund may go up or down, sometimes rapidly or unpredictably, due to factors affecting securities markets generally or particular industries.
Issuer Risk is the risk that the value of a security may decline for a reason directly related to the issuer, such as management performance, financial leverage and reduced demand for the issuer’s goods or services.
Interest Rate Risk is the risk that fixed income securities and dividend-paying equity securities will decline in value because of an increase in interest rates; a fund with a longer average portfolio duration will be more sensitive to changes in interest rates than a fund with a shorter average portfolio duration.
Call Risk is the risk that an issuer may exercise its right to redeem a fixed income security earlier than expected (a call). Issuers may call outstanding securities prior to their maturity for a number of reasons (e.g., declining interest rates, changes in credit spreads and improvements in the issuer’s credit quality). If an issuer calls a security that the Fund has invested in, the Fund may not recoup the full amount of its initial investment and may be forced to reinvest in lower-yielding securities, securities with greater credit risks or securities with other, less favorable features.
Credit Risk is the risk that the Fund could lose money if the issuer or guarantor of a fixed income security, or the counterparty to a derivative contract, is unable or unwilling, or is perceived (whether by market participants, rating agencies, pricing services or otherwise) as unable or unwilling, to meet its financial obligations.
High Yield and Distressed Company Risk is the risk that high yield securities and unrated securities of similar credit quality (commonly known as “junk bonds”) and securities of distressed companies
| | | | | | | | | | |
| | | ANNUAL REPORT | | | | JUNE 30, 2022 | | | 79 | |
Notes to Financial Statements (Cont.)
may be subject to greater levels of credit, issuer and liquidity risks. Securities of distressed companies include both debt and equity securities. High yield securities and debt securities of distressed companies are considered primarily speculative with respect to the issuer’s continuing ability to make principal and interest payments. Distressed companies may be engaged in restructurings or bankruptcy proceedings.
Currency Risk is the risk that foreign (non-U.S.) currencies will change in value relative to the U.S. dollar and affect the Fund’s investments in foreign (non-U.S.) currencies or in securities that trade in, and receive revenues in, or in derivatives that provide exposure to, foreign (non-U.S.) currencies.
Real Estate Risk is the risk that the Fund’s investments in Real Estate Investment Trusts (“REITs”) or real estate-linked derivative instruments will subject the Fund to risks similar to those associated with direct ownership of real estate, including losses from casualty or condemnation, and changes in local and general economic conditions, supply and demand, interest rates, zoning laws, regulatory limitations on rents, property taxes and operating expenses. The Fund’s investments in REITs or real estate-linked derivative instruments subject it to management and tax risks. In addition, privately traded REITs subject the Fund to liquidity and valuation risk.
Liquidity Risk is the risk that a particular investment may be difficult to purchase or sell and that the Fund may be unable to sell illiquid investments at an advantageous time or price or achieve its desired level of exposure to a certain sector.
Leveraging Risk is the risk that certain transactions of the Fund, such as reverse repurchase agreements, loans of portfolio securities, and the use of when-issued, delayed delivery or forward commitment transactions, or derivative instruments, may give rise to leverage, magnifying gains and losses and causing the Fund to be more volatile than if it had not been leveraged. This means that leverage entails a heightened risk of loss.
Management Risk is the risk that the investment techniques and risk analyses applied by PIMCO, including the use of quantitative models or methods, will not produce the desired results and that actual or potential conflicts of interest, legislative, regulatory, or tax restrictions, policies or developments may affect the investment techniques available to PIMCO and the individual portfolio managers in connection with managing the Fund and may cause PIMCO to restrict or prohibit participation in certain investments. There is no guarantee that the investment objective of the Fund will be achieved.
Small-Cap and Mid-Cap Company Risk is the risk that the value of securities issued by small-capitalization and mid-capitalization companies may go up or down, sometimes rapidly and unpredictably, due to narrow markets and limited managerial and financial resources.
Derivatives Risk is the risk of investing in derivative instruments (such as futures, swaps and structured securities), including leverage, liquidity, interest rate, market, credit and management risks and valuation complexity. Changes in the value of a derivative may not correlate perfectly with, and may be more sensitive to market events than, the underlying asset, rate or index, and the Fund could lose more than the initial amount invested. The Fund’s use of derivatives may result in losses to the Fund, a reduction in the Fund’s returns and/or increased volatility. Over-the-counter (“OTC”)
June 30, 2022
derivatives are also subject to the risk that a counterparty to the transaction will not fulfill its contractual obligations to the other party, as many of the protections afforded to centrally-cleared derivative transactions might not be available for OTC derivatives. The primary credit risk on derivatives that are exchange-traded or traded through a central clearing counterparty resides with the Fund’s clearing broker, or the clearinghouse. Changes in regulation relating to a mutual fund’s use of derivatives and related instruments could potentially limit or impact the Fund’s ability to invest in derivatives, limit the Fund’s ability to employ certain strategies that use derivatives and/or adversely affect the value of derivatives and the Fund’s performance.
Model Risk is the risk that the Fund’s investment models used in making investment allocation decisions may not adequately take into account certain factors or may rely on inaccurate data inputs, may contain design flaws or faulty assumptions, and may rely on incomplete or inaccurate data, any of which may result in a decline in the value of an investment in the Fund.
Mortgage-Related and Other Asset-Backed Securities Risk is the risk of investing in mortgage-related and other asset-backed securities, including interest rate risk, extension risk, prepayment risk and credit risk.
Short Exposure Risk is the risk of entering into short sales, including the potential loss of more money than the actual cost of the investment, and the risk that the third party to the short sale will not fulfill its contractual obligations, causing a loss to the Fund.
Exchange-Traded Fund Risk is the risk that an exchange-traded fund may not track the performance of the index it is designed to track, among other reasons, because of exchange rules, market prices of shares of an exchange-traded fund may fluctuate rapidly and materially, or shares of an exchange-traded fund may trade significantly above or below net asset value, any of which may cause losses to the Fund invested in the exchange-traded fund.
Tracking Error Risk is the risk that the portfolio of a Fund that seeks to track the investment results of an underlying index may not closely track the underlying index for a number of reasons. The Fund incurs operating expenses, which are not applicable to the underlying index, and the costs of buying and selling securities, especially when rebalancing the Fund’s portfolio to reflect changes in the composition of the underlying index. Performance of the Fund and the underlying index may vary due to asset valuation differences and differences between the Fund’s portfolio and the underlying index due to legal restrictions, cost or liquidity restraints. The risk that performance of the Fund and the underlying index may vary may be heightened during periods of increased market volatility or other unusual market conditions. In addition, a Fund’s use of a representative sampling approach may cause the Fund to be less correlated to the return of the underlying index than if the Fund held all of the securities in the underlying index.
Indexing Risk is the risk that an Underlying PIMCO Fund that seeks to track the investment results of an underlying index is negatively affected by general declines in the asset classes represented by the underlying index.
LIBOR Transition Risk is the risk related to the anticipated discontinuation of the London Interbank Offered Rate (“LIBOR”). Certain instruments held by the Fund rely in some fashion upon LIBOR.
| | | | | | | | | | |
| | | ANNUAL REPORT | | | | JUNE 30, 2022 | | | 81 | |
Notes to Financial Statements (Cont.)
Although the transition process away from LIBOR has become increasingly well-defined in advance of the anticipated discontinuation date, there remains uncertainty regarding the nature of any replacement rate, and any potential effects of the transition away from LIBOR on the Fund or on certain instruments in which the Fund invests can be difficult to ascertain. The transition process may involve, among other things, increased volatility or illiquidity in markets for instruments that currently rely on LIBOR and may result in a reduction in value of certain instruments held by the Fund.
(b) Other Risks
In general, the Fund may be subject to additional risks, including, but not limited to, risks related to government regulation and intervention in financial markets, operational risks, risks associated with financial, economic and global market disruptions, and cybersecurity risks. Please see the Fund’s prospectus and Statement of Additional Information for a more detailed description of the risks of investing in the Fund. Please see the Important Information section of this report for additional discussion of certain regulatory and market developments that may impact the Fund’s performance.
Market Disruption Risk The Fund is subject to investment and operational risks associated with financial, economic and other global market developments and disruptions, including those arising from war, terrorism, market manipulation, government interventions, defaults and shutdowns, political changes or diplomatic developments, public health emergencies (such as the spread of infectious diseases, pandemics and epidemics) and natural/environmental disasters, which can all negatively impact the securities markets and cause the Fund to lose value. These events can also impair the technology and other operational systems upon which the Fund’s service providers, including PIMCO as the Fund’s investment adviser, rely, and could otherwise disrupt the Fund’s service providers’ ability to fulfill their obligations to the Fund. For example, the recent spread of an infectious respiratory illness caused by a novel strain of coronavirus (known as COVID-19) has caused volatility, severe market dislocations and liquidity constraints in many markets, including markets for the securities the Fund holds, and may adversely affect the Fund’s investments and operations. Please see the Important Information section for additional discussion of the COVID-19 pandemic.
Government Intervention in Financial Markets Federal, state, and other governments, their regulatory agencies, or self-regulatory organizations may take actions that affect the regulation of the instruments in which the Fund invests, or the issuers of such instruments, in ways that are unforeseeable. Legislation or regulation may also change the way in which the Fund itself is regulated. Such legislation or regulation could limit or preclude the Fund’s ability to achieve its investment objective. Furthermore, volatile financial markets can expose the Fund to greater market and liquidity risk and potential difficulty in valuing portfolio instruments held by the Fund. The value of the Fund’s holdings is also generally subject to the risk of future local, national, or global economic disturbances based on unknown weaknesses in the markets in which the Fund invests. In addition, it is not certain that the U.S. Government will intervene in response to a future market disturbance and the effect of any such future intervention cannot be predicted. It is difficult for issuers to prepare for the impact of future financial downturns, although companies can seek to identify and manage future uncertainties through risk management programs.
Regulatory Risk Financial entities, such as investment companies and investment advisers, are generally subject to extensive government regulation and intervention. Government regulation and/or intervention may change the way the Fund is regulated, affect the expenses incurred directly by the
June 30, 2022
Fund and the value of its investments, and limit and/or preclude the Fund’s ability to achieve its investment objective. Government regulation may change frequently and may have significant adverse consequences. Moreover, government regulation may have unpredictable and unintended effects.
Operational Risk An investment in the Fund, like any fund, can involve operational risks arising from factors such as processing errors, human errors, inadequate or failed internal or external processes, failures in systems and technology, changes in personnel and errors caused by third-party service providers. The occurrence of any of these failures, errors or breaches could result in a loss of information, regulatory scrutiny, reputational damage or other events, any of which could have a material adverse effect on the Fund. While the Fund seeks to minimize such events through controls and oversight, there may still be failures that could cause losses to the Fund.
Cyber Security Risk As the use of technology has become more prevalent in the course of business, the Fund has become potentially more susceptible to operational and information security risks resulting from breaches in cyber security. A breach in cyber security refers to both intentional and unintentional cyber events that may, among other things, cause the Fund to lose proprietary information, suffer data corruption and/or destruction or lose operational capacity, result in the unauthorized release or other misuse of confidential information, or otherwise disrupt normal business operations. Cyber security failures or breaches may result in financial losses to the Fund and its shareholders. These failures or breaches may also result in disruptions to business operations, potentially resulting in financial losses; interference with the Fund’s ability to calculate its net asset value, process shareholder transactions or otherwise transact business with shareholders; impediments to trading; violations of applicable privacy and other laws; regulatory fines; penalties; reputational damage; reimbursement or other compensation costs; additional compliance and cyber security risk management costs and other adverse consequences. In addition, substantial costs may be incurred in order to prevent any cyber incidents in the future.
8. MASTER NETTING ARRANGEMENTS
The Fund may be subject to various netting arrangements (“Master Agreements”) with select counterparties. Master Agreements govern the terms of certain transactions, and are intended to reduce the counterparty risk associated with relevant transactions by specifying credit protection mechanisms and providing standardization that is intended to improve legal certainty. Each type of Master Agreement governs certain types of transactions. Different types of transactions may be traded out of different legal entities or affiliates of a particular organization, resulting in the need for multiple agreements with a single counterparty. As the Master Agreements are specific to unique operations of different asset types, they allow the Fund to close out and net its total exposure to a counterparty in the event of a default with respect to all the transactions governed under a single Master Agreement with a counterparty. For financial reporting purposes the Statement of Assets and Liabilities generally presents derivative assets and liabilities on a gross basis, which reflects the full risks and exposures prior to netting.
Master Agreements can also help limit counterparty risk by specifying collateral posting arrangements at pre-arranged exposure levels. Under most Master Agreements, collateral is routinely transferred if the total net exposure to certain transactions (net of existing collateral already in place) governed under the relevant Master Agreement with a counterparty in a given account exceeds a specified
| | | | | | | | | | |
| | | ANNUAL REPORT | | | | JUNE 30, 2022 | | | 83 | |
Notes to Financial Statements (Cont.)
threshold, which typically ranges from zero to $250,000 depending on the counterparty and the type of Master Agreement. United States Treasury Bills and U.S. dollar cash are generally the preferred forms of collateral, although other securities may be used depending on the terms outlined in the applicable Master Agreement. Securities and cash pledged as collateral are reflected as assets on the Statement of Assets and Liabilities as either a component of Investments at value (securities) or Deposits with counterparty. Cash collateral received is not typically held in a segregated account and as such is reflected as a liability on the Statement of Assets and Liabilities as Deposits from counterparty. The market value of any securities received as collateral is not reflected as a component of NAV. The Fund’s overall exposure to counterparty risk can change substantially within a short period, as it is affected by each transaction subject to the relevant Master Agreement.
Master Repurchase Agreements and Global Master Repurchase Agreements (individually and collectively “Master Repo Agreements”) govern repurchase, reverse repurchase, and certain sale-buyback transactions between the Fund and select counterparties. Master Repo Agreements maintain provisions for, among other things, initiation, income payments, events of default, and maintenance of collateral. The market value of transactions under the Master Repo Agreement, collateral pledged or received, and the net exposure by counterparty as of period end are disclosed in the Notes to Schedule of Investments.
Master Securities Forward Transaction Agreements (“Master Forward Agreements”) govern certain forward settling transactions, such as TBA securities, delayed-delivery or certain sale-buyback transactions by and between the Fund and select counterparties. The Master Forward Agreements maintain provisions for, among other things, transaction initiation and confirmation, payment and transfer, events of default, termination, and maintenance of collateral. The market value of forward settling transactions, collateral pledged or received, and the net exposure by counterparty as of period end is disclosed in the Notes to Schedule of Investments.
Customer Account Agreements and related addenda govern cleared derivatives transactions such as futures, options on futures, and cleared OTC derivatives. Such transactions require posting of initial margin as determined by each relevant clearing agency which is segregated in an account at a futures commission merchant (“FCM”) registered with the Commodity Futures Trading Commission. In the United States, counterparty risk may be reduced as creditors of an FCM cannot have a claim to Fund assets in the segregated account. Portability of exposure reduces risk to the Fund. Variation margin, which reflects changes in market value, is generally exchanged daily, but may not be netted between futures and cleared OTC derivatives unless the parties have agreed to a separate arrangement in respect of portfolio margining. The market value or accumulated unrealized appreciation (depreciation), initial margin posted, and any unsettled variation margin as of period end are disclosed in the Notes to Schedule of Investments.
Prime Broker Arrangements may be entered into to facilitate execution and/or clearing of listed equity option transactions or short sales of equity securities between the Fund and selected counterparties. The arrangements provide guidelines surrounding the rights, obligations, and other events, including, but not limited to, margin, execution, and settlement. These agreements maintain provisions for, among other things, payments, maintenance of collateral, events of default, and termination. Margin and other assets delivered as collateral are typically in the
June 30, 2022
possession of the prime broker and would offset any obligations due to the prime broker. The market values of listed options and securities sold short and related collateral are disclosed in the Notes to Schedule of Investments.
International Swaps and Derivatives Association, Inc. Master Agreements and Credit Support Annexes (“ISDA Master Agreements”) govern bilateral OTC derivative transactions entered into by the Fund with select counterparties. ISDA Master Agreements maintain provisions for general obligations, representations, agreements, collateral posting and events of default or termination. Events of termination include conditions that may entitle counterparties to elect to terminate early and cause settlement of all outstanding transactions under the applicable ISDA Master Agreement. Any election to terminate early could be material to the financial statements. The ISDA Master Agreement may contain additional provisions that add counterparty protection beyond coverage of existing daily exposure if the counterparty has a decline in credit quality below a predefined level or as required by regulation. Similarly, if required by regulation, the Fund may be required to post additional collateral beyond coverage of daily exposure. These amounts, if any, may (or if required by law, will) be segregated with a third-party custodian. To the extent the Fund is required by regulation to post additional collateral beyond coverage of daily exposure, it could potentially incur costs, including in procuring eligible assets to meet collateral requirements, associated with such posting. The market value of OTC financial derivative instruments, collateral received or pledged, and net exposure by counterparty as of period end are disclosed in the Notes to Schedule of Investments.
9. FEES AND EXPENSES
(a) Investment Advisory Fee PIMCO is a majority-owned subsidiary of Allianz Asset Management of America L.P. (“Allianz Asset Management”) and serves as the Adviser to the Trust, pursuant to an investment advisory contract. The Adviser receives a monthly fee from the Fund at an annual rate based on average daily net assets (the “Investment Advisory Fee”). The Investment Advisory Fee for all classes is charged at an annual rate as noted in the table in note (b) below.
(b) Supervisory and Administrative Fee PIMCO serves as administrator (the “Administrator”) and provides supervisory and administrative services to the Trust for which it receives a monthly supervisory and administrative fee based on each share class’s average daily net assets (the “Supervisory and Administrative Fee”). As the Administrator, PIMCO bears the costs of various third-party services, including audit, custodial, portfolio accounting, legal, transfer agency and printing costs.
The Investment Advisory Fee and Supervisory and Administrative Fees for all classes, as applicable, are charged at the annual rate as noted in the following table (calculated as a percentage of the Fund’s average daily net assets attributable to each class):
| | | | | | | | | | | | |
| Investment Advisory Fee(1) | | | | Supervisory and Administrative Fee(2) |
| | | | | | |
| All Classes | | | | Institutional Class | | I-2 | | I-3 | | Class A | | Class C |
| | | | | | |
| 0.44% | | | | 0.25% | | 0.35% | | 0.45%*(3) | | 0.35% | | 0.35% |
| (1) | Effective November 1, 2021, the Fund’s investment advisory fee was reduced by 0.01%. |
| (2) | Effective November 1, 2021, the Fund’s supervisory and administrative fee was reduced by 0.05% for each class. |
| (3) | PIMCO has contractually agreed, through October 31, 2022, to waive its supervisory and administrative fee for I-3 shares by 0.05% of the average daily net assets attributable to I-3 shares of the Fund. |
| * | This particular share class has been registered with the SEC, but has not yet launched. |
| | | | | | | | | | |
| | | ANNUAL REPORT | | | | JUNE 30, 2022 | | | 85 | |
Notes to Financial Statements (Cont.)
(c) Distribution and Servicing Fees PIMCO Investments LLC, a wholly-owned subsidiary of PIMCO, serves as the distributor (“Distributor”) of the Trust’s shares.
The Trust has adopted separate Distribution and Servicing Plans with respect to the Class A and Class C shares of the Trust pursuant to Rule 12b-1 under the Act. In connection with the distribution of Class C shares of the Trust, the Distributor receives distribution fees from the Trust of up to 0.75% for Class C shares, and in connection with personal services rendered to Class A and Class C shareholders and the maintenance of such shareholder accounts, the Distributor receives servicing fees from the Trust of up to 0.25% for each of Class A and Class C shares (percentages reflect annual rates of the average daily net assets attributable to the applicable class).
The Trust paid distribution and servicing fees at effective rates as noted in the following table (calculated as a percentage of the Fund’s average daily net assets attributable to each class):
| | | | | | | | | | | | |
| | | | | | Distribution Fee | | | Servicing Fee | |
| | | |
Class A | | | | | | | — | | | | 0.25% | |
| | | |
Class C | | | | | | | 0.75% | | | | 0.25% | |
The Distributor also received the proceeds of the initial sales charges paid by the shareholders upon the purchase of Class A shares and the contingent deferred sales charges paid by the shareholders upon certain redemptions of Class A and Class C shares. For the period ended June 30, 2022, the Distributor retained $37,743 representing commissions (sales charges) and contingent deferred sales charges, net of any commission adjustments payable by the Distributor to broker dealers, from the Trust.
(d) Fund Expenses PIMCO provides or procures supervisory and administrative services for shareholders and also bears the costs of various third-party services required by the Fund, including audit, custodial, portfolio accounting, legal, transfer agency and printing costs. The Trust is responsible for the following expenses: (i) salaries and other compensation of any of the Trust’s executive officers and employees who are not officers, directors, stockholders, or employees of PIMCO or its subsidiaries or affiliates; (ii) taxes and governmental fees; (iii) brokerage fees and commissions and other portfolio transaction expenses; (iv) the costs of borrowing money, including interest expenses; (v) fees and expenses of the Trustees who are not “interested persons” of PIMCO or the Trust, and any counsel retained exclusively for their benefit; (vi) extraordinary expenses, including costs of litigation and indemnification expenses; (vii) organizational expenses; and (viii) any expenses allocated or allocable to a specific class of shares, and may include certain other expenses as permitted by the Trust’s Multi-Class Plan adopted pursuant to Rule 18f-3 under the Act and subject to review and approval by the Trustees. The ratio of expenses to average net assets per share class, as disclosed on the Financial Highlights, may differ from the annual fund operating expenses per share class.
The Trust pays no compensation directly to any Trustee or any other officer who is affiliated with the Administrator, all of whom receive remuneration for their services to the Trust from the Administrator or its affiliates.
(e) Expense Limitation Pursuant to the Expense Limitation Agreement, PIMCO has agreed, through October 31, 2022, to waive a portion of the Fund’s Supervisory and Administrative Fee, or reimburse
June 30, 2022
the Fund, to the extent that the Fund’s organizational expenses, pro rata share of expenses related to obtaining or maintaining a Legal Entity Identifier and pro rata share of Trustee Fees exceed 0.0049%, the “Expense Limit” (calculated as a percentage of the Fund’s average daily net assets attributable to each class). The Expense Limitation Agreement will automatically renew for one-year terms unless PIMCO provides written notice to the Trust at least 30 days prior to the end of the then current term.
In any month in which the investment advisory contract or supervision and administration agreement is in effect, PIMCO is entitled to reimbursement by the Fund of any portion of the supervisory and administrative fee waived or reimbursed as set forth above (the “Reimbursement Amount”) within thirty-six months of the time of the waiver, provided that such amount paid to PIMCO will not: i) together with any organizational expenses, pro rata share of expenses related to obtaining or maintaining a Legal Entity Identifier and pro rata Trustee fees, exceed, for such month, the Expense Limit (or the amount of the expense limit in place at the time the amount being recouped was originally waived if lower than the Expense Limit; ii) exceed the total Reimbursement Amount; or iii) include any amounts previously reimbursed to PIMCO. The total recoverable amounts to PIMCO at June 30, 2022, were as follows (amounts in thousands†):
| | | | | | | | | | | | | | |
| Expiring within | | | | |
| | | |
| 12 months | | | 13-24 months | | | 25-36 months | | | Total | |
| | | |
| $ | 18 | | | $ | 14 | | | $ | 14 | | | $ | 46 | |
| † | A zero balance may reflect actual amounts rounding to less than one thousand. |
Pursuant to a Fee Waiver Agreement, PIMCO has contractually agreed, through October 31, 2022, to waive its supervisory and administrative fee for I-3 shares by 0.05% of the average daily net assets attributable to I-3 shares of the Fund. This Fee Waiver Agreement will automatically renew for one-year terms unless PIMCO provides written notice to the Trust at least 30 days prior to the end of the then current term.
The Waiver is reflected on the Statement of Operations as a component of Waiver and/or Reimbursement by PIMCO. For the period ended June 30, 2022, the amount was $13,525.
(f) Acquired Fund Fees and Expenses Acquired Fund expenses incurred by the Fund, if any, will vary with changes in the expenses of the Acquired Funds, as well as the allocation of the Fund’s assets.
The expenses associated with investing in a fund of funds are generally higher than those for mutual funds that do not invest in other mutual funds. The cost of investing in a fund of funds will generally be higher than the cost of investing in a mutual fund that invests directly in individual stocks and bonds. By investing in a fund of funds, an investor will indirectly bear fees and expenses charged by Acquired Funds in addition to the Fund’s direct fees and expenses. In addition, the use of a fund of funds structure could affect the timing, amount and character of distributions to the shareholders and may therefore increase the amount of taxes payable by shareholders.
PIMCO has contractually agreed, through October 31, 2022, to waive, first, the Investment Advisory Fee and, second, to the extent necessary, the Supervisory and Administrative Fee it receives from the Fund in an amount equal to its proportionate share of the Investment Advisory Fees and Supervisory
| | | | | | | | | | |
| | | ANNUAL REPORT | | | | JUNE 30, 2022 | | | 87 | |
Notes to Financial Statements (Cont.)
and Administrative Fees charged by PIMCO to the Underlying Funds in which the Fund invests (the “Underlying Fund Fees”) indirectly incurred by the Fund in connection with its investments in Underlying Funds, to the extent the Fund’s Investment Advisory Fee or Investment Advisory Fee and Supervisory and Administrative Fee, taken together, are greater than or equal to the Underlying Fund Fees. This waiver will automatically renew for one-year terms unless PIMCO provides written notice to the Trust at least 30 days prior to the end of the then current term.
The waivers are reflected on the Statement of Operations as a component of Waiver and/or Reimbursement by PIMCO. For the period ended June 30, 2022, there were no waived amounts.
10. RELATED PARTY TRANSACTIONS
The Adviser, Administrator, and Distributor are related parties. Fees paid to these parties are disclosed in Note 9, Fees and Expenses, and the accrued related party fee amounts are disclosed on the Statement of Assets and Liabilities.
The Fund is permitted to purchase or sell securities from or to certain related affiliated funds under specified conditions outlined in procedures adopted by the Board. The procedures have been designed to ensure that any purchase or sale of securities by the Fund from or to another fund or portfolio that are, or could be, considered an affiliate, or an affiliate of an affiliate, by virtue of having a common investment adviser (or affiliated investment advisers), common Trustees and/or common officers complies with Rule 17a-7 under the Act. Further, as defined under the procedures, each transaction is effected at the current market price. Purchases and sales of securities pursuant to Rule 17a-7 under the Act for the period ended June 30, 2022, were as follows (amounts in thousands†):
| | | | | | |
| Purchases | | | Sales | |
| |
| $ | 14,165 | | | $ | 1,552 | |
| † | A zero balance may reflect actual amounts rounding to less than one thousand. |
11. GUARANTEES AND INDEMNIFICATIONS
Under the Trust’s organizational documents, each Trustee or officer of the Trust is indemnified and each employee or other agent of the Trust (including the Trust’s investment manager) may be indemnified, to the extent permitted by the Act, against certain liabilities that may arise out of performance of their duties to the Fund. Additionally, in the normal course of business, the Fund enters into contracts that contain a variety of indemnification clauses. The Fund’s maximum exposure under these arrangements is unknown as this would involve future claims that may be made against the Fund that have not yet occurred. However, the Fund has not had prior claims or losses pursuant to these contracts.
12. PURCHASES AND SALES OF SECURITIES
The length of time the Fund has held a particular security is not generally a consideration in investment decisions. A change in the securities held by the Fund is known as “portfolio turnover.” The Fund may engage in frequent and active trading of portfolio securities to achieve its investment objective, particularly during periods of volatile market movements. High portfolio turnover may involve correspondingly greater transaction costs, including brokerage commissions or dealer mark-ups and other transaction costs on the sale of securities and reinvestments in other securities, which are borne by the Fund. Such sales may also result in realization of taxable capital gains,
June 30, 2022
including short-term capital gains (which are generally taxed at ordinary income tax rates when distributed to shareholders). The transaction costs associated with portfolio turnover may adversely affect the Fund’s performance. The portfolio turnover rates are reported in the Financial Highlights.
Purchases and sales of securities (excluding short-term investments) for the period ended June 30, 2022, were as follows (amounts in thousands†):
| | | | | | | | | | | | | | |
| U.S. Government/Agency | | | All Other | |
| | | |
| Purchases | | | Sales | | | Purchases | | | Sales | |
| | | |
| $ | 308,201 | | | $ | 298,497 | | | $ | 197,757 | | | $ | 228,960 | |
| | | | | | | | | | | | | | |
| † | A zero balance may reflect actual amounts rounding to less than one thousand. |
13. SHARES OF BENEFICIAL INTEREST
The Trust may issue an unlimited number of shares of beneficial interest with a $0.001 par value. Changes in shares of beneficial interest were as follows (shares and amounts in thousands†):
| | | | | | | | | | | | | | | | | | | | |
| | | | Year Ended
06/30/2022 | | | Year Ended
06/30/2021 | |
| | | | |
| | | | Shares | | | Amount | | | Shares | | | Amount | |
| | | | | |
Receipts for shares sold | | | | | | | | | | | | | | | | | | | | |
| | | | | |
Institutional Class | | | | | | | 705 | | | $ | 8,804 | | | | 1,581 | | | $ | 19,056 | |
| | | | | |
I-2 | | | | | | | 868 | | | | 10,873 | | | | 366 | | | | 4,274 | |
| | | | | |
Class A | | | | | | | 1,504 | | | | 18,602 | | | | 3,455 | | | | 38,735 | |
| | | | | |
Class C | | | | | | | 375 | | | | 4,638 | | | | 201 | | | | 2,395 | |
| | | | | |
Issued as reinvestment of distributions | | | | | | | | | | | | | | | | | | | | |
| | | | | |
Institutional Class | | | | | | | 71 | | | | 892 | | | | 72 | | | | 851 | |
| | | | | |
I-2 | | | | | | | 35 | | | | 436 | | | | 50 | | | | 580 | |
| | | | | |
Class A | | | | | | | 272 | | | | 3,395 | | | | 300 | | | | 3,479 | |
| | | | | |
Class C | | | | | | | 32 | | | | 395 | | | | 73 | | | | 819 | |
| | | | | |
Cost of shares redeemed | | | | | | | | | | | | | | | | | | | | |
| | | | | |
Institutional Class | | | | | | | (2,216 | ) | | | (27,101 | ) | | | (791 | ) | | | (8,873 | ) |
| | | | | |
I-2 | | | | | | | (887 | ) | | | (11,108 | ) | | | (831 | ) | | | (9,223 | ) |
| | | | | |
Class A | | | | | | | (1,892 | ) | | | (23,450 | ) | | | (2,936 | ) | | | (32,388 | ) |
| | | | | |
Class C | | | | | | | (564 | ) | | | (7,015 | ) | | | (3,598 | ) | | | (39,481 | ) |
| | | | | |
Net increase (decrease) resulting from Fund share transactions | | | | | | | (1,697 | ) | | $ | (20,639 | ) | | | (2,058 | ) | | $ | (19,776 | ) |
| † | A zero balance may reflect actual amounts rounding to less than one thousand. |
14. REGULATORY AND LITIGATION MATTERS
The Fund is not named as a defendant in any material litigation or arbitration proceedings and is not aware of any material litigation or claim pending or threatened against it.
On May 17, 2022, Allianz Global Investors U.S. LLC (“AGI U.S.”) pleaded guilty in connection with the proceeding United States of America v. Allianz Global Investors U.S. LLC. AGI U.S. is an indirect subsidiary of Allianz SE. The conduct resulting in the matter described above occurred entirely within AGI U.S. and did not involve PIMCO or the Distributor, or any personnel of PIMCO or the Distributor.
| | | | | | | | | | |
| | | ANNUAL REPORT | | | | JUNE 30, 2022 | | | 89 | |
Notes to Financial Statements (Cont.)
Nevertheless, because of the disqualifying conduct of AGI U.S., their affiliate, PIMCO would have been disqualified from serving as the investment adviser, and the Distributor would have been disqualified from serving as the principal underwriter, to the Fund in the absence of SEC exemptive relief. PIMCO and the Distributor have received exemptive relief from the SEC to permit them to continue serving as investment adviser and principal underwriter for U.S.-registered investment companies, including the Fund.
The foregoing speaks only as of the date of this report.
15. FEDERAL INCOME TAX MATTERS
The Fund intends to qualify as a regulated investment company under Subchapter M of the Internal Revenue Code (the “Code”) and distribute all of its taxable income and net realized gains, if applicable, to shareholders. Accordingly, no provision for Federal income taxes has been made.
The Fund may be subject to local withholding taxes, including those imposed on realized capital gains. Any applicable foreign capital gains tax is accrued daily based upon net unrealized gains, and may be payable following the sale of any applicable investments.
In accordance with U.S. GAAP, the Adviser has reviewed the Fund’s tax positions for all open tax years. As of June 30, 2022, the Fund has recorded no liability for net unrecognized tax benefits relating to uncertain income tax positions it has taken or expects to take in future tax returns.
The Fund files U.S. federal, state, and local tax returns as required. The Fund’s tax returns are subject to examination by relevant tax authorities until expiration of the applicable statute of limitations, which is generally three years after the filing of the tax return but which can be extended to six years in certain circumstances. Tax returns for open years have incorporated no uncertain tax positions that require a provision for income taxes.
As of June 30, 2022, the components of distributable taxable earnings are as follows (amounts in thousands†):
| | | | | | | | | | | | | | | | | | | | | | | | | | | | | | | | | | | | |
| | | | | | Undistributed
Ordinary
Income(1) | | | Undistributed
Long-Term
Capital Gains | | | Net Tax Basis
Unrealized
Appreciation/
(Depreciation)(2) | | | Other
Book-to-Tax
Accounting
Differences(3) | | | Accumulated
Capital
Losses(4) | | | Qualified
Late-Year Loss
Deferral -
Capital(5) | | | Qualified
Late-Year Loss
Deferral -
Ordinary(6) | | | Total
Components
of
Distributable
Earnings | |
| | | | | | | | | |
| PIMCO Dividend and Income Fund | | | | | | $ | 3,023 | | | $ | 0 | | | $ | (9,975 | ) | | $ | (13 | ) | | $ | (86,198 | ) | | $ | 0 | | | $ | 0 | | | $ | (93,163 | ) |
| † | A zero balance may reflect actual amounts rounding to less than one thousand. |
| (1) | Includes undistributed short-term capital gains, if any. |
| (2) | Adjusted for open wash sale loss deferrals and the accelerated recognition of unrealized gain or loss on certain futures, options and forward contracts for federal income tax purposes. Also adjusted for differences between book and tax realized and unrealized gain (loss) on: hyperinflationary investments, swap contracts, straddle loss deferrals, passive foreign investment companies (PFICs) and interest accrued on defaulted securities. |
| (3) | Represents differences in income tax regulations and financial accounting principles generally accepted in the United States of America, mainly for organizational expenditures. |
| (4) | Capital losses available to offset future net capital gains as shown below. |
June 30, 2022
| (5) | Capital losses realized during the period November 1, 2021 through June 30, 2022 which the Fund elected to defer to the following taxable year pursuant to income tax regulations. |
| (6) | Specified losses realized during the period November 1, 2021 through June 30, 2022 and Ordinary losses realized during the period January 1, 2022 through June 30, 2022 which the Fund elected to defer to the following taxable year pursuant to income tax regulations. |
Under the Regulated Investment Company Modernization Act of 2010, a fund is permitted to carry forward any new capital losses for an unlimited period. Additionally, such capital losses that are carried forward will retain their character as either short-term or long-term capital losses rather than being considered all short-term under previous law.
As of June 30, 2022, the Fund had the following post-effective capital losses with no expiration (amounts in thousands†):
| | | | | | | | | | | | |
| | | | | | Short-Term | | | Long-Term | |
| | | |
PIMCO Dividend and Income Fund | | | | | | $ | 63,808 | | | $ | 22,390 | |
| † | A zero balance may reflect actual amounts rounding to less than one thousand. |
As of June 30, 2022, the aggregate cost and the net unrealized appreciation/(depreciation) of investments for federal income tax purposes are as follows (amounts in thousands†):
| | | | | | | | | | | | | | | | | | | | |
| | | | | | Federal Tax
Cost | | | Unrealized
Appreciation | | | Unrealized
(Depreciation) | | | Net Unrealized
Appreciation/
(Depreciation)(7) | |
| | | | | |
| PIMCO Dividend and Income Fund | | | | | | $ | 189,688 | | | $ | 12,268 | | | $ | (22,240 | ) | | $ | (9,972 | ) |
| † | A zero balance may reflect actual amounts rounding to less than one thousand. |
| (7) | Adjusted for open wash sale loss deferrals and the accelerated recognition of unrealized gain or loss on certain futures, options and forward contracts for federal income tax purposes. Also adjusted for differences between book and tax realized and unrealized gain (loss) on: hyperinflationary investments, swap contracts, straddle loss deferrals, passive foreign investment companies (PFICs) and interest accrued on defaulted securities. |
For the fiscal years ended June 30, 2022 and June 30, 2021, respectively, the Fund made the following tax basis distributions (amounts in thousands†):
| | | | | | | | | | | | | | | | | | | | | | | | | | | | | | | | |
| | | | | | June 30, 2022 | | | | | | June 30, 2021 | |
| | | | | | | | |
| | | | | | Ordinary
Income
Distributions(8) | | | Long-Term
Capital Gain
Distributions | | | Return of
Capital(9) | | | | | | Ordinary
Income
Distributions(8) | | | Long-Term
Capital Gain
Distributions | | | Return of
Capital(9) | |
| | | | | | | | |
| PIMCO Dividend and Income Fund | | | | | | $ | 5,925 | | | $ | 0 | | | $ | 0 | | | | | | | $ | 6,700 | | | $ | 0 | | | $ | 0 | |
| † | A zero balance may reflect actual amounts rounding to less than one thousand. |
| (8) | Includes short-term capital gains distributed, if any. |
| (9) | A portion of the distributions made represents a tax return of capital. Return of capital distributions have been reclassified from undistributed net investment income to paid-in capital to more appropriately conform financial accounting to tax accounting. |
| | | | | | | | | | |
| | | ANNUAL REPORT | | | | JUNE 30, 2022 | | | 91 | |
Report of Independent Registered Public Accounting Firm
To the Board of Trustees of PIMCO Equity Series® and Shareholders of PIMCO Dividend and Income Fund
Opinion on the Financial Statements
We have audited the accompanying statement of assets and liabilities, including the schedule of investments, of PIMCO Dividend and Income Fund (one of the funds constituting PIMCO Equity Series®, referred to hereafter as the “Fund”) as of June 30, 2022, the related statement of operations for the year ended June 30, 2022, the statement of changes in net assets for each of the two years in the period ended June 30, 2022, including the related notes, and the financial highlights for each of the five years in the period ended June 30, 2022 (collectively referred to as the “financial statements”). In our opinion, the financial statements present fairly, in all material respects, the financial position of the Fund as of June 30, 2022, the results of its operations for the year then ended, the changes in its net assets for each of the two years in the period ended June 30, 2022 and the financial highlights for each of the five years in the period ended June 30, 2022 in conformity with accounting principles generally accepted in the United States of America.
Basis for Opinion
These financial statements are the responsibility of the Fund’s management. Our responsibility is to express an opinion on the Fund’s financial statements based on our audits. We are a public accounting firm registered with the Public Company Accounting Oversight Board (United States) (PCAOB) and are required to be independent with respect to the Fund in accordance with the U.S. federal securities laws and the applicable rules and regulations of the Securities and Exchange Commission and the PCAOB.
We conducted our audits of these financial statements in accordance with the standards of the PCAOB. Those standards require that we plan and perform the audit to obtain reasonable assurance about whether the financial statements are free of material misstatement, whether due to error or fraud.
Our audits included performing procedures to assess the risks of material misstatement of the financial statements, whether due to error or fraud, and performing procedures that respond to those risks. Such procedures included examining, on a test basis, evidence regarding the amounts and disclosures in the financial statements. Our audits also included evaluating the accounting principles used and significant estimates made by management, as well as evaluating the overall presentation of the financial statements. Our procedures included confirmation of securities owned as of June 30, 2022 by correspondence with the custodian, transfer agent, brokers and agent banks; when replies were not received from brokers or agent banks, we performed other auditing procedures. We believe that our audits provide a reasonable basis for our opinion.
/s/ PricewaterhouseCoopers LLP
Kansas City, Missouri
August 26, 2022
We have served as the auditor of one or more investment companies in PIMCO Equity Series® since 2010.
Glossary: (abbreviations that may be used in the preceding statements)
(Unaudited)
| | | | | | |
| | |
| Counterparty Abbreviations: | | | | |
| AZD | | Australia and New Zealand Banking Group | | HUS | | HSBC Bank USA N.A. |
| BOA | | Bank of America N.A. | | JPM | | JP Morgan Chase Bank N.A. |
| BPS | | BNP Paribas S.A. | | MYC | | Morgan Stanley Capital Services LLC |
| BRC | | Barclays Bank PLC | | MYI | | Morgan Stanley & Co. International PLC |
| CBK | | Citibank N.A. | | NGF | | Nomura Global Financial Products, Inc. |
| DUB | | Deutsche Bank AG | | RBC | | Royal Bank of Canada |
| FAR | | Wells Fargo Bank National Association | | SAL | | Citigroup Global Markets, Inc. |
| FICC | | Fixed Income Clearing Corporation | | SCX | | Standard Chartered Bank, London |
| GLM | | Goldman Sachs Bank USA | | UAG | | UBS AG Stamford |
| GST | | Goldman Sachs International | | | | |
| | |
| Currency Abbreviations: | | | | |
| ARS | | Argentine Peso | | JPY | | Japanese Yen |
| AUD | | Australian Dollar | | MXN | | Mexican Peso |
| BRL | | Brazilian Real | | NOK | | Norwegian Krone |
| CAD | | Canadian Dollar | | PEN | | Peruvian New Sol |
| CLP | | Chilean Peso | | RUB | | Russian Ruble |
| CNH | | Chinese Renminbi (Offshore) | | TWD | | Taiwanese Dollar |
| EUR | | Euro | | USD (or $) | | United States Dollar |
| GBP | | British Pound | | ZAR | | South African Rand |
| IDR | | Indonesian Rupiah | | | | |
| | |
| Exchange Abbreviations: | | | | |
| CME | | Chicago Mercantile Exchange | | OTC | | Over the Counter |
| | |
| Index/Spread Abbreviations: | | | | |
| BADLARPP | | Argentina Badlar Floating Rate Notes | | LIBOR03M | | 3 Month USD-LIBOR |
| BP0003M | | 3 Month GBP-LIBOR | | LIBOR06M | | 6 Month USD-LIBOR |
| CDX.EM | | Credit Derivatives Index - Emerging Markets | | MUTKCALM | | Tokyo Overnight Average Rate |
| CDX.HY | | Credit Derivatives Index - High Yield | | PRIME | | Daily US Prime Rate |
| CDX.IG | | Credit Derivatives Index - Investment Grade | | SOFR | | Secured Overnight Financing Rate |
| CMBX | | Commercial Mortgage-Backed Index | | SONIO | | Sterling Overnight Interbank Average Rate |
| EUR003M | | 3 Month EUR Swap Rate | | UKRPI | | United Kingdom Retail Prices Index |
| EUR006M | | 6 Month EUR Swap Rate | | US0001M | | ICE 1-Month USD LIBOR |
| LIBOR01M | | 1 Month USD-LIBOR | | US0003M | | ICE 3-Month USD LIBOR |
| | |
| Other Abbreviations: | | | | |
| BABs | | Build America Bonds | | LIBOR | | London Interbank Offered Rate |
| BBR | | Bank Bill Rate | | Lunar | | Monthly payment based on 28-day periods. One year consists of 13 periods. |
| BBSW | | Bank Bill Swap Reference Rate | | OIS | | Overnight Index Swap |
| BTP | | Buoni del Tesoro Poliennali “Long-term Treasury Bond” | | PIK | | Payment-in-Kind |
| CDI | | Brazil Interbank Deposit Rate | | REIT | | Real Estate Investment Trust |
| EBITDA | | Earnings before Interest, Taxes, Depreciation and Amoritization | | TBA | | To-Be-Announced |
| EURIBOR | | Euro Interbank Offered Rate | | TBD% | | Interest rate to be determined when loan settles or at the time of funding |
| JIBAR | | Johannesburg Interbank Agreed Rate | | TIIE | | Tasa de Interés Interbancaria de Equilibrio “Equilibrium Interbank Interest Rate” |
| | | | | | | | | | |
| | | ANNUAL REPORT | | | | JUNE 30, 2022 | | | 93 | |
Federal Income Tax Information
(Unaudited)
As required by the Internal Revenue Code (“Code”) and Treasury Regulations, if applicable, shareholders must be notified within 60 days of the Fund’s fiscal year end regarding the status of qualified dividend income and the dividend received deduction.
Dividend Received Deduction. Corporate shareholders are generally entitled to take the dividend received deduction on the portion of a fund’s dividend distribution that qualifies under tax law. The percentage of the following Fund’s fiscal 2022 ordinary income dividend that qualifies for the corporate dividend corporate dividend received deduction is set forth below:
Qualified Dividend Income. Under the Jobs and Growth Tax Relief Reconciliation Act of 2003, the following percentage of ordinary dividends paid during the fiscal year ended June 30, 2022 was designated as ‘‘qualified dividend income’’ as defined in the Jobs and Growth Tax Relief Reconciliation Act of 2003 subject to reduced tax rates in 2022:
Qualified Interest Income and Qualified Short-Term Capital Gain (for non-U.S. resident shareholders only). Under the American Jobs Creation Act of 2004, the following amounts of ordinary dividends paid during the fiscal year ended June 30, 2022 are considered to be derived from “qualified interest income,” as defined in Section 871(k)(1)(E) of the Code, and therefore are designated as interest-related dividends, as defined in Section 871(k)(1)(C) of the Code. Further, the following amounts of ordinary dividends paid during the fiscal year ended June 30, 2022 are considered to be derived from “qualified short-term capital gain,” as defined in Section 871(k)(2)(D) of the Code, and therefore are designated as qualified short-term gain dividends, as defined by Section 871(k)(2)(C) of the Code.
Section 163(j) Interest Dividends. The Fund intends to pass through the maximum amount allowable as Section 163(j) Interest defined in Proposed Treasury Section 1.163(j)-1(b). The 163(j) amount of ordinary income distributions are as follows:
| | | | | | | | | | | | | | | | | | | | | | | | |
| | | | | | Dividend
Received
Deduction % | | | Qualified
Dividend
Income % | | | Qualified
Interest
Income
(000s)† | | | Qualified
Short-Term
Capital Gains
(000s)† | | | 163(j)
Interest
Dividends
(000s)† | |
| PIMCO Dividend and Income Fund | | | | | | | 31 | % | | | 87 | % | | $ | 2,330 | | | $ | 0 | | | $ | 1,574 | |
| † | A zero balance may reflect actual amounts rounding to less than one thousand. |
Shareholders are advised to consult their own tax advisor with respect to the tax consequences of their investment in the Trust. In January 2023, you will be advised on IRS Form 1099-DIV as to the federal tax status of the dividends and distributions received by you in calendar year 2022.
Section 199A Dividends. Non-corporate fund shareholders of the Fund below meeting certain holding period requirements may be able to deduct up to 20 percent of qualified REIT dividends passed through and reported to the shareholders by the Fund as IRC section 199A dividends. The IRC section 199A percentage of ordinary dividends are as follows:
| | | | | | | | |
| | | | | | 199A Dividends | |
| | |
PIMCO Dividend and Income Fund | | | | | | | 3% | |
Distribution Information
(Unaudited)
For purposes of Section 19 of the Investment Company Act of 1940 (the “Act”), the Funds estimated the periodic sources of any dividends paid during the six month period covered by this report in accordance with good accounting practice. Pursuant to Rule 19a-1(e) under the Act, the table below sets forth the actual source information for dividends paid during the fiscal period ended June 30, 2022 calculated as of each distribution period pursuant to Section 19 of the Act. The information below is not provided for U.S. federal income tax reporting purposes. The tax character of all dividends and distributions is reported on Form 1099-DIV (for shareholders who receive U.S. federal tax reporting) at the end of each calendar year.
See the Financial Highlights section of this report for the tax characterization of distributions determined in accordance with federal income tax regulations for the fiscal year.
| | | | | | | | | | | | | | | | | | | | |
| PIMCO Dividend and Income Fund | |
| Institutional Class | | | | | Net Investment
Income* | | | Net Realized
Capital Gains* | | | Paid-in Surplus or
Other Capital
Sources** | | | Total (per
common share) | |
| | | | | |
| March 2022 | | | | | | $ | 0.0102 | | | $ | 0.0000 | | | $ | 0.0000 | | | $ | 0.0102 | |
| | | | | |
| June 2022 | | | | | | $ | 0.0684 | | | $ | 0.0000 | | | $ | 0.0000 | | | $ | 0.0684 | |
| | | | | |
| I-2 Class | | | | | Net Investment
Income* | | | Net Realized
Capital Gains* | | | Paid-in Surplus or
Other Capital
Sources** | | | Total (per
common share) | |
| | | | | |
| March 2022 | | | | | | $ | 0.0096 | | | $ | 0.0000 | | | $ | 0.0000 | | | $ | 0.0096 | |
| | | | | |
| June 2022 | | | | | | $ | 0.0702 | | | $ | 0.0000 | | | $ | 0.0000 | | | $ | 0.0702 | |
| | | | | |
| Class A | | | | | Net Investment
Income* | | | Net Realized
Capital Gains* | | | Paid-in Surplus or
Other Capital
Sources** | | | Total (per
common share) | |
| | | | | |
| March 2022 | | | | | | $ | 0.0037 | | | $ | 0.0000 | | | $ | 0.0000 | | | $ | 0.0037 | |
| | | | | |
| June 2022 | | | | | | $ | 0.0626 | | | $ | 0.0000 | | | $ | 0.0000 | | | $ | 0.0626 | |
| | | | | |
| Class C | | | | | Net Investment
Income* | | | Net Realized
Capital Gains* | | | Paid-in Surplus or
Other Capital
Sources** | | | Total (per
common share) | |
| | | | | |
| March 2022 | | | | | | $ | 0.0000 | | | $ | 0.0000 | | | $ | 0.0000 | | | $ | 0.0000 | |
| | | | | |
| June 2022 | | | | | | $ | 0.0400 | | | $ | 0.0000 | | | $ | 0.0000 | | | $ | 0.0400 | |
| * | The source of dividends provided in the table differs, in some respects, from information presented in this report prepared in accordance with generally accepted accounting principles, or U.S. GAAP. For example, net earnings from certain interest rate swap contracts are included as a source of net investment income for purposes of Section 19(a). Accordingly, the information in the table may differ from information in the accompanying financial statements that are presented on the basis of U.S. GAAP and may differ from tax information presented in the footnotes. Amounts shown may include accumulated, as well as fiscal period net income and net profits. |
| ** | Occurs when a fund distributes an amount greater than its accumulated net income and net profits. Amounts are not reflective of a fund’s net income, yield, earnings or investment performance. |
| | | | | | | | | | |
| | | ANNUAL REPORT | | | | JUNE 30, 2022 | | | 95 | |
Management of the Trust
The charts below identify the Trustees and executive officers of the Trust. Unless otherwise indicated, the address of all persons below is 650 Newport Center Drive, Newport Beach, CA 92660.
The Funds’ Statement of Additional Information includes more information about the Trustees and Officers. To request a free copy, call PIMCO at (888) 87-PIMCO or visit the Funds’ website at www.pimco.com.
| | | | | | | | |
Name, Year of Birth and
Position Held with Trust* | | Term of Office
and Length of Time
Served† | | Principal Occupation(s) During Past 5 Years | | Number
of Funds
in Fund
Complex
Overseen
by Trustee | | Other Public Company and Investment Company Directorships Held by Trustee During the Past 5 Years |
| | | |
Interested Trustees1 | | | | | | |
| | | | |
Peter G. Strelow (1970) Chairman of the Board and Trustee | | 02/2019 to
present | | Managing Director and Co-Chief Operating Officer, PIMCO. Senior Vice President of the Trust, PIMCO Equity Series VIT, PIMCO Funds, PIMCO Variable Insurance Trust and PIMCO ETF Trust, PIMCO Managed Accounts Trust, PIMCO-Sponsored Interval Funds and PIMCO-Sponsored Closed-End Funds. Formerly, Chief Administrative Officer, PIMCO. | | 149 | | Chairman and Trustee, PIMCO Equity Series VIT, PIMCO Funds, PIMCO Variable Insurance Trust, PIMCO ETF Trust. |
| | | | |
Kimberley G. Stafford (1978) Trustee | | 02/2021 to
present | | Managing Director, Global Head of Product Strategy, PIMCO; and Member of Executive Committee, PIMCO. Formerly, Head of Asia-Pacific, Global Head of Consultant Relations and Head of US Institutional and Alternatives Sales, PIMCO. | | 149 | | Trustee, PIMCO Equity Series VIT, PIMCO Funds, PIMCO Variable Insurance Trust, PIMCO ETF Trust. |
| | | |
Independent Trustees | | | | | | |
| | | | |
George E. Borst (1948) Trustee | | 05/2019 to
present | | Executive Advisor, McKinsey & Company; Formerly, Executive Advisor, Toyota Financial Services; and CEO, Toyota Financial Services. | | 149 | | Trustee, PIMCO Equity Series VIT, PIMCO Funds, PIMCO Variable Insurance and PIMCO ETF Trust; Director, MarineMax Inc. |
| | | | |
Jennifer Holden Dunbar (1963) Trustee | | 02/2016 to
present | | Formerly, Managing Director, Dunbar Partners, LLC (business consulting and investments) (05/05-05/21); and Partner, Leonard Green & Partners, L.P. | | 149 | | Trustee, PIMCO Equity Series VIT, PIMCO Funds, PIMCO Variable Insurance and PIMCO ETF Trust; Director, PS Business Parks; Director, Big 5 Sporting Goods Corporation. |
| | | | |
Kym M. Hubbard (1957) Trustee | | 05/2019 to
present | | Formerly, Global Head of Investments, Chief Investment Officer and Treasurer, Ernst & Young. | | 149 | | Trustee, PIMCO Equity Series VIT, PIMCO Funds, PIMCO Variable Insurance and PIMCO ETF Trust; Director, State Auto Financial Corporation. |
| | | | |
Gary F. Kennedy (1955) Trustee | | 05/2019 to
present | | Formerly, Senior Vice President, General Counsel and Chief Compliance Officer, American Airlines and AMR Corporation (now American Airlines Group). | | 149 | | Trustee, PIMCO Equity Series VIT, PIMCO Funds, PIMCO Variable Insurance and PIMCO ETF Trust. |
| | | | |
Peter B. McCarthy (1950) Trustee | | 09/2011 to
present | | Formerly, Assistant Secretary and Chief Financial Officer, United States Department of Treasury; Deputy Managing Director, Institute of International Finance. | | 149 | | Trustee, PIMCO Equity Series VIT, PIMCO Funds, PIMCO Variable Insurance and PIMCO ETF Trust. |
| | | | |
Ronald C. Parker (1951)
Lead Independent Trustee | | 02/2016 to
present Lead
Independent
Trustee 05/2019 to
present | | Director of Roseburg Forest Products Company. Formerly, Chairman of the Board, The Ford Family Foundation; and President, Chief Executive Officer, Hampton Affiliates (forestry products). | | 149 | | Lead Independent Trustee, PIMCO Equity Series VIT, PIMCO Funds, PIMCO Variable Insurance and PIMCO ETF Trust. |
| * | Unless otherwise noted, the information for the individuals listed is as of June 30, 2022. |
| 1 | Ms. Stafford is an “interested persons” of the Trust (as that term is defined in the 1940 Act) because of his affiliations with PIMCO. |
| † | Trustees serve until their successors are duly elected and qualified. |
(Unaudited)
Executive Officers
| | | | |
Name, Year of Birth and Position Held with Trust* | | Term of Office and Length of Time Served | | Principal Occupation(s) During Past 5 Years† |
| | |
Eric D. Johnson (1970)
President | | 06/2019 to present | | Executive Vice President and Head of Funds Business Group Americas, PIMCO. President, PIMCO Funds, PIMCO Variable Insurance Trust, PIMCO ETF Trust, PIMCO Equity Series VIT, PIMCO Managed Accounts Trust, PIMCO-Sponsored Interval Funds and PIMCO-Sponsored Closed-End Funds. |
| | |
Ryan G. Leshaw (1980)
Chief Legal Officer and Secretary | | 08/2021 to present | | Executive Vice President and Senior Counsel, PIMCO. Chief Legal Officer and Secretary, PIMCO Funds, PIMCO Variable Insurance Trust, PIMCO ETF Trust and PIMCO Equity Series VIT. Chief Legal Officer, PIMCO Managed Accounts Trust, PIMCO-Sponsored Interval Funds and PIMCO-Sponsored Closed-End Funds. Formerly, Associate, Willkie Farr & Gallagher LLP. |
| | |
Keisha Audain-Pressley (1975)**
Chief Compliance Officer | | 01/2020 to present | | Executive Vice President and Deputy Chief Compliance Officer, PIMCO. Chief Compliance Officer, PIMCO Funds, PIMCO Variable Insurance Trust, PIMCO ETF Trust, PIMCO Equity Series VIT, PIMCO Managed Accounts Trust, PIMCO-Sponsored Interval Funds and PIMCO-Sponsored Closed-End Funds. |
| | |
Joshua D. Ratner (1976)**
Senior Vice President | | 05/2019 to present | | Executive Vice President and Head of Americas Operations, PIMCO. Senior Vice President, PIMCO Funds, PIMCO Variable Insurance Trust, PIMCO ETF Trust, PIMCO Equity Series VIT, PIMCO Managed Accounts Trust, PIMCO-Sponsored Interval Funds and PIMCO-Sponsored Closed-End Funds. |
| | |
Peter G. Strelow (1970)
Senior Vice President | | 06/2019 to present | | Managing Director and Co-Chief Operating Officer, PIMCO. Senior Vice President, PIMCO Funds, PIMCO Variable Insurance Trust, PIMCO ETF Trust, PIMCO Equity Series VIT, PIMCO Managed Accounts Trust, PIMCO-Sponsored Interval Funds and PIMCO-Sponsored Closed-End Funds. Formerly, Chief Administrative Officer, PIMCO. |
| | |
Wu-Kwan Kit (1981) Assistant Secretary | | 08/2017 to present | | Senior Vice President and Senior Counsel, PIMCO. Assistant Secretary, PIMCO Funds, PIMCO Variable Insurance Trust, PIMCO ETF Trust and PIMCO Equity Series VIT. Vice President, Senior Counsel and Secretary, PIMCO Managed Accounts Trust, PIMCO-Sponsored Interval Funds and PIMCO-Sponsored Closed-End Funds. Formerly, Assistant General Counsel, VanEck Associates Corp. |
| | |
Douglas B. Burrill (1980)**
Vice President | | 08/2022 to present | | Senior Vice President, PIMCO. Vice President, PIMCO Funds, PIMCO Variable Insurance Trust, PIMCO ETF Trust, PIMCO Equity Series VIT, PIMCO-Sponsored Interval Funds and PIMCO-Sponsored Closed-End Funds. |
| | |
Jeffrey A. Byer (1976) Vice President | | 02/2020 to present | | Executive Vice President, PIMCO. Vice President, PIMCO Funds, PIMCO Variable Insurance Trust, PIMCO ETF Trust, PIMCO Equity Series, PIMCO Equity Series VIT, PIMCO Managed Accounts Trust, PIMCO-Sponsored Interval Funds and PIMCO-Sponsored Closed-End Funds. |
| | |
Elizabeth A. Duggan (1964) Vice President | | 02/2021 to present | | Executive Vice President, PIMCO. Vice President, PIMCO Funds, PIMCO Variable Insurance Trust, PIMCO ETF Trust, PIMCO Equity Series VIT, PIMCO Managed Accounts Trust, PIMCO-Sponsored Interval Funds and PIMCO-Sponsored Closed-End Funds. |
| | |
Mark A. Jelic (1981)
Vice President | | 08/2021 to present | | Senior Vice President, PIMCO. Vice President, PIMCO Funds, PIMCO Variable Insurance Trust, PIMCO ETF Trust, PIMCO Equity Series VIT, PIMCO-Sponsored Interval Funds and PIMCO-Sponsored Closed-End Funds. |
| | |
Kenneth W. Lee (1972)
Vice President | | 08/2022 to present | | Senior Vice President, PIMCO. Vice President, PIMCO Funds, PIMCO Variable Insurance Trust, PIMCO ETF Trust, PIMCO Equity Series VIT, PIMCO-Sponsored Interval Funds and PIMCO-Sponsored Closed-End Funds. |
| | |
Brian J. Pittluck (1977)
Vice President | | 01/2020 to present | | Senior Vice President, PIMCO. Vice President, PIMCO Funds, PIMCO Variable Insurance Trust, PIMCO ETF Trust, PIMCO Equity Series VIT, PIMCO Managed Accounts Trust, PIMCO-Sponsored Interval Funds and PIMCO-Sponsored Closed-End Funds. |
| | |
Keith A. Werber (1973) Vice President | | 05/2022 to present | | Executive Vice President, PIMCO. Vice President, PIMCO Funds, PIMCO Variable Insurance Trust, PIMCO ETF Trust and PIMCO Equity Series VIT. |
| | | | | | | | | | |
| | | ANNUAL REPORT | | | | JUNE 30, 2022 | | | 97 | |
Management of the Trust (Cont.)
(Unaudited)
| | | | |
Name, Year of Birth and Position Held with Trust* | | Term of Office and Length of Time Served | | Principal Occupation(s) During Past 5 Years† |
| | |
Bijal Y. Parikh (1978) Treasurer | | 01/2021 to present | | Senior Vice President, PIMCO. Treasurer, PIMCO Funds, PIMCO Variable Insurance Trust, PIMCO ETF Trust and PIMCO Equity Series VIT, PIMCO Managed Accounts Trust, PIMCO-Sponsored Interval Funds and PIMCO-Sponsored Closed-End Funds. |
| | |
Erik C. Brown (1967)***
Assistant Treasurer | | 03/2010 to present | | Executive Vice President, PIMCO. Assistant Treasurer, PIMCO Funds, PIMCO Variable Insurance Trust, PIMCO ETF Trust, PIMCO Equity Series VIT, PIMCO Managed Accounts Trust, PIMCO-Sponsored Interval Funds and PIMCO-Sponsored Closed-End Funds. |
| | |
Brandon T. Evans (1982)
Assistant Treasurer | | 05/2019 to present | | Senior Vice President, PIMCO. Assistant Treasurer, PIMCO Funds, PIMCO Variable Insurance Trust, PIMCO ETF Trust and PIMCO Equity Series VIT. Deputy Treasurer, PIMCO Managed Accounts Trust, PIMCO-Sponsored Interval Funds and PIMCO-Sponsored Closed-End Funds. |
| * | Unless otherwise noted, the information for the individuals listed is as of August 25, 2022. |
| † | The term “PIMCO-Sponsored Closed-End Funds” as used herein includes: PIMCO Access Income Fund, PIMCO California Municipal Income Fund, PIMCO California Municipal Income Fund II, PIMCO California Municipal Income Fund III, PIMCO Municipal Income Fund, PIMCO Municipal Income Fund II, PIMCO Municipal Income Fund III, PIMCO New York Municipal Income Fund, PIMCO New York Municipal Income Fund II, PIMCO New York Municipal Income Fund III, PCM Fund Inc., PIMCO Corporate & Income Opportunity Fund, PIMCO Corporate & Income Strategy Fund, PIMCO Dynamic Income Fund, PIMCO Dynamic Income Opportunities Fund, PIMCO Energy and Tactical Credit Opportunities Fund, PIMCO Global StocksPLUS® & Income Fund, PIMCO High Income Fund, PIMCO Income Strategy Fund, PIMCO Income Strategy Fund II and PIMCO Strategic Income Fund, Inc.; the term “PIMCO-Sponsored Interval Funds” as used herein includes: PIMCO Flexible Credit Income Fund, PIMCO Flexible Municipal Income Fund, PIMCO California Flexible Municipal Income Fund and PIMCO Flexible Emerging Markets Income Fund. |
| ** | The address of these officers is Pacific Investment Management Company LLC, 1633 Broadway, New York, New York 10019. |
| *** | The address of these officers is Pacific Investment Management Company LLC, 401 Congress Ave., Austin, Texas 78701. |
Privacy Policy1
(Unaudited)
The Funds2,3 consider customer privacy to be a fundamental aspect of their relationships with shareholders and are committed to maintaining the confidentiality, integrity and security of their current, prospective and former shareholders’ non-public personal information. The Funds have developed policies that are designed to protect this confidentiality, while allowing shareholder needs to be served.
Obtaining Non-Public Personal Information
In the course of providing shareholders with products and services, the Funds and certain service providers to the Funds, such as the Funds’ investment advisers or sub-advisers (“Advisers”), may obtain non-public personal information about shareholders, which may come from sources such as account applications and other forms, from other written, electronic or verbal correspondence, from shareholder transactions, from a shareholder’s brokerage or financial advisory firm, financial professional or consultant, and/or from information captured on applicable websites.
Respecting Your Privacy
As a matter of policy, the Funds do not disclose any non-public personal information provided by shareholders or gathered by the Funds to non-affiliated third parties, except as required or permitted by law or as necessary for such third parties to perform their agreements with respect to the Funds. As is common in the industry, non-affiliated companies may from time to time be used to provide certain services, such as preparing and mailing prospectuses, reports, account statements and other information, conducting research on shareholder satisfaction and gathering shareholder proxies. The Funds or their affiliates may also retain non-affiliated companies to market Fund shares or products which use Fund shares and enter into joint marketing arrangements with them and other companies. These companies may have access to a shareholder’s personal and account information, but are permitted to use this information solely to provide the specific service or as otherwise permitted by law. In most cases, the shareholders will be clients of a third party, but the Funds may also provide a shareholder’s personal and account information to the shareholder’s respective brokerage or financial advisory firm and/or financial professional or consultant.
Sharing Information with Third Parties
The Funds reserve the right to disclose or report personal or account information to non-affiliated third parties in limited circumstances where the Funds believe in good faith that disclosure is required under law, to cooperate with regulators or law enforcement authorities, to protect their rights or property, or upon reasonable request by any Fund in which a shareholder has invested. In addition, the Funds may disclose information about a shareholder or a shareholder’s accounts to a non-affiliated third party at the shareholder’s request or with the consent of the shareholder.
Sharing Information with Affiliates
The Funds may share shareholder information with their affiliates in connection with servicing shareholders’ accounts, and subject to applicable law may provide shareholders with information about products and services that the Funds or their Advisers, distributors or their affiliates (“Service Affiliates”) believe may be of interest to such shareholders. The information that the Funds may share may include, for example, a shareholder’s participation in the Funds or in other investment programs sponsored by a Service Affiliate, a shareholder’s ownership of certain types of accounts (such as IRAs), information about the Funds’ experiences or transactions with a shareholder, information captured on applicable websites, or other data about a shareholder’s accounts, subject
| | | | | | | | | | |
| | | ANNUAL REPORT | | | | JUNE 30, 2022 | | | 99 | |
Privacy Policy1 (Cont.)
(Unaudited)
to applicable law. The Funds’ Service Affiliates, in turn, are not permitted to share shareholder information with non-affiliated entities, except as required or permitted by law.
Procedures to Safeguard Private Information
The Funds take seriously the obligation to safeguard shareholder non-public personal information. In addition to this policy, the Funds have implemented procedures that are designed to restrict access to a shareholder’s non-public personal information to internal personnel who need to know that information to perform their jobs, such as servicing shareholder accounts or notifying shareholders of new products or services. Physical, electronic and procedural safeguards are in place to guard a shareholder’s non-public personal information.
Information Collected from Websites
The Funds or their service providers and partners may collect information from shareholders via websites they maintain. The information collected via websites maintained by the Funds or their service providers includes client non-public personal information.
Changes to the Privacy Policy
From time to time, the Funds may update or revise this privacy policy. If there are changes to the terms of this privacy policy, documents containing the revised policy on the relevant website will be updated.
1 Amended as of June 25, 2020.
2 PIMCO Investments LLC (“PI”) serves as the Funds’ distributor and does not provide brokerage services or any financial advice to investors in the Funds solely because it distributes the Funds. This Privacy Policy applies to the activities of PI to the extent that PI regularly effects or engages in transactions with or for a shareholder of a series of a Trust who is the record owner of such shares. For purposes of this Privacy Policy, references to “the Funds” shall include PI when acting in this capacity.
3 When distributing this Policy, a Fund may combine the distribution with any similar distribution of its investment adviser’s privacy policy. The distributed, combined, policy may be written in the first person (i.e. by using “we” instead of “the Funds”).
Liquidity Risk Management Program
(Unaudited)
In compliance with Rule 22e-4 (the “Liquidity Rule”) under the Investment Company Act of 1940, as amended (“1940 Act”), PIMCO Equity Series (the “Trust”) has adopted and implemented a liquidity risk management program (the “Program”) for each series of the Trust (each a “Fund” and collectively, the “Funds”) not regulated as a money market fund under 1940 Act Rule 2a-7, which is reasonably designed to assess and manage the Funds’ liquidity risk. The Trust’s Board of Trustees (the “Board”) previously approved the designation of the PIMCO Liquidity Risk Committee (the “Administrator”) as Program administrator. The PIMCO Liquidity Risk Committee consists of senior members from certain PIMCO business areas, such as Portfolio Risk Management, Americas Operations, Compliance, Account Management and Portfolio Management, and is advised by members of PIMCO Legal.
A Fund’s “liquidity risk” is the risk that the Fund could not meet requests to redeem shares issued by the Fund without significant dilution of the remaining investors’ interests in the Fund. In accordance with the Program, each Fund’s liquidity risk is assessed no less frequently than annually taking into consideration a variety of factors, including, as applicable, the Fund’s investment strategy and liquidity of portfolio investments, cash flow projections, and holdings of cash and cash equivalents, as well as borrowing arrangements and other funding sources. Certain factors are considered under both normal and reasonably foreseeable stressed conditions. Each Fund portfolio investment is classified into one of four liquidity categories (including “highly liquid investments” and “illiquid investments,” discussed below) based on a determination of the number of days it is reasonably expected to take to convert the investment to cash, or sell or dispose of the investment, in current market conditions without significantly changing the investment’s market value. Each Fund has adopted a “Highly Liquid Investment Minimum” (or “HLIM”), which is a minimum amount of Fund net assets to be invested in highly liquid investments that are assets. As required under the Liquidity Rule, each Fund’s HLIM is periodically reviewed, no less frequently than annually, and the Funds have adopted policies and procedures for responding to a shortfall of a Fund’s highly liquid investments below its HLIM. The Liquidity Rule also limits the Funds’ investments in illiquid investments by prohibiting a Fund from acquiring any illiquid investment if, immediately after the acquisition, the Fund would have invested more than 15% of its net assets in illiquid investments that are assets. Certain non-public reporting is generally required if a Fund’s holdings of illiquid investments that are assets were to exceed 15% of Fund net assets.
At a meeting of the Board held on February 15-16, 2022 the Board received a report (the “Report”) from the Administrator addressing the Program’s operation and assessing the adequacy and effectiveness of its implementation for the 12-month period ended December 31, 2021. The Report reviewed the operation of the Program’s components during such period and stated that the Program is operating effectively to assess and manage each Fund’s liquidity risk and that the Program has been and continues to be adequately and effectively implemented to monitor and, as applicable, respond to the Funds’ liquidity developments. This has remained true for the 12-month period ended June 30, 2022.
| | | | | | | | | | |
| | | ANNUAL REPORT | | | | JUNE 30, 2022 | | | 101 | |
General Information
Investment Adviser and Administrator
Pacific Investment Management Company LLC
650 Newport Center Drive
Newport Beach, CA 92660
Investment Sub-Adviser
Research Affiliates, LLC
620 Newport Center Drive, Suite 900
Newport Beach, CA 92660
Portfolio Implementer
Parametric Portfolio Associates
1918 Eighth Avenue, Suite 3100
Seattle, WA 98101
Distributor
PIMCO Investments LLC
1633 Broadway
New York, NY 10019
Custodian
State Street Bank and Trust Company
801 Pennsylvania Avenue
Kansas City, MO 64105
Transfer Agent
DST Asset Manager Solutions, Inc.
Institutional Class, I-2, I-3, Administrative Class
430 W 7th Street STE 219024
Kansas City, MO 64105-1407
DST Asset Manager Solutions, Inc.
Class A, Class C, Class R
430 W 7th Street STE 219294
Kansas City, MO 64105-1407
Legal Counsel
Dechert LLP
1900 K Street, N.W.
Washington, D.C. 20006
Independent Registered Public Accounting Firm
PricewaterhouseCoopers LLP
1100 Walnut Street, Suite 1300
Kansas City, MO 64106
This report is submitted for the general information of the shareholders of the Fund listed on the Report cover.

PES3001AR_063022

PIMCO EQUITY SERIES®
Annual Report
June 30, 2022
PIMCO RAE Emerging Markets Fund
PIMCO RAE Global ex-US Fund
PIMCO RAE International Fund
PIMCO RAE US Fund
PIMCO RAE US Small Fund
Table of Contents
This material is authorized for use only when preceded or accompanied by the current PIMCO Equity Series prospectus. The Shareholder Reports for the other series of the PIMCO Equity Series are printed separately.
Dear Shareholder,
We hope that you and your family are remaining safe and healthy during these challenging times. We continue to work tirelessly to navigate markets and manage the assets that you have entrusted with us. Following this letter is the PIMCO Equity Series Annual Report, which covers the 12-month reporting period ended June 30, 2022. On the subsequent pages, you will find specific details regarding investment results and a discussion of the factors that most affected performance during the reporting period.
For the 12-month reporting period ended June 30, 2022
The global economy continued to be affected by the COVID-19 pandemic (“COVID-19”) and its variants. Looking back, third quarter 2021 U.S. annualized gross domestic product (“GDP”) grew 2.3%. Economic activity accelerated during the fourth quarter, as GDP growth was 6.9%. However, the U.S. economy then experienced a setback, as first quarter 2022 GDP growth was -1.6%. Finally, the Commerce Department’s initial estimate for second quarter 2022 GDP growth — released after the reporting period ended — was -0.9%.
In the U.S., the Federal Reserve Board (the “Fed”) took several steps to tighten monetary policy to combat elevated inflation. The Fed reduced the monthly pace of its net asset purchases of Treasury securities and agency mortgage-backed securities in November 2021 and again in December. The Fed ended its monthly asset purchases in mid-March 2022. The Fed then raised the federal funds rate 0.25% to a range between 0.25% and 0.50% in March 2022, its first rate hike since 2018. The central bank then raised rates 0.50% in its May 2022 meeting and 0.75% in its June meeting. Finally, on July 27, 2022 — after the reporting period ended — the Fed raised rates 0.75%, to a range between 2.25% and 2.50%.
Economies outside the U.S. also continued to be impacted by the pandemic. The war in Ukraine and its repercussions also led to increased uncertainties around the world. In its April 2022 World Economic Outlook Update, the International Monetary Fund (“IMF”) said it expects U.S. gross domestic product (“GDP”) growth to be 3.7% in 2022, compared to 5.7% in 2021. Elsewhere, the IMF expects 2022 GDP to grow 2.8% in the eurozone (from 5.3% in 2021), 3.7% in the U.K. (from 7.4% in 2021) and 2.4% in Japan (from 1.6% in 2021).
Several other central banks began tightening monetary policy during the period. In December 2021, the Bank of England (the “BoE”) surprised the market and raised rates for the first time since COVID-19 began. The BoE again raised rates at its meetings in February, March, May and June 2022. The European Central Bank (the “ECB”) indicated that it intended to raise rates at its September 2022 meeting. Elsewhere, the Bank of Japan (the “BoJ”) maintained its loose monetary policy and appears likely to remain accommodative in the near future given the headwinds facing its economy.
During the reporting period, short- and long-term U.S. Treasury yields moved sharply higher. The yield on the benchmark 10-year U.S. Treasury note was 2.98% on June 30, 2022, versus 1.45% on June 30, 2021. The Bloomberg Global Treasury Index (USD Hedged), which tracks fixed-rate, local currency government debt of investment grade countries, including developed and emerging markets, returned -7.91%. Meanwhile, the Bloomberg Global Aggregate Credit Index (USD Hedged), a widely used index of global investment grade credit bonds, returned -12.75%. Riskier fixed income asset classes, including high yield corporate bonds and emerging market debt, were also weak. The ICE BofAML Developed Markets High Yield Constrained Index (USD Hedged), a widely used index of below-investment-grade bonds, returned -12.85%, whereas emerging market external debt, as represented by the JPMorgan Emerging Markets Bond Index (EMBI) Global (USD Hedged), returned -19.25%. Emerging market local bonds, as represented by the JPMorgan Government Bond Index-Emerging Markets Global Diversified Index (Unhedged), returned -19.28%.
Amid periods of volatility, global equities generally posted weak results during the reporting period as economic and geopolitical concerns weighed on investor sentiment. U.S. equities, as represented by the S&P 500 Index, returned -10.62%. Global equities, as represented by the MSCI World Index, returned -14.34%, while emerging market equities, as measured by the MSCI Emerging Markets Index, returned -25.28%. Meanwhile, Japanese equities, as
represented by the Nikkei 225 Index (in JPY), returned -8.33% and European equities, as represented by the MSCI Europe Index (in EUR), returned -6.54%.
Commodity prices were volatile and generated mixed returns. Brent crude oil, which was approximately $75 a barrel at the start of the reporting period, rose to roughly $112 a barrel at the end of June 2022. We believe the oil-price increase was driven by supply shortages and stronger demand due to economic re-openings as COVID-19 restrictions eased. Repercussions from the war in Ukraine also contributed to higher oil prices. In terms of other commodities prices, copper declined, whereas gold rose during the period.
Finally, there were also periods of volatility in the foreign exchange markets. We believe this was due to several factors, including economic growth expectations and changing central bank monetary policies, as well as rising inflation, COVID-19 variants and geopolitical events. The U.S. dollar strengthened against several major currencies. For example, during the reporting period, the U.S. dollar returned 11.59%, 11.95% and 18.13% versus the euro, the British pound and the Japanese yen, respectively.
Thank you for the assets you have placed with us. We deeply value your trust, and we will continue to work diligently to meet your broad investment needs. For any questions regarding the funds, please contact your account manager or financial adviser, or call one of our shareholder associates at (888) 87-PIMCO. We also invite you to visit our website at www.pimco.com to learn more about our global viewpoints.
| | |
 | | Sincerely, 
Peter G. Strelow Chairman of the Board
PIMCO Equity Series |
Past performance is no guarantee of future results. Unless otherwise noted, index returns reflect the reinvestment of income distributions and capital gains, if any, but do not reflect fees, brokerage commissions or other expenses of investing. It is not possible to invest directly in an unmanaged index.
| | | | | | | | | | | | |
| | | | ANNUAL REPORT | | | | | | | JUNE 30, 2022 | | | 3 |
| | | | |
| Important Information About the Funds | | | | |
PIMCO Equity Series (the “Trust”) is an open-end management investment company that includes PIMCO RAE Emerging Markets Fund, PIMCO RAE Global ex-US Fund, PIMCO RAE International Fund, PIMCO RAE US Fund and PIMCO RAE US Small Fund (each, a “Fund” and collectively, the “Funds”).
We believe that equity funds have an important role to play in a well-diversified investment portfolio. It is important to note, however, that equity funds are subject to notable risks. Among other things, equity and equity-related securities may decline in value due to both real and perceived general market, economic, and industry conditions.
PIMCO RAE Global ex-US Fund is a “fund of funds,” which is a term used to describe mutual funds that pursue their investment objective by investing in other mutual funds instead of investing directly in stocks or bonds of other issuers. Under normal circumstances, the PIMCO RAE Global ex-US Fund invests substantially all of its assets in Institutional Class shares of the International Fund and Emerging Markets Fund, equity securities of small companies economically tied to non-U.S. countries, and securities that are eligible investments for the International Fund and Emerging Markets Fund. The PIMCO RAE Global ex-US Fund may invest in other affiliated funds and unaffiliated funds, which may or may not be registered under the Investment Company Act of 1940 (together with the Underlying Funds, “Acquired Funds”). The cost of investing in these Funds will generally be higher than the cost of investing in a mutual fund that invests directly in individual stocks and bonds.
The values of equity securities, such as common stocks and preferred securities, have historically risen and fallen in periodic cycles and may decline due to general market conditions, which are not specifically related to a particular company, such as real or perceived adverse economic conditions, changes in the general outlook for corporate earnings, changes in interest or currency rates or adverse investor sentiment generally. Equity securities may also decline due to factors that affect a particular industry or industries, such as labor shortages, increased production costs and competitive conditions within an industry. In addition, the value of an equity security may decline for a number of reasons that directly relate to the issuer, such as management performance, financial leverage and reduced demand for the issuer’s goods or services, as well as the historical and prospective earnings of the issuer and the value of its assets. Different types of equity securities may react differently to these developments and a change in the financial condition of a single issuer may affect securities markets as a whole.
During a general downturn in the securities markets, multiple asset classes, including equity securities, may decline in value simultaneously. The market price of equity securities owned by a Fund may go up or
down, sometimes rapidly or unpredictably. Equity securities generally have greater price volatility than fixed income securities and common stocks generally have the greatest appreciation and depreciation potential of all corporate securities.
The Funds may be subject to various risks as described in each Fund’s prospectus and in the Principal and Other Risks in the Notes to Financial Statements.
Classifications of the Funds’ portfolio holdings in this report are made according to financial reporting standards. The classification of a particular portfolio holding as shown in the Allocation Breakdown and Schedule of Investments sections of this report may differ from the classification used for the Funds’ compliance calculations, including those used in the Funds’ prospectus, investment objectives, regulatory, and other investment limitations and policies, which may be based on different asset class, sector or geographical classifications. Each Fund is separately monitored for compliance with respect to prospectus and regulatory requirements.
The geographical classification of foreign (non-U.S.) securities in this report, if any, are classified by the country of incorporation of a holding. In certain instances, a security’s country of incorporation may be different from its country of economic exposure.
Beginning in January 2020, global financial markets have experienced and may continue to experience significant volatility resulting from the spread of a novel coronavirus known as COVID-19. The outbreak of COVID-19 has resulted in travel and border restrictions, quarantines, supply chain disruptions, lower consumer demand and general market uncertainty. The effects of COVID-19 have and may continue to adversely affect the global economy, the economies of certain nations and individual issuers, all of which may negatively impact the Funds’ performance. In addition, COVID-19 and governmental responses to COVID-19 may negatively impact the capabilities of the Funds’ service providers and disrupt the Funds’ operations.
The United States’ enforcement of restrictions on U.S. investments in certain issuers and tariffs on goods from other countries, each with a focus on China, has contributed to international trade tensions and may impact portfolio securities (and/or portfolio securities of Underlying Funds or Acquired Funds, as applicable).
The United Kingdom’s withdrawal from the European Union may impact Fund returns. The withdrawal may cause substantial volatility in foreign exchange markets, lead to weakness in the exchange rate of the British pound, result in a sustained period of market uncertainty, and destabilize some or all of the other European Union member countries and/or the Eurozone.
A Fund may invest in certain instruments that rely in some fashion upon the London Interbank Offered Rate (“LIBOR”). LIBOR is an average interest rate, determined by the ICE Benchmark Administration, that banks charge one another for the use of short-term money. The United Kingdom’s Financial Conduct Authority, which regulates LIBOR, has announced plans to ultimately phase out the use of LIBOR. There remains uncertainty regarding future utilization of LIBOR and the nature of any replacement rate (e.g., the Secured Overnight Financing Rate, which is intended to replace U.S. dollar LIBOR and measures the cost of overnight borrowings through repurchase agreement transactions collateralized with U.S. Treasury securities). Any potential effects of the transition away from LIBOR on a Fund or on certain instruments in which a Fund invests can be difficult to ascertain, and they may vary depending on a variety of factors. The transition may also result in a reduction in the value of certain instruments held by a Fund or a reduction in the effectiveness of related Fund transactions such as hedges. Any such effects of the transition away from LIBOR, as well as other unforeseen effects, could result in losses to a Fund
A Fund may invest in securities and instruments that are economically tied to Russia. Investments in Russia are subject to various risks such as, but not limited to political, economic, legal, market and currency risks. The risks include uncertain political and economic policies, short-term market volatility, poor accounting standards, corruption and crime, an inadequate regulatory system, regional armed conflict and unpredictable taxation. Investments in Russia are particularly subject to the risk that further economic sanctions and other similar measures may be imposed by the United States and/or other countries. Other similar measures may include, but are not limited to, banning Russia or certain persons or entities associated with Russia from global payment systems that facilitate cross-border payments, restricting the settlement of securities transactions by certain investors, and freezing Russian assets or those of particular countries, entities or persons with ties to Russia. Such sanctions and other similar measures — which may impact companies in many sectors, including energy, financial services and defense, among others — may negatively impact a Fund’s performance and/or ability to achieve its investment objective. For example, certain investments may be prohibited and/or existing investments may become illiquid (e.g., in the event that transacting in certain existing investments is prohibited, securities markets close, or market participants cease transacting in certain investments in light of geopolitical events, sanctions or related considerations), which could render any such securities held by a Fund unmarketable for an indefinite period of time and/or cause the Fund to sell other portfolio holdings at a disadvantageous time or price in order to meet shareholder redemptions. In addition, such sanctions or other similar measures, and the Russian government’s response, could result in a downgrade of Russia’s credit rating or of securities of issuers located in or economically tied to Russia, devaluation of Russia’s currency and/or increased volatility with respect to Russian securities and the ruble.
Moreover, disruptions caused by Russian military action or other actions (including cyberattacks, espionage or other asymmetric measures) or resulting actual or threatened responses to such activity may impact Russia’s economy and Russian issuers of securities in which a Fund invests. Such resulting actual or threatened responses may include, but are not limited to, purchasing and financing restrictions, withdrawal of financial intermediaries, boycotts or changes in consumer or purchaser preferences, sanctions, tariffs or cyberattacks on the Russian government, Russian companies or Russian individuals, including politicians. The Russian securities market is characterized by limited volume of trading, resulting in difficulty in obtaining accurate prices and trading. These issues can be magnified as a result of sanctions and other similar measures that may be imposed and the Russian government’s response. The Russian securities market, as compared to U.S. markets, has significant price volatility, less liquidity, a smaller market capitalization and a smaller number of traded securities. There may be little publicly available information about issuers. Settlement, clearing and registration of securities transactions are subject to risks. Prior to the implementation of the National Settlement Depository (“NSD”), a recognized central securities depository, there was no central registration system for equity share registration in Russia, and registration was carried out by either the issuers themselves or by registrars located throughout Russia. Title to Russian equities held through the NSD is now based on the records of the NSD and not the registrars. Although the implementation of the NSD has enhanced the efficiency and transparency of the Russian securities market, issues resulting in loss can still occur. Ownership of securities issued by Russian companies that are not held through depositories such as the NSD may be recorded by companies themselves and by registrars. In such cases, the risk is increased that a Fund could lose ownership rights through fraud, negligence or oversight. While applicable Russian regulations impose liability on registrars for losses resulting from their errors, it may be difficult for a Fund to enforce any rights it may have against the registrar or issuer of the securities in the event of loss of share registration. In addition, issuers and registrars are still prominent in the validation and approval of documentation requirements for corporate action processing in Russia. Because the documentation requirements and approval criteria vary between registrars and issuers, there remain unclear and inconsistent market standards in the Russian market with respect to the completion and submission of corporate action elections. To the extent that a Fund suffers a loss relating to title or corporate actions relating
to its portfolio securities, it may be difficult for the Fund to enforce its rights or otherwise remedy the loss. Russian securities laws may not recognize foreign nominee accounts held with a custodian bank, and therefore the custodian may be considered the ultimate owner of securities they hold for their clients. Adverse currency exchange rates are a risk and there may be a lack of available currency hedging instruments. Investments in Russia may be subject to the risk of
| | | | | | | | | | | | |
| | | | ANNUAL REPORT | | | | | | | JUNE 30, 2022 | | | 5 |
| | | | |
| Important Information About the Funds | | (Cont.) | | |
nationalization or expropriation of assets. Oil, natural gas, metals, and timber account for a significant portion of Russia’s exports, leaving the country vulnerable to swings in world prices, and to sanctions or other actions that may be directed at the Russian economy as a whole or at Russian oil, natural gas, metals or timber industries.
Russia has attempted, and may attempt in the future, to assert its influence in the region through economic or military measures. For example, in February 2022, Russia launched a large-scale invasion of Ukraine. Such measures may have an adverse effect on the Russian economy, which may, in turn, negatively impact a Fund.
Foreign investors also face a high degree of currency risk when investing in Russian securities and a lack of available currency hedging instruments. In addition, there is the risk that the Russian government may impose capital controls on foreign portfolio investments in the event of extreme financial or political crisis. Such capital controls may prevent the sale of a portfolio of foreign assets and the repatriation of investment income and capital.
On each individual Fund Summary page in this Shareholder Report, the Average Annual Total Return table and Cumulative Returns chart measure performance assuming that any dividend and capital gain distributions were reinvested. Returns do not reflect the deduction of taxes that a shareholder would pay on (i) Fund distributions or (ii) the redemption of Fund shares. The Cumulative Returns chart and Average Annual Total Return table reflect any sales load that would have applied at the time of purchase or any Contingent Deferred Sales Charge (“CDSC”) that would have applied if a full redemption occurred
on the last business day of the period shown in the Cumulative Returns chart. Class A shares are subject to an initial sales charge. A CDSC may be imposed in certain circumstances on Class A shares that are purchased without an initial sales charge and then redeemed during the first 12 months after purchase. The Cumulative Returns chart reflects only Institutional Class performance. Performance may vary by share class based on each class’s expense ratios. Performance shown is net of fees and expenses. The minimum initial investment amount for Institutional Class, I-2 and I-3 shares is $1,000,000. The minimum initial investment amount for Class A shares is $1,000. Each Fund measures its performance against at least one broad-based securities market index (“benchmark index”). The benchmark index does not take into account fees, expenses, or taxes. A Fund’s past performance, before and after taxes, is not necessarily an indication of how the Fund will perform in the future. There is no assurance that any Fund, including any Fund that has experienced high or unusual performance for one or more periods, will experience similar levels of performance in the future. High performance is defined as a significant increase in either 1) a Fund’s total return in excess of that of the Fund’s benchmark between reporting periods or 2) a Fund’s total return in excess of the Fund’s historical returns between reporting periods. Unusual performance is defined as a significant change in a Fund’s performance as compared to one or more previous reporting periods. Historical performance for a Fund or share class may have been positively impacted by fee waivers or expense limitations in place during some or all of the periods shown, if applicable. Future performance (including total return or yield) and distributions may be negatively impacted by the expiration or reduction of any such fee waivers or expense limitations.
The following table discloses the inception dates of each Fund and its respective share classes along with the Fund’s diversification status as of period end:
| | | | | | | | | | | | | | | | | | | | | | | | | | | | |
| Fund Name | | | | | Fund
Inception | | | Institutional
Class | | | I-2 | | | I-3 | | | Class A | | | Diversification
Status | |
PIMCO RAE Emerging Markets Fund | | | | | | | 06/05/15 | | | | 06/05/15 | | | | 06/05/15 | | | | — | | | | 06/05/15 | | | | Diversified | |
PIMCO RAE Global ex-US Fund | | | | | | | 06/05/15 | | | | 06/05/15 | | | | 06/05/15 | | | | — | | | | 06/05/15 | | | | Diversified | |
PIMCO RAE International Fund | | | | | | | 06/05/15 | | | | 06/05/15 | | | | 06/05/15 | | | | — | | | | 06/05/15 | | | | Diversified | |
PIMCO RAE US Fund | | | | | | | 06/05/15 | | | | 06/05/15 | | | | 06/05/15 | | | | — | | | | 06/05/15 | | | | Diversified | |
PIMCO RAE US Small Fund | | | | | | | 06/05/15 | | | | 06/05/15 | | | | 06/05/15 | | | | — | | | | 06/05/15 | | | | Diversified | |
An investment in a Fund is not a bank deposit and is not guaranteed or insured by the Federal Deposit Insurance Corporation or any other government agency. It is possible to lose money on investments in a Fund.
The Trustees are responsible generally for overseeing the management of the Trust. The Trustees authorize the Trust to enter into service agreements with the Adviser, the Distributor, the Administrator and other service providers in order to provide, and in some cases authorize
service providers to procure through other parties, necessary or
desirable services on behalf of the Trust and the Funds. Shareholders are not parties to or third-party beneficiaries of such service agreements. Neither a Fund’s prospectus nor a Fund’s summary prospectus, the Trust’s Statement of Additional Information (“SAI”), any contracts filed as exhibits to the Trust’s registration statement, nor any other communications, disclosure documents or regulatory filings (including this report) from or on behalf of the Trust or a Fund creates a contract between or among any shareholder of a Fund, on the one hand, and the Trust, a Fund, a service provider to the Trust or a Fund, and/or the Trustees or officers of the Trust, on the other hand. The
Trustees (or the Trust and its officers, service providers or other delegates acting under authority of the Trustees) may amend the most recent prospectus or use a new prospectus, summary prospectus or SAI with respect to a Fund or the Trust, and/or amend, file and/or issue any other communications, disclosure documents or regulatory filings, and may amend or enter into any contracts to which the Trust or a Fund is a party, and interpret the investment objective(s), policies, restrictions and contractual provisions applicable to any Fund, without shareholder input or approval, except in circumstances in which shareholder approval is specifically required by law (such as changes to fundamental investment policies) or where a shareholder approval requirement is specifically disclosed in the Trust’s then-current prospectus or SAI.
PIMCO has adopted written proxy voting policies and procedures (“Proxy Policy”) as required by Rule 206(4)-6 under the Investment Advisers Act of 1940, as amended. The Proxy Policy has been adopted by the Trust as the policies and procedures that PIMCO will use when voting proxies on behalf of a Fund. A description of the policies and procedures that PIMCO uses to vote proxies relating to portfolio securities of a Fund, and information about how the Fund voted proxies relating to portfolio securities held during the most recent twelve-month period ended June 30th, are available without charge, upon request, by calling the Trust at (888) 87-PIMCO, on the Fund’s website at www.pimco.com, and on the Securities and Exchange Commission’s (“SEC”) website at www.sec.gov.
The Funds file portfolio holdings information with the SEC on Form N-PORT within 60 days of the end of each fiscal quarter. The Funds’ complete schedule of securities holdings as of the end of each fiscal quarter will be made available to the public on the SEC’s website at www.sec.gov and on PIMCO’s website at www.pimco.com, and will be made available, upon request, by calling PIMCO at (888) 87-PIMCO.
SEC rules allow the Funds to fulfill their obligation to deliver shareholder reports to investors by providing access to such reports online free of charge and by mailing a notice that the report is electronically available. Investors may elect to receive all future reports in paper free of charge by contacting their financial intermediary or, if invested directly with the Fund, investors can inform the Fund by calling (888) 87-PIMCO. Any election to receive reports in paper will apply to all funds held with the fund complex if invested directly with the Fund or to all funds held in the investor’s account if invested through a financial intermediary.
In August 2020, the SEC proposed changes to the mutual fund and ETF shareholder report and registration statement disclosure requirements and the registered fund advertising rules, which, if adopted, will change the disclosures provided to shareholders.
In October 2020, the SEC adopted a rule related to the use of derivatives, short sales, reverse repurchase agreements and certain other transactions by registered investment companies that rescinds and withdraws the guidance of the SEC and its staff regarding asset segregation and cover transactions that was applicable to the Funds as of the date of this report. Subject to certain exceptions, the rule requires funds that trade derivatives and other transactions that create future payment or delivery obligations to comply with a value-at-risk leverage limit and certain derivatives risk management program and reporting requirements. These requirements may limit the ability of the Funds to use derivatives and reverse repurchase agreements and similar financing transactions as part of their investment strategies and may increase the cost of the Funds’ investments and cost of doing business, which could adversely affect investors. The rule went into effect on February 19, 2021. The compliance date for the new rule and related reporting requirements is August 19, 2022.
In October 2020, the SEC adopted a rule regarding the ability of a fund to invest in other funds. The rule allows a fund to acquire shares of another fund in excess of certain limitations currently imposed by the Investment Company Act of 1940 (the “Act”) without obtaining individual exemptive relief from the SEC, subject to certain conditions. The rule also includes the rescission of certain exemptive relief from the SEC and guidance from the SEC staff for funds to invest in other funds. The effective date for the rule was January 19, 2021, and the compliance date for the rule was January 19, 2022.
In December 2020, the SEC adopted a rule addressing fair valuation of fund investments. The new rule sets forth requirements for good faith determinations of fair value as well as for the performance of fair value determinations, including related oversight and reporting obligations. The new rule also defines “readily available market quotations” for purposes of the definition of “value” under the Act, and the SEC noted that this definition will apply in all contexts under the Act. The effective date for the rule was March 8, 2021. The compliance date for the new rule and the associated recordkeeping requirements is September 8, 2022.
In May 2022, the SEC proposed amendments to a current rule governing fund naming conventions. In general, the current rule requires funds with certain types of names to adopt a policy to invest at least 80% of their assets in the type of investment suggested by the name. The proposed amendments would expand the scope of the current rule in a number of ways that would result in an expansion of the types of fund names that would require the fund to adopt an 80% investment policy under the rule. Additionally, the proposed amendments would modify the circumstances under which a fund may deviate from its 80% investment policy and address the use and
| | | | | | | | | | | | |
| | | | ANNUAL REPORT | | | | | | | JUNE 30, 2022 | | | 7 |
| | | | |
| Important Information About the Funds | | (Cont.) | | |
valuation of derivatives instruments for purposes of the rule. The proposal’s impact on the Funds will not be known unless and until any final rulemaking is adopted.
In May 2022, the SEC proposed a framework that would require certain registered funds (such as the Funds) to disclose their environmental, social, and governance (“ESG”) investing practices. Among other things, the proposed requirements would mandate that funds meeting three pre-defined classifications (i.e., integrated, ESG focused and/or impact funds) provide prospectus and shareholder report disclosure related to the ESG factors, criteria and processes used in managing the fund. The proposal’s impact on the Funds will not be known unless and until any final rulemaking is adopted.
PIMCO RAE Emerging Markets Fund
Cumulative Returns Through June 30, 2022
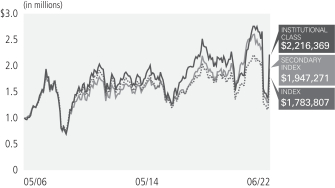
$1,000,000 invested at the end of the month when the Fund’s Institutional Class commenced operations.
Investment Objective and Strategy Overview
PIMCO RAE Emerging Markets Fund seeks long-term capital appreciation by investing under normal circumstances at least 80% of its assets in investments that are economically tied to emerging market countries. Specifically, under normal circumstances, the Fund will obtain exposure to a portfolio of stocks economically tied to emerging market countries (“RAE Emerging Markets Portfolio”) through investment in the securities that comprise the RAE Emerging Markets Portfolio. The stocks are selected by the Fund’s sub-adviser, Research Affiliates, LLC, from a broad universe of companies which satisfy certain liquidity and capacity requirements. Fund strategies may change from time to time. Please refer to the Fund’s current prospectus for more information regarding the Fund’s strategy.
| | | | | | | | | | | | | | | | | | |
|
| Average Annual Total Return for the period ended June 30, 2022* | |
| | | | | |
| | | | | 1 Year | | | 5 Years | | | 10 Years | | | Fund Inception
(05/31/06) | |
 | | PIMCO RAE Emerging Markets Fund Institutional Class | | | (19.72)% | | | | 2.27% | | | | 3.27% | | | | 5.07% | |
| | PIMCO RAE Emerging Markets Fund I-2 | | | (19.78)% | | | | 2.14% | | | | 3.18% | | | | 5.02% | |
| | PIMCO RAE Emerging Markets Fund Class A | | | (19.97)% | | | | 1.91% | | | | 3.02% | | | | 4.92% | |
| | PIMCO RAE Emerging Markets Fund Class A (adjusted) | | | (22.96)% | | | | 1.13% | | | | 2.63% | | | | 4.68% | |
 | | MSCI Emerging Markets Value Index± | | | (18.59)% | | | | 1.25% | | | | 1.46% | | | | 3.66% | |
 | | MSCI Emerging Markets Index±±ª | | | (25.28)% | | | | 2.18% | | | | 3.06% | | | | 4.23% | |
All Fund returns are net of fees and expenses and include applicable fee waivers and/or expense limitations. Absent any applicable fee waivers and/or expense limitations, performance would have been lower and there can be no assurance that any such waivers or limitations will continue in the future
ª Prior to 2/28/2019, the fund’s primary benchmark was the MSCI Emerging Markets Index.
± The MSCI Emerging Markets Value Index captures large and mid-cap securities exhibiting overall value style characteristics across a group of emerging markets countries. The value investment style characteristics for index construction of the MSCI Emerging Markets Value Index are defined using three variables: book value to price, 12-month forward earnings to price and dividend yield.
±± The MSCI Emerging Markets Index is a free float-adjusted market capitalization index that is designed to measure equity market performance of emerging markets.
It is not possible to invest directly in an unmanaged index.
* For periods prior to June 5, 2015, the Fund’s performance reflects the performance when the Fund was a partnership, net of actual fees and expenses charged to individual partnership accounts in the aggregate. If the performance had been restated to reflect the applicable fees and expenses of each share class, the performance may have been higher or lower. The Fund began operations as a partnership on May 31, 2006 and, on June 5, 2015, was reorganized into a newly-formed fund that was registered as an investment company under the Investment Company Act of 1940. Prior to the reorganization, the Fund had an investment objective, investment strategies, investment guidelines, and restrictions that were substantially similar to those currently applicable to the Fund; however, the Fund was not registered as an investment company under the Investment Company Act of 1940 and was not subject to its requirements or requirements imposed by the Internal Revenue Code of 1986 which, if applicable, may have adversely affected its performance. The performance of each class of shares will differ as a result of the different levels of fees and expenses applicable to each class of shares.
Performance quoted represents past performance. Past performance is not a guarantee or a reliable indicator of future results. Current performance may be lower or higher than performance shown. Investment return and the principal value of an investment will fluctuate. Shares may be worth more or less than original cost when redeemed. Returns shown do not reflect the deduction of taxes that a shareholder would pay on fund distributions or the redemption of fund shares. Differences in the Fund’s performance versus the index and related attribution information with respect to particular categories of securities or individual positions may be attributable, in part, to differences in the pricing methodologies used by the Fund and the index. The adjusted returns take into account the maximum sales charge of 3.75% on Class A shares. For performance data current to the most recent month-end, visit www.pimco.com or via (888) 87-PIMCO.
The Fund’s total annual operating expense ratio in effect as of period end was 0.78% for Institutional Class shares, 0.88% for I-2 shares and 1.13% for Class A shares. Details regarding any changes to the Fund’s operating expenses, subsequent to period end, can be found in the Fund’s current prospectus, as supplemented.
| | | | | | | | | | | | |
| | | | ANNUAL REPORT | | | | | | | JUNE 30, 2022 | | | 9 |
| | | | |
| Institutional Class - PEIFX | | I-2 - PEPFX | | Class A - PEAFX |
Geographic Breakdown as of June 30, 2022†§
| | | | | | | | |
China | | | | | | | 17.7% | |
South Korea | | | | | | | 12.7% | |
Brazil | | | | | | | 11.8% | |
India | | | | | | | 10.0% | |
Thailand | | | | | | | 9.1% | |
Taiwan | | | | | | | 7.4% | |
South Africa | | | | | | | 7.3% | |
Mexico | | | | | | | 6.0% | |
Turkey | | | | | | | 3.8% | |
Short-Term Instruments | | | | | | | 3.6% | |
Hong Kong | | | | | | | 3.3% | |
Indonesia | | | | | | | 2.6% | |
Malaysia | | | | | | | 1.3% | |
Poland | | | | | | | 1.0% | |
Other | | | | | | | 2.4% | |
† % of Investments, at value.
§ Geographic Breakdown and % of Investments exclude securities sold short and financial derivative instruments, if any.
Fund Insights
The following affected performance (on a gross basis) during the reporting period:
| » | | Underweight exposure to, and security selection in, the information technology sector contributed to relative returns, as the sector underperformed the benchmark index and the Fund’s holdings outperformed the benchmark index. |
| » | | Underweight exposure to, and security selection in, the consumer discretionary sector contributed to relative returns, as the sector underperformed the benchmark index and the Fund’s holdings outperformed the benchmark index. |
| » | | Overweight exposure to, and security selection in, the communication services sector contributed to relative returns, as the sector and the Fund’s holdings outperformed the benchmark index. |
| » | | Security selection in the financials sector detracted from relative returns, as the Fund’s holdings underperformed the benchmark index. |
| » | | Security selection in the materials sector detracted from relative returns, as the Fund’s holdings underperformed the benchmark index. |
| » | | Underweight exposure to, and security selection in, the consumer staples sector detracted from relative returns, as the sector outperformed the benchmark index and the Fund’s holdings underperformed the benchmark index. |
PIMCO RAE Global ex-US Fund
Cumulative Returns Through June 30, 2022
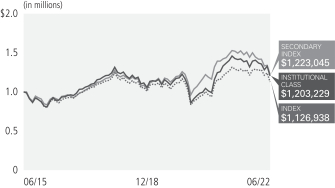
$1,000,000 invested at the end of the month when the Fund’s Institutional Class commenced operations.
Investment Objective and Strategy Overview
PIMCO RAE Global ex-US Fund seeks long-term capital appreciation by investing, under normal circumstances substantially all of its assets in (i) Institutional Class shares of the PIMCO RAE International Fund (“International Fund”) and the PIMCO RAE Emerging Markets Fund (“Emerging Markets Fund”) (together, the International Fund and the Emerging Markets Fund are referred to as the “Underlying Funds”), and (ii) securities that are eligible investments for the Underlying Funds. Under normal circumstances, each of the Underlying Funds obtains exposure to a portfolio of stocks (each, a “RAE Portfolio”) through investment in the securities that comprise the RAE Portfolio. The stocks are selected by the Fund’s sub-adviser, Research Affiliates, LLC, from a broad universe of companies which satisfy certain liquidity and capacity requirements. Fund strategies may change from time to time. Please refer to the Fund’s current prospectus for more information regarding the Fund’s strategy.
| | | | | | | | | | | | | | |
|
| Average Annual Total Return for the period ended June 30, 2022 | |
| | | | |
| | | | | 1 Year | | | 5 Years | | | Fund Inception
(06/05/15) | |
| | PIMCO RAE Global ex-US Fund Institutional Class | | | (15.58)% | | | | 1.73% | | | | 2.45% | |
| | PIMCO RAE Global ex-US Fund I-2 | | | (15.57)% | | | | 1.68% | | | | 2.37% | |
| | PIMCO RAE Global ex-US Fund Class A | | | (15.87)% | | | | 1.38% | | | | 2.10% | |
| | PIMCO RAE Global ex-US Fund Class A (adjusted) | | | (19.04)% | | | | 0.60% | | | | 1.55% | |
| | MSCI All Country World ex US Value Index± | | | (12.77)% | | | | 1.23% | | | | 1.51% | |
| | MSCI All Country World ex US Index±±ª | | | (19.42)% | | | | 2.50% | | | | 2.72% | |
All Fund returns are net of fees and expenses and include applicable fee waivers and/or expense limitations. Absent any applicable fee waivers and/or expense limitations, performance would have been lower and there can be no assurance that any such waivers or limitations will continue in the future
ª Prior to 2/28/2019, the fund’s primary benchmark was the MSCI All Country World ex US Index.
± The MSCI All Country World ex US Value Index captures large and mid-cap securities exhibiting overall value style characteristics across a group of developed and emerging markets countries. The value investment style characteristics for index construction of the MSCI All Country World ex US Value Index are defined using three variables: book value to price, 12-month forward earnings to price and dividend yield.
±± The MSCI All Country World ex US Index is a free float-adjusted market capitalization weighted index that is designed to measure the equity market performance of developed and emerging markets. The Index consists of a group of country indices comprising developed and emerging market country indices.
It is not possible to invest directly in an unmanaged index.
Performance quoted represents past performance. Past performance is not a guarantee or a reliable indicator of future results. Current performance may be lower or higher than performance shown. Investment return and the principal value of an investment will fluctuate. Shares may be worth more or less than original cost when redeemed. Returns shown do not reflect the deduction of taxes that a shareholder would pay on fund distributions or the redemption of fund shares. Differences in the Fund’s performance versus the index and related attribution information with respect to particular categories of securities or individual positions may be attributable, in part, to differences in the pricing methodologies used by the Fund and the index. The adjusted returns take into account the maximum sales charge of 3.75% on Class A shares. For performance data current to the most recent month-end, visit www.pimco.com or via (888) 87-PIMCO.
The Fund’s total annual operating expense ratio in effect as of period end, which includes the Acquired Fund Fees and Expenses (Underlying PIMCO Fund expenses) was 1.12% for Institutional Class shares, 1.22% for I-2 shares and 1.47% for Class A shares. Details regarding any changes to the Fund’s operating expenses, subsequent to period end, can be found in the Fund’s current prospectus, as supplemented.
| | | | | | | | | | | | |
| | | | ANNUAL REPORT | | | | | | | JUNE 30, 2022 | | | 11 |
| | | | |
| Institutional Class - PZRIX | | I-2 - PZRPX | | Class A - PZRAX |
Top Holdings as of June 30, 2022†§
| | | | | | | | |
PIMCO RAE International Fund | | | | | | | 76.3% | |
PIMCO RAE Emerging Markets Fund | | | | | | | 23.5% | |
† % of Investments, at value.
§ Top Holdings and % of Investments exclude securities sold short, financial derivative instruments and short-term instruments, if any.
Fund Insights
The following affected performance (on a gross basis) during the reporting period:
| » | | Security selection in the information technology sector contributed to relative returns, as the Fund’s holdings outperformed the benchmark index. |
| » | | Overweight exposure to, and security selection in, the communication services sector contributed to relative returns, as the sector and the Fund’s holdings outperformed the benchmark index. |
| » | | Security selection in the utilities sector contributed to relative returns, as the Fund’s holdings outperformed the benchmark index. |
| » | | Overweight exposure to the materials sector detracted from relative returns, as the sector underperformed the benchmark index. |
| » | | Security selection in the industrials sector detracted from relative returns, as the Fund’s holdings underperformed the benchmark index. |
| » | | Underweight exposure to the energy sector detracted from relative returns, as the sector outperformed the benchmark index. |
PIMCO RAE International Fund
Cumulative Returns Through June 30, 2022
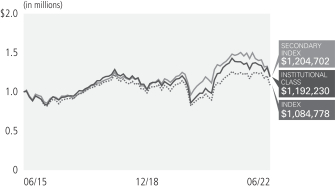
$1,000,000 invested at the end of the month when the Fund’s Institutional Class commenced operations.
Investment Objective and Strategy Overview
PIMCO RAE International Fund seeks long-term capital appreciation under normal circumstances by obtaining exposure to a portfolio of stocks economically tied to at least three foreign (non-U.S.) countries (“RAE International Portfolio”) through investment in the securities that comprise the RAE International Portfolio. The stocks are selected by the Fund’s sub-adviser, Research Affiliates, from a broad universe of companies which satisfy certain liquidity and capacity requirements. Fund strategies may change from time to time. Please refer to the Fund’s current prospectus for more information regarding the Fund’s strategy.
| | | | | | | | | | | | | | |
|
| Average Annual Total Return for the period ended June 30, 2022 | |
| | | | |
| | | | | 1 Year | | | 5 Years | | | Fund Inception
(06/05/15) | |
| | PIMCO RAE International Fund Institutional Class | | | (14.14)% | | | | 1.67% | | | | 2.27% | |
| | PIMCO RAE International Fund I-2 | | | (14.25)% | | | | 1.59% | | | | 2.18% | |
| | PIMCO RAE International Fund Class A | | | (14.41)% | | | | 1.33% | | | | 1.92% | |
| | PIMCO RAE International Fund Class A (adjusted) | | | (17.61)% | | | | 0.55% | | | | 1.37% | |
| | MSCI EAFE Value Index± | | | (11.95)% | | | | 0.52% | | | | 0.94% | |
| | MSCI EAFE Index±±ª | | | (17.77)% | | | | 2.20% | | | | 2.50% | |
All Fund returns are net of fees and expenses and include applicable fee waivers and/or expense limitations. Absent any applicable fee waivers and/or expense limitations, performance would have been lower and there can be no assurance that any such waivers or limitations will continue in the future
ª Prior to 2/28/2019, the fund’s primary benchmark was the MSCI EAFE Index.
± The MSCI EAFE Value Index captures large and mid-cap securities exhibiting overall value style characteristics across developed markets countries around the world, excluding the US and Canada. The value investment style characteristics for index construction of the MSCI EAFE Value Index are defined using three variables: book value to price, 12-month forward earnings to price and dividend yield.
±± MSCI EAFE Index is an unmanaged index designed to represent the performance of large and mid-cap securities across a group of developed markets, including countries in Europe, Australasia and the Far East, excluding the U.S. and Canada.
It is not possible to invest directly in an unmanaged index.
Performance quoted represents past performance. Past performance is not a guarantee or a reliable indicator of future results. Current performance may be lower or higher than performance shown. Investment return and the principal value of an investment will fluctuate. Shares may be worth more or less than original cost when redeemed. Returns shown do not reflect the deduction of taxes that a shareholder would pay on fund distributions or the redemption of fund shares. Differences in the Fund’s performance versus the index and related attribution information with respect to particular categories of securities or individual positions may be attributable, in part, to differences in the pricing methodologies used by the Fund and the index. The adjusted returns take into account the maximum sales charge of 3.75% on Class A shares. For performance data current to the most recent month-end, visit www.pimco.com or via (888) 87-PIMCO.
The Fund’s total annual operating expense ratio in effect as of period end was 0.52% for Institutional Class shares, 0.62% for I-2 shares and 0.87% for Class A shares. Details regarding any changes to the Fund’s operating expenses, subsequent to period end, can be found in the Fund’s current prospectus, as supplemented.
| | | | | | | | | | | | |
| | | | ANNUAL REPORT | | | | | | | JUNE 30, 2022 | | | 13 |
| | | | |
| Institutional Class - PPYIX | | I-2 - PPYPX | | Class A - PPYAX |
Geographic Breakdown as of June 30, 2022†§
| | | | | | | | |
Japan | | | | | | | 29.9% | |
United Kingdom | | | | | | | 12.8% | |
Switzerland | | | | | | | 7.1% | |
Australia | | | | | | | 6.2% | |
Netherlands | | | | | | | 6.2% | |
Spain | | | | | | | 5.9% | |
Short-Term Instruments | | | | | | | 5.5% | |
France | | | | | | | 4.8% | |
Canada | | | | | | | 4.8% | |
Germany | | | | | | | 3.6% | |
Italy | | | | | | | 3.2% | |
Hong Kong | | | | | | | 2.5% | |
Israel | | | | | | | 1.5% | |
Finland | | | | | | | 1.3% | |
Other | | | | | | | 4.7% | |
† % of Investments, at value.
§ Geographic Breakdown and % of Investments exclude securities sold short and financial derivative instruments, if any.
Fund Insights
The following affected performance (on a gross basis) during the reporting period:
| » | | Security selection in the utilities sector contributed to relative returns, as the Fund’s holdings outperformed the benchmark index. |
| » | | Security selection in the financials sector contributed to relative returns, as the Fund’s holdings outperformed the benchmark index. |
| » | | Overweight exposure to, and security selection in, the communication services sector contributed to relative returns, as the sector and the Fund’s holdings outperformed the benchmark index. |
| » | | Security selection in the industrials sector detracted from relative returns, as the Fund’s holdings underperformed the benchmark index. |
| » | | Overweight exposure to, and security selection in, the consumer discretionary sector detracted from relative returns, as the sector and the Fund’s holdings underperformed the benchmark index. |
| » | | Underweight exposure to, and security selection in, the health care sector detracted from relative returns, as the sector outperformed the benchmark index and the Fund’s holdings underperformed the benchmark index. |
PIMCO RAE US Fund
Cumulative Returns Through June 30, 2022
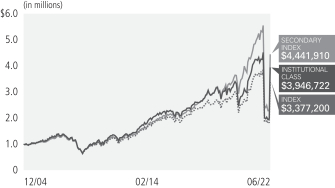
$1,000,000 invested at the end of the month when the Fund’s Institutional Class commenced operations.
Investment Objective and Strategy Overview
PIMCO RAE US Fund seeks long-term capital appreciation by investing under normal circumstances at least 80% of its assets in securities of companies economically tied to the United States (“U.S. companies”). Specifically, under normal circumstances, the Fund will obtain exposure to a portfolio of stocks of U.S. companies (“RAE US Portfolio”) through investment in the securities that comprise the RAE US Portfolio. The stocks are selected by the Fund’s sub-adviser, Research Affiliates, LLC, from a broad universe of companies which satisfy certain liquidity and capacity requirements. Fund strategies may change from time to time. Please refer to the Fund’s current prospectus for more information regarding the Fund’s strategy.
| | | | | | | | | | | | | | | | | | |
|
| Average Annual Total Return for the period ended June 30, 2022* | |
| | | | | |
| | | | | 1 Year | | | 5 Years | | | 10 Years | | | Fund Inception
(12/22/04) | |
| | PIMCO RAE US Fund Institutional Class | | | (7.16)% | | | | 8.56% | | | | 11.19% | | | | 8.14% | |
| | PIMCO RAE US Fund I-2 | | | (7.25)% | | | | 8.45% | | | | 11.11% | | | | 8.10% | |
| | PIMCO RAE US Fund Class A | | | (7.54)% | | | | 8.11% | | | | 10.87% | | | | 7.97% | |
| | PIMCO RAE US Fund Class A (adjusted) | | | (11.03)% | | | | 7.29% | | | | 10.46% | | | | 7.74% | |
| | Russell 1000® Value Index± | | | (6.82)% | | | | 7.17% | | | | 10.50% | | | | 7.20% | |
| | S&P 500 Index±±ª | | | (10.62)% | | | | 11.31% | | | | 12.96% | | | | 8.89% | |
All Fund returns are net of fees and expenses and include applicable fee waivers and/or expense limitations. Absent any applicable fee waivers and/or expense limitations, performance would have been lower and there can be no assurance that any such waivers or limitations will continue in the future
¨ Average annual total return since 12/31/2004.
ª Prior to 2/28/2019, the fund’s primary benchmark was the S&P 500 Index.
± The Russell 1000® Value Index measures the performance of large and midcapitalization value sectors of the U.S. equity market, as defined by FTSE Russell. The Russell 1000® Value Index is a subset of the Russell 1000® Index, which measures the performance of the large and mid-capitalization sector of the U.S. equity market.
±± S&P 500 Index is an unmanaged market index generally considered representative of the stock market as a whole. The Index focuses on the large-cap segment of the U.S. equities market.
It is not possible to invest directly in an unmanaged index.
* For periods prior to June 5, 2015, the Fund’s performance reflects the performance when the Fund was a partnership, net of actual fees and expenses charged to individual partnership accounts in the aggregate. If the performance had been restated to reflect the applicable fees and expenses of each share class, the performance may have been higher or lower. The Fund began operations as a partnership on December 22, 2004 and, on June 5, 2015, was reorganized into a newly-formed fund that was registered as an investment company under the Investment Company Act of 1940. Prior to the reorganization, the Fund had an investment objective, investment strategies, investment guidelines, and restrictions that were substantially similar to those currently applicable to the Fund; however, the Fund was not registered as an investment company under the Investment Company Act of 1940 and was not subject to its requirements or requirements imposed by the Internal Revenue Code of 1986 which, if applicable, may have adversely affected its performance. The performance of each class of shares will differ as a result of the different levels of fees and expenses applicable to each class of shares.
Performance quoted represents past performance. Past performance is not a guarantee or a reliable indicator of future results. Current performance may be lower or higher than performance shown. Investment return and the principal value of an investment will fluctuate. Shares may be worth more or less than original cost when redeemed. Returns shown do not reflect the deduction of taxes that a shareholder would pay on fund distributions or the redemption of fund shares. Differences in the Fund’s performance versus the index and related attribution information with respect to particular categories of securities or individual positions may be attributable, in part, to differences in the pricing methodologies used by the Fund and the index. The adjusted returns take into account the maximum sales charge of 3.75% on Class A shares. For performance data current to the most recent month-end, visit www.pimco.com or via (888) 87-PIMCO.
The Fund’s total annual operating expense ratio in effect as of period end was 0.41% for Institutional Class shares, 0.51% for I-2 shares and 0.81% for Class A shares. Details regarding any changes to the Fund’s operating expenses, subsequent to period end, can be found in the Fund’s current prospectus, as supplemented.
| | | | | | | | | | | | |
| | | | ANNUAL REPORT | | | | | | | JUNE 30, 2022 | | | 15 |
| | | | |
| Institutional Class - PKAIX | | I-2 - PKAPX | | Class A - PKAAX |
Sector Breakdown as of June 30, 2022†§
| | | | | | | | |
Health Care | | | | | | | 22.2% | |
Information Technology | | | | | | | 20.8% | |
Energy | | | | | | | 15.6% | |
Financials | | | | | | | 10.6% | |
Consumer Discretionary | | | | | | | 7.9% | |
Utilities | | | | | | | 7.1% | |
Consumer Staples | | | | | | | 6.6% | |
Industrials | | | | | | | 5.2% | |
Real Estate | | | | | | | 1.4% | |
Communication Services | | | | | | | 1.1% | |
Short-Term Instruments | | | | | | | 0.9% | |
Materials | | | | | | | 0.6% | |
† % of Investments, at value.
§ Sector Breakdown and % of Investments exclude securities sold short and financial derivative instruments, if any.
Fund Insights
The following affected performance (on a gross basis) during the reporting period:
| » | | Overweight exposure to, and security selection in, the energy sector contributed to relative returns, as the sector and the Fund’s holdings outperformed the benchmark index. |
| » | | Underweight exposure to, and security selection in, the health care sector contributed to relative returns, as the sector underperformed the benchmark index and the Fund’s holdings outperformed the benchmark index. |
| » | | Underweight exposure to the communication services sector contributed to relative returns, as the sectors underperformed the benchmark index. |
| » | | Overweight exposure to, and security selection in, the consumer discretionary sector detracted from relative returns, as the sector and the Fund’s holdings underperformed the benchmark index. |
| » | | Underweight exposure to, and security selection in, the consumer staples sector detracted from relative returns, as the sector outperformed the benchmark index and the Fund’s holdings underperformed the benchmark index. |
| » | | Security selection in the industrials sector detracted from relative returns, as the Fund’s holdings underperformed the benchmark index. |
PIMCO RAE US Small Fund
Cumulative Returns Through June 30, 2022
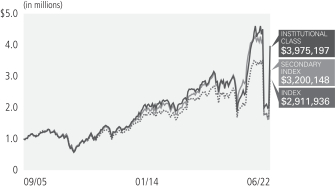
$1,000,000 invested at the end of the month when the Fund’s Institutional Class commenced operations.
Investment Objective and Strategy Overview
PIMCO RAE US Small Fund seeks long-term capital appreciation by investing under normal circumstances at least 80% of its assets in securities of small companies economically tied to the United States (“U.S. companies”). Specifically, under normal circumstances, the Fund will obtain exposure to a portfolio of stocks of small U.S. companies (“RAE US Small Portfolio”) through investment in the securities that comprise the RAE US Small Portfolio. The stocks are selected by the Fund’s sub-adviser, Research Affiliates, LLC, from a broad universe of companies which satisfy certain liquidity and capacity requirements. Fund strategies may change from time to time. Please refer to the Fund’s current prospectus for more information regarding the Fund’s strategy.
| | | | | | | | | | | | | | | | | | |
|
| Average Annual Total Return for the period ended June 30, 2022* | |
| | | | | |
| | | | | 1 Year | | | 5 Years | | | 10 Years | | | Fund Inception
(09/29/05) | |
| | PIMCO RAE US Small Fund Institutional Class | | | (13.65)% | | | | 9.07% | | | | 11.65% | | | | 8.60% | |
| | PIMCO RAE US Small Fund I-2 | | | (13.68)% | | | | 8.98% | | | | 11.57% | | | | 8.55% | |
| | PIMCO RAE US Small Fund Class A | | | (13.98)% | | | | 8.64% | | | | 11.33% | | | | 8.41% | |
| | PIMCO RAE US Small Fund Class A (adjusted) | | | (17.21)% | | | | 7.81% | | | | 10.90% | | | | 8.17% | |
| | Russell 2000® Value Index± | | | (16.28)% | | | | 4.89% | | | | 9.05% | | | | 6.61% | |
| | Russell 2000® Index±±ª | | | (25.20)% | | | | 5.17% | | | | 9.35% | | | | 7.19% | |
All Fund returns are net of fees and expenses and include applicable fee waivers and/or expense limitations. Absent any applicable fee waivers and/or expense limitations, performance would have been lower and there can be no assurance that any such waivers or limitations will continue in the future
¨ Average annual total return since 9/30/2005.
ª Prior to 2/28/2019, the fund’s primary benchmark was the Russell 2000® Index.
± The Russell 2000® Value Index measures the performance of the small-capitalization value sector of the U.S. equity market, as defined by FTSE Russell. The Russell 2000® Value Index is a subset of the Russell 2000® Index.
±± Russell 2000® Index is composed of 2,000 of the smallest companies in the Russell 3000 Index and is considered to be representative of the small cap market in general.
It is not possible to invest directly in an unmanaged index.
* For periods prior to June 5, 2015, the Fund’s performance reflects the performance when the Fund was a partnership, net of actual fees and expenses charged to individual partnership accounts in the aggregate. If the performance had been restated to reflect the applicable fees and expenses of each share class, the performance may have been higher or lower. The Fund began operations as a partnership on September 29, 2005 and, on June 5, 2015, was reorganized into a newly-formed fund that was registered as an investment company under the Investment Company Act of 1940. Prior to the reorganization, the Fund had an investment objective, investment strategies, investment guidelines, and restrictions that were substantially similar to those currently applicable to the Fund; however, the Fund was not registered as an investment company under the Investment Company Act of 1940 and was not subject to its requirements or requirements imposed by the Internal Revenue Code of 1986 which, if applicable, may have adversely affected its performance. The performance of each class of shares will differ as a result of the different levels of fees and expenses applicable to each class of shares.
Performance quoted represents past performance. Past performance is not a guarantee or a reliable indicator of future results. Current performance may be lower or higher than performance shown. Investment return and the principal value of an investment will fluctuate. Shares may be worth more or less than original cost when redeemed. Returns shown do not reflect the deduction of taxes that a shareholder would pay on fund distributions or the redemption of fund shares. Differences in the Fund’s performance versus the index and related attribution information with respect to particular categories of securities or individual positions may be attributable, in part, to differences in the pricing methodologies used by the Fund and the index. The adjusted returns take into account the maximum sales charge of 3.75% on Class A shares. For performance data current to the most recent month-end, visit www.pimco.com or via (888) 87-PIMCO.
The Fund’s total annual operating expense ratio in effect as of period end, which includes the Acquired Fund Fees and Expenses (Underlying PIMCO Fund expenses) was 0.53% for Institutional Class shares, 0.63% for I-2 shares and 0.93% for Class A shares. Details regarding any changes to the Fund’s operating expenses, subsequent to period end, can be found in the Fund’s current prospectus, as supplemented.
| | | | | | | | | | | | |
| | | | ANNUAL REPORT | | | | | | | JUNE 30, 2022 | | | 17 |
| | | | |
| Institutional Class - PMJIX | | I-2 - PMJPX | | Class A - PMJAX |
Sector Breakdown as of June 30, 2022†§
| | | | | | | | |
Energy | | | | | | | 16.8% | |
Consumer Discretionary | | | | | | | 13.3% | |
Real Estate | | | | | | | 13.2% | |
Information Technology | | | | | | | 9.1% | |
Financials | | | | | | | 8.7% | |
Industrials | | | | | | | 8.4% | |
Health Care | | | | | | | 8.2% | |
Short-Term Instruments | | | | | | | 6.6% | |
Consumer Staples | | | | | | | 6.0% | |
Materials | | | | | | | 4.5% | |
Utilities | | | | | | | 4.3% | |
Communication Services | | | | | | | 0.9% | |
† % of Investments, at value.
§ Sector Breakdown and % of Investments exclude securities sold short and financial derivative instruments, if any.
Fund Insights
The following affected performance (on a gross basis) during the reporting period:
| » | | Overweight exposure to, and security selection in, the energy sector contributed to relative returns, as the sector and the Fund’s holdings outperformed the benchmark index. |
| » | | Underweight exposure to, and security selection in, the health care sector contributed to relative returns, as the sector underperformed the benchmark index and the Fund’s holdings outperformed the benchmark index. |
| » | | Security selection in the materials sector contributed to relative returns, as the Fund’s holdings underperformed the benchmark index. |
| » | | Underweight exposure to, and security selection in, the financials sector detracted from relative returns, as the sector outperformed the benchmark index and the Fund’s holdings underperformed the benchmark index. |
| » | | Security selection in the real estate sector detracted from relative returns, as the Fund’s holdings underperformed the benchmark index. |
| » | | Security selection in the consumer staples sector detracted from relative returns, as the Fund’s holdings underperformed the benchmark index. |
Expense Examples
Example
As a shareholder of a Fund, you incur two types of costs: (1) transaction costs, including sales charges (loads) on purchase payments and exchange fees and (2) ongoing costs, including investment advisory fees, supervisory and administrative fees, distribution and/or service (12b-1) fees, and other Fund expenses. The Example is intended to help you understand your ongoing costs (in dollars) of investing in a Fund and to compare these costs with the ongoing costs of investing in other mutual funds.
The Example is based on an investment of $1,000 invested at the beginning of the period and held for the entire period indicated, which for all Funds and share classes is from January 1, 2022 to June 30, 2022 unless noted otherwise in the table and footnotes below.
Actual Expenses
The information in the table under the heading “Actual” provides information about actual account values and actual expenses. You may use this information, together with the amount you invested, to estimate the expenses that you paid over the period. Simply divide your account value by $1,000 (for example, an $8,600 account value divided by $1,000 = 8.60), then multiply the result by the number in the appropriate row for your share class, in the column entitled “Expenses Paid During Period” to estimate the expenses you paid on your account during this period.
Hypothetical Example for Comparison Purposes
The information in the table under the heading “Hypothetical (5% return before expenses)” provides information about hypothetical account values and hypothetical expenses based on a Fund’s actual expense ratio and an assumed rate of return of 5% per year before expenses, which is not the Fund’s actual return. The hypothetical account values and expenses may not be used to estimate the actual ending account balance or expenses you paid for the period. You may use this information to compare the ongoing costs of investing in a Fund and other funds. To do so, compare this 5% hypothetical example with the 5% hypothetical examples that appear in the shareholder reports of the other funds.
Please note that the expenses shown in the table are meant to highlight your ongoing costs only and do not reflect any transactional costs, such as sales charges (loads) on purchase payments and exchange fees. Therefore, the information under the heading “Hypothetical (5% return before expenses)” is useful in comparing ongoing costs only, and will not help you determine the relative total costs of owning different funds. In addition, if these transactional costs were included, your costs would have been higher.
Expense ratios may vary from period to period because of various factors such as an increase in expenses that are not covered by the investment advisory fees and supervisory and administrative fees, such as fees and expenses of the independent trustees and their counsel, extraordinary expenses and interest expense.
| | | | | | | | | | | | | | | | | | | | | | | | | | | | | | | | | | | | | | | | |
| | | | | | Actual | | | | | | Hypothetical
(5% return before expenses) | | | | | | | |
| | | | | | Beginning
Account Value
(01/01/22) | | | Ending
Account Value
(06/30/22) | | | Expenses Paid
During Period* | | | | | | Beginning
Account Value
(01/01/22) | | | Ending
Account Value
(06/30/22) | | | Expenses Paid
During Period* | | | | | | Net Annualized
Expense Ratio** | |
| | | | | | | | | | |
PIMCO RAE Emerging Markets Fund | | | | | | | | | | | | | | | | | | | | | | | | | | | | | | | | | | | | | | | | |
| Institutional Class | | | | | | $ | 1,000.00 | | | $ | 833.30 | | | $ | 3.42 | | | | | | | $ | 1,000.00 | | | $ | 1,020.79 | | | $ | 3.77 | | | | | | | | 0.76 | % |
| I-2 | | | | | | | 1,000.00 | | | | 832.50 | | | | 3.86 | | | | | | | | 1,000.00 | | | | 1,020.30 | | | | 4.26 | | | | | | | | 0.86 | |
| Class A | | | | | | | 1,000.00 | | | | 831.70 | | | | 4.99 | | | | | | | | 1,000.00 | | | | 1,019.08 | | | | 5.50 | | | | | | | | 1.11 | |
| | | | | | | | | | |
PIMCO RAE Global ex-US Fund | | | | | | | | | | | | | | | | | | | | | | | | | | | | | | | | | | | | | | | | |
| Institutional Class | | | | | | $ | 1,000.00 | | | $ | 863.30 | | | $ | 0.05 | | | | | | | $ | 1,000.00 | | | $ | 1,024.47 | | | $ | 0.05 | | | | | | | | 0.01 | % |
| I-2 | | | | | | | 1,000.00 | | | | 863.60 | | | | 0.50 | | | | | | | | 1,000.00 | | | | 1,023.98 | | | | 0.55 | | | | | | | | 0.11 | |
| Class A | | | | | | | 1,000.00 | | | | 862.00 | | | | 1.64 | | | | | | | | 1,000.00 | | | | 1,022.76 | | | | 1.79 | | | | | | | | 0.36 | |
| | | | | | | | | | |
PIMCO RAE International Fund | | | | | | | | | | | | | | | | | | | | | | | | | | | | | | | | | | | | | | | | |
| Institutional Class | | | | | | $ | 1,000.00 | | | $ | 873.80 | | | $ | 2.34 | | | | | | | $ | 1,000.00 | | | $ | 1,022.02 | | | $ | 2.53 | | | | | | | | 0.51 | % |
| I-2 | | | | | | | 1,000.00 | | | | 873.30 | | | | 2.80 | | | | | | | | 1,000.00 | | | | 1,021.53 | | | | 3.02 | | | | | | | | 0.61 | |
| Class A | | | | | | | 1,000.00 | | | | 872.50 | | | | 3.95 | | | | | | | | 1,000.00 | | | | 1,020.30 | | | | 4.26 | | | | | | | | 0.86 | |
| | | | | | | | | | |
PIMCO RAE US Fund | | | | | | | | | | | | | | | | | | | | | | | | | | | | | | | | | | | | | | | | |
| Institutional Class | | | | | | $ | 1,000.00 | | | $ | 873.50 | | | $ | 1.88 | | | | | | | $ | 1,000.00 | | | $ | 1,022.51 | | | $ | 2.03 | | | | | | | | 0.41 | % |
| I-2 | | | | | | | 1,000.00 | | | | 873.30 | | | | 2.34 | | | | | | | | 1,000.00 | | | | 1,022.02 | | | | 2.53 | | | | | | | | 0.51 | |
| Class A | | | | | | | 1,000.00 | | | | 872.10 | | | | 3.72 | | | | | | | | 1,000.00 | | | | 1,020.55 | | | | 4.01 | | | | | | | | 0.81 | |
| | | | | | | | | | | | |
| | | | ANNUAL REPORT | | | | | | | JUNE 30, 2022 | | | 19 |
| | | | | | | | | | | | | | | | | | | | | | | | | | | | | | | | | | | | | | | | |
| | | | | | Actual | | | | | | Hypothetical
(5% return before expenses) | | | | | | | |
| | | | | | Beginning
Account Value
(01/01/22) | | | Ending
Account Value
(06/30/22) | | | Expenses Paid
During Period* | | | | | | Beginning
Account Value
(01/01/22) | | | Ending
Account Value
(06/30/22) | | | Expenses Paid
During Period* | | | | | | Net Annualized
Expense Ratio** | |
| | | | | | | | | | |
PIMCO RAE US Small Fund | | | | | | | | | | | | | | | | | | | | | | | | | | | | | | | | | | | | | | | | |
| Institutional Class | | | | | | $ | 1,000.00 | | | $ | 883.50 | | | $ | 2.36 | | | | | | | $ | 1,000.00 | | | $ | 1,022.02 | | | $ | 2.53 | | | | | | | | 0.51 | % |
| I-2 | | | | | | | 1,000.00 | | | | 884.30 | | | | 2.82 | | | | | | | | 1,000.00 | | | | 1,021.53 | | | | 3.02 | | | | | | | | 0.61 | |
| Class A | | | | | | | 1,000.00 | | | | 882.00 | | | | 4.20 | | | | | | | | 1,000.00 | | | | 1,020.06 | | | | 4.51 | | | | | | | | 0.91 | |
* Expenses Paid During Period are equal to the net annualized expense ratio for the class, multiplied by the average account value over the period, multiplied by 179/365 (to reflect the one-half year period).
** Net Annualized Expense Ratio is reflective of any applicable contractual fee waivers and/or expense reimbursements or voluntary fee waivers. Details regarding fee waivers, if any, can be found in Note 9, Fees and Expenses, in the Notes to Financial Statements.
(THIS PAGE INTENTIONALLY LEFT BLANK)
| | | | | | | | | | | | |
| | | | ANNUAL REPORT | | | | | | | JUNE 30, 2022 | | | 21 |
| | | | | | | | | | | | | | | | | | | | | | | | | | | | | | | | |
| | | | | | Investment Operations | | | Less Distributions(c) | |
| | | | | | | | | | | | | | | | | | | | | | | | | |
| Selected Per Share Data for the Year Ended^: | | Net Asset Value
Beginning of
Year(a) | | | Net Investment
Income (Loss)(b) | | | Net Realized/
Unrealized
Gain (Loss) | | | Total | | | From Net
Investment
Income | | | From Net
Realized
Capital Gains | | | Tax Basis
Return of
Capital | | | Total | |
| | | | | | | | |
PIMCO RAE Emerging Markets Fund | | | | | | | | | | | | | | | | | | | | | | | | | | | | | | | | |
| Institutional Class | | | | | | | | | | | | | | | | | | | | | | | | | | | | | | | | |
| | | | | | | | |
06/30/2022 | | $ | 12.02 | | | $ | 0.55 | | | $ | (2.76 | ) | | $ | (2.21 | ) | | $ | (0.96 | ) | | $ | 0.00 | | | $ | 0.00 | | | $ | (0.96 | ) |
| | | | | | | | |
06/30/2021 | | | 7.83 | | | | 0.27 | | | | 4.09 | | | | 4.36 | | | | (0.17 | ) | | | 0.00 | | | | 0.00 | | | | (0.17 | ) |
| | | | | | | | |
06/30/2020 | | | 9.92 | | | | 0.24 | | | | (2.06 | ) | | | (1.82 | ) | | | (0.24 | ) | | | (0.03 | ) | | | 0.00 | | | | (0.27 | ) |
| | | | | | | | |
06/30/2019 | | | 10.74 | | | | 0.29 | | | | (0.11 | ) | | | 0.18 | | | | (0.26 | ) | | | (0.74 | ) | | | 0.00 | | | | (1.00 | ) |
| | | | | | | | |
06/30/2018 | | | 10.83 | | | | 0.25 | | | | 0.59 | | | | 0.84 | | | | (0.19 | ) | | | (0.74 | ) | | | 0.00 | | | | (0.93 | ) |
| I-2 | | | | | | | | | | | | | | | | | | | | | | | | | | | | | | | | |
| | | | | | | | |
06/30/2022 | | | 11.97 | | | | 0.50 | | | | (2.71 | ) | | | (2.21 | ) | | | (0.96 | ) | | | 0.00 | | | | 0.00 | | | | (0.96 | ) |
| | | | | | | | |
06/30/2021 | | | 7.80 | | | | 0.30 | | | | 4.03 | | | | 4.33 | | | | (0.16 | ) | | | 0.00 | | | | 0.00 | | | | (0.16 | ) |
| | | | | | | | |
06/30/2020 | | | 9.86 | | | | 0.32 | | | | (2.16 | ) | | | (1.84 | ) | | | (0.19 | ) | | | (0.03 | ) | | | 0.00 | | | | (0.22 | ) |
| | | | | | | | |
06/30/2019 | | | 10.68 | | | | 0.29 | | | | (0.11 | ) | | | 0.18 | | | | (0.26 | ) | | | (0.74 | ) | | | 0.00 | | | | (1.00 | ) |
| | | | | | | | |
06/30/2018 | | | 10.79 | | | | 0.24 | | | | 0.57 | | | | 0.81 | | | | (0.18 | ) | | | (0.74 | ) | | | 0.00 | | | | (0.92 | ) |
| Class A | | | | | | | | | | | | | | | | | | | | | | | | | | | | | | | | |
| | | | | | | | |
06/30/2022 | | | 11.86 | | | | 0.47 | | | | (2.68 | ) | | | (2.21 | ) | | | (0.95 | ) | | | 0.00 | | | | 0.00 | | | | (0.95 | ) |
| | | | | | | | |
06/30/2021 | | | 7.75 | | | | 0.23 | | | | 4.03 | | | | 4.26 | | | | (0.15 | ) | | | 0.00 | | | | 0.00 | | | | (0.15 | ) |
| | | | | | | | |
06/30/2020 | | | 9.84 | | | | 0.23 | | | | (2.07 | ) | | | (1.84 | ) | | | (0.22 | ) | | | (0.03 | ) | | | 0.00 | | | | (0.25 | ) |
| | | | | | | | |
06/30/2019 | | | 10.68 | | | | 0.25 | | | | (0.09 | ) | | | 0.16 | | | | (0.26 | ) | | | (0.74 | ) | | | 0.00 | | | | (1.00 | ) |
| | | | | | | | |
06/30/2018 | | | 10.81 | | | | 0.21 | | | | 0.59 | | | | 0.80 | | | | (0.19 | ) | | | (0.74 | ) | | | 0.00 | | | | (0.93 | ) |
| | | | | | | | |
PIMCO RAE Global ex-US Fund | | | | | | | | | | | | | | | | | | | | | | | | | | | | | | | | |
| Institutional Class | | | | | | | | | | | | | | | | | | | | | | | | | | | | | | | | |
| | | | | | | | |
06/30/2022 | | $ | 11.65 | | | $ | 1.15 | | | $ | (2.80 | ) | | $ | (1.65 | ) | | $ | (1.22 | ) | | $ | 0.00 | | | $ | 0.00 | | | $ | (1.22 | ) |
| | | | | | | | |
06/30/2021 | | | 8.20 | | | | 0.21 | | | | 3.45 | | | | 3.66 | | | | (0.21 | ) | | | 0.00 | | | | 0.00 | | | | (0.21 | ) |
| | | | | | | | |
06/30/2020 | | | 10.23 | | | | 0.38 | | | | (1.76 | ) | | | (1.38 | ) | | | (0.37 | ) | | | (0.28 | ) | | | 0.00 | | | | (0.65 | ) |
| | | | | | | | |
06/30/2019 | | | 10.68 | | | | 0.32 | | | | (0.51 | ) | | | (0.19 | ) | | | (0.26 | ) | | | 0.00 | | | | 0.00 | | | | (0.26 | ) |
| | | | | | | | |
06/30/2018 | | | 10.49 | | | | 0.38 | | | | 0.28 | | | | 0.66 | | | | (0.42 | ) | | | 0.00 | | | | (0.05 | ) | | | (0.47 | ) |
| I-2 | | | | | | | | | | | | | | | | | | | | | | | | | | | | | | | | |
| | | | | | | | |
06/30/2022 | | | 11.67 | | | | 1.39 | | | | (3.04 | ) | | | (1.65 | ) | | | (1.22 | ) | | | 0.00 | | | | 0.00 | | | | (1.22 | ) |
| | | | | | | | |
06/30/2021 | | | 8.18 | | | | 0.02 | | | | 3.63 | | | | 3.65 | | | | (0.16 | ) | | | 0.00 | | | | 0.00 | | | | (0.16 | ) |
| | | | | | | | |
06/30/2020 | | | 10.20 | | | | 0.30 | | | | (1.68 | ) | | | (1.38 | ) | | | (0.36 | ) | | | (0.28 | ) | | | 0.00 | | | | (0.64 | ) |
| | | | | | | | |
06/30/2019 | | | 10.65 | | | | 0.26 | | | | (0.46 | ) | | | (0.20 | ) | | | (0.25 | ) | | | 0.00 | | | | 0.00 | | | | (0.25 | ) |
| | | | | | | | |
06/30/2018 | | | 10.47 | | | | 0.29 | | | | 0.35 | | | | 0.64 | | | | (0.41 | ) | | | 0.00 | | | | (0.05 | ) | | | (0.46 | ) |
| Class A | | | | | | | | | | | | | | | | | | | | | | | | | | | | | | | | |
| | | | | | | | |
06/30/2022 | | | 11.48 | | | | 1.08 | | | | (2.74 | ) | | | (1.66 | ) | | | (1.20 | ) | | | 0.00 | | | | 0.00 | | | | (1.20 | ) |
| | | | | | | | |
06/30/2021 | | | 8.10 | | | | 0.18 | | | | 3.39 | | | | 3.57 | | | | (0.19 | ) | | | 0.00 | | | | 0.00 | | | | (0.19 | ) |
| | | | | | | | |
06/30/2020 | | | 10.14 | | | | 0.41 | | | | (1.81 | ) | | | (1.40 | ) | | | (0.36 | ) | | | (0.28 | ) | | | 0.00 | | | | (0.64 | ) |
| | | | | | | | |
06/30/2019 | | | 10.61 | | | | 0.23 | | | | (0.46 | ) | | | (0.23 | ) | | | (0.24 | ) | | | 0.00 | | | | 0.00 | | | | (0.24 | ) |
| | | | | | | | |
06/30/2018 | | | 10.44 | | | | 0.24 | | | | 0.38 | | | | 0.62 | | | | (0.40 | ) | | | 0.00 | | | | (0.05 | ) | | | (0.45 | ) |
| | | | | | | | |
PIMCO RAE International Fund | | | | | | | | | | | | | | | | | | | | | | | | | | | | | | | | |
| Institutional Class | | | | | | | | | | | | | | | | | | | | | | | | | | | | | | | | |
| | | | | | | | |
06/30/2022 | | $ | 11.23 | | | $ | 0.36 | | | $ | (1.69 | ) | | $ | (1.33 | ) | | $ | (0.46 | ) | | $ | (1.89 | ) | | $ | 0.00 | | | $ | (2.35 | ) |
| | | | | | | | |
06/30/2021 | | | 8.11 | | | | 0.27 | | | | 3.08 | | | | 3.35 | | | | (0.23 | ) | | | 0.00 | | | | 0.00 | | | | (0.23 | ) |
| | | | | | | | |
06/30/2020 | | | 9.74 | | | | 0.23 | | | | (1.45 | ) | | | (1.22 | ) | | | (0.41 | ) | | | 0.00 | | | | 0.00 | | | | (0.41 | ) |
| | | | | | | | |
06/30/2019 | | | 10.60 | | | | 0.34 | | | | (0.68 | ) | | | (0.34 | ) | | | (0.25 | ) | | | (0.27 | ) | | | 0.00 | | | | (0.52 | ) |
| | | | | | | | |
06/30/2018 | | | 10.27 | | | | 0.33 | | | | 0.29 | | | | 0.62 | | | | (0.28 | ) | | | (0.01 | ) | | | 0.00 | | | | (0.29 | ) |
| I-2 | | | | | | | | | | | | | | | | | | | | | | | | | | | | | | | | |
| | | | | | | | |
06/30/2022 | | | 11.17 | | | | 0.35 | | | | (1.69 | ) | | | (1.34 | ) | | | (0.43 | ) | | | (1.89 | ) | | | 0.00 | | | | (2.32 | ) |
| | | | | | | | |
06/30/2021 | | | 8.07 | | | | 0.40 | | | | 2.92 | | | | 3.32 | | | | (0.22 | ) | | | 0.00 | | | | 0.00 | | | | (0.22 | ) |
| | | | | | | | |
06/30/2020 | | | 9.71 | | | | 0.21 | | | | (1.43 | ) | | | (1.22 | ) | | | (0.42 | ) | | | 0.00 | | | | 0.00 | | | | (0.42 | ) |
| | | | | | | | |
06/30/2019 | | | 10.57 | | | | 0.30 | | | | (0.64 | ) | | | (0.34 | ) | | | (0.25 | ) | | | (0.27 | ) | | | 0.00 | | | | (0.52 | ) |
| | | | | | | | |
06/30/2018 | | | 10.24 | | | | 0.26 | | | | 0.35 | | | | 0.61 | | | | (0.27 | ) | | | (0.01 | ) | | | 0.00 | | | | (0.28 | ) |
| Class A | | | | | | | | | | | | | | | | | | | | | | | | | | | | | | | | |
| | | | | | | | |
06/30/2022 | | | 11.06 | | | | 0.32 | | | | (1.66 | ) | | | (1.34 | ) | | | (0.44 | ) | | | (1.89 | ) | | | 0.00 | | | | (2.33 | ) |
| | | | | | | | |
06/30/2021 | | | 8.01 | | | | 0.30 | | | | 2.96 | | | | 3.26 | | | | (0.21 | ) | | | 0.00 | | | | 0.00 | | | | (0.21 | ) |
| | | | | | | | |
06/30/2020 | | | 9.64 | | | | 0.18 | | | | (1.41 | ) | | | (1.23 | ) | | | (0.40 | ) | | | 0.00 | | | | 0.00 | | | | (0.40 | ) |
| | | | | | | | |
06/30/2019 | | | 10.53 | | | | 0.30 | | | | (0.67 | ) | | | (0.37 | ) | | | (0.25 | ) | | | (0.27 | ) | | | 0.00 | | | | (0.52 | ) |
| | | | | | | | |
06/30/2018 | | | 10.24 | | | | 0.37 | | | | 0.21 | | | | 0.58 | | | | (0.28 | ) | | | (0.01 | ) | | | 0.00 | | | | (0.29 | ) |
| | | | | | |
| 22 | | PIMCO EQUITY SERIES | | | See Accompanying Notes | |
| | | | | | | | | | | | | | | | | | | | | | | | | | | | | | | | | | |
| | | | | | | Ratios/Supplemental Data | |
| | | | | | | | | | Ratios to Average Net Assets(e) | | | | |
Net Assets
Value End of
Year(a) | | | Total Return(d) | | | Net Assets
End of Year
(000s) | | | Expenses | | | Expenses
Excluding
Waivers | | | Expenses
Excluding
Interest
Expense | | | Expenses
Excluding
Interest
Expense and
Waivers | | | Net
Investment
Income (Loss) | | | Portfolio
Turnover
Rate | |
| | | | | | | | |
| | | | | | | | | | | | | | | | | | | | | | | | | | | | | | | | | | |
| | | | | | | | | | | | | | | | | | | | | | | | | | | | | | | | | | |
| | | | | | | | |
| $ | 8.85 | | | | (19.72 | )% | | $ | 1,247,735 | | | | 0.76 | % | | | 0.77 | % | | | 0.75 | % | | | 0.76 | % | | | 5.13 | % | | | 109 | % |
| | | | | | | | |
| | 12.02 | | | | 56.09 | | | | 1,716,375 | | | | 0.79 | (f) | | | 0.85 | (f) | | | 0.78 | (f) | | | 0.84 | (f) | | | 2.66 | | | | 79 | |
| | | | | | | | |
| | 7.83 | | | | (18.91 | ) | | | 1,184,716 | | | | 0.76 | | | | 0.97 | | | | 0.75 | | | | 0.96 | | | | 2.70 | | | | 56 | |
| | | | | | | | |
| | 9.92 | | | | 2.40 | | | | 2,632,982 | | | | 0.75 | | | | 0.96 | | | | 0.75 | | | | 0.96 | | | | 2.94 | | | | 25 | |
| | | | | | | | |
| | 10.74 | | | | 7.50 | | | | 1,848,953 | | | | 0.76 | | | | 0.97 | | | | 0.76 | | | | 0.97 | | | | 2.13 | | | | 28 | |
| | | | | | | | | | | | | | | | | | | | | | | | | | | | | | | | | | |
| | | | | | | | |
| | 8.80 | | | | (19.78 | ) | | | 69,156 | | | | 0.86 | | | | 0.87 | | | | 0.85 | | | | 0.86 | | | | 4.73 | | | | 109 | |
| | | | | | | | |
| | 11.97 | | | | 55.95 | | | | 59,609 | | | | 0.89 | (g) | | | 0.95 | (g) | | | 0.88 | (g) | | | 0.94 | (g) | | | 2.71 | | | | 79 | |
| | | | | | | | |
| | 7.80 | | | | (19.13 | ) | | | 3,070 | | | | 0.86 | | | | 1.07 | | | | 0.85 | | | | 1.06 | | | | 3.58 | | | | 56 | |
| | | | | | | | |
| | 9.86 | | | | 2.42 | | | | 16,263 | | | | 0.85 | | | | 1.06 | | | | 0.85 | | | | 1.06 | | | | 2.93 | | | | 25 | |
| | | | | | | | |
| | 10.68 | | | | 7.26 | | | | 17,486 | | | | 0.86 | | | | 1.07 | | | | 0.86 | | | | 1.07 | | | | 2.07 | | | | 28 | |
| | | | | | | | | | | | | | | | | | | | | | | | | | | | | | | | | | |
| | | | | | | | |
| | 8.70 | | | | (19.97 | ) | | | 12,611 | | | | 1.11 | | | | 1.12 | | | | 1.10 | | | | 1.11 | | | | 4.43 | | | | 109 | |
| | | | | | | | |
| | 11.86 | | | | 55.42 | | | | 15,798 | | | | 1.14 | (g) | | | 1.20 | (g) | | | 1.13 | (g) | | | 1.19 | (g) | | | 2.24 | | | | 79 | |
| | | | | | | | |
| | 7.75 | | | | (19.27 | ) | | | 7,628 | | | | 1.11 | | | | 1.32 | | | | 1.10 | | | | 1.31 | | | | 2.61 | | | | 56 | |
| | | | | | | | |
| | 9.84 | | | | 2.21 | | | | 16,198 | | | | 1.10 | | | | 1.31 | | | | 1.10 | | | | 1.31 | | | | 2.52 | | | | 25 | |
| | | | | | | | |
| | 10.68 | | | | 7.08 | | | | 7,350 | | | | 1.11 | | | | 1.32 | | | | 1.11 | | | | 1.32 | | | | 1.76 | | | | 28 | |
| | | | | | | | |
| | | | | | | | | | | | | | | | | | | | | | | | | | | | | | | | | | |
| | | | | | | | | | | | | | | | | | | | | | | | | | | | | | | | | | |
| | | | | | | | |
| $ | 8.78 | | | | (15.58 | )% | | $ | 69,094 | | | | 0.00 | % | | | 0.56 | % | | | 0.00 | % | | | 0.56 | % | | | 10.87 | % | | | 7 | % |
| | | | | | | | |
| | 11.65 | | | | 44.96 | | | | 80,502 | | | | 0.02 | (h) | | | 0.63 | (h) | | | 0.02 | (h) | | | 0.63 | (h) | | | 2.08 | | | | 18 | |
| | | | | | | | |
| | 8.20 | | | | (14.73 | ) | | | 53,191 | | | | 0.02 | | | | 0.78 | | | | 0.01 | | | | 0.77 | | | | 4.03 | | | | 34 | |
| | | | | | | | |
| | 10.23 | | | | (1.50 | ) | | | 75,630 | | | | 0.00 | | | | 0.76 | | | | 0.00 | | | | 0.76 | | | | 3.13 | | | | 17 | |
| | | | | | | | |
| | 10.68 | | | | 6.01 | | | | 75,994 | | | | 0.00 | | | | 0.77 | | | | 0.00 | | | | 0.77 | | | | 3.36 | | | | 9 | |
| | | | | | | | | | | | | | | | | | | | | | | | | | | | | | | | | | |
| | | | | | | | |
| | 8.80 | | | | (15.57 | ) | | | 307 | | | | 0.10 | | | | 0.66 | | | | 0.10 | | | | 0.66 | | | | 13.36 | | | | 7 | |
| | | | | | | | |
| | 11.67 | | | | 44.90 | | | | 154 | | | | 0.12 | (f) | | | 0.73 | (f) | | | 0.12 | (f) | | | 0.73 | (f) | | | 0.18 | | | | 18 | |
| | | | | | | | |
| | 8.18 | | | | (14.74 | ) | | | 67 | | | | 0.12 | | | | 0.88 | | | | 0.11 | | | | 0.87 | | | | 3.14 | | | | 34 | |
| | | | | | | | |
| | 10.20 | | | | (1.60 | ) | | | 428 | | | | 0.10 | | | | 0.86 | | | | 0.10 | | | | 0.86 | | | | 2.50 | | | | 17 | |
| | | | | | | | |
| | 10.65 | | | | 5.88 | | | | 900 | | | | 0.10 | | | | 0.87 | | | | 0.10 | | | | 0.87 | | | | 2.58 | | | | 9 | |
| | | | | | | | | | | | | | | | | | | | | | | | | | | | | | | | | | |
| | | | | | | | |
| | 8.62 | | | | (15.87 | ) | | | 9,334 | | | | 0.35 | | | | 0.91 | | | | 0.35 | | | | 0.91 | | | | 10.37 | | | | 7 | |
| | | | | | | | |
| | 11.48 | | | | 44.43 | | | | 11,523 | | | | 0.37 | (f) | | | 0.98 | (f) | | | 0.37 | (f) | | | 0.98 | (f) | | | 1.88 | | | | 18 | |
| | | | | | | | |
| | 8.10 | | | | (15.01 | ) | | | 11,252 | | | | 0.37 | | | | 1.13 | | | | 0.36 | | | | 1.12 | | | | 4.66 | | | | 34 | |
| | | | | | | | |
| | 10.14 | | | | (1.90 | ) | | | 2,035 | | | | 0.35 | | | | 1.11 | | | | 0.35 | | | | 1.11 | | | | 2.32 | | | | 17 | |
| | | | | | | | |
| | 10.61 | | | | 5.69 | | | | 1,531 | | | | 0.35 | | | | 1.12 | | | | 0.35 | | | | 1.12 | | | | 2.14 | | | | 9 | |
| | | | | | | | |
| | | | | | | | | | | | | | | | | | | | | | | | | | | | | | | | | | |
| | | | | | | | | | | | | | | | | | | | | | | | | | | | | | | | | | |
| | | | | | | | |
| $ | 7.55 | | | | (14.14 | )% | | $ | 503,685 | | | | 0.51 | % | | | 0.52 | % | | | 0.50 | % | | | 0.51 | % | | | 3.77 | % | | | 58 | % |
| | | | | | | | |
| | 11.23 | | | | 41.64 | | | | 1,025,896 | | | | 0.51 | (i) | | | 0.55 | (i) | | | 0.51 | (i) | | | 0.55 | (i) | | | 2.79 | | | | 87 | |
| | | | | | | | |
| | 8.11 | | | | (13.27 | ) | | | 756,178 | | | | 0.51 | | | | 0.62 | | | | 0.50 | | | | 0.61 | | | | 2.65 | | | | 93 | |
| | | | | | | | |
| | 9.74 | | | | (2.72 | ) | | | 547,007 | | | | 0.50 | | | | 0.61 | | | | 0.50 | | | | 0.61 | | | | 3.41 | | | | 41 | |
| | | | | | | | |
| | 10.60 | | | | 5.88 | | | | 543,875 | | | | 0.51 | | | | 0.62 | | | | 0.51 | | | | 0.62 | | | | 3.04 | | | | 47 | |
| | | | | | | | | | | | | | | | | | | | | | | | | | | | | | | | | | |
| | | | | | | | |
| | 7.51 | | | | (14.25 | ) | | | 11,264 | | | | 0.61 | | | | 0.62 | | | | 0.60 | | | | 0.61 | | | | 3.44 | | | | 58 | |
| | | | | | | | |
| | 11.17 | | | | 41.51 | | | | 25,494 | | | | 0.61 | (j) | | | 0.65 | (j) | | | 0.61 | (j) | | | 0.65 | (j) | | | 3.66 | | | | 87 | |
| | | | | | | | |
| | 8.07 | | | | (13.40 | ) | | | 841 | | | | 0.61 | | | | 0.72 | | | | 0.60 | | | | 0.71 | | | | 2.39 | | | | 93 | |
| | | | | | | | |
| | 9.71 | | | | (2.73 | ) | | | 832 | | | | 0.60 | | | | 0.71 | | | | 0.60 | | | | 0.71 | | | | 3.02 | | | | 41 | |
| | | | | | | | |
| | 10.57 | | | | 5.84 | | | | 1,994 | | | | 0.61 | | | | 0.72 | | | | 0.61 | | | | 0.72 | | | | 2.33 | | | | 47 | |
| | | | | | | | | | | | | | | | | | | | | | | | | | | | | | | | | | |
| | | | | | | | |
| | 7.39 | | | | (14.41 | ) | | | 21,550 | | | | 0.86 | | | | 0.87 | | | | 0.85 | | | | 0.86 | | | | 3.49 | | | | 58 | |
| | | | | | | | |
| | 11.06 | | | | 41.10 | | | | 25,298 | | | | 0.86 | (j) | | | 0.90 | (j) | | | 0.86 | (j) | | | 0.90 | (j) | | | 2.87 | | | | 87 | |
| | | | | | | | |
| | 8.01 | | | | (13.57 | ) | | | 3,258 | | | | 0.86 | | | | 0.97 | | | | 0.85 | | | | 0.96 | | | | 2.05 | | | | 93 | |
| | | | | | | | |
| | 9.64 | | | | (3.03 | ) | | | 5,072 | | | | 0.85 | | | | 0.96 | | | | 0.85 | | | | 0.96 | | | | 3.06 | | | | 41 | |
| | | | | | | | |
| | 10.53 | | | | 5.53 | | | | 5,007 | | | | 0.86 | | | | 0.97 | | | | 0.86 | | | | 0.97 | | | | 3.34 | | | | 47 | |
| | | | | | | | | | | | |
| | | | ANNUAL REPORT | | | | | | | JUNE 30, 2022 | | | 23 |
| | | | |
| Financial Highlights | | (Cont.) | | |
| | | | | | | | | | | | | | | | | | | | | | | | | | | | | | | | |
| | | | | | Investment Operations | | | Less Distributions(c) | |
| | | | | | | | | | | | | | | | | | | | | | | | | |
| Selected Per Share Data for the Year Ended^: | | Net Asset Value
Beginning of
Year(a) | | | Net Investment
Income (Loss)(b) | | | Net Realized/
Unrealized
Gain (Loss) | | | Total | | | From Net
Investment
Income | | | From Net
Realized
Capital Gains | | | Tax Basis
Return of
Capital | | | Total | |
| | | | | | | | |
PIMCO RAE US Fund | | | | | | | | | | | | | | | | | | | | | | | | | | | | | | | | |
| Institutional Class | | | | | | | | | | | | | | | | | | | | | | | | | | | | | | | | |
| | | | | | | | |
06/30/2022 | | $ | 14.03 | | | $ | 0.26 | | | $ | (1.13 | ) | | $ | (0.87 | ) | | $ | (0.17 | ) | | $ | (1.18 | ) | | $ | 0.00 | | | $ | (1.35 | ) |
| | | | | | | | |
06/30/2021 | | | 9.72 | | | | 0.25 | | | | 4.44 | | | | 4.69 | | | | (0.28 | ) | | | (0.10 | ) | | | 0.00 | | | | (0.38 | ) |
| | | | | | | | |
06/30/2020 | | | 11.09 | | | | 0.28 | | | | (1.08 | ) | | | (0.80 | ) | | | (0.32 | ) | | | (0.25 | ) | | | 0.00 | | | | (0.57 | ) |
| | | | | | | | |
06/30/2019 | | | 11.30 | | | | 0.26 | | | | 0.20 | | | | 0.46 | | | | (0.21 | ) | | | (0.46 | ) | | | 0.00 | | | | (0.67 | ) |
| | | | | | | | |
06/30/2018 | | | 10.57 | | | | 0.23 | | | | 1.16 | | | | 1.39 | | | | (0.22 | ) | | | (0.44 | ) | | | 0.00 | | | | (0.66 | ) |
| I-2 | | | | | | | | | | | | | | | | | | | | | | | | | | | | | | | | |
| | | | | | | | |
06/30/2022 | | | 13.94 | | | | 0.25 | | | | (1.13 | ) | | | (0.88 | ) | | | (0.16 | ) | | | (1.18 | ) | | | 0.00 | | | | (1.34 | ) |
| | | | | | | | |
06/30/2021 | | | 9.67 | | | | 0.23 | | | | 4.41 | | | | 4.64 | | | | (0.27 | ) | | | (0.10 | ) | | | 0.00 | | | | (0.37 | ) |
| | | | | | | | |
06/30/2020 | | | 11.04 | | | | 0.27 | | | | (1.08 | ) | | | (0.81 | ) | | | (0.31 | ) | | | (0.25 | ) | | | 0.00 | | | | (0.56 | ) |
| | | | | | | | |
06/30/2019 | | | 11.26 | | | | 0.25 | | | | 0.20 | | | | 0.45 | | | | (0.21 | ) | | | (0.46 | ) | | | 0.00 | | | | (0.67 | ) |
| | | | | | | | |
06/30/2018 | | | 10.54 | | | | 0.22 | | | | 1.15 | | | | 1.37 | | | | (0.21 | ) | | | (0.44 | ) | | | 0.00 | | | | (0.65 | ) |
| Class A | | | | | | | | | | | | | | | | | | | | | | | | | | | | | | | | |
| | | | | | | | |
06/30/2022 | | | 13.75 | | | | 0.21 | | | | (1.11 | ) | | | (0.90 | ) | | | (0.15 | ) | | | (1.18 | ) | | | 0.00 | | | | (1.33 | ) |
| | | | | | | | |
06/30/2021 | | | 9.55 | | | | 0.19 | | | | 4.37 | | | | 4.56 | | | | (0.26 | ) | | | (0.10 | ) | | | 0.00 | | | | (0.36 | ) |
| | | | | | | | |
06/30/2020 | | | 10.93 | | | | 0.23 | | | | (1.07 | ) | | | (0.84 | ) | | | (0.29 | ) | | | (0.25 | ) | | | 0.00 | | | | (0.54 | ) |
| | | | | | | | |
06/30/2019 | | | 11.19 | | | | 0.22 | | | | 0.19 | | | | 0.41 | | | | (0.21 | ) | | | (0.46 | ) | | | 0.00 | | | | (0.67 | ) |
| | | | | | | | |
06/30/2018 | | | 10.50 | | | | 0.18 | | | | 1.15 | | | | 1.33 | | | | (0.20 | ) | | | (0.44 | ) | | | 0.00 | | | | (0.64 | ) |
| | | | | | | | |
PIMCO RAE US Small Fund | | | | | | | | | | | | | | | | | | | | | | | | | | | | | | | | |
| Institutional Class | | | | | | | | | | | | | | | | | | | | | | | | | | | | | | | | |
| | | | | | | | |
06/30/2022 | | $ | 15.90 | | | $ | 0.15 | | | $ | (1.62 | ) | | $ | (1.47 | ) | | $ | (0.20 | ) | | $ | (5.96 | ) | | $ | 0.00 | | | $ | (6.16 | ) |
| | | | | | | | |
06/30/2021 | | | 8.80 | | | | 0.09 | | | | 8.05 | | | | 8.14 | | | | (0.17 | ) | | | (0.87 | ) | | | 0.00 | | | | (1.04 | ) |
| | | | | | | | |
06/30/2020 | | | 10.72 | | | | 0.14 | | | | (1.88 | ) | | | (1.74 | ) | | | (0.18 | ) | | | 0.00 | | | | 0.00 | | | | (0.18 | ) |
| | | | | | | | |
06/30/2019 | | | 12.33 | | | | 0.17 | | | | (1.05 | ) | | | (0.88 | ) | | | (0.09 | ) | | | (0.64 | ) | | | 0.00 | | | | (0.73 | ) |
| | | | | | | | |
06/30/2018 | | | 11.10 | | | | 0.15 | | | | 1.63 | | | | 1.78 | | | | (0.17 | ) | | | (0.38 | ) | | | 0.00 | | | | (0.55 | ) |
| I-2 | | | | | | | | | | | | | | | | | | | | | | | | | | | | | | | | |
| | | | | | | | |
06/30/2022 | | | 15.80 | | | | 0.15 | | | | (1.61 | ) | | | (1.46 | ) | | | (0.20 | ) | | | (5.96 | ) | | | 0.00 | | | | (6.16 | ) |
| | | | | | | | |
06/30/2021 | | | 8.76 | | | | 0.02 | | | | 8.06 | | | | 8.08 | | | | (0.17 | ) | | | (0.87 | ) | | | 0.00 | | | | (1.04 | ) |
| | | | | | | | |
06/30/2020 | | | 10.67 | | | | 0.16 | | | | (1.90 | ) | | | (1.74 | ) | | | (0.17 | ) | | | 0.00 | | | | 0.00 | | | | (0.17 | ) |
| | | | | | | | |
06/30/2019 | | | 12.29 | | | | 0.15 | | | | (1.04 | ) | | | (0.89 | ) | | | (0.09 | ) | | | (0.64 | ) | | | 0.00 | | | | (0.73 | ) |
| | | | | | | | |
06/30/2018 | | | 11.07 | | | | 0.14 | | | | 1.62 | | | | 1.76 | | | | (0.16 | ) | | | (0.38 | ) | | | 0.00 | | | | (0.54 | ) |
| Class A | | | | | | | | | | | | | | | | | | | | | | | | | | | | | | | | |
| | | | | | | | |
06/30/2022 | | | 15.62 | | | | 0.12 | | | | (1.60 | ) | | | (1.48 | ) | | | (0.18 | ) | | | (5.96 | ) | | | 0.00 | | | | (6.14 | ) |
| | | | | | | | |
06/30/2021 | | | 8.68 | | | | (0.04 | ) | | | 8.01 | | | | 7.97 | | | | (0.16 | ) | | | (0.87 | ) | | | 0.00 | | | | (1.03 | ) |
| | | | | | | | |
06/30/2020 | | | 10.60 | | | | 0.12 | | | | (1.89 | ) | | | (1.77 | ) | | | (0.15 | ) | | | 0.00 | | | | 0.00 | | | | (0.15 | ) |
| | | | | | | | |
06/30/2019 | | | 12.24 | | | | 0.12 | | | | (1.03 | ) | | | (0.91 | ) | | | (0.09 | ) | | | (0.64 | ) | | | 0.00 | | | | (0.73 | ) |
| | | | | | | | |
06/30/2018 | | | 11.05 | | | | 0.09 | | | | 1.62 | | | | 1.71 | | | | (0.14 | ) | | | (0.38 | ) | | | 0.00 | | | | (0.52 | ) |
| ^ | A zero balance may reflect actual amounts rounding to less than $0.01 or 0.01%. |
| (a) | Includes adjustments required by U.S. GAAP and may differ from net asset values and performance reported elsewhere by the Funds. |
| (b) | Per share amounts based on average number of shares outstanding during the year. |
| (c) | The tax characterization of distributions is determined in accordance with Federal income tax regulations. See Note 2, Distributions to Shareholders, in the Notes to Financial Statements for more information. |
| (d) | Includes adjustments required by U.S. GAAP and may differ from net asset values and performance reported elsewhere by the Funds. Additionally, excludes initial sales charges and contingent deferred sales charges. |
| (e) | Ratios shown do not include expenses of the investment companies in which a Fund may invest. See Note 9, Fees and Expenses, in the Notes to Financial Statements for more information regarding the expenses and any applicable fee waivers associated with these investments. |
| (f) | Effective November 1, 2020, the Class’s Supervisory and Administrative fee was decreased by 0.20% to an annual rate of 0.25%. |
| (g) | Effective November 1, 2020, the Class’s Supervisory and Administrative fee was decreased by 0.20% to an annual rate of 0.35%. |
| (h) | Effective November 1, 2020, the Class’s Supervisory and Administrative fee was decreased by 0.20% to an annual rate of 0.15%. |
| (i) | Effective November 1, 2020, the Class’s Supervisory and Administrative fee was decreased by 0.10% to an annual rate of 0.20%. |
| (j) | Effective November 1, 2020, the Class’s Supervisory and Administrative fee was decreased by 0.10% to an annual rate of 0.30%. |
| (k) | Effective November 1, 2020, the Class’s Supervisory and Administrative fee was decreased by 0.10% to an annual rate of 0.15%. |
| (l) | Effective November 1, 2020, the Class’s Supervisory and Administrative fee was decreased by 0.10% to an annual rate of 0.25%. |
| | | | | | |
| 24 | | PIMCO EQUITY SERIES | | | See Accompanying Notes | |
| | | | | | | | | | | | | | | | | | | | | | | | | | | | | | | | | | |
| | | | | | | Ratios/Supplemental Data | |
| | | | | | | | | | Ratios to Average Net Assets(e) | | | | |
Net Assets
Value End of
Year(a) | | | Total Return(d) | | | Net Assets
End of Year
(000s) | | | Expenses | | | Expenses
Excluding
Waivers | | | Expenses
Excluding
Interest
Expense | | | Expenses
Excluding
Interest
Expense and
Waivers | | | Net
Investment
Income (Loss) | | | Portfolio
Turnover
Rate | |
| | | | | | | | |
| | | | | | | | | | | | | | | | | | | | | | | | | | | | | | | | | | |
| | | | | | | | | | | | | | | | | | | | | | | | | | | | | | | | | | |
| | | | | | | | |
| $ | 11.81 | | | | (7.16 | )% | | $ | 778,671 | | | | 0.40 | % | | | 0.41 | % | | | 0.40 | % | | | 0.41 | % | | | 1.94 | % | | | 69 | % |
| | | | | | | | |
| | 14.03 | | | | 48.99 | | | | 915,231 | | | | 0.40 | (k) | | | 0.44 | (k) | | | 0.40 | (k) | | | 0.44 | (k) | | | 2.06 | | | | 54 | |
| | | | | | | | |
| | 9.72 | | | | (8.03 | ) | | | 578,588 | | | | 0.41 | | | | 0.52 | | | | 0.40 | | | | 0.51 | | | | 2.60 | | | | 34 | |
| | | | | | | | |
| | 11.09 | | | | 4.66 | | | | 745,741 | | | | 0.40 | | | | 0.51 | | | | 0.40 | | | | 0.51 | | | | 2.39 | | | | 32 | |
| | | | | | | | |
| | 11.30 | | | | 13.22 | | | | 771,581 | | | | 0.41 | | | | 0.52 | | | | 0.41 | | | | 0.52 | | | | 2.06 | | | | 44 | |
| | | | | | | | | | | | | | | | | | | | | | | | | | | | | | | | | | |
| | | | | | | | |
| | 11.72 | | | | (7.25 | ) | | | 44,350 | | | | 0.50 | | | | 0.51 | | | | 0.50 | | | | 0.51 | | | | 1.87 | | | | 69 | |
| | | | | | | | |
| | 13.94 | | | | 48.77 | | | | 39,056 | | | | 0.50 | (l) | | | 0.54 | (l) | | | 0.50 | (l) | | | 0.54 | (l) | | | 1.92 | | | | 54 | |
| | | | | | | | |
| | 9.67 | | | | (8.08 | ) | | | 16,970 | | | | 0.51 | | | | 0.62 | | | | 0.50 | | | | 0.61 | | | | 2.51 | | | | 34 | |
| | | | | | | | |
| | 11.04 | | | | 4.58 | | | | 14,257 | | | | 0.50 | | | | 0.61 | | | | 0.50 | | | | 0.61 | | | | 2.25 | | | | 32 | |
| | | | | | | | |
| | 11.26 | | | | 13.10 | | | | 7,265 | | | | 0.51 | | | | 0.62 | | | | 0.51 | | | | 0.62 | | | | 1.96 | | | | 44 | |
| | | | | | | | | | | | | | | | | | | | | | | | | | | | | | | | | | |
| | | | | | | | |
| | 11.52 | | | | (7.54 | ) | | | 15,623 | | | | 0.80 | | | | 0.81 | | | | 0.80 | | | | 0.81 | | | | 1.57 | | | | 69 | |
| | | | | | | | |
| | 13.75 | | | | 48.44 | | | | 12,212 | | | | 0.80 | (j) | | | 0.84 | (j) | | | 0.80 | (j) | | | 0.84 | (j) | | | 1.65 | | | | 54 | |
| | | | | | | | |
| | 9.55 | | | | (8.41 | ) | | | 7,432 | | | | 0.81 | | | | 0.92 | | | | 0.80 | | | | 0.91 | | | | 2.21 | | | | 34 | |
| | | | | | | | |
| | 10.93 | | | | 4.24 | | | | 8,197 | | | | 0.80 | | | | 0.91 | | | | 0.80 | | | | 0.91 | | | | 2.03 | | | | 32 | |
| | | | | | | | |
| | 11.19 | | | | 12.73 | | | | 6,973 | | | | 0.81 | | | | 0.92 | | | | 0.81 | | | | 0.92 | | | | 1.65 | | | | 44 | |
| | | | | | | | |
| | | | | | | | | | | | | | | | | | | | | | | | | | | | | | | | | | |
| | | | | | | | | | | | | | | | | | | | | | | | | | | | | | | | | | |
| | | | | | | | |
| $ | 8.27 | | | | (13.65 | )% | | $ | 274,652 | | | | 0.50 | % | | | 0.51 | % | | | 0.50 | % | | | 0.51 | % | | | 1.33 | % | | | 131 | % |
| | | | | | | | |
| | 15.90 | | | | 97.65 | | | | 331,165 | | | | 0.53 | (k) | | | 0.56 | (k) | | | 0.51 | (k) | | | 0.54 | (k) | | | 0.79 | | | | 118 | |
| | | | | | | | |
| | 8.80 | | | | (16.64 | ) | | | 288,592 | | | | 0.53 | | | | 0.63 | | | | 0.52 | | | | 0.62 | | | | 1.50 | | | | 202 | |
| | | | | | | | |
| | 10.72 | | | | (6.74 | ) | | | 119,223 | | | | 0.51 | | | | 0.62 | | | | 0.51 | | | | 0.62 | | | | 1.52 | | | | 64 | |
| | | | | | | | |
| | 12.33 | | | | 16.37 | | | | 128,985 | | | | 0.50 | | | | 0.62 | | | | 0.50 | | | | 0.62 | | | | 1.30 | | | | 30 | |
| | | | | | | | | | | | | | | | | | | | | | | | | | | | | | | | | | |
| | | | | | | | |
| | 8.18 | | | | (13.68 | ) | | | 47,933 | | | | 0.60 | | | | 0.61 | | | | 0.60 | | | | 0.61 | | | | 1.39 | | | | 131 | |
| | | | | | | | |
| | 15.80 | | | | 97.30 | | | | 6,427 | | | | 0.63 | (l) | | | 0.66 | (l) | | | 0.61 | (l) | | | 0.64 | (l) | | | 0.17 | | | | 118 | |
| | | | | | | | |
| | 8.76 | | | | (16.67 | ) | | | 883 | | | | 0.63 | | | | 0.73 | | | | 0.62 | | | | 0.72 | | | | 1.53 | | | | 202 | |
| | | | | | | | |
| | 10.67 | | | | (6.85 | ) | | | 2,565 | | | | 0.61 | | | | 0.72 | | | | 0.61 | | | | 0.72 | | | | 1.34 | | | | 64 | |
| | | | | | | | |
| | 12.29 | | | | 16.27 | | | | 4,366 | | | | 0.60 | | | | 0.72 | | | | 0.60 | | | | 0.72 | | | | 1.19 | | | | 30 | |
| | | | | | | | | | | | | | | | | | | | | | | | | | | | | | | | | | |
| | | | | | | | |
| | 8.00 | | | | (13.98 | ) | | | 73,766 | | | | 0.90 | | | | 0.91 | | | | 0.90 | | | | 0.91 | | | | 1.11 | | | | 131 | |
| | | | | | | | |
| | 15.62 | | | | 96.82 | | | | 46,113 | | | | 0.93 | (j) | | | 0.96 | (j) | | | 0.91 | (j) | | | 0.94 | (j) | | | (0.27 | ) | | | 118 | |
| | | | | | | | |
| | 8.68 | | | | (16.99 | ) | | | 3,900 | | | | 0.93 | | | | 1.03 | | | | 0.92 | | | | 1.02 | | | | 1.22 | | | | 202 | |
| | | | | | | | |
| | 10.60 | | | | (7.05 | ) | | | 4,023 | | | | 0.91 | | | | 1.02 | | | | 0.91 | | | | 1.02 | | | | 1.07 | | | | 64 | |
| | | | | | | | |
| | 12.24 | | | | 15.83 | | | | 4,875 | | | | 0.90 | | | | 1.02 | | | | 0.90 | | | | 1.02 | | | | 0.82 | | | | 30 | |
| | | | | | | | | | | | |
| | | | ANNUAL REPORT | | | | | | | JUNE 30, 2022 | | | 25 |
| | | | |
| Statements of Assets and Liabilities | | | | |
| | | | | | | | | | | | | | | | | | | | |
| (Amounts in thousands†, except per share amounts) | | PIMCO RAE Emerging
Markets Fund | | | PIMCO RAE Global
ex-US Fund | | | PIMCO RAE
International
Fund | | | PIMCO RAE US Fund | | | PIMCO RAE US Small
Fund | |
| | | | | |
Assets: | | | | | | | | | | | | | | | | | | | | |
| | | | | |
Investments, at value | | | | | | | | | | | | | | | | | | | | |
Investments in securities*^ | | $ | 1,319,662 | | | $ | 124 | | | $ | 533,288 | | | $ | 840,010 | | | $ | 396,758 | |
Investments in Affiliates | | | 40,679 | | | | 78,627 | | | | 28,070 | | | | 1,291 | | | | 24,394 | |
Cash | | | 108 | | | | 1 | | | | 1 | | | | 25 | | | | 1 | |
Foreign currency, at value | | | 3,002 | | | | 0 | | | | 0 | | | | 1 | | | | 0 | |
Receivable for investments sold | | | 0 | | | | 0 | | | | 0 | | | | 0 | | | | 1 | |
Receivable for Fund shares sold | | | 407 | | | | 4 | | | | 197 | | | | 87 | | | | 1,347 | |
Interest and/or dividends receivable | | | 11,455 | | | | 0 | | | | 4,620 | | | | 1,144 | | | | 696 | |
Reimbursement receivable from PIMCO | | | 11 | | | | 39 | | | | 9 | | | | 15 | | | | 3 | |
Other assets | | | 9 | | | | 0 | | | | 24 | | | | 0 | | | | 0 | |
Total Assets | | | 1,375,333 | | | | 78,795 | | | | 566,209 | | | | 842,573 | | | | 423,200 | |
| | | | | |
Liabilities: | | | | | | | | | | | | | | | | | | | | |
Payable for investments purchased | | $ | 3,841 | | | $ | 0 | | | $ | 98 | | | $ | 2,250 | | | $ | 1,266 | |
Payable upon return of securities loaned | | | 40,787 | | | | 0 | | | | 28,070 | | | | 1,291 | | | | 24,394 | |
Payable for Fund shares redeemed | | | 329 | | | | 20 | | | | 554 | | | | 66 | | | | 975 | |
Overdraft due to custodian | | | 0 | | | | 0 | | | | 729 | | | | 0 | | | | 0 | |
Accrued investment advisory fees | | | 576 | | | | 27 | | | | 151 | | | | 196 | | | | 129 | |
Accrued supervisory and administrative fees | | | 295 | | | | 11 | | | | 103 | | | | 123 | | | | 69 | |
Accrued servicing fees | | | 3 | | | | 2 | | | | 5 | | | | 3 | | | | 16 | |
Total Liabilities | | | 45,831 | | | | 60 | | | | 29,710 | | | | 3,929 | | | | 26,849 | |
| | | | | |
Net Assets | | $ | 1,329,502 | | | $ | 78,735 | | | $ | 536,499 | | | $ | 838,644 | | | $ | 396,351 | |
| | | | | |
Net Assets Consist of: | | | | | | | | | | | | | | | | | | | | |
| | | | | |
Paid in capital | | $ | 1,610,210 | | | $ | 90,686 | | | $ | 534,432 | | | $ | 644,873 | | | $ | 368,313 | |
Distributable earnings (accumulated loss) | | | (280,708 | ) | | | (11,951 | ) | | | 2,067 | | | | 193,771 | | | | 28,038 | |
| | | | | |
Net Assets | | $ | 1,329,502 | | | $ | 78,735 | | | $ | 536,499 | | | $ | 838,644 | | | $ | 396,351 | |
| | | | | |
Cost of investments in securities | | $ | 1,398,368 | | | $ | 124 | | | $ | 479,143 | | | $ | 690,713 | | | $ | 359,619 | |
Cost of investments in Affiliates | | $ | 40,679 | | | $ | 93,061 | | | $ | 28,070 | | | $ | 1,291 | | | $ | 24,394 | |
Cost of foreign currency held | | $ | 2,726 | | | $ | 0 | | | $ | 0 | | | $ | 0 | | | $ | 0 | |
| | | | | |
* Includes repurchase agreements of: | | $ | 8,387 | | | $ | 124 | | | $ | 2,759 | | | $ | 6,464 | | | $ | 3,245 | |
| | | | | |
^ Includes securities on loan of: | | $ | 37,165 | | | $ | 0 | | | $ | 26,710 | | | $ | 1,263 | | | $ | 23,902 | |
| † | A zero balance may reflect actual amounts rounding to less than one thousand. |
| | | | | | |
| 26 | | PIMCO EQUITY SERIES | | | See Accompanying Notes | |
| | | | | | | | | | | | | | | | | | | | |
| | | PIMCO RAE Emerging
Markets Fund | | | PIMCO RAE Global
ex-US Fund | | | PIMCO RAE
International
Fund | | | PIMCO RAE US Fund | | | PIMCO RAE US Small
Fund | |
| | | | | |
Net Assets: | | | | | | | | | | | | | | | | | | | | |
| | | | | |
Institutional Class | | $ | 1,247,735 | | | $ | 69,094 | | | $ | 503,685 | | | $ | 778,671 | | | $ | 274,652 | |
I-2 | | | 69,156 | | | | 307 | | | | 11,264 | | | | 44,350 | | | | 47,933 | |
Class A | | | 12,611 | | | | 9,334 | | | | 21,550 | | | | 15,623 | | | | 73,766 | |
| | | | | |
Shares Issued and Outstanding: | | | | | | | | | | | | | | | | | | | | |
| | | | | |
Institutional Class | | | 140,975 | | | | 7,867 | | | | 66,738 | | | | 65,958 | | | | 33,202 | |
I-2 | | | 7,859 | | | | 35 | | | | 1,499 | | | | 3,785 | | | | 5,861 | |
Class A | | | 1,449 | | | | 1,082 | | | | 2,917 | | | | 1,357 | | | | 9,222 | |
| | | | | |
Net Asset Value Per Share Outstanding(a): | | | | | | | | | | | | | | | | | | | | |
| | | | | |
Institutional Class | | $ | 8.85 | | | $ | 8.78 | | | $ | 7.55 | | | $ | 11.81 | | | $ | 8.27 | |
I-2 | | | 8.80 | | | | 8.80 | | | | 7.51 | | | | 11.72 | | | | 8.18 | |
Class A | | | 8.70 | | | | 8.62 | | | | 7.39 | | | | 11.52 | | | | 8.00 | |
| (a) | Includes adjustments required by U.S. GAAP and may differ from net asset values and performance reported elsewhere by the Funds. |
| | | | | | | | | | | | |
| | | | ANNUAL REPORT | | | | | | | JUNE 30, 2022 | | | 27 |
| | | | | | | | | | | | | | | | | | | | |
| Year Ended June 30, 2022 | | | | | | | | | | | | | | | |
| (Amounts in thousands†) | | PIMCO RAE Emerging
Markets Fund | | | PIMCO RAE Global
ex-US Fund | | | PIMCO RAE
International
Fund | | | PIMCO RAE US Fund | | | PIMCO RAE
US Small Fund | |
| | | | | |
Investment Income: | | | | | | | | | | | | | | | | | | | | |
| | | | | |
Interest | | $ | 5 | | | $ | 0 | | | $ | 1 | | | $ | 2 | | | $ | 8 | |
Dividends, net of foreign taxes* | | | 73,320 | | | | 0 | | | | 33,425 | | | | 26,279 | | | | 6,733 | |
Dividends from Investments in Affiliates | | | 0 | | | | 9,932 | | | | 0 | | | | 0 | | | | 0 | |
Securities lending income | | | 1,130 | | | | 0 | | | | 1,197 | | | | 10 | | | | 48 | |
Total Income | | | 74,455 | | | | 9,932 | | | | 34,623 | | | | 26,291 | | | | 6,789 | |
| | | | | |
Expenses: | | | | | | | | | | | | | | | | | | | | |
| | | | | |
Investment advisory fees | | | 6,344 | | | | 366 | | | | 2,432 | | | | 2,803 | | | | 1,260 | |
Supervisory and administrative fees | | | 3,259 | | | | 149 | | | | 1,667 | | | | 1,743 | | | | 663 | |
Distribution and/or servicing fees - Class A | | | 39 | | | | 29 | | | | 61 | | | | 34 | | | | 164 | |
Trustee fees | | | 91 | | | | 6 | | | | 62 | | | | 73 | | | | 24 | |
Interest expense | | | 159 | | | | 0 | | | | 45 | | | | 6 | | | | 15 | |
Miscellaneous expense | | | 62 | | | | 5 | | | | 40 | | | | 55 | | | | 18 | |
Total Expenses | | | 9,954 | | | | 555 | | | | 4,307 | | | | 4,714 | | | | 2,144 | |
Waiver and/or Reimbursement by PIMCO | | | (91 | ) | | | (510 | ) | | | (63 | ) | | | (73 | ) | | | (25 | ) |
Net Expenses | | | 9,863 | | | | 45 | | | | 4,244 | | | | 4,641 | | | | 2,119 | |
| | | | | |
Net Investment Income (Loss) | | | 64,592 | | | | 9,887 | | | | 30,379 | | | | 21,650 | | | | 4,670 | |
| | | | | |
Net Realized Gain (Loss): | | | | | | | | | | | | | | | | | | | | |
| | | | | |
Investments in securities** | | | 317,322 | | | | 0 | | | | 140,708 | | | | 82,856 | | | | 96,742 | |
Investments in Affiliates | | | 0 | | | | (1,589 | ) | | | 0 | | | | 0 | | | | 0 | |
Net capital gain distributions received from Affiliate investments | | | 0 | | | | 7,649 | | | | 0 | | | | 0 | | | | 0 | |
Over the counter financial derivative instruments | | | 10 | | | | 0 | | | | (11 | ) | | | 0 | | | | 0 | |
Foreign currency | | | (5,600 | ) | | | 0 | | | | (288 | ) | | | 0 | | | | 0 | |
| | | | | |
Net Realized Gain (Loss) | | | 311,732 | | | | 6,060 | | | | 140,409 | | | | 82,856 | | | | 96,742 | |
| | | | | |
Net Change in Unrealized Appreciation (Depreciation): | | | | | | | | | | | | | | | | | | | | |
| | | | | |
Investments in securities | | | (680,317 | ) | | | 0 | | | | (278,026 | ) | | | (167,813 | ) | | | (165,626 | ) |
Investments in Affiliates | | | 0 | | | | (30,683 | ) | | | 0 | | | | 0 | | | | 0 | |
Exchange-traded or centrally cleared financial derivative instruments | | | 0 | | | | 0 | | | | 0 | | | | 0 | | | | 0 | |
Foreign currency assets and liabilities | | | (44 | ) | | | 0 | | | | (267 | ) | | | 0 | | | | 0 | |
| | | | | |
Net Change in Unrealized Appreciation (Depreciation) | | | (680,361 | ) | | | (30,683 | ) | | | (278,293 | ) | | | (167,813 | ) | | | (165,626 | ) |
| | | | | |
Net Increase (Decrease) in Net Assets Resulting from Operations | | $ | (304,037 | ) | | $ | (14,736 | ) | | $ | (107,505 | ) | | $ | (63,307 | ) | | $ | (64,214 | ) |
| | | | | |
* Foreign tax withholdings - Dividends | | $ | 10,330 | | | $ | 0 | | | $ | 3,160 | | | $ | 0 | | | $ | 2 | |
| | | | | |
** Net of foreign capital gains tax, if applicable | | $ | 12,767 | | | $ | 0 | | | $ | 0 | | | $ | 0 | | | $ | 0 | |
| † | A zero balance may reflect actual amounts rounding to less than one thousand. |
| | | | | | |
| 28 | | PIMCO EQUITY SERIES | | | See Accompanying Notes | |
(THIS PAGE INTENTIONALLY LEFT BLANK)
| | | | | | | | | | | | |
| | | | ANNUAL REPORT | | | | | | | JUNE 30, 2022 | | | 29 |
| | | | |
| Statements of Changes in Net Assets | | | | |
| | | | | | | | | | | | | | | | | | | | | | | | |
| | | PIMCO RAE Emerging Markets Fund | | | PIMCO RAE Global ex-US Fund | | | PIMCO RAE International Fund | |
| | | | | | |
| (Amounts in thousands†) | | Year Ended
June 30, 2022 | | | Year Ended
June 30, 2021 | | | Year Ended
June 30, 2022 | | | Year Ended
June 30, 2021 | | | Year Ended
June 30, 2022 | | | Year Ended
June 30, 2021 | |
| | | | | | |
Increase (Decrease) in Net Assets from: | | | | | | | | | | | | | | | | | | | | | | | | |
| | | | | | |
Operations: | | | | | | | | | | | | | | | | | | | | | | | | |
| | | | | | |
Net investment income (loss) | | $ | 64,592 | | | $ | 41,044 | | | $ | 9,887 | | | $ | 1,632 | | | $ | 30,379 | | | $ | 29,973 | |
Net realized gain (loss) | | | 311,732 | | | | 110,629 | | | | 6,060 | | | | 197 | | | | 140,409 | | | | 132,658 | |
Net change in unrealized appreciation (depreciation) | | | (680,361 | ) | | | 555,371 | | | | (30,683 | ) | | | 26,859 | | | | (278,293 | ) | | | 215,761 | |
| | | | | | |
Net Increase (Decrease) in Net Assets Resulting from Operations | | | (304,037 | ) | | | 707,044 | | | | (14,736 | ) | | | 28,688 | | | | (107,505 | ) | | | 378,392 | |
| | | | | | |
Distributions to Shareholders: | | | | | | | | | | | | | | | | | | | | | | | | |
| | | | | | |
From net investment income and/or net realized capital gains | | | | | | | | | | | | | | | | | | | | | | | | |
Institutional Class | | | (65,718 | ) | | | (27,290 | ) | | | (8,675 | ) | | | (1,351 | ) | | | (159,212 | ) | | | (24,393 | ) |
I-2 | | | (5,877 | ) | | | (44 | ) | | | (42 | ) | | | 0 | | | | (3,032 | ) | | | (20 | ) |
Class A | | | (1,405 | ) | | | (166 | ) | | | (1,283 | ) | | | (249 | ) | | | (5,107 | ) | | | (87 | ) |
| | | | | | |
Total Distributions(a) | | | (73,000 | ) | | | (27,500 | ) | | | (10,000 | ) | | | (1,600 | ) | | | (167,351 | ) | | | (24,500 | ) |
| | | | | | |
Fund Share Transactions: | | | | | | | | | | | | | | | | | | | | | | | | |
| | | | | | |
Net increase (decrease) resulting from Fund share transactions* | | | (85,243 | ) | | | (83,176 | ) | | | 11,292 | | | | 581 | | | | (265,333 | ) | | | (37,481 | ) |
| | | | | | |
Total Increase (Decrease) in Net Assets | | | (462,280 | ) | | | 596,368 | | | | (13,444 | ) | | | 27,669 | | | | (540,189 | ) | | | 316,411 | |
| | | | | | |
Net Assets: | | | | | | | | | | | | | | | | | | | | | | | | |
| | | | | | |
Beginning of year | | | 1,791,782 | | | | 1,195,414 | | | | 92,179 | | | | 64,510 | | | | 1,076,688 | | | | 760,277 | |
End of year | | $ | 1,329,502 | | | $ | 1,791,782 | | | $ | 78,735 | | | $ | 92,179 | | | $ | 536,499 | | | $ | 1,076,688 | |
| † | A zero balance may reflect actual amounts rounding to less than one thousand. |
| * | See Note 13, Shares of Beneficial Interest, in the Notes to Financial Statements. |
| (a) | The tax characterization of distributions is determined in accordance with Federal income tax regulations. See Note 2, Distributions to Shareholders, in the Notes to Financial Statements for more information. |
| | | | | | |
| 30 | | PIMCO EQUITY SERIES | | | See Accompanying Notes | |
| | | | | | | | | | | | | | |
PIMCO
RAE US Fund | | | PIMCO
RAE US Small Fund | |
| | | |
Year Ended
June 30, 2022 | | | Year Ended
June 30, 2021 | | | Year Ended
June 30, 2022 | | | Year Ended
June 30, 2021 | |
| | | |
| | | | | | | | | | | | | | |
| | | |
| | | | | | | | | | | | | | |
| | | |
| $ | 21,650 | | | $ | 16,707 | | | $ | 4,670 | | | $ | 3,509 | |
| | 82,856 | | | | 84,181 | | | | 96,742 | | | | 193,954 | |
| | (167,813 | ) | | | 216,736 | | | | (165,626 | ) | | | 129,472 | |
| | | |
| | (63,307 | ) | | | 317,624 | | | | (64,214 | ) | | | 326,935 | |
| | | |
| | | | | | | | | | | | | | |
| | | |
| | | | | | | | | | | | | | |
| | (114,851 | ) | | | (24,300 | ) | | | (91,057 | ) | | | (47,735 | ) |
| | (3,541 | ) | | | (633 | ) | | | (10,276 | ) | | | (91 | ) |
| | (1,233 | ) | | | (247 | ) | | | (30,767 | ) | | | (476 | ) |
| | | |
| | (119,625 | ) | | | (25,180 | ) | | | (132,100 | ) | | | (48,302 | ) |
| | | |
| | | | | | | | | | | | | | |
| | | |
| | 55,077 | | | | 71,065 | | | | 208,960 | | | | (188,303 | ) |
| | | |
| | (127,855 | ) | | | 363,509 | | | | 12,646 | | | | 90,330 | |
| | | |
| | | | | | | | | | | | | | |
| | | |
| | 966,499 | | | | 602,990 | | | | 383,705 | | | | 293,375 | |
| $ | 838,644 | | | $ | 966,499 | | | $ | 396,351 | | | $ | 383,705 | |
| | | | | | | | | | | | |
| | | | ANNUAL REPORT | | | | | | | JUNE 30, 2022 | | | 31 |
| | | | | | |
| Schedule of Investments | | PIMCO RAE Emerging Markets Fund | | | | |
(Amounts in thousands*, except number of shares, contracts, units and ounces, if any)
| | | | | | | | | | | | |
| | | | | SHARES | | | | | MARKET
VALUE
(000S) | |
| INVESTMENTS IN SECURITIES 99.2% | |
| |
| COMMON STOCKS 93.9% | |
| |
| BRAZIL 7.8% | | | | | | | | | | | | |
| |
| COMMUNICATION SERVICES 0.5% | |
| | | | |
Telefonica Brasil SA | | | | | 764,345 | | | $ | | | 6,873 | |
| | | | | | | | | | | | |
| |
| CONSUMER DISCRETIONARY 0.7% | |
| | | | |
Vibra Energia SA | | | | | 2,797,037 | | | | | | 8,931 | |
| | | | | | | | | | | | |
| |
| CONSUMER STAPLES 0.2% | |
| | | | |
Ambev SA | | | | | 178,300 | | | | | | 457 | |
| | | | |
BRF SA (b) | | | | | 177,300 | | | | | | 460 | |
| | | | |
JBS SA | | | | | 234,475 | | | | | | 1,415 | |
| | | | | | | | | | | | |
| | | | | | | | | | | 2,332 | |
| | | | | | | | | | | | |
| |
| ENERGY 0.4% | |
| | | | |
Ultrapar Participacoes SA | | | | | 2,383,365 | | | | | | 5,606 | |
| | | | | | | | | | | | |
| |
| FINANCIALS 3.7% | |
| | | | |
Banco do Brasil SA | | | | | 6,195,040 | | | | | | 39,513 | |
| | | | |
Banco Santander Brasil SA | | | | | 567,950 | | | | | | 3,126 | |
| | | | |
IRB Brasil Resseguros SA | | | | | 8,652,335 | | | | | | 3,356 | |
| | | | |
Porto Seguro SA | | | | | 479,500 | | | | | | 1,627 | |
| | | | |
XP, Inc. (b) | | | | | 47,014 | | | | | | 846 | |
| | | | |
XP, Inc. ‘A’ (b) | | | | | 34,832 | | | | | | 626 | |
| | | | | | | | | | | | |
| | | | | | | | | | | 49,094 | |
| | | | | | | | | | | | |
| |
| INDUSTRIALS 0.7% | |
| | | | |
CCR SA | | | | | 78,500 | | | | | | 188 | |
| | | | |
Embraer SA (b) | | | | | 4,086,385 | | | | | | 8,932 | |
| | | | | | | | | | | | |
| | | | | | | | | | | 9,120 | |
| | | | | | | | | | | | |
| |
| INFORMATION TECHNOLOGY 1.2% | |
| | | | |
Cielo SA | | | | | 22,485,145 | | | | | | 16,112 | |
| | | | | | | | | | | | |
| |
| MATERIALS 0.2% | |
| | | | |
Vale SA | | | | | 158,284 | | | | | | 2,316 | |
| | | | | | | | | | | | |
| |
| UTILITIES 0.2% | |
| | | | |
Cia de Saneamento Basico do Estado de Sao Paulo | | | | | 97,255 | | | | | | 784 | |
| | | | |
Cia Paranaense de Energia | | | | | 185,600 | | | | | | 1,186 | |
| | | | |
EDP - Energias do Brasil SA | | | | | 325,700 | | | | | | 1,276 | |
| | | | | | | | | | | | |
| | | | | | | | | | | 3,246 | |
| | | | | | | | | | | | |
Total Brazil | | | | | | | | | | | 103,630 | |
| | | | | | | | | | | | |
| |
| CHILE 0.5% | |
| |
| CONSUMER DISCRETIONARY 0.0% | |
| | | | |
Falabella SA | | | | | 169,354 | | | | | | 397 | |
| | | | | | | | | | | | |
| |
| CONSUMER STAPLES 0.2% | |
| | | | |
Cencosud SA | | | | | 1,314,876 | | | | | | 1,673 | |
| | | | |
Cia Cervecerias Unidas SA | | | | | 216,104 | | | | | | 1,366 | |
| | | | | | | | | | | | |
| | | | | | | | | | | 3,039 | |
| | | | | | | | | | | | |
| |
| FINANCIALS 0.1% | |
| | | | |
Banco de Chile | | | | | 4,522,387 | | | | | | 412 | |
| | | | |
Banco Santander Chile | | | | | 14,637,395 | | | | | | 591 | |
| | | | | | | | | | | | |
| | | | | | | | | | | 1,003 | |
| | | | | | | | | | | | |
| |
| | | | | | | | | | | | |
| | | | | SHARES | | | | | MARKET
VALUE
(000S) | |
| UTILITIES 0.2% | |
| | | | |
Aguas Andinas SA | | | | | 2,416,507 | | | $ | | | 389 | |
| | | | |
Colbun SA | | | | | 1,590,142 | | | | | | 110 | |
| | | | |
Enel Chile SA | | | | | 61,335,867 | | | | | | 1,387 | |
| | | | |
Engie Energia Chile SA | | | | | 743,547 | | | | | | 289 | |
| | | | | | | | | | | | |
| | | | | | | | | | | 2,175 | |
| | | | | | | | | | | | |
Total Chile | | | | | | | | | | | 6,614 | |
| | | | | | | | | | | | |
| |
| CHINA 18.1% | |
| |
| CONSUMER DISCRETIONARY 0.5% | |
| | | | |
BAIC Motor Corp. Ltd. ‘H’ | | | | | 9,387,000 | | | | | | 3,126 | |
| | | | |
Fuyao Glass Industry Group Co. Ltd. | | | | | 108,400 | | | | | | 548 | |
| | | | |
Great Wall Motor Co. Ltd. ‘H’ | | | | | 877,000 | | | | | | 1,816 | |
| | | | |
Topsports International Holdings Ltd. | | | | | 1,055,000 | | | | | | 961 | |
| | | | | | | | | | | | |
| | | | | | | | | | | 6,451 | |
| | | | | | | | | | | | |
| |
| CONSUMER STAPLES 0.3% | |
| | | | |
Tingyi Cayman Islands Holding Corp. | | | | | 588,000 | | | | | | 1,010 | |
| | | | |
Want Want China Holdings Ltd. | | | | | 4,012,000 | | | | | | 3,499 | |
| | | | | | | | | | | | |
| | | | | | | | | | | 4,509 | |
| | | | | | | | | | | | |
| |
| ENERGY 3.0% | |
| | | | |
China Coal Energy Co. Ltd. ‘H’ | | | | | 2,390,000 | | | | | | 2,020 | |
| | | | |
China Petroleum & Chemical Corp. ‘H’ | | | | | 48,966,400 | | | | | | 22,064 | |
| | | | |
China Shenhua Energy Co. Ltd. ‘H’ | | | | | 2,321,000 | | | | | | 6,657 | |
| | | | |
PetroChina Co. Ltd. ‘H’ | | | | | 19,126,000 | | | | | | 8,970 | |
| | | | | | | | | | | | |
| | | | | | | | | | | 39,711 | |
| | | | | | | | | | | | |
| |
| FINANCIALS 8.8% | |
| | | | |
Bank of China Ltd. ‘H’ | | | | | 97,196,000 | | | | | | 38,837 | |
| | | | |
Bank of Communications Co. Ltd. ‘H’ | | | | | 8,994,000 | | | | | | 6,234 | |
| | | | |
China Cinda Asset Management Co. Ltd. ‘H’ | | | | | 35,298,000 | | | | | | 5,539 | |
| | | | |
China Construction Bank Corp. ‘H’ | | | | | 57,163,000 | | | | | | 38,542 | |
| | | | |
China Everbright Bank Co. Ltd. ‘H’ | | | | | 1,988,000 | | | | | | 644 | |
| | | | |
Industrial & Commercial Bank of China Ltd. ‘H’ | | | | | 33,048,000 | | | | | | 19,718 | |
| | | | |
PICC Property & Casualty Co. Ltd. ‘H’ | | | | | 7,404,000 | | | | | | 7,721 | |
| | | | | | | | | | | | |
| | | | | | | | | | | 117,235 | |
| | | | | | | | | | | | |
| |
| HEALTH CARE 0.6% | |
| | | | |
China Resources Pharmaceutical Group Ltd. | | | | | 2,906,500 | | | | | | 1,974 | |
| | | | |
Sinopharm Group Co. Ltd. ‘H’ | | | | | 2,358,400 | | | | | | 5,710 | |
| | | | | | | | | | | | |
| | | | | | | | | | | 7,684 | |
| | | | | | | | | | | | |
| |
| INDUSTRIALS 1.5% | |
| | | | |
AviChina Industry & Technology Co. Ltd. ‘H’ | | | | | 968,000 | | | | | | 553 | |
| | | | |
Beijing Capital International Airport Co. Ltd. ‘H’ | | | | | 300,000 | | | | | | 205 | |
| | | | |
China Communications Services Corp. Ltd. ‘H’ | | | | | 5,376,000 | | | | | | 2,365 | |
| | | | |
China Energy Engineering Corp. Ltd. ‘H’ (d) | | | | | 3,080,000 | | | | | | 429 | |
| | | | | | | | | | | | |
| | | | | SHARES | | | | | MARKET
VALUE
(000S) | |
| | | | |
CITIC Ltd. | | | | | 7,437,000 | | | $ | | | 7,581 | |
| | | | |
CRRC Corp. Ltd. ‘H’ | | | | | 3,495,000 | | | | | | 1,303 | |
| | | | |
Guangshen Railway Co. Ltd. ‘H’ | | | | | 1,458,000 | | | | | | 274 | |
| | | | |
Metallurgical Corp. of China Ltd. | | | | | 1,195,000 | | | | | | 287 | |
| | | | |
Sinopec Engineering Group Co. Ltd. ‘H’ | | | | | 2,250,000 | | | | | | 1,033 | |
| | | | |
Sinotruk Hong Kong Ltd. | | | | | 1,398,500 | | | | | | 1,968 | |
| | | | |
Weichai Power Co. Ltd. ‘H’ | | | | | 384,000 | | | | | | 612 | |
| | | | |
Yangzijiang Shipbuilding Holdings Ltd. | | | | | 1,942,000 | | | | | | 1,300 | |
| | | | |
Zhejiang Expressway Co. Ltd. ‘H’ | | | | | 978,000 | | | | | | 901 | |
| | | | |
Zhuzhou CRRC Times Electric Co. Ltd. | | | | | 136,100 | | | | | | 673 | |
| | | | | | | | | | | | |
| | | | | | | | | | | 19,484 | |
| | | | | | | | | | | | |
| |
| INFORMATION TECHNOLOGY 2.1% | |
| | | | |
AAC Technologies Holdings, Inc. (d) | | | | | 488,000 | | | | | | 1,128 | |
| | | | |
FIH Mobile Ltd. (b) | | | | | 9,651,000 | | | | | | 1,381 | |
| | | | |
Lenovo Group Ltd. | | | | | 26,614,000 | | | | | | 25,009 | |
| | | | | | | | | | | | |
| | | | | | | | | | | 27,518 | |
| | | | | | | | | | | | |
| |
| MATERIALS 0.8% | |
| | | | |
Angang Steel Co. Ltd. ‘H’ | | | | | 8,136,000 | | | | | | 3,046 | |
| | | | |
China Hongqiao Group Ltd. | | | | | 581,000 | | | | | | 654 | |
| | | | |
China National Building Material Co. Ltd. ‘H’ | | | | | 4,801,400 | | | | | | 5,143 | |
| | | | |
China Oriental Group Co. Ltd. | | | | | 770,000 | | | | | | 188 | |
| | | | |
Sinopec Shanghai Petrochemical Co. Ltd. ‘H’ | | | | | 12,306,000 | | | | | | 2,104 | |
| | | | | | | | | | | | |
| | | | | | | | | | | 11,135 | |
| | | | | | | | | | | | |
| |
| REAL ESTATE 0.3% | |
| | | | |
China Evergrande Group «(d) | | | | | 1,601,000 | | | | | | 168 | |
| | | | |
Greentown China Holdings Ltd. | | | | | 514,000 | | | | | | 1,069 | |
| | | | |
Guangzhou R&F Properties Co. Ltd. ‘H’ (d) | | | | | 2,307,400 | | | | | | 611 | |
| | | | |
KWG Group Holdings Ltd. (d) | | | | | 1,439,000 | | | | | | 460 | |
| | | | |
Powerlong Real Estate Holdings Ltd. | | | | | 1,407,000 | | | | | | 236 | |
| | | | |
Shui On Land Ltd. | | | | | 5,440,000 | | | | | | 737 | |
| | | | |
Sino-Ocean Group Holding Ltd. | | | | | 6,777,000 | | | | | | 1,151 | |
| | | | | | | | | | | | |
| | | | | | | | | | | 4,432 | |
| | | | | | | | | | | | |
| |
| UTILITIES 0.2% | |
| | | | |
Datang International Power Generation Co. Ltd. ‘H’ | | | | | 3,688,000 | | | | | | 612 | |
| | | | |
Huaneng Power International, Inc. ‘H’ | | | | | 3,964,000 | | | | | | 1,974 | |
| | | | | | | | | | | | |
| | | | | | | | | | | 2,586 | |
| | | | | | | | | | | | |
Total China | | | | | | | | | | | 240,745 | |
| | | | | | | | | | | | |
| |
| GREECE 0.6% | |
| |
| COMMUNICATION SERVICES 0.1% | |
| | | | |
Hellenic Telecommunications Organization SA | | | | | 148,163 | | | | | | 2,588 | |
| | | | | | | | | | | | |
| |
| CONSUMER DISCRETIONARY 0.1% | |
| | | | |
OPAP SA | | | | | 65,535 | | | | | | 943 | |
| | | | | | | | | | | | |
| |
| | | | | | |
| 32 | | PIMCO EQUITY SERIES | | | See Accompanying Notes | |
| | | | | | | | | | | | |
| | | | | SHARES | | | | | MARKET
VALUE
(000S) | |
| ENERGY 0.1% | |
| | | | |
Motor Oil Hellas Corinth Refineries SA | | | | | 41,349 | | | $ | | | 770 | |
| | | | | | | | | | | | |
| |
| FINANCIALS 0.3% | |
| | | | |
Alpha Services & Holdings SA (b) | | | | | 2,337,822 | | | | | | 2,065 | |
| | | | |
National Bank of Greece SA (b) | | | | | 738,616 | | | | | | 2,210 | |
| | | | | | | | | | | | |
| | | | | | | | | | | 4,275 | |
| | | | | | | | | | | | |
Total Greece | | | | | | | | | | | 8,576 | |
| | | | | | | | | | | | |
| |
| HONG KONG 3.4% | |
| |
| FINANCIALS 0.1% | |
| | | | |
China Everbright Ltd. | | | | | 812,000 | | | | | | 765 | |
| | | | |
Far East Horizon Ltd. | | | | | 1,207,000 | | | | | | 1,014 | |
| | | | | | | | | | | | |
| | | | | | | | | | | 1,779 | |
| | | | | | | | | | | | |
| |
| INDUSTRIALS 0.8% | |
| | | | |
China Merchants Port Holdings Co. Ltd. | | | | | 358,000 | | | | | | 610 | |
| | | | |
COSCO SHIPPING Ports Ltd. | | | | | 910,000 | | | | | | 643 | |
| | | | |
Orient Overseas International Ltd. (d) | | | | | 276,000 | | | | | | 7,354 | |
| | | | |
Shanghai Industrial Holdings Ltd. | | | | | 971,000 | | | | | | 1,406 | |
| | | | | | | | | | | | |
| | | | | | | | | | | 10,013 | |
| | | | | | | | | | | | |
| |
| MATERIALS 0.1% | |
| | | | |
China Resources Cement Holdings Ltd. | | | | | 976,000 | | | | | | 658 | |
| | | | | | | | | | | | |
| |
| REAL ESTATE 0.3% | |
| | | | |
China Overseas Land & Investment Ltd. | | | | | 988,000 | | | | | | 3,143 | |
| | | | |
Poly Property Group Co. Ltd. | | | | | 2,658,000 | | | | | | 642 | |
| | | | |
Shenzhen Investment Ltd. | | | | | 3,028,000 | | | | | | 603 | |
| | | | | | | | | | | | |
| | | | | | | | | | | 4,388 | |
| | | | | | | | | | | | |
| |
| UTILITIES 2.1% | |
| | | | |
Beijing Enterprises Holdings Ltd. | | | | | 136,000 | | | | | | 484 | |
| | | | |
China Resources Power Holdings Co. Ltd. | | | | | 8,990,000 | | | | | | 18,569 | |
| | | | |
Kunlun Energy Co. Ltd. | | | | | 10,650,000 | | | | | | 8,733 | |
| | | | | | | | | | | | |
| | | | | | | | | | | 27,786 | |
| | | | | | | | | | | | |
Total Hong Kong | | | | | | | | | | | 44,624 | |
| | | | | | | | | | | | |
| |
| INDIA 10.2% | |
| |
| COMMUNICATION SERVICES 0.0% | |
| | | | |
Zee Entertainment Enterprises Ltd. (b) | | | | | 202,331 | | | | | | 552 | |
| | | | | | | | | | | | |
| |
| CONSUMER DISCRETIONARY 1.2% | |
| | | | |
Bosch Ltd. | | | | | 5,286 | | | | | | 1,023 | |
| | | | |
Hero MotoCorp Ltd. | | | | | 157,815 | | | | | | 5,460 | |
| | | | |
Motherson Sumi Wiring India Ltd. (b) | | | | | 577,281 | | | | | | 513 | |
| | | | |
Rajesh Exports Ltd. | | | | | 218,927 | | | | | | 1,738 | |
| | | | |
Samvardhana Motherson International Ltd. | | | | | 394,768 | | | | | | 594 | |
| | | | |
Tata Motors Ltd. (b) | | | | | 1,187,485 | | | | | | 6,190 | |
| | | | | | | | | | | | |
| | | | | | | | | | | 15,518 | |
| | | | | | | | | | | | |
| |
| | | | | | | | | | | | |
| | | | | SHARES | | | | | MARKET
VALUE
(000S) | |
| CONSUMER STAPLES 0.1% | |
| | | | |
ITC Ltd. | | | | | 214,751 | | | $ | | | 746 | |
| | | | | | | | | | | | |
| |
| ENERGY 3.1% | |
| | | | |
Coal India Ltd. | | | | | 2,573,799 | | | | | | 6,058 | |
| | | | |
Hindustan Petroleum Corp. Ltd. | | | | | 809,931 | | | | | | 2,236 | |
| | | | |
Indian Oil Corp. Ltd. | | | | | 7,442,225 | | | | | | 7,020 | |
| | | | |
Indian Oil Corp. Ltd. (b) | | | | | 3,721,113 | | | | | | 3,499 | |
| | | | |
Oil & Natural Gas Corp. Ltd. | | | | | 9,084,100 | | | | | | 17,394 | |
| | | | |
Oil India Ltd. | | | | | 1,229,555 | | | | | | 3,910 | |
| | | | |
Petronet LNG Ltd. | | | | | 232,703 | | | | | | 641 | |
| | | | | | | | | | | | |
| | | | | | | | | | | 40,758 | |
| | | | | | | | | | | | |
| |
| FINANCIALS 1.7% | |
| | | | |
Bank of India | | | | | 425,650 | | | | | | 240 | |
| | | | |
Canara Bank | | | | | 485,912 | | | | | | 1,121 | |
| | | | |
IDFC Ltd. | | | | | 6,195,612 | | | | | | 3,873 | |
| | | | |
Indiabulls Housing Finance Ltd. ‘L’ (b) | | | | | 5,569,310 | | | | | | 6,714 | |
| | | | |
Power Finance Corp. Ltd. | | | | | 2,059,469 | | | | | | 2,732 | |
| | | | |
REC Ltd. | | | | | 1,771,163 | | | | | | 2,783 | |
| | | | |
Shriram Transport Finance Co. Ltd. | | | | | 56,634 | | | | | | 925 | |
| | | | |
State Bank of India | | | | | 706,191 | | | | | | 4,188 | |
| | | | |
Yes Bank Ltd. (b) | | | | | 3,406,176 | | | | | | 437 | |
| | | | | | | | | | | | |
| | | | | | | | | | | 23,013 | |
| | | | | | | | | | | | |
| |
| HEALTH CARE 0.1% | |
| | | | |
Dr Reddy’s Laboratories Ltd. | | | | | 15,333 | | | | | | 854 | |
| | | | |
Glenmark Pharmaceuticals Ltd. (b) | | | | | 28,929 | | | | | | 142 | |
| | | | |
Sun Pharmaceutical Industries Ltd. | | | | | 71,281 | | | | | | 751 | |
| | | | | | | | | | | | |
| | | | | | | | | | | 1,747 | |
| | | | | | | | | | | | |
| |
| INDUSTRIALS 0.5% | |
| | | | |
Bharat Electronics Ltd. | | | | | 707,708 | | | | | | 2,100 | |
| | | | |
Bharat Heavy Electricals Ltd. (b) | | | | | 6,449,938 | | | | | | 3,680 | |
| | | | |
Hindustan Aeronautics Ltd. (b) | | | | | 11,495 | | | | | | 257 | |
| | | | |
IRB Infrastructure Developers Ltd. (b) | | | | | 165,666 | | | | | | 426 | |
| | | | | | | | | | | | |
| | | | | | | | | | | 6,463 | |
| | | | | | | | | | | | |
| |
| INFORMATION TECHNOLOGY 0.2% | |
| | | | |
Infosys Ltd. | | | | | 33,687 | | | | | | 626 | |
| | | | |
Oracle Financial Services Software Ltd. | | | | | 9,811 | | | | | | 386 | |
| | | | |
Redington India Ltd. | | | | | 488,800 | | | | | | 780 | |
| | | | |
Wipro Ltd. | | | | | 172,011 | | | | | | 910 | |
| | | | | | | | | | | | |
| | | | | | | | | | | 2,702 | |
| | | | | | | | | | | | |
| |
| MATERIALS 2.9% | |
| | | | |
Chambal Fertilisers and Chemicals Ltd. (b) | | | | | 44,917 | | | | | | 152 | |
| | | | |
Dalmia Bharat Ltd. | | | | | 20,640 | | | | | | 337 | |
| | | | |
Grasim Industries Ltd. | | | | | 20,312 | | | | | | 341 | |
| | | | |
Gujarat Narmada Valley Fertilizers & Chemicals Ltd. (b) | | | | | 43,235 | | | | | | 314 | |
| | | | |
Gujarat State Fertilizers & Chemicals Ltd. | | | | | 190,285 | | | | | | 319 | |
| | | | | | | | | | | | |
| | | | | SHARES | | | | | MARKET
VALUE
(000S) | |
| | | | |
Jindal Steel & Power Ltd. | | | | | 200,851 | | | $ | | | 841 | |
| | | | |
National Aluminium Co. Ltd. | | | | | 9,962,991 | | | | | | 8,724 | |
| | | | |
NMDC Ltd. | | | | | 1,236,660 | | | | | | 1,700 | |
| | | | |
Tata Steel Ltd. | | | | | 221,923 | | | | | | 2,447 | |
| | | | |
Vedanta Ltd. | | | | | 8,399,108 | | | | | | 23,788 | |
| | | | | | | | | | | | |
| | | | | | | | | | | 38,963 | |
| | | | | | | | | | | | |
| |
| UTILITIES 0.4% | |
| | | | |
GAIL India Ltd. | | | | | 235,838 | | | | | | 405 | |
| | | | |
Jaiprakash Power Ventures Ltd. (b) | | | | | 15,743,866 | | | | | | 1,293 | |
| | | | |
JSW Energy Ltd. | | | | | 304,609 | | | | | | 804 | |
| | | | |
NHPC Ltd. | | | | | 911,647 | | | | | | 356 | |
| | | | |
PTC India Ltd. | | | | | 1,253,247 | | | | | | 1,211 | |
| | | | |
Reliance Infrastructure Ltd. (b) | | | | | 555,481 | | | | | | 639 | |
| | | | |
Reliance Power Ltd. (b) | | | | | 3,584,298 | | | | | | 526 | |
| | | | | | | | | | | | |
| | | | | | | | | | | 5,234 | |
| | | | | | | | | | | | |
Total India | | | | | | | | | | | 135,696 | |
| | | | | | | | | | | | |
|
| INDONESIA 2.6% | |
|
| COMMUNICATION SERVICES 0.7% | |
| | | | |
Indosat Tbk PT | | | | | 667,300 | | | | | | 294 | |
| | | | |
Telkom Indonesia Persero Tbk PT | | | | | 33,217,300 | | | | | | 8,936 | |
| | | | | | | | | | | | |
| | | | | | | | | | | 9,230 | |
| | | | | | | | | | | | |
| |
| CONSUMER DISCRETIONARY 0.2% | |
| | | | |
Astra International Tbk PT | | | | | 7,661,700 | | | | | | 3,415 | |
| | | | | | | | | | | | |
| |
| CONSUMER STAPLES 0.1% | |
| | | | |
Gudang Garam Tbk PT | | | | | 257,900 | | | | | | 540 | |
| | | | |
Hanjaya Mandala Sampoerna Tbk PT | | | | | 5,298,000 | | | | | | 347 | |
| | | | | | | �� | | | | | |
| | | | | | | | | | | 887 | |
| | | | | | | | | | | | |
| |
| ENERGY 1.0% | |
| | | | |
Adaro Energy Indonesia Tbk PT | | | | | 36,076,600 | | | | | | 6,948 | |
| | | | |
AKR Corporindo Tbk PT | | | | | 5,096,700 | | | | | | 352 | |
| | | | |
Bukit Asam Tbk PT | | | | | 2,878,600 | | | | | | 739 | |
| | | | |
Indo Tambangraya Megah Tbk PT | | | | | 2,881,500 | | | | | | 5,945 | |
| | | | | | | | | | | | |
| | | | | | | | | | | 13,984 | |
| | | | | | | | | | | | |
| |
| FINANCIALS 0.2% | |
| | | | |
Bank Mandiri Persero Tbk PT | | | | | 4,418,400 | | | | | | 2,359 | |
| | | | | | | | | | | | |
| |
| HEALTH CARE 0.0% | |
| | | | |
Kalbe Farma Tbk PT | | | | | 3,215,500 | | | | | | 359 | |
| | | | | | | | | | | | |
| |
| MATERIALS 0.1% | |
| | | | |
Indocement Tunggal Prakarsa Tbk PT | | | | | 1,871,900 | | | | | | 1,192 | |
| | | | | | | | | | | | |
| |
| UTILITIES 0.3% | |
| | | | |
Perusahaan Gas Negara Tbk PT | | | | | 34,031,100 | | | | | | 3,638 | |
| | | | | | | | | | | | |
Total Indonesia | | | | | | | | | | | 35,064 | |
| | | | | | | | | | | | |
| |
| | | | | | | | | | | | |
| See Accompanying Notes | | | ANNUAL REPORT | | | | | | | JUNE 30, 2022 | | | 33 |
| | | | | | |
| Schedule of Investments | | PIMCO RAE Emerging Markets Fund | | (Cont.) | | |
| | | | | | | | | | | | |
| | | | | SHARES | | | | | MARKET
VALUE
(000S) | |
| MALAYSIA 1.4% | |
| |
| COMMUNICATION SERVICES 0.2% | |
| | | | |
Astro Malaysia Holdings Bhd | | | | | 761,900 | | | $ | | | 157 | |
| | | | |
Telekom Malaysia Bhd | | | | | 1,842,700 | | | | | | 2,196 | |
| | | | | | | | | | | | |
| | | | | | | | | | | 2,353 | |
| | | | | | | | | | | | |
| |
| CONSUMER DISCRETIONARY 0.1% | |
| | | | |
Genting Bhd | | | | | 1,687,400 | | | | | | 1,740 | |
| | | | | | | | | | | | |
| |
| CONSUMER STAPLES 0.0% | |
| | | | |
British American Tobacco Malaysia Bhd | | | | | 108,200 | | | | | | 265 | |
| | | | | | | | | | | | |
| |
| ENERGY 0.0% | |
| | | | |
Petronas Dagangan Bhd. | | | | | 67,500 | | | | | | 324 | |
| | | | | | | | | | | | |
| |
| FINANCIALS 0.7% | |
| | | | |
AMMB Holdings Bhd | | | | | 780,300 | | | | | | 661 | |
| | | | |
CIMB Group Holdings Bhd | | | | | 983,000 | | | | | | 1,106 | |
| | | | |
Hong Leong Financial Group Bhd | | | | | 114,500 | | | | | | 481 | |
| | | | |
Malayan Banking Bhd | | | | | 2,538,100 | | | | | | 4,946 | |
| | | | |
Public Bank Bhd | | | | | 653,000 | | | | | | 648 | |
| | | | |
RHB Bank Bhd | | | | | 750,500 | | | | | | 976 | |
| | | | | | | | | | | | |
| | | | | | | | | | | 8,818 | |
| | | | | | | | | | | | |
| |
| INDUSTRIALS 0.2% | |
| | | | |
CAPITAL A BHD (b) | | | | | 11,021,800 | | | | | | 1,528 | |
| | | | |
IJM Corp. Bhd. | | | | | 1,476,800 | | | | | | 580 | |
| | | | |
MISC Bhd | | | | | 141,000 | | | | | | 227 | |
| | | | |
Sime Darby Bhd | | | | | 1,097,200 | | | | | | 531 | |
| | | | | | | | | | | | |
| | | | | | | | | | | 2,866 | |
| | | | | | | | | | | | |
| |
| REAL ESTATE 0.0% | |
| | | | |
Mah Sing Group Bhd | | | | | 2,041,300 | | | | | | 278 | |
| | | | | | | | | | | | |
| |
| UTILITIES 0.2% | |
| | | | |
Petronas Gas Bhd | | | | | 145,200 | | | | | | 541 | |
| | | | |
Tenaga Nasional Bhd | | | | | 566,300 | | | | | | 1,025 | |
| | | | |
YTL Power International Bhd | | | | | 1,594,096 | | | | | | 248 | |
| | | | | | | | | | | | |
| | | | | | | | | | | 1,814 | |
| | | | | | | | | | | | |
Total Malaysia | | | | | | | | | | | 18,458 | |
| | | | | | | | | | | | |
| |
| MEXICO 6.1% | |
| |
| COMMUNICATION SERVICES 2.6% | |
| | | | |
America Movil SAB de CV | | | | | 30,286,210 | | | | | | 30,950 | |
| | | | |
Grupo Televisa SAB | | | | | 1,992,610 | | | | | | 3,271 | |
| | | | | | | | | | | | |
| | | | | | | | | | | 34,221 | |
| | | | | | | | | | | | |
| |
| CONSUMER DISCRETIONARY 0.0% | |
| | | | |
Nemak SAB de CV (b) | | | | | 3,194,000 | | | | | | 632 | |
| | | | | | | | | | | | |
| |
| CONSUMER STAPLES 0.8% | |
| | | | |
Arca Continental SAB de CV | | | | | 162,300 | | | | | | 1,069 | |
| | | | |
Coca-Cola Femsa SAB de CV | | | | | 321,958 | | | | | | 2,304 | |
| | | | |
Gruma SAB de CV | | | | | 151,751 | | | | | | 1,679 | |
| | | | |
Grupo Bimbo SAB de CV | | | | | 918,775 | | | | | | 2,987 | |
| | | | |
Kimberly-Clark de Mexico SAB de CV | | | | | 355,600 | | | | | | 482 | |
| | | | |
Wal-Mart de Mexico SAB de CV | | | | | 440,500 | | | | | | 1,519 | |
| | | | | | | | | | | | |
| | | | | | | | | | | 10,040 | |
| | | | | | | | | | | | |
| |
| | | | | | | | | | | | |
| | | | | SHARES | | | | | MARKET
VALUE
(000S) | |
| FINANCIALS 0.2% | |
| | | | |
Grupo Financiero Inbursa SAB de CV (b) | | | | | 1,822,798 | | | $ | | | 2,902 | |
| | | | | | | | | | | | |
| |
| INDUSTRIALS 0.3% | |
| | | | |
Alfa SAB de CV | | | | | 5,785,200 | | | | | | 4,108 | |
| | | | | | | | | | | | |
| |
| MATERIALS 2.2% | |
| | | | |
Alpek SAB de CV | | | | | 1,262,700 | | | | | | 1,745 | |
| | | | |
Cemex SAB de CV (b) | | | | | 61,288,040 | | | | | | 23,864 | |
| | | | |
Grupo Mexico SAB de CV | | | | | 124,700 | | | | | | 516 | |
| | | | |
Orbia Advance Corp. SAB de CV | | | | | 1,356,100 | | | | | | 3,174 | |
| | | | | | | | | | | | |
| | | | | | | | | | | 29,299 | |
| | | | | | | | | | | | |
Total Mexico | | | | | | | | | | | 81,202 | |
| | | | | | | | | | | | |
| |
| PHILIPPINES 0.7% | |
| |
| COMMUNICATION SERVICES 0.4% | |
| | | | |
Globe Telecom, Inc. | | | | | 17,585 | | | | | | 726 | |
| | | | |
PLDT, Inc. | | | | | 146,755 | | | | | | 4,482 | |
| | | | | | | | | | | | |
| | | | | | | | | | | 5,208 | |
| | | | | | | | | | | | |
| |
| ENERGY 0.1% | |
| | | | |
Semirara Mining & Power Corp. | | | | | 2,546,500 | | | | | | 1,626 | |
| | | | | | | | | | | | |
| |
| INDUSTRIALS 0.2% | |
| | | | |
Alliance Global Group, Inc. | | | | | 4,237,700 | | | | | | 678 | |
| | | | |
DMCI Holdings, Inc. | | | | | 7,518,400 | | | | | | 1,207 | |
| | | | |
International Container Terminal Services, Inc. | | | | | 106,250 | | | | | | 356 | |
| | | | | | | | | | | | |
| | | | | | | | | | | 2,241 | |
| | | | | | | | | | | | |
| |
| UTILITIES 0.0% | |
| | | | |
Aboitiz Power Corp. | | | | | 321,400 | | | | | | 172 | |
| | | | |
First Gen Corp. | | | | | 499,100 | | | | | | 154 | |
| | | | | | | | | | | | |
| | | | | | | | | | | 326 | |
| | | | | | | | | | | | |
Total Philippines | | | | | | | | | | | 9,401 | |
| | | | | | | | | | | | |
| |
| POLAND 1.0% | | | | | | | | | | | | |
| |
| COMMUNICATION SERVICES 0.0% | |
| | | | |
Orange Polska SA | | | | | 460,018 | | | | | | 644 | |
| | | | | | | | | | | | |
| |
| ENERGY 0.1% | | | | | | | | | | | | |
| | | | |
Polski Koncern Naftowy ORLEN SA | | | | | 54,033 | | | | | | 830 | |
| | | | | | | | | | | | |
| |
| FINANCIALS 0.6% | | | | | | | | | | | | |
| | | | |
Bank Polska Kasa Opieki SA | | | | | 217,130 | | | | | | 3,975 | |
| | | | |
mBank SA | | | | | 3,041 | | | | | | 153 | |
| | | | |
Powszechny Zaklad Ubezpieczen SA | | | | | 324,437 | | | | | | 2,175 | |
| | | | |
Santander Bank Polska SA | | | | | 38,212 | | | | | | 1,992 | |
| | | | | | | | | | | | |
| | | | | | | | | | | 8,295 | |
| | | | | | | | | | | | |
| |
| MATERIALS 0.1% | | | | | | | | | | | | |
| | | | |
Jastrzebska Spolka Weglowa SA (b) | | | | | 63,509 | | | | | | 909 | |
| | | | | | | | | | | | |
| |
| UTILITIES 0.2% | | | | | | | | | | | | |
| | | | |
Enea SA (b) | | | | | 127,176 | | | | | | 277 | |
| | | | |
PGE Polska Grupa Energetyczna SA (b) | | | | | 1,119,685 | | | | | | 2,673 | |
| | | | | | | | | | | | |
| | | | | | | | | | | 2,950 | |
| | | | | | | | | | | | |
Total Poland | | | | | | | | | | | 13,628 | |
| | | | | | | | | | | | |
| |
| | | | | | | | | | | | |
| | | | | SHARES | | | | | MARKET
VALUE
(000S) | |
| RUSSIA 0.0% | | | | | | | | | | | | |
| |
| COMMUNICATION SERVICES 0.0% | |
| | | | |
Mobile TeleSystems PJSC «(d) | | | | | 290,070 | | | $ | | | 0 | |
| | | | |
Rostelecom PJSC «(d) | | | | | 341,490 | | | | | | 0 | |
| | | | |
Sistema PJSFC « | | | | | 1,963,160 | | | | | | 0 | |
| | | | | | | | | | | | |
| | | | | | | | | | | 0 | |
| | | | | | | | | | | | |
| |
| CONSUMER STAPLES 0.0% | | | | | | | | | | | | |
| | | | |
Magnit PJSC « | | | | | 11,659 | | | | | | 0 | |
| | | | |
Magnit PJSC « | | | | | 82,104 | | | | | | 0 | |
| | | | | | | | | | | | |
| | | | | | | | | | | 0 | |
| | | | | | | | | | | | |
| |
| ENERGY 0.0% | | | | | | | | | | | | |
| | | | |
Gazprom PJSC « | | | | | 3,725,600 | | | | | | 0 | |
| | | | |
LUKOIL PJSC « | | | | | 254,140 | | | | | | 0 | |
| | | | | | | | | | | | |
| | | | | | | | | | | 0 | |
| | | | | | | | | | | | |
| |
| FINANCIALS 0.0% | | | | | | | | | | | | |
| | | | |
Sberbank of Russia PJSC « | | | | | 4,916,745 | | | | | | 0 | |
| | | | |
VTB Bank PJSC « | | | | | 23,863,615,853 | | | | | | 44 | |
| | | | | | | | | | | | |
| | | | | | | | | | | 44 | |
| | | | | | | | | | | | |
| |
| MATERIALS 0.0% | | | | | | | | | | | | |
| | | | |
Alrosa PJSC « | | | | | 2,122,120 | | | | | | 0 | |
| | | | |
Magnitogorsk Iron & Steel Works PJSC « | | | | | 6,974,129 | | | | | | 0 | |
| | | | |
MMC Norilsk Nickel PJSC « | | | | | 3,797 | | | | | | 0 | |
| | | | |
Novolipetsk Steel PJSC « | | | | | 3,113,725 | | | | | | 0 | |
| | | | |
Severstal PAO ^«(a) | | | | | 339,609 | | | | | | 0 | |
| | | | | | | | | | | | |
| | | | | | | | | | | 0 | |
| | | | | | | | | | | | |
| |
| UTILITIES 0.0% | | | | | | | | | | | | |
| | | | |
Inter RAO UES PJSC « | | | | | 15,264,000 | | | | | | 0 | |
| | | | |
Rosseti PJSC « | | | | | 88,235,012 | | | | | | 0 | |
| | | | |
Unipro PJSC « | | | | | 3,938,000 | | | | | | 0 | |
| | | | | | | | | | | | |
| | | | | | | | | | | 0 | |
| | | | | | | | | | | | |
Total Russia | | | | | | | | | | | 44 | |
| | | | | | | | | | | | |
| |
| SAUDI ARABIA 0.3% | | | | | | | | | | | | |
| |
| FINANCIALS 0.3% | | | | | | | | | | | | |
| | | | |
Alinma Bank | | | | | 265,751 | | | | | | 2,375 | |
| | | | |
Banque Saudi Fransi | | | | | 81,596 | | | | | | 1,034 | |
| | | | | | | | | | | | |
| | | | | | | | | | | 3,409 | |
| | | | | | | | | | | | |
| |
| MATERIALS 0.0% | | | | | | | | | | | | |
| | | | |
Saudi Industrial Investment Group | | | | | 51,562 | | | | | | 392 | |
| | | | | | | | | | | | |
Total Saudi Arabia | | | | | | | | | | | 3,801 | |
| | | | | | | | | | | | |
| |
| SINGAPORE 0.0% | | | | | | | | | | | | |
| |
| FINANCIALS 0.0% | | | | | | | | | | | | |
| | | | |
Yangzijiang Shipbuilding Holdings Ltd. (b) | | | | | 1,942,000 | | | | | | 573 | |
| | | | | | | | | | | | |
Total Singapore | | | | | | | | | | | 573 | |
| | | | | | | | | | | | |
| |
| SOUTH AFRICA 7.4% | | | | | | | | | | | | |
| |
| COMMUNICATION SERVICES 1.4% | |
| | | | |
MTN Group Ltd. | | | | | 1,726,235 | | | | | | 14,048 | |
| | | | |
Telkom SA SOC Ltd. | | | | | 1,112,172 | | | | | | 2,499 | |
| | | | | | |
| 34 | | PIMCO EQUITY SERIES | | | See Accompanying Notes | |
| | | | | | | | | | | | |
| | | | | SHARES | | | | | MARKET
VALUE
(000S) | |
| | | | |
Vodacom Group Ltd. | | | | | 176,601 | | | $ | | | 1,430 | |
| | | | | | | | | | | | |
| | | | | | | | | | | 17,977 | |
| | | | | | | | | | | | |
| |
| CONSUMER DISCRETIONARY 0.7% | |
| | | | |
Motus Holdings Ltd. | | | | | 315,437 | | | | | | 2,075 | |
| | | | |
Pepkor Holdings Ltd. | | | | | 213,202 | | | | | | 250 | |
| | | | |
Truworths International Ltd. | | | | | 849,919 | | | | | | 2,647 | |
| | | | |
Woolworths Holdings Ltd. | | | | | 1,205,658 | | | | | | 4,020 | |
| | | | | | | | | | | | |
| | | | | | | | | | | 8,992 | |
| | | | | | | | | | | | |
| |
| CONSUMER STAPLES 0.7% | | | | | | | | | | | | |
| | | | |
AVI Ltd. | | | | | 41,859 | | | | | | 169 | |
| | | | |
Distell Group Holdings Ltd. (b) | | | | | 40,631 | | | | | | 428 | |
| | | | |
Shoprite Holdings Ltd. | | | | | 594,688 | | | | | | 7,246 | |
| | | | |
Tiger Brands Ltd. (d) | | | | | 227,762 | | | | | | 1,988 | |
| | | | | | | | | | | | |
| | | | | | | | | | | 9,831 | |
| | | | | | | | | | | | |
| |
| ENERGY 0.1% | | | | | | | | | | | | |
| | | | |
Exxaro Resources Ltd. | | | | | 50,876 | | | | | | 618 | |
| | | | | | | | | | | | |
| |
| FINANCIALS 2.3% | | | | | | | | | | | | |
| | | | |
Absa Group Ltd. | | | | | 898,191 | | | | | | 8,576 | |
| | | | |
FirstRand Ltd. | | | | | 582,830 | | | | | | 2,243 | |
| | | | |
Momentum Metropolitan Holdings | | | | | 2,181,570 | | | | | | 1,913 | |
| | | | |
Nedbank Group Ltd. | | | | | 628,779 | | | | | | 8,048 | |
| | | | |
Old Mutual Ltd. | | | | | 2,879,712 | | | | | | 1,952 | |
| | | | |
Sanlam Ltd. | | | | | 94,005 | | | | | | 305 | |
| | | | |
Standard Bank Group Ltd. | | | | | 830,421 | | | | | | 7,923 | |
| | | | | | | | | | | | |
| | | | | | | | | | | 30,960 | |
| | | | | | | | | | | | |
| |
| HEALTH CARE 0.4% | | | | | | | | | | | | |
| | | | |
Life Healthcare Group Holdings Ltd. | | | | | 1,822,608 | | | | | | 2,013 | |
| | | | |
Netcare Ltd. (d) | | | | | 3,479,215 | | | | | | 3,072 | |
| | | | | | | | | | | | |
| | | | | | | | | | | 5,085 | |
| | | | | | | | | | | | |
| |
| INDUSTRIALS 0.1% | | | | | | | | | | | | |
| | | | |
Barloworld Ltd. | | | | | 352,398 | | | | | | 1,944 | |
| | | | | | | | | | | | |
| |
| MATERIALS 1.7% | | | | | | | | | | | | |
| | | | |
AngloGold Ashanti Ltd. | | | | | 34,167 | | | | | | 505 | |
| | | | |
Kumba Iron Ore Ltd. (d) | | | | | 48,245 | | | | | | 1,564 | |
| | | | |
Sappi Ltd. | | | | | 1,123,485 | | | | | | 3,719 | |
| | | | |
Sasol Ltd. (b) | | | | | 741,707 | | | | | | 17,103 | |
| | | | | | | | | | | | |
| | | | | | | | | | | 22,891 | |
| | | | | | | | | | | | |
Total South Africa | | | | | | | | | | | 98,298 | |
| | | | | | | | | | | | |
| |
| SOUTH KOREA 13.0% | | | | | | | | | | | | |
| |
| COMMUNICATION SERVICES 2.4% | |
| | | | |
KT Corp. | | | | | 991,627 | | | | | | 27,883 | |
| | | | |
KT Corp. SP ADR | | | | | 62,706 | | | | | | 875 | |
| | | | |
SK Telecom Co. Ltd. | | | | | 94,150 | | | | | | 3,778 | |
| | | | | | | | | | | | |
| | | | | | | | | | | 32,536 | |
| | | | | | | | | | | | |
| |
| CONSUMER DISCRETIONARY 3.1% | |
| | | | |
Hankook Tire & Technology Co. Ltd. | | | | | 66,880 | | | | | | 1,705 | |
| | | | |
Hyundai Mobis Co. Ltd. | | | | | 6,612 | | | | | | 1,019 | |
| | | | |
Hyundai Wia Corp. | | | | | 15,360 | | | | | | 663 | |
| | | | | | | | | | | | |
| | | | | SHARES | | | | | MARKET
VALUE
(000S) | |
| | | | |
Kia Corp. | | | | | 389,348 | | | $ | | | 23,239 | |
| | | | |
LG Electronics, Inc. | | | | | 181,918 | | | | | | 12,406 | |
| | | | |
LOTTE Himart Co. Ltd. | | | | | 70,219 | | | | | | 910 | |
| | | | |
Lotte Shopping Co. Ltd. | | | | | 10,103 | | | | | | 812 | |
| | | | | | | | | | | | |
| | | | | | | | | | | 40,754 | |
| | | | | | | | | | | | |
| |
| CONSUMER STAPLES 0.3% | | | | | | | | | | | | |
| | | | |
KT&G Corp. | | | | | 67,536 | | | | | | 4,281 | |
| | | | | | | | | | | | |
| |
| FINANCIALS 1.4% | | | | | | | | | | | | |
| | | | |
BNK Financial Group, Inc. | | | | | 195,481 | | | | | | 1,014 | |
| | | | |
DB Insurance Co. Ltd. | | | | | 71,990 | | | | | | 3,410 | |
| | | | |
Hanwha Life Insurance Co. Ltd. | | | | | 1,389,385 | | | | | | 2,386 | |
| | | | |
Hyundai Marine & Fire Insurance Co. Ltd. | | | | | 163,840 | | | | | | 3,916 | |
| | | | |
KB Financial Group, Inc. | | | | | 62,624 | | | | | | 2,339 | |
| | | | |
Meritz Financial Group, Inc. (d) | | | | | 34,617 | | | | | | 692 | |
| | | | |
Meritz Fire & Marine Insurance Co. Ltd. | | | | | 67,312 | | | | | | 1,724 | |
| | | | |
Samsung Card Co. Ltd. | | | | | 103,894 | | | | | | 2,444 | |
| | | | |
Samsung Fire & Marine Insurance Co. Ltd. | | | | | 6,891 | | | | | | 1,071 | |
| | | | | | | | | | | | |
| | | | | | | | | | | 18,996 | |
| | | | | | | | | | | | |
| |
| INDUSTRIALS 2.1% | | | | | | | | | | | | |
| | | | |
GS Holdings Corp. | | | | | 53,890 | | | | | | 1,741 | |
| | | | |
Hanwha Aerospace Co. Ltd. | | | | | 14,627 | | | | | | 549 | |
| | | | |
Hanwha Corp. | | | | | 249,356 | | | | | | 4,975 | |
| | | | |
Hyundai Engineering & Construction Co. Ltd. | | | | | 226,863 | | | | | | 7,256 | |
| | | | |
LG International Corp. | | | | | 216,280 | | | | | | 5,407 | |
| | | | |
LS Corp. | | | | | 41,516 | | | | | | 2,042 | |
| | | | |
Posco International Corp. | | | | | 420,158 | | | | | | 6,237 | |
| | | | |
SK Networks Co. Ltd. | | | | | 71,337 | | | | | | 232 | |
| | | | | | | | | | | | |
| | | | | | | | | | | 28,439 | |
| | | | | | | | | | | | |
| |
| INFORMATION TECHNOLOGY 1.2% | |
| | | | |
LG Display Co. Ltd. (d) | | | | | 665,272 | | | | | | 7,464 | |
| | | | |
LG Innotek Co. Ltd. | | | | | 14,464 | | | | | | 3,836 | |
| | | | |
Samsung Electronics Co. Ltd. | | | | | 95,961 | | | | | | 4,233 | |
| | | | | | | | | | | | |
| | | | | | | | | | | 15,533 | |
| | | | | | | | | | | | |
| |
| MATERIALS 1.2% | | | | | | | | | | | | |
| | | | |
Dongkuk Steel Mill Co. Ltd. (d) | | | | | 146,931 | | | | | | 1,459 | |
| | | | |
KCC Corp. | | | | | 2,483 | | | | | | 551 | |
| | | | |
Kolon Industries, Inc. | | | | | 70,741 | | | | | | 2,860 | |
| | | | |
Lotte Chemical Corp. | | | | | 9,441 | | | | | | 1,316 | |
| | | | |
POSCO Holdings, Inc. | | | | | 52,084 | | | | | | 9,288 | |
| | | | |
Taekwang Industrial Co. Ltd. | | | | | 252 | | | | | | 176 | |
| | | | | | | | | | | | |
| | | | | | | | | | | 15,650 | |
| | | | | | | | | | | | |
| |
| UTILITIES 1.3% | | | | | | | | | | | | |
| | | | |
Korea Electric Power Corp. | | | | | 882,681 | | | | | | 15,394 | |
| | | | |
Korea Gas Corp. | | | | | 46,416 | | | | | | 1,419 | |
| | | | | | | | | | | | |
| | | | | | | | | | | 16,813 | |
| | | | | | | | | | | | |
Total South Korea | | | | | | | | | | | 173,002 | |
| | | | | | | | | | | | |
| |
| TAIWAN 7.6% | | | | | | | | | | | | |
| |
| COMMUNICATION SERVICES 0.2% | |
| | | | |
Chunghwa Telecom Co. Ltd. | | | | | 385,000 | | | | | | 1,581 | |
| | | | | | | | | | | | |
| | | | | SHARES | | | | | MARKET
VALUE
(000S) | |
| | | | |
Far EasTone Telecommunications Co. Ltd. | | | | | 327,000 | | | $ | | | 920 | |
| | | | | | | | | | | | |
| | | | | | | | | | | 2,501 | |
| | | | | | | | | | | | |
| |
| CONSUMER DISCRETIONARY 0.2% | |
| | | | |
Cheng Shin Rubber Industry Co. Ltd. | | | | | 596,000 | | | | | | 710 | |
| | | | |
China Motor Corp. | | | | | 800,000 | | | | | | 1,672 | |
| | | | |
Formosa Taffeta Co. Ltd. | | | | | 332,000 | | | | | | 298 | |
| | | | | | | | | | | | |
| | | | | | | | | | | 2,680 | |
| | | | | | | | | | | | |
| |
| FINANCIALS 0.3% | | | | | | | | | | | | |
| | | | |
CTBC Financial Holding Co. Ltd. | | | | | 682,000 | | | | | | 577 | |
| | | | |
Fubon Financial Holding Co. Ltd. | | | | | 1,551,905 | | | | | | 3,121 | |
| | | | | | | | | | | | |
| | | | | | | | | | | 3,698 | |
| | | | | | | | | | | | |
|
| INDUSTRIALS 0.3% | | | | | | | | | | | | |
| | | | |
Eva Airways Corp. (b) | | | | | 1,175,686 | | | | | | 1,254 | |
| | | | |
Walsin Lihwa Corp. | | | | | 2,590,000 | | | | | | 3,140 | |
| | | | | | | | | | | | |
| | | | | | | | | | | 4,394 | |
| | | | | | | | | | | | |
|
| INFORMATION TECHNOLOGY 6.6% | |
| | | | |
Acer, Inc. | | | | | 767,000 | | | | | | 561 | |
| | | | |
Asustek Computer, Inc. | | | | | 1,196,000 | | | | | | 12,508 | |
| | | | |
AUO Corp. | | | | | 1,294,000 | | | | | | 708 | |
| | | | |
Catcher Technology Co. Ltd. | | | | | 452,000 | | | | | | 2,521 | |
| | | | |
Chicony Electronics Co. Ltd. | | | | | 359,000 | | | | | | 895 | |
| | | | |
Compal Electronics, Inc. | | | | | 14,460,000 | | | | | | 11,071 | |
| | | | |
General Interface Solution Holding Ltd. | | | | | 49,000 | | | | | | 126 | |
| | | | |
Hon Hai Precision Industry Co. Ltd. | | | | | 4,779,316 | | | | | | 17,546 | |
| | | | |
Innolux Corp. | | | | | 5,945,000 | | | | | | 2,419 | |
| | | | |
Inventec Corp. | | | | | 7,942,000 | | | | | | 6,715 | |
| | | | |
Lite-On Technology Corp. | | | | | 1,909,035 | | | | | | 3,715 | |
| | | | |
Pegatron Corp. | | | | | 6,776,000 | | | | | | 12,993 | |
| | | | |
Powertech Technology, Inc. | | | | | 570,000 | | | | | | 1,685 | |
| | | | |
Quanta Computer, Inc. | | | | | 1,445,000 | | | | | | 3,876 | |
| | | | |
Silicon Motion Technology Corp. ADR | | | | | 16,077 | | | | | | 1,346 | |
| | | | |
Supreme Electronics Co. Ltd. | | | | | 1,540,000 | | | | | | 2,181 | |
| | | | |
Synnex Technology International Corp. | | | | | 510,650 | | | | | | 914 | |
| | | | |
Transcend Information, Inc. | | | | | 140,000 | | | | | | 326 | |
| | | | |
Wistron Corp. | | | | | 3,422,515 | | | | | | 3,073 | |
| | | | |
WPG Holdings Ltd. | | | | | 1,217,320 | | | | | | 2,259 | |
| | | | | | | | | | | | |
| | | | | | | | | | | 87,438 | |
| | | | | | | | | | | | |
| |
| REAL ESTATE 0.0% | | | | | | | | | | | | |
| | | | |
Farglory Land Development Co. Ltd. | | | | | 84,000 | | | | | | 177 | |
| | | | | | | | | | | | |
Total Taiwan | | | | | | | | | | | 100,888 | |
| | | | | | | | | | | | |
| |
| THAILAND 9.3% | | | | | | | | | | | | |
| |
| COMMUNICATION SERVICES 0.2% | |
| | | | |
Advanced Info Service PCL | | | | | 332,500 | | | | | | 1,831 | |
| | | | |
Jasmine International PCL (b) | | | | | 10,057,200 | | | | | | 980 | |
| | | | |
Total Access Communication PCL | | | | | 137,800 | | | | | | 174 | |
| | | | | | | | | | | | |
| | | | | | | | | | | 2,985 | |
| | | | | | | | | | | | |
| |
| | | | | | | | | | | | |
| See Accompanying Notes | | | ANNUAL REPORT | | | | | | | JUNE 30, 2022 | | | 35 |
| | | | | | |
| Schedule of Investments | | PIMCO RAE Emerging Markets Fund | | (Cont.) | | |
| | | | | | | | | | | | |
| | | | | SHARES | | | | | MARKET
VALUE
(000S) | |
| CONSUMER STAPLES 0.2% | | | | | | | | | | | | |
| | | | |
Charoen Pokphand Foods PCL | | | | | 807,900 | | | $ | | | 595 | |
| | | | |
Thai Union Group PCL ‘F’ | | | | | 2,875,300 | | �� | | | | 1,393 | |
| | | | | | | | | | | | |
| | | | | | | | | | | 1,988 | |
| | | | | | | | | | | | |
| |
| ENERGY 1.2% | | | | | | | | | | | | |
| | | | |
Bangchak Corp. PCL | | | | | 588,700 | | | | | | 521 | |
| | | | |
Banpu PCL (d) | | | | | 9,858,599 | | | | | | 3,522 | |
| | | | |
IRPC PCL | | | | | 24,818,200 | | | | | | 2,265 | |
| | | | |
PTT Exploration & Production PCL | | | | | 255,200 | | | | | | 1,150 | |
| | | | |
PTT PCL | | | | | 2,052,500 | | | | | | 1,976 | |
| | | | |
Star Petroleum Refining PCL | | | | | 19,345,400 | | | | | | 6,635 | |
| | | | | | | | | | | | |
| | | | | | | | | | | 16,069 | |
| | | | | | | | | | | | |
| |
| FINANCIALS 7.3% | | | | | | | | | | | | |
| | | | |
Bangkok Bank PCL | | | | | 2,152,200 | | | | | | 8,116 | |
| | | | |
Kasikornbank PCL | | | | | 9,019,400 | | | | | | 38,489 | |
| | | | |
Kiatnakin Bank PCL | | | | | 345,200 | | | | | | 606 | |
| | | | |
Krung Thai Bank PCL | | | | | 13,674,975 | | | | | | 6,010 | |
| | | | |
SCB PCL | | | | | 10,968,700 | | | | | | 32,266 | |
| | | | |
Thanachart Capital PCL | | | | | 6,805,504 | | | | | | 7,273 | |
| | | | |
Tisco Financial Group PCL | | | | | 1,705,500 | | | | | | 4,274 | |
| | | | | | | | | | | | |
| | | | | | | | | | | 97,034 | |
| | | | | | | | | | | | |
| |
| INDUSTRIALS 0.0% | | | | | | | | | | | | |
| | | | |
Jasmine Broadband Internet Infrastructure Fund | | | | | 2,000,600 | | | | | | 543 | |
| | | | | | | | | | | | |
| |
| INFORMATION TECHNOLOGY 0.0% | |
| | | | |
Cal-Comp Electronics Thailand PCL (d) | | | | | 2,769,091 | | | | | | 184 | |
| | | | | | | | | | | | |
| |
| MATERIALS 0.3% | | | | | | | | | | | | |
| | | | |
PTT Global Chemical PCL | | | | | 805,900 | | | | | | 1,040 | |
| | | | |
Siam Cement PCL | | | | | 162,600 | | | | | | 1,723 | |
| | | | |
Siam City Cement PCL | | | | | 184,200 | | | | | | 787 | |
| | | | | | | | | | | | |
| | | | | | | | | | | 3,550 | |
| | | | | | | | | | | | |
| |
| REAL ESTATE 0.1% | | | | | | | | | | | | |
| | | | |
Pruksa Holding PCL | | | | | 447,400 | | | | | | 166 | |
| | | | |
Sansiri PCL | | | | | 10,177,800 | | | | | | 291 | |
| | | | |
Supalai PCL | | | | | 990,900 | | | | | | 522 | |
| | | | | | | | | | | | |
| | | | | | | | | | | 979 | |
| | | | | | | | | | | | |
Total Thailand | | | | | | | | | | | 123,332 | |
| | | | | | | | | | | | |
| |
| TURKEY 3.7% | | | | | | | | | | | | |
| |
| COMMUNICATION SERVICES 0.2% | | | | | | | |
| | | | |
Turkcell Iletisim Hizmetleri AS (d) | | | | | 2,825,713 | | | | | | 2,757 | |
| | | | | | | | | | | | |
| |
| CONSUMER DISCRETIONARY 0.2% | | | | | | | |
| | | | |
Arcelik AS (d) | | | | | 219,817 | | | | | | 957 | |
| | | | |
Tofas Turk Otomobil Fabrikasi AS (d) | | | | | 608,825 | | | | | | 2,204 | |
| | | | | | | | | | | | |
| | | | | | | | | | | 3,161 | |
| | | | | | | | | | | | |
| |
| | | | | | | | | | | | |
| | | | | SHARES | | | | | MARKET
VALUE
(000S) | |
| ENERGY 0.1% | | | | | | | | | | | | |
| | | | |
Turkiye Petrol Rafinerileri AS (b) | | | | | 68,401 | | | $ | | | 1,078 | |
| | | | | | | | | | | | |
| |
| FINANCIALS 2.8% | | | | | | | | | | | | |
| | | | |
Akbank TAS (d) | | | | | 9,877,129 | | | | | | 4,746 | |
| | | | |
Haci Omer Sabanci Holding AS (d) | | | | | 7,880,647 | | | | | | 8,928 | |
| | | | |
Is Yatirim Menkul Degerler AS | | | | | 1,669,727 | | | | | | 1,907 | |
| | | | |
Turkiye Garanti Bankasi AS (d) | | | | | 16,542,035 | | | | | | 13,772 | |
| | | | |
Turkiye Is Bankasi AS ‘C’ (d) | | | | | 20,409,264 | | | | | | 5,393 | |
| | | | |
Yapi ve Kredi Bankasi AS (d) | | | | | 6,753,127 | | | | | | 1,752 | |
| | | | | | | | | | | | |
| | | | | | | | | | | 36,498 | |
| | | | | | | | | | | | |
| |
| INDUSTRIALS 0.1% | | | | | | | | | | | | |
| | | | |
AG Anadolu Grubu Holding AS | | | | | 147,931 | | | | | | 420 | |
| | | | |
Tekfen Holding AS | | | | | 492,348 | | | | | | 637 | |
| | | | | | | | | | | | |
| | | | | | | | | | | 1,057 | |
| | | | | | | | | | | | |
| |
| MATERIALS 0.1% | | | | | | | | | | | | |
| | | | |
Eregli Demir ve Celik Fabrikalari TAS | | | | | 664,612 | | | | | | 1,081 | |
| | | | | | | | | | | | |
| |
| UTILITIES 0.2% | | | | | | | | | | | | |
| | | | |
Aygaz AS | | | | | 1,048,476 | | | | | | 2,339 | |
| | | | |
Enerjisa Enerji AS | | | | | 664,145 | | | | | | 542 | |
| | | | | | | | | | | | |
| | | | | | | | | | | 2,881 | |
| | | | | | | | | | | | |
Total Turkey | | | | | | | | | | | 48,513 | |
| | | | | | | | | | | | |
| |
| UNITED STATES 0.2% | | | | | | | | | | | | |
| |
| CONSUMER DISCRETIONARY 0.2% | |
| | | | |
Nexteer Automotive Group Ltd. | | | | | 3,891,000 | | | | | | 2,811 | |
| | | | | | | | | | | | |
Total United States | | | | | | | | | | | 2,811 | |
| | | | | | | | | | | | |
Total Common Stocks (Cost $1,325,160) | | | | | | 1,248,900 | |
| | | | | | | | | | | | |
| |
| PREFERRED STOCKS 4.3% | | | | | | | | | | | | |
| |
| BRAZIL 4.2% | | | | | | | | | | | | |
| |
| BANKING & FINANCE 2.8% | | | | | | | | | | | | |
| | | | |
Banco Bradesco SA | | | | | 3,224,246 | | | | | | 10,597 | |
| | | | |
Banco do Estado do Rio Grande do Sul SA | | | | | 1,787,400 | | | | | | 3,060 | |
| | | | |
Itau Unibanco Holding SA | | | | | 5,509,364 | | | | | | 23,865 | |
| | | | | | | | | | | | |
| | | | | | | | | | | 37,522 | |
| | | | | | | | | | | | |
| |
| ENERGY 0.1% | | | | | | | | | | | | |
| | | | |
Petroleo Brasileiro SA | | | | | 165,500 | | | | | | 883 | |
| | | | | | | | | | | | |
| |
| INDUSTRIALS 0.5% | | | | | | | | | | | | |
| | | | |
Braskem SA | | | | | 1,065,195 | | | | | | 7,580 | |
| | | | | | | | | | | | |
| |
| UTILITIES 0.8% | | | | | | | | | | | | |
| | | | |
Cia Energetica de Minas Gerais | | | | | 4,064,509 | | | | | | 8,061 | |
| | | | |
Cia Paranaense de Energia | | | | | 1,842,500 | | | | | | 2,405 | |
| | | | | | | | | | | | |
| | | | | | | | | | | 10,466 | |
| | | | | | | | | | | | |
Total Brazil | | | | | | | | | | | 56,451 | |
| | | | | | | | | | | | |
| |
| | | | | | | | | | | | |
| | | | | SHARES | | | | | MARKET
VALUE
(000S) | |
| CHILE 0.1% | | | | | | | | | | | | |
| |
| INDUSTRIALS 0.1% | | | | | | | | | | | | |
| | | | |
Embotelladora Andina SA | | | | | 399,787 | | | $ | | | 713 | |
| | | | | | | | | | | | |
Total Chile | | | | | | | | | | | 713 | |
| | | | | | | | | | | | |
| |
| RUSSIA 0.0% | | | | | | | | | | | | |
| |
| ENERGY 0.0% | | | | | | | | | | | | |
| | | | |
Bashneft PJSC « | | | | | 31,237 | | | | | | 0 | |
| | | | |
Transneft PJSC « | | | | | 810 | | | | | | 0 | |
| | | | | | | | | | | | |
| | | | | | | | | | | 0 | |
| | | | | | | | | | | | |
Total Russia | | | | | | | | | | | 0 | |
| | | | | | | | | | | | |
Total Preferred Stocks (Cost $58,739) | | | | | | 57,164 | |
| | | | | | | | | | | | |
| |
| REAL ESTATE INVESTMENT TRUSTS 0.4% | |
| |
| SOUTH AFRICA 0.1% | | | | | | | | | | | | |
| |
| REAL ESTATE 0.1% | | | | | | | | | | | | |
| | | | |
Growthpoint Properties Ltd. | | | | | 476,111 | | | | | | 361 | |
| | | | |
Redefine Properties Ltd. | | | | | 3,894,988 | | | | | | 879 | |
| | | | | | | | | | | | |
| | | | | | | | | | | 1,240 | |
| | | | | | | | | | | | |
Total South Africa | | | | | | | | | | | 1,240 | |
| | | | | | | | | | | | |
| |
| TURKEY 0.3% | | | | | | | | | | | | |
| |
| REAL ESTATE 0.3% | | | | | | | | | | | | |
| | | | |
Emlak Konut Gayrimenkul Yatirim Ortakligi AS (d) | | | | | 24,978,174 | | | | | | 3,971 | |
| | | | | | | | | | | | |
Total Turkey | | | | | | | | | | | 3,971 | |
| | | | | | | | | | | | |
Total Real Estate Investment Trusts
(Cost $6,082) | | | | | | 5,211 | |
| | | | | | | | | | | | |
| |
| SHORT-TERM INSTRUMENTS 0.6% | |
| |
| REPURCHASE AGREEMENTS (f) 0.6% | |
| | | | | | | | | | | 8,387 | |
| | | | | | | | | | | | |
Total Short-Term Instruments
(Cost $8,387) | | | | | | 8,387 | |
| | | | | | | | | | | | |
| | | | |
| | | | | | | | | | | | |
Total Investments in Securities
(Cost $1,398,368) | | | | | | 1,319,662 | |
| | | | | | | | | | | | |
| |
| INVESTMENTS IN AFFILIATES 3.1% | |
| |
| SHORT-TERM INSTRUMENTS 3.1% | |
| |
| MUTUAL FUNDS 3.1% | | | | | | | | | | | | |
|
PIMCO Government Money Market Fund | |
1.450% (c)(d)(e) | | | | | 40,679,266 | | | | | | 40,679 | |
| | | | | | | | | | | | |
Total Short-Term Instruments
(Cost $40,679) | | | | | | 40,679 | |
| | | | | | | | | | | | |
| | | | |
| | | | | | | | | | | | |
Total Investments in Affiliates
(Cost $40,679) | | | | | | 40,679 | |
| | | | |
| | | | | | | | | | | | |
Total Investments 102.3%
(Cost $1,439,047) | | | $ | | | 1,360,341 | |
| |
| Other Assets and Liabilities, net (2.3)% | | | | | | (30,839 | ) |
| | | | | | | | | | | | |
| Net Assets 100.0% | | | | | | | | $ | | | 1,329,502 | |
| | | | | | | | | | | | |
| | | | | | |
| 36 | | PIMCO EQUITY SERIES | | | See Accompanying Notes | |
NOTES TO SCHEDULE OF INVESTMENTS:
| * | A zero balance may reflect actual amounts rounding to less than one thousand. |
| « | Security valued using significant unobservable inputs (Level 3). |
| (a) | Security is not accruing income as of the date of this report. |
| (b) | Security did not produce income within the last twelve months. |
| (c) | Institutional Class Shares of each Fund. |
| (d) | Securities with an aggregate market value of $37,165 were out on loan in exchange for $40,787 of cash collateral as of June 30, 2022. The collateral was invested in a cash collateral reinvestment vehicle as described in Note 5 in the Notes to Financial Statements. |
| (e) | Coupon represents a 7-Day Yield. |
BORROWINGS AND OTHER FINANCING TRANSACTIONS
(f) REPURCHASE AGREEMENTS:
| | | | | | | | | | | | | | | | | | | | | | | | | | | | | | |
| Counterparty | | Lending
Rate | | | Settlement
Date | | | Maturity
Date | | | Principal
Amount | | | Collateralized By | | Collateral
(Received) | | | Repurchase
Agreements,
at Value | | | Repurchase
Agreement
Proceeds
to be
Received(1) | |
| FICC | | | 0.400 | % | | | 06/30/2022 | | | | 07/01/2022 | | | $ | 8,387 | | | U.S. Treasury Notes 3.000% due 06/30/2024 | | $ | (8,555 | ) | | $ | 8,387 | | | $ | 8,387 | |
| | | | | | | | | | | | | | | | | | | | | | | | | | | | | | |
Total Repurchase Agreements | | | | | $ | (8,555 | ) | | $ | 8,387 | | | $ | 8,387 | |
| | | | | | | | | | | | | | | | | | | | | | | | | | | | | | |
BORROWINGS AND OTHER FINANCING TRANSACTIONS SUMMARY
The following is a summary by counterparty of the market value of Borrowings and Other Financing Transactions and collateral pledged/(received) as of June 30, 2022:
| | | | | | | | | | | | | | | | | | | | | | | | | | | | |
| Counterparty | | Repurchase
Agreement
Proceeds
to be
Received(1) | | | Payable for
Reverse
Repurchase
Agreements | | | Payable for
Sale-Buyback
Transactions | | | Securities Out on Loan | | | Total
Borrowings and
Other Financing
Transactions | | | Collateral
Pledged/(Received) | | | Net Exposure(2) | |
Global/Master Repurchase Agreement | |
FICC | | $ | 8,387 | | | $ | 0 | | | $ | 0 | | | $ | 0 | | | $ | 8,387 | | | $ | (8,555 | ) | | $ | (168 | ) |
|
Master Securities Lending Agreement | |
BCY | | | 0 | | | | 0 | | | | 0 | | | | 1,872 | | | | 1,872 | | | | (2,195 | ) | | | (323 | ) |
BOS | | | 0 | | | | 0 | | | | 0 | | | | 2,378 | | | | 2,378 | | | | (2,612 | ) | | | (234 | ) |
GSC | | | 0 | | | | 0 | | | | 0 | | | | 7,197 | | | | 7,197 | | | | (7,598 | ) | | | (401 | ) |
MBC | | | 0 | | | | 0 | | | | 0 | | | | 9,044 | | | | 9,044 | | | | (10,002 | ) | | | (958 | ) |
MSC | | | 0 | | | | 0 | | | | 0 | | | | 11,270 | | | | 11,270 | | | | (12,640 | ) | | | (1,370 | ) |
SAL | | | 0 | | | | 0 | | | | 0 | | | | 3,121 | | | | 3,121 | | | | (3,305 | ) | | | (184 | ) |
UBS | | | 0 | | | | 0 | | | | 0 | | | | 2,283 | | | | 2,283 | | | | (2,435 | ) | | | (152 | ) |
| | | | | | | | | | | | | | | | | | | | | | | | | | | | |
Total Borrowings and Other Financing Transactions | | $ | 8,387 | | | $ | 0 | | | $ | 0 | | | $ | 37,165 | | | | | | | | | | | | | |
| | | | | | | | | | | | | | | | | | | | | | | | | | | | |
CERTAIN TRANSFERS ACCOUNTED FOR AS SECURED BORROWINGS
Remaining Contractual Maturity of the Agreements
| | | | | | | | | | | | | | | | | | | | |
| | | Overnight and
Continuous | | | Up to 30 days | | | 31-90 days | | | Greater Than 90 days | | | Total | |
Securities Lending Transactions(3) | |
Common Stocks | | $ | 40,372 | | | $ | 0 | | | $ | 0 | | | $ | 0 | | | $ | 40,372 | |
Real Estate Investment Trusts | | | 415 | | | | 0 | | | | 0 | | | | 0 | | | | 415 | |
| | | | | | | | | | | | | | | | | | | | |
Total Borrowings | | $ | 40,787 | | | $ | 0 | | | $ | 0 | | | $ | 0 | | | $ | 40,787 | |
| | | | | | | | | | | | | | | | | | | | |
Payable for securities on loan - cash collateral | | | $ | 40,787 | |
| | | | | | | | | | | | | | | | | | | | |
| (1) | Includes accrued interest. |
| (2) | Net Exposure represents the net receivable/(payable) that would be due from/to the counterparty in the event of default. Exposure from borrowings and other financing transactions can only be netted across transactions governed under the same master agreement with the same legal entity. See Note 8, Master Netting Arrangements, in the Notes to Financial Statements for more information. |
| (3) | Includes cash collateral as described in Note 5 in the Notes to Financial Statements. |
| | | | | | | | | | | | |
| See Accompanying Notes | | | ANNUAL REPORT | | | | | | | JUNE 30, 2022 | | | 37 |
| | | | | | |
| Schedule of Investments | | PIMCO RAE Emerging Markets Fund | | (Cont.) | | |
FAIR VALUE OF FINANCIAL DERIVATIVE INSTRUMENTS
The following is a summary of the fair valuation of the Fund’s derivative instruments categorized by risk exposure. See Note 7, Principal and Other Risks, in the Notes to Financial Statements on risks of the Fund.
The effect of Financial Derivative Instruments on the Statements of Operations for the period ended June 30, 2022:
| | | | | | | | | | | | | | | | | | | | | | | | |
| | | Derivatives not accounted for as hedging instruments | |
| | | Commodity
Contracts | | | Credit
Contracts | | | Equity
Contracts | | | Foreign
Exchange
Contracts | | | Interest
Rate Contracts | | | Total | |
Net Realized Gain on Financial Derivative Instruments | |
Over the counter | |
Forward Foreign Currency Contracts | | $ | 0 | | | $ | 0 | | | $ | 0 | | | $ | 10 | | | $ | 0 | | | $ | 10 | |
| | | | | | | | | | | | | | | | | | | | | | | | |
FAIR VALUE MEASUREMENTS
The following is a summary of the fair valuations according to the inputs used as of June 30, 2022 in valuing the Fund’s assets and liabilities:
| | | | | | | | | | | | | | | | |
| Category and Subcategory | | Level 1 | | | Level 2 | | | Level 3 | | | Fair
Value at
06/30/2022 | |
Investments in Securities, at Value | |
Common Stocks | |
Brazil | |
Communication Services | | $ | 6,873 | | | $ | 0 | | | $ | 0 | | | $ | 6,873 | |
Consumer Discretionary | | | 8,931 | | | | 0 | | | | 0 | | | | 8,931 | |
Consumer Staples | | | 2,332 | | | | 0 | | | | 0 | | | | 2,332 | |
Energy | | | 5,606 | | | | 0 | | | | 0 | | | | 5,606 | |
Financials | | | 49,094 | | | | 0 | | | | 0 | | | | 49,094 | |
Industrials | | | 9,120 | | | | 0 | | | | 0 | | | | 9,120 | |
Information Technology | | | 16,112 | | | | 0 | | | | 0 | | | | 16,112 | |
Materials | | | 2,316 | | | | 0 | | | | 0 | | | | 2,316 | |
Utilities | | | 3,246 | | | | 0 | | | | 0 | | | | 3,246 | |
Chile | |
Consumer Discretionary | | | 397 | | | | 0 | | | | 0 | | | | 397 | |
Consumer Staples | | | 3,039 | | | | 0 | | | | 0 | | | | 3,039 | |
Financials | | | 1,003 | | | | 0 | | | | 0 | | | | 1,003 | |
Utilities | | | 2,175 | | | | 0 | | | | 0 | | | | 2,175 | |
China | |
Consumer Discretionary | | | 0 | | | | 6,451 | | | | 0 | | | | 6,451 | |
Consumer Staples | | | 0 | | | | 4,509 | | | | 0 | | | | 4,509 | |
Energy | | | 0 | | | | 39,711 | | | | 0 | | | | 39,711 | |
Financials | | | 0 | | | | 117,235 | | | | 0 | | | | 117,235 | |
Health Care | | | 0 | | | | 7,684 | | | | 0 | | | | 7,684 | |
Industrials | | | 0 | | | | 19,484 | | | | 0 | | | | 19,484 | |
Information Technology | | | 0 | | | | 27,518 | | | | 0 | | | | 27,518 | |
Materials | | | 0 | | | | 11,135 | | | | 0 | | | | 11,135 | |
Real Estate | | | 0 | | | | 4,264 | | | | 168 | | | | 4,432 | |
Utilities | | | 0 | | | | 2,586 | | | | 0 | | | | 2,586 | |
Greece | |
Communication Services | | | 0 | | | | 2,588 | | | | 0 | | | | 2,588 | |
Consumer Discretionary | | | 0 | | | | 943 | | | | 0 | | | | 943 | |
Energy | | | 0 | | | | 770 | | | | 0 | | | | 770 | |
Financials | | | 0 | | | | 4,275 | | | | 0 | | | | 4,275 | |
Hong Kong | |
Financials | | | 0 | | | | 1,779 | | | | 0 | | | | 1,779 | |
Industrials | | | 0 | | | | 10,013 | | | | 0 | | | | 10,013 | |
Materials | | | 0 | | | | 658 | | | | 0 | | | | 658 | |
Real Estate | | | 0 | | | | 4,388 | | | | 0 | | | | 4,388 | |
Utilities | | | 0 | | | | 27,786 | | | | 0 | | | | 27,786 | |
India | |
Communication Services | | | 0 | | | | 552 | | | | 0 | | | | 552 | |
Consumer Discretionary | | | 0 | | | | 15,518 | | | | 0 | | | | 15,518 | |
Consumer Staples | | | 0 | | | | 746 | | | | 0 | | | | 746 | |
Energy | | | 0 | | | | 40,758 | | | | 0 | | | | 40,758 | |
Financials | | | 0 | | | | 23,013 | | | | 0 | | | | 23,013 | |
Health Care | | | 0 | | | | 1,747 | | | | 0 | | | | 1,747 | |
Industrials | | | 0 | | | | 6,463 | | | | 0 | | | | 6,463 | |
Information Technology | | | 0 | | | | 2,702 | | | | 0 | | | | 2,702 | |
Materials | | | 0 | | | | 38,963 | | | | 0 | | | | 38,963 | |
Utilities | | | 0 | | | | 5,234 | | | | 0 | | | | 5,234 | |
| | | | | | | | | | | | | | | | |
| Category and Subcategory | | Level 1 | | | Level 2 | | | Level 3 | | | Fair
Value at
06/30/2022 | |
Indonesia | |
Communication Services | | $ | 0 | | | $ | 9,230 | | | $ | 0 | | | $ | 9,230 | |
Consumer Discretionary | | | 0 | | | | 3,415 | | | | 0 | | | | 3,415 | |
Consumer Staples | | | 0 | | | | 887 | | | | 0 | | | | 887 | |
Energy | | | 0 | | | | 13,984 | | | | 0 | | | | 13,984 | |
Financials | | | 0 | | | | 2,359 | | | | 0 | | | | 2,359 | |
Health Care | | | 0 | | | | 359 | | | | 0 | | | | 359 | |
Materials | | | 0 | | | | 1,192 | | | | 0 | | | | 1,192 | |
Utilities | | | 0 | | | | 3,638 | | | | 0 | | | | 3,638 | |
Malaysia | |
Communication Services | | | 0 | | | | 2,353 | | | | 0 | | | | 2,353 | |
Consumer Discretionary | | | 0 | | | | 1,740 | | | | 0 | | | | 1,740 | |
Consumer Staples | | | 265 | | | | 0 | | | | 0 | | | | 265 | |
Energy | | | 0 | | | | 324 | | | | 0 | | | | 324 | |
Financials | | | 0 | | | | 8,818 | | | | 0 | | | | 8,818 | |
Industrials | | | 0 | | | | 2,866 | | | | 0 | | | | 2,866 | |
Real Estate | | | 0 | | | | 278 | | | | 0 | | | | 278 | |
Utilities | | | 0 | | | | 1,814 | | | | 0 | | | | 1,814 | |
Mexico | |
Communication Services | | | 34,221 | | | | 0 | | | | 0 | | | | 34,221 | |
Consumer Discretionary | | | 632 | | | | 0 | | | | 0 | | | | 632 | |
Consumer Staples | | | 10,040 | | | | 0 | | | | 0 | | | | 10,040 | |
Financials | | | 2,902 | | | | 0 | | | | 0 | | | | 2,902 | |
Industrials | | | 4,108 | | | | 0 | | | | 0 | | | | 4,108 | |
Materials | | | 29,299 | | | | 0 | | | | 0 | | | | 29,299 | |
Philippines | |
Communication Services | | | 0 | | | | 5,208 | | | | 0 | | | | 5,208 | |
Energy | | | 0 | | | | 1,626 | | | | 0 | | | | 1,626 | |
Industrials | | | 0 | | | | 2,241 | | | | 0 | | | | 2,241 | |
Utilities | | | 0 | | | | 326 | | | | 0 | | | | 326 | |
Poland | |
Communication Services | | | 0 | | | | 644 | | | | 0 | | | | 644 | |
Energy | | | 0 | | | | 830 | | | | 0 | | | | 830 | |
Financials | | | 0 | | | | 8,295 | | | | 0 | | | | 8,295 | |
Materials | | | 0 | | | | 909 | | | | 0 | | | | 909 | |
Utilities | | | 0 | | | | 2,950 | | | | 0 | | | | 2,950 | |
Russia | |
Financials | | | 0 | | | | 0 | | | | 44 | | | | 44 | |
Saudi Arabia | |
Financials | | | 0 | | | | 3,409 | | | | 0 | | | | 3,409 | |
Materials | | | 0 | | | | 392 | | | | 0 | | | | 392 | |
Singapore | |
Financials | | | 573 | | | | 0 | | | | 0 | | | | 573 | |
South Africa | |
Communication Services | | | 2,499 | | | | 15,478 | | | | 0 | | | | 17,977 | |
Consumer Discretionary | | | 8,992 | | | | 0 | | | | 0 | | | | 8,992 | |
Consumer Staples | | | 2,585 | | | | 7,246 | | | | 0 | | | | 9,831 | |
Energy | | | 0 | | | | 618 | | | | 0 | | | | 618 | |
Financials | | | 0 | | | | 30,960 | | | | 0 | | | | 30,960 | |
Health Care | | | 0 | | | | 5,085 | | | | 0 | | | | 5,085 | |
Industrials | | | 1,944 | | | | 0 | | | | 0 | | | | 1,944 | |
Materials | | | 3,719 | | | | 19,172 | | | | 0 | | | | 22,891 | |
| | | | | | |
| 38 | | PIMCO EQUITY SERIES | | | See Accompanying Notes | |
| | | | | | | | | | | | | | | | |
| Category and Subcategory | | Level 1 | | | Level 2 | | | Level 3 | | | Fair
Value at
06/30/2022 | |
South Korea | |
Communication Services | | $ | 875 | | | $ | 31,661 | | | $ | 0 | | | $ | 32,536 | |
Consumer Discretionary | | | 0 | | | | 40,754 | | | | 0 | | | | 40,754 | |
Consumer Staples | | | 0 | | | | 4,281 | | | | 0 | | | | 4,281 | |
Financials | | | 0 | | | | 18,996 | | | | 0 | | | | 18,996 | |
Industrials | | | 0 | | | | 28,439 | | | | 0 | | | | 28,439 | |
Information Technology | | | 0 | | | | 15,533 | | | | 0 | | | | 15,533 | |
Materials | | | 0 | | | | 15,650 | | | | 0 | | | | 15,650 | |
Utilities | | | 0 | | | | 16,813 | | | | 0 | | | | 16,813 | |
Taiwan | |
Communication Services | | | 0 | | | | 2,501 | | | | 0 | | | | 2,501 | |
Consumer Discretionary | | | 0 | | | | 2,680 | | | | 0 | | | | 2,680 | |
Financials | | | 0 | | | | 3,698 | | | | 0 | | | | 3,698 | |
Industrials | | | 0 | | | | 4,394 | | | | 0 | | | | 4,394 | |
Information Technology | | | 1,346 | | | | 86,092 | | | | 0 | | | | 87,438 | |
Real Estate | | | 0 | | | | 177 | | | | 0 | | | | 177 | |
Thailand | |
Communication Services | | | 0 | | | | 2,985 | | | | 0 | | | | 2,985 | |
Consumer Staples | | | 0 | | | | 1,988 | | | | 0 | | | | 1,988 | |
Energy | | | 0 | | | | 16,069 | | | | 0 | | | | 16,069 | |
Financials | | | 0 | | | | 97,034 | | | | 0 | | | | 97,034 | |
Industrials | | | 0 | | | | 543 | | | | 0 | | | | 543 | |
Information Technology | | | 0 | | | | 184 | | | | 0 | | | | 184 | |
Materials | | | 0 | | | | 3,550 | | | | 0 | | | | 3,550 | |
Real Estate | | | 0 | | | | 979 | | | | 0 | | | | 979 | |
Turkey | |
Communication Services | | | 0 | | | | 2,757 | | | | 0 | | | | 2,757 | |
Consumer Discretionary | | | 0 | | | | 3,161 | | | | 0 | | | | 3,161 | |
| | | | | | | | | | | | | | | | |
| Category and Subcategory | | Level 1 | | | Level 2 | | | Level 3 | | | Fair
Value at
06/30/2022 | |
Energy | | $ | 0 | | | $ | 1,078 | | | $ | 0 | | | $ | 1,078 | |
Financials | | | 15,426 | | | | 21,072 | | | | 0 | | | | 36,498 | |
Industrials | | | 420 | | | | 637 | | | | 0 | | | | 1,057 | |
Materials | | | 0 | | | | 1,081 | | | | 0 | | | | 1,081 | |
Utilities | | | 2,339 | | | | 542 | | | | 0 | | | | 2,881 | |
United States | |
Consumer Discretionary | | | 0 | | | | 2,811 | | | | 0 | | | | 2,811 | |
Preferred Stocks | |
Brazil | |
Banking & Finance | | | 37,522 | | | | 0 | | | | 0 | | | | 37,522 | |
Energy | | | 883 | | | | 0 | | | | 0 | | | | 883 | |
Industrials | | | 7,580 | | | | 0 | | | | 0 | | | | 7,580 | |
Utilities | | | 10,466 | | | | 0 | | | | 0 | | | | 10,466 | |
Chile | |
Industrials | | | 713 | | | | 0 | | | | 0 | | | | 713 | |
Real Estate Investment Trusts | |
South Africa | |
Real Estate | | | 1,240 | | | | 0 | | | | 0 | | | | 1,240 | |
Turkey | |
Real Estate | | | 0 | | | | 3,971 | | | | 0 | | | | 3,971 | |
Short-Term Instruments | |
Repurchase Agreements | | | 0 | | | | 8,387 | | | | 0 | | | | 8,387 | |
| | | | | | | | | | | | | | | | |
| | $ | 290,833 | | | $ | 1,028,617 | | | $ | 212 | | | $ | 1,319,662 | |
| | | | | | | | | | | | | | | | |
|
Investments in Affiliates, at Value | |
Short-Term Instruments | |
Mutual Funds | | | 40,679 | | | | 0 | | | | 0 | | | | 40,679 | |
| | | | | | | | | | | | | | | | |
| | | | |
Total Investments | | $ | 331,512 | | | $ | 1,028,617 | | | $ | 212 | | | $ | 1,360,341 | |
| | | | | | | | | | | | | | | | |
There were no significant transfers into or out of Level 3 during the period ended June 30, 2022.
| | | | | | | | | | | | |
| See Accompanying Notes | | | ANNUAL REPORT | | | | | | | JUNE 30, 2022 | | | 39 |
| | | | | | |
| Schedule of Investments | | PIMCO RAE Global ex-US Fund | | | | June 30, 2022 |
(Amounts in thousands*, except number of shares, contracts, units and ounces, if any)
| | | | | | | | | | | | |
| | | | | | | | | | MARKET
VALUE
(000S) | |
| INVESTMENTS IN SECURITIES 0.2% | |
|
| SHORT-TERM INSTRUMENTS 0.2% | |
|
| REPURCHASE AGREEMENTS (b) 0.2% | | | | | | | |
| | | | | | | | $ | | | 124 | |
| | | | | | | | | | | | |
Total Short-Term Instruments
(Cost $124) | | | | | | | | | | | 124 | |
| | | | | | | | | | | | |
| | | | |
| | | | | | | | | | | | |
Total Investments in Securities
(Cost $124) | | | | | | | | | | | 124 | |
| | | | | | | | | | | | |
| | | | | | | | | | | | |
| | | | | SHARES | | | | | MARKET
VALUE
(000S) | |
| INVESTMENTS IN AFFILIATES 99.8% | |
| |
| MUTUAL FUNDS (a) 99.8% | |
| |
| UNITED STATES 99.8% | |
| | | | |
PIMCO RAE Emerging Markets Fund | | | | | 2,093,757 | | | $ | | | 18,530 | |
| | | | |
PIMCO RAE International Fund | | | | | 7,959,956 | | | | | | 60,097 | |
| | | | | | | | | | | | |
| Total Mutual Funds (Cost $93,061) | | | | | | 78,627 | |
| | | | | | | | | | | | |
| | | | |
| | | | | | | | | | | | |
Total Investments in Affiliates
(Cost $93,061) | | | | | | | | | | | 78,627 | |
| | | | |
| | | | | | | | | | | | |
Total Investments 100.0%
(Cost $93,185) | | | | | | | | $ | | | 78,751 | |
| |
| Other Assets and Liabilities, net 0.0% | | | | | | (16 | ) |
| | | | | | | | | | | | |
| Net Assets 100.0% | | | | | | | | $ | | | 78,735 | |
| | | | | | | | | | | | |
NOTES TO SCHEDULE OF INVESTMENTS:
| * | A zero balance may reflect actual amounts rounding to less than one thousand. |
| (a) | Institutional Class Shares of each Fund. |
BORROWINGS AND OTHER FINANCING TRANSACTIONS
(b) REPURCHASE AGREEMENTS:
| | | | | | | | | | | | | | | | | | | | | | | | | | | | | | |
| Counterparty | | Lending
Rate | | | Settlement
Date | | | Maturity
Date | | | Principal
Amount | | | Collateralized By | | Collateral
(Received) | | | Repurchase
Agreements,
at Value | | | Repurchase
Agreement
Proceeds
to be
Received(1) | |
| FICC | | | 0.400 | % | | | 06/30/2022 | | | | 07/01/2022 | | | $ | 124 | | | U.S. Treasury Notes 3.000% due 06/30/2024 | | $ | (127 | ) | | $ | 124 | | | $ | 124 | |
| | | | | | | | | | | | | | | | | | | | | | | | | | | | | | |
Total Repurchase Agreements | | | | | $ | (127 | ) | | $ | 124 | | | $ | 124 | |
| | | | | | | | | | | | | | | | | | | | | | | | | | | | | | |
BORROWINGS AND OTHER FINANCING TRANSACTIONS SUMMARY
The following is a summary by counterparty of the market value of Borrowings and Other Financing Transactions and collateral pledged/(received) as of June 30, 2022:
| | | | | | | | | | | | | | | | | | | | | | | | |
| Counterparty | | Repurchase
Agreement
Proceeds
to be
Received(1) | | | Payable for
Reverse
Repurchase
Agreements | | | Payable for
Sale-Buyback
Transactions | | | Total
Borrowings and
Other Financing
Transactions | | | Collateral
Pledged/(Received) | | | Net Exposure(2) | |
Global/Master Repurchase Agreement | |
FICC | | $ | 124 | | | $ | 0 | | | $ | 0 | | | $ | 124 | | | $ | (127 | ) | | $ | (3 | ) |
| | | | | | | | | | | | | | | | | | | | | | | | |
Total Borrowings and Other Financing Transactions | | $ | 124 | | | $ | 0 | | | $ | 0 | | | | | | | | | | | | | |
| | | | | | | | | | | | | | | | | | | | | | | | |
| (1) | Includes accrued interest. |
| (2) | Net Exposure represents the net receivable/(payable) that would be due from/to the counterparty in the event of default. Exposure from borrowings and other financing transactions can only be netted across transactions governed under the same master agreement with the same legal entity. See Note 8, Master Netting Arrangements, in the Notes to Financial Statements for more information. |
FAIR VALUE MEASUREMENTS
The following is a summary of the fair valuations according to the inputs used as of June 30, 2022 in valuing the Fund’s assets and liabilities:
| | | | | | | | | | | | | | | | |
| Category and Subcategory | | Level 1 | | | Level 2 | | | Level 3 | | | Fair
Value at
06/30/2022 | |
Investments in Securities, at Value | |
Short-Term Instruments | |
Repurchase Agreements | | $ | 0 | | | $ | 124 | | | $ | 0 | | | $ | 124 | |
| | | | | | | | | | | | | | | | |
| | $ | 0 | | | $ | 124 | | | $ | 0 | | | $ | 124 | |
| | | | | | | | | | | | | | | | |
|
Investments in Affiliates, at Value | |
Mutual Funds | |
United States | | | 78,627 | | | | 0 | | | | 0 | | | | 78,627 | |
| | | | | | | | | | | | | | | | |
| | | | |
Total Investments | | $ | 78,627 | | | $ | 124 | | | $ | 0 | | | $ | 78,751 | |
| | | | | | | | | | | | | | | | |
There were no significant transfers into or out of Level 3 during the period ended June 30, 2022.
| | | | | | |
| 40 | | PIMCO EQUITY SERIES | | | See Accompanying Notes | |
| | | | | | |
| Schedule of Investments | | PIMCO RAE International Fund | | | | June 30, 2022 |
(Amounts in thousands*, except number of shares, contracts, units and ounces, if any)
| | | | | | | | | | | | |
| | | | | SHARES | | | | | MARKET
VALUE
(000S) | |
| INVESTMENTS IN SECURITIES 99.4% | |
| |
| COMMON STOCKS 97.5% | |
| |
| AUSTRALIA 6.2% | |
| |
| COMMUNICATION SERVICES 0.8% | |
| | | | |
Telstra Corp. Ltd. | | | | | 1,543,493 | | | $ | | | 4,105 | |
| | | | | | | | | | | | |
| |
| CONSUMER DISCRETIONARY 0.2% | |
| | | | |
Wesfarmers Ltd. | | | | | 32,101 | | | | | | 928 | |
| | | | | | | | | | | | |
| |
| CONSUMER STAPLES 0.5% | |
| | | | |
Coles Group Ltd. | | | | | 60,328 | | | | | | 743 | |
| | | | |
Endeavour Group Ltd. | | | | | 19,193 | | | | | | 100 | |
| | | | |
Metcash Ltd. | | | | | 141,563 | | | | | | 415 | |
| | | | |
Woolworths Group Ltd. | | | | | 49,665 | | | | | | 1,220 | |
| | | | | | | | | | | | |
| | | | | | | | | | | 2,478 | |
| | | | | | | | | | | | |
| |
| ENERGY 0.4% | | | | | | | | | | | | |
| | | | |
Ampol Ltd. | | | | | 46,184 | | | | | | 1,090 | |
| | | | |
Viva Energy Group Ltd. | | | | | 185,879 | | | | | | 371 | |
| | | | |
Woodside Energy Group Ltd. | | | | | 25,018 | | | | | | 550 | |
| | | | |
Woodside Energy Group Ltd. (a) | | | | | 5,595 | | | | | | 119 | |
| | | | | | | | | | | | |
| | | | | | | | | | | 2,130 | |
| | | | | | | | | | | | |
| |
| FINANCIALS 1.1% | |
| | | | |
AMP Ltd. (a) | | | | | 874,337 | | | | | | 578 | |
| | | | |
Australia & New Zealand Banking Group Ltd. | | | | | 12,799 | | | | | | 195 | |
| | | | |
Bendigo & Adelaide Bank Ltd. | | | | | 27,724 | | | | | | 174 | |
| | | | |
Medibank Pvt Ltd. | | | | | 554,123 | | | | | | 1,246 | |
| | | | |
QBE Insurance Group Ltd. | | | | | 9,935 | | | | | | 83 | |
| | | | |
Suncorp Group Ltd. | | | | | 482,176 | | | | | | 3,677 | |
| | | | | | | | | | | | |
| | | | | | | | | | | 5,953 | |
| | | | | | | | | | | | |
| |
| INDUSTRIALS 0.3% | | | | | | | | | | | | |
| | | | |
Aurizon Holdings Ltd. | | | | | 442,753 | | | | | | 1,165 | |
| | | | |
Brambles Ltd. | | | | | 27,108 | | | | | | 200 | |
| | | | |
Downer EDI Ltd. | | | | | 59,734 | | | | | | 208 | |
| | | | |
Qantas Airways Ltd. (a) | | | | | 55,599 | | | | | | 172 | |
| | | | | | | | | | | | |
| | | | | | | | | | | 1,745 | |
| | | | | | | | | | | | |
| |
| MATERIALS 1.7% | | | | | | | | | | | | |
| | | | |
BHP Group Ltd. | | | | | 80,141 | | | | | | 2,274 | |
| | | | |
BlueScope Steel Ltd. | | | | | 34,802 | | | | | | 383 | |
| | | | |
Orica Ltd. | | | | | 21,626 | | | | | | 237 | |
| | | | |
Rio Tinto Ltd. | | | | | 87,026 | | | | | | 6,208 | |
| | | | | | | | | | | | |
| | | | | | | | | | | 9,102 | |
| | | | | | | | | | | | |
| |
| REAL ESTATE 0.0% | | | | | | | | | | | | |
| | | | |
Lendlease Corp. Ltd. | | | | | 16,209 | | | | | | 102 | |
| | | | | | | | | | | | |
| |
| UTILITIES 1.2% | | | | | | | | | | | | |
| | | | |
AGL Energy Ltd. (c) | | | | | 1,148,016 | | | | | | 6,563 | |
| | | | | | | | | | | | |
Total Australia | | | | | | | | | | | 33,106 | |
| | | | | | | | | | | | |
| |
| AUSTRIA 0.4% | | | | | | | | | | | | |
| |
| FINANCIALS 0.0% | | | | | | | | | | | | |
| | | | |
Vienna Insurance Group AG Wiener Versicherung Gruppe | | | | | 11,544 | | | | | | 264 | |
| | | | | | | | | | | | |
| |
| | | | | | | | | | | | |
| | | | | SHARES | | | | | MARKET
VALUE
(000S) | |
| INDUSTRIALS 0.0% | | | | | | | | | | | | |
| | | | |
Strabag SE | | | | | 2,547 | | | $ | | | 108 | |
| | | | | | | | | | | | |
| |
| MATERIALS 0.4% | | | | | | | | | | | | |
| | | | |
Lenzing AG | | | | | 1,446 | | | | | | 117 | |
| | | | |
voestalpine AG | | | | | 86,950 | | | | | | 1,859 | |
| | | | | | | | | | | | |
| | | | | | | | | | | 1,976 | |
| | | | | | | | | | | | |
Total Austria | | | | | | | | | | | 2,348 | |
| | | | | | | | | | | | |
| |
| BELGIUM 0.6% | | | | | | | | | | | | |
| |
| COMMUNICATION SERVICES 0.2% | | | | | | | | | | | | |
| | | | |
Proximus SADP | | | | | 87,440 | | | | | | 1,291 | |
| | | | | | | | | | | | |
| |
| CONSUMER STAPLES 0.1% | | | | | | | | | | | | |
| | | | |
Etablissements Franz Colruyt NV | | | | | 20,288 | | | | | | 552 | |
| | | | | | | | | | | | |
| |
| ENERGY 0.0% | | | | | | | | | | | | |
| | | | |
Euronav NV | | | | | 9,663 | | | | | | 117 | |
| | | | | | | | | | | | |
| |
| HEALTH CARE 0.2% | | | | | | | | | | | | |
| | | | |
UCB SA | | | | | 9,597 | | | | | | 813 | |
| | | | | | | | | | | | |
| |
| INDUSTRIALS 0.1% | |
| | | | |
bpost SA | | | | | 55,268 | | | | | | 327 | |
| | | | | | | | | | | | |
| |
| MATERIALS 0.0% | | | | | | | | | | | | |
| | | | |
Bekaert SA | | | | | 2,471 | | | | | | 81 | |
| | | | | | | | | | | | |
Total Belgium | | | | | | | | | | | 3,181 | |
| | | | | | | | | | | | |
| |
| CANADA 4.8% | | | | | | | | | | | | |
| |
| CONSUMER DISCRETIONARY 2.3% | | | | | | | | | | | | |
| | | | |
Canadian Tire Corp. Ltd. ‘A’ | | | | | 6,551 | | | | | | 826 | |
| | | | |
Gildan Activewear, Inc. | | | | | 14,091 | | | | | | 406 | |
| | | | |
Magna International, Inc. | | | | | 198,267 | | | | | | 10,887 | |
| | | | | | | | | | | | |
| | | | | | | | | | | 12,119 | |
| | | | | | | | | | | | |
| |
| CONSUMER STAPLES 0.3% | | | | | | | | | | | | |
| | | | |
George Weston Ltd. | | | | | 3,661 | | | | | | 428 | |
| | | | |
Loblaw Cos., Ltd. | | | | | 11,900 | | | | | | 1,073 | |
| | | | | | | | | | | | |
| | | | | | | | | | | 1,501 | |
| | | | | | | | | | | | |
| |
| ENERGY 0.8% | | | | | | | | | | | | |
| | | | |
Crescent Point Energy Corp. | | | | | 211,517 | | | | | | 1,504 | |
| | | | |
Suncor Energy, Inc. | | | | | 57,741 | | | | | | 2,026 | |
| | | | |
Vermilion Energy, Inc. | | | | | 42,683 | | | | | | 812 | |
| | | | | | | | | | | | |
| | | | | | | | | | | 4,342 | |
| | | | | | | | | | | | |
| |
| FINANCIALS 0.4% | | | | | | | | | | | | |
| | | | |
CI Financial Corp. (c) | | | | | 41,351 | | | | | | 439 | |
| | | | |
Great-West Lifeco, Inc. (e) | | | | | 6,678 | | | | | | 163 | |
| | | | |
IGM Financial, Inc. | | | | | 4,400 | | | | | | 118 | |
| | | | |
Onex Corp. | | | | | 4,310 | | | | | | 215 | |
| | | | |
Power Corp. of Canada | | | | | 41,220 | | | | | | 1,060 | |
| | | | |
Sun Life Financial, Inc. | | | | | 9,453 | | | | | | 433 | |
| | | | | | | | | | | | |
| | | | | | | | | | | 2,428 | |
| | | | | | | | | | | | |
| |
| INDUSTRIALS 0.4% | | | | | | | | | | | | |
| | | | |
Air Canada (a) | | | | | 10,005 | | | | | | 125 | |
| | | | | | | | | | | | |
| | | | | SHARES | | | | | MARKET
VALUE
(000S) | |
| | | | |
Finning International, Inc. | | | | | 9,700 | | | $ | | | 204 | |
| | | | |
Thomson Reuters Corp. | | | | | 16,329 | | | | | | 1,702 | |
| | | | | | | | | | | | |
| | | | | | | | | | | 2,031 | |
| | | | | | | | | | | | |
| |
| INFORMATION TECHNOLOGY 0.2% | |
| | | | |
Celestica, Inc. (a) | | | | | 99,642 | | | | | | 969 | |
| | | | | | | | | | | | |
| |
| MATERIALS 0.0% | | | | | | | | | | | | |
| | | | |
Teck Resources Ltd. ‘B’ | | | | | 1,302 | | | | | | 40 | |
| | | | | | | | | | | | |
| |
| UTILITIES 0.4% | | | | | | | | | | | | |
| | | | |
Atco Ltd. ‘I’ | | | | | 55,681 | | | | | | 1,908 | |
| | | | |
Canadian Utilities Ltd. ‘A’ | | | | | 12,181 | | | | | | 363 | |
| | | | | | | | | | | | |
| | | | | | | | | | | 2,271 | |
| | | | | | | | | | | | |
Total Canada | | | | | | | | | | | 25,701 | |
| | | | | | | | | | | | |
| |
| DENMARK 0.6% | | | | | | | | | | | | |
| |
| CONSUMER STAPLES 0.1% | | | | | | | | | | | | |
| | | | |
Carlsberg AS ‘B’ | | | | | 2,497 | | | | | | 319 | |
| | | | |
Schouw & Co. AS | | | | | 1,034 | | | | | | 72 | |
| | | | | | | | | | | | |
| | | | | | | | | | | 391 | |
| | | | | | | | | | | | |
| |
| HEALTH CARE 0.1% | | | | | | | | | | | | |
| | | | |
H Lundbeck AS | | | | | 35,228 | | | | | | 171 | |
| | | | |
H Lundbeck AS ‘A’ (a) | | | | | 8,807 | | | | | | 42 | |
| | | | |
Novo Nordisk AS ‘B’ | | | | | 1,157 | | | | | | 129 | |
| | | | | | | | | | | | |
| | | | | | | | | | | 342 | |
| | | | | | | | | | | | |
| |
| INDUSTRIALS 0.4% | | | | | | | | | | | | |
| | | | |
ISS AS | | | | | 164,165 | | | | | | 2,617 | |
| | | | | | | | | | | | |
Total Denmark | | | | | | | | | | | 3,350 | |
| | | | | | | | | | | | |
| |
| FINLAND 1.3% | | | | | | | | | | | | |
| |
| CONSUMER DISCRETIONARY 0.0% | | | | | | | | | | | | |
| | | | |
Nokian Renkaat Oyj | | | | | 7,425 | | | | | | 82 | |
| | | | | | | | | | | | |
| |
| CONSUMER STAPLES 0.0% | | | | | | | | | | | | |
| | | | |
Kesko Oyj ‘B’ | | | | | 9,590 | | | | | | 227 | |
| | | | | | | | | | | | |
| |
| FINANCIALS 0.7% | | | | | | | | | | | | |
| | | | |
Nordea Bank Abp | | | | | 420,337 | | | | | | 3,713 | |
| | | | | | | | | | | | |
| |
| INDUSTRIALS 0.0% | | | | | | | | | | | | |
| | | | |
Wartsila Oyj Abp | | | | | 31,401 | | | | | | 246 | |
| | | | | | | | | | | | |
| |
| INFORMATION TECHNOLOGY 0.5% | |
| | | | |
Nokia Oyj | | | | | 537,413 | | | | | | 2,491 | |
| | | | | | | | | | | | |
| |
| MATERIALS 0.1% | | | | | | | | | | | | |
| | | | |
Outokumpu OYJ | | | | | 33,424 | | | | | | 139 | |
| | | | |
UPM-Kymmene Oyj | | | | | 9,586 | | | | | | 294 | |
| | | | | | | | | | | | |
| | | | | | | | | | | 433 | |
| | | | | | | | | | | | |
Total Finland | | | | | | | | | | | 7,192 | |
| | | | | | | | | | | | |
| |
| | | | | | | | | | | | |
| See Accompanying Notes | | | ANNUAL REPORT | | | | | | | JUNE 30, 2022 | | | 41 |
| | | | | | |
| Schedule of Investments | | PIMCO RAE International Fund | | (Cont.) | | |
| | | | | | | | | | | | |
| | | | | SHARES | | | | | MARKET
VALUE
(000S) | |
| FRANCE 4.4% | | | | | | | | | | | | |
| |
| COMMUNICATION SERVICES 0.4% | |
| | | | |
Orange SA | | | | | 171,455 | | | $ | | | 2,020 | |
| | | | | | | | | | | | |
| |
| CONSUMER DISCRETIONARY 1.0% | |
| | | | |
Cie Generale des Etablissements Michelin S.C.A. | | | | | 29,204 | | | | | | 798 | |
| | | | |
Renault SA | | | | | 34,680 | | | | | | 875 | |
| | | | |
Valeo SA | | | | | 172,845 | | | | | | 3,368 | |
| | | | | | | | | | | | |
| | | | | | | | | | | 5,041 | |
| | | | | | | | | | | | |
| |
| CONSUMER STAPLES 0.6% | | | | | | | | | | | | |
| | | | |
Carrefour SA | | | | | 143,383 | | | | | | 2,545 | |
| | | | |
Casino Guichard Perrachon SA (a)(c) | | | | | 32,926 | | | | | | 427 | |
| | | | | | | | | | | | |
| | | | | | | | | | | 2,972 | |
| | | | | | | | | | | | |
| |
| ENERGY 0.2% | | | | | | | | | | | | |
| | | | |
TotalEnergies SE | | | | | 23,598 | | | | | | 1,242 | |
| | | | | | | | | | | | |
| |
| FINANCIALS 0.4% | | | | | | | | | | | | |
| | | | |
AXA SA | | | | | 97,620 | | | | | | 2,230 | |
| | | | | | | | | | | | |
| |
| HEALTH CARE 0.5% | | | | | | | | | | | | |
| | | | |
Sanofi | | | | | 27,238 | | | | | | 2,747 | |
| | | | | | | | | | | | |
| |
| INDUSTRIALS 0.7% | | | | | | | | | | | | |
| | | | |
ALD SA | | | | | 9,271 | | | | | | 109 | |
| | | | |
Cie de Saint-Gobain | | | | | 46,956 | | | | | | 2,029 | |
| | | | |
Eiffage SA | | | | | 3,627 | | | | | | 328 | |
| | | | |
Schneider Electric SE | | | | | 10,897 | | | | | | 1,298 | |
| | | | | | | | | | | | |
| | | | | | | | | | | 3,764 | |
| | | | | | | | | | | | |
| |
| INFORMATION TECHNOLOGY 0.0% | |
| | | | |
Capgemini SE | | | | | 944 | | | | | | 163 | |
| | | | | | | | | | | | |
| |
| UTILITIES 0.6% | | | | | | | | | | | | |
| | | | |
Engie SA | | | | | 232,137 | | | | | | 2,688 | |
| | | | |
Veolia Environnement SA | | | | | 27,877 | | | | | | 683 | |
| | | | | | | | | | | | |
| | | | | | | | | | | 3,371 | |
| | | | | | | | | | | | |
Total France | | | | | | | | | | | 23,550 | |
| | | | | | | | | | | | |
| |
| GERMANY 3.6% | |
| |
| COMMUNICATION SERVICES 0.1% | |
| | | | |
Telefonica Deutschland Holding AG | | | | | 124,134 | | | | | | 358 | |
| | | | | | | | | | | | |
| |
| CONSUMER DISCRETIONARY 1.6% | |
| | | | |
Bayerische Motoren Werke AG | | | | | 34,832 | | | | | | 2,700 | |
| | | | |
Continental AG | | | | | 6,819 | | | | | | 479 | |
| | | | |
Mercedes-Benz Group AG | | | | | 80,850 | | | | | | 4,696 | |
| | | | |
TUI AG | | | | | 359,344 | | | | | | 584 | |
| | | | | | | | | | | | |
| | | | | | | | | | | 8,459 | |
| | | | | | | | | | | | |
| |
| CONSUMER STAPLES 0.4% | |
| | | | |
Metro AG | | | | | 258,342 | | | | | | 2,192 | |
| | | | | | | | | | | | |
| |
| FINANCIALS 0.4% | | | | | | | | | | | | |
| | | | |
Muenchener Rueckversicherungs-Gesellschaft AG in Muenchen | | | | | 6,163 | | | | | | 1,458 | |
| | | | |
Talanx AG | | | | | 9,848 | | | | | | 376 | |
| | | | | | | | | | | | |
| | | | | | | | | | | 1,834 | |
| | | | | | | | | | | | |
| |
| | | | | | | | | | | | |
| | | | | SHARES | | | | | MARKET
VALUE
(000S) | |
| HEALTH CARE 0.1% | | | | | | | | | | | | |
| | | | |
Fresenius Medical Care AG & Co. KGaA | | | | | 9,302 | | | $ | | | 466 | |
| | | | | | | | | | | | |
| |
| INDUSTRIALS 0.4% | | | | | | | | | | | | |
| | | | |
Brenntag SE | | | | | 4,833 | | | | | | 317 | |
| | | | |
Daimler Truck Holding AG (a) | | | | | 24,011 | | | | | | 632 | |
| | | | |
Deutsche Post AG | | | | | 37,164 | | | | | | 1,403 | |
| | | | | | | | | | | | |
| | | | | | | | | | | 2,352 | |
| | | | | | | | | | | | |
| |
| MATERIALS 0.4% | | | | | | | | | | | | |
| | | | |
BASF SE | | | | | 29,665 | | | | | | 1,298 | |
| | | | |
Evonik Industries AG | | | | | 44,972 | | | | | | 964 | |
| | | | | | | | | | | | |
| | | | | | | | | | | 2,262 | |
| | | | | | | | | | | | |
| |
| UTILITIES 0.2% | | | | | | | | | | | | |
| | | | |
Uniper SE | | | | | 75,799 | | | | | | 1,133 | |
| | | | | | | | | | | | |
Total Germany | | | | | | | | | | | 19,056 | |
| | | | | | | | | | | | |
| |
| HONG KONG 2.6% | | | | | | | | | | | | |
| |
| COMMUNICATION SERVICES 0.1% | |
| | | | |
PCCW Ltd. | | | | | 506,000 | | | | | | 268 | |
| | | | | | | | | | | | |
| |
| CONSUMER DISCRETIONARY 0.4% | |
| | | | |
Chow Tai Fook Jewellery Group Ltd. | | | | | 72,600 | | | | | | 137 | |
| | | | |
Melco Resorts & Entertainment Ltd. ADR (a) | | | | | 86,851 | | | | | | 499 | |
| | | | |
Skyworth Group Ltd. | | | | | 1,870,215 | | | | | | 928 | |
| | | | |
Yue Yuen Industrial Holdings Ltd. | | | | | 379,000 | | | | | | 494 | |
| | | | | | | | | | | | |
| | | | | | | | | | | 2,058 | |
| | | | | | | | | | | | |
| |
| CONSUMER STAPLES 0.2% | | | | | | | | | | | | |
| | | | |
First Pacific Co. Ltd. | | | | | 580,000 | | | | | | 226 | |
| | | | |
WH Group Ltd. | | | | | 1,045,500 | | | | | | 809 | |
| | | | | | | | | | | | |
| | | | | | | | | | | 1,035 | |
| | | | | | | | | | | | |
| |
| INDUSTRIALS 0.2% | | | | | | | | | | | | |
| | | | |
CK Hutchison Holdings Ltd. | | | | | 60,000 | | | | | | 407 | |
| | | | |
Hutchison Port Holdings Trust | | | | | 2,972,600 | | | | | | 699 | |
| | | | |
MTR Corp. Ltd. | | | | | 9,500 | | | | | | 50 | |
| | | | | | | | | | | | |
| | | | | | | | | | | 1,156 | |
| | | | | | | | | | | | |
| |
| INFORMATION TECHNOLOGY 0.3% | |
| | | | |
Kingboard Holdings Ltd. | | | | | 281,500 | | | | | | 1,068 | |
| | | | |
Kingboard Laminates Holdings Ltd. | | | | | 422,500 | | | | | | 522 | |
| | | | | | | | | | | | |
| | | | | | | | | | | 1,590 | |
| | | | | | | | | | | | |
| |
| MATERIALS 0.0% | | | | | | | | | | | | |
| | | | |
Lee & Man Paper Manufacturing Ltd. | | | | | 372,000 | | | | | | 160 | |
| | | | |
Nine Dragons Paper Holdings Ltd. | | | | | 102,000 | | | | | | 86 | |
| | | | | | | | | | | | |
| | | | | | | | | | | 246 | |
| | | | | | | | | | | | |
| |
| REAL ESTATE 1.4% | | | | | | | | | | | | |
| | | | |
CK Asset Holdings Ltd. | | | | | 181,500 | | | | | | 1,290 | |
| | | | |
Hang Lung Group Ltd. | | | | | 72,000 | | | | | | 136 | |
| | | | |
Henderson Land Development Co. Ltd. | | | | | 28,000 | | | | | | 105 | |
| | | | | | | | | | | | |
| | | | | SHARES | | | | | MARKET
VALUE
(000S) | |
| | | | |
Hongkong Land Holdings Ltd. | | | | | 71,800 | | | $ | | | 361 | |
| | | | |
Hopson Development Holdings Ltd. | | | | | 94,112 | | | | | | 144 | |
| | | | |
Hysan Development Co. Ltd. | | | | | 23,000 | | | | | | 69 | |
| | | | |
Kerry Properties Ltd. | | | | | 356,500 | | | | | | 991 | |
| | | | |
New World Development Co. Ltd. | | | | | 37,000 | | | | | | 133 | |
| | | | |
Sino Land Co. Ltd. | | | | | 70,000 | | | | | | 103 | |
| | | | |
Sun Hung Kai Properties Ltd. | | | | | 17,000 | | | | | | 201 | |
| | | | |
Swire Pacific Ltd. ‘A’ | | | | | 356,500 | | | | | | 2,129 | |
| | | | |
Wharf Holdings Ltd. | | | | | 490,000 | | | | | | 1,786 | |
| | | | |
Wharf Real Estate Investment Co. Ltd. | | | | | 22,000 | | | | | | 105 | |
| | | | | | | | | | | | |
| | | | | | | | | | | 7,553 | |
| | | | | | | | | | | | |
Total Hong Kong | | | | | | | | | | | 13,906 | |
| | | | | | | | | | | | |
| |
| IRELAND 0.2% | | | | | | | | | | | | |
| |
| FINANCIALS 0.1% | | | | | | | | | | | | |
| | | | |
Bank of Ireland Group PLC | | | | | 87,951 | | | | | | 556 | |
| | | | | | | | | | | | |
| |
| INDUSTRIALS 0.1% | | | | | | | | | | | | |
| | | | |
AerCap Holdings NV (a) | | | | | 12,607 | | | | | | 516 | |
| | | | | | | | | | | | |
Total Ireland | | | | | | | | | | | 1,072 | |
| | | | | | | | | | | | |
| |
| ISRAEL 1.5% | | | | | | | | | | | | |
| |
| COMMUNICATION SERVICES 0.4% | |
| | | | |
Bezeq The Israeli Telecommunication Corp. Ltd. | | | | | 1,503,922 | | | | | | 2,344 | |
| | | | |
Taboola.com Ltd. (a) | | | | | 26,900 | | | | | | 68 | |
| | | | | | | | | | | | |
| | | | | | | | | | | 2,412 | |
| | | | | | | | | | | | |
| |
| ENERGY 0.3% | | | | | | | | | | | | |
| | | | |
Delek Group Ltd. (a) | | | | | 4,538 | | | | | | 590 | |
| | | | |
Oil Refineries Ltd. | | | | | 2,355,141 | | | | | | 846 | |
| | | | |
Paz Oil Co. Ltd. (a) | | | | | 3,615 | | | | | | 435 | |
| | | | | | | | | | | | |
| | | | | | | | | | | 1,871 | |
| | | | | | | | | | | | |
| |
| FINANCIALS 0.1% | | | | | | | | | | | | |
| | | | |
Bank Hapoalim BM | | | | | 43,790 | | | | | | 367 | |
| | | | |
Bank Leumi Le-Israel BM | | | | | 10,590 | | | | | | 95 | |
| | | | | | | | | | | | |
| | | | | | | | | | | 462 | |
| | | | | | | | | | | | |
| |
| HEALTH CARE 0.3% | | | | | | | | | | | | |
| | | | |
Teva Pharmaceutical Industries Ltd. SP - ADR (a) | | | | | 262,612 | | | | | | 1,975 | |
| | | | | | | | | | | | |
| |
| INFORMATION TECHNOLOGY 0.1% | |
| | | | |
Check Point Software Technologies Ltd. (a) | | | | | 2,500 | | | | | | 304 | |
| | | | | | | | | | | | |
| |
| MATERIALS 0.2% | | | | | | | | | | | | |
| | | | |
ICL Group Ltd. | | | | | 6,211 | | | | | | 57 | |
| | | | |
Israel Corp. Ltd. (a) | | | | | 1,906 | | | | | | 845 | |
| | | | | | | | | | | | |
| | | | | | | | | | | 902 | |
| | | | | | | | | | | | |
| |
| REAL ESTATE 0.1% | | | | | | | | | | | | |
| | | | |
G City Ltd. | | | | | 52,922 | | | | | | 303 | |
| | | | | | | | | | | | |
Total Israel | | | | | | | | | | | 8,229 | |
| | | | | | | | | | | | |
| |
| | | | | | |
| 42 | | PIMCO EQUITY SERIES | | | See Accompanying Notes | |
| | | | | | | | | | | | |
| | | | | SHARES | | | | | MARKET
VALUE
(000S) | |
| ITALY 3.4% | |
| |
| COMMUNICATION SERVICES 0.1% | |
| | | | |
Telecom Italia SpA | | | | | 3,381,119 | | | $ | | | 887 | |
| | | | | | | | | | | | |
| |
| ENERGY 1.7% | |
| | | | |
Eni SpA | | | | | 655,963 | | | | | | 7,780 | |
| | | | |
Saras SpA (a) | | | | | 860,100 | | | | | | 1,255 | |
| | | | | | | | | | | | |
| | | | | | | | | | | 9,035 | |
| | | | | | | | | | | | |
| |
| FINANCIALS 0.8% | |
| | | | |
Assicurazioni Generali SpA | | | | | 106,915 | | | | | | 1,708 | |
| | | | |
Banca Monte dei Paschi di Siena SpA (a)(c) | | | | | 237,560 | | | | | | 135 | |
| | | | |
Intesa Sanpaolo SpA | | | | | 960,303 | | | | | | 1,797 | |
| | | | |
Unipol Gruppo SpA | | | | | 85,264 | | | | | | 388 | |
| | | | |
UnipolSai Assicurazioni SpA | | | | | 60,534 | | | | | | 145 | |
| | | | | | | | | | | | |
| | | | | | | | | | | 4,173 | |
| | | | | | | | | | | | |
| |
| INDUSTRIALS 0.1% | | | | | | | | | | | | |
| | | | |
Leonardo SpA | | | | | 32,701 | | | | | | 332 | |
| | | | | | | | | | | | |
| |
| UTILITIES 0.7% | | | | | | | | | | | | |
| | | | |
A2A SpA | | | | | 375,632 | | | | | | 478 | |
| | | | |
Enel SpA | | | | | 610,547 | | | | | | 3,348 | |
| | | | | | | | | | | | |
| | | | | | | | | | | 3,826 | |
| | | | | | | | | | | | |
Total Italy | | | | | | | | | | | 18,253 | |
| | | | | | | | | | | | |
| |
| JAPAN 31.3% | | | | | | | | | | | | |
| |
| COMMUNICATION SERVICES 2.9% | |
| | | | |
Dentsu Group, Inc. (c) | | | | | 3,900 | | | | | | 118 | |
| | | | |
KDDI Corp. | | | | | 70,100 | | | | | | 2,211 | |
| | | | |
Mixi, Inc. | | | | | 43,900 | | | | | | 729 | |
| | | | |
Nippon Telegraph & Telephone Corp. | | | | | 424,500 | | | | | | 12,197 | |
| | | | |
Square Enix Holdings Co. Ltd. | | | | | 4,100 | | | | | | 182 | |
| | | | | | | | | | | | |
| | | | | | | | | | | 15,437 | |
| | | | | | | | | | | | |
| |
| CONSUMER DISCRETIONARY 7.2% | |
| | | | |
Bridgestone Corp. (c) | | | | | 130,700 | | | | | | 4,765 | |
| | | | |
Casio Computer Co. Ltd. | | | | | 18,500 | | | | | | 172 | |
| | | | |
EDION Corp. | | | | | 108,100 | | | | | | 1,015 | |
| | | | |
Exedy Corp. | | | | | 28,100 | | | | | | 356 | |
| | | | |
H2O Retailing Corp. | | | | | 86,900 | | | | | | 671 | |
| | | | |
Isetan Mitsukoshi Holdings Ltd. | | | | | 46,700 | | | | | | 378 | |
| | | | |
Isuzu Motors Ltd. | | | | | 349,400 | | | | | | 3,865 | |
| | | | |
Izumi Co. Ltd. | | | | | 3,500 | | | | | | 79 | |
| | | | |
JTEKT Corp. | | | | | 27,100 | | | | | | 204 | |
| | | | |
K’s Holdings Corp. | | | | | 49,300 | | | | | | 481 | |
| | | | |
Mazda Motor Corp. | | | | | 352,600 | | | | | | 2,878 | |
| | | | |
NHK Spring Co. Ltd. | | | | | 21,500 | | | | | | 141 | |
| | | | |
Nikon Corp. | | | | | 147,500 | | | | | | 1,701 | |
| | | | |
Nissan Motor Co. Ltd. | | | | | 1,338,600 | | | | | | 5,243 | |
| | | | |
NOK Corp. | | | | | 7,100 | | | | | | 58 | |
| | | | |
Paltac Corp. | | | | | 1,900 | | | | | | 59 | |
| | | | |
Panasonic Holdings Corp. | | | | | 1,096,700 | | | | | | 8,855 | |
| | | | |
Sega Sammy Holdings, Inc. | | | | | 69,300 | | | | | | 1,113 | |
| | | | |
Sekisui House Ltd. | | | | | 85,000 | | | | | | 1,492 | |
| | | | |
Shimamura Co. Ltd. | | | | | 11,300 | | | | | | 993 | |
| | | | |
Subaru Corp. | | | | | 112,200 | | | | | | 1,985 | |
| | | | |
Sumitomo Electric Industries Ltd. | | | | | 64,100 | | | | | | 708 | |
| | | | |
Sumitomo Forestry Co. Ltd. | | | | | 8,000 | | | | | | 114 | |
| | | | | | | | | | | | |
| | | | | SHARES | | | | | MARKET
VALUE
(000S) | |
| | | | |
Sumitomo Rubber Industries Ltd. (c) | | | | | 24,500 | | | $ | | | 209 | |
| | | | |
Suzuki Motor Corp. | | | | | 10,800 | | | | | | 339 | |
| | | | |
Tokai Rika Co. Ltd. | | | | | 19,600 | | | | | | 214 | |
| | | | |
TS Tech Co. Ltd. | | | | | 21,100 | | | | | | 218 | |
| | | | |
Yamada Holdings Co. Ltd. | | | | | 110,300 | | | | | | 397 | |
| | | | | | | | | | | | |
| | | | | | | | | | | 38,703 | |
| | | | | | | | | | | | |
| |
| CONSUMER STAPLES 0.9% | | | | | | | | | | | | |
| | | | |
Ajinomoto Co., Inc. | | | | | 34,100 | | | | | | 831 | |
| | | | |
Arcs Co. Ltd. | | | | | 5,200 | | | | | | 77 | |
| | | | |
Itoham Yonekyu Holdings, Inc. | | | | | 71,400 | | | | | | 364 | |
| | | | |
Japan Tobacco, Inc. (c) | | | | | 110,856 | | | | | | 1,921 | |
| | | | |
Kewpie Corp. | | | | | 8,800 | | | | | | 149 | |
| | | | |
NH Foods Ltd. | | | | | 5,000 | | | | | | 157 | |
| | | | |
Pola Orbis Holdings, Inc. (c) | | | | | 18,700 | | | | | | 231 | |
| | | | |
Seven & i Holdings Co. Ltd. | | | | | 13,000 | | | | | | 504 | |
| | | | |
United Super Markets Holdings, Inc. | | | | | 36,800 | | | | | | 290 | |
| | | | |
Yamazaki Baking Co. Ltd. | | | | | 11,500 | | | | | | 141 | |
| | | | | | | | | | | | |
| | | | | | | | | | | 4,665 | |
| | | | | | | | | | | | |
| |
| ENERGY 0.1% | | | | | | | | | | | | |
| | | | |
Cosmo Energy Holdings Co. Ltd. | | | | | 7,100 | | | | | | 196 | |
| | | | |
ENEOS Holdings, Inc. | | | | | 25,500 | | | | | | 96 | |
| | | | | | | | | | | | |
| | | | | | | | | | | 292 | |
| | | | | | | | | | | | |
| |
| FINANCIALS 6.0% | | | | | | | | | | | | |
| | | | |
Chiba Bank Ltd. | | | | | 17,100 | | | | | | 94 | |
| | | | |
Concordia Financial Group Ltd. | | | | | 64,600 | | | | | | 224 | |
| | | | |
Credit Saison Co. Ltd. | | | | | 13,100 | | | | | | 150 | |
| | | | |
Japan Post Holdings Co. Ltd. | | | | | 2,493,800 | | | | | | 17,843 | |
| | | | |
MS&AD Insurance Group Holdings, Inc. | | | | | 195,600 | | | | | | 5,998 | |
| | | | |
ORIX Corp. | | | | | 102,900 | | | | | | 1,725 | |
| | | | |
Sompo Holdings, Inc. | | | | | 84,200 | | | | | | 3,719 | |
| | | | |
Sumitomo Mitsui Trust Holdings, Inc. | | | | | 5,100 | | | | | | 158 | |
| | | | |
Tokio Marine Holdings, Inc. | | | | | 35,800 | | | | | | 2,087 | |
| | | | | | | | | | | | |
| | | | | | | | | | | 31,998 | |
| | | | | | | | | | | | |
| |
| HEALTH CARE 1.0% | | | | | | | | | | | | |
| | | | |
Alfresa Holdings Corp. | | | | | 25,300 | | | | | | 340 | |
| | | | |
Astellas Pharma, Inc. | | | | | 85,400 | | | | | | 1,332 | |
| | | | |
Eisai Co. Ltd. | | | | | 8,300 | | | | | | 351 | |
| | | | |
Medipal Holdings Corp. | | | | | 119,700 | | | | | | 1,689 | |
| | | | |
Shionogi & Co. Ltd. | | | | | 17,600 | | | | | | 898 | |
| | | | |
Suzuken Co. Ltd. | | | | | 26,200 | | | | | | 739 | |
| | | | |
Toho Holdings Co. Ltd. | | | | | 5,100 | | | | | | 79 | |
| | | | | | | | | | | | |
| | | | | | | | | | | 5,428 | |
| | | | | | | | | | | | |
| |
| INDUSTRIALS 3.8% | | | | | | | | | | | | |
| | | | |
AGC, Inc. (c) | | | | | 9,100 | | | | | | 320 | |
| | | | |
Amada Co. Ltd. | | | | | 31,700 | | | | | | 234 | |
| | | | |
ANA Holdings, Inc. | | | | | 6,300 | | | | | | 116 | |
| | | | |
Dai Nippon Printing Co. Ltd. | | | | | 122,600 | | | | | | 2,637 | |
| | | | |
East Japan Railway Co. | | | | | 5,400 | | | | | | 276 | |
| | | | |
Ebara Corp. | | | | | 8,000 | | | | | | 299 | |
| | | | |
Fujikura Ltd. | | | | | 125,900 | | | | | | 713 | |
| | | | |
Furukawa Electric Co. Ltd. | | | | | 33,600 | | | | | | 551 | |
| | | | |
GS Yuasa Corp. | | | | | 17,600 | | | | | | 275 | |
| | | | |
Hanwa Co. Ltd. | | | | | 7,400 | | | | | | 155 | |
| | | | |
Hino Motors Ltd. | | | | | 82,200 | | | | | | 423 | |
| | | | | | | | | | | | |
| | | | | SHARES | | | | | MARKET
VALUE
(000S) | |
| | | | |
Hitachi Transport System Ltd. | | | | | 6,100 | | | $ | | | 386 | |
| | | | |
Inabata & Co. Ltd. | | | | | 37,900 | | | | | | 619 | |
| | | | |
Japan Airlines Co. Ltd. | | | | | 132,600 | | | | | | 2,278 | |
| | | | |
Kajima Corp. | | | | | 19,400 | | | | | | 222 | |
| | | | |
Kandenko Co. Ltd. | | | | | 12,100 | | | | | | 75 | |
| | | | |
Mitsubishi Electric Corp. | | | | | 127,900 | | | | | | 1,375 | |
| | | | |
Mitsubishi Heavy Industries Ltd. | | | | | 44,000 | | | | | | 1,538 | |
| | | | |
Nagase & Co. Ltd. | | | | | 8,800 | | | | | | 121 | |
| | | | |
Nippon Express Holdings, Inc. | | | | | 3,300 | | | | | | 180 | |
| | | | |
Nippon Steel Trading Corp. | | | | | 13,500 | | | | | | 506 | |
| | | | |
NTN Corp. | | | | | 80,100 | | | | | | 153 | |
| | | | |
Obayashi Corp. | | | | | 26,200 | | | | | | 191 | |
| | | | |
Persol Holdings Co. Ltd. | | | | | 52,700 | | | | | | 962 | |
| | | | |
Secom Co. Ltd. | | | | | 11,100 | | | | | | 685 | |
| | | | |
Seibu Holdings, Inc. | | | | | 25,200 | | | | | | 266 | |
| | | | |
SG Holdings Co. Ltd. | | | | | 13,100 | | | | | | 222 | |
| | | | |
Shimizu Corp. | | | | | 54,500 | | | | | | 301 | |
| | | | |
Sojitz Corp. | | | | | 21,720 | | | | | | 308 | |
| | | | |
Taisei Corp. | | | | | 24,900 | | | | | | 776 | |
| | | | |
Toppan, Inc. | | | | | 36,500 | | | | | | 609 | |
| | | | |
Toshiba Corp. | | | | | 16,700 | | | | | | 679 | |
| | | | |
Toyota Tsusho Corp. | | | | | 9,100 | | | | | | 297 | |
| | | | |
West Japan Railway Co. | | | | | 7,100 | | | | | | 261 | |
| | | | |
Yamato Holdings Co. Ltd. | | | | | 89,000 | | | | | | 1,424 | |
| | | | | | | | | | | | |
| | | | | | | | | | | 20,433 | |
| | | | | | | | | | | | |
| |
| INFORMATION TECHNOLOGY 4.5% | | | | | | | | | | | | |
| | | | |
Alps Alpine Co. Ltd. | | | | | 170,100 | | | | | | 1,728 | |
| | | | |
Brother Industries Ltd. | | | | | 24,400 | | | | | | 429 | |
| | | | |
Canon Marketing Japan, Inc. (c) | | | | | 10,700 | | | | | | 223 | |
| | | | |
Canon, Inc. (c) | | | | | 307,150 | | | | | | 6,960 | |
| | | | |
Citizen Watch Co. Ltd. | | | | | 135,900 | | | | | | 553 | |
| | | | |
FUJIFILM Holdings Corp. | | | | | 29,000 | | | | | | 1,558 | |
| | | | |
Fujitsu Ltd. | | | | | 40,700 | | | | | | 5,093 | |
| | | | |
Konica Minolta, Inc. | | | | | 67,500 | | | | | | 225 | |
| | | | |
NEC Corp. | | | | | 7,700 | | | | | | 300 | |
| | | | |
Nippon Electric Glass Co. Ltd. (c) | | | | | 13,200 | | | | | | 253 | |
| | | | |
Omron Corp. | | | | | 11,900 | | | | | | 606 | |
| | | | |
Ricoh Co. Ltd. | | | | | 297,800 | | | | | | 2,325 | |
| | | | |
Rohm Co. Ltd. | | | | | 3,300 | | | | | | 231 | |
| | | | |
SCREEN Holdings Co. Ltd. | | | | | 3,000 | | | | | | 204 | |
| | | | |
Seiko Epson Corp. | | | | | 146,900 | | | | | | 2,078 | |
| | | | |
TDK Corp. | | | | | 14,700 | | | | | | 455 | |
| | | | |
Tokyo Electron Ltd. | | | | | 3,200 | | | | | | 1,044 | |
| | | | |
Trend Micro, Inc. | | | | | 2,700 | | | | | | 132 | |
| | | | | | | | | | | | |
| | | | | | | | | | | 24,397 | |
| | | | | | | | | | | | |
| |
| MATERIALS 2.3% | | | | | | | | | | | | |
| | | | |
Daicel Corp. | | | | | 141,900 | | | | | | 877 | |
| | | | |
DIC Corp. (c) | | | | | 29,900 | | | | | | 531 | |
| | | | |
JFE Holdings, Inc. | | | | | 35,400 | | | | | | 372 | |
| | | | |
JSR Corp. | | | | | 14,300 | | | | | | 372 | |
| | | | |
Kaneka Corp. | | | | | 13,400 | | | | | | 330 | |
| | | | |
Mitsubishi Chemical Holdings Corp. | | | | | 188,100 | | | | | | 1,022 | |
| | | | |
Mitsubishi Materials Corp. | | | | | 16,500 | | | | | | 236 | |
| | | | |
Mitsui Chemicals, Inc. | | | | | 32,900 | | | | | | 702 | |
| | | | |
Nippon Light Metal Holdings Co. Ltd. | | | | | 9,200 | | | | | | 101 | |
| | | | |
Nippon Steel Corp. | | | | | 15,000 | | | | | | 210 | |
| | | | |
Nitto Denko Corp. | | | | | 67,100 | | | | | | 4,340 | |
| | | | |
Taiheiyo Cement Corp. | | | | | 30,500 | | | | | | 454 | |
| | | | |
Toray Industries, Inc. | | | | | 226,700 | | | | | | 1,276 | |
| | | | | | | | | | | | |
| See Accompanying Notes | | | ANNUAL REPORT | | | | | | | JUNE 30, 2022 | | | 43 |
| | | | | | |
| Schedule of Investments | | PIMCO RAE International Fund | | (Cont.) | | |
| | | | | | | | | | | | |
| | | | | SHARES | | | | | MARKET
VALUE
(000S) | |
| | | | |
Toyo Seikan Group Holdings Ltd. | | | | | 124,100 | | | $ | | | 1,302 | |
| | | | |
UBE Corp. | | | | | 10,500 | | | | | | 156 | |
| | | | |
Zeon Corp. | | | | | 10,600 | | | | | | 103 | |
| | | | | | | | | | | | |
| | | | | | | | | | | 12,384 | |
| | | | | | | | | | | | |
| |
| REAL ESTATE 1.1% | |
| | | | |
Daito Trust Construction Co. Ltd. | | | | | 59,800 | | | | | | 5,173 | |
| | | | |
Nomura Real Estate Holdings, Inc. | | | | | 43,800 | | | | | | 1,072 | |
| | | | | | | | | | | | |
| | | | | | | | | | | 6,245 | |
| | | | | | | | | | | | |
| |
| UTILITIES 1.5% | | | | | | | | | | | | |
| | | | |
Chubu Electric Power Co., Inc. | | | | | 249,800 | | | | | | 2,515 | |
| | | | |
Electric Power Development Co. Ltd. ‘C’ | | | | | 106,000 | | | | | | 1,752 | |
| | | | |
Hokkaido Electric Power Co., Inc. | | | | | 84,500 | | | | | | 308 | |
| | | | |
Hokuriku Electric Power Co. | | | | | 52,200 | | | | | | 205 | |
| | | | |
Shikoku Electric Power Co., Inc. | | | | | 48,000 | | | | | | 281 | |
| | | | |
Tohoku Electric Power Co., Inc. | | | | | 185,300 | | | | | | 995 | |
| | | | |
Tokyo Electric Power Co. Holdings, Inc. (a) | | | | | 431,400 | | | | | | 1,805 | |
| | | | | | | | | | | | |
| | | | | | | | | | | 7,861 | |
| | | | | | | | | | | | |
Total Japan | | | | | | | | | | | 167,843 | |
| | | | | | | | | | | | |
| |
| LUXEMBOURG 0.4% | | | | | | | | | | | | |
| |
| COMMUNICATION SERVICES 0.1% | |
| | | | |
Millicom International Cellular SA (a) | | | | | 8,171 | | | | | | 117 | |
| | | | |
RTL Group SA | | | | | 8,739 | | | | | | 366 | |
| | | | | | | | | | | | |
| | | | | | | | | | | 483 | |
| | | | | | | | | | | | |
| |
| MATERIALS 0.3% | | | | | | | | | | | | |
| | | | |
ArcelorMittal SA | | | | | 75,210 | | | | | | 1,687 | |
| | | | | | | | | | | | |
Total Luxembourg | | | | | | | | | | | 2,170 | |
| | | | | | | | | | | | |
| |
| MACAU 0.0% | | | | | | | | | | | | |
| |
| CONSUMER DISCRETIONARY 0.0% | |
| | | | |
Sands China Ltd. (a) | | | | | 47,200 | | | | | | 114 | |
| | | | | | | | | | | | |
Total Macau | | | | | | | | | | | 114 | |
| | | | | | | | | | | | |
| |
| NETHERLANDS 6.4% | | | | | | | | | | | | |
| |
| COMMUNICATION SERVICES 0.3% | |
| | | | |
Koninklijke KPN NV | | | | | 275,979 | | | | | | 982 | |
| | | | |
VEON Ltd. ADR (a) | | | | | 1,443,617 | | | | | | 664 | |
| | | | | | | | | | | | |
| | | | | | | | | | | 1,646 | |
| | | | | | | | | | | | |
| |
| CONSUMER DISCRETIONARY 0.4% | |
| | | | |
Stellantis NV | | | | | 21,871 | | | | | | 272 | |
| | | | |
Stellantis NV (c) | | | | | 162,004 | | | | | | 2,002 | |
| | | | | | | | | | | | |
| | | | | | | | | | | 2,274 | |
| | | | | | | | | | | | |
| |
| CONSUMER STAPLES 3.8% | | | | | | | | | | | | |
| | | | |
Koninklijke Ahold Delhaize NV | | | | | 774,901 | | | | | | 20,170 | |
| | | | | | | | | | | | |
| |
| FINANCIALS 0.2% | |
| | | | |
Aegon NV | | | | | 118,494 | | | | | | 510 | |
| | | | |
ING Groep NV | | | | | 42,057 | | | | | | 415 | |
| | | | | | | | | | | | |
| | | | | | | | | | | 925 | |
| | | | | | | | | | | | |
| |
| | | | | | | | | | | | |
| | | | | SHARES | | | | | MARKET
VALUE
(000S) | |
| HEALTH CARE 0.1% | | | | | | | | | | | | |
| | | | |
Koninklijke Philips NV | | | | | 24,927 | | | $ | | | 535 | |
| | | | | | | | | | | | |
| |
| INDUSTRIALS 1.1% | | | | | | | | | | | | |
| | | | |
Randstad NV | | | | | 70,939 | | | | | | 3,429 | |
| | | | |
Signify NV | | | | | 81,580 | | | | | | 2,691 | |
| | | | | | | | | | | | |
| | | | | | | | | | | 6,120 | |
| | | | | | | | | | | | |
| |
| MATERIALS 0.5% | | | | | | | | | | | | |
| | | | |
Akzo Nobel NV | | | | | 40,714 | | | | | | 2,662 | |
| | | | |
Koninklijke DSM NV | | | | | 1,772 | | | | | | 254 | |
| | | | | | | | | | | | |
| | | | | | | | | | | 2,916 | |
| | | | | | | | | | | | |
Total Netherlands | | | | | | | | | | | 34,586 | |
| | | | | | | | | | | | |
| |
| NEW ZEALAND 0.4% | | | | | | | | | | | | |
| |
| COMMUNICATION SERVICES 0.1% | |
| | | | |
Spark New Zealand Ltd. | | | | | 140,878 | | | | | | 422 | |
| | | | | | | | | | | | |
| |
| INDUSTRIALS 0.2% | | | | | | | | | | | | |
| | | | |
Air New Zealand Ltd. (a) | | | | | 469,971 | | | | | | 167 | |
| | | | |
Fletcher Building Ltd. | | | | | 321,535 | | | | | | 1,009 | |
| | | | | | | | | | | | |
| | | | | | | | | | | 1,176 | |
| | | | | | | | | | | | |
| |
| UTILITIES 0.1% | | | | | | | | | | | | |
| | | | |
Contact Energy Ltd. | | | | | 71,124 | | | | | | 323 | |
| | | | | | | | | | | | |
Total New Zealand | | | | | | | | | | | 1,921 | |
| | | | | | | | | | | | |
| |
| NORWAY 0.7% | | | | | | | | | | | | |
| |
| COMMUNICATION SERVICES 0.1% | |
| | | | |
Telenor ASA | | | | | 34,202 | | | | | | 457 | |
| | | | | | | | | | | | |
| |
| ENERGY 0.4% | | | | | | | | | | | | |
| | | | |
Equinor ASA | | | | | 66,578 | | | | | | 2,320 | |
| | | | | | | | | | | | |
| |
| FINANCIALS 0.0% | | | | | | | | | | | | |
| | | | |
DNB Bank ASA | | | | | 7,489 | | | | | | 135 | |
| | | | | | | | | | | | |
| |
| INFORMATION TECHNOLOGY 0.1% | |
| | | | |
Atea ASA | | | | | 18,036 | | | | | | 188 | |
| | | | | | | | | | | | |
| |
| MATERIALS 0.1% | | | | | | | | | | | | |
| | | | |
Norsk Hydro ASA | | | | | 31,984 | | | | | | 181 | |
| | | | |
Yara International ASA | | | | | 5,394 | | | | | | 226 | |
| | | | | | | | | | | | |
| | | | | | | | | | | 407 | |
| | | | | | | | | | | | |
Total Norway | | | | | | | | | | | 3,507 | |
| | | | | | | | | | | | |
| |
| PORTUGAL 0.6% | | | | | | | | | | | | |
| |
| CONSUMER STAPLES 0.2% | | | | | | | | | | | | |
| | | | |
Jeronimo Martins SGPS SA | | | | | 8,794 | | | | | | 191 | |
| | | | |
Sonae SGPS SA | | | | | 561,222 | | | | | | 688 | |
| | | | | | | | | | | | |
| | | | | | | | | | | 879 | |
| | | | | | | | | | | | |
| |
| ENERGY 0.0% | | | | | | | | | | | | |
| | | | |
Galp Energia SGPS SA | | | | | 21,398 | | | | | | 250 | |
| | | | | | | | | | | | |
| |
| MATERIALS 0.1% | | | | | | | | | | | | |
| | | | |
Navigator Co. SA | | | | | 181,778 | | | | | | 731 | |
| | | | | | | | | | | | |
| |
| | | | | | | | | | | | |
| | | | | SHARES | | | | | MARKET
VALUE
(000S) | |
| UTILITIES 0.3% | | | | | | | | | | | | |
| | | | |
EDP - Energias de Portugal SA | | | | | 337,950 | | | $ | | | 1,575 | |
| | | | | | | | | | | | |
Total Portugal | | | | | | | | | | | 3,435 | |
| | | | | | | | | | | | |
| |
| SINGAPORE 0.3% | | | | | | | | | | | | |
| |
| COMMUNICATION SERVICES 0.1% | |
| | | |
Singapore Telecommunications Ltd. | | | 254,700 | | | | | | 464 | |
| | | | | | | | | | | | |
| |
| CONSUMER STAPLES 0.0% | | | | | | | | | | | | |
| | | | |
Golden Agri-Resources Ltd. | | | | | 1,360,500 | | | | | | 245 | |
| | | | | | | | | | | | |
| |
| INDUSTRIALS 0.2% | | | | | | | | | | | | |
| | | | |
ComfortDelGro Corp. Ltd. | | | | | 534,700 | | | | | | 539 | |
| | | | |
Jardine Cycle & Carriage Ltd. | | | | | 15,100 | | | | | | 308 | |
| | | | | | | | | | | | |
| | | | | | | | | | | 847 | |
| | | | | | | | | | | | |
| |
| UTILITIES 0.0% | | | | | | | | | | | | |
| | | | |
Sembcorp Industries Ltd. | | | | | 67,900 | | | | | | 139 | |
| | | | | | | | | | | | |
Total Singapore | | | | | | | | | | | 1,695 | |
| | | | | | | | | | | | |
| |
| SPAIN 6.2% | | | | | | | | | | | | |
| |
| COMMUNICATION SERVICES 3.5% | |
| | | | |
Telefonica SA | | | | | 3,696,017 | | | | | | 18,870 | |
| | | | | | | | | | | | |
| |
| ENERGY 0.1% | | | | | | | | | | | | |
| | | | |
Repsol SA | | | | | 50,019 | | | | | | 737 | |
| | | | | | | | | | | | |
| |
| FINANCIALS 1.4% | | | | | | | | | | | | |
| | | | |
Banco Bilbao Vizcaya Argentaria SA | | | | | 115,997 | | | | | | 527 | |
| | | | |
Banco de Sabadell SA | | | | | 3,976,599 | | | | | | 3,188 | |
| | | | |
Banco Santander SA | | | | | 937,650 | | | | | | 2,653 | |
| | | | |
Mapfre SA (c) | | | | | 687,494 | | | | | | 1,216 | |
| | | | | | | | | | | | |
| | | | | | | | | | | 7,584 | |
| | | | | | | | | | | | |
| |
| INDUSTRIALS 0.2% | | | | | | | | | | | | |
| | | | |
ACS Actividades de Construccion y Servicios SA | | | | | 32,693 | | | | | | 797 | |
| | | | | | | | | | | | |
| |
| UTILITIES 1.0% | | | | | | | | | | | | |
| | | | |
Endesa SA (c) | | | | | 67,191 | | | | | | 1,271 | |
| | | | |
Naturgy Energy Group SA | | | | | 143,340 | | | | | | 4,142 | |
| | | | | | | | | | | | |
| | | | | | | | | | | 5,413 | |
| | | | | | | | | | | | |
Total Spain | | | | | | | | | | | 33,401 | |
| | | | | | | | | | | | |
| |
| SWEDEN 0.6% | | | | | | | | | | | | |
| |
| COMMUNICATION SERVICES 0.1% | |
| | | | |
Telia Co. AB | | | | | 80,022 | | | | | | 307 | |
| | | | | | | | | | | | |
| |
| CONSUMER DISCRETIONARY 0.2% | |
| | | | |
Electrolux AB (c) | | | | | 15,528 | | | | | | 210 | |
| | | | |
H & M Hennes & Mauritz AB ‘B’ | | | | | 84,421 | | | | | | 1,013 | |
| | | | |
JM AB | | | | | 5,485 | | | | | | 91 | |
| | | | | | | | | | | | |
| | | | | | | | | | | 1,314 | |
| | | | | | | | | | | | |
| |
| FINANCIALS 0.2% | | | | | | | | | | | | |
| | | | |
Ratos AB ‘B’ | | | | | 37,114 | | | | | | 159 | |
| | | | |
Swedbank AB ‘A’ | | | | | 62,703 | | | | | | 795 | |
| | | | | | | | | | | | |
| | | | | | | | | | | 954 | |
| | | | | | | | | | | | |
| | | | | | |
| 44 | | PIMCO EQUITY SERIES | | | See Accompanying Notes | |
| | | | | | | | | | | | |
| | | | | SHARES | | | | | MARKET
VALUE
(000S) | |
| INDUSTRIALS 0.1% | | | | | | | | | | | | |
| | | | |
Securitas AB ‘B’ | | | | | 32,416 | | | $ | | | 280 | |
| | | | |
Skanska AB ‘B’ | | | | | 19,712 | | | | | | 304 | |
| | | | | | | | | | | | |
| | | | | | | | | | | 584 | |
| | | | | | | | | | | | |
| |
| INFORMATION TECHNOLOGY 0.0% | |
| | | | |
Telefonaktiebolaget LM Ericsson ‘B’ | | | | | 7,613 | | | | | | 57 | |
| | | | | | | | | | | | |
| |
| MATERIALS 0.0% | | | | | | | | | | | | |
| | | | |
Hexpol AB | | | | | 7,508 | | | | | | 64 | |
| | | | | | | | | | | | |
Total Sweden | | | | | | | | | | | 3,280 | |
| | | | | | | | | | | | |
| |
| SWITZERLAND 7.5% | | | | | | | | | | | | |
| |
| COMMUNICATION SERVICES 0.1% | |
| | | | |
Swisscom AG | | | | | 1,135 | | | | | | 628 | |
| | | | | | | | | | | | |
| |
| CONSUMER DISCRETIONARY 0.7% | | | | | | | | | | | | |
| | | | |
Swatch Group AG | | | | | 15,810 | | | | | | 3,755 | |
| | | | | | | | | | | | |
| |
| CONSUMER STAPLES 2.7% | | | | | | | | | | | | |
| | | | |
Nestle SA | | | | | 124,665 | | | | | | 14,570 | |
| | | | | | | | | | | | |
| |
| FINANCIALS 1.2% | | | | | | | | | | | | |
| | | | |
Swiss Life Holding AG | | | | | 2,665 | | | | | | 1,301 | |
| | | | |
UBS Group AG | | | | | 81,047 | | | | | | 1,310 | |
| | | | |
Zurich Insurance Group AG | | | | | 8,646 | | | | | | 3,771 | |
| | | | | | | | | | | | |
| | | | | | | | | | | 6,382 | |
| | | | | | | | | | | | |
| |
| HEALTH CARE 1.4% | | | | | | | | | | | | |
| | | | |
Novartis AG | | | | | 32,649 | | | | | | 2,768 | |
| | | | |
Roche Holding AG | | | | | 14,740 | | | | | | 4,928 | |
| | | | | | | | | | | | |
| | | | | | | | | | | 7,696 | |
| | | | | | | | | | | | |
| |
| INDUSTRIALS 0.7% | | | | | | | | | | | | |
| | | | |
ABB Ltd. | | | | | 22,693 | | | | | | 608 | |
| | | | |
Adecco Group AG | | | | | 88,682 | | | | | | 3,023 | |
| | | | | | | | | | | | |
| | | | | | | | | | | 3,631 | |
| | | | | | | | | | | | |
| |
| INFORMATION TECHNOLOGY 0.1% | |
| | | | |
TE Connectivity Ltd. | | | | | 1,953 | | | | | | 221 | |
| | | | | | | | | | | | |
| |
| MATERIALS 0.6% | | | | | | | | | | | | |
| | | | |
Glencore PLC | | | | | 478,057 | | | | | | 2,589 | |
| | | | |
Holcim AG | | | | | 11,257 | | | | | | 483 | |
| | | | | | | | | | | | |
| | | | | | | | | | | 3,072 | |
| | | | | | | | | | | | |
Total Switzerland | | | | | | | | | | | 39,955 | |
| | | | | | | | | | | | |
| |
| UNITED KINGDOM 13.4% | | | | | | | | | | | | |
| |
| COMMUNICATION SERVICES 0.8% | |
| | | | |
ITV PLC | | | | | 189,104 | | | | | | 151 | |
| | | | |
Pearson PLC | | | | | 28,113 | | | | | | 257 | |
| | | | |
WPP PLC | | | | | 387,367 | | | | | | 3,913 | |
| | | | | | | | | | | | |
| | | | | | | | | | | 4,321 | |
| | | | | | | | | | | | |
| |
| CONSUMER DISCRETIONARY 0.8% | |
| | | | |
Barratt Developments PLC | | | | | 48,779 | | | | | | 273 | |
| | | | |
Berkeley Group Holdings PLC | | | | | 6,082 | | | | | | 276 | |
| | | | | | | | | | | | |
| | | | | SHARES | | | | | MARKET
VALUE
(000S) | |
| | | | |
Currys PLC | | | | | 181,738 | | | $ | | | 151 | |
| | | | |
Inchcape PLC | | | | | 256,631 | | | | | | 2,181 | |
| | | | |
Kingfisher PLC | | | | | 420,875 | | | | | | 1,258 | |
| | | | |
Persimmon PLC | | | | | 5,525 | | | | | | 126 | |
| | | | |
Taylor Wimpey PLC | | | | | 69,877 | | | | | | 99 | |
| | | | | | | | | | | | |
| | | | | | | | | | | 4,364 | |
| | | | | | | | | | | | |
| |
| CONSUMER STAPLES 1.1% | | | | | | | | | | | | |
| | | | |
British American Tobacco PLC | | | | | 40,948 | | | | | | 1,755 | |
| | | | |
Imperial Brands PLC | | | | | 67,236 | | | | | | 1,505 | |
| | | | |
Marks & Spencer Group PLC | | | | | 1,152,803 | | | | | | 1,913 | |
| | | | |
Unilever PLC | | | | | 15,604 | | | | | | 711 | |
| | | | | | | | | | | | |
| | | | | | | | | | | 5,884 | |
| | | | | | | | | | | | |
| |
| ENERGY 3.7% | | | | | | | | | | | | |
| | | | |
Shell PLC | | | | | 751,276 | | | | | | 19,535 | |
| | | | |
Subsea 7 SA | | | | | 52,387 | | | | | | 418 | |
| | | | | | | | | | | | |
| | | | | | | | | | | 19,953 | |
| | | | | | | | | | | | |
| |
| FINANCIALS 1.4% | |
| | | | |
abrdn PLC | | | | | 155,329 | | | | | | 303 | |
| | | | |
Aviva PLC | | | | | 166,593 | | | | | | 816 | |
| | | | |
Direct Line Insurance Group PLC | | | | | 162,426 | | | | | | 499 | |
| | | | |
M&G PLC | | | | | 2,439,002 | | | | | | 5,782 | |
| | | | | | | | | | | | |
| | | | | | | | | | | 7,400 | |
| | | | | | | | | | | | |
| |
| HEALTH CARE 0.7% | | | | | | | | | | | | |
| | | | |
GSK PLC | | | | | 166,413 | | | | | | 3,586 | |
| | | | |
Smith & Nephew PLC | | | | | 5,058 | | | | | | 71 | |
| | | | | | | | | | | | |
| | | | | | | | | | | 3,657 | |
| | | | | | | | | | | | |
| |
| INDUSTRIALS 0.4% | | | | | | | | | | | | |
| | | | |
Ferguson PLC | | | | | 6,107 | | | | | | 684 | |
| | | | |
Royal Mail PLC | | | | | 470,897 | | | | | | 1,556 | |
| | | | | | | | | | | | |
| | | | | | | | | | | 2,240 | |
| | | | | | | | | | | | |
| |
| INFORMATION TECHNOLOGY 0.1% | | | | | | | |
| | | | |
Micro Focus International PLC | | | | | 203,824 | | | | | | 694 | |
| | | | | | | | | | | | |
| |
| MATERIALS 2.0% | | | | | | | | | | | | |
| | | | |
Evraz PLC « | | | | | 238,175 | | | | | | 234 | |
| | | | |
Mondi PLC | | | | | 25,586 | | | | | | 454 | |
| | | | |
Rio Tinto PLC | | | | | 167,187 | | | | | | 9,996 | |
| | | | | | | | | | | | |
| | | | | | | | | | | 10,684 | |
| | | | | | | | | | | | |
| |
| UTILITIES 2.4% | | | | | | | | | | | | |
| | | | |
Centrica PLC (a) | | | | | 8,974,415 | | | | | | 8,764 | |
| | | | |
SSE PLC | | | | | 202,102 | | | | | | 3,988 | |
| | | | | | | | | | | | |
| | | | | | | | | | | 12,752 | |
| | | | | | | | | | | | |
Total United Kingdom | | | | | | | | | | | 71,949 | |
| | | | | | | | | | | | |
| |
| UNITED STATES 0.1% | | | | | | | | | | | | |
| |
| MATERIALS 0.1% | | | | | | | | | | | | |
| | | | |
Sims Ltd. | | | | | 37,171 | | | | | | 353 | |
| | | | | | | | | | | | |
Total United States | | | | | | | | | | | 353 | |
| | | | | | | | | | | | |
Total Common Stocks (Cost $467,033) | | | | | | 523,153 | |
| | | | | | | | | | | | |
| |
| | | | | | | | | | | | |
| | | | | SHARES | | | | | MARKET
VALUE
(000S) | |
| WARRANTS 0.0% | | | | | | | | | | | | |
| |
| SPAIN 0.0% | | | | | | | | | | | | |
| |
| INDUSTRIALS 0.0% | | | | | | | | | | | | |
| | | | |
Abengoa SA ‘B’ - Exp. 03/31/2025 | | | | | 226,011 | | | $ | | | 0 | |
| | | | | | | | | | | | |
Total Warrants (Cost $0) | | | | | | | | | | | 0 | |
| | | | | | | | | | | | |
| |
| PREFERRED STOCKS 0.2% | | | | | | | | | | | | |
| |
| GERMANY 0.2% | | | | | | | | | | | | |
| |
| CONSUMER DISCRETIONARY 0.2% | |
| | | | |
Schaeffler AG | | | | | 173,641 | | | | | | 987 | |
| | | | | | | | | | | | |
| |
| INDUSTRIALS 0.0% | | | | | | | | | | | | |
| | | | |
Henkel AG & Co. KGaA | | | | | 2,908 | | | | | | 180 | |
| | | | | | | | | | | | |
Total Preferred Stocks (Cost $1,388) | | | | | | 1,167 | |
| | | | | | | | | | | | |
| |
| REAL ESTATE INVESTMENT TRUSTS 1.2% | |
| |
| AUSTRALIA 0.3% | | | | | | | | | | | | |
| |
| REAL ESTATE 0.3% | | | | | | | | | | | | |
| | | | |
Scentre Group | | | | | 314,656 | | | | | | 565 | |
| | | | |
Stockland | | | | | 253,992 | | | | | | 634 | |
| | | | |
Vicinity Centres | | | | | 276,744 | | | | | | 351 | |
| | | | | | | | | | | | |
| | | | | | | | | | | 1,550 | |
| | | | | | | | | | | | |
Total Australia | | | | | | | | | | | 1,550 | |
| | | | | | | | | | | | |
| |
| CANADA 0.2% | | | | | | | | | | | | |
| |
| REAL ESTATE 0.2% | | | | | | | | | | | | |
| | | | |
H&R Real Estate Investment Trust REIT | | | | | 98,586 | | | | | | 954 | |
| | | | |
Primaris REIT | | | | | 14,671 | | | | | | 139 | |
| | | | |
RioCan Real Estate Investment Trust | | | | | 8,942 | | | | | | 139 | |
| | | | | | | | | | | | |
| | | | | | | | | | | 1,232 | |
| | | | | | | | | | | | |
Total Canada | | | | | | | | | | | 1,232 | |
| | | | | | | | | | | | |
| |
| FRANCE 0.7% | | | | | | | | | | | | |
| |
| REAL ESTATE 0.7% | | | | | | | | | | | | |
| | | | |
Unibail-Rodamco-Westfield | | | | | 67,408 | | | | | | 3,427 | |
| | | | | | | | | | | | |
Total France | | | | | | | | | | | 3,427 | |
| | | | | | | | | | | | |
Total Real Estate Investment Trusts (Cost $7,963) | | | | | | 6,209 | |
| | | | | | | | | | | | |
| |
| SHORT-TERM INSTRUMENTS 0.5% | |
| |
| REPURCHASE AGREEMENTS (f) 0.5% | |
| | | | | | | | | | | 2,759 | |
| | | | | | | | | | | | |
Total Short-Term Instruments
(Cost $2,759) | | | 2,759 | |
| | | | |
| | | | |
| | | | | | | | | | | | |
Total Investments in Securities
(Cost $479,143) | | | 533,288 | |
| | | | |
| |
| | | | | | | | | | | | |
| See Accompanying Notes | | | ANNUAL REPORT | | | | | | | JUNE 30, 2022 | | | 45 |
| | | | | | |
| Schedule of Investments | | PIMCO RAE International Fund | | (Cont.) | | |
| | | | | | | | | | | | |
| | | | | SHARES | | | | | MARKET
VALUE
(000S) | |
| INVESTMENTS IN AFFILIATES 5.2% | |
| |
| SHORT-TERM INSTRUMENTS 5.2% | |
| |
| MUTUAL FUNDS 5.2% | | | | | | | | | | | | |
|
PIMCO Government Money Market Fund | |
1.450% (b)(c)(d) | | | | | 28,069,778 | | | $ | | | 28,070 | |
| | | | | | | | | | | | |
Total Short-Term Instruments
(Cost $28,070) | | | 28,070 | |
| | | | |
| | | | |
| | | | | | | | | | | | |
Total Investments in Affiliates
(Cost $28,070) | | | 28,070 | |
| | | | |
| | | | | | | | | | | | |
Total Investments 104.6%
(Cost $507,213) | | | $ | | | 561,358 | |
| |
| Other Assets and Liabilities, net (4.6)% | | | (24,859 | ) |
| | | | |
| Net Assets 100.0% | | | | | | | | $ | | | 536,499 | |
| | | | | | | | | | | | |
NOTES TO SCHEDULE OF INVESTMENTS:
| * | A zero balance may reflect actual amounts rounding to less than one thousand. |
| « | Security valued using significant unobservable inputs (Level 3). |
| (a) | Security did not produce income within the last twelve months. |
| (b) | Institutional Class Shares of each Fund. |
| (c) | Securities with an aggregate market value of $26,710 were out on loan in exchange for $28,070 of cash collateral as of June 30, 2022. The collateral was invested in a cash collateral reinvestment vehicle as described in Note 5 in the Notes to Financial Statements. |
| (d) | Coupon represents a 7-Day Yield. |
(e) RESTRICTED SECURITIES:
| | | | | | | | | | | | | | |
| Issuer Description | | Acquisition
Date | | Cost | | | Market
Value | | | Market Value
as Percentage
of Net Assets | |
Great-West Lifeco, Inc. | | 03/12/2020 - 04/06/2020 | | $ | 106 | | | $ | 163 | | | | 0.03% | |
| | | | | | | | | | | | | | |
BORROWINGS AND OTHER FINANCING TRANSACTIONS
(f) REPURCHASE AGREEMENTS:
| | | | | | | | | | | | | | | | | | | | | | | | | | | | | | |
| Counterparty | | Lending
Rate | | | Settlement
Date | | | Maturity
Date | | | Principal
Amount | | | Collateralized By | | Collateral
(Received) | | | Repurchase
Agreements,
at Value | | | Repurchase
Agreement
Proceeds
to be
Received(1) | |
| FICC | | | 0.400 | % | | | 06/30/2022 | | | | 07/01/2022 | | | $ | 2,759 | | | U.S. Treasury Notes 3.000% due 06/30/2024 | | $ | (2,814 | ) | | $ | 2,759 | | | $ | 2,759 | |
| | | | | | | | | | | | | | | | | | | | | | | | | | | | | | |
Total Repurchase Agreements | | | | | $ | (2,814 | ) | | $ | 2,759 | | | $ | 2,759 | |
| | | | | | | | | | | | | | | | | | | | | | | | | | | | | | |
BORROWINGS AND OTHER FINANCING TRANSACTIONS SUMMARY
The following is a summary by counterparty of the market value of Borrowings and Other Financing Transactions and collateral pledged/(received) as of June 30, 2022:
| | | | | | | | | | | | | | | | | | | | | | | | | | | | |
| Counterparty | | Repurchase
Agreement
Proceeds
to be
Received(1) | | | Payable for
Reverse
Repurchase
Agreements | | | Payable for
Sale-Buyback
Transactions | | | Securities Out on Loan | | | Total
Borrowings and
Other Financing
Transactions | | | Collateral
Pledged/(Received) | | | Net Exposure(2) | |
Global/Master Repurchase Agreement | |
FICC | | $ | 2,759 | | | $ | 0 | | | $ | 0 | | | $ | 0 | | | $ | 2,759 | | | $ | (2,814 | ) | | $ | (55 | ) |
|
Master Securities Lending Agreement | |
BCY | | | 0 | | | | 0 | | | | 0 | | | | 93 | | | | 93 | | | | (125 | ) | | | (32 | ) |
BSN | | | 0 | | | | 0 | | | | 0 | | | | 444 | | | | 444 | | | | (467 | ) | | | (23 | ) |
FOB | | | 0 | | | | 0 | | | | 0 | | | | 1,291 | | | | 1,291 | | | | (1,362 | ) | | | (71 | ) |
GSC | | | 0 | | | | 0 | | | | 0 | | | | 13,321 | | | | 13,321 | | | | (13,991 | ) | | | (670 | ) |
MBC | | | 0 | | | | 0 | | | | 0 | | | | 506 | | | | 506 | | | | (534 | ) | | | (28 | ) |
MSC | | | 0 | | | | 0 | | | | 0 | | | | 10,188 | | | | 10,188 | | | | (10,651 | ) | | | (463 | ) |
SAL | | | 0 | | | | 0 | | | | 0 | | | | 513 | | | | 513 | | | | (544 | ) | | | (31 | ) |
UBS | | | 0 | | | | 0 | | | | 0 | | | | 354 | | | | 354 | | | | (396 | ) | | | (42 | ) |
| | | | | | | | | | | | | | | | | | | | | | | | | | | | |
Total Borrowings and Other Financing Transactions | | $ | 2,759 | | | $ | 0 | | | $ | 0 | | | $ | 26,710 | | | | | | | | | | | | | |
| | | | | | | | | | | | | | | | | | | | | | | | | | | | |
| | | | | | |
| 46 | | PIMCO EQUITY SERIES | | | See Accompanying Notes | |
CERTAIN TRANSFERS ACCOUNTED FOR AS SECURED BORROWINGS
Remaining Contractual Maturity of the Agreements
| | | | | | | | | | | | | | | | | | | | |
| | | Overnight and
Continuous | | | Up to 30 days | | | 31-90 days | | | Greater Than 90 days | | | Total | |
Securities Lending Transactions(3) | |
Common Stocks | | $ | 28,070 | | | $ | 0 | | | $ | 0 | | | $ | 0 | | | $ | 28,070 | |
| | | | | | | | | | | | | | | | | | | | |
Total Borrowings | | $ | 28,070 | | | $ | 0 | | | $ | 0 | | | $ | 0 | | | $ | 28,070 | |
| | | | | | | | | | | | | | | | | | | | |
Payable for securities on loan - cash collateral | | | $ | 28,070 | |
| | | | | | | | | | | | | | | | | | | | |
| (1) | Includes accrued interest. |
| (2) | Net Exposure represents the net receivable/(payable) that would be due from/to the counterparty in the event of default. Exposure from borrowings and other financing transactions can only be netted across transactions governed under the same master agreement with the same legal entity. See Note 8, Master Netting Arrangements, in the Notes to Financial Statements for more information. |
| (3) | Includes cash as described in Note 5 in the Notes to Financial Statements. |
FAIR VALUE OF FINANCIAL DERIVATIVE INSTRUMENTS
The following is a summary of the fair valuation of the Fund’s derivative instruments categorized by risk exposure. See Note 7, Principal and Other Risks, in the Notes to Financial Statements on risks of the Fund.
The effect of Financial Derivative Instruments on the Statements of Operations for the period ended June 30, 2022:
| | | | | | | | | | | | | | | | | | | | | | | | |
| | | Derivatives not accounted for as hedging instruments | |
| | | Commodity
Contracts | | | Credit
Contracts | | | Equity
Contracts | | | Foreign
Exchange
Contracts | | | Interest
Rate Contracts | | | Total | |
Net Realized (Loss) on Financial Derivative Instruments | |
Over the counter | |
Forward Foreign Currency Contracts | | $ | 0 | | | $ | 0 | | | $ | 0 | | | $ | (11 | ) | | $ | 0 | | | $ | (11 | ) |
| | | | | | | | | | | | | | | | | | | | | | | | |
FAIR VALUE MEASUREMENTS
The following is a summary of the fair valuations according to the inputs used as of June 30, 2022 in valuing the Fund’s assets and liabilities:
| | | | | | | | | | | | | | | | |
| Category and Subcategory | | Level 1 | | | Level 2 | | | Level 3 | | | Fair
Value at
06/30/2022 | |
Investments in Securities, at Value | |
Common Stocks | |
Australia | |
Communication Services | | $ | 0 | | | $ | 4,105 | | | $ | 0 | | | $ | 4,105 | |
Consumer Discretionary | | | 0 | | | | 928 | | | | 0 | | | | 928 | |
Consumer Staples | | | 0 | | | | 2,478 | | | | 0 | | | | 2,478 | |
Energy | | | 119 | | | | 2,011 | | | | 0 | | | | 2,130 | |
Financials | | | 0 | | | | 5,953 | | | | 0 | | | | 5,953 | |
Industrials | | | 0 | | | | 1,745 | | | | 0 | | | | 1,745 | |
Materials | | | 0 | | | | 9,102 | | | | 0 | | | | 9,102 | |
Real Estate | | | 0 | | | | 102 | | | | 0 | | | | 102 | |
Utilities | | | 0 | | | | 6,563 | | | | 0 | | | | 6,563 | |
Austria | |
Financials | | | 0 | | | | 264 | | | | 0 | | | | 264 | |
Industrials | | | 108 | | | | 0 | | | | 0 | | | | 108 | |
Materials | | | 0 | | | | 1,976 | | | | 0 | | | | 1,976 | |
Belgium | |
Communication Services | | | 0 | | | | 1,291 | | | | 0 | | | | 1,291 | |
Consumer Staples | | | 552 | | | | 0 | | | | 0 | | | | 552 | |
Energy | | | 0 | | | | 117 | | | | 0 | | | | 117 | |
Health Care | | | 0 | | | | 813 | | | | 0 | | | | 813 | |
Industrials | | | 0 | | | | 327 | | | | 0 | | | | 327 | |
Materials | | | 0 | | | | 81 | | | | 0 | | | | 81 | |
Canada | |
Consumer Discretionary | | | 12,119 | | | | 0 | | | | 0 | | | | 12,119 | |
Consumer Staples | | | 1,501 | | | | 0 | | | | 0 | | | | 1,501 | |
Energy | | | 4,342 | | | | 0 | | | | 0 | | | | 4,342 | |
Financials | | | 2,428 | | | | 0 | | | | 0 | | | | 2,428 | |
Industrials | | | 2,031 | | | | 0 | | | | 0 | | | | 2,031 | |
Information Technology | | | 969 | | | | 0 | | | | 0 | | | | 969 | |
| | | | | | | | | | | | | | | | |
| Category and Subcategory | | Level 1 | | | Level 2 | | | Level 3 | | | Fair
Value at
06/30/2022 | |
Materials | | $ | 40 | | | $ | 0 | | | $ | 0 | | | $ | 40 | |
Utilities | | | 2,271 | | | | 0 | | | | 0 | | | | 2,271 | |
Denmark | |
Consumer Staples | | | 0 | | | | 391 | | | | 0 | | | | 391 | |
Health Care | | | 213 | | | | 129 | | | | 0 | | | | 342 | |
Industrials | | | 0 | | | | 2,617 | | | | 0 | | | | 2,617 | |
Finland | |
Consumer Discretionary | | | 0 | | | | 82 | | | | 0 | | | | 82 | |
Consumer Staples | | | 0 | | | | 227 | | | | 0 | | | | 227 | |
Financials | | | 0 | | | | 3,713 | | | | 0 | | | | 3,713 | |
Industrials | | | 0 | | | | 246 | | | | 0 | | | | 246 | |
Information Technology | | | 0 | | | | 2,491 | | | | 0 | | | | 2,491 | |
Materials | | | 0 | | | | 433 | | | | 0 | | | | 433 | |
France | |
Communication Services | | | 0 | | | | 2,020 | | | | 0 | | | | 2,020 | |
Consumer Discretionary | | | 0 | | | | 5,041 | | | | 0 | | | | 5,041 | |
Consumer Staples | | | 0 | | | | 2,972 | | | | 0 | | | | 2,972 | |
Energy | | | 0 | | | | 1,242 | | | | 0 | | | | 1,242 | |
Financials | | | 0 | | | | 2,230 | | | | 0 | | | | 2,230 | |
Health Care | | | 0 | | | | 2,747 | | | | 0 | | | | 2,747 | |
Industrials | | | 0 | | | | 3,764 | | | | 0 | | | | 3,764 | |
Information Technology | | | 0 | | | | 163 | | | | 0 | | | | 163 | |
Utilities | | | 0 | | | | 3,371 | | | | 0 | | | | 3,371 | |
Germany | |
Communication Services | | | 0 | | | | 358 | | | | 0 | | | | 358 | |
Consumer Discretionary | | | 0 | | | | 8,459 | | | | 0 | | | | 8,459 | |
Consumer Staples | | | 0 | | | | 2,192 | | | | 0 | | | | 2,192 | |
Financials | | | 0 | | | | 1,834 | | | | 0 | | | | 1,834 | |
Health Care | | | 0 | | | | 466 | | | | 0 | | | | 466 | |
Industrials | | | 0 | | | | 2,352 | | | | 0 | | | | 2,352 | |
| | | | | | | | | | | | |
| See Accompanying Notes | | | ANNUAL REPORT | | | | | | | JUNE 30, 2022 | | | 47 |
| | | | | | |
| Schedule of Investments | | PIMCO RAE International Fund | | (Cont.) | | June 30, 2022 |
| | | | | | | | | | | | | | | | |
| Category and Subcategory | | Level 1 | | | Level 2 | | | Level 3 | | | Fair
Value at
06/30/2022 | |
Materials | | $ | 0 | | | $ | 2,262 | | | $ | 0 | | | $ | 2,262 | |
Utilities | | | 0 | | | | 1,133 | | | | 0 | | | | 1,133 | |
Hong Kong | |
Communication Services | | | 0 | | | | 268 | | | | 0 | | | | 268 | |
Consumer Discretionary | | | 499 | | | | 1,559 | | | | 0 | | | | 2,058 | |
Consumer Staples | | | 0 | | | | 1,035 | | | | 0 | | | | 1,035 | |
Industrials | | | 0 | | | | 1,156 | | | | 0 | | | | 1,156 | |
Information Technology | | | 0 | | | | 1,590 | | | | 0 | | | | 1,590 | |
Materials | | | 0 | | | | 246 | | | | 0 | | | | 246 | |
Real Estate | | | 0 | | | | 7,553 | | | | 0 | | | | 7,553 | |
Ireland | |
Financials | | | 0 | | | | 556 | | | | 0 | | | | 556 | |
Industrials | | | 516 | | | | 0 | | | | 0 | | | | 516 | |
Israel | |
Communication Services | | | 68 | | | | 2,344 | | | | 0 | | | | 2,412 | |
Energy | | | 0 | | | | 1,871 | | | | 0 | | | | 1,871 | |
Financials | | | 0 | | | | 462 | | | | 0 | | | | 462 | |
Health Care | | | 1,975 | | | | 0 | | | | 0 | | | | 1,975 | |
Information Technology | | | 304 | | | | 0 | | | | 0 | | | | 304 | |
Materials | | | 0 | | | | 902 | | | | 0 | | | | 902 | |
Real Estate | | | 0 | | | | 303 | | | | 0 | | | | 303 | |
Italy | |
Communication Services | | | 0 | | | | 887 | | | | 0 | | | | 887 | |
Energy | | | 0 | | | | 9,035 | | | | 0 | | | | 9,035 | |
Financials | | | 0 | | | | 4,173 | | | | 0 | | | | 4,173 | |
Industrials | | | 0 | | | | 332 | | | | 0 | | | | 332 | |
Utilities | | | 0 | | | | 3,826 | | | | 0 | | | | 3,826 | |
Japan | |
Communication Services | | | 0 | | | | 15,437 | | | | 0 | | | | 15,437 | |
Consumer Discretionary | | | 0 | | | | 38,703 | | | | 0 | | | | 38,703 | |
Consumer Staples | | | 0 | | | | 4,665 | | | | 0 | | | | 4,665 | |
Energy | | | 0 | | | | 292 | | | | 0 | | | | 292 | |
Financials | | | 0 | | | | 31,998 | | | | 0 | | | | 31,998 | |
Health Care | | | 0 | | | | 5,428 | | | | 0 | | | | 5,428 | |
Industrials | | | 0 | | | | 20,433 | | | | 0 | | | | 20,433 | |
Information Technology | | | 0 | | | | 24,397 | | | | 0 | | | | 24,397 | |
Materials | | | 0 | | | | 12,384 | | | | 0 | | | | 12,384 | |
Real Estate | | | 0 | | | | 6,245 | | | | 0 | | | | 6,245 | |
Utilities | | | 0 | | | | 7,861 | | | | 0 | | | | 7,861 | |
Luxembourg | |
Communication Services | | | 0 | | | | 483 | | | | 0 | | | | 483 | |
Materials | | | 0 | | | | 1,687 | | | | 0 | | | | 1,687 | |
Macau | |
Consumer Discretionary | | | 0 | | | | 114 | | | | 0 | | | | 114 | |
Netherlands | |
Communication Services | | | 664 | | | | 982 | | | | 0 | | | | 1,646 | |
Consumer Discretionary | | | 2,002 | | | | 272 | | | | 0 | | | | 2,274 | |
Consumer Staples | | | 0 | | | | 20,170 | | | | 0 | | | | 20,170 | |
Financials | | | 0 | | | | 925 | | | | 0 | | | | 925 | |
Health Care | | | 0 | | | | 535 | | | | 0 | | | | 535 | |
Industrials | | | 0 | | | | 6,120 | | | | 0 | | | | 6,120 | |
Materials | | | 0 | | | | 2,916 | | | | 0 | | | | 2,916 | |
New Zealand | |
Communication Services | | | 0 | | | | 422 | | | | 0 | | | | 422 | |
Industrials | | | 0 | | | | 1,176 | | | | 0 | | | | 1,176 | |
Utilities | | | 0 | | | | 323 | | | | 0 | | | | 323 | |
Norway | |
Communication Services | | | 0 | | | | 457 | | | | 0 | | | | 457 | |
Energy | | | 0 | | | | 2,320 | | | | 0 | | | | 2,320 | |
Financials | | | 0 | | | | 135 | | | | 0 | | | | 135 | |
Information Technology | | | 0 | | | | 188 | | | | 0 | | | | 188 | |
Materials | | | 0 | | | | 407 | | | | 0 | | | | 407 | |
Portugal | |
Consumer Staples | | | 0 | | | | 879 | | | | 0 | | | | 879 | |
Energy | | | 0 | | | | 250 | | | | 0 | | | | 250 | |
| | | | | | | | | | | | | | | | |
| Category and Subcategory | | Level 1 | | | Level 2 | | | Level 3 | | | Fair
Value at
06/30/2022 | |
Materials | | $ | 0 | | | $ | 731 | | | $ | 0 | | | $ | 731 | |
Utilities | | | 0 | | | | 1,575 | | | | 0 | | | | 1,575 | |
Singapore | |
Communication Services | | | 0 | | | | 464 | | | | 0 | | | | 464 | |
Consumer Staples | | | 245 | | | | 0 | | | | 0 | | | | 245 | |
Industrials | | | 0 | | | | 847 | | | | 0 | | | | 847 | |
Utilities | | | 0 | | | | 139 | | | | 0 | | | | 139 | |
Spain | |
Communication Services | | | 0 | | | | 18,870 | | | | 0 | | | | 18,870 | |
Energy | | | 0 | | | | 737 | | | | 0 | | | | 737 | |
Financials | | | 0 | | | | 7,584 | | | | 0 | | | | 7,584 | |
Industrials | | | 0 | | | | 797 | | | | 0 | | | | 797 | |
Utilities | | | 0 | | | | 5,413 | | | | 0 | | | | 5,413 | |
Sweden | |
Communication Services | | | 0 | | | | 307 | | | | 0 | | | | 307 | |
Consumer Discretionary | | | 0 | | | | 1,314 | | | | 0 | | | | 1,314 | |
Financials | | | 0 | | | | 954 | | | | 0 | | | | 954 | |
Industrials | | | 0 | | | | 584 | | | | 0 | | | | 584 | |
Information Technology | | | 0 | | | | 57 | | | | 0 | | | | 57 | |
Materials | | | 0 | | | | 64 | | | | 0 | | | | 64 | |
Switzerland | |
Communication Services | | | 0 | | | | 628 | | | | 0 | | | | 628 | |
Consumer Discretionary | | | 0 | | | | 3,755 | | | | 0 | | | | 3,755 | |
Consumer Staples | | | 0 | | | | 14,570 | | | | 0 | | | | 14,570 | |
Financials | | | 0 | | | | 6,382 | | | | 0 | | | | 6,382 | |
Health Care | | | 0 | | | | 7,696 | | | | 0 | | | | 7,696 | |
Industrials | | | 0 | | | | 3,631 | | | | 0 | | | | 3,631 | |
Information Technology | | | 221 | | | | 0 | | | | 0 | | | | 221 | |
Materials | | | 0 | | | | 3,072 | | | | 0 | | | | 3,072 | |
United Kingdom | |
Communication Services | | | 0 | | | | 4,321 | | | | 0 | | | | 4,321 | |
Consumer Discretionary | | | 0 | | | | 4,364 | | | | 0 | | | | 4,364 | |
Consumer Staples | | | 0 | | | | 5,884 | | | | 0 | | | | 5,884 | |
Energy | | | 0 | | | | 19,953 | | | | 0 | | | | 19,953 | |
Financials | | | 0 | | | | 7,400 | | | | 0 | | | | 7,400 | |
Health Care | | | 0 | | | | 3,657 | | | | 0 | | | | 3,657 | |
Industrials | | | 0 | | | | 2,240 | | | | 0 | | | | 2,240 | |
Information Technology | | | 0 | | | | 694 | | | | 0 | | | | 694 | |
Materials | | | 0 | | | | 10,450 | | | | 234 | | | | 10,684 | |
Utilities | | | 0 | | | | 12,752 | | | | 0 | | | | 12,752 | |
United States | |
Materials | | | 0 | | | | 353 | | | | 0 | | | | 353 | |
Preferred Stocks | |
Germany | |
Consumer Discretionary | | | 0 | | | | 987 | | | | 0 | | | | 987 | |
Industrials | | | 0 | | | | 180 | | | | 0 | | | | 180 | |
Real Estate Investment Trusts | |
Australia | |
Real Estate | | | 0 | | | | 1,550 | | | | 0 | | | | 1,550 | |
Canada | |
Real Estate | | | 1,232 | | | | 0 | | | | 0 | | | | 1,232 | |
France | |
Real Estate | | | 0 | | | | 3,427 | | | | 0 | | | | 3,427 | |
Short-Term Instruments | |
Repurchase Agreements | | | 0 | | | | 2,759 | | | | 0 | | | | 2,759 | |
| | | | | | | | | | | | | | | | |
| | $ | 34,419 | | | $ | 498,635 | | | $ | 234 | | | $ | 533,288 | |
| | | | | | | | | | | | | | | | |
|
Investments in Affiliates, at Value | |
Short-Term Instruments | |
Mutual Funds | | | 28,070 | | | | 0 | | | | 0 | | | | 28,070 | |
| | | | | | | | | | | | | | | | |
| | | | |
Total Investments | | $ | 62,489 | | | $ | 498,635 | | | $ | 234 | | | $ | 561,358 | |
| | | | | | | | | | | | | | | | |
There were no significant transfers into or out of Level 3 during the period ended June 30, 2022.
| | | | | | |
| 48 | | PIMCO EQUITY SERIES | | | See Accompanying Notes | |
| | | | | | |
| Schedule of Investments | | PIMCO RAE US Fund | | | | June 30, 2022 |
(Amounts in thousands*, except number of shares, contracts, units and ounces, if any)
| | | | | | | | | | | | |
| | | | | SHARES | | | | | MARKET
VALUE
(000S) | |
| INVESTMENTS IN SECURITIES 100.2% | |
|
| COMMON STOCKS 98.0% | | | | | | | | | | | | |
|
| UNITED KINGDOM 0.2% | | | | | | | | | | | | |
|
| CONSUMER DISCRETIONARY 0.2% | | | | | | | | | | | | |
| | | | |
Capri Holdings Ltd. (a) | | | | | 37,600 | | | $ | | | 1,542 | |
| | | | | | | | | | | | |
| |
| CONSUMER STAPLES 0.0% | | | | | | | | | | | | |
| | | | |
Coca-Cola Europacific Partners PLC | | | | | 6,493 | | | | | | 335 | |
| | | | | | | | | | | | |
Total United Kingdom | | | | | | | | | | | 1,877 | |
| | | | | | | | | | | | |
| |
| UNITED STATES 97.8% | | | | | | | | | | | | |
| |
| COMMUNICATION SERVICES 1.1% | | | | | | | | | | | | |
| | | | |
Altice USA, Inc. ‘A’ (a) | | | | | 65,765 | | | | | | 608 | |
| | | | |
Liberty Media Corp.-Liberty SiriusXM ‘C’ (a) | | | | | 40,898 | | | | | | 1,475 | |
| | | | |
Loyalty Ventures, Inc. (a) | | | | | 14,643 | | | | | | 52 | |
| | | | |
Lumen Technologies, Inc. | | | | | 194,347 | | | | | | 2,120 | |
| | | | |
News Corp. ‘A’ | | | | | 10,397 | | | | | | 162 | |
| | | | |
Paramount Global | | | | | 10,536 | | | | | | 260 | |
| | | | |
Verizon Communications, Inc. | | | | | 95,557 | | | | | | 4,850 | |
| | | | | | | | | | | | |
| | | | | | | | | | | 9,527 | |
| | | | | | | | | | | | |
| |
| CONSUMER DISCRETIONARY 7.7% | | | | | | | | | | | | |
| | | | |
Adient PLC (a) | | | | | 11,299 | | | | | | 335 | |
| | | | |
AutoNation, Inc. (a) | | | | | 6,351 | | | | | | 710 | |
| | | | |
Bed Bath & Beyond, Inc. (a)(c) | | | | | 253,179 | | | | | | 1,258 | |
| | | | |
Best Buy Co., Inc. | | | | | 27,318 | | | | | | 1,781 | |
| | | | |
Booking Holdings, Inc. (a) | | | | | 1,448 | | | | | | 2,532 | |
| | | | |
Carnival Corp. (a) | | | | | 223,306 | | | | | | 1,932 | |
| | | | |
Dick’s Sporting Goods, Inc. | | | | | 2,985 | | | | | | 225 | |
| | | | |
Dollar General Corp. | | | | | 6,404 | | | | | | 1,572 | |
| | | | |
eBay, Inc. | | | | | 220,725 | | | | | | 9,198 | |
| | | | |
Expedia Group, Inc. (a) | | | | | 1,769 | | | | | | 168 | |
| | | | |
Foot Locker, Inc. | | | | | 15,696 | | | | | | 396 | |
| | | | |
Ford Motor Co. | | | | | 477,207 | | | | | | 5,311 | |
| | | | |
Gap, Inc. | | | | | 25,297 | | | | | | 208 | |
| | | | |
General Motors Co. (a) | | | | | 23,291 | | | | | | 740 | |
| | | | |
Goodyear Tire & Rubber Co. (a) | | | | | 64,308 | | | | | | 689 | |
| | | | |
Hyatt Hotels Corp. ‘A’ (a) | | | | | 806 | | | | | | 60 | |
| | | | |
Kohl’s Corp. | | | | | 362,073 | | | | | | 12,922 | |
| | | | |
Las Vegas Sands Corp. (a) | | | | | 14,257 | | | | | | 479 | |
| | | | |
Lear Corp. | | | | | 3,388 | | | | | | 426 | |
| | | | |
Lowe’s Cos., Inc. | | | | | 4,578 | | | | | | 800 | |
| | | | |
Macy’s, Inc. | | | | | 492,131 | | | | | | 9,016 | |
| | | | |
MGM Resorts International | | | | | 7,318 | | | | | | 212 | |
| | | | |
Nordstrom, Inc. | | | | | 61,238 | | | | | | 1,294 | |
| | | | |
Norwegian Cruise Line Holdings Ltd. (a) | | | | | 8,376 | | | | | | 93 | |
| | | | |
PulteGroup, Inc. | | | | | 6,308 | | | | | | 250 | |
| | | | |
Qurate Retail, Inc. | | | | | 491,094 | | | | | | 1,409 | |
| | | | |
Starbucks Corp. | | | | | 1,701 | | | | | | 130 | |
| | | | |
Tapestry, Inc. | | | | | 19,495 | | | | | | 595 | |
| | | | |
Target Corp. | | | | | 58,904 | | | | | | 8,319 | |
| | | | |
Victoria’s Secret & Co. (a) | | | | | 8,514 | | | | | | 238 | |
| | | | |
Whirlpool Corp. | | | | | 8,259 | | | | | | 1,279 | |
| | | | |
Yum! Brands, Inc. | | | | | 3,305 | | | | | | 375 | |
| | | | | | | | | | | | |
| | | | | | | | | | | 64,952 | |
| | | | | | | | | | | | |
| |
| CONSUMER STAPLES 6.5% | | | | | | | | | | | | |
| | | | |
Albertsons Cos., Inc. ‘A’ | | | | | 3,591 | | | | | | 96 | |
| | | | |
Altria Group, Inc. | | | | | 131,987 | | | | | | 5,513 | |
| | | | |
Bunge Ltd. | | | | | 10,469 | | | | | | 949 | |
| | | | | | | | | | | | |
| | | | | SHARES | | | | | MARKET
VALUE
(000S) | |
| | | | |
Ingredion, Inc. | | | | | 3,500 | | | $ | | | 309 | |
| | | | |
Kroger Co. | | | | | 190,477 | | | | | | 9,015 | |
| | | | |
Philip Morris International, Inc. | | | | | 37,466 | | | | | | 3,699 | |
| | | | |
Sysco Corp. | | | | | 14,389 | | | | | | 1,219 | |
| | | | |
Walgreens Boots Alliance, Inc. | | | | | 588,070 | | | | | | 22,288 | |
| | | | |
Walmart, Inc. | | | | | 96,444 | | | | | | 11,726 | |
| | | | | | | | | | | | |
| | | | | | | | | | | 54,814 | |
| | | | | | | | | | | | |
| |
| ENERGY 15.7% | | | | | | | | | | | | |
| | | | |
APA Corp. | | | | | 24,173 | | | | | | 844 | |
| | | | |
Baker Hughes Co. | | | | | 24,595 | | | | | | 710 | |
| | | | |
ConocoPhillips | | | | | 121,905 | | | | | | 10,948 | |
| | | | |
Exxon Mobil Corp. | | | | | 268,317 | | | | | | 22,979 | |
| | | | |
HF Sinclair Corp. | | | | | 129,810 | | | | | | 5,862 | |
| | | | |
Marathon Oil Corp. | | | | | 203,452 | | | | | | 4,574 | |
| | | | |
Marathon Petroleum Corp. | | | | | 319,403 | | | | | | 26,258 | |
| | | | |
PBF Energy, Inc. ‘A’ (a) | | | | | 77,585 | | | | | | 2,251 | |
| | | | |
Phillips 66 | | | | | 247,941 | | | | | | 20,329 | |
| | | | |
Transocean Ltd. (a) | | | | | 547,234 | | | | | | 1,822 | |
| | | | |
Valero Energy Corp. | | | | | 319,411 | | | | | | 33,947 | |
| | | | |
World Fuel Services Corp. | | | | | 43,113 | | | | | | 882 | |
| | | | | | | | | | | | |
| | | | | | | | | | | 131,406 | |
| | | | | | | | | | | | |
| |
| FINANCIALS 10.7% | | | | | | | | | | | | |
| | | | |
Aflac, Inc. | | | | | 20,689 | | | | | | 1,145 | |
| | | | |
Allstate Corp. | | | | | 23,645 | | | | | | 2,997 | |
| | | | |
Ally Financial, Inc. | | | | | 82,189 | | | | | | 2,754 | |
| | | | |
American International Group, Inc. | | | | | 118,837 | | | | | | 6,076 | |
| | | | |
Ameriprise Financial, Inc. | | | | | 12,245 | | | | | | 2,910 | |
| | | | |
Bank of New York Mellon Corp. | | | | | 29,256 | | | | | | 1,220 | |
| | | | |
Capital One Financial Corp. | | | | | 24,963 | | | | | | 2,601 | |
| | | | |
Citigroup, Inc. | | | | | 86,635 | | | | | | 3,984 | |
| | | | |
Comerica, Inc. | | | | | 14,704 | | | | | | 1,079 | |
| | | | |
Discover Financial Services | | | | | 75,593 | | | | | | 7,150 | |
| | | | |
Franklin Resources, Inc. | | | | | 209,354 | | | | | | 4,880 | |
| | | | |
Genworth Financial, Inc. ‘A’ (a) | | | | | 335,279 | | | | | | 1,184 | |
| | | | |
Invesco Ltd. | | | | | 24,332 | | | | | | 392 | |
| | | | |
Jefferies Financial Group, Inc. | | | | | 5,231 | | | | | | 144 | |
| | | | |
Loews Corp. | | | | | 17,380 | | | | | | 1,030 | |
| | | | |
Navient Corp. | | | | | 250,172 | | | | | | 3,500 | |
| | | | |
Old Republic International Corp. | | | | | 1,113 | | | | | | 25 | |
| | | | |
Synchrony Financial | | | | | 405,297 | | | | | | 11,194 | |
| | | | |
Travelers Cos., Inc. | | | | | 30,632 | | | | | | 5,181 | |
| | | | |
Wells Fargo & Co. | | | | | 769,006 | | | | | | 30,122 | |
| | | | | | | | | | | | |
| | | | | | | | | | | 89,568 | |
| | | | | | | | | | | | |
| |
| HEALTH CARE 22.3% | | | | | | | | | | | | |
| | | | |
AmerisourceBergen Corp. | | | | | 979 | | | | | | 139 | |
| | | | |
Amgen, Inc. | | | | | 99,621 | | | | | | 24,238 | |
| | | | |
Biogen, Inc. (a) | | | | | 60,098 | | | | | | 12,256 | |
| | | | |
Cardinal Health, Inc. | | | | | 281,710 | | | | | | 14,725 | |
| | | | |
DaVita, Inc. (a) | | | | | 31,851 | | | | | | 2,547 | |
| | | | |
Elevance Health, Inc. | | | | | 8,292 | | | | | | 4,002 | |
| | | | |
Gilead Sciences, Inc. | | | | | 392,521 | | | | | | 24,262 | |
| | | | |
Humana, Inc. | | | | | 5,778 | | | | | | 2,704 | |
| | | | |
Johnson & Johnson | | | | | 60,905 | | | | | | 10,811 | |
| | | | |
McKesson Corp. | | | | | 71,869 | | | | | | 23,444 | |
| | | | |
Merck & Co., Inc. | | | | | 224,635 | | | | | | 20,480 | |
| | | | |
Organon & Co. | | | | | 46,210 | | | | | | 1,560 | |
| | | | |
Pfizer, Inc. | | | | | 849,168 | | | | | | 44,522 | |
| | | | |
Universal Health Services, Inc. ‘B’ | | | | | 3,751 | | | | | | 378 | |
| | | | |
Viatris, Inc. | | | | | 24,196 | | | | | | 253 | |
| | | | |
Waters Corp. (a) | | | | | 1,146 | | | | | | 379 | |
| | | | | | | | | | | | |
| | | | | | | | | | | 186,700 | |
| | | | | | | | | | | | |
| | | | | | | | | | | | |
| | | | | SHARES | | | | | MARKET
VALUE
(000S) | |
| INDUSTRIALS 5.2% | | | | | | | | | | | | |
| | | | |
AECOM | | | | | 3,236 | | | $ | | | 211 | |
| | | | |
American Airlines Group, Inc. (a) | | | | | 722,881 | | | | | | 9,166 | |
| | | | |
Carlisle Cos., Inc. | | | | | 1,450 | | | | | | 346 | |
| | | | |
CH Robinson Worldwide, Inc. | | | | | 20,300 | | | | | | 2,058 | |
| | | | |
CSX Corp. | | | | | 4,700 | | | | | | 137 | |
| | | | |
Cummins, Inc. | | | | | 4,057 | | | | | | 785 | |
| | | | |
Delta Air Lines, Inc. (a) | | | | | 19,668 | | | | | | 570 | |
| | | | |
Eaton Corp. PLC | | | | | 10,157 | | | | | | 1,280 | |
| | | | |
Emerson Electric Co. | | | | | 16,439 | | | | | | 1,307 | |
| | | | |
Fluor Corp. (a) | | | | | 254,052 | | | | | | 6,184 | |
| | | | |
General Electric Co. | | | | | 107,962 | | | | | | 6,874 | |
| | | | |
Honeywell International, Inc. | | | | | 2,478 | | | | | | 431 | |
| | | | |
Howmet Aerospace, Inc. | | | | | 9,236 | | | | | | 290 | |
| | | | |
Illinois Tool Works, Inc. | | | | | 8,145 | | | | | | 1,484 | |
| | | | |
JetBlue Airways Corp. (a) | | | | | 20,965 | | | | | | 175 | |
| | | | |
Johnson Controls International PLC | | | | | 2,187 | | | | | | 105 | |
| | | | |
ManpowerGroup, Inc. | | | | | 52,849 | | | | | | 4,038 | |
| | | | |
Robert Half International, Inc. | | | | | 3,160 | | | | | | 237 | |
| | | | |
Southwest Airlines Co. (a) | | | | | 18,592 | | | | | | 671 | |
| | | | |
Spirit AeroSystems Holdings, Inc. ‘A’ | | | | | 47,975 | | | | | | 1,406 | |
| | | | |
Union Pacific Corp. | | | | | 24,187 | | | | | | 5,159 | |
| | | | |
United Airlines Holdings, Inc. (a) | | | | | 18,354 | | | | | | 650 | |
| | | | |
WW Grainger, Inc. | | | | | 620 | | | | | | 282 | |
| | | | | | | | | | | | |
| | | | | | | | | | | 43,846 | |
| | | | | | | | | | | | |
| |
| INFORMATION TECHNOLOGY 20.9% | | | | | | | |
| | | | |
Amdocs Ltd. | | | | | 6,574 | | | | | | 548 | |
| | | | |
Apple, Inc. | | | | | 253,106 | | | | | | 34,605 | |
| | | | |
Applied Materials, Inc. | | | | | 35,441 | | | | | | 3,224 | |
| | | | |
Arrow Electronics, Inc. (a) | | | | | 21,724 | | | | | | 2,435 | |
| | | | |
Avnet, Inc. | | | | | 90,387 | | | | | | 3,876 | |
| | | | |
Bread Financial Holdings, Inc. | | | | | 76,310 | | | | | | 2,828 | |
| | | | |
Cisco Systems, Inc. | | | | | 815,578 | | | | | | 34,776 | |
| | | | |
Citrix Systems, Inc. | | | | | 23,558 | | | | | | 2,289 | |
| | | | |
Cognizant Technology Solutions Corp. ‘A’ | | | | | 24,520 | | | | | | 1,655 | |
| | | | |
DXC Technology Co. (a) | | | | | 44,407 | | | | | | 1,346 | |
| | | | |
Flex Ltd. (a) | | | | | 15,641 | | | | | | 226 | |
| | | | |
Hewlett Packard Enterprise Co. | | | | | 528,940 | | | | | | 7,014 | |
| | | | |
HP, Inc. | | | | | 158,435 | | | | | | 5,193 | |
| | | | |
Intel Corp. | | | | | 440,698 | | | | | | 16,486 | |
| | | | |
Jabil, Inc. | | | | | 70,908 | | | | | | 3,631 | |
| | | | |
Juniper Networks, Inc. | | | | | 173,816 | | | | | | 4,954 | |
| | | | |
KLA Corp. | | | | | 3,039 | | | | | | 970 | |
| | | | |
NetApp, Inc. | | | | | 137,765 | | | | | | 8,988 | |
| | | | |
NortonLifeLock, Inc. | | | | | 250,344 | | | | | | 5,498 | |
| | | | |
Oracle Corp. | | | | | 127,609 | | | | | | 8,916 | |
| | | | |
Qorvo, Inc. (a) | | | | | 3,851 | | | | | | 363 | |
| | | | |
QUALCOMM, Inc. | | | | | 124,338 | | | | | | 15,883 | |
| | | | |
Seagate Technology Holdings PLC | | | | | 39,387 | | | | | | 2,814 | |
| | | | |
Skyworks Solutions, Inc. | | | | | 2,685 | | | | | | 249 | |
| | | | |
Texas Instruments, Inc. | | | | | 4,448 | | | | | | 683 | |
| | | | |
Western Digital Corp. (a) | | | | | 69,208 | | | | | | 3,103 | |
| | | | |
Western Union Co. | | | | | 7,513 | | | | | | 124 | |
| | | | |
Xerox Holdings Corp. | | | | | 144,750 | | | | | | 2,149 | |
| | | | | | | | | | | | |
| | | | | | | | | | | 174,826 | |
| | | | | | | | | | | | |
| |
| MATERIALS 0.6% | | | | | | | | | | | | |
| | | | |
Alcoa Corp. | | | | | 7,096 | | | | | | 324 | |
| | | | |
International Paper Co. | | | | | 31,421 | | | | | | 1,314 | |
| | | | |
LyondellBasell Industries NV ‘A’ | | | | | 17,870 | | | | | | 1,563 | |
| | | | |
Reliance Steel & Aluminum Co. | | | | | 8,515 | | | | | | 1,446 | |
| | | | | | | | | | | | |
| | | | | | | | | | | 4,647 | |
| | | | | | | | | | | | |
| | | | | | | | | | | | |
| See Accompanying Notes | | | ANNUAL REPORT | | | | | | | JUNE 30, 2022 | | | 49 |
| | | | | | |
| Schedule of Investments | | PIMCO RAE US Fund | | (Cont.) | | |
| | | | | | | | | | | | |
| | | | | SHARES | | | | | MARKET
VALUE
(000S) | |
| REAL ESTATE 0.0% | | | | | | | | | | | | |
| | | | |
Jones Lang LaSalle, Inc. (a) | | | | | 1,482 | | | $ | | | 259 | |
| | | | | | | | | | | | |
| |
| UTILITIES 7.1% | | | | | | | | | | | | |
| | | | |
AES Corp. | | | | | 134,835 | | | | | | 2,833 | |
| | | | |
Ameren Corp. | | | | | 12,729 | | | | | | 1,150 | |
| | | | |
Consolidated Edison, Inc. | | | | | 21,101 | | | | | | 2,007 | |
| | | | |
Constellation Energy Corp. | | | | | 37,234 | | | | | | 2,132 | |
| | | | |
Evergy, Inc. | | | | | 133,412 | | | | | | 8,705 | |
| | | | |
Exelon Corp. | | | | | 277,627 | | | | | | 12,582 | |
| | | | |
FirstEnergy Corp. | | | | | 119,251 | | | | | | 4,578 | |
| | | | |
NRG Energy, Inc. | | | | | 46,530 | | | | | | 1,776 | |
| | | | |
Pinnacle West Capital Corp. | | | | | 10,041 | | | | | | 734 | |
| | | | |
PPL Corp. | | | | | 75,734 | | | | | | 2,055 | |
| | | | |
Public Service Enterprise Group, Inc. | | | | | 41,534 | | | | | | 2,628 | |
| | | | |
Southern Co. | | | | | 118,567 | | | | | | 8,455 | |
| | | | |
Vistra Corp. | | | | | 435,672 | | | | | | 9,955 | |
| | | | |
WEC Energy Group, Inc. | | | | | 209 | | | | | | 21 | |
| | | | | | | | | | | | |
| | | | | | | | | | | 59,611 | |
| | | | | | | | | | | | |
Total United States | | | | | | | | | | | 820,156 | |
| | | | | | | | | | | | |
Total Common Stocks (Cost $672,171) | | | | | | 822,033 | |
| | | | | | | | | | | | |
| | | | | | | | | | | | |
| | | | | SHARES | | | | | MARKET
VALUE
(000S) | |
| REAL ESTATE INVESTMENT TRUSTS 1.4% | |
| |
| UNITED STATES 1.4% | | | | | | | | | | | | |
| |
| REAL ESTATE 1.4% | | | | | | | | | | | | |
| | | | |
Host Hotels & Resorts, Inc. | | | | | 414,286 | | | $ | | | 6,496 | |
| | | | |
Iron Mountain, Inc. | | | | | 31,285 | | | | | | 1,523 | |
| | | | |
Park Hotels & Resorts, Inc. | | | | | 44,440 | | | | | | 603 | |
| | | | |
Simon Property Group, Inc. | | | | | 16,693 | | | | | | 1,584 | |
| | | | |
Ventas, Inc. | | | | | 5,709 | | | | | | 294 | |
| | | | |
Weyerhaeuser Co. | | | | | 30,579 | | | | | | 1,013 | |
| | | | | | | | | | | | |
| | | | | | | | | | | 11,513 | |
| | | | | | | | | | | | |
Total Real Estate Investment Trusts
(Cost $12,078) | | | | | | 11,513 | |
| | | | | | | | | | | | |
| |
| SHORT-TERM INSTRUMENTS 0.8% | |
| |
| REPURCHASE AGREEMENTS (e) 0.8% | |
| | | | | | | | | | | 6,464 | |
| | | | | | | | | | | | |
Total Short-Term Instruments
(Cost $6,464) | | | | | | | | | | | 6,464 | |
| | | | | | | | | | | | |
| | | | |
| | | | | | | | | | | | |
Total Investments in Securities
(Cost $690,713) | | | | | | | | | | | 840,010 | |
| | | | | | | | | | | | |
| | | | | | | | | | | | |
| | | | | SHARES | | | | | MARKET
VALUE
(000S) | |
| INVESTMENTS IN AFFILIATES 0.1% | |
| |
| SHORT-TERM INSTRUMENTS 0.1% | | | | |
| |
| MUTUAL FUNDS 0.1% | | | | | | | | | | | | |
|
PIMCO Government Money Market Fund | |
1.450% (b)(c)(d) | | | | | 1,290,810 | | | $ | | | 1,291 | |
| | | | | | | | | | | | |
Total Short-Term Instruments
(Cost $1,291) | | | | | | | | | | | 1,291 | |
| | | | | | | | | | | | |
| | | | |
| | | | | | | | | | | | |
Total Investments in Affiliates
(Cost $1,291) | | | | | | | | | | | 1,291 | |
| | | | |
| | | | | | | | | | | | |
Total Investments 100.3%
(Cost $692,004) | | | | | | | | $ | | | 841,301 | |
| |
| Other Assets and Liabilities, net (0.3)% | | | (2,657 | ) |
| | | | | | | | | | | | |
| Net Assets 100.0% | | | | | | | | $ | | | 838,644 | |
| | | | | | | | | | | | |
NOTES TO SCHEDULE OF INVESTMENTS:
| * | A zero balance may reflect actual amounts rounding to less than one thousand. |
| (a) | Security did not produce income within the last twelve months. |
| (b) | Institutional Class Shares of each Fund. |
| (c) | Securities with an aggregate market value of $1,263 were out on loan in exchange for $1,291 of cash collateral as of June 30, 2022. The collateral was invested in a cash collateral reinvestment vehicle as described in Note 5 in the Notes to Financial Statements. |
| (d) | Coupon represents a 7-Day Yield. |
BORROWINGS AND OTHER FINANCING TRANSACTIONS
(e) REPURCHASE AGREEMENTS:
| | | | | | | | | | | | | | | | | | | | | | | | | | | | | | |
| Counterparty | | Lending
Rate | | | Settlement
Date | | | Maturity
Date | | | Principal
Amount | | | Collateralized By | | Collateral
(Received) | | | Repurchase
Agreements,
at Value | | | Repurchase
Agreement
Proceeds
to be
Received(1) | |
| FICC | | | 0.400 | % | | | 06/30/2022 | | | | 07/01/2022 | | | $ | 6,464 | | | U.S. Treasury Notes 3.000% due 06/30/2024 | | $ | (6,593 | ) | | $ | 6,464 | | | $ | 6,464 | |
| | | | | | | | | | | | | | | | | | | | | | | | | | | | | | |
Total Repurchase Agreements | | | | | $ | (6,593 | ) | | $ | 6,464 | | | $ | 6,464 | |
| | | | | | | | | | | | | | | |
BORROWINGS AND OTHER FINANCING TRANSACTIONS SUMMARY
The following is a summary by counterparty of the market value of Borrowings and Other Financing Transactions and collateral pledged/(received) as of June 30, 2022:
| | | | | | | | | | | | | | | | | | | | | | | | | | | | |
| Counterparty | | Repurchase
Agreement
Proceeds
to be
Received(1) | | | Payable for
Reverse
Repurchase
Agreements | | | Payable for
Sale-Buyback
Transactions | | | Securities Out on Loan | | | Total
Borrowings and
Other Financing
Transactions | | | Collateral
Pledged/(Received) | | | Net Exposure(2) | |
Global/Master Repurchase Agreement | |
FICC | | $ | 6,464 | | | $ | 0 | | | $ | 0 | | | $ | 0 | | | $ | 6,464 | | | $ | (6,593 | ) | | $ | (129 | ) |
|
Master Securities Lending Agreement | |
BPG | | | 0 | | | | 0 | | | | 0 | | | | 189 | | | | 189 | | | | (193 | ) | | | (4 | ) |
BSN | | | 0 | | | | 0 | | | | 0 | | | | 1,074 | | | | 1,074 | | | | (1,098 | ) | | | (24 | ) |
| | | | | | | | | | | | | | | | | | | | | | | | | | | | |
Total Borrowings and Other Financing Transactions | | $ | ��6,464 | | | $ | 0 | | | $ | 0 | | | $ | 1,263 | | | | | | | | | | | | | |
| | | | | | | | | | | | | | | | | | | | | | | | | | | | |
| | | | | | |
| 50 | | PIMCO EQUITY SERIES | | | See Accompanying Notes | |
CERTAIN TRANSFERS ACCOUNTED FOR AS SECURED BORROWINGS
Remaining Contractual Maturity of the Agreements
| | | | | | | | | | | | | | | | | | | | |
| | | Overnight and
Continuous | | | Up to 30 days | | | 31-90 days | | | Greater Than 90 days | | | Total | |
Securities Lending Transactions(3) | |
Common Stocks | | $ | 1,291 | | | $ | 0 | | | $ | 0 | | | $ | 0 | | | $ | 1,291 | |
| | | | | | | | | | | | | | | | | | | | |
Total Borrowings | | $ | 1,291 | | | $ | 0 | | | $ | 0 | | | $ | 0 | | | $ | 1,291 | |
| | | | | | | | | | | | | | | | | | | | |
Payable for securities on loan - cash collateral | | | $ | 1,291 | |
| | | | | |
| (1) | Includes accrued interest. |
| (2) | Net Exposure represents the net receivable/(payable) that would be due from/to the counterparty in the event of default. Exposure from borrowings and other financing transactions can only be netted across transactions governed under the same master agreement with the same legal entity. See Note 8, Master Netting Arrangements, in the Notes to Financial Statements for more information. |
| (3) | Includes cash collateral as described in Note 5 in the Notes to Financial Statements. |
FAIR VALUE MEASUREMENTS
The following is a summary of the fair valuations according to the inputs used as of June 30, 2022 in valuing the Fund’s assets and liabilities:
| | | | | | | | | | | | | | | | |
| Category and Subcategory | | Level 1 | | | Level 2 | | | Level 3 | | | Fair
Value at
06/30/2022 | |
Investments in Securities, at Value | |
Common Stocks | |
United Kingdom | |
Consumer Discretionary | | $ | 1,542 | | | $ | 0 | | | $ | 0 | | | $ | 1,542 | |
Consumer Staples | | | 335 | | | | 0 | | | | 0 | | | | 335 | |
United States | |
Communication Services | | | 9,527 | | | | 0 | | | | 0 | | | | 9,527 | |
Consumer Discretionary | | | 64,952 | | | | 0 | | | | 0 | | | | 64,952 | |
Consumer Staples | | | 54,814 | | | | 0 | | | | 0 | | | | 54,814 | |
Energy | | | 131,406 | | | | 0 | | | | 0 | | | | 131,406 | |
Financials | | | 89,568 | | | | 0 | | | | 0 | | | | 89,568 | |
Health Care | | | 186,700 | | | | 0 | | | | 0 | | | | 186,700 | |
Industrials | | | 43,846 | | | | 0 | | | | 0 | | | | 43,846 | |
Information Technology | | | 174,826 | | | | 0 | | | | 0 | | | | 174,826 | |
Materials | | | 4,647 | | | | 0 | | | | 0 | | | | 4,647 | |
| | | | | | | | | | | | | | | | |
| Category and Subcategory | | Level 1 | | | Level 2 | | | Level 3 | | | Fair
Value at
06/30/2022 | |
Real Estate | | $ | 259 | | | $ | 0 | | | $ | 0 | | | $ | 259 | |
Utilities | | | 59,611 | | | | 0 | | | | 0 | | | | 59,611 | |
Real Estate Investment Trusts | |
United States | |
Real Estate | | | 11,513 | | | | 0 | | | | 0 | | | | 11,513 | |
Short-Term Instruments | |
Repurchase Agreements | | | 0 | | | | 6,464 | | | | 0 | | | | 6,464 | |
| | | | | | | | | | | | | | | | |
| | $ | 833,546 | | | $ | 6,464 | | | $ | 0 | | | $ | 840,010 | |
| | | | | | | | | | | | | | | | |
|
Investments in Affiliates, at Value | |
Short-Term Instruments | |
Mutual Funds | | | 1,291 | | | | 0 | | | | 0 | | | | 1,291 | |
| | | | | | | | | | | | | | | | |
| | | | |
Total Investments | | $ | 834,837 | | | $ | 6,464 | | | $ | 0 | | | $ | 841,301 | |
| | | | | | | | | | | | | | | | |
There were no significant transfers into or out of Level 3 during the period ended June 30, 2022.
| | | | | | | | | | | | |
| See Accompanying Notes | | | ANNUAL REPORT | | | | | | | JUNE 30, 2022 | | | 51 |
| | | | | | |
| Schedule of Investments | | PIMCO RAE US Small Fund | | | | |
(Amounts in thousands*, except number of shares, contracts, units and ounces, if any)
| | | | | | | | | | | | |
| | | | | SHARES | | | | | MARKET
VALUE
(000S) | |
| INVESTMENTS IN SECURITIES 100.1% | | | | |
|
| COMMON STOCKS 83.8% | | | | | | | | | | | | |
|
| UNITED KINGDOM 0.4% | | | | | | | | | | | | |
|
| FINANCIALS 0.4% | | | | | | | | | | | | |
| | | | |
Janus Henderson Group PLC | | | | | 65,536 | | | $ | | | 1,541 | |
| | | | | | | | | | | | |
Total United Kingdom | | | | | | | | | | | 1,541 | |
| | | | | | | | | | | | |
|
| UNITED STATES 83.4% | | | | | | | | | | | | |
|
| COMMUNICATION SERVICES 1.0% | | | | | | | | | | | | |
| | | | |
AMC Entertainment Holdings, Inc. ‘A’ (a)(c) | | | | | 3,224 | | | | | | 44 | |
| | | | |
AMC Networks, Inc. ‘A’ (a) | | | | | 49,196 | | | | | | 1,433 | |
| | | | |
Cinemark Holdings, Inc. (a) | | | | | 5,948 | | | | | | 89 | |
| | | | |
iHeartMedia, Inc. ‘A’ (a) | | | | | 25,844 | | | | | | 204 | |
| | | | |
John Wiley & Sons, Inc. ‘A’ | | | | | 15,650 | | | | | | 747 | |
| | | | |
NII Holdings, Inc.(a) | | | | | 22,836 | | | | | | 55 | |
| | | | |
Scholastic Corp. | | | | | 20,514 | | | | | | 738 | |
| | | | |
TripAdvisor, Inc. (a) | | | | | 10,127 | | | | | | 180 | |
| | | | |
Yelp, Inc. (a) | | | | | 17,677 | | | | | | 491 | |
| | | | | | | | | | | | |
| | | | | | | | | | | 3,981 | |
| | | | | | | | | | | | |
|
| CONSUMER DISCRETIONARY 14.1% | | | | |
| | | | |
Aaron’s Co., Inc. | | | | | 2,314 | | | | | | 34 | |
| | | | |
Abercrombie & Fitch Co. ‘A’ (a) | | | | | 295,371 | | | | | | 4,998 | |
| | | | |
Academy Sports & Outdoors, Inc. | | | | | 13,454 | | | | | | 478 | |
| | | | |
Adtalem Global Education, Inc. (a) | | | | | 69,180 | | | | | | 2,488 | |
| | | | |
American Axle & Manufacturing Holdings, Inc. (a) | | | | | 15,192 | | | | | | 114 | |
| | | | |
American Eagle Outfitters, Inc. | | | | | 13,861 | | | | | | 155 | |
| | | | |
Asbury Automotive Group, Inc. (a) | | | | | 5,354 | | | | | | 907 | |
| | | | |
Brinker International, Inc. (a) | | | | | 38,368 | | | | | | 845 | |
| | | | |
Buckle, Inc. | | | | | 18,887 | | | | | | 523 | |
| | | | |
Children’s Place, Inc. (a) | | | | | 17,153 | | | | | | 668 | |
| | | | |
Cracker Barrel Old Country Store, Inc. | | | | | 2,885 | | | | | | 241 | |
| | | | |
Dave & Buster’s Entertainment, Inc. (a) | | | | | 2,507 | | | | | | 82 | |
| | | | |
Designer Brands, Inc.’A’ | | | | | 100,060 | | | | | | 1,307 | |
| | | | |
Dillard’s, Inc. ‘A’ (c) | | | | | 66,281 | | | | | | 14,620 | |
| | | | |
Fossil Group, Inc. (a) | | | | | 6,743 | | | | | | 35 | |
| | | | |
G-III Apparel Group Ltd. (a) | | | | | 60,548 | | | | | | 1,225 | |
| | | | |
GameStop Corp. ‘A’ (a)(c) | | | | | 3,107 | | | | | | 380 | |
| | | | |
Genesco, Inc. (a) | | | | | 5,835 | | | | | | 291 | |
| | | | |
Group 1 Automotive, Inc. | | | | | 1,151 | | | | | | 195 | |
| | | | |
Groupon, Inc. (a)(c) | | | | | 51,024 | | | | | | 577 | |
| | | | |
Guess?, Inc. (c) | | | | | 38,409 | | | | | | 655 | |
| | | | |
H&R Block, Inc. | | | | | 24,644 | | | | | | 870 | |
| | | | |
Hilton Grand Vacations, Inc. (a) | | | | | 16,758 | | | | | | 599 | |
| | | | |
International Game Technology PLC | | | | | 22,559 | | | | | | 419 | |
| | | | |
Jack in the Box, Inc. | | | | | 37,563 | | | | | | 2,106 | |
| | | | |
Kontoor Brands, Inc. | | | | | 1,794 | | | | | | 60 | |
| | | | |
La-Z-Boy, Inc. | | | | | 8,495 | | | | | | 201 | |
| | | | |
Laureate Education, Inc. ‘A’ | | | | | 86,908 | | | | | | 1,006 | |
| | | | |
MDC Holdings, Inc. | | | | | 7,933 | | | | | | 256 | |
| | | | |
Meritage Homes Corp. (a) | | | | | 8,228 | | | | | | 597 | |
| | | | |
Murphy USA, Inc. | | | | | 39,941 | | | | | | 9,301 | |
| | | | |
ODP Corp. (a) | | | | | 37,859 | | | | | | 1,145 | |
| | | | |
Red Rock Resorts, Inc. ‘A’ | | | | | 2,174 | | | | | | 72 | |
| | | | |
Signet Jewelers Ltd. | | | | | 30,176 | | | | | | 1,613 | |
| | | | |
Sleep Number Corp. (a) | | | | | 11,510 | | | | | | 356 | |
| | | | |
Sonic Automotive, Inc. ‘A’ | | | | | 12,704 | | | | | | 465 | |
| | | | |
Steven Madden Ltd. | | | | | 12,455 | | | | | | 401 | |
| | | | |
Travel & Leisure Co. | | | | | 19,384 | | | | | | 752 | |
| | | | | | | | | | | | |
| | | | | SHARES | | | | | MARKET
VALUE
(000S) | |
| | | | |
Tri Pointe Homes, Inc. (a) | | | | | 32,033 | | | $ | | | 540 | |
| | | | |
Tupperware Brands Corp. (a) | | | | | 66,548 | | | | | | 422 | |
| | | | |
Visteon Corp. (a) | | | | | 36,065 | | | | | | 3,736 | |
| | | | |
Wolverine World Wide, Inc. | | | | | 15,074 | | | | | | 304 | |
| | | | | | | | | | | | |
| | | | | | | | | | | 56,039 | |
| | | | | | | | | | | | |
|
| CONSUMER STAPLES 6.4% | | | | | | | | | | | | |
| | | | |
B&G Foods, Inc. (c) | | | | | 108,284 | | | | | | 2,575 | |
| | | | |
Edgewell Personal Care Co. | | | | | 7,467 | | | | | | 258 | |
| | | | |
Fresh Del Monte Produce, Inc. | | | | | 38,836 | | | | | | 1,147 | |
| | | | |
Ingles Markets, Inc. ‘A’ | | | | | 33,122 | | | | | | 2,873 | |
| | | | |
J & J Snack Foods Corp. | | | | | 1,193 | | | | | | 167 | |
| | | | |
National Beverage Corp. | | | | | 4,666 | | | | | | 228 | |
| | | | |
Nu Skin Enterprises, Inc. ‘A’ | | | | | 41,785 | | | | | | 1,809 | |
| | | | |
PriceSmart, Inc. | | | | | 2,656 | | | | | | 190 | |
| | | | |
Rite Aid Corp. (a)(c) | | | | | 650,089 | | | | | | 4,382 | |
| | | | |
Sanderson Farms, Inc. | | | | | 4,928 | | | | | | 1,062 | |
| | | | |
SpartanNash Co. | | | | | 33,538 | | | | | | 1,012 | |
| | | | |
Sprouts Farmers Market, Inc. (a) | | | | | 72,991 | | | | | | 1,848 | |
| | | | |
TreeHouse Foods, Inc. (a) | | | | | 10,387 | | | | | | 434 | |
| | | | |
United Natural Foods, Inc. (a) | | | | | 27,970 | | | | | | 1,102 | |
| | | | |
Universal Corp. | | | | | 36,374 | | | | | | 2,201 | |
| | | | |
USANA Health Sciences, Inc. (a) | | | | | 10,924 | | | | | | 791 | |
| | | | |
Vector Group Ltd. | | | | | 64,798 | | | | | | 680 | |
| | | | |
Weis Markets, Inc. | | | | | 34,607 | | | | | | 2,580 | |
| | | | | | | | | | | | |
| | | | | | | | | | | 25,339 | |
| | | | | | | | | | | | |
| |
| ENERGY 17.8% | | | | | | | | | | | | |
| | | | |
Arch Resources, Inc. (c) | | | | | 6,723 | | | | | | 962 | |
| | | | |
Callon Petroleum Co. (a) | | | | | 1,008 | | | | | | 40 | |
| | | | |
Centennial Resource Development, Inc. (a) | | | | | 1,629,083 | | | | | | 9,742 | |
| | | | |
CNX Resources Corp. (a) | | | | | 91,835 | | | | | | 1,512 | |
| | | | |
CVR Energy, Inc. | | | | | 169,108 | | | | | | 5,665 | |
| | | | |
Delek U.S. Holdings, Inc. | | | | | 151,431 | | | | | | 3,913 | |
| | | | |
Dril-Quip, Inc. (a) | | | | | 4,656 | | | | | | 120 | |
| | | | |
Helmerich & Payne, Inc. | | | | | 299,982 | | | | | | 12,917 | |
| | | | |
Kosmos Energy Ltd. (a) | | | | | 476,044 | | | | | | 2,947 | |
| | | | |
Magnolia Oil & Gas Corp. | | | | | 27,077 | | | | | | 568 | |
| | | | |
Murphy Oil Corp. | | | | | 183,189 | | | | | | 5,531 | |
| | | | |
Nabors Industries Ltd. (a) | | | | | 3,545 | | | | | | 475 | |
| | | | |
Oasis Petroleum, Inc. | | | | | 26,817 | | | | | | 3,262 | |
| | | | |
Oceaneering International, Inc. (a) | | | | | 490,454 | | | | | | 5,238 | |
| | | | |
Patterson-UTI Energy, Inc. | | | | | 648,063 | | | | | | 10,213 | |
| | | | |
PDC Energy, Inc. | | | | | 6,071 | | | | | | 374 | |
| | | | |
Peabody Energy Corp. (a) | | | | | 29,187 | | | | | | 623 | |
| | | | |
RPC, Inc. (a) | | | | | 16,701 | | | | | | 115 | |
| | | | |
SM Energy Co. | | | | | 187,898 | | | | | | 6,424 | |
| | | | | | | | | | | | |
| | | | | | | | | | | 70,641 | |
| | | | | | | | | | | | |
| |
| FINANCIALS 6.0% | | | | | | | | | | | | |
| | | | |
Affiliated Managers Group, Inc. | | | | | 30,890 | | | | | | 3,602 | |
| | | | |
American Equity Investment Life Holding Co. | | | | | 31,824 | | | | | | 1,164 | |
| | | | |
Associated Banc-Corp. | | | | | 28,756 | | | | | | 525 | |
| | | | |
Bank of Hawaii Corp. | | | | | 7,763 | | | | | | 578 | |
| | | | |
Bank OZK | | | | | 5,115 | | | | | | 192 | |
| | | | |
BankUnited, Inc. | | | | | 15,068 | | | | | | 536 | |
| | | | |
Banner Corp. | | | | | 1,473 | | | | | | 83 | |
| | | | |
BGC Partners, Inc. ‘A’ | | | | | 62,406 | | | | | | 210 | |
| | | | |
Brightsphere Investment Group, Inc. | | | | | 50,560 | | | | | | 911 | |
| | | | |
Capitol Federal Financial, Inc. | | | | | 37,301 | | | | | | 342 | |
| | | | | | | | | | | | |
| | | | | SHARES | | | | | MARKET
VALUE
(000S) | |
| | | | |
Cathay General Bancorp | | | | | 12,334 | | | $ | | | 483 | |
| | | | |
Cohen & Steers, Inc. | | | | | 3,575 | | | | | | 227 | |
| | | | |
Columbia Banking System, Inc. | | | | | 3,190 | | | | | | 91 | |
| | | | |
Evercore, Inc. ‘A’ | | | | | 2,782 | | | | | | 260 | |
| | | | |
Federated Hermes, Inc. ‘B’ | | | | | 17,725 | | | | | | 564 | |
| | | | |
First Hawaiian, Inc. | | | | | 26,530 | | | | | | 603 | |
| | | | |
FirstCash Holdings, Inc. | | | | | 1,857 | | | | | | 129 | |
| | | | |
FNB Corp. | | | | | 22,845 | | | | | | 248 | |
| | | | |
Fulton Financial Corp. | | | | | 45,484 | | | | | | 657 | |
| | | | |
Hilltop Holdings, Inc. | | | | | 13,305 | | | | | | 355 | |
| | | | |
Home BancShares, Inc. | | | | | 6,409 | | | | | | 133 | |
| | | | |
Hope Bancorp, Inc. | | | | | 27,011 | | | | | | 374 | |
| | | | |
International Bancshares Corp. | | | | | 7,606 | | | | | | 305 | |
| | | | |
Mercury General Corp. | | | | | 4,848 | | | | | | 215 | |
| | | | |
Nelnet, Inc. ‘A’ | | | | | 5,945 | | | | | | 507 | |
| | | | |
Old National Bancorp | | | | | 9,266 | | | | | | 137 | |
| | | | |
PacWest Bancorp | | | | | 44,464 | | | | | | 1,185 | |
| | | | |
ProAssurance Corp. | | | | | 90,012 | | | | | | 2,127 | |
| | | | |
PROG Holdings, Inc. (a) | | | | | 27,836 | | | | | | 459 | |
| | | | |
Radian Group, Inc. | | | | | 21,640 | | | | | | 425 | |
| | | | |
Stewart Information Services Corp. | | | | | 20,029 | | | | | | 996 | |
| | | | |
Trustmark Corp. | | | | | 15,575 | | | | | | 455 | |
| | | | |
Umpqua Holdings Corp. | | | | | 55,582 | | | | | | 932 | |
| | | | |
Walker & Dunlop, Inc. | | | | | 661 | | | | | | 64 | |
| | | | |
Washington Federal, Inc. | | | | | 63,881 | | | | | | 1,918 | |
| | | | |
White Mountains Insurance Group Ltd. | | | | | 1,505 | | | | | | 1,875 | |
| | | | | | | | | | | | |
| | | | | | | | | | | 23,867 | |
| | | | | | | | | | | | |
| |
| HEALTH CARE 8.7% | | | | | | | | | | | | |
| | | | |
Acadia Healthcare Co., Inc. (a) | | | | | 17,306 | | | | | | 1,170 | |
| | | | |
Allscripts Healthcare Solutions, Inc. (a) | | | | | 61,640 | | | | | | 914 | |
| | | | |
Brookdale Senior Living, Inc. (a) | | | | | 70,386 | | | | | | 319 | |
| | | | |
Haemonetics Corp. (a) | | | | | 1,398 | | | | | | 91 | |
| | | | |
Ionis Pharmaceuticals, Inc. (a) | | | | | 10,567 | | | | | | 391 | |
| | | | |
MEDNAX, Inc. (a) | | | | | 284,357 | | | | | | 5,974 | |
| | | | |
Myriad Genetics, Inc. (a) | | | | | 202,254 | | | | | | 3,675 | |
| | | | |
OPKO Health, Inc. (a) | | | | | 22,772 | | | | | | 58 | |
| | | | |
Owens & Minor, Inc. | | | | | 100,404 | | | | | | 3,158 | |
| | | | |
Patterson Cos., Inc. | | | | | 263,223 | | | | | | 7,976 | |
| | | | |
Syneos Health, Inc. (a) | | | | | 5,425 | | | | | | 389 | |
| | | | |
United Therapeutics Corp. (a) | | | | | 44,189 | | | | | | 10,413 | |
| | | | | | | | | | | | |
| | | | | | | | | | | 34,528 | |
| | | | | | | | | | | | |
| |
| INDUSTRIALS 7.8% | | | | | | | | | | | | |
| | | | |
ABM Industries, Inc. | | | | | 6,354 | | | | | | 276 | |
| | | | |
ACCO Brands Corp. | | | | | 35,798 | | | | | | 234 | |
| | | | |
Acuity Brands, Inc. | | | | | 10,380 | | | | | | 1,599 | |
| | | | |
Allegiant Travel Co. (a) | | | | | 2,558 | | | | | | 289 | |
| | | | |
Allison Transmission Holdings, Inc. | | | | | 46,472 | | | | | | 1,787 | |
| | | | |
Apogee Enterprises, Inc. | | | | | 18,133 | | | | | | 711 | |
| | | | |
Applied Industrial Technologies, Inc. | | | | | 4,054 | | | | | | 390 | |
| | | | |
Arcosa, Inc. | | | | | 9,239 | | | | | | 429 | |
| | | | |
Barnes Group, Inc. | | | | | 6,638 | | | | | | 207 | |
| | | | |
Boise Cascade Co. | | | | | 3,133 | | | | | | 186 | |
| | | | |
Brady Corp. ‘A’ | | | | | 4,910 | | | | | | 232 | |
| | | | |
CoreCivic, Inc. (a) | | | | | 271,088 | | | | | | 3,012 | |
| | | | |
Deluxe Corp. | | | | | 47,913 | | | | | | 1,038 | |
| | | | |
Dycom Industries, Inc. (a) | | | | | 10,263 | | | | | | 955 | |
| | | | |
EMCOR Group, Inc. | | | | | 3,818 | | | | | | 393 | |
| | | | |
Encore Wire Corp. | | | | | 1,849 | | | | | | 192 | |
| | | | |
EnerSys | | | | | 4,683 | | | | | | 276 | |
| | | | |
Forward Air Corp. | | | | | 890 | | | | | | 82 | |
| | | | | | |
| 52 | | PIMCO EQUITY SERIES | | | See Accompanying Notes | |
| | | | | | | | | | | | |
| | | | | SHARES | | | | | MARKET
VALUE
(000S) | |
| | | | |
Franklin Electric Co., Inc. | | | | | 1,953 | | | $ | | | 143 | |
| | | | |
FTI Consulting, Inc. (a) | | | | | 5,664 | | | | | | 1,024 | |
| | | | |
GATX Corp. | | | | | 8,114 | | | | | | 764 | |
| | | | |
Hawaiian Holdings, Inc. (a) | | | | | 16,785 | | | | | | 240 | |
| | | | |
Healthcare Services Group, Inc. | | | | | 42,129 | | | | | | 733 | |
| | | | |
Herc Holdings, Inc. | | | | | 5,703 | | | | | | 514 | |
| | | | |
HNI Corp. | | | | | 12,279 | | | | | | 426 | |
| | | | |
Hub Group, Inc. ‘A’ (a) | | | | | 3,094 | | | | | | 220 | |
| | | | |
Hyster-Yale Materials Handling, Inc. | | | | | 2,330 | | | | | | 75 | |
| | | | |
Kaman Corp. | | | | | 1,999 | | | | | | 62 | |
| | | | |
KBR, Inc. | | | | | 12,256 | | | | | | 593 | |
| | | | |
Kelly Services, Inc. ‘A’ | | | | | 23,331 | | | | | | 463 | |
| | | | |
Kennametal, Inc. | | | | | 6,928 | | | | | | 161 | |
| | | | |
Korn Ferry | | | | | 2,343 | | | | | | 136 | |
| | | | |
Landstar System, Inc. | | | | | 4,523 | | | | | | 658 | |
| | | | |
Matthews International Corp. ‘A’ | | | | | 4,597 | | | | | | 132 | |
| | | | |
Moog, Inc. ‘A’ | | | | | 7,788 | | | | | | 618 | |
| | | | |
Mueller Industries, Inc. | | | | | 14,743 | | | | | | 786 | |
| | | | |
NOW, Inc. (a) | | | | | 136,304 | | | | | | 1,333 | |
| | | | |
Pitney Bowes, Inc. | | | | | 171,977 | | | | | | 623 | |
| | | | |
Primoris Services Corp. | | | | | 3,550 | | | | | | 77 | |
| | | | |
Regal Rexnord Corp. | | | | | 2,986 | | | | | | 339 | |
| | | | |
Resideo Technologies, Inc. (a) | | | | | 13,924 | | | | | | 270 | |
| | | | |
Rush Enterprises, Inc. ‘A’ | | | | | 10,614 | | | | | | 512 | |
| | | | |
Schneider National, Inc. ‘B’ | | | | | 29,657 | | | | | | 664 | |
| | | | |
SkyWest, Inc. (a) | | | | | 6,240 | | | | | | 133 | |
| | | | |
Steelcase, Inc. ‘A’ | | | | | 35,151 | | | | | | 377 | |
| | | | |
Terex Corp. | | | | | 12,672 | | | | | | 347 | |
| | | | |
Tetra Tech, Inc. | | | | | 3,243 | | | | | | 443 | |
| | | | |
Timken Co. | | | | | 6,698 | | | | | | 355 | |
| | | | |
Trinity Industries, Inc. | | | | | 15,371 | | | | | | 372 | |
| | | | |
TrueBlue, Inc. (a) | | | | | 23,865 | | | | | | 427 | |
| | | | |
Tutor Perini Corp. (a) | | | | | 22,677 | | | | | | 199 | |
| | | | |
UFP Industries, Inc. | | | | | 1,907 | | | | | | 130 | |
| | | | |
Valmont Industries, Inc. | | | | | 6,229 | | | | | | 1,399 | |
| | | | |
Veritiv Corp. (a) | | | | | 8,012 | | | | | | 870 | |
| | | | |
Wabash National Corp. | | | | | 97,667 | | | | | | 1,326 | |
| | | | |
Watts Water Technologies, Inc. ‘A’ | | | | | 2,269 | | | | | | 279 | |
| | | | |
Werner Enterprises, Inc. | | | | | 8,754 | | | | | | 337 | |
| | | | | | | | | | | | |
| | | | | | | | | | | 30,848 | |
| | | | | | | | | | | | |
| |
| INFORMATION TECHNOLOGY 9.7% | | | | | | | | | | | | |
| | | | |
Amkor Technology, Inc. | | | | | 48,408 | | | | | | 820 | |
| | | | |
Belden, Inc. | | | | | 9,981 | | | | | | 532 | |
| | | | |
Benchmark Electronics, Inc. | | | | | 81,269 | | | | | | 1,833 | |
| | | | |
Cirrus Logic, Inc. (a) | | | | | 31,625 | | | | | | 2,294 | |
| | | | |
Coherent, Inc. (a) | | | | | 2,057 | | | | | | 548 | |
| | | | |
Conduent, Inc. (a) | | | | | 602,963 | | | | | | 2,605 | |
| | | | |
CSG Systems International, Inc. | | | | | 12,946 | | | | | | 773 | |
| | | | |
Diodes, Inc. (a) | | | | | 5,882 | | | | | | 380 | |
| | | | |
InterDigital, Inc. | | | | | 9,927 | | | | | | 603 | |
| | | | |
Knowles Corp. (a) | | | | | 25,386 | | | | | | 440 | |
| | | | |
LiveRamp Holdings, Inc. (a) | | | | | 5,723 | | | | | | 148 | |
| | | | |
Manhattan Associates, Inc. (a) | | | | | 7,529 | | | | | | 863 | |
| | | | |
NetScout Systems, Inc. (a) | | | | | 113,725 | | | | | | 3,849 | |
| | | | |
PC Connection, Inc. | | | | | 7,356 | | | | | | 324 | |
| | | | |
Plantronics, Inc. (a) | | | | | 42,146 | | | | | | 1,672 | |
| | | | |
Plexus Corp. (a) | | | | | 5,262 | | | | | | 413 | |
| | | | |
Sabre Corp. (a) | | | | | 268,173 | | | | | | 1,563 | |
| | | | |
Sanmina Corp. (a) | | | | | 167,152 | | | | | | 6,808 | |
| | | | |
Silicon Laboratories, Inc. (a) | | | | | 910 | | | | | | 128 | |
| | | | |
Synaptics, Inc. (a) | | | | | 25,792 | | | | | | 3,045 | |
| | | | |
Teradata Corp. (a) | | | | | 184,021 | | | | | | 6,811 | |
| | | | |
TTM Technologies, Inc. (a) | | | | | 40,145 | | | | | | 502 | |
| | | | | | | | | | | | |
| | | | | SHARES | | | | | MARKET
VALUE
(000S) | |
| | | | |
Vishay Intertechnology, Inc. | | | | | 65,345 | | | $ | | | 1,164 | |
| | | | |
Xperi Holding Corp. | | | | | 14,818 | | | | | | 214 | |
| | | | | | | | | | | | |
| | | | | | | | | | | 38,332 | |
| | | | | | | | | | | | |
| |
| MATERIALS 4.8% | |
| | | | |
Cabot Corp. | | | | | 11,462 | | | | | | 731 | |
| | | | |
Carpenter Technology Corp. | | | | | 7,497 | | | | | | 209 | |
| | | | |
Element Solutions, Inc. | | | | | 75,396 | | | | | | 1,342 | |
| | | | |
Graphic Packaging Holding Co. | | | | | 43,919 | | | | | | 900 | |
| | | | |
HB Fuller Co. | | | | | 2,784 | | | | | | 168 | |
| | | | |
Innospec, Inc. | | | | | 2,963 | | | | | | 284 | |
| | | | |
Kaiser Aluminum Corp. | | | | | 3,859 | | | | | | 305 | |
| | | | |
Louisiana-Pacific Corp. | | | | | 4,700 | | | | | | 246 | |
| | | | |
Minerals Technologies, Inc. | | | | | 2,305 | | | | | | 142 | |
| | | | |
NewMarket Corp. | | | | | 1,511 | | | | | | 455 | |
| | | | |
O-I Glass, Inc. (a) | | | | | 22,789 | | | | | | 319 | |
| | | | |
Olin Corp. | | | | | 4,364 | | | | | | 202 | |
| | | | |
Schnitzer Steel Industries, Inc. ‘A’ | | | | | 5,838 | | | | | | 192 | |
| | | | |
Schweitzer-Mauduit International, Inc. | | | | | 8,407 | | | | | | 211 | |
| | | | |
Sensient Technologies Corp. | | | | | 9,756 | | | | | | 786 | |
| | | | |
Stepan Co. | | | | | 2,273 | | | | | | 230 | |
| | | | |
Trinseo PLC | | | | | 25,237 | | | | | | 971 | |
| | | | |
Warrior Met Coal, Inc. | | | | | 369,260 | | | | | | 11,303 | |
| | | | | | | | | | | | |
| | | | | | | | | | | 18,996 | |
| | | | | | | | | | | | |
| |
| REAL ESTATE 2.5% | |
| | | | |
Anywhere Real Estate, Inc. (a) | | | | | 954,028 | | | | | | 9,378 | |
| | | | |
Douglas Elliman, Inc. | | | | | 19,589 | | | | | | 94 | |
| | | | |
Kennedy-Wilson Holdings, Inc. | | | | | 13,777 | | | | | | 261 | |
| | | | |
New York REIT, Inc. «(a) | | | | | 4,082 | | | | | | 32 | |
| | | | | | | | | | | | |
| | | | | | | | | | | 9,765 | |
| | | | | | | | | | | | |
| |
| UTILITIES 4.6% | |
| | | | |
ALLETE, Inc. | | | | | 10,748 | | | | | | 632 | |
| | | | |
Avista Corp. | | | | | 26,437 | | | | | | 1,150 | |
| | | | |
Hawaiian Electric Industries, Inc. | | | | | 40,799 | | | | | | 1,669 | |
| | | | |
IDACORP, Inc. | | | | | 19,383 | | | | | | 2,053 | |
| | | | |
Macquarie Infrastructure Holdings LLC | | | | | 27,271 | | | | | | 107 | |
| | | | |
NorthWestern Corp. | | | | | 15,061 | | | | | | 887 | |
| | | | |
OGE Energy Corp. | | | | | 166,825 | | | | | | 6,433 | |
| | | | |
ONE Gas, Inc. | | | | | 7,678 | | | | | | 623 | |
| | | | |
PNM Resources, Inc. | | | | | 15,477 | | | | | | 739 | |
| | | | |
Portland General Electric Co. | | | | | 49,319 | | | | | | 2,384 | |
| | | | |
Southwest Gas Holdings, Inc. | | | | | 13,459 | | | | | | 1,172 | |
| | | | |
Spire, Inc. | | | | | 5,327 | | | | | | 396 | |
| | | | | | | | | | | | |
| | | | | | | | | | | 18,245 | |
| | | | | | | | | | | | |
Total United States | | | | | | | | | | | 330,581 | |
| | | | | | | | | | | | |
Total Common Stocks (Cost $285,728) | | | 332,122 | |
| | | | | | | | | | | | |
| |
| REAL ESTATE INVESTMENT TRUSTS 15.5% | |
| |
| UNITED STATES 15.5% | | | | | | | | | | | | |
| |
| FINANCIALS 2.8% | | | | | | | | | | | | |
| | | | |
Chimera Investment Corp. | | | | | 979,096 | | | | | | 8,635 | |
| | | | |
Invesco Mortgage Capital, Inc. | | | | | 3,812 | | | | | | 56 | |
| | | | |
Ladder Capital Corp. REIT | | | | | 16,020 | | | | | | 169 | |
| | | | |
MFA Financial, Inc. | | | | | 204,077 | | | | | | 2,194 | |
| | | | |
Two Harbors Investment Corp. | | | | | 28,092 | | | | | | 140 | |
| | | | | | | | | | | | |
| | | | | | | | | | | 11,194 | |
| | | | | | | | | | | | |
| |
| INDUSTRIALS 1.2% | | | | | | | | | | | | |
| | | | |
GEO Group, Inc. | | | | | 698,986 | | | | | | 4,613 | |
| | | | | | | | | | | | |
| | | | | | | | | | | | |
| | | | | SHARES | | | | | MARKET
VALUE
(000S) | |
| REAL ESTATE 11.5% | | | | | | | | | | | | |
| | | | |
Acadia Realty Trust | | | | | 2,822 | | | $ | | | 44 | |
| | | | |
Alexander & Baldwin, Inc. | | | | | 37,987 | | | | | | 682 | |
| | | | |
Apple Hospitality REIT, Inc. | | | | | 286,031 | | | | | | 4,196 | |
| | | | |
Brandywine Realty Trust | | | | | 44,881 | | | | | | 433 | |
| | | | |
Corporate Office Properties Trust | | | | | 15,108 | | | | | | 396 | |
| | | | |
DiamondRock Hospitality Co. | | | | | 163,360 | | | | | | 1,341 | |
| | | | |
DigitalBridge Group, Inc. | | | | | 540,395 | | | | | | 2,637 | |
| | | | |
Diversified Healthcare Trust | | | | | 564,122 | | | | | | 1,027 | |
| | | | |
Empire State Realty Trust, Inc. ‘A’ | | | | | 65,152 | | | | | | 458 | |
| | | | |
Equity Commonwealth | | | | | 16,305 | | | | | | 449 | |
| | | | |
InvenTrust Properties Corp. | | | | | 37,065 | | | | | | 956 | |
| | | | |
Kite Realty Group Trust | | | | | 57,040 | | | | | | 986 | |
| | | | |
Macerich Co. | | | | | 414,016 | | | | | | 3,606 | |
| | | | |
Office Properties Income Trust | | | | | 55,634 | | | | | | 1,110 | |
| | | | |
Outfront Media, Inc. | | | | | 19,161 | | | | | | 325 | |
| | | | |
Paramount Group, Inc. | | | | | 68,648 | | | | | | 496 | |
| | | | |
Pebblebrook Hotel Trust | | | | | 84,847 | | | | | | 1,406 | |
| | | | |
Piedmont Office Realty Trust, Inc. ‘A’ | | | | | 54,464 | | | | | | 715 | |
| | | | |
PS Business Parks, Inc. | | | | | 2,032 | | | | | | 380 | |
| | | | |
Rayonier, Inc. | | | | | 15,631 | | | | | | 584 | |
| | | | |
Retail Opportunity Investments Corp. | | | | | 16,544 | | | | | | 261 | |
| | | | |
RLJ Lodging Trust | | | | | 500,359 | | | | | | 5,519 | |
| | | | |
Ryman Hospitality Properties, Inc. | | | | | 1,406 | | | | | | 107 | |
| | | | |
Sabra Health Care REIT, Inc. | | | | | 12,938 | | | | | | 181 | |
| | | | |
Service Properties Trust | | | | | 200,776 | | | | | | 1,050 | |
| | | | |
SITE Centers Corp. | | | | | 124,119 | | | | | | 1,672 | |
| | | | |
SL Green Realty Corp. | | | | | 22,175 | | | | | | 1,023 | |
| | | | |
Sunstone Hotel Investors, Inc. | | | | | 546,614 | | | | | | 5,423 | |
| | | | |
Tanger Factory Outlet Centers, Inc. | | | | | 180,180 | | | | | | 2,562 | |
| | | | |
Uniti Group, Inc. | | | | | 323,489 | | | | | | 3,047 | |
| | | | |
Urban Edge Properties | | | | | 4,889 | | | | | | 74 | |
| | | | |
Washington REIT | | | | | 7,833 | | | | | | 167 | |
| | | | |
Xenia Hotels & Resorts, Inc. | | | | | 156,283 | | | | | | 2,271 | |
| | | | | | | | | | | | |
| | | | | | | | | | | 45,584 | |
| | | | | | | | | | | | |
Total Real Estate Investment Trusts (Cost $70,646) | | | | | | 61,391 | |
| | | | | | | | | | | | |
| |
| SHORT-TERM INSTRUMENTS 0.8% | |
| |
| REPURCHASE AGREEMENTS (e) 0.8% | |
| | | | | | | | | | | 3,245 | |
| | | | | | | | | | | | |
| Total Short-Term Instruments (Cost $3,245) | | | | | | | | | | | 3,245 | |
| | | | | | | | | | | | |
| | | | |
| | | | | | | | | | | | |
Total Investments in Securities
(Cost $359,619) | | | | | | 396,758 | |
| | | | | | | | | | | | |
| |
| INVESTMENTS IN AFFILIATES 6.2% | |
| |
| SHORT-TERM INSTRUMENTS 6.2% | |
| |
| MUTUAL FUNDS 6.2% | |
|
PIMCO Government Money Market Fund | |
1.450% (b)(c)(d) | | | | | 24,393,764 | | | | | | 24,394 | |
| | | | | | | | | | | | |
Total Short-Term Instruments
(Cost $24,394) | | | | | | | | | | | 24,394 | |
| | | | | | | | | | | | |
| | | | |
| | | | | | | | | | | | |
Total Investments in Affiliates
(Cost $24,394) | | | | | | | | | | | 24,394 | |
| | | | |
| | | | | | | | | | | | |
Total Investments 106.3%
(Cost $384,013) | | | | | | | | $ | | | 421,152 | |
| |
| Other Assets and Liabilities, net (6.3)% | | | | | | (24,801 | ) |
| | | | | | | | | | | | |
| Net Assets 100.0% | | | | | | | | $ | | | 396,351 | |
| | | | | | | | | | | | |
| | | | | | | | | | | | |
| See Accompanying Notes | | | ANNUAL REPORT | | | | | | | JUNE 30, 2022 | | | 53 |
| | | | | | |
| Schedule of Investments | | PIMCO RAE US Small Fund | | (Cont.) | | |
NOTES TO SCHEDULE OF INVESTMENTS:
| * | A zero balance may reflect actual amounts rounding to less than one thousand. |
| « | Security valued using significant unobservable inputs (Level 3). |
| (a) | Security did not produce income within the last twelve months. |
| (b) | Institutional Class Shares of each Fund. |
| (c) | Securities with an aggregate market value of $23,902 were out on loan in exchange for $24,394 of cash collateral as of June 30, 2022. The collateral was invested in a cash collateral reinvestment vehicle as described in Note 5 in the Notes to Financial Statements. |
| (d) | Coupon represents a 7-Day Yield. |
BORROWINGS AND OTHER FINANCING TRANSACTIONS
(e) REPURCHASE AGREEMENTS:
| | | | | | | | | | | | | | | | | | | | | | | | | | | | | | |
| Counterparty | | Lending
Rate | | | Settlement
Date | | | Maturity
Date | | | Principal
Amount | | | Collateralized By | | Collateral
(Received) | | | Repurchase
Agreements,
at Value | | | Repurchase
Agreement
Proceeds
to be
Received(1) | |
| FICC | | | 0.400 | % | | | 06/30/2022 | | | | 07/01/2022 | | | $ | 3,245 | | | U.S. Treasury Notes 3.000% due 06/30/2024 | | $ | (3,310 | ) | | $ | 3,245 | | | $ | 3,245 | |
| | | | | | | | | | | | | | | | | | | | | | | | | | | | | | |
Total Repurchase Agreements | | | | | $ | (3,310 | ) | | $ | 3,245 | | | $ | 3,245 | |
| | | | | | | | | | | | | | | | | | | | | | | | | | | | | | |
BORROWINGS AND OTHER FINANCING TRANSACTIONS SUMMARY
The following is a summary by counterparty of the market value of Borrowings and Other Financing Transactions and collateral pledged/(received) as of June 30, 2022:
| | | | | | | | | | | | | | | | | | | | | | | | | | | | |
| Counterparty | | Repurchase
Agreement
Proceeds
to be
Received(1) | | | Payable for
Reverse
Repurchase
Agreements | | | Payable for
Sale-Buyback
Transactions | | | Securities Out on Loan | | | Total
Borrowings and
Other Financing
Transactions | | | Collateral
Pledged/(Received) | | | Net Exposure(2) | |
Global/Master Repurchase Agreement | |
FICC | | $ | 3,245 | | | $ | 0 | | | $ | 0 | | | $ | 0 | | | $ | 3,245 | | | $ | (3,310 | ) | | $ | (65 | ) |
|
Master Securities Lending Agreement | |
BPG | | | 0 | | | | 0 | | | | 0 | | | | 2,463 | | | | 2,463 | | | | (2,523 | ) | | | (60 | ) |
GSC | | | 0 | | | | 0 | | | | 0 | | | | 18,118 | | | | 18,118 | | | | (18,483 | ) | | | (365 | ) |
MSC | | | 0 | | | | 0 | | | | 0 | | | | 2,668 | | | | 2,668 | | | | (2,722 | ) | | | (54 | ) |
BSN | | | 0 | | | | 0 | | | | 0 | | | | 653 | | | | 653 | | | | (666 | ) | | | (13 | ) |
| | | | | | | | | | | | | | | | | | | | | | | | | | | | |
Total Borrowings and Other Financing Transactions | | $ | 3,245 | | | $ | 0 | | | $ | 0 | | | $ | 23,902 | | | | | | | | | | | | | |
| | | | | | | | | | | | | | | | | | | | | | | | | | | | |
CERTAIN TRANSFERS ACCOUNTED FOR AS SECURED BORROWINGS
Remaining Contractual Maturity of the Agreements
| | | | | | | | | | | | | | | | | | | | |
| | | Overnight and
Continuous | | | Up to 30 days | | | 31-90 days | | | Greater Than 90 days | | | Total | |
Securities Lending Transactions(3) | |
Common Stocks | | $ | 24,394 | | | $ | 0 | | | $ | 0 | | | $ | 0 | | | $ | 24,394 | |
| | | | | | | | | | | | | | | | | | | | |
Total Borrowings | | $ | 24,394 | | | $ | 0 | | | $ | 0 | | | $ | 0 | | | $ | 24,394 | |
| | | | | | | | | | | | | | | | | | | | |
Payable for securities on loan - cash collateral | | | $ | 24,394 | |
| | | | | | | | | | | | | | | | | | | | |
| (1) | Includes accrued interest. |
| (2) | Net Exposure represents the net receivable/(payable) that would be due from/to the counterparty in the event of default. Exposure from borrowings and other financing transactions can only be netted across transactions governed under the same master agreement with the same legal entity. See Note 8, Master Netting Arrangements, in the Notes to Financial Statements for more information. |
| (3) | Includes cash collateral as described in Note 5 in the Notes to Financial Statements. |
| | | | | | |
| 54 | | PIMCO EQUITY SERIES | | | See Accompanying Notes | |
FAIR VALUE MEASUREMENTS
The following is a summary of the fair valuations according to the inputs used as of June 30, 2022 in valuing the Fund’s assets and liabilities:
| | | | | | | | | | | | | | | | |
| Category and Subcategory | | Level 1 | | | Level 2 | | | Level 3 | | | Fair
Value at
06/30/2022 | |
Investments in Securities, at Value | |
Common Stocks | |
United Kingdom | |
Financials | | $ | 1,541 | | | $ | 0 | | | $ | 0 | | | $ | 1,541 | |
United States | |
Communication Services | | | 3,926 | | | | 55 | | | | 0 | | | | 3,981 | |
Consumer Discretionary | | | 56,039 | | | | 0 | | | | 0 | | | | 56,039 | |
Consumer Staples | | | 25,339 | | | | 0 | | | | 0 | | | | 25,339 | |
Energy | | | 70,641 | | | | 0 | | | | 0 | | | | 70,641 | |
Financials | | | 23,867 | | | | 0 | | | | 0 | | | | 23,867 | |
Health Care | | | 34,528 | | | | 0 | | | | 0 | | | | 34,528 | |
Industrials | | | 30,848 | | | | 0 | | | | 0 | | | | 30,848 | |
Information Technology | | | 38,332 | | | | 0 | | | | 0 | | | | 38,332 | |
Materials | | | 18,996 | | | | 0 | | | | 0 | | | | 18,996 | |
Real Estate | | | 9,733 | | | | 0 | | | | 32 | | | | 9,765 | |
| | | | | | | | | | | | | | | | |
| Category and Subcategory | | Level 1 | | | Level 2 | | | Level 3 | | | Fair
Value at
06/30/2022 | |
Utilities | | $ | 18,245 | | | $ | 0 | | | $ | 0 | | | $ | 18,245 | |
Real Estate Investment Trusts | |
United States | |
Financials | | | 11,194 | | | | 0 | | | | 0 | | | | 11,194 | |
Industrials | | | 4,613 | | | | 0 | | | | 0 | | | | 4,613 | |
Real Estate | | | 45,584 | | | | 0 | | | | 0 | | | | 45,584 | |
Short-Term Instruments | |
Repurchase Agreements | | | 0 | | | | 3,245 | | | | 0 | | | | 3,245 | |
| | | | | | | | | | | | | | | | |
| | $ | 393,426 | | | $ | 3,300 | | | $ | 32 | | | $ | 396,758 | |
| | | | | | | | | | | | | | | | |
|
Investments in Affiliates, at Value | |
Short-Term Instruments | |
Mutual Funds | | | 24,394 | | | | 0 | | | | 0 | | | | 24,394 | |
| | | | | | | | | | | | | | | | |
| | | | |
Total Investments | | $ | 417,820 | | | $ | 3,300 | | | $ | 32 | | | $ | 421,152 | |
| | | | | | | | | | | | | | | | |
There were no significant transfers into or out of Level 3 during the period ended June 30, 2022.
| | | | | | | | | | | | |
| See Accompanying Notes | | | ANNUAL REPORT | | | | | | | JUNE 30, 2022 | | | 55 |
| | | | | | |
| Notes to Financial Statements | | | | | | |
1. ORGANIZATION
PIMCO Equity Series (the “Trust”) was established as a Delaware statutory trust on March 30, 2010. The Trust is registered under the Investment Company Act of 1940, as amended (the “Act”), as an open-end management investment company. Information presented in these financial statements pertains to the Institutional Class, I-2 and Class A shares of the funds (each a “Fund” and collectively, the “Funds”) indicated on the cover of this report. Pacific Investment Management Company LLC (“PIMCO”) serves as the investment adviser (the “Adviser”) for the Funds. Research Affiliates, LLC (“Research Affiliates”) serves as the sub-adviser for the Funds. Prior to September 24, 2021, with respect to the PIMCO RAE US Fund and PIMCO RAE US Small Fund, and February 4, 2022, with respect to the PIMCO RAE Emerging Markets Fund, PIMCO RAE Global ex-US Fund, and PIMCO RAE International Fund, PIMCO and Research Affiliates engaged Parametric Portfolio Associates, LLC (“Parametric”) to implement all or a portion of the Funds’ investment strategies. The PIMCO RAE Global ex-US Fund may invest substantially all of its assets in Institutional Class shares of the International Fund and Emerging Markets Fund, equity securities of small companies economically tied to non-U.S. countries, and securities that are eligible investments for the International Fund and Emerging Markets Fund. The PIMCO RAE Global ex-US Fund may invest in other affiliated funds and unaffiliated funds, which may or may not be registered under the Act (together with the Underlying Funds, “Acquired Funds”).
2. SIGNIFICANT ACCOUNTING POLICIES
The following is a summary of significant accounting policies consistently followed by the Trust in the preparation of its financial statements in conformity with accounting principles generally accepted in the United States of America (“U.S. GAAP”). Each Fund is treated as an investment company under the reporting requirements of U.S. GAAP. The functional and reporting currency for the Funds is the U.S. dollar. The preparation of financial statements in accordance with U.S. GAAP requires management to make estimates and assumptions that affect the reported amounts of assets and liabilities and disclosure of contingent assets and liabilities at the date of the financial statements and the reported amounts of increases and decreases in net assets from operations during the reporting period. Actual results could differ from those estimates.
(a) Securities Transactions and Investment Income Securities transactions are recorded as of the trade date for financial reporting purposes. Securities purchased or sold on a when-issued or delayed-delivery basis may be settled beyond a standard settlement period for the security after the trade date. Realized gains (losses) from securities sold are recorded on the identified
cost basis. Dividend income is recorded on the ex-dividend date, except certain dividends from foreign securities where the ex-dividend date may have passed, which are recorded as soon as a Fund is informed of the ex-dividend date. Interest income, adjusted for the accretion of discounts and amortization of premiums, is recorded on the accrual basis from settlement date, with the exception of securities with a forward starting effective date, where interest income is recorded on the accrual basis from effective date. For convertible securities, premiums attributable to the conversion feature are not amortized. Estimated tax liabilities on certain foreign securities are recorded on an accrual basis and are reflected as components of interest income or net change in unrealized appreciation (depreciation) on investments on the Statements of Operations, as appropriate. Tax liabilities realized as a result of such security sales are reflected as a component of net realized gain (loss) on investments on the Statements of Operations. Paydown gains (losses) on mortgage-related and other asset-backed securities, if any, are recorded as components of interest income on the Statements of Operations. Income or short-term capital gain distributions received from registered investment companies, if any, are recorded as dividend income. Long-term capital gain distributions received from registered investment companies, if any, are recorded as realized gains.
Debt obligations may be placed on non-accrual status and related interest income may be reduced by ceasing current accruals and writing off interest receivable when the collection of all or a portion of interest has become doubtful based on consistently applied procedures. A debt obligation is removed from non-accrual status when the issuer resumes interest payments or when collectability of interest is probable.
(b) Foreign Currency Translation The market values of foreign securities, currency holdings and other assets and liabilities denominated in foreign currencies are translated into U.S. dollars based on the current exchange rates each business day. Purchases and sales of securities and income and expense items denominated in foreign currencies, if any, are translated into U.S. dollars at the exchange rate in effect on the transaction date. The Funds do not separately report the effects of changes in foreign exchange rates from changes in market prices on securities held. Such changes are included in net realized gain (loss) and net change in unrealized appreciation (depreciation) from investments on the Statements of Operations. The Funds may invest directly or indirectly through investments in Underlying Funds or Acquired Funds, as applicable, in foreign currency-denominated securities and may engage in foreign currency transactions either on a spot (cash) basis at the rate prevailing in the currency exchange market at the time or through a forward foreign
currency contract. Realized foreign exchange gains (losses) arising from sales of spot foreign currencies, currency gains (losses) realized between the trade and settlement dates on securities transactions and the difference between the recorded amounts of dividends, interest, and foreign withholding taxes and the U.S. dollar equivalent of the amounts actually received or paid are included in net realized gain (loss) on foreign currency transactions on the Statements of Operations. Net unrealized foreign exchange gains (losses) arising from changes in foreign exchange rates on foreign denominated assets and liabilities other than investments in securities held at the end of the reporting period are included in net change in unrealized appreciation (depreciation) on foreign currency assets and liabilities on the Statements of Operations.
(c) Multi-Class Operations Each class offered by the Trust has equal rights as to assets and voting privileges (except that shareholders of a class have exclusive voting rights regarding any matter relating solely to that class of shares). Income and non-class specific expenses are allocated daily to each class on the basis of the relative net assets. Realized and unrealized capital gains (losses) are allocated daily based on the relative net assets of each class of the respective Fund. Class specific expenses, where applicable, currently include supervisory and administrative and distribution and servicing fees. Under certain circumstances, the per share net asset value (“NAV”) of a class of the respective Fund’s shares may be different from the per share NAV of another class of shares as a result of the different daily expense accruals applicable to each class of shares.
(d) Distributions to Shareholders The following table shows the anticipated frequency of distributions from net investment income, if any, for each Fund.
| | | | | | | | | | | | |
| | | | | | Distribution Frequency | |
| | | |
| Fund Name | | | | | Declared | | | Distributed | |
| | | |
PIMCO RAE Emerging Markets Fund | | | | | | | Annually | | | | Annually | |
| | | |
PIMCO RAE Global ex-US Fund | | | | | | | Annually | | | | Annually | |
| | | |
PIMCO RAE International Fund | | | | | | | Annually | | | | Annually | |
| | | |
PIMCO RAE US Fund | | | | | | | Annually | | | | Annually | |
| | | |
PIMCO RAE US Small Fund | | | | | | | Annually | | | | Annually | |
In addition, each Fund distributes any net capital gains it earns from the sale of portfolio securities to shareholders no less frequently than annually. Net short-term capital gains may be paid more frequently.
Income distributions and capital gain distributions are determined in accordance with income tax regulations which may differ from U.S. GAAP. Differences between tax regulations and U.S. GAAP may cause timing differences between income and capital gain recognition. Further, the character of investment income and capital gains may be different for certain transactions under the two methods of accounting.
As a result, income distributions and capital gain distributions declared during a fiscal period may differ significantly from the net investment income (loss) and realized gains (losses) reported on each Fund’s annual financial statements presented under U.S. GAAP.
Separately, if a Fund determines or estimates, as applicable, that a portion of a distribution may be comprised of amounts from sources other than net investment income in accordance with its policies, accounting records (if applicable), and accounting practices, the Fund will notify shareholders of the estimated composition of such distribution through a Section 19 Notice. For these purposes, a Fund determines or estimates, as applicable, the source or sources from which a distribution is paid, to the close of the period as of which it is paid, in reference to its internal accounting records and related accounting practices. If, based on such accounting records and practices, it is determined or estimated, as applicable, that a particular distribution does not include capital gains or paid-in surplus or other capital sources, a Section 19 Notice generally would not be issued. It is important to note that differences exist between a Fund’s daily internal accounting records and practices, a Fund’s financial statements presented in accordance with U.S. GAAP, and recordkeeping practices under income tax regulations. For instance, a Fund’s internal accounting records and practices may take into account, among other factors, tax-related characteristics of certain sources of distributions that differ from treatment under U.S. GAAP. Examples of such differences may include but are not limited to, for certain Funds, the treatment of periodic payments under interest rate swap contracts. Accordingly, among other consequences, it is possible that a Fund may not issue a Section 19 Notice in situations where the Fund’s financial statements prepared later and in accordance with U.S. GAAP and/or the final tax character of those distributions might later report that the sources of those distributions included capital gains and/or a return of capital. Please visit www.pimco.com for the most recent Section 19 Notice, if applicable, for additional information regarding the estimated composition of distributions. Final determination of a distribution’s tax character will be provided to shareholders when such information is available.
Distributions classified as a tax basis return of capital at a Fund’s fiscal year end, if any, are reflected on the Statements of Changes in Net Assets and have been recorded to paid in capital on the Statements of Assets and Liabilities. In addition, other amounts have been reclassified between distributable earnings (accumulated loss) and paid in capital on the Statements of Assets and Liabilities to more appropriately conform U.S. GAAP to tax characterizations of distributions.
(e) New Accounting Pronouncements and Regulatory Updates In March 2020, the Financial Accounting Standards Board issued an
| | | | | | | | | | | | |
| | | | ANNUAL REPORT | | | | | | | JUNE 30, 2022 | | | 57 |
| | | | |
| Notes to Financial Statements | | (Cont.) | | |
Accounting Standards Update (“ASU”), ASU 2020-04, which provides optional guidance to ease the potential accounting burden associated with transitioning away from the London Interbank Offered Rate and other reference rates that are expected to be discontinued. ASU 2020-04 is effective for certain reference rate-related contract modifications that occur during the period March 12, 2020 through December 31, 2022. In March 2021, the administrator for LIBOR announced the extension of the publication of a majority of the USD LIBOR settings to June 30, 2023. Management is continuously evaluating the potential effect a discontinuation of LIBOR could have on the Funds’ investments and has determined that it is unlikely the ASU’s adoption will have a material impact on the Funds’ financial statements.
In October 2020, the U.S. Securities and Exchange Commission (“SEC”) adopted a rule related to the use of derivatives, short sales, reverse repurchase agreements and certain other transactions by registered investment companies that rescinds and withdraws the guidance of the SEC and its staff regarding asset segregation and cover transactions that was applicable to the Funds as of the date of this report. Subject to certain exceptions, the rule requires funds to trade derivatives and other transactions that create future payment or delivery obligations (except reverse repurchase agreements and similar financing transactions) subject to a value-at-risk leverage limit, certain derivatives risk management program and reporting requirements. The rule went into effect on February 19, 2021. The compliance date for the new rule and the related reporting requirements is August 19, 2022. At this time, management is evaluating the implications of these changes on the financial statements.
In October 2020, the SEC adopted a rule regarding the ability of a fund to invest in other funds. The rule allows a fund to acquire shares of another fund in excess of certain limitations currently imposed by the Act without obtaining individual exemptive relief from the SEC, subject to certain conditions. The rule also includes the rescission of certain exemptive relief from the SEC and guidance from the SEC staff for funds to invest in other funds. The effective date for the rule was January 19, 2021, and the compliance date for the rule was January 19, 2022. Management has implemented changes in connection with the rule and has determined that there is no material impact to the Funds’ financial statements.
In December 2020, the SEC adopted a rule addressing fair valuation of fund investments. The new rule sets forth requirements for good faith determinations of fair value as well as for the performance of fair value determinations, including related oversight and reporting obligations. The new rule also defines “readily available market quotations” for purposes of the definition of “value” under the Act, and the SEC noted that this definition would apply in all contexts under the Act. The effective date for the rule was March 8, 2021. The compliance date for
the new rule and the associated recordkeeping requirements is September 8, 2022. At this time, management is evaluating the implications of these changes on the financial statements.
3. INVESTMENT VALUATION AND FAIR VALUE MEASUREMENTS
(a) Investment Valuation Policies The price of a Fund’s shares is based on the Fund’s NAV. The NAV of a Fund, or each of its share classes, as applicable, is determined by dividing the total value of portfolio investments and other assets, less any liabilities attributable to that Fund or class, by the total number of shares outstanding of that Fund or class.
On each day that the New York Stock Exchange (“NYSE”) is open, Fund shares are ordinarily valued as of the close of regular trading (normally 4:00 p.m., Eastern time) (“NYSE Close”). Information that becomes known to the Funds or their agents after the time as of which NAV has been calculated on a particular day will not generally be used to retroactively adjust the price of a security or the NAV determined earlier that day. If regular trading on the NYSE closes earlier than scheduled, each Fund reserves the right to either (i) calculate its NAV as of the earlier closing time or (ii) calculate its NAV as of the normally scheduled close of regular trading on the NYSE for that day. Each Fund generally does not calculate its NAV on days during which the NYSE is closed. However, if the NYSE is closed on a day it would normally be open for business, each Fund reserves the right to calculate its NAV as of the normally scheduled close of regular trading on the NYSE for that day or such other time that the Fund may determine.
For purposes of calculating NAV, portfolio securities and other assets for which market quotes are readily available are valued at market value. Market value is generally determined on the basis of official closing prices or the last reported sales prices, or if no sales are reported, based on quotes obtained from established market makers or prices (including evaluated prices) supplied by the Funds’ approved pricing services, quotation reporting systems and other third-party sources (together, “Pricing Services”). The Funds will normally use pricing data for domestic equity securities received shortly after the NYSE Close and do not normally take into account trading, clearances or settlements that take place after the NYSE Close. If market value pricing is used, a foreign (non-U.S.) equity security traded on a foreign exchange or on more than one exchange is typically valued using pricing information from the exchange considered by PIMCO to be the primary exchange. A foreign (non-U.S.) equity security will be valued as of the close of trading on the foreign exchange, or the NYSE Close, if the NYSE Close occurs before the end of trading on the foreign exchange. Domestic and foreign (non-U.S.) fixed income securities, non-exchange traded derivatives, and equity options are normally valued on the basis of quotes obtained from brokers and dealers or Pricing Services using such data reflecting the principal
markets for those securities. Prices obtained from Pricing Services may be based on, among other things, information provided by market makers or estimates of market values obtained from yield data relating to investments or securities with similar characteristics. Certain fixed income securities purchased on a delayed-delivery basis are marked to market daily until settlement at the forward settlement date. Exchange-traded options, except equity options, futures and options on futures are valued at the settlement price determined by the relevant exchange, quotes obtained from a quotation reporting system, established market makers or pricing services. Swap agreements are valued on the basis of market-based prices supplied by Pricing Services or quotes obtained from brokers and dealers. A Fund’s investments in open-end management investment companies, other than exchange-traded funds (“ETFs”), are valued at the NAVs of such investments. Open-end management investment companies may include affiliated funds.
If a foreign (non-U.S.) equity security’s value has materially changed after the close of the security’s primary exchange or principal market but before the NYSE Close, the security may be valued at fair value based on procedures established and approved by the Board of Trustees of the Trust (the “Board”). Foreign (non-U.S.) equity securities that do not trade when the NYSE is open are also valued at fair value. With respect to foreign (non-U.S.) equity securities, a Fund may determine the fair value of investments based on information provided by Pricing Services and other third-party vendors, which may recommend fair value or adjustments with reference to other securities, indices or assets. In considering whether fair valuation is required and in determining fair values, a Fund may, among other things, consider significant events (which may be considered to include changes in the value of U.S. securities or securities indices) that occur after the close of the relevant market and before the NYSE Close. A Fund may utilize modeling tools provided by third-party vendors to determine fair values of foreign (non-U.S.) securities. For these purposes, any movement in the applicable reference index or instrument (“zero trigger”) between the earlier close of the applicable foreign market and the NYSE Close may be deemed to be a significant event, prompting the application of the pricing model (effectively resulting in daily fair valuations). Foreign exchanges may permit trading in foreign (non-U.S.) equity securities on days when the Trust is not open for business, which may result in a Fund’s portfolio investments being affected when shareholders are unable to buy or sell shares.
Senior secured floating rate loans for which an active secondary market exists to a reliable degree are valued at the mean of the last available bid/ask prices in the market for such loans, as provided by a Pricing Service. Senior secured floating rate loans for which an active secondary market does not exist to a reliable degree are valued at fair value, which is intended to approximate market value. In valuing a senior secured floating rate loan at fair value, the factors considered may include, but are not limited to, the following: (a) the creditworthiness of the borrower
and any intermediate participants, (b) the terms of the loan, (c) recent prices in the market for similar loans, if any, and (d) recent prices in the market for instruments of similar quality, rate, period until next interest rate reset and maturity.
Investments valued in currencies other than the U.S. dollar are converted to the U.S. dollar using exchange rates obtained from Pricing Services. As a result, the value of such investments and, in turn, the NAV of a Fund’s shares may be affected by changes in the value of currencies in relation to the U.S. dollar. The value of investments traded in markets outside the United States or denominated in currencies other than the U.S. dollar may be affected significantly on a day that the Trust is not open for business. As a result, to the extent that a Fund holds foreign (non-U.S.) investments, the value of those investments may change at times when shareholders are unable to buy or sell shares and the value of such investments will be reflected in the Fund’s next calculated NAV.
Investments for which market quotes or market based valuations are not readily available are valued at fair value as determined in good faith by the Board or persons acting at their direction. The Board has adopted methods for valuing securities and other assets in circumstances where market quotes are not readily available, and has delegated to the Adviser the responsibility for applying the fair valuation methods. In the event that market quotes or market based valuations are not readily available, and the security or asset cannot be valued pursuant to a Board approved valuation method, the value of the security or asset will be determined in good faith by the Board. The Adviser may consult with the Sub-Adviser or Parametric in providing such recommendations or otherwise with respect to valuation of the Fund’s portfolio securities or other assets. Market quotes are considered not readily available in circumstances where there is an absence of current or reliable market-based data (e.g., trade information, bid/ask information, indicative market quotations (“Broker Quotes”), Pricing Services’ prices), including where events occur after the close of the relevant market, but prior to the NYSE Close, that materially affect the values of a Fund’s securities or assets. In addition, market quotes are considered not readily available when, due to extraordinary circumstances, the exchanges or markets on which the securities trade do not open for trading for the entire day and no other market prices are available. The Board has delegated, to the Adviser, the responsibility for monitoring significant events that may materially affect the values of a Fund’s securities or assets and for determining whether the value of the applicable securities or assets should be reevaluated in light of such significant events.
When a Fund (or, in each instance in this paragraph, as applicable, an Underlying PIMCO Fund or Acquired Fund) uses fair valuation to determine the value of a portfolio security or other asset for purposes
| | | | | | | | | | | | |
| | | | ANNUAL REPORT | | | | | | | JUNE 30, 2022 | | | 59 |
| | | | |
| Notes to Financial Statements | | (Cont.) | | |
of calculating its NAV, such investments will not be priced on the basis of quotes from the primary market in which they are traded, but rather may be priced by another method that the Board or persons acting at their direction believe reflects fair value. Fair valuation may require subjective determinations about the value of a security. While the Trust’s policy is intended to result in a calculation of a Fund’s NAV that fairly reflects security values as of the time of pricing, the Trust cannot ensure that fair values determined by the Board or persons acting at their direction would accurately reflect the price that a Fund could obtain for a security if it were to dispose of that security as of the time of pricing (for instance, in a forced or distressed sale). The prices used by a Fund may differ from the value that would be realized if the securities were sold. The Funds’ use of fair valuation may also help to deter “stale price arbitrage” as discussed under the “Abusive Trading Practices” section in each Fund’s prospectus.
(b) Fair Value Hierarchy U.S. GAAP describes fair value as the price that a Fund would receive to sell an asset or pay to transfer a liability in an orderly transaction between market participants at the measurement date. It establishes a fair value hierarchy that prioritizes inputs to valuation methods and requires disclosure of the fair value hierarchy, separately for each major category of assets and liabilities, that segregates fair value measurements into levels (Level 1, 2, or 3). The inputs or methodology used for valuing securities are not necessarily an indication of the risks associated with investing in those securities. Levels 1, 2, and 3 of the fair value hierarchy are defined as follows:
| ∎ | | Level 1 — Quoted prices in active markets or exchanges for identical assets and liabilities. |
| ∎ | | Level 2 — Significant other observable inputs, which may include, but are not limited to, quoted prices for similar assets or liabilities in markets that are active, quoted prices for identical or similar assets or liabilities in markets that are not active, inputs other than quoted prices that are observable for the assets or liabilities (such as interest rates, yield curves, volatilities, prepayment speeds, loss severities, credit risks and default rates) or other market corroborated inputs. |
| ∎ | | Level 3 — Significant unobservable inputs based on the best information available in the circumstances, to the extent observable inputs are not available, which may include assumptions made by the Board or persons acting at their direction that are used in determining the fair value of investments. |
In accordance with the requirements of U.S. GAAP, the amounts of transfers into and out of Level 3, if material, are disclosed in the Notes to Schedule of Investments for each respective Fund.
For fair valuations using significant unobservable inputs, U.S. GAAP requires a reconciliation of the beginning to ending balances for reported fair values that presents changes attributable to realized gain
(loss), unrealized appreciation (depreciation), purchases and sales, accrued discounts (premiums), and transfers into and out of the Level 3 category during the period. The end of period value is used for the transfers between Levels of a Fund’s assets and liabilities. Additionally, U.S. GAAP requires quantitative information regarding the significant unobservable inputs used in the determination of fair value of assets or liabilities categorized as Level 3 in the fair value hierarchy. In accordance with the requirements of U.S. GAAP, a fair value hierarchy, and if material, a Level 3 reconciliation and details of significant unobservable inputs, have been included in the Notes to Schedule of Investments for each respective Fund.
(c) Valuation Techniques and the Fair Value Hierarchy
Level 1, Level 2 and Level 3 trading assets and trading liabilities, at fair value The valuation methods (or “techniques”) and significant inputs used in determining the fair values of portfolio securities or other assets and liabilities categorized as Level 1, Level 2 and Level 3 of the fair value hierarchy are as follows:
Common stocks, ETFs, exchange-traded notes and financial derivative instruments, such as futures contracts, rights and warrants, or options on futures that are traded on a national securities exchange, are stated at the last reported sale or settlement price on the day of valuation. To the extent these securities are actively traded and valuation adjustments are not applied, they are categorized as Level 1 of the fair value hierarchy.
Valuation adjustments may be applied to certain securities that are solely traded on a foreign exchange to account for the market movement between the close of the foreign market and the NYSE Close. These securities are valued using Pricing Services that consider the correlation of the trading patterns of the foreign security to the intraday trading in the U.S. markets for investments. Securities using these valuation adjustments are categorized as Level 2 of the fair value hierarchy. Preferred securities and other equities traded on inactive markets or valued by reference to similar instruments are also categorized as Level 2 of the fair value hierarchy.
Valuation adjustments may be applied to certain exchange traded futures and options to account for market movement between the exchange settlement and the NYSE close. These securities are valued using quotes obtained from a quotation reporting system, established market makers or pricing services. Financial derivatives using these valuation adjustments are categorized as Level 2 of the fair value hierarchy.
Equity-linked securities are valued by referencing the last reported sale or settlement price of the linked referenced equity on the day of valuation. Foreign exchange adjustments are applied to the last reported price to convert the linked equity’s trading currency to the contract’s settling currency. These investments are categorized as Level 2 of the fair value hierarchy.
Investments in registered open-end investment companies (other than ETFs) will be valued based upon the NAVs of such investments and are categorized as Level 1 of the fair value hierarchy. Investments in unregistered open-end investment companies will be calculated based upon the NAVs of such investments and are considered Level 1 provided that the NAVs are observable, calculated daily and are the value at which both purchases and sales will be conducted.
When a fair valuation method is applied by the Adviser that uses significant unobservable inputs, investments will be priced by a method
that the Board or persons acting at their direction believe reflects fair value and are categorized as Level 3 of the fair value hierarchy.
Short-term debt instruments (such as commercial paper) having a remaining maturity of 60 days or less may be valued at amortized cost, so long as the amortized cost value of such short-term debt instruments is approximately the same as the fair value of the instrument as determined without the use of amortized cost valuation. These securities are categorized as Level 2 or Level 3 of the fair value hierarchy depending on the source of the base price.
4. SECURITIES AND OTHER INVESTMENTS
(a) Investments in Affiliates
Each Fund eligible to participate in securities lending may invest the cash collateral received for securities out on loan in the PIMCO Government Money Market Fund under the Securities Lending Agreement. All or a portion of Dividend Income as shown in the table below represents the income earned on the cash collateral invested in PIMCO Government Money Market Fund and is included on the Statements of Operations as a component of Securities Lending Income. PIMCO Government Money Market Fund is considered to be affiliated with the Funds. The table below shows the Funds’ transactions in and earnings from investments in the affiliated Fund for the period ended June 30, 2022 (amounts in thousands†):
Investments in PIMCO Government Money Market Fund
| | | | | | | | | | | | | | | | | | | | | | | | | | | | | | | | | | | | |
| Fund Name | | | | | Market Value
06/30/2021 | | | Purchases
at Cost | | | Proceeds
from Sales | | | Net
Realized Gain (Loss) | | | Change in
Unrealized
Appreciation
(Depreciation) | | | Market Value
06/30/2022 | | | Dividend
Income(1) | | | Realized Net
Capital Gain
Distributions(1) | |
| | | | | | | | | |
PIMCO RAE Emerging Markets Fund | | | | | | $ | 66,503 | | | $ | 210,705 | | | $ | (236,529 | ) | | $ | 0 | | | $ | 0 | | | $ | 40,679 | | | $ | 52 | | | $ | 0 | |
| | | | | | | | | |
PIMCO RAE International Fund | | | | | | | 68,669 | | | | 361,442 | | | | (402,041 | ) | | | 0 | | | | 0 | | | | 28,070 | | | | 26 | | | | 0 | |
| | | | | | | | | |
PIMCO RAE US Fund | | | | | | | 4,257 | | | | 122,512 | | | | (125,478 | ) | | | 0 | | | | 0 | | | | 1,291 | | | | 4 | | | | 0 | |
| | | | | | | | | |
PIMCO RAE US Small Fund | | | | | | | 11,264 | | | | 63,184 | | | | (50,054 | ) | | | 0 | | | | 0 | | | | 24,394 | | | | 14 | | | | 0 | |
| † | A zero balance may reflect actual amounts rounding to less than one thousand. |
| (1) | The tax characterization of distributions is determined in accordance with Federal income tax regulations and may contain a return of capital. The actual tax characterization of distributions received is determined at the end of the fiscal year of the affiliated fund. See Note 2, Distributions to Shareholders, in the Notes to Financial Statements for more information. |
The PIMCO RAE Global ex-US Fund may invest substantially all of its assets in Acquired Funds (except the PIMCO RAE US Fund), equity securities of small companies economically tied to non-U.S. countries, and securities that are eligible investments for the
International Fund and Emerging Markets Fund. The Underlying Funds are considered to be affiliated with the PIMCO RAE Global ex-US Fund.
Each Fund may invest in the PIMCO Short Asset Portfolio and the PIMCO Short-Term Floating NAV Portfolio III (“Central Funds”) to the extent permitted by the Act and rules thereunder. The Central Funds are registered investment companies created for use solely by the series of the Trust and other series of registered investment companies advised by the Adviser, in connection with their cash management activities. The main investments of the Central Funds are money market and short maturity fixed income instruments. The Central Funds may incur expenses related to their investment activities, but do not pay Investment Advisory Fees or Supervisory and Administrative Fees to the Adviser. The Central Funds are considered to be affiliated with the Funds. A complete schedule of portfolio holdings for each affiliate fund is filed with the SEC for the first and third quarters of each fiscal year on Form N-PORT and is available at the SEC’s website at www.sec.gov. A copy of each Acquired Fund’s shareholder report is also available at the SEC’s website at www.sec.gov, and a copy of each affiliate fund’s shareholder report is available on the
| | | | | | | | | | | | |
| | | | ANNUAL REPORT | | | | | | | JUNE 30, 2022 | | | 61 |
| | | | |
| Notes to Financial Statements | | (Cont.) | | |
Funds’ website at www.pimco.com, or upon request, as applicable. The table below shows the Funds’ transactions in and earnings from investments in the affiliated Funds for the period ended June 30, 2022 (amounts in thousands†):
PIMCO RAE Global ex-US Fund
| | | | | | | | | | | | | | | | | | | | | | | | | | | | | | | | | | | | |
| Underlying PIMCO Funds | | | | | Market Value
06/30/2021 | | | Purchases
at Cost | | | Proceeds
from Sales | | | Net
Realized
Gain (Loss) | | | Change in
Unrealized
Appreciation
(Depreciation) | | | Market Value
06/30/2022 | | | Dividend
Income(1) | | | Realized Net
Capital Gain
Distributions(1) | |
| | | | | | | | | |
PIMCO RAE Emerging Markets Fund | | | | | | $ | 22,403 | | | $ | 4,269 | | | $ | (1,686 | ) | | $ | (218 | ) | | $ | (6,238 | ) | | $ | 18,530 | | | $ | 1,871 | | | $ | 0 | |
| | | | | | | | | |
PIMCO RAE International Fund | | | | | | | 69,363 | | | | 21,038 | | | | (4,488 | ) | | | (1,371 | ) | | | (24,445 | ) | | | 60,097 | | | | 8,061 | | | | 7,649 | |
| | | | | | | | | |
Totals | | | | | | $ | 91,766 | | | $ | 25,307 | | | $ | (6,174 | ) | | $ | (1,589 | ) | | $ | (30,683 | ) | | $ | 78,627 | | | $ | 9,932 | | | $ | 7,649 | |
| † | A zero balance may reflect actual amounts rounding to less than one thousand. |
| (1) | The tax characterization of distributions is determined in accordance with Federal income tax regulations and may contain a return of capital. The actual tax characterization of distributions received is determined at the end of the fiscal year of the affiliated fund, unless otherwise advised on IRS Form 1099-DIV. See Note 2, Distributions to Shareholders, in the Notes to Financial Statements for more information. |
(b) Investments in Securities
The Funds (and where applicable, certain Acquired Funds and Underlying Funds) may utilize the investments and strategies described below to the extent permitted by each Fund’s respective investment policies.
Equity-Linked Securities are privately issued securities that have a return component based on the performance of a single stock, a basket of stocks, or a stock index. Equity-linked securities are often used for many of the same purposes as, and share many of the same risks with, derivative instruments.
Restricted Investments are subject to legal or contractual restrictions on resale and may generally be sold privately, but may be required to be registered or exempted from such registration before being sold to the public. Private placement securities are generally considered to be restricted except for those securities traded between qualified institutional investors under the provisions of Rule 144A of the Securities Act of 1933. Disposal of restricted investments may involve time-consuming negotiations and expenses, and prompt sale at an acceptable price may be difficult to achieve. Restricted investments held by the Funds as of June 30, 2022, as applicable, are disclosed in the Notes to Schedules of Investments.
Real Estate Investment Trusts (“REITs”) are pooled investment vehicles that own, and typically operate, income-producing real estate. If a REIT meets certain requirements, including distributing to shareholders substantially all of its taxable income (other than net capital gains), then it is not taxed on the income distributed to shareholders. Distributions received from REITs may be characterized as income, capital gain or a return of capital. A return of capital is recorded by a Fund as a reduction to the cost basis of its investment in the REIT. REITs are subject to management fees and other expenses, and so the Funds that invest in REITs will bear their proportionate share of the costs of the REITs’ operations.
Warrants are securities that are usually issued together with a debt security or preferred security and that give the holder the right to buy a proportionate amount of common stock at a specified price. Warrants normally have a life that is measured in years and entitle the holder to buy common stock of a company at a price that is usually higher than the market price at the time the warrant is issued. Warrants may entail greater risks than certain other types of investments. Generally, warrants do not carry the right to receive dividends or exercise voting rights with respect to the underlying securities, and they do not represent any rights in the assets of the issuer. In addition, their value does not necessarily change with the value of the underlying securities, and they cease to have value if they are not exercised on or before their expiration date. If the market price of the underlying stock does not exceed the exercise price during the life of the warrant, the warrant will expire worthless. Warrants may increase the potential profit or loss to be realized from the investment as compared with investing the same amount in the underlying securities. Similarly, the percentage increase or decrease in the value of an equity security warrant may be greater than the percentage increase or decrease in the value of the underlying common stock. Warrants may relate to the purchase of equity or debt securities. Debt obligations with warrants attached to purchase equity securities have many characteristics of convertible securities and their prices may, to some degree, reflect the performance of the underlying stock. Debt obligations also may be issued with warrants attached to purchase additional debt securities at the same coupon rate. A decline in interest rates would permit a Fund to sell such warrants at a profit. If interest rates rise, these warrants would generally expire with no value.
5. BORROWINGS AND OTHER FINANCING TRANSACTIONS
The Funds (and where applicable, certain Acquired Funds and Underlying Funds) may enter into the borrowings and other financing transactions described below to the extent permitted by each Fund’s respective investment policies.
The following disclosures contain information on a Fund’s ability to lend or borrow cash or securities to the extent permitted under the Act, which may be viewed as borrowing or financing transactions by a Fund. The location of these instruments in each Fund’s financial statements is described below.
(a) Repurchase Agreements Under the terms of a typical repurchase agreement, a Fund purchases an underlying debt obligation (collateral) subject to an obligation of the seller to repurchase, and a Fund to resell, the obligation at an agreed-upon price and time. In an open maturity repurchase agreement, there is no pre-determined repurchase date and the agreement can be terminated by the Fund or counterparty at any time. The underlying securities for all repurchase agreements are held by a Fund’s custodian or designated sub custodians under tri-party repurchase agreements and in certain instances will remain in custody with the counterparty. The market value of the collateral must be equal to or exceed the total amount of the repurchase obligations, including interest. Repurchase agreements, if any, including accrued interest, are included on the Statements of Assets and Liabilities. Interest earned is recorded as a component of interest income on the Statements of Operations. In periods of increased demand for collateral, a Fund may pay a fee for the receipt of collateral, which may result in interest expense to the Fund.
(b) Securities Lending The Funds listed below may seek to earn additional income by lending their securities to certain qualified broker-dealers and institutions on a short-term or long-term basis via a lending agent.
|
| Fund Name |
|
PIMCO RAE Emerging Markets Fund |
|
PIMCO RAE Global ex-US Fund |
|
PIMCO RAE International Fund |
|
PIMCO RAE US Fund |
|
PIMCO RAE US Small Fund |
Securities on loan are required to be secured by cash collateral at least equal to 102% of the domestic, or 105% of the foreign security’s market value. If the market value of the collateral at the close of trading on a business day is less than 100% of the market value of the loaned securities at the close of trading on that day, the borrower shall be required to deliver, by the close of business on the following business day, an additional amount of collateral, so that the total amount of posted collateral is equal to at least 100% of the market value of all the loaned securities as of such preceding day. The Funds will then invest the cash collateral received in the PIMCO Government Money Market Fund and record a liability for the return of the collateral during the period the securities are on loan. Each Fund is subject to a lending limit of 33.33% of total assets (including the value of collateral).
The loans are subject to termination at the option of the borrower or the Fund. Upon termination of the loan, the borrower will return to the lender securities identical to the loaned securities. Should the borrower of the securities fail to return loaned securities, the Fund has the right to repurchase the securities using the collateral in the open market.
The borrower pays fees at the Funds’ direction to the lending agent. The lending agent may retain a portion of the fees and interest earned on the cash collateral invested as compensation for its services. Investments made with the cash collateral are disclosed on the Schedules of Investments, if applicable. The lending fees and the Funds’ portion of the interest income earned on cash collateral are included on the Statements of Operations as securities lending income, if applicable.
(c) Interfund Lending In accordance with an exemptive order (the “Order”) from the SEC, the Funds of the Trust may participate in a joint lending and borrowing facility for temporary purposes (the “Interfund Lending Program”), subject to compliance with the terms and conditions of the Order, and to the extent permitted by each Fund’s investment policies and restrictions. The Funds are currently permitted to borrow under the Interfund Lending Program. A lending fund may lend in aggregate up to 15% of its current net assets at the time of the interfund loan, but may not lend more than 5% of its net assets to any one borrowing fund through the Interfund Lending Program. A borrowing fund may not borrow through the Interfund Lending Program or from any other source if its total outstanding borrowings immediately after the borrowing would be more than 33 1/3% of its total assets (or any lower threshold provided for by the fund’s investment restrictions). If a borrowing fund’s total outstanding borrowings exceed 10% of its total assets, each of its outstanding interfund loans will be subject to collateralization of at least 102% of the outstanding principal value of the loan. All interfund loans are for temporary or emergency purposes and the interfund loan rate to be charged will be the average of the highest current overnight repurchase agreement rate available to a lending fund and the bank loan rate, as calculated according to a formula established by the Board.
During the period ended June 30, 2022, the Funds did not participate in the Interfund Lending Program.
6. FINANCIAL DERIVATIVE INSTRUMENTS
The Funds (and where applicable, certain Acquired Funds and Underlying Funds) may enter into the financial derivative instruments described below to the extent permitted by each Fund’s respective investment policies.
The following disclosures contain information on how and why the Funds use financial derivative instruments, and how financial derivative
| | | | | | | | | | | | |
| | | | ANNUAL REPORT | | | | | | | JUNE 30, 2022 | | | 63 |
| | | | |
| Notes to Financial Statements | | (Cont.) | | |
instruments affect the Funds’ financial position, results of operations and cash flows. The location and fair value amounts of these instruments on the Statements of Assets and Liabilities and the net realized gain (loss) and net change in unrealized appreciation (depreciation) on the Statements of Operations, each categorized by type of financial derivative contract and related risk exposure, are included in a table in the Notes to Schedules of Investments. The financial derivative instruments outstanding as of period end and the amounts of net realized gain (loss) and net change in unrealized appreciation (depreciation) on financial derivative instruments during the period, as disclosed in the Notes to Schedules of Investments, serve as indicators of the volume of financial derivative activity for the Funds.
Forward Foreign Currency Contracts may be engaged, in connection with settling planned purchases or sales of securities, to hedge the currency exposure associated with some or all of a Fund’s securities or
as part of an investment strategy. A forward foreign currency contract is an agreement between two parties to buy and sell a currency at a set price on a future date. The market value of a forward foreign currency contract fluctuates with changes in foreign currency exchange rates. Forward foreign currency contracts are marked to market daily, and the change in value is recorded by a Fund as an unrealized gain (loss). Realized gains (losses) are equal to the difference between the value of the contract at the time it was opened and the value at the time it was closed and are recorded upon delivery or receipt of the currency. These contracts may involve market risk in excess of the unrealized gain (loss) reflected on the Statements of Assets and Liabilities. In addition, a Fund could be exposed to risk if the counterparties are unable to meet the terms of the contracts or if the value of the currency changes unfavorably to the U.S. dollar. To mitigate such risk, cash or securities may be exchanged as collateral pursuant to the terms of the underlying contracts.
7. PRINCIPAL AND OTHER RISKS
(a) Principal Risks
The principal risks of investing in a Fund, which could adversely affect its net asset value, yield and total return, are listed below.
| | | | | | | | | | | | | | |
| Risks | | | | | PIMCO
RAE Emerging
Markets
Fund | | PIMCO
RAE Global
ex-US
Fund | | PIMCO
RAE
International
Fund | | PIMCO
RAE US
Fund | | PIMCO
RAE US Small
Fund |
| | | | | | |
Small Fund | | | | | | — | | X | | — | | — | | — |
| | | | | | |
Allocation | | | | | | — | | X | | — | | — | | — |
| | | | | | |
Acquired Fund | | | | | | — | | X | | — | | — | | — |
| | | | | | |
Equity | | | | | | X | | X | | X | | X | | X |
| | | | | | |
Value Investing | | | | | | X | | X | | X | | X | | X |
| | | | | | |
Foreign (Non-U.S.) Investment | | | | | | X | | X | | X | | — | | — |
| | | | | | |
Emerging Markets | | | | | | X | | X | | X | | — | | — |
| | | | | | |
Market | | | | | | X | | X | | X | | X | | X |
| | | | | | |
Issuer | | | | | | X | | X | | X | | X | | X |
| | | | | | |
Credit | | | | | | X | | X | | X | | X | | X |
| | | | | | |
Distressed Company | | | | | | — | | X | | — | | — | | X |
| | | | | | |
Currency | | | | | | X | | X | | X | | — | | — |
| | | | | | |
Real Estate | | | | | | X | | X | | X | | X | | X |
| | | | | | |
Liquidity | | | | | | X | | X | | X | | X | | X |
| | | | | | |
Leveraging | | | | | | X | | X | | X | | X | | X |
| | | | | | |
Management | | | | | | X | | X | | X | | X | | X |
| | | | | | |
Small Company | | | | | | — | | X | | — | | — | | X |
| | | | | | |
Derivatives | | | | | | X | | X | | X | | X | | X |
| | | | | | |
Model | | | | | | X | | X | | X | | X | | X |
The principal risks of investing in a Fund include risks from direct investments and/or for certain Funds that invest in Acquired Funds or Underlying PIMCO Funds, indirect exposure through investment in such Acquired Funds or Underlying PIMCO Funds. Please see “Description of Principal Risks” in a Fund’s prospectus for a more detailed description of the risks of investing in a Fund.
Small Fund Risk is the risk that a smaller Fund may not achieve investment or trading efficiencies. Additionally, a smaller Fund may be more adversely affected by large purchases or redemptions of Fund shares.
Allocation Risk is the risk that a Fund could lose money as a result of less than optimal or poor asset allocation decisions. A Fund could miss
attractive investment opportunities by underweighting markets that subsequently experience significant returns and could lose value by overweighting markets that subsequently experience significant declines.
Acquired Fund Risk is the risk that a Fund’s performance is closely related to the risks associated with the securities and other investments held by the Acquired Funds and that the ability of a Fund to achieve its investment objective will depend upon the ability of the Acquired Funds to achieve their investment objectives.
Equity Risk is the risk that the value of equity securities, such as common stocks and preferred securities, may decline due to general market conditions which are not specifically related to a particular company or to factors affecting a particular industry or industries. Equity securities generally have greater price volatility than fixed income securities.
Value Investing Risk is the risk that a value stock may decrease in price or may not increase in price as anticipated by the Sub-Adviser if it continues to be undervalued by the market or the factors that the portfolio manager believes will cause the stock price to increase do not occur.
Foreign (Non-U.S.) Investment Risk is the risk that investing in foreign (non-U.S.) securities may result in a Fund experiencing more rapid and extreme changes in value than a fund that invests exclusively in securities of U.S. companies, due to smaller markets, differing reporting, accounting and auditing standards, increased risk of delayed settlement of portfolio transactions or loss of certificates of portfolio securities, and the risk of unfavorable foreign government actions, including nationalization, expropriation or confiscatory taxation, currency blockage, or political changes or diplomatic developments. Foreign securities may also be less liquid and more difficult to value than securities of U.S. issuers.
Emerging Markets Risk is the risk of investing in emerging market securities, primarily increased foreign (non-U.S.) investment risk.
Market Risk is the risk that the value of securities owned by a Fund may go up or down, sometimes rapidly or unpredictably, due to factors affecting securities markets generally or particular industries.
Issuer Risk is the risk that the value of a security may decline for a reason directly related to the issuer, such as management performance, financial leverage and reduced demand for the issuer’s goods or services.
Credit Risk is the risk that a Fund could lose money if the counterparty to a derivative contract is unable or unwilling, or is perceived (whether by market participants, rating agencies, pricing services or otherwise) as unable or unwilling, to meet its financial obligations.
Distressed Company Risk is the risk that securities of distressed companies may be subject to greater levels of market, issuer and liquidity risks. Distressed companies may be engaged in restructurings or bankruptcy proceedings, which may cause the value of their securities to fluctuate rapidly or unpredictably.
Currency Risk is the risk that foreign (non-U.S.) currencies will change in value relative to the U.S. dollar and affect a Fund’s investments in foreign (non-U.S.) currencies or in securities that trade in, and receive revenues in, or in derivatives that provide exposure to, foreign (non-U.S.) currencies.
Real Estate Risk is the risk that a Fund’s investments in Real Estate Investment Trusts (“REITs”) or real estate-linked derivative instruments will subject a Fund to risks similar to those associated with direct ownership of real estate, including losses from casualty or condemnation, and changes in local and general economic conditions, supply and demand, interest rates, zoning laws, regulatory limitations on rents, property taxes and operating expenses. A Fund’s investments in REITs or real estate-linked derivative instruments subject it to management and tax risks. In addition, privately traded REITs subject a Fund to liquidity and valuation risk.
Liquidity Risk is the risk that a particular investment may be difficult to purchase or sell and that a Fund may be unable to sell illiquid investments at an advantageous time or price or achieve its desired level of exposure to a certain sector.
Leveraging Risk is the risk that certain transactions of a Fund, such as reverse repurchase agreements, loans of portfolio securities, and the use of when-issued, delayed delivery or forward commitment transactions, or derivative instruments, may give rise to leverage, magnifying gains and losses and causing a Fund to be more volatile than if it had not been leveraged. This means that leverage entails a heightened risk of loss.
Management Risk is the risk that the investment techniques and risk analyses applied by the Sub-Adviser, including the use of quantitative models or methods, will not produce the desired results and that actual or potential conflicts of interest, legislative, regulatory, or tax restrictions, policies or developments may affect the investment techniques available to the Sub-Adviser and the individual portfolio manager in connection with managing a Fund and may cause the Sub-Adviser to restrict or prohibit participation in certain investments. There is no guarantee that the investment objective of a Fund will be achieved.
Small Company Risk is the risk that the value of equity securities issued by small companies, ranked by fundamental size as determined by the Sub-Adviser, may go up or down, sometimes rapidly and unpredictably, due to narrow markets and limited managerial and financial resources.
| | | | | | | | | | | | |
| | | | ANNUAL REPORT | | | | | | | JUNE 30, 2022 | | | 65 |
| | | | |
| Notes to Financial Statements | | (Cont.) | | |
Derivatives Risk is the risk of investing in derivative instruments (such as futures, swaps and structured securities), including leverage, liquidity, interest rate, market, credit and management risks and valuation complexity. Changes in the value of the derivative may not correlate perfectly with, and may be more sensitive to market events than, the underlying asset, rate or index, and a Fund could lose more than the initial amount invested. A Fund’s use of derivatives may result in losses to a Fund, a reduction in a Fund’s returns and/or increased volatility. Over-the-counter (“OTC”) derivatives are also subject to the risk that a counterparty to the transaction will not fulfill its contractual obligations to the other party, as many of the protections afforded to centrally-cleared derivative transactions might not be available for OTC derivatives. The primary credit risk on derivatives that are exchange-traded or traded through a central clearing counterparty resides with a Fund’s clearing broker, or the clearinghouse. Changes in regulation relating to a mutual fund’s use of derivatives and related instruments could potentially limit or impact a Fund’s ability to invest in derivatives, limit a Fund’s ability to employ certain strategies that use derivatives and/or adversely affect the value of derivatives and a Fund’s performance.
Model Risk is the risk that a Fund’s investment models used in making investment allocation decisions may not adequately take into account certain factors or may rely on inaccurate data inputs, may contain design flaws or faulty assumptions, and may rely on incomplete or inaccurate data, any of which may result in a decline in the value of an investment in a Fund.
(b) Other Risks
In general, a Fund may be subject to additional risks, including, but not limited to, risks related to government regulation and intervention in financial markets, operational risks, risks associated with financial, economic and global market disruptions, and cybersecurity risks. Please see a Fund’s prospectus and Statement of Additional Information for a more detailed description of the risks of investing in a Fund. Please see the Important Information section of this report for additional discussion of certain regulatory and market developments that may impact a Fund’s performance.
Market Disruption Risk The Fund is subject to investment and operational risks associated with financial, economic and other global market developments and disruptions, including those arising from war, terrorism, market manipulation, government interventions, defaults and shutdowns, political changes or diplomatic developments, public health emergencies (such as the spread of infectious diseases, pandemics and epidemics) and natural/environmental disasters, which can all negatively impact the securities markets and cause the Fund to lose value. These events can also impair the technology and other operational systems upon which the Fund’s service providers, including PIMCO as the Fund’s investment adviser, rely, and could otherwise
disrupt the Fund’s service providers’ ability to fulfill their obligations to the Fund. For example, the recent spread of an infectious respiratory illness caused by a novel strain of coronavirus (known as COVID-19) has caused volatility, severe market dislocations and liquidity constraints in many markets, including markets for the securities the Fund holds, and may adversely affect the Fund’s investments and operations. Additionally, to the extent the Fund invests in securities and instruments economically tied to Russia, the recent Russian invasion of Ukraine may adversely affect the Fund’s investments. Please see the Important Information section for additional discussion of the COVID-19 pandemic as well as the Russian invasion of Ukraine.
Government Intervention in Financial Markets Federal, state, and other governments, their regulatory agencies, or self-regulatory organizations may take actions that affect the regulation of the instruments in which a Fund invests, or the issuers of such instruments, in ways that are unforeseeable. Legislation or regulation may also change the way in which a Fund itself is regulated. Such legislation or regulation could limit or preclude a Fund’s ability to achieve its investment objective. Furthermore, volatile financial markets can expose a Fund to greater market and liquidity risk and potential difficulty in valuing portfolio instruments held by the Fund. The value of a Fund’s holdings is also generally subject to the risk of future local, national, or global economic disturbances based on unknown weaknesses in the markets in which a Fund invests. In addition, it is not certain that the U.S. Government will intervene in response to a future market disturbance and the effect of any such future intervention cannot be predicted. It is difficult for issuers to prepare for the impact of future financial downturns, although companies can seek to identify and manage future uncertainties through risk management programs.
Regulatory Risk Financial entities, such as investment companies and investment advisers, are generally subject to extensive government regulation and intervention. Government regulation and/or intervention may change the way a Fund is regulated, affect the expenses incurred directly by a Fund and the value of its investments, and limit and/or preclude a Fund’s ability to achieve its investment objective. Government regulation may change frequently and may have significant adverse consequences. Moreover, government regulation may have unpredictable and unintended effects.
Operational Risk An investment in a Fund, like any fund, can involve operational risks arising from factors such as processing errors, human errors, inadequate or failed internal or external processes, failures in systems and technology, changes in personnel and errors caused by third-party service providers. The occurrence of any of these failures, errors or breaches could result in a loss of information, regulatory scrutiny, reputational damage or other events, any of which could have
a material adverse effect on a Fund. While a Fund seeks to minimize such events through controls and oversight, there may still be failures that could cause losses to the Fund.
Cyber Security Risk As the use of technology has become more prevalent in the course of business, the Funds have become potentially more susceptible to operational and information security risks resulting from breaches in cyber security. A breach in cyber security refers to both intentional and unintentional cyber events that may, among other things, cause a Fund to lose proprietary information, suffer data corruption and/or destruction or lose operational capacity, result in the unauthorized release or other misuse of confidential information, or otherwise disrupt normal business operations. Cyber security failures or breaches may result in financial losses to a Fund and its shareholders. These failures or breaches may also result in disruptions to business operations, potentially resulting in financial losses; interference with a Fund’s ability to calculate its net asset value, process shareholder transactions or otherwise transact business with shareholders; impediments to trading; violations of applicable privacy and other laws; regulatory fines; penalties; reputational damage; reimbursement or other compensation costs; additional compliance and cyber security risk management costs and other adverse consequences. In addition, substantial costs may be incurred in order to prevent any cyber incidents in the future.
8. MASTER NETTING ARRANGEMENTS
A Fund may be subject to various netting arrangements (“Master Agreements”) with select counterparties. Master Agreements govern the terms of certain transactions, and are intended to reduce the counterparty risk associated with relevant transactions by specifying credit protection mechanisms and providing standardization that is intended to improve legal certainty. Each type of Master Agreement governs certain types of transactions. Different types of transactions may be traded out of different legal entities or affiliates of a particular organization, resulting in the need for multiple agreements with a single counterparty. As the Master Agreements are specific to unique operations of different asset types, they allow a Fund to close out and net its total exposure to a counterparty in the event of a default with respect to all the transactions governed under a single Master Agreement with a counterparty. For financial reporting purposes the Statements of Assets and Liabilities generally present derivative assets and liabilities on a gross basis, which reflects the full risks and exposures prior to netting.
Master Agreements can also help limit counterparty risk by specifying collateral posting arrangements at pre-arranged exposure levels. Under most Master Agreements, collateral is routinely transferred if the total net exposure to certain transactions (net of existing collateral already in
place) governed under the relevant Master Agreement with a counterparty in a given account exceeds a specified threshold, which typically ranges from zero to $250,000 depending on the counterparty and the type of Master Agreement. United States Treasury Bills and U.S. dollar cash are generally the preferred forms of collateral, although other securities may be used depending on the terms outlined in the applicable Master Agreement. Securities and cash pledged as collateral are reflected as assets on the Statements of Assets and Liabilities as either a component of Investments at value (securities) or Deposits with counterparty. Cash collateral received is not typically held in a segregated account and as such is reflected as a liability on the Statements of Assets and Liabilities as Deposits from counterparty. The market value of any securities received as collateral is not reflected as a component of NAV. A Fund’s overall exposure to counterparty risk can change substantially within a short period, as it is affected by each transaction subject to the relevant Master Agreement.
Master Repurchase Agreements and Global Master Repurchase Agreements (individually and collectively “Master Repo Agreements”) govern repurchase, reverse repurchase, and certain sale-buyback transactions between a Fund and select counterparties. Master Repo Agreements maintain provisions for, among other things, initiation, income payments, events of default, and maintenance of collateral. The market value of transactions under the Master Repo Agreement, collateral pledged or received, and the net exposure by counterparty as of period end are disclosed in the Notes to Schedules of Investments.
Master Securities Forward Transaction Agreements (“Master Forward Agreements”) govern certain forward settling transactions, such as TBA securities, delayed-delivery or certain sale-buyback transactions by and between a Fund and select counterparties. The Master Forward Agreements maintain provisions for, among other things, transaction initiation and confirmation, payment and transfer, events of default, termination, and maintenance of collateral. The market value of forward settling transactions, collateral pledged or received, and the net exposure by counterparty as of period end is disclosed in the Notes to Schedules of Investments.
Customer Account Agreements and related addenda govern cleared derivatives transactions such as futures, options on futures, and cleared OTC derivatives. Such transactions require posting of initial margin as determined by each relevant clearing agency which is segregated in an account at a futures commission merchant (“FCM”) registered with the Commodity Futures Trading Commission. In the United States, counterparty risk may be reduced as creditors of an FCM cannot have a claim to Fund assets in the segregated account. Portability of exposure reduces risk to the Funds. Variation margin, which reflects changes in market value, is generally exchanged daily, but may not be netted between futures
| | | | | | | | | | | | |
| | | | ANNUAL REPORT | | | | | | | JUNE 30, 2022 | | | 67 |
| | | | |
| Notes to Financial Statements | | (Cont.) | | |
and cleared OTC derivatives unless the parties have agreed to a separate arrangement in respect of portfolio margining. The market value or accumulated unrealized appreciation (depreciation), initial margin posted, and any unsettled variation margin as of period end are disclosed in the Notes to Schedules of Investments.
International Swaps and Derivatives Association, Inc. Master Agreements and Credit Support Annexes (“ISDA Master Agreements”) govern bilateral OTC derivative transactions entered into by a Fund with select counterparties. ISDA Master Agreements maintain provisions for general obligations, representations, agreements, collateral posting and events of default or termination. Events of termination include conditions that may entitle counterparties to elect to terminate early and cause settlement of all outstanding transactions under the applicable ISDA Master Agreement. Any election to terminate early could be material to the financial statements. The ISDA Master Agreement may contain additional provisions that add counterparty protection beyond coverage of existing daily exposure if the counterparty has a decline in credit quality below a predefined level or as required by regulation. Similarly, if required by regulation, the Funds may be required to post additional collateral beyond coverage of daily exposure. These amounts, if any, may (or if required by law, will) be segregated with a
third-party custodian. To the extent the Funds are required by regulation to post additional collateral beyond coverage of daily exposure, they could potentially incur costs, including in procuring eligible assets to meet collateral requirements, associated with such posting. The market value of OTC financial derivative instruments, collateral received or pledged, and net exposure by counterparty as of period end are disclosed in the Notes to Schedules of Investments.
9. FEES AND EXPENSES
(a) Investment Advisory Fee PIMCO is a majority-owned subsidiary of Allianz Asset Management of America L.P. (“Allianz Asset Management”) and serves as the Adviser to the Trust, pursuant to an investment advisory contract. The Adviser receives a monthly fee from each Fund at an annual rate based on average daily net assets (the “Investment Advisory Fee”). The Investment Advisory Fee for all classes is charged at an annual rate as noted in the table in note (b) below.
(b) Supervisory and Administrative Fee PIMCO serves as administrator (the “Administrator”) and provides supervisory and administrative services to the Trust for which it receives a monthly supervisory and administrative fee based on each share class’s average daily net assets (the “Supervisory and Administrative Fee”). As the Administrator, PIMCO bears the costs of various third-party services, including audit, custodial, portfolio accounting, legal, transfer agency and printing costs.
The Investment Advisory Fees and Supervisory and Administrative Fees for all classes, as applicable, are charged at the annual rate as noted in the following table (calculated as a percentage of each Fund’s average daily net assets attributable to each class):
| | | | | | | | | | | | | | | | | | | | | | | | | | | | |
| | | | Investment Advisory Fee | | | | | | Supervisory and Administrative Fee | |
| Fund Name | | | | | All Classes | | | | | | Institutional
Class | | | I-2 | | | I-3 | | | Class A | |
PIMCO RAE Emerging Markets Fund | | | | | | | 0.50% | | | | | | | | 0.25% | | | | 0.35% | | | | N/A | | | | 0.35% | |
PIMCO RAE Global ex-US Fund | | | | | | | 0.40% | | | | | | | | 0.15% | | | | 0.25% | | | | N/A | | | | 0.25% | |
PIMCO RAE International Fund | | | | | | | 0.30% | | | | | | | | 0.20% | | | | 0.30% | | | | N/A | | | | 0.30% | |
PIMCO RAE US Fund | | | | | | | 0.25% | | | | | | | | 0.15% | | | | 0.25% | | | | 0.35% | *(1) | | | 0.30% | |
PIMCO RAE US Small Fund | | | | | | | 0.35% | | | | | | | | 0.15% | | | | 0.25% | | | | N/A | | | | 0.30% | |
| (1) | PIMCO has contractually agreed, through October 31, 2022, to waive its supervisory and administrative fee for I-3 shares by 0.05% of the average daily net assets attributable to I-3 shares of the Fund. |
| * | This particular share class has been registered with the SEC, but has not yet launched. |
(c) Distribution and Servicing Fees PIMCO Investments LLC, a wholly-owned subsidiary of PIMCO, serves as the distributor (“Distributor”) of the Trust’s shares.
The Trust has adopted separate Distribution and Servicing Plans with respect to the Class A shares of the Trust pursuant to Rule 12b-1 under the Act. In connection with personal services rendered to Class A shareholders and the maintenance of such shareholder accounts, the Distributor receives servicing fees from the Trust of up to 0.25% for each of Class A shares (percentages reflect annual rates of the average daily net assets attributable to the applicable class).
The Trust paid distribution and servicing fees at effective rates as noted in the following table (calculated as a percentage of each Fund’s average daily net assets attributable to each class):
| | | | | | | | | | | | |
| | | | | | Allowable Rate | |
| | | |
| | | | | | Distribution Fee | | | Servicing Fee | |
| | | |
Class A | | | | | | | — | | | | 0.25% | |
The Distributor also received the proceeds of the initial sales charges paid by the shareholders upon the purchase of Class A shares and the contingent deferred sales charges paid by the shareholders upon certain redemptions of Class A shares. For the
period ended June 30, 2022, the Distributor retained $37,743 representing commissions (sales charges) and contingent deferred sales charges, net of any commission adjustments payable by the Distributor to broker dealers, from the Trust.
(d) Fund Expenses PIMCO provides or procures supervisory and administrative services for shareholders and also bears the costs of various third-party services required by the Funds, including audit, custodial, portfolio accounting, legal, transfer agency and printing costs. The Trust is responsible for the following expenses: (i) salaries and other compensation of any of the Trust’s executive officers and employees who are not officers, directors, stockholders, or employees of PIMCO or its subsidiaries or affiliates; (ii) taxes and governmental fees; (iii) brokerage fees and commissions and other portfolio transaction expenses; (iv) the costs of borrowing money, including interest expenses; (v) fees and expenses of the Trustees who are not “interested persons” of PIMCO or the Trust, and any counsel retained exclusively for their benefit; (vi) extraordinary expenses, including costs of litigation and indemnification expenses; (vii) organizational expenses; and (viii) any expenses allocated or allocable to a specific class of shares, and may include certain other expenses as permitted by the Trust’s Multi-Class Plan adopted pursuant to Rule 18f-3 under the Act and subject to review and approval by the Trustees. The ratio of expenses to average net assets per share class, as disclosed on the Financial Highlights, may differ from the annual fund operating expenses per share class.
The Trust pays no compensation directly to any Trustee or any other officer who is affiliated with the Administrator, all of whom receive
remuneration for their services to the Trust from the Administrator or its affiliates.
(e) Expense Limitation Pursuant to the Expense Limitation Agreement, PIMCO has agreed, through October 31, 2022, to waive a portion of the Funds’ Supervisory and Administrative Fee, or reimburse each Fund, to the extent that each Fund’s organizational expenses, pro rata share of expenses related to obtaining or maintaining a Legal Entity Identifier and pro rata share of Trustee Fees exceed 0.0049%, the “Expense Limit” (calculated as a percentage of each Fund’s average daily net assets attributable to each class). The Expense Limitation Agreement will automatically renew for one-year terms unless PIMCO provides written notice to the Trust at least 30 days prior to the end of the then current term. The waiver is reflected on the Statements of Operations as a component of Waiver and/or Reimbursement by PIMCO.
In any month in which the investment advisory contract or supervision and administration agreement is in effect, PIMCO is entitled to reimbursement by each Fund of any portion of the supervisory and administrative fee waived or reimbursed as set forth above (the “Reimbursement Amount”) during the previous thirty-six months from the time of the waiver, provided that such amount paid to PIMCO will not: i) together with any organizational expenses, pro rata share of expenses related to obtaining or maintaining a Legal Entity Identifier and pro rata Trustee fees, exceed, for such month, the Expense Limit (or the amount of the expense limit in place at the time the amount being recouped was originally waived if lower than the Expense Limit); ii) exceed the total Reimbursement Amount; or iii) include any amounts previously reimbursed to PIMCO.
In addition, in any month in which the investment advisory contract is in effect, PIMCO is entitled to reimbursement by a Fund of any portion of the advisory fee waived as set forth above (the “RAE Reimbursement Amount”) during the previous thirty-six months from the time of waiver, provided that such amount paid to PIMCO will not: i) together with any recoupment of organizational expenses, pro rata share of expenses related to obtaining or maintaining a Legal Entity Identifier and pro rata Trustee fees or supervisory and administrative fees pursuant to the Expense Limitation Agreement, exceed, for such month, the Expense Limit; ii) exceed the total RAE Reimbursement Amount; or iii) include any amounts previously reimbursed to PIMCO. The total recoverable amounts to PIMCO (from the Fee Waiver Agreement and Expense Limitation Agreement combined) at June 30, 2022, were as follows (amounts in thousands†):
| | | | | | | | | | | | | | | | | | | | |
| | | | Expiring within | | | | |
| | | | | |
| Fund Name | | | | | 12 months | | | 13-24 months | | | 25-36 months | | | Total | |
| | | | | |
PIMCO RAE Emerging Markets Fund | | | | | | $ | 5,389 | | | $ | 889 | | | $ | 91 | | | $ | 6,369 | |
| | | | | |
PIMCO RAE Global ex-US Fund | | | | | | | 156 | | | | 51 | | | | 7 | | | | 214 | |
| | | | | |
PIMCO RAE International Fund | | | | | | | 629 | | | | 389 | | | | 63 | | | | 1,081 | |
| | | | | |
PIMCO RAE US Fund | | | | | | | 780 | | | | 288 | | | | 74 | | | | 1,142 | |
| | | | | |
PIMCO RAE US Small Fund | | | | | | | 219 | | | | 158 | | | | 24 | | | | 401 | |
| † | A zero balance may reflect actual amounts rounding to less than one thousand. |
Pursuant to a Fee Waiver, PIMCO has contractually agreed, through October 31, 2022, to waive its supervisory and administrative fee for I-3 shares by 0.05% of the average daily net assets attributable to I-3 shares of PIMCO RAE US Fund. This Fee Waiver Agreement will automatically renew for one-year terms unless PIMCO provides written notice to the Trust at least 30 days prior to the end of the then current term.
| | | | | | | | | | | | |
| | | | ANNUAL REPORT | | | | | | | JUNE 30, 2022 | | | 69 |
| | | | |
| Notes to Financial Statements | | (Cont.) | | |
The waivers are reflected on the Statements of Operations as a component of Waiver and/or Reimbursement by PIMCO. For the period ended June 30, 2022, the amounts were (in thousands†):
| | | | | | | | |
| Fund Name | | | | | Waived Fees | |
| | |
PIMCO RAE Emerging Markets Fund | | | | | | $ | 91 | |
| | |
PIMCO RAE Global ex-US Fund | | | | | | | 6 | |
| | |
PIMCO RAE International Fund | | | | | | | 63 | |
| | |
PIMCO RAE US Fund | | | | | | | 73 | |
| | |
PIMCO RAE US Small Fund | | | | | | | 25 | |
| † | A zero balance may reflect actual amounts rounding to less than one thousand. |
(f) Acquired Fund Fees and Expenses Acquired Fund expenses incurred by the Funds, if any, will vary with changes in the expenses of the Acquired Funds, as well as the allocation of the Funds’ assets.
The expenses associated with investing in a fund of funds are generally higher than those for mutual funds that do not invest in other mutual funds. The cost of investing in a fund of funds will generally be higher than the cost of investing in a mutual fund that invests directly in individual stocks and bonds. By investing in a fund of funds, an investor will indirectly bear fees and expenses charged by Acquired Funds in addition to each Fund’s direct fees and expenses. In addition, the use of a fund of funds structure could affect the timing, amount and character of distributions to the shareholders and may therefore increase the amount of taxes payable by shareholders.
PIMCO has contractually agreed, through October 31, 2022, to waive, first, the Investment Advisory Fee and, second, to the extent necessary, the Supervisory and Administrative Fee it receives from the PIMCO RAE Global ex-US Fund in an amount equal to the Underlying Fund Fees indirectly incurred by the Fund in connection with its investments in Underlying Funds, to the extent the Fund’s Investment Advisory Fee or Investment Advisory Fee and Supervisory and Administrative Fee, taken together, are greater than or equal to the Underlying Fund Fees. This waiver will automatically renew for one-year terms unless PIMCO provides written notice to the Trust at least 30 days prior to the end of the then current term.
The waivers are reflected on the Statements of Operations as a component of Waiver and/or Reimbursement by PIMCO. For the period ended June 30, 2022, the amounts were (in thousands†):
| | | | | | | | |
| Fund Name | | | | | Waived Fees | |
| | |
PIMCO RAE Emerging Markets Fund | | | | | | $ | 0 | |
| | |
PIMCO RAE Global ex-US Fund | | | | | | | 504 | |
| | |
PIMCO RAE International Fund | | | | | | | 0 | |
| | |
PIMCO RAE US Fund | | | | | | | 0 | |
| | |
PIMCO RAE US Small Fund | | | | | | | 0 | |
| † | A zero balance may reflect actual amounts rounding to less than one thousand. |
10. RELATED PARTY TRANSACTIONS
The Adviser, Administrator, and Distributor are related parties. Fees paid to these parties are disclosed in Note 9, Fees and Expenses, and the accrued related party fee amounts are disclosed on the Statements of Assets and Liabilities.
11. GUARANTEES AND INDEMNIFICATIONS
Under the Trust’s organizational documents, each Trustee or officer of the Trust is indemnified and each employee or other agent of the Trust (including the Trust’s investment manager) may be indemnified, to the extent permitted by the Act, against certain liabilities that may arise out of performance of their duties to the Funds. Additionally, in the normal course of business, the Funds enter into contracts that contain a variety of indemnification clauses. The Funds’ maximum exposure under these arrangements is unknown as this would involve future claims that may be made against the Funds that have not yet occurred. However, the Funds have not had prior claims or losses pursuant to these contracts.
12. PURCHASES AND SALES OF SECURITIES
The length of time a Fund has held a particular security is not generally a consideration in investment decisions. A change in the securities held by a Fund is known as “portfolio turnover.” Each Fund may engage in frequent and active trading of portfolio securities to achieve its investment objective, particularly during periods of volatile market movements. High portfolio turnover may involve correspondingly greater transaction costs, including brokerage commissions or dealer mark-ups and other transaction costs on the sale of securities and reinvestments in other securities, which are borne by the Fund. Such sales may also result in realization of taxable capital gains, including short-term capital gains (which are generally taxed at ordinary income tax rates when distributed to shareholders). The transaction costs associated with portfolio turnover may adversely affect a Fund’s performance. The portfolio turnover rates are reported in the Financial Highlights.
Purchases and sales of securities (excluding short-term investments) for the period ended June 30, 2022, were as follows (amounts in thousands†):
| | | | | | | | | | | | | | | | | | | | |
| | | | U.S. Government/Agency | | | All Other | |
| | | | | |
| Fund Name | | | | | Purchases | | | Sales | | | Purchases | | | Sales | |
| | | | | |
PIMCO RAE Emerging Markets Fund | | | | | | $ | 0 | | | $ | 0 | | | $ | 1,402,463 | | | $ | 1,510,792 | |
| | | | | |
PIMCO RAE Global ex-US Fund | | | | | | | 0 | | | | 0 | | | | 25,307 | | | | 6,174 | |
| | | | | |
PIMCO RAE International Fund | | | | | | | 0 | | | | 0 | | | | 460,729 | | | | 862,515 | |
| | | | | |
PIMCO RAE US Fund | | | | | | | 0 | | | | 0 | | | | 790,313 | | | | 753,406 | |
| | | | | |
PIMCO RAE US Small Fund | | | | | | | 0 | | | | 0 | | | | 551,705 | | | | 467,523 | |
| † | A zero balance may reflect actual amounts rounding to less than one thousand. |
13. REDEMPTIONS IN-KIND
The redemptions in-kind are reflected on the Statement of Operations as a component of Net Realized Gain (Loss) on Investments in securities. For the period ended June 30, 2022, the PIMCO RAE US Fund realized gains or losses from in-kind redemptions, by affiliated Funds, of approximately (amounts in thousands†):
| | | | | | |
Realized Gains | | | Realized Losses | |
| |
| $ | 5,900 | | | $ | (14,253) | |
14. SHARES OF BENEFICIAL INTEREST
The Trust may issue an unlimited number of shares of beneficial interest with a $0.001 par value. Changes in shares of beneficial interest were as follows (shares and amounts in thousands†):
| | | | | | | | | | | | | | | | | | | | | | | | | | | | | | | | | | | | | | | | | | | | | | | | | | |
| | | PIMCO RAE Emerging Markets Fund | | | PIMCO RAE Global ex-US Fund | | | PIMCO RAE International Fund | |
| | | | | | |
| | | Year Ended
06/30/2022 | | | Year Ended
06/30/2021 | | | Year Ended
06/30/2022 | | | Year Ended
06/30/2021 | | | Year Ended
06/30/2022 | | | Year Ended
06/30/2021 | |
| | | | | | | | | | | | |
| | | Shares | | | Amount | | | Shares | | | Amount | | | Shares | | | Amount | | | Shares | | | Amount | | | Shares | | | Amount | | | Shares | | | Amount | |
Receipts for shares sold | | | | | | | | | | | | | | | | | | | | | | | | | | | | | | | | | | | | | | | | | | | | | | | | | | |
| | | | | | | | | | | | | |
Institutional Class | | | | | 97,422 | | | $ | 1,018,219 | | | | 90,678 | | | $ | 794,687 | | | | 508 | | | $ | 5,555 | | | | 956 | | | $ | 10,641 | | | | 18,328 | | | $ | 171,420 | | | | 60,949 | | | $ | 545,204 | |
| | | | | | | | | | | | | |
I-2 | | | | | 5,146 | | | | 56,049 | | | | 4,941 | | | | 52,084 | | | | 34 | | | | 371 | | | | 13 | | | | 147 | | | | 2,501 | | | | 25,826 | | | | 2,273 | | | | 25,205 | |
| | | | | | | | | | | | | |
Class A | | | | | 466 | | | | 5,028 | | | | 8,306 | | | | 89,323 | | | | 379 | | | | 3,979 | | | | 285 | | | | 2,595 | | | | 616 | | | | 5,603 | | | | 1,917 | | | | 20,724 | |
Issued as reinvestment of distributions | | | | | | | | | | | | | | | | | | | | | | | | | | | | | | | | | | | | | | | | | | | | | | | | | | |
| | | | | | | | | | | | | |
Institutional Class | | | | | 6,017 | | | | 64,018 | | | | 2,728 | | | | 27,030 | | | | 855 | | | | 8,675 | | | | 133 | | | | 1,351 | | | | 17,771 | | | | 157,094 | | | | 2,431 | | | | 24,117 | |
| | | | | | | | | | | | | |
I-2 | | | | | 507 | | | | 5,364 | | | | 2 | | | | 22 | | | | 4 | | | | 42 | | | | 0 | | | | 0 | | | | 286 | | | | 2,514 | | | | 2 | | | | 17 | |
| | | | | | | | | | | | | |
Class A | | | | | 128 | | | | 1,341 | | | | 17 | | | | 163 | | | | 129 | | | | 1,283 | | | | 25 | | | | 249 | | | | 586 | | | | 5,075 | | | | 9 | | | | 86 | |
Cost of shares redeemed | | | | | | | | | | | | | | | | | | | | | | | | | | | | | | | | | | | | | | | | | | | | | | | | | | |
| | | | | | | | | | | | | |
Institutional Class | | | | | (105,271 | ) | | | (1,201,372 | ) | | | (101,955 | ) | | | (956,691 | ) | | | (408 | ) | | | (4,128 | ) | | | (663 | ) | | | (7,380 | ) | | | (60,704 | ) | | | (591,702 | ) | | | (65,286 | ) | | | (651,421 | ) |
| | | | | | | | | | | | | |
I-2 | | | | | (2,774 | ) | | | (29,044 | ) | | | (357 | ) | | | (3,532 | ) | | | (16 | ) | | | (169 | ) | | | (8 | ) | | | (65 | ) | | | (3,571 | ) | | | (35,682 | ) | | | (96 | ) | | | (959 | ) |
| | | | | | | | | | | | | |
Class A | | | | | (476 | ) | | | (4,846 | ) | | | (7,976 | ) | | | (86,262 | ) | | | (430 | ) | | | (4,316 | ) | | | (695 | ) | | | (6,957 | ) | | | (571 | ) | | | (5,481 | ) | | | (47 | ) | | | (454 | ) |
| | | | | | | | | | | | | |
Net increase (decrease) resulting from Fund share transactions | | | | | 1,165 | | | $ | (85,243 | ) | | | (3,616 | ) | | $ | (83,176 | ) | | | 1,055 | | | $ | 11,292 | | | | 46 | | | $ | 581 | | | | (24,758 | ) | | $ | (265,333 | ) | | | 2,152 | | | $ | (37,481 | ) |
| | | | | | | |
| | | | | PIMCO RAE US Fund | | | PIMCO RAE US Small Fund | | | | | | | | | | | | | |
| | | | | | | | | |
| | | | | Year Ended
06/30/2022 | | | Year Ended
06/30/2021 | | | Year Ended
06/30/2022 | | | Year Ended
06/30/2021 | | | | | | | | | | | | | |
| | | | | | | | | | | | | |
| | | | | Shares | | | Amount | | | Shares | | | Amount | | | Shares | | | Amount | | | Shares | | | Amount | | | | | | | | | | | | | |
Receipts for shares sold | | | | | | | | | | | | | | | | | | | | | | | | | | | | | | | | | | | | | | | | | | | | | | | | | | |
| | | | | | | | | | | | | |
Institutional Class | | | | | 39,919 | | | $ | 555,289 | | | | 22,764 | | | $ | 258,994 | | | | 32,219 | | | $ | 359,498 | | | | 28,708 | | | $ | 305,247 | | | | | | | | | | | | | | | | | |
| | | | | | | | | | | | | |
I-2 | | | | | 1,836 | | | | 24,431 | | | | 1,534 | | | | 20,537 | | | | 6,453 | | | | 69,295 | | | | 440 | | | | 6,253 | | | | | | | | | | | | | | | | | |
| | | | | | | | | | | | | |
Class A | | | | | 616 | | | | 7,999 | | | | 404 | | | | 5,109 | | | | 9,590 | | | | 115,946 | | | | 3,632 | | | | 52,055 | | | | | | | | | | | | | | | | | |
Issued as reinvestment of distributions | | | | | | | | | | | | | | | | | | | | | | | | | | | | | | | | | | | | | | | | | | | | | | | | | | |
| | | | | | | | | | | | | |
Institutional Class | | | | | 8,452 | | | | 112,599 | | | | 2,030 | | | | 23,702 | | | | 9,290 | | | | 88,386 | | | | 4,184 | | | | 47,265 | | | | | | | | | | | | | | | | | |
| | | | | | | | | | | | | |
I-2 | | | | | 268 | | | | 3,540 | | | | 55 | | | | 633 | | | | 1,092 | | | | 10,276 | | | | 8 | | | | 91 | | | | | | | | | | | | | | | | | |
| | | | | | | | | | | | | |
Class A | | | | | 95 | | | | 1,231 | | | | 22 | | | | 247 | | | | 3,337 | | | | 30,755 | | | | 43 | | | | 476 | | | | | | | | | | | | | | | | | |
Cost of shares redeemed | | | | | | | | | | | | | | | | | | | | | | | | | | | | | | | | | | | | | | | | | | | | | | | | | | |
| | | | | | | | | | | | | |
Institutional Class | | | | | (47,655 | ) | | | (631,820 | ) | | | (19,072 | ) | | | (227,677 | ) | | | (29,132 | ) | | | (368,627 | ) | | | (44,846 | ) | | | (581,210 | ) | | | | | | | | | | | | | | | | |
| | | | | | | | | | | | | |
I-2 | | | | | (1,120 | ) | | | (14,972 | ) | | | (543 | ) | | | (6,815 | ) | | | (2,091 | ) | | | (21,259 | ) | | | (142 | ) | | | (2,060 | ) | | | | | | | | | | | | | | | | |
| | | | | | | | | | | | | |
Class A | | | | | (242 | ) | | | (3,220 | ) | | | (316 | ) | | | (3,665 | ) | | | (6,657 | ) | | | (75,310 | ) | | | (1,172 | ) | | | (16,420 | ) | | | | | | | | | | | | | | | | |
| | | | | | | | | | | | | |
Net increase (decrease) resulting from Fund share transactions | | | | | 2,169 | | | $ | 55,077 | | | | 6,878 | | | $ | 71,065 | | | | 24,101 | | | $ | 208,960 | | | | (9,145 | ) | | $ | (188,303 | ) | | | | | | | | | | | | | | | | |
| † | A zero balance may reflect actual amounts rounding to less than one thousand. |
| | | | | | | | | | | | |
| | | | ANNUAL REPORT | | | | | | | JUNE 30, 2022 | | | 71 |
| | | | |
| Notes to Financial Statements | | (Cont.) | | |
The following table discloses the number of shareholders that own 10% or more of the outstanding shares of a Fund along with their respective percent ownership, if any, as of June 30, 2022. Some of these shareholders may be considered related parties, which may include, but are not limited to, the investment adviser and its affiliates, affiliated broker dealers, fund of funds and directors or employees of the Trust or Adviser.
| | | | | | | | | | | | | | | | | | | | |
| | | | | | Shareholders that own 10% or more
of outstanding shares | | | Total percentage of portfolio held by
shareholders that own 10% or more
of outstanding shares | |
| | | | | |
| | | | | | Non-Related Parties | | | Related Parties | | | Non-Related Parties | | | Related Parties | |
| | | | | |
PIMCO RAE Emerging Markets Fund | | | | | | | 0 | | | | 2 | | | | 0% | | | | 45% | |
| | | | | |
PIMCO RAE Global ex-US Fund | | | | | | | 2 | | | | 0 | | | | 70% | | | | 0% | |
| | | | | |
PIMCO RAE International Fund | | | | | | | 0 | | | | 3 | | | | 0% | | | | 53% | |
| | | | | |
PIMCO RAE US Fund | | | | | | | 1 | | | | 0 | | | | 11% | | | | 0% | |
| | | | | |
PIMCO RAE US Small Fund | | | | | | | 0 | | | | 2 | | | | 0% | | | | 23% | |
15. REGULATORY AND LITIGATION MATTERS
The Funds are not named as defendants in any material litigation or arbitration proceedings and are not aware of any material litigation or claim pending or threatened against them.
On May 17, 2022, Allianz Global Investors U.S. LLC (“AGI U.S.”) pleaded guilty in connection with the proceeding United States of America v. Allianz Global Investors U.S. LLC. AGI U.S. is an indirect subsidiary of Allianz SE. The conduct resulting in the matter described above occurred entirely within AGI U.S. and did not involve PIMCO or the Distributor, or any personnel of PIMCO or the Distributor. Nevertheless, because of the disqualifying conduct of AGI U.S., their affiliate, PIMCO would have been disqualified from serving as the investment adviser, and the Distributor would have been disqualified from serving as the principal underwriter, to the Funds in the absence of SEC exemptive relief. PIMCO and the Distributor have received exemptive relief from the SEC to permit them to continue serving as investment adviser and principal underwriter for U.S.-registered investment companies, including the Funds.
The foregoing speaks only as of the date of this report.
16. FEDERAL INCOME TAX MATTERS
Each Fund intends to qualify as a regulated investment company under Subchapter M of the Internal Revenue Code (the “Code”) and
distribute all of its taxable income and net realized gains, if applicable, to shareholders. Accordingly, no provision for Federal income taxes has been made.
A Fund may be subject to local withholding taxes, including those imposed on realized capital gains. Any applicable foreign capital gains tax is accrued daily based upon net unrealized gains, and may be payable following the sale of any applicable investments.
In accordance with U.S. GAAP, the Adviser has reviewed the Funds’ tax positions for all open tax years. As of June 30, 2022, the Funds have recorded no liability for net unrecognized tax benefits relating to uncertain income tax positions they have taken or expect to take in future tax returns.
The Funds file U.S. federal, state, and local tax returns as required. The Funds’ tax returns are subject to examination by relevant tax authorities until expiration of the applicable statute of limitations, which is generally three years after the filing of the tax return but which can be extended to six years in certain circumstances. Tax returns for open years have incorporated no uncertain tax positions that require a provision for income taxes.
As of June 30, 2022, the components of distributable taxable earnings are as follows (amounts in thousands†):
| | | | | | | | | | | | | | | | | | | | | | | | | | | | | | | | | | | | |
| | | | | | Undistributed
Ordinary
Income(1) | | | Undistributed
Long-Term
Capital Gains | | | Net Tax Basis
Unrealized
Appreciation/
(Depreciation)(2) | | | Other
Book-to-Tax
Accounting
Differences (3) | | | Accumulated
Capital
Losses(4) | | | Qualified
Late-
Year Loss
Deferral -
Capital(5) | | | Qualified
Late-Year
Loss
Deferral -
Ordinary(6) | | | Total
Components
of Distributable
Earnings | |
| | | | | | | | | |
PIMCO RAE Emerging Markets Fund | | | | | | $ | 0 | | | $ | 112,011 | | | $ | (135,673 | ) | | $ | (11 | ) | | $ | (256,675 | ) | | $ | 0 | | | $ | (360 | ) | | $ | (280,708 | ) |
| | | | | | | | | |
PIMCO RAE Global ex-US Fund | | | | | | | 304 | | | | 5,806 | | | | (18,059 | ) | | | (2 | ) | | | 0 | | | | 0 | | | | 0 | | | | (11,951 | ) |
| | | | | | | | | |
PIMCO RAE International Fund | | | | | | | 10,586 | | | | 35,028 | | | | 4,787 | | | | (5 | ) | | | (48,329 | ) | �� | | 0 | | | | 0 | | | | 2,067 | |
| | | | | | | | | |
PIMCO RAE US Fund | | | | | | | 10,733 | | | | 66,344 | | | | 123,233 | | | | (11 | ) | | | 0 | | | | (6,528 | ) | | | 0 | | | | 193,771 | |
| | | | | | | | | |
PIMCO RAE US Small Fund | | | | | | | 0 | | | | 41,767 | | | | 10,707 | | | | (2 | ) | | | (24,434 | ) | | | 0 | | | | 0 | | | | 28,038 | |
| † | A zero balance may reflect actual amounts rounding to less than one thousand. |
| (1) | Includes undistributed short-term capital gains, if any. |
| (2) | Adjusted for open wash sale loss deferrals. Also adjusted for differences between book and tax realized and unrealized gain (loss) on: passive foreign investment companies (PFICs) and partnerships. |
| (3) | Represents differences in income tax regulations and financial accounting principles generally accepted in the United States of America, mainly for organizational expenditures. |
| (4) | Capital losses available to offset future net capital gains as shown below. |
| (5) | Capital losses realized during the period November 1, 2021 through June 30, 2022 which the Funds elected to defer to the following taxable year pursuant to income tax regulations. |
| (6) | Specified losses realized during the period November 1, 2021 through June 30, 2022 and Ordinary losses realized during the period January 1, 2022 through June 30, 2022 which the Funds elected to defer to the following taxable year pursuant to income tax regulations. |
Under the Regulated Investment Company Modernization Act of 2010, a fund is permitted to carry forward any new capital losses for an unlimited period. Additionally, such capital losses that are carried forward will retain their character as either short-term or long-term capital losses rather than being considered all short-term under previous law.
As of June 30, 2022, the Funds had the following post-effective capital losses with no expiration (amounts in thousands†):
| | | | | | | | | | | | |
| | | | | | Short-Term | | | Long-Term | |
| | | |
PIMCO RAE Emerging Markets Fund* | | | | | | $ | 121,840 | | | $ | 134,835 | |
| | | |
PIMCO RAE Global ex-US Fund | | | | | | | 0 | | | | 0 | |
| | | |
PIMCO RAE International Fund* | | | | | | | 23,880 | | | | 24,449 | |
| | | |
PIMCO RAE US Fund | | | | | | | 0 | | | | 0 | |
| | | |
PIMCO RAE US Small Fund* | | | | | | | 17,069 | | | | 7,365 | |
| † | A zero balance may reflect actual amounts rounding to less than one thousand. |
| * | Portion of amount represents realized loss and recognized built-in loss under IRC sections 382-83, which is carried forward to future years to offset future realized gain subject to certain limitations. |
As of June 30, 2022, the aggregate cost and the net unrealized appreciation/(depreciation) of investments for federal income tax purposes are as follows (amounts in thousands†):
| | | | | | | | | | | | | | | | | | | | |
| | | | | | Federal
Tax Cost | | | Unrealized
Appreciation | | | Unrealized
(Depreciation) | | | Net Unrealized
Appreciation/
(Depreciation)(7) | |
| | | | | |
PIMCO RAE Emerging Markets Fund | | | | | | $ | 1,496,024 | | | $ | 106,111 | | | $ | (241,794 | ) | | $ | (135,683 | ) |
| | | | | |
PIMCO RAE Global ex-US Fund | | | | | | | 96,811 | | | | 0 | | | | (18,059 | ) | | | (18,059 | ) |
| | | | | |
PIMCO RAE International Fund | | | | | | | 556,335 | | | | 35,337 | | | | (30,313 | ) | | | 5,024 | |
| | | | | |
PIMCO RAE US Fund | | | | | | | 718,053 | | | | 166,223 | | | | (42,975 | ) | | | 123,248 | |
| | | | | |
PIMCO RAE US Small Fund | | | | | | | 410,439 | | | | 36,899 | | | | (26,186 | ) | | | 10,713 | |
| † | A zero balance may reflect actual amounts rounding to less than one thousand. |
| (7) | Adjusted for open wash sale loss deferrals. Also adjusted for differences between book and tax realized and unrealized gain (loss) on: passive foreign investment companies (PFICs) and partnerships. |
For the fiscal years ended June 30, 2022 and June 30, 2021, respectively, the Funds made the following tax basis distributions (amounts in thousands†):
| | | | | | | | | | | | | | | | | | | | | | | | | | | | |
| | | | | | June 30, 2022 | | | June 30, 2021 | |
| | | | | | | |
| | | | | | Ordinary
Income
Distributions(8) | | | Long-Term
Capital Gain
Distributions | | | Return
of Capital(9) | | | Ordinary
Income
Distributions(8) | | | Long-Term
Capital Gain
Distributions | | | Return of
Capital(9) | |
| | | | | | | |
PIMCO RAE Emerging Markets Fund | | | | | | $ | 73,000 | | | $ | 0 | | | $ | 0 | | | $ | 27,500 | | | $ | 0 | | | $ | 0 | |
| | | | | | | |
PIMCO RAE Global ex-US Fund | | | | | | | 10,000 | | | | 0 | | | | 0 | | | | 1,600 | | | | 0 | | | | 0 | |
| | | | | | | |
PIMCO RAE International Fund | | | | | | | 85,901 | | | | 81,450 | | | | 0 | | | | 24,500 | | | | 0 | | | | 0 | |
| | | | | | | |
PIMCO RAE US Fund | | | | | | | 23,950 | | | | 95,675 | | | | 0 | | | | 18,680 | | | | 6,500 | | | | 0 | |
| | | | | | | |
PIMCO RAE US Small Fund | | | | | | | 43,760 | | | | 88,340 | | | | 0 | | | | 44,602 | | | | 3,700 | | | | 0 | |
| † | A zero balance may reflect actual amounts rounding to less than one thousand. |
| (8) | Includes short-term capital gains distributed, if any. |
| (9) | A portion of the distributions made represents a tax return of capital. Return of capital distributions have been reclassified from undistributed net investment income to paid-in capital to more appropriately conform financial accounting to tax accounting. |
| | | | | | | | | | | | |
| | | | ANNUAL REPORT | | | | | | | JUNE 30, 2022 | | | 73 |
| | | | |
| Report of Independent Registered Public Accounting Firm | | | | |
To the Board of Trustees of PIMCO Equity Series® and Shareholders of PIMCO RAE Emerging Markets Fund, PIMCO RAE Global ex-US Fund, PIMCO RAE International Fund, PIMCO RAE US Fund and PIMCO RAE US Small Fund
Opinions on the Financial Statements
We have audited the accompanying statements of assets and liabilities, including the schedules of investments, of PIMCO RAE Emerging Markets Fund, PIMCO RAE Global ex-US Fund, PIMCO RAE International Fund, PIMCO RAE US Fund and PIMCO RAE US Small Fund (five of the funds constituting PIMCO Equity Series®, hereafter collectively referred to as the “Funds”) as of June 30, 2022, the related statements of operations for the year ended June 30, 2022, the statements of changes in net assets for each of the two years in the period ended June 30, 2022, including the related notes, and the financial highlights for each of the five years in the period ended June 30, 2022 (collectively referred to as the “financial statements”). In our opinion, the financial statements present fairly, in all material respects, the financial position of each of the Funds as of June 30, 2022, the results of each of their operations for the year then ended, the changes in each of their net assets for each of the two years in the period ended June 30, 2022 and each of the financial highlights for each of the five years in the period ended June 30, 2022 in conformity with accounting principles generally accepted in the United States of America.
Basis for Opinions
These financial statements are the responsibility of the Funds’ management. Our responsibility is to express an opinion on the Funds’ financial statements based on our audits. We are a public accounting firm registered with the Public Company Accounting Oversight Board (United States) (PCAOB) and are required to be independent with respect to the Funds in accordance with the U.S. federal securities laws and the applicable rules and regulations of the Securities and Exchange Commission and the PCAOB.
We conducted our audits of these financial statements in accordance with the standards of the PCAOB. Those standards require that we plan and perform the audit to obtain reasonable assurance about whether the financial statements are free of material misstatement, whether due to error or fraud.
Our audits included performing procedures to assess the risks of material misstatement of the financial statements, whether due to error or fraud, and performing procedures that respond to those risks. Such procedures included examining, on a test basis, evidence regarding the amounts and disclosures in the financial statements. Our audits also included evaluating the accounting principles used and significant estimates made by management, as well as evaluating the overall presentation of the financial statements. Our procedures included confirmation of securities owned as of June 30, 2022 by correspondence with the custodian, transfer agent and brokers; when replies were not received from brokers, we performed other auditing procedures. We believe that our audits provide a reasonable basis for our opinions.
/s/ PricewaterhouseCoopers LLP
Kansas City, Missouri
August 26, 2022
We have served as the auditor of one or more investment companies in PIMCO Equity Series® since 2010.
| | | | | | |
| Glossary: | | (abbreviations that may be used in the preceding statements) | | | | (Unaudited) |
| | | | | | | | | | |
| | | | |
Counterparty Abbreviations: | | | | | | | | |
| | | | | |
| BCY | | Barclays Capital, Inc. | | FICC | | Fixed Income Clearing Corporation | | MSC | | Morgan Stanley & Co. LLC. |
| | | | | |
| BOS | | BofA Securities, Inc. | | FOB | | Credit Suisse Securities (USA) LLC | | SAL | | Citigroup Global Markets, Inc. |
| | | | | |
| BPG | | BNP Paribas Securities Corp. | | GSC | | Goldman Sachs & Co. LLC | | UBS | | UBS Securities LLC |
| | | | | |
| BSN | | The Bank of Nova Scotia - Toronto | | MBC | | HSBC Bank Plc | | | | |
| | | | |
Currency Abbreviations: | | | | | | | | |
| | | | | |
| USD (or $) | | United States Dollar | | | | | | | | |
| | | | |
Index/Spread Abbreviations: | | | | | | | | |
| | | | | |
| OTC | | Over the Counter | | | | | | | | |
| | | | |
Other Abbreviations: | | | | | | | | |
| | | | | |
| ADR | | American Depositary Receipt | | REIT | | Real Estate Investment Trust | | TBA | | To-Be-Announced |
| | | | |
| AID | | Agency International Development | | SP - ADR | | Sponsored American Depositary Receipt | | |
| | | | | | | | | | | | |
| | | | ANNUAL REPORT | | | | | | | JUNE 30, 2022 | | | 75 |
| | | | |
| Federal Income Tax Information | | | | (Unaudited) |
As required by the Internal Revenue Code (“Code”) and Treasury Regulations, if applicable, shareholders must be notified within 60 days of the Funds’ fiscal year end regarding the status of qualified dividend income and the dividend received deduction.
Dividend Received Deduction. Corporate shareholders are generally entitled to take the dividend received deduction on the portion of a fund’s dividend distribution that qualifies under tax law. The percentage of the following Funds’ fiscal 2022 ordinary income dividend that qualifies for the corporate dividend corporate dividend received deduction is set forth below:
Qualified Dividend Income. Under the Jobs and Growth Tax Relief Reconciliation Act of 2003, the following percentage of ordinary dividends paid during the fiscal year ended June 30, 2022 was designated as ‘‘qualified dividend income’’ as defined in the Jobs and Growth Tax Relief Reconciliation Act of 2003 subject to reduced tax rates in 2022:
Qualified Interest Income and Qualified Short-Term Capital Gain (for non-U.S. resident shareholders only). Under the American Jobs Creation Act of 2004, the following amounts of ordinary dividends paid during the fiscal year ended June 30, 2022 are considered to be derived from “qualified interest income,” as defined in Section 871(k)(1)(E) of the Code, and therefore are designated as interest-related dividends, as defined in Section 871(k)(1)(C) of the Code. Further, the following amounts of ordinary dividends paid during the fiscal year ended June 30, 2022 are considered to be derived from “qualified short-term capital gain,” as defined in Section 871(k)(2)(D) of the Code, and therefore are designated as qualified short-term gain dividends, as defined by Section 871(k)(2)(C) of the Code.
Section 163(j) Interest Dividends. The Funds intend to pass through the maximum amount allowable as Section 163(j) Interest defined in Proposed Treasury Section 1.163(j)-1(b). The 163(j) amount of ordinary income distributions are as follows:
Foreign Taxes. The Funds have made an election under the Internal Revenue Code Section 853 to pass through foreign taxes paid. Shareholders will receive more detailed information along with their Form 1099-DIV.
| | | | | | | | | | | | | | | | | | | | | | | | | | | | | | | | |
| | | | | | Dividend
Received
Deduction % | | | Qualified
Dividend
Income % | | | Qualified
Interest
Income
(000s)† | | | Qualified
Short-Term
Capital Gains
(000s)† | | | 163(j)
Interest Dividends
(000s)† | | | Foreign Source
Income | | | Foreign
Taxes Pass
Through | |
| | | | | | | | |
PIMCO RAE Emerging Markets Fund | | | | | | | 0% | | | | 62% | | | $ | 88 | | | $ | 0 | | | $ | 0 | | | $ | 83,179,882 | | | $ | 10,235,674 | |
| | | | | | | | |
PIMCO RAE Global ex-US Fund | | | | | | | 2% | | | | 29% | | | | 1 | | | | 0 | | | | 0 | | | | 9,905,967 | | | | 1,879,091 | |
| | | | | | | | |
PIMCO RAE International Fund | | | | | | | 2% | | | | 11% | | | | 19 | | | | 47,900 | | | | 0 | | | | 36,539,020 | | | | 3,021,702 | |
| | | | | | | | |
PIMCO RAE US Fund | | | | | | | 100% | | | | 98% | | | | 5 | | | | 7,950 | | | | 0 | | | | 0 | | | | 0 | |
| | | | | | | | |
PIMCO RAE US Small Fund | | | | | | | 87% | | | | 87% | | | | 3 | | | | 40,725 | | | | 0 | | | | 0 | | | | 0 | |
| † | A zero balance may reflect actual amounts rounding to less than one thousand. |
Shareholders are advised to consult their own tax advisor with respect to the tax consequences of their investment in the Trust. In January 2023, you will be advised on IRS Form 1099-DIV as to the federal tax status of the dividends and distributions received by you in calendar year 2022.
Section 199A Dividends. Non-corporate fund shareholders of the Funds below meeting certain holding period requirements may be able to deduct up to 20 percent of qualified REIT dividends passed through and reported to the shareholders by the Funds as IRC section 199A dividends. The IRC section 199A percentage of ordinary dividends are as follows:
| | | | | | | | |
| | | | | | 199A Dividends | |
| | |
PIMCO RAE Emerging Markets Fund | | | | | | | 0% | |
| | |
PIMCO RAE Global ex-US Fund | | | | | | | 0% | |
| | |
PIMCO RAE International Fund | | | | | | | 0% | |
| | |
PIMCO RAE US Fund | | | | | | | 1% | |
| | |
PIMCO RAE US Small Fund | | | | | | | 10% | |
| | | | |
| Distribution Information | | | | (Unaudited) |
For purposes of Section 19 of the Investment Company Act of 1940 (the “Act”), the Funds estimated the periodic sources of any dividends paid during the period covered by this report in accordance with good accounting practice. Rule 19a-1(e) under the Act, sets forth the actual source information for dividends paid during the six month period ended June 30, 2022 calculated as of each distribution period pursuant to Section 19 of the Act. The tax character of all dividends and distributions is reported on Form 1099-DIV (for shareholders who receive U.S. federal tax reporting) at the end of each calendar year. The Funds distribute annually in December. The Funds did not pay distributions for the six month period ending June 30, 2022. See the Financial Highlights section of this report for the tax characterization of distributions determined in accordance with federal income tax regulations for the fiscal year.
| | | | | | | | | | | | |
| | | | ANNUAL REPORT | | | | | | | JUNE 30, 2022 | | | 77 |
The charts below identify the Trustees and executive officers of the Trust. Unless otherwise indicated, the address of all persons below is 650 Newport Center Drive, Newport Beach, CA 92660.
The Funds’ Statement of Additional Information includes more information about the Trustees and Officers. To request a free copy, call PIMCO at (888) 87-PIMCO or visit the Funds’ website at www.pimco.com.
| | | | | | | | |
Name, Year of Birth and
Position Held with Trust* | | Term of
Office and
Length of
Time Served† | | Principal Occupation(s) During Past 5 Years | | Number of Funds in Fund Complex
Overseen by Trustee | | Other Public Company and Investment Company
Directorships Held by Trustee During the Past 5 Years |
| | | | |
| Interested Trustees1 | | | | | | | | |
| | | | |
Peter G. Strelow (1970) Chairman of the Board
and Trustee | | 02/2019 to present | | Managing Director and Co-Chief Operating Officer, PIMCO. Senior Vice President of the Trust, PIMCO Equity Series VIT, PIMCO Funds, PIMCO Variable Insurance Trust and PIMCO ETF Trust, PIMCO Managed Accounts Trust, PIMCO-Sponsored Interval Funds and PIMCO-Sponsored Closed-End Funds. Formerly, Chief Administrative Officer, PIMCO. | | 149 | | Chairman and Trustee, PIMCO Equity Series VIT, PIMCO Funds, PIMCO Variable Insurance Trust, PIMCO ETF Trust. |
| | | | |
Kimberley G. Stafford (1978) Trustee | | 02/2021 to present | | Managing Director, Global Head of Product Strategy, PIMCO; and Member of Executive Committee, PIMCO. Formerly, Head of Asia-Pacific, Global Head of Consultant Relations and Head of US Institutional and Alternatives Sales, PIMCO. | | 149 | | Trustee, PIMCO Equity Series VIT, PIMCO Funds, PIMCO Variable Insurance Trust, PIMCO ETF Trust. |
| | | | |
| Independent Trustees | | | | | | | | |
| | | | |
George E. Borst (1948) Trustee | | 05/2019 to present | | Executive Advisor, McKinsey & Company; Formerly, Executive Advisor, Toyota Financial Services; and CEO, Toyota Financial Services. | | 149 | | Trustee, PIMCO Equity Series VIT, PIMCO Funds, PIMCO Variable Insurance and PIMCO ETF Trust; Director, MarineMax Inc. |
| | | | |
Jennifer Holden Dunbar (1963) Trustee | | 02/2016 to present | | Formerly, Managing Director, Dunbar Partners, LLC (business consulting and investments) (05/05-05/21); and Partner, Leonard Green & Partners, L.P. | | 149 | | Trustee, PIMCO Equity Series VIT, PIMCO Funds, PIMCO Variable Insurance and PIMCO ETF Trust; Director, PS Business Parks; Director, Big 5 Sporting Goods Corporation. |
| | | | |
Kym M. Hubbard (1957) Trustee | | 05/2019 to present | | Formerly, Global Head of Investments, Chief Investment Officer and Treasurer, Ernst & Young. | | 149 | | Trustee, PIMCO Equity Series VIT, PIMCO Funds, PIMCO Variable Insurance and PIMCO ETF Trust; Director, State Auto Financial Corporation. |
| | | | |
Gary F. Kennedy (1955) Trustee | | 05/2019 to present | | Formerly, Senior Vice President, General Counsel and Chief Compliance Officer, American Airlines and AMR Corporation (now American Airlines Group). | | 149 | | Trustee, PIMCO Equity Series VIT, PIMCO Funds, PIMCO Variable Insurance and PIMCO ETF Trust. |
| | | | |
Peter B. McCarthy (1950) Trustee | | 09/2011 to present | | Formerly, Assistant Secretary and Chief Financial Officer, United States Department of Treasury; Deputy Managing Director, Institute of International Finance. | | 149 | | Trustee, PIMCO Equity Series VIT, PIMCO Funds, PIMCO Variable Insurance and PIMCO ETF Trust. |
| | | | |
Ronald C. Parker (1951) Lead Independent Trustee | | 02/2016 to present Lead Independent Trustee 05/2019 to present | | Director of Roseburg Forest Products Company. Formerly, Chairman of the Board, The Ford Family Foundation; and President, Chief Executive Officer, Hampton Affiliates (forestry products). | | 149 | | Lead Independent Trustee, PIMCO Equity Series VIT, PIMCO Funds, PIMCO Variable Insurance and PIMCO ETF Trust. |
| * | Unless otherwise noted, the information for the individuals listed is as of June 30, 2022. |
| 1 | Ms. Stafford is an “interested persons” of the Trust (as that term is defined in the 1940 Act) because of his affiliations with PIMCO. |
| † | Trustees serve until their successors are duly elected and qualified. |
Executive Officers
| | | | |
Name, Year of Birth and
Position Held with Trust* | | Term of Office and
Length of Time Served | | Principal Occupation(s) During Past 5 Years† |
| | |
Eric D. Johnson (1970) President | | 06/2019 to present | | Executive Vice President and Head of Funds Business Group Americas, PIMCO. President, PIMCO Funds, PIMCO Variable Insurance Trust, PIMCO ETF Trust, PIMCO Equity Series VIT, PIMCO Managed Accounts Trust, PIMCO-Sponsored Interval Funds and PIMCO-Sponsored Closed-End Funds. |
| | |
Ryan G. Leshaw (1980) Chief Legal Officer and Secretary | | 08/2021 to present | | Executive Vice President and Senior Counsel, PIMCO. Chief Legal Officer and Secretary, PIMCO Funds, PIMCO Variable Insurance Trust, PIMCO ETF Trust and PIMCO Equity Series VIT. Chief Legal Officer, PIMCO Managed Accounts Trust, PIMCO-Sponsored Interval Funds and PIMCO-Sponsored Closed-End Funds. Formerly, Associate, Willkie Farr & Gallagher LLP. |
| | |
Keisha Audain-Pressley (1975)** Chief Compliance Officer | | 01/2020 to present | | Executive Vice President and Deputy Chief Compliance Officer, PIMCO. Chief Compliance Officer, PIMCO Funds, PIMCO Variable Insurance Trust, PIMCO ETF Trust, PIMCO Equity Series VIT, PIMCO Managed Accounts Trust, PIMCO-Sponsored Interval Funds and PIMCO-Sponsored Closed-End Funds. |
| | |
Joshua D. Ratner (1976)** Senior Vice President | | 05/2019 to present | | Executive Vice President and Head of Americas Operations, PIMCO. Senior Vice President, PIMCO Funds, PIMCO Variable Insurance Trust, PIMCO ETF Trust, PIMCO Equity Series VIT, PIMCO Managed Accounts Trust, PIMCO-Sponsored Interval Funds and PIMCO-Sponsored Closed-End Funds. |
| | |
Peter G. Strelow (1970) Senior Vice President | | 06/2019 to present | | Managing Director and Co-Chief Operating Officer, PIMCO. Senior Vice President, PIMCO Funds, PIMCO Variable Insurance Trust, PIMCO ETF Trust, PIMCO Equity Series VIT, PIMCO Managed Accounts Trust, PIMCO-Sponsored Interval Funds and PIMCO-Sponsored Closed-End Funds. Formerly, Chief Administrative Officer, PIMCO. |
| | |
Wu-Kwan Kit (1981) Assistant Secretary | | 08/2017 to present | | Senior Vice President and Senior Counsel, PIMCO. Assistant Secretary, PIMCO Funds, PIMCO Variable Insurance Trust, PIMCO ETF Trust and PIMCO Equity Series VIT. Vice President, Senior Counsel and Secretary, PIMCO Managed Accounts Trust, PIMCO-Sponsored Interval Funds and PIMCO-Sponsored Closed-End Funds. Formerly, Assistant General Counsel, VanEck Associates Corp. |
| | |
Douglas B. Burrill (1980)** Vice President | | 08/2022 to present | | Senior Vice President, PIMCO. Vice President, PIMCO Funds, PIMCO Variable Insurance Trust, PIMCO ETF Trust, PIMCO Equity Series VIT, PIMCO-Sponsored Interval Funds and PIMCO-Sponsored Closed-End Funds. |
| | |
Jeffrey A. Byer (1976) Vice President | | 02/2020 to present | | Executive Vice President, PIMCO. Vice President, PIMCO Funds, PIMCO Variable Insurance Trust, PIMCO ETF Trust, PIMCO Equity Series, PIMCO Equity Series VIT, PIMCO Managed Accounts Trust, PIMCO-Sponsored Interval Funds and PIMCO-Sponsored Closed-End Funds. |
| | |
Elizabeth A. Duggan (1964) Vice President | | 02/2021 to present | | Executive Vice President, PIMCO. Vice President, PIMCO Funds, PIMCO Variable Insurance Trust, PIMCO ETF Trust, PIMCO Equity Series VIT, PIMCO Managed Accounts Trust, PIMCO-Sponsored Interval Funds and PIMCO-Sponsored Closed-End Funds. |
| | |
Mark A. Jelic (1981) Vice President | | 08/2021 to present | | Senior Vice President, PIMCO. Vice President, PIMCO Funds, PIMCO Variable Insurance Trust, PIMCO ETF Trust, PIMCO Equity Series VIT, PIMCO-Sponsored Interval Funds and PIMCO-Sponsored Closed-End Funds. |
| | |
Kenneth W. Lee (1972) Vice President | | 08/2022 to present | | Senior Vice President, PIMCO. Vice President, PIMCO Funds, PIMCO Variable Insurance Trust, PIMCO ETF Trust, PIMCO Equity Series VIT, PIMCO-Sponsored Interval Funds and PIMCO-Sponsored Closed-End Funds. |
| | |
Brian J. Pittluck (1977) Vice President | | 01/2020 to present | | Senior Vice President, PIMCO. Vice President, PIMCO Funds, PIMCO Variable Insurance Trust, PIMCO ETF Trust, PIMCO Equity Series VIT, PIMCO Managed Accounts Trust, PIMCO-Sponsored Interval Funds and PIMCO-Sponsored Closed-End Funds. |
| | |
Keith A. Werber (1973) Vice President | | 05/2022 to present | | Executive Vice President, PIMCO. Vice President, PIMCO Funds, PIMCO Variable Insurance Trust, PIMCO ETF Trust and PIMCO Equity Series VIT. |
| | |
Bijal Y. Parikh (1978) Treasurer | | 01/2021 to present | | Senior Vice President, PIMCO. Treasurer, PIMCO Funds, PIMCO Variable Insurance Trust, PIMCO ETF Trust and PIMCO Equity Series VIT, PIMCO Managed Accounts Trust, PIMCO-Sponsored Interval Funds and PIMCO-Sponsored Closed-End Funds. |
| | |
Erik C. Brown (1967)*** Assistant Treasurer | | 03/2010 to present | | Executive Vice President, PIMCO. Assistant Treasurer, PIMCO Funds, PIMCO Variable Insurance Trust, PIMCO ETF Trust, PIMCO Equity Series VIT, PIMCO Managed Accounts Trust, PIMCO-Sponsored Interval Funds and PIMCO-Sponsored Closed-End Funds. |
| | |
Brandon T. Evans (1982) Assistant Treasurer | | 05/2019 to present | | Senior Vice President, PIMCO. Assistant Treasurer, PIMCO Funds, PIMCO Variable Insurance Trust, PIMCO ETF Trust and PIMCO Equity Series VIT. Deputy Treasurer, PIMCO Managed Accounts Trust, PIMCO-Sponsored Interval Funds and PIMCO-Sponsored Closed-End Funds. |
| * | Unless otherwise noted, the information for the individuals listed is as of August 25, 2022. |
| † | The term “PIMCO-Sponsored Closed-End Funds” as used herein includes: PIMCO Access Income Fund, PIMCO California Municipal Income Fund, PIMCO California Municipal Income Fund II, PIMCO California Municipal Income Fund III, PIMCO Municipal Income Fund, PIMCO Municipal Income Fund II, PIMCO Municipal Income Fund III, PIMCO New York Municipal Income Fund, PIMCO New York Municipal Income Fund II, PIMCO New York Municipal Income Fund III, PCM Fund Inc., PIMCO Corporate & Income Opportunity Fund, PIMCO Corporate & Income Strategy Fund, PIMCO Dynamic Income Fund, PIMCO Dynamic Income Opportunities Fund, PIMCO Energy and Tactical Credit Opportunities Fund, PIMCO Global StocksPLUS® & Income Fund, PIMCO High Income Fund, PIMCO Income Strategy Fund, PIMCO Income Strategy Fund II and PIMCO Strategic Income Fund, Inc.; the term “PIMCO-Sponsored Interval Funds” as used herein includes: PIMCO Flexible Credit Income Fund, PIMCO Flexible Municipal Income Fund, PIMCO California Flexible Municipal Income Fund and PIMCO Flexible Emerging Markets Income Fund. |
| ** | The address of these officers is Pacific Investment Management Company LLC, 1633 Broadway, New York, New York 10019. |
| *** | The address of these officers is Pacific Investment Management Company LLC, 401 Congress Ave., Austin, Texas 78701. |
| | | | | | | | | | | | |
| | | | ANNUAL REPORT | | | | | | | JUNE 30, 2022 | | | 79 |
| | | | |
| Privacy Policy1 | | | | (Unaudited) |
The Funds2,3 consider customer privacy to be a fundamental aspect of their relationships with shareholders and are committed to maintaining the confidentiality, integrity and security of their current, prospective and former shareholders’ non-public personal information. The Funds have developed policies that are designed to protect this confidentiality, while allowing shareholder needs to be served.
OBTAINING NON-PUBLIC PERSONAL INFORMATION
In the course of providing shareholders with products and services, the Funds and certain service providers to the Funds, such as the Funds’ investment advisers or sub-advisers (“Advisers”), may obtain non-public personal information about shareholders, which may come from sources such as account applications and other forms, from other written, electronic or verbal correspondence, from shareholder transactions, from a shareholder’s brokerage or financial advisory firm, financial professional or consultant, and/or from information captured on applicable websites.
RESPECTING YOUR PRIVACY
As a matter of policy, the Funds do not disclose any non-public personal information provided by shareholders or gathered by the Funds to non-affiliated third parties, except as required or permitted by law or as necessary for such third parties to perform their agreements with respect to the Funds. As is common in the industry, non-affiliated companies may from time to time be used to provide certain services, such as preparing and mailing prospectuses, reports, account statements and other information, conducting research on shareholder satisfaction and gathering shareholder proxies. The Funds or their affiliates may also retain non-affiliated companies to market Fund shares or products which use Fund shares and enter into joint marketing arrangements with them and other companies. These companies may have access to a shareholder’s personal and account information, but are permitted to use this information solely to provide the specific service or as otherwise permitted by law. In most cases, the shareholders will be clients of a third party, but the Funds may also provide a shareholder’s personal and account information to the shareholder’s respective brokerage or financial advisory firm and/or financial professional or consultant.
SHARING INFORMATION WITH THIRD PARTIES
The Funds reserve the right to disclose or report personal or account information to non-affiliated third parties in limited circumstances where the Funds believe in good faith that disclosure is required under law, to cooperate with regulators or law enforcement authorities, to protect their rights or property, or upon reasonable request by any Fund in which a shareholder has invested. In addition, the Funds may disclose information about a shareholder or a shareholder’s accounts to a non-affiliated third party at the shareholder’s request or with the consent of the shareholder.
SHARING INFORMATION WITH AFFILIATES
The Funds may share shareholder information with their affiliates in connection with servicing shareholders’ accounts, and subject to applicable law may provide shareholders with information about products and services that the Funds or their Advisers, distributors or their affiliates (“Service Affiliates”) believe may be of interest to such shareholders. The information that the Funds may share may include, for example, a shareholder’s participation in the Funds or in other investment programs sponsored by a Service Affiliate, a shareholder’s ownership of certain types of accounts (such as IRAs), information about the Funds’ experiences or transactions with a shareholder, information captured on applicable websites, or other data about a shareholder’s accounts, subject to applicable law. The Funds’ Service Affiliates, in turn, are not permitted to share shareholder information with non-affiliated entities, except as required or permitted by law.
PROCEDURES TO SAFEGUARD PRIVATE INFORMATION
The Funds take seriously the obligation to safeguard shareholder non-public personal information. In addition to this policy, the Funds have implemented procedures that are designed to restrict access to a shareholder’s non-public personal information to internal personnel who need to know that information to perform their jobs, such as servicing shareholder accounts or notifying shareholders of new products or services. Physical, electronic and procedural safeguards are in place to guard a shareholder’s non-public personal information.
INFORMATION COLLECTED FROM WEBSITES
The Funds or their service providers and partners may collect information from shareholders via websites they maintain. The information collected via websites maintained by the Funds or their service providers includes client non-public personal information.
CHANGES TO THE PRIVACY POLICY
From time to time, the Funds may update or revise this privacy policy. If there are changes to the terms of this privacy policy, documents containing the revised policy on the relevant website will be updated.
1 Amended as of June 25, 2020.
2 PIMCO Investments LLC (“PI”) serves as the Funds’ distributor and does not provide brokerage services or any financial advice to investors in the Funds solely because it distributes the Funds. This Privacy Policy applies to the activities of PI to the extent that PI regularly effects or engages in transactions with or for a shareholder of a series of a Trust who is the record owner of such shares. For purposes of this Privacy Policy, references to “the Funds” shall include PI when acting in this capacity.
3 When distributing this Policy, a Fund may combine the distribution with any similar distribution of its investment adviser’s privacy policy. The distributed, combined, policy may be written in the first person (i.e. by using “we” instead of “the Funds”).
| | | | |
| Liquidity Risk Management Program | | | | (Unaudited) |
In compliance with Rule 22e-4 (the “Liquidity Rule”) under the Investment Company Act of 1940, as amended (“1940 Act”), PIMCO Equity Series (the “Trust”) has adopted and implemented a liquidity risk management program (the “Program”) for each series of the Trust (each a “Fund” and collectively, the “Funds”) not regulated as a money market fund under 1940 Act Rule 2a-7, which is reasonably designed to assess and manage the Funds’ liquidity risk. The Trust’s Board of Trustees (the “Board”) previously approved the designation of the PIMCO Liquidity Risk Committee (the “Administrator”) as Program administrator. The PIMCO Liquidity Risk Committee consists of senior members from certain PIMCO business areas, such as Portfolio Risk Management, Americas Operations, Compliance, Account Management and Portfolio Management, and is advised by members of PIMCO Legal.
A Fund’s “liquidity risk” is the risk that the Fund could not meet requests to redeem shares issued by the Fund without significant dilution of the remaining investors’ interests in the Fund. In accordance with the Program, each Fund’s liquidity risk is assessed no less frequently than annually taking into consideration a variety of factors, including, as applicable, the Fund’s investment strategy and liquidity of portfolio investments, cash flow projections, and holdings of cash and cash equivalents, as well as borrowing arrangements and other funding sources. Certain factors are considered under both normal and reasonably foreseeable stressed conditions. Each Fund portfolio investment is classified into one of four liquidity categories (including “highly liquid investments” and “illiquid investments,” discussed below) based on a determination of the number of days it is reasonably expected to take to convert the investment to cash, or sell or dispose of the investment, in current market conditions without significantly changing the investment’s market value. Each Fund has adopted a “Highly Liquid Investment Minimum” (or “HLIM”), which is a minimum amount of Fund net assets to be invested in highly liquid investments that are assets. As required under the Liquidity Rule, each Fund’s HLIM is periodically reviewed, no less frequently than annually, and the Funds have adopted policies and procedures for responding to a shortfall of a Fund’s highly liquid investments below its HLIM. The Liquidity Rule also limits the Funds’ investments in illiquid investments by prohibiting a Fund from acquiring any illiquid investment if, immediately after the acquisition, the Fund would have invested more than 15% of its net assets in illiquid investments that are assets. Certain non-public reporting is generally required if a Fund’s holdings of illiquid investments that are assets were to exceed 15% of Fund net assets.
At a meeting of the Board held on February 15-16, 2022, the Board received a report (the “Report”) from the Administrator addressing the Program’s operation and assessing the adequacy and effectiveness of its implementation for the 12-month period ended December 31, 2021. The Report reviewed the operation of the Program’s components during such period and stated that the Program is operating effectively to assess and manage each Fund’s liquidity risk and that the Program has been and continues to be adequately and effectively implemented to monitor and, as applicable, respond to the Funds’ liquidity developments. This has remained true for the 12-month period ended June 30, 2022.
| | | | | | | | | | | | |
| | | | ANNUAL REPORT | | | | | | | JUNE 30, 2022 | | | 81 |
General Information
Investment Adviser and Administrator
Pacific Investment Management Company LLC
650 Newport Center Drive
Newport Beach, CA 92660
Investment Sub-Adviser
Research Affiliates, LLC
620 Newport Center Drive, Suite 900
Newport Beach, CA 92660
Portfolio Implementer
Parametric Portfolio Associates
1918 Eighth Avenue, Suite 3100
Seattle, WA 98101
Distributor
PIMCO Investments LLC
1633 Broadway
New York, NY 10019
Custodian
State Street Bank and Trust Company
801 Pennsylvania Avenue
Kansas City, MO 64105
Transfer Agent
DST Asset Manager Solutions, Inc.
Institutional Class, I-2, I-3, Administrative Class
430 W 7th Street STE 219024
Kansas City, MO 64105-1407
DST Asset Manager Solutions, Inc.
Class A, Class C, Class R
430 W 7th Street STE 219294
Kansas City, MO 64105-1407
Legal Counsel
Dechert LLP
1900 K Street, N.W.
Washington, D.C. 20006
Independent Registered Public Accounting Firm
PricewaterhouseCoopers LLP
1100 Walnut Street, Suite 1300
Kansas City, MO 64106
This report is submitted for the general information of the shareholders of the Funds listed on the Report cover.

PES3003AR_063022

PIMCO EQUITY SERIES®
Annual Report
June 30, 2022
PIMCO REALPATH® Blend 2025 Fund
PIMCO REALPATH® Blend 2030 Fund
PIMCO REALPATH® Blend 2035 Fund
PIMCO REALPATH® Blend 2040 Fund
PIMCO REALPATH® Blend 2045 Fund
PIMCO REALPATH® Blend 2050 Fund
PIMCO REALPATH® Blend 2055 Fund
PIMCO REALPATH® Blend 2060 Fund
PIMCO REALPATH® Blend Income Fund
Table of Contents
This material is authorized for use only when preceded or accompanied by the current PIMCO Equity Series prospectus. The Shareholder Reports for the other series of PIMCO Equity Series are printed separately.
Dear Shareholder,
We hope that you and your family are remaining safe and healthy during these challenging times. We continue to work tirelessly to navigate markets and manage the assets that you have entrusted with us. Following this letter is the PIMCO Equity Series Annual Report, which covers the 12-month reporting period ended June 30, 2022. On the subsequent pages, you will find specific details regarding investment results and a discussion of the factors that most affected performance during the reporting period.
For the 12-month reporting period ended June 30, 2022
The global economy continued to be affected by the COVID-19 pandemic (“COVID-19”) and its variants. Looking back, third quarter 2021 U.S. annualized gross domestic product (“GDP”) grew 2.3%. Economic activity accelerated during the fourth quarter, as GDP growth was 6.9%. However, the U.S. economy then experienced a setback, as first quarter 2022 GDP growth was -1.6%. Finally, the Commerce Department’s initial estimate for second quarter 2022 GDP growth — released after the reporting period ended — was -0.9%.
In the U.S., the Federal Reserve Board (the “Fed”) took several steps to tighten monetary policy to combat elevated inflation. The Fed reduced the monthly pace of its net asset purchases of Treasury securities and agency mortgage-backed securities in November 2021 and again in December. The Fed ended its monthly asset purchases in mid-March 2022. The Fed then raised the federal funds rate 0.25% to a range between 0.25% and 0.50% in March 2022, its first rate hike since 2018. The central bank then raised rates 0.50% in its May 2022 meeting and 0.75% in its June meeting. Finally, on July 27, 2022 — after the reporting period ended — the Fed raised rates 0.75%, to a range between 2.25% and 2.50%.
Economies outside the U.S. also continued to be impacted by the pandemic. The war in Ukraine and its repercussions also led to increased uncertainties around the world. In its April 2022 World Economic Outlook Update, the International Monetary Fund (“IMF”) said it expects U.S. gross domestic product (“GDP”) growth to be 3.7% in 2022, compared to 5.7% in 2021. Elsewhere, the IMF expects 2022 GDP to grow 2.8% in the eurozone (from 5.3% in 2021), 3.7% in the U.K. (from 7.4% in 2021) and 2.4% in Japan (from 1.6% in 2021).
Several other central banks began tightening monetary policy during the period. In December 2021, the Bank of England (the “BoE”) surprised the market and raised rates for the first time since COVID-19 began. The BoE again raised rates at its meetings in February, March, May and June 2022. The European Central Bank (the “ECB”) indicated that it intended to raise rates at its September 2022 meeting. Elsewhere, the Bank of Japan (the “BoJ”) maintained its loose monetary policy and appears likely to remain accommodative in the near future given the headwinds facing its economy.
During the reporting period, short- and long-term U.S. Treasury yields moved sharply higher. The yield on the benchmark 10-year U.S. Treasury note was 2.98% on June 30, 2022, versus 1.45% on June 30, 2021. The Bloomberg Global Treasury Index (USD Hedged), which tracks fixed-rate, local currency government debt of investment grade countries, including developed and emerging markets, returned -7.91%. Meanwhile, the Bloomberg Global Aggregate Credit Index (USD Hedged), a widely used index of global investment grade credit bonds, returned -12.75%. Riskier fixed income asset classes, including high yield corporate bonds and emerging market debt, were also weak. The ICE BofAML Developed Markets High Yield Constrained Index (USD Hedged), a widely used index of below-investment-grade bonds, returned -12.85%, whereas emerging market external debt, as represented by the JPMorgan Emerging Markets Bond Index (EMBI) Global (USD Hedged), returned -19.25%. Emerging market local bonds, as represented by the JPMorgan Government Bond Index-Emerging Markets Global Diversified Index (Unhedged), returned -19.28%.
Amid periods of volatility, global equities generally posted weak results during the reporting period as economic and geopolitical concerns weighed on investor sentiment. U.S. equities, as represented by the S&P 500 Index, returned -10.62%. Global equities, as represented by the MSCI World Index, returned -14.34%, while emerging market
equities, as measured by the MSCI Emerging Markets Index, returned -25.28%. Meanwhile, Japanese equities, as represented by the Nikkei 225 Index (in JPY), returned -8.33% and European equities, as represented by the MSCI Europe Index (in EUR), returned -6.54%.
Commodity prices were volatile and generated mixed returns. Brent crude oil, which was approximately $75 a barrel at the start of the reporting period, rose to roughly $112 a barrel at the end of June 2022. We believe the oil-price increase was driven by supply shortages and stronger demand due to economic re-openings as COVID-19 restrictions eased. Repercussions from the war in Ukraine also contributed to higher oil prices. In terms of other commodities prices, copper declined, whereas gold rose during the period.
Finally, there were also periods of volatility in the foreign exchange markets. We believe this was due to several factors, including economic growth expectations and changing central bank monetary policies, as well as rising inflation, COVID-19 variants and geopolitical events. The U.S. dollar strengthened against several major currencies. For example, during the reporting period, the U.S. dollar returned 11.59%, 11.95% and 18.13% versus the euro, the British pound and the Japanese yen, respectively.
Thank you for the assets you have placed with us. We deeply value your trust, and we will continue to work diligently to meet your broad investment needs. For any questions regarding the funds, please contact your account manager or financial adviser, or call one of our shareholder associates at (888) 87-PIMCO. We also invite you to visit our website at www.pimco.com to learn more about our global viewpoints.
| | |
 | | Sincerely, 
Peter G. Strelow Chairman of the Board
PIMCO Equity Series |
Past performance is no guarantee of future results. Unless otherwise noted, index returns reflect the reinvestment of income distributions and capital gains, if any, but do not reflect fees, brokerage commissions or other expenses of investing. It is not possible to invest directly in an unmanaged index.
| | | | | | | | | | | | |
| | | | ANNUAL REPORT | | | | | | | JUNE 30, 2022 | | | 3 |
| | | | |
| Important Information About the Funds | | | | |
PIMCO Equity Series (the “Trust”) is an open-end management investment company that includes PIMCO REALPATH® Blend 2025 Fund, PIMCO REALPATH® Blend 2030 Fund, PIMCO REALPATH® Blend 2035 Fund, PIMCO REALPATH® Blend 2040 Fund, PIMCO REALPATH® Blend 2045 Fund, PIMCO REALPATH® Blend 2050 Fund, PIMCO REALPATH® Blend 2055 Fund, PIMCO REALPATH® Blend 2060 Fund and PIMCO REALPATH® Blend Income Fund (each, a “Fund” and collectively, the “Funds”).
The Funds are each “fund of funds,” which is a term used to describe mutual funds that pursue their investment objective by investing in other mutual funds instead of investing directly in stocks or bonds of other issuers. Under normal circumstances, the Funds invest in a combination of affiliated and unaffiliated funds that are registered under the Investment Company Act of 1940, as amended, equity securities, fixed income instruments of varying maturities, or related derivatives on any of the preceding securities mentioned. The Funds may invest in Institutional Class or Class M shares of any funds of the Trust and PIMCO Funds, and in other affiliated funds, including funds of PIMCO ETF Trust, except funds of funds and PIMCO California Municipal Intermediate Value Fund, PIMCO California Municipal Opportunistic Value Fund, PIMCO National Municipal Intermediate Value Fund and PIMCO National Municipal Opportunistic Value Fund (collectively, “Underlying PIMCO Funds”), and unaffiliated funds that are registered under the Investment Company Act of 1940 (collectively, “Acquired Funds”). The risks and strategies associated with an investment in the Fund may result from direct investments and/or indirect exposure through investment in Acquired Funds.
We believe that equity funds and bond funds have an important role to play in a well-diversified portfolio. It is important to note, however, that equity funds and bond funds are subject to notable risks.
Among other things, equity and equity-related securities may decline in value due to both real and perceived general market, economic, and industry conditions. The values of equity securities, such as common stocks and preferred securities, have historically risen and fallen in periodic cycles and may decline due to general market conditions, which are not specifically related to a particular company, such as real or perceived adverse economic conditions, changes in the general outlook for corporate earnings, changes in interest or currency rates or adverse investor sentiment generally. Equity securities may also decline due to factors that affect a particular industry or industries, such as labor shortages, increased production costs and competitive conditions within an industry. In addition, the value of an equity security may decline for a number of reasons that directly relate to the issuer, such as management performance, financial leverage and reduced demand for the issuer’s goods or services, as well as the historical and prospective earnings of the issuer and the value of its assets. Different
types of equity securities may react differently to these developments and a change in the financial condition of a single issuer may affect securities markets as a whole.
During a general downturn in the securities markets, multiple asset classes, including equity securities, may decline in value simultaneously. The market price of equity securities owned by a Fund may go up or down, sometimes rapidly or unpredictably. Equity securities generally have greater price volatility than fixed income securities and common stocks generally have the greatest appreciation and depreciation potential of all equity securities.
Bond funds and fixed income securities are subject to a variety of risks, including interest rate risk, liquidity risk and market risk. In an environment where interest rates may trend upward, rising rates would negatively impact the performance of most bond funds, and fixed income securities and other instruments held by a Fund (and/or Underlying PIMCO Funds or Acquired Funds, as applicable) are likely to decrease in value. A wide variety of factors can cause interest rates to rise (e.g., central bank monetary policies, inflation rates, general economic conditions, etc.). In addition, changes in interest rates can be sudden and unpredictable, and there is no guarantee that management will anticipate such movement accurately. A Fund may lose money as a result of movements in interest rates.
As of the date of this report, interest rates in the United States are ascending from historically low levels. Thus, the Funds currently face a heightened level of risk associated with rising interest rates and/or bond yields. This could be driven by a variety of factors, including but not limited to central bank monetary policies, changing inflation or real growth rates, general economic conditions, increasing bond issuances or reduced market demand for low yielding investments. Further, while bond markets have steadily grown over the past three decades, dealer inventories of corporate bonds are near historic lows in relation to market size. As a result, there has been a significant reduction in the ability of dealers to “make markets.”
Bond funds and individual bonds with a longer duration (a measure used to determine the sensitivity of a security’s price to changes in interest rates) tend to be more sensitive to changes in interest rates, usually making them more volatile than securities or funds with shorter durations. All of the factors mentioned above, individually or collectively, could lead to increased volatility and/or lower liquidity in the fixed income markets or negatively impact a Fund’s performance or cause the Fund to incur losses. As a result, a Fund may experience increased shareholder redemptions, which, among other things, could further reduce the net assets of the Fund.
The Funds may be subject to various risks as described in each Fund’s prospectus and in the Principal and Other Risks in the Notes to Financial Statements.
Classifications of the Funds’ portfolio holdings in this report are made according to financial reporting standards. The classification of a particular portfolio holding as shown in the Allocation Breakdown and Schedule of Investments sections of this report may differ from the classification used for the Funds’ compliance calculations, including those used in the Funds’ prospectus, investment objectives, regulatory, and other investment limitations and policies, which may be based on different asset class, sector or geographical classifications. Each Fund is separately monitored for compliance with respect to prospectus and regulatory requirements.
The geographical classification of foreign (non-U.S.) securities in this report, if any, are classified by the country of incorporation of a holding. In certain instances, a security’s country of incorporation may be different from its country of economic exposure.
Beginning in January 2020, global financial markets have experienced and may continue to experience significant volatility resulting from the spread of a novel coronavirus known as COVID-19. The outbreak of COVID-19 has resulted in travel and border restrictions, quarantines, supply chain disruptions, lower consumer demand and general market uncertainty. The effects of COVID-19 have and may continue to adversely affect the global economy, the economies of certain nations and individual issuers, all of which may negatively impact the Funds’ performance. In addition, COVID-19 and governmental responses to COVID-19 may negatively impact the capabilities of the Funds’ service providers and disrupt the Funds’ operations.
The United States’ enforcement of restrictions on U.S. investments in certain issuers and tariffs on goods from other countries, each with a focus on China, has contributed to international trade tensions and may impact portfolio securities held by the Underlying PIMCO Funds or Acquired Funds.
The United Kingdom’s withdrawal from the European Union may impact Fund returns. The withdrawal may cause substantial volatility in foreign exchange markets, lead to weakness in the exchange rate of the British pound, result in a sustained period of market uncertainty, and destabilize some or all of the other European Union member countries and/or the Eurozone.
A Fund may invest in certain instruments that rely in some fashion upon the London Interbank Offered Rate (“LIBOR”). LIBOR is an average interest rate, determined by the ICE Benchmark Administration, that banks charge one another for the use of short-term money. The United Kingdom’s Financial Conduct Authority, which regulates LIBOR, has announced plans to ultimately phase out the use of LIBOR. There remains uncertainty regarding future utilization of LIBOR and the nature of any replacement rate (e.g., the Secured Overnight Financing
Rate, which is intended to replace U.S. dollar LIBOR and measures the cost of overnight borrowings through repurchase agreement transactions collateralized with U.S. Treasury securities). Any potential effects of the transition away from LIBOR on a Fund or on certain instruments in which a Fund invests can be difficult to ascertain, and they may vary depending on a variety of factors. The transition may also result in a reduction in the value of certain instruments held by a Fund or a reduction in the effectiveness of related Fund transactions such as hedges. Any such effects of the transition away from LIBOR, as well as other unforeseen effects, could result in losses to a Fund.
The PIMCO REALPATH® Blend Funds are intended for investors who prefer to have their asset allocation decisions made by professional
money managers and are designed to offer individual investors comprehensive asset allocation strategies tailored to the time when they expect to retire or to begin withdrawing assets. Each PIMCO REALPATH® Blend Fund is designed for investors expecting to retire or to begin withdrawing portions of their investments around the year indicated in the Fund’s name. The retirement year included in the REALPATH® Blend Fund’s name does not necessarily represent the specific year you expect to begin withdrawing your assets. It is intended only as a general guide.
The PIMCO REALPATH® Blend Funds are designed to provide investors with a comprehensive retirement solution tailored to the time when they expect to retire or plan to start withdrawing money (the “target date”). Each PIMCO REALPATH® Blend Fund follows a target asset allocation schedule that changes over time to help reduce portfolio risk, increasing its exposure to conservative investments as the target date approaches. The principal value of a Fund is not guaranteed at any time, including the target date. A Fund’s shareholders may experience losses, including losses near, at, or after the target year indicated in the PIMCO REALPATH® Blend Fund’s name.
On each individual Fund Summary page in this Shareholder Report, the Average Annual Total Return table and Cumulative Returns chart measure performance assuming that any dividend and capital gain distributions were reinvested. Returns do not reflect the deduction of taxes that a shareholder would pay on (i) Fund distributions or (ii) the redemption of Fund shares. The Cumulative Returns chart and Average Annual Total Return table reflect any sales load that would have applied at the time of purchase or any Contingent Deferred Sales Charge (“CDSC”) that would have applied if a full redemption occurred on the last business day of the period shown in the Cumulative Returns chart. Class A shares are subject to an initial sales charge. A CDSC may be imposed in certain circumstances on Class A shares that are purchased without an initial sales charge and then redeemed during the first 12 months after purchase. The Cumulative Returns chart reflects only Institutional Class performance. Performance may vary by share class based on each class’s expense ratios. Performance shown is
| | | | | | | | | | | | |
| | | | ANNUAL REPORT | | | | | | | JUNE 30, 2022 | | | 5 |
| | | | |
| Important Information About the Funds | | (Cont.) | | |
net of fees and expenses. The minimum initial investment amount for Institutional Class and Administrative Class shares is $1,000,000. The minimum initial investment amount for Class A shares is $1,000. Each Fund measures its performance against at least one broad-based securities market index (“benchmark index”). The benchmark index does not take into account fees, expenses, or taxes. A Fund’s past performance, before and after taxes, is not necessarily an indication of how the Fund will perform in the future. There is no assurance that any Fund, including any Fund that has experienced high or unusual performance for one or more periods, will experience similar levels of performance in the future. High performance is defined as a significant increase in either 1) a Fund’s total return in excess of that of the Fund’s benchmark between reporting periods or 2) a Fund’s total return in excess of the Fund’s historical returns between reporting periods. Unusual performance is defined as a significant change in a Fund’s performance as compared to one or more previous reporting periods. Historical performance for a Fund or share class may have been positively impacted by fee waivers or expense limitations in place during some or all of the periods shown, if applicable. Future performance (including total return or yield) and distributions may be negatively impacted by the expiration or reduction of any such fee waivers or expense limitations.
The following table discloses the inception dates of each Fund and its respective share classes along with each Fund’s diversification status as of period end:
| | | | | | | | | | | | | | | | | | | | | | | | | | | | |
| Fund Name | | | | | Fund
Inception | | | Institutional
Class | | | Administrative
Class | | | Class A | | | Class R | | | Diversification
Status | |
PIMCO REALPATH® Blend 2025 Fund | | | | | | | 12/31/14 | | | | 12/31/14 | | | | 12/31/14 | | | | 12/31/14 | | | | — | | | | Diversified | |
PIMCO REALPATH® Blend 2030 Fund | | | | | | | 12/31/14 | | | | 12/31/14 | | | | 12/31/14 | | | | 12/31/14 | | | | — | | | | Diversified | |
PIMCO REALPATH® Blend 2035 Fund | | | | | | | 12/31/14 | | | | 12/31/14 | | | | 12/31/14 | | | | 12/31/14 | | | | — | | | | Diversified | |
PIMCO REALPATH® Blend 2040 Fund | | | | | | | 12/31/14 | | | | 12/31/14 | | | | 12/31/14 | | | | 12/31/14 | | | | — | | | | Diversified | |
PIMCO REALPATH® Blend 2045 Fund | | | | | | | 12/31/14 | | | | 12/31/14 | | | | 12/31/14 | | | | 12/31/14 | | | | — | | | | Diversified | |
PIMCO REALPATH® Blend 2050 Fund | | | | | | | 12/31/14 | | | | 12/31/14 | | | | 12/31/14 | | | | 12/31/14 | | | | — | | | | Diversified | |
PIMCO REALPATH® Blend 2055 Fund | | | | | | | 12/31/14 | | | | 12/31/14 | | | | 12/31/14 | | | | 12/31/14 | | | | — | | | | Diversified | |
PIMCO REALPATH® Blend 2060 Fund | | | | | | | 12/31/19 | | | | 12/31/19 | | | | 12/31/19 | | | | 12/31/19 | | | | — | | | | Diversified | |
PIMCO REALPATH® Blend Income Fund | | | | | | | 12/31/14 | | | | 12/31/14 | | | | 12/31/14 | | | | 12/31/14 | | | | — | | | | Diversified | |
An investment in a Fund is not a bank deposit and is not guaranteed or insured by the Federal Deposit Insurance Corporation or any other government agency. It is possible to lose money on investments in a Fund.
The Trustees are responsible generally for overseeing the management of the Trust. The Trustees authorize the Trust to enter into service agreements with the Adviser, the Distributor, the Administrator and other service providers in order to provide, and in some cases authorize service providers to procure through other parties, necessary or desirable services on behalf of the Trust and the Funds. Shareholders are not parties to or third-party beneficiaries of such service agreements. Neither a Fund’s prospectus nor a Fund’s summary prospectus, the Trust’s Statement of Additional Information (“SAI”), any contracts filed as exhibits to the Trust’s registration statement, nor any other communications, disclosure documents or regulatory filings (including this report) from or on behalf of the Trust or a Fund creates a contract between or among any shareholder of a Fund, on the one hand, and the Trust, a Fund, a service provider to the Trust or a Fund, and/or the Trustees or officers of the Trust, on the other hand. The Trustees (or the Trust and its officers, service providers or other delegates acting under authority of the Trustees) may amend the most recent prospectus or use a new prospectus, summary prospectus or SAI with respect to a Fund or the Trust, and/or amend, file and/or issue any other communications, disclosure documents or regulatory filings, and
may amend or enter into any contracts to which the Trust or a Fund is a party, and interpret the investment objective(s), policies, restrictions and contractual provisions applicable to any Fund, without shareholder input or approval, except in circumstances in which shareholder approval is specifically required by law (such as changes to fundamental investment policies) or where a shareholder approval requirement is specifically disclosed in the Trust’s then-current prospectus or SAI.
PIMCO has adopted written proxy voting policies and procedures (“Proxy Policy”) as required by Rule 206(4)-6 under the Investment Advisers Act of 1940, as amended. The Proxy Policy has been adopted by the Trust as the policies and procedures that PIMCO will use when voting proxies on behalf of a Fund. A description of the policies and procedures that PIMCO uses to vote proxies relating to portfolio securities of a Fund, and information about how the Fund voted proxies relating to portfolio securities held during the most recent twelve-month period ended June 30th, are available without charge, upon request, by calling the Trust at (888) 87-PIMCO, on the Fund’s website at www.pimco.com, and on the Securities and Exchange Commission’s (“SEC”) website at www.sec.gov.
The Funds file portfolio holdings information with the SEC on Form N-PORT within 60 days of the end of each fiscal quarter. The
Funds’ complete schedule of securities holdings as of the end of each fiscal quarter will be made available to the public on the SEC’s website at www.sec.gov and on PIMCO’s website at www.pimco.com, and will be made available, upon request, by calling PIMCO at (888) 87-PIMCO.
SEC rules allow the Funds to fulfill their obligation to deliver shareholder reports to investors by providing access to such reports online free of charge and by mailing a notice that the report is electronically available. Investors may elect to receive all future reports in paper free of charge by contacting their financial intermediary or, if invested directly with a Fund, investors can inform the Fund by calling (888) 87-PIMCO. Any election to receive reports in paper will apply to all funds held with the fund complex if invested directly with a Fund or to all funds held in the investor’s account if invested through a financial intermediary.
In August 2020, the SEC proposed changes to the mutual fund and ETF shareholder report and registration statement disclosure requirements and the registered fund advertising rules, which, if adopted, will change the disclosures provided to shareholders.
In October 2020, the SEC adopted a rule related to the use of derivatives, short sales, reverse repurchase agreements and certain other transactions by registered investment companies that rescinds and withdraws the guidance of the SEC and its staff regarding asset segregation and cover transactions that was applicable to the Funds as of the date of this report. Subject to certain exceptions, the rule requires funds that trade derivatives and other transactions that create future payment or delivery obligations to comply with a value-at-risk leverage limit and a certain derivatives risk management program and reporting requirements. These requirements may limit the ability of the Funds to use derivatives and reverse repurchase agreements and similar financing transactions as part of their investment strategies and may increase the cost of the Funds’ investments and cost of doing business, which could adversely affect investors. The rule went into effect on February 19, 2021. The compliance date for the new rule and related reporting requirements is August 19, 2022.
In October 2020, the SEC adopted a rule regarding the ability of a fund to invest in other funds. The rule allows a fund to acquire shares of another fund in excess of certain limitations currently imposed by the Investment Company Act of 1940 (the “Act”) without obtaining individual exemptive relief from the SEC, subject to certain conditions. The rule also includes the rescission of certain exemptive relief from the SEC and guidance from the SEC staff for funds to invest in other funds. The effective date for the rule was January 19, 2021, and the compliance date for the rule was January 19, 2022.
In December 2020, the SEC adopted a rule addressing fair valuation of fund investments. The new rule sets forth requirements for good faith determinations of fair value as well as for the performance of fair value determinations, including related oversight and reporting obligations. The new rule also defines “readily available market quotations” for purposes of the definition of “value” under the Act, and the SEC noted that this definition will apply in all contexts under the Act. The SEC adopted an eighteen-month transition period beginning from the effective date for both the new rule and the associated new recordkeeping requirements. The effective date for the rule was March 8, 2021. The compliance date for the new rule and the associated recordkeeping requirements is September 8, 2022.
In May 2022, the SEC proposed amendments to a current rule governing fund naming conventions. In general, the current rule requires funds with certain types of names to adopt a policy to invest at least 80% of their assets in the type of investment suggested by the name. The proposed amendments would expand the scope of the current rule in a number of ways that would result in an expansion of the types of fund names that would require the fund to adopt an 80% investment policy under the rule. Additionally, the proposed amendments would modify the circumstances under which a fund may deviate from its 80% investment policy and address the use and valuation of derivatives instruments for purposes of the rule. The proposal’s impact on the Funds will not be known unless and until any final rulemaking is adopted.
In May 2022, the SEC proposed a framework that would require certain registered portfolios (such as the Funds) to disclose their environmental, social, and governance (“ESG”) investing practices. Among other things, the proposed requirements would mandate that funds meeting three pre-defined classifications (i.e., integrated, ESG focused and/or impact funds) provide prospectus and shareholder report disclosure related to the ESG factors, criteria and processes used in managing the fund. The proposal’s impact on the Funds will not be known unless and until any final rulemaking is adopted.
| | | | | | | | | | | | |
| | | | ANNUAL REPORT | | | | | | | JUNE 30, 2022 | | | 7 |
PIMCO REALPATH® Blend 2025 Fund
Cumulative Returns Through June 30, 2022
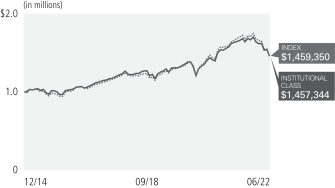
$1,000,000 invested at the end of the month when the Fund’s Institutional Class commenced operations.
Investment Objective and Strategy Overview
PIMCO REALPATH® Blend 2025 Fund seeks to maximize total return, consistent with prudent investment management, by investing under normal circumstances in a combination of affiliated and unaffiliated funds that are registered under the Investment Company Act of 1940, as amended (the “1940 Act”), equity securities, Fixed Income Instruments of varying maturities, or related derivatives on any of the preceding securities mentioned. Under normal circumstances, the Fund seeks to invest substantially all of its equity exposure in index tracking securities, including investments in affiliated or unaffiliated investment companies, which will be registered under the 1940 Act, or related derivatives on such securities or indexes. “Fixed Income Instruments” include bonds, debt securities and other similar instruments issued by various U.S. and non-U.S. public- or private-sector entities. Fund strategies may change from time to time. Please refer to the Fund’s current prospectus for more information regarding the Fund’s strategy.
| | | | | | | | | | | | | | |
|
| Average Annual Total Return for the period ended June 30, 2022 | |
| | | | |
| | | | | 1 Year | | | 5 Years | | | Fund Inception
(12/31/14) | |
 | | PIMCO REALPATH® Blend 2025 Fund Institutional Class | | | (13.36)% | | | | 5.20% | | | | 5.15% | |
| | PIMCO REALPATH® Blend 2025 Fund Administrative Class | | | (13.60)% | | | | 4.95% | | | | 4.88% | |
| | PIMCO REALPATH® Blend 2025 Fund Class A | | | (13.73)% | | | | 4.71% | | | | 4.65% | |
| | PIMCO REALPATH® Blend 2025 Fund Class A (adjusted) | | | (18.45)% | | | | 3.53% | | | | 3.86% | |
 | | S&P Target Date 2025 Index± | | | (11.40)% | | | | 4.87% | | | | 5.17% | |
All Fund returns are net of fees and expenses and include applicable fee waivers and/or expense limitations. Absent any applicable fee waivers and/or expense limitations, performance would have been lower and there can be no assurance that any such waivers or limitations will continue in the future.
± The S&P Target Date Index Series is comprised of eleven multi-asset class indices, each corresponding to a particular target retirement date. Each index provides varying levels of exposure to each asset class. Each target date allocation is created and retired according to a pre-determined schedule related to the respective target date, as indicated in the index name, and is based on market observations through an annual survey of target date fund managers.
It is not possible to invest directly in an unmanaged index.
Performance quoted represents past performance. Past performance is not a guarantee or a reliable indicator of future results. Current performance may be lower or higher than performance shown. Investment return and the principal value of an investment will fluctuate. Shares may be worth more or less than original cost when redeemed. Returns shown do not reflect the deduction of taxes that a shareholder would pay on fund distributions or the redemption of fund shares. Differences in the Fund’s performance versus the index and related attribution information with respect to particular categories of securities or individual positions may be attributable, in part, to differences in the pricing methodologies used by the Fund and the index. The adjusted returns take into account the maximum sales charge of 5.50% on Class A shares. For performance data current to the most recent month-end is available at visit www.pimco.com or via (888) 87-PIMCO.
The Fund’s total annual operating expense ratio in effect as of period end, which includes the Acquired Fund Fees and Expenses (Underlying PIMCO Fund expenses) was 0.34% for the Institutional Class shares, 0.59% for the Administrative Class shares, and 0.79% for the Class A shares. Details regarding any changes to the Fund’s operating expenses, subsequent to period end, can be found in the Fund’s current prospectus, as supplemented.
| | | | |
| Institutional Class - PPZRX | | Administrative Class - PPZDX | | Class A - PPZAX |
Top 10 Holdings as of June 30, 2022†§
| | | | | | | | |
Vanguard Institutional Index Fund ‘Institutional’ | | | | | | | 25.1% | |
Vanguard Developed Markets Index Fund ‘Institutional’ | | | | | | | 17.2% | |
PIMCO Income Fund | | | | | | | 12.1% | |
PIMCO Total Return Fund | | | | | | | 9.9% | |
PIMCO Long-Term U.S. Government Fund | | | | | | | 6.9% | |
Vanguard Emerging Markets Stock Index Fund ‘Institutional’ | | | | | | | 6.2% | |
PIMCO Long-Term Real Return Fund | | | | | | | 5.6% | |
PIMCO Emerging Markets Local Currency and Bond Fund | | | | | | | 5.0% | |
PIMCO Real Return Fund | | | | | | | 3.0% | |
PIMCO High Yield Fund | | | | | | | 2.2% | |
† % of Investments, at value.
§ Top 10 Holdings and % of Investments exclude securities sold short, financial derivative instruments and short-term instruments, if any.
Fund Insights
The following affected performance (on a gross basis) during the reporting period:
| » | | Exposure to global equities detracted from absolute performance, as global equities posted negative returns. |
| » | | Exposure to U.S. large market capitalization equities detracted from absolute performance, as U.S. large market capitalization equities posted negative returns. |
| » | | Exposure to U.S. core bonds detracted from absolute performance, as U.S. core bonds posted negative returns. |
| » | | Exposure to emerging market equities detracted from absolute performance, as emerging market equities posted negative returns. |
| » | | There were no material contributors for this Fund. |
| | | | | | | | | | | | |
| | | | ANNUAL REPORT | | | | | | | JUNE 30, 2022 | | | 9 |
PIMCO REALPATH® Blend 2030 Fund
Cumulative Returns Through June 30, 2022
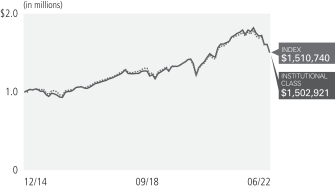
$1,000,000 invested at the end of the month when the Fund’s Institutional Class commenced operations.
Investment Objective and Strategy Overview
PIMCO REALPATH® Blend 2030 Fund seeks to maximize total return, consistent with prudent investment management, by investing under normal circumstances in a combination of affiliated and unaffiliated funds that are registered under the Investment Company Act of 1940, as amended (the “1940 Act”), equity securities, Fixed Income Instruments of varying maturities, or related derivatives on any of the preceding securities mentioned. Under normal circumstances, the Fund seeks to invest substantially all of its equity exposure in index tracking securities, including investments in affiliated or unaffiliated investment companies, which will be registered under the 1940 Act, or related derivatives on such securities or indexes. “Fixed Income Instruments” include bonds, debt securities and other similar instruments issued by various U.S. and non-U.S. public- or private-sector entities. Fund strategies may change from time to time. Please refer to the Fund’s current prospectus for more information regarding the Fund’s strategy.
| | | | | | | | | | | | | | |
| | | |
| Average Annual Total Return for the period ended June 30, 2022 | | | | | | | | | |
| | | | |
| | | | | 1 Year | | | 5 Years | | | Fund Inception
(12/31/14) | |
| | PIMCO REALPATH® Blend 2030 Fund Institutional Class | | | (13.97)% | | | | 5.56% | | | | 5.59% | |
| | PIMCO REALPATH® Blend 2030 Fund Administrative Class | | | (14.20)% | | | | 5.31% | | | | 5.32% | |
| | PIMCO REALPATH® Blend 2030 Fund Class A | | | (14.42)% | | | | 5.06% | | | | 5.07% | |
| | PIMCO REALPATH® Blend 2030 Fund Class A (adjusted) | | | (19.15)% | | | | 3.87% | | | | 4.28% | |
| | S&P Target Date 2030 Index± | | | (12.24)% | | | | 5.39% | | | | 5.65% | |
All Fund returns are net of fees and expenses and include applicable fee waivers and/or expense limitations. Absent any applicable fee waivers and/or expense limitations, performance would have been lower and there can be no assurance that any such waivers or limitations will continue in the future.
± The S&P Target Date Index Series is comprised of eleven multi-asset class indices, each corresponding to a particular target retirement date. Each index provides varying levels of exposure to each asset class. Each target date allocation is created and retired according to a pre-determined schedule related to the respective target date, as indicated in the index name, and is based on market observations through an annual survey of target date fund managers.
It is not possible to invest directly in an unmanaged index.
Performance quoted represents past performance. Past performance is not a guarantee or a reliable indicator of future results. Current performance may be lower or higher than performance shown. Investment return and the principal value of an investment will fluctuate. Shares may be worth more or less than original cost when redeemed. Returns shown do not reflect the deduction of taxes that a shareholder would pay on fund distributions or the redemption of fund shares. Differences in the Fund’s performance versus the index and related attribution information with respect to particular categories of securities or individual positions may be attributable, in part, to differences in the pricing methodologies used by the Fund and the index. The adjusted returns take into account the maximum sales charge of 5.50% on Class A shares. For performance data current to the most recent month-end is available at visit www.pimco.com or via (888) 87-PIMCO.
The Fund’s total annual operating expense ratio in effect as of period end, which includes the Acquired Fund Fees and Expenses (Underlying PIMCO Fund expenses) was 0.29% for the Institutional Class shares, 0.54% for the Administrative Class shares, and 0.74% for the Class A shares. Details regarding any changes to the Fund’s operating expenses, subsequent to period end, can be found in the Fund’s current prospectus, as supplemented.
| | | | |
| Institutional Class - PBPNX | | Administrative Class - PBPRX | | Class A - PBPAX |
Top 10 Holdings as of June 30, 2022†§
| | | | | | | | |
Vanguard Institutional Index Fund ‘Institutional’ | | | | | | | 31.7% | |
Vanguard Developed Markets Index Fund ‘Institutional’ | | | | | | | 19.7% | |
PIMCO Income Fund | | | | | | | 7.6% | |
Vanguard Emerging Markets Stock Index Fund ‘Institutional’ | | | | | | | 7.5% | |
PIMCO Long-Term U.S. Government Fund | | | | | | | 7.1% | |
PIMCO Total Return Fund | | | | | | | 5.9% | |
PIMCO Long-Term Real Return Fund | | | | | | | 4.9% | |
PIMCO Emerging Markets Local Currency and Bond Fund | | | | | | | 4.4% | |
Vanguard Small-Cap Index Fund ‘Institutional’ | | | | | | | 2.7% | |
PIMCO Real Return Fund | | | | | | | 1.9% | |
† % of Investments, at value.
§ Top 10 Holdings and % of Investments exclude securities sold short, financial derivative instruments and short-term instruments, if any.
Fund Insights
The following affected performance (on a gross basis) during the reporting period:
| » | | Exposure to global equities detracted from absolute performance, as global equities posted negative returns. |
| » | | Exposure to U.S. large market capitalization equities detracted from absolute performance, as U.S. large market capitalization equities posted negative returns. |
| » | | Exposure to emerging market equities detracted from absolute performance, as emerging market equities posted negative returns. |
| » | | Exposure to long-term U.S. Treasuries detracted from absolute performance, as long-term U.S. Treasuries posted negative returns. |
| » | | There were no material contributors for this Fund. |
| | | | | | | | | | | | |
| | | | ANNUAL REPORT | | | | | | | JUNE 30, 2022 | | | 11 |
PIMCO REALPATH® Blend 2035 Fund
Cumulative Returns Through June 30, 2022
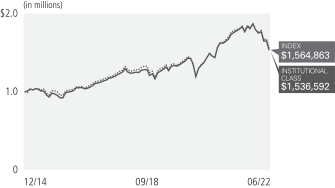
$1,000,000 invested at the end of the month when the Fund’s Institutional Class commenced operations.
Investment Objective and Strategy Overview
PIMCO REALPATH® Blend 2035 Fund seeks to maximize total return, consistent with prudent investment management, by investing under normal circumstances in a combination of affiliated and unaffiliated funds that are registered under the Investment Company Act of 1940, as amended (the “1940 Act”), equity securities, Fixed Income Instruments of varying maturities, or related derivatives on any of the preceding securities mentioned. Under normal circumstances, the Fund seeks to invest substantially all of its equity exposure in index tracking securities, including investments in affiliated or unaffiliated investment companies, which will be registered under the 1940 Act, or related derivatives on such securities or indexes. “Fixed Income Instruments” include bonds, debt securities and other similar instruments issued by various U.S. and non-U.S. public- or private-sector entities. Fund strategies may change from time to time. Please refer to the Fund’s current prospectus for more information regarding the Fund’s strategy.
| | | | | | | | | | | | | | |
|
| Average Annual Total Return for the period ended June 30, 2022 | |
| | | | |
| | | | | 1 Year | | | 5 Years | | | Fund Inception
(12/31/14) | |
| | PIMCO REALPATH® Blend 2035 Fund Institutional Class | | | (14.03)% | | | | 5.96% | | | | 5.90% | |
| | PIMCO REALPATH® Blend 2035 Fund Administrative Class | | | (14.26)% | | | | 5.69% | | | | 5.62% | |
| | PIMCO REALPATH® Blend 2035 Fund Class A | | | (14.46)% | | | | 5.43% | | | | 5.37% | |
| | PIMCO REALPATH® Blend 2035 Fund Class A (adjusted) | | | (19.18)% | | | | 4.24% | | | | 4.58% | |
| | S&P Target Date 2035 Index± | | | (13.15)% | | | | 5.92% | | | | 6.15% | |
All Fund returns are net of fees and expenses and include applicable fee waivers and/or expense limitations. Absent any applicable fee waivers and/or expense limitations, performance would have been lower and there can be no assurance that any such waivers or limitations will continue in the future.
± The S&P Target Date Index Series is comprised of eleven multi-asset class indices, each corresponding to a particular target retirement date. Each index provides varying levels of exposure to each asset class. Each target date allocation is created and retired according to a pre-determined schedule related to the respective target date, as indicated in the index name, and is based on market observations through an annual survey of target date fund managers.
It is not possible to invest directly in an unmanaged index.
Performance quoted represents past performance. Past performance is not a guarantee or a reliable indicator of future results. Current performance may be lower or higher than performance shown. Investment return and the principal value of an investment will fluctuate. Shares may be worth more or less than original cost when redeemed. Returns shown do not reflect the deduction of taxes that a shareholder would pay on fund distributions or the redemption of fund shares. Differences in the Fund’s performance versus the index and related attribution information with respect to particular categories of securities or individual positions may be attributable, in part, to differences in the pricing methodologies used by the Fund and the index. The adjusted returns take into account the maximum sales charge of 5.50% on Class A shares. For performance data current to the most recent month-end is available at visit www.pimco.com or via (888) 87-PIMCO.
The Fund’s total annual operating expense ratio in effect as of period end, which includes the Acquired Fund Fees and Expenses (Underlying PIMCO Fund Expenses) was 0.25% for the Institutional Class shares, 0.50% for the Administrative Class shares, and 0.70% for the Class A shares. Details regarding any changes to the Fund’s operating expenses, subsequent to period end, can be found in the Fund’s current prospectus, as supplemented.
| | | | |
| Institutional Class - PDGZX | | Administrative Class - PDGDX | | Class A - PDGAX |
Top 10 Holdings as of June 30, 2022†§
| | | | | | | | |
Vanguard Institutional Index Fund ‘Institutional’ | | | | | | | 36.2% | |
Vanguard Developed Markets Index Fund ‘Institutional’ | | | | | | | 22.4% | |
Vanguard Emerging Markets Stock Index Fund ‘Institutional’ | | | | | | | 8.1% | |
PIMCO Long-Term U.S. Government Fund | | | | | | | 5.3% | |
PIMCO Income Fund | | | | | | | 5.3% | |
PIMCO Total Return Fund | | | | | | | 4.0% | |
PIMCO Emerging Markets Local Currency and Bond Fund | | | | | | | 3.9% | |
PIMCO Long-Term Real Return Fund | | | | | | | 3.5% | |
Vanguard Small-Cap Index Fund ‘Institutional’ | | | | | | | 3.5% | |
PIMCO Real Return Fund | | | | | | | 1.4% | |
† % of Investments, at value.
§ Top 10 Holdings and % of Investments exclude securities sold short, financial derivative instruments and short-term instruments, if any.
Fund Insights
The following affected performance (on a gross basis) during the reporting period:
| » | | Exposure to global equities detracted from absolute performance, as global equities posted negative returns. |
| » | | Exposure to U.S. large market capitalization equities detracted from absolute performance, as U.S. large market capitalization equities posted negative returns. |
| » | | Exposure to emerging market equities detracted from absolute performance, as emerging market equities posted negative returns. |
| » | | Exposure to long-term U.S. Treasuries detracted from absolute performance, as long-term U.S. Treasuries posted negative returns. |
| » | | There were no material contributors for this Fund. |
| | | | | | | | | | | | |
| | | | ANNUAL REPORT | | | | | | | JUNE 30, 2022 | | | 13 |
PIMCO REALPATH® Blend 2040 Fund
Cumulative Returns Through June 30, 2022
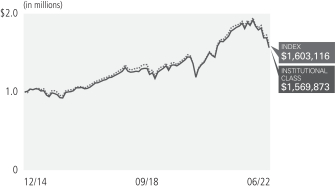
$1,000,000 invested at the end of the month when the Fund’s Institutional Class commenced operations.
Investment Objective and Strategy Overview
PIMCO REALPATH® Blend 2040 Fund seeks to maximize total return, consistent with prudent investment management, by investing under normal circumstances in a combination of affiliated and unaffiliated funds that are registered under the Investment Company Act of 1940, as amended (the “1940 Act”), equity securities, Fixed Income Instruments of varying maturities, or related derivatives on any of the preceding securities mentioned. Under normal circumstances, the Fund seeks to invest substantially all of its equity exposure in index tracking securities, including investments in affiliated or unaffiliated investment companies, which will be registered under the 1940 Act, or related derivatives on such securities or indexes. “Fixed Income Instruments” include bonds, debt securities and other similar instruments issued by various U.S. and non-U.S. public- or private-sector entities. Fund strategies may change from time to time. Please refer to the Fund’s current prospectus for more information regarding the Fund’s strategy.
| | | | | | | | | | | | | | |
|
| Average Annual Total Return for the period ended June 30, 2022 | |
| | | | |
| | | | | 1 Year | | | 5 Years | | | Fund Inception
(12/31/14) | |
| | PIMCO REALPATH® Blend 2040 Fund Institutional Class | | | (14.20)% | | | | 6.30% | | | | 6.20% | |
| | PIMCO REALPATH® Blend 2040 Fund Administrative Class | | | (14.40)% | | | | 6.04% | | | | 5.93% | |
| | PIMCO REALPATH® Blend 2040 Fund Class A | | | (14.58)% | | | | 5.77% | | | | 5.67% | |
| | PIMCO REALPATH® Blend 2040 Fund Class A (adjusted) | | | (19.30)% | | | | 4.58% | | | | 4.88% | |
| | S&P Target Date 2040 Index± | | | (13.76)% | | | | 6.30% | | | | 6.49% | |
All Fund returns are net of fees and expenses and include applicable fee waivers and/or expense limitations. Absent any applicable fee waivers and/or expense limitations, performance would have been lower and there can be no assurance that any such waivers or limitations will continue in the future.
± The S&P Target Date Index Series is comprised of eleven multi-asset class indices, each corresponding to a particular target retirement date. Each index provides varying levels of exposure to each asset class. Each target date allocation is created and retired according to a pre-determined schedule related to the respective target date, as indicated in the index name, and is based on market observations through an annual survey of target date fund managers.
It is not possible to invest directly in an unmanaged index.
Performance quoted represents past performance. Past performance is not a guarantee or a reliable indicator of future results. Current performance may be lower or higher than performance shown. Investment return and the principal value of an investment will fluctuate. Shares may be worth more or less than original cost when redeemed. Returns shown do not reflect the deduction of taxes that a shareholder would pay on fund distributions or the redemption of fund shares. Differences in the Fund’s performance versus the index and related attribution information with respect to particular categories of securities or individual positions may be attributable, in part, to differences in the pricing methodologies used by the Fund and the index. The adjusted returns take into account the maximum sales charge of 5.50% on Class A shares. For performance data current to the most recent month-end is available at visit www.pimco.com or via (888) 87-PIMCO.
The Fund’s total annual operating expense ratio in effect as of period end, which includes the Acquired Fund Fees and Expenses (Underlying PIMCO Fund expenses) was 0.21% for the Institutional Class shares, 0.46% for the Administrative Class shares, and 0.66% for the Class A shares. Details regarding any changes to the Fund’s operating expenses, subsequent to period end, can be found in the Fund’s current prospectus, as supplemented.
| | | | |
| Institutional Class - PVPNX | | Administrative Class - PVPRX | | Class A - PVPAX |
Top 10 Holdings as of June 30, 2022†§
| | | | | | | | |
Vanguard Institutional Index Fund ‘Institutional’ | | | | | | | 39.6% | |
Vanguard Developed Markets Index Fund ‘Institutional’ | | | | | | | 26.0% | |
Vanguard Emerging Markets Stock Index Fund ‘Institutional’ | | | | | | | 8.4% | |
Vanguard Small-Cap Index Fund ‘Institutional’ | | | | | | | 3.8% | |
PIMCO Long-Term U.S. Government Fund | | | | | | | 3.7% | |
PIMCO Income Fund | | | | | | | 3.3% | |
PIMCO Emerging Markets Local Currency and Bond Fund | | | | | | | 3.3% | |
PIMCO Total Return Fund | | | | | | | 2.7% | |
PIMCO Long-Term Real Return Fund | | | | | | | 2.4% | |
PIMCO Real Return Fund | | | | | | | 1.1% | |
† % of Investments, at value.
§ Top 10 Holdings and % of Investments exclude securities sold short, financial derivative instruments and short-term instruments, if any.
Fund Insights
The following affected performance (on a gross basis) during the reporting period:
| » | | Exposure to global equities detracted from absolute performance, as global equities posted negative returns. |
| » | | Exposure to U.S. large capitalization equities detracted from absolute performance, as U.S. large capitalization equities posted negative returns. |
| » | | Exposure to emerging market equities detracted from absolute performance, as emerging market equities posted negative returns. |
| » | | Exposure to U.S. small capitalization equities detracted from absolute performance, as U.S. small capitalization equities posted negative returns. |
| » | | There were no material contributors for this Fund. |
| | | | | | | | | | | | |
| | | | ANNUAL REPORT | | | | | | | JUNE 30, 2022 | | | 15 |
PIMCO REALPATH® Blend 2045 Fund
Cumulative Returns Through June 30, 2022
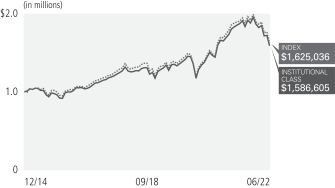
$1,000,000 invested at the end of the month when the Fund’s Institutional Class commenced operations.
Investment Objective and Strategy Overview
PIMCO REALPATH® Blend 2045 Fund seeks to maximize total return, consistent with prudent investment management, by investing under normal circumstances in a combination of affiliated and unaffiliated funds that are registered under the Investment Company Act of 1940, as amended (the “1940 Act”), equity securities, Fixed Income Instruments of varying maturities, or related derivatives on any of the preceding securities mentioned. Under normal circumstances, the Fund seeks to invest substantially all of its equity exposure in index tracking securities, including investments in affiliated or unaffiliated investment companies, which will be registered under the 1940 Act, or related derivatives on such securities or indexes. “Fixed Income Instruments” include bonds, debt securities and other similar instruments issued by various U.S. and non-U.S. public- or private-sector entities. Fund strategies may change from time to time. Please refer to the Fund’s current prospectus for more information regarding the Fund’s strategy.
| | | | | | | | | | | | | | |
|
| Average Annual Total Return for the period ended June 30, 2022 | |
| | | | |
| | | | | 1 Year | | | 5 Years | | | Fund Inception
(12/31/14) | |
| | PIMCO REALPATH® Blend 2045 Fund Institutional Class | | | (14.23)% | | | | 6.60% | | | | 6.35% | |
| | PIMCO REALPATH® Blend 2045 Fund Administrative Class | | | (14.45)% | | | | 6.32% | | | | 6.08% | |
| | PIMCO REALPATH® Blend 2045 Fund Class A | | | (14.69)% | | | | 6.05% | | | | 5.82% | |
| | PIMCO REALPATH® Blend 2045 Fund Class A (adjusted) | | | (19.40)% | | | | 4.86% | | | | 5.02% | |
| | S&P Target Date 2045 Index± | | | (14.15)% | | | | 6.47% | | | | 6.69% | |
All Fund returns are net of fees and expenses and include applicable fee waivers and/or expense limitations. Absent any applicable fee waivers and/or expense limitations, performance would have been lower and there can be no assurance that any such waivers or limitations will continue in the future.
± The S&P Target Date Index Series is comprised of eleven multi-asset class indices, each corresponding to a particular target retirement date. Each index provides varying levels of exposure to each asset class. Each target date allocation is created and retired according to a pre-determined schedule related to the respective target date, as indicated in the index name, and is based on market observations through an annual survey of target date fund managers.
It is not possible to invest directly in an unmanaged index.
Performance quoted represents past performance. Past performance is not a guarantee or a reliable indicator of future results. Current performance may be lower or higher than performance shown. Investment return and the principal value of an investment will fluctuate. Shares may be worth more or less than original cost when redeemed. Returns shown do not reflect the deduction of taxes that a shareholder would pay on fund distributions or the redemption of fund shares. Differences in the Fund’s performance versus the index and related attribution information with respect to particular categories of securities or individual positions may be attributable, in part, to differences in the pricing methodologies used by the Fund and the index. The adjusted returns take into account the maximum sales charge of 5.50% on Class A shares. For performance data current to the most recent month-end is available at visit www.pimco.com or via (888) 87-PIMCO.
The Fund’s total annual operating expense ratio in effect as of period end, which includes the Acquired Fund Fees and Expenses (Underlying PIMCO Fund expenses) was 0.17% for the Institutional Class shares, 0.42% for the Administrative Class shares, and 0.62% for the Class A shares. Details regarding any changes to the Fund’s operating expenses, subsequent to period end, can be found in the Fund’s current prospectus, as supplemented.
| | | | |
| Institutional Class - PVQNX | | Administrative Class - PVQDX | | Class A - PVQAX |
Top 10 Holdings as of June 30, 2022†§
| | | | | | | | |
Vanguard Institutional Index Fund ‘Institutional’ | | | | | | | 41.5% | |
Vanguard Developed Markets Index Fund ‘Institutional’ | | | | | | | 29.3% | |
Vanguard Emerging Markets Stock Index Fund ‘Institutional’ | | | | | | | 8.8% | |
Vanguard Small-Cap Index Fund ‘Institutional’ | | | | | | | 4.1% | |
PIMCO Long-Term U.S. Government Fund | | | | | | | 2.8% | |
PIMCO Emerging Markets Local Currency and Bond Fund | | | | | | | 2.3% | |
PIMCO Income Fund | | | | | | | 1.9% | |
PIMCO Total Return Fund | | | | | | | 1.8% | |
PIMCO Long-Term Real Return Fund | | | | | | | 1.7% | |
PIMCO Real Return Fund | | | | | | | 0.7% | |
† % of Investments, at value.
§ Top 10 Holdings and % of Investments exclude securities sold short, financial derivative instruments and short-term instruments, if any.
Fund Insights
The following affected performance (on a gross basis) during the reporting period:
| » | | Exposure to global equities detracted from absolute performance, as global equities posted negative returns. |
| » | | Exposure to U.S. large capitalization equities detracted from absolute performance, as U.S. large capitalization equities posted negative returns. |
| » | | Exposure to emerging market equities detracted from absolute performance, as emerging market equities posted negative returns. |
| » | | Exposure to U.S. small capitalization equities detracted from absolute performance, as U.S. small capitalization equities posted negative returns. |
| » | | There were no material contributors for this Fund. |
| | | | | | | | | | | | |
| | | | ANNUAL REPORT | | | | | | | JUNE 30, 2022 | | | 17 |
PIMCO REALPATH® Blend 2050 Fund
Cumulative Returns Through June 30, 2022
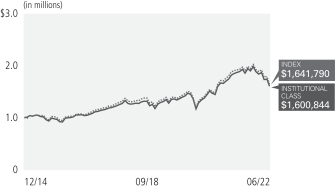
$1,000,000 invested at the end of the month when the Fund’s Institutional Class commenced operations.
Investment Objective and Strategy Overview
PIMCO REALPATH® Blend 2050 Fund seeks to maximize total return, consistent with prudent investment management, by investing under normal circumstances in a combination of affiliated and unaffiliated funds that are registered under the Investment Company Act of 1940, as amended (the “1940 Act”), equity securities, Fixed Income Instruments of varying maturities, or related derivatives on any of the preceding securities mentioned. Under normal circumstances, the Fund seeks to invest substantially all of its equity exposure in index tracking securities, including investments in affiliated or unaffiliated investment companies, which will be registered under the 1940 Act, or related derivatives on such securities or indexes. “Fixed Income Instruments” include bonds, debt securities and other similar instruments issued by various U.S. and non-U.S. public- or private-sector entities. Fund strategies may change from time to time. Please refer to the Fund’s current prospectus for more information regarding the Fund’s strategy.
| | | | | | | | | | | | | | |
|
| Average Annual Total Return for the period ended June 30, 2022 | |
| | | | |
| | | | | 1 Year | | | 5 Years | | | Fund Inception
(12/31/14) | |
| | PIMCO REALPATH® Blend 2050 Fund Institutional Class | | | (14.29)% | | | | 6.70% | | | | 6.48% | |
| | PIMCO REALPATH® Blend 2050 Fund Administrative Class | | | (14.50)% | | | | 6.43% | | | | 6.20% | |
| | PIMCO REALPATH® Blend 2050 Fund Class A | | | (14.73)% | | | | 6.17% | | | | 5.93% | |
| | PIMCO REALPATH® Blend 2050 Fund Class A (adjusted) | | | (19.41)% | | | | 4.98% | | | | 5.14% | |
| | S&P Target Date 2050 Index± | | | (14.33)% | | | | 6.59% | | | | 6.83% | |
All Fund returns are net of fees and expenses and include applicable fee waivers and/or expense limitations. Absent any applicable fee waivers and/or expense limitations, performance would have been lower and there can be no assurance that any such waivers or limitations will continue in the future.
± The S&P Target Date Index Series is comprised of eleven multi-asset class indices, each corresponding to a particular target retirement date. Each index provides varying levels of exposure to each asset class. Each target date allocation is created and retired according to a pre-determined schedule related to the respective target date, as indicated in the index name, and is based on market observations through an annual survey of target date fund managers.
It is not possible to invest directly in an unmanaged index.
Performance quoted represents past performance. Past performance is not a guarantee or a reliable indicator of future results. Current performance may be lower or higher than performance shown. Investment return and the principal value of an investment will fluctuate. Shares may be worth more or less than original cost when redeemed. Returns shown do not reflect the deduction of taxes that a shareholder would pay on fund distributions or the redemption of fund shares. Differences in the Fund’s performance versus the index and related attribution information with respect to particular categories of securities or individual positions may be attributable, in part, to differences in the pricing methodologies used by the Fund and the index. The adjusted returns take into account the maximum sales charge of 5.50% on Class A shares. For performance data current to the most recent month-end is available at visit www.pimco.com or via (888) 87-PIMCO.
The Fund’s total annual operating expense ratio in effect as of period end, which includes the Acquired Fund Fees and Expenses (Underlying PIMCO Fund expenses) was 0.15% for the Institutional Class shares, 0.40% for the Administrative Class shares, and 0.60% for the Class A shares. Details regarding any changes to the Fund’s operating expenses, subsequent to period end, can be found in the Fund’s current prospectus, as supplemented.
| | | | |
| Institutional Class - PPQZX | | Administrative Class - PPQDX | | Class A - PPQAX |
Top 10 Holdings as of June 30, 2022†§
| | | | | | | | |
Vanguard Institutional Index Fund ‘Institutional’ | | | | | | | 43.9% | |
Vanguard Developed Markets Index Fund ‘Institutional’ | | | | | | | 31.2% | |
Vanguard Emerging Markets Stock Index Fund ‘Institutional’ | | | | | | | 8.9% | |
Vanguard Small-Cap Index Fund ‘Institutional’ | | | | | | | 4.4% | |
PIMCO Long-Term U.S. Government Fund | | | | | | | 2.0% | |
PIMCO Emerging Markets Local Currency and Bond Fund | | | | | | | 1.6% | |
PIMCO Long-Term Real Return Fund | | | | | | | 1.2% | |
PIMCO Total Return Fund | | | | | | | 1.2% | |
PIMCO Income Fund | | | | | | | 1.1% | |
PIMCO Real Return Fund | | | | | | | 0.5% | |
† % of Investments, at value.
§ Top 10 Holdings and % of Investments exclude securities sold short, financial derivative instruments and short-term instruments, if any.
Fund Insights
The following affected performance (on a gross basis) during the reporting period:
| » | | Exposure to global equities detracted from absolute performance, as global equities posted negative returns. |
| » | | Exposure to U.S. large capitalization equities detracted from absolute performance, as U.S. large capitalization equities posted negative returns. |
| » | | Exposure to emerging market equities detracted from absolute performance, as emerging market equities posted negative returns. |
| » | | Exposure to U.S. small capitalization equities detracted from absolute performance, as U.S. small capitalization equities posted negative returns. |
| » | | There were no material contributors for this Fund. |
| | | | | | | | | | | | |
| | | | ANNUAL REPORT | | | | | | | JUNE 30, 2022 | | | 19 |
PIMCO REALPATH® Blend 2055 Fund
Cumulative Returns Through June 30, 2022
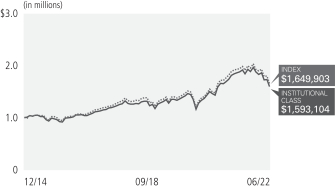
$1,000,000 invested at the end of the month when the Fund’s Institutional Class commenced operations.
Investment Objective and Strategy Overview
PIMCO REALPATH® Blend 2055 Fund seeks to maximize total return, consistent with prudent investment management, by investing under normal circumstances in a combination of affiliated and unaffiliated funds that are registered under the Investment Company Act of 1940, as amended (the “1940 Act”), equity securities, Fixed Income Instruments of varying maturities, or related derivatives on any of the preceding securities mentioned. Under normal circumstances, the Fund seeks to invest substantially all of its equity exposure in index tracking securities, including investments in affiliated or unaffiliated investment companies, which will be registered under the 1940 Act, or related derivatives on such securities or indexes. “Fixed Income Instruments” include bonds, debt securities and other similar instruments issued by various U.S. and non-U.S. public- or private-sector entities. Fund strategies may change from time to time. Please refer to the Fund’s current prospectus for more information regarding the Fund’s strategy.
| | | | | | | | | | | | | | |
|
| Average Annual Total Return for the period ended June 30, 2022 | |
| | | | |
| | | | | 1 Year | | | 5 Years | | | Fund Inception
(12/31/14) | |
| | PIMCO REALPATH® Blend 2055 Fund Institutional Class | | | (14.32)% | | | | 6.62% | | | | 6.41% | |
| | PIMCO REALPATH® Blend 2055 Fund Administrative Class | | | (14.57)% | | | | 6.36% | | | | 6.14% | |
| | PIMCO REALPATH® Blend 2055 Fund Class A | | | (14.73)% | | | | 6.10% | | | | 5.86% | |
| | PIMCO REALPATH® Blend 2055 Fund Class A (adjusted) | | | (19.43)% | | | | 4.91% | | | | 5.07% | |
| | S&P Target Date 2055 Index± | | | (14.40)% | | | | 6.64% | | | | 6.90% | |
All Fund returns are net of fees and expenses and include applicable fee waivers and/or expense limitations. Absent any applicable fee waivers and/or expense limitations, performance would have been lower and there can be no assurance that any such waivers or limitations will continue in the future.
± The S&P Target Date Index Series is comprised of eleven multi-asset class indices, each corresponding to a particular target retirement date. Each index provides varying levels of exposure to each asset class. Each target date allocation is created and retired according to a pre-determined schedule related to the respective target date, as indicated in the index name, and is based on market observations through an annual survey of target date fund managers.
It is not possible to invest directly in an unmanaged index.
Performance quoted represents past performance. Past performance is not a guarantee or a reliable indicator of future results. Current performance may be lower or higher than performance shown. Investment return and the principal value of an investment will fluctuate. Shares may be worth more or less than original cost when redeemed. Returns shown do not reflect the deduction of taxes that a shareholder would pay on fund distributions or the redemption of fund shares. Differences in the Fund’s performance versus the index and related attribution information with respect to particular categories of securities or individual positions may be attributable, in part, to differences in the pricing methodologies used by the Fund and the index. The adjusted returns take into account the maximum sales charge of 5.50% on Class A shares. For performance data current to the most recent month-end is available at visit www.pimco.com or via (888) 87-PIMCO.
The Fund’s total annual operating expense ratio in effect as of period end, which includes the Acquired Fund Fees and Expenses (Underlying PIMCO Fund expenses) was 0.14% for the Institutional Class shares, 0.39% for the Administrative Class shares, and 0.59% for the Class A shares. Details regarding any changes to the Fund’s operating expenses, subsequent to period end, can be found in the Fund’s current prospectus, as supplemented.
| | | | |
| Institutional Class - PRQZX | | Administrative Class - PRQDX | | Class A - PRQAX |
Top 10 Holdings as of June 30, 2022†§
| | | | | | | | |
Vanguard Institutional Index Fund ‘Institutional’ | | | | | | | 44.3% | |
Vanguard Developed Markets Index Fund ‘Institutional’ | | | | | | | 31.4% | |
Vanguard Emerging Markets Stock Index Fund ‘Institutional’ | | | | | | | 8.8% | |
Vanguard Small-Cap Index Fund ‘Institutional’ | | | | | | | 4.4% | |
PIMCO Long-Term U.S. Government Fund | | | | | | | 1.7% | |
PIMCO Emerging Markets Local Currency and Bond Fund | | | | | | | 1.3% | |
PIMCO Long-Term Real Return Fund | | | | | | | 1.0% | |
PIMCO Total Return Fund | | | | | | | 0.9% | |
PIMCO Income Fund | | | | | | | 0.9% | |
PIMCO International Bond Fund (U.S. Dollar-Hedged) | | | | | | | 0.4% | |
† % of Investments, at value.
§ Top 10 Holdings and % of Investments exclude securities sold short, financial derivative instruments and short-term instruments, if any.
Fund Insights
The following affected performance (on a gross basis) during the reporting period:
| » | | Exposure to global equities detracted from absolute performance, as global equities posted negative returns. |
| » | | Exposure to U.S. large capitalization equities detracted from absolute performance, as U.S. large capitalization equities posted negative returns. |
| » | | Exposure to emerging market equities detracted from absolute performance, as emerging market equities posted negative returns. |
| » | | Exposure to U.S. small capitalization equities detracted from absolute performance, as U.S. small capitalization equities posted negative returns. |
| » | | There were no material contributors for this Fund. |
| | | | | | | | | | | | |
| | | | ANNUAL REPORT | | | | | | | JUNE 30, 2022 | | | 21 |
PIMCO REALPATH® Blend 2060 Fund
Cumulative Returns Through June 30, 2022
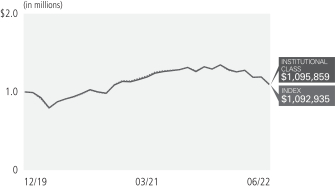
$1,000,000 invested at the end of the month when the Fund’s Institutional Class commenced operations.
Investment Objective and Strategy Overview
PIMCO REALPATH® Blend 2060 Fund seeks to maximize total return, consistent with prudent investment management, by investing under normal circumstances in a combination of affiliated and unaffiliated funds that are registered under the Investment Company Act of 1940, as amended (the “1940 Act”), equity securities, Fixed Income Instruments of varying maturities, or related derivatives on any of the preceding securities mentioned. Under normal circumstances, the Fund seeks to invest substantially all of its equity exposure in index tracking securities, including investments in affiliated or unaffiliated investment companies, which will be registered under the 1940 Act, or related derivatives on such securities or indexes. “Fixed Income Instruments” include bonds, debt securities and other similar instruments issued by various U.S. and non-U.S. public- or private-sector entities. Fund strategies may change from time to time. Please refer to the Fund’s current prospectus for more information regarding the Fund’s strategy.
| | | | | | | | | | |
|
| Average Annual Total Return for the period ended June 30, 2022 | |
| | | |
| | | | | 1 Year | | | Fund Inception
(12/31/19) | |
| | PIMCO REALPATH® Blend 2060 Fund Institutional Class | | | (13.93)% | | | | 3.73% | |
| | PIMCO REALPATH® Blend 2060 Fund Administrative Class | | | (14.19)% | | | | 3.46% | |
| | PIMCO REALPATH® Blend 2060 Fund Class A | | | (14.32)% | | | | 3.27% | |
| | PIMCO REALPATH® Blend 2060 Fund Class A (adjusted) | | | (19.01)% | | | | 0.96% | |
| | S&P Target Date 2060+ Index± | | | (14.45)% | | | | 3.62% | |
All Fund returns are net of fees and expenses and include applicable fee waivers and/or expense limitations. Absent any applicable fee waivers and/or expense limitations, performance would have been lower and there can be no assurance that any such waivers or limitations will continue in the future.
± The S&P Target Date Index Series is comprised of eleven multi-asset class indices, each corresponding to a particular target retirement date. Each index provides varying levels of exposure to each asset class. Each target date allocation is created and retired according to a pre-determined schedule related to the respective target date, as indicated in the index name, and is based on market observations through an annual survey of target date fund managers.
It is not possible to invest directly in an unmanaged index.
Performance quoted represents past performance. Past performance is not a guarantee or a reliable indicator of future results. Current performance may be lower or higher than performance shown. Investment return and the principal value of an investment will fluctuate. Shares may be worth more or less than original cost when redeemed. Returns shown do not reflect the deduction of taxes that a shareholder would pay on fund distributions or the redemption of fund shares. Differences in the Fund’s performance versus the index and related attribution information with respect to particular categories of securities or individual positions may be attributable, in part, to differences in the pricing methodologies used by the Fund and the index. The adjusted returns take into account the maximum sales charge of 5.50% on Class A shares. For performance data current to the most recent month-end is available at visit www.pimco.com or via (888) 87-PIMCO.
The Fund’s total annual operating expense ratio in effect as of period end, which includes the Acquired Fund Fees and Expenses (Underlying PIMCO Fund expenses) was 0.15% for the Institutional Class shares, 0.40% for the Administrative Class shares, and 0.60% for the Class A shares. Details regarding any changes to the Fund’s operating expenses, subsequent to period end, can be found in the Fund’s current prospectus, as supplemented.
| | | | |
| Institutional Class - PRBMX | | Administrative Class - PRBEX | | Class A - PRBAX |
Top 10 Holdings as of June 30, 2022†§
| | | | | | | | |
Vanguard Institutional Index Fund ‘Institutional’ | | | | | | | 44.6% | |
Vanguard Developed Markets Index Fund ‘Admiral’ | | | | | | | 31.6% | |
Vanguard Emerging Markets Stock Index Fund ‘Admiral’ | | | | | | | 8.9% | |
Vanguard Small-Cap Index Fund ‘Admiral’ | | | | | | | 4.4% | |
PIMCO Long-Term U.S. Government Fund | | | | | | | 1.6% | |
PIMCO Emerging Markets Local Currency and Bond Fund | | | | | | | 1.4% | |
PIMCO Long-Term Real Return Fund | | | | | | | 1.0% | |
PIMCO Total Return Fund | | | | | | | 0.9% | |
PIMCO Income Fund | | | | | | | 0.9% | |
PIMCO International Bond Fund (U.S. Dollar-Hedged) | | | | | | | 0.4% | |
† % of Investments, at value.
§ Top 10 Holdings and % of Investments exclude securities sold short, financial derivative instruments and short-term instruments, if any.
Fund Insights
The following affected performance (on a gross basis) during the reporting period:
| » | | Exposure to global equities detracted from absolute performance, as global equities posted negative returns. |
| » | | Exposure to U.S. large capitalization equities detracted from absolute performance, as U.S. large capitalization equities posted negative returns. |
| » | | Exposure to emerging market equities detracted from absolute performance, as emerging market equities posted negative returns. |
| » | | Exposure to U.S. small capitalization equities detracted from absolute performance, as U.S. small capitalization equities posted negative returns. |
| » | | There were no material contributors for this Fund. |
| | | | | | | | | | | | |
| | | | ANNUAL REPORT | | | | | | | JUNE 30, 2022 | | | 23 |
PIMCO REALPATH® Blend Income Fund
Cumulative Returns Through June 30, 2022
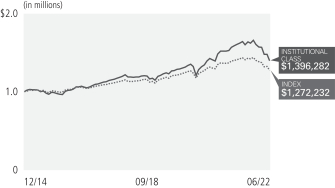
$1,000,000 invested at the end of the month when the Fund’s Institutional Class commenced operations.
Investment Objective and Strategy Overview
PIMCO REALPATH® Blend Income Fund seeks to maximize total return, consistent with prudent investment management, by investing under normal circumstances in a combination of affiliated and unaffiliated funds that are registered under the Investment Company Act of 1940, as amended (the “1940 Act”), equity securities, Fixed Income Instruments of varying maturities, or related derivatives on any of the preceding securities mentioned. The Fund may invest in Institutional Class or Class M shares of any funds of the PIMCO Equity Series (the “Trust”) and PIMCO Funds, and in other affiliated funds, including funds of PIMCO ETF Trust, except funds of funds and PIMCO California Municipal Intermediate Value Fund, PIMCO California Municipal Opportunistic Value Fund, PIMCO National Municipal Intermediate Value Fund and PIMCO National Municipal Opportunistic Value Fund (“Underlying PIMCO Funds”), and unaffiliated funds that are registered under the 1940 Act (collectively, “Acquired Funds”). Under normal circumstances, the Fund seeks to invest substantially all of its equity exposure in index tracking securities, including investments in affiliated or unaffiliated investment companies, which will be registered under the 1940 Act, or related derivatives on such securities or indexes. “Fixed Income Instruments” include bonds, debt securities and other similar instruments issued by various U.S. and non-U.S. public- or private-sector entities. Fund strategies may change from time to time. Please refer to the Fund’s current prospectus for more information regarding the Fund’s strategy.
| | | | | | | | | | | | | | |
|
| Average Annual Total Return for the period ended June 30, 2022 | |
| | | | |
| | | | | 1 Year | | | 5 Years | | | Fund Inception
(12/31/14) | |
| | PIMCO REALPATH® Blend Income Fund Institutional Class | | | (12.98)% | | | | 4.42% | | | | 4.55% | |
| | PIMCO REALPATH® Blend Income Fund Administrative Class | | | (13.25)% | | | | 4.16% | | | | 4.30% | |
| | PIMCO REALPATH® Blend Income Fund Class A | | | (13.41)% | | | | 3.91% | | | | 4.04% | |
| | PIMCO REALPATH® Blend Income Fund Class A (adjusted) | | | (18.18)% | | �� | | 2.74% | | | | 3.26% | |
| | S&P Target Date Retirement Income Index± | | | (9.75)% | | | | 3.13% | | | | 3.26% | |
All Fund returns are net of fees and expenses and include applicable fee waivers and/or expense limitations. Absent any applicable fee waivers and/or expense limitations, performance would have been lower and there can be no assurance that any such waivers or limitations will continue in the future.
± The S&P Target Date Index Series is comprised of eleven multi-asset class indices, each corresponding to a particular target retirement date. Each index provides varying levels of exposure to each asset class. Each target date allocation is created and retired according to a pre-determined schedule related to the respective target date, as indicated in the index name, and is based on market observations through an annual survey of target date fund managers.
It is not possible to invest directly in an unmanaged index.
Performance quoted represents past performance. Past performance is not a guarantee or a reliable indicator of future results. Current performance may be lower or higher than performance shown. Investment return and the principal value of an investment will fluctuate. Shares may be worth more or less than original cost when redeemed. Returns shown do not reflect the deduction of taxes that a shareholder would pay on fund distributions or the redemption of fund shares. Differences in the Fund’s performance versus the index and related attribution information with respect to particular categories of securities or individual positions may be attributable, in part, to differences in the pricing methodologies used by the Fund and the index. The adjusted returns take into account the maximum sales charge of 5.50% on Class A shares. For performance data current to the most recent month-end is available at visit www.pimco.com or via (888) 87-PIMCO.
The Fund’s total annual operating expense ratio in effect as of period end, which includes the Acquired Fund Fees and Expenses (Underlying PIMCO Fund expenses) was 0.39% for the Institutional Class shares, 0.64% for the Administrative Class shares, and 0.84% for the Class A shares. Details regarding any changes to the Fund’s operating expenses, subsequent to period end, can be found in the Fund’s current prospectus, as supplemented.
| | | | |
| Institutional Class - PBRNX | | Administrative Class - PBRDX | | Class A - PBRAX |
Top 10 Holdings as of June 30, 2022†§
| | | | | | | | |
Vanguard Institutional Index Fund ‘Institutional’ | | | | | | | 19.7% | |
PIMCO Income Fund | | | | | | | 16.2% | |
Vanguard Developed Markets Index Fund ‘Institutional’ | | | | | | | 16.0% | |
PIMCO Total Return Fund | | | | | | | 13.7% | |
PIMCO Long-Term U.S. Government Fund | | | | | | | 5.7% | |
PIMCO Long-Term Real Return Fund | | | | | | | 5.5% | |
PIMCO Emerging Markets Local Currency and Bond Fund | | | | | | | 5.4% | |
Vanguard Emerging Markets Stock Index Fund ‘Institutional’ | | | | | | | 5.2% | |
PIMCO Real Return Fund | | | | | | | 4.0% | |
PIMCO International Bond Fund (U.S. Dollar-Hedged) | | | | | | | 3.0% | |
† % of Investments, at value.
§ Top 10 Holdings and % of Investments exclude securities sold short, financial derivative instruments and short-term instruments, if any.
Fund Insights
The following affected performance (on a gross basis) during the reporting period:
| » | | Exposure to U.S. core bonds detracted from absolute performance, as U.S. core bonds posted negative returns. |
| » | | Exposure to global equities detracted from absolute performance, as global equities posted negative returns. |
| » | | Exposure to U.S. large cap equities detracted from absolute performance, as U.S. large cap equities posted negative returns. |
| » | | Exposure to long-term Treasury Inflation Protected Securities (“TIPS”) detracted from absolute performance, as long-term TIPS posted negative returns. |
| » | | There were no material contributors for this Fund. |
| | | | | | | | | | | | |
| | | | ANNUAL REPORT | | | | | | | JUNE 30, 2022 | | | 25 |
Example
As a shareholder of a Fund, you incur two types of costs: (1) transaction costs, including sales charges (loads) on purchase payments and exchange fees and (2) ongoing costs, including investment advisory fees, supervisory and administrative fees, distribution and/or service (12b-1) fees, and other Fund expenses. The Example is intended to help you understand your ongoing costs (in dollars) of investing in a Fund and to compare these costs with the ongoing costs of investing in other mutual funds.
The Example is based on an investment of $1,000 invested at the beginning of the period and held for the entire period indicated, which for all Funds and share classes is from January 1, 2022 to June 30, 2022 unless noted otherwise in the table and footnotes below.
Actual Expenses
The information in the table under the heading “Actual” provides information about actual account values and actual expenses. You may use this information, together with the amount you invested, to estimate the expenses that you paid over the period. Simply divide your account value by $1,000 (for example, an $8,600 account value divided by $1,000 = 8.60), then multiply the result by the number in the appropriate row for your share class, in the column entitled “Expenses Paid During Period” to estimate the expenses you paid on your account during this period.
Hypothetical Example for Comparison Purposes
The information in the table under the heading “Hypothetical (5% return before expenses)” provides information about hypothetical account values and hypothetical expenses based on a Fund’s actual expense ratio and an assumed rate of return of 5% per year before expenses, which is not the Fund’s actual return. The hypothetical account values and expenses may not be used to estimate the actual ending account balance or expenses you paid for the period. You may use this information to compare the ongoing costs of investing in a Fund and other funds. To do so, compare this 5% hypothetical example with the 5% hypothetical examples that appear in the shareholder reports of the other funds.
Please note that the expenses shown in the table are meant to highlight your ongoing costs only and do not reflect any transactional costs, such as sales charges (loads) on purchase payments and exchange fees. Therefore, the information under the heading “Hypothetical (5% return before expenses)” is useful in comparing ongoing costs only, and will not help you determine the relative total costs of owning different funds. In addition, if these transactional costs were included, your costs would have been higher.
Expense ratios may vary from period to period because of various factors such as an increase in expenses that are not covered by the investment advisory fees and supervisory and administrative fees, such as fees and expenses of the independent trustees and their counsel, extraordinary expenses and interest expense.
| | | | | | | | | | | | | | | | | | | | | | | | | | | | | | | | | | | | | | | | |
| | | | | | Actual | | | | | | Hypothetical (5% return before expenses) | | | | | | | |
| | | | | | Beginning
Account Value
(01/01/22) | | | Ending
Account Value
(06/30/22) | | | Expenses Paid
During Period* | | | | | | Beginning
Account Value
(01/01/22) | | | Ending
Account Value
(06/30/22) | | | Expenses Paid
During Period* | | | | | | Net Annualized
Expense Ratio** | |
| | | | | | | | | | |
PIMCO REALPATH® Blend 2025 Fund | | | | | | | | | | | | | | | | | | | | | | | | | | | | | | | | | | | | | | | | |
| Institutional Class | | | | | | $ | 1,000.00 | | | $ | 833.50 | | | $ | 0.18 | | | | | | | $ | 1,000.00 | | | $ | 1,024.32 | | | $ | 0.20 | | | | | | | | 0.04 | % |
| Administrative Class | | | | | | | 1,000.00 | | | | 832.10 | | | | 1.30 | | | | | | | | 1,000.00 | | | | 1,023.10 | | | | 1.44 | | | | | | | | 0.29 | |
| Class A | | | | | | | 1,000.00 | | | | 832.30 | | | | 2.20 | | | | | | | | 1,000.00 | | | | 1,022.12 | | | | 2.43 | | | | | | | | 0.49 | |
| | | | | | | | | | |
PIMCO REALPATH® Blend 2030 Fund | | | | | | | | | | | | | | | | | | | | | | | | | | | | | | | | | | | | | | | | |
| Institutional Class | | | | | | $ | 1,000.00 | | | $ | 824.00 | | | $ | 0.18 | | | | | | | $ | 1,000.00 | | | $ | 1,024.32 | | | $ | 0.20 | | | | | | | | 0.04 | % |
| Administrative Class | | | | | | | 1,000.00 | | | | 822.70 | | | | 1.30 | | | | | | | | 1,000.00 | | | | 1,023.10 | | | | 1.44 | | | | | | | | 0.29 | |
| Class A | | | | | | | 1,000.00 | | | | 821.90 | | | | 2.19 | | | | | | | | 1,000.00 | | | | 1,022.12 | | | | 2.43 | | | | | | | | 0.49 | |
| | | | | | | | | | |
PIMCO REALPATH® Blend 2035 Fund | | | | | | | | | | | | | | | | | | | | | | | | | | | | | | | | | | | | | | | | |
| Institutional Class | | | | | | $ | 1,000.00 | | | $ | 819.60 | | | $ | 0.22 | | | | | | | $ | 1,000.00 | | | $ | 1,024.28 | | | $ | 0.25 | | | | | | | | 0.05 | % |
| Administrative Class | | | | | | | 1,000.00 | | | | 818.20 | | | | 1.34 | | | | | | | | 1,000.00 | | | | 1,023.05 | | | | 1.49 | | | | | | | | 0.30 | |
| Class A | | | | | | | 1,000.00 | | | | 817.20 | | | | 2.23 | | | | | | | | 1,000.00 | | | | 1,022.07 | | | | 2.48 | | | | | | | | 0.50 | |
| | | | | | | | | | |
PIMCO REALPATH® Blend 2040 Fund | | | | | | | | | | | | | | | | | | | | | | | | | | | | | | | | | | | | | | | | |
| Institutional Class | | | | | | $ | 1,000.00 | | | $ | 815.60 | | | $ | 0.27 | | | | | | | $ | 1,000.00 | | | $ | 1,024.23 | | | $ | 0.30 | | | | | | | | 0.06 | % |
| Administrative Class | | | | | | | 1,000.00 | | | | 815.00 | | | | 1.38 | | | | | | | | 1,000.00 | | | | 1,023.00 | | | | 1.54 | | | | | | | | 0.31 | |
| Class A | | | | | | | 1,000.00 | | | | 814.00 | | | | 2.27 | | | | | | | | 1,000.00 | | | | 1,022.02 | | | | 2.53 | | | | | | | | 0.51 | |
| | | | | | | | | | | | | | | | | | | | | | | | | | | | | | | | | | | | | | | | |
| | | | | | Actual | | | | | | Hypothetical (5% return before expenses) | | | | | | | |
| | | | | | Beginning
Account Value
(01/01/22) | | | Ending
Account Value
(06/30/22) | | | Expenses Paid
During Period* | | | | | | Beginning
Account Value
(01/01/22) | | | Ending
Account Value
(06/30/22) | | | Expenses Paid
During Period* | | | | | | Net Annualized
Expense Ratio** | |
| | | | | | | | | | |
PIMCO REALPATH® Blend 2045 Fund | | | | | | | | | | | | | | | | | | | | | | | | | | | | | | | | | | | | | | | | |
| Institutional Class | | | | | | $ | 1,000.00 | | | $ | 812.90 | | | $ | 0.27 | | | | | | | $ | 1,000.00 | | | $ | 1,024.23 | | | $ | 0.30 | | | | | | | | 0.06 | % |
| Administrative Class | | | | | | | 1,000.00 | | | | 812.10 | | | | 1.38 | | | | | | | | 1,000.00 | | | | 1,023.00 | | | | 1.54 | | | | | | | | 0.31 | |
| Class A | | | | | | | 1,000.00 | | | | 811.20 | | | | 2.27 | | | | | | | | 1,000.00 | | | | 1,022.02 | | | | 2.53 | | | | | | | | 0.51 | |
| | | | | | | | | | |
PIMCO REALPATH® Blend 2050 Fund | | | | | | | | | | | | | | | | | | | | | | | | | | | | | | | | | | | | | | | | |
| Institutional Class | | | | | | $ | 1,000.00 | | | $ | 810.90 | | | $ | 0.27 | | | | | | | $ | 1,000.00 | | | $ | 1,024.23 | | | $ | 0.30 | | | | | | | | 0.06 | % |
| Administrative Class | | | | | | | 1,000.00 | | | | 810.20 | | | | 1.38 | | | | | | | | 1,000.00 | | | | 1,023.00 | | | | 1.54 | | | | | | | | 0.31 | |
| Class A | | | | | | | 1,000.00 | | | | 808.70 | | | | 2.26 | | | | | | | | 1,000.00 | | | | 1,022.02 | | | | 2.53 | | | | | | | | 0.51 | |
| | | | | | | | | | |
PIMCO REALPATH® Blend 2055 Fund | | | | | | | | | | | | | | | | | | | | | | | | | | | | | | | | | | | | | | | | |
| Institutional Class | | | | | | $ | 1,000.00 | | | $ | 810.60 | | | $ | 0.27 | | | | | | | $ | 1,000.00 | | | $ | 1,024.23 | | | $ | 0.30 | | | | | | | | 0.06 | % |
| Administrative Class | | | | | | | 1,000.00 | | | | 809.00 | | | | 1.38 | | | | | | | | 1,000.00 | | | | 1,023.00 | | | | 1.54 | | | | | | | | 0.31 | |
| Class A | | | | | | | 1,000.00 | | | | 808.70 | | | | 2.26 | | | | | | | | 1,000.00 | | | | 1,022.02 | | | | 2.53 | | | | | | | | 0.51 | |
| | | | | | | | | | |
PIMCO REALPATH® Blend 2060 Fund | | | | | | | | | | | | | | | | | | | | | | | | | | | | | | | | | | | | | | | | |
| Institutional Class | | | | | | $ | 1,000.00 | | | $ | 813.90 | | | $ | 0.22 | | | | | | | $ | 1,000.00 | | | $ | 1,024.28 | | | $ | 0.25 | | | | | | | | 0.05 | % |
| Administrative Class | | | | | | | 1,000.00 | | | | 812.60 | | | | 1.33 | | | | | | | | 1,000.00 | | | | 1,023.05 | | | | 1.49 | | | | | | | | 0.30 | |
| Class A | | | | | | | 1,000.00 | | | | 812.30 | | | | 2.22 | | | | | | | | 1,000.00 | | | | 1,022.07 | | | | 2.48 | | | | | | | | 0.50 | |
| | | | | | | | | | |
PIMCO REALPATH® Blend Income Fund | | | | | | | | | | | | | | | | | | | | | | | | | | | | | | | | | | | | | | | | |
| Institutional Class | | | | | | $ | 1,000.00 | | | $ | 842.70 | | | $ | 0.18 | | | | | | | $ | 1,000.00 | | | $ | 1,024.32 | | | $ | 0.20 | | | | | | | | 0.04 | % |
| Administrative Class | | | | | | | 1,000.00 | | | | 841.00 | | | | 1.31 | | | | | | | | 1,000.00 | | | | 1,023.10 | | | | 1.44 | | | | | | | | 0.29 | |
| Class A | | | | | | | 1,000.00 | | | | 840.70 | | | | 2.21 | | | | | | | | 1,000.00 | | | | 1,022.12 | | | | 2.43 | | | | | | | | 0.49 | |
* Expenses Paid During Period are equal to the net annualized expense ratio for the class, multiplied by the average account value over the period, multiplied by 179/365 (to reflect the one-half year period).
** Net Annualized Expense Ratio is reflective of any applicable contractual fee waivers and/or expense reimbursements or voluntary fee waivers. Details regarding fee waivers, if any, can be found in Note 9, Fees and Expenses, in the Notes to Financial Statements.
| | | | | | | | | | | | |
| | | | ANNUAL REPORT | | | | | | | JUNE 30, 2022 | | | 27 |
| | | | | | | | | | | | | | | | | | | | | | | | | | | | |
| | | | | | Investment Operations | | | Less Distributions(c) | |
| | | | | | | | | |
| Selected Per Share Data for the Year or Period Ended^: | | Net Asset
Value
Beginning of
Year or
Period(a) | | | Net
Investment
Income
(Loss)(b) | | | Net
Realized/
Unrealized
Gain (Loss) | | | Total | | | From Net
Investment
Income | | | From Net
Realized
Capital Gains | | | Total | |
| | | | | | | |
PIMCO REALPATH® Blend 2025 Fund | | | | | | | | | | | | | | | | | | | | | | | | | | | | |
| Institutional Class | | | | | | | | | | | | | | | | | | | | | | | | | | | | |
| | | | | | | |
06/30/2022 | | $ | 13.50 | | | $ | 0.44 | | | $ | (2.16 | ) | | $ | (1.72 | ) | | $ | (0.37 | ) | | $ | (0.12 | ) | | $ | (0.49 | ) |
| | | | | | | |
06/30/2021 | | | 11.71 | | | | 0.36 | | | | 2.25 | | | | 2.61 | | | | (0.65 | ) | | | (0.17 | ) | | | (0.82 | ) |
| | | | | | | |
06/30/2020 | | | 11.33 | | | | 0.36 | | | | 0.36 | | | | 0.72 | | | | (0.34 | ) | | | 0.00 | | | | (0.34 | ) |
| | | | | | | |
06/30/2019 | | | 11.15 | | | | 0.36 | | | | 0.32 | | | | 0.68 | | | | (0.32 | ) | | | (0.18 | ) | | | (0.50 | ) |
| | | | | | | |
06/30/2018 | | | 10.63 | | | | 0.31 | | | | 0.43 | | | | 0.74 | | | | (0.22 | ) | | | 0.00 | | | | (0.22 | ) |
| Administrative Class | | | | | | | | | | | | | | | | | | | | | | | | | | | | |
| | | | | | | |
06/30/2022 | | | 13.47 | | | | 0.41 | | | | (2.17 | ) | | | (1.76 | ) | | | (0.34 | ) | | | (0.12 | ) | | | (0.46 | ) |
| | | | | | | |
06/30/2021 | | | 11.69 | | | | 0.32 | | | | 2.25 | | | | 2.57 | | | | (0.62 | ) | | | (0.17 | ) | | | (0.79 | ) |
| | | | | | | |
06/30/2020 | | | 11.31 | | | | 0.34 | | | | 0.36 | | | | 0.70 | | | | (0.32 | ) | | | 0.00 | | | | (0.32 | ) |
| | | | | | | |
06/30/2019 | | | 11.13 | | | | 0.32 | | | | 0.34 | | | | 0.66 | | | | (0.30 | ) | | | (0.18 | ) | | | (0.48 | ) |
| | | | | | | |
06/30/2018 | | | 10.62 | | | | 0.33 | | | | 0.38 | | | | 0.71 | | | | (0.20 | ) | | | 0.00 | | | | (0.20 | ) |
| Class A | | | | | | | | | | | | | | | | | | | | | | | | | | | | |
| | | | | | | |
06/30/2022 | | | 13.46 | | | | 0.37 | | | | (2.15 | ) | | | (1.78 | ) | | | (0.31 | ) | | | (0.12 | ) | | | (0.43 | ) |
| | | | | | | |
06/30/2021 | | | 11.68 | | | | 0.28 | | | | 2.27 | | | | 2.55 | | | | (0.60 | ) | | | (0.17 | ) | | | (0.77 | ) |
| | | | | | | |
06/30/2020 | | | 11.31 | | | | 0.31 | | | | 0.35 | | | | 0.66 | | | | (0.29 | ) | | | 0.00 | | | | (0.29 | ) |
| | | | | | | |
06/30/2019 | | | 11.13 | | | | 0.29 | | | | 0.34 | | | | 0.63 | | | | (0.27 | ) | | | (0.18 | ) | | | (0.45 | ) |
| | | | | | | |
06/30/2018 | | | 10.62 | | | | 0.25 | | | | 0.43 | | | | 0.68 | | | | (0.17 | ) | | | 0.00 | | | | (0.17 | ) |
| | | | | | | |
PIMCO REALPATH® Blend 2030 Fund | | | | | | | | | | | | | | | | | | | | | | | | | | | | |
| Institutional Class | | | | | | | | | | | | | | | | | | | | | | | | | | | | |
| | | | | | | |
06/30/2022 | | $ | 14.09 | | | $ | 0.41 | | | $ | (2.30 | ) | | $ | (1.89 | ) | | $ | (0.34 | ) | | $ | (0.17 | ) | | $ | (0.51 | ) |
| | | | | | | |
06/30/2021 | | | 11.76 | | | | 0.34 | | | | 2.69 | | | | 3.03 | | | | (0.55 | ) | | | (0.15 | ) | | | (0.70 | ) |
| | | | | | | |
06/30/2020 | | | 11.54 | | | | 0.35 | | | | 0.22 | | | | 0.57 | | | | (0.33 | ) | | | (0.02 | ) | | | (0.35 | ) |
| | | | | | | |
06/30/2019 | | | 11.39 | | | | 0.34 | | | | 0.39 | | | | 0.73 | | | | (0.32 | ) | | | (0.26 | ) | | | (0.58 | ) |
| | | | | | | |
06/30/2018 | | | 10.81 | | | | 0.30 | | | | 0.54 | | | | 0.84 | | | | (0.24 | ) | | | (0.02 | ) | | | (0.26 | ) |
| Administrative Class | | | | | | | | | | | | | | | | | | | | | | | | | | | | |
| | | | | | | |
06/30/2022 | | | 14.06 | | | | 0.38 | | | | (2.30 | ) | | | (1.92 | ) | | | (0.31 | ) | | | (0.17 | ) | | | (0.48 | ) |
| | | | | | | |
06/30/2021 | | | 11.75 | | | | 0.30 | | | | 2.68 | | | | 2.98 | | | | (0.52 | ) | | | (0.15 | ) | | | (0.67 | ) |
| | | | | | | |
06/30/2020 | | | 11.52 | | | | 0.33 | | | | 0.22 | | | | 0.55 | | | | (0.30 | ) | | | (0.02 | ) | | | (0.32 | ) |
| | | | | | | |
06/30/2019 | | | 11.38 | | | | 0.30 | | | | 0.39 | | | | 0.69 | | | | (0.29 | ) | | | (0.26 | ) | | | (0.55 | ) |
| | | | | | | |
06/30/2018 | | | 10.80 | | | | 0.32 | | | | 0.50 | | | | 0.82 | | | | (0.22 | ) | | | (0.02 | ) | | | (0.24 | ) |
| Class A | | | | | | | | | | | | | | | | | | | | | | | | | | | | |
| | | | | | | |
06/30/2022 | | | 14.02 | | | | 0.35 | | | | (2.30 | ) | | | (1.95 | ) | | | (0.28 | ) | | | (0.17 | ) | | | (0.45 | ) |
| | | | | | | |
06/30/2021 | | | 11.71 | | | | 0.27 | | | | 2.68 | | | | 2.95 | | | | (0.49 | ) | | | (0.15 | ) | | | (0.64 | ) |
| | | | | | | |
06/30/2020 | | | 11.50 | | | | 0.29 | | | | 0.22 | | | | 0.51 | | | | (0.28 | ) | | | (0.02 | ) | | | (0.30 | ) |
| | | | | | | |
06/30/2019 | | | 11.36 | | | | 0.28 | | | | 0.39 | | | | 0.67 | | | | (0.27 | ) | | | (0.26 | ) | | | (0.53 | ) |
| | | | | | | |
06/30/2018 | | | 10.78 | | | | 0.25 | | | | 0.54 | | | | 0.79 | | | | (0.19 | ) | | | (0.02 | ) | | | (0.21 | ) |
| | | | | | | |
PIMCO REALPATH® Blend 2035 Fund | | | | | | | | | | | | | | | | | | | | | | | | | | | | |
| Institutional Class | | | | | | | | | | | | | | | | | | | | | | | | | | | | |
| | | | | | | |
06/30/2022 | | $ | 14.54 | | | $ | 0.39 | | | $ | (2.34 | ) | | $ | (1.95 | ) | | $ | (0.34 | ) | | $ | (0.17 | ) | | $ | (0.51 | ) |
| | | | | | | |
06/30/2021 | | | 11.65 | | | | 0.31 | | | | 3.11 | | | | 3.42 | | | | (0.44 | ) | | | (0.09 | ) | | | (0.53 | ) |
| | | | | | | |
06/30/2020 | | | 11.58 | | | | 0.33 | | | | 0.08 | | | | 0.41 | | | | (0.32 | ) | | | (0.02 | ) | | | (0.34 | ) |
| | | | | | | |
06/30/2019 | | | 11.58 | | | | 0.33 | | | | 0.38 | | | | 0.71 | | | | (0.32 | ) | | | (0.39 | ) | | | (0.71 | ) |
| | | | | | | |
06/30/2018 | | | 10.91 | | | | 0.29 | | | | 0.64 | | | | 0.93 | | | | (0.26 | ) | | | 0.00 | | | | (0.26 | ) |
| Administrative Class | | | | | | | | | | | | | | | | | | | | | | | | | | | | |
| | | | | | | |
06/30/2022 | | | 14.51 | | | | 0.35 | | | | (2.33 | ) | | | (1.98 | ) | | | (0.31 | ) | | | (0.17 | ) | | | (0.48 | ) |
| | | | | | | |
06/30/2021 | | | 11.63 | | | | 0.27 | | | | 3.11 | | | | 3.38 | | | | (0.41 | ) | | | (0.09 | ) | | | (0.50 | ) |
| | | | | | | |
06/30/2020 | | | 11.57 | | | | 0.31 | | | | 0.06 | | | | 0.37 | | | | (0.29 | ) | | | (0.02 | ) | | | (0.31 | ) |
| | | | | | | |
06/30/2019 | | | 11.57 | | | | 0.29 | | | | 0.39 | | | | 0.68 | | | | (0.29 | ) | | | (0.39 | ) | | | (0.68 | ) |
| | | | | | | |
06/30/2018 | | | 10.91 | | | | 0.31 | | | | 0.59 | | | | 0.90 | | | | (0.24 | ) | | | 0.00 | | | | (0.24 | ) |
| Class A | | | | | | | | | | | | | | | | | | | | | | | | | | | | |
| | | | | | | |
06/30/2022 | | | 14.55 | | | | 0.32 | | | | (2.34 | ) | | | (2.02 | ) | | | (0.28 | ) | | | (0.17 | ) | | | (0.45 | ) |
| | | | | | | |
06/30/2021 | | | 11.67 | | | | 0.24 | | | | 3.11 | | | | 3.35 | | | | (0.38 | ) | | | (0.09 | ) | | | (0.47 | ) |
| | | | | | | |
06/30/2020 | | | 11.61 | | | | 0.27 | | | | 0.08 | | | | 0.35 | | | | (0.27 | ) | | | (0.02 | ) | | | (0.29 | ) |
| | | | | | | |
06/30/2019 | | | 11.61 | | | | 0.26 | | | | 0.39 | | | | 0.65 | | | | (0.26 | ) | | | (0.39 | ) | | | (0.65 | ) |
| | | | | | | |
06/30/2018 | | | 10.94 | | | | 0.24 | | | | 0.64 | | | | 0.88 | | | | (0.21 | ) | | | 0.00 | | | | (0.21 | ) |
| | | | | | |
| 28 | | PIMCO EQUITY SERIES | | | See Accompanying Notes | |
| | | | | | | | | | | | | | | | | | | | | | | | | | | | | | | | | | |
| | | | Ratios/Supplemental Data | |
| | | | | | | | | | Ratios to Average Net Assets(e) | | | | |
Net Assets
Value End of
Year or
Period(a) | | | Total
Return(d) | | | Net Assets
End of Year or
Period (000s) | | | Expenses | | | Expenses
Excluding
Waivers | | | Expenses
Excluding
Interest
Expense | | | Expenses
Excluding
Interest
Expense and Waivers | | | Net
Investment
Income (Loss) | | | Portfolio
Turnover
Rate | |
| | | | | | | | |
| | | | | | | | | | | | | | | | | | | | | | | | | | | | | | | | | | |
| | | | | | | | |
| | | | | | | | | | | | | | | | | | | | | | | | | | | | | | | | | | |
| | | | | | | | |
| $ | 11.29 | | | | (13.29 | )% | | $ | 211,435 | | | | 0.04 | % | | | 0.04 | % | | | 0.04 | % | | | 0.04 | % | | | 3.35 | % | | | 21 | % |
| | | | | | | | |
| | 13.50 | | | | 22.73 | | | | 220,130 | | | | 0.04 | | | | 0.04 | | | | 0.04 | | | | 0.04 | | | | 2.78 | | | | 20 | |
| | | | | | | | |
| | 11.71 | | | | 6.41 | | | | 80,067 | | | | 0.04 | | | | 0.05 | | | | 0.04 | | | | 0.05 | | | | 3.18 | | | | 39 | |
| | | | | | | | |
| | 11.33 | | | | 6.53 | | | | 31,946 | | | | 0.04 | | | | 0.05 | | | | 0.04 | | | | 0.05 | | | | 3.26 | | | | 47 | |
| | | | | | | | |
| | 11.15 | | | | 6.92 | | | | 6,824 | | | | 0.04 | | | | 0.04 | | | | 0.04 | | | | 0.04 | | | | 2.75 | | | | 75 | |
| | | | | | | | | | | | | | | | | | | | | | | | | | | | | | | | | | |
| | | | | | | | |
| | 11.25 | | | | (13.60 | ) | | | 25,795 | | | | 0.29 | | | | 0.29 | | | | 0.29 | | | | 0.29 | | | | 3.11 | | | | 21 | |
| | | | | | | | |
| | 13.47 | | | | 22.40 | | | | 29,727 | | | | 0.29 | | | | 0.29 | | | | 0.29 | | | | 0.29 | | | | 2.53 | | | | 20 | |
| | | | | | | | |
| | 11.69 | | | | 6.19 | | | | 28,587 | | | | 0.29 | | | | 0.30 | | | | 0.29 | | | | 0.30 | | | | 2.99 | | | | 39 | |
| | | | | | | | |
| | 11.31 | | | | 6.29 | | | | 21,086 | | | | 0.29 | | | | 0.30 | | | | 0.29 | | | | 0.30 | | | | 2.88 | | | | 47 | |
| | | | | | | | |
| | 11.13 | | | | 6.65 | | | | 19,661 | | | | 0.29 | | | | 0.29 | | | | 0.29 | | | | 0.29 | | | | 2.90 | | | | 75 | |
| | | | | | | | | | | | | | | | | | | | | | | | | | | | | | | | | | |
| | | | | | | | |
| | 11.25 | | | | (13.73 | ) | | | 6,905 | | | | 0.51 | (f) | | | 0.51 | (f) | | | 0.51 | (f) | | | 0.51 | (f) | | | 2.85 | % | | | 21 | |
| | | | | | | | |
| | 13.46 | | | | 22.18 | | | | 10,114 | | | | 0.54 | | | | 0.54 | | | | 0.54 | | | | 0.54 | | | | 2.21 | | | | 20 | |
| | | | | | | | |
| | 11.68 | | | | 5.88 | | | | 6,420 | | | | 0.54 | | | | 0.55 | | | | 0.54 | | | | 0.55 | | | | 2.68 | | | | 39 | |
| | | | | | | | |
| | 11.31 | | | | 6.03 | | | | 5,462 | | | | 0.54 | | | | 0.55 | | | | 0.54 | | | | 0.55 | | | | 2.63 | | | | 47 | |
| | | | | | | | |
| | 11.13 | | | | 6.36 | | | | 5,078 | | | | 0.54 | | | | 0.54 | | | | 0.54 | | | | 0.54 | | | | 2.30 | | | | 75 | |
| | | | | | | | |
| | | | | | | | | | | | | | | | | | | | | | | | | | | | | | | | | | |
| | | | | | | | |
| | | | | | | | | | | | | | | | | | | | | | | | | | | | | | | | | | |
| | | | | | | | |
| $ | 11.69 | | | | (13.97 | )% | | $ | 239,698 | | | | 0.04 | % | | | 0.04 | % | | | 0.04 | % | | | 0.04 | % | | | 3.04 | % | | | 22 | % |
| | | | | | | | |
| | 14.09 | | | | 26.14 | | | | 239,041 | | | | 0.04 | | | | 0.04 | | | | 0.04 | | | | 0.04 | | | | 2.59 | | | | 26 | |
| | | | | | | | |
| | 11.76 | | | | 4.89 | | | | 105,414 | | | | 0.05 | | | | 0.06 | | | | 0.05 | | | | 0.06 | | | | 3.00 | | | | 28 | |
| | | | | | | | |
| | 11.54 | | | | 6.84 | | | | 52,133 | | | | 0.05 | | | | 0.06 | | | | 0.05 | | | | 0.06 | | | | 3.08 | | | | 40 | |
| | | | | | | | |
| | 11.39 | | | | 7.81 | | | | 13,974 | | | | 0.05 | | | | 0.05 | | | | 0.05 | | | | 0.05 | | | | 2.63 | | | | 98 | |
| | | | | | | | |
| | | | | | | | | | | | | | | | | | | | | | | | | | | | | | | | | | |
| | | | | | | | |
| | 11.66 | | | | (14.20 | ) | | | 30,094 | | | | 0.29 | | | | 0.29 | | | | 0.29 | | | | 0.29 | | | | 2.77 | | | | 22 | |
| | | | | | | | |
| | 14.06 | | | | 25.71 | | | | 33,946 | | | | 0.29 | | | | 0.29 | | | | 0.29 | | | | 0.29 | | | | 2.31 | | | | 26 | |
| | | | | | | | |
| | 11.75 | | | | 4.76 | | | | 27,583 | | | | 0.30 | | | | 0.31 | | | | 0.30 | | | | 0.31 | | | | 2.81 | | | | 28 | |
| | | | | | | | |
| | 11.52 | | | | 6.50 | | | | 21,469 | | | | 0.30 | | | | 0.31 | | | | 0.30 | | | | 0.31 | | | | 2.71 | | | | 40 | |
| | | | | | | | |
| | 11.38 | | | | 7.64 | | | | 20,114 | | | | 0.30 | | | | 0.30 | | | | 0.30 | | | | 0.30 | | | | 2.77 | | | | 98 | |
| | | | | | | | |
| | | | | | | | | | | | | | | | | | | | | | | | | | | | | | | | | | |
| | | | | | | | |
| | 11.62 | | | | (14.42 | ) | | | 7,847 | | | | 0.51 | (f) | | | 0.51 | (f) | | | 0.51 | (f) | | | 0.51 | (f) | | | 2.56 | | | | 22 | |
| | | | | | | | |
| | 14.02 | | | | 25.53 | | | | 9,243 | | | | 0.54 | | | | 0.54 | | | | 0.54 | | | | 0.54 | | | | 2.04 | | | | 26 | |
| | | | | | | | |
| | 11.71 | | | | 4.41 | | | | 6,494 | | | | 0.55 | | | | 0.56 | | | | 0.55 | | | | 0.56 | | | | 2.50 | | | | 28 | |
| | | | | | | | |
| | 11.50 | | | | 6.28 | | | | 5,774 | | | | 0.55 | | | | 0.56 | | | | 0.55 | | | | 0.56 | | | | 2.52 | | | | 40 | |
| | | | | | | | |
| | 11.36 | | | | 7.36 | | | | 4,169 | | | | 0.55 | | | | 0.55 | | | | 0.55 | | | | 0.55 | | | | 2.20 | | | | 98 | |
| | | | | | | | |
| | | | | | | | | | | | | | | | | | | | | | | | | | | | | | | | | | |
| | | | | | | | |
| | | | | | | | | | | | | | | | | | | | | | | | | | | | | | | | | | |
| | | | | | | | |
| $ | 12.08 | | | | (14.03 | )% | | $ | 215,450 | | | | 0.05 | % | | | 0.05 | % | | | 0.05 | % | | | 0.05 | % | | | 2.78 | % | | | 17 | % |
| | | | | | | | |
| | 14.54 | | | | 29.68 | | | | 193,069 | | | | 0.04 | | | | 0.05 | | | | 0.04 | | | | 0.05 | | | | 2.32 | | | | 21 | |
| | | | | | | | |
| | 11.65 | | | | 3.47 | | | | 76,525 | | | | 0.06 | | | | 0.07 | | | | 0.06 | | | | 0.07 | | | | 2.85 | | | | 34 | |
| | | | | | | | |
| | 11.58 | | | | 6.67 | | | | 42,033 | | | | 0.06 | | | | 0.07 | | | | 0.06 | | | | 0.07 | | | | 2.94 | | | | 24 | |
| | | | | | | | |
| | 11.58 | | | | 8.56 | | | | 16,958 | | | | 0.06 | | | | 0.07 | | | | 0.06 | | | | 0.07 | | | | 2.52 | | | | 101 | |
| | | | | | | | |
| | | | | | | | | | | | | | | | | | | | | | | | | | | | | | | | | | |
| | | | | | | | |
| | 12.05 | | | | (14.26 | ) | | | 25,937 | | | | 0.30 | | | | 0.30 | | | | 0.30 | | | | 0.30 | | | | 2.52 | | | | 17 | |
| | | | | | | | |
| | 14.51 | | | | 29.36 | | | | 28,579 | | | | 0.29 | | | | 0.30 | | | | 0.29 | | | | 0.30 | | | | 2.05 | | | | 21 | |
| | | | | | | | |
| | 11.63 | | | | 3.15 | | | | 22,984 | | | | 0.31 | | | | 0.32 | | | | 0.31 | | | | 0.32 | | | | 2.66 | | | | 34 | |
| | | | | | | | |
| | 11.57 | | | | 6.43 | | | | 18,672 | | | | 0.31 | | | | 0.32 | | | | 0.31 | | | | 0.32 | | | | 2.58 | | | | 24 | |
| | | | | | | | |
| | 11.57 | | | | 8.29 | | | | 17,270 | | | | 0.31 | | | | 0.32 | | | | 0.31 | | | | 0.32 | | | | 2.69 | | | | 101 | |
| | | | | | | | |
| | | | | | | | | | | | | | | | | | | | | | | | | | | | | | | | | | |
| | | | | | | | |
| | 12.08 | | | | (14.46 | ) | | | 6,983 | | | | 0.52 | (f) | | | 0.52 | (f) | | | 0.52 | (f) | | | 0.52 | (f) | | | 2.29 | | | | 17 | |
| | | | | | | | |
| | 14.55 | | | | 28.97 | | | | 7,914 | | | | 0.54 | | | | 0.55 | | | | 0.54 | | | | 0.55 | | | | 1.80 | | | | 21 | |
| | | | | | | | |
| | 11.67 | | | | 2.95 | | | | 6,109 | | | | 0.56 | | | | 0.57 | | | | 0.56 | | | | 0.57 | | | | 2.36 | | | | 34 | |
| | | | | | | | |
| | 11.61 | | | | 6.15 | | | | 5,062 | | | | 0.56 | | | | 0.57 | | | | 0.56 | | | | 0.57 | | | | 2.33 | | | | 24 | |
| | | | | | | | |
| | 11.61 | | | | 8.06 | | | | 4,330 | | | | 0.56 | | | | 0.57 | | | | 0.56 | | | | 0.57 | | | | 2.10 | | | | 101 | |
| | | | | | | | | | | | |
| | | | ANNUAL REPORT | | | | | | | JUNE 30, 2022 | | | 29 |
| | | | |
| Financial Highlights | | (Cont.) | | |
| | | | | | | | | | | | | | | | | | | | | | | | | | | | |
| | | | | | Investment Operations | | | Less Distributions(c) | |
| | | | | | | | | |
| Selected Per Share Data for the Year or Period Ended^: | | Net Asset
Value
Beginning of
Year or
Period(a) | | | Net
Investment
Income
(Loss)(b) | | | Net
Realized/
Unrealized
Gain (Loss) | | | Total | | | From Net
Investment
Income | | | From Net
Realized
Capital Gains | | | Total | |
| | | | | | | |
PIMCO REALPATH® Blend 2040 Fund | | | | | | | | | | | | | | | | | | | | | | | | | | | | |
| Institutional Class | | | | | | | | | | | | | | | | | | | | | | | | | | | | |
| | | | | | | |
06/30/2022 | | $ | 14.96 | | | $ | 0.38 | | | $ | (2.42 | ) | | $ | (2.04 | ) | | $ | (0.35 | ) | | $ | (0.17 | ) | | $ | (0.52 | ) |
| | | | | | | |
06/30/2021 | | | 11.68 | | | | 0.30 | | | | 3.46 | | | | 3.76 | | | | (0.41 | ) | | | (0.07 | ) | | | (0.48 | ) |
| | | | | | | |
06/30/2020 | | | 11.71 | | | | 0.31 | | | | 0.02 | | | | 0.33 | | | | (0.34 | ) | | | (0.02 | ) | | | (0.36 | ) |
| | | | | | | |
06/30/2019 | | | 11.71 | | | | 0.32 | | | | 0.38 | | | | 0.70 | | | | (0.31 | ) | | | (0.39 | ) | | | (0.70 | ) |
| | | | | | | |
06/30/2018 | | | 11.00 | | | | 0.29 | | | | 0.71 | | | | 1.00 | | | | (0.27 | ) | | | (0.02 | ) | | | (0.29 | ) |
| Administrative Class | | | | | | | | | | | | | | | | | | | | | | | | | | | | |
| | | | | | | |
06/30/2022 | | | 14.92 | | | | 0.34 | | | | (2.40 | ) | | | (2.06 | ) | | | (0.32 | ) | | | (0.17 | ) | | | (0.49 | ) |
| | | | | | | |
06/30/2021 | | | 11.65 | | | | 0.26 | | | | 3.46 | | | | 3.72 | | | | (0.38 | ) | | | (0.07 | ) | | | (0.45 | ) |
| | | | | | | |
06/30/2020 | | | 11.69 | | | | 0.29 | | | | 0.01 | | | | 0.30 | | | | (0.32 | ) | | | (0.02 | ) | | | (0.34 | ) |
| | | | | | | |
06/30/2019 | | | 11.69 | | | | 0.28 | | | | 0.39 | | | | 0.67 | | | | (0.28 | ) | | | (0.39 | ) | | | (0.67 | ) |
| | | | | | | |
06/30/2018 | | | 10.99 | | | | 0.31 | | | | 0.66 | | | | 0.97 | | | | (0.25 | ) | | | (0.02 | ) | | | (0.27 | ) |
| Class A | | | | | | | | | | | | | | | | | | | | | | | | | | | | |
| | | | | | | |
06/30/2022 | | | 14.88 | | | | 0.30 | | | | (2.39 | ) | | | (2.09 | ) | | | (0.30 | ) | | | (0.17 | ) | | | (0.47 | ) |
| | | | | | | |
06/30/2021 | | | 11.62 | | | | 0.22 | | | | 3.45 | | | | 3.67 | | | | (0.34 | ) | | | (0.07 | ) | | | (0.41 | ) |
| | | | | | | |
06/30/2020 | | | 11.67 | | | | 0.26 | | | | 0.00 | | | | 0.26 | | | | (0.29 | ) | | | (0.02 | ) | | | (0.31 | ) |
| | | | | | | |
06/30/2019 | | | 11.67 | | | | 0.26 | | | | 0.38 | | | | 0.64 | | | | (0.25 | ) | | | (0.39 | ) | | | (0.64 | ) |
| | | | | | | |
06/30/2018 | | | 10.98 | | | | 0.23 | | | | 0.70 | | | | 0.93 | | | | (0.22 | ) | | | (0.02 | ) | | | (0.24 | ) |
| | | | | | | |
PIMCO REALPATH® Blend 2045 Fund | | | | | | | | | | | | | | | | | | | | | | | | | | | | |
| Institutional Class | | | | | | | | | | | | | | | | | | | | | | | | | | | | |
| | | | | | | |
06/30/2022 | | $ | 15.11 | | | $ | 0.36 | | | $ | (2.42 | ) | | $ | (2.06 | ) | | $ | (0.32 | ) | | $ | (0.19 | ) | | $ | (0.51 | ) |
| | | | | | | |
06/30/2021 | | | 11.58 | | | | 0.29 | | | | 3.69 | | | | 3.98 | | | | (0.38 | ) | | | (0.07 | ) | | | (0.45 | ) |
| | | | | | | |
06/30/2020 | | | 11.67 | | | | 0.30 | | | | (0.04 | ) | | | 0.26 | | | | (0.33 | ) | | | (0.02 | ) | | | (0.35 | ) |
| | | | | | | |
06/30/2019 | | | 11.79 | | | | 0.31 | | | | 0.37 | | | | 0.68 | | | | (0.32 | ) | | | (0.48 | ) | | | (0.80 | ) |
| | | | | | | |
06/30/2018 | | | 11.00 | | | | 0.28 | | | | 0.77 | | | | 1.05 | | | | (0.26 | ) | | | 0.00 | | | | (0.26 | ) |
| Administrative Class | | | | | | | | | | | | | | | | | | | | | | | | | | | | |
| | | | | | | |
06/30/2022 | | | 15.06 | | | | 0.32 | | | | (2.41 | ) | | | (2.09 | ) | | | (0.29 | ) | | | (0.19 | ) | | | (0.48 | ) |
| | | | | | | |
06/30/2021 | | | 11.55 | | | | 0.25 | | | | 3.68 | | | | 3.93 | | | | (0.35 | ) | | | (0.07 | ) | | | (0.42 | ) |
| | | | | | | |
06/30/2020 | | | 11.65 | | | | 0.28 | | | | (0.06 | ) | | | 0.22 | | | | (0.30 | ) | | | (0.02 | ) | | | (0.32 | ) |
| | | | | | | |
06/30/2019 | | | 11.77 | | | | 0.27 | | | | 0.39 | | | | 0.66 | | | | (0.30 | ) | | | (0.48 | ) | | | (0.78 | ) |
| | | | | | | |
06/30/2018 | | | 10.99 | | | | 0.31 | | | | 0.71 | | | | 1.02 | | | | (0.24 | ) | | | 0.00 | | | | (0.24 | ) |
| Class A | | | | | | | | | | | | | | | | | | | | | | | | | | | | |
| | | | | | | |
06/30/2022 | | | 15.05 | | | | 0.29 | | | | (2.42 | ) | | | (2.13 | ) | | | (0.27 | ) | | | (0.19 | ) | | | (0.46 | ) |
| | | | | | | |
06/30/2021 | | | 11.54 | | | | 0.21 | | | | 3.69 | | | | 3.90 | | | | (0.32 | ) | | | (0.07 | ) | | | (0.39 | ) |
| | | | | | | |
06/30/2020 | | | 11.64 | | | | 0.24 | | | | (0.04 | ) | | | 0.20 | | | | (0.28 | ) | | | (0.02 | ) | | | (0.30 | ) |
| | | | | | | |
06/30/2019 | | | 11.77 | | | | 0.25 | | | | 0.37 | | | | 0.62 | | | | (0.27 | ) | | | (0.48 | ) | | | (0.75 | ) |
| | | | | | | |
06/30/2018 | | | 10.99 | | | | 0.22 | | | | 0.77 | | | | 0.99 | | | | (0.21 | ) | | | 0.00 | | | | (0.21 | ) |
| | | | | | | |
PIMCO REALPATH® Blend 2050 Fund | | | | | | | | | | | | | | | | | | | | | | | | | | | | |
| Institutional Class | | | | | | | | | | | | | | | | | | | | | | | | | | | | |
| | | | | | | |
06/30/2022 | | $ | 15.28 | | | $ | 0.36 | | | $ | (2.44 | ) | | $ | (2.08 | ) | | $ | (0.34 | ) | | $ | (0.21 | ) | | $ | (0.55 | ) |
| | | | | | | |
06/30/2021 | | | 11.59 | | | | 0.29 | | | | 3.83 | | | | 4.12 | | | | (0.36 | ) | | | (0.07 | ) | | | (0.43 | ) |
| | | | | | | |
06/30/2020 | | | 11.74 | | | | 0.29 | | | | (0.08 | ) | | | 0.21 | | | | (0.34 | ) | | | (0.02 | ) | | | (0.36 | ) |
| | | | | | | |
06/30/2019 | | | 11.86 | | | | 0.30 | | | | 0.39 | | | | 0.69 | | | | (0.31 | ) | | | (0.50 | ) | | | (0.81 | ) |
| | | | | | | |
06/30/2018 | | | 11.05 | | | | 0.28 | | | | 0.79 | | | | 1.07 | | | | (0.26 | ) | | | 0.00 | | | | (0.26 | ) |
| Administrative Class | | | | | | | | | | | | | | | | | | | | | | | | | | | | |
| | | | | | | |
06/30/2022 | | | 15.23 | | | | 0.32 | | | | (2.43 | ) | | | (2.11 | ) | | | (0.32 | ) | | | (0.21 | ) | | | (0.53 | ) |
| | | | | | | |
06/30/2021 | | | 11.56 | | | | 0.24 | | | | 3.83 | | | | 4.07 | | | | (0.33 | ) | | | (0.07 | ) | | | (0.40 | ) |
| | | | | | | |
06/30/2020 | | | 11.71 | | | | 0.27 | | | | (0.09 | ) | | | 0.18 | | | | (0.31 | ) | | | (0.02 | ) | | | (0.33 | ) |
| | | | | | | |
06/30/2019 | | | 11.84 | | | | 0.27 | | | | 0.39 | | | | 0.66 | | | | (0.29 | ) | | | (0.50 | ) | | | (0.79 | ) |
| | | | | | | |
06/30/2018 | | | 11.04 | | | | 0.31 | | | | 0.73 | | | | 1.04 | | | | (0.24 | ) | | | 0.00 | | | | (0.24 | ) |
| Class A | | | | | | | | | | | | | | | | | | | | | | | | | | | | |
| | | | | | | |
06/30/2022 | | | 15.16 | | | | 0.29 | | | | (2.43 | ) | | | (2.14 | ) | | | (0.30 | ) | | | (0.21 | ) | | | (0.51 | ) |
| | | | | | | |
06/30/2021 | | | 11.51 | | | | 0.21 | | | | 3.81 | | | | 4.02 | | | | (0.30 | ) | | | (0.07 | ) | | | (0.37 | ) |
| | | | | | | |
06/30/2020 | | | 11.67 | | | | 0.23 | | | | (0.08 | ) | | | 0.15 | | | | (0.29 | ) | | | (0.02 | ) | | | (0.31 | ) |
| | | | | | | |
06/30/2019 | | | 11.80 | | | | 0.24 | | | | 0.39 | | | | 0.63 | | | | (0.26 | ) | | | (0.50 | ) | | | (0.76 | ) |
| | | | | | | |
06/30/2018 | | | 11.00 | | | | 0.22 | | | | 0.79 | | | | 1.01 | | | | (0.21 | ) | | | 0.00 | | | | (0.21 | ) |
| | | | | | |
| 30 | | PIMCO EQUITY SERIES | | | See Accompanying Notes | |
| | | | | | | | | | | | | | | | | | | | | | | | | | | | | | | | | | |
| | | | Ratios/Supplemental Data | |
| | | | | | | | | | Ratios to Average Net Assets(e) | | | | |
Net Assets
Value End of
Year or
Period(a) | | | Total
Return(d) | | | Net Assets
End of Year or
Period (000s) | | | Expenses | | | Expenses
Excluding
Waivers | | | Expenses
Excluding
Interest
Expense | | | Expenses
Excluding
Interest
Expense and Waivers | | | Net
Investment
Income (Loss) | | | Portfolio
Turnover
Rate | |
| | | | | | | | |
| | | | | | | | | | | | | | | | | | | | | | | | | | | | | | | | | | |
| | | | | | | | |
| | | | | | | | | | | | | | | | | | | | | | | | | | | | | | | | | | |
| | | | | | | | |
| $ | 12.40 | | | | (14.20 | )% | | $ | 224,639 | | | | 0.06 | % | | | 0.06 | % | | | 0.06 | % | | | 0.06 | % | | | 2.59 | % | | | 17 | % |
| | | | | | | | |
| | 14.96 | | | | 32.50 | | | | 212,568 | | | | 0.05 | | | | 0.06 | | | | 0.05 | | | | 0.06 | | | | 2.20 | | | | 26 | |
| | | | | | | | |
| | 11.68 | | | | 2.76 | | | | 92,728 | | | | 0.06 | | | | 0.07 | | | | 0.06 | | | | 0.07 | | | | 2.70 | | | | 21 | |
| | | | | | | | |
| | 11.71 | | | | 6.44 | | | | 64,541 | | | | 0.06 | | | | 0.07 | | | | 0.06 | | | | 0.07 | | | | 2.81 | | | | 29 | |
| | | | | | | | |
| | 11.71 | | | | 9.17 | | | | 26,413 | | | | 0.06 | | | | 0.07 | | | | 0.06 | | | | 0.07 | | | | 2.50 | | | | 95 | |
| | | | | | | | | | | | | | | | | | | | | | | | | | | | | | | | | | |
| | | | | | | | |
| | 12.37 | | | | (14.33 | ) | | | 19,014 | | | | 0.31 | | | | 0.31 | | | | 0.31 | | | | 0.31 | | | | 2.32 | % | | | 17 | |
| | | | | | | | |
| | 14.92 | | | | 32.21 | | | | 21,456 | | | | 0.30 | | | | 0.31 | | | | 0.30 | | | | 0.31 | | | | 1.90 | | | | 26 | |
| | | | | | | | |
| | 11.65 | | | | 2.45 | | | | 16,746 | | | | 0.31 | | | | 0.32 | | | | 0.31 | | | | 0.32 | | | | 2.52 | | | | 21 | |
| | | | | | | | |
| | 11.69 | | | | 6.21 | | | | 12,386 | | | | 0.31 | | | | 0.32 | | | | 0.31 | | | | 0.32 | | | | 2.48 | | | | 29 | |
| | | | | | | | |
| | 11.69 | | | | 8.90 | | | | 11,003 | | | | 0.31 | | | | 0.32 | | | | 0.31 | | | | 0.32 | | | | 2.66 | | | | 95 | |
| | | | | | | | | | | | | | | | | | | | | | | | | | | | | | | | | | |
| | | | | | | | |
| | 12.32 | | | | (14.58 | ) | | | 7,441 | | | | 0.53 | (f) | | | 0.53 | (f) | | | 0.53 | (f) | | | 0.53 | (f) | | | 2.08 | % | | | 17 | |
| | | | | | | | |
| | 14.88 | | | | 31.91 | | | | 9,024 | | | | 0.55 | | | | 0.56 | | | | 0.55 | | | | 0.56 | | | | 1.66 | | | | 26 | |
| | | | | | | | |
| | 11.62 | | | | 2.17 | | | | 7,914 | | | | 0.56 | | | | 0.57 | | | | 0.56 | | | | 0.57 | | | | 2.22 | | | | 21 | |
| | | | | | | | |
| | 11.67 | | | | 5.99 | | | | 7,869 | | | | 0.56 | | | | 0.57 | | | | 0.56 | | | | 0.57 | | | | 2.28 | | | | 29 | |
| | | | | | | | |
| | 11.67 | | | | 8.52 | | | | 5,484 | | | | 0.56 | | | | 0.57 | | | | 0.56 | | | | 0.57 | | | | 2.03 | | | | 95 | |
| | | | | | | | |
| | | | | | | | | | | | | | | | | | | | | | | | | | | | | | | | | | |
| | | | | | | | | | | | | | | | | | | | | | | | | | | | | | | | | | |
| | | | | | | | |
| $ | 12.54 | | | | (14.23 | )% | | $ | 207,869 | | | | 0.06 | % | | | 0.06 | % | | | 0.06 | % | | | 0.06 | % | | | 2.47 | % | | | 13 | % |
| | | | | | | | |
| | 15.11 | | | | 34.67 | | | | 200,184 | | | | 0.05 | | | | 0.06 | | | | 0.05 | | | | 0.06 | | | | 2.13 | | | | 22 | |
| | | | | | | | |
| | 11.58 | | | | 2.16 | | | | 91,173 | | | | 0.06 | | | | 0.07 | | | | 0.06 | | | | 0.07 | | | | 2.59 | | | | 16 | |
| | | | | | | | |
| | 11.67 | | | | 6.45 | | | | 69,426 | | | | 0.06 | | | | 0.07 | | | | 0.06 | | | | 0.07 | | | | 2.70 | | | | 16 | |
| | | | | | | | |
| | 11.79 | | | | 9.57 | | | | 41,708 | | | | 0.06 | | | | 0.07 | | | | 0.06 | | | | 0.07 | | | | 2.43 | | | | 105 | |
| | | | | | | | | | | | | | | | | | | | | | | | | | | | | | | | | | |
| | | | | | | | |
| | 12.49 | | | | (14.45 | ) | | | 18,702 | | | | 0.31 | | | | 0.31 | | | | 0.31 | | | | 0.31 | | | | 2.21 | % | | | 13 | |
| | | | | | | | |
| | 15.06 | | | | 34.30 | | | | 20,168 | | | | 0.30 | | | | 0.31 | | | | 0.30 | | | | 0.31 | | | | 1.85 | | | | 22 | |
| | | | | | | | |
| | 11.55 | | | | 1.85 | | | | 14,426 | | | | 0.31 | | | | 0.32 | | | | 0.31 | | | | 0.32 | | | | 2.41 | | | | 16 | |
| | | | | | | | |
| | 11.65 | | | | 6.21 | | | | 10,935 | | | | 0.31 | | | | 0.32 | | | | 0.31 | | | | 0.32 | | | | 2.38 | | | | 16 | |
| | | | | | | | |
| | 11.77 | | | | 9.31 | | | | 10,287 | | | | 0.31 | | | | 0.32 | | | | 0.31 | | | | 0.32 | | | | 2.58 | | | | 105 | |
| | | | | | | | | | | | | | | | | | | | | | | | | | | | | | | | | | |
| | | | | | | | |
| | 12.46 | | | | (14.69 | ) | | | 3,967 | | | | 0.53 | (f) | | | 0.53 | (f) | | | 0.53 | (f) | | | 0.53 | (f) | | | 1.97 | | | | 13 | |
| | | | | | | | |
| | 15.05 | | | | 34.03 | | | | 4,593 | | | | 0.55 | | | | 0.56 | | | | 0.55 | | | | 0.56 | | | | 1.57 | | | | 22 | |
| | | | | | | | |
| | 11.54 | | | | 1.64 | | | | 3,658 | | | | 0.56 | | | | 0.57 | | | | 0.56 | | | | 0.57 | | | | 2.08 | | | | 16 | |
| | | | | | | | |
| | 11.64 | | | | 5.88 | | | | 4,280 | | | | 0.56 | | | | 0.57 | | | | 0.56 | | | | 0.57 | | | | 2.15 | | | | 16 | |
| | | | | | | | |
| | 11.77 | | | | 9.01 | | | | 3,569 | | | | 0.56 | | | | 0.57 | | | | 0.56 | | | | 0.57 | | | | 1.93 | | | | 105 | |
| | | | | | | | |
| | | | | | | | | | | | | | | | | | | | | | | | | | | | | | | | | | |
| | | | | | | | | | | | | | | | | | | | | | | | | | | | | | | | | | |
| | | | | | | | |
| $ | 12.65 | | | | (14.29 | )% | | $ | 206,038 | | | | 0.06 | % | | | 0.06 | % | | | 0.06 | % | | | 0.06 | % | | | 2.43 | % | | | 9 | % |
| | | | | | | | |
| | 15.28 | | | | 35.82 | | | | 200,851 | | | | 0.05 | | | | 0.06 | | | | 0.05 | | | | 0.06 | | | | 2.08 | | | | 19 | |
| | | | | | | | |
| | 11.59 | | | | 1.66 | | | | 103,972 | | | | 0.06 | | | | 0.07 | | | | 0.06 | | | | 0.07 | | | | 2.53 | | | | 20 | |
| | | | | | | | |
| | 11.74 | | | | 6.54 | | | | 84,302 | | | | 0.06 | | | | 0.07 | | | | 0.06 | | | | 0.07 | | | | 2.64 | | | | 16 | |
| | | | | | | | |
| | 11.86 | | | | 9.69 | | | | 50,057 | | | | 0.06 | | | | 0.07 | | | | 0.06 | | | | 0.07 | | | | 2.39 | | | | 108 | |
| | | | | | | | | | | | | | | | | | | | | | | | | | | | | | | | | | |
| | | | | | | | |
| | 12.59 | | | | (14.50 | ) | | | 19,530 | | | | 0.31 | | | | 0.31 | | | | 0.31 | | | | 0.31 | | | | 2.15 | | | | 9 | |
| | | | | | | | |
| | 15.23 | | | | 35.44 | | | | 22,454 | | | | 0.30 | | | | 0.31 | | | | 0.30 | | | | 0.31 | | | | 1.78 | | | | 19 | |
| | | | | | | | |
| | 11.56 | | | | 1.43 | | | | 17,960 | | | | 0.31 | | | | 0.32 | | | | 0.31 | | | | 0.32 | | | | 2.32 | | | | 20 | |
| | | | | | | | |
| | 11.71 | | | | 6.22 | | | | 17,027 | | | | 0.31 | | | | 0.32 | | | | 0.31 | | | | 0.32 | | | | 2.34 | | | | 16 | |
| | | | | | | | |
| | 11.84 | | | | 9.44 | | | | 14,382 | | | | 0.31 | | | | 0.32 | | | | 0.31 | | | | 0.32 | | | | 2.58 | | | | 108 | |
| | | | | | | | | | | | | | | | | | | | | | | | | | | | | | | | | | |
| | | | | | | | |
| | 12.51 | | | | (14.73 | ) | | | 3,704 | | | | 0.53 | (f) | | | 0.53 | (f) | | | 0.53 | (f) | | | 0.53 | (f) | | | 1.93 | | | | 9 | |
| | | | | | | | |
| | 15.16 | | | | 35.11 | | | | 4,896 | | | | 0.55 | | | | 0.56 | | | | 0.55 | | | | 0.56 | | | | 1.51 | | | | 19 | |
| | | | | | | | |
| | 11.51 | | | | 1.16 | | | | 4,101 | | | | 0.56 | | | | 0.57 | | | | 0.56 | | | | 0.57 | | | | 2.03 | | | | 20 | |
| | | | | | | | |
| | 11.67 | | | | 5.99 | | | | 4,520 | | | | 0.56 | | | | 0.57 | | | | 0.56 | | | | 0.57 | | | | 2.09 | | | | 16 | |
| | | | | | | | |
| | 11.80 | | | | 9.20 | | | | 3,782 | | | | 0.56 | | | | 0.57 | | | | 0.56 | | | | 0.57 | | | | 1.90 | | | | 108 | |
| | | | | | | | | | | | |
| | | | ANNUAL REPORT | | | | | | | JUNE 30, 2022 | | | 31 |
| | | | |
| Financial Highlights | | (Cont.) | | |
| | | | | | | | | | | | | | | | | | | | | | | | | | | | |
| | | | | | Investment Operations | | | Less Distributions(c) | |
| | | | | | | | | |
| Selected Per Share Data for the Year or Period Ended^: | | Net Asset
Value
Beginning of
Year or
Period(a) | | | Net
Investment
Income
(Loss)(b) | | | Net
Realized/
Unrealized
Gain (Loss) | | | Total | | | From Net
Investment
Income | | | From Net
Realized
Capital Gains | | | Total | |
| | | | | | | |
PIMCO REALPATH® Blend 2055 Fund | | | | | | | | | | | | | | | | | | | | | | | | | | | | |
| Institutional Class | | | | | | | | | | | | | | | | | | | | | | | | | | | | |
| | | | | | | |
06/30/2022 | | $ | 15.33 | | | $ | 0.37 | | | $ | (2.48 | ) | | $ | (2.11 | ) | | $ | (0.30 | ) | | $ | (0.17 | ) | | $ | (0.47 | ) |
| | | | | | | |
06/30/2021 | | | 11.59 | | | | 0.29 | | | | 3.87 | | | | 4.16 | | | | (0.38 | ) | | | (0.04 | ) | | | (0.42 | ) |
| | | | | | | |
06/30/2020 | | | 11.79 | | | | 0.29 | | | | (0.12 | ) | | | 0.17 | | | | (0.36 | ) | | | (0.01 | ) | | | (0.37 | ) |
| | | | | | | |
06/30/2019 | | | 11.74 | | | | 0.31 | | | | 0.37 | | | | 0.68 | | | | (0.21 | ) | | | (0.42 | ) | | | (0.63 | ) |
| | | | | | | |
06/30/2018 | | | 11.02 | | | | 0.28 | | | | 0.77 | | | | 1.05 | | | | (0.33 | ) | | | 0.00 | | | | (0.33 | ) |
| Administrative Class | | | | | | | | | | | | | | | | | | | | | | | | | | | | |
| | | | | | | |
06/30/2022 | | | 15.31 | | | | 0.33 | | | | (2.48 | ) | | | (2.15 | ) | | | (0.28 | ) | | | (0.17 | ) | | | (0.45 | ) |
| | | | | | | |
06/30/2021 | | | 11.58 | | | | 0.25 | | | | 3.87 | | | | 4.12 | | | | (0.35 | ) | | | (0.04 | ) | | | (0.39 | ) |
| | | | | | | |
06/30/2020 | | | 11.78 | | | | 0.28 | | | | (0.13 | ) | | | 0.15 | | | | (0.34 | ) | | | (0.01 | ) | | | (0.35 | ) |
| | | | | | | |
06/30/2019 | | | 11.75 | | | | 0.29 | | | | 0.35 | | | | 0.64 | | | | (0.19 | ) | | | (0.42 | ) | | | (0.61 | ) |
| | | | | | | |
06/30/2018 | | | 11.03 | | | | 0.30 | | | | 0.73 | | | | 1.03 | | | | (0.31 | ) | | | 0.00 | | | | (0.31 | ) |
| Class A | | | | | | | | | | | | | | | | | | | | | | | | | | | | |
| | | | | | | |
06/30/2022 | | | 15.24 | | | | 0.29 | | | | (2.45 | ) | | | (2.16 | ) | | | (0.27 | ) | | | (0.17 | ) | | | (0.44 | ) |
| | | | | | | |
06/30/2021 | | | 11.53 | | | | 0.21 | | | | 3.86 | | | | 4.07 | | | | (0.32 | ) | | | (0.04 | ) | | | (0.36 | ) |
| | | | | | | |
06/30/2020 | | | 11.73 | | | | 0.23 | | | | (0.12 | ) | | | 0.11 | | | | (0.30 | ) | | | (0.01 | ) | | | (0.31 | ) |
| | | | | | | |
06/30/2019 | | | 11.69 | | | | 0.24 | | | | 0.38 | | | | 0.62 | | | | (0.16 | ) | | | (0.42 | ) | | | (0.58 | ) |
| | | | | | | |
06/30/2018 | | | 10.98 | | | | 0.21 | | | | 0.78 | | | | 0.99 | | | | (0.28 | ) | | | 0.00 | | | | (0.28 | ) |
| | | | | | | |
PIMCO REALPATH® Blend 2060 Fund | | | | | | | | | | | | | | | | | | | | | | | | | | | | |
| Institutional Class | | | | | | | | | | | | | | | | | | | | | | | | | | | | |
| | | | | | | |
06/30/2022 | | $ | 12.47 | | | $ | 0.30 | | | $ | (1.85 | ) | | $ | (1.55 | ) | | $ | (0.27 | ) | | $ | (0.81 | ) | | $ | (1.08 | ) |
| | | | | | | |
06/30/2021 | | | 9.35 | | | | 0.24 | | | | 3.12 | | | | 3.36 | | | | (0.24 | ) | | | 0.00 | | | | (0.24 | ) |
| | | | | | | |
12/31/2019 - 06/30/2020 | | | 10.00 | | | | 0.09 | | | | (0.74 | ) | | | (0.65 | ) | | | 0.00 | | | | 0.00 | | | | 0.00 | |
| Administrative Class | | | | | | | | | | | | | | | | | | | | | | | | | | | | |
| | | | | | | |
06/30/2022 | | | 12.45 | | | | 0.29 | | | | (1.87 | ) | | | (1.58 | ) | | | (0.26 | ) | | | (0.81 | ) | | | (1.07 | ) |
| | | | | | | |
06/30/2021 | | | 9.33 | | | | 0.24 | | | | 3.10 | | | | 3.34 | | | | (0.22 | ) | | | 0.00 | | | | (0.22 | ) |
| | | | | | | |
12/31/2019 - 06/30/2020 | | | 10.00 | | | | 0.08 | | | | (0.75 | ) | | | (0.67 | ) | | | 0.00 | | | | 0.00 | | | | 0.00 | |
| Class A | | | | | | | | | | | | | | | | | | | | | | | | | | | | |
| | | | | | | |
06/30/2022 | | | 12.43 | | | | 0.24 | | | | (1.84 | ) | | | (1.60 | ) | | | (0.24 | ) | | | (0.81 | ) | | | (1.05 | ) |
| | | | | | | |
06/30/2021 | | | 9.32 | | | | 0.20 | | | | 3.11 | | | | 3.31 | | | | (0.20 | ) | | | 0.00 | | | | (0.20 | ) |
| | | | | | | |
12/31/2019 - 06/30/2020 | | | 10.00 | | | | 0.08 | | | | (0.76 | ) | | | (0.68 | ) | | | 0.00 | | | | 0.00 | | | | 0.00 | |
| | | | | | | |
PIMCO REALPATH® Blend Income Fund | | | | | | | | | | | | | | | | | | | | | | | | | | | | |
| Institutional Class | | | | | | | | | | | | | | | | | | | | | | | | | | | | |
| | | | | | | |
06/30/2022 | | $ | 12.92 | | | $ | 0.43 | | | $ | (2.04 | ) | | $ | (1.61 | ) | | $ | (0.37 | ) | | $ | (0.13 | ) | | $ | (0.50 | ) |
| | | | | | | |
06/30/2021 | | | 11.58 | | | | 0.36 | | | | 1.84 | | | | 2.20 | | | | (0.68 | ) | | | (0.18 | ) | | | (0.86 | ) |
| | | | | | | |
06/30/2020 | | | 11.28 | | | | 0.35 | | | | 0.34 | | | | 0.69 | | | | (0.39 | ) | | | 0.00 | | | | (0.39 | ) |
| | | | | | | |
06/30/2019 | | | 10.92 | | | | 0.37 | | | | 0.34 | | | | 0.71 | | | | (0.35 | ) | | | 0.00 | | | | (0.35 | ) |
| | | | | | | |
06/30/2018 | | | 10.54 | | | | 0.32 | | | | 0.26 | | | | 0.58 | | | | (0.20 | ) | | | 0.00 | | | | (0.20 | ) |
| Administrative Class | | | | | | | | | | | | | | | | | | | | | | | | | | | | |
| | | | | | | |
06/30/2022 | | | 12.93 | | | | 0.40 | | | | (2.05 | ) | | | (1.65 | ) | | | (0.34 | ) | | | (0.13 | ) | | | (0.47 | ) |
| | | | | | | |
06/30/2021 | | | 11.59 | | | | 0.33 | | | | 1.84 | | | | 2.17 | | | | (0.65 | ) | | | (0.18 | ) | | | (0.83 | ) |
| | | | | | | |
06/30/2020 | | | 11.28 | | | | 0.33 | | | | 0.34 | | | | 0.67 | | | | (0.36 | ) | | | 0.00 | | | | (0.36 | ) |
| | | | | | | |
06/30/2019 | | | 10.92 | | | | 0.33 | | | | 0.35 | | | | 0.68 | | | | (0.32 | ) | | | 0.00 | | | | (0.32 | ) |
| | | | | | | |
06/30/2018 | | | 10.55 | | | | 0.33 | | | | 0.22 | | | | 0.55 | | | | (0.18 | ) | | | 0.00 | | | | (0.18 | ) |
| Class A | | | | | | | | | | | | | | | | | | | | | | | | | | | | |
| | | | | | | |
06/30/2022 | | | 12.84 | | | | 0.37 | | | | (2.03 | ) | | | (1.66 | ) | | | (0.32 | ) | | | (0.13 | ) | | | (0.45 | ) |
| | | | | | | |
06/30/2021 | | | 11.53 | | | | 0.30 | | | | 1.82 | | | | 2.12 | | | | (0.63 | ) | | | (0.18 | ) | | | (0.81 | ) |
| | | | | | | |
06/30/2020 | | | 11.24 | | | | 0.32 | | | | 0.32 | | | | 0.64 | | | | (0.35 | ) | | | 0.00 | | | | (0.35 | ) |
| | | | | | | |
06/30/2019 | | | 10.88 | | | | 0.32 | | | | 0.34 | | | | 0.66 | | | | (0.30 | ) | | | 0.00 | | | | (0.30 | ) |
| | | | | | | |
06/30/2018 | | | 10.52 | | | | 0.27 | | | | 0.25 | | | | 0.52 | | | | (0.16 | ) | | | 0.00 | | | | (0.16 | ) |
| ^ | A zero balance may reflect actual amounts rounding to less than $0.01 or 0.01%. |
| * | Annualized, except for organizational expense, if any. |
| (a) | Includes adjustments required by U.S. GAAP and may differ from net asset values and performance reported elsewhere by the Funds. |
| (b) | Per share amounts based on average number of shares outstanding during the year or period. |
| (c) | The tax characterization of distributions is determined in accordance with Federal income tax regulations. See Note 2, Distributions to Shareholders, in the Notes to Financial Statements for more information. |
| (d) | Includes adjustments required by U.S. GAAP and may differ from net asset values and performance reported elsewhere by the Funds. Additionally, excludes initial sales charges and contingent deferred sales charges. |
| (e) | Ratios shown do not include expenses of the investment companies in which a Fund may invest. See Note 9, Fees and Expenses, in the Notes to Financial Statements for more information regarding the expenses and any applicable fee waivers associated with these investments. |
| (f) | Effective November 1, 2021, the Class’s Supervisory and Administrative fees was decreased by 0.05% to an annual rate of 0.22%. |
| | | | | | |
| 32 | | PIMCO EQUITY SERIES | | | See Accompanying Notes | |
| | | | | | | | | | | | | | | | | | | | | | | | | | | | | | | | | | |
| | | | Ratios/Supplemental Data | |
| | | | | | | | | | Ratios to Average Net Assets(e) | | | | |
Net Assets
Value End of
Year or
Period(a) | | | Total
Return(d) | | | Net Assets
End of Year or
Period (000s) | | | Expenses | | | Expenses
Excluding
Waivers | | | Expenses
Excluding
Interest
Expense | | | Expenses
Excluding
Interest
Expense and Waivers | | | Net
Investment
Income (Loss) | | | Portfolio
Turnover
Rate | |
| | | | | | | | |
| | | | | | | | | | | | | | | | | | | | | | | | | | | | | | | | | | |
| | | | | | | | |
| | | | | | | | | | | | | | | | | | | | | | | | | | | | | | | | | | |
| | | | | | | | |
| $ | 12.75 | | | | (14.32 | )% | | $ | 145,097 | | | | 0.06 | % | | | 0.06 | % | | | 0.06 | % | | | 0.06 | % | | | 2.47 | % | | | 9 | % |
| | | | | | | | |
| | 15.33 | | | | 36.15 | | | | 122,612 | | | | 0.06 | | | | 0.06 | | | | 0.06 | | | | 0.06 | | | | 2.11 | | | | 14 | |
| | | | | | | | |
| | 11.59 | | | | 1.33 | | | | 51,061 | | | | 0.07 | | | | 0.07 | | | | 0.06 | | | | 0.06 | | | | 2.49 | | | | 28 | |
| | | | | | | | |
| | 11.79 | | | | 6.41 | | | | 32,098 | | | | 0.06 | | | | 0.07 | | | | 0.06 | | | | 0.07 | | | | 2.76 | | | | 51 | |
| | | | | | | | |
| | 11.74 | | | | 9.56 | | | | 10,558 | | | | 0.06 | | | | 0.07 | | | | 0.06 | | | | 0.07 | | | | 2.43 | | | | 67 | |
| | | | | | | | | | | | | | | | | | | | | | | | | | | | | | | | | | |
| | | | | | | | |
| | 12.71 | | | | (14.57 | ) | | | 8,409 | | | | 0.31 | | | | 0.31 | | | | 0.31 | | | | 0.31 | | | | 2.21 | | | | 9 | |
| | | | | | | | |
| | 15.31 | | | | 35.81 | | | | 7,860 | | | | 0.31 | | | | 0.31 | | | | 0.31 | | | | 0.31 | | | | 1.81 | | | | 14 | |
| | | | | | | | |
| | 11.58 | | | | 1.15 | | | | 4,828 | | | | 0.32 | | | | 0.32 | | | | 0.31 | | | | 0.31 | | | | 2.46 | | | | 28 | |
| | | | | | | | |
| | 11.78 | | | | 6.02 | | | | 605 | | | | 0.31 | | | | 0.32 | | | | 0.31 | | | | 0.32 | | | | 2.58 | | | | 51 | |
| | | | | | | | |
| | 11.75 | | | | 9.37 | | | | 152 | | | | 0.31 | | | | 0.32 | | | | 0.31 | | | | 0.32 | | | | 2.54 | | | | 67 | |
| | | | | | | | | | | | | | | | | | | | | | | | | | | | | | | | | | |
| | | | | | | | |
| | 12.64 | | | | (14.73 | ) | | | 2,622 | | | | 0.53 | (f) | | | 0.53 | (f) | | | 0.53 | (f) | | | 0.53 | (f) | | | 1.92 | | | | 9 | |
| | | | | | | | |
| | 15.24 | | | | 35.46 | | | | 3,159 | | | | 0.56 | | | | 0.56 | | | | 0.56 | | | | 0.56 | | | | 1.52 | | | | 14 | |
| | | | | | | | |
| | 11.53 | | | | 0.85 | | | | 2,684 | | | | 0.57 | | | | 0.57 | | | | 0.56 | | | | 0.56 | | | | 1.98 | | | | 28 | |
| | | | | | | | |
| | 11.73 | | | | 5.86 | | | | 2,758 | | | | 0.56 | | | | 0.57 | | | | 0.56 | | | | 0.57 | | | | 2.11 | | | | 51 | |
| | | | | | | | |
| | 11.69 | | | | 9.04 | | | | 2,038 | | | | 0.56 | | | | 0.57 | | | | 0.56 | | | | 0.57 | | | | 1.85 | | | | 67 | |
| | | | | | | | |
| | | | | | | | | | | | | | | | | | | | | | | | | | | | | | | | | | |
| | | | | | | | |
| | | | | | | | | | | | | | | | | | | | | | | | | | | | | | | | | | |
| | | | | | | | |
| $ | 9.84 | | | | (13.93 | )% | | $ | 22,421 | | | | 0.06 | % | | | 0.06 | % | | | 0.06 | % | | | 0.06 | % | | | 2.60 | % | | | 50 | % |
| | | | | | | | |
| | 12.47 | | | | 36.18 | | | | 11,451 | | | | 0.06 | | | | 0.07 | | | | 0.06 | | | | 0.07 | | | | 2.10 | | | | 20 | |
| | | | | | | | |
| | 9.35 | | | | (6.50 | ) | | | 2,817 | | | | 0.05 | * | | | 2.52 | * | | | 0.05 | * | | | 2.52 | * | | | 1.95 | * | | | 12 | |
| | | | | | | | |
| | | | | | | | | | | | | | | | | | | | | | | | | | | | | | | | | | |
| | | | | | | | |
| | 9.80 | | | | (14.19 | ) | | | 364 | | | | 0.31 | | | | 0.31 | | | | 0.31 | | | | 0.31 | | | | 2.60 | | | | 50 | |
| | | | | | | | |
| | 12.45 | | | | 36.00 | | | | 62 | | | | 0.31 | | | | 0.32 | | | | 0.31 | | | | 0.32 | | | | 2.07 | | | | 20 | |
| | | | | | | | |
| | 9.33 | | | | (6.70 | ) | | | 9 | | | | 0.30 | * | | | 2.77 | * | | | 0.30 | * | | | 2.77 | * | | | 1.69 | * | | | 12 | |
| | | | | | | | |
| | | | | | | | | | | | | | | | | | | | | | | | | | | | | | | | | | |
| | | | | | | | |
| | 9.78 | | | | (14.32 | ) | | | 536 | | | | 0.53 | (f) | | | 0.53 | (f) | | | 0.53 | (f) | | | 0.53 | (f) | | | 2.05 | | | | 50 | |
| | | | | | | | |
| | 12.43 | | | | 35.70 | | | | 834 | | | | 0.56 | | | | 0.57 | | | | 0.56 | | | | 0.57 | | | | 1.72 | | | | 20 | |
| | | | | | | | |
| | 9.32 | | | | (6.80 | ) | | | 29 | | | | 0.55 | * | | | 3.02 | * | | | 0.55 | * | | | 3.02 | * | | | 1.70 | * | | | 12 | |
| | | | | | | | |
| | | | | | | | | | | | | | | | | | | | | | | | | | | | | | | | | | |
| | | | | | | | |
| | | | | | | | | | | | | | | | | | | | | | | | | | | | | | | | | | |
| | | | | | | | |
| $ | 10.81 | | | | (12.98 | )% | | $ | 170,997 | | | | 0.03 | % | | | 0.04 | % | | | 0.03 | % | | | 0.04 | % | | | 3.49 | % | | | 18 | % |
| | | | | | | | |
| | 12.92 | | | | 19.37 | | | | 191,873 | | | | 0.03 | | | | 0.04 | | | | 0.03 | | | | 0.04 | | | | 2.88 | | | | 17 | |
| | | | | | | | |
| | 11.58 | | | | 6.16 | | | | 106,005 | | | | 0.04 | | | | 0.05 | | | | 0.04 | | | | 0.05 | | | | 3.08 | | | | 52 | |
| | | | | | | | |
| | 11.28 | | | | 6.70 | | | | 21,432 | | | | 0.04 | | | | 0.05 | | | | 0.04 | | | | 0.05 | | | | 3.41 | | | | 64 | |
| | | | | | | | |
| | 10.92 | | | | 5.52 | | | | 7,556 | | | | 0.04 | | | | 0.04 | | | | 0.04 | | | | 0.04 | | | | 2.91 | | | | 34 | |
| | | | | | | | |
| | | | | | | | | | | | | | | | | | | | | | | | | | | | | | | | | | |
| | | | | | | | |
| | 10.81 | | | | (13.25 | ) | | | 25,098 | | | | 0.28 | | | | 0.29 | | | | 0.28 | | | | 0.29 | | | | 3.23 | | | | 18 | |
| | | | | | | | |
| | 12.93 | | | | 19.09 | | | | 31,198 | | | | 0.28 | | | | 0.29 | | | | 0.28 | | | | 0.29 | | | | 2.67 | | | | 17 | |
| | | | | | | | |
| | 11.59 | | | | 6.02 | | | | 29,547 | | | | 0.29 | | | | 0.30 | | | | 0.29 | | | | 0.30 | | | | 2.93 | | | | 52 | |
| | | | | | | | |
| | 11.28 | | | | 6.44 | | | | 11,586 | | | | 0.29 | | | | 0.30 | | | | 0.29 | | | | 0.30 | | | | 3.08 | | | | 64 | |
| | | | | | | | |
| | 10.92 | | | | 5.17 | | | | 13,340 | | | | 0.29 | | | | 0.29 | | | | 0.29 | | | | 0.29 | | | | 2.98 | | | | 34 | |
| | | | | | | | |
| | | | | | | | | | | | | | | | | | | | | | | | | | | | | | | | | | |
| | | | | | | | |
| | 10.73 | | | | (13.41 | ) | | | 28,738 | | | | 0.50 | (f) | | | 0.51 | (f) | | | 0.50 | (f) | | | 0.51 | (f) | | | 3.03 | | | | 18 | |
| | | | | | | | |
| | 12.84 | | | | 18.71 | | | | 30,699 | | | | 0.53 | | | | 0.54 | | | | 0.53 | | | | 0.54 | | | | 2.39 | | | | 17 | |
| | | | | | | | |
| | 11.53 | | | | 5.71 | | | | 16,501 | | | | 0.54 | | | | 0.55 | | | | 0.54 | | | | 0.55 | | | | 2.82 | | | | 52 | |
| | | | | | | | |
| | 11.24 | | | | 6.25 | | | | 7,204 | | | | 0.54 | | | | 0.55 | | | | 0.54 | | | | 0.55 | | | | 2.92 | | | | 64 | |
| | | | | | | | |
| | 10.88 | | | | 4.91 | | | | 3,535 | | | | 0.54 | | | | 0.54 | | | | 0.54 | | | | 0.54 | | | | 2.51 | | | | 34 | |
| | | | | | | | | | | | |
| | | | ANNUAL REPORT | | | | | | | JUNE 30, 2022 | | | 33 |
| | | | | | |
| Statements of Assets and Liabilities | | | | | | |
| | | | | | | | | | | | | | | | |
| (Amounts in thousands†, except per share amounts) | | PIMCO
REALPATH® Blend
2025
Fund | | | PIMCO
REALPATH® Blend
2030
Fund | | | PIMCO REALPATH® Blend
2035
Fund | | | PIMCO REALPATH® Blend 2040
Fund | |
| | | | |
Assets: | | | | | | | | | | | | | | | | |
| | | | |
Investments, at value | | | | | | | | | | | | | | | | |
Investments in securities* | | $ | 122,236 | | | $ | 171,942 | | | $ | 175,442 | | | $ | 197,346 | |
Investments in Affiliates | | | 118,384 | | | | 104,076 | | | | 72,283 | | | | 54,419 | |
Financial Derivative Instruments | | | | | | | | | | | | | | | | |
Exchange-traded or centrally cleared | | | 1,744 | | | | 1,973 | | | | 0 | | | | 0 | |
Cash | | | 1 | | | | 1 | | | | 1 | | | | 1 | |
Receivable for investments sold | | | 664 | | | | 549 | | | | 664 | | | | 762 | |
Receivable for investments in Affiliates sold | | | 2,913 | | | | 2,483 | | | | 1,448 | | | | 1,194 | |
Receivable for Fund shares sold | | | 1,634 | | | | 896 | | | | 2,098 | | | | 716 | |
Interest and/or dividends receivable | | | 0 | | | | 0 | | | | 0 | | | | 0 | |
Dividends receivable from Affiliates | | | 438 | | | | 383 | | | | 250 | | | | 180 | |
Reimbursement receivable from PIMCO | | | 3 | | | | 3 | | | | 3 | | | | 3 | |
Total Assets | | | 248,017 | | | | 282,306 | | | | 252,189 | | | | 254,621 | |
| | | | |
Liabilities: | | | | | | | | | | | | | | | | |
| | | | |
Financial Derivative Instruments | | | | | | | | | | | | | | | | |
Exchange-traded or centrally cleared | | $ | 395 | | | $ | 447 | | | $ | 0 | | | $ | 0 | |
Over the counter | | | 11 | | | | 12 | | | | 11 | | | | 12 | |
Payable for investments purchased | | | 2,877 | | | | 3,660 | | | | 3,358 | | | | 3,256 | |
Payable for investments in Affiliates purchased | | | 452 | | | | 395 | | | | 258 | | | | 185 | |
Payable for Fund shares redeemed | | | 134 | | | | 137 | | | | 176 | | | | 56 | |
Accrued investment advisory fees | | | 2 | | | | 2 | | | | 4 | | | | 6 | |
Accrued supervisory and administrative fees | | | 5 | | | | 6 | | | | 5 | | | | 6 | |
Accrued distribution fees | | | 5 | | | | 6 | | | | 5 | | | | 4 | |
Accrued servicing fees | | | 1 | | | | 2 | | | | 2 | | | | 2 | |
Total Liabilities | | | 3,882 | | | | 4,667 | | | | 3,819 | | | | 3,527 | |
| | | | |
Net Assets | | $ | 244,135 | | | $ | 277,639 | | | $ | 248,370 | | | $ | 251,094 | |
| | | | |
Net Assets Consist of: | | | | | | | | | | | | | | | | |
| | | | |
Paid in capital | | $ | 261,692 | | | $ | 291,932 | | | $ | 258,841 | | | $ | 255,824 | |
Distributable earnings (accumulated loss) | | | (17,557 | ) | | | (14,293 | ) | | | (10,471 | ) | | | (4,730 | ) |
| | | | |
Net Assets | | $ | 244,135 | | | $ | 277,639 | | | $ | 248,370 | | | $ | 251,094 | |
| | | | |
Cost of investments in securities | | $ | 119,866 | | | $ | 168,566 | | | $ | 175,544 | | | $ | 194,831 | |
Cost of investments in Affiliates | | $ | 140,652 | | | $ | 123,751 | | | $ | 84,608 | | | $ | 63,004 | |
Cost or premiums of financial derivative instruments, net | | $ | 1,304 | | | $ | 1,469 | | | $ | 0 | | | $ | 0 | |
| | | | |
* Includes repurchase agreements of: | | $ | 365 | | | $ | 579 | | | $ | 526 | | | $ | 255 | |
| † | A zero balance may reflect actual amounts rounding to less than one thousand. |
| | | | | | |
| 34 | | PIMCO EQUITY SERIES | | | See Accompanying Notes | |
| | | | | | | | | | | | | | | | | | |
PIMCO REALPATH® Blend 2045
Fund | | | PIMCO REALPATH® Blend
2050
Fund | | | PIMCO REALPATH® Blend
2055
Fund | | | PIMCO REALPATH® Blend 2060
Fund | | | PIMCO REALPATH® Blend Income
Fund | |
| | | | |
| | | | | | | | | | | | | | | | | | |
| | | | |
| | | | | | | | | | | | | | | | | | | |
| $ | 193,775 | | | $ | 204,355 | | | $ | 139,645 | | | $ | 20,566 | | | $ | 93,779 | |
| | 36,234 | | | | 25,020 | | | | 16,226 | | | | 2,425 | | | | 126,777 | |
| | | | | | | | | | | | | | | | | | | |
| | 0 | | | | 0 | | | | 0 | | | | 0 | | | | 1,682 | |
| | 1 | | | | 1 | | | | 1 | | | | 230 | | | | 1 | |
| | 8 | | | | 30 | | | | 22 | | | | 1 | | | | 3,176 | |
| | 0 | | | | 0 | | | | 0 | | | | 0 | | | | 1,211 | |
| | 1,321 | | | | 610 | | | | 1,030 | | | | 177 | | | | 596 | |
| | 0 | | | | 0 | | | | 0 | | | | 0 | | | | 1 | |
| | 109 | | | | 73 | | | | 43 | | | | 6 | | | | 471 | |
| | 3 | | | | 3 | | | | 2 | | | | 0 | | | | 3 | |
| | 231,451 | | | | 230,092 | | | | 156,969 | | | | 23,405 | | | | 227,697 | |
| | | | |
| | | | | | | | | | | | | | | | | | |
| | | | |
| | | | | | | | | | | | | | | | | | | |
| $ | 0 | | | $ | 0 | | | $ | 0 | | | $ | 0 | | | $ | 378 | |
| | 11 | | | | 11 | | | | 8 | | | | 1 | | | | 10 | |
| | 706 | | | | 703 | | | | 475 | | | | 73 | | | | 1,861 | |
| | 112 | | | | 76 | | | | 44 | | | | 6 | | | | 486 | |
| | 68 | | | | 15 | | | | 305 | | | | 2 | | | | 107 | |
| | 6 | | | | 6 | | | | 4 | | | | 1 | | | | 2 | |
| | 5 | | | | 4 | | | | 3 | | | | 1 | | | | 9 | |
| | 4 | | | | 4 | | | | 1 | | | | 0 | | | | 5 | |
| | 1 | | | | 1 | | | | 1 | | | | 0 | | | | 6 | |
| | 913 | | | | 820 | | | | 841 | | | | 84 | | | | 2,864 | |
| | | | |
| $ | 230,538 | | | $ | 229,272 | | | $ | 156,128 | | | $ | 23,321 | | | $ | 224,833 | |
| | | | |
| | | | | | | | | | | | | | | | | | |
| | | | |
| $ | 231,631 | | | $ | 224,709 | | | $ | 160,118 | | | $ | 26,263 | | | $ | 242,787 | |
| | (1,093 | ) | | | 4,563 | | | | (3,990 | ) | | | (2,942 | ) | | | (17,954 | ) |
| | | | |
| $ | 230,538 | | | $ | 229,272 | | | $ | 156,128 | | | $ | 23,321 | | | $ | 224,833 | |
| | | | |
| $ | 191,772 | | | $ | 199,367 | | | $ | 143,666 | | | $ | 23,382 | | | $ | 88,561 | |
| $ | 41,435 | | | $ | 28,507 | | | $ | 18,081 | | | $ | 2,644 | | | $ | 149,142 | |
| $ | 0 | | | $ | 0 | | | $ | 0 | | | $ | 0 | | | $ | 1,260 | |
| | | | |
| $ | 315 | | | $ | 621 | | | $ | 561 | | | $ | 0 | | | $ | 550 | |
| | | | | | | | | | | | |
| | | | ANNUAL REPORT | | | | | | | JUNE 30, 2022 | | | 35 |
| | | | |
| Statements of Assets and Liabilities | | (Cont.) | | |
| | | | | | | | | | | | | | | | |
| | | PIMCO
REALPATH® Blend
2025 Fund | | | PIMCO
REALPATH® Blend
2030 Fund | | | PIMCO REALPATH® Blend
2035 Fund | | | PIMCO REALPATH® Blend
2040 Fund | |
| | | | |
Net Assets: | | | | | | | | | | | | | | | | |
| | | | |
Institutional Class | | $ | 211,435 | | | $ | 239,698 | | | $ | 215,450 | | | $ | 224,639 | |
Administrative Class | | | 25,795 | | | | 30,094 | | | | 25,937 | | | | 19,014 | |
Class A | | | 6,905 | | | | 7,847 | | | | 6,983 | | | | 7,441 | |
| | | | |
Shares Issued and Outstanding: | | | | | | | | | | | | | | | | |
| | | | |
Institutional Class | | | 18,736 | | | | 20,509 | | | | 17,842 | | | | 18,109 | |
Administrative Class | | | 2,292 | | | | 2,581 | | | | 2,152 | | | | 1,538 | |
Class A | | | 614 | | | | 675 | | | | 578 | | | | 604 | |
| | | | |
Net Asset Value Per Share Outstanding(a): | | | | | | | | | | | | | | | | |
| | | | |
Institutional Class | | $ | 11.29 | | | $ | 11.69 | | | $ | 12.08 | | | $ | 12.40 | |
Administrative Class | | | 11.25 | | | | 11.66 | | | | 12.05 | | | | 12.37 | |
Class A | | | 11.25 | | | | 11.62 | | | | 12.08 | | | | 12.32 | |
| (a) | Includes adjustments required by U.S. GAAP and may differ from net asset values and performance reported elsewhere by the Funds. |
| | | | | | |
| 36 | | PIMCO EQUITY SERIES | | | See Accompanying Notes | |
| | | | | | | | | | | | | | | | | | |
PIMCO REALPATH® Blend
2045 Fund | | | PIMCO REALPATH® Blend
2050 Fund | | | PIMCO REALPATH® Blend
2055 Fund | | | PIMCO REALPATH® Blend
2060 Fund | | | PIMCO REALPATH® Blend
Income Fund | |
| | | | |
| | | | | | | | | | | | | | | | | | |
| | | | |
| $ | 207,869 | | | $ | 206,038 | | | $ | 145,097 | | | $ | 22,421 | | | $ | 170,997 | |
| | 18,702 | | | | 19,530 | | | | 8,409 | | | | 364 | | | | 25,098 | |
| | 3,967 | | | | 3,704 | | | | 2,622 | | | | 536 | | | | 28,738 | |
| | | | |
| | | | | | | | | | | | | | | | | | |
| | | | |
| | 16,580 | | | | 16,294 | | | | 11,381 | | | | 2,278 | | | | 15,824 | |
| | 1,497 | | | | 1,551 | | | | 662 | | | | 37 | | | | 2,322 | |
| | 318 | | | | 296 | | | | 208 | | | | 55 | | | | 2,679 | |
| | | | |
| | | | | | | | | | | | | | | | | | |
| | | | |
| $ | 12.54 | | | $ | 12.65 | | | $ | 12.75 | | | $ | 9.84 | | | $ | 10.81 | |
| | 12.49 | | | | 12.59 | | | | 12.71 | | | | 9.80 | | | | 10.81 | |
| | 12.46 | | | | 12.51 | | | | 12.64 | | | | 9.78 | | | | 10.73 | |
| | | | | | | | | | | | |
| | | | ANNUAL REPORT | | | | | | | JUNE 30, 2022 | | | 37 |
| | | | | | | | | | | | | | | | |
| Year Ended June 30, 2022 | | | | | | | | | | | | |
| (Amounts in thousands†) | | PIMCO
REALPATH® Blend 2025 Fund | | | PIMCO REALPATH® Blend
2030 Fund | | | PIMCO REALPATH® Blend
2035 Fund | | | PIMCO REALPATH® Blend 2040 Fund | |
| | | | |
Investment Income: | | | | | | | | | | | | | | | | |
| | | | |
Interest | | $ | 1 | | | $ | 2 | | | $ | 1 | | | $ | 1 | |
Dividends | | | 2,935 | | | | 3,979 | | | | 3,880 | | | | 4,532 | |
Dividends from Investments in Affiliates | | | 5,921 | | | | 5,008 | | | | 3,137 | | | | 2,344 | |
Total Income | | | 8,857 | | | | 8,989 | | | | 7,018 | | | | 6,877 | |
| | | | |
Expenses: | | | | | | | | | | | | | | | | |
| | | | |
Investment advisory fees | | | 26 | | | | 29 | | | | 50 | | | | 78 | |
Supervisory and administrative fees | | | 73 | | | | 79 | | | | 67 | | | | 72 | |
Distribution and/or servicing fees - Administrative Class | | | 73 | | | | 86 | | | | 72 | | | | 54 | |
Distribution and/or servicing fees - Class A | | | 24 | | | | 24 | | | | 20 | | | | 23 | |
Trustee fees | | | 17 | | | | 19 | | | | 16 | | | | 16 | |
Miscellaneous expense | | | 0 | | | | 0 | | | | 0 | | | | 0 | |
Total Expenses | | | 213 | | | | 237 | | | | 225 | | | | 243 | |
Waiver and/or Reimbursement by PIMCO | | | (5 | ) | | | (5 | ) | | | (4 | ) | | | (4 | ) |
Net Expenses | | | 208 | | | | 232 | | | | 221 | | | | 239 | |
| | | | |
Net Investment Income (Loss) | | | 8,649 | | | | 8,757 | | | | 6,797 | | | | 6,638 | |
| | | | |
Net Realized Gain (Loss): | | | | | | | | | | | | | | | | |
| | | | |
Investments in securities | | | 1,342 | | | | 84 | | | | (532 | ) | | | (1,514 | ) |
Investments in Affiliates | | | (2,228 | ) | | | (2,405 | ) | | | (1,297 | ) | | | (957 | ) |
Net capital gain distributions received from investments | | | 1,992 | | | | 2,760 | | | | 2,643 | | | | 3,038 | |
Net capital gain distributions received from Affiliate investments | | | 1,814 | | | | 1,899 | | | | 1,192 | | | | 949 | |
Exchange-traded or centrally cleared financial derivative instruments | | | (1,087 | ) | | | (1,230 | ) | | | 0 | | | | 0 | |
Over the counter financial derivative instruments | | | (466 | ) | | | (594 | ) | | | (584 | ) | | | (601 | ) |
| | | | |
Net Realized Gain (Loss) | | | 1,367 | | | | 514 | | | | 1,422 | | | | 915 | |
| | | | |
Net Change in Unrealized Appreciation (Depreciation): | | | | | | | | | | | | | | | | |
| | | | |
Investments in securities | | | (26,240 | ) | | | (35,189 | ) | | | (35,513 | ) | | | (39,824 | ) |
Investments in Affiliates | | | (21,916 | ) | | | (19,973 | ) | | | (13,226 | ) | | | (9,637 | ) |
Exchange-traded or centrally cleared financial derivative instruments | | | 729 | | | | 836 | | | | 0 | | | | 0 | |
Over the counter financial derivative instruments | | | (7 | ) | | | (8 | ) | | | (8 | ) | | | (8 | ) |
| | | | |
Net Change in Unrealized Appreciation (Depreciation) | | | (47,434 | ) | | | (54,334 | ) | | | (48,747 | ) | | | (49,469 | ) |
| | | | |
Net Increase (Decrease) in Net Assets Resulting from Operations | | $ | (37,418 | ) | | $ | (45,063 | ) | | $ | (40,528 | ) | | $ | (41,916 | ) |
| † | A zero balance may reflect actual amounts rounding to less than one thousand. |
| | | | | | |
| 38 | | PIMCO EQUITY SERIES | | | See Accompanying Notes | |
| | | | | | | | | | | | | | | | | | |
| | | | | | | | | | | | | | |
PIMCO REALPATH® Blend
2045 Fund | | | PIMCO REALPATH® Blend
2050 Fund | | | PIMCO REALPATH® Blend 2055 Fund | | | PIMCO REALPATH® Blend
2060 Fund | | | PIMCO REALPATH® Blend Income Fund | |
| | | | |
| | | | | | | | | | | | | | | | | | |
| | | | |
| $ | 2 | | | $ | 2 | | | $ | 1 | | | $ | 0 | | | $ | 1 | |
| | 4,502 | | | | 4,772 | | | | 3,109 | | | | 374 | | | | 2,363 | |
| | 1,511 | | | | 1,184 | | | | 716 | | | | 79 | | | | 6,590 | |
| | 6,015 | | | | 5,958 | | | | 3,826 | | | | 453 | | | | 8,954 | |
| | | | |
| | | | | | | | | | | | | | | | | | |
| | | | |
| | 72 | | | | 72 | | | | 45 | | | | 5 | | | | 25 | |
| | 58 | | | | 59 | | | | 37 | | | | 5 | | | | 120 | |
| | 52 | | | | 56 | | | | 22 | | | | 1 | | | | 75 | |
| | 11 | | | | 12 | | | | 8 | | | | 2 | | | | 80 | |
| | 15 | | | | 16 | | | | 10 | | | | 1 | | | | 17 | |
| | 0 | | | | 0 | | | | 0 | | | | 0 | | | | 13 | |
| | 208 | | | | 215 | | | | 122 | | | | 14 | | | | 330 | |
| | (4 | ) | | | (4 | ) | | | (2 | ) | | | (0 | ) | | | (17 | ) |
| | 204 | | | | 211 | | | | 120 | | | | 14 | | | | 313 | |
| | | | |
| | 5,811 | | | | 5,747 | | | | 3,706 | | | | 439 | | | | 8,641 | |
| | | | |
| | | | | | | | | | | | | | | | | | |
| | | | |
| | (761 | ) | | | (45 | ) | | | (295 | ) | | | 816 | | | | 12 | |
| | (590 | ) | | | (504 | ) | | | (323 | ) | | | (54 | ) | | | (2,041 | ) |
| | 2,898 | | | | 3,086 | | | | 1,981 | | | | 220 | | | | 1,492 | |
| | 652 | | | | 496 | | | | 259 | | | | 27 | | | | 1,397 | |
| | 0 | | | | 0 | | | | 0 | | | | 0 | | | | (1,130 | ) |
| | (561 | ) | | | (483 | ) | | | (408 | ) | | | (75 | ) | | | (323 | ) |
| | | | |
| | 1,638 | | | | 2,550 | | | | 1,214 | | | | 934 | | | | (593 | ) |
| | | | |
| | | | | | | | | | | | | | | | | | |
| | | | |
| | (39,812 | ) | | | (42,046 | ) | | | (28,269 | ) | | | (4,392 | ) | | | (20,195 | ) |
| | (5,888 | ) | | | (3,981 | ) | | | (2,119 | ) | | | (240 | ) | | | (23,454 | ) |
| | 0 | | | | 0 | | | | 0 | | | | 0 | | | | 768 | |
| | (8 | ) | | | (7 | ) | | | (6 | ) | | | (1 | ) | | | (6 | ) |
| | | | |
| | (45,708 | ) | | | (46,034 | ) | | | (30,394 | ) | | | (4,633 | ) | | | (42,887 | ) |
| | | | |
| $ | (38,259 | ) | | $ | (37,737 | ) | | $ | (25,474 | ) | | $ | (3,260 | ) | | $ | (34,839 | ) |
| | | | | | | | | | | | |
| | | | ANNUAL REPORT | | | | | | | JUNE 30, 2022 | | | 39 |
| | | | |
| Statements of Changes in Net Assets | | | | |
| | | | | | | | | | | | | | | | | | | | | | | | | | | | | | | | |
| | | PIMCO REALPATH® Blend 2025 Fund | | | PIMCO REALPATH® Blend 2030 Fund | | | PIMCO REALPATH® Blend 2035 Fund | | | PIMCO REALPATH® Blend 2040 Fund | |
| | | | | | | | |
| (Amounts in thousands†) | | Year Ended
June 30, 2022 | | | Year Ended
June 30, 2021 | | | Year Ended
June 30, 2022 | | | Year Ended
June 30, 2021 | | | Year Ended
June 30, 2022 | | | Year Ended
June 30, 2021 | | | Year Ended
June 30, 2022 | | | Year Ended
June 30, 2021 | |
| | | | | | | | |
Increase (Decrease) in Net Assets from: | | | | | | | | | | | | | | | | | | | | | | | | | | | | | | | | |
| | | | | | | | |
Operations: | | | | | | | | | | | | | | | | | | | | | | | | | | | | | | | | |
| | | | | | | | |
Net investment income (loss) | | $ | 8,649 | | | $ | 5,351 | | | $ | 8,757 | | | $ | 5,607 | | | $ | 6,797 | | | $ | 3,971 | | | $ | 6,638 | | | $ | 4,017 | |
Net realized gain (loss) | | | 1,367 | | | | 7,444 | | | | 514 | | | | 8,106 | | | | 1,422 | | | | 5,149 | | | | 915 | | | | 5,630 | |
Net change in unrealized appreciation (depreciation) | | | (47,434 | ) | | | 25,245 | | | | (54,334 | ) | | | 35,198 | | | | (48,747 | ) | | | 34,324 | | | | (49,469 | ) | | | 40,612 | |
| | | | | | | | |
Net Increase (Decrease) in Net Assets Resulting from Operations | | | (37,418 | ) | | | 38,040 | | | | (45,063 | ) | | | 48,911 | | | | (40,528 | ) | | | 43,444 | | | | (41,916 | ) | | | 50,259 | |
| | | | | | | | |
Distributions to Shareholders: | | | | | | | | | | | | | | | | | | | | | | | | | | | | | | | | |
| | | | | | | | |
From net investment income and/or net realized capital gains | | | | | | | | | | | | | | | | | | | | | | | | | | | | | | | | |
Institutional Class | | | (8,018 | ) | | | (11,035 | ) | | | (9,001 | ) | | | (10,302 | ) | | | (7,076 | ) | | | (6,202 | ) | | | (7,842 | ) | | | (6,080 | ) |
Administrative Class | | | (1,020 | ) | | | (1,732 | ) | | | (1,183 | ) | | | (1,571 | ) | | | (965 | ) | | | (953 | ) | | | (733 | ) | | | (644 | ) |
Class A | | | (313 | ) | | | (483 | ) | | | (316 | ) | | | (378 | ) | | | (245 | ) | | | (245 | ) | | | (300 | ) | | | (258 | ) |
| | | | | | | | |
Total Distributions(a) | | | (9,351 | ) | | | (13,250 | ) | | | (10,500 | ) | | | (12,251 | ) | | | (8,286 | ) | | | (7,400 | ) | | | (8,875 | ) | | | (6,982 | ) |
| | | | | | | | |
Fund Share Transactions: | | | | | | | | | | | | | | | | | | | | | | | | | | | | | | | | |
| | | | | | | | |
Net increase (decrease) resulting from Fund share transactions* | | | 30,933 | | | | 120,107 | | | | 50,972 | | | | 106,079 | | | | 67,622 | | | | 87,900 | | | | 58,837 | | | | 82,383 | |
| | | | | | | | |
Total Increase (Decrease) in Net Assets | | | (15,836 | ) | | | 144,897 | | | | (4,591 | ) | | | 142,739 | | | | 18,808 | | | | 123,944 | | | | 8,046 | | | | 125,660 | |
| | | | | | | | |
Net Assets: | | | | | | | | | | | | | | | | | | | | | | | | | | | | | | | | |
| | | | | | | | |
Beginning of year | | | 259,971 | | | | 115,074 | | | | 282,230 | | | | 139,491 | | | | 229,562 | | | | 105,618 | | | | 243,048 | | | | 117,388 | |
End of year | | $ | 244,135 | | | $ | 259,971 | | | $ | 277,639 | | | $ | 282,230 | | | $ | 248,370 | | | $ | 229,562 | | | $ | 251,094 | | | $ | 243,048 | |
| † | A zero balance may reflect actual amounts rounding to less than one thousand. |
| * | See Note 13, Shares of Beneficial Interest, in the Notes to Financial Statements. |
| (a) | The tax characterization of distributions is determined in accordance with Federal income tax regulations. See Note 2, Distributions to Shareholders, in the Notes to Financial Statements for more information. |
| | | | | | |
| 40 | | PIMCO EQUITY SERIES | | | See Accompanying Notes | |
| | | | | | | | | | | | | | | | | | | | | | | | | | | | | | | | | | | | | | |
PIMCO REALPATH® Blend 2045 Fund | | | PIMCO REALPATH® Blend 2050 Fund | | | PIMCO REALPATH® Blend 2055 Fund | | | PIMCO REALPATH® Blend 2060 Fund | | | PIMCO REALPATH® Blend Income Fund | |
| | | | | | | | | |
Year Ended
June 30, 2022 | | | Year Ended
June 30, 2021 | | | Year Ended
June 30, 2022 | | | Year Ended
June 30, 2021 | | | Year Ended
June 30, 2022 | | | Year Ended
June 30, 2021 | | | Year Ended
June 30, 2022 | | | Year Ended
June 30, 2021 | | | Year Ended
June 30, 2022 | | | Year Ended
June 30, 2021 | |
| | | | | | | | | |
| | | | | | | | | | | | | | | | | | | | | | | | | | | | | | | | | | | | | | |
| | | | | | | | | |
| | | | | | | | | | | | | | | | | | | | | | | | | | | | | | | | | | | | | | |
| | | | | | | | | |
| $ | 5,811 | | | $ | 3,556 | | | $ | 5,747 | | | $ | 3,682 | | | $ | 3,706 | | | $ | 2,007 | | | $ | 439 | | | $ | 151 | | | $ | 8,641 | | | $ | 5,840 | |
| | 1,638 | | | | 5,475 | | | | 2,550 | | | | 6,521 | | | | 1,214 | | | | 3,188 | | | | 934 | | | | 143 | | | | (593 | ) | | | 7,649 | |
| (45,708 | ) | | | 39,352 | | | | (46,034 | ) | | | 43,063 | | | | (30,394 | ) | | | 23,075 | | | | (4,633 | ) | | | 1,769 | | | | (42,887 | ) | | | 21,836 | |
| | | | | | | | | |
|
(38,259 |
) | | | 48,383 | | | | (37,737 | ) | | | 53,266 | | | | (25,474 | ) | | | 28,270 | | | | (3,260 | ) | | | 2,063 | | | | (34,839 | ) | | | 35,325 | |
| | | | | | | | | |
| | | | | | | | | | | | | | | | | | | | | | | | | | | | | | | | | | | | | | |
| | | | | | | | | |
|
|
| | | | | | | | | | | | | | | | | | | | | | | | | | | | | | | | | | | | |
| | (6,960 | ) | | | (5,403 | ) | | | (7,450 | ) | | | (5,238 | ) | | | (4,157 | ) | | | (3,040 | ) | | | (1,260 | ) | | | (173 | ) | | | (7,604 | ) | | | (11,107 | ) |
| | (675 | ) | | | (556 | ) | | | (792 | ) | | | (580 | ) | | | (261 | ) | | | (189 | ) | | | (14 | ) | | | (1 | ) | | | (1,147 | ) | | | (1,988 | ) |
| | (141 | ) | | | (116 | ) | | | (173 | ) | | | (113 | ) | | | (91 | ) | | | (72 | ) | | | (90 | ) | | | (11 | ) | | | (1,174 | ) | | | (1,655 | ) |
| | | | | | | | | |
| | (7,776 | ) | | | (6,075 | ) | | | (8,415 | ) | | | (5,931 | ) | | | (4,509 | ) | | | (3,301 | ) | | | (1,364 | ) | | | (185 | ) | | | (9,925 | ) | | | (14,750 | ) |
| | | | | | | | | |
| | | | | | | | | | | | | | | | | | | | | | | | | | | | | | | | | | | | | | |
| | | | | | | | | |
|
51,628 |
| | | 73,380 | | | | 47,223 | | | | 54,833 | | | | 52,480 | | | | 50,089 | | | | 15,598 | | | | 7,614 | | | | 15,827 | | | | 81,142 | |
| | | | | | | | | |
| | 5,593 | | | | 115,688 | | | | 1,071 | | | | 102,168 | | | | 22,497 | | | | 75,058 | | | | 10,974 | | | | 9,492 | | | | (28,937 | ) | | | 101,717 | |
| | | | | | | | | |
| | | | | | | | | | | | | | | | | | | | | | | | | | | | | | | | | | | | | | |
| | | | | | | | | |
| | 224,945 | | | | 109,257 | | | | 228,201 | | | | 126,033 | | | | 133,631 | | | | 58,573 | | | | 12,347 | | | | 2,855 | | | | 253,770 | | | | 152,053 | |
| $ | 230,538 | | | $ | 224,945 | | | $ | 229,272 | | | $ | 228,201 | | | $ | 156,128 | | | $ | 133,631 | | | $ | 23,321 | | | $ | 12,347 | | | $ | 224,833 | | | $ | 253,770 | |
| | | | | | | | | | | | |
| | | | ANNUAL REPORT | | | | | | | JUNE 30, 2022 | | | 41 |
| | | | | | |
| Schedule of Investments | | PIMCO REALPATH® Blend 2025 Fund | | | | |
(Amounts in thousands*, except number of shares, contracts, units and ounces, if any)
| | | | | | | | | | | | |
| | | | | SHARES | | | | | MARKET
VALUE
(000S) | |
| INVESTMENTS IN SECURITIES 50.1% | |
| |
| MUTUAL FUNDS 49.5% | |
| | | | |
Vanguard Developed Markets Index Fund ‘Institutional’ | | | | | 3,152,947 | | | $ | | | 41,304 | |
| | | |
Vanguard Emerging Markets Stock Index Fund ‘Institutional’ | | | 571,822 | | | | | | 15,027 | |
| | | | |
Vanguard Institutional Index Fund ‘Institutional’ | | | | | 188,412 | | | | | | 60,407 | |
| | | | |
Vanguard Small-Cap Index Fund ‘Institutional’ | | | | | 48,005 | | | | | | 4,051 | |
| | | | | | | | | | | | |
Total Mutual Funds (Cost $118,419) | | | | | | 120,789 | |
| | | | | | | | | | | | |
| |
| | | | | PRINCIPAL
AMOUNT
(000S) | | | | | | |
| SHORT-TERM INSTRUMENTS 0.6% | |
| |
| REPURCHASE AGREEMENTS (d) 0.1% | |
| | | | | | | | | | | 365 | |
| | | | | | | | | | | | |
| |
| U.S. TREASURY BILLS 0.5% | |
0.958% due 07/26/2022 - 08/18/2022 (a)(b)(g) | | $ | | | 1,083 | | | | | | 1,082 | |
| | | | | | | | | | | | |
| Total Short-Term Instruments (Cost $1,447) | | | | | | 1,447 | |
| | | | | | | | | | | | |
| | | | |
| | | | | | | | | | | | |
| Total Investments in Securities (Cost $119,866) | | | | | | 122,236 | |
| | | | | | | | | | | | |
| | | | | | | | | | | | |
| | | | | SHARES | | | | | MARKET
VALUE
(000S) | |
| INVESTMENTS IN AFFILIATES 48.5% | |
| |
| MUTUAL FUNDS (c) 46.2% | |
| | | | |
PIMCO Emerging Markets Local Currency and Bond Fund | | | | | 2,280,797 | | | $ | | | 11,974 | |
| | | | |
PIMCO High Yield Fund | | | | | 708,969 | | | | | | 5,381 | |
| | | | |
PIMCO Income Fund | | | | | 2,738,078 | | | | | | 29,051 | |
| | | | |
PIMCO International Bond Fund (U.S. Dollar-Hedged) | | | | | 538,500 | | | | | | 5,250 | |
| | | | |
PIMCO Long-Term Real Return Fund | | | | | 2,642,050 | | | | | | 13,527 | |
| | | | |
PIMCO Long-Term U.S. Government Fund | | | | | 3,954,405 | | | | | | 16,688 | |
| | | | |
PIMCO Real Return Fund | | | | | 668,824 | | | | | | 7,170 | |
| | | | |
PIMCO Total Return Fund | | | | | 2,633,205 | | | | | | 23,699 | |
| | | | | | | | | | | | |
| Total Mutual Funds (Cost $135,005) | | | | | | 112,740 | |
| | | | | | | | | | | | |
| |
| | | | | | | | | | | | |
| | | | | SHARES | | | | | MARKET
VALUE
(000S) | |
| SHORT-TERM INSTRUMENTS 2.3% | |
| |
| CENTRAL FUNDS USED FOR CASH MANAGEMENT PURPOSES 2.3% | |
| | | | |
PIMCO Short-Term Floating NAV Portfolio III | | | | | 581,646 | | | $ | | | 5,644 | |
| | | | | | | | | | | | |
| Total Short-Term Instruments (Cost $5,647) | | | | | | 5,644 | |
| | | | | | | | | | | | |
| | | | |
| | | | | | | | | | | | |
| Total Investments in Affiliates (Cost $140,652) | | | | | | 118,384 | |
| | | | |
| | | | | | | | | | | | |
Total Investments 98.6%
(Cost $260,518) | | | $ | | | 240,620 | |
| |
Financial Derivative
Instruments (e)(f) 0.5% (Cost or Premiums, net $1,304) | | | | | | 1,338 | |
| |
| Other Assets and Liabilities, net 0.9% | | | | | | 2,177 | |
| | | | | | | | | | | | |
| Net Assets 100.0% | | | $ | | | 244,135 | |
| | | | | | | | | | | | |
NOTES TO SCHEDULE OF INVESTMENTS:
| * | A zero balance may reflect actual amounts rounding to less than one thousand. |
| (a) | Coupon represents a weighted average yield to maturity. |
| (c) | Institutional Class Shares of each Fund. |
BORROWINGS AND OTHER FINANCING TRANSACTIONS
(d) REPURCHASE AGREEMENTS:
| | | | | | | | | | | | | | | | | | | | | | | | | | | | | | |
| Counterparty | | Lending
Rate | | | Settlement
Date | | | Maturity
Date | | | Principal
Amount | | | Collateralized By | | Collateral
(Received) | | | Repurchase
Agreements,
at Value | | | Repurchase
Agreement
Proceeds
to be
Received(1) | |
| FICC | | | 0.400 | % | | | 06/30/2022 | | | | 07/01/2022 | | | $ | 365 | | | U.S. Treasury Notes 3.000% due 06/30/2024 | | $ | (372 | ) | | $ | 365 | | | $ | 365 | |
| | | | | | | | | | | | | | | | | | | | | | | | | | | | | | |
Total Repurchase Agreements | | | | | $ | (372 | ) | | $ | 365 | | | $ | 365 | |
| | | | | | | | | | | | | | | |
BORROWINGS AND OTHER FINANCING TRANSACTIONS SUMMARY
The following is a summary by counterparty of the market value of Borrowings and Other Financing Transactions and collateral pledged/(received) as of June 30, 2022:
| | | | | | | | | | | | | | | | | | | | | | | | |
| Counterparty | | Repurchase
Agreement
Proceeds
to be
Received(1) | | | Payable for
Reverse
Repurchase
Agreements | | | Payable for
Sale-Buyback
Transactions | | | Total
Borrowings and
Other Financing
Transactions | | | Collateral
Pledged/(Received) | | | Net Exposure(2) | |
Global/Master Repurchase Agreement | |
FICC | | $ | 365 | | | $ | 0 | | | $ | 0 | | | $ | 365 | | | $ | (372 | ) | | $ | (7 | ) |
| | | | | | | | | | | | | | | | | | | | | | | | |
Total Borrowings and Other Financing Transactions | | $ | 365 | | | $ | 0 | | | $ | 0 | | | | | | | | | | | | | |
| | | | | | | | | | | | | | | | | | | | | | | | |
| (1) | Includes accrued interest. |
| (2) | Net Exposure represents the net receivable/(payable) that would be due from/to the counterparty in the event of default. Exposure from borrowings and other financing transactions can only be netted across transactions governed under the same master agreement with the same legal entity. See Note 8, Master Netting Arrangements, in the Notes to Financial Statements for more information. |
| | | | | | |
| 42 | | PIMCO EQUITY SERIES | | | See Accompanying Notes | |
(e) FINANCIAL DERIVATIVE INSTRUMENTS: EXCHANGE-TRADED OR CENTRALLY CLEARED
PURCHASED OPTIONS:
OPTIONS ON INDICES
| | | | | | | | | | | | | | | | | | | | | | | | |
| Description | | Strike
Value | | | Expiration
Date | | | # of
Contracts | | | Notional
Amount | | | Cost | | | Market
Value | |
Put - CBOE S&P 500 | | | 3,100.000 | | | | 09/16/2022 | | | | 21 | | | $ | 2 | | | $ | 166 | | | $ | 58 | |
Put - CBOE S&P 500 | | | 3,425.000 | | | | 09/16/2022 | | | | 22 | | | | 2 | | | | 259 | | | | 154 | |
Put - CBOE S&P 500 | | | 3,175.000 | | | | 12/16/2022 | | | | 13 | | | | 1 | | | | 117 | | | | 110 | |
Put - CBOE S&P 500 | | | 3,525.000 | | | | 12/16/2022 | | | | 25 | | | | 3 | | | | 333 | | | | 402 | |
Put - CBOE S&P 500 | | | 3,050.000 | | | | 03/17/2023 | | | | 14 | | | | 1 | | | | 120 | | | | 140 | |
Put - CBOE S&P 500 | | | 3,375.000 | | | | 03/17/2023 | | | | 27 | | | | 3 | | | | 339 | | | | 444 | |
Put - CBOE S&P 500 | | | 2,850.000 | | | | 06/16/2023 | | | | 45 | | | | 5 | | | | 505 | | | | 436 | |
| | | | | | | | | | | | | | | | | | | | | | | | |
Total Purchased Options | | | $ | 1,839 | | | $ | 1,744 | |
| | | | | | | | | |
WRITTEN OPTIONS:
OPTIONS ON INDICES
| | | | | | | | | | | | | | | | | | | | | | | | |
| Description | | Strike
Value | | | Expiration
Date | | | # of
Contracts | | | Notional
Amount | | | Premiums
(Received) | | | Market
Value | |
Put - CBOE S&P 500 | | | 2,600.000 | | | | 09/16/2022 | | | | 22 | | | $ | 2 | | | $ | (89 | ) | | $ | (20 | ) |
Put - CBOE S&P 500 | | | 2,625.000 | | | | 12/16/2022 | | | | 25 | | | | 3 | | | | (117 | ) | | | (80 | ) |
Put - CBOE S&P 500 | | | 2,500.000 | | | | 03/17/2023 | | | | 27 | | | | 3 | | | | (119 | ) | | | (118 | ) |
Put - CBOE S&P 500 | | | 2,200.000 | | | | 06/16/2023 | | | | 45 | | | | 5 | | | | (210 | ) | | | (177 | ) |
| | | | | | | | | | | | | | | | | | | | | | | | |
Total Written Options | | | $ | (535 | ) | | $ | (395 | ) |
| | | | | | | | | |
FINANCIAL DERIVATIVE INSTRUMENTS: EXCHANGE-TRADED OR CENTRALLY CLEARED SUMMARY
The following is a summary of the market value and variation margin of Exchange-Traded or Centrally Cleared Financial Derivative Instruments as of June 30, 2022:
| | | | | | | | | | | | | | | | | | | | | | | | | | | | | | | | | | | | |
| | | Financial Derivative Assets | | | | | | Financial Derivative Liabilities | |
| | | Market Value | | | Variation Margin
Asset | | | Total | | | | | | Market Value | | | Variation Margin
Liability | | | Total | |
| | | Purchased
Options | | | Futures | | | Swap
Agreements | | | | | | Written
Options | | | Futures | | | Swap
Agreements | |
Total Exchange-Traded or Centrally Cleared | | $ | 1,744 | | | $ | 0 | | | $ | 0 | | | $ | 1,744 | | | | | | | $ | | (395) | | $ | 0 | | | $ | 0 | | | $ | (395) | |
| | | | | | | | | | | | | | | | | | | | | | | | | | | | | | | | | | | | |
(f) FINANCIAL DERIVATIVE INSTRUMENTS: OVER THE COUNTER
SWAP AGREEMENTS:
TOTAL RETURN SWAPS ON EQUITY INDICES
| | | | | | | | | | | | | | | | | | | | | | | | | | | | | | | | | | |
| Counterparty | | Pay/Receive(1) | | Underlying Reference | | # of Units | | | Financing Rate | | Payment
Frequency | | Maturity
Date | | Notional
Amount | | | Premiums
Paid/(Received) | | | Unrealized
Appreciation/
(Depreciation) | | | Swap Agreements,
at Value | |
| | Asset | | | Liability | |
JPM | | Receive | | FNRETR Index | | | 122 | | | 1.510% (1-Month USD-LIBOR
plus a specified spread) | | Monthly | | 08/24/2022 | | $ | 2,586 | | | $ | 0 | | | $ | (4 | ) | | $ | 0 | | | $ | (4 | ) |
| | Receive | | FNRETR Index | | | 300 | | | 1.980% (1-Month USD-LIBOR
plus a specified spread) | | Monthly | | 02/22/2023 | | | 6,359 | | | | 0 | | | | (7 | ) | | | 0 | | | | (7 | ) |
| | | | | | | | | | | | | | | | | | | | | | | | |
Total Swap Agreements | | | $ | 0 | | | $ | (11 | ) | | $ | 0 | | | $ | (11 | ) |
| | | | | | | | | | | | | | | | | |
FINANCIAL DERIVATIVE INSTRUMENTS: OVER THE COUNTER SUMMARY
The following is a summary by counterparty of the market value of OTC financial derivative instruments and collateral pledged/(received) as of June 30, 2022:
| | | | | | | | | | | | | | | | | | | | | | | | | | | | | | | | | | | | | | | | | | | | | | | | |
| | | Financial Derivative Assets | | | | | | Financial Derivative Liabilities | | | | | | | | | | |
| Counterparty | | Forward
Foreign
Currency
Contracts | | | Purchased
Options | | | Swap
Agreements | | | Total
Over the
Counter | | | | | | Forward
Foreign
Currency
Contracts | | | Written
Options | | | Swap
Agreements | | | Total
Over the
Counter | | | Net Market
Value of OTC
Derivatives | | | Collateral
Pledged/
(Received) | | | Net
Exposure(2) | |
JPM | | $ | 0 | | | $ | 0 | | | $ | 0 | | | $ | 0 | | | | | | | $ | 0 | | | $ | 0 | | | $ | (11 | ) | | $ | (11 | ) | | $ | (11 | ) | | $ | 740 | | | $ | 729 | |
| | | | | | | | | | | | | | | | | | | | | | | | | | | | | | | | | | | | | | | | | | | | | | | | |
Total Over the Counter | | $ | 0 | | | $ | 0 | | | $ | 0 | | | $ | 0 | | | | | | | $ | 0 | | | $ | 0 | | | $ | (11 | ) | | $ | (11 | ) | | | | | | | | | | | | |
| | | | | | | | | | | | | | | | | | | | | | | | | | | | | | | | | | | | | | | | | | | | | | | | |
| | | | | | | | | | | | |
| See Accompanying Notes | | | ANNUAL REPORT | | | | | | | JUNE 30, 2022 | | | 43 |
| | | | | | |
| Schedule of Investments | | PIMCO REALPATH® Blend 2025 Fund | | (Cont.) | | |
| (g) | Securities with an aggregate market value of $740 have been pledged as collateral for financial derivative instruments as governed by International Swaps and Derivatives Association, Inc. master agreements as of June 30, 2022. |
| (1) | Receive represents that the Fund receives payments for any positive net return on the underlying reference. The Fund makes payments for any negative net return on such underlying reference. Pay represents that the Fund receives payments for any negative net return on the underlying reference. The Fund makes payments for any positive net return on such underlying reference. |
| (2) | Net Exposure represents the net receivable/(payable) that would be due from/to the counterparty in the event of default. Exposure from OTC financial derivative instruments can only be netted across transactions governed under the same master agreement with the same legal entity. See Note 8, Master Netting Arrangements, in the Notes to Financial Statements for more information. |
FAIR VALUE OF FINANCIAL DERIVATIVE INSTRUMENTS
The following is a summary of the fair valuation of the Fund’s derivative instruments categorized by risk exposure. See Note 7, Principal and Other Risks, in the Notes to Financial Statements on risks of the Fund.
Fair Values of Financial Derivative Instruments on the Statements of Assets and Liabilities as of June 30, 2022:
| | | | | | | | | | | | | | | | | | | | | | | | |
| | | Derivatives not accounted for as hedging instruments | |
| | | Commodity
Contracts | | | Credit
Contracts | | | Equity
Contracts | | | Foreign
Exchange
Contracts | | | Interest
Rate Contracts | | | Total | |
Financial Derivative Instruments - Assets | |
Exchange-traded or centrally cleared | |
Purchased Options | | $ | 0 | | | $ | 0 | | | $ | 1,744 | | | $ | 0 | | | $ | 0 | | | $ | 1,744 | |
| | | | | | | | | | | | | | | | | | | | | | | | |
|
Financial Derivative Instruments - Liabilities | |
Exchange-traded or centrally cleared | |
Written Options | | $ | 0 | | | $ | 0 | | | $ | 395 | | | $ | 0 | | | $ | 0 | | | $ | 395 | |
| | | | | | | | | | | | | | | | | | | | | | | | |
Over the counter | |
Swap Agreements | | $ | 0 | | | $ | 0 | | | $ | 11 | | | $ | 0 | | | $ | 0 | | | $ | 11 | |
| | | | | | | | | | | | | | | | | | | | | | | | |
| | $ | 0 | | | $ | 0 | | | $ | 406 | | | $ | 0 | | | $ | 0 | | | $ | 406 | |
| | | | | | | | | | | | | | | | | | | | | | | | |
The effect of Financial Derivative Instruments on the Statements of Operations for the period ended June 30, 2022:
| | | | | | | | | | | | | | | | | | | | | | | | |
| | | Derivatives not accounted for as hedging instruments | |
| | | Commodity
Contracts | | | Credit
Contracts | | | Equity
Contracts | | | Foreign
Exchange
Contracts | | | Interest
Rate Contracts | | | Total | |
Net Realized Gain (Loss) on Financial Derivative Instruments | |
Exchange-traded or centrally cleared | |
Purchased Options | | $ | 0 | | | $ | 0 | | | $ | (1,349 | ) | | $ | 0 | | | $ | 0 | | | $ | (1,349 | ) |
Written Options | | | 0 | | | | 0 | | | | 262 | | | | 0 | | | | 0 | | | | 262 | |
| | | | | | | | | | | | | | | | | | | | | | | | |
| | $ | 0 | | | $ | 0 | | | $ | (1,087 | ) | | $ | 0 | | | $ | 0 | | | $ | (1,087 | ) |
| | | | | | | | | | | | | | | | | | | | | | | | |
Over the counter | |
Swap Agreements | | $ | 0 | | | $ | 0 | | | $ | (466 | ) | | $ | 0 | | | $ | 0 | | | $ | (466 | ) |
| | | | | | | | | | | | | | | | | | | | | | | | |
| | $ | 0 | | | $ | 0 | | | $ | (1,553 | ) | | $ | 0 | | | $ | 0 | | | $ | (1,553 | ) |
| | | | | | | | | | | | | | | | | | | | | | | | |
|
Net Change in Unrealized Appreciation (Depreciation) on Financial Derivative Instruments | |
Exchange-traded or centrally cleared | |
Purchased Options | | $ | 0 | | | $ | 0 | | | $ | 790 | | | $ | 0 | | | $ | 0 | | | $ | 790 | |
Written Options | | | 0 | | | | 0 | | | | (61 | ) | | | 0 | | | | 0 | | | | (61 | ) |
| | | | | | | | | | | | | | | | | | | | | | | | |
| | $ | 0 | | | $ | 0 | | | $ | 729 | | | $ | 0 | | | $ | 0 | | | $ | 729 | |
| | | | | | | | | | | | | | | | | | | | | | | | |
Over the counter | |
Swap Agreements | | $ | 0 | | | $ | 0 | | | $ | (7 | ) | | $ | 0 | | | $ | 0 | | | $ | (7 | ) |
| | | | | | | | | | | | | | | | | | | | | | | | |
| | $ | 0 | | | $ | 0 | | | $ | 722 | | | $ | 0 | | | $ | 0 | | | $ | 722 | |
| | | | | | | | | | | | | | | | | | | | | | | | |
| | | | | | |
| 44 | | PIMCO EQUITY SERIES | | | See Accompanying Notes | |
FAIR VALUE MEASUREMENTS
The following is a summary of the fair valuations according to the inputs used as of June 30, 2022 in valuing the Fund’s assets and liabilities:
| | | | | | | | | | | | | | | | |
| Category and Subcategory | | Level 1 | | | Level 2 | | | Level 3 | | | Fair
Value at
06/30/2022 | |
Investments in Securities, at Value | |
Mutual Funds | | $ | 120,789 | | | $ | 0 | | | $ | 0 | | | $ | 120,789 | |
Short-Term Instruments | |
Repurchase Agreements | | | 0 | | | | 365 | | | | 0 | | | | 365 | |
U.S. Treasury Bills | | | 0 | | | | 1,082 | | | | 0 | | | | 1,082 | |
| | | | | | | | | | | | | | | | |
| | $ | 120,789 | | | $ | 1,447 | | | $ | 0 | | | $ | 122,236 | |
| | | | | | | | | | | | | | | | |
|
Investments in Affiliates, at Value | |
Mutual Funds | | | 112,740 | | | | 0 | | | | 0 | | | | 112,740 | |
Short-Term Instruments | |
Central Funds Used for Cash Management Purposes | | | 5,644 | | | | 0 | | | | 0 | | | | 5,644 | |
| | | | | | | | | | | | | | | | |
| | $ | 118,384 | | | $ | 0 | | | $ | 0 | | | $ | 118,384 | |
| | | | | | | | | | | | | | | | |
| | | | |
Total Investments | | $ | 239,173 | | | $ | 1,447 | | | $ | 0 | | | $ | 240,620 | |
| | | | | | | | | | | | | | | | |
| | | | | | | | | | | | | | | | |
| Category and Subcategory | | Level 1 | | | Level 2 | | | Level 3 | | | Fair
Value at
06/30/2022 | |
Financial Derivative Instruments - Assets | |
Exchange-traded or centrally cleared | | $ | 0 | | | $ | 1,744 | | | $ | 0 | | | $ | 1,744 | |
| | | | | | | | | | | | | | | | |
|
Financial Derivative Instruments - Liabilities | |
Exchange-traded or centrally cleared | | | 0 | | | | (395 | ) | | | 0 | | | | (395 | ) |
Over the counter | | | 0 | | | | (11 | ) | | | 0 | | | | (11 | ) |
| | | | | | | | | | | | | | | | |
| | $ | 0 | | | $ | (406 | ) | | $ | 0 | | | $ | (406 | ) |
| | | | | | | | | | | | | | | | |
| | | | |
Total Financial Derivative Instruments | | $ | 0 | | | $ | 1,338 | | | $ | 0 | | | $ | 1,338 | |
| | | | | | | | | | | | | | | | |
| | | | |
Totals | | $ | 239,173 | | | $ | 2,785 | | | $ | 0 | | | $ | 241,958 | |
| | | | | | | | | | | | | | | | |
There were no significant transfers into or out of Level 3 during the period ended June 30, 2022.
| | | | | | | | | | | | |
| See Accompanying Notes | | | ANNUAL REPORT | | | | | | | JUNE 30, 2022 | | | 45 |
| | | | | | |
| Schedule of Investments | | PIMCO REALPATH® Blend 2030 Fund | | | | |
(Amounts in thousands*, except number of shares, contracts, units and ounces, if any)
| | | | | | | | | | | | |
| | | | | SHARES | | | | | MARKET
VALUE
(000S) | |
| INVESTMENTS IN SECURITIES 62.0% | |
| |
| MUTUAL FUNDS 61.3% | |
| | | | |
Vanguard Developed Markets Index Fund ‘Institutional’ | | | | | 4,140,110 | | | $ | | | 54,236 | |
| | | | |
Vanguard Emerging Markets Stock Index
Fund ‘Institutional’ | | | | | 788,210 | | | | | | 20,714 | |
| | | | |
Vanguard Institutional Index Fund ‘Institutional’ | | | | | 273,247 | | | | | | 87,606 | |
| | | | |
Vanguard Small-Cap Index Fund ‘Institutional’ | | | | | 89,284 | | | | | | 7,535 | |
| | | | | | | | | | | | |
Total Mutual Funds (Cost $166,714) | | | | | | 170,091 | |
| | | | | | | | | | | | |
| |
| | | | | PRINCIPAL
AMOUNT
(000S) | | | | | | |
| SHORT-TERM INSTRUMENTS 0.7% | |
| |
| REPURCHASE AGREEMENTS (d) 0.2% | |
| | | | | | | | | | | 579 | |
| | | | | | | | | | | | |
| |
| U.S. TREASURY BILLS 0.5% | |
0.943% due 07/26/2022 - 08/18/2022 (a)(b)(g) | | | | $ | 1,274 | | | | | | 1,272 | |
| | | | | | | | | | | | |
Total Short-Term Instruments
(Cost $1,852) | | | 1,851 | |
| | | | |
| | | | |
| | | | | | | | | | | | |
| Total Investments in Securities (Cost $168,566) | | | 171,942 | |
| | | | |
| | | | | | | | | | | | |
| | | | | SHARES | | | | | MARKET
VALUE
(000S) | |
| INVESTMENTS IN AFFILIATES 37.4% | |
| |
| MUTUAL FUNDS (c) 34.6% | |
| | | | |
PIMCO Emerging Markets Local Currency and Bond Fund | | | | | 2,292,239 | | | $ | | | 12,034 | |
| | | | |
PIMCO High Yield Fund | | | | | 635,088 | | | | | | 4,820 | |
| | | | |
PIMCO Income Fund | | | | | 1,978,402 | | | | | | 20,991 | |
| | | | |
PIMCO International Bond Fund (U.S. Dollar-Hedged) | | | | | 360,417 | | | | | | 3,514 | |
| | | | |
PIMCO Long-Term Real
Return Fund | | | | | 2,659,715 | | | | | | 13,618 | |
| | | | |
PIMCO Long-Term U.S. Government Fund | | | | | 4,659,730 | | | | | | 19,664 | |
| | | | |
PIMCO Real Return Fund | | | | | 496,478 | | | | | | 5,322 | |
| | | | |
PIMCO Total Return Fund | | | | | 1,800,040 | | | | | | 16,201 | |
| | | | | | | | | | | | |
| Total Mutual Funds (Cost $115,837) | | | 96,164 | |
| | | | |
| |
| | | | | | | | | | | | |
| | | | | SHARES | | | | | MARKET
VALUE
(000S) | |
| SHORT-TERM INSTRUMENTS 2.8% | |
| |
| CENTRAL FUNDS USED FOR CASH MANAGEMENT PURPOSES 2.8% | |
| | | | |
PIMCO Short-Term
Floating NAV Portfolio III | | | | | 815,328 | | | $ | | | 7,912 | |
| | | | | | | | | | | | |
Total Short-Term Instruments
(Cost $7,914) | | | 7,912 | |
| | | | |
| | | | |
| | | | | | | | | | | | |
| Total Investments in Affiliates (Cost $123,751) | | | | | | 104,076 | |
| | | | |
| | | | | | | | | | | | |
Total Investments 99.4%
(Cost $292,317) | | | $ | | | 276,018 | |
| |
Financial Derivative
Instruments (e)(f) 0.5% (Cost or Premiums, net $1,469) | | | | | | 1,514 | |
| |
| Other Assets and Liabilities, net 0.1% | | | 107 | |
| | | | | | | | | | | | |
| Net Assets 100.0% | | | $ | | | 277,639 | |
| | | | | | | | | | | | |
NOTES TO SCHEDULE OF INVESTMENTS:
| * | A zero balance may reflect actual amounts rounding to less than one thousand. |
| (a) | Coupon represents a weighted average yield to maturity. |
| (c) | Institutional Class Shares of each Fund. |
BORROWINGS AND OTHER FINANCING TRANSACTIONS
(d) REPURCHASE AGREEMENTS:
| | | | | | | | | | | | | | | | | | | | | | | | | | | | | | |
| Counterparty | | Lending
Rate | | | Settlement
Date | | | Maturity
Date | | | Principal
Amount | | | Collateralized By | | Collateral
(Received) | | | Repurchase
Agreements,
at Value | | | Repurchase
Agreement
Proceeds
to be
Received(1) | |
| FICC | | | 0.400 | % | | | 06/30/2022 | | | | 07/01/2022 | | | $ | 579 | | | U.S. Treasury Notes 3.000% due 06/30/2024 | | $ | (591 | ) | | $ | 579 | | | $ | 579 | |
| | | | | | | | | | | | | | | | | | | | | | | | | | | | | | |
Total Repurchase Agreements | | | | | $ | (591 | ) | | $ | 579 | | | $ | 579 | |
| | | | | | | | | | | | | | | | | | | | | | | | | | | | | | |
BORROWINGS AND OTHER FINANCING TRANSACTIONS SUMMARY
The following is a summary by counterparty of the market value of Borrowings and Other Financing Transactions and collateral pledged/(received) as of June 30, 2022:
| | | | | | | | | | | | | | | | | | | | | | | | |
| Counterparty | | Repurchase
Agreement
Proceeds
to be
Received(1) | | | Payable for
Reverse
Repurchase
Agreements | | | Payable for
Sale-Buyback
Transactions | | | Total
Borrowings and
Other Financing
Transactions | | | Collateral
Pledged/(Received) | | | Net Exposure(2) | |
Global/Master Repurchase Agreement | |
FICC | | $ | 579 | | | $ | 0 | | | $ | 0 | | | $ | 579 | | | $ | (591 | ) | | $ | (12 | ) |
| | | | | | | | | | | | | | | | | | | | | | | | |
Total Borrowings and Other Financing Transactions | | $ | 579 | | | $ | 0 | | | $ | 0 | | | | | | | | | | | | | |
| | | | | | | | | | | | | | | | | | | | | | | | |
| (1) | Includes accrued interest. |
| (2) | Net Exposure represents the net receivable/(payable) that would be due from/to the counterparty in the event of default. Exposure from borrowings and other financing transactions can only be netted across transactions governed under the same master agreement with the same legal entity. See Note 8, Master Netting Arrangements, in the Notes to Financial Statements for more information. |
| | | | | | |
| 46 | | PIMCO EQUITY SERIES | | | See Accompanying Notes | |
(e) FINANCIAL DERIVATIVE INSTRUMENTS: EXCHANGE-TRADED OR CENTRALLY CLEARED
PURCHASED OPTIONS:
OPTIONS ON INDICES
| | | | | | | | | | | | | | | | | | | | | | | | |
| Description | | Strike
Value | | | Expiration
Date | | | # of
Contracts | | | Notional
Amount | | | Cost | | | Market
Value | |
Put - CBOE S&P 500 | | | 3,100.000 | | | | 09/16/2022 | | | | 23 | | | $ | 2 | | | $ | 182 | | | $ | 64 | |
Put - CBOE S&P 500 | | | 3,425.000 | | | | 09/16/2022 | | | | 24 | | | | 2 | | | | 283 | | | | 168 | |
Put - CBOE S&P 500 | | | 3,175.000 | | | | 12/16/2022 | | | | 15 | | | | 2 | | | | 135 | | | | 126 | |
Put - CBOE S&P 500 | | | 3,525.000 | | | | 12/16/2022 | | | | 28 | | | | 3 | | | | 373 | | | | 450 | |
Put - CBOE S&P 500 | | | 3,050.000 | | | | 03/17/2023 | | | | 16 | | | | 2 | | | | 137 | | | | 160 | |
Put - CBOE S&P 500 | | | 3,375.000 | | | | 03/17/2023 | | | | 31 | | | | 3 | | | | 389 | | | | 510 | |
Put - CBOE S&P 500 | | | 2,850.000 | | | | 06/16/2023 | | | | 51 | | | | 5 | | | | 572 | | | | 495 | |
| | | | | | | | | | | | | | | | | | | | | | | | |
Total Purchased Options | | | $ | 2,071 | | | $ | 1,973 | |
| | | | | | | | | | | | | | | | | | | | | | | | |
WRITTEN OPTIONS:
OPTIONS ON INDICES
| | | | | | | | | | | | | | | | | | | | | | | | |
| Description | | Strike
Value | | | Expiration
Date | | | # of
Contracts | | | Notional
Amount | | | Premiums
(Received) | | | Market
Value | |
Put - CBOE S&P 500 | | | 2,600.000 | | | | 09/16/2022 | | | | 24 | | | $ | 2 | | | $ | (97 | ) | | $ | (22 | ) |
Put - CBOE S&P 500 | | | 2,625.000 | | | | 12/16/2022 | | | | 28 | | | | 3 | | | | (131 | ) | | | (90 | ) |
Put - CBOE S&P 500 | | | 2,500.000 | | | | 03/17/2023 | | | | 31 | | | | 3 | | | | (136 | ) | | | (135 | ) |
Put - CBOE S&P 500 | | | 2,200.000 | | | | 06/16/2023 | | | | 51 | | | | 5 | | | | (238 | ) | | | (200 | ) |
| | | | | | | | | | | | | | | | | | | | | | | | |
Total Written Options | | | $ | (602 | ) | | $ | (447 | ) |
| | | | | | | | | | | | | | | | | | | | | | | | |
FINANCIAL DERIVATIVE INSTRUMENTS: EXCHANGE-TRADED OR CENTRALLY CLEARED SUMMARY
The following is a summary of the market value and variation margin of Exchange-Traded or Centrally Cleared Financial Derivative Instruments as of June 30, 2022:
| | | | | | | | | | | | | | | | | | | | | | | | | | | | | | | | | | | | |
| | | Financial Derivative Assets | | | | | | Financial Derivative Liabilities | |
| | | Market Value | | | Variation Margin
Asset | | | Total | | | | | | Market Value | | | Variation Margin
Liability | | | Total | |
| | | Purchased
Options | | | Futures | | | Swap
Agreements | | | | | | Written
Options | | | Futures | | | Swap
Agreements | |
Total Exchange-Traded or Centrally Cleared | | $ | 1,973 | | | $ | 0 | | | $ | 0 | | | $ | 1,973 | | | | | | | $ | (447 | ) | | $ | 0 | | | $ | 0 | | | $ | (447 | ) |
| | | | | | | | | | | | | | | | | | | | | | | | | | | | | | | | | | | | |
(f) FINANCIAL DERIVATIVE INSTRUMENTS: OVER THE COUNTER
SWAP AGREEMENTS:
TOTAL RETURN SWAPS ON EQUITY INDICES
| | | | | | | | | | | | | | | | | | | | | | | | | | | | | | | | | | |
Counterparty | | Pay/Receive(1) | | Underlying Reference | | # of Units | | | Financing Rate | | Payment
Frequency | | Maturity
Date | | Notional
Amount | | | Premiums
Paid/(Received) | | | Unrealized
Appreciation/
(Depreciation) | | | Swap Agreements,
at Value | |
| | Asset | | | Liability | |
JPM | | Receive | | FNRETR Index | | | 126 | | | 1.510% (1-Month USD-LIBOR plus a specified spread) | | Monthly | | 08/24/2022 | | $ | 2,671 | | | $ | 0 | | | $ | (3 | ) | | $ | 0 | | | $ | (3 | ) |
| | Receive | | FNRETR Index | | | 362 | | | 1.980% (1-Month USD-LIBOR plus a specified spread) | | Monthly | | 02/22/2023 | | | 7,673 | | | | 0 | | | | (9 | ) | | | 0 | | | | (9 | ) |
| | | | | | | | | | | | | | | | | | | | | | | | | | | | | | | | | | |
Total Swap Agreements | | | $ | 0 | | | $ | (12 | ) | | $ | 0 | | | $ | (12 | ) |
| | | | | | | | | | | | | | | | | | | | | | | | | | | | | | | | | | |
FINANCIAL DERIVATIVE INSTRUMENTS: OVER THE COUNTER SUMMARY
The following is a summary by counterparty of the market value of OTC financial derivative instruments and collateral pledged/received as of June 30, 2022:
| | | | | | | | | | | | | | | | | | | | | | | | | | | | | | | | | | | | | | | | | | | | | | | | |
| | | Financial Derivative Assets | | | | | | Financial Derivative Liabilities | | | | | | | | | | |
| Counterparty | | Forward
Foreign
Currency
Contracts | | | Purchased
Options | | | Swap
Agreements | | | Total
Over the
Counter | | | | | | Forward
Foreign
Currency
Contracts | | | Written
Options | | | Swap
Agreements | | | Total
Over the
Counter | | | Net Market
Value of OTC
Derivatives | | | Collateral
Pledged/ (Received) | | | Net
Exposure(2) | |
JPM | | $ | 0 | | | $ | 0 | | | $ | 0 | | | $ | 0 | | | | | | | $ | 0 | | | $ | 0 | | | $ | (12 | ) | | $ | (12 | ) | | $ | (12 | ) | | $ | 619 | | | $ | 607 | |
| | | | | | | | | | | | | | | | | | | | | | | | | | | | | | | | | | | | | | | | | | | | | | | | |
| | | | | | | | | | | | |
| See Accompanying Notes | | | ANNUAL REPORT | | | | | | | JUNE 30, 2022 | | | 47 |
| | | | | | |
| Schedule of Investments | | PIMCO REALPATH® Blend 2030 Fund | | (Cont.) | | |
| (g) | Securities with an aggregate market value of $619 have been pledged as collateral for financial derivative instruments as governed by International Swaps and Derivatives Association, Inc. master agreements as of June 30, 2022. |
| (1) | Receive represents that the Fund receives payments for any positive net return on the underlying reference. The Fund makes payments for any negative net return on such underlying reference. Pay represents that the Fund receives payments for any negative net return on the underlying reference. The Fund makes payments for any positive net return on such underlying reference. |
| (2) | Net Exposure represents the net receivable/(payable) that would be due from/to the counterparty in the event of default. Exposure from OTC financial derivative instruments can only be netted across transactions governed under the same master agreement with the same legal entity. See Note 8, Master Netting Arrangements, in the Notes to Financial Statements for more information. |
FAIR VALUE OF FINANCIAL DERIVATIVE INSTRUMENTS
The following is a summary of the fair valuation of the Fund’s derivative instruments categorized by risk exposure. See Note 7, Principal and Other Risks, in the Notes to Financial Statements on risks of the Fund.
Fair Values of Financial Derivative Instruments on the Statements of Assets and Liabilities as of June 30, 2022:
| | | | | | | | | | | | | | | | | | | | | | | | |
| | | Derivatives not accounted for as hedging instruments | |
| | | Commodity
Contracts | | | Credit
Contracts | | | Equity
Contracts | | | Foreign
Exchange
Contracts | | | Interest
Rate Contracts | | | Total | |
Financial Derivative Instruments - Assets | |
Exchange-traded or centrally cleared | |
Purchased Options | | $ | 0 | | | $ | 0 | | | $ | 1,973 | | | $ | 0 | | | $ | 0 | | | $ | 1,973 | |
| | | | | | | | | | | | | | | | | | | | | | | | |
|
Financial Derivative Instruments - Liabilities | |
Exchange-traded or centrally cleared | |
Written Options | | $ | 0 | | | $ | 0 | | | $ | 447 | | | $ | 0 | | | $ | 0 | | | $ | 447 | |
| | | | | | | | | | | | | | | | | | | | | | | | |
Over the counter | |
Swap Agreements | | $ | 0 | | | $ | 0 | | | $ | 12 | | | $ | 0 | | | $ | 0 | | | $ | 12 | |
| | | | | | | | | | | | | | | | | | | | | | | | |
| | $ | 0 | | | $ | 0 | | | $ | 459 | | | $ | 0 | | | $ | 0 | | | $ | 459 | |
| | | | | | | | | | | | | | | | | | | | | | | | |
The effect of Financial Derivative Instruments on the Statements of Operations for the period ended June 30, 2022:
| | | | | | | | | | | | | | | | | | | | | | | | |
| | | Derivatives not accounted for as hedging instruments | |
| | | Commodity
Contracts | | | Credit
Contracts | | | Equity
Contracts | | | Foreign
Exchange
Contracts | | | Interest
Rate Contracts | | | Total | |
Net Realized Gain (Loss) on Financial Derivative Instruments | |
Exchange-traded or centrally cleared | |
Purchased Options | | $ | 0 | | | $ | 0 | | | $ | (1,527 | ) | | $ | 0 | | | $ | 0 | | | $ | (1,527 | ) |
Written Options | | | 0 | | | | 0 | | | | 297 | | | | 0 | | | | 0 | | | | 297 | |
| | | | | | | | | | | | | | | | | | | | | | | | |
| | $ | 0 | | | $ | 0 | | | $ | (1,230 | ) | | $ | 0 | | | $ | 0 | | | $ | (1,230 | ) |
| | | | | | | | | | | | | | | | | | | | | | | | |
Over the counter | |
Swap Agreements | | $ | 0 | | | $ | 0 | | | $ | (594 | ) | | $ | 0 | | | $ | 0 | | | $ | (594 | ) |
| | | | | | | | | | | | | | | | | | | | | | | | |
| | $ | 0 | | | $ | 0 | | | $ | (1,824 | ) | | $ | 0 | | | $ | 0 | | | $ | (1,824 | ) |
| | | | | | | | | | | | | | | | | | | | | | | | |
|
Net Change in Unrealized Appreciation (Depreciation) on Financial Derivative Instruments | |
Exchange-traded or centrally cleared | |
Purchased Options | | $ | 0 | | | $ | 0 | | | $ | 909 | | | $ | 0 | | | $ | 0 | | | $ | 909 | |
Written Options | | | 0 | | | | 0 | | | | (73 | ) | | | 0 | | | | 0 | | | | (73 | ) |
| | | | | | | | | | | | | | | | | | | | | | | | |
| | $ | 0 | | | $ | 0 | | | $ | 836 | | | $ | 0 | | | $ | 0 | | | $ | 836 | |
| | | | | | | | | | | | | | | | | | | | | | | | |
Over the counter | |
Swap Agreements | | $ | 0 | | | $ | 0 | | | $ | (8 | ) | | $ | 0 | | | $ | 0 | | | $ | (8 | ) |
| | | | | | | | | | | | | | | | | | | | | | | | |
| | $ | 0 | | | $ | 0 | | | $ | 828 | | | $ | 0 | | | $ | 0 | | | $ | 828 | |
| | | | | | | | | | | | | | | | | | | | | | | | |
| | | | | | |
| 48 | | PIMCO EQUITY SERIES | | | See Accompanying Notes | |
FAIR VALUE MEASUREMENTS
The following is a summary of the fair valuations according to the inputs used as of June 30, 2022 in valuing the Fund’s assets and liabilities:
| | | | | | | | | | | | | | | | |
| Category and Subcategory | | Level 1 | | | Level 2 | | | Level 3 | | | Fair
Value at
06/30/2022 | |
Investments in Securities, at Value | |
Mutual Funds | | $ | 170,091 | | | $ | 0 | | | $ | 0 | | | $ | 170,091 | |
Short-Term Instruments | |
Repurchase Agreements | | | 0 | | | | 579 | | | | 0 | | | | 579 | |
U.S. Treasury Bills | | | 0 | | | | 1,272 | | | | 0 | | | | 1,272 | |
| | | | | | | | | | | | | | | | |
| | $ | 170,091 | | | $ | 1,851 | | | $ | 0 | | | $ | 171,942 | |
| | | | | | | | | | | | | | | | |
|
Investments in Affiliates, at Value | |
Mutual Funds | | | 96,164 | | | | 0 | | | | 0 | | | | 96,164 | |
Short-Term Instruments | |
Central Funds Used for Cash Management Purposes | | | 7,912 | | | | 0 | | | | 0 | | | | 7,912 | |
| | | | | | | | | | | | | | | | |
| | $ | 104,076 | | | $ | 0 | | | $ | 0 | | | $ | 104,076 | |
| | | | | | | | | | | | | | | | |
| | | | |
Total Investments | | $ | 274,167 | | | $ | 1,851 | | | $ | 0 | | | $ | 276,018 | |
| | | | | | | | | | | | | | | | |
| | | | | | | | | | | | | | | | |
| Category and Subcategory | | Level 1 | | | Level 2 | | | Level 3 | | | Fair
Value at
06/30/2022 | |
Financial Derivative Instruments - Assets | |
Exchange-traded or centrally cleared | | $ | 0 | | | $ | 1,973 | | | $ | 0 | | | $ | 1,973 | |
| | | | | | | | | | | | | | | | |
|
Financial Derivative Instruments - Liabilities | |
Exchange-traded or centrally cleared | | | 0 | | | | (447 | ) | | | 0 | | | | (447 | ) |
Over the counter | | | 0 | | | | (12 | ) | | | 0 | | | | (12 | ) |
| | | | | | | | | | | | | | | | |
| | $ | 0 | | | $ | (459 | ) | | $ | 0 | | | $ | (459 | ) |
| | | | | | | | | | | | | | | | |
| | | | |
Total Financial Derivative Instruments | | $ | 0 | | | $ | 1,514 | | | $ | 0 | | | $ | 1,514 | |
| | | | | | | | | | | | | | | | |
| | | | |
Totals | | $ | 274,167 | | | $ | 3,365 | | | $ | 0 | | | $ | 277,532 | |
| | | | | | | | | | | | | | | | |
There were no significant transfers into or out of Level 3 during the period ended June 30, 2022.
| | | | | | | | | | | | |
| See Accompanying Notes | | | ANNUAL REPORT | | | | | | | JUNE 30, 2022 | | | 49 |
| | | | | | |
| Schedule of Investments | | PIMCO REALPATH® Blend 2035 Fund | | | | |
(Amounts in thousands*, except number of shares, contracts, units and ounces, if any)
| | | | | | | | | | | | |
| | | | | SHARES | | | | | MARKET
VALUE
(000S) | |
| INVESTMENTS IN SECURITIES 70.7% | |
| |
| MUTUAL FUNDS 70.1% | |
| | | | |
Vanguard Developed Markets Index Fund ‘Institutional’ | | | | 4,243,607 | | | $ | | | | 55,591 | |
| | | |
Vanguard Emerging Markets Stock Index Fund ‘Institutional’ | | 762,843 | | | | | | | 20,048 | |
| | | |
Vanguard Institutional Index Fund ‘Institutional’ | | 279,329 | | | | | | | 89,556 | |
| | | | |
Vanguard Small-Cap Index Fund ‘Institutional’ | | | | 102,015 | | | | | | | 8,609 | |
| | | | | | | | | | | | |
Total Mutual Funds (Cost $173,906) | | | | 173,804 | |
| | | | | | | | | | | | |
| |
| | | | | PRINCIPAL
AMOUNT
(000S) | | | | | | |
| SHORT-TERM INSTRUMENTS 0.6% | |
| |
| REPURCHASE AGREEMENTS (d) 0.2% | | | | | |
| | | | | | | | | | | 526 | |
| | | | | | | | | | | | |
| |
| U.S. TREASURY BILLS 0.4% | |
0.921% due 07/26/2022 - 08/18/2022 (a)(b)(f) | | $ | | 1,113 | | | | | | | 1,112 | |
| | | | | | | | | | | | |
Total Short-Term Instruments
(Cost $1,638) | | | | 1,638 | |
| | | | | | | | | | | | |
| | | | |
| | | | | | | | | | | | |
Total Investments in Securities
(Cost $175,544) | | | | 175,442 | |
| | | | | | | | | | | | |
| | | | | | | | | | | | |
| | | | | SHARES | | | | | MARKET
VALUE
(000S) | |
| INVESTMENTS IN AFFILIATES 29.0% | |
| |
| MUTUAL FUNDS (c) 25.3% | |
| | | | |
PIMCO Emerging Markets Local Currency and Bond Fund | | | | 1,824,720 | | | $ | | | | 9,580 | |
| | | | |
PIMCO High Yield Fund | | | | 407,413 | | | | | | | 3,092 | |
| | | | |
PIMCO Income Fund | | | | 1,225,786 | | | | | | | 13,006 | |
| | | | |
PIMCO International Bond Fund (U.S. Dollar-Hedged) | | | | 215,943 | | | | | | | 2,105 | |
| | | | |
PIMCO Long-Term Real Return Fund | | | | 1,682,464 | | | | | | | 8,614 | |
| | | | |
PIMCO Long-Term U.S. Government Fund | | | | 3,131,088 | | | | | | | 13,213 | |
| | | | |
PIMCO Real Return Fund | | | | 333,360 | | | | | | | 3,574 | |
| | | | |
PIMCO Total Return Fund | | | | 1,111,693 | | | | | | | 10,005 | |
| | | | | | | | | | | | |
| Total Mutual Funds (Cost $75,511) | | | | 63,189 | |
| | | | | | | | | | | | |
| | | | | | | | | | | | |
| | | | | SHARES | | | | | MARKET
VALUE
(000S) | |
| SHORT-TERM INSTRUMENTS 3.7% | |
| |
| CENTRAL FUNDS USED FOR CASH MANAGEMENT PURPOSES 3.7% | |
| | | | |
PIMCO Short-Term
Floating NAV Portfolio III | | | | 937,113 | | $ | | | | | 9,094 | |
| | | | | | | | | | | | |
Total Short-Term Instruments
(Cost $9,097) | | | | 9,094 | |
| | | | | |
| | | | |
| | | | | | | | | | | | |
Total Investments in Affiliates
(Cost $84,608) | | | | 72,283 | |
| |
| | | | | |
Total Investments 99.7%
(Cost $260,152) | | $ | | | | | 247,725 | |
| |
Financial Derivative
Instruments (e) (0.0)% (Cost or Premiums, net $0) | | | | (11 | ) |
| |
| Other Assets and Liabilities, net 0.3% | | | | 656 | |
| | | | | | | | |
| Net Assets 100.0% | | $ | | | | | 248,370 | |
| | | | | | | | |
NOTES TO SCHEDULE OF INVESTMENTS:
| * | A zero balance may reflect actual amounts rounding to less than one thousand. |
| (a) | Coupon represents a weighted average yield to maturity. |
| (c) | Institutional Class Shares of each Fund. |
BORROWINGS AND OTHER FINANCING TRANSACTIONS
(d) REPURCHASE AGREEMENTS:
| | | | | | | | | | | | | | | | | | | | | | | | | | | | | | |
| Counterparty | | Lending
Rate | | | Settlement
Date | | | Maturity
Date | | | Principal
Amount | | | Collateralized By | | Collateral
(Received) | | | Repurchase
Agreements,
at Value | | | Repurchase
Agreement
Proceeds
to be
Received(1) | |
| FICC | | | 0.400 | % | | | 06/30/2022 | | | | 07/01/2022 | | | $ | 526 | | | U.S. Treasury Notes 3.000% due 06/30/2024 | | $ | (537 | ) | | $ | 526 | | | $ | 526 | |
| | | | | | | | | | | | | | | | | | | | | | | | | | | | | | |
Total Repurchase Agreements | | | | | $ | (537 | ) | | $ | 526 | | | $ | 526 | |
| | | | | | | | | | | | | | | |
BORROWINGS AND OTHER FINANCING TRANSACTIONS SUMMARY
The following is a summary by counterparty of the market value of Borrowings and Other Financing Transactions and collateral pledged/(received) as of June 30, 2022:
| | | | | | | | | | | | | | | | | | | | | | | | |
| Counterparty | | Repurchase
Agreement
Proceeds
to be
Received(1) | | | Payable for
Reverse
Repurchase
Agreements | | | Payable for
Sale-Buyback
Transactions | | | Total
Borrowings and
Other Financing
Transactions | | | Collateral
Pledged/(Received) | | | Net Exposure(2) | |
Global/Master Repurchase Agreement | |
FICC | | $ | 526 | | | $ | 0 | | | $ | 0 | | | $ | 526 | | | $ | (537 | ) | | $ | (11 | ) |
| | | | | | | | | | | | | | | | | | | | | | | | |
Total Borrowings and Other Financing Transactions | | $ | 526 | | | $ | 0 | | | $ | 0 | | | | | | | | | | | | | |
| | | | | | | | | | | | | | | | | | | | | | | | |
| (1) | Includes accrued interest. |
| (2) | Net Exposure represents the net receivable/(payable) that would be due from/to the counterparty in the event of default. Exposure from borrowings and other financing transactions can only be netted across transactions governed under the same master agreement with the same legal entity. See Note 8, Master Netting Arrangements, in the Notes to Financial Statements for more information. |
| | | | | | |
| 50 | | PIMCO EQUITY SERIES | | | See Accompanying Notes | |
(e) FINANCIAL DERIVATIVE INSTRUMENTS: OVER THE COUNTER
SWAP AGREEMENTS:
TOTAL RETURN SWAPS ON EQUITY INDICES
| | | | | | | | | | | | | | | | | | | | | | | | | | | | | | | | | | |
| Counterparty | | Pay/Receive(1) | | Underlying Reference | | # of Units | | | Financing Rate | | Payment
Frequency | | Maturity
Date | | Notional
Amount | | | Premiums
Paid/(Received) | | | Unrealized
Appreciation/
(Depreciation) | | | Swap Agreements,
at Value | |
| | Asset | | | Liability | |
JPM | | Receive | | FNRETR Index | | | 94 | | | 1.510% (1-Month USD-LIBOR plus a specified spread) | | Monthly | | 08/24/2022 | | $ | 1,992 | | | $ | 0 | | | $ | (3 | ) | | $ | 0 | | | $ | (3 | ) |
| | Receive | | FNRETR Index | | | 352 | | | 1.980% (1-Month USD-LIBOR plus a specified spread) | | Monthly | | 02/22/2023 | | | 7,461 | | | | 0 | | | | (8 | ) | | | 0 | | | | (8 | ) |
| | | | | | | | | | | | | | | | | | | | | | | | |
Total Swap Agreements | | | $ | 0 | | | $ | (11 | ) | | $ | 0 | | | $ | (11 | ) |
| | | | | | | | | | | | | | | | | |
FINANCIAL DERIVATIVE INSTRUMENTS: OVER THE COUNTER SUMMARY
The following is a summary by counterparty of the market value of OTC financial derivative instruments and collateral pledged/(received) as of June 30, 2022:
| | | | | | | | | | | | | | | | | | | | | | | | | | | | | | | | | | | | | | | | | | | | | | | | |
| | | Financial Derivative Assets | | | | | | Financial Derivative Liabilities | | | | | | | | | | |
| Counterparty | | Forward
Foreign
Currency
Contracts | | | Purchased
Options | | | Swap
Agreements | | | Total
Over the
Counter | | | | | | Forward
Foreign
Currency
Contracts | | | Written
Options | | | Swap
Agreements | | | Total
Over the
Counter | | | Net Market
Value of OTC
Derivatives | | | Collateral
Pledged/
(Received) | | | Net
Exposure(2) | |
JPM | | $ | 0 | | | $ | 0 | | | $ | 0 | | | $ | 0 | | | | | | | $ | 0 | | | $ | 0 | | | $ | (11 | ) | | $ | (11 | ) | | $ | (11 | ) | | $ | 750 | | | $ | 739 | |
| | | | | | | | | | | | | | | | | | | | | | | | | | | | | | | | | | | | | | | | | | | | | | | | |
Total Over the Counter | | $ | 0 | | | $ | 0 | | | $ | 0 | | | $ | 0 | | | | | | | $ | 0 | | | $ | 0 | | | $ | (11 | ) | | $ | (11 | ) | | | | | | | | | | | | |
| | | | | | | | | | | | | | | | | | | | | | | | | | | | | | | | | | | | | | | | | | | | | | | | |
| (f) | Securities with an aggregate market value of $750 have been pledged as collateral for financial derivative instruments as governed by International Swaps and Derivatives Association, Inc. master agreements as of June 30, 2022. |
| (1) | Receive represents that the Fund receives payments for any positive net return on the underlying reference. The Fund makes payments for any negative net return on such underlying reference. Pay represents that the Fund receives payments for any negative net return on the underlying reference. The Fund makes payments for any positive net return on such underlying reference. |
| (2) | Net Exposure represents the net receivable/(payable) that would be due from/to the counterparty in the event of default. Exposure from OTC financial derivative instruments can only be netted across transactions governed under the same master agreement with the same legal entity. See Note 8, Master Netting Arrangements, in the Notes to Financial Statements for more information. |
FAIR VALUE OF FINANCIAL DERIVATIVE INSTRUMENTS
The following is a summary of the fair valuation of the Fund’s derivative instruments categorized by risk exposure. See Note 7, Principal and Other Risks, in the Notes to Financial Statements on risks of the Fund.
Fair Values of Financial Derivative Instruments on the Statements of Assets and Liabilities as of June 30, 2022:
| | | | | | | | | | | | | | | | | | | | | | | | |
| | | Derivatives not accounted for as hedging instruments | |
| | | Commodity
Contracts | | | Credit
Contracts | | | Equity
Contracts | | | Foreign
Exchange
Contracts | | | Interest
Rate Contracts | | | Total | |
Financial Derivative Instruments - Liabilities | |
Over the counter | |
Swap Agreements | | $ | 0 | | | $ | 0 | | | $ | 11 | | | $ | 0 | | | $ | 0 | | | $ | 11 | |
| | | | | | | | | | | | | | | | | | | | | | | | |
The effect of Financial Derivative Instruments on the Statements of Operations for the period ended June 30, 2022:
| | | | | | | | | | | | | | | | | | | | | | | | |
| | | Derivatives not accounted for as hedging instruments | |
| | | Commodity
Contracts | | | Credit
Contracts | | | Equity
Contracts | | | Foreign
Exchange
Contracts | | | Interest
Rate Contracts | | | Total | |
Net Realized (Loss) on Financial Derivative Instruments | |
Over the counter | |
Swap Agreements | | $ | 0 | | | $ | 0 | | | $ | (584 | ) | | $ | 0 | | | $ | 0 | | | $ | (584 | ) |
| | | | | | | | | | | | | | | | | | | | | | | | |
|
Net Change in Unrealized (Depreciation) on Financial Derivative Instruments | |
Over the counter | |
Swap Agreements | | $ | 0 | | | $ | 0 | | | $ | (8 | ) | | $ | 0 | | | $ | 0 | | | $ | (8 | ) |
| | | | | | | | | | | | | | | | | | | | | | | | |
| | | | | | | | | | | | |
| See Accompanying Notes | | | ANNUAL REPORT | | | | | | | JUNE 30, 2022 | | | 51 |
| | | | | | |
| Schedule of Investments | | PIMCO REALPATH® Blend 2035 Fund | | (Cont.) | | June 30, 2022 |
FAIR VALUE MEASUREMENTS
The following is a summary of the fair valuations according to the inputs used as of June 30, 2022 in valuing the Fund’s assets and liabilities:
| | | | | | | | | | | | | | | | |
| Category and Subcategory | | Level 1 | | | Level 2 | | | Level 3 | | | Fair
Value at
06/30/2022 | |
Investments in Securities, at Value | |
Mutual Funds | | $ | 173,804 | | | $ | 0 | | | $ | 0 | | | $ | 173,804 | |
Short-Term Instruments | |
Repurchase Agreements | | | 0 | | | | 526 | | | | 0 | | | | 526 | |
U.S. Treasury Bills | | | 0 | | | | 1,112 | | | | 0 | | | | 1,112 | |
| | | | | | | | | | | | | | | | |
| | $ | 173,804 | | | $ | 1,638 | | | $ | 0 | | | $ | 175,442 | |
| | | | | | | | | | | | | | | | |
|
Investments in Affiliates, at Value | |
Mutual Funds | | | 63,189 | | | | 0 | | | | 0 | | | | 63,189 | |
Short-Term Instruments | |
Central Funds Used for Cash Management Purposes | | | 9,094 | | | | 0 | | | | 0 | | | | 9,094 | |
| | | | | | | | | | | | | | | | |
| | $ | 72,283 | | | $ | 0 | | | $ | 0 | | | $ | 72,283 | |
| | | | | | | | | | | | | | | | |
| | | | |
Total Investments | | $ | 246,087 | | | $ | 1,638 | | | $ | 0 | | | $ | 247,725 | |
| | | | | | | | | | | | | | | | |
| | | | | | | | | | | | | | | | |
| Category and Subcategory | | Level 1 | | | Level 2 | | | Level 3 | | | Fair
Value at
06/30/2022 | |
Financial Derivative Instruments - Liabilities | |
Over the counter | | $ | 0 | | | $ | (11 | ) | | $ | 0 | | | $ | (11 | ) |
| | | | | | | | | | | | | | | | |
| | | | |
Total Financial Derivative Instruments | | $ | 0 | | | $ | (11 | ) | | $ | 0 | | | $ | (11 | ) |
| | | | | | | | | | | | | | | | |
| | | | |
Totals | | $ | 246,087 | | | $ | 1,627 | | | $ | 0 | | | $ | 247,714 | |
| | | | | | | | | | | | | | | | |
There were no significant transfers into or out of Level 3 during the period ended June 30, 2022.
| | | | | | |
| 52 | | PIMCO EQUITY SERIES | | | See Accompanying Notes | |
| | | | | | |
| Schedule of Investments | | PIMCO REALPATH® Blend 2040 Fund | | | | June 30, 2022 |
(Amounts in thousands*, except number of shares, contracts, units and ounces, if any)
| | | | | | | | | | | | |
| | | | | SHARES | | | | | MARKET
VALUE
(000S) | |
| INVESTMENTS IN SECURITIES 78.6% | |
| |
| MUTUAL FUNDS 78.0% | |
| | | | |
Vanguard Developed Markets Index Fund ‘Institutional’ | | | | | 4,997,489 | | | $ | | | 65,467 | |
| | | | |
Vanguard Emerging Markets Stock Index
Fund ‘Institutional’ | | | | | 801,943 | | | | | | 21,075 | |
| | | | |
Vanguard Institutional Index Fund ‘Institutional’ | | | | | 310,937 | | | | | | 99,689 | |
| | | | |
Vanguard Small-Cap Index Fund ‘Institutional’ | | | | | 114,796 | | | | | | 9,688 | |
| | | | | | | | | | | | |
Total Mutual Funds (Cost $193,404) | | | | | | 195,919 | |
| | | | | | | | | | | | |
| |
| | | | | PRINCIPAL
AMOUNT
(000S) | | | | | | |
| SHORT-TERM INSTRUMENTS 0.6% | |
| |
| REPURCHASE AGREEMENTS (d) 0.1% | |
| | | | | | | | | | | 255 | |
| | | | | | | | | | | | |
| |
| U.S. TREASURY BILLS 0.5% | |
0.920% due 07/26/2022 - 08/18/2022 (a)(b)(f) | | $ | | | 1,173 | | | | | | 1,172 | |
| | | | | | | | | | | | |
| Total Short-Term Instruments (Cost $1,427) | | | | | | | | | | | 1,427 | |
| | | | | | | | | | | | |
| | | | |
| | | | | | | | | | | | |
Total Investments in Securities
(Cost $194,831) | | | | | | 197,346 | |
| | | | | | | | | | | | |
| | | | | | | | | | | | |
| | | | | SHARES | | | | | MARKET
VALUE
(000S) | |
| INVESTMENTS IN AFFILIATES 21.7% | |
| |
| MUTUAL FUNDS (c) 17.7% | |
| | | | |
PIMCO Emerging Markets Local Currency and Bond Fund | | | | | 1,558,904 | | | $ | | | 8,184 | |
| | | | |
PIMCO High Yield Fund | | | | | 186,211 | | | | | | 1,414 | |
| | | | |
PIMCO Income Fund | | | | | 784,435 | | | | | | 8,323 | |
| | | | |
PIMCO International Bond Fund (U.S. Dollar-Hedged) | | | | | 151,203 | | | | | | 1,474 | |
| | | | |
PIMCO Long-Term Real
Return Fund | | | | | 1,203,057 | | | | | | 6,160 | |
| | | | |
PIMCO Long-Term U.S. Government Fund | | | | | 2,233,008 | | | | | | 9,423 | |
| | | | |
PIMCO Real Return Fund | | | | | 247,504 | | | | | | 2,653 | |
| | | | |
PIMCO Total Return Fund | | | | | 761,979 | | | | | | 6,858 | |
| | | | | | | | | | | | |
Total Mutual Funds (Cost $53,071) | | | | | | 44,489 | |
| | | | | | | | | | | | |
| |
| | | | | | | | | | | | |
| | | | | SHARES | | | | | MARKET
VALUE
(000S) | |
| SHORT-TERM INSTRUMENTS 4.0% | |
| |
| CENTRAL FUNDS USED FOR CASH MANAGEMENT PURPOSES 4.0% | |
| | | | |
PIMCO Short-Term
Floating NAV Portfolio III | | | | | 1,023,334 | | | $ | | | 9,930 | |
| | | | | | | | | | | | |
Total Short-Term Instruments
(Cost $9,933) | | | | | | 9,930 | |
| | | | | | | | | | | | |
| | | | |
| | | | | | | | | | | | |
Total Investments in Affiliates
(Cost $63,004) | | | | | | 54,419 | |
| | | | |
| | | | | | | | | | | | |
Total Investments 100.3%
(Cost $257,835) | | | $ | | | 251,765 | |
| |
Financial Derivative Instruments (e)(f) (0.0)% (Cost or Premiums, net $0) | | | | | | | | | | | (12 | ) |
| |
| Other Assets and Liabilities, net (0.3)% | | | | | | (659 | ) |
| | | | | | | | | | | | |
| Net Assets 100.0% | | | $ | | | 251,094 | |
| | | | | | | | | | | | |
NOTES TO SCHEDULE OF INVESTMENTS:
| * | A zero balance may reflect actual amounts rounding to less than one thousand. |
| (a) | Coupon represents a weighted average yield to maturity. |
| (c) | Institutional Class Shares of each Fund. |
BORROWINGS AND OTHER FINANCING TRANSACTIONS
(d) REPURCHASE AGREEMENTS:
| | | | | | | | | | | | | | | | | | | | | | | | | | | | | | |
| Counterparty | | Lending
Rate | | | Settlement
Date | | | Maturity
Date | | | Principal
Amount | | | Collateralized By | | Collateral
(Received) | | | Repurchase
Agreements,
at Value | | | Repurchase
Agreement
Proceeds
to be
Received(1) | |
| FICC | | | 0.400 | % | | | 06/30/2022 | | | | 07/01/2022 | | | $ | 255 | | | U.S. Treasury Notes 3.000% due 06/30/2024 | | $ | (260 | ) | | $ | 255 | | | $ | 255 | |
| | | | | | | | | | | | | | | | | | | | | | | | | | | | | | |
Total Repurchase Agreements | | | | | $ | (260 | ) | | $ | 255 | | | $ | 255 | |
| | | | | | | | | | | | | | | | | | | | | | | | | | | | | | |
BORROWINGS AND OTHER FINANCING TRANSACTIONS SUMMARY
The following is a summary by counterparty of the market value of Borrowings and Other Financing Transactions and collateral pledged/(received) as of June 30, 2022:
| | | | | | | | | | | | | | | | | | | | | | | | |
| Counterparty | | Repurchase
Agreement
Proceeds
to be
Received(1) | | | Payable for
Reverse
Repurchase
Agreements | | | Payable for
Sale-Buyback
Transactions | | | Total
Borrowings and
Other Financing
Transactions | | | Collateral
Pledged/(Received) | | | Net Exposure(2) | |
Global/Master Repurchase Agreement | |
FICC | | $ | 255 | | | $ | 0 | | | $ | 0 | | | $ | 255 | | | $ | (260 | ) | | $ | (5 | ) |
| | | | | | | | | | | | | | | | | | | | | | | | |
Total Borrowings and Other Financing Transactions | | $ | 255 | | | $ | 0 | | | $ | 0 | | | | | | | | | | | | | |
| | | | | | | | | | | | | | | | | | | | | | | | |
| (1) | Includes accrued interest. |
| (2) | Net Exposure represents the net receivable/(payable) that would be due from/to the counterparty in the event of default. Exposure from borrowings and other financing transactions can only be netted across transactions governed under the same master agreement with the same legal entity. See Note 8, Master Netting Arrangements, in the Notes to Financial Statements for more information. |
| | | | | | | | | | | | |
| See Accompanying Notes | | | ANNUAL REPORT | | | | | | | JUNE 30, 2022 | | | 53 |
| | | | | | |
| Schedule of Investments | | PIMCO REALPATH® Blend 2040 Fund | | (Cont.) | | |
(e) FINANCIAL DERIVATIVE INSTRUMENTS: OVER THE COUNTER
SWAP AGREEMENTS:
TOTAL RETURN SWAPS ON EQUITY INDICES
| | | | | | | | | | | | | | | | | | | | | | | | | | | | | | | | | | |
Counterparty | | Pay/Receive(1) | | Underlying Reference | | # of Units | | | Financing Rate | | Payment
Frequency | | Maturity
Date | | Notional
Amount | | | Premiums
Paid/(Received) | | | Unrealized
Appreciation/
(Depreciation) | | | Swap Agreements,
at Value | |
| | Asset | | | Liability | |
JPM | | Receive | | FNRETR Index | | | 136 | | | 1.510% (1-Month USD-LIBOR plus a specified spread) | | Monthly | | 08/24/2022 | | $ | 2,883 | | | $ | 0 | | | $ | (4 | ) | | $ | 0 | | | $ | (4 | ) |
| | Receive | | FNRETR Index | | | 333 | | | 1.980% (1-Month USD-LIBOR plus a specified spread) | | Monthly | | 02/22/2023 | | | 7,058 | | | | 0 | | | | (8 | ) | | | 0 | | | | (8 | ) |
| | | | | | | | | | | | | | | | | | | | | | | | | | | | | | | | | | |
Total Swap Agreements | | | $ | 0 | | | $ | (12 | ) | | $ | 0 | | | $ | (12 | ) |
| | | | | | | | | | | | | | | | | |
FINANCIAL DERIVATIVE INSTRUMENTS: OVER THE COUNTER SUMMARY
The following is a summary by counterparty of the market value of OTC financial derivative instruments and collateral pledged/(received) as of June 30, 2022:
| | | | | | | | | | | | | | | | | | | | | | | | | | | | | | | | | | | | | | | | | | | | | | | | |
| | | Financial Derivative Assets | | | | | | Financial Derivative Liabilities | | | | | | | | | | |
| Counterparty | | Forward
Foreign
Currency
Contracts | | | Purchased
Options | | | Swap
Agreements | | | Total
Over the
Counter | | | | | | Forward
Foreign
Currency
Contracts | | | Written
Options | | | Swap
Agreements | | | Total
Over the
Counter | | | Net Market
Value of OTC
Derivatives | | | Collateral
Pledged/
(Received) | | | Net
Exposure(2) | |
JPM | | $ | 0 | | | $ | 0 | | | $ | 0 | | | $ | 0 | | | | | | | $ | 0 | | | $ | 0 | | | $ | (12 | ) | | $ | (12 | ) | | $ | (12 | ) | | $ | 800 | | | $ | 788 | |
| | | | | | | | | | | | | | | �� | | | | | | | | | | | | | | | | | | | | | | | | | | | | | | | | | |
Total Over the Counter | | $ | 0 | | | $ | 0 | | | $ | 0 | | | $ | 0 | | | | | | | $ | 0 | | | $ | 0 | | | $ | (12 | ) | | $ | (12 | ) | | | | | | | | | | | | |
| | | | | | | | | | | | | | | | | | | | | | | | | | | | | | | | | | | | | | | | | | | | | | | | |
| (f) | Securities with an aggregate market value of $800 have been pledged as collateral for financial derivative instruments as governed by International Swaps and Derivatives Association, Inc. master agreements as of June 30, 2022. |
| (1) | Receive represents that the Fund receives payments for any positive net return on the underlying reference. The Fund makes payments for any negative net return on such underlying reference. Pay represents that the Fund receives payments for any negative net return on the underlying reference. The Fund makes payments for any positive net return on such underlying reference. |
| (2) | Net Exposure represents the net receivable/(payable) that would be due from/to the counterparty in the event of default. Exposure from OTC financial derivative instruments can only be netted across transactions governed under the same master agreement with the same legal entity. See Note 8, Master Netting Arrangements, in the Notes to Financial Statements for more information. |
FAIR VALUE OF FINANCIAL DERIVATIVE INSTRUMENTS
The following is a summary of the fair valuation of the Fund’s derivative instruments categorized by risk exposure. See Note 7, Principal and Other Risks, in the Notes to Financial Statements on risks of the Fund.
Fair Values of Financial Derivative Instruments on the Statements of Assets and Liabilities as of June 30, 2022:
| | | | | | | | | | | | | | | | | | | | | | | | |
| | | Derivatives not accounted for as hedging instruments | |
| | | Commodity
Contracts | | | Credit
Contracts | | | Equity
Contracts | | | Foreign
Exchange
Contracts | | | Interest
Rate Contracts | | | Total | |
Financial Derivative Instruments - Liabilities | |
Over the counter | |
Swap Agreements | | $ | 0 | | | $ | 0 | | | $ | 12 | | | $ | 0 | | | $ | 0 | | | $ | 12 | |
| | | | | | | | | | | | | | | | | | | | | | | | |
The effect of Financial Derivative Instruments on the Statements of Operations for the period ended June 30, 2022:
| | | | | | | | | | | | | | | | | | | | | | | | |
| | | Derivatives not accounted for as hedging instruments | |
| | | Commodity
Contracts | | | Credit
Contracts | | | Equity
Contracts | | | Foreign
Exchange
Contracts | | | Interest
Rate Contracts | | | Total | |
Net Realized (Loss) on Financial Derivative Instruments | |
Over the counter | |
Swap Agreements | | $ | 0 | | | $ | 0 | | | $ | (601 | ) | | $ | 0 | | | $ | 0 | | | $ | (601 | ) |
| | | | | | | | | | | | | | | | | | | | | | | | |
|
Net Change in Unrealized (Depreciation) on Financial Derivative Instruments | |
Over the counter | |
Swap Agreements | | $ | 0 | | | $ | 0 | | | $ | (8 | ) | | $ | 0 | | | $ | 0 | | | $ | (8 | ) |
| | | | | | | | | | | | | | | | | | | | | | | | |
| | | | | | |
| 54 | | PIMCO EQUITY SERIES | | | See Accompanying Notes | |
FAIR VALUE MEASUREMENTS
The following is a summary of the fair valuations according to the inputs used as of June 30, 2022 in valuing the Fund’s assets and liabilities:
| | | | | | | | | | | | | | | | |
| Category and Subcategory | | Level 1 | | | Level 2 | | | Level 3 | | | Fair
Value at
06/30/2022 | |
Investments in Securities, at Value | |
Mutual Funds | | $ | 195,919 | | | $ | 0 | | | $ | 0 | | | $ | 195,919 | |
Short-Term Instruments | |
Repurchase Agreements | | | 0 | | | | 255 | | | | 0 | | | | 255 | |
U.S. Treasury Bills | | | 0 | | | | 1,172 | | | | 0 | | | | 1,172 | |
| | | | | | | | | | | | | | | | |
| | $ | 195,919 | | | $ | 1,427 | | | $ | 0 | | | $ | 197,346 | |
| | | | | | | | | | | | | | | | |
|
Investments in Affiliates, at Value | |
Mutual Funds | | | 44,489 | | | | 0 | | | | 0 | | | | 44,489 | |
Short-Term Instruments | |
Central Funds Used for Cash Management Purposes | | | 9,930 | | | | 0 | | | | 0 | | | | 9,930 | |
| | | | | | | | | | | | | | | | |
| | $ | 54,419 | | | $ | 0 | | | $ | 0 | | | $ | 54,419 | |
| | | | | | | | | | | | | | | | |
| | | | |
Total Investments | | $ | 250,338 | | | $ | 1,427 | | | $ | 0 | | | $ | 251,765 | |
| | | | | | | | | | | | | | | | |
| | | | | | | | | | | | | | | | |
| Category and Subcategory | | Level 1 | | | Level 2 | | | Level 3 | | | Fair
Value at
06/30/2022 | |
Financial Derivative Instruments - Liabilities | |
Over the counter | | $ | 0 | | | $ | (12 | ) | | $ | 0 | | | $ | (12 | ) |
| | | | | | | | | | | | | | | | |
| | | | |
Total Financial Derivative Instruments | | $ | 0 | | | $ | (12 | ) | | $ | 0 | | | $ | (12 | ) |
| | | | | | | | | | | | | | | | |
| | | | |
Totals | | $ | 250,338 | | | $ | 1,415 | | | $ | 0 | | | $ | 251,753 | |
| | | | | | | | | | | | | | | | |
There were no significant transfers into or out of Level 3 during the period ended June 30, 2022.
| | | | | | | | | | | | |
| See Accompanying Notes | | | ANNUAL REPORT | | | | | | | JUNE 30, 2022 | | | 55 |
| | | | | | |
| Schedule of Investments | | PIMCO REALPATH® Blend 2045 Fund | | | | |
(Amounts in thousands*, except number of shares, contracts, units and ounces, if any)
| | | | | | | | | | | | |
| | | | | SHARES | | | | | MARKET
VALUE
(000S) | |
| INVESTMENTS IN SECURITIES 84.1% | |
| |
| MUTUAL FUNDS 83.5% | |
| | | | |
Vanguard Developed Markets Index Fund ‘Institutional’ | | | | | 5,141,487 | | | $ | | | 67,353 | |
| | | | |
Vanguard Emerging Markets Stock Index
Fund ‘Institutional’ | | | | | 769,127 | | | | | | 20,213 | |
| | | | |
Vanguard Institutional Index Fund ‘Institutional’ | | | | | 297,670 | | | | | | 95,436 | |
| | | | |
Vanguard Small-Cap Index Fund ‘Institutional’ | | | | | 111,106 | | | | | | 9,376 | |
| | | | | | | | | | | | |
Total Mutual Funds (Cost $190,375) | | | | | | 192,378 | |
| | | | | | | | | | | | |
| |
| | | | | PRINCIPAL
AMOUNT
(000S) | | | | | | |
| SHORT-TERM INSTRUMENTS 0.6% | |
| |
| REPURCHASE AGREEMENTS (d) 0.1% | |
| | | | | | | | | | | 315 | |
| | | | | | | | | | | | |
| |
| U.S. TREASURY BILLS 0.5% | |
0.918% due 07/26/2022 - 08/18/2022 (a)(b)(f) | | $ | | | 1,083 | | | | | | 1,082 | |
| | | | | | | | | | | | |
Total Short-Term Instruments
(Cost $1,397) | | | | | | 1,397 | |
| | | | | | | | | | | | |
| | | | |
| | | | | | | | | | | | |
Total Investments in Securities
(Cost $191,772) | | | | | | 193,775 | |
| | | | | | | | | | | | |
| | | | | | | | | | | | |
| | | | | SHARES | | | | | MARKET
VALUE
(000S) | |
| INVESTMENTS IN AFFILIATES 15.7% | |
| |
| MUTUAL FUNDS (c) 11.7% | |
| | | | |
PIMCO Emerging Markets Local Currency and Bond Fund | | | | | 1,017,642 | | | $ | | | 5,343 | |
| | | | |
PIMCO High Yield Fund | | | | | 35,797 | | | | | | 272 | |
| | | | |
PIMCO Income Fund | | | | | 416,581 | | | | | | 4,420 | |
| | | | |
PIMCO International Bond Fund (U.S. Dollar-Hedged) | | | | | 103,301 | | | | | | 1,007 | |
| | | | |
PIMCO Long-Term Real
Return Fund | | | | | 781,489 | | | | | | 4,001 | |
| | | | |
PIMCO Long-Term U.S. Government Fund | | | | | 1,504,975 | | | | | | 6,351 | |
| | | | |
PIMCO Real Return Fund | | | | | 148,071 | | | | | | 1,587 | |
| | | | |
PIMCO Total Return Fund | | | | | 453,887 | | | | | | 4,085 | |
| | | | | | | | | | | | |
| Total Mutual Funds (Cost $32,265) | | | | | | 27,066 | |
| | | | | | | | | | | | |
| |
| | | | | | | | | | | | |
| | | | | SHARES | | | | | MARKET
VALUE
(000S) | |
| SHORT-TERM INSTRUMENTS 4.0% | |
| |
| CENTRAL FUNDS USED FOR CASH MANAGEMENT PURPOSES 4.0% | |
| | | | |
PIMCO Short-Term
Floating NAV Portfolio III | | | | | 944,738 | | | $ | | | 9,168 | |
| | | | | | | | | | | | |
Total Short-Term Instruments
(Cost $9,170) | | | | | | 9,168 | |
| | | | | | | | | | | | |
| | | | |
| | | | | | | | | | | | |
Total Investments in Affiliates
(Cost $41,435) | | | | | | 36,234 | |
| | | | |
| | | | | | | | | | | | |
| Total Investments 99.8% (Cost $233,207) | | | | | | | | $ | | | 230,009 | |
| |
Financial Derivative
Instruments (e)(f) (0.0)% (Cost or Premiums, net $0) | | | (11 | ) |
| |
| Other Assets and Liabilities, net 0.2% | | | | | | 540 | |
| | | | | | | | | | | | |
| Net Assets 100.0% | | | $ | | | 230,538 | |
| | | | | | | | | | | | |
NOTES TO SCHEDULE OF INVESTMENTS:
| * | A zero balance may reflect actual amounts rounding to less than one thousand. |
| (a) | Coupon represents a weighted average yield to maturity. |
| (c) | Institutional Class Shares of each Fund. |
BORROWINGS AND OTHER FINANCING TRANSACTIONS
(d) REPURCHASE AGREEMENTS:
| | | | | | | | | | | | | | | | | | | | | | | | | | | | | | |
| Counterparty | | Lending
Rate | | | Settlement
Date | | | Maturity
Date | | | Principal
Amount | | | Collateralized By | | Collateral
(Received) | | | Repurchase
Agreements,
at Value | | | Repurchase
Agreement
Proceeds
to be
Received(1) | |
| FICC | | | 0.400 | % | | | 06/30/2022 | | | | 07/01/2022 | | | $ | 315 | | | U.S. Treasury Notes 3.000% due 06/30/2024 | | $ | (321 | ) | | $ | 315 | | | $ | 315 | |
| | | | | | | | | | | | | | | | | | | | | | | | | | | | | | |
Total Repurchase Agreements | | | | | $ | (321 | ) | | $ | 315 | | | $ | 315 | |
| | | | | | | | | | | | | | | |
BORROWINGS AND OTHER FINANCING TRANSACTIONS SUMMARY
The following is a summary by counterparty of the market value of Borrowings and Other Financing Transactions and collateral pledged/(received) as of June 30, 2022:
| | | | | | | | | | | | | | | | | | | | | | | | |
| Counterparty | | Repurchase
Agreement
Proceeds
to be
Received(1) | | | Payable for
Reverse
Repurchase
Agreements | | | Payable for
Sale-Buyback
Transactions | | | Total
Borrowings and
Other Financing
Transactions | | | Collateral
Pledged/(Received) | | | Net Exposure(2) | |
Global/Master Repurchase Agreement | |
FICC | | $ | 315 | | | $ | 0 | | | $ | 0 | | | $ | 315 | | | $ | (321 | ) | | $ | (6 | ) |
| | | | | | | | | | | | | | | | | | | | | | | | |
Total Borrowings and Other Financing Transactions | | $ | 315 | | | $ | 0 | | | $ | 0 | | | | | | | | | | | | | |
| | | | | | | | | | | | | | | | | | | | | | | | |
| (1) | Includes accrued interest. |
| (2) | Net Exposure represents the net receivable/(payable) that would be due from/to the counterparty in the event of default. Exposure from borrowings and other financing transactions can only be netted across transactions governed under the same master agreement with the same legal entity. See Note 8, Master Netting Arrangements, in the Notes to Financial Statements for more information. |
| | | | | | |
| 56 | | PIMCO EQUITY SERIES | | | See Accompanying Notes | |
(e) FINANCIAL DERIVATIVE INSTRUMENTS: OVER THE COUNTER
SWAP AGREEMENTS:
TOTAL RETURN SWAPS ON EQUITY INDICES
| | | | | | | | | | | | | | | | | | | | | | | | | | | | | | | | | | |
Counterparty | | Pay/Receive(1) | | Underlying Reference | | # of Units | | | Financing Rate | | Payment
Frequency | | Maturity
Date | | Notional
Amount | | | Premiums
Paid/(Received) | | | Unrealized
Appreciation/
(Depreciation) | | | Swap Agreements,
at Value | |
| | Asset | | | Liability | |
JPM | | Receive | | FNRETR Index | | | 131 | | | 1.510% (1-Month USD-LIBOR plus a specified spread) | | Monthly | | 08/24/2022 | | $ | 2,777 | | | $ | 0 | | | $ | (4 | ) | | $ | 0 | | | $ | (4 | ) |
| | Receive | | FNRETR Index | | | 308 | | | 1.980% (1-Month USD-LIBOR plus a specified spread) | | Monthly | | 02/22/2023 | | | 6,528 | | | | 0 | | | | (7 | ) | | | 0 | | | | (7 | ) |
| | | | | | | | | | | | | | | | | | | | | | | | |
Total Swap Agreements | | | $ | 0 | | | $ | (11 | ) | | $ | 0 | | | $ | (11 | ) |
| | | | | | | | | | | | | | | | | |
FINANCIAL DERIVATIVE INSTRUMENTS: OVER THE COUNTER SUMMARY
The following is a summary by counterparty of the market value of OTC financial derivative instruments and collateral pledged/(received) as of June 30, 2022:
| | | | | | | | | | | | | | | | | | | | | | | | | | | | | | | | | | | | | | | | | | | | | | | | |
| | | Financial Derivative Assets | | | | | | Financial Derivative Liabilities | | | | | | | | | | |
| Counterparty | | Forward
Foreign
Currency
Contracts | | | Purchased
Options | | | Swap
Agreements | | | Total
Over the
Counter | | | | | | Forward
Foreign
Currency
Contracts | | | Written
Options | | | Swap
Agreements | | | Total
Over the
Counter | | | Net Market
Value of OTC
Derivatives | | | Collateral
Pledged/
(Received) | | | Net
Exposure(2) | |
JPM | | $ | 0 | | | $ | 0 | | | $ | 0 | | | $ | 0 | | | | | | | $ | 0 | | | $ | 0 | | | $ | (11 | ) | | $ | (11 | ) | | $ | (11 | ) | | $ | 740 | | | $ | 729 | |
| | | | | | | | | | | | | | | | | | | | | | | | | | | | | | | | | | | | | | | | | | | | | | | | |
Total Over the Counter | | $ | 0 | | | $ | 0 | | | $ | 0 | | | $ | 0 | | | | | | | $ | 0 | | | $ | 0 | | | $ | (11 | ) | | $ | (11 | ) | | | | | | | | | | | | |
| | | | | | | | | | | | | | | | | | | | | | | | | | | | | | | | | | | | | | | | | | | | | | | | |
| (f) | Securities with an aggregate market value of $740 have been pledged as collateral for financial derivative instruments as governed by International Swaps and Derivatives Association, Inc. master agreements as of June 30, 2022. |
| (1) | Receive represents that the Fund receives payments for any positive net return on the underlying reference. The Fund makes payments for any negative net return on such underlying reference. Pay represents that the Fund receives payments for any negative net return on the underlying reference. The Fund makes payments for any positive net return on such underlying reference. |
| (2) | Net Exposure represents the net receivable/(payable) that would be due from/to the counterparty in the event of default. Exposure from OTC financial derivative instruments can only be netted across transactions governed under the same master agreement with the same legal entity. See Note 8, Master Netting Arrangements, in the Notes to Financial Statements for more information. |
FAIR VALUE OF FINANCIAL DERIVATIVE INSTRUMENTS
The following is a summary of the fair valuation of the Fund’s derivative instruments categorized by risk exposure. See Note 7, Principal and Other Risks, in the Notes to Financial Statements on risks of the Fund.
Fair Values of Financial Derivative Instruments on the Statements of Assets and Liabilities as of June 30, 2022:
| | | | | | | | | | | | | | | | | | | | | | | | |
| | | Derivatives not accounted for as hedging instruments | |
| | | Commodity
Contracts | | | Credit
Contracts | | | Equity
Contracts | | | Foreign
Exchange
Contracts | | | Interest
Rate Contracts | | | Total | |
Financial Derivative Instruments - Liabilities | |
Over the counter | |
Swap Agreements | | $ | 0 | | | $ | 0 | | | $ | 11 | | | $ | 0 | | | $ | 0 | | | $ | 11 | |
| | | | | | | | | | | | | | | | | | | | | | | | |
The effect of Financial Derivative Instruments on the Statements of Operations for the period ended June 30, 2022:
| | | | | | | | | | | | | | | | | | | | | | | | |
| | | Derivatives not accounted for as hedging instruments | |
| | | Commodity
Contracts | | | Credit
Contracts | | | Equity
Contracts | | | Foreign
Exchange
Contracts | | | Interest Rate Contracts | | | Total | |
Net Realized (Loss) on Financial Derivative Instruments | |
Over the counter | |
Swap Agreements | | $ | 0 | | | $ | 0 | | | $ | (561 | ) | | $ | 0 | | | $ | 0 | | | $ | (561 | ) |
| | | | | | | | | | | | | | | | | | | | | | | | |
|
Net Change in Unrealized (Depreciation) on Financial Derivative Instruments | |
Over the counter | | | | | | | | | | | | | | | | | | | | | | | | |
Swap Agreements | | $ | 0 | | | $ | 0 | | | $ | (8 | ) | | $ | 0 | | | $ | 0 | | | $ | (8 | ) |
| | | | | | | | | | | | | | | | | | | | | | | | |
| | | | | | | | | | | | |
| See Accompanying Notes | | | ANNUAL REPORT | | | | | | | JUNE 30, 2022 | | | 57 |
| | | | | | |
| Schedule of Investments | | PIMCO REALPATH® Blend 2045 Fund | | (Cont.) | | June 30, 2022 |
FAIR VALUE MEASUREMENTS
The following is a summary of the fair valuations according to the inputs used as of June 30, 2022 in valuing the Fund’s assets and liabilities:
| | | | | | | | | | | | | | | | |
| Category and Subcategory | | Level 1 | | | Level 2 | | | Level 3 | | | Fair
Value at
06/30/2022 | |
Investments in Securities, at Value | |
Mutual Funds | | $ | 192,378 | | | $ | 0 | | | $ | 0 | | | $ | 192,378 | |
Short-Term Instruments | |
Repurchase Agreements | | | 0 | | | | 315 | | | | 0 | | | | 315 | |
U.S. Treasury Bills | | | 0 | | | | 1,082 | | | | 0 | | | | 1,082 | |
| | | | | | | | | | | | | | | | |
| | $ | 192,378 | | | $ | 1,397 | | | $ | 0 | | | $ | 193,775 | |
| | | | | | | | | | | | | | | | |
|
Investments in Affiliates, at Value | |
Mutual Funds | | | 27,066 | | | | 0 | | | | 0 | | | | 27,066 | |
Short-Term Instruments | |
Central Funds Used for Cash Management Purposes | | | 9,168 | | | | 0 | | | | 0 | | | | 9,168 | |
| | | | | | | | | | | | | | | | |
| | $ | 36,234 | | | $ | 0 | | | $ | 0 | | | $ | 36,234 | |
| | | | | | | | | | | | | | | | |
| | | | |
Total Investments | | $ | 228,612 | | | $ | 1,397 | | | $ | 0 | | | $ | 230,009 | |
| | | | | | | | | | | | | | | | |
| | | | | | | | | | | | | | | | |
| Category and Subcategory | | Level 1 | | | Level 2 | | | Level 3 | | | Fair
Value at
06/30/2022 | |
Financial Derivative Instruments - Liabilities | |
Over the counter | | $ | 0 | | | $ | (11 | ) | | $ | 0 | | | $ | (11 | ) |
| | | | | | | | | | | | | | | | |
| | | | |
Total Financial Derivative Instruments | | $ | 0 | | | $ | (11 | ) | | $ | 0 | | | $ | (11 | ) |
| | | | | | | | | | | | | | | | |
| | | | |
Totals | | $ | 228,612 | | | $ | 1,386 | | | $ | 0 | | | $ | 229,998 | |
| | | | | | | | | | | | | | | | |
There were no significant transfers into or out of Level 3 during the period ended June 30, 2022.
| | | | | | |
| 58 | | PIMCO EQUITY SERIES | | | See Accompanying Notes | |
| | | | | | |
| Schedule of Investments | | PIMCO REALPATH® Blend 2050 Fund | | | | June 30, 2022 |
(Amounts in thousands*, except number of shares, contracts, units and ounces, if any)
| | | | | | | | | | | | |
| | | | | SHARES | | | | | MARKET
VALUE
(000S) | |
| INVESTMENTS IN SECURITIES 89.1% | |
| |
| MUTUAL FUNDS 88.4% | |
| | | | |
Vanguard Developed Markets Index Fund ‘Institutional’ | | | | | 5,468,377 | | | $ | | | 71,636 | |
| | | | |
Vanguard Emerging Markets Stock Index Fund ‘Institutional’ | | | | | 775,242 | | | | | | 20,373 | |
| | | | |
Vanguard Institutional Index Fund ‘Institutional’ | | | | | 313,942 | | | | | | 100,653 | |
| | | | |
Vanguard Small-Cap Index Fund ‘Institutional’ | | | | | 118,374 | | | | | | 9,990 | |
| | | | | | | | | | | | |
Total Mutual Funds (Cost $197,664) | | | | | | 202,652 | |
| | | | | | | | | | | | |
| |
| | | | | PRINCIPAL
AMOUNT
(000S) | | | | | | |
| SHORT-TERM INSTRUMENTS 0.7% | |
| |
| REPURCHASE AGREEMENTS (d) 0.3% | |
| | | | | | | | | | | 621 | |
| | | | | | | | | | | | |
| |
| U.S. TREASURY BILLS 0.4% | |
0.919% due 07/26/2022 - 08/18/2022 (a)(b)(f) | | $ | | | 1,083 | | | | | | 1,082 | |
| | | | | | | | | | | | |
Total Short-Term Instruments
(Cost $1,703) | | | 1,703 | |
| | | | | | | | | | | | |
| | | | |
| | | | | | | | | | | | |
Total Investments in Securities
(Cost $199,367) | | | 204,355 | |
| | | | | | | | | | | | |
| | | | | | | | | | | | |
| | | | | SHARES | | | | | MARKET
VALUE
(000S) | |
| INVESTMENTS IN AFFILIATES 10.9% | |
| |
| MUTUAL FUNDS (c) 7.9% | |
| | | | |
PIMCO Emerging Markets Local Currency and Bond Fund | | | | | 689,572 | | | $ | | | 3,620 | |
| | | | |
PIMCO Income Fund | | | | | 242,569 | | | | | | 2,573 | |
| | | | |
PIMCO International Bond Fund (U.S. Dollar-Hedged) | | | | | 94,391 | | | | | | 920 | |
| | | | |
PIMCO Long-Term
Real Return Fund | | | | | 550,742 | | | | | | 2,820 | |
| | | | |
PIMCO Long-Term U.S. Government Fund | | | | | 1,063,419 | | | | | | 4,488 | |
| | | | |
PIMCO Real Return Fund | | | | | 99,053 | | | | | | 1,062 | |
| | | | |
PIMCO Total Return Fund | | | | | 300,526 | | | | | | 2,705 | |
| | | | | | | | | | | | |
| Total Mutual Funds (Cost $21,671) | | | 18,188 | |
| | | | | | | | | | | | |
| | | | | | | | | | | | |
| | | | | SHARES | | | | | MARKET
VALUE
(000S) | |
| SHORT-TERM INSTRUMENTS 3.0% | |
| |
| CENTRAL FUNDS USED FOR CASH MANAGEMENT PURPOSES 3.0% | |
| | | | |
PIMCO Short-Term
Floating NAV Portfolio III | | | | | 704,044 | | | $ | | | 6,832 | |
| | | | | | | | | | | | |
Total Short-Term Instruments
(Cost $6,836) | | | 6,832 | |
| | | | |
| | | | |
| | | | | | | | | | | | |
Total Investments in Affiliates
(Cost $28,507) | | | 25,020 | |
| |
| | | | |
Total Investments 100.0%
(Cost $227,874) | | | $ | | | 229,375 | |
| |
Financial Derivative
Instruments (e)(f) (0.0)% (Cost or Premiums, net $0) | | | (11 | ) |
| |
| Other Assets and Liabilities, net 0.0% | | | (92 | ) |
| | | | | | | |
| Net Assets 100.0% | | | $ | | | 229,272 | |
| | | | | | | |
NOTES TO SCHEDULE OF INVESTMENTS:
| * | A zero balance may reflect actual amounts rounding to less than one thousand. |
| (a) | Coupon represents a weighted average yield to maturity. |
| (c) | Institutional Class Shares of each Fund. |
BORROWINGS AND OTHER FINANCING TRANSACTIONS
(d) REPURCHASE AGREEMENTS:
| | | | | | | | | | | | | | | | | | | | | | | | | | | | | | |
| Counterparty | | Lending
Rate | | | Settlement
Date | | | Maturity
Date | | | Principal
Amount | | | Collateralized By | | Collateral
(Received) | | | Repurchase
Agreements,
at Value | | | Repurchase
Agreement
Proceeds
to be
Received(1) | |
| FICC | | | 0.400 | % | | | 06/30/2022 | | | | 07/01/2022 | | | $ | 621 | | | U.S. Treasury Notes 3.000% due 06/30/2024 | | $ | (634 | ) | | $ | 621 | | | $ | 621 | |
| | | | | | | | | | | | | | | | | | | | | | | | | | | | | | |
Total Repurchase Agreements | | | | | $ | (634 | ) | | $ | 621 | | | $ | 621 | |
| | | | | | | | | | | | | | | |
BORROWINGS AND OTHER FINANCING TRANSACTIONS SUMMARY
The following is a summary by counterparty of the market value of Borrowings and Other Financing Transactions and collateral pledged/(received) as of June 30, 2022:
| | | | | | | | | | | | | | | | | | | | | | | | |
| Counterparty | | Repurchase
Agreement
Proceeds
to be
Received(1) | | | Payable for
Reverse
Repurchase
Agreements | | | Payable for
Sale-Buyback
Transactions | | | Total
Borrowings and
Other Financing
Transactions | | | Collateral
Pledged/(Received) | | | Net Exposure(2) | |
Global/Master Repurchase Agreement | |
FICC | | $ | 621 | | | $ | 0 | | | $ | 0 | | | $ | 621 | | | $ | (634 | ) | | $ | (13 | ) |
| | | | | | | | | | | | | | | | | | | | | | | | |
Total Borrowings and Other Financing Transactions | | $ | 621 | | | $ | 0 | | | $ | 0 | | | | | | | | | | | | | |
| | | | | | | | | | | | | | | | | | | | | | | | |
| (1) | Includes accrued interest. |
| (2) | Net Exposure represents the net receivable/(payable) that would be due from/to the counterparty in the event of default. Exposure from borrowings and other financing transactions can only be netted across transactions governed under the same master agreement with the same legal entity. See Note 8, Master Netting Arrangements, in the Notes to Financial Statements for more information. |
| | | | | | | | | | | | |
| See Accompanying Notes | | | ANNUAL REPORT | | | | | | | JUNE 30, 2022 | | | 59 |
| | | | | | |
| Schedule of Investments | | PIMCO REALPATH® Blend 2050 Fund | | (Cont.) | | |
(e) FINANCIAL DERIVATIVE INSTRUMENTS: OVER THE COUNTER
SWAP AGREEMENTS:
TOTAL RETURN SWAPS ON EQUITY INDICES
| | | | | | | | | | | | | | | | | | | | | | | | | | | | | | | | | | |
Counterparty | | Pay/Receive(1) | | Underlying Reference | | # of Units | | | Financing Rate | | Payment
Frequency | | Maturity
Date | | Notional
Amount | | | Premiums
Paid/(Received) | | | Unrealized
Appreciation/
(Depreciation) | | | Swap Agreements,
at Value | |
| | Asset | | | Liability | |
JPM | | Receive | | FNRETR Index | | | 147 | | | 1.510% (1-Month USD-LIBOR plus a specified spread) | | Monthly | | 08/24/2022 | | $ | 3,116 | | | $ | 0 | | | $ | (4 | ) | | $ | 0 | | | $ | (4 | ) |
| | Receive | | FNRETR Index | | | 302 | | | 1.980% (1-Month USD-LIBOR plus a specified spread) | | Monthly | | 02/22/2023 | | | 6,401 | | | | 0 | | | | (7 | ) | | | 0 | | | | (7 | ) |
| | | | | | | | | | | | | | | | | | | | | | | | |
Total Swap Agreements | | | $ | 0 | | | $ | (11 | ) | | $ | 0 | | | $ | (11 | ) |
| | | | | | | | | | | | | | | | | |
FINANCIAL DERIVATIVE INSTRUMENTS: OVER THE COUNTER SUMMARY
The following is a summary by counterparty of the market value of OTC financial derivative instruments and collateral pledged/(received) as of June 30, 2022:
| | | | | | | | | | | | | | | | | | | | | | | | | | | | | | | | | | | | | | | | | | | | | | | | |
| | | Financial Derivative Assets | | | | | | Financial Derivative Liabilities | | | | | | | | | | |
| Counterparty | | Forward
Foreign
Currency
Contracts | | | Purchased
Options | | | Swap
Agreements | | | Total
Over the
Counter | | | | | | Forward
Foreign
Currency
Contracts | | | Written
Options | | | Swap
Agreements | | | Total
Over the
Counter | | | Net Market
Value of OTC
Derivatives | | | Collateral
Pledged/ (Received) | | | Net
Exposure(2) | |
JPM | | $ | 0 | | | $ | 0 | | | $ | 0 | | | $ | 0 | | | | | | | $ | 0 | | | $ | 0 | | | $ | (11 | ) | | $ | (11 | ) | | $ | (11 | ) | | $ | 710 | | | $ | 699 | |
| | | | | | | | | | | | | | | | | | | | | | | | | | | | | | | | | | | | | | | | | | | | | | | | |
Total Over the Counter | | $ | 0 | | | $ | 0 | | | $ | 0 | | | $ | 0 | | | | | | | $ | 0 | | | $ | 0 | | | $ | (11 | ) | | $ | (11 | ) | | | | | | | | | | | | |
| | | | | | | | | | | | | | | | | | | | | | | | | | | | | | | | | | | | | | | | | | | | | | | | |
| (f) | Securities with an aggregate market value of $710 have been pledged as collateral for financial derivative instruments as governed by International Swaps and Derivatives Association, Inc. master agreements as of June 30, 2022. |
| (1) | Receive represents that the Fund receives payments for any positive net return on the underlying reference. The Fund makes payments for any negative net return on such underlying reference. Pay represents that the Fund receives payments for any negative net return on the underlying reference. The Fund makes payments for any positive net return on such underlying reference. |
| (2) | Net Exposure represents the net receivable/(payable) that would be due from/to the counterparty in the event of default. Exposure from OTC financial derivative instruments can only be netted across transactions governed under the same master agreement with the same legal entity. See Note 8, Master Netting Arrangements, in the Notes to Financial Statements for more information. |
FAIR VALUE OF FINANCIAL DERIVATIVE INSTRUMENTS
The following is a summary of the fair valuation of the Fund’s derivative instruments categorized by risk exposure. See Note 7, Principal and Other Risks, in the Notes to Financial Statements on risks of the Fund.
Fair Values of Financial Derivative Instruments on the Statements of Assets and Liabilities as of June 30, 2022:
| | | | | | | | | | | | | | | | | | | | | | | | |
| | | Derivatives not accounted for as hedging instruments | |
| | | Commodity
Contracts | | | Credit
Contracts | | | Equity
Contracts | | | Foreign
Exchange
Contracts | | | Interest
Rate Contracts | | | Total | |
Financial Derivative Instruments - Liabilities | | | | | | | | | | | | | | | | | | | | | | | | |
Over the counter | | | | | | | | | | | | | | | | | | | | | | | | |
Swap Agreements | | $ | 0 | | | $ | 0 | | | $ | 11 | | | $ | 0 | | | $ | 0 | | | $ | 11 | |
| | | | | | | | | | | | | | | | | | | | | | | | |
The effect of Financial Derivative Instruments on the Statements of Operations for the period ended June 30, 2022:
| | | | | | | | | | | | | | | | | | | | | | | | |
| | | Derivatives not accounted for as hedging instruments | |
| | | Commodity
Contracts | | | Credit
Contracts | | | Equity
Contracts | | | Foreign
Exchange
Contracts | | | Interest
Rate Contracts | | | Total | |
Net Realized (Loss) on Financial Derivative Instruments | | | | | | | | | | | | | | | | | | | | | | | | |
Over the counter | | | | | | | | | | | | | | | | | | | | | | | | |
Swap Agreements | | $ | 0 | | | $ | 0 | | | $ | (483 | ) | | $ | 0 | | | $ | 0 | | | $ | (483 | ) |
| | | | | | | | | | | | | | | | | | | | | | | | |
|
Net Change in Unrealized (Depreciation) on Financial Derivative Instruments | |
Over the counter | | | | | | | | | | | | | | | | | | | | | | | | |
Swap Agreements | | $ | 0 | | | $ | 0 | | | $ | (7 | ) | | $ | 0 | | | $ | 0 | | | $ | (7 | ) |
| | | | | | | | | | | | | | | | | | | | | | | | |
| | | | | | |
| 60 | | PIMCO EQUITY SERIES | | | See Accompanying Notes | |
FAIR VALUE MEASUREMENTS
The following is a summary of the fair valuations according to the inputs used as of June 30, 2022 in valuing the Fund’s assets and liabilities:
| | | | | | | | | | | | | | | | |
| Category and Subcategory | | Level 1 | | | Level 2 | | | Level 3 | | | Fair Value at
06/30/2022 | |
Investments in Securities, at Value | |
Mutual Funds | | $ | 202,652 | | | $ | 0 | | | $ | 0 | | | $ | 202,652 | |
Short-Term Instruments | |
Repurchase Agreements | | | 0 | | | | 621 | | | | 0 | | | | 621 | |
U.S. Treasury Bills | | | 0 | | | | 1,082 | | | | 0 | | | | 1,082 | |
| | | | | | | | | | | | | | | | |
| | $ | 202,652 | | | $ | 1,703 | | | $ | 0 | | | $ | 204,355 | |
| | | | | | | | | | | | | | | | |
|
Investments in Affiliates, at Value | |
Mutual Funds | | | 18,188 | | | | 0 | | | | 0 | | | | 18,188 | |
Short-Term Instruments | |
Central Funds Used for Cash Management Purposes | | | 6,832 | | | | 0 | | | | 0 | | | | 6,832 | |
| | | | | | | | | | | | | | | | |
| | $ | 25,020 | | | $ | 0 | | | $ | 0 | | | $ | 25,020 | |
| | | | | | | | | | | | | | | | |
| | | | |
Total Investments | | $ | 227,672 | | | $ | 1,703 | | | $ | 0 | | | $ | 229,375 | |
| | | | | | | | | | | | | | | | |
| | | | | | | | | | | | | | | | |
| Category and Subcategory | | Level 1 | | | Level 2 | | | Level 3 | | | Fair Value at
06/30/2022 | |
Financial Derivative Instruments - Liabilities | |
Over the counter | | $ | 0 | | | $ | (11 | ) | | $ | 0 | | | $ | (11 | ) |
| | | | | | | | | | | | | | | | |
| | | | |
Total Financial Derivative Instruments | | $ | 0 | | | $ | (11 | ) | | $ | 0 | | | $ | (11 | ) |
| | | | | | | | | | | | | | | | |
| | | | |
Totals | | $ | 227,672 | | | $ | 1,692 | | | $ | 0 | | | $ | 229,364 | |
| | | | | | | | | | | | | | | | |
There were no significant transfers into or out of Level 3 during the period ended June 30, 2022.
| | | | | | | | | | | | |
| See Accompanying Notes | | | ANNUAL REPORT | | | | | | | JUNE 30, 2022 | | | 61 |
| | | | | | |
| Schedule of Investments | | PIMCO REALPATH® Blend 2055 Fund | | | | |
(Amounts in thousands*, except number of shares, contracts, units and ounces, if any)
| | | | | | | | | | | | |
| | | | | SHARES | | | | | MARKET
VALUE
(000S) | |
| INVESTMENTS IN SECURITIES 89.4% | |
| |
| MUTUAL FUNDS 88.7% | |
| | | | |
Vanguard Developed Markets Index Fund ‘Institutional’ | | | | | 3,734,585 | | | $ | | | 48,923 | |
| | | |
Vanguard Emerging Markets Stock Index Fund ‘Institutional’ | | | 523,188 | | | | | | 13,749 | |
| | | | |
Vanguard Institutional Index Fund ‘Institutional’ | | | | | 215,320 | | | | | | 69,034 | |
| | | | |
Vanguard Small-Cap Index Fund ‘Institutional’ | | | | | 81,748 | | | | | | 6,899 | |
| | | | | | | | | | | | |
Total Mutual Funds (Cost $142,625) | | | 138,605 | |
| | | | | | | | | | | | |
| |
| | | | | PRINCIPAL
AMOUNT
(000S) | | | | | | |
| SHORT-TERM INSTRUMENTS 0.7% | |
| |
REPURCHASE AGREEMENTS (d) 0.4%
| | | | |
| | | | | | | | | | | 561 | |
| | | | | | | | | | | | |
| |
| U.S. TREASURY BILLS 0.3% | |
1.011% due 07/26/2022 - 08/18/2022 (a)(b)(f) | | $ | | | 480 | | | | | | 479 | |
| | | | | | | | | | | | |
| Total Short-Term Instruments (Cost $1,041) | | | | | | 1,040 | |
| | | | | | | | | | | | |
| | | | |
| | | | | | | | | | | | |
| Total Investments in Securities (Cost $143,666) | | | | | | 139,645 | |
| | | | | | | | | | | | |
| | | | | | | | | | | | |
| | | | | PRINCIPAL
AMOUNT
(000S) | | | | | MARKET
VALUE
(000S) | |
| INVESTMENTS IN AFFILIATES 10.4% | |
| |
| MUTUAL FUNDS (c) 6.6% | |
| | | | |
PIMCO Emerging Markets Local Currency and Bond Fund | | $ | | | 391,575 | | | $ | | | 2,056 | |
| | | | |
PIMCO Income Fund | | | | | 130,464 | | | | | | 1,384 | |
| | | | |
PIMCO International Bond Fund (U.S. Dollar-Hedged) | | | | | 60,739 | | | | | | 592 | |
| | | | |
PIMCO Long-Term Real Return Fund | | | | | 314,660 | | | | | | 1,611 | |
| | | | |
PIMCO Long-Term U.S. Government Fund | | | | | 607,674 | | | | | | 2,565 | |
| | | | |
PIMCO Real Return Fund | | | | | 53,753 | | | | | | 576 | |
| | | | |
PIMCO Total Return Fund | | | | | 159,230 | | | | | | 1,433 | |
| | | | | | | | | | | | |
| Total Mutual Funds (Cost $12,071) | | | | | | 10,217 | |
| | | | | | | | | | | | |
| |
| | | | | | | | | | | | |
| | | | | PRINCIPAL
AMOUNT
(000S) | | | | | MARKET
VALUE
(000S) | |
| SHORT-TERM INSTRUMENTS 3.8% | |
| |
| CENTRAL FUNDS USED FOR CASH MANAGEMENT PURPOSES 3.8% | |
| | | | |
PIMCO Short-Term Floating NAV Portfolio III | | $ | | | 619,230 | | | $ | | | 6,009 | |
| | | | | | | | | | | | |
Total Short-Term Instruments
(Cost $6,010) | | | | | | 6,009 | |
| | | | | | | | | | | | |
| |
Total Investments in Affiliates
(Cost $18,081) | | | 16,226 | |
| | | | |
| | | | | | | | | | | | |
Total Investments 99.8%
(Cost $161,747) | | | $ | | | 155,871 | |
| | | | | | | | | | | | |
Financial Derivative
Instruments (e) (0.0)% (Cost or Premiums, net $0) | | | | | | (8 | ) |
| |
| Other Assets and Liabilities, net 0.2% | | | | | | 265 | |
| | | | | | | | | | | | |
| Net Assets 100.0% | | | | | | | | $ | | | 156,128 | |
| | | | | | | | | | | | |
NOTES TO SCHEDULE OF INVESTMENTS:
| * | A zero balance may reflect actual amounts rounding to less than one thousand. |
| (a) | Coupon represents a weighted average yield to maturity. |
| (c) | Institutional Class Shares of each Fund. |
BORROWINGS AND OTHER FINANCING TRANSACTIONS
(d) REPURCHASE AGREEMENTS:
| | | | | | | | | | | | | | | | | | | | | | | | | | | | | | |
| Counterparty | | Lending
Rate | | | Settlement
Date | | | Maturity
Date | | | Principal
Amount | | | Collateralized By | | Collateral
(Received) | | | Repurchase
Agreements,
at Value | | | Repurchase
Agreement
Proceeds
to be
Received(1) | |
| FICC | | | 0.400 | % | | | 06/30/2022 | | | | 07/01/2022 | | | $ | 561 | | | U.S. Treasury Notes 3.000% due 06/30/2024 | | $ | (572 | ) | | $ | 561 | | | $ | 561 | |
| | | | | | | | | | | | | | | | | | | | | | | | | | | | | | |
Total Repurchase Agreements | | | | | $ | (572 | ) | | $ | 561 | | | $ | 561 | |
| | | | | | | | | | | | | | | |
BORROWINGS AND OTHER FINANCING TRANSACTIONS SUMMARY
The following is a summary by counterparty of the market value of Borrowings and Other Financing Transactions and collateral pledged/(received) as of June 30, 2022:
| | | | | | | | | | | | | | | | | | | | | | | | |
| Counterparty | | Repurchase
Agreement
Proceeds
to be
Received(1) | | | Payable for
Reverse
Repurchase
Agreements | | | Payable for
Sale-Buyback
Transactions | | | Total
Borrowings and
Other Financing
Transactions | | | Collateral
Pledged/(Received) | | | Net Exposure(2) | |
Global/Master Repurchase Agreement | |
FICC | | $ | 561 | | | $ | 0 | | | $ | 0 | | | $ | 561 | | | $ | (572 | ) | | $ | (11 | ) |
| | | | | | | | | | | | | | | | | | | | | | | | |
Total Borrowings and Other Financing Transactions | | $ | 561 | | | $ | 0 | | | $ | 0 | | | | | | | | | | | | | |
| | | | | | | | | | | | | | | | | | | | | | | | |
| (1) | Includes accrued interest. |
| (2) | Net Exposure represents the net receivable/(payable) that would be due from/to the counterparty in the event of default. Exposure from borrowings and other financing transactions can only be netted across transactions governed under the same master agreement with the same legal entity. See Note 8, Master Netting Arrangements, in the Notes to Financial Statements for more information. |
| | | | | | |
| 62 | | PIMCO EQUITY SERIES | | | See Accompanying Notes | |
(e) FINANCIAL DERIVATIVE INSTRUMENTS: OVER THE COUNTER
SWAP AGREEMENTS:
TOTAL RETURN SWAPS ON EQUITY INDICES
| | | | | | | | | | | | | | | | | | | | | | | | | | | | | | | | | | |
| Counterparty | | Pay/Receive(1) | | Underlying Reference | | # of Units | | | Financing Rate | | Payment
Frequency | | Maturity
Date | | Notional
Amount | | | Premiums
Paid/(Received) | | | Unrealized
Appreciation/
(Depreciation) | | | Swap Agreements,
at Value | |
| | Asset | | | Liability | |
JPM | | Receive | | FNRETR Index | | | 81 | | | 1.510% (1-Month USD-LIBOR plus a specified spread) | | Monthly | | 08/24/2022 | | $ | 1,717 | | | $ | 0 | | | $ | (2 | ) | | $ | 0 | | | $ | (2 | ) |
| | Receive | | FNRETR Index | | | 223 | | | 1.980% (1-Month USD-LIBOR plus a specified spread) | | Monthly | | 02/22/2023 | | | 4,727 | | | | 0 | | | | (6 | ) | | | 0 | | | | (6 | ) |
| | | | | | | | | | | | | | | | | | | | | | | | |
Total Swap Agreements | | | $ | 0 | | | $ | (8 | ) | | $ | 0 | | | $ | (8 | ) |
| | | | | | | | | | | | | | | | | |
FINANCIAL DERIVATIVE INSTRUMENTS: OVER THE COUNTER SUMMARY
The following is a summary by counterparty of the market value of OTC financial derivative instruments and collateral pledged/(received) as of June 30, 2022:
| | | | | | | | | | | | | | | | | | | | | | | | | | | | | | | | | | | | | | | | | | | | | | | | |
| | | Financial Derivative Assets | | | | | | Financial Derivative Liabilities | | | | | | | | | | |
| Counterparty | | Forward
Foreign
Currency
Contracts | | | Purchased
Options | | | Swap
Agreements | | | Total
Over the
Counter | | | | | | Forward
Foreign
Currency
Contracts | | | Written
Options | | | Swap
Agreements | | | Total
Over the
Counter | | | Net Market
Value of OTC
Derivatives | | | Collateral
Pledged/
(Received) | | | Net
Exposure(2) | |
JPM | | $ | 0 | | | $ | 0 | | | $ | 0 | | | $ | 0 | | | | | | | $ | 0 | | | $ | 0 | | | $ | (8 | ) | | $ | (8 | ) | | $ | (8 | ) | | $ | 480 | | | $ | 472 | |
| | | | | | | | | | | | | | | | | | | | | | | | | | | | | | | | | | | | | | | | | | | | | | | | |
Total Over the Counter | | $ | 0 | | | $ | 0 | | | $ | 0 | | | $ | 0 | | | | | | | $ | 0 | | | $ | 0 | | | $ | (8 | ) | | $ | (8 | ) | | | | | | | | | | | | |
| | | | | | | | | | | | | | | | | | | | | | | | | | | | | | | | | | | | | | | | | | | | | | | | |
| (f) | Securities with an aggregate market value of $480 have been pledged as collateral for financial derivative instruments as governed by International Swaps and Derivatives Association, Inc. master agreements as of June 30, 2022. |
| (1) | Receive represents that the Fund receives payments for any positive net return on the underlying reference. The Fund makes payments for any negative net return on such underlying reference. Pay represents that the Fund receives payments for any negative net return on the underlying reference. The Fund makes payments for any positive net return on such underlying reference. |
| (2) | Net Exposure represents the net receivable/(payable) that would be due from/to the counterparty in the event of default. Exposure from OTC financial derivative instruments can only be netted across transactions governed under the same master agreement with the same legal entity. See Note 8, Master Netting Arrangements, in the Notes to Financial Statements for more information. |
FAIR VALUE OF FINANCIAL DERIVATIVE INSTRUMENTS
The following is a summary of the fair valuation of the Fund’s derivative instruments categorized by risk exposure. See Note 7, Principal and Other Risks, in the Notes to Financial Statements on risks of the Fund.
Fair Values of Financial Derivative Instruments on the Statements of Assets and Liabilities as of June 30, 2022:
| | | | | | | | | | | | | | | | | | | | | | | | |
| | | Derivatives not accounted for as hedging instruments | |
| | | Commodity
Contracts | | | Credit
Contracts | | | Equity
Contracts | | | Foreign
Exchange
Contracts | | | Interest
Rate Contracts | | | Total | |
Financial Derivative Instruments - Liabilities | |
Over the counter | |
Swap Agreements | | $ | 0 | | | $ | 0 | | | $ | 8 | | | $ | 0 | | | $ | 0 | | | $ | 8 | |
| | | | | | | | | | | | | | | | | | | | | | | | |
The effect of Financial Derivative Instruments on the Statements of Operations for the period ended June 30, 2022:
| | | | | | | | | | | | | | | | | | | | | | | | |
| | | Derivatives not accounted for as hedging instruments | |
| | | Commodity
Contracts | | | Credit
Contracts | | | Equity
Contracts | | | Foreign
Exchange
Contracts | | | Interest
Rate Contracts | | | Total | |
Net Realized (Loss) on Financial Derivative Instruments | |
Over the counter | |
Swap Agreements | | $ | 0 | | | $ | 0 | | | $ | (408 | ) | | $ | 0 | | | $ | 0 | | | $ | (408 | ) |
| | | | | | | | | | | | | | | | | | | | | | | | |
|
Net Change in Unrealized (Depreciation) on Financial Derivative Instruments | |
Over the counter | |
Swap Agreements | | $ | 0 | | | $ | 0 | | | $ | (6 | ) | | $ | 0 | | | $ | 0 | | | $ | (6 | ) |
| | | | | | | | | | | | | | | | | | | | | | | | |
| | | | | | | | | | | | |
| See Accompanying Notes | | | ANNUAL REPORT | | | | | | | JUNE 30, 2022 | | | 63 |
| | | | | | |
| Schedule of Investments | | PIMCO REALPATH® Blend 2055 Fund | | (Cont.) | | June 30, 2022 |
FAIR VALUE MEASUREMENTS
The following is a summary of the fair valuations according to the inputs used as of June 30, 2022 in valuing the Fund’s assets and liabilities:
| | | | | | | | | | | | | | | | |
| Category and Subcategory | | Level 1 | | | Level 2 | | | Level 3 | | | Fair
Value at
06/30/2022 | |
Investments in Securities, at Value | |
Mutual Funds | | $ | 138,605 | | | $ | 0 | | | $ | 0 | | | $ | 138,605 | |
Short-Term Instruments | |
Repurchase Agreements | | | 0 | | | | 561 | | | | 0 | | | | 561 | |
U.S. Treasury Bills | | | 0 | | | | 479 | | | | 0 | | | | 479 | |
| | | | | | | | | | | | | | | | |
| | $ | 138,605 | | | $ | 1,040 | | | $ | 0 | | | $ | 139,645 | |
| | | | | | | | | | | | | | | | |
|
Investments in Affiliates, at Value | |
Mutual Funds | | | 10,217 | | | | 0 | | | | 0 | | | | 10,217 | |
Short-Term Instruments | |
Central Funds Used for Cash Management Purposes | | | 6,009 | | | | 0 | | | | 0 | | | | 6,009 | |
| | | | | | | | | | | | | | | | |
| | $ | 16,226 | | | $ | 0 | | | $ | 0 | | | $ | 16,226 | |
| | | | | | | | | | | | | | | | |
| | | | |
Total Investments | | $ | 154,831 | | | $ | 1,040 | | | $ | 0 | | | $ | 155,871 | |
| | | | | | | | | | | | | | | | |
| | | | | | | | | | | | | | | | |
| Category and Subcategory | | Level 1 | | | Level 2 | | | Level 3 | | | Fair
Value at
06/30/2022 | |
Financial Derivative Instruments - Liabilities | |
Over the counter | | $ | 0 | | | $ | (8 | ) | | $ | 0 | | | $ | (8 | ) |
| | | | | | | | | | | | | | | | |
| | | | |
Total Financial Derivative Instruments | | $ | 0 | | | $ | (8 | ) | | $ | 0 | | | $ | (8 | ) |
| | | | | | | | | | | | | | | | |
| | | | |
Totals | | $ | 154,831 | | | $ | 1,032 | | | $ | 0 | | | $ | 155,863 | |
| | | | | | | | | | | | | | | | |
There were no significant transfers into or out of Level 3 during the period ended June 30, 2022.
| | | | | | |
| 64 | | PIMCO EQUITY SERIES | | | See Accompanying Notes | |
| | | | | | |
| Schedule of Investments | | PIMCO REALPATH® Blend 2060 Fund | | | | June 30, 2022 |
(Amounts in thousands*, except number of shares, contracts, units and ounces, if any)
| | | | | | | | | | | | |
| | | | | SHARES | | | | | MARKET
VALUE
(000S) | |
| INVESTMENTS IN SECURITIES 88.2% | |
| |
| MUTUAL FUNDS 88.2% | |
| | | | |
Vanguard Developed Markets Index Fund ‘Admiral’ | | | | | 554,693 | | | $ | | | 7,255 | |
| | | | |
Vanguard Emerging Markets Stock Index Fund ‘Admiral’ | | | | | 58,962 | | | | | | 2,038 | |
| | | | |
Vanguard Institutional Index Fund ‘Institutional’ | | | | | 31,971 | | | | | | 10,250 | |
| | | | |
Vanguard Small-Cap Index Fund ‘Admiral’ | | | | | 12,118 | | | | | | 1,023 | |
| | | | | | | | | | | | |
| Total Mutual Funds (Cost $23,382) | | | 20,566 | |
| | | | |
| | | | |
| | | | | | | | | | | | |
Total Investments in Securities
(Cost $23,382) | | | 20,566 | |
| | | | |
| |
| | | | | | | | | | | | |
| | | | | SHARES | | | | | MARKET
VALUE
(000S) | |
| INVESTMENTS IN AFFILIATES 10.4% | |
| |
| MUTUAL FUNDS (a) 6.5% | |
| | | | |
PIMCO Emerging Markets Local Currency and Bond Fund | | | | | 59,337 | | | $ | | | 312 | |
| | | | |
PIMCO Income Fund | | | | | 19,781 | | | | | | 210 | |
| | | | |
PIMCO International Bond Fund (U.S. Dollar-Hedged) | | | | | 9,348 | | | | | | 91 | |
| | | | |
PIMCO Long-Term Real Return Fund | | | | | 46,295 | | | | | | 237 | |
| | | | |
PIMCO Long-Term U.S. Government Fund | | | | | 87,729 | | | | | | 370 | |
| | | | |
PIMCO Real Return Fund | | | | | 8,481 | | | | | | 91 | |
| | | | |
PIMCO Total Return Fund | | | | | 23,549 | | | | | | 212 | |
| | | | | | | | | | | | |
| Total Mutual Funds (Cost $1,742) | | | 1,523 | |
| | | | |
| |
| | | | | | | | | | | | |
| | | | | SHARES | | | | | MARKET
VALUE
(000S) | |
| SHORT-TERM INSTRUMENTS 3.9% | |
| |
| CENTRAL FUNDS USED FOR CASH MANAGEMENT PURPOSES 3.9% | |
| | | | |
PIMCO Short-Term Floating NAV Portfolio III | | | | | 92,954 | | | $ | | | 902 | |
| | | | | | | | | | | | |
Total Short-Term Instruments
(Cost $902) | | | 902 | |
| | | | |
| | | | |
| | | | | | | | | | | | |
Total Investments in Affiliates
(Cost $2,644) | | | 2,425 | |
| |
| | | | |
Total Investments 98.6%
(Cost $26,026) | | | $ | | | 22,991 | |
| |
Financial Derivative
Instruments (b) (0.0)% (Cost or Premiums, net $0) | | | | | | (1 | ) |
| |
| Other Assets and Liabilities, net 1.4% | | | 331 | |
| | | | |
| Net Assets 100.0% | | | $ | | | 23,321 | |
| | | | | | | |
NOTES TO SCHEDULE OF INVESTMENTS:
| * | A zero balance may reflect actual amounts rounding to less than one thousand. |
| (a) | Institutional Class Shares of each Fund. |
(b) FINANCIAL DERIVATIVE INSTRUMENTS: OVER THE COUNTER
SWAP AGREEMENTS:
TOTAL RETURN SWAPS ON EQUITY INDICES
| | | | | | | | | | | | | | | | | | | | | | | | | | | | | | | | | | |
| Counterparty | | Pay/Receive(1) | | Underlying Reference | | # of Units | | | Financing Rate | | Payment
Frequency | | Maturity
Date | | Notional
Amount | | | Premiums
Paid/(Received) | | | Unrealized
Appreciation/
(Depreciation) | | | Swap Agreements,
at Value | |
| | Asset | | | Liability | |
JPM | | Receive | | FNRETR Index | | | 10 | | | 1.510% (1-Month USD-LIBOR plus a specified spread) | | Monthly | | 08/24/2022 | | $ | 212 | | | $ | 0 | | | $ | 0 | | | $ | 0 | | | $ | 0 | |
| | Receive | | FNRETR Index | | | 35 | | | 1.980% (1-Month USD-LIBOR plus a specified spread) | | Monthly | | 02/22/2023 | | | 742 | | | | 0 | | | | (1 | ) | | | 0 | | | | (1 | ) |
| | | | | | | | | | | | | | | | | | | | | | | | |
Total Swap Agreements | | | $ | 0 | | | $ | (1 | ) | | $ | 0 | | | $ | (1 | ) |
| | | | | | | | | | | | | | | | | |
FINANCIAL DERIVATIVE INSTRUMENTS: OVER THE COUNTER SUMMARY
The following is a summary by counterparty of the market value of OTC financial derivative instruments and collateral pledged/(received) as of June 30, 2022:
| | | | | | | | | | | | | | | | | | | | | | | | | | | | | | | | | | | | | | | | | | | | | | | | |
| | | Financial Derivative Assets | | | | | | Financial Derivative Liabilities | | | | | | | | | | |
| Counterparty | | Forward
Foreign
Currency
Contracts | | | Purchased
Options | | | Swap
Agreements | | | Total
Over the
Counter | | | | | | Forward
Foreign
Currency
Contracts | | | Written
Options | | | Swap
Agreements | | | Total
Over the
Counter | | | Net Market
Value of OTC
Derivatives | | | Collateral
Pledged/
(Received) | | | Net
Exposure(2) | |
JPM | | $ | 0 | | | $ | 0 | | | $ | 0 | | | $ | 0 | | | | | | | $ | 0 | | | $ | 0 | | | $ | (1 | ) | | $ | (1 | ) | | $ | (1 | ) | | $ | 0 | | | $ | (1 | ) |
| | | | | | | | | | | | | | | | | | | | | | | | | | | | | | | | | | | | | | | | | | | | | | | | |
Total Over the Counter | | $ | 0 | | | $ | 0 | | | $ | 0 | | | $ | 0 | | | | | | | $ | 0 | | | $ | 0 | | | $ | (1 | ) | | $ | (1 | ) | | | | | | | | | | | | |
| | | | | | | | | | | | | | | | | | | | | | | | | | | | | | | | | | | | | | | | | | | | | | | | |
| (1) | Receive represents that the Fund receives payments for any positive net return on the underlying reference. The Fund makes payments for any negative net return on such underlying reference. Pay represents that the Fund receives payments for any negative net return on the underlying reference. The Fund makes payments for any positive net return on such underlying reference. |
| (2) | Net Exposure represents the net receivable/(payable) that would be due from/to the counterparty in the event of default. Exposure from OTC financial derivative instruments can only be netted across transactions governed under the same master agreement with the same legal entity. See Note 8, Master Netting Arrangements, in the Notes to Financial Statements for more information. |
| | | | | | | | | | | | |
| See Accompanying Notes | | | ANNUAL REPORT | | | | | | | JUNE 30, 2022 | | | 65 |
| | | | | | |
| Schedule of Investments | | PIMCO REALPATH® Blend 2060 Fund | | (Cont.) | | June 30, 2022 |
FAIR VALUE OF FINANCIAL DERIVATIVE INSTRUMENTS
The following is a summary of the fair valuation of the Fund’s derivative instruments categorized by risk exposure. See Note 7, Principal and Other Risks, in the Notes to Financial Statements on risks of the Fund.
Fair Values of Financial Derivative Instruments on the Statements of Assets and Liabilities as of June 30, 2022:
| | | | | | | | | | | | | | | | | | | | | | | | |
| | | Derivatives not accounted for as hedging instruments | |
| | | Commodity
Contracts | | | Credit
Contracts | | | Equity
Contracts | | | Foreign
Exchange
Contracts | | | Interest
Rate Contracts | | | Total | |
Financial Derivative Instruments - Liabilities | |
Over the counter | |
Swap Agreements | | $ | 0 | | | $ | 0 | | | $ | 1 | | | $ | 0 | | | $ | 0 | | | $ | 1 | |
| | | | | | | | | | | | | | | | | | | | | | | | |
The effect of Financial Derivative Instruments on the Statements of Operations for the period ended June 30, 2022:
| | | | | | | | | | | | | | | | | | | | | | | | |
| | | Derivatives not accounted for as hedging instruments | |
| | | Commodity
Contracts | | | Credit
Contracts | | | Equity
Contracts | | | Foreign
Exchange
Contracts | | | Interest
Rate Contracts | | | Total | |
Net Realized (Loss) on Financial Derivative Instruments | |
Over the counter | |
Swap Agreements | | $ | 0 | | | $ | 0 | | | $ | (75 | ) | | $ | 0 | | | $ | 0 | | | $ | (75 | ) |
| | | | | | | | | | | | | | | | | | | | | | | | |
|
Net Change in Unrealized (Depreciation) on Financial Derivative Instruments | |
Over the counter | |
Swap Agreements | | $ | 0 | | | $ | 0 | | | $ | (1 | ) | | $ | 0 | | | $ | 0 | | | $ | (1 | ) |
| | | | | | | | | | | | | | | | | | | | | | | | |
FAIR VALUE MEASUREMENTS
The following is a summary of the fair valuations according to the inputs used as of June 30, 2022 in valuing the Fund’s assets and liabilities:
| | | | | | | | | | | | | | | | |
| Category and Subcategory | | Level 1 | | | Level 2 | | | Level 3 | | | Fair
Value at
06/30/2022 | |
Investments in Securities, at Value | |
Mutual Funds | | $ | 20,566 | | | $ | 0 | | | $ | 0 | | | $ | 20,566 | |
| | | | | | | | | | | | | | | | |
| | $ | 20,566 | | | $ | 0 | | | $ | 0 | | | $ | 20,566 | |
| | | | | | | | | | | | | | | | |
|
Investments in Affiliates, at Value | |
Mutual Funds | | | 1,523 | | | | 0 | | | | 0 | | | | 1,523 | |
Short-Term Instruments | |
Central Funds Used for Cash Management Purposes | | | 902 | | | | 0 | | | | 0 | | | | 902 | |
| | | | | | | | | | | | | | | | |
| | $ | 2,425 | | | $ | 0 | | | $ | 0 | | | $ | 2,425 | |
| | | | | | | | | | | | | | | | |
| | | | |
Total Investments | | $ | 22,991 | | | $ | 0 | | | $ | 0 | | | $ | 22,991 | |
| | | | | | | | | | | | | | | | |
| | | | | | | | | | | | | | | | |
| Category and Subcategory | | Level 1 | | | Level 2 | | | Level 3 | | | Fair
Value at
06/30/2022 | |
Financial Derivative Instruments - Liabilities | |
Over the counter | | $ | 0 | | | $ | (1 | ) | | $ | 0 | | | $ | (1 | ) |
| | | | | | | | | | | | | | | | |
| | | | |
Total Financial Derivative Instruments | | $ | 0 | | | $ | (1 | ) | | $ | 0 | | | $ | (1 | ) |
| | | | | | | | | | | | | | | | |
| | | | |
Totals | | $ | 22,991 | | | $ | (1 | ) | | $ | 0 | | | $ | 22,990 | |
| | | | | | | | | | | | | | | | |
There were no significant transfers into or out of Level 3 during the period ended June 30, 2022.
| | | | | | |
| 66 | | PIMCO EQUITY SERIES | | | See Accompanying Notes | |
| | | | | | |
| Schedule of Investments | | PIMCO REALPATH® Blend Income Fund | | | | June 30, 2022 |
(Amounts in thousands*, except number of shares, contracts, units and ounces, if any)
| | | | | | | | | | | | |
| | | | | SHARES | | | | | MARKET
VALUE
(000S) | |
| INVESTMENTS IN SECURITIES 41.7% | |
| |
| MUTUAL FUNDS 41.2% | |
| | | | |
Vanguard Developed Markets Index Fund ‘Institutional’ | | | | 2,686,661 | | | $ | | | | 35,196 | |
| | | | |
Vanguard Emerging Markets Stock Index Fund ‘Institutional’ | | | | 438,169 | | | | | | | 11,515 | |
| | | | |
Vanguard Institutional Index Fund ‘Institutional’ | | | | 135,847 | | | | | | | 43,554 | |
| | | | |
Vanguard Small-Cap Index Fund ‘Institutional’ | | | | 27,658 | | | | | | | 2,334 | |
| | | | | | | | | | | | |
Total Mutual Funds (Cost $87,381) | | | | 92,599 | |
| | | | | | | | | | | | |
| |
| | | | | PRINCIPAL
AMOUNT
(000S) | | | | | | |
| SHORT-TERM INSTRUMENTS 0.5% | |
| |
REPURCHASE AGREEMENTS (d) 0.2%
| |
| | | | | | | | | | | 550 | |
| | | | | | | | | | | | |
| |
| U.S. TREASURY BILLS 0.3% | |
0.989% due 07/26/2022 - 08/18/2022 (a)(b)(g) | | $ | | 631 | | | | | | | 630 | |
| | | | | | | | | | | | |
Total Short-Term Instruments
(Cost $1,180) | | | | | | | 1,180 | |
| | | | | | | | | | | | |
|
| |
Total Investments in Securities
(Cost $88,561) | | | | | | | 93,779 | |
| | | | | | | | | | | | |
| | | | | | | | | | | | |
| | | | | SHARES | | | | | MARKET
VALUE
(000S) | |
| INVESTMENTS IN AFFILIATES 56.4% | |
| |
| MUTUAL FUNDS (c) 54.9% | |
| | | | |
PIMCO Emerging Markets Local Currency and Bond Fund | | | | 2,259,658 | | | $ | | | | 11,863 | |
| | | | |
PIMCO High Yield Fund | | | | 739,540 | | | | | | | 5,613 | |
| | | | |
PIMCO Income Fund | | | | 3,367,095 | | | | | | | 35,725 | |
| | | | |
PIMCO International Bond Fund (U.S. Dollar-Hedged) | | | | 685,239 | | | | | | | 6,681 | |
| | | | |
PIMCO Long-Term Real Return Fund | | | | 2,357,853 | | | | | | | 12,072 | |
| | | | |
PIMCO Long-Term U.S. Government Fund | | | | 2,989,094 | | | | | | | 12,614 | |
| | | | |
PIMCO Real Return Fund | | | | 816,013 | | | | | | | 8,748 | |
| | | | |
PIMCO Total Return Fund | | | | 3,350,892 | | | | | | | 30,158 | |
| | | | | | | | | | | | |
| Total Mutual Funds (Cost $145,840) | | | | | | | 123,474 | |
| | | | | | | | | | | | |
| |
| | | | | | | | | | | | |
| | | | | SHARES | | | | | MARKET
VALUE
(000S) | |
| SHORT-TERM INSTRUMENTS 1.5% | |
| |
| CENTRAL FUNDS USED FOR CASH MANAGEMENT PURPOSES 1.5% | |
| | | | |
PIMCO Short-Term
Floating NAV Portfolio III | | | | | 340,358 | | | $ | | | 3,303 | |
| | | | | | | | | | | | |
Total Short-Term Instruments
(Cost $3,302) | | | | | | 3,303 | |
| | | | | | | | | | | | |
| | | | |
| | | | | | | | | | | | |
Total Investments in Affiliates
(Cost $149,142) | | | | | | 126,777 | |
| | | | |
| | | | | | | | | | | | |
Total Investments 98.1%
(Cost $237,703) | | | $ | | | 220,556 | |
| |
Financial Derivative
Instruments (e)(f) 0.6%
(Cost or Premiums, net $1,260) | | | | | | 1,294 | |
| |
| Other Assets and Liabilities, net 1.3% | | | | | | 2,983 | |
| | | | | | | | | | | | |
| Net Assets 100.0% | | | | | | | | $ | | | 224,833 | |
| | | | | | | | | | | | |
NOTES TO SCHEDULE OF INVESTMENTS:
| * | A zero balance may reflect actual amounts rounding to less than one thousand. |
| (a) | Coupon represents a weighted average yield to maturity. |
| (c) | Institutional Class Shares of each Fund. |
BORROWINGS AND OTHER FINANCING TRANSACTIONS
(d) REPURCHASE AGREEMENTS:
| | | | | | | | | | | | | | | | | | | | | | | | | | | | | | |
| Counterparty | | Lending
Rate | | | Settlement
Date | | | Maturity
Date | | | Principal
Amount | | | Collateralized By | | Collateral
(Received) | | | Repurchase
Agreements,
at Value | | | Repurchase
Agreement
Proceeds
to be
Received(1) | |
| FICC | | | 0.400 | % | | | 06/30/2022 | | | | 07/01/2022 | | | $ | 550 | | | U.S. Treasury Notes 3.000% due 06/30/2024 | | $ | (561 | ) | | $ | 550 | | | $ | 550 | |
| | | | | | | | | | | | | | | | | | | | | | | | | | | | | | |
Total Repurchase Agreements | | | | | $ | (561 | ) | | $ | 550 | | | $ | 550 | |
| | | | | | | | | | | | | | | | | | | | | | | | | | | | | | |
BORROWINGS AND OTHER FINANCING TRANSACTIONS SUMMARY
The following is a summary by counterparty of the market value of Borrowings and Other Financing Transactions and collateral pledged/(received) as of June 30, 2022:
| | | | | | | | | | | | | | | | | | | | | | | | |
| Counterparty | | Repurchase
Agreement
Proceeds
to be
Received(1) | | | Payable for
Reverse
Repurchase
Agreements | | | Payable for
Sale-Buyback
Transactions | | | Total
Borrowings and
Other Financing
Transactions | | | Collateral
Pledged/(Received) | | | Net Exposure(2) | |
Global/Master Repurchase Agreement | |
FICC | | $ | 550 | | | $ | 0 | | | $ | 0 | | | $ | 550 | | | $ | (561 | ) | | $ | (11 | ) |
| | | | | | | | | | | | | | | | | | | | | | | | |
Total Borrowings and Other Financing Transactions | | $ | 550 | | | $ | 0 | | | $ | 0 | | | | | | | | | | | | | |
| | | | | | | | | | | | | | | | | | | | | | | | |
| (1) | Includes accrued interest. |
| (2) | Net Exposure represents the net receivable/(payable) that would be due from/to the counterparty in the event of default. Exposure from borrowings and other financing transactions can only be netted across transactions governed under the same master agreement with the same legal entity. See Note 8, Master Netting Arrangements, in the Notes to Financial Statements for more information. |
| | | | | | | | | | | | |
| See Accompanying Notes | | | ANNUAL REPORT | | | | | | | JUNE 30, 2022 | | | 67 |
| | | | | | |
| Schedule of Investments | | PIMCO REALPATH® Blend Income Fund | | (Cont.) | | |
(e) FINANCIAL DERIVATIVE INSTRUMENTS: EXCHANGE-TRADED OR CENTRALLY CLEARED
PURCHASED OPTIONS:
OPTIONS ON INDICES
| | | | | | | | | | | | | | | | | | | | | | | | |
| Description | | Strike
Value | | | Expiration
Date | | | # of
Contracts | | | Notional
Amount | | | Cost | | | Market
Value | |
Put - CBOE S&P 500 | | | 3,100.000 | | | | 09/16/2022 | | | | 21 | | | $ | 2 | | | $ | 167 | | | $ | 58 | |
Put - CBOE S&P 500 | | | 3,425.000 | | | | 09/16/2022 | | | | 21 | | | | 2 | | | | 247 | | | | 147 | |
Put - CBOE S&P 500 | | | 3,175.000 | | | | 12/16/2022 | | | | 13 | | | | 1 | | | | 117 | | | | 110 | |
Put - CBOE S&P 500 | | | 3,525.000 | | | | 12/16/2022 | | | | 25 | | | | 3 | | | | 333 | | | | 402 | |
Put - CBOE S&P 500 | | | 3,050.000 | | | | 03/17/2023 | | | | 13 | | | | 1 | | | | 111 | | | | 130 | |
Put - CBOE S&P 500 | | | 3,375.000 | | | | 03/17/2023 | | | | 26 | | | | 3 | | | | 326 | | | | 428 | |
Put - CBOE S&P 500 | | | 2,850.000 | | | | 06/16/2023 | | | | 42 | | | | 4 | | | | 472 | | | | 407 | |
| | | | | | | | | | | | | | | | | | | | | | | | |
Total Purchased Options | | | $ | 1,773 | | | $ | 1,682 | |
| | | | | | | | | | | | | | | | | | | | | | | | |
WRITTEN OPTIONS:
OPTIONS ON INDICES
| | | | | | | | | | | | | | | | | | | | | | | | |
| Description | | Strike
Value | | | Expiration
Date | | | # of
Contracts | | | Notional
Amount | | | Premiums
(Received) | | | Market
Value | |
Put - CBOE S&P 500 | | | 2,600.000 | | | | 09/16/2022 | | | | 21 | | | $ | 2 | | | $ | (85 | ) | | $ | (19 | ) |
Put - CBOE S&P 500 | | | 2,625.000 | | | | 12/16/2022 | | | | 25 | | | | 3 | | | | (117 | ) | | | (80 | ) |
Put - CBOE S&P 500 | | | 2,500.000 | | | | 03/17/2023 | | | | 26 | | | | 3 | | | | (115 | ) | | | (114 | ) |
Put - CBOE S&P 500 | | | 2,200.000 | | | | 06/16/2023 | | | | 42 | | | | 4 | | | | (196 | ) | | | (165 | ) |
| | | | | | | | | | | | | | | | | | | | | | | | |
Total Written Options | | | $ | (513 | ) | | $ | (378 | ) |
| | | | | | | | | | | | | | | | | | | | | | | | |
FINANCIAL DERIVATIVE INSTRUMENTS: EXCHANGE-TRADED OR CENTRALLY CLEARED SUMMARY
The following is a summary of the market value and variation margin of Exchange-Traded or Centrally Cleared Financial Derivative Instruments as of June 30, 2022:
| | | | | | | | | | | | | | | | | | | | | | | | | | | | | | | | | | | | |
| | | Financial Derivative Assets | | | | | | Financial Derivative Liabilities | |
| | | Market Value | | | Variation Margin
Asset | | | | | | | | | Market Value | | | Variation Margin
Liability | | | | |
| | | Purchased
Options | | | Futures | | | Swap
Agreements | | | Total | | | | | | Written
Options | | | Futures | | | Swap
Agreements | | | Total | |
Total Exchange-Traded or Centrally Cleared | | $ | 1,682 | | | $ | 0 | | | $ | 0 | | | $ | 1,682 | | | | | | | $ | (378) | | | $ | 0 | | | $ | 0 | | | $ | (378) | |
| | | | | | | | | | | | | | | | | | | | | | | | | | | | | | | | | | | | |
(f) FINANCIAL DERIVATIVE INSTRUMENTS: OVER THE COUNTER
SWAP AGREEMENTS:
TOTAL RETURN SWAPS ON EQUITY INDICES
| | | | | | | | | | | | | | | | | | | | | | | | | | | | | | | | | | |
| Counterparty | | Pay/Receive(1) | | Underlying Reference | | # of Units | | | Financing Rate | | Payment
Frequency | | Maturity
Date | | Notional
Amount | | | Premiums
Paid/(Received) | | | Unrealized
Appreciation/
(Depreciation) | | | Swap Agreements,
at Value | |
| | Asset | | | Liability | |
JPM | | Receive | | FNRETR Index | | | 109 | | | 1.510% (1-Month USD-LIBOR plus a specified spread) | | Monthly | | 08/24/2022 | | $ | 2,310 | | | $ | 0 | | | $ | (3 | ) | | $ | 0 | | | $ | (3 | ) |
| | Receive | | FNRETR Index | | | 274 | | | 1.980% (1-Month USD-LIBOR plus a specified spread) | | Monthly | | 02/22/2023 | | | 5,808 | | | | 0 | | | | (7 | ) | | | 0 | | | | (7 | ) |
| | | | | | | | | | | | | | | | | | | | | | | | |
Total Swap Agreements | | | $ | 0 | | | $ | (10 | ) | | $ | 0 | | | $ | (10 | ) |
| | | | | | | | | | | | | | | | | |
FINANCIAL DERIVATIVE INSTRUMENTS: OVER THE COUNTER SUMMARY
The following is a summary by counterparty of the market value of OTC financial derivative instruments and collateral pledged/(received) as of June 30, 2022:
| | | | | | | | | | | | | | | | | | | | | | | | | | | | | | | | | | | | | | | | | | | | | | | | |
| | | Financial Derivative Assets | | | | | | Financial Derivative Liabilities | | | | | | | | | | |
| Counterparty | | Forward
Foreign
Currency
Contracts | | | Purchased
Options | | | Swap
Agreements | | | Total
Over the
Counter | | | | | | Forward
Foreign
Currency
Contracts | | | Written
Options | | | Swap
Agreements | | | Total
Over the
Counter | | | Net Market
Value of OTC
Derivatives | | | Collateral
Pledged/ (Received) | | | Net
Exposure(2) | |
JPM | | $ | 0 | | | $ | 0 | | | $ | 0 | | | $ | 0 | | | | | | | $ | 0 | | | $ | 0 | | | $ | (10 | ) | | $ | (10 | ) | | $ | (10 | ) | | $ | 630 | | | $ | 620 | |
| | | | | | | | | | | | | | | | | | | | | | | | | | | | | | | | | | | | | | | | | | | | | | | | |
Total Over the Counter | | $ | 0 | | | $ | 0 | | | $ | 0 | | | $ | 0 | | | | | | | $ | 0 | | | $ | 0 | | | $ | (10 | ) | | $ | (10 | ) | | | | | | | | | | | | |
| | | | | | | | | | | | | | | | | | | | | | | | | | | | | | | | | | | | | | | | | | | | | | | | |
| | | | | | |
| 68 | | PIMCO EQUITY SERIES | | | See Accompanying Notes | |
| (g) | Securities with an aggregate market value of $630 have been pledged as collateral for financial derivative instruments as governed by International Swaps and Derivatives Association, Inc. master agreements as of June 30, 2022. |
| (1) | Receive represents that the Fund receives payments for any positive net return on the underlying reference. The Fund makes payments for any negative net return on such underlying reference. Pay represents that the Fund receives payments for any negative net return on the underlying reference. The Fund makes payments for any positive net return on such underlying reference. |
| (2) | Net Exposure represents the net receivable/(payable) that would be due from/to the counterparty in the event of default. Exposure from OTC financial derivative instruments can only be netted across transactions governed under the same master agreement with the same legal entity. See Note 8, Master Netting Arrangements, in the Notes to Financial Statements for more information. |
FAIR VALUE OF FINANCIAL DERIVATIVE INSTRUMENTS
The following is a summary of the fair valuation of the Fund’s derivative instruments categorized by risk exposure. See Note 7, Principal and Other Risks, in the Notes to Financial Statements on risks of the Fund.
Fair Values of Financial Derivative Instruments on the Statements of Assets and Liabilities as of June 30, 2022:
| | | | | | | | | | | | | | | | | | | | | | | | |
| | | Derivatives not accounted for as hedging instruments | |
| | | Commodity
Contracts | | | Credit
Contracts | | | Equity
Contracts | | | Foreign
Exchange
Contracts | | | Interest
Rate Contracts | | | Total | |
Financial Derivative Instruments - Assets | |
Exchange-traded or centrally cleared | |
Purchased Options | | $ | 0 | | | $ | 0 | | | $ | 1,682 | | | $ | 0 | | | $ | 0 | | | $ | 1,682 | |
| | | | | | | | | | | | | | | | | | | | | | | | |
|
Financial Derivative Instruments - Liabilities | |
Exchange-traded or centrally cleared | |
Written Options | | $ | 0 | | | $ | 0 | | | $ | 378 | | | $ | 0 | | | $ | 0 | | | $ | 378 | |
| | | | | | | | | | | | | | | | | | | | | | | | |
Over the counter | |
Swap Agreements | | $ | 0 | | | $ | 0 | | | $ | 10 | | | $ | 0 | | | $ | 0 | | | $ | 10 | |
| | | | | | | | | | | | | | | | | | | | | | | | |
| | $ | 0 | | | $ | 0 | | | $ | 388 | | | $ | 0 | | | $ | 0 | | | $ | 388 | |
| | | | | | | | | | | | | | | | | | | | | | | | |
The effect of Financial Derivative Instruments on the Statements of Operations for the period ended June 30, 2022:
| | | | | | | | | | | | | | | | | | | | | | | | |
| | | Derivatives not accounted for as hedging instruments | |
| | | Commodity
Contracts | | | Credit
Contracts | | | Equity
Contracts | | | Foreign
Exchange
Contracts | | | Interest
Rate Contracts | | | Total | |
Net Realized Gain (Loss) on Financial Derivative Instruments | |
Exchange-traded or centrally cleared | |
Purchased Options | | $ | 0 | | | $ | 0 | | | $ | (1,402 | ) | | $ | 0 | | | $ | 0 | | | $ | (1,402 | ) |
Written Options | | | 0 | | | | 0 | | | | 272 | | | | 0 | | | | 0 | | | | 272 | |
| | | | | | | | | | | | | | | | | | | | | | | | |
| | $ | 0 | | | $ | 0 | | | $ | (1,130 | ) | | $ | 0 | | | $ | 0 | | | $ | (1,130 | ) |
| | | | | | | | | | | | | | | | | | | | | | | | |
Over the counter | |
Swap Agreements | | $ | 0 | | | $ | 0 | | | $ | (323 | ) | | $ | 0 | | | $ | 0 | | | $ | (323 | ) |
| | | | | | | | | | | | | | | | | | | | | | | | |
| | $ | 0 | | | $ | 0 | | | $ | (1,453 | ) | | $ | 0 | | | $ | 0 | | | $ | (1,453 | ) |
| | | | | | | | | | | | | | | | | | | | | | | | |
|
Net Change in Unrealized Appreciation (Depreciation) on Financial Derivative Instruments | |
Exchange-traded or centrally cleared | |
Purchased Options | | $ | 0 | | | $ | 0 | | | $ | 844 | | | $ | 0 | | | $ | 0 | | | $ | 844 | |
Written Options | | | 0 | | | | 0 | | | | (76 | ) | | | 0 | | | | 0 | | | | (76 | ) |
| | | | | | | | | | | | | | | | | | | | | | | | |
| | $ | 0 | | | $ | 0 | | | $ | 768 | | | $ | 0 | | | $ | 0 | | | $ | 768 | |
| | | | | | | | | | | | | | | | | | | | | | | | |
Over the counter | |
Swap Agreements | | $ | 0 | | | $ | 0 | | | $ | (6 | ) | | $ | 0 | | | $ | 0 | | | $ | (6 | ) |
| | | | | | | | | | | | | | | | | | | | | | | | |
| | $ | 0 | | | $ | 0 | | | $ | 762 | | | $ | 0 | | | $ | 0 | | | $ | 762 | |
| | | | | | | | | | | | | | | | | | | | | | | | |
| | | | | | | | | | | | |
| See Accompanying Notes | | | ANNUAL REPORT | | | | | | | JUNE 30, 2022 | | | 69 |
| | | | | | |
| Schedule of Investments | | PIMCO REALPATH® Blend Income Fund | | (Cont.) | | June 30, 2022 |
FAIR VALUE MEASUREMENTS
The following is a summary of the fair valuations according to the inputs used as of June 30, 2022 in valuing the Fund’s assets and liabilities:
| | | | | | | | | | | | | | | | |
| Category and Subcategory | | Level 1 | | | Level 2 | | | Level 3 | | | Fair Value at
06/30/2022 | |
Investments in Securities, at Value | |
Mutual Funds | | $ | 92,599 | | | $ | 0 | | | $ | 0 | | | $ | 92,599 | |
Short-Term Instruments | |
Repurchase Agreements | | | 0 | | | | 550 | | | | 0 | | | | 550 | |
U.S. Treasury Bills | | | 0 | | | | 630 | | | | 0 | | | | 630 | |
| | | | | | | | | | | | | | | | |
| | $ | 92,599 | | | $ | 1,180 | | | $ | 0 | | | $ | 93,779 | |
| | | | | | | | | | | | | | | | |
|
Investments in Affiliates, at Value | |
Mutual Funds | | | 123,474 | | | | 0 | | | | 0 | | | | 123,474 | |
Short-Term Instruments | |
Central Funds Used for Cash Management Purposes | | | 3,303 | | | | 0 | | | | 0 | | | | 3,303 | |
| | | | | | | | | | | | | | | | |
| | $ | 126,777 | | | $ | 0 | | | $ | 0 | | | $ | 126,777 | |
| | | | | | | | | | | | | | | | |
| | | | |
Total Investments | | $ | 219,376 | | | $ | 1,180 | | | $ | 0 | | | $ | 220,556 | |
| | | | | | | | | | | | | | | | |
| | | | | | | | | | | | | | | | |
| Category and Subcategory | | Level 1 | | | Level 2 | | | Level 3 | | | Fair Value at
06/30/2022 | |
Financial Derivative Instruments - Assets | |
Exchange-traded or centrally cleared | | $ | 0 | | | $ | 1,682 | | | $ | 0 | | | $ | 1,682 | |
| | | | | | | | | | | | | | | | |
|
Financial Derivative Instruments - Liabilities | |
Exchange-traded or centrally cleared | | | 0 | | | | (378 | ) | | | 0 | | | | (378 | ) |
Over the counter | | | 0 | | | | (10 | ) | | | 0 | | | | (10 | ) |
| | | | | | | | | | | | | | | | |
| | $ | 0 | | | $ | (388 | ) | | $ | 0 | | | $ | (388 | ) |
| | | | | | | | | | | | | | | | |
| | | | |
Total Financial Derivative Instruments | | $ | 0 | | | $ | 1,294 | | | $ | 0 | | | $ | 1,294 | |
| | | | | | | | | | | | | | | | |
| | | | |
Totals | | $ | 219,376 | | | $ | 2,474 | | | $ | 0 | | | $ | 221,850 | |
| | | | | | | | | | | | | | | | |
There were no significant transfers into or out of Level 3 during the period ended June 30, 2022.
| | | | | | |
| 70 | | PIMCO EQUITY SERIES | | | See Accompanying Notes | |
| | | | |
| Notes to Financial Statements | | | | June 30, 2022 |
1. ORGANIZATION
PIMCO Equity Series (the “Trust”) was established as a Delaware statutory trust on March 30, 2010. The Trust is registered under the Investment Company Act of 1940, as amended (the “Act”), as an open-end management investment company. Information presented in these financial statements pertains to the Institutional Class, Administrative Class, and Class A shares of the funds (each a “Fund” and collectively the “Funds”) indicated on the cover of this report. Pacific Investment Management Company LLC (“PIMCO”) serves as the investment adviser (the “Adviser”) for the Funds. Each Fund may invest substantially all of its assets in Institutional Class or Class M shares of any funds of the Trust and PIMCO Funds, and in other affiliated funds, including funds of PIMCO ETF Trust, except funds of funds and PIMCO California Municipal Intermediate Value Fund, PIMCO California Municipal Opportunistic Value Fund, PIMCO National Municipal Intermediate Value Fund and PIMCO National Municipal Opportunistic Value Fund (“Underlying PIMCO Funds”), and unaffiliated funds that are registered under the Act (collectively, “Acquired Funds”).
2. SIGNIFICANT ACCOUNTING POLICIES
The following is a summary of significant accounting policies consistently followed by the Trust in the preparation of its financial statements in conformity with accounting principles generally accepted in the United States of America (“U.S. GAAP”). Each Fund is treated as an investment company under the reporting requirements of U.S. GAAP. The functional and reporting currency for the Funds is the U.S. dollar. The preparation of financial statements in accordance with U.S. GAAP requires management to make estimates and assumptions that affect the reported amounts of assets and liabilities and disclosure of contingent assets and liabilities at the date of the financial statements and the reported amounts of increases and decreases in net assets from operations during the reporting period. Actual results could differ from those estimates.
(a) Securities Transactions and Investment Income Securities transactions are recorded as of the trade date for financial reporting purposes. Securities purchased or sold on a when-issued or delayed-delivery basis may be settled beyond a standard settlement period for the security after the trade date. Realized gains (losses) from securities sold are recorded on the identified cost basis. Dividend income is recorded on the ex-dividend date, except certain dividends from foreign securities where the ex-dividend date may have passed, which are recorded as soon as a Fund is informed of the ex-dividend date. Interest income, adjusted for the accretion of discounts and amortization of premiums, is recorded on the accrual basis from settlement date, with the exception of securities with a forward starting effective date, where interest income is recorded on the accrual basis from effective date. For convertible securities, premiums attributable to
the conversion feature are not amortized. Estimated tax liabilities on certain foreign securities are recorded on an accrual basis and are reflected as components of interest income or net change in unrealized appreciation (depreciation) on investments on the Statements of Operations, as appropriate. Tax liabilities realized as a result of such security sales are reflected as a component of net realized gain (loss) on investments on the Statements of Operations. Paydown gains (losses) on mortgage-related and other asset-backed securities, if any, are recorded as components of interest income on the Statements of Operations. Income or short-term capital gain distributions received from registered investment companies, if any, are recorded as dividend income. Long-term capital gain distributions received from registered investment companies, if any, are recorded as realized gains.
(b) Multi-Class Operations Each class offered by the Trust has equal rights as to assets and voting privileges (except that shareholders of a class have exclusive voting rights regarding any matter relating solely to that class of shares). Income and non-class specific expenses are allocated daily to each class on the basis of the relative net assets. Realized and unrealized capital gains (losses) are allocated daily based on the relative net assets of each class of the respective Fund. Class specific expenses, where applicable, currently include supervisory and administrative and distribution and servicing fees. Under certain circumstances, the per share net asset value (“NAV”) of a class of the respective Fund’s shares may be different from the per share NAV of another class of shares as a result of the different daily expense accruals applicable to each class of shares.
(c) Distributions to Shareholders The following table shows the anticipated frequency of distributions from net investment income, if any, for each Fund.
| | | | | | | | | | | | |
| | | | Distribution Frequency | |
| | | |
| Fund Name | | | | | Declared | | | Distributed | |
| | | |
PIMCO REALPATH® Blend 2025 Fund | | | | | | | Quarterly | | | | Quarterly | |
| | | |
PIMCO REALPATH® Blend 2030 Fund | | | | | | | Quarterly | | | | Quarterly | |
| | | |
PIMCO REALPATH® Blend 2035 Fund | | | | | | | Quarterly | | | | Quarterly | |
| | | |
PIMCO REALPATH® Blend 2040 Fund | | | | | | | Quarterly | | | | Quarterly | |
| | | |
PIMCO REALPATH® Blend 2045 Fund | | | | | | | Quarterly | | | | Quarterly | |
| | | |
PIMCO REALPATH® Blend 2050 Fund | | | | | | | Quarterly | | | | Quarterly | |
| | | |
PIMCO REALPATH® Blend 2055 Fund | | | | | | | Quarterly | | | | Quarterly | |
| | | |
PIMCO REALPATH® Blend 2060 Fund | | | | | | | Quarterly | | | | Quarterly | |
| | | |
PIMCO REALPATH® Blend Income Fund | | | | | | | Quarterly | | | | Quarterly | |
In addition, each Fund distributes any net capital gains it earns from the sale of portfolio securities to shareholders no less frequently than annually. Net short-term capital gains may be paid more frequently.
Income distributions and capital gain distributions are determined in accordance with income tax regulations which may differ from U.S. GAAP. Differences between tax regulations and U.S. GAAP may cause
| | | | | | | | | | | | |
| | | | ANNUAL REPORT | | | | | | | JUNE 30, 2022 | | | 71 |
| | | | |
| Notes to Financial Statements | | (Cont.) | | |
timing differences between income and capital gain recognition. Further, the character of investment income and capital gains may be different for certain transactions under the two methods of accounting. As a result, income distributions and capital gain distributions declared during a fiscal period may differ significantly from the net investment income (loss) and realized gains (losses) reported on each Fund’s annual financial statements presented under U.S. GAAP.
Separately, if a Fund determines or estimates, as applicable, that a portion of a distribution may be comprised of amounts from sources other than net investment income in accordance with its policies, accounting records (if applicable), and accounting practices, the Fund will notify shareholders of the estimated composition of such distribution through a Section 19 Notice. For these purposes, a Fund determines or estimates, as applicable, the source or sources from which a distribution is paid, to the close of the period as of which it is paid, in reference to its internal accounting records and related accounting practices. If, based on such accounting records and practices, it is determined or estimated, as applicable, that a particular distribution does not include capital gains or paid-in surplus or other capital sources, a Section 19 Notice generally would not be issued. It is important to note that differences exist between a Fund’s daily internal accounting records and practices, a Fund’s financial statements presented in accordance with U.S. GAAP, and recordkeeping practices under income tax regulations. For instance, a Fund’s internal accounting records and practices may take into account, among other factors, tax-related characteristics of certain sources of distributions that differ from treatment under U.S. GAAP. Examples of such differences may include but are not limited to, for certain Funds, the treatment of periodic payments under interest rate swap contracts. Accordingly, among other consequences, it is possible that a Fund may not issue a Section 19 Notice in situations where the Fund’s financial statements prepared later and in accordance with U.S. GAAP and/or the final tax character of those distributions might later report that the sources of those distributions included capital gains and/or a return of capital. Please visit www.pimco.com for the most recent Section 19 Notice, if applicable, for additional information regarding the estimated composition of distributions. Final determination of a distribution’s tax character will be provided to shareholders when such information is available.
Distributions classified as a tax basis return of capital at a Fund’s fiscal year end, if any, are reflected on the Statements of Changes in Net Assets and have been recorded to paid in capital on the Statements of Assets and Liabilities. In addition, other amounts have been reclassified between distributable earnings (accumulated loss) and paid in capital on the Statements of Assets and Liabilities to more appropriately conform U.S. GAAP to tax characterizations of distributions.
(d) New Accounting Pronouncements and Regulatory Updates In March 2020, the Financial Accounting Standards Board issued an Accounting Standards Update (“ASU”), ASU 2020-04, which provides optional guidance to ease the potential accounting burden associated with transitioning away from the London Interbank Offered Rate and other reference rates that are expected to be discontinued. ASU 2020-04 is effective for certain reference rate-related contract modifications that occur during the period March 12, 2020 through December 31, 2022. In March 2021, the administrator for LIBOR announced the extension of the publication of a majority of the USD LIBOR settings to June 30, 2023. Management is continuously evaluating the potential effect a discontinuation of LIBOR could have on the Funds’ investments and has determined that it is unlikely the ASU’s adoption will have a material impact on the Funds’ financial statements.
In October 2020, the U.S. Securities and Exchange Commission (“SEC”) adopted a rule related to the use of derivatives, short sales, reverse repurchase agreements and certain other transactions by registered investment companies that rescinds and withdraws the guidance of the SEC and its staff regarding asset segregation and cover transactions that was applicable to the Funds as of the date of this report. Subject to certain exceptions, the rule requires funds to trade derivatives and other transactions that create future payment or delivery obligations (except reverse repurchase agreements and similar financing transactions) subject to a value-at-risk leverage limit, certain derivatives risk management program and reporting requirements. The rule went into effect on February 19, 2021. The compliance date for the new rule and the related reporting requirements is August 19, 2022. At this time, management is evaluating the implications of these changes on the financial statements.
In October 2020, the SEC adopted a rule regarding the ability of a fund to invest in other funds. The rule allows a fund to acquire shares of another fund in excess of certain limitations currently imposed by the Act without obtaining individual exemptive relief from the SEC, subject to certain conditions. The rule also includes the rescission of certain exemptive relief from the SEC and guidance from the SEC staff for funds to invest in other funds. The effective date for the rule was January 19, 2021, and the compliance date for the rule was January 19, 2022. Management has implemented changes in connection with the rule and has determined that there is no material impact to the Funds’ financial statements.
In December 2020, the SEC adopted a rule addressing fair valuation of fund investments. The new rule sets forth requirements for good faith determinations of fair value as well as for the performance of fair value determinations, including related oversight and reporting obligations. The new rule also defines “readily available market quotations” for purposes of the definition of “value” under the Act, and the SEC noted
that this definition would apply in all contexts under the Act. The effective date for the rule was March 8, 2021. The compliance date for the new rule and the associated recordkeeping requirements is September 8, 2022. At this time, management is evaluating the implications of these changes on the financial statements.
3. INVESTMENT VALUATION AND FAIR VALUE MEASUREMENTS
(a) Investment Valuation Policies The price of a Fund’s shares is based on the Fund’s NAV. The NAV of a Fund, or each of its share classes, as applicable, is determined by dividing the total value of portfolio investments and other assets, less any liabilities attributable to that Fund or class, by the total number of shares outstanding of that Fund or class.
On each day that the New York Stock Exchange (“NYSE”) is open, Fund shares are ordinarily valued as of the close of regular trading (normally 4:00 p.m., Eastern time) (“NYSE Close”). Information that becomes known to the Funds or their agents after the time as of which NAV has been calculated on a particular day will not generally be used to retroactively adjust the price of a security or the NAV determined earlier that day. If regular trading on the NYSE closes earlier than scheduled, each Fund reserves the right to either (i) calculate its NAV as of the earlier closing time or (ii) calculate its NAV as of the normally scheduled close of regular trading on the NYSE for that day. Each Fund generally does not calculate its NAV on days during which the NYSE is closed. However, if the NYSE is closed on a day it would normally be open for business, each Fund reserves the right to calculate its NAV as of the normally scheduled close of regular trading on the NYSE for that day or such other time that the Fund may determine.
For purposes of calculating NAV, portfolio securities and other assets for which market quotes are readily available are valued at market value. Market value is generally determined on the basis of official closing prices or the last reported sales prices, or if no sales are reported, based on quotes obtained from established market makers or prices (including evaluated prices) supplied by the Funds’ approved pricing services, quotation reporting systems and other third-party sources (together, “Pricing Services”). The Funds will normally use pricing data for domestic equity securities received shortly after the NYSE Close and do not normally take into account trading, clearances or settlements that take place after the NYSE Close. If market value pricing is used, a foreign (non-U.S.) equity security traded on a foreign exchange or on more than one exchange is typically valued using pricing information from the exchange considered by PIMCO to be the primary exchange. A foreign (non-U.S.) equity security will be valued as of the close of trading on the foreign exchange, or the NYSE Close, if the NYSE Close occurs before the end of trading on the foreign exchange. Domestic and foreign (non-U.S.) fixed income securities,
non-exchange traded derivatives, and equity options are normally valued on the basis of quotes obtained from brokers and dealers or Pricing Services using such data reflecting the principal markets for those securities. Prices obtained from Pricing Services may be based on, among other things, information provided by market makers or estimates of market values obtained from yield data relating to investments or securities with similar characteristics. Certain fixed income securities purchased on a delayed-delivery basis are marked to market daily until settlement at the forward settlement date. Exchange-traded options, except equity options, futures and options on futures are valued at the settlement price determined by the relevant exchange, quotes obtained from a quotation reporting system, established market makers or pricing services. Swap agreements are valued on the basis of market-based prices supplied by Pricing Services or quotes obtained from brokers and dealers. A Fund’s investments in open-end management investment companies, other than exchange-traded funds (“ETFs”), are valued at the NAVs of such investments. Open-end management investment companies may include affiliated funds.
If a foreign (non-U.S.) equity security’s value has materially changed after the close of the security’s primary exchange or principal market but before the NYSE Close, the security may be valued at fair value based on procedures established and approved by the Board of Trustees of the Trust (the “Board”). Foreign (non-U.S.) equity securities that do not trade when the NYSE is open are also valued at fair value. With respect to foreign (non-U.S.) equity securities, a Fund may determine the fair value of investments based on information provided by Pricing Services and other third-party vendors, which may recommend fair value or adjustments with reference to other securities, indices or assets. In considering whether fair valuation is required and in determining fair values, a Fund may, among other things, consider significant events (which may be considered to include changes in the value of U.S. securities or securities indices) that occur after the close of the relevant market and before the NYSE Close. A Fund may utilize modeling tools provided by third-party vendors to determine fair values of foreign (non-U.S.) securities. For these purposes, any movement in the applicable reference index or instrument (“zero trigger”) between the earlier close of the applicable foreign market and the NYSE Close may be deemed to be a significant event, prompting the application of the pricing model (effectively resulting in daily fair valuations). Foreign exchanges may permit trading in foreign (non-U.S.) equity securities on days when the Trust is not open for business, which may result in a Fund’s portfolio investments being affected when shareholders are unable to buy or sell shares.
Senior secured floating rate loans for which an active secondary market exists to a reliable degree are valued at the mean of the last available bid/ask prices in the market for such loans, as provided by a Pricing
| | | | | | | | | | | | |
| | | | ANNUAL REPORT | | | | | | | JUNE 30, 2022 | | | 73 |
| | | | |
| Notes to Financial Statements | | (Cont.) | | |
Service. Senior secured floating rate loans for which an active secondary market does not exist to a reliable degree are valued at fair value, which is intended to approximate market value. In valuing a senior secured floating rate loan at fair value, the factors considered may include, but are not limited to, the following: (a) the creditworthiness of the borrower and any intermediate participants, (b) the terms of the loan, (c) recent prices in the market for similar loans, if any, and (d) recent prices in the market for instruments of similar quality, rate, period until next interest rate reset and maturity.
Investments valued in currencies other than the U.S. dollar are converted to the U.S. dollar using exchange rates obtained from Pricing Services. As a result, the value of such investments and, in turn, the NAV of a Fund’s shares may be affected by changes in the value of currencies in relation to the U.S. dollar. The value of investments traded in markets outside the United States or denominated in currencies other than the U.S. dollar may be affected significantly on a day that the Trust is not open for business. As a result, to the extent that a Fund holds foreign (non-U.S.) investments, the value of those investments may change at times when shareholders are unable to buy or sell shares and the value of such investments will be reflected in the Fund’s next calculated NAV.
Investments for which market quotes or market based valuations are not readily available are valued at fair value as determined in good faith by the Board or persons acting at their direction. The Board has adopted methods for valuing securities and other assets in circumstances where market quotes are not readily available, and has delegated to the Adviser the responsibility for applying the fair valuation methods. In the event that market quotes or market based valuations are not readily available, and the security or asset cannot be valued pursuant to a Board approved valuation method, the value of the security or asset will be determined in good faith by the Board. Market quotes are considered not readily available in circumstances where there is an absence of current or reliable market-based data (e.g., trade information, bid/ask information, indicative market quotations (“Broker Quotes”), Pricing Services’ prices), including where events occur after the close of the relevant market, but prior to the NYSE Close, that materially affect the values of a Fund’s securities or assets. In addition, market quotes are considered not readily available when, due to extraordinary circumstances, the exchanges or markets on which the securities trade do not open for trading for the entire day and no other market prices are available. The Board has delegated, to the Adviser, the responsibility for monitoring significant events that may materially affect the values of a Fund’s securities or assets and for determining whether the value of the applicable securities or assets should be reevaluated in light of such significant events.
When a Fund (or, in each instance in this paragraph, as applicable, an Underlying PIMCO Fund or Acquired Fund) uses fair valuation to determine the value of a portfolio security or other asset for purposes of calculating its NAV, such investments will not be priced on the basis of quotes from the primary market in which they are traded, but rather may be priced by another method that the Board or persons acting at their direction believe reflects fair value. Fair valuation may require subjective determinations about the value of a security. While the Trust’s policy is intended to result in a calculation of a Fund’s NAV that fairly reflects security values as of the time of pricing, the Trust cannot ensure that fair values determined by the Board or persons acting at their direction would accurately reflect the price that a Fund could obtain for a security if it were to dispose of that security as of the time of pricing (for instance, in a forced or distressed sale). The prices used by a Fund may differ from the value that would be realized if the securities were sold. The Funds’ use of fair valuation may also help to deter “stale price arbitrage” as discussed under the “Abusive Trading Practices” section in each Fund’s prospectus.
(b) Fair Value Hierarchy U.S. GAAP describes fair value as the price that a Fund would receive to sell an asset or pay to transfer a liability in an orderly transaction between market participants at the measurement date. It establishes a fair value hierarchy that prioritizes inputs to valuation methods and requires disclosure of the fair value hierarchy, separately for each major category of assets and liabilities, that segregates fair value measurements into levels (Level 1, 2, or 3). The inputs or methodology used for valuing securities are not necessarily an indication of the risks associated with investing in those securities. Levels 1, 2, and 3 of the fair value hierarchy are defined as follows:
| ∎ | | Level 1 — Quoted prices in active markets or exchanges for identical assets and liabilities. |
| ∎ | | Level 2 — Significant other observable inputs, which may include, but are not limited to, quoted prices for similar assets or liabilities in markets that are active, quoted prices for identical or similar assets or liabilities in markets that are not active, inputs other than quoted prices that are observable for the assets or liabilities (such as interest rates, yield curves, volatilities, prepayment speeds, loss severities, credit risks and default rates) or other market corroborated inputs. |
| ∎ | | Level 3 — Significant unobservable inputs based on the best information available in the circumstances, to the extent observable inputs are not available, which may include assumptions made by the Board or persons acting at their direction that are used in determining the fair value of investments. |
In accordance with the requirements of U.S. GAAP, the amounts of transfers into and out of Level 3, if material, are disclosed in the Notes to Schedule of Investments for each respective Fund.
For fair valuations using significant unobservable inputs, U.S. GAAP requires a reconciliation of the beginning to ending balances for reported fair values that presents changes attributable to realized gain (loss), unrealized appreciation (depreciation), purchases and sales, accrued discounts (premiums), and transfers into and out of the Level 3 category during the period. The end of period value is used for the transfers between Levels of a Fund’s assets and liabilities. Additionally, U.S. GAAP requires quantitative information regarding the significant unobservable inputs used in the determination of fair value of assets or liabilities categorized as Level 3 in the fair value hierarchy. In accordance with the requirements of U.S. GAAP, a fair value hierarchy, and if material, a Level 3 reconciliation and details of significant unobservable inputs, have been included in the Notes to Schedule of Investments for each respective Fund.
(c) Valuation Techniques and the Fair Value Hierarchy
Level 1, Level 2 and Level 3 trading assets and trading liabilities, at fair value The valuation methods (or “techniques”) and significant inputs used in determining the fair values of portfolio securities or other assets and liabilities categorized as Level 1, Level 2 and Level 3 of the fair value hierarchy are as follows:
Common stocks, ETFs, exchange-traded notes and financial derivative instruments, such as futures contracts, rights and warrants, or options on futures that are traded on a national securities exchange, are stated at the last reported sale or settlement price on the day of valuation. To the extent these securities are actively traded and valuation adjustments are not applied, they are categorized as Level 1 of the fair value hierarchy.
Investments in registered open-end investment companies (other than ETFs) will be valued based upon the NAVs of such investments and are categorized as Level 1 of the fair value hierarchy. Investments in unregistered open-end investment companies will be calculated based upon the NAVs of such investments and are considered Level 1 provided that the NAVs are observable, calculated daily and are the value at which both purchases and sales will be conducted.
Equity exchange-traded options and over the counter financial derivative instruments, such as forward foreign currency contracts and options contracts derive their value from underlying asset prices, indices, reference rates, and other inputs or a combination of these factors. These contracts are normally valued on the basis of quotes obtained from a quotation reporting system, established market makers or Pricing Services (normally determined as of the NYSE Close). Depending on the product and the terms of the transaction, financial derivative instruments can be valued by Pricing Services using a series of techniques, including simulation pricing models. The pricing models use inputs that are observed from actively quoted markets such as quoted prices, issuer details, indices, bid/ask spreads, interest rates, implied volatilities, yield curves, dividends and exchange rates. Financial derivative instruments that use similar valuation techniques and inputs as described above are categorized as Level 2 of the fair value hierarchy.
Centrally cleared swaps and over the counter swaps derive their value from underlying asset prices, indices, reference rates, and other inputs or a combination of these factors. They are valued using a broker-dealer bid quotation or on market-based prices provided by Pricing Services (normally determined as of the NYSE Close). Centrally cleared swaps and over the counter swaps can be valued by Pricing Services using a series of techniques, including simulation pricing models. The pricing models may use inputs that are observed from actively quoted markets such as the overnight index swap rate, LIBOR forward rate, interest rates, yield curves and credit spreads. These securities are categorized as Level 2 of the fair value hierarchy.
When a fair valuation method is applied by the Adviser that uses significant unobservable inputs, investments will be priced by a method that the Board or persons acting at their direction believe reflects fair value and are categorized as Level 3 of the fair value hierarchy.
Short-term debt instruments (such as commercial paper) having a remaining maturity of 60 days or less may be valued at amortized cost, so long as the amortized cost value of such short-term debt instruments is approximately the same as the fair value of the instrument as determined without the use of amortized cost valuation. These securities are categorized as Level 2 or Level 3 of the fair value hierarchy depending on the source of the base price.
4. SECURITIES AND OTHER INVESTMENTS
(a) Investments in Affiliates
Each Fund may invest substantially all or a significant portion of its assets in Underlying PIMCO Funds and Acquired Funds. The Underlying PIMCO Funds are considered to be affiliated with the Funds. Each Fund may also invest in the PIMCO Short Asset Portfolio and the PIMCO Short-Term Floating NAV Portfolio III (“Central Funds”) to the extent permitted by the Act and rules thereunder. The Central Funds are registered investment companies created for use solely by the series of the Trust and other series of registered investment companies advised by the Adviser, in connection with their cash management activities. The main investments of the Central Funds are money market and short maturity fixed income instruments. The Central Funds may incur expenses related to their investment activities, but do not pay Investment Advisory Fees or Supervisory and
| | | | | | | | | | | | |
| | | | ANNUAL REPORT | | | | | | | JUNE 30, 2022 | | | 75 |
| | | | |
| Notes to Financial Statements | | (Cont.) | | |
Administrative Fees to the Adviser. The Central Funds are considered to be affiliated with the Funds. A complete schedule of portfolio holdings for each affiliate fund is filed with the SEC for the first and third quarters of each fiscal year on Form N-PORT and is available at the SEC’s website at www.sec.gov. A copy of each Acquired Fund’s shareholder report is also available at the SEC’s website at www.sec.gov, and a copy of each affiliate fund’s shareholder report is available on the Funds’ website at www.pimco.com, or upon request, as applicable. The tables below show the Funds’ transactions in and earnings from investments in the affiliated Funds for the period ended June 30, 2022 (amounts in thousands†):
| | | | | | | | | | | | | | | | | | | | | | | | | | | | | | | | | | | | |
| PIMCO REALPATH® Blend 2025 Fund | | | | | | | |
| Underlying PIMCO Funds | | | | | Market Value
06/30/2021 | | | Purchases
at Cost | | | Proceeds
from Sales | | | Net
Realized
Gain (Loss) | | | Change in
Unrealized
Appreciation
(Depreciation) | | | Market Value
06/30/2022 | | | Dividend
Income(1) | | | Realized Net
Capital Gain
Distributions(1) | |
| | | | | | | | | |
PIMCO Emerging Markets Local Currency and Bond Fund | | | | | | $ | 10,730 | | | $ | 4,989 | | | $ | (1,082 | ) | | $ | (141 | ) | | $ | (2,522 | ) | | $ | 11,974 | | | $ | 504 | | | $ | 0 | |
| | | | | | | | | |
PIMCO High Yield Fund | | | | | | | 3,997 | | | | 2,480 | | | | (137 | ) | | | (15 | ) | | | (944 | ) | | | 5,381 | | | | 217 | | | | 0 | |
| | | | | | | | | |
PIMCO Income Fund | | | | | | | 29,397 | | | | 10,039 | | | | (6,242 | ) | | | (261 | ) | | | (3,882 | ) | | | 29,051 | | | | 1,288 | | | | 0 | |
| | | | | | | | | |
PIMCO International Bond Fund (U.S. Dollar-Hedged) | | | | | | | 2,624 | | | | 3,530 | | | | (393 | ) | | | (36 | ) | | | (475 | ) | | | 5,250 | | | | 61 | | | | 0 | |
| | | | | | | | | |
PIMCO Long-Term Real Return Fund | | | | | | | 17,985 | | | | 6,214 | | | | (4,504 | ) | | | (657 | ) | | | (5,511 | ) | | | 13,527 | | | | 2,079 | | | | 895 | |
| | | | | | | | | |
PIMCO Long-Term U.S. Government Fund | | | | | | | 20,064 | | | | 4,722 | | | | (3,275 | ) | | | (602 | ) | | | (4,221 | ) | | | 16,688 | | | | 366 | | | | 919 | |
| | | | | | | | | |
PIMCO Real Return Fund | | | | | | | 9,592 | | | | 3,095 | | | | (4,442 | ) | | | (89 | ) | | | (986 | ) | | | 7,170 | | | | 639 | | | | 0 | |
| | | | | | | | | |
PIMCO Short-Term Floating NAV Portfolio III | | | | | | | 13,424 | | | | 47,165 | | | | (54,800 | ) | | | (134 | ) | | | (11 | ) | | | 5,644 | | | | 165 | | | | 0 | |
| | | | | | | | | |
PIMCO Total Return Fund | | | | | | | 22,955 | | | | 8,327 | | | | (3,926 | ) | | | (293 | ) | | | (3,364 | ) | | | 23,699 | | | | 602 | | | | 0 | |
| | | | | | | | | |
Totals | | | | | | $ | 130,768 | | | $ | 90,561 | | | $ | (78,801 | ) | | $ | (2,228 | ) | | $ | (21,916 | ) | | $ | 118,384 | | | $ | 5,921 | | | $ | 1,814 | |
|
| PIMCO REALPATH® Blend 2030 Fund | |
| Underlying PIMCO Funds | | | | | Market Value
06/30/2021 | | | Purchases
at Cost | | | Proceeds
from Sales | | | Net
Realized
Gain (Loss) | | | Change in
Unrealized
Appreciation
(Depreciation) | | | Market Value
06/30/2022 | | | Dividend
Income(1) | | | Realized Net
Capital Gain
Distributions(1) | |
| | | | | | | | | |
PIMCO Emerging Markets Local Currency and Bond Fund | | | | | | $ | 9,793 | | | $ | 6,243 | | | $ | (1,402 | ) | | $ | (212 | ) | | $ | (2,388 | ) | | $ | 12,034 | | | $ | 485 | | | $ | 0 | |
| | | | | | | | | |
PIMCO High Yield Fund | | | | | | | 3,713 | | | | 2,151 | | | | (173 | ) | | | (20 | ) | | | (851 | ) | | | 4,820 | | | | 199 | | | | 0 | |
| | | | | | | | | |
PIMCO Income Fund | | | | | | | 22,006 | | | | 8,937 | | | | (6,881 | ) | | | (282 | ) | | | (2,789 | ) | | | 20,991 | | | | 965 | | | | 0 | |
| | | | | | | | | |
PIMCO International Bond Fund (U.S. Dollar-Hedged) | | | | | | | 1,725 | | | | 2,449 | | | | (314 | ) | | | (28 | ) | | | (318 | ) | | | 3,514 | | | | 41 | | | | 0 | |
| | | | | | | | | |
PIMCO Long-Term Real Return Fund | | | | | | | 14,107 | | | | 7,908 | | | | (2,411 | ) | | | (484 | ) | | | (5,502 | ) | | | 13,618 | | | | 1,800 | | | | 712 | |
| | | | | | | | | |
PIMCO Long-Term U.S. Government Fund | | | | | | | 25,532 | | | | 8,973 | | | | (8,821 | ) | | | (880 | ) | | | (5,140 | ) | | | 19,664 | | | | 461 | | | | 1,187 | |
| | | | | | | | | |
PIMCO Real Return Fund | | | | | | | 6,197 | | | | 2,224 | | | | (2,305 | ) | | | (60 | ) | | | (734 | ) | | | 5,322 | | | | 447 | | | | 0 | |
| | | | | | | | | |
PIMCO Short-Term Floating NAV Portfolio III | | | | | | | 12,788 | | | | 56,802 | | | | (61,500 | ) | | | (171 | ) | | | (7 | ) | | | 7,912 | | | | 202 | | | | 0 | |
| | | | | | | | | |
PIMCO Total Return Fund | | | | | | | 15,197 | | | | 6,573 | | | | (3,057 | ) | | | (268 | ) | | | (2,244 | ) | | | 16,201 | | | | 408 | | | | 0 | |
| | | | | | | | | |
Totals | | | | | | $ | 111,058 | | | $ | 102,260 | | | $ | (86,864 | ) | | $ | (2,405 | ) | | $ | (19,973 | ) | | $ | 104,076 | | | $ | 5,008 | | | $ | 1,899 | |
|
| PIMCO REALPATH® Blend 2035 Fund | |
| Underlying PIMCO Funds | | | | | Market Value
06/30/2021 | | | Purchases
at Cost | | | Proceeds
from Sales | | | Net
Realized
Gain (Loss) | | | Change in
Unrealized
Appreciation
(Depreciation) | | | Market Value
06/30/2022 | | | Dividend
Income(1) | | | Realized Net
Capital Gain
Distributions(1) | |
| | | | | | | | | |
PIMCO Emerging Markets Local Currency and Bond Fund | | | | | | $ | 6,937 | | | $ | 5,652 | | | $ | (980 | ) | | $ | (159 | ) | | $ | (1,870 | ) | | $ | 9,580 | | | $ | 365 | | | $ | 0 | |
| | | | | | | | | |
PIMCO High Yield Fund | | | | | | | 1,729 | | | | 1,891 | | | | 0 | | | | 0 | | | | (528 | ) | | | 3,092 | | | | 110 | | | | 0 | |
| | | | | | | | | |
PIMCO Income Fund | | | | | | | 13,351 | | | | 6,532 | | | | (4,938 | ) | | | (214 | ) | | | (1,725 | ) | | | 13,006 | | | | 598 | | | | 0 | |
| | | | | | | | | |
PIMCO International Bond Fund (U.S. Dollar-Hedged) | | | | | | | 890 | | | | 1,585 | | | | (164 | ) | | | (14 | ) | | | (192 | ) | | | 2,105 | | | | 25 | | | | 0 | |
| | | | | | | | | |
PIMCO Long-Term Real Return Fund | | | | | | | 7,422 | | | | 5,303 | | | | (555 | ) | | | (108 | ) | | | (3,448 | ) | | | 8,614 | | | | 1,025 | | | | 387 | |
| | | | | | | | | |
PIMCO Long-Term U.S. Government Fund | | | | | | | 16,939 | | | | 7,938 | | | | (7,567 | ) | | | (479 | ) | | | (3,618 | ) | | | 13,213 | | | | 317 | | | | 805 | |
| | | | | | | | | |
PIMCO Real Return Fund | | | | | | | 3,555 | | | | 1,451 | | | | (930 | ) | | | (27 | ) | | | (475 | ) | | | 3,574 | | | | 272 | | | | 0 | |
| | | | | | | | | |
PIMCO Short-Term Floating NAV Portfolio III | | | | | | | 11,772 | | | | 47,684 | | | | (50,200 | ) | | | (157 | ) | | | (5 | ) | | | 9,094 | | | | 184 | | | | 0 | |
| | | | | | | | | |
PIMCO Total Return Fund | | | | | | | 8,582 | | | | 4,180 | | | | (1,253 | ) | | | (139 | ) | | | (1,365 | ) | | | 10,005 | | | | 241 | | | | 0 | |
| | | | | | | | | |
Totals | | | | | | $ | 71,177 | | | $ | 82,216 | | | $ | (66,587 | ) | | $ | (1,297 | ) | | $ | (13,226 | ) | | $ | 72,283 | | | $ | 3,137 | | | $ | 1,192 | |
| | | | | | | | | | | | | | | | | | | | | | | | | | | | | | | | | | | | |
| PIMCO REALPATH® Blend 2040 Fund | |
| Underlying PIMCO Funds | | | | | Market Value
06/30/2021 | | | Purchases
at Cost | | | Proceeds
from Sales | | | Net
Realized
Gain (Loss) | | | Change in
Unrealized
Appreciation
(Depreciation) | | | Market Value
06/30/2022 | | | Dividend
Income(1) | | | Realized Net
Capital Gain
Distributions(1) | |
| | | | | | | | | |
PIMCO Emerging Markets Local Currency and Bond Fund | | | | | | $ | 5,084 | | | $ | 5,426 | | | $ | (712 | ) | | $ | (129 | ) | | $ | (1,485 | ) | | $ | 8,184 | | | $ | 283 | | | $ | 0 | |
| | | | | | | | | |
PIMCO High Yield Fund | | | | | | | 0 | | | | 1,604 | | | | 0 | | | | 0 | | | | (190 | ) | | | 1,414 | | | | 24 | | | | 0 | |
| | | | | | | | | |
PIMCO Income Fund | | | | | | | 9,834 | | | | 4,551 | | | | (4,725 | ) | | | (163 | ) | | | (1,174 | ) | | | 8,323 | | | | 423 | | | | 0 | |
| | | | | | | | | |
PIMCO International Bond Fund (U.S. Dollar-Hedged) | | | | | | | 709 | | | | 1,052 | | | | (142 | ) | | | (10 | ) | | | (135 | ) | | | 1,474 | | | | 18 | | | | 0 | |
| | | | | | | | | |
PIMCO Long-Term Real Return Fund | | | | | | | 5,860 | | | | 3,345 | | | | (427 | ) | | | 1 | | | | (2,619 | ) | | | 6,160 | | | | 775 | | | | 301 | |
| | | | | | | | | |
PIMCO Long-Term U.S. Government Fund | | | | | | | 13,710 | | | | 6,219 | | | | (7,436 | ) | | | (361 | ) | | | (2,709 | ) | | | 9,423 | | | | 243 | | | | 648 | |
| | | | | | | | | |
PIMCO Real Return Fund | | | | | | | 2,767 | | | | 1,006 | | | | (741 | ) | | | (25 | ) | | | (354 | ) | | | 2,653 | | | | 208 | | | | 0 | |
| | | | | | | | | |
PIMCO Short-Term Floating NAV Portfolio III | | | | | | | 10,505 | | | | 43,290 | | | | (43,700 | ) | | | (162 | ) | | | (3 | ) | | | 9,930 | | | | 190 | | | | 0 | |
| | | | | | | | | |
PIMCO Total Return Fund | | | | | | | 6,860 | | | | 2,393 | | | | (1,319 | ) | | | (108 | ) | | | (968 | ) | | | 6,858 | | | | 180 | | | | 0 | |
| | | | | | | | | |
Totals | | | | | | $ | 55,329 | | | $ | 68,886 | | | $ | (59,202 | ) | | $ | (957 | ) | | $ | (9,637 | ) | | $ | 54,419 | | | $ | 2,344 | | | $ | 949 | |
|
| PIMCO REALPATH® Blend 2045 Fund | |
| Underlying PIMCO Funds | | | | | Market Value
06/30/2021 | | | Purchases
at Cost | | | Proceeds
from Sales | | | Net
Realized
Gain (Loss) | | | Change in
Unrealized
Appreciation
(Depreciation) | | | Market Value
06/30/2022 | | | Dividend
Income(1) | | | Realized Net
Capital Gain
Distributions(1) | |
| | | | | | | | | |
PIMCO Emerging Markets Local Currency and Bond Fund | | | | | | $ | 1,972 | | | $ | 4,523 | | | $ | (292 | ) | | $ | (53 | ) | | $ | (807 | ) | | $ | 5,343 | | | $ | 137 | | | $ | 0 | |
| | | | | | | | | |
PIMCO High Yield Fund | | | | | | | 0 | | | | 309 | | | | 0 | | | | 0 | | | | (37 | ) | | | 272 | | | | 5 | | | | 0 | |
| | | | | | | | | |
PIMCO Income Fund | | | | | | | 5,215 | | | | 2,279 | | | | (2,383 | ) | | | (67 | ) | | | (624 | ) | | | 4,420 | | | | 223 | | | | 0 | |
| | | | | | | | | |
PIMCO International Bond Fund (U.S. Dollar-Hedged) | | | | | | | 475 | | | | 628 | | | | 0 | | | | 0 | | | | (96 | ) | | | 1,007 | | | | 11 | | | | 0 | |
| | | | | | | | | |
PIMCO Long-Term Real Return Fund | | | | | | | 4,045 | | | | 2,111 | | | | (439 | ) | | | (19 | ) | | | (1,697 | ) | | | 4,001 | | | | 521 | | | | 208 | |
| | | | | | | | | |
PIMCO Long-Term U.S. Government Fund | | | | | | | 9,457 | | | | 3,513 | | | | (4,595 | ) | | | (211 | ) | | | (1,813 | ) | | | 6,351 | | | | 165 | | | | 444 | |
| | | | | | | | | |
PIMCO Real Return Fund | | | | | | | 1,891 | | | | 461 | | | | (534 | ) | | | (11 | ) | | | (220 | ) | | | 1,587 | | | | 133 | | | | 0 | |
| | | | | | | | | |
PIMCO Short-Term Floating NAV Portfolio III | | | | | | | 10,743 | | | | 39,599 | | | | (41,000 | ) | | | (170 | ) | | | (4 | ) | | | 9,168 | | | | 199 | | | | 0 | |
| | | | | | | | | |
PIMCO Total Return Fund | | | | | | | 4,732 | | | | 1,471 | | | | (1,469 | ) | | | (59 | ) | | | (590 | ) | | | 4,085 | | | | 117 | | | | 0 | |
| | | | | | | | | |
Totals | | | | | | $ | 38,530 | | | $ | 54,894 | | | $ | (50,712 | ) | | $ | (590 | ) | | $ | (5,888 | ) | | $ | 36,234 | | | $ | 1,511 | | | $ | 652 | |
|
| PIMCO REALPATH® Blend 2050 Fund | |
| Underlying PIMCO Funds | | | | | Market Value
06/30/2021 | | | Purchases
at Cost | | | Proceeds
from Sales | | | Net
Realized
Gain (Loss) | | | Change in
Unrealized
Appreciation
(Depreciation) | | | Market Value
06/30/2022 | | | Dividend
Income(1) | | | Realized Net
Capital Gain
Distributions(1) | |
| | | | | | | | | |
PIMCO Emerging Markets Local Currency and Bond Fund | | | | | | $ | 879 | | | $ | 3,234 | | | $ | 0 | | | $ | 0 | | | $ | (493 | ) | | $ | 3,620 | | | $ | 74 | | | $ | 0 | |
| | | | | | | | | |
PIMCO Income Fund | | | | | | | 3,390 | | | | 1,181 | | | | (1,573 | ) | | | (47 | ) | | | (378 | ) | | | 2,573 | | | | 141 | | | | 0 | |
| | | | | | | | | |
PIMCO International Bond Fund (U.S. Dollar-Hedged) | | | | | | | 357 | | | | 647 | | | | 0 | | | | 0 | | | | (84 | ) | | | 920 | | | | 10 | | | | 0 | |
| | | | | | | | | |
PIMCO Long-Term Real Return Fund | | | | | | | 4,195 | | | | 1,415 | | | | (1,440 | ) | | | (114 | ) | | | (1,236 | ) | | | 2,820 | | | | 485 | | | | 224 | |
| | | | | | | | | |
PIMCO Long-Term U.S. Government Fund | | | | | | | 5,618 | | | | 2,596 | | | | (2,361 | ) | | | (121 | ) | | | (1,244 | ) | | | 4,488 | | | | 106 | | | | 272 | |
| | | | | | | | | |
PIMCO Real Return Fund | | | | | | | 1,323 | | | | 436 | | | | (537 | ) | | | (7 | ) | | | (153 | ) | | | 1,062 | | | | 95 | | | | 0 | |
| | | | | | | | | |
PIMCO Short-Term Floating NAV Portfolio III | | | | | | | 11,908 | | | | 34,490 | | | | (39,400 | ) | | | (162 | ) | | | (4 | ) | | | 6,832 | | | | 190 | | | | 0 | |
| | | | | | | | | |
PIMCO Total Return Fund | | | | | | | 3,462 | | | | 944 | | | | (1,259 | ) | | | (53 | ) | | | (389 | ) | | | 2,705 | | | | 83 | | | | 0 | |
| | | | | | | | | |
Totals | | | | | | $ | 31,132 | | | $ | 44,943 | | | $ | (46,570 | ) | | $ | (504 | ) | | $ | (3,981 | ) | | $ | 25,020 | | | $ | 1,184 | | | $ | 496 | |
| | | | | | | | | | | | |
| | | | ANNUAL REPORT | | | | | | | JUNE 30, 2022 | | | 77 |
| | | | |
| Notes to Financial Statements | | (Cont.) | | |
| | | | | | | | | | | | | | | | | | | | | | | | | | | | | | | | | | | | |
| PIMCO REALPATH® Blend 2055 Fund | |
| Underlying PIMCO Funds | | | | | Market Value
06/30/2021 | | | Purchases
at Cost | | | Proceeds
from Sales | | | Net
Realized
Gain (Loss) | | | Change in
Unrealized
Appreciation
(Depreciation) | | | Market Value
06/30/2022 | | | Dividend
Income(1) | | | Realized Net
Capital Gain
Distributions(1) | |
| | | | | | | | | |
PIMCO Emerging Markets Local Currency and Bond Fund | | | | | | $ | 391 | | | $ | 1,926 | | | $ | 0 | | | $ | 0 | | | $ | (261 | ) | | $ | 2,056 | | | $ | 39 | | | $ | 0 | |
| | | | | | | | | |
PIMCO Income Fund | | | | | | | 1,688 | | | | 563 | | | | (651 | ) | | | (22 | ) | | | (194 | ) | | | 1,384 | | | | 72 | | | | 0 | |
| | | | | | | | | |
PIMCO International Bond Fund (U.S. Dollar-Hedged) | | | | | | | 219 | | | | 424 | | | | 0 | | | | 0 | | | | (51 | ) | | | 592 | | | | 6 | | | | 0 | |
| | | | | | | | | |
PIMCO Long-Term Real Return Fund | | | | | | | 3,134 | | | | 1,287 | | | | (1,943 | ) | | | (161 | ) | | | (706 | ) | | | 1,611 | | | | 347 | | | | 173 | |
| | | | | | | | | |
PIMCO Long-Term U.S. Government Fund | | | | | | | 1,686 | | | | 1,627 | | | | (120 | ) | | | (4 | ) | | | (624 | ) | | | 2,565 | | | | 41 | | | | 86 | |
| | | | | | | | | |
PIMCO Real Return Fund | | | | | | | 677 | | | | 220 | | | | (235 | ) | | | (6 | ) | | | (80 | ) | | | 576 | | | | 49 | | | | 0 | |
| | | | | | | | | |
PIMCO Short-Term Floating NAV Portfolio III | | | | | | | 6,093 | | | | 33,820 | | | | (33,800 | ) | | | (102 | ) | | | (2 | ) | | | 6,009 | | | | 119 | | | | 0 | |
| | | | | | | | | |
PIMCO Total Return Fund | | | | | | | 1,692 | | | | 677 | | | | (707 | ) | | | (28 | ) | | | (201 | ) | | | 1,433 | | | | 43 | | | | 0 | |
| | | | | | | | | |
Totals | | | | | | $ | 15,580 | | | $ | 40,544 | | | $ | (37,456 | ) | | $ | (323 | ) | | $ | (2,119 | ) | | $ | 16,226 | | | $ | 716 | | | $ | 259 | |
|
| PIMCO REALPATH® Blend 2060 Fund | |
| Underlying PIMCO Funds | | | | | Market Value
06/30/2021 | | | Purchases
at Cost | | | Proceeds
from Sales | | | Net
Realized
Gain (Loss) | | | Change in
Unrealized
Appreciation
(Depreciation) | | | Market Value
06/30/2022 | | | Dividend
Income(1) | | | Realized Net
Capital Gain
Distributions(1) | |
| | | | | | | | | |
PIMCO Emerging Markets Local Currency and Bond Fund | | | | | | $ | 32 | | | $ | 337 | | | $ | (25 | ) | | $ | (3 | ) | | $ | (29 | ) | | $ | 312 | | | $ | 5 | | | $ | 0 | |
| | | | | | | | | |
PIMCO Income Fund | | | | | | | 152 | | | | 170 | | | | (86 | ) | | | (4 | ) | | | (22 | ) | | | 210 | | | | 8 | | | | 0 | |
| | | | | | | | | |
PIMCO International Bond Fund (U.S. Dollar-Hedged) | | | | | | | 16 | | | | 82 | | | | 0 | | | | 0 | | | | (7 | ) | | | 91 | | | | 1 | | | | 0 | |
| | | | | | | | | |
PIMCO Long-Term Real Return Fund | | | | | | | 305 | | | | 314 | | | | (275 | ) | | | (24 | ) | | | (83 | ) | | | 237 | | | | 39 | | | | 19 | |
| | | | | | | | | |
PIMCO Long-Term U.S. Government Fund | | | | | | | 128 | | | | 345 | | | | (29 | ) | | | (8 | ) | | | (66 | ) | | | 370 | | | | 4 | | | | 8 | |
| | | | | | | | | |
PIMCO Real Return Fund | | | | | | | 58 | | | | 70 | | | | (26 | ) | | | (1 | ) | | | (10 | ) | | | 91 | | | | 5 | | | | 0 | |
| | | | | | | | | |
PIMCO Short-Term Floating NAV Portfolio III | | | | | | | 501 | | | | 8,311 | | | | (7,900 | ) | | | (10 | ) | | | 0 | | | | 902 | | | | 12 | | | | 0 | |
| | | | | | | | | |
PIMCO Total Return Fund | | | | | | | 153 | | | | 171 | | | | (85 | ) | | | (4 | ) | | | (23 | ) | | | 212 | | | | 5 | | | | 0 | |
| | | | | | | | | |
Totals | | | | | | $ | 1,345 | | | $ | 9,800 | | | $ | (8,426 | ) | | $ | (54 | ) | | $ | (240 | ) | | $ | 2,425 | | | $ | 79 | | | $ | 27 | |
|
| PIMCO REALPATH® Blend Income Fund | |
| Underlying PIMCO Funds | | | | | Market Value
06/30/2021 | | | Purchases
at Cost | | | Proceeds
from Sales | | | Net
Realized
Gain (Loss) | | | Change in
Unrealized
Appreciation
(Depreciation) | | | Market Value
06/30/2022 | | | Dividend
Income(1) | | | Realized Net
Capital Gain
Distributions(1) | |
| | | | | | | | | |
PIMCO Emerging Markets Local Currency and Bond Fund | | | | | | $ | 12,513 | | | $ | 3,475 | | | $ | (1,225 | ) | | $ | (205 | ) | | $ | (2,695 | ) | | $ | 11,863 | | | $ | 569 | | | $ | 0 | |
| | | | | | | | | |
PIMCO High Yield Fund | | | | | | | 4,562 | | | | 2,366 | | | | (276 | ) | | | (41 | ) | | | (998 | ) | | | 5,613 | | | | 241 | | | | 0 | |
| | | | | | | | | |
PIMCO Income Fund | | | | | | | 40,290 | | | | 7,102 | | | | (6,402 | ) | | | (343 | ) | | | (4,922 | ) | | | 35,725 | | | | 1,694 | | | | 0 | |
| | | | | | | | | |
PIMCO International Bond Fund (U.S. Dollar-Hedged) | | | | | | | 3,964 | | | | 4,014 | | | | (618 | ) | | | (50 | ) | | | (629 | ) | | | 6,681 | | | | 85 | | | | 0 | |
| | | | | | | | | |
PIMCO Long-Term Real Return Fund | | | | | | | 16,096 | | | | 5,154 | | | | (3,599 | ) | | | (327 | ) | | | (5,252 | ) | | | 12,072 | | | | 1,860 | | | | 795 | |
| | | | | | | | | |
PIMCO Long-Term U.S. Government Fund | | | | | | | 13,176 | | | | 4,580 | | | | (1,505 | ) | | | (390 | ) | | | (3,247 | ) | | | 12,614 | | | | 258 | | | | 602 | |
| | | | | | | | | |
PIMCO Real Return Fund | | | | | | | 14,244 | | | | 1,900 | | | | (6,029 | ) | | | (121 | ) | | | (1,246 | ) | | | 8,748 | | | | 878 | | | | 0 | |
| | | | | | | | | |
PIMCO Short-Term Floating NAV Portfolio III | | | | | | | 9,477 | | | | 47,060 | | | | (53,100 | ) | | | (130 | ) | | | (4 | ) | | | 3,303 | | | | 158 | | | | 0 | |
| | | | | | | | | |
PIMCO Total Return Fund | | | | | | | 34,243 | | | | 5,463 | | | | (4,653 | ) | | | (434 | ) | | | (4,461 | ) | | | 30,158 | | | | 847 | | | | 0 | |
| | | | | | | | | |
Totals | | | | | | $ | 148,565 | | | $ | 81,114 | | | $ | (77,407 | ) | | $ | (2,041 | ) | | $ | (23,454 | ) | | $ | 126,777 | | | $ | 6,590 | | | $ | 1,397 | |
| † | A zero balance may reflect actual amounts rounding to less than one thousand. |
| (1) | The tax characterization of distributions is determined in accordance with Federal income tax regulations and may contain a return of capital. The actual tax characterization of distributions received is determined at the end of the fiscal year of the affiliated fund, unless otherwise advised on IRS Form 1099-DIV. See Note 2, Distributions to Shareholders, in the Notes to Financial Statements for more information. |
(b) Investments in Securities
The Funds (and where applicable, certain Acquired Funds and Underlying PIMCO Funds) may utilize the investments and strategies described below to the extent permitted by each Fund’s respective investment policies.
Securities Issued by U.S. Government Agencies or Government-Sponsored Enterprises are obligations of and, in certain cases, guaranteed by, the U.S. Government, its agencies or instrumentalities. Some U.S. Government securities, such as Treasury bills, notes and bonds, and securities guaranteed by the Government National Mortgage Association, are supported by the full faith and credit of the U.S. Government; others, such as those of the Federal Home Loan Banks, are supported by the right of the issuer to borrow from the U.S. Department of the Treasury (the “U.S. Treasury”); and others, such as those of the Federal National Mortgage Association (“FNMA” or “Fannie Mae”), are supported by the discretionary authority of the U.S. Government to purchase the agency’s obligations. U.S. Government securities may include zero coupon securities which do not distribute interest on a current basis and tend to be subject to a greater risk than interest-paying securities of similar maturities.
Government-related guarantors (i.e., not backed by the full faith and credit of the U.S. Government) include FNMA and the Federal Home Loan Mortgage Corporation (“FHLMC” or “Freddie Mac”). FNMA is a government-sponsored corporation. FNMA purchases conventional (i.e., not insured or guaranteed by any government agency) residential mortgages from a list of approved seller/servicers which include state and federally chartered savings and loan associations, mutual savings banks, commercial banks and credit unions and mortgage bankers. Pass-through securities issued by FNMA are guaranteed as to timely payment of principal and interest by FNMA, but are not backed by the full faith and credit of the U.S. Government. FHLMC issues Participation Certificates (“PCs”), which are pass-through securities, each representing an undivided interest in a pool of residential mortgages. FHLMC guarantees the timely payment of interest and ultimate collection of principal, but PCs are not backed by the full faith and credit of the U.S. Government.
5. BORROWINGS AND OTHER FINANCING TRANSACTIONS
The Funds (and where applicable, certain Acquired Funds and Underlying PIMCO Funds) may enter into the borrowings and other financing transactions described below to the extent permitted by each Fund’s respective investment policies.
The following disclosures contain information on a Fund’s ability to lend or borrow cash or securities to the extent permitted under the Act,
which may be viewed as borrowing or financing transactions by a Fund. The location of these instruments in each Fund’s financial statements is described below.
(a) Repurchase Agreements Under the terms of a typical repurchase agreement, a Fund purchases an underlying debt obligation (collateral) subject to an obligation of the seller to repurchase, and a Fund to resell, the obligation at an agreed-upon price and time. In an open maturity repurchase agreement, there is no pre-determined repurchase date and the agreement can be terminated by the Fund or counterparty at any time. The underlying securities for all repurchase agreements are held by a Fund’s custodian or designated subcustodians under tri-party repurchase agreements and in certain instances will remain in custody with the counterparty. The market value of the collateral must be equal to or exceed the total amount of the repurchase obligations, including interest. Repurchase agreements, if any, including accrued interest, are included on the Statements of Assets and Liabilities. Interest earned is recorded as a component of interest income on the Statements of Operations. In periods of increased demand for collateral, a Fund may pay a fee for the receipt of collateral, which may result in interest expense to the Fund.
(b) Interfund Lending In accordance with an exemptive order (the “Order”) from the SEC, the Funds of the Trust may participate in a joint lending and borrowing facility for temporary purposes (the “Interfund Lending Program”), subject to compliance with the terms and conditions of the Order, and to the extent permitted by each Fund’s investment policies and restrictions. The Funds are currently permitted to borrow under the Interfund Lending Program. A lending fund may lend in aggregate up to 15% of its current net assets at the time of the interfund loan, but may not lend more than 5% of its net assets to any one borrowing fund through the Interfund Lending Program. A borrowing fund may not borrow through the Interfund Lending Program or from any other source if its total outstanding borrowings immediately after the borrowing would be more than 33 1/3% of its total assets (or any lower threshold provided for by the fund’s investment restrictions). If a borrowing fund’s total outstanding borrowings exceed 10% of its total assets, each of its outstanding interfund loans will be subject to collateralization of at least 102% of the outstanding principal value of the loan. All interfund loans are for temporary or emergency purposes and the interfund loan rate to be charged will be the average of the highest current overnight repurchase agreement rate available to a lending fund and the bank loan rate, as calculated according to a formula established by the Board.
During the period ended June 30, 2022, the Funds did not participate in the Interfund Lending Program.
| | | | | | | | | | | | |
| | | | ANNUAL REPORT | | | | | | | JUNE 30, 2022 | | | 79 |
| | | | |
| Notes to Financial Statements | | (Cont.) | | |
6. FINANCIAL DERIVATIVE INSTRUMENTS
The Funds (and where applicable, certain Acquired Funds and Underlying PIMCO Funds) may enter into the financial derivative instruments described below to the extent permitted by each Fund’s respective investment policies.
The following disclosures contain information on how and why the Funds use financial derivative instruments, and how financial derivative instruments affect the Funds’ financial position, results of operations and cash flows. The location and fair value amounts of these instruments on the Statements of Assets and Liabilities and the net realized gain (loss) and net change in unrealized appreciation (depreciation) on the Statements of Operations, each categorized by type of financial derivative contract and related risk exposure, are included in a table in the Notes to Schedules of Investments. The financial derivative instruments outstanding as of period end and the amounts of net realized gain (loss) and net change in unrealized appreciation (depreciation) on financial derivative instruments during the period, as disclosed in the Notes to Schedules of Investments, serve as indicators of the volume of financial derivative activity for the Funds.
(a) Options Contracts may be written or purchased to enhance returns or to hedge an existing position or future investment. A Fund may write call and put options on securities and financial derivative instruments it owns or in which it may invest. Writing put options tends to increase a Fund’s exposure to the underlying instrument. Writing call options tends to decrease a Fund’s exposure to the underlying instrument. When a Fund writes a call or put, an amount equal to the premium received is recorded and subsequently marked to market to reflect the current value of the option written. These amounts are included on the Statements of Assets and Liabilities. Premiums received from writing options which expire are treated as realized gains. Premiums received from writing options which are exercised or closed are added to the proceeds or offset against amounts paid on the underlying futures, swap, security or currency transaction to determine the realized gain (loss). Certain options may be written with premiums to be determined on a future date. The premiums for these options are based upon implied volatility parameters at specified terms. A Fund as a writer of an option has no control over whether the underlying instrument may be sold (“call”) or purchased (“put”) and as a result bears the market risk of an unfavorable change in the price of the instrument underlying the written option. There is the risk a Fund may not be able to enter into a closing transaction because of an illiquid market.
Purchasing call options tends to increase a Fund’s exposure to the underlying instrument. Purchasing put options tends to decrease a Fund’s exposure to the underlying instrument. A Fund pays a premium which is included as an asset on the Statements of Assets and Liabilities and subsequently marked to market to reflect the current
value of the option. Premiums paid for purchasing options which expire are treated as realized losses. Certain options may be purchased with premiums to be determined on a future date. The premiums for these options are based upon implied volatility parameters at specified terms. The risk associated with purchasing put and call options is limited to the premium paid. Premiums paid for purchasing options which are exercised or closed are added to the amounts paid or offset against the proceeds on the underlying investment transaction to determine the realized gain (loss) when the underlying transaction is executed.
Options on Indices (“Index Option”) use a specified index as the underlying instrument for the option contract. The exercise for an Index Option will not include physical delivery of the underlying index but will result in a cash transfer of the amount of the difference between the settlement price of the underlying index and the strike price.
(b) Swap Agreements are bilaterally negotiated agreements between a Fund and a counterparty to exchange or swap investment cash flows, assets, foreign currencies or market-linked returns at specified, future intervals. Swap agreements may be privately negotiated in the over the counter market (“OTC swaps”) or may be cleared through a third party, known as a central counterparty or derivatives clearing organization (“Centrally Cleared Swaps”). A Fund may enter into asset, credit default, cross-currency, interest rate, total return, variance and other forms of swap agreements to manage its exposure to credit, currency, interest rate, commodity, equity and inflation risk. In connection with these agreements, securities or cash may be identified as collateral or margin in accordance with the terms of the respective swap agreements to provide assets of value and recourse in the event of default or bankruptcy/insolvency.
Centrally Cleared Swaps are marked to market daily based upon valuations as determined from the underlying contract or in accordance with the requirements of the central counterparty or derivatives clearing organization. Changes in market value, if any, are reflected as a component of net change in unrealized appreciation (depreciation) on the Statements of Operations. Daily changes in valuation of centrally cleared swaps (“Swap Variation Margin”), if any, are disclosed within centrally cleared financial derivative instruments on the Statements of Assets and Liabilities. Centrally Cleared and OTC swap payments received or paid at the beginning of the measurement period are included on the Statements of Assets and Liabilities and represent premiums paid or received upon entering into the swap agreement to compensate for differences between the stated terms of the swap agreement and prevailing market conditions (credit spreads, currency exchange rates, interest rates, and other relevant factors). Upfront premiums received (paid) are initially recorded as liabilities (assets) and subsequently marked to market to reflect the current value of the swap. These upfront premiums are recorded as realized gain (loss) on the
Statements of Operations upon termination or maturity of the swap. A liquidation payment received or made at the termination of the swap is recorded as realized gain (loss) on the Statements of Operations. Net periodic payments received or paid by a Fund are included as part of realized gain (loss) on the Statements of Operations.
For purposes of applying certain of a Fund’s investment policies and restrictions, swap agreements, like other derivative instruments, may be valued by a Fund at market value, notional value or full exposure value. In the case of a credit default swap, in applying certain of a Fund’s investment policies and restrictions, the Funds will value the credit default swap at its notional value or its full exposure value (i.e., the sum of the notional amount for the contract plus the market value), but may value the credit default swap at market value for purposes of applying certain of a Fund’s other investment policies and restrictions. For example, a Fund may value credit default swaps at full exposure value for purposes of a Fund’s credit quality guidelines (if any) because such value in general better reflects a Fund’s actual economic exposure during the term of the credit default swap agreement. As a result, a Fund may, at times, have notional exposure to an asset class (before netting) that is greater or lesser than the stated limit or restriction noted in a Fund’s prospectus. In this context, both the notional amount and the market value may be positive or negative depending on whether a Fund is selling or buying protection through the credit default swap. The manner in which certain securities or other instruments are valued by a Fund for purposes of applying investment policies and restrictions may differ from the manner in which those investments are valued by other types of investors.
Entering into swap agreements involves, to varying degrees, elements of interest, credit, market and documentation risk in excess of the amounts recognized on the Statements of Assets and Liabilities. Such risks involve the possibility that there will be no liquid market for these agreements, that the counterparty to the agreements may default on its
obligation to perform or disagree as to the meaning of contractual terms in the agreements and that there may be unfavorable changes in interest rates or the values of the asset upon which the swap is based.
A Fund’s maximum risk of loss from counterparty credit risk is the discounted net value of the cash flows to be received from the counterparty over the contract’s remaining life, to the extent that amount is positive. The risk may be mitigated by having a master netting arrangement between a Fund and the counterparty and by the posting of collateral to a Fund to cover a Fund’s exposure to the counterparty.
To the extent a Fund has a policy to limit the net amount owed to or to be received from a single counterparty under existing swap agreements, such limitation only applies to counterparties to OTC swaps and does not apply to centrally cleared swaps where the counterparty is a central counterparty or derivatives clearing organization.
Total Return Swap Agreements are entered into to gain or mitigate exposure to the underlying reference asset. Total return swap agreements involve commitments where single or multiple cash flows are exchanged based on the price of an underlying reference asset and on a fixed or variable interest rate. Total return swap agreements may involve commitments to pay interest in exchange for a market-linked return. One counterparty pays out the total return of a specific underlying reference asset, which may include a single security, a basket of securities, or an index, and in return receives a fixed or variable rate. At the maturity date, a net cash flow is exchanged where the total return is equivalent to the return of the underlying reference asset less a financing rate, if any. As a receiver, a Fund would receive payments based on any net positive total return and would owe payments in the event of a net negative total return. As the payer, a Fund would owe payments on any net positive total return, and would receive payments in the event of a net negative total return.
7. PRINCIPAL AND OTHER RISKS
(a) Principal Risks
The principal risks of investing in a Fund, which could adversely affect its net asset value, yield and total return, are listed below.
| | | | | | | | | | | | | | | | | | | | | | |
| Risks | | | | | PIMCO
REALPATH®
Blend 2025
Fund | | PIMCO
REALPATH®
Blend 2030
Fund | | PIMCO
REALPATH®
Blend 2035
Fund | | PIMCO
REALPATH®
Blend 2040
Fund | | PIMCO
REALPATH®
Blend 2045
Fund | | PIMCO
REALPATH®
Blend 2050
Fund | | PIMCO
REALPATH®
Blend 2055
Fund | | PIMCO
REALPATH®
Blend 2060
Fund | | PIMCO
REALPATH®
Blend Income
Fund |
| | | | | | | | | | |
Allocation | | | | | | X | | X | | X | | X | | X | | X | | X | | X | | X |
| | | | | | | | | | |
Acquired Fund | | | | | | X | | X | | X | | X | | X | | X | | X | | X | | X |
| | | | | | | | | | |
Small Fund | | | | | | — | | — | | — | | — | | — | | — | | — | | X | | — |
| | | | | | | | | | |
Equity | | | | | | X | | X | | X | | X | | X | | X | | X | | X | | X |
| | | | | | | | | | |
Value Investing | | | | | | X | | X | | X | | X | | X | | X | | X | | X | | X |
| | | | | | | | | | |
Interest Rate | | | | | | X | | X | | X | | X | | X | | X | | X | | X | | X |
| | | | | | | | | | |
Call | | | | | | X | | X | | X | | X | | X | | X | | X | | X | | X |
| | | | | | | | | | |
Credit | | | | | | X | | X | | X | | X | | X | | X | | X | | X | | X |
| | | | | | | | | | |
High Yield and Distressed Company | | | | | | X | | X | | X | | X | | X | | X | | X | | X | | X |
| | | | | | | | | | | | |
| | | | ANNUAL REPORT | | | | | | | JUNE 30, 2022 | | | 81 |
| | | | |
| Notes to Financial Statements | | (Cont.) | | |
| | | | | | | | | | | | | | | | | | | | | | |
| Risks | | | | | PIMCO
REALPATH®
Blend 2025
Fund | | PIMCO
REALPATH®
Blend 2030
Fund | | PIMCO
REALPATH®
Blend 2035
Fund | | PIMCO
REALPATH®
Blend 2040
Fund | | PIMCO
REALPATH®
Blend 2045
Fund | | PIMCO
REALPATH®
Blend 2050
Fund | | PIMCO
REALPATH®
Blend 2055
Fund | | PIMCO
REALPATH®
Blend 2060
Fund | | PIMCO
REALPATH®
Blend Income
Fund |
| | | | | | | | | | |
Market | | | | | | X | | X | | X | | X | | X | | X | | X | | X | | X |
| | | | | | | | | | |
Issuer | | | | | | X | | X | | X | | X | | X | | X | | X | | X | | X |
| | | | | | | | | | |
Liquidity | | | | | | X | | X | | X | | X | | X | | X | | X | | X | | X |
| | | | | | | | | | |
Derivatives | | | | | | X | | X | | X | | X | | X | | X | | X | | X | | X |
| | | | | | | | | | |
Commodity | | | | | | X | | X | | X | | X | | X | | X | | X | | X | | X |
| | | | | | | | | | |
Mortgage-Related and Other Asset-Backed Securities | | | | | | X | | X | | X | | X | | X | | X | | X | | X | | X |
| | | | | | | | | | |
Foreign (Non-U.S.) Investment | | | | | | X | | X | | X | | X | | X | | X | | X | | X | | X |
| | | | | | | | | | |
Real Estate | | | | | | X | | X | | X | | X | | X | | X | | X | | X | | X |
| | | | | | | | | | |
Emerging Markets | | | | | | X | | X | | X | | X | | X | | X | | X | | X | | X |
| | | | | | | | | | |
Sovereign Debt | | | | | | X | | X | | X | | X | | X | | X | | X | | X | | X |
| | | | | | | | | | |
Currency | | | | | | X | | X | | X | | X | | X | | X | | X | | X | | X |
| | | | | | | | | | |
Leveraging | | | | | | X | | X | | X | | X | | X | | X | | X | | X | | X |
| | | | | | | | | | |
Small-Cap and Mid-Cap Company | | | | | | X | | X | | X | | X | | X | | X | | X | | X | | X |
| | | | | | | | | | |
Management | | | | | | X | | X | | X | | X | | X | | X | | X | | X | | X |
| | | | | | | | | | |
Short Exposure | | | | | | X | | X | | X | | X | | X | | X | | X | | X | | X |
| | | | | | | | | | |
Tax | | | | | | X | | X | | X | | X | | X | | X | | X | | X | | X |
| | | | | | | | | | |
Subsidiary | | | | | | X | | X | | X | | X | | X | | X | | X | | X | | X |
| | | | | | | | | | |
Convertible Securities | | | | | | X | | X | | X | | X | | X | | X | | X | | X | | X |
| | | | | | | | | | |
Exchange-Traded Fund | | | | | | X | | X | | X | | X | | X | | X | | X | | X | | X |
| | | | | | | | | | |
LIBOR Transition | | | | | | X | | X | | X | | X | | X | | X | | X | | X | | X |
A Fund is generally subject to a different level and amount of risk relative to its target date and time horizon. The principal risks of investing in a Fund include risks from direct investments and/or for certain Funds that invest in Acquired Funds or Underlying PIMCO Funds, indirect exposure through investment in such Acquired Funds or Underlying PIMCO Funds. Please see “Description of Principal Risks” in a Fund’s prospectus for a more detailed description of the risks of investing in a Fund.
The following risks are principal risks of investing in a Fund.
Allocation Risk is the risk that a Fund could lose money as a result of less than optimal or poor asset allocation decisions. A Fund could miss attractive investment opportunities by underweighting markets that subsequently experience significant returns and could lose value by overweighting markets that subsequently experience significant declines.
Acquired Fund Risk is the risk that a Fund’s performance is closely related to the risks associated with the securities and other investments held by the Acquired Funds and that the ability of a Fund to achieve its investment objective will depend upon the ability of the Acquired Funds to achieve their investment objectives.
The following risks are principal risks of investing in a Fund that include risks from direct investments and/or indirect exposure through investment in Acquired Funds.
Small Fund Risk is the risk that a smaller Fund may not achieve investment or trading efficiencies. Additionally, a smaller Fund may be more adversely affected by large purchases or redemptions of Fund shares.
Equity Risk is the risk that the value of equity securities, such as common stocks and preferred securities, may decline due to general market conditions which are not specifically related to a particular company or to factors affecting a particular industry or industries. Equity securities generally have greater price volatility than fixed income securities.
Value Investing Risk is the risk that a value stock may decrease in price or may not increase in price as anticipated by PIMCO if it continues to be undervalued by the market or the factors that the portfolio manager believes will cause the stock price to increase do not occur.
Interest Rate Risk is the risk that fixed income securities will decline in value because of an increase in interest rates; a fund with a longer average portfolio duration will be more sensitive to changes in interest rates than a fund with a shorter average portfolio duration.
Call Risk is the risk that an issuer may exercise its right to redeem a fixed income security earlier than expected (a call). Issuers may call outstanding securities prior to their maturity for a number of reasons (e.g., declining interest rates, changes in credit spreads and improvements in the issuer’s credit quality). If an issuer calls a security
that a Fund has invested in, a Fund may not recoup the full amount of its initial investment and may be forced to reinvest in lower-yielding securities, securities with greater credit risks or securities with other, less favorable features.
Credit Risk is the risk that a Fund could lose money if the issuer or guarantor of a fixed income security, or the counterparty to a derivative contract, is unable or unwilling, or is perceived (whether by market participants, rating agencies, pricing services or otherwise) as unable or unwilling, to meet its financial obligations.
High Yield and Distressed Company Risk is the risk that high yield securities and unrated securities of similar credit quality (commonly known as “junk bonds”) and securities of distressed companies may be subject to greater levels of credit, issuer and liquidity risks. Securities of distressed companies include both debt and equity securities. High yield securities and debt securities of distressed companies are considered primarily speculative with respect to the issuer’s continuing ability to make principal and interest payments. Distressed companies may be engaged in restructurings or bankruptcy proceedings.
Market Risk is the risk that the value of securities owned by a Fund may go up or down, sometimes rapidly or unpredictably, due to factors affecting securities markets generally or particular industries.
Issuer Risk is the risk that the value of a security may decline for a reason directly related to the issuer, such as management performance, financial leverage and reduced demand for the issuer’s goods or services.
Liquidity Risk is the risk that a particular investment may be difficult to purchase or sell and that a Fund may be unable to sell illiquid investments at an advantageous time or price or achieve its desired level of exposure to a certain sector. Liquidity risk may result from the lack of an active market, reduced number and capacity of traditional market participants to make a market in fixed income securities, and may be magnified in a rising interest rate environment or other circumstances where investor redemptions from fixed income funds may be higher than normal, causing increased supply in the market due to selling activity.
Derivatives Risk is the risk of investing in derivative instruments (such as futures, swaps and structured securities), including leverage, liquidity, interest rate, market, credit and management risks and valuation complexity. Changes in the value of a derivative may not correlate perfectly with, and may be more sensitive to market events than, the underlying asset, rate or index, and a Fund could lose more than the initial amount invested. A Fund’s use of derivatives may result in losses to the Fund, a reduction in a Fund’s returns and/or increased volatility. Over-the-counter (“OTC”) derivatives are also subject to the
risk that a counterparty to the transaction will not fulfill its contractual obligations to the other party, as many of the protections afforded to centrally-cleared derivative transactions might not be available for OTC derivatives. The primary credit risk on derivatives that are exchange-traded or traded through a central clearing counterparty resides with a Fund’s clearing broker, or the clearinghouse. Changes in regulation relating to a mutual fund’s use of derivatives and related instruments could potentially limit or impact a Fund’s ability to invest in derivatives, limit a Fund’s ability to employ certain strategies that use derivatives and/or adversely affect the value of derivatives and a Fund’s performance.
Commodity Risk is the risk that investing in commodity-linked derivative instruments may subject a Fund to greater volatility than investments in traditional securities. The value of commodity-linked derivative instruments may be affected by changes in overall market movements, commodity index volatility, changes in interest rates, or factors affecting a particular industry or commodity, such as drought, floods, weather, livestock disease, public health emergencies, embargoes, tariffs and international economic, political and regulatory developments.
Mortgage-Related and Other Asset-Backed Securities Risk is the risk of investing in mortgage-related and other asset-backed securities, including interest rate risk, extension risk, prepayment risk and credit risk.
Foreign (Non-U.S.) Investment Risk is the risk that investing in foreign (non-U.S.) securities may result in a Fund experiencing more rapid and extreme changes in value than a fund that invests exclusively in securities of U.S. companies, due to smaller markets, differing reporting, accounting and auditing standards, increased risk of delayed settlement of portfolio transactions or loss of certificates of portfolio securities, and the risk of unfavorable foreign government actions, including nationalization, expropriation or confiscatory taxation, currency blockage, or political changes or diplomatic developments. Foreign securities may also be less liquid and more difficult to value than securities of U.S. issuers.
Real Estate Risk is the risk that a Fund’s investments in Real Estate Investment Trusts (“REITs”) or real estate-linked derivative instruments will subject a Fund to risks similar to those associated with direct ownership of real estate, including losses from casualty or condemnation, and changes in local and general economic conditions, supply and demand, interest rates, zoning laws, regulatory limitations on rents, property taxes and operating expenses. A Fund’s investments in REITs or real estate-linked derivative instruments subject it to management and tax risks. In addition, privately traded REITs subject a Fund to liquidity and valuation risk.
| | | | | | | | | | | | |
| | | | ANNUAL REPORT | | | | | | | JUNE 30, 2022 | | | 83 |
| | | | |
| Notes to Financial Statements | | (Cont.) | | |
Emerging Markets Risk is the risk of investing in emerging market securities, primarily increased foreign (non-U.S.) investment risk.
Sovereign Debt Risk is the risk that investments in fixed income instruments issued by sovereign entities may decline in value as a result of default or other adverse credit event resulting from an issuer’s inability or unwillingness to make principal or interest payments in a timely fashion.
Currency Risk is the risk that foreign (non-U.S.) currencies will change in value relative to the U.S. dollar and affect a Fund’s investments in foreign (non-U.S.) currencies or in securities that trade in, and receive revenues in, or in derivatives that provide exposure to, foreign (non-U.S.) currencies.
Leveraging Risk is the risk that certain transactions of a Fund, such as reverse repurchase agreements, loans of portfolio securities, and the use of when-issued, delayed delivery or forward commitment transactions, or derivative instruments, may give rise to leverage, magnifying gains and losses and causing a Fund to be more volatile than if it had not been leveraged. This means that leverage entails a heightened risk of loss.
Small-Cap and Mid-Cap Company Risk is the risk that the value of securities issued by small-capitalization and mid-capitalization companies may go up or down, sometimes rapidly and unpredictably, due to narrow markets and limited managerial and financial resources.
Management Risk is the risk that the investment techniques and risk analyses applied by PIMCO will not produce the desired results and that actual or potential conflicts of interest, legislative, regulatory, or tax restrictions, policies or developments may affect the investment techniques available to PIMCO and the individual portfolio manager in connection with managing a Fund and may cause PIMCO to restrict or prohibit participation in certain investments. There is no guarantee that the investment objective of a Fund will be achieved.
Short Exposure Risk is the risk of entering into short sales, including the potential loss of more money than the actual cost of the investment, and the risk that the third party to the short sale will not fulfill its contractual obligations, causing a loss to a Fund.
Tax Risk is the risk that the tax treatment of swap agreements and other derivative instruments, such as commodity-linked derivative instruments, including commodity index-linked notes, swap agreements, commodity options, futures, and options on futures, may be affected by future regulatory or legislative changes that could affect whether income from such investments is “qualifying income” under Subchapter M of the Internal Revenue Code, or otherwise affect the character, timing and/or amount of a Fund’s taxable income or gains and distributions.
Subsidiary Risk is the risk that, by investing in certain Underlying PIMCO Funds that invest in a subsidiary (each a “Subsidiary”), a Fund is indirectly exposed to the risks associated with a Subsidiary’s investments. The Subsidiaries are not registered under the Act and may not be subject to all the investor protections of the Act. There is no guarantee that the investment objective of a Subsidiary will be achieved.
Convertible Securities Risk is the risk that arises when convertible securities share both fixed income and equity characteristics. Convertible securities are subject to risks to which fixed income and equity investments are subject. These risks include equity risk, interest rate risk and credit risk.
Exchange-Traded Fund Risk is the risk that an exchange-traded fund may not track the performance of the index it is designed to track, among other reasons, because of exchange rules, market prices of shares of an exchange-traded fund may fluctuate rapidly and materially, or shares of an exchange-traded fund may trade significantly above or below net asset value, any of which may cause losses to a Fund invested in the exchange-traded fund.
LIBOR Transition Risk is the risk related to the anticipated discontinuation of the London Interbank Offered Rate (“LIBOR”). Certain instruments held by a Fund rely in some fashion upon LIBOR. Although the transition process away from LIBOR has become increasingly well-defined in advance of the anticipated discontinuation date, there remains uncertainty regarding the nature of any replacement rate, and any potential effects of the transition away from LIBOR on a Fund or on certain instruments in which the Fund invests can be difficult to ascertain. The transition process may involve, among other things, increased volatility or illiquidity in markets for instruments that currently rely on LIBOR and may result in a reduction in value of certain instruments held by a Fund.
(b) Other Risks
In general, a Fund may be subject to additional risks, including, but not limited to, risks related to government regulation and intervention in financial markets, operational risks, risks associated with financial, economic and global market disruptions, and cybersecurity risks. Please see a Fund’s prospectus and Statement of Additional Information for a more detailed description of the risks of investing in a Fund. Please see the Important Information section of this report for additional discussion of certain regulatory and market developments that may impact a Fund’s performance.
Market Disruption Risk The Fund is subject to investment and operational risks associated with financial, economic and other global market developments and disruptions, including those arising from war, terrorism, market manipulation, government interventions, defaults and shutdowns, political changes or diplomatic developments,
public health emergencies (such as the spread of infectious diseases, pandemics and epidemics) and natural/environmental disasters, which can all negatively impact the securities markets and cause the Fund to lose value. These events can also impair the technology and other operational systems upon which the Fund’s service providers, including PIMCO as the Fund’s investment adviser, rely, and could otherwise disrupt the Fund’s service providers’ ability to fulfill their obligations to the Fund. For example, the recent spread of an infectious respiratory illness caused by a novel strain of coronavirus (known as COVID-19) has caused volatility, severe market dislocations and liquidity constraints in many markets, including markets for the securities the Fund holds, and may adversely affect the Fund’s investments and operations.
Government Intervention in Financial Markets Federal, state, and other governments, their regulatory agencies, or self-regulatory organizations may take actions that affect the regulation of the instruments in which a Fund invests, or the issuers of such instruments, in ways that are unforeseeable. Legislation or regulation may also change the way in which a Fund itself is regulated. Such legislation or regulation could limit or preclude a Fund’s ability to achieve its investment objective. Furthermore, volatile financial markets can expose a Fund to greater market and liquidity risk and potential difficulty in valuing portfolio instruments held by the Fund. The value of a Fund’s holdings is also generally subject to the risk of future local, national, or global economic disturbances based on unknown weaknesses in the markets in which a Fund invests. In addition, it is not certain that the U.S. Government will intervene in response to a future market disturbance and the effect of any such future intervention cannot be predicted. It is difficult for issuers to prepare for the impact of future financial downturns, although companies can seek to identify and manage future uncertainties through risk management programs.
Regulatory Risk Financial entities, such as investment companies and investment advisers, are generally subject to extensive government regulation and intervention. Government regulation and/or intervention may change the way a Fund is regulated, affect the expenses incurred directly by a Fund and the value of its investments, and limit and/or preclude a Fund’s ability to achieve its investment objective. Government regulation may change frequently and may have significant adverse consequences. Moreover, government regulation may have unpredictable and unintended effects.
Operational Risk An investment in a Fund, like any fund, can involve operational risks arising from factors such as processing errors, human errors, inadequate or failed internal or external processes, failures in systems and technology, changes in personnel and errors caused by third-party service providers. The occurrence of any of these failures, errors or breaches could result in a loss of information, regulatory
scrutiny, reputational damage or other events, any of which could have a material adverse effect on a Fund. While a Fund seeks to minimize such events through controls and oversight, there may still be failures that could cause losses to the Fund.
Cyber Security Risk As the use of technology has become more prevalent in the course of business, the Funds have become potentially more susceptible to operational and information security risks resulting from breaches in cyber security. A breach in cyber security refers to both intentional and unintentional cyber events that may, among other things, cause a Fund to lose proprietary information, suffer data corruption and/or destruction or lose operational capacity, result in the unauthorized release or other misuse of confidential information, or otherwise disrupt normal business operations. Cyber security failures or breaches may result in financial losses to a Fund and its shareholders. These failures or breaches may also result in disruptions to business operations, potentially resulting in financial losses; interference with a Fund’s ability to calculate its net asset value, process shareholder transactions or otherwise transact business with shareholders; impediments to trading; violations of applicable privacy and other laws; regulatory fines; penalties; reputational damage; reimbursement or other compensation costs; additional compliance and cyber security risk management costs and other adverse consequences. In addition, substantial costs may be incurred in order to prevent any cyber incidents in the future.
8. MASTER NETTING ARRANGEMENTS
A Fund may be subject to various netting arrangements (“Master Agreements”) with select counterparties. Master Agreements govern the terms of certain transactions, and are intended to reduce the counterparty risk associated with relevant transactions by specifying credit protection mechanisms and providing standardization that is intended to improve legal certainty. Each type of Master Agreement governs certain types of transactions. Different types of transactions may be traded out of different legal entities or affiliates of a particular organization, resulting in the need for multiple agreements with a single counterparty. As the Master Agreements are specific to unique operations of different asset types, they allow a Fund to close out and net its total exposure to a counterparty in the event of a default with respect to all the transactions governed under a single Master Agreement with a counterparty. For financial reporting purposes the Statements of Assets and Liabilities generally present derivative assets and liabilities on a gross basis, which reflects the full risks and exposures prior to netting.
Master Agreements can also help limit counterparty risk by specifying collateral posting arrangements at pre-arranged exposure levels. Under most Master Agreements, collateral is routinely transferred if the total net exposure to certain transactions (net of existing collateral already in
| | | | | | | | | | | | |
| | | | ANNUAL REPORT | | | | | | | JUNE 30, 2022 | | | 85 |
| | | | |
| Notes to Financial Statements | | (Cont.) | | |
place) governed under the relevant Master Agreement with a counterparty in a given account exceeds a specified threshold, which typically ranges from zero to $250,000 depending on the counterparty and the type of Master Agreement. United States Treasury Bills and U.S. dollar cash are generally the preferred forms of collateral, although other securities may be used depending on the terms outlined in the applicable Master Agreement. Securities and cash pledged as collateral are reflected as assets on the Statements of Assets and Liabilities as either a component of Investments at value (securities) or Deposits with counterparty. Cash collateral received is not typically held in a segregated account and as such is reflected as a liability on the Statements of Assets and Liabilities as Deposits from counterparty. The market value of any securities received as collateral is not reflected as a component of NAV. A Fund’s overall exposure to counterparty risk can change substantially within a short period, as it is affected by each transaction subject to the relevant Master Agreement.
Master Repurchase Agreements and Global Master Repurchase Agreements (individually and collectively “Master Repo Agreements”) govern repurchase, reverse repurchase, and certain sale-buyback transactions between a Fund and select counterparties. Master Repo Agreements maintain provisions for, among other things, initiation, income payments, events of default, and maintenance of collateral. The market value of transactions under the Master Repo Agreement, collateral pledged or received, and the net exposure by counterparty as of period end are disclosed in the Notes to Schedules of Investments.
Master Securities Forward Transaction Agreements (“Master Forward Agreements”) govern certain forward settling transactions, such as TBA securities, delayed-delivery or certain sale-buyback transactions by and between a Fund and select counterparties. The Master Forward Agreements maintain provisions for, among other things, transaction initiation and confirmation, payment and transfer, events of default, termination, and maintenance of collateral. The market value of forward settling transactions, collateral pledged or received, and the net exposure by counterparty as of period end is disclosed in the Notes to Schedules of Investments.
Customer Account Agreements and related addenda govern cleared derivatives transactions such as futures, options on futures, and cleared OTC derivatives. Such transactions require posting of initial margin as determined by each relevant clearing agency which is segregated in an account at a futures commission merchant (“FCM”) registered with the Commodity Futures Trading Commission. In the United States, counterparty risk may be reduced as creditors of an FCM cannot have a claim to Fund assets in the segregated account. Portability of exposure reduces risk to the Funds. Variation margin, which reflects changes in market value, is generally exchanged daily, but may not be netted between futures and cleared OTC derivatives unless the parties have
agreed to a separate arrangement in respect of portfolio margining. The market value or accumulated unrealized appreciation (depreciation), initial margin posted, and any unsettled variation margin as of period end are disclosed in the Notes to Schedules of Investments.
International Swaps and Derivatives Association, Inc. Master Agreements and Credit Support Annexes (“ISDA Master Agreements”) govern bilateral OTC derivative transactions entered into by a Fund with select counterparties. ISDA Master Agreements maintain provisions for general obligations, representations, agreements, collateral posting and events of default or termination. Events of termination include conditions that may entitle counterparties to elect to terminate early and cause settlement of all outstanding transactions under the applicable ISDA Master Agreement. Any election to terminate early could be material to the financial statements. The ISDA Master Agreement may contain additional provisions that add counterparty protection beyond coverage of existing daily exposure if the counterparty has a decline in credit quality below a predefined level or as required by regulation. Similarly, if required by regulation, the Funds may be required to post additional collateral beyond coverage of daily exposure. These amounts, if any, may (or if required by law, will) be segregated with a third-party custodian. To the extent the Funds are required by regulation to post additional collateral beyond coverage of daily exposure, they could potentially incur costs, including in procuring eligible assets to meet collateral requirements, associated with such posting. The market value of OTC financial derivative instruments, collateral received or pledged, and net exposure by counterparty as of period end are disclosed in the Notes to Schedules of Investments.
9. FEES AND EXPENSES
(a) Investment Advisory Fee PIMCO is a majority-owned subsidiary of Allianz Asset Management of America L.P. (“Allianz Asset Management”) and serves as the Adviser to the Trust, pursuant to an investment advisory contract. The Adviser receives a monthly fee from each Fund at an annual rate based on average daily net assets (the “Investment Advisory Fee”). The Investment Advisory Fee for all classes is charged at an annual rate as noted in the table in note (b) below.
(b) Supervisory and Administrative Fee PIMCO serves as administrator (the “Administrator”) and provides supervisory and administrative services to the Trust for which it receives a monthly supervisory and administrative fee based on each share class’s average daily net assets (the “Supervisory and Administrative Fee”). As the Administrator, PIMCO bears the costs of various third-party services, including audit, custodial, portfolio accounting, legal, transfer agency and printing costs.
The Investment Advisory Fees and Supervisory and Administrative Fees for all classes, as applicable, are charged at the annual rate as noted in the following table (calculated as a percentage of each Fund’s average daily net assets attributable to each class):
| | | | | | | | | | | | | | | | | | | | | | | | | | | | |
| | | | | | Investment Advisory Fee | | | | | | Supervisory and Administrative Fee | |
| Fund Name | | | | | All Classes | | | | | | Institutional
Class | | | Administrative
Class | | | Class A(1) | | | Class R | |
PIMCO REALPATH® Blend 2025 Fund | | | | | | | 0.01% | | | | | | | | 0.02% | | | | 0.02% | | | | 0.22% | | | | 0.27% | * |
PIMCO REALPATH® Blend 2030 Fund | | | | | | | 0.01% | | | | | | | | 0.02% | | | | 0.02% | | | | 0.22% | | | | 0.27% | * |
PIMCO REALPATH® Blend 2035 Fund | | | | | | | 0.02% | | | | | | | | 0.02% | | | | 0.02% | | | | 0.22% | | | | 0.27% | * |
PIMCO REALPATH® Blend 2040 Fund | | | | | | | 0.03% | | | | | | | | 0.02% | | | | 0.02% | | | | 0.22% | | | | 0.27% | * |
PIMCO REALPATH® Blend 2045 Fund | | | | | | | 0.03% | | | | | | | | 0.02% | | | | 0.02% | | | | 0.22% | | | | 0.27% | * |
PIMCO REALPATH® Blend 2050 Fund | | | | | | | 0.03% | | | | | | | | 0.02% | | | | 0.02% | | | | 0.22% | | | | 0.27% | * |
PIMCO REALPATH® Blend 2055 Fund | | | | | | | 0.03% | | | | | | | | 0.02% | | | | 0.02% | | | | 0.22% | | | | 0.27% | * |
PIMCO REALPATH® Blend 2060 Fund | | | | | | | 0.03% | | | | | | | | 0.02% | | | | 0.02% | | | | 0.22% | | | | N/A | |
PIMCO REALPATH® Blend Income Fund | | | | | | | 0.01% | | | | | | | | 0.02% | | | | 0.02% | | | | 0.22% | | | | 0.27% | * |
| (1) | Effective November 1, 2021, the supervisory and administrative fee was reduced by 0.05% for each Fund. |
| * | This particular share class has been registered with the SEC, but has not yet launched. |
(c) Distribution and Servicing Fees PIMCO Investments LLC, a wholly-owned subsidiary of PIMCO, serves as the distributor (“Distributor”) of the Trust’s shares.
The Trust has adopted separate Distribution and Servicing Plans with respect to the Class A and Class R shares of the Trust pursuant to Rule 12b-1 under the Act. In connection with the distribution of Class R shares of the Trust, the Distributor receives distribution fees from the Trust of up to 0.25% for Class R shares and in connection with personal services rendered to Class A and Class R shareholders and the maintenance of such shareholder accounts, the Distributor receives servicing fees from the Trust of up to 0.25% for each of Class A and Class R shares (percentages reflect annual rates of the average daily net assets attributable to the applicable class).
The Trust has adopted a Distribution and Servicing Plan with respect to the Administrative Class shares of each Fund pursuant to Rule 12b-1 under the Act (the “Administrative Class Plan”). Under the terms of the Administrative Class Plan, a Fund may compensate the Distributor for providing, or procuring through financial intermediaries, distribution, administrative, recordkeeping, shareholder and/or related services with respect to Administrative Class shares. The Administrative Class Plan permits a Fund to make total payments at an annual rate of up to 0.25% of the average daily net assets attributable to the Administrative Class shares.
The Trust paid distribution and servicing fees at effective rates as noted in the following table (calculated as a percentage of each Fund’s average daily net assets attributable to each class):
| | | | | | | | | | | | |
| | | | | | Distribution Fee | | | Servicing Fee | |
| | | |
Administrative Class | | | | | | | 0.25% | | | | — | |
| | | |
Class A | | | | | | | — | | | | 0.25% | |
| | | |
Class R | | | | | | | 0.25% | * | | | 0.25% | * |
| * | This particular share class has been registered with the SEC, but has not yet launched. |
The Distributor also received the proceeds of the initial sales charges paid by the shareholders upon the purchase of Class A shares and the contingent deferred sales charges paid by the shareholders upon certain redemptions of Class A and Class C shares. For the period ended June 30, 2022, the Distributor retained $37,743 representing commissions (sales charges) and contingent deferred sales charges, net of any commission adjustments payable by the Distributor to broker dealers, from the Trust.
(d) Fund Expenses PIMCO provides or procures supervisory and administrative services for shareholders and also bears the costs of various third-party services required by the Funds, including audit, custodial, portfolio accounting, legal, transfer agency and printing costs. The Trust is responsible for the following expenses: (i) salaries and other compensation of any of the Trust’s executive officers and employees who are not officers, directors, stockholders, or employees of PIMCO or its subsidiaries or affiliates; (ii) taxes and governmental fees; (iii) brokerage fees and commissions and other portfolio transaction expenses; (iv) the costs of borrowing money, including interest expenses; (v) fees and expenses of the Trustees who are not “interested persons” of PIMCO or the Trust, and any counsel retained exclusively for their benefit; (vi) extraordinary expenses, including costs of litigation and indemnification expenses; (vii) organizational expenses; and (viii) any expenses allocated or allocable to a specific class of shares, which include service fees payable with respect to the Administrative Class Shares, and may include certain other expenses as permitted by the Trust’s Multi-Class Plan adopted pursuant to Rule 18f-3 under the Act and subject to review and approval by the Trustees. The ratio of expenses to average net assets per share class, as disclosed on the Financial Highlights, may differ from the annual fund operating expenses per share class.
| | | | | | | | | | | | |
| | | | ANNUAL REPORT | | | | | | | JUNE 30, 2022 | | | 87 |
| | | | |
| Notes to Financial Statements | | (Cont.) | | |
The Trust pays no compensation directly to any Trustee or any other officer who is affiliated with the Administrator, all of whom receive remuneration for their services to the Trust from the Administrator or its affiliates.
(e) Expense Limitation Pursuant to the Expense Limitation Agreement, PIMCO has agreed, through October 31, 2022, to waive a portion of the Funds’ Supervisory and Administrative Fee, or reimburse each Fund, to the extent that each Fund’s organizational expenses, pro rata share of expenses related to obtaining or
maintaining a Legal Entity Identifier and pro rata share of Trustee Fees exceed 0.0049%, the “Expense Limit” (calculated as a percentage of each Fund’s average daily net assets attributable to each class). The Expense Limitation Agreement will automatically renew for one-year terms unless PIMCO provides written notice to the Trust at least 30 days prior to the end of the then current term. The waiver, if any, is reflected on the Statements of Operations as a component of Waiver and/or Reimbursement by PIMCO.
In any month in which the investment advisory contract or supervision and administration agreement is in effect, PIMCO is entitled to reimbursement by each Fund of any portion of the supervisory and administrative fee waived or reimbursed as set forth above (the “Reimbursement Amount”) within thirty-six months of the time of the waiver, provided that such amount paid to PIMCO will not: i) together with any organizational expenses, pro rata share of expenses related to obtaining or maintaining a Legal Entity Identifier and pro rata Trustee fees, exceed, for such month, the Expense Limit (or the amount of the expense limit in place at the time the amount being recouped was originally waived if lower than the Expense Limit); ii) exceed the total Reimbursement Amount; or iii) include any amounts previously reimbursed to PIMCO. The total recoverable amounts to PIMCO at June 30, 2022, were as follows (amounts in thousands†):
| | | | | | | | | | | | | | | | | | | | |
| | | | | | Expiring within | | | | |
| | | | | |
| Fund Name | | | | | 12 months | | | 13-24 months | | | 25-36 months | | | Total | |
| | | | | |
PIMCO RealPath® Blend 2025 Fund | | | | | | $ | 0 | | | $ | 0 | | | $ | 12 | | | $ | 12 | |
| | | | | |
PIMCO RealPath® Blend 2030 Fund | | | | | | | 0 | | | | 0 | | | | 14 | | | | 14 | |
| | | | | |
PIMCO RealPath® Blend 2035 Fund | | | | | | | 0 | | | | 0 | | | | 12 | | | | 12 | |
| | | | | |
PIMCO RealPath® Blend 2040 Fund | | | | | | | 0 | | | | 0 | | | | 13 | | | | 13 | |
| | | | | |
PIMCO RealPath® Blend 2045 Fund | | | | | | | 0 | | | | 0 | | | | 14 | | | | 14 | |
| | | | | |
PIMCO RealPath® Blend 2050 Fund | | | | | | | 0 | | | | 0 | | | | 16 | | | | 16 | |
| | | | | |
PIMCO RealPath® Blend 2055 Fund | | | | | | | 0 | | | | 0 | | | | 6 | | | | 6 | |
| | | | | |
PIMCO RealPath® Blend 2060 Fund | | | | | | | 67 | | | | 0 | | | | 1 | | | | 68 | |
| | | | | |
PIMCO RealPath® Blend Income Fund | | | | | | | 0 | | | | 0 | | | | 12 | | | | 12 | |
| † | A zero balance may reflect actual amounts rounding to less than one thousand. |
(f) Acquired Fund Fees and Expenses Acquired Fund expenses incurred by the Funds, if any, will vary with changes in the expenses of the Acquired Funds, as well as the allocation of the Funds’ assets.
The expenses associated with investing in a fund of funds are generally higher than those for mutual funds that do not invest in other mutual funds. The cost of investing in a fund of funds will generally be higher than the cost of investing in a mutual fund that invests directly in individual stocks and bonds. By investing in a fund of funds, an investor will indirectly bear fees and expenses charged by Acquired Funds in addition to each Fund’s direct fees and expenses. In addition, the use of a fund of funds structure could affect the timing, amount and character of distributions to the shareholders and may therefore increase the amount of taxes payable by shareholders.
10. RELATED PARTY TRANSACTIONS
The Adviser, Administrator, and Distributor are related parties. Fees paid to these parties are disclosed in Note 9, Fees and Expenses, and the accrued related party fee amounts are disclosed on the Statements of Assets and Liabilities.
11. GUARANTEES AND INDEMNIFICATIONS
Under the Trust’s organizational documents, each Trustee or officer of the Trust is indemnified and each employee or other agent of the Trust (including the Trust’s investment manager) may be indemnified, to the extent permitted by the Act, against certain liabilities that may arise out of performance of their duties to the Funds. Additionally, in the normal course of business, the Funds enter into contracts that contain a variety of indemnification clauses. The Funds’ maximum exposure under these arrangements is unknown as this would involve future claims that may
be made against the Funds that have not yet occurred. However, the Funds have not had prior claims or losses pursuant to these contracts.
12. PURCHASES AND SALES OF SECURITIES
The length of time a Fund has held a particular security is not generally a consideration in investment decisions. A change in the securities held by a Fund is known as “portfolio turnover.” Each Fund may engage in frequent and active trading of portfolio securities to achieve its investment objective, particularly during periods of volatile market
movements. High portfolio turnover may involve correspondingly greater transaction costs, including brokerage commissions or dealer mark-ups and other transaction costs on the sale of securities and reinvestments in other securities, which are borne by the Fund. Such sales may also result in realization of taxable capital gains, including short-term capital gains (which are generally taxed at ordinary income tax rates when distributed to shareholders). The transaction costs associated with portfolio turnover may adversely affect a Fund’s performance. The portfolio turnover rates are reported in the Financial Highlights.
Purchases and sales of securities (excluding short-term investments) for the period ended June 30, 2022, were as follows (amounts in thousands†):
| | | | | | | | | | | | | | | | | | | | |
| | | | U.S. Government/Agency | | | All Other | |
| | | | |
| Fund Name | | | Purchases | | | Sales | | | Purchases | | | Sales | |
| | | | | |
PIMCO REALPATH® Blend 2025 Fund | | | | | | $ | 0 | | | $ | 0 | | | $ | 86,630 | | | $ | 52,264 | |
| | | | | |
PIMCO REALPATH® Blend 2030 Fund | | | | | | | 0 | | | | 0 | | | | 115,491 | | | | 60,464 | |
| | | | | |
PIMCO REALPATH® Blend 2035 Fund | | | | | | | 0 | | | | 0 | | | | 111,629 | | | | 41,220 | |
| | | | | |
PIMCO REALPATH® Blend 2040 Fund | | | | | | | 0 | | | | 0 | | | | 102,637 | | | | 42,147 | |
| | | | | |
PIMCO REALPATH® Blend 2045 Fund | | | | | | | 0 | | | | 0 | | | | 82,780 | | | | 29,871 | |
| | | | | |
PIMCO REALPATH® Blend 2050 Fund | | | | | | | 0 | | | | 0 | | | | 73,189 | | | | 21,201 | |
| | | | | |
PIMCO REALPATH® Blend 2055 Fund | | | | | | | 0 | | | | 0 | | | | 65,644 | | | | 12,590 | |
| | | | | |
PIMCO REALPATH® Blend 2060 Fund | | | | | | | 0 | | | | 0 | | | | 22,562 | | | | 8,202 | |
| | | | | |
PIMCO REALPATH® Blend Income Fund | | | | | | | 0 | | | | 0 | | | | 62,365 | | | | 43,690 | |
| | | | | | | | | | | | | | | | | | | | |
| † | A zero balance may reflect actual amounts rounding to less than one thousand. |
13. SHARES OF BENEFICIAL INTEREST
The Trust may issue an unlimited number of shares of beneficial interest with a $0.001 par value. Changes in shares of beneficial interest were as follows (shares and amounts in thousands†):
| | | | | | | | | | | | | | | | | | | | | | | | | | | | | | | | | | |
| | | | | PIMCO REALPATH® Blend 2025 Fund | | | PIMCO REALPATH® Blend 2030 Fund | |
| | | | | |
| | | | | Year Ended
06/30/2022 | | | Year Ended
06/30/2021 | | | Year Ended
06/30/2022 | | | Year Ended
06/30/2021 | |
| | | | | | | | | |
| | | | | Shares | | | Amount | | | Shares | | | Amount | | | Shares | | | Amount | | | Shares | | | Amount | |
Receipts for shares sold | | | | | | | | | | | | | | | | | | | | | | | | | | | | | | | | | | |
| | | | | | | | | |
Institutional Class | | | | | 6,242 | | | $ | 80,925 | | | | 11,135 | | | $ | 141,756 | | | | 7,130 | | | $ | 96,460 | | | | 9,816 | | | $ | 127,467 | |
| | | | | | | | | |
Administrative Class | | | | | 272 | | | | 3,509 | | | | 188 | | | | 2,422 | | | | 303 | | | | 4,107 | | | | 200 | | | | 2,579 | |
| | | | | | | | | |
Class A | | | | | 141 | | | | 1,844 | | | | 347 | | | | 4,454 | | | | 137 | | | | 1,873 | | | | 130 | | | | 1,723 | |
Issued as reinvestment of distributions | | | | | | | | | | | | | | | | | | | | | | | | | | | | | | | | | | |
| | | | | | | | | |
Institutional Class | | | | | 585 | | | | 7,804 | | | | 819 | | | | 10,693 | | | | 620 | | | | 8,658 | | | | 735 | | | | 9,901 | |
| | | | | | | | | |
Administrative Class | | | | | 76 | | | | 1,020 | | | | 133 | | | | 1,732 | | | | 84 | | | | 1,183 | | | | 117 | | | | 1,571 | |
| | | | | | | | | |
Class A | | | | | 23 | | | | 310 | | | | 37 | | | | 477 | | | | 22 | | | | 315 | | | | 28 | | | | 376 | |
Cost of shares redeemed | | | | | | | | | | | | | | | | | | | | | | | | | | | | | | | | | | |
| | | | | | | | | |
Institutional Class | | | | | (4,395 | ) | | | (57,184 | ) | | | (2,487 | ) | | | (31,940 | ) | | | (4,210 | ) | | | (56,697 | ) | | | (2,543 | ) | | | (33,565 | ) |
| | | | | | | | | |
Administrative Class | | | | | (263 | ) | | | (3,432 | ) | | | (560 | ) | | | (7,146 | ) | | | (220 | ) | | | (3,006 | ) | | | (251 | ) | | | (3,297 | ) |
| | | | | | | | | |
Class A | | | | | (301 | ) | | | (3,863 | ) | | | (182 | ) | | | (2,341 | ) | | | (143 | ) | | | (1,921 | ) | | | (53 | ) | | | (676 | ) |
| | | | | | | | | |
Net increase (decrease) resulting from Fund share transactions | | | | | 2,380 | | | $ | 30,933 | | | | 9,430 | | | $ | 120,107 | | | | 3,723 | | | $ | 50,972 | | | | 8,179 | | | $ | 106,079 | |
| | | | | | | | | | | | | | | | | | | | | | | | | | | | | | | | | | |
| | | | | | | | | | | | |
| | | | ANNUAL REPORT | | | | | | | JUNE 30, 2022 | | | 89 |
| | | | |
| Notes to Financial Statements | | (Cont.) | | |
| | | | | | | | | | | | | | | | | | | | | | | | | | | | | | | | | | |
| | | | | PIMCO REALPATH® Blend 2035 Fund | | | PIMCO REALPATH® Blend 2040 Fund | |
| | | | | |
| | | | | Year Ended
06/30/2022 | | | Year Ended
06/30/2021 | | | Year Ended
06/30/2022 | | | Year Ended
06/30/2021 | |
| | | | | | | | | |
| | | | | Shares | | | Amount | | | Shares | | | Amount | | | Shares | | | Amount | | | Shares | | | Amount | |
Receipts for shares sold | | | | | | | | | | | | | | | | | | | | | | | | | | | | | | | | | | |
| | | | | | | | | |
Institutional Class | | | | | 7,204 | | | $ | 100,911 | | | | 8,363 | | | $ | 109,354 | | | | 6,180 | | | $ | 88,871 | | | | 7,980 | | | $ | 106,187 | |
| | | | | | | | | |
Administrative Class | | | | | 331 | | | | 4,715 | | | | 228 | | | | 3,081 | | | | 208 | | | | 2,931 | | | | 154 | | | | 2,044 | |
| | | | | | | | | |
Class A | | | | | 89 | | | | 1,272 | | | | 94 | | | | 1,259 | | | | 75 | | | | 1,090 | | | | 116 | | | | 1,585 | |
Issued as reinvestment of distributions | | | | | | | | | | | | | | | | | | | | | | | | | | | | | | | | | | |
| | | | | | | | | |
Institutional Class | | | | | 459 | | | | 6,682 | | | | 423 | | | | 5,839 | | | | 489 | | | | 7,393 | | | | 406 | | | | 5,737 | |
| | | | | | | | | |
Administrative Class | | | | | 66 | | | | 965 | | | | 69 | | | | 953 | | | | 48 | | | | 733 | | | | 46 | | | | 644 | |
| | | | | | | | | |
Class A | | | | | 17 | | | | 245 | | | | 18 | | | | 245 | | | | 20 | | | | 300 | | | | 18 | | | | 258 | |
Cost of shares redeemed | | | | | | | | | | | | | | | | | | | | | | | | | | | | | | | | | | |
| | | | | | | | | |
Institutional Class | | | | | (3,103 | ) | | | (43,060 | ) | | | (2,072 | ) | | | (27,626 | ) | | | (2,773 | ) | | | (38,905 | ) | | | (2,114 | ) | | | (28,619 | ) |
| | | | | | | | | |
Administrative Class | | | | | (215 | ) | | | (3,063 | ) | | | (303 | ) | | | (3,987 | ) | | | (156 | ) | | | (2,207 | ) | | | (199 | ) | | | (2,688 | ) |
| | | | | | | | | |
Class A | | | | | (72 | ) | | | (1,045 | ) | | | (92 | ) | | | (1,218 | ) | | | (98 | ) | | | (1,369 | ) | | | (208 | ) | | | (2,765 | ) |
| | | | | | | | | |
Net increase (decrease) resulting from Fund share transactions | | | | | 4,776 | | | $ | 67,622 | | | | 6,728 | | | $ | 87,900 | | | | 3,993 | | | $ | 58,837 | | | | 6,199 | | | $ | 82,383 | |
| | | | | | | | | | | | | | | | | | | | | | | | | | | | | | | | | | |
| | | | | | | | | | | | | | | | | | | | | | | | | | | | | | | | | | |
| | | | | PIMCO REALPATH® Blend 2045 Fund | | | PIMCO REALPATH® Blend 2050 Fund | |
| | | | | |
| | | | | Year Ended
06/30/2022 | | | Year Ended
06/30/2021 | | | Year Ended
06/30/2022 | | | Year Ended
06/30/2021 | |
| | | | | | | | | |
| | | | | Shares | | | Amount | | | Shares | | | Amount | | | Shares | | | Amount | | | Shares | | | Amount | |
Receipts for shares sold | | | | | | | | | | | | | | | | | | | | | | | | | | | | | | | | | | |
| | | | | | | | | |
Institutional Class | | | | | 5,303 | | | $ | 77,193 | | | | 6,517 | | | $ | 87,372 | | | | 4,764 | | | $ | 69,813 | | | | 5,522 | | | $ | 74,111 | |
| | | | | | | | | |
Administrative Class | | | | | 234 | | | | 3,405 | | | | 195 | | | | 2,648 | | | | 176 | | | | 2,585 | | | | 93 | | | | 1,306 | |
| | | | | | | | | |
Class A | | | | | 45 | | | | 659 | | | | 49 | | | | 662 | | | | 64 | | | | 951 | | | | 68 | | | | 925 | |
Issued as reinvestment of distributions | | | | | | | | | | | | | | | | | | | | | | | | | | | | | | | | | | |
| | | | | | | | | |
Institutional Class | | | | | 428 | | | | 6,584 | | | | 356 | | | | 5,111 | | | | 462 | | | | 7,211 | | | | 350 | | | | 5,073 | |
| | | | | | | | | |
Administrative Class | | | | | 44 | | | | 675 | | | | 39 | | | | 556 | | | | 51 | | | | 792 | | | | 40 | | | | 580 | |
| | | | | | | | | |
Class A | | | | | 9 | | | | 141 | | | | 8 | | | | 116 | | | | 11 | | | | 173 | | | | 8 | | | | 113 | |
Cost of shares redeemed | | | | | | | | | | | | | | | | | | | | | | | | | | | | | | | | | | |
| | | | | | | | | |
Institutional Class | | | | | (2,397 | ) | | | (34,648 | ) | | | (1,499 | ) | | | (20,208 | ) | | | (2,080 | ) | | | (30,553 | ) | | | (1,695 | ) | | | (23,028 | ) |
| | | | | | | | | |
Administrative Class | | | | | (120 | ) | | | (1,763 | ) | | | (144 | ) | | | (1,989 | ) | | | (150 | ) | | | (2,242 | ) | | | (213 | ) | | | (2,861 | ) |
| | | | | | | | | |
Class A | | | | | (41 | ) | | | (618 | ) | | | (69 | ) | | | (888 | ) | | | (102 | ) | | | (1,507 | ) | | | (109 | ) | | | (1,386 | ) |
| | | | | | | | | |
Net increase (decrease) resulting from Fund share transactions | | | | | 3,505 | | | $ | 51,628 | | | | 5,452 | | | $ | 73,380 | | | | 3,196 | | | $ | 47,223 | | | | 4,064 | | | $ | 54,833 | |
| | | | | | | | | | | | | | | | | | | | | | | | | | | | | | | | | | |
| | | | | | | | | | | | | | | | | | | | | | | | | | | | | | | | | | |
| | | | | PIMCO REALPATH® Blend 2055 Fund | | | PIMCO REALPATH® Blend 2060 Fund | |
| | | | | |
| | | | | Year Ended
06/30/2022 | | | Year Ended
06/30/2021 | | | Year Ended
06/30/2022 | | | Year Ended
06/30/2021 | |
| | | | | | | | | |
| | | | | Shares | | | Amount | | | Shares | | | Amount | | | Shares | | | Amount | | | Shares | | | Amount | |
Receipts for shares sold | | | | | | | | | | | | | | | | | | | | | | | | | | | | | | | | | | |
| | | | | | | | | |
Institutional Class | | | | | 4,887 | | | $ | 72,104 | | | | 4,689 | | | $ | 63,764 | | | | 1,709 | | | $ | 19,212 | | | | 702 | | | $ | 7,847 | |
| | | | | | | | | |
Administrative Class | | | | | 230 | | | | 3,411 | | | | 170 | | | | 2,333 | | | | 33 | | | | 376 | | | | 4 | | | | 49 | |
| | | | | | | | | |
Class A | | | | | 47 | | | | 684 | | | | 53 | | | | 723 | | | | 35 | | | | 416 | | | | 64 | | | | 690 | |
Issued as reinvestment of distributions | | | | | | | | | | | | | | | | | | | | | | | | | | | | | | | | | | |
| | | | | | | | | |
Institutional Class | | | | | 258 | | | | 4,051 | | | | 202 | | | | 2,964 | | | | 94 | | | | 1,140 | | | | 13 | | | | 154 | |
| | | | | | | | | |
Administrative Class | | | | | 17 | | | | 261 | | | | 13 | | | | 189 | | | | 1 | | | | 14 | | | | 0 | | | | 1 | |
| | | | | | | | | |
Class A | | | | | 6 | | | | 88 | | | | 5 | | | | 72 | | | | 7 | | | | 90 | | | | 1 | | | | 11 | |
Cost of shares redeemed | | | | | | | | | | | | | | | | | | | | | | | | | | | | | | | | | | |
| | | | | | | | | |
Institutional Class | | | | | (1,763 | ) | | | (25,902 | ) | | | (1,297 | ) | | | (17,711 | ) | | | (443 | ) | | | (5,001 | ) | | | (98 | ) | | | (1,121 | ) |
| | | | | | | | | |
Administrative Class | | | | | (98 | ) | | | (1,456 | ) | | | (87 | ) | | | (1,162 | ) | | | (2 | ) | | | (22 | ) | | | 0 | | | | (2 | ) |
| | | | | | | | | |
Class A | | | | | (52 | ) | | | (761 | ) | | | (84 | ) | | | (1,083 | ) | | | (54 | ) | | | (627 | ) | | | (1 | ) | | | (15 | ) |
| | | | | | | | | |
Net increase (decrease) resulting from Fund share transactions | | | | | 3,532 | | | $ | 52,480 | | | | 3,664 | | | $ | 50,089 | | | | 1,380 | | | $ | 15,598 | | | | 685 | | | $ | 7,614 | |
| | | | | | | | | | | | | | | | | | | | | | | | | | | | | | | | | | |
| | | | | | | | | | | | | | | | | | |
| | | | | PIMCO REALPATH® Blend Income Fund | |
| | | |
| | | | | Year Ended
06/30/2022 | | | Year Ended
06/30/2021 | |
| | | | | |
| | | | | Shares | | | Amount | | | Shares | | | Amount | |
Receipts for shares sold | | | | | | | | | | | | | | | | | | |
| | | | | |
Institutional Class | | | | | 5,321 | | | $ | 66,789 | | | | 8,670 | | | $ | 108,154 | |
| | | | | |
Administrative Class | | | | | 221 | | | | 2,789 | | | | 168 | | | | 2,108 | |
| | | | | |
Class A | | | | | 1,004 | | | | 12,546 | | | | 1,083 | | | | 13,537 | |
Issued as reinvestment of distributions | | | | | | | | | | | | | | | | | | |
| | | | | |
Institutional Class | | | | | 583 | | | | 7,420 | | | | 855 | | | | 10,790 | |
| | | | | |
Administrative Class | | | | | 90 | | | | 1,147 | | | | 158 | | | | 1,988 | |
| | | | | |
Class A | | | | | 91 | | | | 1,150 | | | | 130 | | | | 1,633 | |
Cost of shares redeemed | | | | | | | | | | | | | | | | | | |
| | | | | |
Institutional Class | | | | | (4,928 | ) | | | (61,063 | ) | | | (3,828 | ) | | | (48,133 | ) |
| | | | | |
Administrative Class | | | | | (402 | ) | | | (4,987 | ) | | | (462 | ) | | | (5,768 | ) |
| | | | | |
Class A | | | | | (807 | ) | | | (9,964 | ) | | | (254 | ) | | | (3,167 | ) |
| | | | | |
Net increase (decrease) resulting from Fund share transactions | | | | | 1,173 | | | $ | 15,827 | | | | 6,520 | | | $ | 81,142 | |
| | | | | | | | | | | | | | | | | | |
| † | A zero balance may reflect actual amounts rounding to less than one thousand. |
The following table discloses the number of shareholders that owned 10% or more of the outstanding shares of a Fund along with their respective percent ownership, if any, as of June 30, 2022. Some of these shareholders may be considered related parties, which may include, but are not limited to, the investment adviser and its affiliates, affiliated broker dealers, fund of funds and directors or employees of the Trust or Adviser.
| | | | | | | | | | | | | | | | | | | | |
| | | | | | Shareholders that own 10% or more
of outstanding shares | | | Total percentage of portfolio held by
shareholders that own 10% or more
of outstanding shares | |
| | | | | |
| | | | | | Non-Related Parties | | | Related Parties | | | Non-Related Parties | | | Related Parties | |
| | | | | |
PIMCO REALPATH® Blend 2025 Fund | | | | | | | 1 | | | | 0 | | | | 17% | | | | 0% | |
| | | | | |
PIMCO REALPATH® Blend 2030 Fund | | | | | | | 1 | | | | 0 | | | | 12% | | | | 0% | |
| | | | | |
PIMCO REALPATH® Blend 2035 Fund | | | | | | | 1 | | | | 0 | | | | 13% | | | | 0% | |
| | | | | |
PIMCO REALPATH® Blend 2040 Fund | | | | | | | 1 | | | | 0 | | | | 12% | | | | 0% | |
| | | | | |
PIMCO REALPATH® Blend 2045 Fund | | | | | | | 1 | | | | 0 | | | | 12% | | | | 0% | |
| | | | | |
PIMCO REALPATH® Blend 2055 Fund | | | | | | | 1 | | | | 0 | | | | 16% | | | | 0% | |
| | | | | |
PIMCO REALPATH® Blend 2060 Fund | | | | | | | 1 | | | | 0 | | | | 27% | | | | 0% | |
| | | | | | | | | | | | | | | | | | | | |
14. REGULATORY AND LITIGATION MATTERS
The Funds are not named as defendants in any material litigation or arbitration proceedings and are not aware of any material litigation or claim pending or threatened against them.
On May 17, 2022, Allianz Global Investors U.S. LLC (“AGI U.S.”) pleaded guilty in connection with the proceeding United States of America v. Allianz Global Investors U.S. LLC. AGI U.S. is an indirect subsidiary of Allianz SE. The conduct resulting in the matter described above occurred entirely within AGI U.S. and did not involve PIMCO or the Distributor, or any personnel of PIMCO or the Distributor. Nevertheless, because of the disqualifying conduct of AGI U.S., their affiliate, PIMCO would have been disqualified from serving as the investment adviser, and the Distributor would have been disqualified from serving as the principal underwriter, to the Funds in the absence of SEC exemptive relief. PIMCO and the Distributor have received exemptive relief from the SEC to permit them to continue serving as investment adviser and principal underwriter for U.S.-registered investment companies, including the Funds.
The foregoing speaks only as of the date of this report.
15. FEDERAL INCOME TAX MATTERS
Each Fund intends to qualify as a regulated investment company under Subchapter M of the Internal Revenue Code (the “Code”) and distribute all of its taxable income and net realized gains, if applicable, to shareholders. Accordingly, no provision for Federal income taxes has been made.
A Fund may be subject to local withholding taxes, including those imposed on realized capital gains. Any applicable foreign capital gains tax is accrued daily based upon net unrealized gains, and may be payable following the sale of any applicable investments.
In accordance with U.S. GAAP, the Adviser has reviewed the Funds’ tax positions for all open tax years. As of June 30, 2022, the Funds have recorded no liability for net unrecognized tax benefits relating to uncertain income tax positions they have taken or expect to take in future tax returns.
| | | | | | | | | | | | |
| | | | ANNUAL REPORT | | | | | | | JUNE 30, 2022 | | | 91 |
| | | | |
| Notes to Financial Statements | | (Cont.) | | |
The Funds file U.S. federal, state, and local tax returns as required. The Funds’ tax returns are subject to examination by relevant tax authorities until expiration of the applicable statute of limitations, which is generally three years after the filing of the tax return but which
can be extended to six years in certain circumstances. Tax returns for open years have incorporated no uncertain tax positions that require a provision for income taxes.
As of June 30, 2022, the components of distributable taxable earnings are as follows (amounts in thousands†):
| | | | | | | | | | | | | | | | | | | | | | | | | | | | | | | | | | | | |
| | | | | | Undistributed
Ordinary
Income(1) | | | Undistributed
Long-Term
Capital Gains | | | Net Tax Basis
Unrealized
Appreciation/
(Depreciation)(2) | | | Other
Book-to-Tax
Accounting
Differences (3) | | | Accumulated
Capital
Losses(4) | | | Qualified
Late-Year
Loss
Deferral -
Capital(5) | | | Qualified
Late-Year
Loss
Deferral -
Ordinary(6) | | | Total
Components
of Distributable
Earnings | |
| | | | | | | | | |
PIMCO REALPATH® Blend 2025 Fund | | | | | | $ | 1,076 | | | $ | 4,473 | | | $ | (23,106 | ) | | $ | 0 | | | $ | 0 | | | $ | 0 | | | $ | 0 | | | $ | (17,557 | ) |
| | | | | | | | | |
PIMCO REALPATH® Blend 2030 Fund | | | | | | | 1,155 | | | | 4,985 | | | | (20,433 | ) | | | 0 | | | | 0 | | | | 0 | | | | 0 | | | | (14,293 | ) |
| | | | | | | | | |
PIMCO REALPATH® Blend 2035 Fund | | | | | | | 933 | | | | 3,997 | | | | (15,401 | ) | | | 0 | | | | 0 | | | | 0 | | | | 0 | | | | (10,471 | ) |
| | | | | | | | | |
PIMCO REALPATH® Blend 2040 Fund | | | | | | | 769 | | | | 3,830 | | | | (9,329 | ) | | | 0 | | | | 0 | | | | 0 | | | | 0 | | | | (4,730 | ) |
| | | | | | | | | |
PIMCO REALPATH® Blend 2045 Fund | | | | | | | 753 | | | | 3,470 | | | | (5,316 | ) | | | 0 | | | | 0 | | | | 0 | | | | 0 | | | | (1,093 | ) |
| | | | | | | | | |
PIMCO REALPATH® Blend 2050 Fund | | | | | | | 733 | | | | 3,350 | | | | 480 | | | | 0 | | | | 0 | | | | 0 | | | | 0 | | | | 4,563 | |
| | | | | | | | | |
PIMCO REALPATH® Blend 2055 Fund | | | | | | | 620 | | | | 1,969 | | | | (6,579 | ) | | | 0 | | | | 0 | | | | 0 | | | | 0 | | | | (3,990 | ) |
| | | | | | | | | |
PIMCO REALPATH® Blend 2060 Fund | | | | | | | 70 | | | | 232 | | | | (3,244 | ) | | | 0 | | | | 0 | | | | 0 | | | | 0 | | | | (2,942 | ) |
| | | | | | | | | |
PIMCO REALPATH® Blend Income Fund | | | | | | | 962 | | | | 2,184 | | | | (21,100 | ) | | | 0 | | | | 0 | | | | 0 | | | | 0 | | | | (17,954 | ) |
| † | A zero balance may reflect actual amounts rounding to less than one thousand. |
| (1) | Includes undistributed short-term capital gains, if any. |
| (2) | Adjusted for open wash sale loss deferrals and the accelerated recognition of unrealized gain or loss on certain options contracts for federal income tax purposes. Also adjusted for differences between book and tax realized and unrealized gain (loss) on: swap contracts. |
| (3) | Represents differences in income tax regulations and financial accounting principles generally accepted in the United States of America, mainly for organizational expenditures. |
| (4) | Capital losses available to offset future net capital gains as shown below. |
| (5) | Capital losses realized during the period November 1, 2021 through June 30, 2022 which the Funds elected to defer to the following taxable year pursuant to income tax regulations. |
| (6) | Specified losses realized during the period November 1, 2021 through June 30, 2022 and Ordinary losses realized during the period January 1, 2022 through June 30, 2022 which the Funds elected to defer to the following taxable year pursuant to income tax regulations. |
Under the Regulated Investment Company Modernization Act of 2010, a fund is permitted to carry forward any new capital losses for an unlimited period. Additionally, such capital losses that are carried forward will retain their character as either short-term or long-term capital losses rather than being considered all short-term under previous law.
As of June 30, 2022, the Funds had the following post-effective capital losses with no expiration (amounts in thousands†):
| | | | | | | | | | | | |
| | | | | | Short-Term | | | Long-Term | |
| | | |
PIMCO REALPATH® Blend 2025 Fund | | | | | | $ | 0 | | | $ | 0 | |
| | | |
PIMCO REALPATH® Blend 2030 Fund | | | | | | | 0 | | | | 0 | |
| | | |
PIMCO REALPATH® Blend 2035 Fund | | | | | | | 0 | | | | 0 | |
| | | |
PIMCO REALPATH® Blend 2040 Fund | | | | | | | 0 | | | | 0 | |
| | | |
PIMCO REALPATH® Blend 2045 Fund | | | | | | | 0 | | | | 0 | |
| | | |
PIMCO REALPATH® Blend 2050 Fund | | | | | | | 0 | | | | 0 | |
| | | |
PIMCO REALPATH® Blend 2055 Fund | | | | | | | 0 | | | | 0 | |
| | | |
PIMCO REALPATH® Blend 2060 Fund | | | | | | | 0 | | | | 0 | |
| | | |
PIMCO REALPATH® Blend Income Fund | | | | | | | 0 | | | | 0 | |
| † | A zero balance may reflect actual amounts rounding to less than one thousand. |
As of June 30, 2022, the aggregate cost and the net unrealized appreciation/(depreciation) of investments for federal income tax purposes are as follows (amounts in thousands†):
| | | | | | | | | | | | | | | | | | | | |
| | | | | | Federal
Tax Cost | | | Unrealized
Appreciation | | | Unrealized
(Depreciation) | | | Net Unrealized
Appreciation/
(Depreciation)(7) | |
| | | | | |
PIMCO REALPATH® Blend 2025 Fund | | | | | | $ | 265,064 | | | $ | 6,122 | | | $ | (29,227 | ) | | $ | (23,105 | ) |
| | | | | |
PIMCO REALPATH® Blend 2030 Fund | | | | | | | 297,962 | | | | 8,347 | | | | (28,777 | ) | | | (20,430 | ) |
| | | | | |
PIMCO REALPATH® Blend 2035 Fund | | | | | | | 263,114 | | | | 5,802 | | | | (21,202 | ) | | | (15,400 | ) |
| | | | | |
PIMCO REALPATH® Blend 2040 Fund | | | | | | | 261,081 | | | | 8,976 | | | | (18,303 | ) | | | (9,327 | ) |
| | | | | |
PIMCO REALPATH® Blend 2045 Fund | | | | | | | 235,313 | | | | 9,473 | | | | (14,788 | ) | | | (5,315 | ) |
| | | | | |
PIMCO REALPATH® Blend 2050 Fund | | | | | | | 228,884 | | | | 11,428 | | | | (10,948 | ) | | | 480 | |
| | | | | |
PIMCO REALPATH® Blend 2055 Fund | | | | | | | 162,444 | | | | 2,540 | | | | (9,120 | ) | | | (6,580 | ) |
| | | | | |
PIMCO REALPATH® Blend 2060 Fund | | | | | | | 26,233 | | | | 0 | | | | (3,243 | ) | | | (3,243 | ) |
| | | | | |
PIMCO REALPATH® Blend Income Fund | | | | | | | 243,056 | | | | 7,673 | | | | (28,879 | ) | | | (21,206 | ) |
| † | A zero balance may reflect actual amounts rounding to less than one thousand. |
| (7) | Adjusted for open wash sale loss deferrals and the accelerated recognition of unrealized gain or loss on certain options contracts for federal income tax purposes. Also adjusted for differences between book and tax realized and unrealized gain (loss) on: swap contracts. |
For the fiscal years ended June 30, 2022 and June 30, 2021, respectively, the Funds made the following tax basis distributions (amounts in thousands†):
| | | | | | | | | | | | | | | | | | | | | | | | | | | | |
| | | | | | June 30, 2022 | | | June 30, 2021 | |
| | | | | | | |
| | | | | | Ordinary
Income
Distributions(8) | | | Long-Term
Capital Gain
Distributions | | | Return of
Capital(9) | | | Ordinary
Income
Distributions(8) | | | Long-Term
Capital Gain
Distributions | | | Return of
Capital(9) | |
| | | | | | | |
PIMCO REALPATH® Blend 2025 Fund | | | | | | $ | 7,101 | | | $ | 2,250 | | | $ | 0 | | | $ | 9,169 | | | $ | 4,081 | | | $ | 0 | |
| | | | | | | |
PIMCO REALPATH® Blend 2030 Fund | | | | | | | 7,000 | | | | 3,500 | | | | 0 | | | | 9,792 | | | | 2,459 | | | | 0 | |
| | | | | | | |
PIMCO REALPATH® Blend 2035 Fund | | | | | | | 5,736 | | | | 2,550 | | | | 0 | | | | 6,550 | | | | 850 | | | | 0 | |
| | | | | | | |
PIMCO REALPATH® Blend 2040 Fund | | | | | | | 6,200 | | | | 2,675 | | | | 0 | | | | 6,032 | | | | 950 | | | | 0 | |
| | | | | | | |
PIMCO REALPATH® Blend 2045 Fund | | | | | | | 5,201 | | | | 2,575 | | | | 0 | | | | 5,200 | | | | 875 | | | | 0 | |
| | | | | | | |
PIMCO REALPATH® Blend 2050 Fund | | | | | | | 5,515 | | | | 2,900 | | | | 0 | | | | 5,001 | | | | 930 | | | | 0 | |
| | | | | | | |
PIMCO REALPATH® Blend 2055 Fund | | | | | | | 3,059 | | | | 1,450 | | | | 0 | | | | 3,001 | | | | 300 | | | | 0 | |
| | | | | | | |
PIMCO REALPATH® Blend 2060 Fund | | | | | | | 764 | | | | 600 | | | | 0 | | | | 185 | | | | 0 | | | | 0 | |
| | | | | | | |
PIMCO REALPATH® Blend Income Fund | | | | | | | 7,350 | | | | 2,575 | | | | 0 | | | | 10,451 | | | | 4,299 | | | | 0 | |
| | | | | | | | | | | | | | | | | | | | | | | | | | | | |
| † | A zero balance may reflect actual amounts rounding to less than one thousand. |
| (8) | Includes short-term capital gains distributed, if any. |
| (9) | A portion of the distributions made represents a tax return of capital. Return of capital distributions have been reclassified from undistributed net investment income to paid-in capital to more appropriately conform financial accounting to tax accounting. |
| | | | | | | | | | | | |
| | | | ANNUAL REPORT | | | | | | | JUNE 30, 2022 | | | 93 |
| | | | |
| Report of Independent Registered Public Accounting Firm | | | | |
To the Board of Trustees of PIMCO Equity Series® and Shareholders of PIMCO REALPATH® Blend 2025 Fund, PIMCO REALPATH® Blend 2030 Fund, PIMCO REALPATH® Blend 2035 Fund, PIMCO REALPATH® Blend 2040 Fund, PIMCO REALPATH® Blend 2045 Fund, PIMCO REALPATH® Blend 2050 Fund, PIMCO REALPATH® Blend 2055 Fund, PIMCO REALPATH® Blend 2060 Fund and PIMCO REALPATH® Blend Income Fund
Opinions on the Financial Statements
We have audited the accompanying statements of assets and liabilities, including the schedules of investments, of PIMCO REALPATH® Blend 2025 Fund, PIMCO REALPATH® Blend 2030 Fund, PIMCO REALPATH® Blend 2035 Fund, PIMCO REALPATH® Blend 2040 Fund, PIMCO REALPATH® Blend 2045 Fund, PIMCO REALPATH® Blend 2050 Fund, PIMCO REALPATH® Blend 2055 Fund, PIMCO REALPATH® Blend 2060 Fund and PIMCO REALPATH® Blend Income Fund (nine of the funds constituting PIMCO Equity Series®, hereafter collectively referred to as the “Funds”) as of June 30, 2022, the related statements of operations for the year ended June 30, 2022, the statements of changes in net assets for each of the two years in the period ended June 30, 2022, including the related notes, and the financial highlights for each of the periods indicated therein (collectively referred to as the “financial statements”). In our opinion, the financial statements present fairly, in all material respects, the financial position of each of the Funds as of June 30, 2022, the results of each of their operations for the year then ended, the changes in each of their net assets for each of the two years in the period ended June 30, 2022 and each of the financial highlights for each of the periods indicated therein in conformity with accounting principles generally accepted in the United States of America.
Basis for Opinions
These financial statements are the responsibility of the Funds’ management. Our responsibility is to express an opinion on the Funds’ financial statements based on our audits. We are a public accounting firm registered with the Public Company Accounting Oversight Board (United States) (PCAOB) and are required to be independent with respect to the Funds in accordance with the U.S. federal securities laws and the applicable rules and regulations of the Securities and Exchange Commission and the PCAOB.
We conducted our audits of these financial statements in accordance with the standards of the PCAOB. Those standards require that we plan and perform the audit to obtain reasonable assurance about whether the financial statements are free of material misstatement, whether due to error or fraud.
Our audits included performing procedures to assess the risks of material misstatement of the financial statements, whether due to error or fraud, and performing procedures that respond to those risks. Such procedures included examining, on a test basis, evidence regarding the amounts and disclosures in the financial statements. Our audits also included evaluating the accounting principles used and significant estimates made by management, as well as evaluating the overall presentation of the financial statements. Our procedures included confirmation of securities owned as of June 30, 2022 by correspondence with the custodian, transfer agent and brokers. We believe that our audits provide a reasonable basis for our opinions.
/s/ PricewaterhouseCoopers LLP
Kansas City, Missouri
August 26, 2022
We have served as the auditor of one or more investment companies in PIMCO Equity Series® since 2010.
| | | | | | |
| Glossary: | | (abbreviations that may be used in the preceding statements) | | | | (Unaudited) |
| | | | | | |
| | |
Counterparty Abbreviations: | | | | |
| | | |
| FICC | | Fixed Income Clearing Corporation | | JPM | | JP Morgan Chase Bank N.A. |
| | |
Currency Abbreviations: | | | | |
| | | |
| USD (or $) | | United States Dollar | | | | |
| | |
Exchange Abbreviations: | | | | |
| | | |
| CBOE | | Chicago Board Options Exchange | | OTC | | Over the Counter |
| | |
Index/Spread Abbreviations: | | | | |
| | | |
| FNRETR | | FTSE Nareit Equity REITs Total Return Index | | S&P 500 | | Standard & Poor’s 500 Index |
| | |
Other Abbreviations: | | | | |
| | | |
| LIBOR | | London Interbank Offered Rate | | TBA | | To-Be-Announced |
| | | | | | | | | | | | |
| | | | ANNUAL REPORT | | | | | | | JUNE 30, 2022 | | | 95 |
| | | | |
| Federal Income Tax Information | | | | (Unaudited) |
As required by the Internal Revenue Code (“Code”) and Treasury Regulations, if applicable, shareholders must be notified within 60 days of the Funds’ fiscal year end regarding the status of qualified dividend income and the dividend received deduction.
Dividend Received Deduction. Corporate shareholders are generally entitled to take the dividend received deduction on the portion of a fund’s dividend distribution that qualifies under tax law. The percentage of the following Funds’ fiscal 2022 ordinary income dividend that qualifies for the corporate dividend corporate dividend received deduction is set forth below:
Qualified Dividend Income. Under the Jobs and Growth Tax Relief Reconciliation Act of 2003, the following percentage of ordinary dividends paid during the fiscal year ended June 30, 2022 was designated as “qualified dividend income” as defined in the Jobs and Growth Tax Relief Reconciliation Act of 2003 subject to reduced tax rates in 2022:
Qualified Interest Income and Qualified Short-Term Capital Gain (for non-U.S. resident shareholders only). Under the American Jobs Creation Act of 2004, the following amounts of ordinary dividends paid during the fiscal year ended June 30, 2022 are considered to be derived from “qualified interest income,” as defined in Section 871(k)(1)(E) of the Code, and therefore are designated as interest-related dividends, as defined in Section 871(k)(1)(C) of the Code. Further, the following amounts of ordinary dividends paid during the fiscal year ended June 30, 2022 are considered to be derived from “qualified short-term capital gain,” as defined in Section 871(k)(2)(D) of the Code, and therefore are designated as qualified short-term gain dividends, as defined by Section 871(k)(2)(C) of the Code.
Section 163(j) Interest Dividends. The Funds intend to pass through the maximum amount allowable as Section 163(j) Interest defined in Proposed Treasury Section 1.163(j)-1(b). The 163(j) amount of ordinary income distributions are as follows:
| | | | | | | | | | | | | | | | | | | | | | | | |
| | | | | | Dividend
Received
Deduction
% | | | Qualified
Dividend
Income
% | | | Qualified
Interest
Income
(000s)† | | | Qualified
Short-Term
Capital Gains
(000s)† | | | 163(j)
Interest
Dividends
(000s)† | |
| | | | | | |
PIMCO REALPATH® Blend 2025 Fund | | | | | | | 0% | | | | 0% | | | $ | 1 | | | $ | 0 | | | $ | 0 | |
| | | | | | |
PIMCO REALPATH® Blend 2030 Fund | | | | | | | 0% | | | | 0% | | | | 1 | | | | 0 | | | | 0 | |
| | | | | | |
PIMCO REALPATH® Blend 2035 Fund | | | | | | | 0% | | | | 0% | | | | 1 | | | | 85 | | | | 0 | |
| | | | | | |
PIMCO REALPATH® Blend 2040 Fund | | | | | | | 0% | | | | 0% | | | | 1 | | | | 250 | | | | 0 | |
| | | | | | |
PIMCO REALPATH® Blend 2045 Fund | | | | | | | 0% | | | | 0% | | | | 1 | | | | 300 | | | | 0 | |
| | | | | | |
PIMCO REALPATH® Blend 2050 Fund | | | | | | | 0% | | | | 0% | | | | 1 | | | | 315 | | | | 0 | |
| | | | | | |
PIMCO REALPATH® Blend 2055 Fund | | | | | | | 0% | | | | 0% | | | | 0 | | | | 160 | | | | 0 | |
| | | | | | |
PIMCO REALPATH® Blend 2060 Fund | | | | | | | 0% | | | | 0% | | | | 0 | | | | 415 | | | | 0 | |
| | | | | | |
PIMCO REALPATH® Blend Income Fund | | | | | | | 0% | | | | 0% | | | | 0 | | | | 0 | | | | 0 | |
| † | A zero balance may reflect actual amounts rounding to less than one thousand. |
Shareholders are advised to consult their own tax advisor with respect to the tax consequences of their investment in the Trust. In January 2023, you will be advised on IRS Form 1099-DIV as to the federal tax status of the dividends and distributions received by you in calendar year 2022.
Section 199A Dividends. Non-corporate fund shareholders of the Funds below meeting certain holding period requirements may be able to deduct up to 20 percent of qualified REIT dividends passed through and reported to the shareholders by the Funds as IRC section 199A dividends. The IRC section 199A percentage of ordinary dividends are as follows:
| | | | | | | | |
| | | | | | 199A
Dividends | |
| | |
PIMCO REALPATH® Blend 2025 Fund | | | | | | | 0% | |
| | |
PIMCO REALPATH® Blend 2030 Fund | | | | | | | 0% | |
| | |
PIMCO REALPATH® Blend 2035 Fund | | | | | | | 0% | |
| | |
PIMCO REALPATH® Blend 2040 Fund | | | | | | | 0% | |
| | |
PIMCO REALPATH® Blend 2045 Fund | | | | | | | 0% | |
| | |
PIMCO REALPATH® Blend 2050 Fund | | | | | | | 0% | |
| | |
PIMCO REALPATH® Blend 2055 Fund | | | | | | | 0% | |
| | |
PIMCO REALPATH® Blend 2060 Fund | | | | | | | 0% | |
| | |
PIMCO REALPATH® Blend Income Fund | | | | | | | 0% | |
| | | | |
| Distribution Information | | | | (Unaudited) |
For purposes of Section 19 of the Investment Company Act of 1940 (the “Act”), the Funds estimated the periodic sources of any dividends paid during the period covered by this report in accordance with good accounting practice. Pursuant to Rule 19a-1(e) under the Act, the table below sets forth the actual source information for dividends paid during the fiscal period ended June 30, 2022 calculated as of each distribution period pursuant to Section 19 of the Act. The information below is not provided for U.S. federal income tax reporting purposes. The tax character of all dividends and distributions is reported on Form 1099-DIV (for shareholders who receive U.S. federal tax reporting) at the end of each calendar year. See the Financial Highlights section of this report for the tax characterization of distributions determined in accordance with federal income tax regulations for the fiscal year.
| | | | | | | | | | | | | | | | | | | | |
| PIMCO REALPATH® Blend 2025 Fund | | | | | | | | | | | | | | | |
| Institutional Class | | | | | Net Investment
Income* | | | Net Realized
Capital Gains* | | | Paid-in Surplus or
Other Capital
Sources** | | | Total (per
common share) | |
| | | | | |
January 2022 | | | | | | $ | 0.0000 | | | $ | 0.0000 | | | $ | 0.0000 | | | $ | 0.0000 | |
| | | | | |
February 2022 | | | | | | $ | 0.0000 | | | $ | 0.0000 | | | $ | 0.0000 | | | $ | 0.0000 | |
| | | | | |
March 2022 | | | | | | $ | 0.0295 | | | $ | 0.0000 | | | $ | 0.0000 | | | $ | 0.0295 | |
| | | | | |
April 2022 | | | | | | $ | 0.0000 | | | $ | 0.0000 | | | $ | 0.0000 | | | $ | 0.0000 | |
| | | | | |
May 2022 | | | | | | $ | 0.0000 | | | $ | 0.0000 | | | $ | 0.0000 | | | $ | 0.0000 | |
| | | | | |
June 2022 | | | | | | $ | 0.0476 | | | $ | 0.0000 | | | $ | 0.0000 | | | $ | 0.0476 | |
| | | | | |
| Administrative Class | | | | | Net Investment
Income* | | | Net Realized
Capital Gains* | | | Paid-in Surplus or
Other Capital
Sources** | | | Total (per
common share) | |
| | | | | |
January 2022 | | | | | | $ | 0.0000 | | | $ | 0.0000 | | | $ | 0.0000 | | | $ | 0.0000 | |
| | | | | |
February 2022 | | | | | | $ | 0.0000 | | | $ | 0.0000 | | | $ | 0.0000 | | | $ | 0.0000 | |
| | | | | |
March 2022 | | | | | | $ | 0.0223 | | | $ | 0.0000 | | | $ | 0.0000 | | | $ | 0.0223 | |
| | | | | |
April 2022 | | | | | | $ | 0.0000 | | | $ | 0.0000 | | | $ | 0.0000 | | | $ | 0.0000 | |
| | | | | |
May 2022 | | | | | | $ | 0.0000 | | | $ | 0.0000 | | | $ | 0.0000 | | | $ | 0.0000 | |
| | | | | |
June 2022 | | | | | | $ | 0.0399 | | | $ | 0.0000 | | | $ | 0.0000 | | | $ | 0.0399 | |
| | | | | |
| Class A | | | | | Net Investment
Income* | | | Net Realized
Capital Gains* | | | Paid-in Surplus or
Other Capital
Sources** | | | Total (per
common share) | |
| | | | | |
January 2022 | | | | | | $ | 0.0000 | | | $ | 0.0000 | | | $ | 0.0000 | | | $ | 0.0000 | |
| | | | | |
February 2022 | | | | | | $ | 0.0000 | | | $ | 0.0000 | | | $ | 0.0000 | | | $ | 0.0000 | |
| | | | | |
March 2022 | | | | | | $ | 0.0153 | | | $ | 0.0000 | | | $ | 0.0000 | | | $ | 0.0153 | |
| | | | | |
April 2022 | | | | | | $ | 0.0000 | | | $ | 0.0000 | | | $ | 0.0000 | | | $ | 0.0000 | |
| | | | | |
May 2022 | | | | | | $ | 0.0000 | | | $ | 0.0000 | | | $ | 0.0000 | | | $ | 0.0000 | |
| | | | | |
June 2022 | | | | | | $ | 0.0318 | | | $ | 0.0000 | | | $ | 0.0000 | | | $ | 0.0318 | |
| | | | | | | | | | | | |
| | | | ANNUAL REPORT | | | | | | | JUNE 30, 2022 | | | 97 |
| | | | |
| Distribution Information | | (Cont.) | | |
| | | | | | | | | | | | | | | | | | | | |
| PIMCO REALPATH® Blend 2030 Fund | | | | | | | | | | | | | | | |
| Institutional Class | | | | | Net Investment
Income* | | | Net Realized
Capital Gains* | | | Paid-in Surplus or
Other Capital
Sources** | | | Total (per
common share) | |
| | | | | |
January 2022 | | | | | | $ | 0.0000 | | | $ | 0.0000 | | | $ | 0.0000 | | | $ | 0.0000 | |
| | | | | |
February 2022 | | | | | | $ | 0.0000 | | | $ | 0.0000 | | | $ | 0.0000 | | | $ | 0.0000 | |
| | | | | |
March 2022 | | | | | | $ | 0.0312 | | | $ | 0.0000 | | | $ | 0.0000 | | | $ | 0.0312 | |
| | | | | |
April 2022 | | | | | | $ | 0.0000 | | | $ | 0.0000 | | | $ | 0.0000 | | | $ | 0.0000 | |
| | | | | |
May 2022 | | | | | | $ | 0.0000 | | | $ | 0.0000 | | | $ | 0.0000 | | | $ | 0.0000 | |
| | | | | |
June 2022 | | | | | | $ | 0.0429 | | | $ | 0.0000 | | | $ | 0.0000 | | | $ | 0.0429 | |
| | | | | |
| Administrative Class | | | | | Net Investment
Income* | | | Net Realized
Capital Gains* | | | Paid-in Surplus or
Other Capital
Sources** | | | Total (per
common share) | |
| | | | | |
January 2022 | | | | | | $ | 0.0000 | | | $ | 0.0000 | | | $ | 0.0000 | | | $ | 0.0000 | |
| | | | | |
February 2022 | | | | | | $ | 0.0000 | | | $ | 0.0000 | | | $ | 0.0000 | | | $ | 0.0000 | |
| | | | | |
March 2022 | | | | | | $ | 0.0238 | | | $ | 0.0000 | | | $ | 0.0000 | | | $ | 0.0238 | |
| | | | | |
April 2022 | | | | | | $ | 0.0000 | | | $ | 0.0000 | | | $ | 0.0000 | | | $ | 0.0000 | |
| | | | | |
May 2022 | | | | | | $ | 0.0000 | | | $ | 0.0000 | | | $ | 0.0000 | | | $ | 0.0000 | |
| | | | | |
June 2022 | | | | | | $ | 0.0349 | | | $ | 0.0000 | | | $ | 0.0000 | | | $ | 0.0349 | |
| | | | | |
| Class A | | | | | Net Investment
Income* | | | Net Realized
Capital Gains* | | | Paid-in Surplus or
Other Capital
Sources** | | | Total (per
common share) | |
| | | | | |
January 2022 | | | | | | $ | 0.0000 | | | $ | 0.0000 | | | $ | 0.0000 | | | $ | 0.0000 | |
| | | | | |
February 2022 | | | | | | $ | 0.0000 | | | $ | 0.0000 | | | $ | 0.0000 | | | $ | 0.0000 | |
| | | | | |
March 2022 | | | | | | $ | 0.0179 | | | $ | 0.0000 | | | $ | 0.0000 | | | $ | 0.0179 | |
| | | | | |
April 2022 | | | | | | $ | 0.0000 | | | $ | 0.0000 | | | $ | 0.0000 | | | $ | 0.0000 | |
| | | | | |
May 2022 | | | | | | $ | 0.0000 | | | $ | 0.0000 | | | $ | 0.0000 | | | $ | 0.0000 | |
| | | | | |
June 2022 | | | | | | $ | 0.0279 | | | $ | 0.0000 | | | $ | 0.0000 | | | $ | 0.0279 | |
| | | | | |
| PIMCO REALPATH® Blend 2035 Fund | | | | | | | | | | | | | | | |
| Institutional Class | | | | | Net Investment
Income* | | | Net Realized
Capital Gains* | | | Paid-in Surplus or
Other Capital
Sources** | | | Total (per
common share) | |
| | | | | |
January 2022 | | | | | | $ | 0.0000 | | | $ | 0.0000 | | | $ | 0.0000 | | | $ | 0.0000 | |
| | | | | |
February 2022 | | | | | | $ | 0.0000 | | | $ | 0.0000 | | | $ | 0.0000 | | | $ | 0.0000 | |
| | | | | |
March 2022 | | | | | | $ | 0.0138 | | | $ | 0.0000 | | | $ | 0.0000 | | | $ | 0.0138 | |
| | | | | |
April 2022 | | | | | | $ | 0.0000 | | | $ | 0.0000 | | | $ | 0.0000 | | | $ | 0.0000 | |
| | | | | |
May 2022 | | | | | | $ | 0.0000 | | | $ | 0.0000 | | | $ | 0.0000 | | | $ | 0.0000 | |
| | | | | |
June 2022 | | | | | | $ | 0.0304 | | | $ | 0.0000 | | | $ | 0.0000 | | | $ | 0.0304 | |
| | | | | |
| Administrative Class | | | | | Net Investment
Income* | | | Net Realized
Capital Gains* | | | Paid-in Surplus or
Other Capital
Sources** | | | Total (per
common share) | |
| | | | | |
January 2022 | | | | | | $ | 0.0000 | | | $ | 0.0000 | | | $ | 0.0000 | | | $ | 0.0000 | |
| | | | | |
February 2022 | | | | | | $ | 0.0000 | | | $ | 0.0000 | | | $ | 0.0000 | | | $ | 0.0000 | |
| | | | | |
March 2022 | | | | | | $ | 0.0061 | | | $ | 0.0000 | | | $ | 0.0000 | | | $ | 0.0061 | |
| | | | | |
April 2022 | | | | | | $ | 0.0000 | | | $ | 0.0000 | | | $ | 0.0000 | | | $ | 0.0000 | |
| | | | | |
May 2022 | | | | | | $ | 0.0000 | | | $ | 0.0000 | | | $ | 0.0000 | | | $ | 0.0000 | |
| | | | | |
June 2022 | | | | | | $ | 0.0221 | | | $ | 0.0000 | | | $ | 0.0000 | | | $ | 0.0221 | |
| | | | | |
| Class A | | | | | Net Investment
Income* | | | Net Realized
Capital Gains* | | | Paid-in Surplus or
Other Capital
Sources** | | | Total (per
common share) | |
| | | | | |
January 2022 | | | | | | $ | 0.0000 | | | $ | 0.0000 | | | $ | 0.0000 | | | $ | 0.0000 | |
| | | | | |
February 2022 | | | | | | $ | 0.0000 | | | $ | 0.0000 | | | $ | 0.0000 | | | $ | 0.0000 | |
| | | | | |
March 2022 | | | | | | $ | 0.0001 | | | $ | 0.0000 | | | $ | 0.0000 | | | $ | 0.0001 | |
| | | | | |
April 2022 | | | | | | $ | 0.0000 | | | $ | 0.0000 | | | $ | 0.0000 | | | $ | 0.0000 | |
| | | | | |
May 2022 | | | | | | $ | 0.0000 | | | $ | 0.0000 | | | $ | 0.0000 | | | $ | 0.0000 | |
| | | | | |
June 2022 | | | | | | $ | 0.0153 | | | $ | 0.0000 | | | $ | 0.0000 | | | $ | 0.0153 | |
| | | | | | | | | | | | | | | | | | | | |
| PIMCO REALPATH® Blend 2040 Fund | | | | | | | | | | | | | | | |
| Institutional Class | | | | | Net Investment
Income* | | | Net Realized
Capital Gains* | | | Paid-in Surplus or
Other Capital
Sources** | | | Total (per
common share) | |
| | | | | |
January 2022 | | | | | | $ | 0.0000 | | | $ | 0.0000 | | | $ | 0.0000 | | | $ | 0.0000 | |
| | | | | |
February 2022 | | | | | | $ | 0.0000 | | | $ | 0.0000 | | | $ | 0.0000 | | | $ | 0.0000 | |
| | | | | |
March 2022 | | | | | | $ | 0.0028 | | | $ | 0.0000 | | | $ | 0.0000 | | | $ | 0.0028 | |
| | | | | |
April 2022 | | | | | | $ | 0.0000 | | | $ | 0.0000 | | | $ | 0.0000 | | | $ | 0.0000 | |
| | | | | |
May 2022 | | | | | | $ | 0.0000 | | | $ | 0.0000 | | | $ | 0.0000 | | | $ | 0.0000 | |
| | | | | |
June 2022 | | | | | | $ | 0.0205 | | | $ | 0.0000 | | | $ | 0.0000 | | | $ | 0.0205 | |
| | | | | |
| Administrative Class | | | | | Net Investment
Income* | | | Net Realized
Capital Gains* | | | Paid-in Surplus or
Other Capital
Sources** | | | Total (per
common share) | |
| | | | | |
January 2022 | | | | | | $ | 0.0000 | | | $ | 0.0000 | | | $ | 0.0000 | | | $ | 0.0000 | |
| | | | | |
February 2022 | | | | | | $ | 0.0000 | | | $ | 0.0000 | | | $ | 0.0000 | | | $ | 0.0000 | |
| | | | | |
March 2022 | | | | | | $ | 0.0000 | | | $ | 0.0000 | | | $ | 0.0000 | | | $ | 0.0000 | |
| | | | | |
April 2022 | | | | | | $ | 0.0000 | | | $ | 0.0000 | | | $ | 0.0000 | | | $ | 0.0000 | |
| | | | | |
May 2022 | | | | | | $ | 0.0000 | | | $ | 0.0000 | | | $ | 0.0000 | | | $ | 0.0000 | |
| | | | | |
June 2022 | | | | | | $ | 0.0120 | | | $ | 0.0000 | | | $ | 0.0000 | | | $ | 0.0120 | |
| | | | | |
| Class A | | | | | Net Investment
Income* | | | Net Realized
Capital Gains* | | | Paid-in Surplus or
Other Capital
Sources** | | | Total (per
common share) | |
| | | | | |
January 2022 | | | | | | $ | 0.0000 | | | $ | 0.0000 | | | $ | 0.0000 | | | $ | 0.0000 | |
| | | | | |
February 2022 | | | | | | $ | 0.0000 | | | $ | 0.0000 | | | $ | 0.0000 | | | $ | 0.0000 | |
| | | | | |
March 2022 | | | | | | $ | 0.0000 | | | $ | 0.0000 | | | $ | 0.0000 | | | $ | 0.0000 | |
| | | | | |
April 2022 | | | | | | $ | 0.0000 | | | $ | 0.0000 | | | $ | 0.0000 | | | $ | 0.0000 | |
| | | | | |
May 2022 | | | | | | $ | 0.0000 | | | $ | 0.0000 | | | $ | 0.0000 | | | $ | 0.0000 | |
| | | | | |
June 2022 | | | | | | $ | 0.0045 | | | $ | 0.0000 | | | $ | 0.0000 | | | $ | 0.0045 | |
| | | | | |
| PIMCO REALPATH® Blend 2045 Fund | | | | | | | | | | | | | | | |
| Institutional Class | | | | | Net Investment
Income* | | | Net Realized
Capital Gains* | | | Paid-in Surplus or
Other Capital
Sources** | | | Total (per
common share) | |
| | | | | |
January 2022 | | | | | | $ | 0.0000 | | | $ | 0.0000 | | | $ | 0.0000 | | | $ | 0.0000 | |
| | | | | |
February 2022 | | | | | | $ | 0.0000 | | | $ | 0.0000 | | | $ | 0.0000 | | | $ | 0.0000 | |
| | | | | |
March 2022 | | | | | | $ | 0.0000 | | | $ | 0.0000 | | | $ | 0.0000 | | | $ | 0.0000 | |
| | | | | |
April 2022 | | | | | | $ | 0.0000 | | | $ | 0.0000 | | | $ | 0.0000 | | | $ | 0.0000 | |
| | | | | |
May 2022 | | | | | | $ | 0.0000 | | | $ | 0.0000 | | | $ | 0.0000 | | | $ | 0.0000 | |
| | | | | |
June 2022 | | | | | | $ | 0.0120 | | | $ | 0.0000 | | | $ | 0.0000 | | | $ | 0.0120 | |
| | | | | |
| Administrative Class | | | | | Net Investment
Income* | | | Net Realized
Capital Gains* | | | Paid-in Surplus or
Other Capital
Sources** | | | Total (per
common share) | |
| | | | | |
January 2022 | | | | | | $ | 0.0000 | | | $ | 0.0000 | | | $ | 0.0000 | | | $ | 0.0000 | |
| | | | | |
February 2022 | | | | | | $ | 0.0000 | | | $ | 0.0000 | | | $ | 0.0000 | | | $ | 0.0000 | |
| | | | | |
March 2022 | | | | | | $ | 0.0000 | | | $ | 0.0000 | | | $ | 0.0000 | | | $ | 0.0000 | |
| | | | | |
April 2022 | | | | | | $ | 0.0000 | | | $ | 0.0000 | | | $ | 0.0000 | | | $ | 0.0000 | |
| | | | | |
May 2022 | | | | | | $ | 0.0000 | | | $ | 0.0000 | | | $ | 0.0000 | | | $ | 0.0000 | |
| | | | | |
June 2022 | | | | | | $ | 0.0000 | | | $ | 0.0000 | | | $ | 0.0000 | | | $ | 0.0000 | |
| | | | | |
| Class A | | | | | Net Investment
Income* | | | Net Realized
Capital Gains* | | | Paid-in Surplus or
Other Capital
Sources** | | | Total (per
common share) | |
| | | | | |
January 2022 | | | | | | $ | 0.0000 | | | $ | 0.0000 | | | $ | 0.0000 | | | $ | 0.0000 | |
| | | | | |
February 2022 | | | | | | $ | 0.0000 | | | $ | 0.0000 | | | $ | 0.0000 | | | $ | 0.0000 | |
| | | | | |
March 2022 | | | | | | $ | 0.0000 | | | $ | 0.0000 | | | $ | 0.0000 | | | $ | 0.0000 | |
| | | | | |
April 2022 | | | | | | $ | 0.0000 | | | $ | 0.0000 | | | $ | 0.0000 | | | $ | 0.0000 | |
| | | | | |
May 2022 | | | | | | $ | 0.0000 | | | $ | 0.0000 | | | $ | 0.0000 | | | $ | 0.0000 | |
| | | | | |
June 2022 | | | | | | $ | 0.0000 | | | $ | 0.0000 | | | $ | 0.0000 | | | $ | 0.0000 | |
| | | | | | | | | | | | |
| | | | ANNUAL REPORT | | | | | | | JUNE 30, 2022 | | | 99 |
| | | | |
Distribution Information
| | (Cont.) | | |
| | | | | | | | | | | | | | | | | | | | |
| PIMCO REALPATH® Blend 2050 Fund | | | | | | | | | | | | | | | |
| Institutional Class | | | | | Net Investment
Income* | | | Net Realized
Capital Gains* | | | Paid-in Surplus or
Other Capital
Sources** | | | Total (per
common share) | |
| | | | | |
January 2022 | | | | | | $ | 0.0000 | | | $ | 0.0000 | | | $ | 0.0000 | | | $ | 0.0000 | |
| | | | | |
February 2022 | | | | | | $ | 0.0000 | | | $ | 0.0000 | | | $ | 0.0000 | | | $ | 0.0000 | |
| | | | | |
March 2022 | | | | | | $ | 0.0000 | | | $ | 0.0000 | | | $ | 0.0000 | | | $ | 0.0000 | |
| | | | | |
April 2022 | | | | | | $ | 0.0000 | | | $ | 0.0000 | | | $ | 0.0000 | | | $ | 0.0000 | |
| | | | | |
May 2022 | | | | | | $ | 0.0000 | | | $ | 0.0000 | | | $ | 0.0000 | | | $ | 0.0000 | |
| | | | | |
June 2022 | | | | | | $ | 0.0000 | | | $ | 0.0000 | | | $ | 0.0000 | | | $ | 0.0000 | |
| | | | | |
| Administrative Class | | | | | Net Investment
Income* | | | Net Realized
Capital Gains* | | | Paid-in Surplus or
Other Capital
Sources** | | | Total (per
common share) | |
| | | | | |
January 2022 | | | | | | $ | 0.0000 | | | $ | 0.0000 | | | $ | 0.0000 | | | $ | 0.0000 | |
| | | | | |
February 2022 | | | | | | $ | 0.0000 | | | $ | 0.0000 | | | $ | 0.0000 | | | $ | 0.0000 | |
| | | | | |
March 2022 | | | | | | $ | 0.0000 | | | $ | 0.0000 | | | $ | 0.0000 | | | $ | 0.0000 | |
| | | | | |
April 2022 | | | | | | $ | 0.0000 | | | $ | 0.0000 | | | $ | 0.0000 | | | $ | 0.0000 | |
| | | | | |
May 2022 | | | | | | $ | 0.0000 | | | $ | 0.0000 | | | $ | 0.0000 | | | $ | 0.0000 | |
| | | | | |
June 2022 | | | | | | $ | 0.0000 | | | $ | 0.0000 | | | $ | 0.0000 | | | $ | 0.0000 | |
| | | | | |
| Class A | | | | | Net Investment
Income* | | | Net Realized
Capital Gains* | | | Paid-in Surplus or
Other Capital
Sources** | | | Total (per
common share) | |
| | | | | |
January 2022 | | | | | | $ | 0.0000 | | | $ | 0.0000 | | | $ | 0.0000 | | | $ | 0.0000 | |
| | | | | |
February 2022 | | | | | | $ | 0.0000 | | | $ | 0.0000 | | | $ | 0.0000 | | | $ | 0.0000 | |
| | | | | |
March 2022 | | | | | | $ | 0.0000 | | | $ | 0.0000 | | | $ | 0.0000 | | | $ | 0.0000 | |
| | | | | |
April 2022 | | | | | | $ | 0.0000 | | | $ | 0.0000 | | | $ | 0.0000 | | | $ | 0.0000 | |
| | | | | |
May 2022 | | | | | | $ | 0.0000 | | | $ | 0.0000 | | | $ | 0.0000 | | | $ | 0.0000 | |
| | | | | |
June 2022 | | | | | | $ | 0.0000 | | | $ | 0.0000 | | | $ | 0.0000 | | | $ | 0.0000 | |
| | | | | |
| PIMCO REALPATH® Blend 2055 Fund | | | | | | | | | | | | | | | |
| Institutional Class | | | | | Net Investment
Income* | | | Net Realized
Capital Gains* | | | Paid-in Surplus or
Other Capital
Sources** | | | Total (per
common share) | |
| | | | | |
January 2022 | | | | | | $ | 0.0000 | | | $ | 0.0000 | | | $ | 0.0000 | | | $ | 0.0000 | |
| | | | | |
February 2022 | | | | | | $ | 0.0000 | | | $ | 0.0000 | | | $ | 0.0000 | | | $ | 0.0000 | |
| | | | | |
March 2022 | | | | | | $ | 0.0000 | | | $ | 0.0000 | | | $ | 0.0000 | | | $ | 0.0000 | |
| | | | | |
April 2022 | | | | | | $ | 0.0000 | | | $ | 0.0000 | | | $ | 0.0000 | | | $ | 0.0000 | |
| | | | | |
May 2022 | | | | | | $ | 0.0000 | | | $ | 0.0000 | | | $ | 0.0000 | | | $ | 0.0000 | |
| | | | | |
June 2022 | | | | | | $ | 0.0000 | | | $ | 0.0000 | | | $ | 0.0000 | | | $ | 0.0000 | |
| | | | | |
| Administrative Class | | | | | Net Investment
Income* | | | Net Realized
Capital Gains* | | | Paid-in Surplus or
Other Capital
Sources** | | | Total (per
common share) | |
| | | | | |
January 2022 | | | | | | $ | 0.0000 | | | $ | 0.0000 | | | $ | 0.0000 | | | $ | 0.0000 | |
| | | | | |
February 2022 | | | | | | $ | 0.0000 | | | $ | 0.0000 | | | $ | 0.0000 | | | $ | 0.0000 | |
| | | | | |
March 2022 | | | | | | $ | 0.0000 | | | $ | 0.0000 | | | $ | 0.0000 | | | $ | 0.0000 | |
| | | | | |
April 2022 | | | | | | $ | 0.0000 | | | $ | 0.0000 | | | $ | 0.0000 | | | $ | 0.0000 | |
| | | | | |
May 2022 | | | | | | $ | 0.0000 | | | $ | 0.0000 | | | $ | 0.0000 | | | $ | 0.0000 | |
| | | | | |
June 2022 | | | | | | $ | 0.0000 | | | $ | 0.0000 | | | $ | 0.0000 | | | $ | 0.0000 | |
| | | | | |
| Class A | | | | | Net Investment
Income* | | | Net Realized
Capital Gains* | | | Paid-in Surplus or
Other Capital
Sources** | | | Total (per
common share) | |
| | | | | |
January 2022 | | | | | | $ | 0.0000 | | | $ | 0.0000 | | | $ | 0.0000 | | | $ | 0.0000 | |
| | | | | |
February 2022 | | | | | | $ | 0.0000 | | | $ | 0.0000 | | | $ | 0.0000 | | | $ | 0.0000 | |
| | | | | |
March 2022 | | | | | | $ | 0.0000 | | | $ | 0.0000 | | | $ | 0.0000 | | | $ | 0.0000 | |
| | | | | |
April 2022 | | | | | | $ | 0.0000 | | | $ | 0.0000 | | | $ | 0.0000 | | | $ | 0.0000 | |
| | | | | |
May 2022 | | | | | | $ | 0.0000 | | | $ | 0.0000 | | | $ | 0.0000 | | | $ | 0.0000 | |
| | | | | |
June 2022 | | | | | | $ | 0.0000 | | | $ | 0.0000 | | | $ | 0.0000 | | | $ | 0.0000 | |
| | | | | | | | | | | | | | | | | | | | |
| PIMCO REALPATH® Blend 2060 Fund | | | | | | | | | | | | | | | |
| Institutional Class | | | | | Net Investment
Income* | | | Net Realized
Capital Gains* | | | Paid-in Surplus or
Other Capital
Sources** | | | Total (per
common share) | |
| | | | | |
January 2022 | | | | | | $ | 0.0000 | | | $ | 0.0000 | | | $ | 0.0000 | | | $ | 0.0000 | |
| | | | | |
February 2022 | | | | | | $ | 0.0000 | | | $ | 0.0000 | | | $ | 0.0000 | | | $ | 0.0000 | |
| | | | | |
March 2022 | | | | | | $ | 0.0000 | | | $ | 0.0000 | | | $ | 0.0000 | | | $ | 0.0000 | |
| | | | | |
April 2022 | | | | | | $ | 0.0000 | | | $ | 0.0000 | | | $ | 0.0000 | | | $ | 0.0000 | |
| | | | | |
May 2022 | | | | | | $ | 0.0000 | | | $ | 0.0000 | | | $ | 0.0000 | | | $ | 0.0000 | |
| | | | | |
June 2022 | | | | | | $ | 0.0000 | | | $ | 0.0000 | | | $ | 0.0000 | | | $ | 0.0000 | |
| | | | | |
| Administrative Class | | | | | Net Investment
Income* | | | Net Realized
Capital Gains* | | | Paid-in Surplus or
Other Capital
Sources** | | | Total (per
common share) | |
| | | | | |
January 2022 | | | | | | $ | 0.0000 | | | $ | 0.0000 | | | $ | 0.0000 | | | $ | 0.0000 | |
| | | | | |
February 2022 | | | | | | $ | 0.0000 | | | $ | 0.0000 | | | $ | 0.0000 | | | $ | 0.0000 | |
| | | | | |
March 2022 | | | | | | $ | 0.0000 | | | $ | 0.0000 | | | $ | 0.0000 | | | $ | 0.0000 | |
| | | | | |
April 2022 | | | | | | $ | 0.0000 | | | $ | 0.0000 | | | $ | 0.0000 | | | $ | 0.0000 | |
| | | | | |
May 2022 | | | | | | $ | 0.0000 | | | $ | 0.0000 | | | $ | 0.0000 | | | $ | 0.0000 | |
| | | | | |
June 2022 | | | | | | $ | 0.0000 | | | $ | 0.0000 | | | $ | 0.0000 | | | $ | 0.0000 | |
| | | | | |
| Class A | | | | | Net Investment
Income* | | | Net Realized
Capital Gains* | | | Paid-in Surplus or
Other Capital
Sources** | | | Total (per
common share) | |
| | | | | |
January 2022 | | | | | | $ | 0.0000 | | | $ | 0.0000 | | | $ | 0.0000 | | | $ | 0.0000 | |
| | | | | |
February 2022 | | | | | | $ | 0.0000 | | | $ | 0.0000 | | | $ | 0.0000 | | | $ | 0.0000 | |
| | | | | |
March 2022 | | | | | | $ | 0.0000 | | | $ | 0.0000 | | | $ | 0.0000 | | | $ | 0.0000 | |
| | | | | |
April 2022 | | | | | | $ | 0.0000 | | | $ | 0.0000 | | | $ | 0.0000 | | | $ | 0.0000 | |
| | | | | |
May 2022 | | | | | | $ | 0.0000 | | | $ | 0.0000 | | | $ | 0.0000 | | | $ | 0.0000 | |
| | | | | |
June 2022 | | | | | | $ | 0.0000 | | | $ | 0.0000 | | | $ | 0.0000 | | | $ | 0.0000 | |
| | | | | |
| PIMCO REALPATH® Blend Income Fund | | | | | | | | | | | | | | | |
| Institutional Class | | | | | Net Investment
Income* | | | Net Realized
Capital Gains* | | | Paid-in Surplus or
Other Capital
Sources** | | | Total (per
common share) | |
| | | | | |
January 2022 | | | | | | $ | 0.0000 | | | $ | 0.0000 | | | $ | 0.0000 | | | $ | 0.0000 | |
| | | | | |
February 2022 | | | | | | $ | 0.0000 | | | $ | 0.0000 | | | $ | 0.0000 | | | $ | 0.0000 | |
| | | | | |
March 2022 | | | | | | $ | 0.0088 | | | $ | 0.0000 | | | $ | 0.0000 | | | $ | 0.0088 | |
| | | | | |
April 2022 | | | | | | $ | 0.0000 | | | $ | 0.0000 | | | $ | 0.0000 | | | $ | 0.0000 | |
| | | | | |
May 2022 | | | | | | $ | 0.0000 | | | $ | 0.0000 | | | $ | 0.0000 | | | $ | 0.0000 | |
| | | | | |
June 2022 | | | | | | $ | 0.0548 | | | $ | 0.0000 | | | $ | 0.0000 | | | $ | 0.0548 | |
| | | | | |
| Administrative Class | | | | | Net Investment
Income* | | | Net Realized
Capital Gains* | | | Paid-in Surplus or
Other Capital
Sources** | | | Total (per
common share) | |
| | | | | |
January 2022 | | | | | | $ | 0.0000 | | | $ | 0.0000 | | | $ | 0.0000 | | | $ | 0.0000 | |
| | | | | |
February 2022 | | | | | | $ | 0.0000 | | | $ | 0.0000 | | | $ | 0.0000 | | | $ | 0.0000 | |
| | | | | |
March 2022 | | | | | | $ | 0.0022 | | | $ | 0.0000 | | | $ | 0.0000 | | | $ | 0.0022 | |
| | | | | |
April 2022 | | | | | | $ | 0.0000 | | | $ | 0.0000 | | | $ | 0.0000 | | | $ | 0.0000 | |
| | | | | |
May 2022 | | | | | | $ | 0.0000 | | | $ | 0.0000 | | | $ | 0.0000 | | | $ | 0.0000 | |
| | | | | |
June 2022 | | | | | | $ | 0.0472 | | | $ | 0.0000 | | | $ | 0.0000 | | | $ | 0.0472 | |
| | | | | |
| Class A | | | | | Net Investment
Income* | | | Net Realized
Capital Gains* | | | Paid-in Surplus or
Other Capital
Sources** | | | Total (per
common share) | |
| | | | | |
January 2022 | | | | | | $ | 0.0000 | | | $ | 0.0000 | | | $ | 0.0000 | | | $ | 0.0000 | |
| | | | | |
February 2022 | | | | | | $ | 0.0000 | | | $ | 0.0000 | | | $ | 0.0000 | | | $ | 0.0000 | |
| | | | | |
March 2022 | | | | | | $ | 0.0000 | | | $ | 0.0000 | | | $ | 0.0000 | | | $ | 0.0000 | |
| | | | | |
April 2022 | | | | | | $ | 0.0000 | | | $ | 0.0000 | | | $ | 0.0000 | | | $ | 0.0000 | |
| | | | | |
May 2022 | | | | | | $ | 0.0000 | | | $ | 0.0000 | | | $ | 0.0000 | | | $ | 0.0000 | |
| | | | | |
June 2022 | | | | | | $ | 0.0414 | | | $ | 0.0000 | | | $ | 0.0000 | | | $ | 0.0414 | |
| * | The source of dividends provided in the table differs, in some respects, from information presented in this report prepared in accordance with generally accepted accounting principles, or U.S. GAAP. For example, net earnings from certain interest rate swap contracts are included as a source of net investment income for purposes of Section 19(a). Accordingly, the information in the table may differ from information in the accompanying financial statements that are presented on the basis of U.S. GAAP and may differ from tax information presented in the footnotes. Amounts shown may include accumulated, as well as fiscal period net income and net profits. |
| ** | Occurs when a fund distributes an amount greater than its accumulated net income and net profits. Amounts are not reflective of a fund’s net income, yield, earnings or investment performance. |
| | | | | | | | | | | | |
| | | | ANNUAL REPORT | | | | | | | JUNE 30, 2022 | | | 101 |
The charts below identify the Trustees and executive officers of the Trust. Unless otherwise indicated, the address of all persons below is 650 Newport Center Drive, Newport Beach, CA 92660.
The Funds’ Statement of Additional Information includes more information about the Trustees and Officers. To request a free copy, call PIMCO at (888) 87-PIMCO or visit the Funds’ website at www.pimco.com.
| | | | | | | | |
Name, Year of Birth and
Position Held with Trust* | | Term of
Office and
Length of
Time Served† | | Principal Occupation(s) During Past 5 Years | | Number of Funds in Fund Complex
Overseen by Trustee | | Other Public Company and Investment Company
Directorships Held by Trustee During the Past 5 Years |
| | | | |
| Interested Trustees1 | | | | | | | | |
| | | | |
Peter G. Strelow (1970) Chairman of the Board and Trustee | | 02/2019 to present | | Managing Director and Co-Chief Operating Officer, PIMCO. Senior Vice President of the Trust, PIMCO Equity Series VIT, PIMCO Funds, PIMCO Variable Insurance Trust and PIMCO ETF Trust, PIMCO Managed Accounts Trust, PIMCO-Sponsored Interval Funds and PIMCO-Sponsored Closed-End Funds. Formerly, Chief Administrative Officer, PIMCO. | | 149 | | Chairman and Trustee, PIMCO Equity Series VIT, PIMCO Funds, PIMCO Variable Insurance Trust, PIMCO ETF Trust. |
| | | | |
Kimberley G. Stafford (1978) Trustee | | 02/2021 to present | | Managing Director, Global Head of Product Strategy, PIMCO; and Member of Executive Committee, PIMCO. Formerly, Head of Asia-Pacific, Global Head of Consultant Relations and Head of US Institutional and Alternatives Sales, PIMCO. | | 149 | | Trustee, PIMCO Equity Series VIT, PIMCO Funds, PIMCO Variable Insurance Trust, PIMCO ETF Trust. |
| | | |
| Independent Trustees | | | | | | |
| | | | |
George E. Borst (1948) Trustee | | 05/2019 to present | | Executive Advisor, McKinsey & Company; Formerly, Executive Advisor, Toyota Financial Services; and CEO, Toyota Financial Services. | | 149 | | Trustee, PIMCO Equity Series VIT, PIMCO Funds, PIMCO Variable Insurance and PIMCO ETF Trust; Director, MarineMax Inc. |
| | | | |
Jennifer Holden Dunbar (1963) Trustee | | 02/2016 to present | | Formerly, Managing Director, Dunbar Partners, LLC (business consulting and investments) (05/05-05/21); and Partner, Leonard Green & Partners, L.P. | | 149 | | Trustee, PIMCO Equity Series VIT, PIMCO Funds, PIMCO Variable Insurance and PIMCO ETF Trust; Director, PS Business Parks; Director, Big 5 Sporting Goods Corporation. |
| | | | |
Kym M. Hubbard (1957) Trustee | | 05/2019 to present | | Formerly, Global Head of Investments, Chief Investment Officer and Treasurer, Ernst & Young. | | 149 | | Trustee, PIMCO Equity Series VIT, PIMCO Funds, PIMCO Variable Insurance and PIMCO ETF Trust; Director, State Auto Financial Corporation. |
| | | | |
Gary F. Kennedy (1955) Trustee | | 05/2019 to present | | Formerly, Senior Vice President, General Counsel and Chief Compliance Officer, American Airlines and AMR Corporation (now American Airlines Group). | | 149 | | Trustee, PIMCO Equity Series VIT, PIMCO Funds, PIMCO Variable Insurance and PIMCO ETF Trust. |
| | | | |
Peter B. McCarthy (1950) Trustee | | 09/2011 to present | | Formerly, Assistant Secretary and Chief Financial Officer, United States Department of Treasury; Deputy Managing Director, Institute of International Finance. | | 149 | | Trustee, PIMCO Equity Series VIT, PIMCO Funds, PIMCO Variable Insurance and PIMCO ETF Trust. |
| | | | |
Ronald C. Parker (1951) Lead Independent Trustee | | 02/2016 to present Lead Independent Trustee 05/2019 to present | | Director of Roseburg Forest Products Company. Formerly, Chairman of the Board, The Ford Family Foundation; and President, Chief Executive Officer, Hampton Affiliates (forestry products). | | 149 | | Lead Independent Trustee, PIMCO Equity Series VIT, PIMCO Funds, PIMCO Variable Insurance and PIMCO ETF Trust. |
| * | Unless otherwise noted, the information for the individuals listed is as of June 30, 2022. |
| 1 | Ms. Stafford is an “interested persons” of the Trust (as that term is defined in the 1940 Act) because of his affiliations with PIMCO. |
| † | Trustees serve until their successors are duly elected and qualified. |
Executive Officers
| | | | |
Name, Year of Birth and Position Held with Trust* | | Term of Office and Length of Time Served | | Principal Occupation(s) During Past 5 Years† |
| | |
Eric D. Johnson (1970) President | | 06/2019 to present | | Executive Vice President and Head of Funds Business Group Americas, PIMCO. President, PIMCO Funds, PIMCO Variable Insurance Trust, PIMCO ETF Trust, PIMCO Equity Series VIT, PIMCO Managed Accounts Trust, PIMCO-Sponsored Interval Funds and PIMCO-Sponsored Closed-End Funds. |
| | |
Ryan G. Leshaw (1980) Chief Legal Officer and Secretary | | 08/2021 to present | | Executive Vice President and Senior Counsel, PIMCO. Chief Legal Officer and Secretary, PIMCO Funds, PIMCO Variable Insurance Trust, PIMCO ETF Trust and PIMCO Equity Series VIT. Chief Legal Officer, PIMCO Managed Accounts Trust, PIMCO-Sponsored Interval Funds and PIMCO-Sponsored Closed-End Funds. Formerly, Associate, Willkie Farr & Gallagher LLP. |
| | |
Keisha Audain-Pressley (1975)** Chief Compliance Officer | | 01/2020 to present | | Executive Vice President and Deputy Chief Compliance Officer, PIMCO. Chief Compliance Officer, PIMCO Funds, PIMCO Variable Insurance Trust, PIMCO ETF Trust, PIMCO Equity Series VIT, PIMCO Managed Accounts Trust, PIMCO-Sponsored Interval Funds and PIMCO-Sponsored Closed-End Funds. |
| | |
Joshua D. Ratner (1976)** Senior Vice President | | 05/2019 to present | | Executive Vice President and Head of Americas Operations, PIMCO. Senior Vice President, PIMCO Funds, PIMCO Variable Insurance Trust, PIMCO ETF Trust, PIMCO Equity Series VIT, PIMCO Managed Accounts Trust, PIMCO-Sponsored Interval Funds and PIMCO-Sponsored Closed-End Funds. |
| | |
Peter G. Strelow (1970) Senior Vice President | | 06/2019 to present | | Managing Director and Co-Chief Operating Officer, PIMCO. Senior Vice President, PIMCO Funds, PIMCO Variable Insurance Trust, PIMCO ETF Trust, PIMCO Equity Series VIT, PIMCO Managed Accounts Trust, PIMCO-Sponsored Interval Funds and PIMCO-Sponsored Closed-End Funds. Formerly, Chief Administrative Officer, PIMCO. |
| | |
Wu-Kwan Kit (1981) Assistant Secretary | | 08/2017 to present | | Senior Vice President and Senior Counsel, PIMCO. Assistant Secretary, PIMCO Funds, PIMCO Variable Insurance Trust, PIMCO ETF Trust and PIMCO Equity Series VIT. Vice President, Senior Counsel and Secretary, PIMCO Managed Accounts Trust, PIMCO-Sponsored Interval Funds and PIMCO-Sponsored Closed-End Funds. Formerly, Assistant General Counsel, VanEck Associates Corp. |
| | |
Douglas B. Burrill (1980)** Vice President | | 08/2022 to present | | Senior Vice President, PIMCO. Vice President, PIMCO Funds, PIMCO Variable Insurance Trust, PIMCO ETF Trust, PIMCO Equity Series VIT, PIMCO-Sponsored Interval Funds and PIMCO-Sponsored Closed-End Funds. |
| | |
Jeffrey A. Byer (1976) Vice President | | 02/2020 to present | | Executive Vice President, PIMCO. Vice President, PIMCO Funds, PIMCO Variable Insurance Trust, PIMCO ETF Trust, PIMCO Equity Series, PIMCO Equity Series VIT, PIMCO Managed Accounts Trust, PIMCO-Sponsored Interval Funds and PIMCO-Sponsored Closed-End Funds. |
| | |
Elizabeth A. Duggan (1964) Vice President | | 02/2021 to present | | Executive Vice President, PIMCO. Vice President, PIMCO Funds, PIMCO Variable Insurance Trust, PIMCO ETF Trust, PIMCO Equity Series VIT, PIMCO Managed Accounts Trust, PIMCO-Sponsored Interval Funds and PIMCO-Sponsored Closed-End Funds. |
| | |
Mark A. Jelic (1981) Vice President | | 08/2021 to present | | Senior Vice President, PIMCO. Vice President, PIMCO Funds, PIMCO Variable Insurance Trust, PIMCO ETF Trust, PIMCO Equity Series VIT, PIMCO-Sponsored Interval Funds and PIMCO-Sponsored Closed-End Funds. |
| | |
Kenneth W. Lee (1972) Vice President | | 08/2022 to present | | Senior Vice President, PIMCO. Vice President, PIMCO Funds, PIMCO Variable Insurance Trust, PIMCO ETF Trust, PIMCO Equity Series VIT, PIMCO-Sponsored Interval Funds and PIMCO-Sponsored Closed-End Funds. |
| | |
Brian J. Pittluck (1977) Vice President | | 01/2020 to present | | Senior Vice President, PIMCO. Vice President, PIMCO Funds, PIMCO Variable Insurance Trust, PIMCO ETF Trust, PIMCO Equity Series VIT, PIMCO Managed Accounts Trust, PIMCO-Sponsored Interval Funds and PIMCO-Sponsored Closed-End Funds. |
| | |
Keith A. Werber (1973) Vice President | | 05/2022 to present | | Executive Vice President, PIMCO. Vice President, PIMCO Funds, PIMCO Variable Insurance Trust, PIMCO ETF Trust and PIMCO Equity Series VIT. |
| | |
Bijal Y. Parikh (1978) Treasurer | | 01/2021 to present | | Senior Vice President, PIMCO. Treasurer, PIMCO Funds, PIMCO Variable Insurance Trust, PIMCO ETF Trust and PIMCO Equity Series VIT, PIMCO Managed Accounts Trust, PIMCO-Sponsored Interval Funds and PIMCO-Sponsored Closed-End Funds. |
| | |
Erik C. Brown (1967)*** Assistant Treasurer | | 03/2010 to present | | Executive Vice President, PIMCO. Assistant Treasurer, PIMCO Funds, PIMCO Variable Insurance Trust, PIMCO ETF Trust, PIMCO Equity Series VIT, PIMCO Managed Accounts Trust, PIMCO-Sponsored Interval Funds and PIMCO-Sponsored Closed-End Funds. |
| | |
Brandon T. Evans (1982) Assistant Treasurer | | 05/2019 to present | | Senior Vice President, PIMCO. Assistant Treasurer, PIMCO Funds, PIMCO Variable Insurance Trust, PIMCO ETF Trust and PIMCO Equity Series VIT. Deputy Treasurer, PIMCO Managed Accounts Trust, PIMCO-Sponsored Interval Funds and PIMCO-Sponsored Closed-End Funds. |
| * | Unless otherwise noted, the information for the individuals listed is as of August 25, 2022. |
| † | The term “PIMCO-Sponsored Closed-End Funds” as used herein includes: PIMCO Access Income Fund, PIMCO California Municipal Income Fund, PIMCO California Municipal Income Fund II, PIMCO California Municipal Income Fund III, PIMCO Municipal Income Fund, PIMCO Municipal Income Fund II, PIMCO Municipal Income Fund III, PIMCO New York Municipal Income Fund, PIMCO New York Municipal Income Fund II, PIMCO New York Municipal Income Fund III, PCM Fund Inc., PIMCO Corporate & Income Opportunity Fund, PIMCO Corporate & Income Strategy Fund, PIMCO Dynamic Income Fund, PIMCO Dynamic Income Opportunities Fund, PIMCO Energy and Tactical Credit Opportunities Fund, PIMCO Global StocksPLUS® & Income Fund, PIMCO High Income Fund, PIMCO Income Strategy Fund, PIMCO Income Strategy Fund II and PIMCO Strategic Income Fund, Inc.; the term “PIMCO-Sponsored Interval Funds” as used herein includes: PIMCO Flexible Credit Income Fund, PIMCO Flexible Municipal Income Fund, PIMCO California Flexible Municipal Income Fund and PIMCO Flexible Emerging Markets Income Fund. |
| ** | The address of these officers is Pacific Investment Management Company LLC, 1633 Broadway, New York, New York 10019. |
| *** | The address of these officers is Pacific Investment Management Company LLC, 401 Congress Ave., Austin, Texas 78701. |
| | | | | | | | | | | | |
| | | | ANNUAL REPORT | | | | | | | JUNE 30, 2022 | | | 103 |
| | | | |
| Privacy Policy1 | | | | (Unaudited) |
The Funds2,3 consider customer privacy to be a fundamental aspect of their relationships with shareholders and are committed to maintaining the confidentiality, integrity and security of their current, prospective and former shareholders’ non-public personal information. The Funds have developed policies that are designed to protect this confidentiality, while allowing shareholder needs to be served.
OBTAINING NON-PUBLIC PERSONAL INFORMATION
In the course of providing shareholders with products and services, the Funds and certain service providers to the Funds, such as the Funds’ investment advisers or sub-advisers (“Advisers”), may obtain non-public personal information about shareholders, which may come from sources such as account applications and other forms, from other written, electronic or verbal correspondence, from shareholder transactions, from a shareholder’s brokerage or financial advisory firm, financial professional or consultant, and/or from information captured on applicable websites.
RESPECTING YOUR PRIVACY
As a matter of policy, the Funds do not disclose any non-public personal information provided by shareholders or gathered by the Funds to non-affiliated third parties, except as required or permitted by law or as necessary for such third parties to perform their agreements with respect to the Funds. As is common in the industry, non-affiliated companies may from time to time be used to provide certain services, such as preparing and mailing prospectuses, reports, account statements and other information, conducting research on shareholder satisfaction and gathering shareholder proxies. The Funds or their affiliates may also retain non-affiliated companies to market Fund shares or products which use Fund shares and enter into joint marketing arrangements with them and other companies. These companies may have access to a shareholder’s personal and account information, but are permitted to use this information solely to provide the specific service or as otherwise permitted by law. In most cases, the shareholders will be clients of a third party, but the Funds may also provide a shareholder’s personal and account information to the shareholder’s respective brokerage or financial advisory firm and/or financial professional or consultant.
SHARING INFORMATION WITH THIRD PARTIES
The Funds reserve the right to disclose or report personal or account information to non-affiliated third parties in limited circumstances where the Funds believe in good faith that disclosure is required under law, to cooperate with regulators or law enforcement authorities, to protect their rights or property, or upon reasonable request by any Fund in which a shareholder has invested. In addition, the Funds may
disclose information about a shareholder or a shareholder’s accounts to a non-affiliated third party at the shareholder’s request or with the consent of the shareholder.
SHARING INFORMATION WITH AFFILIATES
The Funds may share shareholder information with their affiliates in connection with servicing shareholders’ accounts, and subject to applicable law may provide shareholders with information about products and services that the Funds or their Advisers, distributors or their affiliates (“Service Affiliates”) believe may be of interest to such shareholders. The information that the Funds may share may include, for example, a shareholder’s participation in the Funds or in other investment programs sponsored by a Service Affiliate, a shareholder’s ownership of certain types of accounts (such as IRAs), information about the Funds’ experiences or transactions with a shareholder, information captured on applicable websites, or other data about a shareholder’s accounts, subject to applicable law. The Funds’ Service Affiliates, in turn, are not permitted to share shareholder information with non-affiliated entities, except as required or permitted by law.
PROCEDURES TO SAFEGUARD PRIVATE INFORMATION
The Funds take seriously the obligation to safeguard shareholder non-public personal information. In addition to this policy, the Funds have implemented procedures that are designed to restrict access to a shareholder’s non-public personal information to internal personnel who need to know that information to perform their jobs, such as servicing shareholder accounts or notifying shareholders of new products or services. Physical, electronic and procedural safeguards are in place to guard a shareholder’s non-public personal information.
INFORMATION COLLECTED FROM WEBSITES
The Funds or their service providers and partners may collect information from shareholders via websites they maintain. The information collected via websites maintained by the Funds or their service providers includes client non-public personal information.
CHANGES TO THE PRIVACY POLICY
From time to time, the Funds may update or revise this privacy policy. If there are changes to the terms of this privacy policy, documents containing the revised policy on the relevant website will be updated.
1 Amended as of June 25, 2020.
2 PIMCO Investments LLC (“PI”) serves as the Funds’ distributor and does not provide brokerage services or any financial advice to investors in the Funds solely because it distributes the Funds. This Privacy Policy applies to the activities of PI to the extent that PI regularly effects or engages in transactions with or for a shareholder of a series of a Trust who is the record owner of such shares. For purposes of this Privacy Policy, references to “the Funds” shall include PI when acting in this capacity.
3 When distributing this Policy, a Fund may combine the distribution with any similar distribution of its investment adviser’s privacy policy. The distributed, combined, policy may be written in the first person (i.e. by using “we” instead of “the Funds”).
| | | | |
| Liquidity Risk Management Program | | | | (Unaudited) |
In compliance with Rule 22e-4 (the “Liquidity Rule”) under the Investment Company Act of 1940, as amended (“1940 Act”), PIMCO Equity Series (the “Trust”) has adopted and implemented a liquidity risk management program (the “Program”) for each series of the Trust (each a “Fund” and collectively, the “Funds”) not regulated as a money market fund under 1940 Act Rule 2a-7, which is reasonably designed to assess and manage the Funds’ liquidity risk. The Trust’s Board of Trustees (the “Board”) previously approved the designation of the PIMCO Liquidity Risk Committee (the “Administrator”) as Program administrator. The PIMCO Liquidity Risk Committee consists of senior members from certain PIMCO business areas, such as Portfolio Risk Management, Americas Operations, Compliance, Account Management and Portfolio Management, and is advised by members of PIMCO Legal.
A Fund’s “liquidity risk” is the risk that the Fund could not meet requests to redeem shares issued by the Fund without significant dilution of the remaining investors’ interests in the Fund. In accordance with the Program, each Fund’s liquidity risk is assessed no less frequently than annually taking into consideration a variety of factors, including, as applicable, the Fund’s investment strategy and liquidity of portfolio investments, cash flow projections, and holdings of cash and cash equivalents, as well as borrowing arrangements and other funding sources. Certain factors are considered under both normal and reasonably foreseeable stressed conditions. Each Fund portfolio investment is classified into one of four liquidity categories (including “highly liquid investments” and “illiquid investments,” discussed below) based on a determination of the number of days it is reasonably expected to take to convert the investment to cash, or sell or dispose of the investment, in current market conditions without significantly changing the investment’s market value. Each Fund has adopted a “Highly Liquid Investment Minimum” (or “HLIM”), which is a minimum amount of Fund net assets to be invested in highly liquid investments that are assets. As required under the Liquidity Rule, each Fund’s HLIM is periodically reviewed, no less frequently than annually, and the Funds have adopted policies and procedures for responding to a shortfall of a Fund’s highly liquid investments below its HLIM. The Liquidity Rule also limits the Funds’ investments in illiquid investments by prohibiting a Fund from acquiring any illiquid investment if, immediately after the acquisition, the Fund would have invested more than 15% of its net assets in illiquid investments that are assets. Certain non-public reporting is generally required if a Fund’s holdings of illiquid investments that are assets were to exceed 15% of Fund net assets.
At a meeting of the Board held on February 15-16, 2022, the Board received a report (the “Report”) from the Administrator addressing the Program’s operation and assessing the adequacy and effectiveness of its implementation for the 12-month period ended December 31, 2021. The Report reviewed the operation of the Program’s components during such period and stated that the Program is operating effectively to assess and manage each Fund’s liquidity risk and that the Program has been and continues to be adequately and effectively implemented to monitor and, as applicable, respond to the Funds’ liquidity developments. This has remained true for the 12-month period ended June 30, 2022.
| | | | | | | | | | | | |
| | | | ANNUAL REPORT | | | | | | | JUNE 30, 2022 | | | 105 |
General Information
Investment Adviser and Administrator
Pacific Investment Management Company LLC
650 Newport Center Drive
Newport Beach, CA 92660
Distributor
PIMCO Investments LLC
1633 Broadway
New York, NY 10019
Custodian
State Street Bank and Trust Company
801 Pennsylvania Avenue
Kansas City, MO 64105
Transfer Agent
DST Asset Manager Solutions, Inc.
Institutional Class, I-2, I-3, Administrative Class
430 W 7th Street STE 219024
Kansas City, MO 64105-1407
DST Asset Manager Solutions, Inc.
Class A, Class C, Class R
430 W 7th Street STE 219294
Kansas City, MO 64105-1407
Legal Counsel
Dechert LLP
1900 K Street, N.W.
Washington, D.C. 20006
Independent Registered Public Accounting Firm
PricewaterhouseCoopers LLP
1100 Walnut Street, Suite 1300
Kansas City, MO 64106
This report is submitted for the general information of the shareholders of the Funds listed on the Report cover.

PES3002AR_063022

PIMCO EQUITY SERIES®
Annual Report
June 30, 2022
PIMCO RAFI Dynamic Multi-Factor Emerging Markets Equity ETF | MFEM | NYSE Arca
PIMCO RAFI Dynamic Multi-Factor International Equity ETF | MFDX | NYSE Arca
PIMCO RAFI Dynamic Multi-Factor U.S. Equity ETF | MFUS | NYSE Arca
PIMCO RAFI ESG U.S. ETF | RAFE | NYSE Arca
Table of Contents
This material is authorized for use only when preceded or accompanied by the current PIMCO Equity Series prospectus. The Shareholder Reports for the other series of the PIMCO Equity Series are printed separately.
Chairman’s Letter
Dear Shareholder,
We hope that you and your family are remaining safe and healthy during these challenging times. We continue to work tirelessly to navigate markets and manage the assets that you have entrusted with us. Following this letter is the PIMCO Equity Series Annual Report, which covers the 12-month reporting period ended June 30, 2022. On the subsequent pages, you will find specific details regarding investment results and a discussion of the factors that most affected performance during the reporting period.
For the 12-month reporting period ended June 30, 2022
The global economy continued to be affected by the COVID-19 pandemic (“COVID-19”) and its variants. Looking back, third quarter 2021 U.S. annualized gross domestic product (“GDP”) grew 2.3%. Economic activity accelerated during the fourth quarter, as GDP growth was 6.9%. However, the U.S. economy then experienced a setback, as first quarter 2022 GDP growth was -1.6%. Finally, the Commerce Department’s initial estimate for second quarter 2022 GDP growth — released after the reporting period ended — was -0.9%.
In the U.S., the Federal Reserve Board (the “Fed”) took several steps to tighten monetary policy to combat elevated inflation. The Fed reduced the monthly pace of its net asset purchases of Treasury securities and agency mortgage-backed securities in November 2021 and again in December. The Fed ended its monthly asset purchases in mid-March 2022. The Fed then raised the federal funds rate 0.25% to a range between 0.25% and 0.50% in March 2022, its first rate hike since 2018. The central bank then raised rates 0.50% in its May 2022 meeting and 0.75% in its June meeting. Finally, on July 27, 2022 — after the reporting period ended — the Fed raised rates 0.75%, to a range between 2.25% and 2.50%.
Economies outside the U.S. also continued to be impacted by the pandemic. The war in Ukraine and its repercussions also led to increased uncertainties around the world. In its April 2022 World Economic Outlook Update, the International Monetary Fund (“IMF”) said it expects U.S. gross domestic product (“GDP”) growth to be 3.7% in 2022, compared to 5.7% in 2021. Elsewhere, the IMF expects 2022 GDP to grow 2.8% in the eurozone (from 5.3% in 2021), 3.7% in the U.K. (from 7.4% in 2021) and 2.4% in Japan (from 1.6% in 2021).
Several other central banks began tightening monetary policy during the period. In December 2021, the Bank of England (the “BoE”) surprised the market and raised rates for the first time since COVID-19 began. The BoE again raised rates at its meetings in February, March, May and June 2022. The European Central Bank (the “ECB”) indicated that it intended to raise rates at its September 2022 meeting. Elsewhere, the Bank of Japan (the “BoJ”) maintained its loose monetary policy and appears likely to remain accommodative in the near future given the headwinds facing its economy.
During the reporting period, short- and long-term U.S. Treasury yields moved sharply higher. The yield on the benchmark 10-year U.S. Treasury note was 2.98% on June 30, 2022, versus 1.45% on June 30, 2021. The Bloomberg Global Treasury Index (USD Hedged), which tracks fixed-rate, local currency government debt of investment grade countries, including developed and emerging markets, returned -7.91%. Meanwhile, the Bloomberg Global Aggregate Credit Index (USD Hedged), a widely used index of global investment grade credit bonds, returned -12.75%. Riskier fixed income asset classes, including high yield corporate bonds and emerging market debt, were also weak. The ICE BofAML Developed Markets High Yield Constrained Index (USD Hedged), a widely used index of below-investment-grade bonds, returned -12.85%, whereas emerging market external debt, as represented by the JPMorgan Emerging Markets Bond Index (EMBI) Global (USD Hedged), returned -19.25%. Emerging market local bonds, as represented by the JPMorgan Government Bond Index-Emerging Markets Global Diversified Index (Unhedged), returned -19.28%.
Amid periods of volatility, global equities generally posted weak results during the reporting period as economic and geopolitical concerns weighed on investor sentiment. U.S. equities, as represented by the S&P 500 Index, returned -10.62%. Global equities, as represented by the MSCI World Index, returned -14.34%, while emerging market equities, as measured by the MSCI Emerging Markets Index, returned -25.28%. Meanwhile, Japanese equities, as represented by the Nikkei 225 Index (in JPY), returned -8.33% and European equities, as represented by the MSCI Europe Index (in EUR), returned -6.54%.
Commodity prices were volatile and generated mixed returns. Brent crude oil, which was approximately $75 a barrel at the start of the reporting period, rose to roughly $112 a barrel at the end of June 2022. We believe the oil-price increase was driven by supply shortages and stronger demand due to economic re-openings as COVID-19 restrictions eased. Repercussions from the war in Ukraine also contributed to higher oil prices. In terms of other commodities prices, copper declined, whereas gold rose during the period.
Finally, there were also periods of volatility in the foreign exchange markets. We believe this was due to several factors, including economic growth expectations and changing central bank monetary policies, as well as rising inflation, COVID-19 variants and geopolitical events. The U.S. dollar strengthened against several major currencies. For example, during the reporting period, the U.S. dollar returned 11.59%, 11.95% and 18.13% versus the euro, the British pound and the Japanese yen, respectively.
Thank you for the assets you have placed with us. We deeply value your trust, and we will continue to work diligently to meet your broad investment needs. For any questions regarding the funds, please contact your account manager or financial adviser, or call one of our shareholder associates at (888) 87-PIMCO. We also invite you to visit our website at www.pimco.com to learn more about our global viewpoints.
| | |
 | | Sincerely, 
Peter G. Strelow Chairman of the Board
PIMCO Equity Series |
Past performance is no guarantee of future results. Unless otherwise noted, index returns reflect the reinvestment of income distributions and capital gains, if any, but do not reflect fees, brokerage commissions or other expenses of investing. It is not possible to invest directly in an unmanaged index.
| | | | | | | | | | | | |
| | | | ANNUAL REPORT | | | | | | | JUNE 30, 2022 | | | 3 |
| | | | |
| Important Information About the Funds | | | | |
PIMCO Equity Series (the “Trust”) is an open-end management investment company that includes PIMCO RAFI Dynamic Multi-Factor Emerging Markets Equity ETF, PIMCO RAFI Dynamic Multi-Factor International Equity ETF, PIMCO RAFI Dynamic Multi-Factor U.S. Equity ETF and PIMCO RAFI ESG U.S. ETF, which are exchange-traded funds (“ETFs”) that seek to provide total return that closely corresponds, before fees and expenses, to the total return of a specified index (each, a “Fund” and collectively, the “Funds”). Each Fund employs a representative sampling strategy in seeking to achieve its investment objective. In using this strategy, PIMCO seeks to invest in a combination of instruments such that the portfolio effectively provides exposure to the underlying index. A Fund may not track its underlying index with the same degree of accuracy as a fund that replicates the composition and weighting of the underlying index. Shares of the Funds will be listed and traded at market prices on NYSE Arca, Inc. (“NYSE Arca”) and other secondary markets. The market price for each Fund’s shares may be different from the Fund’s net asset value (“NAV”). Each Fund issues and redeems shares at its NAV only in blocks of a specified number of shares (“Creation Units”). Only certain large institutional investors may purchase or redeem Creation Units directly with the Funds at NAV (“Authorized Participants”). These transactions are in exchange for certain securities similar to a Fund’s portfolio and/or cash. Except when aggregated in Creation Units, shares of a Fund are not redeemable securities. Shareholders who are not Authorized Participants may not redeem shares from the Funds at NAV.
We believe that equity funds have an important role to play in a well-diversified investment portfolio. It is important to note, however, that equity funds are subject to notable risks. Among other things, equity and equity-related securities may decline in value due to both real and perceived general market, economic, and industry conditions.
The values of equity securities, such as common stocks and preferred securities, have historically risen and fallen in periodic cycles and may decline due to general market conditions, which are not specifically related to a particular company, such as real or perceived adverse economic conditions, changes in the general outlook for corporate earnings, changes in interest or currency rates or adverse investor sentiment generally. Equity securities may also decline due to factors that affect a particular industry or industries, such as labor shortages, increased production costs and competitive conditions within an industry. In addition, the value of an equity security may decline for a number of reasons that directly relate to the issuer, such as management performance, financial leverage and reduced demand for the issuer’s goods or services, as well as the historical and prospective earnings of the issuer and the value of its assets. Different types of equity securities may react differently to these developments and a change in the financial condition of a single issuer may affect securities markets as a whole.
During a general downturn in the securities markets, multiple asset classes, including equity securities, may decline in value simultaneously. The market price of equity securities owned by a Fund may go up or down, sometimes rapidly or unpredictably. Equity securities generally have greater price volatility than fixed income securities and common stocks generally have the greatest appreciation and depreciation potential of all equity securities.
The Funds may be subject to various risks as described in each Fund’s prospectus and in the Principal and Other Risks in the Notes to Financial Statements.
Classifications of the Funds’ portfolio holdings in this report are made according to financial reporting standards. The classification of a particular portfolio holding as shown in the Allocation Breakdown and Schedule of Investments sections of this report may differ from the classification used for the Funds’ compliance calculations, including those used in the Funds’ prospectus, investment objectives, regulatory, and other investment limitations and policies, which may be based on different asset class, sector or geographical classifications. Each Fund is separately monitored for compliance with respect to prospectus and regulatory requirements.
The geographical classification of foreign (non-U.S.) securities in this report, if any, are classified by the country of incorporation of a holding. In certain instances, a security’s country of incorporation may be different from its country of economic exposure.
Beginning in January 2020, global financial markets have experienced and may continue to experience significant volatility resulting from the spread of a novel coronavirus known as COVID-19. The outbreak of COVID-19 has resulted in travel and border restrictions, quarantines, supply chain disruptions, lower consumer demand and general market uncertainty. The effects of COVID-19 have and may continue to adversely affect the global economy, the economies of certain nations and individual issuers, all of which may negatively impact the Funds’ performance. In addition, COVID-19 and governmental responses to COVID-19 may negatively impact the capabilities of the Funds’ service providers and disrupt the Funds’ operations.
The United States’ enforcement of restrictions on U.S. investments in certain issuers and tariffs on goods from other countries, each with a focus on China, has contributed to international trade tensions and may impact portfolio securities.
A Fund may have significant exposure to issuers in the United Kingdom. The United Kingdom’s withdrawal from the European Union may impact Fund returns. The withdrawal may cause substantial volatility in foreign exchange markets, lead to weakness in the exchange rate of the British pound, result in a sustained period of
market uncertainty, and destabilize some or all of the other European Union member countries and/or the Eurozone.
A Fund may invest in certain instruments that rely in some fashion upon the London Interbank Offered Rate (“LIBOR”). LIBOR is an average interest rate, determined by the ICE Benchmark Administration, that banks charge one another for the use of short-term money. The United Kingdom’s Financial Conduct Authority, which regulates LIBOR, has announced plans to ultimately phase out the use of LIBOR. There remains uncertainty regarding future utilization of LIBOR and the nature of any replacement rate (e.g., the Secured Overnight Financing Rate, which is intended to replace U.S. dollar LIBOR and measures the cost of overnight borrowings through repurchase agreement transactions collateralized with U.S. Treasury securities). Any potential effects of the transition away from LIBOR on a Fund or on certain instruments in which a Fund invests can be difficult to ascertain, and they may vary depending on a variety of factors. The transition may also result in a reduction in the value of certain instruments held by a Fund or a reduction in the effectiveness of related Fund transactions such as hedges. Any such effects of the transition away from LIBOR, as well as other unforeseen effects, could result in losses to a Fund.
A Fund may invest in securities and instruments that are economically tied to Russia. Investments in Russia are subject to various risks such as, but not limited to political, economic, legal, market and currency risks. The risks include uncertain political and economic policies, short-term market volatility, poor accounting standards, corruption and crime, an inadequate regulatory system, regional armed conflict and unpredictable taxation. Investments in Russia are particularly subject to the risk that further economic sanctions and other similar measures may be imposed by the United States and/or other countries. Other similar measures may include, but are not limited to, banning Russia or certain persons or entities associated with Russia from global payment systems that facilitate cross-border payments, restricting the settlement of securities transactions by certain investors, and freezing Russian assets or those of particular countries, entities or persons with ties to Russia. Such sanctions and other similar measures — which may impact companies in many sectors, including energy, financial services and defense, among others — may negatively impact a Fund’s performance and/or ability to achieve its investment objective. For example, certain investments may be prohibited and/or existing investments may become illiquid (e.g., in the event that transacting in certain existing investments is prohibited, securities markets close, or market participants cease transacting in certain investments in light of geopolitical events, sanctions or related considerations), which could render any such securities held by a Fund unmarketable for an indefinite period of time and/or cause the Fund to sell other portfolio holdings at a disadvantageous time or price in order to meet shareholder redemptions. In addition, such sanctions or other
similar measures, and the Russian government’s response, could result in a downgrade of Russia’s credit rating or of securities of issuers located in or economically tied to Russia, devaluation of Russia’s currency and/or increased volatility with respect to Russian securities and the ruble. Moreover, disruptions caused by Russian military action or other actions (including cyberattacks, espionage or other asymmetric measures) or resulting actual or threatened responses to such activity may impact Russia’s economy and Russian issuers of securities in which a Fund invests. Such resulting actual or threatened responses may include, but are not limited to, purchasing and financing restrictions, withdrawal of financial intermediaries, boycotts or changes in consumer or purchaser preferences, sanctions, tariffs or cyberattacks on the Russian government, Russian companies or Russian individuals, including politicians. The Russian securities market is characterized by limited volume of trading, resulting in difficulty in obtaining accurate prices and trading. These issues can be magnified as a result of sanctions and other similar measures that may be imposed and the Russian government’s response. The Russian securities market, as compared to U.S. markets, has significant price volatility, less liquidity, a smaller market capitalization and a smaller number of traded securities. There may be little publicly available information about issuers. Settlement, clearing and registration of securities transactions are subject to risks. Prior to the implementation of the National Settlement Depository (“NSD”), a recognized central securities depository, there was no central registration system for equity share registration in Russia, and registration was carried out by either the issuers themselves or by registrars located throughout Russia. Title to Russian equities held through the NSD is now based on the records of the NSD and not the registrars. Although the implementation of the NSD has enhanced the efficiency and transparency of the Russian securities market, issues resulting in loss can still occur. Ownership of securities issued by Russian companies that are not held through depositories such as the NSD may be recorded by companies themselves and by registrars. In such cases, the risk is increased that a Fund could lose ownership rights through fraud, negligence or oversight. While applicable Russian regulations impose liability on registrars for losses resulting from their errors, it may be difficult for a Fund to enforce any rights it may have against the registrar or issuer of the securities in the event of loss of share registration. In addition, issuers and registrars are still prominent in the validation and approval of documentation requirements for corporate action processing in Russia. Because the documentation requirements and approval criteria vary between registrars and issuers, there remain unclear and inconsistent market standards in the Russian market with respect to the completion and submission of corporate action elections. To the extent that a Fund suffers a loss relating to title or corporate actions relating to its portfolio securities, it may be difficult for the Fund to enforce its rights or otherwise remedy the loss. Russian securities laws may not recognize foreign nominee accounts held with a custodian bank, and therefore the custodian may be considered the ultimate owner of
| | | | | | | | | | | | |
| | | | ANNUAL REPORT | | | | | | | JUNE 30, 2022 | | | 5 |
| | | | |
| Important Information About the Funds | | (Cont.) | | |
securities they hold for their clients. Adverse currency exchange rates are a risk and there may be a lack of available currency hedging instruments. Investments in Russia may be subject to the risk of nationalization or expropriation of assets. Oil, natural gas, metals, and timber account for a significant portion of Russia’s exports, leaving the country vulnerable to swings in world prices, and to sanctions or other actions that may be directed at the Russian economy as a whole or at Russian oil, natural gas, metals or timber industries.
Russia has attempted, and may attempt in the future, to assert its influence in the region through economic or military measures. For example, in February 2022, Russia launched a large-scale invasion of Ukraine. Such measures may have an adverse effect on the Russian economy, which may, in turn, negatively impact a Fund.
Foreign investors also face a high degree of currency risk when investing in Russian securities and a lack of available currency hedging instruments. In addition, there is the risk that the Russian government may impose capital controls on foreign portfolio investments in the event of extreme financial or political crisis. Such capital controls may prevent the sale of a portfolio of foreign assets and the repatriation of investment income and capital.
Engaging in a responsible investment strategy, which may select or exclude securities of certain issuers for reasons other than performance, carries the risk that a Fund may underperform funds that do not utilize a responsible investment strategy. The application of this strategy may affect a Fund’s exposure to certain sectors or types of investments, which could negatively impact the Fund’s performance. Responsible investing is qualitative and subjective by nature, and there is no guarantee that the criteria utilized or any judgment exercised in pursuing a responsible investment strategy will reflect the beliefs or values of any particular investor. In evaluating a company, the information and data obtained through voluntary or third-party reporting may be incomplete, inaccurate or unavailable, which could cause an incorrect assessment of a company’s business practices with respect to the environment, social responsibility and corporate governance (“ESG practices”). Socially responsible norms differ by region, and a company’s ESG practices or the assessment of a company’s ESG practices may change over time.
On each individual Fund Summary page in this Shareholder Report, the Average Annual Total Return table and the Cumulative Returns chart measure performance assuming that any dividend and capital gain distributions were reinvested. Returns do not reflect the deduction of taxes that a shareholder would pay on: (i) Fund distributions; or (ii) the sale of Fund shares. Each Fund’s performance is measured against the performance of at least one broad-based securities market index (“benchmark index”). A Fund’s past performance, before and after taxes,
is not necessarily an indication of how the Fund will perform in the future. There is no assurance that any Fund, including any Fund that has experienced high or unusual performance for one or more periods, will experience similar levels of performance in the future. High performance is defined as a significant increase in either 1) a Fund’s total return in excess of that of the Fund’s benchmark between reporting periods or 2) a Fund’s total return in excess of the Fund’s historical returns between reporting periods. Unusual performance is defined as a significant change in a Fund’s performance as compared to one or more previous reporting periods. Historical performance for a Fund may have been positively impacted by fee waivers or expense limitations in place during some or all of the periods shown, if applicable. Future performance (including total return or yield) and distributions may be negatively impacted by the expiration or reduction of any such fee waivers or expense limitations.
The following table discloses the inception dates of each Fund along with each Fund’s diversification status as of period end:
| | | | | | | | | | | | |
| | | |
| Fund Name | | | | | Fund
Inception | | | Diversification
Status | |
PIMCO RAFI Dynamic Multi-Factor Emerging Markets Equity ETF | | | | | | | 08/31/17 | | | | Diversified | |
PIMCO RAFI Dynamic Multi-Factor International Equity ETF | | | | | | | 08/31/17 | | | | Diversified | |
PIMCO RAFI Dynamic Multi-Factor U.S. Equity ETF | | | | | | | 08/31/17 | | | | Diversified | |
PIMCO RAFI ESG U.S. ETF | | | | | | | 12/18/19 | | | | Diversified | |
An investment in a Fund is not a bank deposit and is not guaranteed or insured by the Federal Deposit Insurance Corporation or any other government agency. It is possible to lose money on investments in the Funds.
The Trustees are responsible generally for overseeing the management of the Trust. The Trustees authorize the Trust to enter into service
agreements with the Adviser, the Distributor, the Administrator and other service providers in order to provide, and in some cases authorize service providers to procure through other parties, necessary or desirable services on behalf of the Trust and the Funds. Shareholders are not parties to or third-party beneficiaries of such service agreements. Neither a Fund’s prospectus nor a Fund’s summary prospectus, the Trust’s Statement of Additional Information (“SAI”), any contracts filed as exhibits to the Trust’s registration statement, nor any other communications, disclosure documents or regulatory filings (including this report) from or on behalf of the Trust or a Fund creates a contract between or among any shareholder of a Fund, on the one hand, and the Trust, a Fund, a service provider to the Trust or a Fund, and/or the Trustees or officers of the Trust, on the other hand. The Trustees (or the Trust and its officers, service providers or other delegates acting under authority of the Trustees) may amend the most recent prospectus or use a new prospectus, summary prospectus or SAI with respect to a Fund or the Trust, and/or amend, file and/or issue any other communications, disclosure documents or regulatory filings, and
may amend or enter into any contracts to which the Trust or a Fund is a party, and interpret the investment objective(s), policies, restrictions and contractual provisions applicable to any Fund, without shareholder input or approval, except in circumstances in which shareholder approval is specifically required by law (such as changes to fundamental investment policies) or where a shareholder approval requirement is specifically disclosed in the Trust’s then-current prospectus or SAI.
On each business day, before commencement of trading on NYSE Arca, each Fund will disclose on www.pimcoetfs.com the identities and quantities of the Fund’s portfolio holdings. The frequency at which the daily market prices were at a discount or premium to each Fund’s NAV is disclosed on www.pimcoetfs.com. Please see “Disclosure of Portfolio Holdings” in the SAI for information about the availability of the complete schedule of each Fund’s holdings. Fund fact sheets provide additional information regarding a Fund and may be requested by calling (888) 400-4ETF and are available on the Fund’s website at www.pimcoetfs.com.
PIMCO has adopted written proxy voting policies and procedures (“Proxy Policy”) as required by Rule 206(4)-6 under the Investment Advisers Act of 1940, as amended. The Proxy Policy has been adopted by the Trust as the policies and procedures that PIMCO will use when voting proxies on behalf of a Fund. A description of the policies and procedures that PIMCO uses to vote proxies relating to portfolio securities of a Fund, and information about how the Fund voted proxies relating to portfolio securities held during the most recent twelve-month period ended June 30th, are available without charge, upon request, by calling the Trust at (888) 400-4ETF, on the Fund’s website at www.pimcoetfs.com, and on the Securities and Exchange Commission’s (“SEC”) website at www.sec.gov.
The Funds file portfolio holdings information with the SEC on Form N-PORT within 60 days of the end of each fiscal quarter. The Funds’ complete schedule of securities holdings as of the end of each fiscal quarter will be made available to the public on the SEC’s website at www.sec.gov and on PIMCO’s website at www.pimcoetfs.com, and will be made available, upon request, by calling PIMCO at (888) 400-4ETF.
SEC rules allow the Funds to fulfill their obligation to deliver shareholder reports to investors by providing access to such reports online free of charge and by mailing a notice that the report is electronically available. Investors may elect to receive all future reports in paper free of charge by contacting their financial intermediary. Any election to receive reports in paper will apply to all funds held in the investor’s account at the financial intermediary.
In August 2020, the SEC proposed changes to the mutual fund and ETF shareholder report and registration statement disclosure requirements and the registered fund advertising rules, which, if adopted, will change the disclosures provided to shareholders.
In October 2020, the SEC adopted a rule related to the use of derivatives, short sales, reverse repurchase agreements and certain other transactions by registered investment companies that rescinds and withdraws the guidance of the SEC and its staff regarding asset segregation and cover transactions that was applicable to the Funds as of the date of this report. Subject to certain exceptions, the rule requires funds that trade derivatives and other transactions that create future payment or delivery obligations to comply with a value-at-risk leverage limit and a certain derivatives risk management program and reporting requirements. These requirements may limit the ability of the Funds to use derivatives and reverse repurchase agreements and similar financing transactions as part of their investment strategies and may increase the cost of the Funds’ investments and cost of doing business, which could adversely affect investors. The rule went into effect on February 19, 2021. The compliance date for the new rule and related reporting requirements is August 19, 2022.
In October 2020, the SEC adopted a rule regarding the ability of a fund to invest in other funds. The rule allows a fund to acquire shares of another fund in excess of certain limitations currently imposed by the Investment Company Act of 1940 (the “Act”) without obtaining individual exemptive relief from the SEC, subject to certain conditions. The rule also includes the rescission of certain exemptive relief from the SEC and guidance from the SEC staff for funds to invest in other funds. The effective date for the rule was January 19, 2021, and the compliance date for the rule was January 19, 2022.
In December 2020, the SEC adopted a rule addressing fair valuation of fund investments. The new rule sets forth requirements for good faith determinations of fair value as well as for the performance of fair value determinations, including related oversight and reporting obligations. The new rule also defines “readily available market quotations” for purposes of the definition of “value” under the Act, and the SEC noted that this definition will apply in all contexts under the Act. The effective date for the rule was March 8, 2021. The compliance date for the new rule and the associated recordkeeping requirements is September 8, 2022.
In May 2022, the SEC proposed amendments to a current rule governing fund naming conventions. In general, the current rule requires funds with certain types of names to adopt a policy to invest at least 80% of their assets in the type of investment suggested by the name. The proposed amendments would expand the scope of the current rule in a number of ways that would result in an expansion of the types of fund names that would require the fund to adopt an 80% investment policy under the rule. Additionally, the proposed amendments would modify the circumstances under which a fund may deviate from its 80% investment policy and address the use and valuation of derivatives instruments for purposes of the rule. The proposal’s impact on the Funds will not be known unless and until any final rulemaking is adopted.
| | | | | | | | | | | | |
| | | | ANNUAL REPORT | | | | | | | JUNE 30, 2022 | | | 7 |
| | | | |
| Important Information About the Funds | | (Cont.) | | |
In May 2022, the SEC proposed a framework that would require certain registered funds (such as the Funds) to disclose their environmental, social, and governance (“ESG”) investing practices. Among other things, the proposed requirements would mandate that funds meeting three pre-defined classifications (i.e., integrated, ESG focused and/or impact funds) provide prospectus and shareholder report disclosure related to the ESG factors, criteria and processes used in managing the fund. The proposal’s impact on the Funds will not be known unless and until any final rulemaking is adopted.
PIMCO RAFI Dynamic Multi-Factor Emerging Markets Equity ETF
Cumulative Returns Through June 30, 2022
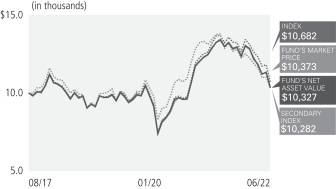
$10,000 invested at the end of the month when the Fund commenced operations.
Investment Objective and Strategy Overview
PIMCO RAFI Dynamic Multi-Factor Emerging Markets Equity ETF seeks to track the investment results of the RAFI Dynamic Multi-Factor Emerging Markets Index (the “Underlying Index”) by investing under normal circumstances, at least 80% of its total assets (exclusive of collateral held from securities lending) in the component securities (“Component Securities”) of the Underlying Index. The Fund may invest the remainder of its assets in cash, securities and instruments that are not Component Securities, but which the Fund’s sub-adviser, Parametric Portfolio Associates LLC, believes will help the Fund track its Underlying Index. The Underlying Index is designed to provide long-only exposure to multiple equity factors that seek to produce attractive long-term returns, and which may lower risk compared to less diversified strategies. Fund strategies may change from time to time. Please refer to the Fund’s current prospectus for more information regarding the Fund’s strategy.
All Fund returns are net of fees and expenses and include applicable fee waivers and/or expense limitations. Absent any applicable fee waivers and/or expense limitations, performance would have been lower and there can be no assurance that any such waivers or limitations will continue in the future.
Market Returns do not include brokerage commissions that may be payable on secondary market transactions. If brokerage commissions were included, market returns would be lower. Market and NAV returns assume that dividends and capital gain distributions have been reinvested in the Fund at market price and NAV, respectively.
(1) The market price is determined using the midpoint between the highest bid and the lowest offer on the listing exchange, as of the time that the Fund’s NAV is calculated.
(2) The Fund was seeded on August 31, 2017, but was not listed for trading until September 6, 2017. Accordingly, there is no Market Price information for August 31, 2017 through September 5, 2017.
± The RAFI Dynamic Multi-Factor EM index strategy takes time-varying exposures to four return factors; value, low volatility, quality, and momentum. The index uses recent and historical metrics to tilt toward factor portfolios which are particularly attractive on a forward looking basis. It is not possible to invest directly in the index.
±± The MSCI Emerging Markets Index is a free float-adjusted market capitalization index that is designed to measure equity market performance of emerging markets.
It is not possible to invest directly in an unmanaged index.
Performance quoted represents past performance. Past performance is not a guarantee or a reliable indicator of future results. Current performance may be lower or higher than performance shown. Investment return and the principal value of an investment will fluctuate. Shares may be worth more or less than original cost when redeemed by authorized participants. Returns shown do not reflect the deduction of taxes that a shareholder would pay on fund distributions or the redemption of Fund shares. Differences in the Fund’s performance versus the index and related attribution information with respect to particular categories of securities or individual positions may be attributable, in part, to differences in the pricing methodologies used by the Fund and the index. Performance data current to the most recent month-end is available at www.pimcoetfs.com or (888) 400-4ETF.
The Fund’s total annual operating expense ratio in effect as of period end was 0.52%. Details regarding any changes to the Fund’s operating expenses, subsequent to period end, can be found in the Fund’s current prospectus, as supplemented.
| | | | | | | | | | | | |
| | | | ANNUAL REPORT | | | | | | | JUNE 30, 2022 | | | 9 |
Top 10 Holdings as of June 30, 2022†§
| | | | | | | | |
Infosys Ltd. | | | | | | | 3.2% | |
Bank of China Ltd. ‘H’ | | | | | | | 1.7% | |
Taiwan Semiconductor Manufacturing Co. Ltd. | | | | | | | 1.4% | |
Tata Consultancy Services Ltd. | | | | | | | 1.2% | |
Hyundai Motor Co. | | | | | | | 1.2% | |
America Movil SAB de CV | | | | | | | 1.2% | |
Kia Corp. | | | | | | | 1.2% | |
ITC Ltd. | | | | | | | 1.0% | |
Vale SA | | | | | | | 1.0% | |
China Petroleum & Chemical Corp. ‘H’ | | | | | | | 1.0% | |
Geographic Breakdown as of June 30, 2022†**
| | | | | | | | |
India | | | | | | | 16.3% | |
Taiwan | | | | | | | 16.1% | |
China | | | | | | | 15.4% | |
South Korea | | | | | | | 13.6% | |
Thailand | | | | | | | 5.7% | |
Brazil | | | | | | | 5.1% | |
South Africa | | | | | | | 4.2% | |
Hong Kong | | | | | | | 3.6% | |
Saudi Arabia | | | | | | | 3.6% | |
Mexico | | | | | | | 3.3% | |
Indonesia | | | | | | | 2.2% | |
Turkey | | | | | | | 2.2% | |
United Kingdom | | | | | | | 2.0% | |
Short-Term Instruments | | | | | | | 1.8% | |
Malaysia | | | | | | | 1.8% | |
Chile | | | | | | | 1.0% | |
Other | | | | | | | 2.1% | |
† % of Investments, at value.
§ Top 10 Holdings and % of Investments exclude securities sold short, financial derivative instruments and short-term instruments, if any.
** Geographic Breakdown and % of Investments exclude securities sold short and financial derivative instruments, if any.
Fund Insights at NAV
The following affected performance (on a gross basis) during the reporting period:
| » | | Underweight exposure to, and security selection in, the information technology sector contributed to relative returns compared to the Fund’s secondary benchmark, the MSCI Emerging Markets Index, as the sector underperformed the secondary benchmark index and the Fund’s holdings outperformed the secondary benchmark index. |
| » | | Underweight exposure to, and security selection in, the health care sector contributed to relative returns compared to the Fund’s secondary benchmark, the MSCI Emerging Markets Index, as the sector underperformed the secondary benchmark index and the Fund’s holdings outperformed the secondary benchmark index. |
| » | | Underweight exposure to, and security selection in, the consumer discretionary sector contributed to relative returns compared to the Fund’s secondary benchmark, the MSCI Emerging Markets Index, as the sector underperformed the secondary benchmark index and the Fund’s holdings outperformed the secondary benchmark index. |
| » | | Security selection in the energy sector detracted from relative returns compared to the Fund’s secondary benchmark, the MSCI Emerging Markets Index, as the Fund’s holdings underperformed the secondary benchmark index. |
| » | | Underweight exposure to the financials sector detracted from relative returns compared to the Fund’s secondary benchmark, the MSCI Emerging Markets Index, as the sector outperformed the secondary benchmark index. |
| » | | Security selection in the materials sector detracted from relative returns compared to the Fund’s secondary benchmark, the MSCI Emerging Markets Index, as the Fund’s holdings underperformed the secondary benchmark index. |
PIMCO RAFI Dynamic Multi-Factor International Equity ETF
Cumulative Returns Through June 30, 2022
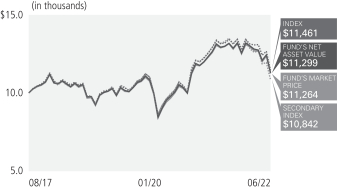
$10,000 invested at the end of the month when the Fund commenced operations.
Investment Objective and Strategy Overview
PIMCO RAFI Dynamic Multi-Factor International Equity ETF seeks to track the investment results of the RAFI Dynamic Multi-Factor Developed Ex-U.S. Index (the “Underlying Index”) by investing under normal circumstances at least 80% of its total assets (exclusive of collateral held from securities lending) in the component securities (“Component Securities”) of the Underlying Index. The Fund may invest the remainder of its assets in cash, securities and instruments that are not Component Securities, but which the Fund’s sub-adviser, Parametric Portfolio Associates LLC, believes will help the Fund track its Underlying Index. The Underlying Index is designed to provide long-only exposure to multiple equity factors that seek to produce attractive long-term returns, and which may lower risk compared to less diversified strategies. Fund strategies may change from time to time. Please refer to the Fund’s current prospectus for more information regarding the Fund’s strategy.
| | | | | | | | | | |
| | |
| Average Annual Total Return for the period ended June 30, 2022 | | | | | | |
| | | |
| | | | | 1 Year | | | Fund Inception
(08/31/17) | |

| | PIMCO RAFI Dynamic Multi-Factor International Equity ETF (Based on Net Asset Value) | | | (12.60)% | | | | 2.56% | |

| | PIMCO RAFI Dynamic Multi-Factor International Equity ETF (At Market Price)(1)(2) | | | (12.60)% | | | | 2.50% | |

| | RAFI Dynamic Multi-Factor Developed Ex-U.S. Index± | | | (12.92)% | | | | 2.86% | |

| | MSCI EAFE Index± | | | (17.77)% | | | | 1.69% | |
All Fund returns are net of fees and expenses and include applicable fee waivers and/or expense limitations. Absent any applicable fee waivers and/or expense limitations, performance would have been lower and there can be no assurance that any such waivers or limitations will continue in the future.
Market Returns do not include brokerage commissions that may be payable on secondary market transactions. If brokerage commissions were included, market returns would be lower. Market and NAV returns assume that dividends and capital gain distributions have been reinvested in the Fund at market price and NAV, respectively.
(1) The market price is determined using the midpoint between the highest bid and the lowest offer on the listing exchange, as of the time that the Fund’s NAV is calculated.
(2) The Fund was seeded on August 31, 2017, but was not listed for trading until September 6, 2017. Accordingly, there is no Market Price information for August 31, 2017 through September 5, 2017.
± The RAFI Dynamic Multi-Factor Dev. ex-US index takes time-varying exposures to five return factors; value, low volatility, quality, momentum and size. The index uses recent and historical metrics to tilt toward factor portfolios which are particularly attractive on a forward looking basis. It is not possible to invest directly in the index.
±± MSCI EAFE Index is an unmanaged index designed to represent the performance of large and mid-cap securities across 21 developed markets, including countries in Europe, Australasia and the Far East, excluding the U.S. and Canada.
It is not possible to invest directly in an unmanaged index.
Performance quoted represents past performance. Past performance is not a guarantee or a reliable indicator of future results. Current performance may be lower or higher than performance shown. Investment return and the principal value of an investment will fluctuate. Shares may be worth more or less than original cost when redeemed by authorized participants. Returns shown do not reflect the deduction of taxes that a shareholder would pay on fund distributions or the redemption of Fund shares. Differences in the Fund’s performance versus the index and related attribution information with respect to particular categories of securities or individual positions may be attributable, in part, to differences in the pricing methodologies used by the Fund and the index. Performance data current to the most recent month-end is available at www.pimcoetfs.com or (888) 400-4ETF.
The Fund’s total annual operating expense ratio in effect as of period end was 0.39%. Details regarding any changes to the Fund’s operating expenses, subsequent to period end, can be found in the Fund’s current prospectus, as supplemented.
| | | | | | | | | | | | |
| | | | ANNUAL REPORT | | | | | | | JUNE 30, 2022 | | | 11 |
Top 10 Holdings as of June 30, 2022†§
| | | | | | | | |
AstraZeneca PLC | | | | | | | 1.6% | |
BP PLC | | | | | | | 1.2% | |
Novo Nordisk AS ‘B’ | | | | | | | 1.2% | |
Nestle SA | | | | | | | 1.1% | |
GSK PLC | | | | | | | 1.0% | |
Glencore PLC | | | | | | | 1.0% | |
Vodafone Group PLC | | | | | | | 0.8% | |
Equinor ASA | | | | | | | 0.8% | |
Koninklijke Ahold Delhaize NV | | | | | | | 0.8% | |
Telefonica SA | | | | | | | 0.8% | |
Geographic Breakdown as of June 30, 2022†**
| | | | | | | | |
Japan | | | | | | | 26.4% | |
United Kingdom | | | | | | | 14.0% | |
Canada | | | | | | | 8.1% | |
France | | | | | | | 7.3% | |
Switzerland | | | | | | | 6.9% | |
Germany | | | | | | | 5.2% | |
Australia | | | | | | | 4.3% | |
Spain | | | | | | | 4.2% | |
Netherlands | | | | | | | 3.8% | |
Short-Term Instruments | | | | | | | 3.0% | |
Italy | | | | | | | 2.5% | |
Denmark | | | | | | | 2.3% | |
Sweden | | | | | | | 1.9% | |
Hong Kong | | | | | | | 1.7% | |
Norway | | | | | | | 1.7% | |
Singapore | | | | | | | 1.5% | |
Ireland | | | | | | | 1.1% | |
Finland | | | | | | | 1.1% | |
Other | | | | | | | 3.0% | |
† % of Investments, at value.
§ Top 10 Holdings and % of Investments exclude securities sold short, financial derivative instruments and short-term instruments, if any.
** Geographic Breakdown and % of investments exclude securities sold short and financial derivative instruments, if any.
Fund Insights at NAV
The following affected performance (on a gross basis) during the reporting period:
| » | | Overweight exposure to, and security selection in, the energy sector contributed to relative returns compared to the Fund’s secondary benchmark, the MSCI EAFE Index, as the sector and the Fund’s holdings outperformed the secondary benchmark index. |
| » | | Security selection in the industrials sector contributed to relative returns compared to the Fund’s secondary benchmark, the MSCI EAFE Index, as the Fund’s holdings outperformed the secondary benchmark index. |
| » | | Security selection in the communication services sector contributed to relative returns compared to the Fund’s secondary benchmark, the MSCI EAFE Index, as the Fund’s holdings outperformed the secondary benchmark index. |
| » | | Underweight exposure to the health care sector detracted from relative returns compared to the Fund’s secondary benchmark, the MSCI EAFE Index, as the sector outperformed the secondary benchmark index. |
| » | | Security selection in the real estate sector detracted from relative returns compared to the Fund’s secondary benchmark, the MSCI EAFE Index, as the Fund’s holdings underperformed the secondary benchmark index. |
| » | | Overweight exposure to, and security selection in, the consumer discretionary sector detracted from relative returns compared to the Fund’s secondary benchmark, the MSCI EAFE Index, as the sector and the Fund’s holdings underperformed the secondary benchmark index. |
PIMCO RAFI Dynamic Multi-Factor U.S. Equity ETF
Cumulative Returns Through June 30, 2022
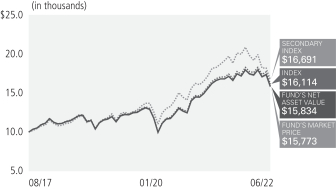
$10,000 invested at the end of the month when the Fund commenced operations.
Investment Objective and Strategy Overview
PIMCO RAFI Dynamic Multi-Factor U.S. Equity ETF seeks to track the investment results of the RAFI Dynamic Multi-Factor U.S. Index (the “Underlying Index”) by investing under normal circumstances, at least 80% of its total assets (exclusive of collateral held from securities lending) in the component securities (“Component Securities”) of the Underlying Index. The Fund may invest the remainder of its assets in cash, securities and instruments that are not Component Securities, but which the Fund’s sub-adviser, Parametric Portfolio Associates LLC, believes will help the Fund track its Underlying Index. The Underlying Index is designed to provide long-only exposure to multiple equity factors that seek to produce attractive long-term returns, and which may lower risk compared to less diversified strategies. Fund strategies may change from time to time. Please refer to the Fund’s current prospectus for more information regarding the Fund’s strategy.
| | | | | | | | | | |
|
| Average Annual Total Return for the period ended June 30, 2022 | |
| | | |
| | | | | 1 Year | | | Fund Inception
(08/31/17) | |
| | PIMCO RAFI Dynamic Multi-Factor U.S. Equity ETF (Based on Net Asset Value) | | | (5.66)% | | | | 9.98% | |
| | PIMCO RAFI Dynamic Multi-Factor U.S. Equity ETF (At Market Price)(1)(2) | | | (6.10)% | | | | 9.93% | |
| | RAFI Dynamic Multi-Factor U.S. Index± | | | (5.40)% | | | | 10.38% | |
| | S&P 500 Index±± | | | (10.62)% | | | | 11.18% | |
All Fund returns are net of fees and expenses and include applicable fee waivers and/or expense limitations. Absent any applicable fee waivers and/or expense limitations, performance would have been lower and there can be no assurance that any such waivers or limitations will continue in the future.
Market Returns do not include brokerage commissions that may be payable on secondary market transactions. If brokerage commissions were included, market returns would be lower. Market and NAV returns assume that dividends and capital gain distributions have been reinvested in the Fund at market price and NAV, respectively.
(1) The market price is determined using the midpoint between the highest bid and the lowest offer on the listing exchange, as of the time that the Fund’s NAV is calculated.
(2) The Fund was seeded on August 31, 2017, but was not listed for trading until September 6, 2017. Accordingly, there is no Market Price information for August 31, 2017 through September 5, 2017.
± The RAFI Dynamic Multi-Factor U.S. index takes time-varying exposures to five return factors; value, low volatility, quality, momentum and size. The index uses recent and historical metrics to tilt toward factor portfolios which are particularly attractive on a forward looking basis.
±± S&P 500 Index is an unmanaged market index generally considered representative of the stock market as a whole. The Index focuses on the large-cap segment of the U.S. equities market.
It is not possible to invest directly in an unmanaged index.
Performance quoted represents past performance. Past performance is not a guarantee or a reliable indicator of future results. Current performance may be lower or higher than performance shown. Investment return and the principal value of an investment will fluctuate. Shares may be worth more or less than original cost when redeemed by authorized participants. Returns shown do not reflect the deduction of taxes that a shareholder would pay on fund distributions or the redemption of Fund shares. Differences in the Fund’s performance versus the index and related attribution information with respect to particular categories of securities or individual positions may be attributable, in part, to differences in the pricing methodologies used by the Fund and the index. Performance data current to the most recent month-end is available at www.pimcoetfs.com or (888) 400-4ETF.
The Fund’s total annual operating expense ratio in effect as of period end was 0.30%. Details regarding any changes to the Fund’s operating expenses, subsequent to period end, can be found in the Fund’s current prospectus, as supplemented.
| | | | | | | | | | | | |
| | | | ANNUAL REPORT | | | | | | | JUNE 30, 2022 | | | 13 |
Top 10 Holdings as of June 30, 2022†§
| | | | | | | | |
Exxon Mobil Corp. | | | | | | | 2.8% | |
Chevron Corp. | | | | | | | 2.5% | |
Pfizer, Inc. | | | | | | | 2.3% | |
Walmart, Inc. | | | | | | | 1.9% | |
Johnson & Johnson | | | | | | | 1.9% | |
Procter & Gamble Co. | | | | | | | 1.8% | |
Merck & Co., Inc. | | | | | | | 1.8% | |
PepsiCo, Inc. | | | | | | | 1.4% | |
Coca-Cola Co. | | | | | | | 1.3% | |
International Business Machines Corp. | | | | | | | 1.3% | |
Sector Breakdown as of June 30, 2022†**
| | | | | | | | |
Health Care | | | | | | | 17.8% | |
Consumer Staples | | | | | | | 15.8% | |
Energy | | | | | | | 11.9% | |
Information Technology | | | | | | | 11.6% | |
Financials | | | | | | | 10.5% | |
Consumer Discretionary | | | | | | | 10.1% | |
Industrials | | | | | | | 7.5% | |
Communication Services | | | | | | | 5.4% | |
Real Estate | | | | | | | 3.3% | |
Materials | | | | | | | 3.2% | |
Utilities | | | | | | | 2.1% | |
Short-Term Instruments | | | | | | | 0.8% | |
† % of Investments, at value.
§ Top 10 Holdings and % of Investments exclude securities sold short, financial derivative instruments and short-term instruments, if any.
** Sector Breakdown and % of investments exclude securities sold short and financial derivative instruments, if any.
Fund Insights at NAV
The following affected performance (on a gross basis) during the reporting period:
| » | | Overweight exposure to, and security selection in, the energy sector contributed to relative returns compared to the Fund’s secondary benchmark, the S&P 500 Index, as the sector and the Fund’s holdings outperformed the secondary benchmark index. |
| » | | Underweight exposure to the communication services sector contributed to relative returns compared to the Fund’s secondary benchmark, the S&P 500 Index, as the sector underperformed the secondary benchmark index. |
| » | | Overweight exposure to, and security selection in, the health care sector contributed to relative returns compared to the Fund’s secondary benchmark, the S&P 500 Index, as the sector and the Fund’s holdings outperformed the secondary benchmark index. |
| » | | Overweight exposure to, and security selection in, the consumer discretionary sector detracted from relative returns compared to the Fund’s secondary benchmark, the S&P 500 Index, as the sector and the Fund’s holdings underperformed the secondary benchmark index. |
| » | | Underweight exposure to the utilities sector detracted from relative returns compared to the Fund’s secondary benchmark, the S&P 500 Index, as the sector outperformed the secondary benchmark index. |
| » | | Security selection in the financials sector detracted from relative returns compared to the Fund’s secondary benchmark, the S&P 500 Index, as the Fund’s holdings underperformed the secondary benchmark index. |
PIMCO RAFI ESG U.S. ETF
Cumulative Returns Through June 30, 2022
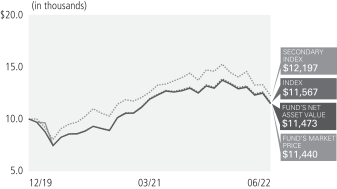
$10,000 invested at the end of the month when the Fund commenced operations.
Investment Objective and Strategy Overview
PIMCO RAFI ESG U.S. ETF seeks to provide total return that closely corresponds, before fees and expenses, to the total return of the RAFI ESG US Index (the “Underlying Index”) by investing under normal circumstances, at least 80% of its total assets (exclusive of collateral held from securities lending) in the component securities (“Component Securities”) of the Underlying Index. The Fund may invest the remainder of its assets in cash, securities and instruments that are not Component Securities, but which the Fund’s sub-adviser, Parametric Portfolio Associates LLC (“Sub-Adviser”), believes will help the Fund track its Underlying Index. The Underlying Index is a long-only, smart beta index that seeks to achieve the dual objectives of social responsibility and long-horizon outperformance of the broad market. Fund strategies may change from time to time. Please refer to the Fund’s current prospectus for more information regarding the Fund’s strategy.
| | | | | | | | | | |
|
| Average Annual Total Return for the period ended June 30, 2022 | |
| | | |
| | | | | 1 Year | | | Fund Inception
(12/18/19) | |
| | PIMCO RAFI ESG U.S. ETF (Based on Net Asset Value) | | | (8.73)% | | | | 5.99% | |
| | PIMCO RAFI ESG U.S. ETF (At Market Price)(1)(2) | | | (9.05)% | | | | 5.72% | |
| | RAFI ESG US Index± | | | (8.52)% | | | | 6.33% | |
| | S&P 500 Index±± | | | (10.62)% | | | | 8.70% | |
All Fund returns are net of fees and expenses and include applicable fee waivers and/or expense limitations. Absent any applicable fee waivers and/or expense limitations, performance would have been lower and there can be no assurance that any such waivers or limitations will continue in the future.
Market Returns do not include brokerage commissions that may be payable on secondary market transactions. If brokerage commissions were included, market returns would be lower. Market and NAV returns assume that dividends and capital gain distributions have been reinvested in the Fund at market price and NAV, respectively.
(1) The market price is determined using the midpoint between the highest bid and the lowest offer on the listing exchange, as of the time that the Fund’s NAV is calculated.
(2) The Fund was seeded on December 18, 2019, but was not listed for trading until December 19, 2019. Accordingly, there is no Market Price information for December 18, 2019.
± The RAFI ESG US Index is a long-only, smart beta index that seeks to achieve the dual objectives of social responsibility and long-horizon outperformance of the broad market. The Index is constructed by RAFI Indices, LLC (the “Index Provider”) using a rules-based approach within publicly traded U.S. equities to create an integrated ESG strategy which overweights companies that rate well across various ESG (Environmental, Social, and Governance) themes and excludes companies with a major involvement in industries such as tobacco, gaming, weapons and fossil fuels. The strategy supplements traditional ESG metrics with metrics linked to long-term value creation, specifically financial discipline and diversity, for improved return potential. It is not possible to invest directly in the index.
±± S&P 500 Index is an unmanaged market index generally considered representative of the stock market as a whole. The Index focuses on the large-cap segment of the U.S. equities market.
It is not possible to invest directly in an unmanaged index.
Performance quoted represents past performance. Past performance is not a guarantee or a reliable indicator of future results. Current performance may be lower or higher than performance shown. Investment return and the principal value of an investment will fluctuate. Shares may be worth more or less than original cost when redeemed by authorized participants. Returns shown do not reflect the deduction of taxes that a shareholder would pay on fund distributions or the redemption of Fund shares. Differences in the Fund’s performance versus the index and related attribution information with respect to particular categories of securities or individual positions may be attributable, in part, to differences in the pricing methodologies used by the Fund and the index. Performance data current to the most recent month-end is available at www.pimcoetfs.com or (888) 400-4ETF.
The Fund’s total annual operating expense ratio in effect as of period end was 0.30%. Details regarding any changes to the Fund’s operating expenses, subsequent to period end, can be found in the Fund’s current prospectus, as supplemented.
| | | | | | | | | | | | |
| | | | ANNUAL REPORT | | | | | | | JUNE 30, 2022 | | | 15 |
Top 10 Holdings as of June 30, 2022†§
| | | | | | | | |
Apple, Inc. | | | | | | | 5.1% | |
Microsoft Corp. | | | | | | | 5.0% | |
Johnson & Johnson | | | | | | | 3.8% | |
AT&T, Inc. | | | | | | | 3.6% | |
Intel Corp. | | | | | | | 3.1% | |
Verizon Communications, Inc. | | | | | | | 2.9% | |
JPMorgan Chase & Co. | | | | | | | 2.6% | |
UnitedHealth Group, Inc. | | | | | | | 2.4% | |
Wells Fargo & Co. | | | | | | | 2.4% | |
Procter & Gamble Co. | | | | | | | 2.4% | |
Sector Breakdown as of June 30, 2022†**
| | | | | | | | |
Information Technology | | | | | | | 27.7% | |
Health Care | | | | | | | 22.7% | |
Financials | | | | | | | 15.3% | |
Communication Services | | | | | | | 9.2% | |
Consumer Staples | | | | | | | 9.0% | |
Consumer Discretionary | | | | | | | 6.7% | |
Industrials | | | | | | | 4.2% | |
Materials | | | | | | | 2.9% | |
Real Estate | | | | | | | 2.0% | |
Utilities | | | | | | | 0.3% | |
† % of Investments, at value.
§ Top 10 Holdings and % of Investments exclude securities sold short, financial derivative instruments and short-term instruments, if any.
** Sector Breakdown and % of investments exclude securities sold short and financial derivative instruments, if any.
Fund Insights at NAV
The following affected performance (on a gross basis) during the reporting period:
| » | | Overweight exposure to, and security selection in, the health care sector contributed to relative returns compared to the Fund’s secondary benchmark, the S&P 500 Index, as the sector and the Fund’s holdings outperformed the secondary benchmark index. |
| » | | Underweight exposure to, and security selection in, the communication services sector contributed to relative returns compared to the Fund’s secondary benchmark, the S&P 500 Index, as the sector underperformed the secondary benchmark index and the Fund’s holdings outperformed the secondary benchmark index. |
| » | | Overweight exposure to, and security selection in, the consumer staples sector contributed to relative returns compared to the Fund’s secondary benchmark, the S&P 500 Index, as the sector and the Fund’s holdings outperformed the secondary benchmark index. |
| » | | Underweight exposure to the energy sector detracted from relative returns compared to the Fund’s secondary benchmark, the S&P 500 Index, as the sector outperformed the secondary benchmark index. |
| » | | Overweight exposure to, and security selection in, the financials sector detracted from relative returns compared to the Fund’s secondary benchmark, the S&P 500 Index, as the sector and the Fund’s holdings underperformed the secondary benchmark index. |
| » | | Underweight exposure to the utilities sector detracted from relative returns compared to the Fund’s secondary benchmark, the S&P 500 Index, as the sector outperformed the secondary benchmark index. |
Example
As a shareholder of a Fund, you incur two types of costs: (1) transaction costs, including sales charges (loads) on purchase payments and exchange fees and (2) ongoing costs, including management fees and other Fund expenses. The Example is intended to help you understand your ongoing costs (in dollars) of investing in a Fund and to compare these costs with the ongoing costs of investing in other mutual funds.
The Example is based on an investment of $1,000 invested at the beginning of the period and held for the entire period indicated, which for all Funds and share classes is from January 1, 2022 to June 30, 2022 unless noted otherwise in the table and footnotes below.
Actual Expenses
The information in the table under the heading “Actual” provides information about actual account values and actual expenses. You may use this information, together with the amount you invested, to estimate the expenses that you paid over the period. Simply divide your account value by $1,000 (for example, an $8,600 account value divided by $1,000 = 8.60), then multiply the result by the number in the appropriate row for your share class, in the column entitled “Expenses Paid During Period” to estimate the expenses you paid on your account during this period.
Hypothetical Example for Comparison Purposes
The information in the table under the heading “Hypothetical (5% return before expenses)” provides information about hypothetical account values and hypothetical expenses based on a Fund’s actual expense ratio and an assumed rate of return of 5% per year before expenses, which is not the Fund’s actual return. The hypothetical account values and expenses may not be used to estimate the actual ending account balance or expenses you paid for the period. You may use this information to compare the ongoing costs of investing in a Fund and other funds. To do so, compare this 5% hypothetical example with the 5% hypothetical examples that appear in the shareholder reports of the other funds.
Please note that the expenses shown in the table are meant to highlight your ongoing costs only and do not reflect any transactional costs, such as sales charges (loads) on purchase payments and exchange fees. Therefore, the information under the heading “Hypothetical (5% return before expenses)” is useful in comparing ongoing costs only, and will not help you determine the relative total costs of owning different funds. In addition, if these transactional costs were included, your costs would have been higher.
Expense ratios may vary period to period because of various factors, such as an increase in expenses not covered by the management fees (such as expenses of the independent trustees and their counsel, extraordinary expenses and interest expense).
| | | | | | | | | | | | | | | | | | | | | | | | | | | | | | | | | | | | | | | | |
| | | | | | Actual | | | | | | Hypothetical
(5% return before expenses) | | | | | | | |
| | | | | | Beginning
Account Value
(01/01/22) | | | Ending
Account Value
(06/30/22) | | | Expenses Paid
During Period* | | | | | | Beginning
Account Value
(01/01/22) | | | Ending
Account Value
(06/30/22) | | | Expenses Paid
During Period* | | | | | | Net Annualized
Expense Ratio** | |
| PIMCO RAFI Dynamic Multi-Factor Emerging Markets Equity ETF | | | | | | $ | 1,000.00 | | | $ | 792.40 | | | $ | 2.20 | | | | | | | $ | 1,000.00 | | | $ | 1,022.07 | | | $ | 2.48 | | | | | | | | 0.50 | % |
| PIMCO RAFI Dynamic Multi-Factor International Equity ETF | | | | | | | 1,000.00 | | | | 856.40 | | | | 1.82 | | | | | | | | 1,000.00 | | | | 1,022.56 | | | | 1.98 | | | | | | | | 0.40 | |
| PIMCO RAFI Dynamic Multi-Factor U.S. Equity ETF | | | | | | | 1,000.00 | | | | 882.00 | | | | 1.38 | | | | | | | | 1,000.00 | | | | 1,023.05 | | | | 1.49 | | | | | | | | 0.30 | |
| PIMCO RAFI ESG U.S. ETF | | | | | | | 1,000.00 | | | | 835.70 | | | | 1.35 | | | | | | | | 1,000.00 | | | | 1,023.05 | | | | 1.49 | | | | | | | | 0.30 | |
* Expenses Paid During Period are equal to the net annualized expense ratio for the class, multiplied by the average account value over the period, multiplied by 179/365 (to reflect the one-half year period).
** Net Annualized Expense Ratio is reflective of any applicable contractual fee waivers and/or expense reimbursements or voluntary fee waivers. Details regarding fee waivers, if any, can be found in Note 9, Fees and Expenses, in the Notes to Financial Statements.
| | | | | | | | | | | | |
| | | | ANNUAL REPORT | | | | | | | JUNE 30, 2022 | | | 17 |
| | | | | | | | | | | | | | | | | | | | | | | | | | | | | | | | |
| | | | | | Investment Operations | | | Less Distributions(c) | |
| | | | | | | | | | | | | | | | | | | | | | | | | |
| Selected Per Share Data for the Year or Period Ended^: | | Net Asset
Value
Beginning
Of Year
or Period(a) | | | Net
Investment
Income
(Loss)(b) | | | Net
Realized/
Unrealized
Gain (Loss) | | | Total | | | From Net
Investment
Income | | | From Net Realized Capital Gains | | | Total | | | Net Assets
End of Year
or Period(a) | |
| | | | | | | | |
PIMCO RAFI Dynamic Multi-Factor Emerging Markets Equity ETF | | | | | | | | | | | | | | | | | | | | | | | | | | | | | | | | |
| | | | | | | | |
06/30/2022 | | $ | 31.06 | | | $ | 1.21 | | | $ | (6.94 | ) | | $ | (5.73 | ) | | $ | (2.46 | ) | | $ | (4.54 | ) | | $ | (7.00 | ) | | $ | 18.33 | |
| | | | | | | | |
06/30/2021 | | | 20.84 | | | | 0.50 | | | | 10.14 | | | | 10.64 | | | | (0.42 | ) | | | 0.00 | | | | (0.42 | ) | | | 31.06 | |
| | | | | | | | |
06/30/2020 | | | 24.24 | | | | 0.59 | | | | (3.41 | ) | | | (2.82 | ) | | | (0.58 | ) | | | 0.00 | | | | (0.58 | ) | | | 20.84 | |
| | | | | | | | |
06/30/2019 | | | 23.94 | | | | 0.64 | | | | 0.39 | | | | 1.03 | | | | (0.73 | ) | | | 0.00 | | | | (0.73 | ) | | | 24.24 | |
| | | | | | | | |
08/31/2017 - 06/30/2018 | | | 25.00 | | | | 0.42 | | | | (1.41 | ) | | | (0.99 | ) | | | (0.07 | ) | | | 0.00 | | | | (0.07 | ) | | | 23.94 | |
| | | | | | | | |
PIMCO RAFI Dynamic Multi-Factor International Equity ETF | | | | | | | | | | | | | | | | | | | | | | | | | | | | | | | | |
| | | | | | | | |
06/30/2022 | | $ | 29.66 | | | $ | 0.95 | | | $ | (4.57 | ) | | $ | (3.62 | ) | | $ | (0.88 | ) | | $ | 0.00 | | | $ | (0.88 | ) | | $ | 25.16 | |
| | | | | | | | |
06/30/2021 | | | 22.86 | | | | 0.69 | | | | 6.53 | | | | 7.22 | | | | (0.42 | ) | | | 0.00 | | | | (0.42 | ) | | | 29.66 | |
| | | | | | | | |
06/30/2020 | | | 24.94 | | | | 0.53 | | | | (1.84 | ) | | | (1.31 | ) | | | (0.77 | ) | | | 0.00 | | | | (0.77 | ) | | | 22.86 | |
| | | | | | | | |
06/30/2019 | | | 25.87 | | | | 0.72 | | | | (0.89 | ) | | | (0.17 | ) | | | (0.76 | ) | | | 0.00 | | | | (0.76 | ) | | | 24.94 | |
| | | | | | | | |
08/31/2017 - 06/30/2018 | | | 25.00 | | | | 0.62 | | | | 0.44 | | | | 1.06 | | | | (0.19 | ) | | | 0.00 | | | | (0.19 | ) | | | 25.87 | |
| | | | | | | | |
PIMCO RAFI Dynamic Multi-Factor U.S. Equity ETF | | | | | | | | | | | | | | | | | | | | | | | | | | | | | | | | |
| | | | | | | | |
06/30/2022 | | $ | 39.00 | | | $ | 0.75 | | | $ | (2.90 | ) | | $ | (2.15 | ) | | $ | (0.61 | ) | | $ | 0.00 | | | $ | (0.61 | ) | | $ | 36.24 | |
| | | | | | | | |
06/30/2021 | | | 27.74 | | | | 0.52 | | | | 11.28 | | | | 11.80 | | | | (0.54 | ) | | | 0.00 | | | | (0.54 | ) | | | 39.00 | |
| | | | | | | | |
06/30/2020 | | | 29.21 | | | | 0.62 | | | | (1.44 | ) | | | (0.82 | ) | | | (0.65 | ) | | | 0.00 | | | | (0.65 | ) | | | 27.74 | |
| | | | | | | | |
06/30/2019 | | | 28.30 | | | | 0.59 | | | | 0.91 | | | | 1.50 | | | | (0.59 | ) | | | 0.00 | | | | (0.59 | ) | | | 29.21 | |
| | | | | | | | |
08/31/2017 - 06/30/2018 | | | 25.00 | | | | 0.43 | | | | 3.17 | | | | 3.60 | | | | (0.30 | ) | | | 0.00 | | | | (0.30 | ) | | | 28.30 | |
| | | | | | | | |
PIMCO RAFI ESG U.S. ETF | | | | | | | | | | | | | | | | | | | | | | | | | | | | | | | | |
| | | | | | | | |
06/30/2022 | | $ | 30.72 | | | $ | 0.60 | | | $ | (3.22 | ) | | $ | (2.62 | ) | | $ | (0.52 | ) | | $ | 0.00 | | | $ | (0.52 | ) | | $ | 27.58 | |
| | | | | | | | |
06/30/2021 | | | 21.40 | | | | 0.51 | | | | 9.32 | | | | 9.83 | | | | (0.51 | ) | | | 0.00 | | | | (0.51 | ) | | | 30.72 | |
| | | | | | | | |
12/18/2019 - 06/30/2020 | | | 25.00 | | | | 0.33 | | | | (3.72 | ) | | | (3.39 | ) | | | (0.21 | ) | | | 0.00 | | | | (0.21 | ) | | | 21.40 | |
| ^ | A zero balance may reflect actual amounts rounding to less than $0.01 or 0.01%. |
| * | Annualized, except for organizational expense, if any. |
| (a) | Includes adjustments required by U.S. GAAP and may differ from net asset values and performance reported elsewhere by the Funds. |
| (b) | Per share amounts based on average number of shares outstanding during the year or period. |
| (c) | The tax characterization of distributions is determined in accordance with Federal income tax regulations. See Note 2, Distributions to Shareholders, in the Notes to Financial Statements for more information. |
| (d) | Includes adjustments required by U.S. GAAP and may differ from net asset values and performance reported elsewhere by the Funds. Additionally, excludes initial sales charges and contingent deferred sales charges. |
| | | | | | |
| 18 | | PIMCO EQUITY SERIES | | | See Accompanying Notes | |
| | | | | | | | | | | | | | | | | | | | | | | | | | | | | | |
| | | | | | | Ratios/Supplemental Data | |
| | | | | | | | | | Ratios to Average Net Assets | |
Total
Return(d) | | | Net Assets
End of Year or
Period (000s) | | | Expenses | | | Expenses Excluding Waivers | | | Expenses Excluding Interest Expense | | | Expenses Excluding Interest Expense and
Waivers | | | Net Investment Income (Loss) | | | Portfolio Turnover Rate | |
| | | | | | | |
| | | | | | | | | | | | | | | | | | | | | | | | | | | | | | | |
| | | | | | | |
| | (23.00 | )% | | $ | 75,517 | | | | 0.49 | % | | | 0.50. | % | | | 0.49 | % | | | 0.50 | % | | | 4.50 | % | | | 54 | % |
| | | | | | | |
| | 51.62 | | | | 494,452 | | | | 0.50 | | | | 0.51 | | | | 0.50 | | | | 0.51 | | | | 1.91 | | | | 58 | |
| | | | | | | |
| | (11.86 | ) | | | 619,324 | | | | 0.49 | | | | 0.50 | | | | 0.49 | | | | 0.50 | | | | 2.66 | | | | 59 | |
| | | | | | | |
| | 4.53 | | | | 477,943 | | | | 0.49 | | | | 0.50 | | | | 0.49 | | | | 0.50 | | | | 2.75 | | | | 43 | |
| | | | | | | |
| | (3.99 | ) | | | 357,169 | | | | 0.50 | * | | | 0.55 | * | | | 0.50 | * | | | 0.55 | * | | | 1.94 | * | | | 52 | |
| | | | | | | |
| | | | | | | | | | | | | | | | | | | | | | | | | | | | | | |
| | | | | | | |
| | (12.60 | )% | | $ | 85,539 | | | | 0.39 | % | | | 0.40 | % | | | 0.39 | % | | | 0.40 | % | | | 3.30 | % | | | 39 | % |
| | | | | | | |
| | 31.87 | | | | 88,978 | | | | 0.40 | | | | 0.40 | | | | 0.40 | | | | 0.40 | | | | 2.54 | | | | 48 | |
| | | | | | | |
| | (5.37 | ) | | | 24,231 | | | | 0.40 | | | | 0.41 | | | | 0.40 | | | | 0.41 | | | | 2.21 | | | | 35 | |
| | | | | | | |
| | (0.59 | ) | | | 42,888 | | | | 0.39 | | | | 0.40 | | | | 0.39 | | | | 0.40 | | | | 2.96 | | | | 24 | |
| | | | | | | |
| | 4.22 | | | | 28,976 | | | | 0.40 | * | | | 0.87 | * | | | 0.40 | * | | | 0.87 | * | | | 2.81 | * | | | 36 | |
| | | | | | | |
| | | | | | | | | | | | | | | | | | | | | | | | | | | | | | |
| | | | | | | |
| | (5.66 | )% | | $ | 94,954 | | | | 0.29 | % | | | 0.30 | % | | | 0.29 | % | | | 0.30 | % | | | 1.88 | % | | | 43 | % |
| | | | | | | |
| | 43.02 | | | | 82,677 | | | | 0.29 | | | | 0.30 | | | | 0.29 | | | | 0.30 | | | | 1.53 | | | | 63 | |
| | | | | | | |
| | (2.80 | ) | | | 25,525 | | | | 0.30 | | | | 0.31 | | | | 0.30 | | | | 0.31 | | | | 2.12 | | | | 36 | |
| | | | | | | |
| | 5.50 | | | | 96,980 | | | | 0.29 | | | | 0.30 | | | | 0.29 | | | | 0.30 | | | | 2.08 | | | | 40 | |
| | | | | | | |
| | 14.43 | | | | 65,658 | | | | 0.29 | * | | | 0.60 | * | | | 0.29 | * | | | 0.60 | * | | | 1.89 | * | | | 56 | |
| | | | | | | |
| | | | | | | | | | | | | | | | | | | | | | | | | | | | | | |
| | | | | | | |
| | (8.73 | )% | | $ | 28,615 | | | | 0.29 | % | | | 0.30 | % | | | 0.29 | % | | | 0.30 | % | | | 1.94 | % | | | 26 | % |
| | | | | | | |
| | 46.63 | | | | 20,584 | | | | 0.30 | | | | 0.31 | | | | 0.30 | | | | 0.31 | | | | 1.91 | | | | 32 | |
| | | | | | | |
| | (13.42 | ) | | | 8,988 | | | | 0.30 | * | | | 0.86 | * | | | 0.30 | * | | | 0.86 | * | | | 2.75 | * | | | 12 | |
| | | | | | | | | | | | |
| | | | ANNUAL REPORT | | | | | | | JUNE 30, 2022 | | | 19 |
| | | | |
| Statements of Assets and Liabilities | | | | June 30, 2022 |
| | | | | | | | | | | | | | | | |
| (Amounts in thousands†, except per share amounts) | | PIMCO RAFI Dynamic
Multi-Factor
Emerging Markets
Equity ETF | | | PIMCO RAFI Dynamic
Multi-Factor
International
Equity ETF | | | PIMCO RAFI Dynamic
Multi-Factor
U.S. Equity ETF | | | PIMCO RAFI ESG U.S. ETF | |
| | | | |
Assets: | | | | | | | | | | | | | | | | |
| | | | |
Investments, at value | | | | | | | | | | | | | | | | |
Investments in securities*^ | | $ | 74,662 | | | $ | 84,683 | | | $ | 94,836 | | | $ | 28,392 | |
Investments in Affiliates | | | 72 | | | | 1,189 | | | | 25 | | | | 0 | |
Cash | | | 0 | | | | 618 | | | | 0 | | | | 203 | |
Foreign currency, at value | | | 489 | | | | 472 | | | | 0 | | | | 0 | |
Receivable for investments sold | | | 0 | | | | 67 | | | | 0 | | | | 0 | |
Receivable for Fund shares sold | | | 0 | | | | 0 | | | | 3,649 | | | | 0 | |
Interest and/or dividends receivable | | | 571 | | | | 345 | | | | 110 | | | | 27 | |
Reimbursement receivable from PIMCO | | | 1 | | | | 1 | | | | 1 | | | | 0 | |
Other assets | | | 1 | | | | 0 | | | | 0 | | | | 0 | |
Total Assets | | | 75,796 | | | | 87,375 | | | | 98,621 | | | | 28,622 | |
| | | | |
Liabilities: | | | | | | | | | | | | | | | | |
Payable for investments purchased | | $ | 175 | | | $ | 0 | | | $ | 3,621 | | | $ | 0 | |
Payable upon return of securities loaned | | | 72 | | | | 1,807 | | | | 25 | | | | 0 | |
Accrued management fees | | | 32 | | | | 29 | | | | 21 | | | | 7 | |
Total Liabilities | | | 279 | | | | 1,836 | | | | 3,667 | | | | 7 | |
| | | | |
Net Assets | | $ | 75,517 | | | $ | 85,539 | | | $ | 94,954 | | | $ | 28,615 | |
| | | | |
Net Assets Consist of: | | | | | | | | | | | | | | | | |
| | | | |
Paid in capital | | $ | 79,547 | | | $ | 99,388 | | | $ | 107,597 | | | $ | 32,066 | |
| | | | |
Distributable earnings (accumulated loss) | | | (4,030 | ) | | | (13,849 | ) | | | (12,643 | ) | | | (3,451 | ) |
| | | | |
Net Assets | | $ | 75,517 | | | $ | 85,539 | | | $ | 94,954 | | | $ | 28,615 | |
| | | | |
Shares Issued and Outstanding | | | 4,120 | | | | 3,400 | | | | 2,620 | | | | 1,038 | |
| | | | |
Net Asset Value Per Share Outstanding(a): | | $ | 18.33 | | | $ | 25.16 | | | $ | 36.24 | | | $ | 27.58 | |
| | | | |
Cost of investments in securities | | $ | 77,949 | | | $ | 86,247 | | | $ | 90,787 | | | $ | 30,422 | |
Cost of investments in Affiliates | | $ | 72 | | | $ | 1,189 | | | $ | 25 | | | $ | 0 | |
Cost of foreign currency held | | $ | 453 | | | $ | 472 | | | $ | 0 | | | $ | 0 | |
| | | | |
* Includes repurchase agreements of: | | $ | 1,300 | | | $ | 1,354 | | | $ | 728 | | | $ | 0 | |
^ Includes securities on loan of: | | $ | 59 | | | $ | 1,695 | | | $ | 24 | | | $ | 0 | |
| † | A zero balance may reflect actual amounts rounding to less than one thousand. |
| (a) | Includes adjustments required by U.S. GAAP and may differ from net asset values and performance reported elsewhere by the Funds. |
| | | | | | |
| 20 | | PIMCO EQUITY SERIES | | | See Accompanying Notes | |
| | | | | | | | | | | | | | | | |
| Year Ended June 30, 2022 | | | | | | | | | | | | |
| (Amounts in thousands†) | | PIMCO RAFI Dynamic
Multi-Factor
Emerging Markets
Equity ETF | | | PIMCO RAFI Dynamic
Multi-Factor
International
Equity ETF | | | PIMCO RAFI Dynamic
Multi-Factor
U.S. Equity ETF | | | PIMCO RAFI ESG U.S. ETF | |
| | | | |
Investment Income: | | | | | | | | | | | | | | | | |
| | | | |
Dividends, net of foreign taxes* | | $ | 8,948 | | | $ | 3,465 | | | $ | 1,893 | | | $ | 574 | |
Securities lending income | | | 116 | | | | 20 | | | | 1 | | | | 0 | |
Total Income | | | 9,064 | | | | 3,485 | | | | 1,894 | | | | 574 | |
| | | | |
Expenses: | | | | | | | | | | | | | | | | |
| | | | |
Management fees | | | 894 | | | | 368 | | | | 253 | | | | 75 | |
Trustee fees | | | 20 | | | | 6 | | | | 5 | | | | 1 | |
Interest expense | | | 6 | | | | 1 | | | | 0 | | | | 0 | |
Miscellaneous expense | | | 9 | | | | 6 | | | | 4 | | | | 1 | |
Total Expenses | | | 929 | | | | 381 | | | | 262 | | | | 77 | |
Waiver and/or Reimbursement by PIMCO | | | (20 | ) | | | (6 | ) | | | (6 | ) | | | (2 | ) |
Net Expenses | | | 909 | | | | 375 | | | | 256 | | | | 75 | |
| | | | |
Net Investment Income (Loss) | | | 8,155 | | | | 3,110 | | | | 1,638 | | | | 499 | |
| | | | |
Net Realized Gain (Loss): | | | | | | | | | | | | | | | | |
| | | | |
Investments in securities | | | 65,155 | | | | (4,937 | ) | | | (2,613 | ) | | | (847 | ) |
In-kind redemptions | | | 17,718 | | | | 6,610 | | | | 3,551 | | | | 1,259 | |
Over the counter financial derivative instruments | | | (1 | ) | | | (5 | ) | | | 0 | | | | 0 | |
Foreign currency | | | (458 | ) | | | (95 | ) | | | 0 | | | | 0 | |
| | | | |
Net Realized Gain (Loss) | | | 82,414 | | | | 1,573 | | | | 938 | | | | 412 | |
| | | | |
Net Change in Unrealized Appreciation (Depreciation): | | | | | | | | | | | | | | | | |
| | | | |
Investments in securities | | | (124,939 | ) | | | (17,516 | ) | | | (8,348 | ) | | | (4,250 | ) |
Foreign currency assets and liabilities | | | 23 | | | | (12 | ) | | | 0 | | | | 0 | |
| | | | |
Net Change in Unrealized Appreciation (Depreciation) | | | (124,916 | ) | | | (17,528 | ) | | | (8,348 | ) | | | (4,250 | ) |
| | | | |
Net Increase (Decrease) in Net Assets Resulting from Operations | | $ | (34,347 | ) | | $ | (12,845 | ) | | $ | (5,772 | ) | | $ | (3,339 | ) |
| | | | |
* Foreign tax withholdings - Dividends | | $ | 1,236 | | | $ | 384 | | | $ | 0 | | | $ | 0 | |
| † | A zero balance may reflect actual amounts rounding to less than one thousand. |
| | | | | | | | | | | | |
| | | | ANNUAL REPORT | | | | | | | JUNE 30, 2022 | | | 21 |
| | | | |
| Statements of Changes in Net Assets | | | | |
| | | | | | | | | | | | | | | | | | | | | | | | | | | | | | | | |
| | | PIMCO RAFI Dynamic Multi-Factor Emerging Markets Equity ETF | | | PIMCO RAFI Dynamic Multi-Factor International Equity ETF | | | PIMCO RAFI Dynamic Multi-Factor U.S. Equity ETF | | | PIMCO RAFI ESG U.S. ETF | |
| | | | | | | | |
| (Amounts in thousands†) | | Year Ended
June 30, 2022 | | | Year Ended
June 30, 2021 | | | Year Ended
June 30, 2022 | | | Year Ended
June 30, 2021 | | | Year Ended
June 30, 2022 | | | Year Ended
June 30, 2021 | | | Year Ended
June 30, 2022 | | | Year Ended
June 30, 2021 | |
| | | | | | | | |
Increase (Decrease) in Net Assets from: | | | | | | | | | | | | | | | | | | | | | | | | | | | | | | | | |
| | | | | | | | |
Operations: | | | | | | | | | | | | | | | | | | | | | | | | | | | | | | | | |
| | | | | | | | |
Net investment income (loss) | | $ | 8,155 | | | $ | 12,389 | | | $ | 3,110 | | | $ | 1,730 | | | $ | 1,638 | | | $ | 937 | | | $ | 499 | | | $ | 244 | |
Net realized gain (loss) | | | 82,414 | | | | 154,863 | | | | 1,573 | | | | (2,024 | ) | | | 938 | | | | 6,125 | | | | 412 | | | | 445 | |
Net change in unrealized appreciation (depreciation) | | | (124,916 | ) | | | 127,110 | | | | (17,528 | ) | | | 17,508 | | | | (8,348 | ) | | | 14,062 | | | | (4,250 | ) | | | 3,930 | |
| | | | | | | | |
Net Increase (Decrease) in Net Assets Resulting from Operations | | | (34,347 | ) | | | 294,362 | | | | (12,845 | ) | | | 17,214 | | | | (5,772 | ) | | | 21,124 | | | | (3,339 | ) | | | 4,619 | |
| | | | | | | | |
Distributions to Shareholders: | | | | | | | | | | | | | | | | | | | | | | | | | | | | | | | | |
| | | | | | | | |
From net investment income and/or net realized capital gains | | | (35,613 | ) | | | (12,004 | ) | | | (2,872 | ) | | | (943 | ) | | | (1,311 | ) | | | (868 | ) | | | (411 | ) | | | (235 | ) |
| | | | | | | | |
Total Distributions(a) | | | (35,613 | ) | | | (12,004 | ) | | | (2,872 | ) | | | (943 | ) | | | (1,311 | ) | | | (868 | ) | | | (411 | ) | | | (235 | ) |
| | | | | | | | |
Fund Share Transactions: | | | | | | | | | | | | | | | | | | | | | | | | | | | | | | | | |
| | | | | | | | |
Receipts for shares sold | | | 19,206 | | | | 23,871 | | | | 36,080 | | | | 50,169 | | | | 31,146 | | | | 64,915 | | | | 17,482 | | | | 10,114 | |
Cost of shares redeemed | | | (368,181 | ) | | | (431,101 | ) | | | (23,802 | ) | | | (1,693 | ) | | | (11,786 | ) | | | (28,019 | ) | | | (5,701 | ) | | | (2,902 | ) |
Net increase (decrease) resulting from Fund share transactions | | | (348,975 | ) | | | (407,230 | ) | | | 12,278 | | | | 48,476 | | | | 19,360 | | | | 36,896 | | | | 11,781 | | | | 7,212 | |
| | | | | | | | |
Total Increase (Decrease) in Net Assets | | | (418,935 | ) | | | (124,872 | ) | | | (3,439 | ) | | | 64,747 | | | | 12,277 | | | | 57,152 | | | | 8,031 | | | | 11,596 | |
| | | | | | | | |
Net Assets: | | | | | | | | | | | | | | | | | | | | | | | | | | | | | | | | |
| | | | | | | | |
Beginning of year | | | 494,452 | | | | 619,324 | | | | 88,978 | | | | 24,231 | | | | 82,677 | | | | 25,525 | | | | 20,584 | | | | 8,988 | |
End of year | | $ | 75,517 | | | $ | 494,452 | | | $ | 85,539 | | | $ | 88,978 | | | $ | 94,954 | | | $ | 82,677 | | | $ | 28,615 | | | $ | 20,584 | |
| | | | | | | | |
Shares of Beneficial Interest: | | | | | | | | | | | | | | | | | | | | | | | | | | | | | | | | |
| | | | | | | | |
Shares sold | | | 800 | | | | 800 | | | | 1,200 | | | | 2,000 | | | | 800 | | | | 2,000 | | | | 550 | | | | 350 | |
Shares redeemed | | | (12,600 | ) | | | (14,600 | ) | | | (800 | ) | | | (60 | ) | | | (300 | ) | | | (800 | ) | | | (182 | ) | | | (100 | ) |
Net increase (decrease) in shares outstanding | | | (11,800 | ) | | | (13,800 | ) | | | 400 | | | | 1,940 | | | | 500 | | | | 1,200 | | | | 368 | | | | 250 | |
| † | A zero balance may reflect actual amounts rounding to less than one thousand. |
| (a) | The tax characterization of distributions is determined in accordance with Federal income tax regulations. See Note 2, Distributions to Shareholders, in the Notes to Financial Statements for more information. |
| | | | | | |
| 22 | | PIMCO EQUITY SERIES | | | See Accompanying Notes | |
| | | | | | |
| Schedule of Investments | | PIMCO RAFI Dynamic Multi-Factor Emerging Markets Equity ETF | | | | June 30, 2022 |
(Amounts in thousands*, except number of shares, contracts, units and ounces, if any)
| | | | | | | | | | | | |
| | | | | SHARES | | | | | MARKET
VALUE
(000S) | |
| INVESTMENTS IN SECURITIES 98.9% | |
| |
| COMMON STOCKS 93.3% | |
| |
| BRAZIL 3.6% | |
| |
| COMMUNICATION SERVICES 0.1% | |
| | | | |
Telefonica Brasil SA | | | | | 6,400 | | | $ | | | 58 | |
| | | | | | | | | | | | |
| |
| CONSUMER DISCRETIONARY 0.2% | |
| | | | |
Vibra Energia SA | | | | | 54,500 | | | | | | 174 | |
| | | | | | | | | | | | |
| |
| CONSUMER STAPLES 0.8% | |
| | | | |
Ambev SA | | | | | 106,800 | | | | | | 273 | |
| | | | |
BRF SA (b) | | | | | 8,100 | | | | | | 21 | |
| | | | |
JBS SA | | | | | 51,000 | | | | | | 308 | |
| | | | |
Raia Drogasil SA | | | | | 8,500 | | | | | | 31 | |
| | | | | | | | | | | | |
| | | | | | | | | | | 633 | |
| | | | | | | | | | | | |
| |
| ENERGY 0.2% | |
| | | | |
Cosan SA | | | | | 6,400 | | | | | | 22 | |
| | | | |
Ultrapar Participacoes SA | | | | | 61,400 | | | | | | 145 | |
| | | | | | | | | | | | |
| | | | | | | | | | | 167 | |
| | | | | | | | | | | | |
| |
| FINANCIALS 0.6% | |
| | | | |
B3 SA - Brasil Bolsa Balcao | | | | | 15,300 | | | | | | 32 | |
| | | | |
Banco BTG Pactual SA | | | | | 5,000 | | | | | | 21 | |
| | | | |
Banco do Brasil SA | | | | | 54,600 | | | | | | 348 | |
| | | | |
BB Seguridade Participacoes SA | | | | | 6,200 | | | | | | 31 | |
| | | | | | | | | | | | |
| | | | | | | | | | | 432 | |
| | | | | | | | | | | | |
| |
| HEALTH CARE 0.0% | |
| | | | |
Hypera SA | | | | | 3,000 | | | | | | 22 | |
| | | | | | | | | | | | |
| |
| INDUSTRIALS 0.1% | |
| | | | |
CCR SA | | | | | 10,900 | | | | | | 26 | |
| | | | |
WEG SA | | | | | 5,500 | | | | | | 28 | |
| | | | | | | | | | | | |
| | | | | | | | | | | 54 | |
| | | | | | | | | | | | |
| |
| MATERIALS 1.3% | |
| | | | |
Cia Siderurgica Nacional SA | | | | | 12,900 | | | | | | 38 | |
| | | | |
Klabin SA | | | | | 21,900 | | | | | | 85 | |
| | | | |
Suzano SA | | | | | 7,100 | | | | | | 67 | |
| | | | |
Vale SA | | | | | 51,500 | | | | | | 753 | |
| | | | | | | | | | | | |
| | | | | | | | | | | 943 | |
| | | | | | | | | | | | |
| |
| UTILITIES 0.3% | |
| | | | |
Centrais Eletricas Brasileiras SA | | | | | 5,700 | | | | | | 51 | |
| | | | |
Cia de Saneamento Basico do Estado de Sao Paulo | | | | | 4,500 | | | | | | 36 | |
| | | | |
Cia Paranaense de Energia | | | | | 13,300 | | | | | | 85 | |
| | | | |
Engie Brasil Energia SA | | | | | 3,325 | | | | | | 26 | |
| | | | |
Equatorial Energia SA | | | | | 6,700 | | | | | | 29 | |
| | | | | | | | | | | | |
| | | | | | | | | | | 227 | |
| | | | | | | | | | | | |
Total Brazil | | | | | | | | | | | 2,710 | |
| | | | | | | | | | | | |
| |
| CHILE 0.7% | |
| |
| CONSUMER DISCRETIONARY 0.1% | |
| | | | |
Falabella SA | | | | | 30,490 | | | | | | 72 | |
| | | | | | | | | | | | |
| |
| | | | | | | | | | | | |
| | | | | SHARES | | | | | MARKET
VALUE
(000S) | |
| CONSUMER STAPLES 0.1% | |
| | | | |
Cencosud SA | | | | | 44,596 | | | $ | | | 57 | |
| | | | |
Cia Cervecerias Unidas SA | | | | | 8,455 | | | | | | 53 | |
| | | | | | | | | | | | |
| | | | | | | | | | | 110 | |
| | | | | | | | | | | | |
| |
| ENERGY 0.1% | |
| | | | |
Empresas COPEC SA | | | | | 5,023 | | | | | | 37 | |
| | | | | | | | | | | | |
| |
| FINANCIALS 0.2% | |
| | | | |
Banco de Chile | | | | | 1,115,175 | | | | | | 101 | |
| | | | |
Banco de Credito e Inversiones SA | | | | | 811 | | | | | | 24 | |
| | | | |
Banco Santander Chile | | | | | 563,873 | | | | | | 23 | |
| | | | | | | | | | | | |
| | | | | | | | | | | 148 | |
| | | | | | | | | | | | |
| |
| MATERIALS 0.0% | |
| | | | |
Empresas CMPC SA | | | | | 14,492 | | | | | | 24 | |
| | | | | | | | | | | | |
| |
| UTILITIES 0.2% | |
| | | | |
Aguas Andinas SA | | | | | 150,567 | | | | | | 24 | |
| | | | |
Colbun SA | | | | | 318,289 | | | | | | 22 | |
| | | | |
Enel Americas SA | | | | | 939,004 | | | | | | 89 | |
| | | | |
Enel Chile SA | | | | | 519,731 | | | | | | 12 | |
| | | | | | | | | | | | |
| | | | | | | | | | | 147 | |
| | | | | | | | | | | | |
Total Chile | | | | | | | | | | | 538 | |
| | | | | | | | | | | | |
| |
| CHINA 15.3% | |
| |
| COMMUNICATION SERVICES 0.6% | |
| | | | |
Baidu, Inc. SP - ADR (b) | | | | | 1,417 | | | | | | 211 | |
| | | | |
China Tower Corp. Ltd. ‘H’ | | | | | 370,000 | | | | | | 47 | |
| | | | |
NetEase, Inc. ADR | | | | | 2,450 | | | | | | 229 | |
| | | | | | | | | | | | |
| | | | | | | | | | | 487 | |
| | | | | | | | | | | | |
| |
| CONSUMER DISCRETIONARY 2.4% | |
| | | | |
ANTA Sports Products Ltd. | | | | | 5,200 | | | | | | 64 | |
| | | | |
BAIC Motor Corp. Ltd. ‘H’ | | | | | 85,000 | | | | | | 28 | |
| | | | |
BYD Co. Ltd. ‘H’ | | | | | 6,000 | | | | | | 242 | |
| | | | |
Dongfeng Motor Group Co. Ltd. ‘H’ | | | | | 68,000 | | | | | | 52 | |
| | | | |
Fuyao Glass Industry Group Co. Ltd. | | | | | 9,600 | | | | | | 49 | |
| | | | |
Great Wall Motor Co. Ltd. ‘H’ | | | | | 76,000 | | | | | | 157 | |
| | | | |
Guangzhou Automobile Group Co. Ltd. ‘H’ | | | | | 34,000 | | | | | | 33 | |
| | | | |
Haier Smart Home Co. Ltd. ‘H’ | | | | | 17,400 | | | | | | 65 | |
| | | | |
JD.com, Inc. ADR | | | | | 5,245 | | | | | | 337 | |
| | | | |
Meituan ‘B’ (b) | | | | | 23,700 | | | | | | 591 | |
| | | | |
Shenzhou International Group Holdings Ltd. | | | | | 8,100 | | | | | | 99 | |
| | | | |
Yum China Holdings, Inc. | | | | | 1,898 | | | | | | 92 | |
| | | | |
Zhongsheng Group Holdings Ltd. | | | | | 5,000 | | | | | | 35 | |
| | | | | | | | | | | | |
| | | | | | | | | | | 1,844 | |
| | | | | | | | | | | | |
| |
| CONSUMER STAPLES 0.6% | |
| | | | |
Dali Foods Group Co. Ltd. | | | | | 44,000 | | | | | | 24 | |
| | | | |
Hengan International Group Co. Ltd. | | | | | 24,500 | | | | | | 115 | |
| | | | |
Nongfu Spring Co. Ltd. | | | | | 8,200 | | | | | | 47 | |
| | | | |
Tingyi Cayman Islands Holding Corp. | | | | | 58,000 | | | | | | 100 | |
| | | | |
Tsingtao Brewery Co. Ltd. ‘H’ | | | | | 4,000 | | | | | | 42 | |
| | | | |
Uni-President China Holdings Ltd. | | | | | 35,000 | | | | | | 30 | |
| | | | |
Want Want China Holdings Ltd. | | | | | 86,000 | | | | | | 75 | |
| | | | | | | | | | | | |
| | | | | | | | | | | 433 | |
| | | | | | | | | | | | |
| |
| | | | | | | | | | | | |
| | | | | SHARES | | | | | MARKET
VALUE
(000S) | |
| ENERGY 2.7% | |
| | | | |
China Oilfield Services Ltd. ‘H’ | | | | | 16,000 | | | $ | | | 15 | |
| | | | |
China Petroleum & Chemical Corp. ‘H’ | | | | | 1,606,000 | | | | | | 724 | |
| | | | |
China Shenhua Energy Co. Ltd. ‘H’ | | | | | 176,000 | | | | | | 505 | |
| | | | |
PetroChina Co. Ltd. ‘H’ | | | | | 1,012,000 | | | | | | 475 | |
| | | | |
Yankuang Energy Group Co. Ltd. ‘H’ | | | | | 94,000 | | | | | | 294 | |
| | | | | | | | | | | | |
| | | | | | | | | | | 2,013 | |
| | | | | | | | | | | | |
| |
| FINANCIALS 4.7% | |
| | | | |
Agricultural Bank of China Ltd. ‘H’ | | | | | 1,062,000 | | | | | | 402 | |
| | | | |
Bank of China Ltd. ‘H’ | | | | | 3,119,000 | | | | | | 1,246 | |
| | | | |
Bank of Communications Co. Ltd. ‘H’ | | | | | 484,000 | | | | | | 336 | |
| | | | |
China Cinda Asset Management Co. Ltd. ‘H’ | | | | | 274,000 | | | | | | 43 | |
| | | | |
China CITIC Bank Corp. Ltd. ‘H’ | | | | | 386,000 | | | | | | 173 | |
| | | | |
China Construction Bank Corp. ‘H’ | | | | | 523,000 | | | | | | 353 | |
| | | | |
China Everbright Bank Co. Ltd. ‘H’ | | | | | 105,000 | | | | | | 34 | |
| | | | |
China Galaxy Securities Co. Ltd. ‘H’ | | | | | 44,000 | | | | | | 25 | |
| | | | |
China Reinsurance Group Corp. ‘H’ | | | | | 271,000 | | | | | | 22 | |
| | | | |
China Zheshang Bank Co. Ltd. ‘H’ | | | | | 66,000 | | | | | | 30 | |
| | | | |
CITIC Securities Co. Ltd. ‘H’ | | | | | 25,500 | | | | | | 57 | |
| | | | |
GF Securities Co. Ltd. ‘H’ | | | | | 14,034 | | | | | | 19 | |
| | | | |
Guotai Junan Securities Co. Ltd. ‘H’ | | | | | 18,400 | | | | | | 23 | |
| | | | |
Huatai Securities Co. Ltd. ‘H’ | | | | | 15,800 | | | | | | 24 | |
| | | | |
Industrial & Commercial Bank of China Ltd. ‘H’ | | | | | 498,000 | | | | | | 297 | |
| | | | |
People’s Insurance Co. Group of China Ltd. ‘H’ | | | | | 99,000 | | | | | | 30 | |
| | | | |
PICC Property & Casualty Co. Ltd. ‘H’ | | | | | 50,000 | | | | | | 52 | |
| | | | |
Postal Savings Bank of China Co. Ltd. ‘H’ | | | | | 453,000 | | | | | | 361 | |
| | | | | | | | | | | | |
| | | | | | | | | | | 3,527 | |
| | | | | | | | | | | | |
| |
| HEALTH CARE 0.4% | |
| | | | |
China Resources Pharmaceutical Group Ltd. | | | | | 89,500 | | | | | | 61 | |
| | | | |
CSPC Pharmaceutical Group Ltd. | | | | | 59,680 | | | | | | 60 | |
| | | | |
Shanghai Pharmaceuticals Holding Co. Ltd. ‘H’ | | | | | 22,900 | | | | | | 38 | |
| | | | |
Sinopharm Group Co. Ltd. ‘H’ | | | | | 45,600 | | | | | | 110 | |
| | | | | | | | | | | | |
| | | | | | | | | | | 269 | |
| | | | | | | | | | | | |
| |
| INDUSTRIALS 1.6% | |
| | | | |
Air China Ltd. ‘H’ | | | | | 52,000 | | | | | | 45 | |
| | | | |
Beijing Capital International Airport Co. Ltd. ‘H’ | | | | | 56,000 | | | | | | 38 | |
| | | | |
China Communications Services Corp. Ltd. ‘H’ | | | | | 46,000 | | | | | | 20 | |
| | | | |
China Energy Engineering Corp. Ltd. ‘H’ | | | | | 262,000 | | | | | | 37 | |
| | | | |
China Railway Group Ltd. ‘H’ (b) | | | | | 476,000 | | | | | | 295 | |
| | | | |
CITIC Ltd. | | | | | 142,000 | | | | | | 145 | |
| | | | |
CRRC Corp. Ltd. ‘H’ | | | | | 99,000 | | | | | | 37 | |
| | | | |
Guangshen Railway Co. Ltd. ‘H’ | | | | | 98,000 | | | | | | 18 | |
| | | | |
Jiangsu Expressway Co. Ltd. ‘H’ | | | | | 50,000 | | | | | | 50 | |
| | | | |
Metallurgical Corp. of China Ltd. | | | | | 145,000 | | | | | | 35 | |
| | | | |
Sinopec Engineering Group Co. Ltd. ‘H’ | | | | | 50,500 | | | | | | 23 | |
| | | | |
Sinotrans Ltd. ‘H’ | | | | | 127,000 | | | | | | 37 | |
| | | | |
Weichai Power Co. Ltd. ‘H’ | | | | | 40,000 | | | | | | 64 | |
| | | | | | | | | | | | |
| See Accompanying Notes | | | ANNUAL REPORT | | | | | | | JUNE 30, 2022 | | | 23 |
| | | | | | |
| Schedule of Investments | | PIMCO RAFI Dynamic Multi-Factor Emerging Markets Equity ETF | | (Cont.) | | |
| | | | | | | | | | | | |
| | | | | SHARES | | | | | MARKET
VALUE
(000S) | |
| | | | |
Yangzijiang Shipbuilding Holdings Ltd. | | | | | 265,600 | | | $ | | | 178 | |
| | | | |
Zhejiang Expressway Co. Ltd. ‘H’ | | | | | 36,000 | | | | | | 33 | |
| | | | |
Zhuzhou CRRC Times Electric Co. Ltd. | | | | | 10,000 | | | | | | 49 | |
| | | | |
ZTO Express Cayman, Inc. ADR | | | | | 2,461 | | | | | | 68 | |
| | | | | | | | | | | | |
| | | | | | | | | | | 1,172 | |
| | | | | | | | | | | | |
| |
| INFORMATION TECHNOLOGY 0.3% | |
| | | | |
FIH Mobile Ltd. (b) | | | | | 179,000 | | | | | | 26 | |
| | | | |
Lenovo Group Ltd. | | | | | 224,000 | | | | | | 210 | |
| | | | | | | | | | | | |
| | | | | | | | | | | 236 | |
| | | | | | | | | | | | |
| |
| MATERIALS 0.8% | |
| | | | |
Angang Steel Co. Ltd. ‘H’ | | | | | 78,000 | | | | | | 29 | |
| | | | |
Anhui Conch Cement Co. Ltd. ‘H’ | | | | | 28,500 | | | | | | 124 | |
| | | | |
China National Building Material Co. Ltd. ‘H’ | | | | | 278,000 | | | | | | 298 | |
| | | | |
China Zhongwang Holdings Ltd. «(b) | | | | | 338,800 | | | | | | 0 | |
| | | | |
Jiangxi Copper Co. Ltd. ‘H’ | | | | | 74,000 | | | | | | 101 | |
| | | | |
Shandong Gold Mining Co. Ltd. | | | | | 20,250 | | | | | | 35 | |
| | | | |
Sinopec Shanghai Petrochemical Co. Ltd. ‘H’ | | | | | 136,000 | | | | | | 23 | |
| | | | | | | | | | | | |
| | | | | | | | | | | 610 | |
| | | | | | | | | | | | |
| |
| REAL ESTATE 0.2% | |
| | | | |
China Evergrande Group «(d) | | | | | 121,000 | | | | | | 13 | |
| | | | |
China Vanke Co. Ltd. ‘H’ | | | | | 17,100 | | | | | | 43 | |
| | | | |
Greentown China Holdings Ltd. | | | | | 25,000 | | | | | | 52 | |
| | | | |
Guangzhou R&F Properties Co. Ltd. ‘H’ | | | | | 79,600 | | | | | | 21 | |
| | | | |
Longfor Group Holdings Ltd. | | | | | 8,500 | | | | | | 40 | |
| | | | | | | | | | | | |
| | | | | | | | | | | 169 | |
| | | | | | | | | | | | |
| |
| UTILITIES 1.0% | |
| | | | |
Beijing Jingneng Clean Energy Co. Ltd. ‘H’ | | | | | 116,000 | | | | | | 27 | |
| | | | |
CGN Power Co. Ltd. ‘H’ | | | | | 146,000 | | | | | | 35 | |
| | | | |
China Longyuan Power Group Corp. Ltd. ‘H’ | | | | | 21,000 | | | | | | 41 | |
| | | | |
Datang International Power Generation Co. Ltd. ‘H’ | | | | | 304,000 | | | | | | 50 | |
| | | | |
ENN Energy Holdings Ltd. | | | | | 16,600 | | | | | | 274 | |
| | | | |
Huadian Power International Corp. Ltd. ‘H’ | | | | | 334,000 | | | | | | 122 | |
| | | | |
Huaneng Power International, Inc. ‘H’ | | | | | 452,000 | | | | | | 225 | |
| | | | | | | | | | | | |
| | | | | | | | | | | 774 | |
| | | | | | | | | | | | |
Total China | | | | | | | | | | | 11,534 | |
| | | | | | | | | | | | |
| |
| GREECE 0.6% | |
| |
| COMMUNICATION SERVICES 0.1% | |
| | | | |
Hellenic Telecommunications Organization SA | | | | | 4,949 | | | | | | 87 | |
| | | | | | | | | | | | |
| |
| CONSUMER DISCRETIONARY 0.1% | |
| | | | |
OPAP SA | | | | | 4,668 | | | | | | 67 | |
| | | | | | | | | | | | |
| |
| ENERGY 0.0% | |
| | | | |
Motor Oil Hellas Corinth Refineries SA | | | | | 1,283 | | | | | | 24 | |
| | | | | | | | | | | | |
| |
| | | | | | | | | | | | |
| | | | | SHARES | | | | | MARKET
VALUE
(000S) | |
| FINANCIALS 0.4% | |
| | | | |
Alpha Services & Holdings SA (b) | | | | | 111,230 | | | $ | | | 98 | |
| | | | |
Eurobank Ergasias Services & Holdings SA (b) | | | | | 88,136 | | | | | | 79 | |
| | | | |
National Bank of Greece SA (b) | | | | | 37,454 | | | | | | 112 | |
| | | | | | | | | | | | |
| | | | | | | | | | | 289 | |
| | | | | | | | | | | | |
| |
| UTILITIES 0.0% | |
| | | | |
Public Power Corp. SA (b) | | | | | 4,020 | | | | | | 22 | |
| | | | | | | | | | | | |
Total Greece | | | | | | | | | | | 489 | |
| | | | | | | | | | | | |
| |
| HONG KONG 3.6% | |
| |
| CONSUMER STAPLES 0.1% | |
| | | | |
China Resources Beer Holdings Co. Ltd. | | | | | 10,000 | | | | | | 75 | |
| | | | | | | | | | | | |
| |
| FINANCIALS 0.8% | |
| | | | |
BOC Hong Kong Holdings Ltd. | | | | | 150,000 | | | | | | 595 | |
| | | | |
Far East Horizon Ltd. | | | | | 27,000 | | | | | | 23 | |
| | | | | | | | | | | | |
| | | | | | | | | | | 618 | |
| | | | | | | | | | | | |
| |
| INDUSTRIALS 0.3% | |
| | | | |
China Merchants Port Holdings Co. Ltd. | | | | | 10,000 | | | | | | 17 | |
| | | | |
China State Construction International Holdings Ltd. | | | | | 18,000 | | | | | | 20 | |
| | | | |
COSCO SHIPPING Ports Ltd. | | | | | 64,000 | | | | | | 46 | |
| | | | |
Orient Overseas International Ltd. | | | | | 3,500 | | | | | | 93 | |
| | | | |
Shanghai Industrial Holdings Ltd. | | | | | 18,000 | | | | | | 26 | |
| | | | | | | | | | | | |
| | | | | | | | | | | 202 | |
| | | | | | | | | | | | |
| |
| REAL ESTATE 0.9% | |
| | | | |
China Jinmao Holdings Group Ltd. | | | | | 140,000 | | | | | | 38 | |
| | | | |
China Overseas Land & Investment Ltd. | | | | | 172,500 | | | | | | 549 | |
| | | | |
China Resources Land Ltd. | | | | | 10,000 | | | | | | 47 | |
| | | | |
Poly Property Group Co. Ltd. | | | | | 113,000 | | | | | | 27 | |
| | | | |
Yuexiu Property Co. Ltd. | | | | | 25,400 | | | | | | 32 | |
| | | | | | | | | | | | |
| | | | | | | | | | | 693 | |
| | | | | | | | | | | | |
| |
| UTILITIES 1.5% | |
| | | | |
Beijing Enterprises Holdings Ltd. | | | | | 10,000 | | | | | | 36 | |
| | | | |
China Power International Development Ltd. | | | | | 501,000 | | | | | | 318 | |
| | | | |
China Resources Gas Group Ltd. | | | | | 28,000 | | | | | | 130 | |
| | | | |
China Resources Power Holdings Co. Ltd. | | | | | 220,000 | | | | | | 454 | |
| | | | |
Guangdong Investment Ltd. | | | | | 68,000 | | | | | | 72 | |
| | | | |
Kunlun Energy Co. Ltd. | | | | | 130,000 | | | | | | 107 | |
| | | | | | | | | | | | |
| | | | | | | | | | | 1,117 | |
| | | | | | | | | | | | |
Total Hong Kong | | | | | | | | | | | 2,705 | |
| | | | | | | | | | | | |
| |
| INDIA 16.0% | |
| |
| COMMUNICATION SERVICES 0.6% | |
| | | | |
Bharti Airtel Ltd. (b) | | | | | 43,096 | | | | | | 375 | |
| | | | |
Indus Towers Ltd. | | | | | 16,618 | | | | | | 44 | |
| | | | | | | | | | | | |
| | | | | | | | | | | 419 | |
| | | | | | | | | | | | |
| |
| CONSUMER DISCRETIONARY 1.1% | |
| | | | |
Bajaj Auto Ltd. | | | | | 1,797 | | | | | | 85 | |
| | | | |
Eicher Motors Ltd. (b) | | | | | 1,117 | | | | | | 40 | |
| | | | | | | | | | | | |
| | | | | SHARES | | | | | MARKET
VALUE
(000S) | |
| | | | |
Hero MotoCorp Ltd. | | | | | 3,183 | | | $ | | | 110 | |
| | | | |
Mahindra & Mahindra Ltd. | | | | | 3,400 | | | | | | 47 | |
| | | | |
Maruti Suzuki India Ltd. (b) | | | | | 638 | | | | | | 69 | |
| | | | |
Rajesh Exports Ltd. | | | | | 4,332 | | | | | | 34 | |
| | | | |
Tata Motors Ltd. (b) | | | | | 67,732 | | | | | | 353 | |
| | | | |
Titan Co. Ltd. | | | | | 3,017 | | | | | | 74 | |
| | | | | | | | | | | | |
| | | | | | | | | | | 812 | |
| | | | | | | | | | | | |
| |
| CONSUMER STAPLES 1.8% | |
| | | | |
Avenue Supermarts Ltd. (b) | | | | | 1,262 | | | | | | 55 | |
| | | | |
Britannia Industries Ltd. | | | | | 807 | | | | | | 36 | |
| | | | |
Dabur India Ltd. (b) | | | | | 4,994 | | | | | | 31 | |
| | | | |
Godrej Consumer Products Ltd. (b) | | | | | 3,743 | | | | | | 36 | |
| | | | |
Hindustan Unilever Ltd. | | | | | 9,362 | | | | | | 265 | |
| | | | |
ITC Ltd. | | | | | 223,506 | | | | | | 776 | |
| | | | |
Marico Ltd. | | | | | 5,421 | | | | | | 33 | |
| | | | |
Nestle India Ltd. | | | | | 273 | | | | | | 61 | |
| | | | |
Tata Consumer Products Ltd. | | | | | 3,414 | | | | | | 31 | |
| | | | | | | | | | | | |
| | | | | | | | | | | 1,324 | |
| | | | | | | | | | | | |
| |
| ENERGY 2.1% | |
| | | | |
Bharat Petroleum Corp. Ltd. | | | | | 23,897 | | | | | | 94 | |
| | | | |
Coal India Ltd. | | | | | 124,887 | | | | | | 294 | |
| | | | |
Hindustan Petroleum Corp. Ltd. | | | | | 41,935 | | | | | | 116 | |
| | | | |
Indian Oil Corp. Ltd. (b) | | | | | 64,433 | | | | | | 61 | |
| | | | |
Indian Oil Corp. Ltd. | | | | | 128,866 | | | | | | 121 | |
| | | | |
Mangalore Refinery & Petrochemicals Ltd. (b) | | | | | 26,560 | | | | | | 30 | |
| | | | |
Oil & Natural Gas Corp. Ltd. | | | | | 139,683 | | | | | | 267 | |
| | | | |
Oil India Ltd. | | | | | 11,908 | | | | | | 38 | |
| | | | |
Petronet LNG Ltd. | | | | | 16,243 | | | | | | 45 | |
| | | | |
Reliance Industries Ltd. (b) | | | | | 16,692 | | | | | | 551 | |
| | | | | | | | | | | | |
| | | | | | | | | | | 1,617 | |
| | | | | | | | | | | | |
| |
| FINANCIALS 1.4% | |
| | | | |
Bajaj Finserv Ltd. | | | | | 290 | | | | | | 40 | |
| | | | |
Bajaj Holdings & Investment Ltd. | | | | | 552 | | | | | | 32 | |
| | | | |
Bandhan Bank Ltd. (b) | | | | | 8,704 | | | | | | 29 | |
| | | | |
Bank of Baroda | | | | | 27,337 | | | | | | 34 | |
| | | | |
Cholamandalam Investment and Finance Co. Ltd. | | | | | 3,873 | | | | | | 31 | |
| | | | |
Federal Bank Ltd. (b) | | | | | 30,650 | | | | | | 35 | |
| | | | |
HDFC Bank Ltd. | | | | | 9,361 | | | | | | 160 | |
| | | | |
ICICI Bank Ltd. | | | | | 36,802 | | | | | | 331 | |
| | | | |
IDFC Ltd. | | | | | 47,946 | | | | | | 30 | |
| | | | |
Indiabulls Housing Finance Ltd. ‘L’ (b) | | | | | 29,339 | | | | | | 35 | |
| | | | |
Kotak Mahindra Bank Ltd. (b) | | | | | 7,410 | | | | | | 157 | |
| | | | |
Power Finance Corp. Ltd. | | | | | 28,405 | | | | | | 38 | |
| | | | |
SBI Life Insurance Co. Ltd. | | | | | 2,394 | | | | | | 33 | |
| | | | |
State Bank of India | | | | | 18,286 | | | | | | 108 | |
| | | | | | | | | | | | |
| | | | | | | | | | | 1,093 | |
| | | | | | | | | | | | |
| |
| HEALTH CARE 0.8% | |
| | | | |
Alkem Laboratories Ltd. | | | | | 812 | | | | | | 31 | |
| | | | |
Aurobindo Pharma Ltd. | | | | | 4,165 | | | | | | 27 | |
| | | | |
Cipla Ltd. (b) | | | | | 8,005 | | | | | | 93 | |
| | | | |
Divi’s Laboratories Ltd. (b) | | | | | 1,009 | | | | | | 47 | |
| | | | |
Dr Reddy’s Laboratories Ltd. | | | | | 2,499 | | | | | | 139 | |
| | | | |
Lupin Ltd. (b) | | | | | 4,165 | | | | | | 32 | |
| | | | |
Sun Pharmaceutical Industries Ltd. | | | | | 22,630 | | | | | | 238 | |
| | | | | | | | | | | | |
| | | | | | | | | | | 607 | |
| | | | | | | | | | | | |
| |
| | | | | | |
| 24 | | PIMCO EQUITY SERIES | | | See Accompanying Notes | |
| | | | | | | | | | | | |
| | | | | SHARES | | | | | MARKET
VALUE
(000S) | |
| INDUSTRIALS 0.5% | |
| | | | |
Adani Enterprises Ltd. (b) | | | | | 8,367 | | | $ | | | 233 | |
| | | | |
Bharat Electronics Ltd. | | | | | 11,587 | | | | | | 35 | |
| | | | |
Havells India Ltd. | | | | | 2,455 | | | | | | 34 | |
| | | | |
Larsen & Toubro Ltd. | | | | | 5,350 | | | | | | 106 | |
| | | | | | | | | | | | |
| | | | | | | | | | | 408 | |
| | | | | | | | | | | | |
| |
| INFORMATION TECHNOLOGY 5.9% | |
| | | | |
HCL Technologies Ltd. | | | | | 37,735 | | | | | | 467 | |
| | | | |
Infosys Ltd. | | | | | 127,531 | | | | | | 2,370 | |
| | | | |
Mindtree Ltd. | | | | | 704 | | | | | | 26 | |
| | | | |
Mphasis Ltd. | | | | | 1,503 | | | | | | 44 | |
| | | | |
Redington India Ltd. | | | | | 26,640 | | | | | | 43 | |
| | | | |
Tata Consultancy Services Ltd. | | | | | 22,246 | | | | | | 924 | |
| | | | |
Tech Mahindra Ltd. | | | | | 22,744 | | | | | | 289 | |
| | | | |
Wipro Ltd. | | | | | 57,503 | | | | | | 304 | |
| | | | | | | | | | | | |
| | | | | | | | | | | 4,467 | |
| | | | | | | | | | | | |
| |
| MATERIALS 0.9% | |
| | | | |
ACC Ltd. | | | | | 1,300 | | | | | | 35 | |
| | | | |
Ambuja Cements Ltd. | | | | | 7,728 | | | | | | 36 | |
| | | | |
Asian Paints Ltd. | | | | | 4,407 | | | | | | 151 | |
| | | | |
Jindal Steel & Power Ltd. | | | | | 27,373 | | | | | | 115 | |
| | | | |
National Aluminium Co. Ltd. | | | | | 79,894 | | | | | | 70 | |
| | | | |
NMDC Ltd. | | | | | 16,686 | | | | | | 23 | |
| | | | |
Pidilite Industries Ltd. (b) | | | | | 1,177 | | | | | | 31 | |
| | | | |
SRF Ltd. | | | | | 1,073 | | | | | | 31 | |
| | | | |
Steel Authority of India Ltd. | | | | | 26,690 | | | | | | 23 | |
| | | | |
Tata Steel Ltd. | | | | | 3,137 | | | | | | 35 | |
| | | | |
UPL Ltd. (b) | | | | | 4,035 | | | | | | 32 | |
| | | | |
Vedanta Ltd. | | | | | 36,154 | | | | | | 102 | |
| | | | | | | | | | | | |
| | | | | | | | | | | 684 | |
| | | | | | | | | | | | |
| |
| REAL ESTATE 0.0% | |
| | | | |
DLF Ltd. (b) | | | | | 7,219 | | | | | | 29 | |
| | | | | | | | | | | | |
| |
| UTILITIES 0.9% | |
| | | | |
Adani Power Ltd. (b) | | | | | 11,390 | | | | | | 38 | |
| | | | |
GAIL India Ltd. | | | | | 16,533 | | | | | | 29 | |
| | | | |
Jaiprakash Power Ventures Ltd. (b) | | | | | 365,442 | | | | | | 30 | |
| | | | |
NTPC Ltd. (b) | | | | | 183,912 | | | | | | 333 | |
| | | | |
Power Grid Corp. of India Ltd. (b) | | | | | 70,915 | | | | | | 191 | |
| | | | |
Tata Power Co. Ltd. | | | | | 10,881 | | | | | | 28 | |
| | | | | | | | | | | | |
| | | | | | | | | | | 649 | |
| | | | | | | | | | | | |
Total India | | | | | | | | | | | 12,109 | |
| | | | | | | | | | | | |
| |
| INDONESIA 2.2% | |
| |
| COMMUNICATION SERVICES 0.5% | |
| | | | |
Telkom Indonesia Persero Tbk PT | | | | | 1,259,300 | | | | | | 339 | |
| | | | | | | | | | | | |
| |
| CONSUMER DISCRETIONARY 0.2% | |
| | | | |
Astra International Tbk PT | | | | | 409,500 | | | | | | 182 | |
| | | | | | | | | | | | |
| |
| CONSUMER STAPLES 0.2% | |
| | | | |
Charoen Pokphand Indonesia Tbk PT | | | | | 49,000 | | | | | | 20 | |
| | | | |
Indofood CBP Sukses Makmur Tbk PT | | | | | 47,000 | | | | | | 30 | |
| | | | |
Indofood Sukses Makmur Tbk PT | | | | | 28,100 | | | | | | 13 | |
| | | | |
Sumber Alfaria Trijaya Tbk PT | | | | | 287,300 | | | | | | 39 | |
| | | | |
Unilever Indonesia Tbk PT | | | | | 107,400 | | | | | | 35 | |
| | | | | | | | | | | | |
| | | | | | | | | | | 137 | |
| | | | | | | | | | | | |
| |
| | | | | | | | | | | | |
| | | | | SHARES | | | | | MARKET
VALUE
(000S) | |
| ENERGY 0.4% | |
| | | | |
Adaro Energy Indonesia Tbk PT | | | | | 729,400 | | | $ | | | 140 | |
| | | | |
Bukit Asam Tbk PT | | | | | 142,900 | | | | | | 37 | |
| | | | |
Indo Tambangraya Megah Tbk PT | | | | | 52,900 | | | | | | 109 | |
| | | | |
United Tractors Tbk PT | | | | | 26,600 | | | | | | 51 | |
| | | | | | | | | | | | |
| | | | | | | | | | | 337 | |
| | | | | | | | | | | | |
| |
| FINANCIALS 0.7% | |
| | | | |
Bank Central Asia Tbk PT | | | | | 700,700 | | | | | | 341 | |
| | | | |
Bank Mandiri Persero Tbk PT | | | | | 57,900 | | | | | | 31 | |
| | | | |
Bank Negara Indonesia Persero Tbk PT | | | | | 63,100 | | | | | | 33 | |
| | | | |
Bank Rakyat Indonesia Persero Tbk PT | | | | | 428,300 | | | | | | 120 | |
| | | | | | | | | | | | |
| | | | | | | | | | | 525 | |
| | | | | | | | | | | | |
| |
| HEALTH CARE 0.0% | |
| | | | |
Kalbe Farma Tbk PT | | | | | 321,700 | | | | | | 36 | |
| | | | | | | | | | | | |
| |
| MATERIALS 0.1% | |
| | | | |
Indah Kiat Pulp & Paper Tbk PT | | | | | 48,800 | | | | | | 25 | |
| | | | |
Indocement Tunggal Prakarsa Tbk PT | | | | | 36,500 | | | | | | 23 | |
| | | | | | | | | | | | |
| | | | | | | | | | | 48 | |
| | | | | | | | | | | | |
| |
| UTILITIES 0.1% | |
| | | | |
Perusahaan Gas Negara Tbk PT | | | | | 410,700 | | | | | | 44 | |
| | | | | | | | | | | | |
Total Indonesia | | | | | | | | | | | 1,648 | |
| | | | | | | | | | | | |
| |
| MALAYSIA 1.8% | |
| |
| COMMUNICATION SERVICES 0.2% | |
| | | | |
Axiata Group Bhd | | | | | 36,100 | | | | | | 23 | |
| | | | |
DiGi.Com Bhd | | | | | 64,800 | | | | | | 52 | |
| | | | |
Maxis Bhd | | | | | 40,100 | | | | | | 30 | |
| | | | |
Telekom Malaysia Bhd | | | | | 42,700 | | | | | | 51 | |
| | | | | | | | | | | | |
| | | | | | | | | | | 156 | |
| | | | | | | | | | | | |
| |
| CONSUMER DISCRETIONARY 0.1% | |
| | | | |
Genting Bhd | | | | | 38,200 | | | | | | 39 | |
| | | | |
Genting Malaysia Bhd | | | | | 80,200 | | | | | | 52 | |
| | | | | | | | | | | | |
| | | | | | | | | | | 91 | |
| | | | | | | | | | | | |
| |
| CONSUMER STAPLES 0.2% | |
| | | | |
IOI Corp. Bhd. | | | | | 22,800 | | | | | | 20 | |
| | | | |
Kuala Lumpur Kepong Bhd | | | | | 4,900 | | | | | | 24 | |
| | | | |
PPB Group Bhd | | | | | 9,800 | | | | | | 35 | |
| | | | |
Sime Darby Plantation Bhd | | | | | 60,600 | | | | | | 60 | |
| | | | | | | | | | | | |
| | | | | | | | | | | 139 | |
| | | | | | | | | | | | |
| |
| ENERGY 0.1% | |
| | | | |
Petronas Dagangan Bhd. | | | | | 7,600 | | | | | | 37 | |
| | | | | | | | | | | | |
| |
| FINANCIALS 0.8% | |
| | | | |
Alliance Bank Malaysia Bhd. | | | | | 44,400 | | | | | | 32 | |
| | | | |
AMMB Holdings Bhd | | | | | 28,200 | | | | | | 24 | |
| | | | |
CIMB Group Holdings Bhd | | | | | 102,800 | | | | | | 116 | |
| | | | |
Hong Leong Bank Bhd | | | | | 7,500 | | | | | | 35 | |
| | | | |
Malayan Banking Bhd | | | | | 83,600 | | | | | | 163 | |
| | | | |
Public Bank Bhd | | | | | 191,100 | | | | | | 189 | |
| | | | |
RHB Bank Bhd | | | | | 41,500 | | | | | | 54 | |
| | | | | | | | | | | | |
| | | | | | | | | | | 613 | |
| | | | | | | | | | | | |
| |
| | | | | | | | | | | | |
| | | | | SHARES | | | | | MARKET
VALUE
(000S) | |
| INDUSTRIALS 0.1% | |
| | | | |
CAPITAL A BHD (b) | | | | | 151,800 | | | $ | | | 21 | |
| | | | |
Malaysia Airports Holdings Bhd (b) | | | | | 21,300 | | | | | | 32 | |
| | | | |
MISC Bhd | | | | | 16,400 | | | | | | 26 | |
| | | | |
Sime Darby Bhd | | | | | 49,600 | | | | | | 24 | |
| | | | | | | | | | | | |
| | | | | | | | | | | 103 | |
| | | | | | | | | | | | |
| |
| MATERIALS 0.2% | |
| | | | |
Petronas Chemicals Group Bhd | | | | | 58,700 | | | | | | 120 | |
| | | | |
Press Metal Aluminium Holdings Bhd | | | | | 15,100 | | | | | | 16 | |
| | | | | | | | | | | | |
| | | | | | | | | | | 136 | |
| | | | | | | | | | | | |
| |
| UTILITIES 0.1% | |
| | | | |
Petronas Gas Bhd | | | | | 6,300 | | | | | | 23 | |
| | | | |
Tenaga Nasional Bhd | | | | | 29,700 | | | | | | 54 | |
| | | | | | | | | | | | |
| | | | | | | | | | | 77 | |
| | | | | | | | | | | | |
Total Malaysia | | | | | | | | | | | 1,352 | |
| | | | | | | | | | | | |
| |
| MEXICO 3.2% | |
| |
| COMMUNICATION SERVICES 1.2% | |
| | | | |
America Movil SAB de CV | | | | | 883,106 | | | | | | 903 | |
| | | | |
Grupo Televisa SAB | | | | | 10,266 | | | | | | 17 | |
| | | | |
Megacable Holdings SAB de CV | | | | | 10,834 | | | | | | 26 | |
| | | | | | | | | | | | |
| | | | | | | | | | | 946 | |
| | | | | | | | | | | | |
| |
| CONSUMER STAPLES 1.2% | |
| | | | |
Arca Continental SAB de CV | | | | | 12,400 | | | | | | 82 | |
| | | | |
Coca-Cola Femsa SAB de CV | | | | | 21,155 | | | | | | 117 | |
| | | | |
Gruma SAB de CV | | | | | 9,089 | | | | | | 101 | |
| | | | |
Grupo Bimbo SAB de CV | | | | | 10,600 | | | | | | 34 | |
| | | | |
Kimberly-Clark de Mexico SAB de CV | | | | | 59,330 | | | | | | 80 | |
| | | | |
Wal-Mart de Mexico SAB de CV | | | | | 155,162 | | | | | | 535 | |
| | | | | | | | | | | | |
| | | | | | | | | | | 949 | |
| | | | | | | | | | | | |
| |
| FINANCIALS 0.2% | |
| | | | |
Grupo Elektra SAB de CV | | | | | 460 | | | | | | 26 | |
| | | | |
Grupo Financiero Banorte SAB de CV | | | | | 14,834 | | | | | | 83 | |
| | | | |
Grupo Financiero Inbursa SAB de CV (b) | | | | | 20,200 | | | | | | 32 | |
| | | | | | | | | | | | |
| | | | | | | | | | | 141 | |
| | | | | | | | | | | | |
| |
| INDUSTRIALS 0.2% | |
| | | | |
Alfa SAB de CV | | | | | 78,898 | | | | | | 56 | |
| | | | |
Grupo Aeroportuario del Pacifico SAB de CV | | | | | 4,566 | | | | | | 64 | |
| | | | |
Grupo Aeroportuario del Sureste SAB de CV | | | | | 1,030 | | | | | | 20 | |
| | | | | | | | | | | | |
| | | | | | | | | | | 140 | |
| | | | | | | | | | | | |
| |
| MATERIALS 0.4% | |
| | | | |
Alpek SAB de CV | | | | | 13,632 | | | | | | 19 | |
| | | | |
Grupo Mexico SAB de CV | | | | | 59,796 | | | | | | 247 | |
| | | | |
Orbia Advance Corp. SAB de CV | | | | | 8,100 | | | | | | 19 | |
| | | | | | | | | | | | |
| | | | | | | | | | | 285 | |
| | | | | | | | | | | | |
Total Mexico | | | | | | | | | | | 2,461 | |
| | | | | | | | | | | | |
| |
| | | | | | | | | | | | |
| See Accompanying Notes | | | ANNUAL REPORT | | | | | | | JUNE 30, 2022 | | | 25 |
| | | | | | |
| Schedule of Investments | | PIMCO RAFI Dynamic Multi-Factor Emerging Markets Equity ETF | | (Cont.) | | |
| | | | | | | | | | | | |
| | | | | SHARES | | | | | MARKET
VALUE
(000S) | |
| PHILIPPINES 0.5% | |
| |
| COMMUNICATION SERVICES 0.1% | |
| | | | |
Globe Telecom, Inc. | | | | | 515 | | | $ | | | 21 | |
| | | | |
PLDT, Inc. | | | | | 1,585 | | | | | | 49 | |
| | | | | | | | | | | | |
| | | | | | | | | | | 70 | |
| | | | | | | | | | | | |
| |
| CONSUMER STAPLES 0.0% | |
| | | | |
Universal Robina Corp. | | | | | 14,670 | | | | | | 30 | |
| | | | | | | | | | | | |
| |
| FINANCIALS 0.1% | |
| | | | |
Bank of the Philippine Islands | | | | | 13,891 | | | | | | 22 | |
| | | | |
BDO Unibank, Inc. | | | | | 11,420 | | | | | | 23 | |
| | | | |
Metro Pacific Investments Corp. | | | | | 435,000 | | | | | | 28 | |
| | | | |
Metropolitan Bank & Trust Co. | | | | | 32,632 | | | | | | 28 | |
| | | | | | | | | | | | |
| | | | | | | | | | | 101 | |
| | | | | | | | | | | | |
| |
| INDUSTRIALS 0.1% | |
| | | | |
Ayala Corp. | | | | | 1,140 | | | | | | 12 | |
| | | | |
International Container Terminal Services, Inc. | | | | | 17,270 | | | | | | 58 | |
| | | | | | | | | | | | |
| | | | | | | | | | | 70 | |
| | | | | | | | | | | | |
| |
| REAL ESTATE 0.1% | |
| | | | |
SM Prime Holdings, Inc. | | | | | 50,900 | | | | | | 34 | |
| | | | | | | | | | | | |
| |
| UTILITIES 0.1% | |
| | | | |
AC Energy Corp. | | | | | 3,420 | | | | | | 1 | |
| | | | |
Manila Electric Co. | | | | | 7,000 | | | | | | 45 | |
| | | | | | | | | | | | |
| | | | | | | | | | | 46 | |
| | | | | | | | | | | | |
Total Philippines | | | | | | | | | | | 351 | |
| | | | | | | | | | | | |
| |
| POLAND 0.8% | |
| |
| COMMUNICATION SERVICES 0.1% | |
| | | | |
Cyfrowy Polsat SA | | | | | 3,165 | | | | | | 15 | |
| | | | |
Orange Polska SA | | | | | 21,608 | | | | | | 30 | |
| | | | | | | | | | | | |
| | | | | | | | | | | 45 | |
| | | | | | | | | | | | |
| |
| ENERGY 0.4% | |
| | | | |
Grupa Lotos SA | | | | | 4,323 | | | | | | 67 | |
| | | | |
Polski Koncern Naftowy ORLEN SA | | | | | 12,724 | | | | | | 195 | |
| | | | |
Polskie Gornictwo Naftowe i Gazownictwo SA | | | | | 32,540 | | | | | | 42 | |
| | | | | | | | | | | | |
| | | | | | | | | | | 304 | |
| | | | | | | | | | | | |
| |
| FINANCIALS 0.1% | |
| | | | |
Powszechny Zaklad Ubezpieczen SA | | | | | 15,520 | | | | | | 104 | |
| | | | | | | | | | | | |
| |
| MATERIALS 0.1% | |
| | | | |
Grupa Azoty SA (b) | | | | | 1,217 | | | | | | 12 | |
| | | | |
Jastrzebska Spolka Weglowa SA (b) | | | | | 2,280 | | | | | | 33 | |
| | | | |
KGHM Polska Miedz SA | | | | | 1,583 | | | | | | 42 | |
| | | | | | | | | | | | |
| | | | | | | | | | | 87 | |
| | | | | | | | | | | | |
| |
| UTILITIES 0.1% | |
| | | | |
PGE Polska Grupa Energetyczna SA (b) | | | | | 20,320 | | | | | | 48 | |
| | | | |
Tauron Polska Energia SA (b) | | | | | 55,439 | | | | | | 43 | |
| | | | | | | | | | | | |
| | | | | | | | | | | 91 | |
| | | | | | | | | | | | |
Total Poland | | | | | | | | | | | 631 | |
| | | | | | | | | | | | |
| |
| | | | | | | | | | | | |
| | | | | SHARES | | | | | MARKET
VALUE
(000S) | |
| ROMANIA 0.0% | |
| |
| REAL ESTATE 0.0% | |
| | | | |
NEPI Rockcastle SA | | | | | 3,317 | | | $ | | | 18 | |
| | | | | | | | | | | | |
Total Romania | | | | | | | | | | | 18 | |
| | | | | | | | | | | | |
| |
| RUSSIA 0.0% | |
| |
| CONSUMER STAPLES 0.0% | |
| | | | |
Magnit PJSC « | | | | | 2,673 | | | | | | 0 | |
| | | | | | | | | | | | |
| |
| ENERGY 0.0% | |
| | | | |
Gazprom Neft PJSC « | | | | | 13,620 | | | | | | 0 | |
| | | | |
Gazprom PJSC « | | | | | 635,130 | | | | | | 0 | |
| | | | |
LUKOIL PJSC « | | | | | 15,703 | | | | | | 0 | |
| | | | |
Novatek PJSC « | | | | | 21,924 | | | | | | 0 | |
| | | | |
Rosneft Oil Co. PJSC « | | | | | 66,050 | | | | | | 0 | |
| | | | |
Surgutneftegas PJSC « | | | | | 701,700 | | | | | | 0 | |
| | | | |
Tatneft PJSC « | | | | | 19,086 | | | | | | 0 | |
| | | | | | | | | | | | |
| | | | | | | | | | | 0 | |
| | | | | | | | | | | | |
| |
| FINANCIALS 0.0% | |
| | | | |
Sberbank of Russia PJSC « | | | | | 117,340 | | | | | | 0 | |
| | | | |
VTB Bank PJSC « | | | | | 598,992,500 | | | | | | 1 | |
| | | | | | | | | | | | |
| | | | | | | | | | | 1 | |
| | | | | | | | | | | | |
| |
| MATERIALS 0.0% | |
| | | | |
Magnitogorsk Iron & Steel Works PJSC « | | | | | 160,600 | | | | | | 0 | |
| | | | |
MMC Norilsk Nickel PJSC « | | | | | 1,269 | | | | | | 0 | |
| | | | |
Novolipetsk Steel PJSC « | | | | | 88,470 | | | | | | 0 | |
| | | | |
Severstal PAO ^«(a) | | | | | 17,344 | | | | | | 0 | |
| | | | | | | | | | | | |
| | | | | | | | | | | 0 | |
| | | | | | | | | | | | |
| |
| UTILITIES 0.0% | |
| | | | |
Inter RAO UES PJSC « | | | | | 1,587,500 | | | | | | 0 | |
| | | | |
Rosseti PJSC « | | | | | 3,309,000 | | | | | | 0 | |
| | | | | | | | | | | | |
| | | | | | | | | | | 0 | |
| | | | | | | | | | | | |
Total Russia | | | | | | | | | | | 1 | |
| | | | | | | | | | | | |
| |
| SAUDI ARABIA 3.6% | |
| |
| COMMUNICATION SERVICES 0.4% | |
| | | | |
Etihad Etisalat Co. | | | | | 3,269 | | | | | | 31 | |
| | | | |
Saudi Telecom Co. | | | | | 11,545 | | | | | | 299 | |
| | | | | | | | | | | | |
| | | | | | | | | | | 330 | |
| | | | | | | | | | | | |
| |
| CONSUMER DISCRETIONARY 0.1% | |
| | | | |
Jarir Marketing Co. | | | | | 1,116 | | | | | | 48 | |
| | | | | | | | | | | | |
| |
| CONSUMER STAPLES 0.1% | |
| | | | |
Almarai Co. JSC | | | | | 3,481 | | | | | | 49 | |
| | | | | | | | | | | | |
| |
| ENERGY 0.5% | |
| | | | |
Saudi Arabian Oil Co. | | | | | 40,948 | | | | | | 423 | |
| | | | | | | | | | | | |
| |
| FINANCIALS 1.3% | |
| | | | |
Al Rajhi Bank | | | | | 22,203 | | | | | | 489 | |
| | | | |
Alinma Bank | | | | | 4,688 | | | | | | 42 | |
| | | | |
Arab National Bank | | | | | 2,200 | | | | | | 17 | |
| | | | |
Bank Al-Jazira | | | | | 5,190 | | | | | | 31 | |
| | | | |
Bank AlBilad (b) | | | | | 2,358 | | | | | | 28 | |
| | | | | | | | | | | | |
| | | | | SHARES | | | | | MARKET
VALUE
(000S) | |
| | | | |
Banque Saudi Fransi | | | | | 2,630 | | | $ | | | 33 | |
| | | | |
Bupa Arabia for Cooperative Insurance Co. | | | | | 823 | | | | | | 35 | |
| | | | |
Riyad Bank | | | | | 3,330 | | | | | | 29 | |
| | | | |
Saudi British Bank | | | | | 5,605 | | | | | | 61 | |
| | | | |
Saudi Investment Bank | | | | | 4,938 | | | | | | 26 | |
| | | | |
Saudi National Bank | | | | | 10,858 | | | | | | 191 | |
| | | | | | | | | | | | |
| | | | | | | | | | | 982 | |
| | | | | | | | | | | | |
| |
| HEALTH CARE 0.0% | |
| | | | |
Dr Sulaiman Al Habib Medical Services Group Co. | | | | | 317 | | | | | | 16 | |
| | | | | | | | | | | | |
| |
| MATERIALS 1.1% | |
| | | | |
Advanced Petrochemical Co. | | | | | 1,389 | | | | | | 19 | |
| | | | |
SABIC Agri-Nutrients Co. | | | | | 4,167 | | | | | | 153 | |
| | | | |
Sahara International Petrochemical Co. | | | | | 1,517 | | | | | | 20 | |
| | | | |
Saudi Arabian Mining Co. (b) | | | | | 4,952 | | | | | | 66 | |
| | | | |
Saudi Basic Industries Corp. | | | | | 16,659 | | | | | | 452 | |
| | | | |
Saudi Industrial Investment Group | | | | | 7,769 | | | | | | 59 | |
| | | | |
Yanbu National Petrochemical Co. | | | | | 2,851 | | | | | | 39 | |
| | | | | | | | | | | | |
| | | | | | | | | | | 808 | |
| | | | | | | | | | | | |
| |
| UTILITIES 0.1% | |
| | | | |
Saudi Electricity Co. | | | | | 7,516 | | | | | | 49 | |
| | | | | | | | | | | | |
Total Saudi Arabia | | | | | | | | | | | 2,705 | |
| | | | | | | | | | | | |
| |
| SINGAPORE 0.1% | |
| |
| INDUSTRIALS 0.1% | |
| | | | |
BOC Aviation Ltd. | | | | | 5,200 | | | | | | 44 | |
| | | | | | | | | | | | |
Total Singapore | | | | | | | | | | | 44 | |
| | | | | | | | | | | | |
| |
| SOUTH AFRICA 4.1% | |
| |
| COMMUNICATION SERVICES 0.7% | |
| | | | |
MTN Group Ltd. | | | | | 49,333 | | | | | | 401 | |
| | | | |
MultiChoice Group | | | | | 7,089 | | | | | | 51 | |
| | | | |
Telkom SA SOC Ltd. | | | | | 19,733 | | | | | | 44 | |
| | | | |
Vodacom Group Ltd. | | | | | 3,545 | | | | | | 29 | |
| | | | | | | | | | | | |
| | | | | | | | | | | 525 | |
| | | | | | | | | | | | |
| |
| CONSUMER DISCRETIONARY 0.3% | |
| | | | |
Foschini Group Ltd. | | | | | 2,943 | | | | | | 22 | |
| | | | |
Motus Holdings Ltd. | | | | | 6,128 | | | | | | 40 | |
| | | | |
Mr Price Group Ltd. | | | | | 4,699 | | | | | | 51 | |
| | | | |
Truworths International Ltd. | | | | | 13,038 | | | | | | 41 | |
| | | | |
Woolworths Holdings Ltd. | | | | | 23,657 | | | | | | 79 | |
| | | | | | | | | | | | |
| | | | | | | | | | | 233 | |
| | | | | | | | | | | | |
| |
| CONSUMER STAPLES 0.5% | |
| | | | |
AVI Ltd. | | | | | 6,208 | | | | | | 25 | |
| | | | |
Bid Corp. Ltd. | | | | | 6,307 | | | | | | 119 | |
| | | | |
Pick n Pay Stores Ltd. | | | | | 8,861 | | | | | | 31 | |
| | | | |
Shoprite Holdings Ltd. | | | | | 13,332 | | | | | | 162 | |
| | | | |
SPAR Group Ltd. | | | | | 4,228 | | | | | | 36 | |
| | | | | | | | | | | | |
| | | | | | | | | | | 373 | |
| | | | | | | | | | | | |
| |
| ENERGY 0.2% | |
| | | | |
Exxaro Resources Ltd. | | | | | 9,615 | | | | | | 117 | |
| | | | | | | | | | | | |
| |
| | | | | | |
| 26 | | PIMCO EQUITY SERIES | | | See Accompanying Notes | |
| | | | | | | | | | | | |
| | | | | SHARES | | | | | MARKET
VALUE
(000S) | |
| FINANCIALS 0.7% | |
| | | | |
Absa Group Ltd. | | | | | 7,364 | | | $ | | | 70 | |
| | | | |
Capitec Bank Holdings Ltd. | | | | | 519 | | | | | | 64 | |
| | | | |
Discovery Ltd. (b) | | | | | 3,177 | | | | | | 25 | |
| | | | |
FirstRand Ltd. | | | | | 36,687 | | | | | | 141 | |
| | | | |
Nedbank Group Ltd. | | | | | 2,467 | | | | | | 32 | |
| | | | |
Old Mutual Ltd. | | | | | 26,846 | | | | | | 18 | |
| | | | |
Remgro Ltd. | | | | | 4,170 | | | | | | 33 | |
| | | | |
Sanlam Ltd. | | | | | 5,366 | | | | | | 18 | |
| | | | |
Standard Bank Group Ltd. | | | | | 17,420 | | | | | | 166 | |
| | | | | | | | | | | | |
| | | | | | | | | | | 567 | |
| | | | | | | | | | | | |
| |
| HEALTH CARE 0.1% | |
| | | | |
Aspen Pharmacare Holdings Ltd. | | | | | 1,457 | | | | | | 13 | |
| | | | |
Life Healthcare Group Holdings Ltd. | | | | | 19,861 | | | | | | 22 | |
| | | | |
Netcare Ltd. | | | | | 24,114 | | | | | | 21 | |
| | | | | | | | | | | | |
| | | | | | | | | | | 56 | |
| | | | | | | | | | | | |
| |
| INDUSTRIALS 0.1% | |
| | | | |
Barloworld Ltd. | | | | | 3,895 | | | | | | 21 | |
| | | | |
Bidvest Group Ltd. | | | | | 1,749 | | | | | | 23 | |
| | | | | | | | | | | | |
| | | | | | | | | | | 44 | |
| | | | | | | | | | | | |
| |
| MATERIALS 1.5% | |
| | | | |
Anglo American Platinum Ltd. | | | | | 309 | | | | | | 27 | |
| | | | |
AngloGold Ashanti Ltd. | | | | | 12,504 | | | | | | 185 | |
| | | | |
Gold Fields Ltd. | | | | | 20,959 | | | | | | 193 | |
| | | | |
Impala Platinum Holdings Ltd. | | | | | 3,578 | | | | | | 40 | |
| | | | |
Kumba Iron Ore Ltd. | | | | | 1,777 | | | | | | 58 | |
| | | | |
Sappi Ltd. | | | | | 18,194 | | | | | | 60 | |
| | | | |
Sasol Ltd. (b) | | | | | 25,987 | | | | | | 599 | |
| | | | | | | | | | | | |
| | | | | | | | | | | 1,162 | |
| | | | | | | | | | | | |
Total South Africa | | | | | | | | | | | 3,077 | |
| | | | | | | | | | | | |
| |
| SOUTH KOREA 13.4% | |
| |
| COMMUNICATION SERVICES 1.6% | |
| | | | |
KT Corp. | | | | | 15,164 | | | | | | 426 | |
| | | | |
LG Uplus Corp. | | | | | 13,133 | | | | | | 129 | |
| | | | |
NAVER Corp. | | | | | 1,169 | | | | | | 218 | |
| | | | |
NCSoft Corp. | | | | | 167 | | | | | | 45 | |
| | | | |
SK Telecom Co. Ltd. | | | | | 9,285 | | | | | | 373 | |
| | | | | | | | | | | | |
| | | | | | | | | | | 1,191 | |
| | | | | | | | | | | | |
| |
| CONSUMER DISCRETIONARY 3.7% | |
| | | | |
Coway Co. Ltd. | | | | | 1,565 | | | | | | 77 | |
| | | | |
Hankook Tire & Technology Co. Ltd. | | | | | 2,456 | | | | | | 63 | |
| | | | |
Hanon Systems | | | | | 3,905 | | | | | | 30 | |
| | | | |
Hyundai Department Store Co. Ltd. | | | | | 639 | | | | | | 35 | |
| | | | |
Hyundai Mobis Co. Ltd. | | | | | 2,232 | | | | | | 344 | |
| | | | |
Hyundai Motor Co. | | | | | 6,475 | | | | | | 905 | |
| | | | |
Hyundai Wia Corp. | | | | | 423 | | | | | | 18 | |
| | | | |
Kangwon Land, Inc. | | | | | 5,338 | | | | | | 105 | |
| | | | |
Kia Corp. | | | | | 14,416 | | | | | | 860 | |
| | | | |
LG Electronics, Inc. | | | | | 4,331 | | | | | | 295 | |
| | | | |
Lotte Shopping Co. Ltd. | | | | | 865 | | | | | | 70 | |
| | | | |
Shinsegae, Inc. | | | | | 116 | | | | | | 20 | |
| | | | | | | | | | | | |
| | | | | | | | | | | 2,822 | |
| | | | | | | | | | | | |
| |
| CONSUMER STAPLES 0.7% | |
| | | | |
Amorepacific Corp. | | | | | 290 | | | | | | 29 | |
| | | | |
Amorepacific Group | | | | | 796 | | | | | | 23 | |
| | | | | | | | | | | | |
| | | | | SHARES | | | | | MARKET
VALUE
(000S) | |
| | | | |
CJ CheilJedang Corp. | | | | | 252 | | | $ | | | 74 | |
| | | | |
E-MART, Inc. | | | | | 1,253 | | | | | | 102 | |
| | | | |
GS Retail Co. Ltd. | | | | | 885 | | | | | | 18 | |
| | | | |
KT&G Corp. | | | | | 3,397 | | | | | | 215 | |
| | | | |
LG H&H Co. Ltd. | | | | | 95 | | | | | | 50 | |
| | | | | | | | | | | | |
| | | | | | | | | | | 511 | |
| | | | | | | | | | | | |
| |
| ENERGY 0.8% | |
| | | | |
HD Hyundai Co. Ltd. | | | | | 2,432 | | | | | | 112 | |
| | | | |
S-Oil Corp. | | | | | 293 | | | | | | 23 | |
| | | | |
SK Innovation Co. Ltd. | | | | | 3,124 | | | | | | 464 | |
| | | | | | | | | | | | |
| | | | | | | | | | | 599 | |
| | | | | | | | | | | | |
| |
| FINANCIALS 2.1% | |
| | | | |
BNK Financial Group, Inc. | | | | | 13,876 | | | | | | 72 | |
| | | | |
DB Insurance Co. Ltd. | | | | | 1,942 | | | | | | 92 | |
| | | | |
DGB Financial Group, Inc. | | | | | 7,910 | | | | | | 47 | |
| | | | |
Hana Financial Group, Inc. | | | | | 2,117 | | | | | | 64 | |
| | | | |
Hanwha Life Insurance Co. Ltd. | | | | | 10,951 | | | | | | 19 | |
| | | | |
Hyundai Marine & Fire Insurance Co. Ltd. | | | | | 5,225 | | | | | | 125 | |
| | | | |
Industrial Bank of Korea | | | | | 15,943 | | | | | | 118 | |
| | | | |
KB Financial Group, Inc. | | | | | 1,722 | | | | | | 64 | |
| | | | |
Meritz Financial Group, Inc. | | | | | 2,312 | | | | | | 46 | |
| | | | |
Meritz Fire & Marine Insurance Co. Ltd. | | | | | 3,551 | | | | | | 91 | |
| | | | |
Samsung Card Co. Ltd. | | | | | 693 | | | | | | 16 | |
| | | | |
Samsung Fire & Marine Insurance Co. Ltd. | | | | | 1,112 | | | | | | 173 | |
| | | | |
Samsung Life Insurance Co. Ltd. | | | | | 2,619 | | | | | | 127 | |
| | | | |
Samsung Securities Co. Ltd. | | | | | 1,116 | | | | | | 29 | |
| | | | |
Shinhan Financial Group Co. Ltd. | | | | | 15,803 | | | | | | 453 | |
| | | | |
Woori Financial Group, Inc. | | | | | 7,357 | | | | | | 69 | |
| | | | | | | | | | | | |
| | | | | | | | | | | 1,605 | |
| | | | | | | | | | | | |
| |
| INDUSTRIALS 1.6% | |
| | | | |
CJ Corp. | | | | | 386 | | | | | | 23 | |
| | | | |
Doosan Co. Ltd. (d) | | | | | 521 | | | | | | 28 | |
| | | | |
Doosan Enerbility Co. Ltd. (b) | | | | | 9,666 | | | | | | 145 | |
| | | | |
GS Engineering & Construction Corp. | | | | | 610 | | | | | | 15 | |
| | | | |
GS Holdings Corp. | | | | | 2,274 | | | | | | 74 | |
| | | | |
Hanwha Corp. | | | | | 2,314 | | | | | | 46 | |
| | | | |
Hyundai Engineering & Construction Co. Ltd. | | | | | 2,461 | | | | | | 79 | |
| | | | |
Hyundai Glovis Co. Ltd. | | | | | 1,226 | | | | | | 170 | |
| | | | |
Korea Shipbuilding & Offshore Engineering Co. Ltd. (b) | | | | | 269 | | | | | | 20 | |
| | | | |
Korean Air Lines Co. Ltd. (b) | | | | | 3,157 | | | | | | 62 | |
| | | | |
LG Corp. | | | | | 2,334 | | | | | | 140 | |
| | | | |
LG International Corp. | | | | | 2,587 | | | | | | 65 | |
| | | | |
LS Corp. | | | | | 767 | | | | | | 38 | |
| | | | |
Posco International Corp. | | | | | 4,462 | | | | | | 66 | |
| | | | |
SK Networks Co. Ltd. | | | | | 5,566 | | | | | | 18 | |
| | | | |
SK, Inc. | | | | | 1,306 | | | | | | 217 | |
| | | | | | | | | | | | |
| | | | | | | | | | | 1,206 | |
| | | | | | | | | | | | |
| |
| INFORMATION TECHNOLOGY 1.1% | |
| | | | |
LG Display Co. Ltd. | | | | | 18,483 | | | | | | 207 | |
| | | | |
Samsung Electro-Mechanics Co. Ltd. | | | | | 720 | | | | | | 73 | |
| | | | |
SK Hynix, Inc. | | | | | 7,413 | | | | | | 523 | |
| | | | | | | | | | | | |
| | | | | | | | | | | 803 | |
| | | | | | | | | | | | |
| |
| | | | | | | | | | | | |
| | | | | SHARES | | | | | MARKET
VALUE
(000S) | |
| MATERIALS 1.3% | |
| | | | |
Dongkuk Steel Mill Co. Ltd. | | | | | 7,423 | | | $ | | | 74 | |
| | | | |
Hyundai Steel Co. | | | | | 5,359 | | | | | | 133 | |
| | | | |
Kolon Industries, Inc. | | | | | 461 | | | | | | 18 | |
| | | | |
Korea Zinc Co. Ltd. | | | | | 346 | | | | | | 130 | |
| | | | |
POSCO Holdings, Inc. | | | | | 3,509 | | | | | | 626 | |
| | | | |
SKC Co. Ltd. | | | | | 130 | | | | | | 13 | |
| | | | | | | | | | | | |
| | | | | | | | | | | 994 | |
| | | | | | | | | | | | |
| |
| UTILITIES 0.5% | |
| | | | |
Korea Electric Power Corp. | | | | | 16,660 | | | | | | 291 | |
| | | | |
Korea Gas Corp. | | | | | 3,375 | | | | | | 103 | |
| | | | | | | | | | | | |
| | | | | | | | | | | 394 | |
| | | | | | | | | | | | |
Total South Korea | | | | | | | | | | | 10,125 | |
| | | | | | | | | | | | |
| |
| TAIWAN 16.0% | |
| |
| COMMUNICATION SERVICES 0.9% | |
| | | | |
Chunghwa Telecom Co. Ltd. | | | | | 90,000 | | | | | | 369 | |
| | | | |
Far EasTone Telecommunications Co. Ltd. | | | | | 61,000 | | | | | | 172 | |
| | | | |
Taiwan Mobile Co. Ltd. | | | | | 28,000 | | | | | | 102 | |
| | | | | | | | | | | | |
| | | | | | | | | | | 643 | |
| | | | | | | | | | | | |
| |
| CONSUMER DISCRETIONARY 0.6% | |
| | | | |
Cheng Shin Rubber Industry Co. Ltd. | | | | | 67,000 | | | | | | 80 | |
| | | | |
China Motor Corp. | | | | | 8,000 | | | | | | 17 | |
| | | | |
Eclat Textile Co. Ltd. | | | | | 3,000 | | | | | | 42 | |
| | | | |
Feng TAY Enterprise Co. Ltd. | | | | | 5,000 | | | | | | 29 | |
| | | | |
Giant Manufacturing Co. Ltd. | | | | | 2,000 | | | | | | 16 | |
| | | | |
Hotai Motor Co. Ltd. | | | | | 3,000 | | | | | | 61 | |
| | | | |
Kinpo Electronics | | | | | 40,000 | | | | | | 18 | |
| | | | |
Nien Made Enterprise Co. Ltd. | | | | | 2,000 | | | | | | 20 | |
| | | | |
Pou Chen Corp. | | | | | 68,000 | | | | | | 68 | |
| | | | |
Ruentex Industries Ltd. | | | | | 15,800 | | | | | | 41 | |
| | | | |
Yulon Motor Co. Ltd. | | | | | 40,509 | | | | | | 64 | |
| | | | | | | | | | | | |
| | | | | | | | | | | 456 | |
| | | | | | | | | | | | |
| |
| CONSUMER STAPLES 0.4% | |
| | | | |
Great Wall Enterprise Co. Ltd. | | | | | 15,960 | | | | | | 26 | |
| | | | |
President Chain Store Corp. | | | | | 14,000 | | | | | | 128 | |
| | | | |
Uni-President Enterprises Corp. | | | | | 71,000 | | | | | | 160 | |
| | | | | | | | | | | | |
| | | | | | | | | | | 314 | |
| | | | | | | | | | | | |
| |
| ENERGY 0.1% | |
| | | | |
Formosa Petrochemical Corp. | | | | | 24,000 | | | | | | 76 | |
| | | | | | | | | | | | |
| |
| FINANCIALS 3.9% | |
| | | | |
Cathay Financial Holding Co. Ltd. | | | | | 235,000 | | | | | | 402 | |
| | | | |
Chailease Holding Co. Ltd. | | | | | 3,832 | | | | | | 27 | |
| | | | |
Chang Hwa Commercial Bank Ltd. | | | | | 120,000 | | | | | | 70 | |
| | | | |
China Development Financial Holding Corp. | | | | | 473,096 | | | | | | 234 | |
| | | | |
CTBC Financial Holding Co. Ltd. | | | | | 514,000 | | | | | | 435 | |
| | | | |
E.Sun Financial Holding Co. Ltd. | | | | | 236,648 | | | | | | 231 | |
| | | | |
First Financial Holding Co. Ltd. | | | | | 165,490 | | | | | | 146 | |
| | | | |
Fubon Financial Holding Co. Ltd. | | | | | 201,369 | | | | | | 405 | |
| | | | |
Hua Nan Financial Holdings Co. Ltd. ‘C’ | | | | | 140,371 | | | | | | 107 | |
| | | | |
Mega Financial Holding Co. Ltd. | | | | | 240,000 | | | | | | 285 | |
| | | | |
Shanghai Commercial & Savings Bank Ltd. | | | | | 22,000 | | | | | | 39 | |
| | | | | | | | | | | | |
| See Accompanying Notes | | | ANNUAL REPORT | | | | | | | JUNE 30, 2022 | | | 27 |
| | | | | | |
| Schedule of Investments | | PIMCO RAFI Dynamic Multi-Factor Emerging Markets Equity ETF | | (Cont.) | | |
| | | | | | | | | | | | |
| | | | | SHARES | | | | | MARKET
VALUE
(000S) | |
| | | | |
Shin Kong Financial Holding Co. Ltd. | | | | | 164,307 | | | $ | | | 49 | |
| | | | |
SinoPac Financial Holdings Co. Ltd. | | | | | 176,528 | | | | | | 100 | |
| | | | |
Taichung Commercial Bank Co. Ltd. | | | | | 46,000 | | | | | | 21 | |
| | | | |
Taishin Financial Holding Co. Ltd. | | | | | 270,552 | | | | | | 148 | |
| | | | |
Taiwan Business Bank (b) | | | | | 97,000 | | | | | | 38 | |
| | | | |
Taiwan Cooperative Financial Holding Co. Ltd. | | | | | 169,560 | | | | | | 153 | |
| | | | |
Yuanta Financial Holding Co. Ltd. | | | | | 84,000 | | | | | | 56 | |
| | | | | | | | | | | | |
| | | | | | | | | | | 2,946 | |
| | | | | | | | | | | | |
| |
| INDUSTRIALS 1.0% | |
| | | | |
China Airlines Ltd. | | | | | 159,000 | | | | | | 126 | |
| | | | |
CTCI Corp. | | | | | 20,000 | | | | | | 30 | |
| | | | |
Eva Airways Corp. (b) | | | | | 123,400 | | | | | | 132 | |
| | | | |
Evergreen Marine Corp. Taiwan Ltd. | | | | | 20,000 | | | | | | 57 | |
| | | | |
Far Eastern New Century Corp. | | | | | 75,000 | | | | | | 80 | |
| | | | |
Taiwan High Speed Rail Corp. | | | | | 20,000 | | | | | | 19 | |
| | | | |
Teco Electric & Machinery Co. Ltd. | | | | | 33,000 | | | | | | 33 | |
| | | | |
Walsin Lihwa Corp. | | | | | 170,000 | | | | | | 206 | |
| | | | |
Wan Hai Lines Ltd. | | | | | 13,000 | | | | | | 52 | |
| | | | | | | | | | | | |
| | | | | | | | | | | 735 | |
| | | | | | | | | | | | |
| |
| INFORMATION TECHNOLOGY 7.0% | |
| | | | |
Accton Technology Corp. | | | | | 3,000 | | | | | | 24 | |
| | | | |
Acer, Inc. | | | | | 122,000 | | | | | | 89 | |
| | | | |
Advantech Co. Ltd. | | | | | 7,291 | | | | | | 85 | |
| | | | |
Asustek Computer, Inc. | | | | | 24,000 | | | | | | 251 | |
| | | | |
AUO Corp. | | | | | 454,000 | | | | | | 249 | |
| | | | |
Catcher Technology Co. Ltd. | | | | | 17,000 | | | | | | 95 | |
| | | | |
Chicony Electronics Co. Ltd. | | | | | 27,000 | | | | | | 67 | |
| | | | |
Compal Electronics, Inc. | | | | | 190,000 | | | | | | 145 | |
| | | | |
Delta Electronics, Inc. | | | | | 10,000 | | | | | | 75 | |
| | | | |
Foxconn Technology Co. Ltd. | | | | | 17,000 | | | | | | 28 | |
| | | | |
Hon Hai Precision Industry Co. Ltd. | | | | | 87,600 | | | | | | 322 | |
| | | | |
HTC Corp. (b) | | | | | 9,000 | | | | | | 15 | |
| | | | |
Innolux Corp. | | | | | 815,000 | | | | | | 332 | |
| | | | |
Inventec Corp. | | | | | 92,000 | | | | | | 78 | |
| | | | |
Largan Precision Co. Ltd. | | | | | 290 | | | | | | 17 | |
| | | | |
Lite-On Technology Corp. | | | | | 58,000 | | | | | | 113 | |
| | | | |
MediaTek, Inc. | | | | | 24,000 | | | | | | 527 | |
| | | | |
Micro-Star International Co. Ltd. | | | | | 25,000 | | | | | | 95 | |
| | | | |
Nan Ya Printed Circuit Board Corp. | | | | | 2,000 | | | | | | 18 | |
| | | | |
Nanya Technology Corp. | | | | | 8,000 | | | | | | 13 | |
| | | | |
Novatek Microelectronics Corp. | | | | | 19,000 | | | | | | 193 | |
| | | | |
Pegatron Corp. | | | | | 63,000 | | | | | | 121 | |
| | | | |
Powertech Technology, Inc. | | | | | 40,000 | | | | | | 118 | |
| | | | |
Quanta Computer, Inc. | | | | | 83,000 | | | | | | 223 | |
| | | | |
Radiant Opto-Electronics Corp. | | | | | 6,000 | | | | | | 17 | |
| | | | |
Realtek Semiconductor Corp. | | | | | 3,000 | | | | | | 37 | |
| | | | |
Silicon Motion Technology Corp. ADR | | | | | 212 | | | | | | 18 | |
| | | | |
Supreme Electronics Co. Ltd. | | | | | 55,593 | | | | | | 79 | |
| | | | |
Synnex Technology International Corp. | | | | | 42,000 | | | | | | 75 | |
| | | | |
Taiwan Semiconductor Manufacturing Co. Ltd. | | | | | 67,000 | | | | | | 1,074 | |
| | | | |
TPK Holding Co. Ltd. | | | | | 11,000 | | | | | | 13 | |
| | | | |
Transcend Information, Inc. | | | | | 6,000 | | | | | | 14 | |
| | | | |
Tripod Technology Corp. | | | | | 10,000 | | | | | | 37 | |
| | | | |
Unimicron Technology Corp. | | | | | 3,000 | | | | | | 16 | |
| | | | |
United Microelectronics Corp. | | | | | 215,000 | | | | | | 287 | |
| | | | |
Wistron Corp. | | | | | 131,347 | | | | | | 118 | |
| | | | |
Wiwynn Corp. | | | | | 1,000 | | | | | | 23 | |
| | | | |
WPG Holdings Ltd. | | | | | 46,560 | | | | | | 86 | |
| | | | | | | | | | | | |
| | | | | SHARES | | | | | MARKET
VALUE
(000S) | |
| | | | |
WT Microelectronics Co. Ltd. | | | | | 23,000 | | | $ | | | 52 | |
| | | | |
Yageo Corp. | | | | | 2,000 | | | | | | 21 | |
| | | | |
Zhen Ding Technology Holding Ltd. | | | | | 9,000 | | | | | | 31 | |
| | | | | | | | | | | | |
| | | | | | | | | | | 5,291 | |
| | | | | | | | | | | | |
| |
| MATERIALS 2.0% | |
| | | | |
Asia Cement Corp. | | | | | 66,000 | | | | | | 97 | |
| | | | |
Cheng Loong Corp. | | | | | 24,000 | | | | | | 21 | |
| | | | |
China Steel Corp. | | | | | 418,000 | | | | | | 400 | |
| | | | |
Eternal Materials Co. Ltd. | | | | | 24,000 | | | | | | 26 | |
| | | | |
Formosa Chemicals & Fibre Corp. | | | | | 50,000 | | | | | | 126 | |
| | | | |
Formosa Plastics Corp. | | | | | 87,000 | | | | | | 318 | |
| | | | |
Nan Ya Plastics Corp. | | | | | 87,000 | | | | | | 243 | |
| | | | |
TA Chen Stainless Pipe | | | | | 12,000 | | | | | | 14 | |
| | | | |
Taiwan Cement Corp. | | | | | 137,422 | | | | | | 183 | |
| | | | |
Taiwan Fertilizer Co. Ltd. | | | | | 10,000 | | | | | | 21 | |
| | | | |
Tung Ho Steel Enterprise Corp. | | | | | 16,020 | | | | | | 28 | |
| | | | |
YFY, Inc. | | | | | 27,000 | | | | | | 23 | |
| | | | | | | | | | | | |
| | | | | | | | | | | 1,500 | |
| | | | | | | | | | | | |
| |
| REAL ESTATE 0.1% | |
| | | | |
Farglory Land Development Co. Ltd. | | | | | 9,000 | | | | | | 19 | |
| | | | |
Highwealth Construction Corp. | | | | | 17,000 | | | | | | 26 | |
| | | | |
Ruentex Development Co. Ltd. | | | | | 19,800 | | | | | | 49 | |
| | | | | | | | | | | | |
| | | | | | | | | | | 94 | |
| | | | | | | | | | | | |
Total Taiwan | | | | | | | | | | | 12,055 | |
| | | | | | | | | | | | |
| |
| THAILAND 5.7% | |
| |
| COMMUNICATION SERVICES 0.6% | |
| | | | |
Advanced Info Service PCL | | | | | 41,400 | | | | | | 228 | |
| | | | |
Digital Telecommunications Infrastructure Fund | | | | | 157,600 | | | | | | 60 | |
| | | | |
Intouch Holdings PCL | | | | | 27,000 | | | | | | 52 | |
| | | | |
Jasmine International PCL (b) | | | | | 312,300 | | | | | | 31 | |
| | | | |
Total Access Communication PCL | | | | | 37,500 | | | | | | 47 | |
| | | | | | | | | | | | |
| | | | | | | | | | | 418 | |
| | | | | | | | | | | | |
| |
| CONSUMER DISCRETIONARY 0.1% | |
| | | | |
Central Retail Corp. PCL | | | | | 30,700 | | | | | | 30 | |
| | | | |
Home Product Center PCL | | | | | 66,100 | | | | | | 24 | |
| | | | |
Sri Trang Agro-Industry PCL | | | | | 52,700 | | | | | | 32 | |
| | | | | | | | | | | | |
| | | | | | | | | | | 86 | |
| | | | | | | | | | | | |
| |
| CONSUMER STAPLES 0.8% | |
| | | | |
Berli Jucker PCL | | | | | 21,400 | | | | | | 20 | |
| | | | |
Charoen Pokphand Foods PCL | | | | | 166,900 | | | | | | 123 | |
| | | | |
CP ALL PCL | | | | | 154,700 | | | | | | 263 | |
| | | | |
Thai Beverage PCL | | | | | 195,900 | | | | | | 91 | |
| | | | |
Thai Union Group PCL ‘F’ | | | | | 221,600 | | | | | | 107 | |
| | | | | | | | | | | | |
| | | | | | | | | | | 604 | |
| | | | | | | | | | | | |
| |
| ENERGY 1.2% | |
| | | | |
Bangchak Corp. PCL | | | | | 88,000 | | | | | | 78 | |
| | | | |
Esso Thailand PCL (b) | | | | | 100,100 | | | | | | 33 | |
| | | | |
IRPC PCL | | | | | 831,100 | | | | | | 76 | |
| | | | |
PTT Exploration & Production PCL | | | | | 20,100 | | | | | | 90 | |
| | | | |
PTT PCL | | | | | 486,800 | | | | | | 468 | |
| | | | |
Star Petroleum Refining PCL | | | | | 204,000 | | | | | | 70 | |
| | | | |
Thai Oil PCL | | | | | 34,100 | | | | | | 50 | |
| | | | | | | | | | | | |
| | | | | | | | | | | 865 | |
| | | | | | | | | | | | |
| | | | | | | | | | | | |
| | | | | SHARES | | | | | MARKET
VALUE
(000S) | |
| FINANCIALS 1.1% | |
| | | | |
Bangkok Bank PCL | | | | | 70,400 | | | $ | | | 265 | |
| | | | |
Kasikornbank PCL | | | | | 33,000 | | | | | | 141 | |
| | | | |
Krung Thai Bank PCL | | | | | 399,700 | | | | | | 176 | |
| | | | |
SCB PCL | | | | | 18,700 | | | | | | 55 | |
| | | | |
Thanachart Capital PCL | | | | | 78,900 | | | | | | 84 | |
| | | | |
Tisco Financial Group PCL | | | | | 20,800 | | | | | | 52 | |
| | | | |
TMBThanachart Bank PCL | | | | | 1,019,300 | | | | | | 36 | |
| | | | | | | | | | | | |
| | | | | | | | | | | 809 | |
| | | | | | | | | | | | |
| |
| HEALTH CARE 0.3% | |
| | | | |
Bangkok Dusit Medical Services PCL ‘F’ | | | | | 249,600 | | | | | | 177 | |
| | | | |
Bumrungrad Hospital PCL | | | | | 15,200 | | | | | | 77 | |
| | | | | | | | | | | | |
| | | | | | | | | | | 254 | |
| | | | | | | | | | | | |
| |
| INDUSTRIALS 0.4% | |
| | | | |
Airports of Thailand PCL | | | | | 66,600 | | | | | | 134 | |
| | | | |
Delta Electronics Thailand PCL | | | | | 8,900 | | | | | | 84 | |
| | | | |
Jasmine Broadband Internet Infrastructure Fund | | | | | 227,700 | | | | | | 62 | |
| | | | | | | | | | | | |
| | | | | | | | | | | 280 | |
| | | | | | | | | | | | |
| |
| INFORMATION TECHNOLOGY 0.0% | |
| | | | |
Fabrinet (b) | | | | | 416 | | | | | | 34 | |
| | | | | | | | | | | | |
| |
| MATERIALS 0.9% | |
| | | | |
Indorama Ventures PCL | | | | | 22,200 | | | | | | 30 | |
| | | | |
PTT Global Chemical PCL | | | | | 84,700 | | | | | | 109 | |
| | | | |
SCG Packaging PCL | | | | | 14,900 | | | | | | 23 | |
| | | | |
Siam Cement PCL | | | | | 47,300 | | | | | | 501 | |
| | | | | | | | | | | | |
| | | | | | | | | | | 663 | |
| | | | | | | | | | | | |
| |
| REAL ESTATE 0.2% | |
| | | | |
Central Pattana PCL | | | | | 22,000 | | | | | | 38 | |
| | | | |
Land & Houses PCL | | | | | 369,400 | | | | | | 88 | |
| | | | |
Sansiri PCL | | | | | 599,200 | | | | | | 17 | |
| | | | |
Supalai PCL | | | | | 53,600 | | | | | | 28 | |
| | | | | | | | | | | | |
| | | | | | | | | | | 171 | |
| | | | | | | | | | | | |
| |
| UTILITIES 0.1% | |
| | | | |
Electricity Generating PCL | | | | | 7,400 | | | | | | 37 | |
| | | | |
Gulf Energy Development PCL | | | | | 25,200 | | | | | | 33 | |
| | | | |
Ratch Group PCL | | | | | 20,250 | | | | | | 22 | |
| | | | | | | | | | | | |
| | | | | | | | | | | 92 | |
| | | | | | | | | | | | |
Total Thailand | | | | | | | | | | | 4,276 | |
| | | | | | | | | | | | |
| |
| TURKEY 2.1% | |
| |
| COMMUNICATION SERVICES 0.2% | |
| | | | |
Turkcell Iletisim Hizmetleri AS | | | | | 150,253 | | | | | | 147 | |
| | | | | | | | | | | | |
| |
| CONSUMER DISCRETIONARY 0.3% | |
| | | | |
Arcelik AS | | | | | 21,434 | | | | | | 93 | |
| | | | |
Ford Otomotiv Sanayi AS | | | | | 4,502 | | | | | | 73 | |
| | | | |
Tofas Turk Otomobil Fabrikasi AS | | | | | 9,376 | | | | | | 34 | |
| | | | | | | | | | | | |
| | | | | | | | | | | 200 | |
| | | | | | | | | | | | |
| |
| CONSUMER STAPLES 0.2% | |
| | | | |
Anadolu Efes Biracilik Ve Malt Sanayii AS | | | | | 10,227 | | | | | | 17 | |
| | | | | | |
| 28 | | PIMCO EQUITY SERIES | | | See Accompanying Notes | |
| | | | | | | | | | | | |
| | | | | SHARES | | | | | MARKET
VALUE
(000S) | |
| | | | |
BIM Birlesik Magazalar AS | | | | | 22,683 | | | $ | | | 110 | |
| | | | |
Coca-Cola Icecek AS | | | | | 2,974 | | | | | | 23 | |
| | | | | | | | | | | | |
| | | | | | | | | | | 150 | |
| | | | | | | | | | | | |
| |
| ENERGY 0.4% | |
| | | | |
Turkiye Petrol Rafinerileri AS (b) | | | | | 17,285 | | | | | | 272 | |
| | | | | | | | | | | | |
| |
| FINANCIALS 0.4% | |
| | | | |
Akbank TAS | | | | | 144,380 | | | | | | 69 | |
| | | | |
Haci Omer Sabanci Holding AS | | | | | 91,257 | | | | | | 103 | |
| | | | |
Is Yatirim Menkul Degerler AS | | | | | 23,883 | | | | | | 27 | |
| | | | |
Turkiye Is Bankasi AS ‘C’ | | | | | 339,324 | | | | | | 90 | |
| | | | |
Turkiye Vakiflar Bankasi TAO ‘D’ (b) | | | | | 87,557 | | | | | | 19 | |
| | | | |
Yapi ve Kredi Bankasi AS | | | | | 100,497 | | | | | | 26 | |
| | | | | | | | | | | | |
| | | | | | | | | | | 334 | |
| | | | | | | | | | | | |
| |
| INDUSTRIALS 0.5% | |
| | | | |
Enka Insaat ve Sanayi AS | | | | | 72,229 | | | | | | 75 | |
| | | | |
KOC Holding AS | | | | | 41,620 | | | | | | 92 | |
| | | | |
Turk Hava Yollari AO (b) | | | | | 67,139 | | | | | | 188 | |
| | | | |
Turkiye Sise ve Cam Fabrikalari AS | | | | | 26,717 | | | | | | 34 | |
| | | | | | | | | | | | |
| | | | | | | | | | | 389 | |
| | | | | | | | | | | | |
| |
| MATERIALS 0.1% | |
| | | | |
Eregli Demir ve Celik Fabrikalari TAS | | | | | 28,731 | | | | | | 47 | |
| | | | |
Petkim Petrokimya Holding AS (b) | | | | | 40,697 | | | | | | 21 | |
| | | | | | | | | | | | |
| | | | | | | | | | | 68 | |
| | | | | | | | | | | | |
| |
| UTILITIES 0.0% | |
| | | | |
Aygaz AS | | | | | 10,166 | | | | | | 23 | |
| | | | | | | | | | | | |
Total Turkey | | | | | | | | | | | 1,583 | |
| | | | | | | | | | | | |
| |
| UNITED STATES 0.0% | |
| |
| CONSUMER DISCRETIONARY 0.0% | |
| | | | |
Nexteer Automotive Group Ltd. | | | | | 40,000 | | | | | | 29 | |
| | | | | | | | | | | | |
Total United States | | | | | | | | | | | 29 | |
| | | | | | | | | | | | |
Total Common Stocks (Cost $74,047) | | | 70,441 | |
| | | | |
| |
| | | | | UNITS | | | | | | |
| EQUITY-LINKED SECURITIES 2.0% | |
| |
| UNITED KINGDOM 2.0% | |
| |
| FINANCIALS 1.7% | |
| | | | |
HSBC Bank PLC, Bank of Beijing Co. Ltd. - Exp. 04/25/2023 | | | | | 139,600 | | | | | | 95 | |
| | | | |
HSBC Bank PLC, Bank of Jiangsu Co. Ltd. - Exp. 05/18/2023 | | | | | 67,695 | | | | | | 72 | |
| | | | |
HSBC Bank PLC, Bank of Nanjing Co. Ltd. - Exp. 12/17/2022 | | | | | 32,100 | | | | | | 50 | |
| | | | |
HSBC Bank PLC, China State Construction Engineering Corp. Ltd. - Exp. 05/18/2023 | | | | | 97,100 | | | | | | 77 | |
| | | | |
HSBC Bank PLC, China Yangtze Power Co. Ltd. - Exp. 05/18/2023 | | | | | 20,800 | | | | | | 72 | |
| | | | |
HSBC Bank PLC, Contemporary Amperex Technology Co. Ltd. - Exp. 03/24/2023 | | | | | 1,000 | | | | | | 80 | |
| | | | |
HSBC Bank PLC, Daqin Railway Co. Ltd. - Exp. 05/18/2023 | | | | | 39,700 | | | | | | 39 | |
| | | | | | | | | | | | |
| | | | | UNITS | | | | | MARKET
VALUE
(000S) | |
| | | | |
HSBC Bank PLC, GD Power Development Co. Ltd. - Exp. 06/17/2023 | | | | | 63,300 | | | $ | | | 37 | |
| | | | |
HSBC Bank PLC, GoerTek, Inc. - Exp. 12/07/2022 | | | | | 7,100 | | | | | | 36 | |
| | | | |
HSBC Bank PLC, Hesteel Co. Ltd. - Exp. 09/22/2022 | | | | | 73,500 | | | | | | 25 | |
| | | | |
HSBC Bank PLC, Huaxia Bank Co. Ltd. - Exp. 06/17/2023 | | | | | 45,100 | | | | | | 35 | |
| | | | |
HSBC Bank PLC, Huayu Automotive Systems Co. Ltd. - Exp. 07/18/2022 | | | | | 5,400 | | | | | | 19 | |
| | | | |
HSBC Bank PLC, Industrial Bank Co. Ltd. - Exp. 09/16/2022 | | | | | 60,300 | | | | | | 179 | |
| | | | |
HSBC Bank PLC, Kweichow Moutai Co. Ltd. - Exp. 08/15/2022 | | | | | 100 | | | | | | 30 | |
| | | | |
HSBC Bank PLC, LONGi Green Energy Technology Co. Ltd. - Exp. 11/02/2022 | | | | | 1,640 | | | | | | 16 | |
| | | | |
HSBC Bank PLC, Luxshare Precision Industry Co. Ltd. - Exp. 04/25/2023 | | | | | 6,800 | | | | | | 34 | |
| | | | |
HSBC Bank PLC, Poly Developments and Holdings Group Co. Ltd. - Exp. 02/11/2023 | | | | | 12,900 | | | | | | 34 | |
| | | | |
HSBC Bank PLC, Power Construction Corp. of China Ltd. - Exp. 05/18/2023 | | | | | 63,400 | | | | | | 74 | |
| | | | |
HSBC Bank PLC, Shanghai Construction Group Co. Ltd. - Exp. 12/02/2022 | | | | | 76,200 | | | | | | 34 | |
| | | | |
HSBC Bank PLC, TBEA Co. Ltd. - Exp. 05/18/2023 | | | | | 19,600 | | | | | | 80 | |
| | | | |
HSBC Bank PLC, Tongling Nonferrous Metals Group Co. Ltd. - Exp. 12/05/2022 | | | | | 59,300 | | | | | | 29 | |
| | | | |
HSBC Bank PLC, Wanhua Chemical Group Co. Ltd. - Exp. 10/11/2022 | | | | | 2,600 | | | | | | 38 | |
| | | | |
HSBC Bank PLC, Wens Foodstuffs Group Co. Ltd. - Exp. 11/02/2022 | | | | | 23,900 | | | | | | 76 | |
| | | | |
HSBC Bank PLC, Xiamen ITG Group Corp. Ltd. - Exp. 06/17/2023 | | | | | 29,300 | | | | | | 33 | |
| | | | | | | | | | | | |
| | | | | | | | | | | 1,294 | |
| | | | | | | | | | | | |
| |
| INDUSTRIALS 0.3% | |
| | | | |
HSBC Bank PLC, China United Network Communications Ltd. - Exp. 06/17/2023 | | | | | 65,900 | | | | | | 34 | |
| | | | |
HSBC Bank PLC, Inner Mongolia Yili Industrial Group Co. Ltd. - Exp. 1/17/2023 | | | | | 10,600 | | | | | | 62 | |
| | | | |
HSBC Bank PLC, SAIC Motor Corp. Ltd. - Exp. 12/07/2022 | | | | | 6,000 | | | | | | 16 | |
| | | | |
HSBC Bank PLC, Tongwei Co. Ltd. - Exp. 12/17/2022 | | | | | 4,500 | | | | | | 40 | |
| | | | |
HSBC Bank PLC, Xiamen C & D, Inc. - Exp. 12/12/2022 | | | | | 18,100 | | | | | | 35 | |
| | | | | | | | | | | | |
| | | | | | | | | | | 187 | |
| | | | | | | | | | | | |
Total Equity-Linked Securities
(Cost $1,450) | | | 1,481 | |
| | | | |
| |
| | | | | SHARES | | | | | | |
| PREFERRED STOCKS 1.8% | |
| |
| BRAZIL 1.5% | |
| |
| BANKING & FINANCE 0.2% | |
| | | | |
Banco do Estado do Rio Grande do Sul SA | | | | | 19,700 | | | | | | 34 | |
| | | | |
Itau Unibanco Holding SA | | | | | 34,450 | | | | | | 149 | |
| | | | | | | | | | | | |
| | | | | | | | | | | 183 | |
| | | | | | | | | | | | |
| |
| | | | | | | | | | | | |
| | | | | SHARES | | | | | MARKET
VALUE
(000S) | |
| ENERGY 0.4% | |
| | | | |
Petroleo Brasileiro SA | | | | | 50,100 | | | $ | | | 267 | |
| | | | | | | | | | | | |
| |
| INDUSTRIALS 0.4% | |
| | | | |
Braskem SA | | | | | 5,400 | | | | | | 39 | |
| | | | |
Gerdau SA | | | | | 33,300 | | | | | | 142 | |
| | | | |
Metalurgica Gerdau SA | | | | | 68,400 | | | | | | 125 | |
| | | | | | | | | | | | |
| | | | | | | | | | | 306 | |
| | | | | | | | | | | | |
| |
| UTILITIES 0.5% | |
| | | | |
Cia de Transmissao de Energia Eletrica Paulista | | | | | 16,300 | | | | | | 71 | |
| | | | |
Cia Energetica de Minas Gerais | | | | | 150,571 | | | | | | 299 | |
| | | | | | | | | | | | |
| | | | | | | | | | | 370 | |
| | | | | | | | | | | | |
Total Brazil | | | | | | | | | | | 1,126 | |
| | | | | | | | | | | | |
| |
| CHILE 0.3% | |
| |
| INDUSTRIALS 0.3% | |
| | | | |
Embotelladora Andina SA | | | | | 22,603 | | | | | | 40 | |
| | | | |
Sociedad Quimica y Minera de Chile SA | | | | | 2,430 | | | | | | 203 | |
| | | | | | | | | | | | |
| | | | | | | | | | | 243 | |
| | | | | | | | | | | | |
Total Chile | | | | | | | | | | | 243 | |
| | | | | | | | | | | | |
| |
| RUSSIA 0.0% | |
| |
| ENERGY 0.0% | |
| | | | |
Bashneft PJSC « | | | | | 2,929 | | | | | | 0 | |
| | | | |
Transneft PJSC «(d) | | | | | 22 | | | | | | 0 | |
| | | | | | | | | | | | |
| | | | | | | | | | | 0 | |
| | | | | | | | | | | | |
Total Russia | | | | | | | | | | | 0 | |
| | | | | | | | | | | | |
Total Preferred Stocks (Cost $1,061) | | | 1,369 | |
| | | | |
| |
| REAL ESTATE INVESTMENT TRUSTS 0.1% | |
| |
| INDIA 0.1% | |
| |
| REAL ESTATE 0.1% | |
| | | | |
Embassy Office Parks REIT | | | | | 7,306 | | | | | | 34 | |
| | | | | | | | | | | | |
Total India | | | | | | | | | | | 34 | |
| | | | | | | | | | | | |
| |
| SOUTH AFRICA 0.0% | |
| |
| REAL ESTATE 0.0% | |
| | | | |
Growthpoint Properties Ltd. | | | | | 23,472 | | | | | | 18 | |
| | | | | | | | | | | | |
Total South Africa | | | | | | | | | | | 18 | |
| | | | | | | | | | | | |
| |
| TURKEY 0.0% | |
| |
| REAL ESTATE 0.0% | |
| | | | |
Emlak Konut Gayrimenkul Yatirim Ortakligi AS (d) | | | | | 119,172 | | | | | | 19 | |
| | | | | | | | | | | | |
Total Turkey | | | | | | | | | | | 19 | |
| | | | | | | | | | | | |
Total Real Estate Investment Trusts
(Cost $91) | | | 71 | |
| | | | |
| |
| SHORT-TERM INSTRUMENTS 1.7% | |
| |
| REPURCHASE AGREEMENTS (f) 1.7% | |
| | | | | | | | | | | 1,300 | |
| | | | | | | | | | | | |
Total Short-Term Instruments
(Cost $1,300) | | | 1,300 | |
| | | | |
| | | | |
| | | | | | | | | | | | |
Total Investments in Securities
(Cost $77,949) | | | 74,662 | |
| | | | |
| |
| | | | | | | | | | | | |
| See Accompanying Notes | | | ANNUAL REPORT | | | | | | | JUNE 30, 2022 | | | 29 |
| | | | | | |
| Schedule of Investments | | PIMCO RAFI Dynamic Multi-Factor Emerging Markets Equity ETF | | (Cont.) | | |
| | | | | | | | | | | | |
| | | | | SHARES | | | | | MARKET
VALUE
(000S) | |
| INVESTMENTS IN AFFILIATES 0.1% | |
| |
| SHORT-TERM INSTRUMENTS 0.1% | |
| |
| MUTUAL FUNDS 0.1% | |
|
PIMCO Government Money Market Fund | |
1.450% (c)(d)(e) | | | | | 72,038 | | | $ | | | 72 | |
| | | | | | | | | | | | |
Total Short-Term Instruments
(Cost $72) | | | | | | 72 | |
| | | | | | | | | | | | |
| | | | |
| | | | | | | | | | | | |
Total Investments in Affiliates
(Cost $72) | | | | | | 72 | |
| | | | |
| | | | | | | | | | | | |
Total Investments 99.0%
(Cost $78,021) | | | $ | | | 74,734 | |
| | | | | | | | | | | | |
| Other Assets and Liabilities, net 1.0% | | | | | | 783 | |
| | | | | | | | | | | | |
| Net Assets 100.0% | | | $ | | | 75,517 | |
| | | | | | | |
NOTES TO SCHEDULE OF INVESTMENTS:
| * | A zero balance may reflect actual amounts rounding to less than one thousand. |
| « | Security valued using significant unobservable inputs (Level 3). |
| (a) | Security is not accruing income as of the date of this report. |
| (b) | Security did not produce income within the last twelve months. |
| (c) | Institutional Class Shares of each Fund. |
| (d) | Securities with an aggregate market value of $59 were out on loan in exchange for $72 of cash collateral as of June 30, 2022. The collateral was invested in a cash collateral reinvestment vehicle as described in Note 5 in the Notes to Financial Statements. |
| (e) | Coupon represents a 7-Day Yield. |
BORROWINGS AND OTHER FINANCING TRANSACTIONS
(f) REPURCHASE AGREEMENTS:
| | | | | | | | | | | | | | | | | | | | | | | | | | | | | | |
| Counterparty | | Lending
Rate | | | Settlement
Date | | | Maturity
Date | | | Principal
Amount | | | Collateralized By | | Collateral
(Received) | | | Repurchase
Agreements,
at Value | | | Repurchase
Agreement
Proceeds
to be
Received(1) | |
| FICC | | | 0.400 | % | | | 06/30/2022 | | | | 07/01/2022 | | | $ | 1,300 | | | U.S. Treasury Notes 2.875% due 06/15/2025 | | $ | (1,326 | ) | | $ | 1,300 | | | $ | 1,300 | |
| | | | | | | | | | | | | | | | | | | | | | | | | | | | | | |
Total Repurchase Agreements | | | | | $ | (1,326 | ) | | $ | 1,300 | | | $ | 1,300 | |
| | | | | | | | | | | | | | | | | | | | | | | | | | | | | | |
BORROWINGS AND OTHER FINANCING TRANSACTIONS SUMMARY
The following is a summary by counterparty of the market value of Borrowings and Other Financing Transactions and collateral pledged/(received) as of June 30, 2022:
| | | | | | | | | | | | | | | | | | | | | | | | | | | | |
| Counterparty | | Repurchase
Agreement
Proceeds
to be
Received(1) | | | Payable for
Reverse
Repurchase
Agreements | | | Payable for
Sale-Buyback
Transactions | | | Securities
Out on Loan | | | Total
Borrowings and
Other Financing
Transactions | | | Collateral
Pledged/(Received) | | | Net Exposure(2) | |
Global/Master Repurchase Agreement | |
FICC | | $ | 1,300 | | | $ | 0 | | | $ | 0 | | | $ | 0 | | | $ | 1,300 | | | $ | (1,326 | ) | | $ | (26 | ) |
|
Master Securities Lending Agreement | |
BCY | | | 0 | | | | 0 | | | | 0 | | | | 42 | | | | 42 | | | | (53 | ) | | | (11 | ) |
MBC | | | 0 | | | | 0 | | | | 0 | | | | 8 | | | | 8 | | | | (9 | ) | | | (1 | ) |
UBS | | | 0 | | | | 0 | | | | 0 | | | | 9 | | | | 9 | | | | (10 | ) | | | (1 | ) |
| | | | | | | | | | | | | | | | | | | | | | | | | | | | |
Total Borrowings and Other Financing Transactions | | $ | 1,300 | | | $ | 0 | | | $ | 0 | | | $ | 59 | | | | | | | | | | | | | |
| | | | | | | | | | | | | | | | | | | | | | | | | | | | |
| | | | | | |
| 30 | | PIMCO EQUITY SERIES | | | See Accompanying Notes | |
CERTAIN TRANSFERS ACCOUNTED FOR AS SECURED BORROWINGS
Remaining Contractual Maturity of the Agreements
| | | | | | | | | | | | | | | | | | | | |
| | | Overnight and
Continuous | | | Up to 30 days | | | 31-90 days | | | Greater Than 90 days | | | Total | |
Securities Lending Transactions(3) | |
Common Stocks | | $ | 53 | | | $ | 0 | | | $ | 0 | | | $ | 0 | | | $ | 53 | |
Preferred Securities | | | 10 | | | | 0 | | | | 0 | | | | 0 | | | | 10 | |
Real Estate Investment Trusts | | | 9 | | | | 0 | | | | 0 | | | | 0 | | | | 9 | |
| | | | | | | | | | | | | | | | | | | | |
Total Borrowings | | $ | 72 | | | $ | 0 | | | $ | 0 | | | $ | 0 | | | $ | 72 | |
| | | | | | | | | | | | | | | | | | | | |
Payable for securities on loan - cash collateral | | | $ | 72 | |
| | | | | | | | | | | | | | | | | | | | |
| (1) | Includes accrued interest. |
| (2) | Net Exposure represents the net receivable/(payable) that would be due from/to the counterparty in the event of default. Exposure from borrowings and other financing transactions can only be netted across transactions governed under the same master agreement with the same legal entity. See Note 8, Master Netting Arrangements, in the Notes to Financial Statements for more information. |
| (3) | Includes cash collateral as described in Note 5 in the Notes to Financial Statements. |
FAIR VALUE OF FINANCIAL DERIVATIVE INSTRUMENTS
The following is a summary of the fair valuation of the Fund’s derivative instruments categorized by risk exposure. See Note 7, Principal and Other Risks, in the Notes to Financial Statements on risks of the Fund.
The effect of Financial Derivative Instruments on the Statements of Operations for the period ended June 30, 2022:
| | | | | | | | | | | | | | | | | | | | | | | | |
| | | Derivatives not accounted for as hedging instruments | |
| | | Commodity
Contracts | | | Credit
Contracts | | | Equity
Contracts | | | Foreign
Exchange
Contracts | | | Interest
Rate Contracts | | | Total | |
Net Realized (Loss) on Financial Derivative Instruments | |
Over the counter | |
Forward Foreign Currency Contracts | | $ | 0 | | | $ | 0 | | | $ | 0 | | | $ | (1 | ) | | $ | 0 | | | $ | (1 | ) |
| | | | | | | | | | | | | | | | | | | | | | | | |
FAIR VALUE MEASUREMENTS
The following is a summary of the fair valuations according to the inputs used as of June 30, 2022 in valuing the Fund’s assets and liabilities:
| | | | | | | | | | | | | | | | |
| Category and Subcategory | | Level 1 | | | Level 2 | | | Level 3 | | | Fair
Value at
06/30/2022 | |
Investments in Securities, at Value | |
Common Stocks | |
Brazil | |
Communication Services | | $ | 58 | | | $ | 0 | | | $ | 0 | | | $ | 58 | |
Consumer Discretionary | | | 174 | | | | 0 | | | | 0 | | | | 174 | |
Consumer Staples | | | 633 | | | | 0 | | | | 0 | | | | 633 | |
Energy | | | 167 | | | | 0 | | | | 0 | | | | 167 | |
Financials | | | 432 | | | | 0 | | | | 0 | | | | 432 | |
Health Care | | | 22 | | | | 0 | | | | 0 | | | | 22 | |
Industrials | | | 54 | | | | 0 | | | | 0 | | | | 54 | |
Materials | | | 943 | | | | 0 | | | | 0 | | | | 943 | |
Utilities | | | 227 | | | | 0 | | | | 0 | | | | 227 | |
Chile | |
Consumer Discretionary | | | 72 | | | | 0 | | | | 0 | | | | 72 | |
Consumer Staples | | | 110 | | | | 0 | | | | 0 | | | | 110 | |
Energy | | | 37 | | | | 0 | | | | 0 | | | | 37 | |
Financials | | | 148 | | | | 0 | | | | 0 | | | | 148 | |
Materials | | | 24 | | | | 0 | | | | 0 | | | | 24 | |
Utilities | | | 147 | | | | 0 | | | | 0 | | | | 147 | |
China | |
Communication Services | | | 440 | | | | 47 | | | | 0 | | | | 487 | |
Consumer Discretionary | | | 429 | | | | 1,415 | | | | 0 | | | | 1,844 | |
Consumer Staples | | | 0 | | | | 433 | | | | 0 | | | | 433 | |
Energy | | | 0 | | | | 2,013 | | | | 0 | | | | 2,013 | |
Financials | | | 30 | | | | 3,497 | | | | 0 | | | | 3,527 | |
Health Care | | | 0 | | | | 269 | | | | 0 | | | | 269 | |
Industrials | | | 68 | | | | 1,104 | | | | 0 | | | | 1,172 | |
Information Technology | | | 0 | | | | 236 | | | | 0 | | | | 236 | |
| | | | | | | | | | | | | | | | |
| Category and Subcategory | | Level 1 | | | Level 2 | | | Level 3 | | | Fair
Value at
06/30/2022 | |
Materials | | $ | 0 | | | $ | 610 | | | $ | 0 | | | $ | 610 | |
Real Estate | | | 0 | | | | 156 | | | | 13 | | | | 169 | |
Utilities | | | 0 | | | | 774 | | | | 0 | | | | 774 | |
Greece | |
Communication Services | | | 0 | | | | 87 | | | | 0 | | | | 87 | |
Consumer Discretionary | | | 0 | | | | 67 | | | | 0 | | | | 67 | |
Energy | | | 0 | | | | 24 | | | | 0 | | | | 24 | |
Financials | | | 0 | | | | 289 | | | | 0 | | | | 289 | |
Utilities | | | 0 | | | | 22 | | | | 0 | | | | 22 | |
Hong Kong | | | | | | | | | | | | | | | | |
Consumer Staples | | | 0 | | | | 75 | | | | 0 | | | | 75 | |
Financials | | | 0 | | | | 618 | | | | 0 | | | | 618 | |
Industrials | | | 0 | | | | 202 | | | | 0 | | | | 202 | |
Real Estate | | | 0 | | | | 693 | | | | 0 | | | | 693 | |
Utilities | | | 0 | | | | 1,117 | | | | 0 | | | | 1,117 | |
India | |
Communication Services | | | 0 | | | | 419 | | | | 0 | | | | 419 | |
Consumer Discretionary | | | 0 | | | | 812 | | | | 0 | | | | 812 | |
Consumer Staples | | | 0 | | | | 1,324 | | | | 0 | | | | 1,324 | |
Energy | | | 0 | | | | 1,617 | | | | 0 | | | | 1,617 | |
Financials | | | 0 | | | | 1,093 | | | | 0 | | | | 1,093 | |
Health Care | | | 0 | | | | 607 | | | | 0 | | | | 607 | |
Industrials | | | 0 | | | | 408 | | | | 0 | | | | 408 | |
Information Technology | | | 0 | | | | 4,467 | | | | 0 | | | | 4,467 | |
Materials | | | 0 | | | | 684 | | | | 0 | | | | 684 | |
Real Estate | | | 0 | | | | 29 | | | | 0 | | | | 29 | |
Utilities | | | 0 | | | | 649 | | | | 0 | | | | 649 | |
| | | | | | | | | | | | |
| See Accompanying Notes | | | ANNUAL REPORT | | | | | | | JUNE 30, 2022 | | | 31 |
| | | | | | |
| Schedule of Investments | | PIMCO RAFI Dynamic Multi-Factor Emerging Markets Equity ETF | | (Cont.) | | June 30, 2022 |
| | | | | | | | | | | | | | | | |
| Category and Subcategory | | Level 1 | | | Level 2 | | | Level 3 | | | Fair
Value at
06/30/2022 | |
Indonesia | |
Communication Services | | $ | 0 | | | $ | 339 | | | $ | 0 | | | $ | 339 | |
Consumer Discretionary | | | 0 | | | | 182 | | | | 0 | | | | 182 | |
Consumer Staples | | | 0 | | | | 137 | | | | 0 | | | | 137 | |
Energy | | | 0 | | | | 337 | | | | 0 | | | | 337 | |
Financials | | | 0 | | | | 525 | | | | 0 | | | | 525 | |
Health Care | | | 0 | | | | 36 | | | | 0 | | | | 36 | |
Materials | | | 0 | | | | 48 | | | | 0 | | | | 48 | |
Utilities | | | 0 | | | | 44 | | | | 0 | | | | 44 | |
Malaysia | |
Communication Services | | | 23 | | | | 133 | | | | 0 | | | | 156 | |
Consumer Discretionary | | | 0 | | | | 91 | | | | 0 | | | | 91 | |
Consumer Staples | | | 79 | | | | 60 | | | | 0 | | | | 139 | |
Energy | | | 0 | | | | 37 | | | | 0 | | | | 37 | |
Financials | | | 0 | | | | 613 | | | | 0 | | | | 613 | |
Industrials | | | 0 | | | | 103 | | | | 0 | | | | 103 | |
Materials | | | 0 | | | | 136 | | | | 0 | | | | 136 | |
Utilities | | | 0 | | | | 77 | | | | 0 | | | | 77 | |
Mexico | |
Communication Services | | | 946 | | | | 0 | | | | 0 | | | | 946 | |
Consumer Staples | | | 949 | | | | 0 | | | | 0 | | | | 949 | |
Financials | | | 141 | | | | 0 | | | | 0 | | | | 141 | |
Industrials | | | 140 | | | | 0 | | | | 0 | | | | 140 | |
Materials | | | 285 | | | | 0 | | | | 0 | | | | 285 | |
Philippines | |
Communication Services | | | 0 | | | | 70 | | | | 0 | | | | 70 | |
Consumer Staples | | | 0 | | | | 30 | | | | 0 | | | | 30 | |
Financials | | | 0 | | | | 101 | | | | 0 | | | | 101 | |
Industrials | | | 0 | | | | 70 | | | | 0 | | | | 70 | |
Real Estate | | | 0 | | | | 34 | | | | 0 | | | | 34 | |
Utilities | | | 0 | | | | 46 | | | | 0 | | | | 46 | |
Poland | |
Communication Services | | | 0 | | | | 45 | | | | 0 | | | | 45 | |
Energy | | | 0 | | | | 304 | | | | 0 | | | | 304 | |
Financials | | | 0 | | | | 104 | | | | 0 | | | | 104 | |
Materials | | | 0 | | | | 87 | | | | 0 | | | | 87 | |
Utilities | | | 0 | | | | 91 | | | | 0 | | | | 91 | |
Romania | |
Real Estate | | | 0 | | | | 18 | | | | 0 | | | | 18 | |
Russia | |
Financials | | | 0 | | | | 0 | | | | 1 | | | | 1 | |
Saudi Arabia | |
Communication Services | | | 0 | | | | 330 | | | | 0 | | | | 330 | |
Consumer Discretionary | | | 0 | | | | 48 | | | | 0 | | | | 48 | |
Consumer Staples | | | 0 | | | | 49 | | | | 0 | | | | 49 | |
Energy | | | 0 | | | | 423 | | | | 0 | | | | 423 | |
Financials | | | 0 | | | | 982 | | | | 0 | | | | 982 | |
Health Care | | | 0 | | | | 16 | | | | 0 | | | | 16 | |
Materials | | | 0 | | | | 808 | | | | 0 | | | | 808 | |
Utilities | | | 0 | | | | 49 | | | | 0 | | | | 49 | |
Singapore | |
Industrials | | | 0 | | | | 44 | | | | 0 | | | | 44 | |
South Africa | |
Communication Services | | | 95 | | | | 430 | | | | 0 | | | | 525 | |
Consumer Discretionary | | | 182 | | | | 51 | | | | 0 | | | | 233 | |
Consumer Staples | | | 211 | | | | 162 | | | | 0 | | | | 373 | |
Energy | | | 0 | | | | 117 | | | | 0 | | | | 117 | |
Financials | | | 33 | | | | 534 | | | | 0 | | | | 567 | |
Health Care | | | 0 | | | | 56 | | | | 0 | | | | 56 | |
Industrials | | | 44 | | | | 0 | | | | 0 | | | | 44 | |
Materials | | | 87 | | | | 1,075 | | | | 0 | | | | 1,162 | |
South Korea | |
Communication Services | | | 0 | | | | 1,191 | | | | 0 | | | | 1,191 | |
Consumer Discretionary | | | 0 | | | | 2,822 | | | | 0 | | | | 2,822 | |
Consumer Staples | | | 0 | | | | 511 | | | | 0 | | | | 511 | |
Energy | | | 0 | | | | 599 | | | | 0 | | | | 599 | |
Financials | | | 0 | | | | 1,605 | | | | 0 | | | | 1,605 | |
| | | | | | | | | | | | | | | | |
| Category and Subcategory | | Level 1 | | | Level 2 | | | Level 3 | | | Fair
Value at
06/30/2022 | |
Industrials | | $ | 0 | | | $ | 1,206 | | | $ | 0 | | | $ | 1,206 | |
Information Technology | | | 0 | | | | 803 | | | | 0 | | | | 803 | |
Materials | | | 0 | | | | 994 | | | | 0 | | | | 994 | |
Utilities | | | 0 | | | | 394 | | | | 0 | | | | 394 | |
Taiwan | |
Communication Services | | | 0 | | | | 643 | | | | 0 | | | | 643 | |
Consumer Discretionary | | | 0 | | | | 456 | | | | 0 | | | | 456 | |
Consumer Staples | | | 0 | | | | 314 | | | | 0 | | | | 314 | |
Energy | | | 0 | | | | 76 | | | | 0 | | | | 76 | |
Financials | | | 0 | | | | 2,946 | | | | 0 | | | | 2,946 | |
Industrials | | | 0 | | | | 735 | | | | 0 | | | | 735 | |
Information Technology | | | 18 | | | | 5,273 | | | | 0 | | | | 5,291 | |
Materials | | | 0 | | | | 1,500 | | | | 0 | | | | 1,500 | |
Real Estate | | | 0 | | | | 94 | | | | 0 | | | | 94 | |
Thailand | |
Communication Services | | | 0 | | | | 418 | | | | 0 | | | | 418 | |
Consumer Discretionary | | | 0 | | | | 86 | | | | 0 | | | | 86 | |
Consumer Staples | | | 0 | | | | 604 | | | | 0 | | | | 604 | |
Energy | | | 0 | | | | 865 | | | | 0 | | | | 865 | |
Financials | | | 0 | | | | 809 | | | | 0 | | | | 809 | |
Health Care | | | 0 | | | | 254 | | | | 0 | | | | 254 | |
Industrials | | | 0 | | | | 280 | | | | 0 | | | | 280 | |
Information Technology | | | 34 | | | | 0 | | | | 0 | | | | 34 | |
Materials | | | 30 | | | | 633 | | | | 0 | | | | 663 | |
Real Estate | | | 0 | | | | 171 | | | | 0 | | | | 171 | |
Utilities | | | 0 | | | | 92 | | | | 0 | | | | 92 | |
Turkey | |
Communication Services | | | 0 | | | | 147 | | | | 0 | | | | 147 | |
Consumer Discretionary | | | 0 | | | | 200 | | | | 0 | | | | 200 | |
Consumer Staples | | | 110 | | | | 40 | | | | 0 | | | | 150 | |
Energy | | | 0 | | | | 272 | | | | 0 | | | | 272 | |
Financials | | | 217 | | | | 117 | | | | 0 | | | | 334 | |
Industrials | | | 222 | | | | 167 | | | | 0 | | | | 389 | |
Materials | | | 0 | | | | 68 | | | | 0 | | | | 68 | |
Utilities | | | 23 | | | | 0 | | | | 0 | | | | 23 | |
United States | |
Consumer Discretionary | | | 0 | | | | 29 | | | | 0 | | | | 29 | |
Equity-Linked Securities | |
United Kingdom | |
Financials | | | 0 | | | | 1,294 | | | | 0 | | | | 1,294 | |
Industrials | | | 0 | | | | 187 | | | | 0 | | | | 187 | |
Preferred Stocks | |
Brazil | |
Banking & Finance | | | 183 | | | | 0 | | | | 0 | | | | 183 | |
Energy | | | 267 | | | | 0 | | | | 0 | | | | 267 | |
Industrials | | | 306 | | | | 0 | | | | 0 | | | | 306 | |
Utilities | | | 370 | | | | 0 | | | | 0 | | | | 370 | |
Chile | |
Industrials | | | 243 | | | | 0 | | | | 0 | | | | 243 | |
Real Estate Investment Trusts | |
India | |
Real Estate | | | 0 | | | | 34 | | | | 0 | | | | 34 | |
South Africa | |
Real Estate | | | 18 | | | | 0 | | | | 0 | | | | 18 | |
Turkey | |
Real Estate | | | 0 | | | | 19 | | | | 0 | | | | 19 | |
Short-Term Instruments | |
Repurchase Agreements | | | 0 | | | | 1,300 | | | | 0 | | | | 1,300 | |
| | | | | | | | | | | | | | | | |
| | $ | 9,471 | | | $ | 65,177 | | | $ | 14 | | | $ | 74,662 | |
| | | | | | | | | | | | | | | | |
|
Investments in Affiliates, at Value | |
Short-Term Instruments | |
Mutual Funds | | | 72 | | | | 0 | | | | 0 | | | | 72 | |
| | | | | | | | | | | | | | | | |
| | | | |
Total Investments | | $ | 9,543 | | | $ | 65,177 | | | $ | 14 | | | $ | 74,734 | |
| | | | | | | | | | | | | | | | |
There were no significant transfers into or out of Level 3 during the period ended June 30, 2022.
| | | | | | |
| 32 | | PIMCO EQUITY SERIES | | | See Accompanying Notes | |
| | | | | | |
| Schedule of Investments | | PIMCO RAFI Dynamic Multi-Factor International Equity ETF | | | | June 30, 2022 |
(Amounts in thousands*, except number of shares, contracts, units and ounces, if any)
| | | | | | | | | | | | |
| | | | | SHARES | | | | | MARKET
VALUE
(000S) | |
| INVESTMENTS IN SECURITIES 99.0% | |
| |
| COMMON STOCKS 95.0% | |
| |
| AUSTRALIA 4.2% | |
| |
| COMMUNICATION SERVICES 0.5% | |
| | | | |
carsales.com Ltd. | | | | | 1,346 | | | $ | | | 17 | |
| | | | |
Nine Entertainment Co. Holdings Ltd. | | | | | 5,374 | | | | | | 7 | |
| | | | |
REA Group Ltd. | | | | | 300 | | | | | | 23 | |
| | | | |
SEEK Ltd. | | | | | 1,816 | | | | | | 26 | |
| | | | |
Telstra Corp. Ltd. | | | | | 123,543 | | | | | | 329 | |
| | | | | | | | | | | | |
| | | | | | | | | | | 402 | |
| | | | | | | | | | | | |
| |
| CONSUMER DISCRETIONARY 0.3% | |
| | | | |
Domino’s Pizza Enterprises Ltd. | | | | | 477 | | | | | | 23 | |
| | | | |
Harvey Norman Holdings Ltd. | | | | | 8,564 | | | | | | 22 | |
| | | | |
JB Hi-Fi Ltd. | | | | | 1,372 | | | | | | 37 | |
| | | | |
Lottery Corp. Ltd. (a) | | | | | 8,397 | | | | | | 26 | |
| | | | |
Super Retail Group Ltd. | | | | | 3,812 | | | | | | 22 | |
| | | | |
Tabcorp Holdings Ltd. | | | | | 8,397 | | | | | | 6 | |
| | | | |
Wesfarmers Ltd. | | | | | 5,021 | | | | | | 145 | |
| | | | | | | | | | | | |
| | | | | | | | | | | 281 | |
| | | | | | | | | | | | |
| |
| CONSUMER STAPLES 0.6% | |
| | | | |
Coles Group Ltd. | | | | | 9,145 | | | | | | 113 | |
| | | | |
GrainCorp Ltd. ‘A’ | | | | | 7,302 | | | | | | 48 | |
| | | | |
Metcash Ltd. | | | | | 19,577 | | | | | | 57 | |
| | | | |
Woolworths Group Ltd. | | | | | 13,339 | | | | | | 328 | |
| | | | | | | | | | | | |
| | | | | | | | | | | 546 | |
| | | | | | | | | | | | |
| |
| ENERGY 0.4% | |
| | | | |
Ampol Ltd. | | | | | 3,218 | | | | | | 76 | |
| | | | |
Santos Ltd. | | | | | 5,824 | | | | | | 29 | |
| | | | |
Viva Energy Group Ltd. | | | | | 16,312 | | | | | | 33 | |
| | | | |
Whitehaven Coal Ltd. | | | | | 14,115 | | | | | | 47 | |
| | | | |
Woodside Energy Group Ltd. | | | | | 5,088 | | | | | | 112 | |
| | | | | | | | | | | | |
| | | | | | | | | | | 297 | |
| | | | | | | | | | | | |
| |
| FINANCIALS 0.7% | |
| | | | |
AMP Ltd. (a) | | | | | 50,368 | | | | | | 33 | |
| | | | |
ASX Ltd. | | | | | 471 | | | | | | 27 | |
| | | | |
Bank of Queensland Ltd. | | | | | 5,127 | | | | | | 24 | |
| | | | |
Bendigo & Adelaide Bank Ltd. | | | | | 4,700 | | | | | | 30 | |
| | | | |
Insurance Australia Group Ltd. | | | | | 8,482 | | | | | | 26 | |
| | | | |
Macquarie Group Ltd. | | | | | 780 | | | | | | 89 | |
| | | | |
Medibank Pvt Ltd. | | | | | 26,444 | | | | | | 59 | |
| | | | |
National Australia Bank Ltd. | | | | | 7,164 | | | | | | 136 | |
| | | | |
NIB Holdings Ltd. | | | | | 4,593 | | | | | | 23 | |
| | | | |
Perpetual Ltd. | | | | | 772 | | | | | | 15 | |
| | | | |
QBE Insurance Group Ltd. | | | | | 5,141 | | | | | | 43 | |
| | | | |
Suncorp Group Ltd. | | | | | 16,557 | | | | | | 126 | |
| | | | | | | | | | | | |
| | | | | | | | | | | 631 | |
| | | | | | | | | | | | |
| |
| HEALTH CARE 0.2% | |
| | | | |
Cochlear Ltd. | | | | | 195 | | | | | | 27 | |
| | | | |
CSL Ltd. | | | | | 431 | | | | | | 80 | |
| | | | |
Ramsay Health Care Ltd. | | | | | 495 | | | | | | 25 | |
| | | | |
Sonic Healthcare Ltd. | | | | | 1,725 | | | | | | 39 | |
| | | | | | | | | | | | |
| | | | | | | | | | | 171 | |
| | | | | | | | | | | | |
| |
| | | | | | | | | | | | |
| | | | | SHARES | | | | | MARKET
VALUE
(000S) | |
| INDUSTRIALS 0.4% | |
| | | | |
Aurizon Holdings Ltd. | | | | | 29,728 | | | $ | | | 78 | |
| | | | |
Brambles Ltd. | | | | | 8,618 | | | | | | 64 | |
| | | | |
Downer EDI Ltd. | | | | | 7,600 | | | | | | 26 | |
| | | | |
Qantas Airways Ltd. (a) | | | | | 7,675 | | | | | | 24 | |
| | | | |
Transurban Group | | | | | 10,973 | | | | | | 109 | |
| | | | | | | | | | | | |
| | | | | | | | | | | 301 | |
| | | | | | | | | | | | |
| |
| INFORMATION TECHNOLOGY 0.0% | |
| | | | |
Computershare Ltd. | | | | | 1,793 | | | | | | 30 | |
| | | | | | | | | | | | |
| |
| MATERIALS 0.8% | |
| | | | |
BHP Group Ltd. | | | | | 4,215 | | | | | | 121 | |
| | | | |
BlueScope Steel Ltd. | | | | | 5,210 | | | | | | 57 | |
| | | | |
CSR Ltd. | | | | | 9,021 | | | | | | 25 | |
| | | | |
Fortescue Metals Group Ltd. | | | | | 11,598 | | | | | | 139 | |
| | | | |
IGO Ltd. | | | | | 3,857 | | | | | | 26 | |
| | | | |
Iluka Resources Ltd. | | | | | 3,811 | | | | | | 25 | |
| | | | |
Incitec Pivot Ltd. | | | | | 20,852 | | | | | | 48 | |
| | | | |
Mineral Resources Ltd. | | | | | 1,097 | | | | | | 37 | |
| | | | |
Newcrest Mining Ltd. | | | | | 4,008 | | | | | | 57 | |
| | | | |
Northern Star Resources Ltd. | | | | | 4,648 | | | | | | 22 | |
| | | | |
Orica Ltd. | | | | | 2,530 | | | | | | 28 | |
| | | | |
Rio Tinto Ltd. | | | | | 1,185 | | | | | | 85 | |
| | | | | | | | | | | | |
| | | | | | | | | | | 670 | |
| | | | | | | | | | | | |
| |
| REAL ESTATE 0.0% | |
| | | | |
Lendlease Corp. Ltd. | | | | | 4,243 | | | | | | 27 | |
| | | | | | | | | | | | |
| |
| UTILITIES 0.3% | |
| | | | |
AGL Energy Ltd. | | | | | 15,523 | | | | | | 89 | |
| | | | |
APA Group | | | | | 5,127 | | | | | | 40 | |
| | | | |
Origin Energy Ltd. | | | | | 29,453 | | | | | | 117 | |
| | | | | | | | | | | | |
| | | | | | | | | | | 246 | |
| | | | | | | | | | | | |
Total Australia | | | | | | | | | | | 3,602 | |
| | | | | | | | | | | | |
| |
| AUSTRIA 0.3% | |
| |
| COMMUNICATION SERVICES 0.0% | |
| | | | |
Telekom Austria AG | | | | | 3,783 | | | | | | 25 | |
| | | | | | | | | | | | |
| |
| ENERGY 0.1% | |
| | | | |
OMV AG | | | | | 1,505 | | | | | | 71 | |
| | | | | | | | | | | | |
| |
| FINANCIALS 0.0% | |
| | | | |
UNIQA Insurance Group AG | | | | | 3,585 | | | | | | 25 | |
| | | | | | | | | | | | |
| |
| INDUSTRIALS 0.0% | |
| | | | |
Andritz AG | | | | | 596 | | | | | | 24 | |
| | | | | | | | | | | | |
| |
| MATERIALS 0.0% | |
| | | | |
voestalpine AG | | | | | 1,069 | | | | | | 23 | |
| | | | | | | | | | | | |
| |
| REAL ESTATE 0.1% | |
| | | | |
CA Immobilien Anlagen AG | | | | | 1,128 | | | | | | 36 | |
| | | | | | | | | | | | |
| |
| UTILITIES 0.1% | |
| | | | |
Verbund AG | | | | | 287 | | | | | | 28 | |
| | | | | | | | | | | | |
Total Austria | | | | | | | | | | | 232 | |
| | | | | | | | | | | | |
| |
| | | | | | | | | | | | |
| | | | | SHARES | | | | | MARKET
VALUE
(000S) | |
| BELGIUM 0.4% | |
| |
| COMMUNICATION SERVICES 0.1% | |
| | | | |
Proximus SADP | | | | | 2,842 | | | $ | | | 42 | |
| | | | | | | | | | | | |
| |
| CONSUMER DISCRETIONARY 0.0% | |
| | | | |
Telenet Group Holding NV | | | | | 1,069 | | | | | | 22 | |
| | | | | | | | | | | | |
| |
| CONSUMER STAPLES 0.1% | |
| | | | |
Etablissements Franz Colruyt NV | | | | | 1,385 | | | | | | 38 | |
| | | | | | | | | | | | |
| |
| FINANCIALS 0.1% | |
| | | | |
Ageas SA | | | | | 919 | | | | | | 40 | |
| | | | |
Gimv NV | | | | | 397 | | | | | | 22 | |
| | | | | | | | | | | | |
| | | | | | | | | | | 62 | |
| | | | | | | | | | | | |
| |
| HEALTH CARE 0.1% | |
| | | | |
UCB SA | | | | | 948 | | | | | | 80 | |
| | | | | | | | | | | | |
| |
| INDUSTRIALS 0.0% | |
| | | | |
Ackermans & Van Haaren NV | | | | | 162 | | | | | | 24 | |
| | | | | | | | | | | | |
| |
| INFORMATION TECHNOLOGY 0.0% | |
| | | | |
Barco NV | | | | | 1,356 | | | | | | 29 | |
| | | | | | | | | | | | |
| |
| MATERIALS 0.0% | |
| | | | |
Solvay SA | | | | | 270 | | | | | | 22 | |
| | | | | | | | | | | | |
Total Belgium | | | | | | | | | | | 319 | |
| | | | | | | | | | | | |
| |
| CANADA 8.0% | |
| |
| COMMUNICATION SERVICES 0.6% | |
| | | | |
BCE, Inc. | | | | | 3,796 | | | | | | 187 | |
| | | | |
Cineplex, Inc. (a) | | | | | 2,891 | | | | | | 24 | |
| | | | |
Cogeco Communications, Inc. | | | | | 351 | | | | | | 24 | |
| | | | |
Quebecor, Inc. ‘B’ | | | | | 1,352 | | | | | | 29 | |
| | | | |
Rogers Communications, Inc. ‘B’ | | | | | 1,652 | | | | | | 79 | |
| | | | |
Shaw Communications, Inc. ‘B’ | | | | | 4,120 | | | | | | 122 | |
| | | | |
TELUS Corp. | | | | | 4,012 | | | | | | 89 | |
| | | | | | | | | | | | |
| | | | | | | | | | | 554 | |
| | | | | | | | | | | | |
| |
| CONSUMER DISCRETIONARY 0.5% | |
| | | | |
Canadian Tire Corp. Ltd. ‘A’ | | | | | 783 | | | | | | 99 | |
| | | | |
Dollarama, Inc. | | | | | 1,255 | | | | | | 72 | |
| | | | |
Gildan Activewear, Inc. | | | | | 1,051 | | | | | | 30 | |
| | | | |
Lululemon Athletica, Inc. (a) | | | | | 126 | | | | | | 34 | |
| | | | |
Magna International, Inc. | | | | | 3,886 | | | | | | 214 | |
| | | | | | | | | | | | |
| | | | | | | | | | | 449 | |
| | | | | | | | | | | | |
| |
| CONSUMER STAPLES 0.8% | |
| | | | |
Alimentation Couche-Tard, Inc. | | | | | 3,840 | | | | | | 150 | |
| | | | |
Empire Co. Ltd. ‘A’ | | | | | 3,209 | | | | | | 99 | |
| | | | |
George Weston Ltd. | | | | | 845 | | | | | | 99 | |
| | | | |
Loblaw Cos., Ltd. | | | | | 1,572 | | | | | | 142 | |
| | | | |
Maple Leaf Foods, Inc. | | | | | 874 | | | | | | 17 | |
| | | | |
Metro, Inc. | | | | | 1,714 | | | | | | 92 | |
| | | | |
North West Co., Inc. | | | | | 907 | | | | | | 23 | |
| | | | |
Premium Brands Holdings Corp. | | | | | 338 | | | | | | 24 | |
| | | | |
Saputo, Inc. | | | | | 1,423 | | | | | | 31 | |
| | | | | | | | | | | | |
| | | | | | | | | | | 677 | |
| | | | | | | | | | | | |
| |
| | | | | | | | | | | | |
| See Accompanying Notes | | | ANNUAL REPORT | | | | | | | JUNE 30, 2022 | | | 33 |
| | | | | | |
| Schedule of Investments | | PIMCO RAFI Dynamic Multi-Factor International Equity ETF | | (Cont.) | | |
| | | | | | | | | | | | |
| | | | | SHARES | | | | | MARKET
VALUE
(000S) | |
| ENERGY 1.9% | |
| | | | |
ARC Resources Ltd. | | | | | 7,754 | | | $ | | | 98 | |
| | | | |
Birchcliff Energy Ltd. | | | | | 4,935 | | | | | | 34 | |
| | | | |
Canadian Natural Resources Ltd. | | | | | 1,604 | | | | | | 86 | |
| | | | |
Crescent Point Energy Corp. | | | | | 26,267 | | | | | | 187 | |
| | | | |
Enbridge, Inc. | | | | | 3,216 | | | | | | 136 | |
| | | | |
Enerplus Corp. | | | | | 5,719 | | | | | | 76 | |
| | | | |
Gibson Energy, Inc. | | | | | 2,372 | | | | | | 44 | |
| | | | |
Imperial Oil Ltd. | | | | | 3,444 | | | | | | 162 | |
| | | | |
MEG Energy Corp. (a) | | | | | 5,927 | | | | | | 82 | |
| | | | |
Peyto Exploration & Development Corp. | | | | | 4,739 | | | | | | 44 | |
| | | | |
Suncor Energy, Inc. | | | | | 13,744 | | | | | | 482 | |
| | | | |
TC Energy Corp. | | | | | 686 | | | | | | 35 | |
| | | | |
Vermilion Energy, Inc. | | | | | 3,509 | | | | | | 67 | |
| | | | |
Whitecap Resources, Inc. (e) | | | | | 11,254 | | | | | | 78 | |
| | | | | | | | | | | | |
| | | | | | | | | | | 1,611 | |
| | | | | | | | | | | | |
| |
| FINANCIALS 1.4% | |
| | | | |
Bank of Montreal | | | | | 1,533 | | | | | | 147 | |
| | | | |
Bank of Nova Scotia | | | | | 2,391 | | | | | | 141 | |
| | | | |
Brookfield Asset Management, Inc. ‘A’ | | | | | 1,499 | | | | | | 67 | |
| | | | |
Canadian Imperial Bank of Commerce | | | | | 4,088 | | | | | | 199 | |
| | | | |
CI Financial Corp. | | | | | 2,825 | | | | | | 30 | |
| | | | |
Fairfax Financial Holdings Ltd. | | | | | 255 | | | | | | 135 | |
| | | | |
Great-West Lifeco, Inc. (e) | | | | | 1,233 | | | | | | 30 | |
| | | | |
Home Capital Group, Inc. | | | | | 1,203 | | | | | | 23 | |
| | | | |
IGM Financial, Inc. | | | | | 889 | | | | | | 24 | |
| | | | |
Intact Financial Corp. (e) | | | | | 714 | | | | | | 101 | |
| | | | |
Onex Corp. | | | | | 472 | | | | | | 23 | |
| | | | |
Power Corp. of Canada | | | | | 2,860 | | | | | | 74 | |
| | | | |
Toronto-Dominion Bank | | | | | 2,762 | | | | | | 181 | |
| | | | | | | | | | | | |
| | | | | | | | | | | 1,175 | |
| | | | | | | | | | | | |
| |
| HEALTH CARE 0.0% | |
| | | | |
Chartwell Retirement Residences | | | | | 2,011 | | | | | | 17 | |
| | | | | | | | | | | | |
| |
| INDUSTRIALS 0.9% | |
| | | | |
Aecon Group, Inc. | | | | | 2,293 | | | | | | 23 | |
| | | | |
Canadian National Railway Co. | | | | | 1,385 | | | | | | 156 | |
| | | | |
Canadian Pacific Railway Ltd. | | | | | 1,906 | | | | | | 133 | |
| | | | |
Finning International, Inc. | | | | | 1,921 | | | | | | 41 | |
| | | | |
Ritchie Bros Auctioneers, Inc. | | | | | 787 | | | | | | 51 | |
| | | | |
Russel Metals, Inc. | | | | | 1,139 | | | | | | 23 | |
| | | | |
TFI International, Inc. | | | | | 960 | | | | | | 77 | |
| | | | |
Thomson Reuters Corp. | | | | | 1,703 | | | | | | 178 | |
| | | | |
Toromont Industries Ltd. | | | | | 818 | | | | | | 66 | |
| | | | |
Westshore Terminals Investment Corp. | | | | | 1,821 | | | | | | 45 | |
| | | | | | | | | | | | |
| | | | | | | | | | | 793 | |
| | | | | | | | | | | | |
| |
| INFORMATION TECHNOLOGY 0.3% | |
| | | | |
Celestica, Inc. (a) | | | | | 3,721 | | | | | | 36 | |
| | | | |
CGI, Inc. (a) | | | | | 1,139 | | | | | | 91 | |
| | | | |
Constellation Software, Inc. (e) | | | | | 40 | | | | | | 59 | |
| | | | |
Open Text Corp. | | | | | 739 | | | | | | 28 | |
| | | | | | | | | | | | |
| | | | | | | | | | | 214 | |
| | | | | | | | | | | | |
| |
| MATERIALS 0.9% | |
| | | | |
Barrick Gold Corp. | | | | | 2,431 | | | | | | 43 | |
| | | | |
Eldorado Gold Corp. (a) | | | | | 3,613 | | | | | | 23 | |
| | | | | | | | | | | | |
| | | | | SHARES | | | | | MARKET
VALUE
(000S) | |
| | | | |
First Quantum Minerals Ltd. | | | | | 2,882 | | | $ | | | 55 | |
| | | | |
Franco-Nevada Corp. | | | | | 660 | | | | | | 87 | |
| | | | |
Interfor Corp. (a) | | | | | 1,260 | | | | | | 25 | |
| | | | |
Methanex Corp. | | | | | 989 | | | | | | 38 | |
| | | | |
Nutrien Ltd. | | | | | 1,242 | | | | | | 99 | |
| | | | |
Resolute Forest Products, Inc. | | | | | 2,362 | | | | | | 30 | |
| | | | |
Stelco Holdings, Inc. | | | | | 1,118 | | | | | | 28 | |
| | | | |
Teck Resources Ltd. ‘B’ | | | | | 6,139 | | | | | | 188 | |
| | | | |
Transcontinental, Inc. ‘A’ | | | | | 1,808 | | | | | | 21 | |
| | | | |
Turquoise Hill Resources Ltd. (a) | | | | | 1,748 | | | | | | 47 | |
| | | | |
West Fraser Timber Co. Ltd. | | | | | 805 | | | | | | 62 | |
| | | | | | | | | | | | |
| | | | | | | | | | | 746 | |
| | | | | | | | | | | | |
| |
| REAL ESTATE 0.1% | |
| | | | |
Colliers International Group, Inc. | | | | | 262 | | | | | | 29 | |
| | | | |
FirstService Corp. | | | | | 299 | | | | | | 36 | |
| | | | | | | | | | | | |
| | | | | | | | | | | 65 | |
| | | | | | | | | | | | |
| |
| UTILITIES 0.6% | |
| | | | |
Algonquin Power & Utilities Corp. | | | | | 1,470 | | | | | | 20 | |
| | | | |
Atco Ltd. ‘I’ | | | | | 1,435 | | | | | | 49 | |
| | | | |
Canadian Utilities Ltd. ‘A’ | | | | | 975 | | | | | | 29 | |
| | | | |
Emera, Inc. | | | | | 1,321 | | | | | | 62 | |
| | | | |
Fortis, Inc. | | | | | 3,000 | | | | | | 142 | |
| | | | |
Hydro One Ltd. | | | | | 2,473 | | | | | | 66 | |
| | | | |
Northland Power, Inc. | | | | | 1,332 | | | | | | 40 | |
| | | | |
Superior Plus Corp. | | | | | 2,784 | | | | | | 24 | |
| | | | |
TransAlta Corp. | | | | | 4,540 | | | | | | 52 | |
| | | | |
TransAlta Renewables, Inc. | | | | | 1,871 | | | | | | 24 | |
| | | | | | | | | | | | |
| | | | | | | | | | | 508 | |
| | | | | | | | | | | | |
Total Canada | | | | | | | | | | | 6,809 | |
| | | | | | | | | | | | |
| |
| CHILE 0.0% | |
| |
| MATERIALS 0.0% | |
| | | | |
Antofagasta PLC | | | | | 1,313 | | | | | | 19 | |
| | | | | | | | | | | | |
Total Chile | | | | | | | | | | | 19 | |
| | | | | | | | | | | | |
| |
| DENMARK 2.3% | |
| |
| CONSUMER DISCRETIONARY 0.0% | |
| | | | |
Pandora AS | | | | | 319 | | | | | | 20 | |
| | | | | | | | | | | | |
| |
| CONSUMER STAPLES 0.2% | |
| | | | |
Carlsberg AS ‘B’ | | | | | 496 | | | | | | 64 | |
| | | | |
Royal Unibrew AS | | | | | 407 | | | | | | 36 | |
| | | | |
Scandinavian Tobacco Group AS | | | | | 1,649 | | | | | | 32 | |
| | | | | | | | | | | | |
| | | | | | | | | | | 132 | |
| | | | | | | | | | | | |
| |
| FINANCIALS 0.1% | |
| | | | |
Sydbank AS | | | | | 952 | | | | | | 30 | |
| | | | |
Topdanmark AS | | | | | 653 | | | | | | 34 | |
| | | | |
Tryg AS | | | | | 1,255 | | | | | | 28 | |
| | | | | | | | | | | | |
| | | | | | | | | | | 92 | |
| | | | | | | | | | | | |
| |
| HEALTH CARE 1.2% | |
| | | | |
Coloplast AS ‘B’ | | | | | 246 | | | | | | 28 | |
| | | | |
Novo Nordisk AS ‘B’ | | | | | 8,994 | | | | | | 997 | |
| | | | | | | | | | | | |
| | | | | | | | | | | 1,025 | |
| | | | | | | | | | | | |
| |
| INDUSTRIALS 0.6% | |
| | | | |
AP Moller - Maersk AS ‘B’ | | | | | 140 | | | | | | 329 | |
| | | | | | | | | | | | |
| | | | | SHARES | | | | | MARKET
VALUE
(000S) | |
| | | | |
D/S Norden AS | | | | | 1,213 | | | $ | | | 42 | |
| | | | |
DSV AS | | | | | 581 | | | | | | 82 | |
| | | | |
ISS AS | | | | | 1,614 | | | | | | 26 | |
| | | | |
Vestas Wind Systems AS | | | | | 1,704 | | | | | | 36 | |
| | | | | | | | | | | | |
| | | | | | | | | | | 515 | |
| | | | | | | | | | | | |
| |
| MATERIALS 0.1% | |
| | | | |
CHR Hansen Holding AS | | | | | 374 | | | | | | 27 | |
| | | | |
Novozymes AS ‘B’ | | | | | 979 | | | | | | 59 | |
| | | | | | | | | | | | |
| | | | | | | | | | | 86 | |
| | | | | | | | | | | | |
| |
| UTILITIES 0.1% | |
| | | | |
Orsted AS | | | | | 544 | | | | | | 57 | |
| | | | | | | | | | | | |
Total Denmark | | | | | | | | | | | 1,927 | |
| | | | | | | | | | | | |
| |
| FINLAND 1.1% | |
| |
| COMMUNICATION SERVICES 0.1% | |
| | | | |
Elisa Oyj | | | | | 1,084 | | | | | | 61 | |
| | | | | | | | | | | | |
| |
| CONSUMER STAPLES 0.1% | |
| | | | |
Kesko Oyj ‘B’ | | | | | 4,232 | | | | | | 100 | |
| | | | | | | | | | | | |
| |
| ENERGY 0.1% | |
| | | | |
Neste Oyj | | | | | 2,094 | | | | | | 93 | |
| | | | | | | | | | | | |
| |
| FINANCIALS 0.2% | |
| | | | |
Nordea Bank Abp | | | | | 8,859 | | | | | | 78 | |
| | | | |
Sampo Oyj ‘A’ | | | | | 3,865 | | | | | | 169 | |
| | | | | | | | | | | | |
| | | | | | | | | | | 247 | |
| | | | | | | | | | | | |
| |
| HEALTH CARE 0.1% | |
| | | | |
Orion Oyj ‘B’ | | | | | 1,186 | | | | | | 53 | |
| | | | | | | | | | | | |
| |
| INDUSTRIALS 0.1% | |
| | | | |
Kone Oyj ‘B’ | | | | | 1,674 | | | | | | 80 | |
| | | | | | | | | | | | |
| |
| INFORMATION TECHNOLOGY 0.1% | |
| | | | |
Nokia Oyj | | | | | 9,917 | | | | | | 46 | |
| | | | |
TietoEVRY Oyj | | | | | 1,230 | | | | | | 30 | |
| | | | | | | | | | | | |
| | | | | | | | | | | 76 | |
| | | | | | | | | | | | |
| |
| MATERIALS 0.2% | |
| | | | |
Kemira Oyj | | | | | 1,882 | | | | | | 23 | |
| | | | |
Outokumpu OYJ | | | | | 6,937 | | | | | | 29 | |
| | | | |
Stora Enso Oyj ‘R’ | | | | | 3,601 | | | | | | 57 | |
| | | | |
UPM-Kymmene Oyj | | | | | 1,842 | | | | | | 57 | |
| | | | | | | | | | | | |
| | | | | | | | | | | 166 | |
| | | | | | | | | | | | |
| |
| REAL ESTATE 0.1% | |
| | | | |
Citycon Oyj | | | | | 3,892 | | | | | | 27 | |
| | | | |
Kojamo OYJ | | | | | 1,730 | | | | | | 30 | |
| | | | | | | | | | | | |
| | | | | | | | | | | 57 | |
| | | | | | | | | | | | |
| |
| UTILITIES 0.0% | |
| | | | |
Fortum Oyj | | | | | 2,483 | | | | | | 38 | |
| | | | | | | | | | | | |
Total Finland | | | | | | | | | | | 971 | |
| | | | | | | | | | | | |
| |
| | | | | | |
| 34 | | PIMCO EQUITY SERIES | | | See Accompanying Notes | |
| | | | | | | | | | | | |
| | | | | SHARES | | | | | MARKET
VALUE
(000S) | |
| FRANCE 7.2% | |
| |
| COMMUNICATION SERVICES 1.1% | |
| | | | |
Eutelsat Communications SA | | | | | 5,488 | | | $ | | | 62 | |
| | | | |
Lagardere SA | | | | | 1,050 | | | | | | 18 | |
| | | | |
Metropole Television SA | | | | | 1,533 | | | | | | 23 | |
| | | | |
Orange SA | | | | | 54,955 | | | | | | 648 | |
| | | | |
Publicis Groupe SA | | | | | 869 | | | | | | 43 | |
| | | | |
Television Francaise 1 | | | | | 2,446 | | | | | | 17 | |
| | | | |
Vivendi SE | | | | | 8,469 | | | | | | 86 | |
| | | | | | | | | | | | |
| | | | | | | | | | | 897 | |
| | | | | | | | | | | | |
| |
| CONSUMER DISCRETIONARY 0.9% | |
| | | | |
Cie Generale des Etablissements Michelin S.C.A. | | | | | 2,416 | | | | | | 66 | |
| | | | |
Faurecia SE | | | | | 1,187 | | | | | | 24 | |
| | | | |
Hermes International | | | | | 91 | | | | | | 102 | |
| | | | |
Kering SA | | | | | 170 | | | | | | 88 | |
| | | | |
LVMH Moet Hennessy Louis Vuitton SE | | | | | 396 | | | | | | 243 | |
| | | | |
Renault SA | | | | | 6,759 | | | | | | 171 | |
| | | | |
Sodexo SA | | | | | 501 | | | | | | 35 | |
| | | | | | | | | | | | |
| | | | | | | | | | | 729 | |
| | | | | | | | | | | | |
| |
| CONSUMER STAPLES 1.1% | |
| | | | |
Carrefour SA | | | | | 22,834 | | | | | | 405 | |
| | | | |
Casino Guichard Perrachon SA (a) | | | | | 1,687 | | | | | | 22 | |
| | | | |
Danone SA | | | | | 3,465 | | | | | | 194 | |
| | | | |
L’Oreal SA | | | | | 429 | | | | | | 149 | |
| | | | |
Pernod Ricard SA | | | | | 731 | | | | | | 135 | |
| | | | | | | | | | | | |
| | | | | | | | | | | 905 | |
| | | | | | | | | | | | |
| |
| ENERGY 0.8% | |
| | | | |
TotalEnergies SE | | | | | 12,600 | | | | | | 663 | |
| | | | | | | | | | | | |
| |
| FINANCIALS 0.7% | |
| | | | |
AXA SA | | | | | 4,795 | | | | | | 109 | |
| | | | |
BNP Paribas SA | | | | | 2,049 | | | | | | 98 | |
| | | | |
Eurazeo SE | | | | | 360 | | | | | | 22 | |
| | | | |
SCOR SE | | | | | 1,149 | | | | | | 25 | |
| | | | |
Societe Generale SA | | | | | 17,317 | | | | | | 383 | |
| | | | | | | | | | | | |
| | | | | | | | | | | 637 | |
| | | | | | | | | | | | |
| |
| HEALTH CARE 0.7% | |
| | | | |
BioMerieux | | | | | 291 | | | | | | 29 | |
| | | | |
Sanofi | | | | | 5,416 | | | | | | 546 | |
| | | | |
Sartorius Stedim Biotech | | | | | 102 | | | | | | 32 | |
| | | | | | | | | | | | |
| | | | | | | | | | | 607 | |
| | | | | | | | | | | | |
| |
| INDUSTRIALS 1.1% | |
| | | | |
Airbus SE | | | | | 254 | | | | | | 25 | |
| | | | |
Alstom SA | | | | | 1,273 | | | | | | 29 | |
| | | | |
Bouygues SA | | | | | 3,405 | | | | | | 105 | |
| | | | |
Bureau Veritas SA | | | | | 3,086 | | | | | | 79 | |
| | | | |
Cie de Saint-Gobain | | | | | 1,821 | | | | | | 79 | |
| | | | |
Dassault Aviation SA | | | | | 297 | | | | | | 46 | |
| | | | |
Elis SA | | | | | 1,875 | | | | | | 25 | |
| | | | |
Legrand SA | | | | | 431 | | | | | | 32 | |
| | | | |
Nexans SA | | | | | 536 | | | | | | 42 | |
| | | | |
Rexel SA | | | | | 6,934 | | | | | | 107 | |
| | | | |
Safran SA | | | | | 443 | | | | | | 44 | |
| | | | |
Societe BIC SA | | | | | 545 | | | | | | 30 | |
| | | | | | | | | | | | |
| | | | | SHARES | | | | | MARKET
VALUE
(000S) | |
| | | | |
Teleperformance | | | | | 157 | | | $ | | | 49 | |
| | | | |
Thales SA | | | | | 803 | | | | | | 99 | |
| | | | |
Vinci SA | | | | | 1,972 | | | | | | 177 | |
| | | | | | | | | | | | |
| | | | | | | | | | | 968 | |
| | | | | | | | | | | | |
| |
| INFORMATION TECHNOLOGY 0.1% | |
| | | | |
Alten SA | | | | | 231 | | | | | | 25 | |
| | | | |
Capgemini SE | | | | | 277 | | | | | | 48 | |
| | | | |
Dassault Systemes SE | | | | | 1,044 | | | | | | 39 | |
| | | | | | | | | | | | |
| | | | | | | | | | | 112 | |
| | | | | | | | | | | | |
| |
| MATERIALS 0.1% | |
| | | | |
Air Liquide SA | | | | | 707 | | | | | | 95 | |
| | | | |
Vicat SA | | | | | 785 | | | | | | 22 | |
| | | | | | | | | | | | |
| | | | | | | | | | | 117 | |
| | | | | | | | | | | | |
| |
| UTILITIES 0.6% | |
| | | | |
Electricite de France SA | | | | | 5,151 | | | | | | 42 | |
| | | | |
Engie SA | | | | | 29,627 | | | | | | 343 | |
| | | | |
Veolia Environnement SA | | | | | 6,060 | | | | | | 149 | |
| | | | | | | | | | | | |
| | | | | | | | | | | 534 | |
| | | | | | | | | | | | |
Total France | | | | | | | | | | | 6,169 | |
| | | | | | | | | | | | |
| |
| GERMANY 4.6% | |
| |
| COMMUNICATION SERVICES 0.3% | |
| | | | |
CTS Eventim AG & Co. KGaA (a) | | | | | 447 | | | | | | 24 | |
| | | | |
Deutsche Telekom AG | | | | | 4,481 | | | | | | 89 | |
| | | | |
Freenet AG | | | | | 2,343 | | | | | | 58 | |
| | | | |
ProSiebenSat.1 Media SE | | | | | 2,585 | | | | | | 24 | |
| | | | |
Scout24 SE | | | | | 465 | | | | | | 24 | |
| | | | |
Telefonica Deutschland Holding AG | | | | | 15,710 | | | | | | 45 | |
| | | | | | | | | | | | |
| | | | | | | | | | | 264 | |
| | | | | | | | | | | | |
| |
| CONSUMER DISCRETIONARY 1.3% | |
| | | | |
adidas AG | | | | | 147 | | | | | | 26 | |
| | | | |
Bayerische Motoren Werke AG | | | | | 6,679 | | | | | | 518 | |
| | | | |
Continental AG | | | | | 1,166 | | | | | | 82 | |
| | | | |
ElringKlinger AG | | | | | 2,359 | | | | | | 18 | |
| | | | |
Fielmann AG | | | | | 507 | | | | | | 25 | |
| | | | |
Hornbach Holding AG & Co. KGaA | | | | | 410 | | | | | | 34 | |
| | | | |
Hugo Boss AG | | | | | 1,087 | | | | | | 57 | |
| | | | |
Mercedes-Benz Group AG | | | | | 5,750 | | | | | | 334 | |
| | | | |
Vitesco Technologies Group AG (a) | | | | | 802 | | | | | | 31 | |
| | | | | | | | | | | | |
| | | | | | | | | | | 1,125 | |
| | | | | | | | | | | | |
| |
| CONSUMER STAPLES 0.1% | |
| | | | |
Beiersdorf AG | | | | | 522 | | | | | | 54 | |
| | | | |
Metro AG | | | | | 4,374 | | | | | | 37 | |
| | | | |
Suedzucker AG | | | | | 1,817 | | | | | | 29 | |
| | | | | | | | | | | | |
| | | | | | | | | | | 120 | |
| | | | | | | | | | | | |
| |
| FINANCIALS 0.9% | |
| | | | |
Aareal Bank AG (a) | | | | | 1,436 | | | | | | 48 | |
| | | | |
Commerzbank AG | | | | | 30,522 | | | | | | 216 | |
| | | | |
Deutsche Bank AG | | | | | 15,565 | | | | | | 137 | |
| | | | |
Deutsche Boerse AG | | | | | 886 | | | | | | 149 | |
| | | | |
Deutsche Pfandbriefbank AG | | | | | 4,228 | | | | | | 38 | |
| | | | |
Hannover Rueck SE | | | | | 301 | | | | | | 44 | |
| | | | |
Muenchener Rueckversicherungs-Gesellschaft AG in Muenchen | | | | | 255 | | | | | | 60 | |
| | | | | | | | | | | | |
| | | | | SHARES | | | | | MARKET
VALUE
(000S) | |
| | | | |
Talanx AG | | | | | 750 | | | $ | | | 29 | |
| | | | | | | | | | | | |
| | | | | | | | | | | 721 | |
| | | | | | | | | | | | |
| |
| HEALTH CARE 0.4% | |
| | | | |
Bayer AG | | | | | 1,501 | | | | | | 90 | |
| | | | |
Carl Zeiss Meditec AG | | | | | 238 | | | | | | 28 | |
| | | | |
Fresenius Medical Care AG & Co. KGaA | | | | | 699 | | | | | | 35 | |
| | | | |
Gerresheimer AG | | | | | 333 | | | | | | 22 | |
| | | | |
Merck KGaA | | | | | 676 | | | | | | 115 | |
| | | | |
Siemens Healthineers AG | | | | | 907 | | | | | | 46 | |
| | | | | | | | | | | | |
| | | | | | | | | | | 336 | |
| | | | | | | | | | | | |
| |
| INDUSTRIALS 0.5% | |
| | | | |
Bilfinger SE | | | | | 901 | | | | | | 26 | |
| | | | |
Deutsche Lufthansa AG | | | | | 20,255 | | | | | | 119 | |
| | | | |
Deutsche Post AG | | | | | 1,329 | | | | | | 50 | |
| | | | |
Hapag-Lloyd AG (c) | | | | | 178 | | | | | | 47 | |
| | | | |
Indus Holding AG | | | | | 981 | | | | | | 23 | |
| | | | |
Kloeckner & Co. SE | | | | | 2,598 | | | | | | 20 | |
| | | | |
Knorr-Bremse AG | | | | | 414 | | | | | | 24 | |
| | | | |
MTU Aero Engines AG | | | | | 136 | | | | | | 25 | |
| | | | |
Rational AG | | | | | 30 | | | | | | 17 | |
| | | | |
Rheinmetall AG | | | | | 116 | | | | | | 27 | |
| | | | | | | | | | | | |
| | | | | | | | | | | 378 | |
| | | | | | | | | | | | |
| |
| INFORMATION TECHNOLOGY 0.2% | |
| | | | |
SAP SE | | | | | 1,799 | | | | | | 164 | |
| | | | | | | | | | | | |
| |
| MATERIALS 0.4% | |
| | | | |
Aurubis AG | | | | | 713 | | | | | | 49 | |
| | | | |
BASF SE | | | | | 1,357 | | | | | | 59 | |
| | | | |
Covestro AG | | | | | 1,736 | | | | | | 60 | |
| | | | |
K&S AG | | | | | 6,722 | | | | | | 164 | |
| | | | |
Salzgitter AG | | | | | 1,543 | | | | | | 38 | |
| | | | | | | | | | | | |
| | | | | | | | | | | 370 | |
| | | | | | | | | | | | |
| |
| REAL ESTATE 0.1% | |
| | | | |
LEG Immobilien SE | | | | | 803 | | | | | | 67 | |
| | | | |
Vonovia SE | | | | | 775 | | | | | | 24 | |
| | | | | | | | | | | | |
| | | | | | | | | | | 91 | |
| | | | | | | | | | | | |
| |
| UTILITIES 0.4% | |
| | | | |
E.ON SE | | | | | 11,713 | | | | | | 99 | |
| | | | |
RWE AG | | | | | 4,939 | | | | | | 183 | |
| | | | |
Uniper SE | | | | | 3,031 | | | | | | 45 | |
| | | | | | | | | | | | |
| | | | | | | | | | | 327 | |
| | | | | | | | | | | | |
Total Germany | | | | | | | | | | | 3,896 | |
| | | | | | | | | | | | |
| |
| HONG KONG 1.7% | |
| |
| COMMUNICATION SERVICES 0.2% | |
| | | | |
HKBN Ltd. | | | | | 26,500 | | | | | | 30 | |
| | | | |
HKT Trust & HKT Ltd. | | | | | 40,000 | | | | | | 54 | |
| | | | |
PCCW Ltd. | | | | | 99,295 | | | | | | 52 | |
| | | | | | | | | | | | |
| | | | | | | | | | | 136 | |
| | | | | | | | | | | | |
| |
| CONSUMER DISCRETIONARY 0.1% | |
| | | | |
Bosideng International Holdings Ltd. | | | | | 68,000 | | | | | | 42 | |
| | | | |
Chow Tai Fook Jewellery Group Ltd. | | | | | 20,000 | | | | | | 38 | |
| | | | | | | | | | | | |
| See Accompanying Notes | | | ANNUAL REPORT | | | | | | | JUNE 30, 2022 | | | 35 |
| | | | | | |
| Schedule of Investments | | PIMCO RAFI Dynamic Multi-Factor International Equity ETF | | (Cont.) | | |
| | | | | | | | | | | | |
| | | | | SHARES | | | | | MARKET
VALUE
(000S) | |
| | | | |
Skyworth Group Ltd. | | | | | 52,000 | | | $ | | | 26 | |
| | | | | | | | | | | | |
| | | | | | | | | | | 106 | |
| | | | | | | | | | | | |
| |
| CONSUMER STAPLES 0.0% | |
| | | | |
WH Group Ltd. | | | | | 50,000 | | | | | | 39 | |
| | | | | | | | | | | | |
| |
| FINANCIALS 0.1% | |
| | | | |
Hong Kong Exchanges & Clearing Ltd. | | | | | 1,500 | | | | | | 74 | |
| | | | | | | | | | | | |
| |
| INDUSTRIALS 0.5% | |
| | | | |
Cathay Pacific Airways Ltd. (a) | | | | | 46,000 | | | | | | 50 | |
| | | | |
CK Hutchison Holdings Ltd. | | | | | 14,000 | | | | | | 95 | |
| | | | |
Hutchison Port Holdings Trust | | | | | 149,100 | | | | | | 35 | |
| | | | |
Jardine Matheson Holdings Ltd. | | | | | 1,500 | | | | | | 79 | |
| | | | |
MTR Corp. Ltd. | | | | | 8,000 | | | | | | 42 | |
| | | | |
NWS Holdings Ltd. | | | | | 31,000 | | | | | | 29 | |
| | | | |
Pacific Basin Shipping Ltd. | | | | | 54,000 | | | | | | 21 | |
| | | | |
SITC International Holdings Co. Ltd. | | | | | 13,000 | | | | | | 37 | |
| | | | |
Xinyi Glass Holdings Ltd. | | | | | 11,000 | | | | | | 27 | |
| | | | | | | | | | | | |
| | | | | | | | | | | 415 | |
| | | | | | | | | | | | |
| |
| INFORMATION TECHNOLOGY 0.1% | |
| | | | |
Kingboard Holdings Ltd. | | | | | 8,200 | | | | | | 31 | |
| | | | |
Kingboard Laminates Holdings Ltd. | | | | | 18,000 | | | | | | 22 | |
| | | | |
Truly International Holdings Ltd. | | | | | 88,000 | | | | | | 27 | |
| | | | | | | | | | | | |
| | | | | | | | | | | 80 | |
| | | | | | | | | | | | |
| |
| REAL ESTATE 0.5% | |
| | | | |
CK Asset Holdings Ltd. | | | | | 17,000 | | | | | | 121 | |
| | | | |
Hongkong Land Holdings Ltd. | | | | | 11,900 | | | | | | 60 | |
| | | | |
Hopson Development Holdings Ltd. | | | | | 21,010 | | | | | | 32 | |
| | | | |
New World Development Co. Ltd. | | | | | 15,000 | | | | | | 54 | |
| | | | |
Sun Hung Kai Properties Ltd. | | | | | 6,000 | | | | | | 71 | |
| | | | |
Swire Pacific Ltd. ‘A’ | | | | | 5,000 | | | | | | 30 | |
| | | | |
Wharf Holdings Ltd. | | | | | 10,000 | | | | | | 36 | |
| | | | | | | | | | | | |
| | | | | | | | | | | 404 | |
| | | | | | | | | | | | |
| |
| UTILITIES 0.2% | |
| | | | |
CLP Holdings Ltd. | | | | | 10,100 | | | | | | 84 | |
| | | | |
HK Electric Investments & HK Electric Investments Ltd. | | | | | 21,000 | | | | | | 19 | |
| | | | |
Hong Kong & China Gas Co. Ltd. | | | | | 25,972 | | | | | | 28 | |
| | | | |
Power Assets Holdings Ltd. | | | | | 5,000 | | | | | | 32 | |
| | | | | | | | | | | | |
| | | | | | | | | | | 163 | |
| | | | | | | | | | | | |
Total Hong Kong | | | | | | | | | | | 1,417 | |
| | | | | | | | | | | | |
| |
| IRELAND 1.1% | |
| |
| CONSUMER DISCRETIONARY 0.0% | |
| | | | |
Aptiv PLC (a) | | | | | 303 | | | | | | 27 | |
| | | | | | | | | | | | |
| |
| CONSUMER STAPLES 0.1% | |
| | | | |
Glanbia PLC | | | | | 3,228 | | | | | | 35 | |
| | | | |
Kerry Group PLC ‘A’ | | | | | 817 | | | | | | 78 | |
| | | | | | | | | | | | |
| | | | | | | | | | | 113 | |
| | | | | | | | | | | | |
| |
| FINANCIALS 0.0% | |
| | | | |
Bank of Ireland Group PLC | | | | | 5,389 | | | | | | 34 | |
| | | | | | | | | | | | |
| |
| | | | | | | | | | | | |
| | | | | SHARES | | | | | MARKET
VALUE
(000S) | |
| HEALTH CARE 0.6% | |
| | | | |
ICON PLC (a) | | | | | 435 | | | $ | | | 94 | |
| | | | |
Jazz Pharmaceuticals PLC (a) | | | | | 230 | | | | | | 36 | |
| | | | |
Medtronic PLC | | | | | 3,792 | | | | | | 341 | |
| | | | | | | | | | | | |
| | | | | | | | | | | 471 | |
| | | | | | | | | | | | |
| |
| INDUSTRIALS 0.2% | |
| | | | |
Allegion PLC | | | | | 253 | | | | | | 25 | |
| | | | |
DCC PLC | | | | | 371 | | | | | | 23 | |
| | | | |
Experian PLC | | | | | 1,639 | | | | | | 48 | |
| | | | |
Grafton Group PLC | | | | | 2,436 | | | | | | 23 | |
| | | | |
Kingspan Group PLC | | | | | 487 | | | | | | 30 | |
| | | | |
Trane Technologies PLC | | | | | 387 | | | | | | 50 | |
| | | | | | | | | | | | |
| | | | | | | | | | | 199 | |
| | | | | | | | | | | | |
| |
| MATERIALS 0.2% | |
| | | | |
CRH PLC | | | | | 716 | | | | | | 25 | |
| | | | |
James Hardie Industries PLC | | | | | 3,624 | | | | | | 79 | |
| | | | |
Smurfit Kappa Group PLC | | | | | 721 | | | | | | 24 | |
| | | | | | | | | | | | |
| | | | | | | | | | | 128 | |
| | | | | | | | | | | | |
Total Ireland | | | | | | | | | | | 972 | |
| | | | | | | | | | | | |
| |
| ISRAEL 0.9% | |
| |
| COMMUNICATION SERVICES 0.1% | |
| | | | |
Bezeq The Israeli Telecommunication Corp. Ltd. | | | | | 39,321 | | | | | | 61 | |
| | | | | | | | | | | | |
| |
| CONSUMER STAPLES 0.0% | |
| | | | |
Strauss Group Ltd. | | | | | 915 | | | | | | 23 | |
| | | | | | | | | | | | |
| |
| ENERGY 0.2% | |
| | | | |
Delek Group Ltd. (a) | | | | | 476 | | | | | | 62 | |
| | | | |
Oil Refineries Ltd. | | | | | 130,768 | | | | | | 47 | |
| | | | |
Paz Oil Co. Ltd. (a) | | | | | 179 | | | | | | 22 | |
| | | | | | | | | | | | |
| | | | | | | | | | | 131 | |
| | | | | | | | | | | | |
| |
| FINANCIALS 0.3% | |
| | | | |
Bank Hapoalim BM | | | | | 9,497 | | | | | | 80 | |
| | | | |
Bank Leumi Le-Israel BM | | | | | 10,252 | | | | | | 91 | |
| | | | |
Harel Insurance Investments & Financial Services Ltd. | | | | | 2,649 | | | | | | 26 | |
| | | | |
Israel Discount Bank Ltd. ‘A’ | | | | | 7,824 | | | | | | 41 | |
| | | | |
Mizrahi Tefahot Bank Ltd. | | | | | 1,045 | | | | | | 35 | |
| | | | |
Plus500 Ltd. | | | | | 1,022 | | | | | | 21 | |
| | | | | | | | | | | | |
| | | | | | | | | | | 294 | |
| | | | | | | | | | | | |
| |
| HEALTH CARE 0.0% | |
| | | | |
Teva Pharmaceutical Industries Ltd. SP - ADR (a) | | | | | 5,554 | | | | | | 42 | |
| | | | | | | | | | | | |
| |
| INDUSTRIALS 0.0% | |
| | | | |
Elbit Systems Ltd. | | | | | 167 | | | | | | 38 | |
| | | | | | | | | | | | |
| |
| INFORMATION TECHNOLOGY 0.1% | |
| | | | |
Check Point Software Technologies Ltd. (a) | | | | | 269 | | | | | | 33 | |
| | | | |
Nice Ltd. (a) | | | | | 137 | | | | | | 26 | |
| | | | | | | | | | | | |
| | | | | | | | | | | 59 | |
| | | | | | | | | | | | |
| |
| | | | | | | | | | | | |
| | | | | SHARES | | | | | MARKET
VALUE
(000S) | |
| MATERIALS 0.1% | |
| | | | |
ICL Group Ltd. | | | | | 12,270 | | | $ | | | 112 | |
| | | | | | | | | | | | |
| |
| REAL ESTATE 0.1% | |
| | | | |
Azrieli Group Ltd. | | | | | 331 | | | | | | 23 | |
| | | | |
G City Ltd. | | | | | 4,360 | | | | | | 25 | |
| | | | | | | | | | | | |
| | | | | | | | | | | 48 | |
| | | | | | | | | | | | |
Total Israel | | | | | | | | | | | 808 | |
| | | | | | | | | | | | |
| |
| ITALY 2.5% | |
| |
| COMMUNICATION SERVICES 0.2% | |
| | | | |
Infrastrutture Wireless Italiane SpA | | | | | 2,855 | | | | | | 29 | |
| | | | |
MFE-MediaForEurope NV ‘B’ | | | | | 9,786 | | | | | | 7 | |
| | | | |
Telecom Italia SpA | | | | | 566,589 | | | | | | 149 | |
| | | | | | | | | | | | |
| | | | | | | | | | | 185 | |
| | | | | | | | | | | | |
| |
| CONSUMER DISCRETIONARY 0.1% | |
| | | | |
Brembo SpA | | | | | 2,525 | | | | | | 25 | |
| | | | |
Ferrari NV | | | | | 289 | | | | | | 53 | |
| | | | |
Moncler SpA | | | | | 616 | | | | | | 26 | |
| | | | | | | | | | | | |
| | | | | | | | | | | 104 | |
| | | | | | | | | | | | |
| |
| CONSUMER STAPLES 0.0% | |
| | | | |
MARR SpA | | | | | 1,399 | | | | | | 19 | |
| | | | | | | | | | | | |
| |
| ENERGY 0.8% | |
| | | | |
Eni SpA | | | | | 55,787 | | | | | | 662 | |
| | | | |
Saras SpA (a) | | | | | 19,683 | | | | | | 29 | |
| | | | | | | | | | | | |
| | | | | | | | | | | 691 | |
| | | | | | | | | | | | |
| |
| FINANCIALS 0.5% | |
| | | | |
Anima Holding SpA | | | | | 6,174 | | | | | | 23 | |
| | | | |
Assicurazioni Generali SpA | | | | | 1,412 | | | | | | 22 | |
| | | | |
Azimut Holding SpA | | | | | 2,153 | | | | | | 37 | |
| | | | |
Banca Generali SpA | | | | | 679 | | | | | | 19 | |
| | | | |
Banca IFIS SpA | | | | | 2,359 | | | | | | 34 | |
| | | | |
Banca Popolare di Sondrio SPA | | | | | 8,351 | | | | | | 29 | |
| | | | |
Banco BPM SpA | | | | | 20,894 | | | | | | 60 | |
| | | | |
BPER Banca | | | | | 20,185 | | | | | | 33 | |
| | | | |
FinecoBank Banca Fineco SpA | | | | | 2,219 | | | | | | 27 | |
| | | | |
UniCredit SpA | | | | | 11,813 | | | | | | 113 | |
| | | | |
Unipol Gruppo SpA | | | | | 12,278 | | | | | | 56 | |
| | | | | | | | | | | | |
| | | | | | | | | | | 453 | |
| | | | | | | | | | | | |
| |
| HEALTH CARE 0.1% | |
| | | | |
Amplifon SpA | | | | | 901 | | | | | | 28 | |
| | | | |
DiaSorin SpA | | | | | 290 | | | | | | 38 | |
| | | | |
Recordati Industria Chimica e Farmaceutica SpA | | | | | 1,021 | | | | | | 44 | |
| | | | | | | | | | | | |
| | | | | | | | | | | 110 | |
| | | | | | | | | | | | |
| |
| INDUSTRIALS 0.2% | |
| | | | |
Atlantia SpA | | | | | 1,098 | | | | | | 26 | |
| | | | |
Enav SpA | | | | | 4,897 | | | | | | 21 | |
| | | | |
Leonardo SpA | | | | | 6,847 | | | | | | 69 | |
| | | | | | | | | | | | |
| | | | | | | | | | | 116 | |
| | | | | | | | | | | | |
| |
| UTILITIES 0.6% | |
| | | | |
Enel SpA | | | | | 47,823 | | | | | | 262 | |
| | | | |
ERG SpA | | | | | 2,138 | | | | | | 67 | |
| | | | | | |
| 36 | | PIMCO EQUITY SERIES | | | See Accompanying Notes | |
| | | | | | | | | | | | |
| | | | | SHARES | | | | | MARKET
VALUE
(000S) | |
| | | | |
Iren SpA | | | | | 10,160 | | | $ | | | 22 | |
| | | | |
Snam SpA | | | | | 12,348 | | | | | | 65 | |
| | | | |
Terna - Rete Elettrica Nazionale | | | | | 10,211 | | | | | | 80 | |
| | | | | | | | | | | | |
| | | | | | | | | | | 496 | |
| | | | | | | | | | | | |
Total Italy | | | | | | | | | | | 2,174 | |
| | | | | | | | | | | | |
| |
| JAPAN 25.7% | |
| |
| COMMUNICATION SERVICES 2.2% | |
| | | | |
Avex, Inc. | | | | | 2,200 | | | | | | 22 | |
| | | | |
Capcom Co. Ltd. | | | | | 1,500 | | | | | | 36 | |
| | | | |
Fuji Media Holdings, Inc. | | | | | 3,300 | | | | | | 28 | |
| | | | |
Internet Initiative Japan, Inc. | | | | | 1,000 | | | | | | 35 | |
| | | | |
Kadokawa Corp. | | | | | 2,200 | | | | | | 47 | |
| | | | |
KDDI Corp. | | | | | 16,800 | | | | | | 530 | |
| | | | |
Koei Tecmo Holdings Co. Ltd. | | | | | 580 | | | | | | 19 | |
| | | | |
Nexon Co. Ltd. | | | | | 1,400 | | | | | | 29 | |
| | | | |
Nintendo Co. Ltd. | | | | | 200 | | | | | | 86 | |
| | | | |
Nippon Telegraph & Telephone Corp. | | | | | 18,700 | | | | | | 537 | |
| | | | |
Nippon Television Holdings, Inc. | | | | | 3,700 | | | | | | 33 | |
| | | | |
Softbank Corp. | | | | | 34,300 | | | | | | 381 | |
| | | | |
Square Enix Holdings Co. Ltd. | | | | | 600 | | | | | | 27 | |
| | | | |
Toho Co. Ltd. | | | | | 900 | | | | | | 33 | |
| | | | |
Yahoo Japan Corp. | | | | | 8,600 | | | | | | 25 | |
| | | | | | | | | | | | |
| | | | | | | | | | | 1,868 | |
| | | | | | | | | | | | |
| |
| CONSUMER DISCRETIONARY 4.8% | |
| | | | |
Aisin Corp. | | | | | 3,100 | | | | | | 96 | |
| | | | |
Arata Corp. | | | | | 100 | | | | | | 3 | |
| | | | |
Bandai Namco Holdings, Inc. | | | | | 1,100 | | | | | | 78 | |
| | | | |
Bridgestone Corp. (c) | | | | | 5,200 | | | | | | 190 | |
| | | | |
Casio Computer Co. Ltd. | | | | | 2,500 | | | | | | 23 | |
| | | | |
DCM Holdings Co. Ltd. | | | | | 4,600 | | | | | | 35 | |
| | | | |
Denso Corp. | | | | | 2,000 | | | | | | 106 | |
| | | | |
EDION Corp. | | | | | 2,800 | | | | | | 26 | |
| | | | |
Exedy Corp. | | | | | 2,200 | | | | | | 28 | |
| | | | |
Food & Life Cos., Ltd. | | | | | 1,900 | | | | | | 41 | |
| | | | |
Haseko Corp. | | | | | 2,000 | | | | | | 24 | |
| | | | |
Honda Motor Co. Ltd. | | | | | 16,900 | | | | | | 407 | |
| | | | |
Iida Group Holdings Co. Ltd. | | | | | 2,000 | | | | | | 31 | |
| | | | |
Isetan Mitsukoshi Holdings Ltd. | | | | | 8,500 | | | | | | 69 | |
| | | | |
Isuzu Motors Ltd. | | | | | 11,900 | | | | | | 132 | |
| | | | |
J Front Retailing Co. Ltd. | | | | | 3,800 | | | | | | 32 | |
| | | | |
JTEKT Corp. | | | | | 5,300 | | | | | | 40 | |
| | | | |
K’s Holdings Corp. | | | | | 4,200 | | | | | | 41 | |
| | | | |
Kohnan Shoji Co. Ltd. | | | | | 1,600 | | | | | | 43 | |
| | | | |
Mazda Motor Corp. | | | | | 20,500 | | | | | | 167 | |
| | | | |
McDonald’s Holdings Co. Japan Ltd. | | | | | 600 | | | | | | 22 | |
| | | | |
Mitsubishi Motors Corp. | | | | | 14,200 | | | | | | 48 | |
| | | | |
NHK Spring Co. Ltd. | | | | | 3,000 | | | | | | 20 | |
| | | | |
Nikon Corp. | | | | | 4,200 | | | | | | 48 | |
| | | | |
Nishimatsuya Chain Co. Ltd. | | | | | 2,300 | | | | | | 24 | |
| | | | |
Nissan Motor Co. Ltd. | | | | | 64,800 | | | | | | 254 | |
| | | | |
Nitori Holdings Co. Ltd. | | | | | 300 | | | | | | 29 | |
| | | | |
NOK Corp. | | | | | 2,800 | | | | | | 23 | |
| | | | |
Oriental Land Co. Ltd. | | | | | 600 | | | | | | 84 | |
| | | | |
Paltac Corp. | | | | | 100 | | | | | | 3 | |
| | | | |
Pan Pacific International Holdings Corp. | | | | | 3,700 | | | | | | 59 | |
| | | | |
Panasonic Holdings Corp. | | | | | 15,500 | | | | | | 125 | |
| | | | |
Plenus Co. Ltd. | | | | | 1,400 | | | | | | 21 | |
| | | | |
Rinnai Corp. | | | | | 100 | | | | | | 7 | |
| | | | |
Round One Corp. | | | | | 2,500 | | | | | | 28 | |
| | | | |
Saizeriya Co. Ltd. | | | | | 1,200 | | | | | | 24 | |
| | | | | | | | | | | | |
| | | | | SHARES | | | | | MARKET
VALUE
(000S) | |
| | | | |
Sankyo Co. Ltd. | | | | | 1,100 | | | $ | | | 33 | |
| | | | |
Sega Sammy Holdings, Inc. | | | | | 1,500 | | | | | | 24 | |
| | | | |
Sekisui Chemical Co. Ltd. | | | | | 2,400 | | | | | | 33 | |
| | | | |
Sekisui House Ltd. | | | | | 3,100 | | | | | | 54 | |
| | | | |
Shimamura Co. Ltd. | | | | | 800 | | | | | | 70 | |
| | | | |
Shimano, Inc. | | | | | 400 | | | | | | 67 | |
| | | | |
Skylark Holdings Co. Ltd. | | | | | 1,400 | | | | | | 16 | |
| | | | |
Sony Group Corp. | | | | | 2,500 | | | | | | 204 | |
| | | | |
Stanley Electric Co. Ltd. | | | | | 1,500 | | | | | | 25 | |
| | | | |
Subaru Corp. | | | | | 4,000 | | | | | | 71 | |
| | | | |
Sumitomo Electric Industries Ltd. | | | | | 10,600 | | | | | | 117 | |
| | | | |
Sumitomo Forestry Co. Ltd. | | | | | 1,800 | | | | | | 26 | |
| | | | |
Sumitomo Rubber Industries Ltd. | | | | | 4,500 | | | | | | 38 | |
| | | | |
Suzuki Motor Corp. | | | | | 1,800 | | | | | | 57 | |
| | | | |
Takashimaya Co. Ltd. | | | | | 2,700 | | | | | | 26 | |
| | | | |
Tokai Rika Co. Ltd. | | | | | 1,500 | | | | | | 16 | |
| | | | |
Tomy Co. Ltd. | | | | | 2,200 | | | | | | 22 | |
| | | | |
Toyo Tire Corp. | | | | | 2,300 | | | | | | 29 | |
| | | | |
Toyoda Gosei Co. Ltd. | | | | | 1,900 | | | | | | 30 | |
| | | | |
Toyota Boshoku Corp. | | | | | 3,000 | | | | | | 45 | |
| | | | |
Toyota Motor Corp. | | | | | 25,100 | | | | | | 387 | |
| | | | |
TS Tech Co. Ltd. | | | | | 2,100 | | | | | | 22 | |
| | | | |
USS Co. Ltd. | | | | | 2,100 | | | | | | 36 | |
| | | | |
Yamada Holdings Co. Ltd. | | | | | 27,600 | | | | | | 99 | |
| | | | |
Yamaha Corp. | | | | | 700 | | | | | | 29 | |
| | | | |
Yamaha Motor Co. Ltd. | | | | | 1,900 | | | | | | 35 | |
| | | | |
Yoshinoya Holdings Co. Ltd. | | | | | 1,200 | | | | | | 22 | |
| | | | |
Zensho Holdings Co. Ltd. | | | | | 1,100 | | | | | | 26 | |
| | | | | | | | | | | | |
| | | | | | | | | | | 4,090 | |
| | | | | | | | | | | | |
| |
| CONSUMER STAPLES 2.6% | |
| | | | |
Aeon Co. Ltd. | | | | | 3,900 | | | | | | 68 | |
| | | | |
Ain Holdings, Inc. | | | | | 100 | | | | | | 5 | |
| | | | |
Ajinomoto Co., Inc. | | | | | 5,400 | | | | | | 132 | |
| | | | |
Asahi Group Holdings Ltd. | | | | | 1,200 | | | | | | 39 | |
| | | | |
Calbee, Inc. | | | | | 1,300 | | | | | | 26 | |
| | | | |
Cawachi Ltd. | | | | | 1,500 | | | | | | 24 | |
| | | | |
Earth Corp. | | | | | 100 | | | | | | 4 | |
| | | | |
Fuji Oil Holdings, Inc. | | | | | 3,600 | | | | | | 57 | |
| | | | |
House Foods Group, Inc. | | | | | 1,200 | | | | | | 25 | |
| | | | |
Itoham Yonekyu Holdings, Inc. | | | | | 5,300 | | | | | | 27 | |
| | | | |
Japan Tobacco, Inc. (c) | | | | | 19,800 | | | | | | 343 | |
| | | | |
Kagome Co. Ltd. | | | | | 1,000 | | | | | | 24 | |
| | | | |
Kao Corp. | | | | | 2,800 | | | | | | 114 | |
| | | | |
Kewpie Corp. | | | | | 1,600 | | | | | | 27 | |
| | | | |
Kikkoman Corp. | | | | | 700 | | | | | | 37 | |
| | | | |
Kirin Holdings Co. Ltd. | | | | | 8,500 | | | | | | 134 | |
| | | | |
Kobe Bussan Co. Ltd. | | | | | 900 | | | | | | 22 | |
| | | | |
Lawson, Inc. | | | | | 800 | | | | | | 27 | |
| | | | |
Maruha Nichiro Corp. | | | | | 1,400 | | | | | | 26 | |
| | | | |
MatsukiyoCocokara & Co. | | | | | 200 | | | | | | 8 | |
| | | | |
MEIJI Holdings Co. Ltd. | | | | | 1,700 | | | | | | 84 | |
| | | | |
Mitsubishi Shokuhin Co. Ltd. | | | | | 1,200 | | | | | | 33 | |
| | | | |
Mitsui DM Sugar Holdings Co. Ltd. | | | | | 1,800 | | | | | | 25 | |
| | | | |
Morinaga & Co. Ltd. | | | | | 1,000 | | | | | | 32 | |
| | | | |
Morinaga Milk Industry Co. Ltd. | | | | | 800 | | | | | | 29 | |
| | | | |
NH Foods Ltd. | | | | | 2,300 | | | | | | 72 | |
| | | | |
Nippn Corp. | | | | | 2,300 | | | | | | 28 | |
| | | | |
Nisshin Oillio Group Ltd. | | | | | 1,000 | | | | | | 23 | |
| | | | |
Nisshin Seifun Group, Inc. | | | | | 2,300 | | | | | | 27 | |
| | | | |
Nissin Foods Holdings Co. Ltd. | | | | | 600 | | | | | | 41 | |
| | | | |
Pola Orbis Holdings, Inc. | | | | | 2,300 | | | | | | 28 | |
| | | | |
Sakata Seed Corp. | | | | | 200 | | | | | | 7 | |
| | | | |
Seven & i Holdings Co. Ltd. | | | | | 8,700 | | | | | | 338 | |
| | | | | | | | | | | | |
| | | | | SHARES | | | | | MARKET
VALUE
(000S) | |
| | | | |
Sugi Holdings Co. Ltd. | | | | | 200 | | | $ | | | 9 | |
| | | | |
Sundrug Co. Ltd. | | | | | 1,300 | | | | | | 29 | |
| | | | |
Suntory Beverage & Food Ltd. | | | | | 1,500 | | | | | | 57 | |
| | | | |
Toyo Suisan Kaisha Ltd. | | | | | 700 | | | | | | 27 | |
| | | | |
Tsuruha Holdings, Inc. | | | | | 600 | | | | | | 33 | |
| | | | |
Unicharm Corp. | | | | | 1,000 | | | | | | 34 | |
| | | | |
United Super Markets Holdings, Inc. | | | | | 3,200 | | | | | | 25 | |
| | | | |
Yakult Honsha Co. Ltd. | | | | | 800 | | | | | | 46 | |
| | | | |
Yamazaki Baking Co. Ltd. | | | | | 2,200 | | | | | | 27 | |
| | | | |
Yokorei Co. Ltd. | | | | | 4,100 | | | | | | 27 | |
| | | | | | | | | | | | |
| | | | | | | | | | | 2,250 | |
| | | | | | | | | | | | |
| |
| ENERGY 0.8% | |
| | | | |
Cosmo Energy Holdings Co. Ltd. | | | | | 2,400 | | | | | | 66 | |
| | | | |
ENEOS Holdings, Inc. | | | | | 68,000 | | | | | | 256 | |
| | | | |
Idemitsu Kosan Co. Ltd. | | | | | 5,512 | | | | | | 132 | |
| | | | |
Inpex Corp. (c) | | | | | 24,400 | | | | | | 261 | |
| | | | |
Iwatani Corp. | | | | | 700 | | | | | | 27 | |
| | | | | | | | | | | | |
| | | | | | | | | | | 742 | |
| | | | | | | | | | | | |
| |
| FINANCIALS 1.8% | |
| | | | |
Aozora Bank Ltd. | | | | | 1,700 | | | | | | 33 | |
| | | | |
Dai-ichi Life Holdings, Inc. | | | | | 2,200 | | | | | | 41 | |
| | | | |
Daiwa Securities Group, Inc. | | | | | 7,600 | | | | | | 34 | |
| | | | |
Hokuhoku Financial Group, Inc. | | | | | 4,200 | | | | | | 26 | |
| | | | |
Hyakujushi Bank Ltd. | | | | | 2,400 | | | | | | 30 | |
| | | | |
Jafco Co. Ltd. | | | | | 700 | | | | | | 8 | |
| | | | |
Japan Post Bank Co. Ltd. | | | | | 7,300 | | | | | | 57 | |
| | | | |
Japan Post Holdings Co. Ltd. | | | | | 60,600 | | | | | | 434 | |
| | | | |
Japan Post Insurance Co. Ltd. | | | | | 1,900 | | | | | | 30 | |
| | | | |
Mebuki Financial Group, Inc. | | | | | 15,000 | | | | | | 30 | |
| | | | |
Mitsubishi UFJ Financial Group, Inc. | | | | | 27,400 | | | | | | 147 | |
| | | | |
Mizuho Financial Group, Inc. | | | | | 4,700 | | | | | | 53 | |
| | | | |
MS&AD Insurance Group Holdings, Inc. | | | | | 2,600 | | | | | | 80 | |
| | | | |
Nanto Bank Ltd. | | | | | 2,300 | | | | | | 34 | |
| | | | |
Nishi-Nippon Financial Holdings, Inc. | | | | | 8,700 | | | | | | 48 | |
| | | | |
ORIX Corp. | | | | | 2,300 | | | | | | 38 | |
| | | | |
Resona Holdings, Inc. | | | | | 7,900 | | | | | | 30 | |
| | | | |
Senshu Ikeda Holdings, Inc. | | | | | 22,500 | | | | | | 33 | |
| | | | |
Seven Bank Ltd. | | | | | 14,900 | | | | | | 28 | |
| | | | |
Sompo Holdings, Inc. | | | | | 600 | | | | | | 26 | |
| | | | |
Sumitomo Mitsui Financial Group, Inc. | | | | | 4,600 | | | | | | 137 | |
| | | | |
Sumitomo Mitsui Trust Holdings, Inc. | | | | | 2,100 | | | | | | 65 | |
| | | | |
Tokio Marine Holdings, Inc. | | | | | 1,300 | | | | | | 76 | |
| | | | |
Zenkoku Hosho Co. Ltd. | | | | | 200 | | | | | | 6 | |
| | | | | | | | | | | | |
| | | | | | | | | | | 1,524 | |
| | | | | | | | | | | | |
| |
| HEALTH CARE 1.9% | |
| | | | |
Alfresa Holdings Corp. | | | | | 2,400 | | | | | | 32 | |
| | | | |
Astellas Pharma, Inc. | | | | | 20,100 | | | | | | 314 | |
| | | | |
Chugai Pharmaceutical Co. Ltd. | | | | | 1,000 | | | | | | 26 | |
| | | | |
Daiichi Sankyo Co. Ltd. | | | | | 4,500 | | | | | | 114 | |
| | | | |
H.U. Group Holdings, Inc. | | | | | 1,200 | | | | | | 26 | |
| | | | |
Hoya Corp. | | | | | 1,500 | | | | | | 128 | |
| | | | |
Kaken Pharmaceutical Co. Ltd. | | | | | 900 | | | | | | 25 | |
| | | | |
M3, Inc. | | | | | 800 | | | | | | 23 | |
| | | | |
Medipal Holdings Corp. | | | | | 2,900 | | | | | | 41 | |
| | | | |
Olympus Corp. | | | | | 4,400 | | | | | | 89 | |
| | | | |
Ono Pharmaceutical Co. Ltd. | | | | | 1,300 | | | | | | 33 | |
| | | | |
Otsuka Holdings Co. Ltd. | | | | | 1,500 | | | | | | 54 | |
| | | | |
Shionogi & Co. Ltd. | | | | | 1,500 | | | | | | 77 | |
| | | | |
Suzuken Co. Ltd. | | | | | 1,100 | | | | | | 31 | |
| | | | | | | | | | | | |
| See Accompanying Notes | | | ANNUAL REPORT | | | | | | | JUNE 30, 2022 | | | 37 |
| | | | | | |
| Schedule of Investments | | PIMCO RAFI Dynamic Multi-Factor International Equity ETF | | (Cont.) | | |
| | | | | | | | | | | | |
| | | | | SHARES | | | | | MARKET
VALUE
(000S) | |
| | | | |
Sysmex Corp. | | | | | 400 | | | $ | | | 24 | |
| | | | |
Taisho Pharmaceutical Holdings Co. Ltd. | | | | | 600 | | | | | | 24 | |
| | | | |
Takeda Pharmaceutical Co. Ltd. | | | | | 15,841 | | | | | | 445 | |
| | | | |
Terumo Corp. | | | | | 1,500 | | | | | | 45 | |
| | | | |
Toho Holdings Co. Ltd. | | | | | 1,900 | | | | | | 29 | |
| | | | |
Tsumura & Co. | | | | | 1,000 | | | | | | 23 | |
| | | | | | | | | | | | |
| | | | | | | | | | | 1,603 | |
| | | | | | | | | | | | |
| |
| INDUSTRIALS 6.0% | |
| | | | |
AGC, Inc. | | | | | 2,600 | | | | | | 91 | |
| | | | |
ANA Holdings, Inc. | | | | | 3,200 | | | | | | 59 | |
| | | | |
Central Glass Co. Ltd. | | | | | 1,300 | | | | | | 30 | |
| | | | |
COMSYS Holdings Corp. | | | | | 1,500 | | | | | | 29 | |
| | | | |
Dai Nippon Printing Co. Ltd. | | | | | 3,300 | | | | | | 71 | |
| | | | |
Daikin Industries Ltd. | | | | | 700 | | | | | | 112 | |
| | | | |
East Japan Railway Co. | | | | | 3,500 | | | | | | 179 | |
| | | | |
EXEO Group, Inc. | | | | | 1,700 | | | | | | 27 | |
| | | | |
FANUC Corp. | | | | | 400 | | | | | | 63 | |
| | | | |
Fuji Electric Co. Ltd. | | | | | 500 | | | | | | 21 | |
| | | | |
Fujikura Ltd. | | | | | 6,600 | | | | | | 37 | |
| | | | |
Fujitec Co. Ltd. | | | | | 1,300 | | | | | | 29 | |
| | | | |
Hankyu Hanshin Holdings, Inc. | | | | | 1,200 | | | | | | 33 | |
| | | | |
Hanwa Co. Ltd. | | | | | 1,000 | | | | | | 21 | |
| | | | |
Hazama Ando Corp. | | | | | 2,500 | | | | | | 15 | |
| | | | |
Hino Motors Ltd. | | | | | 7,100 | | | | | | 37 | |
| | | | |
Hitachi Ltd. | | | | | 12,300 | | | | | | 585 | |
| | | | |
Hitachi Transport System Ltd. | | | | | 800 | | | | | | 51 | |
| | | | |
Hitachi Zosen Corp. | | | | | 5,600 | | | | | | 35 | |
| | | | |
Hoshizaki Corp. | | | | | 200 | | | | | | 6 | |
| | | | |
IHI Corp. | | | | | 1,500 | | | | | | 40 | |
| | | | |
ITOCHU Corp. | | | | | 3,100 | | | | | | 84 | |
| | | | |
Japan Airlines Co. Ltd. | | | | | 5,700 | | | | | | 98 | |
| | | | |
Kajima Corp. | | | | | 2,600 | | | | | | 30 | |
| | | | |
Kamigumi Co. Ltd. | | | | | 1,300 | | | | | | 25 | |
| | | | |
Kandenko Co. Ltd. | | | | | 4,100 | | | | | | 25 | |
| | | | |
Kawasaki Heavy Industries Ltd. | | | | | 2,900 | | | | | | 54 | |
| | | | |
Kawasaki Kisen Kaisha Ltd. | | | | | 800 | | | | | | 49 | |
| | | | |
Keio Corp. | | | | | 700 | | | | | | 25 | |
| | | | |
Kinden Corp. | | | | | 2,300 | | | | | | 27 | |
| | | | |
Kintetsu Group Holdings Co. Ltd. ‘L’ | | | | | 1,100 | | | | | | 34 | |
| | | | |
Kubota Corp. | | | | | 1,600 | | | | | | 24 | |
| | | | |
Kurita Water Industries Ltd. | | | | | 800 | | | | | | 29 | |
| | | | |
Kyushu Railway Co. | | | | | 1,600 | | | | | | 33 | |
| | | | |
LIXIL Group Corp. | | | | | 1,600 | | | | | | 30 | |
| | | | |
Marubeni Corp. | | | | | 31,000 | | | | | | 278 | |
| | | | |
Meitec Corp. | | | | | 900 | | | | | | 14 | |
| | | | |
Minebea Mitsumi, Inc. | | | | | 2,000 | | | | | | 34 | |
| | | | |
Mirait Holdings Corp. | | | | | 1,800 | | | | | | 21 | |
| | | | |
Mitsubishi Corp. | | | | | 2,900 | | | | | | 86 | |
| | | | |
Mitsubishi Heavy Industries Ltd. | | | | | 7,800 | | | | | | 273 | |
| | | | |
Mitsui & Co. Ltd. | | | | | 5,800 | | | | | | 127 | |
| | | | |
Mitsui OSK Lines Ltd. | | | | | 10,500 | | | | | | 242 | |
| | | | |
Nagase & Co. Ltd. | | | | | 2,000 | | | | | | 27 | |
| | | | |
Nagoya Railroad Co. Ltd. (a) | | | | | 1,600 | | | | | | 25 | |
| | | | |
Nankai Electric Railway Co. Ltd. | | | | | 1,400 | | | | | | 28 | |
| | | | |
Nippon Steel Trading Corp. | | | | | 700 | | | | | | 26 | |
| | | | |
Nippon Yusen KK | | | | | 5,800 | | | | | | 398 | |
| | | | |
Nisshinbo Holdings, Inc. | | | | | 4,400 | | | | | | 33 | |
| | | | |
NSK Ltd. | | | | | 11,100 | | | | | | 60 | |
| | | | |
NTN Corp. | | | | | 12,200 | | | | | | 23 | |
| | | | |
Obayashi Corp. | | | | | 5,500 | | | | | | 40 | |
| | | | |
Persol Holdings Co. Ltd. | | | | | 1,500 | | | | | | 27 | |
| | | | |
Recruit Holdings Co. Ltd. | | | | | 4,000 | | | | | | 118 | |
| | | | |
Secom Co. Ltd. | | | | | 1,200 | | | | | | 74 | |
| | | | | | | | | | | | |
| | | | | SHARES | | | | | MARKET
VALUE
(000S) | |
| | | | |
Senko Group Holdings Co. Ltd. | | | | | 3,800 | | | $ | | | 25 | |
| | | | |
SG Holdings Co. Ltd. | | | | | 1,300 | | | | | | 22 | |
| | | | |
Shibaura Machine Co. Ltd. | | | | | 1,200 | | | | | | 23 | |
| | | | |
Shinmaywa Industries Ltd. | | | | | 2,900 | | | | | | 23 | |
| | | | |
SHO-BOND Holdings Co. Ltd. | | | | | 200 | | | | | | 9 | |
| | | | |
SMC Corp. | | | | | 100 | | | | | | 44 | |
| | | | |
Sohgo Security Services Co. Ltd. | | | | | 1,000 | | | | | | 28 | |
| | | | |
Sojitz Corp. | | | | | 5,540 | | | | | | 78 | |
| | | | |
Sotetsu Holdings, Inc. | | | | | 1,500 | | | | | | 26 | |
| | | | |
Sumitomo Corp. | | | | | 2,100 | | | | | | 29 | |
| | | | |
Taikisha Ltd. | | | | | 1,100 | | | | | | 26 | |
| | | | |
Taisei Corp. | | | | | 3,200 | | | | | | 100 | |
| | | | |
Takeuchi Manufacturing Co. Ltd. | | | | | 1,400 | | | | | | 24 | |
| | | | |
Tobu Railway Co. Ltd. | | | | | 1,800 | | | | | | 41 | |
| | | | |
Tokyu Corp. | | | | | 4,700 | | | | | | 55 | |
| | | | |
Toppan, Inc. | | | | | 4,800 | | | | | | 80 | |
| | | | |
Toshiba Corp. | | | | | 4,500 | | | | | | 183 | |
| | | | |
TOTO Ltd. | | | | | 900 | | | | | | 30 | |
| | | | |
Toyota Tsusho Corp. | | | | | 2,900 | | | | | | 95 | |
| | | | |
West Japan Railway Co. | | | | | 2,000 | | | | | | 74 | |
| | | | |
Yaskawa Electric Corp. | | | | | 900 | | | | | | 29 | |
| | | | |
Yuasa Trading Co. Ltd. | | | | | 1,000 | | | | | | 25 | |
| | | | | | | | | | | | |
| | | | | | | | | | | 5,161 | |
| | | | | | | | | | | | |
| |
| INFORMATION TECHNOLOGY 2.5% | |
| | | | |
Advantest Corp. | | | | | 700 | | | | | | 38 | |
| | | | |
Azbil Corp. | | | | | 700 | | | | | | 18 | |
| | | | |
BIPROGY, Inc. | | | | | 900 | | | | | | 18 | |
| | | | |
Brother Industries Ltd. | | | | | 1,500 | | | | | | 26 | |
| | | | |
Canon Marketing Japan, Inc. | | | | | 1,500 | | | | | | 31 | |
| | | | |
Canon, Inc. (c) | | | | | 14,400 | | | | | | 326 | |
| | | | |
Citizen Watch Co. Ltd. | | | | | 7,000 | | | | | | 28 | |
| | | | |
Daiwabo Holdings Co. Ltd. | | | | | 1,900 | | | | | | 25 | |
| | | | |
DTS Corp. | | | | | 1,400 | | | | | | 31 | |
| | | | |
FUJIFILM Holdings Corp. | | | | | 2,400 | | | | | | 129 | �� |
| | | | |
Fujitsu Ltd. | | | | | 1,200 | | | | | | 150 | |
| | | | |
Horiba Ltd. | | | | | 100 | | | | | | 4 | |
| | | | |
Hosiden Corp. | | | | | 2,400 | | | | | | 22 | |
| | | | |
Ibiden Co. Ltd. | | | | | 1,400 | | | | | | 40 | |
| | | | |
Konica Minolta, Inc. | | | | | 11,000 | | | | | | 37 | |
| | | | |
Macnica Fuji Electronics Holdings, Inc. | | | | | 1,300 | | | | | | 25 | |
| | | | |
Maxell Ltd. | | | | | 2,300 | | | | | | 22 | |
| | | | |
Murata Manufacturing Co. Ltd. | | | | | 3,100 | | | | | | 169 | |
| | | | |
NEC Corp. | | | | | 4,300 | | | | | | 168 | |
| | | | |
Nippon Electric Glass Co. Ltd. | | | | | 2,400 | | | | | | 46 | |
| | | | |
Nomura Research Institute Ltd. | | | | | 2,000 | | | | | | 54 | |
| | | | |
Obic Co. Ltd. | | | | | 300 | | | | | | 43 | |
| | | | |
Omron Corp. | | | | | 900 | | | | | | 46 | |
| | | | |
Otsuka Corp. | | | | | 400 | | | | | | 12 | |
| | | | |
Renesas Electronics Corp. (a) | | | | | 2,700 | | | | | | 24 | |
| | | | |
Ricoh Co. Ltd. | | | | | 11,400 | | | | | | 89 | |
| | | | |
SCREEN Holdings Co. Ltd. | | | | | 200 | | | | | | 14 | |
| | | | |
SCSK Corp. | | | | | 300 | | | | | | 5 | |
| | | | |
Seiko Epson Corp. | | | | | 2,100 | | | | | | 30 | |
| | | | |
Shimadzu Corp. | | | | | 800 | | | | | | 25 | |
| | | | |
Shinko Electric Industries Co. Ltd. | | | | | 2,000 | | | | | | 52 | |
| | | | |
SUMCO Corp. | | | | | 1,500 | | | | | | 19 | |
| | | | |
TIS, Inc. | | | | | 1,700 | | | | | | 45 | |
| | | | |
Tokyo Electron Ltd. | | | | | 800 | | | | | | 261 | |
| | | | |
Tokyo Seimitsu Co. Ltd. | | | | | 200 | | | | | | 7 | |
| | | | |
Toshiba TEC Corp. | | | | | 200 | | | | | | 6 | |
| | | | |
Trend Micro, Inc. | | | | | 400 | | | | | | 20 | |
| | | | |
Ulvac, Inc. | | | | | 500 | | | | | | 17 | |
| | | | | | | | | | | | |
| | | | | | | | | | | 2,122 | |
| | | | | | | | | | | | |
| |
| | | | | | | | | | | | |
| | | | | SHARES | | | | | MARKET
VALUE
(000S) | |
| MATERIALS 1.6% | |
| | | | |
Asahi Holdings, Inc. | | | | | 1,500 | | | $ | | | 24 | |
| | | | |
Daicel Corp. | | | | | 4,300 | | | | | | 27 | |
| | | | |
Dowa Holdings Co. Ltd. | | | | | 200 | | | | | | 7 | |
| | | | |
FP Corp. | | | | | 200 | | | | | | 4 | |
| | | | |
Hitachi Metals Ltd. | | | | | 1,700 | | | | | | 26 | |
| | | | |
JFE Holdings, Inc. | | | | | 17,700 | | | | | | 186 | |
| | | | |
Kaneka Corp. | | | | | 900 | | | | | | 22 | |
| | | | |
Kobe Steel Ltd. | | | | | 14,800 | | | | | | 67 | |
| | | | |
Mitsubishi Chemical Holdings Corp. | | | | | 15,300 | | | | | | 83 | |
| | | | |
Mitsubishi Materials Corp. | | | | | 1,700 | | | | | | 24 | |
| | | | |
Mitsui Chemicals, Inc. | | | | | 2,400 | | | | | | 51 | |
| | | | |
Nippon Paper Industries Co. Ltd. ‘L’ | | | | | 4,900 | | | | | | 35 | |
| | | | |
Nippon Steel Corp. | | | | | 23,900 | | | | | | 334 | |
| | | | |
Nissan Chemical Corp. | | | | | 600 | | | | | | 28 | |
| | | | |
Nitto Denko Corp. | | | | | 1,400 | | | | | | 91 | |
| | | | |
Oji Holdings Corp. | | | | | 9,300 | | | | | | 40 | |
| | | | |
Shin-Etsu Chemical Co. Ltd. | | | | | 200 | | | | | | 22 | |
| | | | |
Sumitomo Chemical Co. Ltd. | | | | | 29,000 | | | | | | 113 | |
| | | | |
Sumitomo Osaka Cement Co. Ltd. | | | | | 1,400 | | | | | | 35 | |
| | | | |
Taiheiyo Cement Corp. | | | | | 1,700 | | | | | | 25 | |
| | | | |
Tokuyama Corp. | | | | | 1,900 | | | | | | 24 | |
| | | | |
Tokyo Ohka Kogyo Co. Ltd. | | | | | 900 | | | | | | 44 | |
| | | | |
Tokyo Steel Manufacturing Co. Ltd. | | | | | 3,100 | | | | | | 34 | |
| | | | |
Tosoh Corp. | | | | | 1,900 | | | | | | 24 | |
| | | | |
Toyo Seikan Group Holdings Ltd. | | | | | 3,200 | | | | | | 34 | |
| | | | |
UBE Corp. | | | | | 1,700 | | | | | | 25 | |
| | | | | | | | | | | | |
| | | | | | | | | | | 1,429 | |
| | | | | | | | | | | | |
| |
| REAL ESTATE 0.1% | |
| | | | |
Daito Trust Construction Co. Ltd. | | | | | 600 | | | | | | 52 | |
| | | | | | | | | | | | |
| |
| UTILITIES 1.4% | |
| | | | |
Chubu Electric Power Co., Inc. | | | | | 12,300 | | | | | | 124 | |
| | | | |
Chugoku Electric Power Co., Inc. | | | | | 7,800 | | | | | | 50 | |
| | | | |
Electric Power Development Co. Ltd. ‘C’ | | | | | 6,800 | | | | | | 112 | |
| | | | |
Hokkaido Electric Power Co., Inc. | | | | | 7,200 | | | | | | 26 | |
| | | | |
Hokuriku Electric Power Co. | | | | | 6,000 | | | | | | 24 | |
| | | | |
Kansai Electric Power Co., Inc. | | | | | 9,300 | | | | | | 92 | |
| | | | |
Kyushu Electric Power Co., Inc. | | | | | 8,000 | | | | | | 52 | |
| | | | |
Okinawa Electric Power Co., Inc. | | | | | 3,200 | | | | | | 31 | |
| | | | |
Osaka Gas Co. Ltd. | | | | | 5,000 | | | | | | 96 | |
| | | | |
Shikoku Electric Power Co., Inc. | | | | | 4,600 | | | | | | 27 | |
| | | | |
Toho Gas Co. Ltd. | | | | | 1,300 | | | | | | 31 | |
| | | | |
Tohoku Electric Power Co., Inc. | | | | | 6,700 | | | | | | 36 | |
| | | | |
Tokyo Electric Power Co. Holdings, Inc. (a) | | | | | 79,900 | | | | | | 334 | |
| | | | |
Tokyo Gas Co. Ltd. | | | | | 7,100 | | | | | | 147 | |
| | | | | | | | | | | | |
| | | | | | | | | | | 1,182 | |
| | | | | | | | | | | | |
Total Japan | | | | | | | | | | | 22,023 | |
| | | | | | | | | | | | |
| |
| LUXEMBOURG 0.6% | |
| |
| COMMUNICATION SERVICES 0.2% | |
| | | | |
RTL Group SA | | | | | 672 | | | | | | 28 | |
| | | | |
SES SA | | | | | 10,048 | | | | | | 88 | |
| | | | | | | | | | | | |
| | | | | | | | | | | 116 | |
| | | | | | | | | | | | |
| |
| HEALTH CARE 0.0% | |
| | | | |
Eurofins Scientific SE | | | | | 386 | | | | | | 31 | |
| | | | | | | | | | | | |
| |
| | | | | | |
| 38 | | PIMCO EQUITY SERIES | | | See Accompanying Notes | |
| | | | | | | | | | | | |
| | | | | SHARES | | | | | MARKET
VALUE
(000S) | |
| MATERIALS 0.4% | |
| | | | |
APERAM SA | | | | | 795 | | | $ | | | 22 | |
| | | | |
ArcelorMittal SA | | | | | 15,311 | | | | | | 343 | |
| | | | | | | | | | | | |
| | | | | | | | | | | 365 | |
| | | | | | | | | | | | |
Total Luxembourg | | | | | | | | | | | 512 | |
| | | | | | | | | | | | |
| |
| NETHERLANDS 3.8% | |
| |
| COMMUNICATION SERVICES 0.2% | |
| | | | |
Koninklijke KPN NV | | | | | 43,424 | | | | | | 154 | |
| | | | |
VEON Ltd. ADR (a) | | | | | 53,864 | | | | | | 25 | |
| | | | | | | | | | | | |
| | | | | | | | | | | 179 | |
| | | | | | | | | | | | |
| |
| CONSUMER DISCRETIONARY 0.3% | |
| | | | |
Stellantis NV | | | | | 19,921 | | | | | | 247 | |
| | | | | | | | | | | | |
| |
| CONSUMER STAPLES 0.9% | |
| | | | |
Heineken Holding NV | | | | | 821 | | | | | | 60 | |
| | | | |
Heineken NV | | | | | 700 | | | | | | 64 | |
| | | | |
Koninklijke Ahold Delhaize NV | | | | | 26,356 | | | | | | 686 | |
| | | | | | | | | | | | |
| | | | | | | | | | | 810 | |
| | | | | | | | | | | | |
| |
| FINANCIALS 0.8% | |
| | | | |
ABN AMRO Bank NV | | | | | 16,874 | | | | | | 190 | |
| | | | |
Aegon NV | | | | | 47,946 | | | | | | 207 | |
| | | | |
ASR Nederland NV | | | | | 669 | | | | | | 27 | |
| | | | |
Euronext NV | | | | | 684 | | | | | | 56 | |
| | | | |
Flow Traders | | | | | 845 | | | | | | 24 | |
| | | | |
ING Groep NV | | | | | 7,346 | | | | | | 72 | |
| | | | |
NN Group NV | | | | | 2,631 | | | | | | 119 | |
| | | | | | | | | | | | |
| | | | | | | | | | | 695 | |
| | | | | | | | | | | | |
| |
| HEALTH CARE 0.1% | |
| | | | |
Qiagen NV (a) | | | | | 986 | | | | | | 47 | |
| | | | | | | | | | | | |
| |
| INDUSTRIALS 0.5% | |
| | | | |
Arcadis NV | | | | | 845 | | | | | | 28 | |
| | | | |
IMCD NV | | | | | 459 | | | | | | 63 | |
| | | | |
Intertrust NV (a) | | | | | 1,325 | | | | | | 26 | |
| | | | |
Randstad NV | | | | | 583 | | | | | | 28 | |
| | | | |
Signify NV | | | | | 3,607 | | | | | | 119 | |
| | | | |
TKH Group NV | | | | | 390 | | | | | | 15 | |
| | | | |
Wolters Kluwer NV | | | | | 1,379 | | | | | | 134 | |
| | | | | | | | | | | | |
| | | | | | | | | | | 413 | |
| | | | | | | | | | | | |
| |
| INFORMATION TECHNOLOGY 0.6% | |
| | | | |
ASM International NV | | | | | 361 | | | | | | 90 | |
| | | | |
ASML Holding NV | | | | | 703 | | | | | | 332 | |
| | | | |
BE Semiconductor Industries NV | | | | | 451 | | | | | | 21 | |
| | | | |
NXP Semiconductors NV | | | | | 828 | | | | | | 123 | |
| | | | | | | | | | | | |
| | | | | | | | | | | 566 | |
| | | | | | | | | | | | |
| |
| MATERIALS 0.4% | |
| | | | |
Akzo Nobel NV | | | | | 1,648 | | | | | | 108 | |
| | | | |
Corbion NV | | | | | 790 | | | | | | 24 | |
| | | | |
Koninklijke DSM NV | | | | | 1,288 | | | | | | 184 | |
| | | | | | | | | | | | |
| | | | | | | | | | | 316 | |
| | | | | | | | | | | | |
Total Netherlands | | | | | | | | | | | 3,273 | |
| | | | | | | | | | | | |
| |
| | | | | | | | | | | | |
| | | | | SHARES | | | | | MARKET
VALUE
(000S) | |
| NEW ZEALAND 0.2% | |
| |
| COMMUNICATION SERVICES 0.0% | |
| | | | |
Spark New Zealand Ltd. | | | | | 13,939 | | | $ | | | 42 | |
| | | | | | | | | | | | |
| |
| HEALTH CARE 0.0% | |
| | | | |
Fisher & Paykel Healthcare Corp. Ltd. ‘C’ | | | | | 2,122 | | | | | | 26 | |
| | | | | | | | | | | | |
| |
| INDUSTRIALS 0.1% | |
| | | | |
Auckland International Airport Ltd. (a) | | | | | 5,882 | | | | | | 27 | |
| | | | |
Fletcher Building Ltd. | | | | | 9,026 | | | | | | 28 | |
| | | | | | | | | | | | |
| | | | | | | | | | | 55 | |
| | | | | | | | | | | | |
| |
| REAL ESTATE 0.0% | |
| | | | |
Kiwi Property Group Ltd. | | | | | 42,507 | | | | | | 26 | |
| | | | | | | | | | | | |
| |
| UTILITIES 0.1% | |
| | | | |
Contact Energy Ltd. | | | | | 5,438 | | | | | | 25 | |
| | | | |
Meridian Energy Ltd. | | | | | 7,681 | | | | | | 22 | |
| | | | | | | | | | | | |
| | | | | | | | | | | 47 | |
| | | | | | | | | | | | |
Total New Zealand | | | | | | | | | | | 196 | |
| | | | | | | | | | | | |
| |
| NORWAY 1.8% | |
| |
| COMMUNICATION SERVICES 0.2% | |
| | | | |
Telenor ASA | | | | | 10,611 | | | | | | 142 | |
| | | | | | | | | | | | |
| |
| CONSUMER STAPLES 0.2% | |
| | | | |
Mowi ASA | | | | | 4,067 | | | | | | 93 | |
| | | | |
Orkla ASA | | | | | 8,104 | | | | | | 65 | |
| | | | |
Salmar ASA | | | | | 727 | | | | | | 51 | |
| | | | | | | | | | | | |
| | | | | | | | | | | 209 | |
| | | | | | | | | | | | |
| |
| ENERGY 0.9% | |
| | | | |
Aker Solutions ASA | | | | | 16,025 | | | | | | 43 | |
| | | | |
Equinor ASA | | | | | 19,881 | | | | | | 693 | |
| | | | | | | | | | | | |
| | | | | | | | | | | 736 | |
| | | | | | | | | | | | |
| |
| FINANCIALS 0.1% | |
| | | | |
Gjensidige Forsikring ASA | | | | | 1,712 | | | | | | 35 | |
| | | | |
SpareBank 1 Nord Norge | | | | | 2,584 | | | | | | 23 | |
| | | | |
SpareBank 1 SR-Bank ASA | | | | | 2,874 | | | | | | 31 | |
| | | | | | | | | | | | |
| | | | | | | | | | | 89 | |
| | | | | | | | | | | | |
| |
| INDUSTRIALS 0.1% | |
| | | | |
Tomra Systems ASA | | | | | 2,748 | | | | | | 52 | |
| | | | | | | | | | | | |
| |
| INFORMATION TECHNOLOGY 0.0% | |
| | | | |
Atea ASA | | | | | 2,556 | | | | | | 27 | |
| | | | | | | | | | | | |
| |
| MATERIALS 0.3% | |
| | | | |
Norsk Hydro ASA | | | | | 6,651 | | | | | | 37 | |
| | | | |
Yara International ASA | | | | | 4,292 | | | | | | 180 | |
| | | | | | | | | | | | |
| | | | | | | | | | | 217 | |
| | | | | | | | | | | | |
| |
| REAL ESTATE 0.0% | |
| | | | |
Entra ASA | | | | | 1,788 | | | | | | 23 | |
| | | | | | | | | | | | |
Total Norway | | | | | | | | | | | 1,495 | |
| | | | | | | | | | | | |
| |
| | | | | | | | | | | | |
| | | | | SHARES | | | | | MARKET
VALUE
(000S) | |
| PORTUGAL 0.4% | |
| |
| CONSUMER STAPLES 0.1% | |
| | | | |
Jeronimo Martins SGPS SA | | | | | 2,325 | | | $ | | | 50 | |
| | | | | | | | | | | | |
| |
| UTILITIES 0.3% | |
| | | | |
EDP - Energias de Portugal SA | | | | | 64,565 | | | | | | 301 | |
| | | | |
REN - Redes Energeticas Nacionais SGPS SA | | | | | 9,892 | | | | | | 30 | |
| | | | | | | | | | | | |
| | | | | | | | | | | 331 | |
| | | | | | | | | | | | |
Total Portugal | | | | | | | | | | | 381 | |
| | | | | | | | | | | | |
| |
| SINGAPORE 1.3% | |
| |
| COMMUNICATION SERVICES 0.2% | |
| | | | |
NetLink NBN Trust | | | | | 35,100 | | | | | | 24 | |
| | | | |
Singapore Telecommunications Ltd. | | | | | 93,900 | | | | | | 171 | |
| | | | | | | | | | | | |
| | | | | | | | | | | 195 | |
| | | | | | | | | | | | |
| |
| CONSUMER STAPLES 0.2% | |
| | | | |
Golden Agri-Resources Ltd. | | | | | 255,200 | | | | | | 46 | |
| | | | |
Wilmar International Ltd. | | | | | 37,900 | | | | | | 110 | |
| | | | | | | | | | | | |
| | | | | | | | | | | 156 | |
| | | | | | | | | | | | |
| |
| ENERGY 0.0% | |
| | | | |
BW LPG Ltd. | | | | | 4,563 | | | | | | 34 | |
| | | | | | | | | | | | |
| |
| FINANCIALS 0.4% | |
| | | | |
DBS Group Holdings Ltd. | | | | | 4,100 | | | | | | 88 | |
| | | | |
Oversea-Chinese Banking Corp. Ltd. | | | | | 15,900 | | | | | | 130 | |
| | | | |
United Overseas Bank Ltd. | | | | | 6,600 | | | | | | 125 | |
| | | | | | | | | | | | |
| | | | | | | | | | | 343 | |
| | | | | | | | | | | | |
| |
| INDUSTRIALS 0.4% | |
| | | | |
ComfortDelGro Corp. Ltd. | | | | | 25,300 | | | | | | 26 | |
| | | | |
Jardine Cycle & Carriage Ltd. | | | | | 2,100 | | | | | | 43 | |
| | | | |
Keppel Corp. Ltd. | | | | | 9,300 | | | | | | 43 | |
| | | | |
Singapore Airlines Ltd. (a) | | | | | 37,300 | | | | | | 137 | |
| | | | |
Singapore Technologies Engineering Ltd. | | | | | 16,200 | | | | | | 48 | |
| | | | | | | | | | | | |
| | | | | | | | | | | 297 | |
| | | | | | | | | | | | |
| |
| INFORMATION TECHNOLOGY 0.0% | |
| | | | |
Venture Corp. Ltd. | | | | | 2,400 | | | | | | 29 | |
| | | | | | | | | | | | |
| |
| UTILITIES 0.1% | |
| | | | |
Sembcorp Industries Ltd. | | | | | 29,900 | | | | | | 61 | |
| | | | | | | | | | | | |
Total Singapore | | | | | | | | | | | 1,115 | |
| | | | | | | | | | | | |
| |
| SOUTH AFRICA 0.0% | |
| |
| HEALTH CARE 0.0% | |
| | | | |
Mediclinic International PLC | | | | | 4,940 | | | | | | 28 | |
| | | | | | | | | | | | |
Total South Africa | | | | | | | | | | | 28 | |
| | | | | | | | | | | | |
| |
| SPAIN 4.2% | |
| |
| COMMUNICATION SERVICES 0.8% | |
| | | | |
Mediaset Espana Comunicacion SA | | | | | 6,197 | | | | | | 26 | |
| | | | |
Telefonica SA | | | | | 134,199 | | | | | | 685 | |
| | | | | | | | | | | | |
| | | | | | | | | | | 711 | |
| | | | | | | | | | | | |
| |
| | | | | | | | | | | | |
| See Accompanying Notes | | | ANNUAL REPORT | | | | | | | JUNE 30, 2022 | | | 39 |
| | | | | | |
| Schedule of Investments | | PIMCO RAFI Dynamic Multi-Factor International Equity ETF | | (Cont.) | | |
| | | | | | | | | | | | |
| | | | | SHARES | | | | | MARKET
VALUE
(000S) | |
| CONSUMER DISCRETIONARY 0.1% | |
| | | | |
Gestamp Automocion SA | | | | | 7,518 | | | $ | | | 26 | |
| | | | |
Industria de Diseno Textil SA | | | | | 2,830 | | | | | | 64 | |
| | | | | | | | | | | | |
| | | | | | | | | | | 90 | |
| | | | | | | | | | | | |
| |
| CONSUMER STAPLES 0.1% | |
| | | | |
Viscofan SA | | | | | 687 | | | | | | 38 | |
| | | | | | | | | | | | |
| |
| ENERGY 0.7% | |
| | | | |
Repsol SA | | | | | 40,492 | | | | | | 597 | |
| | | | | | | | | | | | |
| |
| FINANCIALS 1.0% | |
| | | | |
Banco Bilbao Vizcaya Argentaria SA | | | | | 28,472 | | | | | | 129 | |
| | | | |
Banco de Sabadell SA | | | | | 173,332 | | | | | | 139 | |
| | | | |
Banco Santander SA (c) | | | | | 173,669 | | | | | | 492 | |
| | | | |
Bankinter SA | | | | | 5,952 | | | | | | 37 | |
| | | | |
Mapfre SA | | | | | 16,586 | | | | | | 29 | |
| | | | |
Unicaja Banco SA | | | | | 62,445 | | | | | | 61 | |
| | | | | | | | | | | | |
| | | | | | | | | | | 887 | |
| | | | | | | | | | | | |
| |
| HEALTH CARE 0.0% | |
| | | | |
Almirall SA | | | | | 2,442 | | | | | | 27 | |
| | | | | | | | | | | | |
| |
| INDUSTRIALS 0.2% | |
| | | | |
ACS Actividades de Construccion y Servicios SA | | | | | 1,864 | | | | | | 45 | |
| | | | |
Aena SME SA (a) | | | | | 284 | | | | | | 36 | |
| | | | |
Cia de Distribucion Integral Logista Holdings SA | | | | | 1,614 | | | | | | 32 | |
| | | | |
Ferrovial SA | | | | | 20 | | | | | | 1 | |
| | | | |
Sacyr SA | | | | | 8,084 | | | | | | 19 | |
| | | | | | | | | | | | |
| | | | | | | | | | | 133 | |
| | | | | | | | | | | | |
| |
| INFORMATION TECHNOLOGY 0.1% | |
| | | | |
Amadeus IT Group SA (a) | | | | | 818 | | | | | | 46 | |
| | | | | | | | | | | | |
| |
| MATERIALS 0.0% | |
| | | | |
Acerinox SA | | | | | 3,361 | | | | | | 33 | |
| | | | | | | | | | | | |
| |
| UTILITIES 1.2% | |
| | | | |
Acciona SA | | | | | 293 | | | | | | 54 | |
| | | | |
EDP Renovaveis SA | | | | | 1,576 | | | | | | 37 | |
| | | | |
Enagas SA | | | | | 1,148 | | | | | | 25 | |
| | | | |
Endesa SA | | | | | 6,854 | | | | | | 130 | |
| | | | |
Iberdrola SA | | | | | 46,430 | | | | | | 484 | |
| | | | |
Naturgy Energy Group SA | | | | | 6,859 | | | | | | 198 | |
| | | | |
Red Electrica Corp. SA | | | | | 5,640 | | | | | | 107 | |
| | | | | | | | | | | | |
| | | | | | | | | | | 1,035 | |
| | | | | | | | | | | | |
Total Spain | | | | | | | | | | | 3,597 | |
| | | | | | | | | | | | |
| |
| SWEDEN 1.9% | |
| |
| COMMUNICATION SERVICES 0.4% | |
| | | | |
Tele2 AB ‘B’ | | | | | 4,163 | | | | | | 47 | |
| | | | |
Telia Co. AB | | | | | 69,523 | | | | | | 267 | |
| | | | | | | | | | | | |
| | | | | | | | | | | 314 | |
| | | | | | | | | | | | |
| |
| CONSUMER DISCRETIONARY 0.2% | |
| | | | |
Autoliv, Inc. | | | | | 477 | | | | | | 34 | |
| | | | |
Bilia AB ‘A’ | | | | | 1,835 | | | | | | 26 | |
| | | | |
Electrolux AB | | | | | 2,675 | | | | | | 36 | |
| | | | | | | | | | | | |
| | | | | SHARES | | | | | MARKET
VALUE
(000S) | |
| | | | |
H & M Hennes & Mauritz AB ‘B’ | | | | | 5,050 | | | $ | | | 61 | |
| | | | |
Scandic Hotels Group AB | | | | | 8,192 | | | | | | 32 | |
| | | | | | | | | | | | |
| | | | | | | | | | | 189 | |
| | | | | | | | | | | | |
| |
| CONSUMER STAPLES 0.3% | |
| | | | |
AAK AB | | | | | 1,572 | | | | | | 25 | |
| | | | |
Axfood AB | | | | | 1,101 | | | | | | 32 | |
| | | | |
Cloetta AB ‘B’ | | | | | 12,709 | | | | | | 26 | |
| | | | |
Essity AB ‘B’ | | | | | 4,866 | | | | | | 127 | |
| | | | |
Swedish Match AB | | | | | 7,226 | | | | | | 74 | |
| | | | | | | | | | | | |
| | | | | | | | | | | 284 | |
| | | | | | | | | | | | |
| |
| FINANCIALS 0.2% | |
| | | | |
EQT AB | | | | | 987 | | | | | | 21 | |
| | | | |
Skandinaviska Enskilda Banken AB ‘A’ | | | | | 2,939 | | | | | | 29 | |
| | | | |
Svenska Handelsbanken AB ‘A’ | | | | | 8,753 | | | | | | 75 | |
| | | | |
Swedbank AB ‘A’ | | | | | 6,409 | | | | | | 81 | |
| | | | | | | | | | | | |
| | | | | | | | | | | 206 | |
| | | | | | | | | | | | |
| |
| INDUSTRIALS 0.5% | |
| | | | |
Assa Abloy AB ‘B’ | | | | | 1,591 | | | | | | 34 | |
| | | | |
Atlas Copco AB ‘A’ | | | | | 11,676 | | | | | | 109 | |
| | | | |
Epiroc AB | | | | | 3,297 | | | | | | 51 | |
| | | | |
Indutrade AB | | | | | 1,425 | | | | | | 26 | |
| | | | |
Nibe Industrier AB ‘B’ | | | | | 3,769 | | | | | | 28 | |
| | | | |
Sandvik AB | | | | | 3,307 | | | | | | 54 | |
| | | | |
SKF AB ‘B’ | | | | | 2,079 | | | | | | 31 | |
| | | | |
Volvo AB ‘B’ | | | | | 6,711 | | | | | | 105 | |
| | | | | | | | | | | | |
| | | | | | | | | | | 438 | |
| | | | | | | | | | | | |
| |
| INFORMATION TECHNOLOGY 0.1% | |
| | | | |
Telefonaktiebolaget LM Ericsson ‘B’ | | | | | 6,492 | | | | | | 48 | |
| | | | | | | | | | | | |
| |
| MATERIALS 0.1% | |
| | | | |
Hexpol AB | | | | | 1,840 | | | | | | 16 | |
| | | | |
SSAB AB ‘A’ | | | | | 18,640 | | | | | | 82 | |
| | | | | | | | | | | | |
| | | | | | | | | | | 98 | |
| | | | | | | | | | | | |
| |
| REAL ESTATE 0.1% | |
| | | | |
Atrium Ljungberg AB ‘B’ | | | | | 1,784 | | | | | | 23 | |
| | | | |
Hufvudstaden AB ‘A’ | | | | | 2,035 | | | | | | 23 | |
| | | | | | | | | | | | |
| | | | | | | | | | | 46 | |
| | | | | | | | | | | | |
Total Sweden | | | | | | | | | | | 1,623 | |
| | | | | | | | | | | | |
| |
| SWITZERLAND 6.9% | |
| |
| COMMUNICATION SERVICES 0.2% | |
| | | | |
Swisscom AG | | | | | 281 | | | | | | 156 | |
| | | | | | | | | | | | |
| |
| CONSUMER DISCRETIONARY 0.3% | |
| | | | |
Cie Financiere Richemont SA | | | | | 1,517 | | | | | | 163 | |
| | | | |
Forbo Holding AG | | | | | 16 | | | | | | 22 | |
| | | | |
Garmin Ltd. | | | | | 641 | | | | | | 63 | |
| | | | |
Valora Holding AG | | | | | 140 | | | | | | 24 | |
| | | | | | | | | | | | |
| | | | | | | | | | | 272 | |
| | | | | | | | | | | | |
| |
| CONSUMER STAPLES 1.3% | |
| | | | |
Aryzta AG (a) | | | | | 25,883 | | | | | | 29 | |
| | | | |
Barry Callebaut AG | | | | | 19 | | | | | | 43 | |
| | | | |
Chocoladefabriken Lindt & Spruengli AG | | | | | 8 | | | | | | 81 | |
| | | | | | | | | | | | |
| | | | | SHARES | | | | | MARKET
VALUE
(000S) | |
| | | | |
Emmi AG | | | | | 26 | | | $ | | | 25 | |
| | | | |
Nestle SA | | | | | 8,257 | | | | | | 965 | |
| | | | | | | | | | | | |
| | | | | | | | | | | 1,143 | |
| | | | | | | | | | | | |
| |
| FINANCIALS 1.3% | |
| | | | |
Banque Cantonale Vaudoise | | | | | 408 | | | | | | 32 | |
| | | | |
Cembra Money Bank AG | | | | | 428 | | | | | | 31 | |
| | | | |
St Galler Kantonalbank AG | | | | | 51 | | | | | | 23 | |
| | | | |
Swiss Life Holding AG | | | | | 218 | | | | | | 106 | |
| | | | |
Swiss Re AG | | | | | 2,158 | | | | | | 167 | |
| | | | |
UBS Group AG | | | | | 7,492 | | | | | | 121 | |
| | | | |
Valiant Holding AG | | | | | 359 | | | | | | 32 | |
| | | | |
Zurich Insurance Group AG | | | | | 1,407 | | | | | | 614 | |
| | | | | | | | | | | | |
| | | | | | | | | | | 1,126 | |
| | | | | | | | | | | | |
| |
| HEALTH CARE 1.3% | |
| | | | |
Alcon, Inc. | | | | | 994 | | | | | | 70 | |
| | | | |
Galenica AG | | | | | 575 | | | | | | 44 | |
| | | | |
Novartis AG | | | | | 3,237 | | | | | | 275 | |
| | | | |
Roche Holding AG | | | | | 1,867 | | | | | | 624 | |
| | | | |
Sonova Holding AG | | | | | 282 | | | | | | 90 | |
| | | | |
Straumann Holding AG | | | | | 260 | | | | | | 31 | |
| | | | | | | | | | | | |
| | | | | | | | | | | 1,134 | |
| | | | | | | | | | | | |
| |
| INDUSTRIALS 0.8% | |
| | | | |
ABB Ltd. | | | | | 9,944 | | | | | | 267 | |
| | | | |
Adecco Group AG | | | | | 1,311 | | | | | | 45 | |
| | | | |
Bucher Industries AG | | | | | 67 | | | | | | 23 | |
| | | | |
DKSH Holding AG | | | | | 429 | | | | | | 36 | |
| | | | |
Flughafen Zurich AG (a) | | | | | 147 | | | | | | 22 | |
| | | | |
Geberit AG | | | | | 136 | | | | | | 66 | |
| | | | |
Georg Fischer AG | | | | | 520 | | | | | | 26 | |
| | | | |
Kuehne & Nagel International AG | | | | | 435 | | | | | | 103 | |
| | | | |
Schindler Holding AG | | | | | 281 | | | | | | 51 | |
| | | | |
SGS SA | | | | | 18 | | | | | | 41 | |
| | | | | | | | | | | | |
| | | | | | | | | | | 680 | |
| | | | | | | | | | | | |
| |
| INFORMATION TECHNOLOGY 0.1% | |
| | | | |
Landis & Gyr Group AG | | | | | 474 | | | | | | 25 | |
| | | | |
Logitech International SA | | | | | 737 | | | | | | 38 | |
| | | | | | | | | | | | |
| | | | | | | | | | | 63 | |
| | | | | | | | | | | | |
| |
| MATERIALS 1.4% | |
| | | | |
EMS-Chemie Holding AG | | | | | 35 | | | | | | 26 | |
| | | | |
Givaudan SA | | | | | 29 | | | | | | 102 | |
| | | | |
Glencore PLC | | | | | 160,400 | | | | | | 869 | |
| | | | |
SIG Group AG | | | | | 1,565 | | | | | | 35 | |
| | | | |
Sika AG | | | | | 588 | | | | | | 136 | |
| | | | | | | | | | | | |
| | | | | | | | | | | 1,168 | |
| | | | | | | | | | | | |
| |
| REAL ESTATE 0.2% | |
| | | | |
Allreal Holding AG | | | | | 156 | | | | | | 26 | |
| | | | |
PSP Swiss Property AG | | | | | 448 | | | | | | 50 | |
| | | | |
Swiss Prime Site AG | | | | | 839 | | | | | | 73 | |
| | | | | | | | | | | | |
| | | | | | | | | | | 149 | |
| | | | | | | | | | | | |
| |
| UTILITIES 0.0% | |
| | | | |
BKW AG | | | | | 290 | | | | | | 30 | |
| | | | | | | | | | | | |
Total Switzerland | | | | | | | | | | | 5,921 | |
| | | | | | | | | | | | |
| |
| | | | | | |
| 40 | | PIMCO EQUITY SERIES | | | See Accompanying Notes | |
| | | | | | | | | | | | |
| | | | | SHARES | | | | | MARKET
VALUE
(000S) | |
| UNITED KINGDOM 13.8% | |
| |
| COMMUNICATION SERVICES 1.2% | |
| | | | |
BT Group PLC | | | | | 94,814 | | | $ | | | 215 | |
| | | | |
Pearson PLC | | | | | 11,229 | | | | | | 103 | |
| | | | |
Vodafone Group PLC | | | | | 453,389 | | | | | | 705 | |
| | | | | | | | | | | | |
| | | | | | | | | | | 1,023 | |
| | | | | | | | | | | | |
| |
| CONSUMER DISCRETIONARY 0.7% | |
| | | | |
B&M European Value Retail SA | | | | | 5,537 | | | | | | 25 | |
| | | | |
Berkeley Group Holdings PLC | | | | | 535 | | | | | | 24 | |
| | | | |
Burberry Group PLC | | | | | 1,318 | | | | | | 26 | |
| | | | |
Cazoo Group Ltd. (a) | | | | | 1,563 | | | | | | 1 | |
| | | | |
Compass Group PLC | | | | | 6,066 | | | | | | 125 | |
| | | | |
Frasers Group PLC (a) | | | | | 3,339 | | | | | | 27 | |
| | | | |
Greggs PLC | | | | | 1,289 | | | | | | 29 | |
| | | | |
Halfords Group PLC | | | | | 5,881 | | | | | | 10 | |
| | | | |
Inchcape PLC | | | | | 3,077 | | | | | | 26 | |
| | | | |
Kingfisher PLC | | | | | 53,253 | | | | | | 159 | |
| | | | |
Marston’s PLC (a) | | | | | 26,465 | | | | | | 17 | |
| | | | |
Mitchells & Butlers PLC (a) | | | | | 9,268 | | | | | | 21 | |
| | | | |
Next PLC | | | | | 841 | | | | | | 60 | |
| | | | |
Pets at Home Group PLC | | | | | 4,946 | | | | | | 19 | |
| | | | |
Taylor Wimpey PLC | | | | | 15,062 | | | | | | 21 | |
| | | | | | | | | | | | |
| | | | | | | | | | | 590 | |
| | | | | | | | | | | | |
| |
| CONSUMER STAPLES 2.5% | |
| | | | |
Associated British Foods PLC | | | | | 3,713 | | | | | | 72 | |
| | | | |
British American Tobacco PLC | | | | | 7,123 | | | | | | 305 | |
| | | | |
Cranswick PLC | | | | | 576 | | | | | | 22 | |
| | | | |
Diageo PLC | | | | | 11,484 | | | | | | 496 | |
| | | | |
Imperial Brands PLC | | | | | 10,677 | | | | | | 239 | |
| | | | |
J Sainsbury PLC | | | | | 38,134 | | | | | | 95 | |
| | | | |
Marks & Spencer Group PLC | | | | | 34,473 | | | | | | 57 | |
| | | | |
Premier Foods PLC | | | | | 19,561 | | | | | | 27 | |
| | | | |
Reckitt Benckiser Group PLC | | | | | 3,091 | | | | | | 232 | |
| | | | |
Tate & Lyle PLC | | | | | 4,672 | | | | | | 43 | |
| | | | |
Tesco PLC | | | | | 87,231 | | | | | | 272 | |
| | | | |
Unilever PLC | | | | | 5,672 | | | | | | 258 | |
| | | | | | | | | | | | |
| | | | | | | | | | | 2,118 | |
| | | | | | | | | | | | |
| |
| ENERGY 1.9% | |
| | | | |
BP PLC | | | | | 227,026 | | | | | | 1,066 | |
| | | | |
Shell PLC | | | | | 20,782 | | | | | | 541 | |
| | | | |
Subsea 7 SA | | | | | 6,914 | | | | | | 56 | |
| | | | | | | | | | | | |
| | | | | | | | | | | 1,663 | |
| | | | | | | | | | | | |
| |
| FINANCIALS 1.4% | |
| | | | |
3i Group PLC | | | | | 3,145 | | | | | | 43 | |
| | | | |
Admiral Group PLC | | | | | 1,591 | | | | | | 44 | |
| | | | |
Direct Line Insurance Group PLC | | | | | 25,710 | | | | | | 79 | |
| | | | |
HSBC Holdings PLC | | | | | 73,055 | | | | | | 477 | |
| | | | |
IG Group Holdings PLC | | | | | 3,375 | | | | | | 28 | |
| | | | |
M&G PLC | | | | | 40,455 | | | | | | 96 | |
| | | | |
Man Group PLC | | | | | 13,679 | | | | | | 42 | |
| | | | |
NatWest Group PLC | | | | | 28,832 | | | | | | 77 | |
| | | | |
Provident Financial PLC | | | | | 6,647 | | | | | | 16 | |
| | | | |
Schroders PLC | | | | | 655 | | | | | | 21 | |
| | | | |
Standard Chartered PLC | | | | | 38,815 | | | | | | 293 | |
| | | | | | | | | | | | |
| | | | | | | | | | | 1,216 | |
| | | | | | | | | | | | |
| |
| HEALTH CARE 2.7% | |
| | | | |
AstraZeneca PLC | | | | | 10,190 | | | | | | 1,344 | |
| | | | |
ConvaTec Group PLC | | | | | 10,261 | | | | | | 28 | |
| | | | | | | | | | | | |
| | | | | SHARES | | | | | MARKET
VALUE
(000S) | |
| | | | |
GSK PLC | | | | | 41,213 | | | $ | | | 888 | |
| | | | |
Indivior PLC (a) | | | | | 10,813 | | | | | | 41 | |
| | | | |
Smith & Nephew PLC | | | | | 2,898 | | | | | | 41 | |
| | | | | | | | | | | | |
| | | | | | | | | | | 2,342 | |
| | | | | | | | | | | | |
| |
| INDUSTRIALS 1.7% | |
| | | | |
Ashtead Group PLC | | | | | 1,632 | | | | | | 69 | |
| | | | |
BAE Systems PLC | | | | | 34,887 | | | | | | 353 | |
| | | | |
Balfour Beatty PLC | | | | | 8,093 | | | | | | 25 | |
| | | | |
Bunzl PLC | | | | | 1,854 | | | | | | 62 | |
| | | | |
CNH Industrial NV | | | | | 4,858 | | | | | | 56 | |
| | | | |
Diploma PLC | | | | | 921 | | | | | | 25 | |
| | | | |
Ferguson PLC | | | | | 725 | | | | | | 81 | |
| | | | |
Firstgroup PLC | | | | | 24,667 | | | | | | 38 | |
| | | | |
Howden Joinery Group PLC | | | | | 4,698 | | | | | | 35 | |
| | | | |
IMI PLC | | | | | 2,099 | | | | | | 30 | |
| | | | |
International Consolidated Airlines Group SA | | | | | 44,473 | | | | | | 58 | |
| | | | |
Morgan Sindall Group PLC | | | | | 1,045 | | | | | | 23 | |
| | | | |
National Express Group PLC (a) | | | | | 6,143 | | | | | | 15 | |
| | | | |
Pagegroup PLC | | | | | 3,827 | | | | | | 19 | |
| | | | |
RELX PLC | | | | | 12,340 | | | | | | 335 | |
| | | | |
Rentokil Initial PLC | | | | | 7,403 | | | | | | 43 | |
| | | | |
Royal Mail PLC | | | | | 18,485 | | | | | | 61 | |
| | | | |
RS GROUP PLC | | | | | 3,255 | | | | | | 35 | |
| | | | |
Spirax-Sarco Engineering PLC | | | | | 376 | | | | | | 45 | |
| | | | |
Travis Perkins PLC | | | | | 2,003 | | | | | | 24 | |
| | | | |
Ultra Electronics Holdings PLC | | | | | 630 | | | | | | 26 | |
| | | | | | | | | | | | |
| | | | | | | | | | | 1,458 | |
| | | | | | | | | �� | | | |
| |
| INFORMATION TECHNOLOGY 0.1% | |
| | | | |
Computacenter PLC | | | | | 849 | | | | | | 24 | |
| | | | |
Micro Focus International PLC | | | | | 7,781 | | | | | | 27 | |
| | | | | | | | | | | | |
| | | | | | | | | | | 51 | |
| | | | | | | | | | | | |
| |
| MATERIALS 0.5% | |
| | | | |
Anglo American PLC | | | | | 2,948 | | | | | | 105 | |
| | | | |
Croda International PLC | | | | | 1,164 | | | | | | 92 | |
| | | | |
Johnson Matthey PLC | | | | | 1,502 | | | | | | 36 | |
| | | | |
Rio Tinto PLC | | | | | 3,131 | | | | | | 187 | |
| | | | | | | | | | | | |
| | | | | | | | | | | 420 | |
| | | | | | | | | | | | |
| |
| REAL ESTATE 0.1% | |
| | | | |
Grainger PLC | | | | | 5,124 | | | | | | 17 | |
| | | | |
Savills PLC | | | | | 1,759 | | | | | | 22 | |
| | | | | | | | | | | | |
| | | | | | | | | | | 39 | |
| | | | | | | | | | | | |
| |
| UTILITIES 1.0% | |
| | | | |
Centrica PLC (a) | | | | | 107,125 | | | | | | 105 | |
| | | | |
Drax Group PLC | | | | | 6,883 | | | | | | 54 | |
| | | | |
National Grid PLC | | | | | 32,168 | | | | | | 413 | |
| | | | |
Severn Trent PLC | | | | | 980 | | | | | | 33 | |
| | | | |
SSE PLC | | | | | 9,480 | | | | | | 187 | |
| | | | |
United Utilities Group PLC | | | | | 5,011 | | | | | | 62 | |
| | | | | | | | | | | | |
| | | | | | | | | | | 854 | |
| | | | | | | | | | | | |
Total United Kingdom | | | | | | | | | | | 11,774 | |
| | | | | | | | | | | | |
| |
| UNITED STATES 0.1% | |
| |
| MATERIALS 0.1% | |
| | | | |
Sims Ltd. | | | | | 4,222 | | | | | | 40 | |
| | | | | | | | | | | | |
Total United States | | | | | | | | | | | 40 | |
| | | | | | | | | | | | |
Total Common Stocks (Cost $82,407) | | | 81,293 | |
| | | | |
| |
| | | | | | | | | | | | |
| | | | | SHARES | | | | | MARKET
VALUE
(000S) | |
| PREFERRED STOCKS 0.7% | |
| |
| GERMANY 0.7% | |
| |
| CONSUMER DISCRETIONARY 0.5% | |
| | | | |
Schaeffler AG | | | | | 3,766 | | | $ | | | 22 | |
| | | | |
Volkswagen AG | | | | | 2,875 | | | | | | 387 | |
| | | | | | | | | | | | |
| | | | | | | | | | | 409 | |
| | | | | | | | | | | | |
| |
| HEALTH CARE 0.0% | |
| | | | |
Sartorius AG | | | | | 101 | | | | | | 35 | |
| | | | | | | | | | | | |
| |
| INDUSTRIALS 0.2% | |
| | | | |
Fuchs Petrolub SE | | | | | 1,391 | | | | | | 39 | |
| | | | |
Henkel AG & Co. KGaA | | | | | 1,872 | | | | | | 116 | |
| | | | | | | | | | | | |
| | | | | | | | | | | 155 | |
| | | | | | | | | | | | |
Total Preferred Stocks (Cost $845) | | | 599 | |
| | | | |
| |
| REAL ESTATE INVESTMENT TRUSTS 1.7% | |
| |
| AUSTRALIA 0.1% | |
| |
| REAL ESTATE 0.1% | |
| | | | |
GPT Group | | | | | 8,824 | | | | | | 26 | |
| | | | |
Stockland | | | | | 10,231 | | | | | | 25 | |
| | | | |
Vicinity Centres | | | | | 14,643 | | | | | | 19 | |
| | | | | | | | | | | | |
| | | | | | | | | | | 70 | |
| | | | | | | | | | | | |
Total Australia | | | | | | | | | | | 70 | |
| | | | | | | | | | | | |
| |
| BELGIUM 0.1% | |
| |
| REAL ESTATE 0.1% | |
| | | | |
Befimmo SA | | | | | 547 | | | | | | 27 | |
| | | | |
Cofinimmo SA | | | | | 210 | | | | | | 23 | |
| | | | |
Warehouses De Pauw CVA | | | | | 843 | | | | | | 27 | |
| | | | | | | | | | | | |
| | | | | | | | | | | 77 | |
| | | | | | | | | | | | |
Total Belgium | | | | | | | | | | | 77 | |
| | | | | | | | | | | | |
| |
| CANADA 0.1% | |
| |
| REAL ESTATE 0.1% | |
| | | | |
Allied Properties Real Estate Investment Trust | | | | | 850 | | | | | | 22 | |
| | | | |
Canadian Apartment Properties REIT | | | | | 720 | | | | | | 25 | |
| | | | |
Dream Office Real Estate Investment Trust | | | | | 1,299 | | | | | | 19 | |
| | | | |
Granite Real Estate Investment Trust | | | | | 521 | | | | | | 32 | |
| | | | | | | | | | | | |
| | | | | | | | | | | 98 | |
| | | | | | | | | | | | |
Total Canada | | | | | | | | | | | 98 | |
| | | | | | | | | | | | |
| |
| FRANCE 0.1% | |
| |
| REAL ESTATE 0.1% | |
| | | | |
Klepierre SA | | | | | 1,370 | | | | | | 26 | |
| | | | |
Unibail-Rodamco-Westfield | | | | | 567 | | | | | | 29 | |
| | | | | | | | | | | | |
| | | | | | | | | | | 55 | |
| | | | | | | | | | | | |
Total France | | | | | | | | | | | 55 | |
| | | | | | | | | | | | |
| |
| HONG KONG 0.1% | |
| |
| REAL ESTATE 0.1% | |
| | | | |
Fortune REIT | | | | | 25,000 | | | | | | 21 | |
| | | | |
Link REIT | | | | | 7,100 | | | | | | 58 | |
| | | | | | | | | | | | |
| | | | | | | | | | | 79 | |
| | | | | | | | | | | | |
Total Hong Kong | | | | | | | | | | | 79 | |
| | | | | | | | | | | | |
| |
| | | | | | | | | | | | |
| See Accompanying Notes | | | ANNUAL REPORT | | | | | | | JUNE 30, 2022 | | | 41 |
| | | | | | |
| Schedule of Investments | | PIMCO RAFI Dynamic Multi-Factor International Equity ETF | | (Cont.) | | |
| | | | | | | | | | | | |
| | | | | SHARES | | | | | MARKET
VALUE
(000S) | |
| JAPAN 0.8% | |
| |
| REAL ESTATE 0.8% | |
| | | | |
Activia Properties, Inc. | | | | | 7 | | | $ | | | 21 | |
| | | | |
Advance Residence Investment Corp. | | | | | 12 | | | | | | 32 | |
| | | | |
AEON REIT Investment Corp. | | | | | 24 | | | | | | 27 | |
| | | | |
Daiwa House REIT Investment Corp. | | | | | 11 | | | | | | 25 | |
| | | | |
Daiwa Office Investment Corp. | | | | | 2 | | | | | | 10 | |
| | | | |
Daiwa Securities Living Investments Corp. | | | | | 37 | | | | | | 32 | |
| | | | |
Frontier Real Estate Investment Corp. | | | | | 2 | | | | | | 8 | |
| | | | |
Fukuoka REIT Corp. | | | | | 16 | | | | | | 20 | |
| | | | |
GLP J-Reit | | | | | 22 | | | | | | 27 | |
| | | | |
Hulic Reit, Inc. | | | | | 16 | | | | | | 19 | |
| | | | |
Industrial & Infrastructure Fund Investment Corp. | | | | | 16 | | | | | | 21 | |
| | | | |
Japan Excellent, Inc. | | | | | 23 | | | | | | 21 | |
| | | | |
Japan Logistics Fund, Inc. | | | | | 12 | | | | | | 28 | |
| | | | |
Japan Metropolitan Fund Invest | | | | | 50 | | | | | | 39 | |
| | | | |
Japan Prime Realty Investment Corp. | | | | | 8 | | | | | | 24 | |
| | | | |
Japan Real Estate Investment Corp. | | | | | 7 | | | | | | 32 | |
| | | | |
Kenedix Office Investment Corp. | | | | | 5 | | | | | | 25 | |
| | | | |
Mori Hills REIT Investment Corp. | | | | | 17 | | | | | | 19 | |
| | | | |
Mori Trust Sogo Reit, Inc. | | | | | 23 | | | | | | 24 | |
| | | | |
Nippon Accommodations Fund, Inc. | | | | | 3 | | | | | | 15 | |
| | | | |
Nippon Building Fund, Inc. | | | | | 9 | | | | | | 45 | |
| | | | |
Nippon Prologis REIT, Inc. | | | | | 11 | | | | | | 27 | |
| | | | |
Nomura Real Estate Master Fund, Inc. | | | | | 24 | | | | | | 30 | |
| | | | |
NTT UD REIT Investment Corp. | | | | | 26 | | | | | | 28 | |
| | | | |
Orix JREIT, Inc. | | | | | 21 | | | | | | 29 | |
| | | | |
Sekisui House Reit, Inc. | | | | | 42 | | | | | | 25 | |
| | | | |
United Urban Investment Corp. | | | | | 25 | | | | | | 26 | |
| | | | | | | | | | | | |
| | | | | | | | | | | 679 | |
| | | | | | | | | | | | |
Total Japan | | | | | | | | | | | 679 | |
| | | | | | | | | | | | |
| |
| | | | | | | | | | | | |
| | | | | SHARES | | | | | MARKET
VALUE
(000S) | |
| SINGAPORE 0.2% | |
| |
| REAL ESTATE 0.2% | |
| | | | |
Ascendas Real Estate Investment Trust | | | | | 20,700 | | | $ | | | 42 | |
| | | | |
CapitaLand Integrated Commercial Trust | | | | | 16,700 | | | | | | 26 | |
| | | | |
Keppel DC REIT | | | | | 16,300 | | | | | | 23 | |
| | | | |
Mapletree Industrial Trust | | | | | 14,835 | | | | | | 28 | |
| | | | |
Mapletree North Asia Commercial Trust | | | | | 37,900 | | | | | | 33 | |
| | | | | | | | | | | | |
| | | | | | | | | | | 152 | |
| | | | | | | | | | | | |
Total Singapore | | | | | | | | | | | 152 | |
| | | | | | | | | | | | |
| |
| SPAIN 0.0% | |
| |
| REAL ESTATE 0.0% | |
| | | | |
Inmobiliaria Colonial Socimi SA | | | | | 1,958 | | | | | | 13 | |
| | | | | | | | | | | | |
Total Spain | | | | | | | | | | | 13 | |
| | | | | | | | | | | | |
| |
| UNITED KINGDOM 0.2% | |
| |
| REAL ESTATE 0.2% | |
| | | | |
Assura PLC | | | | | 19,339 | | | | | | 15 | |
| | | | |
Big Yellow Group PLC | | | | | 1,505 | | | | | | 24 | |
| | | | |
Great Portland Estates PLC | | | | | 2,564 | | | | | | 18 | |
| | | | |
Land Securities Group PLC | | | | | 4,749 | | | | | | 39 | |
| | | | |
LondonMetric Property PLC | | | | | 9,410 | | | | | | 26 | |
| | | | |
Segro PLC | | | | | 4,069 | | | | | | 49 | |
| | | | |
Tritax Big Box REIT PLC | | | | | 19,292 | | | | | | 43 | |
| | | | | | | | | | | | |
| | | | | | | | | | | 214 | |
| | | | | | | | | | | | |
Total United Kingdom | | | | | | | | | | | 214 | |
| | | | | | | | | | | | |
Total Real Estate Investment Trusts (Cost $1,641) | | | 1,437 | |
| | | | |
| |
| | | | | | | | | | | | |
| | | | | SHARES | | | | | MARKET
VALUE
(000S) | |
| RIGHTS 0.0% | |
| |
| AUSTRALIA 0.0% | |
| |
| ENERGY 0.0% | |
| | | | |
Carsales.com Ltd. (a) | | | | | 324 | | | $ | | | 0 | |
| | | | | | | | | | | | |
Total Rights (Cost $0) | | | 0 | |
| | | | |
| |
| SHORT-TERM INSTRUMENTS 1.6% | |
| |
| REPURCHASE AGREEMENTS (f) 1.6% | |
| | | | | | | | | | | 1,354 | |
| | | | | | | | | | | | |
Total Short-Term Instruments
(Cost $1,354) | | | 1,354 | |
| | | | |
| |
| | | | |
Total Investments in Securities
(Cost $86,247) | | | 84,683 | |
| | | | |
| |
| INVESTMENTS IN AFFILIATES 1.4% | |
| |
| SHORT-TERM INSTRUMENTS 1.4% | |
| |
| MUTUAL FUNDS 1.4% | |
|
PIMCO Government Money Market Fund | |
| | | | |
1.450% (b)(c)(d) | | | | | 1,189,088 | | | | | | 1,189 | |
| | | | | | | | | | | | |
Total Short-Term Instruments
(Cost $1,189) | | | 1,189 | |
| | | | |
| |
| | | | |
Total Investments in Affiliates
(Cost $1,189) | | | 1,189 | |
| |
| | | | |
Total Investments 100.4%
(Cost $87,436) | | | $ | | | 85,872 | |
| |
| Other Assets and Liabilities, net (0.4)% | | | (333 | ) |
| | | | |
| Net Assets 100.0% | | | $ | | | 85,539 | |
| | | | | | | |
NOTES TO SCHEDULE OF INVESTMENTS:
| * | A zero balance may reflect actual amounts rounding to less than one thousand. |
| (a) | Security did not produce income within the last twelve months. |
| (b) | Institutional Class Shares of each Fund. |
| (c) | Securities with an aggregate market value of $1,695 were out on loan in exchange for $1,807 of cash collateral as of June 30, 2022. The collateral was invested in a cash collateral reinvestment vehicle as described in Note 5 in the Notes to Financial Statements. |
| (d) | Coupon represents a 7-Day Yield. |
(e) RESTRICTED SECURITIES:
| | | | | | | | | | | | | | |
| Issuer Description | | Acquisition
Date | | Cost | | | Market
Value | | | Market Value
as Percentage
of Net Assets | |
Constellation Software, Inc. | | 03/01/2019 - 04/12/2022 | | $ | 47 | | | $ | 59 | | | | 0.07 | % |
Great-West Lifeco, Inc. | | 06/27/2018 - 04/12/2022 | | | 29 | | | | 30 | | | | 0.04 | |
Intact Financial Corp. | | 08/12/2019 - 04/12/2022 | | | 86 | | | | 101 | | | | 0.12 | |
Whitecap Resources, Inc. | | 09/30/2020 - 09/15/2021 | | | 32 | | | | 78 | | | | 0.09 | |
| | | | | | | | | | | | | | |
| | $ | 194 | | | $ | 268 | | | | 0.32 | % |
| | | | | | | | | | | | |
BORROWINGS AND OTHER FINANCING TRANSACTIONS
(f) REPURCHASE AGREEMENTS:
| | | | | | | | | | | | | | | | | | | | | | | | | | | | | | |
| Counterparty | | Lending
Rate | | | Settlement
Date | | | Maturity
Date | | | Principal
Amount | | | Collateralized By | | Collateral
(Received) | | | Repurchase
Agreements,
at Value | | | Repurchase
Agreement
Proceeds
to be
Received(1) | |
| FICC | | | 0.400 | % | | | 06/30/2022 | | | | 07/01/2022 | | | $ | 1,354 | | | U.S. Treasury Notes 2.875% due 06/15/2025 | | $ | (1,381 | ) | | $ | 1,354 | | | $ | 1,354 | |
| | | | | | | | | | | | | | | | | | | | | | | | | | | | | | |
Total Repurchase Agreements | | | | | $ | (1,381 | ) | | $ | 1,354 | | | $ | 1,354 | |
| | | | | | | | | | | | | | | |
| | | | | | |
| 42 | | PIMCO EQUITY SERIES | | | See Accompanying Notes | |
BORROWINGS AND OTHER FINANCING TRANSACTIONS SUMMARY
The following is a summary by counterparty of the market value of Borrowings and Other Financing Transactions and collateral pledged/(received) as of June 30, 2022:
| | | | | | | | | | | | | | | | | | | | | | | | | | | | |
| Counterparty | | Repurchase
Agreement
Proceeds
to be
Received(1) | | | Payable for
Reverse
Repurchase
Agreements | | | Payable for
Sale-Buyback
Transactions | | | Securities
Out on Loan | | | Total
Borrowings and
Other Financing
Transactions | | | Collateral
Pledged/(Received) | | | Net Exposure(2) | |
Global/Master Repurchase Agreement | |
FICC | | $ | 1,354 | | | $ | 0 | | | $ | 0 | | | $ | 0 | | | $ | 1,354 | | | $ | (1,381 | ) | | $ | (27 | ) |
|
Master Securities Lending Agreement | |
GSC | | | 0 | | | | 0 | | | | 0 | | | | 1,102 | | | | 1,102 | | | | (1,158 | ) | | | (56 | ) |
BSN | | | 0 | | | | 0 | | | | 0 | | | | 27 | | | | 27 | | | | (31 | ) | | | (4 | ) |
UBS | | | 0 | | | | 0 | | | | 0 | | | | 566 | | | | 566 | | | | (618 | ) | | | (52 | ) |
| | | | | | | | | | | | | | | | | | | | | | | | | | | | |
Total Borrowings and Other Financing Transactions | | $ | 1,354 | | | $ | 0 | | | $ | 0 | | | $ | 1,695 | | | | | | | | | | | | | |
| | | | | | | | | | | | | | | | | | | | | | | | | | | | |
CERTAIN TRANSFERS ACCOUNTED FOR AS SECURED BORROWINGS
Remaining Contractual Maturity of the Agreements
| | | | | | | | | | | | | | | | | | | | |
| | | Overnight and
Continuous | | | Up to 30 days | | | 31-90 days | | | Greater Than 90 days | | | Total | |
Securities Lending Transactions(3) | |
Common Stock | | $ | 1,807 | | | $ | 0 | | | $ | 0 | | | $ | 0 | | | $ | 1,807 | |
| | | | | | | | | | | | | | | | | | | | |
Total Borrowings | | $ | 1,807 | | | $ | 0 | | | $ | 0 | | | $ | 0 | | | $ | 1,807 | |
| | | | | | | | | | | | | | | | | | | | |
Payable for securities on loan - cash collateral | | | $ | 1,807 | |
| | | | | |
| (1) | Includes accrued interest. |
| (2) | Net Exposure represents the net receivable/(payable) that would be due from/to the counterparty in the event of default. Exposure from borrowings and other financing transactions can only be netted across transactions governed under the same master agreement with the same legal entity. See Note 8, Master Netting Arrangements, in the Notes to Financial Statements for more information. |
| (3) | Includes cash collateral as described in Note 5 in the Notes to Financial Statements. |
FAIR VALUE OF FINANCIAL DERIVATIVE INSTRUMENTS
The following is a summary of the fair valuation of the Fund’s derivative instruments categorized by risk exposure. See Note 7, Principal and Other Risks, in the Notes to Financial Statements on risks of the Fund.
The effect of Financial Derivative Instruments on the Statements of Operations for the period ended June 30, 2022:
| | | | | | | | | | | | | | | | | | | | | | | | |
| | | Derivatives not accounted for as hedging instruments | |
| | | Commodity
Contracts | | | Credit
Contracts | | | Equity
Contracts | | | Foreign
Exchange
Contracts | | | Interest
Rate Contracts | | | Total | |
Net Realized (Loss) on Financial Derivative Instruments | |
Over the counter | |
Forward Foreign Currency Contracts | | $ | 0 | | | $ | 0 | | | $ | 0 | | | $ | (5 | ) | | $ | 0 | | | $ | (5 | ) |
| | | | | | | | | | | | | | | | | | | | | | | | |
FAIR VALUE MEASUREMENTS
The following is a summary of the fair valuations according to the inputs used as of June 30, 2022 in valuing the Fund’s assets and liabilities:
| | | | | | | | | | | | | | | | |
| Category and Subcategory | | Level 1 | | | Level 2 | | | Level 3 | | | Fair
Value at
06/30/2022 | |
Investments in Securities, at Value | |
Common Stocks | |
Australia | |
Communication Services | | $ | 0 | | | $ | 402 | | | $ | 0 | | | $ | 402 | |
Consumer Discretionary | | | 26 | | | | 255 | | | | 0 | | | | 281 | |
Consumer Staples | | | 0 | | | | 546 | | | | 0 | | | | 546 | |
Energy | | | 0 | | | | 297 | | | | 0 | | | | 297 | |
Financials | | | 0 | | | | 631 | | | | 0 | | | | 631 | |
Health Care | | | 0 | | | | 171 | | | | 0 | | | | 171 | |
Industrials | | | 0 | | | | 301 | | | | 0 | | | | 301 | |
Information Technology | | | 0 | | | | 30 | | | | 0 | | | | 30 | |
| | | | | | | | | | | | | | | | |
| Category and Subcategory | | Level 1 | | | Level 2 | | | Level 3 | | | Fair
Value at
06/30/2022 | |
Materials | | $ | 0 | | | $ | 670 | | | $ | 0 | | | $ | 670 | |
Real Estate | | | 0 | | | | 27 | | | | 0 | | | | 27 | |
Utilities | | | 0 | | | | 246 | | | | 0 | | | | 246 | |
Austria | |
Communication Services | | | 25 | | | | 0 | | | | 0 | | | | 25 | |
Energy | | | 0 | | | | 71 | | | | 0 | | | | 71 | |
Financials | | | 0 | | | | 25 | | | | 0 | | | | 25 | |
Industrials | | | 0 | | | | 24 | | | | 0 | | | | 24 | |
Materials | | | 0 | | | | 23 | | | | 0 | | | | 23 | |
Real Estate | | | 0 | | | | 36 | | | | 0 | | | | 36 | |
Utilities | | | 0 | | | | 28 | | | | 0 | | | | 28 | |
| | | | | | | | | | | | |
| See Accompanying Notes | | | ANNUAL REPORT | | | | | | | JUNE 30, 2022 | | | 43 |
| | | | | | |
| Schedule of Investments | | PIMCO RAFI Dynamic Multi-Factor International Equity ETF | | (Cont.) | | |
| | | | | | | | | | | | | | | | |
| Category and Subcategory | | Level 1 | | | Level 2 | | | Level 3 | | | Fair
Value at
06/30/2022 | |
Belgium | |
Communication Services | | $ | 0 | | | $ | 42 | | | $ | 0 | | | $ | 42 | |
Consumer Discretionary | | | 0 | | | | 22 | | | | 0 | | | | 22 | |
Consumer Staples | | | 38 | | | | 0 | | | | 0 | | | | 38 | |
Financials | | | 0 | | | | 62 | | | | 0 | | | | 62 | |
Health Care | | | 0 | | | | 80 | | | | 0 | | | | 80 | |
Industrials | | | 0 | | | | 24 | | | | 0 | | | | 24 | |
Information Technology | | | 0 | | | | 29 | | | | 0 | | | | 29 | |
Materials | | | 0 | | | | 22 | | | | 0 | | | | 22 | |
Canada | |
Communication Services | | | 554 | | | | 0 | | | | 0 | | | | 554 | |
Consumer Discretionary | | | 449 | | | | 0 | | | | 0 | | | | 449 | |
Consumer Staples | | | 677 | | | | 0 | | | | 0 | | | | 677 | |
Energy | | | 1,611 | | | | 0 | | | | 0 | | | | 1,611 | |
Financials | | | 1,175 | | | | 0 | | | | 0 | | | | 1,175 | |
Health Care | | | 17 | | | | 0 | | | | 0 | | | | 17 | |
Industrials | | | 793 | | | | 0 | | | | 0 | | | | 793 | |
Information Technology | | | 214 | | | | 0 | | | | 0 | | | | 214 | |
Materials | | | 746 | | | | 0 | | | | 0 | | | | 746 | |
Real Estate | | | 65 | | | | 0 | | | | 0 | | | | 65 | |
Utilities | | | 508 | | | | 0 | | | | 0 | | | | 508 | |
Chile | |
Materials | | | 0 | | | | 19 | | | | 0 | | | | 19 | |
Denmark | |
Consumer Discretionary | | | 0 | | | | 20 | | | | 0 | | | | 20 | |
Consumer Staples | | | 0 | | | | 132 | | | | 0 | | | | 132 | |
Financials | | | 34 | | | | 58 | | | | 0 | | | | 92 | |
Health Care | | | 0 | | | | 1,025 | | | | 0 | | | | 1,025 | |
Industrials | | | 0 | | | | 515 | | | | 0 | | | | 515 | |
Materials | | | 0 | | | | 86 | | | | 0 | | | | 86 | |
Utilities | | | 0 | | | | 57 | | | | 0 | | | | 57 | |
Finland | |
Communication Services | | | 0 | | | | 61 | | | | 0 | | | | 61 | |
Consumer Staples | | | 0 | | | | 100 | | | | 0 | | | | 100 | |
Energy | | | 0 | | | | 93 | | | | 0 | | | | 93 | |
Financials | | | 0 | | | | 247 | | | | 0 | | | | 247 | |
Health Care | | | 0 | | | | 53 | | | | 0 | | | | 53 | |
Industrials | | | 0 | | | | 80 | | | | 0 | | | | 80 | |
Information Technology | | | 0 | | | | 76 | | | | 0 | | | | 76 | |
Materials | | | 0 | | | | 166 | | | | 0 | | | | 166 | |
Real Estate | | | 0 | | | | 57 | | | | 0 | | | | 57 | |
Utilities | | | 0 | | | | 38 | | | | 0 | | | | 38 | |
France | |
Communication Services | | | 0 | | | | 897 | | | | 0 | | | | 897 | |
Consumer Discretionary | | | 0 | | | | 729 | | | | 0 | | | | 729 | |
Consumer Staples | | | 0 | | | | 905 | | | | 0 | | | | 905 | |
Energy | | | 0 | | | | 663 | | | | 0 | | | | 663 | |
Financials | | | 0 | | | | 637 | | | | 0 | | | | 637 | |
Health Care | | | 0 | | | | 607 | | | | 0 | | | | 607 | |
Industrials | | | 0 | | | | 968 | | | | 0 | | | | 968 | |
Information Technology | | | 0 | | | | 112 | | | | 0 | | | | 112 | |
Materials | | | 0 | | | | 117 | | | | 0 | | | | 117 | |
Utilities | | | 0 | | | | 534 | | | | 0 | | | | 534 | |
Germany | |
Communication Services | | | 0 | | | | 264 | | | | 0 | | | | 264 | |
Consumer Discretionary | | | 0 | | | | 1,125 | | | | 0 | | | | 1,125 | |
Consumer Staples | | | 0 | | | | 120 | | | | 0 | | | | 120 | |
Financials | | | 48 | | | | 673 | | | | 0 | | | | 721 | |
Health Care | | | 0 | | | | 336 | | | | 0 | | | | 336 | |
Industrials | | | 0 | | | | 378 | | | | 0 | | | | 378 | |
Information Technology | | | 0 | | | | 164 | | | | 0 | | | | 164 | |
Materials | | | 0 | | | | 370 | | | | 0 | | | | 370 | |
Real Estate | | | 0 | | | | 91 | | | | 0 | | | | 91 | |
Utilities | | | 0 | | | | 327 | | | | 0 | | | | 327 | |
Hong Kong | |
Communication Services | | | 30 | | | | 106 | | | | 0 | | | | 136 | |
Consumer Discretionary | | | 0 | | | | 106 | | | | 0 | | | | 106 | |
Consumer Staples | | | 0 | | | | 39 | | | | 0 | | | | 39 | |
Financials | | | 0 | | | | 74 | | | | 0 | | | | 74 | |
Industrials | | | 0 | | | | 415 | | | | 0 | | | | 415 | |
Information Technology | | | 0 | | | | 80 | | | | 0 | | | | 80 | |
| | | | | | | | | | | | | | | | |
| Category and Subcategory | | Level 1 | | | Level 2 | | | Level 3 | | | Fair
Value at
06/30/2022 | |
Real Estate | | $ | 0 | | | $ | 404 | | | $ | 0 | | | $ | 404 | |
Utilities | | | 19 | | | | 144 | | | | 0 | | | | 163 | |
Ireland | |
Consumer Discretionary | | | 27 | | | | 0 | | | | 0 | | | | 27 | |
Consumer Staples | | | 0 | | | | 113 | | | | 0 | | | | 113 | |
Financials | | | 0 | | | | 34 | | | | 0 | | | | 34 | |
Health Care | | | 471 | | | | 0 | | | | 0 | | | | 471 | |
Industrials | | | 75 | | | | 124 | | | | 0 | | | | 199 | |
Materials | | | 0 | | | | 128 | | | | 0 | | | | 128 | |
Israel | |
Communication Services | | | 0 | | | | 61 | | | | 0 | | | | 61 | |
Consumer Staples | | | 0 | | | | 23 | | | | 0 | | | | 23 | |
Energy | | | 0 | | | | 131 | | | | 0 | | | | 131 | |
Financials | | | 0 | | | | 294 | | | | 0 | | | | 294 | |
Health Care | | | 42 | | | | 0 | | | | 0 | | | | 42 | |
Industrials | | | 0 | | | | 38 | | | | 0 | | | | 38 | |
Information Technology | | | 33 | | | | 26 | | | | 0 | | | | 59 | |
Materials | | | 0 | | | | 112 | | | | 0 | | | | 112 | |
Real Estate | | | 0 | | | | 48 | | | | 0 | | | | 48 | |
Italy | |
Communication Services | | | 0 | | | | 185 | | | | 0 | | | | 185 | |
Consumer Discretionary | | | 0 | | | | 104 | | | | 0 | | | | 104 | |
Consumer Staples | | | 0 | | | | 19 | | | | 0 | | | | 19 | |
Energy | | | 0 | | | | 691 | | | | 0 | | | | 691 | |
Financials | | | 0 | | | | 453 | | | | 0 | | | | 453 | |
Health Care | | | 0 | | | | 110 | | | | 0 | | | | 110 | |
Industrials | | | 0 | | | | 116 | | | | 0 | | | | 116 | |
Utilities | | | 0 | | | | 496 | | | | 0 | | | | 496 | |
Japan | |
Communication Services | | | 0 | | | | 1,868 | | | | 0 | | | | 1,868 | |
Consumer Discretionary | | | 0 | | | | 4,090 | | | | 0 | | | | 4,090 | |
Consumer Staples | | | 0 | | | | 2,250 | | | | 0 | | | | 2,250 | |
Energy | | | 0 | | | | 742 | | | | 0 | | | | 742 | |
Financials | | | 0 | | | | 1,524 | | | | 0 | | | | 1,524 | |
Health Care | | | 0 | | | | 1,603 | | | | 0 | | | | 1,603 | |
Industrials | | | 0 | | | | 5,161 | | | | 0 | | | | 5,161 | |
Information Technology | | | 0 | | | | 2,122 | | | | 0 | | | | 2,122 | |
Materials | | | 0 | | | | 1,429 | | | | 0 | | | | 1,429 | |
Real Estate | | | 0 | | | | 52 | | | | 0 | | | | 52 | |
Utilities | | | 0 | | | | 1,182 | | | | 0 | | | | 1,182 | |
Luxembourg | |
Communication Services | | | 0 | | | | 116 | | | | 0 | | | | 116 | |
Health Care | | | 0 | | | | 31 | | | | 0 | | | | 31 | |
Materials | | | 0 | | | | 365 | | | | 0 | | | | 365 | |
Netherlands | |
Communication Services | | | 25 | | | | 154 | | | | 0 | | | | 179 | |
Consumer Discretionary | | | 0 | | | | 247 | | | | 0 | | | | 247 | |
Consumer Staples | | | 0 | | | | 810 | | | | 0 | | | | 810 | |
Financials | | | 0 | | | | 695 | | | | 0 | | | | 695 | |
Health Care | | | 47 | | | | 0 | | | | 0 | | | | 47 | |
Industrials | | | 26 | | | | 387 | | | | 0 | | | | 413 | |
Information Technology | | | 123 | | | | 443 | | | | 0 | | | | 566 | |
Materials | | | 0 | | | | 316 | | | | 0 | | | | 316 | |
New Zealand | |
Communication Services | | | 0 | | | | 42 | | | | 0 | | | | 42 | |
Health Care | | | 0 | | | | 26 | | | | 0 | | | | 26 | |
Industrials | | | 0 | | | | 55 | | | | 0 | | | | 55 | |
Real Estate | | | 0 | | | | 26 | | | | 0 | | | | 26 | |
Utilities | | | 0 | | | | 47 | | | | 0 | | | | 47 | |
Norway | |
Communication Services | | | 0 | | | | 142 | | | | 0 | | | | 142 | |
Consumer Staples | | | 0 | | | | 209 | | | | 0 | | | | 209 | |
Energy | | | 0 | | | | 736 | | | | 0 | | | | 736 | |
Financials | | | 23 | | | | 66 | | | | 0 | | | | 89 | |
Industrials | | | 0 | | | | 52 | | | | 0 | | | | 52 | |
Information Technology | | | 0 | | | | 27 | | | | 0 | | | | 27 | |
Materials | | | 0 | | | | 217 | | | | 0 | | | | 217 | |
Real Estate | | | 0 | | | | 23 | | | | 0 | | | | 23 | |
Portugal | |
Consumer Staples | | | 0 | | | | 50 | | | | 0 | | | | 50 | |
Utilities | | | 0 | | | | 331 | | | | 0 | | | | 331 | |
| | | | | | |
| 44 | | PIMCO EQUITY SERIES | | | See Accompanying Notes | |
| | | | | | | | | | | | | | | | |
| Category and Subcategory | | Level 1 | | | Level 2 | | | Level 3 | | | Fair
Value at
06/30/2022 | |
Singapore | |
Communication Services | | $ | 24 | | | $ | 171 | | | $ | 0 | | | $ | 195 | |
Consumer Staples | | | 46 | | | | 110 | | | | 0 | | | | 156 | |
Energy | | | 0 | | | | 34 | | | | 0 | | | | 34 | |
Financials | | | 0 | | | | 343 | | | | 0 | | | | 343 | |
Industrials | | | 0 | | | | 297 | | | | 0 | | | | 297 | |
Information Technology | | | 0 | | | | 29 | | | | 0 | | | | 29 | |
Utilities | | | 0 | | | | 61 | | | | 0 | | | | 61 | |
South Africa | |
Health Care | | | 0 | | | | 28 | | | | 0 | | | | 28 | |
Spain | |
Communication Services | | | 0 | | | | 711 | | | | 0 | | | | 711 | |
Consumer Discretionary | | | 0 | | | | 90 | | | | 0 | | | | 90 | |
Consumer Staples | | | 0 | | | | 38 | | | | 0 | | | | 38 | |
Energy | | | 0 | | | | 597 | | | | 0 | | | | 597 | |
Financials | | | 0 | | | | 887 | | | | 0 | | | | 887 | |
Health Care | | | 0 | | | | 27 | | | | 0 | | | | 27 | |
Industrials | | | 0 | | | | 133 | | | | 0 | | | | 133 | |
Information Technology | | | 0 | | | | 46 | | | | 0 | | | | 46 | |
Materials | | | 0 | | | | 33 | | | | 0 | | | | 33 | |
Utilities | | | 0 | | | | 1,035 | | | | 0 | | | | 1,035 | |
Sweden | |
Communication Services | | | 0 | | | | 314 | | | | 0 | | | | 314 | |
Consumer Discretionary | | | 34 | | | | 155 | | | | 0 | | | | 189 | |
Consumer Staples | | | 0 | | | | 284 | | | | 0 | | | | 284 | |
Financials | | | 0 | | | | 206 | | | | 0 | | | | 206 | |
Industrials | | | 0 | | | | 438 | | | | 0 | | | | 438 | |
Information Technology | | | 0 | | | | 48 | | | | 0 | | | | 48 | |
Materials | | | 0 | | | | 98 | | | | 0 | | | | 98 | |
Real Estate | | | 23 | | | | 23 | | | | 0 | | | | 46 | |
Switzerland | |
Communication Services | | | 0 | | | | 156 | | | | 0 | | | | 156 | |
Consumer Discretionary | | | 63 | | | | 209 | | | | 0 | | | | 272 | |
Consumer Staples | | | 0 | | | | 1,143 | | | | 0 | | | | 1,143 | |
Financials | | | 0 | | | | 1,126 | | | | 0 | | | | 1,126 | |
Health Care | | | 0 | | | | 1,134 | | | | 0 | | | | 1,134 | |
Industrials | | | 0 | | | | 680 | | | | 0 | | | | 680 | |
Information Technology | | | 0 | | | | 63 | | | | 0 | | | | 63 | |
Materials | | | 0 | | | | 1,168 | | | | 0 | | | | 1,168 | |
Real Estate | | | 0 | | | | 149 | | | | 0 | | | | 149 | |
Utilities | | | 0 | | | | 30 | | | | 0 | | | | 30 | |
United Kingdom | |
Communication Services | | | 0 | | | | 1,023 | | | | 0 | | | | 1,023 | |
Consumer Discretionary | | | 17 | | | | 573 | | | | 0 | | | | 590 | |
Consumer Staples | | | 27 | | | | 2,091 | | | | 0 | | | | 2,118 | |
| | | | | | | | | | | | | | | | |
| Category and Subcategory | | Level 1 | | | Level 2 | | | Level 3 | | | Fair
Value at
06/30/2022 | |
Energy | | $ | 0 | | | $ | 1,663 | | | $ | 0 | | | $ | 1,663 | |
Financials | | | 0 | | | | 1,216 | | | | 0 | | | | 1,216 | |
Health Care | | | 0 | | | | 2,342 | | | | 0 | | | | 2,342 | |
Industrials | | | 25 | | | | 1,433 | | | | 0 | | | | 1,458 | |
Information Technology | | | 0 | | | | 51 | | | | 0 | | | | 51 | |
Materials | | | 0 | | | | 420 | | | | 0 | | | | 420 | |
Real Estate | | | 17 | | | | 22 | | | | 0 | | | | 39 | |
Utilities | | | 0 | | | | 854 | | | | 0 | | | | 854 | |
United States | |
Materials | | | 0 | | | | 40 | | | | 0 | | | | 40 | |
Preferred Stocks | |
Germany | |
Consumer Discretionary | | | 0 | | | | 409 | | | | 0 | | | | 409 | |
Health Care | | | 0 | | | | 35 | | | | 0 | | | | 35 | |
Industrials | | | 0 | | | | 155 | | | | 0 | | | | 155 | |
Real Estate Investment Trusts | |
Australia | |
Real Estate | | | 0 | | | | 70 | | | | 0 | | | | 70 | |
Belgium | |
Real Estate | | | 0 | | | | 77 | | | | 0 | | | | 77 | |
Canada | |
Real Estate | | | 98 | | | | 0 | | | | 0 | | | | 98 | |
France | |
Real Estate | | | 0 | | | | 55 | | | | 0 | | | | 55 | |
Hong Kong | |
Real Estate | | | 0 | | | | 79 | | | | 0 | | | | 79 | |
Japan | |
Real Estate | | | 0 | | | | 679 | | | | 0 | | | | 679 | |
Singapore | |
Real Estate | | | 0 | | | | 152 | | | | 0 | | | | 152 | |
Spain | |
Real Estate | | | 0 | | | | 13 | | | | 0 | | | | 13 | |
United Kingdom | |
Real Estate | | | 15 | | | | 199 | | | | 0 | | | | 214 | |
Short-Term Instruments | |
Repurchase Agreements | | | 0 | | | | 1,354 | | | | 0 | | | | 1,354 | |
| | | | | | | | | | | | | | | | |
| | $ | 8,310 | | | $ | 76,373 | | | $ | 0 | | | $ | 84,683 | |
| | | | | | | | | | | | | | | | |
|
Investments in Affiliates, at Value | |
Short-Term Instruments | |
Mutual Funds | | | 1,189 | | | | 0 | | | | 0 | | | | 1,189 | |
| | | | | | | | | | | | | | | | |
| | | | |
Total Investments | | $ | 9,499 | | | $ | 76,373 | | | $ | 0 | | | $ | 85,872 | |
| | | | | | | | | | | | | | | | |
There were no significant transfers into or out of Level 3 during the period ended June 30, 2022.
| | | | | | | | | | | | |
| See Accompanying Notes | | | ANNUAL REPORT | | | | | | | JUNE 30, 2022 | | | 45 |
| | | | | | |
| Schedule of Investments | | PIMCO RAFI Dynamic Multi-Factor U.S. Equity ETF | | | | |
(Amounts in thousands*, except number of shares, contracts, units and ounces, if any)
| | | | | | | | | | | | |
| | | | | SHARES | | | | | MARKET
VALUE
(000S) | |
| INVESTMENTS IN SECURITIES 99.9% | |
| |
| COMMON STOCKS 95.4% | |
| |
| IRELAND 0.4% | |
| |
| INFORMATION TECHNOLOGY 0.4% | |
| | | | |
Accenture PLC ‘A’ | | | | | 1,272 | | | $ | | | 353 | |
| | | | | | | | | | | | |
Total Ireland | | | | | | | | | | | 353 | |
| | | | | | | | | | | | |
| |
| SWITZERLAND 0.2% | |
| |
| FINANCIALS 0.2% | |
| | | | |
Chubb Ltd. | | | | | 1,053 | | | | | | 207 | |
| | | | | | | | | | | | |
Total Switzerland | | | | | | | | | | | 207 | |
| | | | | | | | | | | | |
| |
| UNITED KINGDOM 0.3% | |
| |
| COMMUNICATION SERVICES 0.1% | |
| | | | |
Liberty Global PLC ‘C’ (a) | | | | | 5,412 | | | | | | 120 | |
| | | | | | | | | | | | |
| |
| CONSUMER STAPLES 0.0% | |
| | | | |
Nomad Foods Ltd. (a) | | | | | 607 | | | | | | 12 | |
| | | | | | | | | | | | |
| |
| ENERGY 0.0% | |
| | | | |
TechnipFMC PLC (a) | | | | | 3,117 | | | | | | 21 | |
| | | | | | | | | | | | |
| |
| FINANCIALS 0.1% | |
| | | | |
Willis Towers Watson PLC | | | | | 387 | | | | | | 76 | |
| | | | | | | | | | | | |
| |
| INDUSTRIALS 0.1% | |
| | | | |
Nvent Electric PLC | | | | | 252 | | | | | | 8 | |
| | | | |
Pentair PLC | | | | | 675 | | | | | | 31 | |
| | | | | | | | | | | | |
| | | | | | | | 39 | |
| | | | | | | | | |
| |
| MATERIALS 0.0% | |
| | | | |
Amcor PLC | | | | | 2,072 | | | | | | 26 | |
| | | | | | | | | | | | |
Total United Kingdom | | | | | | | | 294 | |
| | | | | | | | | |
| |
| UNITED STATES 94.5% | |
| |
| COMMUNICATION SERVICES 5.2% | |
| | | | |
Activision Blizzard, Inc. | | | | | 777 | | | | | | 60 | |
| | | | |
AMC Entertainment Holdings, Inc. ‘A’ (a)(c) | | | | | 1,020 | | | | | | 14 | |
| | | | |
AMC Networks, Inc. ‘A’ (a) | | | | | 590 | | | | | | 17 | |
| | | | |
AT&T, Inc. | | | | | 59,549 | | | | | | 1,248 | |
| | | | |
Cable One, Inc. | | | | | 12 | | | | | | 15 | |
| | | | |
Charter Communications, Inc. ‘A’ (a) | | | | | 443 | | | | | | 207 | |
| | | | |
Cinemark Holdings, Inc. (a) | | | | | 1,140 | | | | | | 17 | |
| | | | |
Comcast Corp. ‘A’ | | | | | 21,093 | | | | | | 828 | |
| | | | |
Electronic Arts, Inc. | | | | | 1,024 | | | | | | 125 | |
| | | | |
Fox Corp. ‘A’ | | | | | 1,674 | | | | | | 54 | |
| | | | |
iHeartMedia, Inc. ‘A’ (a) | | | | | 1,019 | | | | | | 8 | |
| | | | |
Interpublic Group of Cos., Inc. | | | | | 2,270 | | | | | | 62 | |
| | | | |
John Wiley & Sons, Inc. ‘A’ | | | | | 306 | | | | | | 15 | |
| | | | |
Liberty Broadband Corp. ‘C’ (a) | | | | | 189 | | | | | | 22 | |
| | | | |
Liberty Media Corp.-Liberty Formula One ‘C’ (a) | | | | | 335 | | | | | | 21 | |
| | | | |
Liberty Media Corp.-Liberty SiriusXM ‘C’ (a) | | | | | 2,885 | | | | | | 104 | |
| | | | |
Live Nation Entertainment, Inc. (a) | | | | | 231 | | | | | | 19 | |
| | | | |
Lumen Technologies, Inc. | | | | | 22,233 | | | | | | 243 | |
| | | | |
New York Times Co. ‘A’ | | | | | 288 | | | | | | 8 | |
| | | | |
News Corp. ‘A’ | | | | | 2,927 | | | | | | 46 | |
| | | | |
Nexstar Media Group, Inc. ‘A’ | | | | | 133 | | | | | | 22 | |
| | | | | | | | | | | | |
| | | | | SHARES | | | | | MARKET
VALUE
(000S) | |
| | | | |
Omnicom Group, Inc. | | | | | 1,425 | | | $ | | | 91 | |
| | | | |
Paramount Global | | | | | 4,043 | | | | | | 100 | |
| | | | |
Sinclair Broadcast Group, Inc. ‘A’ | | | | | 331 | | | | | | 7 | |
| | | | |
T-Mobile U.S., Inc. (a) | | | | | 536 | | | | | | 72 | |
| | | | |
Take-Two Interactive Software, Inc. (a) | | | | | 206 | | | | | | 25 | |
| | | | |
TEGNA, Inc. | | | | | 2,212 | | | | | | 46 | |
| | | | |
Telephone & Data Systems, Inc. | | | | | 1,422 | | | | | | 22 | |
| | | | |
TripAdvisor, Inc. (a) | | | | | 268 | | | | | | 5 | |
| | | | |
Verizon Communications, Inc. | | | | | 23,697 | | | | | | 1,203 | |
| | | | |
Walt Disney Co. (a) | | | | | 2,610 | | | | | | 246 | |
| | | | |
Yelp, Inc. (a) | | | | | 454 | | | | | | 13 | |
| | | | | | | | | | | | |
| | | | | | | | | | | 4,985 | |
| | | | | | | | | | | | |
| |
| CONSUMER DISCRETIONARY 10.1% | |
| | | | |
Abercrombie & Fitch Co. ‘A’ (a) | | | | | 951 | | | | | | 16 | |
| | | | |
Academy Sports & Outdoors, Inc. | | | | | 225 | | | | | | 8 | |
| | | | |
Adient PLC (a) | | | | | 1,930 | | | | | | 57 | |
| | | | |
Adtalem Global Education, Inc. (a) | | | | | 662 | | | | | | 24 | |
| | | | |
Advance Auto Parts, Inc. | | | | | 162 | | | | | | 28 | |
| | | | |
American Axle & Manufacturing Holdings, Inc. (a) | | | | | 1,835 | | | | | | 14 | |
| | | | |
American Eagle Outfitters, Inc. | | | | | 2,450 | | | | | | 27 | |
| | | | |
Asbury Automotive Group, Inc. (a) | | | | | 318 | | | | | | 54 | |
| | | | |
AutoNation, Inc. (a) | | | | | 1,154 | | | | | | 129 | |
| | | | |
AutoZone, Inc. (a) | | | | | 82 | | | | | | 176 | |
| | | | |
Bath & Body Works, Inc. | | | | | 526 | | | | | | 14 | |
| | | | |
Bed Bath & Beyond, Inc. (a) | | | | | 5,961 | | | | | | 30 | |
| | | | |
Best Buy Co., Inc. | | | | | 2,425 | | | | | | 158 | |
| | | | |
Big Lots, Inc. | | | | | 336 | | | | | | 7 | |
| | | | |
Bloomin’ Brands, Inc. | | | | | 589 | | | | | | 10 | |
| | | | |
Booking Holdings, Inc. (a) | | | | | 36 | | | | | | 63 | |
| | | | |
BorgWarner, Inc. | | | | | 578 | | | | | | 19 | |
| | | | |
Bright Horizons Family Solutions, Inc. (a) | | | | | 94 | | | | | | 8 | |
| | | | |
Brunswick Corp. | | | | | 367 | | | | | | 24 | |
| | | | |
Buckle, Inc. | | | | | 573 | | | | | | 16 | |
| | | | |
Burlington Stores, Inc. (a) | | | | | 42 | | | | | | 6 | |
| | | | |
Carnival Corp. (a) | | | | | 4,769 | | | | | | 41 | |
| | | | |
Carter’s, Inc. | | | | | 532 | | | | | | 38 | |
| | | | |
Cheesecake Factory, Inc. | | | | | 420 | | | | | | 11 | |
| | | | |
Chipotle Mexican Grill, Inc. (a) | | | | | 109 | | | | | | 142 | |
| | | | |
Churchill Downs, Inc. | | | | | 121 | | | | | | 23 | |
| | | | |
Cracker Barrel Old Country Store, Inc. | | | | | 357 | | | | | | 30 | |
| | | | |
Dana, Inc. | | | | | 2,144 | | | | | | 30 | |
| | | | |
Darden Restaurants, Inc. | | | | | 110 | | | | | | 12 | |
| | | | |
Deckers Outdoor Corp. (a) | | | | | 104 | | | | | | 27 | |
| | | | |
Designer Brands, Inc.’A’ | | | | | 1,647 | | | | | | 22 | |
| | | | |
Dick’s Sporting Goods, Inc. | | | | | 1,454 | | | | | | 110 | |
| | | | |
Dillard’s, Inc. ‘A’ | | | | | 70 | | | | | | 15 | |
| | | | |
Dollar General Corp. | | | | | 1,425 | | | | | | 350 | |
| | | | |
Dollar Tree, Inc. (a) | | | | | 1,243 | | | | | | 194 | |
| | | | |
Domino’s Pizza, Inc. | | | | | 211 | | | | | | 82 | |
| | | | |
Dorman Products, Inc. (a) | | | | | 156 | | | | | | 17 | |
| | | | |
eBay, Inc. | | | | | 5,463 | | | | | | 228 | |
| | | | |
Foot Locker, Inc. | | | | | 2,121 | | | | | | 54 | |
| | | | |
Ford Motor Co. | | | | | 77,052 | | | | | | 858 | |
| | | | |
G-III Apparel Group Ltd. (a) | | | | | 504 | | | | | | 10 | |
| | | | |
Gap, Inc. | | | | | 5,690 | | | | | | 47 | |
| | | | |
General Motors Co. (a) | | | | | 19,931 | | | | | | 633 | |
| | | | |
Gentex Corp. | | | | | 1,253 | | | | | | 35 | |
| | | | |
Genuine Parts Co. | | | | | 422 | | | | | | 56 | |
| | | | |
Goodyear Tire & Rubber Co. (a) | | | | | 8,217 | | | | | | 88 | |
| | | | |
Graham Holdings Co. ‘B’ | | | | | 28 | | | | | | 16 | |
| | | | | | | | | | | | |
| | | | | SHARES | | | | | MARKET
VALUE
(000S) | |
| | | | |
Grand Canyon Education, Inc. (a) | | | | | 184 | | | $ | | | 17 | |
| | | | |
Group 1 Automotive, Inc. | | | | | 254 | | | | | | 43 | |
| | | | |
Guess?, Inc. | | | | | 443 | | | | | | 8 | |
| | | | |
H&R Block, Inc. | | | | | 2,144 | | | | | | 76 | |
| | | | |
Hanesbrands, Inc. | | | | | 2,288 | | | | | | 24 | |
| | | | |
Harley-Davidson, Inc. | | | | | 477 | | | | | | 15 | |
| | | | |
Hasbro, Inc. | | | | | 121 | | | | | | 10 | |
| | | | |
Helen of Troy Ltd. (a) | | | | | 63 | | | | | | 10 | |
| | | | |
Hilton Grand Vacations, Inc. (a) | | | | | 389 | | | | | | 14 | |
| | | | |
Hilton Worldwide Holdings, Inc. | | | | | 466 | | | | | | 52 | |
| | | | |
Home Depot, Inc. | | | | | 2,263 | | | | | | 621 | |
| | | | |
International Game Technology PLC | | | | | 930 | | | | | | 17 | |
| | | | |
Jack in the Box, Inc. | | | | | 381 | | | | | | 21 | |
| | | | |
Kohl’s Corp. | | | | | 4,228 | | | | | | 151 | |
| | | | |
Kontoor Brands, Inc. | | | | | 477 | | | | | | 16 | |
| | | | |
La-Z-Boy, Inc. | | | | | 603 | | | | | | 14 | |
| | | | |
Las Vegas Sands Corp. (a) | | | | | 572 | | | | | | 19 | |
| | | | |
Lear Corp. | | | | | 283 | | | | | | 36 | |
| | | | |
Leggett & Platt, Inc. | | | | | 742 | | | | | | 26 | |
| | | | |
Lithia Motors, Inc. | | | | | 69 | | | | | | 19 | |
| | | | |
LKQ Corp. | | | | | 344 | | | | | | 17 | |
| | | | |
Lowe’s Cos., Inc. | | | | | 1,834 | | | | | | 320 | |
| | | | |
Macy’s, Inc. | | | | | 11,250 | | | | | | 206 | |
| | | | |
Marriott International, Inc. ‘A’ | | | | | 572 | | | | | | 78 | |
| | | | |
Mattel, Inc. (a) | | | | | 532 | | | | | | 12 | |
| | | | |
McDonald’s Corp. | | | | | 2,744 | | | | | | 677 | |
| | | | |
MDC Holdings, Inc. | | | | | 350 | | | | | | 11 | |
| | | | |
Meritage Homes Corp. (a) | | | | | 173 | | | | | | 13 | |
| | | | |
Murphy USA, Inc. | | | | | 457 | | | | | | 106 | |
| | | | |
Newell Brands, Inc. | | | | | 594 | | | | | | 11 | |
| | | | |
NIKE, Inc. ‘B’ | | | | | 554 | | | | | | 57 | |
| | | | |
Nordstrom, Inc. | | | | | 2,387 | | | | | | 50 | |
| | | | |
NVR, Inc. (a) | | | | | 5 | | | | | | 20 | |
| | | | |
O’Reilly Automotive, Inc. (a) | | | | | 380 | | | | | | 240 | |
| | | | |
ODP Corp. (a) | | | | | 610 | | | | | | 18 | |
| | | | |
Penske Automotive Group, Inc. | | | | | 586 | | | | | | 61 | |
| | | | |
Pool Corp. | | | | | 194 | | | | | | 68 | |
| | | | |
PulteGroup, Inc. | | | | | 1,543 | | | | | | 61 | |
| | | | |
PVH Corp. | | | | | 158 | | | | | | 9 | |
| | | | |
Qurate Retail, Inc. | | | | | 12,446 | | | | | | 36 | |
| | | | |
Ralph Lauren Corp. | | | | | 419 | | | | | | 38 | |
| | | | |
Red Rock Resorts, Inc. ‘A’ | | | | | 200 | | | | | | 7 | |
| | | | |
Ross Stores, Inc. | | | | | 118 | | | | | | 8 | |
| | | | |
Sally Beauty Holdings, Inc. (a) | | | | | 1,783 | | | | | | 21 | |
| | | | |
Service Corp. International | | | | | 846 | | | | | | 58 | |
| | | | |
Signet Jewelers Ltd. | | | | | 861 | | | | | | 46 | |
| | | | |
Six Flags Entertainment Corp. (a) | | | | | 449 | | | | | | 10 | |
| | | | |
Sonic Automotive, Inc. ‘A’ | | | | | 238 | | | | | | 9 | |
| | | | |
Starbucks Corp. | | | | | 469 | | | | | | 36 | |
| | | | |
Steven Madden Ltd. | | | | | 410 | | | | | | 13 | |
| | | | |
Target Corp. | | | | | 7,317 | | | | | | 1,033 | |
| | | | |
Taylor Morrison Home Corp. ‘A’ (a) | | | | | 869 | | | | | | 20 | |
| | | | |
Tempur Sealy International, Inc. | | | | | 446 | | | | | | 10 | |
| | | | |
Terminix Global Holdings, Inc. (a) | | | | | 335 | | | | | | 14 | |
| | | | |
Texas Roadhouse, Inc. | | | | | 182 | | | | | | 13 | |
| | | | |
Thor Industries, Inc. | | | | | 201 | | | | | | 15 | |
| | | | |
TJX Cos., Inc. | | | | | 563 | | | | | | 31 | |
| | | | |
Toll Brothers, Inc. | | | | | 680 | | | | | | 30 | |
| | | | |
TopBuild Corp. (a) | | | | | 45 | | | | | | 8 | |
| | | | |
Tractor Supply Co. | | | | | 635 | | | | | | 123 | |
| | | | |
Tri Pointe Homes, Inc. (a) | | | | | 1,109 | | | | | | 19 | |
| | | | |
Ulta Beauty, Inc. (a) | | | | | 190 | | | | | | 73 | |
| | | | |
Urban Outfitters, Inc. (a) | | | | | 702 | | | | | | 13 | |
| | | | |
Vail Resorts, Inc. | | | | | 162 | | | | | | 35 | |
| | | | |
VF Corp. | | | | | 297 | | | | | | 13 | |
| | | | | | |
| 46 | | PIMCO EQUITY SERIES | | | See Accompanying Notes | |
| | | | | | | | | | | | |
| | | | | SHARES | | | | | MARKET
VALUE
(000S) | |
| | | | |
Vista Outdoor, Inc. (a) | | | | | 236 | | | $ | | | 7 | |
| | | | |
Visteon Corp. (a) | | | | | 250 | | | | | | 26 | |
| | | | |
Wendy’s Co. | | | | | 2,691 | | | | | | 51 | |
| | | | |
Whirlpool Corp. | | | | | 712 | | | | | | 110 | |
| | | | |
Williams-Sonoma, Inc. | | | | | 729 | | | | | | 81 | |
| | | | |
Wyndham Hotels & Resorts, Inc. | | | | | 389 | | | | | | 26 | |
| | | | |
Yum! Brands, Inc. | | | | | 1,911 | | | | | | 217 | |
| | | | | | | | | | | | |
| | | | | | | | | | | 9,551 | |
| | | | | | | | | | | | |
| |
| CONSUMER STAPLES 15.8% | |
| | | | |
Altria Group, Inc. | | | | | 16,164 | | | | | | 675 | |
| | | | |
Andersons, Inc. | | | | | 368 | | | | | | 12 | |
| | | | |
Archer-Daniels-Midland Co. | | | | | 7,179 | | | | | | 557 | |
| | | | |
B&G Foods, Inc. (c) | | | | | 744 | | | | | | 18 | |
| | | | |
Boston Beer Co., Inc. ‘A’ (a) | | | | | 33 | | | | | | 10 | |
| | | | |
Brown-Forman Corp. ‘B’ | | | | | 389 | | | | | | 27 | |
| | | | |
Bunge Ltd. | | | | | 3,431 | | | | | | 311 | |
| | | | |
Cal-Maine Foods, Inc. | | | | | 585 | | | | | | 29 | |
| | | | |
Campbell Soup Co. | | | | | 1,184 | | | | | | 57 | |
| | | | |
Casey’s General Stores, Inc. | | | | | 361 | | | | | | 67 | |
| | | | |
Central Garden & Pet Co. ‘A’ (a) | | | | | 260 | | | | | | 10 | |
| | | | |
Church & Dwight Co., Inc. | | | | | 1,221 | | | | | | 113 | |
| | | | |
Clorox Co. | | | | | 452 | | | | | | 64 | |
| | | | |
Coca-Cola Co. | | | | | 20,018 | | | | | | 1,259 | |
| | | | |
Colgate-Palmolive Co. | | | | | 3,217 | | | | | | 258 | |
| | | | |
Conagra Brands, Inc. | | | | | 2,338 | | | | | | 80 | |
| | | | |
Constellation Brands, Inc. ‘A’ | | | | | 481 | | | | | | 112 | |
| | | | |
Costco Wholesale Corp. | | | | | 2,380 | | | | | | 1,141 | |
| | | | |
Darling Ingredients, Inc. (a) | | | | | 310 | | | | | | 19 | |
| | | | |
Edgewell Personal Care Co. | | | | | 679 | | | | | | 23 | |
| | | | |
Estee Lauder Cos., Inc. ‘A’ | | | | | 354 | | | | | | 90 | |
| | | | |
Flowers Foods, Inc. | | | | | 1,599 | | | | | | 42 | |
| | | | |
General Mills, Inc. | | | | | 3,906 | | | | | | 295 | |
| | | | |
Hain Celestial Group, Inc. (a) | | | | | 354 | | | | | | 8 | |
| | | | |
Herbalife Nutrition Ltd. (a) | | | | | 474 | | | | | | 10 | |
| | | | |
Hershey Co. | | | | | 563 | | | | | | 121 | |
| | | | |
Hormel Foods Corp. | | | | | 1,677 | | | | | | 79 | |
| | | | |
Ingles Markets, Inc. ‘A’ | | | | | 172 | | | | | | 15 | |
| | | | |
Ingredion, Inc. | | | | | 771 | | | | | | 68 | |
| | | | |
J M Smucker Co. | | | | | 783 | | | | | | 100 | |
| | | | |
Kellogg Co. | | | | | 1,833 | | | | | | 131 | |
| | | | |
Keurig Dr Pepper, Inc. | | | | | 3,011 | | | | | | 107 | |
| | | | |
Kimberly-Clark Corp. | | | | | 1,801 | | | | | | 243 | |
| | | | |
Kraft Heinz Co. | | | | | 8,250 | | | | | | 315 | |
| | | | |
Kroger Co. | | | | | 13,319 | | | | | | 630 | |
| | | | |
Lamb Weston Holdings, Inc. | | | | | 350 | | | | | | 25 | |
| | | | |
Lancaster Colony Corp. | | | | | 120 | | | | | | 15 | |
| | | | |
McCormick & Co., Inc. | | | | | 929 | | | | | | 77 | |
| | | | |
Molson Coors Beverage Co. ‘B’ | | | | | 2,744 | | | | | | 150 | |
| | | | |
Mondelez International, Inc. ‘A’ | | | | | 6,642 | | | | | | 412 | |
| | | | |
Monster Beverage Corp. (a) | | | | | 386 | | | | | | 36 | |
| | | | |
National Beverage Corp. | | | | | 158 | | | | | | 8 | |
| | | | |
Nu Skin Enterprises, Inc. ‘A’ | | | | | 985 | | | | | | 43 | |
| | | | |
PepsiCo, Inc. | | | | | 7,757 | | | | | | 1,293 | |
| | | | |
Performance Food Group Co. (a) | | | | | 556 | | | | | | 26 | |
| | | | |
Philip Morris International, Inc. | | | | | 9,306 | | | | | | 919 | |
| | | | |
Post Holdings, Inc. (a) | | | | | 467 | | | | | | 38 | |
| | | | |
PriceSmart, Inc. | | | | | 158 | | | | | | 11 | |
| | | | |
Procter & Gamble Co. | | | | | 12,059 | | | | | | 1,734 | |
| | | | |
Sanderson Farms, Inc. | | | | | 370 | | | | | | 80 | |
| | | | |
SpartanNash Co. | | | | | 467 | | | | | | 14 | |
| | | | |
Sprouts Farmers Market, Inc. (a) | | | | | 2,721 | | | | | | 69 | |
| | | | |
Sysco Corp. | | | | | 667 | | | | | | 56 | |
| | | | |
TreeHouse Foods, Inc. (a) | | | | | 610 | | | | | | 25 | |
| | | | | | | | | | | | |
| | | | | SHARES | | | | | MARKET
VALUE
(000S) | |
| | | | |
Tyson Foods, Inc. ‘A’ | | | | | 4,339 | | | $ | | | 373 | |
| | | | |
U.S. Foods Holding Corp. (a) | | | | | 1,787 | | | | | | 55 | |
| | | | |
United Natural Foods, Inc. (a) | | | | | 684 | | | | | | 27 | |
| | | | |
Universal Corp. | | | | | 175 | | | | | | 11 | |
| | | | |
USANA Health Sciences, Inc. (a) | | | | | 106 | | | | | | 8 | |
| | | | |
Vector Group Ltd. | | | | | 1,589 | | | | | | 17 | |
| | | | |
Walgreens Boots Alliance, Inc. | | | | | 14,035 | | | | | | 532 | |
| | | | |
Walmart, Inc. | | | | | 15,084 | | | | | | 1,834 | |
| | | | |
Weis Markets, Inc. | | | | | 119 | | | | | | 9 | |
| | | | | | | | | | | | |
| | | | | | | | | | | 14,993 | |
| | | | | | | | | | | | |
| |
| ENERGY 11.9% | |
| | | | |
Antero Resources Corp. (a) | | | | | 2,933 | | | | | | 90 | |
| | | | |
APA Corp. | | | | | 511 | | | | | | 18 | |
| | | | |
Arch Resources, Inc. | | | | | 58 | | | | | | 8 | |
| | | | |
Archrock, Inc. | | | | | 1,348 | | | | | | 11 | |
| | | | |
Baker Hughes Co. | | | | | 10,846 | | | | | | 313 | |
| | | | |
Centennial Resource Development, Inc. (a) | | | | | 1,834 | | | | | | 11 | |
| | | | |
Cheniere Energy, Inc. | | | | | 336 | | | | | | 45 | |
| | | | |
Chevron Corp. | | | | | 16,409 | | | | | | 2,376 | |
| | | | |
CNX Resources Corp. (a) | | | | | 1,785 | | | | | | 29 | |
| | | | |
ConocoPhillips | | | | | 6,996 | | | | | | 628 | |
| | | | |
Coterra Energy, Inc. | | | | | 2,084 | | | | | | 54 | |
| | | | |
CVR Energy, Inc. | | | | | 543 | | | | | | 18 | |
| | | | |
Delek U.S. Holdings, Inc. | | | | | 1,599 | | | | | | 41 | |
| | | | |
Devon Energy Corp. | | | | | 2,829 | | | | | | 156 | |
| | | | |
Diamondback Energy, Inc. | | | | | 267 | | | | | | 32 | |
| | | | |
Dril-Quip, Inc. (a) | | | | | 345 | | | | | | 9 | |
| | | | |
DT Midstream, Inc. | | | | | 146 | | | | | | 7 | |
| | | | |
EOG Resources, Inc. | | | | | 822 | | | | | | 91 | |
| | | | |
EQT Corp. | | | | | 509 | | | | | | 18 | |
| | | | |
Equitrans Midstream Corp. | | | | | 1,303 | | | | | | 8 | |
| | | | |
Exxon Mobil Corp. | | | | | 30,492 | | | | | | 2,611 | |
| | | | |
Halliburton Co. | | | | | 1,173 | | | | | | 37 | |
| | | | |
Helmerich & Payne, Inc. | | | | | 1,096 | | | | | | 47 | |
| | | | |
Hess Corp. | | | | | 1,075 | | | | | | 114 | |
| | | | |
Kinder Morgan, Inc. | | | | | 7,078 | | | | | | 119 | |
| | | | |
Kosmos Energy Ltd. (a) | | | | | 1,831 | | | | | | 11 | |
| | | | |
Marathon Oil Corp. | | | | | 13,325 | | | | | | 300 | |
| | | | |
Marathon Petroleum Corp. | | | | | 12,242 | | | | | | 1,007 | |
| | | | |
Matador Resources Co. | | | | | 167 | | | | | | 8 | |
| | | | |
Murphy Oil Corp. | | | | | 1,766 | | | | | | 53 | |
| | | | |
NOV, Inc. | | | | | 6,497 | | | | | | 110 | |
| | | | |
Occidental Petroleum Corp. | | | | | 7,808 | | | | | | 460 | |
| | | | |
Oceaneering International, Inc. (a) | | | | | 1,139 | | | | | | 12 | |
| | | | |
ONEOK, Inc. | | | | | 626 | | | | | | 35 | |
| | | | |
Ovintiv, Inc. | | | | | 389 | | | | | | 17 | |
| | | | |
Patterson-UTI Energy, Inc. | | | | | 3,577 | | | | | | 56 | |
| | | | |
PBF Energy, Inc. ‘A’ (a) | | | | | 3,470 | | | | | | 101 | |
| | | | |
PDC Energy, Inc. | | | | | 148 | | | | | | 9 | |
| | | | |
Peabody Energy Corp. (a) | | | | | 799 | | | | | | 17 | |
| | | | |
Phillips 66 | | | | | 8,089 | | | | | | 663 | |
| | | | |
Pioneer Natural Resources Co. | | | | | 322 | | | | | | 72 | |
| | | | |
Range Resources Corp. (a) | | | | | 1,576 | | | | | | 39 | |
| | | | |
Schlumberger NV | | | | | 5,641 | | | | | | 202 | |
| | | | |
SM Energy Co. | | | | | 1,645 | | | | | | 56 | |
| | | | |
Targa Resources Corp. | | | | | 1,234 | | | | | | 74 | |
| | | | |
Transocean Ltd. (a) | | | | | 17,220 | | | | | | 57 | |
| | | | |
Valero Energy Corp. | | | | | 8,555 | | | | | | 909 | |
| | | | |
Whiting Petroleum Corp. | | | | | 425 | | | | | | 29 | |
| | | | |
Williams Cos., Inc. | | | | | 1,715 | | | | | | 54 | |
| | | | |
World Fuel Services Corp. | | | | | 1,082 | | | | | | 22 | |
| | | | | | | | | | | | |
| | | | | | | | | | | 11,264 | |
| | | | | | | | | | | | |
| |
| | | | | | | | | | | | |
| | | | | SHARES | | | | | MARKET
VALUE
(000S) | |
| FINANCIALS 9.8% | |
| | | | |
Affiliated Managers Group, Inc. | | | | | 283 | | | $ | | | 33 | |
| | | | |
Aflac, Inc. | | | | | 2,042 | | | | | | 113 | |
| | | | |
Alleghany Corp. (a) | | | | | 17 | | | | | | 14 | |
| | | | |
Allstate Corp. | | | | | 3,844 | | | | | | 487 | |
| | | | |
Ally Financial, Inc. | | | | | 4,731 | | | | | | 159 | |
| | | | |
American Equity Investment Life Holding Co. | | | | | 447 | | | | | | 16 | |
| | | | |
American Express Co. | | | | | 774 | | | | | | 107 | |
| | | | |
American Financial Group, Inc. | | | | | 108 | | | | | | 15 | |
| | | | |
American International Group, Inc. | | | | | 9,800 | | | | | | 501 | |
| | | | |
Ameriprise Financial, Inc. | | | | | 155 | | | | | | 37 | |
| | | | |
Aon PLC ‘A’ | | | | | 450 | | | | | | 121 | |
| | | | |
Ares Management Corp. | | | | | 290 | | | | | | 16 | |
| | | | |
Arthur J Gallagher & Co. | | | | | 795 | | | | | | 130 | |
| | | | |
Assurant, Inc. | | | | | 81 | | | | | | 14 | |
| | | | |
Bank of New York Mellon Corp. | | | | | 2,466 | | | | | | 103 | |
| | | | |
Berkshire Hathaway, Inc. ‘B’ (a) | | | | | 2,447 | | | | | | 668 | |
| | | | |
Blackstone, Inc. | | | | | 1,414 | | | | | | 129 | |
| | | | |
Brighthouse Financial, Inc. (a) | | | | | 912 | | | | | | 37 | |
| | | | |
Brightsphere Investment Group, Inc. | | | | | 528 | | | | | | 10 | |
| | | | |
Brown & Brown, Inc. | | | | | 990 | | | | | | 58 | |
| | | | |
Capital One Financial Corp. | | | | | 5,103 | | | | | | 532 | |
| | | | |
Capitol Federal Financial, Inc. | | | | | 803 | | | | | | 7 | |
| | | | |
Carlyle Group, Inc. | | | | | 335 | | | | | | 11 | |
| | | | |
Cincinnati Financial Corp. | | | | | 217 | | | | | | 26 | |
| | | | |
Citigroup, Inc. | | | | | 24,149 | | | | | | 1,111 | |
| | | | |
CME Group, Inc. | | | | | 1,357 | | | | | | 278 | |
| | | | |
CNO Financial Group, Inc. | | | | | 1,298 | | | | | | 23 | |
| | | | |
Comerica, Inc. | | | | | 182 | | | | | | 13 | |
| | | | |
Commerce Bancshares, Inc. | | | | | 167 | | | | | | 11 | |
| | | | |
Cullen/Frost Bankers, Inc. | | | | | 87 | | | | | | 10 | |
| | | | |
Discover Financial Services | | | | | 1,528 | | | | | | 145 | |
| | | | |
East West Bancorp, Inc. | | | | | 212 | | | | | | 14 | |
| | | | |
Erie Indemnity Co. ‘A’ | | | | | 105 | | | | | | 20 | |
| | | | |
Evercore, Inc. ‘A’ | | | | | 204 | | | | | | 19 | |
| | | | |
FactSet Research Systems, Inc. | | | | | 108 | | | | | | 42 | |
| | | | |
Federated Hermes, Inc. ‘B’ | | | | | 699 | | | | | | 22 | |
| | | | |
Fidelity National Financial, Inc. | | | | | 654 | | | | | | 24 | |
| | | | |
First American Financial Corp. | | | | | 893 | | | | | | 47 | |
| | | | |
First Horizon Corp. | | | | | 792 | | | | | | 17 | |
| | | | |
Franklin Resources, Inc. | | | | | 4,887 | | | | | | 114 | |
| | | | |
Genworth Financial, Inc. ‘A’ (a) | | | | | 7,251 | | | | | | 26 | |
| | | | |
Goldman Sachs Group, Inc. | | | | | 740 | | | | | | 220 | |
| | | | |
Hanover Insurance Group, Inc. | | | | | 283 | | | | | | 41 | |
| | | | |
Hartford Financial Services Group, Inc. | | | | | 462 | | | | | | 30 | |
| | | | |
Houlihan Lokey, Inc. | | | | | 293 | | | | | | 23 | |
| | | | |
Intercontinental Exchange, Inc. | | | | | 1,260 | | | | | | 118 | |
| | | | |
Invesco Ltd. | | | | | 6,170 | | | | | | 100 | |
| | | | |
Jefferies Financial Group, Inc. | | | | | 1,872 | | | | | | 52 | |
| | | | |
Lincoln National Corp. | | | | | 2,605 | | | | | | 122 | |
| | | | |
Loews Corp. | | | | | 1,708 | | | | | | 101 | |
| | | | |
LPL Financial Holdings, Inc. | | | | | 502 | | | | | | 93 | |
| | | | |
M&T Bank Corp. | | | | | 249 | | | | | | 40 | |
| | | | |
Markel Corp. (a) | | | | | 17 | | | | | | 22 | |
| | | | |
MarketAxess Holdings, Inc. | | | | | 45 | | | | | | 12 | |
| | | | |
Marsh & McLennan Cos., Inc. | | | | | 2,226 | | | | | | 346 | |
| | | | |
Mercury General Corp. | | | | | 305 | | | | | | 14 | |
| | | | |
MetLife, Inc. | | | | | 4,188 | | | | | | 263 | |
| | | | |
MGIC Investment Corp. | | | | | 960 | | | | | | 12 | |
| | | | |
Moelis & Co. ‘A’ | | | | | 215 | | | | | | 8 | |
| | | | |
Moody’s Corp. | | | | | 28 | | | | | | 8 | |
| | | | |
Morningstar, Inc. | | | | | 99 | | | | | | 24 | |
| | | | |
MSCI, Inc. | | | | | 129 | | | | | | 53 | |
| | | | | | | | | | | | |
| See Accompanying Notes | | | ANNUAL REPORT | | | | | | | JUNE 30, 2022 | | | 47 |
| | | | | | |
| Schedule of Investments | | PIMCO RAFI Dynamic Multi-Factor U.S. Equity ETF | | (Cont.) | | |
| | | | | | | | | | | | |
| | | | | SHARES | | | | | MARKET
VALUE
(000S) | |
| | | | |
Nasdaq, Inc. | | | | | 231 | | | $ | | | 35 | |
| | | | |
Navient Corp. | | | | | 3,609 | | | | | | 50 | |
| | | | |
Nelnet, Inc. ‘A’ | | | | | 97 | | | | | | 8 | |
| | | | |
New York Community Bancorp, Inc. | | | | | 3,213 | | | | | | 29 | |
| | | | |
Old Republic International Corp. | | | | | 1,110 | | | | | | 25 | |
| | | | |
OneMain Holdings, Inc. | | | | | 417 | | | | | | 16 | |
| | | | |
PacWest Bancorp | | | | | 633 | | | | | | 17 | |
| | | | |
PRA Group, Inc. (a) | | | | | 287 | | | | | | 10 | |
| | | | |
Principal Financial Group, Inc. | | | | | 355 | | | | | | 24 | |
| | | | |
Progressive Corp. | | | | | 2,967 | | | | | | 345 | |
| | | | |
Prosperity Bancshares, Inc. | | | | | 133 | | | | | | 9 | |
| | | | |
Prudential Financial, Inc. | | | | | 3,985 | | | | | | 381 | |
| | | | |
Raymond James Financial, Inc. | | | | | 262 | | | | | | 23 | |
| | | | |
RLI Corp. | | | | | 180 | | | | | | 21 | |
| | | | |
S&P Global, Inc. | | | | | 95 | | | | | | 32 | |
| | | | |
SEI Investments Co. | | | | | 804 | | | | | | 43 | |
| | | | |
SLM Corp. | | | | | 671 | | | | | | 11 | |
| | | | |
Stewart Information Services Corp. | | | | | 343 | | | | | | 17 | |
| | | | |
Stifel Financial Corp. | | | | | 152 | | | | | | 9 | |
| | | | |
Synchrony Financial | | | | | 2,419 | | | | | | 67 | |
| | | | |
T Rowe Price Group, Inc. | | | | | 329 | | | | | | 37 | |
| | | | |
Travelers Cos., Inc. | | | | | 2,787 | | | | | | 471 | |
| | | | |
Unum Group | | | | | 3,420 | | | | | | 116 | |
| | | | |
Virtu Financial, Inc. ‘A’ | | | | | 598 | | | | | | 14 | |
| | | | |
Voya Financial, Inc. | | | | | 154 | | | | | | 9 | |
| | | | |
Washington Federal, Inc. | | | | | 324 | | | | | | 10 | |
| | | | |
Wells Fargo & Co. | | | | | 10,089 | | | | | | 395 | |
| | | | |
White Mountains Insurance Group Ltd. | | | | | 20 | | | | | | 25 | |
| | | | |
WR Berkley Corp. | | | | | 280 | | | | | | 19 | |
| | | | |
Zions Bancorp NA | | | | | 195 | | | | | | 10 | |
| | | | | | | | | | | | |
| | | | | | | | | | | 9,260 | |
| | | | | | | | | | | | |
| |
| HEALTH CARE 17.8% | |
| | | | |
AbbVie, Inc. | | | | | 3,630 | | | | | | 556 | |
| | | | |
Align Technology, Inc. (a) | | | | | 49 | | | | | | 12 | |
| | | | |
AmerisourceBergen Corp. | | | | | 349 | | | | | | 49 | |
| | | | |
Amgen, Inc. | | | | | 1,416 | | | | | | 344 | |
| | | | |
AMN Healthcare Services, Inc. (a) | | | | | 155 | | | | | | 17 | |
| | | | |
Baxter International, Inc. | | | | | 2,110 | | | | | | 135 | |
| | | | |
Becton Dickinson & Co. | | | | | 977 | | | | | | 241 | |
| | | | |
Bio-Rad Laboratories, Inc. ‘A’ (a) | | | | | 46 | | | | | | 23 | |
| | | | |
Biogen, Inc. (a) | | | | | 160 | | | | | | 33 | |
| | | | |
BioMarin Pharmaceutical, Inc. (a) | | | | | 278 | | | | | | 23 | |
| | | | |
Boston Scientific Corp. (a) | | | | | 2,011 | | | | | | 75 | |
| | | | |
Bristol-Myers Squibb Co. | | | | | 11,934 | | | | | | 919 | |
| | | | |
Brookdale Senior Living, Inc. (a) | | | | | 1,931 | | | | | | 9 | |
| | | | |
Bruker Corp. | | | | | 205 | | | | | | 13 | |
| | | | |
Cardinal Health, Inc. | | | | | 5,460 | | | | | | 285 | |
| | | | |
Centene Corp. (a) | | | | | 806 | | | | | | 68 | |
| | | | |
Chemed Corp. | | | | | 102 | | | | | | 48 | |
| | | | |
Cooper Cos., Inc. | | | | | 87 | | | | | | 27 | |
| | | | |
CVS Health Corp. | | | | | 12,382 | | | | | | 1,147 | |
| | | | |
Danaher Corp. | | | | | 2,449 | | | | | | 621 | |
| | | | |
DaVita, Inc. (a) | | | | | 1,259 | | | | | | 101 | |
| | | | |
Dentsply Sirona, Inc. | | | | | 1,051 | | | | | | 37 | |
| | | | |
Dexcom, Inc. (a) | | | | | 589 | | | | | | 44 | |
| | | | |
Edwards Lifesciences Corp. (a) | | | | | 868 | | | | | | 82 | |
| | | | |
Elevance Health, Inc. | | | | | 1,119 | | | | | | 540 | |
| | | | |
Eli Lilly & Co. | | | | | 3,059 | | | | | | 992 | |
| | | | |
Encompass Health Corp. | | | | | 474 | | | | | | 27 | |
| | | | |
Envista Holdings Corp. (a) | | | | | 245 | | | | | | 9 | |
| | | | |
Exelixis, Inc. (a) | | | | | 479 | | | | | | 10 | |
| | | | |
Gilead Sciences, Inc. | | | | | 19,344 | | | | | | 1,196 | |
| | | | |
HCA Healthcare, Inc. | | | | | 637 | | | | | | 107 | |
| | | | | | | | | | | | |
| | | | | SHARES | | | | | MARKET
VALUE
(000S) | |
| | | | |
Henry Schein, Inc. (a) | | | | | 836 | | | $ | | | 64 | |
| | | | |
Hologic, Inc. (a) | | | | | 806 | | | | | | 56 | |
| | | | |
Humana, Inc. | | | | | 406 | | | | | | 190 | |
| | | | |
ICU Medical, Inc. (a) | | | | | 78 | | | | | | 13 | |
| | | | |
IDEXX Laboratories, Inc. (a) | | | | | 25 | | | | | | 9 | |
| | | | |
Incyte Corp. (a) | | | | | 280 | | | | | | 21 | |
| | | | |
Integra LifeSciences Holdings Corp. (a) | | | | | 125 | | | | | | 7 | |
| | | | |
Johnson & Johnson | | | | | 10,183 | | | | | | 1,808 | |
| | | | |
Laboratory Corp. of America Holdings | | | | | 201 | | | | | | 47 | |
| | | | |
Masimo Corp. (a) | | | | | 103 | | | | | | 13 | |
| | | | |
McKesson Corp. | | | | | 2,324 | | | | | | 758 | |
| | | | |
MEDNAX, Inc. (a) | | | | | 989 | | | | | | 21 | |
| | | | |
Merck & Co., Inc. | | | | | 18,630 | | | | | | 1,698 | |
| | | | |
Mettler-Toledo International, Inc. (a) | | | | | 63 | | | | | | 72 | |
| | | | |
Molina Healthcare, Inc. (a) | | | | | 254 | | | | | | 71 | |
| | | | |
Myriad Genetics, Inc. (a) | | | | | 720 | | | | | | 13 | |
| | | | |
Organon & Co. | | | | | 2,869 | | | | | | 97 | |
| | | | |
Owens & Minor, Inc. | | | | | 888 | | | | | | 28 | |
| | | | |
Patterson Cos., Inc. | | | | | 1,011 | | | | | | 31 | |
| | | | |
PerkinElmer, Inc. | | | | | 189 | | | | | | 27 | |
| | | | |
Pfizer, Inc. | | | | | 40,939 | | | | | | 2,146 | |
| | | | |
Premier, Inc. ‘A’ | | | | | 719 | | | | | | 26 | |
| | | | |
Quest Diagnostics, Inc. | | | | | 885 | | | | | | 118 | |
| | | | |
Regeneron Pharmaceuticals, Inc. (a) | | | | | 189 | | | | | | 112 | |
| | | | |
ResMed, Inc. | | | | | 534 | | | | | | 112 | |
| | | | |
Royalty Pharma PLC ‘A’ | | | | | 587 | | | | | | 25 | |
| | | | |
Sarepta Therapeutics, Inc. (a) | | | | | 126 | | | | | | 9 | |
| | | | |
Seagen, Inc. (a) | | | | | 204 | | | | | | 36 | |
| | | | |
STERIS PLC | | | | | 297 | | | | | | 61 | |
| | | | |
Teleflex, Inc. | | | | | 67 | | | | | | 16 | |
| | | | |
Tenet Healthcare Corp. (a) | | | | | 1,947 | | | | | | 102 | |
| | | | |
Thermo Fisher Scientific, Inc. | | | | | 550 | | | | | | 299 | |
| | | | |
United Therapeutics Corp. (a) | | | | | 550 | | | | | | 130 | |
| | | | |
UnitedHealth Group, Inc. | | | | | 1,312 | | | | | | 674 | |
| | | | |
Universal Health Services, Inc. ‘B’ | | | | | 209 | | | | | | 21 | |
| | | | |
Vertex Pharmaceuticals, Inc. (a) | | | | | 357 | | | | | | 101 | |
| | | | |
Viatris, Inc. | | | | | 3,312 | | | | | | 35 | |
| | | | |
Waters Corp. (a) | | | | | 94 | | | | | | 31 | |
| | | | |
West Pharmaceutical Services, Inc. | | | | | 66 | | | | | | 20 | |
| | | | |
Zoetis, Inc. | | | | | 127 | | | | | | 22 | |
| | | | | | | | | | | | |
| | | | | | | | | | | 16,930 | |
| | | | | | | | | | | | |
| |
| INDUSTRIALS 7.4% | |
| | | | |
3M Co. | | | | | 1,437 | | | | | | 186 | |
| | | | |
A O Smith Corp. | | | | | 662 | | | | | | 36 | |
| | | | |
AAR Corp. (a) | | | | | 341 | | | | | | 14 | |
| | | | |
ABM Industries, Inc. | | | | | 790 | | | | | | 34 | |
| | | | |
Acuity Brands, Inc. | | | | | 163 | | | | | | 25 | |
| | | | |
AECOM | | | | | 1,081 | | | | | | 71 | |
| | | | |
AGCO Corp. | | | | | 721 | | | | | | 71 | |
| | | | |
Allegiant Travel Co. (a) | | | | | 72 | | | | | | 8 | |
| | | | |
Allison Transmission Holdings, Inc. | | | | | 1,256 | | | | | | 48 | |
| | | | |
AMERCO | | | | | 37 | | | | | | 18 | |
| | | | |
American Airlines Group, Inc. (a) | | | | | 8,185 | | | | | | 104 | |
| | | | |
Apogee Enterprises, Inc. | | | | | 253 | | | | | | 10 | |
| | | | |
Applied Industrial Technologies, Inc. | | | | | 94 | | | | | | 9 | |
| | | | |
Arcosa, Inc. | | | | | 254 | | | | | | 12 | |
| | | | |
Armstrong World Industries, Inc. | | | | | 130 | | | | | | 10 | |
| | | | |
ASGN, Inc. (a) | | | | | 74 | | | | | | 7 | |
| | | | |
Atlas Air Worldwide Holdings, Inc. (a) | | | | | 289 | | | | | | 18 | |
| | | | | | | | | | | | |
| | | | | SHARES | | | | | MARKET
VALUE
(000S) | |
| | | | |
Avis Budget Group, Inc. (a) | | | | | 1,349 | | | $ | | | 198 | |
| | | | |
Boise Cascade Co. | | | | | 339 | | | | | | 20 | |
| | | | |
Booz Allen Hamilton Holding Corp. | | | | | 1,020 | | | | | | 92 | |
| | | | |
Builders FirstSource, Inc. (a) | | | | | 257 | | | | | | 14 | |
| | | | |
BWX Technologies, Inc. | | | | | 499 | | | | | | 27 | |
| | | | |
CACI International, Inc. ‘A’ (a) | | | | | 154 | | | | | | 43 | |
| | | | |
Carlisle Cos., Inc. | | | | | 73 | | | | | | 17 | |
| | | | |
Carrier Global Corp. | | | | | 269 | | | | | | 10 | |
| | | | |
Caterpillar, Inc. | | | | | 324 | | | | | | 58 | |
| | | | |
CH Robinson Worldwide, Inc. | | | | | 1,138 | | | | | | 115 | |
| | | | |
Cintas Corp. | | | | | 33 | | | | | | 12 | |
| | | | |
Comfort Systems USA, Inc. | | | | | 92 | | | | | | 8 | |
| | | | |
Copart, Inc. (a) | | | | | 346 | | | | | | 38 | |
| | | | |
CoreCivic, Inc. (a) | | | | | 1,554 | | | | | | 17 | |
| | | | |
Crane Holdings Co. | | | | | 237 | | | | | | 21 | |
| | | | |
CSX Corp. | | | | | 1,926 | | | | | | 56 | |
| | | | |
Cummins, Inc. | | | | | 234 | | | | | | 45 | |
| | | | |
Curtiss-Wright Corp. | | | | | 219 | | | | | | 29 | |
| | | | |
Delta Air Lines, Inc. (a) | | | | | 187 | | | | | | 5 | |
| | | | |
Deluxe Corp. | | | | | 359 | | | | | | 8 | |
| | | | |
Donaldson Co., Inc. | | | | | 451 | | | | | | 22 | |
| | | | |
Emerson Electric Co. | | | | | 651 | | | | | | 52 | |
| | | | |
Encore Wire Corp. | | | | | 160 | | | | | | 17 | |
| | | | |
Equifax, Inc. | | | | | 355 | | | | | | 65 | |
| | | | |
Expeditors International of Washington, Inc. | | | | | 871 | | | | | | 85 | |
| | | | |
Fastenal Co. | | | | | 376 | | | | | | 19 | |
| | | | |
Fluor Corp. (a) | | | | | 3,151 | | | | | | 77 | |
| | | | |
FTI Consulting, Inc. (a) | | | | | 328 | | | | | | 59 | |
| | | | |
GATX Corp. | | | | | 281 | | | | | | 26 | |
| | | | |
Generac Holdings, Inc. (a) | | | | | 187 | | | | | | 39 | |
| | | | |
General Dynamics Corp. | | | | | 342 | | | | | | 76 | |
| | | | |
General Electric Co. | | | | | 6,143 | | | | | | 391 | |
| | | | |
GMS, Inc. (a) | | | | | 247 | | | | | | 11 | |
| | | | |
Graco, Inc. | | | | | 327 | | | | | | 19 | |
| | | | |
Granite Construction, Inc. | | | | | 535 | | | | | | 16 | |
| | | | |
Greenbrier Cos., Inc. | | | | | 525 | | | | | | 19 | |
| | | | |
Hawaiian Holdings, Inc. (a) | | | | | 1,213 | | | | | | 17 | |
| | | | |
Healthcare Services Group, Inc. | | | | | 979 | | | | | | 17 | |
| | | | |
HEICO Corp. | | | | | 152 | | | | | | 20 | |
| | | | |
Hexcel Corp. | | | | | 500 | | | | | | 26 | |
| | | | |
HNI Corp. | | | | | 328 | | | | | | 11 | |
| | | | |
Howmet Aerospace, Inc. | | | | | 254 | | | | | | 8 | |
| | | | |
Hub Group, Inc. ‘A’ (a) | | | | | 292 | | | | | | 21 | |
| | | | |
Hubbell, Inc. | | | | | 132 | | | | | | 24 | |
| | | | |
Huntington Ingalls Industries, Inc. | | | | | 24 | | | | | | 5 | |
| | | | |
IDEX Corp. | | | | | 116 | | | | | | 21 | |
| | | | |
Illinois Tool Works, Inc. | | | | | 252 | | | | | | 46 | |
| | | | |
Insperity, Inc. | | | | | 150 | | | | | | 15 | |
| | | | |
ITT, Inc. | | | | | 221 | | | | | | 15 | |
| | | | |
Jacobs Engineering Group, Inc. | | | | | 547 | | | | | | 70 | |
| | | | |
JB Hunt Transport Services, Inc. | | | | | 183 | | | | | | 29 | |
| | | | |
JetBlue Airways Corp. (a) | | | | | 4,260 | | | | | | 36 | |
| | | | |
KAR Auction Services, Inc. (a) | | | | | 1,127 | | | | | | 17 | |
| | | | |
KBR, Inc. | | | | | 962 | | | | | | 47 | |
| | | | |
Knight-Swift Transportation Holdings, Inc. | | | | | 1,059 | | | | | | 49 | |
| | | | |
L3Harris Technologies, Inc. | | | | | 1,104 | | | | | | 267 | |
| | | | |
Landstar System, Inc. | | | | | 258 | | | | | | 38 | |
| | | | |
Leidos Holdings, Inc. | | | | | 228 | | | | | | 23 | |
| | | | |
Lennox International, Inc. | | | | | 183 | | | | | | 38 | |
| | | | |
Lincoln Electric Holdings, Inc. | | | | | 333 | | | | | | 41 | |
| | | | |
Lockheed Martin Corp. | | | | | 1,447 | | | | | | 622 | |
| | | | |
ManpowerGroup, Inc. | | | | | 831 | | | | | | 64 | |
| | | | |
ManTech International Corp. ‘A’ | | | | | 136 | | | | | | 13 | |
| | | | | | |
| 48 | | PIMCO EQUITY SERIES | | | See Accompanying Notes | |
| | | | | | | | | | | | |
| | | | | SHARES | | | | | MARKET
VALUE
(000S) | |
| | | | |
Masco Corp. | | | | | 200 | | | $ | | | 10 | |
| | | | |
Masonite International Corp. (a) | | | | | 105 | | | | | | 8 | |
| | | | |
Matson, Inc. | | | | | 97 | | | | | | 7 | |
| | | | |
MDU Resources Group, Inc. | | | | | 637 | | | | | | 17 | |
| | | | |
Meritor, Inc. (a) | | | | | 476 | | | | | | 17 | |
| | | | |
MillerKnoll, Inc. | | | | | 401 | | | | | | 11 | |
| | | | |
Moog, Inc. ‘A’ | | | | | 219 | | | | | | 17 | |
| | | | |
MSC Industrial Direct Co., Inc. ‘A’ | | | | | 594 | | | | | | 45 | |
| | | | |
Mueller Industries, Inc. | | | | | 488 | | | | | | 26 | |
| | | | |
Nielsen Holdings PLC | | | | | 796 | | | | | | 18 | |
| | | | |
Nordson Corp. | | | | | 171 | | | | | | 35 | |
| | | | |
Northrop Grumman Corp. | | | | | 936 | | | | | | 448 | |
| | | | |
NOW, Inc. (a) | | | | | 1,234 | | | | | | 12 | |
| | | | |
Oshkosh Corp. | | | | | 377 | | | | | | 31 | |
| | | | |
Otis Worldwide Corp. | | | | | 1,008 | | | | | | 71 | |
| | | | |
Owens Corning | | | | | 386 | | | | | | 29 | |
| | | | |
Pitney Bowes, Inc. | | | | | 2,020 | | | | | | 7 | |
| | | | |
Primoris Services Corp. | | | | | 390 | | | | | | 8 | |
| | | | |
Quanta Services, Inc. | | | | | 1,080 | | | | | | 135 | |
| | | | |
Raytheon Technologies Corp. | | | | | 2,093 | | | | | | 201 | |
| | | | |
Regal Rexnord Corp. | | | | | 101 | | | | | | 11 | |
| | | | |
Republic Services, Inc. | | | | | 1,033 | | | | | | 135 | |
| | | | |
Resideo Technologies, Inc. (a) | | | | | 505 | | | | | | 10 | |
| | | | |
Robert Half International, Inc. | | | | | 388 | | | | | | 29 | |
| | | | |
Rockwell Automation, Inc. | | | | | 65 | | | | | | 13 | |
| | | | |
Rollins, Inc. | | | | | 987 | | | | | | 34 | |
| | | | |
Rush Enterprises, Inc. ‘A’ | | | | | 421 | | | | | | 20 | |
| | | | |
Ryder System, Inc. | | | | | 619 | | | | | | 44 | |
| | | | |
Saia, Inc. (a) | | | | | 39 | | | | | | 7 | |
| | | | |
Schneider National, Inc. ‘B’ | | | | | 617 | | | | | | 14 | |
| | | | |
SkyWest, Inc. (a) | | | | | 386 | | | | | | 8 | |
| | | | |
Southwest Airlines Co. (a) | | | | | 153 | | | | | | 6 | |
| | | | |
Spirit AeroSystems Holdings, Inc. ‘A’ | | | | | 1,484 | | | | | | 43 | |
| | | | |
Steelcase, Inc. ‘A’ | | | | | 1,101 | | | | | | 12 | |
| | | | |
Stericycle, Inc. (a) | | | | | 273 | | | | | | 12 | |
| | | | |
Terex Corp. | | | | | 865 | | | | | | 24 | |
| | | | |
Tetra Tech, Inc. | | | | | 80 | | | | | | 11 | |
| | | | |
Timken Co. | | | | | 325 | | | | | | 17 | |
| | | | |
Toro Co. | | | | | 537 | | | | | | 41 | |
| | | | |
TransDigm Group, Inc. (a) | | | | | 11 | | | | | | 6 | |
| | | | |
TriNet Group, Inc. (a) | | | | | 140 | | | | | | 11 | |
| | | | |
Trinity Industries, Inc. | | | | | 583 | | | | | | 14 | |
| | | | |
UFP Industries, Inc. | | | | | 460 | | | | | | 31 | |
| | | | |
Union Pacific Corp. | | | | | 723 | | | | | | 154 | |
| | | | |
United Airlines Holdings, Inc. (a) | | | | | 411 | | | | | | 15 | |
| | | | |
United Parcel Service, Inc. ‘B’ | | | | | 1,922 | | | | | | 351 | |
| | | | |
Verisk Analytics, Inc. | | | | | 606 | | | | | | 105 | |
| | | | |
Veritiv Corp. (a) | | | | | 57 | | | | | | 6 | |
| | | | |
Waste Connections, Inc. | | | | | 914 | | | | | | 113 | |
| | | | |
Waste Management, Inc. | | | | | 1,872 | | | | | | 286 | |
| | | | |
Watsco, Inc. | | | | | 283 | | | | | | 68 | |
| | | | |
Werner Enterprises, Inc. | | | | | 1,042 | | | | | | 40 | |
| | | | |
WESCO International, Inc. (a) | | | | | 683 | | | | | | 73 | |
| | | | |
WW Grainger, Inc. | | | | | 50 | | | | | | 23 | |
| | | | |
Xylem, Inc. | | | | | 267 | | | | | | 21 | |
| | | | | | | | | | | | |
| | | | | | | | | | | 7,068 | |
| | | | | | | | | | | | |
| |
| INFORMATION TECHNOLOGY 11.2% | |
| | | | |
Advanced Micro Devices, Inc. (a) | | | | | 2,270 | | | | | | 174 | |
| | | | |
Akamai Technologies, Inc. (a) | | | | | 411 | | | | | | 38 | |
| | | | |
Amdocs Ltd. | | | | | 955 | | | | | | 80 | |
| | | | |
Amkor Technology, Inc. | | | | | 616 | | | | | | 10 | |
| | | | |
Ansys, Inc. (a) | | | | | 110 | | | | | | 26 | |
| | | | |
Apple, Inc. | | | | | 8,988 | | | | | | 1,229 | |
| | | | |
Applied Materials, Inc. | | | | | 946 | | | | | | 86 | |
| | | | | | | | | | | | |
| | | | | SHARES | | | | | MARKET
VALUE
(000S) | |
| | | | |
Arista Networks, Inc. (a) | | | | | 348 | | | $ | | | 33 | |
| | | | |
Arrow Electronics, Inc. (a) | | | | | 1,106 | | | | | | 124 | |
| | | | |
Aspen Technology, Inc. (a) | | | | | 187 | | | | | | 34 | |
| | | | |
Automatic Data Processing, Inc. | | | | | 860 | | | | | | 181 | |
| | | | |
Avnet, Inc. | | | | | 1,428 | | | | | | 61 | |
| | | | |
Belden, Inc. | | | | | 300 | | | | | | 16 | |
| | | | |
Black Knight, Inc. (a) | | | | | 440 | | | | | | 29 | |
| | | | |
Bread Financial Holdings, Inc. | | | | | 1,242 | | | | | | 46 | |
| | | | |
Broadcom, Inc. | | | | | 702 | | | | | | 341 | |
| | | | |
Broadridge Financial Solutions, Inc. | | | | | 533 | | | | | | 76 | |
| | | | |
CDK Global, Inc. | | | | | 636 | | | | | | 35 | |
| | | | |
CDW Corp. | | | | | 302 | | | | | | 48 | |
| | | | |
Ciena Corp. (a) | | | | | 208 | | | | | | 10 | |
| | | | |
Cirrus Logic, Inc. (a) | | | | | 252 | | | | | | 18 | |
| | | | |
Cisco Systems, Inc. | | | | | 12,315 | | | | | | 525 | |
| | | | |
Citrix Systems, Inc. | | | | | 542 | | | | | | 53 | |
| | | | |
CMC Materials, Inc. | | | | | 41 | | | | | | 7 | |
| | | | |
Coherent, Inc. (a) | | | | | 35 | | | | | | 9 | |
| | | | |
Concentrix Corp. | | | | | 63 | | | | | | 9 | |
| | | | |
Conduent, Inc. (a) | | | | | 2,373 | | | | | | 10 | |
| | | | |
Corning, Inc. | | | | | 9,689 | | | | | | 305 | |
| | | | |
CSG Systems International, Inc. | | | | | 250 | | | | | | 15 | |
| | | | |
Dell Technologies, Inc. ‘C’ | | | | | 59 | | | | | | 3 | |
| | | | |
Dolby Laboratories, Inc. ‘A’ | | | | | 219 | | | | | | 16 | |
| | | | |
DXC Technology Co. (a) | | | | | 2,840 | | | | | | 86 | |
| | | | |
Entegris, Inc. | | | | | 204 | | | | | | 19 | |
| | | | |
F5, Inc. (a) | | | | | 170 | | | | | | 26 | |
| | | | |
Fair Isaac Corp. (a) | | | | | 41 | | | | | | 16 | |
| | | | |
Flex Ltd. (a) | | | | | 2,332 | | | | | | 34 | |
| | | | |
Fortinet, Inc. (a) | | | | | 1,255 | | | | | | 71 | |
| | | | |
Gartner, Inc. (a) | | | | | 170 | | | | | | 41 | |
| | | | |
Genpact Ltd. | | | | | 1,465 | | | | | | 62 | |
| | | | |
GoDaddy, Inc. ‘A’ (a) | | | | | 245 | | | | | | 17 | |
| | | | |
Hewlett Packard Enterprise Co. | | | | | 20,183 | | | | | | 268 | |
| | | | |
HP, Inc. | | | | | 4,022 | | | | | | 132 | |
| | | | |
Insight Enterprises, Inc. (a) | | | | | 207 | | | | | | 18 | |
| | | | |
International Business Machines Corp. | | | | | 8,859 | | | | | | 1,251 | |
| | | | |
Intuit, Inc. | | | | | 78 | | | | | | 30 | |
| | | | |
Jabil, Inc. | | | | | 2,050 | | | | | | 105 | |
| | | | |
Jack Henry & Associates, Inc. | | | | | 446 | | | | | | 80 | |
| | | | |
Juniper Networks, Inc. | | | | | 8,438 | | | | | | 240 | |
| | | | |
Keysight Technologies, Inc. (a) | | | | | 272 | | | | | | 37 | |
| | | | |
KLA Corp. | | | | | 334 | | | | | | 107 | |
| | | | |
Kyndryl Holdings, Inc. (a) | | | | | 3,488 | | | | | | 34 | |
| | | | |
Lam Research Corp. | | | | | 102 | | | | | | 43 | |
| | | | |
Littelfuse, Inc. | | | | | 35 | | | | | | 9 | |
| | | | |
Lumentum Holdings, Inc. (a) | | | | | 101 | | | | | | 8 | |
| | | | |
Manhattan Associates, Inc. (a) | | | | | 93 | | | | | | 11 | |
| | | | |
Marvell Technology, Inc. | | | | | 1,193 | | | | | | 52 | |
| | | | |
Mastercard, Inc. ‘A’ | | | | | 261 | | | | | | 82 | |
| | | | |
MAXIMUS, Inc. | | | | | 514 | | | | | | 32 | |
| | | | |
Microsoft Corp. | | | | | 3,547 | | | | | | 911 | |
| | | | |
Monolithic Power Systems, Inc. | | | | | 64 | | | | | | 25 | |
| | | | |
Motorola Solutions, Inc. | | | | | 1,465 | | | | | | 307 | |
| | | | |
National Instruments Corp. | | | | | 262 | | | | | | 8 | |
| | | | |
NCR Corp. (a) | | | | | 652 | | | | | | 20 | |
| | | | |
NetApp, Inc. | | | | | 343 | | | | | | 22 | |
| | | | |
NetScout Systems, Inc. (a) | | | | | 605 | | | | | | 20 | |
| | | | |
NortonLifeLock, Inc. | | | | | 4,356 | | | | | | 96 | |
| | | | |
NVIDIA Corp. | | | | | 3,558 | | | | | | 539 | |
| | | | |
ON Semiconductor Corp. (a) | | | | | 606 | | | | | | 30 | |
| | | | |
Oracle Corp. | | | | | 11,426 | | | | | | 798 | |
| | | | |
Palo Alto Networks, Inc. (a) | | | | | 144 | | | | | | 71 | |
| | | | |
Paychex, Inc. | | | | | 1,125 | | | | | | 128 | |
| | | | |
Plexus Corp. (a) | | | | | 189 | | | | | | 15 | |
| | | | | | | | | | | | |
| | | | | SHARES | | | | | MARKET
VALUE
(000S) | |
| | | | |
Pure Storage, Inc. ‘A’ (a) | | | | | 423 | | | $ | | | 11 | |
| | | | |
QUALCOMM, Inc. | | | | | 2,267 | | | | | | 290 | |
| | | | |
Roper Technologies, Inc. | | | | | 53 | | | | | | 21 | |
| | | | |
Sanmina Corp. (a) | | | | | 622 | | | | | | 25 | |
| | | | |
Seagate Technology Holdings PLC | | | | | 99 | | | | | | 7 | |
| | | | |
ServiceNow, Inc. (a) | | | | | 300 | | | | | | 143 | |
| | | | |
Silicon Laboratories, Inc. (a) | | | | | 48 | | | | | | 7 | |
| | | | |
Skyworks Solutions, Inc. | | | | | 171 | | | | | | 16 | |
| | | | |
Splunk, Inc. (a) | | | | | 241 | | | | | | 21 | |
| | | | |
Super Micro Computer, Inc. (a) | | | | | 260 | | | | | | 10 | |
| | | | |
Synaptics, Inc. (a) | | | | | 214 | | | | | | 25 | |
| | | | |
Teledyne Technologies, Inc. (a) | | | | | 120 | | | | | | 45 | |
| | | | |
Teradata Corp. (a) | | | | | 569 | | | | | | 21 | |
| | | | |
Teradyne, Inc. | | | | | 358 | | | | | | 32 | |
| | | | |
Texas Instruments, Inc. | | | | | 668 | | | | | | 103 | |
| | | | |
Tyler Technologies, Inc. (a) | | | | | 30 | | | | | | 10 | |
| | | | |
VeriSign, Inc. (a) | | | | | 90 | | | | | | 15 | |
| | | | |
Visa, Inc. ‘A’ | | | | | 612 | | | | | | 120 | |
| | | | |
Vishay Intertechnology, Inc. | | | | | 1,328 | | | | | | 24 | |
| | | | |
Vontier Corp. | | | | | 293 | | | | | | 7 | |
| | | | |
Western Digital Corp. (a) | | | | | 1,845 | | | | | | 83 | |
| | | | |
Western Union Co. | | | | | 1,466 | | | | | | 24 | |
| | | | |
Xerox Holdings Corp. | | | | | 2,171 | | | | | | 32 | |
| | | | | | | | | | | | |
| | | | | | | | | | | 10,640 | |
| | | | | | | | | | | | |
| |
| MATERIALS 3.2% | |
| | | | |
Albemarle Corp. | | | | | 174 | | | | | | 36 | |
| | | | |
Alcoa Corp. | | | | | 3,963 | | | | | | 181 | |
| | | | |
Allegheny Technologies, Inc. (a) | | | | | 550 | | | | | | 12 | |
| | | | |
AptarGroup, Inc. | | | | | 296 | | | | | | 31 | |
| | | | |
Arconic Corp. (a) | | | | | 730 | | | | | | 20 | |
| | | | |
Ashland Global Holdings, Inc. | | | | | 76 | | | | | | 8 | |
| | | | |
Avery Dennison Corp. | | | | | 243 | | | | | | 39 | |
| | | | |
Avient Corp. | | | | | 324 | | | | | | 13 | |
| | | | |
Axalta Coating Systems Ltd. (a) | | | | | 605 | | | | | | 13 | |
| | | | |
Ball Corp. | | | | | 1,036 | | | | | | 71 | |
| | | | |
Berry Global Group, Inc. (a) | | | | | 468 | | | | | | 26 | |
| | | | |
Cabot Corp. | | | | | 439 | | | | | | 28 | |
| | | | |
Carpenter Technology Corp. | | | | | 445 | | | | | | 12 | |
| | | | |
Celanese Corp. | | | | | 183 | | | | | | 22 | |
| | | | |
CF Industries Holdings, Inc. | | | | | 292 | | | | | | 25 | |
| | | | |
Chemours Co. | | | | | 710 | | | | | | 23 | |
| | | | |
Commercial Metals Co. | | | | | 1,091 | | | | | | 36 | |
| | | | |
Corteva, Inc. | | | | | 1,300 | | | | | | 70 | |
| | | | |
Crown Holdings, Inc. | | | | | 606 | | | | | | 56 | |
| | | | |
DuPont de Nemours, Inc. | | | | | 1,390 | | | | | | 77 | |
| | | | |
Eastman Chemical Co. | | | | | 268 | | | | | | 24 | |
| | | | |
Ecolab, Inc. | | | | | 299 | | | | | | 46 | |
| | | | |
FMC Corp. | | | | | 188 | | | | | | 20 | |
| | | | |
Graphic Packaging Holding Co. | | | | | 3,327 | | | | | | 68 | |
| | | | |
Greif, Inc. ‘A’ | | | | | 210 | | | | | | 13 | |
| | | | |
Huntsman Corp. | | | | | 256 | | | | | | 7 | |
| | | | |
Innospec, Inc. | | | | | 121 | | | | | | 12 | |
| | | | |
International Flavors & Fragrances, Inc. | | | | | 442 | | | | | | 53 | |
| | | | |
Kaiser Aluminum Corp. | | | | | 124 | | | | | | 10 | |
| | | | |
Louisiana-Pacific Corp. | | | | | 691 | | | | | | 36 | |
| | | | |
LyondellBasell Industries NV ‘A’ | | | | | 2,975 | | | | | | 260 | |
| | | | |
Mosaic Co. | | | | | 8,187 | | | | | | 387 | |
| | | | |
NewMarket Corp. | | | | | 44 | | | | | | 13 | |
| | | | |
Newmont Corp. | | | | | 2,088 | | | | | | 125 | |
| | | | |
Nucor Corp. | | | | | 1,268 | | | | | | 132 | |
| | | | |
O-I Glass, Inc. (a) | | | | | 1,421 | | | | | | 20 | |
| | | | |
Olin Corp. | | | | | 1,614 | | | | | | 75 | |
| | | | |
Packaging Corp. of America | | | | | 104 | | | | | | 14 | |
| | | | | | | | | | | | |
| See Accompanying Notes | | | ANNUAL REPORT | | | | | | | JUNE 30, 2022 | | | 49 |
| | | | | | |
| Schedule of Investments | | PIMCO RAFI Dynamic Multi-Factor U.S. Equity ETF | | (Cont.) | | |
| | | | | | | | | | | | |
| | | | | SHARES | | | | | MARKET
VALUE
(000S) | |
| | | | |
PPG Industries, Inc. | | | | | 213 | | | $ | | | 24 | |
| | | | |
Reliance Steel & Aluminum Co. | | | | | 644 | | | | | | 109 | |
| | | | |
Royal Gold, Inc. | | | | | 192 | | | | | | 20 | |
| | | | |
RPM International, Inc. | | | | | 694 | | | | | | 55 | |
| | | | |
Scotts Miracle-Gro Co. | | | | | 287 | | | | | | 23 | |
| | | | |
Sealed Air Corp. | | | | | 1,244 | | | | | | 72 | |
| | | | |
Sensient Technologies Corp. | | | | | 268 | | | | | | 22 | |
| | | | |
Sherwin-Williams Co. | | | | | 664 | | | | | | 149 | |
| | | | |
Silgan Holdings, Inc. | | | | | 654 | | | | | | 27 | |
| | | | |
Sonoco Products Co. | | | | | 821 | | | | | | 47 | |
| | | | |
Steel Dynamics, Inc. | | | | | 704 | | | | | | 47 | |
| | | | |
Sylvamo Corp. | | | | | 363 | | | | | | 12 | |
| | | | |
United States Steel Corp. | | | | | 3,709 | | | | | | 66 | |
| | | | |
Vulcan Materials Co. | | | | | 177 | | | | | | 25 | |
| | | | |
Warrior Met Coal, Inc. | | | | | 1,160 | | | | | | 35 | |
| | | | |
WestRock Co. | | | | | 3,556 | | | | | | 142 | |
| | | | |
Worthington Industries, Inc. | | | | | 217 | | | | | | 10 | |
| | | | | | | | | | | | |
| | | | | | | | | | | 2,999 | |
| | | | | | | | | | | | |
| |
| REAL ESTATE 0.0% | |
| | | | |
Anywhere Real Estate, Inc. (a) | | | | | 2,150 | | | | | | 21 | |
| | | | | | | | | | | | |
| |
| UTILITIES 2.1% | |
| | | | |
AES Corp. | | | | | 3,484 | | | | | | 73 | |
| | | | |
Ameren Corp. | | | | | 361 | | | | | | 33 | |
| | | | |
American Electric Power Co., Inc. | | | | | 1,317 | | | | | | 126 | |
| | | | |
Atmos Energy Corp. | | | | | 208 | | | | | | 23 | |
| | | | |
Avista Corp. | | | | | 447 | | | | | | 19 | |
| | | | |
Black Hills Corp. | | | | | 97 | | | | | | 7 | |
| | | | |
CenterPoint Energy, Inc. | | | | | 886 | | | | | | 26 | |
| | | | |
Clearway Energy, Inc. ‘C’ | | | | | 436 | | | | | | 15 | |
| | | | |
CMS Energy Corp. | | | | | 407 | | | | | | 28 | |
| | | | |
Consolidated Edison, Inc. | | | | | 499 | | | | | | 47 | |
| | | | |
Dominion Energy, Inc. | | | | | 1,672 | | | | | | 133 | |
| | | | |
DTE Energy Co. | | | | | 239 | | | | | | 30 | |
| | | | |
Duke Energy Corp. | | | | | 1,083 | | | | | | 116 | |
| | | | |
Edison International | | | | | 537 | | | | | | 34 | |
| | | | |
Entergy Corp. | | | | | 610 | | | | | | 69 | |
| | | | |
Essential Utilities, Inc. | | | | | 345 | | | | | | 16 | |
| | | | |
Evergy, Inc. | | | | | 929 | | | | | | 61 | |
| | | | |
Eversource Energy | | | | | 479 | | | | | | 41 | |
| | | | |
Exelon Corp. | | | | | 10,576 | | | | | | 479 | |
| | | | |
FirstEnergy Corp. | | | | | 806 | | | | | | 31 | |
| | | | |
Hawaiian Electric Industries, Inc. | | | | | 530 | | | | | | 22 | |
| | | | |
IDACORP, Inc. | | | | | 76 | | | | | | 8 | |
| | | | |
National Fuel Gas Co. | | | | | 580 | | | | | | 38 | |
| | | | |
NiSource, Inc. | | | | | 572 | | | | | | 17 | |
| | | | |
NRG Energy, Inc. | | | | | 616 | | | | | | 24 | |
| | | | |
OGE Energy Corp. | | | | | 304 | | | | | | 12 | |
| | | | |
Ormat Technologies, Inc. | | | | | 189 | | | | | | 15 | |
| | | | |
PG&E Corp. (a) | | | | | 2,725 | | | | | | 27 | |
| | | | |
Public Service Enterprise Group, Inc. | | | | | 1,335 | | | | | | 85 | |
| | | | |
Sempra Energy | | | | | 442 | | | | | | 66 | |
| | | | |
Southern Co. | | | | | 1,493 | | | | | | 107 | |
| | | | |
Southwest Gas Holdings, Inc. | | | | | 187 | | | | | | 16 | |
| | | | |
Vistra Corp. | | | | | 3,499 | | | | | | 80 | |
| | | | |
WEC Energy Group, Inc. | | | | | 443 | | | | | | 45 | |
| | | | |
Xcel Energy, Inc. | | | | | 766 | | | | | | 54 | |
| | | | | | | | | | | | |
| | | | | | | | | | | 2,023 | |
| | | | | | | | | | | | |
Total United States | | | | | | | | | | | 89,734 | |
| | | | | | | | | | | | |
| Total Common Stocks (Cost $86,538) | | | 90,588 | |
| | | | |
| |
| | | | | | | | | | | | |
| | | | | SHARES | | | | | MARKET
VALUE
(000S) | |
| REAL ESTATE INVESTMENT TRUSTS 3.7% | |
| |
| UNITED STATES 3.7% | |
| |
| FINANCIALS 0.4% | |
| | | | |
AGNC Investment Corp. | | | | | 3,835 | | | $ | | | 43 | |
| | | | |
Annaly Capital Management, Inc. | | | | | 9,025 | | | | | | 53 | |
| | | | |
Apollo Commercial Real Estate Finance, Inc. | | | | | 1,082 | | | | | | 11 | |
| | | | |
Blackstone Mortgage Trust, Inc. ‘A’ | | | | | 1,025 | | | | | | 28 | |
| | | | |
Chimera Investment Corp. | | | | | 3,152 | | | | | | 28 | |
| | | | |
Ladder Capital Corp. REIT | | | | | 1,100 | | | | | | 12 | |
| | | | |
MFA Financial, Inc. | | | | | 2,164 | | | | | | 23 | |
| | | | |
New Residential Investment Corp. | | | | | 7,067 | | | | | | 66 | |
| | | | |
New York Mortgage Trust, Inc. | | | | | 3,062 | | | | | | 9 | |
| | | | |
PennyMac Mortgage Investment Trust | | | | | 1,614 | | | | | | 22 | |
| | | | |
Redwood Trust, Inc. | | | | | 1,613 | | | | | | 12 | |
| | | | |
Starwood Property Trust, Inc. | | | | | 2,100 | | | | | | 44 | |
| | | | |
Two Harbors Investment Corp. | | | | | 3,922 | | | | | | 20 | |
| | | | | | | | | | | | |
| | | | | | | | | | | 371 | |
| | | | | | | | | | | | |
| |
| REAL ESTATE 3.3% | |
| | | | |
Agree Realty Corp. | | | | | 112 | | | | | | 8 | |
| | | | |
Alexander & Baldwin, Inc. | | | | | 594 | | | | | | 11 | |
| | | | |
American Campus Communities, Inc. | | | | | 378 | | | | | | 24 | |
| | | | |
American Homes 4 Rent ‘A’ | | | | | 1,023 | | | | | | 36 | |
| | | | |
American Tower Corp. | | | | | 1,197 | | | | | | 306 | |
| | | | |
Apartment Income REIT Corp. | | | | | 204 | | | | | | 8 | |
| | | | |
Apple Hospitality REIT, Inc. | | | | | 2,098 | | | | | | 31 | |
| | | | |
AvalonBay Communities, Inc. | | | | | 193 | | | | | | 38 | |
| | | | |
Boston Properties, Inc. | | | | | 192 | | | | | | 17 | |
| | | | |
Brandywine Realty Trust | | | | | 1,390 | | | | | | 13 | |
| | | | |
Brixmor Property Group, Inc. | | | | | 453 | | | | | | 9 | |
| | | | |
Camden Property Trust | | | | | 480 | | | | | | 65 | |
| | | | |
Corporate Office Properties Trust | | | | | 611 | | | | | | 16 | |
| | | | |
Cousins Properties, Inc. | | | | | 701 | | | | | | 21 | |
| | | | |
Crown Castle International Corp. | | | | | 872 | | | | | | 147 | |
| | | | |
CubeSmart | | | | | 837 | | | | | | 36 | |
| | | | |
DiamondRock Hospitality Co. | | | | | 1,525 | | | | | | 13 | |
| | | | |
Digital Realty Trust, Inc. | | | | | 416 | | | | | | 54 | |
| | | | |
DigitalBridge Group, Inc. | | | | | 5,129 | | | | | | 25 | |
| | | | |
Douglas Emmett, Inc. | | | | | 656 | | | | | | 15 | |
| | | | |
Duke Realty Corp. | | | | | 1,540 | | | | | | 85 | |
| | | | |
EastGroup Properties, Inc. | | | | | 126 | | | | | | 19 | |
| | | | |
Equinix, Inc. | | | | | 146 | | | | | | 96 | |
| | | | |
Equity Commonwealth | | | | | 737 | | | | | | 20 | |
| | | | |
Equity LifeStyle Properties, Inc. | | | | | 520 | | | | | | 37 | |
| | | | |
Equity Residential | | | | | 514 | | | | | | 37 | |
| | | | |
Essex Property Trust, Inc. | | | | | 88 | | | | | | 23 | |
| | | | |
Extra Space Storage, Inc. | | | | | 459 | | | | | | 78 | |
| | | | |
Federal Realty OP LP | | | | | 302 | | | | | | 29 | |
| | | | |
First Industrial Realty Trust, Inc. | | | | | 484 | | | | | | 23 | |
| | | | |
Gaming & Leisure Properties, Inc. | | | | | 1,295 | | | | | | 59 | |
| | | | |
Healthcare Realty Trust, Inc. | | | | | 767 | | | | | | 21 | |
| | | | |
Healthcare Trust of America, Inc. ‘A’ | | | | | 1,150 | | | | | | 32 | |
| | | | |
Highwoods Properties, Inc. | | | | | 423 | | | | | | 14 | |
| | | | |
Host Hotels & Resorts, Inc. | | | | | 2,861 | | | | | | 45 | |
| | | | |
Invitation Homes, Inc. | | | | | 2,262 | | | | | | 80 | |
| | | | |
Iron Mountain, Inc. | | | | | 1,536 | | | | | | 75 | |
| | | | |
Kilroy Realty Corp. | | | | | 638 | | | | | | 33 | |
| | | | |
Kimco Realty Corp. | | | | | 1,616 | | | | | | 32 | |
| | | | |
Kite Realty Group Trust | | | | | 613 | | | | | | 11 | |
| | | | |
Lamar Advertising Co. ‘A’ | | | | | 393 | | | | | | 35 | |
| | | | |
Life Storage, Inc. | | | | | 352 | | | | | | 39 | |
| | | | |
LXP Industrial Trust | | | | | 1,647 | | | | | | 18 | |
| | | | |
Macerich Co. | | | | | 1,754 | | | | | | 15 | |
| | | | | | | | | | | | |
| | | | | SHARES | | | | | MARKET
VALUE
(000S) | |
| | | | |
Medical Properties Trust, Inc. | | | | | 1,261 | | | $ | | | 19 | |
| | | | |
Mid-America Apartment Communities, Inc. | | | | | 162 | | | | | | 28 | |
| | | | |
National Retail Properties, Inc. | | | | | 265 | | | | | | 11 | |
| | | | |
Office Properties Income Trust | | | | | 517 | | | | | | 10 | |
| | | | |
Outfront Media, Inc. | | | | | 563 | | | | | | 10 | |
| | | | |
Paramount Group, Inc. | | | | | 3,025 | | | | | | 22 | |
| | | | |
Park Hotels & Resorts, Inc. | | | | | 3,177 | | | | | | 43 | |
| | | | |
Physicians Realty Trust | | | | | 1,210 | | | | | | 21 | |
| | | | |
Piedmont Office Realty Trust, Inc. ‘A’ | | | | | 1,226 | | | | | | 16 | |
| | | | |
Prologis, Inc. | | | | | 1,803 | | | | | | 212 | |
| | | | |
PS Business Parks, Inc. | | | | | 135 | | | | | | 25 | |
| | | | |
Public Storage | | | | | 603 | | | | | | 189 | |
| | | | |
Rayonier, Inc. | | | | | 799 | | | | | | 30 | |
| | | | |
Realty Income Corp. | | | | | 848 | | | | | | 58 | |
| | | | |
Regency Centers Corp. | | | | | 742 | | | | | | 44 | |
| | | | |
Rexford Industrial Realty, Inc. | | | | | 249 | | | | | | 14 | |
| | | | |
RLJ Lodging Trust | | | | | 1,658 | | | | | | 18 | |
| | | | |
Ryman Hospitality Properties, Inc. | | | | | 223 | | | | | | 17 | |
| | | | |
SBA Communications Corp. | | | | | 203 | | | | | | 65 | |
| | | | |
Service Properties Trust | | | | | 1,733 | | | | | | 9 | |
| | | | |
Simon Property Group, Inc. | | | | | 305 | | | | | | 29 | |
| | | | |
SITE Centers Corp. | | | | | 1,524 | | | | | | 21 | |
| | | | |
SL Green Realty Corp. | | | | | 217 | | | | | | 10 | |
| | | | |
Spirit Realty Capital, Inc. | | | | | 205 | | | | | | 8 | |
| | | | |
STAG Industrial, Inc. | | | | | 560 | | | | | | 17 | |
| | | | |
Sun Communities, Inc. | | | | | 372 | | | | | | 59 | |
| | | | |
Sunstone Hotel Investors, Inc. | | | | | 1,378 | | | | | | 14 | |
| | | | |
UDR, Inc. | | | | | 1,243 | | | | | | 57 | |
| | | | |
Veris Residential, Inc. | | | | | 770 | | | | | | 10 | |
| | | | |
VICI Properties, Inc. | | | | | 825 | | | | | | 25 | |
| | | | |
Washington REIT | | | | | 632 | | | | | | 13 | |
| | | | |
Welltower, Inc. | | | | | 640 | | | | | | 53 | |
| | | | |
Weyerhaeuser Co. | | | | | 1,047 | | | | | | 35 | |
| | | | |
WP Carey, Inc. | | | | | 919 | | | | | | 76 | |
| | | | |
Xenia Hotels & Resorts, Inc. | | | | | 819 | | | | | | 12 | |
| | | | | | | | | | | | |
| | | | | | | | | | | 3,149 | |
| | | | | | | | | | | | |
Total Real Estate Investment Trusts
(Cost $3,521) | | | | | | | | | | | 3,520 | |
| | | | | | | | | | | | |
| | | | | | | | | | | | |
| SHORT-TERM INSTRUMENTS 0.8% | |
| | | | | | | | | | | | |
| REPURCHASE AGREEMENTS (e) 0.8% | |
| | | | | | | | | | | 728 | |
| | | | | | | | | | | | |
Total Short-Term Instruments
(Cost $728) | | | | | | | | | | | 728 | |
| | | | | | | | | | | | |
| | | | |
| | | | | | | | | | | | |
Total Investments in Securities
(Cost $90,787) | | | | | | | | | | | 94,836 | |
| | | | | | | | | | | | |
| | | | | | | | | | | | |
| INVESTMENTS IN AFFILIATES 0.0% | | | | |
| | | | | | | | | | | | |
| SHORT-TERM INSTRUMENTS 0.0% | | | | |
| | | | | | | | | | | | |
| MUTUAL FUNDS 0.0% | | | | |
|
PIMCO Government Money Market Fund | |
1.450% (b)(c)(d) | | | | | 24,787 | | | | | | 25 | |
| | | | | | | | | | | | |
Total Short-Term Instruments
(Cost $25) | | | | | | 25 | |
| | | | | | | | | | | | |
| | | | |
| | | | | | | | | | | | |
Total Investments in Affiliates
(Cost $25) | | | | | | 25 | |
| | | | |
| | | | | | | | | | | | |
Total Investments 99.9%
(Cost $90,812) | | | $ | | | 94,861 | |
| |
| Other Assets and Liabilities, net 0.1% | | | | | | 93 | |
| | | | | | | | | | | | |
| Net Assets 100.0% | | | | | | | | $ | | | 94,954 | |
| | | | | | | | | | | | |
| | | | | | |
| 50 | | PIMCO EQUITY SERIES | | | See Accompanying Notes | |
NOTES TO SCHEDULE OF INVESTMENTS:
| * | A zero balance may reflect actual amounts rounding to less than one thousand. |
| (a) | Security did not produce income within the last twelve months. |
| (b) | Institutional Class Shares of each Fund. |
| (c) | Securities with an aggregate market value of $24 were out on loan in exchange for $25 of cash collateral as of June 30, 2022. The collateral was invested in a cash collateral reinvestment vehicle as described in Note 5 in the Notes to Financial Statements. |
| (d) | Coupon represents a 7-Day Yield. |
BORROWINGS AND OTHER FINANCING TRANSACTIONS
(e) REPURCHASE AGREEMENTS:
| | | | | | | | | | | | | | | | | | | | | | | | | | | | | | |
| Counterparty | | Lending
Rate | | | Settlement
Date | | | Maturity
Date | | | Principal
Amount | | | Collateralized By | | Collateral
(Received) | | | Repurchase
Agreements,
at Value | | | Repurchase
Agreement
Proceeds
to be
Received(1) | |
| FICC | | | 0.400 | % | | | 06/30/2022 | | | | 07/01/2022 | | | $ | 728 | | | U.S. Treasury Notes 2.875% due 06/15/2025 | | $ | (743 | ) | | $ | 728 | | | $ | 728 | |
| | | | | | | | | | | | | | | | | | | | | | | | | | | | | | |
Total Repurchase Agreements | | | | | $ | (743 | ) | | $ | 728 | | | $ | 728 | |
| | | | | | | | | | | | | | | |
BORROWINGS AND OTHER FINANCING TRANSACTIONS SUMMARY
The following is a summary by counterparty of the market value of Borrowings and Other Financing Transactions and collateral pledged/(received) as of June 30, 2022:
| | | | | | | | | | | | | | | | | | | | | | | | | | | | |
| Counterparty | | Repurchase
Agreement
Proceeds
to be
Received(1) | | | Payable for
Reverse
Repurchase
Agreements | | | Payable for
Sale-Buyback
Transactions | | | Securities
Out on Loan | | | Total
Borrowings and
Other Financing
Transactions | | | Collateral
Pledged/(Received) | | | Net Exposure(2) | |
Global/Master Repurchase Agreement | |
FICC | | $ | 728 | | | $ | 0 | | | $ | 0 | | | $ | 0 | | | $ | 728 | | | $ | (743 | ) | | $ | (15 | ) |
|
Master Securities Lending Agreement | |
GSC | | | 0 | | | | 0 | | | | 0 | | | | 24 | | | | 24 | | | | (25 | ) | | | (1 | ) |
| | | | | | | | | | | | | | | | | | | | | | | | | | | | |
Total Borrowings and Other Financing Transactions | | $ | 728 | | | $ | 0 | | | $ | 0 | | | $ | 24 | | | | | | | | | | | | | |
| | | | | | | | | | | | | | | | | | | | | | | | | | | | |
CERTAIN TRANSFERS ACCOUNTED FOR AS SECURED BORROWINGS
Remaining Contractual Maturity of the Agreements
| | | | | | | | | | | | | | | | | | | | |
| | | Overnight and Continuous | | | Up to 30 days | | | 31-90 days | | | Greater Than 90 days | | | Total | |
Securities Lending Transactions(3) | |
Common Stocks | | $ | 25 | | | $ | 0 | | | $ | 0 | | | $ | 0 | | | $ | 25 | |
| | | | | | | | | | | | | | | | | | | | |
Total Borrowings | | $ | 25 | | | $ | 0 | | | $ | 0 | | | $ | 0 | | | $ | 25 | |
| | | | | | | | | | | | | | | | | | | | |
Payable for securities on loan - cash collateral | | | $ | 25 | |
| | | | | |
| (1) | Includes accrued interest. |
| (2) | Net Exposure represents the net receivable/(payable) that would be due from/to the counterparty in the event of default. Exposure from borrowings and other financing transactions can only be netted across transactions governed under the same master agreement with the same legal entity. See Note 8, Master Netting Arrangements, in the Notes to Financial Statements for more information. |
| (3) | Includes cash collateral as described in Note 5 in the Notes to Financial Statements. |
FAIR VALUE MEASUREMENTS
The following is a summary of the fair valuations according to the inputs used as of June 30, 2022 in valuing the Fund’s assets and liabilities:
| | | | | | | | | | | | | | | | |
Category and Subcategory | | Level 1 | | | Level 2 | | | Level 3 | | | Fair Value at 06/30/2022 | |
Investments in Securities, at Value | |
Common Stocks | |
Ireland | |
Information Technology | | $ | 353 | | | $ | 0 | | | $ | 0 | | | $ | 353 | |
Switzerland | |
Financials | | | 207 | | | | 0 | | | | 0 | | | | 207 | |
| | | | | | | | | | | | | | | | |
Category and Subcategory | | Level 1 | | | Level 2 | | | Level 3 | | | Fair Value at 06/30/2022 | |
United Kingdom | |
Communication Services | | $ | 120 | | | $ | 0 | | | $ | 0 | | | $ | 120 | |
Consumer Staples | | | 12 | | | | 0 | | | | 0 | | | | 12 | |
Energy | | | 21 | | | | 0 | | | | 0 | | | | 21 | |
Financials | | | 76 | | | | 0 | | | | 0 | | | | 76 | |
Industrials | | | 39 | | | | 0 | | | | 0 | | | | 39 | |
| | | | | | | | | | | | |
| See Accompanying Notes | | | ANNUAL REPORT | | | | | | | JUNE 30, 2022 | | | 51 |
| | | | | | |
| Schedule of Investments | | PIMCO RAFI Dynamic Multi-Factor U.S. Equity ETF | | (Cont.) | | June 30, 2022 |
| | | | | | | | | | | | | | | | |
Category and Subcategory | | Level 1 | | | Level 2 | | | Level 3 | | | Fair Value at 06/30/2022 | |
Materials | | $ | 26 | | | $ | 0 | | | $ | 0 | | | $ | 26 | |
United States | |
Communication Services | | | 4,985 | | | | 0 | | | | 0 | | | | 4,985 | |
Consumer Discretionary | | | 9,551 | | | | 0 | | | | 0 | | | | 9,551 | |
Consumer Staples | | | 14,993 | | | | 0 | | | | 0 | | | | 14,993 | |
Energy | | | 11,264 | | | | 0 | | | | 0 | | | | 11,264 | |
Financials | | | 9,260 | | | | 0 | | | | 0 | | | | 9,260 | |
Health Care | | | 16,930 | | | | 0 | | | | 0 | | | | 16,930 | |
Industrials | | | 7,068 | | | | 0 | | | | 0 | | | | 7,068 | |
Information Technology | | | 10,640 | | | | 0 | | | | 0 | | | | 10,640 | |
Materials | | | 2,999 | | | | 0 | | | | 0 | | | | 2,999 | |
Real Estate | | | 21 | | | | 0 | | | | 0 | | | | 21 | |
Utilities | | | 2,023 | | | | 0 | | | | 0 | | | | 2,023 | |
| | | | | | | | | | | | | | | | |
Category and Subcategory | | Level 1 | | | Level 2 | | | Level 3 | | | Fair Value at 06/30/2022 | |
Real Estate Investment Trusts | |
United States | |
Financials | | $ | 371 | | | $ | 0 | | | $ | 0 | | | $ | 371 | |
Real Estate | | | 3,149 | | | | 0 | | | | 0 | | | | 3,149 | |
Short-Term Instruments | |
Repurchase Agreements | | | 0 | | | | 728 | | | | 0 | | | | 728 | |
| | | | | | | | | | | | | | | | |
| | $ | 94,108 | | | $ | 728 | | | $ | 0 | | | $ | 94,836 | |
| | | | | | | | | | | | | | | | |
|
Investments in Affiliates, at Value | |
Short-Term Instruments | |
Mutual Funds | | | 25 | | | | 0 | | | | 0 | | | | 25 | |
| | | | | | | | | | | | | | | | |
| | | | |
Total Investments | | $ | 94,133 | | | $ | 728 | | | $ | 0 | | | $ | 94,861 | |
| | | | | | | | | | | | | | | | |
There were no significant transfers into or out of Level 3 during the period ended June 30, 2022.
| | | | | | |
| 52 | | PIMCO EQUITY SERIES | | | See Accompanying Notes | |
| | | | | | |
| Schedule of Investments | | PIMCO RAFI ESG U.S. Exchange-Traded Fund | | | | June 30, 2022 |
(Amounts in thousands*, except number of shares, contracts, units and ounces, if any)
| | | | | | | | | | | | |
| | | | | SHARES | | | | | MARKET
VALUE
(000S) | |
| INVESTMENTS IN SECURITIES 99.2% | |
| |
| COMMON STOCKS 97.5% | |
| |
| IRELAND 0.6% | |
| |
| INFORMATION TECHNOLOGY 0.6% | |
| | | | |
Accenture PLC ‘A’ | | | | | 601 | | | $ | | | 167 | |
| | | | | | | | | | | | |
Total Ireland | | | | | | | | | | | 167 | |
| | | | | | | | | | | | |
| |
| SWITZERLAND 0.1% | |
| |
| INFORMATION TECHNOLOGY 0.1% | |
| | | | |
TE Connectivity Ltd. | | | | | 294 | | | | | | 33 | |
| | | | | | | | | | | | |
Total Switzerland | | | | | | | | | | | 33 | |
| | | | | | | | | | | | |
| |
| UNITED KINGDOM 0.9% | |
| |
| COMMUNICATION SERVICES 0.1% | |
| | | | |
Liberty Global PLC ‘C’ (a) | | | | | 1,812 | | | | | | 40 | |
| | | | | | | | | | | | |
| |
| CONSUMER DISCRETIONARY 0.0% | |
| | | | |
Capri Holdings Ltd. (a) | | | | | 189 | | | | | | 8 | |
| | | | | | | | | | | | |
| |
| MATERIALS 0.8% | |
| | | | |
Amcor PLC | | | | | 1,820 | | | | | | 23 | |
| | | | |
Linde PLC | | | | | 672 | | | | | | 193 | |
| | | | | | | | | | | | |
| | | | | | | | | | | 216 | |
| | | | | | | | | | | | |
Total United Kingdom | | | | | | | | | | | 264 | |
| | | | | | | | | | | | |
| |
| UNITED STATES 95.9% | |
| |
| COMMUNICATION SERVICES 9.0% | |
| | | | |
AT&T, Inc. | | | | | 48,562 | | | | | | 1,018 | |
| | | | |
Comcast Corp. ‘A’ | | | | | 6,978 | | | | | | 274 | |
| | | | |
Electronic Arts, Inc. | | | | | 559 | | | | | | 68 | |
| | | | |
Loyalty Ventures, Inc. (a) | | | | | 39 | | | | | | 0 | |
| | | | |
Lumen Technologies, Inc. | | | | | 5,296 | | | | | | 58 | |
| | | | |
Meta Platforms, Inc. ‘A’ (a) | | | | | 1,203 | | | | | | 194 | |
| | | | |
Omnicom Group, Inc. | | | | | 301 | | | | | | 19 | |
| | | | |
T-Mobile U.S., Inc. (a) | | | | | 198 | | | | | | 26 | |
| | | | |
Verizon Communications, Inc. | | | | | 15,994 | | | | | | 812 | |
| | | | |
Walt Disney Co. (a) | | | | | 1,221 | | | | | | 115 | |
| | | | | | | | | | | | |
| | | | | | | | | | | 2,584 | |
| | | | | | | | | | | | |
| |
| CONSUMER DISCRETIONARY 6.7% | |
| | | | |
Adient PLC (a) | | | | | 568 | | | | | | 17 | |
| | | | |
Advance Auto Parts, Inc. | | | | | 45 | | | | | | 8 | |
| | | | |
Bed Bath & Beyond, Inc. (a) | | | | | 675 | | | | | | 3 | |
| | | | |
Best Buy Co., Inc. | | | | | 1,057 | | | | | | 69 | |
| | | | |
BorgWarner, Inc. | | | | | 398 | | | | | | 13 | |
| | | | |
Carnival Corp. (a) | | | | | 1,394 | | | | | | 12 | |
| | | | |
Dollar General Corp. | | | | | 176 | | | | | | 43 | |
| | | | |
eBay, Inc. | | | | | 2,276 | | | | | | 95 | |
| | | | |
Foot Locker, Inc. | | | | | 260 | | | | | | 7 | |
| | | | |
Ford Motor Co. | | | | | 20,038 | | | | | | 223 | |
| | | | |
Gap, Inc. | | | | | 1,331 | | | | | | 11 | |
| | | | |
General Motors Co. (a) | | | | | 9,214 | | | | | | 293 | |
| | | | |
Genuine Parts Co. | | | | | 109 | | | | | | 15 | |
| | | | |
Goodyear Tire & Rubber Co. (a) | | | | | 3,041 | | | | | | 33 | |
| | | | |
Hilton Worldwide Holdings, Inc. | | | | | 161 | | | | | | 18 | |
| | | | |
Home Depot, Inc. | | | | | 1,102 | | | | | | 302 | |
| | | | |
Kohl’s Corp. | | | | | 750 | | | | | | 27 | |
| | | | |
Lear Corp. | | | | | 244 | | | | | | 31 | |
| | | | |
Lowe’s Cos., Inc. | | | | | 979 | | | | | | 171 | |
| | | | |
Macy’s, Inc. | | | | | 1,336 | | | | | | 25 | |
| | | | |
Marriott International, Inc. ‘A’ | | | | | 364 | | | | | | 50 | |
| | | | | | | | | | | | |
| | | | | SHARES | | | | | MARKET
VALUE
(000S) | |
| | | | |
Newell Brands, Inc. | | | | | 858 | | | $ | | | 16 | |
| | | | |
NIKE, Inc. ‘B’ | | | | | 338 | | | | | | 35 | |
| | | | |
O’Reilly Automotive, Inc. (a) | | | | | 16 | | | | | | 10 | |
| | | | |
PVH Corp. | | | | | 323 | | | | | | 18 | |
| | | | |
Ralph Lauren Corp. | | | | | 71 | | | | | | 6 | |
| | | | |
Starbucks Corp. | | | | | 855 | | | | | | 65 | |
| | | | |
Tapestry, Inc. | | | | | 367 | | | | | | 11 | |
| | | | |
Target Corp. | | | | | 1,143 | | | | | | 161 | |
| | | | |
Tesla, Inc. (a) | | | | | 14 | | | | | | 9 | |
| | | | |
TJX Cos., Inc. | | | | | 881 | | | | | | 49 | |
| | | | |
VF Corp. | | | | | 756 | | | | | | 33 | |
| | | | |
Whirlpool Corp. | | | | | 155 | | | | | | 24 | |
| | | | | | | | | | | | |
| | | | | | | | | | | 1,903 | |
| | | | | | | | | | | | |
| |
| CONSUMER STAPLES 8.9% | |
| | | | |
Archer-Daniels-Midland Co. | | | | | 2,201 | | | | | | 171 | |
| | | | |
Campbell Soup Co. | | | | | 511 | | | | | | 25 | |
| | | | |
Church & Dwight Co., Inc. | | | | | 56 | | | | | | 5 | |
| | | | |
Clorox Co. | | | | | 236 | | | | | | 33 | |
| | | | |
Coca-Cola Co. | | | | | 5,390 | | | | | | 339 | |
| | | | |
Colgate-Palmolive Co. | | | | | 1,489 | | | | | | 119 | |
| | | | |
Conagra Brands, Inc. | | | | | 960 | | | | | | 33 | |
| | | | |
Estee Lauder Cos., Inc. ‘A’ | | | | | 85 | | | | | | 22 | |
| | | | |
General Mills, Inc. | | | | | 1,437 | | | | | | 108 | |
| | | | |
Hershey Co. | | | | | 118 | | | | | | 25 | |
| | | | |
Hormel Foods Corp. | | | | | 243 | | | | | | 12 | |
| | | | |
Ingredion, Inc. | | | | | 253 | | | | | | 22 | |
| | | | |
J M Smucker Co. | | | | | 268 | | | | | | 34 | |
| | | | |
Kellogg Co. | | | | | 689 | | | | | | 49 | |
| | | | |
Keurig Dr Pepper, Inc. | | | | | 221 | | | | | | 8 | |
| | | | |
Kimberly-Clark Corp. | | | | | 658 | | | | | | 89 | |
| | | | |
Kraft Heinz Co. | | | | | 2,089 | | | | | | 80 | |
| | | | |
Kroger Co. | | | | | 1,458 | | | | | | 69 | |
| | | | |
Molson Coors Beverage Co. ‘B’ | | | | | 703 | | | | | | 38 | |
| | | | |
Mondelez International, Inc. ‘A’ | | | | | 1,092 | | | | | | 68 | |
| | | | |
PepsiCo, Inc. | | | | | 1,632 | | | | | | 272 | |
| | | | |
Procter & Gamble Co. | | | | | 4,690 | | | | | | 674 | |
| | | | |
Sysco Corp. | | | | | 1,244 | | | | | | 105 | |
| | | | |
Tyson Foods, Inc. ‘A’ | | | | | 368 | | | | | | 32 | |
| | | | |
Walgreens Boots Alliance, Inc. | | | | | 2,863 | | | | | | 109 | |
| | | | | | | | | | | | |
| | | | | | | | | | | 2,541 | |
| | | | | | | | | | | | |
| |
| FINANCIALS 15.2% | |
| | | | |
Aflac, Inc. | | | | | 1,525 | | | | | | 84 | |
| | | | |
Allstate Corp. | | | | | 843 | | | | | | 107 | |
| | | | |
American Express Co. | | | | | 887 | | | | | | 123 | |
| | | | |
Ameriprise Financial, Inc. | | | | | 219 | | | | | | 52 | |
| | | | |
Bank of America Corp. | | | | | 19,335 | | | | | | 602 | |
| | | | |
Bank of New York Mellon Corp. | | | | | 2,789 | | | | | | 116 | |
| | | | |
BlackRock, Inc. | | | | | 163 | | | | | | 99 | |
| | | | |
Charles Schwab Corp. | | | | | 259 | | | | | | 16 | |
| | | | |
Citigroup, Inc. | | | | | 14,253 | | | | | | 656 | |
| | | | |
Equitable Holdings, Inc. | | | | | 1,148 | | | | | | 30 | |
| | | | |
Goldman Sachs Group, Inc. | | | | | 650 | | | | | | 193 | |
| | | | |
Hartford Financial Services Group, Inc. | | | | | 761 | | | | | | 50 | |
| | | | |
JPMorgan Chase & Co. | | | | | 6,579 | | | | | | 741 | |
| | | | |
Lincoln National Corp. | | | | | 690 | | | | | | 32 | |
| | | | |
MetLife, Inc. | | | | | 2,242 | | | | | | 141 | |
| | | | |
Moody’s Corp. | | | | | 67 | | | | | | 18 | |
| | | | |
Morgan Stanley | | | | | 898 | | | | | | 68 | |
| | | | |
Nasdaq, Inc. | | | | | 24 | | | | | | 4 | |
| | | | |
PNC Financial Services Group, Inc. | | | | | 606 | | | | | | 96 | |
| | | | |
Principal Financial Group, Inc. | | | | | 587 | | | | | | 39 | |
| | | | |
Prudential Financial, Inc. | | | | | 1,649 | | | | | | 158 | |
| | | | |
S&P Global, Inc. | | | | | 204 | | | | | | 69 | |
| | | | | | | | | | | | |
| | | | | SHARES | | | | | MARKET
VALUE
(000S) | |
| | | | |
State Street Corp. | | | | | 816 | | | $ | | | 50 | |
| | | | |
U.S. Bancorp | | | | | 2,718 | | | | | | 125 | |
| | | | |
Wells Fargo & Co. | | | | | 17,560 | | | | | | 688 | |
| | | | | | | | | | | | |
| | | | | | | | | | | 4,357 | |
| | | | | | | | | | | | |
| |
| HEALTH CARE 22.5% | |
| | | | |
Abbott Laboratories | | | | | 1,906 | | | | | | 207 | |
| | | | |
AbbVie, Inc. | | | | | 1,561 | | | | | | 239 | |
| | | | |
Agilent Technologies, Inc. | | | | | 262 | | | | | | 31 | |
| | | | |
AmerisourceBergen Corp. | | | | | 261 | | | | | | 37 | |
| | | | |
Amgen, Inc. | | | | | 1,444 | | | | | | 351 | |
| | | | |
Baxter International, Inc. | | | | | 1,092 | | | | | | 70 | |
| | | | |
Becton Dickinson & Co. | | | | | 389 | | | | | | 96 | |
| | | | |
Biogen, Inc. (a) | | | | | 562 | | | | | | 115 | |
| | | | |
Boston Scientific Corp. (a) | | | | | 791 | | | | | | 29 | |
| | | | |
Bristol-Myers Squibb Co. | | | | | 2,626 | | | | | | 202 | |
| | | | |
Cardinal Health, Inc. | | | | | 1,992 | | | | | | 104 | |
| | | | |
Cigna Corp. | | | | | 1,017 | | | | | | 268 | |
| | | | |
CVS Health Corp. | | | | | 4,132 | | | | | | 383 | |
| | | | |
DaVita, Inc. (a) | | | | | 334 | | | | | | 27 | |
| | | | |
Edwards Lifesciences Corp. (a) | | | | | 281 | | | | | | 27 | |
| | | | |
Elevance Health, Inc. | | | | | 752 | | | | | | 363 | |
| | | | |
Eli Lilly & Co. | | | | | 658 | | | | | | 213 | |
| | | | |
Embecta Corp. (a) | | | | | 63 | | | | | | 2 | |
| | | | |
Gilead Sciences, Inc. | | | | | 4,566 | | | | | | 282 | |
| | | | |
Henry Schein, Inc. (a) | | | | | 54 | | | | | | 4 | |
| | | | |
Humana, Inc. | | | | | 447 | | | | | | 209 | |
| | | | |
Illumina, Inc. (a) | | | | | 107 | | | | | | 20 | |
| | | | |
Intuitive Surgical, Inc. (a) | | | | | 63 | | | | | | 13 | |
| | | | |
Johnson & Johnson | | | | | 6,095 | | | | | | 1,082 | |
| | | | |
Laboratory Corp. of America Holdings | | | | | 125 | | | | | | 29 | |
| | | | |
McKesson Corp. | | | | | 585 | | | | | | 191 | |
| | | | |
Merck & Co., Inc. | | | | | 7,259 | | | | | | 662 | |
| | | | |
Pfizer, Inc. | | | | | 6,925 | | | | | | 363 | |
| | | | |
Quest Diagnostics, Inc. | | | | | 335 | | | | | | 45 | |
| | | | |
Regeneron Pharmaceuticals, Inc. (a) | | | | | 62 | | | | | | 37 | |
| | | | |
Stryker Corp. | | | | | 177 | | | | | | 35 | |
| | | | |
UnitedHealth Group, Inc. | | | | | 1,342 | | | | | | 689 | |
| | | | |
Waters Corp. (a) | | | | | 83 | | | | | | 27 | |
| | | | |
Zimvie, Inc. (a) | | | | | 4 | | | | | | 0 | |
| | | | | | | | | | | | |
| | | | | | | | | | | 6,452 | |
| | | | | | | | | | | | |
| |
| INDUSTRIALS 4.2% | |
| | | | |
3M Co. | | | | | 1,635 | | | | | | 212 | |
| | | | |
American Airlines Group, Inc. (a) | | | | | 2,616 | | | | | | 33 | |
| | | | |
Carrier Global Corp. | | | | | 382 | | | | | | 14 | |
| | | | |
Cummins, Inc. | | | | | 616 | | | | | | 119 | |
| | | | |
Deere & Co. | | | | | 120 | | | | | | 36 | |
| | | | |
Dover Corp. | | | | | 201 | | | | | | 24 | |
| | | | |
Eaton Corp. PLC | | | | | 336 | | | | | | 42 | |
| | | | |
FedEx Corp. | | | | | 283 | | | | | | 64 | |
| | | | |
Illinois Tool Works, Inc. | | | | | 376 | | | | | | 69 | |
| | | | |
Johnson Controls International PLC | | | | | 1,834 | | | | | | 88 | |
| | | | |
ManpowerGroup, Inc. | | | | | 412 | | | | | | 32 | |
| | | | |
Nielsen Holdings PLC | | | | | 1,698 | | | | | | 39 | |
| | | | |
Otis Worldwide Corp. | | | | | 120 | | | | | | 8 | |
| | | | |
Owens Corning | | | | | 391 | | | | | | 29 | |
| | | | |
Republic Services, Inc. | | | | | 234 | | | | | | 31 | |
| | | | |
Rockwell Automation, Inc. | | | | | 146 | | | | | | 29 | |
| | | | |
Stanley Black & Decker, Inc. | | | | | 265 | | | | | | 28 | |
| | | | |
United Parcel Service, Inc. ‘B’ | | | | | 754 | | | | | | 138 | |
| | | | |
United Rentals, Inc. (a) | | | | | 121 | | | | | | 29 | |
| | | | |
Waste Management, Inc. | | | | | 576 | | | | | | 88 | |
| | | | |
WW Grainger, Inc. | | | | | 90 | | | | | | 41 | |
| | | | | | | | | | | | |
| | | | | | | | | | | 1,193 | |
| | | | | | | | | | | | |
| |
| | | | | | | | | | | | |
| See Accompanying Notes | | | ANNUAL REPORT | | | | | | | JUNE 30, 2022 | | | 53 |
| | | | | | |
| Schedule of Investments | | PIMCO RAFI ESG U.S. Exchange-Traded Fund | | (Cont.) | | June 30, 2022 |
| | | | | | | | | | | | |
| | | | | SHARES | | | | | MARKET
VALUE
(000S) | |
| INFORMATION TECHNOLOGY 26.7% | |
| | | | |
Adobe, Inc. (a) | | | | | 246 | | | $ | | | 90 | |
| | | | |
Akamai Technologies, Inc. (a) | | | | | 60 | | | | | | 5 | |
| | | | |
Amdocs Ltd. | | | | | 272 | | | | | | 23 | |
| | | | |
Analog Devices, Inc. | | | | | 446 | | | | | | 65 | |
| | | | |
Apple, Inc. | | | | | 10,591 | | | | | | 1,448 | |
| | | | |
Applied Materials, Inc. | | | | | 1,336 | | | | | | 122 | |
| | | | |
Arrow Electronics, Inc. (a) | | | | | 317 | | | | | | 35 | |
| | | | |
Automatic Data Processing, Inc. | | | | | 438 | | | | | | 92 | |
| | | | |
Avnet, Inc. | | | | | 725 | | | | | | 31 | |
| | | | |
Bread Financial Holdings, Inc. | | | | | 317 | | | | | | 12 | |
| | | | |
Cadence Design Systems, Inc. (a) | | | | | 144 | | | | | | 22 | |
| | | | |
CDW Corp. | | | | | 161 | | | | | | 25 | |
| | | | |
Cisco Systems, Inc. | | | | | 15,318 | | | | | | 653 | |
| | | | |
Citrix Systems, Inc. | | | | | 227 | | | | | | 22 | |
| | | | |
Cognizant Technology Solutions Corp. ‘A’ | | | | | 344 | | | | | | 23 | |
| | | | |
Corning, Inc. | | | | | 2,176 | | | | | | 69 | |
| | | | |
Dell Technologies, Inc. ‘C’ | | | | | 380 | | | | | | 18 | |
| | | | |
DXC Technology Co. (a) | | | | | 1,192 | | | | | | 36 | |
| | | | |
F5, Inc. (a) | | | | | 45 | | | | | | 7 | |
| | | | |
Fidelity National Information Services, Inc. | | | | | 199 | | | | | | 18 | |
| | | | |
Flex Ltd. (a) | | | | | 1,747 | | | | | | 25 | |
| | | | |
Hewlett Packard Enterprise Co. | | | | | 10,567 | | | | | | 140 | |
| | | | |
HP, Inc. | | | | | 4,617 | | | | | | 151 | |
| | | | |
Intel Corp. | | | | | 23,511 | | | | | | 880 | |
| | | |
International Business Machines Corp. | | | 1,656 | | | | | | 234 | |
| | | | |
Intuit, Inc. | | | | | 60 | | | | | | 23 | |
| | | | |
Jabil, Inc. | | | | | 211 | | | | | | 11 | |
| | | | |
Juniper Networks, Inc. | | | | | 1,683 | | | | | | 48 | |
| | | | |
Lam Research Corp. | | | | | 147 | | | | | | 63 | |
| | | | |
Mastercard, Inc. ‘A’ | | | | | 444 | | | | | | 140 | |
| | | | |
Micron Technology, Inc. | | | | | 3,088 | | | | | | 171 | |
| | | | |
Microsoft Corp. | | | | | 5,496 | | | | | | 1,412 | |
| | | | |
Motorola Solutions, Inc. | | | | | 212 | | | | | | 44 | |
| | | | |
NetApp, Inc. | | | | | 766 | | | | | | 50 | |
| | | | |
NortonLifeLock, Inc. | | | | | 1,659 | | | | | | 36 | |
| | | | |
NVIDIA Corp. | | | | | 277 | | | | | | 42 | |
| | | | | | | | | | | | |
| | | | | SHARES | | | | | MARKET
VALUE
(000S) | |
| | | | |
ON Semiconductor Corp. (a) | | | | | 506 | | | $ | | | 25 | |
| | | | |
Oracle Corp. | | | | | 4,737 | | | | | | 331 | |
| | | | |
PayPal Holdings, Inc. (a) | | | | | 219 | | | | | | 15 | |
| | | | |
QUALCOMM, Inc. | | | | | 2,226 | | | | | | 284 | |
| | | | |
salesforce.com, Inc. (a) | | | | | 302 | | | | | | 50 | |
| | | | |
Seagate Technology Holdings PLC | | | | | 598 | | | | | | 43 | |
| | | | |
Skyworks Solutions, Inc. | | | | | 204 | | | | | | 19 | |
| | | | |
Synopsys, Inc. (a) | | | | | 36 | | | | | | 11 | |
| | | | |
Texas Instruments, Inc. | | | | | 1,389 | | | | | | 213 | |
| | | | |
Visa, Inc. ‘A’ | | | | | 1,176 | | | | | | 232 | |
| | | | |
VMware, Inc. ‘A’ | | | | | 247 | | | | | | 28 | |
| | | | |
Western Digital Corp. (a) | | | | | 1,784 | | | | | | 80 | |
| | | | |
Western Union Co. | | | | | 398 | | | | | | 7 | |
| | | | |
Xerox Holdings Corp. | | | | | 1,933 | | | | | | 29 | |
| | | | | | | | | | | | |
| | | | | | | | | | | 7,653 | |
| | | | | | | | | | | | |
| |
| MATERIALS 2.2% | |
| | | | |
Air Products & Chemicals, Inc. | | | | | 159 | | | | | | 38 | |
| | | | |
CF Industries Holdings, Inc. | | | | | 246 | | | | | | 21 | |
| | | | |
Dow, Inc. | | | | | 1,938 | | | | | | 100 | |
| | | | |
DuPont de Nemours, Inc. | | | | | 1,209 | | | | | | 67 | |
| | | | |
Eastman Chemical Co. | | | | | 456 | | | | | | 41 | |
| | | | |
Ecolab, Inc. | | | | | 405 | | | | | | 62 | |
| | | | |
International Flavors & Fragrances, Inc. | | | | | 169 | | | | | | 20 | |
| | | | |
International Paper Co. | | | | | 1,339 | | | | | | 56 | |
| | | | |
Mosaic Co. | | | | | 908 | | | | | | 43 | |
| | | | |
Newmont Corp. | | | | | 785 | | | | | | 47 | |
| | | | |
Packaging Corp. of America | | | | | 179 | | | | | | 25 | |
| | | | |
PPG Industries, Inc. | | | | | 559 | | | | | | 64 | |
| | | | |
Sherwin-Williams Co. | | | | | 137 | | | | | | 31 | |
| | | | |
Sylvamo Corp. | | | | | 33 | | | | | | 1 | |
| | | | | | | | | | | | |
| | | | | | | | | | | 616 | |
| | | | | | | | | | | | |
| |
| REAL ESTATE 0.2% | |
| | | | |
CBRE Group, Inc. ‘A’ (a) | | | | | 512 | | | | | | 38 | |
| | | | |
Jones Lang LaSalle, Inc. (a) | | | | | 80 | | | | | | 14 | |
| | | | | | | | | | | | |
| | | | | | | | | | | 52 | |
| | | | | | | | | | | | |
| |
| | | | | | | | | | | | |
| | | | | SHARES | | | | | MARKET
VALUE
(000S) | |
| UTILITIES 0.3% | |
| | | | |
American Water Works Co., Inc. | | | | | 236 | | | $ | | | 35 | |
| | | | |
Constellation Energy Corp. | | | | | 178 | | | | | | 10 | |
| | | | |
Edison International | | | | | 493 | | | | | | 31 | |
| | | | | | | | | | | | |
| | | | | | | | | | | 76 | |
| | | | | | | | | | | | |
Total United States | | | | | | | | | | | 27,427 | |
| | | | | | | | | | | | |
Total Common Stocks (Cost $29,888) | | | 27,891 | |
| | | | |
| |
| REAL ESTATE INVESTMENT TRUSTS 1.7% | |
| |
| UNITED STATES 1.7% | |
| |
| REAL ESTATE 1.7% | |
| | | | |
American Tower Corp. | | | | | 178 | | | | | | 45 | |
| | | | |
AvalonBay Communities, Inc. | | | | | 143 | | | | | | 28 | |
| | | | |
Digital Realty Trust, Inc. | | | | | 48 | | | | | | 6 | |
| | | | |
Equinix, Inc. | | | | | 52 | | | | | | 34 | |
| | | | |
Equity Residential | | | | | 468 | | | | | | 34 | |
| | | | |
Essex Property Trust, Inc. | | | | | 68 | | | | | | 18 | |
| | | | |
Healthpeak Properties, Inc. | | | | | 906 | | | | | | 23 | |
| | | | |
Host Hotels & Resorts, Inc. | | | | | 2,721 | | | | | | 43 | |
| | | | |
Iron Mountain, Inc. | | | | | 709 | | | | | | 34 | |
| | | | |
Mid-America Apartment Communities, Inc. | | | | | 21 | | | | | | 4 | |
| | | | |
Prologis, Inc. | | | | | 235 | | | | | | 28 | |
| | | | |
Ventas, Inc. | | | | | 1,139 | | | | | | 59 | |
| | | | |
Welltower, Inc. | | | | | 901 | | | | | | 74 | |
| | | | |
Weyerhaeuser Co. | | | | | 2,133 | | | | | | 71 | |
| | | | | | | | | | | | |
| | | | | | | | | | | 501 | |
| | | | | | | | | | | | |
Total Real Estate Investment Trusts
(Cost $534) | | | 501 | |
| | | | |
| | | | |
| | | | | | | | | | | | |
Total Investments in Securities
(Cost $30,422) | | | 28,392 | |
| |
| | | | |
Total Investments 99.2%
(Cost $30,422) | | | $ | | | 28,392 | |
| |
| Other Assets and Liabilities, net 0.8% | | | 223 | |
| | | | |
| Net Assets 100.0% | | | $ | | | 28,615 | |
| | | | | | | |
NOTES TO SCHEDULE OF INVESTMENTS:
| * | A zero balance may reflect actual amounts rounding to less than one thousand. |
| (a) | Security did not produce income within the last twelve months. |
FAIR VALUE MEASUREMENTS
The following is a summary of the fair valuations according to the inputs used as of June 30, 2022 in valuing the Fund’s assets and liabilities:
| | | | | | | | | | | | | | | | |
| Category and Subcategory | | Level 1 | | | Level 2 | | | Level 3 | | | Fair
Value at
06/30/2022 | |
Investments in Securities, at Value | |
Common Stocks | |
Ireland | | | | | | | | | | | | | | | | |
Information Technology | | $ | 167 | | | $ | 0 | | | $ | 0 | | | $ | 167 | |
Switzerland | | | | | | | | | | | | | | | | |
Information Technology | | | 33 | | | | 0 | | | | 0 | | | | 33 | |
United Kingdom | | | | | | | | | | | | | | | | |
Communication Services | | | 40 | | | | 0 | | | | 0 | | | | 40 | |
Consumer Discretionary | | | 8 | | | | 0 | | | | 0 | | | | 8 | |
Materials | | | 216 | | | | 0 | | | | 0 | | | | 216 | |
United States | | | | | | | | | | | | | | | | |
Communication Services | | | 2,584 | | | | 0 | | | | 0 | | | | 2,584 | |
Consumer Discretionary | | | 1,903 | | | | 0 | | | | 0 | | | | 1,903 | |
| | | | | | | | | | | | | | | | |
| Category and Subcategory | | Level 1 | | | Level 2 | | | Level 3 | | | Fair
Value at
06/30/2022 | |
Consumer Staples | | $ | 2,541 | | | $ | 0 | | | $ | 0 | | | $ | 2,541 | |
Financials | | | 4,357 | | | | 0 | | | | 0 | | | | 4,357 | |
Health Care | | | 6,452 | | | | 0 | | | | 0 | | | | 6,452 | |
Industrials | | | 1,193 | | | | 0 | | | | 0 | | | | 1,193 | |
Information Technology | | | 7,653 | | | | 0 | | | | 0 | | | | 7,653 | |
Materials | | | 616 | | | | 0 | | | | 0 | | | | 616 | |
Real Estate | | | 52 | | | | 0 | | | | 0 | | | | 52 | |
Utilities | | | 76 | | | | 0 | | | | 0 | | | | 76 | |
Real Estate Investment Trusts | | | | | | | | | | | | | | | | |
United States | | | | | | | | | | | | | | | | |
Real Estate | | | 501 | | | | 0 | | | | 0 | | | | 501 | |
| | | | | | | | | | | | | | | | |
| | | | |
Total Investments | | $ | 28,392 | | | $ | 0 | | | $ | 0 | | | $ | 28,392 | |
| | | | | | | | | | | | | | | | |
There were no significant transfers into or out of Level 3 during the period ended June 30, 2022.
| | | | | | |
| 54 | | PIMCO EQUITY SERIES | | | See Accompanying Notes | |
| | | | |
| Notes to Financial Statements | | | | June 30, 2022 |
1. ORGANIZATION
PIMCO Equity Series (the “Trust”) was established as a Delaware statutory trust on March 30, 2010. The Trust is registered under the Investment Company Act of 1940, as amended (the “Act”), as an open-end management investment company. Information presented in these financial statements pertains to the funds (each a “Fund” and collectively the “Funds”) indicated on the cover of this report. Pacific Investment Management Company LLC (“PIMCO” or “Manager”) serves as the investment adviser for the Funds. Prior to August 12, 2022, Parametric Portfolio Associates LLC (“Parametric” or “Sub-Adviser”) served as the sub-adviser to each Fund.
Each Fund is an exchange-traded fund (“ETF”). ETFs are funds that trade like other publicly-traded securities and may be designed to track an index or to be actively managed. Unlike shares of a mutual fund, which can be bought from and redeemed by the issuing fund by all shareholders at a price based on net asset value (“NAV”), shares of a Fund may be directly purchased from and redeemed by a Fund at NAV solely by certain large institutional investors. Also unlike shares of a mutual fund, shares of each Fund are listed on a national securities exchange and trade in the secondary market at market prices that change throughout the day. Each Fund offers and issues shares only in aggregations of a specified number of shares (“Creation Units”).
2. SIGNIFICANT ACCOUNTING POLICIES
The following is a summary of significant accounting policies consistently followed by the Trust in the preparation of its financial statements in conformity with accounting principles generally accepted in the United States of America (“U.S. GAAP”). Each Fund is treated as an investment company under the reporting requirements of U.S. GAAP. The functional and reporting currency for the Funds is the U.S. dollar. The preparation of financial statements in accordance with U.S. GAAP requires management to make estimates and assumptions that affect the reported amounts of assets and liabilities and disclosure of contingent assets and liabilities at the date of the financial statements and the reported amounts of increases and decreases in net assets from operations during the reporting period. Actual results could differ from those estimates.
(a) Securities Transactions and Investment Income Securities transactions are recorded as of the trade date for financial reporting purposes. Securities purchased or sold on a when-issued or delayed-delivery basis may be settled beyond a standard settlement period for the security after the trade date. Realized gains (losses) from securities sold are recorded on the identified cost basis. Dividend income is recorded on the ex-dividend date, except certain dividends from foreign securities where the ex-dividend date may have passed, which are recorded as soon as a Fund is informed of the ex-dividend date.
Interest income, adjusted for the accretion of discounts and amortization of premiums, is recorded on the accrual basis from settlement date, with the exception of securities with a forward starting effective date, where interest income is recorded on the accrual basis from effective date. For convertible securities, premiums attributable to the conversion feature are not amortized. Estimated tax liabilities on certain foreign securities are recorded on an accrual basis and are reflected as components of interest income or net change in unrealized appreciation (depreciation) on investments on the Statements of Operations, as appropriate. Tax liabilities realized as a result of such security sales are reflected as a component of net realized gain (loss) on investments on the Statements of Operations. Paydown gains (losses) on mortgage-related and other asset-backed securities, if any, are recorded as components of interest income on the Statements of Operations. Income or short-term capital gain distributions received from registered investment companies, if any, are recorded as dividend income. Long-term capital gain distributions received from registered investment companies, if any, are recorded as realized gains.
Debt obligations may be placed on non-accrual status and related interest income may be reduced by ceasing current accruals and writing off interest receivable when the collection of all or a portion of interest has become doubtful based on consistently applied procedures. A debt obligation is removed from non-accrual status when the issuer resumes interest payments or when collectability of interest is probable.
(b) Foreign Currency Translation The market values of foreign securities, currency holdings and other assets and liabilities denominated in foreign currencies are translated into U.S. dollars based on the current exchange rates each business day. Purchases and sales of securities and income and expense items denominated in foreign currencies, if any, are translated into U.S. dollars at the exchange rate in effect on the transaction date. The Funds do not separately report the effects of changes in foreign exchange rates from changes in market prices on securities held. Such changes are included in net realized gain (loss) and net change in unrealized appreciation (depreciation) from investments on the Statements of Operations. The Funds may invest in foreign currency-denominated securities and may engage in foreign currency transactions either on a spot (cash) basis at the rate prevailing in the currency exchange market at the time or through a forward foreign currency contract. Realized foreign exchange gains (losses) arising from sales of spot foreign currencies, currency gains (losses) realized between the trade and settlement dates on securities transactions and the difference between the recorded amounts of dividends, interest, and foreign withholding taxes and the U.S. dollar equivalent of the amounts actually received or paid are included in net realized gain (loss) on foreign currency transactions on the Statements of Operations. Net unrealized foreign exchange gains
| | | | | | | | | | | | |
| | | | ANNUAL REPORT | | | | | | | JUNE 30, 2022 | | | 55 |
| | | | |
| Notes to Financial Statements | | (Cont.) | | |
(losses) arising from changes in foreign exchange rates on foreign denominated assets and liabilities other than investments in securities held at the end of the reporting period are included in net change in unrealized appreciation (depreciation) on foreign currency assets and liabilities on the Statements of Operations.
(c) Distributions to Shareholders The following table shows the anticipated frequency of distributions from net investment income, if any, for each Fund.
| | | | | | | | | | | | |
| | | | Distribution Frequency | |
| | | |
| Fund Name | | | | | Declared | | | Distributed | |
| | | |
PIMCO RAFI Dynamic Multi-Factor Emerging Markets Equity ETF | | | | | | | Quarterly | | | | Quarterly | |
| | | |
PIMCO RAFI Dynamic Multi-Factor International Equity ETF | | | | | | | Quarterly | | | | Quarterly | |
| | | |
PIMCO RAFI Dynamic Multi-Factor U.S. Equity ETF | | | | | | | Quarterly | | | | Quarterly | |
| | | |
PIMCO RAFI ESG U.S. ETF | | | | | | | Quarterly | | | | Quarterly | |
In addition, each Fund distributes any net capital gains it earns from the sale of portfolio securities to shareholders no less frequently than annually. Net short-term capital gains may be paid more frequently. The Trust does not provide an automatic dividend and/or distributions reinvestment service.
Income distributions and capital gain distributions are determined in accordance with income tax regulations which may differ from U.S. GAAP. Differences between tax regulations and U.S. GAAP may cause timing differences between income and capital gain recognition. Further, the character of investment income and capital gains may be different for certain transactions under the two methods of accounting. As a result, income distributions and capital gain distributions declared during a fiscal period may differ significantly from the net investment income (loss) and realized gains (losses) reported on each Fund’s annual financial statements presented under U.S. GAAP.
Separately, if a Fund determines or estimates, as applicable, that a portion of a distribution may be comprised of amounts from sources other than net investment income in accordance with its policies, accounting records (if applicable), and accounting practices, the Fund will notify shareholders of the estimated composition of such distribution through a Section 19 Notice. For these purposes, a Fund determines or estimates, as applicable, the source or sources from which a distribution is paid, to the close of the period as of which it is paid, in reference to its internal accounting records and related accounting practices. If, based on such accounting records and practices, it is determined or estimated, as applicable, that a particular distribution does not include capital gains or paid-in surplus or other capital sources, a Section 19 Notice generally would not be issued. It is important to note that differences exist between a Fund’s daily internal accounting records and practices, a Fund’s financial statements
presented in accordance with U.S. GAAP, and recordkeeping practices under income tax regulations. For instance, a Fund’s internal accounting records and practices may take into account, among other factors, tax-related characteristics of certain sources of distributions that differ from treatment under U.S. GAAP. Examples of such differences may include but are not limited to, for certain Funds, the treatment of periodic payments under interest rate swap contracts. Accordingly, among other consequences, it is possible that a Fund may not issue a Section 19 Notice in situations where the Fund’s financial statements prepared later and in accordance with U.S. GAAP and/or the final tax character of those distributions might later report that the sources of those distributions included capital gains and/or a return of capital. Please visit www.pimco.com for the most recent Section 19 Notice, if applicable, for additional information regarding the estimated composition of distributions. Final determination of a distribution’s tax character will be provided to shareholders when such information is available.
Distributions classified as a tax basis return of capital at a Fund’s fiscal year end, if any, are reflected on the Statements of Changes in Net Assets and have been recorded to paid in capital on the Statements of Assets and Liabilities. In addition, other amounts have been reclassified between distributable earnings (accumulated loss) and paid in capital on the Statements of Assets and Liabilities to more appropriately conform U.S. GAAP to tax characterizations of distributions.
(d) New Accounting Pronouncements and Regulatory Updates In March 2020, the Financial Accounting Standards Board issued an Accounting Standards Update (“ASU”), ASU 2020-04, which provides optional guidance to ease the potential accounting burden associated with transitioning away from the London Interbank Offered Rate and other reference rates that are expected to be discontinued. ASU 2020-04 is effective for certain reference rate-related contract modifications that occur during the period March 12, 2020 through December 31, 2022. In March 2021, the administrator for LIBOR announced the extension of the publication of a majority of the USD LIBOR settings to June 30, 2023. Management is continuously evaluating the potential effect a discontinuation of LIBOR could have on the Funds’ investments and has determined that it is unlikely the ASU’s adoption will have a material impact on the Funds’ financial statements.
In October 2020, the U.S. Securities and Exchange Commission (“SEC”) adopted a rule related to the use of derivatives, short sales, reverse repurchase agreements and certain other transactions by registered investment companies that rescinds and withdraws the guidance of the SEC and its staff regarding asset segregation and cover transactions that was applicable to the Funds as of the date of this report. Subject to certain exceptions, the rule requires funds to trade
derivatives and other transactions that create future payment or delivery obligations (except reverse repurchase agreements and similar financing transactions) subject to a value-at-risk leverage limit, certain derivatives risk management program and reporting requirements. The rule went into effect on February 19, 2021. The compliance date for the new rule and the related reporting requirements is August 19, 2022. At this time, management is evaluating the implications of these changes on the financial statements.
In October 2020, the SEC adopted a rule regarding the ability of a fund to invest in other funds. The rule allows a fund to acquire shares of another fund in excess of certain limitations currently imposed by the Act without obtaining individual exemptive relief from the SEC, subject to certain conditions. The rule also includes the rescission of certain exemptive relief from the SEC and guidance from the SEC staff for funds to invest in other funds. The effective date for the rule was January 19, 2021, and the compliance date for the rule was January 19, 2022. Management has implemented changes in connection with the rule and has determined that there is no material impact to the Funds’ financial statements.
In December 2020, the SEC adopted a rule addressing fair valuation of fund investments. The new rule sets forth requirements for good faith determinations of fair value as well as for the performance of fair value determinations, including related oversight and reporting obligations. The new rule also defines “readily available market quotations” for purposes of the definition of “value” under the Act, and the SEC noted that this definition would apply in all contexts under the Act. The effective date for the rule was March 8, 2021. The compliance date for the new rule and the associated recordkeeping requirements is September 8, 2022. At this time, management is evaluating the implications of these changes on the financial statements.
3. INVESTMENT VALUATION AND FAIR VALUE MEASUREMENTS
(a) Investment Valuation Policies The NAV of the Fund’s shares is determined by dividing the total value of the Fund’s portfolio investments and other assets, less any liabilities attributable to that Fund, by the total number of shares outstanding.
On each day that the New York Stock Exchange (“NYSE”) is open, Fund shares are ordinarily valued as of the close of regular trading (normally 4:00 p.m., Eastern time) (“NYSE Close”). Information that becomes known to the Funds or their agents after the time as of which NAV has been calculated on a particular day will not generally be used to retroactively adjust the price of a security or the NAV determined earlier that day. If regular trading on the NYSE closes earlier than scheduled, each Fund reserves the right to either (i) calculate its NAV as of the earlier closing time or (ii) calculate its NAV as of the normally
scheduled close of regular trading on the NYSE for that day. Each Fund generally does not calculate their NAV on days during which the NYSE is closed. However, if the NYSE is closed on a day it would normally be open for business, each Fund reserves the right to calculate their NAV as of the normally scheduled close of regular trading on the NYSE for that day or such other time that the Fund may determine.
For purposes of calculating NAV, portfolio securities and other assets for which market quotes are readily available are valued at market value. Market value is generally determined on the basis of official closing prices or the last reported sales prices, or if no sales are reported, based on quotes obtained from established market makers or prices (including evaluated prices) supplied by the Funds’ approved pricing services, quotation reporting systems and other third-party sources (together, “Pricing Services”). The Funds will normally use pricing data for domestic equity securities received shortly after the NYSE Close and do not normally take into account trading, clearances or settlements that take place after the NYSE Close. If market value pricing is used, a foreign (non-U.S.) equity security traded on a foreign exchange or on more than one exchange is typically valued using pricing information from the exchange considered by PIMCO to be the primary exchange. A foreign (non-U.S.) equity security will be valued as of the close of trading on the foreign exchange, or the NYSE Close, if the NYSE Close occurs before the end of trading on the foreign exchange. Domestic and foreign (non-U.S.) fixed income securities, non-exchange traded derivatives, and equity options are normally valued on the basis of quotes obtained from brokers and dealers or Pricing Services using such data reflecting the principal markets for those securities. Prices obtained from Pricing Services may be based on, among other things, information provided by market makers or estimates of market values obtained from yield data relating to investments or securities with similar characteristics. Certain fixed income securities purchased on a delayed-delivery basis are marked to market daily until settlement at the forward settlement date. Exchange-traded options, except equity options, futures and options on futures are valued at the settlement price determined by the relevant exchange, quotes obtained from a quotation reporting system, established market makers or pricing services. Swap agreements are valued on the basis of market-based prices supplied by Pricing Services or quotes obtained from brokers and dealers. A Fund’s investments in open-end management investment companies, other than exchange-traded funds (“ETFs”), are valued at the NAVs of such investments. Open-end management investment companies may include affiliated funds.
If a foreign (non-U.S.) equity security’s value has materially changed after the close of the security’s primary exchange or principal market but before the NYSE Close, the security may be valued at fair value based on procedures established and approved by the Board of Trustees of the Trust (the “Board”). Foreign (non-U.S.) equity securities that do not trade when the NYSE is open are also valued at fair value.
| | | | | | | | | | | | |
| | | | ANNUAL REPORT | | | | | | | JUNE 30, 2022 | | | 57 |
| | | | |
| Notes to Financial Statements | | (Cont.) | | |
With respect to foreign (non-U.S.) equity securities, a Fund may determine the fair value of investments based on information provided by Pricing Services and other third-party vendors, which may recommend fair value or adjustments with reference to other securities, indices or assets. In considering whether fair valuation is required and in determining fair values, a Fund may, among other things, consider significant events (which may be considered to include changes in the value of U.S. securities or securities indices) that occur after the close of the relevant market and before the NYSE Close. A Fund may utilize modeling tools provided by third-party vendors to determine fair values of foreign (non-U.S.) securities. For these purposes, any movement in the applicable reference index or instrument (“zero trigger”) between the earlier close of the applicable foreign market and the NYSE Close may be deemed to be a significant event, prompting the application of the pricing model (effectively resulting in daily fair valuations). Foreign exchanges may permit trading in foreign (non-U.S.) equity securities on days when the Trust is not open for business, which may result in a Fund’s portfolio investments being affected when shareholders are unable to buy or sell shares.
Senior secured floating rate loans for which an active secondary market exists to a reliable degree are valued at the mean of the last available bid/ask prices in the market for such loans, as provided by a Pricing Service. Senior secured floating rate loans for which an active secondary market does not exist to a reliable degree are valued at fair value, which is intended to approximate market value. In valuing a senior secured floating rate loan at fair value, the factors considered may include, but are not limited to, the following: (a) the creditworthiness of the borrower and any intermediate participants, (b) the terms of the loan, (c) recent prices in the market for similar loans, if any, and (d) recent prices in the market for instruments of similar quality, rate, period until next interest rate reset and maturity.
Investments valued in currencies other than the U.S. dollar are converted to the U.S. dollar using exchange rates obtained from Pricing Services. As a result, the value of such investments and, in turn, the NAV of a Fund’s shares may be affected by changes in the value of currencies in relation to the U.S. dollar. The value of investments traded in markets outside the United States or denominated in currencies other than the U.S. dollar may be affected significantly on a day that the Trust is not open for business. As a result, to the extent that a Fund holds foreign (non-U.S.) investments, the value of those investments may change at times when shareholders are unable to buy or sell shares and the value of such investments will be reflected in the Fund’s next calculated NAV.
Investments for which market quotes or market based valuations are not readily available are valued at fair value as determined in good faith by the Board or persons acting at their direction. The Board has
adopted methods for valuing securities and other assets in circumstances where market quotes are not readily available, and has delegated to the Manager the responsibility for applying the fair valuation methods. In the event that market quotes or market based valuations are not readily available, and the security or asset cannot be valued pursuant to a Board approved valuation method, the value of the security or asset will be determined in good faith by the Board. The Manager may consult with the Sub-Adviser in providing such recommendations or otherwise with respect to valuation of a Fund’s portfolio securities or other assets. Market quotes are considered not readily available in circumstances where there is an absence of current or reliable market-based data (e.g., trade information, bid/ask information, indicative market quotations (“Broker Quotes”), Pricing Services’ prices), including where events occur after the close of the relevant market, but prior to the NYSE Close, that materially affect the values of a Fund’s securities or assets. In addition, market quotes are considered not readily available when, due to extraordinary circumstances, the exchanges or markets on which the securities trade do not open for trading for the entire day and no other market prices are available. The Board has delegated, to the Manager, the responsibility for monitoring significant events that may materially affect the values of a Fund’s securities or assets and for determining whether the value of the applicable securities or assets should be reevaluated in light of such significant events.
When a Fund uses fair valuation to determine the value of a portfolio security or other asset for purposes of calculating its NAV, such investments will not be priced on the basis of quotes from the primary market in which they are traded, but rather may be priced by another method that the Board or persons acting at their direction believe reflects fair value. Fair valuation may require subjective determinations about the value of a security. While the Trust’s policy is intended to result in a calculation of a Fund’s NAV that fairly reflects security values as of the time of pricing, the Trust cannot ensure that fair values determined by the Board or persons acting at their direction would accurately reflect the price that a Fund could obtain for a security if it were to dispose of that security as of the time of pricing (for instance, in a forced or distressed sale). The prices used by a Fund may differ from the value that would be realized if the securities were sold. The Funds’ use of fair valuation may also help to deter “stale price arbitrage” as discussed under the “Abusive Trading Practices” section in each Fund’s prospectus.
(b) Fair Value Hierarchy U.S. GAAP describes fair value as the price that a Fund would receive to sell an asset or pay to transfer a liability in an orderly transaction between market participants at the measurement date. It establishes a fair value hierarchy that prioritizes inputs to valuation methods and requires disclosure of the fair value hierarchy,
separately for each major category of assets and liabilities, that segregates fair value measurements into levels (Level 1, 2, or 3). The inputs or methodology used for valuing securities are not necessarily an indication of the risks associated with investing in those securities. Levels 1, 2, and 3 of the fair value hierarchy are defined as follows:
| ∎ | | Level 1 — Quoted prices in active markets or exchanges for identical assets and liabilities. |
| ∎ | | Level 2 — Significant other observable inputs, which may include, but are not limited to, quoted prices for similar assets or liabilities in markets that are active, quoted prices for identical or similar assets or liabilities in markets that are not active, inputs other than quoted prices that are observable for the assets or liabilities (such as interest rates, yield curves, volatilities, prepayment speeds, loss severities, credit risks and default rates) or other market corroborated inputs. |
| ∎ | | Level 3 — Significant unobservable inputs based on the best information available in the circumstances, to the extent observable inputs are not available, which may include assumptions made by the Board or persons acting at their direction that are used in determining the fair value of investments. |
In accordance with the requirements of U.S. GAAP, the amounts of transfers into and out of Level 3, if material, are disclosed in the Notes to Schedule of Investments for each respective Fund.
For fair valuations using significant unobservable inputs, U.S. GAAP requires a reconciliation of the beginning to ending balances for reported fair values that presents changes attributable to realized gain (loss), unrealized appreciation (depreciation), purchases and sales, accrued discounts (premiums), and transfers into and out of the Level 3 category during the period. The end of period value is used for the transfers between Levels of a Fund’s assets and liabilities. Additionally, U.S. GAAP requires quantitative information regarding the significant unobservable inputs used in the determination of fair value of assets or liabilities categorized as Level 3 in the fair value hierarchy. In accordance with the requirements of U.S. GAAP, a fair value hierarchy, and if material, a Level 3 reconciliation and details of significant unobservable inputs, have been included in the Notes to Schedule of Investments for each respective Fund.
(c) Valuation Techniques and the Fair Value Hierarchy
Level 1, Level 2 and Level 3 trading assets and trading liabilities, at fair value The valuation methods (or “techniques”) and significant inputs used in determining the fair values of portfolio securities or other assets and liabilities categorized as Level 1, Level 2 and Level 3 of the fair value hierarchy are as follows:
Fixed income securities including corporate, convertible and municipal bonds and notes, U.S. government agencies, U.S. treasury obligations,
sovereign issues, bank loans, convertible preferred securities and non-U.S. bonds are normally valued on the basis of quotes obtained from brokers and dealers or Pricing Services that use broker-dealer quotations, reported trades or valuation estimates from their internal pricing models. The Pricing Services’ internal models use inputs that are observable such as issuer details, interest rates, yield curves, prepayment speeds, credit risks/spreads, default rates and quoted prices for similar assets. Securities that use similar valuation techniques and inputs as described above are categorized as Level 2 of the fair value hierarchy.
Fixed income securities purchased on a delayed-delivery basis or as a repurchase commitment in a sale-buyback transaction are marked to market daily until settlement at the forward settlement date and are categorized as Level 2 of the fair value hierarchy.
Mortgage-related and asset-backed securities are usually issued as separate tranches, or classes, of securities within each deal. These securities are also normally valued by Pricing Services that use broker-dealer quotations, reported trades or valuation estimates from their internal pricing models. The pricing models for these securities usually consider tranche-level attributes, current market data, estimated cash flows and market-based yield spreads for each tranche, and incorporate deal collateral performance, as available. Mortgage-related and asset-backed securities that use similar valuation techniques and inputs as described above are categorized as Level 2 of the fair value hierarchy.
Common stocks, ETFs, exchange-traded notes and financial derivative instruments, such as futures contracts, rights and warrants, or options on futures that are traded on a national securities exchange, are stated at the last reported sale or settlement price on the day of valuation. To the extent these securities are actively traded and valuation adjustments are not applied, they are categorized as Level 1 of the fair value hierarchy.
Valuation adjustments may be applied to certain securities that are solely traded on a foreign exchange to account for the market movement between the close of the foreign market and the NYSE Close. These securities are valued using Pricing Services that consider the correlation of the trading patterns of the foreign security to the intraday trading in the U.S. markets for investments. Securities using these valuation adjustments are categorized as Level 2 of the fair value hierarchy. Preferred securities and other equities traded on inactive markets or valued by reference to similar instruments are also categorized as Level 2 of the fair value hierarchy.
Valuation adjustments may be applied to certain exchange traded futures and options to account for market movement between the
exchange settlement and the NYSE close. These securities are valued
| | | | | | | | | | | | |
| | | | ANNUAL REPORT | | | | | | | JUNE 30, 2022 | | | 59 |
| | | | |
| Notes to Financial Statements | | (Cont.) | | |
using quotes obtained from a quotation reporting system, established market makers or pricing services. Financial derivatives using these valuation adjustments are categorized as Level 2 of the fair value hierarchy.
Equity-linked securities are valued by referencing the last reported sale or settlement price of the linked referenced equity on the day of valuation. Foreign exchange adjustments are applied to the last reported price to convert the linked equity’s trading currency to the contract’s settling currency. These investments are categorized as Level 2 of the fair value hierarchy.
Investments in registered open-end investment companies (other than ETFs) will be valued based upon the NAVs of such investments and are categorized as Level 1 of the fair value hierarchy. Investments in unregistered open-end investment companies will be calculated based upon the NAVs of such investments and are considered Level 1 provided that the NAVs are observable, calculated daily and are the value at which both purchases and sales will be conducted.
Equity exchange-traded options and over the counter financial derivative instruments, such as forward foreign currency contracts and options contracts derive their value from underlying asset prices, indices, reference rates, and other inputs or a combination of these factors. These contracts are normally valued on the basis of quotes obtained from a quotation reporting system, established market makers or Pricing Services (normally determined as of the NYSE Close). Depending on the product and the terms of the transaction, financial derivative instruments can be valued by Pricing Services using a series of techniques, including simulation pricing models. The pricing models use inputs that are observed from actively quoted markets such as quoted prices, issuer details, indices, bid/ask
spreads, interest rates, implied volatilities, yield curves, dividends and exchange rates. Financial derivative instruments that use similar valuation techniques and inputs as described above are categorized as Level 2 of the fair value hierarchy.
Centrally cleared swaps and over the counter swaps derive their value from underlying asset prices, indices, reference rates, and other inputs or a combination of these factors. They are valued using a broker-dealer bid quotation or on market-based prices provided by Pricing Services (normally determined as of the NYSE Close). Centrally cleared swaps and over the counter swaps can be valued by Pricing Services using a series of techniques, including simulation pricing models. The pricing models may use inputs that are observed from actively quoted markets such as the overnight index swap rate, LIBOR forward rate, interest rates, yield curves and credit spreads. These securities are categorized as Level 2 of the fair value hierarchy.
When a fair valuation method is applied by the Manager that uses significant unobservable inputs, investments will be priced by a method that the Board or persons acting at their direction believe reflects fair value and are categorized as Level 3 of the fair value hierarchy.
Short-term debt instruments (such as commercial paper) having a remaining maturity of 60 days or less may be valued at amortized cost, so long as the amortized cost value of such short-term debt instruments is approximately the same as the fair value of the instrument as determined without the use of amortized cost valuation. These securities are categorized as Level 2 or Level 3 of the fair value hierarchy depending on the source of the base price.
4. SECURITIES AND OTHER INVESTMENTS
(a) Investments in Affiliates
Each Fund eligible to participate in securities lending may invest the cash collateral received for securities out on loan in the PIMCO Government Money Market Fund under the Securities Lending Agreement. All or a portion of Dividend Income as shown in the table below represents the income earned on the cash collateral invested in PIMCO Government Money Market Fund and is included on the Statements of Operations as a component of Securities Lending Income. PIMCO Government Money Market Fund is considered to be affiliated with the Funds. A complete schedule of portfolio holdings for each affiliate fund is filed with the SEC for the first and third quarters of each fiscal year on Form N-PORT and is available at the SEC’s website at www.sec.gov. A copy of each affiliate fund’s shareholder report is also available at the SEC’s website at www.sec.gov, on the Funds’ website at www.pimco.com, or upon request, as applicable. The table below shows the Funds’ transactions in and earnings from investments in the affiliated Fund for the period ended June 30, 2022 (amounts in thousands†):
Investments in PIMCO Government Money Market Fund
| | | | | | | | | | | | | | | | | | | | | | | | | | | | | | | | | | | | |
| Fund Name | | | | | Market Value
06/30/2021 | | | Purchases
at Cost | | | Proceeds
from Sales | | | Net
Realized
Gain (Loss) | | | Change in
Unrealized
Appreciation
(Depreciation) | | | Market Value
06/30/2022 | | | Dividend
Income(1) | | | Realized Net
Capital Gain
Distributions(1) | |
| | | | | | | | | |
PIMCO RAFI Dynamic Multi-Factor Emerging Markets Equity ETF | | | | | | $ | 7,978 | | | $ | 24,044 | | | $ | (31,950 | ) | | $ | 0 | | | $ | 0 | | | $ | 72 | | | $ | 0 | | | $ | 0 | |
| | | | | | | | | |
PIMCO RAFI Dynamic Multi-Factor International Equity ETF | | | | | | | 1,186 | | | | 9,966 | | | | (9,963 | ) | | | 0 | | | | 0 | | | | 1,189 | | | | 1 | | | | 0 | |
| | | | | | | | | |
PIMCO RAFI Dynamic Multi-Factor U.S. Equity ETF | | | | | | | 209 | | | | 2,631 | | | | (2,815 | ) | | | 0 | | | | 0 | | | | 25 | | | | 0 | | | | 0 | |
| † | A zero balance may reflect actual amounts rounding to less than one thousand. |
| (1) | The tax characterization of distributions is determined in accordance with Federal income tax regulations and may contain a return of capital. The actual tax characterization of distributions received is determined at the end of the fiscal year of the affiliated fund. See Note 2, Distributions to Shareholders, in the Notes to Financial Statements for more information. |
(b) Investments in Securities
The Funds may utilize the investments and strategies described below to the extent permitted by each Fund’s respective investment policies.
Equity-Linked Securities are privately issued securities that have a return component based on the performance of a single stock, a basket of stocks, or a stock index. Equity-linked securities are often used for many of the same purposes as, and share many of the same risks with, derivative instruments.
Exchange-Traded Funds typically are index-based investment companies that hold substantially all of their assets in securities representing their specific index, but may also be actively-managed investment companies. Shares of ETFs trade throughout the day on an exchange and represent an investment in a portfolio of securities and other assets. As a shareholder of another investment company, the Funds would bear their pro rata portion of the other investment company’s expenses, including advisory fees, in addition to the expenses the Funds bear directly in connection with their own operations. Investments in ETFs entail certain risks; in particular, investments in ETFs involve the risk that the ETF’s performance may not track the performance of the index the ETF is designed to track.
Real Estate Investment Trusts (“REITs”) are pooled investment vehicles that own, and typically operate, income-producing real estate. If a REIT meets certain requirements, including distributing to shareholders substantially all of its taxable income (other than net capital gains), then it is not taxed on the income distributed to shareholders. Distributions received from REITs may be characterized as income, capital gain or a return of capital. A return of capital is recorded by a Fund as a reduction to the cost basis of its investment in the REIT. REITs are subject to management fees and other expenses, and so the Funds that invest in REITs will bear their proportionate share of the costs of the REITs’ operations.
Restricted Investments are subject to legal or contractual restrictions on resale and may generally be sold privately, but may be required to be registered or exempted from such registration before being sold to the public. Private placement securities are generally considered to be restricted except for those securities traded between qualified institutional investors under the provisions of Rule 144A of the Securities Act of 1933. Disposal of restricted investments may involve time-consuming negotiations and expenses, and prompt sale at an acceptable price may be difficult to achieve. Restricted investments held by the Funds as of June 30, 2022, as applicable, are disclosed in the Notes to Schedules of Investments.
Warrants are securities that are usually issued together with a debt security or preferred security and that give the holder the right to buy a
proportionate amount of common stock at a specified price. Warrants normally have a life that is measured in years and entitle the holder to buy common stock of a company at a price that is usually higher than the market price at the time the warrant is issued. Warrants may entail greater risks than certain other types of investments. Generally, warrants do not carry the right to receive dividends or exercise voting rights with respect to the underlying securities, and they do not represent any rights in the assets of the issuer. In addition, their value does not necessarily change with the value of the underlying securities, and they cease to have value if they are not exercised on or before their expiration date. If the market price of the underlying stock does not exceed the exercise price during the life of the warrant, the warrant will expire worthless. Warrants may increase the potential profit or loss to be realized from the investment as compared with investing the same amount in the underlying securities. Similarly, the percentage increase or decrease in the value of an equity security warrant may be greater than the percentage increase or decrease in the value of the underlying common stock. Warrants may relate to the purchase of equity or debt securities. Debt obligations with warrants attached to purchase equity securities have many characteristics of convertible securities and their prices may, to some degree, reflect the performance of the underlying stock. Debt obligations also may be issued with warrants attached to purchase additional debt securities at the same coupon rate. A decline in interest rates would permit a Fund to sell such warrants at a profit. If interest rates rise, these warrants would generally expire with no value.
5. BORROWINGS AND OTHER FINANCING TRANSACTIONS
The Funds may enter into the borrowings and other financing transactions described below to the extent permitted by each Fund’s respective investment policies.
The following disclosures contain information on a Fund’s ability to lend or borrow cash or securities to the extent permitted under the Act, which may be viewed as borrowing or financing transactions by a Fund. The location of these instruments in each Fund’s financial statements is described below.
(a) Repurchase Agreements Under the terms of a typical repurchase agreement, a Fund purchases an underlying debt obligation (collateral) subject to an obligation of the seller to repurchase, and a Fund to resell, the obligation at an agreed-upon price and time. In an open maturity repurchase agreement, there is no pre-determined repurchase date and the agreement can be terminated by the Fund or counterparty at any time. The underlying securities for all repurchase agreements are held by a Fund’s custodian or designated subcustodians under tri-party repurchase agreements and in certain instances will remain in custody with the counterparty. The market value of the collateral must be equal
| | | | | | | | | | | | |
| | | | ANNUAL REPORT | | | | | | | JUNE 30, 2022 | | | 61 |
| | | | |
| Notes to Financial Statements | | (Cont.) | | |
to or exceed the total amount of the repurchase obligations, including interest. Repurchase agreements, if any, including accrued interest, are included on the Statements of Assets and Liabilities. Interest earned is recorded as a component of interest income on the Statements of Operations. In periods of increased demand for collateral, a Fund may pay a fee for the receipt of collateral, which may result in interest expense to the Fund.
(b) Securities Lending The Funds listed below may seek to earn additional income by lending their securities to certain qualified broker-dealers and institutions on a short-term or long-term basis via a lending agent.
| | | | |
| Fund Name | | | |
| |
PIMCO RAFI Dynamic Multi-Factor Emerging Markets Equity ETF | | | | |
| |
PIMCO RAFI Dynamic Multi-Factor International Equity ETF | | | | |
| |
PIMCO RAFI Dynamic Multi-Factor U.S. Equity ETF | | | | |
| |
PIMCO RAFI ESG U.S. ETF | | | | |
Securities on loan are required to be secured by cash collateral at least equal to 102% of the domestic, or 105% of the foreign security’s market value. If the market value of the collateral at the close of trading on a business day is less than 100% of the market value of the loaned securities at the close of trading on that day, the borrower shall be required to deliver, by the close of business on the following business day, an additional amount of collateral, so that the total amount of posted collateral is equal to at least 100% of the market value of all the loaned securities as of such preceding day. The Funds will then invest the cash collateral received in the PIMCO Government Money Market Fund and record a liability for the return of the collateral during the period the securities are on loan. Each Fund is subject to a lending limit of 33.33% of total assets (including the value of collateral).
The loans are subject to termination at the option of the borrower or the Fund. Upon termination of the loan, the borrower will return to the lender securities identical to the loaned securities. Should the borrower of the securities fail to return loaned securities, the Fund has the right to repurchase the securities using the collateral in the open market.
The borrower pays fees at the Funds’ direction to the lending agent. The lending agent may retain a portion of the fees and interest earned on the cash collateral invested as compensation for its services. Investments made with the cash collateral are disclosed on the Schedules of Investments, if applicable. The lending fees and the Funds’ portion of the interest income earned on cash collateral are included on the Statements of Operations as securities lending income, if applicable.
(c) Interfund Lending In accordance with an exemptive order (the “Order”) from the SEC, the Funds of the Trust may participate in a joint
lending and borrowing facility for temporary purposes (the “Interfund Lending Program”), subject to compliance with the terms and conditions of the Order, and to the extent permitted by each Fund’s investment policies and restrictions. The Funds are currently permitted to borrow under the Interfund Lending Program. A lending fund may lend in aggregate up to 15% of its current net assets at the time of the interfund loan, but may not lend more than 5% of its net assets to any one borrowing fund through the Interfund Lending Program. A borrowing fund may not borrow through the Interfund Lending Program or from any other source if its total outstanding borrowings immediately after the borrowing would be more than 33 1/3% of its total assets (or any lower threshold provided for by the fund’s investment restrictions). If a borrowing fund’s total outstanding borrowings exceed 10% of its total assets, each of its outstanding interfund loans will be subject to collateralization of at least 102% of the outstanding principal value of the loan. All interfund loans are for temporary or emergency purposes and the interfund loan rate to be charged will be the average of the highest current overnight repurchase agreement rate available to a lending fund and the bank loan rate, as calculated according to a formula established by the Board.
During the period ended June 30, 2022, the Funds did not participate in the Interfund Lending Program.
6. FINANCIAL DERIVATIVE INSTRUMENTS
The Funds may enter into the financial derivative instruments described below to the extent permitted by each Fund’s respective investment policies.
The following disclosures contain information on how and why the Funds use financial derivative instruments, and how financial derivative instruments affect the Funds’ financial position, results of operations and cash flows. The location and fair value amounts of these instruments on the Statements of Assets and Liabilities and the net realized gain (loss) and net change in unrealized appreciation (depreciation) on the Statements of Operations, each categorized by type of financial derivative contract and related risk exposure, are included in a table in the Notes to Schedules of Investments. The financial derivative instruments outstanding as of period end and the amounts of net realized gain (loss) and net change in unrealized appreciation (depreciation) on financial derivative instruments during the period, as disclosed in the Notes to Schedules of Investments, serve as indicators of the volume of financial derivative activity for the Funds.
Forward Foreign Currency Contracts may be engaged, in connection with settling planned purchases or sales of securities, to hedge the currency exposure associated with some or all of a Fund’s securities or as part of an investment strategy. A forward foreign currency contract
is an agreement between two parties to buy and sell a currency at a set price on a future date. The market value of a forward foreign currency contract fluctuates with changes in foreign currency exchange rates. Forward foreign currency contracts are marked to market daily, and the change in value is recorded by a Fund as an unrealized gain (loss). Realized gains (losses) are equal to the difference between the value of the contract at the time it was opened and the value at the time it was closed and are
recorded upon delivery or receipt of the currency. These contracts may involve market risk in excess of the unrealized gain (loss) reflected on the Statements of Assets and Liabilities. In addition, a Fund could be exposed to risk if the counterparties are unable to meet the terms of the contracts or if the value of the currency changes unfavorably to the U.S. dollar. To mitigate such risk, cash or securities may be exchanged as collateral pursuant to the terms of the underlying contracts.
7. PRINCIPAL AND OTHER RISKS
(a) Principal Risks
The principal risks of investing in a Fund, which could adversely affect its net asset value, yield and total return, are listed below.
| | | | | | | | | | | | |
| Risks | | | | | PIMCO RAFI Dynamic
Multi-Factor Emerging Markets
Equity ETF | | PIMCO RAFI Dynamic Multi-Factor
International
Equity ETF | | PIMCO RAFI Dynamic Multi-Factor
U.S. Equity ETF | | PIMCO RAFI ESG U.S. ETF |
| | | | | |
Small Fund | | | | | | — | | X | | X | | X |
| | | | | |
Market Trading | | | | | | X | | X | | X | | X |
| | | | | |
Equity | | | | | | X | | X | | X | | X |
| | | | | |
Credit | | | | | | X | | X | | X | | X |
| | | | | |
Market | | | | | | X | | X | | X | | X |
| | | | | |
Liquidity | | | | | | X | | X | | X | | X |
| | | | | |
Issuer | | | | | | X | | X | | X | | X |
| | | | | |
Derivatives | | | | | | X | | X | | X | | X |
| | | | | |
Foreign (Non-U.S.) Investment | | | | | | X | | X | | — | | — |
| | | | | |
Emerging Markets | | | | | | X | | — | | — | | — |
| | | | | |
Currency | | | | | | X | | X | | — | | — |
| | | | | |
Model | | | | | | X | | X | | X | | X |
| | | | | |
Leveraging | | | | | | X | | X | | X | | X |
| | | | | |
Management and Tracking Error | | | | | | X | | X | | X | | X |
| | | | | |
Indexing | | | | | | X | | X | | X | | X |
| | | | | |
Environmental, Social and Governance Investing | | | | | | — | | — | | — | | X |
Please see “Description of Principal Risks” in a Fund’s prospectus for a more detailed description of the risks of investing in a Fund.
Small Fund Risk is the risk that a smaller Fund may not achieve investment or trading efficiencies. Additionally, a smaller Fund may be more adversely affected by large purchases or redemptions of Fund shares.
Market Trading Risk is the risk that an active secondary trading market for Fund shares does not continue once developed, that a Fund may not continue to meet a listing exchange’s trading or listing requirements, or that Fund shares trade at prices other than a Fund’s net asset value particularly during times of market stress.
Equity Risk is the risk that the value of equity securities, such as common stocks and preferred securities, may decline due to general market conditions which are not specifically related to a particular company or to factors affecting a particular industry or industries. Equity securities generally have greater price volatility than fixed income securities.
Credit Risk is the risk that a Fund could lose money if the counterparty to a derivative contract is unable or unwilling, or is perceived (whether
by market participants, rating agencies, pricing services or otherwise) as unable or unwilling, to meet its financial obligations.
Market Risk is the risk that the value of securities owned by a Fund may go up or down, sometimes rapidly or unpredictably, due to factors affecting securities markets generally or particular industries.
Liquidity Risk is the risk that a particular investment may be difficult to purchase or sell and that a Fund may be unable to sell illiquid investments at an advantageous time or price or achieve its desired level of exposure to a certain sector. The liquidity of a Fund’s shares may be constrained by the liquidity of a Fund’s portfolio holdings.
Issuer Risk is the risk that the value of a security may decline for a reason directly related to the issuer, such as management performance, financial leverage and reduced demand for the issuer’s goods or services.
Derivatives Risk is the risk of investing in derivative instruments (such as futures, swaps and structured securities), including leverage, liquidity, interest rate, market, credit and management risks, and valuation complexity. Changes in the value of a derivative may not
| | | | | | | | | | | | |
| | | | ANNUAL REPORT | | | | | | | JUNE 30, 2022 | | | 63 |
| | | | |
| Notes to Financial Statements | | (Cont.) | | |
correlate perfectly with, and may be more sensitive to market events than, the underlying asset, rate or index, and a Fund could lose more than the initial amount invested. A Fund’s use of derivatives may result in losses to a Fund, a reduction in a Fund’s returns and/or increased volatility. Over-the-counter (“OTC”) derivatives are also subject to the risk that a counterparty to the transaction will not fulfill its contractual obligations to the other party, as many of the protections afforded to centrally-cleared derivative transactions might not be available for OTC derivatives. The primary credit risk on derivatives that are exchange-traded or traded through a central clearing counterparty resides with a Fund’s clearing broker, or the clearinghouse. Changes in regulation relating to a fund’s use of derivatives and related instruments could potentially limit or impact the Fund’s ability to invest in derivatives, limit a Fund’s ability to employ certain strategies that use derivatives and/ or adversely affect the value of derivatives and a Fund’s performance.
Foreign (Non-U.S.) Investment Risk is the risk that investing in foreign (non-U.S.) securities may result in a Fund experiencing more rapid and extreme changes in value than a fund that invests exclusively in securities of U.S. companies, due to smaller markets, differing reporting, accounting and auditing standards, increased risk of delayed settlement of portfolio transactions or loss of certificates of portfolio securities, and the risk of unfavorable foreign government actions, including nationalization, expropriation or confiscatory taxation, currency blockage, or political changes or diplomatic developments. Foreign securities may also be less liquid and more difficult to value than securities of U.S. issuers.
Emerging Markets Risk is the risk of investing in emerging market securities, primarily increased foreign (non-U.S.) investment risk.
Currency Risk is the risk that foreign (non-U.S.) currencies will change in value relative to the U.S. dollar and affect a Fund’s investments in foreign (non-U.S.) currencies or in securities that trade in, and receive revenues in, or in derivatives that provide exposure to, foreign (non-U.S.) currencies.
Model Risk is the risk that a Fund’s investment models used in making investment allocation decisions, including the indexation methodologies used in constructing the Underlying Index, may not adequately take into account certain factors, may contain design flaws or faulty assumptions, and may rely on incomplete or inaccurate data, any of which may result in a decline in the value of an investment in a Fund.
Leveraging Risk is the risk that certain transactions of a Fund, such as reverse repurchase agreements, loans of portfolio securities, and the use of when-issued, delayed delivery or forward commitment transactions, or derivative instruments, may give rise to leverage, magnifying gains and losses and causing a Fund to be
more volatile than if it had not been leveraged. This means that leverage entails a heightened risk of loss.
Management and Tracking Error Risk is the risk that the portfolio manager’s investment decisions may not produce the desired results or that a Fund’s portfolio may not closely track the Underlying Index for a number of reasons. A Fund incurs operating expenses, which are not applicable to the Underlying Index, and the costs of buying and selling securities, especially when rebalancing a Fund’s portfolio to reflect changes in the composition of the Underlying Index. Performance of a Fund and the Underlying Index may vary due to asset valuation differences and differences between a Fund’s portfolio and the Underlying Index due to legal restrictions, cost or liquidity restraints. The risk that performance of a Fund and the Underlying Index may vary may be heightened during periods of increased market volatility or other unusual market conditions. In addition, a Fund’s use of a representative sampling approach may cause a Fund to be less correlated to the return of the Underlying Index than if a Fund held all of the securities in the Underlying Index.
Indexing Risk is the risk that a Fund is negatively affected by general declines in the asset classes represented by the Underlying Index.
Environmental, Social and Governance Investing Risk is the risk that, because the Underlying Index may select or exclude securities of certain issuers for reasons other than performance, a Fund’s performance will differ from funds that do not utilize an ESG investing strategy. ESG investing is qualitative and subjective by nature, and there is no guarantee that the factors utilized by the Index Provider or any judgment exercised by the Index Provider in constructing the Underlying Index will reflect the opinions of any particular investor.
(b) Other Risks
In general, a Fund may be subject to additional risks, including, but not limited to, risks related to government regulation and intervention in financial markets, operational risks, risks associated with financial, economic and global market disruptions, and cybersecurity risks. Please see a Fund’s prospectus and Statement of Additional Information for a more detailed description of the risks of investing in a Fund. Please see the Important Information section of this report for additional discussion of certain regulatory and market developments that may impact a Fund’s performance.
Market Disruption Risk The Fund is subject to investment and operational risks associated with financial, economic and other global market developments and disruptions, including those arising from war, terrorism, market manipulation, government interventions, defaults and shutdowns, political changes or diplomatic developments, public health emergencies (such as the spread of infectious diseases, pandemics and epidemics) and natural/environmental disasters, which
can all negatively impact the securities markets and cause the Fund to lose value. These events can also impair the technology and other operational systems upon which the Fund’s service providers, including PIMCO as the Fund’s investment adviser, rely, and could otherwise disrupt the Fund’s service providers’ ability to fulfill their obligations to the Fund. For example, the recent spread of an infectious respiratory illness caused by a novel strain of coronavirus (known as COVID-19) has caused volatility, severe market dislocations and liquidity constraints in many markets, including markets for the securities the Fund holds, and may adversely affect the Fund’s investments and operations. Additionally, to the extent the Fund invests in securities and instruments economically tied to Russia, the recent Russian invasion of Ukraine may adversely affect the Fund’s investments. Please see the Important Information section for additional discussion of the COVID-19 pandemic as well as the Russian invasion of Ukraine.
Government Intervention in Financial Markets Federal, state, and other governments, their regulatory agencies, or self-regulatory organizations may take actions that affect the regulation of the instruments in which a Fund invests, or the issuers of such instruments, in ways that are unforeseeable. Legislation or regulation may also change the way in which a Fund itself is regulated. Such legislation or regulation could limit or preclude a Fund’s ability to achieve its investment objective. Furthermore, volatile financial markets can expose a Fund to greater market and liquidity risk and potential difficulty in valuing portfolio instruments held by the Fund. The value of a Fund’s holdings is also generally subject to the risk of future local, national, or global economic disturbances based on unknown weaknesses in the markets in which a Fund invests. In addition, it is not certain that the U.S. Government will intervene in response to a future market disturbance and the effect of any such future intervention cannot be predicted. It is difficult for issuers to prepare for the impact of future financial downturns, although companies can seek to identify and manage future uncertainties through risk management programs.
Regulatory Risk Financial entities, such as investment companies and investment advisers, are generally subject to extensive government regulation and intervention. Government regulation and/or intervention may change the way a Fund is regulated, affect the expenses incurred directly by a Fund and the value of its investments, and limit and/or preclude a Fund’s ability to achieve its investment objective. Government regulation may change frequently and may have significant adverse consequences. Moreover, government regulation may have unpredictable and unintended effects.
Operational Risk An investment in a Fund, like any fund, can involve operational risks arising from factors such as processing errors, human errors, inadequate or failed internal or external processes, failures in systems and technology, changes in personnel and errors caused by third-party service providers. The occurrence of any of these failures,
errors or breaches could result in a loss of information, regulatory scrutiny, reputational damage or other events, any of which could have a material adverse effect on a Fund. While a Fund seeks to minimize such events through controls and oversight, there may still be failures that could cause losses to the Fund.
Cyber Security Risk As the use of technology has become more prevalent in the course of business, the Funds have become potentially more susceptible to operational and information security risks resulting from breaches in cyber security. A breach in cyber security refers to both intentional and unintentional cyber events that may, among other things, cause a Fund to lose proprietary information, suffer data corruption and/or destruction or lose operational capacity, result in the unauthorized release or other misuse of confidential information, or otherwise disrupt normal business operations. Cyber security failures or breaches may result in financial losses to a Fund and its shareholders. These failures or breaches may also result in disruptions to business operations, potentially resulting in financial losses; interference with a Fund’s ability to calculate its net asset value, process shareholder transactions or otherwise transact business with shareholders; impediments to trading; violations of applicable privacy and other laws; regulatory fines; penalties; reputational damage; reimbursement or other compensation costs; additional compliance and cyber security risk management costs and other adverse consequences. In addition, substantial costs may be incurred in order to prevent any cyber incidents in the future.
8. MASTER NETTING ARRANGEMENTS
A Fund may be subject to various netting arrangements (“Master Agreements”) with select counterparties. Master Agreements govern the terms of certain transactions, and are intended to reduce the counterparty risk associated with relevant transactions by specifying credit protection mechanisms and providing standardization that is intended to improve legal certainty. Each type of Master Agreement governs certain types of transactions. Different types of transactions may be traded out of different legal entities or affiliates of a particular organization, resulting in the need for multiple agreements with a single counterparty. As the Master Agreements are specific to unique operations of different asset types, they allow a Fund to close out and net its total exposure to a counterparty in the event of a default with respect to all the transactions governed under a single Master Agreement with a counterparty. For financial reporting purposes the Statements of Assets and Liabilities generally present derivative assets and liabilities on a gross basis, which reflects the full risks and exposures prior to netting.
Master Agreements can also help limit counterparty risk by specifying collateral posting arrangements at pre-arranged exposure levels. Under most Master Agreements, collateral is routinely transferred if the total net exposure to certain transactions (net of existing collateral already in
| | | | | | | | | | | | |
| | | | ANNUAL REPORT | | | | | | | JUNE 30, 2022 | | | 65 |
| | | | |
| Notes to Financial Statements | | (Cont.) | | |
place) governed under the relevant Master Agreement with a counterparty in a given account exceeds a specified threshold, which typically ranges from zero to $250,000 depending on the counterparty and the type of Master Agreement. United States Treasury Bills and U.S. dollar cash are generally the preferred forms of collateral, although other securities may be used depending on the terms outlined in the applicable Master Agreement. Securities and cash pledged as collateral are reflected as assets on the Statements of Assets and Liabilities as either a component of Investments at value (securities) or Deposits with counterparty. Cash collateral received is not typically held in a segregated account and as such is reflected as a liability on the Statements of Assets and Liabilities as Deposits from counterparty. The market value of any securities received as collateral is not reflected as a component of NAV. A Fund’s overall exposure to counterparty risk can change substantially within a short period, as it is affected by each transaction subject to the relevant Master Agreement.
Master Repurchase Agreements and Global Master Repurchase Agreements (individually and collectively “Master Repo Agreements”) govern repurchase, reverse repurchase, and certain sale-buyback transactions between a Fund and select counterparties. Master Repo Agreements maintain provisions for, among other things, initiation, income payments, events of default, and maintenance of collateral. The market value of transactions under the Master Repo Agreement, collateral pledged or received, and the net exposure by counterparty as of period end are disclosed in the Notes to Schedules of Investments.
Master Securities Forward Transaction Agreements (“Master Forward Agreements”) govern certain forward settling transactions, such as TBA securities, delayed-delivery or certain sale-buyback transactions by and between a Fund and select counterparties. The Master Forward Agreements maintain provisions for, among other things, transaction initiation and confirmation, payment and transfer, events of default, termination, and maintenance of collateral. The market value of forward settling transactions, collateral pledged or received, and the net exposure by counterparty as of period end is disclosed in the Notes to Schedules of Investments.
Customer Account Agreements and related addenda govern cleared derivatives transactions such as futures, options on futures, and cleared OTC derivatives. Such transactions require posting of initial margin as determined by each relevant clearing agency which is segregated in an account at a futures commission merchant (“FCM”) registered with the Commodity Futures Trading Commission. In the United States, counterparty risk may be reduced as creditors of an FCM cannot have a claim to Fund assets in the segregated account. Portability of exposure reduces risk to the Funds. Variation margin, which reflects changes in market value, is generally exchanged daily, but may not be netted between futures and cleared OTC derivatives unless the parties have agreed to a separate
arrangement in respect of portfolio margining. The market value or accumulated unrealized appreciation (depreciation), initial margin posted, and any unsettled variation margin as of period end are disclosed in the Notes to Schedules of Investments.
International Swaps and Derivatives Association, Inc. Master Agreements and Credit Support Annexes (“ISDA Master Agreements”) govern bilateral OTC derivative transactions entered into by a Fund with select counterparties. ISDA Master Agreements maintain provisions for general obligations, representations, agreements, collateral posting and events of default or termination. Events of termination include conditions that may entitle counterparties to elect to terminate early and cause settlement of all outstanding transactions under the applicable ISDA Master Agreement. Any election to terminate early could be material to the financial statements. The ISDA Master Agreement may contain additional provisions that add counterparty protection beyond coverage of existing daily exposure if the counterparty has a decline in credit quality below a predefined level or as required by regulation. Similarly, if required by regulation, the Funds may be required to post additional collateral beyond coverage of daily exposure. These amounts, if any, may (or if required by law, will) be segregated with a third-party custodian. To the extent the Funds are required by regulation to post additional collateral beyond coverage of daily exposure, they could potentially incur costs, including in procuring eligible assets to meet collateral requirements, associated with such posting. The market value of OTC financial derivative instruments, collateral received or pledged, and net exposure by counterparty as of period end are disclosed in the Notes to Schedules of Investments.
9. FEES AND EXPENSES
(a) Management Fee PIMCO, a majority-owned subsidiary of Allianz Asset Management of America L.P. (“Allianz Asset Management”), serves as the Manager to the Trust, pursuant to an investment management agreement. Each Fund pays PIMCO fees in return for providing investment advisory, supervisory and administrative services under an all-in fee structure. Each Fund will pay monthly management fees to PIMCO at an annual rate based on average daily net assets (the “Management Fee”), at an annual rate as noted in the table below.
| | | | | | | | |
| Fund Name | | | | | Management Fee | |
| | |
PIMCO RAFI Dynamic Multi-Factor Emerging Markets Equity ETF | | | | | | | 0.49% | |
| | |
PIMCO RAFI Dynamic Multi-Factor International Equity ETF | | | | | | | 0.39% | |
| | |
PIMCO RAFI Dynamic Multi-Factor U.S. Equity ETF | | | | | | | 0.29% | |
| | |
PIMCO RAFI ESG U.S. ETF | | | | | | | 0.29% | |
(b) Distribution and Servicing Fees PIMCO Investments LLC, a wholly-owned subsidiary of PIMCO, serves as the distributor (“Distributor”) of each Fund’s Creation Units. The Distributor does not maintain a
secondary market in shares of the Funds. During the period ended June 30, 2022 each Fund was permitted to compensate the Distributor at an annual rate of up to 0.25% of a Fund’s average daily net assets (the “12b-1 Plan Fee”). However, the Board of Trustees has determined not to authorize payment of a 12b-1 Plan Fee at this time. The 12b-1 Plan Fee may only be imposed or increased when the Board determines that it is in the best interests of shareholders to do so. Because these fees are paid out of a Fund’s assets on an ongoing basis, to the extent that a fee is authorized, over time it will increase the cost of an investment in the Fund. The 12b-1 Plan Fee may cost an investor more than other types of sales charges.
(c) Fund Expenses PIMCO provides or procures supervisory and administrative services for shareholders and also bears the costs of various third-party services required by the Funds, including audit, custodial, portfolio accounting, legal, transfer agency and printing costs. The Funds bear other expenses which are not covered under the Management Fee which may vary and affect the total level of expenses paid by shareholders, such as (i) salaries and other compensation of any of the Trust’s executive officers and employees who are not officers, directors, stockholders, or employees of PIMCO or its subsidiaries or affiliates; (ii) taxes and governmental fees; (iii) brokerage fees and commissions and other portfolio transaction expenses; (iv) costs of borrowing money, including interest expenses;
(v) securities lending fees and expenses; (vi) fees and expenses of the Trustees who are not “interested persons” of PIMCO or the Trust, and any counsel retained exclusively for their benefit; (vii) extraordinary expenses, including costs of litigation and indemnification expenses; and (viii) organizational expenses. The ratio of expenses to average net assets, as disclosed on the Financial Highlights, may differ from the annual fund operating expenses as disclosed in the prospectus.
The Trust pays no compensation directly to any Trustee or any other officer who is affiliated with the Manager, all of whom receive remuneration for their services to the Trust from the Manager or its affiliates.
(d) Expense Limitation Pursuant to the Expense Limitation Agreement, PIMCO has agreed, through October 31, 2022, to waive a portion of the Funds’ Management Fee, or reimburse each Fund, to the extent that each Fund’s organizational expenses, pro rata share of expenses related to obtaining or maintaining a Legal Entity Identifier and pro rata share of Trustee Fees exceed 0.0049%, the “Expense Limit” (calculated as a percentage of the Fund’s average daily net assets). The Expense Limitation Agreement will automatically renew for one-year terms unless PIMCO provides written notice to the Trust at least 30 days prior to the end of the then current term. The waiver, if any, is reflected on the Statements of Operations as a component of Waiver and/or Reimbursement by PIMCO.
In any month in which the investment management agreement is in effect, PIMCO is entitled to reimbursement by each Fund of any portion of the Management Fee and/or other expenses waived or reimbursed as set forth above (the “Reimbursement Amount”) within thirty-six months of the time of the waiver, provided that such amount paid to PIMCO will not: i) together with any organizational expenses, pro rata share of expenses related to obtaining or maintaining a Legal Entity Identifier and pro rata Trustee fees, exceed, for such month, the Expense Limit (or the amount of the expense limit in place at the time the amount being recouped was originally waived if lower than the Expense Limit); ii) exceed the total Reimbursement Amount; or iii) include any amounts previously reimbursed to PIMCO. The total recoverable amounts to PIMCO at June 30, 2022, were as follows (amounts in thousands†):
| | | | | | | | | | | | | | | | | | | | |
| | | | Expiring within | | | | |
| | | | | |
| Fund Name | | | | | 12 months | | | 13-24 months | | | 25-36 months | | | Total | |
| | | | | |
PIMCO RAFI Dynamic Multi-Factor Emerging Markets Equity ETF | | | | | | $ | 34 | | | $ | 46 | | | $ | 20 | | | $ | 100 | |
| | | | | |
PIMCO RAFI Dynamic Multi-Factor International Equity ETF | | | | | | | 1 | | | | 3 | | | | 6 | | | | 10 | |
| | | | | |
PIMCO RAFI Dynamic Multi-Factor U.S. Equity ETF | | | | | | | 8 | | | | 3 | | | | 6 | | | | 17 | |
| | | | | |
PIMCO RAFI ESG U.S. ETF | | | | | | | 76 | | | | 0 | | | | 2 | | | | 78 | |
| † | A zero balance may reflect actual amounts rounding to less than one thousand. |
10. RELATED PARTY TRANSACTIONS
The Manager and Distributor are related parties. Fees paid to these parties are disclosed in Note 9, Fees and Expenses, and the accrued related party fee amounts are disclosed on the Statements of Assets and Liabilities.
11. GUARANTEES AND INDEMNIFICATIONS
Under the Trust’s organizational documents, each Trustee or officer of the Trust is indemnified and each employee or other agent of the Trust
(including the Trust’s investment manager) may be indemnified, to the extent permitted by the Act, against certain liabilities that may arise out of performance of their duties to the Funds. Additionally, in the normal course of business, the Funds enter into contracts that contain a variety of indemnification clauses. The Funds’ maximum exposure under these arrangements is unknown as this would involve future claims that may be made against the Funds that have not yet occurred. However, the Funds have not had prior claims or losses pursuant to these contracts.
| | | | | | | | | | | | |
| | | | ANNUAL REPORT | | | | | | | JUNE 30, 2022 | | | 67 |
| | | | |
| Notes to Financial Statements | | (Cont.) | | |
12. PURCHASES AND SALES OF SECURITIES
The length of time a Fund has held a particular security is not generally a consideration in investment decisions. A change in the securities held by a Fund is known as “portfolio turnover.” Each Fund may engage in frequent and active trading of portfolio securities to achieve its investment objective, particularly during periods of volatile market movements. High portfolio turnover may involve correspondingly greater transaction costs, including brokerage commissions or dealer mark-ups and other transaction costs on the sale of securities and reinvestments in other securities, which are borne by the Fund. Such sales may also result in realization of taxable capital gains, including short-term capital gains (which are generally taxed at ordinary income tax rates when distributed to shareholders). The transaction costs associated with portfolio turnover may adversely affect a Fund’s performance. The portfolio turnover rates are reported in the Financial Highlights.
Purchases and sales of securities (excluding short-term investments) for the period ended June 30, 2022, were as follows (amounts in thousands†):
| | | | | | | | | | | | | | | | | | | | |
| | | | U.S. Government/Agency | | | All Other | |
| | | | |
| Fund Name | | | Purchases | | | Sales | | | Purchases | | | Sales | |
| | | | | |
PIMCO RAFI Dynamic Multi-Factor Emerging Markets Equity ETF | | | | | | $ | 0 | | | $ | 0 | | | $ | 99,308 | | | $ | 331,546 | |
| | | | | |
PIMCO RAFI Dynamic Multi-Factor International Equity ETF | | | | | | | 0 | | | | 0 | | | | 36,300 | | | | 36,369 | |
| | | | | |
PIMCO RAFI Dynamic Multi-Factor U.S. Equity ETF | | | | | | | 0 | | | | 0 | | | | 37,960 | | | | 37,553 | |
| | | | | |
PIMCO RAFI ESG U.S. ETF | | | | | | | 0 | | | | 0 | | | | 6,771 | | | | 7,708 | |
| † | A zero balance may reflect actual amounts rounding to less than one thousand. |
13. CAPITAL SHARE TRANSACTIONS
Capital shares are issued and redeemed by a Fund only in Creation Units. Except when aggregated in Creation Units, shares of a Fund are not redeemable. Transactions in capital shares for a Fund are disclosed in detail on the Statements of Changes in Net Assets.
The consideration for the purchase of Creation Units of a Fund generally consists of a basket of cash and/or securities that a Fund specifies each business day. Authorized Participants may be charged transaction fees as set forth below. To offset transfer and other transaction costs associated with the issuance and redemption of Creation Units, Authorized Participants are subject to standard creation and redemption transaction fees payable directly to State Street Bank and Trust Company, the sub-administrator of the Funds. PIMCO may, from time to time, at its own expense, compensate purchasers of Creation Units who have purchased substantial amounts of Creation Units and other financial institutions for administrative or marketing services. Creations and redemptions for cash (when cash creations and redemptions are available or specified) may be subject to an additional variable charge up to the maximum amount shown in the table below.
| | | | | | | | | | | | | | | | |
| Fund Name | | | | | Standard Creation/
Redemption
Transaction Fee* | | | Maximum
Variable Charge for
Cash Creations** | | | Maximum Variable Charge for
Cash Redemptions** | |
| | | | |
PIMCO RAFI Dynamic Multi-Factor Emerging Markets Equity ETF | | | | | | $ | 2,250 | | | | 3.00% | | | | 2.00% | |
| | | | |
PIMCO RAFI Dynamic Multi-Factor International Equity ETF | | | | | | $ | 5,000 | | | | 3.00% | | | | 2.00% | |
| | | | |
PIMCO RAFI Dynamic Multi-Factor U.S. Equity ETF | | | | | | $ | 2,250 | | | | 3.00% | | | | 2.00% | |
| | | | |
PIMCO RAFI ESG U.S. ETF | | | | | | $ | 500 | | | | 3.00% | | | | 2.00% | |
| * | Applicable to in-kind contributions or redemptions only. |
| ** | As a percentage of the net asset value per Creation Unit purchased or redeemed, inclusive of the standard creation transaction fee (if imposed). |
14. INVESTMENT TRANSACTIONS
For the period ended June 30, 2022, certain Funds had in-kind contributions and in-kind redemptions as follows (amounts in thousands†):
| | | | | | | | | | | | |
| Fund Name | | | | | Contributions | | | Redemptions | |
| | | |
PIMCO RAFI Dynamic Multi-Factor Emerging Markets Equity ETF | | | | | | $ | 5,158 | | | $ | 139,411 | |
| | | |
PIMCO RAFI Dynamic Multi-Factor International Equity ETF | | | | | | | 35,541 | | | | 23,543 | |
| | | |
PIMCO RAFI Dynamic Multi-Factor U.S. Equity ETF | | | | | | | 30,989 | | | | 11,664 | |
| | | |
PIMCO RAFI ESG U.S. ETF | | | | | | | 17,338 | | | | 4,676 | |
| † | A zero balance may reflect actual amounts rounding to less than one thousand. |
The in-kind contributions and in-kind redemptions in this table may not agree with the Fund Share Transactions on the Statements of Changes in Net Assets. The table represents the accumulation of each Fund’s daily net shareholder transactions which were executed in kind while the Statements of Changes in Net Assets reflect gross shareholder transactions including any cash component of the transactions.
15. REGULATORY AND LITIGATION MATTERS
The Funds are not named as defendants in any material litigation or arbitration proceedings and are not aware of any material litigation or claim pending or threatened against them.
On May 17, 2022, Allianz Global Investors U.S. LLC (“AGI U.S.”) pleaded guilty in connection with the proceeding United States of America v. Allianz Global Investors U.S. LLC. AGI U.S. is an indirect subsidiary of Allianz SE. The conduct resulting in the matter described above occurred entirely within AGI U.S. and did not involve PIMCO or the Distributor, or any personnel of PIMCO or the Distributor. Nevertheless, because of the disqualifying conduct of AGI U.S., their affiliate, PIMCO would have been disqualified from serving as the investment adviser, and the Distributor would have been disqualified from serving as the principal underwriter, to the Funds in the absence of SEC exemptive relief. PIMCO and the Distributor have received exemptive relief from the SEC to permit them to continue serving as investment adviser and principal underwriter for U.S.-registered investment companies, including the Funds.
The foregoing speaks only as of the date of this report.
16. FEDERAL INCOME TAX MATTERS
Each Fund intends to qualify as a regulated investment company under Subchapter M of the Internal Revenue Code (the “Code”) and distribute all of its taxable income and net realized gains, if applicable, to shareholders. Accordingly, no provision for Federal income taxes has been made.
A Fund may be subject to local withholding taxes, including those imposed on realized capital gains. Any applicable foreign capital gains tax is accrued daily based upon net unrealized gains, and may be payable following the sale of any applicable investments.
In accordance with U.S. GAAP, the Manager has reviewed the Funds’ tax positions for all open tax years. As of June 30, 2022, the Funds have recorded no liability for net unrecognized tax benefits relating to uncertain income tax positions they have taken or expect to take in future tax returns.
The Funds file U.S. federal, state, and local tax returns as required. The Funds’ tax returns are subject to examination by relevant tax authorities until expiration of the applicable statute of limitations, which is generally three years after the filing of the tax return but which can be extended to six years in certain circumstances. Tax returns for open years have incorporated no uncertain tax positions that require a provision for income taxes.
As of June 30, 2022, the components of distributable taxable earnings are as follows (amounts in thousands†):
| | | | | | | | | | | | | | | | | | | | | | | | | | | | | | | | | | | | |
| | | | | | Undistributed
Ordinary
Income(1) | | | Undistributed
Long-Term
Capital Gains | | | Net Tax Basis
Unrealized
Appreciation/
(Depreciation)(2) | | | Other Book-to-Tax
Accounting
Differences(3) | | | Accumulated
Capital
Losses(4) | | | Qualified
Late-Year
Loss
Deferral -
Capital(5) | | | Qualified
Late-Year
Loss Deferral -
Ordinary(6) | | | Total
Components of
Distributable
Earnings | |
| | | | | | | | | |
PIMCO RAFI Dynamic Multi-Factor Emerging Markets Equity ETF | | | | | | $ | 1,044 | | | $ | 2,431 | | | $ | (7,505 | ) | | $ | 0 | | | $ | 0 | | | $ | 0 | | | $ | 0 | | | $ | (4,030 | ) |
| | | | | | | | | |
PIMCO RAFI Dynamic Multi-Factor International Equity ETF | | | | | | | 1,126 | | | | 0 | | | | (1,685 | ) | | | 0 | | | | (13,290 | ) | | | 0 | | | | 0 | | | | (13,849 | ) |
| | | | | | | | | |
PIMCO RAFI Dynamic Multi-Factor U.S. Equity ETF | | | | | | | 432 | | | | 0 | | | | 4,011 | | | | 0 | | | | (17,086 | ) | | | 0 | | | | 0 | | | | (12,643 | ) |
| | | | | | | | | |
PIMCO RAFI ESG U.S. ETF | | | | | | | 149 | | | | 0 | | | | (2,437 | ) | | | 0 | | | | (1,163 | ) | | | 0 | | | | 0 | | | | (3,451 | ) |
| † | A zero balance may reflect actual amounts rounding to less than one thousand. |
| (1) | Includes undistributed short-term capital gains, if any. |
| (2) | Adjusted for open wash sale loss deferrals. Also adjusted for differences between book and tax realized and unrealized gain (loss) on: passive foreign investment companies (PFICs), return of capital from Real Estate Investment Trusts (REITs), and partnerships. |
| (3) | Represents differences in income tax regulations and financial accounting principles generally accepted in the United States of America. |
| (4) | Capital losses available to offset future net capital gains as shown below. |
| (5) | Capital losses realized during the period November 1, 2021 through June 30, 2022 which the Funds elected to defer to the following taxable year pursuant to income tax regulations. |
| (6) | Specified losses realized during the period November 1, 2021 through June 30, 2022 and Ordinary losses realized during the period January 1, 2022 through June 30, 2022 which the Funds elected to defer to the following taxable year pursuant to income tax regulations. |
Under the Regulated Investment Company Modernization Act of 2010, a fund is permitted to carry forward any new capital losses for an unlimited period. Additionally, such capital losses that are carried forward will retain their character as either short-term or long-term capital losses rather than being considered all short-term under previous law.
| | | | | | | | | | | | |
| | | | ANNUAL REPORT | | | | | | | JUNE 30, 2022 | | | 69 |
| | | | |
| Notes to Financial Statements | | (Cont.) | | June 30, 2022 |
As of June 30, 2022, the Funds had the following post-effective capital losses with no expiration (amounts in thousands†):
| | | | | | | | | | | | |
| | | | | | Short-Term | | | Long-Term | |
| | | |
PIMCO RAFI Dynamic Multi-Factor Emerging Markets Equity ETF | | | | | | $ | 0 | | | $ | 0 | |
| | | |
PIMCO RAFI Dynamic Multi-Factor International Equity ETF | | | | | | | 9,112 | | | | 4,178 | |
| | | |
PIMCO RAFI Dynamic Multi-Factor U.S. Equity ETF | | | | | | | 12,871 | | | | 4,215 | |
| | | |
PIMCO RAFI ESG U.S. ETF | | | | | | | 1,048 | | | | 115 | |
| † | A zero balance may reflect actual amounts rounding to less than one thousand. |
As of June 30, 2022, the aggregate cost and the net unrealized appreciation/(depreciation) of investments for federal income tax purposes are as follows (amounts in thousands†):
| | | | | | | | | | | | | | | | | | | | |
| | | | | | Federal Tax Cost | | | Unrealized Appreciation | | | Unrealized (Depreciation) | | | Net Unrealized
Appreciation/
(Depreciation)(7) | |
| | | | | |
PIMCO RAFI Dynamic Multi-Factor Emerging Markets Equity ETF | | | | | | $ | 82,271 | | | $ | 9,164 | | | $ | (16,702 | ) | | $ | (7,538 | ) |
| | | | | |
PIMCO RAFI Dynamic Multi-Factor International Equity ETF | | | | | | | 87,545 | | | | 5,392 | | | | (7,065 | ) | | | (1,673 | ) |
| | | | | |
PIMCO RAFI Dynamic Multi-Factor U.S. Equity ETF | | | | | | | 90,850 | | | | 9,002 | | | | (4,992 | ) | | | 4,010 | |
| | | | | |
PIMCO RAFI ESG U.S. ETF | | | | | | | 30,830 | | | | 1,072 | | | | (3,511 | ) | | | (2,439 | ) |
| † | A zero balance may reflect actual amounts rounding to less than one thousand. |
| (7) | Adjusted for open wash sale loss deferrals. Also adjusted for differences between book and tax realized and unrealized gain (loss) on: passive foreign investment companies (PFICs), return of capital from Real Estate Investment Trusts (REITs), and partnerships. |
For the fiscal years ended June 30, 2022 and June 30, 2021, respectively, the Funds made the following tax basis distributions (amounts in thousands†):
| | | | | | | | | | | | | | | | | | | | | | | | | | | | |
| | | | | | June 30, 2022 | | | June 30, 2021 | |
| | | | | | | |
| | | | | | Ordinary
Income
Distributions(8) | | | Long-Term
Capital Gain
Distributions | | | Return of
Capital(9) | | | Ordinary
Income
Distributions(8) | | | Long-Term
Capital Gain
Distributions | | | Return of
Capital(9) | |
| | | | | | | |
PIMCO RAFI Dynamic Multi-Factor Emerging Markets Equity ETF | | | | | | $ | 16,013 | | | $ | 19,600 | | | $ | 0 | | | $ | 12,004 | | | $ | 0 | | | $ | 0 | |
| | | | | | | |
PIMCO RAFI Dynamic Multi-Factor International Equity ETF | | | | | | | 2,872 | | | | 0 | | | | 0 | | | | 943 | | | | 0 | | | | 0 | |
| | | | | | | |
PIMCO RAFI Dynamic Multi-Factor U.S. Equity ETF | | | | | | | 1,311 | | | | 0 | | | | 0 | | | | 868 | | | | 0 | | | | 0 | |
| | | | | | | |
PIMCO RAFI ESG U.S. ETF | | | | | | | 411 | | | | 0 | | | | 0 | | | | 235 | | | | 0 | | | | 0 | |
| | | | | | | | | | | | | | | | | | | | | | | | | | | | |
| † | A zero balance may reflect actual amounts rounding to less than one thousand. |
| (8) | Includes short-term capital gains distributed, if any. |
| (9) | A portion of the distributions made represents a tax return of capital. Return of capital distributions have been reclassified from undistributed net investment income to paid-in capital to more appropriately conform financial accounting to tax accounting. |
17. SUBSEQUENT EVENTS
On August 12, 2022, PIMCO terminated the Sub-Advisory Agreement between PIMCO and Parametric with respect to PIMCO RAFI Dynamic Multi-Factor Emerging Markets Equity ETF, PIMCO RAFI Dynamic Multi- Factor International Equity ETF, PIMCO RAFI Dynamic Multi-Factor U.S. Equity ETF and PIMCO RAFI ESG U.S. ETF.
There were no other subsequent events identified that require recognition or disclosure.
| | | | |
| Report of Independent Registered Public Accounting Firm | | | | |
To the Board of Trustees of PIMCO Equity Series® and Shareholders of PIMCO RAFI Dynamic Multi-Factor Emerging Markets Equity ETF, PIMCO RAFI Dynamic Multi-Factor International Equity ETF, PIMCO RAFI Dynamic Multi-Factor U.S. Equity ETF and PIMCO RAFI ESG U.S. ETF
Opinions on the Financial Statements
We have audited the accompanying statements of assets and liabilities, including the schedules of investments, of PIMCO RAFI Dynamic Multi-Factor Emerging Markets Equity ETF, PIMCO RAFI Dynamic Multi-Factor International Equity ETF, PIMCO RAFI Dynamic Multi-Factor U.S. Equity ETF and PIMCO RAFI ESG U.S. ETF (four of the funds constituting PIMCO Equity Series®, hereafter collectively referred to as the “Funds”) as of June 30, 2022, the related statements of operations for the year ended June 30, 2022, the statements of changes in net assets for each of the two years in the period ended June 30, 2022, including the related notes, and the financial highlights for each of the periods indicated therein (collectively referred to as the “financial statements”). In our opinion, the financial statements present fairly, in all material respects, the financial position of each of the Funds as of June 30, 2022, the results of each of their operations for the year then ended, the changes in each of their net assets for each of the two years in the period ended June 30, 2022 and each of the financial highlights for each of the periods indicated therein in conformity with accounting principles generally accepted in the United States of America.
Basis for Opinions
These financial statements are the responsibility of the Funds’ management. Our responsibility is to express an opinion on the Funds’ financial statements based on our audits. We are a public accounting firm registered with the Public Company Accounting Oversight Board (United States) (PCAOB) and are required to be independent with respect to the Funds in accordance with the U.S. federal securities laws and the applicable rules and regulations of the Securities and Exchange Commission and the PCAOB.
We conducted our audits of these financial statements in accordance with the standards of the PCAOB. Those standards require that we plan and perform the audit to obtain reasonable assurance about whether the financial statements are free of material misstatement, whether due to error or fraud.
Our audits included performing procedures to assess the risks of material misstatement of the financial statements, whether due to error or fraud, and performing procedures that respond to those risks. Such procedures included examining, on a test basis, evidence regarding the amounts and disclosures in the financial statements. Our audits also included evaluating the accounting principles used and significant estimates made by management, as well as evaluating the overall presentation of the financial statements. Our procedures included confirmation of securities owned as of June 30, 2022 by correspondence with the custodian, transfer agent and brokers; when replies were not received from brokers, we performed other auditing procedures. We believe that our audits provide a reasonable basis for our opinions.
/s/ PricewaterhouseCoopers LLP
Kansas City, Missouri
August 26, 2022
We have served as the auditor of one or more investment companies in PIMCO Equity Series® since 2010.
| | | | | | | | | | | | |
| | | | ANNUAL REPORT | | | | | | | JUNE 30, 2022 | | | 71 |
| | | | | | |
| Glossary: | | (abbreviations that may be used in the preceding statements) | | | | (Unaudited) |
| | | | | | | | | | |
| | | | |
Counterparty Abbreviations: | | | | | | | | |
| | | | | |
| BCY | | Barclays Capital, Inc. | | FICC | | Fixed Income Clearing Corporation | | MBC | | HSBC Bank Plc |
| | | | | |
| BSN | | The Bank of Nova Scotia - Toronto | | GSC | | Goldman Sachs & Co. LLC | | UBS | | UBS Securities LLC |
| | | | |
Currency Abbreviations: | | | | | | | | |
| | | | | |
| USD (or $) | | United States Dollar | | | | | | | | |
| | | | |
Other Abbreviations: | | | | | | | | |
| | | | | |
| ADR | | American Depositary Receipt | | REIT | | Real Estate Investment Trust | | TBA | | To-Be-Announced |
| | | | | |
| JSC | | Joint Stock Company | | SP - ADR | | Sponsored American Depositary Receipt | | | | |
| | | | |
| Federal Income Tax Information | | | | (Unaudited) |
As required by the Internal Revenue Code (“Code”) and Treasury Regulations, if applicable, shareholders must be notified within 60 days of the Funds’ fiscal year end regarding the status of qualified dividend income and the dividend received deduction.
Dividend Received Deduction. Corporate shareholders are generally entitled to take the dividend received deduction on the portion of a fund’s dividend distribution that qualifies under tax law. The percentage of the following Funds’ fiscal 2022 ordinary income dividend that qualifies for the corporate dividend corporate dividend received deduction is set forth below:
Qualified Dividend Income. Under the Jobs and Growth Tax Relief Reconciliation Act of 2003, the following percentage of ordinary dividends paid during the fiscal year ended June 30, 2022 was designated as “qualified dividend income’’ as defined in the Jobs and Growth Tax Relief Reconciliation Act of 2003 subject to reduced tax rates in 2022:
Qualified Interest Income and Qualified Short-Term Capital Gain (for non-U.S. resident shareholders only). Under the American Jobs Creation Act of 2004, the following amounts of ordinary dividends paid during the fiscal year ended June 30, 2022 are considered to be derived from “qualified interest income,” as defined in Section 871(k)(1)(E) of the Code, and therefore are designated as interest-related dividends, as defined in Section 871(k)(1)(C) of the Code. Further, the following amounts of ordinary dividends paid during the fiscal year ended June 30, 2022 are considered to be derived from “qualified short-term capital gain,” as defined in Section 871(k)(2)(D) of the Code, and therefore are designated as qualified short-term gain dividends, as defined by Section 871(k)(2)(C) of the Code.
Section 163(j) Interest Dividends. The funds intend to pass through the maximum amount allowable as Section 163(j) Interest defined in Proposed Treasury Section 1.163(j)-1(b). The 163(j) amount of ordinary income distributions are as follows:
Foreign Taxes. The funds have made an election under the Internal Revenue Code Section 853 to pass through foreign taxes paid. Shareholders will receive more detailed information along with their Form 1099-DIV.
| | | | | | | | | | | | | | | | | | | | | | | | | | | | | | | | |
| | | | | | Dividend
Received
Deduction % | | | Qualified
Dividend Income % | | | Qualified Interest Income (000s†) | | | Qualified Short-Term
Capital Gains
(000s†) | | | 163(j) Interest
Dividends (000s†) | | | Foreign Source Income | | | Foreign Taxes Pass
Through | |
| | | | | | | | |
PIMCO RAFI Dynamic Multi-Factor Emerging Markets Equity ETF | | | | | | | 0% | | | | 29% | | | $ | 0 | | | $ | 0 | | | $ | 0 | | | $ | 9,652,783 | | | $ | 1,246,810 | |
| | | | | | | | |
PIMCO RAFI Dynamic Multi-Factor International Equity ETF | | | | | | | 0% | | | | 100% | | | | 0 | | | | 0 | | | | 0 | | | | 3,841,753 | | | | 371,498 | |
| | | | | | | | |
PIMCO RAFI Dynamic Multi-Factor U.S. Equity ETF | | | | | | | 100% | | | | 96% | | | | 0 | | | | 0 | | | | 0 | | | | 0 | | | | 0 | |
| | | | | | | | |
PIMCO RAFI ESG U.S. ETF | | | | | | | 100% | | | | 99% | | | | 0 | | | | 0 | | | | 0 | | | | 0 | | | | 0 | |
| † | A zero balance may reflect actual amounts rounding to less than one thousand. |
Shareholders are advised to consult their own tax advisor with respect to the tax consequences of their investment in the Trust. In January 2023, you will be advised on IRS Form 1099-DIV as to the federal tax status of the dividends and distributions received by you in calendar year 2022.
Section 199A Dividends. Non-corporate fund shareholders of the funds below meeting certain holding period requirements may be able to deduct up to 20 percent of qualified REIT dividends passed through and reported to the shareholders by the funds as IRC section 199A dividends. The IRC section 199A percentage of ordinary dividends are as follows:
| | | | | | | | |
| | | | | | 199A
Dividends | |
| | |
PIMCO RAFI Dynamic Multi-Factor Emerging Markets Equity ETF | | | | | | | 0% | |
| | |
PIMCO RAFI Dynamic Multi-Factor International Equity ETF | | | | | | | 0% | |
| | |
PIMCO RAFI Dynamic Multi-Factor U.S. Equity ETF | | | | | | | 4% | |
| | |
PIMCO RAFI ESG U.S. ETF | | | | | | | 1% | |
| | | | | | | | | | | | |
| | | | ANNUAL REPORT | | | | | | | JUNE 30, 2022 | | | 73 |
| | | | |
| Distribution Information | | | | (Unaudited) |
For purposes of Section 19 of the Investment Company Act of 1940 (the “Act”), the Funds estimated the periodic sources of any dividends paid during the period covered by this report in accordance with good accounting practice. Pursuant to Rule 19a-1(e) under the Act, the table below sets forth the actual source information for dividends paid during the six month period ended June 30, 2022 calculated as of each distribution period pursuant to Section 19 of the Act. The information below is not provided for U.S. federal income tax reporting purposes. The tax character of all dividends and distributions is reported on Form 1099-DIV (for shareholders who receive U.S. federal tax reporting) at the end of each calendar year.
See the Financial Highlights section of this report for the tax characterization of distributions determined in accordance with federal income tax regulations for the fiscal year.
| | | | | | | | | | | | | | | | | | | | |
PIMCO RAFI Dynamic Multi-Factor Emerging
Markets Equity ETF | | | | | Net Investment
Income* | | | Net Realized
Capital Gains* | | | Paid-in Surplus or
Other Capital
Sources** | | | Total (per
common share) | |
| | | | | |
January 2022 | | | | | | $ | 0.0000 | | | $ | 0.0000 | | | $ | 0.0000 | | | $ | 0.0000 | |
| | | | | |
February 2022 | | | | | | $ | 0.0000 | | | $ | 0.0000 | | | $ | 0.0000 | | | $ | 0.0000 | |
| | | | | |
March 2022 | | | | | | $ | 0.0000 | | | $ | 0.0000 | | | $ | 0.0000 | | | $ | 0.0000 | |
| | | | | |
April 2022 | | | | | | $ | 0.1000 | | | $ | 0.0000 | | | $ | 0.0000 | | | $ | 0.1000 | |
| | | | | |
May 2022 | | | | | | $ | 0.0000 | | | $ | 0.0000 | | | $ | 0.0000 | | | $ | 0.0000 | |
| | | | | |
June 2022 | | | | | | $ | 0.0000 | | | $ | 0.0000 | | | $ | 0.0000 | | | $ | 0.0000 | |
| | | | | |
PIMCO RAFI Dynamic Multi-Factor International
Equity ETF | | | | | Net Investment
Income* | | | Net Realized
Capital Gains* | | | Paid-in Surplus or
Other Capital
Sources** | | | Total (per
common share) | |
| | | | | |
January 2022 | | | | | | $ | 0.0000 | | | $ | 0.0000 | | | $ | 0.0000 | | | $ | 0.0000 | |
| | | | | |
February 2022 | | | | | | $ | 0.0000 | | | $ | 0.0000 | | | $ | 0.0000 | | | $ | 0.0000 | |
| | | | | |
March 2022 | | | | | | $ | 0.0000 | | | $ | 0.0000 | | | $ | 0.0000 | | | $ | 0.0000 | |
| | | | | |
April 2022 | | | | | | $ | 0.1000 | | | $ | 0.0000 | | | $ | 0.0000 | | | $ | 0.1000 | |
| | | | | |
May 2022 | | | | | | $ | 0.0000 | | | $ | 0.0000 | | | $ | 0.0000 | | | $ | 0.0000 | |
| | | | | |
June 2022 | | | | | | $ | 0.0000 | | | $ | 0.0000 | | | $ | 0.0000 | | | $ | 0.0000 | |
| | | | | |
| PIMCO RAFI Dynamic Multi-Factor U.S. Equity ETF | | | | | Net Investment
Income* | | | Net Realized
Capital Gains* | | | Paid-in Surplus or
Other Capital
Sources** | | | Total (per
common share) | |
| | | | | |
January 2022 | | | | | | $ | 0.0000 | | | $ | 0.0000 | | | $ | 0.0000 | | | $ | 0.0000 | |
| | | | | |
February 2022 | | | | | | $ | 0.0000 | | | $ | 0.0000 | | | $ | 0.0000 | | | $ | 0.0000 | |
| | | | | |
March 2022 | | | | | | $ | 0.0000 | | | $ | 0.0000 | | | $ | 0.0000 | | | $ | 0.0000 | |
| | | | | |
April 2022 | | | | | | $ | 0.1800 | | | $ | 0.0000 | | | $ | 0.0000 | | | $ | 0.1800 | |
| | | | | |
May 2022 | | | | | | $ | 0.0000 | | | $ | 0.0000 | | | $ | 0.0000 | | | $ | 0.0000 | |
| | | | | |
June 2022 | | | | | | $ | 0.0000 | | | $ | 0.0000 | | | $ | 0.0000 | | | $ | 0.0000 | |
| | | | | |
| PIMCO RAFI ESG U.S. ETF | | | | | Net Investment
Income* | | | Net Realized
Capital Gains* | | | Paid-in Surplus or
Other Capital
Sources** | | | Total (per
common share) | |
| | | | | |
January 2022 | | | | | | $ | 0.0000 | | | $ | 0.0000 | | | $ | 0.0000 | | | $ | 0.0000 | |
| | | | | |
February 2022 | | | | | | $ | 0.0000 | | | $ | 0.0000 | | | $ | 0.0000 | | | $ | 0.0000 | |
| | | | | |
March 2022 | | | | | | $ | 0.0000 | | | $ | 0.0000 | | | $ | 0.0000 | | | $ | 0.0000 | |
| | | | | |
April 2022 | | | | | | $ | 0.1400 | | | $ | 0.0000 | | | $ | 0.0000 | | | $ | 0.1400 | |
| | | | | |
May 2022 | | | | | | $ | 0.0000 | | | $ | 0.0000 | | | $ | 0.0000 | | | $ | 0.0000 | |
| | | | | |
June 2022 | | | | | | $ | 0.0000 | | | $ | 0.0000 | | | $ | 0.0000 | | | $ | 0.0000 | |
| * | The source of dividends provided in the table differs, in some respects, from information presented in this report prepared in accordance with generally accepted accounting principles, or U.S. GAAP. For example, net earnings from certain interest rate swap contracts are included as a source of net investment income for purposes of Section 19(a). Accordingly, the information in the table may differ from information in the accompanying financial statements that are presented on the basis of U.S. GAAP and may differ from tax information presented in the footnotes. Amounts shown may include accumulated, as well as fiscal period net income and net profits. |
| ** | Occurs when a fund distributes an amount greater than its accumulated net income and net profits. Amounts are not reflective of a fund’s net income, yield, earnings or investment performance. |
| | | | |
| Management of the Trust | | | | (Unaudited) |
The charts below identify the Trustees and executive officers of the Trust. Unless otherwise indicated, the address of all persons below is 650 Newport Center Drive, Newport Beach, CA 92660.
The Funds’ Statement of Additional Information includes more information about the Trustees and Officers. To request a free copy, call PIMCO at (888) 87-PIMCO or visit the Funds’ website at www.pimco.com.
| | | | | | | | |
Name, Year of Birth and
Position Held with Trust* | | Term of
Office and
Length of
Time Served† | | Principal Occupation(s) During Past 5 Years | | Number of Funds
in Fund Complex
Overseen by Trustee | | Other Public Company and Investment Company
Directorships Held by Trustee During the Past 5 Years |
| | | | |
| Interested Trustees1 | | | | | | | | |
| | | | |
Peter G. Strelow (1970) Chairman of the Board and Trustee | | 02/2019 to present | | Managing Director and Co-Chief Operating Officer, PIMCO. Senior Vice President of the Trust, PIMCO Equity Series VIT, PIMCO Funds, PIMCO Variable Insurance Trust and PIMCO ETF Trust, PIMCO Managed Accounts Trust, PIMCO-Sponsored Interval Funds and PIMCO-Sponsored Closed-End Funds. Formerly, Chief Administrative Officer, PIMCO. | | 149 | | Chairman and Trustee, PIMCO Equity Series VIT, PIMCO Funds, PIMCO Variable Insurance Trust, PIMCO ETF Trust. |
| | | | |
Kimberley G. Stafford (1978) Trustee | | 02/2021 to present | | Managing Director, Global Head of Product Strategy, PIMCO; and Member of Executive Committee, PIMCO. Formerly, Head of Asia-Pacific, Global Head of Consultant Relations and Head of US Institutional and Alternatives Sales, PIMCO. | | 149 | | Trustee, PIMCO Equity Series VIT, PIMCO Funds, PIMCO Variable Insurance Trust, PIMCO ETF Trust. |
| | | | |
| Independent Trustees | | | | | | | | |
| | | | |
George E. Borst (1948) Trustee | | 05/2019 to present | | Executive Advisor, McKinsey & Company; Formerly, Executive Advisor, Toyota Financial Services; and CEO, Toyota Financial Services. | | 149 | | Trustee, PIMCO Equity Series VIT, PIMCO Funds, PIMCO Variable Insurance and PIMCO ETF Trust; Director, MarineMax Inc. |
| | | | |
Jennifer Holden Dunbar (1963) Trustee | | 02/2016 to present | | Formerly, Managing Director, Dunbar Partners, LLC (business consulting and investments) (05/05-05/21); and Partner, Leonard Green & Partners, L.P. | | 149 | | Trustee, PIMCO Equity Series VIT, PIMCO Funds, PIMCO Variable Insurance and PIMCO ETF Trust; Director, PS Business Parks; Director, Big 5 Sporting Goods Corporation. |
| | | | |
Kym M. Hubbard (1957) Trustee | | 05/2019 to present | | Formerly, Global Head of Investments, Chief Investment Officer and Treasurer, Ernst & Young. | | 149 | | Trustee, PIMCO Equity Series VIT, PIMCO Funds, PIMCO Variable Insurance and PIMCO ETF Trust; Director, State Auto Financial Corporation. |
| | | | |
Gary F. Kennedy (1955) Trustee | | 05/2019 to present | | Formerly, Senior Vice President, General Counsel and Chief Compliance Officer, American Airlines and AMR Corporation (now American Airlines Group). | | 149 | | Trustee, PIMCO Equity Series VIT, PIMCO Funds, PIMCO Variable Insurance and PIMCO ETF Trust. |
| | | | |
Peter B. McCarthy (1950) Trustee | | 09/2011 to present | | Formerly, Assistant Secretary and Chief Financial Officer, United States Department of Treasury; Deputy Managing Director, Institute of International Finance. | | 149 | | Trustee, PIMCO Equity Series VIT, PIMCO Funds, PIMCO Variable Insurance and PIMCO ETF Trust. |
| | | | |
Ronald C. Parker (1951) Lead Independent Trustee | | 02/2016 to present Lead Independent Trustee 05/2019 to present | | Director of Roseburg Forest Products Company. Formerly, Chairman of the Board, The Ford Family Foundation; and President, Chief Executive Officer, Hampton Affiliates (forestry products). | | 149 | | Lead Independent Trustee, PIMCO Equity Series VIT, PIMCO Funds, PIMCO Variable Insurance and PIMCO ETF Trust. |
| * | Unless otherwise noted, the information for the individuals listed is as of June 30, 2022. |
| 1 | Ms. Stafford is an “interested persons” of the Trust (as that term is defined in the 1940 Act) because of his affiliations with PIMCO. |
| † | Trustees serve until their successors are duly elected and qualified. |
| | | | | | | | | | | | |
| | | | ANNUAL REPORT | | | | | | | JUNE 30, 2022 | | | 75 |
| | | | |
| Management of the Trust | | (Cont.) | | (Unaudited) |
Executive Officers
| | | | |
Name, Year of Birth and
Position Held with Trust* | | Term of Office and
Length of Time Served | | Principal Occupation(s) During Past 5 Years† |
| | |
Eric D. Johnson (1970) President | | 06/2019 to present | | Executive Vice President and Head of Funds Business Group Americas, PIMCO. President, PIMCO Funds, PIMCO Variable Insurance Trust, PIMCO ETF Trust, PIMCO Equity Series VIT, PIMCO Managed Accounts Trust, PIMCO-Sponsored Interval Funds and PIMCO-Sponsored Closed-End Funds. |
| | |
Ryan G. Leshaw (1980) Chief Legal Officer and Secretary | | 08/2021 to present | | Executive Vice President and Senior Counsel, PIMCO. Chief Legal Officer and Secretary, PIMCO Funds, PIMCO Variable Insurance Trust, PIMCO ETF Trust and PIMCO Equity Series VIT. Chief Legal Officer, PIMCO Managed Accounts Trust, PIMCO-Sponsored Interval Funds and PIMCO-Sponsored Closed-End Funds. Formerly, Associate, Willkie Farr & Gallagher LLP. |
| | |
Keisha Audain-Pressley (1975)** Chief Compliance Officer | | 01/2020 to present | | Executive Vice President and Deputy Chief Compliance Officer, PIMCO. Chief Compliance Officer, PIMCO Funds, PIMCO Variable Insurance Trust, PIMCO ETF Trust, PIMCO Equity Series VIT, PIMCO Managed Accounts Trust, PIMCO-Sponsored Interval Funds and PIMCO-Sponsored Closed-End Funds. |
| | |
Joshua D. Ratner (1976)** Senior Vice President | | 05/2019 to present | | Executive Vice President and Head of Americas Operations, PIMCO. Senior Vice President, PIMCO Funds, PIMCO Variable Insurance Trust, PIMCO ETF Trust, PIMCO Equity Series VIT, PIMCO Managed Accounts Trust, PIMCO-Sponsored Interval Funds and PIMCO-Sponsored Closed-End Funds. |
| | |
Peter G. Strelow (1970) Senior Vice President | | 06/2019 to present | | Managing Director and Co-Chief Operating Officer, PIMCO. Senior Vice President, PIMCO Funds, PIMCO Variable Insurance Trust, PIMCO ETF Trust, PIMCO Equity Series VIT, PIMCO Managed Accounts Trust, PIMCO-Sponsored Interval Funds and PIMCO-Sponsored Closed-End Funds. Formerly, Chief Administrative Officer, PIMCO. |
| | |
Wu-Kwan Kit (1981) Assistant Secretary | | 08/2017 to present | | Senior Vice President and Senior Counsel, PIMCO. Assistant Secretary, PIMCO Funds, PIMCO Variable Insurance Trust, PIMCO ETF Trust and PIMCO Equity Series VIT. Vice President, Senior Counsel and Secretary, PIMCO Managed Accounts Trust, PIMCO-Sponsored Interval Funds and PIMCO-Sponsored Closed-End Funds. Formerly, Assistant General Counsel, VanEck Associates Corp. |
| | |
Douglas B. Burrill (1980)** Vice President | | 08/2022 to present | | Senior Vice President, PIMCO. Vice President PIMCO Funds, PIMCO Variable Insurance Trust, PIMCO ETF Trust, PIMCO Equity Series VIT, PIMCO-Sponsored Interval Funds and PIMCO Sponsored Closed-End Funds. |
| | |
Jeffrey A. Byer (1976) Vice President | | 02/2020 to present | | Executive Vice President, PIMCO. Vice President, PIMCO Funds, PIMCO Variable Insurance Trust, PIMCO ETF Trust, PIMCO Equity Series, PIMCO Equity Series VIT, PIMCO Managed Accounts Trust, PIMCO-Sponsored Interval Funds and PIMCO-Sponsored Closed-End Funds. |
| | |
Elizabeth A. Duggan (1964) Vice President | | 02/2021 to present | | Executive Vice President, PIMCO. Vice President, PIMCO Funds, PIMCO Variable Insurance Trust, PIMCO ETF Trust, PIMCO Equity Series VIT, PIMCO Managed Accounts Trust, PIMCO-Sponsored Interval Funds and PIMCO-Sponsored Closed-End Funds. |
| | |
Mark A. Jelic (1981) Vice President | | 08/2021 to present | | Senior Vice President, PIMCO. Vice President, PIMCO Funds, PIMCO Variable Insurance Trust, PIMCO ETF Trust, PIMCO Equity Series VIT, PIMCO-Sponsored Interval Funds and PIMCO-Sponsored Closed-End Funds. |
| | |
Kenneth W. Lee (1972) Vice President | | 08/2022 to present | | Senior Vice President, PIMCO. Vice President PIMCO Funds, PIMCO Variable Insurance Trust, PIMCO ETF Trust, PIMCO Equity Series VIT, PIMCO-Sponsored Interval Funds and PIMCO Sponsored Closed-End Funds. |
| | |
Brian J. Pittluck (1977) Vice President | | 01/2020 to present | | Senior Vice President, PIMCO. Vice President, PIMCO Funds, PIMCO Variable Insurance Trust, PIMCO ETF Trust, PIMCO Equity Series VIT, PIMCO Managed Accounts Trust, PIMCO-Sponsored Interval Funds and PIMCO-Sponsored Closed-End Funds. |
| | |
Keith A. Werber (1973) Vice President | | 05/2022 to present | | Executive Vice President, PIMCO. Vice President, PIMCO Funds, PIMCO Variable Insurance Trust, PIMCO ETF Trust and PIMCO Equity Series VIT. |
| | |
Bijal Y. Parikh (1978) Treasurer | | 01/2021 to present | | Senior Vice President, PIMCO. Treasurer, PIMCO Funds, PIMCO Variable Insurance Trust, PIMCO ETF Trust and PIMCO Equity Series VIT, PIMCO Managed Accounts Trust, PIMCO-Sponsored Interval Funds and PIMCO-Sponsored Closed-End Funds. |
| | |
Erik C. Brown (1967)*** Assistant Treasurer | | 03/2010 to present | | Executive Vice President, PIMCO. Assistant Treasurer, PIMCO Funds, PIMCO Variable Insurance Trust, PIMCO ETF Trust, PIMCO Equity Series VIT, PIMCO Managed Accounts Trust, PIMCO-Sponsored Interval Funds and PIMCO-Sponsored Closed-End Funds. |
| | |
Brandon T. Evans (1982) Assistant Treasurer | | 05/2019 to present | | Senior Vice President, PIMCO. Assistant Treasurer, PIMCO Funds, PIMCO Variable Insurance Trust, PIMCO ETF Trust and PIMCO Equity Series VIT. Deputy Treasurer, PIMCO Managed Accounts Trust, PIMCO-Sponsored Interval Funds and PIMCO-Sponsored Closed-End Funds. |
| * | Unless otherwise noted, the information for the individuals listed is as of August 25, 2022. |
| † | The term “PIMCO-Sponsored Closed-End Funds” as used herein includes: PIMCO Access Income Fund, PIMCO California Municipal Income Fund, PIMCO California Municipal Income Fund II, PIMCO California Municipal Income Fund III, PIMCO Municipal Income Fund, PIMCO Municipal Income Fund II, PIMCO Municipal Income Fund III, PIMCO New York Municipal Income Fund, PIMCO New York Municipal Income Fund II, PIMCO New York Municipal Income Fund III, PCM Fund Inc., PIMCO Corporate & Income Opportunity Fund, PIMCO Corporate & Income Strategy Fund, PIMCO Dynamic Income Fund, PIMCO Dynamic Income Opportunities Fund, PIMCO Energy and Tactical Credit Opportunities Fund, PIMCO Global StocksPLUS® & Income Fund, PIMCO High Income Fund, PIMCO Income Strategy Fund, PIMCO Income Strategy Fund II and PIMCO Strategic Income Fund, Inc.; the term “PIMCO-Sponsored Interval Funds” as used herein includes: PIMCO Flexible Credit Income Fund, PIMCO Flexible Municipal Income Fund, PIMCO California Flexible Municipal Income Fund and PIMCO Flexible Emerging Markets Income Fund. |
| ** | The address of these officers is Pacific Investment Management Company LLC, 1633 Broadway, New York, New York 10019. |
| *** | The address of these officers is Pacific Investment Management Company LLC, 401 Congress Ave., Austin, Texas 78701. |
| | | | |
| Privacy Policy1 | | | | (Unaudited) |
The Funds2,3 consider customer privacy to be a fundamental aspect of their relationships with shareholders and are committed to maintaining the confidentiality, integrity and security of their current, prospective and former shareholders’ non-public personal information. The Funds have developed policies that are designed to protect this confidentiality, while allowing shareholder needs to be served.
OBTAINING NON-PUBLIC PERSONAL INFORMATION
In the course of providing shareholders with products and services, the Funds and certain service providers to the Funds, such as the Funds’ investment advisers or sub-advisers (“Advisers”), may obtain non-public personal information about shareholders, which may come from sources such as account applications and other forms, from other written, electronic or verbal correspondence, from shareholder transactions, from a shareholder’s brokerage or financial advisory firm, financial professional or consultant, and/or from information captured on applicable websites.
RESPECTING YOUR PRIVACY
As a matter of policy, the Funds do not disclose any non-public personal information provided by shareholders or gathered by the Funds to non-affiliated third parties, except as required or permitted by law or as necessary for such third parties to perform their agreements with respect to the Funds. As is common in the industry, non-affiliated companies may from time to time be used to provide certain services, such as preparing and mailing prospectuses, reports, account statements and other information, conducting research on shareholder satisfaction and gathering shareholder proxies. The Funds or their affiliates may also retain non-affiliated companies to market Fund shares or products which use Fund shares and enter into joint marketing arrangements with them and other companies. These companies may have access to a shareholder’s personal and account information, but are permitted to use this information solely to provide the specific service or as otherwise permitted by law. In most cases, the shareholders will be clients of a third party, but the Funds may also provide a shareholder’s personal and account information to the shareholder’s respective brokerage or financial advisory firm and/or financial professional or consultant.
SHARING INFORMATION WITH THIRD PARTIES
The Funds reserve the right to disclose or report personal or account information to non-affiliated third parties in limited circumstances where the Funds believe in good faith that disclosure is required under law, to cooperate with regulators or law enforcement authorities, to protect their rights or property, or upon reasonable request by any Fund in which a shareholder has invested. In addition, the Funds may disclose information about a shareholder or a shareholder’s accounts to a non-affiliated third party at the shareholder’s request or with the consent of the shareholder.
SHARING INFORMATION WITH AFFILIATES
The Funds may share shareholder information with their affiliates in connection with servicing shareholders’ accounts, and subject to applicable law may provide shareholders with information about products and services that the Funds or their Advisers, distributors or their affiliates (“Service Affiliates”) believe may be of interest to such shareholders. The information that the Funds may share may include, for example, a shareholder’s participation in the Funds or in other investment programs sponsored by a Service Affiliate, a shareholder’s ownership of certain types of accounts (such as IRAs), information about the Funds’ experiences or transactions with a shareholder, information captured on applicable websites, or other data about a shareholder’s accounts, subject to applicable law. The Funds’ Service Affiliates, in turn, are not permitted to share shareholder information with non-affiliated entities, except as required or permitted by law.
PROCEDURES TO SAFEGUARD PRIVATE INFORMATION
The Funds take seriously the obligation to safeguard shareholder non-public personal information. In addition to this policy, the Funds have implemented procedures that are designed to restrict access to a shareholder’s non-public personal information to internal personnel who need to know that information to perform their jobs, such as servicing shareholder accounts or notifying shareholders of new products or services. Physical, electronic and procedural safeguards are in place to guard a shareholder’s non-public personal information.
INFORMATION COLLECTED FROM WEBSITES
The Funds or their service providers and partners may collect information from shareholders via websites they maintain. The information collected via websites maintained by the Funds or their service providers includes client non-public personal information.
CHANGES TO THE PRIVACY POLICY
From time to time, the Funds may update or revise this privacy policy. If there are changes to the terms of this privacy policy, documents containing the revised policy on the relevant website will be updated.
1 Amended as of June 25, 2020.
2 PIMCO Investments LLC (“PI”) serves as the Funds’ distributor and does not provide brokerage services or any financial advice to investors in the Funds solely because it distributes the Funds. This Privacy Policy applies to the activities of PI to the extent that PI regularly effects or engages in transactions with or for a shareholder of a series of a Trust who is the record owner of such shares. For purposes of this Privacy Policy, references to “the Funds” shall include PI when acting in this capacity.
3 When distributing this Policy, a Fund may combine the distribution with any similar distribution of its investment adviser’s privacy policy. The distributed, combined, policy may be written in the first person (i.e. by using “we” instead of “the Funds”).
| | | | | | | | | | | | |
| | | | ANNUAL REPORT | | | | | | | JUNE 30, 2021 | | | 77 |
| | | | |
| Liquidity Risk Management Program | | (Unaudited) |
In compliance with Rule 22e-4 (the “Liquidity Rule”) under the Investment Company Act of 1940, as amended (“1940 Act”), PIMCO Equity Series (the “Trust”) has adopted and implemented a liquidity risk management program (the “Program”) for each series of the Trust (each a “Fund” and collectively, the “Funds”) not regulated as a money market fund under 1940 Act Rule 2a-7, which is reasonably designed to assess and manage the Funds’ liquidity risk. The Trust’s Board of Trustees (the “Board”) previously approved the designation of the PIMCO Liquidity Risk Committee (the “Administrator”) as Program administrator. The PIMCO Liquidity Risk Committee consists of senior members from certain PIMCO business areas, such as Portfolio Risk Management, Americas Operations, Compliance, Account Management and Portfolio Management, and is advised by members of PIMCO Legal.
A Fund’s “liquidity risk” is the risk that the Fund could not meet requests to redeem shares issued by the Fund without significant dilution of the remaining investors’ interests in the Fund. In accordance with the Program, each Fund’s liquidity risk is assessed no less frequently than annually taking into consideration a variety of factors, including, as applicable, the Fund’s investment strategy and liquidity of portfolio investments, cash flow projections, and holdings of cash and cash equivalents, as well as borrowing arrangements and other funding sources. Certain factors are considered under both normal and reasonably foreseeable stressed conditions. Each Fund portfolio investment is classified into one of four liquidity categories (including “highly liquid investments” and “illiquid investments,” discussed below) based on a determination of the number of days it is reasonably expected to take to convert the investment to cash, or sell or dispose of the investment, in current market conditions without significantly changing the investment’s market value. Each Fund has adopted a “Highly Liquid Investment Minimum” (or “HLIM”), which is a minimum amount of Fund net assets to be invested in highly liquid investments that are assets. As required under the Liquidity Rule, each Fund’s HLIM is periodically reviewed, no less frequently than annually, and the Funds have adopted policies and procedures for responding to a shortfall of a Fund’s highly liquid investments below its HLIM. The Liquidity Rule also limits the Funds’ investments in illiquid investments by prohibiting a Fund from acquiring any illiquid investment if, immediately after the acquisition, the Fund would have invested more than 15% of its net assets in illiquid investments that are assets. Certain non-public reporting is generally required if a Fund’s holdings of illiquid investments that are assets were to exceed 15% of Fund net assets.
At a meeting of the Board held on February 15-16, 2022, the Board received a report (the “Report”) from the Administrator addressing the Program’s operation and assessing the adequacy and effectiveness of its implementation for the 12-month period ended December 31, 2021. The Report reviewed the operation of the Program’s components during such period and stated that the Program is operating effectively to assess and manage each Fund’s liquidity risk and that the Program has been and continues to be adequately and effectively implemented to monitor and, as applicable, respond to the Funds’ liquidity developments. This has remained true for the 12-month period ended June 30, 2022.
General Information
Investment Adviser and Administrator
Pacific Investment Management Company LLC
650 Newport Center Drive
Newport Beach, CA 92660
Investment Sub-Adviser
Parametric Portfolio Associates
1918 Eighth Avenue, Suite 3100
Seattle, WA 98101
Distributor
PIMCO Investments LLC
1633 Broadway
New York, NY 10019
Custodian
State Street Bank & Trust Co.
State Street Financial Center
One Lincoln Street
Boston, MA 02111
Transfer Agent
State Street Bank & Trust Co.
State Street Financial Center
One Lincoln Street
Boston, MA 02111
Legal Counsel
Dechert LLP
1900 K Street, N.W.
Washington, D.C. 20006
Independent Registered Public Accounting Firm
PricewaterhouseCoopers LLP
1100 Walnut Street, Suite 1300
Kansas City, MO 64106
This report is submitted for the general information of the shareholders of the Funds listed on the Report cover.

PES3004AR_063022
| | (b) | Not applicable to the Registrant. |
As of the end of the period covered by this report, the Registrant has adopted a code of ethics (the “Code”) that applies to the Registrant’s principal executive officer and principal financial officer. The Registrant did not grant any waivers, including implicit waivers, from any provisions of the Code to the principal executive officer or principal financial officer during the period covered by this report.
A copy of the Code is included as an exhibit to this report.
| Item 3. | Audit Committee Financial Expert. |
The Board of Trustees has determined that Peter B. McCarthy, who serves on the Board’s Audit Committee, qualifies as an “audit committee financial expert” as such term is defined in the instructions to this Item 3. The Board has also determined that Mr. McCarthy is “independent” as such term is interpreted under this Item 3.
| Item 4. | Principal Accountant Fees and Services. |
| | | | |
(a) | | Fiscal Year Ended | | Audit Fees |
| | June 30, 2022 | | $ 616,174 |
| | June 30, 2021 | | $ 692,562 |
| | |
(b) | | Fiscal Year Ended | | Audit-Related Fees(1) |
| | June 30, 2022 | | $ — |
| | June 30, 2021 | | $ — |
| | |
(c) | | Fiscal Year Ended | | Tax Fees |
| | June 30, 2022 | | $ 89,600 |
| | June 30, 2021 | | $ 144,025 |
| | |
(d) | | Fiscal Year Ended | | All Other Fees(2) |
| | June 30, 2022 | | $ — |
| | June 30, 2021 | | $ — |
“Audit Fees” represents aggregate fees billed for each of the last two fiscal years for professional services rendered for the audit of the PIMCO Equity Series (the “Trust” or “Registrant”) annual financial statements or services that are normally provided by the accountant in connection with statutory or regulatory filings or engagements for those fiscal years.
“Audit-Related Fees” represents aggregate fees billed for each of the last two fiscal years for assurance and related services reasonably related to the performance of the audit of the Trust’s annual financial statements for those years.
“Tax Fees” represents aggregate fees billed for each of the last two fiscal years for professional services related to tax compliance, tax advice and tax planning, including review of federal and state income tax returns, review of excise tax distribution requirements and preparation of excise tax returns.
“All Other Fees” represents aggregate fees, if any, billed for other products and services rendered by the principal accountant to the Trust for the last two fiscal years.
| | (1) | There were no “Audit-Related Fees” for the last two fiscal years. |
| | (2) | There were no “All Other Fees” for the last two fiscal years. |
| | (e) | Pre-approval policies and procedures |
(1) The Registrant’s Audit Committee has adopted pre-approval policies and procedures (the “Procedures”) to govern the Audit Committee’s pre-approval of (i) all audit services and permissible non-audit services to be provided to the Registrant by its independent accountant, and (ii) all permissible non-audit services to be provided by such independent accountant to the Registrant’s investment adviser and to any entity controlling, controlled by, or under common control with the investment adviser that provides ongoing services to the Registrant (collectively, the “Service Affiliates”) if the services provided directly relate to the Registrant’s operations and financial reporting. In accordance with the Procedures, the Audit Committee is responsible for the engagement of the independent accountant to certify the Registrant’s financial statements for each fiscal year. With respect to the pre-approval of non-audit services provided to the Registrant and its Service Affiliates, the Procedures provide that the Audit Committee may annually pre-approve a list of types or categories of non-audit services that may be provided to the Registrant or its Service Affiliates, or the Audit Committee may pre-approve such services on a project-by-project basis as they arise. Unless a type of service has received general pre-approval, it will require specific pre-approval by the Audit Committee if it is to be provided by the independent accountant. The Procedures also permit the Audit Committee to delegate authority to one or more of its members to pre-approve any proposed non-audit services that have not been previously pre-approved by the Audit Committee, subject to the ratification by the full Audit Committee no later than its next scheduled meeting.
(2) With respect to the services described in paragraphs (b) through (d) of this Item 4, no amount was approved by the Audit Committee pursuant to paragraph (c)(7)(i)(C) of Rule 2-01 of Regulation S-X.
| | | | | | | | | | | | |
| | | Aggregate Non-Audit Fees Billed to Entity | |
| | |
| Entity | | June 30, 2022 | | | June 30, 2021 | |
PIMCO Equity Series Trust | | $ | | | | | 89,600 | | | $ | 144,025 | |
Pacific Investment Management Company LLC (“PIMCO”) | | | | | | | 13,128,802 | | | | 15,411,504 | |
| | | | | | | |
Totals | | $ | | | | | 13,218,402 | | | $ | 15,555,529 | |
| | | | | | | | |
| | (h) | The Registrant’s Audit Committee has considered whether the provision of non-audit services that were rendered to the Registrant’s investment adviser, and any entity controlling, controlled by, or under common control with the investment adviser that provides ongoing services to the Registrant which were not pre-approved (not requiring pre-approval) is compatible with maintaining the principal accountant’s independence. |
| Item 5. | Audit Committee of Listed Registrants. |
The Registrant has a separately-designated standing Audit Committee established in accordance with Section 3(a)(58)(A) of the Securities Exchange Act of 1934, as amended. The Audit Committee is comprised of:
George E. Borst
Jennifer Holden Dunbar
Kym M. Hubbard
Gary F. Kennedy
Peter B. McCarthy
Ronald C. Parker
| Item 6. | Schedule of Investments. |
The information required by this Item 6 is included as part of the annual report to shareholders filed under Item 1 of this Form N-CSR.
| Item 7. | Disclosure of Proxy Voting Policies and Procedures for Closed-End Management Investment Companies. |
Not applicable to open-end investment companies.
| Item 8. | Portfolio Managers of Closed-End Management Investment Companies. |
Not applicable to open-end investment companies.
| Item 9. | Purchases of Equity Securities by Closed-End Management Investment Company and Affiliated Purchasers. |
Not applicable to open-end investment companies.
| Item 10. | Submission of Matters to a Vote of Security Holders. |
There have been no material changes to the procedures by which shareholders may recommend nominees to the Trust’s Board of Trustees since the Trust last provided disclosure in response to this item.
| Item 11. | Controls and Procedures. |
| | (a) | The principal executive officer and principal financial & accounting officer have concluded that the Registrant’s disclosure controls and procedures (as defined in Rule 30a-3(c) under the Act) provide reasonable assurances that material information relating to the Registrant is made known to them by the appropriate persons, based on their evaluation of these controls and procedures as of a date within 90 days of the filing of this report. |
| | (b) | There were no changes in the Registrant’s internal control over financial reporting (as defined in Rule 30a-3(d) under the Act) that occurred during the last fiscal quarter of the period covered by this report that have materially affected, or are reasonably likely to materially affect, the Registrant’s internal control over financial reporting. |
| Item 12. | Disclosure of Securities Lending Activities for Closed-End Management Investment Companies. |
Not applicable to open-end investment companies.
| | (a)(3) | Not applicable for open-end investment companies. |
| | (a)(4) | There was no change in the registrant’s independent public accountant for the period covered by the report. |
Signatures
Pursuant to the requirements of the Securities Exchange Act of 1934 and the Investment Company Act of 1940, the registrant has duly caused this report to be signed on its behalf by the undersigned, thereunto duly authorized.
| | |
| PIMCO Equity Series |
| |
| By: | | /s/ Eric D. Johnson |
| | |
| | Eric D. Johnson |
| | President (Principal Executive Officer) |
| |
| Date: | | September 1, 2022 |
Pursuant to the requirements of the Securities Exchange Act of 1934 and the Investment Company Act of 1940, this report has been signed below by the following persons on behalf of the registrant and in the capacities and on the dates indicated.
| | |
| |
| By: | | /s/ Eric D. Johnson |
| | |
| | Eric D. Johnson |
| | President (Principal Executive Officer) |
| |
| Date: | | September 1, 2022 |
| |
| By: | | /s/ Bijal Y. Parikh |
| | |
| | Bijal Y. Parikh |
| | Treasurer (Principal Financial & Accounting Officer) |
| |
| Date: | | September 1, 2022 |