As filed with the Securities and Exchange Commission on May 28, 2014
UNITED STATES
SECURITIES AND EXCHANGE COMMISSION
Washington, D.C. 20549
FORM N-CSR
CERTIFIED SHAREHOLDER REPORT OF REGISTERED
MANAGEMENT INVESTMENT COMPANIES
Investment Company Act file number 811-22378
DoubleLine Funds Trust
(Exact name of registrant as specified in charter)
333 South Grand Avenue, Suite 1800
Los Angeles, CA 90071
(Address of principal executive offices) (Zip code)
Ronald R. Redell
President
DoubleLine Funds Trust
333 South Grand Avenue, Suite 1800
Los Angeles, CA 90071
(Name and address of agent for service)
(213) 633-8200
Registrant’s telephone number, including area code
Date of fiscal year end: March 31
Date of reporting period: March 31, 2014
Item 1. Reports to Stockholders.

Annual Report
March 31, 2014

DoubleLine Total Return Bond Fund
DBLTX (I-share)
DLTNX (N-share)
DoubleLine Core Fixed Income Fund
DBLFX (I-share)
DLFNX (N-share)
DoubleLine Emerging Markets Fixed Income Fund
DBLEX (I-share)
DLENX (N-share)
DoubleLine Multi-Asset Growth Fund
DMLIX (I-share)
DMLAX (A-share)
DoubleLine Low Duration Bond Fund
DBLSX (I-share)
DLSNX (N-share)
DoubleLine Floating Rate Fund
DBFRX (I-share)
DLFRX (N-share)
DoubleLine Shiller Enhanced CAPE®
DSEEX (I-share)
DSENX (N-share)
| | |
| DoubleLine Capital LP | | 333 S. Grand Avenue 18th Floor Los Angeles, California 90071 doubleline.com |

Table of Contents
| | | | | | |
| | Annual Report | | March 31, 2014 | | 3 |
President’s Letter

Dear DoubleLine Funds Shareholder,
On behalf of the DoubleLine Funds, I am pleased to deliver this Annual Report. On the following pages you will find specific information regarding each Fund’s operations and holdings. In addition, we discuss each Fund’s investment performance and the main drivers of that performance during the reporting period.
Investor assets in the DoubleLine Funds were over $36.4 billion as of March 31, 2014. As the DoubleLine Funds mark their four-year anniversary on April 6, 2014, we continue to enhance our overall lineup of investment strategies available to investors. On April 7th, 2014 we launched the DoubleLine Flexible Income Fund (DFLEX/DLINX) and the DoubleLine Low Duration Emerging Markets Fixed Income Fund (DBLLX/DELNX).
If you have any questions regarding the DoubleLine Funds please don’t hesitate to call us at 877-DLine11 (877-354-6311), or visit our website www.doublelinefunds.com to hear our investment management team offer deeper insights and analysis on relevant capital market activity impacting investors today. We value the trust that you have placed with us, and we will continue to strive to offer thoughtful investment solutions to our shareholders.
Sincerely,

Ronald R. Redell, CFA
President
DoubleLine Funds
May 1, 2014
| | |
| Financial Markets Highlights | | |
| | · | | Agency Mortgage Backed Securities (Agency MBS): For the 12-month period ending March 31, 2014, the U.S. Agency MBS sector had a return of 0.2% according to the Barclays U.S. MBS Index. This return included a price return of -0.55%. At the beginning of the period, the duration of the Barclays U.S. MBS Index was around 3.5 years, and as rates rose the duration extended to an all time high of 5.7 years in November. As of March 31, 2014, the duration came down to 5.5 years. Lower coupon mortgages were down in price by more than 5% over the past 12 months, while higher coupon mortgages were actually up in price over this same period. The lower coupon mortgages declined more relative to higher coupon counterparts due to their longer duration. The higher coupon mortgages appreciated in price because prepayment speeds declined substantially as rates went higher. Prepayment speeds declined by more than 50% for the 12-month period as well. Fannie Mae and Freddie Mac prepayment speeds declined by more than Ginnie Mae speeds during this period. In aggregate, prepayment speeds are at a level last seen in 2009. This slowdown in prepayment speeds was a main contributor to the extension in duration the mortgage market experienced over the period. With the decrease in prepayments, there has also been a continuous decrease in gross issuance of MBS – from $150 billion per month one year ago to just $50 billion per month in February 2014. This reduction in supply is important as it comes during an environment where the Federal Reserve is “tapering” its quantitative easing (QE) program. |
| | · | | Non-Agency Mortgage Backed Securities (Non-Agency MBS): The rally in non-Agency MBS in 2012 and the first half of 2013 was largely attributed to improving housing fundamentals. Concerns of banking regulations, rising rates and bond fund redemptions caused a brief sell-off in June 2013. Subsequently, through the remainder of 2013 and the first quarter of 2014, we have seen a rally that is based both off continued improvements on housing fundamentals, albeit more mixed in nature, and supply technicals within the non-Agency MBS sector. Trading volume has been volatile. The past 12-month period can be characterized by periods of low volume followed by large portfolio liquidations, well in excess of $2 billion per list. All of these lists have been well received, with the observation that each portfolio liquidation tended to reprice the market tighter. Total volume (current face) of all non-Agency MBS bid lists for the period was $186 billion. The S&P/Case-Shiller 20-City Home Price Index posted a 12-month Home Price Appreciation (HPA) rate of 13%. Beaten down sectors such as the subprime sector were more levered to a recovering housing market and thus outperformed in the face of a sustained housing rebound. Cleaner non-Agency MBS collateral, such as prime and Alt-A, also performed favorably posting total returns of approximately 7% and 6.5%, respectively, over the period. Against the headwind of a reduction of the government bond buying program and rising rates, the non-Agency sector fared very well over the past 12 months. Fundamentals continued to improve and the lack of supply has boosted prices further. Litigation between loan servicers and investors add the potential that investors could see additional returns in the form of settlements. Meanwhile, loan modifications have the opposite effect, potentially disrupting cashflows. |
| | · | | Emerging Markets Debt (EM Debt): Over the 12-month period ending March 31, 2014, performance across all EM fixed income sectors has been driven by volatility in U.S. Treasury rates and fund outflows from the asset class. Following the May 2013 Federal Open Market Committee (FOMC) meeting, the market began anticipating that the Fed could begin scaling back its bond buying program earlier than expected, leading to 10-year U.S. Treasury rates rising from 1.85% as of March 2013 month-end to touching just above 3.0% in December 2013. Higher yields in U.S. rates led to an outflow from EM, as investors shifted their portfolio allocation into less duration sensitive asset classes. Concerns of slowing growth and growing external imbalances in certain EM economies contributed to credit spreads widening across U.S. dollar denominated EM fixed income (EMFI) sectors. However, risk sentiment has markedly improved in the first few months of 2014, as certain EM countries are beginning to take the correct policy steps to implement pro-growth reform. Over this 12-month period, EM dollar denominated corporate debt outperformed its sovereign counterpart as corporate debt had more moderate outflows and has a shorter duration as an asset class than EM sovereign debt. |
| | · | | Investment Grade Credit: For the 12-month period ending March 31, 2014, investment grade credit recorded a total return of 1.02% as measured by the Barclays U.S. Credit Index. The Index ended March 0.27% tighter and outperformed duration-matched U.S. Treasuries by 2.86%. Within the investment grade sector, investors continued to reach down the credit spectrum as BBBs posted excess returns of 3.70% for the period. Issuers priced approximately $1.141 billion of fixed-rate investment grade supply for the period. |
| | · | | Bank Loans: For the 12-month period ending March 31, 2014, the S&P/LSTA Leveraged Loan Index (“LLI”) returned 4.35%. Single-B loans returned 4.63%, outperforming BB-rated returns of 3.00%. Notable outperformers by industry were Publishing (+8.37%), Radio & Television (+7.95%) and Media (+7.04%). Underperforming industries were Food Service (+0.43%), Cosmetics-Toiletries (+2.39%) and Cable & Satellite TV (+2.66%). |
| | | | | | |
| | Annual Report | | March 31, 2014 | | 5 |
| | |
| Financial Markets Highlights (Cont.) | | |
| | · | | High Yield: For the 12-month period ending March 31, 2014, the Citi High-Yield Cash-Pay Capped Index returned 7.25%. Lower-rated bonds outperformed higher-rated ones, with CCC-rated issues returning 10.42%, B-rated returning 7.58% and BB-rated returning 5.75%. Maturity did not have much effect on returns, with the 1-7 year category returning 7.37% and bonds maturing in 10 years or more returning 7.42%. |
| | · | | Global Equities: Global equities, as measured by the MSCI All Country World Index (MSCI ACWI), performed well for the 12-month period ending March 31 2014, with the index up 14.18%. Global equities were led by strong performances in developed markets. US equities were supported by stronger economic data, especially in labor and housing. Investors shifted allocations from fixed income into equities on fears of rising rates. European equities were supported as the region crawled its way out of a technical recession and the risk premium from a Euro Breakup diminished. In Japan, Kuroda and the Bank of Japan embarked on a large scale asset purchase program which kept Japanese interest rates suppressed and weakened the Yen. Chinese equities and emerging market equities had negative performance over the 12-month period as measured by the Shanghai Composite Index and the MSCI Emerging Markets Index, respectively. Investors worried that China’s economy would stall as it transitioned from investment-led to a consumption-based growth. Emerging markets were negatively impacted by the rise in US interest rates as investors unwound carry trades as funding costs increased. Emerging market countries with large current account deficits (India, Indonesia, South Africa, and Brazil) were hit especially hard as they relied heavily on external debt financing. |
| | · | | Collateralized Loan Obligations (CLOs): After a strong issuance in March 2013, CLOs experienced a slowdown in new issuance during the second and third quarters of 2013. The slowdown can be largely attributed to a more challenging CLO arbitrage environment in combination with the arrival of the FDIC (Federal Deposit Insurance Corporation) assessment fee that will be applied to large bank investors with $10 billion or more in assets. Any deals issued before April 1st, 2013 were grandfathered into an exception from the fee which will range from 0.03% to 0.45%. Managers did bring an increase of new deals to market in the last quarter of 2013 as they rushed to print deals before year end with growing uncertainty regarding the future regulatory environment. November was the most active month for 2013 in new issuance with $12.7 billion across 25 deals issued. New issuance came to a standstill in January 2014 as managers and investors sought clarity on the Volcker rule, but rebounded to $20 billion issued in March. |
| | · | | Commercial Mortgage-Backed Securities (CMBS): Over the 12-month period ending March 31, 2014 CMBS was largely affected by the Federal Reserve tapering and corresponding rise in interest rates along with the broader fixed income sector. Following the May 2013 sell-off following the initial taper talk, prices have rallied back and surpassed the highs seen last year. Additionally, the pace of new issuance remains strong. During the period, the CMBS portion of the Barclays U.S. Aggregate Bond Index returned 0.99% versus -0.10% for the broader index. On the new issue front, non-Agency CMBS issuance was up 29% year-over-year for the prior 12 months with $78 billion in new issuance in 98 deals compared to $60 billion in 75 deals from April 2012 through March 2013. Delinquency rates improved dramatically over the prior 12-months as commercial real estate (CRE) fundamentals improved and special servicers increased liquidations into a rising market: the overall US CMBS delinquency rate ended the first quarter at 6.5%, a 2.88% improvement year-over-year. Overall, delinquency rates have declined across all major property types over the past 12 months. |
| | · | | Real Assets: As measured by the Standard & Poor’s Goldman Sachs Commodity Excess Return Index, the broad-based commodities market posted a 1.08% gain for the 12-month period ending March 31, 2014. Performance was mixed with 11 of 24 commodities posting a positive return for the period. Lean hogs were the best performer returning over 40% after a deadly outbreak of porcine virus that reduced supply. Livestock had the largest gain in the complex, driven primarily by lean hogs, returning 18.80%. Precious metals were the worst performing sector returning -21.41% on low inflation prints despite large central bank balance sheets. |
| | · | | U.S. Large Cap Equities: The three major large capitalization U.S. equity indices all generated positive returns over the five-month period ending March 31, 2014 (the reporting period since inception of DoubleLine Shiller Enhanced CAPE®). The S&P 500® Index earned 7.57%, the NASDAQ Index returned 7.76%, and the Dow Jones Industrial Average increased 6.96%. 2013 was a banner year for equities and the final two months of the year ended on a positive note with the S&P 500® Index scoring a total return of 5.65%. The first quarter of 2014 was marked by moderate growth in U.S. large cap equity prices but was hampered by a severe winter that impacted consumer spending and earnings growth. During the five-month period ending March 31, 2014, the equity market continued its resilience in spite of reduction in the Federal Reserve’s large scale asset purchase program, resulting in a closing price of the S&P 500® Index less than 1% off of the all-time high. |
| | |
| Management’s Discussion of Fund Performance | | |
DoubleLine Total Return Bond Fund
The DoubleLine Total Return Bond Fund outperformed the Barclays U.S. Aggregate Bond Index return of -0.10% as well as the U.S. MBS component of the Index return of 0.20% for the 12-month period ending March 31, 2014. Over the period, interest rates rose meaningfully with the 10-year U.S. Treasury interest rate rising 0.87%. As a result, longer duration securities such as those within Agency residential MBS (RMBS), declined in prices. However, non-Agency RMBS rallied for much of the period, which helped to offset the decline in Agency RMBS, and was the main driver of the portfolio’s positive return. As duration of the Barclays U.S. MBS Index extended to historically high levels in November of 2013, the duration of the Fund also extended. Longer duration collateralized mortgage obligations (CMOs) held in the Fund, such as Agency Z bonds, contributed the most negative total return as the sector suffered from price declines which were only partially offset by positive coupon returns. Lower coupon passthroughs, which typically have longer durations relative to higher coupons, also contributed negative returns to the portfolio. The non-Agency RMBS sleeve performed well over the last twelve months as the sector only experienced a brief sell-off in June of 2013. Non-Agency RMBS rallied during much of the reporting period, contributing close to 7% in total return. Bond prices were up for almost all of the 12-month period with the exception of the month of June where non-Agency RMBS sold off for a brief period due to rising rates and redemptions from bond funds. Subprime securities held in the Fund were the best performers as the sector has benefited from an improving economy that has kept delinquency and default rates on a downward trend. Bonds backed by higher credit quality collateral, such as prime and Alt-A, also performed well contributing relatively strong interest income. The average coupon at the end of March for non-Agency RMBS held within the Fund was 5.4%. CMBS benefited from strong performance for much of the 12-month period as delinquency rates continued to fall. CLOs helped to add positive returns to the portfolio, but returns were muted compared to other sectors within the Fund as CLOs were affected by uncertainty regarding the regulatory environment going forward. MBS durations have declined slightly with the U.S. MBS component of the Barclays U.S. Aggregate Bond Index ending the period at a weighted average duration of 5.51 years, and the Barclays U.S. Aggregate Bond Index extended slightly to end the period at a weighted average duration of 5.65 years. Prepayment speeds in aggregate are as low as they have been since 2009 with the previous low dating back to the year 2000. At the end of the period, the Fund’s portfolio continued to have a shorter duration than that of the Barclays U.S. Aggregate Bond Index at 3.8 years with the duration slightly decreasing since the beginning of the year.
| | | | | | |
| Period Ended 3-31-14 | | | | 1-Year | |
I-Share | | | | | 1.13% | |
N-Share | | | | | 0.88% | |
Barclays Capital U.S. Aggregate Bond Index | | | | | -0.10% | |
For additional performance information, please refer to the “DoubleLine Funds’ Standardized Performance Summary.”
DoubleLine Emerging Markets Fixed Income Fund
Over the 12-month period ending March 31, 2014, the DoubleLine Emerging Markets Fixed Income Fund outperformed the JP Morgan EMBI Global Diversified (EMBI) Index. Over this period, the Fund benefited from a shorter duration relative to the index as 10-year U.S. Treasury yields rose 0.87% to 2.72% at the end of March 2014 from 1.85% 12-months prior. The Fund also benefited from an overweight exposure in EM corporate credits, which outperformed their EM sovereign counterpart. Performance was partially offset by an overweight position in Latin America credits which underperformed over the period due to a slowdown in China growth and lower commodity prices.
| | | | | | |
| Period Ended 3-31-14 | | | | 1-Year | |
I-Share | | | | | 0.95% | |
N-Share | | | | | 0.69% | |
JP Morgan Emerging Markets Bond Global Diversified Index | | | | | 0.56% | |
For additional performance information, please refer to the “DoubleLine Funds’ Standardized Performance Summary.”
DoubleLine Core Fixed Income Fund
The DoubleLine Core Fixed Income Fund outperformed the Barclays U.S. Aggregate Bond Index return of -0.10% for the 12-month period ending March 31, 2014. At the end of the period, the Fund’s duration continued to be shorter than that of the Barclays U.S. Aggregate Bond Index duration of 5.6 years, and the average dollar price of the securities was just over par as of March 31, 2014. High yield was the primary
| | | | | | |
| | Annual Report | | March 31, 2014 | | 7 |
Management’s Discussion of Fund Performance (Cont.)
driver of the portfolio’s outperformance as the sector rallied all through last year adding over 5% in total return for the trailing 12-month period. The sector has benefited from credit spread tightening coupled with a very benign default environment. Not far behind in performance, leveraged loans and CLOs helped boost returns despite regulatory uncertainty. RMBS, which continue to be the largest sector of the Fund at approximately 30% of the portfolio, outperformed the Barclays U.S. MBS Index’s return of 0.20% for the 12-month period. Not surprisingly, due to the rise in interest rates, longer duration Agency RMBS declined in prices. Conversely, non-Agency RMBS rallied for much of the period, which helped to offset the decline in Agency RMBS, and was the main driver in the mortgage sleeve’s outperformance over the Barclays U.S. MBS Index. The non-Agency RMBS portion of the Fund performed well over 12-month period as the sector only experienced a brief sell-off in June of 2013. From a total return perspective, subprime securities gained the most in total return within the non-Agency RMBS sector. In aggregate, the non-Agency RMBS sector also contributed strong interest returns as the average coupon of the sector was over 5.5% as of March 31, 2014. All other sectors, such as investment grade corporate bonds, emerging markets and CMBS also contributed to positive returns during the period, with Governments as the only sector that detracted from total returns.
| | | | | | |
| Period Ended 3-31-14 | | | | 1-Year | |
I-Share | | | | | 1.03% | |
N-Share | | | | | 0.77% | |
Barclays Capital U.S. Aggregate Bond Index | | | | | -0.10% | |
For additional performance information, please refer to the “DoubleLine Funds’ Standardized Performance Summary.”
DoubleLine Multi-Asset Growth Fund
The DoubleLine Multi-Asset Growth Fund turned in positive performance for the 12-month period ending March 31, 2014; however, the Fund underperformed the Blended Benchmark* for the period. Global Equity allocations were the strongest performers over this period. Fixed income exposure was the second strongest asset class, adeptly navigating increased periods of volatility during the initial spike in U.S. Treasury rates seen in May 2013, and further volatility in fixed income markets seen during the second half of 2013. Real Assets were the only sector that experienced a negative return over the period, with commodity markets in general seeing large price declines, and real asset focused investment vehicles seeing significant outflows. Exposure to this asset class, however, remains relatively small compared to the equity and fixed income allocations.
| | | | | | |
| Period Ended 3-31-14 | | | | 1-Year | |
I-Share | | | | | 3.65% | |
A-Share | | | | | | |
No Load | | | | | 3.28% | |
With Load | | | | | -1.11% | |
Blended Benchmark* | | | | | 4.21% | |
S&P 500 Total Return Index | | | | | 21.86% | |
| * | Blended Benchmark: 60% Barclays U.S. Aggregate Index/25% Morgan Stanley Capital International All Country World Index/15% S&P Goldman Sachs Commodity Index Total Return |
For additional performance information, please refer to the “DoubleLine Funds’ Standardized Performance Summary.”
DoubleLine Low Duration Bond Fund
The DoubleLine Low Duration Bond Fund outperformed the Bank of America (BofA)/Merrill Lynch U.S. Treasuries 1-3 Year U.S. Treasury Index’s return of 0.38% over the 12-month period ending March 31, 2014. At the end of the period, the Fund remained invested across multiple asset classes including allocations to U.S. Government securities, RMBS, investment grade credit, EMFI, CLOs and CMBS. The portfolio benefited from more credit sensitive sectors such as non-Agency RMBS and EMFI which were the main drivers of the outperformance of the portfolio over its Index. From a total return perspective, RMBS was the best performing sector aided by strong price gains from non-Agency RMBS. These securities performed well over the 12-month reporting period and only experienced a brief sell-off in the month of June of 2013. Agency RMBS experienced price declines due to the interest rate rise, but the interest income from the sector more than offset the price losses. The RMBS sector was approximately 11% of the Fund with a near zero duration at the end of the reporting period. EMFI was the next best performing sector within the Fund, as credit spreads tightened because of a flattening yield curve. Generally, the sector benefited from a rally in the middle of the quarter despite no material changes in the fundamental picture respective to local
economies. EMFI was roughly 20% of the Fund at the end of the period with a duration of 2.5 years. Other securitized products also performed well with both CMBS and CLO sectors helping to boost returns with price gains. Both sectors have experienced strong demand, and have traded well. CLOs experienced a healthy volume of issuance over the 12-month period as both experienced and new CLO managers were all able to bring new deals to the market. The new deals were met with much interest with spreads tightening in for most of the year, and only widening slightly in the fourth quarter of 2013. The duration of CMBS and CLO securities held within the Fund remained less than 1 year as of March 31, 2014. Other sectors of the portfolio such as investment grade credit, bank loans and governments also contributed positive returns to the portfolio. These sectors all outperformed their benchmark with the exception of the government bonds held in the portfolio. At the end of the period, the overall Fund duration continued to be approximately 1 year with a weighted average life of just over 2 years. Credit exposure remained relatively limited as approximately 80% of the Fund was in cash, government debt or issuers with investment grade credit ratings.
| | | | | | |
| Period Ended 3-31-14 | | | | 1-Year | |
I-Share | | | | | 1.51% | |
N-Share | | | | | 1.26% | |
BofA/Merrill Lynch 1-3 Year U.S. Treasury Index | | | | | 0.38% | |
For additional performance information, please refer to the “DoubleLine Funds’ Standardized Performance Summary.”
DoubleLine Floating Rate Fund
The DoubleLine Floating Rate Fund underperformed the S&P/LSTA Leveraged Loan Index during the 12-month period ending March 31, 2014. This was primarily due to the composition of the portfolio relative to the Index. For instance, the Fund had a higher allocation to BBs than the S&P/LSTA Leveraged Loan Index. During the 12-month period, the Fund had limited exposure to CCCs and second lien loans, which had returns far outpacing lower-risk categories. Defaults continued their muted trend, with the lagging 12-month loan default rate hitting a 16-month low of 1.21% by dollar amount and 1.02% by number of loans.
| | | | | | |
| Period Ended 3-31-14 | | | | 1-Year | |
I-Share | | | | | 3.07% | |
N-Share | | | | | 2.93% | |
S&P LSTA Leveraged Loan Index | | | | | 4.35% | |
Credit Suisse Leveraged Loan Index | | | | | 5.28% | |
For additional performance information, please refer to the “DoubleLine Funds’ Standardized Performance Summary.”
DoubleLine Shiller Enhanced CAPE®
Since the inception of DoubleLine Shiller Enhanced CAPE® through March 31, 2014, the Fund has outperformed both the S&P 500® Index and the Shiller Barclays CAPE® U.S. Sector Total Return Index. Five out of six sectors that the Fund was exposed to during the reporting period (Consumer Staples, Financial, Healthcare, Industrial, and Technology) delivered positive returns. The one sector that the Fund was exposed to that delivered negative returns was Energy, which returned -0.52% for the period. The average return for all six sectors was greater than the return of the S&P 500® Index leading to the outperformance. The fixed income collateral performance was impacted by cash drag during the ramping up of the Fund’s operations but subsequently the pool generated a strong positive return outperforming cash. All bond sectors the Fund had exposure to posted positive returns. Key drivers of performance were emerging markets and corporate bonds as these sectors outperformed the aggregate bond market.
| | | | | | |
| Period Ended 3-31-14 | | | | Since Inception 10-31-2013 (Not Annualized) | |
I-Share | | | | | 7.83% | |
N-Share | | | | | 7.73% | |
S&P 500® Index | | | | | 7.57% | |
Shiller Barclays CAPE® U.S. Sector Total Return Index | | | | | 6.72% | |
For additional performance information, please refer to the “DoubleLine Funds’ Standardized Performance Summary.”
| | | | | | |
| | Annual Report | | March 31, 2014 | | 9 |
Management’s Discussion of Fund Performance (Cont.)
Past performance is not a guarantee of future results.
Opinions expressed herein are as of March 31, 2014 and are subject to change at any time, are not guaranteed and should not be considered investment advice.
The performance shown assumes the reinvestment of all dividends and distributions and does not reflect any reductions for taxes. Investment performance reflects fee waivers in effect. In the absence of such waivers, total return would be reduced.
Fund holdings and sector allocations are subject to change at any time and are not recommendations to buy or sell any security. Please refer to the Schedules of Investments for a complete list of Fund holdings.
This report is for the information of shareholders of the Funds. It may also be used as sales literature when preceded or accompanied by the current prospectus.
Credit distribution is determined from the highest available credit rating from any Nationally Recognized Statistical Rating Organization (S&P, Moody’s and Fitch).
Mutual fund investing involves risk; principal loss is possible. Investments in debt securities typically decrease when interest rates rise. This risk is usually greater for longer-term debt securities. Investments in lower rated and non-rated securities present a great risk of loss to principal and interest than higher rated securities.
The Emerging Markets Fixed Income Fund, Core Fixed Income Fund, Multi-Asset Growth Fund, Total Return Bond Fund, Floating Rate Fund, Shiller Enhanced CAPE® and the Low Duration Bond Fund may invest in Asset-Backed and Mortgage-Backed securities. Investments in Asset-Backed and Mortgage-Backed securities include additional risks that investors should be aware of including credit risk, prepayment risk, possible illiquidity and default, as well as increased susceptibility to adverse economic developments.
The Emerging Markets Fixed Income Fund, Core Fixed Income Fund, Multi-Asset Growth Fund, Low Duration Bond Fund, Floating Rate Fund, and Shiller Enhanced CAPE® will also invest in foreign securities, which involve political, economic, and currency risks, greater volatility, and differences in accounting methods. These risks are greater for investments in emerging markets.
The Multi-Asset Growth Fund may invest in securities related to real estate, which may decline in value as a result of factors affecting the real estate industry. Commodity-linked derivative instruments may involve additional costs and risks such as changes in commodity index volatility or factors affecting a particular industry or commodity, such as drought, floods, weather, livestock disease, embargoes, tariffs and international economic, political and regulatory developments. Investing in derivatives could lose more than the amount invested.
The Total Return Bond Fund, Low Duration Bond Fund, Shiller Enhanced CAPE®, and Core Fixed Income Fund may also invest in securities related to real estate, which may decline in value as a result of factors affecting the real estate industry.
The Multi-Asset Growth Fund and Shiller Enhanced CAPE® may experience equity risk. Equities may decline in value due to both real and perceived general market, economic, and industry conditions.
In order to achieve its investment objectives, the Low Duration Bond Fund, Total Return Bond Fund, Core Fixed Income Fund, Emerging Markets Fixed Income Fund, Multi-Asset Growth Fund, Floating Rate Fund and Shiller Enhanced CAPE® may use certain types of exchange traded funds or investment derivatives. Derivatives involve risks different from, and in certain cases, greater than the risks presented by more traditional investments. Derivatives may involve certain costs and risks such as liquidity, interest rate, market, credit, management and the risk that a position could not be closed when most advantageous. Investing in derivatives could lose more than the amount invested. ETF investments involve additional risks such as the market price trading at a discount to its net asset value, an active secondary trading market may not develop or be maintained, or trading may be halted by the exchange in which they trade, which may impact a fund’s ability to sell its shares.
The DoubleLine Floating Rate Fund will invest in floating rate securities which include additional risks that investors should be aware of such as credit risk, interest rate risk, possible illiquidity and default, as well as increased susceptibility to adverse economic developments.
The DoubleLine Shiller Enhanced CAPE® may make short sales of securities, which involves the risk that losses may exceed the original amount invested.
Additional principal risks for the Funds can be found in the prospectus.
Diversification does not assure a profit or protect against loss in a declining market.
Barclays U.S. Aggregate Bond Index—The Index represents securities that are SEC-registered, taxable, and dollar denominated. The index covers the US investment grade fixed rate bond market, with index components for government and corporate securities, mortgage pass-through securities, and asset-backed securities. These major sectors are subdivided into more specific indices that are calculated and reported on a regular basis.
Barclays U.S. CMBS Index—The Index measures the performance of investment grade commercial mortgage-backed securities, which are classes of securities that represent interests in pools of commercial mortgages.
Barclays U.S. Credit Index—This index is the US Credit component of the US Government/Credit Index and consists of publically issued US corporate and specified foreign debentures and secured notes that meet the specified maturity, liquidity, and quality requirements. To qualify, bonds must be SEC-registered. The US Credit Index is the same as the former US Corporate Investment Grade Index.
Barclays U.S. MBS Index—The Index measures the performance of investment grade fixed-rate mortgage-backed pass-through securities of the Government-Sponsored Enterprises (GSEs): Ginnie Mae (GNMA), Fannie Mae (FNMA), and Freddie Mac (FHLMC).
Below Investment Grade—Refers to a security that is rated below investment grade. These securities are seen as having higher default risk or other adverse credit events, but typically pay higher yields than better quality bonds in order to make them attractive. They are less likely to pay back 100 cents on the dollar.
BofA/Merrill Lynch 1-3 Year U.S. Treasury Index—The index is an unmanaged index that tracks the performance of the direct sovereign debt of the U.S. Government having a maturity of at least one year and less than three years. It is not possible to invest directly in an unmanaged index.
Citi High-Yield Cash-Pay Capped Index—The index represents the cash-pay securities of the Citigroup High-Yield Market Capped Index, which represents a modified version of the High Yield Market Index by delaying the entry of fallen angel issues and capping the par value of individual issuers at $5 billion par amount outstanding.
Cotation Assistée en Continu (CAC)—CAC refers to the CAC 40 Index which is a French stock market index. It tracks 40 of the largest French stocks on the Paris Bourse, or stock exchange.
Credit Suisse Leveraged Loan Index —This index tracks the investable market of the U.S. dollar denominated leveraged loan market. It consists of issues rated “5B” or lower, meaning that the highest rated issues included in this index are Moody’s/S&P ratings of Baa1/BB+ or Ba1/BBB+. All loans are funded term loans with a tenor of at least one year and are made by issuers domiciled in developed countries. The Fund’s investments will likely diverge widely from the components of the benchmark index which could lead to performance dispersion between the Fund and the benchmark Index, meaning that the Fund could outperform or underperform the Index at any given time.
Deutsche Borse AG German Stock Index (DAX)—DAX is the Deutscher Aktien-Index, or the German stock index, which represents 30 of the largest and most liquid German companies that trade on the Frankfurt Exchange.
| | | | | | |
| 10 | | DoubleLine Funds Trust | | | | |
Dow Jones Industrial Average (DJIA)—Invented in 1896, the Dow Jones Industrial Average is a price-weighted average of 30 significant stocks traded on the New York Stock Exchange (NYSE) and the Nasdaq.
Duration—A measure of the sensitivity of a price of a fixed income investment to a change in interest rates, expressed as a number of years.
Federal Open Market Committee (FOMC)—The FOMC is the branch of the Federal Reserve Board that determines the direction of monetary policy. The FOMC is composed of the board of governors, which has seven members, and five reserve bank presidents. The president of the Federal Reserve Bank of New York serves continuously, while the presidents of the other reserve banks rotate their service of one-year terms.
FTSE MIB (Milano Italia Borsa)—FTSE is the Financial Times Stock Exchange, which is similar to S&P in the U.S., and specializes in index calculation. They are best known for the FTSE 100 Index which includes blue-chip stocks on the London Stock Exchange. The FTSE MIB is the benchmark stock market index for the Borsa Italiana, the Italian national stock exchange, which superseded the MIB-30 in September 2004.
House Price Appreciation (HPA)—This is the increase in the value of housing over time that could occur due to any number of reasons including but not limited to increased demand, weakening supply, or changes in interest rates.
IBEX 35—The IBEX 35 is the official index of the Spanish Continuous Market. The index is comprised of the 35 most liquid stocks traded on the Continuous market. It is calculated, supervised and published by the Sociedad de Bolsas.
Investment Grade—Refers to a bond considered investment grade if its credit rating is BBB – or higher by Standard & Poor’s or Baa3 or higher by Moody’s. Ratings are based on corporate bond model. The higher the rating the more likely the bond will pay back par/100 cents on the dollar.
JP Morgan Emerging Markets Bond Global Diversified Index (EMBI)—This index is uniquely-weighted version of the EMBI Global. It limits the weights of those index countries with larger debt stocks by only including specified portions of these countries’ eligible current face amounts of debt outstanding. The countries covered in the EMBI Global Diversified are identical to those covered by EMBI Global.
Merrill Lynch 100 Technology Index—The index is an equal-dollar weighted index of 100 stocks designed to measure the performance of a cross section of large, actively traded technology stocks and American Depositary Receipts.
Morgan Stanley Capital International All Country World Index (MSCI ACWI)—This Index is a market-capitalization-weighted index designed to provide a broad measure of stock performance throughout the world, including both developed and emerging markets.
Morgan Stanley Capital International EAFE Index (MSCI EAFE)—The index is a market-capitalization weighted stock market index designed to measure equity market performance of developed markets outside of the U.S. and Canada. This index includes a selection of stocks from 21 developed markets, excluding the U.S. and Canada.
Morgan Stanley Capital International Emerging Markets Index (MSCI EM)—The Index is a float-adjusted market capitalization index designed to measure equity market performance in global emerging markets. It consists of indices in 26 emerging economies, including but not limited to, Argentina, Brazil, China, India, Poland, Thailand, Turkey, and Venezuela.
NASDAQ—The NASDAQ, or National Association of Securities Dealers Automated Quotation, is an electronic trading system that provides price quotations to market participants on the more actively traded common stock issues; approximately 4,000 common stock issues are included in the system.
Nikkei—The Nikkei is short for Japan’s Nikkei 225 Stock Average, which is the leading index of Japanese stocks. This index is price-weighted and comprised of Japan’s top 225 blue-chip companies on the Tokyo Stock Exchange. The Nikkei is equivalent to the Dow Jones Industrial Average Index in the U.S.
Russell 2000® Growth Index—This index measures the performance of the small-cap growth segment of the U.S. equity universe. It includes those Russell 2000 Index companies with higher price-to-value ratios and higher forecasted growth values.
S&P 500® Index—The index is a capitalized-weighted index of 500 stocks.
S&P/Case-Shiller 20-City Home Price Index—The index measures the value of residential real estate in 20 metropolitan areas of the U.S. It is included in the S&P/Case-Shiller Home Price Index Series which seeks to measure changes in the total value of all existing single-family housing stock.
S&P/Goldman Sachs Commodity Excess Return Index (S&P GSCI ER)—The index is a composite index of commodity sector returns which represents a broadly diversified, unleveraged, long-only position in commodity futures. The index’s components qualify for inclusion in the index based on liquidity measures and are weighted in relation to their global production levels, making the Index a valuable economic indicator and commodities market benchmark. The S&P GSCI Excess Return Index (SPSCI ER) is one of the three S&P GSCI Indices published, measuring the return accrued from investing in uncollateralized nearby commodity futures. This Excess Return Index includes an Energy component, which was referenced in this commentary.
S&P/LSTA Leveraged Loan Index—Capitalization-weighted syndicated loan indices are based upon market weightings, spreads and interest payments, and this index covers the U.S. market back to 1997 and currently calculates on a daily basis. Created by the Leveraged Commentary & Data (LCD) team at S&P Capital IQ, the review provides an overview and outlook of the leveraged loan market as well as an expansive review of the S&P Leveraged Loan Index and sub-indexes. The review consists of index general characteristics, results, risk-return profile, default/distress statistics, and repayment analysis.
Shanghai Composite Index—The Index is a capitalization-weighted index. The index tracks the daily price performance of all A-shares and B-shares listedon the Shanghai Stock Exchange. The index was developed on December 19, 1990 with a base value of 100. Index trade volume on Q is scaled down by a factor of 1000.
Shiller Barclays CAPE® US Sector Total Return Index—The index was launched on September 2012 (“Index”). Any provided performance information relating to a period prior to that date is hypothetical. The Index methodology is available for review upon request. Barclays Bank PLC (“Barclays”) or an affiliate of Barclays prepared the provided performance information (including the hypothetical performance information), is the index sponsor for the Index and potentially is the counterparty to a transaction referencing the Index. It is in Barclays interest to demonstrate positive pre-inception index performance. The pre-inception index performance is included from the period from Feb 1988 to September 2012. Actual performance is highlighted in grey. The data below reflects a cost of 0.28% per annum that is incorporated into the Index formula. The performance information, however, does not reflect any additional fees that may be paid by counterparty to a transaction referencing the Index that may be agreed between the parties thereto. Fees are not reflected in the provided Index performance information.
Weighted Average Life—Weighted average life, or WAL, is the average number of years for which each dollar of unpaid principal on a loan or mortgage remains outstanding.
A direct investment cannot be made in an index. The performance of any index mentioned in this commentary has not been adjusted for ongoing management, distribution and operating expenses applicable to mutual fund investments.
The DoubleLine Funds are distributed by Quasar Distributors, LLC.
DoubleLine® is a registered trademark of DoubleLine Capital LP.
This commentary may include statements that constitute “forward-looking statements” under the U.S. securities laws. Forward-looking statements include, among other things, projections, estimates, and information about possible or future results related to a Fund and market or regulatory developments. The views expressed above are not guarantees of future performance or economic results and involve certain risks, uncertainties and assumptions that could cause actual outcomes and results to differ materially from the views expressed herein.
| | | | | | |
| | Annual Report | | March 31, 2014 | | 11 |
Management’s Discussion of Fund Performance (Cont.)
DoubleLine has no obligation to provide revised assessments in the event of changed circumstances. While we have gathered this information from sources believed to be reliable, DoubleLine cannot guarantee the accuracy of the information provided. Securities discussed are not recommendations and are presented as examples of issue selection or portfolio management processes. They have been picked for comparison or illustration purposes only. No security presented within is either offered for sale or purchase. DoubleLine reserves the right to change its investment perspective and outlook without notice as market conditions dictate or as additional information becomes available.
Investment strategies may not achieve the desired results due to implementation lag, other timing factors, portfolio management decision making, economic or market conditions or other unanticipated factors. The views and forecasts expressed in this material are as of the date indicated, are subject to change without notice, may not come to pass and do not represent a recommendation or offer of any particular security, strategy, or investment. Past performance is no guarantee of future results.
| | | | | | |
| 12 | | DoubleLine Funds Trust | | | | |
DoubleLine Funds’ Standardized Performance Summary
As of March 31, 2014
| | | | | | | | | | | | | | | | |
| DBLTX/DLTNX | | | | | | | | | | | | | |
| Total Return Bond Fund | | | 1 Year | | |
| 3 Year
Annualized |
| |
| Since Inception
Annualized
(4-6-10 to 3-31-14) |
| | Gross
Expense Ratio | | Net
Expense Ratio* |
I-share (DBLTX) | | | 1.13% | | | | 6.16% | | | | 9.34% | | | 0.47% | | 0.48% |
N-share (DLTNX) | | | 0.88% | | | | 5.87% | | | | 9.06% | | | 0.72% | | 0.73% |
Barclays Capital U.S. Aggregate Bond Index | | | -0.10% | | | | 3.75% | | | | 4.25% | | | | | |
| DBLEX/DLENX | | | | | | | | | | | | | |
| Emerging Markets Fixed Income Fund | | | 1 Year | | |
| 3 Year
Annualized |
| |
| Since Inception
Annualized
(4-6-10 to 3-31-14) |
| | Expense Ratio |
I-share (DBLEX) | | | 0.95% | | | | 5.60% | | | | 7.07% | | | 0.92% |
N-share (DLENX) | | | 0.69% | | | | 5.34% | | | | 6.81% | | | 1.17% |
JP Morgan Emerging Markets Bond Global Diversified Index | | | 0.56% | | | | 7.10% | | | | 7.44% | | | | | |
| DBLFX/DLFNX | | | | | | | | | | | | | |
| Core Fixed Income Fund | | | 1 Year | | |
| 3 Year
Annualized |
| |
| Since Inception
Annualized
(6-1-10 to 3-31-14) |
| | Expense Ratio |
I-share (DBLFX) | | | 1.03% | | | | 6.17% | | | | 7.41% | | | 0.48% |
N-share (DLFNX) | | | 0.77% | | | | 5.88% | | | | 7.14% | | | 0.73% |
Barclays Capital U.S. Aggregate Bond Index | | | -0.10% | | | | 3.75% | | | | 3.76% | | | | | |
| DMLIX/DMLAX | | | | | | | | | | | | | |
| Multi-Asset Growth Fund | | | 1 Year | | |
| 3 Year
Annualized |
| |
| Since Inception
Annualized
(12-20-10 to 3-31-14) |
| | Gross
Expense Ratio | | Net
Expense Ratio* |
I-share (DMLIX) | | | 3.65% | | | | 2.94% | | | | 3.07% | | | 1.26% | | 1.13% |
A-share (DLMAX) | | | | | | | | | | | | | | 1.51% | | 1.38% |
A-share (No Load) | | | 3.28% | | | | 2.68% | | | | 2.77% | | | | | |
A-share (With Load) | | | -1.11% | | | | 1.20% | | | | 1.42% | | | | | |
Blended Benchmark** | | | 4.21% | | | | 4.16% | | | | 5.11% | | | | | |
S&P 500® Total Return Index | | | 21.86% | | | | 14.66% | | | | 15.66% | | | | | |
| DBLSX/DLSNX | | | | | | | | | | | | | |
| Low Duration Bond Fund | | | 1 Year | | | | | | |
| Since Inception
Annualized
(9-30-11 to 3-31-14) |
| | Gross
Expense Ratio | | Net
Expense Ratio* |
I-share (DBLSX) | | | 1.51% | | | | | | | | 2.73% | | | 0.48% | | 0.47% |
N-share (DLSNX) | | | 1.26% | | | | | | | | 2.46% | | | 0.73% | | 0.72% |
BofA/Merrill Lynch 1-3 Year U.S. Index Treasury | | | 0.38% | | | | | | | | 0.45% | | | | | |
| DBFRX/DLFRX | | | | | | | | | | | | | |
| Floating Rate Fund | | | 1 Year | | | | | | |
| Since Inception
Annualized
(2-1-13 to 3-31-14) |
| | Gross
Expense Ratio | | Net
Expense Ratio* |
I-share (DBFRX) | | | 3.07% | | | | | | | | 3.35% | | | 0.73% | | 0.73% |
N-share (DLFRX) | | | 2.93% | | | | | | | | 3.23% | | | 0.98% | | 0.98% |
S&P LSTA Leveraged Loan Index | | | 4.35% | | | | | | | | 4.69% | | | | | |
Credit Suisse Leveraged Loan Index | | | 5.28% | | | | | | | | 5.45% | | | | | |
| DSEEX/DSENX | | | | | | | | | | | | | |
| Shiller Enhanced CAPE® | |
| Since Inception
(10-31-13 to 3-31-14) |
| | | | | | | | | | Gross
Expense Ratio | | Net
Expense Ratio* |
I-share (DSEEX) | | | 7.83% | | | | | | | | | | | 4.98% | | 0.65% |
N-share (DSENX) | | | 7.73% | | | | | | | | | | | 5.23% | | 0.90% |
S&P 500® | | | 7.57% | | | | | | | | | | | | | |
Shiller Barclays CAPE® U.S. Sector Total Return USD Index | | | 6.72% | | | | | | | | | | | | | |
| | | | | | |
| | Annual Report | | March 31, 2014 | | 13 |
DoubleLine Funds’ Standardized Performance Summary (Cont.)
The performance information shown assumes the reinvestment of all dividends and distributions. Returns over 1 year are average annual returns. Performance data quoted represents past performance; past performance does not guarantee future results. The prospectus contains more complete information on the investment objectives, risks, charges and expenses of the investment company, which investors should read and consider carefully before investing. To obtain a prospectus, contact a registered representative or visit www.doublelinefunds.com. The investment return and principal value of an investment will fluctuate so that an investor’s shares, when redeemed, may be worth more or less than the original cost. Current performance of a fund may be lower or higher than the performance quoted. Performance data current to the most recent month-end may be obtained by calling (213) 633-8200 or by visiting www.doublelinefunds.com.
Performance data shown for the Multi-Asset Growth Fund Class A shares reflects the maximum sales charge of 4.25%. Performance data shown for the Class A No Load does not reflect the deduction of the sales load or fee. If reflected, the load or fee would reduce the performance quoted. The Multi-Asset Growth Fund imposes a Deferred Sales Charge of 0.75% on purchases of $1 million or more of Class A shares if redeemed within 18 months of purchase. The Multi-Asset Growth Fund and Floating Rate Fund impose a 1.00% redemption fee on all share classes if shares are sold within 90 days of purchase. Performance data does not reflect the redemption fee. If it had, returns would be reduced.
*The Adviser has contractually agreed to waive fees and reimburse expenses through July 31, 2014.
**The Blended Benchmark for the Multi-Asset Growth Fund is 60% Barclays U.S. Aggregate Index, 25% MSCI All Country World Index & 15% S&P Goldman Sachs Commodity Total Return Index
Mutual Fund Investing involves risk. Principal loss is possible.
| | | | | | |
| 14 | | DoubleLine Funds Trust | | | | |
| | |
| Schedule of Investments DoubleLine Total Return Bond Fund | | March 31, 2014 |
| | | | | | | | | | | | | | | | |
PRINCIPAL
AMOUNT | | | SECURITY DESCRIPTION | | RATE | | | MATURITY | | | VALUE $ | |
| | COLLATERALIZED LOAN OBLIGATIONS 3.0% | |
| |
| | | | ALM Loan Funding, | |
| $ | 3,750,000 | | | Series 2012-6A-C | | | 4.98% | #^ | | | 06/14/2023 | | | | 3,767,472 | |
| |
| | | | ARES Ltd., | |
| | 6,351,752 | | | Series 2006-6RA-A2 | | | 0.51% | # | | | 03/12/2018 | | | | 6,297,187 | |
| | 79,724,070 | | | Series2011-16A-AR | | | 1.22% | #^ | | | 05/17/2021 | | | | 79,335,834 | |
| | 25,000,000 | | | Series2013-1A-B | | | 1.99% | #^ | | | 04/15/2025 | | | | 24,574,071 | |
| | 6,500,000 | | | Series2013-1A-D | | | 3.99% | #^ | | | 04/15/2025 | | | | 6,374,337 | |
| |
| | | | Atrium Corporation, | |
| | 109,327 | | | Series 3A-A1 | | | 0.56% | #^ | | | 10/27/2016 | | | | 109,322 | |
| |
| | | | Avery Point Ltd., | |
| | 5,000,000 | | | Series 2014-1A-A | | | 1.75% | #^ | | | 04/25/2026 | | | | 5,000,000 | |
| | 4,250,000 | | | Series 2014-1A-D | | | 3.73% | #^ | | | 04/25/2026 | | | | 4,082,125 | |
| |
| | | | Babson, Inc., | |
| | 4,519,157 | | | Series 2005-3A-A | | | 0.49% | #^ | | | 11/10/2019 | | | | 4,494,399 | |
| |
| | | | Black Diamond Ltd., | |
| | 2,713,518 | | | Series 2005-1A-A1 | | | 0.50% | #^ | | | 06/20/2017 | | | | 2,690,048 | |
| |
| | | | BlueMountain Ltd., | |
| | 25,000,000 | | | Series 2012-2A-A1 | | | 1.65% | #^ | | | 11/20/2024 | | | | 24,933,998 | |
| | 19,000,000 | | | Series 2012-2A-B1 | | | 2.29% | #^ | | | 11/20/2024 | | | | 18,923,956 | |
| | 16,150,000 | | | Series 2012-2A-C | | | 2.98% | #^ | | | 11/20/2024 | | | | 16,052,393 | |
| |
| | | | BMI Trust, | |
| | 115,342,363 | | | Series 2013-1AR-A1R | | | 1.17% | #^ | | | 08/01/2021 | | | | 114,608,285 | |
| |
| | | | Brookside Mill Ltd., | |
| | 17,000,000 | | | Series 2013-1A-C1 | | | 2.94% | #^ | | | 04/17/2025 | | | | 16,789,947 | |
| |
| | | | Canyon Capital Ltd., | |
| | 9,500,000 | | | Series 2012-1A-B1 | | | 2.19% | #^ | | | 01/15/2024 | | | | 9,301,475 | |
| |
| | | | Cent Ltd., | |
| | 3,000,000 | | | Series 2005-10A-D | | | 1.98% | #^ | | | 12/15/2017 | | | | 2,928,905 | |
| |
| | | | Centurion Ltd., | |
| | 2,500,000 | | | Series 2005-8X-C | | | 1.24% | # | | | 03/08/2017 | | | | 2,465,813 | |
| |
| | | | Crown Point Ltd., | |
| | 10,500,000 | | | Series 2012-1A-A1LB | | | 1.73% | #^ | | | 11/21/2022 | | | | 10,496,195 | |
| |
| | | | Dryden Leveraged Loan, | |
| | 569,419 | | | Series 2005-8A-A | | | 0.49% | #^ | | | 05/22/2017 | | | | 569,381 | |
| |
| | | | Dryden Senior Loan Fund, | |
| | 4,000,000 | | | Series 2012-24A-D | | | 4.99% | #^ | | | 11/15/2023 | | | | 4,019,351 | |
| | 10,000,000 | | | Series 2012-25A-B1 | | | 2.49% | #^ | | | 01/15/2025 | | | | 9,997,290 | |
| |
| | | | Fortress Credit Ltd., | |
| | 10,000,000 | | | Series 2013-1A-A | | | 1.42% | #^ | | | 01/19/2025 | | | | 9,826,722 | |
| | 10,000,000 | | | Series 2013-1A-B | | | 2.14% | #^ | | | 01/19/2025 | | | | 9,740,283 | |
| |
| | | | Galaxy Ltd., | |
| | 13,000,000 | | | Series 2013-15A-B | | | 2.09% | #^ | | | 04/15/2025 | | | | 12,797,125 | |
| | 13,100,000 | | | Series 2013-15A-C | | | 2.84% | #^ | | | 04/15/2025 | | | | 12,835,986 | |
| | 6,125,000 | | | Series 2013-15A-D | | | 3.64% | #^ | | | 04/15/2025 | | | | 5,965,368 | |
| |
| | | | Gannett Peak Ltd., | |
| | 2,036,883 | | | Series 2006-1A-A1A | | | 0.49% | #^ | | | 10/27/2020 | | | | 2,032,483 | |
| |
| | | | GLG Ore Hill Ltd., | |
| | 37,000,000 | | | Series 2013-1A-A | | | 1.36% | #^ | | | 07/15/2025 | | | | 36,258,943 | |
| |
| | | | ICE Global Credit Ltd., | |
| | 30,000,000 | | | Series 2013-1A-A1 | | | 1.99% | #^ | | | 04/20/2024 | | | | 29,598,000 | |
| | 25,000,000 | | | Series 2013-1A-B2 | | | 2.79% | #^ | | | 04/20/2024 | | | | 24,137,500 | |
| |
| | | | Kingsland Ltd., | |
| | 500,000 | | | Series 2005-1A-C2 | | | 6.13% | ^ | | | 06/13/2019 | | | | 500,290 | |
| |
| | | | KKR Financial Corporation, | |
| | 5,043,950 | | | Series 2006-1A-A1 | | | 0.51% | #^ | | | 08/25/2018 | | | | 5,018,377 | |
| | 12,701,930 | | | Series 2007-AA-A | | | 0.99% | #^ | | | 10/15/2017 | | | | 12,670,885 | |
| |
| | | | KVK Ltd., | |
| | 20,000,000 | | | Series 2013-1A-A | | | 1.64% | #^ | | | 04/14/2025 | | | | 19,917,985 | |
| |
| | | | LCM LP, | |
| | 3,000,000 | | | Series 10X-A | | | 1.72% | # | | | 04/15/2022 | | | | 3,004,549 | |
| | 3,650,000 | | | Series 11A-D2 | | | 4.19% | #^ | | | 04/19/2022 | | | | 3,652,786 | |
| | 20,000,000 | | | Series 12A-A | | | 1.71% | #^ | | | 10/19/2022 | | | | 19,958,204 | |
| | | | | | | | | | | | | | | | |
PRINCIPAL
AMOUNT | | | SECURITY DESCRIPTION | | RATE | | | MATURITY | | | VALUE $ | |
| |
| | | | LCM LP, (Cont.) | |
| $ | 12,600,000 | | | Series 13A-C | | | 3.14% | #^ | | | 01/19/2023 | | | | 12,576,145 | |
| | 2,075,000 | | | Series 14A-D | | | 3.74% | #^ | | | 07/15/2025 | | | | 2,016,538 | |
| |
| | | | Marathon Ltd., | |
| | 17,000,000 | | | Series 2013-5A-A2A | | | 2.58% | #^ | | | 02/21/2025 | | | | 16,996,748 | |
| |
| | | | Marea Ltd., | |
| | 2,000,000 | | | Series 2012-1A-D | | | 4.79% | #^ | | | 10/16/2023 | | | | 2,008,048 | |
| |
| | | | Nomad Ltd., | |
| | 9,000,000 | | | Series 2013-1A-B | | | 3.19% | #^ | | | 01/15/2025 | | | | 8,971,887 | |
| | 3,500,000 | | | Series 2013-1A-C | | | 3.74% | #^ | | | 01/15/2025 | | | | 3,417,270 | |
| |
| | | | Northwoods Capital Corporation, | |
| | 30,000,000 | | | Series 2012-9A-A | | | 1.66% | #^ | | | 01/18/2024 | | | | 29,970,698 | |
| |
| | | | Oak Hill Credit Partners, | |
| | 25,000,000 | | | Series 2012-7A-A | | | 1.65% | #^ | | | 11/20/2023 | | | | 24,935,578 | |
| | 18,000,000 | | | Series 2012-7A-B1 | | | 2.48% | #^ | | | 11/20/2023 | | | | 18,022,359 | |
| |
| | | | OCP Ltd., | |
| | 2,524,098 | | | Series 2012-2A-X2 | | | 1.72% | #^ | | | 11/22/2023 | | | | 2,528,201 | |
| | 10,000,000 | | | Series 2013-3A-B | | | 2.99% | #^ | | | 01/17/2025 | | | | 9,823,934 | |
| |
| | | | OHA Intrepid Leverage Loan Fund Ltd., | |
| | 10,000,000 | | | Series 2011-1AR-DR | | | 3.29% | #^ | | | 04/20/2021 | | | | 10,005,560 | |
| |
| | | | Race Point Ltd., | |
| | 25,000,000 | | | Series 2012-7A-A | | | 1.66% | #^ | | | 11/08/2024 | | | | 24,982,184 | |
| | 24,000,000 | | | Series 2012-7A-B | | | 2.49% | #^ | | | 11/08/2024 | | | | 23,960,342 | |
| | 5,500,000 | | | Series 2013-8A-B | | | 2.13% | #^ | | | 02/20/2025 | | | | 5,392,835 | |
| |
| | | | Saturn Ltd., | |
| | 3,200,000 | | | Series 2007-1A-D | | | 4.24% | #^ | | | 05/13/2022 | | | | 3,022,553 | |
| |
| | | | Solstice Ltd., | |
| | 9,042,714 | | | Series 2003-3A-A2 | | | 1.33% | #^ | | | 09/15/2033 | | | | 8,686,657 | |
| |
| | | | Symphony Ltd., | |
| | 25,000,000 | | | Series 2013-11A-B1 | | | 2.44% | #^ | | | 01/17/2025 | | | | 24,992,206 | |
| |
| | | | WhiteHorse Ltd., | |
| | 2,000,000 | | | Series 2006-1A-B1L | | | 2.09% | #^ | | | 05/01/2018 | | | | 1,985,027 | |
| | 50,000,000 | | | Series 2012-1A-A1L | | | 1.64% | #^ | | | 02/03/2025 | | | | 49,798,526 | |
| |
| | | | Wind River Ltd., | |
| | 59,000,000 | | | Series 2012-1A-A | | | 1.64% | #^ | | | 01/15/2024 | | | | 58,635,194 | |
| | 17,000,000 | | | Series 2012-1A-B1 | | | 2.34% | #^ | | | 01/15/2024 | | | | 16,638,042 | |
| | 13,750,000 | | | Series 2012-1A-C1 | | | 3.29% | #^ | | | 01/15/2024 | | | | 13,651,103 | |
| | | | | | | | | | | | | | | | |
| | | | Total Collateralized Loan Obligations
(Cost $950,628,997) | | | | 948,744,905 | |
| | | | | | | | | | | | | | | | |
| | NON-AGENCY COMMERCIAL MORTGAGE BACKED OBLIGATIONS 6.6% | |
| |
| | | | Banc of America Commercial Mortgage Trust, | |
| | 19,741,000 | | | Series 2006-4-AM | | | 5.68% | | | | 07/10/2046 | | | | 21,565,828 | |
| | 18,915,000 | | | Series 2007-1-AMFX | | | 5.48% | # | | | 01/15/2049 | | | | 19,919,387 | |
| | 11,700,000 | | | Series 2007-2-AM | | | 5.79% | # | | | 04/10/2049 | | | | 12,946,805 | |
| | 52,650,000 | | | Series 2007-5-AM | | | 5.77% | # | | | 02/10/2051 | | | | 57,153,286 | |
| | 252,063,862 | | | Series 2007-5-XW | | | 0.53% | #^ I/O | | | 02/10/2051 | | | | 2,578,487 | |
| |
| | | | Bear Stearns Commercial Mortgage Securities, Inc., | |
| | 2,534,883 | | | Series 2004-PWR4-A3 | | | 5.47% | # | | | 06/11/2041 | | | | 2,536,995 | |
| | 12,500,000 | | | Series 2005-T18-AJ | | | 5.01% | # | | | 02/13/2042 | | | | 12,908,412 | |
| | 19,225,000 | | | Series 2006-PW14-AM | | | 5.24% | | | | 12/11/2038 | | | | 21,001,948 | |
| | 28,000,000 | | | Series 2007-PW16-AM | | | 5.90% | # | | | 06/11/2040 | | | | 31,255,952 | |
| | 12,815,000 | | | Series 2007-PW17-AMFL | | | 0.85% | #^ | | | 06/11/2050 | | | | 12,531,532 | |
| |
| | | | Boca Hotel Portfolio Trust, | |
| | 9,500,000 | | | Series 2013-BOCA-E | | | 3.91% | #^ | | | 08/15/2026 | | | | 9,523,208 | |
| |
| | | | Capital Trust, | |
| | 676,923 | | | Series 2005-3A-A2 | | | 5.16% | ^ | | | 06/25/2035 | | | | 676,923 | |
| |
| | | | CD Commercial Mortgage Trust, | |
| | 2,865,184 | | | Series 2006-CD2-AAB | | | 5.33% | # | | | 01/15/2046 | | | | 2,897,068 | |
| | 37,500,000 | | | Series 2006-CD2-AM | | | 5.35% | # | | | 01/15/2046 | | | | 40,158,038 | |
| | 2,651,348 | | | Series 2007-CD4-ASB | | | 5.28% | | | | 12/11/2049 | | | | 2,724,764 | |
| | 479,140,275 | | | Series 2007-CD5-XP | | | 0.17% | #^ I/O | | | 11/15/2044 | | | | 639,173 | |
| | 77,690,000 | | | Series 2007-CD4-AMFX | | | 5.37% | # | | | 12/11/2049 | | | | 81,636,419 | |
| |
| | | | CGBAM Commercial Mortgage Trust, | |
| | 20,000,000 | | | Series 2013-BREH-E | | | 4.51% | #^ | | | 05/15/2030 | | | | 20,260,410 | |
| | | | | | |
| The accompanying notes are an integral part of these financial statements. | | Annual Report | | March 31, 2014 | | 15 |
Schedule of Investments DoubleLine Total Return Bond Fund (Cont.)
| | | | | | | | | | | | | | | | |
PRINCIPAL
AMOUNT | | | SECURITY DESCRIPTION | | RATE | | | MATURITY | | | VALUE $ | |
| |
| | | | Citigroup Commercial Mortgage Trust, | |
| $ | 14,503,000 | | | Series 2005-C3-AM | | | 4.83% | # | | | 05/15/2043 | | | | 15,033,701 | |
| | 14,140,000 | | | Series 2007-C6-AM | | | 5.89% | # | | | 12/10/2049 | | | | 15,604,664 | |
| | 11,250,000 | | | Series 2008-C7-AM | | | 6.34% | # | | | 12/10/2049 | | | | 12,632,642 | |
| | 302,034,164 | | | Series 2012-GC8-XA | | | 2.23% | #^ I/O | | | 09/10/2045 | | | | 33,972,803 | |
| |
| | | | COBALT Commercial Mortgage Trust, | |
| | 7,650,000 | | | Series 2007-C2-AJFX | | | 5.57% | # | | | 04/15/2047 | | | | 7,711,384 | |
| | 22,750,000 | | | Series 2007-C2-AMFX | | | 5.53% | # | | | 04/15/2047 | | | | 25,044,952 | |
| |
| | | | Commercial Mortgage Pass-Through Certificates, | |
| | 94,832,727 | | | Series 2002-LC4-XA | | | 2.66% | #^ I/O | | | 12/10/2044 | | | | 12,347,411 | |
| | 4,700,000 | | | Series 2006-C8-AM | | | 5.35% | | | | 12/10/2046 | | | | 5,148,375 | |
| | 8,494,191 | | | Series 2007-C9-AJFL | | | 0.84% | #^ | | | 12/10/2049 | | | | 7,711,010 | |
| | 40,044,759 | | | Series 2012-CR2-XA | | | 1.93% | # I/O | | | 08/15/2045 | | | | 4,318,287 | |
| | 188,110,117 | | | Series 2012-CR3-XA | | | 2.19% | # I/O | | | 10/15/2045 | | | | 22,818,604 | |
| | 17,626,342 | | | Series 2012-MVP-A | | | 2.09% | #^ | | | 11/17/2026 | | | | 17,723,067 | |
| | 3,500,000 | | | Series 2012-MVP-B | | | 1.76% | #^ | | | 11/17/2026 | | | | 3,507,362 | |
| | 3,200,000 | | | Series 2012-MVP-C | | | 2.31% | #^ | | | 11/17/2026 | | | | 3,208,208 | |
| | 88,784,539 | | | Series 2012-MVP-XACP | | | 1.77% | #^ I/O | | | 12/17/2014 | | | | 1,198,281 | |
| | 70,506,326 | | | Series 2012-MVP-XBCP | | | 1.42% | #^ I/O | | | 12/17/2014 | | | | 773,948 | |
| | 4,000,000 | | | Series 2013-FL3-RRI2 | | | 4.41% | #^ | | | 10/13/2028 | | | | 4,006,772 | |
| |
| | | | Credit Suisse First Boston Mortgage Securities Corporation, | |
| | 2,349,858 | | | Series 1998-C2-F | | | 6.75% | #^ | | | 11/15/2030 | | | | 2,431,132 | |
| | 264,755 | | | Series 2001-CF2-G | | | 6.93% | ^ | | | 02/15/2034 | | | | 265,048 | |
| | 7,675,000 | | | Series 2005-C6-AM | | | 5.23% | # | | | 12/15/2040 | | | | 8,170,517 | |
| |
| | | | Credit Suisse Mortgage Capital Certificates, | |
| | 4,750,000 | | | Series 2006-C3-AJ | | | 5.79% | # | | | 06/15/2038 | | | | 4,743,029 | |
| | 2,135,663 | | | Series 2006-C3-AM | | | 5.79% | # | | | 06/15/2038 | | | | 2,322,033 | |
| | 51,221,320 | | | Series 2006-C5-AM | | | 5.34% | | | | 12/15/2039 | | | | 55,297,410 | |
| | 23,148,012 | | | Series 2006-TF2A-A2 | | | 0.33% | #^ | | | 10/15/2021 | | | | 23,056,566 | |
| | 4,752,684 | | | Series 2006-TF2A-KERB | | | 0.61% | #^ | | | 09/15/2021 | | | | 4,701,816 | |
| | 5,963,456 | | | Series 2006-TF2A-SVA1 | | | 0.39% | #^ | | | 10/15/2021 | | | | 5,923,715 | |
| | 12,151,480 | | | Series 2007-TFLA-C | | | 0.33% | #^ | | | 02/15/2022 | | | | 12,119,030 | |
| | 3,874,709 | | | Series 2007-TFLA-G | | | 0.53% | #^ | | | 02/15/2022 | | | | 3,800,816 | |
| | 16,900,000 | | | Series 2009-RR2-IQB | | | 5.69% | #^ | | | 04/16/2049 | | | | 18,218,073 | |
| | 8,800,000 | | | Series 2010-RR1-1B | | | 5.69% | #^ | | | 04/16/2049 | | | | 9,435,140 | |
| | 5,150,000 | | | Series 2010-RR2-3B | | | 5.34% | #^ | | | 12/15/2043 | | | | 5,621,539 | |
| | 10,000,000 | | | Series 2010-RR5-2B | | | 5.34% | #^ | | | 12/16/2043 | | | | 10,845,395 | |
| | 15,000,000 | | | Series 2007-C4-A1AM | | | 5.97% | # | | | 09/15/2039 | | | | 16,187,700 | |
| |
| | | | DBRR Trust, | |
| | 14,554,963 | | | Series 2011-C32-A3B | | | 5.72% | #^ | | | 06/17/2049 | | | | 15,756,577 | |
| | 929,596 | | | Series 2012-EZ1-A | | | 0.95% | ^ | | | 09/25/2045 | | | | 929,318 | |
| |
| | | | DBUBS Mortgage Trust, | |
| | 199,697,713 | | | Series 2011-LC2A-XA | | | 1.60% | #^ I/O | | | 07/10/2044 | | | | 10,825,813 | |
| |
| | | | DDR Corporation, | |
| | 15,414,498 | | | Series 2009-DDR1-A | | | 3.81% | ^ | | | 10/14/2022 | | | | 15,643,164 | |
| |
| | | | Del Coronado Trust, | |
| | 8,000,000 | | | Series 2013-HDC-D | | | 2.11% | #^ | | | 03/15/2026 | | | | 7,958,972 | |
| | 9,550,000 | | | Series 2013-HDC-E | | | 2.81% | #^ | | | 03/15/2026 | | | | 9,444,382 | |
| | 5,500,000 | | | Series 2013-HDMZ-M | | | 5.16% | #^ | | | 03/15/2018 | | | | 5,543,198 | |
| |
| | | | Extended Stay America Trust, | |
| | 3,500,000 | | | Series 2013-ESFL-DFL | | | 3.30% | #^ | | | 12/05/2031 | | | | 3,468,649 | |
| | 8,000,000 | | | Series 2013-ESH5-A15 | | | 1.28% | ^ | | | 12/05/2031 | | | | 7,836,074 | |
| | 2,534,722 | | | Series 2013-ESHM-M | | | 7.63% | ^ | | | 12/05/2019 | | | | 2,608,844 | |
| |
| | | | GE Capital Commercial Mortgage Corporation, | |
| | 7,000,000 | | | Series 2004-C3-B | | | 5.57% | # | | | 07/10/2039 | | | | 7,065,174 | |
| | 11,781,000 | | | Series 2005-C2-B | | | 5.11% | # | | | 05/10/2043 | | | | 12,190,961 | |
| |
| | | | GMAC Commercial Mortgage Securities, Inc., | |
| | 2,523,884 | | | Series 2004-C3-A4 | | | 4.55% | | | | 12/10/2041 | | | | 2,530,818 | |
| | 14,950,000 | | | Series 2006-C1-AJ | | | 5.35% | # | | | 11/10/2045 | | | | 13,963,801 | |
| |
| | | | Greenwich Capital Commercial Funding Corporation, | |
| | 1,756,483 | | | Series 2004-FL2A-D | | | 0.47% | #^ | | | 11/05/2019 | | | | 1,743,309 | |
| | 6,500,000 | | | Series 2004-FL2A-G | | | 0.64% | #^ | | | 11/05/2019 | | | | 6,451,250 | |
| | 20,540,000 | | | Series 2005-GG5-AM | | | 5.28% | # | | | 04/10/2037 | | | | 21,749,785 | |
| | 7,000,000 | | | Series 2006-GG7-AM | | | 6.01% | # | | | 07/10/2038 | | | | 7,627,711 | |
| | 3,766,667 | | | Series 2007-GG11-AJ | | | 6.26% | # | | | 12/10/2049 | | | | 3,812,293 | |
| | 8,350,000 | | | Series 2007-GG11-AM | | | 5.87% | # | | | 12/10/2049 | | | | 9,192,093 | |
| | 43,194,500 | | | Series 2007-GG9-AM | | | 5.48% | | | | 03/10/2039 | | | | 46,551,145 | |
| | 21,460,000 | | | Series 2007-GG9-AMFX | | | 5.48% | | | | 03/10/2039 | | | | 22,973,885 | |
| |
| | | | GS Mortgage Securities Corporation, | |
| | 12,100,000 | | | Series 2006-GG6-AJ | | | 5.75% | # | | | 04/10/2038 | | | | 12,371,796 | |
| | | | | | | | | | | | | | | | |
PRINCIPAL
AMOUNT | | | SECURITY DESCRIPTION | | RATE | | | MATURITY | | | VALUE $ | |
| |
| | | | GS Mortgage Securities Corporation, (Cont.) | |
| $ | 9,055,000 | | | Series 2006-GG6-AM | | | 5.62% | # | | | 04/10/2038 | | | | 9,731,422 | |
| | 156,570,308 | | | Series 2006-GG6-XC | | | 0.16% | #^ I/O | | | 04/10/2038 | | | | 122,125 | |
| | 59,414,000 | | | Series 2006-GG8-AJ | | | 5.62% | | | | 11/10/2039 | | | | 59,005,648 | |
| | 25,000,000 | | | Series 2006-GG8-AM | | | 5.59% | | | | 11/10/2039 | | | | 27,313,912 | |
| | 35,107,526 | | | Series 2011-GC3-X | | | 1.25% | #^ I/O | | | 03/10/2044 | | | | 1,355,028 | |
| | 115,026,682 | | | Series 2012-GC6-XA | | | 2.34% | #^ I/O | | | 01/10/2045 | | | | 13,419,530 | |
| | 2,818,890 | | | Series 2012-GCJ7-A1 | | | 1.14% | | | | 05/10/2045 | | | | 2,829,747 | |
| | 3,700,000 | | | Series 2013-KYO-A | | | 1.00% | #^ | | | 11/08/2029 | | | | 3,715,681 | |
| | 1,500,000 | | | Series 2013-KYO-D | | | 2.76% | #^ | | | 11/08/2029 | | | | 1,524,965 | |
| | 19,500,000 | | | Series 2013-KYO-E | | | 3.75% | #^ | | | 11/08/2029 | | | | 19,862,661 | |
| |
| | | | JP Morgan Chase Commercial Mortgage Securities Corporation, | |
| | 541,586 | | | Series 2001-CIB2-C | | | 6.74% | # | | | 04/15/2035 | | | | 545,706 | |
| | 728,326 | | | Series 2004-C3-A4 | | | 4.66% | | | | 01/15/2042 | | | | 729,044 | |
| | 190,024 | | | Series 2004-CB8-A1A | | | 4.16% | ^ | | | 01/12/2039 | | | | 189,906 | |
| | 18,684,354 | | | Series 2004-CBX-A5 | | | 4.65% | | | | 01/12/2037 | | | | 18,719,593 | |
| | 21,840,609 | | | Series 2004-CBX-X1 | | | 0.86% | #^ I/O | | | 01/12/2037 | | | | 97,802 | |
| | 4,251,938 | | | Series 2004-LN2-A2 | | | 5.12% | | | | 07/15/2041 | | | | 4,273,168 | |
| | 9,260,000 | | | Series 2004-LN2-D | | | 5.25% | # | | | 07/15/2041 | | | | 8,009,043 | |
| | 20,580,000 | | | Series 2005-CIBC12-AJ | | | 4.99% | # | | | 09/12/2037 | | | | 21,344,876 | |
| | 87,134,067 | | | Series 2005-LDP4-X1 | | | 0.26% | #^ I/O | | | 10/15/2042 | | | | 311,504 | |
| | 9,704,000 | | | Series 2006-LDP7-AM | | | 5.84% | # | | | 04/15/2045 | | | | 10,632,896 | |
| | 133,857,531 | | | Series 2006-LDP8-X | | | 0.54% | # I/O | | | 05/15/2045 | | | | 1,564,795 | |
| | 7,540,920 | | | Series 2007-C1-ASB | | | 5.86% | | | | 02/15/2051 | | | | 8,040,703 | |
| | 24,000,000 | | | Series 2007-CB18-AMFX | | | 5.40% | | | | 06/12/2047 | | | | 26,302,884 | |
| | 171,766,541 | | | Series 2007-CB18-X | | | 0.45% | # I/O | | | 06/12/2047 | | | | 1,311,953 | |
| | 18,000,000 | | | Series 2007-CB20-AM | | | 6.09% | # | | | 02/12/2051 | | | | 20,358,126 | |
| | 1,134,243,558 | | | Series 2007-CB20-X1 | | | 0.21% | #^ I/O | | | 02/12/2051 | | | | 10,669,829 | |
| | 15,000,000 | | | Series 2007-CIBC19-AM | | | 5.89% | # | | | 02/12/2049 | | | | 16,321,110 | |
| | 34,390,000 | | | Series 2007-LD12-AM | | | 6.03% | # | | | 02/15/2051 | | | | 38,427,867 | |
| | 11,336,000 | | | Series 2009-RR2-GEB | | | 5.54% | ^ | | | 12/13/2049 | | | | 12,102,676 | |
| | 4,044,738 | | | Series 2011-CCHP-B | | | 3.50% | #^ | | | 07/15/2028 | | | | 4,057,083 | |
| | 2,871,469 | | | Series 2011-PLSD-A1 | | | 2.19% | ^ | | | 11/13/2044 | | | | 2,922,113 | |
| | 227,452,163 | | | Series 2012-C6-XA | | | 1.99% | # I/O | | | 05/15/2045 | | | | 22,562,004 | |
| | 476,002,552 | | | Series 2012-C8-XA | | | 2.15% | # I/O | | | 10/15/2045 | | | | 52,944,574 | |
| | 197,213,704 | | | Series 2012-CBX-XA | | | 2.00% | # I/O | | | 06/15/2045 | | | | 18,915,555 | |
| | 16,350,000 | | | Series 2012-PHH-A | | | 1.82% | #^ | | | 10/15/2025 | | | | 16,416,160 | |
| | 19,700,000 | | | Series 2012-PHH-B | | | 2.02% | #^ | | | 10/15/2025 | | | | 19,748,019 | |
| | 9,700,000 | | | Series 2012-PHH-C | | | 2.52% | #^ | | | 10/15/2025 | | | | 9,732,175 | |
| | 1,550,000 | | | Series 2012-PHH-E | | | 3.42% | #^ | | | 10/15/2025 | | | | 1,546,763 | |
| | 20,000,000 | | | Series 2013-ALC-A | | | 1.66% | #^ | | | 07/17/2026 | | | | 20,040,830 | |
| | 12,300,000 | | | Series 2013-FL3-A1 | | | 0.96% | #^ | | | 04/15/2028 | | | | 12,308,911 | |
| | 8,300,000 | | | Series 2013-FL3-A2 | | | 0.86% | #^ | | | 04/15/2028 | | | | 8,280,877 | |
| |
| | | | LB Commercial Mortgage Trust, | |
| | 7,550,000 | | | Series 2007-C3-AMFL | | | 5.87% | #^ | | | 07/15/2044 | | | | 8,412,323 | |
| |
| | | | LB-UBS Commercial Mortgage Trust, | |
| | 5,614,000 | | | Series 2004-C7-B | | | 4.84% | # | | | 10/15/2036 | | | | 5,718,311 | |
| | 4,150,000 | | | Series 2005-C3-AM | | | 4.79% | | | | 07/15/2040 | | | | 4,320,849 | |
| | 20,600,000 | | | Series 2005-C7-AJ | | | 5.32% | # | | | 11/15/2040 | | | | 21,622,213 | |
| | 157,715,175 | | | Series 2006-C7-XCL | | | 0.63% | #^ I/O | | | 11/15/2038 | | | | 2,396,009 | |
| | 44,700,000 | | | Series 2007-C1-AJ | | | 5.48% | | | | 02/15/2040 | | | | 46,144,771 | |
| | 38,308,952 | | | Series 2007-C1-AM | | | 5.46% | | | | 02/15/2040 | | | | 42,135,039 | |
| | 46,289,000 | | | Series 2007-C2-AM | | | 5.49% | # | | | 02/15/2040 | | | | 49,294,776 | |
| |
| | | | Merrill Lynch Mortgage Investors Trust, | |
| | 167,537,223 | | | Series 1998-C1-IO | | | 0.67% | # I/O | | | 11/15/2026 | | | | 3,301,656 | |
| |
| | | | Merrill Lynch Mortgage Trust, | |
| | 9,427,123 | | | Series 2004-KEY2-A4 | | | 4.86% | # | | | 08/12/2039 | | | | 9,500,112 | |
| | 9,912,000 | | | Series 2006-C2-AJ | | | 5.80% | # | | | 08/12/2043 | | | | 10,026,910 | |
| |
| | | | Merrill Lynch/Countrywide Commercial Mortgage Trust, | |
| | 852,133 | | | Series 2006-4-A2FL | | | 0.28% | # | | | 12/12/2049 | | | | 850,202 | |
| | 42,850,000 | | | Series 2007-5-AM | | | 5.42% | | | | 08/12/2048 | | | | 45,770,613 | |
| |
| | | | Morgan Stanley Capital, Inc., | |
| | 313,795,590 | | | Series 2006-HQ10-X1 | | | 0.71% | #^ I/O | | | 11/12/2041 | | | | 3,790,023 | |
| | 10,650,000 | | | Series 2006-HQ8-AJ | | | 5.68% | # | | | 03/12/2044 | | | | 11,078,103 | |
| | 3,400,000 | | | Series 2007-HQ11-AJ | | | 5.51% | # | | | 02/12/2044 | | | | 3,576,718 | |
| | 5,612,877 | | | Series 2007-HQ12-A2FL | | | 0.41% | # | | | 04/12/2049 | | | | 5,547,529 | |
| | 11,225,755 | | | Series 2007-HQ12-A2FX | | | 5.58% | # | | | 04/12/2049 | | | | 11,468,478 | |
| | 4,372,000 | | | Series 2007-IQ13-AM | | | 5.41% | | | | 03/15/2044 | | | | 4,767,743 | |
| | 16,733,231 | | | Series 2007-XLF9-J | | | 2.26% | #^ | | | 12/15/2020 | | | | 16,529,312 | |
| | 7,010,716 | | | Series 2008-T29-AAB | | | 6.46% | # | | | 01/11/2043 | | | | 7,292,446 | |
| | | | | | |
| 16 | | DoubleLine Funds Trust | | | | The accompanying notes are an integral part of these financial statements. |
March 31, 2014
| | | | | | | | | | | | | | | | |
PRINCIPAL
AMOUNT | | | SECURITY DESCRIPTION | | RATE | | | MATURITY | | | VALUE $ | |
| |
| | | | Morgan Stanley Re-Remic Trust, | |
| $ | 5,022,000 | | | Series 2010-HQ4-AJ | | | 4.97% | ^ | | | 04/15/2040 | | | | 5,093,958 | |
| | 48,500,000 | | | Series 2013-AJ-AJA | | | 0.50% | ^ | | | 12/17/2049 | | | | 42,262,900 | |
| |
| | | | Multi Security Asset Trust, | |
| | 2,232,020 | | | Series 2005-RR4A-A3 | | | 5.00% | ^ | | | 11/28/2035 | | | | 2,285,589 | |
| |
| | | | RREF LLC, | |
| | 4,493,264 | | | Series 2013-LT2-A | | | 2.83% | ^ | | | 05/22/2028 | | | | 4,488,029 | |
| |
| | | | SMA Issuer LLC, | |
| | 509,915 | | | Series 2012-LV1-A | | | 3.50% | ^ | | | 08/20/2025 | | | | 509,231 | |
| |
| | | | TIAA Seasoned Commercial Mortgage Trust, | |
| | 16,746,000 | | | Series 2007-C4-AJ | | | 5.55% | # | | | 08/15/2039 | | | | 17,827,030 | |
| |
| | | | UBS-Barclays Commercial Mortgage Trust, | |
| | 107,236,825 | | | Series 2012-C3-XA | | | 2.32% | #^ I/O | | | 08/10/2049 | | | | 12,864,130 | |
| |
| | | | Wachovia Bank Commercial Mortgage Trust, | |
| | 5,840,000 | | | Series 2005-C22-AM | | | 5.34% | # | | | 12/15/2044 | | | | 6,198,558 | |
| | 46,710,000 | | | Series 2006-C28-AJ | | | 5.63% | # | | | 10/15/2048 | | | | 47,001,564 | |
| | 19,500,000 | | | Series 2006-C28-AM | | | 5.60% | # | | | 10/15/2048 | | | | 21,202,409 | |
| | 10,000,000 | | | Series 2007-30-AMFL | | | 0.36% | #^ | | | 12/15/2043 | | | | 9,763,490 | |
| | 31,858,000 | | | Series 2007-C30-AJ | | | 5.41% | # | | | 12/15/2043 | | | | 32,190,964 | |
| | 20,516,700 | | | Series 2007-C33-AJ | | | 5.95% | # | | | 02/15/2051 | | | | 21,349,329 | |
| | 9,250,000 | | | Series 2007-C33-AM | | | 5.95% | # | | | 02/15/2051 | | | | 10,274,655 | |
| |
| | | | WF-RBS Commercial Mortgage Trust, | |
| | 87,615,791 | | | Series 2011-C4-XA | | | 0.78% | #^ I/O | | | 06/15/2044 | | | | 2,507,914 | |
| | 116,755,088 | | | Series 2012-C6-XA | | | 2.45% | #^ I/O | | | 04/15/2045 | | | | 13,937,113 | |
| | 136,635,078 | | | Series 2012-C8-XA | | | 2.22% | #^ I/O | | | 08/15/2045 | | | | 15,504,119 | |
| | 54,074,676 | | | Series 2012-C9-XA | | | 2.25% | #^ I/O | | | 11/15/2045 | | | | 6,570,506 | |
| | | | | | | | | | | | | | | | |
| | | | Total Non-Agency Commercial Mortgage Backed Obligations
(Cost $2,080,737,433) | | | | 2,090,738,965 | |
| | | | | | | | | | | | | | | | |
| NON-AGENCY RESIDENTIAL COLLATERALIZED MORTGAGE
OBLIGATIONS 29.9% |
|
| |
| | | | ACE Securities Corporation, | |
| | 18,683,803 | | | Series 2006-HE1-A2C | | | 0.34% | # | | | 02/25/2036 | | | | 18,329,081 | |
| | 3,046,094 | | | Series 2006-NC1-A2C | | | 0.35% | # | | | 12/25/2035 | | | | 3,029,901 | |
| |
| | | | Adjustable Rate Mortgage Trust, | |
| | 13,037,302 | | | Series 2005-10-3A31 | | | 4.90% | # | | | 01/25/2036 | | | | 12,095,461 | |
| | 6,200,000 | | | Series 2005-2-6M2 | | | 1.13% | # | | | 06/25/2035 | | | | 5,430,146 | |
| | 7,902,306 | | | Series 2005-7-3A1 | | | 3.02% | # | | | 10/25/2035 | | | | 7,196,480 | |
| | 37,763,559 | | | Series 2006-1-2A1 | | | 2.99% | # | | | 03/25/2036 | | | | 29,066,309 | |
| | 34,691,252 | | | Series 2006-2-3A1 | | | 2.95% | # | | | 05/25/2036 | | | | 30,804,722 | |
| | 29,805,193 | | | Series 2007-1-3A1 | | | 3.20% | # | | | 03/25/2037 | | | | 24,895,234 | |
| | 4,668,894 | | | Series 2007-3-1A1 | | | 3.72% | #^ | | | 11/25/2037 | | | | 3,743,066 | |
| |
| | | | Aegis Asset Backed Securities Trust, | |
| | 506,855 | | | Series 2003-2-M2 | | | 2.70% | # | | | 11/25/2033 | | | | 429,864 | |
| | 2,720,594 | | | Series 2004-1-M2 | | | 2.18% | # | | | 04/25/2034 | | | | 2,353,384 | |
| | 672,968 | | | Series 2004-2-M2 | | | 2.10% | # | | | 06/25/2034 | | | | 431,404 | |
| |
| | | | American General Mortgage Loan Trust, | |
| | 12,000,000 | | | Series 2010-1-A3 | | | 5.65% | #^ | | | 03/25/2058 | | | | 12,420,228 | |
| | 12,000,000 | | | Series 2010-1-A4 | | | 5.65% | #^ | | | 03/25/2058 | | | | 12,381,822 | |
| |
| | | | American Home Mortgage Investment Trust, | |
| | 5,062,224 | | | Series 2005-1-7A2 | | | 2.33% | # | | | 06/25/2045 | | | | 4,758,865 | |
| | 13,084,453 | | | Series 2005-4-3A1 | | | 0.45% | # | | | 11/25/2045 | | | | 10,339,269 | |
| | 2,675,920 | | | Series 2006-2-3A4 | | | 6.60% | # | | | 06/25/2036 | | | | 1,683,820 | |
| | 10,712,759 | | | Series 2007-A-13A1 | | | 6.10% | #^ | | | 01/25/2037 | | | | 7,058,434 | |
| |
| | | | Amortizing Residential Collateral Trust, | |
| | 15,767,023 | | | Series 2002-BC7-M1 | | | 1.35% | # | | | 10/25/2032 | | | | 11,682,859 | |
| |
| | | | Argent Securities, Inc., | |
| | 434,038 | | | Series 2004-W6-M1 | | | 0.70% | # | | | 05/25/2034 | | | | 424,170 | |
| |
| | | | Asset Backed Securities Corporation Home Equity Loan Trust, | |
| | 6,222,590 | | | Series 2003-HE6-M1 | | | 1.13% | # | | | 11/25/2033 | | | | 5,875,176 | |
| | 1,144,980 | | | Series 2004-HE3-M2 | | | 1.83% | # | | | 06/25/2034 | | | | 994,991 | |
| |
| | | | Banc of America Alternative Loan Trust, | |
| | 5,510,866 | | | Series 2005-10-4A1 | | | 5.75% | | | | 11/25/2035 | | | | 5,192,916 | |
| | 6,192,147 | | | Series 2005-5-2CB1 | | | 6.00% | | | | 06/25/2035 | | | | 5,682,310 | |
| | 10,486,727 | | | Series 2005-6-2CB2 | | | 6.00% | | | | 07/25/2035 | | | | 9,902,564 | |
| | | | | | | | | | | | | | | | |
PRINCIPAL
AMOUNT | | | SECURITY DESCRIPTION | | RATE | | | MATURITY | | | VALUE $ | |
| |
| | | | Banc of America Alternative Loan Trust, (Cont.) | |
| $ | 4,913,814 | | | Series 2005-6-4CB1 | | | 6.50% | | | | 07/25/2035 | | | | 4,436,123 | |
| | 3,595,535 | | | Series 2005-8-2CB1 | | | 6.00% | | | | 09/25/2035 | | | | 3,314,447 | |
| | 3,217,386 | | | Series 2006-5-CB14 | | | 6.00% | # | | | 06/25/2046 | | | | 2,745,280 | |
| | 6,240,350 | | | Series 2006-6-CB3 | | | 6.00% | | | | 07/25/2046 | | | | 5,007,413 | |
| | 19,908,745 | | | Series 2006-7-A4 | | | 6.00% | # | | | 10/25/2036 | | | | 14,949,517 | |
| | 9,604,325 | | | Series 2006-8-1A1 | | | 6.35% | # I/F I/O | | | 11/25/2036 | | | | 1,948,569 | |
| | 3,422,925 | | | Series 2006-8-1A2 | | | 0.60% | # | | | 11/25/2036 | | | | 2,248,204 | |
| | 15,777,295 | | | Series 2006-9-1CB1 | | | 6.00% | | | | 01/25/2037 | | | | 12,381,216 | |
| | 2,546,967 | | | Series 2007-2-2A1 | | | 6.00% | | | | 06/25/2037 | | | | 2,018,681 | |
| |
| | | | Banc of America Funding Corporation, | |
| | 19,134,762 | | | Series 2006-2-3A1 | | | 6.00% | | | | 03/25/2036 | | | | 19,491,520 | |
| | 546,423 | | | Series 2006-2-4A1 | | | 22.32% | # I/F | | | 03/25/2036 | | | | 778,965 | |
| | 2,767,791 | | | Series 2006-2-6A2 | | | 5.50% | | | | 03/25/2036 | | | | 2,836,485 | |
| | 16,232,362 | | | Series 2006-3-1A1 | | | 6.00% | | | | 03/25/2036 | | | | 14,607,048 | |
| | 3,162,811 | | | Series 2006-3-6A1 | | | 6.29% | # | | | 03/25/2036 | | | | 3,239,440 | |
| | 17,007,511 | | | Series 2006-6-1A7 | | | 6.25% | | | | 08/25/2036 | | | | 16,909,259 | |
| | 3,658,188 | | | Series 2006-7-T2A5 | | | 6.04% | # | | | 10/25/2036 | | | | 2,931,065 | |
| | 17,242,135 | | | Series 2006-7-T2A8 | | | 5.91% | # | | | 10/25/2036 | | | | 13,714,687 | |
| | 3,560,514 | | | Series 2006-8T2-A8 | | | 6.10% | # | | | 10/25/2036 | | | | 2,896,194 | |
| | 1,965,461 | | | Series 2006-B-7A1 | | | 6.05% | # | | | 03/20/2036 | | | | 1,863,259 | |
| | 18,641,027 | | | Series 2006-D-6A1 | | | 5.05% | # | | | 05/20/2036 | | | | 15,812,791 | |
| | 1,801,792 | | | Series 2006-G-2A1 | | | 0.38% | # | | | 07/20/2036 | | | | 1,694,051 | |
| | 923,187 | | | Series 2006-H-3A1 | | | 2.88% | # | | | 09/20/2046 | | | | 742,454 | |
| | 2,392,070 | | | Series 2007-1-TA10 | | | 5.84% | # | | | 01/25/2037 | | | | 1,952,719 | |
| | 3,154,384 | | | Series 2007-3-TA1B | | | 5.83% | # | | | 04/25/2037 | | | | 2,642,496 | |
| | 4,554,448 | | | Series 2007-5-1A1 | | | 5.50% | | | | 07/25/2037 | | | | 3,938,336 | |
| | 6,032,885 | | | Series 2009-R14-3A | | | 16.11% | #^ I/F | | | 06/26/2035 | | | | 7,537,176 | |
| | 6,107,936 | | | Series 2009-R15A-4A2 | | | 5.75% | ^ | | | 12/26/2036 | | | | 5,574,683 | |
| | 3,384,025 | | | Series 2010-R1-3A | | | 14.04% | #^ I/F | | | 07/26/2036 | | | | 3,454,664 | |
| | 127,300,417 | | | Series 2012-R4-A | | | 0.41% | #^ | | | 03/04/2039 | | | | 124,505,059 | |
| | 44,847,073 | | | Series 2012-R5-A | | | 0.41% | #^ | | | 10/03/2039 | | | | 44,295,360 | |
| |
| | | | Banc of America Mortgage Securities, Inc., | |
| | 2,554,099 | | | Series 2004-K-4A1 | | | 5.17% | # | | | 12/25/2034 | | | | 2,543,625 | |
| | 9,667,827 | | | Series 2006-1-A9 | | | 6.00% | | | | 05/25/2036 | | | | 8,843,316 | |
| | 1,286,041 | | | Series 2007-1-2A5 | | | 5.75% | | | | 01/25/2037 | | | | 1,256,722 | |
| |
| | | | BCAP LLC Trust, | |
| | 6,305,033 | | | Series 2007-AA2-2A7 | | | 6.00% | | | | 04/25/2037 | | | | 5,520,340 | |
| | 6,826,061 | | | Series 2007-AA2-2A8 | | | 5.75% | | | | 04/25/2037 | | | | 5,905,205 | |
| | 18,000,000 | | | Series 2008-RR3-A1B | | | 6.64% | # | | | 10/25/2036 | | | | 13,879,483 | |
| | 6,887,948 | | | Series 2010-RR10-5A1 | | | 7.44% | #^ | | | 04/27/2037 | | | | 7,654,778 | |
| | 12,371,942 | | | Series 2010-RR12-3A15 | | | 4.09% | #^ | | | 08/26/2037 | | | | 13,350,367 | |
| | 3,350,000 | | | Series 2010-RR5-2A3 | | | 6.10% | #^ | | | 04/26/2037 | | | | 3,380,679 | |
| | 4,950,309 | | | Series 2011-RR12-2A5 | | | 2.32% | #^ | | | 12/26/2036 | | | | 4,966,963 | |
| | 10,263,849 | | | Series 2012-RR1-3A3 | | | 3.50% | #^ | | | 10/26/2035 | | | | 10,431,598 | |
| |
| | | | Bear Stearns Adjustable Rate Mortgage Trust, | |
| | 19,397,909 | | | Series 2005-12-13A1 | | | 5.37% | # | | | 02/25/2036 | | | | 18,408,557 | |
| | 16,275,662 | | | Series 2006-4-4A1 | | | 5.33% | # | | | 10/25/2046 | | | | 15,261,721 | |
| | 15,338,720 | | | Series 2007-1-2A1 | | | 2.75% | # | | | 02/25/2047 | | | | 12,224,499 | |
| |
| | | | Bear Stearns Alt-A Trust, | |
| | 5,820,457 | | | Series 2004-11-2A3 | | | 2.49% | # | | | 11/25/2034 | | | | 5,721,076 | |
| | 22,189,313 | | | Series 2006-6-2A1 | | | 4.41% | # | | | 11/25/2036 | | | | 17,015,409 | |
| |
| | | | Bear Stearns Asset Backed Securities Trust, | |
| | 14,173,645 | | | Series 2004-AC4-A2 | | | 6.00% | # | | | 08/25/2034 | | | | 14,746,849 | |
| | 36,834,648 | | | Series 2005-AC2-1A | | | 5.25% | # | | | 04/25/2035 | | | | 35,939,510 | |
| | 11,780,456 | | | Series 2005-AC2-2A1 | | | 5.25% | # | | | 04/25/2035 | | | | 12,110,803 | |
| | 16,365,699 | | | Series 2005-AC7-A4 | | | 5.50% | # | | | 10/25/2035 | | | | 16,332,493 | |
| | 20,851,788 | | | Series 2006-AC1-1A1 | | | 5.75% | # | | | 02/25/2036 | | | | 17,553,432 | |
| | 2,537,532 | | | Series 2007-SD1-1A2A | | | 6.00% | | | | 10/25/2036 | | | | 2,094,733 | |
| | 1,733,025 | | | Series 2007-SD1-1A3A | | | 6.50% | | | | 10/25/2036 | | | | 1,483,476 | |
| | 7,109,611 | | | Series 2007-SD1-23A1 | | | 4.49% | # | | | 10/25/2036 | | | | 5,888,130 | |
| |
| | | | Belle Haven Ltd., | |
| | 1,138,901,098 | | | Series 2006-1A-A1 | | | 0.49% | #^ | | | 07/05/2046 | | | | 91,112,088 | |
| |
| | | | Centex Home Equity, | |
| | 2,750,000 | | | Series 2004-A-AF5 | | | 5.43% | # | | | 01/25/2034 | | | | 2,809,107 | |
| |
| | | | Chase Funding Mortgage Loan Asset-Backed Certificates, | |
| | 2,643,214 | | | Series 2003-4-2M1 | | | 1.05% | # | | | 03/25/2033 | | | | 2,504,496 | |
| |
| | | | Chase Mortgage Finance Corporation, | |
| | 15,701,101 | | | Series 2005-A1-2A4 | | | 2.53% | # | | | 12/25/2035 | | | | 14,693,970 | |
| | 23,461,733 | | | Series 2006-S2-1A9 | | | 6.25% | | | | 10/25/2036 | | | | 21,609,100 | |
| | 13,456,555 | | | Series 2006-S3-1A2 | | | 6.00% | | | | 11/25/2036 | | | | 11,728,451 | |
| | | | | | |
| The accompanying notes are an integral part of these financial statements. | | Annual Report | | March 31, 2014 | | 17 |
Schedule of Investments DoubleLine Total Return Bond Fund (Cont.)
| | | | | | | | | | | | | | | | |
PRINCIPAL
AMOUNT | | | SECURITY DESCRIPTION | | RATE | | | MATURITY | | | VALUE $ | |
| |
| | | | Chase Mortgage Finance Corporation, (Cont.) | |
| $ | 36,710,674 | | | Series 2006-S4-A8 | | | 6.00% | | | | 12/25/2036 | | | | 32,412,074 | |
| | 17,690,185 | | | Series 2007-A2-6A4 | | | 2.69% | # | | | 07/25/2037 | | | | 16,384,225 | |
| | 6,590,151 | | | Series 2007-S3-1A5 | | | 6.00% | | | | 05/25/2037 | | | | 5,700,540 | |
| | 3,234,588 | | | Series 2007-S3-2A1 | | | 5.50% | | | | 05/25/2037 | | | | 3,131,500 | |
| | 7,368,902 | | | Series 2007-S5-1A18 | | | 6.00% | | | | 07/25/2037 | | | | 6,406,619 | |
| |
| | | | Chaseflex Trust, | |
| | 815,771 | | | Series 2006-1-A2A | | | 5.94% | # | | | 06/25/2036 | | | | 832,539 | |
| | 5,635,794 | | | Series 2006-1-A5 | | | 6.16% | # | | | 06/25/2036 | | | | 5,639,722 | |
| | 9,325,326 | | | Series 2006-2-A2B | | | 0.35% | # | | | 09/25/2036 | | | | 7,668,580 | |
| | 7,971,989 | | | Series 2007-1-1A1 | | | 6.50% | | | | 02/25/2037 | | | | 6,367,276 | |
| | 17,858,230 | | | Series 2007-M1-2F4 | | | 4.89% | # | | | 08/25/2037 | | | | 14,215,687 | |
| | 18,574,146 | | | Series 2007-M1-2F5 | | | 4.89% | # | | | 08/25/2037 | | | | 14,784,110 | |
| |
| | | | Citicorp Mortgage Securities, Inc., | |
| | 18,805,272 | | | Series 2005-1-1A4 | | | 5.50% | | | | 02/25/2035 | | | | 20,007,935 | |
| | 4,199,174 | | | Series 2006-7-1A1 | | | 6.00% | | | | 12/25/2036 | | | | 4,119,768 | |
| |
| | | | Citicorp Residential Mortgage Securities, Inc., | |
| | 6,594,000 | | | Series 2006-2-A5 | | | 6.04% | # | | | 09/25/2036 | | | | 6,351,410 | |
| |
| | | | Citigroup Mortgage Loan Trust, Inc., | |
| | 5,017,719 | | | Series 2005-5-2A2 | | | 5.75% | | | | 08/25/2035 | | | | 4,136,061 | |
| | 2,450,385 | | | Series 2005-9-21A1 | | | 5.50% | | | | 11/25/2035 | | | | 2,154,805 | |
| | 6,231,684 | | | Series 2006-FX1-A6 | | | 5.85% | # | | | 10/25/2036 | | | | 4,715,989 | |
| | 3,198,025 | | | Series 2006-WF1-A2D | | | 5.62% | # | | | 03/25/2036 | | | | 2,172,552 | |
| | 18,390,817 | | | Series 2006-WF2-A2D | | | 5.78% | # | | | 05/25/2036 | | | | 11,561,111 | |
| | 14,812,954 | | | Series 2007-10-1A1A | | | 5.68% | # | | | 04/25/2037 | | | | 15,267,178 | |
| | 1,556,585 | | | Series 2007-12-2A1 | | | 6.50% | ^ | | | 10/25/2036 | | | | 1,188,447 | |
| | 1,463,771 | | | Series 2007-2-2A | | | 6.00% | | | | 11/25/2036 | | | | 1,379,980 | |
| | 44,193,933 | | | Series 2007-9-1A1 | | | 5.75% | ^ | | | 04/25/2047 | | | | 36,218,851 | |
| | 2,215,734 | | | Series 2007-9-2A2 | | | 6.50% | ^ | | | 05/25/2037 | | | | 1,740,714 | |
| | 7,806,228 | | | Series 2007-OPX1-A3A | | | 5.97% | # | | | 01/25/2037 | | | | 4,852,742 | |
| | 71,403,367 | | | Series 2007-WFH3-A2 | | | 0.31% | # | | | 06/25/2037 | | | | 67,321,165 | |
| | 20,000,000 | | | Series 2008-AR4-1A1B | | | 2.71% | #^ | | | 11/25/2038 | | | | 18,190,148 | |
| | 2,190,509 | | | Series 2010-12-3A1 | | | 4.00% | ^ | | | 04/25/2037 | | | | 2,245,701 | |
| | 2,186,508 | | | Series 2010-2-5A1 | | | 5.50% | #^ | | | 12/25/2035 | | | | 2,294,123 | |
| | 192,126,878 | | | Series 2010-8-5A4 | | | 8.41% | #^ | | | 11/25/2036 | | | | 168,257,304 | |
| | 16,483,826 | | | Series 2010-8-5A6 | | | 4.00% | ^ | | | 11/25/2036 | | | | 16,842,263 | |
| | 153,749,810 | | | Series 2010-8-6A4 | | | 7.78% | #^ | | | 12/25/2036 | | | | 129,354,404 | |
| | 67,427,364 | | | Series 2010-8-76I2 | | | 1.00% | ^ I/O | | | 06/25/2037 | | | | 1,035,856 | |
| | 137,453,688 | | | Series 2010-8-7A4 | | | 8.11% | #^ | | | 06/25/2037 | | | | 121,049,484 | |
| | 4,161,592 | | | Series 2011-12-1A1 | | | 3.50% | #^ | | | 04/25/2036 | | | | 4,206,801 | |
| | 6,764,115 | | | Series 2011-12-3A1 | | | 2.67% | #^ | | | 09/25/2047 | | | | 6,765,938 | |
| |
| | | | CitiMortgage Alternative Loan Trust, | |
| | 9,482,710 | | | Series 2006-A2-A2 | | | 6.00% | | | | 05/25/2036 | | | | 8,057,420 | |
| | 8,555,730 | | | Series 2006-A3-1A13 | | | 6.00% | | | | 07/25/2036 | | | | 7,698,728 | |
| | 2,823,574 | | | Series 2006-A5-2A1 | | | 5.50% | | | | 10/25/2021 | | | | 2,817,811 | |
| | 7,520,240 | | | Series 2006-A5-3A3 | | | 6.00% | | | | 10/25/2036 | | | | 6,043,212 | |
| | 10,198,270 | | | Series 2007-A1-1A5 | | | 6.00% | | | | 01/25/2037 | | | | 8,528,701 | |
| | 4,972,331 | | | Series 2007-A1-1A7 | | | 6.00% | | | | 01/25/2037 | | | | 4,158,286 | |
| | 12,722,348 | | | Series 2007-A1-1A9 | | | 5.25% | # I/F I/O | | | 01/25/2037 | | | | 1,779,125 | |
| | 11,480,853 | | | Series 2007-A3-1A1 | | | 6.00% | # | | | 03/25/2037 | | | | 10,192,253 | |
| | 26,421,119 | | | Series 2007-A3-1A3 | | | 5.25% | # I/F I/O | | | 03/25/2037 | | | | 4,235,239 | |
| | 10,353,870 | | | Series 2007-A3-1A4 | | | 5.75% | | | | 03/25/2037 | | | | 9,052,275 | |
| | 18,326,990 | | | Series 2007-A4-1A3 | | | 0.48% | # | | | 04/25/2037 | | | | 12,901,358 | |
| | 18,326,990 | | | Series 2007-A4-1A4 | | | 6.52% | # I/F I/O | | | 04/25/2037 | | | | 3,946,662 | |
| | 2,640,843 | | | Series 2007-A5-1A11 | | | 6.00% | | | | 05/25/2037 | | | | 2,368,281 | |
| | 1,311,286 | | | Series 2007-A8-A1 | | | 6.00% | | | | 10/25/2037 | | | | 1,148,344 | |
| |
| | | | Countrywide Alternative Loan Trust, | |
| | 48,229,824 | | | Series 2004-36CB-1A1 | | | 6.00% | | | | 02/25/2035 | | | | 46,239,572 | |
| | 10,964,273 | | | Series 2005-20CB-2A1 | | | 0.65% | # | | | 07/25/2035 | | | | 9,149,752 | |
| | 22,385,391 | | | Series 2005-20CB-2A2 | | | 4.85% | # I/F I/O | | | 07/25/2035 | | | | 2,745,020 | |
| | 2,703,230 | | | Series 2005-20CB-4A1 | | | 5.25% | | | | 07/25/2020 | | | | 2,655,503 | |
| | 7,676,548 | | | Series 2005-26CB-A11 | | | 12.77% | # I/F | | | 07/25/2035 | | | | 8,412,676 | |
| | 10,573,266 | | | Series 2005-28CB-1A2 | | | 0.90% | # | | | 08/25/2035 | | | | 8,652,389 | |
| | 3,480,522 | | | Series 2005-28CB-3A6 | | | 6.00% | | | | 08/25/2035 | | | | 2,821,384 | |
| | 7,030,928 | | | Series 2005-54CB-3A4 | | | 5.50% | | | | 11/25/2035 | | | | 6,151,774 | |
| | 1,435,053 | | | Series 2005-60T1-A7 | | | 34.80% | # I/F | | | 12/25/2035 | | | | 2,155,474 | |
| | 1,943,005 | | | Series 2005-64CB-1A14 | | | 5.50% | | | | 12/25/2035 | | | | 1,829,419 | |
| | 28,200,287 | | | Series 2005-64CB-1A4 | | | 5.50% | | | | 12/25/2035 | | | | 26,551,727 | |
| | 4,845,205 | | | Series 2005-73CB-1A5 | | | 0.95% | # | | | 01/25/2036 | | | | 4,001,287 | |
| | 12,189,534 | | | Series 2005-73CB-1A6 | | | 4.55% | # I/F I/O | | | 01/25/2036 | | | | 1,320,907 | |
| | 109,599,721 | | | Series 2005-77T1-1A1 | | | 6.00% | | | | 02/25/2036 | | | | 100,230,151 | |
| | | | | | | | | | | | | | | | |
PRINCIPAL
AMOUNT | | | SECURITY DESCRIPTION | | RATE | | | MATURITY | | | VALUE $ | |
| |
| | | | Countrywide Alternative Loan Trust, (Cont.) | |
| $ | 2,706,077 | | | Series 2005-79CB-A5 | | | 5.50% | | | | 01/25/2036 | | | | 2,425,178 | |
| | 5,923,333 | | | Series 2005-85CB-2A6 | | | 21.07% | # I/F | | | 02/25/2036 | | | | 7,495,178 | |
| | 3,627,058 | | | Series 2005-86CB-A5 | | | 5.50% | | | | 02/25/2036 | | | | 3,196,783 | |
| | 7,397,137 | | | Series 2005-J10-1A11 | | | 5.50% | | | | 10/25/2035 | | | | 6,637,503 | |
| | 1,683,415 | | | Series 2005-J10-1A13 | | | 0.85% | # | | | 10/25/2035 | | | | 1,290,988 | |
| | 788,586 | | | Series 2005-J10-1A15 | | | 5.50% | | | | 10/25/2035 | | | | 707,603 | |
| | 1,805,573 | | | Series 2005-J11-1A3 | | | 5.50% | | | | 11/25/2035 | | | | 1,629,705 | |
| | 2,077,764 | | | Series 2005-J11-6A1 | | | 6.50% | | | | 09/25/2032 | | | | 2,030,350 | |
| | 3,350,824 | | | Series 2005-J13-2A5 | | | 0.63% | # | | | 11/25/2035 | | | | 2,665,684 | |
| | 6,701,647 | | | Series 2005-J13-2A6 | | | 4.87% | # I/F I/O | | | 11/25/2035 | | | | 803,742 | |
| | 3,891,000 | | | Series 2005-J1-5A3 | | | 5.50% | | | | 02/25/2035 | | | | 3,508,674 | |
| | 4,392,969 | | | Series 2005-J1-7A1 | | | 5.50% | | | | 01/25/2020 | | | | 4,343,071 | |
| | 2,603,829 | | | Series 2005-J2-1A5 | | | 0.65% | # | | | 04/25/2035 | | | | 2,234,528 | |
| | 8,011,780 | | | Series 2005-J2-1A6 | | | 4.85% | # I/F I/O | | | 04/25/2035 | | | | 805,713 | |
| | 7,494,968 | | | Series 2006-12CB-A3 | | | 5.75% | # | | | 05/25/2036 | | | | 6,161,336 | |
| | 3,645,832 | | | Series 2006-15CB-A1 | | | 6.50% | | | | 06/25/2036 | | | | 2,915,441 | |
| | 2,813,211 | | | Series 2006-18CB-A12 | | | 0.75% | # | | | 07/25/2036 | | | | 2,044,420 | |
| | 2,813,211 | | | Series 2006-18CB-A13 | | | 5.35% | # I/F I/O | | | 07/25/2036 | | | | 430,800 | |
| | 14,054,106 | | | Series 2006-19CB-A12 | | | 0.55% | # | | | 08/25/2036 | | | | 10,211,685 | |
| | 19,058,211 | | | Series 2006-19CB-A13 | | | 5.45% | # I/F I/O | | | 08/25/2036 | | | | 3,021,241 | |
| | 2,934,281 | | | Series 2006-19CB-A15 | | | 6.00% | | | | 08/25/2036 | | | | 2,589,453 | |
| | 4,405,932 | | | Series 2006-24CB-A11 | | | 5.75% | | | | 06/25/2036 | | | | 3,871,215 | |
| | 12,895,624 | | | Series 2006-24CB-A14 | | | 7.00% | # I/F I/O | | | 06/25/2036 | | | | 2,996,318 | |
| | 10,340,611 | | | Series 2006-24CB-A22 | | | 6.00% | | | | 06/25/2036 | | | | 9,231,404 | |
| | 11,098,582 | | | Series 2006-24CB-A5 | | | 0.75% | # | | | 06/25/2036 | | | | 7,984,309 | |
| | 4,143,752 | | | Series 2006-26CB-A17 | | | 6.25% | | | | 09/25/2036 | | | | 3,468,205 | |
| | 5,318,859 | | | Series 2006-26CB-A9 | | | 6.50% | | | | 09/25/2036 | | | | 4,530,982 | |
| | 9,887,082 | | | Series 2006-29T1-1A2 | | | 6.25% | | | | 10/25/2036 | | | | 8,741,940 | |
| | 1,367,283 | | | Series 2006-29T1-2A12 | | | 45.15% | # I/F | | | 10/25/2036 | | | | 2,590,621 | |
| | 837,490 | | | Series 2006-29T1-2A23 | | | 32.70% | # I/F | | | 10/25/2036 | | | | 1,303,361 | |
| | 9,351,900 | | | Series 2006-30T1-1A2 | | | 6.25% | | | | 11/25/2036 | | | | 8,224,239 | |
| | 6,499,401 | | | Series 2006-32CB-A1 | | | 0.82% | # | | | 11/25/2036 | | | | 4,798,631 | |
| | 10,841,001 | | | Series 2006-32CB-A2 | | | 5.18% | # I/F I/O | | | 11/25/2036 | | | | 1,412,257 | |
| | 4,522,038 | | | Series 2006-36T2-2A1 | | | 6.25% | | | | 12/25/2036 | | | | 3,563,298 | |
| | 3,761,750 | | | Series 2006-39CB-1A10 | | | 6.00% | | | | 01/25/2037 | | | | 3,358,475 | |
| | 20,724,086 | | | Series 2006-39CB-2A2 | | | 6.40% | # I/F I/O | | | 01/25/2037 | | | | 4,741,826 | |
| | 7,057,529 | | | Series 2006-39CB-2A4 | | | 0.60% | # | | | 01/25/2037 | | | | 2,656,507 | |
| | 6,041,667 | | | Series 2006-40T1-1A11 | | | 6.00% | | | | 01/25/2037 | | | | 5,325,996 | |
| | 10,280,864 | | | Series 2006-40T1-1A4 | | | 5.30% | # I/F I/O | | | 01/25/2037 | | | | 1,278,981 | |
| | 7,883,093 | | | Series 2006-45T1-1A4 | | | 0.75% | # | | | 02/25/2037 | | | | 4,742,413 | |
| | 7,883,093 | | | Series 2006-45T1-1A5 | | | 5.25% | # I/F I/O | | | 02/25/2037 | | | | 1,107,239 | |
| | 3,231,218 | | | Series 2006-6CB-1A4 | | | 5.50% | | | | 05/25/2036 | | | | 2,886,470 | |
| | 19,680,930 | | | Series 2006-J1-1A3 | | | 5.50% | | | | 02/25/2036 | | | | 17,440,748 | |
| | 9,700,001 | | | Series 2006-J1-A10 | | | 5.50% | | | | 02/25/2036 | | | | 8,595,898 | |
| | 3,289,375 | | | Series 2006-J4-2A2 | | | 6.00% | | | | 07/25/2036 | | | | 2,678,311 | |
| | 1,885,252 | | | Series 2007-11T1-A24 | | | 38.97% | # I/F | | | 05/25/2037 | | | | 3,306,164 | |
| | 20,206,317 | | | Series 2007-16CB-2A1 | | | 0.60% | # | | | 08/25/2037 | | | | 11,919,242 | |
| | 5,851,244 | | | Series 2007-16CB-2A2 | | | 53.30% | # I/F | | | 08/25/2037 | | | | 13,590,908 | |
| | 18,440,744 | | | Series 2007-17CB-1A10 | | | 29.19% | # I/F | | | 08/25/2037 | | | | 27,548,259 | |
| | 3,140,364 | | | Series 2007-18CB-2A25 | | | 6.00% | | | | 08/25/2037 | | | | 2,691,989 | |
| | 1,652,821 | | | Series 2007-19-1A10 | | | 38.07% | # I/F | | | 08/25/2037 | | | | 2,863,816 | |
| | 50,566,037 | | | Series 2007-19-2A1 | | | 6.50% | | | | 08/25/2037 | | | | 36,795,641 | |
| | 9,391,939 | | | Series 2007-21CB-2A2 | | | 27.78% | # I/F | | | 09/25/2037 | | | | 13,838,205 | |
| | 36,105,584 | | | Series 2007-22-2A16 | | | 6.50% | | | | 09/25/2037 | | | | 29,625,462 | |
| | 23,161,344 | | | Series 2007-23CB-A3 | | | 0.65% | # | | | 09/25/2037 | | | | 16,628,177 | |
| | 32,870,749 | | | Series 2007-23CB-A4 | | | 6.35% | # I/F I/O | | | 09/25/2037 | | | | 7,247,491 | |
| | 17,892,355 | | | Series 2007-4CB-2A1 | | | 7.00% | | | | 03/25/2037 | | | | 5,706,185 | |
| | 12,040,708 | | | Series 2007-5CB-1A18 | | | 5.50% | # I/F I/O | | | 04/25/2037 | | | | 1,928,133 | |
| | 12,040,709 | | | Series 2007-5CB-1A23 | | | 0.70% | # | | | 04/25/2037 | | | | 8,313,784 | |
| | 832,983 | | | Series 2007-8CB-A12 | | | 39.27% | # I/F | | | 05/25/2037 | | | | 1,543,957 | |
| | 889,197 | | | Series 2007-8CB-A8 | | | 39.15% | # I/F | | | 05/25/2037 | | | | 1,642,622 | |
| | 1,129,472 | | | Series 2007-9T1-1A4 | | | 0.65% | # | | | 05/25/2037 | | | | 772,456 | |
| | 1,129,472 | | | Series 2007-9T1-1A5 | | | 5.35% | # I/F I/O | | | 05/25/2037 | | | | 158,850 | |
| | 30,937,776 | | | Series 2007-9T1-1A6 | | | 6.00% | | | | 05/25/2037 | | | | 25,517,107 | |
| | 3,377,857 | | | Series 2007-9T1-2A1 | | | 6.00% | | | | 05/25/2037 | | | | 2,705,400 | |
| | 2,700,308 | | | Series 2007-9T1-3A1 | | | 5.50% | | | | 05/25/2022 | | | | 2,402,912 | |
| | 9,367,790 | | | Series 2007-HY5R-2A1A | | | 3.02% | # | | | 03/25/2047 | | | | 9,219,173 | |
| | 10,878,413 | | | Series 2007-HY5R-2A1B | | | 3.02% | # | | | 03/25/2047 | | | | 10,040,811 | |
| |
| | | | Countrywide Asset-Backed Certificates, | |
| | 4,158,598 | | | Series 2003-BC6-M1 | | | 0.98% | # | | | 11/25/2033 | | | | 4,041,130 | |
| | 3,064,165 | | | Series 2005-13-AF3 | | | 5.07% | # | | | 04/25/2036 | | | | 2,627,120 | |
| | 2,075,084 | | | Series 2006-2-2A2 | | | 0.34% | # | | | 06/25/2036 | | | | 2,016,433 | |
| | | | | | |
| 18 | | DoubleLine Funds Trust | | | | The accompanying notes are an integral part of these financial statements. |
March 31, 2014
| | | | | | | | | | | | | | | | |
PRINCIPAL
AMOUNT | | | SECURITY DESCRIPTION | | RATE | | | MATURITY | | | VALUE $ | |
| |
| | | | Countrywide Home Loans, | |
| $ | 4,216,584 | | | Series 2002-32-2A6 | | | 5.00% | | | | 01/25/2018 | | | | 4,311,074 | |
| | 6,107,917 | | | Series 2003-60-4A1 | | | 2.53% | # | | | 02/25/2034 | | | | 6,058,324 | |
| | 6,992,073 | | | Series 2004-R2-1AF1 | | | 0.57% | #^ | | | 11/25/2034 | | | | 6,192,935 | |
| | 7,074,045 | | | Series 2004-R2-1AS | | | 5.83% | #^ I/O | | | 11/25/2034 | | | | 1,117,176 | |
| | 14,521,398 | | | Series 2005-20-A5 | | | 5.50% | | | | 10/25/2035 | | | | 14,200,294 | |
| | 10,457,532 | | | Series 2005-20-A8 | | | 5.25% | | | | 10/25/2035 | | | | 10,371,926 | |
| | 32,010,243 | | | Series 2005-23-A1 | | | 5.50% | | | | 11/25/2035 | | | | 30,252,561 | |
| | 8,519,734 | | | Series 2005-24-A8 | | | 5.50% | | | | 11/25/2035 | | | | 8,188,547 | |
| | 2,273,956 | | | Series 2005-27-2A1 | | | 5.50% | | | | 12/25/2035 | | | | 2,112,310 | |
| | 4,542,968 | | | Series 2005-28-A7 | | | 5.25% | | | | 01/25/2019 | | | | 4,333,197 | |
| | 44,663,364 | | | Series 2005-HYB1-4A1 | | | 2.51% | # | | | 03/25/2035 | | | | 42,684,241 | |
| | 4,491,490 | | | Series 2005-HYB8-1A1 | | | 2.50% | # | | | 12/20/2035 | | | | 3,689,826 | |
| | 9,949,335 | | | Series 2005-J3-2A4 | | | 4.50% | | | | 09/25/2035 | | | | 9,642,074 | |
| | 9,700,000 | | | Series 2005-J4-A5 | | | 5.50% | | | | 11/25/2035 | | | | 9,678,495 | |
| | 2,087,374 | | | Series 2005-R1-1AF1 | | | 0.51% | #^ | | | 03/25/2035 | | | | 1,861,468 | |
| | 2,108,692 | | | Series 2005-R1-1AS | | | 5.82% | #^ I/O | | | 03/25/2035 | | | | 266,182 | |
| | 5,827,188 | | | Series 2006-20-1A21 | | | 6.00% | | | | 02/25/2037 | | | | 5,400,055 | |
| | 4,655,520 | | | Series 2006-J3-A4 | | | 5.50% | | | | 05/25/2036 | | | | 4,794,383 | |
| | 51,643,493 | | | Series 2007-11-A1 | | | 6.00% | | | | 08/25/2037 | | | | 46,527,585 | |
| | 39,151,261 | | | Series 2007-12-A9 | | | 5.75% | | | | 08/25/2037 | | | | 37,605,412 | |
| | 19,446,351 | | | Series 2007-13-A110 | | | 6.00% | | | | 08/25/2037 | | | | 17,865,460 | |
| | 1,882,583 | | | Series 2007-15-1A16 | | | 6.25% | | | | 09/25/2037 | | | | 1,783,619 | |
| | 8,336,279 | | | Series 2007-15-1A29 | | | 6.25% | | | | 09/25/2037 | | | | 7,937,388 | |
| | 2,049,233 | | | Series 2007-18-1A1 | | | 6.00% | | | | 11/25/2037 | | | | 1,912,768 | |
| | 6,491,971 | | | Series 2007-3-A12 | | | 6.00% | | | | 04/25/2037 | | | | 5,984,987 | |
| | 16,856,336 | | | Series 2007-3-A1 | | | 6.00% | | | | 04/25/2037 | | | | 15,539,957 | |
| | 12,253,112 | | | Series 2007-4-1A39 | | | 6.00% | | | | 05/25/2037 | | | | 10,534,969 | |
| | 6,649,662 | | | Series 2007-5-A2 | | | 5.75% | | | | 05/25/2037 | | | | 6,314,166 | |
| | 25,000,541 | | | Series 2007-7-A1 | | | 6.00% | | | | 06/25/2037 | | | | 23,377,231 | |
| | 7,494,308 | | | Series 2007-7-A2 | | | 5.75% | | | | 06/25/2037 | | | | 6,918,296 | |
| | 16,833,612 | | | Series 2007-8-1A4 | | | 6.00% | | | | 01/25/2038 | | | | 15,231,389 | |
| | 20,511,195 | | | Series 2007-8-1A9 | | | 6.00% | # | | | 01/25/2038 | | | | 18,559,227 | |
| | 4,113,024 | | | Series 2007-9-A11 | | | 5.75% | | | | 07/25/2037 | | | | 3,868,764 | |
| | 43,520,817 | | | Series 2007-J1-2A1 | | | 6.00% | | | | 02/25/2037 | | | | 35,298,516 | |
| | 1,627,116 | | | Series 2007-J3-A1 | | | 0.65% | # | | | 07/25/2037 | | | | 1,270,119 | |
| | 8,135,581 | | | Series 2007-J3-A2 | | | 5.35% | # I/F I/O | | | 07/25/2037 | | | | 926,850 | |
| |
| | | | Credit Suisse First Boston Mortgage Backed Trust, | |
| | 6,339,899 | | | Series 2006-3-A4B | | | 6.11% | # | | | 11/25/2036 | | | | 3,452,753 | |
| | 4,272,396 | | | Series 2006-4-A6A | | | 5.68% | # | | | 12/25/2036 | | | | 2,790,541 | |
| | 13,974,611 | | | Series 2007-1-1A1A | | | 5.90% | # | | | 05/25/2037 | | | | 7,810,256 | |
| |
| | | | Credit Suisse First Boston Mortgage Securities Corporation, | |
| | 306,533 | | | Series 2004-AR8-2A1 | | | 2.56% | # | | | 09/25/2034 | | | | 311,309 | |
| | 4,960,666 | | | Series 2005-10-5A4 | | | 5.50% | | | | 11/25/2035 | | | | 4,449,767 | |
| | 1,472,461 | | | Series 2005-10-5A5 | | | 5.50% | | | | 11/25/2035 | | | | 1,299,384 | |
| | 13,303,667 | | | Series 2005-12-7A1 | | | 7.00% | | | | 01/25/2036 | | | | 67,006,283 | |
| | 15,310,648 | | | Series 2005-8-3A10 | | | 5.50% | | | | 09/25/2035 | | | | 15,761,348 | |
| |
| | | | Credit Suisse Mortgage Capital Certificates, | |
| | 5,462,386 | | | Series 2005-1R-2A5 | | | 5.75% | ^ | | | 12/26/2035 | | | | 4,564,213 | |
| | 30,694,721 | | | Series 2006-1-2A1 | | | 6.00% | | | | 02/25/2036 | | | | 23,406,720 | |
| | 4,872,343 | | | Series 2006-2-3A1 | | | 6.50% | | | | 03/25/2036 | | | | 3,676,115 | |
| | 6,026,914 | | | Series 2006-2-5A1 | | | 0.85% | # | | | 03/25/2036 | | | | 3,724,295 | |
| | 33,687,676 | | | Series 2006-2-5A2 | | | 5.15% | # I/F I/O | | | 03/25/2036 | | | | 5,560,302 | |
| | 7,017,096 | | | Series 2006-2-5A3 | | | 6.25% | | | | 03/25/2036 | | | | 5,644,748 | |
| | 18,991,068 | | | Series 2006-2-5A4 | | | 6.00% | | | | 03/25/2036 | | | | 14,986,744 | |
| | 3,618,802 | | | Series 2006-3-4A3 | | | 5.50% | | | | 04/25/2036 | | | | 3,516,594 | |
| | 7,837,189 | | | Series 2006-3-4A4 | | | 5.50% | | | | 04/25/2036 | | | | 7,615,839 | |
| | 7,130,629 | | | Series 2006-4-1A8 | | | 6.00% | # | | | 05/25/2036 | | | | 5,721,039 | |
| | 29,400,279 | | | Series 2006-4-4A1 | | | 7.00% | | | | 05/25/2036 | | | | 15,277,414 | |
| | 23,097,361 | | | Series 2006-4-6A1 | | | 6.00% | | | | 05/25/2036 | | | | 21,047,470 | |
| | 20,760,591 | | | Series 2006-6-1A4 | | | 6.00% | | | | 07/25/2036 | | | | 16,644,140 | |
| | 13,863,970 | | | Series 2006-6-3A1 | | | 7.00% | | | | 07/25/2036 | | | | 5,100,651 | |
| | 730,702 | | | Series 2006-7-3A11 | | | 6.00% | | | | 08/25/2036 | | | | 633,009 | |
| | 8,417,466 | | | Series 2006-7-7A5 | | | 6.00% | | | | 08/25/2036 | | | | 7,340,375 | |
| | 11,110,319 | | | Series 2006-9-2A1 | | | 5.50% | | | | 11/25/2036 | | | | 11,299,944 | |
| | 37,755,238 | | | Series 2006-9-3A1 | | | 6.00% | | | | 11/25/2036 | | | | 39,567,584 | |
| | 9,321,960 | | | Series 2006-9-4A1 | | | 6.00% | | | | 11/25/2036 | | | | 9,610,298 | |
| | 17,091,176 | | | Series 2006-9-6A14 | | | 6.00% | | | | 11/25/2036 | | | | 16,606,855 | |
| | 2,776,559 | | | Series 2006-9-6A15 | | | 38.97% | # I/F | | | 11/25/2036 | | | | 4,930,034 | |
| | 13,809,745 | | | Series 2007-1-1A4 | | | 6.13% | # | | | 02/25/2037 | | | | 7,897,600 | |
| | 19,315,893 | | | Series 2007-1-3A1 | | | 6.00% | | | | 02/25/2022 | | | | 15,988,499 | |
| | 11,828,999 | | | Series 2007-1-5A14 | | | 6.00% | | | | 02/25/2037 | | | | 10,455,061 | |
| | 298,479 | | | Series 2007-2-2A1 | | | 5.00% | | | | 03/25/2037 | | | | 296,183 | |
| | 8,966,474 | | | Series 2007-5-2A5 | | | 5.00% | | | | 08/25/2037 | | | | 8,495,250 | |
| | | | | | | | | | | | | | | | |
PRINCIPAL
AMOUNT | | | SECURITY DESCRIPTION | | RATE | | | MATURITY | | | VALUE $ | |
| |
| | | | Credit Suisse Mortgage Capital Certificates, (Cont.) | |
| $ | 65,679,104 | | | Series 2007-5-3A19 | | | 6.00% | | | | 08/25/2037 | | | | 65,867,866 | |
| | 29,600,577 | | | Series 2007-5-3A9 | | | 6.00% | | | | 08/25/2037 | | | | 29,738,308 | |
| | 5,125,847 | | | Series 2009-1R-4A2 | | | 3.04% | #^ | | | 07/20/2035 | | | | 4,482,343 | |
| | 93,898,000 | | | Series 2010-17R-6A1 | | | 4.00% | #^ | | | 06/26/2037 | | | | 80,904,282 | |
| | 3,213,019 | | | Series 2010-1R-5A1 | | | 5.00% | #^ | | | 01/27/2036 | | | | 3,257,596 | |
| | 53,773,126 | | | Series 2010-2R-4A17 | | | 6.56% | #^ | | | 03/26/2037 | | | | 49,336,376 | |
| | 91,145,885 | | | Series 2010-4R-3A17 | | | 6.96% | #^ | | | 06/26/2037 | | | | 84,372,707 | |
| | 45,000,737 | | | Series 2010-4R-8A17 | | | 6.96% | #^ | | | 06/26/2037 | | | | 41,656,646 | |
| | 9,136,261 | | | Series 2010-6R-2A6A | | | 6.25% | ^ | | | 07/26/2037 | | | | 9,630,187 | |
| | 30,762,231 | | | Series 2010-7R-4A17 | | | 6.82% | #^ | | | 04/26/2037 | | | | 27,971,859 | |
| | 50,000,000 | | | Series 2010-9R-2A5 | | | 4.00% | ^ | | | 02/27/2038 | | | | 45,883,005 | |
| | 13,393,672 | | | Series 2011-16R-6A1 | | | 2.42% | #^ | | | 09/27/2035 | | | | 13,389,803 | |
| |
| | | | Credit-Based Asset Servicing and Securitization LLC, | |
| | 986,396 | | | Series 2005-CB6-A4 | | | 4.36% | # | | | 07/25/2035 | | | | 1,001,762 | |
| | 9,750,000 | | | Series 2007-MX1-A3 | | | 5.83% | #^ | | | 12/25/2036 | | | | 8,026,736 | |
| |
| | | | Deutsche ALT-A Securities, Inc. Mortgage Loan Trust, | |
| | 34,816,154 | | | Series 2005-4-A5 | | | 5.50% | # | | | 09/25/2035 | | | | 30,437,744 | |
| | 2,554,443 | | | Series 2005-5-1A6 | | | 34.80% | # I/F | | | 11/25/2035 | | | | 3,906,888 | |
| | 2,486,127 | | | Series 2005-5-2A1 | | | 0.35% | # | | | 11/25/2035 | | | | 1,595,161 | |
| | 7,503,402 | | | Series 2005-5-2A2 | | | 5.15% | # I/F I/O | | | 11/25/2035 | | | | 1,326,902 | |
| | 1,810,047 | | | Series 2006-AB2-A2 | | | 6.16% | # | | | 06/25/2036 | | | | 1,472,553 | |
| | 3,693,511 | | | Series 2006-AB4-A1A | | | 6.01% | # | | | 10/25/2036 | | | | 2,891,395 | |
| | 3,674,227 | | | Series 2006-AB4-A3 | | | 5.90% | # | | | 10/25/2036 | | | | 2,860,834 | |
| | 5,415,286 | | | Series 2006-AB4-A3A1 | | | 5.90% | # | | | 10/25/2036 | | | | 4,216,597 | |
| | 10,793,645 | | | Series 2006-AB4-A6A1 | | | 5.87% | # | | | 10/25/2036 | | | | 8,390,699 | |
| | 10,911,577 | | | Series 2006-AF1-A3 | | | 0.33% | # | | | 04/25/2036 | | | | 10,619,364 | |
| | 93,557,270 | | | Series 2007-1-1A3A | | | 0.36% | # | | | 08/25/2037 | | | | 75,617,009 | |
| | 26,328,659 | | | Series 2007-OA5-A1B | | | 0.37% | # | | | 08/25/2047 | | | | 23,302,022 | |
| |
| | | | Deutsche Mortgage Securities, Inc., | |
| | 29,892,827 | | | Series 2006-PR1-3A1 | | | 11.91% | #^ I/F | | | 04/15/2036 | | | | 35,804,044 | |
| | 9,737,721 | | | Series 2006-PR1-4AI1 | | | 11.89% | #^ I/F | | | 04/15/2036 | | | | 11,204,767 | |
| | 15,939,387 | | | Series 2006-PR1-4AI2 | | | 14.31% | #^ I/F | | | 04/15/2036 | | | | 19,466,582 | |
| | 780,403 | | | Series 2006-PR1-5AI1 | | | 18.89% | #^ I/F | | | 04/15/2036 | | | | 1,104,514 | |
| | 6,788,573 | | | Series 2006-PR1-5AI3 | | | 12.35% | #^ I/F | | | 04/15/2036 | | | | 8,341,235 | |
| | 112,404,458 | | | Series 2006-PR1-5AI4 | | | 11.91% | #^ I/F | | | 04/15/2036 | | | | 135,586,866 | |
| | 29,583,363 | | | Series 2009-RS2-4A2 | | | 0.00% | #^ | | | 04/26/2037 | | | | 27,020,068 | |
| |
| | | | First Franklin Mortgage Loan Trust, | |
| | 13,226,168 | | | Series 2006-FF1-2A3 | | | 0.39% | # | | | 01/25/2036 | | | | 12,856,860 | |
| | 19,434,029 | | | Series 2006-FF3-A2B | | | 0.35% | # | | | 02/25/2036 | | | | 18,386,515 | |
| |
| | | | First Horizon Alternative Mortgage Securities, | |
| | 19,522,050 | | | Series 2005-AA4-1A1 | | | 2.25% | # | | | 05/25/2035 | | | | 16,826,465 | |
| | 11,369,310 | | | Series 2005-FA5-1A4 | | | 5.50% | | | | 08/25/2035 | | | | 11,230,571 | |
| | 17,620,620 | | | Series 2005-FA8-1A4 | | | 5.50% | | | | 11/25/2035 | | | | 16,370,859 | |
| | 2,247,907 | | | Series 2005-FA8-2A1 | | | 5.00% | | | | 11/25/2020 | | | | 2,299,146 | |
| | 6,809,463 | | | Series 2006-FA1-1A12 | | | 6.00% | | | | 04/25/2036 | | | | 6,167,862 | |
| | 612,846 | | | Series 2006-FA1-1A6 | | | 0.90% | # | | | 04/25/2036 | | | | 614,315 | |
| | 4,775,188 | | | Series 2006-FA2-1A5 | | | 6.00% | | | | 05/25/2036 | | | | 4,142,575 | |
| | 1,370,232 | | | Series 2006-FA7-A8 | | | 6.25% | | | | 12/25/2036 | | | | 1,194,674 | |
| | 6,432,214 | | | Series 2006-FA8-1A5 | | | 6.00% | | | | 02/25/2037 | | | | 5,496,140 | |
| | 15,542,015 | | | Series 2006-RE1-A1 | | | 5.50% | | | | 05/25/2035 | | | | 14,712,826 | |
| | 1,949,977 | | | Series 2007-FA3-A4 | | | 6.00% | | | | 06/25/2037 | | | | 1,617,606 | |
| | 2,176,953 | | | Series 2007-FA4-1A13 | | | 6.25% | | | | 08/25/2037 | | | | 1,900,504 | |
| | 3,157,632 | | | Series 2007-FA4-1A5 | | | 6.25% | | | | 08/25/2037 | | | | 2,756,647 | |
| |
| | | | First Horizon Asset Securities, Inc., | |
| | 12,787,881 | | | Series 2007-1-A3 | | | 6.00% | | | | 03/25/2037 | | | | 11,802,063 | |
| | 6,092,273 | | | Series 2007-4-1A1 | | | 6.00% | | | | 08/25/2037 | | | | 5,228,455 | |
| |
| | | | GMACM Mortgage Loan Trust, | |
| | 14,104,992 | | | Series 2005-AR5-3A1 | | | 3.01% | # | | | 09/19/2035 | | | | 13,571,894 | |
| | 21,971,387 | | | Series 2005-J1-A14 | | | 5.50% | | | | 12/25/2035 | | | | 22,247,490 | |
| |
| | | | GS Mortgage Securities Corporation, | |
| | 2,318,222 | | | Series 2008-2R-1A1 | | | 7.50% | #^ | | | 09/25/2036 | | | | 1,956,962 | |
| |
| | | | GSAA Home Equity Trust, | |
| | 867,867 | | | Series 2005-12-AF3 | | | 5.07% | # | | | 09/25/2035 | | | | 819,493 | |
| | 23,696,271 | | | Series 2005-7-AF2 | | | 4.48% | # | | | 05/25/2035 | | | | 24,535,961 | |
| | 45,361,000 | | | Series 2005-7-AF3 | | | 4.75% | # | | | 05/25/2035 | | | | 46,191,696 | |
| | 13,796,803 | | | Series 2006-10-AF3 | | | 5.98% | # | | | 06/25/2036 | | | | 8,076,800 | |
| | 9,874,608 | | | Series 2006-10-AF4 | | | 6.30% | # | | | 06/25/2036 | | | | 5,778,147 | |
| | 19,280,977 | | | Series 2006-15-AF4 | | | 5.96% | # | | | 09/25/2036 | | | | 11,451,223 | |
| | 3,187,361 | | | Series 2006-18-AF3A | | | 5.77% | # | | | 11/25/2036 | | | | 2,031,767 | |
| | 6,700,745 | | | Series 2006-18-AF6 | | | 5.68% | # | | | 11/25/2036 | | | | 3,782,906 | |
| | | | | | |
| The accompanying notes are an integral part of these financial statements. | | Annual Report | | March 31, 2014 | | 19 |
Schedule of Investments DoubleLine Total Return Bond Fund (Cont.)
| | | | | | | | | | | | | | | | |
PRINCIPAL
AMOUNT | | | SECURITY DESCRIPTION | | RATE | | | MATURITY | | | VALUE $ | |
| |
| | | | GSAA Home Equity Trust, (Cont.) | |
| $ | 11,526,016 | | | Series 2007-10-A1A | | | 6.00% | | | | 11/25/2037 | | | | 9,310,439 | |
| | 5,239,220 | | | Series 2007-10-A2A | | | 6.50% | | | | 11/25/2037 | | | | 3,976,143 | |
| |
| | | | GSMPS Mortgage Loan Trust, | |
| | 21,170,551 | | | Series 2005-RP2-1AF | | | 0.50% | #^ | | | 03/25/2035 | | | | 18,667,599 | |
| | 21,170,551 | | | Series 2005-RP2-1AS | | | 5.02% | #^ I/O | | | 03/25/2035 | | | | 2,592,694 | |
| | 11,875,054 | | | Series 2005-RP3-1AF | | | 0.50% | #^ | | | 09/25/2035 | | | | 10,227,782 | |
| | 11,875,054 | | | Series 2005-RP3-1AS | | | 4.87% | #^ I/O | | | 09/25/2035 | | | | 1,739,660 | |
| | 44,950,592 | | | Series 2006-RP1-1AS | | | 4.74% | #^ I/O | | | 01/25/2036 | | | | 5,868,704 | |
| | 44,950,592 | | | Series 2006-RP1-AF1 | | | 0.50% | #^ | | | 01/25/2036 | | | | 38,431,677 | |
| |
| | | | GSR Mortgage Loan Trust, | |
| | 5,103,353 | | | Series 2005-1F-1A2 | | | 5.50% | | | | 02/25/2035 | | | | 5,247,574 | |
| | 10,554,774 | | | Series 2005-1F-3A3 | | | 6.00% | | | | 01/25/2035 | | | | 10,790,737 | |
| | 1,821,942 | | | Series 2005-6F-3A5 | | | 6.00% | | | | 07/25/2035 | | | | 1,893,571 | |
| | 17,543,806 | | | Series 2005-6F-3A9 | | | 6.75% | # I/F I/O | | | 07/25/2035 | | | | 3,202,929 | |
| | 1,522,382 | | | Series 2005-6F-4A1 | | | 0.65% | # | | | 07/25/2035 | | | | 1,233,461 | |
| | 1,168,406 | | | Series 2005-7F-3A1 | | | 0.65% | # | | | 09/25/2035 | | | | 1,092,814 | |
| | 23,402,808 | | | Series 2005-8F-3A5 | | | 6.00% | | | | 11/25/2035 | | | | 21,160,562 | |
| | 7,038,939 | | | Series 2005-8F-4A1 | | | 6.00% | | | | 11/25/2035 | | | | 5,894,668 | |
| | 3,766,580 | | | Series 2006-1F-1A2 | | | 5.50% | | | | 02/25/2036 | | | | 3,654,398 | |
| | 2,272,377 | | | Series 2006-2F-2A3 | | | 5.75% | | | | 02/25/2036 | | | | 2,168,334 | |
| | 7,364,208 | | | Series 2006-2F-3A3 | | | 6.00% | | | | 02/25/2036 | | | | 6,499,318 | |
| | 26,220,108 | | | Series 2006-6F-2A3 | | | 6.00% | | | | 07/25/2036 | | | | 23,876,214 | |
| | 24,494,267 | | | Series 2006-7F-2A1 | | | 6.00% | | | | 08/25/2036 | | | | 22,736,215 | |
| | 13,032,637 | | | Series 2006-7F-3A4 | | | 6.25% | | | | 08/25/2036 | | | | 11,169,205 | |
| | 22,959,092 | | | Series 2006-9F-2A1 | | | 6.00% | | | | 10/25/2036 | | | | 21,556,337 | |
| | 41,653,474 | | | Series 2006-9F-4A1 | | | 6.50% | | | | 10/25/2036 | | | | 36,818,505 | |
| | 456,392 | | | Series 2006-9F-8A1 | | | 5.50% | | | | 08/25/2021 | | | | 449,681 | |
| | 44,633,760 | | | Series 2006-OA1-2A1 | | | 0.34% | # | | | 08/25/2046 | | | | 43,477,500 | |
| | 4,379,783 | | | Series 2007-1F-2A2 | | | 5.50% | | | | 01/25/2037 | | | | 4,251,035 | |
| | 6,112,166 | | | Series 2007-4F-1A1 | | | 5.00% | | | | 07/25/2037 | | | | 5,525,753 | |
| | 72,438,420 | | | Series 2007-4F-3A11 | | | 6.00% | | | | 07/25/2037 | | | | 66,638,493 | |
| |
| | | | Harborview Mortgage Loan Trust, | |
| | 4,796,037 | | | Series 2005-14-3A1A | | | 2.72% | # | | | 12/19/2035 | | | | 4,459,639 | |
| | 12,116,201 | | | Series 2006-10-2A1A | | | 0.34% | # | | | 11/19/2036 | | | | 10,212,685 | |
| |
| | | | Home Equity Asset Trust, | |
| | 2,099,574 | | | Series 2003-3-M1 | | | 1.44% | # | | | 08/25/2033 | | | | 1,980,690 | |
| | 2,064,029 | | | Series 2004-7-M2 | | | 1.14% | # | | | 01/25/2035 | | | | 1,981,981 | |
| |
| | | | Homebanc Mortgage Trust, | |
| | 3,035,775 | | | Series 2005-1-M2 | | | 0.64% | # | | | 03/25/2035 | | | | 2,236,771 | |
| | 48,298,434 | | | Series 2005-3-A1 | | | 0.39% | # | | | 07/25/2035 | | | | 44,391,090 | |
| | 5,252,285 | | | Series 2006-1-3A1 | | | 2.44% | # | | | 04/25/2037 | | | | 4,314,689 | |
| |
| | | | HSI Asset Loan Obligation Trust, | |
| | 2,514,594 | | | Series 2006-2-2A1 | | | 5.50% | | | | 12/25/2021 | | | | 2,404,849 | |
| | 60,027,845 | | | Series 2007-2-3A6 | | | 6.00% | | | | 09/25/2037 | | | | 52,904,160 | |
| | 10,292,379 | | | Series 2007-AR1-3A1 | | | 2.56% | # | | | 01/25/2037 | | | | 8,367,940 | |
| |
| | | | IMPAC Trust, | |
| | 1,752,046 | | | Series 2002-9F-A1 | | | 5.22% | # | | | 12/25/2032 | | | | 1,797,028 | |
| |
| | | | IndyMac Mortgage Loan Trust, | |
| | 9,948,616 | | | Series 2006-AR2-4A1 | | | 2.73% | # | | | 09/25/2036 | | | | 8,478,419 | |
| | 42,425,401 | | | Series 2006-AR3-1A1 | | | 2.62% | # | | | 12/25/2036 | | | | 37,216,707 | |
| | 10,900,301 | | | Series 2007-A1-A1 | | | 6.00% | | | | 08/25/2037 | | | | 9,528,182 | |
| | 7,979,872 | | | Series 2007-A1-A7 | | | 6.00% | | | | 08/25/2037 | | | | 6,975,374 | |
| | 38,478,995 | | | Series 2007-A3-A1 | | | 6.25% | | | | 11/25/2037 | | | | 34,078,806 | |
| | 14,073,895 | | | Series 2007-AR3-3A1 | | | 5.60% | # | | | 07/25/2037 | | | | 13,274,033 | |
| | 944,515 | | | Series 2007-F2-1A2 | | | 6.00% | | | | 07/25/2037 | | | | 851,085 | |
| | 32,367,422 | | | Series 2007-F2-2A1 | | | 6.50% | | | | 07/25/2037 | | | | 22,880,596 | |
| |
| | | | Jefferies & Company, Inc., | |
| | 7,662,912 | | | Series 2010-R1-1A1 | | | 6.00% | #^ | | | 03/26/2037 | | | | 8,120,519 | |
| | 1,426,338 | | | Series 2010-R6-1A2 | | | 6.00% | ^ | | | 09/26/2037 | | | | 1,438,812 | |
| |
| | | | JP Morgan Alternative Loan Trust, | |
| | 23,164,161 | | | Series 2005-S1-2A11 | | | 6.00% | | | | 12/25/2035 | | | | 20,888,884 | |
| | 7,425,936 | | | Series 2005-S1-2A9 | | | 6.00% | | | | 12/25/2035 | | | | 6,696,531 | |
| | 7,434,044 | | | Series 2006-S1-1A8 | | | 5.75% | | | | 03/25/2036 | | | | 6,649,678 | |
| | 6,246,539 | | | Series 2006-S2-A4 | | | 6.19% | # | | | 05/25/2036 | | | | 4,474,677 | |
| | 12,591,538 | | | Series 2006-S4-A3A | | | 5.78% | # | | | 12/25/2036 | | | | 11,847,630 | |
| |
| | | | JP Morgan Mortgage Acquisition Corporation, | |
| | 15,910,669 | | | Series 2006-CH2-AF3 | | | 5.25% | # | | | 10/25/2036 | | | | 12,460,536 | |
| | 5,491,627 | | | Series 2006-WF1-A5 | | | 6.41% | # | | | 07/25/2036 | | | | 3,372,754 | |
| | 15,000,000 | | | Series 2007-CH1-AF5 | | | 5.36% | # | | | 11/25/2036 | | | | 14,549,175 | |
| | 7,094,675 | | | Series 2007-CH5-A3 | | | 0.26% | # | | | 05/25/2037 | | | | 6,881,115 | |
| | | | | | | | | | | | | | | | |
PRINCIPAL
AMOUNT | | | SECURITY DESCRIPTION | | RATE | | | MATURITY | | | VALUE $ | |
| |
| | | | JP Morgan Mortgage Trust, | |
| $ | 3,519,067 | | | Series 2005-A6-5A1 | | | 5.14% | # | | | 08/25/2035 | | | | 3,624,898 | |
| | 5,103,230 | | | Series 2005-S2-2A13 | | | 5.50% | | | | 09/25/2035 | | | | 5,346,103 | |
| | 3,766,326 | | | Series 2006-S2-3A3 | | | 6.00% | | | | 07/25/2036 | | | | 3,431,819 | |
| | 11,423,458 | | | Series 2006-S3-1A2 | | | 6.00% | | | | 08/25/2036 | | | | 10,543,795 | |
| | 12,351,110 | | | Series 2006-S3-1A21 | | | 0.53% | # | | | 08/25/2036 | | | | 7,614,644 | |
| | 12,351,110 | | | Series 2006-S3-1A22 | | | 6.97% | # I/F I/O | | | 08/25/2036 | | | | 3,235,392 | |
| | 5,322,953 | | | Series 2006-S3-1A9 | | | 6.00% | | | | 08/25/2036 | | | | 4,913,059 | |
| | 15,939,347 | | | Series 2006-S4-A8 | | | 0.53% | # | | | 01/25/2037 | | | | 10,577,462 | |
| | 15,939,347 | | | Series 2006-S4-A9 | | | 6.47% | # I/F I/O | | | 01/25/2037 | | | | 3,340,991 | |
| | 4,376,675 | | | Series 2007-A2-2A1 | | | 2.60% | # | | | 04/25/2037 | | | | 3,789,124 | |
| | 20,276,004 | | | Series 2007-S1-2A6 | | | 6.00% | | | | 03/25/2037 | | | | 17,032,390 | |
| | 8,454,326 | | | Series 2007-S3-1A1 | | | 5.50% | | | | 08/25/2037 | | | | 7,510,865 | |
| | 14,310,526 | | | Series 2007-S3-1A35 | | | 6.00% | | | | 08/25/2037 | | | | 12,792,351 | |
| | 2,425,310 | | | Series 2007-S3-1A9 | | | 6.00% | | | | 08/25/2037 | | | | 2,169,347 | |
| | 13,195,036 | | | Series 2007-S3-1A96 | | | 6.00% | | | | 08/25/2037 | | | | 11,812,157 | |
| | 15,027,668 | | | Series 2007-S3-1A97 | | | 6.00% | | | | 08/25/2037 | | | | 13,454,091 | |
| | 6,087,256 | | | Series 2007-S3-2A2 | | | 5.50% | | | | 08/25/2022 | | | | 6,053,685 | |
| |
| | | | JP Morgan Resecuritization Trust, | |
| | 22,710,308 | | | Series 2010-1-1A4 | | | 6.00% | ^ | | | 02/26/2037 | | | | 16,052,527 | |
| | 18,790,788 | | | Series 2010-2-3A9 | | | 6.00% | ^ | | | 07/26/2036 | | | | 15,107,929 | |
| | 4,180,036 | | | Series 2010-8-2A3 | | | 4.50% | #^ | | | 11/26/2034 | | | | 4,206,663 | |
| | 5,371,496 | | | Series 2012-2-3A3 | | | 2.41% | #^ | | | 10/26/2036 | | | | 5,381,461 | |
| |
| | | | Lehman Mortgage Trust, | |
| | 6,999,130 | | | Series 2005-2-3A5 | | | 5.50% | | | | 12/25/2035 | | | | 6,191,108 | |
| | 7,079,189 | | | Series 2005-2-5A5 | | | 5.75% | | | | 12/25/2035 | | | | 6,409,236 | |
| | 10,882,511 | | | Series 2005-3-2A1 | | | 6.00% | | | | 01/25/2036 | | | | 10,392,765 | |
| | 926,693 | | | Series 2005-3-2A3 | | | 5.50% | | | | 01/25/2036 | | | | 871,039 | |
| | 4,977,204 | | | Series 2005-3-2A7 | | | 6.00% | | | | 01/25/2036 | | | | 4,753,215 | |
| | 3,611,055 | | | Series 2006-1-1A1 | | | 0.90% | # | | | 02/25/2036 | | | | 2,651,807 | |
| | 10,833,164 | | | Series 2006-1-1A2 | | | 4.60% | # I/F I/O | | | 02/25/2036 | | | | 1,479,220 | |
| | 16,647,453 | | | Series 2006-1-3A1 | | | 0.90% | # | | | 02/25/2036 | | | | 15,004,683 | |
| | 16,647,453 | | | Series 2006-1-3A2 | | | 4.60% | # I/F I/O | | | 02/25/2036 | | | | 2,054,529 | |
| | 7,984,932 | | | Series 2006-1-3A4 | | | 5.50% | | | | 02/25/2036 | | | | 7,674,170 | |
| | 6,853,364 | | | Series 2006-4-1A3 | | | 5.25% | # I/F I/O | | | 08/25/2036 | | | | 984,612 | |
| | 4,355,850 | | | Series 2006-4-1A4 | | | 6.00% | | | | 08/25/2036 | | | | 3,650,812 | |
| | 11,537,349 | | | Series 2006-5-2A1 | | | 0.50% | # | | | 09/25/2036 | | | | 5,878,279 | |
| | 24,032,172 | | | Series 2006-5-2A2 | | | 7.00% | # I/F I/O | | | 09/25/2036 | | | | 6,923,212 | |
| | 20,168,655 | | | Series 2006-6-3A9 | | | 5.50% | | | | 10/25/2036 | | | | 16,798,836 | |
| | 13,338,645 | | | Series 2006-6-4A5 | | | 6.00% | | | | 12/25/2036 | | | | 13,526,460 | |
| | 5,759,902 | | | Series 2006-7-2A2 | | | 0.60% | # | | | 11/25/2036 | | | | 2,601,523 | |
| | 17,995,491 | | | Series 2006-7-2A5 | | | 6.40% | # I/F I/O | | | 11/25/2036 | | | | 4,021,753 | |
| | 5,491,007 | | | Series 2006-9-1A19 | | | 29.97% | # I/F | | | 01/25/2037 | | | | 8,080,423 | |
| | 6,095,868 | | | Series 2006-9-1A5 | | | 0.75% | # | | | 01/25/2037 | | | | 3,565,650 | |
| | 18,110,628 | | | Series 2006-9-1A6 | | | 5.00% | # I/F I/O | | | 01/25/2037 | | | | 2,665,830 | |
| | 7,268,863 | | | Series 2006-9-2A1 | | | 0.53% | # | | | 01/25/2037 | | | | 3,155,799 | |
| | 15,523,555 | | | Series 2006-9-2A2 | | | 6.47% | # I/F I/O | | | 01/25/2037 | | | | 3,534,054 | |
| | 16,955,396 | | | Series 2007-10-2A1 | | | 6.50% | | | | 01/25/2038 | | | | 14,185,495 | |
| | 5,107,870 | | | Series 2007-2-1A1 | | | 5.75% | | | | 02/25/2037 | | | | 4,032,658 | |
| | 4,958,538 | | | Series 2007-4-2A11 | | | 0.48% | # | | | 05/25/2037 | | | | 2,021,112 | |
| | 18,324,034 | | | Series 2007-4-2A8 | | | 6.52% | # I/F I/O | | | 05/25/2037 | | | | 5,481,103 | |
| | 1,848,888 | | | Series 2007-4-2A9 | | | 0.48% | # | | | 05/25/2037 | | | | 991,004 | |
| | 22,072,864 | | | Series 2007-5-11A1 | | | 5.51% | # | | | 06/25/2037 | | | | 16,395,525 | |
| | 11,949,744 | | | Series 2007-5-3A4 | | | 5.00% | | | | 12/25/2035 | | | | 11,429,273 | |
| | 3,660,522 | | | Series 2007-5-4A3 | | | 39.15% | # I/F | | | 08/25/2036 | | | | 5,863,128 | |
| | 1,512,355 | | | Series 2007-5-7A3 | | | 7.50% | | | | 10/25/2036 | | | | 1,289,166 | |
| | 1,226,094 | | | Series 2007-6-1A8 | | | 6.00% | | | | 07/25/2037 | | | | 1,119,113 | |
| | 10,549,229 | | | Series 2008-2-1A6 | | | 6.00% | | | | 03/25/2038 | | | | 9,843,359 | |
| |
| | | | Lehman XS Trust, | |
| | 2,813,333 | | | Series 2005-10-2A3B | | | 5.55% | # | | | 01/25/2036 | | | | 2,515,168 | |
| | 15,346,848 | | | Series 2005-4-2A3A | | | 5.00% | # | | | 10/25/2035 | | | | 11,823,841 | |
| | 4,434,932 | | | Series 2006-5-2A4A | | | 5.89% | # | | | 04/25/2036 | | | | 4,156,663 | |
| | 28,332,345 | | | Series 2007-1-2A1 | | | 5.76% | # | | | 02/25/2037 | | | | 25,522,768 | |
| |
| | | | Long Beach Mortgage Loan Trust, | |
| | 10,459,969 | | | Series 2006-WL1-2A3 | | | 0.39% | # | | | 01/25/2046 | | | | 9,488,573 | |
| |
| | | | MASTR Adjustable Rate Mortgages Trust, | |
| | 6,636,058 | | | Series 2005-2-2A1 | | | 2.49% | # | | | 03/25/2035 | | | | 5,433,784 | |
| | 7,345,021 | | | Series 2005-6-5A1 | | | 2.46% | # | | | 07/25/2035 | | | | 6,507,490 | |
| | 30,029,429 | | | Series 2007-1-2A1 | | | 2.74% | # | | | 11/25/2036 | | | | 26,661,509 | |
| | 7,925,953 | | | Series 2007-2-A2 | | | 0.26% | # | | | 03/25/2047 | | | | 7,735,496 | |
| |
| | | | MASTR Alternative Loans Trust, | |
| | 3,337,819 | | | Series 2005-2-3A1 | | | 6.00% | | | | 03/25/2035 | | | | 3,455,184 | |
| | 1,275,870 | | | Series 2005-5-2A3 | | | 5.50% | | | | 07/25/2025 | | | | 1,284,736 | |
| | | | | | |
| 20 | | DoubleLine Funds Trust | | | | The accompanying notes are an integral part of these financial statements. |
March 31, 2014
| | | | | | | | | | | | | | | | |
PRINCIPAL
AMOUNT | | | SECURITY DESCRIPTION | | RATE | | | MATURITY | | | VALUE $ | |
| |
| | | | MASTR Alternative Loans Trust, (Cont.) | |
| $ | 8,543,373 | | | Series 2005-6-1A5 | | | 5.50% | | | | 12/25/2035 | | | | 7,802,210 | |
| | 4,549,581 | | | Series 2006-3-1A2 | | | 6.25% | | | �� | 07/25/2036 | | | | 3,903,927 | |
| | 10,946,479 | | | Series 2007-1-1A5 | | | 5.75% | | | | 10/25/2036 | | | | 10,440,916 | |
| | 9,899,792 | | | Series 2007-1-2A7 | | | 6.00% | | | | 10/25/2036 | | | | 8,135,521 | |
| |
| | | | MASTR Asset Backed Securities Trust, | |
| | 4,975,000 | | | Series 2003-OPT1-M3 | | | 4.28% | # | | | 12/25/2032 | | | | 4,559,438 | |
| | 25,862,724 | | | Series 2006-AM2-A3 | | | 0.32% | # | | | 06/25/2036 | | | | 19,692,758 | |
| | 4,606,826 | | | Series 2006-NC1-A3 | | | 0.34% | # | | | 01/25/2036 | | | | 4,524,979 | |
| |
| | | | MASTR Asset Securitization Trust, | |
| | 474,405 | | | Series 2003-1-30B2 | | | 5.75% | | | | 02/25/2033 | | | | 474,505 | |
| | 779,161 | | | Series 2007-1-1A1 | | | 5.50% | | | | 11/25/2037 | | | | 807,228 | |
| | 7,583,234 | | | Series 2007-1-1A3 | | | 6.25% | | | | 11/25/2037 | | | | 6,820,004 | |
| |
| | | | MASTR Seasoned Securitization Trust, | |
| | 1,653,351 | | | Series 2005-2-1A4 | | | 6.00% | | | | 10/25/2032 | | | | 1,657,645 | |
| | 2,387,322 | | | Series 2005-2-2A1 | | | 0.55% | # | | | 10/25/2032 | | | | 2,128,477 | |
| |
| | | | Merrill Lynch Mortgage Investors Trust, | |
| | 13,671,318 | | | Series 2006-3-1A | | | 2.33% | # | | | 10/25/2036 | | | | 13,340,540 | |
| | 4,770,538 | | | Series 2006-F1-1A2 | | | 6.00% | | | | 04/25/2036 | | | | 4,589,887 | |
| |
| | | | Morgan Stanley Capital, Inc., | |
| | 1,491,714 | | | Series 2003-NC6-M2 | | | 3.08% | # | | | 06/25/2033 | | | | 1,349,824 | |
| |
| | | | Morgan Stanley Mortgage Loan Trust, | |
| | 3,584,703 | | | Series 2005-10-1A1 | | | 0.85% | # | | | 12/25/2035 | | | | 2,951,637 | |
| | 8,981,296 | | | Series 2005-10-1A6 | | | 5.75% | | | | 12/25/2035 | | | | 8,680,418 | |
| | 10,698,486 | | | Series 2005-10-2A1 | | | 5.54% | # | | | 12/25/2035 | | | | 10,771,011 | |
| | 1,516,918 | | | Series 2005-6AR-1A1 | | | 0.43% | # | | | 11/25/2035 | | | | 1,508,408 | |
| | 7,076,244 | | | Series 2006-11-1A6 | | | 6.23% | # | | | 08/25/2036 | | | | 3,635,215 | |
| | 18,387,819 | | | Series 2006-11-2A1 | | | 6.00% | | | | 08/25/2036 | | | | 15,091,490 | |
| | 10,084,392 | | | Series 2006-17XS-A3A | | | 5.65% | # | | | 10/25/2046 | | | | 6,892,662 | |
| | 3,094,505 | | | Series 2006-17XS-A6 | | | 5.58% | # | | | 10/25/2046 | | | | 1,881,979 | |
| | 1,091,732 | | | Series 2006-2-2A3 | | | 5.75% | | | | 02/25/2036 | | | | 1,048,614 | |
| | 56,664,134 | | | Series 2006-7-3A | | | 5.43% | # | | | 06/25/2036 | | | | 49,169,055 | |
| | 4,639,184 | | | Series 2006-7-4A4 | | | 6.00% | | | | 06/25/2036 | | | | 3,972,491 | |
| | 4,696,371 | | | Series 2006-7-4A7 | | | 6.00% | | | | 06/25/2036 | | | | 4,021,460 | |
| | 6,472,463 | | | Series 2007-13-6A1 | | | 6.00% | | | | 10/25/2037 | | | | 5,298,973 | |
| | 24,883,951 | | | Series 2007-14AR-2A3 | | | 2.38% | # | | | 10/25/2037 | | | | 20,515,897 | |
| | 4,835,198 | | | Series 2007-1XS-2A3 | | | 5.92% | # | | | 09/25/2046 | | | | 2,900,504 | |
| | 3,583,583 | | | Series 2007-1XS-2A4A | | | 6.08% | # | | | 09/25/2046 | | | | 2,419,377 | |
| | 2,357,754 | | | Series 2007-3XS-1A2A | | | 5.62% | # | | | 01/25/2047 | | | | 2,294,057 | |
| | 10,817,877 | | | Series 2007-3XS-2A3S | | | 5.86% | # | | | 01/25/2047 | | | | 7,762,735 | |
| | 6,327,437 | | | Series 2007-3XS-2A4S | | | 5.96% | # | | | 01/25/2047 | | | | 4,539,917 | |
| |
| | | | Morgan Stanley Re-Remic Trust, | |
| | 2,829,302 | | | Series 2010-R9-1A | | | 4.00% | #^ | | | 08/26/2036 | | | | 2,875,260 | |
| | 7,483,020 | | | Series 2010-R9-1B | | | 6.75% | #^ | | | 08/26/2036 | | | | 5,697,272 | |
| | 61,507,728 | | | Series 2010-R9-3C | | | 6.54% | #^ | | | 11/26/2036 | | | | 50,608,466 | |
| | 8,039,305 | | | Series 2011-R1-1A | | | 5.94% | #^ | | | 02/26/2037 | | | | 8,546,062 | |
| |
| | | | MSCC Heloc Trust, | |
| | 35,106,728 | | | Series 2007-1-A | | | 0.25% | # | | | 12/25/2031 | | | | 32,846,240 | |
| |
| | | | New York Mortgage Trust, | |
| | 1,705,187 | | | Series 2005-2-A | | | 0.48% | # | | | 08/25/2035 | | | | 1,590,562 | |
| |
| | | | Newcastle Mortgage Securities Trust, | |
| | 22,402,257 | | | Series 2006-1-A3 | | | 0.33% | # | | | 03/25/2036 | | | | 22,208,388 | |
| |
| | | | Nomura Asset Acceptance Corporation, | |
| | 1,282,120 | | | Series 2005-AP1-2A5 | | | 4.86% | # | | | 02/25/2035 | | | | 1,321,671 | |
| | 20,258,915 | | | Series 2006-AF1-1A2 | | | 6.16% | # | | | 05/25/2036 | | | | 11,525,439 | |
| | 4,116,973 | | | Series 2006-AF1-1A3 | | | 6.41% | # | | | 05/25/2036 | | | | 2,343,727 | |
| | 19,586,354 | | | Series 2006-AP1-A2 | | | 5.52% | # | | | 01/25/2036 | | | | 12,994,116 | |
| | 4,251,076 | | | Series 2006-AP1-A3 | | | 5.65% | # | | | 01/25/2036 | | | | 2,844,382 | |
| | 2,144,333 | | | Series 2006-WF1-A2 | | | 5.76% | # | | | 06/25/2036 | | | | 1,272,576 | |
| |
| | | | Nomura Home Equity Loan, Inc., | |
| | 21,504,307 | | | Series 2006-AF1-A2 | | | 5.80% | # | | | 10/25/2036 | | | | 11,761,996 | |
| | 3,940,590 | | | Series 2007-1-1A1 | | | 6.06% | # | | | 02/25/2037 | | | | 2,353,951 | |
| | 19,640,811 | | | Series 2007-1-1A3 | | | 5.99% | # | | | 02/25/2037 | | | | 11,733,951 | |
| |
| | | | Option One Mortgage Loan Trust, | |
| | 1,111,148 | | | Series 2002-2-A | | | 0.69% | # | | | 06/25/2032 | | | | 1,037,231 | |
| | 1,575,793 | | | Series 2004-3-M3 | | | 1.13% | # | | | 11/25/2034 | | | | 1,467,345 | |
| |
| | | | PFCA Home Equity Investment Trust, | |
| | 62,777,352 | | | Series 2003-IFC5-A | | | 4.02% | #^ | | | 01/22/2035 | | | | 59,792,729 | |
| | 64,308,395 | | | Series 2003-IFC6-A | | | 3.86% | #^ | | | 04/22/2035 | | | | 59,300,314 | |
| | | | | | | | | | | | | | | | |
PRINCIPAL
AMOUNT | | | SECURITY DESCRIPTION | | RATE | | | MATURITY | | | VALUE $ | |
| |
| | | | PHH Alternative Mortgage Trust, | |
| $ | 1,704,712 | | | Series 2007-2-3A1 | | | 6.00% | | | | 05/25/2037 | | | | 1,447,810 | |
| | 32,646,633 | | | Series 2007-3-A2 | | | 0.34% | # | | | 07/25/2037 | | | | 28,824,887 | |
| |
| | | | Popular ABS Mortgage Pass-Through Trust, | |
| | 1,072,284 | | | Series 2005-5-AF6 | | | 4.75% | # | | | 11/25/2035 | | | | 1,080,311 | |
| |
| | | | Prime Mortgage Trust, | |
| | 1,100,329 | | | Series 2006-1-2A5 | | | 6.00% | | | | 06/25/2036 | | | | 1,105,052 | |
| | 4,626,169 | | | Series 2006-DR1-2A1 | | | 5.50% | ^ | | | 05/25/2035 | | | | 4,634,815 | |
| | 7,182,136 | | | Series 2006-DR1-2A2 | | | 6.00% | ^ | | | 05/25/2035 | | | | 7,138,504 | |
| |
| | | | RAAC Series, | |
| | 2,925,904 | | | Series 2007-SP2-A1 | | | 0.35% | # | | | 06/25/2047 | | | | 2,916,872 | |
| |
| | | | RBSGC Structured Trust, | |
| | 56,422,955 | | | Series 2008-B-A1 | | | 6.00% | ^ | | | 06/25/2037 | | | | 50,571,342 | |
| |
| | | | Renaissance Home Equity Loan Trust, | |
| | 1,706,141 | | | Series 2006-1-AF6 | | | 5.75% | # | | | 05/25/2036 | | | | 1,289,824 | |
| | 11,101,371 | | | Series 2006-4-AF4 | | | 5.47% | # | | | 01/25/2037 | | | | 6,314,660 | |
| | 21,860,860 | | | Series 2006-4-AF5 | | | 5.69% | # | | | 01/25/2037 | | | | 12,905,515 | |
| | 18,295,932 | | | Series 2007-2-AF2 | | | 5.68% | # | | | 06/25/2037 | | | | 10,083,693 | |
| | 9,895,042 | | | Series 2007-2-AF5 | | | 6.20% | # | | | 06/25/2037 | | | | 5,917,067 | |
| |
| | | | Residential Accredit Loans, Inc., | |
| | 9,763,120 | | | Series 2004-QS15-A1 | | | 5.25% | | | | 11/25/2034 | | | | 10,279,037 | |
| | 1,066,712 | | | Series 2005-QS12-A11 | | | 49.45% | # I/F | | | 08/25/2035 | | | | 1,982,769 | |
| | 4,975,877 | | | Series 2005-QS13-1A6 | | | 5.50% | | | | 09/25/2035 | | | | 4,356,977 | |
| | 8,555,758 | | | Series 2005-QS13-2A1 | | | 0.85% | # | | | 09/25/2035 | | | | 6,060,249 | |
| | 35,078,610 | | | Series 2005-QS13-2A2 | | | 4.90% | # I/F I/O | | | 09/25/2035 | | | | 4,408,715 | |
| | 14,387,933 | | | Series 2005-QS14-2A1 | | | 6.00% | | | | 09/25/2035 | | | | 11,690,541 | |
| | 7,191,755 | | | Series 2005-QS15-2A | | | 6.00% | | | | 10/25/2035 | | | | 5,586,275 | |
| | 7,862,491 | | | Series 2005-QS15-3A | | | 6.00% | | | | 10/25/2035 | | | | 6,667,817 | |
| | 8,554,242 | | | Series 2005-QS16-A1 | | | 0.85% | # | | | 11/25/2035 | | | | 6,541,865 | |
| | 8,552,763 | | | Series 2005-QS16-A2 | | | 4.65% | # I/F I/O | | | 11/25/2035 | | | | 1,058,353 | |
| | 3,918,042 | | | Series 2005-QS17-A1 | | | 6.00% | | | | 12/25/2035 | | | | 3,446,047 | |
| | 2,715,001 | | | Series 2005-QS17-A10 | | | 6.00% | | | | 12/25/2035 | | | | 2,387,933 | |
| | 11,355,313 | | | Series 2005-QS17-A11 | | | 6.00% | | | | 12/25/2035 | | | | 9,987,372 | |
| | 8,070,998 | | | Series 2005-QS17-A2 | | | 1.00% | # | | | 12/25/2035 | | | | 6,045,266 | |
| | 8,070,998 | | | Series 2005-QS17-A4 | | | 5.00% | # I/F I/O | | | 12/25/2035 | | | | 1,001,215 | |
| | 6,494,175 | | | Series 2005-QS17-A6 | | | 6.00% | | | | 12/25/2035 | | | | 5,711,841 | |
| | 4,065,795 | | | Series 2005-QS1-A5 | | | 5.50% | | | | 01/25/2035 | | | | 4,115,044 | |
| | 3,271,161 | | | Series 2005-QS5-A3 | | | 5.70% | | | | 04/25/2035 | | | | 3,151,222 | |
| | 3,135,577 | | | Series 2005-QS9-A1 | | | 0.65% | # | | | 06/25/2035 | | | | 2,664,030 | |
| | 7,784,212 | | | Series 2005-QS9-A4 | | | 4.85% | # I/F I/O | | | 06/25/2035 | | | | 1,082,574 | |
| | 3,177,097 | | | Series 2006-QS10-A4 | | | 5.75% | | | | 08/25/2036 | | | | 2,619,822 | |
| | 3,451,498 | | | Series 2006-QS12-1A1 | | | 6.50% | | | | 09/25/2036 | | | | 2,587,146 | |
| | 8,282,033 | | | Series 2006-QS12-2A18 | | | 5.75% | | | | 09/25/2036 | | | | 6,760,963 | |
| | 12,734,431 | | | Series 2006-QS14-A18 | | | 6.25% | | | | 11/25/2036 | | | | 10,249,574 | |
| | 6,906,066 | | | Series 2006-QS15-A1 | | | 6.50% | | | | 10/25/2036 | | | | 5,670,349 | |
| | 2,524,456 | | | Series 2006-QS16-A10 | | | 6.00% | | | | 11/25/2036 | | | | 1,930,464 | |
| | 8,976,566 | | | Series 2006-QS16-A11 | | | 6.00% | | | | 11/25/2036 | | | | 6,864,425 | |
| | 2,620,360 | | | Series 2006-QS16-A7 | | | 6.00% | | | | 11/25/2036 | | | | 2,003,802 | |
| | 2,831,608 | | | Series 2006-QS16-A8 | | | 6.00% | | | | 11/25/2036 | | | | 2,165,345 | |
| | 1,120,520 | | | Series 2006-QS16-A9 | | | 6.00% | | | | 11/25/2036 | | | | 856,854 | |
| | 6,106,380 | | | Series 2006-QS17-A4 | | | 6.00% | | | | 12/25/2036 | | | | 4,802,448 | |
| | 33,924,408 | | | Series 2006-QS17-A5 | | | 6.00% | | | | 12/25/2036 | | | | 26,680,326 | |
| | 3,545,708 | | | Series 2006-QS1-A6 | | | 41.67% | # I/F | | | 01/25/2036 | | | | 6,051,474 | |
| | 23,584,843 | | | Series 2006-QS3-1A11 | | | 6.00% | | | | 03/25/2036 | | | | 20,091,079 | |
| | 5,082,218 | | | Series 2006-QS4-A8 | | | 8.00% | # I/F | | | 04/25/2036 | | | | 4,644,441 | |
| | 15,050,178 | | | Series 2006-QS5-A3 | | | 6.00% | | | | 05/25/2036 | | | | 12,683,508 | |
| | 19,652,080 | | | Series 2006-QS8-A1 | | | 6.00% | | | | 08/25/2036 | | | | 15,412,085 | |
| | 34,079,576 | | | Series 2006-QS8-A5 | | | 5.40% | # I/F I/O | | | 08/25/2036 | | | | 4,675,258 | |
| | 11,608,138 | | | Series 2006-QS9-1A6 | | | 5.15% | # I/F I/O | | | 07/25/2036 | | | | 1,656,528 | |
| | 10,315,263 | | | Series 2007-QS11-A1 | | | 7.00% | | | | 10/25/2037 | | | | 8,310,667 | |
| | 35,599,476 | | | Series 2007-QS1-1A2 | | | 5.30% | # I/F I/O | | | 01/25/2037 | | | | 5,239,869 | |
| | 3,583,465 | | | Series 2007-QS1-1A4 | | | 6.00% | | | | 01/25/2037 | | | | 2,914,131 | |
| | 8,782,544 | | | Series 2007-QS1-2A10 | | | 6.00% | | | | 01/25/2037 | | | | 6,676,270 | |
| | 1,568,525 | | | Series 2007-QS2-A6 | | | 6.25% | | | | 01/25/2037 | | | | 1,257,786 | |
| | 58,243,566 | | | Series 2007-QS3-A1 | | | 6.50% | | | | 02/25/2037 | | | | 49,151,338 | |
| | 9,287,300 | | | Series 2007-QS3-A4 | | | 6.25% | | | | 02/25/2037 | | | | 7,711,783 | |
| | 6,862,565 | | | Series 2007-QS5-A1 | | | 5.50% | | | | 03/25/2037 | | | | 5,388,871 | |
| | 2,831,088 | | | Series 2007-QS5-A5 | | | 0.45% | # | | | 03/25/2037 | | | | 1,811,152 | |
| | 9,402,690 | | | Series 2007-QS5-A8 | | | 6.55% | # I/F I/O | | | 03/25/2037 | | | | 1,767,809 | |
| | 7,699,943 | | | Series 2007-QS6-A102 | | | 5.75% | | | | 04/25/2037 | | | | 6,150,761 | |
| | 2,475,756 | | | Series 2007-QS6-A13 | | | 53.71% | # I/F | | | 04/25/2037 | | | | 5,254,982 | |
| | 11,025,715 | | | Series 2007-QS6-A45 | | | 5.75% | | | | 04/25/2037 | | | | 8,807,407 | |
| | 17,571,582 | | | Series 2007-QS6-A6 | | | 6.25% | | | | 04/25/2037 | | | | 14,470,461 | |
| | | | | | |
| The accompanying notes are an integral part of these financial statements. | | Annual Report | | March 31, 2014 | | 21 |
Schedule of Investments DoubleLine Total Return Bond Fund (Cont.)
| | | | | | | | | | | | | | | | |
PRINCIPAL
AMOUNT | | | SECURITY DESCRIPTION | | RATE | | | MATURITY | | | VALUE $ | |
| |
| | | | Residential Accredit Loans, Inc., (Cont.) | |
| $ | 1,213,614 | | | Series 2007-QS6-A77 | | | 54.55% | # I/F | | | 04/25/2037 | | | | 2,623,393 | |
| | 12,881,672 | | | Series 2007-QS7-2A1 | | | 6.75% | | | | 06/25/2037 | | | | 8,584,617 | |
| | 55,627,473 | | | Series 2007-QS9-A33 | | | 6.50% | | | | 07/25/2037 | | | | 43,407,063 | |
| |
| | | | Residential Asset Mortgage Products, Inc., | |
| | 374,562 | | | Series 2004-RS4-AI6 | | | 5.07% | # | | | 04/25/2034 | | | | 384,677 | |
| | 2,176,393 | | | Series 2004-RS5-AI6 | | | 5.55% | # | | | 05/25/2034 | | | | 2,150,573 | |
| | 8,988,928 | | | Series 2004-RS7-A3 | | | 2.82% | # | | | 07/25/2034 | | | | 7,928,199 | |
| | 4,109,968 | | | Series 2004-RS7-AI6 | | | 5.22% | # | | | 07/25/2034 | | | | 3,909,381 | |
| | 630,788 | | | Series 2004-RS9-AI4 | | | 4.77% | # | | | 10/25/2032 | | | | 649,231 | |
| | 1,080,571 | | | Series 2004-RS9-AI6 | | | 4.72% | # | | | 07/25/2034 | | | | 1,052,120 | |
| | 2,670,421 | | | Series 2004-RZ2-AI4 | | | 5.35% | # | | | 02/25/2033 | | | | 2,575,352 | |
| | 7,550,000 | | | Series 2005-RS1-AI5 | | | 5.41% | # | | | 01/25/2035 | | | | 7,101,862 | |
| | 6,071,063 | | | Series 2006-RS5-A3 | | | 0.32% | # | | | 09/25/2036 | | | | 5,799,486 | |
| | 12,760,000 | | | Series 2006-RX5-A3 | | | 0.40% | # | | | 08/25/2046 | | | | 10,543,741 | |
| | 12,300,000 | | | Series 2006-RZ3-A3 | | | 0.44% | # | | | 08/25/2036 | | | | 10,594,728 | |
| |
| | | | Residential Asset Securities Corporation, | |
| | 528,464 | | | Series 2002-KS1-AI6 | | | 6.08% | # | | | 06/25/2032 | | | | 515,411 | |
| | 2,970,963 | | | Series 2003-KS11-MI1 | | | 5.13% | # | | | 01/25/2034 | | | | 2,862,593 | |
| | 4,019,271 | | | Series 2005-AHL3-A2 | | | 0.39% | # | | | 11/25/2035 | | | | 3,921,054 | |
| | 20,168,597 | | | Series 2006-EMX5-A3 | | | 0.31% | # | | | 07/25/2036 | | | | 16,916,895 | |
| | 1,112,545 | | | Series 2006-KS4-A3 | | | 0.30% | # | | | 06/25/2036 | | | | 1,100,739 | |
| |
| | | | Residential Asset Securitization Trust, | |
| | 8,782,314 | | | Series 2005-A11-2A4 | | | 6.00% | | | | 10/25/2035 | | | | 7,057,608 | |
| | 6,510,500 | | | Series 2005-A12-A7 | | | 4.85% | # I/F I/O | | | 11/25/2035 | | | | 908,212 | |
| | 5,151,517 | | | Series 2005-A12-A8 | | | 0.70% | # | | | 11/25/2035 | | | | 3,961,651 | |
| | 19,899,867 | | | Series 2005-A15-5A3 | | | 5.75% | | | | 02/25/2036 | | | | 17,090,623 | |
| | 4,026,588 | | | Series 2005-A7-A3 | | | 5.50% | | | | 06/25/2035 | | | | 3,697,978 | |
| | 8,964,099 | | | Series 2005-A8CB-A11 | | | 6.00% | | | | 07/25/2035 | | | | 8,366,006 | |
| | 9,087,666 | | | Series 2005-A8CB-A2 | | | 4.85% | # I/F I/O | | | 07/25/2035 | | | | 1,290,021 | |
| | 8,153,972 | | | Series 2006-A10-A5 | | | 6.50% | | | | 09/25/2036 | | | | 6,219,092 | |
| | 1,460,244 | | | Series 2006-A1-1A3 | | | 6.00% | | | | 04/25/2036 | | | | 1,236,731 | |
| | 11,693,935 | | | Series 2006-A12-A1 | | | 6.25% | | | | 11/25/2036 | | | | 9,079,077 | |
| | 11,797,987 | | | Series 2006-A13-A1 | | | 6.25% | | | | 12/25/2036 | | | | 9,005,746 | |
| | 24,826,388 | | | Series 2006-A1-3A2 | | | 6.00% | | | | 04/25/2036 | | | | 20,785,868 | |
| | 20,072,068 | | | Series 2006-A14C-2A6 | | | 0.60% | # | | | 12/25/2036 | | | | 7,657,544 | |
| | 44,296,042 | | | Series 2006-A14C-2A7 | | | 6.40% | # I/F I/O | | | 12/25/2036 | | | | 11,249,068 | |
| | 11,934,486 | | | Series 2006-A2-A11 | | | 6.00% | | | | 01/25/2046 | | | | 9,828,324 | |
| | 1,366,633 | | | Series 2006-A4-2A5 | | | 6.00% | | | | 05/25/2036 | | | | 1,266,828 | |
| | 6,432,105 | | | Series 2006-A8-1A1 | | | 6.00% | | | | 08/25/2036 | | | | 6,003,360 | |
| | 9,573,647 | | | Series 2006-R1-A1 | | | 27.78% | # I/F | | | 01/25/2046 | | | | 14,694,324 | |
| | 57,420,764 | | | Series 2007-A2-1A2 | | | 6.00% | | | | 04/25/2037 | | | | 51,106,547 | |
| | 1,596,319 | | | Series 2007-A3-1A2 | | | 45.20% | # I/F | | | 04/25/2037 | | | | 3,348,759 | |
| | 27,911,167 | | | Series 2007-A5-1A4 | | | 5.95% | # I/F I/O | | | 05/25/2037 | | | | 5,709,773 | |
| | 7,207,966 | | | Series 2007-A5-1A6 | | | 0.55% | # | | | 05/25/2037 | | | | 2,782,895 | |
| | 14,132,467 | | | Series 2007-A5-2A3 | | | 6.00% | | | | 05/25/2037 | | | | 12,944,379 | |
| | 6,193,539 | | | Series 2007-A5-2A5 | | | 6.00% | | | | 05/25/2037 | | | | 5,672,842 | |
| | 22,879,930 | | | Series 2007-A6-1A2 | | | 6.00% | | | | 06/25/2037 | | | | 20,507,144 | |
| | 13,734,031 | | | Series 2007-A7-A1 | | | 6.00% | | | | 07/25/2037 | | | | 11,293,658 | |
| | 26,766,879 | | | Series 2007-A7-A6 | | | 6.00% | | | | 07/25/2037 | | | | 22,010,726 | |
| |
| | | | Residential Funding Mortgage Securities Trust, | |
| | 5,498,310 | | | Series 2003-S16-A1 | | | 4.75% | | | | 09/25/2018 | | | | 5,505,881 | |
| | 7,438,196 | | | Series 2005-S9-A10 | | | 6.25% | | | | 12/25/2035 | | | | 7,321,673 | |
| | 19,078,110 | | | Series 2005-S9-A6 | | | 5.75% | | | | 12/25/2035 | | | | 19,584,939 | |
| | 1,417,926 | | | Series 2005-S9-A8 | | | 5.50% | | | | 12/25/2035 | | | | 1,423,164 | |
| | 25,048,576 | | | Series 2006-S10-1A1 | | | 6.00% | | | | 10/25/2036 | | | | 22,250,199 | |
| | 43,118,901 | | | Series 2006-S11-A1 | | | 6.00% | | | | 11/25/2036 | | | | 39,854,240 | |
| | 8,254,760 | | | Series 2006-S5-A12 | | | 6.00% | | | | 06/25/2036 | | | | 7,801,995 | |
| | 565,156 | | | Series 2006-S5-A15 | | | 6.00% | | | | 06/25/2036 | | | | 534,157 | |
| | 12,894,244 | | | Series 2006-S9-A1 | | | 6.25% | | | | 09/25/2036 | | | | 12,090,520 | |
| | 10,178,001 | | | Series 2007-S1-A7 | | | 6.00% | | | | 01/25/2037 | | | | 9,468,930 | |
| | 8,929,285 | | | Series 2007-S2-A1 | | | 6.00% | | | | 02/25/2037 | | | | 8,171,394 | |
| | 10,059,823 | | | Series 2007-S2-A4 | | | 6.00% | | | | 02/25/2037 | | | | 9,205,975 | |
| | 18,780,539 | | | Series 2007-S2-A5 | | | 6.00% | | | | 02/25/2037 | | | | 17,186,503 | |
| | 2,934,772 | | | Series 2007-S2-A9 | | | 6.00% | | | | 02/25/2037 | | | | 2,685,678 | |
| | 8,480,289 | | | Series 2007-S3-1A4 | | | 6.00% | | | | 03/25/2037 | | | | 7,871,294 | |
| | 2,766,024 | | | Series 2007-S4-A1 | | | 6.00% | | | | 04/25/2037 | | | | 2,408,203 | |
| | 7,383,828 | | | Series 2007-S4-A2 | | | 6.00% | | | | 04/25/2037 | | | | 6,428,633 | |
| | 59,362,570 | | | Series 2007-S5-A1 | | | 6.00% | | | | 05/25/2037 | | | | 54,500,241 | |
| | 10,299,817 | | | Series 2007-S6-2A4 | | | 6.00% | | | | 06/25/2037 | | | | 9,445,561 | |
| | 51,245,191 | | | Series 2007-S7-A20 | | | 6.00% | | | | 07/25/2037 | | | | 47,063,481 | |
| | 20,413,266 | | | Series 2007-S8-1A1 | | | 6.00% | | | | 09/25/2037 | | | | 18,552,882 | |
| | 8,130,023 | | | Series 2007-SA1-4A | | | 5.99% | # | | | 02/25/2037 | | | | 7,674,132 | |
| | 19,151,351 | | | Series 2007-SA2-2A1 | | | 3.03% | # | | | 04/25/2037 | | | | 16,731,291 | |
| | | | | | | | | | | | | | | | |
PRINCIPAL
AMOUNT | | | SECURITY DESCRIPTION | | RATE | | | MATURITY | | | VALUE $ | |
| |
| | | | Saxon Asset Securities Trust, | |
| $ | 72,440,000 | | | Series 2006-3-A3 | | | 0.32% | # | | | 10/25/2046 | | | | 59,171,600 | |
| |
| | | | Sequoia Mortgage Trust, | |
| | 395,996 | | | Series 2003-4-2A1 | | | 0.51% | # | | | 07/20/2033 | | | | 397,431 | |
| |
| | | | Soundview Home Equity Loan Trust, | |
| | 27,353,878 | | | Series 2007-NS1-A2 | | | 0.30% | # | | | 01/25/2037 | | | | 26,554,830 | |
| |
| | | | STARM Mortgage Loan Trust, | |
| | 27,564,843 | | | Series 2007-2-1A1 | | | 2.76% | # | | | 04/25/2037 | | | | 23,339,373 | |
| | 14,800,263 | | | Series 2007-3-1A1 | | | 2.84% | # | | | 06/25/2037 | | | | 13,451,145 | |
| |
| | | | Structured Adjustable Rate Mortgage Loan Trust, | |
| | 14,846,429 | | | Series 2004-12-8A | | | 4.62% | # | | | 09/25/2034 | | | | 14,703,383 | |
| | 5,288,231 | | | Series 2006-1-8A1 | | | 5.45% | # | | | 02/25/2036 | | | | 4,349,649 | |
| |
| | | | Structured Asset Securities Corporation, | |
| | 249,149 | | | Series 2003-18XS-A6 | | | 4.54% | # | | | 06/25/2033 | | | | 252,159 | |
| | 5,629,638 | | | Series 2003-24A-1A3 | | | 2.45% | # | | | 07/25/2033 | | | | 5,664,756 | |
| | 16,200,558 | | | Series 2003-35-1A1 | | | 5.24% | # | | | 12/25/2033 | | | | 16,930,839 | |
| | 8,671,576 | | | Series 2004-11XS-2A2 | | | 5.11% | # | | | 06/25/2034 | | | | 9,880,697 | |
| | 3,506,719 | | | Series 2004-15-2A1 | | | 4.75% | | | | 09/25/2019 | | | | 3,563,899 | |
| | 16,874,661 | | | Series 2004-22-A2 | | | 5.21% | # | | | 01/25/2035 | | | | 17,653,401 | |
| | 39,734,180 | | | Series 2005-10-1A1 | | | 5.75% | | | | 06/25/2035 | | | | 39,826,840 | |
| | 6,569,095 | | | Series 2005-10-6A1 | | | 5.00% | | | | 06/25/2020 | | | | 6,883,699 | |
| | 9,935,242 | | | Series 2005-13-3A1 | | | 6.00% | | | | 09/25/2035 | | | | 8,844,730 | |
| | 3,896,606 | | | Series 2005-14-1A1 | | | 0.45% | # | | | 07/25/2035 | | | | 3,590,999 | |
| | 915,370 | | | Series 2005-14-1A4 | | | 23.84% | # I/F | | | 07/25/2035 | | | | 1,348,379 | |
| | 60,450,552 | | | Series 2005-14-4A1 | | | 5.75% | | | | 07/25/2035 | | | | 60,422,805 | |
| | 6,171,930 | | | Series 2005-15-1A1 | | | 5.50% | | | | 08/25/2035 | | | | 6,487,578 | |
| | 13,525,747 | | | Series 2005-15-2A7 | | | 5.50% | | | | 08/25/2035 | | | | 13,333,289 | |
| | 21,165,886 | | | Series 2005-15-3A1 | | | 5.08% | # | | | 08/25/2035 | | | | 21,872,456 | |
| | 12,797,325 | | | Series 2005-16-1A2 | | | 5.50% | | | | 09/25/2035 | | | | 13,205,291 | |
| | 12,500,000 | | | Series 2005-3-1A6 | | | 5.75% | | | | 03/25/2035 | | | | 11,805,637 | |
| | 4,100,450 | | | Series 2005-6-4A1 | | | 5.00% | | | | 05/25/2035 | | | | 4,151,222 | |
| |
| | | | Suntrust Alternative Loan Trust, | |
| | 1,835,652 | | | Series 2005-1F-2A3 | | | 5.75% | | | | 12/25/2035 | | | | 1,633,756 | |
| | 3,045,540 | | | Series 2006-1F-1A3 | | | 6.00% | | | | 04/25/2036 | | | | 2,476,478 | |
| |
| | | | Thornburg Mortgage Securities Trust, | |
| | 1,629,595 | | | Series 2003-6-A2 | | | 1.15% | # | | | 12/25/2033 | | | | 1,517,495 | |
| | 12,698,386 | | | Series 2004-4-5A | | | 4.82% | # | | | 12/25/2044 | | | | 12,422,913 | |
| | 27,925,676 | | | Series 2007-1-A1 | | | 1.86% | # | | | 03/25/2037 | | | | 26,505,600 | |
| | 7,545,561 | | | Series 2007-1-A2A | | | 1.45% | # | | | 03/25/2037 | | | | 6,847,860 | |
| |
| | | | Washington Mutual Mortgage Pass-Through Certificates, | |
| | 10,552,363 | | | Series 2005-1-2A | | | 6.00% | | | | 03/25/2035 | | | | 9,924,382 | |
| | 6,051,757 | | | Series 2005-4-5A1 | | | 5.50% | | | | 06/25/2035 | | | | 5,851,716 | |
| | 2,072,557 | | | Series 2005-5-CB12 | | | 48.90% | # I/F | | | 07/25/2035 | | | | 3,932,846 | |
| | 6,711,447 | | | Series 2005-5-CB6 | | | 0.75% | # | | | 07/25/2035 | | | | 5,504,199 | |
| | 2,255,119 | | | Series 2005-6-2A7 | | | 5.50% | | | | 08/25/2035 | | | | 2,088,601 | |
| | 2,142,494 | | | Series 2005-7-3CB | | | 6.50% | | | | 08/25/2035 | | | | 1,690,871 | |
| | 5,761,892 | | | Series 2005-9-CX | | | 5.50% | I/O | | | 11/25/2035 | | | | 1,409,618 | |
| | 9,177,079 | | | Series 2006-1-3A1 | | | 5.75% | | | | 02/25/2036 | | | | 8,435,479 | |
| | 4,641,269 | | | Series 2006-1-3A2 | | | 5.75% | | | | 02/25/2036 | | | | 4,266,208 | |
| | 3,943,743 | | | Series 2006-1-3A7 | | | 5.75% | | | | 02/25/2036 | | | | 3,625,049 | |
| | 4,832,923 | | | Series 2006-5-1A8 | | | 5.75% | | | | 07/25/2036 | | | | 3,941,824 | |
| | 8,907,967 | | | Series 2006-5-2CB1 | | | 6.00% | | | | 07/25/2036 | | | | 6,769,343 | |
| | 16,180,618 | | | Series 2006-5-2CB6 | | | 6.00% | | | | 07/25/2036 | | | | 12,294,842 | |
| | 8,957,957 | | | Series 2006-5-3A5 | | | 6.45% | # | | | 07/25/2036 | | | | 4,992,592 | |
| | 5,763,021 | | | Series 2006-9-A7 | | | 5.46% | # | | | 10/25/2036 | | | | 4,110,861 | |
| | 19,735,862 | | | Series 2006-AR10-1A1 | | | 2.36% | # | | | 09/25/2036 | | | | 17,646,940 | |
| | 28,485,733 | | | Series 2006-AR15-1A | | | 0.97% | # | | | 11/25/2046 | | | | 24,201,821 | |
| | 2,783,400 | | | Series 2006-AR6-2A3 | | | 4.70% | # | | | 08/25/2036 | | | | 2,533,657 | |
| | 18,972,460 | | | Series 2007-3-A3 | | | 6.00% | # | | | 04/25/2037 | | | | 16,362,191 | |
| | 17,823,662 | | | Series 2007-4-1A1 | | | 5.50% | | | | 06/25/2037 | | | | 16,913,016 | |
| | 802,436 | | | Series 2007-5-A11 | | | 38.55% | # I/F | | | 06/25/2037 | | | | 1,415,726 | |
| | 20,060,901 | | | Series 2007-5-A6 | | | 6.00% | | | | 06/25/2037 | | | | 16,816,331 | |
| | 38,776,819 | | | Series 2007-HY3-4A1 | | | 2.47% | # | | | 03/25/2037 | | | | 36,547,384 | |
| | 35,519,083 | | | Series 2007-HY5-1A1 | | | 2.15% | # | | | 05/25/2037 | | | | 31,777,432 | |
| | 31,212,710 | | | Series 2007-HY6-2A3 | | | 4.65% | # | | | 06/25/2037 | | | | 27,587,510 | |
| |
| | | | Wells Fargo Alternative Loan Trust, | |
| | 3,951,358 | | | Series 2007-PA1-A10 | | | 6.00% | | | | 03/25/2037 | | | | 3,534,857 | |
| | 17,349,541 | | | Series 2007-PA1-A3 | | | 6.00% | | | | 03/25/2037 | | | | 15,520,778 | |
| | 14,959,099 | | | Series 2007-PA1-A5 | | | 6.00% | | | | 03/25/2037 | | | | 13,382,305 | |
| | 24,517,214 | | | Series 2007-PA1-A6 | | | 6.00% | | | | 03/25/2037 | | | | 21,932,928 | |
| | 115,517,135 | | | Series 2007-PA2-1A1 | | | 6.00% | | | | 06/25/2037 | | | | 111,975,668 | |
| | | | | | |
| 22 | | DoubleLine Funds Trust | | | | The accompanying notes are an integral part of these financial statements. |
March 31, 2014
| | | | | | | | | | | | | | | | |
PRINCIPAL
AMOUNT | | | SECURITY DESCRIPTION | | RATE | | | MATURITY | | | VALUE $ | |
| |
| | | | Wells Fargo Alternative Loan Trust, (Cont.) | |
| $ | 15,908,912 | | | Series 2007-PA2-3A1 | | | 0.50% | # | | | 06/25/2037 | | | | 10,778,829 | |
| | 23,436,290 | | | Series 2007-PA2-3A2 | | | 6.50% | # I/F I/O | | | 06/25/2037 | | | | 4,674,661 | |
| | 1,689,876 | | | Series 2007-PA3-1A4 | | | 5.75% | | | | 07/25/2037 | | | | 1,537,706 | |
| | 41,091,105 | | | Series 2007-PA3-2A1 | | | 6.00% | | | | 07/25/2037 | | | | 37,308,135 | |
| | 16,325,760 | | | Series 2007-PA3-2A4 | | | 6.00% | | | | 07/25/2037 | | | | 14,822,761 | |
| | 25,351,676 | | | Series 2007-PA3-3A1 | | | 6.25% | | | | 07/25/2037 | | | | 23,248,247 | |
| | 15,708,465 | | | Series 2007-PA3-4A3 | | | 6.50% | | | | 07/25/2037 | | | | 12,932,214 | |
| | 210,714,563 | | | Series 2007-PA5-1A1 | | | 6.25% | | | | 11/25/2037 | | | | 200,744,182 | |
| | 1,879,568 | | | Series 2007-PA5-2A1 | | | 6.00% | | | | 11/25/2022 | | | | 1,951,793 | |
| |
| | | | Wells Fargo Mortgage Backed Securities Trust, | |
| | 31,877,920 | | | Series 2004-Y-3A3 | | | 2.62% | # | | | 11/25/2034 | | | | 33,116,664 | |
| | 71,899,164 | | | Series 2005-17-1A1 | | | 5.50% | | | | 01/25/2036 | | | | 74,423,723 | |
| | 432,489 | | | Series 2005-4-A7 | | | 23.28% | # I/F | | | 04/25/2035 | | | | 454,668 | |
| | 6,139,223 | | | Series 2005-8-A1 | | | 5.50% | | | | 10/25/2035 | | | | 6,405,840 | |
| | 4,836,495 | | | Series 2005-AR16-6A4 | | | 2.63% | # | | | 10/25/2035 | | | | 4,504,920 | |
| | 13,455,478 | | | Series 2006-12-A3 | | | 6.00% | | | | 10/25/2036 | | | | 13,224,791 | |
| | 15,842,075 | | | Series 2006-14-A1 | | | 6.00% | | | | 10/25/2036 | | | | 15,611,605 | |
| | 18,882,634 | | | Series 2006-15-A1 | | | 6.00% | | | | 11/25/2036 | | | | 18,357,725 | |
| | 9,787,789 | | | Series 2006-16-A2 | | | 5.00% | | | | 11/25/2036 | | | | 10,160,733 | |
| | 202,716 | | | Series 2006-2-1A4 | | | 18.96% | # I/F | | | 03/25/2036 | | | | 266,264 | |
| | 10,057,320 | | | Series 2006-2-3A1 | | | 5.75% | | | | 03/25/2036 | | | | 10,328,676 | |
| | 39,590,564 | | | Series 2006-3-A11 | | | 5.50% | | | | 03/25/2036 | | | | 41,207,087 | |
| | 6,069,032 | | | Series 2006-3-A6 | | | 5.50% | | | | 03/25/2036 | | | | 6,187,882 | |
| | 241,475 | | | Series 2006-4-1A8 | | | 5.75% | | | | 04/25/2036 | | | | 242,443 | |
| | 628,356 | | | Series 2006-4-2A2 | | | 5.50% | | | | 04/25/2036 | | | | 619,066 | |
| | 9,542,933 | | | Series 2006-6-2A1 | | | 0.55% | # | | | 05/25/2036 | | | | 7,885,698 | |
| | 9,542,933 | | | Series 2006-6-2A2 | | | 6.95% | # I/F I/O | | | 05/25/2036 | | | | 2,052,938 | |
| | 4,366,060 | | | Series 2006-9-2A1 | | | 0.00% | P/O | | | 08/25/2036 | | | | 2,226,992 | |
| | 4,366,060 | | | Series 2006-9-2A2 | | | 6.00% | I/O | | | 08/25/2036 | | | | 878,309 | |
| | 21,315,897 | | | Series 2006-AR12-1A1 | | | 2.74% | # | | | 09/25/2036 | | | | 20,089,466 | |
| | 10,694,898 | | | Series 2006-AR13-A2 | | | 2.61% | # | | | 09/25/2036 | | | | 9,946,971 | |
| | 11,955,711 | | | Series 2006-AR4-2A1 | | | 5.57% | # | | | 04/25/2036 | | | | 11,804,196 | |
| | 4,360,512 | | | Series 2007-10-1A18 | | | 6.00% | | | | 07/25/2037 | | | | 4,251,053 | |
| | 7,220,920 | | | Series 2007-10-2A11 | | | 6.00% | | | | 07/25/2037 | | | | 6,914,164 | |
| | 4,399,529 | | | Series 2007-11-A14 | | | 6.00% | | | | 08/25/2037 | | | | 4,316,303 | |
| | 8,781,002 | | | Series 2007-11-A36 | | | 6.00% | | | | 08/25/2037 | | | | 8,614,892 | |
| | 6,240,530 | | | Series 2007-11-A96 | | | 6.00% | | | | 08/25/2037 | | | | 6,122,363 | |
| | 78,447,351 | | | Series 2007-14-1A1 | | | 6.00% | | | | 10/25/2037 | | | | 80,301,376 | |
| | 47,988,540 | | | Series 2007-2-1A1 | | | 6.00% | | | | 03/25/2037 | | | | 45,967,839 | |
| | 2,777,245 | | | Series 2007-2-1A18 | | | 5.75% | | | | 03/25/2037 | | | | 2,636,603 | |
| | 6,255,090 | | | Series 2007-2-1A9 | | | 6.00% | | | | 03/25/2037 | | | | 5,991,701 | |
| | 4,071,484 | | | Series 2007-2-3A2 | | | 5.25% | | | | 03/25/2037 | | | | 4,190,204 | |
| | 4,549,141 | | | Series 2007-3-1A3 | | | 6.00% | | | | 04/25/2037 | | | | 4,426,719 | |
| | 4,853,816 | | | Series 2007-4-A11 | | | 6.50% | | | | 04/25/2037 | | | | 4,739,525 | |
| | 18,645,170 | | | Series 2007-4-A15 | | | 6.00% | | | | 04/25/2037 | | | | 17,920,162 | |
| | 10,997,766 | | | Series 2007-4-A3 | | | 6.00% | | | | 04/25/2037 | | | | 10,570,124 | |
| | 11,598,618 | | | Series 2007-4-A8 | | | 6.00% | | | | 04/25/2037 | | | | 11,147,612 | |
| | 3,557,599 | | | Series 2007-5-1A6 | | | 23.82% | # I/F | | | 05/25/2037 | | | | 4,795,319 | |
| | 14,365,380 | | | Series 2007-6-A4 | | | 6.00% | | | | 05/25/2037 | | | | 14,213,825 | |
| | 6,864,477 | | | Series 2007-6-A6 | | | 6.00% | | | | 05/25/2037 | | | | 6,792,057 | |
| | 21,638,988 | | | Series 2007-7-A1 | | | 6.00% | | | | 06/25/2037 | | | | 20,763,280 | |
| | 1,504,949 | | | Series 2007-7-A32 | | | 5.75% | | | | 06/25/2037 | | | | 1,430,915 | |
| | 48,729,408 | | | Series 2007-7-A34 | | | 6.00% | | | | 06/25/2037 | | | | 46,757,378 | |
| | 13,073,689 | | | Series 2007-7-A36 | | | 6.00% | | | | 06/25/2037 | | | | 12,775,629 | |
| | 4,488,532 | | | Series 2007-7-A43 | | | 0.65% | # | | | 06/25/2037 | | | | 3,701,648 | |
| | 12,262,575 | | | Series 2007-7-A49 | | | 6.00% | | | | 06/25/2037 | | | | 11,766,321 | |
| | 5,191,325 | | | Series 2007-7-A8 | | | 0.65% | # | | | 06/25/2037 | | | | 4,281,234 | |
| | 2,341,898 | | | Series 2007-7-A9 | | | 38.07% | # I/F | | | 06/25/2037 | | | | 4,059,270 | |
| | 3,454,704 | | | Series 2007-8-1A13 | | | 0.52% | # | | | 07/25/2037 | | | | 2,960,153 | |
| | 3,454,704 | | | Series 2007-8-1A14 | | | 38.85% | # I/F | | | 07/25/2037 | | | | 6,177,162 | |
| | 56,138,936 | | | Series 2007-8-1A16 | | | 6.00% | | | | 07/25/2037 | | | | 55,087,117 | |
| | 37,460,648 | | | Series 2007-8-1A2 | | | 6.00% | | | | 07/25/2037 | | | | 36,758,467 | |
| | 5,295,848 | | | Series 2007-8-1A20 | | | 6.00% | | | | 07/25/2037 | | | | 5,196,580 | |
| | 23,701,768 | | | Series 2007-8-1A22 | | | 6.00% | | | | 07/25/2037 | | | | 23,257,490 | |
| | 16,467,395 | | | Series 2007-8-1A3 | | | 6.00% | | | | 07/25/2037 | | | | 16,158,722 | |
| | 19,332,445 | | | Series 2007-8-2A9 | | | 6.00% | | | | 07/25/2037 | | | | 19,774,936 | |
| | 9,844,087 | | | Series 2007-9-1A5 | | | 5.50% | | | | 07/25/2037 | | | | 10,201,909 | |
| | 94,654,908 | | | Series 2007-AR9-A1 | | | 5.97% | # | | | 12/28/2037 | | | | 94,545,960 | |
| | | | | | | | | | | | | | | | |
PRINCIPAL
AMOUNT | | | SECURITY DESCRIPTION | | RATE | | | MATURITY | | | VALUE $ | |
| |
| | | | Wells Fargo Mortgage Loan Trust, | |
| $ | 27,398,285 | | | Series 2012-RR1-A1 | | | 2.85% | #^ | | | 08/27/2037 | | | | 27,654,493 | |
| | | | | | | | | | | | | | | | |
| | | | Total Non-Agency Residential Collateralized Mortgage Obligations (Cost $9,194,666,934) | | | | 9,487,555,403 | |
| | | | | | | | | | | | | | | | |
| | US GOVERNMENT / AGENCY MORTGAGE BACKED OBLIGATIONS 49.2% | |
| | 50,000,000 | | | Federal Home Loan Banks | | | 5.25% | | | | 06/18/2014 | | | | 50,554,200 | |
| |
| | | | Federal Home Loan Mortgage Corporation, | |
| | 22,228,502 | | | Pool C0-3490 | | | 4.50% | | | | 08/01/2040 | | | | 23,751,975 | |
| | 106,890,141 | | | Pool C9-1388 | | | 3.50% | | | | 02/01/2032 | | | | 110,085,577 | |
| | 55,595,268 | | | Pool C9-1403 | | | 3.50% | | | | 03/01/2032 | | | | 57,256,474 | |
| | 56,241,408 | | | Pool C9-1413 | | | 3.50% | | | | 12/01/2031 | | | | 57,885,529 | |
| | 27,676,608 | | | Pool C9-1417 | | | 3.50% | | | | 01/01/2032 | | | | 28,503,788 | |
| | 108,841,949 | | | Pool C9-1447 | | | 3.50% | | | | 05/01/2032 | | | | 112,093,296 | |
| | 113,326,972 | | | Pool C9-1594 | | | 3.00% | | | | 01/01/2033 | | | | 113,663,895 | |
| | 32,394,290 | | | Pool C9-1596 | | | 3.00% | | | | 02/01/2033 | | | | 32,490,636 | |
| | 18,363,613 | | | Pool D9-8901 | | | 3.50% | | | | 01/01/2032 | | | | 18,900,996 | |
| | 54,484,093 | | | Pool D9-8923 | | | 3.50% | | | | 01/01/2032 | | | | 56,116,712 | |
| | 41,780,595 | | | Pool D9-9724 | | | 3.00% | | | | 11/01/2032 | | | | 41,904,828 | |
| | 58,318,129 | | | Pool G0-1840 | | | 5.00% | | | | 07/01/2035 | | | | 63,689,792 | |
| | 14,033,549 | | | Pool G0-4817 | | | 5.00% | | | | 09/01/2038 | | | | 15,251,264 | |
| | 37,943,851 | | | Pool G0-6172 | | | 5.50% | | | | 12/01/2038 | | | | 41,722,678 | |
| | 52,675,725 | | | Pool G0-6954 | | | 6.00% | | | | 05/01/2040 | | | | 58,510,034 | |
| | 70,636,475 | | | Pool G0-7011 | | | 6.00% | | | | 05/01/2040 | | | | 78,470,364 | |
| | 191,759,385 | | | Pool J2-2834 | | | 2.50% | | | | 03/01/2028 | | | | 192,222,842 | |
| | 176,413,367 | | | Pool Q1-6672 | | | 3.00% | | | | 03/01/2043 | | | | 170,371,996 | |
| | 20,515,403 | | | Pool T6-0392 | | | 4.00% | | | | 10/01/2041 | | | | 21,155,992 | |
| | 15,840,861 | | | Pool T6-0681 | | | 4.00% | | | | 05/01/2042 | | | | 16,333,060 | |
| | 44,471,792 | | | Pool T6-0782 | | | 3.50% | | | | 07/01/2042 | | | | 44,361,486 | |
| | 62,126,304 | | | Pool T6-0853 | | | 3.50% | | | | 09/01/2042 | | | | 61,972,162 | |
| | 58,207,828 | | | Pool T6-0854 | | | 3.50% | | | | 09/01/2042 | | | | 58,063,259 | |
| | 6,774,336 | | | Pool T6-5110 | | | 3.50% | | | | 10/01/2042 | | | | 6,757,546 | |
| | 19,059,483 | | | Pool T6-9016 | | | 5.00% | | | | 06/01/2041 | | | | 20,315,546 | |
| | 1,244,062 | | | Pool U6-0299 | | | 4.00% | | | | 11/01/2040 | | | | 1,290,522 | |
| | 4,520,336 | | | Series 2519-ZD | | | 5.50% | | | | 11/15/2032 | | | | 4,915,986 | |
| | 2,759,202 | | | Series 2596-ZL | | | 5.00% | | | | 04/15/2033 | | | | 2,917,753 | |
| | 83,015,594 | | | Series 267-30 | | | 3.00% | | | | 08/15/2042 | | | | 79,688,500 | |
| | 1,455,035 | | | Series 2684-ZN | | | 4.00% | | | | 10/15/2033 | | | | 1,535,115 | |
| | 151,512,362 | | | Series 269-30 | | | 3.00% | | | | 08/15/2042 | | | | 145,428,220 | |
| | 66,898,705 | | | Series 274-30 | | | 3.00% | | | | 08/15/2042 | | | | 64,020,725 | |
| | 9,048,606 | | | Series 2750-ZT | | | 5.00% | | | | 02/15/2034 | | | | 9,565,888 | |
| | 183,851,680 | | | Series 280-30 | | | 3.00% | | | | 09/15/2042 | | | | 177,602,713 | |
| | 12,747,753 | | | Series 2825-PZ | | | 5.50% | | | | 07/15/2034 | | | | 13,740,739 | |
| | 45,373,000 | | | Series 284-300 | | | 3.00% | | | | 10/15/2042 | | | | 43,823,435 | |
| | 15,049,708 | | | Series 2898-JZ | | | 5.00% | | | | 12/15/2034 | | | | 16,220,674 | |
| | 28,341,636 | | | Series 2899-AZ | | | 5.00% | | | | 12/15/2034 | | | | 30,946,502 | |
| | 22,687,149 | | | Series 2909-Z | | | 5.00% | | | | 12/15/2034 | | | | 24,866,659 | |
| | 45,428,452 | | | Series 2932-Z | | | 5.00% | | | | 02/15/2035 | | | | 49,035,631 | |
| | 3,792,926 | | | Series 2990-JL | | | 6.50% | # I/F I/O | | | 03/15/2035 | | | | 560,019 | |
| | 12,586,828 | | | Series 3002-SN | | | 6.35% | # I/F I/O | | | 07/15/2035 | | | | 2,086,107 | |
| | 8,566,113 | | | Series 3030-SL | | | 5.95% | # I/F I/O | | | 09/15/2035 | | | | 1,266,518 | |
| | 2,575,748 | | | Series 3045-DI | | | 6.58% | # I/F I/O | | | 10/15/2035 | | | | 539,694 | |
| | 22,261,990 | | | Series 3116-Z | | | 5.50% | | | | 02/15/2036 | | | | 24,147,225 | |
| | 6,082,745 | | | Series 3117-ZN | | | 4.50% | | | | 02/15/2036 | | | | 6,586,186 | |
| | 8,081,869 | | | Series 3174-PZ | | | 5.00% | | | | 01/15/2036 | | | | 8,827,236 | |
| | 2,934,247 | | | Series 3187-JZ | | | 5.00% | | | | 07/15/2036 | | | | 3,170,972 | |
| | 6,053,081 | | | Series 3188-ZK | | | 5.00% | | | | 07/15/2036 | | | | 6,731,534 | |
| | 10,154,003 | | | Series 3203-SE | | | 6.35% | # I/F I/O | | | 08/15/2036 | | | | 1,481,214 | |
| | 19,121,302 | | | Series 3203-Z | | | 5.00% | | | | 07/15/2036 | | | | 21,055,785 | |
| | 30,297,838 | | | Series 3203-ZC | | | 5.00% | | | | 07/15/2036 | | | | 33,363,040 | |
| | 12,064,061 | | | Series 3261-SA | | | 6.28% | # I/F I/O | | | 01/15/2037 | | | | 1,960,142 | |
| | 14,697,913 | | | Series 3267-BA | | | 5.80% | | | | 11/15/2036 | | | | 15,914,555 | |
| | 17,833,433 | | | Series 3275-SC | | | 5.93% | # I/F I/O | | | 02/15/2037 | | | | 2,306,353 | |
| | 12,539,406 | | | Series 3315-HZ | | | 6.00% | | | | 05/15/2037 | | | | 13,857,611 | |
| | 34,916,857 | | | Series 3326-GS | | | 6.50% | # I/F I/O | | | 06/15/2037 | | | | 4,578,623 | |
| | 3,394,052 | | | Series 3351-ZC | | | 5.50% | | | | 07/15/2037 | | | | 3,725,458 | |
| | 26,777,585 | | | Series 3355-BI | | | 5.90% | # I/F I/O | | | 08/15/2037 | | | | 3,729,847 | |
| | 3,663,494 | | | Series 3369-Z | | | 6.00% | | | | 09/15/2037 | | | | 4,107,991 | |
| | 10,535,149 | | | Series 3405-ZG | | | 5.50% | | | | 01/15/2038 | | | | 11,510,055 | |
| | 14,303,478 | | | Series 3417-SI | | | 6.03% | # I/F I/O | | | 02/15/2038 | | | | 1,596,282 | |
| | 21,715,523 | | | Series 3423-GS | | | 5.50% | # I/F I/O | | | 03/15/2038 | | | | 2,434,575 | |
| | 3,565,917 | | | Series 3423-SG | | | 5.50% | # I/F I/O | | | 03/15/2038 | | | | 399,783 | |
| | 3,634,592 | | | Series 3451-S | | | 5.88% | # I/F I/O | | | 02/15/2037 | | | | 412,299 | |
| | 5,225,246 | | | Series 3455-SC | | | 5.91% | # I/F I/O | | | 06/15/2038 | | | | 570,335 | |
| | | | | | |
| The accompanying notes are an integral part of these financial statements. | | Annual Report | | March 31, 2014 | | 23 |
Schedule of Investments DoubleLine Total Return Bond Fund (Cont.)
| | | | | | | | | | | | | | | | |
PRINCIPAL
AMOUNT | | | SECURITY DESCRIPTION | | RATE | | | MATURITY | | | VALUE $ | |
| |
| | | | Federal Home Loan Mortgage Corporation, (Cont.) | |
| $ | 3,073,863 | | | Series 3473-SM | | | 5.92% | # I/F I/O | | | 07/15/2038 | | | | 376,752 | |
| | 15,355,285 | | | Series 3484-SE | | | 5.70% | # I/F I/O | | | 08/15/2038 | | | | 1,773,615 | |
| | 12,529,333 | | | Series 3519-SD | | | 5.40% | # I/F I/O | | | 02/15/2038 | | | | 1,600,001 | |
| | 5,329,654 | | | Series 3524-LB | | | 5.26% | # | | | 06/15/2038 | | | | 5,518,121 | |
| | 185,865 | | | Series 3530-GZ | | | 4.50% | | | | 05/15/2039 | | | | 194,267 | |
| | 22,797,494 | | | Series 3541-EI | | | 6.60% | # I/F I/O | | | 06/15/2039 | | | | 3,548,747 | |
| | 7,559,839 | | | Series 3545-SA | | | 6.00% | # I/F I/O | | | 06/15/2039 | | | | 984,318 | |
| | 3,144,878 | | | Series 3549-SA | | | 5.65% | # I/F I/O | | | 07/15/2039 | | | | 357,786 | |
| | 24,900,435 | | | Series 3577-LS | | | 7.05% | # I/F I/O | | | 08/15/2035 | | | | 3,434,014 | |
| | 6,222,626 | | | Series 3582-SA | | | 5.85% | # I/F I/O | | | 10/15/2049 | | | | 789,797 | |
| | 7,603,885 | | | Series 3583-GB | | | 4.50% | | | | 10/15/2039 | | | | 8,056,559 | |
| | 43,444,320 | | | Series 3606-CS | | | 6.20% | # I/F I/O | | | 12/15/2039 | | | | 7,193,024 | |
| | 11,242,454 | | | Series 3616-SG | | | 6.20% | # I/F I/O | | | 03/15/2032 | | | | 1,729,350 | |
| | 21,229,010 | | | Series 3626-AZ | | | 5.50% | | | | 08/15/2036 | | | | 23,314,123 | |
| | 8,135,471 | | | Series 3631-SE | | | 6.25% | # I/F I/O | | | 05/15/2039 | | | | 819,862 | |
| | 27,399,913 | | | Series 3641-Z | | | 5.50% | | | | 02/15/2036 | | | | 29,976,559 | |
| | 21,359,968 | | | Series 3654-ZB | | | 5.50% | | | | 11/15/2037 | | | | 23,443,131 | |
| | 42,790,861 | | | Series 3666-VZ | | | 5.50% | | | | 08/15/2036 | | | | 46,867,996 | |
| | 8,891,666 | | | Series 3667-SB | | | 6.30% | # I/F I/O | | | 05/15/2040 | | | | 1,088,602 | |
| | 18,198,041 | | | Series 3688-CM | | | 4.00% | | | | 07/15/2029 | | | | 18,619,807 | |
| | 21,696,729 | | | Series 3702-SG | | | 5.90% | # I/F I/O | | | 08/15/2032 | | | | 3,184,223 | |
| | 9,191,598 | | | Series 3704-EI | | | 5.00% | I/O | | | 12/15/2036 | | | | 1,881,654 | |
| | 3,741,293 | | | Series 3712-SG | | | 24.23% | # I/F | | | 08/15/2040 | | | | 5,988,438 | |
| | 19,227,408 | | | Series 3724-CM | | | 5.50% | | | | 06/15/2037 | | | | 20,998,819 | |
| | 165,911,930 | | | Series 3725-CS | | | 5.85% | # I/F I/O | | | 05/15/2040 | | | | 28,394,931 | |
| | 57,374,396 | | | Series 3726-SA | | | 5.90% | # I/F I/O | | | 09/15/2040 | | | | 7,677,589 | |
| | 98,000,000 | | | Series 3738-BP | | | 4.00% | | | | 12/15/2038 | | | | 102,685,037 | |
| | 6,792,514 | | | Series 3741-SC | | | 9.69% | # I/F | | | 10/15/2040 | | | | 6,740,289 | |
| | 238,477 | | | Series 3745-SY | | | 9.69% | # I/F | | | 10/15/2040 | | | | 226,502 | |
| | 40,067,174 | | | Series 3752-BS | | | 9.69% | # I/F | | | 11/15/2040 | | | | 40,508,486 | |
| | 1,883,625 | | | Series 3758-SM | | | 9.69% | # I/F | | | 11/15/2040 | | | | 1,775,521 | |
| | 14,112,615 | | | Series 3768-ZX | | | 5.00% | | | | 12/15/2040 | | | | 15,303,867 | |
| | 18,900,000 | | | Series 3771-AL | | | 4.00% | | | | 12/15/2030 | | | | 19,771,545 | |
| | 18,761,630 | | | Series 3779-BY | | | 3.50% | | | | 12/15/2030 | | | | 18,665,495 | |
| | 25,822,330 | | | Series 3779-DZ | | | 4.50% | | | | 12/15/2040 | | | | 26,112,000 | |
| | 24,250,000 | | | Series 3779-LB | | | 4.00% | | | | 12/15/2030 | | | | 25,484,640 | |
| | 2,689,783 | | | Series 3779-SH | | | 9.49% | # I/F | | | 12/15/2040 | | | | 2,651,773 | |
| | 3,500,000 | | | Series 3779-YA | | | 3.50% | | | | 12/15/2030 | | | | 3,472,194 | |
| | 15,000,000 | | | Series 3783-AC | | | 4.00% | | | | 01/15/2031 | | | | 15,465,937 | |
| | 14,957,065 | | | Series 3786-SG | | | 9.19% | # I/F | | | 01/15/2041 | | | | 14,207,119 | |
| | 11,731,674 | | | Series 3788-AY | | | 3.50% | | | | 01/15/2031 | | | | 11,573,027 | |
| | 10,711,867 | | | Series 3790-Z | | | 4.00% | | | | 01/15/2041 | | | | 11,259,179 | |
| | 11,347,995 | | | Series 3795-VZ | | | 4.00% | | | | 01/15/2041 | | | | 11,302,496 | |
| | 916,011 | | | Series 3798-SD | | | 9.29% | # I/F | | | 12/15/2040 | | | | 917,930 | |
| | 17,839,104 | | | Series 3800-VZ | | | 4.50% | | | | 02/15/2041 | | | | 18,463,749 | |
| | 12,267,145 | | | Series 3803-ZM | | | 4.00% | | | | 02/15/2041 | | | | 12,549,664 | |
| | 67,508,068 | | | Series 3806-CZ | | | 5.50% | | | | 07/15/2034 | | | | 72,908,140 | |
| | 18,000,000 | | | Series 3808-DB | | | 3.50% | | | | 02/15/2031 | | | | 17,941,176 | |
| | 15,277,557 | | | Series 3812-EY | | | 3.50% | | | | 02/15/2031 | | | | 15,158,002 | |
| | 12,586,726 | | | Series 3818-CZ | | | 4.50% | | | | 03/15/2041 | | | | 13,195,093 | |
| | 18,863,177 | | | Series 3819-ZU | | | 5.50% | | | | 07/15/2034 | | | | 20,353,491 | |
| | 35,500,000 | | | Series 3824-EY | | | 3.50% | | | | 03/15/2031 | | | | 35,292,698 | |
| | 3,350,433 | | | Series 3828-SW | | | 12.74% | # I/F | | | 02/15/2041 | | | | 3,390,734 | |
| | 14,654,534 | | | Series 3829-VZ | | | 4.00% | | | | 03/15/2041 | | | | 14,335,315 | |
| | 5,783,264 | | | Series 3843-PZ | | | 5.00% | | | | 04/15/2041 | | | | 6,527,796 | |
| | 938,800 | | | Series 3843-SC | | | 12.89% | # I/F | | | 04/15/2041 | | | | 918,304 | |
| | 3,096,992 | | | Series 3845-LS | | | 12.89% | # I/F | | | 03/15/2041 | | | | 2,887,431 | |
| | 60,929,584 | | | Series 3863-ZA | | | 5.50% | | | | 08/15/2034 | | | | 67,046,366 | |
| | 10,229,000 | | | Series 3870-PB | | | 4.50% | | | | 06/15/2041 | | | | 10,953,602 | |
| | 71,059,143 | | | Series 3871-LZ | | | 5.50% | | | | 06/15/2041 | | | | 81,140,623 | |
| | 55,292,442 | | | Series 3872-BA | | | 4.00% | | | | 06/15/2041 | | | | 57,830,974 | |
| | 30,000,000 | | | Series 3877-EY | | | 4.50% | | | | 06/15/2041 | | | | 31,845,840 | |
| | 12,378,000 | | | Series 3877-GY | | | 4.50% | | | | 06/15/2041 | | | | 13,138,579 | |
| | 51,670,886 | | | Series 3877-ZU | | | 4.50% | | | | 06/15/2041 | | | | 55,063,389 | |
| | 29,477,699 | | | Series 3888-ZG | | | 4.00% | | | | 07/15/2041 | | | | 29,123,804 | |
| | 18,035,901 | | | Series 3888-ZU | | | 4.50% | | | | 06/15/2041 | | | | 18,808,721 | |
| | 23,628,302 | | | Series 3900-SB | | | 5.82% | # I/F I/O | | | 07/15/2041 | | | | 2,907,980 | |
| | 39,412,947 | | | Series 3901-VZ | | | 4.00% | | | | 07/15/2041 | | | | 38,319,277 | |
| | 20,476,340 | | | Series 3910-GZ | | | 5.00% | | | | 08/15/2041 | | | | 21,915,479 | |
| | 9,100,596 | | | Series 3910-ZE | | | 5.00% | | | | 10/15/2034 | | | | 9,840,924 | |
| | 12,330,000 | | | Series 3919-KL | | | 4.50% | | | | 09/15/2041 | | | | 13,126,974 | |
| | 26,646,924 | | | Series 3919-ZJ | | | 4.00% | | | | 09/15/2041 | | | | 26,086,752 | |
| | 528,299 | | | Series 3924-US | | | 9.25% | # I/F | | | 09/15/2041 | | | | 533,089 | |
| | 9,236,761 | | | Series 3942-JZ | | | 4.00% | | | | 10/15/2041 | | | | 9,364,852 | |
| | | | | | | | | | | | | | | | |
PRINCIPAL
AMOUNT | | | SECURITY DESCRIPTION | | RATE | | | MATURITY | | | VALUE $ | |
| |
| | | | Federal Home Loan Mortgage Corporation, (Cont.) | |
| $ | 11,013,161 | | | Series 3944-AZ | | | 4.00% | | | | 10/15/2041 | | | | 11,189,146 | |
| | 16,785,622 | | | Series 3946-SM | | | 14.24% | # I/F | | | 10/15/2041 | | | | 16,519,325 | |
| | 7,594,755 | | | Series 3957-DZ | | | 3.50% | | | | 11/15/2041 | | | | 7,126,945 | |
| | 10,000,000 | | | Series 3964-VM | | | 4.00% | | | | 11/15/2034 | | | | 10,478,575 | |
| | 51,853,805 | | | Series 3969-AB | | | 4.00% | | | | 10/15/2033 | | | | 54,131,691 | |
| | 10,786,637 | | | Series 3982-AZ | | | 3.50% | | | | 01/15/2042 | | | | 10,075,193 | |
| | 54,196,378 | | | Series 3990-ZA | | | 3.50% | | | | 01/15/2042 | | | | 50,843,790 | |
| | 45,643,644 | | | Series 3999-ZB | | | 4.00% | | | | 02/15/2042 | | | | 43,122,038 | |
| | 25,879,868 | | | Series 4016-KZ | | | 4.00% | | | | 03/15/2042 | | | | 24,236,885 | |
| | 36,148,288 | | | Series 4050-BC | | | 2.00% | | | | 05/15/2041 | | | | 33,672,473 | |
| | 64,343,000 | | | Series 4057-ZA | | | 4.00% | | | | 06/15/2042 | | | | 61,195,405 | |
| | 64,107,860 | | | Series 4084-TZ | | | 4.00% | | | | 07/15/2042 | | | | 61,156,686 | |
| | 17,468,823 | | | Series 4097-TG | | | 2.00% | | | | 05/15/2039 | | | | 16,298,918 | |
| | 36,405,432 | | | Series 4097-ZA | | | 3.50% | | | | 08/15/2042 | | | | 32,414,250 | |
| | 97,063,000 | | | Series 4109-GE | | | 4.50% | | | | 10/15/2041 | | | | 102,967,197 | |
| | 68,041,186 | | | Series 4109-KD | | | 3.00% | | | | 05/15/2032 | | | | 70,212,823 | |
| | 5,739,836 | | | Series 4121-AV | | | 3.00% | | | | 12/15/2035 | | | | 5,364,161 | |
| | 92,566,030 | | | Series 4160-HP | | | 2.50% | | | | 01/15/2033 | | | | 92,685,671 | |
| | 26,280,704 | | | Series 4162-ZJ | | | 3.00% | | | | 02/15/2033 | | | | 24,151,941 | |
| | 37,337,931 | | | Series 4174-Z | | | 3.50% | | | | 03/15/2043 | | | | 32,938,029 | |
| | 91,899,008 | | | Series 4179-AZ | | | 4.00% | | | | 01/15/2041 | | | | 87,534,081 | |
| | 23,888,991 | | | Series 4186-ZJ | | | 3.00% | | | | 03/15/2033 | | | | 20,320,996 | |
| | 13,000,000 | | | Series 4189-ML | | | 3.00% | | | | 04/15/2038 | | | | 11,985,240 | |
| | 218,567,919 | | | Series 4212-US | | | 5.21% | # I/F | | | 06/15/2043 | | | | 177,648,202 | |
| | 97,012,685 | | | Series 4223-US | | | 5.24% | # I/F | | | 07/15/2043 | | | | 79,893,167 | |
| | 19,375,713 | | | Series 4250-BZ | | | 3.00% | | | | 09/15/2033 | | | | 17,029,876 | |
| | 18,984,865 | | | Series 4267-BZ | | | 4.00% | | | | 10/15/2040 | | | | 18,224,303 | |
| | 196,491,722 | | | Series R003-ZA | | | 5.50% | | | | 10/15/2035 | | | | 217,532,743 | |
| |
| | | | Federal National Mortgage Association, | |
| | 9,750,000 | | | | | | 1.50% | | | | 04/09/2018 | | | | 9,753,110 | |
| | 2,352,941 | | | Series 2002-70-QZ | | | 5.50% | | | | 11/25/2032 | | | | 2,556,583 | |
| | 3,570,403 | | | Series 2002-75-ZG | | | 5.50% | | | | 11/25/2032 | | | | 3,880,433 | |
| | 4,133,150 | | | Series 2003-117-KS | | | 6.95% | # I/F I/O | | | 08/25/2033 | | | | 415,635 | |
| | 35,099,760 | | | Series 2003-129-ZT | | | 5.50% | | | | 01/25/2034 | | | | 38,735,077 | |
| | 9,524,294 | | | Series 2003-29-ZL | | | 5.00% | | | | 04/25/2033 | | | | 10,219,134 | |
| | 5,278,807 | | | Series 2003-64-ZG | | | 5.50% | | | | 07/25/2033 | | | | 5,728,730 | |
| | 21,619,562 | | | Series 2003-84-PZ | | | 5.00% | | | | 09/25/2033 | | | | 23,351,786 | |
| | 19,500,000 | | | Series 2003-W17-1A7 | | | 5.75% | | | | 08/25/2033 | | | | 21,180,734 | |
| | 10,665,027 | | | Series 2004-46-PJ | | | 5.85% | # I/F I/O | | | 03/25/2034 | | | | 1,292,331 | |
| | 7,813,620 | | | Series 2004-51-XP | | | 7.55% | # I/F I/O | | | 07/25/2034 | | | | 1,517,979 | |
| | 5,000,000 | | | Series 2004-W10-A6 | | | 5.75% | | | | 08/25/2034 | | | | 5,500,575 | |
| | 7,000,000 | | | Series 2004-W4-A5 | | | 5.50% | | | | 06/25/2034 | | | | 7,459,270 | |
| | 771,550 | | | Series 2005-107-EG | | | 4.50% | | | | 01/25/2026 | | | | 830,791 | |
| | 2,238,855 | | | Series 2005-37-ZK | | | 4.50% | | | | 05/25/2035 | | | | 2,426,716 | |
| | 20,005,776 | | | Series 2005-87-SE | | | 5.90% | # I/F I/O | | | 10/25/2035 | | | | 2,686,157 | |
| | 16,269,757 | | | Series 2005-87-SG | | | 6.55% | # I/F I/O | | | 10/25/2035 | | | | 3,040,598 | |
| | 12,715,601 | | | Series 2006-101-SA | | | 6.43% | # I/F I/O | | | 10/25/2036 | | | | 1,941,227 | |
| | 5,068,576 | | | Series 2006-123-LI | | | 6.17% | # I/F I/O | | | 01/25/2037 | | | | 867,985 | |
| | 6,980,560 | | | Series 2006-16-HZ | | | 5.50% | | | | 03/25/2036 | | | | 7,631,748 | |
| | 23,069,819 | | | Series 2006-56-SM | | | 6.60% | # I/F I/O | | | 07/25/2036 | | | | 3,616,192 | |
| | 25,480,203 | | | Series 2006-60-YI | | | 6.42% | # I/F I/O | | | 07/25/2036 | | | | 5,302,183 | |
| | 3,686,695 | | | Series 2006-93-SN | | | 6.45% | # I/F I/O | | | 10/25/2036 | | | | 401,090 | |
| | 11,812,583 | | | Series 2007-109-VZ | | | 5.00% | | | | 10/25/2035 | | | | 13,520,777 | |
| | 3,899,398 | | | Series 2007-116-BI | | | 6.10% | # I/F I/O | | | 05/25/2037 | | | | 564,945 | |
| | 23,616,881 | | | Series 2007-14-PS | | | 6.66% | # I/F I/O | | | 03/25/2037 | | | | 3,279,053 | |
| | 738,041 | | | Series 2007-2-SH | | | 32.08% | # I/F | | | 08/25/2036 | | | | 870,086 | |
| | 9,734,939 | | | Series 2007-30-OI | | | 6.29% | # I/F I/O | | | 04/25/2037 | | | | 1,470,435 | |
| | 3,253,261 | | | Series 2007-30-SI | | | 5.96% | # I/F I/O | | | 04/25/2037 | | | | 396,650 | |
| | 11,521,959 | | | Series 2007-32-SG | | | 5.95% | # I/F I/O | | | 04/25/2037 | | | | 1,491,133 | |
| | 9,645,594 | | | Series 2007-57-SX | | | 6.47% | # I/F I/O | | | 10/25/2036 | | | | 1,569,447 | |
| | 15,056,555 | | | Series 2007-60-VZ | | | 6.00% | | | | 07/25/2037 | | | | 16,973,585 | |
| | 9,154,371 | | | Series 2007-71-GZ | | | 6.00% | | | | 07/25/2047 | | | | 10,296,049 | |
| | 10,665,237 | | | Series 2007-75-ID | | | 5.72% | # I/F I/O | | | 08/25/2037 | | | | 1,482,315 | |
| | 2,435,901 | | | Series 2007-93-SB | | | 4.00% | # I/F I/O | | | 01/25/2036 | | | | 70,444 | |
| | 6,060,955 | | | Series 2007-9-SD | | | 6.50% | # I/F I/O | | | 03/25/2037 | | | | 726,453 | |
| | 4,903,136 | | | Series 2008-27-B | | | 5.50% | | | | 04/25/2038 | | | | 5,321,847 | |
| | 14,229,371 | | | Series 2008-29-ZA | | | 4.50% | | | | 04/25/2038 | | | | 15,255,330 | |
| | 22,551,974 | | | Series 2008-48-BE | | | 5.00% | | | | 06/25/2034 | | | | 24,433,429 | |
| | 6,923,186 | | | Series 2008-48-SD | | | 5.85% | # I/F I/O | | | 06/25/2037 | | | | 785,834 | |
| | 6,590,482 | | | Series 2008-53-LI | | | 6.00% | # I/F I/O | | | 07/25/2038 | | | | 642,909 | |
| | 7,707,674 | | | Series 2008-57-SE | | | 5.85% | # I/F I/O | | | 02/25/2037 | | | | 883,926 | |
| | 4,658,982 | | | Series 2008-5-MS | | | 6.10% | # I/F I/O | | | 02/25/2038 | | | | 608,891 | |
| | 5,924,467 | | | Series 2008-61-SC | | | 5.85% | # I/F I/O | | | 07/25/2038 | | | | 697,820 | |
| | | | | | |
| 24 | | DoubleLine Funds Trust | | | | The accompanying notes are an integral part of these financial statements. |
March 31, 2014
| | | | | | | | | | | | | | | | |
PRINCIPAL
AMOUNT | | | SECURITY DESCRIPTION | | RATE | | | MATURITY | | | VALUE $ | |
| |
| | | | Federal National Mortgage Association, (Cont.) | |
| $ | 5,844,050 | | | Series 2008-62-SC | | | 5.85% | # I/F I/O | | | 07/25/2038 | | | | 738,877 | |
| | 8,546,060 | | | Series 2008-65-SA | | | 5.85% | # I/F I/O | | | 08/25/2038 | | | | 1,083,751 | |
| | 12,530,667 | | | Series 2008-81-LP | | | 5.50% | | | | 09/25/2038 | | | | 13,599,282 | |
| | 31,173,390 | | | Series 2009-106-EZ | | | 4.50% | | | | 01/25/2040 | | | | 32,136,881 | |
| | 9,238,727 | | | Series 2009-111-SE | | | 6.10% | # I/F I/O | | | 01/25/2040 | | | | 1,304,063 | |
| | 2,144,339 | | | Series 2009-16-MZ | | | 5.00% | | | | 03/25/2029 | | | | 2,317,742 | |
| | 19,593,090 | | | Series 2009-42-SI | | | 5.85% | # I/F I/O | | | 06/25/2039 | | | | 2,216,596 | |
| | 9,392,279 | | | Series 2009-42-SX | | | 5.85% | # I/F I/O | | | 06/25/2039 | | | | 1,072,615 | |
| | 8,493,099 | | | Series 2009-47-SA | | | 5.95% | # I/F I/O | | | 07/25/2039 | | | | 1,161,890 | |
| | 3,502,276 | | | Series 2009-48-WS | | | 5.80% | # I/F I/O | | | 07/25/2039 | | | | 397,037 | |
| | 18,779,584 | | | Series 2009-49-S | | | 6.60% | # I/F I/O | | | 07/25/2039 | | | | 2,618,650 | |
| | 3,591,805 | | | Series 2009-51-BZ | | | 4.50% | | | | 07/25/2039 | | | | 3,767,340 | |
| | 5,022,550 | | | Series 2009-54-EZ | | | 5.00% | | | | 07/25/2039 | | | | 5,437,498 | |
| | 8,028,509 | | | Series 2009-70-SA | | | 5.65% | # I/F I/O | | | 09/25/2039 | | | | 862,830 | |
| | 10,000,000 | | | Series 2009-80-PM | | | 4.50% | | | | 10/25/2039 | | | | 10,521,715 | |
| | 13,222,894 | | | Series 2009-83-Z | | | 4.50% | | | | 10/25/2039 | | | | 13,659,719 | |
| | 33,928,348 | | | Series 2009-85-ES | | | 7.08% | # I/F I/O | | | 01/25/2036 | | | | 6,451,340 | |
| | 41,847,826 | | | Series 2009-85-JS | | | 6.60% | # I/F I/O | | | 10/25/2039 | | | | 7,716,806 | |
| | 11,440,393 | | | Series 2009-90-IB | | | 5.57% | # I/F I/O | | | 04/25/2037 | | | | 1,208,013 | |
| | 5,877,443 | | | Series 2009-94-BC | | | 5.00% | | | | 11/25/2039 | | | | 6,337,882 | |
| | 36,139,332 | | | Series 2010-101-SA | | | 4.33% | # I/F I/O | | | 09/25/2040 | | | | 3,648,139 | |
| | 20,376,209 | | | Series 2010-101-ZC | | | 4.50% | | | | 09/25/2040 | | | | 21,606,891 | |
| | 57,556,594 | | | Series 2010-101-ZH | | | 4.50% | | | | 07/25/2040 | | | | 60,941,814 | |
| | 18,162,030 | | | Series 2010-10-SA | | | 6.20% | # I/F I/O | | | 02/25/2040 | | | | 2,661,086 | |
| | 9,569,604 | | | Series 2010-10-ZA | | | 4.50% | | | | 02/25/2040 | | | | 9,955,336 | |
| | 5,736,314 | | | Series 2010-111-S | | | 5.80% | # I/F I/O | | | 10/25/2050 | | | | 566,380 | |
| | 12,614,416 | | | Series 2010-116-Z | | | 4.00% | | | | 10/25/2040 | | | | 13,227,035 | |
| | 11,348,354 | | | Series 2010-117-SA | | | 4.35% | # I/F I/O | | | 10/25/2040 | | | | 1,037,546 | |
| | 18,711,252 | | | Series 2010-120-KD | | | 4.00% | | | | 10/25/2040 | | | | 19,179,332 | |
| | 72,328,030 | | | Series 2010-121-SD | | | 4.35% | # I/F I/O | | | 10/25/2040 | | | | 6,675,978 | |
| | 242,685 | | | Series 2010-126-SU | | | 53.30% | # I/F | | | 11/25/2040 | | | | 855,266 | |
| | 178,693 | | | Series 2010-126-SX | | | 14.54% | # I/F | | | 11/25/2040 | | | | 239,977 | |
| | 12,585,859 | | | Series 2010-128-HZ | | | 4.00% | | | | 11/25/2040 | | | | 13,058,797 | |
| | 12,941,090 | | | Series 2010-132-Z | | | 4.50% | | | | 11/25/2040 | | | | 13,774,251 | |
| | 88,008 | | | Series 2010-137-VS | | | 14.54% | # I/F | | | 12/25/2040 | | | | 111,286 | |
| | 6,470,000 | | | Series 2010-142-AV | | | 4.00% | | | | 11/25/2029 | | | | 6,738,715 | |
| | 17,561,769 | | | Series 2010-142-AZ | | | 4.00% | | | | 12/25/2040 | | | | 17,817,767 | |
| | 30,741,720 | | | Series 2010-150-ZA | | | 4.00% | | | | 01/25/2041 | | | | 30,840,462 | |
| | 4,674,000 | | | Series 2010-153-VB | | | 4.00% | | | | 05/25/2027 | | | | 4,867,116 | |
| | 33,518,408 | | | Series 2010-16-SA | | | 5.30% | # I/F I/O | | | 03/25/2040 | | | | 4,296,423 | |
| | 3,362,383 | | | Series 2010-21-DZ | | | 5.00% | | | | 03/25/2040 | | | | 3,736,810 | |
| | 8,542,012 | | | Series 2010-21-KS | | | 4.80% | # I/F I/O | | | 03/25/2040 | | | | 829,147 | |
| | 3,546,129 | | | Series 2010-2-GS | | | 6.30% | # I/F I/O | | | 12/25/2049 | | | | 475,221 | |
| | 8,980,289 | | | Series 2010-2-MS | | | 6.10% | # I/F I/O | | | 02/25/2050 | | | | 1,117,364 | |
| | 16,852,930 | | | Series 2010-31-SA | | | 4.85% | # I/F I/O | | | 04/25/2040 | | | | 1,433,797 | |
| | 21,358,206 | | | Series 2010-31-VZ | | | 4.00% | | | | 04/25/2040 | | | | 22,400,604 | |
| | 18,000,375 | | | Series 2010-34-PS | | | 4.78% | # I/F I/O | | | 04/25/2040 | | | | 1,813,264 | |
| | 4,378,356 | | | Series 2010-35-ES | | | 6.30% | # I/F I/O | | | 04/25/2040 | | | | 483,619 | |
| | 6,667,276 | | | Series 2010-35-SV | | | 6.30% | # I/F I/O | | | 04/25/2040 | | | | 878,355 | |
| | 6,846,861 | | | Series 2010-46-MS | | | 4.80% | # I/F I/O | | | 05/25/2040 | | | | 716,092 | |
| | 23,092,464 | | | Series 2010-49-ZW | | | 4.50% | | | | 05/25/2040 | | | | 24,981,000 | |
| | 7,255,478 | | | Series 2010-4-SK | | | 6.08% | # I/F I/O | | | 02/25/2040 | | | | 1,117,172 | |
| | 4,736,837 | | | Series 2010-58-ES | | | 12.07% | # I/F | | | 06/25/2040 | | | | 5,341,486 | |
| | 18,311,250 | | | Series 2010-59-MS | | | 5.62% | # I/F I/O | | | 06/25/2040 | | | | 2,168,561 | |
| | 43,567,238 | | | Series 2010-59-PS | | | 6.30% | # I/F I/O | | | 03/25/2039 | | | | 6,329,675 | |
| | 21,986,433 | | | Series 2010-59-SC | | | 4.85% | # I/F I/O | | | 01/25/2040 | | | | 2,393,964 | |
| | 5,844,614 | | | Series 2010-60-VZ | | | 5.00% | | | | 10/25/2039 | | | | 6,167,354 | |
| | 3,164,754 | | | Series 2010-61-EL | | | 4.50% | | | | 06/25/2040 | | | | 3,283,442 | |
| | 13,181,260 | | | Series 2010-64-EZ | | | 5.00% | | | | 06/25/2040 | | | | 14,402,404 | |
| | 38,571,021 | | | Series 2010-76-ZK | | | 4.50% | | | | 07/25/2040 | | | | 42,060,561 | |
| | 21,959,249 | | | Series 2010-79-CZ | | | 4.00% | | | | 07/25/2040 | | | | 22,721,653 | |
| | 34,563,770 | | | Series 2010-79-VZ | | | 4.50% | | | | 07/25/2040 | | | | 37,754,109 | |
| | 18,475,840 | | | Series 2010-84-ZC | | | 4.50% | | | | 08/25/2040 | | | | 19,026,965 | |
| | 36,951,601 | | | Series 2010-84-ZD | | | 4.50% | | | | 08/25/2040 | | | | 38,053,849 | |
| | 38,778,028 | | | Series 2010-84-ZG | | | 4.50% | | | | 08/25/2040 | | | | 40,378,145 | |
| | 4,858,674 | | | Series 2010-90-SA | | | 5.70% | # I/F I/O | | | 08/25/2040 | | | | 519,757 | |
| | 6,561,298 | | | Series 2010-94-Z | | | 4.50% | | | | 08/25/2040 | | | | 7,001,164 | |
| | 8,668,587 | | | Series 2010-99-SG | | | 24.23% | # I/F | | | 09/25/2040 | | | | 14,044,973 | |
| | 10,887,121 | | | Series 2010-9-DS | | | 5.15% | # I/F I/O | | | 02/25/2040 | | | | 1,209,464 | |
| | 31,198,942 | | | Series 2011-106-LZ | | | 3.50% | | | | 10/25/2041 | | | | 29,450,382 | |
| | 520,021 | | | Series 2011-110-LS | | | 9.79% | # I/F | | | 11/25/2041 | | | | 547,548 | |
| | 7,502,914 | | | Series 2011-111-EZ | | | 5.00% | | | | 11/25/2041 | | | | 8,192,968 | |
| | 15,418,425 | | | Series 2011-111-VZ | | | 4.00% | | | | 11/25/2041 | | | | 15,752,041 | |
| | 30,000,000 | | | Series 2011-131-PB | | | 4.50% | | | | 12/25/2041 | | | | 32,574,105 | |
| | 29,500,000 | | | Series 2011-16-AL | | | 3.50% | | | | 03/25/2031 | | | | 29,072,280 | |
| | | | | | | | | | | | | | | | |
PRINCIPAL
AMOUNT | | | SECURITY DESCRIPTION | | RATE | | | MATURITY | | | VALUE $ | |
| |
| | | | Federal National Mortgage Association, (Cont.) | |
| $ | 38,800,000 | | | Series 2011-17-NY | | | 3.50% | | | | 03/25/2031 | | | | 38,355,624 | |
| | 6,567,223 | | | Series 2011-17-SA | | | 6.32% | # I/F I/O | | | 03/25/2041 | | | | 842,415 | |
| | 11,000,000 | | | Series 2011-25-KY | | | 3.00% | | | | 04/25/2026 | | | | 10,933,505 | |
| | 4,744,126 | | | Series 2011-27-BS | | | 8.69% | # I/F | | | 04/25/2041 | | | | 4,728,295 | |
| | 56,000,000 | | | Series 2011-29-AL | | | 3.50% | | | | 04/25/2031 | | | | 55,167,924 | |
| | 17,021,993 | | | Series 2011-2-GZ | | | 4.00% | | | | 02/25/2041 | | | | 17,085,128 | |
| | 10,000,000 | | | Series 2011-2-VD | | | 4.00% | | | | 07/25/2027 | | | | 10,377,010 | |
| | 19,620,473 | | | Series 2011-36-VZ | | | 4.50% | | | | 05/25/2041 | | | | 20,932,730 | |
| | 27,914,517 | | | Series 2011-37-Z | | | 4.50% | | | | 05/25/2041 | | | | 29,841,875 | |
| | 7,480,796 | | | Series 2011-38-BZ | | | 4.00% | | | | 05/25/2041 | | | | 7,600,078 | |
| | 8,748,233 | | | Series 2011-39-CB | | | 3.00% | | | | 05/25/2026 | | | | 8,663,078 | |
| | 18,085,671 | | | Series 2011-40-LZ | | | 4.50% | | | | 05/25/2041 | | | | 19,412,426 | |
| | 24,904,559 | | | Series 2011-42-MZ | | | 4.50% | | | | 05/25/2041 | | | | 26,713,414 | |
| | 16,823,690 | | | Series 2011-45-ZA | | | 4.00% | | | | 05/25/2031 | | | | 16,418,979 | |
| | 26,918,181 | | | Series 2011-45-ZB | | | 4.50% | | | | 05/25/2041 | | | | 28,841,148 | |
| | 11,000,000 | | | Series 2011-48-SC | | | 8.89% | # I/F | | | 06/25/2041 | | | | 11,009,552 | |
| | 29,562,362 | | | Series 2011-58-SA | | | 6.40% | # I/F I/O | | | 07/25/2041 | | | | 5,032,247 | |
| | 6,626,629 | | | Series 2011-59-MA | | | 4.50% | | | | 07/25/2041 | | | | 7,114,750 | |
| | 13,969,748 | | | Series 2011-60-EL | | | 3.00% | | | | 07/25/2026 | | | | 13,703,184 | |
| | 16,741,108 | | | Series 2011-63-ZE | | | 4.00% | | | | 08/25/2038 | | | | 17,595,692 | |
| | 62,219,287 | | | Series 2011-64-DB | | | 4.00% | | | | 07/25/2041 | | | | 64,821,920 | |
| | 12,000,000 | | | Series 2011-74-KL | | | 5.00% | | | | 06/25/2040 | | | | 13,274,130 | |
| | 22,919,018 | | | Series 2011-77-Z | | | 3.50% | | | | 08/25/2041 | | | | 21,531,787 | |
| | 21,787,531 | | | Series 2011-8-AV | | | 4.00% | | | | 01/25/2030 | | | | 22,522,119 | |
| | 22,376,736 | | | Series 2011-99-CZ | | | 4.50% | | | | 10/25/2041 | | | | 23,243,443 | |
| | 101,956,880 | | | Series 2011-99-DZ | | | 5.00% | | | | 10/25/2041 | | | | 114,124,618 | |
| | 10,887,478 | | | Series 2012-104-Z | | | 3.50% | | | | 09/25/2042 | | | | 9,337,678 | |
| | 19,861,225 | | | Series 2012-111-LB | | | 3.50% | | | | 05/25/2041 | | | | 20,171,666 | |
| | 87,265,199 | | | Series 2012-111-MJ | | | 4.00% | | | | 04/25/2042 | | | | 90,187,318 | |
| | 47,780,594 | | | Series 2012-114-DC | | | 2.00% | | | | 08/25/2039 | | | | 46,963,880 | |
| | 172,346,089 | | | Series 2012-122-AD | | | 2.00% | | | | 02/25/2040 | | | | 165,724,983 | |
| | 117,641,353 | | | Series 2012-122-DB | | | 3.00% | | | | 11/25/2042 | | | | 115,488,928 | |
| | 126,332,265 | | | Series 2012-125-LA | | | 3.00% | | | | 11/25/2042 | | | | 126,195,763 | |
| | 17,370,079 | | | Series 2012-133-PB | | | 6.50% | | | | 04/25/2042 | | | | 19,790,512 | |
| | 90,226,845 | | | Series 2012-144-PT | | | 4.43% | # | | | 11/25/2049 | | | | 92,486,757 | |
| | 9,237,404 | | | Series 2012-14-BZ | | | 4.00% | | | | 03/25/2042 | | | | 9,093,375 | |
| | 20,024,331 | | | Series 2012-15-PZ | | | 4.00% | | | | 03/25/2042 | | | | 19,282,049 | |
| | 16,132,901 | | | Series 2012-20-ZT | | | 3.50% | | | | 03/25/2042 | | | | 14,652,272 | |
| | 48,741,433 | | | Series 2012-30-DZ | | | 4.00% | | | | 04/25/2042 | | | | 47,656,912 | |
| | 40,076,290 | | | Series 2012-31-Z | | | 4.00% | | | | 04/25/2042 | | | | 39,213,347 | |
| | 25,492,001 | | | Series 2012-63-EB | | | 2.00% | | | | 08/25/2040 | | | | 25,164,327 | |
| | 28,792,936 | | | Series 2012-74-Z | | | 4.00% | | | | 07/25/2042 | | | | 27,004,132 | |
| | 21,420,041 | | | Series 2012-86-ZC | | | 3.50% | | | | 08/25/2042 | | | | 19,114,088 | |
| | 29,843,729 | | | Series 2012-96-VZ | | | 3.50% | | | | 09/25/2042 | | | | 25,764,002 | |
| | 79,112,222 | | | Series 2012-98-BG | | | 4.50% | | | | 08/25/2040 | | | | 84,198,070 | |
| | 110,838,109 | | | Series 2012-99-QE | | | 3.00% | | | | 09/25/2042 | | | | 110,839,716 | |
| | 25,050,781 | | | Series 2013-41-ZH | | | 3.00% | | | | 05/25/2033 | | | | 21,275,972 | |
| | 19,292,416 | | | Series 2013-51-HS | | | 5.21% | # I/F | | | 04/25/2043 | | | | 14,262,254 | |
| | 11,340,851 | | | Series 2013-53-AB | | | 1.50% | | | | 03/25/2028 | | | | 10,734,615 | |
| | 9,845,905 | | | Series 2013-58-SC | | | 5.77% | # I/F | | | 06/25/2043 | | | | 7,858,144 | |
| | 9,339,977 | | | Series 2013-6-ZH | | | 1.50% | | | | 02/25/2043 | | | | 6,838,603 | |
| | 116,687,348 | | | Series 2013-81-ZQ | | | 3.00% | | | | 08/25/2043 | | | | 98,841,302 | |
| | 29,286,307 | | | Series 400-S4 | | | 5.30% | # I/F I/O | | | 11/25/2039 | | | | 3,923,043 | |
| | 173,435,277 | | | Series 412-A3 | | | 3.00% | | | | 08/25/2042 | | | | 165,781,011 | |
| |
| | | | Federal National Mortgage Association Pass-Thru, | |
| | 29,010,988 | | | Pool 555743 | | | 5.00% | | | | 09/01/2033 | | | | 31,862,062 | |
| | 31,227,766 | | | Pool 735141 | | | 5.50% | | | | 01/01/2035 | | | | 34,771,321 | |
| | 11,562,554 | | | Pool 735230 | | | 5.50% | | | | 02/01/2035 | | | | 12,876,369 | |
| | 21,653,059 | | | Pool 735382 | | | 5.00% | | | | 04/01/2035 | | | | 23,675,271 | |
| | 36,012,597 | | | Pool 735402 | | | 5.00% | | | | 04/01/2035 | | | | 39,372,323 | |
| | 25,590,350 | | | Pool 735484 | | | 5.00% | | | | 05/01/2035 | | | | 27,984,242 | |
| | 9,470,382 | | | Pool 735667 | | | 5.00% | | | | 07/01/2035 | | | | 10,369,456 | |
| | 8,393,787 | | | Pool 735893 | | | 5.00% | | | | 10/01/2035 | | | | 9,170,588 | |
| | 21,090,030 | | | Pool 745275 | | | 5.00% | | | | 02/01/2036 | | | | 23,032,506 | |
| | 3,160,541 | | | Pool 745571 | | | 4.00% | | | | 01/01/2019 | | | | 3,346,745 | |
| | 987,624 | | | Pool 888695 | | | 5.00% | | | | 08/01/2037 | | | | 1,076,697 | |
| | 3,788,727 | | | Pool 888968 | | | 5.00% | | | | 08/01/2035 | | | | 4,146,494 | |
| | 12,137,886 | | | Pool 889509 | | | 6.00% | | | | 05/01/2038 | | | | 13,521,730 | |
| | 27,696,274 | | | Pool 889662 | | | 6.00% | | | | 06/01/2038 | | | | 30,849,751 | |
| | 4,303,393 | | | Pool 929321 | | | 5.50% | | | | 03/01/2038 | | | | 4,751,751 | |
| | 2,426,275 | | | Pool 931104 | | | 5.00% | | | | 05/01/2039 | | | | 2,639,141 | |
| | 2,260,794 | | | Pool 961410 | | | 6.00% | | | | 01/01/2038 | | | | 2,518,206 | |
| | 802,787 | | | Pool 975116 | | | 5.00% | | | | 05/01/2038 | | | | 875,190 | |
| | 7,280,605 | | | Pool 982036 | | | 6.00% | | | | 05/01/2038 | | | | 8,109,569 | |
| | | | | | |
| The accompanying notes are an integral part of these financial statements. | | Annual Report | | March 31, 2014 | | 25 |
Schedule of Investments DoubleLine Total Return Bond Fund (Cont.)
| | | | | | | | | | | | | | | | |
PRINCIPAL
AMOUNT | | | SECURITY DESCRIPTION | | RATE | | | MATURITY | | | VALUE $ | |
| |
| | | | Federal National Mortgage Association Pass-Thru, (Cont.) | |
| $ | 10,822,501 | | | Pool 985190 | | | 6.00% | | | | 08/01/2038 | | | | 12,054,743 | |
| | 4,664,666 | | | Pool 986864 | | | 6.50% | | | | 08/01/2038 | | | | 5,251,078 | |
| | 5,408,349 | | | Pool 987316 | | | 6.50% | | | | 09/01/2038 | | | | 6,070,249 | |
| | 19,801,372 | | | Pool 995070 | | | 5.50% | | | | 08/01/2037 | | | | 22,051,072 | |
| | 73,886,840 | | | Pool 995112 | | | 5.50% | | | | 07/01/2036 | | | | 82,290,423 | |
| | 37,766,342 | | | Pool 995203 | | | 5.00% | | | | 07/01/2035 | | | | 41,334,917 | |
| | 3,464,637 | | | Pool 995581 | | | 6.00% | | | | 01/01/2039 | | | | 3,860,654 | |
| | 64,944,064 | | | Pool 995849 | | | 5.00% | | | | 08/01/2036 | | | | 71,012,372 | |
| | 45,397,337 | | | Pool AB2123 | | | 4.00% | | | | 01/01/2031 | | | | 47,936,241 | |
| | 1,058,419 | | | Pool AB2370 | | | 4.50% | | | | 09/01/2035 | | | | 1,116,810 | |
| | 7,327,871 | | | Pool AB3713 | | | 4.00% | | | | 10/01/2031 | | | | 7,731,891 | |
| | 23,613,173 | | | Pool AB3796 | | | 3.50% | | | | 11/01/2031 | | | | 24,305,751 | |
| | 13,342,494 | | | Pool AB3850 | | | 4.00% | | | | 11/01/2041 | | | | 13,752,261 | |
| | 28,921,283 | | | Pool AB3923 | | | 4.00% | | | | 11/01/2041 | | | | 29,809,507 | |
| | 70,443,048 | | | Pool AB4167 | | | 3.50% | | | | 01/01/2032 | | | | 72,509,592 | |
| | 70,654,509 | | | Pool AB4261 | | | 3.50% | | | | 01/01/2032 | | | | 72,832,246 | |
| | 13,593,158 | | | Pool AB5084 | | | 3.50% | | | | 05/01/2032 | | | | 14,011,934 | |
| | 26,913,430 | | | Pool AB5156 | | | 3.50% | | | | 05/01/2032 | | | | 27,740,304 | |
| | 44,357,510 | | | Pool AB5212 | | | 3.50% | | | | 05/01/2032 | | | | 45,727,751 | |
| | 19,343,777 | | | Pool AB5243 | | | 4.00% | | | | 05/01/2042 | | | | 19,937,887 | |
| | 60,770,295 | | | Pool AB5911 | | | 3.00% | | | | 08/01/2032 | | | | 60,687,243 | |
| | 25,433,099 | | | Pool AB6349 | | | 3.00% | | | | 10/01/2032 | | | | 25,398,191 | |
| | 72,908,136 | | | Pool AB6750 | | | 3.00% | | | | 10/01/2032 | | | | 72,808,295 | |
| | 36,108,336 | | | Pool AB6751 | | | 3.00% | | | | 10/01/2032 | | | | 36,058,779 | |
| | 140,787,771 | | | Pool AB7077 | | | 3.00% | | | | 11/01/2042 | | | | 136,326,934 | |
| | 116,014,891 | | | Pool AB7344 | | | 3.00% | | | | 12/01/2032 | | | | 115,855,691 | |
| | 47,107,270 | | | Pool AB7776 | | | 3.00% | | | | 02/01/2043 | | | | 45,123,134 | |
| | 28,058,612 | | | Pool AB8418 | | | 3.00% | | | | 02/01/2033 | | | | 28,020,099 | |
| | 42,801,291 | | | Pool AB8520 | | | 3.00% | | | | 02/01/2033 | | | | 42,742,540 | |
| | 43,941,908 | | | Pool AB8703 | | | 3.00% | | | | 03/01/2038 | | | | 43,016,718 | |
| | 24,199,468 | | | Pool AB8858 | | | 3.00% | | | | 04/01/2033 | | | | 24,166,247 | |
| | 35,831,988 | | | Pool AB9020 | | | 3.00% | | | | 04/01/2038 | | | | 35,077,551 | |
| | 37,787,563 | | | Pool AB9197 | | | 3.00% | | | | 05/01/2033 | | | | 37,735,730 | |
| | 117,005,424 | | | Pool AB9406 | | | 3.00% | | | | 05/01/2033 | | | | 116,845,307 | |
| | 24,758,080 | | | Pool AB9409 | | | 3.00% | | | | 05/01/2033 | | | | 24,724,091 | |
| | 1,311,279 | | | Pool AC1032 | | | 5.00% | | | | 06/01/2040 | | | | 1,410,251 | |
| | 73,793,976 | | | Pool AD0189 | | | 5.50% | | | | 02/01/2039 | | | | 82,121,266 | |
| | 32,141,010 | | | Pool AD0500 | | | 5.50% | | | | 09/01/2036 | | | | 35,775,608 | |
| | 1,714,674 | | | Pool AD2177 | | | 4.50% | | | | 06/01/2030 | | | | 1,840,031 | |
| | 3,506,350 | | | Pool AD6438 | | | 5.00% | | | | 06/01/2040 | | | | 3,840,159 | |
| | 483,356 | | | Pool AD7018 | | | 5.00% | | | | 04/01/2040 | | | | 519,909 | |
| | 2,428,734 | | | Pool AD7859 | | | 5.00% | | | | 06/01/2040 | | | | 2,653,309 | |
| | 4,834,032 | | | Pool AH1140 | | | 4.50% | | | | 12/01/2040 | | | | 5,100,755 | |
| | 19,817,002 | | | Pool AH4437 | | | 4.00% | | | | 01/01/2041 | | | | 20,425,359 | |
| | 4,821,577 | | | Pool AH7309 | | | 4.00% | | | | 02/01/2031 | | | | 5,091,672 | |
| | 25,515,282 | | | Pool AH9323 | | | 4.00% | | | | 04/01/2026 | | | | 27,086,450 | |
| | 3,811,180 | | | Pool AI8889 | | | 4.00% | | | | 08/01/2041 | | | | 3,927,695 | |
| | 18,549,234 | | | Pool AI9831 | | | 4.00% | | | | 09/01/2041 | | | | 19,120,284 | |
| | 6,074,724 | | | Pool AJ1265 | | | 4.00% | | | | 09/01/2041 | �� | | | 6,261,728 | |
| | 7,821,648 | | | Pool AJ1399 | | | 4.00% | | | | 09/01/2041 | | | | 8,062,268 | |
| | 25,914,040 | | | Pool AJ1467 | | | 4.00% | | | | 10/01/2041 | | | | 26,710,825 | |
| | 12,298,441 | | | Pool AJ3392 | | | 4.00% | | | | 10/01/2041 | | | | 12,677,776 | |
| | 8,103,226 | | | Pool AJ3854 | | | 4.00% | | | | 10/01/2041 | | | | 8,353,345 | |
| | 86,858,394 | | | Pool AJ4118 | | | 4.00% | | | | 11/01/2041 | | | | 89,518,938 | |
| | 22,046,452 | | | Pool AJ4131 | | | 4.00% | | | | 10/01/2041 | | | | 22,726,721 | |
| | 6,671,862 | | | Pool AJ5172 | | | 4.00% | | | | 11/01/2041 | | | | 6,877,349 | |
| | 39,412,404 | | | Pool AJ7677 | | | 3.50% | | | | 12/01/2041 | | | | 39,320,559 | |
| | 9,473,772 | | | Pool AJ8334 | | | 4.00% | | | | 12/01/2041 | | | | 9,765,526 | |
| | 72,149,743 | | | Pool AK0713 | | | 3.50% | | | | 01/01/2032 | | | | 74,267,350 | |
| | 22,836,294 | | | Pool AK4039 | | | 4.00% | | | | 02/01/2042 | | | | 23,534,742 | |
| | 16,157,687 | | | Pool AK4763 | | | 4.00% | | | | 02/01/2042 | | | | 16,657,394 | |
| | 19,100,123 | | | Pool AK9438 | | | 4.00% | | | | 03/01/2042 | | | | 19,688,762 | |
| | 27,077,102 | | | Pool AK9439 | | | 4.00% | | | | 03/01/2042 | | | | 27,912,881 | |
| | 4,144,491 | | | Pool AK9446 | | | 4.50% | | | | 03/01/2042 | | | | 4,372,588 | |
| | 24,189,133 | | | Pool AL1485 | | | 6.00% | | | | 01/01/2040 | | | | 27,019,082 | |
| | 12,187,556 | | | Pool AL1548 | | | 6.00% | | | | 07/01/2039 | | | | 13,628,291 | |
| | 24,471,489 | | | Pool AL1554 | | | 6.00% | | | | 01/01/2040 | | | | 27,348,305 | |
| | 48,199,727 | | | Pool AL1690 | | | 6.00% | | | | 05/01/2041 | | | | 53,687,712 | |
| | 69,918,180 | | | Pool AL1744 | | | 6.00% | | | | 10/01/2040 | | | | 77,934,555 | |
| | 21,649,774 | | | Pool AL1745 | | | 6.00% | | | | 03/01/2040 | | | | 24,114,801 | |
| | 23,733,772 | | | Pool AL1793 | | | 6.00% | | | | 01/01/2041 | | | | 26,442,703 | |
| | 141,363,627 | | | Pool AL3038 | | | 3.00% | | | | 01/01/2033 | | | | 141,169,669 | |
| | 183,848,027 | | | Pool AL3699 | | | 3.00% | | | | 06/01/2043 | | | | 176,113,917 | |
| | 93,565,276 | | | Pool AL3883 | | | 3.00% | | | | 07/01/2043 | | | | 89,630,166 | |
| | 11,775,840 | | | Pool AL4292 | | | 4.50% | | | | 04/01/2026 | | | | 12,670,932 | |
| | | | | | | | | | | | | | | | |
PRINCIPAL
AMOUNT | | | SECURITY DESCRIPTION | | RATE | | | MATURITY | | | VALUE $ | |
| |
| | | | Federal National Mortgage Association Pass-Thru, (Cont.) | |
| $ | 79,314,664 | | | Pool AO2980 | | | 4.00% | | | | 05/01/2042 | | | | 81,736,494 | |
| | 128,659,371 | | | Pool AP4787 | | | 3.50% | | | | 09/01/2042 | | | | 128,358,219 | |
| | 125,310,905 | | | Pool AP4789 | | | 3.50% | | | | 09/01/2042 | | | | 125,017,531 | |
| | 7,080,262 | | | Pool MA0264 | | | 4.50% | | | | 12/01/2029 | | | | 7,594,078 | |
| | 138,547 | | | Pool MA0315 | | | 4.50% | | | | 01/01/2025 | | | | 142,746 | |
| | 27,862,468 | | | Pool MA0353 | | | 4.50% | | | | 03/01/2030 | | | | 30,220,258 | |
| | 6,307,812 | | | Pool MA0406 | | | 4.50% | | | | 05/01/2030 | | | | 6,816,295 | |
| | 582,875 | | | Pool MA0445 | | | 5.00% | | | | 06/01/2040 | | | | 626,901 | |
| | 2,232,209 | | | Pool MA0459 | | | 4.00% | | | | 07/01/2020 | | | | 2,363,334 | |
| | 1,742,513 | | | Pool MA0468 | | | 5.00% | | | | 07/01/2040 | | | | 1,864,856 | |
| | 7,132,067 | | | Pool MA0502 | | | 4.00% | | | | 08/01/2020 | | | | 7,551,760 | |
| | 3,082,804 | | | Pool MA0517 | | | 4.00% | | | | 09/01/2020 | | | | 3,267,162 | |
| | 8,353,704 | | | Pool MA0534 | | | 4.00% | | | | 10/01/2030 | | | | 8,817,474 | |
| | 18,602,483 | | | Pool MA0536 | | | 4.00% | | | | 10/01/2020 | | | | 19,698,447 | |
| | 22,260,765 | | | Pool MA0580 | | | 4.00% | | | | 11/01/2020 | | | | 23,571,182 | |
| | 1,672,773 | | | Pool MA0587 | | | 4.00% | | | | 12/01/2030 | | | | 1,766,139 | |
| | 41,842,227 | | | Pool MA0616 | | | 4.00% | | | | 01/01/2031 | | | | 44,180,395 | |
| | 19,398,276 | | | Pool MA0896 | | | 4.00% | | | | 11/01/2041 | | | | 19,994,697 | |
| | 277,611,408 | | | Pool MA0919 | | | 3.50% | | | | 12/01/2031 | | | | 285,729,340 | |
| | 118,120,769 | | | Pool MA0949 | | | 3.50% | | | | 01/01/2032 | | | | 121,579,734 | |
| | 136,673,350 | | | Pool MA0976 | | | 3.50% | | | | 02/01/2032 | | | | 140,885,659 | |
| | 66,560,481 | | | Pool MA1010 | | | 3.50% | | | | 03/01/2032 | | | | 68,613,839 | |
| | 20,565,816 | | | Pool MA1039 | | | 3.50% | | | | 04/01/2042 | | | | 20,517,928 | |
| | 88,349,536 | | | Pool MA1059 | | | 3.50% | | | | 05/01/2032 | | | | 91,074,057 | |
| | 12,573,653 | | | Pool MA1068 | | | 3.50% | | | | 05/01/2042 | | | | 12,544,285 | |
| | 193,753,894 | | | Pool MA1084 | | | 3.50% | | | | 06/01/2032 | | | | 199,750,189 | |
| | 28,940,376 | | | Pool MA1093 | | | 3.50% | | | | 06/01/2042 | | | | 28,872,666 | |
| | 29,857,198 | | | Pool MA1094 | | | 4.00% | | | | 06/01/2042 | | | | 30,768,286 | |
| | 114,696,363 | | | Pool MA1107 | | | 3.50% | | | | 07/01/2032 | | | | 118,246,050 | |
| | 272,628,056 | | | Pool MA1117 | | | 3.50% | | | | 07/01/2042 | | | | 271,989,934 | |
| | 315,335,495 | | | Pool MA1136 | | | 3.50% | | | | 08/01/2042 | | | | 314,597,446 | |
| | 75,299,392 | | | Pool MA1138 | | | 3.50% | | | | 08/01/2032 | | | | 77,629,897 | |
| | 86,641,515 | | | Pool MA1179 | | | 3.50% | | | | 09/01/2042 | | | | 86,438,709 | |
| | 15,047,097 | | | Pool MA1201 | | | 3.50% | | | | 10/01/2032 | | | | 15,512,773 | |
| | 195,444,934 | | | Pool MA1209 | | | 3.50% | | | | 10/01/2042 | | | | 194,987,556 | |
| | 444,240,506 | | | Pool MA1237 | | | 3.00% | | | | 11/01/2032 | | | | 443,632,256 | |
| | 11,886,177 | | | Pool MA1242 | | | 3.50% | | | | 11/01/2042 | | | | 11,858,353 | |
| | 338,124,967 | | | Pool MA1275 | | | 3.00% | | | | 12/01/2032 | | | | 337,661,722 | |
| | 45,412,822 | | | Pool MA1338 | | | 3.00% | | | | 02/01/2033 | | | | 45,350,553 | |
| | 177,758,362 | | | Pool MA1366 | | | 3.00% | | | | 03/01/2033 | | | | 177,514,844 | |
| | 108,071,246 | | | Pool MA1401 | | | 3.00% | | | | 04/01/2033 | | | | 107,923,125 | |
| | 195,214,067 | | | Pool MA1459 | | | 3.00% | | | | 06/01/2033 | | | | 194,947,410 | |
| | 24,048,269 | | | Pool MA1490 | | | 3.00% | | | | 07/01/2033 | | | | 24,015,425 | |
| | 22,146,887 | | | Pool MA3894 | | | 4.00% | | | | 09/01/2031 | | | | 23,384,540 | |
| |
| | | | Government National Mortgage Association, | |
| | 14,700,000 | | | Series 2003-67-SP | | | 6.94% | # I/F I/O | | | 08/20/2033 | | | | 4,552,910 | |
| | 14,438,015 | | | Series 2003-86-ZK | | | 5.00% | | | | 10/20/2033 | | | | 15,815,734 | |
| | 6,452,555 | | | Series 2004-49-Z | | | 6.00% | | | | 06/20/2034 | | | | 7,240,657 | |
| | 6,500,000 | | | Series 2004-80-PH | | | 5.00% | | | | 07/20/2034 | | | | 6,987,081 | |
| | 15,147,223 | | | Series 2004-83-CS | | | 5.92% | # I/F I/O | | | 10/20/2034 | | | | 2,231,846 | |
| | 3,133,693 | | | Series 2005-21-Z | | | 5.00% | | | | 03/20/2035 | | | | 3,497,252 | |
| | 20,510,475 | | | Series 2005-39-ZB | | | 5.00% | | | | 07/20/2034 | | | | 22,369,719 | |
| | 952,610 | | | Series 2006-24-CX | | | 38.82% | # I/F | | | 05/20/2036 | | | | 1,997,217 | |
| | 24,352,299 | | | Series 2007-26-SJ | | | 4.53% | # I/F I/O | | | 04/20/2037 | | | | 2,324,400 | |
| | 10,893,239 | | | Series 2008-2-SM | | | 6.35% | # I/F I/O | | | 01/16/2038 | | | | 1,732,771 | |
| | 19,887,344 | | | Series 2008-42-AI | | | 7.54% | # I/F I/O | | | 05/16/2038 | | | | 3,492,247 | |
| | 9,845,499 | | | Series 2008-43-SH | | | 6.18% | # I/F I/O | | | 05/20/2038 | | | | 1,536,989 | |
| | 11,198,054 | | | Series 2008-51-SC | | | 6.09% | # I/F I/O | | | 06/20/2038 | | | | 1,753,838 | |
| | 6,554,768 | | | Series 2008-51-SE | | | 6.10% | # I/F I/O | | | 06/16/2038 | | | | 956,896 | |
| | 4,428,440 | | | Series 2008-82-SM | | | 5.89% | # I/F I/O | | | 09/20/2038 | | | | 633,388 | |
| | 6,861,114 | | | Series 2008-83-SD | | | 6.41% | # I/F I/O | | | 11/16/2036 | | | | 1,247,723 | |
| | 14,578,414 | | | Series 2009-106-VZ | | | 4.50% | | | | 11/20/2039 | | | | 15,283,535 | |
| | 12,932,267 | | | Series 2009-10-NS | | | 6.50% | # I/F I/O | | | 02/16/2039 | | | | 2,113,041 | |
| | 7,690,893 | | | Series 2009-24-SN | | | 5.94% | # I/F I/O | | | 09/20/2038 | | | | 1,004,961 | |
| | 18,651,186 | | | Series 2009-32-ZE | | | 4.50% | | | | 05/16/2039 | | | | 19,578,579 | |
| | 68,335,295 | | | Series 2009-35-DZ | | | 4.50% | | | | 05/20/2039 | | | | 73,001,194 | |
| | 6,062 | | | Series 2009-41-ZQ | | | 4.50% | | | | 06/16/2039 | | | | 5,422 | |
| | 12,896,531 | | | Series 2009-48-Z | | | 5.00% | | | | 06/16/2039 | | | | 14,185,043 | |
| | 3,537,160 | | | Series 2009-50-KP | | | 4.50% | | | | 06/20/2039 | | | | 3,774,686 | |
| | 10,730,335 | | | Series 2009-69-TS | | | 6.05% | # I/F I/O | | | 04/16/2039 | | | | 1,456,048 | |
| | 9,791,971 | | | Series 2009-75-GZ | | | 4.50% | | | | 09/20/2039 | | | | 10,354,657 | |
| | 15,110,735 | | | Series 2009-87-IG | | | 6.58% | # I/F I/O | | | 03/20/2037 | | | | 1,886,315 | |
| | 1,047,800 | | | Series 2010-166-SJ | | | 9.49% | # I/F | | | 12/20/2040 | | | | 1,064,641 | |
| | 28,671,864 | | | Series 2010-1-SA | | | 5.60% | # I/F I/O | | | 01/16/2040 | | | | 3,492,250 | |
| | | | | | |
| 26 | | DoubleLine Funds Trust | | | | The accompanying notes are an integral part of these financial statements. |
March 31, 2014
| | | | | | | | | | | | | | | | |
PRINCIPAL
AMOUNT /
SHARES | | | SECURITY DESCRIPTION | | RATE | | | MATURITY | | | VALUE $ | |
| |
| | | | Government National Mortgage Association, (Cont.) | |
| $ | 3,082,284 | | | Series 2010-25-ZB | | | 4.50% | | | | 02/16/2040 | | | | 3,052,153 | |
| | 85,096,402 | | | Series 2010-26-QS | | | 6.09% | # I/F I/O | | | 02/20/2040 | | | | 16,149,850 | |
| | 12,767,000 | | | Series 2010-42-AY | | | 5.00% | | | | 11/20/2039 | | | | 13,735,396 | |
| | 19,664,444 | | | Series 2010-42-ES | | | 5.52% | # I/F I/O | | | 04/20/2040 | | | | 3,207,157 | |
| | 6,465,426 | | | Series 2010-61-AS | | | 6.39% | # I/F I/O | | | 09/20/2039 | | | | 907,024 | |
| | 57,878,584 | | | Series 2010-62-SB | | | 5.59% | # I/F I/O | | | 05/20/2040 | | | | 9,386,575 | |
| | 8,181,418 | | | Series 2010-62-ZG | | | 5.50% | | | | 05/16/2040 | | | | 9,202,958 | |
| | 2,043,224 | | | Series 2011-12-PO | | | 0.00% | P/O | | | 12/20/2040 | | | | 1,347,522 | |
| | 7,833,334 | | | Series 2011-18-SN | | | 9.19% | # I/F | | | 12/20/2040 | | | | 7,914,497 | |
| | 8,333,334 | | | Series 2011-18-YS | | | 9.19% | # I/F | | | 12/20/2040 | | | | 8,658,332 | |
| | 11,399,729 | | | Series 2011-51-UZ | | | 4.50% | | | | 04/20/2041 | | | | 12,088,307 | |
| | 10,084,833 | | | Series 2011-69-OC | | | 0.00% | P/O | | | 05/20/2041 | | | | 8,552,299 | |
| | 81,829,328 | | | Series 2011-69-SB | | | 5.19% | # I/F I/O | | | 05/20/2041 | | | | 11,013,786 | |
| | 23,698,941 | | | Series 2011-71-ZA | | | 4.50% | | | | 02/20/2041 | | | | 25,099,477 | |
| | 30,978,580 | | | Series 2011-72-AS | | | 5.22% | # I/F I/O | | | 05/20/2041 | | | | 4,084,039 | |
| | 30,028,685 | | | Series 2011-72-DO | | | 0.00% | P/O | | | 03/16/2033 | | | | 29,103,435 | |
| | 22,186,754 | | | Series 2011-72-SK | | | 5.99% | # I/F I/O | | | 05/20/2041 | | | | 3,004,530 | |
| | 26,971,235 | | | Series 2012-105-SE | | | 6.04% | # I/F I/O | | | 01/20/2041 | | | | 3,956,969 | |
| | 39,164,097 | | | Series 2012-52-PN | | | 2.00% | | | | 12/20/2039 | | | | 37,225,161 | |
| | | | | | | | | | | | | | | | |
| | | | Total US Government /
Agency Mortgage Backed Obligations
(Cost $15,665,093,578) | | | | 15,596,457,078 | |
| | | | | | | | | | | | | | | | |
| | US GOVERNMENT BONDS AND NOTES 6.0% | |
| | 1,325,000,000 | | | United States Treasury Notes | | | 1.63% | | | | 11/15/2022 | | | | 1,226,349,775 | |
| | 700,000,000 | | | United States Treasury Notes | | | 2.00% | | | | 02/15/2023 | | | | 665,791,898 | |
| | | | | | | | | | | | | | | | |
| | | | Total US Government Bonds and Notes
(Cost $1,992,567,906) | | | | 1,892,141,673 | |
| | | | | | | | | | | | | | | | |
| | SHORT TERM INVESTMENTS 5.6% | |
| | 247,820,481 | | | BlackRock Institutional Liquidity Funds FedFund Portfolio | | | 0.01% | ¨ | | | | | | | 247,820,481 | |
| | 100,000,000 | | | Federal Home Loan Discount Note | | | 0.00% | | | | 04/10/2014 | | | | 99,999,125 | |
| | 100,000,000 | | | Federal Home Loan Discount Note | | | 0.00% | | | | 04/21/2014 | | | | 99,996,966 | |
| | 99,000,000 | | | Federal Home Loan Discount Note | | | 0.00% | | | | 04/23/2014 | | | | 98,997,278 | |
| | | | | | | | | | | | | | | | |
SHARES | | | SECURITY DESCRIPTION | | RATE | | | MATURITY | | | VALUE $ | |
| | 100,000,000 | | | Federal Home Loan Discount Note | | | 0.00% | | | | 04/24/2014 | | | | 99,996,806 | |
| | 100,000,000 | | | Federal Home Loan Discount Note | | | 0.00% | | | | 05/07/2014 | | | | 99,994,000 | |
| | 100,000,000 | | | Federal Home Loan Discount Note | | | 0.00% | | | | 05/12/2014 | | | | 99,994,306 | |
| | 100,000,000 | | | Federal Home Loan Discount Note | | | 0.00% | | | | 05/14/2014 | | | | 99,992,236 | |
| | 100,000,000 | | | Federal Home Loan Discount Note | | | 0.00% | | | | 05/23/2014 | | | | 99,990,322 | |
| | 50,000,000 | | | Federal Home Loan Discount Note | | | 0.00% | | | | 06/20/2014 | | | | 49,997,800 | |
| | 50,000,000 | | | Federal Home Loan Discount Note | | | 0.00% | | | | 06/25/2014 | | | | 49,997,649 | |
| | 25,000,000 | | | Federal Home Loan Discount Note | | | 0.00% | | | | 07/23/2014 | | | | 24,997,648 | |
| | 100,000,000 | | | Federal Home Loan Discount Note | | | 0.00% | | | | 09/03/2014 | | | | 99,982,800 | |
| | 247,820,481 | | | Fidelity Institutional Government Portfolio | | | 0.01% | ¨ | | | | | | | 247,820,481 | |
| | 247,820,481 | | | Morgan Stanley Institutional Liquidity Funds | | | 0.04% | ¨ | | | | | | | 247,820,481 | |
| | | | | | | | | | | | | | | | |
| | | | Total Short Term Investments
(Cost $1,767,362,750) | | | | 1,767,398,379 | |
| | | | | | | | | | | | | | | | |
| | | | Total Investments 100.3%
(Cost $31,651,057,598) | | | | 31,783,036,403 | |
| | | | Liabilities in Excess of Other Assets (0.3)% | | | | (80,951,510 | ) |
| | | | | | | | | | | | | | | | |
| | | | NET ASSETS 100.0% | | | $ | 31,702,084,893 | |
| | | | | | | | | | | | | | | | |
| | | | |
| SECURITY TYPE BREAKDOWN as % of Net Assets | |
US Government / Agency Mortgage Backed Obligations | | | 49.2% | |
Non-Agency Residential Collateralized Mortgage Obligations | | | 29.9% | |
Short Term Investments | | | 5.6% | |
Non-Agency Commercial Mortgage Backed Obligations | | | 6.6% | |
US Government Bonds and Notes | | | 6.0% | |
Collateralized Loan Obligations | | | 3.0% | |
Other Assets and Liabilities | | | (0.3)% | |
| | | | |
| | | 100.0% | |
| | | | |
| # | Variable rate security. Rate disclosed as of March 31, 2014. |
| ^ | Security exempt from registration under Rule 144A of the Securities Act of 1933. These securities may be resold in transactions exempt from registration to qualified institutional buyers. These securities are determined to be liquid by DoubleLine Capital LP (the “Adviser”), unless otherwise noted, under procedures established by the Fund’s Board of Trustees. At March 31, 2014, the value of these securities amounted to $3,446,913,890 or 10.9% of net assets. |
| I/O | Interest only security |
| P/O | Principal only security |
| I/F | Inverse floating rate security whose interest rate moves in the opposite direction of reference interest rates |
| ¨ | Seven-day yield as of March 31, 2014 |
| | | | | | |
| The accompanying notes are an integral part of these financial statements. | | Annual Report | | March 31, 2014 | | 27 |
Schedule of Investments DoubleLine Core Fixed Income Fund
| | | | | | | | | | | | | | | | |
PRINCIPAL
AMOUNT | | | SECURITY DESCRIPTION | | RATE | | | MATURITY | | | VALUE $ | |
| | COLLATERALIZED LOAN OBLIGATIONS 3.1% | |
| |
| | | | ALM Loan Funding, | |
| $ | 1,000,000 | | | Series 2011-4A-C | | | 2.99% | #^ | | | 07/18/2022 | | | | 1,000,093 | |
| | | | |
| | | | ARES Ltd., | | | | | | | | | | | | |
| | 1,500,000 | | | Series 2012-2A-D | | | 4.94% | #^ | | | 10/12/2023 | | | | 1,507,171 | |
| | 2,000,000 | | | Series 2013-1A-D | | | 3.99% | #^ | | | 04/15/2025 | | | | 1,961,334 | |
| |
| | | | BlueMountain Ltd., | |
| | 1,500,000 | | | Series 2012-1A-E | | | 5.74% | #^ | | | 07/20/2023 | | | | 1,484,705 | |
| |
| | | | Brookside Mill Ltd., | |
| | 1,250,000 | | | Series 2013-1A-C1 | | | 2.94% | #^ | | | 04/17/2025 | | | | 1,234,555 | |
| | 2,250,000 | | | Series 2013-1A-D | | | 3.29% | #^ | | | 04/17/2025 | | | | 2,125,467 | |
| | 1,250,000 | | | Series 2013-1A-E | | | 4.64% | #^ | | | 04/17/2025 | | | | 1,149,731 | |
| |
| | | | Cent Ltd., | |
| | 2,000,000 | | | Series 2013-18A-D | | | 3.69% | #^ | | | 07/23/2025 | | | | 1,942,654 | |
| | 1,500,000 | | | Series2013-18A-E | | | 4.84% | #^ | | | 07/23/2025 | | | | 1,376,015 | |
| |
| | | | Centurion Ltd., | |
| | 2,000,000 | | | Series 2005-8X-B2 | | | 1.24% | # | | | 03/08/2017 | | | | 1,972,650 | |
| |
| | | | Chatham Light Ltd., | |
| | 1,500,000 | | | Series 2005-2A-C | | | 1.94% | #^ | | | 08/03/2019 | | | | 1,488,617 | |
| |
| | | | Dryden Senior Loan Fund, | |
| | 2,000,000 | | | Series 2012-24A-D | | | 4.99% | #^ | | | 11/15/2023 | | | | 2,009,676 | |
| |
| | | | Four Corners Ltd., | |
| | 2,000,000 | | | Series 2006-3A-D | | | 1.74% | #^ | | | 07/22/2020 | | | | 1,938,857 | |
| |
| | | | Galaxy Ltd., | |
| | 1,000,000 | | | Series 2013-15A-B | | | 2.09% | #^ | | | 04/15/2025 | | | | 984,394 | |
| | 1,000,000 | | | Series 2013-15A-C | | | 2.84% | #^ | | | 04/15/2025 | | | | 979,846 | |
| | 1,000,000 | | | Series 2013-15A-D | | | 3.64% | #^ | | | 04/15/2025 | | | | 973,938 | |
| |
| | | | GLG Ore Hill Ltd., | |
| | 250,000 | | | Series 2013-1A-A | | | 1.36% | #^ | | | 07/15/2025 | | | | 244,993 | |
| |
| | | | GoldenTree Loan Opportunities Ltd., | |
| | 760,000 | | | Series 2007-4A-D | | | 4.49% | #^ | | | 08/18/2022 | | | | 756,517 | |
| | 2,000,000 | | | Series 2012-6A-D | | | 4.44% | #^ | | | 04/17/2022 | | | | 2,004,834 | |
| |
| | | | LCM LP, | |
| | 2,000,000 | | | Series 10A-D | | | 4.84% | #^ | | | 04/15/2022 | | | | 2,009,970 | |
| | 1,000,000 | | | Series10X-A | | | 1.72% | # | | | 04/15/2022 | | | | 1,001,516 | |
| | 2,000,000 | | | Series11A-D2 | | | 4.19% | #^ | | | 04/19/2022 | | | | 2,001,527 | |
| | 1,000,000 | | | Series 12A-E | | | 5.99% | #^ | | | 10/19/2022 | | | | 998,058 | |
| |
| | | | Magnetite Ltd., | |
| | 1,500,000 | | | Series 2012-7A-D | | | 5.49% | #^ | | | 01/15/2025 | | | | 1,459,331 | |
| |
| | | | Nomad Ltd., | |
| | 1,500,000 | | | Series 2013-1A-B | | | 3.19% | #^ | | | 01/15/2025 | | | | 1,495,314 | |
| | 1,500,000 | | | Series 2013-1A-C | | | 3.74% | #^ | | | 01/15/2025 | | | | 1,464,544 | |
| |
| | | | OCP Ltd., | |
| | 2,000,000 | | | Series 2013-3A-B | | | 2.99% | #^ | | | 01/17/2025 | | | | 1,964,787 | |
| |
| | | | Octagon Investment Partners Ltd., | |
| | 2,000,000 | | | Series 2013-1A-D | | | 3.59% | #^ | | | 07/17/2025 | | | | 1,939,244 | |
| | 2,000,000 | | | Series 2013-1A-E | | | 4.74% | #^ | | | 07/17/2025 | | | | 1,853,430 | |
| |
| | | | OHA Intrepid Leverage Loan Fund Ltd., | |
| | 2,000,000 | | | Series 2011-1AR-DR | | | 3.29% | #^ | | | 04/20/2021 | | | | 2,001,112 | |
| |
| | | | Race Point Ltd., | |
| | 1,000,000 | | | Series 2013-8A-B | | | 2.13% | #^ | | | 02/20/2025 | | | | 980,515 | |
| |
| | | | Saturn Ltd., | |
| | 500,000 | | | Series 2007-1A-D | | | 4.24% | #^ | | | 05/13/2022 | | | | 472,274 | |
| |
| | | | Venture Ltd., | |
| | 500,000 | | | Series 2012-10A-C | | | 3.49% | #^ | | | 07/20/2022 | | | | 499,638 | |
| | 2,000,000 | | | Series 2012-10A-D | | | 4.44% | #^ | | | 07/20/2022 | | | | 2,004,964 | |
| |
| | | | WhiteHorse Ltd., | |
| | 2,000,000 | | | Series 2006-1A-B1L | | | 2.09% | #^ | | | 05/01/2018 | | | | 1,985,027 | |
| |
| | | | Wind River Ltd., | |
| | 3,000,000 | | | Series 2013-1A-C | | | 3.64% | #^ | | | 04/20/2025 | | | | 2,850,915 | |
| | | | | | | | | | | | | | | | |
| | | | Total Collateralized Loan Obligations
(Cost $53,836,970) | | | | 54,118,213 | |
| | | | | | | | | | | | | | | | |
| | | | | | | | | | | | | | | | |
PRINCIPAL
AMOUNT | | | SECURITY DESCRIPTION | | RATE | | | MATURITY | | | VALUE $ | |
| | FOREIGN CORPORATE BONDS 17.2% | |
| $ | 700,000 | | | AES Andres Dominicana Ltd. | | | 9.50% | ^ | | | 11/12/2020 | | | | 748,125 | |
| | 4,300,000 | | | AES Andres Dominicana Ltd. | | | 9.50% | | | | 11/12/2020 | | | | 4,595,625 | |
| | 500,000 | | | AES El Salvador Trust | | | 6.75% | | | | 03/28/2023 | | | | 467,500 | |
| | 3,700,000 | | | Alfa Bond Issuance | | | 7.50% | | | | 09/26/2019 | | | | 3,737,000 | |
| | 1,500,000 | | | Alpek S.A. de C.V. | | | 5.38% | ^ | | | 08/08/2023 | | | | 1,552,500 | |
| | 2,100,000 | | | Anadolu Efes Biracilik Ve Malt Sanayii A.S. | | | 3.38% | ^ | | | 11/01/2022 | | | | 1,752,450 | |
| | 4,750,000 | | | Australia and New Zealand Banking Group Ltd. | | | 4.88% | ^ | | | 01/12/2021 | | | | 5,258,868 | |
| | 1,500,000 | | | Automotores Gildemeister S.A. | | | 8.25% | | | | 05/24/2021 | | | | 1,125,000 | |
| | 800,000 | | | B Communications Ltd. | | | 7.38% | ^ | | | 02/15/2021 | | | | 844,000 | |
| | 2,600,000 | | | Banco Davivienda S.A. | | | 5.88% | | | | 07/09/2022 | | | | 2,567,500 | |
| | 4,100,000 | | | Banco de Bogota S.A. | | | 5.38% | | | | 02/19/2023 | | | | 4,105,125 | |
| | 2,500,000 | | | Banco de Bogota S.A. | | | 5.38% | ^ | | | 02/19/2023 | | | | 2,503,125 | |
| | 1,000,000 | | | Banco de Credito del Peru | | | 6.13% | #^ | | | 04/24/2027 | | | | 1,042,500 | |
| | 350,000 | | | Banco de Credito del Peru | | | 9.75% | # | | | 11/06/2069 | | | | 413,875 | |
| | 503,000 | | | Banco de Credito del Peru | | | 9.75% | #^ | | | 11/06/2069 | | | | 594,797 | |
| | 3,000,000 | | | Banco do Brasil S.A. | | | 8.50% | #† | | | 10/20/2020 | | | | 3,405,000 | |
| | 2,000,000 | | | Banco do Brasil S.A. | | | 5.88% | | | | 01/19/2023 | | | | 2,027,500 | |
| | 150,000 | | | Banco GNB Sudameris S.A. | | | 3.88% | | | | 05/02/2018 | | | | 145,688 | |
| | 1,800,000 | | | Banco GNB Sudameris S.A. | | | 7.50% | | | | 07/30/2022 | | | | 1,863,000 | |
| | 2,000,000 | | | Banco International del Peru S.A.A. | | | 6.63% | #^ | | | 03/19/2029 | | | | 2,022,500 | |
| | 1,695,000 | | | Banco International del Peru S.A.A. | | | 8.50% | # | | | 04/23/2070 | | | | 1,817,888 | |
| | 400,000 | | | Banco Regional SAECA | | | 8.13% | ^ | | | 01/24/2019 | | | | 430,000 | |
| | 5,300,000 | | | Bancolombia S.A. | | | 6.13% | | | | 07/26/2020 | | | | 5,637,610 | |
| | 5,250,000 | | | Bank Of Montreal | | | 1.40% | | | | 09/11/2017 | | | | 5,228,281 | |
| | 1,250,000 | | | Bantrab Senior Trust | | | 9.00% | | | | 11/14/2020 | | | | 1,210,000 | |
| | 2,800,000 | | | BBVA Bancomer S.A. | | | 6.50% | | | | 03/10/2021 | | | | 3,041,500 | |
| | 2,307,000 | | | BP Capital Markets PLC | | | 4.75% | | | | 03/10/2019 | | | | 2,567,403 | |
| | 25,000 | | | BP Capital Markets PLC | | | 2.50% | | | | 11/06/2022 | | | | 23,354 | |
| | 1,000,000 | | | BR Malls International Finance Ltd. | | | 8.50% | † | | | 01/21/2016 | | | | 1,018,130 | |
| | 3,300,000 | | | Braskem America Finance Company | | | 7.13% | | | | 07/22/2041 | | | | 3,163,875 | |
| | 800,000 | | | Braskem Finance Ltd. | | | 7.38% | † | | | 10/04/2015 | | | | 799,000 | |
| | 4,488,000 | | | British Telecommunications PLC | | | 5.95% | | | | 01/15/2018 | | | | 5,125,072 | |
| | 200,000 | | | Cementos Progreso Trust | | | 7.13% | ^ | | | 11/06/2023 | | | | 209,500 | |
| | 3,300,000 | | | Cementos Progreso Trust | | | 7.13% | | | | 11/06/2023 | | | | 3,456,750 | |
| | 2,400,000 | | | Cemex Espana S.A. | | | 9.25% | | | | 05/12/2020 | | | | 2,646,000 | |
| | 5,600,000 | | | Cencosud S.A. | | | 4.88% | ^ | | | 01/20/2023 | | | | 5,444,981 | |
| | 1,400,000 | | | Cencosud S.A. | | | 4.88% | | | | 01/20/2023 | | | | 1,361,245 | |
| | 600,000 | | | CFR International S.A. | | | 5.13% | ^ | | | 12/06/2022 | | | | 582,604 | |
| | 5,400,000 | | | CFR International S.A. | | | 5.13% | | | | 12/06/2022 | | | | 5,243,432 | |
| | 4,000,000 | | | Cia Minera Milpo S.A.A. | | | 4.63% | ^ | | | 03/28/2023 | | | | 3,715,000 | |
| | 500,000 | | | Columbus International, Inc. | | | 7.38% | ^ | | | 03/30/2021 | | | | 515,625 | |
| | 5,000,000 | | | Comcel Trust | | | 6.88% | ^ | | | 02/06/2024 | | | | 5,243,750 | |
| | 3,500,000 | | | CorpGroup Banking S.A. | | | 6.75% | ^ | | | 03/15/2023 | | | | 3,447,500 | |
| | 1,500,000 | | | Corporacion Azucarera del Peru S.A. | | | 6.38% | | | | 08/02/2022 | | | | 1,366,875 | |
| | 800,000 | | | Corporacion Pesquera Inca S.A.C. | | | 9.00% | ^ | | | 02/10/2017 | | | | 816,000 | |
| | | | | | |
| 28 | | DoubleLine Funds Trust | | | | The accompanying notes are an integral part of these financial statements. |
| | | | | | | | | | | | | | | | |
PRINCIPAL
AMOUNT | | | SECURITY DESCRIPTION | | RATE | | | MATURITY | | | VALUE $ | |
| $ | 2,444,000 | | | Corporacion Pesquera Inca S.A.C. | | | 9.00% | | | | 02/10/2017 | | | | 2,492,880 | |
| | 1,000,000 | | | Cosan Luxembourg S.A. | | | 5.00% | ^ | | | 03/14/2023 | | | | 942,500 | |
| | 1,300,000 | | | Cosan Luxembourg S.A. | | | 5.00% | | | | 03/14/2023 | | | | 1,225,250 | |
| | 700,000 | | | Cosan Overseas Ltd. | | | 8.25% | † | | | 11/05/2015 | | | | 722,750 | |
| | 1,500,000 | | | Credito Real S.A.B. de C.V. | | | 7.50% | ^ | | | 03/13/2019 | | | | 1,560,000 | |
| | 2,605,000 | | | Diageo Capital PLC | | | 1.50% | | | | 05/11/2017 | | | | 2,624,459 | |
| | 500,000 | | | Digicel Ltd. | | | 7.00% | | | | 02/15/2020 | | | | 522,500 | |
| | 2,900,000 | | | Digicel Ltd. | | | 7.13% | ^ | | | 04/01/2022 | | | | 2,939,875 | |
| | 936,587 | | | ENA Norte Trust | | | 4.95% | | | | 04/25/2023 | | | | 942,441 | |
| | 1,800,000 | | | ENTEL Chile S.A. | | | 4.88% | ^ | | | 10/30/2024 | | | | 1,819,141 | |
| | 4,400,000 | | | ESAL GmbH | | | 6.25% | ^ | | | 02/05/2023 | | | | 4,180,000 | |
| | 2,100,000 | | | ESAL GmbH | | | 6.25% | | | | 02/05/2023 | | | | 1,995,000 | |
| | 2,000,000 | | | Ferreycorp S.A.A. | | | 4.88% | ^ | | | 04/26/2020 | | | | 1,927,500 | |
| | 4,400,000 | | | Fresnillo PLC | | | 5.50% | ^ | | | 11/13/2023 | | | | 4,444,000 | |
| | 8,000,000 | | | Gaz Capital S.A. | | | 4.95% | | | | 02/06/2028 | | | | 6,900,000 | |
| | 3,600,000 | | | GPN Capital S.A. | | | 6.00% | ^ | | | 11/27/2023 | | | | 3,541,500 | |
| | 1,400,000 | | | GPN Capital S.A. | | | 6.00% | | | | 11/27/2023 | | | | 1,377,250 | |
| | 4,300,000 | | | Grupo Aval Ltd. | | | 4.75% | | | | 09/26/2022 | | | | 4,160,250 | |
| | 3,200,000 | | | Grupo Aval Ltd. | | | 4.75% | ^ | | | 09/26/2022 | | | | 3,096,000 | |
| | 400,000 | | | Grupo Elektra S.A.B. de C.V. | | | 7.25% | | | | 08/06/2018 | | | | 418,000 | |
| | 4,000,000 | | | Grupo Idesa S.A. de C.V. | | | 7.88% | ^ | | | 12/18/2020 | | | | 4,175,000 | |
| | 2,400,000 | | | Grupo KUO S.A.B. de C.V. | | | 6.25% | | | | 12/04/2022 | | | | 2,454,000 | |
| | 2,200,000 | | | Grupo KUO S.A.B. de C.V. | | | 6.25% | ^ | | | 12/04/2022 | | | | 2,249,500 | |
| | 1,250,000 | | | Guanay Finance Ltd. | | | 6.00% | ^ | | | 12/15/2020 | | | | 1,325,000 | |
| | 2,253,284 | | | IIRSA Norte Finance Ltd. | | | 8.75% | | | | 05/30/2024 | | | | 2,641,976 | |
| | 2,200,000 | | | Industrial Senior Trust | | | 5.50% | ^ | | | 11/01/2022 | | | | 2,109,250 | |
| | 4,800,000 | | | Industrial Senior Trust | | | 5.50% | | | | 11/01/2022 | | | | 4,602,000 | |
| | 400,000 | | | Inkia Energy Ltd. | | | 8.38% | ^ | | | 04/04/2021 | | | | 436,000 | |
| | 1,100,000 | | | Inkia Energy Ltd. | | | 8.38% | | | | 04/04/2021 | | | | 1,199,000 | |
| | 2,700,000 | | | Instituto Costarricense de Electricidad | | | 6.95% | ^ | | | 11/10/2021 | | | | 2,875,500 | |
| | 2,300,000 | | | Instituto Costarricense de Electricidad | | | 6.95% | | | | 11/10/2021 | | | | 2,449,500 | |
| | 960,000 | | | Intelsat Ltd. | | | 7.75% | | | | 06/01/2021 | | | | 1,014,000 | |
| | 2,500,000 | | | Itau Unibanco Holding S.A. | | | 5.50% | | | | 08/06/2022 | | | | 2,512,500 | |
| | 500,000 | | | Ixe Banco S.A. | | | 9.25% | | | | 10/14/2020 | | | | 592,500 | |
| | 200,000 | | | JBS Investments GmbH | | | 7.25% | ^ | | | 04/03/2024 | | | | 200,000 | |
| | 5,250,000 | | | Korea Development Bank | | | 4.38% | | | | 08/10/2015 | | | | 5,509,276 | |
| | 3,500,000 | | | Lukoil International Finance B.V. | | | 4.56% | | | | 04/24/2023 | | | | 3,211,250 | |
| | 1,250,000 | | | Maestro Peru S.A. | | | 6.75% | | | | 09/26/2019 | | | | 1,121,875 | |
| | 900,000 | | | Magnesita Finance Ltd. | | | 8.63% | † | | | 04/05/2017 | | | | 862,875 | |
| | 2,450,000 | | | Metalsa S.A. de C.V. | | | 4.90% | | | | 04/24/2023 | | | | 2,278,500 | |
| | 3,500,000 | | | Mexichem S.A.B. de C.V. | | | 6.75% | | | | 09/19/2042 | | | | 3,447,500 | |
| | 1,947,000 | | | Mexico Generadora de Energia | | | 5.50% | | | | 12/06/2032 | | | | 1,917,795 | |
| | 1,300,000 | | | Minerva Luxembourg S.A. | | | 8.75% | #^† | | | 04/03/2019 | | | | 1,303,250 | |
| | 3,500,000 | | | Minerva Luxembourg S.A. | | | 7.75% | ^ | | | 01/31/2023 | | | | 3,592,750 | |
| | 300,000 | | | Minerva Luxembourg S.A. | | | 7.75% | | | | 01/31/2023 | | | | 307,950 | |
| | 3,400,000 | | | Minsur S.A. | | | 6.25% | ^ | | | 02/07/2024 | | | | 3,578,500 | |
| | 4,000,000 | | | Noble Group Ltd. | | | 6.75% | | | | 01/29/2020 | | | | 4,360,000 | |
| | 5,300,000 | | | OAS Financial Ltd. | | | 8.88% | #^† | | | 04/25/2018 | | | | 4,995,250 | |
| | 3,200,000 | | | Odebrecht Finance Ltd. | | | 7.50% | † | | | 09/14/2015 | | | | 3,240,000 | |
| | 1,700,000 | | | Odebrecht Finance Ltd. | | | 7.13% | | | | 06/26/2042 | | | | 1,666,000 | |
| | 260,000 | | | Odebrecht Offshore Drilling | | | 6.63% | ^ | | | 10/01/2022 | | | | 271,700 | |
| | 2,440,000 | | | Orange S.A. | | | 2.75% | | | | 09/14/2016 | | | | 2,530,626 | |
| | 1,725,000 | | | Pacific Rubiales Energy Corporation | | | 7.25% | | | | 12/12/2021 | | | | 1,901,812 | |
| | | | | | | | | | | | | | | | |
PRINCIPAL
AMOUNT | | | SECURITY DESCRIPTION | | RATE | | | MATURITY | | | VALUE $ | |
| $ | 3,000,000 | | | Pacific Rubiales Energy Corporation | | | 7.25% | ^ | | | 12/12/2021 | | | | 3,307,500 | |
| | 1,500,000 | | | Pacific Rubiales Energy Corporation | | | 5.13% | ^ | | | 03/28/2023 | | | | 1,466,250 | |
| | 2,875,000 | | | Pacific Rubiales Energy Corporation | | | 5.13% | | | | 03/28/2023 | | | | 2,810,313 | |
| | 5,200,000 | | | Pemex Project Funding Master Trust | | | 6.63% | | | | 06/15/2035 | | | | 5,798,000 | |
| | 1,800,000 | | | Pesquera Exalmar S.A.A. | | | 7.38% | ^ | | | 01/31/2020 | | | | 1,644,750 | |
| | 1,000,000 | | | Pesquera Exalmar S.A.A. | | | 7.38% | | | | 01/31/2020 | | | | 913,750 | |
| | 1,500,000 | | | Petrobras Global Finance B.V. | | | 4.38% | | | | 05/20/2023 | | | | 1,376,281 | |
| | 1,960,000 | | | Reliance Industries Ltd. | | | 5.88% | † | | | 02/05/2018 | | | | 1,798,300 | |
| | 6,000,000 | | | Rosneft International Finance Ltd. | | | 4.20% | | | | 03/06/2022 | | | | 5,340,000 | |
| | 3,108,000 | | | Royal KPN N.V. | | | 8.38% | | | | 10/01/2030 | | | | 4,199,871 | |
| | 4,500,000 | | | SB Capital S.A. | | | 5.13% | | | | 10/29/2022 | | | | 4,218,750 | |
| | 2,408,000 | | | Scotiabank Peru S.A. | | | 4.50% | # | | | 12/13/2027 | | | | 2,215,360 | |
| | 4,200,000 | | | Scotiabank Peru S.A. | | | 4.50% | #^ | | | 12/13/2027 | | | | 3,864,000 | |
| | 1,500,000 | | | SMU S.A. | | | 7.75% | ^ | | | 02/08/2020 | | | | 1,042,500 | |
| | 750,000 | | | Southern Copper Corporation | | | 6.75% | | | | 04/16/2040 | | | | 770,806 | |
| | 3,800,000 | | | Southern Copper Corporation | | | 5.25% | | | | 11/08/2042 | | | | 3,272,393 | |
| | 200,000 | | | Telefonica Celular del Paraguay S.A. | | | 6.75% | ^ | | | 12/13/2022 | | | | 211,250 | |
| | 2,680,000 | | | TransCanada PipeLines Ltd. | | | 4.63% | | | | 03/01/2034 | | | | 2,748,171 | |
| | 3,000,000 | | | Transportadora de Gas Internacional S.A. | | | 5.70% | | | | 03/20/2022 | | | | 3,135,000 | |
| | 200,000 | | | TV Azteca S.A.B. de C.V. | | | 7.50% | | | | 05/25/2018 | | | | 211,750 | |
| | 3,100,000 | | | TV Azteca S.A.B. de C.V. | | | 7.63% | | | | 09/18/2020 | | | | 3,278,250 | |
| | 940,000 | | | Valeant Pharmaceuticals International, Inc. | | | 7.50% | ^ | | | 07/15/2021 | | | | 1,062,200 | |
| | 2,500,000 | | | Vedanta Resources PLC | | | 8.25% | | | | 06/07/2021 | | | | 2,660,938 | |
| | 2,200,000 | | | Vedanta Resources PLC | | | 7.13% | ^ | | | 05/31/2023 | | | | 2,200,000 | |
| | 4,000,000 | | | VimpelCom Holdings B.V. | | | 5.95% | ^ | | | 02/13/2023 | | | | 3,700,000 | |
| | 200,000 | | | Volcan Cia Minera S.A.A. | | | 5.38% | | | | 02/02/2022 | | | | 191,000 | |
| | 5,350,000 | | | VTB Capital S.A. | | | 6.95% | | | | 10/17/2022 | | | | 5,350,054 | |
| | | | | | | | | | | | | | | | |
| | | | Total Foreign Corporate Bonds
(Cost $300,004,025) | | | | 298,434,421 | |
| | | | | | | | | | | | | | | | |
| FOREIGN GOVERNMENT BONDS AND NOTES,
SUPRANATIONALS AND FOREIGN AGENCIES 0.6% |
|
| | 5,240,000 | | | Corporacion Andina de Fomento | | | 3.75% | | | | 01/15/2016 | | | | 5,488,863 | |
| | 4,170,000 | | | United Mexican States | | | 4.00% | | | | 10/02/2023 | | | | 4,216,913 | |
| | | | | | | | | | | | | | | | |
| | | | Total Foreign Government Bonds and Notes, Supranationals and Foreign Agencies
(Cost $9,500,853) | | | | 9,705,776 | |
| | | | | | | | | | | | | | | | |
| | | | | | |
| The accompanying notes are an integral part of these financial statements. | | Annual Report | | March 31, 2014 | | 29 |
Schedule of Investments DoubleLine Core Fixed Income Fund (Cont.)
| | | | | | | | | | | | | | | | |
PRINCIPAL
AMOUNT | | | SECURITY DESCRIPTION | | RATE | | | MATURITY | | | VALUE $ | |
| | NON-AGENCY COMMERCIAL MORTGAGE BACKED OBLIGATIONS 7.5% | |
| |
| | | | BAMLL Commercial Mortgage Securities Trust, | |
| $ | 500,000 | | | Series 2012-CLRN-B | | | 1.76% | #^ | | | 08/15/2029 | | | | 500,430 | |
| | 1,400,000 | | | Series 2012-CLRN-D | | | 2.86% | #^ | | | 08/15/2029 | | | | 1,404,184 | |
| |
| | | | Bear Stearns Commercial Mortgage Securities, Inc., | |
| | 1,000,000 | | | Series 2005-T18-AJ | | | 5.01% | # | | | 02/13/2042 | | | | 1,032,673 | |
| |
| | | | CD Commercial Mortgage Trust, | |
| | 2,902,000 | | | Series 2006-CD3-AM | | | 5.65% | | | | 10/15/2048 | | | | 3,173,636 | |
| | 101,708,474 | | | Series 2007-CD5-XP | | | 0.17% | #^ I/O | | | 11/15/2044 | | | | 135,679 | |
| | 4,800,000 | | | Series 2007-CS4-AMFX | | | 5.37% | # | | | 12/11/2049 | | | | 5,043,826 | |
| |
| | | | Citigroup Commercial Mortgage Trust, | |
| | 2,000,000 | | | Series 2008-C7-AM | | | 6.34% | # | | | 12/10/2049 | | | | 2,245,803 | |
| | 11,769,526 | | | Series 2012-GC8-XA | | | 2.23% | #^ I/O | | | 09/10/2045 | | | | 1,323,836 | |
| |
| | | | Commercial Mortgage Pass-Through Certificates, | |
| | 4,862,219 | | | Series 2002-LC4-XA | | | 2.66% | #^ I/O | | | 12/10/2044 | | | | 633,071 | |
| | 2,500,000 | | | Series 2006-C8-AM | | | 5.35% | | | | 12/10/2046 | | | | 2,738,498 | |
| | 3,144,626 | | | Series 2010-C1-XPA | | | 2.48% | #^ I/O | | | 07/10/2046 | | | | 107,040 | |
| | 29,484,806 | | | Series 2012-CR3-XA | | | 2.19% | # I/O | | | 10/15/2045 | | | | 3,576,640 | |
| | 2,370,000 | | | Series 2014-CR15-D | | | 4.92% | #^ | | | 02/10/2047 | | | | 2,191,230 | |
| |
| | | | Credit Suisse First Boston Mortgage Securities Corporation, | |
| | 770,445 | | | Series 1998-C2-F | | | 6.75% | #^ | | | 11/15/2030 | | | | 797,092 | |
| | 69,672 | | | Series 2001-CF2-G | | | 6.93% | ^ | | | 02/15/2034 | | | | 69,750 | |
| | 2,455,000 | | | Series 2005-C6-AJ | | | 5.23% | # | | | 12/15/2040 | | | | 2,575,187 | |
| |
| | | | Credit Suisse Mortgage Capital Certificates, | |
| | 4,380,000 | | | Series 2006-C3-AM | | | 5.79% | # | | | 06/15/2038 | | | | 4,762,223 | |
| | 1,875,000 | | | Series 2006-C4-AM | | | 5.51% | | | | 09/15/2039 | | | | 2,020,557 | |
| | 2,500,000 | | | Series 2006-C5-AM | | | 5.34% | | | | 12/15/2039 | | | | 2,698,945 | |
| | 1,843,292 | | | Series 2006-TF2A-A2 | | | 0.33% | #^ | | | 10/15/2021 | | | | 1,836,010 | |
| | 2,500,000 | | | Series 2007-C4-A1AM | | | 5.97% | # | | | 09/15/2039 | | | | 2,697,950 | |
| | 3,800,000 | | | Series 2009-RR2-IQB | | | 5.69% | #^ | | | 04/16/2049 | | | | 4,096,372 | |
| |
| | | | DBRR Trust, | |
| | 1,000,000 | | | Series 2011-C32-A3B | | | 5.72% | #^ | | | 06/17/2049 | | | | 1,082,557 | |
| | 2,500,000 | | | Series 2012-EZ1-B | | | 1.39% | ^ | | | 09/25/2045 | | | | 2,501,750 | |
| |
| | | | DBUBS Mortgage Trust, | |
| | 5,783,906 | | | Series 2011-LC2A-XA | | | 1.60% | #^ I/O | | | 07/10/2044 | | | | 313,551 | |
| |
| | | | Extended Stay America Trust, | |
| | 1,000,000 | | | Series 2013-ESFL-DFL | | | 3.30% | #^ | | | 12/05/2031 | | | | 991,043 | |
| | 675,926 | | | Series 2013-ESHM-M | | | 7.63% | ^ | | | 12/05/2019 | | | | 695,692 | |
| |
| | | | GE Capital Commercial Mortgage Corporation, | |
| | 1,000,000 | | | Series 2005-C2-B | | | 5.11% | # | | | 05/10/2043 | | | | 1,034,798 | |
| |
| | | | GMAC Commercial Mortgage Securities, Inc., | |
| | 794,000 | | | Series 2006-C1-AM | | | 5.29% | # | | | 11/10/2045 | | | | 839,803 | |
| |
| | | | Greenwich Capital Commercial Funding Corporation, | |
| | 66,399 | | | Series 2004-FL2A-D | | | 0.47% | #^ | | | 11/05/2019 | | | | 65,901 | |
| | 100,000 | | | Series 2004-FL2A-F | | | 0.56% | #^ | | | 11/05/2019 | | | | 99,250 | |
| | 1,900,000 | | | Series 2007-GG11-AJ | | | 6.26% | # | | | 12/10/2049 | | | | 1,923,015 | |
| | 3,500,000 | | | Series 2007-GG11-AM | | | 5.87% | # | | | 12/10/2049 | | | | 3,852,973 | |
| | 4,000,000 | | | Series 2007-GG9-AMFX | | | 5.48% | | | | 03/10/2039 | | | | 4,282,178 | |
| |
| | | | GS Mortgage Securities Corporation, | |
| | 1,600,000 | | | Series 2006-GG6-AJ | | | 5.75% | # | | | 04/10/2038 | | | | 1,635,940 | |
| | 14,224,964 | | | Series 2006-GG6-XC | | | 0.16% | #^ I/O | | | 04/10/2038 | | | | 11,095 | |
| | 4,831,151 | | | Series 2011-GC5-XA | | | 1.88% | #^ I/O | | | 08/10/2044 | | | | 329,470 | |
| | 5,813,830 | | | Series 2012-GC6-XA | | | 2.34% | #^ I/O | | | 01/10/2045 | | | | 678,268 | |
| |
| | | | JP Morgan Chase Commercial Mortgage Securities Corporation, | |
| | 647,401 | | | Series 2004-C3-A4 | | | 4.66% | | | | 01/15/2042 | | | | 648,039 | |
| | 3,000,000 | | | Series 2005-CB12-B | | | 5.14% | # | | | 09/12/2037 | | | | 2,985,933 | |
| | 36,780,267 | | | Series 2006-LDP8-X | | | 0.54% | # I/O | | | 05/15/2045 | | | | 429,961 | |
| | 1,000,000 | | | Series 2007-CB18-AMFX | | | 5.40% | | | | 06/12/2047 | | | | 1,095,954 | |
| | 4,450,000 | | | Series 2007-CIBC19-AM | | | 5.89% | # | | | 02/12/2049 | | | | 4,841,929 | |
| | 3,750,000 | | | Series 2007-LD12-AM | | | 6.03% | # | | | 02/15/2051 | | | | 4,190,303 | |
| | 12,050,000 | | | Series 2009-IWST-XB | | | 0.29% | #^ I/O | | | 12/05/2027 | | | | 242,175 | |
| | 1,000,000 | | | Series 2009-RR2-GEB | | | 5.54% | ^ | | | 12/13/2049 | | | | 1,067,632 | |
| | 12,210,623 | | | Series 2011-C4-XA | | | 1.50% | #^ I/O | | | 07/15/2046 | | | | 634,153 | |
| | 33,541,688 | | | Series 2012-C8-XA | | | 2.15% | # I/O | | | 10/15/2045 | | | | 3,730,758 | |
| | 8,743,891 | | | Series 2012-CBX-XA | | | 2.00% | # I/O | | | 06/15/2045 | | | | 838,662 | |
| | | | | | | | | | | | | | | | |
PRINCIPAL
AMOUNT | | | SECURITY DESCRIPTION | | RATE | | | MATURITY | | | VALUE $ | |
| |
| | | | LB Commercial Mortgage Trust, | |
| $ | 3,000,000 | | | Series 2007-C3-AMFL | | | 5.87% | #^ | | | 07/15/2044 | | | | 3,342,645 | |
| |
| | | | LB-UBS Commercial Mortgage Trust, | |
| | 250,000 | | | Series 2005-C3-AM | | | 4.79% | | | | 07/15/2040 | | | | 260,292 | |
| | 9,451,505 | | | Series 2006-C7-XCL | | | 0.63% | #^ I/O | | | 11/15/2038 | | | | 143,587 | |
| | 7,622,501 | | | Series 2006-C7-XW | | | 0.63% | #^ I/O | | | 11/15/2038 | | | | 117,139 | |
| | 1,600,000 | | | Series 2007-C1-AJ | | | 5.48% | | | | 02/15/2040 | | | | 1,651,714 | |
| |
| | | | Merrill Lynch Mortgage Trust, | |
| | 3,050,000 | | | Series 2006-C1-AJ | | | 5.86% | # | | | 05/12/2039 | | | | 3,090,609 | |
| | 1,600,000 | | | Series 2006-C2-AJ | | | 5.80% | # | | | 08/12/2043 | | | | 1,618,549 | |
| |
| | | | Merrill Lynch/Countrywide Commercial Mortgage Trust, | |
| | 213,033 | | | Series 2006-4-A2FL | | | 0.28% | # | | | 12/12/2049 | | | | 212,551 | |
| | 4,000,000 | | | Series 2007-5-AM | | | 5.42% | | | | 08/12/2048 | | | | 4,272,636 | |
| |
| | | | Morgan Stanley Bank of America Merrill Lynch Trust, | |
| | 2,936,839 | | | Series 2012-C5-XA | | | 1.88% | #^ I/O | | | 08/15/2045 | | | | 268,744 | |
| | 2,975,000 | | | Series 2014-C14-D | | | 4.84% | #^ | | | 02/15/2047 | | | | 2,696,158 | |
| |
| | | | Morgan Stanley Capital, Inc., | |
| | 4,000,000 | | | Series 2006-HQ8-AJ | | | 5.68% | # | | | 03/12/2044 | | | | 4,160,790 | |
| | 56,129 | | | Series 2007-HQ12-A2FL | | | 0.41% | # | | | 04/12/2049 | | | | 55,475 | |
| | 3,700,000 | | | Series 2007-IQ13-AM | | | 5.41% | | | | 03/15/2044 | | | | 4,034,915 | |
| | 29,152,189 | | | Series 2011-C1-XA | | | 0.93% | #^ I/O | | | 09/15/2047 | | | | 642,398 | |
| |
| | | | SMA Issuer LLC, | |
| | 262,843 | | | Series 2012-LV1-A | | | 3.50% | ^ | | | 08/20/2025 | | | | 262,490 | |
| |
| | | | TIAA Seasoned Commercial Mortgage Trust, | |
| | 1,000,000 | | | Series 2007-C4-AJ | | | 5.55% | # | | | 08/15/2039 | | | | 1,064,554 | |
| |
| | | | UBS-Barclays Commercial Mortgage Trust, | |
| | 14,623,203 | | | Series 2012-C3-XA | | | 2.32% | #^ I/O | | | 08/10/2049 | | | | 1,754,199 | |
| |
| | | | Wachovia Bank Commercial Mortgage Trust, | |
| | 95,051,398 | | | Series 2006-C27-XC | | | 0.25% | #^ I/O | | | 07/15/2045 | | | | 657,090 | |
| | 2,500,000 | | | Series 2006-C28-AJ | | | 5.63% | # | | | 10/15/2048 | | | | 2,515,605 | |
| | 16,394,500 | | | Series 2006-C29-IO | | | 0.38% | # I/O | | | 11/15/2048 | | | | 163,879 | |
| | 1,600,000 | | | Series 2007-C30-AJ | | | 5.41% | # | | | 12/15/2043 | | | | 1,616,722 | |
| | 3,500,000 | | | Series 2007-C33-AM | | | 5.95% | # | | | 02/15/2051 | | | | 3,887,707 | |
| | 2,500,000 | | | Series 2007-C33-B | | | 5.95% | # | | | 02/15/2051 | | | | 2,501,601 | |
| |
| | | | WF-RBS Commercial Mortgage Trust, | |
| | 19,484,965 | | | Series 2012-C9-XA | | | 2.25% | #^ I/O | | | 11/15/2045 | | | | 2,367,579 | |
| | | | | | | | | | | | | | | | |
| | | | Total Non-Agency Commercial Mortgage Backed Obligations
(Cost $131,422,609) | | | | 130,063,043 | |
| | | | | | | | | | | | | | | | |
| NON-AGENCY RESIDENTIAL COLLATERALIZED MORTGAGE
OBLIGATIONS 14.1% |
|
| |
| | | | ACE Securities Corporation, | |
| | 1,294,590 | | | Series 2006-NC1-A2C | | | 0.35% | # | | | 12/25/2035 | | | | 1,287,708 | |
| |
| | | | Adjustable Rate Mortgage Trust, | |
| | 104,983 | | | Series 2007-3-1A1 | | | 3.72% | #^ | | | 11/25/2037 | | | | 84,165 | |
| |
| | | | American General Mortgage Loan Trust, | |
| | 4,000,000 | | | Series 2010-1-A3 | | | 5.65% | #^ | | | 03/25/2058 | | | | 4,140,076 | |
| |
| | | | Banc of America Funding Corporation, | |
| | 3,180,719 | | | Series 2005-G-A3 | | | 8.91% | # | | | 10/20/2035 | | | | 3,140,045 | |
| | 1,811,382 | | | Series 2006-2-6A2 | | | 5.50% | | | | 03/25/2036 | | | | 1,856,338 | |
| | 1,112,207 | | | Series 2006-6-1A2 | | | 6.25% | | | | 08/25/2036 | | | | 1,105,782 | |
| |
| | | | BCAP LLC Trust, | |
| | 1,829,967 | | | Series 2009-RR13-6A5 | | | 6.00% | #^ | | | 04/26/2037 | | | | 1,908,004 | |
| |
| | | | Bear Stearns Asset Backed Securities Trust, | |
| | 335,424 | | | Series 2007-SD1-1A3A | | | 6.50% | | | | 10/25/2036 | | | | 287,124 | |
| |
| | | | Chase Mortgage Finance Corporation, | |
| | 7,878,492 | | | Series 2007-A2-6A4 | | | 2.69% | # | | | 07/25/2037 | | | | 7,296,870 | |
| | 2,393,397 | | | Series 2007-S3-2A1 | | | 5.50% | | | | 05/25/2037 | | | | 2,317,118 | |
| |
| | | | Citicorp Mortgage Securities, Inc., | |
| | 227,193 | | | Series 2005-1-1A4 | | | 5.50% | | | | 02/25/2035 | | | | 241,723 | |
| |
| | | | Citicorp Residential Mortgage Securities, Inc., | |
| | 1,800,000 | | | Series 2006-2-A5 | | | 6.04% | # | | | 09/25/2036 | | | | 1,733,779 | |
| | | | | | |
| 30 | | DoubleLine Funds Trust | | | | The accompanying notes are an integral part of these financial statements. |
| | | | | | | | | | | | | | | | |
PRINCIPAL
AMOUNT | | | SECURITY DESCRIPTION | | RATE | | | MATURITY | | | VALUE $ | |
| |
| | | | Citigroup Mortgage Loan Trust, Inc., | |
| $ | 395,657 | | | Series 2006-WF2-A2C | | | 5.78% | # | | | 05/25/2036 | | | | 248,828 | |
| | 4,928,000 | | | Series 2008-AR4-2A1B | | | 2.72% | #^ | | | 11/25/2038 | | | | 4,617,791 | |
| | 2,811,613 | | | Series 2010-8-5A4 | | | 8.41% | #^ | | | 11/25/2036 | | | | 2,462,302 | |
| | 14,385,947 | | | Series 2010-8-6A4 | | | 7.78% | #^ | | | 12/25/2036 | | | | 12,103,336 | |
| | 2,254,705 | | | Series 2011-12-3A1 | | | 2.67% | #^ | | | 09/25/2047 | | | | 2,255,313 | |
| |
| | | | CitiMortgage Alternative Loan Trust, | |
| | 310,559 | | | Series 2006-A2-A2 | | | 6.00% | | | | 05/25/2036 | | | | 263,881 | |
| | 170,709 | | | Series 2006-A5-3A3 | | | 6.00% | | | | 10/25/2036 | | | | 137,181 | |
| | 304,428 | | | Series 2007-A1-1A7 | | | 6.00% | | | | 01/25/2037 | | | | 254,589 | |
| |
| | | | Countrywide Alternative Loan Trust, | |
| | 397,244 | | | Series 2005-20CB-1A1 | | | 5.50% | | | | 07/25/2035 | | | | 363,724 | |
| | 457,440 | | | Series 2005-28CB-3A6 | | | 6.00% | | | | 08/25/2035 | | | | 370,811 | |
| | 2,262,862 | | | Series 2005-46CB-A22 | | | 5.25% | | | | 10/25/2035 | | | | 2,084,193 | |
| | 420,854 | | | Series 2005-J10-1A13 | | | 0.85% | # | | | 10/25/2035 | | | | 322,747 | |
| | 727,974 | | | Series 2006-26CB-A9 | | | 6.50% | | | | 09/25/2036 | | | | 620,140 | |
| | 2,552,105 | | | Series 2007-12T1-A1 | | | 6.00% | | | | 06/25/2037 | | | | 2,171,811 | |
| | 2,819,486 | | | Series 2007-16CB-2A1 | | | 0.60% | # | | | 08/25/2037 | | | | 1,663,150 | |
| | 816,453 | | | Series 2007-16CB-2A2 | | | 53.30% | # I/F | | | 08/25/2037 | | | | 1,896,406 | |
| | 209,554 | | | Series 2007-17CB-1A10 | | | 29.19% | # I/F | | | 08/25/2037 | | | | 313,048 | |
| | 1,095,320 | | | Series 2007-18CB-2A17 | | | 6.00% | | | | 08/25/2037 | | | | 938,933 | |
| | 4,534,844 | | | Series 2007-23CB-A3 | | | 0.65% | # | | | 09/25/2037 | | | | 3,255,692 | |
| | 4,454,713 | | | Series 2007-23CB-A4 | | | 6.35% | # I/F I/O | | | 09/25/2037 | | | | 982,195 | |
| | 837,775 | | | Series 2007-4CB-2A1 | | | 7.00% | | | | 03/25/2037 | | | | 267,181 | |
| |
| | | | Countrywide Asset-Backed Certificates, | |
| | 195,585 | | | Series 2005-13-AF3 | | | 5.07% | # | | | 04/25/2036 | | | | 167,689 | |
| |
| | | | Countrywide Home Loans, | |
| | 281,106 | | | Series 2002-32-2A6 | | | 5.00% | | | | 01/25/2018 | | | | 287,405 | |
| | 987,602 | | | Series 2005-28-A7 | | | 5.25% | | | | 01/25/2019 | | | | 941,999 | |
| | 1,774,725 | | | Series 2007-10-A5 | | | 6.00% | | | | 07/25/2037 | | | | 1,619,263 | |
| | 781,272 | | | Series 2007-15-1A16 | | | 6.25% | | | | 09/25/2037 | | | | 740,202 | |
| | 2,028,132 | | | Series 2007-3-A17 | | | 6.00% | | | | 04/25/2037 | | | | 1,869,747 | |
| |
| | | | Credit Suisse First Boston Mortgage Securities Corporation, | |
| | 199,936 | | | Series 2005-10-5A5 | | | 5.50% | | | | 11/25/2035 | | | | 176,435 | |
| | 3,349,527 | | | Series 2005-8-1A3 | | | 5.25% | | | | 09/25/2035 | | | | 3,308,181 | |
| |
| | | | Credit Suisse Mortgage Capital Certificates, | |
| | 7,699,120 | | | Series 2006-4-6A1 | | | 6.00% | | | | 05/25/2036 | | | | 7,015,823 | |
| | 346,226 | | | Series 2006-4-7A1 | | | 5.50% | | | | 05/25/2021 | | | | 329,823 | |
| | 218,753 | | | Series 2007-1-3A1 | | | 6.00% | | | | 02/25/2022 | | | | 181,070 | |
| | 117,485 | | | Series 2007-2-2A1 | | | 5.00% | | | | 03/25/2037 | | | | 116,581 | |
| | 9,357,894 | | | Series 2010-4R-3A17 | | | 6.96% | #^ | | | 06/26/2037 | | | | 8,662,496 | |
| |
| | | | Deutsche Mortgage Securities, Inc., | |
| | 2,761,837 | | | Series 2006-PR1-3A1 | | | 11.91% | #^ I/F | | | 04/15/2036 | | | | 3,307,982 | |
| | 277,552 | | | Series 2006-PR1-4AI2 | | | 14.31% | #^ I/F | | | 04/15/2036 | | | | 338,970 | |
| | 1,831,970 | | | Series 2006-PR1-5AI4 | | | 11.91% | #^ I/F | | | 04/15/2036 | | | | 2,209,798 | |
| |
| | | | First Horizon Alternative Mortgage Securities, | |
| | 778,356 | | | Series 2006-FA2-1A5 | | | 6.00% | | | | 05/25/2036 | | | | 675,240 | |
| | 199,138 | | | Series 2006-RE1-A1 | | | 5.50% | | | | 05/25/2035 | | | | 188,514 | |
| |
| | | | GSAA Home Equity Trust, | |
| | 1,016,516 | | | Series 2005-7-AF5 | | | 4.61% | # | | | 05/25/2035 | | | | 1,067,017 | |
| | 2,755,822 | | | Series 2007-10-A1A | | | 6.00% | | | | 11/25/2037 | | | | 2,226,087 | |
| | 1,967,782 | | | Series 2007-10-A2A | | | 6.50% | | | | 11/25/2037 | | | | 1,493,387 | |
| |
| | | | GSR Mortgage Loan Trust, | |
| | 202,119 | | | Series 2006-2F-5A1 | | | 4.50% | | | | 01/25/2021 | | | | 199,591 | |
| | 11,293,747 | | | Series 2006-3F-4A1 | | | 6.00% | | | | 03/25/2036 | | | | 10,568,395 | |
| | 1,817,610 | | | Series 2007-1F-2A2 | | | 5.50% | | | | 01/25/2037 | | | | 1,764,180 | |
| |
| | | | HSI Asset Loan Obligation Trust, | |
| | 217,670 | | | Series 2006-2-2A1 | | | 5.50% | | | | 12/25/2021 | | | | 208,171 | |
| |
| | | | JP Morgan Alternative Loan Trust, | |
| | 480,503 | | | Series 2006-S2-A4 | | | 6.19% | # | | | 05/25/2036 | | | | 344,206 | |
| | 10,000,000 | | | Series 2006-S3-A4 | | | 6.31% | # | | | 08/25/2036 | | | | 8,148,880 | |
| | 2,425,450 | | | Series 2006-S3-A6 | | | 6.12% | # | | | 08/25/2036 | | | | 2,357,108 | |
| | 3,084,748 | | | Series 2006-S4-A6 | | | 5.71% | # | | | 12/25/2036 | | | | 2,970,460 | |
| |
| | | | JP Morgan Mortgage Trust, | |
| | 591,337 | | | Series 2007-S3-1A7 | | | 6.00% | | | | 08/25/2037 | | | | 528,929 | |
| |
| | | | JP Morgan Resecuritization Trust, | |
| | 4,845,668 | | | Series 2011-2-2A3 | | | 2.12% | #^ | | | 07/26/2036 | | | | 4,918,843 | |
| | | | | | | | | | | | | | | | |
PRINCIPAL
AMOUNT | | | SECURITY DESCRIPTION | | RATE | | | MATURITY | | | VALUE $ | |
| |
| | | | Lehman Mortgage Trust, | |
| $ | 3,994,014 | | | Series 2005-1-2A4 | | | 5.50% | | | | 11/25/2035 | | | | 3,844,454 | |
| | 1,139,869 | | | Series 2006-3-1A5 | | | 6.00% | | | | 07/25/2036 | | | | 908,052 | |
| | 83,040 | | | Series 2006-9-1A19 | | | 29.97% | # I/F | | | 01/25/2037 | | | | 122,199 | |
| | 1,474,382 | | | Series 2007-10-2A1 | | | 6.50% | | | | 01/25/2038 | | | | 1,233,521 | |
| | 321,331 | | | Series 2007-2-1A1 | | | 5.75% | | | | 02/25/2037 | | | | 253,690 | |
| |
| | | | MASTR Alternative Loans Trust, | |
| | 221,481 | | | Series 2005-2-3A1 | | | 6.00% | | | | 03/25/2035 | | | | 229,269 | |
| | 5,579,831 | | | Series 2006-2-1A11 | | | 6.00% | # | | | 06/25/2036 | | | | 5,237,525 | |
| | 86,476 | | | Series 2007-1-2A7 | | | 6.00% | | | | 10/25/2036 | | | | 71,065 | |
| |
| | | | MASTR Asset Securitization Trust, | |
| | 323,163 | | | Series 2003-2-30B2 | | | 5.75% | | | | 04/25/2033 | | | | 323,095 | |
| |
| | | | Morgan Stanley Mortgage Loan Trust, | |
| | 704,698 | | | Series 2004-1-1A1 | | | 5.00% | | | | 11/25/2018 | | | | 723,290 | |
| | 2,591,282 | | | Series 2005-7-7A4 | | | 5.50% | | | | 11/25/2035 | | | | 2,644,637 | |
| | 6,044,174 | | | Series 2006-7-3A | | | 5.43% | # | | | 06/25/2036 | | | | 5,244,699 | |
| |
| | | | Morgan Stanley Re-Remic Trust, | |
| | 4,465,126 | | | Series 2010-R6-5C | | | 5.75% | #^ | | | 05/26/2037 | | | | 4,180,403 | |
| |
| | | | Nomura Asset Acceptance Corporation, | |
| | 289,773 | | | Series 2006-AP1-A2 | | | 5.52% | # | | | 01/25/2036 | | | | 192,243 | |
| |
| | | | Nomura Home Equity Loan, Inc., | |
| | 726,462 | | | Series 2006-AF1-A2 | | | 5.80% | # | | | 10/25/2036 | | | | 397,346 | |
| | 1,313,530 | | | Series 2007-1-1A1 | | | 6.06% | # | | | 02/25/2037 | | | | 784,650 | |
| |
| | | | Option One Mortgage Loan Trust, | |
| | 93,683 | | | Series 2004-3-M3 | | | 1.13% | # | | | 11/25/2034 | | | | 87,235 | |
| |
| | | | PHH Alternative Mortgage Trust, | |
| | 1,966,448 | | | Series 2007-2-4A1 | | | 6.00% | | | | 05/25/2022 | | | | 1,892,355 | |
| |
| | | | Residential Accredit Loans, Inc., | |
| | 553,393 | | | Series 2004-QS15-A1 | | | 5.25% | | | | 11/25/2034 | | | | 582,637 | |
| | 795,812 | | | Series 2005-QS14-3A3 | | | 6.00% | | | | 09/25/2035 | | | | 722,771 | |
| | 233,444 | | | Series 2005-QS1-A5 | | | 5.50% | | | | 01/25/2035 | | | | 236,272 | |
| | 839,761 | | | Series 2006-QS10-A4 | | | 5.75% | | | | 08/25/2036 | | | | 692,464 | |
| | 1,920,574 | | | Series 2006-QS6-1A15 | | | 6.00% | | | | 06/25/2036 | | | | 1,568,713 | |
| | 597,980 | | | Series 2006-QS6-2A1 | | | 6.00% | | | | 06/25/2021 | | | | 601,757 | |
| | 2,764,077 | | | Series 2007-QS3-A4 | | | 6.25% | | | | 02/25/2037 | | | | 2,295,174 | |
| |
| | | | Residential Asset Mortgage Products, Inc., | |
| | 550,000 | | | Series 2005-RS1-AI5 | | | 5.41% | # | | | 01/25/2035 | | | | 517,354 | |
| |
| | | | Residential Asset Securitization Trust, | |
| | 372,502 | | | Series 2005-A10-A3 | | | 5.50% | | | | 09/25/2035 | | | | 338,044 | |
| | 439,116 | | | Series 2005-A11-2A4 | | | 6.00% | | | | 10/25/2035 | | | | 352,880 | |
| | 124,534 | | | Series 2005-A7-A3 | | | 5.50% | | | | 06/25/2035 | | | | 114,371 | |
| | 2,282,319 | | | Series 2006-A6-1A1 | | | 6.50% | | | | 07/25/2036 | | | | 1,533,664 | |
| | 235,418 | | | Series 2006-R1-A1 | | | 27.78% | # I/F | | | 01/25/2046 | | | | 361,336 | |
| |
| | | | Residential Funding Mortgage Securities Trust, | |
| | 267,029 | | | Series 2006-S10-1A2 | | | 6.00% | | | | 10/25/2036 | | | | 237,198 | |
| | 1,343,012 | | | Series 2006-S11-A3 | | | 6.00% | | | | 11/25/2036 | | | | 1,241,328 | |
| | 2,514,956 | | | Series 2007-S2-A4 | | | 6.00% | | | | 02/25/2037 | | | | 2,301,494 | |
| | 1,696,058 | | | Series 2007-S3-1A4 | | | 6.00% | | | | 03/25/2037 | | | | 1,574,259 | |
| |
| | | | Structured Adjustable Rate Mortgage Loan Trust, | |
| | 923,630 | | | Series 2005-8XS-A3 | | | 0.71% | # | | | 04/25/2035 | | | | 924,911 | |
| | 234,904 | | | Series 2006-4-7A1 | | | 5.03% | # | | | 05/25/2036 | | | | 235,909 | |
| |
| | | | Structured Asset Securities Corporation, | |
| | 2,258,260 | | | Series 2003-35-1A1 | | | 5.24% | # | | | 12/25/2033 | | | | 2,360,056 | |
| | 3,584,877 | | | Series 2005-14-1A1 | | | 0.45% | # | | | 07/25/2035 | | | | 3,303,719 | |
| | 2,784,224 | | | Series 2005-16-1A3 | | | 5.50% | | | | 09/25/2035 | | | | 2,872,982 | |
| | 2,376,252 | | | Series 2005-RF1-A | | | 0.50% | #^ | | | 03/25/2035 | | | | 2,010,526 | |
| | 2,376,252 | | | Series 2005-RF1-AIO | | | 5.27% | #^ I/O | | | 03/25/2035 | | | | 352,029 | |
| |
| | | | Washington Mutual Mortgage Pass-Through Certificates, | |
| | 209,509 | | | Series 2005-1-2A | | | 6.00% | | | | 03/25/2035 | | | | 197,041 | |
| | 2,360,026 | | | Series 2006-1-3A1 | | | 5.75% | | | | 02/25/2036 | | | | 2,169,312 | |
| | 6,352,101 | | | Series 2006-8-A6 | | | 5.77% | # | | | 10/25/2036 | | | | 4,484,265 | |
| | 5,549,901 | | | Series 2006-AR19-2A | | | 2.03% | # | | | 01/25/2047 | | | | 5,042,978 | |
| | 4,104,469 | | | Series 2007-3-A6 | | | 6.00% | | | | 04/25/2037 | | | | 3,539,768 | |
| | 258,250 | | | Series 2007-5-A11 | | | 38.55% | # I/F | | | 06/25/2037 | | | | 455,627 | |
| | 13,469,410 | | | Series 2007-5-A3 | | | 7.00% | | | | 06/25/2037 | | | | 8,697,238 | |
| |
| | | | Wells Fargo Alternative Loan Trust, | |
| | 3,117,945 | | | Series 2007-PA5-1A1 | | | 6.25% | | | | 11/25/2037 | | | | 2,970,413 | |
| | | | | | |
| The accompanying notes are an integral part of these financial statements. | | Annual Report | | March 31, 2014 | | 31 |
Schedule of Investments DoubleLine Core Fixed Income Fund (Cont.)
| | | | | | | | | | | | | | | | |
PRINCIPAL
AMOUNT | | | SECURITY DESCRIPTION | | RATE | | | MATURITY | | | VALUE $ | |
| |
| | | | Wells Fargo Mortgage Backed Securities Trust, | |
| $ | 3,534,563 | | | Series 2005-17-1A1 | | | 5.50% | | | | 01/25/2036 | | | | 3,658,670 | |
| | 180,574 | | | Series 2005-AR14-A6 | | | 5.35% | # | | | 08/25/2035 | | | | 173,343 | |
| | 268,694 | | | Series 2005-AR16-6A4 | | | 2.63% | # | | | 10/25/2035 | | | | 250,273 | |
| | 1,158,986 | | | Series 2006-2-3A1 | | | 5.75% | | | | 03/25/2036 | | | | 1,190,257 | |
| | 2,685,440 | | | Series 2006-7-2A1 | | | 6.00% | | | | 06/25/2036 | | | | 2,653,193 | |
| | 2,781,228 | | | Series 2007-10-1A5 | | | 6.00% | | | | 07/25/2037 | | | | 2,711,412 | |
| | 2,985,578 | | | Series 2007-10-2A11 | | | 6.00% | | | | 07/25/2037 | | | | 2,858,747 | |
| | 4,647,203 | | | Series 2007-11-A96 | | | 6.00% | | | | 08/25/2037 | | | | 4,559,206 | |
| | 5,534,044 | | | Series 2007-14-1A1 | | | 6.00% | | | | 10/25/2037 | | | | 5,664,835 | |
| | 1,374,836 | | | Series 2007-4-A16 | | | 5.50% | | | | 04/25/2037 | | | | 1,297,986 | |
| | 3,971,273 | | | Series 2007-5-1A1 | | | 5.50% | | | | 05/25/2037 | | | | 4,202,576 | |
| | 354,001 | | | Series 2007-7-A1 | | | 6.00% | | | | 06/25/2037 | | | | 339,675 | |
| | | | | | | | | | | | | | | | |
| | | | Total Non-Agency Residential Collateralized Mortgage Obligations
(Cost $229,924,460) | | | | 244,742,847 | |
| | | | | | | | | | | | | | | | |
| | US CORPORATE BONDS 14.9% | |
| | 945,000 | | | Activision Blizzard, Inc. | | | 5.63% | ^ | | | 09/15/2021 | | | | 1,013,513 | |
| | 1,020,000 | | | Alere, Inc. | | | 6.50% | | | | 06/15/2020 | | | | 1,076,100 | |
| | 5,590,000 | | | Altria Group, Inc. | | | 2.85% | | | | 08/09/2022 | | | | 5,255,276 | |
| | 965,000 | | | American Axle & Manufacturing, Inc. | | | 6.63% | | | | 10/15/2022 | | | | 1,050,644 | |
| | 3,110,000 | | | American Express Credit Corporation | | | 2.13% | | | | 07/27/2018 | | | | 3,127,696 | |
| | 2,045,000 | | | American Express Credit Corporation | | | 2.13% | | | | 03/18/2019 | | | | 2,039,110 | |
| | 2,480,000 | | | Arrow Electronics, Inc. | | | 3.38% | | | | 11/01/2015 | | | | 2,560,285 | |
| | 1,080,000 | | | Ashland, Inc. | | | 4.75% | | | | 08/15/2022 | | | | 1,065,150 | |
| | 2,605,000 | | | AT&T, Inc. | | | 5.35% | | | | 09/01/2040 | | | | 2,671,610 | |
| | 1,115,000 | | | Atlas Pipeline Partners LP | | | 4.75% | | | | 11/15/2021 | | | | 1,064,825 | |
| | 1,035,000 | | | Avis Budget Car Rental LLC | | | 5.50% | | | | 04/01/2023 | | | | 1,047,937 | |
| | 1,405,000 | | | Baxter International, Inc. | | | 3.20% | | | | 06/15/2023 | | | | 1,373,191 | |
| | 2,725,000 | | | BB&T Corporation | | | 2.25% | | | | 02/01/2019 | | | | 2,726,638 | |
| | 3,355,000 | | | Becton Dickinson and Company | | | 3.13% | | | | 11/08/2021 | | | | 3,410,810 | |
| | 985,000 | | | Biomet, Inc. | | | 6.50% | | | | 08/01/2020 | | | | 1,065,770 | |
| | 1,932,000 | | | Boeing Company | | | 6.88% | | | | 03/15/2039 | | | | 2,677,130 | |
| | 400,000 | | | Boston Properties LP | | | 5.63% | | | | 11/15/2020 | | | | 457,504 | |
| | 2,180,000 | | | Boston Properties LP | | | 4.13% | | | | 05/15/2021 | | | | 2,295,390 | |
| | 2,815,000 | | | Burlington Northern Santa Fe LLC | | | 3.00% | | | | 03/15/2023 | | | | 2,661,996 | |
| | 2,690,000 | | | Celgene Corporation | | | 3.25% | | | | 08/15/2022 | | | | 2,626,349 | |
| | 915,000 | | | Cinemark USA, Inc. | | | 7.38% | | | | 06/15/2021 | | | | 1,019,081 | |
| | 1,040,000 | | | CIT Group, Inc. | | | 5.00% | | | | 08/15/2022 | | | | 1,083,554 | |
| | 2,460,000 | | | Coca-Cola Company | | | 1.80% | | | | 09/01/2016 | | | | 2,520,108 | |
| | 2,065,000 | | | ConocoPhillips Company | | | 6.50% | | | | 02/01/2039 | | | | 2,723,056 | |
| | 3,500,000 | | | Covidien International Finance S.A. | | | 2.95% | | | | 06/15/2023 | | | | 3,323,218 | |
| | 2,035,000 | | | Daimler Finance North America LLC | | | 1.13% | ^ | | | 03/10/2017 | | | | 2,021,634 | |
| | 1,020,000 | | | Dana Holding Corporation | | | 5.38% | | | | 09/15/2021 | | | | 1,065,900 | |
| | 1,015,000 | | | DaVita, Inc. | | | 5.75% | | | | 08/15/2022 | | | | 1,084,781 | |
| | 2,730,000 | | | Delphi Corporation | | | 4.15% | | | | 03/15/2024 | | | | 2,732,222 | |
| | 3,899,000 | | | Devon Energy Corporation | | | 6.30% | | | | 01/15/2019 | | | | 4,571,238 | |
| | 563,000 | | | Devon Energy Corporation | | | 4.00% | | | | 07/15/2021 | | | | 589,376 | |
| | 2,720,000 | | | DIRECTV Holdings LLC | | | 4.45% | | | | 04/01/2024 | | | | 2,733,138 | |
| | 2,800,000 | | | Dow Chemical Company | | | 3.00% | | | | 11/15/2022 | | | | 2,666,532 | |
| | 2,563,000 | | | Duke Energy Corporation | | | 3.55% | | | | 09/15/2021 | | | | 2,622,116 | |
| | 700,000 | | | Ecolab, Inc. | | | 2.38% | | | | 12/08/2014 | | | | 708,879 | |
| | 1,800,000 | | | Ecolab, Inc. | | | 1.00% | | | | 08/09/2015 | | | | 1,806,149 | |
| | 943,000 | | | Equinix, Inc. | | | 7.00% | | | | 07/15/2021 | | | | 1,054,981 | |
| | 4,115,000 | | | Ford Motor Company | | | 7.45% | | | | 07/16/2031 | | | | 5,294,079 | |
| | 985,000 | | | Forest Laboratories, Inc. | | | 4.38% | ^ | | | 02/01/2019 | | | | 1,037,944 | |
| | | | | | | | | | | | | | | | |
PRINCIPAL
AMOUNT | | | SECURITY DESCRIPTION | | RATE | | | MATURITY | | | VALUE $ | |
| $ | 4,925,000 | | | General Electric Capital Corporation | | | 2.90% | | | | 01/09/2017 | | | | 5,157,081 | |
| | 3,930,000 | | | Gilead Sciences, Inc. | | | 3.70% | | | | 04/01/2024 | | | | 3,939,809 | |
| | 4,040,000 | | | Glencore Funding LLC | | | 2.50% | ^ | | | 01/15/2019 | | | | 3,905,533 | |
| | 2,250,000 | | | Goldman Sachs Group, Inc. | | | 5.75% | | | | 01/24/2022 | | | | 2,555,392 | |
| | 915,000 | | | Goodyear Tire & Rubber Company | | | 7.00% | | | | 05/15/2022 | | | | 1,020,225 | |
| | 930,000 | | | Gray Television, Inc. | | | 7.50% | | | | 10/01/2020 | | | | 1,013,700 | |
| | 2,175,000 | | | Halliburton Company | | | 6.15% | | | | 09/15/2019 | | | | 2,576,309 | |
| | 1,055,000 | | | Hawk Acquisition Sub, Inc. | | | 4.25% | ^ | | | 10/15/2020 | | | | 1,040,494 | |
| | 520,000 | | | HCA, Inc. | | | 3.75% | | | | 03/15/2019 | | | | 523,250 | |
| | 920,000 | | | HD Supply, Inc. | | | 7.50% | | | | 07/15/2020 | | | | 1,008,550 | |
| | 1,010,000 | | | Hexion Finance Corporation | | | 6.63% | | | | 04/15/2020 | | | | 1,050,400 | |
| | 965,000 | | | IASIS Healthcare LLC | | | 8.38% | | | | 05/15/2019 | | | | 1,034,962 | |
| | 1,050,000 | | | Icahn Enterprises LP | | | 4.88% | ^ | | | 03/15/2019 | | | | 1,071,000 | |
| | 2,505,000 | | | Illinois Tool Works, Inc. | | | 3.38% | | | | 09/15/2021 | | | | 2,565,558 | |
| | 5,350,000 | | | JP Morgan Chase & Company | | | 3.25% | | | | 09/23/2022 | | | | 5,279,915 | |
| | 2,038,000 | | | Kellogg Company | | | 7.45% | | | | 04/01/2031 | | | | 2,694,395 | |
| | 2,225,000 | | | Kinder Morgan Energy Partners LP | | | 6.95% | | | | 01/15/2038 | | | | 2,673,050 | |
| | 3,950,000 | | | Kroger Company | | | 3.40% | | | | 04/15/2022 | | | | 3,914,482 | |
| | 3,510,000 | | | Liberty Mutual Group, Inc. | | | 6.50% | ^ | | | 05/01/2042 | | | | 4,173,207 | |
| | 925,000 | | | Louisiana-Pacific Corporation | | | 7.50% | | | | 06/01/2020 | | | | 1,029,062 | |
| | 2,865,000 | | | Macy’s Retail Holdings, Inc. | | | 2.88% | | | | 02/15/2023 | | | | 2,687,765 | |
| | 905,000 | | | Manitowoc Company, Inc. | | | 8.50% | | | | 11/01/2020 | | | | 1,020,387 | |
| | 2,345,000 | | | Marathon Petroleum Corporation | | | 5.13% | | | | 03/01/2021 | | | | 2,611,111 | |
| | 2,520,000 | | | Mattel, Inc. | | | 2.50% | | | | 11/01/2016 | | | | 2,602,568 | |
| | 2,275,000 | | | MetLife, Inc. | | | 5.70% | | | | 06/15/2035 | | | | 2,644,963 | |
| | 3,010,000 | | | MetLife, Inc. | | | 4.13% | | | | 08/13/2042 | | | | 2,838,752 | |
| | 955,000 | | | MGM Resorts International | | | 6.63% | | | | 12/15/2021 | | | | 1,051,694 | |
| | 2,880,000 | | | Microsoft Corporation | | | 2.13% | | | | 11/15/2022 | | | | 2,671,243 | |
| | 640,000 | | | MidAmerican Energy Holdings Company | | | 5.95% | | | | 05/15/2037 | | | | 753,922 | |
| | 2,679,000 | | | MidAmerican Energy Holdings Company | | | 6.50% | | | | 09/15/2037 | | | | 3,324,026 | |
| | 2,630,000 | | | Morgan Stanley | | | 3.75% | | | | 02/25/2023 | | | | 2,618,231 | |
| | 3,401,000 | | | Motorola Solutions, Inc. | | | 6.00% | | | | 11/15/2017 | | | | 3,890,700 | |
| | 469,000 | | | MPT Operating Partnership LP | | | 6.38% | | | | 02/15/2022 | | | | 504,175 | |
| | 4,740,000 | | | National Rural Utilities Cooperative Finance Corporation | | | 10.38% | | | | 11/01/2018 | | | | 6,397,208 | |
| | 495,000 | | | NCL Corporation Ltd. | | | 5.00% | | | | 02/15/2018 | | | | 516,037 | |
| | 995,000 | | | Newfield Exploration Company | | | 5.75% | | | | 01/30/2022 | | | | 1,062,163 | |
| | 2,625,000 | | | Novartis Capital Corporation | | | 3.40% | | | | 05/06/2024 | | | | 2,627,389 | |
| | 1,005,000 | | | Nuveen Investments, Inc. | | | 9.50% | ^ | | | 10/15/2020 | | | | 1,075,350 | |
| | 975,000 | | | Oasis Petroleum, Inc. | | | 6.88% | ^ | | | 03/15/2022 | | | | 1,060,313 | |
| | 2,425,000 | | | ONEOK Partners LP | | | 6.13% | | | | 02/01/2041 | | | | 2,731,702 | |
| | 3,450,000 | | | Oracle Corporation | | | 1.20% | | | | 10/15/2017 | | | | 3,425,833 | |
| | 1,800,000 | | | Oracle Corporation | | | 2.38% | | | | 01/15/2019 | | | | 1,823,495 | |
| | 980,000 | | | Penn Virginia Resource Partners LP | | | 8.25% | | | | 04/15/2018 | | | | 1,024,713 | |
| | 2,400,000 | | | Phillips 66 | | | 5.88% | | | | 05/01/2042 | | | | 2,786,849 | |
| | 3,825,000 | | | PNC Funding Corporation | | | 4.38% | | | | 08/11/2020 | | | | 4,146,384 | |
| | 1,090,000 | | | PNC Funding Corporation | | | 3.30% | | | | 03/08/2022 | | | | 1,099,060 | |
| | 995,000 | | | Post Holdings, Inc. | | | 7.38% | ^ | | | 02/15/2022 | | | | 1,074,600 | |
| | 1,030,000 | | | Regency Energy Partners LP | | | 5.50% | | | | 04/15/2023 | | | | 1,042,875 | |
| | 1,055,000 | | | Revlon Consumer Products Corporation | | | 5.75% | | | | 02/15/2021 | | | | 1,065,550 | |
| | 1,025,000 | | | Reynolds Group Issuer LLC | | | 5.75% | | | | 10/15/2020 | | | | 1,078,813 | |
| | 895,000 | | | RR Donnelley & Sons Company | | | 7.88% | | | | 03/15/2021 | | | | 1,029,250 | |
| | | | | | |
| 32 | | DoubleLine Funds Trust | | | | The accompanying notes are an integral part of these financial statements. |
| | | | | | | | | | | | | | | | |
PRINCIPAL
AMOUNT | | | SECURITY DESCRIPTION | | RATE | | | MATURITY | | | VALUE $ | |
| $ | 975,000 | | | Safway Group Holding LLC | | | 7.00% | ^ | | | 05/15/2018 | | | | 1,043,250 | |
| | 994,000 | | | Sally Holdings LLC | | | 5.75% | | | | 06/01/2022 | | | | 1,056,125 | |
| | 970,000 | | | SBA Communications Corporation | | | 5.63% | | | | 10/01/2019 | | | | 1,020,925 | |
| | 955,000 | | | Sealed Air Corporation | | | 6.50% | ^ | | | 12/01/2020 | | | | 1,057,663 | |
| | 1,050,000 | | | Select Medical Corporation | | | 6.38% | | | | 06/01/2021 | | | | 1,071,000 | |
| | 1,051,000 | | | Service Corporation International | | | 5.38% | ^ | | | 01/15/2022 | | | | 1,069,393 | |
| | 2,252,000 | | | Simon Property Group LP | | | 5.65% | | | | 02/01/2020 | | | | 2,613,275 | |
| | 816,000 | | | SM Energy Company | | | 5.00% | ^ | | | 01/15/2024 | | | | 797,640 | |
| | 3,613,000 | | | Southern Power Company | | | 4.88% | | | | 07/15/2015 | | | | 3,799,366 | |
| | 3,575,000 | | | Southwest Airlines Company | | | 5.13% | | | | 03/01/2017 | | | | 3,923,008 | |
| | 939,000 | | | Spectrum Brands, Inc. | | | 6.63% | | | | 11/15/2022 | | | | 1,027,031 | |
| | 1,000,000 | | | Sun Merger Sub, Inc. | | | 5.88% | ^ | | | 08/01/2021 | | | | 1,040,000 | |
| | 990,000 | | | Terex Corporation | | | 6.00% | | | | 05/15/2021 | | | | 1,064,250 | |
| | 2,830,000 | | | Teva Pharmaceutical Finance Company B.V. | | | 2.95% | | | | 12/18/2022 | | | | 2,635,109 | |
| | 988,000 | | | Toll Brothers Finance Corporation | | | 5.88% | | | | 02/15/2022 | | | | 1,062,100 | |
| | 4,962,000 | | | Tyson Foods, Inc. | | | 4.50% | | | | 06/15/2022 | | | | 5,184,700 | |
| | 995,000 | | | Ultra Petroleum Corporation | | | 5.75% | ^ | | | 12/15/2018 | | | | 1,047,238 | |
| | 915,000 | | | United Rentals North America, Inc. | | | 7.63% | | | | 04/15/2022 | | | | 1,030,519 | |
| | 1,980,000 | | | United Technologies Corporation | | | 3.10% | | | | 06/01/2022 | | | | 1,980,036 | |
| | 2,261,000 | | | Valero Energy Corporation | | | 6.13% | | | | 02/01/2020 | | | | 2,628,679 | |
| | 2,540,000 | | | Verizon Communications, Inc. | | | 2.50% | | | | 09/15/2016 | | | | 2,631,658 | |
| | 5,076,000 | | | Wal-Mart Stores, Inc. | | | 3.25% | | | | 10/25/2020 | | | | 5,277,984 | |
| | 3,355,000 | | | Waste Management, Inc. | | | 6.13% | | | | 11/30/2039 | | | | 4,073,940 | |
| | 1,040,000 | | | WCI Communities, Inc. | | | 6.88% | ^ | | | 08/15/2021 | | | | 1,081,600 | |
| | 4,966,000 | | | WellPoint, Inc. | | | 2.30% | | | | 07/15/2018 | | | | 4,984,801 | |
| | 4,325,000 | | | Wells Fargo & Company | | | 4.60% | | | | 04/01/2021 | | | | 4,767,465 | |
| | 405,000 | | | Wells Fargo & Company | | | 3.50% | | | | 03/08/2022 | | | | 414,032 | |
| | 2,260,000 | | | Wynn Las Vegas LLC | | | 7.75% | | | | 08/15/2020 | | | | 2,525,550 | |
| | 2,420,000 | | | Xerox Corporation | | | 4.25% | | | | 02/15/2015 | | | | 2,493,975 | |
| | | | | | | | | | | | | | | | |
| | | | Total US Corporate Bonds
(Cost $257,650,033) | | | | 258,840,717 | |
| | | | | | | | | | | | | | | | |
| | US GOVERNMENT / AGENCY MORTGAGE BACKED OBLIGATIONS 15.6% | |
| |
| | | | Federal Home Loan Mortgage Corporation, | |
| | 2,183,339 | | | Pool G0-1840 | | | 5.00% | | | | 07/01/2035 | | | | 2,384,445 | |
| | 1,390,162 | | | Pool G0-4817 | | | 5.00% | | | | 09/01/2038 | | | | 1,510,789 | |
| | 5,487,929 | | | Pool N7-0081 | | | 5.50% | | | | 07/01/2038 | | | | 6,093,890 | |
| | 7,265,079 | | | Pool T6-0854 | | | 3.50% | | | | 09/01/2042 | | | | 7,247,035 | |
| | 1,279,887 | | | Pool U6-0299 | | | 4.00% | | | | 11/01/2040 | | | | 1,327,685 | |
| | 147,915 | | | Series 2692-SC | | | 12.98% | # I/F | | | 07/15/2033 | | | | 176,639 | |
| | 5,300,000 | | | Series 2722-PS | | | 9.72% | # I/F | | | 12/15/2033 | | | | 6,033,529 | |
| | 312,021 | | | Series 2750-ZT | | | 5.00% | | | | 02/15/2034 | | | | 329,858 | |
| | 572,129 | | | Series 3002-SN | | | 6.35% | # I/F I/O | | | 07/15/2035 | | | | 94,823 | |
| | 253,067 | | | Series 3045-DI | | | 6.58% | # I/F I/O | | | 10/15/2035 | | | | 53,025 | |
| | 1,001,790 | | | Series 3116-Z | | | 5.50% | | | | 02/15/2036 | | | | 1,086,625 | |
| | 130,869 | | | Series 3117-ZN | | | 4.50% | | | | 02/15/2036 | | | | 141,700 | |
| | 1,346,571 | | | Series 3203-ZC | | | 5.00% | | | | 07/15/2036 | | | | 1,482,802 | |
| | 363,948 | | | Series 3275-SC | | | 5.93% | # I/F I/O | | | 02/15/2037 | | | | 47,068 | |
| | 3,444,241 | | | Series 3382-SB | | | 5.85% | # I/F I/O | | | 11/15/2037 | | | | 398,712 | |
| | 2,663,273 | | | Series 3384-S | | | 6.24% | # I/F I/O | | | 11/15/2037 | | | | 339,832 | |
| | 3,075,248 | | | Series 3417-SX | | | 6.03% | # I/F I/O | | | 02/15/2038 | | | | 406,996 | |
| | 365,735 | | | Series 3423-GS | | | 5.50% | # I/F I/O | | | 03/15/2038 | | | | 41,003 | |
| | 365,735 | | | Series 3423-SG | | | 5.50% | # I/F I/O | | | 03/15/2038 | | | | 41,003 | |
| | | | | | | | | | | | | | | | |
PRINCIPAL
AMOUNT | | | SECURITY DESCRIPTION | | RATE | | | MATURITY | | | VALUE $ | |
| |
| | | | Federal Home Loan Mortgage Corporation, (Cont.) | |
| $ | 439,245 | | | Series 3524-LB | | | 5.26% | # | | | 06/15/2038 | | | | 454,778 | |
| | 1,322,417 | | | Series 3562-WS | | | 4.80% | # I/F I/O | | | 08/15/2039 | | | | 119,947 | |
| | 811,647 | | | Series 3582-SA | | | 5.85% | # I/F I/O | | | 10/15/2049 | | | | 103,017 | |
| | 1,241,266 | | | Series 3606-CS | | | 6.20% | # I/F I/O | | | 12/15/2039 | | | | 205,515 | |
| | 686,562 | | | Series 3616-SG | | | 6.20% | # I/F I/O | | | 03/15/2032 | | | | 105,609 | |
| | 3,821,222 | | | Series 3626-AZ | | | 5.50% | | | | 08/15/2036 | | | | 4,196,542 | |
| | 1,274,703 | | | Series 3666-SC | | | 5.62% | # I/F I/O | | | 05/15/2040 | | | | 137,612 | |
| | 617,056 | | | Series 3666-VZ | | | 5.50% | | | | 08/15/2036 | | | | 675,849 | |
| | 318,878 | | | Series 3688-CM | | | 4.00% | | | | 07/15/2029 | | | | 326,268 | |
| | 50,069 | | | Series 3745-SY | | | 9.69% | # I/F | | | 10/15/2040 | | | | 47,555 | |
| | 2,321,008 | | | Series 3779-DZ | | | 4.50% | | | | 12/15/2040 | | | | 2,347,045 | |
| | 1,400,000 | | | Series 3779-YA | | | 3.50% | | | | 12/15/2030 | | | | 1,388,878 | |
| | 294,243 | | | Series 3780-YS | | | 9.59% | # I/F | | | 12/15/2040 | | | | 288,349 | |
| | 815,840 | | | Series 3786-SG | | | 9.19% | # I/F | | | 01/15/2041 | | | | 774,934 | |
| | 2,269,599 | | | Series 3795-VZ | | | 4.00% | | | | 01/15/2041 | | | | 2,260,499 | |
| | 114,501 | | | Series 3798-SD | | | 9.29% | # I/F | | | 12/15/2040 | | | | 114,741 | |
| | 59,906 | | | Series 3805-KS | | | 9.19% | # I/F | | | 02/15/2041 | | | | 57,944 | |
| | 1,776,528 | | | Series 3806-CZ | | | 5.50% | | | | 07/15/2034 | | | | 1,918,635 | |
| | 1,156,635 | | | Series 3808-DB | | | 3.50% | | | | 02/15/2031 | | | | 1,152,855 | |
| | 4,576,991 | | | Series 3818-CZ | | | 4.50% | | | | 03/15/2041 | | | | 4,798,216 | |
| | 2,340,170 | | | Series 3819-ZU | | | 5.50% | | | | 07/15/2034 | | | | 2,525,059 | |
| | 3,736,782 | | | Series 3824-EY | | | 3.50% | | | | 03/15/2031 | | | | 3,714,961 | |
| | 251,282 | | | Series 3828-SW | | | 12.74% | # I/F | | | 02/15/2041 | | | | 254,305 | |
| | 3,930,941 | | | Series 3863-ZA | | | 5.50% | | | | 08/15/2034 | | | | 4,325,572 | |
| | 3,337,098 | | | Series 3888-ZG | | | 4.00% | | | | 07/15/2041 | | | | 3,297,034 | |
| | 2,472,607 | | | Series 3910-GZ | | | 5.00% | | | | 08/15/2041 | | | | 2,646,389 | |
| | 18,735,717 | | | Series 3967-ZP | | | 4.00% | | | | 09/15/2041 | | | | 18,289,376 | |
| | 5,409,049 | | | Series 3972-AZ | | | 3.50% | | | | 12/15/2041 | | | | 4,909,158 | |
| | 21,447,667 | | | Series 4057-ZA | | | 4.00% | | | | 06/15/2042 | | | | 20,398,468 | |
| | 7,896,354 | | | Series 4096-DZ | | | 3.50% | | | | 08/15/2042 | | | | 7,043,019 | |
| | 1,356,051 | | | Series R003-ZA | | | 5.50% | | | | 10/15/2035 | | | | 1,501,261 | |
| |
| | | | Federal National Mortgage Association, | |
| | 200,524 | | | Series 2003-117-KS | | | 6.95% | # I/F I/O | | | 08/25/2033 | | | | 20,165 | |
| | 500,000 | | | Series 2003-W17-1A7 | | | 5.75% | | | | 08/25/2033 | | | | 543,096 | |
| | 5,000,000 | | | Series 2005-20-QH | | | 5.00% | | | | 03/25/2035 | | | | 5,427,830 | |
| | 1,060,333 | | | Series 2006-101-SA | | | 6.43% | # I/F I/O | | | 10/25/2036 | | | | 161,876 | |
| | 492,594 | | | Series 2006-56-SM | | | 6.60% | # I/F I/O | | | 07/25/2036 | | | | 77,214 | |
| | 419,918 | | | Series 2007-116-BI | | | 6.10% | # I/F I/O | | | 05/25/2037 | | | | 60,838 | |
| | 1,668,847 | | | Series 2007-30-OI | | | 6.29% | # I/F I/O | | | 04/25/2037 | | | | 252,075 | |
| | 345,853 | | | Series 2008-29-ZA | | | 4.50% | | | | 04/25/2038 | | | | 370,789 | |
| | 389,603 | | | Series 2008-62-SC | | | 5.85% | # I/F I/O | | | 07/25/2038 | | | | 49,258 | |
| | 2,924,967 | | | Series 2009-111-EZ | | | 5.00% | | | | 01/25/2040 | | | | 3,115,747 | |
| | 163,036 | | | Series 2009-111-SE | | | 6.10% | # I/F I/O | | | 01/25/2040 | | | | 23,013 | |
| | 246,688 | | | Series 2009-16-MZ | | | 5.00% | | | | 03/25/2029 | | | | 266,637 | |
| | 412,032 | | | Series 2009-48-WS | | | 5.80% | # I/F I/O | | | 07/25/2039 | | | | 46,710 | |
| | 2,065,412 | | | Series 2009-62-PS | | | 5.95% | # I/F I/O | | | 08/25/2039 | | | | 213,820 | |
| | 3,671,989 | | | Series 2009-77-ZA | | | 4.50% | | | | 10/25/2039 | | | | 3,988,862 | |
| | 1,175,368 | | | Series 2009-83-Z | | | 4.50% | | | | 10/25/2039 | | | | 1,214,197 | |
| | 312,200 | | | Series 2010-101-ZH | | | 4.50% | | | | 07/25/2040 | | | | 330,562 | |
| | 55,491 | | | Series 2010-109-BS | | | 53.33% | # I/F | | | 10/25/2040 | | | | 186,232 | |
| | 1,725,009 | | | Series 2010-112-ZA | | | 4.00% | | | | 10/25/2040 | | | | 1,801,750 | |
| | 727,295 | | | Series 2010-121-SD | | | 4.35% | # I/F I/O | | | 10/25/2040 | | | | 67,130 | |
| | 29,336 | | | Series 2010-137-VS | | | 14.54% | # I/F | | | 12/25/2040 | | | | 37,095 | |
| | 2,277,164 | | | Series 2010-150-ZA | | | 4.00% | | | | 01/25/2041 | | | | 2,284,479 | |
| | 495,674 | | | Series 2010-31-SA | | | 4.85% | # I/F I/O | | | 04/25/2040 | | | | 42,170 | |
| | 348,394 | | | Series 2010-34-PS | | | 4.78% | # I/F I/O | | | 04/25/2040 | | | | 35,095 | |
| | 529,751 | | | Series 2010-35-SP | | | 6.20% | # I/F I/O | | | 04/25/2050 | | | | 74,936 | |
| | 307,106 | | | Series 2010-35-SV | | | 6.30% | # I/F I/O | | | 04/25/2040 | | | | 40,459 | |
| | 8,885,849 | | | Series 2010-37-MY | | | 4.50% | | | | 04/25/2040 | | | | 9,202,519 | |
| | 675,784 | | | Series 2010-59-PS | | | 6.30% | # I/F I/O | | | 03/25/2039 | | | | 98,181 | |
| | 737,800 | | | Series 2010-59-SC | | | 4.85% | # I/F I/O | | | 01/25/2040 | | | | 80,334 | |
| | 5,225,070 | | | Series 2010-60-VZ | | | 5.00% | | | | 10/25/2039 | | | | 5,513,598 | |
| | 363,235 | | | Series 2010-64-EZ | | | 5.00% | | | | 06/25/2040 | | | | 396,886 | |
| | 1,981,753 | | | Series 2010-7-PE | | | 5.00% | | | | 02/25/2040 | | | | 2,125,325 | |
| | 928,726 | | | Series 2010-90-GS | | | 5.85% | # I/F I/O | | | 08/25/2040 | | | | 103,067 | |
| | 57,791 | | | Series 2010-99-SG | | | 24.23% | # I/F | | | 09/25/2040 | | | | 93,633 | |
| | 6,665,894 | | | Series 2011-141-PZ | | | 4.00% | | | | 01/25/2042 | | | | 6,790,333 | |
| | 14,250,971 | | | Series 2011-18-UZ | | | 4.00% | | | | 03/25/2041 | | | | 14,132,888 | |
| | 1,533,918 | | | Series 2011-25-KY | | | 3.00% | | | | 04/25/2026 | | | | 1,524,645 | |
| | 1,000,000 | | | Series 2011-29-AL | | | 3.50% | | | | 04/25/2031 | | | | 985,142 | |
| | 4,595,997 | | | Series 2011-59-MA | | | 4.50% | | | | 07/25/2041 | | | | 4,934,540 | |
| | 10,044,665 | | | Series 2011-63-ZE | | | 4.00% | | | | 08/25/2038 | | | | 10,557,415 | |
| | 652,263 | | | Series 2011-88-SB | | | 8.99% | # I/F | | | 09/25/2041 | | | | 636,416 | |
| | 998,397 | | | Series 400-S4 | | | 5.30% | # I/F I/O | | | 11/25/2039 | | | | 133,740 | |
| | | | | | |
| The accompanying notes are an integral part of these financial statements. | | Annual Report | | March 31, 2014 | | 33 |
Schedule of Investments DoubleLine Core Fixed Income Fund (Cont.)
| | | | | | | | | | | | | | | | |
PRINCIPAL
AMOUNT/ SHARES | | | SECURITY DESCRIPTION | | RATE | | | MATURITY | | | VALUE $ | |
| |
| | | | Federal National Mortgage Association Pass-Thru, | |
| $ | 425,381 | | | Pool 555743 | | | 5.00% | | | | 09/01/2033 | | | | 467,186 | |
| | 360,884 | | | Pool 735382 | | | 5.00% | | | | 04/01/2035 | | | | 394,588 | |
| | 2,842,854 | | | Pool 735383 | | | 5.00% | | | | 04/01/2035 | | | | 3,107,829 | |
| | 1,500,525 | | | Pool 735402 | | | 5.00% | | | | 04/01/2035 | | | | 1,640,513 | |
| | 2,177,719 | | | Pool 735484 | | | 5.00% | | | | 05/01/2035 | | | | 2,381,437 | |
| | 404,379 | | | Pool 931104 | | | 5.00% | | | | 05/01/2039 | | | | 439,857 | |
| | 2,586,039 | | | Pool 995112 | | | 5.50% | | | | 07/01/2036 | | | | 2,880,165 | |
| | 2,423,694 | | | Pool 995203 | | | 5.00% | | | | 07/01/2035 | | | | 2,652,711 | |
| | 1,875,712 | | | Pool AB2123 | | | 4.00% | | | | 01/01/2031 | | | | 1,980,614 | |
| | 204,341 | | | Pool AB2370 | | | 4.50% | | | | 09/01/2035 | | | | 215,614 | |
| | 69,329 | | | Pool AC1032 | | | 5.00% | | | | 06/01/2040 | | | | 74,562 | |
| | 48,428 | | | Pool AD2177 | | | 4.50% | | | | 06/01/2030 | | | | 51,969 | |
| | 2,892,946 | | | Pool AH7309 | | | 4.00% | | | | 02/01/2031 | | | | 3,055,003 | |
| | 1,699,263 | | | Pool MA0264 | | | 4.50% | | | | 12/01/2029 | | | | 1,822,579 | |
| | 186,859 | | | Pool MA0282 | | | 5.00% | | | | 12/01/2039 | | | | 205,838 | |
| | 1,265,733 | | | Pool MA0353 | | | 4.50% | | | | 03/01/2030 | | | | 1,372,843 | |
| | 111,524 | | | Pool MA0468 | | | 5.00% | | | | 07/01/2040 | | | | 119,354 | |
| |
| | | | Government National Mortgage Association, | |
| | 1,494,846 | | | Pool 752494 | | | 5.50% | | | | 09/20/2039 | | | | 1,656,096 | |
| | 271,875 | | | Series 2003-67-SP | | | 6.94% | # I/F I/O | | | 08/20/2033 | | | | 84,206 | |
| | 442,844 | | | Series 2008-82-SM | | | 5.89% | # I/F I/O | | | 09/20/2038 | | | | 63,339 | |
| | 5,934,468 | | | Series 2009-32-ZE | | | 4.50% | | | | 05/16/2039 | | | | 6,229,548 | |
| | 4,348,610 | | | Series 2009-35-DZ | | | 4.50% | | | | 05/20/2039 | | | | 4,645,531 | |
| | 4,283,987 | | | Series 2009-75-GZ | | | 4.50% | | | | 09/20/2039 | | | | 4,530,163 | |
| | 5,006,950 | | | Series 2009-75-HZ | | | 5.00% | | | | 09/20/2039 | | | | 5,428,387 | |
| | 106,551 | | | Series 2010-25-ZB | | | 4.50% | | | | 02/16/2040 | | | | 105,509 | |
| | 6,865,487 | | | Series 2011-45-GZ | | | 4.50% | | | | 03/20/2041 | | | | 7,213,983 | |
| | 8,390,271 | | | Series 2011-70-WS | | | 9.39% | # I/F | | | 12/20/2040 | | | | 8,352,636 | |
| | 11,357,140 | | | Series 2011-71-ZA | | | 4.50% | | | | 02/20/2041 | | | | 12,028,313 | |
| | | | | | | | | | | | | | | | |
| | | | Total US Government / Agency Mortgage Backed Obligations
(Cost $266,073,492) | | | | 270,857,919 | |
| | | | | | | | | | | | | | | | |
| | US GOVERNMENT BONDS AND NOTES 16.7% | |
| | 31,900,000 | | | United States Treasury Bonds | | | 3.75% | | | | 08/15/2041 | | | | 33,245,797 | |
| | 45,500,000 | | | United States Treasury Notes | | | 0.25% | | | | 05/31/2014 | | | | 45,516,881 | |
| | 25,500,000 | | | United States Treasury Notes | | | 0.13% | | | | 07/31/2014 | | | | 25,506,477 | |
| | 14,600,000 | | | United States Treasury Notes | | | 1.50% | | | | 01/31/2019 | | | | 14,472,819 | |
| | 44,900,000 | | | United States Treasury Notes | | | 1.00% | | | | 08/31/2019 | | | | 42,844,433 | |
| | 43,400,000 | | | United States Treasury Notes | | | 1.88% | | | | 06/30/2020 | | | | 42,749,000 | |
| | 57,100,000 | | | United States Treasury Notes | | | 1.63% | | | | 08/15/2022 | | | | 53,103,000 | |
| | 32,100,000 | | | United States Treasury Notes | | | 2.75% | | | | 11/15/2023 | | | | 32,247,949 | |
| | | | | | | | | | | | | | | | |
| | | | Total US Government Bonds and Notes
(Cost $293,531,184) | | | | 289,686,356 | |
| | | | | | | | | | | | | | | | |
| | AFFILIATED MUTUAL FUNDS 6.0% (a) | |
| | 10,281,654 | | | DoubleLine Floating Rate Fund | | | | | | | | | | | 104,358,793 | |
| | | | | | | | | | | | | | | | |
| | | | Total Affiliated Mutual Funds
(Cost $103,628,896) | | | | 104,358,793 | |
| | | | | | | | | | | | | | | | |
| | | | | | | | | | | | | | |
SHARES | | | SECURITY DESCRIPTION | | RATE | | | MATURITY | | VALUE $ | |
| | SHORT TERM INVESTMENTS 3.6% | |
| | 20,737,540 | | | BlackRock Institutional Liquidity Funds FedFund Portfolio | | | 0.01% | ¨ | | | | | 20,737,540 | |
| | 20,737,539 | | | Fidelity Institutional Government Portfolio | | | 0.01% | ¨ | | | | | 20,737,539 | |
| | 20,737,540 | | | Morgan Stanley Institutional Liquidity Funds | |
| 0.04%
| ¨
| | | | | 20,737,540 | |
| | | | | | | | | | | | | | |
| | | | Total Short Term Investments
(Cost $62,212,619) | | | 62,212,619 | |
| | | | | | | | | | | | | | |
| | | | Total Investments 99.3%
(Cost $1,707,785,141) | | | 1,723,020,704 | |
| | | | Other Assets in Excess of Liabilities 0.7% | | | 12,451,331 | |
| | | | | | | | | | | | | | |
| | | | NET ASSETS 100.0% | | $ | 1,735,472,035 | |
| | | | | | | | | | | | | | |
| | | | |
| SECURITY TYPE BREAKDOWN as % of Net Assets | |
Foreign Corporate Bonds | | | 17.2% | |
US Government Bonds and Notes | | | 16.7% | |
US Government / Agency Mortgage Backed Obligations | | | 15.6% | |
US Corporate Bonds | | | 14.9% | |
Non-Agency Residential Collateralized Mortgage Obligations | | | 14.1% | |
Non-Agency Commercial Mortgage Backed Obligations | | | 7.5% | |
Affiliated Mutual Funds | | | 6.0% | |
Short Term Investments | | | 3.6% | |
Collateralized Loan Obligations | | | 3.1% | |
Foreign Government Bonds and Notes, Supranationals and Foreign Agencies | | | 0.6% | |
Other Assets and Liabilities | | | 0.7% | |
| | | | |
| | | 100.0% | |
| | | | |
| | | | |
| COUNTRY BREAKDOWN as a % of Net Assets: | |
United States | | | 81.5% | |
Mexico | | | 2.6% | |
Brazil | | | 2.3% | |
Peru | | | 2.2% | |
Russia | | | 2.2% | |
Colombia | | | 2.1% | |
Chile | | | 1.2% | |
Guatemala | | | 1.0% | |
United Kingdom | | | 0.6% | |
Canada | | | 0.5% | |
India | | | 0.4% | |
South Korea | | | 0.3% | |
Supranational | | | 0.3% | |
Dominican Republic | | | 0.3% | |
Costa Rica | | | 0.3% | |
Australia | | | 0.3% | |
China | | | 0.3% | |
Netherlands | | | 0.3% | |
Jamaica | | | 0.2% | |
France | | | 0.1% | |
Turkey | | | 0.1% | |
Luxembourg | | | 0.1% | |
Panama | | | 0.1% | |
Israel | | | 0.0% | ~ |
Paraguay | | | 0.0% | ~ |
Barbados | | | 0.0% | ~ |
El Salvador | | | 0.0% | ~ |
Other Assets and Liabilities | | | 0.7% | |
| | | | |
| | | 100.0% | |
| | | | |
| | | | | | |
| 34 | | DoubleLine Funds Trust | | | | The accompanying notes are an integral part of these financial statements. |
| | | | |
| INVESTMENT BREAKDOWN as a % of Net Assets: | | | | |
US Government Bonds and Notes | | | 16.7% | |
US Government / Agency Mortgage Backed Obligations | | | 15.6% | |
Non-Agency Residential Collateralized Mortgage Obligations | | | 14.1% | |
Non-Agency Commercial Mortgage Backed Obligations | | | 7.5% | |
Affiliated Mutual Funds | | | 6.0% | |
Banking | | | 6.0% | |
Oil and Gas | | | 3.7% | |
Short Term Investments | | | 3.6% | |
Collateralized Loan Obligations | | | 3.1% | |
Telecommunications | | | 2.2% | |
Consumer Products | | | 1.8% | |
Chemicals/Plastics | | | 1.6% | |
Utilities | | | 1.6% | |
Health Care | | | 1.5% | |
Mining | | | 1.2% | |
Financial Intermediaries | | | 1.1% | |
Automotive | | | 1.0% | |
Building and Development | | | 0.9% | |
Retail | | | 0.8% | |
Transportation | | | 0.7% | |
Pharmaceuticals | | | 0.7% | |
Food/Drug Retailers | | | 0.6% | |
Finance | | | 0.6% | |
Energy | | | 0.6% | |
| | | | |
| INVESTMENT BREAKDOWN as a % of Net Assets: (Cont.) | | | | |
Conglomerates | | | 0.6% | |
Construction | | | 0.6% | |
Foreign Government Bonds and Notes, Supranationals and Foreign Agencies | | | 0.6% | |
Insurance | | | 0.6% | |
Business Equipment and Services | | | 0.5% | |
Software | | | 0.4% | |
Media | | | 0.4% | |
Real Estate | | | 0.4% | |
Beverage and Tobacco | | | 0.3% | |
Hotels/Motels/Inns and Casinos | | | 0.3% | |
Environmental Control | | | 0.2% | |
Industrial | | | 0.2% | |
Air Transport | | | 0.2% | |
Food Products | | | 0.2% | |
Machinery and Tools | | | 0.1% | |
Electronics/Electric | | | 0.1% | |
Leisure | | | 0.1% | |
Containers and Glass Products | | | 0.1% | |
Cosmetics/Toiletries | | | 0.1% | |
Drugs | | | 0.1% | |
Other Assets and Liabilities | | | 0.7% | |
| | | | |
| | | 100.0% | |
| | | | |
| # | Variable rate security. Rate disclosed as of March 31, 2014. |
| ^ | Security exempt from registration under Rule 144A of the Securities Act of 1933. These securities may be resold in transactions exempt from registration to qualified institutional buyers. These securities are determined to be liquid by the Adviser, unless otherwise noted, under procedures established by the Fund’s Board of Trustees. At March 31, 2014, the value of these securities amounted to $270,150,204 or 15.6% of net assets. |
| I/O | Interest only security |
| I/F | Inverse floating rate security whose interest rate moves in the opposite direction of reference interest rates |
| (a) | Institutional class shares held |
| ¨ | Seven-day yield as of March 31, 2014 |
| ~ | Represents less than 0.05% of net assets |
Investments in Affiliates
Generally, an issuer is an affiliate of a Fund under the Investment Company Act of 1940 if the Fund holds 5% or more of the outstanding voting securities of the issuer or if the issuer is under common control with the Fund.
A summary of DoubleLine Core Fixed Income Fund’s investments in affiliated mutual funds for the year ended March 31, 2014 is as follows:
| | | | | | | | | | | | | | | | | | | | | | | | | | | | |
| Fund | | Value at
March 31,
2013 | | | Gross
Purchases | | | Gross
Sales | | | Shares
Held at
March 31,
2014 | | | Value at
March 31,
2014 | | | Dividend
Income Earned
in the Year
Ended March 31,
2014 | | | Net Realized
Gain (Loss) in the
Year Ended
March 31, 2014 | |
DoubleLine Floating Rate Fund | | $ | 58,383,641 | | | $ | 70,211,000 | | | $ | 25,000,000 | | | | 10,281,654 | | | $ | 104,358,793 | | | $ | 2,719,936 | | | $ | 417,896 | |
| | | | | | |
| The accompanying notes are an integral part of these financial statements. | | Annual Report | | March 31, 2014 | | 35 |
Schedule of Investments DoubleLine Emerging Markets Fixed Income Fund
| | | | | | | | | | | | | | | | |
PRINCIPAL
AMOUNT | | | SECURITY DESCRIPTION | | RATE | | | MATURITY | | | VALUE $ | |
| | FOREIGN CORPORATE BONDS 97.8% | | | | | | | | | |
| | |
| | BARBADOS 0.2% | |
| $ | 900,000 | | | Columbus International, Inc. | | | 7.38% | ^ | | | 03/30/2021 | | | | 928,125 | |
| | | | | | | | | | | | | | | | |
| | | | | | | | | | | | | | | 928,125 | |
| | | | | | | | | | | | | | | | |
| | BRAZIL 15.8% | |
| | 2,000,000 | | | Banco do Brasil S.A. | | | 8.50% | #† | | | 10/20/2020 | | | | 2,270,000 | |
| | 1,500,000 | | | Banco do Brasil S.A. | | | 5.88% | | | | 01/19/2023 | | | | 1,520,625 | |
| | 3,000,000 | | | BR Malls International Finance Ltd. | | | 8.50% | † | | | 01/21/2016 | | | | 3,054,390 | |
| | 2,700,000 | | | Braskem America Finance Company | | | 7.13% | | | | 07/22/2041 | | | | 2,588,625 | |
| | 5,165,000 | | | Braskem Finance Ltd. | | | 7.38% | † | | | 10/04/2015 | | | | 5,158,544 | |
| | 1,300,000 | | | Cosan Luxembourg S.A. | | | 5.00% | ^ | | | 03/14/2023 | | | | 1,225,250 | |
| | 1,000,000 | | | Cosan Overseas Ltd. | | | 8.25% | † | | | 11/05/2015 | | | | 1,032,500 | |
| | 8,600,000 | | | ESAL GmbH | | | 6.25% | ^ | | | 02/05/2023 | | | | 8,170,000 | |
| | 2,000,000 | | | ESAL GmbH | | | 6.25% | | | | 02/05/2023 | | | | 1,900,000 | |
| | 2,000,000 | | | Itau Unibanco Holding S.A. | | | 5.50% | | | | 08/06/2022 | | | | 2,010,000 | |
| | 2,000,000 | | | JBS Investments GmbH | | | 7.25% | ^ | | | 04/03/2024 | | | | 2,000,000 | |
| | 3,275,000 | | | Magnesita Finance Ltd. | | | 8.63% | † | | | 04/05/2017 | | | | 3,139,906 | |
| | 2,550,000 | | | Minerva Luxembourg S.A. | | | 8.75% | #^† | | | 04/03/2019 | | | | 2,556,375 | |
| | 8,100,000 | | | Minerva Luxembourg S.A. | | | 7.75% | ^ | | | 01/31/2023 | | | | 8,314,650 | |
| | 500,000 | | | Minerva Luxembourg S.A. | | | 7.75% | | | | 01/31/2023 | | | | 513,250 | |
| | 11,000,000 | | | OAS Financial Ltd. | | | 8.88% | #^† | | | 04/25/2018 | | | | 10,367,500 | |
| | 8,100,000 | | | Odebrecht Finance Ltd. | | | 7.50% | † | | | 09/14/2015 | | | | 8,201,250 | |
| | 4,900,000 | | | Odebrecht Finance Ltd. | | | 7.13% | | | | 06/26/2042 | | | | 4,802,000 | |
| | 520,000 | | | Odebrecht Offshore Drilling | | | 6.63% | ^ | | | 10/01/2022 | | | | 543,400 | |
| | 3,900,000 | | | Petrobras Global Finance B.V. | | | 4.38% | | | | 05/20/2023 | | | | 3,578,332 | |
| | 4,800,000 | | | Samarco Mineracao S.A. | | | 4.13% | ^ | | | 11/01/2022 | | | | 4,428,000 | |
| | 4,325,000 | | | Samarco Mineracao S.A. | | | 4.13% | | | | 11/01/2022 | | | | 3,989,812 | |
| | | | | | | | | | | | | | | | |
| | | | | | | | | | | | | | | 81,364,409 | |
| | | | | | | | | | | | | | | | |
| | CHILE 7.3% | |
| | 3,500,000 | | | Automotores Gildemeister S.A. | | | 8.25% | | | | 05/24/2021 | | | | 2,625,000 | |
| | 11,000,000 | | | Cencosud S.A. | | | 4.88% | ^ | | | 01/20/2023 | | | | 10,695,498 | |
| | 2,000,000 | | | CFR International S.A. | | | 5.13% | ^ | | | 12/06/2022 | | | | 1,942,012 | |
| | 8,200,000 | | | CorpGroup Banking S.A. | | | 6.75% | ^ | | | 03/15/2023 | | | | 8,077,000 | |
| | 4,700,000 | | | ENTEL Chile S.A. | | | 4.88% | ^ | | | 10/30/2024 | | | | 4,749,980 | |
| | 3,350,000 | | | Guanay Finance Ltd. | | | 6.00% | ^ | | | 12/15/2020 | | | | 3,551,000 | |
| | 3,900,000 | | | SMU S.A. | | | 7.75% | ^ | | | 02/08/2020 | | | | 2,710,500 | |
| | 3,500,000 | | | Tanner Servicios Financieros S.A. | | | 4.38% | ^ | | | 03/13/2018 | | | | 3,524,143 | |
| | | | | | | | | | | | | | | | |
| | | | | | | | | | | | | | | 37,875,133 | |
| | | | | | | | | | | | | | | | |
| | CHINA 1.9% | |
| | 9,000,000 | | | Noble Group Ltd. | | | 6.75% | | | | 01/29/2020 | | | | 9,810,000 | |
| | | | | | | | | | | | | | | | |
| | | | | | | | | | | | | | | 9,810,000 | |
| | | | | | | | | | | | | | | | |
| | COLOMBIA 13.1% | |
| | 1,900,000 | | | Banco Davivienda S.A. | | | 5.88% | | | | 07/09/2022 | | | | 1,876,250 | |
| | 4,000,000 | | | Banco de Bogota S.A. | | | 5.38% | ^ | | | 02/19/2023 | | | | 4,005,000 | |
| | 3,050,000 | | | Banco de Bogota S.A. | | | 5.38% | | | | 02/19/2023 | | | | 3,053,813 | |
| | 3,400,000 | | | Banco GNB Sudameris S.A. | | | 3.88% | ^ | | | 05/02/2018 | | | | 3,302,250 | |
| | 3,100,000 | | | Banco GNB Sudameris S.A. | | | 7.50% | | | | 07/30/2022 | | | | 3,208,500 | |
| | 10,080,000 | | | Bancolombia S.A. | | | 6.13% | | | | 07/26/2020 | | | | 10,722,096 | |
| | 12,000,000 | | | Grupo Aval Ltd. | | | 4.75% | ^ | | | 09/26/2022 | | | | 11,610,000 | |
| | 6,000,000 | | | Grupo Aval Ltd. | | | 4.75% | | | | 09/26/2022 | | | | 5,805,000 | |
| | | | | | | | | | | | | | | | |
PRINCIPAL
AMOUNT | | | SECURITY DESCRIPTION | | RATE | | | MATURITY | | | VALUE $ | |
| $ | 4,654,000 | | | Pacific Rubiales Energy Corporation | | | 7.25% | ^ | | | 12/12/2021 | | | | 5,131,035 | |
| | 6,040,000 | | | Pacific Rubiales Energy Corporation | | | 7.25% | | | | 12/12/2021 | | | | 6,659,100 | |
| | 9,053,000 | | | Pacific Rubiales Energy Corporation | | | 5.13% | | | | 03/28/2023 | | | | 8,849,307 | |
| | 3,000,000 | | | Transportadora de Gas Internacional S.A. | | | 5.70% | | | | 03/20/2022 | | | | 3,135,000 | |
| | | | | | | | | | | | | | | | |
| | | | | | | | | | | | | | | 67,357,351 | |
| | | | | | | | | | | | | | | | |
| | COSTA RICA 2.2% | |
| | 6,000,000 | | | Instituto Costarricense de Electricidad | | | 6.95% | ^ | | | 11/10/2021 | | | | 6,390,000 | |
| | 4,775,000 | | | Instituto Costarricense de Electricidad | | | 6.95% | | | | 11/10/2021 | | | | 5,085,375 | |
| | | | | | | | | | | | | | | | |
| | | | | | | | | | | | | | | 11,475,375 | |
| | | | | | | | | | | | | | | | |
| | DOMINICAN REPUBLIC 2.7% | |
| | 1,600,000 | | | AES Andres Dominicana Ltd. | | | 9.50% | ^ | | | 11/12/2020 | | | | 1,710,000 | |
| | 11,463,000 | | | AES Andres Dominicana Ltd. | | | 9.50% | | | | 11/12/2020 | | | | 12,251,081 | |
| | | | | | | | | | | | | | | | |
| | | | | | | | | | | | | | | 13,961,081 | |
| | | | | | | | | | | | | | | | |
| | EL SALVADOR 0.1% | |
| | 800,000 | | | AES El Salvador Trust | | | 6.75% | | | | 03/28/2023 | | | | 748,000 | |
| | | | | | | | | | | | | | | | |
| | | | | | | | | | | | | | | 748,000 | |
| | | | | | | | | | | | | | | | |
| | GUATEMALA 6.3% | |
| | 2,500,000 | | | Bantrab Senior Trust | | | 9.00% | | | | 11/14/2020 | | | | 2,420,000 | |
| | 600,000 | | | Cementos Progreso Trust | | | 7.13% | ^ | | | 11/06/2023 | | | | 628,500 | |
| | 6,400,000 | | | Cementos Progreso Trust | | | 7.13% | | | | 11/06/2023 | | | | 6,704,000 | |
| | 9,000,000 | | | Comcel Trust | | | 6.88% | ^ | | | 02/06/2024 | | | | 9,438,750 | |
| | 5,900,000 | | | Industrial Senior Trust | | | 5.50% | ^ | | | 11/01/2022 | | | | 5,656,625 | |
| | 8,100,000 | | | Industrial Senior Trust | | | 5.50% | | | | 11/01/2022 | | | | 7,765,875 | |
| | | | | | | | | | | | | | | | |
| | | | | | | | | | | | | | | 32,613,750 | |
| | | | | | | | | | | | | | | | |
| | INDIA 2.8% | |
| | 3,740,000 | | | Reliance Industries Ltd. | | | 5.88% | † | | | 02/05/2018 | | | | 3,431,450 | |
| | 500,000 | | | Reliance Industries Ltd. | | | 8.25% | | | | 01/15/2027 | | | | 618,388 | |
| | 5,400,000 | | | Vedanta Resources PLC | | | 8.25% | | | | 06/07/2021 | | | | 5,747,625 | |
| | 4,400,000 | | | Vedanta Resources PLC | | | 7.13% | ^ | | | 05/31/2023 | | | | 4,400,000 | |
| | | | | | | | | | | | | | | | |
| | | | | | | | | | | | | | | 14,197,463 | |
| | | | | | | | | | | | | | | | |
| | ISRAEL 0.3% | |
| | 1,600,000 | | | B Communications Ltd. | | | 7.38% | ^ | | | 02/15/2021 | | | | 1,688,000 | |
| | | | | | | | | | | | | | | | |
| | | | | | | | | | | | | | | 1,688,000 | |
| | | | | | | | | | | | | | | | |
| | JAMAICA 1.2% | |
| | 500,000 | | | Digicel Ltd. | | | 7.00% | | | | 02/15/2020 | | | | 522,500 | |
| | 5,500,000 | | | Digicel Ltd. | | | 7.13% | ^ | | | 04/01/2022 | | | | 5,575,625 | |
| | | | | | | | | | | | | | | | |
| | | | | | | | | | | | | | | 6,098,125 | |
| | | | | | | | | | | | | | | | |
| | MALAYSIA 0.2% | |
| | 1,000,000 | | | IOI Investment BHD | | | 4.38% | | | | 06/27/2022 | | | | 987,350 | |
| | | | | | | | | | | | | | | | |
| | | | | | | | | | | | | | | 987,350 | |
| | | | | | | | | | | | | | | | |
| | MEXICO 14.2% | |
| | 2,000,000 | | | Alpek S.A. de C.V. | | | 5.38% | ^ | | | 08/08/2023 | | | | 2,070,000 | |
| | 500,000 | | | BBVA Bancomer S.A. | | | 6.50% | | | | 03/10/2021 | | | | 543,125 | |
| | 6,200,000 | | | Cemex Espana S.A. | | | 9.25% | | | | 05/12/2020 | | | | 6,835,500 | |
| | 3,000,000 | | | Credito Real S.A.B. de C.V. | | | 7.50% | ^ | | | 03/13/2019 | | | | 3,120,000 | |
| | 8,900,000 | | | Fresnillo PLC | | | 5.50% | ^ | | | 11/13/2023 | | | | 8,989,000 | |
| | 1,200,000 | | | Grupo Elektra S.A.B. de C.V. | | | 7.25% | | | | 08/06/2018 | | | | 1,254,000 | |
| | | | | | |
| 36 | | DoubleLine Funds Trust | | | | The accompanying notes are an integral part of these financial statements. |
| | | | | | | | | | | | | | | | |
PRINCIPAL
AMOUNT | | | SECURITY DESCRIPTION | | RATE | | | MATURITY | | | VALUE $ | |
| $ | 8,500,000 | | | Grupo Idesa S.A. de C.V. | | | 7.88% | ^ | | | 12/18/2020 | | | | 8,871,875 | |
| | 6,000,000 | | | Grupo KUO S.A.B. de C.V. | | | 6.25% | ^ | | | 12/04/2022 | | | | 6,135,000 | |
| | 7,000,000 | | | Grupo KUO S.A.B. de C.V. | | | 6.25% | | | | 12/04/2022 | | | | 7,157,500 | |
| | 1,745,000 | | | Ixe Banco S.A. | | | 9.25% | | | | 10/14/2020 | | | | 2,067,825 | |
| | 6,512,000 | | | Metalsa S.A. de C.V. | | | 4.90% | | | | 04/24/2023 | | | | 6,056,160 | |
| | 6,600,000 | | | Mexichem S.A.B. de C.V. | | | 6.75% | | | | 09/19/2042 | | | | 6,501,000 | |
| | 6,293,000 | | | Mexico Generadora de Energia | | | 5.50% | | | | 12/06/2032 | | | | 6,198,605 | |
| | 500,000 | | | TV Azteca S.A.B. de C.V. | | | 7.50% | | | | 05/25/2018 | | | | 529,375 | |
| | 6,475,000 | | | TV Azteca S.A.B. de C.V. | | | 7.63% | | | | 09/18/2020 | | | | 6,847,313 | |
| | | | | | | | | | | | | | | | |
| | | | | | | | | | | | | | | 73,176,278 | |
| | | | | | | | | | | | | | | | |
| | PANAMA 0.7% | |
| | 3,746,350 | | | ENA Norte Trust | | | 4.95% | | | | 04/25/2023 | | | | 3,769,764 | |
| | | | | | | | | | | | | | | | |
| | | | | | | | | | | | | | | 3,769,764 | |
| | | | | | | | | | | | | | | | |
| | PARAGUAY 0.3% | |
| | 900,000 | | | Banco Regional SAECA | | | 8.13% | ^ | | | 01/24/2019 | | | | 967,500 | |
| | 400,000 | | | Telefonica Celular del Paraguay S.A. | | | 6.75% | ^ | | | 12/13/2022 | | | | 422,500 | |
| | | | | | | | | | | | | | | | |
| | | | | | | | | | | | | | | 1,390,000 | |
| | | | | | | | | | | | | | | | |
| | PERU 14.9% | |
| | 2,000,000 | | | Banco de Credito del Peru | | | 6.13% | #^ | | | 04/24/2027 | | | | 2,085,000 | |
| | 3,135,000 | | | Banco de Credito del Peru | | | 9.75% | # | | | 11/06/2069 | | | | 3,707,138 | |
| | 4,000,000 | | | Banco International del Peru S.A.A. | | | 6.63% | #^ | | | 03/19/2029 | | | | 4,045,000 | |
| | 3,508,000 | | | Banco International del Peru S.A.A. | | | 8.50% | # | | | 04/23/2070 | | | | 3,762,330 | |
| | 7,483,000 | | | Cia Minera Milpo S.A.A. | | | 4.63% | ^ | | | 03/28/2023 | | | | 6,949,836 | |
| | 3,000,000 | | | Corporacion Azucarera del Peru S.A. | | | 6.38% | | | | 08/02/2022 | | | | 2,733,750 | |
| | 400,000 | | | Corporacion Lindley S.A. | | | 4.63% | ^ | | | 04/12/2023 | | | | 375,500 | |
| | 1,700,000 | | | Corporacion Pesquera Inca S.A.C. | | | 9.00% | ^ | | | 02/10/2017 | | | | 1,734,000 | |
| | 6,305,000 | | | Corporacion Pesquera Inca S.A.C. | | | 9.00% | | | | 02/10/2017 | | | | 6,431,100 | |
| | 3,600,000 | | | Ferreycorp S.A.A. | | | 4.88% | ^ | | | 04/26/2020 | | | | 3,469,500 | |
| | 2,163,153 | | | IIRSA Norte Finance Ltd. | | | 8.75% | | | | 05/30/2024 | | | | 2,536,297 | |
| | 600,000 | | | Inkia Energy Ltd. | | | 8.38% | ^ | | | 04/04/2021 | | | | 654,000 | |
| | 1,900,000 | | | Inkia Energy Ltd. | | | 8.38% | | | | 04/04/2021 | | | | 2,071,000 | |
| | 2,500,000 | | | Maestro Peru S.A. | | | 6.75% | | | | 09/26/2019 | | | | 2,243,750 | |
| | 6,250,000 | | | Minsur S.A. | | | 6.25% | ^ | | | 02/07/2024 | | | | 6,578,125 | |
| | 4,100,000 | | | Pesquera Exalmar S.A.A. | | | 7.38% | ^ | | | 01/31/2020 | | | | 3,746,375 | |
| | 2,730,000 | | | Pesquera Exalmar S.A.A. | | | 7.38% | | | | 01/31/2020 | | | | 2,494,537 | |
| | 3,800,000 | | | Scotiabank Peru S.A. | | | 4.50% | #^ | | | 12/13/2027 | | | | 3,496,000 | |
| | 7,200,000 | | | Scotiabank Peru S.A. | | | 4.50% | # | | | 12/13/2027 | | | | 6,624,000 | |
| | 1,900,000 | | | Southern Copper Corporation | | | 6.75% | | | | 04/16/2040 | | | | 1,952,710 | |
| | 9,600,000 | | | Southern Copper Corporation | | | 5.25% | | | | 11/08/2042 | | | | 8,267,098 | |
| | 700,000 | | | Volcan Cia Minera S.A.A. | | | 5.38% | | | | 02/02/2022 | | | | 668,500 | |
| | | | | | | | | | | | | | | | |
| | | | | | | | | | | | | | | 76,625,546 | |
| | | | | | | | | | | | | | | | |
| | RUSSIA 12.7% | |
| | 6,800,000 | | | Alfa Bond Issuance | | | 7.50% | | | | 09/26/2019 | | | | 6,868,000 | |
| | 13,400,000 | | | Gaz Capital S.A. | | | 4.95% | | | | 02/06/2028 | | | | 11,557,500 | |
| | 1,000,000 | | | Gaz Capital S.A. | | | 7.29% | | | | 08/16/2037 | | | | 1,035,000 | |
| | 5,900,000 | | | GPN Capital S.A. | | | 6.00% | ^ | | | 11/27/2023 | | | | 5,804,125 | |
| | 2,500,000 | | | Lukoil International Finance B.V. | | | 4.56% | | | | 04/24/2023 | | | | 2,293,750 | |
| | | | | | | | | | | | | | | | |
PRINCIPAL
AMOUNT /
SHARES | | | SECURITY DESCRIPTION | | RATE | | | MATURITY | | | VALUE $ | |
| $ | 500,000 | | | Polyus Gold International Ltd. | | | 5.63% | ^ | | | 04/29/2020 | | | | 468,750 | |
| | 11,000,000 | | | Rosneft International Finance Ltd. | | | 4.20% | | | | 03/06/2022 | | | | 9,790,000 | |
| | 9,600,000 | | | SB Capital S.A. | | | 5.13% | | | | 10/29/2022 | | | | 9,000,000 | |
| | 8,100,000 | | | VimpelCom Holdings B.V. | | | 5.95% | ^ | | | 02/13/2023 | | | | 7,492,500 | |
| | 11,450,000 | | | VTB Capital S.A. | | | 6.95% | | | | 10/17/2022 | | | | 11,450,115 | |
| | | | | | | | | | | | | | | | |
| | | | | | | | | | | | | | | 65,759,740 | |
| | | | | | | | | | | | | | | | |
| | TURKEY 0.9% | |
| | 5,700,000 | | | Anadolu Efes Biracilik Ve Malt Sanayii A.S. | | | 3.38% | ^ | | | 11/01/2022 | | | | 4,756,649 | |
| | | | | | | | | | | | | | | | |
| | | | | | | | | | | | | | | 4,756,649 | |
| | | | | | | | | | | | | | | | |
| | | | Total Foreign Corporate Bonds
(Cost $507,378,403) | | | | 504,582,139 | |
| | | | | | | | | | | | | | | | |
| | SHORT TERM INVESTMENTS 1.9% | |
| | 3,294,511 | | | BlackRock Institutional Liquidity Funds FedFund Portfolio | | | 0.01% | ¨ | | | | | | | 3,294,511 | |
| | 3,294,510 | | | Fidelity Institutional Government Portfolio | | | 0.01% | ¨ | | | | | | | 3,294,510 | |
| | 3,294,510 | | | Morgan Stanley Institutional Liquidity Funds | | | 0.04% | ¨ | | | | | | | 3,294,510 | |
| | | | | | | | | | | | | | | | |
| | | | Total Short Term Investments
(Cost $9,883,531) | | | | 9,883,531 | |
| | | | | | | | | | | | | | | | |
| | | | Total Investments 99.7%
(Cost $517,261,934) | | | | 514,465,670 | |
| | | | Other Assets in Excess of Liabilities 0.3% | | | | 1,300,954 | |
| | | | | | | | | | | | | | | | |
| | | | NET ASSETS 100.0% | | | $ | 515,766,624 | |
| | | | | | | | | | | | | | | | |
| | | | | | |
| The accompanying notes are an integral part of these financial statements. | | Annual Report | | March 31, 2014 | | 37 |
Schedule of Investments DoubleLine Emerging Markets Fixed Income Fund (Cont.)
| | | | |
| COUNTRY BREAKDOWN as a % of Net Assets: | | | | |
Brazil | | | 15.8% | |
Peru | | | 14.9% | |
Mexico | | | 14.2% | |
Colombia | | | 13.1% | |
Russia | | | 12.7% | |
Chile | | | 7.3% | |
Guatemala | | | 6.3% | |
India | | | 2.8% | |
Dominican Republic | | | 2.7% | |
Costa Rica | | | 2.2% | |
China | | | 1.9% | |
United States | | | 1.9% | |
| | | | |
| COUNTRY BREAKDOWN as a % of Net Assets: (Cont.) | | | | |
Jamaica | | | 1.2% | |
Turkey | | | 0.9% | |
Panama | | | 0.7% | |
Israel | | | 0.3% | |
Paraguay | | | 0.3% | |
Barbados | | | 0.2% | |
Malaysia | | | 0.2% | |
El Salvador | | | 0.1% | |
Other Assets and Liabilities | | | 0.3% | |
| | | | |
| | | 100.0% | |
| | | | |
| # | Variable rate security. Rate disclosed as of March 31, 2014. |
| ^ | Security exempt from registration under Rule 144A of the Securities Act of 1933. These securities may be resold in transactions exempt from registration to qualified institutional buyers. These securities are determined to be liquid by the Adviser, unless otherwise noted, under procedures established by the Fund’s Board of Trustees. At March 31, 2014, the value of these securities amounted to $215,550,454 or 41.8% of net assets. |
| ¨ | Seven-day yield as of March 31, 2014 |
| | | | | | |
| 38 | | DoubleLine Funds Trust | | | | See Accompanying Notes |
| | |
| Schedule of Investments (Consolidated) DoubleLine Multi-Asset Growth Fund | | March 31, 2014 |
| | | | | | | | | | | | | | | | |
PRINCIPAL
AMOUNT | | | SECURITY DESCRIPTION | | RATE | | | MATURITY | | | VALUE $ | |
| | COLLATERALIZED LOAN OBLIGATIONS 2.9% | |
| |
| | | | Brookside Mill Ltd., | |
| $ | 1,000,000 | | | Series 2013-1A-E | | | 4.64% | #^ | | | 04/17/2025 | | | | 919,785 | |
| | 1,000,000 | | | Series 2013-1A-SUB | | | 15.50% | #^@ | | | 04/17/2025 | | | | 1,020,450 | |
| |
| | | | Cent Ltd., | |
| | 1,000,000 | | | Series 2013-18A-D | | | 3.69% | #^ | | | 07/23/2025 | | | | 971,327 | |
| | 1,000,000 | | | Series 2013-18A-E | | | 4.84% | #^ | | | 07/23/2025 | | | | 917,343 | |
| | 1,000,000 | | | Series 2013-18A-SUB | | | 11.68% | #^@ | | | 07/23/2025 | | | | 960,345 | |
| | | | | | | | | | | | | | | | |
| | | | Total Collateralized Loan Obligations
(Cost $4,705,197) | | | | 4,789,250 | |
| | | | | | | | | | | | | | | | |
| NON-AGENCY RESIDENTIAL COLLATERALIZED MORTGAGE
OBLIGATIONS 7.6% |
|
| | | | Adjustable Rate Mortgage Trust, | |
| | 342,800 | | | Series 2006-1-2A1 | | | 2.99% | # | | | 03/25/2036 | | | | 263,851 | |
| |
| | | | Banc of America Alternative Loan Trust, | |
| | 615,734 | | | Series 2006-7-A4 | | | 6.00% | # | | | 10/25/2036 | | | | 462,356 | |
| |
| | | | BCAP LLC Trust, | |
| | 66,093 | | | Series 2007-AA2-2A5 | | | 6.00% | | | | 04/25/2037 | | | | 58,000 | |
| | 2,708,439 | | | Series 2009-RR4-1A2 | | | 4.25% | #^ | | | 06/26/2037 | | | | 1,395,208 | |
| | 106,000 | | | Series 2010-RR6-1A20 | | | 5.96% | #^ | | | 08/26/2022 | | | | 108,029 | |
| |
| | | | Chaseflex Trust, | |
| | 341,291 | | | Series 2007-M1-2F4 | | | 4.89% | # | | | 08/25/2037 | | | | 271,678 | |
| |
| | | | Citicorp Mortgage Securities, Inc., | |
| | 132,377 | | | Series 2007-2-3A1 | | | 5.50% | | | | 02/25/2037 | | | | 132,375 | |
| |
| | | | Citigroup Mortgage Loan Trust, Inc., | |
| | 357,888 | | | Series 2009-7-2A2 | | | 5.50% | ^ | | | 10/25/2021 | | | | 354,079 | |
| |
| | | | CitiMortgage Alternative Loan Trust, | |
| | 421,578 | | | Series 2007-A6-1A11 | | | 6.00% | | | | 06/25/2037 | | | | 359,693 | |
| | 152,452 | | | Series 2006-32CB-A16 | | | 5.50% | | | | 11/25/2036 | | | | 133,202 | |
| | 883,967 | | | Series 2006-J1-2A1 | | | 7.00% | | | | 02/25/2036 | | | | 389,080 | |
| | 33,529 | | | Series 2007-17CB-1A10 | | | 29.19% | # I/F | | | 08/25/2037 | | | | 50,088 | |
| | 23,480 | | | Series 2007-21CB-2A2 | | | 27.78% | # I/F | | | 09/25/2037 | | | | 34,596 | |
| |
| | | | Countrywide Home Loans, | |
| | 423,204 | | | Series 2007-10-A5 | | | 6.00% | | | | 07/25/2037 | | | | 386,132 | |
| | 21,651 | | | Series 2007-4-1A5 | | | 6.50% | | | | 05/25/2037 | | | | 19,157 | |
| |
| | | | Credit Suisse First Boston Mortgage Securities Corporation, | |
| | 267,962 | | | Series 2005-8-1A3 | | | 5.25% | | | | 09/25/2035 | | | | 264,654 | |
| |
| | | | Credit Suisse Mortgage Capital Certificates, | |
| | 52,966 | | | Series2006-9-4A1 | | | 6.00% | | | | 11/25/2036 | | | | 54,604 | |
| | 439,460 | | | Series2010-7R-4A17 | | | 6.82% | #^ | | | 04/26/2037 | | | | 399,598 | |
| |
| | | | Deutsche Mortgage Securities, Inc., | |
| | 245,726 | | | Series 2006-PR1-3A1 | | | 11.91% | #^ I/F | | | 04/15/2036 | | | | 294,317 | |
| | 366,394 | | | Series2006-PR1-5AI4 | | | 11.91% | #^ I/F | | | 04/15/2036 | | | | 441,959 | |
| |
| | | | First Horizon Alternative Mortgage Securities, | |
| | 86,257 | | | Series 2007-FA2-1A3 | | | 6.00% | | | | 04/25/2037 | | | | 69,805 | |
| |
| | | | GSAA Home Equity Trust, | |
| | 1,000,000 | | | Series 2006-15-AF3B | | | 5.93% | # | | | 09/25/2036 | | | | 244,137 | |
| |
| | | | GSR Mortgage Loan Trust, | |
| | 243,744 | | | Series 2006-2F-2A20 | | | 10.95% | # I/F | | | 02/25/2036 | | | | 254,744 | |
| |
| | | | JP Morgan Alternative Loan Trust, | |
| | 53,456 | | | Series 2005-S1-2A11 | | | 6.00% | | | | 12/25/2035 | | | | 48,205 | |
| | 786,512 | | | Series 2006-S1-1A3 | | | 5.50% | | | | 03/25/2036 | | | | 687,534 | |
| |
| | | | JP Morgan Mortgage Acquisition Corporation, | |
| | 198,883 | | | Series 2006-CH2-AF3 | | | 5.25% | # | | | 10/25/2036 | | | | 155,757 | |
| |
| | | | Lavender Trust, | |
| | 297,000 | | | Series 2010-R12A-A3 | | | 6.00% | ^ | | | 06/26/2037 | | | | 308,028 | |
| |
| | | | Lehman Mortgage Trust, | |
| | 129,309 | | | Series 2006-4-1A3 | | | 5.25% | # I/F I/O | | | 08/25/2036 | | | | 18,578 | |
| | 8,081 | | | Series 2006-4-1A4 | | | 6.00% | | | | 08/25/2036 | | | | 6,773 | |
| | 73,576 | | | Series 2007-5-11A1 | | | 5.51% | # | | | 06/25/2037 | | | | 54,652 | |
| |
| | | | Lehman XS Trust, | |
| | 309,290 | | | Series 2005-1-3A3A | | | 5.11% | # | | | 07/25/2035 | | | | 274,403 | |
| |
| | | | Long Beach Mortgage Loan Trust, | |
| | 351,409 | | | Series 2005-WL2-M1 | | | 0.62% | # | | | 08/25/2035 | | | | 342,223 | |
| | | | | | | | | | | | | | | | |
PRINCIPAL
AMOUNT | | | SECURITY DESCRIPTION | | RATE | | | MATURITY | | | VALUE $ | |
| |
| | | | MASTR Resecuritization Trust, | |
| $ | 462,488 | | | Series 2008-4-A1 | | | 6.00% | #^ | | | 06/27/2036 | | | | 418,248 | |
| |
| | | | Morgan Stanley Mortgage Loan Trust, | |
| | 422,491 | | | Series 2007-13-6A1 | | | 6.00% | | | | 10/25/2037 | | | | 345,891 | |
| |
| | | | Residential Accredit Loans, Inc., | |
| | 362,192 | | | Series 2006-QS10-A9 | | | 6.50% | | | | 08/25/2036 | | | | 313,198 | |
| | 6,463 | | | Series 2006-QS13-1A8 | | | 6.00% | | | | 09/25/2036 | | | | 5,047 | |
| | 363,730 | | | Series 2006-QS2-1A4 | | | 5.50% | | | | 02/25/2036 | | | | 299,947 | |
| | 74,103 | | | Series2006-QS7-A4 | | | 0.55% | # | | | 06/25/2036 | | | | 49,400 | |
| | 222,310 | | | Series2006-QS7-A5 | | | 5.45% | # I/F I/O | | | 06/25/2036 | | | | 31,202 | |
| | 140,488 | | | Series2006-QS8-A4 | | | 0.60% | # | | | 08/25/2036 | | | | 90,011 | |
| | 421,464 | | | Series2006-QS8-A5 | | | 5.40% | # I/F I/O | | | 08/25/2036 | | | | 57,819 | |
| |
| | | | Residential Asset Mortgage Products, Inc., | |
| | 421,517 | | | Series 2004-RS2-MII1 | | | 1.02% | # | | | 02/25/2034 | | | | 402,500 | |
| | 1,399 | | | Series 2004-RS9-AI4 | | | 4.77% | # | | | 10/25/2032 | | | | 1,440 | |
| |
| | | | Residential Asset Securitization Trust, | |
| | 35,000 | | | Series 2005-A12-A12 | | | 5.50% | | | | 11/25/2035 | | | | 32,691 | |
| | 812,340 | | | Series2006-A16-1A3 | | | 6.00% | | | | 02/25/2037 | | | | 683,293 | |
| | 610,965 | | | Series 2007-A1-A8 | | | 6.00% | | | | 03/25/2037 | | | | 476,558 | |
| | 641,673 | | | Series 2007-A5-2A5 | | | 6.00% | | | | 05/25/2037 | | | | 587,727 | |
| |
| | | | Washington Mutual Mortgage Pass-Through Certificates, | |
| | 373,653 | | | Series 2006-8-A6 | | | 5.77% | # | | | 10/25/2036 | | | | 263,780 | |
| | | | | | | | | | | | | | | | |
| | | | Total Non-Agency Residential Collateralized Mortgage Obligations
(Cost $11,290,290) | | | | 12,396,247 | |
| | | | | | | | | | | | | | | | |
| | US GOVERNMENT / AGENCY MORTGAGE BACKED OBLIGATIONS 3.3% | |
| |
| | | | Federal Home Loan Mortgage Corporation, | |
| | 120,641 | | | Series 3261-SA | | | 6.28% | # I/F I/O | | | 01/15/2037 | | | | 19,601 | |
| | 142,094 | | | Series 3317-DS | | | 14.61% | # I/F | | | 05/15/2037 | | | | 168,569 | |
| | 250,258 | | | Series 3355-BI | | | 5.90% | # I/F I/O | | | 08/15/2037 | | | | 34,858 | |
| | 249,682 | | | Series 3384-S | | | 6.24% | # I/F I/O | | | 11/15/2037 | | | | 31,859 | |
| | 464,254 | | | Series 3384-SG | | | 6.16% | # I/F I/O | | | 08/15/2036 | | | | 60,744 | |
| | 286,070 | | | Series 3417-SX | | | 6.03% | # I/F I/O | | | 02/15/2038 | | | | 37,860 | |
| | 457,169 | | | Series 3423-GS | | | 5.50% | # I/F I/O | | | 03/15/2038 | | | | 51,254 | |
| | 4,633,401 | | | Series 3423-TG | | | 0.35% | # I/F I/O | | | 03/15/2038 | | | | 41,798 | |
| | 522,475 | | | Series 3500-SA | | | 5.37% | # I/F I/O | | | 01/15/2039 | | | | 62,456 | |
| | 580,095 | | | Series 3523-SM | | | 5.85% | # I/F I/O | | | 04/15/2039 | | | | 67,474 | |
| | 132,242 | | | Series 3562-WS | | | 4.80% | # I/F I/O | | | 08/15/2039 | | | | 11,995 | |
| | 586,610 | | | Series 3728-SV | | | 4.30% | # I/F I/O | | | 09/15/2040 | | | | 60,724 | |
| | 499,772 | | | Series 3758-S | | | 5.88% | # I/F I/O | | | 11/15/2040 | | | | 64,787 | |
| | 72,810 | | | Series 3779-DZ | | | 4.50% | | | | 12/15/2040 | | | | 73,627 | |
| | 27,715 | | | Series 3780-YS | | | 9.59% | # I/F | | | 12/15/2040 | | | | 27,160 | |
| | 582,948 | | | Series 3815-ST | | | 5.70% | # I/F I/O | | | 02/15/2041 | | | | 66,932 | |
| | 251,365 | | | Series 3900-SB | | | 5.82% | # I/F I/O | | | 07/15/2041 | | | | 30,936 | |
| | 372,709 | | | Series 3923-CZ | | | 5.00% | | | | 09/15/2041 | | | | 408,610 | |
| |
| | | | Federal National Mortgage Association, | |
| | 220,903 | | | Series 2006-101-SA | | | 6.43% | # I/F I/O | | | 10/25/2036 | | | | 33,724 | |
| | 111,509 | | | Series 2006-123-LI | | | 6.17% | # I/F I/O | | | 01/25/2037 | | | | 19,096 | |
| | 778,667 | | | Series 2007-39-AI | | | 5.97% | # I/F I/O | | | 05/25/2037 | | | | 106,666 | |
| | 410,451 | | | Series 2007-57-SX | | | 6.47% | # I/F I/O | | | 10/25/2036 | | | | 66,785 | |
| | 28,914 | | | Series 2009-49-S | | | 6.60% | # I/F I/O | | | 07/25/2039 | | | | 4,032 | |
| | 623,323 | | | Series 2009-86-CI | | | 5.65% | # I/F I/O | | | 09/25/2036 | | | | 69,318 | |
| | 379,075 | | | Series 2009-90-IA | | | 5.60% | # I/F I/O | | | 03/25/2037 | | | | 40,559 | |
| | 343,212 | | | Series 2009-90-IB | | | 5.57% | # I/F I/O | | | 04/25/2037 | | | | 36,240 | |
| | 677,968 | | | Series 2010-39-SL | | | 5.52% | # I/F I/O | | | 05/25/2040 | | | | 86,152 | |
| | 472,676 | | | Series 2011-5-PS | | | 6.25% | # I/F I/O | | | 11/25/2040 | | | | 60,083 | |
| | 323,860 | | | Series 2012-30-DZ | | | 4.00% | | | | 04/25/2042 | | | | 316,654 | |
| | 1,025,283 | | | Series 2013-53-ZC | | | 3.00% | | | | 06/25/2043 | | | | 801,033 | |
| | 957,272 | | | Series 2013-55-KS | | | 5.77% | # I/F | | | 06/25/2043 | | | | 767,561 | |
| | 957,494 | | | Series 2013-55-VZ | | | 3.00% | | | | 06/25/2043 | | | | 779,714 | |
| |
| | | | Government National Mortgage Association, | |
| | 69,392 | | | Series 2009-6-SM | | | 5.79% | # I/F I/O | | | 02/20/2038 | | | | 9,833 | |
| | 13,621 | | | Series 2011-12-PO | | | 0.00% | P/O | | | 12/20/2040 | | | | 8,984 | |
| | 572,124 | | | Series 2011-45-GZ | | | 4.50% | | | | 03/20/2041 | | | | 601,165 | |
| | 250,000 | | | Series 2011-7-LS | | | 9.57% | # I/F | | | 12/20/2040 | | | | 273,551 | |
| | | | | | | | | | | | | | | | |
| | | | Total US Government / Agency Mortgage Backed Obligations
(Cost $5,686,039) | | | | 5,402,394 | |
| | | | | | | | | | | | | | | | |
| | | | | | |
| The accompanying notes are an integral part of these financial statements. | | Annual Report | | March 31, 2014 | | 39 |
Schedule of Investments (Consolidated) DoubleLine Multi-Asset Growth Fund (Cont.)
| | | | | | | | | | | | |
SHARES | | | SECURITY DESCRIPTION | | | | | | VALUE $ | |
| | EXCHANGE TRADED FUNDS AND COMMON STOCK 19.5% | |
| | 450,000 | | | First Trust ISE-Revere Natural Gas Index Fund | | | | | | | 9,315,000 | |
| | 180,000 | | | ING Prime Rate Trust | | | | | | | 1,044,000 | |
| | 85,000 | | | Invesco Dynamic Credit Opportunities Fund | | | | | | | 1,099,900 | |
| | 255,000 | | | Japan Equity Fund, Inc. | | | | | | | 1,665,150 | |
| | 283,000 | | | Market Vectors Gold Miners ETF | | | | | | | 6,678,800 | |
| | 91,000 | | | Nuveen Floating Rate Income Fund | | | | | | | 1,088,360 | |
| | 100,000 | | | Pioneer Floating Rate Trust | | | | | | | 1,264,000 | |
| | 235,000 | | | Vanguard FTSE Developed Markets ETF | | | | | | | 9,698,450 | |
| | | | | | | | | | | | |
| | | | Total Exchange Traded Funds and Common Stock
(Cost $30,092,821) | | | 31,853,660 | |
| | | | | | | | | | | | |
| | AFFILIATED MUTUAL FUNDS 22.7% (a) | |
| | 654,370 | | | DoubleLine Core Fixed Income Fund | | | | | | | 7,119,545 | |
| | 375,141 | | | DoubleLine Floating Rate Fund | | | | | | | 3,807,681 | |
| | 2,388,645 | | | DoubleLine Total Return Bond Fund | | | | | | | 26,036,229 | |
| | | | | | | | | | | | |
| | | | Total Affiliated Mutual Funds
(Cost $37,931,161) | | | 36,963,455 | |
| | | | | | | | | | | | |
| | PURCHASED OPTIONS 1.0% | |
| | 10 | | | Gold London PM Fix Call, Expiration December 2014, Strike Price $2,000.00 | | | | | | | 1,140 | |
| | 5,000,000 | | | Euro / U.S. Dollar Call, Expiration November 2014, Strike Price $1.34 | | | | | | | 192,611 | |
| | 500 | | | Market Vectors Gold Miners ETF Call, June 2014, Strike Price $28.00 | | | | | | | 14,000 | |
| | 1,000 | | | Market Vectors Gold Miners ETF Call, June 2014, Strike Price $30.00 | | | | | | | 15,000 | |
| | 20,000,000 | | | U.S. Dollar / Chinese Renminbi Call, Expiration March 2016, Strike Price $6.23 | | | | | | | 476,900 | |
| | 25,000,000 | | | U.S. Dollar / Singapore Dollar Call, Expiration May 2014, Strike Price $1.28 | | | | | | | 35,823 | |
| | 5,000,000 | | | Euro / U.S. Dollar Put, Expiration November 2014, Strike Price $1.34 | | | | | | | 66,275 | |
| | 491 | | | iShares Russell 2000 ETF Put, Expiration June 2014, Strike Price $113.00 | | | | | | | 141,408 | |
| | 161 | | | PowerShares QQQ Trust Series 1 Put, Expiration June 2014, Strike Price $85.63 | | | | | | | 30,751 | |
| | 2,000 | | | SPDR S&P 500 ETF Trust Put, Expiration June 2014, Strike Price $176.00 | | | | | | | 370,000 | |
| | 20,000,000 | | | U.S. Dollar / Chinese Renminbi Put, Expiration March 2016, Strike Price $6.23 | | | | | | | 287,658 | |
| | | | | | | | | | | | |
| | | | Total Purchased Options
(Cost $2,824,421) | | | 1,631,566 | |
| | | | | | | | | | | | |
| | | | | | | | | | | | | | | | |
PRINCIPAL
AMOUNT/ SHARES | | | SECURITY DESCRIPTION | | RATE | | | MATURITY | | | VALUE $ | |
| | SHORT TERM INVESTMENTS 40.6% | |
| $ | 8,936,134 | | | BlackRock Institutional Liquidity Funds FedFund Portfolio | | | 0.01% | ¨ | | | | | | | 8,936,134 | |
| | 10,963,377 | | | Fidelity Institutional Government Portfolio | | | 0.01% | ¨ | | | | | | | 10,963,377 | |
| | 9,953,134 | | | Morgan Stanley Institutional Liquidity Funds | | | 0.04% | ¨ | | | | | | | 9,953,134 | |
| | 8,300,000 | | | United States Treasury Bills | | | 0.00% | | | | 04/03/2014 | | | | 8,299,977 | |
| | 25,000,000 | | | United States Treasury Bills | | | 0.00% | | | | 04/17/2014 | | | | 24,999,500 | |
| | 3,000,000 | | | United States Treasury Bills | | | 0.00% | | | | 05/08/2014 | | | | 2,999,846 | |
| | | | | | | | | | | | | | | | |
| | | | Total Short Term Investments (Cost $66,151,968) | | | | 66,151,968 | |
| | | | | | | | | | | | | | | | |
| | | | Total Investments 97.6% (Cost $158,681,897) | | | | 159,188,540 | |
| | | | Other Assets in Excess of Liabilities 2.4% | | | | 3,836,797 | |
| | | | | | | | | | | | | | | | |
| | | | NET ASSETS 100.0% | | | $ | 163,025,337 | |
| | | | | | | | | | | | | | | | |
| | | | |
| SECURITY TYPE BREAKDOWN as % of Net Assets | | | | |
Short Term Investments | | | 40.6% | |
Affiliated Mutual Funds | | | 22.7% | |
Exchange Traded Funds and Common Stock | | | 19.5% | |
Non-Agency Residential Collateralized Mortgage Obligations | | | 7.6% | |
US Government / Agency Mortgage Backed Obligations | | | 3.3% | |
Collateralized Loan Obligations | | | 2.9% | |
Purchased Options | | | 1.0% | |
Other Assets and Liabilities | | | 2.4% | |
| | | | |
| | | 100.0% | |
| | | | |
| | | | | | |
| 40 | | DoubleLine Funds Trust | | | | The accompanying notes are an integral part of these financial statements. |
| # | Variable rate security. Rate disclosed as of March 31, 2014. |
| ^ | Security exempt from registration under Rule 144A of the Securities Act of 1933. These securities may be resold in transactions exempt from registration to qualified institutional buyers. These securities are determined to be liquid by the Adviser, unless otherwise noted, under procedures established by the Fund’s Board of Trustees. At March 31, 2014, the value of these securities amounted to $8,508,716 or 5.2% of net assets. |
| I/F | Inverse floating rate security whose interest rate moves in the opposite direction of reference interest rates |
| I/O | Interest only security |
| P/O | Principal only security |
| (a) | Institutional class shares held at each Fund |
| ¨ | Seven-day yield as of March 31, 2014 |
| @ | Security pays interest at rates that represent residual cashflows available after more senior tranches have been paid. The interest rate disclosed reflects the estimated rate in effect as of March 31, 2014. |
| | | | | | | | | | |
| Futures Contracts - Long | | | | | | |
| Contracts | | Security Description | | Expiration
Month | | | Unrealized
Appreciation
(Depreciation) | |
68 | | Hard Red Winter Wheat Future | | | 05/2014 | | | $ | 294,715 | |
73 | | Wheat Future | | | 05/2014 | | | | 323,686 | |
250 | | mini MSCI EAFE Index Future | | | 06/2014 | | | | 463,307 | |
89 | | NASDAQ-100 EMINI Future | | | 06/2014 | | | | (90,009 | ) |
230 | | Nikkei-225 Stock Average Future | | | 06/2014 | | | | (440,395 | ) |
130 | | S&P500 EMINI Future | | | 06/2014 | | | | 205,650 | |
144 | | 10-Year U.S. Treasury Note Future | | | 06/2014 | | | | (94,788 | ) |
| | | | | | | | | | |
| | | | | | | | $ | 662,166 | |
| | | | | | | | | | |
| | | | | | | | | | | | | | |
| Total Return Swaps - Long | | | | | | | | | |
| Reference Entity | | Counterparty | | Notional
Amount | | | Termination
Date | | | Unrealized
Appreciation
(Depreciation) | |
S&P GSCI Brent Crude Official Close Index | | Morgan Stanley | | | 795,000 | | | | 04/03/2014 | | | $ | (517 | ) |
S&P GSCI Crude Oil Official Close Index | | Morgan Stanley | | | 795,000 | | | | 04/03/2014 | | | | 2,355 | |
S&P GSCI Cotton Official Close Index | | Morgan Stanley | | | 795,000 | | | | 04/03/2014 | | | | 8,245 | |
S&P GSCI Heating Oil Official Close Index | | Morgan Stanley | | | 795,000 | | | | 04/03/2014 | | | | (3,539 | ) |
S&P GSCI Unleaded Gasoline Official Close Index | | Morgan Stanley | | | 795,000 | | | | 04/03/2014 | | | | (5,815 | ) |
S&P GSCI Soybeans Official Close Index | | Morgan Stanley | | | 795,000 | | | | 04/03/2014 | | | | 15,219 | |
NYSE Arca Natural Gas Index | | Goldman Sachs | | | 7,500,000 | | | | 06/26/2014 | | | | 178,274 | |
| | | | | | | | | | | | | | |
| | | | | | | | | | | | $ | 194,222 | |
| | | | | | | | | | | | | | |
| | | |
| Total Return Swaps - Short | | | | | | | | | |
| Reference Entity | | Counterparty | | Notional
Amount | | | Termination
Date | | | Unrealized
Appreciation
(Depreciation) | |
S&P GSCI Corn Official Close Index | | Morgan Stanley | | | 795,000 | | | | 04/03/2014 | | | $ | (16,159 | ) |
S&P GSCI Aluminum Official Close Index | | Morgan Stanley | | | 795,000 | | | | 04/03/2014 | | | | (21,471 | ) |
S&P GSCI Coffee Official Close Index | | Morgan Stanley | | | 795,000 | | | | 04/03/2014 | | | | (6,987 | ) |
S&P GSCI Natural Gas Official Close Index | | Morgan Stanley | | | 795,000 | | | | 04/03/2014 | | | | 29,256 | |
S&P GSCI Sugar Official Close Index | | Morgan Stanley | | | 795,000 | | | | 04/03/2014 | | | | 4,449 | |
S&P GSCI Wheat Official Close Index | | Morgan Stanley | | | 795,000 | | | | 04/03/2014 | | | | 14,826 | |
| | | | | | | | | | | | | | |
| | | | | | | | | | | | $ | 3,914 | |
| | | | | | | | | | | | | | |
Investments in Affiliates
Generally, an issuer is an affiliate of a Fund under the Investment Company Act of 1940 if the Fund holds 5% or more of the outstanding voting securities of the issuer or if the issuer is under common control with the Fund.
A summary of DoubleLine Multi-Asset Growth Fund’s (Consolidated) investments in affiliated mutual funds for the year ended March 31, 2014 is as follows:
| | | | | | | | | | | | | | | | | | | | | | | | | | | | |
| Fund | | Value at
March 31,
2013 | | | Gross
Purchases | | | Gross
Sales | | | Shares
Held at
March 31,
2014 | | | Value at
March 31,
2014 | | | Dividend
Income Earned
in the Year
Ended March 31,
2014 | | | Net Realized
Gain (Loss)
in the Year
Ended March 31,
2014 | |
DoubleLine Core Fixed Income Fund | | $ | — | | | $ | 7,100,000 | | | $ | — | | | | 654,370 | | | $ | 7,119,545 | | | $ | 72,738 | | | $ | — | |
DoubleLine Floating Rate Fund | | | — | | | | 4,800,000 | | | | 1,000,000 | | | | 375,141 | | | | 3,807,681 | | | | 79,798 | | | | 3,929 | |
DoubleLine Total Return Bond Fund | | | 54,934,079 | | | | 3,300,000 | | | | 30,200,000 | | | | 2,388,645 | | | | 26,036,229 | | | | 1,722,794 | | | | (518,989 | ) |
| | | | | | | | | | | | | | | | | | | | | | | | | | | | |
| | $ | 54,934,079 | | | $ | 15,200,000 | | | $ | 31,200,000 | | | | 3,418,156 | | | $ | 36,963,455 | | | $ | 1,875,330 | | | $ | (515,060 | ) |
| | | | | | | | | | | | | | | | | | | | | | | | | | | | |
| | | | | | |
| The accompanying notes are an integral part of these financial statements. | | Annual Report | | March 31, 2014 | | 41 |
| | |
| Schedule of Investments DoubleLine Low Duration Bond Fund | | |
| | | | | | | | | | | | | | | | |
PRINCIPAL
AMOUNT | | | SECURITY DESCRIPTION | | RATE | | | MATURITY | | | VALUE $ | |
| | ASSET BACKED OBLIGATIONS 0.7% | | | | | |
| |
| | | | SoFi Professional Loan Program, | |
| $ | 13,843,729 | | | Series 2013-A-A | | | 3.75% | ^ | | | 06/25/2020 | | | | 13,984,935 | |
| | | | | | | | | | | | | | | | |
| | | | Total Asset Backed Obligations
(Cost $13,843,272) | | | | 13,984,935 | |
| | | | | | | | | | | | | | | | |
| | BANK LOANS 9.9% | | | | | |
| |
| | | | Activision Blizzard, Inc., | |
| | 5,085,000 | | | Guaranteed Senior Secured 1st Lien Term Loan, Tranche B | | | 3.25% | # | | | 10/13/2020 | | | | 5,091,356 | |
| |
| | | | Calpine Construction Finance LP, | |
| | 7,984,962 | | | Guaranteed Senior Secured 1st Lien Delayed-Draw Term Loan, Tranche B1 | | | 3.00% | # | | | 05/04/2020 | | | | 7,867,184 | |
| |
| | | | CBS Outdoor Americas Capital LLC, | |
| | 8,000,000 | | | Guaranteed Senior Secured 1st Lien Term Loan, Tranche B | | | 3.00% | # | | | 02/01/2021 | | | | 7,982,520 | |
| |
| | | | CIH International, | |
| | 5,969,925 | | | Guaranteed Senior Secured 1st Lien Term Loan, Tranche B | | | 2.75% | # | | | 06/05/2020 | | | | 6,004,222 | |
| |
| | | | DaVita, Inc., | |
| | 5,969,773 | | | Guaranteed Senior Secured 1st Lien Term Loan, Tranche B2 | | | 4.00% | # | | | 11/01/2019 | | | | 6,009,333 | |
| |
| | | | Delta Air Lines, Inc., | |
| | 4,984,887 | | | Guaranteed Senior Secured 1st Lien Term Loan, Tranche B1 | | | 3.50% | # | | | 10/18/2018 | | | | 4,995,405 | |
| |
| | | | Energy Transfer Equity LP, | |
| | 8,000,000 | | | Guaranteed Senior Secured 1st Lien Term Loan | | | 3.25% | # | | | 12/02/2019 | | | | 7,992,640 | |
| |
| | | | Goodyear Tire & Rubber Company, | |
| | 6,000,000 | | | Guaranteed Senior Secured 2nd Lien Term Loan | | | 4.75% | # | | | 04/30/2019 | | | | 6,042,480 | |
| |
| | | | H.J. Heinz Company, | |
| | 5,959,925 | | | Guaranteed Senior Secured 1st Lien Term Loan, Tranche B2 | | | 3.50% | # | | | 06/05/2020 | | | | 5,992,309 | |
| |
| | | | HCA, Inc., | |
| | 5,970,000 | | | Guaranteed Senior Secured 1st Lien Term Loan, Tranche B4 | | | 2.98% | # | | | 05/01/2018 | | | | 5,975,267 | |
| |
| | | | Hilton Worldwide Finance LLC, | |
| | 4,578,947 | | | Guaranteed Senior Secured 1st Lien Term Loan, Tranche B | | | 3.50% | # | | | 10/26/2020 | | | | 4,591,850 | |
| |
| | | | Huntsman International LLC, | |
| | 5,979,730 | | | Guaranteed Senior Secured 1st Lien Term Loan, Tranche B | | | 2.69% | # | | | 04/19/2017 | | | | 5,998,480 | |
| |
| | | | Jazz Pharmaceuticals, Inc., | |
| | 6,000,000 | | | Guaranteed Senior Secured 1st Lien Term Loan, Tranche B | | | 3.25% | # | | | 06/12/2018 | | | | 6,009,750 | |
| | | | | | | | | | | | | | | | |
PRINCIPAL
AMOUNT | | | SECURITY DESCRIPTION | | RATE | | | MATURITY | | | VALUE $ | |
| |
| | | | KAR Auction Services, Inc., | |
| $ | 5,988,206 | | | Guaranteed Senior Secured 1st Lien Term Loan, Tranche B2 | | | 3.50% | # | | | 03/11/2021 | | | | 5,973,235 | |
| |
| | | | Las Vegas Sands LLC, | |
| | 5,985,000 | | | Guaranteed Senior Secured 1st Lien Term Loan, Tranche B | | | 3.25% | # | | | 12/18/2020 | | | | 5,984,430 | |
| |
| | | | MEG Energy Corporation, | |
| | 5,984,739 | | | Guaranteed Senior Secured 1st Lien Term Loan, Tranche B | | | 3.75% | # | | | 03/31/2020 | | | | 6,018,881 | |
| |
| | | | NRG Energy, Inc., | |
| | 7,969,849 | | | Guaranteed Senior Secured 1st Lien Term Loan, Tranche B | | | 2.75% | # | | | 07/02/2018 | | | | 7,909,643 | |
| |
| | | | Pinnacle Foods Finance LLC, | |
| | 7,984,925 | | | Guaranteed Senior Secured 1st Lien Term Loan, Tranche G | | | 3.25% | # | | | 04/29/2020 | | | | 7,957,257 | |
| |
| | | | Regal Cinemas Corporation, | |
| | 5,987,225 | | | Guaranteed Senior Secured 1st Lien Term Loan | | | 2.73% | # | | | 08/23/2017 | | | | 6,019,527 | |
| |
| | | | Ruby Western Pipeline Holdings LLC, | |
| | 5,822,957 | | | Senior Secured 1st Lien Term Loan, Tranche B | | | 3.50% | # | | | 03/27/2020 | | | | 5,819,347 | |
| |
| | | | SBA Senior Finance LLC, | |
| | 6,000,000 | | | Guaranteed Senior Secured 1st Lien Term Loan, Tranche B | | | 3.25% | # | | | 03/24/2021 | | | | 5,987,700 | |
| |
| | | | Schaeffler AG, | |
| | 6,000,000 | | | Senior Secured 1st Lien Term Loan, Tranche C | | | 4.25% | # | | | 01/27/2017 | | | | 6,035,610 | |
| |
| | | | Sealed Air Corporation, | |
| | 6,000,000 | | | Guaranteed Senior Secured 1st Lien Term Loan, Tranche B1 | | | 3.00% | # | | | 10/03/2018 | | | | 6,019,681 | |
| |
| | | | Southwire Company, | |
| | 6,000,000 | | | Guaranteed Senior Secured 1st Lien Term Loan, Tranche B | | | 3.25% | # | | | 02/10/2021 | | | | 5,997,930 | |
| |
| | | | Terex Corporation, | |
| | 5,957,687 | | | Guaranteed Senior Secured 1st Lien Term Loan | | | 3.50% | # | | | 04/28/2017 | | | | 5,991,283 | |
| |
| | | | Tomkins LLC, | |
| | 5,881,788 | | | Guaranteed Senior Secured 1st Lien Term Loan, Tranche B2 | | | 3.75% | # | | | 09/29/2016 | | | | 5,900,895 | |
| |
| | | | Valeant Pharmaceuticals International, Inc., | |
| | 5,559,115 | | | Guaranteed Senior Secured 1st Lien Term Loan, Tranche BE | | | 3.75% | # | | | 08/05/2020 | | | | 5,583,436 | |
| |
| | | | Vantiv LLC, | |
| | 1,974,359 | | | Guaranteed Senior Secured 1st Lien Term Loan, Tranche A | | | 1.90% | # | | | 05/15/2018 | | | | 1,978,429 | |
| |
| | | | Virgin Media Investment Holdings Ltd., | |
| | 8,000,000 | | | Guaranteed Senior Secured 1st Lien Term Loan, Tranche B | | | 3.50% | # | | | 06/08/2020 | | | | 7,989,640 | |
| |
| | | | WMG Acquisition Corporation, | |
| | 5,970,000 | | | Guaranteed Senior Secured 1st Lien Term Loan, Tranche B | | | 3.75% | # | | | 07/01/2020 | | | | 5,948,304 | |
| |
| | | | WR Grace & Company, | |
| | 1,578,947 | | | Senior Secured 1st Lien Delayed-Draw Term Loan | | | 1.00% | #& | | | 02/03/2021 | | | | 1,577,795 | |
| | | | | | |
| 42 | | DoubleLine Funds Trust | | | | The accompanying notes are an integral part of these financial statements. |
March 31, 2014
| | | | | | | | | | | | | | | | |
PRINCIPAL
AMOUNT | | | SECURITY DESCRIPTION | | RATE | | | MATURITY | | | VALUE $ | |
| |
| | | | WR Grace & Company, | |
| $ | 4,421,053 | | | Senior Secured 1st Lien Term Loan, Tranche B | | | 3.00% | # | | | 02/03/2021 | | | | 4,417,825 | |
| | | | | | | | | | | | | | | | |
| | | | Total Bank Loans
(Cost $189,946,250) | | | | 189,663,644 | |
| | | | | | | | | | | | | | | | |
| | COLLATERALIZED LOAN OBLIGATIONS 19.9% | | | | | |
| |
| | | | ACA Ltd., | |
| | 299,058 | | | Series 2006-1A-A1 | | | 0.49% | #^ | | | 07/25/2018 | | | | 298,282 | |
| |
| | | | ACAS Ltd., | |
| | 2,000,000 | | | Series 2007-1X-A1S | | | 0.45% | # | | | 04/20/2021 | | | | 1,979,476 | |
| |
| | | | Apidos Ltd., | |
| | 7,024,646 | | | Series 2006-3A-A1 | | | 0.49% | #^ | | | 06/12/2020 | | | | 6,992,048 | |
| | 3,250,000 | | | Series 2013-16A-X | | | 1.26% | #^ | | | 01/19/2025 | | | | 3,250,171 | |
| | 2,250,000 | | | Series 2014-17A-X | | | 1.23% | #^ | | | 04/17/2026 | | | | 2,250,000 | |
| |
| | | | ARES Ltd., | |
| | 380,816 | | | Series 2006-6RA-A1B | | | 0.46% | #^ | | | 03/12/2018 | | | | 380,777 | |
| | 552,326 | | | Series 2006-6RA-A2 | | | 0.51% | # | | | 03/12/2018 | | | | 547,582 | |
| |
| | | | Atrium Corporation, | |
| | 72,884 | | | Series 3A-A1 | | | 0.56% | #^ | | | 10/27/2016 | | | | 72,881 | |
| | 2,445,297 | | | Series 4A-A1A | | | 0.49% | #^ | | | 06/08/2019 | | | | 2,434,523 | |
| | 2,361,935 | | | Series 4A-A2 | | | 0.49% | #^ | | | 06/08/2019 | | | | 2,351,528 | |
| | 703,949 | | | Series 4X-A1A | | | 0.49% | # | | | 06/08/2019 | | | | 700,848 | |
| |
| | | | Avenue Ltd., | |
| | 2,260,000 | | | Series 2005-2A-A2L | | | 0.66% | #^ | | | 10/30/2017 | | | | 2,251,493 | |
| | 1,950,000 | | | Series 2005-2A-B1L | | | 2.04% | #^ | | | 10/30/2017 | | | | 1,933,179 | |
| | 1,020,853 | | | Series 2006-3A-A1L | | | 0.50% | #^ | | | 07/20/2018 | | | | 1,020,625 | |
| | 520,452 | | | Series 2007-6A-A1 | | | 0.46% | #^ | | | 07/17/2019 | | | | 515,946 | |
| |
| | | | Avery Point Ltd., | |
| | 3,500,000 | | | Series 2013-3A-X | | | 1.29% | #^ | | | 01/18/2025 | | | | 3,500,085 | |
| | 3,000,000 | | | Series 2014-1A-A | | | 1.75% | #^ | | | 04/25/2026 | | | | 3,000,000 | |
| | 1,000,000 | | | Series 2014-1A-B1 | | | 2.33% | #^ | | | 04/25/2026 | | | | 1,000,000 | |
| | 3,750,000 | | | Series 2014-1A-X | | | 1.23% | #^ | | | 04/25/2026 | | | | 3,750,000 | |
| |
| | | | Babson, Inc., | |
| | 4,500,000 | | | Series 2005-2A-A2 | | | 0.64% | #^ | | | 07/20/2019 | | | | 4,434,849 | |
| | 13,532,436 | | | Series 2007-1X-A2A | | | 0.45% | # | | | 01/18/2021 | | | | 13,378,671 | |
| |
| | | | Black Diamond Ltd., | |
| | 16,360,266 | | | Series 2005-1A-A1 | | | 0.50% | #^ | | | 06/20/2017 | | | | 16,218,761 | |
| | 162,283 | | | Series 2005-1A-A1A | | | 0.48% | #^ | | | 06/20/2017 | | | | 162,283 | |
| |
| | | | BlackRock Senior Income, | |
| | 12,115,529 | | | Series 2006-4A-A | | | 0.48% | #^ | | | 04/20/2019 | | | | 11,958,345 | |
| | 7,799,422 | | | Series 2007-5A-A3 | | | 0.47% | #^ | | | 08/13/2019 | | | | 7,626,833 | |
| |
| | | | BlueMountain Ltd., | |
| | 4,500,000 | | | Series 2005-1A-A2 | | | 0.61% | #^ | | | 11/15/2017 | | | | 4,480,530 | |
| |
| | | | BMI Trust, | |
| | 3,744,882 | | | Series 2013-1AR-A1R | | | 1.17% | #^ | | | 08/01/2021 | | | | 3,721,048 | |
| |
| | | | Brookside Mill Ltd., | |
| | 1,555,000 | | | Series 2013-1A-X | | | 1.14% | #^ | | | 04/17/2025 | | | | 1,554,721 | |
| |
| | | | Callidus Debt Partners Fund Ltd., | |
| | 3,948,840 | | | Series 2006-5A-A1B | | | 0.47% | #^ | | | 11/20/2020 | | | | 3,900,498 | |
| |
| | | | Carlyle Global Market Strategies Ltd., | |
| | 2,250,000 | | | Series 2013-2A-D | | | 3.99 | %#^ | | | 04/18/2025 | | | | 2,219,553 | |
| | 530,000 | | | Series 2013-4A-A1 | | | 1.71 | %#^ | | | 10/15/2025 | | | | 527,589 | |
| | 5,000,000 | | | Series 2014-1A-X | | | 1.24 | %#^ | | | 04/17/2025 | | | | 5,000,000 | |
| |
| | | | Carlyle High Yield Partners Ltd., | |
| | 2,320,739 | | | Series 2006-8A-A1 | | | 0.48% | #^ | | | 05/21/2021 | | | | 2,287,469 | |
| | 16,462,028 | | | Series 2006-8A-A2A | | | 0.47% | #^ | | | 05/21/2021 | | | | 16,342,160 | |
| | | | |
| | | | Catamaran Ltd., | | | | | | | | | | | | |
| | 5,000,000 | | | Series 2012-1A-A | | | 1.64% | #^ | | | 12/20/2023 | | | | 4,988,584 | |
| | | | |
| | | | Cent Ltd., | | | | | | | | | | | | |
| | 3,340,212 | | | Series 2005-10A-A1 | | | 0.48% | #^ | | | 12/15/2017 | | | | 3,325,331 | |
| | 500,000 | | | Series 2013-18A-A | | | 1.36% | #^ | | | 07/23/2025 | | | | 492,224 | |
| | | | |
| | | | Chatham Light Ltd., | | | | | | | | | | | | |
| | 3,300,000 | | | Series 2005-2A-A2 | | | 0.64% | #^ | | | 08/03/2019 | | | | 3,247,993 | |
| | | | | | | | | | | | | | | | |
PRINCIPAL
AMOUNT | | | SECURITY DESCRIPTION | | RATE | | | MATURITY | | | VALUE $ | |
| | | | |
| | | | ColumbusNova Ltd., | | | | | | | | | | | | |
| $ | 11,225,958 | | | Series 2007-1A-A1 | | | 0.49% | #^ | | | 05/16/2019 | | | | 11,121,013 | |
| | | | |
| | | | Denali Capital Ltd., | | | | | | | | | | | | |
| | 111,677 | | | Series 6A-A1L | | | 0.50% | #^ | | | 04/21/2020 | | | | 111,885 | |
| |
| | | | Dryden Leveraged Loan, | |
| | 341,651 | | | Series 2005-8A-A | | | 0.49% | #^ | | | 05/22/2017 | | | | 341,629 | |
| | 1,300,000 | | | Series 2005-8A-B | | | 0.64% | #^ | | | 05/22/2017 | | | | 1,295,206 | |
| |
| | | | Dryden Senior Loan Fund, | |
| | 500,000 | | | Series 2012-25A-D | | | 4.24% | #^ | | | 01/15/2025 | | | | 500,044 | |
| | | | |
| | | | Eaton Vance Ltd., | | | | | | | | | | | | |
| | 3,886,711 | | | Series 2007-9A-A2 | | | 0.47% | #^ | | | 04/20/2019 | | | | 3,870,319 | |
| | | | |
| | | | Four Corners Ltd., | | | | | | | | | | | | |
| | 2,378,675 | | | Series 2006-3A-A | | | 0.49% | #^ | | | 07/22/2020 | | | | 2,348,263 | |
| | | | |
| | | | Franklin Ltd., | | | | | | | | | | | | |
| | 289,561 | | | Series 2006-5A-A2 | | | 0.49% | #^ | | | 06/15/2018 | | | | 285,746 | |
| | | | |
| | | | Galaxy Ltd., | | | | | | | | | | | | |
| | 5,000,000 | | | Series 2012-12X-A | | | 1.64% | # | | | 05/19/2023 | | | | 5,010,362 | |
| | | | |
| | | | Gannett Peak Ltd., | | | | | | | | | | | | |
| | 3,752,957 | | | Series 2006-1A-A1A | | | 0.49% | #^ | | | 10/27/2020 | | | | 3,744,850 | |
| |
| | | | GoldenTree Loan Opportunities Ltd., | |
| | 1,000,000 | | | Series 2012-6A-D | | | 4.44% | #^ | | | 04/17/2022 | | | | 1,002,417 | |
| | 5,000,000 | | | Series 2014-8A-A | | | 1.61% | #^ | | | 04/19/2026 | | | | 4,982,500 | |
| |
| | | | Gulf Stream-Sextant Ltd., | |
| | 591,228 | | | Series 2006-1A-A2 | | | 0.48% | #^ | | | 08/21/2020 | | | | 586,710 | |
| |
| | | | Halcyon Loan Advisors Funding Ltd., | |
| | 2,000,000 | | | Series 2014-1A-X | | | 1.28% | #^ | | | 04/18/2026 | | | | 2,000,000 | |
| | | | |
| | | | ING Ltd., | | | | | | | | | | | | |
| | 5,000,000 | | | Series 2012-1RA-A1R | | | 1.69% | #^ | | | 03/14/2022 | | | | 5,000,934 | |
| | 1,000,000 | | | Series 2012-1RA-A2R | | | 3.24% | #^ | | | 03/14/2022 | | | | 1,000,199 | |
| | 700,000 | | | Series 2012-4A-A1 | | | 1.63% | #^ | | | 10/15/2023 | | | | 698,460 | |
| | | | |
| | | | Jersey Street Ltd., | | | | | | | | | | | | |
| | 158,219 | | | Series 2006-1A-A | | | 0.49% | #^ | | | 10/20/2018 | | | | 157,519 | |
| |
| | | | Kennecott Funding Ltd., | |
| | 45,262 | | | Series 2005-1X-A2B | | | 0.61% | # | | | 01/13/2018 | | | | 45,282 | |
| |
| | | | KKR Financial Corporation, | |
| | 232,877 | | | Series 2005-1A-A1 | | | 0.51% | #^ | | | 04/26/2017 | | | | 231,526 | |
| | 16,465,788 | | | Series 2006-1A-A1 | | | 0.51% | #^ | | | 08/25/2018 | | | | 16,382,303 | |
| | 3,365,148 | | | Series 2007-1A-A | | | 0.59% | #^ | | | 05/15/2021 | | | | 3,305,987 | |
| | 10,164,136 | | | Series 2007-AA-A | | | 0.99% | #^ | | | 10/15/2017 | | | | 10,139,294 | |
| | 5,000,000 | | | Series 2013-1A-A1 | | | 1.39% | #^ | | | 07/15/2025 | | | | 4,904,852 | |
| |
| | | | Landmark Ltd., | |
| | 371,818 | | | Series 2005-1X-A2L | | | 0.69% | # | | | 06/01/2017 | | | | 372,390 | |
| | 2,500,000 | | | Series 2005-6X-E | | | 4.99% | # | | | 01/14/2018 | | | | 2,476,398 | |
| | 284,542 | | | Series 2006-7A-A1L | | | 0.51% | #^ | | | 07/15/2018 | | | | 284,184 | |
| | 6,948,815 | | | Series 2006-8A-A1 | | | 0.48% | #^ | | | 10/19/2020 | | | | 6,919,861 | |
| |
| | | | LCM LP, | |
| | 1,000,000 | | | Series 10X-A | | | 1.72% | # | | | 04/15/2022 | | | | 1,001,516 | |
| | 1,000,000 | | | Series 11A-B | | | 2.39% | #^ | | | 04/19/2022 | | | | 1,000,709 | |
| | 3,500,000 | | | Series 12A-A | | | 1.71% | #^ | | | 10/19/2022 | | | | 3,492,686 | |
| | 1,750,000 | | | Series 15A-A | | | 1.73% | #^ | | | 08/25/2024 | | | | 1,749,922 | |
| | 1,000,000 | | | Series 15A-C | | | 3.33% | #^ | | | 08/25/2024 | | | | 1,000,668 | |
| | 4,000,000 | | | Series 15A-X | | | 1.23% | #^ | | | 02/25/2017 | | | | 4,000,191 | |
| | 15,000,000 | | | Series 5A-A1 | | | 0.46% | #^ | | | 03/21/2019 | | | | 14,967,219 | |
| |
| | | | Madison Park Funding Ltd., | |
| | 2,550,000 | | | Series 2014-13A-X | | | 1.19% | #^ | | | 01/19/2025 | | | | 2,551,844 | |
| |
| | | | Mountain Capital Ltd., | |
| | 170,007 | | | Series 2005-4A-A1L | | | 0.48% | #^ | | | 03/15/2018 | | | | 169,722 | |
| |
| | | | Mountain Hawk Ltd., | |
| | 5,000,000 | | | Series 2014-A3-A | | | 1.73% | #^ | | | 04/18/2025 | | | | 4,973,000 | |
| |
| | | | NewMark Capital Funding Ltd., | |
| | 9,750,000 | | | Series 2013-1A-A2 | | | 1.36% | #^ | | | 06/02/2025 | | | | 9,542,366 | |
| | 10,000,000 | | | Series 2013-A1-A1 | | | 1.18% | #^ | | | 06/02/2025 | | | | 9,772,065 | |
| |
| | | | NOB Hill Ltd., | |
| | 535,315 | | | Series 2006-1X-A1 | | | 0.49% | # | | | 08/15/2018 | | | | 532,861 | |
| | | | | | |
| The accompanying notes are an integral part of these financial statements. | | Annual Report | | March 31, 2014 | | 43 |
Schedule of Investments DoubleLine Low Duration Bond Fund (Cont.)
| | | | | | | | | | | | | | | | |
PRINCIPAL
AMOUNT | | | SECURITY DESCRIPTION | | RATE | | | MATURITY | | | VALUE $ | |
| |
| | | | Oak Hill Credit Partners, | |
| $ | 1,000,000 | | | Series 2012-7A-A | | | 1.65% | #^ | | | 11/20/2023 | | | | 997,423 | |
| |
| | | | Ocean Trails, | |
| | 9,750,000 | | | Series 2013-4A-A | | | 1.54% | #^ | | | 08/13/2025 | | | | 9,657,170 | |
| |
| | | | OZLM Ltd., | |
| | 5,000,000 | | | Series 2014-6A-A1 | | | 1.74% | #^ | | | 04/17/2026 | | | | 4,999,500 | |
| |
| | | | Pacific Bay Ltd., | |
| | 14,500,000 | | | Series 2003-1A-A2 | | | 1.60% | #^ | | | 11/04/2038 | | | | 13,847,500 | |
| |
| | | | Race Point Ltd., | |
| | 6,730,830 | | | Series 2006-3-A | | | 0.50% | #^ | | | 04/15/2020 | | | | 6,692,259 | |
| | 2,125,386 | | | Series 2007-4A-A1A | | | 0.44% | #^ | | | 08/01/2021 | | | | 2,106,399 | |
| |
| | | | Sands Point Funding Ltd., | |
| | 11,271,053 | | | Series 2006-1A-A1 | | | 0.50% | #^ | | | 07/18/2020 | | | | 11,167,668 | |
| |
| | | | Slater Mill Loan Fund, | |
| | 3,800,000 | | | Series 2012-1A-B | | | 2.89% | #^ | | | 08/17/2022 | | | | 3,807,644 | |
| |
| | | | Venture Ltd., | |
| | 500,000 | | | Series 2005-1A-A2 | | | 0.69% | #^ | | | 11/22/2018 | | | | 488,308 | |
| | 9,250,000 | | | Series 2014-16A-A1L | | | 1.87% | #^ | | | 04/15/2026 | | | | 9,203,182 | |
| |
| | | | Vitesse Ltd., | |
| | 1,777,829 | | | Series 2006-1A-A1L | | | 0.49% | #^ | | | 08/17/2020 | | | | 1,769,363 | |
| |
| | | | Wasatch Ltd., | |
| | 9,843,559 | | | Series 2006-1A-A1B | | | 0.48% | #^ | | | 11/14/2022 | | | | 9,628,007 | |
| |
| | | | Westwood Ltd., | |
| | 466,254 | | | Series 2007-2A-A1 | | | 0.46% | #^ | | | 04/25/2022 | | | | 457,608 | |
| |
| | | | WhiteHorse Ltd., | |
| | 2,500,000 | | | Series 2012-1A-B1L | | | 4.49% | #^ | | | 02/03/2025 | | | | 2,499,075 | |
| | 5,000,000 | | | Series 2013-1A-A1L | | | 1.64% | #^ | | | 11/24/2025 | | | | 4,976,512 | |
| |
| | | | Wind River Ltd., | |
| | 10,000,000 | | | Series 2013-2A-A1 | | | 1.69% | #^ | | | 01/18/2026 | | | | 9,997,295 | |
| | | | | | | | | | | | | | | | |
| | | | Total Collateralized Loan Obligations
(Cost $379,313,985) | | | | 380,266,701 | |
| | | | | | | | | | | | | | | | |
| | FOREIGN CORPORATE BONDS 20.1% | |
| | 2,500,000 | | | Alfa Bond Issuance | | | 7.88% | | | | 09/25/2017 | | | | 2,656,250 | |
| | 600,000 | | | Alfa Bond Issuance | | | 7.50% | | | | 09/26/2019 | | | | 606,000 | |
| | 5,865,000 | | | Andrade Gutierrez International S.A. | | | 4.00% | | | | 04/30/2018 | | | | 5,850,338 | |
| | 300,000 | | | Andrade Gutierrez International S.A. | | | 4.00% | ^ | | | 04/30/2018 | | | | 299,250 | |
| | 1,700,000 | | | Australia and New Zealand Banking Group Ltd. | | | 3.25% | ^ | | | 03/01/2016 | | | | 1,778,851 | |
| | 1,000,000 | | | Banco Bradesco S.A. | | | 2.34% | # | | | 05/16/2014 | | | | 1,000,352 | |
| | 1,500,000 | | | Banco Davivienda S.A. | | | 2.95% | ^ | | | 01/29/2018 | | | | 1,481,250 | |
| | 8,500,000 | | | Banco Davivienda S.A. | | | 2.95% | | | | 01/29/2018 | | | | 8,393,750 | |
| | 200,000 | | | Banco de Bogota S.A. | | | 5.00% | ^ | | | 01/15/2017 | | | | 212,750 | |
| | 9,000,000 | | | Banco de Bogota S.A. | | | 5.00% | | | | 01/15/2017 | | | | 9,573,749 | |
| | 2,815,000 | | | Banco de Chile | | | 6.25% | | | | 06/15/2016 | | | | 3,070,670 | |
| | 7,923,000 | | | Banco de Credito del Peru | | | 4.75% | | | | 03/16/2016 | | | | 8,398,380 | |
| | 8,000,000 | | | Banco de Credito e Inversiones | | | 3.00% | | | | 09/13/2017 | | | | 8,151,136 | |
| | 1,000,000 | | | Banco del Estado de Chile | | | 2.00% | ^ | | | 11/09/2017 | | | | 996,289 | |
| | 2,500,000 | | | Banco del Estado de Chile | | | 2.00% | | | | 11/09/2017 | | | | 2,490,723 | |
| | 2,000,000 | | | Banco do Brasil S.A. | | | 3.88% | | | | 01/23/2017 | | | | 2,070,000 | |
| | 2,000,000 | | | Banco GNB Sudameris S.A. | | | 3.88% | ^ | | | 05/02/2018 | | | | 1,942,500 | |
| | 5,000,000 | | | Banco GNB Sudameris S.A. | | | 3.88% | | | | 05/02/2018 | | | | 4,856,250 | |
| | 300,000 | | | Banco Latinoamericano de Comercio Exterior S.A. | | | 3.75% | ^ | | | 04/04/2017 | | | | 310,800 | |
| | | | | | | | | | | | | | | | |
PRINCIPAL
AMOUNT | | | SECURITY DESCRIPTION | | RATE | | | MATURITY | | | VALUE $ | |
| $ | 1,700,000 | | | Banco Latinoamericano de Comercio Exterior S.A. | | | 3.75% | | | | 04/04/2017 | | | | 1,761,200 | |
| | 5,800,000 | | | Banco Mercantil del Norte | | | 4.38% | | | | 07/19/2015 | | | | 6,032,000 | |
| | 7,000,000 | | | Banco Nacional de Costa Rica | | | 4.88% | | | | 11/01/2018 | | | | 7,078,750 | |
| | 600,000 | | | Banco Safra S.A. | | | 3.50% | | | | 05/16/2014 | | | | 602,250 | |
| | 8,000,000 | | | Banco Santander | | | 1.84% | # | | | 01/19/2016 | | | | 7,940,000 | |
| | 2,150,000 | | | Banco Santander | | | 2.11% | # | | | 06/07/2018 | | | | 2,158,063 | |
| | 2,500,000 | | | Bancolombia S.A. | | | 4.25% | | | | 01/12/2016 | | | | 2,618,750 | |
| | 1,146,000 | | | Bancolombia S.A. | | | 6.88% | | | | 05/25/2017 | | | | 1,278,363 | |
| | 500,000 | | | Bancolombia S.A. | | | 6.13% | | | | 07/26/2020 | | | | 531,850 | |
| | 3,400,000 | | | Bank Of Montreal | | | 1.30% | | | | 07/15/2016 | | | | 3,430,267 | |
| | 2,925,000 | | | Bank Of Nova Scotia | | | 1.38% | | | | 07/15/2016 | | | | 2,955,985 | |
| | 450,000 | | | Bank Of Nova Scotia | | | 2.55% | | | | 01/12/2017 | | | | 467,105 | |
| | 10,000,000 | | | BBVA Banco Continental S.A. | | | 3.25% | | | | 04/08/2018 | | | | 10,074,999 | |
| | 5,200,000 | | | BBVA Bancomer S.A. | | | 4.50% | | | | 03/10/2016 | | | | 5,525,000 | |
| | 850,000 | | | BP Capital Markets PLC | | | 3.63% | | | | 05/08/2014 | | | | 852,728 | |
| | 2,050,000 | | | BP Capital Markets PLC | | | 3.13% | | | | 10/01/2015 | | | | 2,127,986 | |
| | 600,000 | | | BP Capital Markets PLC | | | 1.85% | | | | 05/05/2017 | | | | 609,814 | |
| | 3,300,000 | | | British Telecommunications PLC | | | 1.63% | | | | 06/28/2016 | | | | 3,345,107 | |
| | 1,270,000 | | | Celulosa Arauco y Constitucion S.A. | | | 5.63% | | | | 04/20/2015 | | | | 1,323,332 | |
| | 3,500,000 | | | Cemex S.A.B. de C.V. | | | 4.99% | # | | | 10/15/2018 | | | | 3,710,000 | |
| | 2,010,000 | | | CNPC General Capital Ltd. | | | 1.45% | | | | 04/16/2016 | | | | 2,010,999 | |
| | 3,000,000 | | | CNPC General Capital Ltd. | | | 1.45% | ^ | | | 04/16/2016 | | | | 3,001,491 | |
| | 9,000,000 | | | Corpbanca S.A. | | | 3.13% | | | | 01/15/2018 | | | | 8,869,302 | |
| | 9,000,000 | | | DBS Bank Ltd. | | | 5.00% | # | | | 11/15/2019 | | | | 9,180,270 | |
| | 3,100,000 | | | Diageo Capital PLC | | | 1.50% | | | | 05/11/2017 | | | | 3,123,157 | |
| | 2,326,100 | | | Dolphin Energy Ltd. | | | 5.89% | | | | 06/15/2019 | | | | 2,601,743 | |
| | 3,170,000 | | | Embraer Overseas Ltd. | | | 6.38% | | | | 01/24/2017 | | | | 3,530,588 | |
| | 2,500,000 | | | Empresas Publicas de Medellin | | | 7.63% | | | | 07/29/2019 | | | | 2,987,500 | |
| | 9,038,069 | | | ENA Norte Trust | | | 4.95% | | | | 04/25/2023 | | | | 9,094,557 | |
| | 1,800,000 | | | Freeport-McMoRan Copper & Gold, Inc. | | | 2.15% | | | | 03/01/2017 | | | | 1,827,841 | |
| | 1,600,000 | | | Freeport-McMoRan Copper & Gold, Inc. | | | 2.38% | | | | 03/15/2018 | | | | 1,596,904 | |
| | 1,000,000 | | | Gaz Capital S.A. | | | 8.15% | | | | 04/11/2018 | | | | 1,135,000 | |
| | 6,500,000 | | | Gazprombank OJSC | | | 6.50% | | | | 09/23/2015 | | | | 6,760,000 | |
| | 5,960,000 | | | Global Bank Corporation | | | 4.75% | | | | 10/05/2017 | | | | 6,146,250 | |
| | 914,000 | | | Globo Communicacao e Participacoes S.A. | | | 5.31% | # | | | 05/11/2022 | | | | 974,553 | |
| | 8,800,000 | | | Grupo Aval Ltd. | | | 5.25% | | | | 02/01/2017 | | | | 9,328,000 | |
| | 200,000 | | | Grupo Aval Ltd. | | | 5.25% | ^ | | | 02/01/2017 | | | | 212,000 | |
| | 8,000,000 | | | Grupo Televisa S.A.B | | | 6.00% | | | | 05/15/2018 | | | | 9,011,536 | |
| | 1,625,000 | | | Hutchison Whampoa International Ltd. | | | 2.00% | | | | 11/08/2017 | | | | 1,638,622 | |
| | 7,000,000 | | | Industry & Construction Bank | | | 5.01% | # | | | 09/29/2015 | | | | 6,851,250 | |
| | 915,641 | | | Interoceanica IV Finance Ltd. | | | 0.00% | | | | 11/30/2018 | | | | 824,077 | |
| | 8,000,000 | | | Inversiones CMPC S.A. | | | 4.75% | | | | 01/19/2018 | | | | 8,481,888 | |
| | 1,005,000 | | | IOI Ventures BHD | | | 5.25% | | | | 03/16/2015 | | | | 1,036,911 | |
| | 275,000 | | | Korea Development Bank | | | 4.38% | | | | 08/10/2015 | | | | 288,581 | |
| | 2,900,000 | | | Korea Development Bank | | | 3.25% | | | | 03/09/2016 | | | | 3,033,429 | |
| | 8,000,000 | | | LPG International, Inc. | | | 7.25% | | | | 12/20/2015 | | | | 8,740,000 | |
| | 2,500,000 | | | Lukoil International Finance B.V. | | | 3.42% | | | | 04/24/2018 | | | | 2,438,125 | |
| | 1,375,000 | | | National Australia Bank Ltd. | | | 1.60% | | | | 08/07/2015 | | | | 1,394,401 | |
| | 1,500,000 | | | National Australia Bank Ltd. | | | 3.00% | ^ | | | 07/27/2016 | | | | 1,572,222 | |
| | 4,600,000 | | | Noble Group Ltd. | | | 6.63% | | | | 08/05/2020 | | | | 4,876,000 | |
| | 650,000 | | | Orange S.A. | | | 2.13% | | | | 09/16/2015 | | | | 660,944 | |
| | 2,600,000 | | | Orange S.A. | | | 2.75% | | | | 09/14/2016 | | | | 2,696,569 | |
| | 9,005,000 | | | Oversea-Chinese Banking Corporation | | | 4.25% | # | | | 11/18/2019 | | | | 9,155,392 | |
| | | | | | |
| 44 | | DoubleLine Funds Trust | | | | The accompanying notes are an integral part of these financial statements. |
March 31, 2014
| | | | | | | | | | | | | | | | |
PRINCIPAL
AMOUNT | | | SECURITY DESCRIPTION | | RATE | | | MATURITY | | | VALUE $ | |
| $ | 3,700,000 | | | Pacific Rubiales Energy | | | 5.38% | | | | 01/26/2019 | | | | 3,847,999 | |
| | 3,800,000 | | | Pacific Rubiales Energy | | | 5.38% | ^ | | | 01/26/2019 | | | | 3,952,000 | |
| | 1,850,000 | | | PCCW-HKT Capital No 3 Ltd. | | | 5.25% | | | | 07/20/2015 | | | | 1,949,961 | |
| | 3,211,000 | | | PCCW-HKT Capital No 4 Ltd. | | | 4.25% | | | | 02/24/2016 | | | | 3,379,016 | |
| | 660,000 | | | Pemex Project Funding Master Trust | | | 5.75% | | | | 12/15/2015 | | | | 710,820 | |
| | 7,644,916 | | | Peru Enhanced Pass-Through Finance Ltd. | | | 0.00% | | | | 05/31/2018 | | | | 7,109,772 | |
| | 6,500,000 | | | Petrobras Global Finance B.V. | | | 1.85% | # | | | 05/20/2016 | | | | 6,443,125 | |
| | 1,500,000 | | | Petrobras Global Finance B.V. | | | 2.00% | | | | 05/20/2016 | | | | 1,490,625 | |
| | 2,400,000 | | | Petroleos Mexicanos | | | 2.26% | # | | | 07/18/2018 | | | | 2,508,000 | |
| | 1,500,000 | | | Petroleos Mexicanos | | | 3.50% | | | | 07/18/2018 | | | | 1,560,000 | |
| | 1,500,000 | | | Phosagro Bond Funding Ltd. | | | 4.20% | | | | 02/13/2018 | | | | 1,436,250 | |
| | 3,050,000 | | | Prime Holdings Labuan Ltd. | | | 5.38% | | | | 09/22/2014 | | | | 3,103,897 | |
| | 5,000,000 | | | PTTEP Australia International Finance Ltd. | | | 4.15% | | | | 07/19/2015 | | | | 5,164,630 | |
| | 4,500,000 | | | Raizen Energy Finance Ltd. | | | 7.00% | | | | 02/01/2017 | | | | 4,972,500 | |
| | 1,900,000 | | | Raizen Fuels Finance Ltd. | | | 9.50% | | | | 08/15/2014 | | | | 1,961,180 | |
| | 3,195,900 | | | Ras Laffan Liquefied Natural Gas Company | | | 5.30% | | | | 09/30/2020 | | | | 3,453,490 | |
| | 7,500,000 | | | Rosneft International Finance Ltd. | | | 3.15% | | | | 03/06/2017 | | | | 7,387,500 | |
| | 6,500,000 | | | Rosneft International Finance Ltd. | | | 7.88% | | | | 03/13/2018 | | | | 7,296,250 | |
| | 1,500,000 | | | SB Capital S.A. | | | 4.95% | | | | 02/07/2017 | | | | 1,554,000 | |
| | 1,400,000 | | | SB Capital S.A. | | | 5.18% | | | | 06/28/2019 | | | | 1,428,000 | |
| | 9,000,000 | | | Sigma Alimentos S.A. | | | 5.63% | | | | 04/14/2018 | | | | 9,821,250 | |
| | 3,000,000 | | | SK Telecom Company Ltd. | | | 2.13% | | | | 05/01/2018 | | | | 2,977,740 | |
| | 6,700,000 | | | Sociedad Quimica y Minera S.A. | | | 6.13% | | | | 04/15/2016 | | | | 7,191,144 | |
| | 2,738,000 | | | Southern Copper Corporation | | | 6.38% | | | | 07/27/2015 | | | | 2,909,125 | |
| | 1,450,000 | | | Southern Copper Corporation | | | 1.95% | | | | 09/01/2016 | | | | 1,486,051 | |
| | 1,000,000 | | | Tanner Servicios Financieros S.A. | | | 4.38% | ^ | | | 03/13/2018 | | | | 1,006,898 | |
| | 1,500,000 | | | Tanner Servicios Financieros S.A. | | | 4.38% | | | | 03/13/2018 | | | | 1,510,347 | |
| | 2,000,000 | | | Telefonos de Mexico S.A.B. | | | 5.50% | | | | 01/27/2015 | | | | 2,068,500 | |
| | 3,500,000 | | | Telemovil Finance Company Ltd. | | | 8.00% | | | | 10/01/2017 | | | | 3,758,125 | |
| | 820,000 | | | TM Global, Inc. | | | 5.25% | | | | 09/22/2014 | | | | 837,103 | |
| | 2,500,000 | | | TransCapitalInvest Ltd. | | | 8.70% | | | | 08/07/2018 | | | | 2,931,250 | |
| | 4,500,000 | | | VEB Finance PLC | | | 5.45% | | | | 11/22/2017 | | | | 4,606,650 | |
| | 2,000,000 | | | VEB Finance PLC | | | 4.22% | | | | 11/21/2018 | | | | 1,925,000 | |
| | 2,000,000 | | | VTB Capital S.A. | | | 6.88% | | | | 05/29/2018 | | | | 2,130,000 | |
| | 2,942,000 | | | Westpac Banking Corporation | | | 1.13% | | | | 09/25/2015 | | | | 2,964,036 | |
| | 375,000 | | | Westpac Banking Corporation | | | 2.00% | | | | 08/14/2017 | | | | 381,449 | |
| | 2,200,000 | | | WPP Finance UK | | | 8.00% | | | | 09/15/2014 | | | | 2,272,107 | |
| | | | | | | | | | | | | | | | |
| | | | Total Foreign Corporate Bonds
(Cost $382,446,523) | | | | 385,128,729 | |
| | | | | | | | | | | | | | | | |
| FOREIGN GOVERNMENT BONDS AND NOTES,
SUPRANATIONALS AND FOREIGN AGENCIES 1.3% |
|
| | 2,400,000 | | | Banco Nacional de Desenvolvimento Economico e Social | | | 3.38% | ^ | | | 09/26/2016 | | | | 2,451,000 | |
| | | | | | | | | | | | | | | | |
PRINCIPAL
AMOUNT | | | SECURITY DESCRIPTION | | RATE | | | MATURITY | | | VALUE $ | |
| $ | 5,000,000 | | | Banco Nacional de Desenvolvimento Economico e Social | | | 6.37% | | | | 06/16/2018 | | | | 5,612,500 | |
| | 800,000 | | | Brazilian Government International Bond | | | 8.00% | | | | 01/15/2018 | | | | 895,000 | |
| | 6,000,000 | | | Caixa Economica Federal | | | 2.38% | | | | 11/06/2017 | | | | 5,805,000 | |
| | 2,000,000 | | | Caixa Economica Federal | | | 4.50% | | | | 10/03/2018 | | | | 2,040,000 | |
| | 566,000 | | | Colombia Government International Bond | | | 2.04% | # | | | 11/16/2015 | | | | 561,755 | |
| | 2,184,000 | | | Colombia Government International Bond | | | 8.70% | | | | 02/15/2016 | | | | 2,448,810 | |
| | 2,945,000 | | | Corporacion Andina de Fomento | | | 3.75% | | | | 01/15/2016 | | | | 3,084,867 | |
| | 1,800,000 | | | Ecopetrol S.A. | | | 4.25% | | | | 09/18/2018 | | | | 1,912,500 | |
| | | | | | | | | | | | | | | | |
| | | | Total Foreign Government Bonds and Notes, Supranationals and Foreign Agencies
(Cost $24,268,967) | | | | 24,811,432 | |
| | | | | | | | | | | | | | | | |
| | NON-AGENCY COMMERCIAL MORTGAGE BACKED OBLIGATIONS 16.2% | |
| |
| | | | Asset Securitization Corporation, | |
| | 6,009,416 | | | Series 1997-D4-PS1 | | | 1.10% | # I/O | | | 04/14/2029 | | | | 258,780 | |
| |
| | | | BAMLL Commercial Mortgage Securities Trust, | |
| | 2,000,000 | | | Series 2012-CLRN-A | | | 1.31% | #^ | | | 08/15/2029 | | | | 2,001,632 | |
| |
| | | | Banc of America Commercial Mortgage Trust, | |
| | 6,450,000 | | | Series 2005-3-AM | | | 4.73% | | | | 07/10/2043 | | | | 6,654,335 | |
| | 9,750,000 | | | Series 2006-5-AM | | | 5.45% | | | | 09/10/2047 | | | | 10,459,376 | |
| |
| | | | Bear Stearns Commercial Mortgage Securities, Inc., | |
| | 388,082 | | | Series 2004-PWR4-A3 | | | 5.47% | # | | | 06/11/2041 | | | | 388,406 | |
| | 2,905,190 | | | Series 2005-PWR8-A4 | | | 4.67% | | | | 06/11/2041 | | | | 3,006,800 | |
| | 6,250,000 | | | Series 2005-PWR8-AJ | | | 4.75% | | | | 06/11/2041 | | | | 6,456,475 | |
| | 1,300,000 | | | Series 2005-T18-AJ | | | 5.01% | # | | | 02/13/2042 | | | | 1,342,475 | |
| | 402,327 | | | Series 2006-PW12-AAB | | | 5.87% | # | | | 09/11/2038 | | | | 402,578 | |
| | 599,068 | | | Series 2007-PW17-AAB | | | 5.70% | | | | 06/11/2050 | | | | 606,871 | |
| |
| | | | Boca Hotel Portfolio Trust, | |
| | 3,887,401 | | | Series 2013-BOCA-A | | | 1.31% | #^ | | | 08/15/2026 | | | | 3,890,272 | |
| | 4,100,000 | | | Series 2013-BOCA-D | | | 3.21% | #^ | | | 08/15/2026 | | | | 4,110,543 | |
| |
| | | | Capital Trust, | |
| | 55,431 | | | Series 2005-3A-A2 | | | 5.16% | ^ | | | 06/25/2035 | | | | 55,431 | |
| |
| | | | CD Commercial Mortgage Trust, | |
| | 13,039,548 | | | Series 2007-CD5-XP | | | 0.17% | #^ I/O | | | 11/15/2044 | | | | 17,395 | |
| |
| | | | Citigroup Commercial Mortgage Trust, | |
| | 615,000 | | | Series 2005-C3-AM | | | 4.83% | # | | | 05/15/2043 | | | | 637,504 | |
| |
| | | | Commercial Mortgage Pass-Through Certificates, | |
| | 2,468,833 | | | Series 2006-FL12-B | | | 0.33% | #^ | | | 12/15/2020 | | | | 2,457,977 | |
| | 9,767,014 | | | Series 2012-CR2-XA | | | 1.93% | # I/O | | | 08/15/2045 | | | | 1,053,241 | |
| | 93,261 | | | Series 2012-MVP-A | | | 2.09% | #^ | | | 11/17/2026 | | | | 93,773 | |
| | 27,978,321 | | | Series 2012-MVP-XACP | | | 1.77% | #^ I/O | | | 12/17/2014 | | | | 377,609 | |
| | 30,000,000 | | | Series 2012-MVP-XBCP | | | 1.42% | #^ I/O | | | 12/17/2014 | | | | 329,310 | |
| | 3,890,000 | | | Series 2014-TWC-C | | | 2.01% | #^ | | | 02/13/2032 | | | | 3,898,459 | |
| |
| | | | Credit Suisse First Boston Mortgage Securities Corporation, | |
| | 385,223 | | | Series 1998-C2-F | | | 6.75% | #^ | | | 11/15/2030 | | | | 398,546 | |
| | 9,500,000 | | | Series 2005-C2-AMFX | | | 4.88% | | | | 04/15/2037 | | | | 9,595,646 | |
| | 2,000,000 | | | Series 2005-C6-AM | | | 5.23% | # | | | 12/15/2040 | | | | 2,129,125 | |
| |
| | | | Credit Suisse Mortgage Capital Certificates, | |
| | 5,940,000 | | | Series 2006-C4-AM | | | 5.51% | | | | 09/15/2039 | | | | 6,401,125 | |
| | 1,843,292 | | | Series 2006-TF2A-A2 | | | 0.33% | #^ | | | 10/15/2021 | | | | 1,836,010 | |
| | 4,411,684 | | | Series 2006-TF2A-KERB | | | 0.61% | #^ | | | 09/15/2021 | | | | 4,364,466 | |
| | 10,954,617 | | | Series 2006-TFL2A-KERE | | | 0.76% | #^ | | | 09/15/2021 | | | | 10,768,400 | |
| | 5,725,000 | | | Series 2017-C4-A1AM | | | 5.97% | # | | | 09/15/2039 | | | | 6,178,306 | |
| | 10,398,830 | | | Series 2007-TF2A-A1 | | | 0.34% | #^ | | | 04/15/2022 | | | | 10,314,833 | |
| | 20,200,000 | | | Series 2007-TFLA-G | | | 0.53% | #^ | | | 02/15/2022 | | | | 19,814,775 | |
| | 4,350,000 | | | Series 2014-SURF-E | | | 3.26% | #^ | | | 02/15/2029 | | | | 4,365,978 | |
| |
| | | | DBRR Trust, | |
| | 929,596 | | | Series 2012-EZ1-A | | | 0.95% | ^ | | | 09/25/2045 | | | | 929,318 | |
| | 687,000 | | | Series 2012-EZ1-B | | | 1.39% | ^ | | | 09/25/2045 | | | | 687,481 | |
| |
| | | | DDR Corporation, | |
| | 2,706,039 | | | Series 2009-DDR1-A | | | 3.81% | ^ | | | 10/14/2022 | | | | 2,746,181 | |
| | | | | | |
| The accompanying notes are an integral part of these financial statements. | | Annual Report | | March 31, 2014 | | 45 |
Schedule of Investments DoubleLine Low Duration Bond Fund (Cont.)
| | | | | | | | | | | | | | | | |
PRINCIPAL
AMOUNT | | | SECURITY DESCRIPTION | | RATE | | | MATURITY | | | VALUE $ | |
| |
| | | | Del Coronado Trust, | |
| $ | 2,100,000 | | | Series 2013-HDC-A | | | 0.96% | #^ | | | 03/15/2026 | | | | 2,100,923 | |
| | 2,500,000 | | | Series 2013-HDC-B | | | 1.46% | #^ | | | 03/15/2026 | | | | 2,497,389 | |
| |
| | | | Extended Stay America Trust, | |
| | 5,000,000 | | | Series 2013-ESH5-A15 | | | 1.28% | ^ | | | 12/05/2031 | | | | 4,897,547 | |
| |
| | | | GE Capital Commercial Mortgage Corporation, | |
| | 487,000 | | | Series 2004-C3-B | | | 5.57% | # | | | 07/10/2039 | | | | 491,534 | |
| | 1,100,000 | | | Series 2005-C2-B | | | 5.11% | # | | | 05/10/2043 | | | | 1,138,278 | |
| |
| | | | Greenwich Capital Commercial Funding Corporation, | |
| | 1,460,000 | | | Series 2004-FL2A-F | | | 0.56% | #^ | | | 11/05/2019 | | | | 1,449,050 | |
| | 5,019,000 | | | Series 2004-FL2A-G | | | 0.64% | #^ | | | 11/05/2019 | | | | 4,981,358 | |
| | 5,537,328 | | | Series 2004-FL2A-L | | | 1.26% | #^ | | | 11/05/2019 | | | | 5,385,051 | |
| | 7,250,000 | | | Series 2006-FL4A-D | | | 0.43% | #^ | | | 11/05/2021 | | | | 7,163,979 | |
| | 2,552,239 | | | Series 2006-FL4A-G | | | 0.58% | #^ | | | 11/05/2021 | | | | 2,448,261 | |
| |
| | | | GS Mortgage Securities Corporation, | |
| | 783,025 | | | Series 2012-GCJ7-A1 | | | 1.14% | | | | 05/10/2045 | | | | 786,041 | |
| | 5,000,000 | | | Series 2013-KYO-A | | | 1.00% | #^ | | | 11/08/2029 | | | | 5,021,190 | |
| |
| | | | JP Morgan Chase Commercial Mortgage Securities Corporation, | |
| | 77,435 | | | Series 2004-CB8-A1A | | | 4.16% | ^ | | | 01/12/2039 | | | | 77,387 | |
| | 2,428,707 | | | Series 2004-LN2-A2 | | | 5.12% | | | | 07/15/2041 | | | | 2,440,834 | |
| | 5,200,000 | | | Series 2005-CB12-B | | | 5.14% | # | | | 09/12/2037 | | | | 5,175,617 | |
| | 76,600 | | | Series 2006-CB14-ASB | | | 5.51% | # | | | 12/12/2044 | | | | 78,872 | |
| | 301,809 | | | Series 2006-CB15-ASB | | | 5.79% | # | | | 06/12/2043 | | | | 311,995 | |
| | 1,538,658 | | | Series 2006-CB17-ASB | | | 5.42% | | | | 12/12/2043 | | | | 1,607,619 | |
| | 3,589,145 | | | Series 2010-C1-A1 | | | 3.85% | ^ | | | 06/15/2043 | | | | 3,691,806 | |
| | 574,294 | | | Series 2011-PLSD-A1 | | | 2.19% | ^ | | | 11/13/2044 | | | | 584,423 | |
| | 4,000,000 | | | Series 2012-PHH-A | | | 1.82% | #^ | | | 10/15/2025 | | | | 4,016,186 | |
| | 1,000,000 | | | Series 2012-PHH-B | | | 2.02% | #^ | | | 10/15/2025 | | | | 1,002,438 | |
| | 1,000,000 | | | Series 2012-PHH-C | | | 2.52% | #^ | | | 10/15/2025 | | | | 1,003,317 | |
| | 4,000,000 | | | Series 2013-ALC-A | | | 1.66% | #^ | | | 07/17/2026 | | | | 4,008,166 | |
| | 3,500,000 | | | Series 2013-ALC-B | | | 3.01% | #^ | | | 07/17/2026 | | | | 3,534,004 | |
| | 2,600,000 | | | Series 2013-FL3-A1 | | | 0.96% | #^ | | | 04/15/2028 | | | | 2,601,884 | |
| | 2,500,000 | | | Series 2013-FL3-A2 | | | 0.86% | #^ | | | 04/15/2028 | | | | 2,494,240 | |
| | 6,000,000 | | | Series 2013-INN-B | | | 2.31% | #^ | | | 10/15/2030 | | | | 6,013,830 | |
| | 3,000,000 | | | Series 2013-INN-D | | | 3.56% | #^ | | | 10/15/2030 | | | | 3,011,556 | |
| | 5,000,000 | | | Series 2013-JWRZ-A | | | 0.94% | #^ | | | 04/15/2030 | | | | 4,968,743 | |
| | 2,400,000 | | | Series 2013-JWRZ-D | | | 3.15% | #^ | | | 04/15/2030 | | | | 2,402,713 | |
| | 5,750,000 | | | Series 2014-FBLU-B | | | 1.66% | #^ | | | 12/15/2028 | | | | 5,757,147 | |
| |
| | | | LB-UBS Commercial Mortgage Trust, | |
| | 865,223 | | | Series 2004-C6-A6 | | | 5.02% | # | | | 08/15/2029 | | | | 871,610 | |
| | 6,830,000 | | | Series 2005-C2-AJ | | | 5.21% | # | | | 04/15/2030 | | | | 7,068,937 | |
| | 10,345,000 | | | Series 2005-C7-AJ | | | 5.32% | # | | | 11/15/2040 | | | | 10,858,340 | |
| | 4,350,000 | | | Series 2006-C7-AM | | | 5.38% | | | | 11/15/2038 | | | | 4,737,120 | |
| |
| | | | Merrill Lynch Mortgage Trust, | |
| | 961,567 | | | Series 2004-KEY2-A4 | | | 4.86% | # | | | 08/12/2039 | | | | 969,011 | |
| | 500,000 | | | Series 2005-CIP1-AM | | | 5.11% | # | | | 07/12/2038 | | | | 525,611 | |
| | 10,350,000 | | | Series 2005-CKI1-AJ | | | 5.46% | # | | | 11/12/2037 | | | | 10,887,284 | |
| |
| | | | Merrill Lynch/Countrywide Commercial Mortgage Trust, | |
| | 123,772 | | | Series 2006-4-A2FL | | | 0.28% | # | | | 12/12/2049 | | | | 123,492 | |
| |
| | | | Morgan Stanley Bank of America Merrill Lynch Trust, | |
| | 3,915,786 | | | Series 2012-C5-XA | | | 1.88% | #^ I/O | | | 08/15/2045 | | | | 358,326 | |
| |
| | | | Morgan Stanley Capital, Inc., | |
| | 175,914 | | | Series 2005-HQ6-AAB | | | 4.97% | | | | 08/13/2042 | | | | 177,979 | |
| | 9,000,000 | | | Series 2005-HQ7-AJ | | | 5.38% | # | | | 11/14/2042 | | | | 9,430,205 | |
| | 4,750,000 | | | Series 2005-IQ10-AJ | | | 5.20% | # | | | 09/15/2042 | | | | 4,966,873 | |
| | 1,389,371 | | | Series 2005-T17-A5 | | | 4.78% | | | | 12/13/2041 | | | | 1,413,699 | |
| | 10,750,000 | | | Series 2005-T19-AJ | | | 4.99% | # | | | 06/12/2047 | | | | 11,170,485 | |
| | 22,413,971 | | | Series 2006-HQ10-X1 | | | 0.71% | #^ I/O | | | 11/12/2041 | | | | 270,716 | |
| | 9,252,567 | | | Series 2006-XLF-J | | | 0.59% | #^ | | | 07/15/2019 | | | | 9,084,869 | |
| | 252,351 | | | Series 2007-T25-AAB | | | 5.51% | | | | 11/12/2049 | | | | 254,700 | |
| | 7,275,318 | | | Series 2007-XLF9-J | | | 2.26% | #^ | | | 12/15/2020 | | | | 7,186,657 | |
| |
| | | | Morgan Stanley Re-Remic Trust, | |
| | 1,126,477 | | | Series 2012-IO-AXA | | | 1.00% | ^ | | | 03/27/2051 | | | | 1,123,773 | |
| |
| | | | RBS Greenwich Capital Mortgage Loan Trust, | |
| | 4,300,000 | | | Series 2010-MB1-C | | | 4.69% | #^ | | | 04/15/2024 | | | | 4,426,661 | |
| |
| | | | RREF LLC, | |
| | 921,119 | | | Series 2013-LT2-A | | | 2.83% | ^ | | | 05/22/2028 | | | | 920,046 | |
| |
| | | | SMA Issuer LLC, | |
| | 105,137 | | | Series 2012-LV1-A | | | 3.50% | ^ | | | 08/20/2025 | | | | 104,996 | |
| | | | | | | | | | | | | | | | |
PRINCIPAL
AMOUNT | | | SECURITY DESCRIPTION | | RATE | | | MATURITY | | | VALUE $ | |
| |
| | | | Wachovia Bank Commercial Mortgage Trust, | |
| $ | 982,792 | | | Series 2005-C17-A4 | | | 5.08% | # | | | 03/15/2042 | | | | 1,007,380 | |
| | 46,049 | | | Series 2006-C26-APB | | | 6.00% | | | | 06/15/2045 | | | | 48,283 | |
| |
| | | | WF-RBS Commercial Mortgage Trust, | |
| | 230,179 | | | Series 2011-C3-A1 | | | 1.99% | ^ | | | 03/15/2044 | | | | 232,847 | |
| | 3,430,393 | | | Series 2012-C8-XA | | | 2.22% | #^ I/O | | | 08/15/2045 | | | | 389,250 | |
| | | | | | | | | | | | | | | | |
| | | | Total Non-Agency Commercial Mortgage Backed Obligations
(Cost $310,688,009) | | | | 310,781,960 | |
| | | | | | | | | | | | | | | | |
| NON-AGENCY RESIDENTIAL COLLATERALIZED MORTGAGE
OBLIGATIONS 8.3% |
|
| |
| | | | ACE Securities Corporation, | |
| | 335,527 | | | Series 2006-NC1-A2C | | | 0.35% | # | | | 12/25/2035 | | | | 333,744 | |
| |
| | | | Banc of America Funding Corporation, | |
| | 1,633,187 | | | Series 2005-E-6A1 | | | 4.09% | # | | | 05/20/2035 | | | | 1,657,179 | |
| | 1,340,004 | | | Series 2012-R4-A | | | 0.41% | #^ | | | 03/04/2039 | | | | 1,310,580 | |
| | 4,435,425 | | | Series 2012-R5-A | | | 0.41% | #^ | | | 10/03/2039 | | | | 4,380,860 | |
| |
| | | | BCAP LLC Trust, | |
| | 49,250 | | | Series 2009-RR13-6A5 | | | 6.00% | #^ | | | 04/26/2037 | | | | 51,350 | |
| | 1,195,438 | | | Series 2011-RR12-2A5 | | | 2.32% | #^ | | | 12/26/2036 | | | | 1,199,460 | |
| |
| | | | Bear Stearns Asset Backed Securities Trust, | |
| | 1,784,719 | | | Series 2004-AC2-2A | | | 5.00% | | | | 05/25/2034 | | | | 1,798,544 | |
| | 185,973 | | | Series 2005-3-A1 | | | 0.60% | # | | | 09/25/2035 | | | | 186,283 | |
| |
| | | | Carrington Mortgage Loan Trust, | |
| | 1,641,645 | | | Series 2007-RFC1-A1 | | | 0.20% | # | | | 12/25/2036 | | | | 1,615,611 | |
| |
| | | | Citigroup Mortgage Loan Trust, Inc., | |
| | 5,000,000 | | | Series 2007-WFHE2-A3 | | | 0.33% | # | | | 03/25/2037 | | | | 4,744,930 | |
| | 660,488 | | | Series 2010-12-3A1 | | | 4.00% | ^ | | | 04/25/2037 | | | | 677,130 | |
| | 1,794,004 | | | Series 2010-8-5A6 | | | 4.00% | ^ | | | 11/25/2036 | | | | 1,833,014 | |
| | 1,182,271 | | | Series 2011-12-1A1 | | | 3.50% | #^ | | | 04/25/2036 | | | | 1,195,114 | |
| | 864,003 | | | Series 2011-12-3A1 | | | 2.67% | #^ | | | 09/25/2047 | | | | 864,236 | |
| |
| | | | Countrywide Alternative Loan Trust, | |
| | 509,016 | | | Series 2007-HY5R-2A1A | | | 3.02% | # | | | 03/25/2047 | | | | 500,941 | |
| |
| | | | Countrywide Asset-Backed Certificates, | |
| | 2,206,945 | | | Series 2005-15-1AF6 | | | 4.68% | # | | | 04/25/2036 | | | | 2,227,732 | |
| | 873,719 | | | Series 2006-2-2A2 | | | 0.34% | # | | | 06/25/2036 | | | | 849,025 | |
| |
| | | | Credit Suisse First Boston Mortgage Securities Corporation, | |
| | 1,149,805 | | | Series 2005-11-5A1 | | | 5.25% | | | | 12/25/2020 | | | | 1,180,762 | |
| |
| | | | Credit Suisse Mortgage Capital Certificates, | |
| | 1,144,131 | | | Series 2009-13R-2A1 | | | 6.00% | ^ | | | 01/26/2037 | | | | 1,167,051 | |
| | 8,892,188 | | | Series 2010-18R-4A2 | | | 2.35% | #^ | | | 04/26/2038 | | | | 8,911,785 | |
| | 46,566 | | | Series 2010-1R-5A1 | | | 5.00% | #^ | | | 01/27/2036 | | | | 47,212 | |
| | 1,377,137 | | | Series 2011-16R-6A1 | | | 2.42% | #^ | | | 09/27/2035 | | | | 1,376,740 | |
| | 8,933,248 | | | Series 2013-3R-1A1 | | | 1.29% | #^ | | | 04/27/2035 | | | | 8,529,596 | |
| |
| | | | Ellington Loan Acquisition Trust, | |
| | 1,649,878 | | | Series 2007-2-A2A | | | 1.05% | #^ | | | 05/25/2037 | | | | 1,625,518 | |
| |
| | | | Fieldstone Mortgage Investment Trust, | |
| | 3,164,697 | | | Series 2004-5-M2 | | | 1.88% | # | | | 02/25/2035 | | | | 3,078,986 | |
| |
| | | | First Franklin Mortgage Loan Trust, | |
| | 7,063,742 | | | Series 2005-FF12-A2B | | | 0.41% | # | | | 11/25/2036 | | | | 6,882,186 | |
| | 1,138,567 | | | Series 2006-FF1-2A3 | | | 0.39% | # | | | 01/25/2036 | | | | 1,106,776 | |
| |
| | | | GreenPoint Mortgage Funding Trust, | |
| | 108 | | | Series 2007-AR2-1A1 | | | 0.28% | # | | | 04/25/2047 | | | | 108 | |
| |
| | | | GSR Mortgage Loan Trust, | |
| | 2,567,305 | | | Series 2006-4F-2A7 | | | 5.50% | | | | 05/25/2036 | | | | 2,556,073 | |
| |
| | | | Jefferies & Company, Inc., | |
| | 742,030 | | | Series 2010-R7-5A1 | | | 1.15% | #^ | | | 09/26/2035 | | | | 719,200 | |
| |
| | | | JP Morgan Alternative Loan Trust, | |
| | 2,056,499 | | | Series 2006-S4-A6 | | | 5.71% | # | | | 12/25/2036 | | | | 1,980,307 | |
| |
| | | | JP Morgan Mortgage Acquisition Corporation, | |
| | 4,225,662 | | | Series 2006-NC1-A4 | | | 0.32% | # | | | 04/25/2036 | | | | 4,079,644 | |
| | 6,739,942 | | | Series 2007-CH5-A3 | | | 0.26% | # | | | 05/25/2037 | | | | 6,537,059 | |
| | | | | | |
| 46 | | DoubleLine Funds Trust | | | | The accompanying notes are an integral part of these financial statements. |
| | | | | | | | | | | | | | | | |
PRINCIPAL
AMOUNT | | | SECURITY DESCRIPTION | | RATE | | | MATURITY | | | VALUE $ | |
| |
| | | | JP Morgan Mortgage Trust, | |
| $ | 366,385 | | | Series 2007-S1-1A1 | | | 5.00% | | | | 03/25/2022 | | | | 363,409 | |
| | 362,337 | | | Series 2007-S3-2A2 | | | 5.50% | | | | 08/25/2022 | | | | 360,338 | |
| |
| | | | JP Morgan Resecuritization Trust, | |
| | 515,223 | | | Series 2009-7-8A1 | | | 2.81% | #^ | | | 01/27/2047 | | | | 516,494 | |
| | 403,806 | | | Series 2011-2-2A3 | | | 2.12% | #^ | | | 07/26/2036 | | | | 409,904 | |
| | 3,194,518 | | | Series 2011-2-6A11 | | | 5.50% | #^ | | | 12/26/2035 | | | | 3,179,104 | |
| | 979,473 | | | Series 2012-2-3A3 | | | 2.41% | #^ | | | 10/26/2036 | | | | 981,291 | |
| |
| | | | MASTR Adjustable Rate Mortgages Trust, | |
| | 3,618,370 | | | Series 2007-2-A2 | | | 0.26% | # | | | 03/25/2047 | | | | 3,531,422 | |
| |
| | | | MASTR Asset Backed Securities Trust, | |
| | 180,289 | | | Series 2006-NC1-A3 | | | 0.34% | # | | | 01/25/2036 | | | | 177,086 | |
| |
| | | | Morgan Stanley Capital, Inc., | |
| | 2,234,313 | | | Series 2005-WMC3-M3 | | | 0.86% | # | | | 03/25/2035 | | | | 2,228,788 | |
| | 3,643,983 | | | Series 2006-NC2-A2C | | | 0.33% | # | | | 02/25/2036 | | | | 3,615,923 | |
| |
| | | | Morgan Stanley Mortgage Loan Trust, | |
| | 256,254 | | | Series 2004-1-1A1 | | | 5.00% | | | | 11/25/2018 | | | | 263,015 | |
| |
| | | | Opteum Mortgage Acceptance Corporation, | |
| | 3,380,776 | | | Series 2005-5-2AN | | | 5.68% | # | | | 12/25/2035 | | | | 3,574,322 | |
| |
| | | | RAAC Series, | |
| | 1,525,771 | | | Series 2007-SP2-A1 | | | 0.35% | # | | | 06/25/2047 | | | | 1,521,061 | |
| |
| | | | Residential Asset Mortgage Products, Inc., | |
| | 13,582,713 | | | Series 2006-RS4-A3 | | | 0.32% | # | | | 07/25/2036 | | | | 12,877,877 | |
| |
| | | | Residential Asset Securities Corporation, | |
| | 5,475,012 | | | Series 2006-KS6-A3 | | | 0.30% | # | | | 08/25/2036 | | | | 5,190,405 | |
| | 2,892,211 | | | Series 2006-KS9-AI2 | | | 0.27% | # | | | 11/25/2036 | | | | 2,877,073 | |
| | 15,867,557 | | | Series 2007-KS2-AI2 | | | 0.27% | # | | | 02/25/2037 | | | | 15,411,205 | |
| |
| | | | Residential Asset Securitization Trust, | |
| | 779,843 | | | Series 2005-A5-A1 | | | 0.45% | # | | | 05/25/2035 | | | | 780,148 | |
| | 779,843 | | | Series 2005-A5-A2 | | | 5.05% | # I/F I/O | | | 05/25/2035 | | | | 6,638 | |
| |
| | | | Residential Funding Mortgage Securities Trust, | |
| | 233,971 | | | Series 2003-S16-A1 | | | 4.75% | | | | 09/25/2018 | | | | 234,293 | |
| |
| | | | Soundview Home Equity Loan Trust, | |
| | 7,273,420 | | | Series 2007-NS1-A2 | | | 0.30% | # | | | 01/25/2037 | | | | 7,060,952 | |
| |
| | | | Structured Adjustable Rate Mortgage Loan Trust, | |
| | 437,669 | | | Series 2006-5-5A3 | | | 4.89% | # | | | 06/25/2036 | | | | 433,216 | |
| | 4,543,520 | | | Series 2007-1-2A2 | | | 4.65% | # | | | 02/25/2037 | | | | 4,356,050 | |
| |
| | | | Structured Asset Securities Corporation, | |
| | 665,316 | | | Series 2003-24A-1A3 | | | 2.45% | # | | | 07/25/2033 | | | | 669,466 | |
| | 330,823 | | | Series 2004-15-2A1 | | | 4.75% | | | | 09/25/2019 | | | | 336,217 | |
| | 911,033 | | | Series 2005-10-6A1 | | | 5.00% | | | | 06/25/2020 | | | | 954,664 | |
| | 9,431,280 | | | Series 2005-AXS-1A3 | | | 5.00% | # | | | 03/25/2035 | | | | 9,758,615 | |
| |
| | | | Wells Fargo Alternative Loan Trust, | |
| | 871,169 | | | Series 2007-PA5-2A1 | | | 6.00% | | | | 11/25/2022 | | | | 904,645 | |
| |
| | | | Wells Fargo Mortgage Backed Securities Trust, | |
| | 37,210 | | | Series 2006-4-1A8 | | | 5.75% | | | | 04/25/2036 | | | | 37,359 | |
| |
| | | | Wells Fargo Mortgage Loan Trust, | |
| | 684,957 | | | Series 2012-RR1-A1 | | | 2.85% | #^ | | | 08/27/2037 | | | | 691,362 | |
| | | | | | | | | | | | | | | | |
| | | | Total Non-Agency Residential Collateralized Mortgage Obligations
(Cost $155,898,872) | | | | 158,507,078 | |
| | | | | | | | | | | | | | | | |
| | US CORPORATE BONDS 8.8% | |
| | 3,050,000 | | | Altria Group, Inc. | | | 4.13% | | | | 09/11/2015 | | | | 3,197,254 | |
| | 3,000,000 | | | American Express Credit Corporation | | | 1.75% | | | | 06/12/2015 | | | | 3,042,511 | |
| | 500,000 | | | American Express Credit Corporation | | | 1.30% | | | | 07/29/2016 | | | | 504,181 | |
| | 850,000 | | | Amgen, Inc. | | | 1.88% | | | | 11/15/2014 | | | | 856,790 | |
| | 2,450,000 | | | Amgen, Inc. | | | 2.13% | | | | 05/15/2017 | | | | 2,499,908 | |
| | 700,000 | | | Anheuser-Busch Inbev Worldwide, Inc. | | | 1.38% | | | | 07/15/2017 | | | | 701,592 | |
| | 750,000 | | | Anheuser-Busch InBev Worldwide, Inc. | | | 5.38% | | | | 11/15/2014 | | | | 772,931 | |
| | | | | | | | | | | | | | | | |
PRINCIPAL
AMOUNT | | | SECURITY DESCRIPTION | | RATE | | | MATURITY | | | VALUE $ | |
| $ | 2,200,000 | | | Anheuser-Busch InBev Worldwide, Inc. | | | 0.80% | | | | 07/15/2015 | | | | 2,208,005 | |
| | 3,000,000 | | | AT&T, Inc. | | | 2.50% | | | | 08/15/2015 | | | | 3,075,585 | |
| | 600,000 | | | AT&T, Inc. | | | 1.70% | | | | 06/01/2017 | | | | 605,657 | |
| | 2,122,000 | | | BB&T Corporation | | | 3.20% | | | | 03/15/2016 | | | | 2,215,705 | |
| | 1,145,000 | | | BB&T Corporation | | | 2.15% | | | | 03/22/2017 | | | | 1,172,357 | |
| | 2,575,000 | | | Berkshire Hathaway Finance Corporation | | | 0.95% | | | | 08/15/2016 | | | | 2,589,772 | |
| | 912,000 | | | Berkshire Hathaway, Inc. | | | 2.20% | | | | 08/15/2016 | | | | 942,849 | |
| | 971,000 | | | Boeing Capital Corporation | | | 3.25% | | | | 10/27/2014 | | | | 987,161 | |
| | 2,175,000 | | | Boeing Company | | | 3.75% | | | | 11/20/2016 | | | | 2,338,423 | |
| | 1,400,000 | | | Caterpillar Financial Services Corporation | | | 1.10% | | | | 05/29/2015 | | | | 1,409,906 | |
| | 1,900,000 | | | Caterpillar Financial Services Corporation | | | 1.35% | | | | 09/06/2016 | | | | 1,921,144 | |
| | 3,505,000 | | | Citigroup, Inc. | | | 1.35% | | | | 03/10/2017 | | | | 3,490,560 | |
| | 2,637,000 | | | Comcast Corporation | | | 6.50% | | | | 01/15/2015 | | | | 2,758,482 | |
| | 750,000 | | | Comcast Corporation | | | 6.50% | | | | 01/15/2017 | | | | 856,832 | |
| | 3,490,000 | | | ConocoPhillips Company | | | 4.60% | | | | 01/15/2015 | | | | 3,603,523 | |
| | 3,655,000 | | | Daimler Finance North America LLC | | | 1.45% | ^ | | | 08/01/2016 | | | | 3,691,466 | |
| | 3,400,000 | | | Devon Energy Corporation | | | 1.88% | | | | 05/15/2017 | | | | 3,427,183 | |
| | 1,400,000 | | | DIRECTV Holdings LLC | | | 4.75% | | | | 10/01/2014 | | | | 1,427,549 | |
| | 1,600,000 | | | DIRECTV Holdings LLC | | | 2.40% | | | | 03/15/2017 | | | | 1,636,088 | |
| | 2,935,000 | | | Dow Chemical Company | | | 2.50% | | | | 02/15/2016 | | | | 3,025,583 | |
| | 3,000,000 | | | Duke Energy Corporation | | | 2.15% | | | | 11/15/2016 | | | | 3,082,971 | |
| | 3,045,000 | | | eBay, Inc. | | | 0.70% | | | | 07/15/2015 | | | | 3,057,262 | |
| | 550,000 | | | Ecolab, Inc. | | | 2.38% | | | | 12/08/2014 | | | | 556,977 | |
| | 2,531,000 | | | Ecolab, Inc. | | | 1.00% | | | | 08/09/2015 | | | | 2,539,646 | |
| | 490,000 | | | Ecolab, Inc. | | | 3.00% | | | | 12/08/2016 | | | | 513,789 | |
| | 2,900,000 | | | Express Scripts Holding Company | | | 2.10% | | | | 02/12/2015 | | | | 2,937,578 | |
| | 2,920,000 | | | General Electric Capital Corporation | | | 1.63% | | | | 07/02/2015 | | | | 2,960,600 | |
| | 675,000 | | | General Electric Capital Corporation | | | 2.90% | | | | 01/09/2017 | | | | 706,808 | |
| | 1,650,000 | | | General Mills, Inc. | | | 5.20% | | | | 03/17/2015 | | | | 1,722,612 | |
| | 1,700,000 | | | General Mills, Inc. | | | 5.70% | | | | 02/15/2017 | | | | 1,905,494 | |
| | 1,600,000 | | | Gilead Sciences, Inc. | | | 2.40% | | | | 12/01/2014 | | | | 1,619,553 | |
| | 1,900,000 | | | Gilead Sciences, Inc. | | | 3.05% | | | | 12/01/2016 | | | | 1,999,190 | |
| | 3,080,000 | | | Goldman Sachs Group, Inc. | | | 5.75% | | | | 10/01/2016 | | | | 3,414,925 | |
| | 3,450,000 | | | Hewlett-Packard Company | | | 3.30% | | | | 12/09/2016 | | | | 3,630,863 | |
| | 1,440,000 | | | John Deere Capital Corporation | | | 0.88% | | | | 04/17/2015 | | | | 1,448,474 | |
| | 1,600,000 | | | John Deere Capital Corporation | | | 1.40% | | | | 03/15/2017 | | | | 1,612,317 | |
| | 1,875,000 | | | JP Morgan Chase & Company | | | 1.10% | | | | 10/15/2015 | | | | 1,883,409 | |
| | 1,400,000 | | | JP Morgan Chase & Company | | | 3.15% | | | | 07/05/2016 | | | | 1,465,829 | |
| | 1,765,000 | | | Kellogg Company | | | 1.13% | | | | 05/15/2015 | | | | 1,776,179 | |
| | 1,400,000 | | | Kellogg Company | | | 1.75% | | | | 05/17/2017 | | | | 1,410,891 | |
| | 1,350,000 | | | Kinder Morgan Energy Partners LP | | | 3.50% | | | | 03/01/2016 | | | | 1,407,043 | |
| | 1,524,000 | | | Kinder Morgan Energy Partners LP | | | 6.00% | | | | 02/01/2017 | | | | 1,699,931 | |
| | 2,850,000 | | | Kraft Foods, Inc. | | | 4.13% | | | | 02/09/2016 | | | | 3,013,624 | |
| | 1,900,000 | | | Kroger Company | | | 4.95% | | | | 01/15/2015 | | | | 1,963,942 | |
| | 245,000 | | | Kroger Company | | | 2.20% | | | | 01/15/2017 | | | | 250,777 | |
| | 1,329,000 | | | Marriott International, Inc. | | | 5.81% | | | | 11/10/2015 | | | | 1,429,155 | |
| | 1,500,000 | | | Marriott International, Inc. | | | 6.20% | | | | 06/15/2016 | | | | 1,646,645 | |
| | 800,000 | | | MetLife Institutional Funding | | | 1.63% | ^ | | | 04/02/2015 | | | | 809,743 | |
| | 750,000 | | | Metropolitan Life Global Funding | | | 5.13% | ^ | | | 06/10/2014 | | | | 756,875 | |
| | 200,000 | | | Metropolitan Life Global Funding | | | 2.00% | ^ | | | 01/09/2015 | | | | 202,449 | |
| | 1,460,000 | | | Metropolitan Life Global Funding | | | 2.50% | ^ | | | 09/29/2015 | | | | 1,500,064 | |
| | 3,475,000 | | | Morgan Stanley | | | 1.75% | | | | 02/25/2016 | | | | 3,521,476 | |
| | | | | | |
| The accompanying notes are an integral part of these financial statements. | | Annual Report | | March 31, 2014 | | 47 |
Schedule of Investments DoubleLine Low Duration Bond Fund (Cont.)
| | | | | | | | | | | | | | | | |
PRINCIPAL
AMOUNT | | | SECURITY DESCRIPTION | | RATE | | | MATURITY | | | VALUE $ | |
| $ | 3,400,000 | | | Mylan, Inc. | | | 1.80% | | | | 06/24/2016 | | | | 3,449,515 | |
| | 2,019,000 | | | National Rural Utilities Cooperative Finance Corporation | | | 3.88% | | | | 09/16/2015 | | | | 2,114,644 | |
| | 780,000 | | | National Rural Utilities Cooperative Finance Corporation | | | 1.90% | | | | 11/01/2015 | | | | 796,084 | |
| | 50,000 | | | National Rural Utilities Cooperative Finance Corporation | | | 1.10% | | | | 01/27/2017 | | | | 49,856 | |
| | 2,910,000 | | | ONEOK Partners LP | | | 3.25% | | | | 02/01/2016 | | | | 3,026,915 | |
| | 3,179,000 | | | Phillips 66 | | | 1.95% | | | | 03/05/2015 | | | | 3,216,782 | |
| | 400,000 | | | Phillips 66 | | | 2.95% | | | | 05/01/2017 | | | | 417,577 | |
| | 1,650,000 | | | PNC Funding Corporation | | | 4.25% | | | | 09/21/2015 | | | | 1,732,708 | |
| | 1,525,000 | | | PNC Funding Corporation | | | 2.70% | | | | 09/19/2016 | | | | 1,585,951 | |
| | 2,852,000 | | | Procter & Gamble Company | | | 3.15% | | | | 09/01/2015 | | | | 2,960,804 | |
| | 908,000 | | | Simon Property Group LP | | | 5.25% | | | | 12/01/2016 | | | | 999,925 | |
| | 1,375,000 | | | Southern Power Company | | | 4.88% | | | | 07/15/2015 | | | | 1,445,925 | |
| | 152,000 | | | Southwest Airlines Company | | | 5.25% | | | | 10/01/2014 | | | | 155,365 | |
| | 200,000 | | | Southwest Airlines Company | | | 5.75% | | | | 12/15/2016 | | | | 222,207 | |
| | 1,900,000 | | | Southwest Airlines Company | | | 5.13% | | | | 03/01/2017 | | | | 2,084,956 | |
| | 3,375,000 | | | Thomson Reuters Corporation | | | 1.30% | | | | 02/23/2017 | | | | 3,360,348 | |
| | 1,040,000 | | | Toyota Motor Credit Corporation | | | 1.00% | | | | 02/17/2015 | | | | 1,046,615 | |
| | 2,290,000 | | | Toyota Motor Credit Corporation | | | 1.75% | | | | 05/22/2017 | | | | 2,324,819 | |
| | 2,401,000 | | | Valero Energy Corporation | | | 4.50% | | | | 02/01/2015 | | | | 2,479,100 | |
| | 1,000,000 | | | Valero Energy Corporation | | | 6.13% | | | | 06/15/2017 | | | | 1,147,203 | |
| | 3,245,000 | | | Verizon Communications, Inc. | | | 2.50% | | | | 09/15/2016 | | | | 3,362,099 | |
| | 2,900,000 | | | Wal-Mart Stores, Inc. | | | 0.60% | | | | 04/11/2016 | | | | 2,900,287 | |
| | 225,000 | | | Wal-Mart Stores, Inc. | | | 5.38% | | | | 04/05/2017 | | | | 253,404 | |
| | 3,577,000 | | | Waste Management, Inc. | | | 2.60% | | | | 09/01/2016 | | | | 3,706,470 | |
| | 426,000 | | | WellPoint, Inc. | | | 5.00% | | | | 12/15/2014 | | | | 439,391 | |
| | 2,334,000 | | | WellPoint, Inc. | | | 5.25% | | | | 01/15/2016 | | | | 2,508,641 | |
| | 2,912,000 | | | Wells Fargo & Company | | | 1.50% | | | | 07/01/2015 | | | | 2,946,798 | |
| | 575,000 | | | Wells Fargo & Company | | | 2.10% | | | | 05/08/2017 | | | | 589,202 | |
| | 2,975,000 | | | Xerox Corporation | | | 4.25% | | | | 02/15/2015 | | | | 3,065,940 | |
| | | | | | | | | | | | | | | | |
| | | | Total US Corporate Bonds
(Cost $166,879,655) | | | | 167,795,619 | |
| | | | | | | | | | | | | | | | |
| | US GOVERNMENT / AGENCY MORTGAGE BACKED OBLIGATIONS 1.5% | |
| |
| | | | Federal Home Loan Mortgage Corporation, | |
| | 303,144 | | | Pool G0-6871 | | | 6.00% | | | | 06/01/2038 | | | | 339,065 | |
| | 669,576 | | | Pool G0-6954 | | | 6.00% | | | | 05/01/2040 | | | | 743,737 | |
| | 658,551 | | | Pool N7-0081 | | | 5.50% | | | | 07/01/2038 | | | | 731,267 | |
| | 173,291 | | | Series 3267-BA | | | 5.80% | | | | 11/15/2036 | | | | 187,636 | |
| | 748,723 | | | Series 3818-JA | | | 4.50% | | | | 01/15/2040 | | | | 778,506 | |
| | 128,956 | | | Series 3872-BA | | | 4.00% | | | | 06/15/2041 | | | | 134,877 | |
| | 7,080,125 | | | Series 4050-BC | | | 2.00% | | | | 05/15/2041 | | | | 6,595,204 | |
| |
| | | | Federal National Mortgage Association, | |
| | 421,468 | | | Series 2011-64-DB | | | 4.00% | | | | 07/25/2041 | | | | 439,098 | |
| | | | | | | | | | | | | | | | |
PRINCIPAL
AMOUNT/ SHARES | | | SECURITY DESCRIPTION | | RATE | | | MATURITY | | | VALUE $ | |
| |
| | | | Federal National Mortgage Association, (Cont.) | |
| $ | 3,474,016 | | | Series 2012-133-PB | | | 6.50% | | | | 04/25/2042 | | | | 3,958,102 | |
| |
| | | | Federal National Mortgage Association Pass-Thru, | |
| | 92,359 | | | Pool 995112 | | | 5.50% | | | | 07/01/2036 | | | | 102,863 | |
| | 343,447 | | | Pool AB3850 | | | 4.00% | | | | 11/01/2041 | | | | 353,994 | |
| | 309,483 | | | Pool AD0189 | | | 5.50% | | | | 02/01/2039 | | | | 344,407 | |
| | 603,400 | | | Pool AL1690 | | | 6.00% | | | | 05/01/2041 | | | | 672,103 | |
| | 476,795 | | | Pool AL1691 | | | 6.00% | | | | 06/01/2041 | | | | 531,414 | |
| | 659,847 | | | Pool AL1744 | | | 6.00% | | | | 10/01/2040 | | | | 735,500 | |
| | 10,994,272 | | | Pool AL4292 | | | 4.50% | | | | 04/01/2026 | | | | 11,829,955 | |
| | | | | | | | | | | | | | | | |
| | | | Total US Government / Agency Mortgage Backed Obligations
(Cost $28,307,442) | | | | 28,477,728 | |
| | | | | | | | | | | | | | | | |
| | US GOVERNMENT BONDS AND NOTES 7.0% | |
| | 40,200,000 | | | United States Treasury Notes | | | 0.25% | | | | 05/31/2014 | | | | 40,214,914 | |
| | 40,000,000 | | | United States Treasury Notes | | | 0.13% | | | | 07/31/2014 | | | | 40,010,160 | |
| | 28,800,000 | | | United States Treasury Notes | | | 0.88% | | | | 12/31/2016 | | | | 28,870,877 | |
| | 17,900,000 | | | United States Treasury Notes | | | 0.75% | | | | 06/30/2017 | | | | 17,734,980 | |
| | 8,100,000 | | | United States Treasury Notes | | | 0.75% | | | | 12/31/2017 | | | | 7,943,062 | |
| | | | | | | | | | | | | | | | |
| | | | Total US Government Bonds and Notes
(Cost $134,845,243) | | | | 134,773,993 | |
| | | | | | | | | | | | | | | | |
| | SHORT TERM INVESTMENTS 9.7% | |
| | 61,833,369 | | | BlackRock Institutional Liquidity Funds FedFund Portfolio | | | 0.01% | ¨ | | | | | | | 61,833,369 | |
| | 61,833,369 | | | Fidelity Institutional Government Portfolio | | | 0.01% | ¨ | | | | | | | 61,833,369 | |
| | 61,833,368 | | | Morgan Stanley Institutional Liquidity Funds | | | 0.04% | ¨ | | | | | | | 61,833,368 | |
| | | | | | | | | | | | | | | | |
| | | | Total Short Term Investments
(Cost $185,500,106) | | | | 185,500,106 | |
| | | | | | | | | | | | | | | | |
| | | | Total Investments 103.4%
(Cost $1,971,938,324) | | | | 1,979,691,925 | |
| | | | Liabilities in Excess of Other Assets (3.4)% | | | | (65,833,632 | ) |
| | | | | | | | | | | | | | | | |
| | | | NET ASSETS 100.0% | | | $ | 1,913,858,293 | |
| | | | | | | | | | | | | | | | |
| | | | | | |
| 48 | | DoubleLine Funds Trust | | | | The accompanying notes are an integral part of these financial statements. |
March 31, 2014
| | | | |
| SECURITY TYPE BREAKDOWN as % of Net Assets | | | | |
Foreign Corporate Bonds | | | 20.1% | |
Collateralized Loan Obligations | | | 19.9% | |
Non-Agency Commercial Mortgage Backed Obligations | | | 16.2% | |
Bank Loans | | | 9.9% | |
Short Term Investments | | | 9.7% | |
US Corporate Bonds | | | 8.8% | |
Non-Agency Residential Collateralized Mortgage Obligations | | | 8.3% | |
US Government Bonds and Notes | | | 7.0% | |
US Government / Agency Mortgage Backed Obligations | | | 1.5% | |
Foreign Government Bonds and Notes, Supranationals and Foreign Agencies | | | 1.3% | |
Asset Backed Obligations | | | 0.7% | |
Other Assets and Liabilities | | | (3.4)% | |
| | | | |
| | | 100.0% | |
| | | | |
| | | | |
| COUNTRY BREAKDOWN as a % of Net Assets: | | | | |
United States | | | 82.0% | |
Colombia | | | 2.9% | |
Brazil | | | 2.9% | |
Chile | | | 2.8% | |
Russia | | | 2.7% | |
Mexico | | | 2.1% | |
Peru | | | 1.6% | |
Singapore | | | 1.0% | |
Panama | | | 0.9% | |
United Kingdom | | | 0.6% | |
China | | | 0.6% | |
Australia | | | 0.4% | |
Costa Rica | | | 0.4% | |
Canada | | | 0.3% | |
South Korea | | | 0.3% | |
Hong Kong | | | 0.3% | |
Thailand | | | 0.3% | |
Malaysia | | | 0.2% | |
El Salvador | | | 0.2% | |
Qatar | | | 0.2% | |
Indonesia | | | 0.2% | |
France | | | 0.2% | |
Supranational | | | 0.2% | |
Abu Dhabi | | | 0.1% | |
Other Assets and Liabilities | | | (3.4)% | |
| | | | |
| | | 100.0% | |
| | | | |
| | | | |
| INVESTMENT BREAKDOWN as a % of Net Assets: | | | | |
Collateralized Loan Obligations | | | 19.9% | |
Non-Agency Commercial Mortgage Backed Obligations | | | 16.2% | |
Banking | | | 10.6% | |
Short Term Investments | | | 9.7% | |
Non-Agency Residential Collateralized Mortgage Obligations | | | 8.3% | |
US Government Bonds and Notes | | | 7.0% | |
Oil and Gas | | | 4.4% | |
Chemicals/Plastics | | | 2.4% | |
Telecommunications | | | 1.8% | |
US Government / Agency Mortgage Backed Obligations | | | 1.5% | |
Transportation | | | 1.4% | |
Business Equipment and Services | | | 1.4% | |
Foreign Government Bonds and Notes, Supranationals and Foreign Agencies | | | 1.3% | |
Financial Intermediaries | | | 1.3% | |
Food Products | | | 1.2% | |
Utilities | | | 1.2% | |
Health Care | | | 1.1% | |
Leisure | | | 1.1% | |
Media | | | 1.1% | |
Consumer Products | | | 1.0% | |
Automotive | | | 0.8% | |
Energy | | | 0.7% | |
Asset Backed Obligations | | | 0.7% | |
Beverage and Tobacco | | | 0.7% | |
Pharmaceuticals | | | 0.7% | |
Hotels/Motels/Inns and Casinos | | | 0.6% | |
Industrial Equipment | | | 0.6% | |
Pulp & Paper | | | 0.5% | |
Finance | | | 0.5% | |
Cable Television | | | 0.4% | |
Mining | | | 0.4% | |
Air Transport | | | 0.4% | |
Conglomerates | | | 0.4% | |
Insurance | | | 0.4% | |
Construction | | | 0.3% | |
Industrial | | | 0.3% | |
Drugs | | | 0.3% | |
Retail | | | 0.2% | |
Building and Development | | | 0.2% | |
Environmental Control | | | 0.2% | |
Food/Drug Retailers | | | 0.1% | |
Real Estate | | | 0.1% | |
Other Assets and Liabilities | | | (3.4)% | |
| | | | |
| | | 100.0% | |
| | | | |
| ^ | Security exempt from registration under Rule 144A of the Securities Act of 1933. These securities may be resold in transactions exempt from registration to qualified institutional buyers. These securities are determined to be liquid by the Adviser, unless otherwise noted, under procedures established by the Fund’s Board of Trustees. At March 31, 2014, the value of these securities amounted to $612,720,267 or 32.0% of net assets. |
| # | Variable rate security. Rate disclosed as of March 31, 2014. |
| I/O | Interest only security |
| I/F | Inverse floating rate security whose interest rate moves in the opposite direction of reference interest rates |
| ¨ | Seven-day yield as of March 31, 2014 |
| & | Unfunded loan commitments |
| | | | | | |
| The accompanying notes are an integral part of these financial statements. | | Annual Report | | March 31, 2014 | | 49 |
| | |
| Schedule of Investments DoubleLine Floating Rate Fund | | March 31, 2014 |
| | | | | | | | | | | | | | | | |
PRINCIPAL
AMOUNT
| | | SECURITY DESCRIPTION | | RATE | | | MATURITY | | | VALUE $ | |
| | BANK LOANS 92.2% | |
| | | | | | | | | | | | | | | | |
| | AIR TRANSPORT 2.1% | |
| |
| | | | Continental Airlines, Inc., | |
| $ | 3,963,722 | | | Guaranteed Senior Secured 1st Lien Term Loan, Tranche B | | | 3.50% | # | | | 04/01/2019 | | | | 3,970,658 | |
| |
| | | | Delta Air Lines, Inc., | |
| | 3,962,387 | | | Guaranteed Senior Secured 1st Lien Term Loan, Tranche B1 | | | 3.50% | # | | | 10/18/2018 | | | | 3,970,748 | |
| | | | | | | | | | | | | | | | |
| | | | | | | | | | | | | | | 7,941,406 | |
| | | | | | | | | | | | | | | | |
| | AUTOMOTIVE 2.7% | |
| |
| | | | Cooper-Standard Automotive, Inc., | |
| | 500,000 | | | Senior Secured 1st Lien Term Loan, Tranche B | | | 4.00% | # | | | 03/17/2021 | | | | 501,565 | |
| |
| | | | Schaeffler AG, | |
| | 4,000,000 | | | Senior Secured 1st Lien Term Loan, Tranche C | | | 4.25% | # | | | 01/27/2017 | | | | 4,023,740 | |
| |
| | | | Tower Automotive Holdings LLC, | |
| | 5,833,520 | | | Guaranteed Senior Secured 1st Lien Term Loan, Tranche B | | | 4.00% | # | | | 04/23/2020 | | | | 5,829,874 | |
| | | | | | | | | | | | | | | | |
| | | | | | | | | | | | | | | 10,355,179 | |
| | | | | | | | | | | | | | | | |
| | BUILDING AND DEVELOPMENT 5.7% | |
| |
| | | | Capital Automotive LP, | |
| | 3,740,464 | | | Senior Secured 1st Lien Term Loan, Tranche B | | | 4.00% | # | | | 04/10/2019 | | | | 3,759,166 | |
| |
| | | | CPG International, Inc., | |
| | 5,970,000 | | | Guaranteed Senior Secured 1st Lien Term Loan, Tranche B | | | 4.75% | # | | | 09/30/2020 | | | | 5,999,850 | |
| |
| | | | HD Supply, Inc., | |
| | 5,954,545 | | | Guaranteed Senior Secured 1st Lien Term Loan, Tranche B | | | 4.00% | # | | | 06/28/2018 | | | | 5,969,432 | |
| |
| | | | Realogy Group LLC, | |
| | 5,948,797 | | | Guaranteed Senior Secured 1st Lien Term Loan, Tranche B | | | 3.75% | # | | | 03/05/2020 | | | | 5,978,541 | |
| | | | | | | | | | | | | | | | |
| | | | | | | | | | | | | | | 21,706,989 | |
| | | | | | | | | | | | | | | | |
| | BUSINESS EQUIPMENT AND SERVICES 11.9% | |
| |
| | | | AlixPartners LLP, | |
| | 3,925,000 | | | Guaranteed Senior Secured 1st Lien Term Loan, Tranche B2 | | | 4.00% | # | | | 07/10/2020 | | | | 3,939,111 | |
| |
| | | | Allied Security Holdings LLC, | |
| | 785,714 | | | Senior Secured 1st Lien Delayed-Draw Term Loan, Tranche B | | | 0.00% | #& | | | 02/12/2021 | | | | 784,119 | |
| |
| | | | Allied Security Holdings LLC, | |
| | 2,214,286 | | | Senior Secured 1st Lien Term Loan, Tranche B | | | 4.25% | # | | | 02/12/2021 | | | | 2,209,791 | |
| |
| | | | Brand Energy & Infrastructure Services, Inc., | |
| | 1,993,884 | | | Senior Secured 1st Lien Term Loan, Tranche B | | | 4.75% | # | | | 11/26/2020 | | | | 2,004,352 | |
| |
| | | | Duff & Phelps LLC, | |
| | 5,462,500 | | | Senior Secured 1st Lien Term Loan, Tranche B | | | 4.50% | # | | | 04/23/2020 | | | | 5,495,794 | |
| |
| | | | Emdeon, Inc., | |
| | 3,920,022 | | | Guaranteed Senior Secured 1st Lien Term Loan, Tranche B2 | | | 3.75% | # | | | 11/02/2018 | | | | 3,926,568 | |
| |
| | | | Ion Trading Technologies Ltd., | |
| | 4,000,000 | | | Senior Secured 2nd Lien Term Loan, Tranche B | | | 8.25% | # | | | 05/21/2021 | | | | 4,061,660 | |
| | | | | | | | | | | | | | | | |
PRINCIPAL
AMOUNT
| | | SECURITY DESCRIPTION | | RATE | | | MATURITY | | | VALUE $ | |
| |
| | | | KAR Auction Services, Inc., | |
| $ | 4,449,174 | | | Guaranteed Senior Secured 1st Lien Term Loan, Tranche B2 | | | 3.50% | # | | | 03/11/2021 | | | | 4,438,051 | |
| |
| | | | Mitchell International, Inc., | |
| | 2,992,500 | | | Guaranteed Senior Secured 1st Lien Term Loan, Tranche B | | | 4.50% | # | | | 10/13/2020 | | | | 3,005,966 | |
| |
| | | | Mitchell International, Inc., | |
| | 2,500,000 | | | Guaranteed Senior Secured 2nd Lien Term Loan | | | 8.50% | # | | | 10/11/2021 | | | | 2,564,063 | |
| |
| | | | Monitronics International, Inc., | |
| | 4,962,312 | | | Guaranteed Senior Secured 1st Lien Term Loan, Tranche B | | | 4.25% | # | | | 03/23/2018 | | | | 4,973,179 | |
| |
| | | | Protection One, Inc., | |
| | 5,947,013 | | | Senior Secured 1st Lien Term Loan, Tranche B | | | 4.25% | # | | | 03/21/2019 | | | | 5,945,169 | |
| |
| | | | TransUnion LLC, | |
| | 2,000,000 | | | Guaranteed Senior Secured 1st Lien Term Loan, Tranche B | | | 4.00% | # | | | 03/19/2021 | | | | 2,006,250 | |
| | | | | | | | | | | | | | | | |
| | | | | | | | | | | | | | | 45,354,073 | |
| | | | | | | | | | | | | | | | |
| | CABLE TELEVISION 1.0% | |
| |
| | | | Virgin Media Investment Holdings Ltd., | |
| | 4,000,000 | | | Guaranteed Senior Secured 1st Lien Term Loan, Tranche B | | | 3.50% | # | | | 06/08/2020 | | | | 3,994,820 | |
| | | | | | | | | | | | | | | | |
| | CHEMICALS/PLASTICS 6.8% | |
| |
| | | | AI Chem & CY SCA, | |
| | 2,613,816 | | | Senior Secured 1st Lien Term Loan, Tranche B1 | | | 4.50% | # | | | 10/03/2019 | | | | 2,630,153 | |
| |
| | | | AI Chem & CY SCA, | |
| | 1,356,184 | | | Senior Secured 1st Lien Term Loan, Tranche B2 | | | 4.50% | # | | | 10/03/2019 | | | | 1,364,660 | |
| |
| | | | Arysta Lifescience LLC, | |
| | 5,451,238 | | | Guaranteed Senior Secured 1st Lien Term Loan | | | 4.50% | # | | | 05/29/2020 | | | | 5,470,562 | |
| |
| | | | Clondalkin Acquisition BV, | |
| | 6,031,346 | | | Senior Secured 1st Lien Term Loan, Tranche B | | | 4.50% | # | | | 05/29/2020 | | | | 6,074,078 | |
| |
| | | | PolarPak, Inc., | |
| | 3,872,175 | | | Senior Secured 1st Lien Term Loan, Tranche B | | | 5.50% | # | | | 06/05/2020 | | | | 3,886,695 | |
| |
| | | | Univar, Inc., | |
| | 3,992,282 | | | Senior Secured 1st Lien Term Loan, Tranche B | | | 5.00% | # | | | 06/30/2017 | | | | 3,987,012 | |
| |
| | | | WNA Holdings, Inc., | |
| | 2,603,013 | | | Senior Secured 1st Lien Term Loan, Tranche B | | | 4.50% | # | | | 06/05/2020 | | | | 2,612,774 | |
| | | | | | | | | | | | | | | | |
| | | | | | | | | | | | | | | 26,025,934 | |
| | | | | | | | | | | | | | | | |
| | CONGLOMERATES 0.5% | |
| |
| | | | Spectrum Brands, Inc., | |
| | 1,985,013 | | | Guaranteed Senior Secured 1st Lien Term Loan, Tranche C | | | 3.50% | # | | | 09/04/2019 | | | | 1,989,657 | |
| | | | | | | | | | | | | | | | |
| | CONTAINERS AND GLASS PRODUCTS 3.7% | |
| |
| | | | Ardagh Holdings USA, Inc., | |
| | 1,000,000 | | | Guaranteed Senior Secured 1st Lien Delayed-Draw Term Loan, Tranche B | | | 4.00% | # | | | 12/17/2019 | | | | 1,001,875 | |
| |
| | | | Ardagh Holdings, Inc., | |
| | 997,500 | | | Guaranteed Senior Secured 1st Lien Term Loan, Tranche B | | | 4.25% | # | | | 12/17/2019 | | | | 1,003,580 | |
| | | | | | |
| 50 | | DoubleLine Funds Trust | | | | The accompanying notes are an integral part of these financial statements. |
| | | | | | | | | | | | | | | | |
PRINCIPAL
AMOUNT
| | | SECURITY DESCRIPTION | | RATE | | | MATURITY | | | VALUE $ | |
| |
| | | | Exopack Holdings S.A., | |
| $ | 5,996,250 | | | Senior Secured 1st Lien Term Loan, Tranche B | | | 5.25% | # | | | 05/08/2019 | | | | 6,076,810 | |
| |
| | | | Reynolds Group Holdings, Inc., | |
| | 5,962,425 | | | Guaranteed Senior Secured 1st Lien Term Loan, Tranche B | | | 4.00% | # | | | 12/01/2018 | | | | 5,989,076 | |
| | | | | | | | | | | | | | | | |
| | | | | | | | | | | | | | | 14,071,341 | |
| | | | | | | | | | | | | | | | |
| | COSMETICS/TOILETRIES 1.1% | |
| |
| | | | Revlon Consumer Products Corporation, | |
| | 3,990,000 | | | Guaranteed Senior Secured 1st Lien Term Loan | | | 4.00% | # | | | 08/19/2019 | | | | 4,001,631 | |
| | | | | | | | | | | | | | | | |
| | DRUGS 4.8% | |
| |
| | | | Akorn, Inc., | |
| | 6,000,000 | | | Senior Secured 1st Lien Term Loan, Tranche B | | | 4.50% | # | | | 11/13/2020 | | | | 6,071,250 | |
| |
| | | | Ikaria, Inc., | |
| | 4,000,000 | | | Senior Secured 1st Lien Term Loan, Tranche B | | | 5.00% | # | | | 02/12/2021 | | | | 4,033,200 | |
| |
| | | | Salix Pharmaceuticals Ltd., | |
| | 2,468,750 | | | Guaranteed Senior Secured 1st Lien Term Loan, Tranche B | | | 4.25% | # | | | 01/02/2020 | | | | 2,495,647 | |
| |
| | | | Valeant Pharmaceuticals International, Inc., | |
| | 5,522,043 | | | Guaranteed Senior Secured 1st Lien Term Loan, Tranche BE | | | 3.75% | # | | | 08/05/2020 | | | | 5,546,202 | |
| | | | | | | | | | | | | | | | |
| | | | | | | | | | | | | | | 18,146,299 | |
| | | | | | | | | | | | | | | | |
| | ELECTRONICS/ELECTRIC 3.1% | |
| |
| | | | Allflex Holdings, Inc., | |
| | 5,970,000 | | | Guaranteed Senior Secured 1st Lien Term Loan, Tranche B | | | 4.25% | # | | | 07/17/2020 | | | | 5,994,268 | |
| |
| | | | BMC Software Finance, Inc., | |
| | 5,985,000 | | | Guaranteed Senior Secured 1st Lien Term Loan, Tranche B | | | 5.00% | # | | | 09/10/2020 | | | | 6,003,164 | |
| | | | | | | | | | | | | | | | |
| | | | | | | | | | | | | | | 11,997,432 | |
| | | | | | | | | | | | | | | | |
| | FINANCIAL INTERMEDIARIES 4.5% | |
| |
| | | | Grosvenor Capital Management Holdings LLP, | |
| | 2,992,500 | | | Senior Secured 1st Lien Term Loan, Tranche B | | | 3.75% | # | | | 01/04/2021 | | | | 2,983,164 | |
| |
| | | | Guggenheim Partners Investment Management, | |
| | 5,970,000 | | | Guaranteed Senior Secured 1st Lien Term Loan, Tranche B | | | 4.25% | # | | | 07/22/2020 | | | | 6,008,805 | |
| |
| | | | National Financial Partners Corporation, | |
| | 5,251,384 | | | Guaranteed Senior Secured 1st Lien Term Loan, Tranche B | | | 5.25% | # | | | 07/01/2020 | | | | 5,292,423 | |
| |
| | | | RCS Capital Corporation, | |
| | 3,000,000 | | | Guaranteed Senior Secured 1st Lien Term Loan | | | 6.50% | # | | | 03/29/2019 | | | | 3,023,130 | |
| | | | | | | | | | | | | | | | |
| | | | | | | | | | | | | | | 17,307,522 | |
| | | | | | | | | | | | | | | | |
| | FOOD PRODUCTS 2.5% | |
| |
| | | | CSM Bakery Supplies LLC, | |
| | 5,974,987 | | | Senior Secured 1st Lien Term Loan, Tranche B | | | 4.75% | # | | | 07/03/2020 | | | | 6,022,309 | |
| |
| | | | Del Monte Corporation, | |
| | 3,442,000 | | | Guaranteed Senior Secured 1st Lien Term Loan, Tranche B | | | 3.50% | # | | | 03/09/2020 | | | | 3,437,715 | |
| | | | | | | | | | | | | | | | |
| | | | | | | | | | | | | | | 9,460,024 | |
| | | | | | | | | | | | | | | | |
| | | | | | | | | | | | | | | | |
PRINCIPAL
AMOUNT
| | | SECURITY DESCRIPTION | | RATE | | | MATURITY | | | VALUE $ | |
| | FOOD/DRUG RETAILERS 1.6% | |
| |
| | | | SUPERVALU, Inc., | |
| $ | 5,909,939 | | | Guaranteed Senior Secured 1st Lien Term Loan | | | 4.50% | # | | | 03/21/2019 | | | | 5,926,753 | |
| | | | | | | | | | | | | | | | |
| | HEALTH CARE 8.0% | |
| |
| | | | American Renal Holdings, Inc., | |
| | 5,949,937 | | | Senior Secured 1st Lien Delayed-Draw Term Loan, Tranche B | | | 4.50% | # | | | 08/20/2019 | | | | 5,961,093 | |
| |
| | | | Britax US Holdings, Inc. | |
| | 3,482,500 | | | Guaranteed Senior Secured 1st Lien Term Loan, Tranche B | | | 4.50% | # | | | 10/15/2020 | | | | 3,334,494 | |
| |
| | | | CHS/Community Health Systems, Inc., | |
| | 3,990,000 | | | Guaranteed Senior Secured 1st Lien Term Loan, Tranche D | | | 4.25% | # | | | 01/27/2021 | | | | 4,028,743 | |
| |
| | | | DaVita, Inc., | |
| | 5,954,774 | | | Guaranteed Senior Secured 1st Lien Term Loan, Tranche B2 | | | 4.00% | # | | | 11/01/2019 | | | | 5,994,135 | |
| |
| | | | PharMEDium Healthcare Corporation, | |
| | 4,000,000 | | | Senior Secured 1st Lien Term Loan | | | 4.25% | # | | | 01/28/2021 | | | | 4,012,520 | |
| |
| | | | Select Medical Corporation, | |
| | 1,500,000 | | | Guaranteed Senior Secured 1st Lien Term Loan, Tranche E | | | 3.75% | # | | | 06/01/2018 | | | | 1,509,997 | |
| |
| | | | Surgical Care Affiliates, Inc., | |
| | 3,970,000 | | | Guaranteed Senior Secured 1st Lien Delayed-Draw Term Loan, Tranche C | | | 4.00% | # | | | 06/29/2018 | | | | 3,979,925 | |
| |
| | | | U.S. Renal Care, Inc., | |
| | 1,492,500 | | | Guaranteed Senior Secured 1st Lien Term Loan | | | 4.25% | # | | | 07/03/2019 | | | | 1,493,127 | |
| | | | | | | | | | | | | | | | |
| | | | | | | | | | | | | | | 30,314,034 | |
| | | | | | | | | | | | | | | | |
| | HOME FURNISHINGS 0.5% | |
| |
| | | | Interline Brands, Inc., | |
| | 2,000,000 | | | Guaranteed Senior Secured 1st Lien Term Loan | | | 4.00% | # | | | 03/17/2021 | | | | 2,001,880 | |
| | | | | | | | | | | | | | | | |
| | HOTELS/MOTELS/INNS AND CASINOS 2.1% | |
| |
| | | | Belmond Interfin Ltd., | |
| | 2,000,000 | | | Guaranteed Senior Secured 1st Lien Term Loan | | | 4.00% | # | | | 03/19/2021 | | | | 2,009,160 | |
| |
| | | | Four Seasons Holdings, Inc., | |
| | 5,970,000 | | | Guaranteed Senior Secured 1st Lien Term Loan | | | 3.50% | # | | | 06/29/2020 | | | | 5,981,194 | |
| | | | | | | | | | | | | | | | |
| | | | | | | | | | | | | | | 7,990,354 | |
| | | | | | | | | | | | | | | | |
| | INDUSTRIAL EQUIPMENT 5.1% | |
| |
| | | | Crosby Worldwide Ltd. | |
| | 3,992,500 | | | Senior Secured 1st Lien Term Loan | | | 4.00% | # | | | 11/23/2020 | | | | 3,977,528 | |
| |
| | | | Filtration Group, Inc., | |
| | 3,990,000 | | | Senior Secured 1st Lien Term Loan, Tranche B | | | 4.50% | # | | | 11/20/2020 | | | | 4,022,419 | |
| |
| | | | Ply Gem Industries, Inc., | |
| | 1,500,000 | | | Guaranteed Senior Secured 1st Lien Term Loan, Tranche B | | | 4.00% | # | | | 02/01/2021 | | | | 1,504,380 | |
| |
| | | | Rexnord LLC, | |
| | 3,980,000 | | | Guaranteed Senior Secured 1st Lien Term Loan, Tranche B | | | 4.00% | # | | | 08/21/2020 | | | | 3,989,094 | |
| | | | | | |
| The accompanying notes are an integral part of these financial statements. | | Annual Report | | March 31, 2014 | | 51 |
Schedule of Investments DoubleLine Floating Rate Fund (Cont.)
| | | | | | | | | | | | | | | | |
PRINCIPAL
AMOUNT
| | | SECURITY DESCRIPTION | | RATE | | | MATURITY | | | VALUE $ | |
| |
| | | | TMS International Corporation, | |
| $ | 5,970,000 | | | Senior Secured 1st Lien Term Loan, Tranche B | | | 4.50% | # | | | 10/16/2020 | | | | 5,992,519 | |
| | | | | | | | | | | | | | | | |
| | | | | | | | | | | | | | | 19,485,940 | |
| | | | | | | | | | | | | | | | |
| | INSURANCE 2.1% | |
| |
| | | | Applied Systems, Inc., | |
| | 4,000,000 | | | Secured 2nd Lien Term Loan, Tranche B | | | 7.50% | # | | | 01/24/2022 | | | | 4,077,500 | |
| |
| | | | Asurion LLC, | |
| | 1,984,956 | | | Senior Secured 1st Lien Term Loan, Tranche B1 | | | 5.00% | # | | | 05/24/2019 | | | | 1,992,658 | |
| |
| | | | Asurion LLC, | |
| | 2,000,000 | | | Senior Secured 2nd Lien Term Loan | | | 8.50% | # | | | 03/03/2021 | | | | 2,071,250 | |
| | | | | | | | | | | | | | | | |
| | | | | | | | | | | | | | | 8,141,408 | |
| | | | | | | | | | | | | | | | |
| | LEISURE 5.9% | |
| |
| | | | Emerald Expositions Holding, Inc., | |
| | 5,955,024 | | | Senior Secured 1st Lien Term Loan, Tranche B | | | 5.50% | # | | | 06/17/2020 | | | | 6,012,103 | |
| |
| | | | Hilton Worldwide Finance LLC, | |
| | 4,578,947 | | | Guaranteed Senior Secured 1st Lien Term Loan, Tranche B | | | 3.50% | # | | | 10/26/2020 | | | | 4,591,631 | |
| |
| | | | IMG Worldwide, Inc., | |
| | 4,000,000 | | | Senior Secured 1st Lien Term Loan, Tranche B | | | 5.25% | # | | | 03/19/2021 | | | | 3,982,520 | |
| |
| | | | Live Nation Entertainment, Inc., | |
| | 3,980,000 | | | Guaranteed Senior Secured 1st Lien Term Loan, Tranche B1 | | | 3.50% | # | | | 08/14/2020 | | | | 3,983,721 | |
| |
| | | | WMG Acquisition Corporation, | |
| | 3,970,000 | | | Guaranteed Senior Secured 1st Lien Term Loan, Tranche B | | | 3.75% | # | | | 07/01/2020 | | | | 3,955,609 | |
| | | | | | | | | | | | | | | | |
| | | | | | | | | | | | | | | 22,525,584 | |
| | | | | | | | | | | | | | | | |
| | MEDIA 1.0% | |
| |
| | | | Media General, Inc., | |
| | 3,841,808 | | | Guaranteed Senior Secured 1st Lien Delayed-Draw Term Loan, Tranche B | | | 4.25% | # | | | 07/31/2020 | | | | 3,877,844 | |
| | | | | | | | | | | | | | | | |
| | OIL AND GAS 5.3% | |
| |
| | | | Drillships Financing Holding, Inc., | |
| | 5,970,000 | | | Guaranteed Senior Secured 1st Lien Term Loan, Tranche B1 | | | 6.00% | # | | | 03/31/2021 | | | | 6,096,863 | |
| |
| | | | Fieldwood Energy LLC, | |
| | 1,990,003 | | | Guaranteed Senior Secured 1st Lien Term Loan, Tranche B | | | 3.88% | # | | | 09/28/2018 | | | | 1,995,505 | |
| |
| | | | Fieldwood Energy LLC, | |
| | 4,000,000 | | | Senior Secured 2nd Lien Term Loan | | | 8.13% | # | | | 09/30/2020 | | | | 4,176,260 | |
| |
| | | | Ruby Western Pipeline Holdings LLC, | |
| | 5,753,635 | | | Senior Secured 1st Lien Term Loan, Tranche B | | | 3.50% | # | | | 03/27/2020 | | | | 5,750,067 | |
| |
| | | | Seadrill Operating LP, | |
| | 1,995,000 | | | Guaranteed Senior Secured 1st Lien Term Loan, Tranche B | | | 4.00% | # | | | 02/21/2021 | | | | 1,992,506 | |
| | | | | | | | | | | | | | | | |
| | | | | | | | | | | | | | | 20,011,201 | |
| | | | | | | | | | | | | | | | |
| | | | | | | | | | | | | | | | |
PRINCIPAL
AMOUNT
| | | SECURITY DESCRIPTION | | RATE | | | MATURITY | | | VALUE $ | |
| | PUBLISHING 1.6% | |
| |
| | | | Springer Science + Business Media GmbH, | |
| $ | 5,970,000 | | | Senior Secured 1st Lien Term Loan, Tranche B2 | | | 5.00% | # | | | 08/14/2020 | | | | 5,988,656 | |
| | | | | | | | | | | | | | | | |
| | RETAILERS (OTHER THAN FOOD/DRUG) 3.9% | |
| |
| | | | CDW LLC, | |
| | 3,962,490 | | | Guaranteed Senior Secured 1st Lien Term Loan, Tranche B | | | 3.25% | # | | | 04/29/2020 | | | | 3,932,415 | |
| |
| | | | National Vision, Inc., | |
| | 4,000,000 | | | Senior Secured 1st Lien Term Loan, Tranche B | | | 4.00% | # | | | 03/12/2021 | | | | 3,982,500 | |
| |
| | | | Serta Simmons Holdings LLC, | |
| | 1,984,377 | | | Senior Secured 1st Lien Term Loan, Tranche B | | | 4.25% | # | | | 10/01/2019 | | | | 1,994,855 | |
| |
| | | | Spin Holdco, Inc., | |
| | 4,972,538 | | | Guaranteed Senior Secured 1st Lien Term Loan, Tranche B | | | 4.25% | # | | | 11/14/2019 | | | | 4,979,375 | |
| | | | | | | | | | | | | | | | |
| | | | | | | | | | | | | | | 14,889,145 | |
| | | | | | | | | | | | | | | | |
| | TELECOMMUNICATIONS 0.5% | |
| |
| | | | Telesat Canada, | |
| | 1,969,894 | | | Guaranteed Senior Secured 1st Lien Term Loan, Tranche B2 | | | 3.50% | # | | | 03/28/2019 | | | | 1,967,018 | |
| | | | | | | | | | | | | | | | |
| | UTILITIES 4.2% | |
| |
| | | | Calpine Corporation, | |
| | 997,500 | | | Guaranteed Senior Secured 1st Lien Delayed-Draw Term Loan | | | 4.00% | # | | | 10/30/2020 | | | | 1,002,253 | |
| |
| | | | Calpine Corporation, | |
| | 3,954,159 | | | Senior Secured 1st Lien Term Loan, Tranche B1 | | | 3.54% | # | | | 04/02/2018 | | | | 3,972,013 | |
| |
| | | | EFS Cogen Holdings I LLC, | |
| | 2,400,253 | | | Guaranteed Senior Secured 1st Lien Term Loan, Tranche B | | | 3.75% | # | | | 12/17/2020 | | | | 2,416,263 | |
| |
| | | | GIM Channelview Cogeneration LLC, | |
| | 3,842,000 | | | Guaranteed Senior Secured 1st Lien Term Loan, Tranche B | | | 4.25% | # | | | 05/08/2020 | | | | 3,870,815 | |
| |
| | | | WTG Holdings Corporation, | |
| | 3,990,000 | | | Guaranteed Senior Secured 1st Lien Term Loan | | | 4.75% | # | | | 01/15/2021 | | | | 4,011,207 | |
| |
| | | | WTG Holdings Corporation, | |
| | 500,000 | | | Guaranteed Senior Secured 2nd Lien Term Loan | | | 8.50% | # | | | 01/14/2022 | | | | 505,000 | |
| | | | | | | | | | | | | | | | |
| | | | | | | | | | | | | | | 15,777,551 | |
| | | | | | | | | | | | | | | | |
| | | | Total Bank Loans
(Cost $350,104,583) | | | | 351,249,675 | |
| | | | | | | | | | | | | | | | |
| | NON-AGENCY COMMERCIAL MORTGAGE BACKED OBLIGATIONS 2.0% | |
| |
| | | | CGBAM Commercial Mortgage Trust, | |
| | 7,650,000 | | | Series 2013-BREH-E | | | 4.51% | #^ | | | 05/15/2030 | | | | 7,749,607 | |
| | | | | | | | | | | | | | | | |
| | | | Total Non-Agency Commercial Mortgage Backed Obligations
(Cost $7,711,041) | | | | 7,749,607 | |
| | | | | | | | | | | | | | | | |
| | | | | | |
| 52 | | DoubleLine Funds Trust | | | | The accompanying notes are an integral part of these financial statements. |
| | | | | | | | | | | | | | |
| SHARES | | | SECURITY DESCRIPTION | | RATE | | | | | VALUE $ | |
| | SHORT TERM INVESTMENTS 8.4% | |
| | 10,645,454 | | | BlackRock Institutional Liquidity Funds FedFund Portfolio | | | 0.01% | ¨ | | | | | 10,645,454 | |
| | 10,645,453 | | | Fidelity Institutional Government Portfolio | | | 0.01% | ¨ | | | | | 10,645,453 | |
| | 10,645,454 | | | Morgan Stanley Institutional Liquidity Funds | | | 0.04% | ¨ | | | | | 10,645,454 | |
| | | | | | | | | | | | | | |
| | | | Total Short Term Investments
(Cost $31,936,361) | | | 31,936,361 | |
| | | | | | | | | | | | | | |
| | | | Total Investments 102.6%
(Cost $389,751,985) | | | 390,935,643 | |
| | | | Liabilities in Excess of Other Assets (2.6)% | | | (9,879,085 | ) |
| | | | | | | | | | | | | | |
| | | | NET ASSETS 100.0% | | $ | 381,056,558 | |
| | | | | | | | | | | | | | |
| | | | |
| SECURITY TYPE BREAKDOWN as % of Net Assets | |
Bank Loans | | | 92.2% | |
Short Term Investments | | | 8.4% | |
Non-Agency Commercial Mortgage Backed Obligations | | | 2.0% | |
Other Assets and Liabilities | | | (2.6)% | |
| | | | |
| | | 100.0% | |
| | | | |
| # | Variable rate security. Rate disclosed as of March 31, 2014. |
| ^ | Security exempt from registration under Rule 144A of the Securities Act of 1933. These securities may be resold in transactions exempt from registration to qualified institutional buyers. These securities are determined to be liquid by the Adviser, unless otherwise noted, under procedures established by the Fund’s Board of Trustees. At March 31, 2014, the value of these securities amounted to $7,749,607 or 2.0% of net assets. |
| ¨ | Seven-day yield as of March 31, 2014 |
| & | Unfunded loan commitment |
| | | | | | |
| The accompanying notes are an integral part of these financial statements. | | Annual Report | | March 31, 2014 | | 53 |
| | |
| Schedule of Investments DoubleLine Shiller Enhanced CAPE® | | March 31, 2014 |
| | | | | | | | | | | | | | | | |
PRINCIPAL
AMOUNT | | | SECURITY DESCRIPTION | | RATE | | | MATURITY | | | VALUE $ | |
| | COLLATERALIZED LOAN OBLIGATIONS 17.0% | |
| |
| | | | ARES Ltd., Series | |
| $ | 500,000 | | | 2014-1A-A2 | | | 2.23% | #^ | | | 04/17/2026 | | | | 497,075 | |
| |
| | | | Avery Point Ltd., | |
| | 250,000 | | | Series 2014-1A-B1 | | | 2.33% | #^ | | | 04/25/2026 | | | | 250,000 | |
| | 500,000 | | | Series 2014-1A-C | | | 3.33% | #^ | | | 04/25/2026 | | | | 500,000 | |
| | 250,000 | | | Series 2014-1A-D | | | 3.73% | #^ | | | 04/25/2026 | | | | 240,125 | |
| |
| | | | Black Diamond Ltd., | |
| | 138,253 | | | Series 2005-1A-A1A | | | 0.48% | #^ | | | 06/20/2017 | | | | 138,253 | |
| | 355,314 | | | Series 2005-2A-A | | | 0.49% | #^ | | | 01/07/2018 | | | | 352,587 | |
| |
| | | | Cornerstone Ltd., | |
| | 250,000 | | | Series 2007-1A-A1S | | | 0.46% | #^ | | | 07/15/2021 | | | | 245,182 | |
| |
| | | | Halcyon Loan Advisors Funding Ltd., | |
| | 250,000 | | | Series 2014-1A-X | | | 1.28% | #^ | | | 04/18/2026 | | | | 250,000 | |
| |
| | | | ING Ltd., | |
| | 500,000 | | | Series 2012-1RA-A2R | | | 2.08% | #^ | | | 03/14/2022 | | | | 500,099 | |
| | 500,000 | | | Series 2012-1RA-BR | | | 2.98% | #^ | | | 03/14/2022 | | | | 500,429 | |
| |
| | | | Jersey Street Ltd., | |
| | 221,507 | | | Series 2006-1A-A | | | 0.49% | #^ | | | 10/20/2018 | | | | 220,527 | |
| |
| | | | LCM LP, | |
| | 500,000 | | | Series 11A-B | | | 2.39% | #^ | | | 04/19/2022 | | | | 500,355 | |
| | 250,000 | | | Series 11A-D2 | | | 4.19% | #^ | | | 04/19/2022 | | | | 250,191 | |
| | 250,000 | | | Series 14A-D | | | 3.74% | #^ | | | 07/15/2025 | | | | 242,956 | |
| |
| | | | Madison Park Funding Ltd., | |
| | 250,000 | | | Series 2014-13A-X | | | 1.19% | #^ | | | 01/19/2025 | | | | 250,181 | |
| |
| | | | Race Point Ltd., | |
| | 212,539 | | | Series 2007-4A-A1A | | | 0.44% | #^ | | | 08/01/2021 | | | | 210,640 | |
| |
| | | | Slater Mill Loan Fund, | |
| | 500,000 | | | Series 2012-1A-B | | | 2.89% | #^ | | | 08/17/2022 | | | | 501,006 | |
| |
| | | | Stone Tower Ltd., | |
| | 45,130 | | | Series 2006-4X-A1 | | | 0.51% | # | | | 03/16/2018 | | | | 45,171 | |
| |
| | | | Venture Ltd., | |
| | 500,000 | | | Series 2012-10A-C | | | 3.49% | #^ | | | 07/20/2022 | | | | 499,638 | |
| | 500,000 | | | Series 2013-14A-B1 | | | 2.08% | #^ | | | 08/28/2025 | | | | 491,205 | |
| | 250,000 | | | Series 2014-16A-A1L | | | 1.87% | #^ | | | 04/15/2026 | | | | 248,735 | |
| | | | | | | | | | | | | | | | |
| | | | Total Collateralized Loan Obligations
(Cost $6,932,290) | | | | 6,934,355 | |
| | | | | | | | | | | | | | | | |
| | FOREIGN CORPORATE BONDS 18.9% | |
| | 200,000 | | | Alfa Bond Issuance | | | 7.50% | | | | 09/26/2019 | | | | 202,000 | |
| | 200,000 | | | Banco Davivienda S.A. | | | 2.95% | | | | 01/29/2018 | | | | 197,500 | |
| | 100,000 | | | Banco de Credito del Peru | | | 5.38% | | | | 09/16/2020 | �� | | | 106,375 | |
| | 200,000 | | | Banco de Credito e Inversiones | | | 3.00% | | | | 09/13/2017 | | | | 203,778 | |
| | 150,000 | | | Banco GNB Sudameris S.A. | | | 3.88% | | | | 05/02/2018 | | | | 145,688 | |
| | 200,000 | | | Banco International del Peru S.A.A. | | | 5.75% | | | | 10/07/2020 | | | | 209,749 | |
| | 200,000 | | | Banco Latinoamericano de Comercio Exterior S.A. | | | 3.75% | | | | 04/04/2017 | | | | 207,200 | |
| | 200,000 | | | Banco Nacional de Costa Rica | | | 4.88% | | | | 11/01/2018 | | | | 202,250 | |
| | 200,000 | | | Banco Santander | | | 1.84% | # | | | 01/19/2016 | | | | 198,500 | |
| | 150,000 | | | Bancolombia S.A. | | | 6.13% | | | | 07/26/2020 | | | | 159,555 | |
| | 75,000 | | | Bank Of Montreal | | | 1.30% | | | | 07/15/2016 | | | | 75,668 | |
| | 100,000 | | | Bank Of Nova Scotia | | | 2.55% | | | | 01/12/2017 | | | | 103,801 | |
| | 100,000 | | | BBVA Banco Continental S.A. | | | 3.25% | | | | 04/08/2018 | | | | 100,750 | |
| | 75,000 | | | BP Capital Markets PLC | | | 1.85% | | | | 05/05/2017 | | | | 76,227 | |
| | 200,000 | | | Cemex S.A.B. de C.V. | | | 4.99% | # | | | 10/15/2018 | | | | 212,000 | |
| | 200,000 | | | Corpbanca S.A. | | | 3.13% | | | | 01/15/2018 | | | | 197,096 | |
| | 100,000 | | | DBS Bank Ltd. | | | 5.00% | # | | | 11/15/2019 | | | | 102,003 | |
| | 50,000 | | | Diageo Capital PLC | | | 1.50% | | | | 05/11/2017 | | | | 50,374 | |
| | 200,000 | | | Empresa de Energia de Bogota S.A. | | | 6.13% | | | | 11/10/2021 | | | | 215,000 | |
| | 374,635 | | | ENA Norte Trust | | | 4.95% | | | | 04/25/2023 | | | | 376,976 | |
| | | | | | | | | | | | | | | | |
PRINCIPAL
AMOUNT | | | SECURITY DESCRIPTION | | RATE | | | MATURITY | | | VALUE $ | |
| $ | 200,000 | | | Global Bank Corporation | | | 4.75% | | | | 10/05/2017 | | | | 206,250 | |
| | 200,000 | | | Globo Communicacao e Participacoes S.A. | | | 5.31% | # | | | 05/11/2022 | | | | 213,250 | |
| | 200,000 | | | Grupo Aval Ltd. | | | 5.25% | | | | 02/01/2017 | | | | 212,000 | |
| | 200,000 | | | Grupo Televisa S.A.B | | | 6.00% | | | | 05/15/2018 | | | | 225,289 | |
| | 250,000 | | | Guanay Finance Ltd. | | | 6.00% | | | | 12/15/2020 | | | | 264,999 | |
| | 100,000 | | | Industry & Construction Bank | | | 5.01% | # | | | 09/29/2015 | | | | 97,875 | |
| | 25,000 | | | Intelsat Ltd. | | | 7.75% | | | | 06/01/2021 | | | | 26,406 | |
| | 100,000 | | | Intercorp Retail Trust | | | 8.88% | | | | 11/14/2018 | | | | 107,125 | |
| | 100,000 | | | Inversiones CMPC S.A. | | | 4.75% | | | | 01/19/2018 | | | | 106,024 | |
| | 100,000 | | | Korea Development Bank | | | 3.25% | | | | 03/09/2016 | | | | 104,601 | |
| | 100,000 | | | LPG International, Inc. | | | 7.25% | | | | 12/20/2015 | | | | 109,250 | |
| | 100,000 | | | National Australia Bank Ltd. | | | 3.00% | ^ | | | 07/27/2016 | | | | 104,815 | |
| | 100,000 | | | Noble Group Ltd. | | | 6.63% | | | | 08/05/2020 | | | | 106,000 | |
| | 200,000 | | | Odebrecht Offshore Drilling | | | 6.63% | ^ | | | 10/01/2022 | | | | 208,999 | |
| | 50,000 | | | Orange S.A. | | | 2.75% | | | | 09/14/2016 | | | | 51,857 | |
| | 100,000 | | | Oversea-Chinese Banking Corporation | | | 4.25% | # | | | 11/18/2019 | | | | 101,670 | |
| | 200,000 | | | Pacific Rubiales Energy | | | 5.38% | | | | 01/26/2019 | | | | 208,000 | |
| | 242,066 | | | Peru Enhanced Pass-Through Finance Ltd. | | | 0.00% | | | | 05/31/2018 | | | | 225,121 | |
| | 100,000 | | | Petrobras Global Finance B.V. | | | 1.85% | # | | | 05/20/2016 | | | | 99,125 | |
| | 100,000 | | | Petroleos Mexicanos | | | 2.26% | # | | | 07/18/2018 | | | | 104,500 | |
| | 159,000 | | | Raizen Energy Finance Ltd. | | | 7.00% | | | | 02/01/2017 | | | | 175,695 | |
| | 177,550 | | | Ras Laffan Liquefied Natural Gas Company | | | 5.30% | | | | 09/30/2020 | | | | 191,861 | |
| | 100,000 | | | Rearden G Holdings EINS GmbH | | | 7.88% | | | | 03/30/2020 | | | | 104,750 | |
| | 100,000 | | | Rosneft International Finance Ltd. | | | 7.88% | | | | 03/13/2018 | | | | 112,250 | |
| | 200,000 | | | Sigma Alimentos S.A. | | | 6.88% | | | | 12/16/2019 | | | | 229,500 | |
| | 200,000 | | | Sistema International Funding S.A. | | | 6.95% | | | | 05/17/2019 | | | | 207,000 | |
| | 40,000 | | | Southern Copper Corporation | | | 1.95% | | | | 09/01/2016 | | | | 40,995 | |
| | 100,000 | | | Tanner Servicios Financieros S.A. | | | 4.38% | | | | 03/13/2018 | | | | 100,690 | |
| | 100,000 | | | Telemovil Finance Company Ltd. | | | 8.00% | | | | 10/01/2017 | | | | 107,375 | |
| | 100,000 | | | TV Azteca S.A.B. de C.V. | | | 7.63% | | | | 09/18/2020 | | | | 105,750 | |
| | 25,000 | | | Valeant Pharmaceuticals International, Inc. | | | 7.50% | ^ | | | 07/15/2021 | | | | 28,250 | |
| | 25,000 | | | Westpac Banking Corporation | | | 1.13% | | | | 09/25/2015 | | | | 25,187 | |
| | 50,000 | | | Westpac Banking Corporation | | | 2.00% | | | | 08/14/2017 | | | | 50,860 | |
| | | | | | | | | | | | | | | | |
| | | | Total Foreign Corporate Bonds
(Cost $7,666,922) | | | | 7,705,809 | |
| | | | | | | | | | | | | | | | |
| FOREIGN GOVERNMENT BONDS AND NOTES,
SUPRANATIONALS AND FOREIGN AGENCIES 0.6%
|
|
| | 150,000 | | | Caixa Economica Federal | | | 4.50% | | | | 10/03/2018 | | | | 153,000 | |
| | 101,000 | | | Corporacion Andina de Fomento | | | 3.75% | | | | 01/15/2016 | | | | 105,797 | |
| | | | | | | | | | | | | | | | |
| | | | Total Foreign Government Bonds and Notes, Supranationals and Foreign Agencies
(Cost $256,832) | | | | 258,797 | |
| | | | | | | | | | | | | | | | |
| NON-AGENCY COMMERCIAL MORTGAGE BACKED OBLIGATIONS 12.4%
|
|
| |
| | | | Banc of America Commercial Mortgage Trust, | |
| | 250,000 | | | Series 2005-3-AM | | | 4.73% | | | | 07/10/2043 | | | | 257,920 | |
| | 250,000 | | | Series 2006-5-AM | | | 5.45% | | | | 09/10/2047 | | | | 268,189 | |
| | 100,000 | | | Series 2007-1-AMFX | | | 5.48% | # | | | 01/15/2049 | | | | 105,310 | |
| |
| | | | Bear Stearns Commercial Mortgage Securities Trust, | |
| | 110,000 | | | Series 2004-PWR4-D | | | 5.93% | # | | | 06/11/2041 | | | | 117,345 | |
| | | | | | |
| 54 | | DoubleLine Funds Trust | | | | The accompanying notes are an integral part of these financial statements. |
| | | | | | | | | | | | | | | | |
PRINCIPAL
AMOUNT | | | SECURITY DESCRIPTION | | RATE | | | MATURITY | | | VALUE $ | |
| |
| | | | Commercial Mortgage Pass-Through Certificates, | |
| $ | 110,000 | | | Series 2006-C7-AM | | | 5.93% | # | | | 06/10/2046 | | | | 118,544 | |
| | 115,000 | | | Series 2006-C8-AM | | | 5.35% | | | | 12/10/2046 | | | | 125,971 | |
| | 110,000 | | | Series 2014-TWC-C | | | 2.01% | #^ | | | 02/13/2032 | | | | 110,239 | |
| |
| | | | Credit Suisse First Boston Mortgage Securities Corporation, | |
| | 110,000 | | | Series 2005-C2-AMFX | | | 4.88% | | | | 04/15/2037 | | | | 111,107 | |
| | 110,000 | | | Series 2005-C6-AJ | | | 5.23% | # | | | 12/15/2040 | | | | 115,385 | |
| |
| | | | Credit Suisse Mortgage Capital Certificates, | |
| | 100,000 | | | Series 2006-C1-C | | | 5.47% | # | | | 02/15/2039 | | | | 103,523 | |
| | 150,000 | | | Series 2006-C3-AM | | | 5.79% | # | | | 06/15/2038 | | | | 163,090 | |
| | 110,000 | | | Series 2006-C4-AM | | | 5.51% | | | | 09/15/2039 | | | | 118,539 | |
| | 90,000 | | | Series 2006-C5-AM | | | 5.34% | | | | 12/15/2039 | | | | 97,162 | |
| | 187,000 | | | Series 2007-C2-AM | | | 5.55% | # | | | 01/15/2049 | | | | 202,069 | |
| | 150,000 | | | Series 2014-SURF-E | | | 3.26% | #^ | | | 02/15/2029 | | | | 150,551 | |
| | 150,000 | | | Series 2007-C4-A1AM | | | 5.97% | # | | | 09/15/2039 | | | | 161,877 | |
| |
| | | | Greenwich Capital Commercial Funding Corporation, | |
| | 150,000 | | | Series 2007-GG11-AJ | | | 6.26% | # | | | 12/10/2049 | | | | 151,817 | |
| | 250,000 | | | Series 2007-GG11-AM | | | 5.87% | # | | | 12/10/2049 | | | | 275,211 | |
| | 150,000 | | | Series 2007-GG9-AM | | | 5.48% | | | | 03/10/2039 | | | | 161,657 | |
| |
| | | | JP Morgan Chase Commercial Mortgage Securities Corporation, | |
| | 200,000 | | | Series 2005-CB12-B | | | 5.14% | # | | | 09/12/2037 | | | | 199,062 | |
| |
| | | | LB-UBS Commercial Mortgage Trust, | |
| | 150,000 | | | Series 2006-C7-AM | | | 5.38% | | | | 11/15/2038 | | | | 163,349 | |
| | 100,000 | | | Series 2007-C2-AM | | | 5.49% | # | | | 02/15/2040 | | | | 106,494 | |
| |
| | | | Merrill Lynch Mortgage Trust, | |
| | 250,000 | | | Series 2006-C1-AJ | | | 5.86% | # | | | 05/12/2039 | | | | 253,329 | |
| | 150,000 | | | Series 2006-C2-AJ | | | 5.80% | # | | | 08/12/2043 | | | | 151,739 | |
| | 100,000 | | | Series 2006-C2-AM | | | 5.78% | # | | | 08/12/2043 | | | | 109,279 | |
| |
| | | | Morgan Stanley Capital, Inc., | |
| | 110,000 | | | Series 2005-HQ7-AJ | | | 5.38% | # | | | 11/14/2042 | | | | 115,258 | |
| | 94,000 | | | Series 2005-HQ7-AM | | | 5.38% | # | | | 11/14/2042 | | | | 99,317 | |
| | 190,000 | | | Series 2007-HQ11-AJ | | | 5.51% | # | | | 02/12/2044 | | | | 199,875 | |
| |
| | | | Wachovia Bank Commercial Mortgage Trust, | |
| | 110,000 | | | Series 2005-C22-AM | | | 5.34% | # | | | 12/15/2044 | | | | 116,754 | |
| | 250,000 | | | Series 2006-C28-AJ | | | 5.63% | # | | | 10/15/2048 | | | | 251,561 | |
| | 110,000 | | | Series 2006-C28-AM | | | 5.60% | # | | | 10/15/2048 | | | | 119,603 | |
| |
| | | | WF-RBS Commercial Mortgage Trust, | |
| | 3,000,000 | | | Series 2014-C19-XA | | | 1.51% | # I/O | | | 03/15/2047 | | | | 251,655 | |
| | | | | | | | | | | | | | | | |
| | | | Total Non-Agency Commercial Mortgage Backed Obligations
(Cost $5,059,240) | | | | 5,052,781 | |
| | | | | | | | | | | | | | | | |
| NON-AGENCY RESIDENTIAL COLLATERALIZED MORTGAGE
OBLIGATIONS 5.0%
|
|
| |
| | | | Chase Mortgage Finance Trust, | |
| | 40,000 | | | Series 2004-S3-2A4 | | | 5.50% | | | | 03/25/2034 | | | | 41,002 | |
| |
| | | | Credit Suisse First Boston Mortgage Securities Corporation, | |
| | 59,033 | | | Series 2004-8-6A1 | | | 4.50% | | | | 12/25/2019 | | | | 60,305 | |
| |
| | | | GSR Mortgage Loan Trust, | |
| | 101,262 | | | Series 2004-2F-14A1 | | | 5.50% | | | | 09/25/2019 | | | | 104,669 | |
| |
| | | | Home Equity Mortgage Trust, | |
| | 217,825 | | | Series 2003-6-M2 | | | 2.35% | # | | | 03/25/2034 | | | | 212,245 | |
| |
| | | | HSI Asset Loan Obligation Trust, | |
| | 513,248 | | | Series 2006-2-1A1 | | | 6.00% | | | | 12/25/2036 | | | | 346,264 | |
| |
| | | | Lehman XS Trust, | |
| | 64,958 | | | Series 2005-6-3A2B | | | 5.42% | # | | | 11/25/2035 | | | | 65,369 | |
| |
| | | | NovaStar Mortgage Funding Trust, | |
| | 466,291 | | | Series 2005-4-A2C | | | 0.39% | # | | | 01/25/2036 | | | | 462,293 | |
| |
| | | | Structured Adjustable Rate Mortgage Loan Trust, | |
| | 160,617 | | | Series 2006-8-4A2 | | | 5.42% | # | | | 09/25/2036 | | | | 160,134 | |
| |
| | | | Washington Mutual Mortgage Pass-Through Certificates, | |
| | 312,323 | | | Series 2006-5-1A5 | | | 6.00% | | | | 07/25/2036 | | | | 259,030 | |
| |
| | | | Wells Fargo Alternative Loan Trust, | |
| | 225,122 | | | Series 2007-PA5-1A1 | | | 6.25% | | | | 11/25/2037 | | | | 214,470 | |
| | | | | | | | | | | | | | | | |
PRINCIPAL
AMOUNT | | | SECURITY DESCRIPTION | | RATE | | | MATURITY | | | VALUE $ | |
| |
| | | | Wells Fargo Mortgage Backed Securities, | |
| $ | 100,000 | | | Series 2005-9-2A2 | | | 5.25% | | | | 10/25/2035 | | | | 103,986 | |
| | | | | | | | | | | | | | | | |
| | | | Total Non-Agency Residential Collateralized Mortgage Obligations
(Cost $2,010,706) | | | | 2,029,767 | |
| | | | | | | | | | | | | | | | |
| | US CORPORATE BONDS 11.7% | |
| | 50,000 | | | Activision Blizzard, Inc. | | | 5.63% | ^ | | | 09/15/2021 | | | | 53,625 | |
| | 25,000 | | | Alere, Inc. | | | 6.50% | | | | 06/15/2020 | | | | 26,375 | |
| | 25,000 | | | Altria Group, Inc. | | | 4.13% | | | | 09/11/2015 | | | | 26,207 | |
| | 35,000 | | | American Axle & Manufacturing, Inc. | | | 6.63% | | | | 10/15/2022 | | | | 38,106 | |
| | 76,000 | | | American Express Credit Corporation | | | 1.30% | | | | 07/29/2016 | | | | 76,635 | |
| | 50,000 | | | Amgen, Inc. | | | 2.13% | | | | 05/15/2017 | | | | 51,019 | |
| | 75,000 | | | Anheuser-Busch Inbev Worldwide, Inc. | | | 1.38% | | | | 07/15/2017 | | | | 75,171 | |
| | 40,000 | | | Ashland, Inc. | | | 4.75% | | | | 08/15/2022 | | | | 39,450 | |
| | 75,000 | | | AT&T, Inc. | | | 1.70% | | | | 06/01/2017 | | | | 75,707 | |
| | 50,000 | | | Atlas Pipeline Partners LP | | | 4.75% | | | | 11/15/2021 | | | | 47,750 | |
| | 40,000 | | | Avis Budget Car Rental LLC | | | 5.50% | | | | 04/01/2023 | | | | 40,500 | |
| | 75,000 | | | BB&T Corporation | | | 2.15% | | | | 03/22/2017 | | | | 76,792 | |
| | 75,000 | | | Berkshire Hathaway Finance Corporation | | | 0.95% | | | | 08/15/2016 | | | | 75,430 | |
| | 40,000 | | | Biomet, Inc. | | | 6.50% | | | | 08/01/2020 | | | | 43,280 | |
| | 75,000 | | | Boeing Company | | | 3.75% | | | | 11/20/2016 | | | | 80,634 | |
| | 50,000 | | | Caterpillar Financial Services Corporation | | | 1.35% | | | | 09/06/2016 | | | | 50,556 | |
| | 50,000 | | | Cinemark USA, Inc. | | | 7.38% | | | | 06/15/2021 | | | | 55,688 | |
| | 35,000 | | | CIT Group, Inc. | | | 5.00% | | | | 08/15/2022 | | | | 36,466 | |
| | 70,000 | | | Citigroup, Inc. | | | 1.35% | | | | 03/10/2017 | | | | 69,712 | |
| | 75,000 | | | Comcast Corporation | | | 6.50% | | | | 01/15/2017 | | | | 85,683 | |
| | 35,000 | | | ConocoPhillips Company | | | 4.60% | | | | 01/15/2015 | | | | 36,138 | |
| | 35,000 | | | Dana Holding Corporation | | | 5.38% | | | | 09/15/2021 | | | | 36,575 | |
| | 35,000 | | | DaVita, Inc. | | | 5.75% | | | | 08/15/2022 | | | | 37,406 | |
| | 50,000 | | | Devon Energy Corporation | | | 1.88% | | | | 05/15/2017 | | | | 50,400 | |
| | 75,000 | | | DIRECTV Holdings LLC | | | 2.40% | | | | 03/15/2017 | | | | 76,691 | |
| | 50,000 | | | Dow Chemical Company | | | 2.50% | | | | 02/15/2016 | | | | 51,543 | |
| | 83,000 | | | Duke Energy Corporation | | | 2.15% | | | | 11/15/2016 | | | | 85,296 | |
| | 50,000 | | | eBay, Inc. | | | 1.35% | | | | 07/15/2017 | | | | 50,026 | |
| | 60,000 | | | Ecolab, Inc. | | | 3.00% | | | | 12/08/2016 | | | | 62,912 | |
| | 25,000 | | | Equinix, Inc. | | | 7.00% | | | | 07/15/2021 | | | | 27,969 | |
| | 25,000 | | | Express Scripts Holding Company | | | 2.10% | | | | 02/12/2015 | | | | 25,324 | |
| | 25,000 | | | Forest Laboratories, Inc. | | | 4.38% | ^ | | | 02/01/2019 | | | | 26,344 | |
| | 75,000 | | | General Electric Capital Corporation | | | 2.90% | | | | 01/09/2017 | | | | 78,535 | |
| | 100,000 | | | Gilead Sciences, Inc. | | | 3.05% | | | | 12/01/2016 | | | | 105,220 | |
| | 75,000 | | | Goldman Sachs Group, Inc. | | | 5.75% | | | | 10/01/2016 | | | | 83,155 | |
| | 25,000 | | | Goodyear Tire & Rubber Company | | | 7.00% | | | | 05/15/2022 | | | | 27,875 | |
| | 25,000 | | | Gray Television, Inc. | | | 7.50% | | | | 10/01/2020 | | | | 27,250 | |
| | 35,000 | | | Hawk Acquisition Sub, Inc. | | | 4.25% | ^ | | | 10/15/2020 | | | | 34,519 | |
| | 15,000 | | | HCA, Inc. | | | 3.75% | | | | 03/15/2019 | | | | 15,094 | |
| | 50,000 | | | HD Supply, Inc. | | | 7.50% | | | | 07/15/2020 | | | | 54,813 | |
| | 75,000 | | | Hewlett-Packard Company | | | 3.30% | | | | 12/09/2016 | | | | 78,931 | |
| | 35,000 | | | Hexion Finance Corporation | | | 6.63% | | | | 04/15/2020 | | | | 36,400 | |
| | 25,000 | | | IASIS Healthcare LLC | | | 8.38% | | | | 05/15/2019 | | | | 26,813 | |
| | 40,000 | | | Icahn Enterprises LP | | | 4.88% | ^ | | | 03/15/2019 | | | | 40,800 | |
| | 50,000 | | | John Deere Capital Corporation | | | 1.40% | | | | 03/15/2017 | | | | 50,385 | |
| | 50,000 | | | JP Morgan Chase & Company | | | 3.15% | | | | 07/05/2016 | | | | 52,351 | |
| | 50,000 | | | Kellogg Company | | | 1.75% | | | | 05/17/2017 | | | | 50,389 | |
| | 25,000 | | | Kinder Morgan Energy Partners LP | | | 6.00% | | | | 02/01/2017 | | | | 27,886 | |
| | | | | | |
| The accompanying notes are an integral part of these financial statements. | | Annual Report | | March 31, 2014 | | 55 |
| | |
| Schedule of Investments DoubleLine Shiller Enhanced CAPE® (Cont.) | | March 31, 2014 |
| | | | | | | | | | | | | | | | |
PRINCIPAL
AMOUNT | | | SECURITY DESCRIPTION | | RATE | | | MATURITY | | | VALUE $ | |
| $ | 75,000 | | | Kraft Foods, Inc. | | | 4.13% | | | | 02/09/2016 | | | | 79,306 | |
| | 50,000 | | | Kroger Company | | | 2.20% | | | | 01/15/2017 | | | | 51,179 | |
| | 25,000 | | | Louisiana-Pacific Corporation | | | 7.50% | | | | 06/01/2020 | | | | 27,813 | |
| | 25,000 | | | Manitowoc Company, Inc. | | | 8.50% | | | | 11/01/2020 | | | | 28,188 | |
| | 50,000 | | | MGM Resorts International | | | 6.63% | | | | 12/15/2021 | | | | 55,063 | |
| | 75,000 | | | Morgan Stanley | | | 1.75% | | | | 02/25/2016 | | | | 76,003 | |
| | 25,000 | | | MPT Operating Partnership LP | | | 6.38% | | | | 02/15/2022 | | | | 26,875 | |
| | 100,000 | | | Mylan, Inc. | | | 1.80% | | | | 06/24/2016 | | | | 101,456 | |
| | 75,000 | | | National Rural Utilities Cooperative Finance Corporation | | | 1.10% | | | | 01/27/2017 | | | | 74,785 | |
| | 50,000 | | | Newfield Exploration Company | | | 5.75% | | | | 01/30/2022 | | | | 53,375 | |
| | 50,000 | | | Nuveen Investments, Inc. | | | 9.50% | ^ | | | 10/15/2020 | | | | 53,500 | |
| | 35,000 | | | Oasis Petroleum, Inc. | | | 6.88% | ^ | | | 03/15/2022 | | | | 38,063 | |
| | 50,000 | | | ONEOK Partners LP | | | 3.25% | | | | 02/01/2016 | | | | 52,009 | |
| | 35,000 | | | Penn Virginia Resource Partners LP | | | 8.25% | | | | 04/15/2018 | | | | 36,596 | |
| | 75,000 | | | Phillips 66 | | | 2.95% | | | | 05/01/2017 | | | | 78,295 | |
| | 50,000 | | | PNC Funding Corporation | | | 2.70% | | | | 09/19/2016 | | | | 51,998 | |
| | 50,000 | | | Post Holdings, Inc. | | | 7.38% | ^ | | | 02/15/2022 | | | | 53,999 | |
| | 50,000 | | | Procter & Gamble Company | | | 0.75% | | | | 11/04/2016 | | | | 49,891 | |
| | 35,000 | | | Regency Energy Partners LP | | | 5.50% | | | | 04/15/2023 | | | | 35,438 | |
| | 35,000 | | | Revlon Consumer Products Corporation | | | 5.75% | | | | 02/15/2021 | | | | 35,350 | |
| | 35,000 | | | Reynolds Group Issuer LLC | | | 5.75% | | | | 10/15/2020 | | | | 36,838 | |
| | 50,000 | | | RR Donnelley & Sons Company | | | 7.88% | | | | 03/15/2021 | | | | 57,500 | |
| | 35,000 | | | Safway Group Holding LLC | | | 7.00% | ^ | | | 05/15/2018 | | | | 37,450 | |
| | 50,000 | | | Sally Holdings LLC | | | 5.75% | | | | 06/01/2022 | | | | 53,125 | |
| | 25,000 | | | SBA Communications Corporation | | | 5.63% | | | | 10/01/2019 | | | | 26,313 | |
| | 25,000 | | | Sealed Air Corporation | | | 6.50% | ^ | | | 12/01/2020 | | | | 27,688 | |
| | 50,000 | | | Select Medical Corporation | | | 6.38% | | | | 06/01/2021 | | | | 51,000 | |
| | 25,000 | | | Service Corporation International | | | 5.38% | ^ | | | 01/15/2022 | | | | 25,438 | |
| | 100,000 | | | Simon Property Group LP | | | 2.15% | | | | 09/15/2017 | | | | 102,264 | |
| | 10,000 | | | SM Energy Company | | | 5.00% | ^ | | | 01/15/2024 | | | | 9,775 | |
| | 25,000 | | | Southwest Airlines Company | | | 5.13% | | | | 03/01/2017 | | | | 27,434 | |
| | 25,000 | | | Spectrum Brands, Inc. | | | 6.63% | | | | 11/15/2022 | | | | 27,344 | |
| | 50,000 | | | Sun Merger Sub, Inc. | | | 5.88% | ^ | | | 08/01/2021 | | | | 52,000 | |
| | 35,000 | | | Terex Corporation | | | 6.00% | | | | 05/15/2021 | | | | 37,625 | |
| | 75,000 | | | Thomson Reuters Corporation | | | 1.30% | | | | 02/23/2017 | | | | 74,674 | |
| | 35,000 | | | Toll Brothers Finance Corporation | | | 5.88% | | | | 02/15/2022 | | | | 37,625 | |
| | 50,000 | | | Toyota Motor Credit Corporation | | | 1.75% | | | | 05/22/2017 | | | | 50,760 | |
| | 40,000 | | | Ultra Petroleum Corporation | | | 5.75% | ^ | | | 12/15/2018 | | | | 42,100 | |
| | 25,000 | | | United Rentals North America, Inc. | | | 7.63% | | | | 04/15/2022 | | | | 28,156 | |
| | 25,000 | | | Valero Energy Corporation | | | 6.13% | | | | 06/15/2017 | | | | 28,680 | |
| | 75,000 | | | Verizon Communications, Inc. | | | 2.50% | | | | 09/15/2016 | | | | 77,706 | |
| | 50,000 | | | Wal-Mart Stores, Inc. | | | 5.38% | | | | 04/05/2017 | | | | 56,312 | |
| | 75,000 | | | Waste Management, Inc. | | | 2.60% | | | | 09/01/2016 | | | | 77,715 | |
| | 40,000 | | | WCI Communities, Inc. | | | 6.88% | ^ | | | 08/15/2021 | | | | 41,600 | |
| | 50,000 | | | WellPoint, Inc. | | | 5.25% | | | | 01/15/2016 | | | | 53,741 | |
| | 75,000 | | | Wells Fargo & Company | | | 2.10% | | | | 05/08/2017 | | | | 76,853 | |
| | 25,000 | | | Xerox Corporation | | | 2.95% | | | | 03/15/2017 | | | | 26,010 | |
| | | | | | | | | | | | | | | | |
| | | | Total US Corporate Bonds
(Cost $4,793,225) | | | | 4,784,734 | |
| | | | | | | | | | | | | | | | |
| | | | | | | | | | | | | | | | |
PRINCIPAL
AMOUNT /
SHARES | | | SECURITY DESCRIPTION | | RATE | | | MATURITY | | | VALUE $ | |
| | US GOVERNMENT BONDS AND NOTES 4.4% | |
| $ | 580,000 | | | United States Treasury Notes | | | 0.25% | | | | 05/31/2014 | | | | 580,216 | |
| | 490,000 | | | United States Treasury Notes | | | 0.13% | | | | 07/31/2014 | | | | 490,124 | |
| | 390,000 | | | United States Treasury Notes | | | 0.88% | | | | 12/31/2016 | | | | 390,960 | |
| | 240,000 | | | United States Treasury Notes | | | 0.75% | | | | 06/30/2017 | | | | 237,787 | |
| | 110,000 | | | United States Treasury Notes | | | 0.75% | | | | 12/31/2017 | | | | 107,869 | |
| | | | | | | | | | | | | | | | |
| | | | Total US Government Bonds and Notes
(Cost $1,810,253) | | | | 1,806,956 | |
| | | | | | | | | | | | | | | | |
| | AFFILIATED MUTUAL FUNDS 22.4% (a) | |
| | 486,435 | | | DoubleLine Core Fixed Income Fund | | | | | | | | | | | 5,292,413 | |
| | 377,470 | | | DoubleLine Floating Rate Fund | | | | | | | | | | | 3,831,323 | |
| | | | | | | | | | | | | | | | |
| | | | Total Affiliated Mutual Funds
(Cost $9,122,947) | | | | 9,123,736 | |
| | | | | | | | | | | | | | | | |
| | SHORT TERM INVESTMENTS 4.8% | |
| | 645,828 | | | BlackRock Institutional Liquidity Funds FedFund Portfolio | | | 0.01% | ¨ | | | | | | | 645,828 | |
| | 645,828 | | | Fidelity Institutional Government Portfolio | | | 0.01% | ¨ | | | | | | | 645,828 | |
| | 645,828 | | | Morgan Stanley Institutional Liquidity Funds | | | 0.04% | ¨ | | | | | | | 645,828 | |
| | | | | | | | | | | | | | | | |
| | | | Total Short Term Investments
(Cost $1,937,484) | | | | 1,937,484 | |
| | | | | | | | | | | | | | | | |
| | | | Total Investments 97.2%
(Cost $39,589,899) | | | | 39,634,419 | |
| | | | Other Assets in Excess of Liabilities 2.8% | | | | 1,140,633 | |
| | | | | | | | | | | | | | | | |
| | | | NET ASSETS 100.0% | | | | | | | | | | $ | 40,775,052 | |
| | | | | | | | | | | | | | | | |
| | | | |
| SECURITY TYPE BREAKDOWN as % of Net Assets | |
Affiliated Mutual Funds | | | 22.4% | |
Foreign Corporate Bonds | | | 18.9% | |
Collateralized Loan Obligations | | | 17.0% | |
Non-Agency Commercial Mortgage Backed Obligations | | | 12.4% | |
US Corporate Bonds | | | 11.7% | |
Non-Agency Residential Collateralized Mortgage Obligations | | | 5.0% | |
Short Term Investments | | | 4.8% | |
US Government Bonds and Notes | | | 4.4% | |
Foreign Government Bonds and Notes, Supranationals and Foreign Agencies | | | 0.6% | |
Other Assets and Liabilities | | | 2.8% | |
| | | | |
| | | 100.0% | |
| | | | |
| | | | | | |
| 56 | | DoubleLine Funds Trust | | | | The accompanying notes are an integral part of these financial statements. |
| | | | |
| COUNTRY BREAKDOWN as a % of Net Assets: | |
United States | | | 77.7% | |
Colombia | | | 2.7% | |
Chile | | | 2.6% | |
Brazil | | | 2.6% | |
Mexico | | | 2.2% | |
Panama | | | 1.9% | |
Peru | | | 1.9% | |
Russia | | | 1.5% | |
Canada | | | 0.5% | |
Singapore | | | 0.5% | |
Costa Rica | | | 0.5% | |
Qatar | | | 0.5% | |
Australia | | | 0.4% | |
United Kingdom | | | 0.3% | |
El Salvador | | | 0.3% | |
China | | | 0.3% | |
Supranational | | | 0.3% | |
South Korea | | | 0.3% | |
France | | | 0.1% | |
Luxembourg | | | 0.1% | |
Other Assets and Liabilities | | | 2.8% | |
| | | | |
| | | 100.0% | |
| | | | |
| | | | |
| INVESTMENT BREAKDOWN as a % of Net Assets: | |
Affiliated Mutual Funds | | | 22.4% | |
Collateralized Loan Obligations | | | 17.0% | |
Non-Agency Commercial Mortgage Backed Obligations | | | 12.4% | |
Banking | | | 8.9% | |
Non-Agency Residential Collateralized Mortgage Obligations | | | 5.0% | |
Short Term Investments | | | 4.8% | |
US Government Bonds and Notes | | | 4.4% | |
Oil and Gas | | | 3.4% | |
Transportation | | | 2.3% | |
Media | | | 2.0% | |
Financial Intermediaries | | | 1.4% | |
Telecommunications | | | 1.4% | |
Consumer Products | | | 1.4% | |
Building and Development | | | 1.1% | |
Health Care | | | 1.0% | |
Business Equipment and Services | | | 0.9% | |
Chemicals/Plastics | | | 0.9% | |
Utilities | | | 0.7% | |
Foreign Government Bonds and Notes, Supranationals and Foreign Agencies | | | 0.6% | |
Retail | | | 0.5% | |
Finance | | | 0.5% | |
Food Products | | | 0.4% | |
Pharmaceuticals | | | 0.4% | |
Energy | | | 0.4% | |
Conglomerates | | | 0.3% | |
Real Estate | | | 0.3% | |
Beverage and Tobacco | | | 0.3% | |
Hotels/Motels/Inns and Casinos | | | 0.3% | |
Pulp & Paper | | | 0.3% | |
Automotive | | | 0.2% | |
Environmental Control | | | 0.2% | |
Insurance | | | 0.2% | |
Industrial | | | 0.2% | |
Leisure | | | 0.1% | |
Food/Drug Retailers | | | 0.1% | |
Mining | | | 0.1% | |
Containers and Glass Products | | | 0.1% | |
Cosmetics/Toiletries | | | 0.1% | |
Drugs | | | 0.1% | |
Air Transport | | | 0.1% | |
Other Assets and Liabilities | | | 2.8% | |
| | | | |
| | | 100.0% | |
| | | | |
| # | Variable rate security. Rate disclosed as of March 31, 2014. |
| ^ | Security exempt from registration under Rule 144A of the Securities Act of 1933. These securities may be resold in transactions exempt from registration to qualified institutional buyers. These securities are determined to be liquid by the Adviser, unless otherwise noted, under procedures established by the Fund’s Board of Trustees. At March 31, 2014, the value of these securities amounted to $8,028,939 or 19.7% of net assets. |
| I/O | Interest only security |
| (a) | Institutional class shares held |
| ¨ | Seven-day yield as of March 31, 2014 |
| | | | | | |
| The accompanying notes are an integral part of these financial statements. | | Annual Report | | March 31, 2014 | | 57 |
Schedule of Investments DoubleLine Shiller Enhanced CAPE® (Cont.)
| | | | | | | | | | | | | | |
| Total Return Swaps - Long | | | | | | | | | |
| Reference Entity | | Counterparty | | Notional
Amount | | | Termination
Date | | | Unrealized
Appreciation
(Depreciation) | |
Shiller Barclays CAPE® US Sector ER USD Index | | Barclays Capital, Inc. | | | 97,000 | | | | 04/03/2014 | | | $ | 753 | |
Shiller Barclays CAPE® US Sector ER USD Index | | Barclays Capital, Inc. | | | 225,000 | | | | 04/03/2014 | | | | 2,690 | |
Shiller Barclays CAPE® US Sector ER USD Index | | Barclays Capital, Inc. | | | 90,000 | | | | 04/03/2014 | | | | 1,004 | |
Shiller Barclays CAPE® US Sector ER USD Index | | Barclays Capital, Inc. | | | 58,000 | | | | 04/03/2014 | | | | 252 | |
Shiller Barclays CAPE® US Sector ER USD Index | | Barclays Capital, Inc. | | | 130,000 | | | | 04/03/2014 | | | | — | |
Shiller Barclays CAPE® US Sector ER II USD Index | | Barclays Capital, Inc. | | | 5,717,000 | | | | 11/20/2014 | | | | 395,597 | |
Shiller Barclays CAPE® US Sector ER II USD Index | | Barclays Capital, Inc. | | | 5,534,000 | | | | 12/18/2014 | | | | 207,655 | |
Shiller Barclays CAPE® US Sector ER II USD Index | | Barclays Capital, Inc. | | | 3,967,000 | | | | 12/18/2014 | | | | 205,406 | |
Shiller Barclays CAPE® US Sector ER II USD Index | | Barclays Capital, Inc. | | | 2,370,000 | | | | 12/18/2014 | | | | 138,193 | |
Shiller Barclays CAPE® US Sector ER II USD Index | | Barclays Capital, Inc. | | | 550,000 | | | | 01/29/2015 | | | | 13,726 | |
Shiller Barclays CAPE® US Sector ER II USD Index | | Barclays Capital, Inc. | | | 1,540,000 | | | | 01/29/2015 | | | | 46,956 | |
Shiller Barclays CAPE® US Sector ER II USD Index | | Barclays Capital, Inc. | | | 3,000,000 | | | | 01/29/2015 | | | | 68,467 | |
Shiller Barclays CAPE® US Sector ER II USD Index | | Barclays Capital, Inc. | | | 2,050,000 | | | | 01/29/2015 | | | | 62,242 | |
Shiller Barclays CAPE® US Sector ER II USD Index | | Barclays Capital, Inc. | | | 194,000 | | | | 02/26/2015 | | | | 4,105 | |
Shiller Barclays CAPE® US Sector ER II USD Index | | Barclays Capital, Inc. | | | 603,000 | | | | 02/26/2015 | | | | 38,756 | |
Shiller Barclays CAPE® US Sector ER II USD Index | | Barclays Capital, Inc. | | | 600,000 | | | | 02/26/2015 | | | | 29,646 | |
Shiller Barclays CAPE® US Sector ER II USD Index | | Barclays Capital, Inc. | | | 8,000,000 | | | | 03/26/2015 | | | | 47,555 | |
Shiller Barclays CAPE® US Sector ER II USD Index | | Barclays Capital, Inc. | | | 498,000 | | | | 03/26/2015 | | | | 743 | |
Shiller Barclays CAPE® US Sector ER II USD Index | | Barclays Capital, Inc. | | | 703,000 | | | | 03/26/2015 | | | | 12,872 | |
Shiller Barclays CAPE® US Sector ER II USD Index | | Barclays Capital, Inc. | | | 500,000 | | | | 03/26/2015 | | | | 6,591 | |
Shiller Barclays CAPE® US Sector ER II USD Index | | Barclays Capital, Inc. | | | 2,000,000 | | | | 05/01/2015 | | | | 22,754 | |
| | | | | | | | | | | | | | |
| | | | | | | | | | | | $ | 1,305,963 | |
| | | | | | | | | | | | | | |
Shiller Barclays CAPE® US Sector ER USD Index aims to provide notional long exposure to the top four United States equity sectors that are relatively undervalued, as defined by a modified version of the classic CAPE® Ratio (the “Relative CAPE® Indicator”) and that possess relatively strong price momentum over the prior twelve months. Each U.S. equity sector is represented by an exchange-traded fund that invests primarily in equity securities of companies in the relevant sector.
Shiller Barclays CAPE® US Sector ER II USD Index aims to provide notional long exposure to the top four United States equity sectors that are relatively undervalued, as defined by a modified version of the classic CAPE® Ratio (the “Relative CAPE® Indicator”) and that possess relatively strong price momentum over the prior twelve months. Each U.S. equity sector is represented by an index that invests primarily in equity securities of companies in the relevant sector.
Investments in Affiliates
Generally, an issuer is an affiliate of a Fund under the Investment Company Act of 1940 if the Fund holds 5% or more of the outstanding voting securities of the issuer or if the issuer is under common control with the Fund.
A summary of DoubleLine Shiller Enhanced CAPE®’s investment in affiliated mutual funds for the period ended March 31, 2014 is as follows:
| | | | | | | | | | | | | | | | | | | | | | | | | | | | |
| Fund | | Value at
October 31,
2013 | | | Gross Purchases | | | Gross Sales | | | Shares
Held at
March 31,
2014 | | | Value at
March 31,
2014 | | | Dividend
Income Earned
in the Period
Ended March 31,
2014 | | | Net Realized
Gain (Loss)
in the Period
Ended March 31,
2014 | |
DoubleLine Core Fixed Income Fund | | $ | — | | | $ | 21,703,000 | | | $ | 15,973,000 | | | | 486,435 | | | $ | 5,292,413 | | | $ | 160,148 | | | $ | 73,526 | |
DoubleLine Floating Rate Fund | | | — | | | | 3,827,000 | | | | — | | | | 377,470 | | | | 3,831,323 | | | | 31,169 | | | | — | |
DoubleLine Low Duration Bond Fund | | | — | | | | 10,914,000 | | | | 10,925,117 | | | | — | | | | — | | | | 20,963 | | |
| 11,117
|
|
| | | | | | | | | | | | | | | | | | | | | | | | | | | | |
| | $ | — | | | $ | 36,444,000 | | | $ | 26,898,117 | | | | 863,905 | | | $ | 9,123,736 | | | $ | 212,280 | | | $ | 84,643 | |
| | | | | | | | | | | | | | | | | | | | | | | | | | | | |
| | | | | | |
| 58 | | DoubleLine Funds Trust | | | | See Accompanying Notes |
| | |
| Statements of Assets and Liabilities | | March 31, 2014 |
| | | | | | | | | | | | | | | | | | | | | | | | | | | | |
| | | DoubleLine
Total Return
Bond Fund | | | DoubleLine
Core Fixed
Income Fund | | | DoubleLine
Emerging Markets
Fixed Income Fund | | | DoubleLine
Multi-Asset
Growth Fund
(Consolidated) | | | DoubleLine
Low Duration
Bond Fund
| | | DoubleLine
Floating
Rate Fund | | | DoubleLine
Shiller
Enhanced
CAPE® | |
| | | | | | | |
ASSETS | | | | | | | | | | | | | | | | | | | | | | | | | | | | |
Investments in Unaffiliated Securities, at Value* | | $ | 30,015,638,024 | | | $ | 1,556,449,292 | | | $ | 504,582,139 | | | $ | 56,073,117 | | | $ | 1,794,191,819 | | | $ | 358,999,282 | | | $ | 28,573,199 | |
Investments in Affiliated Securities, at Value* | | | — | | | | 104,358,793 | | | | — | | | | 36,963,455 | | | | — | | | | — | | | | 9,123,736 | |
Short-term Securities* | | | 1,767,398,379 | | | | 62,212,619 | | | | 9,883,531 | | | | 66,151,968 | | | | 185,500,106 | | | | 31,936,361 | | | | 1,937,484 | |
Interest and Dividends Receivable | | | 121,393,427 | | | | 11,691,899 | | | | 7,598,648 | | | | 275,804 | | | | 8,085,178 | | | | 2,663,033 | | | | 217,528 | |
Receivable for Fund Shares Sold | | | 102,405,626 | | | | 12,065,080 | | | | 6,016,697 | | | | 176,164 | | | | 5,081,085 | | | | 536,067 | | | | 1,211,315 | |
Prepaid Expenses and Other Assets | | | 286,351 | | | | 51,276 | | | | 53,944 | | | | 26,338 | | | | 127,301 | | | | 50,164 | | | | 48,995 | |
Receivable for Investments Sold | | | — | | | | 902,503 | | | | 2,159,756 | | | | — | | | | 245,227 | | | | 25,037,225 | | | | 500,000 | |
Cash | | | — | | | | 25,758 | | | | — | | | | 490,610 | | | | — | | | | — | | | | — | |
Deposit at Broker for Futures | | | — | | | | — | | | | — | | | | 3,494,500 | | | | — | | | | — | | | | — | |
Variation Margin Receivable | | | — | | | | — | | | | — | | | | 280,023 | | | | — | | | | — | | | | — | |
Unrealized Appreciation on Swaps | | | — | | | | — | | | | — | | | | 198,136 | | | | — | | | | — | | | | 1,305,963 | |
Investment Advisory Fees Receivable | | | — | | | | — | | | | — | | | | — | | | | — | | | | — | | | | 43,333 | |
Total Assets | | | 32,007,121,807 | | | | 1,747,757,220 | | | | 530,294,715 | | | | 164,130,115 | | | | 1,993,230,716 | | | | 419,222,132 | | | | 42,961,553 | |
| | | | | | | |
LIABILITIES | | | | | | | | | | | | | | | | | | | | | | | | | | | | |
Payable for Fund Shares Redeemed | | | 157,828,121 | | | | 3,871,924 | | | | 877,234 | | | | 384,181 | | | | 4,900,861 | | | | 317,735 | | | | 71,354 | |
Payable for Investments Purchased | | | 85,091,898 | | | | 5,528,829 | | | | 12,440,385 | | | | — | | | | 72,663,302 | | | | 36,876,161 | | | | 2,050,797 | |
Distribution Payable | | | 41,979,117 | | | | 1,463,738 | | | | 569,363 | | | | 427,103 | | | | 425,393 | | | | 537,480 | | | | 7,739 | |
Investment Advisory Fees Payable | | | 11,522,856 | | | | 546,652 | | | | 319,641 | | | | 117,602 | | | | 506,492 | | | | 181,851 | | | | — | |
Transfer Agent Expenses Payable | | | 3,041,312 | | | | 334,187 | | | | 70,767 | | | | 37,381 | | | | 112,299 | | | | 32,689 | | | | 12,963 | |
Distribution Fees Payable | | | 3,023,214 | | | | 180,699 | | | | 58,453 | | | | 30,541 | | | | 412,600 | | | | 64,253 | | | | 4,124 | |
Accrued Expenses | | | 1,705,309 | | | | 285,452 | | | | 166,247 | | | | 93,196 | | | | 125,608 | | | | 80,790 | | | | 29,078 | |
Administration, Fund Accounting and Custodian Fees Payable | | | 837,749 | | | | 73,120 | | | | 26,001 | | | | 14,681 | | | | 59,174 | | | | 29,306 | | | | 6,788 | |
Registration Fees Payable | | | 7,338 | | | | 584 | | | | — | | | | 93 | | | | 166,694 | | | | 45,309 | | | | 3,658 | |
Total Liabilities | | | 305,036,914 | | | | 12,285,185 | | | | 14,528,091 | | | | 1,104,778 | | | | 79,372,423 | | | | 38,165,574 | | | | 2,186,501 | |
Net Assets | | $ | 31,702,084,893 | | | $ | 1,735,472,035 | | | $ | 515,766,624 | | | $ | 163,025,337 | | | $ | 1,913,858,293 | | | $ | 381,056,558 | | | $ | 40,775,052 | |
| | | | | | | |
NET ASSETS CONSIST OF: | | | | | | | | | | | | | | | | | | | | | | | | | | | | |
Paid-in Capital | | $ | 32,721,926,970 | | | $ | 1,754,724,135 | | | $ | 538,744,882 | | | $ | 156,348,567 | | | $ | 1,908,919,755 | | | $ | 379,545,002 | | | $ | 39,378,656 | |
Undistributed (Accumulated) Net Investment Income (Loss) | | | 12,870,889 | | | | 793,887 | | | | 688,465 | | | | 327,510 | | | | 232,289 | | | | 62,412 | | | | 4,763 | |
Accumulated Net Realized Gain (Loss) on Investments | | | (1,164,691,771 | ) | | | (35,281,550 | ) | | | (20,870,459 | ) | | | 4,982,315 | | | | (3,047,352 | ) | | | 265,486 | | | | 41,150 | |
Net Unrealized Appreciation (Depreciation) on: | | | | | | | | | | | | | | | | | | | | | | | | | | | | |
Investments in Unaffiliated Securities | | | 131,943,176 | | | | 14,505,666 | | | | (2,796,264 | ) | | | 1,474,349 | | | | 7,753,601 | | | | 1,183,658 | | | | 43,731 | |
Investments in Affiliated Securities | | | — | | | | 729,897 | | | | — | | | | (967,706 | ) | | | — | | | | — | | | | 789 | |
Short-term Securities | | | 35,629 | | | | — | | | | — | | | | — | | | | — | | | | — | | | | — | |
Futures | | | — | | | | — | | | | — | | | | 662,166 | | | | — | | | | — | | | | — | |
Swaps | | | — | | | | — | | | | — | | | | 198,136 | | | | — | | | | — | | | | 1,305,963 | |
Net Assets | | $ | 31,702,084,893 | | | $ | 1,735,472,035 | | | $ | 515,766,624 | | | $ | 163,025,337 | | | $ | 1,913,858,293 | | | $ | 381,056,558 | | | $ | 40,775,052 | |
| | | | | | | |
*Identified Cost: | | | | | | | | | | | | | | | | | | | | | | | | | | | | |
Investments in Unaffiliated Securities | | $ | 29,883,694,848 | | | $ | 1,541,943,626 | | | $ | 507,378,403 | | | $ | 54,598,768 | | | $ | 1,786,438,218 | | | $ | 357,815,624 | | | $ | 28,529,468 | |
Investments in Affiliated Securities | | | — | | | | 103,628,896 | | | | — | | | | 37,931,161 | | | | — | | | | — | | | | 9,122,947 | |
Short-term Securities | | | 1,767,362,750 | | | | 62,212,619 | | | | 9,883,531 | | | | 66,151,968 | | | | 185,500,106 | | | | 31,936,361 | | | | 1,937,484 | |
| | | | | | | |
Class I (unlimited shares authorized): | | | | | | | | | | | | | | | | | | | | | | | | | | | | |
Net Assets | | $ | 24,631,306,039 | | | $ | 1,351,760,234 | | | $ | 331,789,850 | | | $ | 66,291,526 | | | $ | 851,770,538 | | | $ | 276,736,740 | | | $ | 30,061,327 | |
Shares Outstanding | | | 2,260,077,618 | | | | 124,288,498 | | | | 31,648,291 | | | | 6,565,780 | | | | 83,596,892 | | | | 27,278,140 | | | | 2,814,795 | |
Net Asset Value, Offering and Redemption Price per Share | | $ | 10.90 | | | $ | 10.88 | | | $ | 10.48 | | | $ | 10.10 | | | $ | 10.19 | | | $ | 10.15 | | | $ | 10.68 | |
| | | | | | | |
Class N (unlimited shares authorized): | | | | | | | | | | | | | | | | | | | | | | | | | | | | |
Net Assets | | $ | 7,070,778,854 | | | $ | 383,711,801 | | | $ | 183,976,774 | | | $ | — | | | $ | 1,062,087,755 | | | $ | 104,319,818 | | | $ | 10,713,725 | |
Shares Outstanding | | | 649,026,486 | | | | 35,299,393 | | | | 17,546,668 | | | | — | | | | 104,304,377 | | | | 10,268,502 | | | | 1,003,360 | |
Net Asset Value, Offering and Redemption Price per Share | | $ | 10.89 | | | $ | 10.87 | | | $ | 10.48 | | | $ | — | | | $ | 10.18 | | | $ | 10.16 | | | $ | 10.68 | |
| | | | | | | |
Class A (unlimited shares authorized): | | | | | | | | | | | | | | | | | | | | | | | | | | | | |
Net Assets | | $ | — | | | $ | — | | | $ | — | | | $ | 96,733,811 | | | $ | — | | | $ | — | | | $ | — | |
Shares Outstanding | | | — | | | | — | | | | — | | | | 9,601,525 | | | | — | | | | — | | | | — | |
Net Asset Value, Offering Price per Share | | $ | — | | | $ | — | | | $ | — | | | $ | 10.50 | | | $ | — | | | $ | — | | | $ | — | |
Net Asset Value, Redemption Price per Share | | $ | — | | | $ | — | | | $ | — | | | $ | 10.07 | | | $ | — | | | $ | — | | | $ | — | |
| | | | | | |
| The accompanying notes are an integral part of these financial statements. | | Annual Report | | March 31, 2014 | | 59 |
| | |
| Statements of Operations | | Period ended March 31, 2014 |
| | | | | | | | | | | | | | | | | | | | | | | | | | | | |
| | | DoubleLine
Total Return
Bond Fund | | | DoubleLine
Core Fixed
Income Fund | | | DoubleLine
Emerging Markets
Fixed Income Fund | | | DoubleLine
Multi-Asset
Growth Fund
(Consolidated) | | | DoubleLine
Low Duration
Bond Fund | | | DoubleLine
Floating
Rate Fund | | | DoubleLine
Shiller
Enhanced
CAPE®1 | |
| | | | | | | |
INVESTMENT INCOME | | | | | | | | | | | | | | | | | | | | | | | | | | | | |
Income: | | | | | | | | | | | | | | | | | | | | | | | | | | | | |
Interest | | $ | 1,497,388,892 | | | $ | 82,237,371 | | | $ | 32,996,446 | | | $ | 2,285,388 | | | $ | 23,207,793 | | | $ | 9,819,609 | | | $ | 65,638 | |
Dividends from Unaffiliated Securities | | | — | | | | — | | | | — | | | | 1,755,281 | | | | — | | | | — | | | | — | |
Dividends from Affiliated Securities | | | — | | | | 2,719,936 | | | | — | | | | 1,875,330 | | | | — | | | | — | | | | 212,280 | |
Total Investment Income | | | 1,497,388,892 | | | | 84,957,307 | | | | 32,996,446 | | | | 5,915,999 | | | | 23,207,793 | | | | 9,819,609 | | | | 277,918 | |
Expenses: | | | | | | | | | | | | | | | | | | | | | | | | | | | | |
Investment Advisory Fees | | | 142,668,210 | | | | 7,541,529 | | | | 4,625,614 | | | | 2,229,588 | | | | 4,114,174 | | | | 1,412,216 | | | | 17,938 | |
Distribution Fees - Class N | | | 20,325,606 | | | | 1,289,303 | | | | 403,107 | | | | — | | | | 1,605,729 | | | | 189,407 | | | | 10,618 | |
Distribution Fees - Class A | | | — | | | | — | | | | — | | | | 329,644 | | | | — | | | | — | | | | — | |
Transfer Agent Expenses | | | 14,071,227 | | | | 1,077,745 | | | | 407,790 | | | | 141,876 | | | | 635,132 | | | | 142,341 | | | | 33,106 | |
Administration, Fund Accounting and Custodian Fees | | | 6,072,262 | | | | 482,528 | | | | 156,930 | | | | 80,713 | | | | 313,539 | | | | 115,457 | | | | 11,650 | |
Shareholder Reporting Expenses | | | 1,465,148 | | | | 117,997 | | | | 52,077 | | | | 39,091 | | | | 56,983 | | | | 29,150 | | | | 35,054 | |
Registration Fees | | | 1,073,525 | | | | 140,936 | | | | 92,355 | | | | 88,518 | | | | 304,012 | | | | 146,080 | | | | 8,294 | |
Professional Fees | | | 1,013,048 | | | | 220,394 | | | | 181,713 | | | | 152,047 | | | | 130,499 | | | | 183,159 | | | | 321,126 | |
Insurance Expenses | | | 933,484 | | | | 67,322 | | | | 21,881 | | | | 8,437 | | | | 16,082 | | | | 3,730 | | | | 126 | |
Trustees’ Fees and Expenses | | | 633,249 | | | | 35,122 | | | | 10,112 | | | | 4,021 | | | | 26,420 | | | | 6,315 | | | | 335 | |
Miscellaneous Expenses | | | 308,328 | | | | 28,869 | | | | 105,654 | | | | 8,437 | | | | 12,038 | | | | 22,196 | | | | 7,974 | |
Total Expenses | | | 188,564,087 | | | | 11,001,745 | | | | 6,057,233 | | | | 3,082,372 | | | | 7,214,608 | | | | 2,250,051 | | | | 446,221 | |
Less: Fees (Waived)/Recouped | | | 2,120,101 | | | | — | | | | 34,442 | | | | (283,515 | ) | | | (105,391 | ) | | | (3,277 | ) | | | (399,206 | ) |
Net Expenses | | | 190,684,188 | | | | 11,001,745 | | | | 6,091,675 | | | | 2,798,857 | | | | 7,109,217 | | | | 2,246,774 | | | | 47,015 | |
| | | | | | | |
Net Investment Income | | | 1,306,704,704 | | | | 73,955,562 | | | | 26,904,771 | | | | 3,117,142 | | | | 16,098,576 | | | | 7,572,835 | | | | 230,903 | |
| | | | | | | |
REALIZED & UNREALIZED GAIN (LOSS) ON INVESTMENTS | | | | | | | | | | | | | | | | | | | | | | | | | | | | |
Net Realized Gain (Loss) on: | | | | | | | | | | | | | | | | | | | | | | | | | | | | |
Investments in Unaffiliated Securities | | | (27,164,096 | ) | | | (22,910,501 | ) | | | (20,321,605 | ) | | | (251,677 | ) | | | 863,812 | | | | 273,530 | | | | 81 | |
Investments in Affiliated Securities | | | — | | | | 417,896 | | | | — | | | | (515,060 | ) | | | — | | | | — | | | | 84,643 | |
Futures | | | — | | | | — | | | | — | | | | 3,357,731 | | | | — | | | | — | | | | — | |
Forwards | | | — | | | | — | | | | — | | | | 337,892 | | | | — | | | | — | | | | — | |
Swaps | | | — | | | | — | | | | — | | | | (878,472 | ) | | | — | | | | — | | | | (43,549 | ) |
Written Options | | | — | | | | — | | | | — | | | | 339,850 | | | | — | | | | — | | | | — | |
Net Change in Unrealized Appreciation (Depreciation) on: | | | | | | | | | | | | | | | | | | | | | | | | | | | | |
Investments in Unaffiliated Securities | | | (1,091,381,122 | ) | | | (56,775,979 | ) | | | (16,108,225 | ) | | | 10,564 | | | | 4,227,453 | | | | 762,318 | | | | 43,731 | |
Investments in Affiliated Securities | | | — | | | | 346,256 | | | | — | | | | (1,455,564 | ) | | | — | | | | — | | | | 789 | |
Short-term Securities | | | (747,351 | ) | | | — | | | | — | | | | — | | | | — | | | | 2,023 | | | | — | |
Futures | | | — | | | | — | | | | — | | | | 2,120,692 | | | | — | | | | — | | | | — | |
Swaps | | | — | | | | — | | | | — | | | | 464,855 | | | | — | | | | — | | | | 1,305,963 | |
Written Options | | | — | | | | — | | | | — | | | | (234,584 | ) | | | — | | | | — | | | | — | |
Net Realized and Unrealized Gain (Loss) on Investments | | | (1,119,292,569 | ) | | | (78,922,328 | ) | | | (36,429,830 | ) | | | 3,296,227 | | | | 5,091,265 | | | | 1,037,871 | | | | 1,391,658 | |
| | | | | | | |
NET INCREASE (DECREASE) IN NET ASSETS RESULTING FROM OPERATIONS | | $ | 187,412,135 | | | $ | (4,966,766 | ) | | $ | (9,525,059 | ) | | $ | 6,413,369 | | | $ | 21,189,841 | | | $ | 8,610,706 | | | $ | 1,622,561 | |
| 1 | Commencement of operations on October 31, 2013 |
| | | | | | |
| 60 | | DoubleLine Funds Trust | | | | The accompanying notes are an integral part of these financial statements. |
| | |
| Statements of Changes in Net Assets | | |
| | | | | | | | | | | | | | | | |
| | | DoubleLine
Total Return Bond Fund | | | DoubleLine
Core Fixed Income Fund | |
| | | Year Ended
March 31, 2014 | | | Year Ended
March 31, 2013 | | | Year Ended
March 31, 2014 | | | Year Ended
March 31, 2013 | |
| | | | |
OPERATIONS | | | | | | | | | | | | | | | | |
Net Investment Income | | $ | 1,306,704,704 | | | $ | 1,276,925,558 | | | $ | 73,955,562 | | | $ | 80,090,728 | |
Net Realized Gain (Loss) on Investments | | | (27,164,096 | ) | | | 4,484,908 | | | | (22,492,605 | ) | | | 33,274,675 | |
Net Change in Unrealized Appreciation (Depreciation) of Investments | | | (1,092,128,473 | ) | | | 907,541,862 | | | | (56,429,723 | ) | | | 43,470,367 | |
Net Increase (Decrease) in Net Assets Resulting from Operations | | | 187,412,135 | | | | 2,188,952,328 | | | | (4,966,766 | ) | | | 156,835,770 | |
| | | | |
DISTRIBUTIONS TO SHAREHOLDERS | | | | | | | | | | | | | | | | |
From Net Investment Income | | | | | | | | | | | | | | | | |
Class I | | | (1,379,861,329 | ) | | | (1,369,454,321 | ) | | | (63,903,379 | ) | | | (73,833,620 | ) |
Class N | | | (385,329,341 | ) | | | (435,657,389 | ) | | | (19,950,791 | ) | | | (25,573,765 | ) |
From Net Realized Gain | | | | | | | | | | | | | | | | |
Class I | | | — | | | | — | | | | (5,663,885 | ) | | | (8,259,212 | ) |
Class N | | | — | | | | — | | | | (1,613,333 | ) | | | (3,270,018 | ) |
| | | | |
Total Distributions to Shareholders | | | (1,765,190,670 | ) | | | (1,805,111,710 | ) | | | (91,131,388 | ) | | | (110,936,615 | ) |
| | | | |
NET SHARE TRANSACTIONS | | | | | | | | | | | | | | | | |
Class I | | | (4,558,179,006 | ) | | | 13,889,037,951 | | | | (408,475,174 | ) | | | 249,977,552 | |
Class N | | | (2,001,943,791 | ) | | | 3,224,760,062 | | | | (321,003,550 | ) | | | 181,860,465 | |
Increase (Decrease) in Net Assets Resulting from Net Share Transactions | | | (6,560,122,797 | ) | | | 17,113,798,013 | | | | (729,478,724 | ) | | | 431,838,017 | |
| | | | |
Total Increase (Decrease) in Net Assets | | $ | (8,137,901,332 | ) | | $ | 17,497,638,631 | | | $ | (825,576,878 | ) | | $ | 477,737,172 | |
| | | | |
NET ASSETS | | | | | | | | | | | | | | | | |
Beginning of Period | | $ | 39,839,986,225 | | | $ | 22,342,347,594 | | | $ | 2,561,048,913 | | | $ | 2,083,311,741 | |
End of Period | | $ | 31,702,084,893 | | | $ | 39,839,986,225 | | | $ | 1,735,472,035 | | | $ | 2,561,048,913 | |
| | | | |
Accumulated (Undistributed) Net Investment Income (Loss) | | $ | 12,870,889 | | | $ | 13,667,741 | | | $ | 793,887 | | | $ | 704,511 | |
| | | | | | |
| The accompanying notes are an integral part of these financial statements. | | Annual Report | | March 31, 2014 | | 61 |
| | |
| Statements of Changes in Net Assets | | |
| | | | | | | | | | | | | | | | |
| | | DoubleLine
Emerging Markets
Fixed Income Fund | | | DoubleLine
Multi-Asset
Growth Fund
(Consolidated) | |
| | | Year Ended
March 31, 2014 | | | Year Ended
March 31, 2013 | | | Year Ended
March 31, 2014 | | | Year Ended
March 31, 2013 | |
| | | | |
OPERATIONS | | | | | | | | | | | | | | | | |
Net Investment Income | | $ | 26,904,771 | | | $ | 21,779,269 | | | $ | 3,117,142 | | | $ | 4,202,798 | |
Net Realized Gain (Loss) on Investments | | | (20,321,605 | ) | | | 15,854,005 | | | | 2,390,264 | | | | (1,949,093 | ) |
Net Change in Unrealized Appreciation (Depreciation) of Investments | | | (16,108,225 | ) | | | 6,102,561 | | | | 905,963 | | | | 892,332 | |
Net Increase (Decrease) in Net Assets Resulting from Operations | | | (9,525,059 | ) | | | 43,735,835 | | | | 6,413,369 | | | | 3,146,037 | |
| | | | |
DISTRIBUTIONS TO SHAREHOLDERS | | | | | | | | | | | | | | | | |
From Net Investment Income | | | | | | | | | | | | | | | | |
Class I | | | (19,891,979 | ) | | | (17,525,904 | ) | | | (1,703,969 | ) | | | (2,646,441 | ) |
Class N | | | (6,995,101 | ) | | | (4,075,759 | ) | | | — | | | | — | |
Class A | | | — | | | | — | | | | (2,264,145 | ) | | | (2,688,413 | ) |
From Net Realized Gain | | | | | | | | | | | | | | | | |
Class I | | | (5,281,666 | ) | | | (6,946,690 | ) | | | — | | | | — | |
Class N | | | (2,327,665 | ) | | | (1,698,083 | ) | | | — | | | | — | |
Class A | | | — | | | | — | | | | — | | | | — | |
| | | | |
Total Distributions to Shareholders | | | (34,496,411 | ) | | | (30,246,436 | ) | | | (3,968,114 | ) | | | (5,334,854 | ) |
| | | | |
NET SHARE TRANSACTIONS | | | | | | | | | | | | | | | | |
Class I | | | (252,764,751 | ) | | | 259,941,421 | | | | (39,665,897 | ) | | | 21,098,152 | |
Class N | | | 24,323,638 | | | | 83,389,248 | | | | — | | | | — | |
Class A | | | — | | | | — | | | | (64,581,935 | ) | | | 118,585,276 | |
Increase (Decrease) in Net Assets Resulting from Net Share Transactions | | | (228,441,113 | ) | | | 343,330,669 | | | | (104,247,832 | ) | | | 139,683,428 | |
| | | | |
Total Increase (Decrease) in Net Assets | | $ | (272,462,583 | ) | | $ | 356,820,068 | | | $ | (101,802,577 | ) | | $ | 137,494,611 | |
| | | | |
NET ASSETS | | | | | | | | | | | | | | | | |
Beginning of Period | | $ | 788,229,207 | | | $ | 431,409,139 | | | $ | 264,827,914 | | | $ | 127,333,303 | |
End of Period | | $ | 515,766,624 | | | $ | 788,229,207 | | | $ | 163,025,337 | | | $ | 264,827,914 | |
| | | | |
Accumulated (Undistributed) Net Investment Income (Loss) | | $ | 688,465 | | | $ | 190,376 | | | $ | 327,510 | | | $ | (118,514 | ) |
| | | | | | |
| 62 | | DoubleLine Funds Trust | | | | The accompanying notes are an integral part of these financial statements. |
| | | | | | | | | | | | | | | | |
| | | DoubleLine
Low Duration
Bond Fund | | | DoubleLine
Floating Rate
Fund | |
| | | Year Ended
March 31, 2014 | | | Year Ended
March 31, 2013 | | | Year Ended
March 31, 2014 | | | Period Ended
March 31, 20131 | |
| | | | |
OPERATIONS | | | | | | | | | | | | | | | | |
Net Investment Income (Loss) | | $ | 16,098,576 | | | $ | 8,030,477 | | | $ | 7,572,835 | | | $ | (8,435 | ) |
Net Realized Gain (Loss) on Investments | | | 863,812 | | | | 277,382 | | | | 273,530 | | | | — | |
Net Change in Unrealized Appreciation (Depreciation) of Investments | | | 4,227,453 | | | | 2,755,237 | | | | 764,341 | | | | 419,317 | |
Net Increase (Decrease) in Net Assets Resulting from Operations | | | 21,189,841 | | | | 11,063,096 | | | | 8,610,706 | | | | 410,882 | |
| | | | |
DISTRIBUTIONS TO SHAREHOLDERS | | | | | | | | | | | | | | | | |
From Net Investment Income | | | | | | | | | | | | | | | | |
Class I | | | (9,321,891 | ) | | | (6,198,894 | ) | | | (5,424,016 | ) | | | — | |
Class N | | | (9,318,777 | ) | | | (3,234,539 | ) | | | (2,077,972 | ) | | | — | |
From Net Realized Gain | | | | | | | | | | | | | | | | |
Class I | | | — | | | | (106,019 | ) | | | (5,406 | ) | | | — | |
Class N | | | — | | | | (68,847 | ) | | | (2,638 | ) | | | — | |
| | | | |
Total Distributions to Shareholders | | | (18,640,668 | ) | | | (9,608,299 | ) | | | (7,510,032 | ) | | | — | |
| | | | |
NET SHARE TRANSACTIONS | | | | | | | | | | | | | | | | |
Class I | | | 476,032,359 | | | | 242,735,409 | | | | 212,411,666 | | | | 63,025,000 | |
Class N | | | 821,710,023 | | | | 151,916,322 | | | | 104,098,336 | | | | 10,000 | |
Increase (Decrease) in Net Assets Resulting from Net Share Transactions | | | 1,297,742,382 | | | | 394,651,731 | | | | 316,510,002 | | | | 63,035,000 | |
| | | | |
Total Increase (Decrease) in Net Assets | | $ | 1,300,291,555 | | | $ | 396,106,528 | | | $ | 317,610,676 | | | $ | 63,445,882 | |
| | | | |
NET ASSETS | | | | | | | | | | | | | | | | |
Beginning of Period | | $ | 613,566,738 | | | $ | 217,460,210 | | | $ | 63,445,882 | | | $ | — | |
End of Period | | $ | 1,913,858,293 | | | $ | 613,566,738 | | | $ | 381,056,558 | | | $ | 63,445,882 | |
| | | | |
Accumulated (Undistributed) Net Investment Income (Loss) | | $ | 232,289 | | | $ | 55,235 | | | $ | 62,412 | | | $ | — | |
| 1 | Commencement of operations on February 1, 2013 |
| | | | | | |
| The accompanying notes are an integral part of these financial statements. | | Annual Report | | March 31, 2014 | | 63 |
| | |
| Statements of Changes in Net Assets | | |
| | | | |
| | | DoubleLine
Shiller Enhanced
CAPE® | |
| | | Period Ended
March 31, 20141 | |
| |
OPERATIONS | | | | |
Net Investment Income | | $ | 230,903 | |
Net Realized Gain (Loss) on Investments | | | 41,175 | |
Net Change in Unrealized Appreciation (Depreciation) of Investments | | | 1,350,483 | |
Net Increase (Decrease) in Net Assets Resulting from Operations | | | 1,622,561 | |
| |
DISTRIBUTIONS TO SHAREHOLDERS | | | | |
From Net Investment Income | | | | |
Class I | | | (130,379 | ) |
Class N | | | (95,786 | ) |
| |
Total Distributions to Shareholders | | | (226,165 | ) |
| |
NET SHARE TRANSACTIONS | | | | |
Class I | | | 29,316,916 | |
Class N | | | 10,061,740 | |
Increase (Decrease) in Net Assets Resulting from Net Share Transactions | | | 39,378,656 | |
| |
Total Increase (Decrease) in Net Assets | | $ | 40,775,052 | |
| |
NET ASSETS | | | | |
Beginning of Period | | $ | — | |
End of Period | | $ | 40,775,052 | |
| |
Accumulated (Undistributed) Net Investment Income (Loss) | | $ | 4,763 | |
| 1 | Commencement of operations on October 31, 2013 |
| | | | | | |
| 64 | | DoubleLine Funds Trust | | | | The accompanying notes are an integral part of these financial statements. |
| | | | | | | | | | | | | | | | | | | | | | | | | | | | | | | | |
| | | DoubleLine Total Return Bond Fund | | | | |
| | | Year Ended
March 31,
2014 | | | Year Ended
March 31,
2013 | | | Year Ended
March 31,
2012 | | | Period Ended
March 31,
20111 | | | Year Ended
March 31,
2014 | | | Year Ended
March 31,
2013 | | | Year Ended
March 31,
2012 | | | Period Ended
March 31,
20111 | |
| | | Class I | | | Class I | | | Class I | | | Class I | | | Class N | | | Class N | | | Class N | | | Class N | |
| | | | | | | | |
Net Asset Value, Beginning of Period | | $ | 11.34 | | | $ | 11.17 | | | $ | 10.96 | | | $ | 10.00 | | | $ | 11.33 | | | $ | 11.16 | | | $ | 10.96 | | | $ | 10.00 | |
| | | | | | | | |
Income (Loss) from Investment Operations: | | | | | | | | | | | | | | | | | | | | | | | | | | | | | | | | |
Net Investment Income (Loss)4 | | | 0.42 | | | | 0.46 | | | | 0.77 | | | | 1.02 | | | | 0.39 | | | | 0.44 | | | | 0.73 | | | | 0.99 | |
Net Gain (Loss) on Investments (Realized and Unrealized) | | | (0.30 | ) | | | 0.34 | | | | 0.31 | | | | 0.87 | | | | (0.30 | ) | | | 0.34 | | | | 0.31 | | | | 0.87 | |
Total from Investment Operations | | | 0.12 | | | | 0.80 | | | | 1.08 | | | | 1.89 | | | | 0.09 | | | | 0.78 | | | | 1.04 | | | | 1.86 | |
| | | | | | | | |
Less Distributions: | | | | | | | | | | | | | | | | | | | | | | | | | | | | | | | | |
Distributions from Net Investment Income | | | (0.56 | ) | | | (0.63 | ) | | | (0.87 | ) | | | (0.93 | ) | | | (0.53 | ) | | | (0.61 | ) | | | (0.84 | ) | | | (0.90 | ) |
Distributions from Net Realized Gain | | | — | | | | — | | | | — | | | | — | | | | — | | | | — | | | | — | | | | — | |
Total Distributions | | | (0.56 | ) | | | (0.63 | ) | | | (0.87 | ) | | | (0.93 | ) | | | (0.53 | ) | | | (0.61 | ) | | | (0.84 | ) | | | (0.90 | ) |
Net Asset Value, End of Period | | $ | 10.90 | | | $ | 11.34 | | | $ | 11.17 | | | $ | 10.96 | | | $ | 10.89 | | | $ | 11.33 | | | $ | 11.16 | | | $ | 10.96 | |
Total Return | | | 1.13% | | | | 7.37% | | | | 10.18% | | | | 19.28% | 2 | | | 0.88% | | | | 7.11% | | | | 9.83% | | | | 19.04% | 2 |
| | | | | | | | |
Supplemental Data: | | | | | | | | | | | | | | | | | | | | | | | | | | | | | | | | |
Net Assets, End of Period (000’s) | | $ | 24,631,306 | | | $ | 30,398,069 | | | $ | 16,226,569 | | | $ | 4,330,408 | | | $ | 7,070,779 | | | $ | 9,441,917 | | | $ | 6,115,779 | | | $ | 1,479,601 | |
Ratios to Average Net Assets: | | | | | | | | | | | | | | | | | | | | | | | | | | | | | | | | |
Expenses Before Fees (Waived)/Recouped | | | 0.47% | | | | 0.48% | | | | 0.50% | | | | 0.53% | 3 | | | 0.72% | | | | 0.73% | | | | 0.75% | | | | 0.78% | 3 |
Expenses After Fees (Waived)/Recouped | | | 0.48% | | | | 0.48% | | | | 0.49% | | | | 0.49% | 3 | | | 0.73% | | | | 0.73% | | | | 0.74% | | | | 0.74% | 3 |
Net Investment Income (Loss) | | | 3.78% | | | | 4.02% | | | | 6.86% | | | | 9.42% | 3 | | | 3.25% | | | | 3.76% | | | | 6.58% | | | | 9.17% | 3 |
Portfolio Turnover Rate | | | 14% | | | | 23% | | | | 15% | | | | 17% | 2 | | | 14% | | | | 23% | | | | 15% | | | | 17% | 2 |
| 1 | Commencement of operations on April 6, 2010 |
| 4 | Calculated based on average shares outstanding during the period. |
| | | | | | |
| The accompanying notes are an integral part of these financial statements. | | Annual Report | | March 31, 2014 | | 65 |
| | | | | | | | | | | | | | | | | | | | | | | | | | | | | | | | |
| | | DoubleLine Core Fixed Income Fund | |
| | | Year Ended
March 31,
2014 | | | Year Ended
March 31,
2013 | | | Year Ended
March 31,
2012 | | | Period Ended
March 31,
20111 | | | Year Ended
March 31,
2014 | | | Year Ended
March 31,
2013 | | | Year Ended
March 31,
2012 | | | Period Ended
March 31,
20111 | |
| | | Class I | | | Class I | | | Class I | | | Class I | | | Class N | | | Class N | | | Class N | | | Class N | |
| | | | | | | | |
Net Asset Value, Beginning of Period | | $ | 11.29 | | | $ | 11.06 | | | $ | 10.46 | | | $ | 10.00 | | | $ | 11.28 | | | $ | 11.05 | | | $ | 10.46 | | | $ | 10.00 | |
| | | | | | | | |
Income (Loss) from Investment Operations: | | | | | | | | | | | | | | | | | | | | | | | | | | | | | | | | |
Net Investment Income (Loss)4 | | | 0.41 | | | | 0.36 | | | | 0.50 | | | | 0.57 | | | | 0.40 | | | | 0.33 | | | | 0.47 | | | | 0.55 | |
Net Gain (Loss) on Investments (Realized and Unrealized) | | | (0.31 | ) | | | 0.36 | | | | 0.65 | | | | 0.41 | | | | (0.31 | ) | | | 0.36 | | | | 0.65 | | | | 0.41 | |
Total from Investment Operations | | | 0.10 | | | | 0.72 | | | | 1.15 | | | | 0.98 | | | | 0.09 | | | | 0.69 | | | | 1.12 | | | | 0.96 | |
| | | | | | | | |
Less Distributions: | | | | | | | | | | | | | | | | | | | | | | | | | | | | | | | | |
Distributions from Net Investment Income | | | (0.47 | ) | | | (0.44 | ) | | | (0.52 | ) | | | (0.48 | ) | | | (0.46 | ) | | | (0.41 | ) | | | (0.50 | ) | | | (0.46 | ) |
Distributions from Net Realized Gain | | | (0.04 | ) | | | (0.05 | ) | | | (0.03 | ) | | | (0.04 | ) | | | (0.04 | ) | | | (0.05 | ) | | | (0.03 | ) | | | (0.04 | ) |
Total Distributions | | | (0.51 | ) | | | (0.49 | ) | | | (0.55 | ) | | | (0.52 | ) | | | (0.50 | ) | | | (0.46 | ) | | | (0.53 | ) | | | (0.50 | ) |
Net Asset Value, End of Period | | $ | 10.88 | | | $ | 11.29 | | | $ | 11.06 | | | $ | 10.46 | | | $ | 10.87 | | | $ | 11.28 | | | $ | 11.05 | | | $ | 10.46 | |
Total Return | | | 1.03% | | | | 6.53% | | | | 11.19% | | | | 9.90% | 2 | | | 0.77% | | | | 6.27% | | | | 10.85% | | | | 9.71% | 2 |
| | | | | | | | |
Supplemental Data: | | | | | | | | | | | | | | | | | | | | | | | | | | | | | | | | |
Net Assets, End of Period (000’s) | | $ | 1,351,760 | | | $ | 1,829,092 | | | $ | 1,544,169 | | | $ | 158,043 | | | $ | 383,712 | | | $ | 731,957 | | | $ | 539,143 | | | $ | 30,586 | |
Ratios to Average Net Assets: | | | | | | | | | | | | | | | | | | | | | | | | | | | | | | | | |
Expenses Before Fees Waived | | | 0.48% | | | | 0.51% | | | | 0.54% | | | | 0.85% | 3 | | | 0.73% | | | | 0.76% | | | | 0.79% | | | | 1.09% | 3 |
Expenses After Fees Waived | | | 0.48% | | | | 0.50% | | | | 0.49% | | | | 0.49% | 3 | | | 0.73% | | | | 0.75% | | | | 0.74% | | | | 0.74% | 3 |
Net Investment Income (Loss) | | | 3.76% | | | | 3.14% | | | | 4.51% | | | | 6.56% | 3 | | | 3.32% | | | | 2.91% | | | | 4.22% | | | | 6.38% | 3 |
Portfolio Turnover Rate | | | 53% | | | | 83% | | | | 81% | | | | 84% | 2 | | | 53% | | | | 83% | | | | 81% | | | | 84% | 2 |
| 1 | Commencement of operations on June 1, 2010 |
| 4 | Calculated based on average shares outstanding during the period. |
| | | | | | |
| 66 | | DoubleLine Funds Trust | | | | The accompanying notes are an integral part of these financial statements. |
| | | | | | | | | | | | | | | | | | | | | | | | | | | | | | | | |
| | | DoubleLine Emerging Markets Fixed Income Fund | | | | |
| | | Year Ended
March 31,
2014 | | | Year Ended
March 31,
2013 | | | Year Ended
March 31,
2012 | | | Period Ended
March 31,
20111 | | | Year Ended
March 31,
2014 | | | Year Ended
March 31,
2013 | | | Year Ended
March 31,
2012 | | | Period Ended
March 31,
20111 | |
| | | Class I | | | Class I | | | Class I | | | Class I | | | Class N | | | Class N | | | Class N | | | Class N | |
| | | | | | | | |
Net Asset Value, Beginning of Period | | $ | 11.03 | | | $ | 10.70 | | | $ | 10.57 | | | $ | 10.00 | | | $ | 11.03 | | | $ | 10.70 | | | $ | 10.57 | | | $ | 10.00 | |
| | | | | | | | |
Income (Loss) from Investment Operations: | | | | | | | | | | | | | | | | | | | | | | | | | | | | | | | | |
Net Investment Income (Loss)4 | | | 0.46 | | | | 0.38 | | | | 0.58 | | | | 0.60 | | | | 0.44 | | | | 0.36 | | | | 0.55 | | | | 0.58 | |
Net Gain (Loss) on Investments (Realized and Unrealized) | | | (0.38 | ) | | | 0.46 | | | | 0.23 | | | | 0.52 | | | | (0.38 | ) | | | 0.46 | | | | 0.23 | | | | 0.52 | |
Total from Investment Operations | | | 0.08 | | | | 0.84 | | | | 0.81 | | | | 1.12 | | | | 0.06 | | | | 0.82 | | | | 0.78 | | | | 1.10 | |
| | | | | | | | |
Less Distributions: | | | | | | | | | | | | | | | | | | | | | | | | | | | | | | | | |
Distributions from Net Investment Income | | | (0.48 | ) | | | (0.38 | ) | | | (0.58 | ) | | | (0.52 | ) | | | (0.46 | ) | | | (0.36 | ) | | | (0.55 | ) | | | (0.50 | ) |
Distributions from Net Realized Gain | | | (0.15 | ) | | | (0.13 | ) | | | (0.10 | ) | | | (0.03 | ) | | | (0.15 | ) | | | (0.13 | ) | | | (0.10 | ) | | | (0.03 | ) |
Total Distributions | | | (0.63 | ) | | | (0.51 | ) | | | (0.68 | ) | | | (0.55 | ) | | | (0.61 | ) | | | (0.49 | ) | | | (0.65 | ) | | | (0.53 | ) |
Net Asset Value, End of Period | | $ | 10.48 | | | $ | 11.03 | | | $ | 10.70 | | | $ | 10.57 | | | $ | 10.48 | | | $ | 11.03 | | | $ | 10.70 | | | $ | 10.57 | |
Total Return | | | 0.95% | | | | 8.04% | | | | 7.96% | | | | 11.48% | 2 | | | 0.69% | | | | 7.78% | | | | 7.71% | | | | 11.25% | 2 |
| | | | | | | | |
Supplemental Data: | | | | | | | | | | | | | | | | | | | | | | | | | | | | | | | | |
Net Assets, End of Period (000’s) | | $ | 331,790 | | | $ | 620,479 | | | $ | 349,926 | | | $ | 106,227 | | | $ | 183,977 | | | $ | 167,750 | | | $ | 81,484 | | | $ | 26,277 | |
Ratios to Average Net Assets: | | | | | | | | | | | | | | | | | | | | | | | | | | | | | | | | |
Expenses Before Fees (Waived)/Recouped | | | 0.92% | | | | 0.91% | | | | 0.95% | | | | 1.32% | 3 | | | 1.17% | | | | 1.16% | | | | 1.20% | | | | 1.57% | 3 |
Expenses After Fees (Waived)/Recouped | | | 0.92% | | | | 0.91% | | | | 0.95% | | | | 0.95% | 3 | | | 1.17% | | | | 1.16% | | | | 1.20% | | | | 1.20% | 3 |
Net Investment Income (Loss) | | | 4.40% | | | | 3.53% | | | | 5.47% | | | | 5.85% | 3 | | | 4.25% | | | | 3.30% | | | | 5.26% | | | | 5.66% | 3 |
Portfolio Turnover Rate | | | 79% | | | | 105% | | | | 177% | | | | 109% | 2 | | | 79% | | | | 105% | | | | 177% | | | | 109% | 2 |
| 1 | Commencement of operations on April 6, 2010 |
| 4 | Calculated based on average shares outstanding during the period. |
| | | | | | |
| The accompanying notes are an integral part of these financial statements. | | Annual Report | | March 31, 2014 | | 67 |
| | | | | | | | | | | | | | | | | | | | | | | | | | | | | | | | |
| | | DoubleLine Multi-Asset Growth Fund (Consolidated) | | | | |
| | | Year Ended
March 31,
2014 | | | Year Ended
March 31,
2013 | | | Year Ended
March 31,
2012 | | | Period Ended
March 31,
20111 | | | Year Ended
March 31,
2014 | | | Year Ended
March 31,
2013 | | | Year Ended
March 31,
2012 | | | Period Ended
March 31,
20111 | |
| | | Class I | | | Class I | | | Class I | | | Class I | | | Class A | | | Class A | | | Class A | | | Class A | |
| | | | | | | | |
Net Asset Value, Beginning of Period | | $ | 9.96 | | | $ | 10.03 | | | $ | 10.11 | | | $ | 10.00 | | | $ | 9.95 | | | $ | 10.02 | | | $ | 10.09 | | | $ | 10.00 | |
| | | | | | | | |
Income (Loss) from Investment Operations: | | | | | | | | | | | | | | | | | | | | | | | | | | | | | | | | |
Net Investment Income (Loss)4 | | | 0.18 | | | | 0.31 | | | | 0.42 | | | | 0.10 | | | | 0.12 | | | | 0.29 | | | | 0.41 | | | | 0.10 | |
Net Gain (Loss) on Investments (Realized and Unrealized) | | | 0.18 | | | | (0.06 | ) | | | (0.16 | ) | | | 0.02 | | | | 0.19 | | | | (0.06 | ) | | | (0.16 | ) | | | — | |
Total from Investment Operations | | | 0.36 | | | | 0.25 | | | | 0.26 | | | | 0.12 | | | | 0.31 | | | | 0.23 | | | | 0.25 | | | | 0.10 | |
| | | | | | | | |
Less Distributions: | | | | | | | | | | | | | | | | | | | | | | | | | | | | | | | | |
Distributions from Net Investment Income | | | (0.22 | ) | | | (0.32 | ) | | | (0.34 | ) | | | (0.01 | ) | | | (0.19 | ) | | | (0.30 | ) | | | (0.32 | ) | | | (0.01 | ) |
Distributions from Net Realized Gain | | | — | | | | — | | | | — | | | | — | | | | — | | | | — | | | | — | | | | — | |
Total Distributions | | | (0.22 | ) | | | (0.32 | ) | | | (0.34 | ) | | | (0.01 | ) | | | (0.19 | ) | | | (0.30 | ) | | | (0.32 | ) | | | (0.01 | ) |
Net Asset Value, End of Period | | $ | 10.10 | | | $ | 9.96 | | | $ | 10.03 | | | $ | 10.11 | | | $ | 10.07 | | | $ | 9.95 | | | $ | 10.02 | | | $ | 10.09 | |
Total Return5 | | | 3.65% | | | | 2.49% | | | | 2.67% | | | | 1.24% | 2 | | | 3.28% | | | | 2.19% | | | | 2.57% | | | | 1.02% | 2 |
| | | | | | | | |
Supplemental Data: | | | | | | | | | | | | | | | | | | | | | | | | | | | | | | | | |
Net Assets, End of Period (000’s) | | $ | 66,292 | | | $ | 105,114 | | | $ | 85,073 | | | $ | 22,128 | | | $ | 96,734 | | | $ | 159,714 | | | $ | 42,261 | | �� | $ | 6,071 | |
Ratios to Average Net Assets: | | | | | | | | | | | | | | | | | | | | | | | | | | | | | | | | |
Expenses Before Fees Waived | | | 1.26% | | | | 1.35% | | | | 1.51% | | | | 5.11% | 3 | | | 1.51% | | | | 1.60% | | | | 1.76% | | | | 6.05% | 3 |
Expenses After Fees Waived | | | 1.13% | | | | 1.10% | | | | 1.09% | | | | 1.18% | 3 | | | 1.38% | | | | 1.35% | | | | 1.34% | | | | 1.43% | 3 |
Net Investment Income (Loss) | | | 1.67% | | | | 3.11% | | | | 4.14% | | | | 3.57% | 3 | | | 1.01% | | | | 2.48% | | | | 3.88% | | | | 3.57% | 3 |
Portfolio Turnover Rate | | | 150% | | | | 88% | | | | 48% | | | | 19% | 2 | | | 150% | | | | 88% | | | | 48% | | | | 19% | 2 |
| 1 | Commencement of operations on December 20, 2010 |
| 4 | Calculated based on average shares outstanding during the period. |
| 5 | Total return does not include the effects of sales charges for Class A. |
| | | | | | |
| 68 | | DoubleLine Funds Trust | | | | The accompanying notes are an integral part of these financial statements. |
| | | | | | | | | | | | | | | | | | | | | | | | |
| | | DoubleLine Low Duration Bond Fund | |
| | | Year Ended
March 31, 2014 | | | Year Ended
March 31, 2013 | | | Period Ended
March 31, 20121 | | | Year Ended
March 31, 2014 | | | Year Ended
March 31, 2013 | | | Period Ended
March 31, 20121 | |
| | | Class I | | | Class I | | | Class I | | | Class N | | | Class N | | | Class N | |
| | | | | | |
Net Asset Value, Beginning of Period | | $ | 10.21 | | | $ | 10.16 | | | $ | 10.00 | | | $ | 10.20 | | | $ | 10.15 | | | $ | 10.00 | |
| | | | | | |
Income (Loss) from Investment Operations: | | | | | | | | | | | | | | | | | | | | | | | | |
Net Investment Income (Loss)4 | | | 0.15 | | | | 0.20 | | | | 0.11 | | | | 0.13 | | | | 0.17 | | | | 0.09 | |
Net Gain (Loss) on Investments (Realized and Unrealized) | | | — | | | | 0.09 | | | | 0.13 | | | | — | | | | 0.09 | | | | 0.13 | |
Total from Investment Operations | | | 0.15 | | | | 0.29 | | | | 0.24 | | | | 0.13 | | | | 0.26 | | | | 0.22 | |
| | | | | | |
Less Distributions: | | | | | | | | | | | | | | | | | | | | | | | | |
Distributions from Net Investment Income | | | (0.17 | ) | | | (0.24 | ) | | | (0.08 | ) | | | (0.15 | ) | | | (0.21 | ) | | | (0.07 | ) |
Distributions from Net Realized Gain | | | — | | | | — | | | | — | | | | — | | | | — | | | | — | |
Total Distributions | | | (0.17 | ) | | | (0.24 | ) | | | (0.08 | ) | | | (0.15 | ) | | | (0.21 | ) | | | (0.07 | ) |
Net Asset Value, End of Period | | $ | 10.19 | | | $ | 10.21 | | | $ | 10.16 | | | $ | 10.18 | | | $ | 10.20 | | | $ | 10.15 | |
Total Return | | | 1.51% | | | | 2.88% | | | | 2.44% | 2 | | | 1.26% | | | | 2.64% | | | | 2.25% | 2 |
| | | | | | |
Supplemental Data: | | | | | | | | | | | | | | | | | | | | | | | | |
Net Assets, End of Period (000’s) | | $ | 851,771 | | | $ | 375,840 | | | $ | 132,117 | | | $ | 1,062,088 | | | $ | 237,727 | | | $ | 85,343 | |
Ratios to Average Net Assets: | | | | | | | | | | | | | | | | | | | | | | | | |
Expenses Before Fees Waived | | | 0.48% | | | | 0.53% | | | | 0.94% | 3 | | | 0.73% | | | | 0.78% | | | | 1.19% | 3 |
Expenses After Fees Waived | | | 0.47% | | | | 0.47% | | | | 0.47% | 3 | | | 0.72% | | | | 0.72% | | | | 0.72% | 3 |
Net Investment Income (Loss) | | | 1.46% | | | | 1.98% | | | | 2.10% | 3 | | | 1.30% | | | | 1.70% | | | | 1.74% | 3 |
Portfolio Turnover Rate | | | 53% | | | | 71% | | | | 46% | 2 | | | 53% | | | | 71% | | | | 46% | 2 |
| 1 | Commencement of operations on September 30, 2011 |
| 4 | Calculated based on average shares outstanding during the period. |
| | | | | | |
| The accompanying notes are an integral part of these financial statements. | | Annual Report | | March 31, 2014 | | 69 |
| | | | | | | | | | | | | | | | |
| | | DoubleLine Floating Rate Fund | |
| | | Year Ended
March 31, 2014 | | | Period Ended
March 31, 20131 | | | Year Ended
March 31, 2014 | | | Period Ended
March 31, 20131 | |
| | | Class I | | | Class I | | | Class N | | | Class N | |
| | | | |
Net Asset Value, Beginning of Period | | $ | 10.08 | | | $ | 10.00 | | | $ | 10.08 | | | $ | 10.00 | |
| | | | |
Income (Loss) from Investment Operations: | | | | | | | | | | | | | | | | |
Net Investment Income (Loss)4 | | | 0.27 | | | | — | | | | 0.25 | | | | — | |
Net Gain (Loss) on Investments (Realized and Unrealized) | | | 0.04 | | | | 0.08 | | | | 0.05 | | | | 0.08 | |
Total from Investment Operations | | | 0.31 | | | | 0.08 | | | | 0.30 | | | | 0.08 | |
| | | | |
Less Distributions: | | | | | | | | | | | | | | | | |
Distributions from Net Investment Income | | | (0.24) | | | | — | | | | (0.22) | | | | — | |
Distributions from Net Realized Gain | | | — | | | | — | | | | — | | | | — | |
Total Distributions | | | (0.24) | | | | — | | | | (0.22) | | | | — | |
Net Asset Value, End of Period | | $ | 10.15 | | | $ | 10.08 | | | $ | 10.16 | | | $ | 10.08 | |
Total Return | | | 3.07 | % | | | 0.80 | %2 | | | 2.93 | % | | | 0.80 | %2 |
| | | | |
Supplemental Data: | | | | | | | | | | | | | | | | |
Net Assets, End of Period (000’s) | | $ | 276,737 | | | $ | 63,436 | | | $ | 104,320 | | | $ | 10 | |
Ratios to Average Net Assets: | | | | | | | | | | | | | | | | |
Expenses Before Fees Waived | | | 0.73% | | | | 2.01% | 3 | | | 0.98% | | | | 2.26% | 3 |
Expenses After Fees Waived | | | 0.73% | | | | 0.75% | 3 | | | 0.98% | | | | 1.00% | 3 |
Net Investment Income (Loss) | | | 2.68% | | | | (0.13)% | 3 | | | 2.68% | | | | (0.13)% | 3 |
Portfolio Turnover Rate | | | 66% | | | | 20% | 2 | | | 66% | | | | 20% | 2 |
| 1 | Commencement of operations on February 1, 2013 |
| 4 | Calculated based on average shares outstanding during the period. |
| | | | | | |
| 70 | | DoubleLine Funds Trust | | | | The accompanying notes are an integral part of these financial statements. |
| | | | | | | | |
| | | DoubleLine Shiller Enhanced CAPE® | |
| | | Period Ended
March 31, 20141 | | | Period Ended
March 31, 20141 | |
| | | Class I | | | Class N | |
| | |
Net Asset Value, Beginning of Period | | $ | 10.00 | | | $ | 10.00 | |
| | |
Income (Loss) from Investment Operations: | | | | | | | | |
Net Investment Income (Loss)4 | | | 0.11 | | | | 0.10 | |
Net Gain (Loss) on Investments (Realized and Unrealized) | | | 0.67 | | | | 0.67 | |
Total from Investment Operations | | | 0.78 | | | | 0.77 | |
| | |
Less Distributions: | | | | | | | | |
Distributions from Net Investment Income | | | (0.10 | ) | | | (0.09 | ) |
Distributions from Net Realized Gain | | | — | | | | — | |
Total Distributions | | | (0.10 | ) | | | (0.09 | ) |
Net Asset Value, End of Period | | $ | 10.68 | | | $ | 10.68 | |
Total Return | | | 7.83% | 2 | | | 7.73% | 2 |
| | |
Supplemental Data: | | | | | | | | |
Net Assets, End of Period (000’s) | | $ | 30,061 | | | $ | 10,714 | |
Ratios to Average Net Assets: | | | | | | | | |
Expenses Before Fees Waived | | | 4.98% | 3 | | | 5.23% | 3 |
Expenses After Fees Waived | | | 0.65% | 3 | | | 0.90% | 3 |
Net Investment Income (Loss) | | | 2.64% | 3 | | | 2.35% | 3 |
Portfolio Turnover Rate | | | 120% | 2 | | | 120% | 2 |
| 1 | Commencement of operations on October 31, 2013 |
| 4 | Calculated based on average shares outstanding during the period. |
| | | | | | |
| The accompanying notes are an integral part of these financial statements. | | Annual Report | | March 31, 2014 | | 71 |
| | |
| Notes to Financial Statements | | |
1. Organization
DoubleLine Funds Trust, a Delaware statutory trust (the “Trust”), is an open-end investment management company registered under the Investment Company Act of 1940, as amended (the “1940 Act”). The Trust consists of seven funds, DoubleLine Total Return Bond Fund, DoubleLine Core Fixed Income Fund, DoubleLine Emerging Markets Fixed Income Fund, DoubleLine Multi-Asset Growth Fund, DoubleLine Low Duration Bond Fund, DoubleLine Floating Rate Fund and DoubleLine Shiller Enhanced CAPE® (each a “Fund” and collectively the “Funds”). The DoubleLine Total Return Bond Fund, DoubleLine Core Fixed Income Fund, DoubleLine Emerging Markets Fixed Income Fund, DoubleLine Low Duration Bond Fund, DoubleLine Floating Rate Fund and DoubleLine Shiller Enhanced CAPE® each offer two classes of shares, Class N shares and Class I shares. The DoubleLine Multi-Asset Growth Fund currently offers two classes of shares, Class A shares and Class I shares.
The DoubleLine Total Return Bond Fund and DoubleLine Emerging Markets Fixed Income Fund commenced operations on April 6, 2010. The DoubleLine Core Fixed Income Fund commenced operations on June 1, 2010. The DoubleLine Multi-Asset Growth Fund commenced operations on December 20, 2010. The DoubleLine Low Duration Bond Fund commenced operations on September 30, 2011. The DoubleLine Floating Rate Fund commenced operations on February 1, 2013. The DoubleLine Shiller Enhanced CAPE® commenced operations on October 31, 2013.
The DoubleLine Total Return Bond Fund’s investment objective is to seek to maximize total return. The DoubleLine Core Fixed Income Fund’s investment objective is to seek to maximize current income and total return. The DoubleLine Emerging Markets Fixed Income Fund’s investment objective is to seek high total return from current income and capital appreciation. The DoubleLine Multi-Asset Growth Fund’s investment objective is to seek long-term capital appreciation. The DoubleLine Low Duration Bond Fund’s investment objective is to seek current income. The DoubleLine Floating Rate Fund’s investment objective is to seek a high level of current income. The DoubleLine Shiller Enhanced CAPE®’s investment objective is to seek total return which exceeds the total return of its benchmark index.
2. Significant Accounting Policies
The following is a summary of the significant accounting policies of the Funds. These policies are in conformity with accounting principles generally accepted in the United States of America (“US GAAP”).
A. Security Valuation. The Funds have adopted US GAAP fair value accounting standards which establish a definition of fair value and set out a hierarchy for measuring fair value. These standards require additional disclosures about the various inputs and valuation techniques used to develop the measurements of fair value and a discussion of changes in valuation techniques and related inputs during the period. These inputs are summarized in the three broad levels listed below:
| | • | | Level 1—Unadjusted quoted market prices in active markets for identical securities |
| | • | | Level 2—Quoted prices for identical or similar assets in markets that are not active, or inputs derived from observable market data |
| | • | | Level 3—Significant unobservable inputs (including the reporting entity’s estimates and assumptions) |
Assets and liabilities may be transferred between levels. The Funds use end of period timing recognition to account for any transfers.
Market values for domestic and foreign fixed income securities are normally determined on the basis of valuations provided by independent pricing services. Vendors typically value such securities based on one or more inputs described in the following table which is not intended to be a complete list. The table provides examples of inputs that are commonly relevant for valuing particular classes of fixed income securities in which the Fund is authorized to invest. However, these classifications are not exclusive, and any of the inputs may be used to value any other class of fixed-income securities. Securities that use similar valuation techniques and inputs as described in the following table are categorized as Level 2 of the fair value hierarchy. To the extent the significant inputs are unobservable, the values generally would be categorized as Level 3.
| | | | |
| Fixed-income class | | | | Examples of Standard Inputs |
All | | | | Benchmark yields, transactions, bids, offers, quotations from dealers and trading systems, new issues, spreads and other relationships observed in the markets among comparable securities; and pricing models such as yield measures calculated using factors such as cash flows, financial or collateral performance and other reference data (collectively referred to as “standard inputs”) |
Corporate bonds and notes; convertible securities | | | | Standard inputs and underlying equity of the issuer |
Bonds and notes of government and government agencies | | | | Standard inputs |
Mortgage-backed; asset-backed obligations (including collateralized loan obligations) | | | | Standard inputs and cash flows, prepayment information, default rates, delinquency and loss assumptions, collateral characteristics, credit enhancements and specific deal information, trustee reports |
Bank loans | | | | Quotations from dealers and trading systems |
Investments in registered open-end management investment companies will be valued based upon the net asset value (“NAV”) of such investments and are categorized as Level 1 of the fair value hierarchy. Investments in private investment funds typically will be valued based upon the NAVs of such investments and are categorized as Level 2 of the fair value hierarchy. As of March 31, 2014, the Funds did not hold any investments in private investment funds.
Short-term debt investments having a maturity of 60 days or less are generally valued at amortized cost which approximates fair market value. These investments are categorized as Level 2 of the fair value hierarchy.
| | | | | | |
| 72 | | DoubleLine Funds Trust | | | | |
March 31, 2014
Common stocks, exchange-traded funds and financial derivative instruments, such as futures contracts or options contracts, that are traded on a national securities or commodities exchange, are typically valued at the last reported sales price, in the case of common stocks and exchange-traded funds, or, in the case of futures contracts or options contracts, the settlement price determined by the relevant exchange. To the extent these securities are actively traded and valuation adjustments are not applied, they are categorized as Level 1 of the fair value hierarchy.
Over-the-counter financial derivative instruments, such as foreign currency contracts, options contracts, futures, or swaps agreements, derive their values from underlying asset prices, indices, reference rates, other inputs or a combination of these factors. These instruments are normally valued on the basis of valuations provided by independent pricing services or broker dealer quotations. Depending on the instrument and the terms of the transaction, the value of the derivative instruments can be estimated by a pricing service provider using a series of techniques, such as simulation pricing models. The pricing models use issuer details and other inputs that are observed from actively quoted markets such as indices, spreads, interest rates, curves, dividends and exchange rates. Derivatives that use similar valuation techniques and inputs as described above are normally categorized as Level 2 of the fair value hierarchy.
Certain securities may be fair valued in accordance with the fair valuation procedures approved by the Board of Trustees (the “Board”). The Valuation Committee is generally responsible for overseeing the day to day valuation processes and reports periodically to the Board. The Valuation Committee is authorized to make all necessary determinations of the fair values of portfolio securities and other assets for which market quotations are not readily available or if it is deemed that the prices obtained from brokers and dealers or independent pricing services are deemed to be unreliable indicators of market value. As of March 31, 2014, the Funds did not hold securities fair valued by the Valuation Committee.
The following is a summary of the fair valuations according to the inputs used to value the Funds’ investments as of March 31, 2014:
| | | | | | | | | | | | | | | | | | | | | | | | | | | | | | |
| Category | | | | DoubleLine
Total Return
Bond Fund | | | DoubleLine
Core Fixed
Income Fund | | | DoubleLine
Emerging
Markets Fixed
Income Fund | | | DoubleLine
Multi-Asset
Growth Fund
(Consolidated) | | | DoubleLine
Low Duration
Bond Fund | | | DoubleLine
Floating
Rate Fund | | | DoubleLine
Shiller
Enhanced
CAPE® | |
Investments in Securities | | | | | | | | | | | | | | | | | | | | | | | | | | | | | | |
Level 1 | | | | | | | | | | | | | | | | | | | | | | | | | | | | | | |
Money Market Funds | | | | $ | 743,461,443 | | | $ | 62,212,619 | | | $ | 9,883,531 | | | $ | 29,852,645 | | | $ | 185,500,106 | | | $ | 31,936,361 | | | $ | 1,937,484 | |
Affiliated Mutual Funds | | | | | — | | | | 104,358,793 | | | | — | | | | 36,963,455 | | | | — | | | | — | | | | 9,123,736 | |
Exchange Traded Funds and Common Stock | | | | | — | | | | — | | | | — | | | | 31,853,660 | | | | — | | | | — | | | | — | |
Purchased Options | | | | | — | | | | — | | | | — | | | | 1,630,426 | | | | — | | | | — | | | | — | |
Total Level 1 | | | | | 743,461,443 | | | | 166,571,412 | | | | 9,883,531 | | | | 100,300,186 | | | | 185,500,106 | | | | 31,936,361 | | | | 11,061,220 | |
Level 2 | | | | | | | | | | | | | | | | | | | | | | | | | | | | | | |
US Government / Agency Mortgage Backed Obligations | | | | | 15,596,457,078 | | | | 270,857,919 | | | | — | | | | 5,402,394 | | | | 28,477,728 | | | | — | | | | — | |
Non-Agency Residential Collateralized Mortgage Obligations | | | | | 8,625,402,107 | | | | 216,896,922 | | | | — | | | | 11,578,401 | | | | 158,507,078 | | | | — | | | | 2,029,767 | |
Non-Agency Commercial Mortgage Backed Obligations | | | | | 2,090,738,965 | | | | 130,063,043 | | | | — | | | | — | | | | 310,781,960 | | | | 7,749,607 | | | | 5,052,781 | |
US Government Bonds and Notes | | | | | 1,892,141,673 | | | | 289,686,356 | | | | — | | | | — | | | | 134,773,993 | | | | — | | | | 1,806,956 | |
Other Short Term Investments | | | | | 1,023,936,936 | | | | — | | | | — | | | | 36,299,323 | | | | — | | | | — | | | | — | |
Collateralized Loan Obligations | | | | | 948,744,905 | | | | 54,118,213 | | | | — | | | | 4,789,250 | | | | 380,266,701 | | | | — | | | | 6,934,355 | |
Foreign Corporate Bonds | | | | | — | | | | 298,434,421 | | | | 504,582,139 | | | | — | | | | 385,128,729 | | | | — | | | | 7,705,809 | |
US Corporate Bonds | | | | | — | | | | 258,840,717 | | | | — | | | | — | | | | 167,795,619 | | | | — | | | | 4,784,734 | |
Foreign Government Bonds and Notes, Supranationals and Foreign Agencies | | | | | — | | | | 9,705,776 | | | | — | | | | — | | | | 24,811,432 | | | | — | | | | 258,797 | |
Purchased Options | | | | | — | | | | — | | | | — | | | | 1,140 | | | | — | | | | — | | | | — | |
Bank Loans | | | | | — | | | | — | | | | — | | | | — | | | | 189,663,644 | | | | 351,249,675 | | | | — | |
Total Level 2 | | | | | 30,177,421,664 | | | | 1,528,603,367 | | | | 504,582,139 | | | | 58,070,508 | | | | 1,780,206,884 | | | | 358,999,282 | | | | 28,573,199 | |
Level 3 | | | | | | | | | | | | | | | | | | | | | | | | | | | | | | |
Non-Agency Residential Collateralized Mortgage Obligations | | | | | 862,153,296 | | | | 27,845,925 | | | | — | | | | 817,846 | | | | — | | | | — | | | | — | |
Asset Backed Obligations | | | | | — | | | | — | | | | — | | | | — | | | | 13,984,935 | | | | — | | | | — | |
Total Level 3 | | | | | 862,153,296 | | | | 27,845,925 | | | | — | | | | 817,846 | | | | 13,984,935 | | | | — | | | | — | |
Total | | | | | 31,783,036,403 | | | | 1,723,020,704 | | | | 514,465,670 | | | | 159,188,540 | | | | 1,979,691,925 | | | | 390,935,643 | | | | 39,634,419 | |
Other Financial Instruments | | | | | | | | | | | | | | | | | | | | | | | | | | | | | | |
Level 1 | | | | | | | | | | | | | | | | | | | | | | | | | | | | | | |
Futures Contracts | | | | | — | | | | — | | | | — | | | | 662,166 | | | | — | | | | — | | | | — | |
Total Level 1 | | | | | — | | | | — | | | | — | | | | 662,166 | | | | — | | | | — | | | | — | |
Level 2 | | | | | | | | | | | | | | | | | | | | | | | | | | | | | | |
Swaps | | | | | — | | | | — | | | | — | | | | 198,136 | | | | — | | | | — | | | | 1,305,963 | |
Total Level 2 | | | | | — | | | | — | | | | — | | | | 198,136 | | | | — | | | | — | | | | 1,305,963 | |
Level 3 | | | | | — | | | | — | | | | — | | | | — | | | | — | | | | — | | | | — | |
Total | | | | | — | | | | — | | | | — | | | | 860,302 | | | | — | | | | — | | | | 1,305,963 | |
| See | the Schedules of Investments for further disaggregation of investment categories. |
| 1 | There were no transfers into and out of Level 1 during the period ended March 31, 2014. |
| | | | | | |
| | Annual Report | | March 31, 2014 | | 73 |
Notes to Financial Statements (Cont.)
The following is a reconciliation of investments in which significant unobservable inputs (Level 3) were used in determining fair value:
| | | | | | | | | | | | | | | | | | | | | | | | | | | | | | | | | | | | | | | | |
DoubleLine Total
Return Bond Fund | | Balance as of
3/31/2013 | | | Net Realized Gain
(Loss) | | | Change in Net
Unrealized
Appreciation
(Depreciation)3 | | | Net Accretion
(Amortization) | | | Purchases | | | Sales1 | | | Transfers Into
Level 32 | | | Transfers Out
of Level 32 | | | Balance as of
3/31/2014 | | | Net Change in
Unrealized
Appreciation
(Depreciation)
on securities
held at
3/31/20143 | |
Investments in Securities | | | | | | | | | | | | | | | | | | | | | | | | | | | | | | | | | | | | | | | | |
Non-Agency Residential Collateralized Mortgage Obligations | | $ | 769,302,261 | | | $ | 8,340,402 | | | $ | 40,180,681 | | | $ | 40,428,472 | | | $ | 49,078,844 | | | $ | (49,249,585 | ) | | $ | 68,523,046 | | | $ | (64,450,825 | ) | | $ | 862,153,296 | | | $ | 38,538,290 | |
| | | | | | | | |
Total | | $ | 769,302,261 | | | $ | 8,340,402 | | | $ | 40,180,681 | | | $ | 40,428,472 | | | $ | 49,078,844 | | | $ | (49,249,585 | ) | | $ | 68,523,046 | | | $ | (64,450,825 | ) | | $ | 862,153,296 | | | $ | 38,538,290 | |
| | | | | | | | |
| | | | | | | | | | | | | | | | | | | | | | | | | | | | | | | | | | | | | | | | |
DoubleLine Core
Fixed Income Fund | | Balance as of
3/31/2013 | | | Net Realized Gain
(Loss) | | | Change in Net
Unrealized
Appreciation
(Depreciation)3 | | | Net Accretion
(Amortization) | | | Purchases | | | Sales1 | | | Transfers Into
Level 32 | | | Transfers Out of Level 32 | | | Balance as of
3/31/2014 | | | Net Change in
Unrealized
Appreciation
(Depreciation)
on securities
held at
3/31/20143 | |
Investments in Securities | | | | | | | | | | | | | | | | | | | | | | | | | | | | | | | | | | | | | | | | |
Non-Agency Residential Collateralized Mortgage Obligations | | $ | 24,349,167 | | | $ | 292,645 | | | $ | 3,167,115 | | | $ | 1,424,591 | | | $ | — | | | $ | (1,387,593 | ) | | $ | — | | | $ | — | | | $ | 27,845,925 | | | $ | 3,167,115 | |
| | | | | | | | |
Total | | $ | 24,349,167 | | | $ | 292,645 | | | $ | 3,167,115 | | | $ | 1,424,591 | | | $ | — | | | $ | (1,387,593 | ) | | $ | — | | | $ | — | | | $ | 27,845,925 | | | $ | 3,167,115 | |
| | | | | | | | |
| 1 | Sales include all sales of securities, maturities, and paydowns. |
| 2 | Transfers between Level 2 and Level 3 were due to a change in observable and/or unobservable inputs. |
| 3 | Any differences between Net Change in Unrealized Appreciation (Depreciation) and Net Change in Unrealized Appreciation (Depreciation) on securities held at March 31, 2014 may be due to a security that was not held or categorized as Level 3 at either period end. |
The following is a summary of quantitative information about Level 3 Fair Value Measurements:
| | | | | | | | | | | | | | |
| DoubleLine Total Return Bond Fund | | Fair Value as of
3/31/2014* | | | Valuation Techniques | | Unobservable
Input | | Input Values | | | Impact to valuation from
an increase to input |
Non-Agency Residential Collateralized Mortgage Obligations | | $ | 862,153,296 | | | Market Comparables | | Market Quotes | | $ | 45.80 - $124.93 | | | Significant changes in the market quotes would result in direct and proportional changes in the fair value of the security |
| | | | | | | | | | | | | | |
| | | | | |
| DoubleLine Core Fixed Income Fund | | Fair Value as of
3/31/2014 * | | | Valuation Techniques | | Unobservable
Input | | Input Values | | | Impact to valuation from
an increase to input |
Non-Agency Residential Collateralized Mortgage Obligations | | $ | 27,845,925 | | | Market Comparables | | Market Quotes | | $ | 68.86 - $105.13 | | | Significant changes in the market quotes would result in direct and proportional changes in the fair value of the security |
| * | Level 3 securities are typically valued by pricing vendors. The appropriateness of fair values for these securities is monitored on an ongoing basis, by the Adviser, which may include back testing, results of vendor due diligence, unchanged price review and consideration of market and/or sector events. |
B. Federal Income Taxes. Each Fund has elected to be taxed as a “regulated investment company” and intends to distribute substantially all of its taxable income to its shareholders and otherwise comply with the provisions of Subchapter M of the Internal Revenue Code applicable to regulated investment companies. Therefore, no provision for federal income taxes has been made.
The Funds may be subject to a nondeductible 4% excise tax calculated as a percentage of certain undistributed amounts of net investment income and net capital gains.
The Funds have adopted financial reporting rules that require the Funds to analyze all open tax years, as defined by the applicable statute of limitations, for all major jurisdictions. Open tax years, 2013, 2012 and 2011 for the Funds, are those that are open for exam by taxing authorities. As of March 31, 2014 the Funds have no examinations in progress.
Management has analyzed the Funds’ tax positions, and has concluded that no liability should be recorded related to uncertain tax positions expected to be taken on the tax return for the fiscal year-ended March 31, 2014. The Funds identify their major tax jurisdictions as U.S. Federal and the State of California.
| | | | | | |
| 74 | | DoubleLine Funds Trust | | | | |
March 31, 2014
The Funds are not aware of any tax positions for which it is reasonably possible that the total amounts of unrecognized tax benefits will significantly change in the next twelve months.
C. Security Transactions, Investment Income. Investment securities transactions are accounted for on trade date. Gains and losses realized on sales of securities are determined on a specific identification basis. Interest income is recorded on an accrual basis. Discounts/premiums on debt securities purchased are accreted/amortized over the life of the respective securities using the effective interest method except for certain deep discount bonds where Management does not expect the par value above the bond’s cost to be fully realized. Dividend income and corporate transactions, if any, are recorded on the ex-date. Non-cash dividends included in dividend income, if any, are recorded at the fair market value of securities received. Paydown gains and losses on mortgage-related and other asset-backed securities are recorded as components of interest income on the statements of operations.
D. Dividends and Distributions to Shareholders. Dividends from the net investment income of the DoubleLine Total Return Bond Fund, DoubleLine Core Fixed Income Fund, DoubleLine Emerging Markets Fixed Income Fund, DoubleLine Low Duration Bond Fund, DoubleLine Floating Rate Fund and DoubleLine Shiller Enhanced CAPE® will be declared and paid monthly. Dividends from the net investment income of the DoubleLine Multi-Asset Growth Fund will be declared and paid quarterly. The Funds will distribute any net realized long or short-term capital gains at least annually. Distributions are recorded on the ex-dividend date.
Income and capital gain distributions are determined in accordance with income tax regulations which may differ from accounting principles generally accepted in the United States of America. Permanent book and tax basis differences relating to shareholder distributions will result in reclassifications between paid-in capital, undistributed net investment income (loss), and/or undistributed (accumulated) realized gain (loss). Undistributed net investment income or loss may include temporary book and tax basis differences which will reverse in a subsequent period. Any taxable income or capital gain remaining at fiscal year end is distributed in the following year.
Distributions from investment companies will be classified as investment income or realized gains in the Statements of Operations based on the U.S. income tax characteristics of the distribution if such information is available. In cases where the tax characteristics are not available, such distributions are generally classified as investment income.
E. Use of Estimates. The preparation of financial statements in conformity with accounting principles generally accepted in the United States of America requires management to make estimates and assumptions that affect the reported amounts of assets and liabilities and disclosure of contingent assets and liabilities at the date of the financial statements, as well as the reported amounts of revenues and expenses during the period. Actual results could differ from those estimates.
F. Share Valuation. The NAV per share of a class of shares of a Fund is calculated by dividing the sum of the value of the securities held by the Fund, plus cash and other assets, attributable to that class, minus all liabilities (including estimated accrued expenses) attributable to that class by the total number of shares of that class outstanding, rounded to the nearest cent. The Funds’ NAV will not be calculated on the days on which the NYSE is closed for trading, or, except with respect to DoubleLine Multi-Asset Growth Fund, on holidays when the principal U.S. bond markets are closed, such as Columbus Day and Veterans Day.
G. Unfunded Loan Commitments. The Funds may enter into certain credit agreements, of which all or a portion may be unfunded. These commitments are disclosed in the accompanying Schedule of Investments. The Funds are obligated to fund these commitments at the borrower’s discretion. The Funds generally will maintain with their custodian liquid investments having an aggregate value at least equal to the par value of unfunded loan commitments.
H. Guarantees and Indemnifications. Under the Trust’s organizational documents, each Trustee and officer of the Fund is indemnified, to the extent permitted by the 1940 Act, against certain liabilities that may arise out of performance of their duties to the Fund. Additionally, in the normal course of business, the Funds enter into contracts that contain a variety of indemnification clauses. Each Fund’s maximum exposure under these arrangements is unknown as this would involve future claims that may be made against the Funds that have not yet occurred. However, the Funds have not had prior claims or losses pursuant to these contracts.
I. Basis for Consolidation for the DoubleLine Multi-Asset Growth Fund. The DoubleLine Multi-Asset Growth Fund may invest up to 25% of its total assets in DoubleLine Cayman Multi-Asset Growth Fund I, Ltd. (the “Subsidiary”). The Subsidiary, which is organized under the laws of the Cayman Islands, is wholly-owned and controlled by the DoubleLine Multi-Asset Growth Fund. The Subsidiary invests in commodity-related investments and other investments. As of March 31, 2014 net assets of the DoubleLine Multi-Asset Growth Fund were $163,025,337 of which $14,758,514, or approximately 9.05%, represented the DoubleLine Multi-Asset Growth Fund’s ownership of the Subsidiary. Intercompany balances and transactions have been eliminated in consolidation.
J. Other. Each share class of a Fund is charged for those expenses that are directly attributable to that share class. Expenses that are not directly attributable to a Fund are allocated among all appropriate Funds in proportion to their respective net assets or on another reasonable basis. Investment income, expenses which are not class-specific, and realized and unrealized gains and losses are allocated directly to each class based upon the relative net assets of the classes.
3. Related and Other Party Transactions
DoubleLine Capital LP (the “Adviser”) provides the Funds with investment management services under an Investment Advisory and Management Agreement (the “Agreement”). Under the Agreement, the Adviser manages the investment of the assets of each Fund, places orders for the purchase and sale of its portfolio securities and is responsible for the day-to-day management of the Trust’s business affairs. As compensation for its services, the Adviser is entitled to a monthly fee at the annual rate of 0.40%, 0.40%, 0.75%, 1.00%, 0.35%, 0.50% and 0.45% of the average daily net assets of the DoubleLine Total Return Bond Fund, DoubleLine Core Fixed Income Fund, DoubleLine Emerging Markets Fixed Income Fund, DoubleLine Multi-Asset Growth Fund, DoubleLine Low Duration Bond Fund, DoubleLine Floating Rate Fund and DoubleLine Shiller Enhanced CAPE®, respectively. The Adviser has arrangements with DoubleLine Group LP to provide personnel and other resources to the Funds.
| | | | | | |
| | Annual Report | | March 31, 2014 | | 75 |
Notes to Financial Statements (Cont.)
The Adviser has contractually agreed to limit the DoubleLine Emerging Markets Fixed Income Fund’s ordinary operating expenses so that its ratio of such expenses to average net assets will not exceed 0.95% for the Class I shares and 1.20% for the Class N shares. The Adviser has contractually agreed to limit the DoubleLine Multi-Asset Growth Fund’s ordinary operating expenses so that its ratio of such expenses to average net assets will not exceed 1.20% for the Class I shares and 1.45% for the Class A shares. The Adviser has contractually agreed to limit the DoubleLine Low Duration Bond Fund’s ordinary operating expenses so that its ratio of such expenses to average net assets will not exceed 0.47% for the Class I shares and 0.72% for the Class N shares. The Adviser has contractually agreed to limit the DoubleLine Floating Rate Fund’s ordinary operating expenses so that its ratio of such expenses to average net assets will not exceed 0.75% for the Class I shares and 1.00% for the Class N shares. The Adviser has contractually agreed to limit the DoubleLine Shiller Enhanced CAPE®’s ordinary operating expenses so that its ratio of such expenses to average net assets will not exceed 0.65% for the Class I shares and 0.90% for the Class N shares. For the purposes of the expense limitation agreement between the Adviser and the Funds, “ordinary operating expenses” excludes taxes, commissions, mark-ups, litigation expenses, indemnification expenses, interest expenses, acquired fund fees and expenses, and any extraordinary expenses. Each Fund’s expense limitation may be terminated during its term only by a majority vote of the disinterested Trustees of the Board.
The Adviser is permitted to be reimbursed for fee waivers and/or expense reimbursements it made to a Fund in the prior three fiscal years. Each Fund must pay its current ordinary operating expenses before the Adviser is entitled to any reimbursement of fees waived and/or expenses reimbursed. Any such reimbursement requested by the Adviser is subject to review by the Board and will be subject to the Fund’s expense limitations in place when the fees were waived or the expenses were reimbursed.
The Adviser contractually waived a portion of its fees or reimbursed certain operating expenses and may recapture a portion of the amounts no later than the dates as stated below:
| | | | | | | | | | | | | | | | | | | | | | | | | | | | |
| Year of Expiration | | DoubleLine
Total Return
Bond Fund | | | DoubleLine
Core Fixed
Income Fund | | | DoubleLine
Emerging
Markets Fixed
Income Fund | | | DoubleLine
Multi-Asset
Growth Fund
(Consolidated) | | | DoubleLine Low
Duration Bond
Fund | | | DoubleLine
Floating
Rate Fund | | | DoubleLine
Shiller
Enhanced
CAPE® | |
March 31, 2015 | | $ | 709,426 | | | $ | 461,517 | | | $ | — | | | $ | 350,372 | | | $ | 206,049 | | | $ | — | | | $ | — | |
March 31, 2016 | | | 12,622 | | | | 203,659 | | | | 11,145 | | | | 391,977 | | | | 246,512 | | | | 80,826 | | | | — | |
March 31, 2017 | | | — | | | | — | | | | — | | | | 283,515 | | | | 105,391 | | | | 3,277 | | | | 399,206 | |
For the period ended March 31, 2014, The Adviser recouped $2,120,101 from the DoubleLine Total Return Bond Fund and $34,442 from the DoubleLine Emerging Markets Fixed Income Fund.
All Officers and two of the trustees of the Trust are Officers or employees of DoubleLine Group LP. The Trust pays a fee only to those trustees who are not affiliated with DoubleLine Group LP or the Adviser.
The Adviser may from time to time recommend an investment mix of various Funds to certain platforms or programs. If such recommendations are followed, such investment potentially could be material to certain of the Funds’ overall assets and operations. Depending on market conditions prevalent at the time, there can be no assurance that a redemption of such assets would not result in a material adverse impact to the Funds.
If a Fund invested in an affiliated Fund sponsored by the Adviser, the Adviser will waive its advisory fee to the Fund in an amount equal to the advisory fees paid by the affiliated Fund in respect of the Fund’s investment in the affiliated fund. Accordingly, the Adviser waived $574,631, $161,804 and $23,545 in fees with respect to the DoubleLine Core Fixed Income Fund, DoubleLine Multi-Asset Growth Fund and DoubleLine Shiller Enhanced CAPE®, respectively, for the period ended March 31, 2014.
As of March 31, 2014, 27% of the outstanding shares of the DoubleLine Floating Rate Fund were owned by the DoubleLine Core Fixed Income Fund.
4. Distribution, Sales Charge and Redemption Fees
Class N shares and Class A shares of the Funds make payments under a distribution plan (“Distribution Plan”) adopted pursuant to Rule 12b-1 under the 1940 Act. Pursuant to the Distribution Plan, each Fund compensates the Fund’s distributor for distribution and related services at an annual rate equal to 0.25% of the average daily net assets of the Fund attributable to its Class N and Class A shares. The fees may be used to pay the Fund’s distributor for distribution services and sales support services provided in connection with Class N and Class A shares.
The Class A shares of DoubleLine Multi-Asset Growth Fund have a maximum sales charge imposed on purchases of 4.25% of the offering price and a maximum contingent deferred sales charge of 0.75% that applies to purchases of $1 million or more of Class A shares if the shares are redeemed within 18 months of purchase.
The DoubleLine Multi-Asset Growth Fund and the DoubleLine Floating Rate Fund each impose redemption fees. Redemption fees are paid to and retained by the Funds to limit the opportunity to market time the Funds and to help offset estimated portfolio transaction costs and other related costs incurred by the Funds as a result of short-term trading. The Funds will apply a redemption fee equal to 1% of the value of any shares redeemed within 90 days of purchase.
| | | | | | |
| 76 | | DoubleLine Funds Trust | | | | |
March 31, 2014
5. Purchases and Sales of Securities
Investment transaction (excluding short-term investments) for the period ended March 31, 2014 were as follows:
| | | | | | | | | | | | | | | | | | |
| | | | | All Other | | | U.S. Government1 | |
| | | | | Purchases at
Cost | | | Sales or
Maturity
Proceeds | | | Purchases at
Cost | | | Sales or
Maturity
Proceeds | |
DoubleLine Total Return Bond Fund | | | | $ | 4,639,158,539 | | | $ | 7,213,306,592 | | | $ | — | | | $ | — | |
DoubleLine Core Fixed Income Fund | | | | | 678,647,885 | | | | 1,280,771,876 | | | | 328,597,649 | | | | 473,766,858 | |
DoubleLine Emerging Markets Fixed Income Fund | | | | | 474,824,069 | | | | 678,200,608 | | | | 2,143,953 | | | | 2,150,504 | |
DoubleLine Multi-Asset Growth Fund (Consolidated) | | | | | 175,668,162 | | | | 216,827,229 | | | | — | | | | — | |
DoubleLine Low Duration Bond Fund | | | | | 1,590,594,713 | | | | 473,509,084 | | | | 124,219,914 | | | | 94,883,223 | |
DoubleLine Floating Rate Fund | | | | | 496,898,992 | | | | 165,909,810 | | | | — | | | | — | |
DoubleLine Shiller Enhanced CAPE® | | | | | 62,832,946 | | | | 27,093,355 | | | | 740,039 | | | | — | |
| 1 | U.S. Government transactions are defined as those involving U.S. Treasury bills, bonds, and notes. |
6. Income Tax Information
The tax character of distributions for the Funds were as follows:
| | | | | | | | | | | | | | | | | | | | | | | | | | |
| | | | | DoubleLine Total Return Bond Fund | | | DoubleLine Core Fixed Income Fund | | | DoubleLine Emerging Markets Fixed
Income Fund | |
| | | | | Year Ended
March 31, 2014 | | | Year Ended
March 31, 2013 | | | Year Ended
March 31, 2014 | | | Year Ended
March 31, 2013 | | | Year Ended
March 31, 2014 | | | Year Ended
March 31, 2013 | |
Distributions Paid From: | | | | | | | | | | | | | | | | | | | | | | | | | | |
Ordinary Income | | | | $ | 1,765,190,670 | | | $ | 1,805,111,710 | | | $ | 85,341,715 | | | $ | 110,936,615 | | | $ | 33,266,474 | | | $ | 30,246,436 | |
Long Term Capital Gain | | | | | — | | | | — | | | | 5,789,673 | | | | — | | | | 1,229,937 | | | | — | |
Total Distributions Paid | | | | $ | 1,765,190,670 | | | $ | 1,805,111,710 | | | $ | 91,131,388 | | | $ | 110,936,615 | | | $ | 34,496,411 | | | $ | 30,246,436 | |
| | | | | | | | | | | | | | | | | | | | | | | | | | | | | | |
| | | | | DoubleLine Multi-Asset Growth Fund
(Consolidated) | | | DoubleLine Low Duration Bond Fund | | | DoubleLine Floating Rate Fund | | | DoubleLine Shiller
Enhanced CAPE® | |
| | | | | Year Ended
March 31, 2014 | | | Year Ended
March 31, 2013 | | | Year Ended
March 31, 2014 | | | Year Ended
March 31, 2013 | | | Year Ended
March 31, 2014 | | | Period Ended
March 31, 2013 | | | Period Ended
March 31, 2014 | |
Distributions Paid From: | �� | | | | | | | | | | | | | | | | | | | | | | | | | | | | | |
Ordinary Income | | | | $ | 3,968,114 | | | $ | 5,334,854 | | | $ | 18,640,668 | | | $ | 9,608,299 | | | $ | 7,510,032 | | | $ | — | | | $ | 226,165 | |
Long Term Capital Gain | | | | | — | | | | — | | | | — | | | | | | | | — | | | | — | | | | — | |
Total Distributions Paid | | | | $ | 3,968,114 | | | $ | 5,334,854 | | | $ | 18,640,668 | | | $ | 9,608,299 | | | $ | 7,510,032 | | | $ | — | | | $ | 226,165 | |
The Fund designated as long-term capital gain dividend, pursuant to Internal Revenue Code Section 852(b)(3), the amount necessary to reduce the earnings and profits of the Fund related to net capital gain to zero.
The cost basis of investments for federal income tax purposes as of March 31, 2014 was as follows:
| | | | | | | | | | | | | | | | | | | | | | | | | | | | | | |
| | | | | DoubleLine Total
Return Bond Fund | | | DoubleLine Core
Fixed Income Fund | | | DoubleLine
Emerging Markets
Fixed Income Fund | | | DoubleLine Multi-
Asset Growth Fund
(Consolidated) | | | DoubleLine Low
Duration Bond
Fund | | | DoubleLine
Floating Rate
Fund | | | DoubleLine
Shiller Enhanced
CAPE® | |
Tax Cost of Investments | | | | $ | 31,785,401,837 | | | $ | 1,714,894,322 | | | $ | 518,036,442 | | | $ | 159,413,363 | | | $ | 1,971,984,481 | | | $ | 389,752,008 | | | $ | 39,589,899 | |
Gross Tax Unrealized Appreciation | | | | | 896,426,696 | | | | 36,930,703 | | | | 9,524,910 | | | | 7,126,325 | | | | 12,600,266 | | | | 1,909,809 | | | | 103,505 | |
Gross Tax Unrealized Depreciation | | | | | (898,792,130 | ) | | | (28,804,321 | ) | | | (13,095,682 | ) | | | (7,351,148 | ) | | | (4,892,822 | ) | | | (726,174 | ) | | | (58,985 | ) |
Net Tax Unrealized Appreciation (Depreciation) | | | | $ | (2,365,434 | ) | | $ | 8,126,382 | | | $ | (3,570,772 | ) | | $ | (224,823 | ) | | $ | 7,707,444 | | | $ | 1,183,635 | | | $ | 44,520 | |
| | | | | | |
| | Annual Report | | March 31, 2014 | | 77 |
Notes to Financial Statements (Cont.)
As of March 31, 2014, the components of accumulated earnings (losses) for income tax purposes were as follows:
| | | | | | | | | | | | | | | | | | | | | | | | | | | | | | |
| | | | | DoubleLine Total
Return Bond Fund | | | DoubleLine Core
Fixed Income Fund | | | DoubleLine
Emerging Markets
Fixed Income Fund | | | DoubleLine Multi-
Asset Growth Fund
(Consolidated) | | | DoubleLine Low
Duration Bond
Fund | | | DoubleLine
Floating Rate
Fund | | | DoubleLine
Shiller Enhanced
CAPE® | |
Net Tax Unrealized Appreciation (Depreciation) | | | | $ | (2,365,434 | ) | | $ | 8,126,382 | | | $ | (3,570,772 | ) | | $ | (224,823 | ) | | $ | 7,707,444 | | | $ | 1,183,635 | | | $ | 44,520 | |
Undistributed Ordinary Income | | | | | 54,850,006 | | | | 2,537,962 | | | | 1,998,121 | | | | 4,563,032 | | | | 657,682 | | | | 853,478 | | | | 31,822 | |
Undistributed Long Term Capital Gain | | | | | — | | | | — | | | | — | | | | 1,756,833 | | | | — | | | | 11,923 | | | | 21,830 | |
Total Distributable Earnings | | | | | 54,850,006 | | | | 2,537,962 | | | | 1,998,121 | | | | 6,319,865 | | | | 657,682 | | | | 865,401 | | | | 53,652 | |
Other Accumulated Gains (Losses) | | | | | (1,072,326,649 | ) | | | (29,916,444 | ) | | | (21,405,607 | ) | | | 581,728 | | | | (3,426,588 | ) | | | (537,480 | ) | | | 1,298,224 | |
Total Accumulated Earnings (Losses) | | | | $ | (1,019,842,077 | ) | | $ | (19,252,100 | ) | | $ | (22,978,258 | ) | | $ | 6,676,770 | | | $ | 4,938,538 | | | $ | 1,511,556 | | | $ | 1,396,396 | |
Under the Regulated Investment Company Modernization Act of 2010, capital losses incurred by the Funds after January 1, 2011 will not be subject to expiration. In addition, such losses must be utilized prior to the losses incurred in the years preceding enactment.
As of March 31, 2014, the following capital loss carryforwards were available:
| | | | | | | | | | |
| | | | | Capital Loss
Carryforward | | | Expires | |
DoubleLine Total Return Bond Fund | | | | $ | 3,709,758 | | | | 3/31/2019 | |
DoubleLine Total Return Bond Fund | | | | | 778,547,485 | | | | Indefinite | |
DoubleLine Core Fixed Income Fund | | | | | 24,748,617 | | | | Indefinite | |
DoubleLine Emerging Markets Fixed Income Fund | | | | | 16,252,599 | | | | Indefinite | |
DoubleLine Low Duration Bond Fund | | | | | 2,635,597 | | | | Indefinite | |
For the period ended March 31, 2014, the DoubleLine Multi-Asset Growth Fund utilized $2,160,080 of its capital loss carryforward.
As of March 31, 2014, the following Funds deferred, on a tax basis, post-October losses of:
| | | | | | |
DoubleLine Total Return Bond Fund | | | | $ | 248,090,289 | |
DoubleLine Core Fixed Income Fund | | | | | 3,704,089 | |
DoubleLine Emerging Markets Fixed Income Fund | | | | | 4,583,645 | |
DoubleLine Multi-Asset Growth Fund (Consolidated) | | | | | — | |
DoubleLine Low Duration Bond Fund | | | | | 365,598 | |
DoubleLine Floating Rate Fund | | | | | — | |
DoubleLine Shiller Enhanced CAPE® | | | | | — | |
Additionally, US GAAP require that certain components of net assets relating to permanent differences be reclassified between financial and tax reporting. These reclassifications have no effect on net assets or net asset value per share. The permanent differences primarily relate to paydown losses, accretion of discount on certain debt instruments and foreign currency gains (losses). For the period ended March 31, 2014, the following table shows the reclassifications made:
| | | | | | | | | | | | | | |
| | | | | Undistributed
Net Investment
Income (Loss) | | | Accumulated Net
Realized Gain
(Loss) | | | Paid In Capital | |
DoubleLine Total Return Bond Fund | | | | $ | 457,689,114 | | | $ | (457,689,114 | ) | | $ | — | |
DoubleLine Core Fixed Income Fund | | | | | 9,987,984 | | | | (9,987,984 | ) | | | — | |
DoubleLine Emerging Markets Fixed Income Fund | | | | | 480,398 | | | | (480,398 | ) | | | — | |
DoubleLine Multi-Asset Growth Fund (Consolidated) | | | | | 1,296,996 | | | | 6,058,472 | | | | (7,355,468 | ) |
DoubleLine Low Duration Bond Fund | | | | | 2,719,146 | | | | (2,719,146 | ) | | | — | |
DoubleLine Floating Rate Fund | | | | | (8,435 | ) | | | — | | | | 8,435 | |
DoubleLine Shiller Enhanced CAPE® | | | | | 25 | | | | (25 | ) | | | — | |
| | | | | | |
| 78 | | DoubleLine Funds Trust | | | | |
March 31, 2014
7. Share Transactions
Transactions in each Fund’s shares were as follows:
| | | | | | | | | | | | | | | | | | | | | | | | | | | | | | | | | | | | |
| | | | | DoubleLine Total Return Bond Fund | | | | | DoubleLine Core Fixed Income Fund | |
| | | | | Year Ended
March 31, 2014 | | | Year Ended
March 31, 2013 | | | | | Year Ended
March 31, 2014 | | | Year Ended
March 31, 2013 | |
| | | | | Shares | | | Amount | | | Shares | | | Amount | | | | | Shares | | | Amount | | | Shares | | | Amount | |
Shares Sold | | | | | | | | | | | | | | | | | | | | | | | | | | | | | | | | | | | | |
Class I | | | | | 1,031,663,229 | | | $ | 11,427,193,274 | | | | 1,778,166,858 | | | $ | 20,131,686,434 | | | | | | 70,269,777 | | | $ | 772,152,766 | | | | 104,558,418 | | | $ | 1,180,273,168 | |
Class N | | | | | 277,503,986 | | | | 3,071,207,850 | | | | 488,761,842 | | | | 5,533,030,576 | | | | | | 20,690,105 | | | | 227,519,631 | | | | 44,395,670 | | | | 501,821,233 | |
Reinvested Dividends | | | | | | | | | | | | | | | | | | | | | | | | | | | | | | | | | | | | |
Class I | | | | | 79,819,280 | | | | 878,017,247 | | | | 78,448,695 | | | | 887,256,580 | | | | | | 4,554,311 | | | | 49,619,411 | | | | 4,605,037 | | | | 52,118,831 | |
Class N | | | | | 27,102,303 | | | | 298,129,358 | | | | 30,161,160 | | | | 340,903,493 | | | | | | 1,663,484 | | | | 18,144,770 | | | | 2,189,926 | | | | 24,780,654 | |
Shares Redeemed | | | | | | | | | | | | | | | | | | | | | | | | | | | | | | | | | | | | |
Class I | | | | | (1,532,225,773 | ) | | | (16,863,389,527 | ) | | | (628,750,469 | ) | | | (7,129,905,063 | ) | | | | | (112,516,721 | ) | | | (1,230,247,351 | ) | | | (86,827,480 | ) | | | (982,414,447 | ) |
Class N | | | | | (488,591,413 | ) | | | (5,371,280,999 | ) | | | (233,699,047 | ) | | | (2,649,174,007 | ) | | | | | (51,915,655 | ) | | | (566,667,951 | ) | | | (30,506,362 | ) | | | (344,741,422 | ) |
Net Increase (Decrease) Resulting From Fund Share Transactions | | | | | (604,728,388 | ) | | $ | (6,560,122,797 | ) | | | 1,513,089,039 | | | $ | 17,113,798,013 | | | | | | (67,254,699 | ) | | $ | (729,478,724 | ) | | | 38,415,209 | | | $ | 431,838,017 | |
| | | | | | | | | | | | | | | | | | | | |
| | | | | DoubleLine Emerging Markets Fixed Income Fund | | | | | DoubleLine Multi-Asset Growth Fund (Consolidated) | |
| | | | | Year Ended
March 31, 2014 | | | Year Ended
March 31, 2013 | | | | | Year Ended
March 31, 2014 | | | Year Ended
March 31, 2013 | |
| | | | | Shares | | | Amount | | | Shares | | | Amount | | | | | Shares | | | Amount | | | Shares | | | Amount | |
Shares Sold | | | | | | | | | | | | | | | | | | | | | | | | | | | | | | | | | | | | |
Class I | | | | | 20,169,003 | | | $ | 212,554,617 | | | | 46,720,515 | | | $ | 512,780,814 | | | | | | 3,711,339 | | | $ | 37,171,840 | | | | 7,474,186 | | | $ | 74,738,820 | |
Class N | | | | | 14,455,439 | | | | 151,680,438 | | | | 14,275,040 | | | | 156,616,577 | | | | | | — | | | | — | | | | — | | | | — | |
Class A | | | | | — | | | | — | | | | — | | | | — | | | | | | 4,417,677 | | | | 44,102,001 | | | | 16,529,445 | | | | 165,299,833 | |
Reinvested Dividends | | | | | | | | | | | | | | | | | | | | | | | | | | | | | | | | | | | | |
Class I | | | | | 1,693,391 | | | | 17,529,848 | | | | 1,448,523 | | | | 15,942,854 | | | | | | 119,162 | | | | 1,198,077 | | | | 195,825 | | | | 1,946,146 | |
Class N | | | | | 668,682 | | | | 6,899,691 | | | | 476,976 | | | | 5,248,587 | | | | | | — | | | | — | | | | — | | | | — | |
Class A | | | | | — | | | | — | | | | — | | | | — | | | | | | 47,577 | | | | 477,314 | | | | 221,311 | | | | 2,203,059 | |
Shares Redeemed | | | | | | | | | | | | | | | | | | | | | | | | | | | | | | | | | | | | |
Class I | | | | | (46,491,820 | ) | | | (482,849,216 | ) | | | (24,609,798 | ) | | | (268,782,247 | ) | | | | | (7,814,272 | ) | | | (78,035,814 | )* | | | (5,604,179 | ) | | | (55,586,814 | )# |
Class N | | | | | (12,792,405 | ) | | | (134,256,491 | ) | | | (7,155,319 | ) | | | (78,475,916 | ) | | | | | — | | | | — | | | | — | | | | — | |
Class A | | | | | — | | | | — | | | | — | | | | — | | | | | | (10,922,811 | ) | | | (109,161,250 | )* | | | (4,910,724 | ) | | | (48,917,616 | )# |
Net Increase (Decrease) Resulting From Fund Share Transactions | | | | | (22,297,710 | ) | | $ | (228,441,113 | ) | | | 31,155,937 | | | $ | 343,330,669 | | | | | | (10,441,328 | ) | | $ | (104,247,832 | ) | | | 13,905,864 | | | $ | 139,683,428 | |
| | | | | | | | | | | | | | | | | | | | |
| | | | |
| | | | | DoubleLine Low Duration Bond Fund | | | | | DoubleLine Floating Rate Fund | |
| | | | | Year Ended
March 31, 2014 | | | Year Ended
March 31, 2013 | | | | | Year Ended
March 31, 2014 | | | Period Ended
March 31, 2013 | |
| | | | | Shares | | | Amount | | | Shares | | | Amount | | | | | Shares | | | Amount | | | Shares | | | Amount | |
Shares Sold | | | | | | | | | | | | | | | | | | | | | | | | | | | | | | | | | | | | |
Class I | | | | | 101,456,040 | | | $ | 1,032,848,486 | | | | 48,770,730 | | | $ | 497,596,443 | | | | | | 28,702,601 | | | $ | 290,762,751 | | | | 6,291,546 | | | $ | 63,025,000 | |
Class N | | | | | 109,669,589 | | | | 1,113,469,189 | | | | 27,629,374 | | | | 281,776,346 | | | | | | 16,121,720 | | | | 163,649,322 | | | | 1,000 | | | | 10,000 | |
Reinvested Dividends | | | | | | | | | | | | | | | | | | | | | | | | | | | | | | | | | | | | |
Class I | | | | | 721,367 | | | | 7,343,381 | | | | 505,183 | | | | 5,149,859 | | | | | | 165,560 | | | | 1,680,180 | | | | — | | | | — | |
Class N | | | | | 742,346 | | | | 7,552,818 | | | | 280,843 | | | | 2,860,451 | | | | | | 137,273 | | | | 1,395,100 | | | | — | | | | — | |
Shares Redeemed | | | | | | | | | | | | | | | | | | | | | | | | | | | | | | | | | | | | |
Class I | | | | | (55,389,051 | ) | | | (564,159,508 | ) | | | (25,468,125 | ) | | | (260,010,893 | ) | | | | | (7,881,567 | ) | | | (80,031,265 | )^ | | | — | | | | — | |
Class N | | | | | (29,407,261 | ) | | | (299,311,984 | ) | | | (13,014,742 | ) | | | (132,720,475 | ) | | | | | (5,991,491 | ) | | | (60,946,086 | )^ | | | — | | | | — | |
Net Increase (Decrease) Resulting From Fund Share Transactions | | | | | 127,793,030 | | | $ | 1,297,742,382 | | | | 38,703,263 | | | $ | 394,651,731 | | | | | | 31,254,096 | | | $ | 316,510,002 | | | | 6,292,546 | | | $ | 63,035,000 | |
| | | | | | |
| | Annual Report | | March 31, 2014 | | 79 |
Notes to Financial Statements (Cont.)
| | | | | | | | | | | | | | | | | | | | | | | | |
| | | | | | |
| | | | | DoubleLine Shiller Enhanced CAPE® | | | | | | | | | |
| | | | | Period Ended
March 31, 2014 | | | | | | | | | |
| | | | | Shares | | | Amount | | | | | | | | | | | | | | | |
Shares Sold | | | | | | | | | | | | | | | | | | | | | | | | |
Class I | | | | | 2,877,090 | | | $ | 29,950,853 | | | | | | | | | | | | | | | |
Class N | | | | | 1,424,882 | | | | 14,494,826 | | | | | | | | | | | | | | | |
Reinvested Dividends | | | | | | | | | | | | | | | | | | | | | | | | |
Class I | | | | | 9,305 | | | | 97,421 | | | | | | | | | | | | | | | |
Class N | | | | | 8,824 | | | | 91,474 | | | | | | | | | | | | | | | |
Shares Redeemed | | | | | | | | | | | | | | | | | | | | | | | | |
Class I | | | | | (71,600 | ) | | | (731,358 | ) | | | | | | | | | | | | | | |
Class N | | | | | (430,346 | ) | | | (4,524,560 | ) | | | | | | | | | | | | | | |
Net Increase (Decrease) Resulting From Fund Share Transactions | | | | | 3,818,155 | | | $ | 39,378,656 | | | | | | | | | | | | | | | |
| * | Net of redemption fees of $43,059 and $7,342 for Class I and Class A, respectively |
| # | Net of redemption fees of $40,161 and $11,470 for Class I and Class A, respectively |
| ^ | Net of redemption fees of $82,265 and $44,002 for Class I and N, respectively |
8. Additional Disclosures about Derivative Instruments
The following disclosures provide information on the Funds’ use of derivatives and certain related risks. The location and fair value amounts of these instruments on the Statements of Assets and Liabilities and the realized and changes in unrealized gains and losses on the Statements of Operations, each categorized by type of derivative contract, are included in the following tables.
The average volume of derivative activity during the period ended March 31, 2014 is as follows:
| | | | | | | | | | |
| | | | | DoubleLine Multi-Asset Growth
Fund (Consolidated) | | | DoubleLine Shiller Enhanced
CAPE® | |
Average Market Value | | | | | | | | | | |
Purchased Options | | | | $ | 1,104,552 | | | $ | — | |
Written Options | | | | | (20,100 | ) | | | — | |
Futures Contracts - Long | | | | | 647,076 | | | | — | |
Futures Contracts - Short | | | | | (15,899 | ) | | | — | |
| | | |
Average Notional Balance | | | | | | | | | | |
Credit Default Swaps - Sell Protection | | | | $ | 4,000,000 | | | $ | — | |
Total Return Swaps - Long | | | | | 7,932,000 | | | | 29,125,500 | |
Total Return Swaps - Short | | | | | 6,432,000 | | | | — | |
Forward Currency Exchange Contracts | | | | | 14,716,820 | | | | — | |
Options Contracts The Funds may purchase or sell put and call options. When a Fund purchases an option it pays a premium in return for the potential to profit from the change in value of an underlying investment or index during the term of the option. The option premium is included on the Funds’ Statements of Assets and Liabilities as an investment and subsequently marked to market to reflect the current value of the option. Premiums paid for purchasing options which expire are treated as realized losses. Certain options may be purchased with premiums to be determined on a future date. The premiums for these options are based upon implied volatility parameters at specified terms. The risk associated with purchasing options is limited to the loss of the premium paid. Premiums paid for purchasing options which are exercised or closed are added to the amounts paid or offset against the proceeds on the underlying investment transaction to determine the realized gain or loss. When a Fund writes (i.e., sells) option it receives a premium in return for bearing the risk of the change in value of an underlying instrument during the term off the option. Writing put options tends to increase a Fund’s exposure to the underlying instrument. Writing call options tends to decrease a Fund’s exposure to the underlying instrument. When a Fund writes a call or put, an amount equal to the premium received is recorded as a liability and subsequently marked to market to reflect the current value of the option written. These liabilities are reflected as written options outstanding on the Statements of Assets and Liabilities. Premiums received from writing options which expire are treated as realized gains. Premiums received from writing options which are exercised or closed are added to the proceeds or offset against amounts paid on the underlying instrument to determine the realized gain or loss when the underlying instrument is sold. A Fund as a writer of an option has no control over whether the underlying instrument may be sold (call) or purchased (put) and as a result bears the market risk of an unfavorable change in the price of the instrument underlying the written option. There is the risk a Fund may not be able to enter into a closing transaction because of an illiquid market.
| | | | | | |
| 80 | | DoubleLine Funds Trust | | | | |
March 31, 2014
The activity in written options during the period ended March 31, 2014, is as follows:
| | | | | | | | | | |
DoubleLine Multi-Asset Growth Fund
(Consolidated) | | | | Number of
Contracts | | | Premium
Amount | |
Outstanding, Beginning of Period | | | | | 4,005 | | | $ | 294,684 | |
Options Written | | | | | 4,584 | | | | 90,174 | |
Options Expired | | | | | (6,239 | ) | | | (356,017 | ) |
Options Exercised | | | | | (1,841 | ) | | | (21,729 | ) |
Options Closed | | | | | (509 | ) | | | (7,112 | ) |
Outstanding, End of Period | | | | | — | | | $ | — | |
Futures Contracts Risks associated with the use of futures contracts include the potential for imperfect correlation between the change in market value of the securities held by the Funds and the prices of futures contracts and the possibility of an illiquid market. Futures contracts are valued based upon their quoted daily settlement prices determined by the relevant exchange. Upon entering into a futures contract, a Fund is required to deposit with its futures broker an amount of cash in accordance with the initial margin requirements of the broker or exchange. Futures contracts are marked to market daily and an appropriate payment reflecting the change in value (“variation margin”) is made or received by or for the accounts of the Funds. Gains or losses are recognized but not considered realized until the contracts expire or are closed. Futures contracts involve, to varying degrees, risk of loss in excess of the variation margin disclosed on the Statements of Assets and Liabilities.
Credit Default Swap Agreements Credit default swap agreements often involve one party making a stream of payments (generally referred to as the buyer of protection) to another party (the seller of protection) in exchange for the right to receive a specified return in the event of a default or other credit event in respect of a referenced entity, obligation or index. As a seller of protection on credit default swap agreements, a Fund generally will receive from the buyer of protection a fixed rate of income throughout the term of the swap. As the seller, a Fund would effectively add leverage to its portfolio because, in addition to its total net assets, the Fund would be subject to investment exposure on the notional amount of the swap.
If a Fund is a seller of protection and a credit event occurs, as defined under the terms of that particular swap agreement, the Fund will either (i) pay to the buyer of protection an amount equal to the notional amount of the swap and take delivery of the referenced obligation, other deliverable obligations or the affected securities in the referenced index or (ii) pay a net settlement amount in the form of cash or securities equal to the notional amount of the swap less the recovery value of the referenced obligation or the affected securities in the referenced index. If a Fund is a buyer of protection and a credit event occurs, as defined under the terms of that particular swap agreement, the Fund typically will either (i) receive from the seller of protection an amount equal to the notional amount of the swap and deliver the referenced obligation, other deliverable obligations or the affected securities in the referenced index or (ii) receive a net settlement amount in the form of cash or securities equal to the notional amount of the swap less the recovery value of the referenced obligation or the affected securities in the referenced index. Recovery values are typically estimated by market makers considering either industry standard recovery rates or entity specific factors and considerations until a credit event occurs. An index credit default swap references all the names in the index, and if there is a default with respect to a single name in the index, the credit event is settled based on that name’s weight in the index.
Credit Default Swaps are considered to have credit risk related contingent features since they require payment by the protection seller to the protection buyer upon occurrence of a defined credit event. A Fund’s maximum risk of loss from counterparty risk, as the protection buyer, is the fair value of the contract, which may be mitigated by the posting of collateral by the counterparty to a Fund to cover a Fund’s exposure to the counterparty.
Total Return Swap Agreements The Funds may enter into total return swaps for investment purposes. Total return swaps are agreements to exchange the return generated by one instrument for the return generated by another instrument. For example, the agreement to pay a predetermined or fixed interest rate in exchange for a market-linked return based on a notional amount. To the extent the total return of a referenced index or instrument exceeds the offsetting interest obligation, a Fund will receive a payment from the counterparty. To the extent it is less, a Fund will make a payment to the counterparty. Payments received or made at the termination of the swap are recorded as realized gain or loss on the Statement of Operations.
The Funds’ derivative instrument holdings are summarized in the following tables.
The effect of derivative instruments on the Statements of Assets and Liabilities for the period ended March 31, 2014:
| | | | | | | | | | |
| Fund | | | | Derivatives not accounted
for as hedging instruments | | Statement of Assets and Liabilities Location | | Unrealized
Appreciation
(Depreciation) | |
DoubleLine Multi-Asset Growth Fund
(Consolidated) | | | | Purchased Options | | | | | | |
| | | | Commodity | | | | $ | (241,360 | ) |
| | | | Exchange Rate | | | | | (410,608 | ) |
| | | | Equity | | | | | (540,887 | ) |
| | | | | | Net Unrealized Appreciation (Depreciation) on Unaffiliated Securities | | $ | (1,192,855 | ) |
| | | | | | |
| | Annual Report | | March 31, 2014 | | 81 |
Notes to Financial Statements (Cont.)
| | | | | | | | | | |
| Fund | | | | Derivatives not accounted
for as hedging instruments | | Statement of Assets and Liabilities Location | | Unrealized
Appreciation
(Depreciation) | |
| | | | |
DoubleLine Multi-Asset Growth Fund
(Consolidated) | | | | Futures contracts | | | | | | |
| | | | Commodity | | | | $ | 618,401 | |
| | | | Index | | | | | 138,553 | |
| | | | Treasury Bond | | | | | (94,788 | ) |
| | | | | | Net Unrealized Appreciation (Depreciation) on Futures | | $ | 662,166 | |
| | | | |
| | | | Swap contracts | | | | | | |
| | | | Total Return | | Net Unrealized Appreciation (Depreciation) on Swaps | | $ | 198,136 | |
| DoubleLine Shiller Enhanced CAPE® | | | | Swap contracts | | | | | | |
| | | | Total Return | | Net Unrealized Appreciation (Depreciation) on Swaps | | $ | 1,305,963 | |
The effect of derivative instruments on the Statements of Operations for the period ended March 31, 2014:
| | | | | | | | | | | | | | |
| Fund | | | | Derivatives not accounted
for as hedging instruments | | Location of Gain (Loss) on
Derivatives in Income | | Realized Gain (Loss)
on Derivatives | | | Change in Unrealized
Appreciation
(Depreciation)
on Derivatives | |
| DoubleLine Multi-Asset Growth Fund (Consolidated) | | | | Purchased Options | | | | | | | | | | |
| | | | Commodity | | | | $ | (22,518 | ) | | | (21,328 | ) |
| | | | Exchange Rate | | | | | 55,845 | | | | (410,608 | ) |
| | | | Equity | | | | | (599,002 | ) | | | (540,887 | ) |
| | | | Index | | | | | (2,553,547 | ) | | | 2,448,790 | |
| | | | | | Net Realized and Unrealized Gain (Loss) on Unaffiliated Securities | | $ | (3,119,221 | ) | | $ | 1,475,967 | |
| | | | | |
| | | | Written Options | | | | | | | | | | |
| | | | Commodity | | | | $ | 4,983 | | | $ | (4,883 | ) |
| | | | Index | | | | | 334,867 | | | | (229,701 | ) |
| | | | | | Net Realized and Unrealized Gain (Loss) on Written Options | | $ | 339,850 | | | $ | (234,584 | ) |
| | | | | |
| | | | Futures contracts | | | | | | | | | | |
| | | | Commodity | | | | $ | (6,258,641 | ) | | $ | 3,069,939 | |
| | | | Exchange Rate | | | | | (164,742 | ) | | | 256,643 | |
| | | | Index | | | | | 9,749,873 | | | | (1,111,102 | ) |
| | | | Treasury Bond | | | | | 31,241 | | | | (94,788 | ) |
| | | | | | Net Realized and Unrealized Gain (Loss) on Futures | | $ | 3,357,731 | | | $ | 2,120,692 | |
| | | | | |
| | | | Swap contracts | | | | | | | | | | |
| | | | Credit Default | | | | $ | (27,777 | ) | | $ | 266,719 | |
| | | | Total Return | | | | | (850,695 | ) | | | 198,136 | |
| | | | | | Net Realized and Unrealized Gain (Loss) on Swaps | | $ | (878,472 | ) | | $ | 464,855 | |
| | | | | |
| | | | Forward contracts | | | | | | | | | | |
| | | | Currency | | Net Realized and Unrealized Gain (Loss) on Forwards | | $ | 337,892 | | | $ | — | |
| | | | | |
| DoubleLine Shiller Enhanced CAPE® | | | | Swap contracts | | | | | | | | | | |
| | | | Total Return | | Net Realized and Unrealized Gain (Loss) on Swaps | | $ | (43,549 | ) | | $ | 1,305,963 | |
| | | | | | |
| 82 | | DoubleLine Funds Trust | | | | |
March 31, 2014
9. Offsetting Assets and Liabilities
The Funds are subject to various Master Netting Arrangements, which govern the terms of certain transactions with select counterparties. The Master Netting Arrangements allow the Funds to close out and net their total exposure to a counterparty in the event of a default with respect to all the transactions governed under a single agreement with a counterparty. The Master Netting Arrangements also specify collateral posting arrangements at pre-arranged exposure levels. Under the Master Netting Arrangements, collateral is routinely transferred if the total net exposure to certain transactions (net of existing collateral already in place) governed under the relevant Master Netting Arrangement with a counterparty in a given account exceeds a specified threshold depending on the counterparty and the type of Master Netting Arrangement.
As of March 31, 2014, the DoubleLine Multi-Asset Growth Fund (Consolidated) held the following derivative instruments that were subject to offsetting on the Statement of Assets and Liabilities:
Assets:
| | | | | | | | | | | | | | | | | | | | | | | | |
| | | Gross
Amounts of
Recognized
Assets | | | Gross amounts
offset in the
Statement of
Assets and
Liabilities | | | Net amounts
presented in the
Statement of
Assets and
Liabilities | | | Gross Amounts not offset in the
Statement of Assets and Liabilities | | | | |
| Description | | | | | Financial
Instruments | | | Cash
Collateral
Received | | | Net
Amount | |
Futures | | $ | 289,023 | | | $ | 9,000 | | | | 280,023 | | | $ | — | | | $ | — | | | $ | 280,023 | |
Swap Contracts | | | 252,624 | | | | 54,488 | | | | 198,136 | | | | — | | | | — | | | | 198,136 | |
| | $ | 541,647 | | | $ | 63,488 | | | $ | 478,159 | | | $ | — | | | $ | — | | | $ | 478,159 | |
Liabilities:
| | | | | | | | | | | | | | | | | | | | | | | | |
| | | Gross
Amounts of
Recognized
Liabilities | | | Gross amounts
offset in the
Statement of
Assets and
Liabilities | | | Net amounts
presented in the
Statement of
Assets and
Liabilities | | | Gross Amounts not offset in the
Statement of Assets and Liabilities | | | | |
| Description | | | | | Financial
Instruments | | | Cash
Collateral
Pledged | | | Net
Amount | |
Futures | | $ | 9,000 | | | $ | 9,000 | | | $ | — | | | $ | — | | | $ | — | | | $ | — | |
Swap Contracts | | | 54,488 | | | | 54,488 | | | | — | | | | — | | | | — | | | | — | |
| | $ | 63,488 | | | $ | 63,488 | | | $ | — | | | $ | — | | | $ | — | | | $ | — | |
As of March 31, 2014, the DoubleLine Shiller Enhanced CAPE® held the following derivative instruments that were subject to offsetting on the Statement of Assets and Liabilities:
Assets:
| | | | | | | | | | | | | | | | | | | | | | | | |
| | | Gross
Amounts of
Recognized
Assets | | | Gross amounts
offset in the
Statement of
Assets and
Liabilities | | | Net amounts
presented in the
Statement of
Assets and
Liabilities | | | Gross Amounts not offset in the
Statement of Assets and Liabilities | | | | |
| Description | | | | | Financial
Instruments | | | Cash
Collateral
Received | | | Net
Amount | |
Swap Contracts | | $ | 1,305,963 | | | $ | — | | | $ | 1,305,963 | | | $ | 1,009,197 | | | $ | — | | | $ | 296,766 | |
Liabilities:
| | | | | | | | | | | | | | | | | | | | | | | | |
| | | Gross
Amounts of
Recognized
Liabilities | | | Gross amounts
offset in the
Statement of
Assets and
Liabilities | | | Net amounts
presented in the
Statement of
Assets and
Liabilities | | | Gross Amounts not offset in the
Statement of Assets and Liabilities | | | | |
| Description | | | | | Financial
Instruments | | | Cash
Collateral
Pledged | | | Net
Amount | |
Swap Contracts | | $ | — | | | $ | — | | | $ | — | | | $ | — | | | $ | — | | | $ | — | |
10. Bank Loans
Floating rate loans (“bank loans”), are typically debt obligations with interest rates that adjust or “float” periodically, often on a daily, monthly, quarterly, or semiannual basis by reference to a base lending rate (such as LIBOR) plus a premium. Certain floating rate loans are secured by specific collateral of the borrower and are senior to most other securities of the borrower (e.g., common stock and other debt instruments) in the event of bankruptcy. Other floating rate loans may be unsecured obligations of the borrower. A floating rate loan may be structured and administered by a financial institution that acts as the agent of the lenders participating in the floating rate loan. Such floating rate loans may be acquired through the agent or from the borrower, as an assignment from another lender who holds a direct interest in the floating rate loan, or as a participation interest in another lender’s portion of the floating rate loan. Coupon rates for bank loans are generally floating, not fixed, and are tied to a benchmark lending rate. The Funds record an investment when the borrower withdraws money and records the interest as it is earned. The Funds may purchase and sell interests in bank loans on a when-issued and delayed delivery basis, with payment delivery scheduled for a future date. Securities purchased on a delayed delivery basis are marked to market daily and no income accrues to the Funds prior to the date the Funds actually take delivery of such securities. These transactions are subject to market fluctuations and are subject, among other risks, to the risk that the value at delivery may be more or less than the trade purchase price.
| | | | | | |
| | Annual Report | | March 31, 2014 | | 83 |
Notes to Financial Statements (Cont.)
11. Credit Facility
U.S. Bank, N.A. (the “Bank”) has made available to the Trust, along with another affiliated trust, an uncommitted, $450,000,000 credit facility for short term liquidity in connection with shareholder redemptions. Under the terms of the credit facility, borrowings for each Fund are limited to one-third of the total assets (including the amount borrowed) of the respective Fund. Fifty percent of the credit facility is available to all of the Funds, as well as the funds in the affiliated trust, on a first come, first served basis. The remaining 50% of the credit facility is allocated among the Funds and the funds in the affiliated trust in accordance with procedures adopted by the Board. Borrowings under this credit facility bear interest at the Bank’s prime rate less 0.50% (weighted average rate of 2.75% for the period ended March 31, 2014).
The Bank has also made available to the DoubleLine Floating Rate Fund, a committed $40,000,000 credit facility. Borrowings under this credit facility bear interest at the Bank’s prime rate less 0.50% and the credit facility bears an unused commitment fee equal to 0.12% on the unused portion of the credit facility. The Fund did not borrow on this credit facility during the period ended March 31, 2014.
For the year ended March 31, 2014, the Funds’ credit facility activity is as follows:
| | | | | | | | | | | | | | | | | | |
| | | | | Average
Borrowings | | | Maximum
Amount
Outstanding | | | Interest
Expense | | | Commitment Fee | |
DoubleLine Core Fixed Income Fund | | | | $ | 1,935,500 | | | $ | 3,779,000 | | | $ | 296 | | | $ | — | |
DoubleLine Emerging Markets Fixed Income Fund | | | | | 5,446,262 | | | | 22,654,000 | | | | 76,134 | | | | — | |
DoubleLine Low Duration Bond Fund | | | | | 81,000 | | | | 81,000 | | | | 6 | | | | — | |
DoubleLine Floating Rate Fund | | | | | — | | | | — | | | | — | | | | 17,444 | |
12. Principal Risks
Below are summaries of the principal risks of investing in one or more of the Funds, each of which could adversely affect a Fund’s NAV, yield and total return. Each risk listed below does not necessarily apply to each Fund, and you should read each Fund’s prospectus carefully for a description of the principal risks associated with investing in a particular Fund.
| | • | affiliated fund risk: the risk that, due to its own financial interest or other business considerations, the Adviser may choose to invest a portion of a Fund’s assets in investment companies sponsored or managed by the Adviser or its affiliates in lieu of investments by the Fund directly in portfolio securities, or may choose to invest in such investment companies over investment companies sponsored or managed by others. |
| | • | asset allocation risk: the risk that a Fund’s investment performance may depend, at least in part, on how its assets are allocated and reallocated among asset classes and underlying funds and that such allocation will focus on asset classes, sectors, underlying funds, or investments that perform poorly or underperform other asset classes, sectors, underlying funds, or available investments. |
| | • | asset-backed securities investment risk: the risk that borrowers may default on the obligations that underlie the asset-backed security and that, during periods of falling interest rates, asset-backed securities may be called or prepaid, which may result in a Fund having to reinvest proceeds in other investments at a lower interest rate, and the risk that the impairment of the value of the collateral underlying a security in which a Fund invests (due, for example, to non-payment of loans) will result in a reduction in the value of the security. |
| | • | commodities risk: the risk that the value of a Fund’s shares may be affected by changes in the values of one or more commodities, which may be extremely volatile and difficult to value, risk of possible illiquidity, and the risks and costs associated with delivery, storage, and maintenance of precious metals or minerals or other commodity-related investments. |
| | • | confidential information access risk: the risk that the intentional or unintentional receipt of material, non-public information by the Adviser could limit a Fund’s ability to sell certain investments held by the Fund or pursue certain investment opportunities on behalf of the Fund, potentially for a substantial period of time. |
| | • | counterparty risk: the risk that a Fund will be subject to credit risk with respect to the counterparties to the derivative contracts and other instruments entered into directly by the Fund or held by special purpose or structured vehicles in which the Fund invests. To the extent that a Fund enters into multiple transactions with a single or a small set of counterparties, it will be subject to increased counterparty risk. |
| | ° | | credit risk: the risk that changes in the financial condition of an issuer or counterparty, changes in specific economic, social or political conditions that affect a particular type of security or other instrument or an issuer, and changes in economic, social or political conditions generally can increase the risk of default by an issuer or counterparty, which can affect a security’s or other instrument’s credit quality or value and an issuer’s or counterparty’s ability to pay interest and principal when due. |
| | ° | | extension risk: the risk that if interest rates rise, repayments of principal on certain debt securities may occur at a slower rate than expected and the expected maturity of those securities could lengthen as a result. |
| | ° | | interest rate risk: the risk that debt securities will decline in value because of increases in interest rates. The value of a security with a longer duration will be more sensitive to changes in interest rates than a similar security with a shorter duration. |
| | | | | | |
| 84 | | DoubleLine Funds Trust | | | | |
March 31, 2014
| | • | defaulted securities risk: the risk of the uncertainty of repayment of defaulted securities and obligations of distressed issuers. |
| | • | derivatives risk: the risk that an investment in derivatives will not perform as anticipated, cannot be closed out at a favorable time or price, or will increase a Fund’s volatility; that derivatives may create investment leverage; that, when a derivative is used as a substitute for or alternative to a direct cash investment, the transaction may not provide a return that corresponds precisely with that of the cash investment; or that, when used for hedging purposes, derivatives will not provide the anticipated protection, causing a Fund to lose money on both the derivatives transaction and the exposure the Fund sought to hedge. |
| | • | emerging market country risk: the risk that investing in emerging markets will be subject to greater political and economic instability, greater volatility in currency exchange rates, less developed securities markets, possible trade barriers, currency transfer restrictions, a more limited number of potential buyers, an emerging market country’s dependence on revenue from particular commodities or international aid, less governmental supervision and regulation, unavailability of currency hedging techniques, differences in auditing and financial reporting standards, and less developed legal systems than in many more developed countries. |
| | • | equity issuer risk: the risk that the market price of common stocks and other equity securities may go up or down, sometimes rapidly or unpredictably, including due to factors affecting equity securities markets generally, particular industries represented in those markets, or the issuer itself. |
| | • | exchange-traded note risk: the risk that the level of the particular market benchmark or strategy to which the note’s return is linked will fall in value; exchange-traded notes are subject to credit risk generally to the same extent as debt securities. |
| | • | financial services risk: the risk that an investment in issuers in the financial services sector may be adversely affected by, among other things: (i) changes in the regulatory framework or economic conditions that may negatively affect financial service businesses; (ii) exposure of a financial institution to non-diversified or concentrated loan portfolios; (iii) exposure to financial leverage and/or investments or agreements which, under certain circumstances, may lead to losses, for example sub-prime loans; and (iv) the risk that a market shock or other unexpected market, economic, political, regulatory, or other event might lead to a sudden decline in the values of most or all companies in the financial services sector. |
| | • | foreign currency risk: the risk that fluctuations in exchange rates may adversely affect the value of a Fund’s investments denominated in foreign currencies. |
| | • | foreign investing risk: the risk that a Fund’s investments will be affected by political, regulatory, and economic risks not present in domestic investments. In addition, if a Fund buys securities denominated in a foreign currency, there are special risks such as changes in currency exchange rates and the risk that a foreign government could regulate or restrict foreign exchange transactions. |
| | • | index risk: the risk that the DoubleLine Shiller Enhanced CAPE®’s return may not match or exceed the return of the Shiller Barclays CAPE® US Sector TR USD Index (the “Index”) for a number of reasons, including, for example, (i) the performance of derivatives in which the Fund invests may not correlate with the performance of the Index; (ii) the Fund may not be able to find counterparties willing to enter into derivative instruments whose returns are based on the return of the Index or find parties who are willing to do so at an acceptable cost or level of risk to the Fund; (iii) the Fund’s overall performance may be adversely affected by the performance of the Fund’s investments in debt instruments and (iv) errors may arise in carrying out the Index’s methodology, or the Index provider may incorrectly report information concerning the Index. Unavailability of the Index could affect adversely the ability of the Fund to achieve its investment objective. |
| | • | inflation-indexed bond risk: the risk that such bonds will change in value in response to changes in actual or anticipated changes in inflation rates, in a manner unanticipated by a Fund’s portfolio management team or investors generally. Inflation-indexed bonds are subject to debt securities risk. |
| | • | investment company and exchange traded fund risk: the risk that an investment company, including any exchange-traded fund (“ETF”), in which a Fund invests will not achieve its investment objective or execute its investment strategies effectively or that large purchase or redemption activity by shareholders of such an investment company might negatively affect the value of the investment company’s shares. A Fund must pay its pro rata portion of an investment company’s fees and expenses. |
| | • | junk bond risk: the risk that these bonds have a higher degree of default risk and may be less liquid and subject to greater price volatility than investment grade bonds. |
| | • | large shareholder risk: the risk that certain account holders, including funds or accounts over which the Adviser has investment discretion, may from time to time own or control a significant percentage of a Fund’s shares. A Fund is subject to the risk that a redemption by those shareholders of all or a portion of their Fund shares will adversely affect the Fund’s performance if it is forced to sell portfolio securities or invest cash when it would not otherwise do so. Redemptions of a large number of shares may affect the liquidity of a Fund’s portfolio, increase a Fund’s transaction costs, and accelerate the realization of taxable income and/or gains to shareholders. |
| | • | leveraging risk: the risk that certain investments by a Fund involving leverage may have the effect of increasing the volatility of the Fund’s portfolio, and the risk of loss in excess of invested capital. |
| | • | limited operating history risk: the risk that a newly formed fund has a limited operating history to evaluate and may not attract sufficient assets to achieve or maximize investment and operational efficiencies. |
| | • | liquidity risk: the risk that a Fund may be unable to sell a portfolio investment at a desirable time or at the value the Fund has placed on the investment. |
| | | | | | |
| | Annual Report | | March 31, 2014 | | 85 |
Notes to Financial Statements (Cont.)
| | • | loan risk: includes, among other risks, the risk that (i) if a Fund holds a loan through another financial institution, or relies on a financial institution to administer the loan, its receipt of principal and interest on the loan may be subject to the credit risk of that financial institution; (ii) it is possible that any collateral securing a loan may be insufficient or unavailable to a Fund; (iii) investments in highly leveraged loans or loans of stressed, distressed, or defaulted issuers may be subject to significant credit and liquidity risk; (iv) a bankruptcy or other court proceeding could delay or limit the ability of a Fund to collect the principal and interest payments on that borrower’s loans or adversely affect the Fund’s rights in collateral relating to a loan; (v) if a borrower fails to comply with various restrictive covenants that are typically in loan agreements, the borrower may default in payment of the loan; (vi) transactions in loans may settle on a delayed basis; and (vii) loans may be difficult to value and may be illiquid, which may adversely affect an investment in a Fund. |
| | • | market capitalization risk: the risk that investing substantially in issuers in one market capitalization category (large, medium or small) may adversely affect a Fund because of unfavorable market conditions particular to that category of issuers, such as larger, more established companies being unable to respond quickly to new competitive challenges or attain the high growth rates of successful smaller companies, or, conversely, stocks of smaller companies being more volatile than those of larger companies due to, among other things, narrower product lines, more limited financial resources, fewer experienced managers and there typically being less publicly available information about small capitalization companies. |
| | • | market risk: the risk that the overall market will perform poorly or that the returns from the securities in which a Fund invests will underperform returns from the general securities markets or other types of investments. |
| | • | mortgage-backed securities risk: the risk that borrowers may default on their mortgage obligations or the guarantees underlying the mortgage-backed securities will default or otherwise fail and that, during periods of falling interest rates, mortgage-backed securities will be called or prepaid, which may result in a Fund having to reinvest proceeds in other investments at a lower interest rate. During periods of rising interest rates, the average life of a mortgage-backed security may extend, which may lock in a below-market interest rate, increase the security’s duration, and reduce the value of the security. Enforcing rights against the underlying assets or collateral may be difficult, or the underlying assets or collateral may be insufficient if the issuer defaults. The values of certain types of mortgage-backed securities, such as inverse floaters and interest-only and principal-only securities, may be extremely sensitive to changes in interest rates and prepayment rates. |
| | • | non-diversification risk: the risk that, because a relatively higher percentage of a Fund’s assets may be invested in the securities of a limited number of issuers, the Fund may be more susceptible to any single economic, political or regulatory event than a more diversified fund. A decline in the market value of one of a Fund’s investments may affect the Fund’s value more than if the Fund were a diversified fund. |
| | • | portfolio management risk: the risk that an investment strategy may fail to produce the intended results or that the securities held by a Fund will underperform other comparable funds because of the portfolio managers’ choice of investments. |
| | • | portfolio turnover risk: the risk that frequent purchases and sales of portfolio securities may result in higher Fund expenses and may result in larger distributions of taxable capital gains to investors as compared to a fund that trades less frequently. |
| | • | preferred securities risk: the risk that: (i) certain preferred stocks contain provisions that allow an issuer under certain conditions to skip or defer distributions; (ii) preferred stocks may be subject to redemption, including at the issuer’s call, and, in the event of redemption, the Fund may not be able to reinvest the proceeds at comparable rates of return; (iii) preferred stocks are generally subordinated to bonds and other debt securities in an issuer’s capital structure in terms of priority for corporate income and liquidation payments; and (iv) preferred stocks may trade less frequently and in a more limited volume and may be subject to more abrupt or erratic price movements than many other securities. |
| | • | prepayment risk: the risk that the issuer of a debt security, including floating rate loans and mortgage-related securities, repays all or a portion of the principal prior to the security’s maturity. |
| | • | price volatility risk: the risk that the value of a Fund’s investment portfolio will change, potentially frequently and in large amounts, as the prices of its investments go up or down. |
| | • | real estate risk: the risk that real estate related investments may decline in value as a result of factors affecting the real estate industry, such as the supply of real property in certain markets, changes in zoning laws, delays in completion of construction, changes in real estate values, changes in property taxes, levels of occupancy, and local and regional market conditions. |
| | • | reliance on the adviser: the risk associated with each Fund’s ability to achieve its investment objective being dependent upon the Adviser’s ability to identify profitable investment opportunities for the Fund. While the portfolio managers of a Fund may have considerable experience in managing other portfolios with investment objectives, policies and strategies that are similar, the past experience of the portfolio managers does not guarantee future results for the Fund. |
| | • | securities or sector selection risk: the risk that the securities held by a Fund will underperform securities held in other funds investing in similar asset classes or comparable benchmarks because of the portfolio managers’ choice of securities or sectors for investment. |
| | • | short sales risk: the risk that a security a Fund has sold short increases in value. |
| | • | tax risk: in order to qualify as a regulated investment company under the Internal Revenue Code of 1986, as amended (“Code”), a Fund must meet requirements regarding, among other things, the source of its income. It is possible that certain of a Fund’s investments in commodity-linked derivatives, ETFs and other investment pools will not give rise to “qualifying income” for this purpose. Any income a Fund derives from investments in instruments that do not generate “qualifying income” must be limited to a maximum of 10% of the Fund’s annual gross income. If a Fund were to earn non-qualifying income in excess of 10% of its annual gross income, it could fail to qualify as a regulated investment company for that year. If a |
| | | | | | |
| 86 | | DoubleLine Funds Trust | | | | |
March 31, 2014
| | Fund were to fail to qualify as a regulated investment company, the Fund would be subject to tax and shareholders of the Fund would be subject to the risk of diminished returns. |
| | • | U.S. Government securities risk: the risk that debt securities issued or guaranteed by certain U.S. Government agencies, instrumentalities, and sponsored enterprises are not supported by the full faith and credit of the U.S. Government, and so involve credit risk greater than investments in other types of U.S. Government securities. |
13. Recently Issued Accounting Pronouncements
In June 2013, the FASB issued Accounting Standards Update (“ASU”) No. 2013-08, Financial Services — Investment Companies (Topic 946): Amendments to the Scope, Measurement, and Disclosure Requirements. ASU No. 2013-08 sets forth a new approach for determining whether a public or private entity is an investment company and sets certain measurement and disclosure requirements for an investment company. ASU No. 2013-08 is effective in annual reporting periods beginning on or after December 15, 2013, and for interim periods within those annual reporting periods. Management is currently evaluating the implications of these changes and their impact on the financial statements.
14. Subsequent Events
DoubleLine Flexible Income Fund and DoubleLine Low Duration Emerging Markets Fixed Income Fund, each a new series of the Trust, commenced operations on April 7, 2014. DoubleLine Flexible Income Fund’s investment objective is to seek long-term total return while striving to generate current income. DoubleLine Low Duration Emerging Markets Fixed Income Fund’s investment objective is to seek long term total return.
In preparing these financial statements, the Funds have evaluated events and transactions for potential recognition or disclosure through the date the financial statements were issued. The Funds have determined there are no subsequent events that would need to be disclosed in the Funds’ financial statements.
| | | | | | |
| | Annual Report | | March 31, 2014 | | 87 |
Report of Independent Registered Public Accounting Firm
To the Board of Trustees and Shareholders of DoubleLine Funds Trust
In our opinion, the accompanying statements of assets and liabilities, including the schedules of investments, and the related statements of operations and of changes in net assets and the financial highlights present fairly, in all material respects, the financial position of DoubleLine Total Return Bond Fund, DoubleLine Core Fixed Income Fund, DoubleLine Emerging Markets Fixed Income Fund, DoubleLine Multi-Asset Growth Fund (Consolidated), DoubleLine Low Duration Bond Fund, DoubleLine Floating Rate Fund and DoubleLine Shiller Enhanced CAPE® (constituting DoubleLine Funds Trust, hereafter referred to as the “Funds”) at March 31, 2014, and the results of each of their operations, the changes in each of their net assets and the financial highlights for each of the periods indicated, in conformity with accounting principles generally accepted in the United States of America. These financial statements and financial highlights (hereafter referred to as “financial statements”) are the responsibility of the Funds’ management; our responsibility is to express an opinion on these financial statements based on our audits. We conducted our audits of these financial statements in accordance with the standards of the Public Company Accounting Oversight Board (United States). Those standards require that we plan and perform the audit to obtain reasonable assurance about whether the financial statements are free of material misstatement. An audit includes examining, on a test basis, evidence supporting the amounts and disclosures in the financial statements, assessing the accounting principles used and significant estimates made by management, and evaluating the overall financial statement presentation. We believe that our audits, which included confirmation of securities at March 31, 2014 by correspondence with the custodian and brokers, provide a reasonable basis for our opinion.
PricewaterhouseCoopers LLP
Los Angeles, California
May 22, 2014
| | | | | | |
| 88 | | DoubleLine Funds Trust | | | | |
| | |
| Shareholder Expenses | | (Unaudited) |
Example
As a shareholder of DoubleLine Total Return Bond Fund, DoubleLine Core Fixed Income Fund, DoubleLine Emerging Markets Fixed Income Fund, DoubleLine Multi-Asset Growth Fund (Consolidated), DoubleLine Low Duration Bond Fund, DoubleLine Floating Rate Fund and DoubleLine Shiller Enhanced CAPE® (each a “Fund” and collectively the “Funds”), you incur two basic types of costs: (1) transaction costs , including sales charges (loads) on purchase payments, reinvested dividends, or other distributions; redemption fees; and exchange fees; and (2) ongoing costs, including management fees; distribution (12b-1) fees and other Fund expenses.
This Example is intended to help you understand your ongoing costs (in dollars) of investing in each Fund and to compare these costs with the ongoing costs of investing in other mutual funds. The Example is based on an investment of $1,000 invested at the beginning of the period and held for the entire period covered by this report.
Actual Expenses
The actual return columns in the following table provide information about account values based on actual returns and actual expenses. You may use the information in these columns, together with the amount you invested, to estimate the expenses that you paid over the period. Simply divide your account value by $1,000 (for example, an $8,600 account value divided by $1,000 = 8.6), then multiply the result by the number in the respective line under the heading entitled “Expenses Paid During Period” to estimate the expenses you paid on your account during this period. In addition to the expenses shown below in the table, as a shareholder you will be assessed fees for outgoing wire transfers, returned checks and stop payment orders at prevailing rates charged by U.S. Bancorp Fund Services, LLC, the Fund’s transfer agent. Currently, if you request a redemption be made by wire, a $15.00 fee is charged by the Fund’s transfer agent. You will be charged a redemption fee equal to 1.00% of the net amount of the redemption if you redeem shares that have been held for less than 90 days in the DoubleLine Multi-Asset Growth Fund and the DoubleLine Floating Rate Fund. An Individual Retirement Account (“IRA”) will be charged a $15.00 annual maintenance fee. The transfer agent charges a transaction fee of $25.00 on returned checks and stop payment orders. If you paid a transaction fee, you would add the fee amount to the expenses paid on your account this period to obtain your total expenses paid.
Hypothetical Example for Comparison Purposes
The hypothetical return columns in the following table provide information about hypothetical account values and hypothetical expenses based on a Fund’s actual expense ratio and an assumed rate of return of 5% per year before expenses, which is not a Fund’s actual return. The hypothetical account values and expenses may not be used to estimate the actual ending account balance or expenses you paid for the period. You may use this information to compare the ongoing costs of investing in the Fund and other funds. To do so, compare this 5% hypothetical example with the 5% hypothetical examples that appear in the shareholder reports of the other funds. Please note that the expenses shown in the table are meant to highlight your ongoing costs only and do not reflect the transaction fees discussed above. Therefore, those columns are useful in comparing ongoing costs only, and will not help you determine the relative total costs of owning different funds. In addition, if these transactional costs were included, your costs would have been higher.
| | | | | | | | | | | | | | | | | | | | | | | | | | | | | | |
| | | | | | | | | | | | | Actual | | | | | Hypothetical
(5% return
before expenses) | |
| | | | | | | Fund’s
Annualized
Expense Ratio1 | | | Beginning
Account
Value | | | Ending
Account
Value
9/30/13 | | | Expenses
Paid During
Period*1 | | | | | Ending
Account
Value
9/30/13 | | | Expenses
Paid During
Period*1 | |
DoubleLine Total Return Bond Fund | | | | Class I | | | 0.48% | | | $ | 1,000 | | | $ | 1,021 | | | $ | 4.85 | | | | | $ | 1,045 | | | $ | 4.91 | |
| | | | Class N | | | 0.73% | | | $ | 1,000 | | | $ | 1,020 | | | $ | 7.37 | | | | | $ | 1,043 | | | $ | 7.46 | |
DoubleLine Core Fixed Income Fund | | | | Class I | | | 0.47% | | | $ | 1,000 | | | $ | 1,034 | | | $ | 4.78 | | | | | $ | 1,045 | | | $ | 4.81 | |
| | | | Class N | | | 0.72% | | | $ | 1,000 | | | $ | 1,032 | | | $ | 7.32 | | | | | $ | 1,043 | | | $ | 7.35 | |
DoubleLine Emerging Markets Fixed Income Fund | | | | Class I | | | 0.94% | | | $ | 1,000 | | | $ | 1,066 | | | $ | 9.71 | | | | | $ | 1,041 | | | $ | 9.59 | |
| | | | Class N | | | 1.19% | | | $ | 1,000 | | | $ | 1,065 | | | $ | 12.28 | | | | | $ | 1,038 | | | $ | 12.13 | |
DoubleLine Multi-Asset Growth Fund (Consolidated) | | | | Class I | | | 1.13% | | | $ | 1,000 | | | $ | 1,035 | | | $ | 11.50 | | | | | $ | 1,039 | | | $ | 11.52 | |
| | | | Class A | | | 1.38% | | | $ | 1,000 | | | $ | 1,032 | | | $ | 14.02 | | | | | $ | 1,036 | | | $ | 14.05 | |
DoubleLine Low Duration Bond Fund | | | | Class I | | | 0.47% | | | $ | 1,000 | | | $ | 1,011 | | | $ | 4.73 | | | | | $ | 1,045 | | | $ | 4.81 | |
| | | | Class N | | | 0.72% | | | $ | 1,000 | | | $ | 1,010 | | | $ | 7.24 | | | | | $ | 1,043 | | | $ | 7.35 | |
DoubleLine Floating Rate Bond Fund | | | | Class I | | | 0.74% | | | $ | 1,000 | | | $ | 1,020 | | | $ | 7.48 | | | | | $ | 1,043 | | | $ | 7.56 | |
| | | | Class N | | | 0.99% | | | $ | 1,000 | | | $ | 1,018 | | | $ | 9.99 | | | | | $ | 1,040 | | | $ | 10.10 | |
DoubleLine Shiller Enhanced CAPE® | | | | Class I | | | 0.65% | | | $ | 1,000 | | | $ | 1,078 | | | $ | 2.79 | | | | | $ | 1,044 | | | $ | 6.64 | |
| | | | Class N | | | 0.90% | | | $ | 1,000 | | | $ | 1,077 | | | $ | 3.87 | | | | | $ | 1,041 | | | $ | 9.18 | |
* Expenses Paid During Period are equal to the net annualized expense ratio for the class, multiplied by the average account value over the period, multiplied by 182/365 (to reflect the one-half year period). The actual dollar amounts shown as expenses paid during the period for the DoubleLine Shiller Enhanced CAPE® are multiplied by 151/365, which is based on the date of inception (October 31, 2013).
1 Reflects fee waiver and expense limitation arrangements in effect during the period.
| | | | | | |
| | Annual Report | | March 31, 2014 | | 89 |
DoubleLine Total Return Bond Fund
Value of a $100,000 Investment
Class I Shares1
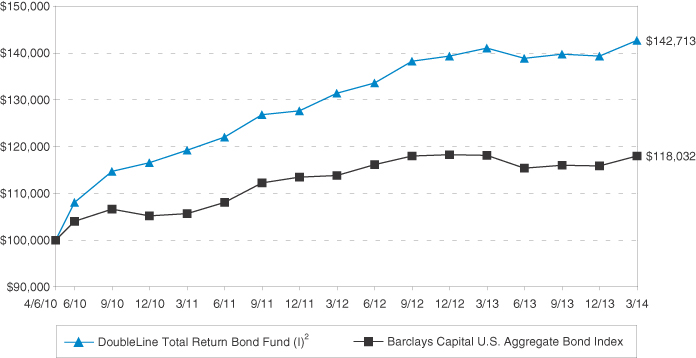
Average Annual Total Returns1
As of March 31, 2014
| | | | | | | | | | |
| | | | | 1 Year | | | Since
Inception
(4/6/2010) | |
DoubleLine Total Return Bond Fund Class I | | | | | 1.13 | | | | 9.34% | |
Barclays Capital U.S. Aggregate Bond Index | | | | | (0.10 | ) | | | 4.25% | |
| | | |
DoubleLine Total Return Bond Fund Class N | | | | | 0.88 | | | | 9.06% | |
| 1 | Past performance is not an indication of future results. Returns represent past performance and reflect changes in share prices, the reinvestment of all dividends and capital gains, expense limitations and the effects of compounding. The prospectus contains more complete information on the investment objectives, risks, charges and expenses of the investment company, which investors should read and consider carefully before investing. To obtain a prospectus, contact a registered representative or visit www.doubleline.com. The Fund’s adviser waived a portion of its management fee and/or reimbursed Fund expenses during the period shown. Had the adviser not done so, the Fund’s total returns would have been lower. The returns shown do not reflect taxes a shareholder would pay on distributions or redemptions. Total investment return and principal value of your investment will fluctuate, and your shares, when redeemed, may be worth more or less than their original cost. Current performance may be higher or lower than the performance data quoted. Call 877-DLine11 or visit www.doubleline.com for performance results current to the most recent month-end. |
| 2 | Performance of other classes will be greater or less than the line shown based on the differences in loads and fees paid by shareholders investing in the different classes. |
| | Barclays Capital U.S. Aggregate Bond Index — This index represents securities that are SEC-registered, taxable, and dollar denominated. The index covers the US investment grade fixed rate bond market, with index components for government and corporate securities, mortgage pass-through securities, and asset-backed securities. These major sectors are subdivided into more specific indices that are calculated and reported on a regular basis. The Fund’s investments likely will diverge widely from the components of the benchmark Index which could lead to performance dispersion between the Fund and the benchmark Index, meaning that the Fund could outperform or underperform the Index at any given time. |
| | | | | | |
| 90 | | DoubleLine Funds Trust | | | | |
| | |
| | | (Unaudited) March 31, 2014 |
DoubleLine Core Fixed Income Fund
Value of a $100,000 Investment
Class I Shares1
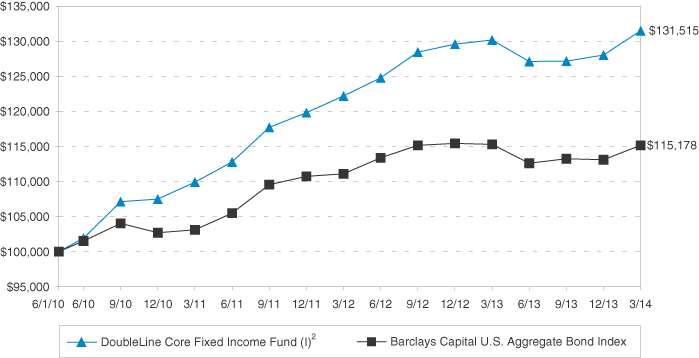
Average Annual Total Returns1
As of March 31, 2014
| | | | | | | | | | |
| | | | | 1 Year | | | Since
Inception
(6/1/2010) | |
DoubleLine Core Fixed Income Fund Class I | | | | | 1.03 | | | | 7.41% | |
Barclays Capital U.S. Aggregate Bond Index | | | | | (0.10 | ) | | | 3.76% | |
| | | |
DoubleLine Core Fixed Income Fund Class N | | | | | 0.77 | | | | 7.14% | |
| 1 | Past performance is not an indication of future results. Returns represent past performance and reflect changes in share prices, the reinvestment of all dividends and capital gains, expense limitations and the effects of compounding. The prospectus contains more complete information on the investment objectives, risks, charges and expenses of the investment company, which investors should read and consider carefully before investing. To obtain a prospectus, contact a registered representative or visit www.doubleline.com. The Fund’s adviser waived a portion of its management fee and/or reimbursed Fund expenses during the period shown. Had the adviser not done so, the Fund’s total returns would have been lower. The returns shown do not reflect taxes a shareholder would pay on distributions or redemptions. Total investment return and principal value of your investment will fluctuate, and your shares, when redeemed, may be worth more or less than their original cost. Current performance may be higher or lower than the performance data quoted. Call 877-DLine11 or visit www.doubleline.com for performance results current to the most recent month-end. |
| 2 | Performance of other classes will be greater or less than the line shown based on the differences in loads and fees paid by shareholders investing in the different classes. |
| | Barclays Capital U.S. Aggregate Bond Index — This index represents securities that are SEC-registered, taxable, and dollar denominated. The index covers the US investment grade fixed rate bond market, with index components for government and corporate securities, mortgage pass-through securities, and asset-backed securities. These major sectors are subdivided into more specific indices that are calculated and reported on a regular basis. The Fund’s investments likely will diverge widely from the components of the benchmark Index which could lead to performance dispersion between the Fund and the benchmark Index, meaning that the Fund could outperform or underperform the Index at any given time. |
| | | | | | |
| | Annual Report | | March 31, 2014 | | 91 |
| | |
| Growth of Investment (Cont.) | | |
DoubleLine Emerging Markets Fixed Income Fund
Value of a $100,000 Investment
Class I Shares1
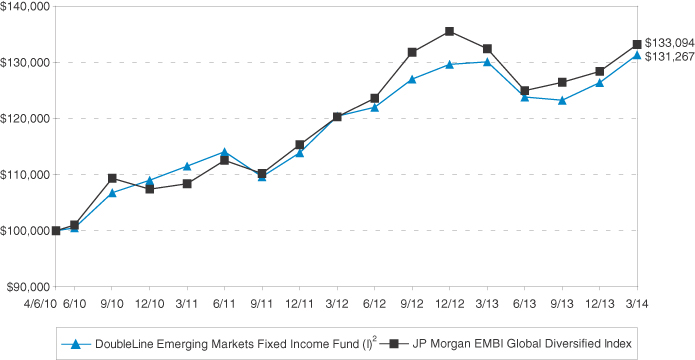
Average Annual Total Returns1
As of March 31, 2014
| | | | | | | | | | |
| | | | | 1 Year | | | Since
Inception
(4/6/2010) | |
DoubleLine Emerging Markets Fixed Income Fund Class I | | | | | 0.95 | | | | 7.07% | |
JP Morgan EMBI Global Diversified Index | | | | | 0.56 | | | | 7.44% | |
| | | |
DoubleLine Emerging Markets Fixed Income Fund Class N | | | | | 0.69 | | | | 6.81% | |
| 1 | Past performance is not an indication of future results. Returns represent past performance and reflect changes in share prices, the reinvestment of all dividends and capital gains, expense limitations and the effects of compounding. The prospectus contains more complete information on the investment objectives, risks, charges and expenses of the investment company, which investors should read and consider carefully before investing. To obtain a prospectus, contact a registered representative or visit www.doubleline.com. The Fund’s adviser waived a portion of its management fee and/or reimbursed Fund expenses during the period shown. Had the adviser not done so, the Fund’s total returns would have been lower. The returns shown do not reflect taxes a shareholder would pay on distributions or redemptions. Total investment return and principal value of your investment will fluctuate, and your shares, when redeemed, may be worth more or less than their original cost. Current performance may be higher or lower than the performance data quoted. Call 877-DLine11 or visit www.doubleline.com for performance results current to the most recent month-end. |
| 2 | Performance of other classes will be greater or less than the line shown based on the differences in loads and fees paid by shareholders investing in the different classes. |
| | JP Morgan EMBI Global Diversified Index — This index is an uniquely-weighted version of the EMBI Global. It limits the weights of those index countries with larger debt supplies by only including specified portions of these countries’ eligible current face amounts of debt outstanding. The countries covered in the EMBI Global Diversified are identical to those covered by EMBI Global. The Fund’s investments likely will diverge widely from the components of the benchmark Index which could lead to performance dispersion between the Fund and the benchmark Index, meaning that the Fund could outperform or underperform the Index at any given time. |
| | | | | | |
| 92 | | DoubleLine Funds Trust | | | | |
| | |
| | | (Unaudited) March 31, 2014 |
DoubleLine Multi-Asset Growth Fund
Value of a $100,000 Investment
Class I Shares1
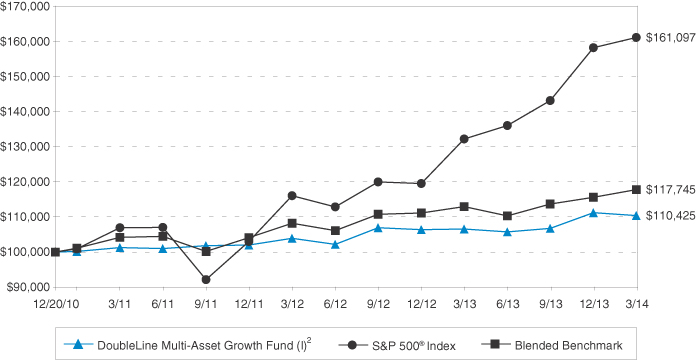
Average Annual Total Returns1
As of March 31, 2014
| | | | | | | | | | |
| | | | | 1 Year | | | Since
Inception
(12/20/2010) | |
DoubleLine Multi-Asset Growth Fund Class I | | | | | 3.65 | | | | 3.07% | |
S&P 500® Index | | | | | 21.86 | | | | 15.66% | |
Blended Benchmark | | | | | 4.21 | | | | 5.11% | |
| | | |
DoubleLine Multi-Asset Growth Fund (with load) Class A | | | | | (1.11 | ) | | | 1.42% | |
| 1 | Past performance is not an indication of future results. Returns represent past performance and reflect changes in share prices, the reinvestment of all dividends and capital gains, expense limitations and the effects of compounding. The prospectus contains more complete information on the investment objectives, risks, charges and expenses of the investment company, which investors should read and consider carefully before investing. To obtain a prospectus, contact a registered representative or visit www.doubleline.com. The Fund’s adviser waived a portion of its management fee and/or reimbursed Fund expenses during the period shown. Had the adviser not done so, the Fund’s total returns would have been lower. The returns shown do not reflect taxes a shareholder would pay on distributions or redemptions. Total investment return and principal value of your investment will fluctuate, and your shares, when redeemed, may be worth more or less than their original cost. Current performance may be higher or lower than the performance data quoted. Call 877-DLine11 or visit www.doubleline.com for performance results current to the most recent month-end. |
| 2 | Performance of other classes will be greater or less than the line shown based on the differences in loads and fees paid by shareholders investing in the different classes. |
| | The S&P 500® Index is an unmanaged capitalization-weighted index of 500 stocks designed to measure performance of the broad domestic economy through changes in the aggregate market value of 500 stocks representing all major industries. |
| | Blended Benchmark: 60% Barclays Capital U.S. Aggregate Bond Index/ 25% Morgan Stanley Capital International All Country World Index/ 15% S&P Goldman Sachs Commodity Total Return Index. The Barclays Capital U.S. Aggregate Bond Index covers the US investment grade fixed rate bond market, with index components for government and corporate securities, mortgage pass-through securities, and asset-backed securities. These major sectors are subdivided into more specific indices that are calculated and reported on a regular basis. The Standard & Poor’s/Goldman Sachs Commodity Total Return Index is a composite index of commodity sector returns which represents a broadly diversified, unleveraged, long-only position in commodity futures. This index’s components qualify for inclusion in the index based on liquidity measures and are weighted in relation to their global production levels, making the index a valuable economic indicator and commodities market benchmark. The Morgan Stanley Capital International All Country World Index is designed to provide a broad measure of stock performance throughout the world, with the exception of U.S.-based companies. The MSCI All Country World Index Ex-U.S. includes both developed and emerging markets. The Fund’s investments likely will diverge widely from the components of the benchmark Index which could lead to performance dispersion between the Fund and the benchmark Index, meaning that the Fund could outperform or underperform the Index at any given time. |
| | | | | | |
| | Annual Report | | March 31, 2014 | | 93 |
| | |
| Growth of Investment (Cont.) | | |
DoubleLine Low Duration Bond Fund
Value of a $100,000 Investment
Class I Shares1
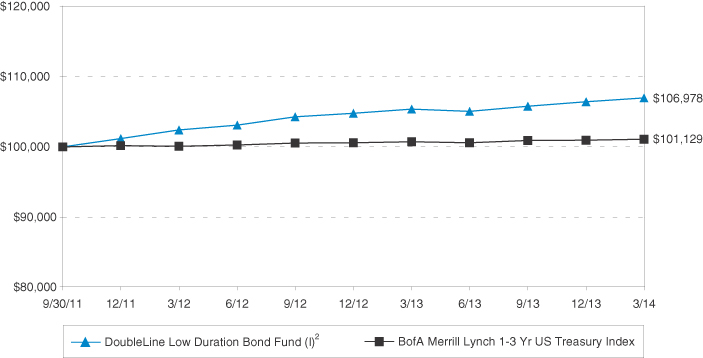
Average Annual Total Returns1
As of March 31, 2014
| | | | | | | | | | |
| | | | | 1 Year | | | Since
Inception
(9/30/2011) | |
DoubleLine Low Duration Bond Fund Class I | | | | | 1.51 | | | | 2.73% | |
BofA Merrill Lynch 1-3 year Treasury Index | | | | | 0.38 | | | | 0.45% | |
| | | |
DoubleLine Low Duration Bond Fund Class N | | | | | 1.26 | | | | 2.46% | |
| 1 | Past performance is not an indication of future results. Returns represent past performance and reflect changes in share prices, the reinvestment of all dividends and capital gains, expense limitations and the effects of compounding. The prospectus contains more complete information on the investment objectives, risks, charges and expenses of the investment company, which investors should read and consider carefully before investing. To obtain a prospectus, contact a registered representative or visit www.doubleline.com. The Fund’s adviser waived a portion of its management fee and/or reimbursed Fund expenses during the period shown. Had the adviser not done so, the Fund’s total returns would have been lower. The returns shown do not reflect taxes a shareholder would pay on distributions or redemptions. Total investment return and principal value of your investment will fluctuate, and your shares, when redeemed, may be worth more or less than their original cost. Current performance may be higher or lower than the performance data quoted. Call 877-DLine11 or visit www.doubleline.com for performance results current to the most recent month-end. |
| 2 | Performance of other classes will be greater or less than the line shown based on the differences in loads and fees paid by shareholders investing in the different classes. |
| | The BofA Merrill Lynch 1-3 Year US Treasury Index is an unmanaged index that tracks the performance of the direct sovereign debt of the U.S. Government having a maturity of at least one year and less than three years. The Fund’s investments likely will diverge widely from the components of the benchmark Index which could lead to performance dispersion between the Fund and the benchmark Index, meaning that the Fund could outperform or underperform the Index at any given time. |
| | | | | | |
| 94 | | DoubleLine Funds Trust | | | | |
| | |
| | | (Unaudited) March 31, 2014 |
DoubleLine Floating Rate Fund
Value of a $100,000 Investment
Class I Shares1
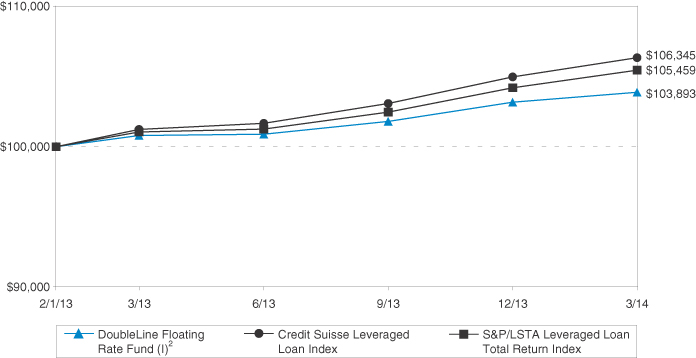
Average Annual Total Returns1
As of March 31, 2014
| | | | | | | | | | |
| | | | | 1 Year | | | Since
Inception
(2/1/2013) | |
DoubleLine Floating Rate Fund Class I | | | | | 3.07 | | | | 3.35% | |
S&P/LSTA Leveraged Loan Total Return Index | | | | | 4.35 | | | | 4.69% | |
Credit Suisse Leveraged Loan Index | | | | | 5.28 | | | | 5.45% | |
| | | |
DoubleLine Floating Rate Fund Class N | | | | | 2.93 | | | | 3.23% | |
| 1 | Past performance is not an indication of future results. Returns represent past performance and reflect changes in share prices, the reinvestment of all dividends and capital gains, expense limitations and the effects of compounding. The prospectus contains more complete information on the investment objectives, risks, charges and expenses of the investment company, which investors should read and consider carefully before investing. To obtain a prospectus, contact a registered representative or visit www.doubleline.com. The Fund’s adviser waived a portion of its management fee and/or reimbursed Fund expenses during the period shown. Had the adviser not done so, the Fund’s total returns would have been lower. The returns shown do not reflect taxes a shareholder would pay on distributions or redemptions. Total investment return and principal value of your investment will fluctuate, and your shares, when redeemed, may be worth more or less than their original cost. Current performance may be higher or lower than the performance data quoted. Call 877-DLine11 or visit www.doubleline.com for performance results current to the most recent month-end. |
| 2 | Performance of other classes will be greater or less than the line shown based on the differences in loads and fees paid by shareholders investing in the different classes. |
| | S&P/LSTA Leveraged Loan Index — The S&P/LSTA Leveraged Loan Index is a broad index designed to reflect the performance of U.S. dollar facilities in the leverage loan market. The Fund’s investments likely will diverge widely from the components of the benchmark Index which could lead to performance dispersion between the Fund and the benchmark Index, meaning that the Fund could outperform or underperform the Index at any given time. |
| | Credit Suisse Leveraged Loan Index —This index tracks the investable market of the U.S. dollar denominated leveraged loan market. It consists of issues rated “5B” or lower, meaning that the highest rated issues included in this index are Moody’s/S&P ratings of Baa1/BB+ or Ba1/BBB+. All loans are funded term loans with a tenor of at least one year and are made by issuers domiciled in developed countries. The Fund’s investments will likely diverge widely from the components of the benchmark index which could lead to performance dispersion between the Fund and the benchmark Index, meaning that the Fund could outperform or underperform the Index at any given time. |
| | | | | | |
| | Annual Report | | March 31, 2014 | | 95 |
| | |
| Growth of Investment (Cont.) | | (Unaudited) |
DoubleLine Shiller Enhanced CAPE®
Value of a $100,000 Investment
Class I Shares1
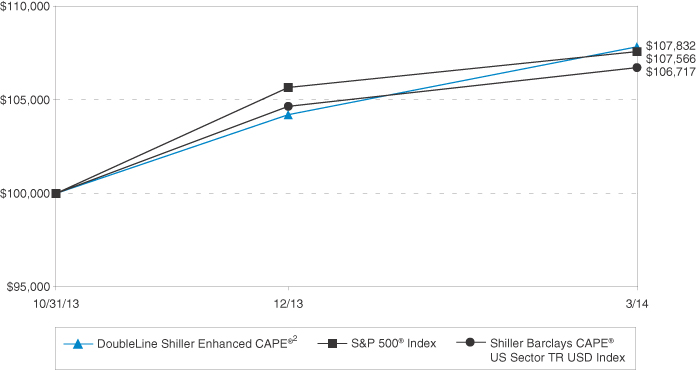
Total Returns1
As of March 31, 2014
| | | | | | |
| | | | | Since
Inception
(10/31/2013) | |
DoubleLine Shiller Enhanced CAPE® Class I | | | | | 7.83% | |
S&P 500 TR | | | | | 7.57% | |
Shiller Barclays CAPE® US Sector TR USD Index | | | | | 6.72% | |
| | |
DoubleLine Shiller Enhanced CAPE® Class N | | | | | 7.73% | |
| 1 | Past performance is not an indication of future results. Returns represent past performance and reflect changes in share prices, the reinvestment of all dividends and capital gains, expense limitations and the effects of compounding. The prospectus contains more complete information on the investment objectives, risks, charges and expenses of the investment company, which investors should read and consider carefully before investing. To obtain a prospectus, contact a registered representative or visit www.doubleline.com. The Fund’s adviser waived a portion of its management fee and/or reimbursed Fund expenses during the period shown. Had the adviser not done so, the Fund’s total returns would have been lower. The returns shown do not reflect taxes a shareholder would pay on distributions or redemptions. Total investment return and principal value of your investment will fluctuate, and your shares, when redeemed, may be worth more or less than their original cost. Current performance may be higher or lower than the performance data quoted. Call 877-DLine11 or visit www.doubleline.com for performance results current to the most recent month-end. |
| 2 | Performance of other classes will be greater or less than the line shown based on the differences in loads and fees paid by shareholders investing in the different classes. |
| | Shiller Barclays CAPE® US Sector TR USD Index — The Index incorporates the principles of long-term investing distilled by Dr. Robert Shiller and expressed through the CAPE® (Cyclically Adjusted Price Earnings) ratio (the “CAPE® Ratio”). The Index aims to identify undervalued sectors based on a modified CAPE® Ratio, and then uses a momentum factor to seek to reduce the risk of investing in a sector that may appear undervalued, but which may have also had recent relative price underperformance due to fundamental issues with the sector that may negatively affect the sector’s long-term total return. |
| | The S&P 500® Index is an unmanaged capitalization-weighted index of 500 stocks designed to measure performance of the broad domestic economy through changes in the aggregate market value of 500 stocks representing all major industries. |
| | | | | | |
| 96 | | DoubleLine Funds Trust | | | | |
| | |
| Evaluation of Advisory Agreement by the Boards of Trustees | | (Unaudited) |
DoubleLine Total Return Bond Fund
DoubleLine Core Fixed Income Fund
DoubleLine Emerging Markets Fixed Income Fund
DoubleLine Multi-Asset Growth Fund
DoubleLine Low Duration Bond Fund
DoubleLine Floating Rate Fund
At the February 26, 2014 meeting (the “Meeting”) of the Board of Trustees of DoubleLine Funds Trust (the “Trust”), the Board of Trustees, including the Trustees who are not “interested persons” (as defined in the Investment Company Act of 1940, as amended) of the Trust (“Independent Trustees”) voting separately, approved the renewal of the Investment Advisory and Management Agreements (the “Advisory Agreements”) between DoubleLine Capital LP (“DoubleLine” or the “Adviser”) and the Trust, in respect of the DoubleLine Total Return Bond Fund, the DoubleLine Core Fixed Income Fund, the DoubleLine Emerging Markets Fixed Income Fund, the DoubleLine Multi-Asset Growth Fund, the DoubleLine Low Duration Bond Fund and the DoubleLine Floating Rate Fund (each, a “Fund” and, collectively, the “Funds”) for an additional one-year period through March 24, 2015.
The Trustees meet over the course of the year with investment advisory personnel from DoubleLine and regularly review detailed information, presented both orally and in writing, regarding the investment program, performance and operations of each Fund. The Trustees’ determination to approve the continuance of the Advisory Agreements was made on the basis of each Trustee’s business judgment after an evaluation of all of the information provided to the Trustees, both at the February 26, 2014 meeting and at prior meetings. This summary describes a number, but not necessarily all, of the most important factors considered by the Board and the Independent Trustees. Individual Trustees may have given different weights to certain factors and assigned various degrees of materiality to information received in connection with the approval process. No single factor was determined to be decisive. In all of their deliberations, the Board of Trustees and the Independent Trustees were advised by counsel to the Funds and the Independent Trustees.
The Trustees considered the nature, extent, and quality of the services provided and expected to be provided by DoubleLine, including the expertise and experience of its investment personnel. In this regard, the Trustees considered that DoubleLine provides a full investment program for each of the Funds, and noted DoubleLine’s representation that it seeks to provide attractive returns with a strong emphasis on risk management. The Board considered the difficulty of managing debt-related funds, noting that managing such funds requires a portfolio management team to balance a number of factors, which may include, among others, varying maturities, prepayments, collateral management, counter-party management, pay-downs, credit events, workouts and net new issuances. The Trustees reviewed reports (the “Strategic Insight Reports”) provided by Strategic Insight (“Strategic Insight”), an Asset International Company, that compared the Funds’ management fee rates, total expense ratios (Class I shares), and performance records (Class I shares) for the one-year period and, where applicable, performance records (Class I shares) for the three-year period ending December 31, 2013 against a group of each Fund’s peer funds. In advance of the meeting, the Trustees met telephonically with a representative of Strategic Insight to discuss the Strategic Insight Reports, including the processes Strategic Insight used in constructing the peer groups for each of the Funds and in compiling the information presented in the Strategic Insight Report, the results of the analyses conducted by Strategic Insight, and certain factors important in evaluating the results of the analyses presented, such as differences between a Fund and some or all of the other funds in its peer group. The Trustees noted in particular that the DoubleLine Total Return Bond Fund, the DoubleLine Core Fixed Income Fund, the DoubleLine Emerging Markets Fixed Income Fund and the DoubleLine Low Duration Bond Fund generally had experienced favorable relative investment results since their inception dates. The Trustees considered DoubleLine’s explanation that, although the DoubleLine Multi-Asset Growth Fund’s performance record was below most of the members of its peer group, DoubleLine believed that the relative underperformance was the result of DoubleLine’s focus on limiting downside risk in that Fund—so that the Fund should not be expected to outperform in a rising market but the Fund might be expected to outperform in more volatile markets. In this regard the Trustees noted DoubleLine’s assertion that its risk-controlled process and long-term outlook led to the Fund having the lowest one-year standard deviation in its peer group, while the Fund still outperformed its benchmark index. The Trustees further noted DoubleLine’s assertion that the DoubleLine Multi-Asset-Growth Fund, unlike many of the other funds in its peer group, included a substantial allocation to fixed-income assets. The Trustees noted that other funds in the peer group had more significant allocations to equity securities, which significantly outperformed fixed-income assets over recent periods. With respect to the DoubleLine Floating Rate Fund, the Trustees considered DoubleLine’s explanation that, although the Fund’s performance record was below its peer group’s average, DoubleLine believes the Fund’s underperformance over the Fund’s limited operating history was primarily attributable to the Fund having held a sizable amount of its portfolio in cash as it ramped up its operations. The Trustees also noted DoubleLine’s assertion that the Fund’s underperformance relative to its index was due at least in part to DoubleLine’s underweighting in lower-rated credits, which outperformed over the period.
The Trustees considered that DoubleLine provides a variety of other services to the Funds in addition to investment advisory services, including, among others, a number of back-office services, valuation services, compliance services, certain forms of information technology services (such as internal reporting), assistance with accounting and distribution services and supervision and monitoring of the Funds’ other service providers. The Trustees reviewed DoubleLine’s ongoing efforts to keep the Trustees informed about matters relevant to the Trust and its shareholders. The Trustees also considered the structure of the Funds’ compliance program, including the policies and procedures of the Funds and their various service providers (including the Adviser). The Trustees also considered DoubleLine’s reports, provided at the Board’s regular meetings, that it had continued to hire additional resources, including investment personnel, to support those services.
The Trustees considered DoubleLine’s prior representations that it has attempted to set its management fees at a Fund’s inception at rates that reflect competitive market levels, and that further reflect the experience and expertise DoubleLine brings to managing the Funds. The Trustees noted that the rapid growth or large asset base of certain of the Funds created some difficulties in comparing expenses in the Strategic Insight Report in some cases.
| | | | | | |
| | Annual Report | | March 31, 2014 | | 97 |
| | |
| Evaluation of Advisory Agreement by the Board of Trustees (Cont.) | | |
The Trustees noted the Strategic Insight Reports showed the gross and net management fees paid by the DoubleLine Total Return Bond Fund were slightly below the median of its peers, and that the gross and net management fees paid by the DoubleLine Core Fixed Income Fund were below the median of its peers. The Trustees further noted that the materials indicated that the performance of each of those two Funds generally remained favorable compared to most of their peers. The Trustees noted that the net management fee paid by the DoubleLine Emerging Markets Fixed Income Fund was higher than the Fund’s expense group median, though not the highest of the peer funds, and that the Fund’s net operating expenses were near the median of its peer group. The Trustees also noted that, although the DoubleLine Multi-Asset Growth Fund’s gross management fee was among the highest of its peers, the Fund’s net management fee was close to the median of its peer group, due principally to the substantial fee waivers incurred by DoubleLine. The Trustees considered that a portion of those waivers were intended to offset the amounts of advisory fees paid indirectly to DoubleLine through the DoubleLine Multi-Asset Growth Fund’s investments in other funds advised by DoubleLine. The Trustees noted that both the gross and net management fees paid by each of the DoubleLine Low Duration Bond Fund and the DoubleLine Floating Rate Fund were below their respective peer group medians.
The Trustees considered information relating to the fees charged by DoubleLine to clients other than the Funds, including institutional separate accounts and mutual funds for which DoubleLine serves as sub-adviser. The Trustees took into account DoubleLine’s representation that certain large institutional separate accounts and funds sub-advised by DoubleLine are subject to fee schedules that differ from, including some that are lower than, the rates paid by the Funds. The Trustees considered that DoubleLine had also explained that administrative, compliance, operational, legal, and other burdens of providing investment advice to mutual funds exceed in many respects those required to provide advisory services to non-mutual fund clients, such as institutional accounts for retirement or pension plans, which may have differing contractual requirements. The Trustees also took into account DoubleLine’s representation that there are substantially greater legal and other responsibilities and risks to DoubleLine in managing public mutual funds than in managing private accounts or in sub-advising mutual funds sponsored by others, and that the services and resources required of DoubleLine when it sub-advises mutual funds sponsored by others generally are less than in the case of the Funds because many of the operational and compliance responsibilities related to the advisory function are retained by the primary adviser. The Trustees concluded that the fees paid by each Fund to DoubleLine were generally reasonable in light of the services provided, the quality of the portfolio management teams, and each Fund’s performance to date.
The Trustees reviewed financial information regarding DoubleLine for 2013, including information as to the Adviser’s operating costs and profitability with respect to the Funds. The Trustees also reviewed information concerning the profitability to DoubleLine of its service arrangements with the Funds and took into account both the direct and indirect benefits to the Adviser from managing the Funds. The Trustees noted other benefits received by DoubleLine and its affiliates as a result of DoubleLine’s relationship with the Trust, including possible ancillary benefits to DoubleLine’s institutional investment management business due to the reputation and market penetration of the Funds. In evaluating the Adviser’s profitability, the Trustees considered that the Adviser presented profitability information that was reduced by certain payments made to the Adviser’s employee owners that may be comparable to the ordinary compensation expense incurred by investment advisers that are not closely-held by their employees. The Trustees considered DoubleLine’s compensation practices and considered DoubleLine’s representation that those compensation and incentive policies and practices enable DoubleLine to retain, motivate, and attract highly qualified and experienced employees. The Trustees also considered the potential benefits that DoubleLine receives in respect of certain research purchased with soft dollar credits generated by the brokerage commissions paid by the DoubleLine funds and noted DoubleLine’s representation that those arrangements are only in place with respect to a small number of Funds and that their use is limited. The Trustees also took into account DoubleLine’s representation that it was continuing to invest in its business to maintain its ability to provide high quality services for the Funds. In so doing, the Board considered DoubleLine’s need to invest in technology, infrastructure and staff to continue to provide services and accommodate rapidly changing regulatory requirements.
The Trustees discussed with DoubleLine whether economies of scale would likely be realized as the Funds grow and whether a reduction in the advisory fees paid by the Funds by means of breakpoints would be appropriate. The Trustees considered DoubleLine’s statement that it did not believe that implementation of breakpoints or fee reductions would be appropriate at this time, for a number of reasons. The Trustees considered DoubleLine’s representation that each of the DoubleLine Total Return Bond Fund, the DoubleLine Core Fixed Income Fund, the DoubleLine Low Duration Bond Fund and the DoubleLine Floating Rate Fund already pay net management fees that are approximately at or below their peer medians. In addition, the Trustees observed that DoubleLine was still subsidizing the expenses incurred by the DoubleLine Multi-Asset Growth Fund, and that, although DoubleLine’s profitability was higher in respect of DoubleLine Emerging Markets Fixed Income Fund as compared to the other Funds based on the expense allocation methodology used, DoubleLine Emerging Markets Fixed Income Fund’s profitability was reasonable nonetheless. The Trustees also noted that DoubleLine’s rapid growth required DoubleLine to re-invest significantly in its business. After considering the information provided, the Trustees concluded that the profitability of the Funds to DoubleLine did not appear excessive or such as to preclude renewal of the Advisory Agreements and that, for the reasons noted, it did not appear that implementation of breakpoints for any of the Funds would be appropriate at this time.
On the basis of these considerations as well as others and in the exercise of their business judgment, the Trustees determined that they were satisfied with the nature, extent and the quality of the services provided to the Funds under the Advisory Agreements; that it appeared that the management fees paid by the Funds to DoubleLine were generally within the range of management fees paid by their peer funds, and in some cases lower than the median management fees paid by their peer funds, and generally reasonable in light of the quality of the portfolio management teams and the Funds’ performance to date; that the fees paid by the Funds did not appear inconsistent with the fee schedules charged to DoubleLine’s other clients in light of the nature of the services provided and the risks borne by DoubleLine; and that it would be appropriate to approve the Advisory Agreements for an additional one-year period.
| | | | | | |
| 98 | | DoubleLine Funds Trust | | | | |
DoubleLine Shiller Enhanced CAPE®
At the August 21, 2013 meeting of the Board of Trustees (the “Meeting”) of DoubleLine Funds Trust (the “Trust”), the Board of Trustees, including the Independent Trustees voting separately, approved an Investment Advisory Agreement (the “Agreement”) between the Trust, on behalf of DoubleLine Shiller Enhanced CAPE® (the “Fund”), and DoubleLine Capital LP (the “Adviser”). This summary describes a number, but not necessarily all, of the most important factors considered by the Board and the Independent Trustees.
The Trustees considered a wide range of materials, including information previously provided to the Trustees in connection with the approval of advisory contracts between the Adviser and the other series of the Trust. The Trustees’ determination to approve the Agreement was based on an evaluation of all of the information provided to them. This summary describes a number, but not necessarily all, of the most important factors considered by the Board and the Independent Trustees. Individual Trustees may have given different weights to certain factors and assigned various degrees of materiality to information received in connection with the approval process. No single factor was determined to be decisive. In all of their deliberations, the Board of Trustees and the Independent Trustees were advised by counsel to the Trust and counsel to the Independent Trustees.
In the process of considering the approval of the Agreement, the Trustees considered the terms of the proposed Agreement between the Adviser and the Trust, with respect to the Fund, and noted that the proposed Agreement, with the exception of the rate of the advisory fees payable, had the same terms as the advisory agreements between the Adviser and the other series of the Trust. The Trustees considered the Adviser’s specific responsibilities in all aspects of day-to-day management of the Fund as well as the qualifications, experience, and responsibilities of the portfolio managers, including with respect to investment in derivatives, and other key personnel that would be involved in the day-to-day activities of the Fund. The Board considered the expected difficulty of managing the Fund given the unusual aspects of its strategy, noting that managing the Fund’s strategy requires a portfolio management team to balance a number of factors, which may include, among others, varying maturities, prepayments, counter-party exposure, credit events, subscription and redemption activity and the potential extensive use of derivative instruments, and that the Fund’s strategy would be more complex and challenging to manage than the strategies of either a traditional equity or bond fund. The Trustees considered the performance of the other series of the Trust, and considered the possible effect of an additional fund to the Trust on the capacities of the Adviser. The Trustees reviewed the proposed services the Adviser would provide to the Fund as investment adviser. The Trustees considered that the Adviser would provide a variety of other services to the Fund in addition to investment advisory services, including, among others, a number of back-office services, valuation services, compliance services, certain forms of information technology services (such as internal reporting), assistance with accounting and distribution services, and supervision and monitoring of the Fund’s other service providers. The Trustees reviewed DoubleLine’s ongoing efforts to keep the Trustees informed about matters relevant to the Trust and its shareholders. The Trustees also considered the structure of the compliance procedures and the trading capabilities of the Adviser. The Trustees concluded that it appeared the Adviser would have, or have available to it, sufficient quality and depth of personnel, resources, investment methods, and would have compliance policies and procedures essential to performing its duties under the proposed Agreement and that, in the Trustees’ view, the nature, overall quality, and extent of the management services to be provided appeared likely to be satisfactory and reliable.
The Board then turned to the anticipated cost of the proposed services, and the proposed structure and level of the advisory fees to be paid under the Agreement. The Trustees considered that the Adviser anticipated launching the Fund with two classes and noted the overall fee structure and expense caps proposed for the Fund. The Trustees considered information provided by Strategic Insight (“Strategic Insight”), an Asset International Company. In this regard, the Trustees considered Strategic Insight’s representation that it is somewhat difficult to develop an entirely suitable expense group for the Fund, because the Fund is in an emerging investment category. However, the Trustees noted that the information provided by Strategic Insight indicated that the Fund’s proposed advisory fee under the Agreement was at approximately the median of the peer funds presented to them for consideration, and that the information showed that the Fund’s anticipated net expense ratio for Class I shares was also near the median of the peer funds presented.
The Trustees discussed information provided by the Adviser as to the estimated profitability of the Adviser from managing the Fund. In assessing profitability, the Trustees reviewed the Adviser’s financial information provided both at the Meeting and at previous meetings of the Trustees and took into account both the likely direct and indirect benefits to the Adviser from managing the Fund. The Trustees noted other benefits received by DoubleLine and its affiliates as a result of DoubleLine’s relationship with the Trust, including possible ancillary benefits to DoubleLine’s institutional investment management business due to the reputation and market penetration of the Fund. The Trustees concluded that the Adviser’s profit from managing the Fund would likely not be excessive in the start-up period, which would likely last for some time. The Trustees noted that the Adviser had represented that it does not currently manage other funds or accounts with a similar overall investment strategy, but that a portion of the Fund’s assets may be invested in a portfolio of fixed income assets substantially similar to that of another series of the Trust. The Trustees concluded that it did not appear appropriate at this time to consider the implementation of breakpoints in the investment advisory fee.
On the basis of these considerations and others and in the exercise of their business judgment, the Trustees determined to approve the Agreement for the proposed initial term.
| | | | | | |
| | Annual Report | | March 31, 2014 | | 99 |
| | |
| Federal Tax Information | | (Unaudited) |
For the fiscal year ended March 31, 2014, certain dividends paid by the Funds may be subject to a maximum tax rate of 20%, as provided for by the Jobs and Growth Tax Relief Reconciliation Act of 2003. The percentage of dividends declared from ordinary income designated as qualified dividend income is as follows:
| | | | | | |
| Qualified Dividend Income | | | | | |
DoubleLine Total Return Bond Fund | | | | | 0.00% | |
DoubleLine Core Fixed Income Fund | | | | | 0.00% | |
DoubleLine Emerging Markets Fixed Income Fund | | | | | 0.00% | |
DoubleLine Multi-Asset Growth Fund (Consolidated) | | | | | 4.04% | |
DoubleLine Low Duration Bond Fund | | | | | 0.00% | |
DoubleLine Floating Rate Fund | | | | | 0.00% | |
DoubleLine Shiller Enhanced CAPE® | | | | | 0.00% | |
For corporate shareholders, the percent of ordinary income distributions qualifying for the corporate dividends received deduction for the fiscal year ended March 31, 2014 is as follows:
| | | | | | |
| Dividends Received Deduction | | | | | |
DoubleLine Total Return Bond Fund | | | | | 0.00% | |
DoubleLine Core Fixed Income Fund | | | | | 0.00% | |
DoubleLine Emerging Markets Fixed Income Fund | | | | | 0.00% | |
DoubleLine Multi-Asset Growth Fund (Consolidated) | | | | | 1.10% | |
DoubleLine Low Duration Bond Fund | | | | | 0.00% | |
DoubleLine Floating Rate Fund | | | | | 0.00% | |
DoubleLine Shiller Enhanced CAPE® | | | | | 0.00% | |
The percentage of taxable ordinary income distributions that are designated as short-term capital gain distributions under Internal Revenue Section 871(k)(2)(c) for each Fund were as follows:
| | | | | | |
DoubleLine Total Return Bond Fund | | | | | 0.00% | |
DoubleLine Core Fixed Income Fund | | | | | 1.74% | |
DoubleLine Emerging Markets Fixed Income Fund | | | | | 19.18% | |
DoubleLine Multi-Asset Growth Fund (Consolidated) | | | | | 0.00% | |
DoubleLine Low Duration Bond Fund | | | | | 0.00% | |
DoubleLine Floating Rate Fund | | | | | 0.11% | |
DoubleLine Shiller Enhanced CAPE® | | | | | 0.00% | |
The percentage of taxable ordinary income distributions that are designated as interest related dividends under Internal Revenue Section 871(k)(1)(c) for each Fund were as follows:
| | | | | | |
DoubleLine Total Return Bond Fund | | | | | 95.22% | |
DoubleLine Core Fixed Income Fund | | | | | 87.82% | |
DoubleLine Emerging Markets Fixed Income Fund | | | | | 0.00% | |
DoubleLine Multi-Asset Growth Fund (Consolidated) | | | | | 28.58% | |
DoubleLine Low Duration Bond Fund | | | | | 98.31% | |
DoubleLine Floating Rate Fund | | | | | 99.37% | |
DoubleLine Shiller Enhanced CAPE® | | | | | 22.28% | |
Shareholders are advised to consult their own tax adviser with respect to the tax consequences of their investment in the Funds.
| | | | | | |
| 100 | | DoubleLine Funds Trust | | | | |
| | |
| Trustees and Officers | | (Unaudited) |
| | | | | | | | | | |
Name, Address, and
Year of Birth(1) | | Position
with Trust | | Term of Office
and Length of
Time Served | | Principal Occupation(s) During Past 5 Years | | Number of
Portfolios
Overseen(2) | | Other Directorships
Held by Trustee
During Past 5 years |
| | | | |
Independent Trustees | | | | | | | | |
| | | | | |
| Joseph J. Ciprari, 1964 | | Trustee | | Indefinite / Since Inception | | President, Remo Consultants, a real estate financial consulting firm. Formerly, Managing Director, UBS AG. Formerly, Managing Director, Ally Securities LLC. | | 14 | | None |
| | | | | |
| John C. Salter, 1957 | | Trustee | | Indefinite / Since Inception | | Managing Director, Municipals, Chapdelaine & Co. Formerly, Partner, Stark, Salter & Smith, a securities brokerage firm specializing in tax exempt bonds. | | 14 | | None |
| | | | | |
| Raymond B. Woolson, 1958 | | Trustee | | Indefinite / Since Inception | | President, Apogee Group, Inc., a company providing financial consulting services. | | 14 | | None |
(1) The address of each Independent Trustee is c/o DoubleLine Capital LP, 333 South Grand Avenue, Suite 1800, Los Angeles, CA 90071.
(2) Includes each series of DoubleLine Funds Trust and DoubleLine Equity Funds, DoubleLine Opportunistic Credit Fund and DoubleLine Income Solutions Fund.
The following Trustees are “interested persons” of the Fund Complex as defined in the 1940 Act because they are officers of the Adviser, and indirect shareholders in the Adviser.
| | | | | | | | | | |
Name, Address, and
Year of Birth(1) | | Position
with Trust | | Term of Office
and Length of
Time Served | | Principal Occupation(s) During Past 5 Years | | Number of
Portfolios
Overseen | | Other Directorships
Held by Trustee
During Past 5
years |
| | | | |
Interested Trustees | | | | | | | | |
| | | | | |
| Jeffrey E. Gundlach, 1959 | | Trustee | | Indefinite / Since Inception | | Chief Executive Officer and Chief Investment Officer, DoubleLine Equity LP (since January 2013); Chief Executive Officer and Chief Investment Officer, DoubleLine Capital LP (since December 2009); prior thereto, Chief Investment Officer, Group Managing Director and President, TCW Group. | | 12 | | None |
| | | | | |
| Phillip A. Barach, 1952 | | Trustee | | Indefinite / Since Inception | | President, DoubleLine Capital LP (since December 2009); prior thereto, Group Managing Director, TCW Group. | | 9 | | None |
(1) The address of each Interested Trustee is c/o DoubleLine Capital LP, 333 South Grand Avenue, Suite 1800, Los Angeles, CA 90071.
Officers
The officers of the Trust who are not also Trustees of the Trust are:
| | | | | | |
Name, Address, and
Year of Birth(1) | | Position(s)
Held with
Trust | | Term of Office
and Length of
Time Served | | Principal Occupation(s) During Past 5 Years |
| | | |
| Ronald R. Redell, 1970 | | President | | Indefinite/Since Inception | | President, DoubleLine Equity Funds (since February 2013); Trustee, Chairman, President and Chief Executive Officer, DoubleLine Income Solutions Fund (since January 2013); Executive, DoubleLine Group LP (since January 2013); Trustee, Chairman, President and Chief Executive Officer, DoubleLine Opportunistic Credit Fund (since July 2011); Executive, DoubleLine Capital LP (since July 2010); President, DoubleLine Funds Trust (since January 2010). Formerly, President and Chief Executive Officer, TCW Funds, Inc. and TCW Strategic Income Fund, Inc. |
| | | |
| Susan Nichols, 1962 | | Treasurer and Principal Financial and Accounting Officer | | Indefinite/Since October 2011 | | Treasurer and Principal Financial and Accounting Officer, DoubleLine Equity Funds (since February 2013); Treasurer and Principal Financial and Accounting Officer, DoubleLine Income Solutions Fund (since January 2013); Treasurer and Principal Financial and Accounting Officer, DoubleLine Funds Trust (since October 2011); Treasurer and Principal Financial and Accounting Officer, DoubleLine Opportunistic Credit Fund (since July 2011); Director of Mutual Funds Operations, DoubleLine Capital LP. Formerly, Southern Wholesaler, DoubleLine Capital LP. Formerly, Assistant Treasurer, DoubleLine Funds Trust. Formerly, Senior Vice President, TCW. |
| | | | | | |
| | Annual Report | | March 31, 2014 | | 101 |
| | |
| Trustees and Officers (Cont.) | | (Unaudited) |
| | | | | | |
Name, Address, and
Year of Birth(1) | | Position(s)
Held with
Trust | | Term of Office
and Length of
Time Served | | Principal Occupation(s) During Past 5 Years |
| | | |
| Keith T. Kirk, 1963 | | Chief Compliance Officer | | Indefinite/Since May 2012 | | Chief Compliance Officer, DoubleLine Equity Funds (since February 2013); Chief Compliance Officer, DoubleLine Income Solutions Fund (since January 2013); Chief Compliance Officer, DoubleLine Funds Trust (since May 2012); Chief Compliance Officer, DoubleLine Opportunistic Credit Fund (since May 2012); Deputy General Counsel and Chief Compliance Officer, DoubleLine Capital LP (since January 2012). Formerly, Independent Compliance Consultant (from September 2009 through December 2011). Formerly, Chief Compliance Officer, Metropolitan West Asset Management LLC and Metropolitan West Funds (September 2004 through August 2009). |
| | | |
| Louis C. Lucido, 1948 | | Secretary | | Indefinite/Since Inception | | Member of the Board of Directors, 826LA (since June 2013); Member of the Board of Directors, Junior Achievement of Southern California (since June 2013); Secretary, DoubleLine Equity Funds (since February 2013); Member of the Board of Directors, CASA of Los Angeles (since February 2013); Secretary, DoubleLine Income Solutions Fund (since January 2013); Member of the Advisory Board, Tanenbaum Landscape & Design Inc. (since January 2013); Secretary, DoubleLine Opportunistic Credit Fund (since July 2011); Chief Operating Officer, DoubleLine Capital LP (since June 2010); Secretary, DoubleLine Funds Trust (since January 2010); Member of Dean’s Executive Board, Stern School of Business, New York University (since June 2007). Formerly, Executive Vice President, DoubleLine Capital LP (from December 2009 through May 2010). Formerly, Group Managing Director, TCW. |
| | | |
| Grace Walker, 1970 | | Assistant
Treasurer | | Indefinite/Since March 2012 | | Assistant Treasurer, DoubleLine Equity Funds (since February 2013); Assistant
Treasurer, DoubleLine Income Solutions Fund (since January 2013); Assistant
Treasurer, DoubleLine Opportunistic Credit Fund (since March 2012); Assistant
Treasurer, DoubleLine Funds Trust (since March 2012). Formerly, Assistant
Treasurer of the private funds of Western Asset Management Company (from
December 2004 through March 2012). |
| | | |
| Earl A. Lariscy, 1966 | | Vice President | | Indefinite/Since May 2012 | | Vice President, DoubleLine Equity Funds (since February 2013); Vice President and Assistant Secretary, DoubleLine Income Solutions Fund (since January 2013); Vice President, DoubleLine Funds Trust (since May 2012); Vice President and Assistant Secretary, DoubleLine Opportunistic Credit Fund (since May 2012 and inception, respectively); General Counsel, DoubleLine Capital LP (since April 2010). Formerly, Director, Barclays Capital and Agency. Formerly, General Manager, Barclays Bank PLC’s California-based banking operations. Formerly, Vice President/Associate General Counsel, TCW. Formerly, Attorney, Linklaters. |
| | | |
| Cris Santa Ana, 1965 | | Vice President | | Indefinite/Since April 2011 | | Vice President, DoubleLine Equity Funds (since February 2013); Vice President, DoubleLine Income Solutions Fund (since January 2013); Vice President, DoubleLine Opportunistic Credit Fund (since July 2011); Vice President, DoubleLine Funds Trust (since April 2011); Chief Risk Officer, DoubleLine (since June 2010). Formerly, Chief Operating Officer, DoubleLine Capital LP (from December 2009 through May 2010). Formerly, Managing Director, TCW. |
| | | |
| David Kennedy, 1964 | | Vice President | | Indefinite/Since May 2012 | | Vice President, DoubleLine Equity Funds (since February 2013); Vice President, DoubleLine Income Solutions Fund (since January 2013); Vice President, DoubleLine Funds Trust (since May 2012); Vice President, DoubleLine Opportunistic Credit Fund (since May 2012); Director, Trading and Settlements, DoubleLine Capital LP (since December 2009). Formerly, Senior Vice President, TCW. |
| | | |
| Patrick A. Townzen, 1978 | | Vice President | | Indefinite/Since September 2012 | | Vice President, DoubleLine Equity Funds (since February 2013); Vice President, DoubleLine Income Solutions Fund (since January 2013); Vice President, DoubleLine Funds Trust (since September 2012); Vice President, DoubleLine Opportunistic Credit Fund (since September 2012); Director of Operations, DoubleLine Capital LP (since September 2012). Formerly, Manager, Western Asset Management Company. |
(1) The address of each officer is c/o DoubleLine Capital LP, 333 South Grand Avenue, Suite 1800, Los Angeles, CA 90071.
The Statement of Additional Information includes additional information about the Trustees and is available, without charge, upon request, by calling 877-DLine11 (877-354-6311).
| | | | | | |
| 102 | | DoubleLine Funds Trust | | | | |
| | |
| Information About Proxy Voting | | (Unaudited) |
Information about how a Fund voted proxies relating to portfolio securities held during the most recent twelve month period ended June 30th is available no later than the following August 31st without charge, upon request, by calling 877-DLine11 (877-354-6311) and on the Securities and Exchange Commission’s (the “SEC”) website at http://www.sec.gov.
A description of the Funds’ proxy voting policies and procedures is available (i) without charge, upon request, by calling 877-DLine11 (877-354-6311); and (ii) on the commission’s web site at http://www.sec.gov.
Information About Portfolio Holdings
It is the policy of the Trust to provide certain unaudited information regarding the portfolio composition of the Funds as of month-end to shareholders and others upon request to the Funds, beginning on the 15th calendar day after the end of the month (or, if not a business day, the next business day thereafter).
Shareholders and others who wish to obtain portfolio holdings for a particular month may make a request by contacting the Funds at no charge at 877-DLine11 (877-354-6311) between the hours of 7:00 a.m. and 5:00 p.m. Pacific time, Monday through Friday, beginning on the 15th day following the end of that month (or, if not a business day, the next business day thereafter). Requests for portfolio holdings may be made on a monthly basis pursuant to this procedure, or standing requests for portfolio holdings may be accepted.
The Trust is required to file its complete schedule of portfolio holdings with the SEC for its first and third fiscal quarters on Form N-Q. The Trust’s Forms N-Q are available on the SEC website at www.sec.gov. You can also review and obtain copies of the Forms N-Q at the SEC Public Reference Room in Washington, DC (information on the operation of Public Reference Room may be obtained by calling 1-800-SEC-0330).
Householding — Important Notice Regarding Delivery of Shareholder Documents
In an effort to conserve resources, the Funds intend to reduce the number of duplicate Prospectuses and Annual and Semi-Annual Reports you receive by sending only one copy of each to addresses where we reasonably believe two or more accounts are from the same family. If you would like to discontinue householding of your accounts, please call toll-free 877-DLine11 (877-354-6311) to request individual copies of these documents. We will begin sending individual copies thirty days after receiving your request to stop householding.
| | | | | | |
| | Annual Report | | March 31, 2014 | | 103 |
| | |
| Privacy Notice | | (Unaudited) |
What Does DoubleLine Do With Your Personal Information?
Financial companies choose how they share your personal information. This notice provides information about how we collect, share, and protect your personal information, and how you might choose to limit our ability to share certain information about you. Please read this notice carefully.
All financial companies need to share customers’ personal information to run their everyday businesses. Accordingly, information, confidential and proprietary, plays an important role in the success of our business. However, we recognize that you have entrusted us with your personal and financial data, and we recognize our obligation to keep this information secure. Maintaining your privacy is important to us, and we hold ourselves to a high standard in its safekeeping and use. Most importantly, DoubleLine does not sell its customers’ non-public personal information to any third parties. DoubleLine uses its customers’ non-public personal information primarily to complete financial transactions that its customers request or to make its customers aware of other financial products and services offered by a DoubleLine affiliated company.
DoubleLine may collect non-public information about you from the following sources:
| | • | Information we receive about you on applications or other forms; |
| | • | Information you may give us orally; |
| | • | Information about your transactions with us or others; |
| | • | Information you submit to us in correspondence, including emails or other electronic communications; and |
| | • | Information about any bank account you use for transfers between your bank account and any Fund account, including information provided when effecting wire transfers. |
The types of personal information DoubleLine collects and shares depend on the product or service you have with us. This information may include:
| | • | transaction or loss history; |
DoubleLine does not disclose any non-public personal information about our customers or former customers without the customer’s authorization, except that we may disclose the information listed above, as follows:
| | • | It may be necessary for DoubleLine to provide information to nonaffiliated third parties in connection with our performance of the services we have agreed to provide you. For example, it might be necessary to do so in order to process transactions and maintain accounts. |
| | • | DoubleLine will release any of the non-public information listed above about a customer if directed to do so by that customer or if DoubleLine is authorized by law to do so, such as in the case of a court order, legal investigation, or other properly executed governmental request. |
| | • | In order to alert a customer to other financial products and services offered by an affiliate, DoubleLine may share information with an affiliate, including companies using the DoubleLine name. Such products and services may include, for example, other investment products offered by a DoubleLine company. If you prefer that we not disclose non-public personal information about you to our affiliates for this purpose, you may direct us not to make such disclosures (other than disclosures permitted by law) by calling 877-DLine11(877-354-6311). If you limit this sharing and you have a joint account, your decision will be applied to all owners of the account. |
We will limit access to your personal account information to those agents and vendors who need to know that information to provide products and services to you. Your information is not provided by us to nonaffiliated third parties for marketing purposes. We maintain physical, electronic, and procedural safeguards to guard your non-public personal information.
As required by federal law, DoubleLine will notify customers of DoubleLine’s Privacy Policy annually. DoubleLine reserves the right to modify this policy at any time, but in the event that there is a change, DoubleLine will promptly inform its customers of that change.
| | | | | | |
| 104 | | DoubleLine Funds Trust | | | | |
| | | | |
| DoubleLine Capital LP | | 333 South Grand Avenue 18th Floor Los Angeles, CA 90071 doubleline.com | | info@doubleline.com 1. 213. 633. 8200 |

Investment Adviser:
DoubleLine Capital LP
333 South Grand Avenue
18th Floor
Los Angeles, CA 90071
Distributor:
Quasar Distributors, LLC
615 East Michigan Street
Milwaukee, WI 53202
Administrator and Transfer Agent:
U.S. Bancorp Fund Services, LLC
P.O. Box 701
Milwaukee, WI 53201
Custodian:
U.S. Bank, N.A.
1555 North River Center
Drive, Suite 302
Milwaukee, WI 53212
Independent Registered
Public Accounting Firm:
PricewaterhouseCoopers LLP
601 South Figueroa Street
Los Angeles, CA 90017
Legal Counsel:
Ropes & Gray LLP
Prudential Tower
800 Boylston Street
Boston, MA 02199
Contact Information:
doublelinefunds.com
fundinfo@doubleline.com
1-877-DLine11 or
1-877-354-6311
Item 2. Code of Ethics.
The registrant has adopted a code of ethics that applies to the registrant’s principal executive officer and principal financial officer. The registrant has not made any substantive amendments to its code of ethics during the period covered by this report. The registrant has not granted any waivers from any provisions of the code of ethics during the period covered by this report. A copy of the registrant’s Code of Ethics is filed herewith.
Item 3. Audit Committee Financial Expert.
The registrant’s board of trustees has determined that there is at least one audit committee financial expert serving on its audit committee. Raymond B. Woolson is the “audit committee financial expert” and is considered to be “independent” as each term is defined in Item 3 of Form N-CSR.
Item 4. Principal Accountant Fees and Services.
The registrant has engaged its principal accountant to perform audit services, audit-related services, tax services and other services during the past two fiscal years. “Audit services” refer to performing an audit of the registrant’s annual financial statements or services that are normally provided by the accountant in connection with statutory and regulatory filings or engagements for those fiscal years. “Audit-related services” refer to the assurance and related services by the principal accountant that are reasonably related to the performance of the audit. “Tax services” refer to professional services rendered by the principal accountant for tax compliance, tax advice, and tax planning. There were no “Other services” provided by the principal accountant. The following table details the aggregate fees billed or expected to be billed for each of the last two fiscal years for audit fees, audit-related fees, tax fees and other fees by the principal accountant.
| | | | |
| | | FYE 3/31/2014 | | FYE 3/31/2013 |
Audit Fees | | $647,450 | | $611,385 |
Audit-Related Fees | | $8,516 | | $3,439 |
Tax Fees | | $95,200 | | $88,179 |
All Other Fees | | N/A | | N/A |
The audit committee has adopted pre-approval policies and procedures that require the audit committee to pre-approve all audit and non-audit services of the registrant, including services provided to any entity affiliated with the registrant.
The percentage of fees billed by PricewaterhouseCoopers LLP applicable to non-audit services pursuant to waiver of pre-approval requirement were as follows:
| | | | |
| | | FYE 3/31/2014 | | FYE 3/31/2013 |
Audit-Related Fees | | 0% | | 0% |
Tax Fees | | 0% | | 0% |
All Other Fees | | 0% | | 0% |
All of the principal accountant’s hours spent on auditing the registrant’s financial statements were attributed to work performed by full-time permanent employees of the principal accountant.
(If more than 50 percent of the accountant’s hours were spent to audit the registrant’s financial statements for the most recent fiscal year, state how many hours were attributed to work performed by persons other than the principal accountant’s full-time, permanent employees.)
The following table indicates the non-audit fees billed or expected to be billed by the registrant’s accountant for services to the registrant and to the registrant’s investment adviser (and any other controlling entity, etc.—not sub-adviser) for the last two years. The audit committee of the board of trustees/directors has considered whether the provision of non-audit services that were rendered to the registrant’s investment adviser is compatible with maintaining the principal accountant’s independence and has concluded that the provision of such non-audit services by the accountant has not compromised the accountant’s independence.
| | | | |
| Non-Audit Related Fees | | FYE 3/31/2014 | | FYE 3/31/2013 |
Registrant | | $95,200 | | $88,179 |
Registrant’s Investment Adviser | | $665,100 | | $478,800 |
Item 5. Audit Committee of Listed Registrants.
Not applicable to registrants who are not listed issuers (as defined in Rule 10A-3 under the Securities Exchange Act of 1934).
Item 6. Investments.
| (a) Schedule | of Investments is included as part of the report to shareholders filed under Item 1 of this Form. |
Item 7. Disclosure of Proxy Voting Policies and Procedures for Closed-End Management Investment Companies.
Not applicable to open-end investment companies.
Item 8. Portfolio Managers of Closed-End Management Investment Companies.
Not applicable to open-end investment companies.
Item 9. Purchases of Equity Securities by Closed-End Management Investment Company and Affiliated Purchasers.
Not applicable to open-end investment companies.
Item 10. Submission of Matters to a Vote of Security Holders.
There have been no material changes to the procedures by which shareholders may recommend nominees to the registrant’s board of trustees.
Item 11. Controls and Procedures.
| (a) | The Registrant’s principal executive and principal financial officers have reviewed the Registrant’s disclosure controls and procedures (as defined in Rule 30a-3(c) under the Investment Company Act of 1940 (the “Act”)) as of a date within 90 days of the filing of this report, as required by Rule 30a-3(b) under the Act and Rules 13a-15(b) or 15d-15(b) under the Securities Exchange Act of 1934. Based on their review, such officers have concluded that the disclosure controls and procedures are effective in ensuring that information required to be disclosed in this report is appropriately recorded, processed, summarized and reported and made known to them by others within the Registrant and by the Registrant’s service provider. |
| (b) | There were no changes in the Registrant’s internal control over financial reporting (as defined in Rule 30a-3(d) under the Act) that occurred during the last fiscal quarter of the period covered by this report that has materially affected, or is reasonably likely to materially affect, the Registrant’s internal control over financial reporting. |
Item 12. Exhibits.
| (a) | (1) Any code of ethics or amendment thereto, that is the subject of the disclosure required by Item 2, to the extent that the registrant intends to satisfy Item 2 requirements through filing an exhibit. Filed herewith. |
(2) A separate certification for each principal executive and principal financial officer pursuant to Section 302 of the Sarbanes-Oxley Act of 2002. Filed herewith.
(3) Any written solicitation to purchase securities under Rule 23c-1 under the Act sent or given during the period covered by the report by or on behalf of the registrant to 10 or more persons. Not applicable to open-end investment companies.
| (b) | Certifications pursuant to Section 906 of the Sarbanes-Oxley Act of 2002. Furnished herewith. |
SIGNATURES
Pursuant to the requirements of the Securities Exchange Act of 1934 and the Investment Company Act of 1940, the registrant has duly caused this report to be signed on its behalf by the undersigned, thereunto duly authorized.
(Registrant) DoubleLine Funds Trust
By (Signature and Title) /s/ Ronald R. Redell
Ronald R. Redell, President
Date 5/28/14
Pursuant to the requirements of the Securities Exchange Act of 1934 and the Investment Company Act of 1940, this report has been signed below by the following persons on behalf of the registrant and in the capacities and on the dates indicated.
By (Signature and Title) /s/ Ronald R. Redell
Ronald R. Redell, President
Date 5/28/14
By (Signature and Title) /s/ Susan Nichols
Susan Nichols, Treasurer and
Principal Financial and Accounting Officer
Date 5/28/14