As filed with the Securities and Exchange Commission on May 29, 2020
UNITED STATES
SECURITIES AND EXCHANGE COMMISSION
Washington, D.C. 20549
FORMN-CSR
CERTIFIED SHAREHOLDER REPORT OF REGISTERED
MANAGEMENT INVESTMENT COMPANIES
Investment Company Act file number811-22378
DoubleLine Funds Trust
(Exact name of registrant as specified in charter)
333 South Grand Avenue, Suite 1800
Los Angeles, CA 90071
(Address of principal executive offices) (Zip code)
Ronald R. Redell
President
DoubleLine Funds Trust
333 South Grand Avenue, Suite 1800
Los Angeles, CA 90071
(Name and address of agent for service)
(213)633-8200
Registrant’s telephone number, including area code
Date of fiscal year end: March 31
Date of reporting period: March 31, 2020
| Item 1. | Reports to Stockholders. |
| | |
| |
 | | Annual Report March 31, 2020 |

DoubleLine Selective Credit Fund
I Share Class: DBSCX
Shares of the DoubleLine Selective Credit Fund (the “Fund”) may currently be purchased in transactions by DoubleLine Capital LP (the “Adviser”) or its affiliates acting in their capacity as investment adviser (or in a similar capacity) for clients, including separately managed private accounts, investment companies registered under the Investment Company Act of 1940, as amended, and other funds, each of which must be an “accredited investor” as defined in Regulation D under the Securities Act of 1933, as amended (the “Securities Act”). The Fund also may permit purchases of shares by (i) qualified employees, officers and Trustees of the Fund and their qualified family members; (ii) qualified employees and officers of the Adviser or DoubleLine Group LP and their qualified family members; (iii) qualified affiliates of the Adviser or DoubleLine Group LP; and (iv) other qualified accounts.
DoubleLine Capital LP || 333 South Grand Avenue, 18th Floor || Los Angeles, CA 90071 || (213) 633-8200
fundinfo@doubleline.com|| www.doubleline.com
| | | | | | |
| | Annual Report | | March 31, 2020 | | 3 |
| | |
| President’s Letter | | (Unaudited) March 31, 2020 |

Dear DoubleLine Funds Shareholder,
On behalf of the DoubleLine Selective Credit Fund (DBSCX, the “Fund”), I am pleased to deliver this Annual Report for the12-month period ended March 31, 2020. On the following pages you will find specific information regarding the Fund’s operations and holdings. In addition, we discuss the Fund’s investment performance and the main drivers of that performance during the reporting period.
If you have any questions regarding the DoubleLine Funds please don’t hesitate to call us at877-DLine11(877-354-6311), or visit our website www.doublelinefunds.com where our investment management team offers deeper insights and analysis on relevant capital market activity impacting investors today. We value the trust that you have placed with us, and we will continue to strive to offer thoughtful investment solutions to our shareholders.
Sincerely,

Ronald R. Redell, CFA
President
DoubleLine Funds
May 1, 2020
| | | | | | |
| 4 | | DoubleLine Selective Credit Fund | | | | |
| | |
| Financial Markets Highlights | | (Unaudited) March 31, 2020 |
| · | | Non-Agency Mortgage-Backed Securities(Non-Agency MBS) |
For the12-month period ended March 31, 2020, spreads were significantly wider forNon-Agency MBS. Given the backdrop of the governmental and market reaction to theCOVID-19 pandemic at the end of the period, the market was processing potential outcomes including the probability of many homeowners struggling to make payments and potential forbearance scenarios. Net issuance reached approximately $110 billion over the period, outpacing the same period a year ago ($87 billion). Housing market fundamentals remained strong for home price appreciation as prices finished the period 3.1% higher than a year ago. Mortgage rates were supportive for home prices as the Freddie Mac30-year Commitment Rate fell by 56 basis points (bps) to finish the period at 3.5%. This highlights that the housing market was on a positive trajectorypre-COVID-19, but byperiod-end some mortgage brokers believed that home prices would fall by 3% by the end of 2020. Given the material credit spread widening and general market volatility in March 2020, we believe that new issuance across the sector will be muted for the foreseeable future. We believe mortgage servicers are the focal point during this time as borrowers pursue forbearance. Servicers must advance principal and interest payments under particular circumstances but servicers may not have the capital to do so for a prolonged period of time. Any expansion in the Term Asset-Backed Securities Loan Facility (TALF) program by the Federal Reserve (Fed) to includeNon-Agency MBS bonds would be a relief for this market. Any support for mortgage servicers directly would also be supportive and perhaps stymie further deleveraging from Real Estate Investment Trusts (REITs) receiving margin calls based upon this bearish premise.
| · | | Commercial Mortgage-Backed Securities (CMBS) |
For the12-month period ended March 31, 2020, new issuance of $116.9 billion of CMBS priced compared to $88.5 billion for the previous12-month period. New issue CMBS spreads were wider, alongside broader spreads in credit and equity indices and a sharp decline in interest rates at the end of the period, as a result of market volatility associated with the governmental and market reaction toCOVID-19. Private-label CMBS issuance set a post-crisis record in 2019 with $112.9 billion. Higher than expected issuance in 2019 was aided by robust Commercial Real Estate (CRE) fundamentals, lower interest rates, and stable investor demand. While this sentiment leaked into 2020, with record setting issuance in December, March saw a material slowdown in new issuance given broader market volatility associated with reactions toCOVID-19. Spreads on10-year AAA last cash flows (LCFs) andBBB- bonds widened materially, especially over a span of the last two weeks of the period. This was largely liquidity driven as fund redemptions and levered CMBS investors created a liquidity vacuum for CMBS bonds as supply flooded the secondary market with limited dealer support. The Trepp CMBS Delinquency Rate for CRE loans had fallen in 20 of the last 26 months as of period end, and was at 2.07%, 81 bps lower year-over-year, at period end. The Bloomberg Barclays U.S. CMBS ERISA Eligible Total Return Index returned 6.13%, underperforming the broader Bloomberg Barclays U.S. Aggregate Bond Index return of 8.93%. The Moody’s/RCA Commercial Property Price Index (CPPI) increased by 6.46% on the national level for the12-month period ended February 29, 2020, as compared to 6.67% over the previous12-month period.
| · | | Collateralized Loan Obligations (CLOs) |
For the12-month period ended March 31, 2020, the CLO market saw a total of $106.41 billion in new issuance and an additional $57.7 billion in refinancing and reset activity. Excluding the last month of the period, investment grade CLO spreads were tighter on average while lower mezzanine tranches saw some spread widening. During March 2020, however, the broader market experienced heightened volatility brought on by the governmental and market reaction to theCOVID-19 pandemic as did the CLO market with spreads widening significantly up and down the capital structure. This volatility caused the JP Morgan CLO Total Return Level Index to dip into negative territory, ending the period with a total return of-4.97%.
| | | | | | |
| | Annual Report | | March 31, 2020 | | 5 |
| | |
| Management Discussion of Fund Performance | | (Unaudited) March 31, 2020 |
DoubleLine Selective Credit Fund
For the12-month period ended March 31, 2020, the DoubleLine Selective Credit Fund underperformed the Bloomberg Barclays U.S. Aggregate Bond Index return of 8.93%. The underperformance was driven by a lack of U.S. Treasury exposure relevant to the Index and significant credit spread widening at the end of the period. The Fund’s average duration over the period was 1.9 while the Index duration was 6.0. Rates rallied during the period, with2-year and10-year U.S. Treasury yields down 201 bps and 174 bps, respectively.Non-Agency credit spreads widened substantially in March as a result of market risks related to theCOVID-19 pandemic. While the Fed’s program at the end of the period was established to support U.S. Treasuries, Agency MBS, and certain portions of the ABS markets, along with other asset classes, it failed to includeNon-Agency MBS which further led to the Fund’s underperformance.
| | | | | | | | | | |
| | |
| 12-Month Period Ended3-31-20 | | | | 1-Year |
| | |
I-Share | | | | | | | | | -7.11% | |
| | |
Bloomberg Barclays U.S. Aggregate Bond Index | | | | | | | | | 8.93% | |
For additional performance information, please refer to the“Standardized Performance Summary.”
Past Performance is not a guarantee of future results.
Opinions expressed herein are as of March 31, 2020 and are subject to change at any time, are not guaranteed and should not be considered investment advice. This report is for the information of shareholders of the Fund. It may also be used as sales literature when preceded or accompanied by the current private placement memorandum.
The performance shown assumes the reinvestment of all dividends and distributions and does not reflect any reductions for taxes. Investment performance reflects fee waivers in effect. In the absence of such waivers, total return would be reduced.
Fund holdings and sector allocations are subject to change at any time and are not recommendations to buy or sell any security. Please refer to the Schedule of Investments for a complete list of Fund holdings.
Since the Fund is currently offered only to a limited number of investors, as described in the private placement memorandum, the Fund’s assets may grow at a slower rate than if the Fund engaged in a broader public offering. As a result, the Fund may incur operating expenses as a percentage of net assets at a rate higher than mutual funds that are larger or more broadly offered. In addition, the Fund’s assets may not achieve a size sufficient to make the Fund economically viable. A liquidation of the Fund may result in a sale of assets of the Fund at an unfavorable time or at prices below those at which the Fund has valued them.
Diversification does not assure a profit or protect against loss in a declining market.
Investing involves risk. Principal loss is possible. Investments indebt securities typically decline in value when interest rates rise. This risk is usually greater for longer-term debt securities. Investments in lower rated andnon-rated securities present a great risk of loss to principal and interest than higher rated securities. Investments inAsset-Backed and Mortgage-Backed securities include additional risks that investors should be aware of including credit risk, prepayment risk, possible illiquidity and default, as well as increased susceptibility to adverse economic developments. Derivatives involve risks different from, and in certain cases, greater than the risks presented by more traditional investments. Derivatives may involve certain costs and risks such as liquidity, interest rate, market, credit, management and the risk that a position could not be closed when most advantageous. Investing in derivatives could lose more than the amount invested.
Credit ratings from Moody’s Investor Service, Inc. (“Moody’s”) range from the highest rating of Aaa for bonds of the highest quality that offer the lowest degree of investment risk to the lowest rating of C for the lowest rated class of bonds. Credit ratings from S&P Global Ratings (“S&P”) range from the highest rating of AAA for bonds of the highest quality that offer the lowest degree of investment risk to the lowest rating of D for bonds that are in default. In limited situations when the rating agency has not issued a formal rating, the rating agency will classify the security as nonrated. Credit ratings are determined from the highest available credit rating from any Nationally Recognized Statistical Rating Organization (“NRSRO”). DoubleLine displays credit ratings using S&P’s rating convention, although the rating itself might be sourced from another NRSRO.
Basis Point—A unit that is equal to 1/100th of 1%, and is used to denote the change in a financial instrument.
Bloomberg Barclays U.S. Aggregate Bond Index—This index represents securities that areSEC-registered, taxable, and dollar denominated. The index covers the U.S. investment grade fixed rate bond market, with index components for government and corporate securities, mortgage pass-through securities, and asset-backed securities. These major sectors are subdivided into more specific indices that are calculated and reported on a regular basis.
Bloomberg Barclays U.S. CMBS ERISA Eligible Total Return Index—This index measures the performance of investment grade commercial mortgage-backed securities, which are classes of securities that represent interests in pools of commercial mortgages, and includes only ERISA-eligible CMBS.
Duration—A measure of the sensitivity of the price of a fixed income investment to a change in interest rates, expressed as a number of years.
Freddie Mac U.S.30-year Commitment Rates—The interest rate charged by Freddie Mac to lend money to a qualified borrower on a30-year fixed-rate mortgage loan.
J.P. Morgan CLO Total Return Level Index—This index holistically captures theUSD-denominated CLO market, representing over 3000 instruments at a total par value of US $236.1 billion. It allows market participants to track securitized loan market valuations.
Last Cash Flow (LCF)—The last revenue stream paid to a bond over a given period.
Moody’s/RCA Commercial Property Price Index (CPPI)—An index that describes variousnon-residential property types for the U.S. (10 monthly series from 2000). This index is a periodic same-property round-trip investment price change index of the U.S. commercial investment property market. The dataset contains 20 monthly indicators.
Spread—The difference between yields on differing debt instruments, calculated by deducting the yield of one instrument from another. The higher the yield spread, the greater the difference between the yields offered by each instrument. The spread can be measured between debt instruments of differing maturities, credit ratings and risk.
Trepp CMBS Delinquency Rate—A report published by Trepp on a monthly basis giving the total principal balances of loans with delinquencies divided by the total principal balance of all loans.
| | | | | | |
| 6 | | DoubleLine Selective Credit Fund | | | | |
| | |
| | | (Unaudited) March 31, 2020 |
An investment cannot be made directly in an index. The performance of any index mentioned in this commentary has not been adjusted for ongoing management, distribution and operating expenses applicable to mutual fund investments.
This commentary may include statements that constitute “forward-looking statements” under the U.S. securities laws. Forward-looking statements include, among other things, projections, estimates, and information about possible or future results related to a Fund and market or regulatory developments. The views expressed above are not guarantees of future performance or economic results and involve certain risks, uncertainties and assumptions that could cause actual outcomes and results to differ materially from the views expressed herein.
DoubleLine has no obligation to provide revised assessments in the event of changed circumstances. While we have gathered this information from sources believed to be reliable, DoubleLine cannot guarantee the accuracy of the information provided. Securities discussed are not recommendations and are presented as examples of issue selection or portfolio management processes. They have been picked for comparison or illustration purposes only. No security presented within is either offered for sale or purchase. DoubleLine reserves the right to change its investment perspective and outlook without notice as market conditions dictate or as additional information becomes available.
Investment strategies may not achieve the desired results due to implementation lag, other timing factors, portfolio management decision making, economic or market conditions or other unanticipated factors. The views and forecasts expressed in this material are as of the date indicated, are subject to change without notice, may not come to pass and do not represent a recommendation or offer of any particular security, strategy, or investment. Past performance is no guarantee of future results.
DoubleLine® is a registered trademark of DoubleLine Capital LP.
Quasar Distributors, LLC provides filing administration for DoubleLine Capital LP.
| | | | | | |
| | Annual Report | | March 31, 2020 | | 7 |
| | |
| Standardized Performance Summary | | (Unaudited) March 31, 2020 |
| | | | | | | | | | | | | | | | | | | | |
DBSCX | | | | | | | | |
DoubleLine Selective Credit Fund Returns as of March 31, 2020 | | 1-Year | | 3-Year Annualized | | 5-Year Annualized | | Since Inception Annualized (8-4-14 to 3-31-20) |
| | | | |
I-share (DBSCX) | | | | -7.11% | | | | | 1.32% | | | | | 2.80% | | | | | 3.32% | |
| | | | |
Bloomberg Barclays U.S. Aggregate Bond Index | | | | 8.93% | | | | | 4.82% | | | | | 3.36% | | | | | 3.60% | |
The performance information shown assumes the reinvestment of all dividends and distributions. Performance reflects management fees and other fund expenses. Returns over 1 year are average annual returns. Performance data quoted represents past performance; past performance does not guarantee future results. The investment return and principal value of an investment will fluctuate so that an investor’s shares, when redeemed, may be worth more or less than the original cost. Current performance of the Fund may be lower or higher than the performance quoted. Performance data current to the most recent month-end may be obtained by calling(213) 633-8200.
| | | | | | |
| 8 | | DoubleLine Selective Credit Fund | | | | |
| | |
| Schedule of Investments DoubleLine Selective Credit Fund | | March 31, 2020 |
| | | | | | | | | | | | | | | | |
PRINCIPAL
AMOUNT $ | | | SECURITY DESCRIPTION | | RATE | | | MATURITY | | | VALUE $ | |
| | ASSET BACKED OBLIGATIONS 0.2% | |
| |
| | | | Waterfall Commercial Mortgage Trust, | |
| | 1,938,759 | | | Series 2015-SBC5-A | | | 4.10% | #^ | | | 09/14/2022 | | | | 1,926,845 | |
| | | | | | | | | | | | | | | | |
| | | | Total Asset Backed Obligations
(Cost $1,934,318) | | | | 1,926,845 | |
| | | | | | | | | | | | | | | | |
| | COLLATERALIZED LOAN OBLIGATIONS 0.2% | |
| |
| | | | Babson Ltd., | |
| | 1,000,000 | | | Series 2015-2A-ER (3 Month LIBOR USD + 6.45%) | | | 8.27% | ^ | | | 10/20/2030 | | | | 676,400 | |
| | |
| | | | Octagon Investment Partners Ltd., | | | | | |
| | 1,000,000 | | | Series 2012-1A-DR (3 Month LIBOR USD + 7.15%) | | | 8.98% | ^ | | | 07/15/2029 | | | | 684,930 | |
| |
| | | | Voya Ltd., | |
| | 500,000 | | | Series 2016-4A-E2 (3 Month LIBOR USD + 6.65%) | | | 8.47% | ^ | | | 07/20/2029 | | | | 338,373 | |
| | | | | | | | | | | | | | | | |
| | | | Total Collateralized Loan Obligations
(Cost $2,480,000) | | | | 1,699,703 | |
| | | | | | | | | | | | | | | | |
| NON-AGENCY COMMERCIAL MORTGAGE BACKED
OBLIGATIONS 0.4% |
|
| |
| | | | 20 Times Square Trust, | |
| | 530,000 | | | Series 2018-20TS-G | | | 3.10% | #^ | | | 05/15/2035 | | | | 446,435 | |
| |
| | | | BB-UBS Trust, | |
| | 214,000 | | | Series 2012-TFT-TE | | | 3.56% | #^ | | | 06/05/2030 | | | | 210,250 | |
| |
| | | | BX Commercial Mortgage Trust, | |
| | 755,000 | | | Series 2018-BIOA-E (1 Month LIBOR USD + 1.95%, 1.98% Floor) | | | 2.66% | ^ | | | 03/15/2037 | | | | 622,713 | |
| |
| | | | Citigroup Commercial Mortgage Trust, | |
| | 224,000 | | | Series 2015-GC27-D | | | 4.42% | #^ | | | 02/10/2048 | | | | 187,660 | |
| | 216,000 | | | Series 2016-GC36-D | | | 2.85% | ^ | | | 02/10/2049 | | | | 153,512 | |
| |
| | | | Commercial Mortgage Pass-Through Certificates, | |
| | 227,000 | | | Series 2012-CR4-D | | | 4.59% | #^Þ | | | 10/15/2045 | | | | 84,932 | |
| | 194,000 | | | Series 2014-CR19-C | | | 4.73% | # | | | 08/10/2047 | | | | 176,639 | |
| |
| | | | FREMF Mortgage Trust, | |
| | 75,093 | | | Series 2016-KF22-B (1 Month LIBOR USD + 5.05%, 5.05% Floor) | | | 6.57% | ^ | | | 07/25/2023 | | | | 65,511 | |
| |
| | | | JP Morgan Chase Commercial Mortgage Securities Trust, | |
| | 111,527 | | | Series 2006-LDP9-AMS | | | 5.34% | | | | 05/15/2047 | | | | 110,127 | |
| | 208,000 | | | Series 2016-WIKI-E | | | 4.01% | #^ | | | 10/05/2031 | | | | 173,633 | |
| | 350,000 | | | Series 2018-WPT-EFL (1 Month LIBOR USD + 2.60%, 2.60% Floor) | | | 3.98% | ^ | | | 07/05/2033 | | | | 304,196 | |
| | 350,000 | | | Series 2018-WPT-EFX | | | 5.54% | ^ | | | 07/05/2033 | | | | 298,728 | |
| | 350,000 | | | Series 2018-WPT-FFX | | | 5.54% | ^ | | | 07/05/2033 | | | | 269,677 | |
| |
| | | | Morgan Stanley Bank of America Merrill Lynch Trust, | |
| | 250,000 | | | Series 2014-C18-C | | | 4.52% | # | | | 10/15/2047 | | | | 224,802 | |
| | 350,000 | | | Series 2014-C19-C | | | 4.00% | | | | 12/15/2047 | | | | 304,958 | |
| |
| | | | Morgan Stanley Capital Trust, | |
| | 556,000 | | | Series 2017-CLS-F (1 Month LIBOR USD + 2.60%, 2.60% Floor) | | | 3.30% | ^ | | | 11/15/2034 | | | | 482,196 | |
| |
| | | | Tharaldson Hotel Portfolio Trust, | |
| | 409,901 | | | Series 2018-THL-E (1 Month LIBOR USD + 3.18%, 3.10% Floor) | | | 4.19% | ^ | | | 11/11/2034 | | | | 346,725 | |
| | | | | | | | | | | | | | | | |
| | | | Total Non-Agency Commercial Mortgage Backed Obligations
(Cost $5,224,681) | | | | 4,462,694 | |
| | | | | | | | | | | | | | | | |
| | | | | | | | | | | | | | | | |
PRINCIPAL
AMOUNT $ | | | SECURITY DESCRIPTION | | RATE | | | MATURITY | | | VALUE $ | |
| NON-AGENCY RESIDENTIAL COLLATERALIZED MORTGAGE
OBLIGATIONS 90.9% |
|
| |
| | | | Ajax Mortgage Loan Trust, | |
| | 5,602,907 | | | Series 2017-C-A | | | 3.75% | ^§ | | | 07/25/2060 | | | | 5,621,222 | |
| |
| | | | Alternative Loan Trust, | |
| | 3,011,729 | | | Series 2005-4-1A3 | | | 5.75% | | | | 04/25/2035 | | | | 2,425,993 | |
| | 5,619,797 | | | Series 2005-55CB-2A1 | | | 5.50% | | | | 11/25/2035 | | | | 4,472,961 | |
| | 4,855,054 | | | Series 2005-79CB-A1 (1 Month LIBOR USD + 0.55%, 0.55% Floor, 5.50% Cap) | | | 1.50% | | | | 01/25/2036 | | | | 3,122,490 | |
| | 4,855,054 | | | Series 2005-79CB-A2 (-1 x 1 Month LIBOR USD + 4.95%, 4.95% Cap) | | | 4.00% | I/F I/O | | | 01/25/2036 | | | | 835,290 | |
| | 8,137,388 | | | Series 2005-80CB-4A1 | | | 6.00% | | | | 02/25/2036 | | | | 5,365,596 | |
| | 6,477,306 | | | Series 2007-OA8-1A1 (1 Month LIBOR USD + 0.18%, 0.18% Floor) | | | 1.13% | | | | 06/25/2047 | | | | 4,831,068 | |
| |
| | | | Angel Oak Mortgage Trust LLC, | |
| | 10,845,238 | | | Series 2019-4-A3 | | | 3.30% | #^ | | | 07/26/2049 | | | | 10,722,113 | |
| |
| | | | Arroyo Mortgage Trust, | |
| | 7,539,000 | | | Series 2019-3-M1 | | | 4.20% | #^ | | | 10/25/2048 | | | | 5,971,144 | |
| |
| | | | Asset Backed Securities CorporationHome Equity Loan Trust, | |
| | 6,630,306 | | | Series 2003-HE1-M3 (1 Month LIBOR USD + 5.25%, 3.50% Floor) | | | 5.95% | | | | 01/15/2033 | | | | 6,071,090 | |
| |
| | | | Banc of America Funding Corporation, | |
| | 2,722,832 | | | Series 2006-2-2A11 | | | 5.50% | | | | 03/25/2036 | | | | 2,465,694 | |
| | 1,549,259 | | | Series 2007-1-TA8 | | | 5.85% | ß | | | 01/25/2037 | | | | 1,575,412 | |
| |
| | | | Banc of America Mortgage Securities Trust, | |
| | 2,386,763 | | | Series 2006-3-1A10 | | | 6.00% | | | | 10/25/2036 | | | | 2,195,631 | |
| |
| | | | BCAP LLC Trust, | |
| | 16,629,334 | | | Series 2012-RR4-6A2 | | | 3.89% | #^ | | | 11/26/2035 | | | | 10,153,455 | |
| | 8,362,024 | | | Series 2013-RR2-6A2 | | | 4.29% | #^ | | | 06/26/2037 | | | | 7,001,155 | |
| |
| | | | Bear Stearns Adjustable Rate Mortgage Trust, | |
| | 4,391,111 | | | Series 2006-2-2A1 | | | 4.08% | # | | | 07/25/2036 | | | | 3,737,452 | |
| |
| | | | Bear Stearns Asset Backed Securities Trust, | |
| | 4,223,322 | | | Series 2005-10-23A1 | | | 3.84% | # | | | 01/25/2036 | | | | 3,688,185 | |
| | 2,579,846 | | | Series 2006-4-31A1 | | | 4.02% | # | | | 07/25/2036 | | | | 2,258,356 | |
| | 3,263,739 | | | Series 2006-AC5-A1 | | | 6.25% | ß | | | 12/25/2036 | | | | 2,834,517 | |
| | 11,248,744 | | | Series 2006-AQ1-12A (1 Month LIBOR USD + 0.14%, 0.14% Floor) | | | 1.09% | | | | 10/25/2036 | | | | 12,978,169 | |
| | 1,655,420 | | | Series 2006-IM1-A1 (1 Month LIBOR USD + 0.23%, 0.23% Floor) | | | 1.18% | | | | 04/25/2036 | | | | 2,076,377 | |
| |
| | | | Carrington Mortgage Loan Trust, | |
| | 10,998,000 | | | Series 2007-RFC1-A3 (1 Month LIBOR USD + 0.14%, 0.14% Floor, 14.50% Cap) | | | 1.09% | | | | 12/25/2036 | | | | 9,109,158 | |
| |
| | | | Chase Mortgage Finance Trust, | |
| | 2,396,165 | | | Series 2006-S2-1A9 | | | 6.25% | | | | 10/25/2036 | | | | 1,617,280 | |
| | 4,648,321 | | | Series 2006-S3-1A2 | | | 6.00% | | | | 11/25/2036 | | | | 3,053,558 | |
| | 413,215 | | | Series 2007-S3-1A12 | | | 6.00% | | | | 05/25/2037 | | | | 282,158 | |
| |
| | | | CHL Mortgage Pass-Through Trust, | |
| | 2,797,672 | | | Series 2006-13-1A17 (-1 x 1 Month LIBOR USD + 5.65%, 5.65% Cap) | | | 4.70% | I/F I/O | | | 09/25/2036 | | | | 331,917 | |
| | 2,797,672 | | | Series 2006-13-1A3 (1 Month LIBOR USD + 0.60%, 0.60% Floor, 6.25% Cap) | | | 1.55% | | | | 09/25/2036 | | | | 1,191,820 | |
| | 8,376,530 | | | Series 2007-21-1A1 | | | 6.25% | | | | 02/25/2038 | | | | 6,141,706 | |
| | 5,569,171 | | | Series 2007-HYB1-2A1 | | | 3.29% | # | | | 03/25/2037 | | | | 4,558,672 | |
| |
| | | | CIM Trust, | |
| | 4,000,000 | | | Series 2016-1RR-B2 | | | 6.96% | #^Þ | | | 07/26/2055 | | | | 3,663,291 | |
| | 3,000,000 | | | Series 2016-2RR-B2 | | | 7.57% | #^Þ | | | 02/25/2056 | | | | 2,776,830 | |
| | 3,000,000 | | | Series 2016-3RR-B2 | | | 7.97% | #^Þ | | | 02/27/2056 | | | | 2,759,581 | |
| | | | | | |
| The accompanying notes are an integral part of these financial statements. | | Annual Report | | March 31, 2020 | | 9 |
| | |
| Schedule of Investments DoubleLine Selective Credit Fund (Cont.) | | March 31, 2020 |
| | | | | | | | | | | | | | | | |
PRINCIPAL
AMOUNT $ | | | SECURITY DESCRIPTION | | RATE | | | MATURITY | | | VALUE $ | |
| |
| | | | Citi Mortgage Alternative Loan Trust, | |
| | 1,897,395 | | | Series 2006-A1-1A6 | | | 6.00% | | | | 04/25/2036 | | | | 1,796,491 | |
| |
| | | | Citigroup Mortgage Loan Trust, Inc., | |
| | 1,317,073 | | | Series 2005-9-21A2 | | | 5.50% | | | | 11/25/2035 | | | | 1,250,024 | |
| | 736,232 | | | Series 2007-AR8-1A1A | | | 3.84% | # | | | 08/25/2047 | | | | 602,336 | |
| | 8,380,000 | | | Series 2007-WFH4-M3B (1 Month LIBOR USD + 1.00%, 1.00% Floor) | | | 1.95% | | | | 07/25/2037 | | | | 6,618,449 | |
| | 1,918,678 | | | Series 2011-12-1A2 | | | 3.86% | #^ | | | 04/25/2036 | | | | 1,490,273 | |
| | 14,061,619 | | | Series 2019-A-PT1 | | | 3.92% | ^ | | | 10/25/2058 | | | | 13,489,876 | |
| | 21,020,638 | | | Series 2019-E-A1 | | | 3.23% | ^§ | | | 11/25/2070 | | | | 21,741,949 | |
| |
| | | | CitiMortgage Alternative Loan Trust, | |
| | 7,028,226 | | | Series 2006-A2-A5 (1 Month LIBOR USD + 0.60%, 0.60% Floor, 6.00% Cap) | | | 1.55% | | | | 05/25/2036 | | | | 5,478,342 | |
| | 7,739,764 | | | Series 2006-A2-A6 (-1 x 1 Month LIBOR USD + 5.40%, 5.40% Cap) | | | 4.45% | I/F I/O | | | 05/25/2036 | | | | 1,095,574 | |
| | 11,748,422 | | | Series 2007-A5-1A3 (1 Month LIBOR USD + 0.50%, 0.50% Floor, 6.10% Cap) | | | 1.45% | | | | 05/25/2037 | | | | 7,386,958 | |
| | 11,748,422 | | | Series 2007-A5-1A4 (-1 x 1 Month LIBOR USD + 5.60%, 5.60% Cap) | | | 4.65% | I/F I/O | | | 05/25/2037 | | | | 2,000,440 | |
| | 3,419,195 | | | Series 2007-A6-1A4 | | | 6.00% | | | | 06/25/2037 | | | | 3,103,717 | |
| | 2,330,131 | | | Series 2007-A6-1A5 | | | 6.00% | | | | 06/25/2037 | | | | 2,098,958 | |
| | 3,413,562 | | | Series 2007-A8-A1 | | | 6.00% | | | | 10/25/2037 | | | | 3,056,288 | |
| |
| | | | Countrywide Alternative Loan Trust, | |
| | 709,743 | | | Series 2004-22CB-1A1 | | | 6.00% | | | | 10/25/2034 | | | | 731,002 | |
| | 1,211,013 | | | Series 2005-28CB-2A7 | | | 5.75% | | | | 08/25/2035 | | | | 997,897 | |
| | 1,838,506 | | | Series 2005-46CB-A20 | | | 5.50% | | | | 10/25/2035 | | | | 1,369,406 | |
| | 3,832,579 | | | Series 2005-65CB-1A11 | | | 6.00% | | | | 01/25/2036 | | | | 3,283,499 | |
| | 278,168 | | | Series 2005-73CB-1A3 | | | 6.25% | | | | 01/25/2036 | | | | 267,307 | |
| | 1,606,693 | | | Series 2006-14CB-A8 | | | 6.00% | | | | 06/25/2036 | | | | 1,144,467 | |
| | 3,575,205 | | | Series 2006-41CB-2A12 | | | 6.00% | | | | 01/25/2037 | | | | 2,564,651 | |
| | 1,364,774 | | | Series 2006-41CB-2A15 | | | 5.75% | | | | 01/25/2037 | | | | 956,843 | |
| | 3,946,004 | | | Series 2006-46-A6 | | | 6.00% | | | | 02/25/2047 | | | | 2,824,558 | |
| | 2,272,799 | | | Series 2006-7CB-2A1 | | | 6.50% | | | | 05/25/2036 | | | | 1,436,145 | |
| | 1,224,682 | | | Series 2006-8T1-1A4 | | | 6.00% | | | | 04/25/2036 | | | | 840,784 | |
| | 1,614,245 | | | Series 2006-J4-2A13 | | | 6.00% | | | | 07/25/2036 | | | | 1,139,606 | |
| | 4,445,306 | | | Series 2006-J4-2A8 | | | 6.00% | | | | 07/25/2036 | | | | 3,138,247 | |
| | 1,216,040 | | | Series 2006-J6-A5 | | | 6.00% | | | | 09/25/2036 | | | | 903,032 | |
| | 1,088,311 | | | Series 2007-13-A4 | | | 6.00% | | | | 06/25/2047 | | | | 796,550 | |
| | 92,866 | | | Series 2007-J2-2A1 | | | 6.00% | | | | 07/25/2037 | | | | 92,059 | |
| |
| | | | Countrywide Asset Backed Certificates, | |
| | 24,079,361 | | | Series 2006-25-1A (1 Month LIBOR USD + 0.14%, 0.14% Floor) | | | 1.09% | | | | 06/25/2047 | | | | 20,265,003 | |
| |
| | | | Countrywide Home Loans, | |
| | 131,118 | | | Series 2006-10-1A11 | | | 5.85% | | | | 05/25/2036 | | | | 92,929 | |
| | 755,154 | | | Series 2006-17-A6 | | | 6.00% | | | | 12/25/2036 | | | | 514,436 | |
| | 1,850,244 | | | Series 2006-19-1A7 | | | 6.00% | | | | 01/25/2037 | | | | 1,355,245 | |
| | 2,610,537 | | | Series 2006-9-A2 | | | 6.00% | | | | 05/25/2036 | | | | 1,875,904 | |
| | 8,789,450 | | | Series 2007-15-1A29 | | | 6.25% | | | | 09/25/2037 | | | | 7,145,542 | |
| | 639,845 | | | Series 2007-4-1A10 | | | 6.00% | | | | 05/25/2037 | | | | 445,547 | |
| | 462,039 | | | Series 2007-8-1A5 | | | 5.44% | | | | 01/25/2038 | | | | 303,691 | |
| |
| | | | Credit Suisse First Boston Mortgage Securities Corporation, | |
| | 1,681,528 | | | Series 2005-12-5A1 | | | 5.25% | | | | 01/25/2036 | | | | 1,574,312 | |
| | 913,156 | | | Series 2005-9-3A2 | | | 6.00% | | | | 10/25/2035 | | | | 411,061 | |
| |
| | | | Credit Suisse Mortgage Capital Certificates, | |
| | 940,033 | | | Series 2006-6-1A10 | | | 6.00% | | | | 07/25/2036 | | | | 690,025 | |
| | 999,049 | | | Series 2008-2R-1A1 | | | 6.00% | ^ | | | 07/25/2037 | | | | 921,366 | |
| | 4,070,727 | | | Series 2009-9R-10A2 | | | 5.50% | ^ | | | 12/26/2035 | | | | 3,236,244 | |
| | 1,531,408 | | | Series 2011-17R-1A2 | | | 5.75% | ^Þ | | | 02/27/2037 | | | | 1,508,922 | |
| |
| | | | CSMC Mortgage-Backed Trust, | |
| | 4,722,984 | | | Series 2006-7-10A1 | | | 6.75% | | | | 08/25/2036 | | | | 3,587,280 | |
| |
| | | | CSMC Trust, | |
| | 13,558,025 | | | Series 2019-JR1-A1 | | | 4.10% | #^ | | | 09/27/2066 | | | | 13,520,187 | |
| | 19,649,749 | | | Series 2020-RPL1-PT1 | | | 3.47% | ^ | | | 10/25/2069 | | | | 16,904,149 | |
| | | | | | | | | | | | | | | | |
PRINCIPAL
AMOUNT $ | | | SECURITY DESCRIPTION | | RATE | | | MATURITY | | | VALUE $ | |
| |
| | | | Deutsche Mortgage Securities, Inc., | |
| | 2,129,109 | | | Series 2009-RS2-1A2 | | | 4.82% | #^ | | | 09/26/2036 | | | | 2,001,950 | |
| |
| | | | Deutsche Securities, Inc., | |
| | 938,359 | | | Series 2005-6-2A1 | | | 5.50% | | | | 12/25/2035 | | | | 838,983 | |
| | 371,270 | | | Series 2006-AB4-A1A | | | 6.01% | # | | | 10/25/2036 | | | | 324,584 | |
| |
| | | | First Horizon Alternative Mortgage Securities Trust, | |
| | 925,735 | | | Series 2005-FA8-1A3 | | | 5.50% | | | | 11/25/2035 | | | | 673,950 | |
| | 2,474,227 | | | Series 2007-FA3-A8 | | | 6.00% | | | | 06/25/2037 | | | | 1,579,219 | |
| | 2,709,208 | | | Series 2007-FA4-1A4 | | | 6.25% | | | | 08/25/2037 | | | | 1,809,803 | |
| |
| | | | First Horizon Mortgage Pass-Through Trust, | |
| | 224,003 | | | Series 2006-1-1A2 | | | 6.00% | | | | 05/25/2036 | | | | 165,449 | |
| | 1,533,509 | | | Series 2007-3-A4 | | | 6.00% | | | | 06/25/2037 | | | | 998,786 | |
| |
| | | | FMC GMSR Issuer Trust, | |
| | 10,000,000 | | | Series 2019-GT1-A | | | 5.07% | #^ | | | 05/25/2024 | | | | 10,149,008 | |
| |
| | | | FWD, | |
| | 2,150,000 | | | Series 2019-INV1-M1 | | | 3.48% | #^ | | | 06/25/2049 | | | | 1,782,271 | |
| |
| | | | GCAT LLC, | |
| | 4,589,970 | | | Series 2019-2-A1 | | | 3.47% | ^§ | | | 06/25/2024 | | | | 4,575,129 | |
| |
| | | | GreenPoint Mortgage Funding Trust, | |
| | 6,251,224 | | | Series 2005-AR4-3A1 (12 Month US Treasury Average + 1.40%, 1.40% Floor) | | | 3.37% | | | | 10/25/2045 | | | | 4,785,705 | |
| |
| | | | GSR Mortgage Loan Trust, | |
| | 465,116 | | | Series 2006-2F-3A4 | | | 6.00% | | | | 02/25/2036 | | | | 329,401 | |
| | 2,368,907 | | | Series 2006-9F-5A2 (-1 x 1 Month LIBOR USD + 6.55%, 6.55% Cap) | | | 5.60% | I/F I/O | | | 10/25/2036 | | | | 649,081 | |
| | 2,368,907 | | | Series 2006-9F-5A3 (1 Month LIBOR USD + 0.45%, 0.45% Floor, 7.00% Cap) | | | 1.40% | | | | 10/25/2036 | | | | 1,023,083 | |
| | 1,414,358 | | | Series 2007-1F-3A14 | | | 5.75% | | | | 01/25/2037 | | | | 1,193,135 | |
| | 2,953,756 | | | Series 2007-2F-3A3 | | | 6.00% | | | | 03/25/2037 | | | | 2,330,508 | |
| |
| | | | HarborView Mortgage Loan Trust, | |
| | 10,041,049 | | | Series 2006-BU1-1A1A (1 Month LIBOR USD + 0.21%, 0.21% Floor, 10.50% Cap) | | | 0.96% | | | | 02/19/2046 | | | | 8,064,057 | |
| | 11,159,428 | | | Series 2007-4-1A1 (1 Month LIBOR USD + 0.22%, 10.00% Cap) | | | 0.97% | | | | 07/19/2047 | | | | 9,641,762 | |
| | 5,784,793 | | | Series 2007-7-1A1 (1 Month LIBOR USD + 1.00%, 10.50% Cap) | | | 1.95% | | | | 10/25/2037 | | | | 4,565,229 | |
| |
| | | | HMIR, | |
| | 5,392,239 | | | Series 2019-1-M1 (1 Month LIBOR USD + 1.65%) | | | 2.60% | ^ | | | 05/25/2029 | | | | 5,372,338 | |
| |
| | | | Home Partners of America Trust, | |
| | 3,986,914 | | | Series 2019-2-C | | | 3.02% | ^ | | | 10/19/2039 | | | | 3,666,314 | |
| | 4,242,460 | | | Series 2019-2-D | | | 3.12% | ^ | | | 10/19/2039 | | | | 3,796,815 | |
| | 7,985,807 | | | Series 2019-2-E | | | 3.32% | ^ | | | 10/19/2039 | | | | 6,716,455 | |
| |
| | | | HSI Asset Loan Obligation Trust, | |
| | 2,315,087 | | | Series 2007-1-3A6 | | | 6.00% | | | | 06/25/2037 | | | | 1,275,331 | |
| |
| | | | Impac Secured Assets Trust, | |
| | 531,164 | | | Series 2006-5-1A1B (1 Month LIBOR USD + 0.20%, 0.20% Floor, 11.50% Cap) | | | 1.15% | | | | 02/25/2037 | | | | 469,908 | |
| |
| | | | IndyMac Mortgage Loan Trust, | |
| | 5,261,247 | | | Series 2007-AR1-3A1 | | | 3.87% | # | | | 06/25/2037 | | | | 4,024,147 | |
| |
| | | | JP Morgan Alternative Loan Trust, | |
| | 5,419,464 | | | Series 2006-S4-A4 | | | 5.96% | ß | | | 12/25/2036 | | | | 5,088,935 | |
| | 3,302,614 | | | Series 2008-R2-A1 | | | 6.00% | ^ | | | 11/25/2036 | | | | 2,569,747 | |
| |
| | | | JP Morgan Mortgage Trust, | |
| | 464,921 | | | Series 2005-S3-1A1 | | | 6.50% | | | | 01/25/2036 | | | | 354,952 | |
| | | | | | |
| 10 | | DoubleLine Selective Credit Fund | | | | The accompanying notes are an integral part of these financial statements. |
| | | | | | | | | | | | | | | | |
PRINCIPAL
AMOUNT $ | | | SECURITY DESCRIPTION | | RATE | | | MATURITY | | | VALUE $ | |
| |
| | | | JP Morgan Mortgage Trust, (Cont.) | |
| | 2,549,426 | | | Series 2006-A5-3A2 | | | 4.11% | # | | | 08/25/2036 | | | | 2,089,167 | |
| | 2,587,403 | | | Series 2007-S1-2A8 | | | 5.75% | | | | 03/25/2037 | | | | 1,640,972 | |
| |
| | | | Lavender Trust, | |
| | 1,344,373 | | | Series 2010-R11A-A4 | | | 4.32% | #^ | | | 10/26/2036 | | | | 934,939 | |
| |
| | | | Legacy Mortgage Asset Trust, | |
| | 8,765,834 | | | Series 2018-GS2-A1 | | | 4.00% | ^§ | | | 04/25/2058 | | | | 8,003,000 | |
| | 9,250,000 | | | Series 2018-SL1-M | | | 4.50% | #^ | | | 02/25/2058 | | | | 8,941,907 | |
| | 15,874,900 | | | Series 2019-GS3-A1 | | | 3.75% | ^§ | | | 04/25/2059 | | | | 15,545,942 | |
| | 3,979,047 | | | Series 2019-GS5-A1 | | | 3.20% | ^§ | | | 05/25/2059 | | | | 3,985,668 | |
| | 12,500,000 | | | Series 2019-GS6-A2 | | | 4.45% | ^§ | | | 06/25/2059 | | | | 8,957,426 | |
| | 11,200,000 | | | Series 2019-GS7-A2 | | | 4.50% | ^§ | | | 11/25/2059 | | | | 12,025,158 | |
| | 18,510,551 | | | Series 2019-RPL3-PT1 | | | 4.30% | ^ | | | 06/25/2058 | | | | 16,446,717 | |
| | 17,381,594 | | | Series 2019-SL3-A | | | 3.47% | ^§ | | | 11/25/2061 | | | | 17,180,217 | |
| |
| | | | Lehman XS Trust, | |
| | 2,790,265 | | | Series 2006-17-1A4A (1 Month LIBOR USD + 0.17%, 0.17% Floor) | | | 1.12% | | | | 08/25/2046 | | | | 2,300,213 | |
| | 26,696,058 | | | Series 2007-14H-A3 (1 Month LIBOR USD + 0.55%, 0.55% Floor) | | | 1.50% | | | | 07/25/2047 | | | | 15,449,185 | |
| |
| | | | LHOME Mortgage Trust, | |
| | 5,800,000 | | | Series 2019-RTL3-A1 | | | 3.87% | ^ | | | 07/25/2024 | | | | 5,339,428 | |
| |
| | | | MASTR Alternative Loans Trust, | |
| | 1,216,307 | | | Series 2004-10-5A5 | | | 5.75% | D | | | 09/25/2034 | | | | 1,171,082 | |
| |
| | | | MASTR Asset Backed Securities Trust, | |
| | 4,208,130 | | | Series 2004-WMC1-M1 (1 Month LIBOR USD + 0.78%, 0.52% Floor) | | | 1.73% | | | | 02/25/2034 | | | | 4,016,466 | |
| |
| | | | Merrill Lynch Alternative Note Asset Trust, | |
| | 1,770,967 | | | Series 2007-F1-2A6 | | | 6.00% | | | | 03/25/2037 | | | | 1,094,622 | |
| |
| | | | Merrill Lynch Mortgage Investors Trust, | |
| | 1,359,645 | | | Series 2006-AF1-AF3B | | | 6.25% | | | | 08/25/2036 | | | | 863,225 | |
| |
| | | | Morgan Stanley Mortgage Loan Trust, | |
| | 6,571,394 | | | Series 2005-10-4A1 | | | 5.50% | | | | 12/25/2035 | | | | 5,389,163 | |
| | 1,019,739 | | | Series 2007-12-3A4 | | | 6.25% | | | | 08/25/2037 | | | | 669,421 | |
| |
| | | | New Century Home Equity Loan Trust, | |
| | 7,162,982 | | | Series 2006-1-A2B (1 Month LIBOR USD + 0.18%, 0.18% Floor, 12.50% Cap) | | | 1.13% | | | | 05/25/2036 | | | | 5,698,921 | |
| |
| | | | New Residential Mortgage Loan Trust, | |
| | 6,250,468 | | | Series 2018-FNT1-B | | | 3.91% | ^ | | | 05/25/2023 | | | | 6,164,486 | |
| | 2,300,000 | | | Series 2019-NQM4-B1 | | | 3.74% | #^ | | | 09/25/2059 | | | | 1,887,337 | |
| |
| | | | Nomura Asset Acceptance Corporation, | |
| | 3,719,966 | | | Series 2006-AP1-A2 | | | 5.52% | # | | | 01/25/2036 | | | | 1,601,006 | |
| | 1,225,293 | | | Series 2007-1-1A1A | | | 6.00% | ß | | | 03/25/2047 | | | | 1,108,439 | |
| |
| | | | NRZ Excess Spread-Collateralized Notes, | |
| | 3,604,047 | | | Series 2018-PLS1-D | | | 4.37% | ^ | | | 01/25/2023 | | | | 3,454,251 | |
| |
| | | | Oaktown Ltd., | |
| | 12,000,000 | | | Series 2018-1A-M2 (1 Month LIBOR USD + 2.85%) | | | 3.80% | ^ | | | 07/25/2028 | | | | 11,128,700 | |
| |
| | | | Opteum Mortgage Acceptance Corporation Trust, | |
| | 9,020,973 | | | Series 2006-2-A1C (1 Month LIBOR USD + 0.27%, 0.27% Floor) | | | 1.22% | | | | 07/25/2036 | | | | 4,462,020 | |
| |
| | | | PMT Credit Risk Transfer Trust, | |
| | 19,238,389 | | | Series 2019-2R-A (1 Month LIBOR USD + 2.75%, 2.75% Floor) | | | 4.36% | ^ | | | 05/27/2023 | | | | 18,203,692 | |
| |
| | | | PMT Credit Risk Transfer Trust, | |
| | 15,029,213 | | | Series 2019-3R-A (1 Month LIBOR USD + 2.70%, 2.70% Floor) | | | 3.66% | ^ | | | 10/27/2022 | | | | 14,574,152 | |
| | | | | | | | | | | | | | | | |
PRINCIPAL
AMOUNT $ | | | SECURITY DESCRIPTION | | RATE | | | MATURITY | | | VALUE $ | |
| |
| | | | PNMAC GMSR Trust, | |
| | 11,000,000 | | | Series 2018-FT1-A (1 Month LIBOR USD + 2.35%) | | | 3.30% | ^ | | | 04/25/2023 | | | | 9,856,970 | |
| |
| | | | PR Mortgage Loan Trust, | |
| | 572,839 | | | Series 2014-1-APT | | | 5.91% | #^ | | | 10/25/2049 | | | | 569,864 | |
| |
| | | | Pretium Mortgage Credit Partners LLC, | |
| | 10,418,839 | | | Series 2019-CFL1-A1 | | | 3.72% | ^§ | | | 01/25/2059 | | | | 9,131,869 | |
| | 9,132,668 | | | Series 2019-NPL2-A1 | | | 3.84% | ^§ | | | 12/25/2058 | | | | 7,929,642 | |
| | 13,278,069 | | | Series 2020-CFL1-A2 | | | 4.21% | ^§ | | | 02/27/2060 | | | | 10,954,540 | |
| | 6,833,571 | | | Series 2020-NPL1-A1 | | | 2.86% | ^§ | | | 05/27/2059 | | | | 5,165,783 | |
| | 22,600,000 | | | Series 2020-NPL1-A2 | | | 3.97% | ^§ | | | 05/27/2059 | | | | 17,169,017 | |
| |
| | | | PRPM LLC, | |
| | 17,509,246 | | | Series 2019-2A-A1 | | | 3.97% | ^§ | | | 04/25/2024 | | | | 15,683,371 | |
| | 22,468,797 | | | Series 2019-3A-A1 | | | 3.35% | ^§ | | | 07/25/2024 | | | | 22,328,677 | |
| | 10,029,717 | | | Series 2020-1A-A1 | | | 2.98% | ^§ | | | 02/25/2025 | | | | 8,084,901 | |
| | 8,000,000 | | | Series 2020-1A-A2 | | | 3.97% | ^§ | | | 02/25/2025 | | | | 4,635,880 | |
| |
| | | | RBSGC Mortgage Loan Trust, | |
| | 939,772 | | | Series 2007-A-2A4 | | | 6.25% | | | | 01/25/2037 | | | | 882,639 | |
| |
| | | | Residential Accredit Loans, Inc., | |
| | 2,527,068 | | | Series 2005-QS12-A3 | | | 5.50% | | | | 08/25/2035 | | | | 2,277,588 | |
| | 1,747,949 | | | Series 2005-QS13-1A6 | | | 5.50% | | | | 09/25/2035 | | | | 1,558,541 | |
| | 540,544 | | | Series 2006-QS12-1A1 | | | 6.50% | | | | 09/25/2036 | | | | 367,896 | |
| | 3,143,639 | | | Series 2006-QS12-2A12 (1 Month LIBOR USD + 0.20%, 0.20% Floor, 7.50% Cap) | | | 1.15% | | | | 09/25/2036 | | | | 2,206,729 | |
| | 3,143,639 | | | Series 2006-QS12-2A13 | | | 5.73% | I/F I/O ± | | | 09/25/2036 | | | | 737,620 | |
| | 3,835,456 | | | Series 2006-QS18-1A4 | | | 6.25% | | | | 12/25/2036 | | | | 3,434,792 | |
| | 1,300,130 | | | Series 2006-QS7-A2 | | | 6.00% | | | | 06/25/2036 | | | | 1,126,674 | |
| | 1,062,625 | | | Series 2007-QS11-A1 | | | 7.00% | | | | 10/25/2037 | | | | 883,979 | |
| | 8,262,433 | | | Series 2007-QS1-1A2 (-1 x 1 Month LIBOR USD + 5.45%, 5.45% Cap) | | | 4.50% | I/F I/O | | | 01/25/2037 | | | | 1,243,498 | |
| | 8,262,433 | | | Series 2007-QS1-1A5 (1 Month LIBOR USD + 0.55%, 0.55% Floor, 6.00% Cap) | | | 1.50% | | | | 01/25/2037 | | | | 5,780,339 | |
| | 661,049 | | | Series 2007-QS5-A1 | | | 5.50% | | | | 03/25/2037 | | | | 553,647 | |
| |
| | | | Residential Asset Securities Corporation, | |
| | 1,507,453 | | | Series 2007-KS3-AI3 (1 Month LIBOR USD + 0.25%, 0.25% Floor, 14.00% Cap) | | | 1.20% | | | | 04/25/2037 | | | | 1,475,557 | |
| |
| | | | Residential Asset Securitization Trust, | |
| | 4,553,534 | | | Series 2006-A12-A1 | | | 6.25% | | | | 11/25/2036 | | | | 2,503,603 | |
| | 1,374,626 | | | Series 2006-A8-1A1 | | | 6.00% | | | | 08/25/2036 | | | | 1,074,744 | |
| |
| | | | Residential Funding Mortgage Securities Trust, | |
| | 723,466 | | | Series 2006-SA2-3A1 | | | 5.15% | # | | | 08/25/2036 | | | | 678,747 | |
| |
| | | | Securitized Asset Backed Receivables LLC Trust, | |
| | 14,961,295 | | | Series 2006-NC1-A3 (1 Month LIBOR USD + 0.27%, 0.27% Floor) | | | 1.22% | | | | 03/25/2036 | | | | 12,987,379 | |
| |
| | | | Soundview Home Loan Trust, | |
| | 8,000,000 | | | Series 2005-OPT4-M1 (1 Month LIBOR USD + 0.46%, 0.46% Floor) | | | 1.41% | | | | 12/25/2035 | | | | 5,984,164 | |
| |
| | | | Stanwich Mortgage Loan Company, | |
| | 6,331,789 | | | Series 2019-RPL1-A | | | 3.72% | ^§ | | | 03/15/2049 | | | | 6,250,358 | |
| |
| | | | Structured Adjustable Rate Mortgage Loan Trust, | |
| | 4,020,653 | | | Series 2005-17-5A1 | | | 3.70% | # | | | 08/25/2035 | | | | 2,868,624 | |
| | 3,401,082 | | | Series 2005-22-4A1 | | | 4.04% | # | | | 12/25/2035 | | | | 2,968,079 | |
| | 1,633,705 | | | Series 2008-1-A2 | | | 3.69% | # | | | 10/25/2037 | | | | 1,303,450 | |
| |
| | | | Structured Asset Mortgage Investments Trust, | |
| | 4,744,651 | | | Series 2006-AR6-1A1 (1 Month LIBOR USD + 0.18%, 0.18% Floor, 10.50% Cap) | | | 1.13% | | | | 07/25/2046 | | | | 3,677,085 | |
| | | | | | |
| The accompanying notes are an integral part of these financial statements. | | Annual Report | | March 31, 2020 | | 11 |
| | |
| Schedule of Investments DoubleLine Selective Credit Fund (Cont.) | | March 31, 2020 |
| | | | | | | | | | | | | | | | |
PRINCIPAL
AMOUNT $ | | | SECURITY DESCRIPTION | | RATE | | | MATURITY | | | VALUE $ | |
| |
| | | | Structured Asset Mortgage Investments Trust, (Cont.) | |
| | 5,102,905 | | | Series 2006-AR6-1A3 (1 Month LIBOR USD + 0.19%, 0.19% Floor, 10.50% Cap) | | | 1.14% | | | | 07/25/2046 | | | | 3,459,615 | |
| | 9,968,672 | | | Series 2006-AR7-A1A (1 Month LIBOR USD + 0.21%, 0.21% Floor, 10.50% Cap) | | | 1.16% | | | | 08/25/2036 | | | | 8,043,988 | |
| | 4,284,018 | | | Series 2006-AR8-A2 (1 Month LIBOR USD + 0.21%, 0.21% Floor, 11.50% Cap) | | | 1.16% | | | | 10/25/2036 | | | | 3,956,470 | |
| | 9,265,653 | | | Series 2007-AR3-2A1 (1 Month LIBOR USD + 0.19%, 0.19% Floor, 10.50% Cap) | | | 1.14% | | | | 09/25/2047 | | | | 7,819,248 | |
| |
| | | | Structured Asset Securities Corporation, | |
| | 18,809,425 | | | Series 2007-RF1-1A (1 Month LIBOR USD + 0.19%, 0.19% Floor) | | | 1.14% | ^ | | | 03/25/2037 | | | | 14,460,676 | |
| |
| | | | Thornburg Mortgage Securities Trust, | |
| | 349,796 | | | Series 2007-4-2A1 | | | 3.93% | # | | | 09/25/2037 | | | | 326,891 | |
| |
| | | | Toorak Mortgage Corporation Ltd., | |
| | 1,800,000 | | | Series 2019-2-A2 | | | 4.21% | § | | | 09/25/2022 | | | | 1,604,891 | |
| |
| | | | TVC Mortgage Trust, | |
| | 4,300,000 | | | Series 2020-RTL1-A2 | | | 3.97% | ^§ | | | 09/25/2024 | | | | 3,383,135 | |
| |
| | | | Velocity Commercial Capital Loan Trust, | |
| | 2,321,415 | | | Series 2019-1-M6 | | | 6.79% | #^ | | | 03/25/2049 | | | | 1,258,934 | |
| | 647,795 | | | Series 2019-2-M5 | | | 4.93% | #^ | | | 07/25/2049 | | | | 413,945 | |
| | 4,497,436 | | | Series 2019-2-M6 | | | 6.30% | #^ | | | 07/25/2049 | | | | 2,339,745 | |
| | 2,088,118 | | | Series 2020-1-M6 | | | 5.69% | #^ | | | 02/25/2050 | | | | 680,908 | |
| |
| | | | Verus Securitization Trust, | |
| | 2,092,220 | | | Series 2018-INV1-A2 | | | 3.85% | #^ | | | 03/25/2058 | | | | 2,015,193 | |
| | 3,269,094 | | | Series 2018-INV1-A3 | | | 4.05% | #^ | | | 03/25/2058 | | | | 3,156,563 | |
| | 2,200,000 | | | Series 2020-1-B1 | | | 3.62% | #^ | | | 01/25/2060 | | | | 1,869,148 | |
| |
| | | | VOLT LLC, | |
| | 8,324,025 | | | Series 2017-NP11-A1 | | | 3.38% | ^§ | | | 10/25/2047 | | | | 7,788,646 | |
| | 9,367,466 | | | Series 2019-NPL9-A1A | | | 3.33% | ^§ | | | 11/26/2049 | | | | 8,520,969 | |
| | 14,117,725 | | | Series 2020-NPL1-A1A | | | 3.23% | ^§ | | | 01/25/2050 | | | | 12,789,992 | |
| | 12,730,246 | | | Series 2020-NPL3-A1A | | | 2.98% | ^§ | | | 02/25/2050 | | | | 9,337,801 | |
| | 5,000,000 | | | Series 2020-NPL4-A2 | | | 4.09% | ^§ | | | 03/25/2050 | | | | 3,735,810 | |
| |
| | | | Washington Mutual Mortgage Pass-Through Certificates, | |
| | 1,618,998 | | | Series 2005-10-2A8 | | | 6.00% | | | | 11/25/2035 | | | | 1,437,376 | |
| | 3,764,570 | | | Series 2006-5-2CB6 | | | 6.00% | | | | 07/25/2036 | | | | 3,102,544 | |
| | 10,350,488 | | | Series 2006-AR11-1A (12 Month US Treasury Average + 0.96%, 0.96% Floor) | | | 2.93% | | | | 09/25/2046 | | | | 8,437,522 | |
| | | | | | | | | | | | | | | | |
PRINCIPAL
AMOUNT $/
SHARES | | | SECURITY DESCRIPTION | | RATE | | | MATURITY | | | VALUE $ | |
| |
| | | | Washington Mutual Mortgage Pass-Through Certificates, (Cont.) | |
| | 2,757,089 | | | Series 2007-2-1A6 | | | 6.00% | | | | 04/25/2037 | | | | 2,121,771 | |
| | 234,181 | | | Series 2007-4-1A1 | | | 5.50% | | | | 06/25/2037 | | | | 225,141 | |
| |
| | | | Wells Fargo Alternative Loan Trust, | |
| | 811,240 | | | Series 2007-PA3-1A4 | | | 5.75% | | | | 07/25/2037 | | | | 707,363 | |
| |
| | | | Wells Fargo Mortgage Backed Securities Trust, | |
| | 1,128,123 | | | Series 2006-AR4-2A1 | | | 4.09% | # | | | 04/25/2036 | | | | 1,101,011 | |
| | 6,190,261 | | | Series 2007-7-A1 | | | 6.00% | | | | 06/25/2037 | | | | 6,001,429 | |
| | | | | | | | | | | | | | | | |
| | | | Total Non-Agency Residential Collateralized Mortgage Obligations
(Cost $1,025,737,578) | | | | 889,512,840 | |
| | | | | | | | | | | | | | | | |
| | SHORT TERM INVESTMENTS—8.0% | |
| | 25,943,721 | | | First American Government Obligations Fund - Class U | | | 0.47% | ¨ | | | | | | | 25,943,721 | |
| | 25,943,720 | | | JP Morgan U.S. Government Money Market Fund - Institutional Share Class | | | 0.36% | ¨ | | | | | | | 25,943,720 | |
| | 25,943,720 | | | Morgan Stanley Institutional Liquidity Funds Government Portfolio - Institutional Share Class | | | 0.26% | ¨ | | | | | | | 25,943,720 | |
| | | | | | | | | | | | | | | | |
| | | | Total Short Term Investments
(Cost $77,831,161) | | | | 77,831,161 | |
| | | | | | | | | | | | | | | | |
| | | | Total Investments 99.7%
(Cost $1,113,207,738) | | | | 975,433,243 | |
| | | | Other Assets in Excess of Liabilities 0.3% | | | | 2,982,285 | |
| | | | | | | | | | | | | | | | |
| | | | NET ASSETS 100.0% | | | $ | 978,415,528 | |
| | | | | | | | | | | | | | | | |
| | | | | |
| SECURITY TYPE BREAKDOWN as a % of Net Assets: | | | | | |
Non-Agency Residential Collateralized Mortgage Obligations | | | | 90.9% | |
Short Term Investments | | | | 8.0% | |
Non-Agency Commercial Mortgage Backed Obligations | | | | 0.4% | |
Asset Backed Obligations | | | | 0.2% | |
Collateralized Loan Obligations | | | | 0.2% | |
Other Assets and Liabilities | | | | 0.3% | |
| | | | | |
| | | | 100.0% | |
| | | | | |
| # | Coupon rate is variable based on the weighted average coupon of the underlying collateral. To the extent the weighted average coupon of the underlying assets which comprise the collateral increases or decreases, the coupon rate of this security will increase or decrease correspondingly. The rate disclosed is as of March 31, 2020. |
| ± | Coupon rate is variable or floats based on components including but not limited to reference rate and spread. These securities may not indicate a reference rate and/or spread in their description. The rate disclosed is as of March 31, 2020. |
| ^ | Security exempt from registration under Rule 144A of the Securities Act of 1933. These securities may be resold in transactions exempt from registration to qualified institutional buyers. |
| Þ | Value determined using significant unobservable inputs. |
| § | The interest rate will step up if the issuer does not redeem the bond on or before a scheduled redemption date in accordance with the terms of the instrument. The interest rate shown is the rate in effect as of March 31, 2020. |
| I/O | Interest only security |
| ß | The interest rate may step up conditioned upon the aggregate remaining principal balance of the underlying mortgage loans being reduced below a targeted percentage of the aggregate original principal balance of the mortgage loans. The interest rate shown is the rate in effect as of March 31, 2020. |
| I/F | Inverse floating rate security whose interest rate moves in the opposite direction of reference interest rates. Reference interest rates are typically based on a negative multiplier or slope. Interest rate may also be subject to a cap or floor. |
| ¨ | Seven-day yield as of March 31, 2020 |
| D | This mortgage-backed bond accrues interest which is added to the outstanding principal balance. The interest payment will be deferred until all other tranches in the structure are paid off. The rate disclosed is as of March 31, 2020. |
| | | | | | |
| 12 | | DoubleLine Selective Credit Fund | | | | The accompanying notes are an integral part of these financial statements. |
| | |
| Statement of Assets and Liabilities | | March 31, 2020 |
| | | | | |
| |
ASSETS | | | | | |
Investments in Securities, at Value* | | | $ | 897,602,082 | |
Short Term Investments, at Value* | | | | 77,831,161 | |
Receivable for Fund Shares Sold | | | | 5,700,000 | |
Interest and Dividends Receivable | | | | 2,126,827 | |
Receivable for Investments Sold | | | | 17,121 | |
Prepaid Expenses and Other Assets | | | | 3,420 | |
Total Assets | | | | 983,280,611 | |
| |
LIABILITIES | | | | | |
Distribution Payable | | | | 4,735,087 | |
Administration, Fund Accounting and Custodian Fees Payable | | | | 45,893 | |
Transfer Agent Expenses Payable | | | | 27,405 | |
Professional Fees Payable | | | | 20,614 | |
Accrued Expenses | | | | 17,480 | |
Trustees Fees Payable (See Note 7) | | | | 11,701 | |
Shareholder Reporting Expenses Payable | | | | 6,903 | |
Total Liabilities | | | | 4,865,083 | |
Net Assets | | | $ | 978,415,528 | |
| |
NET ASSETS CONSIST OF: | | | | | |
Paid-in Capital | | | $ | 1,175,951,566 | |
Undistributed (Accumulated) Net Investment Income (Loss) | | | | 26,874 | |
Accumulated Net Realized Gain (Loss) on Investments | | | | (59,788,417 | ) |
Net Unrealized Appreciation (Depreciation) on Investments | | | | (137,774,495 | ) |
Total Distributable Earnings (Loss) (See Note 5) | | | | (197,536,038 | ) |
Net Assets | | | $ | 978,415,528 | |
| |
*Identified Cost: | | | | | |
Investments in Securities | | | $ | 1,035,376,577 | |
Short Term Investments | | | | 77,831,161 | |
| |
Class I (unlimited shares authorized): | | | | | |
Shares Outstanding | | | | 126,991,258 | |
Net Asset Value, Offering and Redemption Price per Share | | | $ | 7.70 | |
| | | | | | |
| The accompanying notes are an integral part of these financial statements. | | Annual Report | | March 31, 2020 | | 13 |
| | |
| Statement of Operations | | For the Year Ended March 31, 2020 |
| | | | | |
| |
INVESTMENT INCOME | | | | | |
Income: | | | | | |
Interest | | | $ | 48,150,657 | |
Total Investment Income | | | | 48,150,657 | |
| |
Expenses: | | | | | |
Investment Advisory Fees | | | | 5,477,393 | |
Administration, Fund Accounting and Custodian Fees | | | | 171,183 | |
Professional Fees | | | | 92,403 | |
Transfer Agent Expenses | | | | 83,348 | |
Registration Fees | | | | 18,176 | |
Shareholder Reporting Expenses | | | | 15,901 | |
Trustees Fees | | | | 11,585 | |
Insurance Expenses | | | | 11,227 | |
Miscellaneous Expenses | | | | 5,007 | |
Total Expenses | | | | 5,886,223 | |
Less: Investment Advisory Fees (Waived) | | | | (5,477,393 | ) |
Net Expenses | | | | 408,830 | |
| |
Net Investment Income (Loss) | | | | 47,741,827 | |
| |
REALIZED & UNREALIZED GAIN (LOSS) ON INVESTMENTS | | | | | |
| |
Net Realized Gain (Loss) on Investments | | | | (10,308,964 | ) |
Net Change in Unrealized Appreciation (Depreciation) on Investments | | | | (115,298,638 | ) |
Net Realized and Unrealized Gain (Loss) on Investments | | | | (125,607,602 | ) |
| |
NET INCREASE (DECREASE) IN NET ASSETS RESULTING FROM OPERATIONS | | | $ | (77,865,775 | ) |
| | | | | | |
| 14 | | DoubleLine Selective Credit Fund | | | | The accompanying notes are an integral part of these financial statements. |
| | |
| Statements of Changes in Net Assets | | |
| | | | | | | | | | |
| | | Year Ended
March 31, 2020 | | Year Ended
March 31, 2019 |
| | |
OPERATIONS | | | | | | | | | | |
Net Investment Income (Loss) | | | $ | 47,741,827 | | | | $ | 42,800,649 | |
Net Realized Gain (Loss) on Investments | | | | (10,308,964 | ) | | | | 2,964,653 | |
Net Change in Unrealized Appreciation (Depreciation) on Investments | | | | (115,298,638 | ) | | | | (15,108,327 | ) |
Net Increase (Decrease) in Net Assets Resulting from Operations | | | | (77,865,775 | ) | | | | 30,656,975 | |
| | |
DISTRIBUTIONS TO SHAREHOLDERS | | | | | | | | | | |
From Earnings | | | | (56,100,700 | ) | | | | (56,433,352 | ) |
| | |
Total Distributions to Shareholders | | | | (56,100,700 | ) | | | | (56,433,352 | ) |
| | |
NET SHARE TRANSACTIONS | | | | | | | | | | |
Increase (Decrease) in Net Assets Resulting from Net Share Transactions | | | | 295,007,856 | | | | | 110,500,000 | |
| | |
Total Increase (Decrease) in Net Assets | | | $ | 161,041,381 | | | | $ | 84,723,623 | |
| | |
NET ASSETS | | | | | | | | | | |
Beginning of Period | | | $ | 817,374,147 | | | | $ | 732,650,524 | |
End of Period | | | $ | 978,415,528 | | | | $ | 817,374,147 | |
| | | | | | |
| The accompanying notes are an integral part of these financial statements. | | Annual Report | | March 31, 2020 | | 15 |
| | | | | | | | | | | | | | | | | | | | | | | | | | | | | | | | | | | | | | | | | | | | | | | | | | | | | | | | | | | | | | | | | | | | | | | | | |
| | | | | Income (Loss) from
Investment Operations: | | Less Distributions: | | | | | | | | Ratios to Average Net Assets: |
For the
Year Ended | | Net Asset
Value,
Beginning
of Period | | Net
Investment
Income
(Loss)1 | | Net Gain
(Loss) on
Investments
(Realized and
Unrealized) | | Total from
Investment
Operations | | Distributions
from Net
Investment
Income | | Distributions
from Net
Realized
Gain | | Total
Distributions | | Net Asset
Value,
End of
Period | | Total
Return | | Net Assets,
End of Period
(000’s) | | Expenses
Before
Advisory Fees
(Waived) and
Other Fees
(Reimbursed)/ Recouped | | Expenses
After
Investment
Advisory
Fees
(Waived) | | Expenses
After
Advisory Fees
(Waived) and
Other Fees
(Reimbursed)/ Recouped | | Net
Investment
Income
(Loss) |
| | | 3/31/2020 | | | | $ | 8.77 | | | | | 0.42 | | | | | (1.00 | ) | | | | (0.58 | ) | | | | (0.49 | ) | | | | — | | | | | (0.49 | ) | | | $ | 7.70 | | | | | (7.11 | )% | | | $ | 978,416 | | | | | 0.59 | % | | | | 0.04 | % | | | | 0.04 | % | | | | 4.79 | % |
| | | 3/31/2019 | | | | $ | 9.05 | | | | | 0.47 | | | | | (0.13 | ) | | | | 0.34 | | | | | (0.62 | ) | | | | — | | | | | (0.62 | ) | | | $ | 8.77 | | | | | 3.85 | % | | | $ | 817,374 | | | | | 0.61 | % | | | | 0.06 | % | | | | 0.06 | % | | | | 5.26 | % |
| | | 3/31/2018 | | | | $ | 9.14 | | | | | 0.56 | | | | | 0.13 | | | | | 0.69 | | | | | (0.78 | ) | | | | — | | | | | (0.78 | ) | | | $ | 9.05 | | | | | 7.81 | % | | | $ | 732,651 | | | | | 0.60 | % | | | | 0.05 | % | | | | 0.08 | % | | | | 6.04 | % |
| | | 3/31/2017 | | | | $ | 9.26 | | | | | 0.65 | | | | | 0.12 | | | | | 0.77 | | | | | (0.89 | ) | | | | — | | | | | (0.89 | ) | | | $ | 9.14 | | | | | 8.69 | % | | | $ | 476,739 | | | | | 0.62 | % | | | | 0.07 | % | | | | 0.07 | % | | | | 6.99 | % |
| | | 3/31/2016 | | | | $ | 10.02 | | | | | 0.61 | | | | | (0.45 | ) | | | | 0.16 | | | | | (0.92 | ) | | | | — | | | | | (0.92 | ) | | | $ | 9.26 | | | | | 1.56 | % | | | $ | 266,110 | | | | | 0.64 | % | | | | 0.09 | % | | | | 0.09 | % | | | | 6.28 | % |
| | | | | | | | | | |
| | | | | | | | | | | | | | | | | | | | | For the Year Ended |
| | | | | | | | | | | | | | | | | | | | | 3/31/2020 | | 3/31/2019 | | 3/31/2018 | | 3/31/2017 | | 3/31/2016 |
| | | Portfolio turnover rate | | | | | | | | | | | | | | | | | | | | | | | | | | | | | | | | | | | 34% | | | | | 25% | | | | | 23% | | | | | 20% | | | | | 16% | |
|
| |
| 1 Calculated based on average shares outstanding during the period.
|
|
| | | | | | |
| 16 | | DoubleLine Selective Credit Fund | | | | The accompanying notes are an integral part of these financial statements. |
| | |
| Notes to Financial Statements | | March 31, 2020 |
1. Organization
The Fund is a separate investment series of DoubleLine Funds Trust (the “Trust”). The Fund commenced operations on August 4, 2014 and was originally classified as anon-diversified fund. The Fund is currently operating as a diversified fund. Currently under the Investment Company Act of 1940, as amended (the “1940 Act”), a diversified fund generally may not, with respect to 75% of its total assets, invest more than 5% of its total assets in the securities of any one issuer or own more than 10% of the outstanding voting securities of such issuer (except, in each case, U.S. Government securities, cash, cash items and the securities of other investment companies). The remaining 25% of a fund’s total assets is not subject to this limitation. Shares of the Fund may currently be purchased in transactions by the Adviser or its affiliates acting in their capacity as investment adviser (or in a similar capacity) for clients, including separately managed private accounts, investment companies registered under the 1940 Act, and other funds, each of which must be an “accredited investor” as defined in Regulation D under the Securities Act. The Fund also may permit purchases of shares by (i) qualified employees, officers and Trustees of the Fund and their qualified family members; (ii) qualified employees and officers of the Adviser or DoubleLine Group LP and their qualified family members; (iii) qualified affiliates of the Adviser or DoubleLine Group LP; and (iv) other qualified accounts. The Fund’s investment objective is to seek long-term total return.
2. Significant Accounting Policies
The Fund is an investment company that applies the accounting and reporting guidance issued in Topic 946, “Financial Services—Investment Companies”, by the Financial Accounting Standards Board (“FASB”). The following is a summary of the significant accounting policies of the Fund. These policies are in conformity with accounting principles generally accepted in the United States of America (“US GAAP”).
A. Security Valuation. The Fund has adopted US GAAP fair value accounting standards which establish a definition of fair value and set out a hierarchy for measuring fair value. These standards require additional disclosures about the various inputs and valuation techniques used to develop the measurements of fair value and a discussion of changes in valuation techniques and related inputs during the period. These inputs are summarized in the three broad levels listed below:
| | • | | Level 1—Unadjusted quoted market prices in active markets for identical securities |
| | • | | Level 2—Quoted prices for identical or similar assets in markets that are not active, or inputs derived from observable market data |
| | • | | Level 3—Significant unobservable inputs (including the reporting entity’s estimates and assumptions) |
Market values for domestic and foreign fixed income securities are normally determined on the basis of valuations provided by independent pricing services. Vendors typically value such securities based on one or more inputs described in the following table which is not intended to be a complete list. The table provides examples of inputs that are commonly relevant for valuing particular classes of fixed income securities in which the Fund is authorized to invest. However, these classifications are not exclusive, and any of the inputs may be used to value any other class of fixed-income securities. Securities that use similar valuation techniques and inputs as described in the following table are categorized as Level 2 of the fair value hierarchy. To the extent the significant inputs are unobservable, the values generally would be categorized as Level 3. Assets and liabilities may be transferred between levels.
| | | | | | |
| | |
| Fixed-income class | | | | | Examples of Inputs |
| | |
All | | | | | | Benchmark yields, transactions, bids, offers, quotations from dealers and trading systems, new issues, spreads and other relationships observed in the markets among comparable securities; and proprietary pricing models such as yield measures calculated using factors such as cash flows, financial or collateral performance and other reference data (collectively referred to as “standard inputs”) |
| | |
Corporate bonds and notes; convertible securities | | | | | | Standard inputs and underlying equity of the issuer |
| | |
US bonds and notes of government and government agencies | | | | | | Standard inputs |
| | |
Residential and commercial mortgage-backed obligations; asset-backed obligations (including collateralized loan obligations) | | | | | | Standard inputs and cash flows, prepayment information, default rates, delinquency and loss assumptions, collateral characteristics, credit enhancements and specific deal information, trustee reports |
Investments in registeredopen-end management investment companies will be valued based upon the net asset value (“NAV”) of such investments and are categorized as Level 1 of the fair value hierarchy.
| | | | | | | | |
| | | | Annual Report | | March 31, 2020 | | 17 |
| | |
| Notes to Financial Statements (Cont.) | | March 31, 2020 |
Securities may be fair valued by the Adviser in accordance with the fair valuation procedures approved by the Board of Trustees (the “Board”). The Adviser’s valuation committee is generally responsible for overseeing the day to day valuation processes and reports periodically to the Board. The Adviser’s valuation committee and the pricing group are authorized to make all necessary determinations of the fair values of portfolio securities and other assets for which market quotations or third party vendor prices are not readily available or if it is deemed that the prices obtained from brokers and dealers or independent pricing services are deemed to be unreliable indicators of market or fair value.
The following is a summary of the fair valuations according to the inputs used to value the Fund’s investments as of March 31, 2020:
| | | | | | | | | | |
| | |
| Category | | | | |
| | |
Investments in Securities | | | | | | | | | | |
| | |
Level 1 | | | | | | | | | | |
| | |
Money Market Funds | | | | | | | | $ | 77,831,161 | |
| | |
Total Level 1 | | | | | | | | | 77,831,161 | |
| | |
Level 2 | | | | | | | | | | |
| | |
Non-Agency Residential Collateralized Mortgage Obligations | | | | | | | | $ | 878,804,216 | |
| | |
Non-Agency Commercial Mortgage Backed Obligations | | | | | | | | | 4,377,762 | |
| | |
Asset Backed Obligations | | | | | | | | | 1,926,845 | |
| | |
Collateralized Loan Obligations | | | | | | | | | 1,699,703 | |
| | |
Total Level 2 | | | | | | | | | 886,808,526 | |
| | |
Level 3 | | | | | | | | | | |
| | |
Non-Agency Residential Collateralized Mortgage Obligations | | | | | | | | | 10,708,624 | |
| | |
Non-Agency Commercial Mortgage Backed Obligations | | | | | | | | | 84,932 | |
| | |
Total Level 3 | | | | | | | | | 10,793,556 | |
| | |
Total | | | | | | | | $ | 975,433,243 | |
See the Schedule of Investments for further disaggregation of investment categories.
The following is a reconciliation of investments in which significant unobservable inputs (Level 3) were used in determining fair value:
| | | | | | | | | | | | | | | | | | | | | | | | | | | | | | | | | | | | | | | | | | | | | | | | | | | | | | | |
| | | | | | | | | | | |
| | | | | Fair Value as of
3/31/2019 | | Net Realized
Gain (Loss) | | Net Change in
Unrealized
Appreciation
(Depreciation)3 | | Net Accretion
(Amortization) | | Purchases1 | | Sales2 | | Transfers Into Level 34 | | Transfers Out
of Level 34 | | Fair Value as
of 3/31/2020 | | Net Change in
Unrealized
Appreciation
(Depreciation)
on securities
held at
3/31/20203 |
Investments in Securities | | | | | | | | | | | | | | | | | | | | | | | | | | | | | | | | | | | | | | | | | | | | | | | | | | | | | | | |
Non-Agency Residential Collateralized Mortgage Obligations | | | | | | | | $ | 14,121,799 | | | | $ | 40,764 | | | | $ | (1,606,924 | ) | | | $ | 220,980 | | | | $ | — | | | | $ | (577,722 | ) | | | $ | — | | | | $ | (1,490,273 | ) | | | $ | 10,708,624 | | | | $ | (1,367,884 | ) |
Non-Agency Commercial Mortgage Backed Obligations | | | | | | | | | 96,054 | | | | | — | | | | | (11,122 | ) | | | | — | | | | | — | | | | | — | | | | | — | | | | | — | | | | | 84,932 | | | | | (11,122 | ) |
Total | | | | | | | | $ | 14,217,853 | | | | $ | 40,764 | | | | $ | (1,618,046 | ) | | | $ | 220,980 | | | | $ | — | | | | $ | (577,722 | ) | | | $ | — | | | | $ | (1,490,273 | ) | | | $ | 10,793,556 | | | | $ | (1,379,006 | ) |
| 1 | Purchases include all purchases of securities, payups and corporate actions. |
| 2 | Sales include all sales of securities, maturities, and paydowns. |
| 3 | Any difference between Net Change in Unrealized Appreciation (Depreciation) and Net Change in Unrealized Appreciation (Depreciation) on securities held at March 31, 2020 may be due to a security that was not held or categorized as Level 3 at either period end. |
| 4 | Transfers into or out of Level 3 can be attributed to changes in the availability of pricing sources and/or in the observability of significant inputs used to measure the fair value of those instruments. |
| | | | | | |
| 18 | | DoubleLine Selective Credit Fund | | | | |
The following is a summary of quantitative information about Level 3 Fair Value Measurements:
| | | | | | | | | | | | | | | | | | |
| | | | | | |
| | | | | | Fair Value as of
3/31/2020 | | | Valuation
Techniques | | Unobservable
Input | | Unobservable Input Values (Weighted Average) + | | | Impact to valuation from an increase to input |
| | | | | | |
Non-Agency Residential Collateralized Mortgage Obligations | | | | | | $ | 10,708,624 | | | Market
Comparables | | Market
Quotes | | | $91.58-$98.53 ($92.92) | | | Significant changes in the market quotes would have resulted in direct and proportional changes in the fair value of the security |
| | | | | | |
Non-Agency Commercial Mortgage Backed Obligations | | | | | | $ | 84,932 | | | Market
Comparables | | Yields | | | 33.00% (33.00%) | | | Increase in the yields would have resulted in the decrease in the fair value of the security |
| + | Unobservable inputs were weighted by the relative fair value of the instruments. |
B. Federal Income Taxes. The Fund has elected to be taxed as a “regulated investment company” and intends to distribute substantially all of its taxable income to its shareholders and otherwise comply with the provisions of Subchapter M of the Internal Revenue Code applicable to regulated investment companies. Therefore, no provision for federal income taxes has been made.
The Fund may be subject to a nondeductible 4% excise tax calculated as a percentage of certain undistributed amounts of net investment income and net capital gains.
The Fund is considered a personal holding company as defined under Section 542 of the Internal Revenue Code because 50% of the value of the Fund’s shares were owned directly or indirectly by five or fewer individuals at certain times during the last half of the year. For this purpose, the term “individual” includes pension trusts, private foundations and certain other tax-exempt trusts. As a personal holding company, the Fund is subject to federal income taxes on undistributed personal holding company income at the maximum individual income tax rate. Generally, provisions for income taxes are not included in the financial statements as the Fund intends to distribute to shareholders all taxable investment income and realized gains and otherwise comply with Subchapter M of the Internal Revenue Code applicable to regulated investment companies.
The Fund has adopted financial reporting rules that require the Fund to analyze all open tax years, as defined by the applicable statute of limitations, for all major jurisdictions. Open tax years 2017-2019 (Federal) and 2016-2019 (CA) for the Fund, are those that are open for exam by taxing authorities. As of March 31, 2020, the Fund has no examination in progress.
Management has analyzed the Fund’s tax position, and has concluded that no liability should be recorded related to uncertain tax positions expected to be taken on the tax return for the fiscal year-ended March 31, 2020. The Fund identifies its major tax jurisdiction as U.S. Federal, the State of Delaware and the State of California. The Fund is not aware of any tax position for which it is reasonably possible that the total amount of unrecognized tax benefits will significantly change in the next twelve months.
C. Security Transactions, Investment Income. Investment securities transactions are accounted for on trade date. Gains and losses realized on sales of securities are determined on a specific identification basis. Interest income, including non-cash interest, is recorded on an accrual basis. Discounts/premiums on debt securities purchased, which may include residual and subordinate notes, are accreted/amortized over the life of the respective securities using the effective interest method except for certain deep discount bonds where management does not expect the par value above the bond’s cost to be fully realized. Dividend income and corporate action transactions, if any, are recorded on the ex-date. Non-cash dividends included in dividend income, if any, are recorded at the fair market value of securities received. Paydown gains and losses on mortgage-related and other asset-backed securities are recorded as components of interest income on the Statement of Operations.
D. Dividends and Distributions to Shareholders. Dividends from net investment income will be declared and paid monthly. The Fund will distribute any net realized long or short-term capital gains at least annually. Distributions are recorded on the ex-dividend date.
Income and capital gain distributions are determined in accordance with income tax regulations which may differ from US GAAP. Permanent book and tax basis differences relating to shareholder distributions will result in reclassifications between paid-in capital, undistributed (accumulated) net investment income (loss), and/or undistributed (accumulated) realized gain (loss). Undistributed (accumulated) net investment income or loss may include temporary book and tax basis differences which will reverse in a subsequent period. Any taxable income or capital gain remaining at fiscal year end is distributed in the following year.
Distributions from investment companies will be classified as investment income or realized gains in the Statement of Operations based on the U.S. income tax characteristics of the distribution if such information is available. In cases where the tax characteristics are not available, such distributions are generally classified as investment income.
| | | | | | |
| | Annual Report | | March 31, 2020 | | 19 |
| | |
| Notes to Financial Statements (Cont.) | | March 31, 2020 |
E. Use of Estimates. The preparation of financial statements in conformity with US GAAP requires management to make estimates and assumptions that affect the reported amounts of assets and liabilities and disclosure of contingent assets and liabilities at the date of the financial statements, as well as the reported amounts of revenues and expenses during the period. Actual results could differ from those estimates.
F. Share Valuation. The NAV per share of the Fund is calculated by dividing the sum of the value of the securities held by the Fund, plus cash and other assets, minus all liabilities (including estimated accrued expenses), by the total number of shares outstanding, rounded to the nearest cent. The Fund’s NAV is typically calculated on days when the New York Stock Exchange opens for regular trading.
G. Guarantees and Indemnifications. Under the Fund’s organizational documents, each Trustee and officer of the Fund is indemnified, to the extent permitted by the 1940 Act, against certain liabilities that may arise out of performance of their duties to the Fund. Additionally, in the normal course of business, the Fund enters into contracts that contain a variety of indemnification clauses. The Fund’s maximum exposure under these arrangements is unknown as this would involve future claims that may be made against the Fund that have not yet occurred. However, the Fund has not had prior claims or losses pursuant to these contracts.
3. Related and Other Party Transactions
The Adviser provides the Fund with investment management services under an Investment Management Agreement (the “Agreement”). Under the Agreement, the Adviser manages the investment of the assets of the Fund, places orders for the purchase and sale of its portfolio securities and is responsible for providing certain resources to assist with the day-to-day management of the Fund’s business affairs. As compensation for its services, the Adviser is entitled to a monthly fee at the annual rate of 0.55% of the average daily net assets of the Fund. The Adviser has arrangements with DoubleLine Group LP to provide personnel and other resources to the Fund.
Pursuant to a letter agreement dated November 20, 2014 between the Adviser and the Trust, on behalf of the Fund (the “Letter Agreement”), the Adviser has agreed to waive the entire investment advisory fee it is entitled to receive pursuant to the Advisory Agreement effective as of December 1, 2014. Such waiver shall continue until terminated (1) by the Adviser upon 60 days’ notice to the Board or (2) immediately upon the approval of a majority vote of the Trustees of the Trust who are not “interested persons” of the Trust, as defined under the 1940 Act. The Adviser may not seek reimbursement from the Fund with respect to any advisory fees waived to comply with the terms of the Letter Agreement. Under the Letter Agreement, for the year ended March 31, 2020, the Adviser fully waived the total investment advisory fee of $5,477,393.
In addition, pursuant to an Expense Limitation Agreement between Trust, on behalf of the Fund, and the Adviser (the “Expense Limitation Agreement”), the Adviser has agreed to waive its investment advisory fee and to reimburse other ordinary operating expenses of the Fund to the extent necessary to limit the ordinary operating expenses to an amount not to exceed 0.64% for Class I shares. Ordinary operating expenses exclude taxes, commissions, mark-ups, litigation expenses, indemnification expenses, interest expenses, Acquired Fund Fees and Expenses, and any extraordinary expenses. The expense limitations described above are expected to apply until at least July 31, 2020. However, these expense limitations may be terminated by the Fund’s Board at any time.
Other than described above, to the extent that the Adviser waives its investment advisory fee and/or reimburses a Fund for other ordinary operating expenses pursuant to the Expense Limitation Agreement, it may seek reimbursement of a portion or all of such amounts at any time within three fiscal years after the fiscal year in which such amounts were waived or reimbursed. The Fund must pay its current ordinary operating expenses before the Adviser is entitled to any recoupment. Any such recoupment would be subject to review by the Board and to the Fund’s expense limitations in place when the expenses were reimbursed or the fees were waived.
As of March 31, 2020, there is no amount remaining that is eligible for reimbursement or recoupment.
4. Purchases and Sales of Securities
For the year ended March 31, 2020, purchases and sales of investments, excluding short term investments, were $556,104,861 and $323,308,758, respectively. There were no transactions in U.S. Government securities (defined as long-term U.S. Treasury bills, bonds and notes) during the period.
| | | | | | |
| 20 | | DoubleLine Selective Credit Fund | | | | |
5. Income Tax Information and Distributions to Shareholders
The tax character of distributions for the Fund was as follows:
| | | | | | | | | | | | | | | |
| | | |
| | | | | Year Ended
March 31, 2020 | | Year Ended
March 31, 2019 |
| | | |
Distributions Paid From: | | | | | | | | | | | | | | | |
| | | |
Ordinary Income | | | | | | | | $ | 56,100,700 | | | | $ | 56,433,352 | |
| | | |
Total Distributions Paid | | | | | | | | $ | 56,100,700 | | | | $ | 56,433,352 | |
The cost basis of investments for federal income tax purposes as of March 31, 2020, was as follows:
| | | | | | | | | | |
| | |
Tax Cost of Investments | | | | | | | | $ | 1,113,207,738 | |
| | |
Gross Tax Unrealized Appreciation | | | | | | | | | 5,553,370 | |
| | |
Gross Tax Unrealized Depreciation | | | | | | | | | (143,327,865 | ) |
| | |
Net Tax Unrealized Appreciation (Depreciation) | | | | | | | | $ | (137,774,495 | ) |
As of March 31, 2020, the components of accumulated earnings (losses) for income tax purposes were as follows:
| | | | | | | | | | |
| | |
Net Tax Unrealized Appreciation (Depreciation) | | | | | | | | $ | (137,774,495 | ) |
| | |
Undistributed Ordinary Income | | | | | | | | | 4,770,289 | |
| | |
Undistributed Long Term Capital Gains | | | | | | | | | — | |
| | |
Total Distributable Earnings | | | | | | | | | 4,770,289 | |
| | |
Other Accumulated Gains (Losses) | | | | | | | | | (64,531,832 | ) |
| | |
Total Accumulated Earnings (Losses) | | | | | | | | $ | (197,536,038 | ) |
As of March 31, 2020, the Fund had $59,788,417 available for a capital loss carryforward.
As of March 31, 2020, the Fund did not have any late year losses or post-October losses.
Additionally, US GAAP requires that certain components of net assets relating to permanent differences be reclassified between financial and tax reporting. These reclassifications have no effect on net assets or NAV per share. The permanent differences primarily relate to paydown losses. For the year ended March 31, 2020, the following table shows the reclassifications made:
| | | | | | | | | | | | | | | | | | | | |
| | | | |
| | | | | Undistributed
(Accumulated)
Net Investment
Income(Loss) | | Accumulated
Net Realized
Gain(Loss) | | Paid-In
Capital |
| | | | |
DoubleLine Selective Credit Fund | | | | | | | | $ | 8,111,084 | | | | $ | (8,111,084 | ) | | | $ | — | |
6. Share Transactions
Transactions in the Fund’s shares were as follows:
| | | | | | | | | | | | | | | | | | | | | | | | | |
| | | |
| | | | | Year Ended
March 31, 2020 | | Year Ended
March 31, 2019 |
| | | | | |
| | | | | Shares | | Amount | | Shares | | Amount |
| | | | | |
Shares Sold | | | | | | | | | 46,234,191 | | | | $ | 402,566,705 | | | | | 22,105,189 | | | | $ | 198,000,000 | |
| | | | | |
Shares Redeemed | | | | | | | | | (12,438,978 | ) | | | | (107,558,849 | ) | | | | (9,863,169 | ) | | | | (87,500,000 | ) |
| | | | | |
Increase (Decrease) in Net Assets Resulting from Net Share Transactions | | | | | | | | | 33,795,213 | | | | $ | 295,007,856 | | | | | 12,242,020 | | | | $ | 110,500,000 | |
| | | | | | |
| | Annual Report | | March 31, 2020 | | 21 |
| | |
| Notes to Financial Statements (Cont.) | | March 31, 2020 |
7. Trustees Fees
Trustees who are not affiliated with the Adviser and its affiliates received, as a group, fees of $11,585 from the Fund during the year ended March 31, 2020. These trustees may elect to defer the cash payment of part or all of their compensation. These deferred amounts, which remain as liabilities of the Fund, are treated as if invested in shares of the Fund or other funds managed by the Adviser and its affiliates. These amounts represent general, unsecured liabilities of the Fund and vary according to the total returns of the selected funds. Trustees Fees in the Statement of Operations are shown as $11,585 which includes $10,697 in current fees (either paid in cash or deferred) and an increase of $888 in the value of the deferred amounts. Certain trustees and officers of the Fund are also officers of the Adviser; such trustees and officers are not compensated by the Fund.
8. Credit Facility
U.S. Bank, N.A. (the “Bank”) has made available to the Trust, (the “DoubleLine Funds”) an uncommitted, $725,000,000 credit facility for short term liquidity in connection with shareholder redemptions. Under the terms of the credit facility, borrowings for each DoubleLine Fund are limited to one-third of the total assets (including the amount borrowed) of such DoubleLine Fund. Fifty percent of the credit facility is available to all of the DoubleLine Funds, on a first come, first served basis. The remaining 50% of the credit facility is allocated among the DoubleLine Funds in accordance with procedures adopted by the Board. Borrowings under this credit facility bear interest at the Bank’s prime rate less 0.50%.
For the year ended March 31, 2020, the Fund did not draw on its available credit facility.
9. Significant Shareholder Holdings
As of March 31, 2020, the Fund had 16 shareholders of record; five of the Fund’s shareholders, two of which were under common control with each other, collectively owned 49% of the total outstanding shares of the Fund. Each shareholder is an institutional separate account over which the Adviser has investment discretion. See the description of Large Shareholder Risk in the following Principal Risks Note.
10. Principal Risks
Below are summaries of some, but not all, of the principal risks of investing in the Fund, each of which could adversely affect the Fund’s NAV, yield and total return. You should read the Fund’s private placement memorandum carefully for a description of the principal risks associated with investing in the Fund.
| | • | | asset allocation risk: the risk that the Fund’s investment performance may depend, at least in part, on how its assets are allocated and reallocated among asset classes, sectors, underlying funds and/or investments and that such allocation will focus on asset classes, sectors, underlying funds, or investments that perform poorly or underperform other asset classes, sectors, underlying funds, or available investments. |
| | • | | asset-backed securities investment risk: the risk that borrowers may default on the obligations that underlie the asset-backed security and that, during periods of falling interest rates, asset backed securities may be called or prepaid, which may result in the Fund having to reinvest proceeds in other investments at a lower interest rate, and the risk that the impairment of the value of the collateral underlying a security in which the Fund invests (due, for example, to non-payment of loans) will result in a reduction in the value of the security. |
| | • | | cash position risk: to the extent that the Fund holds assets in cash, cash equivalents, and other short-term investments, the ability of the Fund to meet its objective may be limited. |
| | • | | collateralized debt obligations risk: the risks of an investment in a collateralized debt obligation (“CDO”) depend largely on the quality and type of the collateral and the tranche of the CDO in which the Fund invests. Normally, collateralized bond obligations (“CBOs”), collateralized loan obligations (“CLO”) and other CDOs are privately offered and sold, and thus are not registered under the securities laws. As a result, investments in CDOs may be characterized by the Fund as illiquid securities; however, an active dealer market, or other relevant measures of liquidity, may exist for CDOs allowing a CDO potentially to be deemed liquid by the Adviser under liquidity policies approved by the Board. In addition to the risks associated with debt instruments (e.g., interest rate risk and credit risk), CDOs carry additional risks including, but not limited to: (i) the possibility that distributions from the collateral will not be adequate to make interest or other payments; (ii) the quality of the collateral may decline in value or default; (iii) the possibility that the Fund may invest in CDOs that are subordinate to other classes of the issuer’s securities; and (iv) the complex structure of the security may not be fully understood at the time of investment and may produce disputes with the issuer or unexpected investment results. |
| | | | | | |
| 22 | | DoubleLine Selective Credit Fund | | | | |
| | • | | counterparty risk: the risk that the Fund will be subject to credit risk with respect to the counterparties to the derivative contracts and other instruments, such as repurchase and reverse repurchase agreements, entered into by the Fund or held by special purpose or structured vehicles in which the Fund invests. Subject to certain limitations for U.S. federal income tax purposes, the Fund is not subject to any limit with respect to the number of transactions it can enter into with a single counterparty. To the extent that the Fund enters into multiple transactions with a single or a small set of counterparties, it will be subject to increased counterparty risk. |
| | ° | | credit risk: the risk that an issuer or counterparty will fail to pay its obligations to the Fund when they are due. As a result, the Fund’s income might be reduced, the value of the Fund’s investment might fall, and/or the Fund could lose the entire amount of its investment. Changes in the financial condition of an issuer or counterparty, changes in specific economic, social or political conditions that affect a particular type of security or other instrument or an issuer, and changes in economic, social or political conditions generally can increase the risk of default by an issuer or counterparty, which can affect a security’s or other instrument’s credit quality or value and an issuer’s or counterparty’s ability to pay interest and principal when due. The values of lower quality debt securities (commonly known as “junk bonds”), including floating rate loans, tend to be particularly sensitive to these changes. The values of securities also may decline for a number of other reasons that relate directly to the issuer, such as management performance, financial leverage and reduced demand for the issuer’s goods and services, as well as the historical and prospective earnings of the issuer and the value of its assets. |
| | ° | | extension risk: the risk that if interest rates rise, repayments of principal on certain debt securities, including, but not limited to, floating rate loans and mortgage-related securities, may occur at a slower rate than expected and the expected maturity of those securities could lengthen as a result. Securities that are subject to extension risk generally have a greater potential for loss when prevailing interest rates rise, which could cause their values to fall sharply. |
| | ° | | interest rate risk: the risk that debt instruments will change in value because of changes in interest rates. The value of an instrument with a longer duration (whether positive or negative) will be more sensitive to changes in interest rates than a similar instrument with a shorter duration. |
| | ° | | prepayment risk: the risk that the issuer of a debt security, including floating rate loans and mortgage-related securities, repays all or a portion of the principal prior to the security’s maturity. In times of declining interest rates, there is a greater likelihood that the Fund’s higher yielding securities will be pre-paid with the Fund being unable to reinvest the proceeds in an investment with as great a yield. Prepayments can therefore result in lower yields to shareholders of the Fund. |
| | • | | defaulted securities risk: the risk of the uncertainty of repayment of defaulted securities (e.g., a security on which a principal or interest payment is not made when due) and obligations of distressed issuers. |
| | • | | derivatives risk: the risk that an investment in derivatives will not perform as anticipated by the Adviser, may not be available at the time or price desired, cannot be closed out at a favorable time or price, will increase the Fund’s transaction costs, or will increase the Fund’s volatility; that derivatives may create investment leverage; that, when a derivative is used as a substitute for or alternative to a direct cash investment, the transaction may not provide a return that corresponds precisely or at all with that of the cash investment; or that, when used for hedging purposes, derivatives will not provide the anticipated protection, causing the Fund to lose money on both the derivatives transaction and the exposure the Fund sought to hedge. |
| | • | | focused investment risk: the risk that a fund that invests a substantial portion of its assets in a particular market, industry, sector, group of industries or sectors, country, region, group of countries or asset class is, relative to a fund that invests in a more diverse investment portfolio, more susceptible to any single economic, market, political, regulatory or other occurrence affecting, for example, the particular markets, industries, regions, sectors or asset classes in which the Fund is invested. |
| | • | | foreign currency risk: the risk that fluctuations in exchange rates may adversely affect the value of the Fund’s investments denominated in foreign currencies. |
| | • | | foreign investing risk: the risk that investments in foreign securities or in issuers with significant exposure to foreign markets, as compared to investments in U.S. securities or in issuers with predominantly domestic market exposure, may be more vulnerable to economic, political, and social instability and subject to less government supervision, lack of transparency, inadequate regulatory and accounting standards, and foreign taxes. If the Fund buys securities denominated |
| | | | | | |
| | Annual Report | | March 31, 2020 | | 23 |
| | |
| Notes to Financial Statements (Cont.) | | March 31, 2020 |
| | in a foreign currency, receives income in foreign currencies, or holds foreign currencies from time to time, the value of the Fund’s assets, as measured in U.S. dollars, can be affected unfavorably by changes in exchange rates relative to the U.S. dollar or other foreign currencies. Foreign markets are also subject to the risk that a foreign government could restrict foreign exchange transactions or otherwise implement unfavorable currency regulations. |
| | • | | fund level tax risk: the risk that the Fund could be considered a personal holding company for federal income tax purposes, which will result in Fund-level income tax and an additional personal holding company tax of 20% on all the investment income and gains of the Fund not timely distributed to shareholders. |
| | • | | high yield risk: the risk that debt instruments rated below investment grade or debt instruments that are unrated and of comparable or lesser quality are predominantly speculative. These instruments, commonly known as ‘junk bonds’, have a higher degree of default risk and may be less liquid than higher-rated bonds. These instruments may be subject to greater price volatility due to such factors as specific corporate developments, interest rate sensitivity, negative perceptions of high yield investments generally, and less secondary market liquidity. |
| | • | | large shareholder risk: the risk that certain account holders, including the Adviser or funds or accounts over which the Adviser (or related parties of the Adviser) has investment discretion, may from time to time own or control a significant percentage of the Fund’s shares. The Fund is subject to the risk that a redemption by those shareholders of all or a portion of their Fund shares, including as a result of an asset allocation decision made by the Adviser (or related parties of the Adviser), will adversely affect the Fund’s performance if it is forced to sell portfolio securities or invest cash when the Adviser would not otherwise choose to do so. Redemptions of a large number of shares may affect the liquidity of the Fund’s portfolio, increase the Fund’s transaction costs, and accelerate the realization of taxable income and/or gains to shareholders. |
| | • | | leveraging risk: the risk that certain investments by the Fund involving leverage may have the effect of increasing the volatility of the Fund’s value of the portfolio, and the risk of loss in excess of invested capital. |
| | • | | limited offering risk: the risk that since the Fund is currently offered only to a limited number of investors, the Fund’s assets may grow at a slower rate than if the Fund engaged in a broader public offering. As a result, the Fund may incur operating expenses at a rate higher than mutual funds that are larger or more broadly offered. In addition, the Fund’s assets may not achieve a size sufficient to make the Fund economically viable. Any liquidation of the Fund may result in a sale of assets of the Fund at an unfavorable time or at prices below those at which the Fund has valued them. |
| | • | | LIBOR risk: the terms of many investments, financings or other transactions to which the Fund may be a party have been historically tied to the London Interbank Offered Rate, or “LIBOR.” LIBOR is the offered rate at which major international banks can obtain wholesale, unsecured funding, and LIBOR may be available for different durations (e.g., 1 month or 3 months) and for different currencies. LIBOR may be a significant factor in determining the Fund’s payment obligations under a derivative investment, the cost of financing to the Fund or an investment’s value or return to the Fund, and may be used in other ways that affect the Fund’s investment performance. In July 2017, the Financial Conduct Authority, the United Kingdom’s financial regulatory body, announced that after 2021 it will cease its active encouragement of banks to provide the quotations needed to sustain LIBOR. That announcement suggests that LIBOR may cease to be published after that time. Various financial industry groups have begun planning for that transition, but there are obstacles to converting certain securities and transactions to a new benchmark. Transition planning is at an early stage, and neither the effect of the transition process nor its ultimate success can yet be known. The transition away from LIBOR might lead to increased volatility and illiquidity in markets for instruments whose terms currently include LIBOR, reduce the effectiveness of new hedges placed against existing LIBOR-based investments, increased costs for certain LIBOR-related instruments or financing transactions and cause prolonged adverse market conditions for the Fund. All of the aforementioned may adversely affect the Fund’s performance or NAV. |
| | • | | liquidity risk: the risk that the Fund may be unable to sell a portfolio investment at a desirable time or at the value the Fund has placed on the investment. |
| | • | | market risk: the risk that markets will perform poorly or that the returns from the securities in which the Fund invests will underperform returns from the general securities markets or other types of investments. Markets may, in response to governmental actions or intervention, political, economic or market developments, or other external factors such as those experienced recently in the first calendar quarter of 2020 in response to an outbreak of respiratory disease caused by a novel coronavirus designated as COVID-19, experience periods of high volatility and reduced liquidity. During those periods, the Fund may experience high levels of shareholder redemptions, and may have to sell securities at times when the Fund would otherwise not do so, and potentially at unfavorable prices. Certain securities may be difficult to value during such periods. These risks may be heightened for fixed income securities due to the current low interest rate environment. |
| | | | | | |
| 24 | | DoubleLine Selective Credit Fund | | | | |
| | • | | mortgage-backed securities risk: the risk that borrowers may default on their mortgage obligations or the guarantees underlying the mortgage-backed securities will default or otherwise fail and that, during periods of falling interest rates, mortgage-backed securities will be called or prepaid, which may result in the Fund having to reinvest proceeds in other investments at a lower interest rate. During periods of rising interest rates, the average life of a mortgage-backed security may extend, which may lock in a below-market interest rate, increase the security’s duration, and reduce the value of the security. Enforcing rights against the underlying assets or collateral may be difficult, or the underlying assets or collateral may be insufficient if the issuer defaults. The values of certain types of mortgage-backed securities, such as inverse floaters and interest-only and principal-only securities, may be extremely sensitive to changes in interest rates and prepayment rates. The Fund may invest in mortgage-backed securities that are subordinate in their right to receive payment of interest and re-payment of principal to other classes of the issuer’s securities. |
| | • | | operational risk: an investment in the Fund, like any fund, can involve operational risks arising from factors such as processing errors, human errors, inadequate or failed internal or external processes, failures in systems and technology, changes in personnel and errors caused by third-party service providers. The occurrence of any of these failures, errors or breaches could result in investment losses to the Fund, a loss of information, regulatory scrutiny, reputational damage or other events, any of which could have a material adverse effect on the Fund. While the Fund seeks to minimize such events through controls and oversight, there may still be failures that could cause losses to the Fund. |
| | • | | portfolio management risk: the risk that an investment strategy may fail to produce the intended results or that the securities held by the Fund will underperform other comparable funds because of the portfolio managers’ choice of investments. |
| | • | | portfolio turnover risk: the risk that frequent purchases and sales of portfolio securities may result in higher Fund expenses and may result in larger distributions of taxable capital gains to investors as compared to a fund that trades less frequently. |
| | • | | price volatility risk: the risk that the value of the Fund’s investment portfolio will change, potentially frequently and in large amounts, as the prices of its investments go up or down. |
| | • | | reliance on the adviser: the risk associated with the Fund’s ability to achieve its investment objective being dependent upon the Adviser’s ability to identify profitable investment opportunities for the Fund. While the portfolio managers of the Fund may have considerable experience in managing other portfolios with investment objectives, policies and strategies that are similar, the past experience of the portfolio managers, including with other strategies and funds, does not guarantee future results for the Fund. |
| | • | | restricted securities risk: the risk that the Fund may be prevented or limited by law or the terms of an agreement from selling a security (a “restricted security”). To the extent that the Fund is permitted to sell a restricted security, there can be no assurance that a trading market will exist at any particular time and the Fund may be unable to dispose of the security promptly at reasonable prices or at all. The Fund may have to bear the expense of registering the securities for resale and the risk of substantial delays in effecting the registration. Also, restricted securities may be difficult to value because market quotations may not be readily available, and the values of restricted securities may have significant volatility. |
| | • | | securities or sector selection risk: the risk that the securities held by the Fund will underperform securities held in other funds investing in similar asset classes or comparable benchmarks because of the portfolio managers’ choice of securities or sectors for investment. To the extent the Fund focuses or concentrates its investments in a particular sector or related sectors, the Fund will be more susceptible to events or factors affecting companies in that sector or related sectors. |
| | • | | structured products and structured notes risk: the risk that an investment in a structured product may decline in value due to changes in the underlying instruments on which the product is based. In addition to the general risks associated with fixed income securities discussed herein, structured products carry additional risks including, but not limited to: (i) the possibility that distributions from underlying investments will not be adequate to make interest or other payments; (ii) the quality of the underlying investments may decline in value or default; (iii) the possibility that the security may be subordinate to other classes of the issuer’s securities; and (iv) the complex structure of the security may not be fully understood at the time of investment and may produce disputes with the issuer or unexpected investment results. |
| | • | | valuation risk: the valuation of the Fund’s investments involves subjective judgment. There can be no assurance that the Fund will value its investments in a manner that accurately reflects their market values or that the Fund will be able to sell any investment at a price equal to the valuation ascribed to that investment for purposes of calculating the Fund’s NAV. Certain securities in which the Fund may invest, including, for example, high yield bonds, commodities, derivatives, emerging market securities, mortgage-related securities, complex securities, and thinly-traded or illiquid investments may be more difficult to value accurately, especially during periods of market disruptions or extreme market volatility. |
| | | | | | |
| | Annual Report | | March 31, 2020 | | 25 |
| | |
| Notes to Financial Statements (Cont.) | | March 31, 2020 |
| | Technological issues or other service disruption issues involving third party service providers may also cause the Fund to value its investments incorrectly. Incorrect valuations of the Fund’s portfolio holdings could result in the Fund’s shareholder transactions being effected at an NAV that does not accurately reflect the underlying value of the Fund’s portfolio, resulting in the dilution of shareholder interests. |
11. Subsequent Events
In preparing these financial statements, the Fund has evaluated events and transactions for potential recognition or disclosure through the date the financial statements were issued. The Fund has determined there are no subsequent events that would need to be disclosed in the Fund’s financial statements.
| | | | | | |
| 26 | | DoubleLine Selective Credit Fund | | | | |
| | |
| Report of Independent Registered Public Accounting Firm | | |
To the Board of Trustees of DoubleLine Funds Trust and Shareholders of DoubleLine Selective Credit Fund
Opinion on the Financial Statements
We have audited the accompanying statement of assets and liabilities, including the schedule of investments, ofDoubleLine Selective Credit Fund(one of the funds constituting DoubleLine Funds Trust, referred to hereafter asthe “Fund”) as of March 31, 2020, the related statement of operationsfor the year ended March 31, 2020, the statement of changes in net assets for each of the two years in the period ended March 31, 2020, including the related notes,and the financial highlights for each of the five years in the period ended March 31, 2020 (collectively referred to as the “financial statements”). In our opinion, the financial statements present fairly, in all material respects, the financial position of the Fund as of March 31, 2020, the results of its operations for the year then ended, the changes in its net assets for each of the two years in the period ended March 31, 2020 and the financial highlights for each of the five years in the period ended March 31 ,2020, in conformity with accounting principles generally accepted in the United States of America.
Basis for Opinion
These financial statements are the responsibility of the Fund’s management. Our responsibility is to express an opinion on the Fund’s financial statements based on our audits. We are a public accounting firm registered with the Public Company Accounting Oversight Board (United States) (PCAOB) and are required to be independent with respect to the Fund in accordance with the U.S. federal securities laws and the applicable rules and regulations of the Securities and Exchange Commission and the PCAOB.
We conducted our audits of these financial statements in accordance with the standards of the PCAOB. Those standards require that we plan and perform the audit to obtain reasonable assurance about whether the financial statements are free of material misstatement, whether due to error or fraud.
Our audits included performing procedures to assess the risks of material misstatement of the financial statements, whether due to error or fraud, and performing procedures that respond to those risks. Such procedures included examining, on a test basis, evidence regarding the amounts and disclosures in the financial statements. Our audits also included evaluating the accounting principles used and significant estimates made by management, as well as evaluating the overall presentation of the financial statements. Our procedures included confirmation of securities owned as of March 31, 2020 by correspondence with the custodian and brokers; when replies were not received from brokers, we performed other auditing procedures. We believe that our audits provide a reasonable basis for our opinion.

Los Angeles, California
May 21, 2020
We have served as the auditor of one or more investment companies in DoubleLine Investment Company Complex since 2010.
| | | | | | |
| | Annual Report | | March 31, 2020 | | 27 |
| | |
| Shareholder Expenses | | (Unaudited) March 31, 2020 |
Example
As a shareholder of the Fund, you incur two basic types of costs: (1) transaction costs and (2) ongoing costs, including management fees and other Fund expenses.
This Example is intended to help you understand your ongoing costs (in dollars) of investing in the Fund and to compare these costs with the ongoing costs of investing in other mutual funds. The Example is based on an investment of $1,000 invested at the beginning of the period and held for the entire period 10/1/19 through 3/31/20. Expenses Paid During Period are equal to the net annualized expense ratio for the Fund, multiplied by the average account value over the period, multiplied by 183/366 (to reflect the one-half year period).
Actual Expenses
The actual return columns in the following table provide information about account values based on actual returns and actual expenses. You may use the information in these columns, together with the amount you invested, to estimate the expenses that you paid over the period. Simply divide your account value by $1,000 (for example, an $8,600 account value divided by $1,000 = 8.6), then multiply the result by the number in the respective line under the heading entitled “Expenses Paid During Period” to estimate the expenses you paid on your account during this period. In addition to the expenses shown below in the table, as a shareholder you will be assessed fees for returned checks and stop payment orders at prevailing rates charged by U.S. Bancorp Fund Services, LLC, the Fund’s transfer agent. The transfer agent charges a transaction fee of $25.00 on returned checks and stop payment orders. If you paid a transaction fee, you would add the fee amount to the expenses paid on your account this period to obtain your total expenses paid.
Hypothetical Example for Comparison Purposes
The hypothetical return columns in the following table provide information about hypothetical account values and hypothetical expenses based on a Fund’s actual expense ratio and an assumed rate of return of 5% per year before expenses, which is not a Fund’s actual return. The hypothetical account values and expenses may not be used to estimate the actual ending account balance or expenses you paid for the period. You may use this information to compare the ongoing costs of investing in the Fund and other funds. To do so, compare this 5% hypothetical example with the 5% hypothetical examples that appear in the shareholder reports of the other funds. Please note that the expenses shown in the table are meant to highlight your ongoing costs only and do not reflect the transaction fees discussed above. Therefore, those columns are useful in comparing ongoing costs only, and will not help you determine the relative total costs of owning different funds. In addition, if these transactional costs were included, your costs would have been higher.
| | | | | | | | | | | | | | | | | | | | | | | | | | | | | | | | | | | | | | | | |
| | | | | | |
| | | | | | | | | | | Actual | | Hypothetical
(5% return
before expenses) |
| | | | | | | | |
| | | | | | | Fund’s
Annualized
Expense Ratio1 | | Beginning
Account
Value | | Ending
Account
Value
3/31/20 | | Expenses
Paid During
Period*1 | | Ending
Account
Value
3/31/20 | | Expenses
Paid During
Period*1 |
| | | | | | | | |
DoubleLine Selective Credit Fund | | | | | | | Class I | | | | 0.04% | | | | $ | 1,000 | | | | $ | 898 | | | | $ | 0.19 | | | | $ | 1,025 | | | | $ | 0.20 | |
* Expenses Paid During Period are equal to the net annualized expense ratio for the Fund, multiplied by the average account value over the period, multiplied by 183/366 (to reflect the one-half year period).
1 Reflects fee waiver and expense limitation arrangements in effect during the period.
| | | | | | |
| 28 | | DoubleLine Selective Credit Fund | | | | |
| | |
| Growth of Investment | | (Unaudited) March 31, 2020 |
DoubleLine Selective Credit Fund
Value of a $100,000 Investment
Class I Shares1
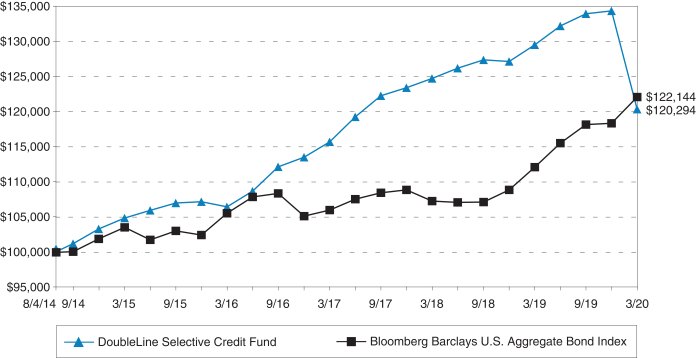
Average Annual Total Returns1
As of March 31, 2020
| | | | | | | | | | | | | | | | | | | | |
| | | | |
| | | | | 1 Year | | 5 Year | | Since
Inception
(8/4/2014) |
| | | | |
DoubleLine Selective Credit Fund Class I | | | | | | | | | -7.11% | | | | | 2.80% | | | | | 3.32% | |
| | | | |
Bloomberg Barclays U.S. Aggregate Bond Index | | | | | | | | | 8.93% | | | | | 3.36% | | | | | 3.60% | |
| 1 | Past performance is not an indication of future results. Returns represent past performance and reflect changes in share prices, the reinvestment of all dividends and capital gains, expense limitations and the effects of compounding. The private placement memorandum contains more complete information on the investment objectives, risks, charges and expenses of the investment company, which investors should read and consider carefully before investing. To obtain a private placement memorandum, contact an authorized representative at 213-633-8200. The Fund’s adviser waived a portion of its management fee and/or reimbursed Fund expenses during the period shown. Had the adviser not done so, the Fund’s total returns would have been lower. The returns shown do not reflect taxes a shareholder would pay on distributions or redemptions. Total investment return and principal value of your investment will fluctuate, and your shares, when redeemed, may be worth more or less than their original cost. Current performance may be higher or lower than the performance data quoted. Please call213-633-8200 to receive performance results current to the most recent month-end. Bloomberg Barclays U.S. Aggregate Bond Index-This index represents securities that are SEC-registered, taxable, and dollar denominated. The index covers the US investment grade fixed rate bond market, with index components for government and corporate securities, mortgage pass-through securities, and asset-backed securities. These major sectors are subdivided into more specific indices that are calculated and reported on a regular basis. The Fund’s investments likely will diverge widely from the components of the benchmark Index which could lead to performance dispersion between the Fund and the benchmark Index, meaning that the Fund could outperform or underperform the Index at any given time. |
| | | | | | |
| | Annual Report | | March 31, 2020 | | 29 |
| | |
| Evaluation of Advisory Agreement by the Board of Trustees | | (Unaudited) March 31, 2020 |
DoubleLine Total Return Bond Fund
DoubleLine Core Fixed Income Fund
DoubleLine Emerging Markets Fixed Income Fund
DoubleLine Multi-Asset Growth Fund
DoubleLine Cayman Multi-Asset Growth Fund I Ltd.
DoubleLine Low Duration Bond Fund
DoubleLine Floating Rate Fund
DoubleLine Shiller Enhanced CAPE®
DoubleLine Flexible Income Fund
DoubleLine Low Duration Emerging Markets Fixed Income Fund
DoubleLine Long Duration Total Return Bond Fund
DoubleLine Selective Credit Fund
DoubleLine Strategic Commodity Fund
DoubleLine Strategic Commodity Ltd.
DoubleLine Global Bond Fund
DoubleLine Infrastructure Income Fund
DoubleLine Ultra Short Bond Fund
DoubleLine Shiller Enhanced International CAPE®
DoubleLine Colony Real Estate and Income Fund
DoubleLine Opportunistic Credit Fund
DoubleLine Income Solutions Fund
Atan in-person meeting in February 2020, the Boards of Trustees (the “Board” or the “Trustees”) of theDoubleLine open-end mutual funds andclosed-end funds (the “Funds”) approved the continuation of the investment advisory andsub-advisory agreements (the “Advisory Agreements”) between DoubleLine and those Funds. That approval included approval by the Trustees who are not “interested persons” (as defined in the Investment Company Act of 1940, as amended) of the Funds (the “Independent Trustees”) voting separately. When used in this summary, “DoubleLine” refers collectively to DoubleLine Capital LP and to DoubleLine Alternatives LP.
The Trustees’ determination to approve the continuation of each Advisory Agreement was made on the basis of each Trustee’s business judgment after an evaluation of all of the information provided to the Trustees, including information provided for their consideration at their February 2020 meeting with management and at meetings held in preparation for that February 2020 meeting, including portions held outside the presence of management, specifically to review and consider materials related to the proposed continuation of each Advisory Agreement. The Trustees meet over the course of the year with investment advisory, compliance, and other personnel from DoubleLine and regularly review detailed information, presented both orally and in writing, regarding the services performed by DoubleLine for the benefit of the Funds and the investment program, performance, and operations of each Fund. In considering whether to approve the continuation of the Advisory Agreements, the Trustees took into account information presented to them over the course of the past year.
This summary describes a number, but not necessarily all, of the most important factors considered by the Board and the Independent Trustees. Individual Trustees may have given different weights to certain factors and assigned various degrees of materiality to information received in connection with the approval process. No single factor was determined to be decisive. In all of their deliberations, the Independent Trustees were advised by independent counsel.
The Trustees considered the nature, extent, and quality of the services, including the expertise and experience of investment personnel, provided and expected to be provided by DoubleLine to each Fund. In this regard, the Trustees considered that DoubleLine provides a full investment program for the Funds, and noted DoubleLine’s representation that it seeks to provide attractive returns with a strong emphasis on risk management. The Board considered in particular the difficulty of managing debt related portfolios, noting that managing such portfolios requires a portfolio management team to balance a number of factors, which may include, among others, securities of varying maturities and durations, actual and anticipated interest rate changes and volatility, prepayments, collateral management, counterpartymanagement, pay-downs, credit events, workouts, and net new issuances. In their evaluation of the services provided by DoubleLine and the Funds’ contractual relationships with DoubleLine, the Trustees considered generally the long-term performance record of the firm’s portfolio management personnel, including among others Mr. Jeffrey Gundlach, and the strong overall demand for products managed by DoubleLine.
| | | | | | |
| 30 | | DoubleLine Selective Credit Fund | | | | |
| | |
| | | (Unaudited) March 31, 2020 |
The Trustees reviewed reports (the “Strategic Insight Reports”) provided by Strategic Insight, an Asset International Company (“Strategic Insight”), that comparedeach open-end Fund’s net management fee ratio and net total expense ratio (Class I shares) against its Strategic Insight peer group, andeach open-end Fund’s performance records (Class I shares) for theone-year, three-year (where applicable) and five-year (where applicable) periods ended December 31, 2019 against its Morningstar category. The Independent Trustees met with Strategic Insight representatives to review Strategic Insight’s selection of peer groups, including the factors Strategic Insight considers in assembling peer groups of funds for the various Funds.
With respect to the comparative performance information in the Strategic Insight Reports, the Trustees noted in particular thateach open-end Fund, other than DoubleLine Floating Rate Fund (“Floating Rate”), DoubleLine Low Duration Emerging Markets Fixed Income Fund (“Low Duration EMFI”), DoubleLine Global Bond Fund (“Global Bond”), DoubleLine Ultra Short Fund (“Ultra Short”), and DoubleLine Shiller Enhanced International CAPE (“International CAPE”), was in the first or second performance quartile relative to its respective Morningstar category for the longest period ended December 31, 2019 for which comparative performance information was presented by Strategic Insight. The Trustees considered specific factors cited by DoubleLine for any relative underperformance of theopen-end Funds, which in most cases resulted from decisions of the Funds’ portfolio management team as to risk management and the overall positioning and strategy of the Funds. In respect of Low Duration EMFI and Ultra Short, the Trustees considered DoubleLine’s explanation that conservative credit and duration positioning contributed significantly to the relative performance of those Funds. In respect of Floating Rate, the Trustees considered DoubleLine’s representation that conservative credit positioning contributed to the relative underperformance of that Fund. The Trustees also considered information Strategic Insight and DoubleLine provided regarding peer group construction issues and differences in investment mandate in their evaluations of the relative performance of Low Duration EMFI, Global Bond and International CAPE.
The Trustees considered the portion of the Strategic Insight Reports coveringthe open-end Funds’ expenses and advisory fees, noting that the reports showed thateach open-end Fund, other than DoubleLine Emerging Markets Fixed Income Fund (“EMFI”), DoubleLine Multi-Asset Growth Fund (“MAG”), DoubleLine Long Duration Total Return Fund (“Long Duration Total Return”), DoubleLine Strategic Commodity Fund (“Strategic Commodity”), and DoubleLine Infrastructure Income Fund (“Infrastructure Income”), had a net total expense ratio in the first or second quartile of its peer group. The Trustees noted that none of the Funds had a net total expense ratio that was in the fourth comparative quartile of its peer group and that EMFI and Infrastructure Income were within four basis points (or less) of its expense group median.
The Trustees consideredeach open-end Fund’s net management fee ratio relative to its expense peer group and, in respect of those Funds with a net management fee ratio above the median of its peer group, the Trustees considered DoubleLine’s pricing policy for its advisory fees and that DoubleLine does not seek to be a lowest cost provider, nor does it have a policy to set its advisory fees below the median of a Fund’s peers. In respect of MAG, Long Duration Total Return, Strategic Commodity and Infrastructure Income, each of which had a net management fee that fell in the fourth quartile of its expense peer group, the Trustees considered the long-term relative performance of those Funds and that each had performed in either the first or second quartile of its Morningstar category over the longest-period of performance shown in the Strategic Insight report. The Trustees also considered information provided by DoubleLine that reflected differences in investment mandate, approach or flexibility between each of those Funds and the bulk of their peers generally, as well as DoubleLine’s undertaking to reduce the management fee of Long Duration Total Return to a level that would have been below the median of its expense peer group had it been in effect at the time the comparative information was compiled.
As to the Opportunistic Credit Fund (“DBL”), the Trustees noted that DBL’s net management fee ratio and net total expense ratio were shown in the Strategic Insight Reports to be higher than the median of the Fund’s peer group. The Trustees noted DBL’s favorable relative long-term performance, with its performance ranking in the second quartile of its Morningstar peer group for the five-year period ended December 31, 2019. They also noted its less favorable performance over the three-and one-year periods ended December 31, 2019. The Trustees considered DoubleLine’s explanation for DBL’s recent underperformance, including its greater focus on investment in mortgage-backed securities and its more limited exposure to credit risk than many of its more diversified peers.
As to the Income Solutions Fund (“DSL”), the Trustees noted that, although DSL was shown in the Strategic Insight Reports to have performed in the fourth quartile of its peers overthe one-year period ended December 31, 2019, it performed in the first quartile of its Morningstar peer group over the three- and five-year periods ended December 31, 2019. They noted that DSL’s net management fee ratio and net total expense ratio were higher than the median of its peer group, though both were in the third quartile of the peer group. In evaluating the comparative net management fee and net total expense ratio of DSL, the Trustees considered DSL’s favorable relative performance and DoubleLine’s statement that the Fund’s fees reflect the experience and expertise DoubleLine brings to managing the Fund. The Trustees noted that both DBL and DSL had employed leverage for the
| | | | | | |
| | Annual Report | | March 31, 2020 | | 31 |
| | |
| Evaluation of Advisory Agreement by the Board of Trustees (Cont.) | | (Unaudited) March 31, 2020 |
period shown in the Strategic Insight Reports, and considered information from DoubleLine intended to show that each Fund’s use of leverage was accretive to the Fund’s investment performance, after taking into account any expenses related to the leverage.
The Trustees considered that DoubleLine provides a variety of other services to the Funds in addition to investment advisory services, including, among others, a number of back-office services, valuation services, compliance services, certain forms of information technology services (such as internal reporting), assistance with accounting and distribution services, and supervision and monitoring of the Funds’ other service providers. The Trustees considered DoubleLine’s ongoing efforts to keep the Trustees informed about matters relevant to the Funds and their shareholders. The Trustees also considered the nature and structure of the Funds’ compliance program, including the policies and procedures of the Funds and their various service providers (including DoubleLine). The Trustees considered the quality ofthose non-investment advisory services and determined that their quality appeared to support the continuation of the Funds’ arrangements with DoubleLine.
The Trustees considered DoubleLine’s reports, provided at the Board’s regular meetings, that it had continued to hire additional resources and to invest in technology enhancements to support DoubleLine’s ability to provide services to the Funds. The Trustees concluded that it appeared that DoubleLine continued to have sufficient quality and depth of personnel, resources, and investment methods.
The Trustees considered materials relating to the fees charged by DoubleLineto non-Fund clients for which DoubleLine employs investment strategies substantially similar to one or more Funds’ investment strategies, including institutional separate accounts advised by DoubleLine and mutual funds for which DoubleLine serves as subadviser. The Trustees noted the information DoubleLine provided regarding certain institutional separate accounts advised by it and funds subadvised by it that are subject to fee schedules that differ from, including those that are lower than, the rates paid by a Fund with substantially similar investment strategies. The Trustees noted DoubleLine’s representations that administrative, compliance, operational, legal, and other burdens of providing investment advice to mutual funds exceed in many respects those required to provide advisory servicesto non-mutual fund clients, such as institutional accounts for retirement or pension plans, which may have differing contractual requirements. The Trustees noted DoubleLine’s representations that DoubleLine bears substantially greater legal and other responsibilities and risks in managing and sponsoring mutual funds than in managing private accounts or in subadvising mutual funds sponsored by others, and that the services and resources required of DoubleLine when it subadvises mutual funds sponsored by others generally are less extensive than those required of DoubleLine to serve the Funds, because, where DoubleLine serves as a subadviser, many of the sponsorship, operational, and compliance responsibilities related to the advisory function are retained by the primary adviser.
The Trustees reviewed information as to general estimates of DoubleLine’s profitability with respect to each Fund, taking into account both the direct and the indirect benefits to DoubleLine from managing the Funds. The Trustees considered information provided by DoubleLine as to the methods it uses, and the assumptions it makes, in calculating its profitability. The Trustees considered representations from DoubleLine that its compensation and incentive policies and practices enable DoubleLine to attract, retain, and motivate highly qualified and experienced employees. The Trustees noted that DoubleLine experienced significant profitability in respect of certain of the Funds, but noted that in those cases it would be appropriate to consider that profitability in light of various other considerations such as the nature, extent, and quality of the services provided by DoubleLine, the relative performance of the Funds, and the competitiveness of the management fees and total operating expenses of the Funds. The Trustees separately considered DoubleLine’s statement that it is continuing to invest in its business to maintain its ability to provide high-quality services to the Funds, and noted DoubleLine’s need to invest in technology, infrastructure, and staff to continue to provide services and accommodate rapidly changing regulatory requirements.
In their evaluation of economies of scale, the Trustees considered, among other things, the pricing of the Funds, DoubleLine’s reported profitability and that a number ofthe open-end Funds had achieved significant size. They noted also that none of the Funds has breakpoints in its advisory fee schedule, though the Trustees considered management’s view that the fee schedules for the Funds remained consistent with DoubleLine’s original pricing philosophy of proposing an initial management fee rate that generally reflects reasonably foreseeable economies of scale instead of relying on breakpoints in a Fund’s management fee rate. In this regard, the Trustees noted also that the information provided by Strategic Insight supported the view that the largestopen-end Funds’ net management fees remained fairly priced, with all but two of theopen-end Funds with $1 billion in assets under management or more having net management fees below the median of their peer groups. The Trustees noted that, although DoubleLine Total Return Bond Fund and EMFI had net management fees above their median, their net management fees were within 4 and 2 basis points, respectively, of their respective medians. The Trustees further noted that DoubleLine was subsidizing the expenses of a number of other Funds with less scale, with the prospect of recouping those fees at a later date. In evaluating economics of scale more generally, the Trustees also noted DoubleLine’s continued growth and ongoing changes to the regulatory
| | | | | | |
| 32 | | DoubleLine Selective Credit Fund | | | | |
| | |
| | | (Unaudited) March 31, 2020 |
environment, each of which required DoubleLineto re-invest in its business and infrastructure. On the basis of these factors and others, the Trustees concluded that it was not necessary at the present time to implement breakpoints for any of the Funds, although they would continue to consider the question periodically in the future.
With regard to DBL and DSL, the Trustees noted that these Funds have not increased in assets significantly from their initial offerings due principally to their statusas closed-end investment companies and that there were therefore no substantial increases in economies of scale realized with respect to these Funds since their inception. They noted DoubleLine’s view that the levels of its profitability in respect of DBL and DSL are appropriate in light of the investment it has made in these Funds, the quality of the investment management and other teams provided by it, and its continued investments in its own business.
On the basis of these considerations as well as others and in the exercise of their business judgment, the Trustees determined that they were satisfied with the nature, extent, and quality of the services provided to each Fund under its Advisory Agreement(s); that it appeared that the management fees paid by each Fund to DoubleLine were generally within the range of management fees paid by its peer funds, and, with respect to a number of Funds, lower than the median management fees paid by their peer funds, and generally reasonable in light of the services provided, the quality of the portfolio management teams, and each Fund’s performance to date; that the fees paid by each Fund did not appear inappropriate in light of the fee schedules charged to DoubleLine’s other clients with substantially similar investment strategies (where applicable) in light of the differences in the services provided and the risks borne by DoubleLine; that the profitability of each Fund to DoubleLine did not appear excessive or such as to preclude continuation of the Fund’s Advisory Agreement; that absence of breakpoints in any Fund’s management fee did not render that Fund’s fee unreasonable or inappropriate under the circumstances, although the Trustees would continue to consider the topic over time; and that it would be appropriate to approve each Advisory Agreement for anadditional one-year period.
| | | | | | |
| | Annual Report | | March 31, 2020 | | 33 |
| | |
| Statement Regarding the Fund’s Liquidity Risk Management Program | | (Unaudited) March 31, 2020 |
The Fund has adopted a liquidity risk management program. The program’s principal objectives include mitigating the risk that the Fund is unable to meet its redemption obligations timely and supporting the Fund’s compliance with its limits on investments in illiquid assets. Since the program’s inception through the end of the period covered by this report, the program administrator determined that the program supported the Fund’s ability to honor redemption requests timely and the Adviser’s management of the Fund’s liquidity profile. The program includes a number of elements that support the assessment and management of liquidity risk, including the periodic classification andre-classification of the Fund’s investments into groupings based on the Adviser’s view of their liquidity. There can be no assurance that the program will achieve its objectives. Please refer to your Fund’s private placement memorandum for more information regarding the Fund’s exposure to liquidity risk and other risks to which an investment in the Fund may be subject.
* * * * *
| | | | | | |
| 34 | | DoubleLine Selective Credit Fund | | | | |
| | |
| Federal Tax Information | | (Unaudited) March 31, 2020 |
For the fiscal year ended March 31, 2020, certain dividends paid by the Fund may be subject to a maximum tax rate of 15% (20% for taxpayers with taxable income greater than $425,800 for single individuals and $479,000 for married couples filing jointly), as provided for by the Jobs and Growth Tax Relief Reconciliation Act of 2003 and The Tax Cuts and Jobs Act of 2017. The percentage of dividends declared from ordinary income designated as qualified dividend income was as follows:
| | | | | | | | | | |
| | |
| Qualified Dividend Income | | | | |
| | |
DoubleLine Selective Credit Fund | | | | | | | | | 0.00% | |
For corporate shareholders, the percent of ordinary income distributions qualifying for corporate dividends received deduction for the fiscal year ended March 31, 2020, was as follows:
| | | | | | | | | | |
| | |
| Dividends Received Deduction | | | | |
| | |
DoubleLine Selective Credit Fund | | | | | | | | | 0.00% | |
The percentage of taxable ordinary income distributions that are designated as short-term capital gain distributions under Internal Revenue Section 871(k)(2)(c) for the fiscal year ended March 31, 2020, for the Fund was as follows:
| | | | | | | | | | |
| | |
| Qualified Short-Term Gains | | | | |
| | |
DoubleLine Selective Credit Fund | | | | | | | | | 0.00% | |
The percentage of taxable ordinary income distributions that are designated as interest related dividends under Internal Revenue Section 871(k)(1)(c) for the fiscal year ended March 31, 2020, for the Fund was as follows:
| | | | | | | | | | |
| | |
| Qualified Interest Income | | | | |
| | |
DoubleLine Selective Credit Fund | | | | | | | | | 100.00% | |
Shareholders are advised to consult their own tax adviser with respect to the tax consequences of their investment in the Fund.
| | | | | | |
| | Annual Report | | March 31, 2020 | | 35 |
| | |
| Trustees and Officers | | (Unaudited) March 31, 2020 |
| | | | | | | | | | |
Name, Address, and
Year of Birth(1) | | Position with Trust | | Term of Office
and Length of
Time Served | | Principal Occupation(s) During Past 5 Years | | Number of
Portfolios
Overseen(2) | | Other Directorships
Held by Trustee
During Past 5 Years |
| | | | | |
Independent Trustees | | | | | | | | | | |
| | | | | |
| Joseph J. Ciprari, 1964 | | Trustee | | Indefinite / Since March 2010 | | President, Remo Consultants, a real estate financial consulting firm. Formerly, Managing Director, UBS AG. Formerly, Managing Director, Ally Securities LLC. | | 22 | | None |
| | | | | |
| John C. Salter, 1957 | | Trustee | | Indefinite / Since March 2010 | | Partner, Stark Municipal Brokers. Formerly, Managing Director, Municipals, Tullet Prebon Financial Services LLC (d/b/a Chapdelaine). Formerly, Partner, Stark, Salter & Smith, a securities brokerage firm specializing in tax exempt bonds. | | 22 | | None |
| | | | | |
| Raymond B. Woolson, 1958 | | Trustee | | Indefinite / Since March 2010 | | President, Apogee Group, Inc., a company providing financial consulting services. | | 22 | | Independent
Trustee,
Advisors
Series Trust
(an open-end
investment
company
with 39
portfolios)(3) |
(1) The address of each Independent Trustee is c/o DoubleLine Funds, 333 South Grand Avenue, Suite 1800, Los Angeles, CA 90071.
(2) Includes each series of DoubleLine Funds Trust, DoubleLine Opportunistic Credit Fund, DoubleLine Income Solutions Fund and DoubleLine Yield Opportunities Fund.
(3) Quasar Distributors, LLC serves as the principal underwriter of DoubleLine Funds Trust and Advisors Series Trust.
Each of the following Trustees is an interested person of the Trust as defined in the 1940 Act because they are officers of the Advisers and hold direct or indirect ownership interests in DoubleLine Capital LP and DoubleLine Alternatives LP. Additionally, Mr. Redell is an officer of the Trust.
| | | | | | | | | | |
Name, Address, and
Year of Birth(1) | | Position with Trust | | Term of Office
and Length of
Time Served | | Principal Occupation(s) During Past 5 Years | | Number of
Portfolios
Overseen(2) | | Other Directorships
Held by Trustee
During Past 5 Years |
| | | | | |
Interested Trustees | | | | | | | | | | |
| | | | | |
| Jeffrey E. Gundlach, 1959 | | Trustee | | Indefinite / Since January 2010 | | Chief Executive Officer and Chief Investment Officer, DoubleLine Capital (since December 2009). | | 19 | | None |
| | | | | |
| Ronald R. Redell, 1970 | | President and Trustee | | Indefinite/Since Inception | | Trustee, Chairman, President and Chief Executive Officer, DoubleLine Yield Opportunities Fund (since November 2019); Trustee, Chairman, President and Chief Executive Officer, DoubleLine Income Solutions Fund (since January 2013); Executive, DoubleLine Group LP (since January 2013); Trustee, Chairman, President and Chief Executive Officer, DoubleLine Opportunistic Credit Fund (since July 2011); Executive, DoubleLine Capital (since July 2010); President, DoubleLine Funds Trust (since January 2010). | | 22 | | None |
(1) The address of each Interested Trustee is c/o DoubleLine Funds, 333 South Grand Avenue, Suite 1800, Los Angeles, CA 90071.
(2) Includes each series of DoubleLine Funds Trust, DoubleLine Opportunistic Credit Fund, DoubleLine Income Solutions Fund and DoubleLine Yield Opportunities Fund.
| | | | | | |
| 36 | | DoubleLine Selective Credit Fund | | | | |
| | |
| | | (Unaudited) March 31, 2020 |
Officers
The officers of the Trust who are not also Trustees of the Trust are:
| | | | | | |
Name, Address, and
Year of Birth(1) | | Position(s)
Held with Trust | | Term of Office
and Length of
Time Served | | Principal Occupation(s) During Past 5 Years |
| | | |
| Henry V. Chase, 1949 | | Treasurer and Principal Financial and Accounting Officer | | Indefinite/Since January 2020; | | Treasurer and Principal Financial and Accounting Officer, DoubleLine Funds Trust (since January 2020); Treasurer and Principal Financial and Accounting Officer, Doubleline Yield Opportunities Fund (since January 2020); Treasurer and Principal Financial and Accounting Officer, DoubleLine Income Solutions Fund (since January 2020); Treasurer and Principal Financial and Accounting Officer, DoubleLine Opportunistic Credit Fund (since January 2020); Chief Financial Officer, DoubleLine Capital (since January 2013). Formerly, Vice President, DoubleLine Yield Opportunities Fund (since Inception); Vice President, DoubleLine Income Solutions Fund (since May 2019); Vice President, DoubleLine Funds Trust (since May 2019); Vice President, DoubleLine Opportunistic Credit Fund (since May 2019). |
| | | |
| Youse Guia, 1972 | | Chief Compliance Officer | | Indefinite/Since March 2018 | | Chief Compliance Officer, DoubleLine Yield Opportunities Fund (since November 2019); Chief Compliance Officer, DoubleLine Capital (since March 2018); Chief Compliance Officer, DoubleLine Equity LP (since March 2018); Chief Compliance Officer, DoubleLine Funds Trust (since March 2018); Chief Compliance Officer, DoubleLine Opportunistic Credit Fund (since March 2018); Chief Compliance Officer, DoubleLine Income Solutions Fund (since March 2018). Formerly, Executive Vice President and Deputy Chief Compliance Officer, Pacific Investment Management Company LLC (“PIMCO”) (from April 2014 to February 2018); Chief Compliance Officer, PIMCO Managed Accounts Trust (from September 2014 to February 2018); Chief Compliance Officer, PIMCO-sponsored closed-end funds (from September 2014 to February 2018); Chief Compliance Officer, PIMCO Flexible Credit Income Fund (from February 2017 to February 2018). Formerly, Head of Compliance, Allianz Global Investors U.S. Holdings LLC (from October 2012 to March 2014); Chief Compliance Officer, Allianz Funds, Allianz Multi-Strategy Trust, Allianz Global Investors Sponsored Closed-End Funds, Premier Multi-Series VIT and The Korea Fund, Inc. (from October 2004 to December 2013). |
| | | |
| Winnie Han, 1988 | | Assistant Treasurer | | Indefinite/Since May 2017 | | Assistant Treasurer, DoubleLine Yield Opportunities Fund (since November 2019); Assistant Treasurer, DoubleLine Income Solutions Fund (since May 2017); Assistant Treasurer, DoubleLine Funds Trust (since May 2017); Assistant Treasurer, DoubleLine Opportunistic Credit Fund (since May 2017); Assistant Treasurer, DoubleLine Capital (since March 2017); Formerly, Investment Accounting Supervisor, Alexandria Real Estate Equities, Inc. (June 2016 to March 2017); Formerly, Manager, PricewaterhouseCoopers (January 2011 to June 2016). |
| | | |
| Cris Santa Ana, 1965 | | Vice President and Secretary | | Indefinite/Vice President Since April 2011; Indefinite/Secretary Since July 2018 | | Vice President and Secretary, DoubleLine Yield Opportunities Fund (since November 2019); Secretary, DoubleLine Income Solutions Fund (since July 2018); Secretary, DoubleLine Opportunistic Credit Fund (since July 2018); Secretary, DoubleLine Funds Trust (since July 2018); Vice President, DoubleLine Income Solutions Fund (since January 2013); Vice President, DoubleLine Opportunistic Credit Fund (since July 2011); Vice President, DoubleLine Funds Trust (since April 2011); Chief Risk Officer, DoubleLine Capital (since June 2010). Formerly, Chief Operating Officer, DoubleLine Capital (from December 2009 through May 2010). |
| | | |
| Earl A. Lariscy, 1966 | | Vice President | | Indefinite/Since May 2012 | | Vice President, DoubleLine Yield Opportunities Fund (since November 2019); Vice President and Assistant Secretary, DoubleLine Income Solutions Fund (since January 2013); Vice President, DoubleLine Funds Trust (since May 2012); Vice President and Assistant Secretary, DoubleLine Opportunistic Credit Fund (since May 2012 and inception, respectively); General Counsel, DoubleLine Capital (since April 2010). |
| | | |
| David Kennedy, 1964 | | Vice President | | Indefinite/Since May 2012 | | Vice President, DoubleLine Yield Opportunities Fund (since November 2019); Vice President, DoubleLine Income Solutions Fund (since January 2013); Vice President, DoubleLine Funds Trust (since May 2012); Vice President, DoubleLine Opportunistic Credit Fund (since May 2012); Manager, Trading and Settlements, DoubleLine Capital (since December 2009). |
| | | | | | |
| | Annual Report | | March 31, 2020 | | 37 |
| | |
| Trustees and Officers (Cont.) | | (Unaudited) March 31, 2020 |
| | | | | | |
Name, Address, and
Year of Birth(1) | | Position(s)
Held with Trust | | Term of Office
and Length of
Time Served | | Principal Occupation(s) During Past 5 Years |
| | | |
| Patrick A. Townzen, 1978 | | Vice President | | Indefinite/Since September 2012 | | Vice President, DoubleLine Yield Opportunities Fund (since September 2019); Vice President, DoubleLine Income Solutions Fund (since January 2013); Vice President, DoubleLine Funds Trust (since September 2012); Vice President, DoubleLine Opportunistic Credit Fund (since September 2012); Director of Operations of DoubleLine Capital (since March 2018). Formerly, Manager of Operations, DoubleLine Capital (from September 2012 to March 2018). |
| | | |
| Brady J. Femling, 1987 | | Vice President | | Indefinite/Since May 2017 | | Vice President, DoubleLine Yield Opportunities Fund (since November 2019); Vice President, DoubleLine Income Solutions Fund (since May 2017); Vice President, DoubleLine Opportunistic Credit Fund (since May 2017); Vice President, DoubleLine Funds Trust (since May 2017); Senior Fund Accountant, DoubleLine Capital (Since April 2013). Fund Accounting Supervisor, ALPS Fund Services (From October 2009 to April 2013). |
| | | |
| Neal L. Zalvan, 1973 | | AML Officer and Vice President | | Indefinite/AML Officer Since May 2016; Indefinite/Vice President Since May 2017 | | Anti-Money Laundering Officer and Vice President, DoubleLine Yield Opportunities Fund (since November 2019); Anti-Money Laundering Officer, DoubleLine Funds Trust (since May 2016); Anti-Money Laundering Officer, DoubleLine Capital, DoubleLine Equity LP and DoubleLine Alternatives (since March 2016); Legal/Compliance, DoubleLine Group LP (since January 2013); Legal/Compliance, Batterymarch Financial Management, Inc. (From June 2011 to December 2012). |
| | | |
| Adam D. Rossetti, 1978 | | Vice President | | Indefinite/Since February 2019 | | Vice President, DoubleLine Yield Opportunities Fund (since November 2019); Vice President, DoubleLine Funds Trust (since February 2019); Vice President, DoubleLine Income Solutions Fund (since February 2019); Vice President, DoubleLine Opportunistic Credit Fund (since February 2019); Chief Compliance Officer, DoubleLine Alternatives LP (since June 2015); Legal/Compliance, DoubleLine Group LP (since April 2015). Formerly, Chief Compliance Officer, DoubleLine Capital (from August 2017 to March 2018); Chief Compliance Officer, DoubleLine Equity LP (from August 2017 to March 2018); Chief Compliance Officer, DoubleLine Funds Trust (from August 2017 to March 2018); Chief Compliance Officer, DoubleLine Income Solutions Fund (from August 2017 to March 2018); Chief Compliance Officer, DoubleLine Opportunistic Credit Fund (from August 2017 to March 2018); Vice President and Counsel, PIMCO (from April 2012 to April 2015). |
| | | |
| Gheorghe Rotar, 1984 | | Vice President | | Indefinite/Since February 2019 | | Vice President, DoubleLine Funds Trust (since February 2019); U.S. Funds Operations Manager, DoubleLine Group LP (since January 2018). Formerly, Operations Specialist, DoubleLine Group LP (from April 2014 to December 2017); Fund Operations, PIMCO (from September 2007 to April 2014). |
| | | |
| Grace Walker, 1970 | | Assistant Treasurer | | Indefinite/Since January 2020 | | Assistant Treasurer, DoubleLine Funds Trust (since January 2020); Assistant Treasurer, DoubleLine Income Solutions Fund (since January 2020); Assistant Treasurer, DoubleLine Opportunistic Credit Fund (since January 2020); Assistant Treasurer, DoubleLine Yield Opportunities Fund (since January 2020); Treasurer, DoubleLine Funds (Luxembourg) and DoubleLine Cayman Unit Trust (since March 2017). Formerly, Assistant Treasurer, DoubleLine Income Solutions Fund (from January 2013 to May 2017); Assistant Treasurer, DoubleLine Opportunistic Credit Fund (from March 2012 to May 2017); Assistant Treasurer, DoubleLine Funds Trust (from March 2012 to May 2017). |
| | | |
| Dawn Oswald, 1980 | | Vice President | | Indefinite/Since January 2020 | | Vice President, DoubleLine Funds Trust (since January 2020); Vice President, DoubleLine Yield Opportunities Fund (since January 2020); Vice President, DoubleLine Income Solutions Fund (since January 2020); Vice President, DoubleLine Opportunistic Credit Fund (since January 2020); Pricing Manager, DoubleLine Capital (since January 2018). Formerly, Operations Specialist, DoubleLine Capital (from July 2016 to January 2018). Global Securities Fixed Income Valuation Senior Analyst, Capital Group (from April 2015 to July 2016). Global Securities Fair Valuation Analyst, Capital Group (from January 2010 to April 2015). |
(1) The address of each officer is c/o DoubleLine Funds, 333 South Grand Avenue, Suite 1800, Los Angeles, CA 90071.
The Statement of Additional Information includes additional information about the Trustees and is available, without charge, upon request, by calling 877-DLine11(877-354-6311).
| | | | | | |
| 38 | | DoubleLine Selective Credit Fund | | | | |
| | |
| Information About Proxy Voting | | (Unaudited) March 31, 2020 |
Information about how the Fund voted proxies relating to portfolio securities held during the most recent twelve month period ended June 30th is available no later than the following August 31st without charge, upon request, by calling877-DLine11(877-354-6311) and on the Securities and Exchange Commission’s (the “SEC”) website at www.sec.gov.
A description of the Fund’s proxy voting policies and procedures is available (i) without charge, upon request, by calling877-DLine11(877-354-6311); and (ii) on the SEC’s website at www.sec.gov.
Information About Portfolio Holdings
The Fund is required to file its complete schedule of portfolio holdings with the SEC for its first and third fiscal quarters on Part Fof Form N-PORT. When available, the Fund’s Part F of Form N-PORT (and Form N-Q prior to March 31, 2019) is available on the SEC’s website at www.sec.gov.
Householding—Important Notice Regarding Delivery of Shareholder Documents
In an effort to conserve resources, the Fund intends to reduce the number of duplicate Annual and Semi-Annual Reports you receive by sending only one copy of each to addresses where we reasonably believe two or more accounts are from the same family. If you would like to discontinue householding of your accounts, please call toll-free877-DLine11(877-354-6311) to request individual copies of these documents. We will begin sending individual copies thirty days after receiving your request to stop householding.
| | | | | | |
| | Annual Report | | March 31, 2020 | | 39 |
| | |
| Privacy Policy | | (Unaudited) March 31, 2020 |
What Does DoubleLine Do With Your Personal Information?
This notice provides information about how DoubleLine (“we” and “our”) collects, shares, and protects your personal information, and how you might choose to limit our ability to share certain information about you. Please read this notice carefully.
Why do we need your personal information?
All financial companies need to share customers’ personal information to run their everyday businesses, to appropriately tailor the services offered to you (where applicable), and to comply with our regulatory obligations. Accordingly, information, confidential and proprietary, plays an important role in the success of our business. However, we recognize that you have entrusted us with your personal and financial data, and we recognize our obligation to keep this information secure. Maintaining your privacy is important to us, and we hold ourselves to a high standard in its safekeeping and use. Most importantly, DoubleLine does not sell its customers’non-public personal information to any third parties. DoubleLine uses its customers’non-public personal information primarily to complete financial transactions that its customers request (where applicable), to make its customers aware of other financial products and services offered by a DoubleLine affiliated company, and to satisfy obligations we owe to regulatory bodies.
Information we may collect
We may collect various types of personal data about you, including:
| | • | Your personal identification information, which may include your name and passport information, your IP address, politically exposed person (“PEP”) status, and such other information as may be necessary for us to provide our services to you and to complete our customer due diligence process and discharge anti-money laundering obligations; |
| | • | Your contact information, which may include postal address ande-mail address and your home and mobile telephone numbers; |
| | • | Your family relationships, which may include your marital status, the identity of your spouse and the number of children that you have; |
| | • | Your professional and employment information, which may include your level of education and professional qualifications, your employment, employer’s name and details of directorships and other offices which you may hold; and |
| | • | Financial information, risk tolerance, sources of wealth and your assets, which may include details of shareholdings and beneficial interests in financial instruments, your bank details and your credit history. |
Where we obtain your personal information
DoubleLine may collectnon-public information about you from the following sources:
| | • | Information we receive about you on applications or other forms; |
| | • | Information you may give us orally; |
| | • | Information about your transactions with us or others; |
| | • | Information you submit to us in correspondence, including emails or other electronic communications; and |
| | • | Information about any bank account you use for transfers between your bank account and any Fund account, including information provided when effecting wire transfers. |
Information Collected from Websites
Websites maintained by DoubleLine or its service providers may use a variety of technologies to collect information that help DoubleLine and its service providers understand how the website is used. Information collected from your web browser (including small files stored on your device that are commonly referred to as “cookies”) allow the websites to recognize your web browser and help to personalize and improve your user experience and enhance navigation of the website. You can change your cookie preferences by changing the setting on your web browser to delete or reject cookies. If you delete or reject cookies, some website pages may not function properly. Our websites may contain links that are maintained or controlled by third parties, each of which has privacy policies which may differ, in some cases significantly, from the privacy policies described in this notice. Please read the privacy policies of such third parties and understand that accessing their website is at your own risk. Please contact your DoubleLine representative if you would like to receive more information about the privacy policies of third parties.
We also use web analytics services, which currently include but are not limited to Google Analytics and Adobe Analytics. Such web analytics services use cookies and similar technologies to evaluate visitor’s use of the domain, compile statistical reports on domain activity, and provide other services related to our websites. For more information about Google Analytics, or to opt out of Google Analytics, please go to https://tools.google. com/dlpage/gaoptout. For more information about Adobe Analytics, or to opt out of Adobe Analytics, please go to:http://www.adobe.com/privacy/opt-out.html.
| | | | | | |
| 40 | | DoubleLine Selective Credit Fund | | | | |
| | |
| | | (Unaudited) March 31, 2020 |
How and why we may share your information
DoubleLine does not disclose anynon-public personal information about our customers or former customers without the customer’s authorization, except that we may disclose the information listed above, as follows:
| | • | It may be necessary for DoubleLine to provide information to nonaffiliated third parties in connection with our performance of the services we have agreed to provide to the Funds or you. For example, it might be necessary to do so in order to process transactions and maintain accounts. |
| | • | DoubleLine will release any of thenon-public information listed above about a customer if directed to do so by that customer or if DoubleLine is authorized by law to do so, such as in the case of a court order, legal investigation, or other properly executed governmental request. |
| | • | In order to alert a customer to other financial products and services offered by an affiliate, DoubleLine may share information with an affiliate, including companies using the DoubleLine name. Such products and services may include, for example, other investment products offered by a DoubleLine company. If you prefer that we not disclosenon-public personal information about you to our affiliates for this purpose, you may direct us not to make such disclosures (other than disclosures permitted by law) by calling1 (213) 633-8200. If you limit this sharing and you have a joint account, your decision will be applied to all owners of the account. |
We will limit access to your personal account information to those agents and vendors who need to know that information to provide products and services to you. Your information is not provided by us to nonaffiliated third parties for marketing purposes. We maintain physical, electronic, and procedural safeguards to guard yournon-public personal information.
Notice related to the California Consumer Privacy Act (CCPA) and to “natural persons” residing in the State of California
DoubleLine collects and uses information that identifies, describes, references, links or relates to, or is associated with, a particular consumer or device (“Personal Information”). Personal Information we collect from our customers, website visitors and consumers is covered under the Gramm-Leach-Bliley Act and is therefore excluded from the scope of the California Consumer Privacy Act.
Notice to “natural persons” residing in the European Economic Area (the “EEA”)
If you reside in the EEA, we may transfer your personal information outside the EEA, and will ensure that it is protected and transferred in a manner consistent with legal requirements applicable to the information. This can be done in a number of different ways, for instance:
| | • | the country to which we send the personal information may have been assessed by the European Commission as providing an “adequate” level of protection for personal data; |
| | • | the recipient may have signed a contract based on standard contractual clauses approved by the European Commission; or |
| | • | where the recipient is located in the U.S., it may be a certified member of theEU-U.S. Privacy Shield scheme. |
In other circumstances, the law may permit us to otherwise transfer your personal information outside the EEA. In all cases, however, any transfer of your personal information will be compliant with applicable data protection law.
Retention of personal information and security
Your personal information will be retained for as long as required:
| | • | for the purposes for which the personal information was collected; |
| | • | in order to establish or defend legal rights or obligations or to satisfy any reporting or accounting obligations; and/or |
| | • | as required by data protection laws and any other applicable laws or regulatory requirements, including, but not limited to, U.S. laws and regulations applicable to our business. |
We will undertake commercially reasonable efforts to protect the personal information that we hold with appropriate security measures.
Access To and Control of Your Personal Information
Depending on your country of domicile, you may have the following rights in respect of the personal information about you that we process:
| | • | the right to access and port personal information; |
| | • | the right to rectify personal information; |
| | • | the right to restrict the use of personal information; |
| | • | the right to request that personal information is erased; and |
| | • | the right to object to processing of personal information. |
| | | | | | |
| | Annual Report | | March 31, 2020 | | 41 |
| | |
| Privacy Policy (Cont.) | | (Unaudited) March 31, 2020 |
Although you have the right to request that your personal information be deleted at any time, applicable laws or regulatory requirements may prohibit us from doing so. If you are an investor in the DoubleLine funds, certain of the rights described above that may apply to direct clients of DoubleLine domiciled or resident outside the United States will not apply to you. In addition, if you invest in a DoubleLine fund through a financial intermediary, DoubleLine may not have access to personal information about you.
If you wish to exercise any of the rights set out above, please contact privacy@doubleline.com.
Changes to DoubleLine’s Privacy Policy
As required by U.S. federal law, DoubleLine will notify customers of DoubleLine’s Privacy Policy annually. DoubleLine reserves the right to modify its privacy policy at any time, but in the event that there is a change, that affects the content of this notice materially, DoubleLine will promptly inform its customers of that change, in accordance with applicable law.
| | | | | | |
| 42 | | DoubleLine Selective Credit Fund | | | | |
Investment Adviser:
DoubleLine Capital LP
333 South Grand Avenue
18th Floor
Los Angeles, CA 90071
Administrator and Transfer Agent:
U.S. Bancorp Fund Services, LLC
P.O. Box 701
Milwaukee, WI 53201
Custodian:
U.S. Bank National Association
1555 North Rivercenter Drive
Suite 302
Milwaukee, WI 53212
Independent Registered Public Accounting Firm:
PricewaterhouseCoopers LLP
601 South Figueroa Street
Los Angeles, CA 90017
Legal Counsel:
Ropes & Gray LLP
Prudential Tower
800 Boylston Street
Boston, MA 02199
Contact Information:
doubleline.com
fundinfo@doubleline.com
(877) DLine11 or (877)354-6311
DoubleLine Capital LP|| 333 South Grand Avenue, 18th Floor || Los Angeles, CA 90071 || (213) 633-8200
fundinfo@doubleline.com|| www.doubleline.com
The registrant has adopted a code of ethics that applies to the registrant’s principal executive officer and principal financial officer. The registrant has not made any amendments to its code of ethics during the period covered by this report. The registrant has not granted any waivers from any provisions of the code of ethics during the period covered by this report. A copy of the registrant’s Code of Ethics is filed herewith.
| Item 3. | Audit Committee Financial Expert. |
The registrant’s board of trustees has determined that there is at least one audit committee financial expert serving on its audit committee. Raymond B. Woolson is the “audit committee financial expert” and is considered to be “independent” as each term is defined in Item 3 ofForm N-CSR.
| Item 4. | Principal Accountant Fees and Services. |
The registrant has engaged its principal accountant to perform audit services, audit-related services, tax services and other services during the past two fiscal years. “Audit services” refer to performing an audit of the registrant’s annual financial statements or services that are normally provided by the accountant in connection with statutory and regulatory filings or engagements for those fiscal years. “Audit-related services” refer to the assurance and related services by the principal accountant that are reasonably related to the performance of the audit. “Tax services” refer to professional services rendered by the principal accountant for tax compliance, tax advice, and tax planning. There were no “Other services” provided by the principal accountant. The following table details the aggregate fees billed or expected to be billed for each of the last two fiscal years for audit fees, audit-related fees, tax fees and other fees by the principal accountant.
| | | | | | | | |
| | | FYE 3/31/2020 | | | FYE 3/31/2019 | |
Audit Fees | | $ | 1,050,255 | | | $ | 1,004,260 | |
Audit-Related Fees | | $ | 900 | | | $ | 900 | |
Tax Fees | | $ | 243,003 | | | $ | 209,136 | |
All Other Fees | | | N/A | | | | N/A | |
The audit committee has adoptedpre-approval policies and procedures that require the audit committee topre-approve all audit andnon-audit services of the registrant, including services provided to any entity affiliated with the registrant.
The percentage of fees billed by PricewaterhouseCoopersLLP applicable tonon-audit services pursuant to waiver ofpre-approval requirement were as follows:
| | | | | | | | |
| | | FYE 3/31/2020 | | | FYE 3/31/2019 | |
Audit-Related Fees | | | 0 | % | | | 0 | % |
Tax Fees | | | 0 | % | | | 0 | % |
All Other Fees | | | 0 | % | | | 0 | % |
1
All of the principal accountant’s hours spent on auditing the registrant’s financial statements were attributed to work performed byfull-time permanent employees of the principal accountant. (If more than 50 percent of the accountant’s hours were spent to audit the registrant’s financial statements for the most recent fiscal year, state how many hours were attributed to work performed by persons other than the principal accountant’s full-time, permanent employees.)
The following table indicates thenon-audit fees billed or expected to be billed by the registrant’s accountant for services to the registrant and to the registrant’s investment adviser (and any other controlling entity, etc.—notsub-adviser) for the last two years. The audit committee of the board of trustees/directors has considered whether the provision ofnon-audit services that were rendered to the registrant’s investment adviser is compatible with maintaining the principal accountant’s independence and has concluded that the provision of suchnon-audit services by the accountant has not compromised the accountant’s independence.
| | | | | | | | |
Non-Audit Related Fees | | FYE 3/31/2020 | | | FYE 3/31/2019 | |
Registrant | | $ | 243,003 | | | $ | 209,136 | |
Registrant’s Investment Adviser | | $ | 1,093,738 | | | $ | 1,034,479 | |
| Item 5. | Audit Committee of Listed Registrants. |
Not applicable to registrants who are not listed issuers (as defined in Rule10A-3 under the Securities Exchange Act of 1934).
| (a) | Schedule of Investments is included as part of the report to shareholders filed under Item 1 of this Form. |
| Item 7. | Disclosure of Proxy Voting Policies and Procedures forClosed-End Management Investment Companies. |
Not applicable toopen-end investment companies.
| Item 8. | Portfolio Managers ofClosed-End Management Investment Companies. |
Not applicable toopen-end investment companies.
| Item 9. | Purchases of Equity Securities byClosed-End Management Investment Company and Affiliated Purchasers. |
Not applicable toopen-end investment companies.
| Item 10. | Submission of Matters to a Vote of Security Holders. |
There have been no material changes to the procedures by which shareholders may recommend nominees to the registrant’s board of trustees.
2
| Item 11. | Controls and Procedures. |
| (a) | The Registrant’s principal executive and principal financial officers have reviewed the Registrant’s disclosure controls and procedures (as defined in Rule30a-3(c) under the Investment Company Act of 1940 (the “Act”)) as of a date within 90 days of the filing of this report, as required by Rule30a-3(b) under the Act and Rules13a-15(b) or15d-15(b) under the Securities Exchange Act of 1934. Based on their review, such officers have concluded that the disclosure controls and procedures are effective in ensuring that information required to be disclosed in this report is appropriately recorded, processed, summarized and reported and made known to them by others within the Registrant and by the Registrant’s service provider. |
| (b) | There were no changes in the Registrant’s internal control over financial reporting (as defined in Rule30a-3(d) under the Act) that occurred during the period covered by this report that has materially affected, or is reasonably likely to materially affect, the Registrant’s internal control over financial reporting. |
| Item 12. | Disclosure of Securities Lending Activities forClosed-End Management Investment Companies |
Not applicable toopen-end investment companies.
(2) A separate certification for each principal executive and principal financial officer pursuant to Section 302 of the Sarbanes-Oxley Act of 2002. Filed herewith.
(3) Any written solicitation to purchase securities under Rule23c-1 under the Act sent or given during the period covered by the report by or on behalf of the registrant to 10 or more persons. Not applicable toopen-end investment companies.
(4) Change in the registrant’s independent public accountant. There was no change in the registrant’s independent public accountant for the period covered by this report.
3
SIGNATURES
Pursuant to the requirements of the Securities Exchange Act of 1934 and the Investment Company Act of 1940, the registrant has duly caused this report to be signed on its behalf by the undersigned, thereunto duly authorized.
| | | | | | |
| | (Registrant) DoubleLine Funds Trust |
| | |
| | By (Signature and Title) /s/ Ronald R. Redell | | |
| | | | Ronald R. Redell, President | | |
| |
| | Date5/27/2020 |
Pursuant to the requirements of the Securities Exchange Act of 1934 and the Investment Company Act of 1940, this report has been signed below by the following persons on behalf of the registrant and in the capacities and on the dates indicated.
| | | | | | |
| | By (Signature and Title) /s/ Ronald R. Redell | | |
| | | | Ronald R. Redell, President | | |
| |
| | Date5/27/2020 |
| |
| | By (Signature and Title) /s/ Henry V.Chase |
| | | | Henry V. Chase, Treasurer and | | |
| | | | Principal Financial and Accounting Officer | | |
| |
| | Date5/27/2020 |
4