As filed with the Securities and Exchange Commission on May 29, 2020
UNITED STATES
SECURITIES AND EXCHANGE COMMISSION
Washington, D.C. 20549
FORMN-CSR
CERTIFIED SHAREHOLDER REPORT OF REGISTERED
MANAGEMENT INVESTMENT COMPANIES
Investment Company Act file number811-22378
DoubleLine Funds Trust
(Exact name of registrant as specified in charter)
333 South Grand Avenue, Suite 1800
Los Angeles, CA 90071
(Address of principal executive offices) (Zip code)
Ronald R. Redell
President
DoubleLine Funds Trust
333 South Grand Avenue, Suite 1800
Los Angeles, CA 90071
(Name and address of agent for service)
(213)633-8200
Registrant’s telephone number, including area code
Date of fiscal year end: March 31
Date of reporting period: March 31, 2020
Item 1. Reports to Stockholders.
| | |
| |
 | | Annual Report March 31, 2020 |

| | | | | | | | | | | | | | | | | | | | | | | | | | | | | | | | | | | | |
| | | Class | | | | Class | | | | Class | | | | Class | | |
| | | | | I | | | | | | | | N | | | | | | | | A | | | | | | | | R | | | | 6 | | | | |
| | | Shares | | | | Shares | | | | Shares | | | | Shares | | |
DoubleLine Total Return Bond Fund | | DBLTX | | | | DLTNX | | | | – | | | | DDTRX | | |
DoubleLine Core Fixed Income Fund | | DBLFX | | | | DLFNX | | | | – | | | | DDCFX | | |
DoubleLine Emerging Markets Fixed Income Fund | | DBLEX | | | | DLENX | | | | – | | | | – | | |
DoubleLine Multi-Asset Growth Fund | | DMLIX | | | | DMLNX | | | | DMLAX | | | | – | | |
DoubleLine Low Duration Bond Fund | | DBLSX | | | | DLSNX | | | | – | | | | DDLDX | | |
DoubleLine Floating Rate Fund | | DBFRX | | | | DLFRX | | | | – | | | | – | | |
DoubleLine Shiller Enhanced CAPE® | | DSEEX | | | | DSENX | | | | – | | | | DDCPX | | |
DoubleLine Flexible Income Fund | | DFLEX | | | | DLINX | | | | – | | | | DFFLX | | |
DoubleLine Low Duration Emerging Markets Fixed Income Fund | | DBLLX | | | | DELNX | | | | – | | | | – | | |
DoubleLine Long Duration Total Return Bond Fund | | DBLDX | | | | DLLDX | | | | – | | | | – | | |
DoubleLine Strategic Commodity Fund | | DBCMX | | | | DLCMX | | | | – | | | | – | | |
DoubleLine Global Bond Fund | | DBLGX | | | | DLGBX | | | | – | | | | – | | |
DoubleLine Infrastructure Income Fund | | BILDX | | | | BILTX | | | | – | | | | – | | |
DoubleLine Ultra Short Bond Fund | | DBULX | | | | DLUSX | | | | – | | | | – | | |
DoubleLine Shiller Enhanced International CAPE® | | DSEUX | | | | DLEUX | | | | – | | | | – | | |
DoubleLine Colony Real Estate and Income Fund | | DBRIX | | | | DLREX | | | | – | | | | – | | |
DoubleLine Emerging Markets Local Currency Bond Fund | | DBELX | | | | DLELX | | | | – | | | | – | | |
DoubleLine Income Fund | | DBLIX | | | | DBLNX | | | | – | | | | – | | |
Beginning on January 1, 2021, as permitted by regulations adopted by the Securities and Exchange Commission, paper copies of the Funds’ annual andsemi-annual shareholder reports will no longer be sent by mail, unless you specifically request paper copies of the reports. Instead, the reports will be made available on the Funds’ website (www.doublelinefunds.com), and you will be notified by mail each time a report is posted and provided with a website link to access the report.
If you already elected to receive shareholder reports electronically, you will not be affected by this change and you need not take any action. You may elect to receive shareholder reports and other communications from a Fund electronically anytime by contacting your financial intermediary (such as a broker-dealer or bank) or, if you are a direct investor, by calling877-DLine11(877-354-6311) or by sending ane-mail request to DoubleLine at fundinfo@doubleline.com.
Beginning on January 1, 2019, you may elect to receive all future reports in paper free of charge. If you invest through a financial intermediary, you can contact your financial intermediary to request that you continue to receive paper copies of your shareholder reports. If you invest directly with a Fund, you cancall 877-DLINE11(877-354-6311) or send an email request to fundinfo@doubleline.com to let the Fund know you wish to continue receiving paper copies of your shareholder reports. Your election to receive reports in paper will apply to all funds held in your account if you invest through your financial intermediary or all funds held with the fund complex if you invest directly with a Fund.
DoubleLine Capital LP & DoubleLine Alternatives LP || 333 South Grand Avenue, 18th Floor || Los Angeles, CA 90071 || (213) 633-8200
fundinfo@doubleline.com|| www.doubleline.com
| | | | | | |
| | Annual Report | | March 31, 2020 | | 3 |
| | |
| President’s Letter | | (Unaudited) March 31, 2020 |

Dear DoubleLine Funds Shareholder,
On behalf of the DoubleLine Funds, I am pleased to deliver the Annual Report for the12-month period ended March 31, 2020. On the following pages you will find specific information regarding each Fund’s operations and holdings. In addition, we discuss each Fund’s investment performance and the main drivers of that performance during the reporting period.
If you have any questions regarding the DoubleLine Funds please don’t hesitate to call us at877-DLine11(877-354-6311), or visit our website www.doublelinefunds.com where our investment management team offers deeper insights and analysis on relevant capital market activity impacting investors today. We value the trust that you have placed with us, and we will continue to strive to offer thoughtful investment solutions to our shareholders.
Sincerely,

Ronald R. Redell, CFA
President
DoubleLine Funds Trust
May 1, 2020
| | |
| Financial Markets Highlights | | (Unaudited) March 31, 2020 |
· Agency Mortgage-Backed Securities (Agency MBS)
For the12-month period ended March 31, 2020, the Bloomberg Barclays U.S. MBS Index returned 7.03%, underperforming the Bloomberg Barclays U.S. Government/Credit Bond Index and outperforming the Bloomberg Barclays U.S. Corporate Index. During the period, rates rallied across the U.S. Treasury yield curve, with2-year yields decreasing by 202 basis points (bps) and10-year yields decreasing by 174 bps. The30-year mortgage rate (based on Freddie Mac U.S.30-year Commitment Rates) decreased by 56 bps and refinancing activity, as measured by the Mortgage Bankers Association (MBA) Refinance Index Seasonally-Adjusted, increased by over 250%. Overall gross issuance of Agency MBS increased to approximately $1.80 trillion over the12-month period, and net issuance increased to approximately $248 billion. At the end of the period, the Federal Reserve (the Fed) announced and implemented an infinite Quantitative Easing program in response to the sharp decline in economic activity arising out of the governmental and market reaction to theCOVID-19 pandemic. The Fed stated it would purchase Agency MBS to support smooth market functioning and effective transmission of monetary policy. As of March 31, the Fed’s gross Agency MBS purchases totaled $295 billion. While purchases includedTBA-eligible pools (primarily current coupon production), they did not include Agency collateralized mortgage obligations (“CMOs”). Overall purchasing activity experienced a steep decline at the end of the period as many people who were interested in buying new homes were confronted with “shelter in place” orders.
· Non-Agency Mortgage-Backed Securities(Non-Agency MBS)
For the12-month period ended March 31, 2020, spreads were significantly wider forNon-Agency MBS. Given the backdrop of the governmental and market reaction to theCOVID-19 pandemic at the end of the period, the market was processing potential outcomes including the probability of many homeowners struggling to make payments and potential forbearance scenarios. Net issuance reached approximately $110 billion over the period, outpacing the same period a year ago ($87 billion). Housing market fundamentals remained strong for home price appreciation as prices finished the period 3.1% higher than a year ago. Mortgage rates were supportive for home prices as Freddie Mac30-year Commitment Rates fell by 56 bps to finish the period at 3.5%. This highlights that the housing market was on a positive trajectorypre-COVID-19, but byperiod-end some mortgage brokers believed that home prices would fall by 3% by the end of 2020. Given the material credit spread widening and general market volatility in March 2020, we believe that new issuance across the sector will be muted for the foreseeable future. We believe mortgage servicers are the focal point during this time as borrowers pursue forbearance. Servicers must advance principal and interest payments under particular circumstances but servicers may not have the capital to do so for a prolonged period of time. Any expansion in the Term Asset-Backed Securities Loan Facility (TALF) program by the Fed to includeNon-Agency MBS bonds would be a relief for this market. Any support for mortgage servicers directly would also be supportive and perhaps stymie further deleveraging from Real Estate Investment Trusts (REITs) receiving margin calls based upon this bearish premise.
· Commercial Mortgage-Backed Securities (CMBS)
For the12-month period ended March 31, 2020, new issuance of $116.9 billion of CMBS priced compared to $88.5 billion for the previous12-month period. New issue CMBS spreads were wider, alongside broader spreads in credit and equity indices and a sharp decline in interest rates at the end of the period, as a result of market volatility associated with the governmental and market reaction toCOVID-19. Private-label CMBS issuance set a post-crisis record in 2019 with $112.9 billion. Higher than expected issuance in 2019 was aided by robust Commercial Real Estate (CRE) fundamentals, lower interest rates, and stable investor demand. While this sentiment leaked into 2020, with a record setting issuance in December, March saw a material slowdown in new issuance given broader market volatility associated with reactions toCOVID-19. Spreads on10-year AAA last cash flows (LCFs) andBBB- bonds widened materially, especially over a span of the last two weeks of the period. This was largely liquidity driven as fund redemptions and levered CMBS investors created a liquidity vacuum for CMBS bonds as supply flooded the secondary market with limited dealer support. The Trepp CMBS Delinquency Rate for CRE loans had fallen in 20 of the last 26 months to 2.07% as of period end, 81 bps lower year-over-year. The Bloomberg Barclays U.S. CMBS ERISA Eligible Total Return Index returned 6.13%, underperforming the broader Bloomberg Barclays U.S. Aggregate Bond Index return of 8.93%. The Moody’s/RCA Commercial Property Price Index (CPPI) increased by 6.46% on the national level for the12-month period ended February 29, 2020, as compared to 6.67% over the previous12-month period.
· Emerging Markets (EM) Debt
For the12-month period ended March 31, 2020, U.S. dollar (USD)-denominated EM fixed income sovereign and corporate bonds indices, represented by the J.P. Morgan Emerging Markets Bond (EMBI) Global Diversified Index and the J.P. Morgan Corporate
| | | | | | |
| | Annual Report | | March 31, 2020 | | 5 |
| | |
| Financial Markets Highlights (Cont.) | | (Unaudited) March 31, 2020 |
Emerging Markets Bond Index (CEMBI) Broad Diversified, posted negative returns of-6.84% and-3.39%, respectively. For the period, the sovereign and corporate indices’ spreads widened 275 bps and 263 bps, respectively, as measured by the EMBI and CEMBI. Spreads grinded marginally tighter over the first 10 months of the period as central banks continued to provide accommodative measures and U.S.–China trade negotiations made positive strides, culminating in the “Phase 1” trade deal reached in January 2020. In late February and the first 3 weeks of March 2020, EM spreads widened to levels that had not been reached since the global financial crisis of 2008 as global markets grappled with the impact of a global economic shutdown due to the governmental and market reaction toCOVID-19. EM Investment Grade (IG) credits significantly outperformed their High Yield (HY) counterparts over the period in both the EMBI and CEMBI. At the regional level, Europe was the best performing region and Africa was the worst performing region for both the sovereign and corporate indices, as measured by the EMBI and CEMBI.
· International Sovereign
For the12-month period ended March 31, 2020, the Financial Times Stock Exchange World Government Bond Index (FTSE WGBI) posted a 6.17% return. The positive performance over the period was driven primarily by falling global bond yields which offset foreign exchange market (FX) depreciation against the U.S. Dollar (USD), as indicated by the U.S. Dollar Index (DXY), which rose 1.81% over the period. Global government yields declined amid a deteriorating outlook for economic growth and increased intervention from central banks. The Fed lowered rates by a cumulative 75 bps in the second half of 2019 amid concerns about slowing global growth and elevated trade tensions with China. The Fed cut rates further by 150 bps in the last quarter of the period to near zero, deployed substantial liquidity measures, and expanded its asset purchase program in an emergency response to the anticipated economic impact of the governmental and market reaction to theCOVID-19 pandemic. The USD strengthened against most of itsG-10 peers, as well as emerging market currencies, amid a‘flight-to-safety’ response due to concerns about the economic impact from lockdown measures taken to contain the spread ofCOVID-19. U.S. government bond exposure was the largest positive contributor to performance in the FTSE WGBI, while Australia, South Africa and Mexico government bond exposures were the largest detractors of performance for the period.
· Investment Grade (IG) Credit
For the12-month period ended March 31, 2020, the Bloomberg Barclays U.S. Credit Index provided a total return of 5.10%. IG credit spreads began the period at 113 bps and ended the period at 90 bps. However, spreads widened back out to 255 bps by March 31, 2020 as countries put large parts of their economies into lockdown in response toCOVID-19, causing havoc in the financial markets. Yields for the period went from a low of 2.14% on March 6 to a high of 4.22% on March 20. The Index underperformed duration-matched Treasuries by 1,009 bps for the period. The Index’s best-performing sectors for the period on a total return basis were Wirelines, Supermarkets, Cable Satellite, Pharmaceuticals, and Industrial (other). The Index’s worst performing sectors on a total return basis were Independent Energy, Leisure, Oil Field Services, Midstream, and Refining. USD IG new issuance for the period was $1.449 trillion gross and $486.6 million net. This represents an increase of 20.4% and 56.3% from the12-month period ending March 31, 2019 on a gross and net basis, respectively.
· Bank Loans
For the12-month period ended March 31, 2020, the S&P/LSTA Leveraged Loan Index returned-9.16%, with pressure from the-12.37% return in March. Consistent with the negative returns, higher quality credits outperformed lower quality credits.BB-rated loans returned-6.61%, ahead ofB-rated loans(-9.50%) andCCC-rated loans(-22.98%). The Index’s worst performing sectors were Nonferrous Metals-Minerals(-42.67%) and Oil & Gas(-38.88%), while the only sector with positive returns was Cable & Satellite, up 0.41%. The weighted-average bid price of the Index at the end of the period was $82.85, down 14% from $96.41 in March 2019. The trailing12-month default rate (by issuer count) remained low but rose from 1.40% in March 2019 to 2.02% in March 2020, as reported by the Leveraged Commentary & Data (LCD) team at S&P Capital IQ.
· U.S. High Yield (U.S. HY)
For the12-month period ended March 31, 2020, the Bloomberg Barclays U.S. Corporate High Yield Index returned-6.94%. Intermediate maturity bonds returned-7.09%, underperforming longer maturity bonds, which returned-3.10%. Higher-rated bonds outpaced those with lower ratings, asBB-rated bonds returned-3.19%,single-B bonds returned-6.81%, andCCC-rated bonds returned-18.80%. For the period, notable outperformers by industry were Wireless, Supermarkets, and Railroads. Notable underperformers over the period were Oil Field Services, Independent Energy, and Retail REITs.
| | |
| | | (Unaudited) March 31, 2020 |
· Collateralized Loan Obligations (CLOs)
For the12-month period ended March 31, 2020, the CLO market saw a total of $106.41 billion in new issuance and an additional $57.7 billion in refinancing and reset activity. Excluding the last month of the period, investment grade CLO spreads were tighter on average while lower mezzanine tranches saw some spread widening. During March 2020, however, the broader market experienced heightened volatility brought on by the governmental and market reaction to theCOVID-19 pandemic as did the CLO market with spreads widening significantly up and down the capital structure. This volatility caused the J.P. Morgan CLO Total Return Level Index to dip into negative territory, ending the period with a total return of-4.97%.
· Global Equities
For the12-month period ended March 31, 2020, Global Equities, as measured by the Morgan Stanley Capital International All Country World Index (MSCI ACWI), were down 10.78%. U.S. equities outperformed, with the S&P 500 Index returning-6.98% during the period. European equities underperformed the broader market, with the Eurostoxx 50 Index returning-13.90%. Asian equity markets outperformed, with Japanese equities, as measured by the Nikkei 225 Index, down 8.92%. Chinese equities, as measured by the Shanghai Composite Index, were down 8.84%. EM equities, as measured by the Morgan Stanley Capital International Emerging Markets Index (MSCI EM), significantly underperformed the broader market, and were down 17.42% over the period.
· Commodities
For the12-month period ended March 31, 2020, the broad commodity market declined by 42.08% and 23.71% as measured by the S&P Goldman Sachs Commodity Index (GSCI) and Bloomberg Commodity Excess Return Index, respectively. The best performing sector was Precious Metals, which rallied 17.29% as Gold increased 20.03% and Silver declined 9.28%. The worst performing sector was Energy, which declined 60.34%; WTI (West Texas Intermediate) Crude and Brent Crude plunged 66.59% and 58.02%, respectively. Agriculture declined 7.19% with the best performer, Wheat, up 20.41% while the worst performer, Cotton, declined 36.35% for the period. As Industrial Metals declined 23.53%, the best performing industrial metal was Nickel(-12.32%) and the worst was Zinc(-32.91%).
· Infrastructure Debt
For the12-month period ended March 31, 2020, Infrastructure-related Debt produced slightly negative total returns. Similar to other asset classes, Infrastructure returns were firmly in positive territory through February 2020, but ultimately fell victim to the sharp market selloff that occurred in March 2020. Political and investor reactions to theCOVID-19 pandemic caused a significant amount of selling pressure on many segments of the market, and some Infrastructure Debt assets weathered this shock better than others. Utilities and other countercyclical names generally experienced only modest price declines while most structured product cohorts suffered steeper declines. Nominal spreads on the infrastructure assets that we track rose by about 325 basis points over the period, with the majority of the spread change occurring in March 2020.
· Asset-Backed Securities (ABS)
For the12-month period ended March 31, 2020, the Bloomberg Barclays U.S. ABS Index returned 2.79% and ABS gross new issuance was approximately $188 billion. Similar to other risk assets, ABS faced two major headwinds during this time period: the U.S.-China trade conflict and governmental and market reaction to theCOVID-19 pandemic. The trade conflict weighed on ABS performance as it generally brought U.S. interest rates lower and ABS spreads lagged the spread tightening experienced by longer duration sectors such as corporate bonds. The actions taken by governments in response to theCOVID-19 pandemic were especially punitive for ABS because it caused price declines for global transportation assets as well as consumer-related exposures in the U.S. As ofperiod-end, the Fed programs supported corporate bonds more than ABS, particularly relative to the portions of the ABS market in which we typically find value.
· U.S. Large Cap Equities
For the12-month period ended March 31, 2020, the activity in the U.S. equity market was unprecedented. At the beginning of the period, the U.S. equity markets had just rebounded sharply from the near-bear market of late 2018. Thanks to the Fed’s quick “pivot” away from higher short-term interest rates and quantitative tightening, the S&P 500 Index was already over 21% off its lows and within days of a newall-time high at the beginning of the period. For the first6-months of the period, the Index shrugged off gradually
| | | | | | |
| | Annual Report | | March 31, 2020 | | 7 |
| | |
| Financial Markets Highlights (Cont.) | | (Unaudited) March 31, 2020 |
deteriorating fundamental data to close above 3,000 for the first time and set a series of new highs. International economic metrics felt the impact of the ongoing U.S.-China trade war and domestically, the job market and consumer sector remained strong. With corporate profits essentially flat compared to 2018, equity values were increasing through multiple expansion. At the end of summer 2019, “Trade Peace” broke out with the “Phase I” trade agreement announcement with China. Macroeconomic data showed some signs of improvement at the same time as the Fed followed their July rate cut with cuts in September and October. Risk assets likely also benefited from the liquidity provided by the Fed’s wholesale funding actions launched in September. By the end of December, the Fed had undone over half of the “quantitative tightening” of 2018 and 2019. By late February 2020, the Index had returned nearly 22% from its March 31, 2019 levels and was atall-time highs, with valuations rich by historical standards and corporate buybacks the leading incremental buyer of shares. Corporations, however, continued to show little or no earnings growth. This was a recipe for disappointment and the trigger was to come from an unexpected source: the governmental and market reaction to theCOVID-19 pandemic. The S&P 500, which closed at anall-time high as recently as February 19, quickly entered a bear market. Atperiod-end, the Index had lost over a third of its peak level before staging a sharp 17.43% recovery in the final five trading days of the month bringing returns for the period to-6.98%.
· Government Securities
For the12-month period ended March 31, 2020, activity in the U.S. Government sector was tumultuous. The period began with the U.S. Treasury market in the midst of a powerful and sustained rally that started in November 2018. The ongoing decline in growth and inflation prompted the Fed to cut the Fed Funds rate in July 2019 for the first time in over 10 years. The10-year U.S. Treasury yield fell to a cycle low of 1.43% in September, then stabilized in a 1.50% to 2.00% range throughyear-end. By early January 2020, the10-year yield had drifted to the upper end of the range, reaching 1.94% on generally upbeat assessments of the outlook for economic growth. While the initial investor reaction toCOVID-19 was subdued, the rapid spread ofCOVID-19 and the dramatic measures taken in March to combat it became a grave threat to global economies and Treasury yields plummeted. U.S. Treasuries were purchased against the wholesale liquidation of virtually all other assets as the drop in yields was compounded by an oil price war. On March 3, the Fed intervened and announced an intra-meeting 50 bps rate cut. On March 15, it announced a second emergency rate cut (bringing the Fed Funds rate to near-zero), swap lines with foreign central banks, unlimited repo financing, and a massive, open-ended, asset purchase program that included, among others, U.S. Treasuries. Treasury yields and the shape of the yield curve were extremely volatile throughout March. By the end of the period, however, the Fed’s aggressive steps appeared to have made considerable progress toward restoring U.S. Treasury market liquidity. The Bloomberg Barclays U.S. Government Bond Index returned 7.24% over the period and the Bloomberg Barclays U.S. Treasury-Inflation Protected (TIPS) Total Return Index returned 2.50%.
| | |
| Management’s Discussion of Fund Performance | | (Unaudited) March 31, 2020 |
DoubleLine Total Return Bond Fund
For the12-month period ended March 31, 2020, the DoubleLine Total Return Bond Fund underperformed the Bloomberg Barclays U.S. Aggregate Bond Index return of 8.93%. The underperformance was primarily driven by duration positioning, and an underweight position to U.S. Treasuries relative to the Index. The Fund’s average duration of 3.53 years remained shorter than the Index’s average duration of 5.80 years, which detracted from performance as rates broadly fell, with2-year and10-year U.S. Treasury yields down 201 bps and 174 bps, respectively. Agency MBS was the largest contributor to performance. Securitized credit sectors detracted from performance for the period, with a majority of the underperformance stemming from volatility during the month of March 2020. ABS and CMBS were the two largest detractors from performance, largely due to concerns regarding aviation ABS and mortgage forbearance uncertainty as a result of governmental responses toCOVID-19.
| | | | | | | | | | |
| | |
| 12-Month Period Ended3-31-20 | | | | 1-Year |
| | |
I-Share | | | | | | | | | 2.97% | |
| | |
N-Share | | | | | | | | | 2.71% | |
| | |
R6-Share* | | | | | | | | | 3.00% | |
| | |
Bloomberg Barclays U.S. Aggregate Bond Index | | | | | | | | | 8.93% | |
| * | The inception date of the Class R6 shares was 7/31/2019. The returns shown for the period prior to its inception date reflect the actual unadjusted returns of the Class I shares. |
For additional performance information, please refer to the “Standardized Performance Summary.”
DoubleLine Core Fixed Income Fund
For the12-month period ended March 31, 2020, the DoubleLine Core Fixed Income Fund underperformed the Bloomberg Barclays U.S. Aggregate Bond Index return of 8.93%. During the period, U.S. Treasury rates fell across the yield curve and a portion of the Fund’s underperformance can be attributed to the underweight position in duration at 4.52 years versus the Index’s duration of 5.69 years. U.S. Government securities and Agency MBS were the largest contributors to performance as both asset classes benefitted from falling U.S. Treasury rates for the period. The bout of volatility atperiod-end retraced a large portion of positive performance for fixed income assets with credit risk. Specifically, holdings of CMBS, EM Debt, and CLOs were the largest detractors to overall performance for the period.
| | | | | | | | | | |
| | |
| 12-Month Period Ended3-31-20 | | | | 1-Year |
| | |
I-Share | | | | | | | | | 1.42% | |
| | |
N-Share | | | | | | | | | 1.17% | |
| | |
R6-Share* | | | | | | | | | 1.44% | |
| | |
Bloomberg Barclays U.S. Aggregate Bond Index | | | | | | | | | 8.93% | |
| * | The inception date of the Class R6 shares was 7/31/2019. The returns shown for the period prior to its inception date reflect the actual unadjusted returns of Class I shares. |
For additional performance information, please refer to the “Standardized Performance Summary.”
DoubleLine Emerging Markets Fixed Income Fund
For the12-month period ended March 31, 2020, the DoubleLine Emerging Markets Fixed Income Fund posted negative performance and underperformed its benchmark, the J.P. Morgan Emerging Markets Bond (EMBI) Global Diversified Index. Negative returns across the Fund and the Index were driven by significant credit spread widening, which was offset only partially by lower U.S. Treasury yields and accrued interest. Over the period, IG credit significantly outperformed HY credit, and Africa and Latin America were the worst performing regions in the Index. A higher allocation to HY credit and an overweight positioning in Latin American countries negatively impacted relative Fund performance. An overweight positioning in corporate issuers, which outperformed their sovereign counterparts, supported the Fund’s performance.
| | | | | | | | | | |
| | |
| 12-Month Period Ended3-31-20 | | | | 1-Year |
| | |
I-Share | | | | | | | | | -10.43% | |
| | |
N-Share | | | | | | | | | -10.68% | |
| | |
J.P. Morgan Emerging Markets Bond (EMBI) Global Diversified Index | | | | | | | | | -6.84% | |
For additional performance information, please refer to the “Standardized Performance Summary.”
| | | | | | |
| | Annual Report | | March 31, 2020 | | 9 |
| | |
| Management’s Discussion of Fund Performance (Cont.) | | (Unaudited) March 31, 2020 |
DoubleLine Multi-Asset Growth Fund
For the12-month period ended March 31, 2020, the DoubleLine Multi-Asset Growth Fund underperformed its benchmarks. The equity sleeve underperformed Global Equities, which were down 10.78%, as measured by the MSCI ACWI. An overweight position in EM equities, exposure to the Shiller Barclays CAPE® U.S. Sector TR USD Index (achieved through swaps), and energy stocks detracted from performance. The fixed income sleeve contributed positively to performance, particularly the U.S. Treasuries and Agency MBS; however, an overweight exposure to securitized credit detracted from performance, leading to underperformance versus the Bloomberg Barclays Global Aggregate Bond Index. The short USD position detracted from performance for the period. Investments in real assets detracted from performance as well, driven by a systematic long/short commodity strategy, which is executed through the use of swap contracts.
| | | | | | | | | | |
| | |
| 12-Month Period Ended3-31-20 | | | | 1-Year |
| | |
I-Share | | | | | | | | | -12.32% | |
| | |
A-Share | | | | | | | | | | |
| | |
Without Load | | | | | | | | | -12.42% | |
| | |
With Load | | | | | | | | | -16.14% | |
| | |
S&P 500® Index | | | | | | | | | -6.98% | |
| | |
Blended Benchmark: MSCI ACWI (60%)/Bloomberg Barclays Global Aggregate Bond Index (40%) | | | | | | | | | -4.94% | |
| | |
Blended Benchmark: MSCI ACWI (60%)/Bloomberg Barclays Global Aggregate Bond Index Hedged to USD (40%) | | | | | | | | | -4.02% | |
For additional performance information, please refer to the“Standardized Performance Summary.”
DoubleLine Low Duration Bond Fund
For the12-month period ended March 31, 2020, the DoubleLine Low Duration Bond Fund underperformed the ICE BofAML1-3 Year U.S. Treasury Index return of 5.42%. U.S. Treasury yields fell substantially over the period, with the1-year yield falling 223 bps and the5-year yield falling 185 bps. CMBS and EM debt were the largest detractors from the Fund’s performance, while Agency MBS and U.S. Treasuries contributed positively to performance during the period.
| | | | | | | | | | |
| | |
| 12-Month Period Ended3-31-20 | | | | 1-Year |
| | |
I-Share | | | | | | | | | -1.59% | |
| | |
N-Share | | | | | | | | | -1.84% | |
| | |
R6-Share* | | | | | | | | | -1.58% | |
| | |
ICE BofAML1-3 Year U.S. Treasury Index | | | | | | | | | 5.42% | |
| | |
Bloomberg Barclays U.S. Aggregate1-3 Year Bond Index | | | | | | | | | 4.63% | |
| * | The inception date of the Class R6 shares was 7/31/2019. The returns shown for period prior to its inception date reflect the actual unadjusted returns of Class I shares. |
For additional performance information, please refer to the“Standardized Performance Summary.”
DoubleLine Floating Rate Fund
For the12-month period ended March 31, 2020, the DoubleLine Floating Rate Fund outperformed the S&P/LSTA Leveraged Loan Index return of-9.16%. Within the Bank Loan allocation, the Fund generally maintained an overweight position insingle-B credits and an underweight position in BB and CCC credits. The Fund’slow-weighting in CCC loans contributed positively to performance, while the underweight of BB loans and overweight ofsingle-B loans detracted from performance. A bias towards higher quality credits amongsingle-B names contributed positively to performance. On a sector basis, overweight positions in Healthcare and Food Products were beneficial to performance, while a small overweight in Food/Drug Retailers detracted from performance. An underweight position in Electronics/Electrical detracted from performance, while an underweight exposure to Retailers contributed positively to performance. The
| | | | | | |
| 10 | | DoubleLine Funds Trust | | | | |
| | |
| | | (Unaudited) March 31, 2020 |
HY allocation outperformed the Index over the period, given the relative high quality and low duration of those investments, and the Fund’s small cash balance also helped performance.
| | | | | | | | | | |
| | |
| 12-Month Period Ended3-31-20 | | | | 1-Year |
| | |
I-Share | | | | | | | | | -7.99% | |
| | |
N-Share | | | | | | | | | -8.32% | |
| | |
S&P/LSTA Leveraged Loan Index | | | | | | | | | -9.16% | |
For additional performance information, please refer to the“Standardized Performance Summary.”
DoubleLine Shiller Enhanced CAPE®
For the12-month period ended March 31, 2020, the DoubleLine Shiller Enhanced CAPE® Fund underperformed the S&P 500 Index return of-6.98%. During the period, the Shiller Barclays CAPE® US Sector TR USD Index (the “CAPE Index”) (which the Fund gained exposure to through the use of swap contracts) was allocated to nine sectors over the course of the period: Communication Services, Consumer Discretionary, Consumer Staples, Energy, Financials, Healthcare, Industrials, Materials, and Technology. The sectors providing the highest returns when constituents of the CAPE Index were Technology, Consumer Staples, and Healthcare, all of which delivered positive returns. The most negative returns were in the Financials, Materials, and Industrials sectors. The fixed income collateral portfolio decreased in value during the period. The three fixed income sectors with the highest returns within the portfolio were U.S. Governments and Agency MBS, both of which delivered positive returns, as well as IG corporates. The fixed income sectors declining most in value during the period were CMBS, ABS, and Bank Loans.
| | | | | | | | | | |
| | |
| 12-Month Period Ended3-31-20 | | | | 1-Year |
| | |
I-Share | | | | | | | | | -16.78% | |
| | |
N-Share | | | | | | | | | -17.00% | |
| | |
R6-Share* | | | | | | | | | -16.68% | |
| | |
S&P 500® Index | | | | | | | | | -6.98% | |
| | |
Shiller Barclays CAPE® US Sector TR USD Index | | | | | | | | | -10.27% | |
| * | The inception date of the Class R6 shares was 7/31/2019. The returns shown for the period prior to its inception date reflect the actual unadjusted returns of the Class I shares. |
For additional performance information, please refer to the“Standardized Performance Summary.”
DoubleLine Flexible Income Fund
For the12-month period ended March 31, 2020, the DoubleLine Flexible Income Fund underperformed the ICE BofA Lynch1-3 Year Eurodollar Index (formerly the ICE BofAML1-3 Year Eurodollar Index) return of 2.96%. During the last two months of the period, therisk-off sentiment increased, turning many sectors negative and detracting from performance. Securitized credit assets, IG Corporates and EM debt all experienced negative returns as the market repriced credit risk in light of the impact on the global economy from the governmental and market reaction to theCOVID-19 pandemic. U.S. Governments and Agency MBS contributed positively to performance over the period as market participants sought outFed-supported asset classes for protection as volatility increased at theperiod-end.
| | | | | | | | | | |
| | |
| 12-Month Period Ended3-31-20 | | | | 1-Year |
| | |
I-Share | | | | | | | | | -9.06% | |
| | |
N-Share | | | | | | | | | -9.30% | |
| | |
R6-Share* | | | | | | | | | -9.04% | |
| | |
ICE BofA1-3 Year Eurodollar Index | | | | | | | | | 2.96% | |
| | |
LIBOR** USD 3 Month | | | | | | | | | 2.14% | |
| * | The inception date of the Class R6 shares was 7/31/2019. The returns shown for the period prior to its inception date reflect the actual unadjusted returns of the Class I shares. |
| ** | LIBOR stands for the London Interbank Offered Rate. |
For additional performance information, please refer to the“Standardized Performance Summary.”
| | | | | | |
| | Annual Report | | March 31, 2020 | | 11 |
| | |
| Management’s Discussion of Fund Performance (Cont.) | | (Unaudited) March 31, 2020 |
DoubleLine Low Duration Emerging Markets Fixed Income Fund
For the12-month period ended March 31, 2020, the DoubleLine Low Duration Emerging Markets Fixed Income Fund outperformed the J.P. Morgan Corporate Emerging Markets Bond Index (CEMBI) Broad Diversified1-3 Year Index return of-2.81%. The Fund benefitted from an overweight position in IG credits, which significantly outperformed their HY counterparts over the period. The Fund’s underweight positioning in Africa credits also supported the Fund’s performance as Africa was the worst performing region in the Index over the period.
| | | | | | | | | | |
| | |
| 12-Month Period Ended3-31-20 | | | | 1-Year |
| | |
I-Share | | | | | | | | | -0.62% | |
| | |
N-Share | | | | | | | | | -0.77% | |
| | |
J.P. Morgan CEMBI Broad Diversified1-3 Year Index | | | | | | | | | -2.81% | |
For additional performance information, please refer to the“Standardized Performance Summary.”
DoubleLine Long Duration Total Return Bond Fund
For the12-month period ended March 31, 2020, the DoubleLine Long Duration Total Return Bond Fund outperformed the Bloomberg Barclays U.S. Long Government/Credit Index return of 19.32%. U.S. Government exposure within the Fund was the primary driver of outperformance. Additionally, the Fund’s overweight to Agency MBS contributed to relative performance and outperformed corporate benchmark exposure. Over the period, the Fed cut rates a cumulative 225 bps, of which 150 bps came in the first quarter of 2020. On average, the Fund maintained a duration of 15.35 years compared to the benchmark duration of 15.84 years.
| | | | | | | | | | |
| | |
| 12-Month Period Ended3-31-20 | | | | 1-Year |
| | |
I-Share | | | | | | | | | 24.85% | |
| | |
N-Share | | | | | | | | | 24.44% | |
| | |
Bloomberg Barclays U.S. Long Government/Credit Index | | | | | | | | | 19.32% | |
For additional performance information, please refer to the“Standardized Performance Summary.”
DoubleLine Strategic Commodity Fund
For the12-month period ended March 31, 2020, the DoubleLine Strategic Commodity Fund declined 28.25%. During the period the broad commodity market declined by 41.01% and 22.31% as measured by the S&P GSCI and BCOM, respectively. The Morgan Stanley Backwardation-Focused Multi-Commodity Index (MS BFMCISM) (beta exposure), which the Fund gained exposure to through the use of swaps contracts, declined by 27.42% while the DoubleLine Commodity Long Short Strategy (DCLS) (tactical exposure), a systematic long/short commodity strategy implemented through swap contracts, decreased by 19.96%. The Fund’s underperformance relative to the BCOM was driven by the underperformance of the MS BFMCISM and the Fund’s allocation timing to the DCLS. The Fund’s use of derivative instruments to gain exposure to commodities facilitated investment of the Fund’s remaining assets in U.S. Treasuries, which added incremental return in the period.
| | | | | | | | | | |
| | |
| 12-Month Period Ended3-31-20 | | | | 1-Year |
| | |
I-Share | | | | | | | | | -28.25% | |
| | |
N-Share | | | | | | | | | -28.28% | |
| | |
Bloomberg Commodity Index Total Return | | | | | | | | | -22.31% | |
For additional performance information, please refer to the“Standardized Performance Summary.”
DoubleLine Global Bond Fund
For the12-month period ended March 31, 2020, the DoubleLine Global Bond Fund underperformed the FTSE WGBI return of 6.17%. Global government bond yields generally fell over the period and most relevant FX pairs depreciated against the USD. Accordingly, relative performance to the benchmark was hurt by the Fund’s shorter duration of 5.4 years and underweight position in the U.S. As of 3/31/2020,
| | | | | | |
| 12 | | DoubleLine Funds Trust | | | | |
| | |
| | | (Unaudited) March 31, 2020 |
the benchmark duration was 8.6 years. Overweight positioning in South Africa, Mexico and the Central Eastern Europe countries also detracted from performance during the period.
| | | | | | | | | | |
| | |
| 12-Month Period Ended3-31-20 | | | | 1-Year |
| | |
I-Share | | | | | | | | | 0.43% | |
| | |
N-Share | | | | | | | | | 0.23% | |
| | |
FTSE World Government Bond Index (WGBI) | | | | | | | | | 6.17% | |
For additional performance information, please refer to the“Standardized Performance Summary.”
DoubleLine Infrastructure Income Fund
For the12-month period ended March 31, 2020, the DoubleLine Infrastructure Income Fund underperformed the Bloomberg Barclays U.S. Aggregate Bond Index return of 8.93%. The primary driver of underperformance was asset allocation. The Index consistently maintained a roughly 40% allocation to U.S. Treasuries, which was thetop-performing fixed income sector over the period during a sharpflight-to-quality event. The Fund held U.S. Treasuries during this period, but on a much smaller scale than the Index. During the period, several Fed programs supported Agency MBS and IG corporate markets, two sectors that are more heavily weighted in the Index than the Fund. The Fund’s allocations to structured products and EM debt detracted from performance, as these sectors were generally left unaddressed by the Fed’s actions.
| | | | | | | | | | |
| | |
| 12-Month Period Ended3-31-20 | | | | 1-Year |
| | |
I-Share | | | | | | | | | -2.32% | |
| | |
N-Share | | | | | | | | | -2.55% | |
| | |
Bloomberg Barclays U.S. Aggregate Bond Index | | | | | | | | | 8.93% | |
For additional performance information, please refer to the“Standardized Performance Summary.”
DoubleLine Ultra Short Bond Fund
For the12-month period ended March 31, 2020, the DoubleLine Ultra Short Bond Fund underperformed the ICE BofA3-Month U.S. Treasury Bill Index return of 2.25 %. The3-month U.S. Treasury yield decreased 2.32% to end the period at 0.06%, while3-month LIBOR decreased 1.15% to end the period at 1.45%. Within the Fund, corporate credit underperformed3-month U.S. Treasuries, with corporate spreads widening as measured by the Bloomberg Barclays U.S.1-3 Year Credit Index. The relative underperformance of the Fund’s corporate credit position was due to the Fund being overweight commercial paper and floating rate notes. Treasury Bills outperformed the corporate creditsell-off caused by the reactions to theCOVID-19 pandemic at theperiod-end.
| | | | | | | | | | |
| | |
| 12-Month Period Ended3-31-20 | | | | 1-Year |
| | |
I-Share | | | | | | | | | -0.04% | |
| | |
N-Share | | | | | | | | | -0.19% | |
| | |
ICE BofA3-Month U.S. Treasury Bill Index | | | | | | | | | 2.25% | |
For additional performance information, please refer to the“Standardized Performance Summary.”
DoubleLine Shiller Enhanced International CAPE®
For the12-month period ended March 31, 2020, the DoubleLine Shiller Enhanced International CAPE® underperformed the broad European equity market as measured by the MSCI Europe Index return of-15.50%. During the period, the Shiller Barclays CAPE® Europe Sector Net TR NoC USD Index (“the CAPE Index”), which the Fund gained exposure to through the use of swap contracts, was allocated to seven sectors over the course of the period: Communication Services, Consumer Discretionary, Consumer Staples, Healthcare, Industrials, Materials, and Utilities. The sectors providing the best returns when constituents of the CAPE Index were Healthcare and Utilities, both of which were positive, and Industrials. The most negative returns were in the Consumer Discretionary, Communication Services, and Materials sectors. The fixed income collateral portfolio decreased in value during the period. The three fixed income sectors with the
| | | | | | |
| | Annual Report | | March 31, 2020 | | 13 |
| | |
| Management’s Discussion of Fund Performance (Cont.) | | (Unaudited) March 31, 2020 |
highest returns within the portfolio were U.S. Governments, Agency MBS, and ABS, all of which delivered positive returns. The fixed income sectors declining most in value during the period were CMBS, Bank Loans, and CLOs.
| | | | | | | | | | |
| | |
| 12-Month Period Ended3-31-20 | | | | 1-Year |
| | |
I-Share | | | | | | | | | -20.29% | |
| | |
N-Share | | | | | | | | | -20.50% | |
| | |
MSCI Europe Index | | | | | | | | | -15.50% | |
For additional performance information, please refer to the “Standardized Performance Summary.”
DoubleLine Colony Real Estate and Income Fund
For the12-month period ended March 31, 2020, the DoubleLine Colony Real Estate and Income Fund outperformed the Dow Jones U.S. Select REIT Total Return Index return of-23.96%. Exposure to the REIT sector of the U.S. equity market was obtained through exposure to the Colony Capital Fundamental U.S. Real Estate Index, which the Fund gained through the use of swap contracts. The fixed income collateral portfolio decreased in value during the period. The three fixed income sectors with the highest returns within the portfolio were U.S. Governments and Agency MBS, which delivered positive returns, as well as IG Corporates. The fixed income sectors declining most in value during the period were CMBS, Bank Loans, andNon-Agency MBS.
| | | | | | | | | | |
| | |
| 12-Month Period Ended3-31-20 | | | | 1-Year |
| | |
I-Share | | | | | | | | | -22.08% | |
| | |
N-Share | | | | | | | | | -22.21% | |
| | |
Dow Jones U.S. Select REIT Total Return Index | | | | | | | | | -23.96% | |
For additional performance information, please refer to the“Standardized Performance Summary.”
DoubleLine Emerging Markets Local Currency Bond Fund
For the period since inception on June 28, 2019 through March 31, 2020, the DoubleLine Emerging Markets Local Currency Bond Fund underperformed the J.P. MorganGBI-EM Global Diversified TR Index return of-11.51%. Negative returns were driven by sharp FX depreciation against the USD in the first quarter of 2020. An overweight positioning in Argentina earlier in the period and underweight positioning in Thailand and Turkey detracted from relative performance. An overweight position in the Philippines and Israel, as well as an underweight position in South Africa, contributed positively to performance.
| | | | | | | | | | |
| | |
| Period Ended3-31-20 | | | | Since Inception* (Not Annualized) |
| | |
I-Share | | | | | | | | | -12.52% | |
| | |
N-Share | | | | | | | | | -12.69% | |
| | |
J.P. MGBI-EM Global Diversified TR Index | | | | | | | | | -11.51% | |
For additional performance information, please refer to the“Standardized Performance Summary.”
DoubleLine Income Fund
For the period since inception on September 3, 2019 through March 31, 2020, the DoubleLine Income Fund underperformed the Bloomberg Barclays U.S. Aggregate Bond Index return of 2.60%. The underperformance was driven by substantial credit spread widening during the period and having less exposure to U.S. Treasuries than the Index. Prior to the market volatility atperiod-end, the Fund was underperforming the Index as a result of not having any U.S. Treasury exposure as U.S. rates rallied notably. The duration of the portfolio of 3.2 years was also significantly less than that of the Index of 5.7 years, which detracted from performance as well. The Fed purchase program atperiod-end began to purchase U.S. Treasuries and Agency MBS to stabilize markets, and Agency MBS was the best performing sector for the period as a result. Conversely, holdings inNon-Agency MBS, CLOs, and CMBS detracted from performance largely as a result of not being a part of the Fed purchase program. The ABS allocation within the portfolio largely consists of subsectors that are not a part of the Fed purchase program.
| | | | | | | | | | |
| | |
| Period Ended3-31-20 | | | | Since Inception* (Not Annualized) |
| | |
I-Share | | | | | | | | | -17.35% | |
| | |
N-Share | | | | | | | | | -17.46% | |
| | |
Bloomberg Barclays U.S. Aggregate Bond Index | | | | | | | | | 2.60% | |
| | | | | | |
| 14 | | DoubleLine Funds Trust | | | | |
| | |
| | | (Unaudited) March 31, 2020 |
For additional performance information, please refer to the“Standardized Performance Summary.”
Past Performance is not a guarantee of future results.
Opinions expressed herein are as of March 31, 2020 and are subject to change at any time, are not guaranteed and should not be considered investment advice. This report is for the information of shareholders of the Funds. It may also be used as sales literature when preceded or accompanied by the current prospectus.
A Fund’s investment objectives, risks, charges and expenses must be considered carefully before investing. You can obtain the summary or statutory prospectus by calling 1 (877)354-6311/ 1 (877) DLINE11, or visiting www.doublelinefunds.com. You should read the prospectus carefully before investing.
The performance shown assumes the reinvestment of all dividends and distributions and does not reflect any reductions for taxes. Investment performance reflects fee waivers in effect. In the absence of such waivers, total return would be reduced.
Fund holdings and sector allocations are subject to change at any time and are not recommendations to buy or sell any security. Please refer to the Schedules of Investments for a complete list of Fund holdings.
Mutual fund investing involves risk. Principal loss is possible.
Investments insecurities related to real estate may decline in value as a result of factors affecting the real estate industry. Investments indebt securities typically decline in value when interest rates rise. This risk is usually greater for longer-term debt securities. Investments inasset-backed and mortgage-backed securities include additional risks that investors should be aware of including credit risk, prepayment risk, possible illiquidity and default, as well as increased susceptibility to adverse economic developments. The Funds may invest inforeign securities (orderivativeswhich give exposure to foreign securities) which involve greater volatility and political, economic and currency risks and differences in accounting methods. These risks are greater for investments in emerging markets. Investments inlower rated andnon-rated securities present a greater risk of loss to principal and interest than higher rated securities.Commodity-linked derivative instruments may involve additional costs and risks such as changes in commodity index volatility or factors affecting a particular industry or commodity, such as drought, floods, weather, livestock disease, embargoes, tariffs and international economic, political and regulatory developments. Investing in derivatives could result in losing more than the amount invested.Derivatives involve risks different from, and in certain cases, greater than the risks presented by more traditional investments. Derivatives may involve certain costs and risks such as liquidity, interest rate, market, credit, management and the risk that a position could not be closed when most advantageous. Investing in derivatives could lose more than the amount invested.Equities may decline in value due to both real and perceived general market, economic, and industry conditions.Exchange-tradedfund investments involve additional risks such as the market price trading at a discount to its net asset value, an active secondary trading market may not develop or be maintained, or trading may be halted by the exchange in which they trade, which may impact a fund’s ability to sell its shares.Floating rate loans and other floating rate investments are subject to credit risk, interest rate risk, counterparty risk and financial services risks, among others. In addition, the Funds may invest in other asset classes and investments such as, among others,REITs, credit default swaps, short sales, derivatives and smaller companies which include additional risks. Investment strategies may not achieve the desired results due to implementation lag, other timing factors, portfolio management decision-making, economic or market conditions or other unanticipated factors.Additional principal risks for the Fundscan be found in the prospectus.
Diversification does not assure a profit or protect against loss in a declining market.
Earnings growth is not representative of the fund’s future performance.
Credit ratings from Moody’s Investor Services, Inc. (“Moody’s”) range from the highest rating of Aaa for bonds of the highest quality that offer the lowest degree of investment risk to the lowest rating of C for the lowest rated class of bonds. Credit ratings from S&P Global Ratings (“S&P”) range from the highest rating of AAA for bonds of the highest quality that offer the lowest degree of investment risk to the lowest rating of D for bonds that are in default. In limited situations when the rating agency has not issued a formal rating, the rating agency will classify the security as nonrated.
Credit ratings are determined by the highest available credit rating from any Nationally Recognized Statistical Rating Organization (“NRSRO”, generally S&P, Moody’s and Fitch Ratings, Inc.). DoubleLine displays credit ratings using S&P’s rating convention, although the rating itself might be sourced from another NRSRO.
Index Disclaimers
Shiller Barclays CAPE® Index Disclaimers
Barclays Capital Inc. and its affiliates (“Barclays”) is not the issuer, sponsor or promoter of DoubleLine Shiller Enhanced CAPE® or DoubleLine Shiller Enhanced International CAPE® (together, in this paragraph, the “Funds”) and Barclays has no responsibilities, obligations or duties to investors in the Funds. The Shiller Barclays CAPE® US Sector TR USD Index and Shiller Barclays CAPE® Europe Sector Net TR NoC USD Index (each an “Index” and together the “Indices”) consist of the respective trademarks of Barclays Bank PLC and trademarks owned by or licensed to RSBB-I, LLC and Barclays Bank PLC and that are licensed for use by DoubleLine Funds Trust as the Issuer of the Funds. Barclays’ only relationship with the Issuer in respect of the Indices is the licensing of these trademarks and the Indices which are determined, composed and calculated by Barclays without regard to the Issuer or the Funds or the owners of the Funds. Additionally, DoubleLine Capital LP may for the Funds execute transaction(s) with Barclays in or relating to the Funds’ respective Index in connection with which investors of one of the Funds acquire shares of their respective Fund from DoubleLine Funds Trust and investors neither acquire any interest in that Fund’s respective Index nor enter into any relationship of any kind whatsoever with Barclays upon making an investment in that Fund. The Funds are not sponsored, endorsed, sold or promoted by Barclays. Barclays does not make any representation or warranty, express or implied regarding the advisability of investing in the Funds or the advisability of investing in securities generally or the ability of the Indices to track corresponding or relative market performance. Barclays has not passed on the legality or suitability of the Funds’ names or the Indices with respect to any person or entity. Barclays is not responsible for and has not participated in the determination of the timing of, prices of, or quantities of the shares of the Funds to be issued. Barclays has no obligation to take the needs of the Issuer or the owners of the Funds or any other third party into consideration in determining, composing or calculating the Indices. Barclays has no obligation or liability in connection with administration, marketing or trading of the Funds. The licensing agreement between DoubleLine Funds Trust and Barclays is solely for the benefit of the Funds and Barclays and not for the benefit of the owners of the Funds, investors or other third parties.
BARCLAYS SHALL HAVE NO LIABILITY TO THE ISSUER, INVESTORS OR TO OTHER THIRD PARTIES FOR THE USE OF THE DOUBLELINE SHILLER ENHANCED CAPE® AND DOUBLELINE SHILLER ENHANCED INTERNATIONAL CAPE® NAMES, OR THE QUALITY, ACCURACY AND/OR COMPLETENESS OF THE SHILLER BARCLAYS CAPE® US SECTOR TR USD INDEX OR SHILLER BARCLAYS CAPE® EUROPE SECTOR NET TR NOC USD INDEX OR ANY DATA INCLUDED THEREIN OR FOR INTERRUPTIONS IN THE DELIVERY OF THE SHILLER BARCLAYS CAPE® US SECTOR TR USD INDEX OR SHILLER BARCLAYS CAPE® EUROPE SECTOR NET TR NOC USD INDEX. BARCLAYS MAKES NO WARRANTY, EXPRESS OR IMPLIED, AS TO RESULTS TO BE OBTAINED BY THE ISSUER, THE INVESTORS OR ANY OTHER PERSON OR ENTITY FROM THE USE OF THE SHILLER BARCLAYS CAPE® US SECTOR TR USD INDEX OR SHILLER BARCLAYS CAPE® EUROPE SECTOR NET TR NOC USD INDEX OR ANY DATA INCLUDED THEREIN. BARCLAYS MAKES NO EXPRESS OR IMPLIED WARRANTIES, AND HEREBY EXPRESSLY DISCLAIMS ALL WARRANTIES OF MERCHANTABILITY OR FITNESS FOR A PARTICULAR PURPOSE OR USE WITH RESPECT TO DOUBLELINE SHILLER ENHANCED CAPE® AND DOUBLELINE SHILLER ENHANCED INTERNATIONAL CAPE® NAMES, THE SHILLER BARCLAYS CAPE® US SECTOR TR USD INDEX OR SHILLER BARCLAYS CAPE® EUROPE SECTOR NET TR NOC USD INDEX OR ANY DATA INCLUDED THEREIN. BARCLAYS RESERVES THE RIGHT TO CHANGE THE METHODS OF CALCULATION OR PUBLICATION, OR TO CEASE THE CALCULATION OR PUBLICATION OF THE SHILLER BARCLAYS CAPE® US SECTOR TR USD INDEX AND
| | | | | | |
| | Annual Report | | March 31, 2020 | | 15 |
| | |
| Management’s Discussion of Fund Performance (Cont.) | | (Unaudited) March 31, 2020 |
SHILLER BARCLAYS CAPE® EUROPE SECTOR NET TR NOC USD INDEX, AND BARCLAYS SHALL NOT BE LIABLE FOR ANY MISCALCULATION OF OR ANY INCORRECT, DELAYED OR INTERRUPTED PUBLICATION WITH RESPECT TO ANY OF THE SHILLER BARCLAYS CAPE® US SECTOR TR USD INDEX AND SHILLER BARCLAYS CAPE® EUROPE SECTOR NET TR NOC USD INDEX. BARCLAYS SHALL NOT BE LIABLE FOR ANY DAMAGES, INCLUDING, WITHOUT LIMITATION, ANY SPECIAL, INDIRECT OR CONSEQUENTIAL DAMAGES, OR ANY LOST PROFITS AND EVEN IF ADVISED OF THE POSSIBILITY OF SUCH, RESULTING FROM THE USE OF THE SHILLER BARCLAYS CAPE® US SECTOR TR USD INDEX OR SHILLER BARCLAYS CAPE® EUROPE SECTOR NET TR NOC USD INDEX OR ANY DATA INCLUDED THEREIN OR WITH RESPECT TO THE DOUBLELINE SHILLER ENHANCED CAPE® OR DOUBLELINE SHILLER ENHANCED INTERNATIONAL CAPE®.
None of the information supplied by Barclays Bank PLC and used in this publication may be reproduced in any manner without the prior written permission of Barclays Capital, the investment banking division of Barclays Bank PLC. Barclays Bank PLC is registered in England No. 1026167. Registered office 1 Churchill Place London E14 5HP.
THE SHILLER BARCLAYS CAPE® US INDEX FAMILY AND SHILLER BARCLAYS CAPE® EUROPE INDEX FAMILY HAVE BEEN DEVELOPED IN PART BY RSBB-I, LLC, THE RESEARCH PRINCIPAL OF WHICH IS ROBERT J. SHILLER. RSBB-I, LLC IS NOT AN INVESTMENT ADVISER AND DOES NOT GUARANTEE THE ACCURACY AND COMPLETENESS OF THE SHILLER BARCLAYS CAPE® US INDEX FAMILY OR THE SHILLER BARCLAYS CAPE® EUROPE INDEX FAMILY OR ANY DATA OR METHODOLOGY EITHER INCLUDED THEREIN OR UPON WHICH THEY ARE BASED. RSBB-I, LLC SHALL HAVE NO LIABILITY FOR ANY ERRORS, OMISSIONS OR INTERRUPTIONS THEREIN AND MAKES NO WARRANTIES EXPRESSED OR IMPLIED, AS TO THE PERFORMANCE OR RESULTS EXPERIENCED BY ANY PARTY FROM THE USE OF ANY INFORMATION INCLUDED THEREIN OR UPON WHICH IT IS BASED, AND EXPRESSLY DISCLAIMS ALL WARRANTIES OF THE MERCHANTABILITY OR FITNESS FOR A PARTICULAR PURPOSE WITH RESPECT THERETO, AND SHALL NOT BE LIABLE FOR ANY CLAIMS OR LOSSES OF ANY NATURE IN CONNECTION WITH THE USE OF SUCH INFORMATION, INCLUDING BUT NOT LIMITED TO, LOST PROFITS OR PUNITIVE OR CONSEQUENTIAL DAMAGES EVEN IF RSBB-I, LLC IS ADVISED OF THE POSSIBILITY OF SAME.
Morgan Stanley Index Disclaimers
NOTHING IN THE FOLLOWING DISCLAIMER IS INTENDED TO MODIFY THE OBLIGATIONS OF ANY MORGAN STANLEY AFFILIATE, INCLUDING WITHOUT LIMITATION, MORGAN STANLEY SMITH BARNEY LLC (“MSSB”), UNDER ANY APPLICABLE AGREEMENT BETWEEN ANY SUCH AFFILIATE AND ITS RESPECTIVE CLIENTS WHO PURCHASE DOUBLELINE STRATEGIC COMMODITY FUND (“FUND”) SHARES THROUGH SUCH AFFILIATE.
THIS FUND IS NOT SPONSORED, ENDORSED, SOLD OR PROMOTED BY MORGAN STANLEY CAPITAL GROUP INC. (“MORGAN STANLEY”). NEITHER MORGAN STANLEY NOR ANY OF ITS OR ITS AFFILIATES’ AGENTS (INCLUDING CALCULATION AGENTS), DATA PROVIDERS (WHICH FOR PURPOSES OF THIS DISCLAIMER INCLUDES WITHOUT LIMITATION ICE DATA, LLP, CHICAGO MERCANTILE EXCHANGE INC., AND THE LONDON METAL EXCHANGE) OR ANY THIRD PARTY PROVIDING SERVICES IN CONNECTION WITH THE INDEX MAKES ANY REPRESENTATION OR WARRANTY, EXPRESS OR IMPLIED, REGARDING THE ADVISABILITY OF INVESTING IN THIS FUND OR THE ABILITY OF THE MORGAN STANLEY BFMCISM (THE “INDEX”) TO TRACK MARKET PERFORMANCE. THE INDEX IS THE EXCLUSIVE PROPERTY OF MORGAN STANLEY. MORGAN STANLEY AND THE INDEX ARE SERVICE MARKS OF MORGAN STANLEY AND/OR A MORGAN STANLEY AFFILIATE AND HAVE BEEN LICENSED TO DOUBLELINE ALTERNATIVES LP FOR USE FOR CERTAIN PURPOSES BY DOUBLELINE ALTERNATIVES LP (“LICENSEE”). MORGAN STANLEY HAS NO OBLIGATION TO TAKE THE NEEDS OF THE LICENSEE, ISSUER OR OWNERS OF THIS FUND INTO CONSIDERATION IN DETERMINING, COMPOSING OR CALCULATING THE INDEX. NEITHER MORGAN STANLEY NOR ANY OF ITS OR ITS AFFILIATES’ AGENTS (INCLUDING CALCULATION AGENTS), DATA PROVIDERS OR ANY THIRD PARTY PROVIDING SERVICES IN CONNECTION WITH THE INDEX IS RESPONSIBLE FOR AND HAS NOT PARTICIPATED IN THE DETERMINATION OF THE TIMING OF, PRICES AT, OR QUANTITIES OF THIS FUND OR ITS ASSETS OR IN THE DETERMINATION OR CALCULATION OF THE EQUATION BY WHICH THIS FUND IS REDEEMABLE. NEITHER MORGAN STANLEY NOR ANY OF ITS OR ITS AFFILIATES’ AGENTS (INCLUDING CALCULATION AGENTS), DATA PROVIDERS OR ANY THIRD PARTY PROVIDING SERVICES IN CONNECTION WITH THE INDEX HAS OR WILL HAVE ANY OBLIGATION OR LIABILITY TO OWNERS OF THIS FUND IN CONNECTION WITH THE ADMINISTRATION, MARKETING OR TRADING OF THIS FUND.
ALTHOUGH MORGAN STANLEY OR ITS AGENTS OR SERVICE PROVIDERS SHALL OBTAIN INFORMATION FOR INCLUSION IN OR FOR USE IN THE CALCULATION OF THE INDEX FROM SOURCES WHICH MORGAN STANLEY CONSIDERS RELIABLE, NEITHER MORGAN STANLEY NOR ANY OF ITS OR ITS AFFILIATES’ AGENTS (INCLUDING CALCULATION AGENTS), DATA PROVIDERS OR ANY THIRD PARTY PROVIDING SERVICES IN CONNECTION WITH THE INDEX GUARANTEES THE ACCURACY AND/OR THE COMPLETENESS OF THE INDEX OR ANY DATA INCLUDED THEREIN. NEITHER MORGAN STANLEY NOR ANY OF ITS OR ITS AFFILIATES’ AGENTS (INCLUDING CALCULATION AGENTS), DATA PROVIDERS OR ANY THIRD PARTY PROVIDING SERVICES IN CONNECTION WITH THE INDEX MAKES ANY WARRANTY, EXPRESS OR IMPLIED, AS TO RESULTS TO BE OBTAINED BY LICENSEE, LICENSEE’S CUSTOMERS AND COUNTERPARTIES, OWNERS OF OR INVESTORS IN THE FUND, OR ANY OTHER PERSON OR ENTITY FROM THE USE OF THE INDEX OR ANY DATA INCLUDED THEREIN IN CONNECTION WITH THE RIGHTS LICENSED HEREUNDER OR FOR ANY OTHER USE. NEITHER MORGAN STANLEY NOR ANY OF ITS OR ITS AFFILIATES’ AGENTS (INCLUDING CALCULATION AGENTS), DATA PROVIDERS OR ANY THIRD PARTY PROVIDING SERVICES IN CONNECTION WITH THE INDEX MAKES ANY EXPRESS OR IMPLIED WARRANTIES, AND DO HEREBY EXPRESSLY DISCLAIM ALL WARRANTIES OF MERCHANTABILITY OR FITNESS FOR A PARTICULAR PURPOSE WITH RESPECT TO THE INDEX OR ANY DATA INCLUDED THEREIN. WITHOUT LIMITING ANY OF THE FOREGOING, IN NO EVENT SHALL MORGAN STANLEY OR ANY AGENT OF MORGAN STANLEY OR ANY MORGAN STANLEY AFFILIATE (INCLUDING CALCULATION AGENTS), DATA PROVIDERS OR ANY THIRD PARTY PROVIDING SERVICES IN CONNECTION WITH THE INDEX HAVE ANY LIABILITY FOR ANY DIRECT, INDIRECT, SPECIAL, PUNITIVE, CONSEQUENTIAL OR ANY OTHER DAMAGES (INCLUDING LOST PROFITS) EVEN IF NOTIFIED OF THE POSSIBILITY OF SUCH DAMAGES.
NO PURCHASER, SELLER OR HOLDER OF THIS SECURITY, OR ANY OTHER PERSON OR ENTITY, SHOULD USE OR REFER TO ANY MORGAN STANLEY TRADE NAME, TRADEMARK OR SERVICE MARK TO SPONSOR, ENDORSE, MARKET OR PROMOTE THIS PRODUCT WITHOUT FIRST CONTACTING MORGAN STANLEY TO DETERMINE WHETHER MORGAN STANLEY’S PERMISSION IS REQUIRED. UNDER NO CIRCUMSTANCES MAY ANY PERSON OR ENTITY CLAIM ANY AFFILIATION WITH MORGAN STANLEY WITHOUT THE PRIOR WRITTEN PERMISSION OF MORGAN STANLEY.
As part of the license agreements related to the use of the Colony Capital Fundamental US Real Estate Index, the DoubleLine Colony Real Estate and Income Fund is required to include the following disclaimers in its Prospectus. The following disclaimers have been provided by Colony Capital, Inc. and Barclays Bank PLC, respectively. Neither the DoubleLine Colony Real Estate and Income Fund nor the Adviser has verified the information in these disclaimers and both the Fund and the Adviser disclaim responsibility for the content of these disclaimers.
Colony Capital, Inc.
The Colony Capital Fundamental US Real Estate Index (the “Index”) has been licensed by Barclays for use by DoubleLine Alternatives LP. Colony Capital is a registered trademark of Colony Capital QIS, LLC or its affiliates and has been sub-licensed for use for certain purposes by DoubleLine Alternatives LP. DoubleLine Colony Real Estate and Income Fund (the “Fund”) is not sponsored, endorsed, sold, or promoted by Colony Capital QIS, LLC or any of its affiliates. Neither Colony Capital QIS, LLC nor any of its affiliates make any representation or warranty, express or implied, to the owners of the Fund or any member of the public regarding the advisability of investing in securities generally or in the Fund particularly or the ability of the Index to track market performance. Colony Capital QIS, LLC’s and its affiliates’ only relationship to DoubleLine Alternatives LP with respect to the Index is through the sublicensing of certain rules incorporated in the Index and certain trademarks, service marks, and/or trade names owned by Colony Capital QIS, LLC and its affiliates through Barclays and/or its affiliates to DoubleLine Alternatives LP. The Index is not determined, composed, or calculated by Colony Capital QIS, LLC. Neither Colony Capital QIS, LLC nor its affiliates are responsible for and have not participated in the determination of the prices or amount of shares of the Fund or the timing of the issuance or sale of shares of the Fund or in the determination or calculation of the equation by which shares of the Fund are to be converted into cash, surrendered, or redeemed, as the case may be. Colony Capital QIS, LLC and its affiliates have no obligation or liability in connection with the administration, marketing, or trading of the Fund. There is no assurance that investment products based on the Index shall accurately track index performance or provide positive investment returns. Colony Capital QIS, LLC and its affiliates are not investment advisors with respect to investors in the Fund. Inclusion of a security within an index is not a recommendation by Colony Capital QIS, LLC or its affiliates to buy, sell, or hold such security, nor is it considered to be investment advice.
| | | | | | |
| 16 | | DoubleLine Funds Trust | | | | |
| | |
| | | (Unaudited) March 31, 2020 |
NEITHER COLONY CAPITAL QIS, LLC NOR ITS AFFILIATES GUARANTEE THE ADEQUACY, ACCURACY, TIMELINESS, AND/OR COMPLETENESS OF THE INDEX, ANY DATA RELATED THERETO, OR ANY COMMUNICATIONS, INCLUDING BUT NOT LIMITED TO, ORAL, WRITTEN, OR ELECTRONIC COMMUNICATIONS WITH RESPECT THERETO AND LICENSOR AND ITS AFFILIATES SHALL NOT BE SUBJECT TO ANY DAMAGES OR LIABILITY FOR ANY ERRORS, OMISSIONS, OR DELAYS THEREIN. COLONY CAPITAL QIS, LLC AND ITS AFFILIATES MAKE NO EXPRESS OR IMPLIED WARRANTIES, AND EXPRESSLY DISCLAIM ALL WARRANTIES OF MERCHANTABILITY, FITNESS FOR A PARTICULAR PURPOSE, OR USE, OR AS TO RESULTS TO BE OBTAINED BY DOUBLELINE ALTERNATIVES LP, INVESTORS IN THE FUND, OR ANY OTHER PERSON OR ENTITY FROM THE USE OF THE INDEX OR WITH RESPECT TO ANY DATA RELATED THERETO. WITHOUT LIMITING ANY OF THE FOREGOING, IN NO EVENT WHATSOEVER SHALL LICENSOR OR ITS AFFILIATES BE LIABLE, WHETHER IN CONTRACT, TORT, STRICT LIABILITY, OR OTHERWISE, FOR ANY INDIRECT, SPECIAL, INCIDENTAL, PUNITIVE, OR CONSEQUENTIAL DAMAGES OR FOR LOSS OF PROFITS, TRADING LOSSES, LOST TIME, OR GOODWILL, EVEN IF THEY HAVE BEEN ADVISED OF THE POSSIBILITY OF SUCH DAMAGES.
Barclays Bank PLC
©Barclays Bank PLC, its wholly-owned subsidiary©Barclays Capital Inc. or an affiliate (collectively “Barclays”) owns the intellectual property and licensing rights in and to the Colony Capital Fundamental US Real Estate Index (the “Index”) and either entity may act as licensor of the Index. All rights reserved. Neither Barclays nor the Index Sponsor, as defined below, make any representation or warranty, express or implied, to DoubleLine Colony Real Estate and Income Fund (the “Fund”) or any member of the public regarding the advisability of investing in transactions generally or other instruments or related derivatives or in the Index particularly or the ability of the Barclays indices, including without limitation, the Index, to track the performance of any market or underlying assets or data. Neither Barclays nor the Index Sponsor has any obligation to take the needs of the Fund into consideration in determining, composing or calculating the Index. Barclays’ indices are administered, calculated and published by the Index Sponsor. The Index Sponsor role is performed by Barclays Index Administration (“BINDA”), a distinct function within the Investment Bank of Barclays Bank PLC. As the administrator of the Barclays family of indices, BINDA operates independently from Barclays Investment Bank’s sales, trading, structuring and banking departments. Notwithstanding the foregoing, potential conflicts of interest may exist where: (i) Barclays acts in multiple capacities with respect to a particular Barclays index, including but not limited to functioning as index sponsor, index administrator, calculation agent, licensing agent, and/or publisher; (ii) sales, trading or structuring desks in Barclays Investment Bank launch products linked to the performance of a Barclays index, which are typically hedged by Barclays’ trading desks. In hedging an index, a trading desk may purchase or sell constituents of that index. These purchases or sales may affect the prices of the index constituents which could in turn affect the level of that index; and (iii) Barclays may use price contributions from trading desks in Barclays Investment Bank as a pricing source for a Barclays index. Barclays has in place policies and governance procedures (including separation of reporting lines) that are designed to avoid or otherwise appropriately manage such conflicts of interest and ensure the independence of BINDA and the integrity of Barclays indices. Where permitted and subject to appropriate restrictions, BINDA personnel regularly interact with trading and structuring desk personnel in Barclays Investment Bank regarding current market conditions and prices although decisions made by BINDA are independent and not influenced by trading and structuring desk personnel. Additional information about Barclays indices together with copies of the BINDA IOSCO Compliance Statement and Control Framework are available at: https://index.barcap.com/Home/BINDA. The Index Sponsor is under no obligation to continue the calculation, publication and dissemination of the Index or the level of the Index. While the Index Sponsor currently employs the methodology ascribed to the Index (and application of such methodology shall be conclusive and binding), no assurance can be given that market, regulatory, juridical, financial, fiscal or other circumstances (including, but not limited to, any changes to or any suspension or termination of or any other events affecting any constituent within the Index) will not arise that would, in the view of the Index Sponsor, necessitate an adjustment, modification or change of such methodology. In certain circumstances, the Index Sponsor may suspend or terminate the Index.
BARCLAYS AND THE INDEX SPONSOR DO NOT GUARANTEE, AND SHALL HAVE NO LIABILITY TO THE PURCHASERS OR TRADERS, AS THE CASE MAY BE, OF THE FUND OR TO THIRD PARTIES FOR, THE QUALITY, ACCURACY AND/OR COMPLETENESS OF THE BARCLAYS INDICES, OR ANY DATA INCLUDED THEREIN, OR FOR INTERRUPTIONS IN THE DELIVERY OF THE BARCLAYS INDICES. BARCLAYS AND THE INDEX SPONSOR MAKE NO EXPRESS OR IMPLIED WARRANTIES, AND HEREBY EXPRESSLY DISCLAIM ALL WARRANTIES OF MERCHANTABILITY OR FITNESS FOR A PARTICULAR PURPOSE OR USE WITH RESPECT TO THE BARCLAYS INDICES, INCLUDING WITHOUT LIMITATION, THE INDEX, OR ANY DATA INCLUDED THEREIN. WITHOUT LIMITING ANY OF THE FOREGOING, IN NO EVENT SHALL BARCLAYS OR THE INDEX SPONSOR HAVE ANY LIABILITY FOR ANY SPECIAL, PUNITIVE, INDIRECT, OR CONSEQUENTIAL DAMAGES (INCLUDING LOST PROFITS), EVEN IF NOTIFIED OF THE POSSIBILITY OF SUCH DAMAGES SAVE TO THE EXTENT THAT SUCH EXCLUSION OF LIABILITY IS PROHIBITED BY LAW.
Basis Points (bps)—A basis point equals 0.01%.
Beta—The measure of a mutual fund’s volatility in relation to the market. By definition, the market has a beta of 1.0, and individual mutual funds are ranked according to how much they deviate from the market. A beta of above 1.0 means the fund swings more than the market. If the fund moves less than the market, the beta is less than 1.0.
Bloomberg Barclays Global Aggregate Bond Index—This index provides a broad-based measure of the global investment-grade fixed income markets. The three major components of this index are the U.S. Aggregate, thePan-European Aggregate, and the Asian-Pacific Aggregate Indices. The index also includes Eurodollar andEuro-Yen corporate bonds, Canadian government, agency and corporate securities, and USD investment grade 144A securities.
Bloomberg Barclays U.S.1-3 Year Credit Index—This index measures the performance of investment grade corporate debt and sovereign, supranational, local authority, andnon-US agency bonds that have a remaining maturity of at least one year and less than three years.
Bloomberg Barclays U.S. ABS Index—This index represents the ABS component of the Bloomberg Barclays U.S. Aggregate Index. It includes securities whose value and income payments are derived from and collateralized (“or backed”) by a specified pool of underlying assets including credit cards, auto loans, etc.
Bloomberg Barclays U.S. Aggregate Bond Index—This index represents securities that areSEC-registered, taxable, and dollar denominated. The index covers the U.S. investment grade fixed rate bond market, with index components for government and corporate securities, mortgage pass-through securities, and asset-backed securities. These major sectors are subdivided into more specific indices that are calculated and reported on a regular basis.
Bloomberg Barclays U.S. Aggregate1-3 Year Index—This index represents the1-3 year component of the Bloomberg Barclays U.S. Aggregate Index.
Bloomberg Barclays U.S. CMBS ERISA Eligible Total Return Index—This index measures the performance of investment-grade CMBS and includes only CMBS that are Employee Retirement Income Security Act of 1974, which will deem ERISA eligible the certificates with the first priority of principal repayment, as long as certain conditions are met, including the requirement that the certificates be rated in one of the three highest rating categories by Fitch, Inc., Moody’s Investors Services or Standard & Poor’s.
Bloomberg Barclays U.S. Corporate Index—An index that represents the total return measure of the corporates portion of the Barclays U.S. Aggregate Index.
Bloomberg Barclays U.S. Corporate High Yield Index—This index measures theUSD-denominated, high yield, fixed-rate corporate bond market. Securities are classified as high yield if the middle rating of Moody’s, Fitch and S&P is Ba1/BB+/BB+ or below. The Bloomberg Barclays U.S. High Yield Long Index, including bonds with maturities of 10 years or greater, and the Bloomberg Barclays U.S. High Yield Intermediate Index, including bonds with maturities of 1 to 9.999 years, are subindices of the Bloomberg Barclays U.S. Corporate High Yield Index.
Bloomberg Barclays U.S. Credit Index—This index is the US Credit component of the US Government/Credit Index and consists of publically issued US corporate and specified foreign debentures and secured notes that meet the specified maturity, liquidity, and quality requirements. To qualify, bonds must beSEC-registered. The US Credit Index is the same as the former US Corporate Investment Grade Index.
Bloomberg Barclays U.S. Government Bond Index—This index is comprised of the U.S. Treasury and U.S. Agency Indices, the Index includes U.S. dollar-denominated, fixed-rate, nominal U.S. Treasuries and U.S. agency debentures (securities issued by U.S. government-owned or government-sponsored entities, and debt explicitly guaranteed by the U.S. government).
| | | | | | |
| | Annual Report | | March 31, 2020 | | 17 |
| | |
| Management’s Discussion of Fund Performance (Cont.) | | (Unaudited) March 31, 2020 |
Bloomberg Barclays U.S. Government/Credit Bond Index—This index is a broad-based flagship benchmark that measures thenon-securitized component of the U.S. Aggregate Index. It includes investment grade, US dollar-denominated, fixed-rate Treasuries, government-related and corporate securities.
Bloomberg Barclays U.S. Long Government/Credit Index—The index includes publicly issued U.S. Treasury debt, U.S. government agency debt, taxable debt issued by U.S. states and territories and their political subdivisions, debt issued by U.S. andnon-U.S. corporations,non-U.S. government debt and supranational debt.
Bloomberg Barclays U.S. MBS Index—This index measures the performance of investment grade fixed-rate mortgage-backed pass-through securities of the Government-Sponsored Enterprises (GSEs): Ginnie Mae (GNMA), Fannie Mae (FNMA), and Freddie Mac (FHLMC).
Bloomberg Barclays U.S. TIPS Total Return Index—This index measures the performance of the U.S. TIPS market. Federal Reserve holdings of US TIPS are not index eligible and are excluded from the face amount outstanding of each bond in the index.
Bloomberg Commodity Excess Return Index—An index calculated on an excess return basis that reflects commodity futures price movements. The index rebalances annually weighted 2/3 by trading volume and 1/3 by world production and weight-caps are applied at the commodity, sector and group level for diversification. Roll period typically occurs from6th-10th business day based on the roll schedule.
Bloomberg Commodity Total Return Index (BCOM)—An index that reflects commodity futures price movements. The index rebalances annually weighted 2/3 by trading volume and 1/3 by world production and weight-caps are applied at the commodity, sector and group level for diversification. Roll period typically occurs from6th-10th business day based on the roll schedule. The BCOM Total Return Index includes collateral to the futures in the form of treasury securities.
Colony Capital Fundamental U.S. Real Estate Index—This Index is a rules-based index that incorporates the fundamental criteria originally developed by Colony Capital, Inc. The Index is rebalanced and reconstituted quarterly by applying a systematic methodology to the universe of REITs. It is not possible to invest directly in an index.
Dow Jones U.S. Select REIT Total Return Index—This index tracks the performance of publicly traded REITs and REIT-like securities and is designed to serve as a proxy for direct real estate investment, in part by excluding companies whose performance may be driven by factors other than the value of real estate.
Duration—A measure of the sensitivity of a price of a fixed income investment to a change in interest rates, expressed as a number of years.
Fed Funds Rate—The interest rate at which banks and other depository institutions lend money to each other, usually on an overnight basis. The law requires banks to keep a certain percentage of their customer’s money on reserve, where the banks earn no interest on it.
Freddie Mac U.S.30-year Commitment Rates—The interest rate charged by Freddie Mac to lend money to a qualified borrower on a30-year fixed-rate mortgage loan.
Eurostoxx 50 Index—A stock index of Eurozone stocks designed by STOXX, an index provider owned by Deutsche Borse Group and SIX group, with the goal of providing a blue-chip representation of Supersector leaders in the Eurozone.
FTSE World Government Bond Index (WGBI)—This index measures the performance of fixed-rate, local currency, investment grade sovereign bonds. The WGBI is a widely used benchmark that currently comprises sovereign debt from over 20 countries, denominated in a variety of currencies, and has more than 25 years of history available. The WGBI provides a broad benchmark for the global sovereign fixed income market. Sub-indices are available in any combination of currency, maturity, or rating.
G-10 (Group of 10)—The G10 consists of eleven industrialized nations that meet on an annual basis or more frequently, as necessary, to consult each other, debate and cooperate on international financial matters. The member countries are: Belgium, Canada, France, Germany, Italy, Japan, the Netherlands, Sweden, Switzerland, the United Kingdom and the United States.
ICE BofA1-3 Year Eurodollar Index—This index is a subset of the BAML Eurodollar Index including all securities with a remaining term to final maturity less than 3 years. The BAML Eurodollar Index tracks the performance of US dollar-denominated investment grade quasigovernment, corporate, securitized and collateralized debt publicly issued in the eurobond markets.
ICE BofA1-3 Year U.S. Treasury Index—This index is an unmanaged index that tracks the performance of the direct soversign debt of the U.S. Government having a maturity of at least one year and less than three years.
ICE BofA3-Month Treasury Bill Index—This index is an unmanaged index of U.S. Treasury securities maturing in 90 days that assumes reinvestment of all income.
J.P. Morgan CLO TR Level Index—This index holistically captures theUSD-denominated CLO market, representing over 3000 instruments at a total par value of US $236.1 billion. It allows market participants to track securitized loan market valuations.
J.P. Morgan Corporate Emerging Markets Bond Index (CEMBI) Broad Diversified—This index is a market capitalization weighted index consisting ofU.S-denominated Emerging Market corporate bonds. It is a liquid global corporate benchmark representing Asia, Latin America, Europe and the Middle East/Africa.
J.P. Morgan Corporate Emerging Markets Bond Index (CEMBI) Broad Diversified1-3 Year Index—This index is a market capitalization weighted index consisting ofUS-denominated Emerging Market corporate bonds with1-3 year maturity. It is a liquid global corporate benchmark representing Asia, Latin America, Europe and the Middle East/Africa.
J.P. Morgan Emerging Markets Bond (EMBI) Global Diversified Index—This index is a uniquely-weighted version of the EMBI Global. It limits the weights of those index countries with larger debt stocks by only including specified portions of these countries’ eligible current face amounts of debt outstanding. The countries covered in the EMBI Global Diversified are identical to those covered by EMBI Global. There is also a high yield sub-index and investment grade sub-index which are subsets of the EMBI.
J.P. MorganGBI-EM Global Diversified Index—This index tracks local currency bonds issued by Emerging Market governments.
Last Cash Flow (LCF)—The last revenue stream paid to a bond over a given period.
London Interbank Offered Rate (LIBOR)—An indicative average interest rate at which a selection of banks known as the panel banks are prepared to lend one another unsecured funds on the London money market.
Moody’s/RCA Commercial Property Price Index (CPPI)—An index that describes variousnon-residential property types for the U.S. (10 monthly series from 2000). This index is a periodic same-property round-trip investment price change index of the U.S. commercial investment property market. The dataset contains 20 monthly indicators.
Morgan Stanley Backwardation Focused Multi-Commodity Index (MS BFMCISM)—An index comprised of futures contracts selected based on (i) the contracts’ historical backwardation relative to other commodity-related futures contracts and (ii) the contracts’ historical liquidity. The sectors represented in the index (industrial metals, energy and agricultural/livestock) have been selected to provide diversified exposure. The index is typicallyre-balanced annually in January.
Morgan Stanley Capital International All Country World Index (MSCI ACWI)—A market-capitalization-weighted index designed to provide a broad measure of stock performance throughout the world, including both developed and emerging markets.
Morgan Stanley Capital International Emerging Markets Index (MSCI EM)—The index is a float-adjusted market capitalization index designed to measure equity market performance in global emerging markets. It consists of indices in 26 emerging economies, including but not limited to, Argentina, Brazil, China, India, Poland, Thailand, Turkey, and Venezuela.
| | | | | | |
| 18 | | DoubleLine Funds Trust | | | | |
| | |
| | | (Unaudited) March 31, 2020 |
Morgan Stanley Capital International (MSCI) Europe Net Total Return Index—The index is part of the Modern Index Strategy and represents the performance of large andmid-cap equities across 15 developed countries in Europe. The Index has a number of sub-Indexes which cover varioussub-regions market segments/sizes, sectors and covers approximately 85% of the free float-adjusted market capitalization in each country.
Mortgage Bankers Association (MBA) Refinance Index Seasonally-Adjusted—An index that covers all mortgage applications to refinance an existing mortgage adjusted to take into account changes in data due to seasonality. It includes conventional and government refinances.
Nikkei 225 Index—A price-weighted index comprised of Japan’s top 225 blue-chip companies on the Tokyo Stock Exchange. The Nikkei is equivalent to the Dow Jones Industrial Average Index in the U.S.
Shanghai Composite Index—A capitalization-weighted index that tracks the daily performance of allA-shares andB-shares listed on the Shanghai Stock Exchange. The index was developed on December 19, 1990 with a base value of 100.
Shiller Barclays CAPE® US Sector Total Return Index—An index that incorporates the principles of long-term investing distilled by Dr. Robert Shiller and expressed through the CAPE® (Cyclically Adjusted Price Earnings) ratio (the “CAPE® Ratio”). It aims to identify undervalued sectors based on a modified CAPE® Ratio, and then uses a momentum factor to seek to mitigate the effects of potential value traps.
Shiller Barclays CAPE® Europe Sector Net TR NoC USD Index (European CAPE Index)—The index incorporates the principles of long-term investing distilled by Dr. Robert Shiller and expressed through the CAPE® (Cyclically Adjusted Price Earnings) ratio (the “CAPE® Ratio”). The classic CAPE® Ratio assesses equity market valuations and averages ten years of inflation adjusted earnings to account for earnings and market cycles.
Spread—The difference between yields on differing debt instruments, calculated by deducting the yield of one instrument from another. The higher the yield spread, the greater the difference between the yields offered by each instrument. The spread can be measured between debt instruments of differing maturities, credit ratings and risk.
S&P 500® Index—The Index is an unmanaged capitalization-weighted index of 500 stocks designed to measure performance of the broad domestic economy through changes in the aggregate market value of 500 stocks representing all major industries.
S&P Goldman Sachs Commodity Index (GSCI)—This composite index of commodity sector returns represents a broadly diversified, unleveraged, long-only position in commodity futures. The index’s components qualify for inclusion in the index based on liquidity measures and are weighted in relation to their global production levels, making the Index a valuable economic indicator and commodities market benchmark.
S&P/LSTA Leveraged Loan Index—Capitalization-weighted syndicated loan indices are based upon market weightings, spreads and interest payments, and this index covers the U.S. market back to 1997 and currently calculates on a daily basis. Created by the Leveraged Commentary & Data (LCD) team at S&P Capital IQ, the review provides an overview and outlook of the leveraged loan market as well as an expansive review of the S&P Leveraged Loan Index and sub-indexes. The review consists of index general characteristics, results, risk-return profile, default/distress statistics, and repayment analysis.
Trepp CMBS Delinquency Rate—Trepp, LLC, provides information, analytics and technology to the structured finance, commercial real estate (CRE) and banking markets. A delinquency rate is the percentage of loans within a loan portfolio that have delinquent payments.
U.S. Dollar Index (DXY)—A weighted geometric mean of the United States dollar’s value relative to a basket of 6 major foreign currencies, including the Euro, Japanese yen, Pound sterling, Canadian dollar, Swedish krona and Swiss franc.
Yield curve—A curve in which the yield of fixed interest securities is plotted against the length of time they have to run to maturity.
A direct investment cannot be made in an index. The performance of any index mentioned in this commentary has not been adjusted for ongoing management, distribution and operating expenses applicable to mutual fund investments.
This commentary may include statements that constitute “forward-looking statements” under the U.S. securities laws. Forward-looking statements include, among other things, projections, estimates, and information about possible or future results related to a Fund and market or regulatory developments. The views expressed above are not guarantees of future performance or economic results and involve certain risks, uncertainties and assumptions that could cause actual outcomes and results to differ materially from the views expressed herein.
DoubleLine has no obligation to provide revised assessments in the event of changed circumstances. While we have gathered this information from sources believed to be reliable, DoubleLine cannot guarantee the accuracy of the information provided. Securities discussed are not recommendations and are presented as examples of issue selection or portfolio management processes. They have been picked for comparison or illustration purposes only. No security presented within is either offered for sale or purchase. DoubleLine reserves the right to change its investment perspective and outlook without notice as market conditions dictate or as additional information becomes available.
Investment strategies may not achieve the desired results due to implementation lag, other timing factors, portfolio management decision making, economic or market conditions or other unanticipated factors. The views and forecasts expressed in this material are as of the date indicated, are subject to change without notice, may not come to pass and do not represent a recommendation or offer of any particular security, strategy, or investment. Past performance is no guarantee of future results.
The DoubleLine Funds are distributed by Quasar Distributors, LLC.
DoubleLine® is a registered trademark of DoubleLine Capital LP.
| | | | | | |
| | Annual Report | | March 31, 2020 | | 19 |
| | |
| Standardized Performance Summary | | (Unaudited) March 31, 2020 |
The performance information shown assumes the reinvestment of all dividends and distributions. Returns over 1 year are average annual returns.Performance data quoted represents past performance; past performance does not guarantee future results.The investment return and principal value of an investment will fluctuate so that an investor’s shares, when redeemed, may be worth more or less than the original cost. Current performance of the Fund may be lower or higher than the performance quoted. The Funds’ gross and net expense ratios shown are from the most recent prospectus and may change over time. See the financial highlights section of the financial statements for more recent expense ratios. The Funds’ gross and net expense ratios also include “acquired fund fees and expenses,” which are expenses incurred indirectly as a result of a Fund’s investments in one or more underlying funds, including ETFs and money market funds. Because these costs are indirect, the expense ratios will not correlate to the expense ratios in the Funds’ financial statements, since financial statements only include direct costs of the Funds and not indirect costs of investing in the underlying funds.Performance data current to the most recentmonth-end may be obtained by calling (213)633-8200 or by visiting www.doublelinefunds.com. Short term performance, in particular, is not a good indication of the Funds’ future performance, and an investment should not be made based solely on returns.
| | | | | | | | | | | | | | | | | | | | | | | | | | | |
| DBLTX/DLTNX/DDTRX | | | | | | | | | | | | |
DoubleLine Total Return Bond Fund
Returns as of March 31, 2020 | | 1-Year | | 3-Year
Annualized | | 5-Year
Annualized | | Since Inception
Annualized
(4-6-10 to 3-31-20) | | Expense Ratio |
| | | | | |
I Share (DBLTX) | | | | 2.97% | | | | | 3.15% | | | | | 2.67% | | | | | 5.61% | | | | | 0.48% | |
| | | | | |
N Share (DLTNX) | | | | 2.71% | | | | | 2.90% | | | | | 2.42% | | | | | 5.36% | | | | | 0.73% | |
| | | | | |
R6 Share (DDTRX)1 | | | | 3.00% | | | | | 3.16% | | | | | 2.68% | | | | | 5.61% | | | | | 0.43% | |
| | | | | | |
Bloomberg Barclays U.S. Aggregate Bond Index | | | | 8.93% | | | | | 4.82% | | | | | 3.36% | | | | | 3.95% | | | | | | | | |
| DBLFX/DLFNX/DDCFX | | | | | | | | | | | | |
DoubleLine Core Fixed Income Fund
Returns as of March 31, 2020 | | 1-Year | | 3-Year
Annualized | | 5-Year
Annualized | | Since Inception
Annualized
(6-1-10 to3-31-20) | | Expense Ratio |
| | | | | |
I Share (DBLFX) | | | | 1.42% | | | | | 2.54% | | | | | 2.35% | | | | | 4.67% | | | | | 0.48% | |
| | | | | |
N Share (DLFNX) | | | | 1.17% | | | | | 2.29% | | | | | 2.07% | | | | | 4.41% | | | | | 0.73% | |
| | | | | |
R6 Share (DDCFX)2 | | | | 1.44% | | | | | 2.55% | | | | | 2.35% | | | | | 4.67% | | | | | 0.43% | |
| | | | | | |
Bloomberg Barclays U.S. Aggregate Bond Index | | | | 8.93% | | | | | 4.82% | | | | | 3.36% | | | | | 3.75% | | | | | | | | |
| DBLEX/DLENX | | | | | | | | | | | | |
DoubleLine Emerging Markets Fixed Income Fund
Returns as of March 31, 2020 | | 1-Year | | 3-Year
Annualized | | 5-Year
Annualized | | Since Inception
Annualized
(4-6-10 to3-31-20) | | Expense Ratio |
| | | | | |
I Share (DBLEX) | | | | -10.43% | | | | | -1.43% | | | | | 1.53% | | | | | 3.84% | | | | | 0.89% | |
| | | | | |
N Share (DLENX) | | | | -10.68% | | | | | -1.68% | | | | | 1.27% | | | | | 3.59% | | | | | 1.14% | |
| | | | | | |
J.P. Morgan Emerging Markets Bond Index Global Diversified | | | | -6.84% | | | | | 0.42% | | | | | 2.82% | | | | | 4.92% | | | | | | | | |
| DMLIX/DMLAX | | | | | | | | | | | | |
DoubleLine Multi-Asset Growth Fund
Returns as of March 31, 2020 | | 1-Year | | 3-Year
Annualized | | 5-Year
Annualized | | Since Inception
Annualized
(12-20-10 to 3-31-20) | | Expense Ratio |
| | | | | |
I Share (DMLIX) | | | | -12.32% | | | | | -2.03% | | | | | 0.63% | | | | | 2.08% | | | | | 1.35% | |
| | | | | |
A-share (DMLAX)3 | | | | | | | | | | | | | | | | | | | | | | | | 1.60% |
| | | | | | |
A-share (No Load) | | | | -12.42% | | | | | -2.25% | | | | | 0.40% | | | | | 1.82% | | | | | | | | |
| | | | | | |
A-share (With Load) | | | | -16.14% | | | | | -3.65% | | | | | -0.47% | | | | | 1.34% | | | | | | | | |
| | | | | | |
S&P 500® Index | | | | -6.98% | | | | | 5.10% | | | | | 6.73% | | | | | 10.45% | | | | | | | | |
| | | | | | |
Blended Benchmark USD Unhedged4 | | | | -4.94% | | | | | 2.58% | | | | | 2.99% | | | | | 4.42% | | | | | | | | |
| | | | | | |
Blended Benchmark USD Hedged4 | | | | -4.02% | | | | | 3.04% | | | | | 3.35% | | | | | 5.21% | | | | | | | | |
| DBLSX/DLSNX/DDLDX | | | | | | | | | | | | |
DoubleLine Low Duration Bond Fund
Returns as of March 31, 2020 | | 1-Year | | 3-Year
Annualized | | 5-Year
Annualized | | Since Inception
Annualized
(9-30-11 to3-31-20) | | Expense Ratio |
| | | | | |
I Share (DBLSX) | | | | -1.59% | | | | | 1.10% | | | | | 1.45% | | | | | 1.87% | | | | | 0.43% | |
| | | | | |
N Share (DLSNX) | | | | -1.84% | | | | | 0.85% | | | | | 1.20% | | | | | 1.61% | | | | | 0.68% | |
| | | | | |
R6 Share (DDLDX)5 | | | | -1.58% | | | | | 1.10% | | | | | 1.46% | | | | | 1.87% | | | | | 0.38% | |
| | | | | | |
ICE BofAML1-3 Year U.S. Treasury Index | | | | 5.42% | | | | | 2.70% | | | | | 1.85% | | | | | 1.33% | | | | | | | | |
| | | | | | |
Bloomberg Barclays U.S. Aggregate1-3 Yr Bond Index | | | | 4.63% | | | | | 2.63% | | | | | 1.93% | | | | | 1.56% | | | | | | | | |
| DBFRX/DLFRX | | | | | | | | | | | | |
DoubleLine Floating Rate Fund
Returns as of March 31, 2020 | | 1-Year | | 3-Year
Annualized | | 5-Year
Annualized | | Since Inception
Annualized
(2-1-13 to 3-31-20) | | Expense Ratio |
| | | | | |
I Share (DBFRX)6 | | | | -7.99% | | | | | -0.63% | | | | | 0.60% | | | | | 1.42% | | | | | 0.65% | |
| | | | | |
N Share (DLFRX)6 | | | | -8.32% | | | | | -0.92% | | | | | 0.32% | | | | | 1.19% | | | | | 0.89% | |
| | | | | | |
S&P/LSTA Leveraged Loan Index | | | | -9.16% | | | | | -0.78% | | | | | 1.14% | | | | | 1.90% | | | | | | | | |
| | | | | | |
| 20 | | DoubleLine Funds Trust | | | | |
| | |
| | | (Unaudited) March 31, 2020 |
| | | | | | | | | | | | | | | | | | | | | | | | | | | |
| DSEEX/DSENX/DDCPX | | | | | | | | | | | | |
DoubleLine Shiller Enhanced CAPE®
Returns as of March 31, 2020 | | 1-Year | | 3-Year
Annualized | | 5-Year
Annualized | | Since Inception
Annualized
(10-31-13 to 3-31-20) | | Expense Ratio |
| | | | | |
I Share (DSEEX) | | | | -16.78% | | | | | 1.50% | | | | | 6.71% | | | | | 9.07% | | | | | 0.57% | |
| | | | | |
N Share (DSENX) | | | | -17.00% | | | | | 1.25% | | | | | 6.46% | | | | | 8.80% | | | | | 0.82% | |
| | | | | |
R6 Share (DDCPX)7 | | | | -16.68% | | | | | 1.54% | | | | | 6.74% | | | | | 9.09% | | | | | 0.52% | |
| | | | | | |
S&P 500® Index8 | | | | -6.98% | | | | | 5.10% | | | | | 6.73% | | | | | 8.42% | | | | | | | | |
| | | | | | |
Shiller Barclays CAPE® U.S. Sector TR USD Index8 | | | | -10.27% | | | | | 4.16% | | | | | 8.20% | | | | | 9.69% | | | | | | | | |
| DFLEX/DLINX/DFFLX | | | | | | | | | | | | |
DoubleLine Flexible Income Fund
Returns as of March 31, 2020 | | 1-Year | | 3-Year
Annualized | | 5-Year
Annualized | | Since Inception
Annualized
(4-7-14 to3-31-20) | | Expense Ratio |
| | | | | |
I Share (DFLEX) | | | | -9.06% | | | | | -0.90% | | | | | 0.63% | | | | | 1.16% | | | | | 0.76% | |
| | | | | |
N Share (DLINX) | | | | -9.30% | | | | | -1.19% | | | | | 0.36% | | | | | 0.90% | | | | | 1.01% | |
| | | | | |
R6 Share (DFFLX)9 | | | | -9.04% | | | | | -0.90% | | | | | 0.63% | | | | | 1.17% | | | | | 0.71% | |
| | | | | | |
ICE BofAML1-3 Year Eurodollar Index | | | | 2.96% | | | | | 2.46% | | | | | 2.02% | | | | | 1.89% | | | | | | | | |
| | | | | | |
LIBOR USD 3 Month | | | | 2.14% | | | | | 2.03% | | | | | 1.46% | | | | | 1.27% | | | | | | | | |
| DBLLX/DELNX | | | | | | | | | | | | |
DoubleLine Low Duration Emerging Markets Fixed
Income Fund
Returns as of March 31, 2020 | | 1-Year | | 3-Year
Annualized | | 5-Year
Annualized | | Since Inception
Annualized
(4-7-14 to3-31-20) | | Gross
Expense
Ratio | | Net
Expense
Ratio10 |
| | | | | | |
I Share (DBLLX) | | | | -0.62% | | | | | 1.64% | | | | | 2.37% | | | | | 2.30% | | | | | 0.65% | | | 0.59% |
| | | | | | |
N Share (DELNX) | | | | -0.77% | | | | | 1.40% | | | | | 2.13% | | | | | 2.08% | | | | | 0.93% | | | 0.84% |
| | | | | | |
J.P. Morgan CEMBI Broad Diversified1-3 Year Index | | | | -2.81% | | | | | 1.15% | | | | | 2.45% | | | | | 2.38% | | | | | | | | |
| DBLDX/DLLDX | | | | | | | | | | | | |
DoubleLine Long Duration Total Return Bond Fund
Returns as of March 31, 2020 | | 1-Year | | 3-Year
Annualized | | 5-Year
Annualized | | Since Inception
Annualized
(12-15-14to 3-31-20) | | Gross
Expense
Ratio | | Net
Expense
Ratio10 |
| | | | | | |
I Share (DBLDX) | | | | 24.85% | | | | | 10.35% | | | | | 6.06% | | | | | 6.72% | | | | | 0.70% | | | 0.65% |
| | | | | | |
N Share (DLLDX) | | | | 24.44% | | | | | 10.09% | | | | | 5.80% | | | | | 6.45% | | | | | 0.95% | | | 0.90% |
| | | | | | |
Bloomberg Barclays U.S. Long Government/Credit Index | | | | 19.32% | | | | | 9.68% | | | | | 5.99% | | | | | 6.40% | | | | | | | | |
| DBCMX/DLCMX | | | | | | | | | | | | |
DoubleLine Strategic Commodity Fund
Returns as of March 31, 2020 | | 1-Year | | 3-Year
Annualized | | | | Since Inception
Annualized
(5-18-15 to 3-31-20) | | Expense Ratio |
| | | | | |
I Share (DBCMX) | | | | -28.25% | | | | | -7.29% | | | | | | | | | | -5.79% | | | | | 1.11% | |
| | | | | |
N Share (DLCMX) | | | | -28.28% | | | | | -7.48% | | | | | | | | | | -6.03% | | | | | 1.36% | |
| | | | | | |
Bloomberg Commodity Index Total Return | | | | -22.31% | | | | | -8.61% | | | | | | | | | | -9.25% | | | | | | | | |
| DBLGX/DLGBX | | | | | | | | | | | | |
DoubleLine Global Bond Fund
Returns as of March 31, 2020 | | 1-Year | | 3-Year
Annualized | | | | Since Inception
Annualized
(12-17-15 to 3-31-20) | | Expense Ratio |
| | | | | |
I Share (DBLGX) | | | | 0.43% | | | | | 1.76% | | | | | | | | | | 1.44% | | | | | 0.55% | |
| | | | | |
N Share (DLGBX) | | | | 0.23% | | | | | 1.54% | | | | | | | | | | 1.21% | | | | | 0.80% | |
| | | | | | |
FTSE World Government Bond Index | | | | 6.17% | | | | | 4.27% | | | | | | | | | | 3.82% | | | | | | | | |
| BILDX/BILTX | | | | | | | | | | | | |
DoubleLine Infrastructure Income Fund
Returns as of March 31, 2020 | | 1-Year | | 3-Year
Annualized | | | | Since Inception
Annualized
(4-1-16 to 3-31-20) | | Expense Ratio |
| | | | | |
I Share (BILDX) | | | | -2.32% | | | | | 1.57% | | | | | | | | | | 1.95% | | | | | 0.59% | |
| | | | | |
N Share (BILTX) | | | | -2.55% | | | | | 1.35% | | | | | | | | | | 1.70% | | | | | 0.84% | |
| | | | | | |
Bloomberg Barclays U.S. Aggregate Bond Index | | | | 8.93% | | | | | 4.82% | | | | | | | | | | 3.72% | | | | | | | | |
| DBULX/DLUSX | | | | | | | | | | | | |
DoubleLine Ultra Short Bond Fund
Returns as of March 31, 2020 | | 1-Year | | 3-Year
Annualized | | | | Since Inception
Annualized
(6-30-16 to3-31-20) | | Expense Ratio |
| | | | | |
I Share (DBULX) | | | | -0.04% | | | | | 1.19% | | | | | | | | | | 1.05% | | | | | 0.22% | |
| | | | | |
N Share (DLUSX) | | | | -0.19% | | | | | 0.98% | | | | | | | | | | 0.83% | | | | | 0.47% | |
| | | | | | |
ICE BofAML 3 Month U.S. Treasury Bill Index | | | | 2.25% | | | | | 1.83% | | | | | | | | | | 1.54% | | | | | | | | |
| | | | | | |
| | Annual Report | | March 31, 2020 | | 21 |
| | |
| Standardized Performance Summary (Cont.) | | (Unaudited) March 31, 2020 |
| | | | | | | | | | | | | | | | | | | | | | | | | | | |
| DSEUX/DLEUX | | | | | | | | | | | | |
DoubleLine Shiller Enhanced International CAPE®
Returns as of March 31, 2020 | | 1-Year | | 3-Year
Annualized | | | | Since Inception
Annualized
(12-23-16 to 3-31-20) | | Gross
Expense
Ratio | | Net
Expense
Ratio10 |
| | | | | | |
I Share (DSEUX) | | | | -20.29% | | | | | -4.67% | | | | | | | | | | -1.81% | | | | | 0.98% | | | 0.67% |
| | | | | | |
N Share (DLEUX) | | | | -20.50% | | | | | -4.91% | | | | | | | | | | -2.04% | | | | | 1.22% | | | 0.92% |
| | | | | | |
MSCI Europe Net Return USD Index8 | | | | -15.50% | | | | | -2.34% | | | | | | | | | | 0.40% | | | | | | | | |
| DBRIX/DLREX | | | | | | | | | | | | |
DoubleLine Colony Real Estate and Income Fund
Returns as of March 31, 2020 | | 1-Year | | | | | | Since Inception
Annualized
(12-17-18 to 3-31-20) | | Gross
Expense
Ratio | | Net
Expense
Ratio11 |
| | | | | | |
I Share (DBRIX) | | | | -22.08% | | | | | | | | | | | | | | | -9.00% | | | | | 0.75% | | | 0.66% |
| | | | | | |
N Share (DLREX) | | | | -22.21% | | | | | | | | | | | | | | | -9.21% | | | | | 1.00% | | | 0.91% |
| | | | | | |
Dow Jones U.S. Select REIT Total Return Index | | | | -23.96% | | | | | | | | | | | | | | | -11.55% | | | | | | | | |
| DBELX/DLELX | | | | | | | | | | | | |
DoubleLine Emerging Markets Local Currency Bond
Fund
Returns as of March 31, 2020 | | | | | | | | Since Inception
Not Annualized
(6-28-19 to 3-31-20) | | Gross
Expense
Ratio | | Net
Expense
Ratio12 |
| | | | | | |
I Share (DBELX) | | | | | | | | | | | | | | | | | | | -12.52% | | | | | 1.05% | | | 0.91% |
| | | | | | |
N Share (DLELX) | | | | | | | | | | | | | | | | | | | -12.69% | | | | | 1.30% | | | 1.16% |
| | | | | | |
JPMGBI-EM Global Diversified TR Index | | | | | | | | | | | | | | | | | | | -11.51% | | | | | | | | |
| DBLIX/DBLNX | | | | | | | | | | | | |
DoubleLine Income Fund
Returns as of March 31, 2020 | | | | | | | | Since Inception
Not Annualized
(9-3-19 to 3-31-20) | | Gross
Expense
Ratio | | Net
Expense
Ratio13 |
| | | | | | |
I Share (DBLIX) | | | | | | | | | | | | | | | | | | | -17.35% | | | | | 0.80% | | | 0.66% |
| | | | | | |
N Share (DBLNX) | | | | | | | | | | | | | | | | | | | -17.46% | | | | | 1.05% | | | 0.91% |
| | | | | | |
Bloomberg Barclays U.S. Aggregate Bond Index | | | | | | | | | | | | | | | | | | | 2.60% | | | | | | | | |
1 The inception date of the Class I shares of DoubleLine Total Return Bond Fund (DBLTX) was 4/6/2010, while the inception date of the R6 Class (DDTRX) was 7/31/2019. The returns of DDTRX shown for periods prior to its inception date reflect the returns of DBLTX.
2 The inception date of the Class I shares of DoubleLine Core Fixed Income Fund (DBLFX) was 6/1/2010, while the inception date of the R6 Class (DDCFX) was 7/31/2019. The returns of DDCFX shown for periods prior to its inception date reflect the returns of DBLFX.
3 Performance data shown for theMulti-Asset Growth Fund reflect the Class A maximum sales charge of 4.25%. TheMulti-Asset Growth Fund imposes a Deferred Sales Charge of 0.75% on purchases of $1 million or more of Class A shares if redeemed within 18 months of purchase. Performance data shown for the Class A No Load does not reflect the deduction of the sales load or fee. If reflected, the load or fee would reduce the performance quoted. Performance data does not reflect the deferred sales charge. If it had, returns would have been reduced.
4 The Blended Benchmark Unhedged is MSCI ACWI (60%)/Bloomberg Barclays Global Aggregate Bond Index (40%). The Blended Benchmark USD Hedged is MSCI ACWI (60%)/Bloomberg Barclays Global Aggregate Bond index (40%) Hedged to USD.
5 The inception date of the Class I shares of DoubleLine Low Duration Bond Fund (DBLSX) was 9/30/2011, while the inception date of the R6 Class (DDLDX) was 7/31/2019. The returns of DDLDX shown for periods prior to its inception date reflect the returns of DBLSX.
6 The Floating Rate Fund imposes a 1.00% Redemption Fee on all share classes if shares are sold within 90 days of purchase. Performance data does not reflect the redemption fee. If it had, returns would be reduced.
7 The inception date of the Class I shares of DoubleLine Shiller Enhanced CAPE (DSEEX) was 10/31/2013, while the inception date of the R6 Class (DDCPX) was 7/31/2019. The returns of DDCPX shown for periods prior to its inception date reflect the returns of DSEEX.
8 Reflects no deduction for fees, expenses, or taxes.
9 The inception date of the Class I shares of DoubleLine Flexible Income Fund (DFLEX) was 4/7/2014, while the inception date of the R6 Class (DFFLX) was 7/31/2019. The returns of DFFLX shown for periods prior to its inception date reflect the returns of DFLEX.
10 The Adviser has contractually agreed to waive fees and reimburse expenses through July 31, 2020. For additional information regarding these expense limitation arrangements, please see note 3 in the notes to financial statements.
11 The Adviser has contractually agreed to waive fees and expenses through December 11, 2020. For additional information regarding these expense limitations arrangements, please see note 3 in the notes to financial statements.
12 The Adviser has contractually agreed to waive fees and expenses through June 26, 2021. For additional information regarding these expense limitations arrangements, please see note 3 in the notes to financial statements.
13 The Adviser has contractually agreed to waive fees and expenses through September 2, 2021. For additional information regarding these expense limitations arrangements, please see note 3 in the notes to financial statements.
Mutual fund investing involves risk. Principal loss is possible.
| | | | | | |
| 22 | | DoubleLine Funds Trust | | | | |
| | |
| Schedule of Investments - Summary DoubleLine Total Return Bond Fund | | March 31, 2020 |
| | | | | | | | | | | | | | | | | | | | |
PRINCIPAL
AMOUNT $ | | | SECURITY DESCRIPTION | | RATE | | | MATURITY | | | VALUE $ | | | % OF NET
ASSETS | |
| | ASSET BACKED OBLIGATIONSµ | |
| | | | Total Asset Backed Obligations
(Cost $2,081,617,206) | | | | | | | | | | | 1,801,461,818 | | | | 3.5% | |
| | | | | | | | | | | | | | | | | |
| | COLLATERALIZED LOAN OBLIGATIONSµ | |
| | | | Total Collateralized Loan Obligations
(Cost $2,209,340,503) | | | | | | | | | | | 2,081,431,495 | | | | 4.1% | |
| | | | | | | | | | | | | | | | | |
| | NON-AGENCY COMMERCIAL MORTGAGE BACKED OBLIGATIONSµ | |
| | | | TotalNon-Agency Commercial Mortgage Backed Obligations
(Cost $4,728,312,372) | | | | | | | | | | | 3,901,674,990 | | | | 7.6% | |
| | | | | | | | | | | | | | | | | |
| | NON-AGENCY RESIDENTIAL COLLATERALIZED MORTGAGE OBLIGATIONS | |
| | | | | |
| | | | Citigroup Mortgage Loan Trust, Inc., | | | | | | | | | | | | | | | | |
| | 182,617,278 | | | Series2017-RP2-A1A | | | 3.93% | #^ | | | 07/25/2067 | | | | 185,829,059 | | | | 0.4% | |
| | | | | |
| | | | Citigroup Mortgage Loan Trust, | | | | | | | | | | | | | | | | |
| | 178,091,086 | | | Series2019-A-PT1 | | | 3.92% | ^ | | | 10/25/2058 | | | | 170,849,938 | | | | 0.3% | |
| | | | | |
| | | | Citigroup Mortgage Loan Trust, | | | | | | | | | | | | | | | | |
| | 263,772,011 | | | Series2019-D-PT1 | | | 3.34% | ^ | | | 04/25/2064 | | | | 245,626,633 | | | | 0.5% | |
| | | | | |
| | | | CSMC Mortgage-Backed Trust, | | | | | | | | | | | | | | | | |
| | 287,917,744 | | | Series2019-RPL6-PT1 | | | 3.98% | #^ | | | 11/25/2058 | | | | 268,635,979 | | | | 0.5% | |
| | | | | |
| | | | CSMC Trust, | | | | | | | | | | | | | | | | |
| | 167,697,593 | | | Series2018-RPL7-A1 | | | 4.00% | ^ | | | 08/26/2058 | | | | 174,877,549 | | | | 0.3% | |
| | | | | |
| | | | CSMC Trust, | | | | | | | | | | | | | | | | |
| | 284,411,669 | | | Series2020-RPL1-PT1 | | | 3.47% | ^ | | | 10/25/2069 | | | | 244,671,680 | | | | 0.5% | |
| | | | | |
| | | | Legacy Mortgage Asset Trust, | | | | | | | | | | | | | | | | |
| | 194,840,441 | | | Series2019-RPL3-PT1 | | | 4.30% | ^ | | | 06/25/2058 | | | | 173,116,706 | | | | 0.3% | |
| | | | | |
| | | | PR Mortgage Loan Trust, | | | | | | | | | | | | | | | | |
| | 189,235,615 | | | Series2014-1-APT | | | 5.91% | #^ | | | 10/25/2049 | | | | 188,252,725 | | | | 0.4% | |
| | | | | |
| | | | Securitized Mortgage Asset Loan Trust, | | | | | | | | | | | | | | | | |
| | 278,474,393 | | | Series2015-1-PC | | | 2.92% | #^ | | | 02/25/2054 | | | | 228,594,283 | | | | 0.5% | |
| | | | | |
| | | | VOLT LLC, | | | | | | | | | | | | | | | | |
| | 185,295,477 | | | Series2019-NPL6-A1A | | | 3.23% | ^§ | | | 10/25/2049 | | | | 174,247,604 | | | | 0.3% | |
| | |
| | OtherNon-Agency Residential Collateralized Mortgage Obligationsµ | | | | 11,461,867,348 | | | | 22.4% | |
| | | | | | | | | | | | | | | | | | | | |
| | | | TotalNon-Agency Residential Collateralized Mortgage Obligations
(Cost $14,798,366,614) | | | | 13,516,569,504 | | | | 26.4% | |
| | | | | | | | | | | | | | | | | |
| | US GOVERNMENT AND AGENCY MORTGAGE BACKED OBLIGATIONS | | | | | | | | | |
| | | | | |
| | 195,602,395 | | | Federal Home Loan Mortgage Corporation | | | 3.00% | | | | 04/01/2045 | | | | 207,159,161 | | | | 0.4% | |
| | | | Pool G08635 | | | | | | | | | | | | | | | | |
| | | | Pool Z40117 | | | | | | | | | | | | | | | | |
| | | | | |
| | | | Federal Home Loan Mortgage Corporation, | | | | | | | | | | | | | | | | |
| | 302,079,306 | | | Pool G08648 | | | 3.00% | | | | 06/01/2045 | | | | 319,924,626 | | | | 0.6% | |
| | | | | |
| | | | Federal Home Loan Mortgage Corporation, | | | | | | | | | | | | | | | | |
| | 459,133,785 | | | Pool G08675 | | | 3.00% | | | | 11/01/2045 | | | | 486,100,361 | | | | 1.0% | |
| | | | | |
| | 193,021,162 | | | Federal Home Loan Mortgage Corporation, | | | 3.00% | | | | 12/01/2045 | | | | 204,364,720 | | | | 0.4% | |
| | | | Pool G08680 | | | | | | | | | | | | | | | | |
| | | | Pool V82117 | | | | | | | | | | | | | | | | |
| | | | | |
| | | | Federal Home Loan Mortgage Corporation, | | | | | | | | | | | | | | | | |
| | 180,347,480 | | | Pool G08692 | | | 3.00% | | | | 02/01/2046 | | | | 190,947,396 | | | | 0.4% | |
| | | | | |
| | | | Federal Home Loan Mortgage Corporation, | | | | | | | | | | | | | | | | |
| | 168,457,631 | | | Pool G60393 | | | 3.50% | | | | 01/01/2046 | | | | 180,287,632 | | | | 0.4% | |
| | | | | |
| | | | Federal Home Loan Mortgage Corporation, | | | | | | | | | | | | | | | | |
| | 153,271,475 | | | Pool RB5022 | | | 3.00% | | | | 11/01/2039 | | | | 161,076,235 | | | | 0.3% | |
| | | | | |
| | 118,222,396 | | | Federal Home Loan Mortgage Corporation, | | | 3.00% | | | | 08/01/2045 | | | | 125,240,139 | | | | 0.2% | |
| | | | Pool V81821 | | | | | | | | | | | | | | | | |
| | | | Pool G08658 | | | | | | | | | | | | | | | | |
| | | | | |
| | | | Federal Home Loan Mortgage Corporation, | | | | | | | | | | | | | | | | |
| | 153,292,200 | | | Series4212-US(-1 x 1 Month LIBOR USD + 5.40%, 5.40% Cap) | | | 3.77% | I/F | | | 06/15/2043 | | | | 170,214,218 | | | | 0.3% | |
| | | | | |
| | 116,779,918 | | | Federal Home Loan Mortgage Corporation, | | | 4.00% | > | | | 01/15/2041 | | | | 132,849,477 | | | | 0.3% | |
| | | | Series4179-AZ | | | | | | | | | | | | | | | | |
| | | | Series3795-VZ | | | | | | | | | | | | | | | | |
| | | | Series3790-Z | | | | | | | | | | | | | | | | |
| | | | | | |
| The accompanying notes are an integral part of these financial statements. | | Annual Report | | March 31, 2020 | | 23 |
| | |
| Schedule of Investments - Summary DoubleLine Total Return Bond Fund (Cont.) | | March 31, 2020 |
| | | | | | | | | | | | | | | | | | | | |
PRINCIPAL
AMOUNT $ | | | SECURITY DESCRIPTION | | RATE | | | MATURITY | | | VALUE $ | | | % OF NET
ASSETS | |
| | | | | |
| | 127,494,137 | | | Federal Home Loan Mortgage Corporation, | | | 3.00% | | | | 06/15/2040 | | | | 133,566,147 | | | | 0.3% | |
| | | | Series4390-NY | | | | | | | | | | | | | | | | |
| | | | Series4323-GA | | | | | | | | | | | | | | | | |
| | | | | |
| | 140,554,716 | | | Federal Home Loan Mortgage Corporation, | | | 3.00% | > | | | 09/15/2044 | | | | 145,777,673 | | | | 0.3% | |
| | | | Series4390-NZ | | | | | | | | | | | | | | | | |
| | | | Series4384-ZY | | | | | | | | | | | | | | | | |
| | | | | |
| | 116,147,471 | | | Federal Home Loan Mortgage Corporation, | | | 3.00% | | | | 12/15/2041 | | | | 122,873,827 | | | | 0.2% | |
| | | | Series4471-BA | | | | | | | | | | | | | | | | |
| | | | Series4471-BC | | | | | | | | | | | | | | | | |
| | | | | |
| | 166,769,743 | | | Federal Home Loan Mortgage Corporation, | | | 3.00% | | | | 06/15/2044 | | | | 177,698,948 | | | | 0.3% | |
| | | | Series4483-CA | | | | | | | | | | | | | | | | |
| | | | Series4533-AB | | | | | | | | | | | | | | | | |
| | | | | |
| | 113,240,699 | | | Federal Home Loan Mortgage Corporation, | | | 3.00% | | | | 02/15/2044 | | | | 120,971,913 | | | | 0.2% | |
| | | | Series4527-CA | | | | | | | | | | | | | | | | |
| | | | Series4471-GA | | | | | | | | | | | | | | | | |
| | | | Series4588-DA | | | | | | | | | | | | | | | | |
| | | | Series4527-GA | | | | | | | | | | | | | | | | |
| | | | | |
| | | | Federal Home Loan Mortgage Corporation, | | | | | | | | | | | | | | | | |
| | 156,479,275 | | | Series4573-CA | | | 3.00% | | | | 11/15/2044 | | | | 171,968,626 | | | | 0.3% | |
| | | | | |
| | 203,269,409 | | | Federal Home Loan Mortgage Corporation, | | | 3.00% | | | | 05/15/2048 | | | | 213,580,128 | | | | 0.4% | |
| | | | Series4791-JT | | | | | | | | | | | | | | | | |
| | | | Series4792-A | | | | | | | | | | | | | | | | |
| | | | Series4791-LI | | | | | | | | | | | | | | | | |
| | | | Series4791-IO | | | | | | | | | | | | | | | | |
| | 3,890,346,994 | | | Federal Home Loan Mortgage Corporation | | | 0.00% – 18.22% | > I/F I/O P/O | | | 12/15/2030 – 10/15/2049 | | | | 4,084,813,757 | | | | 8.0% | |
| | 2,091,790,359 | | | Federal Home Loan Mortgage Corporation | | | 2.50% – 5.00% | | | | 03/01/2028 – 06/01/2048 | | | | 2,224,920,510 | | | | 4.3% | |
| | 593,752,111 | | | Federal Home Loan Mortgage Corporation | | | 2.50% – 3.00% | | | | 04/01/2033 – 12/01/2049 | | | | 620,368,140 | | | | 1.2% | |
| | | | | |
| | 96,502,886 | | | Federal National Mortgage Association Pass-Thru, | | | 3.00% | | | | 11/01/2042 | | | | 102,219,793 | | | | 0.2% | |
| | | | Pool AB6854 | | | | | | | | | | | | | | | | |
| | | | Pool AB7077 | | | | | | | | | | | | | | | | |
| | | | Pool MA1242 | | | | | | | | | | | | | | | | |
| | | | | |
| | 120,719,791 | | | Federal National Mortgage Association Pass-Thru, | | | 3.00% | | | | 12/01/2044 | | | | 127,794,039 | | | | 0.2% | |
| | | | Pool AS3961 | | | | | | | | | | | | | | | | |
| | | | Pool AS4154 | | | | | | | | | | | | | | | | |
| | | | Pool MA2114 | | | | | | | | | | | | | | | | |
| | | | | |
| | 242,430,108 | | | Federal National Mortgage Association Pass-Thru, | | | 3.00% | | | | 03/01/2045 | | | | 256,721,496 | | | | 0.5% | |
| | | | Pool AS4625 | | | | | | | | | | | | | | | | |
| | | | Pool AS4645 | | | | | | | | | | | | | | | | |
| | | | Pool AY3974 | | | | | | | | | | | | | | | | |
| | | | Pool AY5471 | | | | | | | | | | | | | | | | |
| | | | | |
| | 141,589,691 | | | Federal National Mortgage Association, | | | 3.00% | | | | 08/01/2046 | | | | 148,798,221 | | | | 0.3% | |
| | | | Pool AS7661 | | | | | | | | | | | | | | | | |
| | | | Pool MA2711 | | | | | | | | | | | | | | | | |
| | | | | |
| | 103,889,000 | | | Federal National Mortgage Association, | | | 2.54% | | | | 02/01/2030 | | | | 110,480,678 | | | | 0.2% | |
| | | | Pool BL5401 | | | | | | | | | | | | | | | | |
| | | | Pool BL5400 | | | | | | | | | | | | | | | | |
| | | | | |
| | | | Federal National Mortgage Association, | | | | | | | | | | | | | | | | |
| | 162,564,864 | | | Pool BO4657 | | | 2.50% | | | | 11/01/2049 | | | | 168,781,348 | | | | 0.3% | |
| | | | | |
| | 126,367,465 | | | Federal National Mortgage Association, | | | 3.00% | | | | 11/01/2046 | | | | 133,558,239 | | | | 0.3% | |
| | | | Pool MA2806 | | | | | | | | | | | | | | | | |
| | | | Pool AS8356 | | | | | | | | | | | | | | | | |
| | | | Pool AS8269 | | | | | | | | | | | | | | | | |
| | | | Pool BC9003 | | | | | | | | | | | | | | | | |
| | | | | |
| | 61,937,780 | | | Federal National Mortgage Association, | | | 4.00% | > | | | 04/25/2042 | | | | 67,029,501 | | | | 0.1% | |
| | | | Series2012-30-DZ | | | | | | | | | | | | | | | | |
| | | | Series2012-31-Z | | | | | | | | | | | | | | | | |
| | | | Series2012-111-MJ | | | | | | | | | | | | | | | | |
| | | | | |
| | 129,166,320 | | | Federal National Mortgage Association, | | | 3.00% | > | | | 04/25/2044 | | | | 146,780,305 | | | | 0.3% | |
| | | | Series2015-88-BA | | | | | | | | | | | | | | | | |
| | | | Series2014-21-GZ | | | | | | | | | | | | | | | | |
| | | | | |
| | 80,808,612 | | | Federal National Mortgage Association, | | | 3.00% | > | | | 10/25/2044 | | | | 88,700,979 | | | | 0.2% | |
| | | | Series2016-32-LA | | | | | | | | | | | | | | | | |
| | | | Series2014-60-EZ | | | | | | | | | | | | | | | | |
| | | | Series2014-61-ZV | | | | | | | | | | | | | | | | |
| | | | Series2014-64-NZ | | | | | | | | | | | | | | | | |
| | | | Series2014-67-DZ | | | | | | | | | | | | | | | | |
| | | | | | |
| 24 | | DoubleLine Funds Trust | | | | The accompanying notes are an integral part of these financial statements. |
| | | | | | | | | | | | | | | | | | | | |
PRINCIPAL
AMOUNT $/
SHARES | | | SECURITY DESCRIPTION | | RATE | | | MATURITY | | | VALUE $ | | | % OF NET
ASSETS | |
| | | | | |
| | 171,760,471 | | | Federal National Mortgage Association, | | | 3.00% | | | | 06/25/2048 | | | | 182,143,598 | | | | 0.4% | |
| | | | Series2018-39-AB | | | | | | | | | | | | | | | | |
| | | | Series2018-36-A | | | | | | | | | | | | | | | | |
| | | | Series2018-38-JB | | | | | | | | | | | | | | | | |
| | 6,130,256,324 | | | Federal National Mortgage Association | | | 2.15% – 6.50% | | | | 07/01/2020 – 09/01/2053 | | | | 6,537,386,555 | | | | 12.8% | |
| | 3,663,615,640 | | | Federal National Mortgage Association | | | 0.00% – 37.61% | #> I/F I/O P/O | | | 01/25/2026 – 10/25/2050 | | | | 3,669,829,002 | | | | 7.2% | |
| | | | |
| | Other US Government and Agency Mortgage Backed Obligationsµ | | | | | | | | | | | 2,620,670,660 | | | | 5.1% | |
| | | | | | | | | | | | | | | | | |
| | | | Total US Government and Agency Mortgage Backed Obligations
(Cost $22,997,540,432) | | | | 24,555,598,048 | | | | 47.9% | |
| | | | | | | | | | | | | | | | | |
| | US GOVERNMENT AND AGENCY OBLIGATIONS | | | | | | | | | | | | | | | | |
| | | | | |
| | 400,000,000 | | | United States Treasury Notes | | | 1.13% | | | | 02/28/2025 | | | | 415,000,000 | | | | 0.8% | |
| | 500,000,000 | | | United States Treasury Notes | | | 2.25% | | | | 02/15/2027 | | | | 557,988,280 | | | | 1.1% | |
| | 470,000,000 | | | United States Treasury Notes | | | 2.88% | | | | 05/15/2028 | | | | 554,489,841 | | | | 1.1% | |
| | 300,000,000 | | | United States Treasury Notes | | | 2.88% | | | | 08/15/2028 | | | | 354,937,500 | | | | 0.7% | |
| | 500,000,000 | | | United States Treasury Notes | | | 3.13% | | | | 11/15/2028 | | | | 603,945,310 | | | | 1.2% | |
| | 310,800,000 | | | United States Treasury Notes | | | 2.63% | | | | 02/15/2029 | | | | 363,490,313 | | | | 0.7% | |
| | 608,200,000 | | | United States Treasury Notes | | | 2.38% | | | | 05/15/2029 | | | | 700,047,700 | | | | 1.3% | |
| | 700,000,000 | | | United States Treasury Notes | | | 1.75% | | | | 11/15/2029 | | | | 769,617,184 | | | | 1.5% | |
| | 200,000,000 | | | United States Treasury Notes | | | 1.50% | | | | 02/15/2030 | | | | 215,636,718 | | | | 0.4% | |
| | | | |
| | Other US Government and Agency Obligationsµ | | | | | | | | | | | 95,387,800 | | | | 0.2% | |
| | | | | | | | | | | | | | | | | |
| | | | Total US Government and Agency Obligations
(Cost $4,107,380,257) | | | | 4,630,540,646 | | | | 9.0% | |
| | | | | | | | | | | | | | | | | |
| | AFFILIATED MUTUAL FUNDSµ | | | | | | | | | | | | | | | | |
| | | | Total Affiliated Mutual Funds
(Cost $70,059,642) | | | | | | | | 56,624,814 | | | | 0.1% | |
| | | | | | | | | | | | | | | | | |
| | SHORT TERM INVESTMENTS | | | | | | | | | | | | | | | | |
| | 187,856,750 | | | First American Government Obligations Fund - Class U | | | 0.47% | ¨ | | | | | | | 187,856,750 | | | | 0.3% | |
| | 188,050,075 | | | JP Morgan U.S. Government Money Market Fund - Institutional Share Class | | | 0.36% | ¨ | | | | | | | 188,050,075 | | | | 0.4% | |
| | 188,050,075 | | | Morgan Stanley Institutional Liquidity Funds Government Portfolio - Institutional Share Class | | | 0.26% | ¨ | | | | | | | 188,050,075 | | | | 0.4% | |
| | | | | | | | | | | | | | | | | | | | |
| | | | Total Short Term Investments
(Cost $563,956,900) | | | | | | | | | | | 563,956,900 | | | | 1.1% | |
| | | | | | | | | | | | | | | | | |
| | | | Total Investments
(Cost $51,556,573,926) | | | | | | | | | | | 51,107,858,215 | | | | 99.7% | |
| | | | Other Assets in Excess of Liabilities | | | | | | | | | | | 134,064,638 | | | | 0.3% | |
| | | | | | | | | | | | | | | | | |
| | | | NET ASSETS | | | | | | | | | | $ | 51,241,922,853 | | | | 100.0% | |
| | | | | | | | | | | | | | | | | |
| | | | | |
| SECURITY TYPE BREAKDOWNas a % of Net Assets: | | | | | |
US Government and Agency Mortgage Backed Obligations | | | | 47.9% | |
Non-Agency Residential Collateralized Mortgage Obligations | | | | 26.4% | |
US Government and Agency Obligations | | | | 9.0% | |
Non-Agency Commercial Mortgage Backed Obligations | | | | 7.6% | |
Collateralized Loan Obligations | | | | 4.1% | |
Asset Backed Obligations | | | | 3.5% | |
Short Term Investments | | | | 1.1% | |
Affiliated Mutual Funds | | | | 0.1% | |
Other Assets and Liabilities | | | | 0.3% | |
| | | | | |
| | | | 100.0% | |
| | | | | |
| µ | Represents issues not identified as the top 50 holdings in terms of market value and issues or issuers not exceeding 1% of net assets individually or in aggregate, respectively as of March 31, 2020. |
| ^ | Security exempt from registration under Rule 144A of the Securities Act of 1933. These securities may be resold in transactions exempt from registration to qualified institutional buyers. |
| # | Includes variable rate securities. Coupon rate is variable based on the weighted average coupon of the underlying collateral. To the extent the weighted average coupon of the underlying assets which comprise the collateral increases or decreases, the coupon rate of this security will increase or decrease correspondingly. The rate disclosed is as of March 31, 2020. |
| § | The interest rate will step up if the issuer does not redeem the bond on or before a scheduled redemption date in accordance with the terms of the instrument. The interest rate shown is the rate in effect as of March 31, 2020. |
| | | | | | |
| The accompanying notes are an integral part of these financial statements. | | Annual Report | | March 31, 2020 | | 25 |
| | |
| Schedule of Investments - Summary DoubleLine Total Return Bond Fund (Cont.) | | March 31, 2020 |
| I/F | Includes inverse floating rate securities whose interest rate moves in the opposite direction of reference interest rates. Reference interest rates are typically based on a negative multiplier or slope. Interest rate may also be subject to a cap or floor. |
| I/O | Includes interest only securities |
| P/O | Includes principal only securities |
| > | Includes U.S. Agency bonds that accrue interest which is added to the outstanding principal balance. The interest payment will be deferred until all other tranches in the structure are paid off. The rate disclosed is as of March 31, 2020. |
| ¨ | Seven-day yield as of March 31, 2020 |
| | | | | | | | | | | | | | | | | | | | | | | | | |
| | |
| Futures Contracts | | | | |
| Description | | Long/Short | | Contract Quantity | | Expiration Date | | Notional Amount• | | Value/
Unrealized
Appreciation
(Depreciation) |
10-Year US Treasury Note Future | | Long | | | | 7,000 | | | | | 06/19/2020 | | | | | 970,812,500 | | | | $ | 42,648,127 | |
CME Ultra Long Term US Treasury Bond Future | | Long | | | | 1,500 | | | | | 06/19/2020 | | | | | 332,812,500 | | | | | 30,910,883 | |
US Treasury Long Bond Future | | Long | | | | 1,750 | | | | | 06/19/2020 | | | | | 313,359,375 | | | | | 24,506,952 | |
Ultra10-Year US Treasury Note Future | | Long | | | | 250 | | | | | 06/19/2020 | | | | | 39,007,813 | | | | | 2,513,142 | |
| | | | | | | | | | | | | | | | | | | | | | |
| | | | | | | | | | | | | | | | | | | | $ | 100,579,104 | |
| | | | | | | | | | | | | | | | | | | | | | |
| • | Notional Amount is determined based on the number of contracts multiplied by the contract size and the quoted daily settlement price in US dollars. |
A summary of the DoubleLine Total Return Bond Fund’s investments in affiliated mutual funds for the year ended March 31, 2020 is as follows:
| | | | | | | | | | | | | | | | | | | | | | | | | | | | | | | | | | | | | | | | |
| Fund | | Value at
March 31,
2019 | | Gross
Purchases | | Gross
Sales | | Shares Held at
March 31,
2020 | | Value at
March 31,
2020 | | Change in
Unrealized for the
Year Ended
March 31,
2020 | | Dividend Income
Earned in the
Year Ended
March 31,
2020 | | Net Realized
Gain (Loss) in
the Year Ended
March 31,
2020 |
DoubleLine Income Fund (Class I) | | | $ | — | | | | $ | 80,000,000 | | | | $ | (10,000,000 | ) | | | | 7,034,138 | | | | $ | 56,624,814 | | | | $ | (13,434,828 | ) | | | $ | 1,895,428 | | | | $ | 59,642 | |
| | | | | | |
| 26 | | DoubleLine Funds Trust | | | | The accompanying notes are an integral part of these financial statements. |
| | |
| Schedule of Investments - Summary DoubleLine Core Fixed Income Fund | | March 31, 2020 |
| | | | | | | | | | | | | | | | | | | | |
PRINCIPAL AMOUNT $ | | | SECURITY DESCRIPTION | | RATE | | | MATURITY | | | VALUE $ | | | % OF NET
ASSETS | |
| | ASSET BACKED OBLIGATIONSµ | |
| | | | Total Asset Backed Obligations
(Cost $325,697,729) | | | | | | | | | | | 282,267,697 | | | | 2.5% | |
| | | | | | | | | | | | | | | | | | | | |
| | BANK LOANSµ | |
| | | | Total Bank Loans
(Cost $408,888,740) | | | | | | | | | | | 360,936,086 | | | | 3.1% | |
| | | | | | | | | | | | | | | | | | | | |
| | COLLATERALIZED LOAN OBLIGATIONSµ | |
| | | | Total Collateralized Loan Obligations
(Cost $310,937,608) | | | | | | | | | | | 244,835,524 | | | | 2.1% | |
| | | | | | | | | | | | | | | | | | | | |
| | FOREIGN CORPORATE BONDSµ | |
| | | | Total Foreign Corporate Bonds
(Cost $1,376,267,079) | | | | | | | | | | | 1,208,853,796 | | | | 10.5% | |
| | | | | | | | | | | | | | | | | | | | |
| | FOREIGN GOVERNMENT BONDS, FOREIGN AGENCIES AND FOREIGN GOVERNMENT SPONSORED CORPORATIONSµ | |
| | | | Total Foreign Government Bonds, Foreign Agencies and Foreign Government Sponsored Corporations
(Cost $43,749,526) | | | | 44,019,443 | | | | 0.4% | |
| | | | | | | | | | | | | | | | | | | | |
| | MUNICIPAL BONDSµ | |
| | | | Total Municipal Bonds
(Cost $9,940,675) | | | | | | | | | | | 10,939,156 | | | | 0.1% | |
| | | | | | | | | | | | | | | | | | | | |
| | NON-AGENCY COMMERCIAL MORTGAGE BACKED OBLIGATIONSµ | |
| | | | TotalNon-Agency Commercial Mortgage Backed Obligations
(Cost $750,297,532) | | | | 609,400,303 | | | | 5.3% | |
| | | | | | | | | | | | | | | | | | | | |
| | NON-AGENCY RESIDENTIAL COLLATERALIZED MORTGAGE OBLIGATIONS 8.6% | | | | | |
| | | | | |
| | | | Citigroup Mortgage Loan Trust, | | | | | | | | | | | | | | | | |
| | 42,184,855 | | | Series2019-A-PT1 | | | 3.92% | ^ | | | 10/25/2058 | | | | 40,469,628 | | | | 0.3% | |
| | | | | |
| | | | CSMC Trust, | | | | | | | | | | | | | | | | |
| | 39,846,436 | | | Series2018-RPL8-A1 | | | 4.13% | #^ | | | 07/25/2058 | | | | 37,217,552 | | | | 0.3% | |
| | | | | |
| | | | CSMC Trust, | | | | | | | | | | | | | | | | |
| | 49,124,373 | | | Series2020-RPL1-PT1 | | | 3.47% | ^ | | | 10/25/2069 | | | | 42,260,371 | | | | 0.4% | |
| | | | | |
| | | | Legacy Mortgage Asset Trust, | | | | | | | | | | | | | | | | |
| | 38,091,344 | | | Series2018-SL1-A | | | 4.00% | #^ | | | 02/25/2058 | | | | 38,274,434 | | | | 0.3% | |
| | | | |
| | OtherNon-Agency Residential Collateralized Mortgage Obligationsµ | | | | | | | | | | | 839,340,118 | | | | 7.3% | |
| | | | | | | | | | | | | | | | | | | | |
| | | | TotalNon-Agency Residential Collateralized Mortgage Obligations
(Cost $1,072,146,764) | | | | | | | | 997,562,103 | | | | 8.6% | |
| | | | | | | | | | | | | | | | | | | | |
| | US CORPORATE BONDSµ | |
| | | | Total US Corporate Bonds
(Cost $1,470,479,996) | | | | | | | | | | | 1,411,631,571 | | | | 12.2% | |
| | | | | | | | | | | | | | | | | | | | |
| | US GOVERNMENT AND AGENCY MORTGAGE BACKED OBLIGATIONS | |
| | | | | |
| | | | Federal Home Loan Mortgage Corporation, | | | | | | | | | | | | | | | | |
| | 38,065,331 | | | Pool G08701 | | | 3.00% | | | | 04/01/2046 | | | | 40,304,413 | | | | 0.3% | |
| | | | | |
| | | | Federal Home Loan Mortgage Corporation, | | | | | | | | | | | | | | | | |
| | 47,980,457 | | | Pool G61645 | | | 4.00% | | | | 10/01/2048 | | | | 51,277,316 | | | | 0.4% | |
| | | | | |
| | | | Federal Home Loan Mortgage Corporation, | | | | | | | | | | | | | | | | |
| | 48,477,687 | | | Pool RB5022 | | | 3.00% | | | | 11/01/2039 | | | | 50,946,226 | | | | 0.4% | |
| | | | | |
| | | | Federal Home Loan Mortgage Corporation, | | | | | | | | | | | | | | | | |
| | 50,020,924 | | | Pool SD0035 | | | 3.00% | | | | 04/01/2047 | | | | 52,741,538 | | | | 0.5% | |
| | | | | |
| | | | Federal Home Loan Mortgage Corporation, | | | | | | | | | | | | | | | | |
| | 32,504,044 | | | Pool ZT1827 | | | 3.00% | | | | 07/01/2047 | | | | 34,347,965 | | | | 0.3% | |
| | | | | |
| | | | Federal Home Loan Mortgage Corporation, | | | | | | | | | | | | | | | | |
| | 53,612,921 | | | Series358-300 | | | 3.00% | | | | 10/15/2047 | | | | 57,754,780 | | | | 0.5% | |
| | | | | |
| | | | Federal Home Loan Mortgage Corporation, | | | | | | | | | | | | | | | | |
| | 43,115,788 | | | Series4542-AC | | | 2.70% | | | | 01/15/2045 | | | | 45,259,923 | | | | 0.4% | |
| | | | | |
| | | | Federal Home Loan Mortgage Corporation, | | | | | | | | | | | | | | | | |
| | 71,728,112 | | | Series4750-PA | | | 3.00% | | | | 07/15/2046 | | | | 76,637,399 | | | | 0.7% | |
| | | | | | |
| The accompanying notes are an integral part of these financial statements. | | Annual Report | | March 31, 2020 | | 27 |
| | |
| Schedule of Investments - Summary DoubleLine Core Fixed Income Fund (Cont.) | | March 31, 2020 |
| | | | | | | | | | | | | | | | | | | | |
PRINCIPAL AMOUNT $ | | | SECURITY DESCRIPTION | | RATE | | | MATURITY | | | VALUE $ | | | % OF NET
ASSETS | |
| | | | | |
| | | | Federal Home Loan Mortgage Corporation, | | | | | | | | | | | | | | | | |
| | 54,020,588 | | | Series4752-PL | | | 3.00% | | | | 09/15/2046 | | | | 56,999,197 | | | | 0.5% | |
| | 257,207,706 | | | Federal Home Loan Mortgage Corporation | | | 2.50% – 11.88% | > I/F I/O | | | 12/15/2030 – 01/15/2054 | | | | 271,916,769 | | | | 2.4% | |
| | 30,210,928 | | | Federal Home Loan Mortgage Corporation | | | 2.50% – 3.00% | | | | 08/01/2034 – 02/01/2035 | | | | 31,663,408 | | | | 0.3% | |
| | 60,991,853 | | | Federal Home Loan Mortgage Corporation | | | 3.00% – 5.50% | | | | 07/01/2035 – 04/01/2047 | | | | 65,117,355 | | | | 0.6% | |
| | | | | |
| | 47,220,144 | | | Federal National Mortgage Association, | | | 3.00% | | | | 08/01/2046 | | | | 49,536,154 | | | | 0.4% | |
| | | | Pool AS7661 | | | | | | | | | | | | | | | | |
| | | | Pool MA2711 | | | | | | | | | | | | | | | | |
| | | | | |
| | | | Federal National Mortgage Association, | | | | | | | | | | | | | | | | |
| | 15,640,000 | | | Pool BL4419 | | | 2.14% | | | | 10/01/2029 | | | | 16,525,163 | | | | 0.1% | |
| | | | | |
| | | | Federal National Mortgage Association, | | | | | | | | | | | | | | | | |
| | 39,950,000 | | | Pool BL4421 | | | 2.14% | | | | 10/01/2029 | | | | 42,211,015 | | | | 0.4% | |
| | | | | |
| | | | Federal National Mortgage Association, | | | | | | | | | | | | | | | | |
| | 25,972,000 | | | Pool BL4424 | | | 2.14% | | | | 10/01/2029 | | | | 27,441,914 | | | | 0.2% | |
| | | | | |
| | | | Federal National Mortgage Association, | | | | | | | | | | | | | | | | |
| | 28,707,000 | | | Pool BL4425 | | | 2.14% | | | | 10/01/2029 | | | | 30,331,705 | | | | 0.3% | |
| | | | | |
| | | | Federal National Mortgage Association, | | | | | | | | | | | | | | | | |
| | 32,930,000 | | | Pool BL4592 | | | 2.28% | | | | 11/01/2029 | | | | 35,240,197 | | | | 0.3% | |
| | | | | |
| | | | Federal National Mortgage Association, | | | | | | | | | | | | | | | | |
| | 49,345,000 | | | Pool BL5156 | | | 2.37% | | | | 12/01/2029 | | | | 53,226,382 | | | | 0.5% | |
| | | | | |
| | | | Federal National Mortgage Association, | | | | | | | | | | | | | | | | |
| | 42,953,525 | | | Pool MA3867 | | | 2.50% | | | | 12/01/2039 | | | | 44,925,047 | | | | 0.4% | |
| | | | | |
| | | | Federal National Mortgage Association, | | | | | | | | | | | | | | | | |
| | 33,884,922 | | | Series2013-6-ZB | | | 3.00% | > | | | 02/25/2043 | | | | 35,981,270 | | | | 0.3% | |
| | | | | |
| | 36,238,710 | | | Federal National Mortgage Association, | | | 3.00% | > | | | 11/25/2044 | | | | 38,511,328 | | | | 0.3% | |
| | | | Series2014-73-CZ | | | | | | | | | | | | | | | | |
| | | | Series2014-70-VZ | | | | | | | | | | | | | | | | |
| | | | | |
| | | | Federal National Mortgage Association, | | | | | | | | | | | | | | | | |
| | 78,220,028 | | | Series2018-21-PO | | | 0.00% | P/O | | | 04/25/2048 | | | | 72,644,426 | | | | 0.6% | |
| | | | | |
| | | | Federal National Mortgage Association, | | | | | | | | | | | | | | | | |
| | 47,828,397 | | | Series2018-27-JA | | | 3.00% | | | | 12/25/2047 | | | | 50,741,778 | | | | 0.4% | |
| | | | | |
| | | | Federal National Mortgage Association, | | | | | | | | | | | | | | | | |
| | 141,325,797 | | | Series2018-35-PO | | | 0.00% | P/O | | | 05/25/2048 | | | | 133,614,355 | | | | 1.2% | |
| | | | | |
| | 74,116,082 | | | Federal National Mortgage Association, | | | 3.00% | | | | 06/25/2048 | | | | 78,205,342 | | | | 0.7% | |
| | | | Series2018-39-AB | | | | | | | | | | | | | | | | |
| | | | Series2018-36-A | | | | | | | | | | | | | | | | |
| | 358,068,385 | | | Federal National Mortgage Association | | | 2.26% – 5.00% | | | | 10/01/2029 – 04/01/2047 | | | | 378,377,221 | | | | 3.3% | |
| | 182,087,361 | | | Federal National Mortgage Association | | | 1.75% – 25.44% | > I/F I/O P/O | | | 04/25/2026 – 06/25/2057 | | | | 119,679,778 | | | | 1.0% | |
| | | | |
| | Other US Government and Agency Mortgage Backed Obligationsµ | | | | | | | | | | | 50,162,276 | | | | 0.4% | |
| | | | | | | | | | | | | | | | | | | | |
| | | | Total US Government and Agency Mortgage Backed Obligations
(Cost $1,951,095,824) | | | | | | | | 2,092,321,640 | | | | 18.1% | |
| | | | | | | | | | | | | | | | | | | | |
| | US GOVERNMENT AND AGENCY OBLIGATIONS | |
| | | | | |
| | 201,350,000 | | | United States Treasury Notes | | | 1.75% | | | | 11/30/2021 | | | | 206,517,458 | | | | 1.8% | |
| | 82,100,000 | | | United States Treasury Notes | | | 1.38% | | | | 01/31/2022 | | | | 83,836,607 | | | | 0.7% | |
| | 114,950,000 | | | United States Treasury Notes | | | 2.63% | | | | 02/28/2023 | | | | 122,789,949 | | | | 1.1% | |
| | 120,200,000 | | | United States Treasury Notes | | | 2.50% | | | | 03/31/2023 | | | | 128,163,250 | | | | 1.1% | |
| | 110,800,000 | | | United States Treasury Notes | | | 2.75% | | | | 04/30/2023 | | | | 119,196,563 | | | | 1.0% | |
| | 72,900,000 | | | United States Treasury Notes | | | 1.63% | | | | 05/31/2023 | | | | 75,938,449 | | | | 0.6% | |
| | 124,100,000 | | | United States Treasury Notes | | | 2.13% | | | | 09/30/2024 | | | | 133,892,266 | | | | 1.2% | |
| | 105,273,756 | | | United States Treasury Notes | | | 0.13% | | | | 10/15/2024 | | | | 106,577,169 | | | | 0.9% | |
| | 135,400,000 | | | United States Treasury Notes | | | 2.25% | | | | 10/31/2024 | | | | 146,993,625 | | | | 1.3% | |
| | 71,700,000 | | | United States Treasury Notes | | | 2.75% | | | | 02/28/2025 | | | | 79,956,703 | | | | 0.7% | |
| | 46,200,000 | | | United States Treasury Notes | | | 0.50% | | | | 03/31/2025 | | | | 46,490,552 | | | | 0.4% | |
| | 124,450,000 | | | United States Treasury Notes | | | 3.00% | | | | 09/30/2025 | | | | 141,629,934 | | | | 1.2% | |
| | 121,500,000 | | | United States Treasury Notes | | | 1.63% | | | | 10/31/2026 | | | | 130,095,176 | | | | 1.1% | |
| | 139,550,000 | | | United States Treasury Notes | | | 2.25% | | | | 08/15/2027 | | | | 156,677,583 | | | | 1.3% | |
| | 121,100,000 | | | United States Treasury Notes | | | 2.25% | | | | 11/15/2027 | | | | 136,261,152 | | | | 1.2% | |
| | 106,400,000 | | | United States Treasury Notes | | | 2.38% | | | | 05/15/2029 | | | | 122,468,062 | | | | 1.1% | |
| | 74,350,000 | | | United States Treasury Notes | | | 3.13% | | | | 02/15/2043 | | | | 101,708,477 | | | | 0.9% | |
| | 59,250,000 | | | United States Treasury Notes | | | 3.63% | | | | 08/15/2043 | | | | 87,384,492 | | | | 0.8% | |
| | 58,600,000 | | | United States Treasury Notes | | | 3.75% | | | | 11/15/2043 | | | | 88,128,906 | | | | 0.8% | |
| | 166,100,000 | | | United States Treasury Notes | | | 2.75% | | | | 11/15/2047 | | | | 219,907,316 | | | | 1.9% | |
| | 58,650,000 | | | United States Treasury Notes | | | 2.00% – 2.88% | | | | 10/15/2021 – 02/15/2050 | | | | 67,112,490 | | | | 0.6% | |
| | 24,519,840 | | | United States Treasury Inflation Indexed Bonds | | | 0.88% | | | | 01/15/2029 | | | | 26,671,312 | | | | 0.2% | |
| | | | | | | | | | | | | | | | | | | | |
| | | | Total US Government and Agency Obligations
(Cost $2,277,415,885) | | | | | | | | | | | 2,528,397,491 | | | | 21.9% | |
| | | | | | | | | | | | | | | | | | | | |
| | | | | | |
| 28 | | DoubleLine Funds Trust | | | | The accompanying notes are an integral part of these financial statements. |
| | | | | | | | | | | | | | | | | | | | |
PRINCIPAL AMOUNT $/
SHARES | | | SECURITY DESCRIPTION | | RATE | | | MATURITY | | | VALUE $ | | | % OF NET
ASSETS | |
| | AFFILIATED MUTUAL FUNDS | |
| | | | | |
| | 91,647,117 | | | DoubleLine Global Bond Fund (Class I) | | | | | | | | | | | 935,717,064 | | | | 8.1% | |
| | 45,674,545 | | | DoubleLine Infrastructure Income Fund (Class I) | | | | | | | | | | | 436,648,648 | | | | 3.8% | |
| | 5,000,000 | | | DoubleLine Long Duration Total Return Bond Fund (Class I) | | | | | | | | | | | 58,750,000 | | | | 0.5% | |
| | | | | | | | | | | | | | | | | | | | |
| | | | Total Affiliated Mutual Funds
(Cost $1,450,400,000) | | | | | | | | | | | 1,431,115,712 | | | | 12.4% | |
| | | | | | | | | | | | | | | | | | | | |
| | EXCHANGE TRADED FUNDS AND COMMON STOCKSµ | |
| | | | Total Exchange Traded Funds and Common Stocks
(Cost $12,623,486) | | | | | | | | | | | 391,459 | | | | 0.0% | |
| | | | | | | | | | | | | | | | | | | | |
| | WARRANTSµ | |
| | | | Total Warrants
(Cost $—) | | | | | | | | | | | — | | | | 0.0% | |
| | | | | | | | | | | | | | | | | | | | |
| | SHORT TERM INVESTMENTS | |
| | 85,527,617 | | | First American Government Obligations Fund - Class U | | | 0.47% | ¨ | | | | | | | 85,527,617 | | | | 0.7% | |
| | 85,527,618 | | | JP Morgan U.S. Government Money Market Fund - Institutional Share Class | | | 0.36% | ¨ | | | | | | | 85,527,618 | | | | 0.7% | |
| | 85,527,617 | | | Morgan Stanley Institutional Liquidity Funds Government Portfolio - Institutional Share Class | | | 0.26% | ¨ | | | | | | | 85,527,617 | | | | 0.7% | |
| | | | |
| | Other Short Term Investmentsµ | | | | | | | | | | | 4,147,544 | | | | 0.2% | |
| | | | | | | | | | | | | | | | | | | | |
| | | | Total Short Term Investments
(Cost $260,694,277) | | | | | | | | | | | 260,730,396 | | | | 2.3% | |
| | | | | | | | | | | | | | | | | | | | |
| | | | Total Investments
(Cost $11,720,635,121) | | | | | | | | | | | 11,483,402,377 | | | | 99.5% | |
| | | | Other Assets in Excess of Liabilities | | | | | | | | | | | 60,888,204 | | | | 0.5% | |
| | | | | | | | | | | | | | | | | | | | |
| | | | NET ASSETS | | | | | | | | | | $ | 11,544,290,581 | | | | 100.0% | |
| | | | | | | | | | | | | | | | | | | | |
| | | | | |
| SECURITY TYPE BREAKDOWNas a % of Net Assets: | | | | | |
US Government and Agency Obligations | | | | 21.9% | |
US Government and Agency Mortgage Backed Obligations | | | | 18.1% | |
Affiliated Mutual Funds | | | | 12.4% | |
US Corporate Bonds | | | | 12.2% | |
Foreign Corporate Bonds | | | | 10.5% | |
Non-Agency Residential Collateralized Mortgage Obligations | | | | 8.6% | |
Non-Agency Commercial Mortgage Backed Obligations | | | | 5.3% | |
Bank Loans | | | | 3.1% | |
Asset Backed Obligations | | | | 2.5% | |
Short Term Investments | | | | 2.3% | |
Collateralized Loan Obligations | | | | 2.1% | |
Foreign Government Bonds, Foreign Agencies and Foreign Government Sponsored Corporations | | | | 0.4% | |
Municipal Bonds | | | | 0.1% | |
Exchange Traded Funds and Common Stocks | | | | 0.0% | ~ |
Warrants | | | | 0.0% | ~ |
Other Assets and Liabilities | | | | 0.5% | |
| | | | | |
| | | | 100.0% | |
| | | | | |
| | | | | |
| INVESTMENT BREAKDOWNas a % of Net Assets: | | | | | |
US Government and Agency Obligations | | | | 21.9% | |
US Government and Agency Mortgage Backed Obligations | | | | 18.1% | |
Affiliated Mutual Funds | | | | 12.4% | |
Non-Agency Residential Collateralized Mortgage Obligations | | | | 8.6% | |
Non-Agency Commercial Mortgage Backed Obligations | | | | 5.3% | |
Banking | | | | 5.0% | |
Asset Backed Obligations | | | | 2.5% | |
Short Term Investments | | | | 2.3% | |
Energy | | | | 2.3% | |
Collateralized Loan Obligations | | | | 2.1% | |
Utilities | | | | 2.0% | |
Telecommunications | | | | 1.9% | |
Healthcare | | | | 1.2% | |
Media | | | | 1.1% | |
Finance | | | | 1.0% | |
Insurance | | | | 0.8% | |
| | | | | |
INVESTMENT BREAKDOWNas a % of Net Assets: (Cont.) | | | | | |
Transportation | | | | 0.7% | |
Real Estate | | | | 0.7% | |
Pharmaceuticals | | | | 0.7% | |
Consumer Products | | | | 0.6% | |
Technology | | | | 0.6% | |
Automotive | | | | 0.6% | |
Food Products | | | | 0.6% | |
Electronics/Electric | | | | 0.5% | |
Mining | | | | 0.5% | |
Chemicals/Plastics | | | | 0.5% | |
Foreign Government Bonds, Foreign Agencies and Foreign Government Sponsored Corporations | | | | 0.4% | |
Business Equipment and Services | | | | 0.4% | |
Beverage and Tobacco | | | | 0.4% | |
Aerospace & Defense | | | | 0.4% | |
Hotels/Motels/Inns and Casinos | | | | 0.4% | |
Pulp & Paper | | | | 0.3% | |
Retailers (other than Food/Drug) | | | | 0.3% | |
Construction | | | | 0.3% | |
Building and Development (including Steel/Metals) | | | | 0.3% | |
Leisure | | | | 0.3% | |
Food/Drug Retailers | | | | 0.2% | |
Food Service | | | | 0.2% | |
Diversified Manufacturing | | | | 0.2% | |
Environmental Control | | | | 0.2% | |
Commercial Services | | | | 0.2% | |
Containers and Glass Products | | | | 0.2% | |
Municipal Bonds | | | | 0.1% | |
Chemical Products | | | | 0.1% | |
Industrial Equipment | | | | 0.1% | |
Financial Intermediaries | | | | 0.0% | ~ |
Cosmetics/Toiletries | | | | 0.0% | ~ |
Conglomerates | | | | 0.0% | ~ |
Other Assets and Liabilities | | | | 0.5% | |
| | | | | |
| | | | 100.0% | |
| | | | | |
| | | | | | |
| The accompanying notes are an integral part of these financial statements. | | Annual Report | | March 31, 2020 | | 29 |
| | |
| Schedule of Investments - Summary DoubleLine Core Fixed Income Fund (Cont.) | | March 31, 2020 |
| µ | Represents issues not identified as the top 50 holdings in terms of market value and issues or issuers not exceeding 1% of net assets individually or in aggregate, respectively as of March 31, 2020. |
| ^ | Security exempt from registration under Rule 144A of the Securities Act of 1933. These securities may be resold in transactions exempt from registration to qualified institutional buyers. |
| # | Coupon rate is variable based on the weighted average coupon of the underlying collateral. To the extent the weighted average coupon of the underlying assets which comprise the collateral increases or decreases, the coupon rate of this security will increase or decrease correspondingly. The rate disclosed is as of March 31, 2020. |
| I/O | Includes interest only securities |
| I/F | Includes inverse floating rate securities whose interest rate moves in the opposite direction of reference interest rates. Reference interest rates are typically based on a negative multiplier or slope. Interest rate may also be subject to a cap or floor. |
| > | Includes U.S. Agency bonds that accrue interest which is added to the outstanding principal balance. The interest payments will be deferred until all other tranches in the structure are paid off. The rate disclosed is as of March 31, 2020. |
| P/O | Includes Principal only securities |
| ¨ | Seven-day yield as of March 31, 2020 |
| ~ | Represents less than 0.05% of net assets |
A summary of the DoubleLine Core Fixed Income Fund’s investments in affiliated mutual funds for the year ended March 31, 2020 is as follows:
| | | | | | | | | | | | | | | | | | | | | | | | | | | | | | | | | | | | | | | | |
| Fund | | Value at
March 31,
2019 | | Gross
Purchases | | Gross
Sales | | Shares Held at
March 31,
2020 | | Value at
March 31,
2020 | | Change in
Unrealized for the
Year Ended
March 31,
2020 | | Dividend Income
Earned in the
Year Ended
March 31,
2020 | | Net Realized
Gain (Loss) in
the Year Ended
March 31,
2020 |
DoubleLine Global Bond Fund (Class I) | | | $ | 779,217,300 | | | | $ | 165,000,000 | | | | $ | — | | | | | 91,647,117 | | | | $ | 935,717,064 | | | | $ | (8,500,236 | ) | | | $ | 9,926,763 | | | | $ | 49,489 | |
DoubleLine Infrastructure Income Fund (Class I) | | | | 461,769,648 | | | | | — | | | | | — | | | | | 45,674,545 | | | | | 436,648,648 | | | | | (25,121,000 | ) | | | | 15,364,088 | | | | | — | |
DoubleLine Long Duration Total Return Bond Fund (Class I) | | | | 49,400,000 | | | | | — | | | | | — | | | | | 5,000,000 | | | | | 58,750,000 | | | | | 9,350,000 | | | | | 1,353,517 | | | | | 1,234,250 | |
| | | | | |
| | | $ | 1,290,386,948 | | | | $ | 165,000,000 | | | | $ | — | | | | | 142,321,662 | | | | $ | 1,431,115,712 | | | | $ | (24,271,236 | ) | | | $ | 26,644,368 | | | | $ | 1,283,739 | |
| | | | | |
| | | | | | |
| 30 | | DoubleLine Funds Trust | | | | The accompanying notes are an integral part of these financial statements. |
| | |
| Schedule of Investments DoubleLine Emerging Markets Fixed Income Fund | | March 31, 2020 |
| | | | | | | | | | | | | | | | |
PRINCIPAL
AMOUNT $ | | | SECURITY DESCRIPTION | | RATE | | | MATURITY | | | VALUE $ | |
| | FOREIGN CORPORATE BONDS 89.3% | |
| | |
| | ARGENTINA 2.9% | |
| | 2,350,000 | | | Banco Macro S.A. (5 Year Swap Rate USD + 5.46%) | | | 6.75% | ^ | | | 11/04/2026 | | | | 1,433,523 | |
| | 9,650,000 | | | Banco Macro S.A. (5 Year Swap Rate USD + 5.46%) | | | 6.75% | | | | 11/04/2026 | | | | 5,886,597 | |
| | 11,645,000 | | | Pampa Energia S.A. | | | 7.50% | | | | 01/24/2027 | | | | 7,856,468 | |
| | 1,000,000 | | | Pampa Energia S.A. | | | 9.13% | ^ | | | 04/15/2029 | | | | 673,552 | |
| | 150,000 | | | Pampa Energia S.A. | | | 9.13% | | | | 04/15/2029 | | | | 101,033 | |
| | 9,785,692 | | | Stoneway Capital Corporation | | | 10.00% | W | | | 03/01/2027 | | | | 1,467,952 | |
| | 700,000 | | | Transportadora de Gas del Sur S.A. | | | 6.75% | | | | 05/02/2025 | | | | 509,782 | |
| | 9,700,000 | | | YPF S.A. | | | 8.50% | | | | 07/28/2025 | | | | 5,090,027 | |
| | 4,400,000 | | | YPF S.A. | | | 6.95% | | | | 07/21/2027 | | | | 2,304,907 | |
| | | | | | | | | | | | | | | | |
| | | | | | | | | | | | | | | 25,323,841 | |
| | | | | | | | | | | | | | | | |
| | BRAZIL 14.3% | |
| | 17,000,000 | | | Banco BTG Pactual S.A. (5 Year CMT Rate + 5.26%) | | | 7.75% | ^ | | | 02/15/2029 | | | | 14,620,000 | |
| | 17,000,000 | | | Banco do Brasil S.A. (10 Year CMT Rate + 4.40%) | | | 6.25% | † | | | 04/15/2024 | | | | 13,434,250 | |
| | 7,631,000 | | | Cosan Overseas Ltd. | | | 8.25% | † | | | 05/05/2020 | | | | 6,881,750 | |
| | 7,200,000 | | | CSN Islands Corporation | | | 7.00% | † | | | 06/23/2020 | | | | 4,322,196 | |
| | 6,800,000 | | | CSN Islands Corporation | | | 6.75% | ^ | | | 01/28/2028 | | | | 4,385,932 | |
| | 1,500,000 | | | CSN Resources S.A. | | | 7.63% | | | | 02/13/2023 | | | | 1,051,883 | |
| | 7,100,000 | | | CSN Resources S.A. | | | 7.63% | ^ | | | 04/17/2026 | | | | 4,662,960 | |
| | 600,000 | | | CSN Resources S.A. | | | 7.63% | | | | 04/17/2026 | | | | 394,053 | |
| | 2,800,000 | | | Globo Comunicacao e Participacoes S.A. | | | 4.84% | | | | 06/08/2025 | | | | 2,562,714 | |
| | 1,500,000 | | | Globo Comunicacao e Participacoes S.A. | | | 4.88% | ^ | | | 01/22/2030 | | | | 1,289,625 | |
| | 1,929,352 | | | Invepar Holdings | | | 0.00% | ÞW | | | 12/30/2028 | | | | 82,503 | |
| | 2,000,000 | | | Itau Unibanco Holding S.A. (5 Year CMT Rate + 3.86%) | | | 6.50% | † | | | 03/19/2023 | | | | 1,910,220 | |
| | 3,555,000 | | | Itau Unibanco Holding S.A. (5 Year CMT Rate + 3.98%) | | | 6.13% | † | | | 12/12/2022 | | | | 3,366,585 | |
| | 3,600,000 | | | Itau Unibanco Holding S.A. (5 Year CMT Rate + 32.22%) | | | 4.63% | ^† | | | 02/27/2025 | | | | 2,953,800 | |
| | 1,528,000 | | | JBS Investments GMBH | | | 6.25% | | | | 02/05/2023 | | | | 1,512,728 | |
| | 8,300,000 | | | JBS Investments GMBH | | | 7.00% | ^ | | | 01/15/2026 | | | | 8,316,932 | |
| | 5,000,000 | | | JBS Investments GMBH | | | 5.75% | ^ | | | 01/15/2028 | | | | 4,880,250 | |
| | 15,200,000 | | | JSL Europe S.A. | | | 7.75% | | | | 07/26/2024 | | | | 11,058,685 | |
| | 3,500,000 | | | MARB BondCo PLC | | | 7.00% | ^ | | | 03/15/2024 | | | | 3,145,607 | |
| | 500,000 | | | MARB BondCo PLC | | | 7.00% | | | | 03/15/2024 | | | | 449,373 | |
| | 10,880,000 | | | MARB BondCo PLC | | | 6.88% | | | | 01/19/2025 | | | | 9,873,654 | |
| | 9,000,000 | | | Minerva Luxembourg S.A. | | | 6.50% | | | | 09/20/2026 | | | | 8,270,618 | |
| | 5,500,000 | | | Minerva Luxembourg S.A. | | | 5.88% | | | | 01/19/2028 | | | | 4,861,725 | |
| | 1,500,000 | | | NBM US Holdings, Inc. | | | 7.00% | ^ | | | 05/14/2026 | | | | 1,371,926 | |
| | 3,000,000 | | | Petrobras Global Finance B.V. | | | 5.75% | | | | 02/01/2029 | | | | 2,845,650 | |
| | 3,450,000 | | | Petrobras Global Finance B.V. | | | 7.25% | | | | 03/17/2044 | | | | 3,522,812 | |
| | 3,750,000 | | | Petrobras Global Finance B.V. | | | 6.90% | | | | 03/19/2049 | | | | 3,675,844 | |
| | | | | | | | | | | | | | | | |
| | | | | | | | | | | | | | | 125,704,275 | |
| | | | | | | | | | | | | | | | |
| | | | | | | | | | | | | | | | |
PRINCIPAL
AMOUNT $ | | | SECURITY DESCRIPTION | | RATE | | | MATURITY | | | VALUE $ | |
| | CHILE 9.1% | |
| | 3,200,000 | | | AES Gener S.A. | | | 5.00% | | | | 07/14/2025 | | | | 2,973,768 | |
| | 5,000,000 | | | AES Gener S.A. (5 Year CMT Rate + 4.92%) | | | 6.35% | | | | 10/07/2079 | | | | 3,822,500 | |
| | 9,000,000 | | | AES Gener S.A. (5 Year Swap Rate USD + 4.64%) | | | 7.13% | ^ | | | 03/26/2079 | | | | 7,093,142 | |
| | 6,800,000 | | | AES Gener S.A. (5 Year Swap Rate USD + 4.64%) | | | 7.13% | | | | 03/26/2079 | | | | 5,359,263 | |
| | 2,000,000 | | | Celulosa Arauco y Constitucion S.A. | | | 5.50% | ^ | | | 04/30/2049 | | | | 1,600,610 | |
| | 4,543,000 | | | Empresa Electrica Angamos S.A. | | | 4.88% | | | | 05/25/2029 | | | | 4,377,374 | |
| | 8,240,000 | | | Empresa Electrica Guacolda S.A. | | | 4.56% | | | | 04/30/2025 | | | | 5,855,220 | |
| | 8,392,000 | | | ENTEL Chile S.A. | | | 4.75% | | | | 08/01/2026 | | | | 7,981,900 | |
| | 13,000,000 | | | Geopark Ltd. | | | 6.50% | | | | 09/21/2024 | | | | 7,491,185 | |
| | 3,200,000 | | | Geopark Ltd. | | | 5.50% | ^ | | | 01/17/2027 | | | | 1,544,000 | |
| | 2,800,000 | | | GNL Quintero S.A. | | | 4.63% | | | | 07/31/2029 | | | | 2,683,919 | |
| | 5,075,000 | | | Latam Finance Ltd. | | | 6.88% | | | | 04/11/2024 | | | | 2,287,835 | |
| | 7,200,000 | | | Latam Finance Ltd. | | | 7.00% | ^ | | | 03/01/2026 | | | | 3,319,380 | |
| | 900,000 | | | Sociedad Quimica y Minera S.A. | | | 4.38% | | | | 01/28/2025 | | | | 868,729 | |
| | 4,500,000 | | | SUAM Finance B.V. | | | 4.88% | | | | 04/17/2024 | | | | 4,438,102 | |
| | 935,000 | | | Transelec S.A. | | | 4.25% | | | | 01/14/2025 | | | | 896,427 | |
| | 2,084,000 | | | VTR Finance B.V. | | | 6.88% | ^ | | | 01/15/2024 | | | | 1,948,540 | |
| | 16,917,000 | | | VTR Finance B.V. | | | 6.88% | | | | 01/15/2024 | | | | 15,817,395 | |
| | | | | | | | | | | | | | | | |
| | | | | | | | | | | | | | | 80,359,289 | |
| | | | | | | | | | | | | | | | |
| | CHINA 1.4% | |
| | 250,000 | | | Syngenta Finance N.V. | | | 4.38% | | | | 03/28/2042 | | | | 188,012 | |
| | 700,000 | | | Syngenta Finance N.V. | | | 5.68% | ^ | | | 04/24/2048 | | | | 565,096 | |
| | 14,000,000 | | | Syngenta Finance N.V. | | | 5.68% | | | | 04/24/2048 | | | | 11,301,920 | |
| | | | | | | | | | | | | | | | |
| | | | | | | | | | | | | | | 12,055,028 | |
| | | | | | | | | | | | | | | | |
| | COLOMBIA 9.6% | |
| | 652,000 | | | AI Candelaria Spain SLU | | | 7.50% | ^ | | | 12/15/2028 | | | | 488,050 | |
| | 4,250,000 | | | AI Candelaria Spain SLU | | | 7.50% | | | | 12/15/2028 | | | | 3,181,306 | |
| | 3,123,000 | | | Banco de Bogota S.A. | | | 5.38% | | | | 02/19/2023 | | | | 3,056,652 | |
| | 4,000,000 | | | Bancolombia S.A. (5 Year CMT Rate + 2.93%) | | | 4.88% | | | | 10/18/2027 | | | | 3,642,240 | |
| | 11,200,000 | | | Bancolombia S.A. (5 Year CMT Rate + 2.94%) | | | 4.63% | | | | 12/18/2029 | | | | 9,884,000 | |
| | 8,100,000 | | | BBVA Colombia S.A. | | | 4.88% | | | | 04/21/2025 | | | | 7,711,241 | |
| | 1,545,000 | | | Canacol Energy Ltd. | | | 7.25% | ^ | | | 05/03/2025 | | | | 1,342,226 | |
| | 12,000,000 | | | Canacol Energy Ltd. | | | 7.25% | | | | 05/03/2025 | | | | 10,425,060 | |
| | 9,800,000 | | | Empresas Publicas de Medellin ESP | | | 4.25% | ^ | | | 07/18/2029 | | | | 8,438,216 | |
| | 2,000,000 | | | Fideicomiso Pacifico Tres | | | 8.25% | | | | 01/15/2035 | | | | 1,950,000 | |
| | 1,500,000 | | | Gilex Holding Sarl | | | 8.50% | ^ | | | 05/02/2023 | | | | 1,288,867 | |
| | 4,568,000 | | | Gilex Holding Sarl | | | 8.50% | | | | 05/02/2023 | | | | 3,925,031 | |
| | 400,000 | | | Gran Tierra Energy International Holdings Ltd. | | | 6.25% | ^ | | | 02/15/2025 | | | | 103,500 | |
| | 11,300,000 | | | Gran Tierra Energy International Holdings Ltd. | | | 6.25% | | | | 02/15/2025 | | | | 2,923,875 | |
| | 2,100,000 | | | Gran Tierra Energy, Inc. | | | 7.75% | ^ | | | 05/23/2027 | | | | 548,625 | |
| | 3,100,000 | | | Grupo Aval Ltd. | | | 4.75% | | | | 09/26/2022 | | | | 2,942,098 | |
| | 5,700,000 | | | Grupo Aval Ltd. | | | 4.38% | ^ | | | 02/04/2030 | | | | 4,595,625 | |
| | 200,000 | | | Grupo Aval Ltd. | | | 4.38% | | | | 02/04/2030 | | | | 161,250 | |
| | 4,000,000 | | | Millicom International Cellular S.A. | | | 6.00% | | | | 03/15/2025 | | | | 3,900,020 | |
| | 5,500,000 | | | Millicom International Cellular S.A. | | | 5.13% | | | | 01/15/2028 | | | | 4,831,984 | |
| | 6,500,000 | | | Millicom International Cellular S.A. | | | 6.25% | ^ | | | 03/25/2029 | | | | 5,853,575 | |
| | 2,500,000 | | | Oleoducto Central S.A. | | | 4.00% | | | | 05/07/2021 | | | | 2,396,750 | |
| | 1,100,000 | | | Tecnoglass, Inc. | | | 8.20% | | | | 01/31/2022 | | | | 933,214 | |
| | | | | | | | | | | | | | | | |
| | | | | | | | | | | | | | | 84,523,405 | |
| | | | | | | | | | | | | | | | |
| | | | | | |
| The accompanying notes are an integral part of these financial statements. | | Annual Report | | March 31, 2020 | | 31 |
| | |
| Schedule of Investments DoubleLine Emerging Markets Fixed Income Fund (Cont.) | | March 31, 2020 |
| | | | | | | | | | | | | | | | |
PRINCIPAL
AMOUNT $ | | | SECURITY DESCRIPTION | | RATE | | | MATURITY | | | VALUE $ | |
| | DOMINICAN REPUBLIC 1.9% | |
| | 7,500,000 | | | AES Andres B.V. | | | 7.95% | ^ | | | 05/11/2026 | | | | 7,023,750 | |
| | 4,000,000 | | | AES Dominicana | | | 7.95% | | | | 05/11/2026 | | | | 3,746,000 | |
| | 1,800,000 | | | Banco de Reservas de la Republica Dominicana | | | 7.00% | ^ | | | 02/01/2023 | | | | 1,723,500 | |
| | 4,000,000 | | | Banco de Reservas de la Republica Dominicana | | | 7.00% | | | | 02/01/2023 | | | | 3,830,000 | |
| | | | | | | | | | | | | | | | |
| | | | | | | | | | | | | | | 16,323,250 | |
| | | | | | | | | | | | | | | | |
| | GUATEMALA 1.0% | |
| | 2,500,000 | | | Bantrab Senior Trust | | | 9.00% | | | | 11/14/2020 | | | | 2,450,000 | |
| | 2,783,000 | | | Comcel Trust | | | 6.88% | | | | 02/06/2024 | | | | 2,716,946 | |
| | 3,323,000 | | | Energuate Trust | | | 5.88% | | | | 05/03/2027 | | | | 3,323,033 | |
| | | | | | | | | | | | | | | | |
| | | | | | | | | | | | | | | 8,489,979 | |
| | | | | | | | | | | | | | | | |
| | HONG KONG 1.7% | |
| | 15,950,000 | | | Radiant Access Ltd. | | | 4.60% | † | | | 05/18/2020 | | | | 14,981,038 | |
| | | | | | | | | | | | | | | | |
| | | | | | | | | | | | | | | 14,981,038 | |
| | | | | | | | | | | | | | | | |
| | INDIA 7.9% | |
| | 4,432,000 | | | Adani Ports & Special Economic Zone Ltd. | | | 3.95% | | | | 01/19/2022 | | | | 4,099,511 | |
| | 4,205,000 | | | Adani Ports & Special Economic Zone Ltd. | | | 3.38% | | | | 07/24/2024 | | | | 3,617,772 | |
| | 4,200,000 | | | BPRL International Singapore Pte Ltd. | | | 4.38% | | | | 01/18/2027 | | | | 3,842,520 | |
| | 13,225,000 | | | Indian Oil Corporation Ltd. | | | 5.75% | | | | 08/01/2023 | | | | 13,006,313 | |
| | 3,100,000 | | | Network i2i Ltd. (5 Year CMT Rate + 4.28%) | | | 5.65% | ^† | | | 01/15/2025 | | | | 2,509,450 | |
| | 22,500,000 | | | ONGC Videsh Ltd. | | | 3.75% | | | | 07/27/2026 | | | | 20,294,935 | |
| | 4,080,000 | | | Reliance Holdings, Inc. | | | 5.40% | | | | 02/14/2022 | | | | 4,162,047 | |
| | 500,000 | | | Reliance Industries Ltd. | | | 8.25% | | | | 01/15/2027 | | | | 621,552 | |
| | 9,500,000 | | | UPL Corporation | | | 3.25% | | | | 10/13/2021 | | | | 8,787,254 | |
| | 4,800,000 | | | Vedanta Resources Finance PLC | | | 9.25% | ^ | | | 04/23/2026 | | | | 2,040,000 | |
| | 3,000,000 | | | Vedanta Resources Ltd. | | | 7.13% | | | | 05/31/2023 | | | | 1,166,235 | |
| | 13,100,000 | | | Vedanta Resources Ltd. | | | 6.13% | | | | 08/09/2024 | | | | 4,968,337 | |
| | | | | | | | | | | | | | | | |
| | | | | | | | | | | | | | | 69,115,926 | |
| | | | | | | | | | | | | | | | |
| | INDONESIA 5.7% | |
| | 13,550,000 | | | Freeport-McMoRan, Inc. | | | 5.40% | | | | 11/14/2034 | | | | 12,628,160 | |
| | 7,000,000 | | | Freeport-McMoRan, Inc. | | | 5.45% | | | | 03/15/2043 | | | | 6,319,600 | |
| | 8,651,700 | | | LLPL Capital Pte Ltd. | | | 6.88% | ^ | | | 02/04/2039 | | | | 8,513,749 | |
| | 2,600,000 | | | Medco Bell Pte Ltd. | | | 6.38% | ^ | | | 01/30/2027 | | | | 1,540,484 | |
| | 7,000,000 | | | Minejesa Capital B.V. | | | 4.63% | | | | 08/10/2030 | | | | 6,310,202 | |
| | 5,000,000 | | | Minejesa Capital B.V. | | | 5.63% | | | | 08/10/2037 | | | | 4,451,525 | |
| | 184,000 | | | Star Energy Geothermal Wayang Windu Ltd. | | | 6.75% | ^ | | | 04/24/2033 | | | | 167,294 | |
| | 11,086,920 | | | Star Energy Geothermal Wayang Windu Ltd. | | | 6.75% | | | | 04/24/2033 | | | | 10,080,272 | |
| | | | | | | | | | | | | | | | |
| | | | | | | | | | | | | | | 50,011,286 | |
| | | | | | | | | | | | | | | | |
| | ISRAEL 0.5% | |
| | 1,300,000 | | | Delek & Avner Tamar Bond Ltd. | | | 5.08% | ^ | | | 12/30/2023 | | | | 1,274,914 | |
| | 2,320,000 | | | Delek & Avner Tamar Bond Ltd. | | | 5.41% | ^ | | | 12/30/2025 | | | | 2,221,815 | |
| | 1,000,000 | | | Israel Electric Corporation Ltd. | | | 5.00% | ^ | | | 11/12/2024 | | | | 1,050,005 | |
| | | | | | | | | | | | | | | | |
| | | | | | | | | | | | | | | 4,546,734 | |
| | | | | | | | | | | | | | | | |
| | JAMAICA 0.2% | |
| | 19,779,251 | | | Digicel Group Ltd. (7.13% Cash + 2.00% PIK) | | | 9.13% | ^ | | | 04/01/2024 | | | | 2,144,466 | |
| | | | | | | | | | | | | | | | |
| | | | | | | | | | | | | | | 2,144,466 | |
| | | | | | | | | | | | | | | | |
| | | | | | | | | | | | | | | | |
PRINCIPAL
AMOUNT $ | | | SECURITY DESCRIPTION | | RATE | | | MATURITY | | | VALUE $ | |
| | MALAYSIA 2.9% | |
| | 15,000,000 | | | Gohl Capital Ltd. | | | 4.25% | | | | 01/24/2027 | | | | 12,451,096 | |
| | 4,900,000 | | | Malayan Banking BHD (3 Month LIBOR USD + 0.80%) | | | 2.49% | | | | 08/16/2024 | | | | 4,681,411 | |
| | 8,000,000 | | | Malayan Banking BHD (5 Year Swap Rate USD + 2.54%) | | | 3.91% | | | | 10/29/2026 | | | | 8,136,000 | |
| | 200,000 | | | TNB Global Ventures Capital BHD | | | 3.24% | | | | 10/19/2026 | | | | 205,168 | |
| | | | | | | | | | | | | | | | |
| | | | | | | | | | | | | | | 25,473,675 | |
| | | | | | | | | | | | | | | | |
| | MEXICO 15.2% | |
| | 16,472,000 | | | Banco Mercantil del Norte S.A. (10 Year CMT Rate + 5.35%) | | | 7.63% | † | | | 01/10/2028 | | | | 12,647,613 | |
| | 8,100,000 | | | Banco Mercantil del Norte S.A. (10 Year CMT Rate + 5.47%) | | | 7.50% | ^† | | | 06/27/2029 | | | | 6,186,456 | |
| | 3,000,000 | | | Banco Mercantil del Norte S.A. (5 Year CMT Rate + 5.04%) | | | 6.88% | † | | | 07/06/2022 | | | | 2,415,915 | |
| | 8,600,000 | | | Banco Nacional de Comercio Exterior S.N.C. (5 Year CMT Rate + 3.00%) | | | 3.80% | | | | 08/11/2026 | | | | 7,841,501 | |
| | 5,000,000 | | | Banco Santander (5 Year CMT Rate + 3.00%) | | | 5.95% | ^ | | | 10/01/2028 | | | | 4,657,287 | |
| | 17,500,000 | | | BBVA Bancomer S.A. (5 Year CMT Rate + 2.65%) | | | 5.13% | | | | 01/18/2033 | | | | 14,622,562 | |
| | 3,061,000 | | | BBVA Bancomer S.A. (5 Year CMT Rate + 3.00%) | | | 5.35% | | | | 11/12/2029 | | | | 2,811,659 | |
| | 2,400,000 | | | BBVA Bancomer S.A. (5 Year CMT Rate + 4.31%) | | | 5.88% | ^ | | | 09/13/2034 | | | | 2,016,120 | |
| | 7,500,000 | | | Braskem Idesa SAPI | | | 7.45% | ^ | | | 11/15/2029 | | | | 5,319,300 | |
| | 4,700,000 | | | Cemex S.A.B. de C.V. | | | 6.13% | | | | 05/05/2025 | | | | 4,200,601 | |
| | 7,942,000 | | | Cemex S.A.B. de C.V. | | | 7.75% | | | | 04/16/2026 | | | | 7,152,248 | |
| | 16,957,500 | | | Cometa Energia S.A. de C.V. | | | 6.38% | | | | 04/24/2035 | | | | 15,834,066 | |
| | 3,000,000 | | | Controladora Mabe S.A. de C.V. | | | 5.60% | | | | 10/23/2028 | | | | 2,860,628 | |
| | 7,500,000 | | | Credito Real S.A.B. de C.V. | | | 9.50% | ^ | | | 02/07/2026 | | | | 6,186,619 | |
| | 5,983,000 | | | Credito Real S.A.B. de C.V. (5 Year CMT Rate + 7.03%) | | | 9.13% | † | | | 11/29/2022 | | | | 4,608,795 | |
| | 5,500,000 | | | Docuformas SAPI de C.V. | | | 10.25% | ^ | | | 07/24/2024 | | | | 3,788,152 | |
| | 4,000,000 | | | Fresnillo PLC | | | 5.50% | | | | 11/13/2023 | | | | 3,994,980 | |
| | 9,300,000 | | | Grupo Bimbo S.A.B. de C.V. (5 Year CMT Rate + 3.28%) | | | 5.95% | † | | | 04/17/2023 | | | | 8,762,460 | |
| | 500,000 | | | Grupo Idesa S.A. de C.V. | | | 7.88% | ^ | | | 12/18/2020 | | | | 230,375 | |
| | 6,004,000 | | | Grupo Idesa S.A. de C.V. | | | 7.88% | | | | 12/18/2020 | | | | 2,766,343 | |
| | 5,400,000 | | | Operadora de Servicios Mega S.A. | | | 8.25% | ^ | | | 02/11/2025 | | | | 3,719,250 | |
| | 1,000,000 | | | Unifin Financiera S.A.B. de C.V. | | | 7.38% | | | | 02/12/2026 | | | | 608,553 | |
| | 17,533,000 | | | Unifin Financiera S.A.B. de C.V. (5 Year CMT Rate + 6.31%) | | | 8.88% | † | | | 01/29/2025 | | | | 10,686,714 | |
| | | | | | | | | | | | | | | | |
| | | | | | | | | | | | | | | 133,918,197 | |
| | | | | | | | | | | | | | | | |
| | PANAMA 6.3% | |
| | 200,000 | | | Aeropuerto Internacional de Tocumen S.A. | | | 5.63% | | | | 05/18/2036 | | | | 205,002 | |
| | | | | | |
| 32 | | DoubleLine Funds Trust | | | | The accompanying notes are an integral part of these financial statements. |
| | | | | | | | | | | | | | | | |
PRINCIPAL
AMOUNT $ | | | SECURITY DESCRIPTION | | RATE | | | MATURITY | | | VALUE $ | |
| | 4,000,000 | | | Banistmo S.A. | | | 3.65% | ^ | | | 09/19/2022 | | | | 3,706,256 | |
| | 2,000,000 | | | C&W Senior Financing DAC | | | 7.50% | ^ | | | 10/15/2026 | | | | 1,846,065 | |
| | 800,000 | | | C&W Senior Financing DAC | | | 7.50% | | | | 10/15/2026 | | | | 738,426 | |
| | 1,000,000 | | | C&W Senior Financing DAC | | | 6.88% | ^ | | | 09/15/2027 | | | | 869,468 | |
| | 15,743,000 | | | C&W Senior Financing DAC | | | 6.88% | | | | 09/15/2027 | | | | 13,688,027 | |
| | 1,100,000 | | | Cable Onda S.A. | | | 4.50% | ^ | | | 01/30/2030 | | | | 974,105 | |
| | 6,000,000 | | | Empresa de Transmision Electrica S.A. | | | 5.13% | ^ | | | 05/02/2049 | | | | 6,121,830 | |
| | 6,843,644 | | | ENA Norte Trust | | | 4.95% | | | | 04/25/2023 | | | | 6,835,124 | |
| | 300,000 | | | Global Bank Corporation | | | 4.50% | ^ | | | 10/20/2021 | | | | 294,000 | |
| | 5,000,000 | | | Global Bank Corporation (3 Month LIBOR USD + 3.30%) | | | 5.25% | ^ | | | 04/16/2029 | | | | 4,875,000 | |
| | 8,243,573 | | | Panama Metro Line SP | | | 0.00% | ^ | | | 12/05/2022 | | | | 7,653,630 | |
| | 8,243,573 | | | Panama Metro Line SP | | | 0.00% | | | | 12/05/2022 | | | | 7,653,630 | |
| | | | | | | | | | | | | | | | |
| | | | | | | | | | | | | | | 55,460,563 | |
| | | | | | | | | | | | | | | | |
| | PARAGUAY 0.5% | |
| | 4,600,000 | | | Telefonica Celular del Paragu | | | 5.88% | ^ | | | 04/15/2027 | | | | 4,188,104 | |
| | | | | | | | | | | | | | | | |
| | | | | | | | | | | | | | | 4,188,104 | |
| | | | | | | | | | | | | | | | |
| | PERU 2.1% | |
| | 3,900,000 | | | AJE Corporation B.V. | | | 6.50% | | | | 05/14/2022 | | | | 3,099,275 | |
| | 3,000,000 | | | Banco International del Peru S.A.A. (3 Month LIBOR USD + 5.76%) | | | 6.63% | | | | 03/19/2029 | | | | 3,049,627 | |
| | 200,000 | | | Inkia Energy Ltd. | | | 5.88% | ^ | | | 11/09/2027 | | | | 177,000 | |
| | 6,000,000 | | | Inkia Energy Ltd. | | | 5.88% | | | | 11/09/2027 | | | | 5,310,000 | |
| | 2,000,000 | | | Orazul Energy Egenor S en C por A | | | 5.63% | | | | 04/28/2027 | | | | 1,777,085 | |
| | 5,000,000 | | | Transportadora de Gas del Peru S.A. | | | 4.25% | | | | 04/30/2028 | | | | 4,762,763 | |
| | | | | | | | | | | | | | | | |
| | | | | | | | | | | | | | | 18,175,750 | |
| | | | | | | | | | | | | | | | |
| | PHILIPPINES 1.5% | |
| | 13,500,000 | | | BDO Unibank, Inc. | | | 2.95% | | | | 03/06/2023 | | | | 13,398,750 | |
| | | | | | | | | | | | | | | | |
| | | | | | | | | | | | | | | 13,398,750 | |
| | | | | | | | | | | | | | | | |
| | SINGAPORE 4.4% | |
| | 200,000 | | | DBS Group Holdings Ltd. (3 Month LIBOR USD + 0.62%) | | | 2.41% | | | | 07/25/2022 | | | | 199,542 | |
| | 16,300,000 | | | DBS Group Holdings Ltd. (5 Year Swap Rate USD + 2.39%) | | | 3.60% | † | | | 09/07/2021 | | | | 15,110,263 | |
| | 1,500,000 | | | Oversea-Chinese Banking Ltd. (3 Month LIBOR USD + 0.45%) | | | 2.14% | | | | 05/17/2021 | | | | 1,493,343 | |
| | 3,000,000 | | | United Overseas Bank Ltd. (5 Year Swap Rate USD + 1.65%) | | | 2.88% | | | | 03/08/2027 | | | | 2,958,270 | |
| | 6,500,000 | | | United Overseas Bank Ltd. (5 Year Swap Rate USD + 1.79%) | | | 3.88% | † | | | 10/19/2023 | | | | 6,199,046 | |
| | 13,000,000 | | | United Overseas Bank Ltd. (5 Year Swap Rate USD + 2.24%) | | | 3.50% | | | | 09/16/2026 | | | | 13,026,650 | |
| | | | | | | | | | | | | | | | |
| | | | | | | | | | | | | | | 38,987,114 | |
| | | | | | | | | | | | | | | | |
| | | | | | | | | | | | | | | | |
PRINCIPAL
AMOUNT $/
SHARES | | | SECURITY DESCRIPTION | | RATE | | | MATURITY | | | VALUE $ | |
| | THAILAND 0.2% | |
| | 1,700,000 | | | Export Import Bank of Thailand (3 Month LIBOR USD + 0.90%) | | | 2.59% | | | | 11/20/2023 | | | | 1,687,837 | |
| | | | | | | | | | | | | | | | |
| | | | | | | | | | | | | | | 1,687,837 | |
| | | | | | | | | | | | | | | | |
| | | | Total Foreign Corporate Bonds
(Cost $958,661,868) | | | | 784,868,507 | |
| | | | | | | | | | | | | | | | |
| FOREIGN GOVERNMENT BONDS, FOREIGN AGENCIES AND FOREIGN
GOVERNMENT SPONSORED CORPORATIONS 1.3% |
|
| | |
| | DOMINICAN REPUBLIC 1.3% | |
| | 8,500,000 | | | Dominican Republic International Bond | | | 4.50% | ^ | | | 01/30/2030 | | | | 7,433,250 | |
| | 4,000,000 | | | Dominican Republic International Bond | | | 6.40% | ^ | | | 06/05/2049 | | | | 3,561,220 | |
| | | | | | | | | | | | | | | | |
| | | | | | | | | | | | | | | 10,994,470 | |
| | | | | | | | | | | | | | | | |
| | INDONESIA 0.0% | |
| | 200,000 | | | Perusahaan Penerbit | | | 3.40% | | | | 03/29/2022 | | | | 199,602 | |
| | | | | | | | | | | | | | | | |
| | | | | | | | | | | | | | | 199,602 | |
| | | | | | | | | | | | | | | | |
| | | | Total Foreign Government Bonds, Foreign Agencies and Foreign Government Sponsored Corporations
(Cost $12,586,968) | | | | 11,194,072 | |
| | | | | | | | | | | | | | | | |
| | EXCHANGE TRADED FUNDS AND COMMON STOCKS 0.1% | |
| | 228,497 | | | Frontera Energy Corporation | | | | | | | | | | | 564,389 | |
| | | | | | | | | | | | | | | | |
| | | | Total Exchange Traded Funds and Common Stocks
(Cost $20,010,064) | | | | 564,389 | |
| | | | | | | | | | | | | | | | |
| | WARRANTS 0.0% | |
| | 1,609,815 | | | OAS S.A., Expiration 5/16/2039, Strike Price BRL 1.00*Þ | | | | | | | | | | | — | |
| | | | | | | | | | | | | | | | |
| | | | Total Warrants (Cost $—) | | | | — | |
| | | | | | | | | | | | | | | | |
| | SHORT TERM INVESTMENTS 5.4% | |
| | 15,904,578 | | | First American Government Obligations Fund - Class U | | | 0.47% | ¨ | | | | | | | 15,904,578 | |
| | 15,904,578 | | | JP Morgan U.S. Government Money MarketFund - Institutional Share Class | | | 0.36% | ¨ | | | | | | | 15,904,578 | |
| | 15,904,579 | | | Morgan Stanley Institutional Liquidity Funds Government Portfolio - Institutional Share Class | | | 0.26% | ¨ | | | | | | | 15,904,579 | |
| | | | | | | | | | | | | | | | |
| | | | Total Short Term Investments
(Cost $47,713,735) | | | | 47,713,735 | |
| | | | | | | | | | | | | | | | |
| | | | Total Investments 96.1%
(Cost $1,038,972,635) | | | | 844,340,703 | |
| | | | Other Assets in Excess of Liabilities 3.9% | | | | 34,033,783 | |
| | | | | | | | | | | | | | | | |
| | | | NET ASSETS 100.0% | | | $ | 878,374,486 | |
| | | | | | | | | | | | | | | | |
| | | | | | |
| The accompanying notes are an integral part of these financial statements. | | Annual Report | | March 31, 2020 | | 33 |
| | |
| Schedule of Investments DoubleLine Emerging Markets Fixed Income Fund (Cont.) | | March 31, 2020 |
| | | | | |
| INVESTMENT BREAKDOWNas a % of Net Assets: | | | | | |
Banking | | | | 23.7% | |
Utilities | | | | 14.0% | |
Energy | | | | 10.2% | |
Telecommunications | | | | 8.0% | |
Transportation | | | | 7.3% | |
Consumer Products | | | | 6.8% | |
Short Term Investments | | | | 5.4% | |
Finance | | | | 5.1% | |
Mining | | | | 3.5% | |
Building and Development (including Steel/Metals) | | | | 3.3% | |
Chemicals/Plastics | | | | 2.5% | |
Real Estate | | | | 1.7% | |
Hotels/Motels/Inns and Casinos | | | | 1.4% | |
Foreign Government Bonds, Foreign Agencies and Foreign Government Sponsored Corporations | | | | 1.3% | |
Chemical Products | | | | 0.9% | |
Media | | | | 0.4% | |
Containers and Glass Products | | | | 0.4% | |
Pulp & Paper | | | | 0.2% | |
Construction | | | | 0.0% | ~ |
Other Assets and Liabilities | | | | 3.9% | |
| | | | | |
| | | | 100.0% | |
| | | | | |
| | | | | |
| COUNTRY BREAKDOWNas a % of Net Assets: | | | | | |
Mexico | | | | 15.2% | |
Brazil | | | | 14.3% | |
Colombia | | | | 9.7% | |
Chile | | | | 9.1% | |
India | | | | 7.9% | |
Panama | | | | 6.3% | |
Indonesia | | | | 5.7% | |
United States | | | | 5.4% | |
Singapore | | | | 4.4% | |
Dominican Republic | | | | 3.2% | |
Malaysia | | | | 2.9% | |
Argentina | | | | 2.9% | |
Peru | | | | 2.1% | |
Hong Kong | | | | 1.7% | |
Philippines | | | | 1.5% | |
China | | | | 1.4% | |
Guatemala | | | | 1.0% | |
Israel | | | | 0.5% | |
Paraguay | | | | 0.5% | |
Jamaica | | | | 0.2% | |
Thailand | | | | 0.2% | |
Other Assets and Liabilities | | | | 3.9% | |
| | | | | |
| | | | 100.0% | |
| | | | | |
| ^ | Security exempt from registration under Rule 144A of the Securities Act of 1933. These securities may be resold in transactions exempt from registration to qualified institutional buyers. |
| PIK | Apayment-in-kind security in which the issuer may make interest or dividend payments in cash or additional securities. These additional securities generally have the same terms as the original holdings. |
| W | Security is in default or has failed to make a scheduled payment. Income is not being accrued. |
| Þ | Value determined using significant unobservable inputs. |
| ¨ | Seven-day yield as of March 31, 2020 |
| * | Non-income producing security |
| ~ | Represents less than 0.05% of net assets |
| | | | | | |
| 34 | | DoubleLine Funds Trust | | | | The accompanying notes are an integral part of these financial statements. |
| | |
| Schedule of Investments DoubleLine Multi-Asset Growth Fund (Consolidated) | | March 31, 2020 |
| | | | | | | | | | | | | | | | |
PRINCIPAL
AMOUNT $ | | | SECURITY DESCRIPTION | | RATE | | | MATURITY | | | VALUE $ | |
| | COLLATERALIZED LOAN OBLIGATIONS 0.2% | |
| |
| | | | Brookside Mill Ltd., | |
| | 1,000,000 | | | Series2013-1A-SUB | | | 6.81% | #^Þ@ | | | 01/17/2028 | | | | 72,621 | |
| | | | | | | | | | | | | | | | |
| | | | Total Collateralized Loan Obligations
(Cost $460,280) | | | | 72,621 | |
| | | | | | | | | | | | | |
| NON-AGENCY RESIDENTIAL COLLATERALIZED MORTGAGE
OBLIGATIONS 28.3% |
|
| |
| | | | Adjustable Rate Mortgage Trust, | |
| | 137,206 | | | Series2006-1-2A1 | | | 4.17% | # | | | 03/25/2036 | | | | 92,611 | |
| |
| | | | Alternative Loan Trust, | |
| | 319,351 | | | Series2005-55CB-1A1 | | | 5.50% | | | | 11/25/2035 | | | | 267,763 | |
| | 245,972 | | | Series2005-J8-1A5 | | | 5.50% | | | | 07/25/2035 | | | | 209,660 | |
| | 353,477 | | | Series2006-OA7-1A2 (12 Month US Treasury Average + 0.94%, 0.94% Floor) | | | 2.91% | | | | 06/25/2046 | | | | 293,474 | |
| | 310,687 | | | Series2007-HY4-4A1 | | | 3.98% | # | | | 06/25/2037 | | | | 263,164 | |
| |
| | | | Banc of America Alternative Loan Trust, | |
| | 323,628 | | | Series2006-7-A4 | | | 6.00% | ß | | | 10/25/2036 | | | | 138,710 | |
| |
| | | | BCAP LLC Trust, | |
| | 29,042 | | | Series2007-AA2-2A5 | | | 6.00% | | | | 04/25/2037 | | | | 21,244 | |
| | 2,564,011 | | | Series2009-RR4-1A2 | | | 6.50% | #^D | | | 06/26/2037 | | | | 1,032,616 | |
| |
| | | | Chase Mortgage Finance Trust Series, | |
| | 200,298 | | | Series2006-S2-1A13 | | | 6.25% | | | | 10/25/2036 | | | | 135,190 | |
| |
| | | | ChaseFlex Trust, | |
| | 162,735 | | | Series2007-M1-2F4 | | | 4.17% | ß | | | 08/25/2037 | | | | 144,134 | |
| |
| | | | CIM Trust, | |
| | 910,000 | | | Series2017-3RR-B2 | | | 10.50% | #^Þ | | | 01/27/2057 | | | | 896,350 | |
| |
| | | | CitiCorporationMortgage Securities, Inc., | |
| | 274 | | | Series2007-2-3A1 | | | 5.50% | | | | 02/25/2037 | | | | 274 | |
| |
| | | | Citigroup Mortgage Loan Trust, Inc., | |
| | 40,357 | | | Series2009-7-2A2 | | | 5.50% | ^ | | | 10/25/2021 | | | | 39,478 | |
| |
| | | | CitiMortgage Alternative Loan Trust, | |
| | 157,396 | | | Series2007-A6-1A11 | | | 6.00% | | | | 06/25/2037 | | | | 141,778 | |
| |
| | | | Countrywide Alternative Loan Trust, | |
| | 247,392 | | | Series2005-48T1-A2 | | | 5.50% | | | | 11/25/2035 | | | | 193,861 | |
| | 517,731 | | | Series2006-15CB-A1 | | | 6.50% | | | | 06/25/2036 | | | | 340,649 | |
| | 67,244 | | | Series2006-32CB-A16 | | | 5.50% | | | | 11/25/2036 | | | | 49,762 | |
| | 700,494 | | | Series2006-J1-2A1 | | | 7.00% | | | | 02/25/2036 | | | | 152,732 | |
| | 13,013 | | | Series 2007-17CB-1A10(-5 x 1 Month LIBOR USD + 29.90%, 29.90% Cap) | | | 25.55% | I/F | | | 08/25/2037 | | | | 24,706 | |
| | 9,331 | | | Series2007-21CB-2A2(-4 x 1 Month LIBOR USD + 28.40%, 28.40% Cap) | | | 24.61% | I/F | | | 09/25/2037 | | | | 11,757 | |
| |
| | | | Countrywide Home Loans, | |
| | 146,117 | | | Series2007-10-A5 | | | 6.00% | | | | 07/25/2037 | | | | 107,684 | |
| | 7,998 | | | Series2007-4-1A5 | | | 6.50% | | | | 05/25/2037 | | | | 5,846 | |
| |
| | | | Credit Suisse First Boston Mortgage Securities Corporation, | |
| | 83,711 | | | Series2005-8-1A3 | | | 5.25% | | | | 09/25/2035 | | | | 77,978 | |
| |
| | | | Credit Suisse Mortgage Capital Certificates, | |
| | 31,716 | | | Series2006-9-4A1 | | | 6.00% | | | | 11/25/2036 | | | | 23,115 | |
| |
| | | | Deutsche Mortgage Securities, Inc., | |
| | 52,599 | | | Series2006-PR1-3A1(-1 x 1 Month LIBOR USD + 12.12%, 12.12% Cap) | | | 11.14% | ^ I/F | | | 04/15/2036 | | | | 48,902 | |
| | 230,066 | | | Series2006-PR1-5AI4(-1 x 1 Month LIBOR USD + 12.12%, 12.12% Cap) | | | 11.14% | ^ I/F | | | 04/15/2036 | | | | 227,374 | |
| |
| | | | First Horizon Alternative Mortgage Securities Trust, | |
| | 33,655 | | | Series2007-FA2-1A3 | | | 6.00% | | | | 04/25/2037 | | | | 20,479 | |
| |
| | | | GreenPoint Mortgage Funding Trust, | |
| | 986,617 | | | Series2005-AR3-2A1 (1 Month LIBOR USD + 0.26%, 0.26% Floor, 10.50% Cap) | | | 1.21% | | | | 08/25/2045 | | | | 582,961 | |
| | | | | | | | | | | | | | | | |
PRINCIPAL
AMOUNT $ | | | SECURITY DESCRIPTION | | RATE | | | MATURITY | | | VALUE $ | |
| |
| | | | GSAA Home Equity Trust, | |
| | 1,000,000 | | | Series2006-15-AF3B | | | 5.93% | # | | | 09/25/2036 | | | | 85,636 | |
| |
| | | | GSR Mortgage Loan Trust, | |
| | 63,159 | | | Series2006-2F-2A20(-1 x 1 Month LIBOR USD + 11.10%, 5.00% Floor, 11.10% Cap) | | | 9.52% | I/F | | | 02/25/2036 | | | | 63,679 | |
| |
| | | | HarborView Mortgage Loan Trust, | |
| | 391,523 | | | Series2006-14-1A1A (1 Month LIBOR USD + 0.18%, 0.18% Floor) | | | 0.93% | | | | 01/25/2047 | | | | 308,012 | |
| |
| | | | JP Morgan Alternative Loan Trust, | |
| | 20,648 | | | Series2005-S1-2A11 | | | 6.00% | | | | 12/25/2035 | | | | 17,779 | |
| | 314,910 | | | Series2006-S1-1A3 | | | 5.50% | D | | | 03/25/2036 | | | | 217,747 | |
| |
| | | | JP Morgan Mortgage Acquisition Trust, | |
| | 112,233 | | | Series2006-CH2-AF3 | | | 5.46% | ß | | | 09/25/2029 | | | | 86,228 | |
| |
| | | | Lehman Mortgage Trust, | |
| | 58,812 | | | Series2006-4-1A3(-1 x 1 Month LIBOR USD + 5.40%, 5.40% Cap) | | | 4.45% | I/F I/O | | | 08/25/2036 | | | | 11,122 | |
| | 3,676 | | | Series2006-4-1A4 | | | 6.00% | | | | 08/25/2036 | | | | 3,247 | |
| | 725,999 | | | Series2007-10-2A1 | | | 6.50% | | | | 01/25/2038 | | | | 404,831 | |
| | 33,857 | | | Series2007-5-11A1 | | | 5.11% | # | | | 06/25/2037 | | | | 24,104 | |
| | 809,571 | | | Series2007-5-1A3 | | | 5.75% | | | | 06/25/2037 | | | | 759,636 | |
| |
| | | | Lehman XS Trust, | |
| | 117,895 | | | Series2005-1-3A3A | | | 5.11% | | | | 07/25/2035 | | | | 109,015 | |
| |
| | | | MASTR Resecuritization Trust, | |
| | 188,744 | | | Series2008-4-A1 | | | 6.00% | #^ | | | 06/27/2036 | | | | 165,230 | |
| |
| | | | Morgan Stanley Mortgage Loan Trust, | |
| | 1,378,587 | | | Series2006-8AR-1A4 (1 Month LIBOR USD + 0.50%, 0.25% Floor) | | | 1.45% | | | | 06/25/2036 | | | | 586,647 | |
| | 218,226 | | | Series2007-13-6A1 | | | 6.00% | | | | 10/25/2037 | | | | 154,012 | |
| |
| | | | Residential Accredit Loans, Inc., | |
| | 134,375 | | | Series2006-QS10-A9 | | | 6.50% | | | | 08/25/2036 | | | | 123,335 | |
| | 2,521 | | | Series2006-QS13-1A8 | | | 6.00% | | | | 09/25/2036 | | | | 2,125 | |
| | 132,270 | | | Series2006-QS2-1A4 | | | 5.50% | | | | 02/25/2036 | | | | 118,124 | |
| | 26,038 | | | Series2006-QS7-A4 (1 Month LIBOR USD + 0.40%, 0.40% Floor, 6.00% Cap) | | | 1.35% | | | | 06/25/2036 | | | | 18,200 | |
| | 78,115 | | | Series2006-QS7-A5(-1 x 1 Month LIBOR USD + 5.60%, 5.60% Cap) | | | 4.65% | I/F I/O | | | 06/25/2036 | | | | 13,359 | |
| | 49,449 | | | Series2006-QS8-A4 (1 Month LIBOR USD + 0.45%, 0.45% Floor) | | | 1.40% | | | | 08/25/2036 | | | | 35,376 | |
| | 148,347 | | | Series2006-QS8-A5(-1 x 1 Month LIBOR USD + 5.55%, 5.55% Cap) | | | 4.60% | I/F I/O | | | 08/25/2036 | | | | 24,147 | |
| |
| | | | Residential Asset Mortgage Products, Inc., | |
| | 173,672 | | | Series2004-RS2-MII1 (1 Month LIBOR USD + 0.87%, 0.58% Floor, 14.00% Cap) | | | 1.82% | | | | 02/25/2034 | | | | 164,151 | |
| |
| | | | Residential Asset Securitization Trust, | |
| | 193,996 | | | Series2005-A11-1A4 | | | 5.50% | | | | 10/25/2035 | | | | 159,988 | |
| | 16,238 | | | Series2005-A12-A12 | | | 5.50% | | | | 11/25/2035 | | | | 13,091 | |
| | 409,380 | | | Series2006-A16-1A3 | | | 6.00% | | | | 02/25/2037 | | | | 257,868 | |
| | 594,039 | | | Series2006-A9CB-A6 | | | 6.00% | | | | 09/25/2036 | | | | 313,628 | |
| | 338,186 | | | Series2007-A1-A8 | | | 6.00% | | | | 03/25/2037 | | | | 178,932 | |
| | 250,944 | | | Series2007-A5-2A5 | | | 6.00% | | | | 05/25/2037 | | | | 180,824 | |
| |
| | | | Washington Mutual Mortgage Pass-Through Certificates, | |
| | 234,161 | | | Series2006-8-A6 | | | 4.31% | ß | | | 10/25/2036 | | | | 118,733 | |
| | | | | | | | | | | | | | | | |
| | | | TotalNon-Agency Residential Collateralized Mortgage Obligations
(Cost $12,489,375) | | | | 10,263,058 | |
| | | | | | | | | | | | | |
| | | | | | |
| The accompanying notes are an integral part of these financial statements. | | Annual Report | | March 31, 2020 | | 35 |
| | |
| Schedule of Investments DoubleLine Multi-Asset Growth Fund (Consolidated) (Cont.) | | March 31, 2020 |
| | | | | | | | | | | | | | | | |
PRINCIPAL
AMOUNT $ | | | SECURITY DESCRIPTION | | RATE | | | MATURITY | | | VALUE $ | |
| US GOVERNMENT AND AGENCY MORTGAGE BACKED
OBLIGATIONS 16.1% |
|
| |
| | | | Federal Home Loan Mortgage Corporation, | |
| | 40,352 | | | Series3261-SA(-1 x 1 Month LIBOR USD + 6.43%, 6.43% Cap) | | | 5.73% | I/F I/O | | | 01/15/2037 | | | | 8,962 | |
| | 78,828 | | | Series3355-BI(-1 x 1 Month LIBOR USD + 6.05%, 6.05% Cap) | | | 5.35% | I/F I/O | | | 08/15/2037 | | | | 14,863 | |
| | 28,092 | | | Series3384-S(-1 x 1 Month LIBOR USD + 6.39%, 6.39% Cap) | | | 5.69% | I/F I/O | | | 11/15/2037 | | | | 4,269 | |
| | 91,203 | | | Series3384-SG(-1 x 1 Month LIBOR USD + 6.31%, 6.31% Cap) | | | 5.61% | I/F I/O | | | 08/15/2036 | | | | 19,160 | |
| | 35,347 | | | Series3417-SX(-1 x 1 Month LIBOR USD + 6.18%, 6.18% Cap) | | | 5.48% | I/F I/O | | | 02/15/2038 | | | | 4,114 | |
| | 45,919 | | | Series3423-GS(-1 x 1 Month LIBOR USD + 5.65%, 5.65% Cap) | | | 4.95% | I/F I/O | | | 03/15/2038 | | | | 4,991 | |
| | 413,290 | | | Series3423-TG(-1 x 1 Month LIBOR USD + 6.00%, 0.35% Cap) | | | 0.35% | I/F I/O | | | 03/15/2038 | | | | 3,087 | |
| | 53,186 | | | Series3500-SA(-1 x 1 Month LIBOR USD + 5.52%, 5.52% Cap) | | | 4.82% | I/F I/O | | | 01/15/2039 | | | | 6,738 | |
| | 144,877 | | | Series3523-SM(-1 x 1 Month LIBOR USD + 6.00%, 6.00% Cap) | | | 5.30% | I/F I/O | | | 04/15/2039 | | | | 26,372 | |
| | 11,461 | | | Series3562-WS(-1 x 1 Month LIBOR USD + 4.95%, 4.95% Cap) | | | 4.25% | I/F I/O | | | 08/15/2039 | | | | 1,418 | |
| | 117,628 | | | Series3728-SV(-1 x 1 Month LIBOR USD + 4.45%, 4.45% Cap) | | | 3.75% | I/F I/O | | | 09/15/2040 | | | | 13,564 | |
| | 112,030 | | | Series3758-S(-1 x 1 Month LIBOR USD + 6.03%, 6.03% Cap) | | | 5.33% | I/F I/O | | | 11/15/2040 | | | | 20,875 | |
| | 75,105 | | | Series3779-DZ | | | 4.50% | > | | | 12/15/2040 | | | | 80,365 | |
| | 141,805 | | | Series3815-ST(-1 x 1 Month LIBOR USD + 5.85%, 5.85% Cap) | | | 5.15% | I/F I/O | | | 02/15/2041 | | | | 27,493 | |
| | 50,588 | | | Series3900-SB(-1 x 1 Month LIBOR USD + 5.97%, 5.97% Cap) | |
| 5.27%
| I/F I/O
| | | 07/15/2041 | | | | 7,840 | |
| | 616,677 | | | Series4183-Z | | | 3.00% | > | | | 03/15/2043 | | | | 662,208 | |
| |
| | | | Federal National Mortgage Association, | |
| | 65,941 | | | Series2006-101-SA(-1 x 1 Month LIBOR USD + 6.58%, 6.58% Cap) | | | 5.63% | I/F I/O | | | 10/25/2036 | | | | 14,343 | |
| | 34,001 | | | Series2006-123-LI(-1 x 1 Month LIBOR USD + 6.32%, 6.32% Cap) | | | 5.37% | I/F I/O | | | 01/25/2037 | | | | 7,223 | |
| | 247,435 | | | Series2007-39-AI(-1 x 1 Month LIBOR USD + 6.12%, 6.12% Cap) | | | 5.17% | I/F I/O | | | 05/25/2037 | | | | 48,166 | |
| | 104,348 | | | Series2007-57-SX(-1 x 1 Month LIBOR USD + 6.62%, 6.62% Cap) | | | 5.67% | I/F I/O | | | 10/25/2036 | | | | 19,760 | |
| | 6,995 | | | Series2009-49-S(-1 x 1 Month LIBOR USD + 6.75%, 6.75% Cap) | | | 5.80% | I/F I/O | | | 07/25/2039 | | | | 1,268 | |
| | 116,717 | | | Series2009-86-CI(-1 x 1 Month LIBOR USD + 5.80%, 5.80% Cap) | | | 4.85% | I/F I/O | | | 09/25/2036 | | | | 18,565 | |
| | 33,428 | | | Series2009-90-IA(-1 x 1 Month LIBOR USD + 5.75%, 5.75% Cap) | | | 4.80% | I/F I/O | | | 03/25/2037 | | | | 4,459 | |
| | 33,058 | | | Series2009-90-IB(-1 x 1 Month LIBOR USD + 5.72%, 5.72% Cap) | | | 4.77% | I/F I/O | | | 04/25/2037 | | | | 4,776 | |
| | | | | | | | | | | | | | | | |
PRINCIPAL
AMOUNT $/
SHARES | | | SECURITY DESCRIPTION | | RATE | | | MATURITY | | | VALUE $ | |
| |
| | | | Federal National Mortgage Association, (Cont.) | |
| | 179,479 | | | Series2010-39-SL(-1 x 1 Month LIBOR USD + 5.67%, 5.67% Cap) | | | 4.72% | I/F I/O | | | 05/25/2040 | | | | 32,277 | |
| | 67,608 | | | Series2011-5-PS(-1 x 1 Month LIBOR USD + 6.40%, 6.40% Cap) | | | 5.45% | I/F I/O | | | 11/25/2040 | | | | 6,121 | |
| | 411,542 | | | Series2012-30-DZ | | | 4.00% | > | | | 04/25/2042 | | | | 445,374 | |
| | 1,227,211 | | | Series2013-53-ZC | | | 3.00% | > | | | 06/25/2043 | | | | 1,310,330 | |
| | 1,146,072 | | | Series2013-55-VZ | | | 3.00% | > | | | 06/25/2043 | | | | 1,194,493 | |
| | 591,049 | | | Series2014-58-VZ | | | 3.00% | > | | | 09/25/2044 | | | | 650,756 | |
| | 597,208 | | | Series2015-9-ZA | | | 3.50% | > | | | 03/25/2045 | | | | 656,172 | |
| |
| | | | Government National Mortgage Association, | |
| | 17,879 | | | Series2009-6-SM(-1 x 1 Month LIBOR USD + 5.95%, 5.95% Cap) | | | 5.18% | I/F I/O | | | 02/20/2038 | | | | 2,244 | |
| | 303,983 | | | Series2011-45-GZ | | | 4.50% | | | | 03/20/2041 | | | | 336,703 | |
| | 164,107 | | | Series2011-7-LS(-2 x 1 Month LIBOR USD + 9.88%, 9.88% Cap) | | | 8.33% | I/F | | | 12/20/2040 | | | | 186,860 | |
| | | | | | | | | | | | | | | | |
| | | | Total US Government and Agency Mortgage Backed Obligations
(Cost $5,189,812) | | | | 5,846,209 | |
| | | | | | | | | | | | | |
| | AFFILIATED MUTUAL FUNDS 23.5% | |
| | 204,751 | | | DoubleLine Core Fixed Income Fund (Class I) | | | | | | | | | | | 2,174,460 | |
| | 234,527 | | | DoubleLine Flexible Income Fund (Class I) | | | | | | | | | | | 1,970,026 | |
| | 227,248 | | | DoubleLine Low Duration Bond Fund (Class I) | | | | | | | | | | | 2,161,127 | |
| | 212,202 | | | DoubleLine Total Return Bond Fund (Class I) | | | | | | | | | | | 2,219,628 | |
| | | | | | | | | | | | | | | | |
| | | | Total Affiliated Mutual Funds
(Cost $9,076,577) | | | | 8,525,241 | |
| | | | | | | | | | | | | |
| | SHORT TERM INVESTMENTS 31.0% | |
| | 2,253,862 | | | First American Government Obligations Fund - Class U | | | 0.47% | ¨ | | | | | | | 2,253,862 | |
| | 2,253,862 | | | JP Morgan U.S. Government Money Market Fund - Institutional Share Class | | | 0.36% | ¨ | | | | | | | 2,253,862 | |
| | 2,253,862 | | | Morgan Stanley Institutional Liquidity Funds Government Portfolio - Institutional Share Class | | | 0.26% | ¨ | | | | | | | 2,253,862 | |
| | 2,500,000 | | | United States Treasury Bills | | | 0.00% | | | | 04/02/2020 | | | | 2,500,001 | |
| | 2,000,000 | | | United States Treasury Bills | | | 0.00% | ‡ | | | 12/03/2020 | | | | 1,998,752 | |
| | | | | | | | | | | | | | | | |
| | | | Total Short Term Investments
(Cost $11,240,802) | | | | 11,260,339 | |
| | | | | | | | | | | | | | | | |
| | | | Total Investments 99.1%
(Cost $38,456,846) | | | | | | | | 35,967,468 | |
| | | | Other Assets in Excess of Liabilities 0.9% | | | | 318,968 | |
| | | | | | | | | | | | | | | | |
| | | | NET ASSETS 100.0% | | | | | | | $ | 36,286,436 | |
| | | | | | | | | | | | | | | | |
| | | | | | |
| 36 | | DoubleLine Funds Trust | | | | The accompanying notes are an integral part of these financial statements. |
| | | | |
| SECURITY TYPE BREAKDOWNas a % of Net Assets: | |
Short Term Investments | | | 31.0% | |
Non-Agency Residential Collateralized Mortgage Obligations | | | 28.3% | |
Affiliated Mutual Funds | | | 23.5% | |
US Government and Agency Mortgage Backed Obligations | | | 16.1% | |
Collateralized Loan Obligations | | | 0.2% | |
Other Assets and Liabilities | | | 0.9% | |
| | | | |
| | | 100.0% | |
| | | | |
| Þ | Value determined using significant unobservable inputs. |
| # | Coupon rate is variable based on the weighted average coupon of the underlying collateral. To the extent the weighted average coupon of the underlying assets which comprise the collateral increases or decreases, the coupon rate of this security will increase or decrease correspondingly. The rate disclosed is as of March 31, 2020. |
| ^ | Security exempt from registration under Rule 144A of the Securities Act of 1933. These securities may be resold in transactions exempt from registration to qualified institutional buyers. |
| @ | Security pays interest at rates that represent residual cashflows available after more senior tranches have been paid. The interest rate disclosed reflects the estimated rate in effect as of March 31, 2020. |
| ß | The interest rate may step up conditioned upon the aggregate remaining principal balance of the underlying mortgage loans being reduced below a targeted percentage of the aggregate original principal balance of the mortgage loans. The interest rate shown is the rate in effect as of March 31, 2020. |
| I/F | Inverse floating rate security whose interest rate moves in the opposite direction of reference interest rates. Reference interest rates are typically based on a negative multiplier or slope. Interest rate may also be subject to a cap or floor. |
| I/O | Interest only security |
| > | This U.S. Agency bond accrues interest which is added to the outstanding principal balance. The interest payment will be deferred until all other tranches in the structure are paid off. The rate disclosed is as of March 31, 2020. |
| ¨ | Seven-day yield as of March 31, 2020 |
| ‡ | All or a portion of this security has been pledged as collateral. |
| D | This mortgage-backed bond accrues interest which is added to the outstanding principal balance. The interest payment will be deferred until all other tranches in the structure are paid off. The rate disclosed is as of March 31, 2020. |
| | | | | | | | | | | | | | | | | | | | | | | | | |
| Futures Contracts | | | | |
| Description | | Long/Short | | Contract Quantity | | Expiration Date | | Notional
Amount• | | Value/Unrealized
Appreciation
(Depreciation) |
MSCI EAFE Index Futures | �� | Long | | | | 66 | | | | | 06/19/2020 | | | | | 5,145,690 | | | | $ | 558,231 | |
CMEE-Mini Standard & Poor’s 500 Index Future | | Long | | | | 31 | | | | | 06/19/2020 | | | | | 3,983,035 | | | | | 240,263 | |
CBOT 5 Year US Treasury Note Future | | Long | | | | 42 | | | | | 06/30/2020 | | | | | 5,265,094 | | | | | 193,177 | |
CME Japanese Yen Currency Future | | Long | | | | 33 | | | | | 06/15/2020 | | | | | 3,844,294 | | | | | 5,041 | |
| | | | | | | | | | | | | | | | | | | | | | |
| | | | | | | | | | | | | | | | | | | | $ | 996,712 | |
| | | | | | | | | | | | | | | | | | | | | | |
| • | Notional Amount is determined based on the number of contracts multiplied by the contract size and the quoted daily settlement price in US dollars. |
| | | | | | | | | | | | | | | | | | | | | | | | | | | | | | | | | | | |
| | | | | | | |
| Swap Agreements | | | | | | | | | | | | | | |
| | | | | | | |
| Excess Return Swaps | | | | | | | | | | | | | | |
| Reference Entity | | Counterparty | | Long/Short | | Financing
Rate | | Payment
Frequency | | Termination
Date | | Notional
Amount | | Value/Unrealized
Appreciation
(Depreciation) |
Shiller Barclays CAPE® US Sector ER II USD Index ¤ | | Barclays Capital, Inc. | | | | Long | | | | | 0.40 | % | | | | Termination | | | | | 07/31/2020 | | | | | 10,500,000 | | | | $ | (1,657,056 | ) |
Short Commodity Basket Swap | | Morgan Stanley | | | | Short | | | | | (0.22 | )% | | | | Termination | | | | | 04/02/2020 | | | | | (2,160,000 | ) | | | | 106,833 | |
Long Commodity Basket Swap | | Morgan Stanley | | | | Long | | | | | 0.19 | % | | | | Termination | | | | | 04/02/2020 | | | | | 2,160,000 | | | | | (59,514 | ) |
| | | | | | | | | | | | | | | | | | | | | | | | | | | | | | | | |
| | | | | | | | | | | | | | | | | | | | | | | | | | | | | | $ | (1,609,737 | ) |
| | | | | | | | | | | | | | | | | | | | | | | | | | | | | | | | |
| ¤ | Shiller Barclays CAPE® US Sector ER II USD Index aims to provide notional long exposure to the top four United States equity sectors that are relatively undervalued, as defined by a modified version of the classic CAPE® Ratio (the “Relative CAPE® Indicator”) and that possess relatively strong price momentum over the prior twelve months. Each U.S. equity sector is represented by an index of equity securities of companies in the relevant sector. Information on the sector constituents as of March 31, 2020, is available on the Barclays Capital, Inc. website at https://indices.barclays/IM/12/en/indices/details.app;ticker=BXIICS2E. |
| Long Commodity Basket Swap represents a swap on a basket of commoditysub-indices of the Morgan Stanley index. At March 31, 2020, all constituents and their weightings were as follows: |
| | | | | | | | | | | | | | | | | | | | |
| Sub-Index | | Ticker | | Contract Value d | | Value of Index | | Weightings |
Morgan Stanley Copper Roll | | | | MSCYLP0 | | | | | 0.14 | | | | $ | 52 | | | | | 17.7 | % |
Morgan Stanley Wheat Roll | | | | MSCYWH0 | | | | | 0.18 | | | | | 51 | | | | | 17.1 | % |
Morgan Stanley Silver Roll | | | | MSCYSI0 | | | | | 0.12 | | | | | 49 | | | | | 16.5 | % |
Morgan Stanley Gold Roll | | | | MSCYGC0 | | | | | 0.08 | | | | | 49 | | | | | 16.5 | % |
Morgan Stanley Coffee (Arabica) Roll | | | | MSCYKC0 | | | | | 0.24 | | | | | 48 | | | | | 16.4 | % |
Morgan Stanley Sugar Roll | | | | MSCYSB0 | | | | | 0.19 | | | | | 46 | | | | | 15.8 | % |
| | | | | | | | | | | | | | | |
| | | | | | | | | | | | | $ | 295 | | | | | 100.0 | % |
| | | | | | | | | | | | | | | |
| | | | | | |
| The accompanying notes are an integral part of these financial statements. | | Annual Report | | March 31, 2020 | | 37 |
| | |
| Schedule of Investments DoubleLine Multi-Asset Growth Fund (Consolidated) (Cont.) | | March 31, 2020 |
| Short Commodity Basket Swap represents a swap on a basket of commoditysub-indices of the Morgan Stanley index. At March 31, 2020, all constituents and their weightings were as follows: |
| | | | | | | | | | | | | | | | | | | | |
| Sub-Index | | Ticker | | Contract Value d | | Value of Index | | Weightings |
Morgan Stanley RBOB Roll | | | | MSCYXB0 | | | | | 0.41 | | | | $ | 63 | | | | | 17.4 | % |
Morgan Stanley Natural Gas Roll | | | | MSCYNG0 | | | | | 0.59 | | | | | 61 | | | | | 17.0 | % |
Morgan Stanley Gasoil Roll | | | | MSCYQS0 | | | | | 0.26 | | | | | 61 | | | | | 16.9 | % |
Morgan Stanley Heating Oil Roll | | | | MSCYHO0 | | | | | 0.27 | | | | | 60 | | | | | 16.7 | % |
Morgan Stanley Brent Oil Roll | | | | MSCYCO0 | | | | | 0.33 | | | | | 58 | | | | | 16.1 | % |
Morgan Stanley Crude Oil Roll | | | | MSCYCL0 | | | | | 0.56 | | | | | 57 | | | | | 15.9 | % |
| | | | | | | | | | | | | | | |
| | | | | | | | | | | | | $ | 360 | | | | | 100.0 | % |
| | | | | | | | | | | | | | | |
| d | Contract value represents the number of units of the underlying constituent’s index in one unit of the custom basket index at creation. The contract value is calculated by multiplying each constituent’s weight by the starting price of the custom basket index and dividing by the starting price of the constituent’s index. The contract value will differ depending on the date the swap is initiated. |
A summary of the DoubleLine Multi-Asset Growth Fund’s (Consolidated) investments in affiliated mutual funds for the year ended March 31, 2020 is as follows:
| | | | | | | | | | | | | | | | | | | | | | | | | | | | | | | | | | | | | | | | |
| Fund | | Value at
March 31,
2019 | | Gross
Purchases | | Gross
Sales | | Shares Held at
March 31,
2020 | | Value at
March 31,
2020 | | Change in
Unrealized for the
Year Ended
March 31,
2020 | | Dividend Income
Earned in the
Year Ended
March 31,
2020 | | Net Realized
Gain (Loss) in
the Year Ended
March 31,
2020 |
DoubleLine Total Return Bond Fund (Class I) | | | $ | 34,759,366 | | | | $ | — | | | | $ | (33,284,000 | ) | | | | 212,202 | | | | $ | 2,219,628 | | | | $ | 2,018,105 | | | | $ | 680,639 | | | | $ | (1,273,843 | ) |
DoubleLine Flexible Income Fund (Class I) | | | | 9,756,624 | | | | | — | | | | | (7,524,500 | ) | | | | 234,527 | | | | | 1,970,026 | | | | | (90,034 | ) | | | | 269,765 | | | | | (172,064 | ) |
DoubleLine Low Duration Bond Fund (Class I) | | | | 9,630,203 | | | | | — | | | | | (7,420,000 | ) | | | | 227,248 | | | | | 2,161,127 | | | | | (34,860 | ) | | | | 191,229 | | | | | (14,216 | ) |
DoubleLine Core Fixed Income Fund (Class I) | | | | 9,552,886 | | | | | — | | | | | (7,553,500 | ) | | | | 204,751 | | | | | 2,174,460 | | | | | 6,689 | | | | | 204,765 | | | | | 168,385 | |
| | | | | |
| | | $ | 63,699,079 | | | | $ | — | | | | $ | (55,782,000 | ) | | | | 878,728 | | | | $ | 8,525,241 | | | | $ | 1,899,900 | | | | $ | 1,346,398 | | | | $ | (1,291,738 | ) |
| | | | | |
| | | | | | |
| 38 | | DoubleLine Funds Trust | | | | The accompanying notes are an integral part of these financial statements. |
| | |
| Schedule of Investments DoubleLine Low Duration Bond Fund | | March 31, 2020 |
| | | | | | | | | | | | | | | | |
PRINCIPAL
AMOUNT $ | | | SECURITY DESCRIPTION | | RATE | | | MATURITY | | | VALUE $ | |
| | ASSET BACKED OBLIGATIONS 8.3% | |
| |
| | | | AASET Ltd., | |
| | 10,607,858 | | | Series 2019-2-A | | | 3.38% | ^ | | | 10/16/2039 | | | | 7,599,809 | |
| |
| | | | AccessLex Institute, | |
| | 5,917,864 | | | Series 2004-2-A3 (3 Month LIBOR USD + 0.19%, 0.19% Floor) | | | 1.98% | | | | 10/25/2024 | | | | 5,756,353 | |
| | 5,891,374 | | | Series 2007-A-B (3 Month LIBOR USD + 0.55%, 0.55% Floor) | | | 2.23% | | | | 02/25/2037 | | | | 5,270,959 | |
| |
| | | | Arivo Acceptance Auto Loan Receivables Trust, | |
| | 7,348,869 | | | Series2019-1-A | | | 2.99% | ^ | | | 07/15/2024 | | | | 7,218,167 | |
| |
| | | | Avant Loans Funding Trust, | |
| | 1,203,365 | | | Series2017-B-C | | | 4.99% | ^ | | | 11/15/2023 | | | | 1,201,625 | |
| | 5,279,089 | | | Series2019-A-A | | | 3.48% | ^ | | | 07/15/2022 | | | | 5,140,240 | |
| | 9,893,571 | | | Series2019-B-A | | | 2.72% | ^ | | | 10/15/2026 | | | | 9,639,563 | |
| | | | |
| | | | CLUB Credit Trust, | | | | | | | | | | | | |
| | 4,179,304 | | | Series 2018-2-PT | | | 6.24% | #^ | | | 02/15/2041 | | | | 3,869,721 | |
| |
| | | | Commonbond Student Loan Trust, | |
| | 3,413,903 | | | Series 2017-BGS-A1 | | | 2.68% | ^ | | | 09/25/2042 | | | | 3,473,103 | |
| |
| | | | Consumer Loan Underlying Bond Credit Trust, | |
| | 2,220,485 | | | Series2018-P1-A | | | 3.39% | ^ | | | 07/15/2025 | | | | 2,202,388 | |
| | 3,989,710 | | | Series2018-P2-A | | | 3.47% | ^ | | | 10/15/2025 | | | | 3,938,577 | |
| | 11,440,815 | | | Series2019-P2-A | | | 2.47% | ^ | | | 10/15/2026 | | | | 10,797,256 | |
| |
| | | | Credit Acceptance Auto Loan Trust, | |
| | 3,066,552 | | | Series 2017-2A-A | | | 2.55% | ^ | | | 02/17/2026 | | | | 3,055,819 | |
| |
| | | | DRB Prime Student Loan Trust, | |
| | 9,607,043 | | | Series2015-D-A2 | | | 3.20% | ^ | | | 01/25/2040 | | | | 9,763,057 | |
| | 3,265,834 | | | Series2016-R-A1 (1 Month LIBOR USD + 1.90%) | | | 2.85% | ^ | | | 10/25/2044 | | | | 3,245,884 | |
| | 5,028,584 | | | Series2016-R-A2 | | | 3.07% | ^ | | | 10/25/2044 | | | | 5,104,773 | |
| |
| | | | Earnest Student Loan Program, | |
| | 2,739,561 | | | Series 2016-A-A2 | | | 2.50% | ^ | | | 04/25/2033 | | | | 2,743,799 | |
| | 5,778,617 | | | Series 2017-A-A2 | | | 2.65% | ^ | | | 01/25/2041 | | | | 5,774,923 | |
| |
| | | | Flagship Credit Auto Trust, | |
| | 455,862 | | | Series2017-1-B | | | 2.83% | ^ | | | 03/15/2023 | | | | 455,561 | |
| |
| | | | Foundation Finance Trust, | |
| | 7,172,381 | | | Series2019-1A-A | | | 3.86% | ^ | | | 11/15/2034 | | | | 6,866,884 | |
| |
| | | | Freed Trust, | |
| | 4,225,840 | | | Series 2019-1-A | | | 3.42% | ^ | | | 06/18/2026 | | | | 4,152,840 | |
| | 13,742,371 | | | Series 2020-FP1-A | | | 2.52% | ^ | | | 03/18/2027 | | | | 13,083,995 | |
| |
| | | | GLS Auto Receivables Issuer Trust, | |
| | 3,596,981 | | | Series 2019-1A-A | | | 3.37% | ^ | | | 01/17/2023 | | | | 3,585,385 | |
| | 8,663,856 | | | Series 2019-2A-A | | | 3.06% | ^ | | | 04/17/2023 | | | | 8,480,851 | |
| |
| | | | Hilton Grand Vacations Trust, | |
| | 2,862,689 | | | Series2018-AA-A | | | 3.54% | ^ | | | 02/25/2032 | | | | 2,868,981 | |
| |
| | | | Jimmy Johns Funding LLC, | |
| | 4,729,725 | | | Series2017-1A-A2I | | | 3.61% | ^ | | | 07/30/2047 | | | | 4,717,442 | |
| |
| | | | Kabbage Funding LLC, | |
| | 15,750,000 | | | Series2019-1-A | | | 3.83% | ^ | | | 03/15/2024 | | | | 15,350,671 | |
| |
| | | | Laurel Road Prime Student Loan Trust, | |
| | 9,877,657 | | | Series2019-A-A1FX | | | 2.34% | ^ | | | 10/25/2048 | | | | 9,873,047 | |
| |
| | | | LendingClub Receivables Trust, | |
| | 18,651,061 | | | Series2020-3-A | | | 3.50% | ^ | | | 01/16/2046 | | | | 18,156,062 | |
| | 15,000,000 | | | Series2020-5A-A | | | 3.50% | ^ | | | 03/15/2046 | | | | 13,681,425 | |
| |
| | | | Lendingpoint Asset Securitization Trust, | |
| | 13,921,793 | | | Series2019-2-A | | | 3.07% | ^ | | | 11/10/2025 | | | | 13,442,349 | |
| | 12,944,612 | | | Series2020-1-A | | | 2.51% | ^ | | | 02/10/2026 | | | | 12,211,315 | |
| |
| | | | Marlette Funding Trust, | |
| | 2,584,578 | | | Series2018-3A-A | | | 3.20% | ^ | | | 09/15/2028 | | | | 2,568,160 | |
| | 4,264,917 | | | Series2019-1A-A | | | 3.44% | ^ | | | 04/16/2029 | | | | 4,124,700 | |
| | 9,067,455 | | | Series2019-2A-A | | | 3.13% | ^ | | | 07/16/2029 | | | | 8,717,786 | |
| | 9,266,070 | | | Series2019-3A-A | | | 2.69% | ^ | | | 09/17/2029 | | | | 8,978,233 | |
| | 10,842,962 | | | Series2019-4A-A | | | 2.39% | ^ | | | 12/17/2029 | | | | 10,476,771 | |
| | | | | | | | | | | | | | | | |
PRINCIPAL
AMOUNT $ | | | SECURITY DESCRIPTION | | RATE | | | MATURITY | | | VALUE $ | |
| |
| | | | Navient Private Education Refinance Loan Trust, | |
| | 4,017,161 | | | Series2019-CA-A1 | | | 2.82% | ^ | | | 02/15/2068 | | | | 4,024,006 | |
| |
| | | | NP SPE II LLC, | |
| | 17,727,673 | | | Series 2019-2A-A1 | | | 2.86% | ^ | | | 11/19/2049 | | | | 17,677,431 | |
| |
| | | | NP SPE LLC, | |
| | 6,941,770 | | | Series 2019-1A-A1 | | | 2.57% | ^ | | | 09/20/2049 | | | | 6,663,847 | |
| |
| | | | OneMain Financial Issuance Trust, | |
| | 13,007,759 | | | Series 2017-1A-A1 | | | 2.37% | ^ | | | 09/14/2032 | | | | 12,797,414 | |
| |
| | | | Oxford Finance Funding LLC, | |
| | 18,000,000 | | | Series2020-1A-A2 | | | 3.10% | ^ | | | 02/15/2028 | | | | 17,381,502 | |
| |
| | | | Pagaya AI Debt Selection Trust, | |
| | 12,547,790 | | | Series2019-3-A | | | 3.82% | ^ | | | 11/16/2026 | | | | 11,688,781 | |
| |
| | | | Prosper Marketplace Issuance Trust, | |
| | 956,689 | | | Series 2018-2A-A | | | 3.35% | ^ | | | 10/15/2024 | | | | 951,071 | |
| | 3,238,492 | | | Series 2019-1A-A | | | 3.54% | ^ | | | 04/15/2025 | | | | 3,206,440 | |
| | 1,887,921 | | | Series 2019-2A-A | | | 3.20% | ^ | | | 09/15/2025 | | | | 1,842,969 | |
| | 15,202,209 | | | Series 2019-4A-A | | | 2.48% | ^ | | | 02/17/2026 | | | | 14,468,359 | |
| |
| | | | SCF Equipment Leasing LLC, | |
| | 1,402,341 | | | Series2017-1A-A | | | 3.77% | ^ | | | 01/20/2023 | | | | 1,406,199 | |
| | 3,895,589 | | | Series2017-2A-A | | | 3.41% | ^ | | | 12/20/2023 | | | | 3,875,419 | |
| |
| | | | Sierra Timeshare Receivables Funding LLC, | |
| | 3,220,411 | | | Series2016-2A-A | | | 2.33% | ^ | | | 07/20/2033 | | | | 3,182,945 | |
| |
| | | | SLM Private Credit Student Loan Trust, | |
| | 9,986,536 | | | Series2006-A-A5 (3 Month LIBOR USD + 0.29%, 0.29% Floor) | | | 1.03% | | | | 06/15/2039 | | | | 9,641,090 | |
| | 5,969,881 | | | Series2006-B-A5 (3 Month LIBOR USD + 0.27%, 0.27% Floor) | | | 1.01% | | | | 12/15/2039 | | | | 5,708,332 | |
| |
| | | | Small Business Lending Trust, | |
| | 32,956,963 | | | Series2020-A-A | | | 2.62% | ^ | | | 12/15/2026 | | | | 32,172,445 | |
| |
| | | | SoFi Consumer Loan Program LLC, | |
| | 261,740 | | | Series 2016-1-A | | | 3.26% | ^ | | | 08/25/2025 | | | | 253,542 | |
| | 472,675 | | | Series 2016-3-A | | | 3.05% | ^ | | | 12/26/2025 | | | | 468,316 | |
| |
| | | | SoFi Consumer Loan Program Trust, | |
| | 486,779 | | | Series 2016-2-A | | | 3.09% | ^ | | | 10/27/2025 | | | | 478,395 | |
| | 1,604,419 | | | Series 2017-1-A | | | 3.28% | ^ | | | 01/26/2026 | | | | 1,576,684 | |
| | 1,199,789 | | | Series 2017-2-A | | | 3.28% | ^ | | | 02/25/2026 | | | | 1,195,544 | |
| | 1,773,605 | | | Series 2017-3-A | | | 2.77% | ^ | | | 05/25/2026 | | | | 1,761,135 | |
| | 2,689,517 | | | Series2017-5-A2 | | | 2.78% | ^ | | | 09/25/2026 | | | | 2,548,297 | |
| | 4,434,307 | | | Series2019-1-A | | | 3.24% | ^ | | | 02/25/2028 | | | | 4,303,710 | |
| | 2,186,156 | | | Series2019-2-A | | | 3.01% | ^ | | | 04/25/2028 | | | | 2,123,362 | |
| | 9,645,272 | | | Series2019-F-PT1 | | | 1.87% | #^ | | | 02/15/2045 | | | | 9,575,502 | |
| |
| | | | SoFi Professional Loan Program, | |
| | 4,246,572 | | | Series2015-C-A2 | | | 2.51% | ^ | | | 08/25/2033 | | | | 4,289,774 | |
| | 2,588,705 | | | Series2016-A-A2 | | | 2.76% | ^ | | | 12/26/2036 | | | | 2,617,005 | |
| | 3,664,034 | | | Series2017-A-A2B | | | 2.40% | ^ | | | 03/26/2040 | | | | 3,587,229 | |
| | 2,478,607 | | | Series2019-A-A1FX | | | 3.18% | ^ | | | 06/15/2048 | | | | 2,478,159 | |
| | 18,446,787 | | | Series2019-C-A1FX | | | 2.13% | ^ | | | 11/16/2048 | | | | 18,430,069 | |
| |
| | | | SoFi Professional Loan ProgramTrust, | |
| | 1,900,282 | | | Series2018-D-A1FX | | | 3.12% | ^ | | | 02/25/2048 | | | | 1,910,466 | |
| |
| | | | Springleaf Funding Trust, | |
| | 1,725,726 | | | Series2016-AA-A | | | 2.90% | ^ | | | 11/15/2029 | | | | 1,711,662 | |
| | 25,000,000 | | | Series2017-AA-A | | | 2.68% | ^ | | | 07/15/2030 | | | | 24,002,940 | |
| |
| | | | Spruce Asset Backed Securities Trust, | |
| | 172,415 | | | Series2016-E1-A | | | 4.32% | ^ | | | 06/15/2028 | | | | 170,102 | |
| |
| | | | TAL Advantage LLC, | |
| | 1,228,333 | | | Series2013-2A-A | | | 3.55% | ^ | | | 11/20/2038 | | | | 1,193,579 | |
| |
| | | | Tesla Auto Lease Trust, | |
| | 5,000,000 | | | Series2019-A-C | | | 2.68% | ^ | | | 01/20/2023 | | | | 4,846,924 | |
| |
| | | | Triton Container Finance LLC, | |
| | 7,037,155 | | | Series2017-2A-A | | | 3.62% | ^ | | | 08/20/2042 | | | | 6,155,410 | |
| |
| | | | Upgrade Master Pass-Thru Trust, | |
| | 3,579,147 | | | Series2019-ST1-A | | | 4.00% | ^ | | | 07/15/2025 | | | | 3,516,333 | |
| | | | | | |
| The accompanying notes are an integral part of these financial statements. | | Annual Report | | March 31, 2020 | | 39 |
| | |
| Schedule of Investments DoubleLine Low Duration Bond Fund (Cont.) | | March 31, 2020 |
| | | | | | | | | | | | | | | | |
PRINCIPAL
AMOUNT $ | | | SECURITY DESCRIPTION | | RATE | | | MATURITY | | | VALUE $ | |
| |
| | | | Upgrade Receivables Trust, | |
| | 218,872 | | | Series2018-1A-A | | | 3.76% | ^ | | | 11/15/2024 | | | | 216,811 | |
| | 3,976,893 | | | Series2019-1A-A | | | 3.48% | ^ | | | 03/15/2025 | | | | 3,946,718 | |
| |
| | | | Upstart Securitization Trust, | |
| | 4,670,000 | | | Series2019-1-B | | | 4.19% | ^ | | | 04/20/2026 | | | | 4,375,487 | |
| | 13,975,843 | | | Series2019-2-A | | | 2.90% | ^ | | | 09/20/2029 | | | | 12,974,824 | |
| | 15,000,000 | | | Series2020-1-A | | | 2.32% | ^ | | | 04/22/2030 | | | | 14,170,618 | |
| |
| | | | Westlake Automobile Receivables Trust, | |
| | 9,191,480 | | | Series2017-2A-C | | | 2.59% | ^ | | | 12/15/2022 | | | | 9,181,824 | |
| | 9,695,225 | | | Series2018-2A-B | | | 3.20% | ^ | | | 01/16/2024 | | | | 9,668,653 | |
| | 4,107,529 | | | Series2019-2A-A2A | | | 2.57% | ^ | | | 02/15/2023 | | | | 4,094,634 | |
| | | | | | | | | | | | | | | | |
| | | | Total Asset Backed Obligations
(Cost $581,399,114) | | | | 562,100,432 | |
| | | | | | | | | | | | | |
| | BANK LOANS 2.3% | |
| |
| | | | 1011778 B.C. Unlimited Liability Company, | |
| | 5,136,135 | | | Senior Secured First Lien Term Loan (1 Month LIBOR USD + 1.75%) | | | 2.67% | | | | 11/19/2026 | | | | 4,763,765 | |
| |
| | | | Axalta Coating Systems Dutch Holding B.B.V., | |
| | 5,022,475 | | | Senior Secured First Lien Term Loan (3 Month LIBOR USD + 1.75%) | | | 3.20% | | | | 05/31/2024 | | | | 4,796,463 | |
| |
| | | | Berry Global, Inc., | |
| | 5,706,829 | | | Senior Secured First Lien Term Loan (1 Month LIBOR USD + 2.00%) | | | 2.86% | | | | 07/01/2026 | | | | 5,454,787 | |
| |
| | | | Charter Communications Operating LLC, | |
| | 5,646,564 | | | Senior Secured First Lien Term Loan (1 Month LIBOR USD + 1.75%) | | | 2.74% | | | | 02/01/2027 | | | | 5,448,934 | |
| |
| | | | CSC Holdings LLC, | |
| | 5,699,240 | | | Senior Secured First Lien Term Loan (1 Month LIBOR USD + 2.25%) | | | 2.86% | | | | 07/17/2025 | | | | 5,480,788 | |
| |
| | | | Dell International LLC, | |
| | 5,561,901 | | | Senior Secured First Lien Term Loan (1 Month LIBOR USD + 2.00%, 0.75% Floor) | | | 2.99% | | | | 09/19/2025 | | | | 5,344,653 | |
| |
| | | | Elanco Animal Health, Inc., | |
| | 1,480,000 | | | Senior Secured First Lien Term Loan | | | 3.55% | ± | | | 02/26/2027 | | | | 1,417,100 | |
| |
| | | | Gardner Denver, Inc., | |
| | 1,035,000 | | | Senior Secured First Lien Term Loan (1 Month LIBOR USD + 1.75%) | | | 2.74% | | | | 03/01/2027 | | | | 979,369 | |
| |
| | | | Generac Power Systems, Inc., | |
| | 249,255 | | | Senior Secured First Lien Term Loan (1 Month LIBOR USD + 1.75%) | | | 2.73% | | | | 12/11/2026 | | | | 239,908 | |
| |
| | | | Go Daddy Operating Company LLC, | |
| | 6,008,910 | | | Senior Secured First Lien Term Loan (1 Month LIBOR USD + 2.00%) | | | 3.35% | | | | 02/15/2024 | | | | 5,783,576 | |
| |
| | | | Gray Television, Inc., | |
| | 3,247,352 | | | Senior Secured First Lien Term Loan (1 Month LIBOR USD + 2.50%) | | | 3.49% | | | | 01/02/2026 | | | | 3,055,758 | |
| |
| | | | Grifols Worldwide Operations USA, Inc., | |
| | 5,231,982 | | | Senior Secured First Lien Term Loan (1 Month LIBOR USD + 2.00%) | | | 2.50% | | | | 11/15/2027 | | | | 4,992,174 | |
| |
| | | | HCA, Inc., | |
| | 6,092,032 | | | Senior Secured First Lien Term Loan (1 Month LIBOR USD + 1.75%) | | | 2.74% | | | | 03/18/2026 | | | | 5,823,983 | |
| | | | | | | | | | | | | | | | |
PRINCIPAL
AMOUNT $ | | | SECURITY DESCRIPTION | | RATE | | | MATURITY | | | VALUE $ | |
| |
| | | | HD Supply, Inc., | |
| | 4,166,080 | | | Senior Secured First Lien Term Loan (1 Month LIBOR USD + 1.75%) | | | 2.74% | | | | 10/17/2023 | | | | 3,930,009 | |
| |
| | | | IAA, Inc., | |
| | 3,526,587 | | | Senior Secured First Lien Term Loan (1 Month LIBOR USD + 2.25%) | | | 3.25% | | | | 06/29/2026 | | | | 3,385,523 | |
| |
| | | | IQVIA, Inc., | |
| | 5,671,515 | | | Senior Secured First Lien Term Loan (2 Month LIBOR USD + 1.75%) | | | 3.20% | | | | 06/09/2025 | | | | 5,473,012 | |
| |
| | | | Iron Mountain Information Management LLC, | |
| | 3,863,919 | | | Senior Secured First Lien Term Loan (1 Month LIBOR USD + 1.75%) | | | 2.74% | | | | 01/02/2026 | | | | 3,690,042 | |
| |
| | | | Jacobs Douwe Egberts International B.V., | |
| | 5,693,297 | | | Senior Secured First Lien Term Loan (1 Month LIBOR USD + 2.00%) | | | 3.00% | | | | 11/03/2025 | | | | 5,380,166 | |
| |
| | | | JBS USA Lux S.A., | |
| | 5,897,957 | | | Senior Secured First Lien Term Loan (1 Month LIBOR USD + 2.50%) | | | 3.07% | | | | 05/01/2026 | | | | 5,565,135 | |
| |
| | | | KAR Auction Services, Inc., | |
| | 2,440,612 | | | Senior Secured First Lien Term Loan (1 Month LIBOR USD + 2.25%) | | | 3.19% | | | | 09/19/2026 | | | | 2,269,769 | |
| |
| | | | KFC Holding Company, | |
| | 5,657,991 | | | Senior Secured First Lien Term Loan (1 Month LIBOR USD + 1.75%) | | | 2.36% | | | | 04/03/2025 | | | | 5,403,382 | |
| |
| | | | Lamar Media Corporation, | |
| | 1,940,438 | | | Senior Secured First Lien Term Loan (1 Month LIBOR USD + 1.50%) | | | 2.48% | | | | 01/29/2027 | | | | 1,867,671 | |
| |
| | | | Level 3 Financing, Inc., | |
| | 3,856,010 | | | Senior Secured First Lien Term Loan (1 Month LIBOR USD + 1.75%) | | | 2.74% | | | | 03/01/2027 | | | | 3,636,700 | |
| |
| | | | Microchip Technology, Inc., | |
| | 5,696,851 | | | Senior Secured First Lien Term Loan (1 Month LIBOR USD + 2.00%) | | | 2.99% | | | | 05/29/2025 | | | | 5,525,945 | |
| |
| | | | Nexstar Broadcasting, Inc., | |
| | 4,087,460 | | | Senior Secured First Lien Term Loan (1 Month LIBOR USD + 2.75%) | | | 3.73% | | | | 09/18/2026 | | | | 3,854,474 | |
| |
| | | | Open Text Corporation, | |
| | 1,960,000 | | | Senior Secured First Lien Term Loan (1 Month LIBOR USD + 1.75%) | | | 3.35% | | | | 05/30/2025 | | | | 1,869,840 | |
| |
| | | | Reynolds Consumer Products LLC, | |
| | 1,180,000 | | | Senior Secured First Lien Term Loan (3 Month LIBOR USD + 1.75%) | | | 3.50% | | | | 02/04/2027 | | | | 1,120,410 | |
| |
| | | | RPI Intermediate Finance Trust, | |
| | 1,619,500 | | | Senior Secured First Lien Term Loan (1 Month LIBOR USD + 1.75%) | | | 2.74% | | | | 02/11/2027 | | | | 1,520,306 | |
| | 1,635,900 | | | Senior Secured First Lien Term Loan (1 Month LIBOR USD + 1.75%) | | | 2.74% | | | | 02/11/2027 | | | | 1,529,566 | |
| |
| | | | Science Applications International Corporation, | |
| | 5,623,813 | | | Senior Secured First Lien Term Loan (1 Month LIBOR USD + 1.75%) | | | 2.86% | | | | 10/31/2025 | | | | 5,311,016 | |
| | | | | | |
| 40 | | DoubleLine Funds Trust | | | | The accompanying notes are an integral part of these financial statements. |
| | | | | | | | | | | | | | | | |
PRINCIPAL
AMOUNT $ | | | SECURITY DESCRIPTION | | RATE | | | MATURITY | | | VALUE $ | |
| |
| | | | ServiceMaster Company LLC, | |
| | 6,114,675 | | | Senior Secured First Lien Term Loan (1 Month LIBOR USD + 1.75%) | | | 2.74% | | | | 11/05/2026 | | | | 5,888,432 | |
| |
| | | | Syneos Health, Inc., | |
| | 5,672,296 | | | Senior Secured First Lien Term Loan (1 Month LIBOR USD + 2.00%) | | | 2.74% | | | | 08/01/2024 | | | | 5,502,128 | |
| |
| | | | Trans Union LLC, | |
| | 6,418,437 | | | Senior Secured First Lien Term Loan (1 Month LIBOR USD + 1.75%) | | | 2.74% | | | | 11/13/2026 | | | | 6,187,373 | |
| |
| | | | Universal Health Services, Inc., | |
| | 4,509,972 | | | Senior Secured First Lien Term Loan (1 Month LIBOR USD + 1.75%) | | | 2.74% | | | | 10/31/2025 | | | | 4,329,573 | |
| |
| | | | US Foods, Inc., | |
| | 6,109,300 | | | Senior Secured First Lien Term Loan (3 Month LIBOR USD + 2.00%, 0.75% Floor) | | | 3.07% | | | | 09/14/2026 | | | | 5,632,775 | |
| |
| | | | Virgin Media Bristol LLC, | |
| | 3,799,969 | | | Senior Secured First Lien Term Loan (1 Month LIBOR USD + 2.50%) | | | 3.20% | | | | 01/31/2028 | | | | 3,543,471 | |
| |
| | | | Vistra Operations Company LLC, | |
| | | | Senior Secured First Lien Term Loan | | | | | | | | | | | | |
| | 1,081,583 | | | (1 Month LIBOR USD + 1.75%) | | | 2.55% | | | | 12/31/2025 | | | | 1,033,588 | |
| | 4,519,571 | | | (1 Month LIBOR USD + 1.75%) | | | 2.74% | | | | 12/31/2025 | | | | 4,319,015 | |
| |
| | | | W.R. Grace & Company, | |
| | 2,102,596 | | | Senior Secured First Lien Term Loan (3 Month LIBOR USD + 1.75%) | | | 3.20% | | | | 04/03/2025 | | | | 1,831,224 | |
| | 3,604,451 | | | Senior Secured First Lien Term Loan (3 Month LIBOR USD + 1.75%) | | | 3.20% | | | | 04/03/2025 | | | | 3,139,242 | |
| | | | | | | | | | | | | | | | |
| | | | Total Bank Loans
(Cost $164,595,468) | | | | 156,321,045 | |
| | | | | | | | | | | | | |
| | COLLATERALIZED LOAN OBLIGATIONS 13.6% | |
| |
| | | | AIMCO, | |
| | 25,000,000 | | | Series2015-AA-AR (3 Month LIBOR USD + 0.85%, 0.85% Floor) | | | 2.68% | ^ | | | 01/15/2028 | | | | 24,542,908 | |
| |
| | | | Assurant Ltd., | |
| | 20,000,000 | | | Series2019-1A-A (3 Month LIBOR USD + 1.35%, 1.35% Floor) | | | 3.17% | ^ | | | 04/20/2030 | | | | 19,013,313 | |
| |
| | | | Atlas Senior Loan Fund Ltd., | |
| | 16,828,394 | | | Series2013-1A-AR (3 Month LIBOR USD + 0.83%) | | | 2.52% | ^ | | | 11/17/2027 | | | | 16,317,776 | |
| |
| | | | Avery Point Ltd., | |
| | 20,000,000 | | | Series2015-6A-AR (3 Month LIBOR USD + 1.05%) | | | 2.79% | ^ | | | 08/05/2027 | | | | 19,570,000 | |
| | 29,500,000 | | | Series2015-7A-AR (3 Month LIBOR USD + 1.14%) | | | 2.97% | ^ | | | 01/15/2028 | | | | 28,526,974 | |
| |
| | | | Babson Ltd., | |
| | 5,987,000 | | | Series2015-2A-AR (3 Month LIBOR USD + 1.19%) | | | 3.01% | ^ | | | 10/20/2030 | | | | 5,747,520 | |
| | | | | | | | | | | | | | | | |
PRINCIPAL
AMOUNT $ | | | SECURITY DESCRIPTION | | RATE | | | MATURITY | | | VALUE $ | |
| |
| | | | Battalion Ltd., | |
| | 44,000,000 | | | Series2014-7A-A1RR (3 Month LIBOR USD + 1.04%) | | | 2.88% | ^ | | | 07/17/2028 | | | | 43,165,805 | |
| |
| | | | CarVal Ltd., | |
| | 42,000,000 | | | Series2019-1A-AN (3 Month LIBOR USD + 1.48%, 1.48% Floor) | | | 3.30% | ^ | | | 04/20/2032 | | | | 38,839,421 | |
| |
| | | | Catamaran Ltd., | |
| | 3,000,000 | | | Series2018-1A-A1 (3 Month LIBOR USD + 1.25%, 1.25% Floor) | | | 3.04% | ^ | | | 10/25/2031 | | | | 2,844,106 | |
| |
| | | | Cathedral Lake Ltd., | |
| | 35,000,000 | | | Series2018-5A-A1 (3 Month LIBOR USD + 1.20%, 1.20% Floor) | | | 3.02% | ^ | | | 10/21/2030 | | | | 31,516,563 | |
| |
| | | | CFIP Ltd., | |
| | 26,500,000 | | | Series2014-1A-AR (3 Month LIBOR USD + 1.32%) | | | 3.17% | ^ | | | 07/13/2029 | | | | 25,463,313 | |
| |
| | | | Crown Point Ltd., | |
| | 20,000,000 | | | Series2018-6A-A1 (3 Month LIBOR USD + 1.17%, 1.17% Floor) | | | 2.99% | ^ | | | 10/20/2028 | | | | 19,300,291 | |
| |
| | | | Dryden Ltd., | |
| | 21,000,000 | | | Series2019-75A-AR (3 Month LIBOR USD + 1.20%, 1.20% Floor) | | | 3.03% | ^ | | | 07/15/2030 | | | | 20,298,078 | |
| |
| | | | Greywolf Ltd., | |
| | 5,585,000 | | | Series2015-1A-A1R (3 Month LIBOR USD + 1.16%, 1.16% Floor) | | | 2.95% | ^ | | | 01/27/2031 | | | | 5,300,939 | |
| | 9,100,000 | | | Series2018-2A-A1 (3 Month LIBOR USD + 1.18%, 1.18% Floor) | | | 3.00% | ^ | | | 10/20/2031 | | | | 8,395,011 | |
| |
| | | | Halcyon Loan Advisors Funding Ltd., | |
| | 86,960 | | | Series2014-1A-A1R (3 Month LIBOR USD + 1.13%) | | | 2.95% | ^ | | | 04/18/2026 | | | | 86,975 | |
| | 8,345,274 | | | Series2014-3A-AR (3 Month LIBOR USD + 1.10%) | | | 2.90% | ^ | | | 10/22/2025 | | | | 8,337,488 | |
| | 21,668,163 | | | Series2015-3A-A1R (3 Month LIBOR USD + 0.90%) | | | 2.72% | ^ | | | 10/18/2027 | | | | 21,374,881 | |
| |
| | | | Harbourview Ltd., | |
| | 9,000,000 | | | Series7RA-A1 (3 Month LIBOR USD + 1.13%, 1.13% Floor) | | | 2.95% | ^ | | | 07/18/2031 | | | | 8,195,506 | |
| |
| | | | Jamestown Ltd., | |
| | 2,148,617 | | | Series2014-4A-A1AR (3 Month LIBOR USD + 0.69%) | | | 2.52% | ^ | | | 07/15/2026 | | | | 2,053,558 | |
| | 10,500,000 | | | Series2018-6RA-A1 (3 Month LIBOR USD + 1.15%, 1.15% Floor) | | | 2.94% | ^ | | | 04/25/2030 | | | | 9,785,894 | |
| |
| | | | Jefferson Mill Ltd., | |
| | 10,000,000 | | | Series2015-1A-AR (3 Month LIBOR USD + 1.18%) | | | 2.99% | ^ | | | 10/20/2031 | | | | 9,482,979 | |
| |
| | | | Kingsland Ltd., | |
| | 22,000,000 | | | Series2018-8A-A (3 Month LIBOR USD + 1.12%, 1.12% Floor) | | | 2.94% | ^ | | | 04/20/2031 | | | | 20,736,287 | |
| |
| | | | LCM LP, | |
| | 35,000,000 | | | Series19A-AR (3 Month LIBOR USD + 1.24%, 1.24% Floor) | | | 3.07% | ^ | | | 07/15/2027 | | | | 34,305,660 | |
| | | | | | |
| The accompanying notes are an integral part of these financial statements. | | Annual Report | | March 31, 2020 | | 41 |
| | |
| Schedule of Investments DoubleLine Low Duration Bond Fund (Cont.) | | March 31, 2020 |
| | | | | | | | | | | | | | | | |
PRINCIPAL
AMOUNT $ | | | SECURITY DESCRIPTION | | RATE | | | MATURITY | | | VALUE $ | |
| |
| | | | Madison Park Funding Ltd., | |
| | 8,750,000 | | | Series2012-10A-AR2 (3 Month LIBOR USD + 1.22%) | | | 3.04% | ^ | | | 01/20/2029 | | | | 8,555,692 | |
| | 26,000,000 | | | Series2013-11A-AR (3 Month LIBOR USD + 1.16%) | | | 2.97% | ^ | | | 07/23/2029 | | | | 25,241,709 | |
| |
| | | | Marathon Ltd., | |
| | 20,423,788 | | | Series2013-5A-A1R (3 Month LIBOR USD + 0.87%) | | | 2.57% | ^ | | | 11/21/2027 | | | | 19,889,049 | |
| | 3,000,000 | | | Series2017-9A-A2 (3 Month LIBOR USD + 1.75%) | | | 3.58% | ^ | | | 04/15/2029 | | | | 2,591,449 | |
| | 24,100,000 | | | Series2018-12A-A1 (3 Month LIBOR USD + 1.18%) | | | 3.00% | ^ | | | 04/18/2031 | | | | 22,190,193 | |
| |
| | | | Marble Point Ltd., | |
| | 13,500,000 | | | Series2018-2A-A1 (3 Month LIBOR USD + 1.33%, 1.33% Floor) | | | 3.15% | ^ | | | 01/20/2032 | | | | 12,633,864 | |
| |
| | | | MP Ltd., | |
| | 35,000,000 | | | Series2013-2A-ARR (3 Month LIBOR USD + 1.28%) | | | 3.07% | ^ | | | 07/25/2029 | | | | 33,870,746 | |
| | 13,000,000 | | | Series2015-1A-ARR (3 Month LIBOR USD + 1.08%) | | | 2.90% | ^ | | | 10/18/2028 | | | | 12,654,011 | |
| | 24,679,739 | | | Series2015-2A-AR (3 Month LIBOR USD + 0.91%) | | | 2.71% | ^ | | | 10/28/2027 | | | | 24,162,782 | |
| |
| | | | Ocean Trails, | |
| | 25,000,000 | | | Series2014-5A-ARR (3 Month LIBOR USD + 1.28%, 1.28% Floor) | | | 3.13% | ^ | | | 10/13/2031 | | | | 22,942,119 | |
| |
| | | | OCP Ltd., | |
| | 16,500,000 | | | Series2014-5A-A1R (3 Month LIBOR USD + 1.08%, 1.08% Floor) | | | 2.87% | ^ | | | 04/26/2031 | | | | 15,602,813 | |
| |
| | | | Palmer Square Loan Funding Ltd., | |
| | 13,153,512 | | | Series2018-5A-A1 (3 Month LIBOR USD + 0.85%, 0.85% Floor) | | | 2.67% | ^ | | | 01/20/2027 | | | | 12,899,922 | |
| |
| | | | Park Avenue Institutional Advisers Ltd., | |
| | 34,000,000 | | | Series2018-1A-A1A (3 Month LIBOR USD + 1.28%, 1.28% Floor) | | | 3.10% | ^ | | | 10/20/2031 | | | | 31,362,842 | |
| |
| | | | Race Point Ltd., | |
| | 25,000,000 | | | Series2015-9A-A1AR (3 Month LIBOR USD + 1.21%) | | | 3.04% | ^ | | | 10/15/2030 | | | | 22,957,880 | |
| |
| | | | Regatta Funding Ltd., | |
| | 12,500,000 | | | Series2018-3A-A (3 Month LIBOR USD + 1.19%) | | | 2.98% | ^ | | | 10/25/2031 | | | | 11,019,030 | |
| |
| | | | Riserva Ltd., | |
| | 10,000,000 | | | Series2016-3A-AR (3 Month LIBOR USD + 1.14%) | | | 2.96% | ^ | | | 10/18/2028 | | | | 9,698,765 | |
| |
| | | | Romark Ltd., | |
| | 22,000,000 | | | Series2018-1A-A1 (3 Month LIBOR USD + 1.03%) | | | 2.85% | ^ | | | 04/20/2031 | | | | 20,185,000 | |
| | | | | | | | | | | | | | | | |
PRINCIPAL
AMOUNT $ | | | SECURITY DESCRIPTION | | RATE | | | MATURITY | | | VALUE $ | |
| |
| | | | Sound Point Ltd., | |
| | 16,000,000 | | | Series2014-2RA-A (3 Month LIBOR USD + 1.25%, 1.25% Floor) | | | 3.07% | ^ | | | 10/20/2031 | | | | 15,216,754 | |
| | 25,000,000 | | | Series2015-1RA-A (3 Month LIBOR USD + 1.36%, 1.36% Floor) | | | 3.19% | ^ | | | 04/15/2030 | | | | 24,131,710 | |
| |
| | | | Steele Creek Ltd., | |
| | 2,365,000 | | | Series2014-1RA-A (3 Month LIBOR USD + 1.07%, 1.07% Floor) | | | 2.89% | ^ | | | 04/21/2031 | | | | 2,206,774 | |
| | 18,000,000 | | | Series2019-2A-A1 (3 Month LIBOR USD + 1.36%, 1.36% Floor) | | | 3.19% | ^ | | | 07/15/2032 | | | | 16,446,090 | |
| |
| | | | TCI-Flatiron Ltd., | |
| | 20,000,000 | | | Series2016-1A-AR (3 Month LIBOR USD + 1.22%, 1.22% Floor) | | | 3.06% | ^ | | | 07/17/2028 | | | | 19,495,890 | |
| |
| | | | Tralee Ltd., | |
| | 44,000,000 | | | Series2019-6A-A1 (3 Month LIBOR USD + 1.45%) | | | 3.24% | ^ | | | 10/25/2032 | | | | 42,920,132 | |
| |
| | | | Trimaran CAVU LLC, | |
| | 10,000,000 | | | Series2019-1A-A1 (3 Month LIBOR USD + 1.46%, 1.46% Floor) | | | 3.28% | ^ | | | 07/20/2032 | | | | 9,631,637 | |
| |
| | | | Vibrant Ltd., | |
| | 22,000,000 | | | Series2015-3A-A1RR (3 Month LIBOR USD + 1.25%) | | | 3.07% | ^ | | | 10/20/2031 | | | | 20,876,531 | |
| |
| | | | Wellfleet Ltd., | |
| | 24,700,000 | | | Series2016-1A-AR (3 Month LIBOR USD + 0.91%) | | | 2.73% | ^ | | | 04/20/2028 | | | | 24,182,602 | |
| |
| | | | WhiteHorse Ltd., | |
| | 1,955,587 | | | Series2014-1A-AR (3 Month LIBOR USD + 0.90%) | | | 2.66% | ^ | | | 05/01/2026 | | | | 1,953,948 | |
| |
| | | | Zais Ltd., | |
| | 1,382,936 | | | Series2014-2A-A1AR (3 Month LIBOR USD + 1.20%) | | | 2.99% | ^ | | | 07/25/2026 | | | | 1,381,617 | |
| | 13,000,000 | | | Series2016-2A-A1 (3 Month LIBOR USD + 1.53%) | | | 3.36% | ^ | | | 10/15/2028 | | | | 12,660,267 | |
| | | | | | | | | | | | | | | | |
| | | | Total Collateralized Loan Obligations
(Cost $966,714,025) | | | | 922,763,064 | |
| | | | | | | | | | | | | |
| | FOREIGN CORPORATE BONDS 14.4% | |
| | 13,200,000 | | | Adani Ports & Special Economic Zone Ltd. | | | 3.95% | | | | 01/19/2022 | | | | 12,209,736 | |
| | 3,200,000 | | | Adani Ports & Special Economic Zone Ltd. | | | 3.38% | | | | 07/24/2024 | | | | 2,753,120 | |
| | 5,906,000 | | | AerCap Global Aviation Trust | | | 4.63% | | | | 10/30/2020 | | | | 5,729,668 | |
| | 1,370,000 | | | AES Dominicana | | | 7.95% | | | | 05/11/2026 | | | | 1,283,005 | |
| | 884,000 | | | AES Gener S.A. | | | 5.00% | | | | 07/14/2025 | | | | 821,503 | |
| | 3,500,000 | | | AES Gener S.A. (5 Year Swap Rate USD + 4.64%) | | | 7.13% | ^ | | | 03/26/2079 | | | | 2,758,444 | |
| | 5,926,000 | | | AES Gener S.A. (5 Year Swap Rate USD + 4.64%) | | | 7.13% | | | | 03/26/2079 | | | | 4,670,440 | |
| | 5,570,000 | | | ANZ New Zealand International Ltd. | | | 1.90% | ^ | | | 02/13/2023 | | | | 5,610,999 | |
| | 600,000 | | | AstraZeneca PLC | | | 2.38% | | | | 06/12/2022 | | | | 604,940 | |
| | 735,000 | | | AstraZeneca PLC | | | 3.50% | | | | 08/17/2023 | | | | 771,940 | |
| | 6,115,000 | | | Avolon Holdings Funding Ltd. | | | 3.63% | ^ | | | 05/01/2022 | | | | 5,427,320 | |
| | | | | | |
| 42 | | DoubleLine Funds Trust | | | | The accompanying notes are an integral part of these financial statements. |
| | | | | | | | | | | | | | | | |
PRINCIPAL
AMOUNT $ | | | SECURITY DESCRIPTION | | RATE | | | MATURITY | | | VALUE $ | |
| | 29,000,000 | | | Axiata SPV2 BHD | | | 3.47% | | | | 11/19/2020 | | | | 29,049,736 | |
| | 17,805,000 | | | Banco Bradesco S.A. | | | 5.90% | | | | 01/16/2021 | | | | 17,969,696 | |
| | 7,200,000 | | | Banco Bradesco S.A. | | | 2.85% | ^ | | | 01/27/2023 | | | | 6,816,672 | |
| | 2,500,000 | | | Banco BTG Pactual S.A. (5 Year CMT Rate + 5.26%) | | | 7.75% | ^ | | | 02/15/2029 | | | | 2,150,000 | |
| | 3,600,000 | | | Banco de Reservas de la Republica Dominicana | | | 7.00% | | | | 02/01/2023 | | | | 3,447,000 | |
| | 8,500,000 | | | Banco del Estado de Chile | | | 3.88% | | | | 02/08/2022 | | | | 8,463,991 | |
| | 12,785,000 | | | Banco do Brasil S.A. (10 Year CMT Rate + 7.78%) | | | 8.50% | † | | | 10/20/2020 | | | | 12,820,862 | |
| | 4,350,000 | | | Banco Internacional del Peru S.A.A. | | | 3.38% | | | | 01/18/2023 | | | | 4,148,791 | |
| | 2,000,000 | | | Banco International del Peru S.A.A. (3 Month LIBOR USD + 6.74%) | | | 8.50% | | | | 04/23/2070 | | | | 1,960,000 | |
| | 8,000,000 | | | Banco Latinoamericano do Comercio Exterior S.A. | | | 3.25% | | | | 05/07/2020 | | | | 7,970,000 | |
| | 20,200,000 | | | Banco Mercantil del Norte S.A. (5 Year CMT Rate + 5.04%) | | | 6.88% | † | | | 07/06/2022 | | | | 16,267,161 | |
| | 23,500,000 | | | Banco Nacional de Comercio Exterior S.N.C. (5 Year CMT Rate + 3.00%) | | | 3.80% | | | | 08/11/2026 | | | | 21,427,359 | |
| | 5,595,000 | | | Banco Santander | | | 4.13% | | | | 11/09/2022 | | | | 5,466,315 | |
| | 2,000,000 | | | Banco Santander (5 Year CMT Rate + 3.00%) | | | 5.95% | ^ | | | 10/01/2028 | | | | 1,862,915 | |
| | 3,094,000 | | | Banco Santander Chile | | | 2.50% | | | | 12/15/2020 | | | | 3,097,713 | |
| | 9,490,000 | | | Bangkok Bank PCL | | | 4.80% | | | | 10/18/2020 | | | | 9,639,949 | |
| | 5,683,000 | | | Bangkok Bank PCL | | | 3.88% | | | | 09/27/2022 | | | | 5,929,978 | |
| | 2,400,000 | | | Banistmo S.A. | | | 3.65% | ^ | | | 09/19/2022 | | | | 2,223,754 | |
| | 19,020,000 | | | Banistmo S.A. | | | 3.65% | | | | 09/19/2022 | | | | 17,623,247 | |
| | 5,500,000 | | | Bank of the Philippine Islands | | | 2.50% | | | | 09/10/2024 | | | | 5,288,680 | |
| | 12,618,000 | | | Barclays Bank PLC | | | 2.65% | | | | 01/11/2021 | | | | 12,584,736 | |
| | 10,000,000 | | | BBVA Banco Continental S.A. | | | 5.00% | | | | 08/26/2022 | | | | 9,984,460 | |
| | 6,700,000 | | | BBVA Bancomer S.A. | | | 7.25% | | | | 04/22/2020 | | | | 6,673,736 | |
| | 9,560,000 | | | BBVA Bancomer S.A. | | | 6.50% | | | | 03/10/2021 | | | | 9,629,406 | |
| | 5,200,000 | | | BBVA Bancomer S.A. | | | 6.75% | | | | 09/30/2022 | | | | 5,188,768 | |
| | 4,071,000 | | | BBVA Bancomer S.A. (5 Year CMT Rate + 3.00%) | | | 5.35% | | | | 11/12/2029 | | | | 3,739,387 | |
| | 8,500,000 | | | BDO Unibank, Inc. | | | 2.63% | | | | 10/24/2021 | | | | 8,479,000 | |
| | 2,105,000 | | | BDO Unibank, Inc. | | | 2.95% | | | | 03/06/2023 | | | | 2,089,212 | |
| | 4,440,000 | | | BPCE S.A. | | | 2.38% | ^ | | | 01/14/2025 | | | | 4,131,368 | |
| | 4,250,000 | | | Brasil Bolsa Balcao S.A. | | | 5.50% | | | | 07/16/2020 | | | | 4,225,605 | |
| | 12,500,000 | | | C&W Senior Financing DAC | | | 7.50% | | | | 10/15/2026 | | | | 11,537,906 | |
| | 13,900,000 | | | Cemex S.A.B. de C.V. | | | 6.13% | | | | 05/05/2025 | | | | 12,423,056 | |
| | 3,750,000 | | | Cemex S.A.B. de C.V. | | | 7.75% | | | | 04/16/2026 | | | | 3,377,100 | |
| | 15,204,000 | | | CNAC HK Finbridge Company Ltd., | | | 3.50% | | | | 07/19/2022 | | | | 15,112,946 | |
| | 8,200,000 | | | CNOOC Finance Ltd. | | | 2.63% | | | | 05/05/2020 | | | | 8,203,116 | |
| | 15,550,000 | �� | | CNOOC Finance Ltd. | | | 3.88% | | | | 05/02/2022 | | | | 16,048,847 | |
| | 7,491,000 | | | CNPC General Capital Ltd. | | | 3.95% | | | | 04/19/2022 | | | | 7,752,111 | |
| | 5,729,000 | | | CNPC Overseas Capital Ltd. | | | 4.50% | | | | 04/28/2021 | | | | 5,934,181 | |
| | 1,500,000 | | | Colbun S.A. | | | 4.50% | | | | 07/10/2024 | | | | 1,534,225 | |
| | 3,514,000 | | | Colombia Telecomunicaciones S.A. | | | 5.38% | | | | 09/27/2022 | | | | 3,379,625 | |
| | 5,915,000 | | | Comcel Trust | | | 6.88% | | | | 02/06/2024 | | | | 5,774,607 | |
| | 3,670,000 | | | Commonwealth Bank of Australia | | | 2.05% | ^ | | | 09/18/2020 | | | | 3,632,189 | |
| | 3,275,000 | | | Commonwealth Bank of Australia | | | 2.75% | ^ | | | 03/10/2022 | | | | 3,287,074 | |
| | | | | | | | | | | | | | | | |
��
PRINCIPAL
AMOUNT $ | | | SECURITY DESCRIPTION | | RATE | | | MATURITY | | | VALUE $ | |
| | 900,000 | | | Corp Nacional del Cobre de Chile | | | 3.88% | | | | 11/03/2021 | | | | 916,681 | |
| | 6,125,000 | | | Credit Suisse Group AG (3 Month LIBOR USD + 1.24%) | | | 2.02% | ^ | | | 06/12/2024 | | | | 5,414,329 | |
| | 212,000 | | | DBS Group Holdings Ltd. | | | 2.85% | ^ | | | 04/16/2022 | | | | 217,781 | |
| | 4,188,000 | | | DBS Group Holdings Ltd. | | | 2.85% | | | | 04/16/2022 | | | | 4,302,212 | |
| | 1,500,000 | | | DBS Group Holdings Ltd. (3 Month LIBOR USD + 0.62%) | | | 2.41% | | | | 07/25/2022 | | | | 1,496,564 | |
| | 2,000,000 | | | DBS Group Holdings Ltd. (5 Year Mid Swap Rate USD + 1.59%) | | | 4.52% | | | | 12/11/2028 | | | | 2,081,819 | |
| | 20,027,000 | | | DBS Group Holdings Ltd. (5 Year Swap Rate USD + 2.39%) | | | 3.60% | † | | | 09/07/2021 | | | | 18,565,229 | |
| | 6,320,000 | | | Delek & Avner Tamar Bond Ltd. | | | 4.44% | ^ | | | 12/30/2020 | | | | 6,285,189 | |
| | 3,400,000 | | | Digicel Group Ltd. | | | 8.25% | ^ | | | 09/30/2022 | | | | 595,000 | |
| | 660,800 | | | Empresa Electrica Angamos S.A. | | | 4.88% | | | | 05/25/2029 | | | | 636,709 | |
| | 1,000,000 | | | Empresa Electrica Guacolda S.A. | | | 4.56% | | | | 04/30/2025 | | | | 710,585 | |
| | 13,561,821 | | | ENA Norte Trust | | | 4.95% | | | | 04/25/2023 | | | | 13,544,936 | |
| | 3,200,000 | | | Export Import Bank of Thailand (3 Month LIBOR USD + 0.90%) | | | 2.59% | | | | 11/20/2023 | | | | 3,177,104 | |
| | 10,000,000 | | | Export-Import Bank of India | | | 3.13% | | | | 07/20/2021 | | | | 10,128,700 | |
| | 150,000 | | | Fondo Mivivienda S.A. | | | 3.50% | | | | 01/31/2023 | | | | 142,726 | |
| | 6,500,000 | | | Freeport-McMoRan, Inc. | | | 3.55% | | | | 03/01/2022 | | | | 6,270,290 | |
| | 11,200,000 | | | Freeport-McMoRan, Inc. | | | 4.55% | | | | 11/14/2024 | | | | 10,646,776 | |
| | 864,000 | | | GlaxoSmithKline Capital PLC | | | 3.13% | | | | 05/14/2021 | | | | 876,022 | |
| | 10,670,000 | | | GlaxoSmithKline Capital PLC | | | 2.88% | | | | 06/01/2022 | | | | 10,926,557 | |
| | 9,620,000 | | | Global Bank Corporation | | | 4.50% | | | | 10/20/2021 | | | | 9,427,600 | |
| | 1,900,000 | | | Global Bank Corporation | | | 4.50% | ^ | | | 10/20/2021 | | | | 1,862,000 | |
| | 7,500,000 | | | Grupo Aval Ltd. | | | 4.75% | | | | 09/26/2022 | | | | 7,117,980 | |
| | 2,578,000 | | | Grupo Bimbo S.A.B. de C.V. | | | 4.88% | | | | 06/30/2020 | | | | 2,606,533 | |
| | 6,605,000 | | | Grupo Bimbo S.A.B. de C.V. | | | 4.50% | | | | 01/25/2022 | | | | 6,649,595 | |
| | 12,600,000 | | | Grupo Bimbo S.A.B. de C.V. (5 Year CMT Rate + 3.28%) | | | 5.95% | † | | | 04/17/2023 | | | | 11,871,720 | |
| | 10,236,000 | | | GrupoSura Finance S.A. | | | 5.70% | | | | 05/18/2021 | | | | 10,284,212 | |
| | 6,527,000 | | | HPHT Finance Ltd. | | | 2.88% | | | | 11/05/2024 | | | | 6,772,872 | |
| | 6,085,000 | | | HSBC Holdings PLC (3 Month LIBOR USD + 1.00%) | | | 2.69% | | | | 05/18/2024 | | | | 5,678,419 | |
| | 5,235,000 | | | Indian Oil Corporation Ltd. | | | 5.63% | | | | 08/02/2021 | | | | 5,280,492 | |
| | 6,000,000 | | | Indian Oil Corporation Ltd. | | | 5.75% | | | | 08/01/2023 | | | | 5,900,785 | |
| | 1,000,000 | | | Indian Oil Corporation Ltd. | | | 4.75% | | | | 01/16/2024 | | | | 953,637 | |
| | 3,396,826 | | | Interoceanica Finance Ltd. | | | 0.00% | | | | 11/30/2025 | | | | 3,082,619 | |
| | 10,725,000 | | | Inversiones CMPC S.A. | | | 4.50% | | | | 04/25/2022 | | | | 10,440,992 | |
| | 1,600,000 | | | Israel Electric Corporation Ltd. | | | 6.88% | | | | 06/21/2023 | | | | 1,762,896 | |
| | 3,450,000 | | | Itau Unibanco Holding S.A. | | | 6.20% | | | | 04/15/2020 | | | | 3,454,312 | |
| | 7,525,000 | | | Itau Unibanco Holding S.A. | | | 5.75% | | | | 01/22/2021 | | | | 7,568,570 | |
| | 3,500,000 | | | Itau Unibanco Holding S.A. | | | 6.20% | | | | 12/21/2021 | | | | 3,565,450 | |
| | 1,300,000 | | | Itau Unibanco Holding S.A. (5 Year CMT Rate + 3.98%) | | | 6.13% | † | | | 12/12/2022 | | | | 1,231,100 | |
| | 1,796,000 | | | JBS Investments GMBH | | | 6.25% | | | | 02/05/2023 | | | | 1,778,049 | |
| | 1,000,000 | | | JBS Investments GMBH | | | 7.00% | ^ | | | 01/15/2026 | | | | 1,002,040 | |
| | 10,000,000 | | | Latam Finance Ltd. | | | 6.88% | | | | 04/11/2024 | | | | 4,508,050 | |
| | 6,250,000 | | | Macquarie Bank Ltd. | | | 2.10% | ^ | | | 10/17/2022 | | | | 6,214,670 | |
| | | | | | |
| The accompanying notes are an integral part of these financial statements. | | Annual Report | | March 31, 2020 | | 43 |
| | |
| Schedule of Investments DoubleLine Low Duration Bond Fund (Cont.) | | March 31, 2020 |
| | | | | | | | | | | | | | | | |
PRINCIPAL
AMOUNT $ | | | SECURITY DESCRIPTION | | RATE | | | MATURITY | | | VALUE $ | |
| | 2,000,000 | | | Malayan Banking BHD (3 Month LIBOR USD + 0.80%) | | | 2.49% | | | | 08/16/2024 | | | | 1,910,780 | |
| | 11,428,000 | | | Malayan Banking BHD (5 Year Swap Rate USD + 2.54%) | | | 3.91% | | | | 10/29/2026 | | | | 11,622,276 | |
| | 19,600,000 | | | MARB BondCo PLC | | | 7.00% | | | | 03/15/2024 | | | | 17,615,402 | |
| | 9,500,000 | | | Millicom International Cellular S.A. | | | 6.00% | | | | 03/15/2025 | | | | 9,262,548 | |
| | 1,500,000 | | | Millicom International Cellular S.A. | | | 6.63% | | | | 10/15/2026 | | | | 1,431,675 | |
| | 12,670,000 | | | Mitsubishi UFJ Financial Group, Inc. (3 Month LIBOR USD + 0.86%) | | | 2.65% | | | | 07/26/2023 | | | | 11,641,629 | |
| | 12,725,000 | | | Mizuho Financial Group, Inc. (3 Month LIBOR USD + 0.79%) | | | 2.10% | | | | 03/05/2023 | | | | 11,878,662 | |
| | 6,900,000 | | | Multibank, Inc. | | | 4.38% | | | | 11/09/2022 | | | | 6,406,277 | |
| | 5,484,000 | | | Nacional Financiera S.N.C. | | | 3.38% | | | | 11/05/2020 | | | | 5,382,998 | |
| | 14,150,000 | | | Oleoducto Central S.A. | | | 4.00% | | | | 05/07/2021 | | | | 13,565,605 | |
| | 15,295,000 | | | ONGC Videsh Ltd. | | | 2.88% | | | | 01/27/2022 | | | | 14,964,475 | |
| | 6,625,000 | | | ONGC Videsh Ltd. | | | 3.75% | | | | 05/07/2023 | | | | 6,463,993 | |
| | 5,918,000 | | | Oversea-Chinese Banking Corporation | | | 4.25% | | | | 06/19/2024 | | | | 6,102,562 | |
| | 3,000,000 | | | Pampa Energia S.A. | | | 7.38% | | | | 07/21/2023 | | | | 2,017,515 | |
| | 16,132,673 | | | Panama Metro Line SP | | | 0.00% | | | | 12/05/2022 | | | | 14,978,154 | |
| | 3,868,138 | | | Panama Metro Line SP | | | 0.00% | ^ | | | 12/05/2022 | | | | 3,591,319 | |
| | 3,334,000 | | | Perusahaan Listrik Negara PT | | | 5.50% | | | | 11/22/2021 | | | | 3,379,676 | |
| | 3,876,000 | | | Petrobras Global Finance B.V. | | | 5.38% | | | | 01/27/2021 | | | | 3,890,496 | |
| | 10,900,000 | | | Petrobras Global Finance B.V. | | | 4.38% | | | | 05/20/2023 | | | | 10,529,400 | |
| | 1,900,000 | | | Reliance Holdings, Inc. | | | 4.50% | | | | 10/19/2020 | | | | 1,914,119 | |
| | 19,310,000 | | | Reliance Holdings, Inc. | | | 5.40% | | | | 02/14/2022 | | | | 19,698,315 | |
| | 6,380,000 | | | Royal Bank of Scotland Group PLC (3 Month LIBOR USD + 1.55%) | | | 2.77% | | | | 06/25/2024 | | | | 5,782,253 | |
| | 7,990,000 | | | Santander UK PLC | | | 2.50% | | | | 01/05/2021 | | | | 7,778,625 | |
| | 4,455,000 | | | Santander UK PLC | | | 2.10% | | | | 01/13/2023 | | | | 4,326,160 | |
| | 4,160,000 | | | Scotiabank Peru S.A. (3 Month LIBOR USD + 3.86%) | | | 4.50% | | | | 12/13/2027 | | | | 3,945,978 | |
| | 11,800,000 | | | Sinochem Overseas Capital Ltd. | | | 4.50% | | | | 11/12/2020 | | | | 11,783,794 | |
| | 10,800,000 | | | Sinopec Group Overseas Development Ltd. | | | 2.50% | | | | 04/28/2020 | | | | 10,813,058 | |
| | 500,000 | | | Sinopec Group Overseas Development Ltd. | | | 2.25% | | | | 09/13/2020 | | | | 500,135 | |
| | 2,000,000 | | | Sinopec Group Overseas Development Ltd. | | | 2.75% | | | | 05/03/2021 | | | | 2,012,010 | |
| | 3,000,000 | | | Sinopec Group Overseas Development Ltd. | | | 2.00% | ^ | | | 09/29/2021 | | | | 2,981,055 | |
| | 2,090,000 | | | Sinopec Group Overseas Development Ltd. | | | 2.00% | | | | 09/29/2021 | | | | 2,076,802 | |
| | 1,750,000 | | | Sociedad Quimica y Minera S.A. | | | 5.50% | | | | 04/21/2020 | | | | 1,765,726 | |
| | 13,600,000 | | | Southern Copper Corporation | | | 5.38% | | | | 04/16/2020 | | | | 13,542,180 | |
| | 4,475,000 | | | Southern Copper Corporation | | | 3.50% | | | | 11/08/2022 | | | | 4,401,224 | |
| | 13,250,000 | | | Sumitomo Mitsui Financial Group, Inc. | | | 2.06% | | | | 07/14/2021 | | | | 13,151,322 | |
| | 6,252,000 | | | Takeda Pharmaceutical Ltd. | | | 4.00% | | | | 11/26/2021 | | | | 6,337,006 | |
| | 6,511,000 | | | Tecnoglass, Inc. | | | 8.20% | | | | 01/31/2022 | | | | 5,523,776 | |
| | 16,500,000 | | | Telefonica Chile S.A. | | | 3.88% | | | | 10/12/2022 | | | | 16,020,609 | |
| | 6,205,000 | | | Toronto-Dominion Bank | | | 3.25% | | | | 06/11/2021 | | | | 6,336,204 | |
| | 1,395,000 | | | Toronto-Dominion Bank (Secured Overnight Financing Rate + 4.80%) | | | 1.36% | | | | 01/27/2023 | | | | 1,307,259 | |
| | 6,580,000 | | | UBS AG | | | 2.45% | ^ | | | 12/01/2020 | | | | 6,564,083 | |
| | 9,720,000 | | | Unifin Financiera S.A.B. de C.V. | | | 7.25% | | | | 09/27/2023 | | | | 6,840,499 | |
| | | | | | | | | | | | | | | | |
PRINCIPAL
AMOUNT $ | | | SECURITY DESCRIPTION | | RATE | | | MATURITY | | | VALUE $ | |
| | 4,300,000 | | | Union Bank of the Philippines | | | 3.37% | | | | 11/29/2022 | | | | 4,266,661 | |
| | 775,000 | | | United Overseas Bank Ltd. (3 Month LIBOR USD + 0.48%) | | | 2.29% | ^ | | | 04/23/2021 | | | | 749,303 | |
| | 850,000 | | | United Overseas Bank Ltd. (3 Month LIBOR USD + 0.48%) | | | 2.29% | | | | 04/23/2021 | | | | 821,817 | |
| | 9,815,000 | | | United Overseas Bank Ltd. (5 Year CMT Rate + 1.50%) | | | 3.75% | | | | 04/15/2029 | | | | 10,191,722 | |
| | 9,637,000 | | | United Overseas Bank Ltd. (5 Year Swap Rate USD + 1.65%) | | | 2.88% | | | | 03/08/2027 | | | | 9,502,949 | |
| | 7,550,000 | | | United Overseas Bank Ltd. (5 Year Swap Rate USD + 2.24%) | | | 3.50% | | | | 09/16/2026 | | | | 7,565,477 | |
| | 10,000,000 | | | UPL Corporation | | | 3.25% | | | | 10/13/2021 | | | | 9,249,741 | |
| | 2,915,000 | | | Vedanta Resources Ltd. | | | 7.13% | | | | 05/31/2023 | | | | 1,133,192 | |
| | 1,000,000 | | | Vedanta Resources Ltd. | | | 6.13% | | | | 08/09/2024 | | | | 379,262 | |
| | 15,289,000 | | | VTR Finance B.V. | | | 6.88% | | | | 01/15/2024 | | | | 14,295,215 | |
| | | | | | | | | | | | | | | | |
| | | | Total Foreign Corporate Bonds
(Cost $1,030,527,736) | | | | 977,130,370 | |
| | | | | | | | | | | | | |
| FOREIGN GOVERNMENT BONDS, FOREIGN AGENCIES AND FOREIGN
GOVERNMENT SPONSORED CORPORATIONS 0.9% |
|
| | 3,500,000 | | | Chile Government International Bond | | | 3.88% | | | | 08/05/2020 | | | | 3,521,875 | |
| | 16,350,000 | | | Colombia Government International Bond | | | 4.38% | | | | 07/12/2021 | | | | 16,538,189 | |
| | 24,033,333 | | | Dominican Republic International Bond | | | 7.50% | | | | 05/06/2021 | | | | 24,105,674 | |
| | 6,500,000 | | | Indonesia Government International Bond | | | 4.88% | | | | 05/05/2021 | | | | 6,581,770 | |
| | 9,725,000 | | | Perusahaan Penerbit | | | 3.40% | | | | 03/29/2022 | | | | 9,705,647 | |
| | 3,711,000 | | | Wakala Global Sukuk BHD | | | 4.65% | | | | 07/06/2021 | | | | 3,824,110 | |
| | | | | | | | | | | | | | | | |
| | | | Total Foreign Government Bonds, Foreign Agencies and Foreign Government Sponsored Corporations
(Cost $65,339,219) | | | | 64,277,265 | |
| | | | | | | | | | | | | |
| NON-AGENCY COMMERCIAL MORTGAGE BACKED
OBLIGATIONS 15.6% |
|
| |
| | | | Americold LLC, | |
| | 1,900,000 | | | Series2010-ARTA-D | | | 7.44% | ^ | | | 01/14/2029 | | | | 1,907,360 | |
| |
| | | | Arbor Realty Ltd., | |
| | 10,812,000 | | | Series2018-FL1-A (1 Month LIBOR USD + 1.15%) | | | 1.85% | ^ | | | 06/15/2028 | | | | 8,847,957 | |
| |
| | | | Ashford Hospitality Trust, | |
| | 6,452,658 | | | Series2018-ASHF-A (1 Month LIBOR USD + 0.90%, 0.90% Floor) | | | 1.60% | ^ | | | 04/15/2035 | | | | 5,364,444 | |
| |
| | | | Atrium Hotel Portfolio Trust, | |
| | 12,019,000 | | | Series2017-ATRM-E (1 Month LIBOR USD + 3.05%, 3.05% Floor) | | | 3.75% | ^ | | | 12/15/2036 | | | | 9,630,774 | |
| | 7,570,000 | | | Series2018-ATRM-A (1 Month LIBOR USD + 0.95%, 0.95% Floor) | | | 1.65% | ^ | | | 06/15/2035 | | | | 6,294,198 | |
| | 225,000 | | | Series2018-ATRM-E (1 Month LIBOR USD + 3.40%, 3.40% Floor) | | | 4.10% | ^ | | | 06/15/2035 | | | | 170,001 | |
| | | | | | |
| 44 | | DoubleLine Funds Trust | | | | The accompanying notes are an integral part of these financial statements. |
| | | | | | | | | | | | | | | | |
PRINCIPAL
AMOUNT $ | | | SECURITY DESCRIPTION | | RATE | | | MATURITY | | | VALUE $ | |
| |
| | | | Bancorp Commercial Mortgage Trust, | |
| | 5,732,143 | | | Series2018-CRE4-A (1 Month LIBOR USD + 0.90%, 0.95% Floor) | | | 1.60% | ^ | | | 09/15/2035 | | | | 5,120,311 | |
| |
| | | | BANK, | |
| | 88,510,140 | | | Series2017-BNK5-XA | | | 1.08% | # I/O | | | 06/15/2060 | | | | 4,627,177 | |
| | 102,036,191 | | | Series2017-BNK6-XA | | | 0.84% | # I/O | | | 07/15/2060 | | | | 4,529,897 | |
| | 195,858,000 | | | Series2020-BN26-XA | | | 1.36% | # I/O | | | 03/15/2063 | | | | 17,904,555 | |
| |
| | | | Barclays Commercial Mortgage Securities LLC, | |
| | 94,366,630 | | | Series2017-C1-XA | | | 1.50% | # I/O | | | 02/15/2050 | | | | 7,231,409 | |
| | 2,261,000 | | | Series2017-DELC-C (1 Month LIBOR USD + 1.20%, 1.20% Floor) | | | 1.90% | ^ | | | 08/15/2036 | | | | 1,733,967 | |
| | 2,577,000 | | | Series2017-DELC-D (1 Month LIBOR USD + 1.70%, 1.70% Floor) | | | 2.40% | ^ | | | 08/15/2036 | | | | 1,936,186 | |
| | 5,175,000 | | | Series2017-DELC-F (1 Month LIBOR USD + 3.50%, 3.50% Floor) | | | 4.20% | ^ | | | 08/15/2036 | | | | 3,189,332 | |
| |
| | | | BBCMS Mortgage Trust, | |
| | 13,011,000 | | | Series2017-DELC-B (1 Month LIBOR USD + 10.30%, 1.03% Floor) | | | 1.73% | ^ | | | 08/15/2036 | | | | 10,212,748 | |
| | 13,430,131 | | | Series2018-BXH-A (1 Month LIBOR USD + 1.00%, 1.00% Floor) | | | 1.70% | ^ | | | 10/15/2037 | | | | 10,717,835 | |
| | 168,500 | | | Series2018-CBM-D (1 Month LIBOR USD + 2.39%, 2.39% Floor) | | | 3.10% | ^ | | | 07/15/2037 | | | | 155,712 | |
| | 17,989,000 | | | Series2018-TALL-A (1 Month LIBOR USD + 0.72%, 0.72% Floor) | | | 1.43% | ^ | | | 03/15/2037 | | | | 17,003,913 | |
| | 10,696,000 | | | Series2018-TALL-B (1 Month LIBOR USD + 0.97%) Series2018-TALL-B (1 Month LIBOR USD + 9.71%, 0.97% Floor) | | | 1.68% | ^ | | | 03/15/2037 | | | | 9,624,859 | |
| | 240,587,709 | | | Series2020-C6-XA | | | 1.06% | # I/O | | | 02/15/2053 | | | | 18,362,376 | |
| | 59,000,000 | | | Series2020-C6-XB | | | 0.68% | # I/O | | | 02/15/2053 | | | | 3,377,278 | |
| |
| | | | BDS Ltd., | |
| | 3,316,000 | | | Series2019-FL4-A (1 Month LIBOR USD + 1.10%) | | | 1.80% | ^ | | | 08/15/2036 | | | | 2,961,158 | |
| |
| | | | Bear Stearns Commercial Mortgage Securities Trust, | |
| | 3,675,000 | | | Series2006-PW13-D | | | 5.75% | #^ | | | 09/11/2041 | | | | 2,994,512 | |
| |
| | | | Bear Stearns Commercial Mortgage Securities, Inc., | |
| | 1,309,278 | | | Series2005-PW10-AJ | | | 5.59% | # | | | 12/11/2040 | | | | 1,307,927 | |
| |
| | | | Benchmark Mortgage Trust, | |
| | 128,441,038 | | | Series2018-B1-XA | | | 0.52% | # I/O | | | 01/15/2051 | | | | 4,090,590 | |
| | 175,653,437 | | | Series2020-B16-XA | | | 0.93% | # I/O | | | 02/15/2053 | | | | 12,422,738 | |
| | 35,720,000 | | | Series2020-IG1-XB | | | 0.13% | # I/O | | | 09/15/2043 | | | | 489,293 | |
| |
| | | | BFLD, | |
| | 20,049,000 | | | Series2019-DPLO-E (1 Month LIBOR USD + 2.24%, 2.24% Floor) | | | 2.94% | ^ | | | 10/15/2034 | | | | 15,210,040 | |
| |
| | | | BHMS Trust, | |
| | 7,792,000 | | | Series2018-ATLS-A (1 Month LIBOR USD + 1.25%, 1.25% Floor) | | | 1.95% | ^ | | | 07/15/2035 | | | | 6,713,472 | |
| | 2,050,000 | | | Series2018-ATLS-C (1 Month LIBOR USD + 1.90%, 1.90% Floor) | | | 2.60% | ^ | | | 07/15/2035 | | | | 1,484,259 | |
| |
| | | | BHP Trust, | |
| | 8,797,000 | | | Series2019-BXHP-A (1 Month LIBOR USD + 0.98%, 0.98% Floor) | | | 1.68% | ^ | | | 08/15/2036 | | | | 7,520,274 | |
| | | | | | | | | | | | | | | | |
PRINCIPAL
AMOUNT $ | | | SECURITY DESCRIPTION | | RATE | | | MATURITY | | | VALUE $ | |
| |
| | | | BHP Trust, (Cont.) | |
| | 5,797,000 | | | Series2019-BXHP-C (1 Month LIBOR USD + 1.52%, 1.52% Floor) | | | 2.23% | ^ | | | 08/15/2036 | | | | 4,876,710 | |
| |
| | | | Bsprt Issuer Ltd., | |
| | 18,407,000 | | | Series2019-FL5-A (1 Month LIBOR USD + 1.15%, 1.15% Floor) | | | 1.85% | ^ | | | 05/15/2029 | | | | 17,313,882 | |
| |
| | | | BX Commercial Mortgage Trust, | |
| | 615,000 | | | Series2018-BIOA-C (1 Month LIBOR USD + 1.12%, 1.10% Floor) | | | 1.83% | ^ | | | 03/15/2037 | | | | 547,252 | |
| | 3,590,000 | | | Series2018-BIOA-D (1 Month LIBOR USD + 1.32%, 1.35% Floor) | | | 2.03% | ^ | | | 03/15/2037 | | | | 3,104,691 | |
| | 1,950,883 | | | Series2018-EXCL-C (1 Month LIBOR USD + 1.98%, 1.98% Floor) | | | 2.68% | ^ | | | 09/15/2037 | | | | 1,425,619 | |
| | 9,308,003 | | | Series2018-IND-A (1 Month LIBOR USD + 0.75%, 0.75% Floor) | | | 1.45% | ^ | | | 11/15/2035 | | | | 8,916,583 | |
| |
| | | | BX Trust, | |
| | 4,214,133 | | | Series2017-APPL-E (1 Month LIBOR USD + 3.15%, 3.15% Floor) | | | 3.85% | ^ | | | 07/15/2034 | | | | 3,464,145 | |
| | 6,117,000 | | | Series2017-FL1-C (1 Month LIBOR USD + 1.95%, 1.95% Floor) | | | 2.75% | ^ | | | 06/15/2035 | | | | 5,416,481 | |
| | 5,854,800 | | | Series2017-SLCT-D (1 Month LIBOR USD + 2.05%, 2.05% Floor) | | | 2.75% | ^ | | | 07/15/2034 | | | | 4,595,938 | |
| | 9,922,900 | | | Series2017-SLCT-E (1 Month LIBOR USD + 3.15%, 3.15% Floor) | | | 3.85% | ^ | | | 07/15/2034 | | | | 7,806,286 | |
| | 14,601,676 | | | Series2018-EXCL-A (1 Month LIBOR USD + 1.09%, 1.09% Floor) | | | 1.79% | ^ | | | 09/15/2037 | | | | 13,115,433 | |
| | 3,532,459 | | | Series2018-EXCL-B (1 Month LIBOR USD + 1.33%, 1.33% Floor) | | | 2.03% | ^ | | | 09/15/2037 | | | | 3,150,413 | |
| | 6,441,000 | | | Series2018-GW-A (1 Month LIBOR USD + 0.80%, 0.80% Floor) | | | 1.50% | ^ | | | 05/15/2035 | | | | 5,842,563 | |
| | 1,001,000 | | | Series2018-GW-D (1 Month LIBOR USD + 1.77%, 1.77% Floor) | | | 2.47% | ^ | | | 05/15/2035 | | | | 846,138 | |
| | 10,620,000 | | | Series2019-MMP-B (1 Month LIBOR USD + 1.30%, 1.30% Floor) | | | 2.00% | ^ | | | 08/15/2036 | | | | 10,111,780 | |
| | 1,905,000 | | | Series2019-MMP-C (1 Month LIBOR USD + 1.45%, 1.45% Floor) | | | 2.15% | ^ | | | 08/15/2036 | | | | 1,819,300 | |
| | 660,000 | | | Series2019-MMP-E (1 Month LIBOR USD + 1.90%, 1.90% Floor) | | | 2.60% | ^ | | | 08/15/2036 | | | | 639,032 | |
| |
| | | | BXMT Ltd., | |
| | 8,181,000 | | | Series2020-FL2-C (1 Month LIBOR USD + 1.65%, 1.65% Floor) | | | 2.45% | ^ | | | 02/16/2037 | | | | 6,302,274 | |
| |
| | | | CAMB Commercial Mortgage Trust, | |
| | 16,284,000 | | | Series2019-LIFE-A (1 Month LIBOR USD + 1.07%, 1.07% Floor) | | | 1.77% | ^ | | | 12/15/2037 | | | | 15,261,868 | |
| |
| | | | CCRESG Commercial Mortgage Trust, | |
| | 712,000 | | | Series2016-HEAT-A | | | 3.36% | ^ | | | 04/10/2029 | | | | 694,146 | |
| |
| | | | CD Commercial Mortgage Trust, | |
| | 26,018,951 | | | Series2017-CD4-XA | | | 1.31% | # I/O | | | 05/10/2050 | | | | 1,688,289 | |
| |
| | | | CF Trust, | |
| | 6,444,000 | | | Series2019-MF1-A (1 Month LIBOR USD + 1.05%, 1.05% Floor) | | | 2.05% | ^ | | | 08/21/2032 | | | | 6,279,441 | |
| | | | | | |
| The accompanying notes are an integral part of these financial statements. | | Annual Report | | March 31, 2020 | | 45 |
| | |
| Schedule of Investments DoubleLine Low Duration Bond Fund (Cont.) | | March 31, 2020 |
| | | | | | | | | | | | | | | | |
PRINCIPAL
AMOUNT $ | | | SECURITY DESCRIPTION | | RATE | | | MATURITY | | | VALUE $ | |
| |
| | | | CFCRE Commercial Mortgage Trust, | |
| | 113,290,383 | | | Series2017-C8-XA | | | 1.61% | # I/O | | | 06/15/2050 | | | | 8,954,189 | |
| | 42,452,000 | | | Series2017-C8-XB | | | 0.95% | # I/O | | | 06/15/2050 | | | | 2,465,370 | |
| | 5,586,000 | | | Series2018-TAN-B | | | 4.69% | ^ | | | 02/15/2033 | | | | 5,367,618 | |
| | 4,752,000 | | | Series2018-TAN-C | | | 5.29% | ^ | | | 02/15/2033 | | | | 4,544,025 | |
| | 2,851,000 | | | Series2018-TAN-D | | | 6.10% | ^ | | | 02/15/2033 | | | | 2,673,862 | |
| |
| | | | CFK Trust, | |
| | 55,675,000 | | | Series2020-MF2-X | | | 0.89% | #^ I/O | | | 03/15/2039 | | | | 2,711,150 | |
| |
| | | | CG-CCRE Commercial Mortgage Trust, | |
| | 1,364,901 | | | Series2014-FL2-A (1 Month LIBOR USD + 1.85%, 1.85% Floor) | | | 2.56% | ^ | | | 11/15/2031 | | | | 1,312,135 | |
| |
| | | | CGDBB Commercial Mortgage Trust, | |
| | 2,201,640 | | | Series2017-BIOC-A (1 Month LIBOR USD + 0.79%, 0.75% Floor) | | | 1.49% | ^ | | | 07/15/2032 | | | | 2,019,622 | |
| | 3,804,908 | | | Series2017-BIOC-B (1 Month LIBOR USD + 0.97%, 0.95% Floor) | | | 1.67% | ^ | | | 07/15/2032 | | | | 3,469,160 | |
| |
| | | | CHT Mortgage Trust, | |
| | 183,000 | | | Series2017-CSMO-A (1 Month LIBOR USD + 0.93%, 0.11% Floor) | | | 1.63% | ^ | | | 11/15/2036 | | | | 158,056 | |
| | 7,731,000 | | | Series2017-CSMO-E (1 Month LIBOR USD + 3.00%, 3.00% Floor) | | | 3.70% | ^ | | | 11/15/2036 | | | | 6,152,250 | |
| | 3,653,000 | | | Series2017-CSMO-F (1 Month LIBOR USD + 3.74%, 3.74% Floor) | | | 4.45% | ^ | | | 11/15/2036 | | | | 2,819,915 | |
| |
| | | | Citigroup Commercial Mortgage Trust, | |
| | 33,342,565 | | | Series2016-GC36-XA | | | 1.27% | # I/O | | | 02/10/2049 | | | | 1,884,772 | |
| | 59,616,771 | | | Series2016-P3-XA | | | 1.70% | # I/O | | | 04/15/2049 | | | | 4,394,227 | |
| | 9,000,000 | | | Series2018-TBR-A (1 Month LIBOR USD + 0.83%, 0.80% Floor) | | | 1.53% | ^ | | | 12/15/2036 | | | | 7,342,762 | |
| | 179,000 | | | Series2018-TBR-D (1 Month LIBOR USD + 1.80%, 1.80% Floor) | | | 2.50% | ^ | | | 12/15/2036 | | | | 122,822 | |
| | 242,000 | | | Series2019-PRM-D | | | 4.35% | ^ | | | 05/10/2036 | | | | 228,796 | |
| |
| | | | CLNC Ltd., | |
| | 20,344,000 | | | Series2019-FL1-A (1 Month LIBOR USD + 1.25%, 1.25% Floor) | | | 2.00% | ^ | | | 08/20/2035 | | | | 18,462,567 | |
| |
| | | | Commercial Mortgage Pass-Through Certificates, | |
| | 7,622,306 | | | Series2012-CR2-XA | | | 1.63% | # I/O | | | 08/15/2045 | | | | 232,702 | |
| | 106,985,026 | | | Series2013-CR12-XA | | | 1.13% | # I/O | | | 10/10/2046 | | | | 3,593,563 | |
| | 20,629,024 | | | Series2013-LC6-XA | | | 1.37% | # I/O | | | 01/10/2046 | | | | 602,790 | |
| | 2,950,000 | | | Series2014-FL5-C (1 Month LIBOR USD + 2.15%, 2.15% Floor) | | | 3.05% | ^ | | | 10/15/2031 | | | | 2,833,356 | |
| | 6,657,000 | | | Series2014-FL5-D (1 Month LIBOR USD + 4.00%, 4.00% Floor) | | | 3.05% | ^ | | | 10/15/2031 | | | | 6,323,568 | |
| | 157,656,393 | | | Series2015-CR25-XA | | | 0.84% | # I/O | | | 08/10/2048 | | | | 5,672,887 | |
| | 21,308,000 | | | Series2018-HCLV-A (1 Month LIBOR USD + 1.00%, 1.00% Floor) | | | 1.70% | ^ | | | 09/15/2033 | | | | 20,155,437 | |
| |
| | | | Credit Suisse Commercial Mortgage Securities Corporation, | |
| | 10,603,000 | | | Series2019-SKLZ-A (1 Month LIBOR USD + 1.25%, 1.25% Floor) | | | 1.95% | ^ | | | 01/15/2034 | | | | 9,955,243 | |
| |
| | | | Credit Suisse Mortgage Trust, | |
| | 5,464,000 | | | Series2017-LSTK-C | | | 3.23% | ^ | | | 04/05/2033 | | | | 5,327,220 | |
| | 6,501,000 | | | Series2017-LSTK-D | | | 3.33% | #^ | | | 04/05/2033 | | | | 6,347,548 | |
| |
| | | | CSAIL Commercial Mortgage Trust, | |
| | 126,019,264 | | | Series2017-C8-XA | | | 1.24% | # I/O | | | 06/15/2050 | | | | 6,607,077 | |
| | 19,916,153 | | | Series2017-CX9-XA | | | 0.88% | # I/O | | | 09/15/2050 | | | | 663,301 | |
| | | | | | | | | | | | | | | | |
PRINCIPAL
AMOUNT $ | | | SECURITY DESCRIPTION | | RATE | | | MATURITY | | | VALUE $ | |
| |
| | | | CSMC Trust, | |
| | 10,862,000 | | | Series2017-CHOP-D (1 Month LIBOR USD + 1.90%, 1.90% Floor) | | | 2.60% | ^ | | | 07/15/2032 | | | | 8,955,999 | |
| | 811,000 | | | Series2017-LSTK-E | | | 3.33% | #^ | | | 04/05/2033 | | | | 783,893 | |
| | 583,000 | | | Series2017-MOON-D | | | 3.20% | #^ | | | 07/10/2034 | | | | 559,051 | |
| |
| | | | CSWF Trust, | |
| | 17,722,268 | | | Series2018-TOP-A (1 Month LIBOR USD + 1.00%, 1.00% Floor) | | | 1.70% | ^ | | | 08/15/2035 | | | | 16,018,568 | |
| |
| | | | DBCG Mortgage Trust, | |
| | 12,925,000 | | | Series2017-BBG-B (1 Month LIBOR USD + 0.85%, 0.95% Floor) | | | 1.55% | ^ | | | 06/15/2034 | | | | 11,336,926 | |
| |
| | | | DBGS Mortgage Trust, | |
| | 11,744,670 | | | Series2018-BIOD-A (1 Month LIBOR USD + 0.80%, 0.80% Floor) | | | 1.51% | ^ | | | 05/15/2035 | | | | 10,867,334 | |
| |
| | | | Exantas Capital Corporation Ltd., | |
| | 16,629,983 | | | Series2019-RSO7-A (1 Month LIBOR USD + 1.00%, 1.00% Floor) | | | 1.80% | ^ | | | 04/15/2036 | | | | 13,722,729 | |
| |
| | | | Exantas Capital Corporation, | |
| | 10,000,000 | | | Series2020-RSO8-A (1 Month LIBOR USD + 1.15%, 1.15% Floor) | | | 2.85% | ^ | | | 03/15/2035 | | | | 9,305,760 | |
| | 15,000,000 | | | Series2020-RSO8-AS (1 Month LIBOR USD + 1.45%, 1.45% Floor) | | | 3.15% | ^ | | | 03/15/2035 | | | | 13,782,195 | |
| |
| | | | FS Rialto, | |
| | 29,135,000 | | | Series2019-FL1-A (1 Month LIBOR USD + 1.20%, 1.20% Floor) | | | 2.86% | ^ | | | 12/16/2036 | | | | 26,876,513 | |
| |
| | | | GPMT Ltd., | |
| | 3,270,249 | | | Series2018-FL1-A (1 Month LIBOR USD + 0.90%, 0.90% Floor) | | | 1.67% | ^ | | | 11/21/2035 | | | | 3,216,607 | |
| | 12,432,000 | | | Series2018-FL1-D (1 Month LIBOR USD + 2.95%, 2.95% Floor) | | | 3.72% | ^ | | | 11/21/2035 | | | | 10,453,795 | |
| | 17,691,000 | | | Series2019-FL2-A (1 Month LIBOR USD + 1.30%, 1.30% Floor) | | | 2.00% | ^ | | | 02/22/2036 | | | | 16,990,737 | |
| |
| | | | Great Wolf Trust, | |
| | 20,623,000 | | | Series2019-WOLF-E (1 Month LIBOR USD + 2.73%, 2.73% Floor) | | | 3.44% | ^ | | | 12/15/2036 | | | | 17,009,364 | |
| |
| | | | GS Mortgage Securities Corporation Trust, | |
| | 1,512,000 | | | Series2017-500K-D (1 Month LIBOR USD + 1.30%, 1.55% Floor) | | | 2.00% | ^ | | | 07/15/2032 | | | | 1,374,562 | |
| |
| | | | GS Mortgage Securities Corporation, | |
| | 6,000,000 | | | Series2018-TWR-A (1 Month LIBOR USD + 0.90%, 0.85% Floor) | | | 1.60% | ^ | | | 07/15/2031 | | | | 5,233,695 | |
| | 6,000,000 | | | Series2018-TWR-D (1 Month LIBOR USD + 1.60%, 1.50% Floor) | | | 2.30% | ^ | | | 07/15/2031 | | | | 4,681,222 | |
| |
| | | | GS Mortgage Securities Trust, | |
| | 110,521,581 | | | Series2017-GS6-XA | | | 1.04% | # I/O | | | 05/10/2050 | | | | 6,527,935 | |
| | 132,883,894 | | | Series2017-GS7-XA | | | 1.13% | # I/O | | | 08/10/2050 | | | | 8,261,843 | |
| | 153,618,793 | | | Series2017-GS8-XA | | | 0.98% | # I/O | | | 11/10/2050 | | | | 8,547,872 | |
| |
| | | | Hilton Orlando Trust, | |
| | 4,330,000 | | | Series2018-ORL-B (1 Month LIBOR USD + 1.05%, 1.05% Floor) | | | 1.75% | ^ | | | 12/15/2034 | | | | 3,669,143 | |
| | | | | | |
| 46 | | DoubleLine Funds Trust | | | | The accompanying notes are an integral part of these financial statements. |
| | | | | | | | | | | | | | | | |
PRINCIPAL
AMOUNT $ | | | SECURITY DESCRIPTION | | RATE | | | MATURITY | | | VALUE $ | |
| |
| | | | Hunt Ltd., | |
| | 7,250,000 | | | Series2017-FL1-B (1 Month LIBOR USD + 1.65%) | | | 2.35% | ^ | | | 08/15/2034 | | | | 6,593,810 | |
| | 20,301,000 | | | Series2018-FL2-A (1 Month LIBOR USD + 1.08%, 1.08% Floor) | | | 1.78% | ^ | | | 08/15/2028 | | | | 18,702,195 | |
| |
| | | | IMT Trust, | |
| | 3,605,955 | | | Series2017-APTS-DFL (1 Month LIBOR USD + 1.55%, 1.55% Floor) | | | 2.25% | ^ | | | 06/15/2034 | | | | 3,099,495 | |
| |
| | | | JP Morgan Chase Commercial Mortgage Securities Corporation, | |
| | 9,247 | | | Series2015-JP1-A1 | | | 1.95% | | | | 01/15/2049 | | | | 9,237 | |
| | 417,144 | | | Series2017-FL10-D (1 Month LIBOR USD + 1.90%, 1.90% Floor) | | | 2.60% | ^ | | | 06/15/2032 | | | | 389,049 | |
| | 10,937,218 | | | Series2018-LAQ-A (1 Month LIBOR USD + 1.00%, 1.00% Floor) | | | 1.70% | ^ | | | 06/15/2032 | | | | 10,461,055 | |
| |
| | | | JP Morgan Chase Commercial Mortgage Securities Trust, | |
| | 376,595 | | | Series2006-LDP9-AMS | | | 5.34% | | | | 05/15/2047 | | | | 371,865 | |
| | 4,546,000 | | | Series2011-C4-E | | | 5.54% | #^ | | | 07/15/2046 | | | | 4,414,930 | |
| | 14,827,372 | | | Series2014-C20-XA | | | 0.94% | # I/O | | | 07/15/2047 | | | | 336,525 | |
| | 69,200,016 | | | Series2016-JP4-XA | | | 0.73% | # I/O | | | 12/15/2049 | | | | 2,005,666 | |
| | 12,491,000 | | | Series2018-WPT-EFL (1 Month LIBOR USD + 2.60%, 2.60% Floor) | | | 3.98% | ^ | | | 07/05/2033 | | | | 10,856,324 | |
| | 59,178,200 | | | Series2020-ACE-XA | | | 0.34% | #^ I/O | | | 01/10/2037 | | | | 1,008,811 | |
| | 117,285,000 | | | Series2020-MKST-XCP | | | 2.63% | #^ I/O | | | 12/15/2036 | | | | 5,231,615 | |
| | 12,920,000 | | | Series2020-NNN-BFL (1 Month LIBOR USD + 1.10%, 1.10% Floor) | | | 1.80% | ^ | | | 01/16/2037 | | | | 11,983,235 | |
| |
| | | | JPMBB Commercial Mortgage Securities Trust, | |
| | 81,727,445 | | | Series2015-C32-XA | | | 1.33% | # I/O | | | 11/15/2048 | | | | 2,708,472 | |
| |
| | | | JPMCC Commercial Mortgage Securities Trust, | |
| | 26,165,211 | | | Series2019-COR5-XA | | | 1.50% | # I/O | | | 06/13/2052 | | | | 2,616,312 | |
| | 15,902,000 | | | Series2019-MFP-A (1 Month LIBOR USD + 1.00%, 0.96% Floor) | | | 1.66% | ^ | | | 07/15/2036 | | | | 14,374,448 | |
| |
| | | | KKR Industrial Portfolio Trust, | |
| | 11,281,000 | | | Series2020-AIP-F (1 Month LIBOR USD + 3.43%, 3.43% Floor) | | | 4.43% | ^ | | | 03/15/2037 | | | | 8,729,227 | |
| |
| | | | LCCM Mortgage Trust, | |
| | 500,000 | | | Series2014-909-D | | | 3.90% | #^ | | | 05/15/2031 | | | | 490,368 | |
| |
| | | | LMREC, Inc., | |
| | 362,673 | | | Series2015-CRE1-AR (1 Month LIBOR USD + 0.98%, 0.98% Floor) | | | 1.91% | ^ | | | 02/22/2032 | | | | 347,921 | |
| |
| | | | LoanCore Issuer Ltd., | |
| | 10,410,000 | | | Series2018-CRE1-A (1 Month LIBOR USD + 1.13%, 1.13% Floor) | | | 1.83% | ^ | | | 05/15/2028 | | | | 8,573,738 | |
| | 18,273,000 | | | Series2019-CRE2-AS (1 Month LIBOR USD + 1.50%, 1.50% Floor) | | | 2.20% | ^ | | | 05/15/2036 | | | | 15,639,057 | |
| | 12,297,000 | | | Series2019-CRE3-A (1 Month LIBOR USD + 1.05%, 1.05% Floor) | | | 1.75% | ^ | | | 04/15/2034 | | | | 11,143,898 | |
| |
| | | | LSTAR Commercial Mortgage Trust, | |
| | 64,754,838 | | | Series2017-5-X | | | 1.00% | #^ I/O | | | 03/10/2050 | | | | 2,434,303 | |
| |
| | | | Marathon CRE, | |
| | 11,968,000 | | | Series2018-FL1-A (1 Month LIBOR USD + 1.15%, 1.15% Floor) | | | 1.85% | ^ | | | 06/15/2028 | | | | 9,751,347 | |
| | | | | | | | | | | | | | | | |
PRINCIPAL
AMOUNT $ | | | SECURITY DESCRIPTION | | RATE | | | MATURITY | | | VALUE $ | |
| |
| | | | MF1 Ltd., | |
| | 16,723,000 | | | Series2019-FL2-A (1 Month LIBOR USD + 1.13%, 1.13% Floor) | | | 2.08% | ^ | | | 12/25/2034 | | | | 13,597,287 | |
| |
| | | | Morgan Stanley Bank of America Merrill Lynch Trust, | |
| | 2,524,545 | | | Series2012-C5-XA | | | 1.43% | #^ I/O | | | 08/15/2045 | | | | 64,438 | |
| | 14,829,773 | | | Series2014-C19-LNCX | | | 0.60% | ^ I/O | | | 12/15/2046 | | | | 366,619 | |
| |
| | | | Morgan Stanley Capital Barclays Bank Trust, | |
| | 3,384,000 | | | Series2016-MART-B | | | 2.48% | ^ | | | 09/13/2031 | | | | 3,180,458 | |
| |
| | | | Morgan Stanley Capital Trust, | |
| | 1,426,790 | | | Series2006-HQ10-X1 | | | 0.36% | #^ I/O | | | 11/12/2041 | | | | 14 | |
| | 2,014,912 | | | Series2006-IQ11-B | | | 6.06% | # | | | 10/15/2042 | | | | 1,929,369 | |
| | 3,216,000 | | | Series2017-ASHF-D (1 Month LIBOR USD + 2.20%, 2.20% Floor) | | | 2.90% | ^ | | | 11/15/2034 | | | | 2,126,326 | |
| | 4,824,000 | | | Series2017-ASHF-E (1 Month LIBOR USD + 3.15%, 3.15% Floor) | | | 3.85% | ^ | | | 11/15/2034 | | | | 2,609,654 | |
| | 3,655,000 | | | Series2017-ASHF-F (1 Month LIBOR USD + 4.35%, 4.35% Floor) | | | 5.05% | ^ | | | 11/15/2034 | | | | 1,968,174 | |
| | 68,449,730 | | | Series2017-H1-XA | | | 1.43% | # I/O | | | 06/15/2050 | | | | 4,659,709 | |
| | 12,901,000 | | | Series2018-SUN-A (1 Month LIBOR USD + 0.90%, 0.90% Floor) | | | 1.60% | ^ | | | 07/15/2035 | | | | 10,727,939 | |
| | 7,895,000 | | | Series2019-PLND-D (1 Month LIBOR USD + 17.50%, 1.75% Floor) | | | 2.45% | ^ | | | 05/15/2036 | | | | 6,438,717 | |
| |
| | | | Motel 6 Trust, | |
| | 10,191,088 | | | Series2017-MTL6-D (1 Month LIBOR USD + 2.15%, 2.15% Floor) | | | 2.85% | ^ | | | 08/15/2034 | | | | 9,074,492 | |
| |
| | | | MSCG Trust, | |
| | 16,416,000 | | | Series2018-SELF-A (1 Month LIBOR USD + 0.90%, 0.90% Floor) | | | 1.60% | ^ | | | 10/15/2037 | | | | 15,448,093 | |
| |
| | | | Natixis Commercial Mortgage Securities Trust, | |
| | 12,013,132 | | | Series2018-FL1-A (1 Month LIBOR USD + 0.95%, 0.95% Floor) | | | 2.61% | ^ | | | 06/15/2035 | | | | 11,348,960 | |
| | 5,185,000 | | | Series2018-850T-C (1 Month LIBOR USD + 1.15%, 1.15% Floor) | | | 1.86% | ^ | | | 07/15/2033 | | | | 5,000,997 | |
| |
| | | | NLY Commercial Mortgage Trust, | |
| | 19,570,000 | | | Series2019-FL2-AS (1 Month LIBOR USD + 1.60%, 1.60% Floor) | | | 2.30% | ^ | | | 02/15/2036 | | | | 18,176,773 | |
| |
| | | | PFP Ltd., | |
| | 12,799,816 | | | Series2019-5-A (1 Month LIBOR USD + 0.97%, 0.97% Floor) | | | 1.67% | ^ | | | 04/14/2036 | | | | 10,455,812 | |
| | 5,621,000 | | | Series2019-6-A (1 Month LIBOR USD + 1.05%, 1.05% Floor) | | | 1.75% | ^ | | | 04/14/2037 | | | | 4,726,766 | |
| |
| | | | Rosslyn Portfolio Trust, | |
| | 5,437,000 | | | Series2017-ROSS-A (1 Month LIBOR USD + 0.95%, 1.94% Floor) | | | 1.94% | ^ | | | 06/15/2033 | | | | 4,907,550 | |
| | 6,186,000 | | | Series2017-ROSS-B (1 Month LIBOR USD + 1.25%, 2.24% Floor) | | | 2.24% | ^ | | | 06/15/2033 | | | | 5,536,713 | |
| |
| | | | Shelter Growth Issuer Ltd., | |
| | 16,918,281 | | | Series2019-FL2-B (1 Month LIBOR USD + 1.80%, 1.80% Floor) | | | 3.00% | ^ | | | 05/15/2036 | | | | 14,678,656 | |
| |
| | | | SLIDE, | |
| | 14,421,886 | | | Series2018-FUN-A (1 Month LIBOR USD + 0.90%, 0.90% Floor) | | | 1.60% | ^ | | | 06/15/2031 | | | | 13,642,155 | |
| | | | | | |
| The accompanying notes are an integral part of these financial statements. | | Annual Report | | March 31, 2020 | | 47 |
| | |
| Schedule of Investments DoubleLine Low Duration Bond Fund (Cont.) | | March 31, 2020 |
| | | | | | | | | | | | | | | | |
PRINCIPAL
AMOUNT $ | | | SECURITY DESCRIPTION | | RATE | | | MATURITY | | | VALUE $ | |
| |
| | | | STWD Ltd., | |
| | 12,887,000 | | | Series2019-FL1-AS (1 Month LIBOR USD + 1.40%) | | | 2.10% | ^ | | | 07/15/2038 | | | | 11,324,026 | |
| |
| | | | TRTX Issuer Ltd., | |
| | 16,923,000 | | | Series2019-FL3-AS (1 Month LIBOR USD + 1.45%, 1.45% Floor) | | | 2.25% | ^ | | | 09/15/2034 | | | | 13,858,499 | |
| |
| | | | UBS Commercial Mortgage Trust, | |
| | 25,846,608 | | | Series2012-C1-XA | | | 2.07% | #^ I/O | | | 05/10/2045 | | | | 795,008 | |
| | 69,979,798 | | | Series2017-C1-XA | | | 1.56% | # I/O | | | 06/15/2050 | | | | 5,698,119 | |
| | 105,123,040 | | | Series2017-C3-XA | | | 1.11% | # I/O | | | 08/15/2050 | | | | 6,038,698 | |
| | 117,695,444 | | | Series2018-C8-XA | | | 0.88% | # I/O | | | 02/15/2051 | | | | 6,299,437 | |
| | 552,000 | | | Series2018-NYCH-D (1 Month LIBOR USD + 2.10%, 2.10% Floor) | | | 2.80% | ^ | | | 02/15/2032 | | | | 492,618 | |
| |
| | | | VMC Finance LLC, | |
| | 13,961,642 | | | Series2018-FL2-A (1 Month LIBOR USD + 0.92%, 0.92% Floor) | | | 1.72% | ^ | | | 10/15/2035 | | | | 12,884,236 | |
| |
| | | | Wells Fargo Commercial Mortgage Trust, | |
| | 29,269,809 | | | Series2015-LC22-XA | | | 0.78% | # I/O | | | 09/15/2058 | | | | 986,928 | |
| | 183,940,282 | | | Series2019-C51-XA | | | 1.38% | # I/O | | | 06/15/2052 | | | | 16,941,636 | |
| |
| | | | WF-RBS Commercial Mortgage Trust, | |
| | 12,118,044 | | | Series2012-C8-XA | | | 1.81% | #^ I/O | | | 08/15/2045 | | | | 381,488 | |
| | | | | | | | | | | | | | | | |
| | | | TotalNon-Agency Commercial Mortgage Backed Obligations
(Cost $1,217,436,010) | | | | 1,056,567,816 | |
| | | | | | | | | | | | | |
| NON-AGENCY RESIDENTIAL COLLATERALIZED MORTGAGE
OBLIGATIONS 18.3% |
|
| |
| | | | Ajax Mortgage Loan Trust, | |
| | 16,808,722 | | | Series2017-C-A | | | 3.75% | ^§ | | | 07/25/2060 | | | | 16,863,665 | |
| | 8,631,742 | | | Series2018-E-A | | | 4.38% | #^ | | | 06/25/2058 | | | | 8,713,350 | |
| | 32,512,463 | | | Series2018-F-A | | | 4.38% | #^ | | | 11/25/2058 | | | | 32,019,964 | |
| | 3,371,651 | | | Series2019-C-A | | | 3.95% | #^ | | | 10/25/2058 | | | | 3,298,826 | |
| |
| | | | Angel Oak Mortgage Trust LLC, | |
| | 1,381,937 | | | Series2017-1-A1 | | | 2.81% | #^ | | | 01/25/2047 | | | | 1,368,625 | |
| | 675,388 | | | Series2017-1-A2 | | | 3.09% | #^ | | | 01/25/2047 | | | | 669,081 | |
| |
| | | | Arroyo Mortgage Trust, | |
| | 19,527,244 | | | Series2019-3-A2 | | | 3.21% | #^ | | | 10/25/2048 | | | | 18,574,260 | |
| | 10,553,484 | | | Series2019-3-A3 | | | 3.42% | #^ | | | 10/25/2048 | | | | 10,075,763 | |
| |
| | | | Banc of America Funding Corporation, | |
| | 177,836 | | | Series2005-E-6A1 | | | 4.53% | # | | | 05/20/2035 | | | | 166,756 | |
| |
| | | | Banc of America Mortgage Securities Trust, | |
| | 878,194 | | | Series2005-E-2A1 | | | 4.64% | # | | | 06/25/2035 | | | | 709,001 | |
| |
| | | | Bayview Opportunity Master Fund Trust, | |
| | 8,419,612 | | | Series2019-SBR1-A1 | | | 3.47% | ^§ | | | 06/28/2034 | | | | 8,361,344 | |
| | 16,247,319 | | | Series2019-SBR2-A1 | | | 3.43% | ^§ | | | 06/28/2034 | | | | 16,091,073 | |
| |
| | | | BCAP LLC Trust, | |
| | 884,910 | | | Series2011-RR1-8A3 | | | 6.00% | #^ | | | 08/28/2021 | | | | 871,082 | |
| |
| | | | Bear Stearns Adjustable Rate Mortgage Trust, | |
| | 2,157,322 | | | Series2003-9-4A1 | | | 4.00% | # | | | 02/25/2034 | | | | 1,893,960 | |
| |
| | | | Bear Stearns Asset Backed Securities Trust, | |
| | 233,903 | | | Series2004-AC2-2A | | | 5.00% | | | | 05/25/2034 | | | | 241,578 | |
| |
| | | | Carrington Mortgage Loan Trust, | |
| | 4,892,831 | | | Series2007-FRE1-A2 (1 Month LIBOR USD + 0.20%, 0.20% Floor, 14.50% Cap) | | | 1.15% | | | | 02/25/2037 | | | | 4,848,145 | |
| | | | | | | | | | | | | | | | |
PRINCIPAL
AMOUNT $ | | | SECURITY DESCRIPTION | | RATE | | | MATURITY | | | VALUE $ | |
| |
| | | | CitiCorporationResidential Mortgage Securities, Inc., | |
| | 273,498 | | | Series2007-1-A4 | | | 5.26% | ß | | | 03/25/2037 | | | | 274,044 | |
| | 2,311,073 | | | Series2007-2-A4 | | | 5.02% | ß | | | 06/25/2037 | | | | 2,315,881 | |
| |
| | | | Citigroup Mortgage Loan Trust, Inc., | |
| | 859,932 | | | Series2006-AR1-2A1 (1 Year CMT Rate + 2.40%, 2.40% Floor, 9.87% Cap) | | | 4.14% | | | | 03/25/2036 | | | | 755,070 | |
| | 36,265,823 | | | Series2018-A-A1 | | | 4.00% | #^ | | | 01/25/2068 | | | | 33,957,442 | |
| | 21,386,150 | | | Series2018-C-A1 | | | 4.13% | ^§ | | | 03/25/2059 | | | | 19,882,032 | |
| |
| | | | Citigroup Mortgage Loan Trust, | |
| | 9,769,695 | | | Series2019-B-A1 | | | 3.26% | #^ | | | 04/25/2066 | | | | 9,700,859 | |
| | 6,711,423 | | | Series2019-C-A1 | | | 3.23% | ^§ | | | 09/25/2059 | | | | 6,666,609 | |
| | 33,574,631 | | | Series2019-E-A1 | | | 3.23% | ^§ | | | 11/25/2070 | | | | 34,726,724 | |
| |
| | | | COLT Mortgage Loan Trust, | |
| | 2,835,093 | | | Series2018-3-A1 | | | 3.69% | #^ | | | 10/26/2048 | | | | 2,815,545 | |
| | 1,959,549 | | | Series2018-3-A2 | | | 3.76% | #^ | | | 10/26/2048 | | | | 1,946,767 | |
| | 1,876,164 | | | Series2018-3-A3 | | | 3.87% | #^ | | | 10/26/2048 | | | | 1,865,129 | |
| |
| | | | Countrywide Asset-Backed Certificates, | |
| | 4,321 | | | Series2005-15-1AF6 | | | 3.77% | # | | | 04/25/2036 | | | | 4,311 | |
| |
| | | | Countrywide Home Loans, | |
| | 2,189,150 | | | Series2004-HYB9-1A1 | | | 3.74% | # | | | 02/20/2035 | | | | 2,034,607 | |
| |
| | | | Credit Suisse First Boston Mortgage Securities Corporation, | |
| | 27,008 | | | Series2005-11-5A1 | | | 5.25% | | | | 12/25/2020 | | | | 15,849 | |
| |
| | | | Credit Suisse Mortgage Capital Certificates, | |
| | 5,505,117 | | | Series2011-5R-6A9 | | | 3.82% | #^ | | | 11/27/2037 | | | | 5,356,952 | |
| | 7,292,206 | | | Series2019-RPL4-A1 | | | 3.55% | ^ | | | 08/26/2058 | | | | 7,582,140 | |
| | 56,178,716 | | | Series2020-BPL1-A1 | | | 3.39% | ^§ | | | 02/25/2024 | | | | 55,654,367 | |
| |
| | | | CSMC Trust, | |
| | 24,245,762 | | | Series2018-RPL7-A1 | | | 4.00% | ^ | | | 08/26/2058 | | | | 25,283,842 | |
| | 42,266,709 | | | Series2018-RPL8-A1 | | | 4.13% | #^ | | | 07/25/2058 | | | | 39,478,146 | |
| | 46,335,799 | | | Series2019-RP10-A1 | | | 3.32% | #^ | | | 12/26/2059 | | | | 47,606,511 | |
| | 18,457,097 | | | Series2019-RPL2-A1 | | | 3.88% | #^ | | | 11/25/2058 | | | | 19,068,663 | |
| |
| | | | Deephaven Residential Mortgage Trust, | |
| | 1,440,423 | | | Series2017-2A-A1 | | | 2.45% | #^ | | | 06/25/2047 | | | | 1,408,762 | |
| | 699,634 | | | Series2017-2A-A2 | | | 2.61% | #^ | | | 06/25/2047 | | | | 684,420 | |
| | 1,028,874 | | | Series2017-2A-A3 | | | 2.71% | #^ | | | 06/25/2047 | | | | 1,006,738 | |
| | 3,513,259 | | | Series2019-1A-A1 | | | 3.74% | #^ | | | 01/25/2059 | | | | 3,426,982 | |
| |
| | | | First Horizon Mortgage Pass-Through Trust, | |
| | 3,844,115 | | | Series2007-AR2-1A1 | | | 4.79% | # | | | 08/25/2037 | | | | 2,491,499 | |
| |
| | | | GCAT LLC, | |
| | 8,663,569 | | | Series2019-2-A1 | | | 3.47% | ^§ | | | 06/25/2024 | | | | 8,635,555 | |
| | 12,437,425 | | | Series2019-3-A1 | | | 3.35% | ^§ | | | 10/25/2049 | | | | 12,411,045 | |
| | 9,550,387 | | | Series2020-1-A1 | | | 2.98% | ^§ | | | 01/26/2060 | | | | 9,556,489 | |
| |
| | | | GS Mortgage-Backed Securities Trust, | |
| | 27,704,022 | | | Series2019-SL1-A1 | | | 2.63% | #^ | | | 01/25/2059 | | | | 27,361,226 | |
| |
| | | | GSR Mortgage Loan Trust, | |
| | 1,868,591 | | | Series2005-AR7-3A1 | | | 4.44% | # | | | 11/25/2035 | | | | 1,548,082 | |
| |
| | | | Homeward Opportunities Fund Trust, | |
| | 4,378,301 | | | Series2018-1-A1 | | | 3.77% | #^ | | | 06/25/2048 | | | | 4,263,078 | |
| | 5,669,168 | | | Series2018-1-A2 | | | 3.90% | #^ | | | 06/25/2048 | | | | 5,520,281 | |
| | 6,587,413 | | | Series2018-1-A3 | | | 4.00% | #^ | | | 06/25/2048 | | | | 6,416,001 | |
| |
| | | | Invitation Homes Trust, | |
| | 28,675,676 | | | Series2017-SFR2-A (1 Month LIBOR USD + 0.85%, 0.85% Floor) | | | 1.65% | ^ | | | 12/17/2036 | | | | 26,668,011 | |
| | 18,145,663 | | | Series2018-SFR1-A (1 Month LIBOR USD + 0.70%) | | | 1.50% | ^ | | | 03/17/2037 | | | | 16,915,554 | |
| |
| | | | JP Morgan Alternative Loan Trust, | |
| | 133,170 | | | Series2006-S4-A6 | | | 5.71% | ß | | | 12/25/2036 | | | | 127,103 | |
| |
| | | | JP Morgan Mortgage Trust, | |
| | 11,257 | | | Series2007-S1-1A1 | | | 5.00% | | | | 03/25/2022 | | | | 10,972 | |
| | 22,677 | | | Series2007-S3-2A2 | | | 5.50% | | | | 08/25/2022 | | | | 21,896 | |
| | | | | | |
| 48 | | DoubleLine Funds Trust | | | | The accompanying notes are an integral part of these financial statements. |
| | | | | | | | | | | | | | | | |
PRINCIPAL
AMOUNT $ | | | SECURITY DESCRIPTION | | RATE | | | MATURITY | | | VALUE $ | |
| |
| | | | Legacy Mortgage Asset Trust, | |
| | 15,751,159 | | | Series2017-GS1-A1 | | | 3.50% | ^§ | | | 01/25/2057 | | | | 15,449,444 | |
| | 21,262,128 | | | Series2018-GS1-A1 | | | 4.00% | ^§ | | | 03/25/2058 | | | | 20,748,001 | |
| | 17,913,294 | | | Series2018-GS3-A1 | | | 4.00% | ^§ | | | 06/25/2058 | | | | 17,432,433 | |
| | 31,984,062 | | | Series2019-GS1-A1 | | | 4.00% | ^§ | | | 01/25/2059 | | | | 29,340,605 | |
| | 29,552,427 | | | Series2019-GS3-A1 | | | 3.75% | ^§ | | | 04/25/2059 | | | | 28,940,044 | |
| | 14,005,382 | | | Series2019-GS4-A1 | | | 3.44% | ^§ | | | 05/25/2059 | | | | 14,217,919 | |
| | 511,087 | | | Series2019-GS5-A1 | | | 3.20% | ^§ | | | 05/25/2059 | | | | 511,938 | |
| | 29,201,810 | | | Series2019-GS6-A1 | | | 3.00% | ^§ | | | 06/25/2059 | | | | 26,183,514 | |
| | 24,263,397 | | | Series2019-GS7-A1 | | | 3.25% | ^§ | | | 11/25/2059 | | | | 24,638,633 | |
| |
| | | | MASTR Adjustable Rate Mortgages Trust, | |
| | 3,309,714 | | | Series2006-2-2A1 | | | 4.30% | # | | | 04/25/2036 | | | | 2,598,760 | |
| |
| | | | Merrill Lynch Mortgage Investors Trust, | |
| | 2,021,308 | | | Series2005-3-2A (0.12% Floor) | | | 3.80% | ± | | | 11/25/2035 | | | | 1,771,472 | |
| |
| | | | MFA LLC, | |
| | 10,892,438 | | | Series2017-NPL1-A1 | | | 3.35% | ^§ | | | 11/25/2047 | | | | 11,105,401 | |
| | 14,213,416 | | | Series2018-NPL1-A1 | | | 3.88% | ^§ | | | 05/25/2048 | | | | 14,661,490 | |
| |
| | | | Mill City Mortgage Loan Trust, | |
| | 14,948,042 | | | Series2017-3-A1 | | | 2.75% | #^ | | | 01/25/2061 | | | | 15,018,208 | |
| |
| | | | Morgan Stanley Mortgage Loan Trust, | |
| | 7,360 | | | Series2004-1-1A1 | | | 5.00% | | | | 08/25/2020 | | | | 6,948 | |
| |
| | | | Morgan StanleyRe-Remic Trust, | |
| | 286,425 | | | Series2012-R3-2A (1 Month LIBOR USD + 0.23%, 0.23% Floor) | | | 1.18% | ^ | | | 02/26/2037 | | | | 286,008 | |
| |
| | | | Nationstar HECM Loan Trust, | |
| | 4,400,000 | | | Series2018-2A-M2 | | | 3.82% | #^ | | | 07/25/2028 | | | | 4,398,332 | |
| |
| | | | New Residential Mortgage Loan Trust, | |
| | 12,500,936 | | | Series2018-FNT1-A | | | 3.61% | ^ | | | 05/25/2023 | | | | 12,327,512 | |
| | 8,447,580 | | | Series2019-NQM1-A2 | | | 3.88% | #^ | | | 01/25/2049 | | | | 8,408,538 | |
| |
| | | | NRZ Excess Spread-Collateralized Notes, | |
| | 15,017,786 | | | Series2018-PLS1-A | | | 3.19% | ^ | | | 01/25/2023 | | | | 14,997,087 | |
| | 12,771,425 | | | Series2018-PLS2-A | | | 3.27% | ^ | | | 02/25/2023 | | | | 12,735,038 | |
| | | | |
| | | | Oaktown Ltd., | | | | | | | | | | | | |
| | 4,752,720 | | | Series2019-1A-M1A (1 Month LIBOR USD + 1.40%, 1.40% Floor) | | | 2.35% | ^ | | | 07/25/2029 | | | | 4,736,370 | |
| | | | |
| | | | OBX Trust, | | | | | | | | | | | | |
| | 4,064,813 | | | Series2018-1-A2 (1 Month LIBOR USD + 0.65%) | | | 1.60% | ^ | | | 06/25/2057 | | | | 3,835,841 | |
| |
| | | | Opteum Mortgage Acceptance Corporation, | |
| | 27,135 | | | Series2005-5-2AN | | | 5.68% | # | | | 12/25/2035 | | | | 26,916 | |
| |
| | | | Park Avenue Funding Trust, | |
| | 39,200,317 | | | Series2019-1-PT (1 Month LIBOR USD + 1.50%, 1.50% Floor) | | | 2.46% | ^ | | | 11/27/2020 | | | | 37,778,757 | |
| |
| | | | Pretium Mortgage Credit Partners LLC, | |
| | 38,101,830 | | | Series2019-1A-A1 | | | 4.50% | ^§ | | | 01/25/2024 | | | | 38,698,208 | |
| | 3,044,223 | | | Series2019-NPL2-A1 | | | 3.84% | ^§ | | | 12/25/2058 | | | | 2,643,214 | |
| | 49,127,035 | | | Series2020-NPL1-A1 | | | 2.86% | ^§ | | | 05/27/2059 | | | | 37,137,189 | |
| | | | |
| | | | PRPM LLC, | | | | | | | | | | | | |
| | 14,850,579 | | | Series2018-1A-A1 | | | 3.75% | #^ | | | 04/25/2023 | | | | 15,071,344 | �� |
| | 8,184,947 | | | Series2019-3A-A1 | | | 3.35% | ^§ | | | 07/25/2024 | | | | 8,133,904 | |
| | 15,283,480 | | | Series2019-4A-A1 | | | 3.35% | ^§ | | | 11/25/2024 | | | | 15,161,297 | |
| | 35,019,679 | | | Series2020-1A-A1 | | | 2.98% | ^§ | | | 02/25/2025 | | | | 28,229,178 | |
| | | | |
| | | | Radnor Ltd., | | | | | | | | | | | | |
| | 11,409,246 | | | Series2019-2-M1A (1 Month LIBOR USD + 1.20%, 1.20% Floor) | | | 2.15% | ^ | | | 06/25/2029 | | | | 11,381,501 | |
| |
| | | | Starwood Mortgage Residential Trust, | |
| | 4,619,751 | | | Series2018-IMC1-A2 | | | 3.90% | #^ | | | 03/25/2048 | | | | 4,531,444 | |
| |
| | | | Structured Asset Securities Corporation, | |
| | 232,585 | | | Series2003-24A-1A3 | | | 3.73% | # | | | 07/25/2033 | | | | 208,070 | |
| |
| | | | Toorak Mortgage Corporation Ltd., | |
| | 45,000,000 | | | Series2020-1-A1 | | | 2.73% | ^§ | | | 03/25/2023 | | | | 45,192,690 | |
| | | | | | | | | | | | | | | | |
PRINCIPAL
AMOUNT $ | | | SECURITY DESCRIPTION | | RATE | | | MATURITY | | | VALUE $ | |
| |
| | | | Velocity Commercial Capital Loan Trust, | |
| | 179,669 | | | Series2016-2-AFX | | | 3.00% | # | | | 10/25/2046 | | | | 179,251 | |
| | 6,989,782 | | | Series2019-2-A | | | 3.13% | #^ | | | 07/25/2049 | | | | 6,551,622 | |
| |
| | | | Vericrest Opportunity Loan Trust, | |
| | 12,171,253 | | | Series2019-NPL7-A1A | | | 3.18% | ^§ | | | 10/25/2049 | | | | 11,078,775 | |
| | 21,990,495 | | | Series2019-NPL8-A1A | | | 3.28% | ^§ | | | 11/25/2049 | | | | 20,116,472 | |
| | 14,402,034 | | | Series2020-NPL2-A1A | | | 2.98% | ^§ | | | 02/25/2050 | | | | 12,771,896 | |
| | 14,347,253 | | | Series2020-NPL5-A1A | | | 2.98% | ^§ | | | 03/25/2050 | | | | 13,045,071 | |
| |
| | | | Verus Securitization Trust, | |
| | 4,443,871 | | | Series2017-1A-A1 | | | 2.85% | #^ | | | 01/25/2047 | | | | 4,364,207 | |
| | 658,351 | | | Series2017-1A-A2 | | | 3.16% | #^ | | | 01/25/2047 | | | | 646,915 | |
| | | | |
| | | | VOLT LLC, | | | | | | | | | | | | |
| | 4,802,910 | | | Series2019-NP10-A1A | | | 3.43% | ^§ | | | 12/27/2049 | | | | 4,536,724 | |
| | 13,497,799 | | | Series2019-NPL6-A1A | | | 3.23% | ^§ | | | 10/25/2049 | | | | 12,693,020 | |
| | 13,625,405 | | | Series2019-NPL9-A1A | | | 3.33% | ^§ | | | 11/26/2049 | | | | 12,394,137 | |
| | 11,764,770 | | | Series2020-NPL1-A1A | | | 3.23% | ^§ | | | 01/25/2050 | | | | 10,658,327 | |
| | 8,341,305 | | | Series2020-NPL3-A1A | | | 2.98% | ^§ | | | 02/25/2050 | | | | 6,118,456 | |
| | 29,083,279 | | | Series2020-NPL4-A1 | | | 2.98% | ^§ | | | 03/25/2050 | | | | 26,113,231 | |
| |
| | | | Washington Mutual Mortgage Pass-Through Certificates, | |
| | 708,445 | | | Series2002-AR16-A | | | 3.95% | # | | | 12/25/2032 | | | | 627,421 | |
| | | | | | | | | | | | | | | | |
| | | | TotalNon-Agency Residential Collateralized Mortgage Obligations
(Cost $1,294,314,344) | | | | 1,240,670,430 | |
| | | | | | | | | | | | | |
| | US CORPORATE BONDS 5.8% | |
| | 5,887,000 | | | AbbVie, Inc. | | | 3.38% | | | | 11/14/2021 | | | | 6,005,515 | |
| | 3,280,000 | | | AbbVie, Inc. | | | 2.30% | ^ | | | 11/21/2022 | | | | 3,281,570 | |
| | 6,748,000 | | | American Express Company (3 Month LIBOR USD + 0.65%) | | | 2.29% | | | | 02/27/2023 | | | | 6,458,658 | |
| | 331,000 | | | Amgen, Inc. | | | 2.70% | | | | 05/01/2022 | | | | 339,173 | |
| | 4,637,000 | | | Amgen, Inc. | | | 2.65% | | | | 05/11/2022 | | | | 4,694,449 | |
| | 4,575,000 | | | Amgen, Inc. | | | 3.63% | | | | 05/15/2022 | | | | 4,745,467 | |
| | 3,300,000 | | | Amgen, Inc. | | | 1.90% | | | | 02/21/2025 | | | | 3,332,622 | |
| | 6,825,000 | | | Analog Devices, Inc. | | | 2.95% | | | | 01/12/2021 | | | | 6,835,781 | |
| | 10,600,000 | | | Anthem, Inc. | | | 2.50% | | | | 11/21/2020 | | | | 10,563,433 | |
| | 12,114,000 | | | AT&T, Inc. | | | 2.80% | | | | 02/17/2021 | | | | 12,170,973 | |
| | 3,330,000 | | | Bank of America Corporation (3 Month LIBOR USD + 0.79%) | | | 2.10% | | | | 03/05/2024 | | | | 3,120,542 | |
| | 7,170,000 | | | BAT Capital Corporation | | | 2.76% | | | | 08/15/2022 | | | | 7,070,468 | |
| | 4,595,000 | | | BB&T Corporation | | | 2.20% | | | | 03/16/2023 | | | | 4,609,962 | |
| | 5,291,000 | | | Bristol-Myers Squibb Company | | | 2.88% | ^ | | | 08/15/2020 | | | | 5,309,926 | |
| | 1,675,000 | | | Bristol-Myers Squibb Company | | | 2.60% | ^ | | | 05/16/2022 | | | | 1,710,535 | |
| | 6,139,000 | | | Capital One Financial Corporation | | | 2.40% | | | | 10/30/2020 | | | | 6,126,920 | |
| | 12,540,000 | | | Cardinal Health, Inc. | | | 2.62% | | | | 06/15/2022 | | | | 12,604,369 | |
| | 6,435,000 | | | Carrier Global Corporation | | | 1.92% | ^ | | | 02/15/2023 | | | | 6,347,883 | |
| | 5,970,000 | | | Cigna Corporation | | | 3.40% | | | | 09/17/2021 | | | | 6,063,900 | |
| | 6,471,000 | | | Cintas Corporation | | | 2.90% | | | | 04/01/2022 | | | | 6,475,839 | |
| | 4,656,000 | | | Citigroup, Inc. | | | 2.75% | | | | 04/25/2022 | | | | 4,683,772 | |
| | 6,700,000 | | | Citigroup, Inc. (3 Month LIBOR USD + 1.02%) | | | 2.60% | | | | 06/01/2024 | | | | 6,248,936 | |
| | 2,020,000 | | | Citigroup, Inc. (Secured Overnight Financing Rate + 8.67%) | | | 2.31% | | | | 11/04/2022 | | | | 2,009,788 | |
| | 1,114,000 | | | Consolidated Edison, Inc. | | | 2.00% | | | | 05/15/2021 | | | | 1,100,866 | |
| | 6,243,000 | | | Continental Resources, Inc. | | | 4.50% | | | | 04/15/2023 | | | | 3,440,232 | |
| | | | | | |
| The accompanying notes are an integral part of these financial statements. | | Annual Report | | March 31, 2020 | | 49 |
| | |
| Schedule of Investments DoubleLine Low Duration Bond Fund (Cont.) | | March 31, 2020 |
| | | | | | | | | | | | | | | | |
PRINCIPAL
AMOUNT $ | | | SECURITY DESCRIPTION | | RATE | | | MATURITY | | | VALUE $ | |
| | 12,705,000 | | | CVS Health Corporation | | | 3.70% | | | | 03/09/2023 | | | | 13,241,873 | |
| | 4,760,000 | | | Daimler Finance North America LLC | | | 2.30% | ^ | | | 02/12/2021 | | | | 4,641,143 | |
| | 200,000 | | | Daimler Finance North America LLC | | | 3.40% | ^ | | | 02/22/2022 | | | | 194,523 | |
| | 6,180,000 | | | Delta Air Lines, Inc. | | | 3.40% | | | | 04/19/2021 | | | | 5,631,188 | |
| | 2,975,000 | | | DTE Energy Company | | | 2.25% | | | | 11/01/2022 | | | | 2,948,446 | |
| | 2,410,000 | | | DTE Energy Company | | | 2.53% | | | | 10/01/2024 | | | | 2,347,087 | |
| | 4,280,000 | | | DuPont de Nemours, Inc. | | | 3.77% | | | | 11/15/2020 | | | | 4,294,089 | |
| | 6,615,000 | | | eBay, Inc. | | | 2.75% | | | | 01/30/2023 | | | | 6,495,948 | |
| | 4,195,000 | | | Energy Transfer Operating LP | | | 4.25% | | | | 03/15/2023 | | | | 3,764,700 | |
| | 1,855,000 | | | Energy Transfer Operating LP | | | 2.90% | | | | 05/15/2025 | | | | 1,571,764 | |
| | 6,315,000 | | | General Electric Company | | | 2.70% | | | | 10/09/2022 | | | | 6,219,601 | |
| | 6,252,000 | | | General Mills, Inc. | | | 3.15% | | | | 12/15/2021 | | | | 6,336,358 | |
| | 5,355,000 | | | Goldman Sachs Group, Inc. | | | 3.20% | | | | 06/05/2020 | | | | 5,356,132 | |
| | 7,000,000 | | | Goldman Sachs Group, Inc. | | | 2.35% | | | | 11/15/2021 | | | | 6,995,688 | |
| | 6,205,000 | | | Hyundai Capital America | | | 2.85% | ^ | | | 11/01/2022 | | | | 6,065,796 | |
| | 5,515,000 | | | JPMorgan Chase & Company (3 Month LIBOR USD + 0.70%) | | | 3.21% | | | | 04/01/2023 | | | | 5,625,324 | |
| | 5,565,000 | | | Kinder Morgan Energy Partners LP | | | 3.95% | | | | 09/01/2022 | | | | 5,520,925 | |
| | 5,650,000 | | | Kinder Morgan, Inc. | | | 3.15% | | | | 01/15/2023 | | | | 5,602,616 | |
| | 5,840,000 | | | Marathon Petroleum Corporation | | | 4.75% | | | | 12/15/2023 | | | | 5,539,647 | |
| | 5,424,000 | | | Marsh & McLennan Companies, Inc. (3 Month LIBOR USD + 1.20%) | | | 2.57% | | | | 12/29/2021 | | | | 5,429,017 | |
| | 6,455,000 | | | Microchip Technology, Inc. | | | 3.92% | | | | 06/01/2021 | | | | 6,294,097 | |
| | 11,415,000 | | | Mondelez International, Inc. | | | 3.00% | | | | 05/07/2020 | | | | 11,301,070 | |
| | 1,515,000 | | | Mondelez International, Inc. | | | 3.63% | | | | 05/07/2023 | | | | 1,591,621 | |
| | 11,355,000 | | | Morgan Stanley (3 Month LIBOR USD + 0.93%) | | | 2.73% | | | | 07/22/2022 | | | | 11,053,250 | |
| | 6,030,000 | | | NextEra Energy Capital Holdings, Inc. | | | 3.34% | | | | 09/01/2020 | | | | 6,036,695 | |
| | 12,478,000 | | | Northrop Grumman Corporation | | | 2.08% | | | | 10/15/2020 | | | | 12,431,079 | |
| | 3,720,000 | | | ORACLE Corporation | | | 2.50% | | | | 04/01/2025 | | | | 3,802,019 | |
| | 4,930,000 | | | PayPal Holdings, Inc. | | | 2.20% | | | | 09/26/2022 | | | | 4,912,418 | |
| | 6,140,000 | | | Penske Truck Leasing Company | | | 2.70% | ^ | | | 11/01/2024 | | | | 5,741,159 | |
| | 2,425,000 | | | PNC Bank | | | 2.45% | | | | 11/05/2020 | | | | 2,429,720 | |
| | 1,955,000 | | | PNC Bank (3 Month LIBOR USD + 0.42%) | | | 2.03% | | | | 12/09/2022 | | | | 1,961,156 | |
| | 1,905,000 | | | PNC Funding Corporation | | | 3.30% | | | | 03/08/2022 | | | | 1,937,873 | |
| | 679,000 | | | Prudential Financial, Inc. | | | 4.50% | | | | 11/15/2020 | | | | 683,789 | |
| | 1,770,000 | | | Prudential Financial, Inc. | | | 4.50% | | | | 11/16/2021 | | | | 1,786,619 | |
| | 10,010,000 | | | Prudential Financial, Inc. | | | 3.50% | | | | 05/15/2024 | | | | 10,431,289 | |
| | 2,359,000 | | | PSEG Power LLC | | | 3.85% | | | | 06/01/2023 | | | | 2,402,644 | |
| | 6,515,000 | | | Republic Services, Inc. | | | 2.50% | | | | 08/15/2024 | | | | 6,572,686 | |
| | 3,295,000 | | | Reynolds American, Inc. | | | 3.25% | | | | 06/12/2020 | | | | 3,285,233 | |
| | 2,922,000 | | | Reynolds American, Inc. | | | 4.00% | | | | 06/12/2022 | | | | 2,961,654 | |
| | 5,870,000 | | | Schlumberger Holdings Corporation | | | 3.75% | ^ | | | 05/01/2024 | | | | 5,565,765 | |
| | 6,900,000 | | | Simon Property Group LP | | | 2.00% | | | | 09/13/2024 | | | | 6,634,647 | |
| | 4,625,000 | | | Synchrony Financial | | | 3.75% | | | | 08/15/2021 | | | | 4,648,541 | |
| | 1,535,000 | | | Synchrony Financial | | | 2.85% | | | | 07/25/2022 | | | | 1,464,214 | |
| | | | | | | | | | | | | | | | |
PRINCIPAL
AMOUNT $ | | | SECURITY DESCRIPTION | | RATE | | | MATURITY | | | VALUE $ | |
| | 6,455,000 | | | Union Pacific Corporation | | | 3.20% | | | | 06/08/2021 | | | | 6,519,145 | |
| | 2,285,000 | | | Verizon Communications, Inc. (3 Month LIBOR USD + 1.10%) | | | 2.79% | | | | 05/15/2025 | | | | 2,084,165 | |
| | 7,220,000 | | | Volkswagen Group of America Finance LLC | | | 4.00% | ^ | | | 11/12/2021 | | | | 7,146,515 | |
| | 1,870,000 | | | Waste Management, Inc. | | | 2.95% | | | | 06/15/2024 | | | | 1,905,099 | |
| | 12,485,000 | | | Wells Fargo & Company | | | 2.60% | | | | 01/15/2021 | | | | 12,545,796 | |
| | 5,885,000 | | | Welltower, Inc. | | | 3.63% | | | | 03/15/2024 | | | | 5,787,397 | |
| | | | | | | | | | | | | | | | |
| | | | Total US Corporate Bonds
(Cost $399,044,922) | | | | 391,090,799 | |
| | | | | | | | | | | | | |
| US GOVERNMENT AND AGENCY MORTGAGE BACKED
OBLIGATIONS 7.7% |
|
| |
| | | | Federal Home Loan Mortgage Corporation Pass-Thru, | |
| | 126,075,303 | | | SeriesK722-X1 | | | 1.31% | # I/O | | | 03/25/2023 | | | | 3,828,037 | |
| |
| | | | Federal Home Loan Mortgage Corporation, | |
| | 2,052,190 | | | Pool 840632 (12 Month LIBOR USD + 1.62%, 1.62% Floor, 7.67% Cap) | | | 3.22% | | | | 05/01/2045 | | | | 2,076,226 | |
| | 217,562 | | | Pool N70081 | | | 5.50% | | | | 07/01/2038 | | | | 247,054 | |
| | 1,690,255 | | | Series3025-FW (1 Month LIBOR USD + 0.25%, 0.25% Floor, 7.00% Cap) | | | 0.95% | | | | 08/15/2035 | | | | 1,659,568 | |
| | 13,068,479 | | | Series317-F3 (1 Month LIBOR USD + 0.52%, 0.52% Floor 6.50% Cap) | | | 1.22% | | | | 11/15/2043 | | | | 13,154,295 | |
| | 21,426 | | | Series3818-JA | | | 4.50% | | | | 01/15/2040 | | | | 21,535 | |
| | 10,092,724 | | | Series3843-FB (1 Month LIBOR USD + 0.33%, 0.33% Floor, 7.00% Cap) | | | 1.03% | | | | 04/15/2041 | | | | 10,040,597 | |
| | 25,618 | | | Series3872-BA | | | 4.00% | | | | 06/15/2041 | | | | 27,539 | |
| | 2,075,650 | | | Series4050-BC | | | 2.00% | | | | 05/15/2041 | | | | 2,119,298 | |
| | 760,651 | | | Series4074-KF (1 Month LIBOR USD + 0.30%, 0.30% Floor, 7.00% Cap) | | | 1.00% | | | | 02/15/2041 | | | | 755,624 | |
| | 3,686,459 | | | Series4203-NB | | | 2.00% | | | | 10/15/2040 | | | | 3,844,502 | |
| | 12,691,048 | | | Series4211-AP | | | 1.60% | | | | 03/15/2043 | | | | 12,926,824 | |
| | 928,482 | | | Series4238-FD (1 Month LIBOR USD + 0.30%, 0.30% Floor, 7.00% Cap) | | | 1.00% | | | | 02/15/2042 | | | | 922,266 | |
| | 2,245,675 | | | Series4381-FK (1 Month LIBOR USD + 0.35%, 0.35% Floor, 6.50% Cap) | | | 1.05% | | | | 06/15/2044 | | | | 2,220,063 | |
| | 10,591,363 | | | Series4484-CD | | | 1.75% | | | | 07/15/2030 | | | | 10,792,206 | |
| | 6,104,980 | | | Series4631-GF (1 Month LIBOR USD + 0.50%, 0.50% Floor, 6.50% Cap) | | | 1.20% | | | | 11/15/2046 | | | | 6,055,693 | |
| | 11,571,250 | | | Series4725-FB (1 Month LIBOR USD + 0.35%, 0.35% Floor, 6.50% Cap) | | | 1.05% | | | | 08/15/2047 | | | | 11,404,548 | |
| | 16,123,793 | | | Series4768-FG (1 Month LIBOR USD + 0.30%, 0.30% Floor, 6.50% Cap) | | | 1.00% | | | | 03/15/2048 | | | | 15,847,390 | |
| | 6,595,802 | | | Series4773-EA | | | 4.00% | | | | 10/15/2042 | | | | 6,858,858 | |
| | | | | | |
| 50 | | DoubleLine Funds Trust | | | | The accompanying notes are an integral part of these financial statements. |
| | | | | | | | | | | | | | | | |
PRINCIPAL
AMOUNT $ | | | SECURITY DESCRIPTION | | RATE | | | MATURITY | | | VALUE $ | |
| |
| | | | Federal Home Loan Mortgage Corporation, (Cont.) | |
| | 11,653,218 | | | Series4778-NA | | | 4.50% | | | | 06/15/2044 | | | | 12,054,922 | |
| | 8,709,491 | | | Series4824-FC (1 Month LIBOR USD + 0.35%, 0.35% Floor, 6.50% Cap) | | | 1.05% | | | | 09/15/2048 | | | | 8,603,877 | |
| | 7,904,066 | | | Series4842-FA (1 Month LIBOR USD + 0.35%, 0.35% Floor, 6.50% Cap) | | | 1.05% | | | | 11/15/2048 | | | | 7,827,888 | |
| | 42,901,064 | | | Federal Home Loan Mortgage Corporation, Series4920-FA (1 Month LIBOR USD + 0.45%, 0.45% Floor, 6.50% Cap) | | | 1.15% | | | | 10/25/2049 | | | | 42,497,511 | |
| |
| | | | Federal National Mortgage Association Pass-Thru, | |
| | 90,070 | | | Pool AB3850 | | | 4.00% | | | | 11/01/2041 | | | | 95,891 | |
| | 2,998,285 | | | Pool AL2987 (12 Month LIBOR USD + 1.63%, 1.63% Floor, 7.33% Cap) | | | 3.89% | | | | 11/01/2042 | | | | 3,046,012 | |
| | 2,172,245 | | | Pool AL4292 | | | 4.50% | | | | 04/01/2026 | | | | 2,315,624 | |
| |
| | | | Federal National Mortgage Association, | |
| | 2,850,606 | | | Pool AL9932 | | | 3.04% | # | | | 01/01/2024 | | | | 3,047,249 | |
| | 9,150,000 | | | Pool AM6134 | | | 2.67% | | | | 09/01/2021 | | | | 9,307,718 | |
| | 3,905,024 | | | Pool BC0057 (12 Month LIBOR USD + 1.60%, 1.60% Floor, 7.41% Cap) | | | 2.42% | | | | 12/01/2045 | | | | 3,942,989 | |
| | 3,199,474 | | | Pool BM3520 (12 Month LIBOR USD + 1.56%, 1.56% Floor, 7.00% Cap) | | | 2.05% | | | | 05/01/2045 | | | | 3,222,536 | |
| | 2,536,157 | | | Series2006-97-FE (1 Month LIBOR USD + 0.45%, 0.45% Floor, 6.50% Cap) | | | 1.40% | | | | 10/25/2035 | | | | 2,517,673 | |
| | 1,010,988 | | | Series2010-113-FA (1 Month LIBOR USD + 0.40%, 0.40% Floor, 7.00% Cap) | | | 1.35% | | | | 10/25/2040 | | | | 1,000,494 | |
| | 39,613,378 | | | Series2010-54-FB (1 Month LIBOR USD + 0.39%, 0.39% Floor, 7.00% Cap) | | | 1.34% | | | | 06/25/2036 | | | | 39,169,807 | |
| | 917,669 | | | Series2011-128-FK (1 Month LIBOR USD + 0.35%, 0.35% Floor, 7.00% Cap) | | | 1.30% | | | | 07/25/2041 | | | | 913,808 | |
| | 10,288,854 | | | Series2011-63-FA (1 Month LIBOR USD + 0.58%, 0.58% Floor, 6.50% Cap) | | | 1.53% | | | | 07/25/2041 | | | | 10,216,008 | |
| | 16,310,674 | | | Series2011-63-FP (1 Month LIBOR USD + 0.32%, 0.32% Floor, 7.00% Cap) | | | 1.27% | | | | 07/25/2041 | | | | 16,098,705 | |
| | 94,639 | | | Series2011-64-DB | | | 4.00% | | | | 07/25/2041 | | | | 105,207 | |
| | 6,436,161 | | | Series2011-86-KF (1 Month LIBOR USD + 0.55%, 0.55% Floor, 6.50% Cap) | | | 1.50% | | | | 09/25/2041 | | | | 6,414,812 | |
| | 26,384,220 | | | Series2011-96-FA (1 Month LIBOR USD + 0.45%, 0.45% Floor, 7.00% Cap) | | | 1.40% | | | | 10/25/2041 | | | | 26,192,346 | |
| | 2,309,781 | | | Series2012-110-MF (1 Month LIBOR USD + 0.46%, 0.46% Floor, 6.50% Cap) | | | 1.41% | | | | 10/25/2042 | | | | 2,295,969 | |
| | 966,626 | | | Series2012-111-JF (1 Month LIBOR USD + 0.40%, 0.40% Floor, 6.50% Cap) | | | 1.35% | | | | 07/25/2040 | | | | 962,654 | |
| | 8,199,213 | | | Series2012-56-FA (1 Month LIBOR USD + 0.55%, 0.55% Floor, 6.50% Cap) | | | 1.50% | | | | 06/25/2042 | | | | 8,180,893 | |
| | | | | | | | | | | | | | | | |
PRINCIPAL
AMOUNT $ | | | SECURITY DESCRIPTION | | RATE | | | MATURITY | | | VALUE $ | |
| |
| | | | Federal National Mortgage Association, (Cont.) | |
| | 17,278,035 | | | Series2012-56-FK (1 Month LIBOR USD + 0.45%, 0.45% Floor, 6.50% Cap) | | | 1.40% | | | | 06/25/2042 | | | | 17,154,932 | |
| | 2,314,322 | | | Series2013-81-EF (1 Month LIBOR USD + 0.35%, 0.35% Floor, 6.50% Cap) | | | 1.30% | | | | 12/25/2042 | | | | 2,294,489 | |
| | 10,978,393 | | | Series2016-89-FH (1 Month LIBOR USD + 0.50%, 0.50% Floor, 6.50% Cap) | | | 1.45% | | | | 12/25/2046 | | | | 10,877,593 | |
| | 7,112,687 | | | Series2017-3-FA (1 Month LIBOR USD + 0.50%, 0.50% Floor) | | | 1.45% | | | | 02/25/2047 | | | | 7,049,170 | |
| | 20,620,160 | | | Series2017-96-FA (1 Month LIBOR USD + 0.40%, 0.40% Floor, 6.50% Cap) | | | 1.35% | | | | 12/25/2057 | | | | 20,283,280 | |
| | 12,889,476 | | | Series2018-15-JF (1 Month LIBOR USD + 0.30%, 0.30% Floor, 6.50% Cap) | | | 1.25% | | | | 03/25/2048 | | | | 12,473,656 | |
| | 10,526,190 | | | Series2018-49-FB (1 Month LIBOR USD + 0.30%, 0.30% Floor, 6.50% Cap) | | | 1.25% | | | | 07/25/2048 | | | | 10,221,454 | |
| | 16,659,968 | | | Series2018-55-FA (1 Month LIBOR USD + 0.30%, 0.30% Floor, 6.50% Cap) | | | 1.25% | | | | 08/25/2048 | | | | 16,204,022 | |
| | 10,892,971 | | | Series2018-64-FA (1 Month LIBOR USD + 0.35%, 0.35% Floor, 6.50% Cap) | | | 1.30% | | | | 09/25/2048 | | | | 10,754,811 | |
| | 18,751,279 | | | Series2018-70-HF (1 Month LIBOR USD + 0.35%, 0.35% Floor, 6.50% Cap) | | | 1.30% | | | | 10/25/2058 | | | | 18,485,634 | |
| | 15,909,777 | | | Series2018-71-FA (1 Month LIBOR USD + 0.30%, 0.30% Floor, 6.50% Cap) | | | 1.25% | | | | 09/25/2048 | | | | 15,810,805 | |
| | 10,326,026 | | | Series2018-77-FA (1 Month LIBOR USD + 0.30%, 0.30% Floor, 6.50% Cap) | | | 1.25% | | | | 10/25/2048 | | | | 10,182,411 | |
| | 7,401,930 | | | Series2019-42-KF (1 Month LIBOR USD + 0.35%, 0.35% Floor, 7.50% Cap) | | | 1.30% | | | | 08/25/2049 | | | | 7,339,175 | |
| | 8,180,423 | | | Series2019-42-LF (1 Month LIBOR USD + 0.35%, 0.35% Floor, 7.00% Cap) | | | 1.30% | | | | 08/25/2049 | | | | 8,099,467 | |
| | 13,691,239 | | | Series2019-57-FE (1 Month LIBOR USD + 0.45%, 0.45% Floor, 6.50% Cap) | | | 1.40% | | | | 10/25/2049 | | | | 13,518,920 | |
| | 4,508,957 | | | Series2019-6-KF (1 Month LIBOR USD + 0.45%, 0.45% Floor, 6.50% Cap) | | | 1.40% | | | | 03/25/2049 | | | | 4,465,036 | |
| | 7,204,637 | | | Series404-F13 (1 Month LIBOR USD + 0.60%, 0.60% Floor, 7.00% Cap) | | | 1.55% | | | | 05/25/2040 | | | | 7,259,590 | |
| |
| | | | Government National Mortgage Association, | |
| | 4,657,930 | | | Series2006-14-FA (1 Month LIBOR USD + 0.20%, 0.20% Floor, 6.50% Cap) | | | 0.97% | | | | 03/20/2036 | | | | 4,562,234 | |
| | 6,731,319 | | | Series2010-115-AF (1 Month LIBOR USD + 0.45%, 0.45% Floor, 6.50% Cap) | | | 1.22% | | | | 09/20/2040 | | | | 6,643,831 | |
| | | | | | |
| The accompanying notes are an integral part of these financial statements. | | Annual Report | | March 31, 2020 | | 51 |
| | |
| Schedule of Investments DoubleLine Low Duration Bond Fund (Cont.) | | March 31, 2020 |
| | | | | | | | | | | | | | | | |
PRINCIPAL
AMOUNT $/
SHARES | | | SECURITY DESCRIPTION | | RATE | | | MATURITY | | | VALUE $ | |
| |
| | | | Government National Mortgage Association, (Cont.) | |
| | 6,477,709 | | | Series2013-26-FQ (1 Month LIBOR USD + 0.45%, 0.45% Floor, 6.00% Cap) | | | 1.15% | | | | 02/16/2043 | | | | 6,393,569 | |
| | | | | | | | | | | | | | | | |
| | | | Total US Government and Agency Mortgage Backed Obligations
(Cost $525,891,745) | | | | 524,906,795 | |
| | | | | | | | | | | | | | | | |
| | US GOVERNMENT AND AGENCY OBLIGATIONS 8.5% | |
| | 35,000,000 | | | United States Treasury Notes | | | 1.38% | | | | 09/15/2020 | | | | 35,200,976 | |
| | 68,500,000 | | | United States Treasury Notes | | | 2.88% | | | | 10/31/2020 | | | | 69,590,381 | |
| | 80,100,000 | | | United States Treasury Notes | | | 2.75% | | | | 11/30/2020 | | | | 81,490,799 | |
| | 79,150,000 | | | United States Treasury Notes | | | 2.75% | | | | 09/15/2021 | | | | 82,059,381 | |
| | 91,500,000 | | | United States Treasury Notes | | | 1.50% | | | | 10/31/2021 | | | | 93,360,382 | |
| | 95,200,000 | | | United States Treasury Notes | | | 1.63% | | | | 04/30/2023 | | | | 99,112,125 | |
| | 108,900,000 | | | United States Treasury Notes | | | 2.25% | | | | 12/31/2023 | | | | 116,735,696 | |
| | | | | | | | | | | | | | | | |
| | | | Total US Government and Agency Obligations
(Cost $560,245,791) | | | | 577,549,740 | |
| | | | | | | | | | | | | | | | |
| | AFFILIATED MUTUAL FUNDS 0.7% | |
| | 5,000,000 | | | DoubleLine Low Duration Emerging Markets Fixed Income Fund (Class I) | | | | | | | | | | | 46,800,000 | |
| | | | | | | | | | | | | | | | |
| | | | Total Affiliated Mutual Funds
(Cost $50,000,000) | | | | 46,800,000 | |
| | | | | | | | | | | | | | | | |
| | EXCHANGE TRADED FUNDS AND COMMON STOCKS 0.0% | |
| | 89,329 | | | Frontera Energy Corporation | | | | | | | | | | | 220,642 | |
| | | | | | | | | | | | | | | | |
| | | | Total Exchange Traded Funds and Common Stocks
(Cost $8,231,569) | | | | 220,642 | |
| | | | | | | | | | | | | | | | |
| | SHORT TERM INVESTMENTS 3.1% | |
| | 69,571,410 | | | First American Government Obligations Fund - Class U | | | 0.47% | ¨ | | | | | | | 69,571,410 | |
| | 69,571,410 | | | JP Morgan U.S. Government Money MarketFund - Institutional Share Class | | | 0.36% | ¨ | | | | | | | 69,571,410 | |
| | 69,571,410 | | | Morgan Stanley Institutional Liquidity Funds Government Portfolio - Institutional Share Class | | | 0.26% | ¨ | | | | | | | 69,571,410 | |
| | | | | | | | | | | | | | | | |
| | | | Total Short Term Investments
(Cost $208,714,230) | | | | 208,714,230 | |
| | | | | | | | | | | | | | | | |
| | | | Total Investments 99.2%
(Cost $7,072,454,173) | | | | 6,729,112,628 | |
| | | | Other Assets in Excess of Liabilities 0.8% | | | | 51,367,941 | |
| | | | | | | | | | | | | | | | |
| | | | NET ASSETS 100.0% | | | | | | | $ | 6,780,480,569 | |
| | | | | | | | | | | | | | | | |
| | | | | |
| SECURITY TYPE BREAKDOWNas a % of Net Assets: | |
Non-Agency Residential Collateralized Mortgage Obligations | | | | 18.3% | |
Non-Agency Commercial Mortgage Backed Obligations | | | | 15.6% | |
Foreign Corporate Bonds | | | | 14.4% | |
Collateralized Loan Obligations | | | | 13.6% | |
US Government and Agency Obligations | | | | 8.5% | |
Asset Backed Obligations | | | | 8.3% | |
US Government and Agency Mortgage Backed Obligations | | | | 7.7% | |
US Corporate Bonds | | | | 5.8% | |
Short Term Investments | | | | 3.1% | |
Bank Loans | | | | 2.3% | |
Foreign Government Bonds, Foreign Agencies and Foreign Government Sponsored Corporations | | | | 0.9% | |
Affiliated Mutual Funds | | | | 0.7% | |
Exchange Traded Funds and Common Stocks | | | | 0.0% | ~ |
Other Assets and Liabilities | | | | 0.8% | |
| | | | | |
| | | | 100.0% | |
| | | | | |
| | | | | |
| INVESTMENT BREAKDOWNas a % of Net Assets: | | | | | |
Non-Agency Residential Collateralized Mortgage Obligations | | | | 18.3% | |
Non-Agency Commercial Mortgage Backed Obligations | | | | 15.6% | |
Collateralized Loan Obligations | | | | 13.6% | |
US Government and Agency Obligations | | | | 8.5% | |
Asset Backed Obligations | | | | 8.3% | |
Banking | | | | 8.0% | |
US Government and Agency Mortgage Backed Obligations | | | | 7.7% | |
Short Term Investments | | | | 3.1% | |
Energy | | | | 2.4% | |
Telecommunications | | | | 1.5% | |
Transportation | | | | 1.3% | |
Healthcare | | | | 1.1% | |
Foreign Government Bonds, Foreign Agencies and Foreign Government Sponsored Corporations | | | | 0.9% | |
Pharmaceuticals | | | | 0.8% | |
Chemicals/Plastics | | | | 0.7% | |
Affiliated Mutual Funds | | | | 0.7% | |
Finance | | | | 0.7% | |
Consumer Products | | | | 0.6% | |
Mining | | | | 0.6% | |
Utilities | | | | 0.6% | |
Food Products | | | | 0.4% | |
Building and Development (including Steel/Metals) | | | | 0.4% | |
Electronics/Electric | | | | 0.4% | |
Technology | | | | 0.3% | |
Media | | | | 0.3% | |
Automotive | | | | 0.3% | |
Aerospace & Defense | | | | 0.3% | |
Food Service | | | | 0.3% | |
Insurance | | | | 0.2% | |
Business Equipment and Services | | | | 0.2% | |
Diversified Manufacturing | | | | 0.2% | |
Real Estate | | | | 0.2% | |
Pulp & Paper | | | | 0.2% | |
Beverage and Tobacco | | | | 0.1% | |
Environmental Control | | | | 0.1% | |
Industrial Equipment | | | | 0.1% | |
Containers and Glass Products | | | | 0.1% | |
Commercial Services | | | | 0.1% | |
Financial Intermediaries | | | | 0.0% | ~ |
Other Assets and Liabilities | | | | 0.8% | |
| | | | | |
| | | | 100.0% | |
| | | | | |
| | | | | | |
| 52 | | DoubleLine Funds Trust | | | | The accompanying notes are an integral part of these financial statements. |
| ^ | Security exempt from registration under Rule 144A of the Securities Act of 1933. These securities may be resold in transactions exempt from registration to qualified institutional buyers. |
| # | Coupon rate is variable based on the weighted average coupon of the underlying collateral. To the extent the weighted average coupon of the underlying assets which comprise the collateral increases or decreases, the coupon rate of this security will increase or decrease correspondingly. The rate disclosed is as of March 31, 2020. |
| ± | Coupon rate is variable or floats based on components including but not limited to reference rate and spread. These securities may not indicate a reference rate and/or spread in their description. The rate disclosed is as of March 31, 2020. |
| I/O | Interest only security |
| § | The interest rate will step up if the issuer does not redeem the bond on or before a scheduled redemption date in accordance with the terms of the instrument. The interest rate shown is the rate in effect as of March 31, 2020. |
| ß | The interest rate may step up conditioned upon the aggregate remaining principal balance of the underlying mortgage loans being reduced below a targeted percentage of the aggregate original principal balance of the mortgage loans. The interest rate shown is the rate in effect as of March 31, 2020. |
| ¨ | Seven-day yield as of March 31, 2020 |
| ~ | Represents less than 0.05% of net assets |
A summary of the DoubleLine Low Duration Bond Fund’s investments in affiliated mutual funds for the year ended March 31, 2020 is as follows:
| | | | | | | | | | | | | | | | | | | | | | | | | | | | | | | | | | | | | | | | |
| Fund | | Value at
March 31,
2019 | | Gross
Purchases | | Gross
Sales | | Shares Held at
March 31,
2020 | | Value at
March 31,
2020 | | Change in
Unrealized for the
Year Ended
March 31,
2020 | | Dividend Income
Earned in the
Year Ended
March 31,
2020 | | Net Realized
Gain (Loss) in
the Year Ended
March 31,
2020 |
DoubleLine Low Duration Emerging Markets Fixed Income Fund (Class I) | | | $ | 49,000,000 | | | | $ | — | | | | $ | — | | | | | 5,000,000 | | | | $ | 46,800,000 | | | | $ | (2,200,000 | ) | | | $ | 1,965,707 | | | | $ | — | |
| | | | | | |
| The accompanying notes are an integral part of these financial statements. | | Annual Report | | March 31, 2020 | | 53 |
| | |
| Schedule of Investments DoubleLine Floating Rate Fund | | March 31, 2020 |
| | | | | | | | | | | | | | | | |
PRINCIPAL
AMOUNT $ | | | SECURITY DESCRIPTION | | RATE | | | MATURITY | | | VALUE $ | |
| | BANK LOANS 82.3% | | | | | | | | | | | | |
| | |
| | AEROSPACE & DEFENSE 2.0% | |
| |
| | | | American Airlines, Inc., | |
| | 250,052 | | | Senior Secured First Lien Term Loan (1 Month LIBOR USD + 1.75%) | | | 2.69% | | | | 01/29/2027 | | | | 207,699 | |
| |
| | | | Dynasty Acquisition Company, Inc., | |
| | 595,784 | | | Senior Secured First Lien Term Loan (3 Month LIBOR USD + 3.50%) | | | 4.95% | | | | 04/06/2026 | | | | 483,330 | |
| | 320,314 | | | Senior Secured First Lien Term Loan (3 Month LIBOR USD + 3.50%) | | | 4.95% | | | | 04/06/2026 | | | | 259,855 | |
| |
| | | | Kestrel Bidco, Inc., | |
| | 1,561,088 | | | Senior Secured First Lien Term Loan (3 Month LIBOR USD + 3.00%, 1.00% Floor) | | | 4.00% | | | | 12/11/2026 | | | | 1,228,053 | |
| |
| | | | Syncreon Group Holdings B.V., | |
| | 426,716 | | | Senior Secured First Lien Term Loan (1 Month LIBOR USD + 5.00%) | | | 6.07% | | | | 10/01/2024 | | | | 369,109 | |
| | 763,301 | | | Senior Secured First Lien Term Loan (1 Month LIBOR USD + 6.00%) | | | 7.45% | | | | 04/01/2025 | | | | 515,228 | |
| |
| | | | WP CPP Holdings LLC, | |
| | | | Senior Secured First Lien Term Loan | | | | | | | | | | | | |
| | 3,412 | | | (1 Month LIBOR USD + 3.75%, 1.00% Floor) | | | 5.36% | | | | 04/30/2025 | | | | 2,602 | |
| | 1,418,361 | | | (3 Month LIBOR USD + 3.75%, 1.00% Floor) | | | 5.53% | | | | 04/30/2025 | | | | 1,081,500 | |
| | | | | | | | | | | | | | | | |
| | | | | | | | | | | | | | | 4,147,376 | |
| | | | | | | | | | | | | | | | |
| | AUTOMOTIVE 1.7% | |
| |
| | | | American Tire Distributors, Inc., | |
| | | | Senior Secured First Lien Term Loan | | | | | | | | | | | | |
| | 650,871 | | | (1 Month LIBOR USD + 7.50%, 1.00% Floor, 8.00% PIK) | | | 8.50% | | | | 09/02/2024 | | | | 439,338 | |
| | 82,175 | | | (3 Month LIBOR USD + 7.50%, 1.00% Floor, 8.00% PIK) | | | 8.95% | | | | 09/02/2024 | | | | 55,468 | |
| | | | |
| | | | Dealer Tire, LLC, | | | | | | | | | | | | |
| | 144,638 | | | Senior Secured First Lien Term Loan (1 Month LIBOR USD + 4.25%) | | | 5.24% | | | | 12/12/2025 | | | | 120,290 | |
| | | | |
| | | | IAA, Inc., | | | | | | | | | | | | |
| | 382,163 | | | Senior Secured First Lien Term Loan (1 Month LIBOR USD + 2.25%) | | | 3.25% | | | | 06/29/2026 | | | | 366,876 | |
| |
| | | | Mavis Tire Express Services Corporation, | |
| | 997,737 | | | Senior Secured First Lien Term Loan (1 Month LIBOR USD + 3.25%) | | | 4.70% | | | | 03/20/2025 | | | | 809,414 | |
| |
| | | | Panther BF Aggregator LP, | |
| | 507,450 | | | Senior Secured First Lien Term Loan (1 Month LIBOR USD + 3.50%) | | | 4.44% | | | | 04/30/2026 | | | | 466,854 | |
| |
| | | | Wand NewCo 3, Inc., | |
| | | | Senior Secured First Lien Term Loan | | | | | | | | | | | | |
| | 180,652 | | | (3 Month LIBOR USD + 3.00%) | | | 4.07% | | | | 02/05/2026 | | | | 163,490 | |
| | 1,144,751 | | | (6 Month LIBOR USD + 3.00%) | | | 4.07% | | | | 02/05/2026 | | | | 1,036,000 | |
| | | | | | | | | | | | | | | | |
| | | | | | | | | | | | | | | 3,457,730 | |
| | | | | | | | | | | | | | | | |
| | BEVERAGE AND TOBACCO 0.2% | |
| | | | |
| | | | Arctic Glacier, Inc., | | | | | | | | | | | | |
| | 585,285 | | | Senior Secured First Lien Term Loan (1 Month LIBOR USD + 3.50%, 1.00% Floor) | | | 4.95% | | | | 03/20/2024 | | | | 482,860 | |
| | | | | | | | | | | | | | | | |
| | | | | | | | | | | | | | | | |
PRINCIPAL
AMOUNT $ | | | SECURITY DESCRIPTION | | RATE | | | MATURITY | | | VALUE $ | |
| | BUILDING AND DEVELOPMENT (INCLUDING STEEL/METALS) 2.8% | |
| |
| | | | Advanced Drainage Systems, Inc., | |
| | 435,254 | | | Senior Secured First Lien Term Loan (1 Month LIBOR USD + 2.25%) | | | 3.23% | | | | 07/31/2026 | | | | 406,962 | |
| |
| | | | Aleris International, Inc., | |
| | 1,327,278 | | | Senior Secured First Lien Term Loan (1 Month LIBOR USD + 4.75%) | | | 5.74% | | | | 02/27/2023 | | | | 1,202,846 | |
| |
| | | | Arconic Corporation, | |
| | 565,000 | | | Senior Secured First Lien Term Loan | | | 4.66% | ± | | | 02/04/2027 | | | | 516,975 | |
| |
| | | | Foresight Energy LLC, | |
| | 178,334 | | | Senior Secured First Lien Delayed-Draw Term Loan (1 Month LIBOR USD + 11.00%, 2.00% Floor) | | | 13.00% | & | | | 09/10/2020 | | | | 172,984 | |
| | 2,162,786 | | | Senior Secured First Lien Term Loan (3 Month LIBOR USD + 5.75%, 1.00% Floor) | | | 7.36% | W | | | 03/28/2022 | | | | 367,674 | |
| |
| | | | Forest City Enterprises L.P., | |
| | 1,417,387 | | | Senior Secured First Lien Term Loan (1 Month LIBOR USD + 3.50%) | | | 4.49% | | | | 12/08/2025 | | | | 1,233,126 | |
| |
| | | | GrafTech Finance, Inc., | |
| | 1,171,049 | | | Senior Secured First Lien Term Loan (1 Month LIBOR USD + 3.50%, 1.00% Floor) | | | 4.50% | | | | 02/12/2025 | | | | 1,024,668 | |
| |
| | | | KBR, Inc., | |
| | 80,000 | | | Senior Secured First Lien Term Loan (1 Month LIBOR USD + 2.75%) | | | 3.74% | | | | 02/05/2027 | | | | 71,766 | |
| |
| | | | Phoenix Services International LLC, | |
| | 348,648 | | | Senior Secured First Lien Term Loan (1 Month LIBOR USD + 3.75%, 1.00% Floor) | | | 4.75% | | | | 03/03/2025 | | | | 287,635 | |
| |
| | | | Pisces Midco, Inc., | |
| | 517,367 | | | Senior Secured First Lien Term Loan (1 Month LIBOR USD + 3.75%) | | | 4.56% | | | | 04/12/2025 | | | | 443,642 | |
| | | | | | | | | | | | | | | | |
| | | | | | | | | | | | | | | 5,728,278 | |
| | | | | | | | | | | | | | | | |
| | BUSINESS EQUIPMENT AND SERVICES 10.2% | |
| | | | |
| | | | AlixPartners LLP, | | | | | | | | | | | | |
| | 858,363 | | | Senior Secured First Lien Term Loan (1 Month LIBOR USD + 2.75%, 1.00% Floor) | | | 3.50% | | | | 04/04/2024 | | | | 826,175 | |
| |
| | | | Allied Universal Holdco LLC, | |
| | 1,448,622 | | | Senior Secured First Lien Term Loan (6 Month LIBOR USD + 4.25%) | | | 5.24% | | | | 07/10/2026 | | | | 1,347,218 | |
| | | | |
| | | | Amentum Holdings LLC, | | | | | | | | | | | | |
| | 240,000 | | | Senior Secured First Lien Term Loan (1 Month LIBOR USD + 4.00%) | | | 4.99% | | | | 02/01/2027 | | | | 224,400 | |
| |
| | | | Brand Energy & Infrastructure Services, Inc., | |
| | | | Senior Secured First Lien Term Loan | | | | | | | | | | | | |
| | 280,428 | | | (3 Month LIBOR USD + 4.25%, 1.00% Floor) | | | 5.64% | | | | 06/21/2024 | | | | 227,452 | |
| | 4,685 | | | (3 Month LIBOR USD + 4.25%, 1.00% Floor) | | | 5.70% | | | | 06/21/2024 | | | | 3,800 | |
| | 323,323 | | | (3 Month LIBOR USD + 4.25%, 1.00% Floor) | | | 6.06% | | | | 06/21/2024 | | | | 262,244 | |
| | | | | | |
| 54 | | DoubleLine Funds Trust | | | | The accompanying notes are an integral part of these financial statements. |
| | | | | | | | | | | | | | | | |
PRINCIPAL
AMOUNT $ | | | SECURITY DESCRIPTION | | RATE | | | MATURITY | | | VALUE $ | |
| |
| | | | Camelot US Acquisition Company, | |
| | 1,381,538 | | | Senior Secured First Lien Term Loan (1 Month LIBOR USD + 3.25%) | | | 4.24% | | | | 10/30/2026 | | | | 1,319,368 | |
| |
| | | | Clear Channel Outdoor Holdings, Inc., | |
| | 263,675 | | | Senior Secured First Lien Term Loan (1 Month LIBOR USD + 3.50%) | | | 4.49% | | | | 08/21/2026 | | | | 224,124 | |
| |
| | | | Cvent, Inc., | |
| | 1,117,398 | | | Senior Secured First Lien Term Loan (1 Month LIBOR USD + 3.75%, 1.00% Floor) | | | 4.75% | | | | 11/29/2024 | | | | 813,840 | |
| |
| | | | Deerfield Holdings Corporation, | |
| | 910,000 | | | Senior Secured First Lien Term Loan | | | 4.75% | ± | | | 02/25/2027 | | | | 782,600 | |
| | 1,021,143 | | | Senior Secured First Lien Term Loan (1 Month LIBOR USD + 3.25%, 1.00% Floor) | | | 4.25% | | | | 02/13/2025 | | | | 1,008,379 | |
| |
| | | | Dun & Bradstreet Corporation, | |
| | 1,469,181 | | | Senior Secured First Lien Term Loan (1 Month LIBOR USD + 5.00%) | | | 4.96% | | | | 02/06/2026 | | | | 1,335,118 | |
| |
| | | | EAB Global, Inc., | |
| | 1,432,722 | | | Senior Secured First Lien Term Loan (6 Month LIBOR USD + 3.75%, 1.00% Floor) | | | 5.74% | | | | 11/15/2024 | | | | 1,171,608 | |
| |
| | | | Flexential Intermediate Corporation, | |
| | 616,837 | | | Senior Secured First Lien Term Loan (3 Month LIBOR USD + 3.50%) | | | 4.95% | | | | 08/01/2024 | | | | 443,351 | |
| |
| | | | Genesys Telecommunications Laboratories, Inc., | |
| | 1,717,062 | | | Senior Secured First Lien Term Loan (1 Month LIBOR USD + 3.25%) | | | 4.24% | | | | 12/01/2023 | | | | 1,622,624 | |
| |
| | | | ION Trading Technologies SARL, | |
| | 756,729 | | | Senior Secured First Lien Term Loan (3 Month LIBOR USD + 4.00%, 1.00% Floor) | | | 5.07% | | | | 11/21/2024 | | | | 630,609 | |
| |
| | | | IRI Holdings, Inc., | |
| | 396,985 | | | Senior Secured First Lien Term Loan (3 Month LIBOR USD + 4.50%) | | | 6.11% | | | | 12/01/2025 | | | | 318,084 | |
| |
| | | | KAR Auction Services, Inc., | |
| | 500,309 | | | Senior Secured First Lien Term Loan (1 Month LIBOR USD + 2.25%) | | | 3.19% | | | | 09/19/2026 | | | | 465,287 | |
| |
| | | | Kronos, Inc., | |
| | 1,562,153 | | | Senior Secured First Lien Term Loan (3 Month LIBOR USD + 3.00%, 1.00% Floor) | | | 4.76% | | | | 11/01/2023 | | | | 1,439,376 | |
| |
| | | | Mitchell International, Inc., | |
| | 1,169,036 | | | Senior Secured First Lien Term Loan (1 Month LIBOR USD + 3.25%) | | | 4.24% | | | | 11/29/2024 | | | | 981,990 | |
| | 250,000 | | | Senior Secured Second Lien Term Loan (1 Month LIBOR USD + 7.25%) | | | 8.24% | | | | 12/01/2025 | | | | 196,666 | |
| |
| | | | Presidio Holdings, Inc., | |
| | 210,000 | | | Senior Secured First Lien Term Loan (3 Month LIBOR USD + 3.50%) | | | 5.28% | | | | 01/22/2027 | | | | 197,400 | |
| |
| | | | Prime Security Services Borrower, LLC, | |
| | 1,024,850 | | | Senior Secured First Lien Term Loan (1 Month LIBOR USD + 3.25%, 1.00% Floor) | | | 4.27% | | | | 09/23/2026 | | | | 931,076 | |
| | | | | | | | | | | | | | | | |
PRINCIPAL
AMOUNT $ | | | SECURITY DESCRIPTION | | RATE | | | MATURITY | | | VALUE $ | |
| |
| | | | Rockwood Service Corporation, | |
| | 40,000 | | | Senior Secured First Lien Term Loan (3 Month LIBOR USD + 4.25%) | | | 5.70% | | | | 01/23/2027 | | | | 34,600 | |
| |
| | | | ServiceMaster Company LLC, | |
| | 413,963 | | | Senior Secured First Lien Term Loan (1 Month LIBOR USD + 1.75%) | | | 2.74% | | | | 11/05/2026 | | | | 398,646 | |
| |
| | | | SIWF Holdings, Inc., | |
| | 482,544 | | | Senior Secured First Lien Term Loan (1 Month LIBOR USD + 4.25%) | | | 5.32% | | | | 06/13/2025 | | | | 434,290 | |
| |
| | | | SMG US Midco 2, Inc., | |
| | 167,883 | | | Senior Secured First Lien Term Loan (1 Month LIBOR USD + 2.50%) | | | 4.13% | | | | 01/23/2025 | | | | 144,799 | |
| |
| | | | Southern Graphics, Inc., | |
| | 820,481 | | | Senior Secured First Lien Term Loan (1 Month LIBOR USD + 3.25%) | | | 4.70% | | | | 12/30/2022 | | | | 441,009 | |
| |
| | | | Tempo Acquisition LLC, | |
| | 1,462,813 | | | Senior Secured First Lien Term Loan (1 Month LIBOR USD + 3.00%) | | | 3.74% | | | | 05/01/2024 | | | | 1,328,234 | |
| |
| | | | Trans Union LLC, | |
| | 621,803 | | | Senior Secured First Lien Term Loan (1 Month LIBOR USD + 1.75%) | | | 2.74% | | | | 11/13/2026 | | | | 599,418 | |
| |
| | | | Travelport Finance SARL, | |
| | 830,825 | | | Senior Secured First Lien Term Loan (3 Month LIBOR USD + 5.00%) | | | 6.07% | | | | 05/29/2026 | | | | 545,021 | |
| | | | | | | | | | | | | | | | |
| | | | | | | | | | | | | | | 20,698,806 | |
| | | | | | | | | | | | | | | | |
| | CHEMICALS/PLASTICS 2.7% | |
| | | | |
| | | | Charter NEX US, Inc., | | | | | | | | | | | | |
| | 683,570 | | | Senior Secured First Lien Term Loan (1 Month LIBOR USD + 3.50%) | | | 4.49% | | | | 05/16/2024 | | | | 602,680 | |
| |
| | | | Cyanco Intermediate Corporation, | |
| | 397,925 | | | Senior Secured First Lien Term Loan (1 Month LIBOR USD + 3.50%) | | | 4.49% | | | | 03/17/2025 | | | | 342,218 | |
| |
| | | | Diamond B.V., | |
| | 1,134,731 | | | Senior Secured First Lien Term Loan (3 Month LIBOR USD + 3.00%) | | | 4.78% | | | | 09/06/2024 | | | | 866,180 | |
| |
| | | | Messer Industries LLC, | |
| | 522,291 | | | Senior Secured First Lien Term Loan (3 Month LIBOR USD + 2.50%) | | | 3.95% | | | | 03/02/2026 | | | | 467,451 | |
| |
| | | | Natgasoline LLC, | |
| | 698,048 | | | Senior Secured First Lien Term Loan (1 Month LIBOR USD + 3.50%) | | | 5.44% | | | | 11/14/2025 | | | | 610,792 | |
| |
| | | | Pregis Topco LLC, | |
| | 907,725 | | | Senior Secured First Lien Term Loan (3 Month LIBOR USD + 4.00%) | | | 4.99% | | | | 07/31/2026 | | | | 798,798 | |
| |
| | | | Solenis International LP, | |
| | 1,082,137 | | | Senior Secured First Lien Term Loan (3 Month LIBOR USD + 4.00%) | | | 5.61% | | | | 06/26/2025 | | | | 872,927 | |
| | 55,000 | | | Senior Secured Second Lien Term Loan (3 Month LIBOR USD + 8.50%) | | | 10.11% | | | | 06/26/2026 | | | | 38,225 | |
| | | | | | |
| The accompanying notes are an integral part of these financial statements. | | Annual Report | | March 31, 2020 | | 55 |
| | |
| Schedule of Investments DoubleLine Floating Rate Fund (Cont.) | | March 31, 2020 |
| | | | | | | | | | | | | | | | |
PRINCIPAL
AMOUNT $ | | | SECURITY DESCRIPTION | | RATE | | | MATURITY | | | VALUE $ | |
| |
| | | | Starfruit US Holdco LLC, | |
| | 636,700 | | | Senior Secured First Lien Term Loan (1 Month LIBOR USD + 3.25%) | | | 3.86% | | | | 10/01/2025 | | | | 577,805 | |
| |
| | | | Univar Solutions USA, Inc., | |
| | 279,300 | | | Senior Secured First Lien Term Loan (1 Month LIBOR USD + 2.00%) | | | 3.45% | | | | 07/01/2026 | | | | 248,446 | |
| | | | | | | | | | | | | | | | |
| | | | | | | | | | | | | | | 5,425,522 | |
| | | | | | | | | | | | | | | | |
| | CONTAINERS AND GLASS PRODUCTS 2.1% | |
| | | | |
| | | | Berry Global, Inc., | | | | | | | | | | | | |
| | 235,660 | | | Senior Secured First Lien Term Loan (1 Month LIBOR USD + 2.00%) | | | 2.86% | | | | 10/03/2022 | | | | 227,313 | |
| |
| | | | Flex Acquisition Company Inc, | |
| | 625,000 | | | Senior Secured First Lien Term Loan (3 Month LIBOR USD + 3.00%, 1.00% Floor) | | | 4.43% | | | | 12/29/2023 | | | | 575,000 | |
| | 675,000 | | | Senior Secured First Lien Term Loan (3 Month LIBOR USD + 3.25%) | | | 4.68% | | | | 06/30/2025 | | | | 621,000 | |
| |
| | | | Klockner-Pentaplast of America, Inc., | |
| | 696,936 | | | Senior Secured First Lien Term Loan (1 Month LIBOR USD + 4.25%, 1.00% Floor) | | | 5.25% | | | | 06/30/2022 | | | | 493,473 | |
| |
| | | | Reynolds Consumer Products LLC, | |
| | 450,000 | | | Senior Secured First Lien Term Loan (3 Month LIBOR USD + 1.75%) | | | 3.50% | | | | 02/04/2027 | | | | 427,275 | |
| |
| | | | Reynolds Group Holdings, Inc., | |
| | 1,330,151 | | | Senior Secured First Lien Term Loan (1 Month LIBOR USD + 2.75%) | | | 3.74% | | | | 02/06/2023 | | | | 1,266,969 | |
| |
| | | | Trident TPI Holdings, Inc., | |
| | | | Senior Secured First Lien Term Loan | | | | | | | | | | | | |
| | 1,785 | | | (3 Month LIBOR USD + 3.25%, 1.00% Floor) | | | 4.70% | | | | 10/17/2024 | | | | 1,499 | |
| | 684,704 | | | (6 Month LIBOR USD + 3.25%, 1.00% Floor) | | | 4.32% | | | | 10/17/2024 | | | | 575,151 | |
| | | | | | | | | | | | | | | | |
| | | | | | | | | | | | | | | 4,187,680 | |
| | | | | | | | | | | | | | | | |
| | ELECTRONICS/ELECTRIC 11.1% | |
| | | | |
| | | | Access CIG LLC, | | | | | | | | | | | | |
| | 1,151,750 | | | Senior Secured First Lien Term Loan (1 Month LIBOR USD + 3.75%) | | | 5.53% | | | | 02/27/2025 | | | | 948,754 | |
| |
| | | | Almonde, Inc., | |
| | 1,265,767 | | | Senior Secured First Lien Term Loan (6 Month LIBOR USD + 3.50%, 1.00% Floor) | | | 5.28% | | | | 06/13/2024 | | | | 1,093,832 | |
| | 500,000 | | | Senior Secured Second Lien Term Loan (6 Month LIBOR USD + 7.25%, 1.00% Floor) | | | 9.03% | | | | 06/16/2025 | | | | 384,000 | |
| |
| | | | Blackhawk Network Holdings, Inc., | |
| | 1,432,795 | | | Senior Secured First Lien Term Loan (1 Month LIBOR USD + 3.00%) | | | 3.99% | | | | 06/16/2025 | | | | 1,186,147 | |
| |
| | | | Castle US Holding Corporation, | |
| | 1,530,000 | | | Senior Secured First Lien Term Loan (1 Month LIBOR USD + 3.75%) | | | 5.20% | | | | 01/27/2027 | | | | 1,246,958 | |
| |
| | | | Excelitas Technologies Corporation, | |
| | 656,641 | | | Senior Secured First Lien Term Loan (3 Month LIBOR USD + 3.50%, 1.00% Floor) | | | 4.95% | | | | 12/02/2024 | | | | 574,561 | |
| | | | | | | | | | | | | | | | |
PRINCIPAL
AMOUNT $ | | | SECURITY DESCRIPTION | | RATE | | | MATURITY | | | VALUE $ | |
| |
| | | | Flexera Software LLC, | |
| | 931,826 | | | Senior Secured First Lien Term Loan (1 Month LIBOR USD + 3.25%, 1.00% Floor) | | | 4.50% | | | | 02/26/2025 | | | | 850,291 | |
| |
| | | | GoodRX, Inc., | |
| | 1,141,184 | | | Senior Secured First Lien Term Loan (1 Month LIBOR USD + 3.00%) | | | 3.74% | | | | 10/10/2025 | | | | 1,078,419 | |
| |
| | | | Hyland Software, Inc., | |
| | 1,215,222 | | | Senior Secured First Lien Term Loan (1 Month LIBOR USD + 3.50%, 0.75% Floor) | | | 4.85% | | | | 07/01/2024 | | | | 1,140,790 | |
| | 422,234 | | | Senior Secured Second Lien Term Loan (1 Month LIBOR USD + 7.00%, 0.75% Floor) | | | 7.99% | | | | 07/07/2025 | | | | 387,400 | |
| |
| | | | Informatica LLC, | |
| | 445,000 | | | Senior Secured First Lien Term Loan (1 Month LIBOR USD + 3.25%) | | | 4.24% | | | | 02/25/2027 | | | | 390,118 | |
| |
| | | | NCR Corporation, | |
| | 582,075 | | | Senior Secured First Lien Term Loan (1 Month LIBOR USD + 2.50%) | | | 3.49% | | | | 08/28/2026 | | | | 532,599 | |
| |
| | | | ON Semiconductor Corporation, | |
| | 447,750 | | | Senior Secured First Lien Term Loan (1 Month LIBOR USD + 2.00%) | | | 2.99% | | | | 09/18/2026 | | | | 423,683 | |
| |
| | | | Project Alpha Intermediate Holding, Inc., | |
| | 1,663,147 | | | Senior Secured First Lien Term Loan (6 Month LIBOR USD + 3.50%, 1.00% Floor) | | | 5.38% | | | | 04/26/2024 | | | | 1,513,464 | |
| |
| | | | Renaissance Holding Corporation, | |
| | 1,468,994 | | | Senior Secured First Lien Term Loan (1 Month LIBOR USD + 3.25%) | | | 4.24% | | | | 05/30/2025 | | | | 1,244,972 | |
| |
| | | | Science Applications International Corporation, | |
| | 535,000 | | | Senior Secured First Lien Term Loan (1 Month LIBOR USD + 2.25%) | | | 3.24% | | | | 03/12/2027 | | | | 506,912 | |
| |
| | | | Severin Acquisition LLC, | |
| | 1,481,339 | | | Senior Secured First Lien Term Loan (3 Month LIBOR USD + 3.25%) | | | 4.74% | | | | 08/01/2025 | | | | 1,301,112 | |
| |
| | | | Solera LLC, | |
| | 1,444,374 | | | Senior Secured First Lien Term Loan (1 Month LIBOR USD + 2.75%) | | | 4.36% | | | | 03/03/2023 | | | | 1,364,934 | |
| |
| | | | Sophia LP, | |
| | 1,734,309 | | | Senior Secured First Lien Term Loan (3 Month LIBOR USD + 3.25%, 1.00% Floor) | | | 4.70% | | | | 09/30/2022 | | | | 1,664,936 | |
| |
| | | | STG-Fairway Holdings, LLC, | |
| | 255,000 | | | Senior Secured First Lien Term Loan (6 Month LIBOR USD + 3.50%) | | | 4.57% | | | | 02/01/2027 | | | | 220,575 | |
| |
| | | | Surf Holdings LLC, | |
| | 1,245,000 | | | Senior Secured First Lien Term Loan (3 Month LIBOR USD + 3.50%) | | | 4.81% | | | | 03/05/2027 | | | | 1,117,387 | |
| |
| | | | TIBCO Software Inc, | |
| | 110,000 | | | Senior Secured Second Lien Term Loan (1 Month LIBOR USD + 7.25%) | | | 8.66% | | | | 03/03/2028 | | | | 105,050 | |
| |
| | | | Ultimate Software Group, | |
| | 1,224,625 | | | Senior Secured First Lien Term Loan (1 Month LIBOR USD + 3.75%) | | | 4.74% | | | | 05/04/2026 | | | | 1,153,186 | |
| | | | | | |
| 56 | | DoubleLine Funds Trust | | | | The accompanying notes are an integral part of these financial statements. |
| | | | | | | | | | | | | | | | |
PRINCIPAL
AMOUNT $ | | | SECURITY DESCRIPTION | | RATE | | | MATURITY | | | VALUE $ | |
| |
| | | | Vertafore, Inc., | |
| | 951,119 | | | Senior Secured First Lien Term Loan (1 Month LIBOR USD + 3.25%) | | | 4.24% | | | | 07/02/2025 | | | | 848,498 | |
| |
| | | | Web.Com Group, Inc., | |
| | 585,000 | | | Senior Secured First Lien Term Loan (1 Month LIBOR USD + 3.75%) | | | 4.95% | | | | 10/10/2025 | | | | 485,550 | |
| |
| | | | WeddingWire, Inc., | |
| | 821,264 | | | Senior Secured First Lien Term Loan (1 Month LIBOR USD + 4.50%) | | | 5.95% | | | | 12/19/2025 | | | | 718,606 | |
| | | | | | | | | | | | | | | | |
| | | | | | | | | | | | | | | 22,482,734 | |
| | | | | | | | | | | | | | | | |
| | ENERGY 2.4% | |
| |
| | | | Blackstone CQP Holdco LP, | |
| | 1,178,506 | | | Senior Secured First Lien Term Loan (3 Month LIBOR USD + 3.50%) | | | 4.62% | | | | 09/30/2024 | | | | 941,037 | |
| | | | |
| | | | Brazos Delaware LLC, | | | | | | | | | | | | |
| | 1,251,983 | | | Senior Secured First Lien Term Loan (1 Month LIBOR USD + 4.00%) | | | 4.92% | | | | 05/21/2025 | | | | 660,421 | |
| | | | |
| | | | Buckeye Partners LP, | | | | | | | | | | | | |
| | 990,000 | | | Senior Secured First Lien Term Loan (1 Month LIBOR USD + 2.75%) | | | 3.77% | | | | 11/02/2026 | | | | 916,245 | |
| | | | |
| | | | Gavilan Resources LLC, | | | | | | | | | | | | |
| | 620,000 | | | Senior Secured Second Lien Term Loan (1 Month LIBOR USD + 6.00%, 1.00% Floor) | | | 6.99% | | | | 03/01/2024 | | | | 74,400 | |
| |
| | | | Gulf Finance LLC, | |
| | | | Senior Secured First Lien Term Loan | | | | | | | | | | | | |
| | 441,397 | | | (1 Month LIBOR USD + 5.25%, 1.00% Floor) | | | 6.25% | | | | 08/25/2023 | | | | 229,968 | |
| | 265,630 | | | (3 Month LIBOR USD + 5.25%, 1.00% Floor) | | | 6.71% | | | | 08/25/2023 | | | | 138,393 | |
| |
| | | | Lower Cadence Holdings LLC, | |
| | 701,392 | | | Senior Secured First Lien Term Loan (1 Month LIBOR USD + 4.00%) | | | 4.99% | | | | 05/22/2026 | | | | 427,849 | |
| |
| | | | Lucid Energy Group II Borrower LLC, | |
| | 747,924 | | | Senior Secured First Lien Term Loan (1 Month LIBOR USD + 3.00%, 1.00% Floor) | | | 4.00% | | | | 02/18/2025 | | | | 433,172 | |
| |
| | | | McDermott International, Inc., | |
| | 447,040 | | | Senior Secured First Lien Term Loan (3 Month LIBOR USD + 5.00%, 1.00% Floor) | | | 2.00% | W | | | 05/12/2025 | | | | 137,588 | |
| |
| | | | Prairie ECI Acquiror LP, | |
| | 474,597 | | | Senior Secured First Lien Term Loan (3 Month LIBOR USD + 4.75%) | | | 6.20% | | | | 03/11/2026 | | | | 252,604 | |
| |
| | | | UGI Energy Services LLC, | |
| | 659,080 | | | Senior Secured First Lien Term Loan (1 Month LIBOR USD + 3.75%) | | | 4.74% | | | | 08/13/2026 | | | | 570,104 | |
| | | | | | | | | | | | | | | | |
| | | | | | | | | | | | | | | 4,781,781 | |
| | | | | | | | | | | | | | | | |
| | ENVIRONMENTAL CONTROL 0.1% | |
| |
| | | | US Ecology, Inc., | |
| | 329,175 | | | Senior Secured First Lien Term Loan (1 Month LIBOR USD + 2.50%) | | | 3.49% | | | | 11/02/2026 | | | | 317,654 | |
| | | | | | | | | | | | | | | | |
| | | | | | | | | | | | | | | | |
PRINCIPAL
AMOUNT $ | | | SECURITY DESCRIPTION | | RATE | | | MATURITY | | | VALUE $ | |
| | FINANCIAL INTERMEDIARIES 1.9% | |
| |
| | | | Millennium Trust Company LLC, | |
| | 1,424,643 | | | Senior Secured First Lien Term Loan (1 Month LIBOR USD + 5.00%) | | | 5.99% | | | | 03/27/2026 | | | | 1,208,568 | |
| |
| | | | RPI Intermediate Finance Trust, | |
| | 613,463 | | | Senior Secured First Lien Term Loan (1 Month LIBOR USD + 1.75%) | | | 2.74% | | | | 02/11/2027 | | | | 573,587 | |
| | 607,313 | | | Senior Secured First Lien Term Loan (1 Month LIBOR USD + 1.75%) | | | 2.74% | | | | 02/11/2027 | | | | 570,115 | |
| |
| | | | The Edelman Financial Center LLC, | |
| | 1,174,613 | | | Senior Secured First Lien Term Loan (1 Month LIBOR USD + 3.25%) | | | 4.18% | | | | 07/21/2025 | | | | 1,011,636 | |
| |
| | | | Victory Capital Holdings, Inc., | |
| | 498,545 | | | Senior Secured First Lien Term Loan (3 Month LIBOR USD + 2.50%) | | | 3.94% | | | | 07/01/2026 | | | | 441,213 | |
| | | | | | | | | | | | | | | | |
| | | | | | | | | | | | | | | 3,805,119 | |
| | | | | | | | | | | | | | | | |
| | FOOD PRODUCTS 3.4% | |
| |
| | | | B&G Foods, Inc., | |
| | 298,500 | | | Senior Secured First Lien Term Loan (1 Month LIBOR USD + 2.50%) | | | 3.49% | | | | 10/10/2026 | | | | 281,709 | |
| |
| | | | CHG PPC Parent LLC, | |
| | 1,433,540 | | | Senior Secured First Lien Term Loan (1 Month LIBOR USD + 2.75%) | | | 3.74% | | | | 03/31/2025 | | | | 1,297,354 | |
| |
| | | | CSM Bakery Solutions LLC, | |
| | 1,091,026 | | | Senior Secured First Lien Term Loan (3 Month LIBOR USD + 4.00%, 1.00% Floor) | | | 5.87% | | | | 07/03/2020 | | | | 902,825 | |
| |
| | | | Froneri US, Inc., | |
| | 700,000 | | | Senior Secured First Lien Term Loan (1 Month LIBOR USD + 2.25%) | | | 3.24% | | | | 01/29/2027 | | | | 672,000 | |
| |
| | | | H-Food Holdings, LLC, | |
| | 851,163 | | | Senior Secured First Lien Term Loan (1 Month LIBOR USD + 3.69%) | | | 4.68% | | | | 05/23/2025 | | | | 722,072 | |
| |
| | | | Jacobs Douwe Egberts International B.V., | |
| | 1,006,422 | | | Senior Secured First Lien Term Loan (1 Month LIBOR USD + 2.00%) | | | 3.00% | | | | 11/03/2025 | | | | 951,068 | |
| |
| | | | JBS USA Lux S.A., | |
| | 1,557,972 | | | Senior Secured First Lien Term Loan (1 Month LIBOR USD + 2.50%) | | | 3.07% | | | | 05/01/2026 | | | | 1,470,057 | |
| |
| | | | United Natural Foods, Inc., | |
| | 623,426 | | | Senior Secured First Lien Term Loan (1 Month LIBOR USD + 4.25%) | | | 5.24% | | | | 10/22/2025 | | | | 540,042 | |
| | | | | | | | | | | | | | | | |
| | | | | | | | | | | | | | | 6,837,127 | |
| | | | | | | | | | | | | | | | |
| | FOOD SERVICE 3.1% | |
| |
| | | | 1011778 B.C. Unlimited Liability Company, | |
| | 1,007,974 | | | Senior Secured First Lien Term Loan (1 Month LIBOR USD + 1.75%) | | | 2.67% | | | | 11/19/2026 | | | | 934,896 | |
| |
| | | | Aramark Services, Inc., | |
| | 585,000 | | | Senior Secured First Lien Term Loan (1 Month LIBOR USD + 1.75%) | | | 2.74% | | | | 01/15/2027 | | | | 546,975 | |
| | | | | | |
| The accompanying notes are an integral part of these financial statements. | | Annual Report | | March 31, 2020 | | 57 |
| | |
| Schedule of Investments DoubleLine Floating Rate Fund (Cont.) | | March 31, 2020 |
| | | | | | | | | | | | | | | | |
PRINCIPAL
AMOUNT $ | | | SECURITY DESCRIPTION | | RATE | | | MATURITY | | | VALUE $ | |
| |
| | | | Houston Foods, Inc., | |
| | 986,689 | | | Senior Secured First Lien Term Loan (1 Month LIBOR USD + 3.75%) | | | 4.74% | | | | 07/21/2025 | | | | 833,752 | |
| |
| | | | IRB Holding Corporation, | |
| | | | Senior Secured First Lien Term Loan | | | | | | | | | | | | |
| | 3,312 | | | (3 Month LIBOR USD + 2.75%, 1.00% Floor) | | | 3.75% | | | | 02/05/2025 | | | | 2,593 | |
| | 1,270,328 | | | (6 Month LIBOR USD + 2.75%, 1.00% Floor) | | | 3.75% | | | | 02/05/2025 | | | | 994,629 | |
| |
| | | | TKC Holdings, Inc., | |
| | 1,431,316 | | | Senior Secured First Lien Term Loan (1 Month LIBOR USD + 3.75%, 1.00% Floor) | | | 4.75% | | | | 02/01/2023 | | | | 1,169,743 | |
| |
| | | | US Foods, Inc., | |
| | 1,009,925 | | | Senior Secured First Lien Term Loan (3 Month LIBOR USD + 2.00%, 0.75% Floor) | | | 3.07% | | | | 09/14/2026 | | | | 931,151 | |
| |
| | | | Whatabrands LLC, | |
| | 1,024,856 | | | Senior Secured First Lien Term Loan (1 Month LIBOR USD + 2.75%) | | | 3.73% | | | | 07/31/2026 | | | | 859,065 | |
| | | | | | | | | | | | | | | | |
| | | | | | | | | | | | | | | 6,272,804 | |
| | | | | | | | | | | | | | | | |
| | FOOD/DRUG RETAILERS 0.8% | |
| |
| | | | GOBP Holdings Inc, | |
| | 1,662,143 | | | Senior Secured First Lien Term Loan (3 Month LIBOR USD + 2.75%) | | | 3.74% | | | | 10/22/2025 | | | | 1,562,415 | |
| | | | | | | | | | | | | | | | |
| | HEALTHCARE 11.5% | |
| |
| | | | Agiliti Health, Inc., | |
| | 694,845 | | | Senior Secured First Lien Term Loan (1 Month LIBOR USD + 3.00%) | | | 4.44% | | | | 01/05/2026 | | | | 670,526 | |
| |
| | | | Air Medical Group Holdings, Inc., | |
| | 1,194,551 | | | Senior Secured First Lien Term Loan (1 Month LIBOR USD + 3.25%, 1.00% Floor) | | | 4.93% | | | | 04/28/2022 | | | | 1,116,905 | |
| |
| | | | Air Methods Corporation, | |
| | 1,277,760 | | | Senior Secured First Lien Term Loan (3 Month LIBOR USD + 3.50%, 1.00% Floor) | | | 4.95% | | | | 04/22/2024 | | | | 912,889 | |
| |
| | | | Aldevron LLC, | |
| | 1,285,000 | | | Senior Secured First Lien Term Loan (1 Month LIBOR USD + 4.25%, 1.00% Floor) | | | 5.70% | | | | 10/13/2026 | | | | 1,214,325 | |
| |
| | | | Athenahealth, Inc., | |
| | | | Senior Secured First Lien Term Loan | | | | | | | | | | | | |
| | 148 | | | (1 Month LIBOR USD + 4.50%) | | | 5.31% | | | | 02/11/2026 | | | | 139 | |
| | 1,481,463 | | | (3 Month LIBOR USD + 4.50%) | | | 5.28% | | | | 02/11/2026 | | | | 1,392,575 | |
| |
| | | | Auris Luxembourg III Sarl, | |
| | 1,064,489 | | | Senior Secured First Lien Term Loan (1 Month LIBOR USD + 3.75%) | | | 4.74% | | | | 02/27/2026 | | | | 816,996 | |
| |
| | | | Avantor, Inc., | |
| | 581,849 | | | Senior Secured First Lien Term Loan (1 Month LIBOR USD + 3.00%, 1.00% Floor) | | | 3.25% | | | | 11/21/2024 | | | | 554,211 | |
| |
| | | | Azalea TopCo, | |
| | 1,432,837 | | | Inc., Senior Secured First Lien Term Loan (1 Month LIBOR USD + 3.50%) | | | 4.49% | | | | 07/24/2026 | | | | 1,328,957 | |
| | | | | | | | | | | | | | | | |
PRINCIPAL
AMOUNT $ | | | SECURITY DESCRIPTION | | RATE | | | MATURITY | | | VALUE $ | |
| |
| | | | CHG Healthcare Services, Inc., | |
| | | | Senior Secured First Lien Term Loan | | | | | | | | | | | | |
| | 646,280 | | | (1 Month LIBOR USD + 3.00%, 1.00% Floor) | | | 4.07% | | | | 06/07/2023 | | | | 582,728 | |
| | 1,685 | | | (3 Month LIBOR USD + 3.00%, 1.00% Floor) | | | 4.45% | | | | 06/07/2023 | | | | 1,519 | |
| |
| | | | DentalCorporationPerfect Smile ULC, | |
| | 1,391,764 | | | Senior Secured First Lien Term Loan (1 Month LIBOR USD + 3.75%, 1.00% Floor) | | | 4.75% | | | | 06/06/2025 | | | | 1,106,453 | |
| |
| | | | Elanco Animal Health, Inc., | |
| | 555,000 | | | Senior Secured First Lien Term Loan | | | 3.55% | ± | | | 02/26/2027 | | | | 531,412 | |
| |
| | | | Envision Healthcare Corporation, | |
| | 1,102,371 | | | Senior Secured First Lien Term Loan (1 Month LIBOR USD + 3.75%) | | | 4.74% | | | | 10/10/2025 | | | | 590,689 | |
| |
| | | | HC Group Holdings, Inc., | |
| | 1,142,138 | | | Senior Secured First Lien Term Loan (1 Month LIBOR USD + 4.50% | | | 5.49% | | | | 08/06/2026 | | | | 965,106 | |
| |
| | | | Kindred Healthcare, Inc., | |
| | 857,823 | | | Senior Secured First Lien Term Loan (1 Month LIBOR USD + 5.00%) | | | 6.00% | | | | 07/02/2025 | | | | 729,149 | |
| |
| | | | MED ParentCo LP, | |
| | 648,894 | | | Senior Secured First Lien Term Loan (1 Month LIBOR USD + 4.25%) | | | 5.24% | | | | 08/31/2026 | | | | 545,074 | |
| | | | Senior Secured First Lien Term Loan | | | | | | | | | | | | |
| | 85,899 | | | (1 Month LIBOR USD + 4.25%) | | | 5.18% | & | | | 08/31/2026 | | | | 72,156 | |
| | 76,574 | | | (1 Month LIBOR USD + 4.25%) | | | 5.24% | & | | | 08/31/2026 | | | | 64,323 | |
| |
| | | | MPH Acquisition Holdings LLC, | |
| | 1,115,859 | | | Senior Secured First Lien Term Loan (3 Month LIBOR USD + 2.75%, 1.00% Floor) | | | 4.20% | | | | 06/07/2023 | | | | 1,004,273 | |
| |
| | | | Outcomes Group Holdings, Inc., | |
| | 979,008 | | | Senior Secured First Lien Term Loan (3 Month LIBOR USD + 3.50%) | | | 5.11% | | | | 10/24/2025 | | | | 807,681 | |
| |
| | | | Parexel International Corporation, | |
| | 1,126,330 | | | Senior Secured First Lien Term Loan (1 Month LIBOR USD + 2.75%) | | | 3.74% | | | | 09/27/2024 | | | | 972,868 | |
| |
| | | | Radiology Partners, Inc., | |
| | | | Senior Secured First Lien Term Loan | | | | | | | | | | | | |
| | 524,455 | | | (2 Month LIBOR USD + 4.25%) | | | 5.98% | | | | 07/09/2025 | | | | 439,493 | |
| | 611,712 | | | (12 Month LIBOR USD + 4.25%) | | | 5.99% | | | | 07/09/2025 | | | | 512,615 | |
| |
| | | | RegionalCare Hospital Partners Holdings, Inc., | |
| | 422,607 | | | Senior Secured First Lien Term Loan (1 Month LIBOR USD + 4.50%) | | | 4.74% | | | | 11/14/2025 | | | | 394,611 | |
| |
| | | | Sotera Health Holdings LLC, | |
| | 1,460,000 | | | Senior Secured First Lien Term Loan (1 Month LIBOR USD + 4.50%, 1.00% Floor) | | | 5.50% | | | | 12/11/2026 | | | | 1,289,822 | |
| |
| | | | Sound Inpatient Physicians, Inc., | |
| | 1,606,284 | | | Senior Secured First Lien Term Loan (1 Month LIBOR USD + 2.75%) | | | 3.74% | | | | 06/27/2025 | | | | 1,440,306 | |
| | 300,000 | | | Senior Secured Second Lien Term Loan (1 Month LIBOR USD + 6.75%) | | | 7.74% | | | | 06/26/2026 | | | | 265,500 | |
| | | | | | |
| 58 | | DoubleLine Funds Trust | | | | The accompanying notes are an integral part of these financial statements. |
| | | | | | | | | | | | | | | | |
PRINCIPAL
AMOUNT $ | | | SECURITY DESCRIPTION | | RATE | | | MATURITY | | | VALUE $ | |
| |
| | | | Sunshine Luxembourg VII SARL, | |
| | 508,725 | | | Senior Secured First Lien Term Loan (3 Month LIBOR USD + 4.25%) | | | 5.32% | | | | 10/01/2026 | | | | 462,940 | |
| |
| | | | Team Health Holdings, Inc., | |
| | 597,537 | | | Senior Secured First Lien Term Loan (1 Month LIBOR USD + 2.75%, 1.00% Floor) | | | 3.75% | | | | 02/06/2024 | | | | 385,411 | |
| |
| | | | Upstream Newco, Inc., | |
| | 560,000 | | | Senior Secured First Lien Term Loan (1 Month LIBOR USD + 4.50%) | | | 5.49% | | | | 11/20/2026 | | | | 467,600 | |
| |
| | | | Wink Holdco, Inc., | |
| | 1,447,194 | | | Senior Secured First Lien Term Loan (1 Month LIBOR USD + 3.00%, 1.00% Floor) | | | 4.45% | | | | 12/02/2024 | | | | 1,235,904 | |
| |
| | | | Zelis Cost Management Buyer, Inc., | |
| | 384,038 | | | Senior Secured First Lien Term Loan (1 Month LIBOR USD + 4.75%) | | | 5.74% | | | | 09/30/2026 | | | | 357,155 | |
| | | | | | | | | | | | | | | | |
| | | | | | | | | | | | | | | 23,232,311 | |
| | | | | | | | | | | | | | | | |
| | HOTELS/MOTELS/INNS AND CASINOS 1.7% | |
| |
| | | | CEOC LLC, | |
| | 663,941 | | | Senior Secured First Lien Term Loan (1 Month LIBOR USD + 2.00%) | | | 2.99% | | | | 10/04/2024 | | | | 547,752 | |
| |
| | | | Golden Nugget, Inc., | |
| | | | Senior Secured First Lien Term Loan | | | | | | | | | | | | |
| | 824,467 | | | (1 Month LIBOR USD + 2.50%, 0.75% Floor) | | | 4.10% | | | | 10/04/2023 | | | | 647,207 | |
| | 703,740 | | | (3 Month LIBOR USD + 2.50%, 0.75% Floor) | | | 3.70% | | | | 10/04/2023 | | | | 552,436 | |
| |
| | | | PCI Gaming Authority, | |
| | 439,135 | | | Senior Secured First Lien Term Loan (1 Month LIBOR USD + 3.00%) | | | 3.49% | | | | 05/29/2026 | | | | 364,043 | |
| |
| | | | Penn National Gaming, Inc., | |
| | 400,940 | | | Senior Secured First Lien Term Loan (1 Month LIBOR USD + 2.25%, 0.75% Floor) | | | 3.24% | | | | 10/15/2025 | | | | 307,541 | |
| |
| | | | VICI Properties LLC, | |
| | 1,005,040 | | | Senior Secured First Lien Term Loan (1 Month LIBOR USD + 2.00%) | | | 2.67% | | | | 12/20/2024 | | | | 935,315 | |
| | | | | | | | | | | | | | | | |
| | | | | | | | | | | | | | | 3,354,294 | |
| | | | | | | | | | | | | | | | |
| | INDUSTRIAL EQUIPMENT 1.5% | |
| |
| | | | CPM Holdings, Inc., | |
| | | | Senior Secured First Lien Term Loan | | | | | | | | | | | | |
| | 656,423 | | | (1 Month LIBOR USD + 3.75%) | | | 4.73% | | | | 11/17/2025 | | | | 544,174 | |
| | 1,645 | | | (6 Month LIBOR USD + 3.75%) | | | 4.84% | | | | 11/17/2025 | | | | 1,364 | |
| |
| | | | Gardner Denver, Inc., | |
| | 390,000 | | | Senior Secured First Lien Term Loan (1 Month LIBOR USD + 1.75%) | | | 2.74% | | | | 03/01/2027 | | | | 369,037 | |
| |
| | | | Gates Global LLC, | |
| | 350,000 | | | Senior Secured First Lien Term Loan (1 Month LIBOR USD + 2.75%, 1.00% Floor) | | | 3.75% | | | | 04/01/2024 | | | | 308,350 | |
| | | | | | | | | | | | | | | | |
PRINCIPAL
AMOUNT $ | | | SECURITY DESCRIPTION | | RATE | | | MATURITY | | | VALUE $ | |
| |
| | | | Pro Mach Group, Inc., | |
| | 661,624 | | | Senior Secured First Lien Term Loan (1 Month LIBOR USD + 3.00%) | | | 3.68% | | | | 03/07/2025 | | | | 532,608 | |
| |
| | | | TAMKO Building Products LLC, | |
| | | | Senior Secured First Lien Term Loan | | | 4.24% | | | | | | | | | |
| | 479,155 | | | (1 Month LIBOR USD + 3.25%) | | | 4.24% | | | | 05/29/2026 | | | | 452,801 | |
| | 92,970 | | | (1 Month LIBOR USD + 3.25%) | | | 4.25% | | | | 05/29/2026 | | | | 87,857 | |
| |
| | | | Titan Acquisition Ltd., | |
| | 925,279 | | | Senior Secured First Lien Term Loan (1 Month LIBOR USD + 3.00%) | | | 4.45% | | | | 03/28/2025 | | | | 770,027 | |
| | | | | | | | | | | | | | | | |
| | | | | | | | | | | | | | | 3,066,218 | |
| | | | | | | | | | | | | | | | |
| | INSURANCE 3.6% | |
| |
| | | | Achilles Acquisition LLC, | |
| | 1,208,945 | | | Senior Secured First Lien Term Loan (1 Month LIBOR USD + 4.00%) | | | 5.00% | | | | 10/13/2025 | | | | 1,072,939 | |
| |
| | | | Alera Group Intermediate Holdings, Inc., | |
| | | | Senior Secured First Lien Term Loan | | | | | | | | | | | | |
| | 3,027 | | | (1 Month LIBOR USD + 4.00%) | | | 4.99% | | | | 08/01/2025 | | | | 2,664 | |
| | 1,207,687 | | | (6 Month LIBOR USD + 4.00%) | | | 5.07% | | | | 08/01/2025 | | | | 1,062,764 | |
| |
| | | | Alliant Holdings Intermediate LLC, | |
| | 1,022,275 | | | Senior Secured First Lien Term Loan (1 Month LIBOR USD + 3.25%) | | | 3.86% | | | | 05/09/2025 | | | | 938,960 | |
| |
| | | | AssuredPartners, Inc., | |
| | 2,001,136 | | | Senior Secured First Lien Term Loan (1 Month LIBOR USD + 3.50%) | | | 4.49% | | | | 02/12/2027 | | | | 1,766,003 | |
| |
| | | | Asurion LLC, | |
| | 854,841 | | | Senior Secured Second Lien Term Loan (1 Month LIBOR USD + 6.50%) | | | 7.49% | | | | 08/04/2025 | | | | 792,331 | |
| |
| | | | Frontdoor, Inc., | |
| | 487,726 | | | Senior Secured First Lien Term Loan (1 Month LIBOR USD + 2.50%) | | | 3.50% | | | | 08/18/2025 | | | | 470,655 | |
| |
| | | | Sedgwick Claims Management Services, Inc., | |
| | 1,446,845 | | | Senior Secured First Lien Term Loan (1 Month LIBOR USD + 3.25%) | | | 4.24% | | | | 12/31/2025 | | | | 1,294,326 | |
| | | | | | | | | | | | | | | | |
| | | | | | | | | | | | | | | 7,400,642 | |
| | | | | | | | | | | | | | | | |
| | LEISURE 3.0% | |
| |
| | | | Alterra Mountain Company, | |
| | 1,383,539 | | | Senior Secured First Lien Term Loan (1 Month LIBOR USD + 3.00%, 1.00% Floor) | | | 3.75% | | | | 07/31/2024 | | | | 1,265,938 | |
| |
| | | | ClubCorporationHoldings, Inc., | |
| | 696,949 | | | Senior Secured First Lien Term Loan (3 Month LIBOR USD + 2.75%) | | | 4.20% | | | | 09/18/2024 | | | | 446,396 | |
| |
| | | | Equinox Holdings, Inc., | |
| | 699,229 | | | Senior Secured First Lien Term Loan (1 Month LIBOR USD + 3.00%, 1.00% Floor) | | | 4.07% | | | | 03/08/2024 | | | | 519,398 | |
| |
| | | | Lions Gate Capital Holdings LLC, | |
| | 368,185 | | | Senior Secured First Lien Term Loan (1 Month LIBOR USD + 2.25%) | | | 3.24% | | | | 03/24/2025 | | | | 335,969 | |
| | | | | | |
| The accompanying notes are an integral part of these financial statements. | | Annual Report | | March 31, 2020 | | 59 |
| | |
| Schedule of Investments DoubleLine Floating Rate Fund (Cont.) | | March 31, 2020 |
| | | | | | | | | | | | | | | | |
PRINCIPAL
AMOUNT $ | | | SECURITY DESCRIPTION | | RATE | | | MATURITY | | | VALUE $ | |
| |
| | | | Motion Finco, LLC, | |
| | | | Senior Secured First Lien Term Loan | | | | | | | | | | | | |
| | 119 | | | (3 Month LIBOR USD + 3.25%) | | | 4.70% | | | | 11/04/2026 | | | | 98 | |
| | 47,388 | | | (6 Month LIBOR USD + 3.25%) | | | 4.32% | | | | 11/04/2026 | | | | 39,174 | |
| | 904 | | | (3 Month LIBOR USD + 3.25%) | | | 4.70% | | | | 11/04/2026 | | | | 747 | |
| | 360,564 | | | (6 Month LIBOR USD + 3.25%) | | | 4.32% | | | | 11/04/2026 | | | | 298,066 | |
| |
| | | | Nascar Holdings, Inc., | |
| | 835,101 | | | Senior Secured First Lien Term Loan (3 Month LIBOR USD + 2.75%) | | | 3.67% | | | | 10/19/2026 | | | | 743,240 | |
| |
| | | | Pug LLC, | |
| | 349,125 | | | Senior Secured First Lien Term Loan (1 Month LIBOR USD + 3.50%) | | | 4.49% | | | | 02/12/2027 | | | | 303,739 | |
| |
| | | | Travel Leaders Group LLC, | |
| | 697,575 | | | Senior Secured First Lien Term Loan (1 Month LIBOR USD + 4.00%) | | | 4.96% | | | | 01/25/2024 | | | | 535,971 | |
| |
| | | | UFC Holdings LLC, | |
| | 1,706,537 | | | Senior Secured First Lien Term Loan (1 Month LIBOR USD + 3.25%) | | | 4.25% | | | | 04/29/2026 | | | | 1,520,951 | |
| | | | | | | | | | | | | | | | |
| | | | | | | | | | | | | | | 6,009,687 | |
| | | | | | | | | | | | | | | | |
| | MEDIA 8.0% | |
| |
| | | | Ascend Learning LLC, | |
| | 1,543,983 | | | Senior Secured First Lien Term Loan (1 Month LIBOR USD + 3.00%, 1.00% Floor) | | | 4.00% | | | | 07/12/2024 | | | | 1,401,165 | |
| |
| | | | Cengage Learning, Inc., | |
| | 1,119,567 | | | Senior Secured First Lien Term Loan (1 Month LIBOR USD + 4.25%, 1.00% Floor) | | | 5.25% | | | | 06/07/2023 | | | | 918,045 | |
| |
| | | | CSC Holdings LLC, | |
| | 1,336,260 | | | Senior Secured First Lien Term Loan (1 Month LIBOR USD + 2.25%) | | | 2.86% | | | | 07/17/2025 | | | | 1,285,041 | |
| | 643,500 | | | Senior Secured First Lien Term Loan (1 Month LIBOR USD + 2.25%) | | | 2.86% | | | | 01/15/2026 | | | | 620,977 | |
| | 141,218 | | | Senior Secured First Lien Term Loan (1 Month LIBOR USD + 2.50%) | | | 3.11% | | | | 04/15/2027 | | | | 136,745 | |
| |
| | | | Diamond Sports Group LLC, | |
| | 109,450 | | | Senior Secured First Lien Term Loan (1 Month LIBOR USD + 3.25%) | | | 4.18% | | | | 08/24/2026 | | | | 85,918 | |
| |
| | | | E.W. Scripps Company, | |
| | 1,466,917 | | | Senior Secured First Lien Term Loan (1 Month LIBOR USD + 2.50%) | | | 3.49% | | | | 05/01/2026 | | | | 1,400,906 | |
| |
| | | | Fleet Bidco Limited, | |
| | 835,800 | | | Senior Secured First Lien Term Loan (6 Month LIBOR USD + 3.25%) | | | 4.32% | | | | 10/05/2026 | | | | 764,757 | |
| |
| | | | Getty Images, Inc., | |
| | 836,347 | | | Senior Secured First Lien Term Loan (1 Month LIBOR USD + 4.50%) | | | 5.50% | | | | 02/19/2026 | | | | 679,532 | |
| |
| | | | Gray Television, Inc., | |
| | 623,113 | | | Senior Secured First Lien Term Loan (1 Month LIBOR USD + 2.50%) | | | 3.49% | | | | 01/02/2026 | | | | 586,349 | |
| |
| | | | IHeartCommunications, Inc., | |
| | 638,400 | | | Senior Secured First Lien Term Loan (1 Month LIBOR USD + 3.00%) | | | 3.99% | | | | 05/01/2026 | | | | 543,639 | |
| | | | | | | | | | | | | | | | |
PRINCIPAL
AMOUNT $ | | | SECURITY DESCRIPTION | | RATE | | | MATURITY | | | VALUE $ | |
| |
| | | | Nexstar Broadcasting, Inc., | |
| | 1,613,850 | | | Senior Secured First Lien Term Loan (1 Month LIBOR USD + 2.75%) | | | 3.73% | | | | 09/18/2026 | | | | 1,521,861 | |
| |
| | | | Numericable U.S. LLC, | |
| | 1,216,521 | | | Senior Secured First Lien Term Loan (1 Month LIBOR USD + 4.00%) | | | 4.70% | | | | 08/14/2026 | | | | 1,164,819 | |
| |
| | | | Radiate Finance, Inc., | |
| | 1,156,663 | | | Senior Secured First Lien Term Loan (1 Month LIBOR USD + 3.00%, 0.75% Floor) | | | 3.99% | | | | 02/01/2024 | | | | 1,081,480 | |
| |
| | | | RentPath, Inc., | |
| | 1,281,637 | | | Senior Secured First Lien Term Loan (1 Month LIBOR USD + 4.75%, 1.00% Floor) | | | 7.00% | W | | | 12/17/2021 | | | | 981,894 | |
| | 222,556 | | | Senior Secured First Lien Term Loan (1 Month LIBOR USD + 7.00%, 1.00% Floor) | | | 8.00% | | | | 08/31/2020 | | | | 212,541 | |
| |
| | | | Sinclair Television Group, Inc., | |
| | 671,625 | | | Senior Secured First Lien Term Loan (1 Month LIBOR USD + 2.50%) | | | 3.21% | | | | 09/30/2026 | | | | 641,402 | |
| |
| | | | Terrier Media Buyer, Inc., | |
| | 863,888 | | | Senior Secured First Lien Term Loan (3 Month LIBOR USD + 4.25%) | | | 5.70% | | | | 12/17/2026 | | | | 783,978 | |
| |
| | | | Virgin Media Bristol LLC, | |
| | 1,291,895 | | | Senior Secured First Lien Term Loan (1 Month LIBOR USD + 2.50%) | | | 3.20% | | | | 01/31/2028 | | | | 1,204,692 | |
| |
| | | | Ziggo Financing Partnership, | |
| | 170,000 | | | Senior Secured First Lien Term Loan (1 Month LIBOR USD + 2.50%) | | | 3.20% | | | | 04/28/2028 | | | | 162,350 | |
| | | | | | | | | | | | | | | | |
| | | | | | | | | | | | | | | 16,178,091 | |
| | | | | | | | | | | | | | | | |
| | PHARMACEUTICALS 0.6% | |
| |
| | | | Catalent Pharma Solutions, Inc., | |
| | 785,682 | | | Senior Secured First Lien Term Loan (1 Month LIBOR USD + 2.25%) | | | 3.24% | | | | 05/18/2026 | | | | 766,040 | |
| |
| | | | Grifols Worldwide Operations USA, Inc., | |
| | 624,460 | | | Senior Secured First Lien Term Loan (1 Month LIBOR USD + 2.00%) | | | 2.50% | | | | 11/15/2027 | | | | 595,838 | |
| | | | | | | | | | | | | | | | |
| | | | | | | | | | | | | | | 1,361,878 | |
| | | | | | | | | | | | | | | | |
| | RETAILERS (OTHER THAN FOOD/DRUG) 1.4% | |
| |
| | | | Harbor Freight Tools USA, Inc., | |
| | 879,478 | | | Senior Secured First Lien Term Loan (1 Month LIBOR USD + 2.50%, 0.75% Floor) | | | 3.49% | | | | 08/18/2023 | | | | 807,361 | |
| |
| | | | Jo-Ann Stores LLC, | |
| | 529,239 | | | Senior Secured First Lien Term Loan (3 Month LIBOR USD + 5.00%, 1.00% Floor) | | | 6.00% | | | | 10/20/2023 | | | | 207,160 | |
| |
| | | | Mister Car Wash Holdings, Inc., | |
| | 16,031 | | | Senior Secured First Lien Term Loan | | | 5.19% | ± | | | 05/14/2026 | | | | 13,455 | |
| | | | | | |
| 60 | | DoubleLine Funds Trust | | | | The accompanying notes are an integral part of these financial statements. |
| | | | | | | | | | | | | | | | |
PRINCIPAL
AMOUNT $ | | | SECURITY DESCRIPTION | | RATE | | | MATURITY | | | VALUE $ | |
| |
| | | | Mister Car Wash Holdings, Inc., (Cont.) | |
| | 1,324,165 | | | Senior Secured First Lien Term Loan (3 Month LIBOR USD + 3.50%) | | | 3.86% | | | | 05/14/2026 | | | | 1,111,352 | |
| |
| | | | Staples, Inc., | |
| | 774,703 | | | Senior Secured First Lien Term Loan (2 Month LIBOR USD + 5.00%) | | | 6.02% | | | | 04/16/2026 | | | | 618,988 | |
| | | | | | | | | | | | | | | | |
| | | | | | | | | | | | | | | 2,758,316 | |
| | | | | | | | | | | | | | | | |
| | TELECOMMUNICATIONS 2.7% | |
| |
| | | | Avaya, Inc., | |
| | 1,013,018 | | | Senior Secured First Lien Term Loan (1 Month LIBOR USD + 4.25%) | | | 4.95% | | | | 12/16/2024 | | | | 873,728 | |
| |
| | | | CenturyLink, Inc., | |
| | 967,575 | | | Senior Secured First Lien Term Loan (1 Month LIBOR USD + 2.25%) | | | 3.24% | | | | 03/15/2027 | | | | 908,921 | |
| |
| | | | Connect U.S. Finco LLC, | |
| | 675,000 | | | Senior Secured First Lien Term Loan (1 Month LIBOR USD + 4.50%, 1.00% Floor) | | | 5.50% | | | | 12/11/2026 | | | | 544,219 | |
| |
| | | | GTT Communications, Inc., | |
| | 616,861 | | | Senior Secured First Lien Term Loan (1 Month LIBOR USD + 2.75%) | | | 3.74% | | | | 06/02/2025 | | | | 448,766 | |
| |
| | | | Intelsat Jackson Holdings S.A., | |
| | 1,460,699 | | | Senior Secured First Lien Term Loan (1 Month LIBOR USD + 3.75%, 1.00% Floor) | | | 5.68% | | | | 11/27/2023 | | | | 1,353,885 | |
| |
| | | | MLN US HoldCo LLC, | |
| | 554,358 | | | Senior Secured First Lien Term Loan (1 Month LIBOR USD + 4.50%) | | | 5.49% | | | | 11/28/2025 | | | | 396,366 | |
| |
| | | | Securus Technologies Holdings, Inc., | |
| | | | Senior Secured First Lien Term Loan | | | | | | | | | | | | |
| | 2,737 | | | (1 Month LIBOR USD + 4.50%, 1.00% Floor) | | | 5.50% | | | | 11/01/2024 | | | | 2,176 | |
| | 1,050,144 | | | (6 Month LIBOR USD + 4.50%, 1.00% Floor) | | | 5.50% | | | | 11/01/2024 | | | | 834,864 | |
| |
| | | | Speedcast International Ltd., | |
| | 529,204 | | | Senior Secured First Lien Term Loan (3 Month LIBOR USD + 2.75%) | | | 5.00% | W | | | 05/15/2025 | | | | 133,624 | |
| | | | | | | | | | | | | | | | |
| | | | | | | | | | | | | | | 5,496,549 | |
| | | | | | | | | | | | | | | | |
| | TRANSPORTATION 1.4% | |
| |
| | | | Genesee & Wyoming, Inc., | |
| | 955,000 | | | Senior Secured First Lien Term Loan (1 Month LIBOR USD + 2.00%) | | | 3.45% | | | | 12/30/2026 | | | | 921,580 | |
| |
| | | | Lineage Logistics, LLC, | |
| | 339,135 | | | Senior Secured First Lien Term Loan (1 Month LIBOR USD + 3.00%, 1.00% Floor) | | | 4.00% | | | | 02/27/2025 | | | | 321,754 | |
| |
| | | | PODS LLC, | |
| | 1,728,275 | | | Senior Secured First Lien Term Loan (3 Month LIBOR USD + 2.75%, 1.00% Floor) | | | 3.75% | | | | 12/06/2024 | | | | 1,546,806 | |
| | | | | | | | | | | | | | | | |
| | | | | | | | | | | | | | | 2,790,140 | |
| | | | | | | | | | | | | | | | |
| | UTILITIES 2.4% | |
| |
| | | | Calpine Corporation, | |
| | 139,300 | | | Senior Secured First Lien Term Loan (1 Month LIBOR USD + 2.50%) | | | 2.99% | | | | 08/12/2026 | | | | 133,031 | |
| | | | | | | | | | | | | | | | |
PRINCIPAL
AMOUNT $ | | | SECURITY DESCRIPTION | | RATE | | | MATURITY | | | VALUE $ | |
| |
| | | | Calpine Corporation, (Cont.) | |
| | 1,652,513 | | | Senior Secured First Lien Term Loan (3 Month LIBOR USD + 2.75%) | | | 3.24% | | | | 04/06/2026 | | | | 1,582,281 | |
| |
| | | | Compass Power Generation LLC, | |
| | 1,370,949 | | | Senior Secured First Lien Term Loan (1 Month LIBOR USD + 3.50%, 1.00% Floor) | | | 4.50% | | | | 12/20/2024 | | | | 1,247,563 | |
| |
| | | | Exgen Renewables IV LLC, | |
| | 390,175 | | | Senior Secured First Lien Term Loan (3 Month LIBOR USD + 3.00%, 1.00% Floor) | | | 4.62% | | | | 11/29/2024 | | | | 354,084 | |
| |
| | | | PowerTeam Services LLC, | |
| | 785,805 | | | Senior Secured First Lien Term Loan (3 Month LIBOR USD + 3.25%, 1.00% Floor) | | | 4.70% | | | | 03/06/2025 | | | | 661,385 | |
| |
| | | | USIC Holdings, Inc., | |
| | 1,064,514 | | | Senior Secured First Lien Term Loan (1 Month LIBOR USD + 3.25%, 1.00% Floor) | | | 4.25% | | | | 12/08/2023 | | | | 907,498 | |
| | | | | | | | | | | | | | | | |
| | | | | | | | | | | | | | | 4,885,842 | |
| | | | | | | | | | | | | | | | |
| | | | Total Bank Loans
(Cost $193,712,419) | | | | 166,721,854 | |
| | | | | | | | | | | | | |
| | FOREIGN CORPORATE BONDS 0.3% | |
| | |
| | RETAILERS (OTHER THAN FOOD/DRUG) 0.3% | |
| | 700,000 | | | eG Global Finance PLC | | | 6.75% | ^ | | | 02/07/2025 | | | | 578,379 | |
| | | | | | | | | | | | | | | | |
| | | | Total Foreign Corporate Bonds
(Cost $700,000) | | | | | | | | 578,379 | |
| | | | | | | | | | | | | |
| | US CORPORATE BONDS 9.1% | |
| | |
| | COMMERCIAL SERVICES 0.3% | |
| | 725,000 | | | Allied Universal Holding Company | | | 6.63% | ^ | | | 07/15/2026 | | | | 713,674 | |
| | | | | | | | | | | | | | | | |
| | FOOD/DRUG RETAILERS 0.4% | |
| | 815,000 | | | Albertsons LLC | | | 5.88% | ^ | | | 02/15/2028 | | | | 834,030 | |
| | | | | | | | | | | | | | | | |
| | HEALTHCARE 1.3% | |
| | 2,000,000 | | | Avantor, Inc. | | | 9.00% | ^ | | | 10/01/2025 | | | | 2,117,910 | |
| | 150,000 | | | Centene Corporation | | | 4.25% | ^ | | | 12/15/2027 | | | | 151,118 | |
| | 135,000 | | | Centene Corporation | | | 4.63% | ^ | | | 12/15/2029 | | | | 136,424 | |
| | 350,000 | | | Ortho-Clinical Diagnostics Inc. | | | 7.25% | ^ | | | 02/01/2028 | | | | 303,590 | |
| | | | | | | | | | | | | | | | |
| | | | | | | | | | | | | | | 2,709,042 | |
| | | | | | | | | | | | | | | | |
| | HOTELS/MOTELS/INNS AND CASINOS 0.1% | |
| | 135,000 | | | VICI Properties LP | | | 3.75% | ^ | | | 02/15/2027 | | | | 127,997 | |
| | | | | | | | | | | | | | | | |
| | MEDIA 2.0% | |
| | 3,000,000 | | | CCO Holdings LLC | | | 5.25% | | | | 09/30/2022 | | | | 2,963,520 | |
| | 660,000 | | | iHeartCommunications, Inc. | | | 4.75% | ^ | | | 01/15/2028 | | | | 597,663 | |
| | 500,000 | | | Univision Communications, Inc. | | | 5.13% | ^ | | | 05/15/2023 | | | | 446,250 | |
| | | | | | | | | | | | | | | | |
| | | | | | | | | | | | | | | 4,007,433 | |
| | | | | | | | | | | | | | | | |
| | MINING 0.2% | |
| | 190,000 | | | Arconic Corporation | | | 6.13% | ^ | | | 02/15/2028 | | | | 195,700 | |
| | 225,000 | | | Novelis Corporation | | | 4.75% | ^ | | | 01/30/2030 | | | | 201,516 | |
| | | | | | | | | | | | | | | | |
| | | | | | | | | | | | | | | 397,216 | |
| | | | | | | | | | | | | | | | |
| | | | | | |
| The accompanying notes are an integral part of these financial statements. | | Annual Report | | March 31, 2020 | | 61 |
| | |
| Schedule of Investments DoubleLine Floating Rate Fund (Cont.) | | March 31, 2020 |
| | | | | | | | | | | | | | | | |
PRINCIPAL
AMOUNT $/
SHARES | | | SECURITY DESCRIPTION | | RATE | | | MATURITY | | | VALUE $ | |
| | PHARMACEUTICALS 1.7% | |
| | 3,000,000 | | | Bausch Health Companies, Inc. | | | 6.50% | ^ | | | 03/15/2022 | | | | 3,041,250 | |
| | 350,000 | | | Bausch Health Companies, Inc. | | | 5.00% | ^ | | | 01/30/2028 | | | | 333,970 | |
| | | | | | | | | | | | | | | | |
| | | | | | | | | | | | | | | 3,375,220 | |
| | | | | | | | | | | | | | | | |
| | RETAILERS (OTHER THAN FOOD/DRUG) 0.3% | |
| | 750,000 | | | PetSmart, Inc. | | | 5.88% | ^ | | | 06/01/2025 | | | | 744,375 | |
| | | | | | | | | | | | | | | | |
| | TECHNOLOGY 0.8% | |
| | 1,500,000 | | | Financial & Risk US Holdings, Inc. | | | 6.25% | ^ | | | 05/15/2026 | | | | 1,557,075 | |
| | | | | | | | | | | | | | | | |
| | TELECOMMUNICATIONS 2.0% | |
| | 305,000 | | | CenturyLink, Inc. | | | 4.00% | ^ | | | 02/15/2027 | | | | 293,562 | |
| | 750,000 | | | Cincinnati Bell, Inc. | | | 7.00% | ^ | | | 07/15/2024 | | | | 760,290 | |
| | 430,000 | | | Front Range BidCo, Inc. | | | 4.00% | ^ | | | 03/01/2027 | | | | 413,875 | |
| | 2,522,000 | | | Level 3 Financing, Inc. | | | 5.38% | | | | 08/15/2022 | | | | 2,536,502 | |
| | | | | | | | | | | | | | | | |
| | | | | | | | | | | | | | | 4,004,229 | |
| | | | | | | | | | | | | | | | |
| | | | Total US Corporate Bonds
(Cost $18,763,060) | | | | 18,470,291 | |
| | | | | | | | | | | | | |
| | SHORT TERM INVESTMENTS 0.0% | |
| | 1,546 | | | First American Government Obligations Fund - Class U | | | 0.47% | ¨ | | | | | | | 1,546 | |
| | | | | | | | | | | | | | | | |
SHARES | | | SECURITY DESCRIPTION | | RATE | | | MATURITY | | | VALUE $ | |
| | 1,547 | | | JP Morgan U.S. Government Money Market Fund - Institutional Share Class | | | 0.36% | ¨ | | | | | | | 1,547 | |
| | 1,546 | | | Morgan Stanley Institutional Liquidity Funds Government Portfolio - Institutional Share Class | | | 0.26% | ¨ | | | | | | | 1,546 | |
| | | | | | | | | | | | | | | | |
| | | | Total Short Term Investments
(Cost $4,639) | | | | | | | | 4,639 | |
| | | | | | | | | | | | | |
| | | | Total Investments 91.7%
(Cost $213,180,118) | | | | | | | | | | | 185,775,163 | |
| | | | Other Assets in Excess of Liabilities 8.3% | | | | 16,762,109 | |
| | | | | | | | | | | | | |
| | | | NET ASSETS 100.0% | | | | | | | | | | $ | 202,537,272 | |
| | | | | | | | | | | | | |
| | | | | |
| SECURITY TYPE BREAKDOWNas a % of Net Assets: | |
Bank Loans | | | | 82.3% | |
US Corporate Bonds | | | | 9.1% | |
Foreign Corporate Bonds | | | | 0.3% | |
Short Term Investments | | | | 0.0% | ~ |
Other Assets and Liabilities | | | | 8.3% | |
| | | | | |
| | | | 100.0% | |
| | | | | |
| ^ | Security exempt from registration under Rule 144A of the Securities Act of 1933. These securities may be resold in transactions exempt from registration to qualified institutional buyers. |
| W | Security is in default or has failed to make a scheduled payment. Income is not being accrued. |
| ± | Coupon rate is variable or floats based on components including but not limited to reference rate and spread. These securities may not indicate a reference rate and/or spread in their description. The rate desclosed is as of March 31, 2020. |
| & | Unfunded or partially unfunded loan commitment. At March 31, 2020, the value of these securities amounted to $309,463 or 0.2% of net assets. |
| ¨ | Seven-day yield as of March 31, 2020 |
| ~ | Represents less than 0.05% of net assets |
| PIK | A payment-in-kind security in which the issuer may make interest or dividend payments in cash or additional securities. These additional securities generally have the same terms as the original holdings. |
| | | | | | |
| 62 | | DoubleLine Funds Trust | | | | The accompanying notes are an integral part of these financial statements. |
| | |
| Schedule of Investments - Summary DoubleLine Shiller Enhanced CAPE® | | March 31, 2020 |
| | | | | | | | | | | | | | | | | | | | |
PRINCIPAL
AMOUNT $ | | | SECURITY DESCRIPTION | | RATE | | | MATURITY | | | VALUE $ | | | % OF NET
ASSETS | |
| | ASSET BACKED OBLIGATIONS | | | | | | | | | | | | | | | | |
| | | | | |
| | 18,573,750 | | | Jimmy Johns Funding LLC, | | | | | | | | | | | | | | | | |
| | | | Series2017-1A-A2II | | | 4.85% | ^ | | | 07/30/2047 | | | | 18,780,255 | | | | 0.3% | |
| | | | | |
| | 18,651,061 | | | LendingClub Receivables Trust, | | | | | | | | | | | | | | | | |
| | | | Series2020-3-A | | | 3.50% | ^ | | | 01/16/2046 | | | | 18,156,062 | | | | 0.3% | |
| | 20,000,000 | | | SBA Tower Trust | | | 3.17% | ^ | | | 04/11/2022 | | | | 19,905,014 | | | | 0.3% | |
| | | | | |
| | 20,000,000 | | | Springleaf Funding Trust, | | | | | | | | | | | | | | | | |
| | | | Series2017-AA-A | | | 2.68% | ^ | | | 07/15/2030 | | | | 19,202,352 | | | | 0.3% | |
| | | | | |
| | 16,954,564 | | | TAL Advantage LLC, | | | | | | | | | | | | | | | | |
| | | | Series2017-1A-A | | | 4.50% | ^ | | | 04/20/2042 | | | | 16,471,805 | | | | 0.3% | |
| | |
| | Other Asset Backed Obligationsµ | | | | 357,846,924 | | | | 6.1% | |
| | | | | | | | | | | | | | | | | | | | |
| | | | Total Asset Backed Obligations
(Cost $510,093,987) | | | | 450,362,412 | | | | 7.6% | |
| | | | | | | | | | | | | | | | | |
| | BANK LOANSµ | | | | | | | | | | | | | | | | |
| | | | Total Bank Loans
(Cost $284,909,977) | | | | 246,023,526 | | | | 4.2% | |
| | | | | | | | | | | | | | | | | |
| | COLLATERALIZED LOAN OBLIGATIONS | | | | | | | | | | | | | | | | |
| | | | | |
| | 25,000,000 | | | Anchorage Capital Ltd., | | | | | | | | | | | | | | | | |
| | | | Series2016-9A-AR (3 Month LIBOR USD + 1.37%) | | | 3.20% | ^ | | | 07/15/2032 | | | | 23,716,672 | | | | 0.4% | |
| | | | | |
| | 17,323,347 | | | Atlas Senior Loan Fund Ltd., | | | | | | | | | | | | | | | | |
| | | | Series2013-1A-AR (3 Month LIBOR USD + 0.83%) | | | 2.52% | ^ | | | 11/17/2027 | | | | 16,797,711 | | | | 0.3% | |
| | | | | |
| | 18,000,000 | | | Battalion Ltd., | | | | | | | | | | | | | | | | |
| | | | Series2020-15A-A1 (3 Month LIBOR USD + 1.35%, 1.35% Floor) | | | 3.01% | ^ | | | 01/17/2033 | | | | 17,192,427 | | | | 0.3% | |
| | | | | |
| | 30,000,000 | | | CarVal Ltd., | | | | | | | | | | | | | | | | |
| | | | Series2019-2A-A (3 Month LIBOR USD + 1.35%, 1.35% Floor) | | | 3.17% | ^ | | | 07/20/2032 | | | | 27,346,107 | | | | 0.4% | |
| | | | | |
| | 22,000,000 | | | CFIP Ltd., | | | | | | | | | | | | | | | | |
| | | | Series2014-1A-AR (3 Month LIBOR USD + 1.32%) | | | 3.17% | ^ | | | 07/13/2029 | | | | 21,139,354 | | | | 0.4% | |
| | | | | |
| | 25,000,000 | | | CVP Ltd., | | | | | | | | | | | | | | | | |
| | | | Series2017-1A-A (3 Month LIBOR USD + 1.34%) | | | 3.16% | ^ | | | 07/20/2030 | | | | 23,465,552 | | | | 0.4% | |
| | | | | |
| | 20,000,000 | | | Elevation Ltd., | | | | | | | | | | | | | | | | |
| | | | Series2018-9A-A1 (3 Month LIBOR USD + 1.12%, 1.12% Floor) | | | 2.95% | ^ | | | 07/15/2031 | | | | 18,842,326 | | | | 0.3% | |
| | | | | |
| | 21,668,163 | | | Halcyon Loan Advisors Funding Ltd., | | | | | | | | | | | | | | | | |
| | | | Series2015-3A-A1R (3 Month LIBOR USD + 0.90%) | | | 2.72% | ^ | | | 10/18/2027 | | | | 21,374,881 | | | | 0.4% | |
| | | | | |
| | 20,000,000 | | | LCM LP, | | | | | | | | | | | | | | | | |
| | | | Series17A-A2RR (3 Month LIBOR USD + 1.15%, 1.15% Floor) | | | 2.98% | ^ | | | 10/15/2031 | | | | 18,820,428 | | | | 0.3% | |
| | | | | |
| | 24,684,298 | | | Marathon Ltd., | | | | | | | | | | | | | | | | |
| | | | Series2013-5A-A1R (3 Month LIBOR USD + 0.87%) | | | 2.57% | ^ | | | 11/21/2027 | | | | 24,038,009 | | | | 0.4% | |
| | | | | |
| | 29,500,000 | | | Marble Point Ltd., | | | | | | | | | | | | | | | | |
| | | | Series2020-1A-A (3 Month LIBOR USD + 1.30%, 1.30% Floor) | | | 2.20% | ^ | | | 04/20/2033 | | | | 26,896,883 | | | | 0.5% | |
| | | | | |
| | 25,000,000 | | | MP Ltd., | | | | | | | | | | | | | | | | |
| | | | Series2013-2A-ARR (3 Month LIBOR USD + 1.28%) | | | 3.07% | ^ | | | 07/25/2029 | | | | 24,193,390 | | | | 0.4% | |
| | | | | |
| | 20,000,000 | | | Nassau Ltd., | | | | | | | | | | | | | | | | |
| | | | Series2018-IA-A (3 Month LIBOR USD + 1.15%) | | | 2.98% | ^ | | | 07/15/2031 | | | | 18,244,884 | | | | 0.3% | |
| | | | | |
| | 18,000,000 | | | Steele Creek Ltd., | | | | | | | | | | | | | | | | |
| | | | Series2019-2A-A1 (3 Month LIBOR USD + 1.36%, 1.36% Floor) | | | 3.19% | ^ | | | 07/15/2032 | | | | 16,446,090 | | | | 0.3% | |
| | | | | |
| | 17,500,000 | | | Wellfleet Ltd., | | | | | | | | | | | | | | | | |
| | | | Series2020-1A-A1A (3 Month LIBOR USD + 1.31%, 1.31% Floor) | | | 0.01% | ^ | | | 04/15/2033 | | | | 16,196,810 | | | | 0.3% | |
| | |
| | Other Collateralized Loan Obligationsµ | | | | 530,664,607 | | | | 9.0% | |
| | | | | | | | | | | | | | | | | | | | |
| | | | Total Collateralized Loan Obligations
(Cost $898,377,465) | | | | 845,376,131 | | | | 14.4% | |
| | | | | | | | | | | | | | | | | |
| | FOREIGN CORPORATE BONDSµ | | | | | | | | | | | | | | | | |
| | | | Total Foreign Corporate Bonds
(Cost $593,275,487) | | | | 562,598,989 | | | | 9.6% | |
| | | | | | | | | | | | | | | | | |
| | FOREIGN GOVERNMENT BONDS, FOREIGN AGENCIES AND FOREIGN GOVERNMENT SPONSORED CORPORATIONSµ | | | | | | | | | |
| | | | Total Foreign Government Bonds, Foreign Agencies and Foreign Government Sponsored Corporations
(Cost $10,757,603) | | | | 10,511,436 | | | | 0.2% | |
| | | | | | | | | | | | | | | | | |
| | | | | | |
| The accompanying notes are an integral part of these financial statements. | | Annual Report | | March 31, 2020 | | 63 |
| | |
| Schedule of Investments - Summary DoubleLine Shiller Enhanced CAPE® (Cont.) | | March 31, 2020 |
| | | | | | | | | | | | | | | | | | | | |
PRINCIPAL
AMOUNT $ | | | SECURITY DESCRIPTION | | RATE | | | MATURITY | | | VALUE $ | | | % OF NET
ASSETS | |
| | NON-AGENCY COMMERCIAL MORTGAGE BACKED OBLIGATIONS | | | | | | | | | | | | | | | | |
| | | | | |
| | 32,508,000 | | | Fontainebleau Miami Beach Trust, | | | 4.10% | ^ | | | 12/10/2036 | | | | 21,294,374 | | | | 0.3% | |
| | | | Series2019-FBLU-F | | | | | | | | | | | | | | | | |
| | | | Series2019-FBLU-G | | | | | | | | | | | | | | | | |
| | | | | |
| | 20,416,000 | | | JP Morgan Chase Commercial Mortgage Securities Trust, | | | 4.45% | #^ | | | 05/05/2032 | | | | 16,068,910 | | | | 0.3% | |
| | | | Series2019-UES-D | | | | | | | | | | | | | | | | |
| | | | Series2019-UES-E | | | | | | | | | | | | | | | | |
| | | | Series2019-UES-F | | | | | | | | | | | | | | | | |
| | | | Series2019-UES-G | | | | | | | | | | | | | | | | |
| | |
| | OtherNon-Agency Commercial Mortgage Backed Obligationsµ | | | | 741,185,785 | | | | 12.6% | |
| | | | | | | | | | | | | | | | | | | | |
| | | | TotalNon-Agency Commercial Mortgage Backed Obligations
(Cost $981,955,750) | | | | 778,549,069 | | | | 13.2% | |
| | | | | | | | | | | | | | | | | |
| | NON-AGENCY RESIDENTIAL COLLATERALIZED MORTGAGE OBLIGATIONS | | | | | | | | | |
| | | | | |
| | 19,835,330 | | | Ajax Mortgage Loan Trust, | | | | | | | | | | | | | | | | |
| | | | Series2019-C-A | | | 3.95% | #^ | | | 10/25/2058 | | | | 19,406,906 | | | | 0.3% | |
| | | | | |
| | 16,616,576 | | | Bayview Opportunity Master Fund Trust, | | | | | | | | | | | | | | | | |
| | | | Series2019-SBR2-A1 | | | 3.43% | ^§ | | | 06/28/2034 | | | | 16,456,779 | | | | 0.3% | |
| | | | | |
| | 26,966,894 | | | Citigroup Mortgage Loan Trust, Inc., | | | | | | | | | | | | | | | | |
| | | | Series2018-A-A1 | | | 4.00% | #^ | | | 01/25/2068 | | | | 25,250,405 | | | | 0.4% | |
| | | | | |
| | 31,920,229 | | | Citigroup Mortgage Loan Trust, | | | | | | | | | | | | | | | | |
| | | | Series2019-E-A1 | | | 3.23% | ^§ | | | 11/25/2070 | | | | 33,015,552 | | | | 0.6% | |
| | | | | |
| | 18,697,964 | | | Credit Suisse Mortgage Capital Certificates, | | | | | | | | | | | | | | | | |
| | | | Series2019-RPL4-A1 | | | 3.55% | ^ | | | 08/26/2058 | | | | 19,441,384 | | | | 0.3% | |
| | | | | |
| | 55,414,794 | | | Credit Suisse Mortgage Capital Certificates, | | | | | | | | | | | | | | | | |
| | | | Series2020-BPL1-A1 | | | 3.39% | ^§ | | | 02/25/2024 | | | | 54,897,575 | | | | 0.9% | |
| | | | | |
| | 62,409,459 | | | CSMC Trust, | | | | | | | | | | | | | | | | |
| | | | Series2019-RP10-A1 | | | 3.32% | #^ | | | 12/26/2059 | | | | 64,120,976 | | | | 1.1% | |
| | | | | |
| | 18,457,097 | | | CSMC Trust, | | | | | | | | | | | | | | | | |
| | | | Series2019-RPL2-A1 | | | 3.88% | #^ | | | 11/25/2058 | | | | 19,068,663 | | | | 0.3% | |
| | | | | |
| | 24,082,498 | | | CSMC Trust, | | | | | | | | | | | | | | | | |
| | | | Series2019-RPL9-A1 | | | 3.32% | #^ | | | 10/27/2059 | | | | 23,653,252 | | | | 0.4% | |
| | | | | |
| | 19,910,891 | | | Legacy Mortgage Asset Trust, | | | | | | | | | | | | | | | | |
| | | | Series2019-GS3-A1 | | | 3.75% | ^§ | | | 04/25/2059 | | | | 19,498,300 | | | | 0.3% | |
| | | | | |
| | 39,200,317 | | | Park Avenue Funding Trust, | | | | | | | | | | | | | | | | |
| | | | Series2019-1-PT (1 Month LIBOR USD + 1.50%, 1.50% Floor) | | | 2.46% | ^ | | | 11/27/2020 | | | | 37,778,757 | | | | 0.7% | |
| | | | | |
| | 16,057,328 | | | PRPM LLC, | | | | | | | | | | | | | | | | |
| | | | Series2019-4A-A1 | | | 3.35% | ^§ | | | 11/25/2024 | | | | 15,928,957 | | | | 0.3% | |
| | | | | |
| | 40,000,000 | | | Toorak Mortgage Corporation Ltd., | | | | | | | | | | | | | | | | |
| | | | Series2020-1-A1 | | | 2.73% | ^§ | | | 03/25/2023 | | | | 40,171,280 | | | | 0.7% | |
| | | | | |
| | 21,760,129 | | | Vericrest Opportunity Loan Trust, | | | | | | | | | | | | | | | | |
| | | | Series2019-NPL4-A1A | | | 3.35% | ^§ | | | 08/25/2049 | | | | 20,279,374 | | | | 0.4% | |
| | | | | |
| | 32,688,827 | | | Vericrest Opportunity Loan Trust, | | | | | | | | | | | | | | | | |
| | | | Series2020-NPL2-A1A | | | 2.98% | ^§ | | | 02/25/2050 | | | | 28,988,844 | | | | 0.5% | |
| | |
| | OtherNon-Agency Residential Collateralized Mortgage Obligationsµ | | | | 383,005,428 | | | | 6.5% | |
| | | | | | | | | | | | | | | | | | | | |
| | | | TotalNon-Agency Residential Collateralized Mortgage Obligations
(Cost $855,699,211) | | | | 820,962,432 | | | | 14.0% | |
| | | | | | | | | | | | | | | | | |
| | US CORPORATE BONDSµ | | | | | | | | | |
| | | | Total US Corporate Bonds
(Cost $350,585,392) | | | | 342,812,739 | | | | 5.8% | |
| | | | | | | | | | | | | | | | | |
| | US GOVERNMENT AND AGENCY MORTGAGE BACKED OBLIGATIONS | | | | | | | | | |
| | | | | |
| | 15,611,031 | | | Federal Home Loan Mortgage Corporation, | | | | | | | | | | | | | | | | |
| | | | Series4738-LA | | | 3.00% | | | | 11/15/2043 | | | | 16,094,096 | | | | 0.3% | |
| | 68,122,271 | | | Federal Home Loan Mortgage Corporation | | | 1.05% – 5.58% | I/F I/O | | | 09/15/2026 – 09/15/2047 | | | | 69,202,476 | | | | 1.2% | |
| | | | | |
| | 15,833,240 | | | Federal National Mortgage Association, | | | | | | | | | | | | | | | | |
| | | | Series2018-77-FA (1 Month LIBOR USD + 0.30%, 0.30% Floor, 6.50% Cap) | | | 1.25% | | | | 10/25/2048 | | | | 15,613,030 | | | | 0.2% | |
| | 156,784,586 | | | Federal National Mortgage Association | | | 1.20% – 3.50% | | | | 11/26/2026 – 10/25/2048 | | | | 156,406,791 | | | | 2.7% | |
| | |
| | Other US Government and Agency Mortgage Backed Obligationsµ | | | | 96,265,930 | | | | 1.6% | |
| | | | | | | | | | | | | | | | | | | | |
| | | | Total US Government and Agency Mortgage Backed Obligations
(Cost $351,318,338) | | | | 353,582,323 | | | | 6.0% | |
| | | | | | | | | | | | | | | | | |
| | | | | | |
| 64 | | DoubleLine Funds Trust | | | | The accompanying notes are an integral part of these financial statements. |
| | | | | | | | | | | | | | | | | | | | |
PRINCIPAL
AMOUNT $/
SHARES | | | SECURITY DESCRIPTION | | RATE | | | MATURITY | | | VALUE $ | | | % OF NET
ASSETS | |
| | US GOVERNMENT AND AGENCY OBLIGATIONS | | | | | | | | | |
| | | | | |
| | 88,750,000 | | | United States Treasury Notes | | | 1.38% | ‡ | | | 09/15/2020 | | | | 89,259,619 | | | | 1.5% | |
| | 173,700,000 | | | United States Treasury Notes | | | 2.88% | ‡ | | | 10/31/2020 | | | | 176,464,951 | | | | 3.0% | |
| | 202,950,000 | | | United States Treasury Notes | | | 2.75% | ‡ | | | 11/30/2020 | | | | 206,473,878 | | | | 3.5% | |
| | 200,900,000 | | | United States Treasury Notes | | | 2.75% | ‡ | | | 09/15/2021 | | | | 208,284,644 | | | | 3.6% | |
| | 232,150,000 | | | United States Treasury Notes | | | 1.50% | ‡ | | | 10/31/2021 | | | | 236,870,081 | | | | 4.0% | |
| | 241,850,000 | | | United States Treasury Notes | | | 1.63% | ‡ | | | 04/30/2023 | | | | 251,788,524 | | | | 4.3% | |
| | 276,850,000 | | | United States Treasury Notes | | | 2.25% | ‡ | | | 12/31/2023 | | | | 296,770,221 | | | | 5.0% | |
| | | | | | | | | | | | | | | | | | | | |
| | | | Total US Government and Agency Obligations
(Cost $1,422,660,193) | | | | 1,465,911,918 | | | | 24.9% | |
| | | | | | | | | | | | | | | | | |
| | AFFILIATED MUTUAL FUNDS | | | | | | | | | |
| | | | | |
| | 19,895,522 | | | DoubleLine Ultra Short Bond Fund (Class I) | | | | | | | | | | | 195,175,073 | | | | 3.3% | |
| | | | | | | | | | | | | | | | | | | | |
| | | | Total Affiliated Mutual Funds
(Cost $199,501,692) | | | | 195,175,073 | | | | 3.3% | |
| | | | | | | | | | | | | | | | | |
| | WARRANTSµ | | | | | | | | | |
| | | | Total Warrants
(Cost $—) | | | | — | | | | 0.0% | |
| | | | | | | | | | | | | | | | | |
| | SHORT TERM INVESTMENTS | | | | | | | | | |
| | | | | |
| | 263,710,739 | | | First American Government Obligations Fund - Class U | | | 0.47% | ¨ | | | | | | | 263,710,739 | | | | 4.5% | |
| | 263,710,739 | | | JP Morgan U.S. Government Money Market Fund - Institutional Share Class | | | 0.36% | ¨ | | | | | | | 263,710,739 | | | | 4.5% | |
| | 263,710,739 | | | Morgan Stanley Institutional Liquidity Funds Government Portfolio - Institutional Share Class | | | 0.26% | ¨ | | | | | | | 263,710,739 | | | | 4.5% | |
| | | | | | | | | | | | | | | | | | | | |
| | | | Total Short Term Investments
(Cost $791,132,217) | | | | 791,132,217 | | | | 13.5% | |
| | | | | | | | | | | | | | | | | |
| | | | Total Investments
(Cost $7,250,267,312) | | | | | | | | | | | 6,862,998,265 | | | | 116.7% | |
| | | | Liabilities in Excess of Other Assets | | | | | | | | | | | (982,302,825 | ) | | | (16.7)% | |
| | | | | | | | | | | | | | | | | |
| | | | NET ASSETS | | | | | | | | | | $ | 5,880,695,440 | | | | 100.0% | |
| | | | | | | | | | | | | | | | | |
| | | | | |
| SECURITY TYPE BREAKDOWNas a % of Net Assets: | | | | | |
US Government and Agency Obligations | | | | 24.9% | |
Collateralized Loan Obligations | | | | 14.4% | |
Non-Agency Residential Collateralized Mortgage Obligations | | | | 14.0% | |
Short Term Investments | | | | 13.5% | |
Non-Agency Commercial Mortgage Backed Obligations | | | | 13.2% | |
Foreign Corporate Bonds | | | | 9.6% | |
Asset Backed Obligations | | | | 7.6% | |
US Government and Agency Mortgage Backed Obligations | | | | 6.0% | |
US Corporate Bonds | | | | 5.8% | |
Bank Loans | | | | 4.2% | |
Affiliated Mutual Funds | | | | 3.3% | |
Foreign Government Bonds, Foreign Agencies and Foreign Government Sponsored Corporations | | | | 0.2% | |
Warrants | | | | 0.0% | ~ |
Other Assets and Liabilities | | | | (16.7)% | |
| | | | | |
| | | | 100.0% | |
| | | | | |
| | | | | |
| INVESTMENT BREAKDOWNas a % of Net Assets: | | |
US Government and Agency Obligations | | | | 24.9% | |
Collateralized Loan Obligations | | | | 14.4% | |
Non-Agency Residential Collateralized Mortgage Obligations | | | | 14.0% | |
Short Term Investments | | | | 13.5% | |
Non-Agency Commercial Mortgage Backed Obligations | | | | 13.2% | |
Asset Backed Obligations | | | | 7.6% | |
US Government and Agency Mortgage Backed Obligations | | | | 6.0% | |
Banking | | | | 5.9% | |
Affiliated Mutual Funds | | | | 3.3% | |
Energy | | | | 1.9% | |
Telecommunications | | | | 1.1% | |
| | | | | |
INVESTMENT BREAKDOWNas a % of Net Assets: (Cont.) | | |
Healthcare | | | | 1.0% | |
Transportation | | | | 1.0% | |
Pharmaceuticals | | | | 0.9% | |
Chemicals/Plastics | | | | 0.6% | |
Utilities | | | | 0.6% | |
Business Equipment and Services | | | | 0.5% | |
Finance | | | | 0.5% | |
Electronics/Electric | | | | 0.5% | |
Food Products | | | | 0.5% | |
Insurance | | | | 0.4% | |
Automotive | | | | 0.4% | |
Technology | | | | 0.4% | |
Consumer Products | | | | 0.3% | |
Building and Development (including Steel/Metals) | | | | 0.3% | |
Media | | | | 0.3% | |
Aerospace & Defense | | | | 0.3% | |
Hotels/Motels/Inns and Casinos | | | | 0.2% | |
Mining | | | | 0.2% | |
Industrial Equipment | | | | 0.2% | |
Diversified Manufacturing | | | | 0.2% | |
Food Service | | | | 0.2% | |
Real Estate | | | | 0.2% | |
Foreign Government Bonds, Foreign Agencies and Foreign Government Sponsored Corporations | | | | 0.2% | |
Beverage and Tobacco | | | | 0.2% | |
Leisure | | | | 0.2% | |
Pulp & Paper | | | | 0.1% | |
Environmental Control | | | | 0.1% | |
Commercial Services | | | | 0.1% | |
Financial Intermediaries | | | | 0.1% | |
| | | | | | |
| The accompanying notes are an integral part of these financial statements. | | Annual Report | | March 31, 2020 | | 65 |
| | |
| Schedule of Investments - Summary DoubleLine Shiller Enhanced CAPE® (Cont.) | | March 31, 2020 |
| | | | | |
INVESTMENT BREAKDOWNas a % of Net Assets: (Cont.) | | |
Containers and Glass Products | | | | 0.1% | |
Retailers (other than Food/Drug) | | | | 0.1% | |
Food/Drug Retailers | | | | 0.0% | ~ |
Cosmetics/Toiletries | | | | 0.0% | ~ |
Conglomerates | | | | 0.0% | ~ |
Construction | | | | 0.0% | ~ |
Other Assets and Liabilities | | | | (16.7)% | |
| | | | | |
| | | | 100.0% | |
| | | | | |
| µ | Represents issues not identified as the top 50 holdings in terms of market value and issues or issuers not exceeding 1% of net assets individually or in aggregate, respectively as of March 31, 2020. |
| ^ | Security exempt from registration under Rule 144A of the Securities Act of 1933. These securities may be resold in transactions exempt from registration to qualified institutional buyers. |
| # | Coupon rate is variable based on the weighted average coupon of the underlying collateral. To the extent the weighted average coupon of the underlying assets which comprise the collateral increases or decreases, the coupon rate of this security will increase or decrease correspondingly. The rate disclosed is as of March 31, 2020. |
| § | The interest rate will step up if the issuer does not redeem the bond on or before a scheduled redemption date in accordance with the terms of the instrument. The interest rate shown is the rate in effect as of March 31, 2020. |
| I/O | Inclues interest only securities |
| I/F | Includes inverse floating rate securities whose interest rate moves in the opposite direction of reference interest rates. Reference interest rates are typically based on a negative multiplier or slope. Interest rate may also be subject to a cap or floor. |
| ¨ | Seven-day yield as of March 31, 2020 |
| ‡ | All or a portion of this security has been pledged as collateral. |
| ~ | Represents less than 0.05% of net assets. |
| | | | | | | | | | | | | | | | | | | | | | | | | | | | | | | | | | | |
| | | | | | | |
| Excess Return Swaps | | | | | | | | | | | | | | |
| Reference Entity | | Counterparty | | Long/Short | | Financing
Rate | | Payment
Frequency | | Termination
Date | | Notional
Amount | | Unrealized
Appreciation
(Depreciation)/
Value |
Shiller Barclays CAPE® US Sector ER II USD Index ¤ | | Barclays Capital, Inc. | | | | Long | | | | | 0.40 | % | | | | Termination | | | | | 04/02/2020 | | | | | 32,500,000 | | | | $ | 1,501,932 | |
Shiller Barclays CAPE® US Sector ER II USD Index ¤ | | Canadian Imperial Bank of
Commerce | | | | Long | | | | | 0.40 | % | | | | Termination | | | | | 03/31/2021 | | | | | 35,000,000 | | | | | (5,451,533 | ) |
Shiller Barclays CAPE® US Sector ER II USD Index ¤ | | Barclays Capital, Inc. | | | | Long | | | | | 0.40 | % | | | | Termination | | | | | 04/29/2021 | | | | | 100,000,000 | | | | | (5,667,043 | ) |
Shiller Barclays CAPE® US Sector ER II USD Index ¤ | | Canadian Imperial Bank of
Commerce | | | | Long | | | | | 0.40 | % | | | | Termination | | | | | 03/17/2021 | | | | | 50,000,000 | | | | | (7,775,974 | ) |
Shiller Barclays CAPE® US Sector ER II USD Index ¤ | | Bank of America Merrill Lynch | | | | Long | | | | | 0.38 | % | | | | Termination | | | | | 09/29/2020 | | | | | 50,000,000 | | | | | (8,046,516 | ) |
Shiller Barclays CAPE® US Sector ER II USD Index ¤ | | Canadian Imperial Bank of
Commerce | | | | Long | | | | | 0.40 | % | | | | Termination | | | | | 04/14/2021 | | | | | 100,000,000 | | | | | (10,213,088 | ) |
Shiller Barclays CAPE® US Sector ER II USD Index ¤ | | Barclays Capital, Inc. | | | | Long | | | | | 0.40 | % | | | | Termination | | | | | 04/08/2021 | | | | | 75,000,000 | | | | | (10,897,395 | ) |
Shiller Barclays CAPE® US Sector ER II USD Index ¤ | | Bank of America Merrill Lynch | | | | Long | | | | | 0.38 | % | | | | Termination | | | | | 04/07/2020 | | | | | 100,000,000 | | | | | (10,935,445 | ) |
Shiller Barclays CAPE® US Sector ER II USD Index ¤ | | BNP Paribas | | | | Long | | | | | 0.39 | % | | | | Termination | | | | | 04/22/2020 | | | | | 100,000,000 | | | | | (11,744,810 | ) |
Shiller Barclays CAPE® US Sector ER II USD Index ¤ | | Barclays Capital, Inc. | | | | Long | | | | | 0.40 | % | | | | Termination | | | | | 02/04/2021 | | | | | 50,000,000 | | | | | (12,057,974 | ) |
Shiller Barclays CAPE® US Sector ER II USD Index ¤ | | BNP Paribas | | | | Long | | | | | 0.39 | % | | | | Termination | | | | | 05/06/2020 | | | | | 100,000,000 | | | | | (12,299,002 | ) |
Shiller Barclays CAPE® US Sector ER II USD Index ¤ | | Canadian Imperial Bank of
Commerce | | | | Long | | | | | 0.40 | % | | | | Termination | | | | | 06/09/2020 | | | | | 100,000,000 | | | | | (12,376,508 | ) |
Shiller Barclays CAPE® US Sector ER II USD Index ¤ | | Canadian Imperial Bank of
Commerce | | | | Long | | | | | 0.40 | % | | | | Termination | | | | | 04/28/2020 | | | | | 100,000,000 | | | | | (12,513,462 | ) |
Shiller Barclays CAPE® US Sector ER II USD Index ¤ | | Barclays Capital, Inc. | | | | Long | | | | | 0.40 | % | | | | Termination | | | | | 06/25/2020 | | | | | 100,000,000 | | | | | (12,707,220 | ) |
Shiller Barclays CAPE® US Sector ER II USD Index ¤ | | Bank of America Merrill Lynch | | | | Long | | | | | 0.38 | % | | | | Termination | | | | | 06/23/2020 | | | | | 100,000,000 | | | | | (13,361,580 | ) |
Shiller Barclays CAPE® US Sector ER II USD Index ¤ | | BNP Paribas | | | | Long | | | | | 0.39 | % | | | | Termination | | | | | 09/09/2020 | | | | | 100,000,000 | | | | | (13,367,054 | ) |
Shiller Barclays CAPE® US Sector ER II USD Index ¤ | | BNP Paribas | | | | Long | | | | | 0.39 | % | | | | Termination | | | | | 08/26/2020 | | | | | 100,000,000 | | | | | (13,367,054 | ) |
Shiller Barclays CAPE® US Sector ER II USD Index ¤ | | Bank of America Merrill Lynch | | | | Long | | | | | 0.38 | % | | | | Termination | | | | | 10/06/2020 | | | | | 100,000,000 | | | | | (13,426,805 | ) |
Shiller Barclays CAPE® US Sector ER II USD Index ¤ | | Barclays Capital, Inc. | | | | Long | | | | | 0.40 | % | | | | Termination | | | | | 08/20/2020 | | | | | 100,000,000 | | | | | (13,439,353 | ) |
Shiller Barclays CAPE® US Sector ER II USD Index ¤ | | Barclays Capital, Inc. | | | | Long | | | | | 0.40 | % | | | | Termination | | | | | 12/09/2020 | | | | | 90,000,000 | | | | | (13,467,476 | ) |
Shiller Barclays CAPE® US Sector ER II USD Index ¤ | | BNP Paribas | | | | Long | | | | | 0.39 | % | | | | Termination | | | | | 04/07/2021 | | | | | 100,000,000 | | | | | (13,486,196 | ) |
Shiller Barclays CAPE® US Sector ER II USD Index ¤ | | BNP Paribas | | | | Long | | | | | 0.39 | % | | | | Termination | | | | | 07/08/2020 | | | | | 100,000,000 | | | | | (13,489,903 | ) |
Shiller Barclays CAPE® US Sector ER II USD Index ¤ | | Canadian Imperial Bank of
Commerce | | | | Long | | | | | 0.40 | % | | | | Termination | | | | | 12/08/2020 | | | | | 100,000,000 | | | | | (13,610,570 | ) |
Shiller Barclays CAPE® US Sector ER II USD Index ¤ | | Bank of America Merrill Lynch | | | | Long | | | | | 0.38 | % | | | | Termination | | | | | 10/14/2020 | | | | | 100,000,000 | | | | | (13,701,046 | ) |
Shiller Barclays CAPE® US Sector ER II USD Index ¤ | | Barclays Capital, Inc. | | | | Long | | | | | 0.40 | % | | | | Termination | | | | | 11/05/2020 | | | | | 90,000,000 | | | | | (14,017,954 | ) |
Shiller Barclays CAPE® US Sector ER II USD Index ¤ | | Barclays Capital, Inc. | | | | Long | | | | | 0.40 | % | | | | Termination | | | | | 06/11/2020 | | | | | 100,000,000 | | | | | (14,025,181 | ) |
Shiller Barclays CAPE® US Sector ER II USD Index ¤ | | BNP Paribas | | | | Long | | | | | 0.39 | % | | | | Termination | | | | | 10/07/2020 | | | | | 100,000,000 | | | | | (14,116,898 | ) |
| | | | | | |
| 66 | | DoubleLine Funds Trust | | | | The accompanying notes are an integral part of these financial statements. |
| | | | | | | | | | | | | | | | | | | | | | | | | | | | | | | | | | | |
| Reference Entity | | Counterparty | | Long/Short | | Financing
Rate | | Payment
Frequency | | Termination
Date | | Notional
Amount | | Unrealized
Appreciation
(Depreciation)/
Value |
Shiller Barclays CAPE® US Sector ER II USD Index ¤ | | Canadian Imperial Bank of
Commerce | | | | Long | | | | | 0.40 | % | | | | Termination | | | | | 05/12/2020 | | | | | 100,000,000 | | | | $ | (14,187,163 | ) |
Shiller Barclays CAPE® US Sector ER II USD Index ¤ | | BNP Paribas | | | | Long | | | | | 0.39 | % | | | | Termination | | | | | 07/22/2020 | | | | | 100,000,000 | | | | | (14,260,645 | ) |
Shiller Barclays CAPE® US Sector ER II USD Index ¤ | | Barclays Capital, Inc. | | | | Long | | | | | 0.40 | % | | | | Termination | | | | | 11/19/2020 | | | | | 100,000,000 | | | | | (14,313,637 | ) |
Shiller Barclays CAPE® US Sector ER II USD Index ¤ | | Canadian Imperial Bank of
Commerce | | | | Long | | | | | 0.40 | % | | | | Termination | | | | | 12/15/2020 | | | | | 100,000,000 | | | | | (14,407,384 | ) |
Shiller Barclays CAPE® US Sector ER II USD Index ¤ | | Canadian Imperial Bank of
Commerce | | | | Long | | | | | 0.40 | % | | | | Termination | | | | | 07/07/2020 | | | | | 100,000,000 | | | | | (14,420,600 | ) |
Shiller Barclays CAPE® US Sector ER II USD Index ¤ | | BNP Paribas | | | | Long | | | | | 0.39 | % | | | | Termination | | | | | 05/13/2020 | | | | | 100,000,000 | | | | | (14,611,181 | ) |
Shiller Barclays CAPE® US Sector ER II USD Index ¤ | | Barclays Capital, Inc. | | | | Long | | | | | 0.40 | % | | | | Termination | | | | | 05/07/2020 | | | | | 100,000,000 | | | | | (14,629,150 | ) |
Shiller Barclays CAPE® US Sector ER II USD Index ¤ | | Barclays Capital, Inc. | | | | Long | | | | | 0.40 | % | | | | Termination | | | | | 07/09/2020 | | | | | 100,000,000 | | | | | (14,724,353 | ) |
Shiller Barclays CAPE® US Sector ER II USD Index ¤ | | Canadian Imperial Bank of
Commerce | | | | Long | | | | | 0.40 | % | | | | Termination | | | | | 10/13/2020 | | | | | 100,000,000 | | | | | (14,730,685 | ) |
Shiller Barclays CAPE® US Sector ER II USD Index ¤ | | Barclays Capital, Inc. | | | | Long | | | | | 0.40 | % | | | | Termination | | | | | 05/28/2020 | | | | | 100,000,000 | | | | | (14,732,207 | ) |
Shiller Barclays CAPE® US Sector ER II USD Index ¤ | | Canadian Imperial Bank of
Commerce | | | | Long | | | | | 0.40 | % | | | | Termination | | | | | 09/08/2020 | | | | | 100,000,000 | | | | | (14,756,352 | ) |
Shiller Barclays CAPE® US Sector ER II USD Index ¤ | | Bank of America Merrill Lynch | | | | Long | | | | | 0.38 | % | | | | Termination | | | | | 03/16/2021 | | | | | 100,000,000 | | | | | (14,781,722 | ) |
Shiller Barclays CAPE® US Sector ER II USD Index ¤ | | Barclays Capital, Inc. | | | | Long | | | | | 0.40 | % | | | | Termination | | | | | 04/01/2021 | | | | | 100,000,000 | | | | | (14,783,530 | ) |
Shiller Barclays CAPE® US Sector ER II USD Index ¤ | | Barclays Capital, Inc. | | | | Long | | | | | 0.40 | % | | | | Termination | | | | | 08/13/2020 | | | | | 100,000,000 | | | | | (14,839,278 | ) |
Shiller Barclays CAPE® US Sector ER II USD Index ¤ | | Bank of America Merrill Lynch | | | | Long | | | | | 0.38 | % | | | | Termination | | | | | 07/21/2020 | | | | | 100,000,000 | | | | | (15,000,314 | ) |
Shiller Barclays CAPE® US Sector ER II USD Index ¤ | | BNP Paribas | | | | Long | | | | | 0.39 | % | | | | Termination | | | | | 11/18/2020 | | | | | 100,000,000 | | | | | (15,035,900 | ) |
Shiller Barclays CAPE® US Sector ER II USD Index ¤ | | BNP Paribas | | | | Long | | | | | 0.39 | % | | | | Termination | | | | | 08/05/2020 | | | | | 100,000,000 | | | | | (15,035,910 | ) |
Shiller Barclays CAPE® US Sector ER II USD Index ¤ | | Canadian Imperial Bank of
Commerce | | | | Long | | | | | 0.40 | % | | | | Termination | | | | | 10/20/2020 | | | | | 100,000,000 | | | | | (15,047,999 | ) |
Shiller Barclays CAPE® US Sector ER II USD Index ¤ | | BNP Paribas | | | | Long | | | | | 0.39 | % | | | | Termination | | | | | 06/10/2020 | | | | | 100,000,000 | | | | | (15,187,603 | ) |
Shiller Barclays CAPE® US Sector ER II USD Index ¤ | | Bank of America Merrill Lynch | | | | Long | | | | | 0.38 | % | | | | Termination | | | | | 08/04/2020 | | | | | 100,000,000 | | | | | (15,213,465 | ) |
Shiller Barclays CAPE® US Sector ER II USD Index ¤ | | Canadian Imperial Bank of
Commerce | | | | Long | | | | | 0.40 | % | | | | Termination | | | | | 11/03/2020 | | | | | 100,000,000 | | | | | (15,230,759 | ) |
Shiller Barclays CAPE® US Sector ER II USD Index ¤ | | Barclays Capital, Inc. | | | | Long | | | | | 0.40 | % | | | | Termination | | | | | 08/06/2020 | | | | | 100,000,000 | | | | | (15,331,887 | ) |
Shiller Barclays CAPE® US Sector ER II USD Index ¤ | | Canadian Imperial Bank of
Commerce | | | | Long | | | | | 0.40 | % | | | | Termination | | | | | 11/10/2020 | | | | | 100,000,000 | | | | | (15,575,504 | ) |
Shiller Barclays CAPE® US Sector ER II USD Index ¤ | | BNP Paribas | | | | Long | | | | | 0.39 | % | | | | Termination | | | | | 05/27/2020 | | | | | 100,000,000 | | | | | (16,029,060 | ) |
Shiller Barclays CAPE® US Sector ER II USD Index ¤ | | Bank of America Merrill Lynch | | | | Long | | | | | 0.38 | % | | | | Termination | | | | | 05/19/2020 | | | | | 100,000,000 | | | | | (16,060,763 | ) |
Shiller Barclays CAPE® US Sector ER II USD Index ¤ | | Canadian Imperial Bank of
Commerce | | | | Long | | | | | 0.40 | % | | | | Termination | | | | | 09/22/2020 | | | | | 100,000,000 | | | | | (16,105,690 | ) |
Shiller Barclays CAPE® US Sector ER II USD Index ¤ | | Barclays Capital, Inc. | | | | Long | | | | | 0.40 | % | | | | Termination | | | | | 11/12/2020 | | | | | 100,000,000 | | | | | (16,144,333 | ) |
Shiller Barclays CAPE® US Sector ER II USD Index ¤ | | Canadian Imperial Bank of
Commerce | | | | Long | | | | | 0.40 | % | | | | Termination | | | | | 12/29/2020 | | | | | 100,000,000 | | | | | (16,296,420 | ) |
Shiller Barclays CAPE® US Sector ER II USD Index ¤ | | Canadian Imperial Bank of
Commerce | | | | Long | | | | | 0.40 | % | | | | Termination | | | | | 11/17/2020 | | | | | 100,000,000 | | | | | (16,476,118 | ) |
Shiller Barclays CAPE® US Sector ER II USD Index ¤ | | BNP Paribas | | | | Long | | | | | 0.39 | % | | | | Termination | | | | | 11/11/2020 | | | | | 100,000,000 | | | | | (16,508,938 | ) |
Shiller Barclays CAPE® US Sector ER II USD Index ¤ | | Bank of America Merrill Lynch | | | | Long | | | | | 0.38 | % | | | | Termination | | | | | 12/22/2020 | | | | | 100,000,000 | | | | | (16,740,467 | ) |
Shiller Barclays CAPE® US Sector ER II USD Index ¤ | | BNP Paribas | | | | Long | | | | | 0.39 | % | | | | Termination | | | | | 09/16/2020 | | | | | 100,000,000 | | | | | (16,853,148 | ) |
Shiller Barclays CAPE® US Sector ER II USD Index ¤ | | Bank of America Merrill Lynch | | | | Long | | | | | 0.38 | % | | | | Termination | | | | | 12/01/2020 | | | | | 100,000,000 | | | | | (16,934,848 | ) |
Shiller Barclays CAPE® US Sector ER II USD Index ¤ | | Bank of America Merrill Lynch | | | | Long | | | | | 0.38 | % | | | | Termination | | | | | 11/04/2020 | | | | | 100,000,000 | | | | | (17,255,454 | ) |
Shiller Barclays CAPE® US Sector ER II USD Index ¤ | | Bank of America Merrill Lynch | | | | Long | | | | | 0.38 | % | | | | Termination | | | | | 09/01/2020 | | | | | 100,000,000 | | | | | (17,723,620 | ) |
Shiller Barclays CAPE® US Sector ER II USD Index ¤ | | Bank of America Merrill Lynch | | | | Long | | | | | 0.38 | % | | | | Termination | | | | | 03/23/2021 | | | | | 100,000,000 | | | | | (17,785,511 | ) |
Shiller Barclays CAPE® US Sector ER II USD Index ¤ | | Bank of America Merrill Lynch | | | | Long | | | | | 0.38 | % | | | | Termination | | | | | 01/12/2021 | | | | | 100,000,000 | | | | | (18,087,701 | ) |
Shiller Barclays CAPE® US Sector ER II USD Index ¤ | | Bank of America Merrill Lynch | | | | Long | | | | | 0.38 | % | | | | Termination | | | | | 01/05/2021 | | | | | 100,000,000 | | | | | (18,098,383 | ) |
Shiller Barclays CAPE® US Sector ER II USD Index ¤ | | BNP Paribas | | | | Long | | | | | 0.39 | % | | | | Termination | | | | | 03/10/2021 | | | | | 100,000,000 | | | | | (18,515,134 | ) |
Shiller Barclays CAPE® US Sector ER II USD Index ¤ | | Canadian Imperial Bank of
Commerce | | | | Long | | | | | 0.40 | % | | | | Termination | | | | | 03/09/2021 | | | | | 100,000,000 | | | | | (18,516,065 | ) |
Shiller Barclays CAPE® US Sector ER II USD Index ¤ | | Bank of America Merrill Lynch | | | | Long | | | | | 0.38 | % | | | | Termination | | | | | 03/02/2021 | | | | | 100,000,000 | | | | | (18,721,041 | ) |
Shiller Barclays CAPE® US Sector ER II USD Index ¤ | | BNP Paribas | | | | Long | | | | | 0.39 | % | | | | Termination | | | | | 03/24/2021 | | | | | 100,000,000 | | | | | (18,724,174 | ) |
Shiller Barclays CAPE® US Sector ER II USD Index ¤ | | Barclays Capital, Inc. | | | | Long | | | | | 0.40 | % | | | | Termination | | | | | 03/25/2021 | | | | | 100,000,000 | | | | | (18,724,914 | ) |
Shiller Barclays CAPE® US Sector ER II USD Index ¤ | | BNP Paribas | | | | Long | | | | | 0.39 | % | | | | Termination | | | | | 12/16/2020 | | | | | 100,000,000 | | | | | (19,164,404 | ) |
Shiller Barclays CAPE® US Sector ER II USD Index ¤ | | Canadian Imperial Bank of
Commerce | | | | Long | | | | | 0.40 | % | | | | Termination | | | | | 01/19/2021 | | | | | 100,000,000 | | | | | (19,228,745 | ) |
Shiller Barclays CAPE® US Sector ER II USD Index ¤ | | Bank of America Merrill Lynch | | | | Long | | | | | 0.38 | % | | | | Termination | | | | | 02/09/2021 | | | | | 100,000,000 | | | | | (19,383,180 | ) |
| | | | | | | | | | | | | | | | | | | | | | | | | | | | | | | | | | |
| | | | | | | | | | | | | | | | | | | | | | | | | | | | | | $ | (1,052,976,447 | ) |
| | | | | | | | | | | | | | | | | | | | | | | | | | | | | | | | | | |
| ¤ | Shiller Barclays CAPE® US Sector ER II USD Index aims to provide notional long exposure to the top four United States equity sectors that are relatively undervalued, as defined by a modified version of the classic CAPE® Ratio (the “Relative CAPE® Indicator”) and that possess relatively strong price momentum over the prior twelve months. Each U.S. equity sector is represented by an index of equity securities of companies in the relevant sector. Information on the sector constituents as of March 31, 2020, is available on the Barclays Capital, Inc. website at https://indices.barclays/IM/12/en/indices/details.app;ticker=BXIICS2E. |
| | | | | | |
| The accompanying notes are an integral part of these financial statements. | | Annual Report | | March 31, 2020 | | 67 |
| | |
| Schedule of Investments - Summary DoubleLine Shiller Enhanced CAPE® (Cont.) | | March 31, 2020 |
A summary of the DoubleLine Shiller Enhanced CAPE®’s investments in affiliated mutual funds for the year ended March 31, 2020 is as follows:
| | | | | | | | | | | | | | | | | | | | | | | | | | | | | | | | | | | | | | | | |
| Fund | | Value at
March 31,
2019 | | Gross
Purchases | | Gross
Sales | | Shares Held at
March 31,
2020 | | Value at
March 31,
2020 | | Change in
Unrealized for the
Year Ended
March 31,
2020 | | Dividend Income
Earned in the
Year Ended
March 31,
2020 | | Net Realized
Gain (Loss) in
the Year Ended
March 31,
2020 |
DoubleLine Ultra Short Bond Fund (Class I) | | | $ | 199,950,099 | | | | $ | 100,000,000 | | | | $ | (100,000,000 | ) | | | | 19,895,522 | | | | $ | 195,175,073 | | | | $ | (4,376,618 | ) | | | $ | 5,707,070 | | | | $ | (375,404 | ) |
| | | | | | |
| 68 | | DoubleLine Funds Trust | | | | The accompanying notes are an integral part of these financial statements. |
| | |
| Schedule of Investments - Summary DoubleLine Flexible Income Fund | | March 31, 2020 |
| | | | | | | | | | | | | | | | | | | | |
PRINCIPAL
AMOUNT $ | | | SECURITY DESCRIPTION | | RATE | | | MATURITY | | | VALUE $ | | | % OF NET
ASSETS | |
| | ASSET BACKED OBLIGATIONS | | | | | | | | | |
| | | | | |
| | | | ExteNet Issuer LLC, | | | | | | | | | | | | | | | | |
| | 6,250,000 | | | Series2019-1A-C | | | 5.22% | ^ | | | 07/26/2049 | | | | 5,484,487 | | | | 0.5% | |
| | | | | |
| | | | Harley Marine Financing LLC, | | | | | | | | | | | | | | | | |
| | 4,434,311 | | | Series2018-1A-A2 | | | 5.68% | ^ | | | 05/15/2043 | | | | 3,998,285 | | | | 0.4% | |
| | | | | |
| | | | Mosaic Solar Loan Trust, | | | | | | | | | | | | | | | | |
| | 5,162,637 | | | Series2018-1A-C | | | 0.00% | ^ P/O | | | 06/22/2043 | | | | 4,286,955 | | | | 0.4% | |
| | | | | |
| | | | Vivint Colar Financing LLC, | | | | | | | | | | | | | | | | |
| | 4,904,219 | | | Series2018-1A-A | | | 4.73% | ^ | | | 04/30/2048 | | | | 4,060,762 | | | | 0.4% | |
| | | | | |
| | | | Wave LLC, | | | | | | | | | | | | | | | | |
| | 8,203,125 | | | Series2019-1-C | | | 6.41% | ^ | | | 09/15/2044 | | | | 5,099,177 | | | | 0.5% | |
| | | | | |
| | | | Zephyrus Capital Aviation Partners Ltd., | | | | | | | | | | | | | | | | |
| | 4,530,800 | | | Series2018-1-A | | | 4.61% | ^ | | | 10/15/2038 | | | | 3,711,482 | | | | 0.3% | |
| | | | | |
| | | | Other Asset Backed Obligationsµ | | | | | | | | | | | 20,341,741 | | | | 1.8% | |
| | | | | | | | | | | | | | | | | |
| | | | Total Asset Backed Obligations
(Cost $57,159,915) | | | | 46,982,889 | | | | 4.3% | |
| | | | | | | | | | | | | | | | | |
| | BANK LOANSµ | | | | | | | | | | | | | | | | |
| | | | Total Bank Loans
(Cost $63,571,459) | | | | | | | | | | | 54,546,251 | | | | 4.9% | |
| | | | | | | | | | | | | | | | | |
| | COLLATERALIZED LOAN OBLIGATIONS | | | | | | | | | | | | | | | | |
| | | | | |
| | | | Canyon Capital Ltd., | | | | | | | | | | | | | | | | |
| | 10,000,000 | | | Series2017-1A-B (3 Month LIBOR USD + 1.70%) | | | 3.53% | ^ | | | 07/15/2030 | | | | 8,993,362 | | | | 0.8% | |
| | | | | |
| | | | GoldenTree Loan Management Ltd., | | | | | | | | | | | | | | | | |
| | 5,500,000 | | | Series2017-2A-D (3 Month LIBOR USD + 2.65%) | | | 4.47% | ^ | | | 11/28/2030 | | | | 4,174,215 | | | | 0.4% | |
| | | | | |
| | | | LCM Ltd., | | | | | | | | | | | | | | | | |
| | 5,000,000 | | | Series26A-D (3 Month LIBOR USD + 2.50%, 2.50% Floor) | | | 4.32% | ^ | | | 01/20/2031 | | | | 3,434,403 | | | | 0.3% | |
| | | | | |
| | | | Marble Point Ltd., | | | | | | | | | | | | | | | | |
| | 6,500,000 | | | Series2019-1A-B (3 Month LIBOR USD + 2.15%) | | | 3.96% | ^ | | | 07/23/2032 | | | | 5,923,190 | | | | 0.6% | |
| | | | | |
| | | | Octagon Investment Partners Ltd., | | | | | | | | | | | | | | | | |
| | 4,500,000 | | | Series2012-1A-CR (3 Month LIBOR USD + 4.00%) | | | 5.83% | ^ | | | 07/15/2029 | | | | 3,560,870 | | | | 0.3% | |
| | | | | |
| | | | Steele Creek Ltd., | | | | | | | | | | | | | | | | |
| | 5,000,000 | | | Series2019-2A-B (3 Month LIBOR USD + 2.25%, 2.25% Floor) | | | 4.08% | ^ | | | 07/15/2032 | | | | 4,411,063 | | | | 0.4% | |
| | | | | |
| | | | Trimaran CAVU LLC, | | | | | | | | | | | | | | | | |
| | 6,000,000 | | | Series2019-1A-B (3 Month LIBOR USD + 2.20%, 2.20% Floor) | | | 4.02% | ^ | | | 07/20/2032 | | | | 5,520,347 | | | | 0.5% | |
| | | | | |
| | | | Venture Ltd., | | | | | | | | | | | | | | | | |
| | 5,000,000 | | | Series2018-34A-A (3 Month LIBOR USD + 1.23%, 1.23% Floor) | | | 3.06% | ^ | | | 10/15/2031 | | | | 4,739,775 | | | | 0.4% | |
| | | | | |
| | | | Wind River Ltd., | | | | | | | | | | | | | | | | |
| | 7,975,000 | | | Series2015-2A-ER (3 Month LIBOR USD + 5.55%) | | | 7.38% | ^ | | | 10/15/2027 | | | | 5,590,298 | | | | 0.5% | |
| | | | | |
| | | | Other Collateralized Loan Obligationsµ | | | | | | | | | | | 123,480,332 | | | | 11.2% | |
| | | | | | | | | | | | | | | | | |
| | | | Total Collateralized Loan Obligations
(Cost $216,176,245) | | | | | | | | | | | 169,827,855 | | | | 15.4% | |
| | | | | | | | | | | | | | | | | |
| | FOREIGN CORPORATE BONDS | | | | | | | | | | | | | | | | |
| | | | | |
| | 4,400,000 | | | BBVA Bancomer S.A. (5 Year CMT Rate + 2.65%) | | | 5.13% | | | | 01/18/2033 | | | | 3,676,530 | | | | 0.3% | |
| | 3,500,000 | | | Malayan Banking BHD (5 Year Swap Rate USD + 2.54%) | | | 3.91% | | | | 10/29/2026 | | | | 3,559,500 | | | | 0.3% | |
| | 3,703,000 | | | VTR Finance B.V. | | | 6.88% | | | | 01/15/2024 | | | | 3,462,305 | | | | 0.3% | |
| | | | | |
| | | | Other Foreign Corporate Bondsµ | | | | | | | | | | | 156,412,292 | | | | 14.2% | |
| | | | | | | | | | | | | | | | | |
| | | | Total Foreign Corporate Bonds
(Cost $196,776,203) | | | | | | | | | | | 167,110,627 | | | | 15.1% | |
| | | | | | | | | | | | | | | | | |
| | FOREIGN GOVERNMENT BONDS, FOREIGN AGENCIES AND FOREIGN GOVERNMENT SPONSORED CORPORATIONSµ | |
| | | | Total Foreign Government Bonds, Foreign Agencies and Foreign Government Sponsored Corporations
(Cost $1,980,800) | | | | | | | | 1,761,644 | | | | 0.2% | |
| | | | | | | | | | | | | | | | | |
| | NON-AGENCY COMMERCIAL MORTGAGE BACKED OBLIGATIONSµ | | | | | | | | | | | | | | | | |
| | | | TotalNon-Agency Commercial Mortgage Backed Obligations
(Cost $149,065,154) | | | | | | | | | | | 118,961,672 | | | | 10.8% | |
| | | | | | | | | | | | | | | | | |
| | | | | | |
| The accompanying notes are an integral part of these financial statements. | | Annual Report | | March 31, 2020 | | 69 |
| | |
| Schedule of Investments - Summary DoubleLine Flexible Income Fund (Cont.) | | March 31, 2020 |
| | | | | | | | | | | | | | | | | | | | |
PRINCIPAL
AMOUNT $ | | | SECURITY DESCRIPTION | | RATE | | | MATURITY | | | VALUE $ | | | % OF NET
ASSETS | |
| | NON-AGENCY RESIDENTIAL COLLATERALIZED MORTGAGE OBLIGATIONS | | | | | | | | | | | | | | | | |
| | | | | |
| | | | Ajax Mortgage Loan Trust, | | | | | | | | | | | | | | | | |
| | 4,902,544 | | | Series2017-C-A | | | 3.75% | ^§ | | | 07/25/2060 | | | | 4,918,569 | | | | 0.5% | |
| | | | | |
| | | | APS Resecuritization Trust, | | | | | | | | | | | | | | | | |
| | 8,260,406 | | | Series2015-3-1MZ (12 Month US Treasury Average + 0.96%, 0.96% Floor) | | | 2.19% | ^D | | | 10/27/2046 | | | | 5,754,475 | | | | 0.5% | |
| | | | | |
| | | | Bayview Koitere Fund Trust, | | | | | | | | | | | | | | | | |
| | 5,888,077 | | | Series2018-SBR4-A1 | | | 4.38% | ^§ | | | 06/28/2033 | | | | 5,923,459 | | | | 0.5% | |
| | | | | |
| | | | CHL Mortgage Pass-Through Trust, | | | | | | | | | | | | | | | | |
| | 7,101,712 | | | Series2007-14-A19 | | | 6.00% | | | | 09/25/2037 | | | | 5,399,693 | | | | 0.5% | |
| | | | | |
| | 12,101,239 | | | CHL Mortgage Pass-Through Trust, | | | 5.75% | | | | 07/25/2037 | | | | 9,078,424 | | | | 0.8% | |
| | | | Series2007-9-A1 | | | | | | | | | | | | | | | | |
| | | | Series2007-9-A13 | | | | | | | | | | | | | | | | |
| | | | | |
| | | | CHL Mortgage Pass-Through Trust, | | | | | | | | | | | | | | | | |
| | 8,688,000 | | | Series2018-GT1-A (1 Month LIBOR USD + 2.75%) | | | 3.70% | ^ | | | 05/25/2023 | | | | 8,077,990 | | | | 0.7% | |
| | | | | |
| | | | CIM Trust, | | | | | | | | | | | | | | | | |
| | 13,420,000 | | | Series2017-3RR-B2 | | | 10.50% | #^Þ | | | 01/27/2057 | | | | 13,218,700 | | | | 1.2% | |
| | | | | |
| | | | Citigroup Mortgage Loan Trust, Inc., | | | | | | | | | | | | | | | | |
| | 4,020,428 | | | Series2006-AR6-2A3 (1 Month LIBOR USD + 0.25%, 0.25% Floor) | | | 1.20% | | | | 09/25/2036 | | | | 3,437,371 | | | | 0.3% | |
| | | | | |
| | | | Connecticut Avenue Securities Trust, | | | | | | | | | | | | | | | | |
| | 12,300,000 | | | Series2020-R01-1M2 (1 Month LIBOR USD + 2.05%) | | | 3.00% | ^ | | | 01/25/2040 | | | | 7,486,228 | | | | 0.7% | |
| | | | | |
| | | | FMC GMSR Issuer Trust, | | | | | | | | | | | | | | | | |
| | 15,000,000 | | | Series2019-GT1-A | | | 5.07% | #^ | | | 05/25/2024 | | | | 15,223,512 | | | | 1.4% | |
| | | | | |
| | | | Home Partners of America Trust, | | | | | | | | | | | | | | | | |
| | 13,951,379 | | | Series2019-2-F | | | 3.87% | ^ | | | 10/19/2039 | | | | 11,555,718 | | | | 1.1% | |
| | | | | |
| | | | Lehman Trust, | | | | | | | | | | | | | | | | |
| | 8,131,102 | | | Series2006-GP3-1A1 (1 Month LIBOR USD + 0.20%, 0.20% Floor) | | | 1.15% | | | | 06/25/2046 | | | | 6,647,500 | | | | 0.6% | |
| | | | | |
| | | | MFA LLC, | | | | | | | | | | | | | | | | |
| | 8,787,777 | | | Series2018-NPL2-A1 | | | 4.16% | ^§ | | | 07/25/2048 | | | | 8,759,678 | | | | 0.8% | |
| | | | | |
| | | | Morgan Stanley Resecuritization Trust, | | | | | | | | | | | | | | | | |
| | 10,575,554 | | | Series2013-R7-8B (12 Month US Treasury Average + 0.96%, 0.96% Floor) | | | 3.01% | ^Þ | | | 12/26/2046 | | | | 7,299,303 | | | | 0.7% | |
| | | | | |
| | | | New Residential Mortgage Loan Trust, | | | | | | | | | | | | | | | | |
| | 5,835,807 | | | Series2018-FNT2-B | | | 4.09% | ^ | | | 07/25/2054 | | | | 5,833,547 | | | | 0.5% | |
| | | | | |
| | | | NovaStar Mortgage Funding Trust Series, | | | | | | | | | | | | | | | | |
| | 12,366,400 | | | Series2006-3-A2C (1 Month LIBOR USD + 0.16%, 0.16% Floor) | | | 1.11% | | | | 10/25/2036 | | | | 7,942,658 | | | | 0.7% | |
| | | | | |
| | | | PMT Credit Risk Transfer Trust2019-2R, | | | | | | | | | | | | | | | | |
| | 19,729,164 | | | Series2019-2R-A (1 Month LIBOR USD + 2.75%, 2.75% Floor) | | | 4.36% | ^ | | | 05/27/2023 | | | | 18,668,072 | | | | 1.7% | |
| | | | | |
| | | | PNMAC GMSR Trust, | | | | | | | | | | | | | | | | |
| | 17,600,000 | | | Series2018-FT1-A (1 Month LIBOR USD + 2.35%) | | | 3.30% | ^ | | | 04/25/2023 | | | | 15,771,152 | | | | 1.4% | |
| | | | | |
| | | | PRPM LLC, | | | | | | | | | | | | | | | | |
| | 5,425,196 | | | Series2018-1A-A1 | | | 3.75% | #^ | | | 04/25/2023 | | | | 5,505,846 | | | | 0.5% | |
| | | | | |
| | | | PRPM LLC, | | | | | | | | | | | | | | | | |
| | 7,677,518 | | | Series2019-GS1-A2 | | | 4.75% | #^ | | | 10/25/2024 | | | | 7,677,760 | | | | 0.7% | |
| | | | | |
| | | | Residential Funding Mortgage Securities Trust, | | | | | | | | | | | | | | | | |
| | 5,928,246 | | | Series2006-S8-A10 | | | 6.00% | | | | 09/25/2036 | | | | 5,118,808 | | | | 0.5% | |
| | | | | |
| | | | Residential Mortgage Loan Trust, | | | | | | | | | | | | | | | | |
| | 5,750,000 | | | Series2020-1-B1 | | | 3.95% | #^ | | | 02/25/2024 | | | | 4,929,924 | | | | 0.4% | |
| | | | | |
| | | | Soundview Home Loan Trust, | | | | | | | | | | | | | | | | |
| | 6,386,425 | | | Series2007-OPT1-2A2 (1 Month LIBOR USD + 0.15%, 0.15% Floor) | | | 1.10% | | | | 06/25/2037 | | | | 4,547,922 | | | | 0.4% | |
| | | | | |
| | | | Structured Asset Securities Corporation, | | | | | | | | | | | | | | | | |
| | 7,523,770 | | | Series2007-RF1-1A (1 Month LIBOR USD + 0.19%, 0.19% Floor) | | | 1.14% | ^ | | | 03/25/2037 | | | | 5,784,271 | | | | 0.5% | |
| | | | | |
| | | | Toorak Mortgage Corporation Ltd., | | | | | | | | | | | | | | | | |
| | 5,000,000 | | | Series2019-1-A1 | | | 4.46% | ^§ | | | 03/25/2022 | | | | 4,370,030 | | | | 0.4% | |
| | | | | |
| | | | Tricon American Homes Trust, | | | | | | | | | | | | | | | | |
| | 5,000,000 | | | Series2019-SFR1-F | | | 3.75% | ^ | | | 03/17/2038 | | | | 3,778,436 | | | | 0.3% | |
| | | |
| | OtherNon-Agency Residential Collateralized Mortgage Obligationsµ | | | | | | | | 62,756,764 | | | | 5.7% | |
| | | | | | | | | | | | | | | | | | | | |
| | | | TotalNon-Agency Residential Collateralized Mortgage Obligations
(Cost $302,796,229) | | | | 265,465,810 | | | | 24.0% | |
| | | | | | | | | | | | | | | | | | | | |
| | US CORPORATE BONDSµ | | | | | |
| | | | Total US Corporate Bonds
(Cost $91,899,975) | | | | 79,113,421 | | | | 7.2% | |
| | | | | | | | | | | | | | | | | | | | |
| | | | | | |
| 70 | | DoubleLine Funds Trust | | | | The accompanying notes are an integral part of these financial statements. |
| | | | | | | | | | | | | | | | | | | | |
PRINCIPAL
AMOUNT $/
SHARES | | | SECURITY DESCRIPTION | | RATE | | | MATURITY | | | VALUE $ | | | % OF NET
ASSETS | |
| | US GOVERNMENT AND AGENCY MORTGAGE BACKED OBLIGATIONSµ | | | | | |
| | | | Total US Government and Agency Mortgage Backed Obligations
(Cost $11,673,986) | | | | 6,443,985 | | | | 0.6% | |
| | | | | | | | | | | | | | | | | | | | |
| | US GOVERNMENT AND AGENCY OBLIGATIONS | | | | | |
| | | | | |
| | 32,507,241 | | | United States Treasury Inflation Indexed Bonds | | | 0.63% | | | | 04/15/2023 | | | | 32,757,922 | | | | 3.0% | |
| | 5,216,535 | | | United States Treasury Inflation Indexed Bonds | | | 0.50% | | | | 04/15/2024 | | | | 5,293,378 | | | | 0.4% | |
| | | | | | | | | | | | | | | | | | | | |
| | | | Total US Government and Agency Obligations
(Cost $37,934,511) | | | | 38,051,300 | | | | 3.4% | |
| | | | | | | | | | | | | | | | | | | | |
| | AFFILIATED MUTUAL FUNDS | | | | | |
| | | | | |
| | 10,365,365 | | | DoubleLine Global Bond Fund (Class I) | | | | | | | | | | | 105,830,380 | | | | 9.6% | |
| | | | | | | | | | | | | | | | | | | | |
| | | | Total Affiliated Mutual Funds
(Cost $106,418,043) | | | | 105,830,380 | | | | 9.6% | |
| | | | | | | | | | | | | | | | | | | | |
| | EXCHANGE TRADED FUNDS AND COMMON STOCKSµ | | | | | |
| | | | Total Exchange Traded Funds and Common Stocks
(Cost $631,863) | | | | 25,517 | | | | 0.0% | |
| | | | | | | | | | | | | | | | | | | | |
| | WARRANTSµ | | | | | |
| | | | Total Warrants
(Cost $—) | | | | — | | | | 0.0% | |
| | | | | | | | | | | | | | | | | | | | |
| | SHORT TERM INVESTMENTS | | | | | |
| | 10,141,547 | | | First American Government Obligations Fund - Class U | | | 0.47% | ¨ | | | | | | | 10,141,547 | | | | 0.9% | |
| | 10,141,547 | | | JP Morgan U.S. Government Money Market Fund - Institutional Share Class | | | 0.36% | ¨ | | | | | | | 10,141,547 | | | | 0.9% | |
| | 10,141,547 | | | Morgan Stanley Institutional Liquidity Funds Government Portfolio - Institutional Share Class | | | 0.26% | ¨ | | | | | | | 10,141,547 | | | | 0.9% | |
| | | | | | | | | | | | | | | | | | | | |
| | | | Total Short Term Investments
(Cost $30,424,641) | | | | 30,424,641 | | | | 2.7% | |
| | | | | | | | | | | | | | | | | | | | |
| | | | Total Investments
(Cost $1,266,509,024) | | | | 1,084,545,992 | | | | 98.2% | |
| | | | Other Assets in Excess of Liabilities | | | | 20,168,928 | | | | 1.8% | |
| | | | | | | | | | | | | | | | | | | | |
| | | | NET ASSETS | | | | | | | | | | $ | 1,104,714,920 | | | | 100.0% | |
| | | | | | | | | | | | | | | | | | | | |
| | | | | |
| SECURITY TYPE BREAKDOWNas a % of Net Assets: | | | | | |
Non-Agency Residential Collateralized Mortgage Obligations | | | | 24.0% | |
Collateralized Loan Obligations | | | | 15.4% | |
Foreign Corporate Bonds | | | | 15.1% | |
Non-Agency Commercial Mortgage Backed Obligations | | | | 10.8% | |
Affiliated Mutual Funds | | | | 9.6% | |
US Corporate Bonds | | | | 7.2% | |
Bank Loans | | | | 4.9% | |
Asset Backed Obligations | | | | 4.3% | |
US Government and Agency Obligations | | | | 3.4% | |
Short Term Investments | | | | 2.7% | |
US Government and Agency Mortgage Backed Obligations | | | | 0.6% | |
Foreign Government Bonds, Foreign Agencies and Foreign Government Sponsored Corporations | | | | 0.2% | |
Exchange Traded Funds and Common Stocks | | | | 0.0% | ~ |
Warrants | | | | 0.0% | ~ |
Other Assets and Liabilities | | | | 1.8% | |
| | | | | |
| | | | 100.0% | |
| | | | | |
| | | | | |
| INVESTMENT BREAKDOWNas a % of Net Assets: | | |
Non-Agency Residential Collateralized Mortgage Obligations | | | | 24.0% | |
Collateralized Loan Obligations | | | | 15.4% | |
Non-Agency Commercial Mortgage Backed Obligations | | | | 10.8% | |
Affiliated Mutual Funds | | | | 9.6% | |
Asset Backed Obligations | | | | 4.3% | |
| | | | | |
INVESTMENT BREAKDOWNas a % of Net Assets: (Cont.) | | |
Banking | | | | 4.2% | |
US Government and Agency Obligations | | | | 3.4% | |
Short Term Investments | | | | 2.7% | |
Utilities | | | | 2.6% | |
Telecommunications | | | | 2.2% | |
Energy | | | | 2.2% | |
Healthcare | | | | 1.3% | |
Finance | | | | 1.2% | |
Media | | | | 1.2% | |
Transportation | | | | 1.0% | |
Consumer Products | | | | 1.0% | |
Mining | | | | 0.8% | |
Hotels/Motels/Inns and Casinos | | | | 0.7% | |
Food Products | | | | 0.7% | |
Chemicals/Plastics | | | | 0.7% | |
Business Equipment and Services | | | | 0.6% | |
Building and Development (including Steel/Metals) | | | | 0.6% | |
US Government and Agency Mortgage Backed Obligations | | | | 0.6% | |
Electronics/Electric | | | | 0.5% | |
Leisure | | | | 0.5% | |
Technology | | | | 0.5% | |
Food Service | | | | 0.4% | |
Pharmaceuticals | | | | 0.4% | |
Aerospace & Defense | | | | 0.4% | |
Real Estate | | | | 0.4% | |
| | | | | | |
| The accompanying notes are an integral part of these financial statements. | | Annual Report | | March 31, 2020 | | 71 |
| | |
| Schedule of Investments - Summary DoubleLine Flexible Income Fund (Cont.) | | March 31, 2020 |
| | | | | |
INVESTMENT BREAKDOWNas a % of Net Assets: (Cont.) | | |
Automotive | | | | 0.4% | |
Retailers (other than Food/Drug) | | | | 0.4% | |
Commercial Services | | | | 0.4% | |
Construction | | | | 0.3% | |
Insurance | | | | 0.3% | |
Containers and Glass Products | | | | 0.3% | |
Environmental Control | | | | 0.2% | |
Foreign Government Bonds, Foreign Agencies and Foreign Government Sponsored Corporations | | | | 0.2% | |
Industrial Equipment | | | | 0.2% | |
Pulp & Paper | | | | 0.2% | |
Diversified Manufacturing | | | | 0.1% | |
Chemical Products | | | | 0.1% | |
Financial Intermediaries | | | | 0.1% | |
Food/Drug Retailers | | | | 0.1% | |
Cosmetics/Toiletries | | | | 0.0% | ~ |
Beverage and Tobacco | | | | 0.0% | ~ |
Other Assets and Liabilities | | | | 1.8% | |
| | | | | |
| | | | 100.0% | |
| | | | | |
| µ | Represents issues not identified as the top 50 holdings in terms of market value and issues or issuers not exceeding 1% of net assets individually or in aggregate, respectively as of March 31, 2020. |
| ^ | Security exempt from registration under Rule 144A of the Securities Act of 1933. These securities may be resold in transactions exempt from registration to qualified institutional buyers. |
| § | The interest rate will step up if the issuer does not redeem the bond on or before a scheduled redemption date in accordance with the terms of the instrument. The interest rate shown is the rate in effect as of March 31, 2020. |
| D | This mortgage-backed bond accrues interest which is added to the outstanding principal balance. The interest payment will be deferred until all other tranches in the structure are paid off. The rate disclosed is as of March 31, 2020. |
| P/O | Principal only security |
| # | Coupon rate is variable based on the weighted average coupon of the underlying collateral. To the extent the weighted average coupon of the underlying assets which comprise the collateral increases or decreases, the coupon rate of this security will increase or decrease correspondingly. The rate disclosed is as of March 31, 2020. |
| Þ | Value determined using significant unobservable inputs. |
| ¨ | Seven-day yield as of March 31, 2020 |
| ~ | Represents less than 0.05% of net assets |
A summary of the DoubleLine Flexible Income Fund’s investments in affiliated mutual funds for the year ended March 31, 2020 is as follows:
| | | | | | | | | | | | | | | | | | | | | | | | | | | | | | | | | | | | | | | | |
| Fund | | Value at
March 31,
2019 | | Gross
Purchases | | Gross
Sales | | Shares Held at
March 31,
2020 | | Value at
March 31,
2020 | | Change in
Unrealized for the
Year Ended
March 31,
2020 | | Dividend Income
Earned in the
Year Ended
March 31,
2020 | | Net Realized
Gain (Loss) in
the Year Ended
March 31,
2020 |
DoubleLine Global Bond Fund (Class I) | | | $ | 84,749,820 | | | | $ | 22,000,000 | | | | $ | — | | | | | 10,365,365 | | | | $ | 105,830,380 | | | | $ | (919,440 | ) | | | $ | 1,119,087 | | | | $ | 5,597 | |
| | | | | | |
| 72 | | DoubleLine Funds Trust | | | | The accompanying notes are an integral part of these financial statements. |
| | |
| Schedule of Investments DoubleLine Low Duration Emerging Markets Fixed Income Fund | | March 31, 2020 |
| | | | | | | | | | | | | | | | |
PRINCIPAL
AMOUNT $ | | | SECURITY DESCRIPTION | | RATE | | | MATURITY | | | VALUE $ | |
| | FOREIGN CORPORATE BONDS 77.1% | |
| | |
| | ARGENTINA 0.2% | |
| | 450,000 | | | Pampa Energia S.A. | | | 7.38% | | | | 07/21/2023 | | | | 302,627 | |
| | | | | | | | | | | | | | | | |
| | | | | | | | | | | | | | | 302,627 | |
| | | | | | | | | | | | | | | | |
| | BRAZIL 10.0% | | | | | | | | | | | | |
| | 3,200,000 | | | Banco Bradesco S.A. | | | 5.90% | | | | 01/16/2021 | | | | 3,229,600 | |
| | 1,600,000 | | | Banco BTG Pactual S.A. (5 Year CMT Rate + 5.26%) | | | 7.75% | ^ | | | 02/15/2029 | | | | 1,376,000 | |
| | 2,397,000 | | | Banco do Brasil S.A. (10 Year CMT Rate + 7.78%) | | | 8.50% | † | | | 10/20/2020 | | | | 2,403,724 | |
| | 1,500,000 | | | Brasil Bolsa Balcao S.A. | | | 5.50% | | | | 07/16/2020 | | | | 1,491,390 | |
| | 105,102 | | | Invepar Holdings | | | 0.00% | WÞ | | | 12/30/2028 | | | | 4,494 | |
| | 500,000 | | | Itau Unibanco Holding S.A. | | | 6.20% | | | | 04/15/2020 | | | | 500,625 | |
| | 1,600,000 | | | Itau Unibanco Holding S.A. | | | 5.75% | | | | 01/22/2021 | | | | 1,609,264 | |
| | 200,000 | | | Itau Unibanco Holding S.A. | | | 6.20% | | | | 12/21/2021 | | | | 203,740 | |
| | 300,000 | | | Itau Unibanco Holding S.A. (5 Year CMT Rate + 3.98%) | | | 6.13% | † | | | 12/12/2022 | | | | 284,100 | |
| | 497,000 | | | JBS Investments GMBH | | | 6.25% | | | | 02/05/2023 | | | | 492,032 | |
| | 300,000 | | | JBS Investments GMBH | | | 7.00% | ^ | | | 01/15/2026 | | | | 300,612 | |
| | 3,500,000 | | | MARB BondCo PLC | | | 7.00% | | | | 03/15/2024 | | | | 3,145,608 | |
| | 750,000 | | | Petrobras Global Finance B.V. | | | 5.38% | | | | 01/27/2021 | | | | 752,805 | |
| | 4,200,000 | | | Petrobras Global Finance B.V. | | | 4.38% | | | | 05/20/2023 | | | | 4,057,200 | |
| | | | | | | | | | | | | | | | |
| | | | | | | | | | | | | | | 19,851,194 | |
| | | | | | | | | | | | | | | | |
| | CHILE 5.6% | | | | | | | | | | | | |
| | 200,000 | | | AES Gener S.A. | | | 5.00% | | | | 07/14/2025 | | | | 185,860 | |
| | 800,000 | | | AES Gener S.A. (5 Year Swap Rate USD + 4.64%) | | | 7.13% | ^ | | | 03/26/2079 | | | | 630,501 | |
| | 700,000 | | | AES Gener S.A. (5 Year Swap Rate USD + 4.64%) | | | 7.13% | | | | 03/26/2079 | | | | 551,689 | |
| | 300,000 | | | Colbun S.A. | | | 4.50% | | | | 07/10/2024 | | | | 306,845 | |
| | 200,000 | | | Corp Nacional del Cobre de Chile | | | 3.88% | | | | 11/03/2021 | | | | 203,707 | |
| | 495,600 | | | Empresa Electrica Angamos S.A. | | | 4.88% | | | | 05/25/2029 | | | | 477,532 | |
| | 2,185,000 | | | Inversiones CMPC S.A. | | | 4.50% | | | | 04/25/2022 | | | | 2,127,139 | |
| | 1,900,000 | | | Latam Finance Ltd. | | | 6.88% | | | | 04/11/2024 | | | | 856,530 | |
| | 700,000 | | | Sociedad Quimica y Minera S.A. | | | 5.50% | | | | 04/21/2020 | | | | 706,290 | |
| | 2,500,000 | | | Telefonica Chile S.A. | | | 3.88% | | | | 10/12/2022 | | | | 2,427,365 | |
| | 2,800,000 | | | VTR Finance B.V. | | | 6.88% | | | | 01/15/2024 | | | | 2,618,000 | |
| | | | | | | | | | | | | | | | |
| | | | | | | | | | | | | | | 11,091,458 | |
| | | | | | | | | | | | | | | | |
| | CHINA 12.1% | | | | | | | | | | | | |
| | 2,500,000 | | | CNAC HK Finbridge Company Ltd., | | | 3.50% | | | | 07/19/2022 | | | | 2,485,028 | |
| | 4,220,000 | | | CNOOC Finance Ltd. | | | 2.63% | | | | 05/05/2020 | | | | 4,221,604 | |
| | 200,000 | | | CNOOC Finance Ltd. | | | 4.25% | | | | 01/26/2021 | | | | 203,482 | |
| | 1,400,000 | | | CNOOC Finance Ltd. | | | 3.88% | | | | 05/02/2022 | | | | 1,444,912 | |
| | 3,835,000 | | | CNPC General Capital Ltd. | | | 3.95% | | | | 04/19/2022 | | | | 3,968,675 | |
| | 900,000 | | | CNPC Overseas Capital Ltd. | | | 4.50% | | | | 04/28/2021 | | | | 932,233 | |
| | 1,200,000 | | | HPHT Finance Ltd. | | | 2.88% | | | | 11/05/2024 | | | | 1,245,204 | |
| | 3,700,000 | | | Sinochem Overseas Capital Ltd. | | | 4.50% | | | | 11/12/2020 | | | | 3,694,918 | |
| | 4,300,000 | | | Sinopec Group Overseas Development Ltd. | | | 2.50% | | | | 04/28/2020 | | | | 4,305,199 | |
| | 700,000 | | | Sinopec Group Overseas Development Ltd. | | | 2.00% | ^ | | | 09/29/2021 | | | | 695,580 | |
| | 600,000 | | | Sinopec Group Overseas Development Ltd. | | | 2.00% | | | | 09/29/2021 | | | | 596,211 | |
| | | | | | | | | | | | | | | | |
PRINCIPAL
AMOUNT $ | | | SECURITY DESCRIPTION | | RATE | | | MATURITY | | | VALUE $ | |
| | 200,000 | | | Syngenta Finance N.V. | | | 3.70% | | | | 04/24/2020 | | | | 199,618 | |
| | | | | | | | | | | | | | | | |
| | | | | | | | | | | | | | | 23,992,664 | |
| | | | | | | | | | | | | | | | |
| | COLOMBIA 5.3% | | | | | | | | | | | | |
| | 900,000 | | | Colombia Telecomunicaciones S.A. | | | 5.38% | | | | 09/27/2022 | | | | 865,584 | |
| | 1,500,000 | | | Grupo Aval Ltd. | | | 4.75% | | | | 09/26/2022 | | | | 1,423,596 | |
| | 1,300,000 | | | GrupoSura Finance S.A. | | | 5.70% | | | | 05/18/2021 | | | | 1,306,123 | |
| | 1,800,000 | | | Millicom International Cellular S.A. | | | 6.00% | | | | 03/15/2025 | | | | 1,755,009 | |
| | 300,000 | | | Millicom International Cellular S.A. | | | 6.63% | | | | 10/15/2026 | | | | 286,335 | |
| | 3,800,000 | | | Oleoducto Central S.A. | | | 4.00% | | | | 05/07/2021 | | | | 3,643,060 | |
| | 1,400,000 | | | Tecnoglass, Inc. | | | 8.20% | | | | 01/31/2022 | | | | 1,187,726 | |
| | | | | | | | | | | | | | | | |
| | | | | | | | | | | | | | | 10,467,433 | |
| | | | | | | | | | | | | | | | |
| | DOMINICAN REPUBLIC 0.6% | | | | | | | | | | | | |
| | 400,000 | | | AES Dominicana | | | 7.95% | | | | 05/11/2026 | | | | 374,600 | |
| | 900,000 | | | Banco de Reservas de la Republica Dominicana | | | 7.00% | | | | 02/01/2023 | | | | 861,750 | |
| | | | | | | | | | | | | | | | |
| | | | | | | | | | | | | | | 1,236,350 | |
| | | | | | | | | | | | | | | | |
| | GUATEMALA 0.7% | | | | | | | | | | | | |
| | 1,100,000 | | | Comcel Trust | | | 6.88% | | | | 02/06/2024 | | | | 1,073,892 | |
| | 368,000 | | | Industrial Senior Trust | | | 5.50% | | | | 11/01/2022 | | | | 358,708 | |
| | | | | | | | | | | | | | | | |
| | | | | | | | | | | | | | | 1,432,600 | |
| | | | | | | | | | | | | | | | |
| | INDIA 8.8% | | | | | | | | | | | | |
| | 2,500,000 | | | Adani Ports & Special Economic Zone Ltd. | | | 3.95% | | | | 01/19/2022 | | | | 2,312,450 | |
| | 600,000 | | | Adani Ports & Special Economic Zone Ltd. | | | 3.38% | | | | 07/24/2024 | | | | 516,210 | |
| | 2,805,000 | | | Indian Oil Corporation Ltd. | | | 5.63% | | | | 08/02/2021 | | | | 2,829,375 | |
| | 3,635,000 | | | ONGC Videsh Ltd. | | | 2.88% | | | | 01/27/2022 | | | | 3,556,448 | |
| | 700,000 | | | ONGC Videsh Ltd. | | | 3.75% | | | | 05/07/2023 | | | | 682,988 | �� |
| | 3,905,000 | | | Reliance Holdings, Inc. | | | 4.50% | | | | 10/19/2020 | | | | 3,934,018 | |
| | 1,400,000 | | | Reliance Holdings, Inc. | | | 5.40% | | | | 02/14/2022 | | | | 1,428,153 | |
| | 1,900,000 | | | UPL Corporation | | | 3.25% | | | | 10/13/2021 | | | | 1,757,451 | |
| | 900,000 | | | Vedanta Resources Ltd. | | | 7.13% | | | | 05/31/2023 | | | | 349,871 | |
| | | | | | | | | | | | | | | | |
| | | | | | | | | | | | | | | 17,366,964 | |
| | | | | | | | | | | | | | | | |
| | INDONESIA 2.2% | | | | | | | | | | | | |
| | 500,000 | | | Freeport-McMoRan, Inc. | | | 3.55% | | | | 03/01/2022 | | | | 482,330 | |
| | 2,200,000 | | | Freeport-McMoRan, Inc. | | | 4.55% | | | | 11/14/2024 | | | | 2,091,331 | |
| | 1,800,000 | | | Perusahaan Listrik Negara PT | | | 5.50% | | | | 11/22/2021 | | | | 1,824,660 | |
| | | | | | | | | | | | | | | | |
| | | | | | | | | | | | | | | 4,398,321 | |
| | | | | | | | | | | | | | | | |
| | ISRAEL 1.4% | | | | | | | | | | | | |
| | 2,481,000 | | | Delek & Avner Tamar Bond Ltd. | | | 4.44% | ^ | | | 12/30/2020 | | | | 2,467,335 | |
| | 300,000 | | | Israel Electric Corporation Ltd. | | | 6.88% | | | | 06/21/2023 | | | | 330,543 | |
| | | | | | | | | | | | | | | | |
| | | | | | | | | | | | | | | 2,797,878 | |
| | | | | | | | | | | | | | | | |
| | JAMAICA 0.1% | | | | | | | | | | | | |
| | 1,000,000 | | | Digicel Group Ltd. | | | 8.25% | ^ | | | 09/30/2022 | | | | 175,000 | |
| | | | | | | | | | | | | | | | |
| | | | | | | | | | | | | | | 175,000 | |
| | | | | | | | | | | | | | | | |
| | MALAYSIA 4.0% | | | | | | | | | | | | |
| | 5,350,000 | | | Axiata SPV2 BHD | | | 3.47% | | | | 11/19/2020 | | | | 5,359,175 | |
| | 2,485,000 | | | Malayan Banking BHD (5 Year Swap Rate USD + 2.54%) | | | 3.91% | | | | 10/29/2026 | | | | 2,527,245 | |
| | | | | | | | | | | | | | | | |
| | | | | | | | | | | | | | | 7,886,420 | |
| | | | | | | | | | | | | | | | |
| | | | | | |
| The accompanying notes are an integral part of these financial statements. | | Annual Report | | March 31, 2020 | | 73 |
| | |
| Schedule of Investments DoubleLine Low Duration Emerging Markets Fixed Income Fund (Cont.) | | March 31, 2020 |
| | | | | | | | | | | | | | | | |
PRINCIPAL
AMOUNT $ | | | SECURITY DESCRIPTION | | RATE | | | MATURITY | | | VALUE $ | |
| | MEXICO 10.5% | | | | | | | | | | | | |
| | 4,300,000 | | | Banco Mercantil del Norte S.A. (5 Year CMT Rate + 5.04%) | | | 6.88% | † | | | 07/06/2022 | | | | 3,462,811 | |
| | 4,200,000 | | | Banco Nacional de Comercio Exterior S.N.C. (5 Year CMT Rate + 3.00%) | | | 3.80% | | | | 08/11/2026 | | | | 3,829,570 | |
| | 250,000 | | | Banco Santander (5 Year CMT Rate + 3.00%) | | | 5.95% | ^ | | | 10/01/2028 | | | | 232,864 | |
| | 750,000 | | | BBVA Bancomer S.A. | | | 7.25% | | | | 04/22/2020 | | | | 747,060 | |
| | 2,900,000 | | | BBVA Bancomer S.A. | | | 6.50% | | | | 03/10/2021 | | | | 2,921,054 | |
| | 600,000 | | | BBVA Bancomer S.A. | | | 6.75% | | | | 09/30/2022 | | | | 598,704 | |
| | 1,000,000 | | | BBVA Bancomer S.A. (5 Year CMT Rate + 3.00%) | | | 5.35% | | | | 11/12/2029 | | | | 918,543 | |
| | 2,200,000 | | | Cemex S.A.B. de C.V. | | | 6.13% | | | | 05/05/2025 | | | | 1,966,239 | |
| | 700,000 | | | Cemex S.A.B. de C.V. | | | 7.75% | | | | 04/16/2026 | | | | 630,392 | |
| | 573,000 | | | Grupo Bimbo S.A.B. de C.V. | | | 4.88% | | | | 06/30/2020 | | | | 579,342 | |
| | 300,000 | | | Grupo Bimbo S.A.B. de C.V. | | | 4.50% | | | | 01/25/2022 | | | | 302,026 | |
| | 2,600,000 | | | Grupo Bimbo S.A.B. de C.V. (5 Year CMT Rate + 3.28%) | | | 5.95% | † | | | 04/17/2023 | | | | 2,449,720 | |
| | 1,000,000 | | | Nacional Financiera S.N.C. | | | 3.38% | | | | 11/05/2020 | | | | 981,583 | |
| | 1,750,000 | | | Unifin Financiera S.A.B. de C.V. | | | 7.25% | | | | 09/27/2023 | | | | 1,231,571 | |
| | | | | | | | | | | | | | | | |
| | | | | | | | | | | | | | | 20,851,479 | |
| | | | | | | | | | | | | | | | |
| | PANAMA 5.8% | | | | | | | | | | | | |
| | 1,000,000 | | | Banco Latinoamericano do Comercio Exterior S.A. | | | 3.25% | | | | 05/07/2020 | | | | 996,250 | |
| | 650,000 | | | Banistmo S.A. | | | 3.65% | | | | 09/19/2022 | | | | 602,267 | |
| | 2,200,000 | | | C&W Senior Financing DAC | | | 7.50% | | | | 10/15/2026 | | | | 2,030,672 | |
| | 2,797,339 | | | ENA Norte Trust | | | 4.95% | | | | 04/25/2023 | | | | 2,793,857 | |
| | 1,700,000 | | | Global Bank Corporation | | | 4.50% | | | | 10/20/2021 | | | | 1,666,000 | |
| | 400,000 | | | Multibank, Inc. | | | 4.38% | | | | 11/09/2022 | | | | 371,378 | |
| | 1,163,612 | | | Panama Metro Line SP | | | 0.00% | ^ | | | 12/05/2022 | | | | 1,080,339 | |
| | 1,987,969 | | | Panama Metro Line SP | | | 0.00% | | | | 12/05/2022 | | | | 1,845,702 | |
| | | | | | | | | | | | | | | | |
| | | | | | | | | | | | | | | 11,386,465 | |
| | | | | | | | | | | | | | | | |
| | PERU 3.1% | | | | | | | | | | | | |
| | 300,000 | | | Banco International del Peru S.A.A. (3 Month LIBOR USD + 6.74%) | | | 8.50% | | | | 04/23/2070 | | | | 294,000 | |
| | 1,735,000 | | | BBVA Banco Continental S.A. | | | 5.00% | | | | 08/26/2022 | | | | 1,732,304 | |
| | 639,904 | | | Interoceanica Finance Ltd. | | | 0.00% | | | | 11/30/2025 | | | | 580,713 | |
| | 3,500,000 | | | Southern Copper Corporation | | | 5.38% | | | | 04/16/2020 | | | | 3,485,120 | |
| | | | | | | | | | | | | | | | |
| | | | | | | | | | | | | | | 6,092,137 | |
| | | | | | | | | | | | | | | | |
| | PHILIPPINES 1.4% | | | | | | | | | | | | |
| | 1,000,000 | | | Bank of the Philippine Islands | | | 2.50% | | | | 09/10/2024 | | | | 961,578 | |
| | 500,000 | | | BDO Unibank, Inc. | | | 2.63% | | | | 10/24/2021 | | | | 498,765 | |
| | 1,250,000 | | | BDO Unibank, Inc. | | | 2.95% | | | | 03/06/2023 | | | | 1,240,625 | |
| | | | | | | | | | | | | | | | |
| | | | | | | | | | | | | | | 2,700,968 | |
| | | | | | | | | | | | | | | | |
| | SINGAPORE 4.0% | | | | | | | | | | | | |
| | 200,000 | | | DBS Group Holdings Ltd. (3 Month LIBOR USD + 0.49%) | | | 1.49% | | | | 06/08/2020 | | | | 199,661 | |
| | 400,000 | | | DBS Group Holdings Ltd. (5 Year Mid Swap Rate USD + 1.59%) | | | 4.52% | | | | 12/11/2028 | | | | 416,364 | |
| | | | | | | | | | | | | | | | |
PRINCIPAL
AMOUNT $/
SHARES | | | SECURITY DESCRIPTION | | RATE | | | MATURITY | | | VALUE $ | |
| | 3,100,000 | | | DBS Group Holdings Ltd. (5 Year Swap Rate USD + 2.39%) | | | 3.60% | † | | | 09/07/2021 | | | | 2,873,731 | |
| | 200,000 | | | Oversea-Chinese Banking Corporation | | | 4.25% | | | | 06/19/2024 | | | | 206,237 | |
| | 800,000 | | | United Overseas Bank Ltd. (5 Year CMT Rate + 1.50%) | | | 3.75% | | | | 04/15/2029 | | | | 830,706 | |
| | 400,000 | | | United Overseas Bank Ltd. (5 Year Swap Rate USD + 1.65%) | | | 2.88% | | | | 03/08/2027 | | | | 394,436 | |
| | 3,000,000 | | | United Overseas Bank Ltd. (5 Year Swap Rate USD + 2.24%) | | | 3.50% | | | | 09/16/2026 | | | | 3,006,150 | |
| | | | | | | | | | | | | | | | |
| | | | | | | | | | | | | | | 7,927,285 | |
| | | | | | | | | | | | | | | | |
| | THAILAND 1.3% | | | | | | | | | | | | |
| | 1,100,000 | | | Bangkok Bank PCL | | | 4.80% | | | | 10/18/2020 | | | | 1,117,381 | |
| | 1,200,000 | | | Bangkok Bank PCL | | | 3.88% | | | | 09/27/2022 | | | | 1,252,151 | |
| | 300,000 | | | Export Import Bank of Thailand (3 Month LIBOR USD + 0.90%) | | | 2.59% | | | | 11/20/2023 | | | | 297,853 | |
| | | | | | | | | | | | | | | | |
| | | | | | | | | | | | | | | 2,667,385 | |
| | | | | | | | | | | | | | | | |
| | | | Total Foreign Corporate Bonds
(Cost $162,255,444) | | | | 152,624,628 | |
| | | | | | | | | | | | | | | | |
| FOREIGN GOVERNMENT BONDS, FOREIGN AGENCIES AND FOREIGN
GOVERNMENT SPONSORED CORPORATIONS 8.3% |
|
| | |
| | COLOMBIA 2.8% | |
| | 5,500,000 | | | Colombia Government International Bond | | | 4.38% | | | | 07/12/2021 | | | | 5,563,305 | |
| | | | | | | | | | | | | | | | |
| | | | | | | | | | | | | | | 5,563,305 | |
| | | | | | | | | | | | | | | | |
| | DOMINICAN REPUBLIC 2.5% | | | | | | | | | | | | |
| | 4,846,667 | | | Dominican Republic International Bond | | | 7.50% | | | | 05/06/2021 | | | | 4,861,255 | |
| | | | | | | | | | | | | | | | |
| | | | | | | | | | | | | | | 4,861,255 | |
| | | | | | | | | | | | | | | | |
| | INDONESIA 2.6% | | | | | | | | | | | | |
| | 2,005,000 | | | Indonesia Government International Bond | | | 4.88% | | | | 05/05/2021 | | | | 2,030,223 | |
| | 2,805,000 | | | Indonesia Government International Bond | | | 3.70% | | | | 01/08/2022 | | | | 2,834,534 | |
| | 300,000 | | | Perusahaan Penerbit | | | 3.40% | | | | 03/29/2022 | | | | 299,403 | |
| | | | | | | | | | | | | | | | |
| | | | | | | | | | | | | | | 5,164,160 | |
| | | | | | | | | | | | | | | | |
| | MALAYSIA 0.4% | | | | | | | | | | | | |
| | 750,000 | | | Wakala Global Sukuk BHD | | | 4.65% | | | | 07/06/2021 | | | | 772,860 | |
| | | | | | | | | | | | | | | | |
| | | | | | | | | | | | | | | 772,860 | |
| | | | | | | | | | | | | | | | |
| | | | Total Foreign Government Bonds, Foreign Agencies and Foreign Government Sponsored Corporations
(Cost $16,559,878) | | | | 16,361,580 | |
| | | | | | | | | | | | | | | | |
| | EXCHANGE TRADED FUNDS AND COMMON STOCKS 0.0% | |
| | 21,248 | | | Frontera Energy Corporation | | | | | | | | | | | 52,482 | |
| | | | | | | | | | | | | | | | |
| | | | Total Exchange Traded Funds and Common Stocks
(Cost $1,923,481) | | | | 52,482 | |
| | | | | | | | | | | | | | | | |
| | WARRANTS 0.0% | |
| | 87,695 | | | OAS S.A., Expiration 5/16/2039, Strike Price BRL 1.00*Þ | | | | | | | | | | | — | |
| | | | | | | | | | | | | | | | |
| | | | Total Warrants (Cost $—) | | | | — | |
| | | | | | | | | | | | | | | | |
| | | | | | |
| 74 | | DoubleLine Funds Trust | | | | The accompanying notes are an integral part of these financial statements. |
| | | | | | | | | | | | | | | | |
| SHARES | | | SECURITY DESCRIPTION | | RATE | | | MATURITY | | | VALUE $ | |
| | SHORT TERM INVESTMENTS 13.5% | |
| | 8,874,725 | | | First American Government Obligations Fund - Class U | | | 0.47% | ¨ | | | | | | | 8,874,725 | |
| | 8,874,726 | | | JP Morgan U.S. Government Money Market Fund - Institutional Share Class | | | 0.36% | ¨ | | | | | | | 8,874,726 | |
| | 8,874,725 | | | Morgan Stanley Institutional Liquidity Funds Government Portfolio - Institutional Share Class | | | 0.26% | ¨ | | | | | | | 8,874,725 | |
| | | | | | | | | | | | | | | | |
| | | | Total Short Term Investments
(Cost $26,624,176) | | | | 26,624,176 | |
| | | | | | | | | | | | | | | | |
| | | | Total Investments 98.9%
(Cost $207,362,979) | | | | 195,662,866 | |
| | | | Other Assets in Excess of Liabilities 1.1% | | | | 1,988,731 | |
| | | | | | | | | | | | | | | | |
| | | | NET ASSETS 100.0% | | | $ | 197,651,597 | |
| | | | | | | | | | | | | | | | |
| | | | | |
| INVESTMENT BREAKDOWNas a % of Net Assets: | | | | | |
Banking | | | | 23.2% | |
Energy | | | | 18.3% | |
Short Term Investments | | | | 13.5% | |
Telecommunications | | | | 8.4% | |
Foreign Government Bonds, Foreign Agencies and Foreign Government Sponsored Corporations | | | | 8.3% | |
Transportation | | | | 7.5% | |
Chemicals/Plastics | | | | 4.4% | |
Consumer Products | | | | 3.7% | |
Mining | | | | 3.3% | |
Finance | | | | 2.8% | |
Utilities | | | | 2.5% | |
Building and Development (including Steel/Metals) | | | | 1.9% | |
Pulp & Paper | | | | 1.1% | |
Construction | | | | 0.0% | ~ |
Other Assets and Liabilities | | | | 1.1% | |
| | | | | |
| | | | 100.0% | |
| | | | | |
| | | | | |
| COUNTRY BREAKDOWNas a % of Net Assets: | |
United States | | | | 13.5% | |
China | | | | 12.1% | |
Mexico | | | | 10.5% | |
Brazil | | | | 10.0% | |
India | | | | 8.8% | |
Colombia | | | | 8.1% | |
Panama | | | | 5.8% | |
Chile | | | | 5.6% | |
Indonesia | | | | 4.8% | |
Malaysia | | | | 4.4% | |
Singapore | | | | 4.0% | |
Dominican Republic | | | | 3.1% | |
Peru | | | | 3.1% | |
Israel | | | | 1.4% | |
Philippines | | | | 1.4% | |
Thailand | | | | 1.3% | |
Guatemala | | | | 0.7% | |
Argentina | | | | 0.2% | |
Jamaica | | | | 0.1% | |
Other Assets and Liabilities | | | | 1.1% | |
| | | | | |
| | | | 100.0% | |
| | | | | |
| ^ | Security exempt from registration under Rule 144A of the Securities Act of 1933. These securities may be resold in transactions exempt from registration to qualified institutional buyers. |
| Þ | Value determined using significant unobservable inputs. |
| W | Security is in default or has failed to make a scheduled payment. Income is not being accrued. |
| ¨ | Seven-day yield as of March 31, 2020 |
| * | Non-income producing security |
| ~ | Represents less than 0.05% of net assets |
| | | | | | |
| The accompanying notes are an integral part of these financial statements. | | Annual Report | | March 31, 2020 | | 75 |
| | |
| Schedule of Investments DoubleLine Long Duration Total Return Bond Fund | | March 31, 2020 |
| | | | | | | | | | | | | | | | |
PRINCIPAL
AMOUNT $ | | | SECURITY DESCRIPTION | | RATE | | | MATURITY | | | VALUE $ | |
| US GOVERNMENT AND AGENCY MORTGAGE BACKED
OBLIGATIONS 60.2% |
|
| |
| | | | Federal Home Loan Mortgage Corporation, | |
| | 1,835,519 | | | Series4057-ZB | | | 3.50% | > | | | 06/15/2042 | | | | 1,986,621 | |
| | 1,835,519 | | | Series4057-ZC | | | 3.50% | > | | | 06/15/2042 | | | | 1,987,149 | |
| | 1,230,279 | | | Series4194-ZL | | | 3.00% | > | | | 04/15/2043 | | | | 1,308,816 | |
| | 2,750,343 | | | Series4204-QZ | | | 3.00% | > | | | 05/15/2043 | | | | 2,693,491 | |
| | 1,904,622 | | | Series4206-LZ | | | 3.50% | > | | | 05/15/2043 | | | | 2,090,250 | |
| | 366,329 | | | Series4226-GZ | | | 3.00% | > | | | 07/15/2043 | | | | 377,133 | |
| | 2,641,297 | | | Series4390-NZ | | | 3.00% | > | | | 09/15/2044 | | | | 2,739,446 | |
| | 2,340,701 | | | Series4417-PZ | | | 3.00% | > | | | 12/15/2044 | | | | 2,383,313 | |
| | 3,124,497 | | | Series4420-CZ | | | 3.00% | > | | | 12/15/2044 | | | | 3,252,695 | |
| | 2,270,723 | | | Series4440-ZD | | | 2.50% | > | | | 02/15/2045 | | | | 2,400,817 | |
| | 1,061,513 | | | Series4460-KB | | | 3.50% | | | | 03/15/2045 | | | | 1,213,980 | |
| | 2,317,440 | | | Series4461-LZ | | | 3.00% | > | | | 03/15/2045 | | | | 2,441,891 | |
| |
| | | | Federal National Mortgage Association, | |
| | 1,000,000 | | | Pool AN7330 | | | 3.26% | | | | 12/01/2037 | | | | 1,150,985 | |
| | 1,204,816 | | | Pool AN7884 | | | 3.31% | | | | 12/01/2032 | | | | 1,376,979 | |
| | 1,116,988 | | | Pool BL4697 | | | 2.57% | | | | 10/01/2031 | | | | 1,222,191 | |
| | 2,100,000 | | | Series2012-128-UC | | | 2.50% | | | | 11/25/2042 | | | | 2,041,759 | |
| | 1,835,519 | | | Series2012-68-ZA | | | 3.50% | > | | | 07/25/2042 | | | | 1,985,349 | |
| | 2,614,545 | | | Series2012-92-AZ | | | 3.50% | > | | | 08/25/2042 | | | | 2,811,018 | |
| | 3,372,846 | | | Series2013-127-MZ | | | 3.00% | > | | | 12/25/2043 | | | | 3,437,853 | |
| | 568,766 | | | Series2013-66-ZK | | | 3.00% | > | | | 07/25/2043 | | | | 611,621 | |
| | 162,016 | | | Series2013-72-ZL | | | 3.50% | > | | | 07/25/2043 | | | | 171,583 | |
| | 1,899,083 | | | Series2013-74-ZH | | | 3.50% | > | | | 07/25/2043 | | | | 2,052,814 | |
| | 1,373,187 | | | Series2014-42-BZ | | | 3.00% | > | | | 07/25/2044 | | | | 1,478,378 | |
| | 1,500,000 | | | Series2014-67-HD | | | 3.00% | | | | 10/25/2044 | | | | 1,643,460 | |
| | 904,000 | | | Series2014-68-TD | | | 3.00% | | | | 11/25/2044 | | | | 981,615 | |
| | 2,736,340 | | | Series2014-80-DZ | | | 3.00% | > | | | 12/25/2044 | | | | 2,849,820 | |
| | 858,130 | | | Series2014-80-KL | | | 2.00% | | | | 05/25/2043 | | | | 783,568 | |
| | 3,399,003 | | | Series2015-16-ZY | | | 2.50% | > | | | 04/25/2045 | | | | 3,521,088 | |
| | 3,036,481 | | | Series2015-52-GZ | | | 3.00% | > | | | 07/25/2045 | | | | 3,267,938 | |
| | 1,173,300 | | | Series2018-21-PO | | | 0.00% | P/O | | | 04/25/2048 | | | | 1,089,666 | |
| |
| | | | Government National Mortgage Association, | |
| | 430,290 | | | Series2013-180-LO | | | 0.00% | P/O | | | 11/16/2043 | | | | 407,437 | |
| | 3,520,979 | | | Series2015-53-EZ | | | 2.00% | > | | | 04/16/2045 | | | | 3,429,139 | |
| | 3,152,791 | | | Series2015-79-VZ | | | 2.50% | > | | | 05/20/2045 | | | | 3,292,532 | |
| | 306,164 | | | Series2016-12-MZ | | | 3.00% | > | | | 01/20/2046 | | | | 341,001 | |
| | | | | | | | | | | | | | | | |
| | | | Total US Government and Agency Mortgage Backed Obligations (Cost $58,532,086) | | | | 64,823,396 | |
| | | | | | | | | | | | | |
| | US GOVERNMENT AND AGENCY OBLIGATIONS 34.8% | |
| | 100,000 | | | Tennessee Valley Authority | | | 5.38% | | | | 04/01/2056 | | | | 179,906 | |
| | 1,700,000 | | | Tennessee Valley Authority | | | 4.63% | | | | 09/15/2060 | | | | 2,815,636 | |
| | | | | | | | | | | | | | | | |
PRINCIPAL
AMOUNT $/
SHARES | | | SECURITY DESCRIPTION | | RATE | | | MATURITY | | | VALUE $ | |
| | 300,000 | | | Tennessee Valley Authority | | | 4.25% | | | | 09/15/2065 | | | | 477,735 | |
| | 1,000,000 | | | United States Treasury Notes | | | 1.50% | | | | 02/15/2030 | | | | 1,078,184 | |
| | 2,400,000 | | | United States Treasury Notes | | | 4.63% | | | | 02/15/2040 | | | | 3,920,719 | |
| | 600,000 | | | United States Treasury Notes | | | 3.13% | | | | 05/15/2048 | | | | 850,922 | |
| | 6,200,000 | | | United States Treasury Notes | | | 3.00% | | | | 02/15/2049 | | | | 8,647,789 | |
| | 16,050,000 | | | United States Treasury Notes | | | 2.25% | | | | 08/15/2049 | | | | 19,532,098 | |
| | | | | | | | | | | | | | | | |
| | | | Total US Government and Agency Obligations (Cost $31,520,841) | | | | 37,502,989 | |
| | | | | | | | | | | | | |
| | SHORT TERM INVESTMENTS 3.9% | |
| | 1,388,899 | | | First American Government Obligations Fund - Class U | | | 0.47% | ¨ | | | | | | | 1,388,899 | |
| | 1,388,899 | | | JP Morgan U.S. Government Money Market Fund - Institutional Share Class | | | 0.36% | ¨ | | | | | | | 1,388,899 | |
| | 1,388,899 | | | Morgan Stanley Institutional Liquidity Funds Government Portfolio - Institutional Share Class | | | 0.26% | ¨ | | | | | | | 1,388,899 | |
| | | | | | | | | | | | | | | | |
| | | | Total Short Term Investments (Cost $4,166,697) | | | | 4,166,697 | |
| | | | | | | | | | | | | |
| | | | Total Investments 98.9% (Cost $94,219,624) | | | | 106,493,082 | |
| | | | Other Assets in Excess of Liabilities 1.1% | | | | 1,200,713 | |
| | | | | | | | | | | | | |
| | | | NET ASSETS 100.0% | | | | | | | | | | $ | 107,693,795 | |
| | | | | | | | | | | | | |
| | | | | |
| SECURITY TYPE BREAKDOWNas a % of Net Assets: | |
US Government and Agency Mortgage Backed Obligations | | | | 60.2% | |
US Government and Agency Obligations | | | | 34.8% | |
Short Term Investments | | | | 3.9% | |
Other Assets and Liabilities | | | | 1.1% | |
| | | | | |
| | | | 100.0% | |
| | | | | |
| > | This U.S. Agency bond accrues interest which is added to the outstanding principal balance. The interest payment will be deferred until all other tranches in the structure are paid off. The rate disclosed is as of March 31, 2020. |
| P/O | Principal only security |
| ¨ | Seven-day yield as of March 31, 2020 |
| | | | | | | | | | | | | | | | | | | | | | |
| | |
| Futures Contracts | | | | |
| Description | | Long/Short | | Contract Quantity | | Expiration Date | | Notional Amount• | | Value/Unrealized
Appreciation
(Depreciation) |
CME Ultra Long Term US Treasury Bond Future | | Long | | | | 103 | | | | | 06/19/2020 | | | | | 22,853,125 | | | | $ | 2,064,795 | |
US Treasury Long Bond Future | | Long | | | | 129 | | | | | 06/19/2020 | | | | | 23,099,063 | | | | | 1,250,998 | |
10-Year US Treasury Note Future | | Short | | | | (71 | ) | | | | 06/19/2020 | | | | | (9,846,813 | ) | | | | (435,580 | ) |
Ultra10-Year US Treasury Note Future | | Short | | | | (130 | ) | | | | 06/19/2020 | | | | | (20,284,063 | ) | | | | (1,397,776 | ) |
| | | | | | | | | | | | | | | | | | | | | | |
| | | | | | | | | | | | | | | | | | | | $ | 1,482,437 | |
| | | | | | | | | | | | | | | | | | | | | | |
| • | Notional Amount is determined based on the number of contracts multiplied by the contract size and the quoted daily settlement price in US dollars. |
| | | | | | |
| 76 | | DoubleLine Funds Trust | | | | The accompanying notes are an integral part of these financial statements. |
| | |
| Schedule of Investments DoubleLine Strategic Commodity Fund (Consolidated) | | March 31, 2020 |
| | | | | | | | | | | | | | | | |
PRINCIPAL
AMOUNT $/
SHARES | | | SECURITY DESCRIPTION | | RATE | | | MATURITY | | | VALUE $ | |
| | SHORT TERM INVESTMENTS 103.0% | | | | | |
| | 11,165,393 | | | First American Government Obligations Fund - Class U | | | 0.47% | ¨ | | | | | | | 11,165,393 | |
| | 11,165,392 | | | JP Morgan U.S. Government Money Market Fund - Institutional Share Class | | | 0.36% | ¨ | | | | | | | 11,165,392 | |
| | 11,165,392 | | | Morgan Stanley Institutional Liquidity Funds Government Portfolio - Institutional Share Class | | | 0.26% | ¨ | | | | | | | 11,165,392 | |
| | 8,000,000 | | | United States Treasury Bills | | | 0.00% | | | | 04/30/2020 | | | | 7,999,662 | |
| | 35,000,000 | | | United States Treasury Bills | | | 0.00% | ‡ | | | 07/02/2020 | | | | 34,990,385 | |
| | | | | | | | | | | | | | | | |
PRINCIPAL
AMOUNT $/
SHARES | | | SECURITY DESCRIPTION | | RATE | | | MATURITY | | | VALUE $ | |
| | 30,000,000 | | | United States Treasury Bills | | | 0.00% | ‡ | | | 12/03/2020 | | | | 29,981,294 | |
| | 40,000,000 | | | United States Treasury Bills | | | 0.00% | | | | 02/25/2021 | | | | 39,953,433 | |
| | | | | | | | | | | | | | | | |
| | | | Total Short Term Investments
(Cost $145,865,891) | | | | 146,420,951 | |
| | | | | | | | | | | | | | | | |
| | | | Total Investments 103.0%
(Cost $145,865,891) | | | | 146,420,951 | |
| | | | Liabilities in Excess of Other Assets (3.0)% | | | | (4,261,611 | ) |
| | | | | | | | | | | | | | | | |
| | | | NET ASSETS 100.0% | | | $ | 142,159,340 | |
| | | | | | | | | | | | | | | | |
| | | | | |
| SECURITY TYPE BREAKDOWN as a % of Net Assets: | |
Short Term Investments | | | | 103.0% | |
Other Assets and Liabilities | | | | (3.0)% | |
| | | | | |
| | | | 100.0% | |
| | | | | |
| ¨ | Seven-day yield as of March 31, 2020 |
| All or a portion of this security is owned by DoubleLine Strategic Commodity Ltd., which is a wholly-owned subsidiary of the DoubleLine Strategic Commodity Fund. |
| ‡ | All or a portion of this security has been pledged as collateral. |
| | | | | | | | | | | | | | | | | | | | | | | | | | |
| | | | |
| Excess Return Swaps | | | | | | | | | | | | | |
| Reference Entity | | Counterparty | | Long/Short | | | Financing
Rate | | | Payment
Frequency | | | Termination
Date | | | Notional
Amount | | | Unrealized
Appreciation
(Depreciation) /
Value | |
Short Commodity Basket Swapy | | Bank of America Merrill Lynch | | | Short | | | | 0.00 | % | | | Termination | | | | 04/01/2020 | | | | (24,700,000 | ) | | $ | 728,381 | |
Commodity Beta Basket Swapg | | Bank of America Merrill Lynch | | | Long | | | | 0.23 | % | | | Termination | | | | 04/01/2020 | | | | 5,100,000 | | | | (913,250 | ) |
Long Commodity Basket Swapf | | Bank of America Merrill Lynch | | | Long | | | | 0.20 | % | | | Termination | | | | 04/01/2020 | | | | 24,700,000 | | | | (4,949,319 | ) |
Commodity Beta Basket Swapg | | Barclays Capital, Inc. | | | Long | | | | 0.20 | % | | | Termination | | | | 04/01/2020 | | | | 55,000,000 | | | | (9,880,075 | ) |
Commodity Beta Basket Swapg | | Canadian Imperial Bank of Commerce | | | Long | | | | 0.21 | % | | | Termination | | | | 04/01/2020 | | | | 55,500,000 | | | | (9,970,333 | ) |
| | | | | | | | | | | | | | | | | | | | | | | | | | |
| | | | | | | | | | | | | | | | | | | | | | | | $ | (24,984,596 | ) |
| | | | | | | | | | | | | | | | | | | | | | | | | | |
| All or a portion of this security is owned by DoubleLine Strategic Commodity Ltd., which is a wholly-owned subsidiary of the DoubleLine Strategic Commodity Fund. |
| f | Long Commodity Basket Swap represents a swap on a basket of commoditysub-indices of the S&P GSCI index. At March 31, 2020, all constituents and their weightings were as follows: |
| | | | | | | | | | | | | | | | | | | | |
| Sub-Index | | Ticker | | Contract Value d | | Value of Index | | Weightings |
S&P GSCI 2 Month Forward Corn Index ER | | | | SG2MCNP | | | | | 1.04 | | | | $ | 20 | | | | | 22.9 | % |
S&P GSCI 2 Month Forward Nickel Index ER | | | | SG2MIKP | | | | | 0.11 | | | | | 19 | | | | | 22.6 | % |
S&P GSCI 2 Month Forward Copper Index ER | | | | SG2MICP | | | | | 0.06 | | | | | 19 | | | | | 21.7 | % |
S&P GSCI 2 Month Forward Cocoa Index | | | | SG2MCCP | | | | | 0.32 | | | | | 18 | | | | | 21.1 | % |
S&P GSCI 2 Month Forward Unleaded Gas Index ER | | | | SG2MHUP | | | | | 0.03 | | | | | 10 | | | | | 11.7 | % |
| | | | | | | | | | | | | | | |
| | | | | | | | | | | | | $ | 86 | | | | | 100.0 | % |
| | | | | | | | | | | | | | | |
| g | Commodity Beta Basket Swap represents a swap on a basket of commodity indices designed to approximate the broad commodity market. At March 31, 2020, all constituents and their weightings were as follows: |
| | | | | | | | | | | | | | | | | | | | |
| Index | | Ticker | | Contract Value d | | Value of Index | | Weightings |
Soybean Future | | | | S1 | | | | | 0.35 | | | | $ | 77 | | | | | 24.8 | % |
Electrolytic Copper Future | | | | LP1 | | | | | 0.20 | | | | | 69 | | | | | 22.2 | % |
Nickel Future | | | | LN1 | | | | | 0.20 | | | | | 47 | | | | | 15.0 | % |
Brent Crude Future | | | | CO1 | | | | | 0.09 | | | | | 26 | | | | | 8.4 | % |
Crude Oil Future | | | | CL1 | | | | | 0.09 | | | | | 26 | | | | | 8.2 | % |
Live Cattle Future | | | | LC1 | | | | | 0.11 | | | | | 16 | | | | | 5.2 | % |
Sugar No. 11 Future | | | | SB1 | | | | | 0.16 | | | | | 15 | | | | | 4.7 | % |
Cotton No. 2 Future | | | | CT1 | | | | | 0.32 | | | | | 11 | | | | | 3.6 | % |
Low Sulphur Gas Oil Future | | | | QS1 | | | | | 0.10 | | | | | 11 | | | | | 3.5 | % |
NY Harbor ULSD Heating Oil Future | | | | HO1 | | | | | 0.09 | | | | | 7 | | | | | 2.2 | % |
Gasoline RBOB Future | | | | XB1 | | | | | 0.07 | | | | | 7 | | | | | 2.2 | % |
| | | | | | | | | | | | | | | |
| | | | | | | | | | | | | $ | 312 | | | | | 100.0 | % |
| | | | | | | | | | | | | | | |
| | | | | | |
| The accompanying notes are an integral part of these financial statements. | | Annual Report | | March 31, 2020 | | 77 |
| | |
| Schedule of Investments DoubleLine Strategic Commodity Fund (Consolidated) (Cont.) | | March 31, 2020 |
| y | Short Commodity Basket Swap represents a swap on a basket of commoditysub-indices of the S&P GSCI index. At March 31, 2020, all constituents and their weightings were as follows: |
| | | | | | | | | | | | | | | | | | | | |
| Sub-Index | | Ticker | | Contract Value d | | Value of Index | | Weightings |
S&P GSCI 2 Month Forward Kansas Wheat Index ER | | | | SG2MKWP | | | | | 0.72 | | | | $ | 18 | | | | | 22.2 | % |
S&P GSCI 2 Month Forward Coffee Index ER | | | | SG2MKCP | | | | | 1.83 | | | | | 17 | | | | | 21.1 | % |
S&P GSCI 2 Month Forward Natural Gas Index ER | | | | SG2MNGP | | | | | 1.54 | | | | | 17 | | | | | 20.2 | % |
S&P GSCI 2 Month Forward Soybeans Index ER | | | | SG2MSOP | | | | | 0.08 | | | | | 17 | | | | | 20.1 | % |
S&P GSCI 2 Month Forward Cotton Index ER | | | | SG2MCTP | | | | | 0.54 | | | | | 13 | | | | | 16.4 | % |
| | | | | | | | | | | | | | | |
| | | | | | | | | | | | | $ | 82 | | | | | 100.0 | % |
| | | | | | | | | | | | | | | |
| d | Contract value represents the number of units of the underlying constituent’s index in one unit of the custom basket index at creation. The contract value is calculated by multiplying each constituent’s weight by the starting price of the custom basket index and dividing by the starting price of the constituent’s index. The contract value will differ depending on the date the swap is initiated. |
| | | | | | |
| 78 | | DoubleLine Funds Trust | | | | The accompanying notes are an integral part of these financial statements. |
| | |
| Schedule of Investments DoubleLine Global Bond Fund | | March 31, 2020 |
| | | | | | | | | | | | | | | | | | | | |
PRINCIPAL
AMOUNT | | | | | | SECURITY DESCRIPTION | | RATE | | | MATURITY | | | VALUE $ | |
| FOREIGN GOVERNMENT BONDS, FOREIGN AGENCIES AND FOREIGN
GOVERNMENT SPONSORED CORPORATIONS 65.5% |
|
| | | | | | |
| | AUSTRALIA 2.5% | |
| | 4,025,000 | | | | AUD | | | Australia Government Bond | | | 5.50% | | | | 04/21/2023 | | | | 2,870,186 | |
| | 16,730,000 | | | | AUD | | | Australia Government Bond | | | 2.75% | | | | 04/21/2024 | | | | 11,293,022 | |
| | 22,820,000 | | | | AUD | | | Australia Government Bond | | | 3.25% | | | | 04/21/2025 | | | | 16,021,083 | |
| | | | | | | | | | | | | | | | | | | | |
| | | | | | | | | | | | | | | | | | | 30,184,291 | |
| | | | | | | | | | | | | | | | | | | | |
| | BELGIUM 3.3% | |
| | 10,000,000 | | | | EUR | | | Kingdom of Belgium Government Bond | | | 0.80% | ^ | | | 06/22/2025 | | | | 11,624,683 | |
| | 20,850,000 | | | | EUR | | | Kingdom of Belgium Government Bond | | | 1.00% | ^ | | | 06/22/2026 | | | | 24,641,857 | |
| | 3,290,000 | | | | EUR | | | Kingdom of Belgium Government Bond | | | 0.90% | ^ | | | 06/22/2029 | | | | 3,931,232 | |
| | | | | | | | | | | | | | | | | | | | |
| | | | | | | | | | | | | | | | | | | 40,197,772 | |
| | | | | | | | | | | | | | | | | | | | |
| | CANADA 2.4% | |
| | 9,000,000 | | | | CAD | | | Canadian Government Bond | | | 2.25% | | | | 02/01/2021 | | | | 6,493,487 | |
| | 9,410,000 | | | | CAD | | | Canadian Government Bond | | | 0.50% | | | | 03/01/2022 | | | | 6,692,336 | |
| | 22,705,000 | | | | CAD | | | Canadian Government Bond | | | 1.50% | | | | 06/01/2023 | | | | 16,628,957 | |
| | | | | | | | | | | | | | | | | | | | |
| | | | | | | | | | | | | | | | | | | 29,814,780 | |
| | | | | | | | | | | | | | | | | | | | |
| | CZECH REPUBLIC 2.5% | |
| | 52,500,000 | | | | CZK | | | Czech Republic Government Bond | | | 0.45% | | | | 10/25/2023 | | | | 2,065,641 | |
| | 200,000,000 | | | | CZK | | | Czech Republic Government Bond | | | 5.70% | | | | 05/25/2024 | | | | 9,530,591 | |
| | 444,100,000 | | | | CZK | | | Czech Republic Government Bond | | | 2.40% | | | | 09/17/2025 | | | | 18,922,239 | |
| | | | | | | | | | | | | | | | | | | | |
| | | | | | | | | | | | | | | | | | | 30,518,471 | |
| | | | | | | | | | | | | | | | | | | | |
| | FRANCE 4.1% | |
| | 16,900,000 | | | | EUR | | | France Government Bond | | | 0.00% | | | | 11/25/2029 | | | | 18,659,673 | |
| | 18,340,000 | | | | EUR | | | French Republic Government Bond | | | 0.25% | | | | 11/25/2026 | | | | 20,846,549 | |
| | 8,395,000 | | | | EUR | | | French Republic Government Bond | | | 1.00% | | | | 05/25/2027 | | | | 10,031,780 | |
| | | | | | | | | | | | | | | | | | | | |
| | | | | | | | | | | | | | | | | | | 49,538,002 | |
| | | | | | | | | | | | | | | | | | | | |
| | GERMANY 0.9% | |
| | 4,900,000 | | | | EUR | | | Bundesrepublik Deutschland | | | 0.50% | | | | 02/15/2026 | | | | 5,774,828 | |
| | 4,950,000 | | | | EUR | | | Bundesrepublik Deutschland | | | 0.00% | * | | | 08/15/2026 | | | | 5,682,850 | |
| | | | | | | | | | | | | | | | | | | | |
| | | | | | | | | | | | | | | | | | | 11,457,678 | |
| | | | | | | | | | | | | | | | | | | | |
| | HUNGARY 1.9% | |
| | 1,583,300,000 | | | | HUF | | | Hungary Government Bond | | | 1.75% | | | | 10/26/2022 | | | | 4,909,152 | |
| | 5,790,600,000 | | | | HUF | | | Hungary Government Bond | | | 2.50% | | | | 10/24/2024 | | | | 18,483,988 | |
| | | | | | | | | | | | | | | | | | | | |
| | | | | | | | | | | | | | | | | | | 23,393,140 | |
| | | | | | | | | | | | | | | | | | | | |
| | IRELAND 4.0% | |
| | 10,725,000 | | | | EUR | | | Ireland Government Bond | | | 5.40% | | | | 03/13/2025 | | | | 15,106,433 | |
| | 16,600,000 | | | | EUR | | | Ireland Government Bond | | | 1.00% | | | | 05/15/2026 | | | | 19,537,506 | |
| | 9,150,000 | | | | EUR | | | Ireland Government Bond | | | 0.90% | | | | 05/15/2028 | | | | 10,848,772 | |
| | | | | | | | | | | | | | | | | | | | |
PRINCIPAL
AMOUNT | | | | | | SECURITY DESCRIPTION | | RATE | | | MATURITY | | | VALUE $ | |
| | 2,750,000 | | | | EUR | | | Ireland Government Bond | | | 1.10% | | | | 05/15/2029 | | | | 3,317,324 | |
| | | | | | | | | | | | | | | | | | | | |
| | | | | | | | | | | | | | | | | | | 48,810,035 | |
| | | | | | | | | | | | | | | | | | | | |
| | ISRAEL 1.0% | |
| | 38,630,000 | | | | ILS | | | Israel Government Bond | | | 4.25% | | | | 03/31/2023 | | | | 12,123,849 | |
| | | | | | | | | | | | | | | | | | | | |
| | | | | | | | | | | | | | | | | | | 12,123,849 | |
| | | | | | | | | | | | | | | | | | | | |
| | JAPAN 19.9% | |
| | 1,090,000,000 | | | | JPY | | | Japan Government Ten Year Bond | | | 0.10% | | | | 12/20/2026 | | | | 10,288,830 | |
| | 1,305,000,000 | | | | JPY | | | Japan Government Ten Year Bond | | | 0.10% | | | | 12/20/2027 | | | | 12,347,544 | |
| | 2,445,000,000 | | | | JPY | | | Japan Government Ten Year Bond | | | 0.10% | | | | 03/20/2028 | | | | 23,115,085 | |
| | 2,590,000,000 | | | | JPY | | | Japan Government Ten Year Bond | | | 0.10% | | | | 12/20/2028 | | | | 24,431,400 | |
| | 1,385,000,000 | | | | JPY | | | Japan Government Twenty Year Bond | | | 2.20% | | | | 09/20/2027 | | | | 15,125,451 | |
| | 1,495,000,000 | | | | JPY | | | Japan Government Twenty Year Bond | | | 2.10% | | | | 12/20/2027 | | | | 16,288,694 | |
| | 910,000,000 | | | | JPY | | | Japan Government Twenty Year Bond | | | 1.90% | | | | 12/20/2028 | | | | 9,904,390 | |
| | 1,740,000,000 | | | | JPY | | | Japan Government Twenty Year Bond | | | 1.90% | | | | 03/20/2031 | | | | 19,361,480 | |
| | 280,000,000 | | | | JPY | | | Japan Government Twenty Year Bond | | | 1.60% | | | | 03/20/2033 | | | | 3,070,038 | |
| | 3,230,500,000 | | | | JPY | | | Japan Government Twenty Year Bond | | | 1.60% | | | | 12/20/2033 | | | | 35,572,886 | |
| | 1,915,000,000 | | | | JPY | | | Japan Government Twenty Year Bond | | | 1.50% | | | | 06/20/2034 | | | | 20,911,058 | |
| | 1,300,000,000 | | | | JPY | | | Japan Government Twenty Year Bond | | | 1.30% | | | | 06/20/2035 | | | | 13,934,258 | |
| | 2,040,000,000 | | | | JPY | | | Japan Government Twenty Year Bond | | | 1.20% | | | | 09/20/2035 | | | | 21,617,104 | |
| | 1,740,000,000 | | | | JPY | | | Japan Government Twenty Year Bond | | | 0.50% | | | | 03/20/2038 | | | | 16,725,498 | |
| | | | | | | | | | | | | | | | | | | | |
| | | | | | | | | | | | | | | | | | | 242,693,716 | |
| | | | | | | | | | | | | | | | | | | | |
| | MEXICO 4.3% | |
| | 2,434,000 | | | | MXN | | | Mexican Bonos | | | 8.00% | | | | 06/11/2020 | | | | 10,289,235 | |
| | 695,000 | | | | MXN | | | Mexican Bonos | | | 7.25% | | | | 12/09/2021 | | | | 2,979,367 | |
| | 9,391,000 | | | | MXN | | | Mexican Bonos | | | 6.50% | | | | 06/09/2022 | | | | 39,703,276 | |
| | | | | | | | | | | | | | | | | | | | |
| | | | | | | | | | | | | | | | | | | 52,971,878 | |
| | | | | | | | | | | | | | | | | | | | |
| | NEW ZEALAND 3.1% | |
| | 22,190,000 | | | | NZD | | | New Zealand Government Bond | | | 5.50% | | | | 04/15/2023 | | | | 15,239,869 | |
| | 33,960,000 | | | | NZD | | | New Zealand Government Bond | | | 2.75% | | | | 04/15/2025 | | | | 22,315,133 | |
| | | | | | | | | | | | | | | | | | | | |
| | | | | | | | | | | | | | | | | | | 37,555,002 | |
| | | | | | | | | | | | | | | | | | | | |
| | PERU 2.0% | |
| | 32,130,000 | | | | PEN | | | Peruvian Government International Bond | | | 6.95% | ^ | | | 08/12/2031 | | | | 10,753,181 | |
| | 44,815,000 | | | | PEN | | | Peruvian Government International Bond | | | 5.40% | ^ | | | 08/12/2034 | | | | 13,056,853 | |
| | | | | | | | | | | | | | | | | | | | |
| | | | | | | | | | | | | | | | | | | 23,810,034 | |
| | | | | | | | | | | | | | | | | | | | |
| | POLAND 2.9% | |
| | 29,800,000 | | | | PLN | | | Republic of Poland Government Bond | | | 1.50% | | | | 04/25/2020 | | | | 7,206,592 | |
| | 64,300,000 | | | | PLN | | | Republic of Poland Government Bond | | | 2.25% | | | | 04/25/2022 | | | | 15,979,597 | |
| | 32,850,000 | | | | PLN | | | Republic of Poland Government Bond | | | 2.50% | | | | 01/25/2023 | | | | 8,286,851 | |
| | | | | | |
| The accompanying notes are an integral part of these financial statements. | | Annual Report | | March 31, 2020 | | 79 |
| | |
| Schedule of Investments DoubleLine Global Bond Fund (Cont.) | | March 31, 2020 |
| | | | | | | | | | | | | | | | | | | | |
PRINCIPAL
AMOUNT | | | | | | SECURITY DESCRIPTION | | RATE | | | MATURITY | | | VALUE $ | |
| | 15,800,000 | | | | PLN | | | Republic of Poland Government Bond | | | 3.25% | | | | 07/25/2025 | | | | 4,206,336 | |
| | | | | | | | | | | | | | | | | | | | |
| | | | | | | | | | | | | | | | | | | 35,679,376 | |
| | | | | | | | | | | | | | | | | | | | |
| | PORTUGAL 4.0% | |
| | 22,400,000 | | | | EUR | | | Portugal Obrigacoes do Tesouro OT | | | 2.20% | ^ | | | 10/17/2022 | | | | 26,107,426 | |
| | 14,450,000 | | | | EUR | | | Portugal Obrigacoes do Tesouro OT | | | 2.88% | ^ | | | 10/15/2025 | | | | 18,090,336 | |
| | 3,630,000 | | | | EUR | | | Portugal Obrigacoes do Tesouro OT | | | 1.95% | ^ | | | 06/15/2029 | | | | 4,424,036 | |
| | | | | | | | | | | | | | | | | | | | |
| | | | | | | | | | | | | | | | | | | 48,621,798 | |
| | | | | | | | | | | | | | | | | | | | |
| | SOUTH AFRICA 1.7% | |
| | 294,425,000 | | | | ZAR | | | Republic of South Africa Government Bond | | | 7.75% | | | | 02/28/2023 | | | | 16,768,669 | |
| | 83,400,000 | | | | ZAR | | | Republic of South Africa Government Bond | | | 8.00% | | | | 01/31/2030 | | | | 3,828,552 | |
| | | | | | | | | | | | | | | | | | | | |
| | | | | | | | | | | | | | | | | | | 20,597,221 | |
| | | | | | | | | | | | | | | | | | | | |
| | SPAIN 5.0% | |
| | 7,550,000 | | | | EUR | | | Spain Government Bond | | | 5.85% | ^ | | | 01/31/2022 | | | | 9,258,163 | |
| | 4,875,000 | | | | EUR | | | Spain Government Bond | | | 0.40% | | | | 04/30/2022 | | | | 5,444,178 | |
| | 20,460,000 | | | | EUR | | | Spain Government Bond | | | 0.35% | | | | 07/30/2023 | | | | 22,777,633 | |
| | 10,900,000 | | | | EUR | | | Spain Government Bond | | | 2.75% | ^ | | | 10/31/2024 | | | | 13,432,390 | |
| | 4,350,000 | | | | EUR | | | Spain Government Bond | | | 1.60% | ^ | | | 04/30/2025 | | | | 5,134,386 | |
| | 500,000 | | | | EUR | | | Spain Government Bond | | | 1.30% | ^ | | | 10/31/2026 | | | | 584,328 | |
| | 4,450,000 | | | | EUR | | | Spain Government Bond | | | 0.60% | ^ | | | 10/31/2029 | | | | 4,895,834 | |
| | | | | | | | | | | | | | | | | | | | |
| | | | | | | | | | | | | | | | | | | 61,526,912 | |
| | | | | | | | | | | | | | | | | | | | |
| | | | | | | | Total Foreign Government Bonds, Foreign Agencies and Foreign Government Sponsored Corporations (Cost $820,416,654) | | | | 799,493,955 | |
| | | | | | | | | | | | | |
| | US GOVERNMENT AND AGENCY OBLIGATIONS 26.9% | |
| | | | | | |
| | UNITED STATES 26.9% | |
| | 15,660,000 | | | | USD | | | United States Treasury Notes | | | 1.38% | | | | 04/30/2020 | | | | 15,676,276 | |
| | 19,240,000 | | | | USD | | | United States Treasury Notes | | | 1.88% | | | | 12/15/2020 | | | | 19,478,996 | |
| | 18,460,000 | | | | USD | | | United States Treasury Notes | | | 2.00% | | | | 01/15/2021 | | | | 18,738,342 | |
| | 8,510,000 | | | | USD | | | United States Treasury Notes | | | 1.75% | | | | 04/30/2022 | | | | 8,780,259 | |
| | 11,720,000 | | | | USD | | | United States Treasury Notes | | | 1.75% | | | | 06/30/2022 | | | | 12,123,333 | |
| | 11,680,000 | | | | USD | | | United States Treasury Notes | | | 1.88% | | | | 08/31/2022 | | | | 12,137,619 | |
| | 11,630,000 | | | | USD | | | United States Treasury Notes | | | 2.00% | | | | 11/30/2022 | | | | 12,163,345 | |
| | 9,620,000 | | | | USD | | | United States Treasury Notes | | | 2.75% | | | | 05/31/2023 | | | | 10,366,301 | |
| | 8,120,000 | | | | USD | | | United States Treasury Notes | | | 2.25% | | | | 01/31/2024 | | | | 8,718,216 | |
| | 11,750,000 | | | | USD | | | United States Treasury Notes | | | 2.50% | | | | 05/15/2024 | | | | 12,787,764 | |
| | 13,990,000 | | | | USD | | | United States Treasury Notes | | | 2.00% | | | | 06/30/2024 | | | | 14,961,649 | |
| | 13,790,000 | | | | USD | | | United States Treasury Notes | | | 2.38% | | | | 08/15/2024 | | | | 14,999,318 | |
| | 14,490,000 | | | | USD | | | United States Treasury Notes | | | 2.00% | | | | 02/15/2025 | | | | 15,619,767 | |
| | | | | | | | | | | | | | | | | | | | |
PRINCIPAL
AMOUNT/
SHARES | | | | | | SECURITY DESCRIPTION | | RATE | | | MATURITY | | | VALUE $ | |
| | 15,720,000 | | | | USD | | | United States Treasury Notes | | | 2.00% | | | | 08/15/2025 | | | | 17,016,286 | |
| | 16,310,000 | | | | USD | | | United States Treasury Notes | | | 1.63% | | | | 02/15/2026 | | | | 17,379,707 | |
| | 14,740,000 | | | | USD | | | United States Treasury Notes | | | 2.00% | | | | 11/15/2026 | | | | 16,140,876 | |
| | 30,500,000 | | | | USD | | | United States Treasury Notes | | | 1.63% | | | | 11/30/2026 | | | | 32,681,465 | |
| | 30,500,000 | | | | USD | | | United States Treasury Notes | | | 1.75% | | | | 12/31/2026 | | | | 32,954,297 | |
| | 14,240,000 | | | | USD | | | United States Treasury Notes | | | 2.38% | | | | 05/15/2029 | | | | 16,390,462 | |
| | 16,970,000 | | | | USD | | | United States Treasury Notes | | | 1.63% | | | | 08/15/2029 | | | | 18,430,348 | |
| | | | | | | | | | | | | | | | | | | | |
| | | | | | | | | | | | | | | | | | | 327,544,626 | |
| | | | | | | | | | | | | | | | | | | | |
| | | | | | | | Total US Government and Agency Obligations (Cost $308,048,131) | | | | 327,544,626 | |
| | | | | | | | | | | | | |
| | SHORT TERM INVESTMENTS 6.2% | |
| | 25,100,388 | | | | | | | First American Government Obligations Fund Class U | | | 0.47% | ¨ | | | | | | | 25,100,388 | |
| | 25,100,389 | | | | | | | JP Morgan U.S. Government Money Market Fund Institutional Share Class | | | 0.36% | ¨ | | | | | | | 25,100,389 | |
| | 25,100,388 | | | | | | | Morgan Stanley Institutional Liquidity Funds Government Portfolio Institutional Share Class | | | 0.26% | ¨ | | | | | | | 25,100,388 | |
| | | | | | | | | | | | | | | | | | | | |
| | | | | | | | Total Short Term Investments (Cost $75,301,165) | | | | | | | | 75,301,165 | |
| | | | | | | | | | | | | |
| | | | | | | | Total Investments 98.6% (Cost $1,203,765,950) | | | | | | | | 1,202,339,746 | |
| | | | | | | | | | | | | |
| | | | | | | | Other Assets in Excess of Liabilities 1.4% | | | | | | | | 17,167,101 | |
| | | | | | | | | | | | | | | | | | | | |
| | | | | | | | NET ASSETS 100.0% | | | | | | | $ | 1,219,506,847 | |
| | | | | | | | | | | | | |
| | | | | |
| COUNTRY BREAKDOWNas a % of Net Assets: | |
United States | | | | 33.1% | |
Japan | | | | 19.9% | |
Spain | | | | 5.0% | |
Mexico | | | | 4.3% | |
France | | | | 4.1% | |
Ireland | | | | 4.0% | |
Portugal | | | | 4.0% | |
Belgium | | | | 3.3% | |
New Zealand | | | | 3.1% | |
Poland | | | | 2.9% | |
Czech Republic | | | | 2.5% | |
Australia | | | | 2.5% | |
Canada | | | | 2.4% | |
Peru | | | | 2.0% | |
Hungary | | | | 1.9% | |
South Africa | | | | 1.7% | |
Israel | | | | 1.0% | |
Germany | | | | 0.9% | |
Other Assets and Liabilities | | | | 1.4% | |
| | | | | |
| | | | 100.0% | |
| | | | | |
| | | | | | |
| 80 | | DoubleLine Funds Trust | | | | The accompanying notes are an integral part of these financial statements. |
| | | | | |
| SECURITY TYPE BREAKDOWNas a % of Net Assets: | |
Foreign Government Bonds, Foreign Agencies and Foreign Government Sponsored Corporations | | | | 65.5% | |
US Government and Agency Obligations | | | | 26.9% | |
Short Term Investments | | | | 6.2% | |
Other Assets and Liabilities | | | | 1.4% | |
| | | | | |
| | | | 100.0% | |
| | | | | |
| ^ | Security exempt from registration under Rule 144A of the Securities Act of 1933. These securities may be resold in transactions exempt from registration to qualified institutional buyers. |
| ¨ | Seven-day yield as of March 31, 2020 |
| * | Non-income producing security |
| Principal amount is stated in 100 Mexican Peso Units. |
| | | | | | | | | | | | | | | | | | | | | | | | |
|
| FORWARD CURRENCY EXCHANGE CONTRACTS | |
| Settlement Date | | Counterparty | | | Currency to be Delivered | | Value | | | Currency to be Received | | | Value | | Unrealized
Appreciation
(Depreciation) | |
| 04/16/2020 | | | State Street Bank | | | 265,000,000 | | MXN | | $ | 11,140,138 | | | 11,620,355 | | | USD | | | $11,620,355 | | $ | 480,217 | |
| 04/16/2020 | | | Citibank | | | 228,300,000 | | MXN | | | 9,597,334 | | | 9,997,542 | | | USD | | | 9,997,542 | | | 400,208 | |
| 04/16/2020 | | | Australia and New Zealand Banking Group | | | 20,650,000 | | NZD | | | 12,319,922 | | | 12,313,265 | | | USD | | | 12,313,265 | | | (6,657 | ) |
| 04/16/2020 | | | Australia and New Zealand Banking Group | | | 18,500,000 | | AUD | | | 11,380,328 | | | 11,137,388 | | | USD | | | 11,137,388 | | | (242,940 | ) |
| | | | | | | | | | | | | | | | | | | | | | | | |
| | | | | | | | | | $ | 44,437,722 | | | | | | | | | $45,068,550 | | $ | 630,828 | |
| | | | | | | | | | | | | | | | | | | | | | | | |
| | | | | | |
| The accompanying notes are an integral part of these financial statements. | | Annual Report | | March 31, 2020 | | 81 |
| | |
| Schedule of Investments DoubleLine Infrastructure Income Fund | | March 31, 2020 |
| | | | | | | | | | | | | | | | |
PRINCIPAL
AMOUNT $ | | | SECURITY DESCRIPTION | | RATE | | | MATURITY | | | VALUE $ | |
| | ASSET BACKED OBLIGATIONS 39.9% | | | | | | | | | |
| |
| | | | AASET Ltd., | |
| | 1,168,468 | | | Series 2018-1A-A | | | 3.84% | ^ | | | 01/16/2038 | | | | 955,638 | |
| |
| | | | Blackbird Capital Aircraft Lease Securitization Ltd., | |
| | 5,213,542 | | | Series2016-1A-B | | | 5.68% | ^§ | | | 12/16/2041 | | | | 3,397,238 | |
| |
| | | | CAL Funding Ltd., | |
| | 1,083,000 | | | Series2013-1A-A | | | 3.35% | ^ | | | 03/27/2028 | | | | 1,072,585 | |
| | 3,958,333 | | | Series2018-1A-A | | | 3.96% | ^ | | | 02/25/2043 | | | | 3,930,173 | |
| |
| | | | Castlelake Aircraft Securitization Trust, | |
| | 4,408,267 | | | Series2016-1-A | | | 4.45% | | | | 08/15/2041 | | | | 3,365,990 | |
| | 5,200,203 | | | Series2017-1-A | | | 3.97% | | | | 07/15/2042 | | | | 3,950,017 | |
| |
| | | | CLI Funding LLC, | |
| | 139,527 | | | Series2013-1A-NOTE | | | 2.83% | ^ | | | 03/18/2028 | | | | 135,798 | |
| | 1,102,850 | | | Series2013-2A-NOTE | | | 3.22% | ^ | | | 06/18/2028 | | | | 1,071,023 | |
| | 597,613 | | | Series2014-1A-A | | | 3.29% | ^ | | | 06/18/2029 | | | | 575,800 | |
| | 2,916,040 | | | Series2014-2A-A | | | 3.38% | ^ | | | 10/18/2029 | | | | 2,665,504 | |
| | 3,495,184 | | | Series2017-1A-A | | | 3.62% | ^ | | | 05/18/2042 | | | | 3,421,897 | |
| | 3,191,147 | | | Series2018-1A-A | | | 4.03% | ^ | | | 04/18/2043 | | | | 3,056,549 | |
| | 2,756,320 | | | Series2019-1A-A | | | 3.71% | ^ | | | 05/18/2044 | | | | 2,585,841 | |
| |
| | | | ECAF Ltd., | |
| | 1,030,135 | | | Series2015-1A-A1 | | | 3.47% | ^ | | | 06/15/2040 | | | | 920,934 | |
| |
| | | | Falcon Aerospace Ltd., | |
| | 7,136,527 | | | Series2017-1-A | | | 4.58% | ^ | | | 02/15/2042 | | | | 5,663,876 | |
| |
| | | | GAIA Aviation Ltd., | |
| | 4,282,619 | | | Series2019-1-A | | | 3.97% | ^§ | | | 12/15/2044 | | | | 2,879,637 | |
| |
| | | | Global SC Finance Ltd., | |
| | 4,038,500 | | | Series2018-1A-A | | | 4.29% | ^ | | | 05/17/2038 | | | | 3,935,977 | |
| |
| | | | Global SC Finance SRL, | |
| | 1,695,833 | | | Series2013-1A-A | | | 2.98% | ^ | | | 04/17/2028 | | | | 1,657,640 | |
| | 2,368,167 | | | Series2014-1A-A1 | | | 3.19% | ^ | | | 07/17/2029 | | | | 2,235,289 | |
| |
| | | | Harbour Aircraft Investments Ltd., | |
| | 9,313,354 | | | Series2017-1-A | | | 4.00% | | | | 11/15/2037 | | | | 7,810,365 | |
| |
| | | | Helios Issuer LLC, | |
| | 15,058,439 | | | Series2017-1A-A | | | 4.94% | ^ | | | 09/20/2049 | | | | 14,239,519 | |
| |
| | | | HERO Funding Trust, | |
| | 35,064 | | | Series2015-2A-A | | | 3.99% | ^ | | | 09/20/2040 | | | | 36,767 | |
| | 1,045,447 | | | Series2016-3A-A2 | | | 3.91% | ^ | | | 09/20/2042 | | | | 1,095,588 | |
| | 2,425,416 | | | Series2016-4A-A2 | | | 4.29% | ^ | | | 09/20/2047 | | | | 2,578,969 | |
| |
| | | | Horizon Aircraft Finance Ltd., | |
| | 5,217,948 | | | Series2019-1-A | | | 3.72% | ^ | | | 07/15/2039 | | | | 3,558,740 | |
| |
| | | | InSite Issuer LLC, | |
| | 2,250,000 | | | Series2016-1A-B | | | 4.56% | ^ | | | 11/15/2046 | | | | 1,929,633 | |
| |
| | | | JOL Air Ltd., | |
| | 4,555,359 | | | Series2019-1-A | | | 3.97% | ^ | | | 04/15/2044 | | | | 3,285,001 | |
| |
| | | | Mosaic Solar Loan Trust, | |
| | 7,084,872 | | | Series2017-1A-A | | | 4.45% | ^ | | | 06/20/2042 | | | | 6,982,374 | |
| | 3,292,499 | | | Series2018-1A-A | | | 4.01% | ^ | | | 06/22/2043 | | | | 3,165,443 | |
| | 5,000,000 | | | Series2019-2A-B | | | 3.28% | ^ | | | 09/20/2040 | | | | 4,307,380 | |
| |
| | | | NP SPE LLC, | |
| | 158,714 | | | Series2016-1A-A1 | | | 4.16% | ^ | | | 04/20/2046 | | | | 161,514 | |
| | 2,496,057 | | | Series2017-1A-A1 | | | 3.37% | ^ | | | 10/21/2047 | | | | 2,448,329 | |
| |
| | | | Raptor Aircraft Finance LLC, | |
| | 4,097,989 | | | Series2019-1-A | | | 4.21% | ^ | | | 08/23/2044 | | | | 2,849,877 | |
| | | | |
| | 2,500,000 | | | SBA Tower Trust | | | 2.88% | ^ | | | 07/09/2021 | | | | 2,494,511 | |
| | 8,050,000 | | | SBA Tower Trust | | | 3.17% | ^ | | | 04/11/2022 | | | | 8,011,768 | |
| |
| | | | Shenton Aircraft Investment Ltd., | |
| | 167,977 | | | Series2015-1A-A | | | 4.75% | ^ | | | 10/15/2042 | | | | 134,064 | |
| |
| | | | Sprite Ltd., | |
| | 4,009,068 | | | Series2017-1-A | | | 4.25% | ^ | | | 12/15/2037 | | | | 2,812,414 | |
| |
| | | | Stack Infrastructure Issuer LLC, | |
| | 2,967,500 | | | Series2019-1A-A2 | | | 4.54% | ^ | | | 02/25/2044 | | | | 2,981,190 | |
| | 4,500,000 | | | Series2019-2A-A2 | | | 3.08% | ^ | | | 10/25/2044 | | | | 4,278,964 | |
| | | | |
| | | | Start Ltd., | | | | | | | | | | | | |
| | 1,464,318 | | | Series2018-1-A | | | 4.09% | ^ | | | 05/15/2043 | | | | 1,057,538 | |
| | | | | | | | | | | | | | | | |
PRINCIPAL
AMOUNT $ | | | SECURITY DESCRIPTION | | RATE | | | MATURITY | | | VALUE $ | |
| |
| | | | Sunnova Helios Issuer LLC, | |
| | 2,836,500 | | | Series2018-1A-A | | | 4.87% | ^ | | | 07/20/2048 | | | | 2,573,902 | |
| |
| | | | TAL Advantage LLC, | |
| | 128,333 | | | Series2013-2A-A | | | 3.55% | ^ | | | 11/20/2038 | | | | 124,702 | |
| | 431,617 | | | Series2014-1A-A | | | 3.51% | ^ | | | 02/22/2039 | | | | 418,679 | |
| | 646,249 | | | Series2014-1A-B | | | 4.10% | ^ | | | 02/22/2039 | | | | 632,753 | |
| | 15,582,722 | | | Series2017-1A-A | | | 4.50% | ^ | | | 04/20/2042 | | | | 15,139,025 | |
| |
| | | | Textainer Marine Containers Ltd., | |
| | 5,167,033 | | | Series2017-1A-A | | | 3.72% | ^ | | | 05/20/2042 | | | | 4,678,680 | |
| |
| | | | Thunderbolt Aircraft Lease Ltd., | |
| | 5,873,171 | | | Series2017-A-A | | | 4.21% | ^§ | | | 05/17/2032 | | | | 4,461,801 | |
| | 1,785,714 | | | Series2018-A-A | | | 4.15% | ^§ | | | 09/15/2038 | | | | 1,251,909 | |
| | 2,678,571 | | | Series2018-A-B | | | 5.07% | ^§ | | | 09/15/2038 | | | | 1,676,079 | |
| |
| | | | Trinity Rail Leasing LLC, | |
| | 3,884,583 | | | Series2010-1A-A | | | 5.19% | ^ | | | 10/16/2040 | | | | 4,171,245 | |
| |
| | | | Trip Rail Master Funding LLC, | |
| | 1,636,769 | | | Series2017-1A-A1 | | | 2.71% | ^ | | | 08/15/2047 | | | | 1,620,800 | |
| |
| | | | Triton Container Finance LLC, | |
| | 3,637,403 | | | Series2017-1A-A | | | 3.52% | ^ | | | 06/20/2042 | | | | 3,476,087 | |
| | 1,521,547 | | | Series2017-2A-A | | | 3.62% | ^ | | | 08/20/2042 | | | | 1,330,900 | |
| | 8,000,000 | | | Series2018-1A-A | | | 3.95% | ^ | | | 03/20/2043 | | | | 7,933,852 | |
| |
| | | | USQ Rail LLC, | |
| | 3,726,715 | | | Series2018-1-A1 | | | 3.78% | ^ | | | 04/25/2048 | | | | 3,759,741 | |
| |
| | | | Vantage Data Centers Issuer LLC, | |
| | 11,505,208 | | | Series2018-1A-A2 | | | 4.07% | ^ | | | 02/16/2043 | | | | 11,476,319 | |
| |
| | | | VB-S1 Issuer LLC, | |
| | 6,000,000 | | | Series2018-1A-C | | | 3.41% | ^ | | | 02/15/2048 | | | | 5,264,182 | |
| |
| | | | Vivint Colar Financing LLC, | |
| | 4,904,219 | | | Series2018-1A-A | | | 4.73% | ^ | | | 04/30/2048 | | | | 4,060,762 | |
| |
| | | | Zephyrus Capital Aviation Partners Ltd., | |
| | 8,237,818 | | | Series2018-1-A | | | 4.61% | ^ | | | 10/15/2038 | | | | 6,748,149 | |
| | | | | | | | | | | | | | | | |
| | | | Total Asset Backed Obligations
(Cost $229,533,406) | | | | 204,496,921 | |
| | | | | | | | | | | | | | | | |
| | FOREIGN CORPORATE BONDS 19.0% | |
| | 3,650,000 | | | Adani Ports & Special Economic Zone Ltd. | | | 4.00% | ^ | | | 07/30/2027 | | | | 2,938,423 | |
| | 10,500,000 | | | APT Pipelines Ltd. | | | 4.25% | ^ | | | 07/15/2027 | | | | 10,956,459 | |
| | 10,253,841 | | | Celeo Redes Operacion Chile S.A. | | | 5.20% | ^ | | | 06/22/2047 | | | | 10,048,764 | |
| | 2,520,000 | | | Delek & Avner Tamar Bond Ltd. | | | 5.41% | ^ | | | 12/30/2025 | | | | 2,413,351 | |
| | 2,000,000 | | | Emirates Semb CorporationWater & Power Company PJSC | | | 4.45% | ^ | | | 08/01/2035 | | | | 2,076,000 | |
| | 7,507,000 | | | Empresa de Transporte de Pasajeros Metro S.A. | | | 5.00% | ^ | | | 01/25/2047 | | | | 7,584,360 | |
| | 9,569,163 | | | Energia Eolica S.A. | | | 6.00% | Þ | | | 08/30/2034 | | | | 9,904,084 | |
| | 2,947,656 | | | Fermaca Enterprises S. de R.L. de C.V. | | | 6.38% | ^ | | | 03/30/2038 | | | | 2,887,241 | |
| | 1,582,207 | | | Fermaca Enterprises S. de R.L. de C.V. | | | 6.38% | | | | 03/30/2038 | | | | 1,573,813 | |
| | 2,666,268 | | | Interoceanica Finance Ltd. | | | 0.00% | ^ | | | 11/30/2025 | | | | 2,419,638 | |
| | 6,132,423 | | | Interoceanica Finance Ltd. | | | 0.00% | | | | 11/30/2025 | | | | 5,565,174 | |
| | 3,640,000 | | | Israel Electric Corporation Ltd. | | | 5.00% | ^ | | | 11/12/2024 | | | | 3,822,018 | |
| | 8,600,000 | | | Korea Expressway Corporation (3 Month LIBOR USD + 0.70%) | | | 2.52% | ^ | | | 04/20/2020 | | | | 8,604,791 | |
| | 3,538,124 | | | Lima Metro Finance Ltd. | | | 5.88% | ^ | | | 07/05/2034 | | | | 3,807,207 | |
| | | | | | |
| 82 | | DoubleLine Funds Trust | | | | The accompanying notes are an integral part of these financial statements. |
| | | | | | | | | | | | | | | | |
PRINCIPAL
AMOUNT $ | | | SECURITY DESCRIPTION | | RATE | | | MATURITY | | | VALUE $ | |
| | 190,514 | | | Lima Metro Finance Ltd. | | | 5.88% | | | | 07/05/2034 | | | | 205,003 | |
| | 3,075,487 | | | Panama Metro Line SP | | | 0.00% | ^ | | | 12/05/2022 | | | | 2,855,393 | |
| | 4,216,000 | | | Sydney Airport Finance Company Pty Ltd. | | | 3.38% | ^ | | | 04/30/2025 | | | | 4,184,678 | |
| | 2,440,000 | | | Sydney Airport Finance Company Pty Ltd. | | | 3.63% | ^ | | | 04/28/2026 | | | | 2,620,838 | |
| | 6,175,000 | | | TransCanada PipeLines Ltd. | | | 4.25% | | | | 05/15/2028 | | | | 6,320,378 | |
| | 840,000 | | | Transelec S.A. | | | 4.63% | ^ | | | 07/26/2023 | | | | 855,964 | |
| | 500,000 | | | Transelec S.A. | | | 4.25% | ^ | | | 01/14/2025 | | | | 479,373 | |
| | 6,000,000 | | | Transelec S.A. | | | 3.88% | ^ | | | 01/12/2029 | | | | 5,455,815 | |
| | | | | | | | | | | | | | | | |
| | | | Total Foreign Corporate Bonds
(Cost $98,212,665) | | | | 97,578,765 | |
| | | | | | | | | | | | | | | | |
| | US CORPORATE BONDS 31.4% | | | | | | | | | |
| | 6,383,000 | | | Ameren Corporation | | | 3.65% | | | | 02/15/2026 | | | | 6,493,331 | |
| | 6,860,000 | | | American Electric Power Company, Inc. | | | 2.95% | | | | 12/15/2022 | | | | 6,663,039 | |
| | 11,200,000 | | | American Tower Corporation | | | 4.40% | | | | 02/15/2026 | | | | 11,817,720 | |
| | 700,000 | | | American Tower Corporation | | | 3.38% | | | | 10/15/2026 | | | | 701,751 | |
| | 474,000 | | | American Transmission Systems, Inc. | | | 5.25% | ^ | | | 01/15/2022 | | | | 504,523 | |
| | 7,515,000 | | | American Water Capital Corporation | | | 3.40% | | | | 03/01/2025 | | | | 7,560,824 | |
| | 11,015,000 | | | AT&T, Inc. | | | 4.30% | | | | 12/15/2042 | | | | 11,694,440 | |
| | 2,500,000 | | | Connecticut Light & Power Company | | | 3.20% | | | | 03/15/2027 | | | | 2,654,200 | |
| | 1,157,000 | | | Crown Castle International Corporation | | | 3.70% | | | | 06/15/2026 | | | | 1,173,853 | |
| | 5,716,000 | | | Crown Castle International Corporation | | | 3.65% | | | | 09/01/2027 | | | | 5,707,773 | |
| | 9,000,000 | | | Digital Realty Trust | | | 3.70% | | | | 08/15/2027 | | | | 8,716,785 | |
| | 4,175,000 | | | DTE Energy Company | | | 2.85% | | | | 10/01/2026 | | | | 4,179,483 | |
| | 5,000,000 | | | DTE Energy Company | | | 3.80% | | | | 03/15/2027 | | | | 5,118,242 | |
| | 700,000 | | | Duke Energy Corporation | | | 3.15% | | | | 08/15/2027 | | | | 691,074 | |
| | 8,655,000 | | | Duquesne Light Holdings, Inc. | | | 3.62% | ^ | | | 08/01/2027 | | | | 8,543,832 | |
| | 8,635,000 | | | Eversource Energy | | | 2.80% | | | | 05/01/2023 | | | | 8,691,826 | |
| | 7,266,000 | | | Exelon Corporation | | | 3.40% | | | | 04/15/2026 | | | | 7,059,976 | |
| | 10,000,000 | | | ITC Holdings Corporation | | | 3.25% | | | | 06/30/2026 | | | | 10,185,602 | |
| | 6,873,000 | | | Metropolitan Edison Company | | | 4.00% | ^ | | | 04/15/2025 | | | | 7,443,719 | |
| | 6,000,000 | | | MPLX LP | | | 4.00% | | | | 03/15/2028 | | | | 5,119,920 | |
| | 7,069,000 | | | NextEra Energy Capital Holdings, Inc. | | | 3.63% | | | | 06/15/2023 | | | | 7,216,962 | |
| | 7,220,000 | | | Oncor Electric Delivery Company LLC | | | 2.95% | | | | 04/01/2025 | | | | 7,358,093 | |
| | 7,350,000 | | | Sierra Pacific Power Company | | | 2.60% | | | | 05/01/2026 | | | | 7,365,254 | |
| | | | | | | | | | | | | | | | |
PRINCIPAL
AMOUNT $/
SHARES | | | SECURITY DESCRIPTION | | RATE | | | MATURITY | | | VALUE $ | |
| | 6,000,000 | | | Spectra Energy Partners LP | | | 4.75% | | | | 03/15/2024 | | | | 5,775,591 | |
| | 7,250,000 | | | Sunoco Logistics Partners Operations LP | | | 3.90% | | | | 07/15/2026 | | | | 6,121,035 | |
| | 6,417,000 | | | Xcel Energy, Inc. | | | 3.30% | | | | 06/01/2025 | | | | 6,520,153 | |
| | | | | | | | | | | | | | | | |
| | | | Total US Corporate Bonds
(Cost $161,580,834) | | | | 161,079,001 | |
| | | | | | | | | | | | | | | | |
| | SHORT TERM INVESTMENTS 9.3% | | | | | | | | | |
| | 15,950,148 | | | First American Government Obligations Fund - Class U | | | 0.47% | ¨ | | | | | | | 15,950,148 | |
| | 15,950,149 | | | JP Morgan U.S. Government Money Market Fund - Institutional Share Class | | | 0.36% | ¨ | | | | | | | 15,950,149 | |
| | 15,950,148 | | | Morgan Stanley Institutional Liquidity Funds Government Portfolio - Institutional Share Class | | | 0.26% | ¨ | | | | | | | 15,950,148 | |
| | | | | | | | | | | | | | | | |
| | | | Total Short Term Investments
(Cost $47,850,445) | | | | 47,850,445 | |
| | | | | | | | | | | | | | | | |
| | | | Total Investments 99.6%
(Cost $537,177,350) | | | | 511,005,132 | |
| | | | Other Assets in Excess of Liabilities 0.4% | | | | 1,924,607 | |
| | | | | | | | | | | | | | | | |
| | | | NET ASSETS 100.0% | | | $ | 512,929,739 | |
| | | | | | | | | | | | | | | | |
| | | | | |
| INVESTMENT BREAKDOWNas a % of Net Assets: | | | | | |
Asset Backed Obligations | | | | 39.9% | |
Utilities | | | | 26.7% | |
Short Term Investments | | | | 9.3% | |
Transportation | | | | 8.8% | |
Energy | | | | 7.2% | |
Telecommunications | | | | 6.0% | |
Real Estate | | | | 1.7% | |
Other Assets and Liabilities | | | | 0.4% | |
| | | | | |
| | | | 100.0% | |
| | | | | |
| | | | | |
| SECURITY TYPE BREAKDOWNas a % of Net Assets: | | | | | |
Asset Backed Obligations | | | | 39.9% | |
US Corporate Bonds | | | | 31.4% | |
Foreign Corporate Bonds | | | | 19.0% | |
Short Term Investments | | | | 9.3% | |
Other Assets and Liabilities | | | | 0.4% | |
| | | | | |
| | | | 100.0% | |
| | | | | |
| ^ | Security exempt from registration under Rule 144A of the Securities Act of 1933. These securities may be resold in transactions exempt from registration to qualified institutional buyers. |
| § | The interest rate will step up if the issuer does not redeem the bond on or before a scheduled redemption date in accordance with the terms of the instrument. The interest rate shown is the rate in effect as of March 31, 2020. |
| Þ | Value determined using significant unobservable inputs. |
| ¨ | Seven-day yield as of March 31, 2020 |
| | | | | | |
| The accompanying notes are an integral part of these financial statements. | | Annual Report | | March 31, 2020 | | 83 |
| | |
| Schedule of Investments DoubleLine Ultra Short Bond Fund | | March 31, 2020 |
| | | | | | | | | | | | | | | | |
PRINCIPAL
AMOUNT $ | | | SECURITY DESCRIPTION | | RATE | | | MATURITY | | | VALUE $ | |
| | FOREIGN CORPORATE BONDS 20.8% | |
| | 3,500,000 | | | Bank of Montreal (Secured Overnight Financing Rate + 6.80%) | | | 0.82% | | | | 03/10/2023 | | | | 3,199,492 | |
| | 3,000,000 | | | Barclays Bank PLC | | | 2.65% | | | | 01/11/2021 | | | | 2,992,091 | |
| | 3,000,000 | | | BMW Finance NV (3 Month LIBOR USD + 0.79%) | | | 2.50% | ^ | | | 08/12/2022 | | | | 2,879,194 | |
| | 1,000,000 | | | BP Capital Markets PLC (3 Month LIBOR USD + 0.25%) | | | 1.93% | | | | 11/24/2020 | | | | 983,195 | |
| | 500,000 | | | Canadian Imperial Bank of Commerce (3 Month LIBOR USD + 0.31%) | | | 2.21% | | | | 10/05/2020 | | | | 497,075 | |
| | 1,000,000 | | | Commonwealth Bank of Australia (3 Month LIBOR USD + 0.68%) | | | 1.57% | ^ | | | 09/18/2022 | | | | 962,174 | |
| | 1,500,000 | | | Credit Agricole S.A. (3 Month LIBOR USD + 1.43%) | | | 3.26% | ^ | | | 01/10/2022 | | | | 1,471,696 | |
| | 2,000,000 | | | Diageo Capital PLC (3 Month LIBOR USD + 0.24%) | | | 1.93% | | | | 05/18/2020 | | | | 1,997,166 | |
| | 2,500,000 | | | DNB Bank ASA (3 Month LIBOR USD + 0.62%) | | | 2.20% | ^ | | | 12/02/2022 | | | | 2,382,534 | |
| | 500,000 | | | HSBC Holdings PLC (3 Month LIBOR USD + 0.60%) | | | 2.29% | | | | 05/18/2021 | | | | 489,821 | |
| | 1,000,000 | | | HSBC Holdings PLC (3 Month LIBOR USD + 1.50%) | | | 3.40% | | | | 01/05/2022 | | | | 959,044 | |
| | 1,500,000 | | | Mitsubishi UFJ Financial Group, Inc. (3 Month LIBOR USD + 0.65%) | | | 2.44% | | | | 07/26/2021 | | | | 1,437,960 | |
| | 1,700,000 | | | Mitsubishi UFJ Financial Group, Inc. (3 Month LIBOR USD + 1.06%) | | | 1.83% | | | | 09/13/2021 | | | | 1,674,672 | |
| | 3,000,000 | | | Mizuho Financial Group, Inc. (3 Month LIBOR USD + 0.94%) | | | 2.55% | | | | 02/28/2022 | | | | 2,888,654 | |
| | 2,500,000 | | | National Australia Bank Ltd. (3 Month LIBOR USD + 0.72%) | | | 2.40% | ^ | | | 05/22/2022 | | | | 2,371,266 | |
| | 1,000,000 | | | National Australia Bank Ltd. (3 Month LIBOR USD + 0.89%) | | | 2.72% | | | | 01/10/2022 | | | | 990,305 | |
| | 1,500,000 | | | Reckitt Benckiser Treasury Services PLC (3 Month LIBOR USD + 0.56%) | | | 1.76% | ^ | | | 06/24/2022 | | | | 1,447,091 | |
| | 3,240,000 | | | Royal Bank of Canada (3 Month LIBOR USD + 0.47%) | | | 2.24% | | | | 04/29/2022 | | | | 3,110,822 | |
| | 4,000,000 | | | Santander UK PLC (3 Month LIBOR USD + 0.66%) | | | 2.35% | | | | 11/15/2021 | | | | 3,886,936 | |
| | 1,500,000 | | | Siemens Financieringsmaatschappij N.V. (3 Month LIBOR USD + 0.61%) | | | 1.35% | ^ | | | 03/16/2022 | | | | 1,462,378 | |
| | 3,000,000 | | | Sumitomo Mitsui Financial Group, Inc. (3 Month LIBOR USD + 0.78%) | | | 2.62% | | | | 07/12/2022 | | | | 2,856,444 | |
| | 500,000 | | | Sumitomo Mitsui Financial Group, Inc. (3 Month LIBOR USD + 1.68%) | | | 2.68% | | | | 03/09/2021 | | | | 494,683 | |
| | 2,700,000 | | | Toronto-Dominion Bank (Secured Overnight Financing Rate + 4.80%) | | | 1.36% | | | | 01/27/2023 | | | | 2,530,178 | |
| | 2,000,000 | | | UBS Group Funding Switzerland AG (3 Month LIBOR USD + 1.22%) | | | 2.90% | ^ | | | 05/23/2023 | | | | 1,871,839 | |
| | | | | | | | | | | | | | | | |
PRINCIPAL
AMOUNT $ | | | SECURITY DESCRIPTION | | RATE | | | MATURITY | | | VALUE $ | |
| | 2,000,000 | | | UBS Group Funding Switzerland AG (3 Month LIBOR USD + 1.53%) | | | 3.29% | ^ | | | 02/01/2022 | | | | 1,949,316 | |
| | 1,000,000 | | | Westpac Banking Corporation (3 Month LIBOR USD + 0.71%) | | | 2.08% | | | | 06/28/2022 | | | | 981,157 | |
| | | | | | | | | | | | | | | | |
| | | | Total Foreign Corporate Bonds (Cost $50,836,437) | | | | 48,767,183 | |
| | | | | | | | | | | | | |
| | US CORPORATE BONDS 37.1% | | | | | | | | | | | | |
| | 1,000,000 | | | Allstate Corporation (3 Month LIBOR USD + 0.43%) | | | 1.80% | | | | 03/29/2021 | | | | 982,606 | |
| | 1,500,000 | | | Allstate Corporation (3 Month LIBOR USD + 0.63%) | | | 2.00% | | | | 03/29/2023 | | | | 1,419,261 | |
| | 3,000,000 | | | American Express Company (3 Month LIBOR USD + 0.60%) | | | 2.34% | | | | 11/05/2021 | | | | 2,953,765 | |
| | 2,000,000 | | | American Honda Finance Corporation (3 Month LIBOR USD + 0.29%) | | | 1.19% | | | | 12/10/2021 | | | | 1,879,087 | |
| | 1,000,000 | | | American Honda Finance Corporation (3 Month LIBOR USD + 0.54%) | | | 1.81% | | | | 06/27/2022 | | | | 929,873 | |
| | 1,000,000 | | | Bank of America Corporation (3 Month LIBOR USD + 0.65%) | | | 1.87% | | | | 06/25/2022 | | | | 977,066 | |
| | 2,500,000 | | | Bank of America Corporation (3 Month LIBOR USD + 1.18%) | | | 3.00% | | | | 10/21/2022 | | | | 2,415,574 | |
| | 2,000,000 | | | BP Capital Markets America, Inc. | | | 4.50% | | | | 10/01/2020 | | | | 1,999,580 | |
| | 3,500,000 | | | Bristol-Myers Squibb Company (3 Month LIBOR USD + 0.38%) | | | 2.07% | ^ | | | 05/16/2022 | | | | 3,415,973 | |
| | 2,500,000 | | | Caterpillar Financial Services Corporation (3 Month LIBOR USD + 0.59%) | | | 1.59% | | | | 06/06/2022 | | | | 2,392,571 | |
| | 1,000,000 | | | Citibank NA (3 Month LIBOR USD + 0.60%) | | | 2.29% | | | | 05/20/2022 | | | | 966,564 | |
| | 1,000,000 | | | Citigroup, Inc. (3 Month LIBOR USD + 0.87%) | | | 1.55% | | | | 11/04/2022 | | | | 939,787 | |
| | 1,000,000 | | | Citigroup, Inc. (3 Month LIBOR USD + 0.96%) | | | 2.75% | | | | 04/25/2022 | | | | 979,369 | |
| | 2,000,000 | | | ConocoPhillips Company (3 Month LIBOR USD + 0.90%) | | | 2.59% | | | | 05/15/2022 | | | | 1,941,849 | |
| | 3,500,000 | | | Credit Suisse AG (Secured Overnight Financing Rate + 4.50%) | | | 1.20% | | | | 02/04/2022 | | | | 3,278,536 | |
| | 2,500,000 | | | Daimler Finance North America LLC (3 Month LIBOR USD + 0.67%) | | | 2.41% | ^ | | | 11/05/2021 | | | | 2,411,733 | |
| | 1,000,000 | | | Daimler Finance North America LLC (3 Month LIBOR USD + 0.88%) | | | 2.56% | ^ | | | 02/22/2022 | | | | 943,405 | |
| | 1,000,000 | | | DuPont de Nemours, Inc. (3 Month LIBOR USD + 0.71%) | | | 2.40% | | | | 11/15/2020 | | | | 993,004 | |
| | 2,500,000 | | | Georgia-Pacific LLC | | | 5.40% | ^ | | | 11/01/2020 | | | | 2,524,138 | |
| | 3,500,000 | | | Goldman Sachs Group, Inc. (3 Month LIBOR USD + 1.11%) | | | 2.90% | | | | 04/26/2022 | | | | 3,405,508 | |
| | 1,000,000 | | | Honeywell International, Inc. (3 Month LIBOR USD + 0.37%) | | | 2.10% | | | | 08/08/2022 | | | | 958,557 | |
| | | | | | |
| 84 | | DoubleLine Funds Trust | | | | The accompanying notes are an integral part of these financial statements. |
| | | | | | | | | | | | | | | | |
PRINCIPAL
AMOUNT $ | | | SECURITY DESCRIPTION | | RATE | | | MATURITY | | | VALUE $ | |
| | 3,000,000 | | | International Bank for Reconstruction & Development (Secured Overnight Financing Rate USD + 0.30%) | | | 1.07% | | | | 08/06/2024 | | | | 2,998,685 | |
| | 1,000,000 | | | Jackson National Life Global Funding (3 Month LIBOR USD + 0.73%) | | | 2.00% | ^ | | | 06/27/2022 | | | | 956,000 | |
| | 2,500,000 | | | Jackson National Life Global Funding (Secured Overnight Financing Rate + 6.00%) | | | 1.79% | ^ | | | 01/06/2023 | | | | 2,417,251 | |
| | 1,000,000 | | | John Deere Capital Corporation (3 Month LIBOR USD + 0.48%) | | | 1.48% | | | | 09/08/2022 | | | | 957,410 | |
| | 1,000,000 | | | John Deere Capital Corporation (3 Month LIBOR USD + 0.49%) | | | 1.26% | | | | 06/13/2022 | | | | 968,609 | |
| | 3,500,000 | | | JPMorgan Chase & Company (3 Month LIBOR USD + 0.61%) | | | 1.50% | | | | 06/18/2022 | | | | 3,414,834 | |
| | 3,000,000 | | | Metropolitan Life Global Funding (3 Month LIBOR USD + 0.23%) | | | 2.10% | ^ | | | 01/08/2021 | | | | 2,968,620 | |
| | 3,335,000 | | | Morgan Stanley (3 Month LIBOR USD + 0.93%) | | | 2.73% | | | | 07/22/2022 | | | | 3,246,375 | |
| | 500,000 | | | New York Life Global Funding (3 Month LIBOR USD + 0.32%) | | | 2.06% | ^ | | | 08/06/2021 | | | | 486,038 | |
| | 2,000,000 | | | New York Life Global Funding (3 Month LIBOR USD + 0.44%) | | | 2.29% | ^ | | | 07/12/2022 | | | | 1,921,866 | |
| | 3,000,000 | | | Nissan Motor Acceptance Corporation (3 Month LIBOR USD + 0.52%) | | | 1.26% | ^ | | | 03/15/2021 | | | | 2,944,872 | |
| | 1,000,000 | | | PNC Bank (3 Month LIBOR USD + 0.45%) | | | 2.25% | | | | 07/22/2022 | | | | 969,835 | |
| | 2,500,000 | | | PNC Bank (3 Month LIBOR USD + 3.25%) | | | 2.00% | | | | 02/24/2023 | | | | 2,357,241 | |
| | 2,695,000 | | | Qualcomm, Inc. (3 Month LIBOR USD + 0.73%) | | | 2.50% | | | | 01/30/2023 | | | | 2,569,243 | |
| | 2,300,000 | | | Rabobank (3 Month LIBOR USD + 0.83%) | | | 2.66% | | | | 01/10/2022 | | | | 2,294,486 | |
| | 1,000,000 | | | SunTrust Bank (3 Month LIBOR USD + 0.59%) | | | 2.28% | | | | 05/17/2022 | | | | 975,436 | |
| | 250,000 | | | Toyota Motor Credit Corporation (3 Month LIBOR USD + 0.26%) | | | 2.10% | | | | 04/17/2020 | | | | 249,894 | |
| | 3,000,000 | | | Toyota Motor Credit Corporation (3 Month LIBOR USD + 0.48%) | | | 1.48% | | | | 09/08/2022 | | | | 2,878,034 | |
| | 2,500,000 | | | Truist Bank (Secured Overnight Financing Rate + 7.30%) | | | 0.88% | | | | 03/09/2023 | | | | 2,278,202 | |
| | 2,000,000 | | | Volkswagen Group of America Finance LLC (3 Month LIBOR USD + 0.86%) | | | 2.06% | ^ | | | 09/24/2021 | | | | 1,832,181 | |
| | 2,500,000 | | | Volkswagen Group of America Finance LLC (3 Month LIBOR USD + 0.94%) | | | 2.65% | ^ | | | 11/12/2021 | | | | 2,447,151 | |
| | 3,000,000 | | | Wells Fargo & Company | | | 2.55% | | | | 12/07/2020 | | | | 3,008,618 | |
| | 1,000,000 | | | Wells Fargo & Company (3 Month LIBOR USD + 0.93%) | | | 2.66% | | | | 02/11/2022 | | | | 981,023 | |
| | | | | | | | | | | | | | | | |
PRINCIPAL
AMOUNT $ | | | SECURITY DESCRIPTION | | RATE | | | MATURITY | | | VALUE $ | |
| | 2,500,000 | | | Wells Fargo Bank NA (3 Month LIBOR USD + 0.62%) | | | 2.26% | | | | 05/27/2022 | | | | 2,465,082 | |
| | | | | | | | | | | | | | | | |
| | | | Total US Corporate Bonds (Cost $90,354,909) | | | | 87,294,792 | |
| | | | | | | | | | | | | |
| US GOVERNMENT AND AGENCY MORTGAGE BACKED
OBLIGATIONS 7.5% |
| | | | |
| | 4,000,000 | | | Federal Home Loan Banks (Secured Overnight Financing Rate USD + 2.00%) | | | 0.03% | | | | 05/14/2020 | | | | 3,999,660 | |
| | 4,000,000 | | | Federal Home Loan Banks (Secured Overnight Financing Rate USD + 5.00%) | | | 0.06% | | | | 01/28/2021 | | | | 3,998,099 | |
| | 2,500,000 | | | Federal National Mortgage Association (Secured Overnight Financing Rate USD + 1.00%) | | | 0.02% | | | | 05/22/2020 | | | | 2,499,780 | |
| | 5,000,000 | | | Federal National Mortgage Association (Secured Overnight Financing Rate USD + 4.00%) | | | 0.05% | | | | 01/29/2021 | | | | 4,992,434 | |
| | 2,250,000 | | | Federal National Mortgage Association (Secured Overnight Financing Rate USD + 7.50%) | | | 0.09% | | | | 10/30/2020 | | | | 2,248,348 | |
| | | | | | | | | | | | | | | | |
| | | | Total US Government and Agency Mortgage Backed Obligations (Cost $17,750,591) | | | | 17,738,321 | |
| | | | | | | | | | | | | |
| | SHORT TERM INVESTMENTS 34.5% | |
| | |
| | COMMERCIAL PAPER 23.4% | |
| | 2,500,000 | | | Airbus SE | | | 0.00% | ^ | | | 04/22/2020 | | | | 2,498,246 | |
| | 3,500,000 | | | Airbus SE | | | 0.00% | ^ | | | 04/24/2020 | | | | 3,497,305 | |
| | 50,000 | | | Coca Cola Company | | | 0.00% | ^ | | | 04/15/2020 | | | | 49,977 | |
| | 1,500,000 | | | Exxon Mobil Corporation | | | 0.00% | | | | 06/30/2020 | | | | 1,492,322 | |
| | 1,500,000 | | | GlaxoSmithKline PLC | | | 0.00% | ^ | | | 04/06/2020 | | | | 1,499,898 | |
| | 4,500,000 | | | GlaxoSmithKline PLC | | | 0.00% | ^ | | | 05/04/2020 | | | | 4,494,696 | |
| | 1,500,000 | | | Henkel Corporation | | | 0.00% | ^ | | | 05/04/2020 | | | | 1,498,289 | |
| | 1,000,000 | | | Henkel Corporation | | | 0.00% | ^ | | | 05/06/2020 | | | | 998,785 | |
| | 1,000,000 | | | JP Morgan Securities LLC | | | 0.00% | | | | 07/31/2020 | | | | 994,795 | |
| | 1,000,000 | | | Koch Industries, Inc. | | | 0.00% | | | | 04/02/2020 | | | | 999,996 | |
| | 4,500,000 | | | Komatsu Finance America, Inc. | | | 0.00% | ^ | | | 04/07/2020 | | | | 4,499,567 | |
| | 2,000,000 | | | Komatsu Finance America, Inc. | | | 0.00% | ^ | | | 05/01/2020 | | | | 1,997,937 | |
| | 3,500,000 | | | Metlife Short Term Funding LLC | | | 0.00% | ^ | | | 07/13/2020 | | | | 3,484,732 | |
| | 1,500,000 | | | Mitsubishi Trust Corporation | | | 0.00% | ^ | | | 04/15/2020 | | | | 1,499,654 | |
| | 3,000,000 | | | National Bank of Canada | | | 0.00% | ^ | | | 05/04/2020 | | | | 2,996,577 | |
| | 1,500,000 | | | Nestle Capital Corporation | | | 0.00% | ^ | | | 05/07/2020 | | | | 1,498,230 | |
| | 1,500,000 | | | PACCAR Financial Corporation | | | 0.00% | | | | 04/30/2020 | | | | 1,498,506 | |
| | 2,000,000 | | | Schlumberger Holdings Corporation | | | 0.00% | ^ | | | 04/20/2020 | | | | 1,998,775 | |
| | 6,500,000 | | | Shell Finance International B.V. | | | 0.00% | ^ | | | 08/31/2020 | | | | 6,460,634 | |
| | 6,500,000 | | | Total Capital Ltd. | | | 0.00% | ^ | | | 08/03/2020 | | | | 6,468,786 | |
| | 1,000,000 | | | Walt Disney Company | | | 0.00% | ^ | | | 05/15/2020 | | | | 998,506 | |
| | 3,500,000 | | | Walt Disney Company | | | 0.00% | ^ | | | 06/26/2020 | | | | 3,489,503 | |
| | | | | | | | | | | | | | | | |
| | | | | | | | | | | | | | | 54,915,716 | |
| | | | | | | | | | | | | | | | |
| | | | | | |
| The accompanying notes are an integral part of these financial statements. | | Annual Report | | March 31, 2020 | | 85 |
| | |
| Schedule of Investments DoubleLine Ultra Short Bond Fund (Cont.) | | March 31, 2020 |
| | | | | | | | | | | | | | | | |
SHARES | | | SECURITY DESCRIPTION | | RATE | | | MATURITY | | | VALUE $ | |
| | MONEY MARKET FUNDS 11.1% | |
| | 8,700,301 | | | First American Government Obligations Fund Class U | | | 0.47% | ¨ | | | | | | | 8,700,301 | |
| | 8,700,300 | | | JP Morgan U.S. Government Money Market Fund Institutional Share Class | | | 0.36% | ¨ | | | | | | | 8,700,300 | |
| | 8,700,300 | | | Morgan Stanley Institutional Liquidity Funds Government Portfolio Institutional Share Class | | | 0.26% | ¨ | | | | | | | 8,700,300 | |
| | | | | | | | | | | | | | | | |
| | | | | | | | | | | | | | | 26,100,901 | |
| | | | | | | | | | | | | | | | |
| | | | Total Short Term Investments
(Cost $80,987,975) | | | | 81,016,617 | |
| | | | | | | | | | | | | |
| | | | Total Investments 99.9%
(Cost $239,929,912) | | | | 234,816,913 | |
| | | | Other Assets in Excess of Liabilities 0.1% | | | | 134,521 | |
| | | | | | | | | | | | | |
| | | | NET ASSETS 100.0% | | | $ | 234,951,434 | |
| | | | | | | | | | | | | |
| | | | | |
| INVESTMENT BREAKDOWNas a % of Net Assets: | |
Banking | | | | 36.8% | |
Money Market Funds | | | | 11.1% | |
Energy | | | | 9.5% | |
Automotive | | | | 8.9% | |
US Government and Agency Mortgage Backed Obligations | | | | 7.5% | |
Insurance | | | | 6.2% | |
Pharmaceuticals | | | | 4.0% | |
Diversified Manufacturing | | | | 3.8% | |
Aerospace & Defense | | | | 2.6% | |
Media | | | | 1.9% | |
Construction | | | | 1.8% | |
Consumer Products | | | | 1.7% | |
Food Products | | | | 1.5% | |
Technology | | | | 1.1% | |
Pulp & Paper | | | | 1.1% | |
Chemicals/Plastics | | | | 0.4% | |
Other Assets and Liabilities | | | | 0.1% | |
| | | | | |
| | | | 100.0% | |
| | | | | |
| | | | | |
| SECURITY TYPE BREAKDOWNas a % of Net Assets: | |
US Corporate Bonds | | | | 37.1% | |
Commercial Paper | | | | 23.4% | |
Foreign Corporate Bonds | | | | 20.8% | |
Money Market Funds | | | | 11.1% | |
US Government and Agency Mortgage Backed Obligations | | | | 7.5% | |
Other Assets and Liabilities | | | | 0.1% | |
| | | | | |
| | | | 100.0% | |
| | | | | |
| ^ | Security exempt from registration under Rule 144A of the Securities Act of 1933. These securities may be resold in transactions exempt from registration to qualified institutional buyers. |
| ¨ | Seven-day yield as of March 31, 2020 |
| | | | | | |
| 86 | | DoubleLine Funds Trust | | | | The accompanying notes are an integral part of these financial statements. |
| | |
| Schedule of Investments DoubleLine Shiller Enhanced International CAPE® | | March 31, 2020 |
| | | | | | | | | | | | | | | | |
PRINCIPAL
AMOUNT $ | | | SECURITY DESCRIPTION | | RATE | | | MATURITY | | | VALUE $ | |
| | ASSET BACKED OBLIGATIONS 2.9% | |
| |
| | | | Global SC Finance SRL, | |
| | 201,500 | | | Series2014-1A-A1 | | | 3.19% | ^ | | | 07/17/2029 | | | | 190,194 | |
| |
| | | | Navient Private Education Loan Trust, | |
| | 500,000 | | | Series2018-A-B | | | 3.68% | ^ | | | 02/18/2042 | | | | 517,030 | |
| | | | |
| | 250,000 | | | SBA Tower Trust | | | 3.17% | ^ | | | 04/11/2022 | | | | 248,813 | |
| |
| | | | SoFi Consumer Loan Program Trust, | |
| | 29,995 | | | Series2017-2-A | | | 3.28% | ^ | | | 02/25/2026 | | | | 29,888 | |
| |
| | | | TAL Advantage LLC, | |
| | 211,053 | | | Series2017-1A-A | | | 4.50% | ^ | | | 04/20/2042 | | | | 205,043 | |
| | | | | | | | | | | | | | | | |
| | | | Total Asset Backed Obligations
(Cost $1,190,081) | | | | 1,190,968 | |
| | | | | | | | | | | | | | | | |
| | COLLATERALIZED LOAN OBLIGATIONS 13.2% | |
| |
| | | | Anchorage Capital Ltd., | |
| | 500,000 | | | Series2015-6A-AR (3 Month LIBOR USD + 1.27%) | | | 3.10% | ^ | | | 07/15/2030 | | | | 478,878 | |
| |
| | | | Benefit Street Partners Ltd., | |
| | 250,000 | | | Series2013-IIIA-A1R (3 Month LIBOR USD + 1.25%) | | | 3.07% | ^ | | | 07/20/2029 | | | | 241,428 | |
| |
| | | | CFIP Ltd., | |
| | 500,000 | | | Series2014-1A-AR (3 Month LIBOR USD + 1.32%) | | | 3.17% | ^ | | | 07/13/2029 | | | | 480,440 | |
| |
| | | | CVP Ltd., | |
| | 500,000 | | | Series2017-1A-A (3 Month LIBOR USD + 1.34%) | | | 3.16% | ^ | | | 07/20/2030 | | | | 469,311 | |
| |
| | | | Elmwood Ltd., | |
| | 500,000 | | | Series2020-1A-A (3 Month LIBOR USD + 1.24%, 1.24% Floor) | | | 0.01% | ^ | | | 04/15/2033 | | | | 477,128 | |
| |
| | | | Highbridge Loan Management Ltd., | |
| | 500,000 | | | Series3A-2014-CR (3 Month LIBOR USD + 3.60%) | | | 5.42% | ^ | | | 07/18/2029 | | | | 389,456 | |
| |
| | | | Steele Creek Ltd., | |
| | 500,000 | | | Series2015-1A-AR (3 Month LIBOR USD + 1.26%) | | | 2.96% | ^ | | | 05/21/2029 | | | | 477,531 | |
| |
| | | | Venture Ltd., | |
| | 500,000 | | | Series2017-29A-A (3 Month LIBOR USD + 1.28%) | | | 2.97% | ^ | | | 09/07/2030 | | | | 478,735 | |
| |
| | | | Whitehorse Ltd., | |
| | 1,000,000 | | | Series2018-12A-A (3 Month LIBOR USD + 1.25%, 1.25% Floor) | | | 3.08% | ^ | | | 10/15/2031 | | | | 917,067 | |
| |
| | | | Wind River Ltd., | |
| | 1,000,000 | | | Series2014-2A-AR (3 Month LIBOR USD + 1.14%, 1.14% Floor) | | | 2.97% | ^ | | | 01/15/2031 | | | | 944,060 | |
| | | | | | | | | | | | | | | | |
| | | | Total Collateralized Loan Obligations
(Cost $5,757,202) | | | | 5,354,034 | |
| | | | | | | | | | | | | | | | |
| | FOREIGN CORPORATE BONDS 4.9% | |
| | 100,000 | | | Avolon Holdings Funding Ltd. | | | 3.63% | ^ | | | 05/01/2022 | | | | 88,754 | |
| | 150,000 | | | Banco de Reservas de la Republica Dominicana | | | 7.00% | | | | 02/01/2023 | | | | 143,625 | |
| | 100,000 | | | Banco do Brasil S.A. (10 Year CMT Rate + 7.78%) | | | 8.50% | † | | | 10/20/2020 | | | | 100,281 | |
| | 150,000 | | | BDO Unibank, Inc. | | | 2.95% | | | | 03/06/2023 | | | | 148,875 | |
| | 200,000 | | | Cemex S.A.B. de C.V. | | | 6.13% | | | | 05/05/2025 | | | | 178,749 | |
| | 200,000 | | | DBS Group Holdings Ltd. (5 Year Swap Rate USD + 2.39%) | | | 3.60% | † | | | 09/07/2021 | | | | 185,402 | |
| | 100,000 | | | Freeport-McMoRan, Inc. | | | 3.55% | | | | 03/01/2022 | | | | 96,466 | |
| | | | | | | | | | | | | | | | |
PRINCIPAL
AMOUNT $ | | | SECURITY DESCRIPTION | | RATE | | | MATURITY | | | VALUE $ | |
| | 200,000 | | | HPHT Finance Ltd. | | | 2.88% | | | | 11/05/2024 | | | | 207,534 | |
| | 53,325 | | | Interoceanica Finance Ltd. | | | | | | | 11/30/2025 | | | | 48,393 | |
| | 70,000 | | | Macquarie Bank Ltd. | | | 2.10% | ^ | | | 10/17/2022 | | | | 69,604 | |
| | 200,000 | | | Malayan Banking BHD (5 Year Swap Rate USD + 2.54%) | | | 3.91% | | | | 10/29/2026 | | | | 203,400 | |
| | 100,000 | | | Petrobras Global Finance B.V. | | | 5.38% | | | | 01/27/2021 | | | | 100,374 | |
| | 80,000 | | | Southern Copper Corporation | | | 5.38% | | | | 04/16/2020 | | | | 79,660 | |
| | 140,000 | | | Sumitomo Mitsui Financial Group, Inc. | | | 2.06% | | | | 07/14/2021 | | | | 138,957 | |
| | 200,000 | | | Tecnoglass, Inc. | | | 8.20% | | | | 01/31/2022 | | | | 169,675 | |
| | 25,000 | | | Toronto-Dominion Bank (Secured Overnight Financing Rate + 4.80%) | | | 1.36% | | | | 01/27/2023 | | | | 23,428 | |
| | | | | | | | | | | | | | | | |
| | | | Total Foreign Corporate Bonds
(Cost $2,084,403) | | | | 1,983,177 | |
| | | | | | | | | | | | | | | | |
| NON-AGENCY COMMERCIAL MORTGAGE BACKED
OBLIGATIONS 11.8% |
|
| |
| | | | AREIT Trust, | |
| | 231,000 | | | Series2019-CRE3-D (1 Month LIBOR USD + 2.65%, 2.65% Floor) | | | 3.35% | ^ | | | 09/14/2036 | | | | 164,305 | |
| |
| | | | Atrium Hotel Portfolio Trust, | |
| | 251,000 | | | Series2017-ATRM-E (1 Month LIBOR USD + 3.05%, 3.05% Floor) | | | 3.75% | ^ | | | 12/15/2036 | | | | 201,125 | |
| | 115,000 | | | Series2018-ATRM-E (1 Month LIBOR USD + 3.40%, 3.40% Floor) | | | 4.10% | ^ | | | 06/15/2035 | | | | 86,890 | |
| |
| | | | Bancorp Commercial Mortgage Trust, | |
| | 177,000 | | | Series2018-CRE4-D (1 Month LIBOR USD + 2.10%, 0.25% Floor) | | | 2.80% | ^ | | | 09/15/2035 | | | | 136,569 | |
| |
| | | | BB-UBS Trust, | |
| | 3,844,000 | | | Series2012-SHOW-XB | | | 0.14% | #^ I/O | | | 11/05/2036 | | | | 31,464 | |
| |
| | | | BX Commercial Mortgage Trust, | |
| | 186,000 | | | Series2019-IMC-F (1 Month LIBOR USD + 2.90%, 2.90% Floor) | | | 3.60% | ^ | | | 04/15/2034 | | | | 160,889 | |
| |
| | | | BX Trust, | |
| | 850,000 | | | Series2017-SLCT-D (1 Month LIBOR USD + 2.05%, 2.05% Floor) | | | 2.75% | ^ | | | 07/15/2034 | | | | 667,238 | |
| |
| | | | CFCRE Commercial Mortgage Trust, | |
| | 3,545,000 | | | Series2018-TAN-X | | | 1.63% | #^ I/O | | | 02/15/2033 | | | | 147,391 | |
| |
| | | | Citigroup Commercial Mortgage Trust, | |
| | 2,949,534 | | | Series2014-GC19-XA | | | 1.15% | # I/O | | | 03/10/2047 | | | | 109,975 | |
| | 268,000 | | | Series2018-TBR-E (1 Month LIBOR USD + 2.80%, 2.90% Floor) | | | 3.50% | ^ | | | 12/15/2036 | | | | 177,413 | |
| | 255,000 | | | Series2018-TBR-F (1 Month LIBOR USD + 3.65%, 3.75% Floor) | | | 4.35% | ^ | | | 12/15/2036 | | | | 161,881 | |
| |
| | | | Commercial Mortgage Pass-Through Certificates, | |
| | 186,000 | | | Series2015-DC1-C | | | 4.31% | # | | | 02/10/2048 | | | | 165,051 | |
| |
| | | | Credit Suisse Mortgage Trust, | |
| | 394,000 | | | Series2017-LSTK-D | | | 3.33% | #^ | | | 04/05/2033 | | | | 384,700 | |
| |
| | | | GS Mortgage Securities Corporation Trust, | |
| | 186,000 | | | Series2020-UPTN-F | | | 3.25% | #^ | | | 02/10/2037 | | | | 124,466 | |
| |
| | | | GS Mortgage Securities Trust, | |
| | 312,000 | | | Series2014-GC26-D | | | 4.51% | #^ | | | 11/10/2047 | | | | 235,832 | |
| | 6,090,692 | | | Series2016-GS4-XA | | | 0.57% | # I/O | | | 11/10/2049 | | | | 151,938 | |
| | | | | | |
| The accompanying notes are an integral part of these financial statements. | | Annual Report | | March 31, 2020 | | 87 |
| | |
| Schedule of Investments DoubleLine Shiller Enhanced International CAPE® (Cont.) | | March 31, 2020 |
| | | | | | | | | | | | | | | | |
PRINCIPAL
AMOUNT $ | | | SECURITY DESCRIPTION | | RATE | | | MATURITY | | | VALUE $ | |
| |
| | | | HPLY Trust, | |
| | 200,747 | | | Series2019-HIT-D (1 Month LIBOR USD + 2.00%, 2.00% Floor) | | | 2.70% | ^ | | | 11/15/2036 | | | | 156,070 | |
| |
| | | | Hunt Ltd., | |
| | 190,000 | | | Series2018-FL2-C (1 Month LIBOR USD + 2.35%, 2.35% Floor) | | | 3.05% | ^ | | | 08/15/2028 | | | | 141,014 | |
| |
| | | | JP Morgan Chase Commercial Mortgage Securities Trust, | |
| | 300,000 | | | Series2018-BCON-E | | | 3.76% | #^ | | | 01/05/2031 | | | | 276,371 | |
| | 104,000 | | | Series2018-WPT-EFX | | | 5.54% | ^ | | | 07/05/2033 | | | | 88,765 | |
| | 300,000 | | | Series2018-WPT-FFX | | | 5.54% | ^ | | | 07/05/2033 | | | | 231,152 | |
| |
| | | | MFT Trust, | |
| | 186,000 | | | Series2020-ABC-D | | | 3.48% | #^ | | | 02/06/2030 | | | | 102,754 | |
| |
| | | | Morgan Stanley Capital Trust, | |
| | 88,000 | | | Series2017-ASHF-D (1 Month LIBOR USD + 2.20%, 2.20% Floor) | | | 2.90% | ^ | | | 11/15/2034 | | | | 58,183 | |
| | 188,000 | | | Series2017-ASHF-E (1 Month LIBOR USD + 3.15%, 3.15% Floor) | | | 3.85% | ^ | | | 11/15/2034 | | | | 101,703 | |
| | 142,000 | | | Series2017-ASHF-F (1 Month LIBOR USD + 4.35%, 4.35% Floor) | | | 5.05% | ^ | | | 11/15/2034 | | | | 76,465 | |
| | 15,277,000 | | | Series2017-ASHF-XCP | | | 0.00% | #^ I/O | | | 05/15/2019 | | | | 15 | |
| |
| | | | SLIDE, | |
| | 8,372,698 | | | Series2018-FUN-XCP | | | 0.98% | #^ I/O | | | 12/15/2020 | | | | 57,326 | |
| |
| | | | Wells Fargo Commercial Mortgage Trust, | |
| | 6,607,424 | | | Series2015-NXS2-XA | | | 0.71% | # I/O | | | 07/15/2058 | | | | 194,741 | |
| | 5,423,894 | | | Series2015-P2-XA | | | 0.98% | # I/O | | | 12/15/2048 | | | | 202,324 | |
| | | | | | | | | | | | | | | | |
| | | | TotalNon-Agency Commercial Mortgage Backed Obligations
(Cost $6,214,513) | | | | 4,794,010 | |
| | | | | | | | | | | | | | | | |
| NON-AGENCY RESIDENTIAL COLLATERALIZED MORTGAGE
OBLIGATIONS 14.0% |
|
| |
| | | | Alternative Loan Trust, | |
| | 534,953 | | | Series 2005-64CB-1A10 | | | 5.75% | | | | 12/25/2035 | | | | 500,346 | |
| |
| | | | Bayview Opportunity Master Fund Trust, | |
| | 443,109 | | | Series2019-SBR2-A1 | | | 3.43% | ^§ | | | 06/28/2034 | | | | 438,848 | |
| |
| | | | Citigroup Mortgage Loan Trust, | |
| | 251,770 | | | Series2006-AR2-1A2 | | | 3.96% | # | | | 03/25/2036 | | | | 221,757 | |
| |
| | | | CSMC Trust, | |
| | 392,211 | | | Series2018-RPL7-A1 | | | 4.00% | ^ | | | 08/26/2058 | | | | 409,003 | |
| | 689,524 | | | Series2019-RPL9-A1 | | | 3.32% | #^ | | | 10/27/2059 | | | | 677,234 | |
| |
| | | | Deephaven Residential Mortgage Trust, | |
| | 99,575 | | | Series2017-1A-A1 | | | 2.73% | #^ | | | 12/26/2046 | | | | 97,863 | |
| | 99,575 | | | Series2017-1A-A2 | | | 2.93% | #^ | | | 12/26/2046 | | | | 97,886 | |
| |
| | | | Legacy Mortgage Asset Trust, | |
| | 418,162 | | | Series2019-GS5-A1 | | | 3.20% | ^§ | | | 05/25/2059 | | | | 418,858 | |
| |
| | | | PRPM LLC, | |
| | 402,538 | | | Series2019-3A-A1 | | | 3.35% | ^§ | | | 07/25/2024 | | | | 400,028 | |
| |
| | | | Velocity Commercial Capital Loan Trust, | |
| | 702,598 | | | Series2018-2-A | | | 4.05% | #^ | | | 10/26/2048 | | | | 710,815 | |
| |
| | | | Vericrest Opportunity Loan Trust, | |
| | 663,252 | | | Series2020-NPL2-A1A | | | 2.98% | ^§ | | | 02/25/2050 | | | | 588,180 | |
| |
| | | | Verus Securitization Trust, | |
| | 164,588 | | | Series2017-1A-A2 | | | 3.16% | #^ | | | 01/25/2047 | | | | 161,729 | |
| |
| | | | VOLT LLC, | |
| | 470,591 | | | Series2020-NPL1-A1A | | | 3.23% | ^§ | | | 01/25/2050 | | | | 426,333 | |
| | 589,526 | | | Series2020-NPL4-A1 | | | 2.98% | ^§ | | | 03/25/2050 | | | | 529,322 | |
| | | | | | | | | | | | | | | | |
| | | | TotalNon-Agency Residential Collateralized Mortgage Obligations
(Cost $5,904,648) | | | | 5,678,202 | |
| | | | | | | | | | | | | | | | |
| | | | | | | | | | | | | | | | |
PRINCIPAL
AMOUNT $ | | | SECURITY DESCRIPTION | | RATE | | | MATURITY | | | VALUE $ | |
| | US CORPORATE BONDS 6.6% | |
| | 50,000 | | | AbbVie, Inc. | | | 2.30% | ^ | | | 11/21/2022 | | | | 50,024 | |
| | 55,000 | | | Air Lease Corporation | | | 2.50% | | | | 03/01/2021 | | | | 50,601 | |
| | 105,000 | | | Analog Devices, Inc. | | | 2.95% | | | | 01/12/2021 | | | | 105,166 | |
| | 60,000 | | | Anthem, Inc. | | | 2.50% | | | | 11/21/2020 | | | | 59,793 | |
| | 105,000 | | | Bristol-Myers Squibb Company | | | 2.60% | ^ | | | 05/16/2022 | | | | 107,228 | |
| | 35,000 | | | Capital One Financial Corporation | | | 2.40% | | | | 10/30/2020 | | | | 34,931 | |
| | 60,000 | | | Capital One Financial Corporation | | | 3.20% | | | | 01/30/2023 | | | | 59,381 | |
| | 140,000 | | | Cardinal Health, Inc. | | | 2.62% | | | | 06/15/2022 | | | | 140,719 | |
| | 100,000 | | | Carrier Global Corporation | | | 1.92% | ^ | | | 02/15/2023 | | | | 98,646 | |
| | 95,000 | | | Cigna Corporation | | | 3.40% | | | | 09/17/2021 | | | | 96,494 | |
| | 95,000 | | | Cintas Corporation | | | 2.90% | | | | 04/01/2022 | | | | 95,071 | |
| | 135,000 | | | Citigroup, Inc. (3 Month LIBOR USD + 1.02%) | | | 2.60% | | | | 06/01/2024 | | | | 125,911 | |
| | 185,000 | | | Daimler Finance North America LLC | | | 2.30% | ^ | | | 02/12/2021 | | | | 180,381 | |
| | 95,000 | | | Delta Air Lines, Inc. | | | 3.40% | | | | 04/19/2021 | | | | 86,564 | |
| | 55,000 | | | DTE Energy Company | | | 2.25% | | | | 11/01/2022 | | | | 54,509 | |
| | 100,000 | | | eBay, Inc. | | | 2.75% | | | | 01/30/2023 | | | | 98,200 | |
| | 70,000 | | | General Electric Company | | | 2.70% | | | | 10/09/2022 | | | | 68,942 | |
| | 95,000 | | | Hyundai Capital America | | | 2.85% | ^ | | | 11/01/2022 | | | | 92,869 | |
| | 70,000 | | | Marsh & McLennan Companies, Inc. (3 Month LIBOR USD + 1.20%) | | | 2.57% | | | | 12/29/2021 | | | | 70,065 | |
| | 100,000 | | | Microchip Technology, Inc. | | | 3.92% | | | | 06/01/2021 | | | | 97,507 | |
| | 90,000 | | | Mondelez International, Inc. | | | 3.00% | | | | 05/07/2020 | | | | 89,102 | |
| | 95,000 | | | Omnicom Capital, Inc. | | | 3.63% | | | | 05/01/2022 | | | | 96,657 | |
| | 20,000 | | | ORACLE Corporation | | | 2.50% | | | | 04/01/2025 | | | | 20,441 | |
| | 85,000 | | | PayPal Holdings, Inc. | | | 2.20% | | | | 09/26/2022 | | | | 84,697 | |
| | 105,000 | | | Penske Truck Leasing Company | | | 2.70% | ^ | | | 11/01/2024 | | | | 98,179 | |
| | 65,000 | | | Prudential Financial, Inc. | | | 3.50% | | | | 05/15/2024 | | | | 67,736 | |
| | 95,000 | | | Republic Services, Inc. | | | 2.50% | | | | 08/15/2024 | | | | 95,841 | |
| | 20,000 | | | Reynolds American, Inc. | | | 4.00% | | | | 06/12/2022 | | | | 20,271 | |
| | 65,000 | | | Schlumberger Holdings Corporation | | | 3.75% | ^ | | | 05/01/2024 | | | | 61,631 | |
| | 70,000 | | | Simon Property Group LP | | | 2.00% | | | | 09/13/2024 | | | | 67,308 | |
| | 95,000 | | | Union Pacific Corporation | | | 3.20% | | | | 06/08/2021 | | | | 95,944 | |
| | 90,000 | | | Welltower, Inc. | | | 3.63% | | | | 03/15/2024 | | | | 88,507 | |
| | | | | | | | | | | | | | | | |
| | | | Total US Corporate Bonds
(Cost $2,705,974) | | | | 2,659,316 | |
| | | | | | | | | | | | | | | | |
| US GOVERNMENT AND AGENCY MORTGAGE BACKED
OBLIGATIONS 11.3% |
|
| |
| | | | Federal Home Loan Mortgage Corporation, | |
| | 1,537,429 | | | Series3312-FJ (1 Month LIBOR USD + 0.22%, 0.22% Floor, 7.00% Cap) | | | 0.92% | | | | 07/15/2036 | | | | 1,517,007 | |
| | 1,894,172 | | | Series3747-FA (1 Month LIBOR USD + 0.50%, 0.50% Floor, 7.00% Cap) | | | 1.20% | | | | 10/15/2040 | | | | 1,875,138 | |
| |
| | | | Federal National Mortgage Association, | |
| | 1,150,967 | | | Series2013-74-YA | | | 3.00% | | | | 05/25/2042 | | | | 1,196,008 | |
| | | | | | | | | | | | | | | | |
| | | | Total US Government and Agency Mortgage Backed Obligations
(Cost $4,549,188) | | | | 4,588,153 | |
| | | | | | | | | | | | | | | | |
| | | | | | |
| 88 | | DoubleLine Funds Trust | | | | The accompanying notes are an integral part of these financial statements. |
| | | | | | | | | | | | | | | | |
PRINCIPAL
AMOUNT $/
SHARES | | | SECURITY DESCRIPTION | | RATE | | | MATURITY | | | VALUE $ | |
| | US GOVERNMENT AND AGENCY OBLIGATIONS 26.6% | |
| | 650,000 | | | United States Treasury Notes | | | 1.38% | ‡ | | | 09/15/2020 | | | | 653,732 | |
| | 1,280,000 | | | United States Treasury Notes | | | 2.88% | ‡ | | | 10/31/2020 | | | | 1,300,375 | |
| | 1,500,000 | | | United States Treasury Notes | | | 2.75% | ‡ | | | 11/30/2020 | | | | 1,526,045 | |
| | 1,485,000 | | | United States Treasury Notes | | | 2.75% | ‡ | | | 09/15/2021 | | | | 1,539,585 | |
| | 1,715,000 | | | United States Treasury Notes | | | 1.50% | ‡ | | | 10/31/2021 | | | | 1,749,870 | |
| | 1,775,000 | | | United States Treasury Notes | | | 1.63% | ‡ | | | 04/30/2023 | | | | 1,847,941 | |
| | 2,035,000 | | | United States Treasury Notes | | | 2.25% | ‡ | | | 12/31/2023 | | | | 2,181,425 | |
| | | | | | | | | | | | | | | | |
| | | | Total US Government and Agency Obligations
(Cost $10,484,713) | | | | 10,798,973 | |
| | | | | | | | | | | | | |
| | AFFILIATED MUTUAL FUNDS 5.8% | |
| | 281,035 | | | DoubleLine Floating Rate Fund (Class I) | | | | | | | | | | | 2,371,933 | |
| | | | | | | | | | | | | | | | |
| | | | Total Affiliated Mutual Funds
(Cost $2,782,244) | | | | 2,371,933 | |
| | | | | | | | | | | | | |
| | SHORT TERM INVESTMENTS 22.6% | |
| | 3,054,084 | | | First American Government Obligations Fund - Class U | | | 0.47% | ¨ | | | | | | | 3,054,084 | |
| | 3,054,085 | | | JP Morgan U.S. Government Money Market Fund - Institutional Share Class | | | 0.36% | ¨ | | | | | | | 3,054,085 | |
| | 3,054,085 | | | Morgan Stanley Institutional Liquidity Funds Government Portfolio - Institutional Share Class | | | 0.26% | ¨ | | | | | | | 3,054,085 | |
| | | | | | | | | | | | | | | | |
| | | | Total Short Term Investments
(Cost $9,162,254) | | | | 9,162,254 | |
| | | | | | | | | | | | | |
| | | | Total Investments 119.7%
(Cost $50,835,220) | | | | 48,581,020 | |
| | | | Liabilities in Excess of Other Assets (19.7)% | | | | (8,014,281 | ) |
| | | | | | | | | | | | | |
| | | | NET ASSETS 100.0% | | | $ | 40,566,739 | |
| | | | | | | | | | | | | |
| | | | | |
| SECURITY TYPE BREAKDOWNas a % of Net Assets: | |
US Government and Agency Obligations | | | | 26.6% | |
Short Term Investments | | | | 22.6% | |
Non-Agency Residential Collateralized Mortgage Obligations | | | | 14.0% | |
Collateralized Loan Obligations | | | | 13.2% | |
Non-Agency Commercial Mortgage Backed Obligations | | | | 11.8% | |
US Government and Agency Mortgage Backed Obligations | | | | 11.3% | |
US Corporate Bonds | | | | 6.6% | |
Affiliated Mutual Funds | | | | 5.8% | |
Foreign Corporate Bonds | | | | 4.9% | |
Asset Backed Obligations | | | | 2.9% | |
Other Assets and Liabilities | | | | (19.7)% | |
| | | | | |
| | | | 100.0% | |
| | | | | |
| | | | | |
| INVESTMENT BREAKDOWNas a % of Net Assets: | |
US Government and Agency Obligations | | | | 26.6% | |
Short Term Investments | | | | 22.6% | |
Non-Agency Residential Collateralized Mortgage Obligations | | | | 14.0% | |
Collateralized Loan Obligations | | | | 13.2% | |
Non-Agency Commercial Mortgage Backed Obligations | | | | 11.8% | |
US Government and Agency Mortgage Backed Obligations | | | | 11.3% | |
Affiliated Mutual Funds | | | | 5.8% | |
Banking | | | | 3.2% | |
Asset Backed Obligations | | | | 2.9% | |
Transportation | | | | 1.0% | |
Building and Development (including Steel/Metals) | | | | 0.8% | |
Technology | | | | 0.8% | |
Healthcare | | | | 0.8% | |
Automotive | | | | 0.7% | |
Energy | | | | 0.5% | |
Mining | | | | 0.4% | |
Diversified Manufacturing | | | | 0.4% | |
Pharmaceuticals | | | | 0.4% | |
Real Estate | | | | 0.4% | |
Insurance | | | | 0.4% | |
Finance | | | | 0.3% | |
Commercial Services | | | | 0.2% | |
Media | | | | 0.2% | |
Environmental Control | | | | 0.2% | |
Industrial Equipment | | | | 0.2% | |
Food Products | | | | 0.2% | |
Aerospace & Defense | | | | 0.2% | |
Utilities | | | | 0.1% | |
Beverage and Tobacco | | | | 0.1% | |
Other Assets and Liabilities | | | | (19.7)% | |
| | | | | |
| | | | 100.0% | |
| | | | | |
| ^ | Security exempt from registration under Rule 144A of the Securities Act of 1933. These securities may be resold in transactions exempt from registration to qualified institutional buyers. |
| # | Coupon rate is variable based on the weighted average coupon of the underlying collateral. To the extent the weighted average coupon of the underlying assets which comprise the collateral increases or decreases, the coupon rate of this security will increase or decrease correspondingly. The rate disclosed is as of March 31, 2020. |
| I/O | Interest only security |
| § | The interest rate will step up if the issuer does not redeem the bond on or before a scheduled redemption date in accordance with the terms of the instrument. The interest rate shown is the rate in effect as of March 31, 2020. |
| ¨ | Seven-day yield as of March 31, 2020 |
| ‡ | All or a portion of this security has been pledged as collateral. |
| | | | | | |
| The accompanying notes are an integral part of these financial statements. | | Annual Report | | March 31, 2020 | | 89 |
| | |
| Schedule of Investments DoubleLine Shiller Enhanced International CAPE® (Cont.) | | March 31, 2020 |
| | | | | | | | | | | | | | | | | | | | | | | | | | | | | | |
|
| Excess Return Swaps | |
| Reference Entity | | Counterparty | | Long/Short | | | Financing
Rate | | | Payment
Frequency | | | Termination
Date | | | Notional
Amount | | | Unrealized
Appreciation
(Depreciation)/
Value | |
Shiller Barclays CAPE® Europe Sector Net ER NoC Index | | Barclays Capital, Inc. | | | Long | | | | 0.20 | % | | | Termination | | | | 10/30/2020 | | | | 500,000 | | | | EUR | | | $ | (103,222 | ) |
Shiller Barclays CAPE® Europe Sector Net ER NoC Index | | BNP Paribas | | | Long | | | | 0.20 | % | | | Termination | | | | 03/31/2021 | | | | 1,500,000 | | | | EUR | | | | (216,844 | ) |
Shiller Barclays CAPE® Europe Sector Net ER NoC Index | | BNP Paribas | | | Long | | | | 0.20 | % | | | Termination | | | | 09/30/2020 | | | | 10,500,000 | | | | EUR | | | | (1,982,016 | ) |
Shiller Barclays CAPE® Europe Sector Net ER NoC Index | | BNP Paribas | | | Long | | | | 0.20 | % | | | Termination | | | | 01/29/2021 | | | | 11,500,000 | | | | EUR | | | | (2,650,517 | ) |
Shiller Barclays CAPE® Europe Sector Net ER NoC Index | | Barclays Capital, Inc. | | | Long | | | | 0.20 | % | | | Termination | | | | 06/30/2020 | | | | 20,000,000 | | | | EUR | | | | (2,690,873 | ) |
| | | | | | | | | | | | | | | | | | | | | | | | | | | | | | |
| | | | | | | | | | | | | | | | | | | | | | | | | | | | $ | (7,643,472 | ) |
| | | | | | | | | | | | | | | | | | | | | | | | | | | | | | |
| Shiller Barclays CAPE® Europe Sector Net ER NoC Index aims to provide notional long exposure to the top four European equity sectors that are relatively undervalued, as defined by a modified version of the classic CAPE® Ratio (the “Relative CAPE® Indicator”) and that possess relatively strong price momentum over the prior twelve months. Each European sector is represented by an index of equity securities of companies in the relevant sector. Information on the sector constituents as of March 31, 2020, is available on the Barclays Capital, Inc. website at https://indices.barclays/IM/12/en/indices/details.app;ticker=BXIIESAE. |
| | | | | | | | | | | | | | | | | | | | | | | | |
|
| Forward Currency Exchange Contracts | |
Settlement
Date | | Counterparty | | Currency to be Delivered | | Value | | | Currency to be Received | | Value | | Unrealized
Appreciation
(Depreciation) | |
| 06/19/2020 | | Barclays Capital, Inc. | | | 10,900,000 | | | EUR | | $ | 12,058,722 | | | | 12,172,030 | | | USD | | $12,172,030 | | $ | 113,308 | |
| 06/19/2020 | | Barclays Capital, Inc. | | | 1,915,953 | | | USD | | | 1,915,953 | | | | 1,700,000 | | | EUR | | 1,880,718 | | | (35,235 | ) |
| 06/19/2020 | | JP Morgan Securities LLC | | | 3,700,000 | | | EUR | | | 4,093,328 | | | | 4,026,963 | | | USD | | 4,026,963 | | | (66,365 | ) |
| 06/19/2020 | | JP Morgan Securities LLC | | | 12,115,415 | | | USD | | | 12,115,415 | | | | 10,800,000 | | | EUR | | 11,948,092 | | | (167,323 | ) |
| 06/19/2020 | | Goldman Sachs | | | 51,903,787 | | | USD | | | 51,903,787 | | | | 46,100,000 | | | EUR | | 51,000,653 | | | (903,134 | ) |
| | | | | | | | | | | | | | | | | | | | | | | | |
| | | | | | | | | | $ | 82,087,205 | | | | | | | | | $81,028,456 | | $ | (1,058,749 | ) |
| | | | | | | | | | | | | | | | | | | | | | | | |
A summary of the DoubleLine Shiller Enhanced International CAPE®’s investments in affiliated mutual funds for the year ended March 31, 2020 is as follows:
| | | | | | | | | | | | | | | | | | | | | | | | | | | | | | | | | | | | | | | | |
| Fund | | Value at
March 31,
2019 | | Gross
Purchases | | Gross
Sales | | Shares Held at
March 31,
2020 | | Value at
March 31,
2020 | | Change in
Unrealized for the
Year Ended
March 31,
2020 | | Dividend Income
Earned in the
Year Ended
March 31,
2020 | | Net Realized
Gain (Loss) in
the Year Ended
March 31,
2020 |
DoubleLine Floating Rate Fund (Class I) | | | $ | 5,908,672 | | | | $ | — | | | | $ | (3,200,000 | ) | | | | 281,035 | | | | $ | 2,371,933 | | | | $ | (257,236 | ) | | | $ | 178,949 | | | | $ | (79,503 | ) |
| | | | | | |
| 90 | | DoubleLine Funds Trust | | | | The accompanying notes are an integral part of these financial statements. |
| | |
| Schedule of Investments DoubleLine Colony Real Estate and Income Fund | | March 31, 2020 |
| | | | | | | | | | | | | | | | |
PRINCIPAL
AMOUNT $ | | | SECURITY DESCRIPTION | | RATE | | | MATURITY | | | VALUE $ | |
| | ASSET BACKED OBLIGATIONS 7.9% | |
| |
| | | | AASET Ltd., | |
| | 584,234 | | | Series 2018-1A-A | | | 3.84% | ^ | | | 01/16/2038 | | | | 477,819 | |
| |
| | | | Castlelake Aircraft Securitization Trust, | |
| | 867,960 | | | Series 2019-1A-A | | | 3.97% | ^ | | | 04/15/2039 | | | | 615,547 | |
| |
| | | | Consumer Loan Underlying Bond Credit Trust, | |
| | 211,609 | | | Series 2018-P1-A | | | 3.39% | ^ | | | 07/15/2025 | | | | 209,885 | |
| | 346,691 | | | Series 2019-P2-A | | | 2.47% | ^ | | | 10/15/2026 | | | | 327,190 | |
| |
| | | | CPS Auto Receivables Trust, | |
| | 371,573 | | | Series 2019-B-A | | | 2.89% | ^ | | | 05/16/2022 | | | | 370,180 | |
| |
| | | | DRB Prime Student Loan Trust, | |
| | 370,163 | | | Series 2015-D-A2 | | | 3.20% | ^ | | | 01/25/2040 | | | | 376,174 | |
| |
| | | | Foundation Finance Trust, | |
| | 341,542 | | | Series 2019-1A-A | | | 3.86% | ^ | | | 11/15/2034 | | | | 326,994 | |
| |
| | | | GAIA Aviation Ltd., | |
| | 428,262 | | | Series 2019-1-A | | | 3.97% | ^§ | | | 12/15/2044 | | | | 287,964 | |
| |
| | | | Kabbage Funding LLC, | |
| | 500,000 | | | Series 2019-1-A | | | 3.83% | ^ | | | 03/15/2024 | | | | 487,323 | |
| |
| | | | Marlette Funding Trust, | |
| | 397,178 | | | Series 2019-4A-A | | | 2.39% | ^ | | | 12/17/2029 | | | | 383,764 | |
| |
| | | | Oxford Finance Funding LLC, | |
| | 500,000 | | | Series 2020-1A-A2 | | | 3.10% | ^ | | | 02/15/2028 | | | | 482,819 | |
| |
| | | | Prosper Marketplace Issuance Trust, | |
| | 361,957 | | | Series 2019-4A-A | | | 2.48% | ^ | | | 02/17/2026 | | | | 344,485 | |
| |
| | | | SoFi Consumer Loan Program Trust, | |
| | 443,431 | | | Series 2019-1-A | | | 3.24% | ^ | | | 02/25/2028 | | | | 430,371 | |
| |
| | | | Stack Infrastructure Issuer LLC, | |
| | 247,292 | | | Series 2019-1A-A2 | | | 4.54% | ^ | | | 02/25/2044 | | | | 248,433 | |
| |
| | | | START Ireland, | |
| | 464,286 | | | Series 2019-1-A | | | 4.09% | ^ | | | 03/15/2044 | | | | 316,559 | |
| |
| | | | Textainer Marine Containers Ltd., | |
| | 695,000 | | | Series 2019-1A-A | | | 3.96% | ^ | | | 04/20/2044 | | | | 654,647 | |
| |
| | | | Upgrade Receivables Trust, | |
| | 220,632 | | | Series 2019-1A-A | | | 3.48% | ^ | | | 03/15/2025 | | | | 218,958 | |
| |
| | | | Upstart Securitization Trust, | |
| | 524,094 | | | Series 2019-2-A | | | 2.90% | ^ | | | 09/20/2029 | | | | 486,556 | |
| | 750,000 | | | Series 2020-1-A | | | 2.32% | ^ | | | 04/22/2030 | | | | 708,531 | |
| | | | | | | | | | | | | | | | |
| | | | Total Asset Backed Obligations
(Cost $8,628,494) | | | | 7,754,199 | |
| | | | | | | | | | | | | | | | |
| | BANK LOANS 2.5% | |
| |
| | | | Access CIG LLC, | |
| | 24,873 | | | Senior Secured First Lien Term Loan (1 Month LIBOR USD + 3.75%) | | | 5.53% | | | | 02/27/2025 | | | | 20,489 | |
| |
| | | | Air Methods Corporation, | |
| | 34,910 | | | Senior Secured First Lien Term Loan (3 Month LIBOR USD + 3.50%, 1.00% Floor) | | | 4.95% | | | | 04/22/2024 | | | | 24,941 | |
| |
| | | | Aldevron LLC, | |
| | 60,000 | | | Senior Secured First Lien Term Loan (1 Month LIBOR USD + 4.25%, 1.00% Floor) | | | 5.70% | | | | 10/13/2026 | | | | 56,700 | |
| |
| | | | AlixPartners LLP, | |
| | 109,436 | | | Senior Secured First Lien Term Loan (1 Month LIBOR USD + 2.75%, 1.00% Floor) | | | 3.50% | | | | 04/04/2024 | | | | 105,332 | |
| |
| | | | Allied Universal Holdco LLC, | |
| | 49,886 | | | Senior Secured First Lien Term Loan (6 Month LIBOR USD + 4.25%) | | | 5.24% | | | | 07/10/2026 | | | | 46,394 | |
| | | | | | | | | | | | | | | | |
PRINCIPAL
AMOUNT $ | | | SECURITY DESCRIPTION | | RATE | | | MATURITY | | | VALUE $ | |
| |
| | | | Almonde, Inc., | |
| | 10,000 | | | Senior Secured Second Lien Term Loan (6 Month LIBOR USD + 7.25%, 1.00% Floor) | | | 9.03% | | | | 06/16/2025 | | | | 7,680 | |
| |
| | | | American Airlines, Inc., | |
| | 109,214 | | | Senior Secured First Lien Term Loan (1 Month LIBOR USD + 2.00%) | | | 2.70% | | | | 12/15/2023 | | | | 88,409 | |
| |
| | | | American Tire Distributors, Inc., | |
| | | | Senior Secured First Lien Term Loan | |
| | 13,252 | | | (1 Month LIBOR USD + 7.50%, 1.00% Floor, 8.00% PIK) | | | 8.50% | | | | 09/02/2024 | | | | 8,945 | |
| | 1,673 | | | (3 Month LIBOR USD + 7.50%, 1.00% Floor, 8.00% PIK) | | | 8.95% | | | | 09/02/2024 | | | | 1,129 | |
| |
| | | | Avaya, Inc., | |
| | 20,000 | | | Senior Secured First Lien Term Loan (1 Month LIBOR USD + 4.25%) | | | 4.95% | | | | 12/16/2024 | | | | 17,250 | |
| |
| | | | Blackhawk Network Holdings, Inc., | |
| | 63,606 | | | Senior Secured First Lien Term Loan (1 Month LIBOR USD + 3.00%) | | | 3.99% | | | | 06/16/2025 | | | | 52,657 | |
| |
| | | | Blackstone CQP Holdco LP, | |
| | 44,887 | | | Senior Secured First Lien Term Loan (3 Month LIBOR USD + 3.50%) | | | 4.62% | | | | 09/30/2024 | | | | 35,842 | |
| |
| | | | Brand Energy & Infrastructure Services, Inc., | |
| | | | Senior Secured First Lien Term Loan | |
| | 6,896 | | | (3 Month LIBOR USD + 4.25%, 1.00% Floor) | | | 5.64% | | | | 06/21/2024 | | | | 5,593 | |
| | 115 | | | (3 Month LIBOR USD + 4.25%, 1.00% Floor) | | | 5.70% | | | | 06/21/2024 | | | | 93 | |
| | 7,951 | | | (3 Month LIBOR USD + 4.25%, 1.00% Floor) | | | 6.06% | | | | 06/21/2024 | | | | 6,449 | |
| |
| | | | Buckeye Partners LP, | |
| | 40,000 | | | Senior Secured First Lien Term Loan (1 Month LIBOR USD + 2.75%) | | | 3.77% | | | | 11/02/2026 | | | | 37,020 | |
| |
| | | | Calpine Corporation, | |
| | 402 | | | Senior Secured First Lien Term Loan (3 Month LIBOR USD + 2.75%) | | | 3.24% | | | | 04/06/2026 | | | | 385 | |
| |
| | | | Cengage Learning, Inc., | |
| | 24,871 | | | Senior Secured First Lien Term Loan (1 Month LIBOR USD + 4.25%, 1.00% Floor) | | | 5.25% | | | | 06/07/2023 | | | | 20,394 | |
| |
| | | | Charter NEX US, Inc., | |
| | 30,000 | | | Senior Secured First Lien Term Loan (1 Month LIBOR USD + 3.50%) | | | 4.49% | | | | 05/16/2024 | | | | 26,450 | |
| |
| | | | Clear Channel Outdoor Holdings, Inc., | |
| | 4,975 | | | Senior Secured First Lien Term Loan (1 Month LIBOR USD + 3.50%) | | | 4.49% | | | | 08/21/2026 | | | | 4,229 | |
| |
| | | | ClubCorporationHoldings, Inc., | |
| | 19,949 | | | Senior Secured First Lien Term Loan (3 Month LIBOR USD + 2.75%) | | | 4.20% | | | | 09/18/2024 | | | | 12,777 | |
| |
| | | | CSC Holdings LLC, | |
| | 103,944 | | | Senior Secured First Lien Term Loan (1 Month LIBOR USD + 2.50%) | | | 3.11% | | | | 04/15/2027 | | | | 100,652 | |
| |
| | | | Cvent, Inc., | |
| | 59,847 | | | Senior Secured First Lien Term Loan (1 Month LIBOR USD + 3.75%, 1.00% Floor) | | | 4.75% | | | | 11/29/2024 | | | | 43,589 | |
| | | | | | |
| The accompanying notes are an integral part of these financial statements. | | Annual Report | | March 31, 2020 | | 91 |
| | |
| Schedule of Investments DoubleLine Colony Real Estate and Income Fund (Cont.) | | March 31, 2020 |
| | | | | | | | | | | | | | | | |
PRINCIPAL
AMOUNT $ | | | SECURITY DESCRIPTION | | RATE | | | MATURITY | | | VALUE $ | |
| |
| | | | Deerfield Holdings Corporation, | |
| | 45,000 | | | Senior Secured First Lien Term Loan | | | 4.75% | ± | | | 02/25/2027 | | | | 38,700 | |
| | 24,873 | | | Senior Secured First Lien Term Loan (1 Month LIBOR USD + 3.25%, 1.00% Floor) | | | 4.25% | | | | 02/13/2025 | | | | 24,562 | |
| |
| | | | Diamond B.V., | |
| | 19,898 | | | Senior Secured First Lien Term Loan (3 Month LIBOR USD + 3.00%) | | | 4.78% | | | | 09/06/2024 | | | | 15,189 | |
| |
| | | | EG America LLC, | |
| | 14,619 | | | Senior Secured First Lien Term Loan (3 Month LIBOR USD + 4.00%) | | | 5.07% | | | | 02/06/2025 | | | | 10,876 | |
| |
| | | | Envision Healthcare Corporation, | |
| | 24,937 | | | Senior Secured First Lien Term Loan (1 Month LIBOR USD + 3.75%) | | | 4.74% | | | | 10/10/2025 | | | | 13,362 | |
| |
| | | | Equinox Holdings, Inc., | |
| | 29,760 | | | Senior Secured First Lien Term Loan (1 Month LIBOR USD + 3.00%, 1.00% Floor) | | | 4.07% | | | | 03/08/2024 | | | | 22,106 | |
| |
| | | | Filtration Group Corporation, | |
| | 108,416 | | | Senior Secured First Lien Term Loan (1 Month LIBOR USD + 3.00%) | | | 3.99% | | | | 03/31/2025 | | | | 95,813 | |
| |
| | | | Flex Acquisition Company Inc, | |
| | 45,000 | | | Senior Secured First Lien Term Loan (3 Month LIBOR USD + 3.00%, 1.00% Floor) | | | 4.43% | | | | 12/29/2023 | | | | 41,400 | |
| |
| | | | Flexential Intermediate Corporation, | |
| | 14,962 | | | Senior Secured First Lien Term Loan (3 Month LIBOR USD + 3.50%) | | | 4.95% | | | | 08/01/2024 | | | | 10,754 | |
| |
| | | | Froneri US, Inc., | |
| | 35,000 | | | Senior Secured First Lien Term Loan (1 Month LIBOR USD + 2.25%) | | | 3.24% | | | | 01/29/2027 | | | | 33,600 | |
| |
| | | | Genesee & Wyoming, Inc., | |
| | 40,000 | | | Senior Secured First Lien Term Loan (1 Month LIBOR USD + 2.00%) | | | 3.45% | | | | 12/30/2026 | | | | 38,600 | |
| |
| | | | Getty Images, Inc., | |
| | 19,736 | | | Senior Secured First Lien Term Loan (1 Month LIBOR USD + 4.50%) | | | 5.50% | | | | 02/19/2026 | | | | 16,035 | |
| |
| | | | Golden Nugget, Inc., | |
| | | | Senior Secured First Lien Term Loan | |
| | 70,871 | | | (1 Month LIBOR USD + 2.50%, 0.75% Floor) | | | 4.10% | | | | 10/04/2023 | | | | 55,634 | |
| | 60,493 | | | (3 Month LIBOR USD + 2.50%, 0.75% Floor) | | | 3.70% | | | | 10/04/2023 | | | | 47,487 | |
| |
| | | | GrafTech Finance, Inc., | |
| | 26,737 | | | Senior Secured First Lien Term Loan (1 Month LIBOR USD + 3.50%, 1.00% Floor) | | | 4.50% | | | | 02/12/2025 | | | | 23,395 | |
| | | | |
| | | | H-Food Holdings, LLC, | | | | | | | | | | | | |
| | 29,886 | | | Senior Secured First Lien Term Loan (1 Month LIBOR USD + 3.69%) | | | 4.68% | | | | 05/23/2025 | | | | 25,353 | |
| |
| | | | Hyland Software, Inc., | |
| | 89,495 | | | Senior Secured First Lien Term Loan (1 Month LIBOR USD + 3.50%, 0.75% Floor) | | | 4.85% | | | | 07/01/2024 | | | | 84,014 | |
| | | | | | | | | | | | | | | | |
PRINCIPAL
AMOUNT $ | | | SECURITY DESCRIPTION | | RATE | | | MATURITY | | | VALUE $ | |
| |
| | | | Intelsat Jackson Holdings S.A., | |
| | 45,000 | | | Senior Secured First Lien Term Loan (1 Month LIBOR USD + 3.75%, 1.00% Floor) | | | 5.68% | | | | 11/27/2023 | | | | 41,709 | |
| |
| | | | ION Trading Technologies SARL, | |
| | 9,949 | | | Senior Secured First Lien Term Loan (3 Month LIBOR USD + 4.00%, 1.00% Floor) | | | 5.07% | | | | 11/21/2024 | | | | 8,291 | |
| |
| | | | IRB Holding Corporation, | |
| | | | Senior Secured First Lien Term Loan | | | | | | | | | |
| | 154 | | | (3 Month LIBOR USD + 2.75%, 1.00% Floor) | | | 3.75% | | | | 02/05/2025 | | | | 121 | |
| | 59,238 | | | (6 Month LIBOR USD + 2.75%, 1.00% Floor) | | | 3.75% | | | | 02/05/2025 | | | | 46,382 | |
| | | | |
| | | | Kestrel Bidco, Inc., | | | | | | | | | | | | |
| | 49,875 | | | Senior Secured First Lien Term Loan (3 Month LIBOR USD + 3.00%, 1.00% Floor) | | | 4.00% | | | | 12/11/2026 | | | | 39,235 | |
| |
| | | | Klockner-Pentaplast of America, Inc., | |
| | 14,962 | | | Senior Secured First Lien Term Loan (1 Month LIBOR USD + 4.25%, 1.00% Floor) | | | 5.25% | | | | 06/30/2022 | | | | 10,594 | |
| |
| | | | Kronos Acquisition Holdings, Inc., | |
| | 30,000 | | | Senior Secured First Lien Term Loan (3 Month LIBOR USD + 4.00%, 1.00% Floor) | | | 5.00% | | | | 05/15/2023 | | | | 27,138 | |
| |
| | | | Mavis Tire Express Services Corporation, | |
| | 19,909 | | | Senior Secured First Lien Term Loan (1 Month LIBOR USD + 3.25%) | | | 4.70% | | | | 03/20/2025 | | | | 16,151 | |
| |
| | | | Mister Car Wash Holdings, Inc., | |
| | 477 | | | Senior Secured First Lien Term Loan | | | 5.19% | ± | | | 05/14/2026 | | | | 401 | |
| | 39,422 | | | Senior Secured First Lien Term Loan (3 Month LIBOR USD + 3.50%) | | | 3.86% | | | | 05/14/2026 | | | | 33,087 | |
| |
| | | | MLN US HoldCo LLC, | |
| | 14,849 | | | Senior Secured First Lien Term Loan (1 Month LIBOR USD + 4.50%) | | | 5.49% | | | | 11/28/2025 | | | | 10,617 | |
| |
| | | | Panther BF Aggregator LP, | |
| | 24,875 | | | Senior Secured First Lien Term Loan (1 Month LIBOR USD + 3.50%) | | | 4.44% | | | | 04/30/2026 | | | | 22,885 | |
| |
| | | | Parexel International Corporation, | |
| | 60,000 | | | Senior Secured First Lien Term Loan (1 Month LIBOR USD + 2.75%) | | | 3.74% | | | | 09/27/2024 | | | | 51,825 | |
| |
| | | | RegionalCare Hospital Partners Holdings, Inc., | |
| | 7,577 | | | Senior Secured First Lien Term Loan (1 Month LIBOR USD + 4.50%) | | | 4.74% | | | | 11/14/2025 | | | | 7,075 | |
| |
| | | | RPI Intermediate Finance Trust, | |
| | 29,625 | | | Senior Secured First Lien Term Loan (1 Month LIBOR USD + 1.75%) | | | 2.74% | | | | 02/11/2027 | | | | 27,811 | |
| | 29,925 | | | Senior Secured First Lien Term Loan (1 Month LIBOR USD + 1.75%) | | | 2.74% | | | | 02/11/2027 | | | | 27,980 | |
| |
| | | | Sedgwick Claims Management Services, Inc., | |
| | 59,550 | | | Senior Secured First Lien Term Loan (1 Month LIBOR USD + 4.00%) | | | 4.99% | | | | 09/03/2026 | | | | 54,377 | |
| |
| | | | Solenis International LP, Senior | |
| | 45,000 | | | Secured First Lien Term Loan (3 Month LIBOR USD + 4.00%) | | | 5.61% | | | | 06/26/2025 | | | | 36,300 | |
| | | | | | |
| 92 | | DoubleLine Funds Trust | | | | The accompanying notes are an integral part of these financial statements. |
| | | | | | | | | | | | | | | | |
PRINCIPAL
AMOUNT $ | | | SECURITY DESCRIPTION | | RATE | | | MATURITY | | | VALUE $ | |
| |
| | | | Sophia LP, | |
| | 99,798 | | | Senior Secured First Lien Term Loan (3 Month LIBOR USD + 3.25%, 1.00% Floor) | | | 4.70% | | | | 09/30/2022 | | | | 95,806 | |
| |
| | | | Sotera Health Holdings LLC, | |
| | 60,000 | | | Senior Secured First Lien Term Loan (1 Month LIBOR USD + 4.50%, 1.00% Floor) | | | 5.50% | | | | 12/11/2026 | | | | 53,006 | |
| |
| | | | Surf Holdings LLC, | |
| | 60,000 | | | Senior Secured First Lien Term Loan (3 Month LIBOR USD + 3.50%) | | | 4.81% | | | | 03/05/2027 | | | | 53,850 | |
| |
| | | | Team Health Holdings, Inc., | |
| | 14,961 | | | Senior Secured First Lien Term Loan (1 Month LIBOR USD + 2.75%, 1.00% Floor) | | | 3.75% | | | | 02/06/2024 | | | | 9,650 | |
| |
| | | | TIBCO Software Inc, | |
| | 24,975 | | | Senior Secured First Lien Term Loan (1 Month LIBOR USD + 3.75%) | | | 4.74% | | | | 06/30/2026 | | | | 23,726 | |
| |
| | | | Titan Acquisition Ltd., | |
| | 24,936 | | | Senior Secured First Lien Term Loan (1 Month LIBOR USD + 3.00%) | | | 4.45% | | | | 03/28/2025 | | | | 20,752 | |
| |
| | | | TKC Holdings, Inc., | |
| | 64,831 | | | Senior Secured First Lien Term Loan (1 Month LIBOR USD + 3.75%, 1.00% Floor) | | | 4.75% | | | | 02/01/2023 | | | | 52,983 | |
| |
| | | | Trans Union LLC, | |
| | 102,860 | | | Senior Secured First Lien Term Loan (1 Month LIBOR USD + 1.75%) | | | 2.74% | | | | 11/13/2026 | | | | 99,157 | |
| |
| | | | TransDigm, Inc., | |
| | 106,147 | | | Senior Secured First Lien Term Loan (1 Month LIBOR USD + 2.25%) | | | 3.24% | | | | 12/09/2025 | | | | 97,832 | |
| |
| | | | Travelport Finance SARL, | |
| | 19,900 | | | Senior Secured First Lien Term Loan (3 Month LIBOR USD + 5.00%) | | | 6.07% | | | | 05/29/2026 | | | | 13,054 | |
| |
| | | | United Natural Foods, Inc., | |
| | 14,962 | | | Senior Secured First Lien Term Loan (1 Month LIBOR USD + 4.25%) | | | 5.24% | | | | 10/22/2025 | | | | 12,961 | |
| |
| | | | Vertafore, Inc., | |
| | 34,761 | | | Senior Secured First Lien Term Loan (1 Month LIBOR USD + 3.25%) | | | 4.24% | | | | 07/02/2025 | | | | 31,010 | |
| |
| | | | Vistra Operations Company LLC, | |
| | 3,185 | | | Senior Secured First Lien Term Loan (1 Month LIBOR USD + 1.75%) | | | 2.55% | | | | 12/31/2025 | | | | 3,043 | |
| |
| | | | Web.Com Group, Inc., | |
| | 25,000 | | | Senior Secured First Lien Term Loan (1 Month LIBOR USD + 3.75%) | | | 4.95% | | | | 10/10/2025 | | | | 20,750 | |
| |
| | | | WP CPP Holdings LLC, | |
| | | | Senior Secured First Lien Term Loan | | | | | | | | | | | | |
| | 144 | | | (1 Month LIBOR USD + 3.75%, 1.00% Floor) | | | 5.36% | | | | 04/30/2025 | | | | 110 | |
| | 59,704 | | | (3 Month LIBOR USD + 3.75%, 1.00% Floor) | | | 5.53% | | | | 04/30/2025 | | | | 45,525 | |
| | | | | | | | | | | | | | | | |
| | | | Total Bank Loans
(Cost $2,763,067) | | | | | | | | 2,415,473 | |
| | | | | | | | | | | | | | | | |
| | | | | | | | | | | | | | | | |
PRINCIPAL
AMOUNT $ | | | SECURITY DESCRIPTION | | RATE | | | MATURITY | | | VALUE $ | |
| | COLLATERALIZED LOAN OBLIGATIONS 13.2% | |
| |
| | | | CarVal Ltd., | |
| | 500,000 | | | Series2019-2A-A (3 Month LIBOR USD + 1.35%, 1.35% Floor) | | | 3.17% | ^ | | | 07/20/2032 | | | | 455,769 | |
| |
| | | | CBAM Ltd., | |
| | 500,000 | | | Series2019-10A-B (3 Month LIBOR USD + 2.05%, 2.05% Floor) | | | 3.87% | ^ | | | 04/20/2032 | | | | 444,934 | |
| |
| | | | Cedar Funding Ltd., | |
| | 450,000 | | | Series2017-8A-A1 (3 Month LIBOR USD + 1.25%) | | | 3.09% | ^ | | | 10/17/2030 | | | | 430,102 | |
| |
| | | | CFIP Ltd., | |
| | 1,000,000 | | | Series2013-1A-AR (3 Month LIBOR USD + 1.34%) | | | 3.16% | ^ | | | 04/20/2029 | | | | 955,839 | |
| |
| | | | Halcyon Loan Advisors Funding Ltd., | |
| | 1,000,000 | | | Series2017-1A-A1B (3 Month LIBOR USD + 1.28%) | | | 3.07% | ^ | | | 06/25/2029 | | | | 937,202 | |
| |
| | | | KVK Ltd., | |
| | 1,000,000 | | | Series2013-1A-AR (3 Month LIBOR USD + 0.90%) | | | 2.74% | ^ | | | 01/14/2028 | | | | 976,665 | |
| |
| | | | LCM LP, | |
| | 500,000 | | | Series19A-AR (3 Month LIBOR USD + 1.24%, 1.24% Floor) | | | 3.07% | ^ | | | 07/15/2027 | | | | 490,081 | |
| |
| | | | Marble Point Ltd., | |
| | 500,000 | | | Series2020-1A-A (3 Month LIBOR USD + 13.00%, 1.30% Floor) | | | 2.20% | ^ | | | 04/20/2033 | | | | 455,879 | |
| |
| | | | Midocean Credit Partners, | |
| | 1,000,000 | | | Series2018-8A-A1 (3 Month LIBOR USD + 1.15%) | | | 2.84% | ^ | | | 02/20/2031 | | | | 923,948 | |
| |
| | | | MP Ltd., | |
| | 1,000,000 | | | Series2013-2A-ARR (3 Month LIBOR USD + 1.28%) | | | 3.07% | ^ | | | 07/25/2029 | | | | 967,736 | |
| |
| | | | OFSI Fund Ltd., | |
| | 259,913 | | | Series2014-7A-AR (3 Month LIBOR USD + 0.90%) | | | 2.72% | ^ | | | 10/18/2026 | | | | 259,779 | |
| | 1,000,000 | | | Series2018-1A-A (3 Month LIBOR USD + 1.15%, 1.15% Floor) | | | 2.98% | ^ | | | 07/15/2031 | | | | 946,198 | |
| |
| | | | Shackleton Ltd., | |
| | 775,000 | | | Series2015-7RA-A1 (3 Month LIBOR USD + 1.17%) | | | 3.00% | ^ | | | 07/15/2031 | | | | 715,494 | |
| |
| | | | Steele Creek Ltd., | |
| | 400,000 | | | Series2017-1A-A (3 Month LIBOR USD + 12.50%) | | | 3.08% | ^ | | | 01/15/2030 | | | | 380,657 | |
| | 900,000 | | | Series2019-1A-B (3 Month LIBOR USD + 2.20%, 2.20% Floor) | | | 4.03% | ^ | | | 04/15/2032 | | | | 792,961 | |
| |
| | | | Wellfleet Ltd., | |
| | 500,000 | | | Series2020-1A-A1A (3 Month LIBOR USD + 13.10%, 1.31% Floor) | | | 0.01% | ^ | | | 04/15/2033 | | | | 462,766 | |
| |
| | | | Wind River Ltd., | |
| | 1,000,000 | | | Series2013-2A-AR (3 Month LIBOR USD + 1.23%) | | | 3.05% | ^ | | | 10/18/2030 | | | | 930,901 | |
| | | | | | |
| The accompanying notes are an integral part of these financial statements. | | Annual Report | �� | March 31, 2020 | | 93 |
| | |
| Schedule of Investments DoubleLine Colony Real Estate and Income Fund (Cont.) | | March 31, 2020 |
| | | | | | | | | | | | | | | | |
PRINCIPAL
AMOUNT $ | | | SECURITY DESCRIPTION | | RATE | | | MATURITY | | | VALUE $ | |
| |
| | | | Wind River Ltd., (Cont.) | |
| | 1,000,000 | | | Series2014-2A-AR (3 Month LIBOR USD + 1.14%, 1.14% Floor) | | | 2.97% | ^ | | | 01/15/2031 | | | | 944,061 | |
| | 500,000 | | | Series2019-3A-B (3 Month LIBOR USD + 2.10%) | | | 3.93% | ^ | | | 04/15/2031 | | | | 436,390 | |
| | | | | | | | | | | | | | | | |
| | | | Total Collateralized Loan Obligations
(Cost $13,716,236) | | | | 12,907,362 | |
| | | | | | | | | | | | | | | | |
| | FOREIGN CORPORATE BONDS 5.0% | |
| | 200,000 | | | Adani Ports & Special Economic Zone Ltd. | | | 3.95% | | | | 01/19/2022 | | | | 184,996 | |
| | 200,000 | | | AES Gener S.A. (5 Year Swap Rate USD + 4.64%) | | | 7.13% | ^ | | | 03/26/2079 | | | | 157,625 | |
| | 25,000 | | | AstraZeneca PLC | | | 2.38% | | | | 06/12/2022 | | | | 25,206 | |
| | 225,000 | | | Avolon Holdings Funding Ltd. | | | 3.63% | ^ | | | 05/01/2022 | | | | 199,697 | |
| | 200,000 | | | Axiata SPV2 BHD | | | 3.47% | | | | 11/19/2020 | | | | 200,343 | |
| | 150,000 | | | Banco de Reservas de la Republica Dominicana | | | 7.00% | | | | 02/01/2023 | | | | 143,625 | |
| | 200,000 | | | Banco Nacional de Comercio Exterior S.N.C. (5 Year CMT Rate + 3.00%) | | | 3.80% | | | | 08/11/2026 | | | | 182,360 | |
| | 200,000 | | | BBVA Bancomer S.A. (5 Year CMT Rate + 3.00%) | | | 5.35% | | | | 11/12/2029 | | | | 183,708 | |
| | 200,000 | | | Cemex S.A.B. de C.V. | | | 6.13% | | | | 05/05/2025 | | | | 178,749 | |
| | 200,000 | | | CNAC HK Finbridge Company Ltd., | | | 3.50% | | | | 07/19/2022 | | | | 198,802 | |
| | 200,000 | | | DBS Group Holdings Ltd. (3 Month LIBOR USD + 0.49%) | | | 1.49% | | | | 06/08/2020 | | | | 199,661 | |
| | 114,061 | | | ENA Norte Trust | | | 4.95% | | | | 04/25/2023 | | | | 113,919 | |
| | 150,000 | | | Freeport-McMoRan, Inc. | | | 3.55% | | | | 03/01/2022 | | | | 144,699 | |
| | 200,000 | | | GrupoSura Finance S.A. | | | 5.70% | | | | 05/18/2021 | | | | 200,942 | |
| | 200,000 | | | HPHT Finance Ltd. | | | 2.88% | | | | 11/05/2024 | | | | 207,534 | |
| | 53,325 | | | Interoceanica Finance Ltd. | | | 0.00% | | | | 11/30/2025 | | | | 48,393 | |
| | 175,000 | | | Macquarie Bank Ltd. | | | 2.10% | ^ | | | 10/17/2022 | | | | 174,011 | |
| | 200,000 | | | Malayan Banking BHD (5 Year Swap Rate USD + 2.54%) | | | 3.91% | | | | 10/29/2026 | | | | 203,400 | |
| | 200,000 | | | MARB BondCo PLC | | | 7.00% | | | | 03/15/2024 | | | | 179,749 | |
| | 200,000 | | | Oleoducto Central S.A. | | | 4.00% | | | | 05/07/2021 | | | | 191,740 | |
| | 200,000 | | | ONGC Videsh Ltd. | | | 2.88% | | | | 01/27/2022 | | | | 195,678 | |
| | 126,824 | | | Panama Metro Line SP | | | 0.00% | | | | 12/05/2022 | | | | 117,748 | |
| | 340,000 | | | Sumitomo Mitsui Financial Group, Inc. | | | 2.06% | | | | 07/14/2021 | | | | 337,468 | |
| | 200,000 | | | Tecnoglass, Inc. | | | 8.20% | | | | 01/31/2022 | | | | 169,675 | |
| | 200,000 | | | Toronto-Dominion Bank (Secured Overnight Financing Rate + 4.80%) | | | 1.36% | | | | 01/27/2023 | | | | 187,421 | |
| | 200,000 | | | United Overseas Bank Ltd. (5 Year Swap Rate USD + 1.65%) | | | 2.88% | | | | 03/08/2027 | | | | 197,218 | |
| | 200,000 | | | UPL Corporation | | | 3.25% | | | | 10/13/2021 | | | | 184,995 | |
| | 200,000 | | | VTR Finance B.V. | | | 6.88% | | | | 01/15/2024 | | | | 187,000 | |
| | | | | | | | | | | | | | | | |
| | | | Total Foreign Corporate Bonds
(Cost $5,176,830) | | | | 4,896,362 | |
| | | | | | | | | | | | | |
| FOREIGN GOVERNMENT BONDS, FOREIGN AGENCIES AND FOREIGN
GOVERNMENT SPONSORED CORPORATIONS 0.3% |
|
| | 250,000 | | | Wakala Global Sukuk BHD | | | 4.65% | | | | 07/06/2021 | | | | 257,621 | |
| | | | | | | | | | | | | | | | |
| | | | Total Foreign Government Bonds, Foreign Agencies and Foreign Government Sponsored Corporations
(Cost $257,551) | | | | 257,621 | |
| | | | | | | | | | | | | |
| | | | | | | | | | | | | | | | |
PRINCIPAL
AMOUNT $ | | | SECURITY DESCRIPTION | | RATE | | | MATURITY | | | VALUE $ | |
| NON-AGENCY COMMERCIAL MORTGAGE BACKED
OBLIGATIONS 11.9% |
|
| |
| | | | Atrium Hotel Portfolio Trust, | |
| | 1,000,000 | | | Series2018-ATRM-E (1 Month LIBOR USD + 3.40%, 3.40% Floor) | | | 4.10% | ^ | | | 06/15/2035 | | | | 755,562 | |
| |
| | | | BBCMS Mortgage Trust, | |
| | 264,000 | | | Series2015-MSQ-D | | | 3.99% | #^ | | | 09/15/2032 | | | | 254,251 | |
| | 1,000,000 | | | Series2018-CBM-D (1 Month LIBOR USD + 2.39%, 2.39% Floor) | | | 3.10% | ^ | | | 07/15/2037 | | | | 924,105 | |
| | 186,000 | | | Series2019-BWAY-E (1 Month LIBOR USD + 2.85%, 2.85% Floor) | | | 3.55% | ^ | | | 11/25/2034 | | | | 179,370 | |
| |
| | | | BFLD, | |
| | 265,000 | | | Series2019-DPLO-F (1 Month LIBOR USD + 2.54%, 2.54% Floor) | | | 3.24% | ^ | | | 10/15/2034 | | | | 159,000 | |
| |
| | | | BHP Trust, | |
| | 261,000 | | | Series2019-BXHP-D (1 Month LIBOR USD + 1.77%, 1.77% Floor) | | | 2.48% | ^ | | | 08/15/2036 | | | | 218,925 | |
| |
| | | | BX Commercial Mortgage Trust, | |
| | 680,540 | | | Series2018-EXCL-C (1 Month LIBOR USD + 1.98%, 1.98% Floor) | | | 2.68% | ^ | | | 09/15/2037 | | | | 497,309 | |
| | 250,000 | | | Series2019-IMC-D (1 Month LIBOR USD + 1.90%, 1.90% Floor) | | | 2.60% | ^ | | | 04/15/2034 | | | | 224,131 | |
| |
| | | | BX Trust, | |
| | 162,000 | | | Series2019-MMP-E (1 Month LIBOR USD + 1.90%, 1.90% Floor) | | | 2.60% | ^ | | | 08/15/2036 | | | | 156,853 | |
| |
| | | | BXP Trust, | |
| | 750,000 | | | Series2017-CQHP-E (1 Month LIBOR USD + 3.00%, 3.00% Floor) | | | 3.70% | ^ | | | 11/15/2034 | | | | 632,178 | |
| |
| | | | Carbon Capital Commercial Mortgage Trust, | |
| | 244,000 | | | Series2019-FL2-B (1 Month LIBOR USD + 2.85%, 2.85% Floor) | | | 3.55% | ^ | | | 10/15/2035 | | | | 211,438 | |
| |
| | | | CHT Mortgage Trust, | |
| | 750,000 | | | Series2017-CSMO-E (1 Month LIBOR USD + 3.00%, 3.00% Floor) | | | 3.70% | ^ | | | 11/15/2036 | | | | 596,842 | |
| |
| | | | CLNC Ltd., | |
| | 277,000 | | | Series2019-FL1-D (1 Month LIBOR USD + 2.90%, 2.90% Floor) | | | 3.65% | ^ | | | 08/20/2035 | | | | 201,546 | |
| |
| | | | CSAIL Commercial Mortgage Trust, | |
| | 202,000 | | | Series2020-C19-C | | | 3.73% | | | | 03/15/2053 | | | | 102,081 | |
| |
| | | | DBGS Mortgage Trust, | |
| | 550,000 | | | Series2018-5BP-D (1 Month LIBOR USD + 1.35%, 1.35% Floor) | | | 2.05% | ^ | | | 06/15/2033 | | | | 518,580 | |
| |
| | | | Fontainebleau Miami Beach Trust, | |
| | 281,000 | | | Series2019-FBLU-G | | | 4.10% | #^ | | | 12/10/2036 | | | | 180,966 | |
| |
| | | | GPMT Ltd., | |
| | 234,000 | | | Series2019-FL2-D (1 Month LIBOR USD + 2.95%, 2.95% Floor) | | | 3.65% | ^ | | | 02/22/2036 | | | | 196,877 | |
| |
| | | | Great Wolf Trust, | |
| | 826,000 | | | Series2019-WOLF-F (1 Month LIBOR USD + 3.13%, 3.13% Floor) | | | 3.84% | ^ | | | 12/15/2036 | | | | 560,795 | |
| | | | | | |
| 94 | | DoubleLine Funds Trust | | | | The accompanying notes are an integral part of these financial statements. |
| | | | | | | | | | | | | | | | |
PRINCIPAL
AMOUNT $ | | | SECURITY DESCRIPTION | | RATE | | | MATURITY | | | VALUE $ | |
| |
| | | | Greystone Commercial Real Estate Notes, | |
| | 256,000 | | | Series2019-FL2-D (1 Month LIBOR USD + 2.40%, 2.40% Floor) | | | 3.10% | ^ | | | 09/15/2037 | | | | 189,767 | |
| |
| | | | GS Mortgage Securities Trust, | |
| | 187,000 | | | Series2019-SMP-E (1 Month LIBOR USD + 2.60%, 2.60% Floor) | | | 3.30% | ^ | | | 08/15/2032 | | | | 152,103 | |
| |
| | | | GSCG Trust, | |
| | 261,000 | | | Series2019-600C-E | | | 4.12% | #^ | | | 09/06/2034 | | | | 213,561 | |
| |
| | | | Hilton USA Trust, | |
| | 600,000 | | | Series2016-SFP-E | | | 5.52% | ^ | | | 11/05/2035 | | | | 547,608 | |
| |
| | | | HPLY Trust, | |
| | 218,053 | | | Series2019-HIT-F (1 Month LIBOR USD + 3.15%, 3.15% Floor) | | | 3.85% | ^ | | | 11/15/2036 | | | | 130,628 | |
| |
| | | | JP Morgan Chase Commercial Mortgage Securities Corporation, | |
| | 279,000 | | | Series2018-MINN-E (1 Month LIBOR USD + 2.50%, 2.50% Floor) | | | 4.16% | ^ | | | 11/15/2035 | | | | 234,521 | |
| |
| | | | JP Morgan Chase Commercial Mortgage Securities Trust, | |
| | 1,000,000 | | | Series2011-C3-D | | | 5.66% | #^ | | | 02/15/2046 | | | | 979,398 | |
| | 201,000 | | | Series2020-NNN-EFX | | | 3.97% | ^ | | | 01/16/2037 | | | | 168,499 | |
| |
| | | | JPMBB Commercial Mortgage Securities Trust, | |
| | 700,000 | | | Series2014-C23-D | | | 3.97% | #^ | | | 09/15/2047 | | | | 581,271 | |
| |
| | | | LCCM Mortgage Trust, | |
| | 750,000 | | | Series2014-909-E | | | 3.90% | #^ | | | 05/15/2031 | | | | 710,107 | |
| |
| | | | MKT Mortgage Trust, | |
| | 300,000 | | | Series2020-525M-F | | | 2.94% | #^ | | | 02/12/2040 | | | | 160,824 | |
| |
| | | | Morgan Stanley Capital Trust, | |
| | 750,000 | | | Series2014-150E-F | | | 4.30% | #^ | | | 09/09/2032 | | | | 662,341 | |
| |
| | | | TRTX Issuer Ltd., | |
| | 277,000 | | | Series2019-FL3-D (1 Month LIBOR USD + 2.45%, 2.45% Floor) | | | 3.25% | ^ | | | 09/15/2034 | | | | 203,101 | |
| |
| | | | Wells Fargo Commercial Mortgage Trust, | |
| | 202,000 | | | Series2016-C33-D | | | 3.12% | ^ | | | 03/15/2059 | | | | 149,290 | |
| | | | | | | | | | | | | | | | |
| | | | TotalNon-Agency Commercial Mortgage Backed Obligations
(Cost $14,044,413) | | | | 11,653,828 | |
| | | | | | | | | | | | | |
| NON-AGENCY RESIDENTIAL COLLATERALIZED MORTGAGE
OBLIGATIONS 10.0% |
|
| |
| | | | Ajax Mortgage Loan Trust, | |
| | 1,376,995 | | | Series2018-E-A | | | 4.38% | #^ | | | 06/25/2058 | | | | 1,390,014 | |
| |
| | | | Bellemeade Ltd., | |
| | 177,451 | | | Series2017-1-M1 (1 Month LIBOR USD + 1.70%) | | | 2.65% | ^ | | | 10/25/2027 | | | | 177,265 | |
| |
| | | | Bunker Hill Loan Depositary Trust, | |
| | 524,011 | | | Series2019-1-A1 | | | 3.61% | ^§ | | | 10/26/2048 | | | | 516,107 | |
| |
| | | | Citigroup Mortgage Loan Trust, | |
| | 1,972,727 | | | Series2019-B-A1 | | | 3.26% | #^ | | | 04/25/2066 | | | | 1,958,827 | |
| |
| | | | HMIR, | |
| | 539,224 | | | Series2019-1-M1 (1 Month LIBOR USD + 1.65%) | | | 2.60% | ^ | | | 05/25/2029 | | | | 537,234 | |
| |
| | | | Pretium Mortgage Credit Partners LLC, | |
| | 762,037 | | | Series2019-1A-A1 | | | 4.50% | ^§ | | | 01/25/2024 | | | | 773,964 | |
| | 1,237,781 | | | Series2019-NPL2-A1 | | | 3.84% | ^§ | | | 12/25/2058 | | | | 1,074,731 | |
| | 1,353,941 | | | Series2020-NPL1-A1 | | | 2.86% | ^§ | | | 05/27/2059 | | | | 1,023,501 | |
| |
| | | | PRPM LLC, | |
| | 596,651 | | | Series2019-3A-A1 | | | 3.35% | ^§ | | | 07/25/2024 | | | | 592,930 | |
| |
| | | | Velocity Commercial Capital Loan Trust, | |
| | 977,629 | | | Series2019-3-M3 | | | 3.38% | #^ | | | 10/25/2049 | | | | 761,179 | |
| | | | | | | | | | | | | | | | |
PRINCIPAL
AMOUNT $ | | | SECURITY DESCRIPTION | | RATE | | | MATURITY | | | VALUE $ | |
| |
| | | | Vericrest Opportunity Loan Trust, | |
| | 1,137,003 | | | Series2020-NPL2-A1A | | | 2.98% | ^§ | | | 02/25/2050 | | | | 1,008,308 | |
| | | | | | | | | | | | | | | | |
| | | | TotalNon-Agency Residential Collateralized Mortgage Obligations
(Cost $10,662,157) | | | | 9,814,060 | |
| | | | | | | | | | | | | |
| | US CORPORATE BONDS 6.1% | |
| | 105,000 | | | AbbVie, Inc. | | | 2.30% | ^ | | | 11/21/2022 | | | | 105,050 | |
| | 115,000 | | | Air Lease Corporation | | | 2.50% | | | | 03/01/2021 | | | | 105,801 | |
| | 210,000 | | | Analog Devices, Inc. | | | 2.95% | | | | 01/12/2021 | | | | 210,332 | |
| | 185,000 | | | Anthem, Inc. | | | 2.50% | | | | 11/21/2020 | | | | 184,362 | |
| | 50,000 | | | Anthem, Inc. | | | 3.30% | | | | 01/15/2023 | | | | 50,751 | |
| | 255,000 | | | BAT Capital Corporation | | | 2.76% | | | | 08/15/2022 | | | | 251,460 | |
| | 215,000 | | | Bristol-Myers Squibb Company | | | 2.60% | ^ | | | 05/16/2022 | | | | 219,561 | |
| | 95,000 | | | Capital One Financial Corporation | | | 2.40% | | | | 10/30/2020 | | | | 94,813 | |
| | 120,000 | | | Capital One Financial Corporation | | | 3.20% | | | | 01/30/2023 | | | | 118,763 | |
| | 305,000 | | | Cardinal Health, Inc. | | | 2.62% | | | | 06/15/2022 | | | | 306,566 | |
| | 225,000 | | | Carrier Global Corporation | | | 1.92% | ^ | | | 02/15/2023 | | | | 221,954 | |
| | 205,000 | | | Cigna Corporation | | | 3.40% | | | | 09/17/2021 | | | | 208,224 | |
| | 221,000 | | | Cintas Corporation | | | 2.90% | | | | 04/01/2022 | | | | 221,165 | |
| | 335,000 | | | Citigroup, Inc. (3 Month LIBOR USD + 1.02%) | | | 2.60% | | | | 06/01/2024 | | | | 312,447 | |
| | 250,000 | | | Daimler Finance North America LLC | | | 2.30% | ^ | | | 02/12/2021 | | | | 243,757 | |
| | 190,000 | | | Delta Air Lines, Inc. | | | 3.40% | | | | 04/19/2021 | | | | 173,127 | |
| | 125,000 | | | DTE Energy Company | | | 2.25% | | | | 11/01/2022 | | | | 123,884 | |
| | 205,000 | | | eBay, Inc. | | | 2.75% | | | | 01/30/2023 | | | | 201,310 | |
| | 165,000 | | | General Electric Company | | | 2.70% | | | | 10/09/2022 | | | | 162,507 | |
| | 220,000 | | | Hyundai Capital America | | | 2.85% | ^ | | | 11/01/2022 | | | | 215,064 | |
| | 155,000 | | | Marsh & McLennan Companies, Inc. (3 Month LIBOR USD + 1.20%) | | | 2.57% | | | | 12/29/2021 | | | | 155,143 | |
| | 215,000 | | | Microchip Technology, Inc. | | | 3.92% | | | | 06/01/2021 | | | | 209,641 | |
| | 185,000 | | | Mondelez International, Inc. | | | 3.00% | | | | 05/07/2020 | | | | 183,154 | |
| | 10,000 | | | Mondelez International, Inc. | | | 3.63% | | | | 05/07/2023 | | | | 10,506 | |
| | 205,000 | | | Omnicom Capital, Inc. | | | 3.63% | | | | 05/01/2022 | | | | 208,576 | |
| | 55,000 | | | ORACLE Corporation | | | 2.50% | | | | 04/01/2025 | | | | 56,213 | |
| | 165,000 | | | PayPal Holdings, Inc. | | | 2.20% | | | | 09/26/2022 | | | | 164,412 | |
| | 205,000 | | | Penske Truck Leasing Company | | | 2.70% | ^ | | | 11/01/2024 | | | | 191,684 | |
| | 115,000 | | | Prudential Financial, Inc. | | | 4.50% | | | | 11/16/2021 | | | | 116,080 | |
| | 55,000 | | | Prudential Financial, Inc. | | | 3.50% | | | | 05/15/2024 | | | | 57,315 | |
| | 190,000 | | | Republic Services, Inc. | | | 2.50% | | | | 08/15/2024 | | | | 191,682 | |
| | 40,000 | | | Reynolds American, Inc. | | | 4.00% | | | | 06/12/2022 | | | | 40,543 | |
| | 150,000 | | | Schlumberger Holdings Corporation | | | 3.75% | ^ | | | 05/01/2024 | | | | 142,226 | |
| | 175,000 | | | Simon Property Group LP | | | 2.00% | | | | 09/13/2024 | | | | 168,270 | |
| | 195,000 | | | Union Pacific Corporation | | | 3.20% | | | | 06/08/2021 | | | | 196,938 | |
| | 220,000 | | | Welltower, Inc. | | | 3.63% | | | | 03/15/2024 | | | | 216,351 | |
| | | | | | | | | | | | | | | | |
| | | | Total US Corporate Bonds
(Cost $6,142,108) | | | | 6,039,632 | |
| | | | | | | | | | | | | | | | |
| US GOVERNMENT AND AGENCY MORTGAGE BACKED
OBLIGATIONS 9.6% |
|
| |
| | | | Federal Home Loan Mortgage Corporation, | |
| | 927,112 | | | Pool SB8011 | | | 3.00% | | | | 10/01/2034 | | | | 972,803 | |
| | 2,182,134 | | | Series 3316-FA (1 Month LIBOR USD + 0.27%, 0.27% Floor, 7.00% Cap) | | | 0.97% | | | | 05/15/2037 | | | | 2,152,917 | |
| | | | | | |
| The accompanying notes are an integral part of these financial statements. | | Annual Report | | March 31, 2020 | | 95 |
| | |
| Schedule of Investments DoubleLine Colony Real Estate and Income Fund (Cont.) | | March 31, 2020 |
| | | | | | | | | | | | | | | | |
PRINCIPAL
AMOUNT $/
SHARES | | | SECURITY DESCRIPTION | | RATE | | | MATURITY | | | VALUE $ | |
| |
| | | | Federal National Mortgage Association, | |
| | 1,400,000 | | | Pool BP0662 | | | 2.00% | | | | 03/01/2035 | | | | 1,440,829 | |
| | 2,894,212 | | | Series 2011-93-GF (1 Month LIBOR USD + 0.45%, 0.45% Floor, 7.00% Cap) | | | 1.40% | | | | 04/25/2039 | | | | 2,874,831 | |
| | 1,977,788 | | | Series 2014-73-AF (1 Month LIBOR USD + 0.45%, 0.45% Floor, 6.50% Cap) | | | 1.40% | | | | 11/25/2044 | | | | 1,967,438 | |
| | | | | | | | | | | | | | | | |
| | | | Total US Government and Agency Mortgage Backed Obligations
(Cost $9,393,146) | | | | 9,408,818 | |
| | | | | | | | | | | | | | | | |
| | US GOVERNMENT AND AGENCY OBLIGATIONS 39.6% | |
| | 1,625,000 | | | United States Treasury Notes | | | 1.38% | ‡ | | | 09/15/2020 | | | | 1,634,331 | |
| | 3,175,000 | | | United States Treasury Notes | | | 2.88% | ‡ | | | 10/31/2020 | | | | 3,225,539 | |
| | 3,715,000 | | | United States Treasury Notes | | | 2.75% | ‡ | | | 11/30/2020 | | | | 3,779,505 | |
| | 3,675,000 | | | United States Treasury Notes | | | 2.75% | ‡ | | | 09/15/2021 | | | | 3,810,085 | |
| | 4,255,000 | | | United States Treasury Notes | | | 1.50% | ‡ | | | 10/31/2021 | | | | 4,341,513 | |
| | 12,000,000 | | | United States Treasury Notes | | | 0.38% | | | | 03/31/2022 | | | | 12,033,047 | |
| | 4,440,000 | | | United States Treasury Notes | | | 1.63% | ‡ | | | 04/30/2023 | | | | 4,622,456 | |
| | 5,080,000 | | | United States Treasury Notes | | | 2.25% | ‡ | | | 12/31/2023 | | | | 5,445,522 | |
| | | | | | | | | | | | | | | | |
| | | | Total US Government and Agency Obligations
(Cost $38,180,609) | | | | 38,891,998 | |
| | | | | | | | | | | | | | | | |
| | SHORT TERM INVESTMENTS 14.3% | |
| | 4,680,230 | | | First American Government Obligations Fund - Class U | | | 0.47% | ¨ | | | | | | | 4,680,230 | |
| | 4,680,231 | | | JP Morgan U.S. Government Money Market Fund - Institutional Share Class | | | 0.36% | ¨ | | | | | | | 4,680,231 | |
| | 4,680,230 | | | Morgan Stanley Institutional Liquidity Funds Government Portfolio - Institutional Share Class | | | 0.26% | ¨ | | | | | | | 4,680,230 | |
| | | | | | | | | | | | | | | | |
| | | | Total Short Term Investments
(Cost $14,040,691) | | | | 14,040,691 | |
| | | | | | | | | | | | | | | | |
| | | | Total Investments 120.4%
(Cost $123,005,302) | | | | 118,080,044 | |
| | | | Liabilities in Excess of Other Assets (20.4)% | | | | (19,982,198 | ) |
| | | | | | | | | | | | | | | | |
| | | | NET ASSETS 100.0% | | | $ | 98,097,846 | |
| | | | | | | | | | | | | | | | |
| | | | | |
| SECURITY TYPE BREAKDOWNas a % of Net Assets: | |
US Government and Agency Obligations | | | | 39.6% | |
Short Term Investments | | | | 14.3% | |
Collateralized Loan Obligations | | | | 13.2% | |
Non-Agency Commercial Mortgage Backed Obligations | | | | 11.9% | |
Non-Agency Residential Collateralized Mortgage Obligations | | | | 10.0% | |
US Government and Agency Mortgage Backed Obligations | | | | 9.6% | |
Asset Backed Obligations | | | | 7.9% | |
US Corporate Bonds | | | | 6.1% | |
Foreign Corporate Bonds | | | | 5.0% | |
Bank Loans | | | | 2.5% | |
Foreign Government Bonds, Foreign Agencies and Foreign Government Sponsored Corporations | | | | 0.3% | |
Other Assets and Liabilities | | | | (20.4)% | |
| | | | | |
| | | | 100.0% | |
| | | | | |
| | | | | |
| INVESTMENT BREAKDOWNas a % of Net Assets: | |
US Government and Agency Obligations | | | | 39.6% | |
Short Term Investments | | | | 14.3% | |
Collateralized Loan Obligations | | | | 13.2% | |
Non-Agency Commercial Mortgage Backed Obligations | | | | 11.9% | |
Non-Agency Residential Collateralized Mortgage Obligations | | | | 10.0% | |
US Government and Agency Mortgage Backed Obligations | | | | 9.6% | |
Asset Backed Obligations | | | | 7.9% | |
Banking | | | | 2.3% | |
Transportation | | | | 1.4% | |
Healthcare | | | | 1.1% | |
Technology | | | | 0.7% | |
Aerospace & Defense | | | | 0.6% | |
Finance | | | | 0.5% | |
Telecommunications | | | | 0.5% | |
Automotive | | | | 0.5% | |
Chemicals/Plastics | | | | 0.5% | |
Business Equipment and Services | | | | 0.4% | |
Insurance | | | | 0.4% | |
Electronics/Electric | | | | 0.4% | |
Real Estate | | | | 0.4% | |
Diversified Manufacturing | | | | 0.4% | |
Building and Development (including Steel/Metals) | | | | 0.4% | |
Energy | | | | 0.3% | |
Pharmaceuticals | | | | 0.3% | |
Media | | | | 0.3% | |
Industrial Equipment | | | | 0.3% | |
Beverage and Tobacco | | | | 0.3% | |
Utilities | | | | 0.3% | |
Foreign Government Bonds, Foreign Agencies and Foreign Government Sponsored Corporations | | | | 0.3% | |
Food Products | | | | 0.2% | |
Commercial Services | | | | 0.2% | |
Environmental Control | | | | 0.2% | |
Consumer Products | | | | 0.2% | |
Food Service | | | | 0.1% | |
Mining | | | | 0.1% | |
Hotels/Motels/Inns and Casinos | | | | 0.1% | |
Containers and Glass Products | | | | 0.1% | |
Financial Intermediaries | | | | 0.1% | |
Retailers (other than Food/Drug) | | | | 0.0% | ~ |
Leisure | | | | 0.0% | ~ |
Cosmetics/Toiletries | | | | 0.0% | ~ |
Other Assets and Liabilities | | | | (20.4)% | |
| | | | | |
| | | | 100.0% | |
| | | | | |
| | | | | | |
| 96 | | DoubleLine Funds Trust | | | | The accompanying notes are an integral part of these financial statements. |
| ^ | Security exempt from registration under Rule 144A of the Securities Act of 1933. These securities may be resold in transactions exempt from registration to qualified institutional buyers. |
| § | The interest rate will step up if the issuer does not redeem the bond on or before a scheduled redemption date in accordance with the terms of the instrument. The interest rate shown is the rate in effect as of March 31, 2020. |
| # | Coupon rate is variable based on the weighted average coupon of the underlying collateral. To the extent the weighted average coupon of the underlying assets which comprise the collateral increases or decreases, the coupon rate of this security will increase or decrease correspondingly. The rate disclosed is as of March 31, 2020. |
| ± | Coupon rate is variable or floats based on components including but not limited to reference rate and spread. These securities may not indicate a reference rate and/or spread in their description. The rate disclosed is as of March 31, 2020. |
| ¨ | Seven-day yield as of March 31, 2020 |
| PIK | A payment-in-kind security in which the issuer may make interest or dividend payments in cash or additional securities. These additional securities generally have the same terms as the original holdings. |
| ‡ | All or a portion of this security has been pledged as collateral. |
| ~ | Represents less than 0.05% of net assets |
A summary of the DoubleLine Colony Real Estate and Income Fund‘s investments in affiliated mutual funds for the year ended March 31, 2020 is as follows:
| | | | | | | | | | | | | | | | | | | | | | | | | | | | | | | | | | | | | | | | |
| Fund | | Value at
March 31,
2019 | | Gross
Purchases | | Gross
Sales | | Shares Held at
March 31,
2020 | | Value at
March 31,
2020 | | Change in
Unrealized for the
Year Ended
March 31,
2020 | | Dividend Income
Earned in the
Year Ended
March 31,
2020 | | Net Realized
Gain (Loss) in
the Year Ended
March 31,
2020 |
DoubleLine Floating Rate Fund (Class I) | | | $ | 9,516,745 | | | | $ | — | | | | $ | (9,556,192 | ) | | | | — | | | | $ | — | | | | $ | (16,745 | ) | | | $ | 86,733 | | | | $ | 56,192 | |
| | | | | | | | | | | | | | | | | | | | | | | | | | |
|
| Excess Return Swaps | |
| Reference Entity | | Counterparty | | Long/Short | | | Financing
Rate | | | Payment
Frequency | | | Termination
Date | | | Notional
Amount | | | Unrealized
Appreciation
(Depreciation) /
Value | |
Colony Capital Fundamental US Real Estate Index Excess Return | | BNP Paribas | | | Long | | | | 0.45 | % | | | Termination | | | | 04/14/2021 | | | | 18,000,000 | | | $ | — | |
Colony Capital Fundamental US Real Estate Index Excess Return | | Barclays Capital, Inc. | | | Long | | | | 0.45 | % | | | Termination | | | | 04/16/2020 | | | | 21,000,000 | | | | (239,431 | ) |
Colony Capital Fundamental US Real Estate Index Excess Return | | Barclays Capital, Inc. | | | Long | | | | 0.45 | % | | | Termination | | | | 03/18/2021 | | | | 14,000,000 | | | | (2,837,162 | ) |
Colony Capital Fundamental US Real Estate Index Excess Return | | BNP Paribas | | | Long | | | | 0.45 | % | | | Termination | | | | 03/24/2021 | | | | 18,000,000 | | | | (2,977,424 | ) |
Colony Capital Fundamental US Real Estate Index Excess Return | | Barclays Capital, Inc. | | | Long | | | | 0.45 | % | | | Termination | | | | 02/04/2021 | | | | 12,000,000 | | | | (2,982,207 | ) |
Colony Capital Fundamental US Real Estate Index Excess Return | | BNP Paribas | | | Long | | | | 0.45 | % | | | Termination | | | | 01/20/2021 | | | | 18,000,000 | | | | (3,833,754 | ) |
Colony Capital Fundamental US Real Estate Index Excess Return | | BNP Paribas | | | Long | | | | 0.45 | % | | | Termination | | | | 02/10/2021 | | | | 18,000,000 | | | | (4,473,311 | ) |
| | | | | | | | | | | | | | | | | | | | | | | | | | |
| | | | | | | | | | | | | | | | | | | | | | | | $ | (17,343,289 | ) |
| | | | | | | | | | | | | | | | | | | | | | | | | | |
| The Colony Capital Fundamental US Real Estate Index Excess Return aims to provide notional long exposure to Real Estate Investment Trusts (REITs) excluding mortgage REITs that meet certain market capitalization, liquidity and fundamental criteria. The constituents of the index are ordinary shares, which are REITs. Information on the sector constituents as of March 31, 2020, is available on the Barclays Capital, Inc. website at https://indices.barclays/doubleline. |
| | | | | | |
| The accompanying notes are an integral part of these financial statements. | | Annual Report | | March 31, 2020 | | 97 |
| | |
| Schedule of Investments DoubleLine Emerging Markets Local Currency Bond Fund | | March 31, 2020 |
| | | | | | | | | | | | | | | | | | | | |
PRINCIPAL
AMOUNT | | | | | | SECURITY DESCRIPTION | | RATE | | | MATURITY | | | VALUE $ | |
| | FOREIGN CORPORATE BONDS 5.7% | |
| | | | | | |
| | COLOMBIA 2.2% | |
| | 320,000,000 | | | | COP | | | Emgesa S.A. | | | 8.75 | % | | | 01/25/2021 | | | | 80,059 | |
| | 500,000,000 | | | | COP | | | Empresas Publicas de Medellin ESP | | | 8.38 | %^ | | | 11/08/2027 | | | | 112,632 | |
| | | | | | | | | | | | | | | | | | | | |
| | | | | | | | | | | | | | | | | | | 192,691 | |
| | | | | | | | | | | | | | | | | | | | |
| | MEXICO 2.3% | |
| | 2,030,000 | | | | MXN | | | America Movil S.A.B. de C.V. | | | 6.45 | % | | | 12/05/2022 | | | | 80,516 | |
| | 2,800,000 | | | | MXN | | | International Finance Corporation | | | 8.50 | % | | | 11/23/2020 | | | | 119,383 | |
| | | | | | | | | | | | | | | | | | | | |
| | | | | | | | | | | | | | | | | | | 199,899 | |
| | | | | | | | | | | | | | | | | | | | |
| | PERU 1.2% | |
| | 44,000 | | | | PEN | | | Banco de Credito del Peru | | | 4.85 | % | | | 10/30/2020 | | | | 12,891 | |
| | 325,000 | | | | PEN | | | Banco de Credito del Peru | | | 4.65 | %^ | | | 09/17/2024 | | | | 95,879 | |
| | | | | | | | | | | | | | | | | | | | |
| | | | | | | | | | | | | | | | | | | 108,770 | |
| | | | | | | | | | | | | | | | | | | | |
| | | | | | | | Total Foreign Corporate Bonds
(Cost $626,156) | | | | 501,360 | |
| | | | | | | | | | | | | | | | | | | | |
| FOREIGN GOVERNMENT BONDS, FOREIGN AGENCIES AND FOREIGN
GOVERNMENT SPONSORED CORPORATIONS 83.3% |
|
| | | | | | |
| | BRAZIL 7.5% | |
| | 1,000 | | | | BRL | | | Nota Do Tesouro Nacional | | | 10.00 | % | | | 01/01/2025 | | | | 217,691 | |
| | 2,000 | | | | BRL | | | Nota Do Tesouro Nacional | | | 10.00 | % | | | 01/01/2029 | | | | 439,109 | |
| | | | | | | | | | | | | | | | | | | | |
| | | | | | | | | | | | | | | | | | | 656,800 | |
| | | | | | | | | | | | | | | | | | | | |
| | CHILE 4.3% | |
| | 160,000,000 | | | | CLP | | | Bonos de la Tesoreria de la Republica en pesos | | | 4.00 | %^ | | | 03/01/2023 | | | | 199,921 | |
| | 140,000,000 | | | | CLP | | | Bonos de la Tesoreria de la Republica en pesos | | | 4.50 | % | | | 03/01/2026 | | | | 178,973 | |
| | | | | | | | | | | | | | | | | | | | |
| | | | | | | | | | | | | | | | | | | 378,894 | |
| | | | | | | | | | | | | | | | | | | | |
| | COLOMBIA 4.0% | |
| | 725,000,000 | | | | COP | | | Colombian TES | | | 6.25 | % | | | 11/26/2025 | | | | 173,115 | |
| | 700,000,000 | | | | COP | | | Colombian TES | | | 7.50 | % | | | 08/26/2026 | | | | 176,551 | |
| | | | | | | | | | | | | | | | | | | | |
| | | | | | | | | | | | | | | | | | | 349,666 | |
| | | | | | | | | | | | | | | | | | | | |
| | CZECH REPUBLIC 4.4% | |
| | 9,840,000 | | | | CZK | | | Czech Republic Government Bond | | | 0.45 | % | | | 10/25/2023 | | | | 387,160 | |
| | | | | | | | | | | | | | | | | | | | |
| | | | | | | | | | | | | | | | | | | 387,160 | |
| | | | | | | | | | | | | | | | | | | | |
| | HUNGARY 4.4% | |
| | 119,000,000 | | | | HUF | | | Hungary Government Bond | | | 3.00 | % | | | 06/26/2024 | | | | 387,237 | |
| | | | | | | | | | | | | | | | | | | | |
| | | | | | | | | | | | | | | | | | | 387,237 | |
| | | | | | | | | | | | | | | | | | | | |
| | INDONESIA 8.3% | |
| | 6,500,000,000 | | | | IDR | | | Indonesia Treasury Bond | | | 6.13 | % | | | 05/15/2028 | | | | 351,228 | |
| | 6,170,000,000 | | | | IDR | | | Indonesia Treasury Bond | | | 8.38 | % | | | 03/15/2034 | | | | 376,215 | |
| | | | | | | | | | | | | | | | | | | | |
| | | | | | | | | | | | | | | | | | | 727,443 | |
| | | | | | | | | | | | | | | | | | | | |
| | ISRAEL 4.2% | |
| | 1,230,000 | | | | ILS | | | Israel Government Bond | | | 1.75 | % | | | 08/31/2025 | | | | 365,925 | |
| | | | | | | | | | | | | | | | | | | | |
| | | | | | | | | | | | | | | | | | | 365,925 | |
| | | | | | | | | | | | | | | | | | | | |
| | | | | | | | | | | | | | | | | | | | |
PRINCIPAL
AMOUNT | | | | | | SECURITY DESCRIPTION | | RATE | | | MATURITY | | | VALUE $ | |
| | MALAYSIA 5.0% | |
| | 1,875,000 | | | | MYR | | | Malaysia Government Bond | | | 3.50 | % | | | 05/31/2027 | | | | 440,538 | |
| | | | | | | | | | | | | | | | | | | | |
| | | | | | | | | | | | | | | | | | | 440,538 | |
| | | | | | | | | | | | | | | | | | | | |
| | MEXICO 4.8% | |
| | 57,100 | | | | MXN | | | Mexican Bonos | | | 8.00 | % | | | 06/11/2020 | | | | 241,379 | |
| | 20,000 | | | | MXN | | | Mexican Bonos | | | 6.50 | % | | | 06/10/2021 | | | | 84,425 | |
| | 23,000 | | | | MXN | | | Mexican Bonos | | | 6.50 | % | | | 06/09/2022 | | | | 97,239 | |
| | | | | | | | | | | | | | | | | | | | |
| | | | | | | | | | | | | | | | | | | 423,043 | |
| | | | | | | | | | | | | | | | | | | | |
| | PERU 4.0% | |
| | 560,000 | | | | PEN | | | Peru Government Bond | | | 6.15 | %^ | | | 08/12/2032 | | | | 175,616 | |
| | 580,000 | | | | PEN | | | Peru Government Bond | | | 5.40 | %^ | | | 08/12/2034 | | | | 168,983 | |
| | | | | | | | | | | | | | | | | | | | |
| | | | | | | | | | | | | | | | | | | 344,599 | |
| | | | | | | | | | | | | | | | | | | | |
| | PHILIPPINES 5.2% | |
| | 18,000,000 | | | | PHP | | | Philippine Government Bond | | | 4.95 | % | | | 01/15/2021 | | | | 351,274 | |
| | 4,500,000 | | | | PHP | | | Philippine Government Bond | | | 6.88 | % | | | 01/10/2029 | | | | 101,521 | |
| | | | | | | | | | | | | | | | | | | | |
| | | | | | | | | | | | | | | | | | | 452,795 | |
| | | | | | | | | | | | | | | | | | | | |
| | POLAND 7.2% | |
| | 1,065,000 | | | | PLN | | | Republic of Poland Government Bond | | | 2.25 | % | | | 04/25/2022 | | | | 264,670 | |
| | 1,364,000 | | | | PLN | | | Republic of Poland Government Bond | | | 3.25 | % | | | 07/25/2025 | | | | 363,129 | |
| | | | | | | | | | | | | | | | | | | | |
| | | | | | | | | | | | | | | | | | | 627,799 | |
| | | | | | | | | | | | | | | | | | | | |
| | ROMANIA 3.2% | |
| | 1,160,000 | | | | RON | | | Romania Government Bond | | | 5.85 | % | | | 04/26/2023 | | | | 280,231 | |
| | | | | | | | | | | | | | | | | | | | |
| | | | | | | | | | | | | | | | | | | 280,231 | |
| | | | | | | | | | | | | | | | | | | | |
| | RUSSIA 4.1% | |
| | 12,000,000 | | | | RUB | | | Russian Federal Bond | | | 6.90 | % | | | 05/23/2029 | | | | 155,844 | |
| | 15,000,000 | | | | RUB | | | Russian Federal Bond | | | 7.65 | % | | | 04/10/2030 | | | | 204,632 | |
| | | | | | | | | | | | | | | | | | | | |
| | | | | | | | | | | | | | | | | | | 360,476 | |
| | | | | | | | | | | | | | | | | | | | |
| | SINGAPORE 2.8% | |
| | 332,000 | | | | SGD | | | Singapore Government Bond | | | 2.00 | % | | | 02/01/2024 | | | | 243,064 | |
| | | | | | | | | | | | | | | | | | | | |
| | | | | | | | | | | | | | | | | | | 243,064 | |
| | | | | | | | | | | | | | | | | | | | |
| | SOUTH AFRICA 4.7% | |
| | 4,100,000 | | | | ZAR | | | Republic of South Africa Government Bond | | | 7.75 | % | | | 02/28/2023 | | | | 233,511 | |
| | 3,780,000 | | | | ZAR | | | Republic of South Africa Government Bond | | | 8.00 | % | | | 01/31/2030 | | | | 173,525 | |
| | | | | | | | | | | | | | | | | | | | |
| | | | | | | | | | | | | | | | | | | 407,036 | |
| | | | | | | | | | | | | | | | | | | | |
| | THAILAND 5.2% | |
| | 7,170,000 | | | | THB | | | Thailand Government Bond | | | 3.63 | % | | | 06/16/2023 | | | | 236,879 | |
| | 6,150,000 | | | | THB | | | Thailand Government Bond | | | 3.85 | % | | | 12/12/2025 | | | | 215,229 | |
| | | | | | | | | | | | | | | | | | | | |
| | | | | | | | | | | | | | | | | | | 452,108 | |
| | | | | | | | | | | | | | | | | | | | |
| | | | | | | | Total Foreign Government Bonds, Foreign Agencies and Foreign Government Sponsored Corporations
(Cost $8,413,674) | | | | 7,284,814 | |
| | | | | | | | | | | | | | | | | | | | |
| | | | | | |
| 98 | | DoubleLine Funds Trust | | | | The accompanying notes are an integral part of these financial statements. |
| | | | | | | | | | | | | | | | |
SHARES | | | SECURITY DESCRIPTION | | RATE | | | MATURITY | | | VALUE $ | |
| | SHORT TERM INVESTMENTS 8.6% | |
| | 250,302 | | | BlackRock Liquidity Funds FedFund - Institutional Shares | | | 0.33% | ¨ | | | | | | | 250,302 | |
| | 250,301 | | | Fidelity Institutional Money Market Government Portfolio - Class I | | | 0.31% | ¨ | | | | | | | 250,301 | |
| | 250,301 | | | Morgan Stanley Institutional Liquidity Funds Government Portfolio - Institutional Share Class | | | 0.26% | ¨ | | | | | | | 250,301 | |
| | | | | | | | | | | | | | | | |
| | | | Total Short Term Investments
(Cost $750,904) | | | | 750,904 | |
| | | | | | | | | | | | | | | | |
| | | | Total Investments 97.6%
(Cost $9,790,734) | | | | 8,537,078 | |
| | | | Other Assets in Excess of Liabilities 2.4% | | | | 213,917 | |
| | | | | | | | | | | | | | | | |
| | | | NET ASSETS 100.0% | | | $ | 8,750,995 | |
| | | | | | | | | | | | | | | | |
| | | | | |
| SECURITY TYPE BREAKDOWNas a % of Net Assets: | |
Foreign Government Bonds, Foreign Agencies and Foreign Government Sponsored Corporations | | | | 83.3% | |
Short Term Investments | | | | 8.6% | |
Foreign Corporate Bonds | | | | 5.7% | |
Other Assets and Liabilities | | | | 2.4% | |
| | | | | |
| | | | 100.0% | |
| | | | | |
| | | | | |
| COUNTRY BREAKDOWNas a % of Net Assets: | | | | | |
United States | | | | 8.6% | |
Indonesia | | | | 8.3% | |
Brazil | | | | 7.5% | |
Poland | | | | 7.2% | |
Mexico | | | | 7.1% | |
Colombia | | | | 6.2% | |
Peru | | | | 5.2% | |
Philippines | | | | 5.2% | |
Thailand | | | | 5.2% | |
Malaysia | | | | 5.0% | |
South Africa | | | | 4.7% | |
Hungary | | | | 4.4% | |
Czech Republic | | | | 4.4% | |
Chile | | | | 4.3% | |
Israel | | | | 4.2% | |
Russia | | | | 4.1% | |
Romania | | | | 3.2% | |
Singapore | | | | 2.8% | |
Other Assets and Liabilities | | | | 2.4% | |
| | | | | |
| | | | 100.0% | |
| | | | | |
| ^ | Security exempt from registration under Rule 144A of the Securities Act of 1933. These securities may be resold in transactions exempt from registration to qualified institutional buyers. These securities are determined to be liquid by the Adviser, unless otherwise noted, under procedures established by the Fund’s Board of Trustees. At March 31, 2020, the value of these securities amounted to $753,031 or 8.6% of net assets. |
| ¨ | Seven-day yield as of March 31, 2020 |
| Principal amount is stated in 100 Mexican Peso Units. |
| | | | | | |
| The accompanying notes are an integral part of these financial statements. | | Annual Report | | March 31, 2020 | | 99 |
| | |
| Schedule of Investments DoubleLine Income Fund | | March 31, 2020 |
| | | | | | | | | | | | | | | | |
PRINCIPAL
AMOUNT $ | | | SECURITY DESCRIPTION | | RATE | | | MATURITY | | | VALUE $ | |
| | ASSET BACKED OBLIGATIONS 14.5% | | | | | |
| | |
| | | | AASET Ltd., | | | | | |
| | 1,417,142 | | | Series2019-2-C | | | 6.41% | ^ | | | 10/16/2039 | | | | 1,020,426 | |
| | |
| | | | GAIA Aviation Ltd., | | | | | |
| | 1,279,791 | | | Series2019-1-C | | | 7.00% | ^§ | | | 12/15/2044 | | | | 830,444 | |
| | |
| | | | Pioneer Aircraft Finance Ltd., | | | | | |
| | 904,762 | | | Series2019-1-C | | | 6.90% | ^ | | | 06/15/2044 | | | | 612,344 | |
| | |
| | | | SoFi Professional Loan Program, | | | | | |
| | 20,000 | | | Series2018-A-R1 | | | 6.11% | ^@ | | | 02/25/2042 | | | | 1,191,891 | |
| | 5,930 | | | Series2018-A-R2 | | | 6.11% | ^@ | | | 02/25/2042 | | | | 353,396 | |
| | |
| | | | START Ireland, | | | | | |
| | 1,519,948 | | | Series2019-1-C | | | 6.41% | ^ | | | 03/15/2044 | | | | 1,007,175 | |
| | |
| | | | Start Ltd., | | | | | |
| | 1,446,000 | | | Series2019-2-C | | | 6.66% | ^ | | | 11/15/2044 | | | | 929,338 | |
| | |
| | | | Sunnova Helios Issuer LLC, | | | | | |
| | 1,778,428 | | | Series2019-AA-B | | | 4.49% | ^ | | | 06/20/2046 | | | | 1,577,141 | |
| | |
| | | | Tesla Auto Lease Trust, | | | | | |
| | 1,500,000 | | | Series2019-A-E | | | 5.48% | ^ | | | 05/22/2023 | | | | 1,500,031 | |
| | |
| | | | Wave LLC, | | | | | |
| | 1,875,000 | | | Series2019-1-C | | | 6.41% | ^ | | | 09/15/2044 | | | | 1,165,526 | |
| | | | | | | | | | | | | | | | |
| | | | Total Asset Backed Obligations
(Cost $13,460,181) | | | | 10,187,712 | |
| | | | | | | | | | | | | | | | |
| | COLLATERALIZED LOAN OBLIGATIONS 13.0% | |
| | |
| | | | Cathedral Lake Ltd., | | | | | |
| | 2,000,000 | | | Series2016-4A-D (3 Month LIBOR USD + 4.51%) | | | 6.33% | ^ | | | 10/20/2028 | | | | 1,613,246 | |
| | |
| | | | GoldenTree Loan Opportunities Ltd., | | | | | |
| | 1,000,000 | | | Series2016-12A-DR (3 Month LIBOR USD + 2.90%) | | | 4.72% | ^ | | | 07/21/2030 | | | | 753,540 | |
| | |
| | | | Highbridge Loan Management Ltd., | | | | | |
| | 2,000,000 | | | Series12A-18-C (3 Month LIBOR USD + 2.75%, 2.75% Floor) | | | 4.57% | ^ | | | 07/18/2031 | | | | 1,470,917 | |
| | |
| | | | Magnetite Ltd., | | | | | |
| | 500,000 | | | Series2019-23A-D (3 Month LIBOR USD + 3.60%, 3.60% Floor) | | | 5.47% | ^ | | | 10/25/2032 | | | | 381,555 | |
| | |
| | | | OHA Credit Funding Ltd., | | | | | |
| | 1,000,000 | | | Series2019-4A-D (3 Month LIBOR USD + 3.75%, 3.75% Floor) | | | 5.69% | ^ | | | 10/22/2032 | | | | 781,728 | |
| | |
| | | | Trimaran CAVU LLC, | | | | | |
| | 1,000,000 | | | Series2019-1A-B (3 Month LIBOR USD + 2.20%, 2.20% Floor) | | | 4.02% | ^ | | | 07/20/2032 | | | | 920,058 | |
| | 3,500,000 | | | Series2019-2A-C (3 Month LIBOR USD + 4.72%, 4.72% Floor) | | | 6.63% | ^ | | | 11/26/2032 | | | | 3,205,165 | |
| | | | | | | | | | | | | | | | |
| | | | Total Collateralized Loan Obligations
(Cost $10,802,972) | | | | 9,126,209 | |
| | | | | | | | | | | | | | | | |
| NON-AGENCY COMMERCIAL MORTGAGE BACKED
OBLIGATIONS 30.5% |
|
| |
| | | | Banc of America Commercial Mortgage Trust, | |
| | 243,008 | | | Series2007-4-G | | | 5.86% | #^ | | | 02/10/2051 | | | | 248,935 | |
| |
| | | | Bancorp Commercial Mortgage Trust, | |
| | 1,500,000 | | | Series2019-CRE5-E (1 Month LIBOR USD + 3.75%, 3.75% Floor) | | | 4.45% | ^ | | | 03/15/2036 | | | | 1,351,279 | |
| | | | | | | | | | | | | | | | |
PRINCIPAL
AMOUNT $ | | | SECURITY DESCRIPTION | | RATE | | | MATURITY | | | VALUE $ | |
| |
| | | | Bancorp Commercial Mortgage Trust, (Cont.) | |
| | 1,000,000 | | | Series2019-CRE6-E (1 Month LIBOR USD + 2.85%, 2.85% Floor) | | | 3.55% | ^ | | | 09/15/2036 | | | | 837,459 | |
| | |
| | | | BANK, | | | | | |
| | 13,409,430 | | | Series2019-BN19-XFG | | | 1.03% | #^ I/O | | | 08/15/2061 | | | | 1,055,830 | |
| | |
| | | | Barclays Commercial Mortgage Securities LLC, | | | | | |
| | 1,000,000 | | | Series2017-DELC-F (1 Month LIBOR USD + 3.50%, 3.50% Floor) | | | 4.20% | ^ | | | 08/15/2036 | | | | 616,296 | |
| | |
| | | | Citigroup Commercial Mortgage Trust, | | | | | |
| | 1,500,000 | | | Series2017-P7-D | | | 3.25% | ^ | | | 04/14/2050 | | | | 1,059,849 | |
| | |
| | | | CLNC Ltd., | | | | | |
| | 1,000,000 | | | Series2019-FL1-D (1 Month LIBOR USD + 2.90%, 2.90% Floor) | | | 3.65% | ^ | | | 08/20/2035 | | | | 727,604 | |
| | |
| | | | Commercial Mortgage Trust, | | | | | |
| | 17,739,000 | | | Series2014-CR20-XF | | | 1.29% | #^ I/O | | | 11/10/2047 | | | | 933,125 | |
| | |
| | | | DBGS Mortgage Trust, | | | | | |
| | 87,000 | | | Series2018-5BP-F (1 Month LIBOR USD + 2.45%, 2.45% Floor) | | | 3.15% | ^ | | | 06/15/2033 | | | | 64,752 | |
| | |
| | | | Fontainebleau Miami Beach Trust, | | | | | |
| | 1,500,000 | | | Series2019-FBLU-H | | | 4.10% | #^ | | | 12/10/2036 | | | | 897,916 | |
| | |
| | | | Great Wolf Trust, | | | | | |
| | 1,500,000 | | | Series2019-WOLF-F (1 Month LIBOR USD + 3.13%, 3.13% Floor) | | | 3.84% | ^ | | | 12/15/2036 | | | | 1,018,393 | |
| | |
| | | | GS Mortgage Securities Trust, | | | | | |
| | 1,500,000 | | | Series2014-GC26-D | | | 4.51% | #^ | | | 11/10/2047 | | | | 1,133,806 | |
| | 1,500,000 | | | Series2015-GC32-D | | | 3.35% | | | | 07/10/2048 | | | | 1,181,415 | |
| | 1,500,000 | | | Series2015-GC34-D | | | 2.98% | | | | 10/10/2048 | | | | 1,046,053 | |
| | 1,000,000 | | | Series2019-SMP-F (1 Month LIBOR USD + 3.10%, 3.10% Floor) | | | 3.80% | ^ | | | 08/15/2032 | | | | 798,355 | |
| |
| | | | JP Morgan Chase Commercial Mortgage Securities Trust, | |
| | 1,000,000 | | | Series2019-UES-G | | | 4.45% | #^ | | | 05/05/2032 | | | | 699,695 | |
| | |
| | | | JPMBB Commercial Mortgage Securities Trust, | | | | | |
| | 1,500,000 | | | Series2014-C23-E | | | 3.36% | #^Þ | | | 09/15/2047 | | | | 1,074,676 | |
| | |
| | | | JPMCC Commercial Mortgage Securities Trust, | | | | | |
| | 2,000,000 | | | Series2019-MFP-F (1 Month LIBOR USD + 3.10%, 3.00% Floor) | | | 3.70% | ^ | | | 07/15/2036 | | | | 1,239,429 | |
| | |
| | | | Morgan Stanley Capital Trust, | | | | | |
| | 1,000,000 | | | Series2017-ASHF-F (1 Month LIBOR USD + 4.35%, 4.35% Floor) | | | 5.05% | ^ | | | 11/15/2034 | | | | 538,488 | |
| | |
| | | | MRCD Mortgage Trust, | | | | | |
| | 1,643,000 | | | Series2019-PARK-G | | | 2.72% | ^ | | | 12/15/2036 | | | | 1,364,769 | |
| | |
| | | | Tharaldson Hotel Portfolio Trust, | | | | | |
| | 405,040 | | | Series2018-THL-E (1 Month LIBOR USD + 3.18%, 3.10% Floor) | | | 4.19% | ^ | | | 11/11/2034 | | | | 342,614 | |
| | 810,080 | | | Series2018-THL-F (1 Month LIBOR USD + 3.95%, 4.04% Floor) | | | 4.96% | ^ | | | 11/11/2034 | | | | 675,783 | |
| | |
| | | | UBS Commercial Mortgage Trust, | | | | | |
| | 1,562,000 | | | Series2013-C5-D | | | 4.10% | #^ | | | 03/10/2046 | | | | 1,349,339 | |
| | 1,500,000 | | | Series2018-NYCH-G (1 Month LIBOR USD + 4.84%, 4.84% Floor) | | | 5.54% | ^ | | | 02/15/2032 | | | | 1,170,609 | |
| | | | | | | | | | | | | | | | |
| | | | TotalNon-Agency Commercial Mortgage Backed Obligations
(Cost $27,459,046) | | | | 21,426,469 | |
| | | | | | | | | | | | | | | | |
| | | | | | |
| 100 | | DoubleLine Funds Trust | | | | The accompanying notes are an integral part of these financial statements. |
| | | | | | | | | | | | | | | | |
PRINCIPAL
AMOUNT $ | | | SECURITY DESCRIPTION | | RATE | | | MATURITY | | | VALUE $ | |
| NON-AGENCY RESIDENTIAL COLLATERALIZED
MORTGAGE OBLIGATIONS 23.5% |
| | | | |
| | |
| | | | CitiMortgage Alternative Loan Trust, | | | | | |
| | 2,598,956 | | | Series2007-A3-1A1 (4.00% Floor, 6.00% Cap) | | | 6.00% | | | | 03/25/2037 | | | | 2,489,603 | |
| | |
| | | | Connecticut Avenue Securities Trust, | | | | | |
| | 1,500,000 | | | Series2019-R06-2M2 (1 Month LIBOR USD + 2.10%) | | | 3.05% | ^ | | | 09/25/2039 | | | | 1,179,469 | |
| | 2,500,000 | | | Series2020-R01-1M2 (1 Month LIBOR USD + 2.05%) | | | 3.00% | ^ | | | 01/25/2040 | | | | 1,521,591 | |
| | |
| | | | FMC GMSR Issuer Trust, | | | | | |
| | 2,500,000 | | | Series2019-GT2-B | | | 4.72% | #^ | | | 09/25/2024 | | | | 1,444,011 | |
| | |
| | | | Legacy Mortgage Asset Trust, | | | | | |
| | 2,500,000 | | | Series2018-SL1-M | | | 4.50% | #^ | | | 02/25/2058 | | | | 2,416,732 | |
| | 2,500,000 | | | Series2019-GS6-A2 | | | 4.45% | ^§ | | | 06/25/2059 | | | | 1,791,485 | |
| |
| | | | Mello Warehouse Securitization Trust, | |
| | 2,000,000 | | | Series2019-2-F (1 Month LIBOR USD + 3.25%, 3.25% Floor) | | | 4.20% | ^ | | | 11/25/2052 | | | | 1,921,461 | |
| | |
| | | | Pretium Mortgage Credit Partners LLC, | | | | | |
| | 2,500,000 | | | Series2019-NPL3-A2 | | | 4.58% | ^§ | | | 07/27/2059 | | | | 1,743,076 | |
| | |
| | | | VOLT LLC, | | | | | |
| | 2,500,000 | | | Series2017-NP11-A2 | | | 4.63% | ^§ | | | 10/25/2047 | | | | 1,948,432 | |
| | | | | | | | | | | | | | | | |
| | | | TotalNon-Agency Residential Collateralized Mortgage Obligations
(Cost $21,142,670) | | | | 16,455,860 | |
| | | | | | | | | | | | | | | | |
| | US GOVERNMENT AND AGENCY OBLIGATIONS 8.2% | | | | | |
| | 1,400,000 | | | United States Treasury Notes | | | 2.25% | | | | 03/31/2026 | | | | 1,545,578 | |
| | 3,900,000 | | | United States Treasury Notes | | | 1.63% | | | | 08/15/2029 | | | | 4,235,613 | |
| | | | | | | | | | | | | | | | |
| | | | Total US Government and Agency Obligations
(Cost $5,398,519) | | | | 5,781,191 | |
| | | | | | | | | | | | | | | | |
| | | | | | | | | | | | | | | | |
SHARES | | | SECURITY DESCRIPTION | | RATE | | | MATURITY | | | VALUE $ | |
| | SHORT TERM INVESTMENTS 10.3% | | | | | |
| | 2,405,932 | | | First American Government Obligations Fund - Class U | | | 0.47% | ¨ | | | | | | | 2,405,932 | |
| | 2,405,932 | | | JP Morgan U.S. Government Money Market Fund - Institutional Share Class | | | 0.36% | ¨ | | | | | | | 2,405,932 | |
| | 2,405,932 | | | Morgan Stanley Institutional Liquidity Funds Government Portfolio - Institutional Share Class | | | 0.26% | ¨ | | | | | | | 2,405,932 | |
| | | | | | | | | | | | | | | | |
| | | | Total Short Term Investments
(Cost $7,217,796) | | | | 7,217,796 | |
| | | | | | | | | | | | | | | | |
| | | | Total Investments 100.0%
(Cost $85,481,184) | | | | 70,195,237 | |
| | | | Liabilities in Excess of Other Assets (0.0)% | | | | (22,897 | ) |
| | | | | | | | | | | | | | | | |
| | | | NET ASSETS 100.0% | | | $ | 70,172,340 | |
| | | | | | | | | | | | | | | | |
| | | | | |
| SECURITY TYPE BREAKDOWNas a % of Net Assets: | |
Non-Agency Commercial Mortgage Backed Obligations | | | | 30.5% | |
Non-Agency Residential Collateralized Mortgage Obligations | | | | 23.5% | |
Asset Backed Obligations | | | | 14.5% | |
Collateralized Loan Obligations | | | | 13.0% | |
Short Term Investments | | | | 10.3% | |
US Government and Agency Obligations | | | | 8.2% | |
Other Assets and Liabilities | | | | (0.0)% | ~ |
| | | | | |
| | | | 100.0% | |
| | | | | |
| ^ | Security exempt from registration under Rule 144A of the Securities Act of 1933. These securities may be resold in transactions exempt from registration to qualified institutional buyers. |
| § | The interest rate will step up if the issuer does not redeem the bond on or before a scheduled redemption date in accordance with the terms of the instrument. The interest rate shown is the rate in effect as of March 31, 2020. |
| # | Coupon rate is variable based on the weighted average coupon of the underlying collateral. To the extent the weighted average coupon of the underlying assets which comprise the collateral increases or decreases, the coupon rate of this security will increase or decrease correspondingly. The rate disclosed is as of March 31, 2020. |
| I/O | Interest only security |
| Þ | Value determined using significant unobservable inputs. |
| ¨ | Seven-day yield as of March 31, 2020 |
| @ | Security pays interest at rates that represent residual cashflows available after more senior tranches have been paid. The interest rate disclosed reflects the estimated rate in effect as of March 31, 2020. |
| ~ | Represents less than 0.05% of net assets. |
| | | | | | |
| The accompanying notes are an integral part of these financial statements. | | Annual Report | | March 31, 2020 | | 101 |
| | |
| Statements of Assets and Liabilities | | March 31, 2020 |
| | | | | | | | | | | | | | | | | | | | | | | | | | | | | | |
| | | DoubleLine
Total Return
Bond Fund | | DoubleLine
Core Fixed
Income Fund | | DoubleLine
Emerging
Markets Fixed
Income Fund | | DoubleLine
Multi-Asset
Growth Fund
(Consolidated) | | DoubleLine
Low Duration
Bond Fund | | DoubleLine
Floating
Rate Fund |
| | | | | | |
ASSETS | | | | | | | | | | | | | | | | | | | | | | | | | | | | | | |
Investments in Unaffiliated Securities, at Value * | | | $ | 50,487,276,501 | | | | $ | 9,791,556,269 | | | | $ | 796,626,968 | | | | $ | 16,181,888 | | | | $ | 6,473,598,398 | | | | $ | 185,770,524 | |
Investments in Affiliated Mutual Funds, at Value * | | | | 56,624,814 | | | | | 1,431,115,712 | | | | | — | | | | | 8,525,241 | | | | | 46,800,000 | | | | | — | |
Short Term Investments, at Value* | | | | 563,956,900 | | | | | 260,730,396 | | | | | 47,713,735 | | | | | 11,260,339 | | | | | 208,714,230 | | | | | 4,639 | |
Foreign Currency, at Value * | | | | — | | | | | — | | | | | — | | | | | — | | | | | — | | | | | — | |
Receivable for Fund Shares Sold | | | | 198,016,749 | | | | | 33,201,928 | | | | | 1,814,227 | | | | | 98,442 | | | | | 20,493,399 | | | | | 2,772,167 | |
Interest and Dividends Receivable | | | | 165,190,686 | | | | | 63,965,831 | | | | | 14,721,614 | | | | | 124,342 | | | | | 32,980,134 | | | | | 1,248,701 | |
Deposit at Broker for Futures | | | | 46,212,500 | | | | | — | | | | | — | | | | | 982,545 | | | | | — | | | | | — | |
Prepaid Expenses and Other Assets | | | | 619,546 | | | | | 81,743 | | | | | 70,793 | | | | | 29,080 | | | | | 152,611 | | | | | 34,123 | |
Receivable for Investments Sold | | | | — | | | | | 102,172,192 | | | | | 23,737,178 | | | | | — | | | | | 45,830,740 | | | | | 27,128,018 | |
Cash | | | | — | | | | | 536,439 | | | | | — | | | | | — | | | | | 221,594 | | | | | 274,272 | |
Cash Collateral for Swaps | | | | — | | | | | — | | | | | — | | | | | 1,520,000 | | | | | — | | | | | — | |
Net Unrealized Appreciation on Swaps | | | | — | | | | | — | | | | | — | | | | | 47,319 | | | | | — | | | | | — | |
Due from Broker | | | | — | | | | | — | | | | | — | | | | | — | | | | | — | | | | | — | |
Net Unrealized Appreciation on Forward Currency Exchange Contracts | | | | — | | | | | — | | | | | — | | | | | — | | | | | — | | | | | — | |
Due from Advisor (See Note 3) | | | | — | | | | | — | | | | | — | | | | | — | | | | | — | | | | | — | |
Total Assets | | | | 51,517,897,696 | | | | | 11,683,360,510 | | | | | 884,684,515 | | | | | 38,769,196 | | | | | 6,828,791,106 | | | | | 217,232,444 | |
| | | | | | |
LIABILITIES | | | | | | | | | | | | | | | | | | | | | | | | | | | | | | |
Payable for Fund Shares Redeemed | | | | 173,224,299 | | | | | 21,024,963 | | | | | 3,145,314 | | | | | 329,955 | | | | | 34,828,199 | | | | | 779,045 | |
Distribution Payable | | | | 34,675,773 | | | | | 11,267,818 | | | | | 1,697,490 | | | | | 262,881 | | | | | 4,205,246 | | | | | 545,337 | |
Payable for Investments Purchased | | | | 28,178,635 | | | | | 100,969,122 | | | | | 164,410 | | | | | — | | | | | 5,197,191 | | | | | 6,810,562 | |
Investment Advisory Fees Payable | | | | 18,529,225 | | | | | 3,572,579 | | | | | 686,896 | | | | | 17,338 | | | | | 2,262,541 | | | | | 97,717 | |
Variation Margin Payable | | | | 8,839,844 | | | | | — | | | | | — | | | | | 95,623 | | | | | — | | | | | — | |
Sub-Transfer Agent Expenses Payable | | | | 4,209,383 | | | | | 572,117 | | | | | 290,577 | | | | | 5,963 | | | | | 245,129 | | | | | 80,141 | |
Distribution Fees Payable | | | | 2,447,670 | | | | | 261,751 | | | | | 43,434 | | | | | 7,374 | | | | | 825,028 | | | | | 11,340 | |
Administration, Fund Accounting and Custodian Fees Payable | | | | 1,769,768 | | | | | 481,815 | | | | | 49,909 | | | | | 11,775 | | | | | 281,132 | | | | | 50,511 | |
Accrued Expenses | | | | 1,580,225 | | | | | 335,974 | | | | | 96,870 | | | | | 20,255 | | | | | 153,450 | | | | | 57,026 | |
Transfer Agent Expenses Payable | | | | 1,160,033 | | | | | 270,051 | | | | | 31,556 | | | | | 4,360 | | | | | 151,614 | | | | | 8,947 | |
Trustees Fees Payable (See Note 8) | | | | 993,714 | | | | | 175,710 | | | | | 20,656 | | | | | 4,453 | | | | | 97,951 | | | | | 10,374 | |
Professional Fees Payable | | | | 366,274 | | | | | 138,029 | | | | | 82,917 | | | | | 65,727 | | | | | 63,056 | | | | | 55,172 | |
Net Unrealized Depreciation on Swaps | | | | — | | | | | — | | | | | — | | | | | 1,657,056 | | | | | — | | | | | — | |
Loans Payable (See Note 12) | | | | — | | | | | — | | | | | — | | | | | — | | | | | — | | | | | 6,189,000 | |
Net Unrealized Depreciation on Forward Currency Exchange Contracts | | | | — | | | | | — | | | | | — | | | | | — | | | | | — | | | | | — | |
Due to Broker | | | | — | | | | | — | | | | | — | | | | | — | | | | | — | | | | | — | |
Total Liabilities | | | | 275,974,843 | | | | | 139,069,929 | | | | | 6,310,029 | | | | | 2,482,760 | | | | | 48,310,537 | | | | | 14,695,172 | |
Commitments and Contingencies (See Note 2) | | | | | | | | | | | | | | | | | | | | | | | | | | | | | | |
Net Assets | | | $ | 51,241,922,853 | | | | $ | 11,544,290,581 | | | | $ | 878,374,486 | | | | $ | 36,286,436 | | | | $ | 6,780,480,569 | | | | $ | 202,537,272 | |
| | | | | | |
NET ASSETS CONSIST OF: | | | | | | | | | | | | | | | | | | | | | | | | | | | | | | |
Paid-in Capital | | | $ | 54,857,856,546 | | | | $ | 11,914,964,517 | | | | $ | 1,111,778,592 | | | | $ | 52,158,500 | | | | $ | 7,215,391,233 | | | | $ | 263,113,651 | |
Undistributed (Accumulated) Net Investment Income (Loss) | | | | 4,745,608 | | | | | (561,455 | ) | | | | 1,058,802 | | | | | (66,792 | ) | | | | 1,539,641 | | | | | (148,263 | ) |
Accumulated Net Realized Gain (Loss) on Investments | | | | (3,272,542,694 | ) | | | | (132,879,737 | ) | | | | (39,830,976 | ) | | | | (12,702,869 | ) | | | | (93,108,760 | ) | | | | (33,023,161 | ) |
Net Unrealized Appreciation (Depreciation) on: | | | | | | | | | | | | | | | | | | | | | | | | | | | | | | |
Investments in Unaffiliated Securities | | | | (435,280,883 | ) | | | | (217,984,575 | ) | | | | (194,631,932 | ) | | | | (1,957,579 | ) | | | | (340,141,545 | ) | | | | (27,404,955 | ) |
Investments in Affiliated Mutual Funds | | | | (13,434,828 | ) | | | | (19,284,288 | ) | | | | — | | | | | (551,336 | ) | | | | (3,200,000 | ) | | | | — | |
Short Term Investments | | | | — | | | | | 36,119 | | | | | — | | | | | 19,537 | | | | | — | | | | | — | |
Foreign Currency | | | | — | | | | | — | | | | | — | | | | | — | | | | | — | | | | | — | |
Forwards | | | | — | | | | | — | | | | | — | | | | | — | | | | | — | | | | | — | |
Futures | | | | 100,579,104 | | | | | — | | | | | — | | | | | 996,712 | | | | | — | | | | | — | |
Swaps | | | | — | | | | | — | | | | | — | | | | | (1,609,737 | ) | | | | — | | | | | — | |
Translation of Other Assets and Liabilities Denominated in Foreign Currency | | | | — | | | | | — | | | | | — | | | | | — | | | | | — | | | | | — | |
Total Distributable Earnings (Loss) (See Note 6) | | | | (3,615,933,693 | ) | | | | (370,673,936 | ) | | | | (233,404,106 | ) | | | | (15,872,064 | ) | | | | (434,910,664 | ) | | | | (60,576,379 | ) |
Net Assets | | | $ | 51,241,922,853 | | | | $ | 11,544,290,581 | | | | $ | 878,374,486 | | | | $ | 36,286,436 | | | | $ | 6,780,480,569 | | | | $ | 202,537,272 | |
| | | | | | |
*Identified Cost: | | | | | | | | | | | | | | | | | | | | | | | | | | | | | | |
Investments in Unaffiliated Securities | | | $ | 50,922,557,384 | | | | $ | 10,009,540,844 | | | | $ | 991,258,900 | | | | $ | 18,139,467 | | | | $ | 6,813,739,943 | | | | $ | 213,175,479 | |
Investments in Affiliated Mutual Funds | | | | 70,059,642 | | | | | 1,450,400,000 | | | | | — | | | | | 9,076,577 | | | | | 50,000,000 | | | | | — | |
Short Term Investments | | | | 563,956,900 | | | | | 260,694,277 | | | | | 47,713,735 | | | | | 11,240,802 | | | | | 208,714,230 | | | | | 4,639 | |
Foreign Currency | | | | — | | | | | — | | | | | — | | | | | — | | | | | — | | | | | — | |
| | | | | | |
Class I (unlimited shares authorized): | | | | | | | | | | | | | | | | | | | | | | | | | | | | | | |
Net Assets | | | $ | 44,623,759,588 | | | | $ | 10,724,408,869 | | | | $ | 755,647,750 | | | | $ | 16,738,900 | | | | $ | 5,296,794,909 | | | | $ | 150,891,517 | |
Shares Outstanding | | | | 4,265,803,472 | | | | | 1,009,599,256 | | | | | 85,572,176 | | | | | 2,153,069 | | | | | 556,879,315 | | | | | 17,880,841 | |
Net Asset Value, Offering and Redemption Price per Share | | | $ | 10.46 | | | | $ | 10.62 | | | | $ | 8.83 | | | | $ | 7.77 | | | | $ | 9.51 | | | | $ | 8.44 | |
| | | | | | |
Class N (unlimited shares authorized): | | | | | | | | | | | | | | | | | | | | | | | | | | | | | | |
Net Assets | | | $ | 6,552,760,129 | | | | $ | 706,970,291 | | | | $ | 122,726,736 | | | | $ | — | | | | $ | 1,483,316,333 | | | | $ | 51,645,755 | |
Shares Outstanding | | | | 626,689,841 | | | | | 66,605,705 | | | | | 13,893,939 | | | | | — | | | | | 156,078,008 | | | | | 6,108,457 | |
Net Asset Value, Offering and Redemption Price per Share | | | $ | 10.46 | | | | $ | 10.61 | | | | $ | 8.83 | | | | $ | — | | | | $ | 9.50 | | | | $ | 8.45 | |
| | | | | | |
Class A (unlimited shares authorized): | | | | | | | | | | | | | | | | | | | | | | | | | | | | | | |
Net Assets | | | $ | — | | | | $ | — | | | | $ | — | | | | $ | 19,547,536 | | | | $ | — | | | | $ | — | |
Shares Outstanding | | | | — | | | | | — | | | | | — | | | | | 2,523,708 | | | | | — | | | | | — | |
Net Asset Value, Offering Price per Share | | | $ | — | | | | $ | — | | | | $ | — | | | | $ | 8.08 | | | | $ | — | | | | $ | — | |
Net Asset Value, Redemption Price per Share | | | $ | — | | | | $ | — | | | | $ | — | | | | $ | 7.75 | | | | $ | — | | | | $ | — | |
| | | | | | |
Class R6 (unlimited shares authorized): | | | | | | | | | | | | | | | | | | | | | | | | | | | | | | |
Net Assets | | | $ | 65,403,136 | | | | $ | 112,911,421 | | | | $ | — | | | | $ | — | | | | $ | 369,327 | | | | $ | — | |
Shares Outstanding | | | | 6,250,598 | | | | | 10,630,248 | | | | | — | | | | | — | | | | | 38,819 | | | | | — | |
Net Asset Value, Offering and Redemption Price per Share | | | $ | 10.46 | | | | $ | 10.62 | | | | $ | — | | | | $ | — | | | | $ | 9.51 | | | | $ | — | |
| | | | | | |
| 102 | | DoubleLine Funds Trust | | | | The accompanying notes are an integral part of these financial statements. |
| | | | | | | | | | | | | | | | | | | | | | | | | | | | | | |
| | | DoubleLine
Shiller
Enhanced
CAPE® | | DoubleLine
Flexible
Income Fund | | DoubleLine
Low Duration
Emerging
Markets Fixed
Income Fund | | DoubleLine
Long Duration
Total Return
Bond Fund | | DoubleLine
Strategic
Commodity
Fund
(Consolidated) | | DoubleLine
Global
Bond Fund |
| | | | | | |
ASSETS | | | | | | | | | | | | | | | | | | | | | | | | | | | | | | |
Investments in Unaffiliated Securities, at Value * | | | $ | 5,876,690,975 | | | | $ | 948,290,971 | | | | $ | 169,038,690 | | | | $ | 102,326,385 | | | | $ | — | | | | $ | 1,127,038,581 | |
Investments in Affiliated Mutual Funds, at Value * | | | | 195,175,073 | | | | | 105,830,380 | | | | | — | | | | | — | | | | | — | | | | | — | |
Short Term Investments, at Value* | | | | 791,132,217 | | | | | 30,424,641 | | | | | 26,624,176 | | | | | 4,166,697 | | | | | 146,420,951 | | | | | 75,301,165 | |
Foreign Currency, at Value * | | | | — | | | | | — | | | | | — | | | | | — | | | | | — | | | | | 9,260,089 | |
Receivable for Fund Shares Sold | | | | 29,187,679 | | | | | 4,987,188 | | | | | 814,151 | | | | | 59,693 | | | | | 8,628,574 | | | | | 16,123 | |
Interest and Dividends Receivable | | | | 31,162,999 | | | | | 8,701,562 | | | | | 2,385,697 | | | | | 249,291 | | | | | 21,140 | | | | | 7,968,352 | |
Deposit at Broker for Futures | | | | — | | | | | — | | | | | — | | | | | 1,622,012 | | | | | — | | | | | — | |
Prepaid Expenses and Other Assets | | | | 173,557 | | | | | 78,058 | | | | | 21,857 | | | | | 26,770 | | | | | 33,400 | | | | | 24,729 | |
Receivable for Investments Sold | | | | 56,357,442 | | | | | 14,394,535 | | | | | 182,332 | | | | | — | | | | | — | | | | | — | |
Cash | | | | 485,160 | | | | | 103,841 | | | | | — | | | | | — | | | | | — | | | | | — | |
Cash Collateral for Swaps | | | | — | | | | | — | | | | | — | | | | | — | | | | | 16,075,000 | | | | | — | |
Net Unrealized Appreciation on Swaps | | | | — | | | | | — | | | | | — | | | | | — | | | | | — | | | | | — | |
Due from Broker | | | | 3,125,268 | | | | | — | | | | | — | | | | | — | | | | | — | | | | | — | |
Net Unrealized Appreciation on Forward Currency Exchange Contracts | | | | — | | | | | — | | | | | — | | | | | — | | | | | — | | | | | 880,425 | |
Due from Advisor (See Note 3) | | | | — | | | | | — | | | | | — | | | | | — | | | | | — | | | | | — | |
Total Assets | | | | 6,983,490,370 | | | | | 1,112,811,176 | | | | | 199,066,903 | | | | | 108,450,848 | | | | | 171,179,065 | | | | | 1,220,489,464 | |
| | | | | | |
LIABILITIES | | | | | | | | | | | | | | | | | | | | | | | | | | | | | | |
Payable for Fund Shares Redeemed | | | | 20,122,625 | | | | | 3,308,745 | | | | | 1,108,865 | | | | | 60,562 | | | | | 3,715,625 | | | | | 48,189 | |
Distribution Payable | | | | 4,745,675 | | | | | 1,536,514 | | | | | 150,150 | | | | | 123,999 | | | | | — | | | | | — | |
Payable for Investments Purchased | | | | 20,653,689 | | | | | 2,127,566 | | | | | — | | | | | — | | | | | — | | | | | — | |
Investment Advisory Fees Payable | | | | 2,559,883 | | | | | 669,131 | | | | | 75,763 | | | | | 42,792 | | | | | 172,159 | | | | | 522,378 | |
Variation Margin Payable | | | | — | | | | | — | | | | | — | | | | | 476,591 | | | | | — | | | | | — | |
Sub-Transfer Agent Expenses Payable | | | | 555,570 | | | | | 49,679 | | | | | 4,963 | | | | | 3,581 | | | | | 68,100 | | | | | 11,326 | |
Distribution Fees Payable | | | | 381,652 | | | | | 133,475 | | | | | 6,059 | | | | | 4,491 | | | | | 9,734 | | | | | 587 | |
Administration, Fund Accounting and Custodian Fees Payable | | | | 313,810 | | | | | 124,045 | | | | | 14,792 | | | | | 5,685 | | | | | 9,488 | | | | | 61,883 | |
Accrued Expenses | | | | 183,579 | | | | | 46,544 | | | | | 20,497 | | | | | 6,378 | | | | | 17,757 | | | | | 26,996 | |
Transfer Agent Expenses Payable | | | | 166,712 | | | | | 35,240 | | | | | 5,487 | | | | | 2,567 | | | | | 7,714 | | | | | 26,413 | |
Trustees Fees Payable (See Note 8) | | | | 70,715 | | | | | 20,037 | | | | | 4,078 | | | | | 1,329 | | | | | 5,412 | | | | | 9,287 | |
Professional Fees Payable | | | | 64,573 | | | | | 45,280 | | | | | 24,652 | | | | | 29,078 | | | | | 29,140 | | | | | 25,961 | |
Net Unrealized Depreciation on Swaps | | | | 1,052,976,447 | | | | | — | | | | | — | | | | | — | | | | | 24,984,596 | | | | | — | |
Loans Payable (See Note 12) | | | | — | | | | | — | | | | | — | | | | | — | | | | | — | | | | | — | |
Net Unrealized Depreciation on Forward Currency Exchange Contracts | | | | — | | | | | — | | | | | — | | | | | — | | | | | — | | | | | 249,597 | |
Due to Broker | | | | — | | | | | — | | | | | — | | | | | — | | | | | — | | | | | — | |
Total Liabilities | | | | 1,102,794,930 | | | | | 8,096,256 | | | | | 1,415,306 | | | | | 757,053 | | | | | 29,019,725 | | | | | 982,617 | |
Commitments and Contingencies (See Note 2) | | | | | | | | | | | | | | | | | | | | | | | | | | | | | | |
Net Assets | | | $ | 5,880,695,440 | | | | $ | 1,104,714,920 | | | | $ | 197,651,597 | | | | $ | 107,693,795 | | | | $ | 142,159,340 | | | | $ | 1,219,506,847 | |
| | | | | | |
NET ASSETS CONSIST OF: | | | | | | | | | | | | | | | | | | | | | | | | | | | | | | |
Paid-in Capital | | | $ | 7,563,144,659 | | | | $ | 1,326,165,503 | | | | $ | 209,334,192 | | | | $ | 92,470,227 | | | | $ | 166,066,046 | | | | $ | 1,226,147,047 | |
Undistributed (Accumulated) Net Investment Income (Loss) | | | | 769,532 | | | | | 307,250 | | | | | 138,449 | | | | | 310 | | | | | 112,119 | | | | | (5,297,947 | ) |
Accumulated Net Realized Gain (Loss) on Investments | | | | (242,973,257 | ) | | | | (39,794,801 | ) | | | | (120,931 | ) | | | | 1,467,363 | | | | | 410,711 | | | | | 387,978 | |
Net Unrealized Appreciation (Depreciation) on: | | | | | | | | | | | | | | | | | | | | | | | | | | | | | | |
Investments in Unaffiliated Securities | | | | (382,942,428 | ) | | | | (181,375,369 | ) | | | | (11,700,113 | ) | | | | 12,273,458 | | | | | — | | | | | (1,426,204 | ) |
Investments in Affiliated Mutual Funds | | | | (4,326,619 | ) | | | | (587,663 | ) | | | | — | | | | | — | | | | | — | | | | | — | |
Short Term Investments | | | | — | | | | | — | | | | | — | | | | | — | | | | | 555,060 | | | | | — | |
Foreign Currency | | | | — | | | | | — | | | | | — | | | | | — | | | | | — | | | | | (447,865 | ) |
Forwards | | | | — | | | | | — | | | | | — | | | | | — | | | | | — | | | | | 630,828 | |
Futures | | | | — | | | | | — | | | | | — | | | | | 1,482,437 | | | | | — | | | | | — | |
Swaps | | | | (1,052,976,447 | ) | | | | — | | | | | — | | | | | — | | | | | (24,984,596 | ) | | | | — | |
Translation of Other Assets and Liabilities Denominated in Foreign Currency | | | | — | | | | | — | | | | | — | | | | | — | | | | | — | | | | | (486,990 | ) |
Total Distributable Earnings (Loss) (See Note 6) | | | | (1,682,449,219 | ) | | | | (221,450,583 | ) | | | | (11,682,595 | ) | | | | 15,223,568 | | | | | (23,906,706 | ) | | | | (6,640,200 | ) |
Net Assets | | | $ | 5,880,695,440 | | | | $ | 1,104,714,920 | | | | $ | 197,651,597 | | | | $ | 107,693,795 | | | | $ | 142,159,340 | | | | $ | 1,219,506,847 | |
| | | | | | |
*Identified Cost: | | | | | | | | | | | | | | | | | | | | | | | | | | | | | | |
Investments in Unaffiliated Securities | | | $ | 6,259,633,403 | | | | $ | 1,129,666,340 | | | | $ | 180,738,803 | | | | $ | 90,052,927 | | | | $ | — | | | | $ | 1,128,464,785 | |
Investments in Affiliated Mutual Funds | | | | 199,501,692 | | | | | 106,418,043 | | | | | — | | | | | — | | | | | — | | | | | — | |
Short Term Investments | | | | 791,132,217 | | | | | 30,424,641 | | | | | 26,624,176 | | | | | 4,166,697 | | | | | 145,865,891 | | | | | 75,301,165 | |
Foreign Currency | | | | — | | | | | — | | | | | — | | | | | — | | | | | — | | | | | 9,707,954 | |
| | | | | | |
Class I (unlimited shares authorized): | | | | | | | | | | | | | | | | | | | | | | | | | | | | | | |
Net Assets | | | $ | 4,633,848,444 | | | | $ | 874,593,524 | | | | $ | 180,730,025 | | | | $ | 87,468,639 | | | | $ | 116,738,725 | | | | $ | 1,217,100,255 | |
Shares Outstanding | | | | 396,315,423 | | | | | 104,166,626 | | | | | 19,301,315 | | | | | 7,444,021 | | | | | 16,887,550 | | | | | 119,171,734 | |
Net Asset Value, Offering and Redemption Price per Share | | | $ | 11.69 | | | | $ | 8.40 | | | | $ | 9.36 | | | | $ | 11.75 | | | | $ | 6.91 | | | | $ | 10.21 | |
| | | | | | |
Class N (unlimited shares authorized): | | | | | | | | | | | | | | | | | | | | | | | | | | | | | | |
Net Assets | | | $ | 1,246,722,680 | | | | $ | 230,032,679 | | | | $ | 16,921,572 | | | | $ | 20,225,156 | | | | $ | 25,420,615 | | | | $ | 2,406,592 | |
Shares Outstanding | | | | 106,730,368 | | | | | 27,420,646 | | | | | 1,804,336 | | | | | 1,722,584 | | | | | 3,702,000 | | | | | 235,700 | |
Net Asset Value, Offering and Redemption Price per Share | | | $ | 11.68 | | | | $ | 8.39 | | | | $ | 9.38 | | | | $ | 11.74 | | | | $ | 6.87 | | | | $ | 10.21 | |
| | | | | | |
Class A (unlimited shares authorized): | | | | | | | | | | | | | | | | | | | | | | | | | | | | | | |
Net Assets | | | $ | — | | | | $ | — | | | | $ | — | | | | $ | — | | | | $ | — | | | | $ | — | |
Shares Outstanding | | | | — | | | | | — | | | | | — | | | | | — | | | | | — | | | | | — | |
Net Asset Value, Offering Price per Share | | | $ | — | | | | $ | — | | | | $ | — | | | | $ | — | | | | $ | — | | | | $ | — | |
Net Asset Value, Redemption Price per Share | | | $ | — | | | | $ | — | | | | $ | — | | | | $ | — | | | | $ | — | | | | $ | — | |
| | | | | | |
Class R6 (unlimited shares authorized): | | | | | | | | | | | | | | | | | | | | | | | | | | | | | | |
Net Assets | | | $ | 124,316 | | | | $ | 88,717 | | | | $ | — | | | | $ | — | | | | $ | — | | | | $ | — | |
Shares Outstanding | | | | 10,629 | | | | | 10,564 | | | | | — | | | | | — | | | | | — | | | | | — | |
Net Asset Value, Offering and Redemption Price per Share | | | $ | 11.70 | | | | $ | 8.40 | | | | $ | — | | | | $ | — | | | | $ | — | | | | $ | — | |
| | | | | | |
| The accompanying notes are an integral part of these financial statements. | | Annual Report | | March 31, 2020 | | 103 |
| | |
| Statements of Assets and Liabilities (Cont.) | | March 31, 2020 |
| | | | | | | | | | | | | | | | | | | | | | | | | | | | | | |
| | | DoubleLine
Infrastructure
Income Fund | | DoubleLine
Ultra Short
Bond Fund | | DoubleLine
Shiller Enhanced
International CAPE® | | DoubleLine
Colony Real
Estate and
Income Fund | | DoubleLine
Emerging Markets
Local Currency
Bond Fund | | DoubleLine
Income Fund |
| | | | | | |
ASSETS | | | | | | | | | | | | | | | | | | | | | | | | | | | | | | |
Investments in Unaffiliated Securities, at Value * | | | $ | 463,154,687 | | | | $ | 153,800,296 | | | | $ | 37,046,833 | | | | $ | 104,039,353 | | | | $ | 7,786,174 | | | | $ | 62,977,441 | |
Investments in Affiliated Mutual Funds, at Value * | | | | — | | | | | — | | | | | 2,371,933 | | | | | — | | | | | — | | | | | — | |
Short Term Investments, at Value* | | | | 47,850,445 | | | | | 81,016,617 | | | | | 9,162,254 | | | | | 14,040,691 | | | | | 750,904 | | | | | 7,217,796 | |
Foreign Currency, at Value * | | | | — | | | | | — | | | | | 536,110 | | | | | — | | | | | 5,258 | | | | | — | |
Receivable for Fund Shares Sold | | | | 414,759 | | | | | 2,797 | | | | | 56,169 | | | | | 78,394 | | | | | — | | | | | 70,000 | |
Interest and Dividends Receivable | | | | 2,675,491 | | | | | 563,016 | | | | | 212,741 | | | | | 452,012 | | | | | 130,187 | | | | | 341,693 | |
Deposit at Broker for Futures | | | | — | | | | | — | | | | | — | | | | | — | | | | | — | | | | | — | |
Prepaid Expenses and Other Assets | | | | 15,142 | | | | | 11,977 | | | | | 16,514 | | | | | 1,389 | | | | | 552 | | | | | 823 | |
Receivable for Investments Sold | | | | — | | | | | — | | | | | 21,267 | | | | | 2,726,183 | | | | | — | | | | | — | |
Cash | | | | — | | | | | — | | | | | — | | | | | 6,357 | | | | | 214,307 | | | | | — | |
Cash Collateral for Swaps | | | | — | | | | | — | | | | | — | | | | | 9,000,000 | | | | | — | | | | | — | |
Net Unrealized Appreciation on Swaps | | | | — | | | | | — | | | | | — | | | | | — | | | | | — | | | | | — | |
Due from Broker | | | | — | | | | | — | | | | | — | | | | | — | | | | | — | | | | | — | |
Net Unrealized Appreciation on Forward Currency Exchange Contracts | | | | — | | | | | — | | | | | 78,073 | | | | | — | | | | | — | | | | | — | |
Due from Advisor (See Note 3) | | | | — | | | | | — | | | | | — | | | | | — | | | | | 16,326 | | | | | — | |
Total Assets | | | | 514,110,524 | | | | | 235,394,703 | | | | | 49,501,894 | | | | | 130,344,379 | | | | | 8,903,708 | | | | | 70,607,753 | |
| | | | | | |
LIABILITIES | | | | | | | | | | | | | | | | | | | | | | | | | | | | | | |
Payable for Fund Shares Redeemed | | | | 68,691 | | | | | 1,603 | | | | | 11,385 | | | | | 2,435,002 | | | | | — | | | | | 760 | |
Distribution Payable | | | | 777,571 | | | | | 347,114 | | | | | 16,889 | | | | | 234,637 | | | | | — | | | | | 313,178 | |
Payable for Investments Purchased | | | | — | | | | | — | | | | | 19,993 | | | | | 4,978,469 | | | | | — | | | | | — | |
Investment Advisory Fees Payable | | | | 227,206 | | | | | 34,833 | | | | | 8,169 | | | | | 45,403 | | | | | — | | | | | 13,011 | |
Variation Margin Payable | | | | — | | | | | — | | | | | — | | | | | — | | | | | — | | | | | — | |
Sub-Transfer Agent Expenses Payable | | | | 1,710 | | | | | 6,329 | | | | | 2,511 | | | | | 15,401 | | | | | 697 | | | | | 4,318 | |
Distribution Fees Payable | | | | 2,227 | | | | | 793 | | | | | 4,139 | | | | | 1,167 | | | | | 184 | | | | | 375 | |
Administration, Fund Accounting and Custodian Fees Payable | | | | 28,948 | | | | | 15,448 | | | | | 22,397 | | | | | 31,191 | | | | | 19,284 | | | | | 10,182 | |
Accrued Expenses | | | | 20,592 | | | | | 4,384 | | | | | 8,669 | | | | | 21,216 | | | | | 20,628 | | | | | 12,907 | |
Transfer Agent Expenses Payable | | | | 12,702 | | | | | 5,665 | | | | | 6,044 | | | | | 2,742 | | | | | 701 | | | | | 2,273 | |
Trustees Fees Payable (See Note 8) | | | | 9,155 | | | | | 3,109 | | | | | 1,608 | | | | | 2,840 | | | | | 556 | | | | | 534 | |
Professional Fees Payable | | | | 31,983 | | | | | 23,991 | | | | | 53,057 | | | | | 70,440 | | | | | 110,663 | | | | | 77,875 | |
Net Unrealized Depreciation on Swaps | | | | — | | | | | — | | | | | 7,643,472 | | | | | 17,343,289 | | | | | — | | | | | — | |
Loans Payable (See Note 12) | | | | — | | | | | — | | | | | — | | | | | — | | | | | — | | | | | — | |
Net Unrealized Depreciation on Forward Currency Exchange Contracts | | | | — | | | | | — | | | | | 1,136,822 | | | | | — | | | | | — | | | | | — | |
Due to Broker | | | | — | | | | | — | | | | | — | | | | | 7,064,736 | | | | | — | | | | | — | |
Total Liabilities | | | | 1,180,785 | | | | | 443,269 | | | | | 8,935,155 | | | | | 32,246,533 | | | | | 152,713 | | | | | 435,413 | |
Commitments and Contingencies (See Note 2) | | | | | | | | | | | | | | | | | | | | | | | | | | | | | | |
Net Assets | | | $ | 512,929,739 | | | | $ | 234,951,434 | | | | $ | 40,566,739 | | | | $ | 98,097,846 | | | | $ | 8,750,995 | | | | $ | 70,172,340 | |
| | | | | | |
NET ASSETS CONSIST OF: | | | | | | | | | | | | | | | | | | | | | | | | | | | | | | |
Paid-in Capital | | | $ | 542,146,196 | | | | $ | 240,480,765 | | | | $ | 66,166,789 | | | | $ | 121,452,856 | | | | $ | 10,119,842 | | | | $ | 86,906,201 | |
Undistributed (Accumulated) Net Investment Income (Loss) | | | | 36,557 | | | | | (16,115 | ) | | | | 11,289 | | | | | 30,887 | | | | | 763 | | | | | (279,121 | ) |
Accumulated Net Realized Gain (Loss) on Investments | | | | (3,080,796 | ) | | | | (400,217 | ) | | | | (14,652,689 | ) | | | | (1,117,350 | ) | | | | (99,440 | ) | | | | (1,168,793 | ) |
Net Unrealized Appreciation (Depreciation) on: | | | | | | | | | | | | | | | | | | | | | | | | | | | | | | |
Investments in Unaffiliated Securities | | | | (26,172,218 | ) | | | | (5,141,641 | ) | | | | (1,843,889 | ) | | | | (4,925,258 | ) | | | | (1,253,656 | ) | | | | (15,285,947 | ) |
Investments in Affiliated Mutual Funds | | | | — | | | | | — | | | | | (410,311 | ) | | | | — | | | | | — | | | | | — | |
Short Term Investments | | | | — | | | | | 28,642 | | | | | — | | | | | — | | | | | — | | | | | — | |
Foreign Currency | | | | — | | | | | — | | | | | (2,229 | ) | | | | — | | | | | (1,213 | ) | | | | — | |
Forwards | | | | — | | | | | — | | | | | (1,058,749 | ) | | | | — | | | | | — | | | | | — | |
Futures | | | | — | | | | | — | | | | | — | | | | | — | | | | | — | | | | | — | |
Swaps | | | | — | | | | | — | | | | | (7,643,472 | ) | | | | (17,343,289 | ) | | | | — | | | | | — | |
Translation of Other Assets and Liabilities Denominated in Foreign Currency | | | | — | | | | | — | | | | | — | | | | | — | | | | | (15,301 | ) | | | | — | |
Total Distributable Earnings (Loss) (See Note 6) | | | | (29,216,457 | ) | | | | (5,529,331 | ) | | | | (25,600,050 | ) | | | | (23,355,010 | ) | | | | (1,368,847 | ) | | | | (16,733,861 | ) |
Net Assets | | | $ | 512,929,739 | | | | $ | 234,951,434 | | | | $ | 40,566,739 | | | | $ | 98,097,846 | | | | $ | 8,750,995 | | | | $ | 70,172,340 | |
| | | | | | |
*Identified Cost: | | | | | | | | | | | | | | | | | | | | | | | | | | | | | | |
Investments in Unaffiliated Securities | | | $ | 489,326,905 | | | | $ | 158,941,937 | | | | $ | 38,890,722 | | | | $ | 108,964,611 | | | | $ | 9,039,830 | | | | $ | 78,263,388 | |
Investments in Affiliated Mutual Funds | | | | — | | | | | — | | | | | 2,782,244 | | | | | — | | | | | — | | | | | — | |
Short Term Investments | | | | 47,850,445 | | | | | 80,987,975 | | | | | 9,162,254 | | | | | 14,040,691 | | | | | 750,904 | | | | | 7,217,796 | |
Foreign Currency | | | | — | | | | | — | | | | | 538,339 | | | | | — | | | | | 6,471 | | | | | — | |
| | | | | | |
Class I (unlimited shares authorized): | | | | | | | | | | | | | | | | | | | | | | | | | | | | | | |
Net Assets | | | $ | 503,145,784 | | | | $ | 232,158,684 | | | | $ | 27,522,593 | | | | $ | 94,288,538 | | | | $ | 8,663,649 | | | | $ | 69,580,268 | |
Shares Outstanding | | | | 52,644,146 | | | | | 23,660,738 | | | | | 3,492,669 | | | | | 11,076,010 | | | | | 1,002,331 | | | | | 8,648,868 | |
Net Asset Value, Offering and Redemption Price per Share | | | $ | 9.56 | | | | $ | 9.81 | | | | $ | 7.88 | | | | $ | 8.51 | | | | $ | 8.64 | | | | $ | 8.05 | |
| | | | | | |
Class N (unlimited shares authorized): | | | | | | | | | | | | | | | | | | | | | | | | | | | | | | |
Net Assets | | | $ | 9,783,955 | | | | $ | 2,792,750 | | | | $ | 13,044,146 | | | | $ | 3,809,308 | | | | $ | 87,346 | | | | $ | 592,072 | |
Shares Outstanding | | | | 1,023,627 | | | | | 284,213 | | | | | 1,655,297 | | | | | 447,665 | | | | | 10,105 | | | | | 73,582 | |
Net Asset Value, Offering and Redemption Price per Share | | | $ | 9.56 | | | | $ | 9.83 | | | | $ | 7.88 | | | | $ | 8.51 | | | | $ | 8.64 | | | | $ | 8.05 | |
| | | | | | |
Class A (unlimited shares authorized): | | | | | | | | | | | | | | | | | | | | | | | | | | | | | | |
Net Assets | | | $ | — | | | | $ | — | | | | $ | — | | | | $ | — | | | | $ | — | | | | $ | — | |
Shares Outstanding | | | | — | | | | | — | | | | | — | | | | | — | | | | | — | | | | | — | |
Net Asset Value, Offering Price per Share | | | $ | — | | | | $ | — | | | | $ | — | | | | $ | — | | | | $ | — | | | | $ | — | |
Net Asset Value, Redemption Price per Share | | | $ | — | | | | $ | — | | | | $ | — | | | | $ | — | | | | $ | — | | | | $ | — | |
| | | | | | |
Class R6 (unlimited shares authorized): | | | | | | | | | | | | | | | | | | | | | | | | | | | | | | |
Net Assets | | | $ | — | | | | $ | — | | | | $ | — | | | | $ | — | | | | $ | — | | | | $ | — | |
Shares Outstanding | | | | — | | | | | — | | | | | — | | | | | — | | | | | — | | | | | — | |
Net Asset Value, Offering and Redemption Price per Share | | | $ | — | | | | $ | — | | | | $ | — | | | | $ | — | | | | $ | — | | | | $ | — | |
| | | | | | |
| 104 | | DoubleLine Funds Trust | | | | The accompanying notes are an integral part of these financial statements. |
| | |
| Statements of Operations | | For the Year Ended March 31, 2020 |
| | | | | | | | | | | | | | | | | | | | | | | | | | | | | | |
| | | DoubleLine
Total Return
Bond Fund | | DoubleLine
Core Fixed
Income Fund | | DoubleLine
Emerging
Markets Fixed
Income Fund | | DoubleLine
Multi-Asset
Growth Fund
(Consolidated) | | DoubleLine
Low Duration
Bond Fund | | DoubleLine
Floating
Rate Fund |
| | | | | | |
INVESTMENT INCOME | | | | | | | | | | | | | | | | | | | | | | | | | | | | | | |
Income: | | | | | | | | | | | | | | | | | | | | | | | | | | | | | | |
Interest | | | $ | 2,030,348,035 | | | | $ | 434,140,586 | | | | $ | 67,307,863 | | | | $ | 2,292,420 | | | | $ | 259,514,103 | | | | $ | 18,596,452 | |
Dividends from Affiliated Mutual Funds | | | | 1,895,428 | | | | | 26,644,368 | | | | | — | | | | | 1,346,398 | | | | | 1,965,707 | | | | | — | |
Dividends from Unaffiliated Securities | | | | — | | | | | 114,675 | | | | | 193,109 | | | | | 1,112,309 | | | | | 75,494 | | | | | — | |
Non-Cash Interest | | | | — | | | | | — | | | | | — | | | | | — | | | | | — | | | | | — | |
Total Investment Income | | | | 2,032,243,463 | | | | | 460,899,629 | | | | | 67,500,972 | | | | | 4,751,127 | | | | | 261,555,304 | | | | | 18,596,452 | |
| | | | | | |
Expenses: | | | | | | | | | | | | | | | | | | | | | | | | | | | | | | |
Investment Advisory Fees | | | | 215,671,865 | | | | | 49,736,338 | | | | | 9,047,173 | | | | | 1,319,251 | | | | | 26,431,763 | | | | | 1,678,045 | |
Sub-Transfer Agent Expenses - Class I | | | | 24,873,020 | | | | | 3,456,203 | | | | | 946,243 | | | | | 5,243 | | | | | 1,612,947 | | | | | 62,988 | |
Sub-Transfer Agent Expenses - Class N | | | | 3,761,125 | | | | | 245,085 | | | | | 152,824 | | | | | — | | | | | 426,579 | | | | | 21,912 | |
Sub-Transfer Agent Expenses - Class A | | | | — | | | | | — | | | | | — | | | | | 17,480 | | | | | — | | | | | — | |
Distribution Fees - Class N | | | | 17,684,802 | | | | | 2,049,602 | | | | | 419,751 | | | | | — | | | | | 3,955,600 | | | | | 215,567 | |
Distribution Fees - Class A | | | | — | | | | | — | | | | | — | | | | | 262,313 | | | | | — | | | | | — | |
Administration, Fund Accounting and Custodian Fees | | | | 6,775,760 | | | | | 1,923,175 | | | | | 190,670 | | | | | 43,601 | | | | | 1,132,622 | | | | | 170,543 | |
Transfer Agent Expenses | | | | 4,491,658 | | | | | 1,106,510 | | | | | 80,131 | | | | | 7,859 | | | | | 677,245 | | | | | 33,004 | |
Shareholder Reporting Expenses | | | | 1,828,724 | | | | | 332,196 | | | | | 68,421 | | | | | 11,911 | | | | | 231,797 | | | | | 26,051 | |
Registration Fees | | | | 1,518,285 | | | | | 460,914 | | | | | 150,955 | | | | | 54,920 | | | | | 433,004 | | | | | 80,453 | |
Professional Fees | | | | 1,173,912 | | | | | 441,335 | | | | | 138,808 | | | | | 118,743 | | | | | 251,083 | | | | | 95,538 | |
Trustees Fees | | | | 606,491 | | | | | 174,272 | | | | | 14,150 | | | | | 2,681 | | | | | 103,576 | | | | | 7,362 | |
Insurance Expenses | | | | 469,800 | | | | | 117,658 | | | | | 13,410 | | | | | 3,948 | | | | | 74,822 | | | | | 8,159 | |
Miscellaneous Expenses | | | | 394,087 | | | | | 91,055 | | | | | 46,419 | | | | | 13,733 | | | | | 61,904 | | | | | 178,123 | |
Total Expenses | | | | 279,249,529 | | | | | 60,134,343 | | | | | 11,268,955 | | | | | 1,861,683 | | | | | 35,392,942 | | | | | 2,577,745 | |
Less: Investment Advisory Fees (Waived) | | | | (267,591 | ) | | | | (7,093,767 | ) | | | | — | | | | | (161,777 | ) | | | | (247,417 | ) | | | | — | |
Less: Other Fees (Reimbursed)/Recouped | | | | — | | | | | — | | | | | — | | | | | (41,276 | ) | | | | (3 | ) | | | | — | |
Net Expenses | | | | 278,981,938 | | | | | 53,040,576 | | | | | 11,268,955 | | | | | 1,658,630 | | | | | 35,145,522 | | | | | 2,577,745 | |
| | | | | | |
Net Investment Income (Loss) | | | | 1,753,261,525 | | | | | 407,859,053 | | | | | 56,232,017 | | | | | 3,092,497 | | | | | 226,409,782 | | | | | 16,018,707 | |
| | | | | | |
REALIZED & UNREALIZED GAIN (LOSS) ON
INVESTMENTS | | | | | | | | | | | | | | | | | | | | | | | | | | | | | | |
| | | | | | |
Net Realized Gain (Loss) on: | | | | | | | | | | | | | | | | | | | | | | | | | | | | | | |
| | | | | | |
Investments in Unaffiliated Securities | | | | 15,214,488 | | | | | 26,527,956 | | | | | (22,660,297 | ) | | | | (4,325,908 | ) | | | | (36,119,268 | ) | | | | (14,708,861 | ) |
| | | | | | |
Investments in Affiliated Mutual Funds | | | | 59,642 | | | | | 1,283,739 | | | | | — | | | | | (1,291,738 | ) | | | | — | | | | | — | |
| | | | | | |
Foreign Currency | | | | — | | | | | (158 | ) | | | | (124 | ) | | | | (49,827 | ) | | | | (42 | ) | | | | — | |
| | | | | | |
Forwards | | | | — | | | | | — | | | | | — | | | | | (237,704 | ) | | | | — | | | | | — | |
| | | | | | |
Futures | | | | 36,443,581 | | | | | — | | | | | — | | | | | (2,245,275 | ) | | | | — | | | | | — | |
| | | | | | |
Swaps | | | | — | | | | | — | | | | | — | | | | | 2,575,944 | | | | | — | | | | | — | |
| | | | | | |
Net Change in Unrealized Appreciation (Depreciation) on: | | | | | | | | | | | | | | | | | | | | | | | | | | | | | | |
| | | | | | |
Investments in Unaffiliated Securities | | | | (379,291,139 | ) | | | | (243,505,490 | ) | | | | (150,268,656 | ) | | | | 1,171,571 | | | | | (326,089,800 | ) | | | | (19,712,795 | ) |
| | | | | | |
Investments in Affiliated Mutual Funds | | | | (13,434,828 | ) | | | | (24,271,236 | ) | | | | — | | | | | 1,899,900 | | | | | (2,200,000 | ) | | | | — | |
| | | | | | |
Short Term Investments | | | | (211,638 | ) | | | | (165,092 | ) | | | | — | | | | | 20,454 | | | | | (62,531 | ) | | | | — | |
| | | | | | |
Foreign Currency | | | | — | | | | | — | | | | | — | | | | | 18,465 | | | | | — | | | | | — | |
| | | | | | |
Forwards | | | | — | | | | | — | | | | | — | | | | | 51,280 | | | | | — | | | | | — | |
| | | | | | |
Futures | | | | 100,579,104 | | | | | — | | | | | — | | | | | 311,502 | | | | | — | | | | | — | |
| | | | | | |
Swaps | | | | — | | | | | — | | | | | — | | | | | (4,303,876 | ) | | | | — | | | | | — | |
| | | | | | |
Translation of Other Assets and Liabilities Denominated in Foreign Currency | | | | — | | | | | — | | | | | — | | | | | — | | | | | — | | | | | — | |
Net Realized and Unrealized Gain (Loss) on Investments | | | | (240,640,790 | ) | | | | (240,130,281 | ) | | | | (172,929,077 | ) | | | | (6,405,212 | ) | | | | (364,471,641 | ) | | | | (34,421,656 | ) |
| | | | | | |
NET INCREASE (DECREASE) IN NET ASSETS
RESULTING FROM OPERATIONS | | | $ | 1,512,620,735 | | | | $ | 167,728,772 | | | | $ | (116,697,060 | ) | | | $ | (3,312,715 | ) | | | $ | (138,061,859 | ) | | | $ | (18,402,949 | ) |
| | | | | | |
| The accompanying notes are an integral part of these financial statements. | | Annual Report | | March 31, 2020 | | 105 |
| | |
| Statements of Operations (Cont.) | | For the Year Ended March 31, 2020 |
| | | | | | | | | | | | | | | | | | | | | | | | | | | | | | |
| | | DoubleLine
Shiller
Enhanced
CAPE® | | DoubleLine
Flexible
Income Fund | | DoubleLine
Low Duration
Emerging
Markets Fixed
Income Fund | | DoubleLine
Long Duration
Total Return
Bond Fund | | DoubleLine
Strategic
Commodity
Fund
(Consolidated) | | DoubleLine
Global
Bond Fund |
| | | | | | |
INVESTMENT INCOME | | | | | | | | | | | | | | | | | | | | | | | | | | | | | | |
Income: | | | | | | | | | | | | | | | | | | | | | | | | | | | | | | |
Interest | | | $ | 233,473,628 | | | | $ | 67,607,106 | | | | $ | 8,631,314 | | | | $ | 1,166,805 | | | | $ | 8,766,991 | | | | $ | 22,556,518 | |
Dividends from Affiliated Mutual Funds | | | | 5,707,070 | | | | | 1,119,087 | | | | | — | | | | | — | | | | | — | | | | | — | |
Dividends from Unaffiliated Securities | | | | 996 | | | | | 4,706 | | | | | 17,957 | | | | | — | | | | | — | | | | | — | |
Non-Cash Interest | | | | — | | | | | — | | | | | — | | | | | 1,789,777 | | | | | — | | | | | — | |
Total Investment Income | | | | 239,181,694 | | | | | 68,730,899 | | | | | 8,649,271 | | | | | 2,956,582 | | | | | 8,766,991 | | | | | 22,556,518 | |
| | | | | | |
Expenses: | | | | | | | | | | | | | | | | | | | | | | | | | | | | | | |
Investment Advisory Fees | | | | 33,207,861 | | | | | 8,866,577 | | | | | 1,129,165 | | | | | 461,547 | | | | | 3,752,572 | | | | | 5,967,117 | |
Sub-Transfer Agent Expenses - Class I | | | | 3,142,942 | | | | | 456,589 | | | | | 91,347 | | | | | 18,548 | | | | | 343,402 | | | | | 7,055 | |
Sub-Transfer Agent Expenses - Class N | | | | 813,533 | | | | | 98,812 | | | | | 8,797 | | | | | 4,488 | | | | | 46,557 | | | | | 335 | |
Sub-Transfer Agent Expenses - Class A | | | | — | | | | | — | | | | | — | | | | | — | | | | | — | | | | | — | |
Distribution Fees - Class N | | | | 3,790,777 | | | | | 644,333 | | | | | 50,995 | | | | | 39,941 | | | | | 124,399 | | | | | 21,550 | |
Distribution Fees - Class A | | | | — | | | | | — | | | | | — | | | | | — | | | | | — | | | | | — | |
Administration, Fund Accounting and Custodian Fees | | | | 1,211,884 | | | | | 454,447 | | | | | 50,851 | | | | | 18,440 | | | | | 54,853 | | | | | 277,011 | |
Transfer Agent Expenses | | | | 651,382 | | | | | 124,177 | | | | | 1,726 | | | | | 1,998 | | | | | 49,255 | | | | | 111,995 | |
Shareholder Reporting Expenses | | | | 343,891 | | | | | 65,325 | | | | | 34,908 | | | | | 2,813 | | | | | 42,459 | | | | | 18,005 | |
Registration Fees | | | | 425,390 | | | | | 169,246 | | | | | 42,237 | | | | | 62,998 | | | | | 112,738 | | | | | 76,521 | |
Professional Fees | | | | 236,823 | | | | | 95,399 | | | | | 45,226 | | | | | 53,527 | | | | | 102,476 | | | | | 76,372 | |
Trustees Fees | | | | 92,687 | | | | | 17,452 | | | | | 2,603 | | | | | 1,047 | | | | | 7,604 | | | | | 13,061 | |
Insurance Expenses | | | | 65,591 | | | | | 17,858 | | | | | 3,780 | | | | | 2,021 | | | | | 7,618 | | | | | 13,980 | |
Miscellaneous Expenses | | | | 50,949 | | | | | 17,788 | | | | | 11,463 | | | | | 4,382 | | | | | 10,928 | | | | | 14,227 | |
Total Expenses | | | | 44,033,710 | | | | | 11,028,003 | | | | | 1,473,098 | | | | | 671,750 | | | | | 4,654,861 | | | | | 6,597,229 | |
Less: Investment Advisory Fees (Waived) | | | | (395,489 | ) | | | | (505,948 | ) | | | | — | | | | | — | | | | | — | | | | | — | |
Less: Other Fees (Reimbursed)/Recouped | | | | — | | | | | — | | | | | (91,791 | ) | | | | (31,792 | ) | | | | 57,047 | | | | | — | |
Net Expenses | | | | 43,638,221 | | | | | 10,522,055 | | | | | 1,381,307 | | | | | 639,958 | | | | | 4,711,908 | | | | | 6,597,229 | |
| | | | | | |
Net Investment Income (Loss) | | | | 195,543,473 | | | | | 58,208,844 | | | | | 7,267,964 | | | | | 2,316,624 | | | | | 4,055,083 | | | | | 15,959,289 | |
| | | | | | |
REALIZED & UNREALIZED GAIN (LOSS) ON
INVESTMENTS | | | | | | | | | | | | | | | | | | | | | | | | | | | | | | |
| | | | | | |
Net Realized Gain (Loss) on: | | | | | | | | | | | | | | | | | | | | | | | | | | | | | | |
| | | | | | |
Investments in Unaffiliated Securities | | | | (83,492,364 | ) | | | | (24,250,343 | ) | | | | 2,432,805 | | | | | 2,915,974 | | | | | 687,789 | | | | | (10,304,716 | ) |
| | | | | | |
Investments in Affiliated Mutual Funds | | | | (375,404 | ) | | | | 5,597 | | | | | — | | | | | — | | | | | — | | | | | — | |
| | | | | | |
Foreign Currency | | | | — | | | | | (6 | ) | | | | (13 | ) | | | | — | | | | | — | | | | | (343,889 | ) |
| | | | | | |
Forwards | | | | — | | | | | — | | | | | — | | | | | — | | | | | — | | | | | 5,898,506 | |
| | | | | | |
Futures | | | | — | | | | | — | | | | | — | | | | | 2,732,686 | | | | | — | | | | | — | |
| | | | | | |
Swaps | | | | 81,171,310 | | | | | — | | | | | — | | | | | — | | | | | (90,603,568 | ) | | | | — | |
| | | | | | |
Net Change in Unrealized Appreciation (Depreciation) on: | | | | | | | | | | | | | | | | | | | | | | | | | | | | | | |
| | | | | | |
Investments in Unaffiliated Securities | | | | (361,723,107 | ) | | | | (165,682,280 | ) | | | | (10,875,258 | ) | | | | 11,343,545 | | | | | — | | | | | (7,747,268 | ) |
| | | | | | |
Investments in Affiliated Mutual Funds | | | | (4,376,618 | ) | | | | (919,440 | ) | | | | — | | | | | — | | | | | — | | | | | — | |
| | | | | | |
Short Term Investments | | | | (124,161 | ) | | | | — | | | | | — | | | | | (5,990 | ) | | | | 399,104 | | | | | — | |
| | | | | | |
Foreign Currency | | | | — | | | | | — | | | | | — | | | | | — | | | | | — | | | | | (197,991 | ) |
| | | | | | |
Forwards | | | | — | | | | | — | | | | | — | | | | | — | | | | | — | | | | | 630,828 | |
| | | | | | |
Futures | | | | — | | | | | — | | | | | — | | | | | 1,271,528 | | | | | — | | | | | — | |
| | | | | | |
Swaps | | | | (1,281,219,595 | ) | | | | — | | | | | — | | | | | — | | | | | (27,469,186 | ) | | | | — | |
| | | | | | |
Translation of Other Assets and Liabilities Denominated in Foreign Currency | | | | — | | | | | — | | | | | — | | | | | — | | | | | — | | | | | (370,029 | ) |
Net Realized and Unrealized Gain (Loss) on Investments | | | | (1,650,139,939 | ) | | | | (190,846,472 | ) | | | | (8,442,466 | ) | | | | 18,257,743 | | | | | (116,985,861 | ) | | | | (12,434,559 | ) |
| | | | | | |
NET INCREASE (DECREASE) IN NET ASSETS
RESULTING FROM OPERATIONS | | | $ | (1,454,596,466 | ) | | | $ | (132,637,628 | ) | | | $ | (1,174,502 | ) | | | $ | 20,574,367 | | | | $ | (112,930,778 | ) | | | $ | 3,524,730 | |
| | | | | | |
| 106 | | DoubleLine Funds Trust | | | | The accompanying notes are an integral part of these financial statements. |
| | |
| | | For the Year or Period Ended March 31, 2020 |
| | | | | | | | | | | | | | | | | | | | | | | | | | | | | | |
| | | DoubleLine
Infrastructure
Income Fund | | DoubleLine
Ultra Short
Bond Fund | | DoubleLine
Shiller Enhanced
International CAPE® | | DoubleLine
Colony Real
Estate and
Income Fund | | DoubleLine
Emerging Markets
Local Currency
Bond Fund1 | | DoubleLine
Income Fund2 |
| | | | | | |
INVESTMENT INCOME | | | | | | | | | | | | | | | | | | | | | | | | | | | | | | |
Income: | | | | | | | | | | | | | | | | | | | | | | | | | | | | | | |
Interest | | | $ | 20,489,217 | | | | $ | 7,182,851 | | | | $ | 1,975,134 | | | | $ | 3,896,817 | | | | $ | 320,404 | | | | $ | 2,285,185 | |
Dividends from Affiliated Mutual Funds | | | | — | | | | | — | | | | | 178,949 | | | | | 86,733 | | | | | — | | | | | — | |
Dividends from Unaffiliated Securities | | | | — | | | | | — | | | | | — | | | | | — | | | | | — | | | | | — | |
Non-Cash Interest | | | | — | | | | | — | | | | | — | | | | | — | | | | | — | | | | | — | |
Total Investment Income | | | | 20,489,217 | | | | | 7,182,851 | | | | | 2,154,083 | | | | | 3,983,550 | | | | | 320,404 | | | | | 2,285,185 | |
| | | | | | |
Expenses: | | | | | | | | | | | | | | | | | | | | | | | | | | | | | | |
Investment Advisory Fees | | | | 2,728,423 | | | | | 454,435 | | | | | 310,545 | | | | | 616,665 | | | | | 55,287 | | | | | 241,766 | |
Sub-Transfer Agent Expenses - Class I | | | | 20,322 | | | | | 20,635 | | | | | 30,723 | | | | | 20,458 | | | | | 689 | | | | | 4,456 | |
Sub-Transfer Agent Expenses - Class N | | | | 147 | | | | | 252 | | | | | 13,999 | | | | | 843 | | | | | 7 | | | | | 24 | |
Sub-Transfer Agent Expenses - Class A | | | | — | | | | | — | | | | | — | | | | | — | | | | | — | | | | | — | |
Distribution Fees - Class N | | | | 12,267 | | | | | 9,253 | | | | | 48,497 | | | | | 13,474 | | | | | 184 | | | | | 677 | |
Distribution Fees - Class A | | | | — | | | | | — | | | | | — | | | | | — | | | | | — | | | | | — | |
Administration, Fund Accounting and Custodian Fees | | | | 106,074 | | | | | 63,197 | | | | | 37,491 | | | | | 87,790 | | | | | 22,894 | | | | | 22,558 | |
Transfer Agent Expenses | | | | 42,834 | | | | | 22,801 | | | | | 2,060 | | | | | 11,634 | | | | | 1,154 | | | | | 4,750 | |
Shareholder Reporting Expenses | | | | 14,859 | | | | | 7,442 | | | | | 8,549 | | | | | 2,809 | | | | | 21,688 | | | | | 26,549 | |
Registration Fees | | | | 62,187 | | | | | 57,878 | | | | | 50,335 | | | | | 58,032 | | | | | 15,844 | | | | | 9,175 | |
Professional Fees | | | | 61,881 | | | | | 56,278 | | | | | 32,767 | | | | | 358,418 | | | | | 334,077 | | | | | 227,708 | |
Trustees Fees | | | | 7,622 | | | | | 2,586 | | | | | 1,085 | | | | | 1,912 | | | | | 594 | | | | | 803 | |
Insurance Expenses | | | | 8,573 | | | | | 4,436 | | | | | 2,044 | | | | | 2,228 | | | | | — | | | | | 82 | |
Miscellaneous Expenses | | | | 10,512 | | | | | 6,484 | | | | | 7,351 | | | | | 11,756 | | | | | 7,156 | | | | | 6,276 | |
Total Expenses | | | | 3,075,701 | | | | | 705,677 | | | | | 545,446 | | | | | 1,186,019 | | | | | 459,574 | | | | | 544,824 | |
Less: Investment Advisory Fees (Waived) | | | | — | | | | | — | | | | | (18,117 | ) | | | | (10,974 | ) | | | | — | | | | | — | |
Less: Other Fees (Reimbursed)/Recouped | | | | — | | | | | — | | | | | (93,238 | ) | | | | (310,642 | ) | | | | (393,049 | ) | | | | (229,850 | ) |
Net Expenses | | | | 3,075,701 | | | | | 705,677 | | | | | 434,091 | | | | | 864,403 | | | | | 66,525 | | | | | 314,974 | |
| | | | | | |
Net Investment Income (Loss) | | | | 17,413,516 | | | | | 6,477,174 | | | | | 1,719,992 | | | | | 3,119,147 | | | | | 253,879 | | | | | 1,970,211 | |
| | | | | | |
REALIZED & UNREALIZED GAIN (LOSS) ON
INVESTMENTS | | | | | | | | | | | | | | | | | | | | | | | | | | | | | | |
| | | | | | |
Net Realized Gain (Loss) on: | | | | | | | | | | | | | | | | | | | | | | | | | | | | | | |
| | | | | | |
Investments in Unaffiliated Securities | | | | (510,106 | ) | | | | (374,682 | ) | | | | (345,083 | ) | | | | (2,025,149 | ) | | | | (229,446 | ) | | | | (1,181,804 | ) |
| | | | | | |
Investments in Affiliated Mutual Funds | | | | — | | | | | — | | | | | (79,503 | ) | | | | 56,192 | | | | | — | | | | | — | |
| | | | | | |
Foreign Currency | | | | — | | | | | — | | | | | 2,293,724 | | | | | — | | | | | (3,268 | ) | | | | — | |
| | | | | | |
Forwards | | | | — | | | | | — | | | | | (3,286,136 | ) | | | | — | | | | | — | | | | | — | |
| | | | | | |
Futures | | | | — | | | | | — | | | | | — | | | | | — | | | | | — | | | | | — | |
| | | | | | |
Swaps | | | | — | | | | | — | | | | | (276,308 | ) | | | | 1,731,657 | | | | | — | | | | | — | |
| | | | | | |
Net Change in Unrealized Appreciation (Depreciation) on: | | | | | | | | | | | | | | | | | | | | | | | | | | | | | | |
| | | | | | |
Investments in Unaffiliated Securities | | | | (29,049,988 | ) | | | | (5,108,197 | ) | | | | (1,853,444 | ) | | | | (5,550,958 | ) | | | | (1,253,656 | ) | | | | (15,285,947 | ) |
| | | | | | |
Investments in Affiliated Mutual Funds | | | | — | | | | | — | | | | | (257,236 | ) | | | | (16,745 | ) | | | | — | | | | | — | |
| | | | | | |
Short Term Investments | | | | — | | | | | 46,483 | | | | | — | | | | | (8,543 | ) | | | | — | | | | | — | |
| | | | | | |
Foreign Currency | | | | — | | | | | — | | | | | (2,229 | ) | | | | — | | | | | (1,213 | ) | | | | — | |
| | | | | | |
Forwards | | | | — | | | | | — | | | | | 421,037 | | | | | — | | | | | — | | | | | — | |
| | | | | | |
Futures | | | | — | | | | | — | | | | | — | | | | | — | | | | | — | | | | | — | |
| | | | | | |
Swaps | | | | — | | | | | — | | | | | (10,859,552 | ) | | | | (28,623,868 | ) | | | | — | | | | | — | |
| | | | | | |
Translation of Other Assets and Liabilities Denominated in Foreign Currency | | | | — | | | | | — | | | | | (25,115 | ) | | | | — | | | | | (15,301 | ) | | | | — | |
Net Realized and Unrealized Gain (Loss) on Investments | | | | (29,560,094 | ) | | | | (5,436,396 | ) | | | | (14,269,845 | ) | | | | (34,437,414 | ) | | | | (1,502,884 | ) | | | | (16,467,751 | ) |
| | | | | | |
NET INCREASE (DECREASE) IN NET ASSETS
RESULTING FROM OPERATIONS | | | $ | (12,146,578 | ) | | | $ | 1,040,778 | | | | $ | (12,549,853 | ) | | | $ | (31,318,267 | ) | | | $ | (1,249,005 | ) | | | $ | (14,497,540 | ) |
| 1 | Commenced operations on June 28, 2019. |
| 2 | Commenced operations on September 3, 2019. |
| | | | | | |
| The accompanying notes are an integral part of these financial statements. | | Annual Report | | March 31, 2020 | | 107 |
| | |
| Statements of Changes in Net Assets | | March 31, 2020 |
| | | | | | | | | | | | | | | | | | | | |
| | | DoubleLine Total Return Bond Fund | | DoubleLine Core Fixed Income Fund |
| | | Year Ended
March 31, 2020 | | Year Ended
March 31, 2019 | | Year Ended
March 31, 2020 | | Year Ended
March 31, 2019 |
| | | | |
OPERATIONS | | | | | | | | | | | | | | | | | | | | |
Net Investment Income (Loss) | | | $ | 1,753,261,525 | | | | $ | 1,643,035,050 | | | | $ | 407,859,053 | | | | $ | 362,063,137 | |
Net Realized Gain (Loss) on Investments | | | | 51,717,711 | | | | | (151,551,012 | ) | | | | 27,811,537 | | | | | (89,308,613 | ) |
Net Change in Unrealized Appreciation (Depreciation) on Investments | | | | (292,358,501 | ) | | | | 532,029,096 | | | | | (267,941,818 | ) | | | | 123,739,576 | |
Net Increase (Decrease) in Net Assets Resulting from Operations | | | | 1,512,620,735 | | | | | 2,023,513,134 | | | | | 167,728,772 | | | | | 396,494,100 | |
| | | | |
DISTRIBUTIONS TO SHAREHOLDERS | | | | | | | | | | | | | | | | | | | | |
From Earnings | | | | | | | | | | | | | | | | | | | | |
Class I | | | | (1,682,833,349 | ) | | | | (1,568,571,397 | ) | | | | (390,047,338 | ) | | | | (338,848,915 | ) |
Class N | | | | (236,162,405 | ) | | | | (246,861,429 | ) | | | | (25,423,762 | ) | | | | (29,195,691 | ) |
Class R6 | | | | (292,522 | ) | | | | — | | | | | (1,420,636 | ) | | | | — | |
| | | | |
Total Distributions to Shareholders | | | | (1,919,288,276 | ) | | | | (1,815,432,826 | ) | | | | (416,891,736 | ) | | | | (368,044,606 | ) |
| | | | |
NET SHARE TRANSACTIONS | | | | | | | | | | | | | | | | | | | | |
Class I | | | | 1,305,860,834 | | | | | 500,888,099 | | | | | 282,562,989 | | | | | 1,260,677,792 | |
Class N | | | | (239,768,302 | ) | | | | (1,614,987,568 | ) | | | | (120,931,455 | ) | | | | (182,676,499 | ) |
Class R6 | | | | 68,552,428 | | | | | — | | | | | 118,545,100 | | | | | — | |
Increase (Decrease) in Net Assets Resulting from Net Share Transactions | | | | 1,134,644,960 | | | | | (1,114,099,469 | ) | | | | 280,176,634 | | | | | 1,078,001,293 | |
| | | | |
Total Increase (Decrease) in Net Assets | | | $ | 727,977,419 | | | | $ | (906,019,161 | ) | | | $ | 31,013,670 | | | | $ | 1,106,450,787 | |
| | | | |
NET ASSETS | | | | | | | | | | | | | | | | | | | | |
Beginning of Period | | | $ | 50,513,945,434 | | | | $ | 51,419,964,595 | | | | $ | 11,513,276,911 | | | | $ | 10,406,826,124 | |
End of Period | | | $ | 51,241,922,853 | | | | $ | 50,513,945,434 | | | | $ | 11,544,290,581 | | | | $ | 11,513,276,911 | |
| | | | | | |
| 108 | | DoubleLine Funds Trust | | | | The accompanying notes are an integral part of these financial statements. |
| | | | | | | | | | | | | | | | | | | | |
| | | DoubleLine Emerging Markets Fixed Income Fund | | DoubleLine Multi-Asset Growth Fund (Consolidated) |
| | | Year Ended
March 31, 2020 | | Year Ended
March 31, 2019 | | Year Ended
March 31, 2020 | | Year Ended
March 31, 2019 |
| | | | |
OPERATIONS | | | | | | | | | | | | | | | | | | | | |
Net Investment Income (Loss) | | | $ | 56,232,017 | | | | $ | 39,935,717 | | | | $ | 3,092,497 | | | | $ | 5,287,724 | |
Net Realized Gain (Loss) on Investments | | | | (22,660,421 | ) | | | | (15,160,511 | ) | | | | (5,574,508 | ) | | | | (3,963,413 | ) |
Net Change in Unrealized Appreciation (Depreciation) on Investments | | | | (150,268,656 | ) | | | | 8,514,791 | | | | | (830,704 | ) | | | | (874,825 | ) |
Net Increase (Decrease) in Net Assets Resulting from Operations | | | | (116,697,060 | ) | | | | 33,289,997 | | | | | (3,312,715 | ) | | | | 449,486 | |
| | | | |
DISTRIBUTIONS TO SHAREHOLDERS | | | | | | | | | | | | | | | | | | | | |
From Earnings | | | | | | | | | | | | | | | | | | | | |
Class I | | | | (48,344,890 | ) | | | | (36,181,890 | ) | | | | (997,428 | ) | | | | (1,877,578 | ) |
Class N | | | | (7,355,562 | ) | | | | (6,006,531 | ) | | | | — | | | | | — | |
Class A | | | | — | | | | | — | | | | | (2,631,764 | ) | | | | (4,858,535 | ) |
| | | | |
Total Distributions to Shareholders | | | | (55,700,452 | ) | | | | (42,188,421 | ) | | | | (3,629,192 | ) | | | | (6,736,113 | ) |
| | | | |
NET SHARE TRANSACTIONS | | | | | | | | | | | | | | | | | | | | |
Class I | | | | (39,817,950 | ) | | | | 12,352,203 | | | | | (24,124,621 | ) | | | | (17,113,193 | ) |
Class N | | | | (16,878,662 | ) | | | | (31,526,623 | ) | | | | — | | | | | — | |
Class A | | | | — | | | | | — | | | | | (154,741,437 | ) | | | | 27,857,318 | |
Increase (Decrease) in Net Assets Resulting from Net Share Transactions | | | | (56,696,612 | ) | | | | (19,174,420 | ) | | | | (178,866,058 | ) | | | | 10,744,125 | |
| | | | |
Total Increase (Decrease) in Net Assets | | | $ | (229,094,124 | ) | | | $ | (28,072,844 | ) | | | $ | (185,807,965 | ) | | | $ | 4,457,498 | |
| | | | |
NET ASSETS | | | | | | | | | | | | | | | | | | | | |
Beginning of Period | | | $ | 1,107,468,610 | | | | $ | 1,135,541,454 | | | | $ | 222,094,401 | | | | $ | 217,636,903 | |
End of Period | | | $ | 878,374,486 | | | | $ | 1,107,468,610 | | | | $ | 36,286,436 | | | | $ | 222,094,401 | |
| | | | | | |
| The accompanying notes are an integral part of these financial statements. | | Annual Report | | March 31, 2020 | | 109 |
| | |
| Statements of Changes in Net Assets (Cont.) | | March 31, 2020 |
| | | | | | | | | | | | | | | | | | | | |
| | | DoubleLine Low Duration Bond Fund | | DoubleLine Floating Rate Fund |
| | | Year Ended
March 31, 2020 | | Year Ended
March 31, 2019 | | Year Ended
March 31, 2020 | | Year Ended
March 31, 2019 |
| | | | |
OPERATIONS | | | | | | | | | | | | | | | | | | | | |
Net Investment Income (Loss) | | | $ | 226,409,782 | | | | $ | 185,616,948 | | | | $ | 16,018,707 | | | | $ | 30,695,387 | |
Net Realized Gain (Loss) on Investments | | | | (36,119,310 | ) | | | | (18,157,813 | ) | | | | (14,708,861 | ) | | | | (9,870,401 | ) |
Net Change in Unrealized Appreciation (Depreciation) on Investments | | | | (328,352,331 | ) | | | | 26,996,492 | | | | | (19,712,795 | ) | | | | (9,467,309 | ) |
Net Increase (Decrease) in Net Assets Resulting from Operations | | | | (138,061,859 | ) | | | | 194,455,627 | | | | | (18,402,949 | ) | | | | 11,357,677 | |
| | | | |
DISTRIBUTIONS TO SHAREHOLDERS | | | | | | | | | | | | | | | | | | | | |
From Earnings | | | | | | | | | | | | | | | | | | | | |
Class I | | | | (184,148,149 | ) | | | | (146,238,970 | ) | | | | (12,290,737 | ) | | | | (23,730,667 | ) |
Class N | | | | (45,083,925 | ) | | | | (41,061,794 | ) | | | | (4,099,480 | ) | | | | (6,968,852 | ) |
Class R6 | | | | (2,785 | ) | | | | — | | | | | — | | | | | — | |
| | | | |
Total Distributions to Shareholders | | | | (229,234,859 | ) | | | | (187,300,764 | ) | | | | (16,390,217 | ) | | | | (30,699,519 | ) |
| | | | |
NET SHARE TRANSACTIONS | | | | | | | | | | | | | | | | | | | | |
Class I | | | | 131,553,599 | | | | | 1,379,133,038 | | | | | (180,591,747 | ) | | | | (55,512,629 | ) |
Class N | | | | 79,520,857 | | | | | 41,194,669 | | | | | (56,514,141 | ) | | | | (24,377,357 | ) |
Class R6 | | | | 374,370 | | | | | — | | | | | — | | | | | — | |
Increase (Decrease) in Net Assets Resulting from Net Share Transactions | | | | 211,448,826 | | | | | 1,420,327,707 | | | | | (237,105,888 | ) | | | | (79,889,986 | ) |
| | | | |
Total Increase (Decrease) in Net Assets | | | $ | (155,847,892 | ) | | | $ | 1,427,482,570 | | | | $ | (271,899,054 | ) | | | $ | (99,231,828 | ) |
| | | | |
NET ASSETS | | | | | | | | | | | | | | | | | | | | |
Beginning of Period | | | $ | 6,936,328,461 | | | | $ | 5,508,845,891 | | | | $ | 474,436,326 | | | | $ | 573,668,154 | |
End of Period | | | $ | 6,780,480,569 | | | | $ | 6,936,328,461 | | | | $ | 202,537,272 | | | | $ | 474,436,326 | |
| | | | | | |
| 110 | | DoubleLine Funds Trust | | | | The accompanying notes are an integral part of these financial statements. |
| | | | | | | | | | | | | | | | | | | | |
| | | DoubleLine Shiller Enhanced CAPE® | | DoubleLine Flexible Income Fund |
| | | Year Ended
March 31, 2020 | | Year Ended
March 31, 2019 | | Year Ended
March 31, 2020 | | Year Ended
March 31, 2019 |
| | | | |
OPERATIONS | | | | | | | | | | | | | | | | | | | | |
Net Investment Income (Loss) | | | $ | 195,543,473 | | | | $ | 159,694,872 | | | | $ | 58,208,844 | | | | $ | 53,506,204 | |
Net Realized Gain (Loss) on Investments | | | | (2,696,458 | ) | | | | 283,685,683 | | | | | (24,244,752 | ) | | | | (6,354,590 | ) |
Net Change in Unrealized Appreciation (Depreciation) on Investments | | | | (1,647,443,481 | ) | | | | 96,022,901 | | | | | (166,601,720 | ) | | | | (11,296,599 | ) |
Net Increase (Decrease) in Net Assets Resulting from Operations | | | | (1,454,596,466 | ) | | | | 539,403,456 | | | | | (132,637,628 | ) | | | | 35,855,015 | |
| | | | |
DISTRIBUTIONS TO SHAREHOLDERS | | | | | | | | | | | | | | | | | | | | |
From Earnings | | | | | | | | | | | | | | | | | | | | |
Class I | | | | (321,927,614 | ) | | | | (548,723,592 | ) | | | | (50,225,540 | ) | | | | (48,388,448 | ) |
Class N | | | | (77,510,294 | ) | | | | (143,615,446 | ) | | | | (10,505,272 | ) | | | | (8,833,685 | ) |
Class R6 | | | | (5,500 | ) | | | | — | | | | | (2,816 | ) | | | | — | |
| | | | |
Total Distributions to Shareholders | | | | (399,443,408 | ) | | | | (692,339,038 | ) | | | | (60,733,628 | ) | | | | (57,222,133 | ) |
| | | | |
NET SHARE TRANSACTIONS | | | | | | | | | | | | | | | | | | | | |
Class I | | | | 1,544,162,763 | | | | | 689,123,688 | | | | | (59,045,455 | ) | | | | 98,867,605 | |
Class N | | | | 376,943,027 | | | | | 221,010,054 | | | | | 61,169,389 | | | | | 15,774,561 | |
Class R6 | | | | 168,109 | | | | | — | | | | | 102,816 | | | | | — | |
Increase (Decrease) in Net Assets Resulting from Net Share Transactions | | | | 1,921,273,899 | | | | | 910,133,742 | | | | | 2,226,750 | | | | | 114,642,166 | |
| | | | |
Total Increase (Decrease) in Net Assets | | | $ | 67,234,025 | | | | $ | 757,198,160 | | | | $ | (191,144,506 | ) | | | $ | 93,275,048 | |
| | | | |
NET ASSETS | | | | | | | | | | | | | | | | | | | | |
Beginning of Period | | | $ | 5,813,461,415 | | | | $ | 5,056,263,255 | | | | $ | 1,295,859,426 | | | | $ | 1,202,584,378 | |
End of Period | | | $ | 5,880,695,440 | | | | $ | 5,813,461,415 | | | | $ | 1,104,714,920 | | | | $ | 1,295,859,426 | |
| | | | | | |
| The accompanying notes are an integral part of these financial statements. | | Annual Report | | March 31, 2020 | | 111 |
| | |
| Statements of Changes in Net Assets (Cont.) | | March 31, 2020 |
| | | | | | | | | | | | | | | | | | | | |
| | | DoubleLine Low Duration Emerging Markets Fixed Income Fund | | DoubleLine Long Duration Total Return Bond Fund |
| | | Year Ended
March 31, 2020 | | Year Ended
March 31, 2019 | | Year Ended
March 31, 2020 | | Year Ended
March 31, 2019 |
| | | | |
OPERATIONS | | | | | | | | | | | | | | | | | | | | |
Net Investment Income (Loss) | | | $ | 7,267,964 | | | | $ | 5,491,494 | | | | $ | 2,316,624 | | | | $ | 2,233,152 | |
Net Realized Gain (Loss) on Investments | | | | 2,432,792 | | | | | (1,732,726 | ) | | | | 5,648,660 | | | | | (670,103 | ) |
Net Change in Unrealized Appreciation (Depreciation) on Investments | | | | (10,875,258 | ) | | | | 4,442,364 | | | | | 12,609,083 | | | | | 2,135,991 | |
Net Increase (Decrease) in Net Assets Resulting from Operations | | | | (1,174,502 | ) | | | | 8,201,132 | | | | | 20,574,367 | | | | | 3,699,040 | |
| | | | |
DISTRIBUTIONS TO SHAREHOLDERS | | | | | | | | | | | | | | | | | | | | |
From Earnings | | | | | | | | | | | | | | | | | | | | |
Class I | | | | (8,136,505 | ) | | | | (4,939,700 | ) | | | | (3,720,836 | ) | | | | (1,879,825 | ) |
Class N | | | | (732,838 | ) | | | | (864,730 | ) | | | | (695,919 | ) | | | | (352,050 | ) |
| | | | |
Total Distributions to Shareholders | | | | (8,869,343 | ) | | | | (5,804,430 | ) | | | | (4,416,755 | ) | | | | (2,231,875 | ) |
| | | | |
NET SHARE TRANSACTIONS | | | | | | | | | | | | | | | | | | | | |
Class I | | | | (7,593,692 | ) | | | | 53,033,957 | | | | | 7,846,582 | | | | | 9,528,057 | |
Class N | | | | (6,370,488 | ) | | | | (33,801,178 | ) | | | | 3,147,441 | | | | | 3,174,269 | |
Increase (Decrease) in Net Assets Resulting from Net Share Transactions | | | | (13,964,180 | ) | | | | 19,232,779 | | | | | 10,994,023 | | | | | 12,702,326 | |
| | | | |
Total Increase (Decrease) in Net Assets | | | $ | (24,008,025 | ) | | | $ | 21,629,481 | | | | $ | 27,151,635 | | | | $ | 14,169,491 | |
| | | | |
NET ASSETS | | | | | | | | | | | | | | | | | | | | |
Beginning of Period | | | $ | 221,659,622 | | | | $ | 200,030,141 | | | | $ | 80,542,160 | | | | $ | 66,372,669 | |
End of Period | | | $ | 197,651,597 | | | | $ | 221,659,622 | | | | $ | 107,693,795 | | | | $ | 80,542,160 | |
| | | | | | |
| 112 | | DoubleLine Funds Trust | | | | The accompanying notes are an integral part of these financial statements. |
| | | | | | | | | | | | | | | | | | | | |
| | | DoubleLine Strategic Commodity Fund
(Consolidated) | | DoubleLine Global Bond Fund |
| | | Year Ended
March 31, 2020 | | Year Ended
March 31, 2019 | | Year Ended
March 31, 2020 | | Year Ended
March 31, 2019 |
| | | | |
OPERATIONS | | | | | | | | | | | | | | | | | | | | |
Net Investment Income (Loss) | | | $ | 4,055,083 | | | | $ | 5,462,268 | | | | $ | 15,959,289 | | | | $ | 10,095,568 | |
Net Realized Gain (Loss) on Investments | | | | (89,915,779 | ) | | | | (31,046,936 | ) | | | | (4,750,099 | ) | | | | 992,561 | |
Net Change in Unrealized Appreciation (Depreciation) on Investments | | | | (27,070,082 | ) | | | | 2,499,993 | | | | | (7,684,460 | ) | | | | (30,055,529 | ) |
Net Increase (Decrease) in Net Assets Resulting from Operations | | | | (112,930,778 | ) | | | | (23,084,675 | ) | | | | 3,524,730 | | | | | (18,967,400 | ) |
| | | | |
DISTRIBUTIONS TO SHAREHOLDERS | | | | | | | | | | | | | | | | | | | | |
From Earnings | | | | | | | | | | | | | | | | | | | | |
Class I | | | | (3,449,253 | ) | | | | (4,969,784 | ) | | | | (13,232,198 | ) | | | | (9,558,847 | ) |
Class N | | | | (354,426 | ) | | | | (611,399 | ) | | | | (60,110 | ) | | | | (267,873 | ) |
| | | | |
Total Distributions to Shareholders | | | | (3,803,679 | ) | | | | (5,581,183 | ) | | | | (13,292,308 | ) | | | | (9,826,720 | ) |
| | | | |
NET SHARE TRANSACTIONS | | | | | | | | | | | | | | | | | | | | |
Class I | | | | (225,152,334 | ) | | | | 255,573,863 | | | | | 173,886,471 | | | | | 417,362,128 | |
Class N | | | | (26,163,834 | ) | | | | 1,711,831 | | | | | (14,557,603 | ) | | | | (11,374,663 | ) |
Increase (Decrease) in Net Assets Resulting from Net Share Transactions | | | | (251,316,168 | ) | | | | 257,285,694 | | | | | 159,328,868 | | | | | 405,987,465 | |
| | | | |
Total Increase (Decrease) in Net Assets | | | $ | (368,050,625 | ) | | | $ | 228,619,836 | | | | $ | 149,561,290 | | | | $ | 377,193,345 | |
| | | | |
NET ASSETS | | | | | | | | | | | | | | | | | | | | |
Beginning of Period | | | $ | 510,209,965 | | | | $ | 281,590,129 | | | | $ | 1,069,945,557 | | | | $ | 692,752,212 | |
End of Period | | | $ | 142,159,340 | | | | $ | 510,209,965 | | | | $ | 1,219,506,847 | | | | $ | 1,069,945,557 | |
| | | | | | |
| The accompanying notes are an integral part of these financial statements. | | Annual Report | | March 31, 2020 | | 113 |
| | |
| Statements of Changes in Net Assets (Cont.) | | March 31, 2020 |
| | | | | | | | | | | | | | | | | | | | |
| | | DoubleLine Infrastructure Income Fund | | DoubleLine Ultra Short Bond Fund |
| | | Year Ended
March 31, 2020 | | Year Ended
March 31, 2019 | | Year Ended
March 31, 2020 | | Year Ended
March 31, 2019 |
| | | | |
OPERATIONS | | | | | | | | | | | | | | | | | | | | |
Net Investment Income (Loss) | | | $ | 17,413,516 | | | | $ | 17,804,433 | | | | $ | 6,477,174 | | | | $ | 5,911,425 | |
Net Realized Gain (Loss) on Investments | | | | (510,106 | ) | | | | (1,975,791 | ) | | | | (374,682 | ) | | | | 110,903 | |
Net Change in Unrealized Appreciation (Depreciation) on Investments | | | | (29,049,988 | ) | | | | 7,430,751 | | | | | (5,061,714 | ) | | | | (23,777 | ) |
Net Increase (Decrease) in Net Assets Resulting from Operations | | | | (12,146,578 | ) | | | | 23,259,393 | | | | | 1,040,778 | | | | | 5,998,551 | |
| | | | |
DISTRIBUTIONS TO SHAREHOLDERS | | | | | | | | | | | | | | | | | | | | |
From Earnings | | | | | | | | | | | | | | | | | | | | |
Class I | | | | (17,600,022 | ) | | | | (17,370,012 | ) | | | | (6,503,652 | ) | | | | (5,942,421 | ) |
Class N | | | | (165,333 | ) | | | | (319,001 | ) | | | | (71,361 | ) | | | | (34,746 | ) |
| | | | |
Total Distributions to Shareholders | | | | (17,765,355 | ) | | | | (17,689,013 | ) | | | | (6,575,013 | ) | | | | (5,977,167 | ) |
| | | | |
NET SHARE TRANSACTIONS | | | | | | | | | | | | | | | | | | | | |
Class I | | | | (3,405,063 | ) | | | | (2,516,052 | ) | | | | 2,558,721 | | | | | 68,801,863 | |
Class N | | | | 7,953,615 | | | | | (16,544,178 | ) | | | | 332,444 | | | | | 2,239,031 | |
Increase (Decrease) in Net Assets Resulting from Net Share Transactions | | | | 4,548,552 | | | | | (19,060,230 | ) | | | | 2,891,165 | | | | | 71,040,894 | |
| | | | |
Total Increase (Decrease) in Net Assets | | | $ | (25,363,381 | ) | | | $ | (13,489,850 | ) | | | $ | (2,643,070 | ) | | | $ | 71,062,278 | |
| | | | |
NET ASSETS | | | | | | | | | | | | | | | | | | | | |
Beginning of Period | | | $ | 538,293,120 | | | | $ | 551,782,970 | | | | $ | 237,594,504 | | | | $ | 166,532,226 | |
End of Period | | | $ | 512,929,739 | | | | $ | 538,293,120 | | | | $ | 234,951,434 | | | | $ | 237,594,504 | |
| | | | | | |
| 114 | | DoubleLine Funds Trust | | | | The accompanying notes are an integral part of these financial statements. |
| | | | | | | | | | | | | | | | | | | | |
| | | DoubleLine Shiller Enhanced International CAPE® | | DoubleLine Colony Real Estate and Income Fund |
| | | Year Ended
March 31, 2020 | | Year Ended
March 31, 2019 | | Year Ended
March 31, 2020 | | Period Ended
March 31, 20191 |
| | | | |
OPERATIONS | | | | | | | | | | | | | | | | | | | | |
Net Investment Income (Loss) | | | $ | 1,719,992 | | | | $ | 2,465,169 | | | | $ | 3,119,147 | | | | $ | 692,911 | |
Net Realized Gain (Loss) on Investments | | | | (1,693,306 | ) | | | | (8,895,047 | ) | | | | (237,300 | ) | | | | 543,349 | |
Net Change in Unrealized Appreciation (Depreciation) on Investments | | | | (12,576,539 | ) | | | | 4,466,563 | | | | | (34,200,114 | ) | | | | 11,931,567 | |
Net Increase (Decrease) in Net Assets Resulting from Operations | | | | (12,549,853 | ) | | | | (1,963,315 | ) | | | | (31,318,267 | ) | | | | 13,167,827 | |
| | | | |
DISTRIBUTIONS TO SHAREHOLDERS | | | | | | | | | | | | | | | | | | | | |
From Earnings | | | | | | | | | | | | | | | | | | | | |
Class I | | | | (1,204,028 | ) | | | | (4,143,799 | ) | | | | (4,459,765 | ) | | | | (565,396 | ) |
Class N | | | | (498,498 | ) | | | | (1,977,256 | ) | | | | (168,896 | ) | | | | (10,513 | ) |
| | | | |
Total Distributions to Shareholders | | | | (1,702,526 | ) | | | | (6,121,055 | ) | | | | (4,628,661 | ) | | | | (575,909 | ) |
| | | | |
NET SHARE TRANSACTIONS | | | | | | | | | | | | | | | | | | | | |
Class I | | | | (4,716,661 | ) | | | | (30,024,572 | ) | | | | 7,642,413 | | | | | 108,790,913 | |
Class N | | | | (3,037,887 | ) | | | | (6,638,864 | ) | | | | 853,952 | | | | | 4,165,578 | |
Increase (Decrease) in Net Assets Resulting from Net Share Transactions | | | | (7,754,548 | ) | | | | (36,663,436 | ) | | | | 8,496,365 | | | | | 112,956,491 | |
| | | | |
Total Increase (Decrease) in Net Assets | | | $ | (22,006,927 | ) | | | $ | (44,747,806 | ) | | | $ | (27,450,563 | ) | | | $ | 125,548,409 | |
| | | | |
NET ASSETS | | | | | | | | | | | | | | | | | | | | |
Beginning of Period | | | $ | 62,573,666 | | | | $ | 107,321,472 | | | | $ | 125,548,409 | | | | $ | — | |
End of Period | | | $ | 40,566,739 | | | | $ | 62,573,666 | | | | $ | 98,097,846 | | | | $ | 125,548,409 | |
| 1 | Commenced operations on December 17, 2018. |
| | | | | | |
| The accompanying notes are an integral part of these financial statements. | | Annual Report | | March 31, 2020 | | 115 |
| | |
| Statements of Changes in Net Assets (Cont.) | | March 31, 2020 |
| | | | | | | | | | |
| | | DoubleLine
Emerging Markets Local
Currency Bond Fund | | DoubleLine Income Fund |
| | | Period Ended
March 31, 20201 | | Period Ended
March 31, 20202 |
|
| | |
OPERATIONS | | | | | | | | | | |
Net Investment Income (Loss) | | | $ | 253,879 | | | | $ | 1,970,211 | |
Net Realized Gain (Loss) on Investments | | | | (232,714 | ) | | | | (1,181,804 | ) |
Net Change in Unrealized Appreciation (Depreciation) on Investments | | | | (1,270,170 | ) | | | | (15,285,947 | ) |
Net Increase (Decrease) in Net Assets Resulting from Operations | | | | (1,249,005 | ) | | | | (14,497,540 | ) |
| | |
DISTRIBUTIONS TO SHAREHOLDERS | | | | | | | | | | |
From Earnings | | | | | | | | | | |
Class I | | | | (118,826 | ) | | | | (2,221,928 | ) |
Class N | | | | (1,016 | ) | | | | (14,393 | ) |
| | |
Total Distributions to Shareholders | | | | (119,842 | ) | | | | (2,236,321 | ) |
| | |
NET SHARE TRANSACTIONS | | | | | | | | | | |
Class I | | | | 10,018,826 | | | | | 86,164,537 | |
Class N | | | | 101,016 | | | | | 741,664 | |
Increase (Decrease) in Net Assets Resulting from Net Share Transactions | | | | 10,119,842 | | | | | 86,906,201 | |
| | |
Total Increase (Decrease) in Net Assets | | | $ | 8,750,995 | | | | $ | 70,172,340 | |
| | |
NET ASSETS | | | | | | | | | | |
Beginning of Period | | | $ | — | | | | $ | — | |
End of Period | | | $ | 8,750,995 | | | | $ | 70,172,340 | |
| 1 | Commenced operations on June 28, 2019. |
| 2 | Commenced operations on September 3, 2019. |
| | | | | | |
| 116 | | DoubleLine Funds Trust | | | | The accompanying notes are an integral part of these financial statements. |
| | | | | | | | | | | | | | | | | | | | | | | | | | | | | | | | | | | | | | | | | | | | | | | | | | | | | | | | | | |
| | | | | | | Income (Loss) from
Investment Operations: | | | Less Distributions: | | | | | | | | | | | | Ratios to Average Net Assets: | |
For the Year or Period Ended | | | Net Asset
Value,
Beginning
of Period | | | Net
Investment
Income
(Loss)1 | | | Net Gain
(Loss) on
Investments
(Realized and
Unrealized) | | | Total from
Investment
Operations | | | Distributions
from Net
Investment
Income | | | Distributions
from Net
Realized
Gain | | | Total
Distributions | | | Net Asset
Value,
End of
Period | | | Total Return3 | | | Net Assets,
End of Period (000’s) | | | Expenses
Before
Advisory Fees
(Waived) and Other Fees (Reimbursed)/ Recouped4 | | | Expenses After
Investment
Advisory Fees
(Waived)4 | | | Expenses After
Advisory Fees
(Waived) and Other Fees (Reimbursed)/ Recouped4 | | | Net Investment
Income (Loss)4 | |
|
| | DoubleLine Total Return Bond Fund - Class I: | |
| | 3/31/2020 | | | $ | 10.53 | | | | 0.34 | | | | (0.03 | ) | | | 0.31 | | | | (0.38 | ) | | | — | | | | (0.38 | ) | | $ | 10.46 | | | | 2.97 | % | | $ | 44,623,760 | | | | 0.49 | % | | | 0.48 | % | | | 0.48 | % | | | 3.28 | % |
| | 3/31/2019 | | | $ | 10.48 | | | | 0.36 | | | | 0.08 | | | | 0.44 | | | | (0.39 | ) | | | — | | | | (0.39 | ) | | $ | 10.53 | | | | 4.31 | % | | $ | 43,682,910 | | | | 0.48 | % | | | 0.48 | % | | | 0.48 | % | | | 3.39 | % |
| | 3/31/2018 | | | $ | 10.63 | | | | 0.32 | | | | (0.09 | ) | | | 0.23 | | | | (0.38 | ) | | | — | | | | (0.38 | ) | | $ | 10.48 | | | | 2.19 | % | | $ | 42,992,354 | | | | 0.47 | % | | | 0.47 | % | | | 0.47 | % | | | 3.04 | % |
| | 3/31/2017 | | | $ | 10.87 | | | | 0.27 | | | | (0.11 | ) | | | 0.16 | | | | (0.40 | ) | | | — | | | | (0.40 | ) | | $ | 10.63 | | | | 1.46 | % | | $ | 44,379,730 | | | | 0.47 | % | | | 0.47 | % | | | 0.47 | % | | | 2.45 | % |
| | 3/31/2016 | | | $ | 11.04 | | | | 0.35 | | | | (0.09 | ) | | | 0.26 | | | | (0.43 | ) | | | — | | | | (0.43 | ) | | $ | 10.87 | | | | 2.45 | % | | $ | 46,082,294 | | | | 0.47 | % | | | 0.47 | % | | | 0.47 | % | | | 3.29 | % |
|
| | DoubleLine Total Return Bond Fund - Class N: | |
| | 3/31/2020 | | | $ | 10.53 | | | | 0.32 | | | | (0.03 | ) | | | 0.29 | | | | (0.36 | ) | | | — | | | | (0.36 | ) | | $ | 10.46 | | | | 2.71 | % | | $ | 6,552,760 | | | | 0.73 | % | | | 0.73 | % | | | 0.73 | % | | | 3.03 | % |
| | 3/31/2019 | | | $ | 10.48 | | | | 0.33 | | | | 0.08 | | | | 0.41 | | | | (0.36 | ) | | | — | | | | (0.36 | ) | | $ | 10.53 | | | | 4.05 | % | | $ | 6,831,035 | | | | 0.73 | % | | | 0.73 | % | | | 0.73 | % | | | 3.14 | % |
| | 3/31/2018 | | | $ | 10.63 | | | | 0.30 | | | | (0.09 | ) | | | 0.21 | | | | (0.36 | ) | | | — | | | | (0.36 | ) | | $ | 10.48 | | | | 1.93 | % | | $ | 8,427,611 | | | | 0.72 | % | | | 0.72 | % | | | 0.72 | % | | | 2.79 | % |
| | 3/31/2017 | | | $ | 10.87 | | | | 0.24 | | | | (0.11 | ) | | | 0.13 | | | | (0.37 | ) | | | — | | | | (0.37 | ) | | $ | 10.63 | | | | 1.21 | % | | $ | 9,974,264 | | | | 0.72 | % | | | 0.72 | % | | | 0.72 | % | | | 2.20 | % |
| | 3/31/2016 | | | $ | 11.04 | | | | 0.33 | | | | (0.09 | ) | | | 0.24 | | | | (0.41 | ) | | | — | | | | (0.41 | ) | | $ | 10.87 | | | | 2.20 | % | | $ | 11,750,754 | | | | 0.72 | % | | | 0.72 | % | | | 0.72 | % | | | 3.04 | % |
|
| | DoubleLine Total Return Bond Fund - Class R6: | |
| | 3/31/2020 | 2 | | $ | 10.66 | | | | 0.24 | | | | (0.18 | ) | | | 0.06 | | | | (0.26 | ) | | | — | | | | (0.26 | ) | | $ | 10.46 | | | | 0.52 | % | | $ | 65,403 | | | | 0.45 | % | | | 0.45 | % | | | 0.45 | % | | | 3.33 | % |
| | | | | | | | | | |
| | | | | | | | | | | | | | | | | | | | | | | | | | | | | | | For the Year or Period Ended | |
| | | | | | | | | | | | | | | | | | | | | | | | | | | | | | | 3/31/2020 | | | 3/31/2019 | | | 3/31/2018 | | | 3/31/2017 | | | 3/31/2016 | |
| | Portfolio turnover rate for all share classes3 | | | | | | | | | | | | | | | | 31% | | | | 28% | | | | 22% | | | | 22% | | | | 15% | |
|
| 1 Calculated based on average shares outstanding during the period.
2 Commenced operations on July 31, 2019. Total return is based on operations for a period that is less than one year. 3 Not annualized for periods less than one year. 4 Annualized for periods less than one year. |
|
| | | | | | | |
| | | | | | | Income (Loss) from
Investment Operations: | | | Less Distributions: | | | | | | | | | | | | Ratios to Average Net Assets: | |
For the Year or Period Ended | | | Net Asset
Value,
Beginning
of Period | | | Net
Investment
Income
(Loss)1 | | | Net Gain
(Loss) on
Investments
(Realized and
Unrealized) | | | Total from
Investment
Operations | | | Distributions
from Net
Investment
Income | | | Distributions
from Net
Realized
Gain | | | Total
Distributions | | | Net Asset
Value,
End of
Period | | | Total
Return3 | | | Net Assets, End of Period
(000’s) | | | Expenses
Before
Advisory Fees
(Waived) and Other Fees (Reimbursed)/ Recouped4 | | | Expenses After
Investment
Advisory Fees (Waived)4 | | | Expenses After Advisory Fees
(Waived) and Other Fees (Reimbursed)/ Recouped4 | | | Net Investment
Income (Loss)4 | |
|
| | DoubleLine Core Fixed Income Fund - Class I: | |
| | 3/31/2020 | | | $ | 10.83 | | | | 0.36 | | | | (0.20 | ) | | | 0.16 | | | | (0.37 | ) | | | — | | | | (0.37 | ) | | $ | 10.62 | | | | 1.42 | % | | $ | 10,724,409 | | | | 0.47 | % | | | 0.41 | % | | | 0.41 | % | | | 3.30 | % |
| | 3/31/2019 | | | $ | 10.81 | | | | 0.37 | | | | 0.02 | | | | 0.39 | | | | (0.37 | ) | | | — | | | | (0.37 | ) | | $ | 10.83 | | | | 3.71 | % | | $ | 10,672,087 | | | | 0.47 | % | | | 0.42 | % | | | 0.42 | % | | | 3.42 | % |
| | 3/31/2018 | | | $ | 10.86 | | | | 0.31 | | | | (0.04 | ) | | | 0.27 | | | | (0.32 | ) | | | — | | | | (0.32 | ) | | $ | 10.81 | | | | 2.51 | % | | $ | 9,381,508 | | | | 0.47 | % | | | 0.42 | % | | | 0.42 | % | | | 2.86 | % |
| | 3/31/2017 | | | $ | 10.87 | | | | 0.29 | | | | 0.01 | | | | 0.30 | | | | (0.31 | ) | | | — | | | | (0.31 | ) | | $ | 10.86 | | | | 2.80 | % | | $ | 7,034,665 | | | | 0.47 | % | | | 0.44 | % | | | 0.44 | % | | | 2.72 | % |
| | 3/31/2016 | | | $ | 11.10 | | | | 0.36 | | | | (0.22 | ) | | | 0.14 | | | | (0.37 | ) | | | — | | | | (0.37 | ) | | $ | 10.87 | | | | 1.31 | % | | $ | 5,114,336 | | | | 0.47 | % | | | 0.46 | % | | | 0.46 | % | | | 3.17 | % |
|
| | DoubleLine Core Fixed Income Fund - Class N: | |
| | 3/31/2020 | | | $ | 10.82 | | | | 0.34 | | | | (0.20 | ) | | | 0.14 | | | | (0.35 | ) | | | — | | | | (0.35 | ) | | $ | 10.61 | | | | 1.17 | % | | $ | 706,970 | | | | 0.72 | % | | | 0.66 | % | | | 0.66 | % | | | 3.05 | % |
| | 3/31/2019 | | | $ | 10.80 | | | | 0.34 | | | | 0.02 | | | | 0.36 | | | | (0.34 | ) | | | — | | | | (0.34 | ) | | $ | 10.82 | | | | 3.45 | % | | $ | 841,190 | | | | 0.72 | % | | | 0.67 | % | | | 0.67 | % | | | 3.15 | % |
| | 3/31/2018 | | | $ | 10.85 | | | | 0.29 | | | | (0.04 | ) | | | 0.25 | | | | (0.30 | ) | | | — | | | | (0.30 | ) | | $ | 10.80 | | | | 2.26 | % | | $ | 1,025,318 | | | | 0.72 | % | | | 0.67 | % | | | 0.67 | % | | | 2.61 | % |
| | 3/31/2017 | | | $ | 10.86 | | | | 0.27 | | | | 0.01 | | | | 0.28 | | | | (0.29 | ) | | | — | | | | (0.29 | ) | | $ | 10.85 | | | | 2.54 | % | | $ | 1,074,854 | | | | 0.72 | % | | | 0.69 | % | | | 0.69 | % | | | 2.47 | % |
| | 3/31/2016 | | | $ | 11.10 | | | | 0.32 | | | | (0.22 | ) | | | 0.10 | | | | (0.34 | ) | | | — | | | | (0.34 | ) | | $ | 10.86 | | | | 0.97 | % | | $ | 952,919 | | | | 0.72 | % | | | 0.71 | % | | | 0.71 | % | | | 2.92 | % |
|
| | DoubleLine Core Fixed Income Fund - Class R6: | |
| | 3/31/2020 | 2 | | $ | 11.05 | | | | 0.24 | | | | (0.42 | ) | | | (0.18 | ) | | | (0.25 | ) | | | — | | | | (0.25 | ) | | $ | 10.62 | | | | (1.72 | )% | | $ | 112,911 | | | | 0.45 | % | | | 0.39 | % | | | 0.39 | % | | | 3.26 | % |
| | | | | | | | | | |
| | | | | | | | | | | | | | | | | | | | | | | | | | | | | | | For the Year or Period Ended | |
| | | | | | | | | | | | | | | | | | | | | | | | | | | | | | | 3/31/2020 | | | 3/31/2019 | | | 3/31/2018 | | | 3/31/2017 | | | 3/31/2016 | |
| | Portfolio turnover rate for all share classes3 | | | | | | | | | | | | | | | | 43% | | | | 66% | | | | 77% | | | | 81% | | | | 70% | |
|
| 1 Calculated based on average shares outstanding during the period.
2 Commenced operations on July 31, 2019. Total return is based on operations for a period that is less than one year. 3 Not annualized for periods less than one year. 4 Annualized for periods less than one year. |
|
| | | | | | |
| The accompanying notes are an integral part of these financial statements. | | Annual Report | | March 31, 2020 | | 117 |
| | |
| Financial Highlights (Cont.) | | |
| | | | | | | | | | | | | | | | | | | | | | | | | | | | | | | | | | | | | | | | | | | | | | | | | | | | | | | | | | |
| | | | | | | Income (Loss) from
Investment Operations: | | | Less Distributions: | | | | | | | | | | | | Ratios to Average Net Assets: | |
For the Year or Period
Ended | | | Net Asset
Value,
Beginning
of Period | | | Net
Investment
Income
(Loss)1 | | | Net Gain
(Loss) on
Investments
(Realized and
Unrealized) | | | Total from
Investment
Operations | | | Distributions
from Net
Investment
Income | | | Distributions
from Net
Realized
Gain | | | Total
Distributions | | | Net Asset
Value,
End of
Period | | | Total
Return | | | Net Assets,
End of Period
(000’s) | | | Expenses
Before
Advisory Fees
(Waived) and
Other Fees (Reimbursed)/ Recouped | | | Expenses
After
Investment
Advisory
Fees
(Waived) | | | Expenses
After
Advisory Fees
(Waived) and
Other Fees (Reimbursed)/ Recouped | | | Net
Investment
Income
(Loss) | |
|
| | DoubleLine Emerging Markets Fixed Income Fund - Class I: | |
| | 3/31/2020 | | | $ | 10.34 | | | | 0.49 | | | | (1.51 | ) | | | (1.02 | ) | | | (0.49 | ) | | | — | | | | (0.49 | ) | | $ | 8.83 | | | | (10.43 | )% | | $ | 755,648 | | | | 0.90 | % | | | 0.90 | % | | | 0.90 | % | | | 4.69 | % |
| | 3/31/2019 | | | $ | 10.42 | | | | 0.41 | | | | (0.06 | ) | | | 0.35 | | | | (0.41 | ) | | | (0.02 | ) | | | (0.43 | ) | | $ | 10.34 | | | | 3.52 | % | | $ | 943,368 | | | | 0.89 | % | | | 0.89 | % | | | 0.89 | % | | | 3.99 | % |
| | 3/31/2018 | | | $ | 10.50 | | | | 0.33 | | | | 0.02 | | | | 0.35 | | | | (0.34 | ) | | | (0.09 | ) | | | (0.43 | ) | | $ | 10.42 | | | | 3.30 | % | | $ | 937,978 | | | | 0.88 | % | | | 0.88 | % | | | 0.88 | % | | | 3.12 | % |
| | 3/31/2017 | | | $ | 9.68 | | | | 0.45 | | | | 0.81 | | | | 1.26 | | | | (0.44 | ) | | | — | | | | (0.44 | ) | | $ | 10.50 | | | | 13.19 | % | | $ | 775,961 | | | | 0.92 | % | | | 0.92 | % | | | 0.92 | % | | | 4.28 | % |
| | 3/31/2016 | | | $ | 10.23 | | | | 0.49 | | | | (0.54 | ) | | | (0.05 | ) | | | (0.50 | ) | | | — | | | | (0.50 | ) | | $ | 9.68 | | | | (0.48 | )% | | $ | 548,221 | | | | 0.90 | % | | | 0.90 | % | | | 0.90 | % | | | 4.92 | % |
|
| | DoubleLine Emerging Markets Fixed Income Fund - Class N: | |
| | 3/31/2020 | | | $ | 10.34 | | | | 0.47 | | | | (1.51 | ) | | | (1.04 | ) | | | (0.47 | ) | | | — | | | | (0.47 | ) | | $ | 8.83 | | | | (10.68 | )% | | $ | 122,727 | | | | 1.15 | % | | | 1.15 | % | | | 1.15 | % | | | 4.46 | % |
| | 3/31/2019 | | | $ | 10.43 | | | | 0.37 | | | | (0.06 | ) | | | 0.31 | | | | (0.38 | ) | | | (0.02 | ) | | | (0.40 | ) | | $ | 10.34 | | | | 3.16 | % | | $ | 164,101 | | | | 1.14 | % | | | 1.14 | % | | | 1.14 | % | | | 3.66 | % |
| | 3/31/2018 | | | $ | 10.50 | | | | 0.31 | | | | 0.02 | | | | 0.33 | | | | (0.31 | ) | | | (0.09 | ) | | | (0.40 | ) | | $ | 10.43 | | | | 3.14 | % | | $ | 197,564 | | | | 1.13 | % | | | 1.13 | % | | | 1.13 | % | | | 2.93 | % |
| | 3/31/2017 | | | $ | 9.68 | | | | 0.42 | | | | 0.81 | | | | 1.23 | | | | (0.41 | ) | | | — | | | | (0.41 | ) | | $ | 10.50 | | | | 12.91 | % | | $ | 231,087 | | | | 1.17 | % | | | 1.17 | % | | | 1.17 | % | | | 4.03 | % |
| | 3/31/2016 | | | $ | 10.23 | | | | 0.46 | | | | (0.54 | ) | | | (0.08 | ) | | | (0.47 | ) | | | — | | | | (0.47 | ) | | $ | 9.68 | | | | (0.73 | )% | | $ | 201,290 | | | | 1.15 | % | | | 1.15 | % | | | 1.15 | % | | | 4.67 | % |
| | | | | | | | | | |
| | | | | | | | | | | | | | | | | | | | | | | | | | | | | | | For the Year or Period Ended | |
| | | | | | | | | | | | | | | | | | | | | | | | | | | | | | | 3/31/2020 | | | 3/31/2019 | | | 3/31/2018 | | | 3/31/2017 | | | 3/31/2016 | |
| | Portfolio turnover rate for all share classes | | | | | | | | | | | | | | | | 37% | | | | 66% | | | | 78% | | | | 108% | | | | 75% | |
|
| 1 Calculated based on average shares outstanding during the period.
|
|
| | | | | | | |
| | | | | | | Income (Loss) from
Investment Operations: | | | Less Distributions: | | | | | | | | | | | | Ratios to Average Net Assets: | |
For the Year or Period
Ended | | | Net Asset
Value,
Beginning
of Period | | | Net
Investment
Income
(Loss)1 | | | Net Gain
(Loss) on
Investments
(Realized and
Unrealized) | | | Total from
Investment
Operations | | | Distributions
from Net
Investment
Income | | | Distributions
from Net
Realized
Gain | | | Total
Distributions | | | Net Asset
Value,
End of
Period | | | Total
Return2 | | | Net Assets,
End of Period (000’s) | | | Expenses
Before
Advisory Fees
(Waived) and
Other Fees (Reimbursed)/ Recouped | | | Expenses
After
Investment
Advisory
Fees (Waived) | | | Expenses
After
Advisory Fees
(Waived) and
Other Fees (Reimbursed)/ Recouped | | | Net
Investment
Income
(Loss) | |
|
| | DoubleLine Multi-Asset Growth Fund (Consolidated) - Class I: | |
| | 3/31/2020 | | | $ | 9.17 | | | | 0.20 | | | | (1.30 | ) | | | (1.10 | ) | | | (0.30 | ) | | | — | | | | (0.30 | ) | | $ | 7.77 | | | | (12.32 | )% | | $ | 16,739 | | | | 1.22 | % | | | 1.09 | % | | | 1.00 | % | | | 2.53 | % |
| | 3/31/2019 | | | $ | 9.43 | | | | 0.24 | | | | (0.21 | ) | | | 0.03 | | | | (0.29 | ) | | | — | | | | (0.29 | ) | | $ | 9.17 | | | | 0.42 | % | | $ | 44,493 | | | | 1.12 | % | | | 1.00 | % | | | 1.03 | % | | | 2.58 | % |
| | 3/31/2018 | | | $ | 9.84 | | | | 0.23 | | | | 0.43 | | | | 0.66 | | | | (0.27 | ) | | | (0.80 | ) | | | (1.07 | ) | | $ | 9.43 | | | | 6.80 | % | | $ | 63,651 | | | | 1.12 | % | | | 1.01 | % | | | 1.02 | % | | | 2.31 | % |
| | 3/31/2017 | | | $ | 8.85 | | | | 0.18 | | | | 1.09 | | | | 1.27 | | | | (0.28 | ) | | | — | | | | (0.28 | ) | | $ | 9.84 | | | | 14.63 | % | | $ | 49,380 | | | | 1.21 | % | | | 1.10 | % | | | 1.09 | % | | | 1.87 | % |
| | 3/31/2016 | | | $ | 9.81 | | | | 0.24 | | | | (0.65 | ) | | | (0.41 | ) | | | (0.44 | ) | | | (0.11 | ) | | | (0.55 | ) | | $ | 8.85 | | | | (4.29 | )% | | $ | 42,075 | | | | 1.25 | % | | | 1.12 | % | | | 1.07 | % | | | 2.72 | % |
|
| | DoubleLine Multi-Asset Growth Fund (Consolidated) - Class A: | |
| | 3/31/2020 | | | $ | 9.13 | | | | 0.20 | | | | (1.30 | ) | | | (1.10 | ) | | | (0.28 | ) | | | — | | | | (0.28 | ) | | $ | 7.75 | | | | (12.42 | )% | | $ | 19,548 | | | | 1.38 | % | | | 1.27 | % | | | 1.26 | % | | | 2.13 | % |
| | 3/31/2019 | | | $ | 9.40 | | | | 0.21 | | | | (0.21 | ) | | | — | | | | (0.27 | ) | | | — | | | | (0.27 | ) | | $ | 9.13 | | | | 0.07 | % | | $ | 177,602 | | | | 1.37 | % | | | 1.24 | % | | | 1.28 | % | | | 2.28 | % |
| | 3/31/2018 | | | $ | 9.81 | | | | 0.21 | | | | 0.43 | | | | 0.64 | | | | (0.25 | ) | | | (0.80 | ) | | | (1.05 | ) | | $ | 9.40 | | | | 6.57 | % | | $ | 153,986 | | | | 1.37 | % | | | 1.26 | % | | | 1.27 | % | | | 2.08 | % |
| | 3/31/2017 | | | $ | 8.83 | | | | 0.15 | | | | 1.09 | | | | 1.24 | | | | (0.26 | ) | | | — | | | | (0.26 | ) | | $ | 9.81 | | | | 14.27 | % | | $ | 119,435 | | | | 1.46 | % | | | 1.35 | % | | | 1.34 | % | | | 1.62 | % |
| | 3/31/2016 | | | $ | 9.78 | | | | 0.22 | | | | (0.65 | ) | | | (0.43 | ) | | | (0.41 | ) | | | (0.11 | ) | | | (0.52 | ) | | $ | 8.83 | | | | (4.42 | )% | | $ | 113,806 | | | | 1.50 | % | | | 1.37 | % | | | 1.32 | % | | | 2.47 | % |
| | | | | | | | | | |
| | | | | | | | | | | | | | | | | | | | | | | | | | | | | | | For the Year or Period Ended | |
| | | | | | | | | | | | | | | | | | | | | | | | | | | | | | | 3/31/2020 | | | 3/31/2019 | | | 3/31/2018 | | | 3/31/2017 | | | 3/31/2016 | |
| | Portfolio turnover rate for all share classes | | | | | | | | | | | | | | | | 13% | | | | 45% | | | | 83% | | | | 59% | | | | 56% | |
|
| 1 Calculated based on average shares outstanding during the period.
2 Total return does not include the effects of sales charges for Class A. |
|
| | | | | | |
| 118 | | DoubleLine Funds Trust | | | | The accompanying notes are an integral part of these financial statements. |
| | | | | | | | | | | | | | | | | | | | | | | | | | | | | | | | | | | | | | | | | | | | | | | | | | | | | | | | | | |
| | | | | | | Income (Loss) from
Investment Operations: | | | Less Distributions: | | | | | | | | | | | | Ratios to Average Net Assets: | |
For the
Year or
Period
Ended | | | Net Asset
Value,
Beginning
of Period | | | Net
Investment
Income
(Loss)1 | | | Net Gain
(Loss) on
Investments
(Realized and
Unrealized) | | | Total from
Investment
Operations | | | Distributions
from Net
Investment
Income | | | Distributions
from Net
Realized
Gain | | | Total
Distributions | | | Net Asset
Value,
End of
Period | | | Total
Return3 | | | Net Assets,
End of Period
(000’s) | | | Expenses
Before
Advisory Fees
(Waived) and
Other Fees
(Reimbursed)/ Recouped4 | | | Expenses
After
Investment
Advisory
Fees
(Waived)4 | | | Expenses
After
Advisory Fees
(Waived) and
Other Fees
(Reimbursed)/ Recouped4 | | | Net Investment
Income (Loss)4 | |
|
| | DoubleLine Low Duration Bond Fund - Class I: | |
| | 3/31/2020 | | | $ | 9.97 | | | | 0.30 | | | | (0.45 | ) | | | (0.15 | ) | | | (0.31 | ) | | | — | | | | (0.31 | ) | | $ | 9.51 | | | | (1.59 | )% | | $ | 5,296,795 | | | | 0.42 | % | | | 0.41 | % | | | 0.41 | % | | | 3.05 | % |
| | 3/31/2019 | | | $ | 9.97 | | | | 0.31 | | | | — | | | | 0.31 | | | | (0.31 | ) | | | — | | | | (0.31 | ) | | $ | 9.97 | | | | 3.13 | % | | $ | 5,455,532 | | | | 0.42 | % | | | 0.41 | % | | | 0.41 | % | | | 3.10 | % |
| | 3/31/2018 | | | $ | 10.04 | | | | 0.22 | | | | (0.04 | ) | | | 0.18 | | | | (0.25 | ) | | | — | | | | (0.25 | ) | | $ | 9.97 | | | | 1.82 | % | | $ | 4,069,943 | | | | 0.42 | % | | | 0.41 | % | | | 0.41 | % | | | 2.26 | % |
| | 3/31/2017 | | | $ | 9.99 | | | | 0.24 | | | | 0.06 | | | | 0.30 | | | | (0.25 | ) | | | — | | | | (0.25 | ) | | $ | 10.04 | | | | 2.99 | % | | $ | 2,756,498 | | | | 0.43 | % | | | 0.42 | % | | | 0.42 | % | | | 2.25 | % |
| | 3/31/2016 | | | $ | 10.14 | | | | 0.22 | | | | (0.12 | ) | | | 0.10 | | | | (0.25 | ) | | | — | | | | (0.25 | ) | | $ | 9.99 | | | | 1.00 | % | | $ | 1,722,942 | | | | 0.43 | % | | | 0.42 | % | | | 0.43 | % | | | 2.30 | % |
|
| | DoubleLine Low Duration Bond Fund - Class N: | |
| | 3/31/2020 | | | $ | 9.96 | | | | 0.28 | | | | (0.45 | ) | | | (0.17 | ) | | | (0.29 | ) | | | — | | | | (0.29 | ) | | $ | 9.50 | | | | (1.84 | )% | | $ | 1,483,316 | | | | 0.67 | % | | | 0.66 | % | | | 0.66 | % | | | 2.80 | % |
| | 3/31/2019 | | | $ | 9.96 | | | | 0.28 | | | | — | | | | 0.28 | | | | (0.28 | ) | | | — | | | | (0.28 | ) | | $ | 9.96 | | | | 2.87 | % | | $ | 1,480,796 | | | | 0.67 | % | | | 0.66 | % | | | 0.66 | % | | | 2.83 | % |
| | 3/31/2018 | | | $ | 10.03 | | | | 0.20 | | | | (0.04 | ) | | | 0.16 | | | | (0.23 | ) | | | — | | | | (0.23 | ) | | $ | 9.96 | | | | 1.57 | % | | $ | 1,438,903 | | | | 0.67 | % | | | 0.66 | % | | | 0.66 | % | | | 1.99 | % |
| | 3/31/2017 | | | $ | 9.99 | | | | 0.20 | | | | 0.06 | | | | 0.26 | | | | (0.22 | ) | | | — | | | | (0.22 | ) | | $ | 10.03 | | | | 2.64 | % | | $ | 1,540,448 | | | | 0.68 | % | | | 0.67 | % | | | 0.67 | % | | | 2.00 | % |
| | 3/31/2016 | | | $ | 10.13 | | | | 0.21 | | | | (0.12 | ) | | | 0.09 | | | | (0.23 | ) | | | — | | | | (0.23 | ) | | $ | 9.99 | | | | 0.85 | % | | $ | 1,162,303 | | | | 0.68 | % | | | 0.67 | % | | | 0.68 | % | | | 2.05 | % |
|
| | DoubleLine Low Duration Bond Fund - Class R6: | |
| | 3/31/2020 | 2 | | $ | 10.03 | | | | 0.20 | | | | (0.52 | ) | | | (0.32 | ) | | | (0.20 | ) | | | — | | | | (0.20 | ) | | $ | 9.51 | | | | (3.25 | )% | | $ | 369 | | | | 0.39 | % | | | 0.38 | % | | | 0.38 | % | | | 2.98 | % |
| | | | | | | | | | |
| | | | | | �� | | | | | | | | | | | | | | | | | | | | | | | | | For the Year or Period Ended | |
| | | | | | | | | | | | | | | | | | | | | | | | | | | | | | | 3/31/2020 | | | 3/31/2019 | | | 3/31/2018 | | | 3/31/2017 | | | 3/31/2016 | |
| | Portfolio turnover rate for all share classes3 | | | | | | | | | | | | | | | | 60% | | | | 54% | | | | 62% | | | | 69% | | | | 66% | |
|
| 1 Calculated based on average shares outstanding during the period.
2 Commenced operations on July 31, 2019. Total return is based on operations for a period that is less than one year. 3 Not annualized for periods less than one year. 4 Annualized for periods less than one year. |
|
| | | | | | | |
| | | | | | | Income (Loss) from
Investment Operations: | | | Less Distributions: | | | | | | | | | | | | Ratios to Average Net Assets: | |
For the Year or
Period
Ended | | | Net Asset
Value,
Beginning
of Period | | | Net
Investment
Income
(Loss)1 | | | Net Gain
(Loss) on
Investments
(Realized and
Unrealized) | | | Total from
Investment
Operations | | | Distributions
from Net
Investment
Income | | | Distributions
from Net
Realized
Gain | | | Total
Distributions | | | Net Asset
Value,
End of
Period | | | Total
Return | | | Net Assets,
End of Period
(000’s) | | | Expenses
Before
Advisory Fees
(Waived) and
Other Fees
(Reimbursed)/
Recouped | | | Expenses
After
Investment
Advisory
Fees
(Waived) | | | Expenses
After
Advisory Fees
(Waived) and
Other Fees
(Reimbursed)/ Recouped | | | Net
Investment
Income
(Loss) | |
|
| | DoubleLine Floating Rate Fund - Class I: | |
| | 3/31/2020 | | | $ | 9.65 | | | | 0.47 | | | | (1.20 | ) | | | (0.73 | ) | | | (0.48 | ) | | | — | | | | (0.48 | ) | | $ | 8.44 | | | | (7.99 | )% | | $ | 150,892 | | | | 0.70 | % | | | 0.70 | % | | | 0.70 | % | | | 4.84 | % |
| | 3/31/2019 | | | $ | 9.94 | | | | 0.49 | | | | (0.28 | ) | | | 0.21 | | | | (0.50 | ) | | | — | | | | (0.50 | ) | | $ | 9.65 | | | | 2.15 | % | | $ | 358,062 | | | | 0.64 | % | | | 0.64 | % | | | 0.64 | % | | | 5.00 | % |
| | 3/31/2018 | | | $ | 9.90 | | | | 0.41 | | | | 0.02 | | | | 0.43 | | | | (0.39 | ) | | | — | | | | (0.39 | ) | | $ | 9.94 | | | | 4.39 | % | | $ | 428,379 | | | | 0.65 | % | | | 0.65 | % | | | 0.65 | % | | | 3.98 | % |
| | 3/31/2017 | | | $ | 9.77 | | | | 0.35 | | | | 0.13 | | | | 0.48 | | | | (0.35 | ) | | | — | | | | (0.35 | ) | | $ | 9.90 | | | | 4.99 | % | | $ | 297,060 | | | | 0.68 | % | | | 0.68 | % | | | 0.68 | % | | | 3.60 | % |
| | 3/31/2016 | | | $ | 10.14 | | | | 0.36 | | | | (0.36 | ) | | | — | | | | (0.37 | ) | | | — | | | | (0.37 | ) | | $ | 9.77 | | | | 0.02 | % | | $ | 229,612 | | | | 0.65 | % | | | 0.65 | % | | | 0.65 | % | | | 3.70 | % |
|
| | DoubleLine Floating Rate Fund - Class N: | |
| | 3/31/2020 | | | $ | 9.67 | | | | 0.44 | | | | (1.20 | ) | | | (0.76 | ) | | | (0.46 | ) | | | — | | | | (0.46 | ) | | $ | 8.45 | | | | (8.32 | )% | | $ | 51,646 | | | | 0.95 | % | | | 0.95 | % | | | 0.95 | % | | | 4.59 | % |
| | 3/31/2019 | | | $ | 9.95 | | | | 0.47 | | | | (0.28 | ) | | | 0.19 | | | | (0.47 | ) | | | — | | | | (0.47 | ) | | $ | 9.67 | | | | 1.99 | % | | $ | 116,374 | | | | 0.88 | % | | | 0.88 | % | | | 0.88 | % | | | 4.74 | % |
| | 3/31/2018 | | | $ | 9.92 | | | | 0.37 | | | | 0.02 | | | | 0.39 | | | | (0.36 | ) | | | — | | | | (0.36 | ) | | $ | 9.95 | | | | 4.02 | % | | $ | 145,289 | | | | 0.90 | % | | | 0.90 | % | | | 0.90 | % | | | 3.71 | % |
| | 3/31/2017 | | | $ | 9.79 | | | | 0.33 | | | | 0.13 | | | | 0.46 | | | | (0.33 | ) | | | — | | | | (0.33 | ) | | $ | 9.92 | | | | 4.73 | % | | $ | 130,944 | | | | 0.93 | % | | | 0.93 | % | | | 0.93 | % | | | 3.35 | % |
| | 3/31/2016 | | | $ | 10.16 | | | | 0.34 | | | | (0.36 | ) | | | (0.02 | ) | | | (0.35 | ) | | | — | | | | (0.35 | ) | | $ | 9.79 | | | | (0.23 | )% | | $ | 72,281 | | | | 0.90 | % | | | 0.90 | % | | | 0.90 | % | | | 3.45 | % |
| | | | | | | | | | |
| | | | | | | | | | | | | | | | | | | | | | | | | | | | | | | For the Year or Period Ended | |
| | | | | | | | | | | | | | | | | | | | | | | | | | | | | | | 3/31/2020 | | | 3/31/2019 | | | 3/31/2018 | | | 3/31/2017 | | | 3/31/2016 | |
| | Portfolio turnover rate for all share classes | | | | | | | | | | | | | | | | 58% | | | | 88% | | | | 77% | | | | 106% | | | | 70% | |
|
| 1 Calculated based on average shares outstanding during the period.
|
|
| | | | | | |
| The accompanying notes are an integral part of these financial statements. | | Annual Report | | March 31, 2020 | | 119 |
| | |
| Financial Highlights (Cont.) | | |
| | | | | | | | | | | | | | | | | | | | | | | | | | | | | | | | | | | | | | | | | | | | | | | | | | | | | | | | | | |
| | | | | | | Income (Loss) from
Investment Operations: | | | Less Distributions: | | | | | | | | | | | | Ratios to Average Net Assets: | |
For the Year or Period Ended | | | Net Asset
Value,
Beginning
of Period | | | Net
Investment
Income
(Loss)1 | | | Net Gain
(Loss) on
Investments
(Realized and
Unrealized) | | | Total from
Investment
Operations | | | Distributions
from Net
Investment
Income | | | Distributions
from Net
Realized
Gain | | | Total
Distributions | | | Net Asset
Value,
End of
Period | | | Total Return3 | | | Net Assets, End of Period
(000’s) | | | Expenses
Before
Advisory Fees
(Waived) and
Other Fees (Reimbursed)/ Recouped4 | | | Expenses After
Investment
Advisory Fees (Waived)4 | | | Expenses After Advisory Fees
(Waived) and
Other Fees (Reimbursed)/ Recouped4 | | | Net Investment
Income (Loss)4 | |
|
| | DoubleLine Shiller Enhanced CAPE® - Class I: | |
| | 3/31/2020 | | | $ | 14.81 | | | | 0.42 | | | | (2.72 | ) | | | (2.30 | ) | | | (0.43 | ) | | | (0.39 | ) | | | (0.82 | ) | | $ | 11.69 | | | | (16.78 | )% | | $ | 4,633,848 | | | | 0.55 | % | | | 0.54 | % | | | 0.54 | % | | | 2.70 | % |
| | 3/31/2019 | | | $ | 15.16 | | | | 0.45 | | | | 1.19 | | | | 1.64 | | | | (0.46 | ) | | | (1.53 | ) | | | (1.99 | ) | | $ | 14.81 | | | | 11.78 | % | | $ | 4,577,386 | | | | 0.56 | % | | | 0.55 | % | | | 0.55 | % | | | 2.99 | % |
| | 3/31/2018 | | | $ | 14.76 | | | | 0.35 | | | | 1.46 | | | | 1.81 | | | | (0.35 | ) | | | (1.06 | ) | | | (1.41 | ) | | $ | 15.16 | | | | 12.40 | % | | $ | 4,013,700 | | | | 0.55 | % | | | 0.54 | % | | | 0.54 | % | | | 2.17 | % |
| | 3/31/2017 | | | $ | 12.32 | | | | 0.27 | | | | 2.72 | | | | 2.99 | | | | (0.28 | ) | | | (0.27 | ) | | | (0.55 | ) | | $ | 14.76 | | | | 24.75 | % | | $ | 2,432,725 | | | | 0.55 | % | | | 0.55 | % | | | 0.60 | % | | | 2.01 | % |
| | 3/31/2016 | | | $ | 12.13 | | | | 0.32 | | | | 0.40 | | | | 0.72 | | | | (0.34 | ) | | | (0.19 | ) | | | (0.53 | ) | | $ | 12.32 | | | | 6.09 | % | | $ | 673,308 | | | | 0.63 | % | | | 0.63 | % | | | 0.63 | % | | | 2.66 | % |
|
| | DoubleLine Shiller Enhanced CAPE® - Class N: | |
| | 3/31/2020 | | | $ | 14.80 | | | | 0.38 | | | | (2.72 | ) | | | (2.34 | ) | | | (0.39 | ) | | | (0.39 | ) | | | (0.78 | ) | | $ | 11.68 | | | | (17.00 | )% | | $ | 1,246,723 | | | | 0.80 | % | | | 0.79 | % | | | 0.79 | % | | | 2.46 | % |
| | 3/31/2019 | | | $ | 15.14 | | | | 0.42 | | | | 1.19 | | | | 1.61 | | | | (0.42 | ) | | | (1.53 | ) | | | (1.95 | ) | | $ | 14.80 | | | | 11.59 | % | | $ | 1,236,075 | | | | 0.81 | % | | | 0.80 | % | | | 0.80 | % | | | 2.75 | % |
| | 3/31/2018 | | | $ | 14.75 | | | | 0.30 | | | | 1.46 | | | | 1.76 | | | | (0.31 | ) | | | (1.06 | ) | | | (1.37 | ) | | $ | 15.14 | | | | 12.06 | % | | $ | 1,042,563 | | | | 0.80 | % | | | 0.79 | % | | | 0.79 | % | | | 1.91 | % |
| | 3/31/2017 | | | $ | 12.31 | | | | 0.24 | | | | 2.72 | | | | 2.96 | | | | (0.25 | ) | | | (0.27 | ) | | | (0.52 | ) | | $ | 14.75 | | | | 24.48 | % | | $ | 758,400 | | | | 0.80 | % | | | 0.80 | % | | | 0.85 | % | | | 1.76 | % |
| | 3/31/2016 | | | $ | 12.12 | | | | 0.29 | | | | 0.40 | | | | 0.69 | | | | (0.31 | ) | | | (0.19 | ) | | | (0.50 | ) | | $ | 12.31 | | | | 5.84 | % | | $ | 186,985 | | | | 0.88 | % | | | 0.88 | % | | | 0.88 | % | | | 2.41 | % |
|
| | DoubleLine Shiller Enhanced CAPE® - Class R6: | |
| | 3/31/2020 | 2 | | $ | 15.69 | | | | 0.27 | | | | (3.59 | ) | | | (3.32 | ) | | | (0.28 | ) | | | (0.39 | ) | | | (0.67 | ) | | $ | 11.70 | | | | (22.15 | )% | | $ | 124 | | | | 0.49 | % | | | 0.48 | % | | | 0.48 | % | | | 2.60 | % |
| | | | | | | | | | |
| | | | | | | | | | | | | | | | | | | | | | | | | | | | | | | For the Year or Period Ended | |
| | | | | | | | | | | | | | | | | | | | | | | | | | | | | | | 3/31/2020 | | | 3/31/2019 | | | 3/31/2018 | | | 3/31/2017 | | | 3/31/2016 | |
| | Portfolio turnover rate for all share classes3 | | | | | | | | | | | | | | | | 62% | | | | 55% | | | | 60% | | | | 68% | | | | 67% | |
|
| 1 Calculated based on average shares outstanding during the period.
2 Commenced operations on July 31, 2019. Total return is based on operations for a period that is less than one year. 3 Not annualized for periods less than one year. 4 Annualized for periods less than one year. |
|
| | | | | | | |
| | | | | | | Income (Loss) from
Investment Operations: | | | Less Distributions: | | | | | | | | | | | | Ratios to Average Net Assets: | |
For the Year or Period Ended | | | Net Asset
Value,
Beginning
of Period | | | Net
Investment
Income
(Loss)1 | | | Net Gain
(Loss) on
Investments
(Realized and
Unrealized) | | | Total from
Investment
Operations | | | Distributions
from Net
Investment
Income | | | Distributions
from Net
Realized
Gain | | | Total
Distributions | | | Net Asset
Value,
End of
Period | | | Total Return2 | | | Net Assets, End of Period
(000’s) | | | Expenses
Before
Advisory Fees
(Waived) and
Other Fees (Reimbursed)/ Recouped3 | | | Expenses After
Investment
Advisory Fees (Waived)3 | | | Expenses After Advisory Fees
(Waived) and
Other Fees (Reimbursed)/ Recouped3 | | | Net Investment
Income (Loss)3 | |
|
| | DoubleLine Flexible Income Fund - Class I: | |
| | 3/31/2020 | | | $ | 9.65 | | | | 0.39 | | | | (1.22 | ) | | | (0.83 | ) | | | (0.42 | ) | | | — | | | | (0.42 | ) | | $ | 8.40 | | | | (9.06 | )% | | $ | 874,594 | | | | 0.73 | % | | | 0.69 | % | | | 0.69 | % | | | 4.12 | % |
| | 3/31/2019 | | | $ | 9.81 | | | | 0.42 | | | | (0.14 | ) | | | 0.28 | | | | (0.44 | ) | | | — | | | | (0.44 | ) | | $ | 9.65 | | | | 2.95 | % | | $ | 1,088,368 | | | | 0.74 | % | | | 0.72 | % | | | 0.72 | % | | | 4.26 | % |
| | 3/31/2018 | | | $ | 9.82 | | | | 0.35 | | | | 0.03 | | | | 0.38 | | | | (0.39 | ) | | | — | | | | (0.39 | ) | | $ | 9.81 | | | | 3.94 | % | | $ | 1,007,491 | | | | 0.76 | % | | | 0.74 | % | | | 0.77 | % | | | 3.61 | % |
| | 3/31/2017 | | | $ | 9.55 | | | | 0.32 | | | | 0.29 | | | | 0.61 | | | | (0.34 | ) | | | — | | | | (0.34 | ) | | $ | 9.82 | | | | 6.48 | % | | $ | 593,153 | | | | 0.80 | % | | | 0.76 | % | | | 0.76 | % | | | 3.36 | % |
| | 3/31/2016 | | | $ | 9.99 | | | | 0.36 | | | | (0.40 | ) | | | (0.04 | ) | | | (0.40 | ) | | | — | | | | (0.40 | ) | | $ | 9.55 | | | | (0.43 | )% | | $ | 160,590 | | | | 0.87 | % | | | 0.82 | % | | | 0.77 | % | | | 3.75 | % |
|
| | DoubleLine Flexible Income Fund - Class N: | |
| | 3/31/2020 | | | $ | 9.64 | | | | 0.37 | | | | (1.22 | ) | | | (0.85 | ) | | | (0.40 | ) | | | — | | | | (0.40 | ) | | $ | 8.39 | | | | (9.30 | )% | | $ | 230,033 | | | | 0.98 | % | | | 0.94 | % | | | 0.94 | % | | | 3.83 | % |
| | 3/31/2019 | | | $ | 9.81 | | | | 0.39 | | | | (0.14 | ) | | | 0.25 | | | | (0.42 | ) | | | — | | | | (0.42 | ) | | $ | 9.64 | | | | 2.59 | % | | $ | 207,491 | | | | 0.99 | % | | | 0.97 | % | | | 0.97 | % | | | 4.01 | % |
| | 3/31/2018 | | | $ | 9.82 | | | | 0.33 | | | | 0.03 | | | | 0.36 | | | | (0.37 | ) | | | — | | | | (0.37 | ) | | $ | 9.81 | | | | 3.69 | % | | $ | 195,093 | | | | 1.01 | % | | | 0.99 | % | | | 1.02 | % | | | 3.36 | % |
| | 3/31/2017 | | | $ | 9.55 | | | | 0.30 | | | | 0.29 | | | | 0.59 | | | | (0.32 | ) | | | — | | | | (0.32 | ) | | $ | 9.82 | | | | 6.23 | % | | $ | 147,095 | | | | 1.05 | % | | | 1.01 | % | | | 1.01 | % | | | 3.11 | % |
| | 3/31/2016 | | | $ | 9.99 | | | | 0.34 | | | | (0.40 | ) | | | (0.06 | ) | | | (0.38 | ) | | | — | | | | (0.38 | ) | | $ | 9.55 | | | | (0.66 | )% | | $ | 62,880 | | | | 1.12 | % | | | 1.07 | % | | | 1.02 | % | | | 3.50 | % |
|
| | DoubleLine Flexible Income Fund - Class R6: | |
| | 3/31/2020 | 4 | | $ | 9.74 | | | | 0.25 | | | | (1.32 | ) | | | (1.07 | ) | | | (0.27 | ) | | | — | | | | (0.27 | ) | | $ | 8.40 | | | | (11.26 | )% | | $ | 89 | | | | 0.68 | % | | | 0.65 | % | | | 0.65 | % | | | 3.91 | % |
| | | | | | | | | | |
| | | | | | | | | | | | | | | | | | | | | | | | | | | | | | | For the Year or Period Ended | |
| | | | | | | | | | | | | | | | | | | | | | | | | | | | | | | 3/31/2020 | | | 3/31/2019 | | | 3/31/2018 | | | 3/31/2017 | | | 3/31/2016 | |
| | Portfolio turnover rate for all share classes2 | | | | | | | | | | | | | | | | 41% | | | | 44% | | | | 41% | | | | 58% | | | | 42% | |
|
| 1 Calculated based on average shares outstanding during the period.
2 Not annualized for periods less than one year. 3 Annualized for periods less than one year. 4 Commenced operations on July 31, 2019. Total return is based on operations for a period that is less than one year. |
|
| | | | | | |
| 120 | | DoubleLine Funds Trust | | | | The accompanying notes are an integral part of these financial statements. |
| | | | | | | | | | | | | | | | | | | | | | | | | | | | | | | | | | | | | | | | | | | | | | | | | | | | | | | | | | |
| | | | | | | Income (Loss) from
Investment Operations: | | | Less Distributions: | | | | | | | | | | | | Ratios to Average Net Assets: | |
For the Year or Period Ended | | | Net Asset
Value,
Beginning
of Period | | | Net
Investment
Income
(Loss)1 | | | Net Gain
(Loss) on
Investments
(Realized and
Unrealized) | | | Total from
Investment
Operations | | | Distributions
from Net
Investment
Income | | | Distributions
from Net
Realized
Gain | | | Total
Distributions | | | Net Asset
Value,
End of
Period | | | Total Return | | | Net Assets, End of Period
(000’s) | | | Expenses
Before
Advisory Fees
(Waived) and
Other Fees (Reimbursed)/ Recouped | | | Expenses After
Investment
Advisory Fees
(Waived) | | | Expenses
After
Advisory Fees
(Waived) and
Other Fees (Reimbursed)/ Recouped | | | Net Investment
Income (Loss) | |
|
| | DoubleLine Low Duration Emerging Markets Fixed Income Fund - Class I: | |
| | 3/31/2020 | | | $ | 9.80 | | | | 0.32 | | | | (0.36 | ) | | | (0.04 | ) | | | (0.32 | ) | | | (0.08 | ) | | | (0.40 | ) | | $ | 9.36 | | | | (0.62 | )% | | $ | 180,730 | | | | 0.63 | % | | | 0.63 | % | | | 0.59 | % | | | 3.24 | % |
| | 3/31/2019 | | | $ | 9.70 | | | | 0.28 | | | | 0.12 | | | | 0.40 | | | | (0.29 | ) | | | (0.01 | ) | | | (0.30 | ) | | $ | 9.80 | | | | 4.22 | % | | $ | 197,585 | | | | 0.65 | % | | | 0.65 | % | | | 0.59 | % | | | 3.02 | % |
| | 3/31/2018 | | | $ | 9.85 | | | | 0.24 | | | | (0.11 | ) | | | 0.13 | | | | (0.26 | ) | | | (0.02 | ) | | | (0.28 | ) | | $ | 9.70 | | | | 1.37 | % | | $ | 142,174 | | | | 0.89 | % | | | 0.89 | % | | | 0.59 | % | | | 2.50 | % |
| | 3/31/2017 | | | $ | 9.59 | | | | 0.29 | | | | 0.27 | | | | 0.56 | | | | (0.29 | ) | | | (0.01 | ) | | | (0.30 | ) | | $ | 9.85 | | | | 5.95 | % | | $ | 133,047 | | | | 0.74 | % | | | 0.74 | % | | | 0.59 | % | | | 3.03 | % |
| | 3/31/2016 | | | $ | 9.83 | | | | 0.33 | | | | (0.23 | ) | | | 0.10 | | | | (0.34 | ) | | | — | | | | (0.34 | ) | | $ | 9.59 | | | | 1.06 | % | | $ | 66,797 | | | | 0.84 | % | | | 0.84 | % | | | 0.59 | % | | | 3.44 | % |
|
| | DoubleLine Low Duration Emerging Markets Fixed Income Fund - Class N: | |
| | 3/31/2020 | | | $ | 9.81 | | | | 0.30 | | | | (0.36 | ) | | | (0.06 | ) | | | (0.29 | ) | | | (0.08 | ) | | | (0.37 | ) | | $ | 9.38 | | | | (0.77 | )% | | $ | 16,922 | | | | 0.88 | % | | | 0.88 | % | | | 0.84 | % | | | 3.03 | % |
| | 3/31/2019 | | | $ | 9.71 | | | | 0.25 | | | | 0.12 | | | | 0.37 | | | | (0.26 | ) | | | (0.01 | ) | | | (0.27 | ) | | $ | 9.81 | | | | 3.93 | % | | $ | 24,075 | | | | 0.93 | % | | | 0.93 | % | | | 0.84 | % | | | 2.54 | % |
| | 3/31/2018 | | | $ | 9.86 | | | | 0.22 | | | | (0.11 | ) | | | 0.11 | | | | (0.24 | ) | | | (0.02 | ) | | | (0.26 | ) | | $ | 9.71 | | | | 1.10 | % | | $ | 57,856 | | | | 1.14 | % | | | 1.14 | % | | | 0.84 | % | | | 2.25 | % |
| | 3/31/2017 | | | $ | 9.60 | | | | 0.27 | | | | 0.27 | | | | 0.54 | | | | (0.27 | ) | | | (0.01 | ) | | | (0.28 | ) | | $ | 9.86 | | | | 5.69 | % | | $ | 216,718 | | | | 0.99 | % | | | 0.99 | % | | | 0.84 | % | | | 2.78 | % |
| | 3/31/2016 | | | $ | 9.84 | | | | 0.31 | | | | (0.23 | ) | | | 0.08 | | | | (0.32 | ) | | | — | | | | (0.32 | ) | | $ | 9.60 | | | | 0.82 | % | | $ | 118,802 | | | | 1.09 | % | | | 1.09 | % | | | 0.84 | % | | | 3.19 | % |
| | | | | | | | | | |
| | | | | | | | | | | | | | | | | | | | | | | | | | | | | | | For the Year or Period Ended | |
| | | | | | | | | | | | | | | | | | | | | | | | | | | | | | | 3/31/2020 | | | 3/31/2019 | | | 3/31/2018 | | | 3/31/2017 | | | 3/31/2016 | |
| | Portfolio turnover rate for all share classes | | | | | | | | | | | | | | | | | | | | | | | | | | | | 65% | | | | 42% | | | | 37% | | | | 61% | | | | 39% | |
|
| 1 Calculated based on average shares outstanding during the period.
|
|
| | | | | | | |
| | | | | | | Income (Loss) from Investment
Operations: | | | Less Distributions: | | | | | | | | | | | | Ratios to Average Net Assets: | |
For the Year or Period
Ended | | | Net Asset
Value,
Beginning
of Period | | | Net
Investment
Income
(Loss)1 | | | Net Gain
(Loss) on
Investments
(Realized and
Unrealized) | | | Total from
Investment
Operations | | | Distributions
from Net
Investment
Income | | | Distributions
from Net
Realized
Gain | | | Total
Distributions | | | Net Asset
Value,
End of
Period | | | Total
Return | | | Net Assets,
End of Period (000’s) | | | Expenses
Before
Advisory Fees
(Waived) and
Other Fees (Reimbursed)/ Recouped | | | Expenses
After
Investment
Advisory
Fees
(Waived) | | | Expenses
After
Advisory Fees
(Waived) and
Other Fees (Reimbursed)/ Recouped | | | Net
Investment
Income
(Loss) | |
|
| | DoubleLine Long Duration Total Return Bond Fund - Class I: | |
| | 3/31/2020 | | | $ | 9.88 | | | | 0.28 | | | | 2.11 | | | | 2.39 | | | | (0.27 | ) | | | (0.25 | ) | | | (0.52 | ) | | $ | 11.75 | | | | 24.85 | % | | $ | 87,469 | | | | 0.68 | % | | | 0.68 | % | | | 0.65 | % | | | 2.55 | % |
| | 3/31/2019 | | | $ | 9.73 | | | | 0.29 | | | | 0.16 | | | | 0.45 | | | | (0.30 | ) | | | — | | | | (0.30 | ) | | $ | 9.88 | | | | 4.77 | % | | $ | 66,226 | | | | 0.70 | % | | | 0.70 | % | | | 0.65 | % | | | 3.15 | % |
| | 3/31/2018 | | | $ | 9.79 | | | | 0.33 | | | | (0.06 | ) | | | 0.27 | | | | (0.33 | ) | | | — | | | | (0.33 | ) | | $ | 9.73 | | | | 2.74 | % | | $ | 55,357 | | | | 0.81 | % | | | 0.81 | % | | | 0.65 | % | | | 3.33 | % |
| | 3/31/2017 | | | $ | 10.40 | | | | 0.32 | | | | (0.60 | ) | | | (0.28 | ) | | | (0.33 | ) | | | — | | | | (0.33 | ) | | $ | 9.79 | | | | (2.82 | )% | | $ | 50,465 | | | | 0.76 | % | | | 0.76 | % | | | 0.65 | % | | | 3.13 | % |
| | 3/31/2016 | | | $ | 10.43 | | | | 0.29 | | | | (0.02 | ) | | | 0.27 | | | | (0.29 | ) | | | (0.01 | ) | | | (0.30 | ) | | $ | 10.40 | | | | 2.76 | % | | $ | 56,843 | | | | 0.84 | % | | | 0.84 | % | | | 0.65 | % | | | 2.87 | % |
|
| | DoubleLine Long Duration Total Return Bond Fund - Class N: | |
| | 3/31/2020 | | | $ | 9.88 | | | | 0.24 | | | | 2.11 | | | | 2.35 | | | | (0.24 | ) | | | (0.25 | ) | | | (0.49 | ) | | $ | 11.74 | | | | 24.44 | % | | $ | 20,225 | | | | 0.93 | % | | | 0.93 | % | | | 0.90 | % | | | 2.31 | % |
| | 3/31/2019 | | | $ | 9.72 | | | | 0.27 | | | | 0.16 | | | | 0.43 | | | | (0.27 | ) | | | — | | | | (0.27 | ) | | $ | 9.88 | | | | 4.61 | % | | $ | 14,317 | | | | 0.95 | % | | | 0.95 | % | | | 0.90 | % | | | 2.90 | % |
| | 3/31/2018 | | | $ | 9.78 | | | | 0.30 | | | | (0.06 | ) | | | 0.24 | | | | (0.30 | ) | | | — | | | | (0.30 | ) | | $ | 9.72 | | | | 2.48 | % | | $ | 11,016 | | | | 1.06 | % | | | 1.06 | % | | | 0.90 | % | | | 3.06 | % |
| | 3/31/2017 | | | $ | 10.39 | | | | 0.29 | | | | (0.60 | ) | | | (0.31 | ) | | | (0.30 | ) | | | — | | | | (0.30 | ) | | $ | 9.78 | | | | (3.08 | )% | | $ | 11,276 | | | | 1.01 | % | | | 1.01 | % | | | 0.90 | % | | | 2.79 | % |
| | 3/31/2016 | | | $ | 10.42 | | | | 0.26 | | | | (0.02 | ) | | | 0.24 | | | | (0.26 | ) | | | (0.01 | ) | | | (0.27 | ) | | $ | 10.39 | | | | 2.51 | % | | $ | 25,763 | | | | 1.09 | % | | | 1.09 | % | | | 0.90 | % | | | 2.62 | % |
| | | | | | | | | | |
| | | | | | | | | | | | | | | | | | | | | | | | | | | | | | | For the Year or Period Ended | |
| | | | | | | | | | | | | | | | | | | | | | | | | | | | | | | 3/31/2020 | | | 3/31/2019 | | | 3/31/2018 | | | 3/31/2017 | | | 3/31/2016 | |
| | Portfolio turnover rate for all share classes | | | | | | | | | | | | | | | | | | | | | | | | | | | | 40% | | | | 25% | | | | 33% | | | | 94% | | | | 52% | |
|
| 1 Calculated based on average shares outstanding during the period.
|
|
| | | | | | |
| The accompanying notes are an integral part of these financial statements. | | Annual Report | | March 31, 2020 | | 121 |
| | |
| Financial Highlights (Cont.) | | |
| | | | | | | | | | | | | | | | | | | | | | | | | | | | | | | | | | | | | | | | | | | | | | | | | | | | | | | | | | | | | | | | | | | | | | | | | |
| | | | | Income (Loss) from
Investment Operations: | | Less Distributions: | | | | | | Ratios to Average Net Assets: |
For the Year or Period
Ended | | Net Asset
Value,
Beginning
of Period | | Net
Investment
Income
(Loss)1 | | Net Gain
(Loss) on
Investments
(Realized and
Unrealized) | | Total from
Investment
Operations | | Distributions
from Net
Investment
Income | | Distributions
from Net
Realized
Gain | | Total
Distributions | | Net Asset
Value,
End of
Period | | Total
Return3 | | Net Assets, End of Period
(000’s) | | Expenses
Before
Advisory Fees
(Waived) and
Other Fees
(Reimbursed)/ Recouped4 | | Expenses
After
Investment
Advisory Fees
(Waived)4 | | Expenses
After
Advisory Fees
(Waived) and
Other Fees
(Reimbursed)/ Recouped4 | | Net Investment
Income (Loss)4 |
|
| | | DoubleLine Strategic Commodity Fund (Consolidated) - Class I: | |
| | | 3/31/2020 | | | | $ | 9.72 | | | | | 0.07 | | | | | (2.78 | ) | | | | (2.71 | ) | | | | (0.10 | ) | | | | — | | | | | (0.10 | ) | | | $ | 6.91 | | | | | (28.25 | )% | | | $ | 116,739 | | | | | 1.09 | % | | | | 1.09 | % | | | | 1.10 | % | | | | 1.00 | % |
| | | 3/31/2019 | | | | $ | 10.11 | | | | | 0.12 | | | | | (0.40 | ) | | | | (0.28 | ) | | | | (0.11 | ) | | | | — | | | | | (0.11 | ) | | | $ | 9.72 | | | | | (2.59 | )% | | | $ | 444,918 | | | | | 1.02 | % | | | | 1.02 | % | | | | 1.10 | % | | | | 1.14 | % |
| | | 3/31/2018 | | | | $ | 9.33 | | | | | 0.04 | | | | | 1.27 | | | | | 1.31 | | | | | (0.53 | ) | | | | — | 5 | | | | (0.53 | ) | | | $ | 10.11 | | | | | 14.03 | % | | | $ | 213,752 | | | | | 1.16 | % | | | | 1.16 | % | | | | 1.10 | % | | | | 0.33 | % |
| | | 3/31/2017 | | | | $ | 8.69 | | | | | (0.06 | ) | | | | 0.75 | | | | | 0.69 | | | | | (0.05 | ) | | | | — | | | | | (0.05 | ) | | | $ | 9.33 | | | | | 7.93 | % | | | $ | 22,243 | | | | | 1.77 | % | | | | 1.77 | % | | | | 1.10 | % | | | | (0.75 | )% |
| | | 3/31/2016 | 2 | | | $ | 10.00 | | | | | (0.07 | ) | | | | (1.24 | ) | | | | (1.31 | ) | | | | — | | | | | — | 5 | | | | — | 5 | | | $ | 8.69 | | | | | (13.07 | )% | | | $ | 27,997 | | | | | 4.42 | % | | | | 4.42 | % | | | | 1.06 | % | | | | (1.05 | )% |
|
| | | DoubleLine Strategic Commodity Fund (Consolidated) - Class N: | |
| | | 3/31/2020 | | | | $ | 9.65 | | | | | 0.07 | | | | | (2.78 | ) | | | | (2.71 | ) | | | | (0.07 | ) | | | | — | | | | | (0.07 | ) | | | $ | 6.87 | | | | | (28.28 | )% | | | $ | 25,421 | | | | | 1.34 | % | | | | 1.34 | % | | | | 1.35 | % | | | | 0.75 | % |
| | | 3/31/2019 | | | | $ | 10.04 | | | | | 0.09 | | | | | (0.40 | ) | | | | (0.31 | ) | | | | (0.08 | ) | | | | — | | | | | (0.08 | ) | | | $ | 9.65 | | | | | (2.97 | )% | | | $ | 65,292 | | | | | 1.27 | % | | | | 1.27 | % | | | | 1.35 | % | | | | 0.87 | % |
| | | 3/31/2018 | | | | $ | 9.28 | | | | | 0.01 | | | | | 1.27 | | | | | 1.28 | | | | | (0.52 | ) | | | | — | 5 | | | | (0.52 | ) | | | $ | 10.04 | | | | | 13.79 | % | | | $ | 67,838 | | | | | 1.41 | % | | | | 1.41 | % | | | | 1.35 | % | | | | 0.09 | % |
| | | 3/31/2017 | | | | $ | 8.67 | | | | | (0.09 | ) | | | | 0.75 | | | | | 0.66 | | | | | (0.05 | ) | | | | — | | | | | (0.05 | ) | | | $ | 9.28 | | | | | 7.55 | % | | | $ | 6,540 | | | | | 2.23 | % | | | | 2.23 | % | | | | 1.35 | % | | | | (1.00 | )% |
| | | 3/31/2016 | 2 | | | $ | 10.00 | | | | | (0.09 | ) | | | | (1.24 | ) | | | | (1.33 | ) | | | | — | | | | | — | 5 | | | | — | 5 | | | $ | 8.67 | | | | | (13.27 | )% | | | $ | 1,421 | | | | | 4.67 | % | | | | 4.67 | % | | | | 1.31 | % | | | | (1.30 | )% |
| | | | | | | | | | |
| | | | | | | | | | | | | | | | | | | | | For the Year or Period Ended |
| | | | | | | | | | | | | | | | | | | | | 3/31/2020 | | 3/31/2019 | | 3/31/2018 | | 3/31/2017 | | 3/31/2016 |
| | | Portfolio turnover rate for all share classes3 | | | | | | | | | | | | | | | | | | | | | | | | | | | | | | | | | | | 0% | | | | | 0% | | | | | 0% | | | | | 0% | | | | | 0% | |
|
| |
| 1 Calculated based on average shares outstanding during the period.
2 Commenced operations on May 18, 2015. 3 Not annualized for periods less than one year. 4 Annualized for periods less than one year. 5 Less than $0.005 per share. |
|
| | | | | | | | | | | | | | | | | | | | | | | | | | | | | | | | | | | | | | | | | | | | | | | | | | | | | | | | | | | | | | | | | | | | | | | | | | | | | | |
| | | | | | | |
| | | | | Income (Loss) from
Investment Operations: | | Less Distributions: | | | | | | | | Ratios to Average Net Assets: |
For the Year or
Period
Ended | | Net Asset
Value,
Beginning
of Period | | Net
Investment
Income
(Loss)1 | | Net Gain
(Loss) on
Investments
(Realized and
Unrealized) | | Total from
Investment
Operations | | Distributions
from Net
Investment
Income | | Distributions
from Net
Realized
Gain | | Distributions
from Return
of Capital | | Total
Distributions | | Net Asset
Value,
End of
Period | | Total
Return3 | | Net Assets,
End of Period
(000’s) | | Expenses
Before
Advisory Fees
(Waived) and
Other Fees (Reimbursed)/ Recouped4 | | Expenses
After
Investment
Advisory
Fees (Waived)4 | | Expenses
After
Advisory Fees
(Waived) and
Other Fees (Reimbursed)/ Recouped4 | | Net
Investment
Income
(Loss)4 |
|
| | | DoubleLine Global Bond Fund - Class I: | |
| | | 3/31/2020 | | | | $ | 10.28 | | | | | 0.15 | | | | | (0.10 | ) | | | | 0.05 | | | | | (0.12 | ) | | | | — | 5 | | | | — | | | | | (0.12 | ) | | | $ | 10.21 | | | | | 0.43 | % | | | $ | 1,217,100 | | | | | 0.55 | % | | | | 0.55 | % | | | | 0.55 | % | | | | 1.34 | % |
| | | 3/31/2019 | | | | $ | 10.71 | | | | | 0.12 | | | | | (0.42 | ) | | | | (0.30 | ) | | | | (0.13 | ) | | | | — | | | | | — | | | | | (0.13 | ) | | | $ | 10.28 | | | | | (2.80 | )% | | | $ | 1,053,218 | | | | | 0.55 | % | | | | 0.55 | % | | | | 0.55 | % | | | | 1.22 | % |
| | | 3/31/2018 | | | | $ | 10.04 | | | | | 0.09 | | | | | 0.72 | | | | | 0.81 | | | | | (0.14 | ) | | | | — | | | | | — | | | | | (0.14 | ) | | | $ | 10.71 | | | | | 7.96 | % | | | $ | 663,208 | | | | | 0.56 | % | | | | 0.56 | % | | | | 0.56 | % | | | | 0.82 | % |
| | | 3/31/2017 | | | | $ | 10.49 | | | | | 0.05 | | | | | (0.47 | ) | | | | (0.42 | ) | | | | (0.02 | ) | | | | — | | | | | (0.01 | ) | | | | (0.03 | ) | | | $ | 10.04 | | | | | (4.00 | )% | | | $ | 475,328 | | | | | 0.66 | % | | | | 0.66 | % | | | | 0.66 | % | | | | 0.52 | % |
| | | 3/31/2016 | 2 | | | $ | 10.00 | | | | | 0.02 | | | | | 0.49 | | | | | 0.51 | | | | | (0.02 | ) | | | | — | | | | | — | | | | | (0.02 | ) | | | $ | 10.49 | | | | | 5.11 | % | | | $ | 94,631 | | | | | 1.29 | % | | | | 1.29 | % | | | | 0.70 | % | | | | 0.83 | % |
|
| | | DoubleLine Global Bond Fund - Class N: | |
| | | 3/31/2020 | | | | $ | 10.26 | | | | | 0.12 | | | | | (0.10 | ) | | | | 0.02 | | | | | (0.07 | ) | | | | — | 5 | | | | — | | | | | (0.07 | ) | | | $ | 10.21 | | | | | 0.23 | % | | | $ | 2,407 | | | | | 0.80 | % | | | | 0.80 | % | | | | 0.80 | % | | | | 1.13 | % |
| | | 3/31/2019 | | | | $ | 10.69 | | | | | 0.09 | | | | | (0.42 | ) | | | | (0.33 | ) | | | | (0.10 | ) | | | | — | | | | | — | | | | | (0.10 | ) | | | $ | 10.26 | | | | | (3.08 | )% | | | $ | 16,728 | | | | | 0.80 | % | | | | 0.80 | % | | | | 0.80 | % | | | | 0.89 | % |
| | | 3/31/2018 | | | | $ | 10.02 | | | | | 0.06 | | | | | 0.72 | | | | | 0.78 | | | | | (0.11 | ) | | | | — | | | | | — | | | | | (0.11 | ) | | | $ | 10.69 | | | | | 7.77 | % | | | $ | 29,544 | | | | | 0.81 | % | | | | 0.81 | % | | | | 0.81 | % | | | | 0.57 | % |
| | | 3/31/2017 | | | | $ | 10.49 | | | | | 0.02 | | | | | (0.47 | ) | | | | (0.45 | ) | | | | (0.01 | ) | | | | — | | | | | (0.01 | ) | | | | (0.02 | ) | | | $ | 10.02 | | | | | (4.31 | )% | | | $ | 24,058 | | | | | 0.91 | % | | | | 0.91 | % | | | | 0.91 | % | | | | 0.20 | % |
| | | 3/31/2016 | 2 | | | $ | 10.00 | | | | | 0.02 | | | | | 0.49 | | | | | 0.51 | | | | | (0.02 | ) | | | | — | | | | | — | | | | | (0.02 | ) | | | $ | 10.49 | | | | | 5.07 | % | | | $ | 41,937 | | | | | 1.54 | % | | | | 1.54 | % | | | | 0.95 | % | | | | 0.58 | % |
| | | | | | | | | | | |
| | | | | | | | | | | | | | | | | | | | | | | For the Year or Period Ended |
| | | | | | | | | | | | | | | | | | | | | | | 3/31/2020 | | 3/31/2019 | | 3/31/2018 | | 3/31/2017 | | 3/31/2016 |
| |
| Portfolio turnover rate for all share
classes3 |
| | | | | | | | | | | | | | | | | | | | | | | | | | | | | | | | | | | | | | | 21% | | | | | 24% | | | | | 16% | | | | | 57% | | | | | 13% | |
|
| |
| 1 Calculated based on average shares outstanding during the period.
2 Commenced operations on December 17, 2015. 3 Not annualized for periods less than one year. 4 Annualized for periods less than one year. 5 Less than $0.005 per share. |
|
| | | | | | |
| 122 | | DoubleLine Funds Trust | | | | The accompanying notes are an integral part of these financial statements. |
| | | | | | | | | | | | | | | | | | | | | | | | | | | | | | | | | | | | | | | | | | | | | | | | | | | | | | | | | | |
| | | | | | | Income (Loss) from
Investment Operations: | | | Less Distributions: | | | | | | | | | | | | Ratios to Average Net Assets: | |
For the Year or
Period
Ended | | | Net Asset
Value,
Beginning
of Period | | | Net
Investment
Income
(Loss)1 | | | Net Gain
(Loss) on
Investments
(Realized and
Unrealized) | | | Total from
Investment
Operations | | | Distributions
from Net
Investment
Income | | | Distributions
from Net
Realized
Gain | | | Total
Distributions | | | Net Asset
Value,
End of
Period | | | Total
Return3 | | | Net Assets,
End of Period
(000’s) | | | Expenses
Before
Advisory Fees
(Waived) and
Other Fees
(Reimbursed)/ Recouped4 | | | Expenses
After
Investment
Advisory
Fees
(Waived)4 | | | Expenses
After
Advisory Fees
(Waived) and
Other Fees
(Reimbursed)/ Recouped4 | | | Net
Investment
Income
(Loss)4 | |
| | | | |
| | DoubleLine Infrastructure Income Fund - Class I: | | | | | | | | | | | | | | | | | |
| | 3/31/2020 | | | $ | 10.11 | | | | 0.33 | | | | (0.54 | ) | | | (0.21 | ) | | | (0.34 | ) | | | — | | | | (0.34 | ) | | $ | 9.56 | | | | (2.32 | )% | | $ | 503,146 | | | | 0.56 | % | | | 0.56 | % | | | 0.56 | % | | | 3.19 | % |
| | 3/31/2019 | | | $ | 10.00 | | | | 0.32 | | | | 0.11 | | | | 0.43 | | | | (0.32 | ) | | | — | 5 | | | (0.32 | ) | | $ | 10.11 | | | | 4.47 | % | | $ | 535,621 | | | | 0.58 | % | | | 0.58 | % | | | 0.58 | % | | | 3.30 | % |
| | 3/31/2018 | | | $ | 10.07 | | | | 0.30 | | | | (0.03 | ) | | | 0.27 | | | | (0.33 | ) | | | (0.01 | ) | | | (0.34 | ) | | $ | 10.00 | | | | 2.67 | % | | $ | 532,404 | | | | 0.57 | % | | | 0.57 | % | | | 0.57 | % | | | 3.18 | % |
| | 3/31/2017 | 2 | | $ | 10.00 | | | | 0.29 | | | | 0.01 | | | | 0.30 | | | | (0.23 | ) | | | — | 5 | | | (0.23 | ) | | $ | 10.07 | | | | 3.11 | % | | $ | 392,117 | | | | 0.77 | % | | | 0.77 | % | | | 0.64 | % | | | 2.78 | % |
| | | | | |
| | DoubleLine Infrastructure Income Fund - Class N: | | | | | | | | | | | | | | | | | | | | | |
| | 3/31/2020 | | | $ | 10.11 | | | | 0.30 | | | | (0.54 | ) | | | (0.24 | ) | | | (0.31 | ) | | | — | | | | (0.31 | ) | | $ | 9.56 | | | | (2.55 | )% | | $ | 9,784 | | | | 0.81 | % | | | 0.81 | % | | | 0.81 | % | | | 2.93 | % |
| | 3/31/2019 | | | $ | 10.00 | | | | 0.30 | | | | 0.11 | | | | 0.41 | | | | (0.30 | ) | | | — | 5 | | | (0.30 | ) | | $ | 10.11 | | | | 4.17 | % | | $ | 2,672 | | | | 0.83 | % | | | 0.83 | % | | | 0.83 | % | | | 3.00 | % |
| | 3/31/2018 | | | $ | 10.06 | | | | 0.29 | | | | (0.03 | ) | | | 0.26 | | | | (0.31 | ) | | | (0.01 | ) | | | (0.32 | ) | | $ | 10.00 | | | | 2.54 | % | | $ | 19,379 | | | | 0.82 | % | | | 0.82 | % | | | 0.82 | % | | | 2.86 | % |
| | 3/31/2017 | 2 | | $ | 10.00 | | | | 0.26 | | | | 0.01 | | | | 0.27 | | | | (0.21 | ) | | | — | 5 | | | (0.21 | ) | | $ | 10.06 | | | | 2.76 | % | | $ | 567 | | | | 1.50 | % | | | 1.50 | % | | | 0.89 | % | | | 2.53 | % |
| | | | | | | | | | | |
| | | | | | | | | | | | | | | | | | | | | | | | | | | | | | | | | | For the Year or Period Ended | |
| | | | | | | | | | | | | | | | | | | | | | | | | | | | | | | | | | 3/31/2020 | | | 3/31/2019 | | | 3/31/2018 | | | 3/31/2017 | |
| | Portfolio turnover rate for all share classes3 | | | | | | | | | | | | | | | | | | | | | | | | | | | | | | | | 10% | | | | 15% | | | | 29% | | | | 43% | |
|
| 1 Calculated based on average shares outstanding during the period.
2 Commenced operations on April 1, 2016. 3 Not annualized for periods less than one year. 4 Annualized for periods less than one year. 5 Less than $0.005 per share. |
|
| | | | | | | |
| | | | | | | Income (Loss) from
Investment Operations: | | | Less Distributions: | | | | | | | | | | | | Ratios to Average Net Assets: | |
For the Year or
Period
Ended | | | Net Asset
Value,
Beginning
of Period | | | Net
Investment
Income
(Loss)1 | | | Net Gain
(Loss) on
Investments
(Realized and
Unrealized) | | | Total from
Investment
Operations | | | Distributions
from Net
Investment
Income | | | Distributions
from Net
Realized
Gain | | | Total
Distributions | | | Net Asset
Value,
End of
Period | | | Total
Return3 | | | Net Assets,
End of Period
(000’s) | | | Expenses
Before
Advisory Fees
(Waived) and
Other Fees
(Reimbursed)/ Recouped4 | | | Expenses
After
Investment
Advisory
Fees
(Waived)4 | | | Expenses
After
Advisory Fees
(Waived) and
Other Fees
(Reimbursed)/ Recouped4 | | | Net
Investment
Income
(Loss)4 | |
| | | | |
| | DoubleLine Ultra Short Bond Fund - Class I: | | | | | | | | | | | | | | | | | |
| | 3/31/2020 | | | $ | 10.03 | | | | 0.22 | | | | (0.22 | ) | | | — | | | | (0.22 | ) | | | — | 5 | | | (0.22 | ) | | $ | 9.81 | | | | (0.04 | )% | | $ | 232,159 | | | | 0.23 | % | | | 0.23 | % | | | 0.23 | % | | | 2.14 | % |
| | 3/31/2019 | | | $ | 10.03 | | | | 0.24 | | | | (0.01 | ) | | | 0.23 | | | | (0.23 | ) | | | — | 5 | | | (0.23 | ) | | $ | 10.03 | | | | 2.32 | % | | $ | 235,078 | | | | 0.22 | % | | | 0.22 | % | | | 0.22 | % | | | 2.28 | % |
| | 3/31/2018 | | | $ | 10.01 | | | | 0.13 | | | | — | | | | 0.13 | | | | (0.11 | ) | | | — | 5 | | | (0.11 | ) | | $ | 10.03 | | | | 1.31 | % | | $ | 166,255 | | | | 0.32 | % | | | 0.32 | % | | | 0.29 | % | | | 1.24 | % |
| | 3/31/2017 | 2 | | $ | 10.00 | | | | 0.03 | | | | 0.01 | | | | 0.04 | | | | (0.03 | ) | | | — | | | | (0.03 | ) | | $ | 10.01 | | | | 0.36 | % | | $ | 8,294 | | | | 4.87 | % | | | 4.87 | % | | | 0.35 | % | | | 0.42 | % |
| | | | | |
| | DoubleLine Ultra Short Bond Fund - Class N: | | | | | | | | | | | | | | | | | | | | | |
| | 3/31/2020 | | | $ | 10.04 | | | | 0.20 | | | | (0.22 | ) | | | (0.02 | ) | | | (0.19 | ) | | | — | 5 | | | (0.19 | ) | | $ | 9.83 | | | | (0.19 | )% | | $ | 2,793 | | | | 0.48 | % | | | 0.48 | % | | | 0.48 | % | | | 1.94 | % |
| | 3/31/2019 | | | $ | 10.03 | | | | 0.22 | | | | (0.01 | ) | | | 0.21 | | | | (0.20 | ) | | | — | 5 | | | (0.20 | ) | | $ | 10.04 | | | | 2.18 | % | | $ | 2,517 | | | | 0.47 | % | | | 0.47 | % | | | 0.47 | % | | | 2.17 | % |
| | 3/31/2018 | | | $ | 10.02 | | | | 0.09 | | | | — | | | | 0.09 | | | | (0.08 | ) | | | — | 5 | | | (0.08 | ) | | $ | 10.03 | | | | 0.95 | % | | $ | 278 | | | | 0.57 | % | | | 0.57 | % | | | 0.41 | % | | | 0.92 | % |
| | 3/31/2017 | 2 | | $ | 10.00 | | | | 0.01 | | | | 0.01 | | | | 0.02 | | | | — | | | | — | | | | — | | | $ | 10.02 | | | | 0.20 | % | | $ | 125 | | | | 5.42 | % | | | 5.42 | % | | | 0.60 | % | | | 0.11 | % |
| | | | | | | | | | | |
| | | | | | | | | | | | | | | | | | | | | | | | | | | | | | | | | | For the Year or Period Ended | |
| | | | | | | | | | | | | | | | | | | | | | | | | | | | | | | | | | 3/31/2020 | | | 3/31/2019 | | | 3/31/2018 | | | 3/31/2017 | |
| | Portfolio turnover rate for all share classes3 | | | | | | | | | | | | | | | | | | | | | | | | | | | | | | | | 60% | | | | 128% | | | | 74% | | | | 79% | |
|
| 1 Calculated based on average shares outstanding during the period.
2 Commenced operations on June 30, 2016. 3 Not annualized for periods less than one year. 4 Annualized for periods less than one year. 5 Less than $0.005 per share |
|
| | | | | | |
| The accompanying notes are an integral part of these financial statements. | | Annual Report | | March 31, 2020 | | 123 |
| | |
| Financial Highlights (Cont.) | | |
| | | | | | | | | | | | | | | | | | | | | | | | | | | | | | | | | | | | | | | | | | | | | | | | | | | | | | | | | | |
| | | | | | | Income (Loss) from
Investment Operations: | | | Less Distributions: | | | | | | | | | | | | Ratios to Average Net Assets: | |
For the
Year or
Period
Ended | | | Net Asset
Value,
Beginning
of Period | | | Net
Investment
Income
(Loss)1 | | | Net Gain
(Loss) on
Investments
(Realized and
Unrealized) | | | Total from
Investment
Operations | | | Distributions
from Net
Investment
Income | | | Distributions
from Net
Realized
Gain | | | Total
Distributions | | | Net Asset
Value,
End of
Period | | | Total
Return3 | | | Net Assets,
End of Period
(000’s) | | | Expenses
Before
Advisory Fees
(Waived) and
Other Fees
(Reimbursed)/
Recouped4 | | | Expenses
After
Investment
Advisory
Fees
(Waived)4 | | | Expenses
After
Advisory Fees
(Waived) and
Other Fees
(Reimbursed)/
Recouped4 | | | Net
Investment
Income
(Loss)4 | |
|
| | DoubleLine Shiller Enhanced International CAPE® - Class I: | |
| | 3/31/2020 | | | $ | 10.17 | | | | 0.29 | | | | (2.29 | ) | | | (2.00 | ) | | | (0.29 | ) | | | — | | | | (0.29 | ) | | $ | 7.88 | | | | (20.29 | )% | | $ | 27,523 | | | | 0.80 | % | | | 0.77 | % | | | 0.62 | % | | | 2.84 | % |
| | 3/31/2019 | | | $ | 11.24 | | | | 0.34 | | | | (0.52 | ) | | | (0.18 | ) | | | (0.43 | ) | | | (0.46 | ) | | | (0.89 | ) | | $ | 10.17 | | | | (1.13 | )% | | $ | 42,621 | | | | 0.96 | % | | | 0.91 | % | | | 0.60 | % | | | 3.25 | % |
| | 3/31/2018 | | | $ | 10.86 | | | | 0.22 | | | | 0.86 | | | | 1.08 | | | | (0.35 | ) | | | (0.35 | ) | | | (0.70 | ) | | $ | 11.24 | | | | 9.92 | % | | $ | 78,162 | | | | 1.04 | % | | | 1.02 | % | | | 0.63 | % | | | 1.79 | % |
| | 3/31/2017 | 2 | | $ | 10.00 | | | | 0.03 | | | | 0.85 | | | | 0.88 | | | | (0.02 | ) | | | — | | | | (0.02 | ) | | $ | 10.86 | | | | 8.76 | % | | $ | 19,384 | | | | 7.10 | % | | | 7.10 | % | | | 0.64 | % | | | 0.72 | % |
|
| | DoubleLine Shiller Enhanced International CAPE® - Class N: | |
| | 3/31/2020 | | | $ | 10.17 | | | | 0.27 | | | | (2.29 | ) | | | (2.02 | ) | | | (0.27 | ) | | | — | | | | (0.27 | ) | | $ | 7.88 | | | | (20.50 | )% | | $ | 13,044 | | | | 1.05 | % | | | 1.02 | % | | | 0.87 | % | | | 2.61 | % |
| | 3/31/2019 | | | $ | 11.23 | | | | 0.32 | | | | (0.52 | ) | | | (0.20 | ) | | | (0.40 | ) | | | (0.46 | ) | | | (0.86 | ) | | $ | 10.17 | | | | (1.29 | )% | | $ | 19,953 | | | | 1.20 | % | | | 1.15 | % | | | 0.85 | % | | | 3.03 | % |
| | 3/31/2018 | | | $ | 10.86 | | | | 0.18 | | | | 0.86 | | | | 1.04 | | | | (0.32 | ) | | | (0.35 | ) | | | (0.67 | ) | | $ | 11.23 | | | | 9.56 | % | | $ | 29,160 | | | | 1.29 | % | | | 1.27 | % | | | 0.87 | % | | | 1.52 | % |
| | 3/31/2017 | 2 | | $ | 10.00 | | | | 0.02 | | | | 0.85 | | | | 0.87 | | | | (0.01 | ) | | | — | | | | (0.01 | ) | | $ | 10.86 | | | | 8.72 | % | | $ | 11,499 | | | | 4.93 | % | | | 4.93 | % | | | 0.89 | % | | | 0.58 | % |
| | | | | | | | | | | |
| | | | | | | | | | | | | | | | | | | | | | | | | | | | | | | | | | For the Year or Period Ended | |
| | | | | | | | | | | | | | | | | | | | | | | | | | | | | | | | | | 3/31/2020 | | | 3/31/2019 | | | 3/31/2018 | | | 3/31/2017 | |
| | Portfolio turnover rate for all share classes3 | | | | | | | | | | | | | | | | | | | | | | | | | | | | | | | | 48% | | | | 72% | | | | 69% | | | | 38% | |
|
| 1 Calculated based on average shares outstanding during the period.
2 Commenced operations on December 23, 2016. 3 Not annualized for periods less than one year. 4 Annualized for periods less than one year. |
|
| | | | | | | |
| | | | | | | Income (Loss) from
Investment Operations: | | | Less Distributions: | | | | | | | | | | | | Ratios to Average Net Assets: | |
For the
Year or
Period
Ended | | | Net Asset
Value,
Beginning
of Period | | | Net
Investment
Income
(Loss)1 | | | Net Gain
(Loss) on
Investments
(Realized and
Unrealized) | | | Total from
Investment
Operations | | | Distributions
from Net
Investment
Income | | | Distributions
from Net
Realized
Gain | | | Total
Distributions | | | Net Asset
Value,
End of
Period | | | Total
Return3 | | | Net Assets,
End of Period
(000’s) | | | Expenses
Before
Advisory Fees
(Waived) and
Other Fees
(Reimbursed)/
Recouped4 | | | Expenses
After
Investment
Advisory
Fees
(Waived)4 | | | Expenses
After
Advisory Fees
(Waived) and
Other Fees
(Reimbursed)/
Recouped4 | | | Net
Investment
Income
(Loss)4 | |
|
| | DoubleLine Colony Real Estate and Income Fund - Class I: | |
| | 3/31/2020 | | | $ | 11.30 | | | | 0.25 | | | | (2.65 | ) | | | (2.40 | ) | | | (0.28 | ) | | | (0.11 | ) | | | (0.39 | ) | | $ | 8.51 | | | | (22.08 | )% | | $ | 94,289 | | | | 0.86 | % | | | 0.85 | % | | | 0.62 | % | | | 2.29 | % |
| | 3/31/2019 | 2 | | $ | 10.00 | | | | 0.10 | | | | 1.26 | | | | 1.36 | | | | (0.06 | ) | | | — | | | | (0.06 | ) | | $ | 11.30 | | | | 13.69 | % | | $ | 121,180 | | | | 1.46 | % | | | 1.42 | % | | | 0.61 | % | | | 3.00 | % |
|
| | DoubleLine Colony Real Estate and Income Fund - Class N: | |
| | 3/31/2020 | | | $ | 11.29 | | | | 0.24 | | | | (2.65 | ) | | | (2.41 | ) | | | (0.26 | ) | | | (0.11 | ) | | | (0.37 | ) | | $ | 8.51 | | | | (22.21 | )% | | $ | 3,809 | | | | 1.11 | % | | | 1.10 | % | | | 0.87 | % | | | 2.03 | % |
| | 3/31/2019 | 2 | | $ | 10.00 | | | | 0.09 | | | | 1.26 | | | | 1.35 | | | | (0.06 | ) | | | — | | | | (0.06 | ) | | $ | 11.29 | | | | 13.53 | % | | $ | 4,369 | | | | 1.67 | % | | | 1.62 | % | | | 0.87 | % | | | 2.79 | % |
| | | | | | | | | | | | | |
| | | | | | | | | | | | | | | | | | | | | | | | | | | | | | | | | | | | | | | | For the Year or
Period Ended | |
| | | | | | | | | | | | | | | | | | | | | | | | | | | | | | | | | | | | | | | | 3/31/2020 | | | 3/31/2019 | |
| | Portfolio turnover rate for all share classes3 | | | | | | | | | | | | | | | | | | | | | | | | | | | | | | | | | | | | | | | | 100% | | | | 70% | |
|
| 1 Calculated based on average shares outstanding during the period.
2 Commenced operations on December 17, 2018. 3 Not annualized for periods less than one year. 4 Annualized for periods less than one year. |
|
| | | | | | |
| 124 | | DoubleLine Funds Trust | | | | The accompanying notes are an integral part of these financial statements. |
| | | | | | | | | | | | | | | | | | | | | | | | | | | | | | | | | | | | | | | | | | | | | | | | | | | | | | | | | | |
| | | | | | | Income (Loss) from
Investment Operations: | | | Less Distributions: | | | | | | | | | | | | Ratios to Average Net Assets: | |
For the
Year or
Period
Ended | | | Net Asset
Value,
Beginning
of Period | | | Net
Investment
Income
(Loss)1 | | | Net Gain
(Loss) on
Investments
(Realized and
Unrealized) | | | Total from
Investment
Operations | | | Distributions
from Net
Investment
Income | | | Distributions
from Net
Realized
Gain | | | Total
Distributions | | | Net Asset
Value,
End of
Period | | | Total
Return3 | | | Net Assets,
End of Period
(000’s) | | | Expenses
Before
Advisory Fees
(Waived) and
Other Fees
(Reimbursed)/ Recouped4 | | | Expenses
After
Investment
Advisory
Fees
(Waived)4 | | | Expenses
After
Advisory Fees
(Waived) and
Other Fees
(Reimbursed)/ Recouped4 | | | Net
Investment
Income
(Loss)4 | |
| |
| | DoubleLine Emerging Markets Local Currency Bond Fund - Class I: | | | | | |
| | 3/31/2020 | 2 | | $ | 10.00 | | | | 0.25 | | | | (1.49 | ) | | | (1.24 | ) | | | (0.12 | ) | | | — | | | | (0.12 | ) | | $ | 8.64 | | | | (12.52 | )% | | $ | 8,664 | | | | 6.23 | % | | | 6.23 | % | | | 0.90 | % | | | 3.45 | % |
| |
| | DoubleLine Emerging Markets Local Currency Bond Fund - Class N: | | | | | |
| | 3/31/2020 | 2 | | $ | 10.00 | | | | 0.23 | | | | (1.49 | ) | | | (1.26 | ) | | | (0.10 | ) | | | — | | | | (0.10 | ) | | $ | 8.64 | | | | (12.69 | )% | | $ | 87 | | | | 6.48 | % | | | 6.48 | % | | | 1.15 | % | | | 3.19 | % |
| | | | | | | | | | | | | | |
| | | | | | | | | | | | | | | | | | | | | | | | | | | | | | | | | | | | | | | | | | | For the
Year or Period
Ended | |
| | | | | | | | | | | | | | | | | | | | | | | | | | | | | | | | | | | | | | | | | | | 3/31/2020 | |
| | Portfolio turnover rate for all share classes3 | | | | | | | | | | | | | | | | | | | | | | | | | | | | | | | | | | | | | | | | | | | | 13% | |
|
| 1 Calculated based on average shares outstanding during the period.
2 Commenced operations on June 28, 2019. 3 Not annualized for periods less than one year. 4 Annualized for periods less than one year. |
|
| | | | | | | |
| | | | | | | Income (Loss) from
Investment Operations: | | | Less Distributions: | | | | | | | | | | | | Ratios to Average Net Assets: | |
For the
Year or
Period
Ended | | | Net Asset
Value,
Beginning
of Period | | | Net
Investment
Income
(Loss)1 | | | Net Gain
(Loss) on
Investments
(Realized and
Unrealized) | | | Total from
Investment
Operations | | | Distributions
from Net
Investment
Income | | | Distributions
from Net
Realized
Gain | | | Total
Distributions | | | Net Asset
Value,
End of
Period | | | Total
Return3 | | | Net Assets,
End of Period
(000’s) | | | Expenses
Before
Advisory Fees
(Waived) and
Other Fees
(Reimbursed)/ Recouped4 | | | Expenses
After
Investment
Advisory
Fees
(Waived)4 | | | Expenses
After
Advisory Fees
(Waived) and
Other Fees
(Reimbursed)/ Recouped4 | | | Net
Investment
Income
(Loss)4 | |
| |
| | DoubleLine Income Fund - Class I: | | | | | |
| | 3/31/2020 | 2 | | $ | 10.00 | | | | 0.24 | | | | (1.94 | ) | | | (1.70 | ) | | | (0.25 | ) | | | — | | | | (0.25 | ) | | $ | 8.05 | | | | (17.35 | )% | | $ | 69,580 | | | | 1.13 | % | | | 1.13 | % | | | 0.65 | % | | | 4.07 | % |
| |
| | DoubleLine Income Fund - Class N: | | | | | |
| | 3/31/2020 | 2 | | $ | 10.00 | | | | 0.23 | | | | (1.94 | ) | | | (1.71 | ) | | | (0.24 | ) | | | — | | | | (0.24 | ) | | $ | 8.05 | | | | (17.46 | )% | | $ | 592 | | | | 1.26 | % | | | 1.26 | % | | | 0.90 | % | | | 4.13 | % |
| | | | | | | | | | | | | | |
| | | | | | | | | | | | | | | | | | | | | | | | | | | | | | | | | | | | | | | | | | | For the
Year or Period
Ended | |
| | | | | | | | | | | | | | | | | | | | | | | | | | | | | | | | | | | | | | | | | | | 3/31/2020 | |
| | Portfolio turnover rate for all share classes3 | | | | | | | | | | | | | | | | | | | | | | | | | | | | | | | | | | | | | | | | | | | | 33% | |
|
| 1 Calculated based on average shares outstanding during the period.
2 Commenced operations on September 3, 2019. 3 Not annualized for periods less than one year. 4 Annualized for periods less than one year. |
|
| | | | | | |
| The accompanying notes are an integral part of these financial statements. | | Annual Report | | March 31, 2020 | | 125 |
| | |
| Notes to Financial Statements | | March 31, 2020 |
1. Organization
DoubleLine Funds Trust, a Delaware statutory trust (the “Trust”), is anopen-end investment management company registered under the Investment Company Act of 1940, as amended (the “1940 Act”). The Trust consists of 19 funds, DoubleLine Total Return Bond Fund, DoubleLine Core Fixed Income Fund, DoubleLine Emerging Markets Fixed Income Fund, DoubleLine Multi-Asset Growth Fund, DoubleLine Low Duration Bond Fund, DoubleLine Floating Rate Fund, DoubleLine Shiller Enhanced CAPE®, DoubleLine Flexible Income Fund, DoubleLine Low Duration Emerging Markets Fixed Income Fund, DoubleLine Selective Credit Fund, Doubleline Long Duration Total Return Bond Fund, DoubleLine Strategic Commodity Fund, DoubleLine Global Bond Fund, DoubleLine Infrastructure Income Fund, DoubleLine Ultra Short Bond Fund, DoubleLine Shiller Enhanced International CAPE®, DoubleLine Colony Real Estate and Income Fund, DoubleLine Emerging Markets Local Currency Bond Fund and DoubleLine Income Fund (each, a “Fund” and, collectively, the “Funds”). For financial information related to the DoubleLine Selective Credit Fund, please refer to the DoubleLine Selective Credit Fund’s separate annual report. Shares of the DoubleLine Emerging Markets Local Currency Bond Fund are currently only available for purchase by employees and officers of DoubleLine Capital LP (“DoubleLine Capital”) and DoubleLine Alternatives LP (formerly DoubleLine Commodity LP) (each, an “Adviser” and, collectively, the “Advisers”), their affiliates and their family members, and the Advisers and their affiliates.
Each Fund is classified as a diversified fund under the 1940 Act, except the DoubleLine Global Bond Fund, the DoubleLine Emerging Markets Local Currency Bond Fund and the DoubleLine Income Fund, which are classified as non-diversified Funds. Currently under the 1940 Act, a diversified fund generally may not, with respect to 75% of its total assets, invest more than 5% of its total assets in the securities of any one issuer or own more than 10% of the outstanding voting securities of such issuer (except, in each case, U.S. Government securities, cash, cash items and the securities of other investment companies). The remaining 25% of a fund’s total assets is not subject to this limitation.
The Funds’ investment objectives and dates each share class commenced operations are as follows:
| | | | | | | | | | | | | | | | | | | | | | | | | | | | | | | | |
| | | | |
| | | | | | | | | Commencement of Operations |
| | | | | | | |
| Fund Name | | | | Investment Objective | | | | I Shares | | N Shares | | A Shares | | R6 Shares |
| | | | | | | |
DoubleLine Total Return Bond Fund | | | | | | | Maximize total return | | | | | | | | | 4/6/2010 | | | | | 4/6/2010 | | | | | — | | | | | 7/31/2019 | |
| | | | | | | |
DoubleLine Core Fixed Income Fund | | | | | | | Maximize current income and total return | | | | | | | | | 6/1/2010 | | | | | 6/1/2010 | | | | | — | | | | | 7/31/2019 | |
| | | | | | | |
DoubleLine Emerging Markets Fixed Income Fund | | | | | | | Seek high total return from current income and capital appreciation | | | | | | | | | 4/6/2010 | | | | | 4/6/2010 | | | | | — | | | | | — | |
| | | | | | | |
DoubleLine Multi-Asset Growth Fund (Consolidated) | | | | | | | Seek long-term capital appreciation | | | | | | | | | 12/20/2010 | | | | | — | | | | | 12/20/2010 | | | | | — | |
| | | | | | | |
DoubleLine Low Duration Bond Fund | | | | | | | Seek current income | | | | | | | | | 9/30/2011 | | | | | 9/30/2011 | | | | | — | | | | | 7/31/2019 | |
| | | | | | | |
DoubleLine Floating Rate Fund | | | | | | | Seek a high level of current income | | | | | | | | | 2/1/2013 | | | | | 2/1/2013 | | | | | — | | | | | — | |
| | | | | | | |
DoubleLine Shiller Enhanced CAPE® | | | | | | | Seek total return which exceeds the total return of its benchmark index | | | | | | | | | 10/31/2013 | | | | | 10/31/2013 | | | | | — | | | | | 7/31/2019 | |
| | | | | | | |
DoubleLine Flexible Income Fund | | | | | | | Seek long-term total return while striving to generate current income | | | | | | | | | 4/7/2014 | | | | | 4/7/2014 | | | | | — | | | | | 7/31/2019 | |
| | | | | | | |
DoubleLine Low Duration Emerging Markets Fixed Income Fund | | | | | | | Seek long-term total return | | | | | | | | | 4/7/2014 | | | | | 4/7/2014 | | | | | — | | | | | — | |
| | | | | | | |
DoubleLine Long Duration Total Return Bond Fund | | | | | | | Seek long-term total return | | | | | | | | | 12/15/2014 | | | | | 12/15/2014 | | | | | — | | | | | — | |
| | | | | | | |
DoubleLine Strategic Commodity Fund (Consolidated) | | | | | | | Seek long-term total return | | | | | | | | | 5/18/2015 | | | | | 5/18/2015 | | | | | — | | | | | — | |
| | | | | | | |
DoubleLine Global Bond Fund | | | | | | | Seek long-term total return | | | | | | | | | 12/17/2015 | | | | | 12/17/2015 | | | | | — | | | | | — | |
| | | | | | | |
DoubleLine Infrastructure Income Fund | | | | | | | Seek long-term total return while striving to generate current income | | | | | | | | | 4/1/2016 | | | | | 4/1/2016 | | | | | — | | | | | — | |
| | | | | | | |
DoubleLine Ultra Short Bond Fund | | | | | | | Seek to provide a level of current income consistent with limited price volatility | | | | | | | | | 6/30/2016 | | | | | 6/30/2016 | | | | | — | | | | | — | |
| | | | | | | |
DoubleLine Shiller Enhanced International CAPE® | | | | | | | Seek total return which exceeds the total return of its benchmark index over a full market cycle | | | | | | | | | 12/23/2016 | | | | | 12/23/2016 | | | | | — | | | | | — | |
| | | | | | | |
DoubleLine Colony Real Estate and Income Fund | | | | | | | Seek total return which exceeds the total return of its benchmark index over a full market cycle | | | | | | | | | 12/17/2018 | | | | | 12/17/2018 | | | | | — | | | | | — | |
| | | | | | | |
DoubleLine Emerging Markets Local Currency Bond Fund | | | | | | | Seek high total return from current income and capital appreciation | | | | | | | | | 6/28/2019 | | | | | 6/28/2019 | | | | | — | | | | | — | |
| | | | | | | |
DoubleLine Income Fund | | | | | | | Maximize total return through investment principally in income-producing securities | | | | | | | | | 9/3/2019 | | | | | 9/3/2019 | | | | | — | | | | | — | |
| | | | | | |
| 126 | | DoubleLine Funds Trust | | | | |
2. Significant Accounting Policies
Each Fund is an investment company that applies the accounting and reporting guidance issued in Topic 946, “Financial Services—Investment Companies”, by the Financial Accounting Standards Board (“FASB”). The following is a summary of the significant accounting policies of the Funds. These policies are in conformity with accounting principles generally accepted in the United States of America (“US GAAP”).
A. Security Valuation. The Funds have adopted US GAAP fair value accounting standards which establish a definition of fair value and set out a hierarchy for measuring fair value. These standards require additional disclosures about the various inputs and valuation techniques used to develop the measurements of fair value and a discussion of changes in valuation techniques and related inputs during the period. These inputs are summarized in the three broad levels listed below:
| | • | | Level 1—Unadjusted quoted market prices in active markets for identical securities |
| | • | | Level 2—Quoted prices for identical or similar assets in markets that are not active, or inputs derived from observable market data |
| | • | | Level 3—Significant unobservable inputs (including the reporting entity’s estimates and assumptions) |
Market values for domestic and foreign fixed income securities are normally determined on the basis of valuations provided by independent pricing services. Vendors typically value such securities based on one or more inputs described in the following table which is not intended to be a complete list. The table provides examples of inputs that are commonly relevant for valuing particular classes of fixed income securities in which the Funds are authorized to invest. However, these classifications are not exclusive, and any of the inputs may be used to value any other class of fixed-income securities. Securities that use similar valuation techniques and inputs as described in the following table are categorized as Level 2 of the fair value hierarchy. To the extent the significant inputs are unobservable, the values generally would be categorized as Level 3. Assets and liabilities may be transferred between levels.
| | | | | | |
| | |
| Fixed-income class | | | | | Examples of Inputs |
| | |
All | | | | | | Benchmark yields, transactions, bids, offers, quotations from dealers and trading systems, new issues, spreads and other relationships observed in the markets among comparable securities; and proprietary pricing models such as yield measures calculated using factors such as cash flows, financial or collateral performance and other reference data (collectively referred to as “standard inputs”) |
| | |
Corporate bonds and notes; convertible securities | | | | | | Standard inputs and underlying equity of the issuer |
| | |
US bonds and notes of government and government agencies | | | | | | Standard inputs |
| | |
Residential and commercial mortgage-backed obligations; asset-backed obligations (including collateralized loan obligations) | | | | | | Standard inputs and cash flows, prepayment information, default rates, delinquency and loss assumptions, collateral characteristics, credit enhancements and specific deal information, trustee reports |
| | |
Bank loans | | | | | | Standard inputs |
Investments in registered open-end management investment companies will be valued based upon the net asset value (“NAV”) of such investments and are categorized as Level 1 of the fair value hierarchy.
Common stocks, exchange-traded funds and financial derivative instruments, such as futures contracts or options contracts, that are traded on a national securities or commodities exchange, are typically valued at the last reported sales price, in the case of common stocks and exchange-traded funds, or, in the case of futures contracts or options contracts, the settlement price determined by the relevant exchange. To the extent these securities are actively traded and valuation adjustments are not applied, they are categorized as Level 1 of the fair value hierarchy.
Over-the-counter financial derivative instruments, such as forward currency exchange contracts, options contracts, or swap agreements, derive their values from underlying asset prices, indices, reference rates, other inputs or a combination of these factors. These instruments are normally valued on the basis of evaluations provided by independent pricing services or broker dealer quotations. Depending on the instrument and the terms of the transaction, the value of the derivative instruments can be estimated by a pricing service provider using a series of techniques, such as simulation pricing models. The pricing models use issuer details and other inputs that are observed from actively quoted markets such as indices, spreads, interest rates, curves, dividends and exchange rates. Derivatives that use similar valuation techniques and inputs as described above are normally categorized as Level 2 of the fair value hierarchy.
Securities may be fair valued by the Adviser in accordance with the fair valuation procedures approved by the Board of Trustees (the “Board”). The Adviser’s valuation committee is generally responsible for overseeing the day to day valuation processes and
| | | | | | |
| | Annual Report | | March 31, 2020 | | 127 |
| | |
| Notes to Financial Statements (Cont.) | | March 31, 2020 |
reports periodically to the Board. The Adviser’s valuation committee and the pricing group are authorized to make all necessary determinations of the fair values of portfolio securities and other assets for which market quotations or third party vendor prices are not readily available or if it is deemed that the prices obtained from brokers and dealers or independent pricing services are deemed to be unreliable indicators of market or fair value.
The following is a summary of the fair valuations according to the inputs used to value the Funds’ investments as of March 31, 2020:
| | | | | | | | | | | | | | | | | | | | | | | | | | | | | | | | | | | |
| | | | | | | |
| Category | | | | DoubleLine
Total Return
Bond Fund | | DoubleLine
Core Fixed
Income Fund | | DoubleLine
Emerging
Markets Fixed
Income Fund | | DoubleLine
Multi-Asset
Growth Fund
(Consolidated) | | DoubleLine
Low Duration
Bond Fund | | DoubleLine
Floating
Rate Fund |
| | | | | | | |
Investments in Securities | | | | | | | | | | | | | | | | | | | | | | | | | | | | | | | | | | | |
| | | | | | | |
Level 1 | | | | | | | | | | | | | | | | | | | | | | | | | | | | | | | | | | | |
| | | | | | | |
Money Market Funds | | | | | | | | $ | 563,956,900 | | | | $ | 256,582,852 | | | | $ | 47,713,735 | | | | $ | 6,761,586 | | | | $ | 208,714,230 | | | | $ | 4,639 | |
| | | | | | | |
Affiliated Mutual Funds | | | | | | | | | 56,624,814 | | | | | 1,431,115,712 | | | | | — | | | | | 8,525,241 | | | | | 46,800,000 | | | | | — | |
| | | | | | | |
Exchange Traded Funds and Common Stocks | | | | | | | | | — | | | | | 391,459 | | | | | 564,389 | | | | | — | | | | | 220,642 | | | | | — | |
| | | | | | | |
Total Level 1 | | | | | | | | | 620,581,714 | | | | | 1,688,090,023 | | | | | 48,278,124 | | | | | 15,286,827 | | | | | 255,734,872 | | | | | 4,639 | |
| | | | | | | |
Level 2 | | | | | | | | | | | | | | | | | | | | | | | | | | | | | | | | | | | |
| | | | | | | |
US Government and Agency Mortgage Backed Obligations | | | | | | | | | 24,555,598,048 | | | | | 2,092,321,640 | | | | | — | | | | | 5,846,209 | | | | | 524,906,795 | | | | | — | |
| | | | | | | |
Non-Agency Residential Collateralized Mortgage Obligations | | | | | | | | | 13,229,560,579 | | | | | 960,482,248 | | | | | — | | | | | 9,366,708 | | | | | 1,240,670,430 | | | | | — | |
| | | | | | | |
US Government and Agency Obligations | | | | | | | | | 4,630,540,646 | | | | | 2,528,397,491 | | | | | — | | | | | — | | | | | 577,549,740 | | | | | — | |
| | | | | | | |
Non-Agency Commercial Mortgage Backed Obligations | | | | | | | | | 3,901,674,990 | | | | | 606,172,885 | | | | | — | | | | | — | | | | | 1,056,567,816 | | | | | — | |
| | | | | | | |
Collateralized Loan Obligations | | | | | | | | | 2,080,168,663 | | | | | 244,835,524 | | | | | — | | | | | — | | | | | 922,763,064 | | | | | — | |
| | | | | | | |
Asset Backed Obligations | | | | | | | | | 1,801,461,818 | | | | | 282,267,697 | | | | | — | | | | | — | | | | | 562,100,432 | | | | | — | |
| | | | | | | |
US Corporate Bonds | | | | | | | | | — | | | | | 1,411,631,571 | | | | | — | | | | | — | | | | | 391,090,799 | | | | | 18,470,291 | |
| | | | | | | |
Foreign Corporate Bonds | | | | | | | | | — | | | | | 1,208,802,794 | | | | | 784,786,004 | | | | | — | | | | | 977,130,370 | | | | | 578,379 | |
| | | | | | | |
Bank Loans | | | | | | | | | — | | | | | 360,936,086 | | | | | — | | | | | — | | | | | 156,321,045 | | | | | 166,721,854 | |
| | | | | | | |
Foreign Government Bonds, Foreign Agencies and Foreign Government Sponsored Corporations | | | | | | | | | — | | | | | 44,019,443 | | | | | 11,194,072 | | | | | — | | | | | 64,277,265 | | | | | — | |
| | | | | | | |
Municipal Bonds | | | | | | | | | — | | | | | 10,939,156 | | | | | — | | | | | — | | | | | — | | | | | — | |
| | | | | | | |
Other Short Term Investments | | | | | | | | | — | | | | | 4,147,544 | | | | | — | | | | | 4,498,753 | | | | | — | | | | | — | |
| | | | | | | |
Warrants | | | | | | | | | — | | | | | — | | | | | — | | | | | — | | | | | — | | | | | — | |
| | | | | | | |
Total Level 2 | | | | | | | | | 50,199,004,744 | | | | | 9,754,954,079 | | | | | 795,980,076 | | | | | 19,711,670 | | | | | 6,473,377,756 | | | | | 185,770,524 | |
| | | | | | | |
Level 3 | | | | | | | | | | | | | | | | | | | | | | | | | | | | | | | | | | | |
| | | | | | | |
Non-Agency Residential Collateralized Mortgage Obligations | | | | | | | | | 287,008,925 | | | | | 37,079,855 | | | | | — | | | | | 896,350 | | | | | — | | | | | — | |
| | | | | | | |
Collateralized Loan Obligations | | | | | | | | | 1,262,832 | | | | | — | | | | | — | | | | | 72,621 | | | | | — | | | | | — | |
| | | | | | | |
Non-Agency Commercial Mortgage Backed Obligations | | | | | | | | | — | | | | | 3,227,418 | | | | | — | | | | | — | | | | | — | | | | | — | |
| | | | | | | |
Foreign Corporate Bonds | | | | | | | | | — | | | | | 51,002 | | | | | 82,503 | | | | | — | | | | | — | | | | | — | |
| | | | | | | |
Total Level 3 | | | | | | | | | 288,271,757 | | | | | 40,358,275 | | | | | 82,503 | | | | | 968,971 | | | | | — | | | | | — | |
| | | | | | | |
Total | | | | | | | | $ | 51,107,858,215 | | | | $ | 11,483,402,377 | | | | $ | 844,340,703 | | | | $ | 35,967,468 | | | | $ | 6,729,112,628 | | | | $ | 185,775,163 | |
| | | | | | | |
Other Financial Instruments | | | | | | | | | | | | | | | | | | | | | | | | | | | | | | | | | | | |
| | | | | | | |
Level 1 | | | | | | | | | | | | | | | | | | | | | | | | | | | | | | | | | | | |
| | | | | | | |
Futures Contracts | | | | | | | | $ | 100,579,104 | | | | $ | — | | | | $ | — | | | | $ | 996,712 | | | | $ | — | | | | $ | — | |
| | | | | | | |
Total Level 1 | | | | | | | | $ | 100,579,104 | | | | | — | | | | | — | | | | | 996,712 | | | | | — | | | | | — | |
| | | | | | | |
Level 2 | | | | | | | | | | | | | | | | | | | | | | | | | | | | | | | | | | | |
| | | | | | | |
Excess Return Swaps | | | | | | | | | — | | | | | — | | | | | — | | | | | (1,609,737 | ) | | | | — | | | | | — | |
| | | | | | | |
Total Level 2 | | | | | | | | | — | | | | | — | | | | | — | | | | | (1,609,737 | ) | | | | — | | | | | — | |
| | | | | | | |
Level 3 | | | | | | | | | — | | | | | — | | | | | — | | | | | — | | | | | — | | | | | — | |
| | | | | | | |
Total | | | | | | | | $ | 100,579,104 | | | | $ | — | | | | $ | — | | | | $ | (613,025 | ) | | | $ | — | | | | $ | — | |
| | | | | | |
| 128 | | DoubleLine Funds Trust | | | | |
| | | | | | | | | | | | | | | | | | | | | | | | | | | | | | | | | | | |
| | | | | | | |
| Category | | | | DoubleLine
Shiller
Enhanced
CAPE® | | DoubleLine
Flexible
Income Fund | | DoubleLine
Low Duration
Emerging
Markets Fixed
Income Fund | | DoubleLine
Long Duration
Total Return
Bond Fund | | DoubleLine
Strategic
Commodity
Fund
(Consolidated) | | DoubleLine
Global
Bond Fund |
| | | | | | | |
Investments in Securities | | | | | | | | | | | | | | | | | | | | | | | | | | | | | | | | | | | |
| | | | | | | |
Level 1 | | | | | | | | | | | | | | | | | | | | | | | | | | | | | | | | | | | |
| | | | | | | |
Money Market Funds | | | | | | | | $ | 791,132,217 | | | | $ | 30,424,641 | | | | $ | 26,624,176 | | | | $ | 4,166,697 | | | | $ | 33,496,177 | | | | $ | 75,301,165 | |
| | | | | | | |
Affiliated Mutual Funds | | | | | | | | | 195,175,073 | | | | | 105,830,380 | | | | | — | | | | | — | | | | | — | | | | | — | |
| | | | | | | |
Exchange Traded Funds and Common Stocks | | | | | | | | | — | | | | | 25,517 | | | | | 52,482 | | | | | — | | | | | — | | | | | — | |
| | | | | | | |
Total Level 1 | | | | | | | | | 986,307,290 | | | | | 136,280,538 | | | | | 26,676,658 | | | | | 4,166,697 | | | | | 33,496,177 | | | | | 75,301,165 | |
| | | | | | | |
Level 2 | | | | | | | | | | | | | | | | | | | | | | | | | | | | | | | | | | | |
| | | | | | | |
US Government and Agency Obligations | | | | | | | | | 1,465,911,918 | | | | | 38,051,300 | | | | | — | | | | | 37,502,989 | | | | | — | | | | | 327,544,626 | |
| | | | | | | |
Collateralized Loan Obligations | | | | | | | | | 845,376,131 | | | | | 169,647,451 | | | | | — | | | | | — | | | | | — | | | | | — | |
| | | | | | | |
Non-Agency Residential Collateralized Mortgage Obligations | | | | | | | | | 820,962,432 | | | | | 244,947,807 | | | | | — | | | | | — | | | | | — | | | | | — | |
| | | | | | | |
Non-Agency Commercial Mortgage Backed Obligations | | | | | | | | | 776,440,360 | | | | | 118,517,556 | | | | | — | | | | | — | | | | | — | | | | | — | |
| | | | | | | |
Foreign Corporate Bonds | | | | | | | | | 562,597,491 | | | | | 167,109,127 | | | | | 152,620,134 | | | | | — | | | | | — | | | | | — | |
| | | | | | | |
Asset Backed Obligations | | | | | | | | | 450,362,412 | | | | | 46,982,889 | | | | | — | | | | | — | | | | | — | | | | | — | |
| | | | | | | |
US Government and Agency Mortgage Backed Obligations | | | | | | | | | 353,582,323 | | | | | 6,443,985 | | | | | — | | | | | 64,823,396 | | | | | — | | | | | — | |
| | | | | | | |
US Corporate Bonds | | | | | | | | | 342,812,739 | | | | | 79,113,421 | | | | | — | | | | | — | | | | | — | | | | | — | |
| | | | | | | |
Bank Loans | | | | | | | | | 246,023,526 | | | | | 54,546,251 | | | | | — | | | | | — | | | | | — | | | | | — | |
| | | | | | | |
Foreign Government Bonds, Foreign Agencies and Foreign Government Sponsored Corporations | | | | | | | | | 10,511,436 | | | | | 1,761,644 | | | | | 16,361,580 | | | | | — | | | | | — | | | | | 799,493,955 | |
| | | | | | | |
Other Short Term Investments | | | | | | | | | — | | | | | — | | | | | — | | | | | — | | | | | 112,924,774 | | | | | — | |
| | | | | | | |
Warrants | | | | | | | | | — | | | | | — | | | | | — | | | | | — | | | | | — | | | | | — | |
| | | | | | | |
Total Level 2 | | | | | | | | | 5,874,580,768 | | | | | 927,121,431 | | | | | 168,981,714 | | | | | 102,326,385 | | | | | 112,924,774 | | | | | 1,127,038,581 | |
| | | | | | | |
Level 3 | | | | | | | | | | | | | | | | | | | | | | | | | | | | | | | | | | | |
| | | | | | | |
Non-Agency Commercial Mortgage Backed Obligations | | | | | | | | | 2,108,709 | | | | | 444,116 | | | | | — | | | | | — | | | | | — | | | | | — | |
| | | | | | | |
Foreign Corporate Bonds | | | | | | | | | 1,498 | | | | | 1,500 | | | | | 4,494 | | | | | — | | | | | — | | | | | — | |
| | | | | | | |
Non-Agency Residential Collateralized Mortgage Obligations | | | | | | | | | — | | | | | 20,518,003 | | | | | — | | | | | — | | | | | — | | | | | — | |
| | | | | | | |
Collateralized Loan Obligations | | | | | | | | | — | | | | | 180,404 | | | | | — | | | | | — | | | | | — | | | | | — | |
| | | | | | | |
Total Level 3 | | | | | | | | | 2,110,207 | | | | | 21,144,023 | | | | | 4,494 | | | | | — | | | | | — | | | | | — | |
| | | | | | | |
Total | | | | | | | | $ | 6,862,998,265 | | | | $ | 1,084,545,992 | | | | $ | 195,662,866 | | | | $ | 106,493,082 | | | | $ | 146,420,951 | | | | $ | 1,202,339,746 | |
| | | | | | | |
Other Financial Instruments | | | | | | | | | | | | | | | | | | | | | | | | | | | | | | | | | | | |
| | | | | | | |
Level 1 | | | | | | | | | | | | | | | | | | | | | | | | | | | | | | | | | | | |
| | | | | | | |
Futures Contracts | | | | | | | | $ | — | | | | $ | — | | | | $ | — | | | | $ | 1,482,437 | | | | $ | — | | | | $ | — | |
| | | | | | | |
Total Level 1 | | | | | | | | | — | | | | | — | | | | | — | | | | | 1,482,437 | | | | | — | | | | | — | |
| | | | | | | |
Level 2 | | | | | | | | | | | | | | | | | | | | | | | | | | | | | | | | | | | |
| | | | | | | |
Excess Return Swaps | | | | | | | | | (1,052,976,447 | ) | | | | — | | | | | — | | | | | — | | | | | (24,984,596 | ) | | | | — | |
| | | | | | | |
Forward Currency Exchange Contracts | | | | | | | | | — | | | | | — | | | | | — | | | | | — | | | | | — | | | | | 630,828 | |
| | | | | | | |
Total Level 2 | | | | | | | | | (1,052,976,447 | ) | | | | — | | | | | — | | | | | — | | | | | (24,984,596 | ) | | | | 630,828 | |
| | | | | | | |
Level 3 | | | | | | | | | — | | | | | — | | | | | — | | | | | — | | | | | — | | | | | — | |
| | | | | | | |
Total | | | | | | | | $ | (1,052,976,447 | ) | | | $ | — | | | | $ | — | | | | $ | 1,482,437 | | | | $ | (24,984,596 | ) | | | $ | 630,828 | |
| | | | | | |
| | Annual Report | | March 31, 2020 | | 129 |
| | |
| Notes to Financial Statements ��(Cont.) | | March 31, 2020 |
| | | | | | | | | | | | | | | | | | | | | | | | | | | | | | | | | | | |
| | | | | | | |
| Category | | | | DoubleLine
Infrastructure
Income Fund | | DoubleLine
Ultra Short
Bond Fund | | DoubleLine
Shiller
Enhanced
International
CAPE® | | Doubleline
Colony
Real Estate and
Income Fund | | Doubleline
Emerging Markets
Local Currency
Bond Fund | | Doubleline
Income Fund |
| | | | | | | |
Investments in Securities | | | | | | | | | | | | | | | | | | | | | | | | | | | | | | | | | | | |
| | | | | | | |
Level 1 | | | | | | | | | | | | | | | | | | | | | | | | | | | | | | | | | | | |
| | | | | | | |
Money Market Funds | | | | | | | | $ | 47,850,445 | | | | $ | 26,100,901 | | | | $ | 9,162,254 | | | | $ | 14,040,691 | | | | $ | 750,904 | | | | $ | 7,217,796 | |
| | | | | | | |
Affiliated Mutual Funds | | | | | | | | | — | | | | | — | | | | | 2,371,933 | | | | | — | | | | | — | | | | | — | |
| | | | | | | |
Total Level 1 | | | | | | | | | 47,850,445 | | | | | 26,100,901 | | | | | 11,534,187 | | | | | 14,040,691 | | | | | 750,904 | | | | | 7,217,796 | |
| | | | | | | |
Level 2 | | | | | | | | | | | | | | | | | | | | | | | | | | | | | | | | | | | |
| | | | | | | |
Asset Backed Obligations | | | | | | | | | 204,496,921 | | | | | — | | | | | 1,190,968 | | | | | 7,754,199 | | | | | — | | | | | 10,187,712 | |
| | | | | | | |
US Corporate Bonds | | | | | | | | | 161,079,001 | | | | | 87,294,792 | | | | | 2,659,316 | | | | | 6,039,632 | | | | | — | | | | | — | |
| | | | | | | |
Foreign Corporate Bonds | | | | | | | | | 87,674,681 | | | | | 48,767,183 | | | | | 1,983,177 | | | | | 4,896,362 | | | | | 501,360 | | | | | — | |
| | | | | | | |
Commercial Paper | | | | | | | | | — | | | | | 54,915,716 | | | | | — | | | | | — | | | | | — | | | | | — | |
| | | | | | | |
US Government and Agency Mortgage Backed Obligations | | | | | | | | | — | | | | | 17,738,321 | | | | | 4,588,153 | | | | | 9,408,818 | | | | | — | | | | | — | |
| | | | | | | |
US Government and Agency Obligations | | | | | | | | | — | | | | | — | | | | | 10,798,973 | | | | | 38,891,998 | | | | | — | | | | | 5,781,191 | |
| | | | | | | |
Non-Agency Residential Collateralized Mortgage Obligations | | | | | | | | | — | | | | | — | | | | | 5,678,202 | | | | | 9,814,060 | | | | | — | | | | | 16,455,860 | |
| | | | | | | |
Collateralized Loan Obligations | | | | | | | | | — | | | | | — | | | | | 5,354,034 | | | | | 12,907,362 | | | | | — | | | | | 9,126,209 | |
| | | | | | | |
Non-Agency Commercial Mortgage Backed Obligations | | | | | | | | | — | | | | | — | | | | | 4,794,010 | | | | | 11,653,828 | | | | | — | | | | | 20,351,793 | |
| | | | | | | |
Bank Loans | | | | | | | | | — | | | | | — | | | | | — | | | | | 2,415,473 | | | | | — | | | | | — | |
| | | | | | | |
Foreign Government Bonds, Foreign Agencies and Foreign Government Sponsored Corporations | | | | | | | | | — | | | | | — | | | | | — | | | | | 257,621 | | | | | 7,284,814 | | | | | — | |
| | | | | | | |
Total Level 2 | | | | | | | | | 453,250,603 | | | | | 208,716,012 | | | | | 37,046,833 | | | | | 104,039,353 | | | | | 7,786,174 | | | | | 61,902,765 | |
| | | | | | | |
Level 3 | | | | | | | | | | | | | | | | | | | | | | | | | | | | | | | | | | | |
| | | | | | | |
Foreign Corporate Bonds | | | | | | | | | 9,904,084 | | | | | — | | | | | — | | | | | — | | | | | — | | | | | — | |
| | | | | | | |
Non-Agency Commercial Mortgage Backed Obligations | | | | | | | | | — | | | | | — | | | | | — | | | | | — | | | | | — | | | | | 1,074,676 | |
| | | | | | | |
Total Level 3 | | | | | | | | | 9,904,084 | | | | | — | | | | | — | | | | | — | | | | | — | | | | | 1,074,676 | |
| | | | | | | |
Total | | | | | | | | $ | 511,005,132 | | | | $ | 234,816,913 | | | | $ | 48,581,020 | | | | $ | 118,080,044 | | | | $ | 8,537,078 | | | | $ | 70,195,237 | |
| | | | | | | |
Other Financial Instruments | | | | | | | | | | | | | | | | | | | | | | | | | | | | | | | | | | | |
| | | | | | | |
Level 1 | | | | | | | | $ | — | | | | $ | — | | | | $ | — | | | | $ | — | | | | $ | — | | | | $ | — | |
| | | | | | | |
Total Level 1 | | | | | | | | | — | | | | | — | | | | | — | | | | | — | | | | | — | | | | | — | |
| | | | | | | |
Level 2 | | | | | | | | | | | | | | | | | | | | | | | | | | | | | | | | | | | |
| | | | | | | |
Forward Currency Exchange Contracts | | | | | | | | | — | | | | | — | | | | | (1,058,749 | ) | | | | — | | | | | — | | | | | — | |
| | | | | | | |
Excess Return Swaps | | | | | | | | | — | | | | | — | | | | | (7,643,472 | ) | | | | (17,343,289 | ) | | | | — | | | | | — | |
| | | | | | | |
Total Level 2 | | | | | | | | | — | | | | | — | | | | | (8,702,221 | ) | | | | (17,343,289 | ) | | | | — | | | | | — | |
| | | | | | | |
Level 3 | | | | | | | | | — | | | | | — | | | | | — | | | | | — | | | | | — | | | | | — | |
| | | | | | | |
Total | | | | | | | | $ | — | | | | $ | — | | | | $ | (8,702,221 | ) | | | $ | (17,343,289 | ) | | | $ | — | | | | $ | — | |
See the Schedules of Investments for further disaggregation of investment categories.
The following is a reconciliation of investments in which significant unobservable inputs (Level 3) were used in determining fair value:
| | | | | | | | | | | | | | | | | | | | | | | | | | | | | | | | | | | | | | | | | | | | | | | | | | | | | | | |
| | | | | | | | | | | |
| DoubleLine Multi-Asset Growth Fund | | | | Fair Value as of
3/31/2019 | | Net Realized
Gain (Loss) | | Net Change in
Unrealized
Appreciation
(Depreciation)3 | | Net Accretion
(Amortization) | | Purchases1 | | Sales2 | | Transfers Into
Level 34 | | Transfers Out
of Level 34 | | Fair Value as of
3/31/2020 | | Net Change in
Unrealized
Appreciation
(Depreciation)
on securities
held at
3/31/20203 |
Investments in Securities | | | | | | | | | | | | | | | | | | | | | | | | | | | | | | | | | | | | | | | | | | | | | | | | | | | | | | | |
Non-Agency Residential Collateralized Mortgage Obligations | | | | | | | | $ | 1,042,150 | | | | $ | — | | | | $ | (137,477 | ) | | | $ | (8,323 | ) | | | $ | — | | | | $ | — | | | | $ | — | | | | $ | — | | | | $ | 896,350 | | | | $ | (137,477 | ) |
Collateralized Loan Obligations | | | | | | | | | — | | | | | — | | | | | — | | | | | — | | | | | — | | | | | — | | | | | 72,621 | | | | | — | | | | | 72,621 | | | | | — | |
Total | | | | | | | | $ | 1,042,150 | | | | $ | — | | | | $ | (137,477 | ) | | | $ | (8,323 | ) | | | $ | — | | | | $ | — | | | | $ | 72,621 | | | | $ | — | | | | $ | 968,971 | | | | $ | (137,477 | ) |
| | | | | | |
| 130 | | DoubleLine Funds Trust | | | | |
| | | | | | | | | | | | | | | | | | | | | | | | | | | | | | | | | | | | | | | | | | | | | | | | | | | | | | | |
| | | | | | | | | | | |
DoubleLine Flexible Income
Fund | | | | Fair Value as of
3/31/2019 | | Net Realized
Gain (Loss) | | Net Change in
Unrealized
Appreciation
(Depreciation)3 | | Net Accretion
(Amortization) | | Purchases1 | | Sales2 | | Transfers Into
Level 34 | | Transfers Out
of Level 34 | | Fair Value as of
3/31/2020 | | Net Change in
Unrealized
Appreciation
(Depreciation)
on securities
held at
3/31/20203 |
Investments in Securities | | | | | | | | | | | | | | | | | | | | | | | | | | | | | | | | | | | | | | | | | | | | | | | | | | | | | | | |
Non-Agency Residential Collateralized Mortgage Backed Obgligations | | | | | | | | $ | 31,930,691 | | | | $ | 35,215 | | | | $ | (6,302,208 | ) | | | $ | 423,233 | | | | $ | 397,954 | | | | $ | (212,407 | ) | | | $ | — | | | | $ | (5,754,475 | ) | | | $ | 20,518,003 | | | | $ | (4,540,909 | ) |
Non-Agency Commercial Mortgage Backed Obgligations | | | | | | | | | 502,275 | | | | | — | | | | | (58,159 | ) | | | | — | | | | | — | | | | | — | | | | | — | | | | | — | | | | | 444,116 | | | | | (58,159 | ) |
Collateralized Loan Obligations | | | | | | | | | — | | | | | — | | | | | — | | | | | — | | | | | — | | | | | — | | | | | 180,404 | | | | | — | | | | | 180,404 | | | | | — | |
Foreign Corporate Bonds | | | | | | | | | — | | | | | — | | | | | (195,500 | ) | | | | — | | | | | 197,000 | | | | | — | | | | | — | | | | | — | | | | | 1,500 | | | | | — | |
Total | | | | | | | | $ | 32,432,966 | | | | $ | 35,215 | | | | $ | (6,555,867 | ) | | | $ | 423,233 | | | | $ | 594,954 | | | | $ | (212,407 | ) | | | $ | 180,404 | | | | $ | (5,754,475 | ) | | | $ | 21,144,023 | | | | $ | (4,599,068 | ) |
| | | | | | | | | | | | | | | | | | | | | | | | | | | | | | | | | | | | | | | | | | | | | | | | | | | | | | | |
| | | | | | | | | | | |
DoubleLine Infrastructure
Income Fund | | | | Fair Value as of
3/31/2019 | | Net Realized
Gain (Loss) | | Net Change in
Unrealized
Appreciation
(Depreciation)3 | | Net Accretion
(Amortization) | | Purchases1 | | Sales2 | | Transfers Into
Level 34 | | Transfers Out
of Level 34 | | Fair Value as of
3/31/2020 | | Net Change in
Unrealized
Appreciation
(Depreciation)
on securities
held at
3/31/20203 |
Investments in Securities | | | | | | | | | | | | | | | | | | | | | | | | | | | | | | | | | | | | | | | | | | | | | | | | | | | | | | | |
Foreign Corporate Bonds | | | | | | | | $ | 10,288,000 | | | | $ | (2,025 | ) | | | $ | (79,683 | ) | | | $ | (2,786 | ) | | | $ | — | | | | $ | (299,422 | ) | | | $ | — | | | | $ | — | | | | $ | 9,904,084 | | | | $ | (55,175 | ) |
Asset Backed Obligations | | | | | | | | | 4,987,050 | | | | | 24,986 | | | | | (14,992 | ) | | | | — | | | | | — | | | | | (4,997,044 | ) | | | | — | | | | | — | | | | | — | | | | | — | |
Total | | | | | | | | $ | 15,275,050 | | | | $ | 22,961 | | | | $ | (94,675 | ) | | | $ | (2,786 | ) | | | $ | — | | | | $ | (5,296,466 | ) | | | $ | — | | | | $ | — | | | | $ | 9,904,084 | | | | $ | (55,175 | ) |
| | | | | | | | | | | | | | | | | | | | | | | | | | | | | | | | | | | | | | | | | | | | | | | | | | | | | | | |
| | | | | | | | | | | |
| DoubleLine Income Fund | | | | Fair Value as of
3/31/2019 | | Net Realized
Gain (Loss) | | Net Change in
Unrealized
Appreciation
(Depreciation)3 | | Net Accretion
(Amortization) | | Purchases 1 | | Sales 2 | | Transfers Into
Level 34 | | Transfers Out
of Level 34 | | Fair Value as of
3/31/2020 | | Net Change in
Unrealized
Appreciation
(Depreciation)
on securities
held at
3/31/20203 |
Investments in Securities | | | | | | | | | | | | | | | | | | | | | | | | | | | | | | | | | | | | | | | | | | | | | | | | | | | | | | | |
Non-Agency Commercial Mortgage Backed Obligations | | | | | | | | $ | — | | | | $ | — | | | | $ | (203,013 | ) | | | $ | 8,021 | | | | $ | 1,269,668 | | | | $ | — | | | | $ | — | | | | $ | — | | | | $ | 1,074,676 | | | | $ | — | |
| 1 | Purchases include all purchases of securities, payups and corporate actions. |
| 2 | Sales include all sales of securities, maturities, and paydowns. |
| 3 | Any difference between Net Change in Unrealized Appreciation (Depreciation) and Net Change in Unrealized Appreciation (Depreciation) on securities held at March 31, 2020 may be due to a security that was not held or categorized as Level 3 at either period end. |
| 4 | Transfers into or out of Level 3 can be attributed to changes in the availability of pricing sources and/or in the observability of significant inputs used to measure the fair value of those instruments. |
The following is a summary of quantitative information about Level 3 Fair Value Measurements:
| | | | | | | | | | | | | | | | | | | | | | | | | | | |
| | | | | | |
| DoubleLine Multi-Asset Growth Fund | | | | Fair Value as of
3/31/2020 | | Valuation
Techniques | | Unobservable
Input | | Unobservable Input Values
(Weighted Average)+ | | Impact to valuation from an increase to input |
| | | | | | |
Non-Agency Residential Collateralized Mortgage Obligations | | | | | | | | $ | 896,350 | | | Market
Comparables |
| | Market
Quotes | | | $ | 98.50 ($98.50 | ) | | Significant changes in the market quotes would have resulted in direct and proportional changes in the fair value of the security |
| | | | | | |
Collateralized Loan Obligations | | | | | | | | $ | 72,621 | | | Market
Comparables |
| | Market
Quotes | | | | $7.26 ($7.26) | | | Significant changes in the market quotes would have resulted in direct and proportional changes in the fair value of the security |
| | | | | | | | | | | | | | | | | | | | | | | | | |
| | | | | | |
| | Annual Report | | March 31, 2020 | | 131 |
| | |
| Notes to Financial Statements (Cont.) | | March 31, 2020 |
| | | | | | | | | | | | | | | | | | | | | | | | | | | |
| | | | | | |
| DoubleLine Flexible Income Fund | | | | Fair Value as of
3/31/2020 | | Valuation
Techniques | | Unobservable
Input | | Unobservable Input Values
(Weighted Average)+ | | Impact to valuation from an increase to input |
| | | | | | |
Non-Agency Residential Collateralized Mortgage Backed Obgligations | | | | | | | | $ | 20,518,003 | | | Market
Comparables |
| | Market
Quotes | | | | $69.02 - $98.50 ($88.01 | ) | | Significant changes in the market quotes would have resulted in direct and proportional changes in the fair value of the security |
| | | | | | |
Non-Agency Commercial Mortgage Backed Obgligations | | | | | | | | $ | 444,116 | | | Market
Comparables |
| | Yields | | | | 33.00% (33.00% | ) | | Increase in yields would have resulted in the decrease in the fair vale of the security |
| | | | | | |
Collateralized Loan Obligations | | | | | | | | $ | 180,404 | | | Market
Comparables |
| | Market
Quotes | | | | $72.16 ($72.16 | ) | | Significant changes in the market quotes would have resulted in direct and proportional changes in the fair value of the security |
| | | | | | |
Foreign Corporate Bonds | | | | | | | | $ | 1,500 | | | Enterprise
Values |
| | EBITDA
Multiples | | | | 5x - 6.5x (5.75x) | | | Significant changes in the EBITDA multiple would have resulted in direct changes in the fair value of the security. |
| | | | | | | | | | | | | | | | | | | | | | | | | |
| | | | | | |
| DoubleLine Infrastructure Income Fund | | | | Fair Value as of
3/31/2020 | | Valuation
Techniques | | Unobservable
Input | | Unobservable Input Values
(Weighted Average)+ | | Impact to valuation from an increase to input |
| | | | | | |
Foreign Corporate Bonds | | | | | | | | $ | 9,904,084 | | | Market
Comparables |
| | Market
Quotes | | | | $103.50 ($103.50) | | | Significant changes in the market quotes would have resulted in direct and proportional changes in the fair value of the security |
| | | | | | | | | | | | | | | | | | | | | | | | | |
| | | | | | |
| DoubleLine Income Fund | | | | Fair Value as of
3/31/2020 | | Valuation
Techniques | | Unobservable
Input | | Unobservable Input Values
(Weighted Average)+ | | Impact to valuation from an increase to input |
| | | | | | |
Non-Agency Commercial Mortgage Backed Obligations | | | | | | | | $ | 1,074,676 | | | Market
Comparables |
| | Yields | | | | 12.02% (12.02%) | | | Increase in the yields would have resulted in the decrease in the fair value of the security |
| + | Unobservable inputs were weighted by the relative fair value of the instruments. |
B. Federal Income Taxes. Each Fund has elected to be taxed as a “regulated investment company” and intends to distribute substantially all of its taxable income to its shareholders and otherwise comply with the provisions of Subchapter M of the Internal Revenue Code applicable to regulated investment companies. Therefore, no provision for federal income taxes has been made.
The Funds may be subject to a nondeductible 4% excise tax calculated as a percentage of certain undistributed amounts of net investment income and net capital gains.
The Funds have adopted financial reporting rules that require the Funds to analyze all open tax years, as defined by the applicable statute of limitations, for all major jurisdictions. Open tax years 2017-2019 (Federal) and 2016-2019 (CA) for the Funds, are those that are open for exam by taxing authorities to the extent that each Fund operated within those respective tax years. As of March 31, 2020, the Funds have no examinations in progress.
Management has analyzed the Funds’ tax positions, and has concluded that no liability should be recorded related to uncertain tax positions expected to be taken on the tax return for the fiscalyear-ended March 31, 2020. The Funds identify their major tax jurisdictions as U.S. Federal, the State of Delaware and the State of California. The Funds are not aware of any tax positions for which it is reasonably possible that the total amounts of unrecognized tax benefits will significantly change in the next twelve months.
C. Security Transactions, Investment Income. Investment securities transactions are accounted for on trade date. Gains and losses realized on sales of securities are determined on a specific identification basis. Interest income, including non-cash interest, is recorded on an accrual basis. Discounts/premiums on debt securities purchased, which may include residual and subordinate notes, are accreted/amortized over the life of the respective securities using the effective interest method except for certain deep discount bonds where management does not expect the par value above the bond’s cost to be fully realized. Dividend income and corporate action transactions, if any, are recorded on the ex-date. Non-cash dividends included in dividend income, if any, are recorded at the fair market value of securities received. Paydown gains and losses on mortgage-related and other asset-backed securities are recorded as components of interest income on the Statements of Operations. Estimated tax liabilities on certain foreign securities are recorded on an accrual basis and are reflected as components of interest income on the Statements of Operations.
D. Foreign Currency Translation. The Funds’ books and records are maintained in U.S. dollars. Investment securities and other assets and liabilities denominated in foreign currencies are translated into U.S. dollars based on the exchange rate of such currencies against U.S. dollars on the date of valuation. Investment securities transactions, income and expense items denominated in foreign currencies are translated into U.S. dollars at the exchange rate in effect on the transaction date. The Funds do not isolate changes in the exchange rates from the changes in the market prices of investments held or sold for financial
| | | | | | |
| 132 | | DoubleLine Funds Trust | | | | |
reporting purposes. Accordingly, the effects of changes in exchange rates on investments are not segregated in the Statement of Operations from the effects of changes in market prices of those investments, but are included as a component of net realized and unrealized gain (loss) from investments.
E. Dividends and Distributions to Shareholders. With the exception of the DoubleLine Multi-Asset Growth Fund, the DoubleLine Strategic Commodity Fund, the DoubleLine Global Bond Fund and the DoubleLine Emerging Markets Local Currency Bond Fund, dividends from net investment income will be declared and paid monthly. Dividends from the net investment income of the DoubleLine Multi-Asset Growth Fund, the DoubleLine Global Bond Fund and the DoubleLine Emerging Markets Local Currency Bond Fund will be declared and paid quarterly. Dividends from the net investment income of the DoubleLine Strategic Commodity Fund will be declared and paid annually. The Funds will distribute any net realized long or short-term capital gains at least annually. Distributions are recorded on theex-dividend date.
Income and capital gain distributions are determined in accordance with income tax regulations which may differ from US GAAP. Permanent book and tax basis differences relating to shareholder distributions will result in reclassifications betweenpaid-in capital, undistributed (accumulated) net investment income (loss), and/or undistributed (accumulated) realized gain (loss). Undistributed (accumulated) net investment income or loss may include temporary book and tax basis differences which will reverse in a subsequent period. Any taxable income or capital gain remaining at fiscal year end is distributed in the following year.
Distributions from investment companies will be classified as investment income or realized gains in the Statements of Operations based on the U.S. income tax characteristics of the distribution if such information is available. In cases where the tax characteristics are not available, such distributions are generally classified as investment income.
F. Use of Estimates. The preparation of financial statements in conformity with US GAAP requires management to make estimates and assumptions that affect the reported amounts of assets and liabilities and disclosure of contingent assets and liabilities at the date of the financial statements, as well as the reported amounts of revenues and expenses during the period. Actual results could differ from those estimates.
G. Share Valuation. The NAV per share of a class of shares of a Fund is calculated by dividing the sum of the value of the securities held by the Fund, plus cash and other assets, attributable to that class, minus all liabilities (including estimated accrued expenses), attributable to that class by the total number of shares of that class outstanding, rounded to the nearest cent. The Funds’ NAV is typically calculated on days when the New York Stock Exchange opens for regular trading.
H. Unfunded Loan Commitments. The Funds may enter into certain credit agreements, of which all or a portion may be unfunded. These commitments are disclosed in the accompanying Schedules of Investments. The Funds are obligated to fund these commitments at the borrower’s discretion. The Funds generally will maintain with their custodian liquid investments having an aggregate value at least equal to the par value of unfunded loan commitments.
I. Contingencies. Between 2011 and 2014, the Commonwealth of Puerto Rico issued certain general obligation bonds, which are currently the subject of litigation. DoubleLine Multi-Asset Growth Fund previously purchased and sold certain of these general obligation bonds and may have some exposure to this litigation. At this time, it is anticipated that a material adverse effect on the Multi-Asset Growth Fund as a result of this litigation is remote. As of March 31, 2020, no loss contingency has been recorded in the financial statements.
J. Guarantees and Indemnifications. Under the Trust’s organizational documents, each Trustee and officer of the Funds is indemnified, to the extent permitted by the 1940 Act, against certain liabilities that may arise out of performance of their duties to the Fund. Additionally, in the normal course of business, the Funds enter into contracts that contain a variety of indemnification clauses. Each Fund’s maximum exposure under these arrangements is unknown as this would involve future claims that may be made against the Funds that have not yet occurred. However, the Funds have not had prior claims or losses pursuant to these contracts.
K. Basis for Consolidation. The DoubleLine Multi-Asset Growth Fund and the DoubleLine Strategic Commodity Fund may invest up to 25% of their total assets in the DoubleLine Cayman Multi-Asset Growth Fund I, Ltd. and the DoubleLine Strategic Commodity, Ltd. (each, a “Subsidiary” and, collectively, the “Subsidiaries”), respectively. The Subsidiaries, which are organized under the laws of the Cayman Islands, are wholly-owned and controlled by each respective Fund. Each Subsidiary invests in commodity-related investments and other investments. The consolidated financial statements include the accounts and balances of each Fund and its respective Subsidiary. Intercompany balances and transactions have been eliminated in consolidation.
| | | | | | |
| | Annual Report | | March 31, 2020 | | 133 |
| | |
| Notes to Financial Statements (Cont.) | | March 31, 2020 |
As of March 31, 2020, the relationship of the Subsidiary to each respective Fund was as follows:
| | | | | | | | | | | | | | | |
| | | |
| | | | | DoubleLine
Multi-Asset
Growth Fund
(Consolidated) | | DoubleLine
Strategic
Commodity
Fund
(Consolidated) |
| | | |
Commencement of Operations | | | | | | | | | 6/15/2011 | | | | | 5/18/2015 | |
| | | |
Fund Net Assets | | | | | | | | $ | 36,286,436 | | | | $ | 142,159,340 | |
| | | |
Subsidiary % of Fund Net Assets | | | | | | | | | 22.94% | | | | | 22.62% | |
| | | |
Subsidiary Financial Statement Information | | | | | | | | | | | | | | | |
| | | |
Net Assets | | | | | | | | $ | 8,323,929 | | | | $ | 32,155,175 | |
| | | |
Total Income | | | | | | | | | 197,387 | | | | | 2,056,596 | |
| | | |
Net Realized Gain/(Loss) | | | | | | | | | (876,378 | ) | | | | (90,350,924 | ) |
L. Other. Each share class of a Fund is charged for those expenses that are directly attributable to that share class. Expenses that are not directly attributable to a Fund are allocated among all appropriate Funds in proportion to their respective net assets or in such a manner as the Funds’ Board may in its sole discretion consider fair and equitable to each Fund. Investment income, Fund expenses which are not class-specific, and realized and unrealized gains and losses are allocated directly to each class based upon the relative net assets of the classes.
3. Related and Other Party Transactions
The Advisers provide the Funds with investment management services under Investment Management Agreements (the “Agreements”). Under the Agreements, each Adviser manages the investment of the assets of the applicable Fund, places orders for the purchase and sale of its portfolio securities and is responsible for providing certain resources to assist with the day-to-day management of the Trust’s business affairs. As compensation for its services, each Adviser is entitled to a monthly fee at the annual rates of the average daily net assets of the Funds (the “Advisory Fee”) in the following table. Each Adviser has arrangements with DoubleLine Group LP to provide personnel and other resources to the Funds. On December 11, 2018, DoubleLine Alternatives LP, the investment adviser of the DoubleLine Colony Real Estate and Income Fund, engaged DoubleLine Capital LP to serve as sub-adviser to the DoubleLine Colony Real Estate and Income Fund to manage its investment in debt instruments.
Each Adviser has contractually agreed to limit certain of the Funds’ ordinary operating expenses so that its ratio of such expenses to average net assets will not exceed the following ratios (the “Expense Caps”). For the purposes of the expense limitation agreement between each Adviser and the Funds, “ordinary operating expenses” excludes taxes, commissions, mark-ups, litigation expenses, indemnification expenses, interest expenses, acquired fund fees and expenses, and any extraordinary expenses. With the exception of the DoubleLine Colony Real Estate and Income Fund, the DoubleLine Emerging Markets Local Currency Bond Fund and the DoubleLine Income Fund, each Fund’s expense limitation is expected to apply until at least July 31, 2020. DoubleLine Colony Real Estate and Income Fund’s expense limitation is expected to apply until at least December 11, 2020. DoubleLine Emerging Markets Local Currency Bond Fund’s expense limitation is expected to apply until at least June 26, 2021. DoubleLine Income Fund’s expense limitation is expected to apply until at least September 2, 2021. Each may be terminated during the term only by a majority vote of the disinterested Trustees of the Board.
| | | | | | | | | | | | | | | | | | | | | | | | | | | | | | |
| | | | | | | Expense Caps |
| | | | | | |
| | | | | Advisory Fee | | I Shares | | N Shares | | A Shares | | R6 Shares |
| | | | | | |
DoubleLine Total Return Bond Fund | | | | | | | | | 0.40% | | | | | N/A | | | | | N/A | | | | | N/A | | | | | N/A | |
| | | | | | |
DoubleLine Core Fixed Income Fund | | | | | | | | | 0.40% | | | | | N/A | | | | | N/A | | | | | N/A | | | | | N/A | |
| | | | | | |
DoubleLine Emerging Markets Fixed Income Fund | | | | | | | | | 0.75% | | | | | 0.95% | | | | | 1.20% | | | | | N/A | | | | | N/A | |
| | | | | | |
DoubleLine Multi-Asset Growth Fund (Consolidated) | | | | | | | | | 0.95% | | | | | 1.15% | | | | | N/A | | | | | 1.40% | | | | | N/A | |
| | | | | | |
DoubleLine Low Duration Bond Fund | | | | | | | | | 0.35% | | | | | 0.47% | | | | | 0.72% | | | | | N/A | | | | | 0.42% | |
| | | | | | |
DoubleLine Floating Rate Fund | | | | | | | | | 0.50% | | | | | 0.75% | | | | | 1.00% | | | | | N/A | | | | | N/A | |
| | | | | | |
DoubleLine Shiller Enhanced CAPE® | | | | | | | | | 0.45% | | | | | 0.65% | | | | | 0.90% | | | | | N/A | | | | | 0.60% | |
| | | | | | |
DoubleLine Flexible Income Fund | | | | | | | | | 0.62% | | | | | 0.82% | | | | | 1.07% | | | | | N/A | | | | | 0.77% | |
| | | | | | |
DoubleLine Low Duration Emerging Markets Fixed Income Fund | | | | | | | | | 0.50% | | | | | 0.59% | | | | | 0.84% | | | | | N/A | | | | | N/A | |
| | | | | | |
DoubleLine Long Duration Total Return Bond Fund | | | | | | | | | 0.50% | | | | | 0.65% | | | | | 0.90% | | | | | N/A | | | | | N/A | |
| | | | | | |
| 134 | | DoubleLine Funds Trust | | | | |
| | | | | | | | | | | | | | | | | | | | | | | | | | | | | | |
| | | | | | | Expense Caps |
| | | | | | |
| | | | | Advisory Fee | | I Shares | | N Shares | | A Shares | | R6 Shares |
| | | | | | |
DoubleLine Strategic Commodity Fund (Consolidated) | | | | | | | | | 0.90% | | | | | 1.10% | | | | | 1.35% | | | | | N/A | | | | | N/A | |
| | | | | | |
DoubleLine Global Bond Fund | | | | | | | | | 0.50% | | | | | 0.70% | | | | | 0.95% | | | | | N/A | | | | | N/A | |
| | | | | | |
DoubleLine Infrastructure Income Fund | | | | | | | | | 0.50% | | | | | 0.65% | | | | | 0.90% | | | | | N/A | | | | | N/A | |
| | | | | | |
DoubleLine Ultra Short Bond Fund | | | | | | | | | 0.15% | | | | | 0.30% | | | | | 0.55% | | | | | N/A | | | | | N/A | |
| | | | | | |
DoubleLine Shiller Enhanced International CAPE® | | | | | | | | | 0.50% | | | | | 0.65% | | | | | 0.90% | | | | | N/A | | | | | N/A | |
| | | | | | |
DoubleLine Colony Real Estate and Income Fund | | | | | | | | | 0.45% | | | | | 0.65% | | | | | 0.90% | | | | | N/A | | | | | N/A | |
| | | | | | |
DoubleLine Emerging Markets Local Currency Bond Fund | | | | | | | | | 0.75% | | | | | 0.90% | | | | | 1.15% | | | | | N/A | | | | | N/A | |
| | | | | | |
DoubleLine Income Fund | | | | | | | | | 0.50% | | | | | 0.65% | | | | | 0.90% | | | | | N/A | | | | | N/A | |
Other than as described above, to the extent that an Adviser waives its investment advisory fee and/or reimburses a Fund for other ordinary operating expenses, it may seek reimbursement of a portion or all of such amounts at any time within three fiscal years after the fiscal year in which such amounts were waived or reimbursed. Each Fund must pay its current ordinary operating expenses before each Adviser is entitled to any recoupment. Any such recoupment would be subject to review by the Board and will be subject to the Fund’s expense limitations in place when the fees were waived or the expenses were reimbursed.
Each Adviser, as applicable, contractually waived a portion of its fees or reimbursed certain operating expenses and may recapture a portion of the amounts no later than the dates as stated in the following table:
| | | | | | | | | | | | | | | | | | | | |
| | |
| | | | | March 31, |
| | | | |
| | | | | 2021 | | 2022 | | 2023 |
| | | | |
DoubleLine Multi-Asset Growth Fund (Consolidated) | | | | | | | | $ | — | | | | $ | — | | | | $ | 70,875 | |
| | | | |
DoubleLine Low Duration Bond Fund | | | | | | | | $ | — | | | | $ | — | | | | $ | 3 | |
| | | | |
DoubleLine Low Duration Emerging Markets Fixed Income Fund | | | | | | | | $ | 613,726 | | | | $ | 119,396 | | | | $ | 91,791 | |
| | | | |
DoubleLine Long Duration Total Return Bond Fund | | | | | | | | $ | 101,274 | | | | $ | 36,189 | | | | $ | 31,792 | |
| | | | |
DoubleLine Strategic Commodity Fund (Consolidated) | | | | | | | | $ | 90,794 | | | | $ | 18,303 | | | | $ | 47,728 | |
| | | | |
DoubleLine Ultra Short Bond Fund | | | | | | | | $ | 30,967 | | | | $ | — | | | | $ | — | |
| | | | |
DoubleLine Shiller Enhanced International CAPE® | | | | | | | | $ | 389,095 | | | | $ | 236,220 | | | | $ | 93,238 | |
| | | | |
DoubleLine Colony Real Estate and Income Fund | | | | | | | | $ | — | | | | $ | 186,881 | | | | $ | 310,642 | |
| | | | |
DoubleLine Emerging Markets Local Currency Fund | | | | | | | | $ | — | | | | $ | — | | | | $ | 393,049 | |
| | | | |
DoubleLine Income Fund | | | | | | | | $ | — | | | | $ | — | | | | $ | 229,850 | |
For the year ended March 31, 2020, each Adviser recouped the amounts shown from the following Funds:
| | | | | | | | | | |
| | |
DoubleLine Multi-Asset Growth Fund (Consolidated) | | | | | | | | $ | 38,244 | |
| | |
DoubleLine Strategic Commodity Fund (Consolidated) | | | | | | | | $ | 104,775 | |
The DoubleLine Multi-Asset Growth Fund reimbursed certain operating expenses of $8,645 during the current fiscal year and subsequently was able to recoup $8,645 within the current fiscal year.
If a Fund invested in other investment vehicles sponsored by an Adviser (“other DoubleLine Funds”) during the period, such Adviser waived its advisory fee to the Fund in an amount equal to the advisory fees paid to the Adviser by the other DoubleLine Funds in respect of Fund assets so invested. Accordingly, the Adviser waived the following fees for the year ended March 31, 2020.
| | | | | | | | | | |
| | |
DoubleLine Total Return Bond Fund | | | | | | | | $ | 267,591 | |
| | |
DoubleLine Core Fixed Income Fund | | | | | | | | $ | 7,093,767 | |
| | |
DoubleLine Multi-Asset Growth Fund (Consolidated) | | | | | | | | $ | 161,777 | |
| | |
DoubleLine Low Duration Bond Fund | | | | | | | | $ | 247,417 | |
| | |
DoubleLine Shiller Enhanced CAPE® | | | | | | | | $ | 395,489 | |
| | |
DoubleLine Flexible Income Fund | | | | | | | | $ | 505,948 | |
| | |
DoubleLine Shiller Enhanced International CAPE® | | | | | | | | $ | 18,117 | |
| | |
DoubleLine Colony Real Estate and Income Fund | | | | | | | | $ | 10,974 | |
| | | | | | |
| | Annual Report | | March 31, 2020 | | 135 |
| | |
| Notes to Financial Statements (Cont.) | | March 31, 2020 |
As of March 31, 2020, greater than 5% of the following DoubleLine Funds was held by other DoubleLine Funds as follows:
| | | | | | | | | | | | |
| | | |
Affiliated Fund Held | | | | | | | | | % Owned | | | Significant Owner |
| | | |
DoubleLine Global Bond Fund | | | | | | | | | 77% | | | DoubleLine Core Fixed Income Fund |
| | | |
DoubleLine Infrastructure Income Fund | | | | | | | | | 85% | | | DoubleLine Core Fixed Income Fund |
| | | |
DoubleLine Long Duration Total Return Bond Fund | | | | | | | | | 55% | | | DoubleLine Core Fixed Income Fund |
| | | |
DoubleLine Global Bond Fund | | | | | | | | | 9% | | | DoubleLine Flexible Income Fund |
| | | |
DoubleLine Low Duration Emerging Markets Fixed Income Fund | | | | | | | | | 24% | | | DoubleLine Low Duration Bond Fund |
| | | |
DoubleLine Ultra Short Bond Fund | | | | | | | | | 83% | | | DoubleLine Shiller Enhanced CAPE® |
| | | |
DoubleLine Income Fund | | | | | | | | | 81% | | | DoubleLine Total Return Bond Fund |
DoubleLine Capital LP and certain DoubleLine affiliated advisers provide investment advisory, sub-advisory, or consulting services to a variety of investors, including investment program sponsors, separate accounts, and mutual funds sponsored by third parties (collectively “third-party accounts”). Those services may result, directly or indirectly, in investments by the third-party accounts in one or more of the Funds. At times, the third-party accounts’ investments, individually or in the aggregate, may represent material interests in one or more of the Funds. The third-party accounts’ transaction activity in a Fund may cause a Fund to incur material transaction costs, to realize taxable gains distributable to shareholders, and/or to buy or sell assets at a time when the Fund might not otherwise do so, each of which may adversely affect a Fund’s performance. See the description of Large Shareholder Risk in the Principal Risks Note for more information. Records available to the Funds reflect that greater than 25% of the following Funds were held by third-party accounts as of March 31, 2020:
| | | | | | | | | | |
| | |
| | | | | % Owned |
| | |
DoubleLine Multi-Asset Growth Fund (Consolidated) | | | | | | | | | 56% | |
4. Distribution, Sales Charge and Redemption Fees
Class N shares and Class A shares of the Funds make payments under a distribution plan (the “Distribution Plan”) adopted pursuant to Rule 12b-1 under the 1940 Act. Pursuant to the Distribution Plan, each Fund compensates the Fund’s distributor for distribution and related services at an annual rate equal to 0.25% of the average daily net assets of the Fund attributable to its Class N and Class A shares. The fees may be used to pay the Fund’s distributor for distribution services and sales support services provided in connection with Class N and Class A shares.
The Class A shares of DoubleLine Multi-Asset Growth Fund have a maximum sales charge imposed on purchases of 4.25% of the offering price and a maximum contingent deferred sales charge of 0.75% that applies to purchases of $1 million or more of Class A shares if the shares are redeemed within 18 months of purchase.
The DoubleLine Floating Rate Fund imposes redemption fees. Redemption fees are paid to and retained by the Fund to limit the opportunity to market time the Fund and to help offset estimated portfolio transaction costs and other related costs incurred by the Fund as a result of short-term trading. Subject to the exceptions discussed in the Fund’s prospectus, the DoubleLine Floating Rate Fund will apply a redemption fee equal to 1% of the value of any shares redeemed within 90 days of purchase.
Effective March 31, 2020, Foreside Financial Group, LLC (“Foreside”) acquired Quasar Distributors, LLC (“Quasar”), the Funds’ distributor, from U.S. Bancorp. As a result of the acquisition, Quasar became a wholly-owned broker-dealer subsidiary of Foreside and is no longer affiliated with U.S. Bancorp. The Board of the Funds has approved a new distribution agreement to enable Quasar to continue serving as the Funds’ distributor.
| | | | | | |
| 136 | | DoubleLine Funds Trust | | | | |
5. Purchases and Sales of Securities
Investment transactions (excluding short-term investments) for the year ended March 31, 2020 were as follows:
| | | | | | | | | | | | | | | | | | | | | | | | | |
| | | |
| | | | | All Other | | U.S. Government1 |
| | | | | |
| | | | | Purchases at
Cost | | Sales or
Maturity
Proceeds | | Purchases at
Cost | | Sales or
Maturity
Proceeds |
| | | | | |
DoubleLine Total Return Bond Fund | | | | | | | | $ | 15,545,936,414 | | | | $ | 13,685,950,475 | | | | $ | 4,264,995,750 | | | | $ | 2,370,342,695 | |
| | | | | |
DoubleLine Core Fixed Income Fund | | | | | | | | $ | 3,456,030,232 | | | | $ | 3,076,952,658 | | | | $ | 2,367,983,532 | | | | $ | 1,988,732,765 | |
| | | | | |
DoubleLine Emerging Markets Fixed Income Fund | | | | | | | | $ | 423,814,047 | | | | $ | 543,058,596 | | | | $ | — | | | | $ | — | |
| | | | | |
DoubleLine Multi-Asset Growth Fund (Consolidated) | | | | | | | | $ | 11,897,896 | | | | $ | 137,524,452 | | | | $ | — | | | | $ | — | |
| | | | | |
DoubleLine Low Duration Bond Fund | | | | | | | | $ | 3,698,336,420 | | | | $ | 3,672,626,470 | | | | $ | 538,289,502 | | | | $ | 456,359,000 | |
| | | | | |
DoubleLine Floating Rate Fund | | | | | | | | $ | 186,042,298 | | | | $ | 427,298,929 | | | | $ | — | | | | $ | — | |
| | | | | |
Doubleline Shiller Enhanced CAPE® | | | | | | | | $ | 3,768,674,481 | | | | $ | 3,164,875,704 | | | | $ | 1,157,839,000 | | | | $ | 535,869,121 | |
| | | | | |
DoubleLine Flexible Income Fund | | | | | | | | $ | 478,399,390 | | | | $ | 445,141,750 | | | | $ | 96,682,321 | | | | $ | 102,571,144 | |
| | | | | |
DoubleLine Low Duration Emerging Markets Fixed Income Fund | | | | | | | | $ | 132,611,539 | | | | $ | 173,900,906 | | | | $ | — | | | | $ | — | |
| | | | | |
DoubleLine Selective Credit Fund | | | | | | | | $ | 556,104,861 | | | | $ | 323,308,758 | | | | $ | — | | | | $ | — | |
| | | | | |
DoubleLine Long Duration Total Return Bond Fund | | | | | | | | $ | 4,657,129 | | | | $ | 10,836,908 | | | | $ | 44,020,363 | | | | $ | 24,788,445 | |
| | | | | |
DoubleLine Strategic Commodity Fund (Consolidated) | | | | | | | | $ | — | | | | $ | — | | | | $ | — | | | | $ | — | |
| | | | | |
DoubleLine Global Bond Fund | | | | | | | | $ | 199,009,298 | | | | $ | 176,326,183 | | | | $ | 150,185,635 | | | | $ | 62,489,690 | |
| | | | | |
DoubleLine Infrastructure Income Fund | | | | | | | | $ | 48,962,165 | | | | $ | 60,264,534 | | | | $ | 5,512,246 | | | | $ | 5,423,086 | |
| | | | | |
DoubleLine Ultra Short Bond Fund | | | | | | | | $ | 129,953,149 | | | | $ | 85,872,836 | | | | $ | — | | | | $ | — | |
| | | | | |
Doubleline Shiller Enhanced International CAPE | | | | | | | | $ | 15,683,110 | | | | $ | 39,915,744 | | | | $ | 9,058,877 | | | | $ | 5,100,561 | |
| | | | | |
Doubleline Colony Real Estate and Income Fund | | | | | | | | $ | 69,073,385 | | | | $ | 80,283,989 | | | | $ | 43,878,383 | | | | $ | 23,741,665 | |
| | | | | |
DoubleLine Emerging Markets Local Currency Bond Fund | | | | | | | | $ | 9,479,002 | | | | $ | 783,035 | | | | $ | — | | | | $ | — | |
| | | | | |
DoubleLine Income Fund | | | | | | | | $ | 106,881,334 | | | | $ | 32,716,609 | | | | $ | 20,377,477 | | | | $ | 14,772,680 | |
| 1 | U.S. Government transactions are defined as those involving long-term U.S. Treasury bills, bonds and notes. |
6. Income Tax Information and Distributions to Shareholders
The tax character of distributions for the Funds were as follows:
| | | | | | | | | | | | | | | | | | | | | | | | | |
| | | |
| | | | | Period Ended March 31, 2020 | | Period Ended March 31, 2019 |
| | | | | |
| | | | | Ordinary Income | | Long Term
Capital Gain | | Ordinary Income | | Long Term Capital Gain |
| | | | | |
DoubleLine Total Return Bond Fund | | | | | | | | $ | 1,919,288,276 | | | | $ | — | | | | $ | 1,815,432,826 | | | | $ | — | |
| | | | | |
DoubleLine Core Fixed Income Fund | | | | | | | | $ | 416,891,736 | | | | $ | — | | | | $ | 368,044,606 | | | | $ | — | |
| | | | | |
DoubleLine Emerging Markets Fixed Income Fund | | | | | | | | $ | 55,700,452 | | | | $ | — | | | | $ | 42,188,421 | | | | $ | — | |
| | | | | |
DoubleLine Multi-Asset Growth Fund (Consolidated) | | | | | | | | $ | 3,629,192 | | | | $ | — | | | | $ | 6,736,113 | | | | $ | — | |
| | | | | |
DoubleLine Low Duration Bond Fund | | | | | | | | $ | 229,234,859 | | | | $ | — | | | | $ | 187,300,764 | | | | $ | — | |
| | | | | |
DoubleLine Floating Rate Fund | | | | | | | | $ | 16,390,217 | | | | $ | — | | | | $ | 30,699,519 | | | | $ | — | |
| | | | | |
Doubleline Shiller Enhanced CAPE® | | | | | | | | $ | 199,768,063 | | | | $ | 199,675,345 | | | | $ | 171,498,030 | | | | $ | 520,841,008 | |
| | | | | |
DoubleLine Flexible Income Fund | | | | | | | | $ | 60,733,628 | | | | $ | — | | | | $ | 57,222,133 | | | | $ | — | |
| | | | | |
DoubleLine Low Duration Emerging Markets Fixed Income Fund | | | | | | | | $ | 8,869,343 | | | | $ | — | | | | $ | 5,656,066 | | | | $ | 148,364 | |
| | | | | |
DoubleLine Long Duration Total Return Bond Fund | | | | | | | | $ | 2,329,767 | | | | $ | 2,086,988 | | | | $ | 2,231,875 | | | | $ | — | |
| | | | | |
DoubleLine Strategic Commodity Fund (Consolidated) | | | | | | | | $ | 3,803,679 | | | | $ | — | | | | $ | 5,581,183 | | | | $ | — | |
| | | | | |
DoubleLine Global Bond Fund | | | | | | | | $ | 13,226,966 | | | | $ | 65,342 | | | | $ | 9,826,720 | | | | $ | — | |
| | | | | |
DoubleLine Infrastructure Income Fund | | | | | | | | $ | 17,765,355 | | | | $ | — | | | | $ | 17,600,337 | | | | $ | 88,676 | |
| | | | | |
DoubleLine Ultra Short Bond Fund | | | | | | | | $ | 6,549,034 | | | | $ | 25,979 | | | | $ | 5,966,067 | | | | $ | 11,100 | |
| | | | | |
Doubleline Shiller Enhanced International CAPE® | | | | | | | | $ | 1,702,526 | | | | $ | — | | | | $ | 3,041,578 | | | | $ | 3,079,477 | |
| | | | | |
Doubleline Colony Real Estate and Income Fund | | | | | | | | $ | 4,628,661 | | | | $ | — | | | | $ | 575,909 | | | | $ | — | |
| | | | | |
DoubleLine Emerging Markets Local Currency Bond Fund | | | | | | | | $ | 119,842 | | | | $ | — | | | | $ | ��� | | | | $ | — | |
| | | | | |
DoubleLine Income Fund | | | | | | | | $ | 2,236,321 | | | | $ | — | | | | $ | — | | | | $ | — | |
| | | | | | |
| | Annual Report | | March 31, 2020 | | 137 |
| | |
| Notes to Financial Statements (Cont.) | | March 31, 2020 |
The Funds designated as long-term capital gain dividend, pursuant to Internal Revenue Code Section 852(b)(3), the amount necessary to reduce the earnings and profits of the Funds related to net capital gain to zero.
The cost basis of investments for federal income tax purposes as of March 31, 2020, was as follows:
| | | | | | | | | | | | | | | | | | | | | | | | | | | | | | | | | | | |
| | | | | | | |
| | | | | DoubleLine
Total Return
Bond Fund | | DoubleLine
Core Fixed
Income Fund | | DoubleLine
Emerging
Markets Fixed
Income Fund | | DoubleLine
Multi-Asset
Growth Fund
(Consolidated) | | DoubleLine
Low Duration
Bond Fund | | DoubleLine
Floating
Rate Fund |
| | | | | | | |
Tax Cost of Investments | | | | | | | | $ | 51,927,248,855 | | | | $ | 11,730,181,775 | | | | $ | 1,039,677,874 | | | | $ | 41,941,433 | | | | $ | 7,072,803,289 | | | | $ | 213,375,481 | |
| | | | | | | |
Gross Tax Unrealized Appreciation | | | | | | | | | 2,595,712,488 | | | | | 468,603,687 | | | | | 2,697,521 | | | | | 5,789,904 | | | | | 32,447,946 | | | | | 169,716 | |
| | | | | | | |
Gross Tax Unrealized Depreciation | | | | | | | | | (3,314,524,024 | ) | | | | (715,383,085 | ) | | | | (198,034,692 | ) | | | | (12,376,894 | ) | | | | (376,138,607 | ) | | | | (27,770,034 | ) |
| | | | | | | |
Net Tax Unrealized Appreciation (Depreciation) | | | | | | | | | (718,811,536 | ) | | | | (246,779,398 | ) | | | | (195,337,171 | ) | | | | (6,586,990 | ) | | | | (343,690,661 | ) | | | | (27,600,318 | ) |
| | | | | | | | | | | | | | | | | | | | | | | | | | | | | | | | | | | |
| | | | | | | |
| | | | | DoubleLine
Shiller Enhanced
CAPE® | | DoubleLine
Flexible
Income Fund | | DoubleLine
Low Duration
Emerging
Markets Fixed
Income Fund | | DoubleLine
Long Duration
Total Return
Bond Fund | | DoubleLine
Strategic
Commodity Fund
(Consolidated) | | DoubleLine
Global Bond
Fund |
| | | | | | | |
Tax Cost of Investments | | | | | | | | $ | 7,251,024,191 | | | | $ | 1,271,488,136 | | | | $ | 207,580,216 | | | | $ | 97,739,677 | | | | $ | 145,865,891 | | | | $ | 1,206,881,196 | |
| | | | | | | |
Gross Tax Unrealized Appreciation | | | | | | | | | 1,096,495,357 | | | | | 3,137,994 | | | | | 254,190 | | | | | 12,341,229 | | | | | 53,506,912 | | | | | 35,869,354 | |
| | | | | | | |
Gross Tax Unrealized Depreciation | | | | | | | | | (2,537,497,730 | ) | | | | (190,080,138 | ) | | | | (12,171,540 | ) | | | | (2,105,387 | ) | | | | (77,936,448 | ) | | | | (39,779,976 | ) |
| | | | | | | |
Net Tax Unrealized Appreciation (Depreciation) | | | | | | | | | (1,441,002,373 | ) | | | | (186,942,144 | ) | | | | (11,917,350 | ) | | | | 10,235,842 | | | | | (24,429,536 | ) | | | | (3,910,622 | ) |
| | | | | | | | | | | | | | | | | | | | | | | | | | | | | | | | | | | |
| | | | | | | |
| | | | | DoubleLine
Infrastructure
Income Fund | | DoubleLine
Ultra Short
Bond Fund | | DoubleLine
Shiller
Enhanced
International
CAPE® | | DoubleLine
Colony Real
Estate and
Income Fund | | DoubleLine
Emering Markets
Local Currency
Bond Fund | | DoubleLine
Income Fund |
| | | | | | | |
Tax Cost of Investments | | | | | | | | $ | 537,482,329 | | | | $ | 239,929,941 | | | | $ | 49,779,619 | | | | $ | 123,005,645 | | | | $ | 9,790,734 | | | | $ | 85,433,215 | |
| | | | | | | |
Gross Tax Unrealized Appreciation | | | | | | | | | 5,525,260 | | | | | 30,283 | | | | | 2,100,836 | | | | | 826,029 | | | | | 10,404 | | | | | 721,979 | |
| | | | | | | |
Gross Tax Unrealized Depreciation | | | | | | | | | (32,002,457 | ) | | | | (5,143,311 | ) | | | | (12,001,656 | ) | | | | (23,094,919 | ) | | | | (1,264,060 | ) | | | | (15,959,957 | ) |
| | | | | | | |
Net Tax Unrealized Appreciation (Depreciation) | | | | | | | | | (26,477,197 | ) | | | | (5,113,028 | ) | | | | (9,900,820 | ) | | | | (22,268,890 | ) | | | | (1,253,656 | ) | | | | (15,237,978 | ) |
As of March 31, 2020, the components of accumulated earnings (losses) for income tax purposes were as follows: | |
| | | | | | | |
| | | | | DoubleLine
Total Return
Bond Fund | | DoubleLine
Core Fixed
Income Fund | | DoubleLine
Emerging
Markets Fixed
Income Fund | | DoubleLine
Multi-Asset
Growth Fund
(Consolidated) | | DoubleLine
Low Duration
Bond Fund | | DoubleLine
Floating
Rate Fund |
| | | | | | | |
Net Tax Unrealized Appreciation (Depreciation) | | | | | | | | $ | (718,811,536 | ) | | | $ | (246,779,398 | ) | | | $ | (195,337,171 | ) | | | $ | (6,586,990 | ) | | | $ | (343,690,661 | ) | | | $ | (27,600,318 | ) |
| | | | | | | |
Undistributed Ordinary Income | | | | | | | | | 40,206,937 | | | | | 10,311,183 | | | | | 1,272,857 | | | | | 198,765 | | | | | 4,946,775 | | | | | 562,202 | |
| | | | | | | |
Undistributed Long Term Capital Gains | | | | | | | | | — | | | | | — | | | | | — | | | | | — | | | | | — | | | | | — | |
| | | | | | | |
Total Distributable Earnings | | | | | | | | | 40,206,937 | | | | | 10,311,183 | | | | | 1,272,857 | | | | | 198,765 | | | | | 4,946,775 | | | | | 562,202 | |
| | | | | | | |
Other Accumulated Gains (Losses) | | | | | | | | | (2,937,329,094 | ) | | | | (134,205,721 | ) | | | | (39,339,792 | ) | | | | (9,483,839 | ) | | | | (96,166,778 | ) | | | | (33,538,263 | ) |
| | | | | | | |
Total Accumulated Earnings (Losses) | | | | | | | | | (3,615,933,693 | ) | | | | (370,673,936 | ) | | | | (233,404,106 | ) | | | | (15,872,064 | ) | | | | (434,910,664 | ) | | | | (60,576,379 | ) |
| | | | | | | | | | | | | | | | | | | | | | | | | | | | | | | | | | | |
| | | | | | | |
| | | | | DoubleLine
Shiller Enhanced
CAPE® | | DoubleLine Flexible
Income Fund | | DoubleLine
Low Duration
Emerging
Markets Fixed
Income Fund | | DoubleLine
Long Duration
Total Return
Bond Fund | | DoubleLine
Strategic
Commodity Fund
(Consolidated) | | DoubleLine
Global Bond
Fund |
| | | | | | | |
Net Tax Unrealized Appreciation (Depreciation) | | | | | | | | $ | (1,441,002,373 | ) | | | $ | (186,942,144 | ) | | | $ | (11,917,350 | ) | | | $ | 10,235,842 | | | | $ | (24,429,536 | ) | | | $ | (3,910,622 | ) |
| | | | | | | |
Undistributed Ordinary Income | | | | | | | | | 5,318,974 | | | | | 1,505,077 | | | | | 290,707 | | | | | 2,740,160 | | | | | 525,574 | | | | | — | |
| | | | | | | |
Undistributed Long Term Capital Gains | | | | | | | | | — | | | | | — | | | | | — | | | | | 2,372,616 | | | | | — | | | | | 428,833 | |
| | | | | | | |
Total Distributable Earnings | | | | | | | | | 5,318,974 | | | | | 1,505,077 | | | | | 290,707 | | | | | 5,112,776 | | | | | 525,574 | | | | | 428,833 | |
| | | | | | | |
Other Accumulated Gains (Losses) | | | | | | | | | (246,765,820 | ) | | | | (36,013,516 | ) | | | | (55,952 | ) | | | | (125,050 | ) | | | | (2,744 | ) | | | | (3,158,411 | ) |
| | | | | | | |
Total Accumulated Earnings (Losses) | | | | | | | | | (1,682,449,219 | ) | | | | (221,450,583 | ) | | | | (11,682,595 | ) | | | | 15,223,568 | | | | | (23,906,706 | ) | | | | (6,640,200 | ) |
| | | | | | | | | | | | | | | | | | | | | | | | | | | | | | | | | | | |
| | | | | | |
| 138 | | DoubleLine Funds Trust | | | | |
| | | | | | | | | | | | | | | | | | | | | | | | | | | | | | | | | | | |
| | | | | | | |
| | | | | DoubleLine
Infrastructure
Income Fund | | DoubleLine
Ultra Short
Bond Fund | | DoubleLine Shiller
Enhanced
International
CAPE® | | DoubleLine
Colony Real
Estate and
Income Fund | | DoubleLine
Emering Markets
Local Currency
Bond Fund | | DoubleLine
Income Fund |
| | | | | | | |
Net Tax Unrealized Appreciation (Depreciation) | | | | | | | | $ | (26,477,197 | ) | | | $ | (5,113,028 | ) | | | $ | (9,900,820 | ) | | | $ | (22,268,890 | ) | | | $ | (1,253,656 | ) | | | $ | (15,237,978 | ) |
| | | | | | | |
Undistributed Ordinary Income | | | | | | | | | 1,123,803 | | | | | 332,848 | | | | | 27,599 | | | | | 264,915 | | | | | 781 | | | | | 34,194 | |
| | | | | | | |
Undistributed Long Term Capital Gains | | | | | | | | | — | | | | | — | | | | | — | | | | | — | | | | | — | | | | | — | |
| | | | | | | |
Total Distributable Earnings | | | | | | | | | 1,123,803 | | | | | 332,848 | | | | | 27,599 | | | | | 264,915 | | | | | 781 | | | | | 34,194 | |
| | | | | | | |
Other Accumulated Gains (Losses) | | | | | | | | | (3,863,063 | ) | | | | (749,151 | ) | | | | (15,726,829 | ) | | | | (1,351,035 | ) | | | | (115,972 | ) | | | | (1,530,077 | ) |
| | | | | | | |
Total Accumulated Earnings (Losses) | | | | | | | | | (29,216,457 | ) | | | | (5,529,331 | ) | | | | (25,600,050 | ) | | | | (23,355,010 | ) | | | | (1,368,847 | ) | | | | (16,733,861 | ) |
Under the Regulated Investment Company Modernization Act of 2010, capital losses incurred by the Funds after January 1, 2011 will not be subject to expiration. In addition, such losses must be utilized prior to the losses incurred in the years preceding enactment.
As of March 31, 2020, the following capital loss carryforwards were available:
| | | | | | | | | | | | | | | |
| | | |
| | | | | Capital Loss
Carryforward | | Expires |
| | | |
DoubleLine Total Return Bond Fund | | | | | | | | $ | 2,901,867,765 | | | | | Indefinite | |
| | | |
DoubleLine Core Fixed Income Fund | | | | | | | | $ | 124,722,744 | | | | | Indefinite | |
| | | |
DoubleLine Emerging Markets Fixed Income Fund | | | | | | | | $ | 39,735,267 | | | | | Indefinite | |
| | | |
DoubleLine Multi-Asset Growth Fund | | | | | | | | $ | 9,218,282 | | | | | Indefinite | |
| | | |
DoubleLine Low Duration Bond Fund | | | | | | | | $ | 92,930,384 | | | | | Indefinite | |
| | | |
DoubleLine Floating Rate Fund | | | | | | | | $ | 32,986,522 | | | | | Indefinite | |
| | | |
DoubleLine Flexible Income Fund | | | | | | | | $ | 34,900,596 | | | | | Indefinite | |
| | | |
DoubleLine Infrastructure Income Fund | | | | | | | | $ | 3,080,796 | | | | | Indefinite | |
| | | |
DoubleLine Shiller Enhanced International CAPE® | | | | | | | | $ | 15,711,337 | | | | | Indefinite | |
| | | |
DoubleLine Emerging Markets Local Currency Bond Fund | | | | | | | | $ | 99,440 | | | | | Indefinite | |
| | | |
DoubleLine Income Fund | | | | | | | | $ | 1,216,762 | | | | | Indefinite | |
As of March 31, 2020, the following funds deferred, on a tax basis, losses of:
| | | | | | | | | | | | | | | |
| | | |
| | | | | Post- October
Loss | | Late-Year
Loss |
| | | |
DoubleLine Shiller Enhanced CAPE® | | | | | | | | $ | 242,461,710 | | | | $ | — | |
| | | |
DoubleLine Low Duration Emerging Markets Fixed Income Fund | | | | | | | | $ | 108,432 | | | | $ | — | |
| | | |
DoubleLine Global Bond Fund | | | | | | | | $ | — | | | | $ | 2,215,468 | |
| | | |
DoubleLine Ultra Short Bond Fund | | | | | | | | $ | 400,188 | | | | $ | — | |
| | | |
DoubleLine Colony Real Estate and Income Fund | | | | | | | | $ | 1,115,928 | | | | $ | — | |
Additionally, US GAAP requires that certain components of net assets relating to permanent differences be reclassified between financial and tax reporting. These reclassifications have no effect on net assets or NAV per share. The permanent differences primarily relate to paydown losses, accretion of discount on certain debt instruments, foreign currency gains (losses), consent fee income and equalization. For the period ended March 31, 2020, the following table shows the reclassifications made:
| | | | | | | | | | | | | | | | | | | | |
| | | | |
| | | | | Undistributed
(Accumulated)
Net Investment
Income (Loss) | | Accumulated
Net Realized
Gain (Loss) | | Paid In
Capital |
| | | | |
DoubleLine Total Return Bond Fund | | | | | | | | $ | 176,332,203 | | | | $ | (176,332,203 | ) | | | $ | — | |
| | | | |
DoubleLine Core Fixed Income Fund | | | | | | | | $ | 9,009,468 | | | | $ | (9,009,468 | ) | | | $ | — | |
| | | | |
DoubleLine Emerging Markets Fixed Income Fund | | | | | | | | $ | 524,131 | | | | $ | (524,131 | ) | | | $ | — | |
| | | | | | |
| | Annual Report | | March 31, 2020 | | 139 |
| | |
| Notes to Financial Statements (Cont.) | | March 31, 2020 |
| | | | | | | | | | | | | | | | | | | | |
| | | | |
| | | | | Undistributed
(Accumulated)
Net Investment
Income (Loss) | | Accumulated
Net Realized
Gain (Loss) | | Paid In
Capital |
| | | | |
DoubleLine Multi-Asset Growth Fund (Consolidated) | | | | | | | | $ | 321,953 | | | | $ | 473,009 | | | | $ | (794,962 | ) |
| | | | |
DoubleLine Low Duration Bond Fund | | | | | | | | $ | 2,508,679 | | | | $ | (2,508,679 | ) | | | $ | — | |
| | | | |
DoubleLine Floating Rate Fund | | | | | | | | $ | 16,264 | | | | $ | (16,264 | ) | | | $ | — | |
| | | | |
DoubleLine Shiller Enhanced CAPE® | | | | | | | | $ | 3,634,142 | | | | $ | (20,459,181 | ) | | | $ | 16,825,039 | |
| | | | |
DoubleLine Flexible Income Fund | | | | | | | | $ | 2,372,225 | | | | $ | (2,372,225 | ) | | | $ | — | |
| | | | |
DoubleLine Low Duration Emerging Markets Fixed Income Fund | | | | | | | | $ | 117,647 | | | | $ | (117,647 | ) | | | $ | — | |
| | | | |
DoubleLine Long Duration Total Return Bond Fund | | | | | | | | $ | 161 | | | | $ | (161 | ) | | | $ | — | |
| | | | |
DoubleLine Strategic Commodity Fund (Consolidated) | | | | | | | | $ | (1,154,555 | ) | | | $ | 90,350,924 | | | | $ | (89,196,369 | ) |
| | | | |
DoubleLine Global Bond Fund | | | | | | | | $ | (5,427,398 | ) | | | $ | 5,427,398 | | | | $ | — | |
| | | | |
DoubleLine Infrastructure Income Fund | | | | | | | | $ | 388,466 | | | | $ | (388,466 | ) | | | $ | — | |
| | | | |
DoubleLine Ultra Short Bond Fund | | | | | | | | $ | (23,318 | ) | | | $ | 23,318 | | | | $ | — | |
| | | | |
DoubleLine Shiller Enhanced International CAPE® | | | | | | | | $ | (16,537 | ) | | | $ | 16,537 | | | | $ | — | |
| | | | |
DoubleLine Colony Real Estate and Income Fund | | | | | | | | $ | 111,740 | | | | $ | (111,740 | ) | | | $ | — | |
| | | | |
DoubleLine Emerging Markets Local Currency Bond Fund | | | | | | | | $ | (133,274 | ) | | | $ | 133,274 | | | | $ | — | |
| | | | |
DoubleLine Income Fund | | | | | | | | $ | (13,011 | ) | | | $ | 13,011 | | | | $ | — | |
7. Share Transactions
Transactions in each Fund’s shares were as follows:
| | | | | | | | | | | | | | | | | | | | | | | | | | | | | | | | | | | | | | | | | | | | | | | | | | |
| | | | |
| | | | | DoubleLine Total Return Bond Fund | | | | DoubleLine Core Fixed Income Fund |
| | | | | | |
| | | | | Year Ended
March 31, 2020 | | Year Ended
March 31, 2019 | | | | Year Ended
March 31, 2020 | | Year Ended
March 31, 2019 |
| | | | | | | | | | |
| | | | | Shares | | Amount | | Shares | | Amount | | | | Shares | | Amount | | | | |
| | | | | | | | | | |
Shares Sold | | | | | | | | | | | | | | | | | | | | | | | | | | | | | | | | | | | | | | | | | | | | | | | | | | |
| | | | | | | | | | |
Class I | | | | | | | | | 1,419,527,206 | | | | $ | 15,174,230,767 | | | | | 1,490,179,137 | | | | $ | 15,510,544,602 | | | | | | | | | | 324,932,983 | | | | $ | 3,595,489,519 | | | | | 464,583,673 | | | | $ | 4,957,014,783 | |
| | | | | | | | | | |
Class N | | | | | | | | | 198,485,947 | | | | | 2,119,734,154 | | | | | 183,601,877 | | | | | 1,910,373,756 | | | | | | | | | | 22,072,348 | | | | | 243,793,205 | | | | | 22,061,542 | | | | | 235,534,950 | |
| | | | | | | | | | |
Class R6 | | | | | | | | | 6,657,384 | | | | | 72,854,434 | | | | | — | | | | | — | | | | | | | | | | 10,510,242 | | | | | 117,224,464 | | | | | — | | | | | — | |
| | | | | | | | | | |
Reinvested Dividends | | | | | | | | | | | | | | | | | | | | | | | | | | | | | | | | | | | | | | | | | | | | | | | | | | |
| | | | | | | | | | |
Class I | | | | | | | | | 122,654,917 | | | | | 1,310,680,892 | | | | | 116,927,597 | | | | | 1,216,005,602 | | | | | | | | | | 23,384,493 | | | | | 258,441,781 | | | | | 21,266,340 | | | | | 227,044,296 | |
| | | | | | | | | | |
Class N | | | | | | | | | 19,439,883 | | | | | 207,646,224 | | | | | 20,756,543 | | | | | 215,731,862 | | | | | | | | | | 2,138,592 | | | | | 23,618,740 | | | | | 2,534,350 | | | | | 27,030,113 | |
| | | | | | | | | | |
Class R6 | | | | | | | | | 27,728 | | | | | 292,522 | | | | | — | | | | | — | | | | | | | | | | 128,786 | | | | | 1,420,636 | | | | | — | | | | | — | |
| | | | | | | | | | |
Shares Redeemed | | | | | | | | | | | | | | | | | | | | | | | | | | | | | | | | | | | | | | | | | | | | | | | | | | |
| | | | | | | | | | |
Class I | | | | | | | | | (1,424,155,620 | ) | | | | (15,179,050,825 | ) | | | | (1,561,094,553 | ) | | | | (16,225,662,105 | ) | | | | | | | | | (324,432,292 | ) | | | | (3,571,368,311 | ) | | | | (368,274,555 | ) | | | | (3,923,381,287 | ) |
| | | | | | | | | | |
Class N | | | | | | | | | (240,153,238 | ) | | | | (2,567,148,680 | ) | | | | (359,862,616 | ) | | | | (3,741,093,186 | ) | | | | | | | | | (35,360,020 | ) | | | | (388,343,400 | ) | | | | (41,791,012 | ) | | | | (445,241,562 | ) |
| | | | | | | | | | |
Class R6 | | | | | | | | | (434,514 | ) | | | | (4,594,528 | ) | | | | — | | | | | — | | | | | | | | | | (8,780 | ) | | | | (100,000 | ) | | | | — | | | | | — | |
| | | | | | | | | | |
Increase (Decrease) in Net Assets Resulting from Net Share Transactions | | | | | | | | | 102,049,693 | | | | $ | 1,134,644,960 | | | | | (109,492,015 | ) | | | $ | (1,114,099,469 | ) | | | | | | | | | 23,366,352 | | | | $ | 280,176,634 | | | | | 100,380,338 | | | | $ | 1,078,001,293 | |
| | | | | | | | | | | | | | | | | | | | | | | | | | | | | | | | | | | | | | | | | | | | | | | | | | |
| | | | | | |
| 140 | | DoubleLine Funds Trust | | | | |
| | | | | | | | | | | | | | | | | | | | | | | | | | | | | | | | | | | | | | | | | | | | | | | | | | |
| | | | |
| | | | | DoubleLine Emerging Markets Fixed Income Fund | | | | DoubleLine Multi-Asset Growth Fund (Consolidated) |
| | | | | | |
| | | | | Year Ended
March 31, 2020 | | Year Ended
March 31, 2019 | | | | Year Ended
March 31, 2020 | | Year Ended
March 31, 2019 |
| | | | | | | | | | |
| | | | | Shares | | Amount | | Shares | | Amount | | | | Shares | | Amount | | Shares | | Amount |
| | | | | | | | | | |
Shares Sold | | | | | | | | | | | | | | | | | | | | | | | | | | | | | | | | | | | | | | | | | | | | | | | | | | |
| | | | | | | | | | |
Class I | | | | | | | | | 47,202,020 | | | | $ | 496,223,444 | | | | | 49,438,398 | | | | $ | 504,827,778 | | | | | | | | | | 1,645,387 | | | | $ | 15,385,456 | | | | | 3,149,417 | | | | $ | 28,788,520 | |
| | | | | | | | | | |
Class N | | | | | | | | | 10,123,471 | | | | | 106,118,057 | | | | | 8,624,137 | | | | | 88,009,516 | | | | | | | | | | — | | | | | — | | | | | — | | | | | — | |
| | | | | | | | | | |
Class A | | | | | | | | | — | | | | | — | | | | | — | | | | | — | | | | | | | | | | 4,424,651 | | | | | 40,672,511 | | | | | 10,395,458 | | | | | 94,432,779 | |
| | | | | | | | | | |
Reinvested Dividends | | | | | | | | | | | | | | | | | | | | | | | | | | | | | | | | | | | | | | | | | | | | | | | | | | |
| | | | | | | | | | |
Class I | | | | | | | | | 3,198,800 | | | | | 33,170,752 | | | | | 2,558,655 | | | | | 26,044,732 | | | | | | | | | | 68,490 | | | | | 612,445 | | | | | 108,061 | | | | | 986,751 | |
| | | | | | | | | | |
Class N | | | | | | | | | 462,629 | | | | | 4,799,019 | | | | | 399,647 | | | | | 4,071,656 | | | | | | | | | | — | | | | | — | | | | | — | | | | | — | |
| | | | | | | | | | |
Class A | | | | | | | | | — | | | | | — | | | | | — | | | | | — | | | | | | | | | | 18,062 | | | | | 162,839 | | | | | 42,502 | | | | | 385,282 | |
| | | | | | | | | | |
Shares Redeemed | | | | | | | | | | | | | | | | | | | | | | | | | | | | | | | | | | | | | | | | | | | | | | | | | | |
| | | | | | | | | | |
Class I | | | | | | | | | (56,059,511 | ) | | | | (569,212,146 | ) | | | | (50,744,106 | ) | | | | (518,520,307 | ) | | | | | | | | | (4,415,047 | ) | | | | (40,122,522 | ) | | | | (5,152,073 | ) | | | | (46,888,464 | )# |
| | | | | | | | | | |
Class N | | | | | | | | | (12,560,686 | ) | | | | (127,795,738 | ) | | | | (12,102,876 | ) | | | | (123,607,795 | ) | | | | | | | | | — | | | | | — | | | | | — | | | | | — | |
| | | | | | | | | | |
Class A | | | | | | | | | — | | | | | — | | | | | — | | | | | — | | | | | | | | | | (21,374,834 | ) | | | | (195,576,787 | ) | | | | (7,371,729 | ) | | | | (66,960,743 | )# |
| | | | | | | | | | |
Increase (Decrease) in Net Assets Resulting from Net Share Transactions | | | | | | | | | (7,633,277 | ) | | | $ | (56,696,612 | ) | | | | (1,826,145 | ) | | | $ | (19,174,420 | ) | | | | | | | | | (19,633,291 | ) | | | $ | (178,866,058 | ) | | | | 1,171,636 | | | | $ | 10,744,125 | |
| | | | | | | | | | | | | | | | | | | | | | | | | | | | | | | | | | | | | | | | | | | | | | | | | | |
| | | | |
| | | | | DoubleLine Low Duration Bond Fund | | | | DoubleLine Floating Rate Fund |
| | | | | | |
| | | | | Year Ended
March 31, 2020 | | Year Ended
March 31, 2019 | | | | Year Ended
March 31, 2020 | | Year Ended
March 31, 2019 |
| | | | | | | | | | |
| | | | | Shares | | Amount | | Shares | | Amount | | | | Shares | | Amount | | Shares | | Amount |
| | | | | | | | | | |
Shares Sold | | | | | | | | | | | | | | | | | | | | | | | | | | | | | | | | | | | | | | | | | | | | | | | | | | |
| | | | | | | | | | |
Class I | | | | | | | | | 413,299,047 | | | | $ | 4,142,041,555 | | | | | 391,622,024 | | | | $ | 3,891,548,519 | | | | | | | | | | 4,897,503 | | | | $ | 46,272,444 | | | | | 23,857,689 | | | | $ | 235,473,395 | |
| | | | | | | | | | |
Class N | | | | | | | | | 68,201,797 | | | | | 683,148,009 | | | | | 53,547,553 | | | | | 531,783,254 | | | | | | | | | | 2,844,946 | | | | | 27,251,918 | | | | | 6,681,284 | | | | | 65,821,008 | |
| | | | | | | | | | |
Class R6 | | | | | | | | | 38,536 | | | | | 371,585 | | | | | — | | | | | — | | | | | | | | | | — | | | | | — | | | | | — | | | | | — | |
| | | | | | | | | | |
Reinvested Dividends | | | | | | | | | | | | | | | | | | | | | | | | | | | | | | | | | | | | | | | | | | | | | | | | | | |
| | | | | | | | | | |
Class I | | | | | | | | | 14,612,138 | | | | | 145,904,774 | | | | | 11,776,968 | | | | | 116,992,306 | | | | | | | | | | 642,036 | | | | | 6,126,407 | | | | | 1,187,834 | | | | | 11,628,545 | |
| | | | | | | | | | |
Class N | | | | | | | | | 3,383,533 | | | | | 33,746,613 | | | | | 3,256,885 | | | | | 32,321,353 | | | | | | | | | | 212,025 | | | | | 2,022,529 | | | | | 313,544 | | | | | 3,072,852 | |
| | | | | | | | | | |
Class R6 | | | | | | | | | 283 | | | | | 2,785 | | | | | — | | | | | — | | | | | | | | | | — | | | | | — | | | | | — | | | | | — | |
| | | | | | | | | | |
Shares Redeemed | | | | | | | | | | | | | | | | | | | | | | | | | | | | | | | | | | | | | | | | | | | | | | | | | | |
| | | | | | | | | | |
Class I | | | | | | | | | (418,140,806 | ) | | | | (4,156,392,730 | ) | | | | (264,585,052 | ) | | | | (2,629,407,787 | ) | | | | | | | | | (24,754,479 | ) | | | | (232,990,598 | )^ | | | | (31,064,172 | ) | | | | (302,614,569 | )~ |
| | | | | | | | | | |
Class N | | | | | | | | | (64,123,211 | ) | | | | (637,373,765 | ) | | | | (52,645,346 | ) | | | | (522,909,938 | ) | | | | | | | | | (8,984,612 | ) | | | | (85,788,588 | )^ | | | | (9,558,966 | ) | | | | (93,271,217 | )~ |
| | | | | | | | | | |
Class R6 | | | | | | | | | — | | | | | — | | | | | — | | | | | — | | | | | | | | | | — | | | | | — | | | | | — | | | | | — | |
| | | | | | | | | | |
Increase (Decrease) in Net Assets Resulting from Net Share Transactions | | | | | | | | | 17,271,317 | | | | $ | 211,448,826 | | | | | 142,973,032 | | | | $ | 1,420,327,707 | | | | | | | | | | (25,142,581 | ) | | | $ | (237,105,888 | ) | | | | (8,582,787 | ) | | | $ | (79,889,986 | ) |
| | | | | | | | | | | | | | | | | | | | | | | | | | | | | | | | | | | | | | | | | | | | | | | | | | |
| | | | |
| | | | | DoubleLine Shiller Enhanced CAPE® | | | | DoubleLine Flexible Income Fund |
| | | | | | |
| | | | | Year Ended
March 31, 2020 | | Year Ended
March 31, 2019 | | | | Year Ended
March 31, 2020 | | Year Ended
March 31, 2019 |
| | | | | | | | | | |
| | | | | Shares | | Amount | | Shares | | Amount | | | | Shares | | Amount | | | | |
| | | | | | | | | | |
Shares Sold | | | | | | | | | | | | | | | | | | | | | | | | | | | | | | | | | | | | | | | | | | | | | | | | | | |
| | | | | | | | | | |
Class I | | | | | | | | | 213,871,084 | | | | $ | 3,255,382,681 | | | | | 151,929,898 | | | | $ | 2,267,115,217 | | | | | | | | | | 60,811,160 | | | | $ | 587,177,744 | | | | | 59,682,054 | | | | $ | 577,648,219 | |
| | | | | | | | | | |
Class N | | | | | | | | | 63,934,509 | | | | | 968,063,993 | | | | | 40,052,173 | | | | | 604,670,228 | | | | | | | | | | 18,048,736 | | | | | 174,437,169 | | | | | 13,525,967 | | | | | 130,809,752 | |
| | | | | | | | | | |
Class R6 | | | | | | | | | 10,276 | | | | | 162,682 | | | | | — | | | | | — | | | | | | | | | | 10,267 | | | | | 100,000 | | | | | — | | | | | — | |
| | | | | | | | | | |
Reinvested Dividends | | | | | | | | | | | | | | | | | | | | | | | | | | | | | | | | | | | | | | | | | | | | | | | | | | |
| | | | | | | | | | |
Class I | | | | | | | | | 16,977,686 | | | | | 261,778,092 | | | | | 31,787,951 | | | | | 450,246,732 | | | | | | | | | | 3,760,894 | | | | | 36,060,759 | | | | | 3,775,328 | | | | | 36,469,886 | |
| | | | | | | | | | |
Class N | | | | | | | | | 3,632,280 | | | | | 56,263,787 | | | | | 8,856,673 | | | | | 124,462,493 | | | | | | | | | | 934,670 | | | | | 8,941,661 | | | | | 855,875 | | | | | 8,260,527 | |
| | | | | | | | | | |
Class R6 | | | | | | | | | 358 | | | | | 5,500 | | | | | — | | | | | — | | | | | | | | | | 297 | | | | | 2,816 | | | | | — | | | | | — | |
| | | | | | | | | | |
Shares Redeemed | | | | | | | | | | | | | | | | | | | | | | | | | | | | | | | | | | | | | | | | | | | | | | | | | | |
| | | | | | | | | | |
Class I | | | | | | | | | (143,599,930 | ) | | | | (1,972,998,010 | ) | | | | (139,483,637 | ) | | | | (2,028,238,261 | ) | | | | | | | | | (73,191,440 | ) | | | | (682,283,958 | ) | | | | (53,356,139 | ) | | | | (515,250,500 | ) |
| | | | | | | | | | |
Class N | | | | | | | | | (44,377,265 | ) | | | | (647,384,753 | ) | | | | (34,219,885 | ) | | | | (508,122,667 | ) | | | | | | | | | (13,080,764 | ) | | | | (122,209,441 | ) | | | | (12,760,234 | ) | | | | (123,295,718 | ) |
| | | | | | | | | | |
Class R6 | | | | | | | | | (5 | ) | | | | (73 | ) | | | | — | | | | | — | | | | | | | | | | — | | | | | — | | | | | — | | | | | — | |
| | | | | | | | | | |
Increase (Decrease) in Net Assets Resulting from Net Share Transactions | | | | | | | | | 110,448,993 | | | | $ | 1,921,273,899 | | | | | 58,923,173 | | | | $ | 910,133,742 | | | | | | | | | | (2,706,180 | ) | | | $ | 2,226,750 | | | | | 11,722,851 | | | | $ | 114,642,166 | |
| | | | | | |
| | Annual Report | | March 31, 2020 | | 141 |
| | |
| Notes to Financial Statements (Cont.) | | March 31, 2020 |
| | | | | | | | | | | | | | | | | | | | | | | | | | | | | | | | | | | | | | | | | | | | | | | | | | |
| | | | |
| | | | | DoubleLine Low Duration Emerging Markets Fixed Income Fund | | | | DoubleLine Long Duration Total Return Bond Fund |
| | | | | | |
| | | | | Year Ended
March 31, 2020 | | Year Ended
March 31, 2019 | | | | Year Ended
March 31, 2020 | | Year Ended
March 31, 2019 |
| | | | | | | | | | |
| | | | | Shares | | Amount | | Shares | | Amount | | | | Shares | | Amount | | Shares | | Amount |
| | | | | | | | | | |
Shares Sold | | | | | | | | | | | | | | | | | | | | | | | | | | | | | | | | | | | | | | | | | | | | | | | | | | |
| | | | | | | | | | |
Class I | | | | | | | | | 6,511,312 | | | | $ | 64,411,677 | | | | | 13,253,315 | | | | $ | 127,800,155 | | | | | | | | | | 2,475,975 | | | | $ | 26,253,003 | | | | | 1,453,308 | | | | $ | 13,757,195 | |
| | | | | | | | | | |
Class N | | | | | | | | | 950,189 | | | | | 9,409,964 | | | | | 1,624,940 | | | | | 15,708,751 | | | | | | | | | | 1,624,424 | | | | | 17,424,363 | | | | | 1,787,097 | | | | | 17,180,959 | |
| | | | | | | | | | |
Reinvested Dividends | | | | | | | | | | | | | | | | | | | | | | | | | | | | | | | | | | | | | | | | | | | | | | | | | | |
| | | | | | | | | | |
Class I | | | | | | | | | 474,868 | | | | | 4,692,687 | | | | | 268,895 | | | | | 2,596,179 | | | | | | | | | | 93,786 | | | | | 994,938 | | | | | 31,489 | | | | | 298,458 | |
| | | | | | | | | | |
Class N | | | | | | | | | 70,197 | | | | | 694,641 | | | | | 82,239 | | | | | 794,132 | | | | | | | | | | 61,399 | | | | | 649,692 | | | | | 34,051 | | | | | 323,273 | |
| | | | | | | | | | |
Shares Redeemed | | | | | | | | | | | | | | | | | | | | | | | | | | | | | | | | | | | | | | | | | | | | | | | | | | |
| | | | | | | | | | |
Class I | | | | | | | | | (7,843,036 | ) | | | | (76,698,056 | ) | | | | (8,026,631 | ) | | | | (77,362,377 | ) | | | | | | | | | (1,825,854 | ) | | | | (19,401,359 | ) | | | | (476,449 | ) | | | | (4,527,596 | ) |
| | | | | | | | | | |
Class N | | | | | | | | | (1,668,978 | ) | | | | (16,475,093 | ) | | | | (5,214,706 | ) | | | | (50,304,061 | ) | | | | | | | | | (1,412,741 | ) | | | | (14,926,614 | ) | | | | (1,505,170 | ) | | | | (14,329,963 | ) |
| | | | | | | | | | |
Increase (Decrease) in Net Assets Resulting from Net Share Transactions | | | | | | | | | (1,505,448 | ) | | | $ | (13,964,180 | ) | | | | 1,988,052 | | | | $ | 19,232,779 | | | | | | | | | | 1,016,989 | | | | $ | 10,994,023 | | | | | 1,324,326 | | | | $ | 12,702,326 | |
| | | | | | | | | | | | | | | | | | | | | | | | | | | | | | | | | | | | | | | | | | | | | | | | | | |
| | | | |
| | | | | DoubleLine Strategic Commodity Fund (Consolidated) | | | | DoubleLine Global Bond Fund |
| | | | | | |
| | | | | Year Ended
March 31, 2020 | | Year Ended
March 31, 2019 | | | | Year Ended
March 31, 2020 | | Year Ended
March 31, 2019 |
| | | | | | | | | | |
| | | | | Shares | | Amount | | Shares | | Amount | | | | Shares | | Amount | | Shares | | Amount |
| | | | | | | | | | |
Shares Sold | | | | | | | | | | | | | | | | | | | | | | | | | | | | | | | | | | | | | | | | | | | | | | | | | | |
| | | | | | | | | | |
Class I | | | | | | | | | 20,623,212 | | | | $ | 183,631,088 | | | | | 51,965,097 | | | | $ | 516,765,655 | | | | | | | | | | 19,247,504 | | | | $ | 200,229,741 | | | | | 41,896,109 | | | | $ | 431,191,745 | |
| | | | | | | | | | |
Class N | | | | | | | | | 1,911,244 | | | | | 17,239,232 | | | | | 4,278,833 | | | | | 43,053,774 | | | | | | | | | | 87,124 | | | | | 903,488 | | | | | 454,642 | | | | | 4,665,810 | |
| | | | | | | | | | |
Reinvested Dividends | | | | | | | | | | | | | | | | | | | | | | | | | | | | | | | | | | | | | | | | | | | | | | | | | | |
| | | | | | | | | | |
Class I | | | | | | | | | 348,516 | | | | | 3,213,314 | | | | | 492,779 | | | | | 4,381,702 | | | | | | | | | | 8,715 | | | | | 91,029 | | | | | 11,116 | | | | | 112,997 | |
| | | | | | | | | | |
Class N | | | | | | | | | 36,492 | | | | | 334,269 | | | | | 64,971 | | | | | 573,842 | | | | | | | | | | 5,694 | | | | | 59,631 | | | | | 24,717 | | | | | 250,561 | |
| | | | | | | | | | |
Shares Redeemed | | | | | | | | | | | | | | | | | | | | | | | | | | | | | | | | | | | | | | | | | | | | | | | | | | |
| | | | | | | | | | |
Class I | | | | | | | | | (49,835,301 | ) | | | | (411,996,736 | ) | | | | (27,846,073 | ) | | | | (265,573,494 | ) | | | | | | | | | (2,555,226 | ) | | | | (26,434,299 | ) | | | | (1,374,705 | ) | | | | (13,942,614 | ) |
| | | | | | | | | | |
Class N | | | | | | | | | (5,009,510 | ) | | | | (43,737,335 | ) | | | | (4,339,895 | ) | | | | (41,915,785 | ) | | | | | | | | | (1,487,227 | ) | | | | (15,520,722 | ) | | | | (1,613,491 | ) | | | | (16,291,034 | ) |
| | | | | | | | | | |
Increase (Decrease) in Net Assets Resulting from Net Share Transactions | | | | | | | | | (31,925,347 | ) | | | $ | (251,316,168 | ) | | | | 24,615,712 | | | | $ | 257,285,694 | | | | | | | | | | 15,306,584 | | | | $ | 159,328,868 | | | | | 39,398,388 | | | | $ | 405,987,465 | |
| | | | | | | | | | | | | | | | | | | | | | | | | | | | | | | | | | | | | | | | | | | | | | | | | | |
| | | | |
| | | | | DoubleLine Infrastructure Income Fund | | | | DoubleLine Ultra Short Bond Fund |
| | | | | | |
| | | | | Year Ended
March 31, 2020 | | Year Ended
March 31, 2019 | | | | Year Ended
March 31, 2020 | | Year Ended
March 31, 2019 |
| | | | | | | | | | |
| | | | | Shares | | Amount | | Shares | | Amount | | | | Shares | | Amount | | | | |
| | | | | | | | | | |
Shares Sold | | | | | | | | | | | | | | | | | | | | | | | | | | | | | | | | | | | | | | | | | | | | | | | | | | |
| | | | | | | | | | |
Class I | | | | | | | | | 2,567,017 | | | | $ | 26,138,314 | | | | | 4,224,035 | | | | $ | 41,902,955 | | | | | | | | | | 13,315,273 | | | | $ | 133,720,564 | | | | | 13,957,515 | | | | $ | 140,002,062 | |
| | | | | | | | | | |
Class N | | | | | | | | | 920,832 | | | | | 9,590,935 | | | | | 302,384 | | | | | 3,006,495 | | | | | | | | | | 373,762 | | | | | 3,749,983 | | | | | 310,286 | | | | | 3,115,733 | |
| | | | | | | | | | |
Reinvested Dividends | | | | | | | | | | | | | | | | | | | | | | | | | | | | | | | | | | | | | | | | | | | | | | | | | | |
| | | | | | | | | | |
Class I | | | | | | | | | 49,970 | | | | | 517,158 | | | | | 82,364 | | | | | 816,483 | | | | | | | | | | 67,680 | | | | | 678,943 | | | | | 53,340 | | | | | 534,792 | |
| | | | | | | | | | |
Class N | | | | | | | | | 9,293 | | | | | 95,470 | | | | | 27,897 | | | | | 276,193 | | | | | | | | | | 7,040 | | | | | 70,733 | | | | | 3,341 | | | | | 33,526 | |
| | | | | | | | | | |
Shares Redeemed | | | | | | | | | | | | | | | | | | | | | | | | | | | | | | | | | | | | | | | | | | | | | | | | | | |
| | | | | | | | | | |
Class I | | | | | | | | | (2,940,267 | ) | | | | (30,060,535 | ) | | | | (4,570,223 | ) | | | | (45,235,490 | ) | | | | | | | | | (13,157,246 | ) | | | | (131,840,786 | ) | | | | (7,159,074 | ) | | | | (71,734,991 | ) |
| | | | | | | | | | |
Class N | | | | | | | | | (170,711 | ) | | | | (1,732,790 | ) | | | | (2,004,820 | ) | | | | (19,826,866 | ) | | | | | | | | | (347,238 | ) | | | | (3,488,272 | ) | | | | (90,656 | ) | | | | (910,228 | ) |
| | | | | | | | | | |
Increase (Decrease) in Net Assets Resulting from Net Share Transactions | | | | | | | | | 436,134 | | | | $ | 4,548,552 | | | | | (1,938,363 | ) | | | $ | (19,060,230 | ) | | | | | | | | | 259,271 | | | | $ | 2,891,165 | | | | | 7,074,752 | | | | $ | 71,040,894 | |
| | | | | | | | | | | | | | | | | | | | | | | | | | | | | | | | | | | | | | | | | | | | | | | | | | |
| | | | | | |
| 142 | | DoubleLine Funds Trust | | | | |
| | | | | | | | | | | | | | | | | | | | | | | | | | | | | | | | | | | | | | | | | | | | | | | | | | |
| | | | |
| | | | | DoubleLine Shiller Enhanced International CAPE® | | | | DoubleLine Colony Real Estate and Income Fund |
| | | | | | |
| | | | | Year Ended
March 31, 2020 | | Year Ended
March 31, 2019 | | | | Year Ended
March 31, 2020 | | Period Ended
March 31, 2019 |
| | | | | | | | | | |
| | | | | Shares | | Amount | | Shares | | Amount | | | | Shares | | Amount | | Shares | | Amount |
| | | | | | | | | | |
Shares Sold | | | | | | | | | | | | | | | | | | | | | | | | | | | | | | | | | | | | | | | | | | | | | | | | | | |
| | | | | | | | | | |
Class I | | | | | | | | | 1,678,761 | | | | $ | 17,835,556 | | | | | 1,839,855 | | | | $ | 18,854,935 | | | | | | | | | | 1,634,476 | | | | $ | 19,520,897 | | | | | 10,736,749 | | | | $ | 108,929,014 | |
| | | | | | | | | | |
Class N | | | | | | | | | 740,096 | | | | | 7,485,413 | | | | | 802,298 | | | | | 8,490,189 | | | | | | | | | | 280,709 | | | | | 3,262,973 | | | | | 392,524 | | | | | 4,227,770 | |
| | | | | | | | | | |
Reinvested Dividends | | | | | | | | | | | | | | | | | | | | | | | | | | | | | | | | | | | | | | | | | | | | | | | | | | |
| | | | | | | | | | |
Class I | | | | | | | | | 75,291 | | | | | 782,116 | | | | | 331,862 | | | | | 3,274,802 | | | | | | | | | | 45,274 | | | | | 522,681 | | | | | 5,314 | | | | | 55,692 | |
| | | | | | | | | | |
Class N | | | | | | | | | 45,512 | | | | | 472,474 | | | | | 193,658 | | | | | 1,915,570 | | | | | | | | | | 14,102 | | | | | 162,272 | | | | | 925 | | | | | 10,283 | |
| | | | | | | | | | |
Shares Redeemed | | | | | | | | | | | | | | | | | | | | | | | | | | | | | | | | | | | | | | | | | | | | | | | | | | |
| | | | | | | | | | |
Class I | | | | | | | | | (2,450,928 | ) | | | | (23,334,333 | ) | | | | (4,938,424 | ) | | | | (52,154,309 | ) | | | | | | | | | (1,327,759 | ) | | | | (12,401,165 | ) | | | | (18,044 | ) | | | | (193,793 | ) |
| | | | | | | | | | |
Class N | | | | | | | | | (1,091,672 | ) | | | | (10,995,774 | ) | | | | (1,630,229 | ) | | | | (17,044,623 | ) | | | | | | | | | (233,942 | ) | | | | (2,571,293 | ) | | | | (6,653 | ) | | | | (72,475 | ) |
| | | | | | | | | | |
Increase (Decrease) in Net Assets Resulting from Net Share Transactions | | | | | | | | | (1,002,940 | ) | | | $ | (7,754,548 | ) | | | | (3,400,980 | ) | | | $ | (36,663,436 | ) | | | | | | | | | 412,860 | | | | $ | 8,496,365 | | | | | 11,110,815 | | | | $ | 112,956,491 | |
| | | | | | | | | | | | | | | | | | | | | | | | | | | | | | | | | | | | | | | | | | | | | | | | | | |
| | | | | | | | | | | | | | | | | | | | | | | | | | | | | | |
| | | | |
| | | | | DoubleLine Emerging Markets
Local Currency Bond Fund | | | | DoubleLine Income Fund |
| | | | |
| | | | | Period Ended
March 31, 2020 | | | | Period Ended
March 31, 2020 |
| | | | | | |
| | | | | Shares | | Amount | | | | Shares | | Amount |
| | | | | | |
Shares Sold | | | | | | | | | | | | | | | | | | | | | | | | | | | | | | |
| | | | | | |
Class I | | | | | | | | | 990,000 | | | | $ | 9,900,000 | | | | | | | | | | 9,700,301 | | | | $ | 96,648,583 | |
| | | | | | |
Class N | | | | | | | | | 10,000 | | | | | 100,000 | | | | | | | | | | 112,263 | | | | | 1,111,380 | |
| | | | | | |
Reinvested Dividends | | | | | | | | | | | | | | | | | | | | | | | | | | | | | | |
| | | | | | |
Class I | | | | | | | | | 12,331 | | | | | 118,826 | | | | | | | | | | 27,151 | | | | | 260,324 | |
| | | | | | |
Class N | | | | | | | | | 105 | | | | | 1,016 | | | | | | | | | | 1,435 | | | | | 13,697 | |
| | | | | | |
Shares Redeemed | | | | | | | | | | | | | | | | | | | | | | | | | | | | | | |
| | | | | | |
Class I | | | | | | | | | — | | | | | — | | | | | | | | | | (1,078,584 | ) | | | | (10,744,370 | ) |
| | | | | | |
Class N | | | | | | | | | — | | | | | — | | | | | | | | | | (40,116 | ) | | | | (383,413 | ) |
| | | | | | |
Increase (Decrease) in Net Assets Resulting from Net Share Transactions | | | | | | | | | 1,012,436 | | | | $ | 10,119,842 | | | | | | | | | | 8,722,450 | | | | $ | 86,906,201 | |
| ^ | Net of redemption fees of $13,891 and $4,763 for Class I and Class N, respectively. |
| # | Net of redemption fees of $731 and $1,737 for Class I and Class A, respectively. |
| ~ | Net of redemption fees of $135,897 and $43,503 for Class I and Class N, respectively. |
8. Trustees Fees
Trustees who are not affiliated with each Adviser and its affiliates receive fees from the Trust. These trustees may elect to defer the cash payment of part or all of their compensation. These deferred amounts, which remain as liabilities of the Funds, are treated as if invested in shares of Funds designated by each Trustee or other funds managed by each Adviser and its affiliates. These amounts represent general unsecured liabilities of each Fund and vary according to the total returns of the selected funds. Trustees Fees in the Statements of Operations include current fees (either paid in cash or deferred) and any increase (decrease) in the value of the deferred amounts. Certain trustees and officers of the Funds are also officers of each Adviser; such trustees and officers are not compensated by the Funds.
| | | | | | |
| | Annual Report | | March 31, 2020 | | 143 |
| | |
| Notes to Financial Statements (Cont.) | | March 31, 2020 |
For the year ended March 31, 2020, the Trustees received as a group:
| | | | | | | | | | | | | | | | | | | | |
| | | | |
| | | | | Current
Fees | | Increase/(Decrease) in
Value of Deferred
Amount | | Trustees Fees |
| | | | |
DoubleLine Total Return Bond Fund | | | | | | | | $ | 558,473 | | | | $ | 48,018 | | | | $ | 606,491 | |
| | | | |
DoubleLine Core Fixed Income Fund | | | | | | | | | 163,175 | | | | | 11,097 | | | | | 174,272 | |
| | | | |
DoubleLine Emerging Markets Fixed Income Fund | | | | | | | | | 13,052 | | | | | 1,098 | | | | | 14,150 | |
| | | | |
DoubleLine Multi-Asset Growth Fund (Consolidated) | | | | | | | | | 2,572 | | | | | 109 | | | | | 2,681 | |
| | | | |
DoubleLine Low Duration Bond Fund | | | | | | | | | 96,852 | | | | | 6,724 | | | | | 103,576 | |
| | | | |
DoubleLine Floating Rate Fund | | | | | | | | | 7,068 | | | | | 294 | | | | | 7,362 | |
| | | | |
DoubleLine Shiller Enhanced CAPE® | | | | | | | | | 85,775 | | | | | 6,912 | | | | | 92,687 | |
| | | | |
DoubleLine Flexible Income Fund | | | | | | | | | 16,174 | | | | | 1,278 | | | | | 17,452 | |
| | | | |
DoubleLine Low Duration Emerging Markets Fixed Income Fund | | | | | | | | | 2,402 | | | | | 201 | | | | | 2,603 | |
| | | | |
DoubleLine Long Duration Total Return Bond Fund | | | | | | | | | 967 | | | | | 80 | | | | | 1,047 | |
| | | | |
DoubleLine Strategic Commodity Fund (Consolidated) | | | | | | | | | 7,238 | | | | | 366 | | | | | 7,604 | |
| | | | |
DoubleLine Global Bond Fund | | | | | | | | | 11,994 | | | | | 1,067 | | | | | 13,061 | |
| | | | |
DoubleLine Infrastructure Income Fund | | | | | | | | | 7,134 | | | | | 488 | | | | | 7,622 | |
| | | | |
DoubleLine Ultra Short Bond Fund | | | | | | | | | 2,311 | | | | | 275 | | | | | 2,586 | |
| | | | |
DoubleLine Shiller Enhanced International CAPE® | | | | | | | | | 1,027 | | | | | 58 | | | | | 1,085 | |
| | | | |
DoubleLine Colony Real Estate and Income Fund | | | | | | | | | 1,788 | | | | | 124 | | | | | 1,912 | |
| | | | |
DoubleLine Emerging Markets Local Currency Bond Fund | | | | | | | | | 587 | | | | | 7 | | | | | 594 | |
| | | | |
DoubleLine Income Fund | | | | | | | | | 753 | | | | | 50 | | | | | 803 | |
9. Additional Disclosures about Derivative Instruments
The following disclosures provide information on the Funds’ use of derivatives and certain related risks. The location and fair value amounts of these instruments on the Statements of Assets and Liabilities and the realized gains and losses and changes in unrealized gains and losses on the Statements of Operations, each categorized by type of derivative contract, are included in the following tables.
The average volume of derivative activity during the year ended March 31, 2020 is as follows:
| | | | | | | | | | | | | | | | | | | | | | | | | | | | | | | | | | | | | | | | | | | | | |
| | | | | | | | | |
| | | | | DoubleLine
Total Return
Bond Fund | | DoubleLine
Multi-Asset
Growth Fund
(Consolidated) | | DoubleLine
Shiller
Enhanced CAPE® | | DoubleLine
Long Duration
Total Return
Bond Fund | | DoubleLine
Strategic
Commodity
Fund
(Consolidated) | | DoubleLine
Global
Bond Fund | | DoubleLine
Shiller
Enhanced
International CAPE® | | DoubleLine
Colony
Real Estate
and Income Fund |
| | | | | | | | | |
Average Market Value | | | | | | | | | | | | | | | | | | | | | | | | | | | | | | | | | | | | | | | | | | | | | |
| | | | | | | | | |
Futures Contracts - Long | | | | | | | | $ | 22,947,476 | | | | $ | 492,449 | | | | $ | — | | | | $ | 860,035 | | | | $ | — | | | | $ | — | | | | $ | — | | | | $ | — | |
| | | | | | | | | |
Futures Contracts - Short | | | | | | | | | — | | | | | 17,740 | | | | | — | | | | | (626,914 | ) | | | | — | | | | | — | | | | | — | | | | | — | |
| | | | | | | | | |
Average Notional Balance | | | | | | | | | | | | | | | | | | | | | | | | | | | | | | | | | | | | | | | | | | | | | |
| | | | | | | | | |
Excess Return Swaps - Long | | | | | | | | | — | | | | | 34,140,000 | | | | | 6,794,800,000 | | | | | — | | | | | 334,140,000 | | | | | — | | | | | 51,660,000 | | | | | 120,064,000 | |
| | | | | | | | | |
Excess Return Swaps - Short | | | | | | | | | — | | | | | 3,576,000 | | | | | — | | | | | — | | | | | 47,860,000 | | | | | — | | | | | — | | | | | — | |
| | | | | | | | | |
Interest Rate Swaps | | | | | | | | | — | | | | | 15,000,000 | | | | | — | | | | | — | | | | | — | | | | | — | | | | | — | | | | | — | |
| | | | | | | | | |
Forward Currency Exchange Contracts | | | | | | | | | — | | | | | 27,799,154 | | | | | — | | | | | — | | | | | — | | | | | 45,068,550 | | | | | 69,615,525 | | | | | — | |
Options Contracts The Funds may purchase or sell put and call options. When a Fund purchases an option it pays a premium in return for the potential to profit from the change in value of an underlying investment or index during the term of the option. The option premium is included on the Funds’ Statements of Assets and Liabilities as an investment and marked to market to reflect the current value of the option. Premiums paid for purchasing options which expire are treated as realized losses and are recorded in net realized gain (loss) on investments on the Statements of Operations. Certain options may be purchased with premiums to be determined on a future date. The premiums for these options are based upon implied volatility parameters at specified terms. The risk associated with purchasing options is limited to the loss of the premium paid. Premiums paid for purchasing options which are exercised or closed are added to the amounts paid or offset against the proceeds on the underlying investment transaction to
| | | | | | |
| 144 | | DoubleLine Funds Trust | | | | |
determine the realized gain or loss and are recorded in net realized gain (loss) on investments on the Statements of Operations. When a Fund writes (i.e., sells) an option it receives a premium in return for bearing the risk of the change in value of an underlying instrument during the term off the option. Writing put options tends to increase a Fund’s exposure to the risk that the value of the underlying instrument will depreciate. Writing call options tends to decrease a Fund’s ability to benefit from appreciation in the value in the underlying instrument. When a Fund writes a call or put, an amount equal to the premium received is recorded as a liability on the Fund’s Statement of Assets and Liabilities and marked to market to reflect the current value of the option written. Premiums received from writing options which expire are treated as realized gains and are recorded in net realized gain (loss) on written options on the Statements of Operations. Premiums received from writing options which are exercised or closed are added to the proceeds or offset against amounts paid on the underlying instrument to determine the realized gain or loss when the underlying instrument is sold and are recorded in net realized gain (loss) on written options on the Statements of Operations. A Fund as a writer of an option has no control over whether the underlying instrument may be sold (call) or purchased (put), and as a result bears the market risk of an unfavorable change in the price of the instrument underlying the written option. There is the risk that the market for options contracts may be illiquid and that a Fund may not be able to close out or sell an option at a particular time or at an anticipated price.
Futures Contracts Futures contracts typically involve a contractual commitment to buy or sell a particular instrument or index unit at a specified price on a future date. Risks associated with the use of futures contracts include the potential for imperfect correlation between the change in market value of the securities held by the Funds and the prices of futures contracts and the possibility of an illiquid market. Futures contracts are valued based upon their quoted daily settlement prices determined by the relevant exchange. Upon entering into a futures contract, a Fund is required to deposit with its futures broker an amount of cash in accordance with the initial margin requirements of the broker or exchange. Such collateral is recorded in deposit at broker for futures in the Statements of Assets and Liabilities. Futures contracts are marked-to-market daily and an appropriate payment reflecting the change in value (“variation margin”) is made or received by or for the accounts of the Funds. The variation margin is recorded on the Statements of Assets and Liabilities. The cumulative change in value of futures contracts is recorded in net unrealized appreciation (depreciation) on futures on the Statements of Assets and Liabilities. Gains or losses are recognized but not considered realized until the contracts expire or are closed and are recorded in net realized gain (loss) on futures on the Statements of Operations. Futures contracts involve, to varying degrees, risk of loss in excess of the variation margin disclosed on the Statements of Assets and Liabilities.
Forward Foreign Currency Contracts Forward foreign currency contracts are agreements between two parties to buy and sell a currency at a set exchange rate on a future date. Unless a Fund’s registration statement expressly states otherwise, each Fund may enter into forward foreign currency contracts for any investment purpose. The market value of a forward foreign currency contract fluctuates with the changes in foreign currency exchange rates. The contract is marked-to-market daily and the change in market value is recorded in net unrealized appreciation (depreciation) on forwards on the Statements of Assets and Liabilities. When the contract is closed, a Fund records a realized gain or loss equal to the difference between the value at the time it was opened and the value at the time it was closed on the Statements of Operations. The use of foreign currency exchange contracts involves the risk that the value of a foreign currency exchange contract changes unfavorably due to movements in the value of the referenced foreign currencies and the risk that a counterparty to the contract does not perform its obligations under the agreement.
Credit Default Swap Agreements Credit default swap agreements typically involve one party making a stream of payments (generally referred to as the buyer of protection) to another party (the seller of protection) in exchange for the right to receive a specified return in the event of a default or other credit event in respect of a referenced entity, obligation or index. As a seller of protection on credit default swap agreements, a Fund generally will receive from the buyer of protection a fixed rate of income throughout the term of the swap. As the seller, a Fund would effectively add leverage to its portfolio because, in addition to its total net assets, the Fund would be subject to investment exposure on the notional amount of the swap.
If a Fund is a seller of protection and a credit event occurs, as defined under the terms of that particular swap agreement, the Fund typically will either (i) pay to the buyer of protection an amount equal to the notional amount of the swap and take delivery of the referenced obligation, other deliverable obligations or the affected securities in the referenced index or (ii) pay a net settlement amount in the form of cash or securities equal to the notional amount of the swap less the recovery value of the referenced obligation or the affected securities in the referenced index. If a Fund is a buyer of protection and a credit event occurs, as defined under the terms of that particular swap agreement, the Fund typically will either (i) receive from the seller of protection an amount equal to the notional amount of the swap and deliver the referenced obligation, other deliverable obligations or the affected securities in the referenced index or (ii) receive a net settlement amount in the form of cash or securities equal to the notional amount of the swap less the recovery value of the referenced obligation or the affected securities in the referenced index. Recovery values are typically estimated by market makers considering either industry standard recovery rates or entity specific factors and considerations until a credit event occurs. An index credit default swap references all the names in the index, and if there is a default with respect to a single name in the index, the credit event is generally settled based on that name’s weight in the index.
| | | | | | |
| | Annual Report | | March 31, 2020 | | 145 |
| | |
| Notes to Financial Statements (Cont.) | | March 31, 2020 |
Credit default swaps are considered to have credit risk related contingent features since they require payment by the protection seller to the protection buyer upon occurrence of a defined credit event. A Fund’s maximum risk of loss from counterparty risk, as the protection buyer, is the fair value of the contract, which may be mitigated by the posting of collateral by the counterparty to a Fund to cover a Fund’s exposure to the counterparty. Upfront premiums (received) paid including accretion (amortization) less any collateral held at the counterparty are reflected in deposit at broker for swaps on the Statements of Assets and Liabilities. The marked-to-market value less a financing rate, if any, is included in net unrealized appreciation (depreciation) on swaps on the Statements of Assets and Liabilities. At termination or maturity of the swap, the cumulative marked-to-market on the value less a financing rate, if any, is recorded in realized gain (loss) on swaps on the Statements of Operations.
Interest Rate Swap Agreements The Funds may enter into interest rate swap agreements. Interest rate swap agreements involve an exchange with another party for their respective commitment to pay or receive interest on the notional amount of principal. Certain forms of interest rate swap agreements may include: (i) interest rate caps, under which, in return for a premium, one party agrees to make payments to the other to the extent that interest rates exceed a specified rate, or “cap”, (ii) interest rate floors, under which, in return for a premium, one party agrees to make payments to the other to the extent that interest rates fall below a specified rate, or “floor”, (iii) interest rate collars, under which a party sells a cap and purchases a floor or vice versa in an attempt to protect itself against interest rate movements exceeding given minimum or maximum levels, (iv) callable interest rate swaps, under which the buyer pays an upfront fee in consideration for the right to early terminate the swap transaction in whole, at zero cost and at a predetermined date and time prior to the maturity date, (v) spread locks, which allow the interest rate swap users to lock in the forward differential (or spread) between the interest rate swap rate and a specified benchmark, or (vi) basis swaps, under which two parties can exchange variable interest rates based on different segments of money markets. The value is marked to market and is recorded in net unrealized appreciation (depreciation) on swaps on the Statements of Assets and Liabilities. At termination or maturity date, the interest on the notional amount of principal is exchanged and is recorded in net realized gain (loss) on swaps on the Statements of Operations.
Excess Return Swap Agreements The Funds may enter into excess return swaps for investment purposes. Excess return swaps are agreements to exchange the return generated by one instrument for the return generated by another instrument. For example, the agreement to pay a predetermined or fixed interest rate in exchange for a market-linked return based on a notional amount. To the extent the total return of a referenced index or instrument exceeds the offsetting interest obligation, a Fund will receive a payment from the counterparty. To the extent it is less, a Fund will make a payment to the counterparty. The marked-to-market value less a financing rate, if any, is recorded in net unrealized appreciation (depreciation) on swaps on the Statements of Assets and Liabilities. At termination or maturity date, a net cash flow is exchanged where the total return is equivalent to the return of the underlying reference asset less a financing rate, if any, and is recorded in net realized gain (loss) on swaps on the Statements of Operations. To the extent the marked-to-market value of an excess return swap appreciates to the benefit of a Fund and exceeds certain contractual thresholds, a Fund’s counterparty may be contractually required to provide collateral. If the marked-to-market value of an excess return swap depreciates in value to the benefit of a counterparty and exceeds certain contractual thresholds, a Fund would generally be required to provide collateral for the benefit of its counterparty. Assets provided by the Funds as collateral are reflected as a component of investments in unaffiliated securities at value on the Statements of Assets and Liabilities and are noted on the Schedules of Investments. Assets provided to a Fund by a counterparty as collateral are not assets of the Fund and are not a component of a Fund’s net asset value.
The Funds’ derivative instrument holdings are summarized in the following tables.
The effect of derivative instruments on the Statements of Assets and Liabilities for the year ended March 31, 2020 was as follows:
| | | | | | | | | | | | | | | | | | | | | | | | | | | | | | | | |
| | | |
| | | | | | | Derivatives not accounted for as hedging instruments |
| | | | | | |
| Statements of Assets and Liabilities Location | | | | Commodity Risk | | Equity Risk | | Foreign Exchange
Rate Risk | | Interest Rate
Risk | | Total |
| Net Unrealized Appreciation (Depreciation) on: | | | | | | | | | | | | | | | | | | | | | | | | | | | | | | |
Forwards | | | | | | | | | | | | | | | | | | | | | | | | | | | | | | |
DoubleLine Global Bond Fund | | | | | | | | $ | — | | | | $ | — | | | | $ | 630,828 | | | | $ | — | | | | $ | 630,828 | |
DoubleLine Shiller Enhanced International CAPE® | | | | | | | | | — | | | | | — | | | | | (1,058,749 | ) | | | | — | | | | | (1,058,749 | ) |
Futures | | | | | | | | | | | | | | | | | | | | | | | | | | | | | | |
DoubleLine Total Return Bond Fund | | | | | | | | $ | — | | | | $ | — | | | | $ | — | | | | $ | 100,579,104 | | | | $ | 100,579,104 | |
DoubleLine Multi-Asset Growth Fund (Consolidated) | | | | | | | | | — | | | | | 798,494 | | | | | 5,041 | | | | | 193,177 | | | | | 996,712 | |
DoubleLine Long Duration Total Return Bond Fund | | | | | | | | | — | | | | | — | | | | | — | | | | | 1,482,437 | | | | | 1,482,437 | |
Swaps | | | | | | | | | | | | | | | | | | | | | | | | | | | | | | |
DoubleLine Multi-Asset Growth Fund (Consolidated) | | | | | | | | $ | 47,319 | | | | $ | (1,657,056 | ) | | | $ | — | | | | $ | — | | | | $ | (1,609,737 | ) |
DoubleLine Shiller Enhanced CAPE® | | | | | | | | | — | | | | | (1,052,976,447 | ) | | | | — | | | | | — | | | | | (1,052,976,447 | ) |
DoubleLine Strategic Commodity Fund (Consolidated) | | | | | | | | | (24,984,596 | ) | | | | — | | | | | — | | | | | — | | | | | (24,984,596 | ) |
DoubleLine Shiller Enhanced International CAPE® | | | | | | | | | — | | | | | (7,643,472 | ) | | | | — | | | | | — | | | | | (7,643,472 | ) |
DoubleLine Colony Real Estate and Income Fund | | | | | | | | | — | | | | | (17,343,289 | ) | | | | — | | | | | — | | | | | (17,343,289 | ) |
| | | | | | |
| 146 | | DoubleLine Funds Trust | | | | |
The effect of derivative instruments on the Statements of Operations for the year ended March 31, 2020 was as follows:
| | | | | | | | | | | | | | | | | | | | | | | | | | | | | | | | |
| | | |
| | | | | | | Derivatives not accounted for as hedging instruments |
| | | | | | |
| Statements of Operations Location | | | | Commodity Risk | | Equity Risk | | Foreign Exchange
Rate Risk | | Interest Rate Risk | | Total |
| Net Realized Gain (Loss) on: | | | | | | | | | | | | | | | | | | | | | | | | | | | | | | |
Forwards | | | | | | | | | | | | | | | | | | | | | | | | | | | | | | |
DoubleLine Multi-Asset Growth Fund (Consolidated) | | | | | | | | $ | — | | | | $ | — | | | | $ | (237,704 | ) | | | $ | — | | | | $ | (237,704 | ) |
DoubleLine Global Bond Fund | | | | | | | | | — | | | | | — | | | | | 5,898,506 | | | | | — | | | | | 5,898,506 | |
DoubleLine Shiller Enhanced International CAPE® | | | | | | | | | — | | | | | — | | | | | (3,286,136 | ) | | | | — | | | | | (3,286,136 | ) |
Futures | | | | | | | | | | | | | | | | | | | | | | | | | | | | | | |
DoubleLine Total Return Bond Fund | | | | | | | | $ | — | | | | $ | — | | | | $ | — | | | | $ | 36,443,581 | | | | $ | 36,443,581 | |
DoubleLine Multi-Asset Growth Fund (Consolidated) | | | | | | | | | — | | | | | (3,166,099 | ) | | | | (243,698 | ) | | | | 1,164,522 | | | | | (2,245,275 | ) |
DoubleLine Long Duration Total Return Bond Fund | | | | | | | | | — | | | | | — | | | | | — | | | | | 2,732,686 | | | | | 2,732,686 | |
Swaps | | | | | | | | | | | | | | | | | | | | | | | | | | | | | | |
DoubleLine Multi-Asset Growth Fund (Consolidated) | | | | | | | | $ | (879,733 | ) | | | $ | 3,621,768 | | | | $ | — | | | | $ | (166,091 | ) | | | $ | 2,575,944 | |
DoubleLine Shiller Enhanced CAPE® | | | | | | | | | — | | | | | 81,171,310 | | | | | — | | | | | — | | | | | 81,171,310 | |
DoubleLine Strategic Commodity Fund (Consolidated) | | | | | | | | | (90,603,568 | ) | | | | — | | | | | — | | | | | — | | | | | (90,603,568 | ) |
DoubleLine Shiller Enhanced International CAPE® | | | | | | | | | — | | | | | (276,308 | ) | | | | — | | | | | — | | | | | (276,308 | ) |
DoubleLine Colony Real Estate and Income Fund | | | | | | | | | — | | | | | 1,731,657 | | | | | — | | | | | — | | | | | 1,731,657 | |
| Net Change in Unrealized Appreciation (Depreciation) on: | | | | | | | | | | | | | | | | | | | | | | | | | | | | | | |
Forwards | | | | | | | | | | | | | | | | | | | | | | | | | | | | | | |
DoubleLine Multi-Asset Growth Fund (Consolidated) | | | | | | | | $ | — | | | | $ | — | | | | $ | 51,280 | | | | $ | — | | | | $ | 51,280 | |
DoubleLine Global Bond Fund | | | | | | | | | — | | | | | — | | | | | 630,828 | | | | | — | | | | | 630,828 | |
DoubleLine Shiller Enhanced International CAPE® | | | | | | | | | — | | | | | — | | | | | 421,037 | | | | | — | | | | | 421,037 | |
Futures | | | | | | | | | | | | | | | | | | | | | | | | | | | | | | |
DoubleLine Total Return Bond Fund | | | | | | | | $ | — | | | | $ | — | | | | $ | — | | | | $ | 100,579,104 | | | | $ | 100,579,104 | |
DoubleLine Multi-Asset Growth Fund (Consolidated) | | | | | | | | | — | | | | | 380,103 | | | | | 60,281 | | | | | (128,882 | ) | | | | 311,502 | |
DoubleLine Long Duration Total Return Bond Fund | | | | | | | | | — | | | | | — | | | | | — | | | | | 1,271,528 | | | | | 1,271,528 | |
Swaps | | | | | | | | | | | | | | | | | | | | | | | | | | | | | | |
DoubleLine Multi-Asset Growth Fund (Consolidated) | | | | | | | | $ | (44,951 | ) | | | $ | (4,258,925 | ) | | | $ | — | | | | $ | — | | | | $ | (4,303,876 | ) |
DoubleLine Shiller Enhanced CAPE® | | | | | | | | | — | | | | | (1,281,219,595 | ) | | | | — | | | | | — | | | | | (1,281,219,595 | ) |
DoubleLine Strategic Commodity Fund (Consolidated) | | | | | | | | | (27,469,186 | ) | | | | — | | | | | — | | | | | — | | | | | (27,469,186 | ) |
DoubleLine Shiller Enhanced International CAPE® | | | | | | | | | — | | | | | (10,859,552 | ) | | | | — | | | | | — | | | | | (10,859,552 | ) |
DoubleLine Colony Real Estate and Income Fund | | | | | | | | | — | | | | | (28,623,868 | ) | | | | — | | | | | — | | | | | (28,623,868 | ) |
10. Offsetting Assets and Liabilities
The Funds are subject to various Master Netting Arrangements, which govern the terms of certain transactions with select counterparties. The Master Netting Arrangements are intended to allow the Funds to close out and net their total exposure to a counterparty in the event of a default with respect to all the transactions governed under a single agreement with a counterparty. The Master Netting Arrangements also specify collateral posting arrangements at pre-arranged exposure levels. Under the Master Netting Arrangements, collateral is routinely transferred if the total net exposure to certain transactions (net of existing collateral already in place) governed under the relevant Master Netting Arrangement with a counterparty in a given account exceeds a specified threshold depending on the counterparty and the type of Master Netting Arrangement.
| | | | | | |
| | Annual Report | | March 31, 2020 | | 147 |
| | |
| Notes to Financial Statements (Cont.) | | March 31, 2020 |
As of March 31, 2020 the Funds held the following derivative instruments that were subject to offsetting on the Statements of Assets and Liabilities:
DoubleLine Multi-Asset Growth Fund (Consolidated)
Assets:
| | | | | | | | | | | | | | | | | | | | | | | | | | | | | | |
| Description | | Gross
Amounts of
Recognized
Assets | | Gross Amounts
Offset in the
Statement of
Assets and
Liabilities | | Net Amounts
presented in the
Statement of
Assets and
Liabilities | | Gross Amounts not offset in the
Statement of Assets and Liabilities | | Net
Amount |
| | Financial
Instruments | | Cash
Collateral
Received |
| | | | | | |
Swap Contracts | | | $ | 106,833 | | | | $ | 59,514 | | | | $ | 47,319 | | | | $ | — | | | | $ | — | | | | $ | 47,319 | |
Liabilities:
| | | | | | | | | | | | | | | | | | | | | | | | | | | | | | |
| Description | | Gross
Amounts of
Recognized
Liabilities | | Gross Amounts
Offset in the
Statement of
Assets and
Liabilities | | Net Amounts
presented in the
Statement of
Assets and
Liabilities | | Gross Amounts not offset in the
Statement of Assets and Liabilities | | Net
Amount |
| | Financial
Instruments | | Cash
Collateral
Pledged |
| | | | | | |
Swap Contracts | | | $ | 1,716,570 | | | | $ | 59,514 | | | | $ | 1,657,056 | | | | $ | — | | | | $ | 1,520,000 | | | | $ | 137,056 | |
DoubleLine Shiller Enhanced CAPE®
Assets:
| | | | | | | | | | | | | | | | | | | | | | | | | | | | | | |
| Description | | Gross
Amounts of
Recognized
Assets | | Gross Amounts
Offset in the
Statement of
Assets and
Liabilities | | Net Amounts
presented in the
Statement of
Assets and
Liabilities | | Gross Amounts not offset in the
Statement of Assets and Liabilities | | Net
Amount |
| | Financial
Instruments | | Cash
Collateral
Received |
| | | | | | |
Swap Contracts | | | $ | 1,501,932 | | | | $ | 1,501,932 | | | | $ | — | | | | $ | — | | | | $ | — | | | | $ | — | |
Liabilities:
| | | | | | | | | | | | | | | | | | | | | | | | | | | | | | |
| Description | | Gross
Amounts of
Recognized
Liabilities | | Gross Amounts
Offset in the
Statement of
Assets and
Liabilities | | Net Amounts
presented in the
Statement of
Assets and
Liabilities | | Gross Amounts not offset in the
Statement of Assets and Liabilities | | Net
Amount |
| | Financial
Instruments | | Cash
Collateral
Pledged |
| | | | | | |
Swap Contracts | | | $ | 1,054,478,379 | | | | $ | 1,501,932 | | | | $ | 1,052,976,447 | | | | $ | 969,081,695 | | | | $ | — | | | | $ | 83,894,752 | |
DoubleLine Strategic Commodity Fund (Consolidated)
Assets:
| | | | | | | | | | | | | | | | | | | | | | | | | | | | | | |
| Description | | Gross
Amounts of
Recognized
Assets | | Gross Amounts
Offset in the
Statement of
Assets and
Liabilities | | Net Amounts
presented in the
Statement of
Assets and
Liabilities | | Gross Amounts not offset in the
Statement of Assets and Liabilities | | Net
Amount |
| | Financial
Instruments | | Cash
Collateral
Received |
| | | | | | |
Swap Contracts | | | $ | 728,381 | | | | $ | 728,381 | | | | $ | — | | | | $ | — | | | | $ | — | | | | $ | — | |
Liabilities:
| | | | | | | | | | | | | | | | | | | | | | | | | | | | | | |
| Description | | Gross
Amounts of
Recognized
Liabilities | | Gross Amounts
Offset in the
Statement of
Assets and
Liabilities | | Net Amounts
presented in the
Statement of
Assets and
Liabilities | | Gross Amounts not offset in the
Statement of Assets and Liabilities | | Net
Amount |
| | Financial
Instruments | | Cash
Collateral
Pledged |
| | | | | | |
Swap Contracts | | | $ | 25,712,977 | | | | $ | 728,381 | | | | $ | 24,984,596 | | | | $ | 8,909,596 | | | | $ | 16,075,000 | | | | $ | — | |
| | | | | | |
| 148 | | DoubleLine Funds Trust | | | | |
DoubleLine Global Bond Fund
Assets:
| | | | | | | | | | | | | | | | | | | | | | | | | | | | | | |
| Description | | Gross
Amounts of
Recognized
Assets | | Gross Amounts
Offset in the
Statement of
Assets and
Liabilities | | Net Amounts
presented in the
Statement of
Assets and
Liabilities | | Gross Amounts not offset in the
Statement of Assets and Liabilities | | Net
Amount |
| | Financial
Instruments | | Cash
Collateral
Received |
| | | | | | |
Forwards | | | $ | 880,425 | | | | $ | — | | | | $ | 880,425 | | | | $ | — | | | | $ | 400,208 | | | | $ | 480,217 | |
Liabilities:
| | | | | | | | | | | | | | | | | | | | | | | | | | | | | | |
| | | | | | | | | | | | | | | | | | | | | | | | | | | | | | |
| Description | | Gross
Amounts of
Recognized
Liabilities | | Gross Amounts
Offset in the
Statement of
Assets and
Liabilities | | Net Amounts
presented in the
Statement of
Assets and
Liabilities | | Gross Amounts not offset in the
Statement of Assets and Liabilities | | Net
Amount |
| | Financial
Instruments | | Cash
Collateral
Pledged |
| | | | | | |
Forwards | | | $ | 249,597 | | | | $ | — | | | | $ | 249,597 | | | | $ | — | | | | $ | — | | | | $ | 249,597 | |
DoubleLine Shiller Enhanced International CAPE®
Assets:
| | | | | | | | | | | | | | | | | | | | | | | | | | | | | | |
| Description | | Gross
Amounts of
Recognized
Assets | | Gross Amounts
Offset in the
Statement of
Assets and
Liabilities | | Net Amounts
presented in the
Statement of
Assets and
Liabilities | | Gross Amounts not offset in the
Statement of Assets and Liabilities | | Net
Amount |
| | Financial
Instruments | | Cash
Collateral
Received |
| | | | | | |
Forwards | | | $ | 113,308 | | | | $ | 35,235 | | | | $ | 78,073 | | | | $ | — | | | | $ | — | | | | $ | 78,073 | |
Liabilities:
| | | | | | | | | | | | | | | | | | | | | | | | | | | | | | |
| Description | | Gross
Amounts of
Recognized
Liabilities | | Gross Amounts
Offset in the
Statement of
Assets and
Liabilities | | Net Amounts
presented in the
Statement of
Assets and
Liabilities | | Gross Amounts not offset in the
Statement of Assets and Liabilities | | Net
Amount |
| | Financial
Instruments | | Cash
Collateral
Pledged |
| | | | | | |
Forwards | | | $ | 1,172,057 | | | | $ | 35,235 | | | | $ | 1,136,822 | | | | $ | 1,026,529 | | | | $ | — | | | | $ | 110,293 | |
| | | | | | |
Swap Contracts | | | | 7,643,472 | | | | | — | | | | | 7,643,472 | | | | | 7,643,472 | | | | | — | | | | | — | |
| | | | | | |
| | | $ | 8,815,529 | | | | $ | 35,235 | | | | $ | 8,780,294 | | | | $ | 8,670,001 | | | | $ | — | | | | $ | 110,293 | |
DoubleLine Colony Real Estate and Income Fund
Liabilities:
| | | | | | | | | | | | | | | | | | | | | | | | | | | | | | |
| Description | | Gross
Amounts of
Recognized
Liabilities | | Gross Amounts
Offset in the
Statement of
Assets and
Liabilities | | Net Amounts
presented in the
Statement of
Assets and
Liabilities | | Gross Amounts not offset in the
Statement of Assets and Liabilities | | Net
Amount |
| | Financial
Instruments | | Cash
Collateral
Pledged |
| | | | | | |
Swap Contracts | | | $ | 17,343,289 | | | | $ | — | | | | $ | 17,343,289 | | | | $ | 8,343,289 | | | | $ | 9,000,000 | | | | $ | — | |
11. Bank Loans
The Funds may make loans directly to borrowers and may acquire or invest in loans made by others (“loans”). The Funds may acquire a loan interest directly by acting as a member of the original lending syndicate. Alternatively, the Funds may acquire some or all of the interest of a bank or other lending institution in a loan to a particular borrower by means of a novation, an assignment or a participation. The loans in which the Funds may invest include those that pay fixed rates of interest and those that pay floating rates—i.e., rates that adjust periodically based on a known lending rate, such as a bank’s prime rate. The Funds may purchase and sell interests in bank loans on a when-issued and delayed delivery basis, with payment delivery scheduled for a future date. Securities purchased on a delayed delivery basis are marked to market daily and no income accrues to the Funds prior to the date the Funds actually take delivery of such securities. These transactions are subject to market fluctuations and are subject, among other risks, to the risk that the value at delivery may be more or less than the trade purchase price.
12. Credit Facility
U.S. Bank, N.A. (the “Bank”) has made available to the Trust, excluding the DoubleLine Emerging Markets Local Currency Bond Fund, (the “DoubleLine Funds”) an uncommitted $725,000,000 credit facility for short term liquidity in connection with
| | | | | | |
| | Annual Report | | March 31, 2020 | | 149 |
| | |
| Notes to Financial Statements (Cont.) | | March 31, 2020 |
shareholder redemptions. Under the terms of the credit facility, borrowings for each DoubleLine Fund are limited to one-third of the total assets (including the amount borrowed) of such DoubleLine Fund. Fifty percent of the credit facility is available to all of the DoubleLine Funds, on a first come, first served basis. The remaining 50% of the credit facility is allocated among the DoubleLine Funds in accordance with procedures adopted by the Board. Borrowings under this credit facility bear interest at the Bank’s prime rate less 0.50% annually.
The Bank has also made available to the DoubleLine Floating Rate Fund a committed $50,000,000 credit facility. Prior to February 9, 2020, the amount available was $100,000,000. Borrowings under this credit facility bear interest at the Bank’s prime rate less 0.50% annually and the credit facility bears an unused commitment fee equal to 0.12% annually on the unused portion of the credit facility.
For the year ended March 31, 2020, the Funds’ credit facility activity is as follows:
| | | | | | | | | | | | | | | | | | | | | | | | | | | | | | |
| | | | | | |
| | | | | Average
Borrowings | | Maximum
Amount
Outstanding | | Interest
Expense | | Commitment
Fee | | Average
Interest Rate |
| | | | | | |
DoubleLine Emerging Markets Fixed Income Fund | | | | | | | | $ | 10,854,000 | | | | $ | 27,305,000 | | | | $ | 24,550 | | | | $ | — | | | | | 4.14% | |
| | | | | | |
DoubleLine Multi-Asset Growth Fund (Consolidated) | | | | | | | | | 15,224,400 | | | | | 18,901,000 | | | | | 9,490 | | | | | — | | | | | 4.15% | |
| | | | | | |
DoubleLine Low Duration Bond Fund | | | | | | | | | 8,000 | | | | | 8,000 | | | | | 1 | | | | | — | | | | | 5.00% | |
| | | | | | |
DoubleLine Floating Rate Fund | | | | | | | | | 7,642,667 | | | | | 37,222,000 | | | | | 21,269 | | | | | 112,722 | | | | | 4.08% | |
| | | | | | |
DoubleLine Flexible Income Fund | | | | | | | | | 7,448,400 | | | | | 21,331,000 | | | | | 2,845 | | | | | — | | | | | 2.75% | |
| | | | | | |
DoubleLine Low Duration Emerging Markets Fixed Income Fund | | | | | | | | | 922,600 | | | | | 5,474,000 | | | | | 1,829 | | | | | — | | | | | 4.65% | |
| | | | | | |
DoubleLine Long Duration Total Return Bond Fund | | | | | | | | | 383,714 | | | | | 2,280,000 | | | | | 223 | | | | | — | | | | | 4.21% | |
| | | | | | |
DoubleLine Global Bond Fund | | | | | | | | | 318,333 | | | | | 319,000 | | | | | 133 | | | | | — | | | | | 5.00% | |
| | | | | | |
DoubleLine Shiller Enhanced International CAPE® | | | | | | | | | 1,404,000 | | | | | 1,404,000 | | | | | 107 | | | | | — | | | | | 2.75% | |
13. Significant Shareholder Holdings
As of March 31, 2020, a single beneficial shareholder unaffiliated with the Funds held 89% of the outstanding Class I shares of DoubleLine Colony Real Estate and Income Fund and 86% of DoubleLine Colony Real Estate and Income Fund’s total outstanding shares. That shareholder may be deemed to control the DoubleLine Colony Real Estate and Income Fund and a redemption of all or a substantial portion of that shareholder’s investment in DoubleLine Colony Real Estate and Income Fund may adversely affect its investment performance.
As of March 31, 2020, unaffiliated shareholders owned 5% or more of the following Funds’ share classes:
| | | | | | | | | | | | | | | | | | | | |
| | | | |
| | | | | Shares | | % of Total Outstanding
Shares - Per Class | | % of Total Outstanding
Shares - Total Fund |
| | | | |
DoubleLine Colony Real Estate and Income Fund - Class I | | | | | | | | | 9,855,511 | | | | | 89% | | | | | 86% | |
As of March 31, 2020, shareholders affiliated with the Funds and/or Advisers (other than other DoubleLine Funds) owned shares of the Funds as follows:
| | | | | | | | | | | | | | | | | | | | |
| | | | |
| | | | | Shares | | % of Total Outstanding
Shares- Per Class | | % of Total Outstanding
Shares - Total Fund |
| | | | |
DoubleLine Low Duration Bond Fund - Class R6 | | | | | | | | | 10,174 | | | | | 26% | | | | | 0% | |
| | | | |
DoubleLine Shiller Enhanced CAPE® - Class R6 | | | | | | | | | 7,928 | | | | | 75% | | | | | 0% | |
| | | | |
DoubleLine Flexible Income Fund - Class R6 | | | | | | | | | 10,564 | | | | | 100% | | | | | 0% | |
| | | | |
DoubleLine Emerging Markets Local Currency Bond Fund - Class I | | | | | | | | | 1,002,331 | | | | | 100% | | | | | 100% | |
| | | | |
DoubleLine Emerging Markets Local Currency Bond Fund - Class N | | | | | | | | | 10,105 | | | | | 100% | | | | | 100% | |
| | | | |
DoubleLine Income Fund - Class I | | | | | | | | | 1,016,427 | | | | | 12% | | | | | 12% | |
| | | | |
DoubleLine Income Fund - Class N | | | | | | | | | 10,254 | | | | | 14% | | | | | 12% | |
Investment activities of these shareholders could have a material affect on each Fund. See the description of Large Shareholder Risk in the following Principal Risks Note. For information on greater than 5% holders of certain Funds by other DoubleLine Funds, see Note 3 on Related and Other Party Transactions.
| | | | | | |
| 150 | | DoubleLine Funds Trust | | | | |
14. Principal Risks:
Below are summaries of some, but not all, of the principal risks of investing in one or more of the Funds, each of which could adversely affect a Fund’s NAV, yield and total return. Each risk listed below does not necessarily apply to each Fund, and you should read each Fund’s prospectus carefully for a description of the principal risks associated with investing in a particular Fund.
| | • | | affiliated fund risk: the risk that, due to its own financial interest or other business considerations, an Adviser will have an incentive to invest a Fund’s assets in investment companies sponsored or managed by the Adviser or its related parties in lieu of investments by the Fund directly in portfolio securities, and will have an incentive to invest in such investment companies over investment companies sponsored or managed by others. Similarly, an Adviser will have an incentive to delay or decide against the sale of interests held by the Fund in investment companies sponsored or managed by the Adviser or its related parties. |
| | • | | asset allocation risk: the risk that a Fund’s investment performance may depend, at least in part, on how its assets are allocated and reallocated among asset classes, sectors, underlying funds and/or investments and that such allocation will focus on asset classes, sectors, underlying funds, or investments that perform poorly or underperform other asset classes, sectors, underlying funds, or available investments. |
| | • | | asset-backed securities investment risk: the risk that borrowers may default on the obligations that underlie the asset-backed security and that, during periods of falling interest rates, asset-backed securities may be called or prepaid, which may result in a Fund having to reinvest proceeds in other investments at a lower interest rate, and the risk that the impairment of the value of the collateral underlying a security in which a Fund invests (due, for example, to non-payment of loans) will result in a reduction in the value of the security. |
| | • | | cash position risk: to the extent that a Fund holds assets in cash, cash equivalents, and other short-term investments, the ability of the Fund to meet its objective may be limited. |
| | • | | collateralized debt obligations risk: the risks of an investment in a collateralized debt obligation (“CDO”) depend largely on the quality and type of the collateral and the tranche of the CDO in which a Fund invests. Normally, collateralized bond obligations (“CBOs”), collateralized loan obligations (“CLOs”) and other CDOs are privately offered and sold, and thus are not registered under the securities laws. As a result, investments in CDOs may be characterized by a Fund as illiquid securities; however, an active dealer market, or other relevant measures of liquidity, may exist for CDOs allowing a CDO potentially to be deemed liquid by an Adviser under liquidity policies approved by the Board. In addition to the risks associated with debt instruments (e.g., interest rate risk and credit risk), CDOs carry additional risks including, but not limited to: (i) the possibility that distributions from collateral will not be adequate to make interest or other payments; (ii) the quality of the collateral may decline in value or default; (iii) the possibility that a Fund may invest in CDOs that are subordinate to other classes of the issuer’s securities; and (iv) the complex structure of the security may not be fully understood at the time of investment and may produce disputes with the issuer or unexpected investment results. |
| | • | | commodities risk: the risk that the value of a Fund’s shares may be affected by changes in the values of the Fund’s investment exposures to commodities or commodity-related instruments, which may be extremely volatile and difficult to value. The value of commodities and commodity-related instruments may be affected by market movements, commodity index volatility, changes in interest rates, or factors affecting a particular sector, industry or commodity, such as drought, floods, weather, livestock disease, embargoes, tariffs and international economic, political and regulatory developments. A Fund will likely at times have significant exposure to particular sectors through its commodities-related investments, including, for example, the energy, industrial metals, and agricultural and livestock sectors and may be exposed to greater risk associated with events affecting those sectors. |
| | • | | confidential information access risk: the risk that the intentional or unintentional receipt of material, non-public information by an Adviser could limit a Fund’s ability to sell certain investments held by the Fund or pursue certain investment opportunities on behalf of the Fund, potentially for a substantial period of time. |
| | • | | counterparty risk: the risk that a Fund will be subject to credit risk with respect to the counterparties to the derivative contracts and other instruments, such as repurchase and reverse repurchase agreements, entered into directly by the Fund or held by special purpose or structured vehicles in which the Fund invests. Subject to certain U.S. federal income tax limitations, the Fund is not subject to any limit with respect to the number of transactions it can enter into with a single counterparty. To the extent that a Fund enters into multiple transactions with a single or a small set of counterparties, it will be subject to increased counterparty risk. |
| | ° | | credit risk: the risk that an issuer or counterparty will fail to pay its obligations to a Fund when they are due. As a result, a Fund’s income might be reduced, the value of the Fund’s investment might fall, and/or the Fund could lose the entire |
| | | | | | |
| | Annual Report | | March 31, 2020 | | 151 |
| | |
| Notes to Financial Statements (Cont.) | | March 31, 2020 |
| | amount of its investment. Changes in the financial condition of an issuer or counterparty, changes in specific economic, social or political conditions that affect a particular type of security or other instrument or an issuer, and changes in economic, social or political conditions generally can increase the risk of default by an issuer or counterparty, which can affect a security’s or other instrument’s credit quality or value and an issuer’s or counterparty’s ability to pay interest and principal when due. The values of lower-quality debt securities (commonly known as “junk bonds”), including floating rate loans, tend to be particularly sensitive to these changes. The values of securities also may decline for a number of other reasons that relate directly to the issuer, such as management performance, financial leverage and reduced demand for the issuer’s goods and services, as well as the historical and prospective earnings of the issuer and the value of its assets. |
| | ° | | extension risk: the risk that if interest rates rise, repayments of principal on certain debt securities, including, but not limited to, floating rate loans and mortgage-related securities, may occur at a slower rate than expected and the expected maturity of those securities could lengthen as a result. Securities that are subject to extension risk generally have a greater potential for loss when prevailing interest rates rise, which could cause their values to fall sharply. |
| | ° | | interest rate risk: the risk that debt instruments will change in value because of changes in interest rates. The value of an instrument with a longer duration (whether positive or negative) will be more sensitive to changes in interest rates than a similar instrument with a shorter duration. |
| | ° | | prepayment risk: the risk that the issuer of a debt security, including floating rate loans and mortgage-related securities, repays all or a portion of the principal prior to the security’s maturity. In times of declining interest rates, there is a greater likelihood that a Fund’s higher yielding securities will be pre-paid with the Fund being unable to reinvest the proceeds in an investment with as great a yield. Prepayments can therefore result in lower yields to shareholders of a Fund. |
| | • | | defaulted securities risk: the risk of the uncertainty of repayment of defaulted securities (e.g., a security on which a principal or interest payment is not made when due) and obligations of distressed issuers. |
| | • | | derivatives risk: the risk that an investment in derivatives will not perform as anticipated by an Adviser, may not be available at the time or price desired, cannot be closed out at a favorable time or price, will increase a Fund’s transaction costs, or will increase a Fund’s volatility; that derivatives may create investment leverage; that, when a derivative is used as a substitute for or alternative to a direct cash investment, the transaction may not provide a return that corresponds precisely or at all with that of the cash investment; or that, when used for hedging purposes, derivatives will not provide the anticipated protection, causing a Fund to lose money on both the derivatives transaction and the exposure the Fund sought to hedge. |
| | • | | emerging market country risk: the risk that investing in emerging markets, as compared to foreign developed markets, increases the likelihood that a Fund will lose money, due to more limited information about the issuer and/or the security; higher brokerage costs; different accounting, auditing and financial reporting standards; less developed legal systems and thinner trading markets; the possibility of currency blockages or transfer restrictions; an emerging market country’s dependence on revenue from particular commodities or international aid; and expropriation, nationalization or other adverse political or economic developments. |
| | • | | equity issuer risk: the risk that the market price of common stocks and other equity securities may go up or down, sometimes rapidly or unpredictably, including due to factors affecting equity securities markets generally, particular industries represented in those markets, or the issuer itself. |
| | • | | exchange-traded note risk: the risk that the level of the particular market benchmark or strategy to which the note’s return is linked will fall in value; exchange-traded notes are subject to the credit risk of the issuer. |
| | • | | financial services risk: the risk that an investment in issuers in the financial services sector or transactions with one or more counterparties in the financial services sector may be adversely affected by, among other things: (i) changes in governmental regulation, which may limit both the amounts and the types of loans and other financial commitments financial services companies can make, the interest rates and fees they can charge, the scope of their activities, the prices they can charge and the amount of capital they must maintain; (ii) fluctuations, including as a result of interest rate changes or increased competition, in the availability and cost of capital of funds on which the profitability of financial services companies is largely dependent; (iii) deterioration of the credit markets; (iv) credit losses resulting from financial difficulties of borrowers, especially when financial services companies are exposed to non-diversified or concentrated loan portfolios; (v) financial losses associated with investment activities, especially when financial services companies are exposed to financial leverage; (vi) the risk that any financial services company experiences substantial declines in the valuations of its assets, takes action to raise capital, or ceases operations; (vii) the risk that a market shock or other unexpected market, economic, political, regulatory, or other event might lead to a sudden decline in the values of most or all companies in the |
| | | | | | |
| 152 | | DoubleLine Funds Trust | | | | |
| | financial services sector; and (viii) the interconnectedness or interdependence among financial services companies, including the risk that the financial distress or failure of one financial services company may materially and adversely affect a number of other financial services companies. |
| | • | | focused investment risk: the risk that a Fund that invests a substantial portion of its assets in a particular market, industry, sector, group of industries or sectors, country, region, group of countries or asset class is, relative to a Fund that invests in a more diverse investment portfolio, more susceptible to any single economic, market, political, regulatory or other occurrence. This is because, for example, issuers in a particular market, industry, region, sector or asset class may react similarly to specific economic, market, regulatory, political or other developments. The particular markets, industries, regions, sectors or asset classes in which the Fund may focus its investments may change over time and the Fund may alter its focus at inopportune times. |
| | • | | foreign currency risk: the risk that fluctuations in exchange rates may adversely affect the value of a Fund’s investments denominated in foreign currencies. |
| | • | | foreign investing risk: the risk that investments in foreign securities or in issuers with significant exposure to foreign markets, as compared to investments in U.S. securities or in issuers with predominantly domestic market exposure, may be more vulnerable to economic, political, and social instability and subject to less government supervision, lack of transparency, inadequate regulatory and accounting standards, and foreign taxes. If a Fund buys securities denominated in a foreign currency, receives income in foreign currencies, or holds foreign currencies from time to time, the value of the Fund’s assets, as measured in U.S. dollars, can be affected unfavorably by changes in exchange rates relative to the U.S. dollar or other foreign currencies. Foreign markets are also subject to the risk that a foreign government could restrict foreign exchange transactions or otherwise implement unfavorable currency regulations. |
| | • | | high yield risk: the risk that debt instruments rated below investment grade or debt instruments that are unrated and of comparable or lesser quality are predominantly speculative. These instruments, commonly known as “junk bonds”, have a higher degree of default risk and may be less liquid than higher-rated bonds. These instruments may be subject to greater price volatility due to such factors as specific corporate developments, interest rate sensitivity, negative perceptions of high yield investments generally, and less secondary market liquidity. |
| | • | | index risk: the risk that the portion of a Fund invested in instruments based on an index or basket of commodities or that use an index or basket of commodities as the reference asset may not match or may underperform the return of the index or basket for a number of reasons, including, for example, (i) the performance of derivatives related to an index or basket in which a Fund invests may not correlate with the performance of the index or basket and/or may underperform the index or basket due to by transaction costs, fees, or other aspects of the transaction’s pricing; (ii) the Fund may not be able to find counterparties willing to enter into derivative instruments whose returns are based on the return of the index or basket, or the Fund may be unable to find parties who are willing to do so transactions at an acceptable cost or level of risk to the Fund; and (iii) errors may arise in carrying out an index’s methodology, or an index provider may incorrectly report information concerning the index. There can be no guarantee that any index, will be maintained indefinitely or that a Fund will be able to continue to utilize a specific index to implement the Fund’s principal investment strategies indefinitely. |
| | • | | inflation-indexed bond risk: the risk that such bonds will change in value in response to actual or anticipated changes in inflation rates in a manner unanticipated by a Fund’s portfolio management team or investors generally. Inflation-indexed bonds are subject to debt securities risks. |
| | • | | investment company and exchange-traded fund risk: the risk that an investment company or other pooled investment vehicle, including any exchange-traded funds (“ETFs”) or money market funds, in which a Fund invests will not achieve its investment objective or execute its investment strategies effectively or that significant purchase or redemption activity by shareholders of such an investment company might negatively affect the value of the investment company’s shares. A Fund must pay its pro rata portion of an investment company’s fees and expenses. |
| | • | | large shareholder risk: the risk that certain account holders, including an Adviser or funds or accounts over which an Adviser (or related parties of an Adviser) has investment discretion, may from time to time own or control a significant percentage of a Fund’s shares. A Fund is subject to the risk that a redemption by those shareholders of all or a portion of their Fund shares, including as a result of an asset allocation decision made by an Adviser (or related parties of an Adviser), will adversely affect the Fund’s performance if it is forced to sell portfolio securities or invest cash when the Adviser would not otherwise choose to do so. Redemptions of a large number of shares may affect the liquidity of a Fund’s portfolio, increase a Fund’s transaction costs, and accelerate the realization of taxable income and/or gains to shareholders. |
| | • | | leveraging risk: the risk that certain investments by a Fund involving leverage may have the effect of increasing the volatility of value of the the Fund’s portfolio, and the risk of loss in excess of invested capital. |
| | | | | | |
| | Annual Report | | March 31, 2020 | | 153 |
| | |
| Notes to Financial Statements (Cont.) | | March 31, 2020 |
| | • | | LIBOR risk: the terms of many investments, financings or other transactions to which a Fund may be a party have been historically tied to the London Interbank Offered Rate, or “LIBOR.” LIBOR is the offered rate at which major international banks can obtain wholesale, unsecured funding, and LIBOR may be available for different durations (e.g., 1 month or 3 months) and for different currencies. LIBOR may be a significant factor in determining a Fund’s payment obligations under a derivative investment, the cost of financing to a Fund or an investment’s value or return to a Fund, and may be used in other ways that affect a Fund’s investment performance. In July 2017, the Financial Conduct Authority, the United Kingdom’s financial regulatory body, announced that after 2021 it will cease its active encouragement of banks to provide the quotations needed to sustain LIBOR. That announcement suggests that LIBOR may cease to be published after that time. Various financial industry groups have begun planning for that transition, but there are obstacles to converting certain securities and transactions to a new benchmark. Transition planning is at an early stage, and neither the effect of the transition process nor its ultimate success can yet be known. The transition away from LIBOR might lead to increased volatility and illiquidity in markets for instruments whose terms currently include LIBOR, reduce the effectiveness of new hedges placed against existing LIBOR-based investments, increased costs for certain LIBOR-related instruments or financing transactions and cause prolonged adverse market conditions for the Funds. All of the aforementioned may adversely affect the Funds’ performance or NAV. |
| | • | | limited operating history risk: the risk that a recently formed fund has no or a limited operating history to evaluate and may not attract sufficient assets to achieve or maximize investment and operational efficiencies. |
| | • | | liquidity risk: the risk that a Fund may be unable to sell a portfolio investment at a desirable time or at the value the Fund has placed on the investment. |
| | • | | loan risk: the risk that (i) if a Fund holds a loan through another financial institution, or relies on a financial institution to administer the loan, its receipt of principal and interest on the loan may be subject to the credit risk of that financial institution; (ii) any collateral securing a loan may be insufficient or unavailable to a Fund because, for example, the value of the collateral securing a loan can decline, be insufficient to meet the obligations of the borrower, or be difficult to liquidate, and the Fund’s rights to collateral may be limited by bankruptcy or insolvency laws; (iii) investments in highly leveraged loans or loans of stressed, distressed, or defaulted issuers may be subject to significant credit and liquidity risk; (iv) a bankruptcy or other court proceeding could delay or limit the ability of a Fund to collect the principal and interest payments on that borrower’s loans or adversely affect the Fund’s rights in collateral relating to a loan; (v) there may be limited public information available regarding the loan and the relevant borrower(s); (vi) the use of a particular interest rate benchmark, such as LIBOR, may limit the Fund’s ability to achieve a net return to shareholders that consistently approximates the average published Prime Rate of U.S. banks; (vii) the prices of certain floating rate loans that include a feature that prevents their interest rates from adjusting if market interest rates are below a specified minimum level appreciate less than other instruments in response to changes in interest rates should interest rates rise but remain below the applicable minimum level; (viii) if a borrower fails to comply with various restrictive covenants that may be found in loan agreements, the borrower may default in payment of the loan; (ix) if a Fund invests in loans that contain fewer or less restrictive constraints on the borrower than certain other types of loans (“covenant-lite” loans), it may have fewer rights against the borrowers of such loans, including fewer protections against the possibility of default and fewer remedies in the event of default; (x) the Fund’s investments in loans may be subject to risks associated with collateral impairment or access and risks associated with investing in unsecured loans; (xi) opportunities to invest in loans or certain types of loans, such as senior loans, may be limited; (xii) transactions in loans may settle on a delayed basis, and the Fund may not receive the proceeds from the sale of a loan for a substantial period of time after the sale, which may result in sale proceeds related to the sale of loans not being available to make additional investments or to meet a Fund’s redemption obligations until potentially a substantial period after the sale of the loans; and (xiii) loans may be difficult to value and may be illiquid, which may adversely affect an investment in the Fund. |
| | • | | market capitalization risk: the risk that investing substantially in issuers in one market capitalization category (large, medium or small) may adversely affect a Fund because of unfavorable market conditions particular to that category of issuers, such as larger, more established companies being unable to respond quickly to new competitive challenges or attain the high growth rates of successful smaller companies, or, conversely, stocks of smaller companies being more volatile than those of larger companies due to, among other things, narrower product lines, more limited financial resources, fewer experienced managers and there typically being less publicly available information about small capitalization companies. |
| | • | | market risk: the risk that markets will perform poorly or that the returns from the securities in which a Fund invests will underperform returns from the general securities markets or other types of investments. Markets may, in response to governmental actions or intervention, political, economic or market developments, or other external factors, such as those experienced recently in the first calendar quarter of 2020 in response to an outbreak of respiratory disease caused by a novel |
| | | | | | |
| 154 | | DoubleLine Funds Trust | | | | |
| | coronavirus designated as COVID-19, experience periods of high volatility and reduced liquidity. During those periods, the Fund may experience high levels of shareholder redemptions, and may have to sell securities at times when the Fund would otherwise not do so, and potentially at unfavorable prices. Certain securities may be difficult to value during such periods. These risks may be heightened for fixed income securities due to the current low interest rate environment. |
| | • | | mortgage-backed securities risk: the risk that borrowers may default on their mortgage obligations or the guarantees underlying the mortgage-backed securities will default or otherwise fail and that, during periods of falling interest rates, mortgage-backed securities will be called or prepaid, which may result in a Fund having to reinvest proceeds in other investments at a lower interest rate. During periods of rising interest rates, the average life of a mortgage-backed security may extend, which may lock in a below-market interest rate, increase the security’s duration, and reduce the value of the security. Enforcing rights against the underlying assets or collateral may be difficult, or the underlying assets or collateral may be insufficient if the issuer defaults. The values of certain types of mortgage-backed securities, such as inverse floaters and interest-only and principal-only securities, may be extremely sensitive to changes in interest rates and prepayment rates. A Fund may invest in mortgage-backed securities that are subordinate in their right to receive payment of interest and re-payment of principal to other classes of the issuer’s securities. |
| | • | | operational risk: an investment in a Fund, like any fund, can involve operational risks arising from factors such as processing errors, human errors, inadequate or failed internal or external processes, failures in systems and technology, changes in personnel and errors caused by third-party service providers. The occurrence of any of these failures, errors or breaches could result in investment losses to a Fund, a loss of information, regulatory scrutiny, reputational damage or other events, any of which could have a material adverse effect on a Fund. While the Funds seek to minimize such events through controls and oversight, there may still be failures that could cause losses to a Fund. |
| | • | | portfolio management risk: the risk that an investment strategy may fail to produce the intended results or that the securities held by a Fund will underperform other comparable funds because of the portfolio managers’ choice of investments. |
| | • | | portfolio turnover risk: the risk that frequent purchases and sales of portfolio securities may result in higher Fund expenses and may result in larger distributions of taxable capital gains to investors as compared to a fund that trades less frequently. |
| | • | | preferred securities risk: the risk that: (i) the terms of certain preferred stocks contain provisions that allow an issuer under certain conditions to skip or defer distributions; (ii) preferred stocks may be subject to redemption, including at the issuer’s call, and, in the event of redemption, a Fund may not be able to reinvest the proceeds at comparable or favorable rates of return; (iii) preferred stocks are generally subordinated to bonds and other debt securities in an issuer’s capital structure in terms of priority for corporate income and liquidation payments; and (iv) preferred stocks may trade less frequently and in a more limited volume and may be subject to more abrupt or erratic price movements than many other securities. |
| | • | | price volatility risk: the risk that the value of a Fund’s investment portfolio will change, potentially frequently and in large amounts, as the prices of its investments go up or down. |
| | • | | real estate risk: the risk that real estate-related investments may decline in value as a result of factors affecting the real estate sector, such as the supply of real property in certain markets, changes in zoning laws, delays in completion of construction, changes in real estate values, changes in property taxes, levels of occupancy, and local and regional market conditions. Along with the risks common to different types of real estate-related investments, real estate investment trusts (“REITs”), no matter the type, involve additional risk factors, including poor performance by the REIT’s manager, adverse changes to the tax laws, and the possible failure by the REIT to qualify for the favorable tax treatment available to REITs under the Internal Revenue Code of 1986, as amended (the “Code”), or the exemption from registration under the 1940 Act. REITs are not diversified and are heavily dependent on cash flow earned on the property interests they hold. |
| | • | | reliance on each adviser: the risk associated with each Fund’s ability to achieve its investment objective being dependent upon each Adviser’s ability to identify profitable investment opportunities for the Fund. While the portfolio managers of a Fund may have considerable experience in managing other portfolios with investment objectives, policies and strategies that are similar, the past experience of the portfolio managers, including with other strategies and funds, does not guarantee future results for the Fund. |
| | • | | restricted securities risk: the risk that a Fund may be prevented or limited by law or the terms of an agreement from selling a security (a “restricted security”). To the extent that a Fund is permitted to sell a restricted security, there can be no assurance that a trading market will exist at any particular time and a Fund may be unable to dispose of the security promptly at reasonable prices or at all. A Fund may have to bear the expense of registering the securities for resale and the risk of substantial delays in effecting the registration. Also, restricted securities may be difficult to value because market quotations may not be readily available, and the values of restricted securities may have significant volatility. |
| | | | | | |
| | Annual Report | | March 31, 2020 | | 155 |
| | |
| Notes to Financial Statements (Cont.) | | March 31, 2020 |
| | • | | securities or sector selection risk: the risk that the securities held by a Fund will underperform securities held in other funds investing in similar asset classes or comparable benchmarks because of the portfolio managers’ choice of securities or sectors for investment. To the extent a Fund focuses or concentrates its investments in a particular sector or related sectors, the Fund will be more susceptible to events or factors affecting companies in that sector or related sectors. |
| | • | | short position risk: the risk that an increase in the value of an instrument, index or interest rate with respect to which a Fund has established a short position will result in a loss to the Fund. |
| | • | | sovereign debt obligations risk: the risk that investments in debt obligations of sovereign governments may lose value due to the government entity’s unwillingness or inability to repay principal and interest when due in accordance with the terms of the debt or otherwise in a timely manner. |
| | • | | structured products and structured notes risk: the risk that an investment in a structured product may decline in value due to changes in the underlying instruments on which the product is based. In addition to the general risks associated with fixed income securities discussed herein, structured products carry additional risks including, but not limited to: (i) the possibility that distributions from underlying investments will not be adequate to make interest or other payments; (ii) the quality of the underlying investments may decline in value or default; (iii) the possibility that the security may be subordinate to other classes of the issuer’s securities; and (iv) the complex structure of the security may not be fully understood at the time of investment and may produce disputes with the issuer or unexpected investment results. |
| | • | | tax risk: in order to qualify as a regulated investment company under the Code, a Fund must meet requirements regarding, among other things, the source of its income. Certain investments in commodity-linked derivatives do not give rise to qualifying income for this purpose, and it is possible that certain investments in other commodity-linked instruments, ETFs and other investment pools will not give rise to qualifying income. Any income a Fund derives from investments in instruments that do not generate qualifying income must be limited to a maximum of 10% of a Fund’s annual gross income. If a Fund were to earn non-qualifying income in excess of 10% of its annual gross income, it could fail to qualify as a regulated investment company for that year. If a Fund were to fail to qualify as a regulated investment company, the Fund would be subject to tax and shareholders of the Fund would be subject to the risk of diminished returns. |
| | • | | U.S. Government securities risk: the risk that debt securities issued or guaranteed by certain U.S. Government agencies, instrumentalities, and sponsored enterprises are not supported by the full faith and credit of the U.S. Government, and so investments in their securities or obligations issued by them involve credit risk greater than investments in other types of U.S. Government securities. |
| | • | | valuation risk: the risk that a Fund will not value its investments in a manner that accurately reflects their market values or that the Fund will not be able to sell any investment at a price equal to the valuation ascribed to that investment for purposes of calculating the Fund’s net asset value (“NAV”). The valuation of a Fund’s investments involves subjective judgment. Certain securities in which the Fund may invest may be more difficult to value accurately, especially during periods of market disruptions or extreme market volatility. Incorrect valuations of the Fund’s portfolio holdings could result in the Fund’s shareholder transactions being effected at an NAV that does not accurately reflect the underlying value of the Fund’s portfolio, resulting in the dilution of shareholder interests. |
15. Subsequent Events
Effective April 30, 2020, the DoubleLine Long Duration Total Return Bond Fund reduced its Advisory Fee rate to 0.35% and lowered its expense caps. Under the revised expense caps, the Adviser has contractually agreed to waive its investment advisory fee and to reimburse the DoubleLine Long Duration Total Return Bond Fund for other ordinary operating expenses to the extent necessary to limit the Fund’s ordinary operating expenses to amounts not to exceed 0.55% for Class I shares and 0.80% for Class N shares. Ordinary operating expenses exclude taxes, commissions, mark-ups, litigation expenses, indemnification expenses, interest expenses, Acquired Fund Fees and Expenses, and any extraordinary expenses. These expense limitations are expected to apply until April 30, 2021, except that they may be terminated by the Board at any time.
In preparing these financial statements, the Funds have evaluated events and transactions for potential recognition or disclosure through the date the financial statements were issued. The Funds have determined there are no additional subsequent events that would need to be disclosed in the Funds’ financial statements.
| | | | | | |
| 156 | | DoubleLine Funds Trust | | | | |
| | |
| Report of Independent Registered Public Accounting Firm | | |
To the Board of Trustees of DoubleLine Funds Trust and Shareholders of DoubleLine Total Return Bond Fund, DoubleLine Core Fixed Income Fund, DoubleLine Emerging Markets Fixed Income Fund, DoubleLine Multi-Asset Growth Fund (Consolidated), DoubleLine Low Duration Bond Fund, DoubleLine Floating Rate Fund, DoubleLine Shiller Enhanced CAPE®, DoubleLine Flexible Income Fund, DoubleLine Low Duration Emerging Markets Fixed Income Fund, DoubleLine Long Duration Total Return Bond Fund, DoubleLine Strategic Commodity Fund (Consolidated), DoubleLine Global Bond Fund, DoubleLine Infrastructure Income Fund, DoubleLine Ultra Short Bond Fund, DoubleLine Shiller Enhanced International CAPE®, DoubleLine Colony Real Estate and Income Fund, DoubleLine Emerging Markets Local Currency Bond Fund and DoubleLine Income Fund
Opinions on the Financial Statements
We have audited the accompanying statements of assets and liabilities, including the schedules of investments—summary for DoubleLine Total Return Bond Fund, DoubleLine Core Fixed Income Fund, DoubleLine Shiller Enhanced CAPE®, and DoubleLine Flexible Income Fund, and schedules of investmentsfor DoubleLine Emerging Markets Fixed Income Fund, DoubleLine Multi-Asset Growth Fund (Consolidated), DoubleLine Low Duration Bond Fund, DoubleLine Floating Rate Fund, DoubleLine Low Duration Emerging Markets Fixed Income Fund, DoubleLine Long Duration Total Return Bond Fund, DoubleLine Strategic Commodity Fund (Consolidated), DoubleLine Global Bond Fund, DoubleLine Infrastructure Income Fund, DoubleLine Ultra Short Bond Fund, DoubleLine Shiller Enhanced International CAPE®, DoubleLine Colony Real Estate and Income Fund, DoubleLine Emerging Markets Local Currency Bond Fund and DoubleLine Income Fund (eighteen of the funds constituting DoubleLine Funds Trust, hereafter collectively referred to as the “Funds”) as of March 31, 2020, the related statements of operations and of changes in net assets for each of the periods indicated in the table below, including the related notes, and the financial highlightsfor each of the periods indicated therein (collectively referred to as the “financial statements”). In our opinion, the financial statements present fairly, in all material respects, the financial position of each of the Funds as of March 31, 2020, the results of each of their operations and the changes in each of their net assets for each of the periods indicated in the table below, and each of the financial highlights for each of the periods indicated therein in conformity with accounting principles generally accepted in the United States of America.
|
Fund |
DoubleLine Total Return Bond Fund(1) |
DoubleLine Core Fixed Income Fund(1) |
DoubleLine Emerging Markets Fixed Income Fund(1) |
DoubleLine Multi-Asset Growth Fund (Consolidated)(1) |
DoubleLine Low Duration Bond Fund(1) |
DoubleLine Floating Rate Fund(1) |
DoubleLine Shiller Enhanced CAPE®(1) |
DoubleLine Flexible Income Fund(1) |
DoubleLine Low Duration Emerging Markets Fixed Income Fund(1) |
DoubleLine Long Duration Total Return Bond Fund(1) |
DoubleLine Strategic Commodity Fund (Consolidated)(1) |
DoubleLine Global Bond Fund(1) |
DoubleLine Infrastructure Income Fund(1) |
DoubleLine Ultra Short Bond Fund(1) |
DoubleLine Shiller Enhanced International CAPE®(1) |
DoubleLine Colony Real Estate and Income Fund(2) |
DoubleLine Emerging Markets Local Currency Bond Fund(3) |
DoubleLine Income Fund(4) |
| (1) | Statement of operations for the year ended March 31, 2020 and statement of changes in net assets for each of the two years in the period ended March 31, 2020 |
| (2) | Statement of operations for the year ended March 31, 2020 and statement of changes in net assets for the year ended March 31, 2020 and for the period December 17, 2018 (commencement of operations) through March 31, 2019 |
| (3) | Statement of operations and statement of changes in net assets for the period June 28, 2019 (commencement of operations) through March 31, 2020 |
| (4) | Statement of operations and statement of changes in net assets for the period September 3, 2019 (commencement of operations) through March 31, 2020 |
Basis for Opinions
These financial statements are the responsibility of the Funds’ management. Our responsibility is to express an opinion on the Funds’ financial statements based on our audits. We are a public accounting firm registered with the Public Company Accounting
| | | | | | |
| | Annual Report | | March 31, 2020 | | 157 |
| | |
| Report of Independent Registered Public Accounting Firm (Cont.) | | March 31, 2020 |
Oversight Board (United States) (PCAOB) and are required to be independent with respect to the Funds in accordance with the U.S. federal securities laws and the applicable rules and regulations of the Securities and Exchange Commission and the PCAOB.
We conducted our audits of these financial statements in accordance with the standards of the PCAOB. Those standards require that we plan and perform the audit to obtain reasonable assurance about whether the financial statements are free of material misstatement, whether due to error or fraud.
Our audits included performing procedures to assess the risks of material misstatement of the financial statements, whether due to error or fraud, and performing procedures that respond to those risks. Such procedures included examining, on a test basis, evidence regarding the amounts and disclosures in the financial statements. Our audits also included evaluating the accounting principles used and significant estimates made by management, as well as evaluating the overall presentation of the financial statements. Our procedures included confirmation of securities owned as of March 31, 2020 by correspondence with the custodians and brokers; when replies were not received from brokers, we performed other auditing procedures. We believe that our audits provide a reasonable basis for our opinions.
Los Angeles, California
May 21, 2020
We have served as the auditor of one or more investment companies in the DoubleLine Investment Company Complex since 2010.
| | | | | | |
| 158 | | DoubleLine Funds Trust | | | | |
| | |
| Shareholder Expenses | | (Unaudited) March 31, 2020 |
Example
As a shareholder of the Funds, you incur two basic types of costs: (1) transaction costs , including sales charges (loads) on purchase payments, reinvested dividends, or other distributions; redemption fees; and exchange fees; and (2) ongoing costs, including management fees; distribution(12b-1) fees and other Fund expenses.
This Example is intended to help you understand your ongoing costs (in dollars) of investing in each Fund and to compare these costs with the ongoing costs of investing in other mutual funds. The Example is based on an investment of $1,000 invested at the beginning of the period and held for the entire period 10/1/19 through 3/31/20. Expenses paid during the period are equal to the net annualized expense ratio for the class, multiplied by the average account value over the period, multiplied by 183/366 (to reflect the one-half year period).
Actual Expenses
The actual return columns in the following table provide information about account values based on actual returns and actual expenses. You may use the information in these columns, together with the amount you invested, to estimate the expenses that you paid over the period. Simply divide your account value by $1,000 (for example, an $8,600 account value divided by $1,000 = 8.6), then multiply the result by the number in the respective line under the heading entitled “Expenses Paid During Period” to estimate the expenses you paid on your account during this period. In addition to the expenses shown below in the table, as a shareholder you will be assessed fees for outgoing wire transfers, returned checks and stop payment orders at prevailing rates charged by U.S. Bancorp Fund Services, LLC, the Fund’s transfer agent. Currently, if you request a redemption be made by wire, a $15.00 fee is charged by the Fund’s transfer agent. You will be charged a redemption fee equal to 1.00% of the net amount of the redemption if you redeem shares that have been held for less than 90 days in the DoubleLine Floating Rate Fund. An Individual Retirement Account (“IRA”) will be charged a $15.00 annual maintenance fee. The transfer agent charges a transaction fee of $25.00 on returned checks and stop payment orders. If you paid a transaction fee, you would add the fee amount to the expenses paid on your account this period to obtain your total expenses paid.
Hypothetical Example for Comparison Purposes
The hypothetical return columns in the following table provide information about hypothetical account values and hypothetical expenses based on a Fund’s actual expense ratio and an assumed rate of return of 5% per year before expenses, which is not a Fund’s actual return. The hypothetical account values and expenses may not be used to estimate the actual ending account balance or expenses you paid for the period. You may use this information to compare the ongoing costs of investing in a Fund and other funds. To do so, compare this 5% hypothetical example with the 5% hypothetical examples that appear in the shareholder reports of the other funds. Please note that the expenses shown in the table are meant to highlight your ongoing costs only and do not reflect the transaction fees discussed above. Therefore, those columns are useful in comparing ongoing costs only, and will not help you determine the relative total costs of owning different funds. In addition, if these transactional costs were included, your costs would have been higher.
| | | | | | | | | | | | | | | | | | | | | | | | | | | | | | | | | | | | | | | | |
| | | | | | |
| | | | | | | | | | | Actual | | Hypothetical
(5% return
before expenses) |
| | | | | | | | |
| | | | | | | Fund’s
Annualized
Expense Ratio1 | | Beginning
Account
Value | | Ending
Account
Value
3/31/20 | | Expenses
Paid During
Period*1 | | Ending
Account
Value
3/31/20 | | Expenses
Paid During
Period*1 |
| | | | | | | | |
DoubleLine Total Return Bond Fund | | | | | | | Class I | | | | 0.48% | | | | $ | 1,000 | | | | $ | 991 | | | | $ | 2.39 | | | | $ | 1,023 | | | | $ | 2.43 | |
| | | | | | | | |
| | | | | | | Class N | | | | 0.73% | | | | $ | 1,000 | | | | $ | 989 | | | | $ | 3.63 | | | | $ | 1,021 | | | | $ | 3.69 | |
| | | | | | | | |
| | | | | | | Class R6 | | | | 0.45% | | | | $ | 1,000 | | | | $ | 991 | | | | $ | 2.24 | | | | $ | 1,023 | | | | $ | 2.28 | |
| | | | | | | | |
DoubleLine Core Fixed Income Fund | | | | | | | Class I | | | | 0.41% | | | | $ | 1,000 | | | | $ | 970 | | | | $ | 2.02 | | | | $ | 1,023 | | | | $ | 2.07 | |
| | | | | | | | |
| | | | | | | Class N | | | | 0.66% | | | | $ | 1,000 | | | | $ | 969 | | | | $ | 3.25 | | | | $ | 1,022 | | | | $ | 3.34 | |
| | | | | | | | |
| | | | | | | Class R6 | | | | 0.39% | | | | $ | 1,000 | | | | $ | 970 | | | | $ | 1.92 | | | | $ | 1,023 | | | | $ | 1.97 | |
| | | | | | | | |
DoubleLine Emerging Markets Fixed Income Fund | | | | | | | Class I | | | | 0.90% | | | | $ | 1,000 | | | | $ | 864 | | | | $ | 4.19 | | | | $ | 1,021 | | | | $ | 4.55 | |
| | | | | | | | |
| | | | | | | Class N | | | | 1.15% | | | | $ | 1,000 | | | | $ | 863 | | | | $ | 5.36 | | | | $ | 1,019 | | | | $ | 5.81 | |
| | | | | | | | |
DoubleLine Multi-Asset Growth Fund (Consolidated) | | | | | | | Class I | | | | 1.08% | | | | $ | 1,000 | | | | $ | 856 | | | | $ | 5.01 | | | | $ | 1,020 | | | | $ | 5.45 | |
| | | | | | | | |
| | | | | | | Class A | | | | 1.31% | | | | $ | 1,000 | | | | $ | 856 | | | | $ | 6.08 | | | | $ | 1,018 | | | | $ | 6.61 | |
| | | | | | | | |
DoubleLine Low Duration Bond Fund | | | | | | | Class I | | | | 0.41% | | | | $ | 1,000 | | | | $ | 962 | | | | $ | 2.01 | | | | $ | 1,023 | | | | $ | 2.07 | |
| | | | | | | | |
| | | | | | | Class N | | | | 0.66% | | | | $ | 1,000 | | | | $ | 961 | | | | $ | 3.24 | | | | $ | 1,022 | | | | $ | 3.34 | |
| | | | | | | | |
| | | | | | | Class R6 | | | | 0.39% | | | | $ | 1,000 | | | | $ | 963 | | | | $ | 1.91 | | | | $ | 1,023 | | | | $ | 1.97 | |
| | | | | | |
| | Annual Report | | March 31, 2020 | | 159 |
| | |
| Shareholder Expenses (Cont.) | | (Unaudited) March 31, 2020 |
| | | | | | | | | | | | | | | | | | | | | | | | | | | | | | | | | | | | | | | | |
| | | | | | |
| | | | | | | | | | | Actual | | Hypothetical
(5% return
before expenses) |
| | | | | | | | |
| | | | | | | Fund’s
Annualized
Expense Ratio1 | | Beginning
Account
Value | | Ending
Account
Value
3/31/20 | | Expenses
Paid During
Period*1 | | Ending
Account
Value
3/31/20 | | Expenses
Paid During
Period*1 |
| | | | | | | | |
DoubleLine Floating Rate Fund | | | | | | | Class I | | | | 0.73% | | | | $ | 1,000 | | | | $ | 904 | | | | $ | 3.48 | | | | $ | 1,021 | | | | $ | 3.69 | |
| | | | | | | | |
| | | | | | | Class N | | | | 0.98% | | | | $ | 1,000 | | | | $ | 903 | | | | $ | 4.66 | | | | $ | 1,020 | | | | $ | 4.95 | |
| | | | | | | | |
DoubleLine Shiller Enhanced CAPE® | | | | | | | Class I | | | | 0.54% | | | | $ | 1,000 | | | | $ | 784 | | | | $ | 2.41 | | | | $ | 1,022 | | | | $ | 2.73 | |
| | | | | | | | |
| | | | | | | Class N | | | | 0.79% | | | | $ | 1,000 | | | | $ | 783 | | | | $ | 3.52 | | | | $ | 1,021 | | | | $ | 3.99 | |
| | | | | | | | |
| | | | | | | Class R6 | | | | 0.49% | | | | $ | 1,000 | | | | $ | 785 | | | | $ | 2.19 | | | | $ | 1,023 | | | | $ | 2.48 | |
| | | | | | | | |
DoubleLine Flexible Income Fund | | | | | | | Class I | | | | 0.68% | | | | $ | 1,000 | | | | $ | 885 | | | | $ | 3.21 | | | | $ | 1,022 | | | | $ | 3.44 | |
| | | | | | | | |
| | | | | | | Class N | | | | 0.93% | | | | $ | 1,000 | | | | $ | 884 | | | | $ | 4.38 | | | | $ | 1,020 | | | | $ | 4.70 | |
| | | | | | | | |
| | | | | | | Class R6 | | | | 0.65% | | | | $ | 1,000 | | | | $ | 886 | | | | $ | 3.06 | | | | $ | 1,022 | | | | $ | 3.29 | |
| | | | | | | | |
DoubleLine Low Duration Emerging Markets Fixed Income Fund | | | | | | | Class I | | | | 0.59% | | | | $ | 1,000 | | | | $ | 964 | | | | $ | 2.90 | | | | $ | 1,022 | | | | $ | 2.98 | |
| | | | | | | | |
| | | | | | | Class N | | | | 0.84% | | | | $ | 1,000 | | | | $ | 963 | | | | $ | 4.12 | | | | $ | 1,021 | | | | $ | 4.24 | |
| | | | | | | | |
DoubleLine Long Duration Total Return Bond Fund | | | | | | | Class I | | | | 0.65% | | | | $ | 1,000 | | | | $ | 1,113 | | | | $ | 3.43 | | | | $ | 1,022 | | | | $ | 3.29 | |
| | | | | | | | |
| | | | | | | Class N | | | | 0.90% | | | | $ | 1,000 | | | | $ | 1,111 | | | | $ | 4.75 | | | | $ | 1,021 | | | | $ | 4.55 | |
| | | | | | | | |
DoubleLine Strategic Commodity Fund (Consolidated) | | | | | | | Class I | | | | 1.10% | | | | $ | 1,000 | | | | $ | 763 | | | | $ | 4.85 | | | | $ | 1,020 | | | | $ | 5.55 | |
| | | | | | | | |
| | | | | | | Class N | | | | 1.35% | | | | $ | 1,000 | | | | $ | 763 | | | | $ | 5.95 | | | | $ | 1,018 | | | | $ | 6.81 | |
| | | | | | | | |
DoubleLine Global Bond Fund | | | | | | | Class I | | | | 0.55% | | | | $ | 1,000 | | | | $ | 993 | | | | $ | 2.74 | | | | $ | 1,022 | | | | $ | 2.78 | |
| | | | | | | | |
| | | | | | | Class N | | | | 0.79% | | | | $ | 1,000 | | | | $ | 991 | | | | $ | 3.93 | | | | $ | 1,021 | | | | $ | 3.99 | |
| | | | | | | | |
DoubleLine Infrastructure Income Fund | | | | | | | Class I | | | | 0.56% | | | | $ | 1,000 | | | | $ | 931 | | | | $ | 2.70 | | | | $ | 1,022 | | | | $ | 2.83 | |
| | | | | | | | |
| | | | | | | Class N | | | | 0.81% | | | | $ | 1,000 | | | | $ | 930 | | | | $ | 3.91 | | | | $ | 1,021 | | | | $ | 4.09 | |
| | | | | | | | |
DoubleLine Ultra Short Bond Fund | | | | | | | Class I | | | | 0.23% | | | | $ | 1,000 | | | | $ | 986 | | | | $ | 1.14 | | | | $ | 1,024 | | | | $ | 1.16 | |
| | | | | | | | |
| | | | | | | Class N | | | | 0.48% | | | | $ | 1,000 | | | | $ | 986 | | | | $ | 2.38 | | | | $ | 1,023 | | | | $ | 2.43 | |
| | | | | | | | |
DoubleLine Shiller Enhanced International CAPE® | | | | | | | Class I | | | | 0.63% | | | | $ | 1,000 | | | | $ | 763 | | | | $ | 2.78 | | | | $ | 1,022 | | | | $ | 3.18 | |
| | | | | | | | |
| | | | | | | Class N | | | | 0.88% | | | | $ | 1,000 | | | | $ | 762 | | | | $ | 3.88 | | | | $ | 1,021 | | | | $ | 4.45 | |
| | | | | | | | |
DoubleLine Colony Real Estate and Income Fund | | | | | | | Class I | | | | 0.61% | | | | $ | 1,000 | | | | $ | 710 | | | | $ | 2.61 | | | | $ | 1,022 | | | | $ | 3.08 | |
| | | | | | | | |
| | | | | | | Class N | | | | 0.86% | | | | $ | 1,000 | | | | $ | 709 | | | | $ | 3.67 | | | | $ | 1,021 | | | | $ | 4.34 | |
| | | | | | | | |
DoubleLine Emerging Markets Local Currency Bond Fund | | | | | | | Class I | | | | 0.90% | | | | $ | 1,000 | | | | $ | 904 | | | | $ | 4.28 | | | | $ | 1,021 | | | | $ | 4.55 | |
| | | | | | | | |
| | | | | | | Class N | | | | 1.15% | | | | $ | 1,000 | | | | $ | 903 | | | | $ | 5.47 | | | | $ | 1,019 | | | | $ | 5.81 | |
| | | | | | | | |
DoubleLine Income Fund | | | | | | | Class I | | | | 0.65% | | | | $ | 1,000 | | | | $ | 829 | | | | $ | 2.97 | | | | $ | 1,022 | | | | $ | 3.29 | |
| | | | | | | | |
| | | | | | | Class N | | | | 0.91% | | | | $ | 1,000 | | | | $ | 827 | | | | $ | 4.16 | | | | $ | 1,020 | | | | $ | 4.60 | |
* Expenses Paid During Period are equal to the net annualized expense ratio for the class, multiplied by the average account value over the period, multiplied by 183/366 (to reflect the one-half year period).
1 Reflects fee waiver and expense limitation arrangements in effect during the period.
| | | | | | |
| 160 | | DoubleLine Funds Trust | | | | |
| | |
| Growth of Investment | | (Unaudited) March 31, 2020 |
DoubleLine Total Return Bond Fund
Value of a $100,000 Investment
Class I Shares1
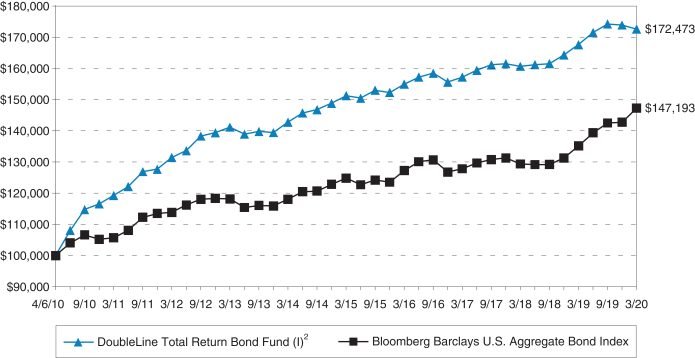
Average Annual Total Returns1
As of March 31, 2020
| | | | | | | | | | | | | | | | | | | | |
| | | | |
| | | | | 1 Year | | 5 Year | | Since
Inception
(4/6/2010) |
| | | | |
DoubleLine Total Return Bond Fund Class I | | | | | | | | | 2.97% | | | | | 2.67% | | | | | 5.61% | |
| | | | |
Bloomberg Barclays U.S. Aggregate Bond Index | | | | | | | | | 8.93% | | | | | 3.36% | | | | | 3.95% | |
| | | | |
DoubleLine Total Return Bond Fund Class R6 | | | | | | | | | 3.00% | | | | | 2.68% | | | | | 5.61% | |
| | | | |
DoubleLine Total Return Bond Fund Class N | | | | | | | | | 2.71% | | | | | 2.42% | | | | | 5.36% | |
| 1 | Past performance is not an indication of future results. Returns represent past performance and reflect changes in share prices, the reinvestment of all dividends and capital gains, expense limitations and the effects of compounding. The prospectus contains more complete information on the investment objectives, risks, charges and expenses of the investment company, which investors should read and consider carefully before investing. To obtain a prospectus, contact a registered representative or visit www.doubleline.com. The Fund’s adviser waived a portion of its management fee and/or reimbursed Fund expenses during the period shown. Had the adviser not done so, the Fund’s total returns would have been lower. The inception date of Class I shares of DoubleLine Total Return Bond Fund was 4/6/2010, while the inception date of Class R6 shares was 7/31/2019. The returns of Class R6 shares shown for periods prior to its inception date reflect the returns of Class I shares. The returns shown do not reflect taxes a shareholder would pay on distributions or redemptions. Total investment return and principal value of your investment will fluctuate, and your shares, when redeemed, may be worth more or less than their original cost. Current performance may be higher or lower than the performance data quoted. Call 877-DLine11 or visit www.doubleline.com for performance results current to the most recent month-end. |
| 2 | Performance of other classes will be greater or less than the line shown based on the differences in loads and fees paid by shareholders investing in the different classes. |
| | Bloomberg Barclays U.S. Aggregate Bond Index—This index represents securities that are SEC-registered, taxable, and dollar denominated. The index covers the US investment grade fixed rate bond market, with index components for government and corporate securities, mortgage pass-through securities, and asset-backed securities. These major sectors are subdivided into more specific indices that are calculated and reported on a regular basis. The Fund’s investments likely will diverge widely from the components of the benchmark Index which could lead to performance dispersion between the Fund and the benchmark Index, meaning that the Fund could outperform or underperform the Index at any given time. |
| | | | | | |
| | Annual Report | | March 31, 2020 | | 161 |
| | |
| Growth of Investment (Cont.) | | (Unaudited) March 31, 2020 |
DoubleLine Core Fixed Income Fund
Value of a $100,000 Investment
Class I Shares1
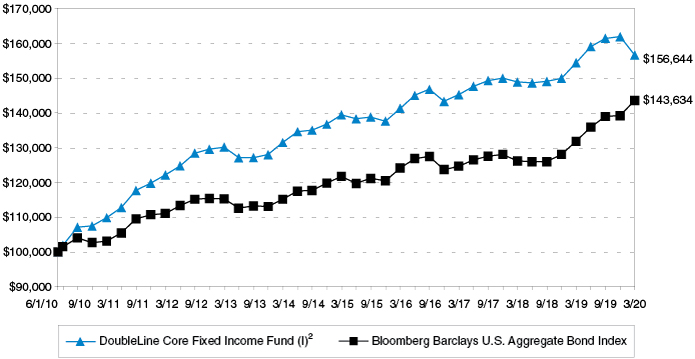
Average Annual Total Returns1
As of March 31, 2020
| | | | | | | | | | | | | | | | | | | | |
| | | | |
| | | | | 1 Year | | 5 Year | | Since
Inception
(6/1/2010) |
| | | | |
DoubleLine Core Fixed Income Fund Class I | | | | | | | | | 1.42% | | | | | 2.35% | | | | | 4.67% | |
| | | | |
Bloomberg Barclays U.S. Aggregate Bond Index | | | | | | | | | 8.93% | | | | | 3.36% | | | | | 3.75% | |
| | | | |
DoubleLine Core Fixed Income Fund Class R6 | | | | | | | | | 1.44% | | | | | 2.35% | | | | | 4.67% | |
| | | | |
DoubleLine Core Fixed Income Fund Class N | | | | | | | | | 1.17% | | | | | 2.07% | | | | | 4.41% | |
| 1 | Past performance is not an indication of future results. Returns represent past performance and reflect changes in share prices, the reinvestment of all dividends and capital gains, expense limitations and the effects of compounding. The prospectus contains more complete information on the investment objectives, risks, charges and expenses of the investment company, which investors should read and consider carefully before investing. To obtain a prospectus, contact a registered representative or visit www.doubleline.com. The Fund’s adviser waived a portion of its management fee and/or reimbursed Fund expenses during the period shown. Had the adviser not done so, the Fund’s total returns would have been lower. The inception date of Class I shares of DoubleLine Core Fixed Income Fund was 6/1/2010, while the inception date of Class R6 shares was 7/31/2019. The returns of Class R6 shares shown for periods prior to its inception date reflect the returns of Class I shares. The returns shown do not reflect taxes a shareholder would pay on distributions or redemptions. Total investment return and principal value of your investment will fluctuate, and your shares, when redeemed, may be worth more or less than their original cost. Current performance may be higher or lower than the performance data quoted. Call 877-DLine11 or visit www.doubleline.com for performance results current to the most recent month-end. |
| 2 | Performance of other classes will be greater or less than the line shown based on the differences in loads and fees paid by shareholders investing in the different classes. |
| | Bloomberg Barclays U.S. Aggregate Bond Index—This index represents securities that are SEC-registered, taxable, and dollar denominated. The index covers the US investment grade fixed rate bond market, with index components for government and corporate securities, mortgage pass-through securities, and asset-backed securities. These major sectors are subdivided into more specific indices that are calculated and reported on a regular basis. The Fund’s investments likely will diverge widely from the components of the benchmark Index which could lead to performance dispersion between the Fund and the benchmark Index, meaning that the Fund could outperform or underperform the Index at any given time. |
| | | | | | |
| 162 | | DoubleLine Funds Trust | | | | |
| | |
| | | (Unaudited) March 31, 2020 |
DoubleLine Emerging Markets Fixed Income Fund
Value of a $100,000 Investment
Class I Shares1
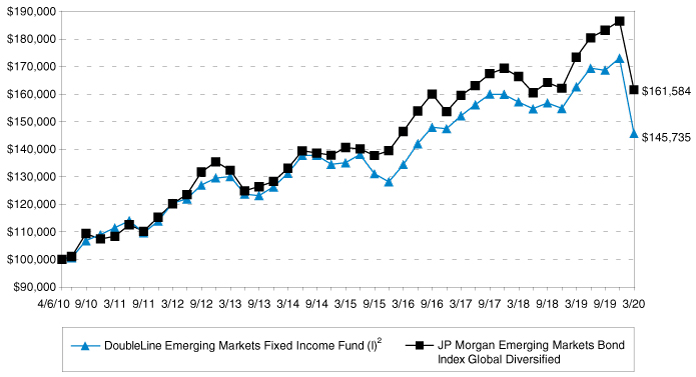
Average Annual Total Returns1
As of March 31, 2020
| | | | | | | | | | | | | | | | | | | | |
| | | | |
| | | | | 1 Year | | 5 Year | | Since
Inception
(4/6/2010) |
| | | | |
DoubleLine Emerging Markets Fixed Income Fund Class I | | | | | | | | | (10.43 | )% | | | | 1.53% | | | | | 3.84% | |
| | | | |
JP Morgan Emerging Markets Bond Index Global Diversified | | | | | | | | | (6.84 | )% | | | | 2.82% | | | | | 4.92% | |
| | | | |
DoubleLine Emerging Markets Fixed Income Fund Class N | | | | | | | | | (10.68 | )% | | | | 1.27% | | | | | 3.59% | |
| 1 | Past performance is not an indication of future results. Returns represent past performance and reflect changes in share prices, the reinvestment of all dividends and capital gains, expense limitations and the effects of compounding. The prospectus contains more complete information on the investment objectives, risks, charges and expenses of the investment company, which investors should read and consider carefully before investing. To obtain a prospectus, contact a registered representative or visit www.doubleline.com. The Fund’s adviser waived a portion of its management fee and/or reimbursed Fund expenses during the period shown. Had the adviser not done so, the Fund’s total returns would have been lower. The returns shown do not reflect taxes a shareholder would pay on distributions or redemptions. Total investment return and principal value of your investment will fluctuate, and your shares, when redeemed, may be worth more or less than their original cost. Current performance may be higher or lower than the performance data quoted. Call 877-DLine11 or visit www.doubleline.com for performance results current to the most recent month-end. |
| 2 | Performance of other classes will be greater or less than the line shown based on the differences in loads and fees paid by shareholders investing in the different classes. |
| | JP Morgan Emerging Markets Bond Index Global Diversified—This index is a uniquely-weighted version of the EMBI Global. It limits the weights of those index countries with larger debt supplies by only including specified portions of these countries’ eligible current face amounts of debt outstanding. The countries covered in the Emerging Markets Bond Global Diversified are identical to those covered by EMBI Global. The Fund’s investments likely will diverge widely from the components of the benchmark Index which could lead to performance dispersion between the Fund and the benchmark Index, meaning that the Fund could outperform or underperform the Index at any given time. |
| | | | | | |
| | Annual Report | | March 31, 2020 | | 163 |
| | |
| Growth of Investment (Cont.) | | (Unaudited) March 31, 2020 |
DoubleLine Multi-Asset Growth Fund
Value of a $100,000 Investment
Class I Shares1
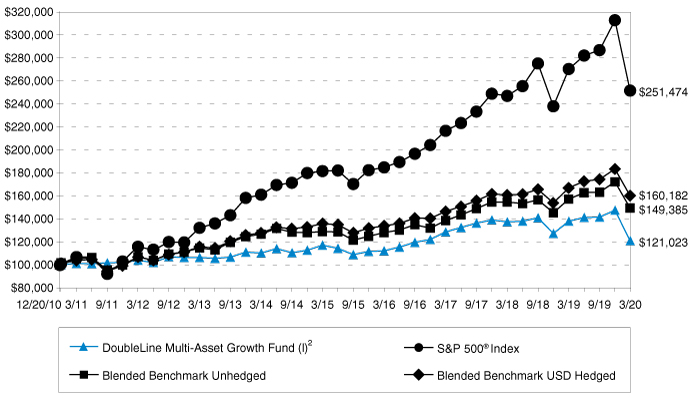
Average Annual Total Returns1
As of March 31, 2020
| | | | | | | | | | | | | | | | | | | | |
| | | | |
| | | | | 1 Year | | 5 Year | | Since
Inception
(12/20/2010) |
| | | | |
DoubleLine Multi-Asset Growth Fund Class I | | | | | | | | | (12.32 | )% | | | | 0.63% | | | | | 2.08% | |
| | | | |
S&P 500® Index | | | | | | | | | (6.98 | )% | | | | 6.73% | | | | | 10.45% | |
| | | | |
Blended Benchmark Unhedged | | | | | | | | | (4.94 | )% | | | | 2.99% | | | | | 4.42% | |
| | | | |
Blended Benchmark USD Hedged | | | | | | | | | (4.02 | )% | | | | 3.35% | | | | | 5.21% | |
| | | | |
DoubleLine Multi-Asset Growth Fund (with load) Class A | | | | | | | | | (16.14 | )% | | | | (0.47)% | | | | | 1.34% | |
| 1 | Past performance is not an indication of future results. Returns represent past performance and reflect changes in share prices, the reinvestment of all dividends and capital gains, expense limitations and the effects of compounding. The prospectus contains more complete information on the investment objectives, risks, charges and expenses of the investment company, which investors should read and consider carefully before investing. To obtain a prospectus, contact a registered representative or visit www.doubleline.com. The Fund’s adviser waived a portion of its management fee and/or reimbursed Fund expenses during the period shown. Had the adviser not done so, the Fund’s total returns would have been lower. The returns shown do not reflect taxes a shareholder would pay on distributions or redemptions. Total investment return and principal value of your investment will fluctuate, and your shares, when redeemed, may be worth more or less than their original cost. Current performance may be higher or lower than the performance data quoted. Call 877-DLine11 or visit www.doubleline.com for performance results current to the most recent month-end. |
| 2 | Performance of other classes will be greater or less than the line shown based on the differences in loads and fees paid by shareholders investing in the different classes. |
| | The S&P 500® Index is an unmanaged capitalization-weighted index of 500 stocks designed to measure performance of the broad domestic economy through changes in the aggregate market value of 500 stocks representing all major industries. |
| | Blended Benchmark—The Blended Benchmark Unhedged is MSCI ACWI (60%)/Bloomberg Barclays Global Aggregate Bond Index (40%). The Blended Benchmark USD Hedged is MSCI ACWI (60%)/Bloomberg Barclays Global Aggregate Bond Index (40%) Hedged to USD. The MSCI ACWI is a market-capitalization-weighted index designed to provide a broad measure of stock performance throughout the world, including both developed and emerging markets. The Bloomberg Barclays Global Aggregate Bond Index and Bloomberg Barclays Global Aggregate Bond Index Hedged to USD represent measures of global investment grade debt from twenty-four local currency markets. These multi-currency benchmarks include treasury, government-related, corporate and securitized fixed-rate bonds from both developed and emerging markets issuers. Returns on the Bloomberg Barclays Global Aggregate Bond Index are calculated on a currency unhedged basis; returns on the Bloomberg Barclays Global Aggregate Bond Index Hedged to USD are calculated on a currency hedged basis in U.S. dollars. |
| | | | | | |
| 164 | | DoubleLine Funds Trust | | | | |
| | |
| | | (Unaudited) March 31, 2020 |
DoubleLine Low Duration Bond Fund
Value of a $100,000 Investment
Class I Shares1
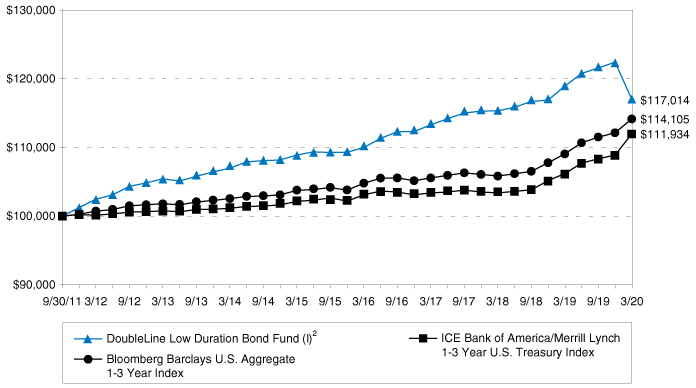
Average Annual Total Returns1
As of March 31, 2020
| | | | | | | | | | | | | | | | | | | | |
| | | | |
| | | | | 1 Year | | 5 Year | | Since
Inception
(9/30/2011) |
| | | | |
DoubleLine Low Duration Bond Fund Class I | | | | | | | | | (1.59)% | | | | | 1.45% | | | | | 1.87% | |
| | | | |
ICE Bank of America/Merrill Lynch 1-3 Year U.S. Treasury Index | | | | | | | | | 5.42% | | | | | 1.85% | | | | | 1.33% | |
| | | | |
Bloomberg Barclays U.S. Aggregate 1-3 Year Index | | | | | | | | | 4.63% | | | | | 1.93% | | | | | 1.56% | |
| | | | |
DoubleLine Low Duration Bond Fund Class R6 | | | | | | | | | (1.58)% | | | | | 1.46% | | | | | 1.87% | |
| | | | |
DoubleLine Low Duration Bond Fund Class N | | | | | | | | | (1.84)% | | | | | 1.20% | | | | | 1.61% | |
| 1 | Past performance is not an indication of future results. Returns represent past performance and reflect changes in share prices, the reinvestment of all dividends and capital gains, expense limitations and the effects of compounding. The prospectus contains more complete information on the investment objectives, risks, charges and expenses of the investment company, which investors should read and consider carefully before investing. To obtain a prospectus, contact a registered representative or visit www.doubleline.com. The Fund’s adviser waived a portion of its management fee and/or reimbursed Fund expenses during the period shown. Had the adviser not done so, the Fund’s total returns would have been lower. The inception date of Class I shares of DoubleLine Low Duration Bond Fund was 9/30/2011, while the inception date of Class R6 shares was 7/31/2019. The returns of Class R6 shares shown for periods prior to its inception date reflect the returns of Class I shares. The returns shown do not reflect taxes a shareholder would pay on distributions or redemptions. Total investment return and principal value of your investment will fluctuate, and your shares, when redeemed, may be worth more or less than their original cost. Current performance may be higher or lower than the performance data quoted. Call 877-DLine11 or visit www.doubleline.com for performance results current to the most recent month-end. |
| 2 | Performance of other classes will be greater or less than the line shown based on the differences in loads and fees paid by shareholders investing in the different classes. |
| | The ICE Bank of America/Merrill Lynch 1-3 Year U.S. Treasury Index is an unmanaged index that tracks the performance of the direct sovereign debt of the U.S. Government having a maturity of at least one year and less than three years. The Fund’s investments likely will diverge widely from the components of the benchmark Index which could lead to performance dispersion between the Fund and the benchmark Index, meaning that the Fund could outperform or underperform the Index at any given time. |
| | The Bloomberg Barclays U.S. Aggregate 1-3 Year Index is the 1-3 year component of the Bloomberg Barclays U.S. Aggregate Bond Index. The Bloomberg Barclays U.S. Aggregate Index represents securities that are SEC-registered, taxable, and dollar denominated. The index covers the U.S. investment grade fixed rate bond market, with the index components for government and corporate securities, mortgage pass-through securities, and asset-backed securities. These major sectors are subdivided into more specific indices that are calculated and reported on a regular basis. |
| | | | | | |
| | Annual Report | | March 31, 2020 | | 165 |
| | |
| Growth of Investment (Cont.) | | (Unaudited) March 31, 2020 |
DoubleLine Floating Rate Fund
Value of a $100,000 Investment
Class I Shares1
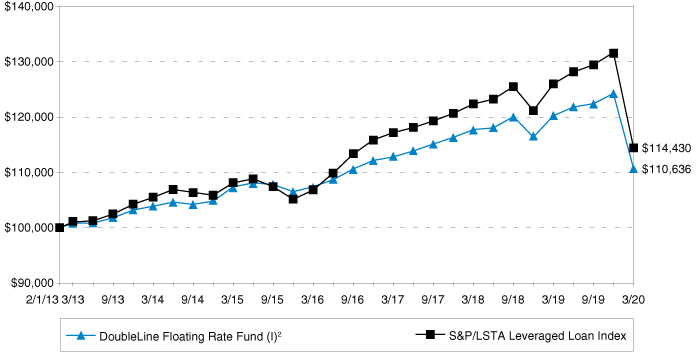
Average Annual Total Returns1
As of March 31, 2020
| | | | | | | | | | | | | | | | | | | | |
| | | | |
| | | | | 1 Year | | 5 Year | | Since
Inception
(2/1/2013) |
| | | | |
DoubleLine Floating Rate Fund Class I | | | | | | | | | (7.99 | )% | | | | 0.60% | | | | | 1.42% | |
| | | | |
S&P/LSTA Leveraged Loan Index | | | | | | | | | (9.16 | )% | | | | 1.14% | | | | | 1.90% | |
| | | | |
DoubleLine Floating Rate Fund Class N | | | | | | | | | (8.32 | )% | | | | 0.32% | | | | | 1.19% | |
| 1 | Past performance is not an indication of future results. Returns represent past performance and reflect changes in share prices, the reinvestment of all dividends and capital gains, expense limitations and the effects of compounding. The prospectus contains more complete information on the investment objectives, risks, charges and expenses of the investment company, which investors should read and consider carefully before investing. To obtain a prospectus, contact a registered representative or visit www.doubleline.com. The Fund’s adviser waived a portion of its management fee and/or reimbursed Fund expenses during the period shown. Had the adviser not done so, the Fund’s total returns would have been lower. The returns shown do not reflect taxes a shareholder would pay on distributions or redemptions. Total investment return and principal value of your investment will fluctuate, and your shares, when redeemed, may be worth more or less than their original cost. Current performance may be higher or lower than the performance data quoted. Call 877-DLine11 or visit www.doubleline.com for performance results current to the most recent month-end. |
| 2 | Performance of other classes will be greater or less than the line shown based on the differences in loads and fees paid by shareholders investing in the different classes. |
| | S&P/LSTA Leveraged Loan Index—The S&P/LSTA Leveraged Loan Index is a capitalization-weighted syndicated loan index based upon market weightings, spreads and interest payments, and this index covers the U.S. market back to 1997 and currently calculates on a daily basis. The Fund’s investments likely will diverge widely from the components of the benchmark Index which could lead to performance dispersion between the Fund and the benchmark Index, meaning that the Fund could outperform or underperform the Index at any given time. |
| | | | | | |
| 166 | | DoubleLine Funds Trust | | | | |
| | |
| | | (Unaudited) March 31, 2020 |
DoubleLine Shiller Enhanced CAPE®
Value of a $100,000 Investment
Class I Shares1
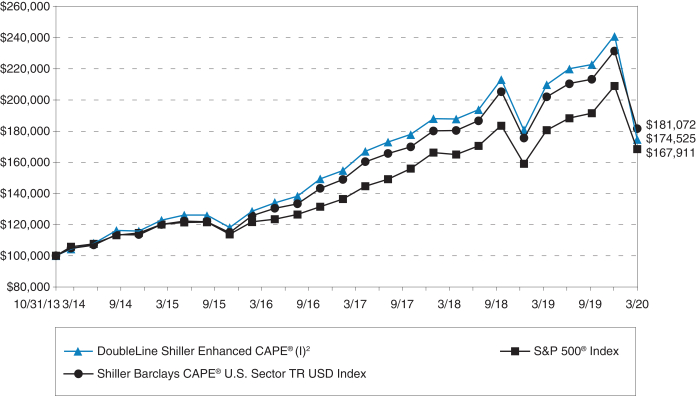
Average Annual Total Returns1
As of March 31, 2020
| | | | | | | | | | | | | | | | | | | | |
| | | | |
| | | | | 1 Year | | 5 Year | | Since
Inception
(10/31/2013) |
| | | | |
DoubleLine Shiller Enhanced CAPE® Class I | | | | | | | | | (16.78 | )% | | | | 6.71% | | | | | 9.07% | |
| | | | |
S&P 500® Index | | | | | | | | | (6.98 | )% | | | | 6.73% | | | | | 8.42% | |
| | | | |
Shiller Barclays CAPE® U.S. Sector TR USD Index | | | | | | | | | (10.27 | )% | | | | 8.20% | | | | | 9.69% | |
| | | | |
DoubleLine Shiller Enhanced CAPE® Class R6 | | | | | | | | | (16.68 | )% | | | | 6.74% | | | | | 9.09% | |
| | | | |
DoubleLine Shiller Enhanced CAPE® Class N | | | | | | | | | (17.00 | )% | | | | 6.46% | | | | | 8.80% | |
| 1 | Past performance is not an indication of future results. Returns represent past performance and reflect changes in share prices, the reinvestment of all dividends and capital gains, expense limitations and the effects of compounding. The prospectus contains more complete information on the investment objectives, risks, charges and expenses of the investment company, which investors should read and consider carefully before investing. To obtain a prospectus, contact a registered representative or visit www.doubleline.com. The Fund’s adviser waived a portion of its management fee and/or reimbursed Fund expenses during the period shown. Had the adviser not done so, the Fund’s total returns would have been lower. The inception date of Class I shares of DoubleLine Shiller Enhanced CAPE® was 10/31/2013, while the inception date of Class R6 shares was 7/31/2019. The returns of Class R6 shares shown for periods prior to its inception date reflect the returns of Class I shares. The returns shown do not reflect taxes a shareholder would pay on distributions or redemptions. Total investment return and principal value of your investment will fluctuate, and your shares, when redeemed, may be worth more or less than their original cost. Current performance may be higher or lower than the performance data quoted. Call 877-DLine11 or visit www.doubleline.com for performance results current to the most recent month-end. |
| 2 | Performance of other classes will be greater or less than the line shown based on the differences in loads and fees paid by shareholders investing in the different classes. |
| | Shiller Barclays CAPE® U.S. Sector TR USD Index—The Index incorporates the principles of long-term investing distilled by Dr. Robert Shiller and expressed through the CAPE® (Cyclically Adjusted Price Earnings) ratio (the “CAPE® Ratio”). The Index aims to identify undervalued sectors based on a modified CAPE® Ratio, and then uses a momentum factor to seek to reduce the risk of investing in a sector that may appear undervalued, but which may have also had recent relative price underperformance due to fundamental issues with the sector that may negatively affect the sector’s long-term total return. |
| | The S&P 500® Index is an unmanaged capitalization-weighted index of 500 stocks designed to measure performance of the broad domestic economy through changes in the aggregate market value of 500 stocks representing all major industries. The Fund’s investments likely will diverge widely from the components of the benchmark Index which could lead to performance dispersion between the Fund and the benchmark Index, meaning that the Fund could outperform or underperform the Index at any given time. |
| | | | | | |
| | Annual Report | | March 31, 2020 | | 167 |
| | |
| Growth of Investment (Cont.) | | (Unaudited) March 31, 2020 |
DoubleLine Flexible Income Fund
Value of a $100,000 Investment
Class I Shares1
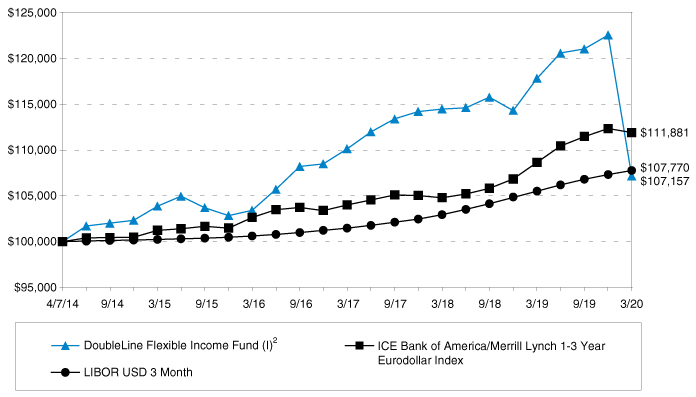
Average Annual Total Returns1
As of March 31, 2020
| | | | | | | | | | | | | | | | | | | | |
| | | | |
| | | | | 1 Year | | 5 Year | | Since Inception (4/7/2014) |
| | | | |
DoubleLine Flexible Income Fund Class I | | | | | | | | | (9.06)% | | | | | 0.63% | | | | | 1.16% | |
| | | | |
LIBOR USD 3 Month | | | | | | | | | 2.14% | | | | | 1.46% | | | | | 1.27% | |
| | | | |
ICE Bank of America/Merrill Lynch 1-3 Year Eurodollar Index | | | | | | | | | 2.96% | | | | | 2.02% | | | | | 1.89% | |
| | | | |
DoubleLine Flexible Income Fund Class R6 | | | | | | | | | (9.04)% | | | | | 0.63% | | | | | 1.17% | |
| | | | |
DoubleLine Flexible Income Fund Class N | | | | | | | | | (9.30)% | | | | | 0.36% | | | | | 0.90% | |
| 1 | Past performance is not an indication of future results. Returns represent past performance and reflect changes in share prices, the reinvestment of all dividends and capital gains, expense limitations and the effects of compounding. The prospectus contains more complete information on the investment objectives, risks, charges and expenses of the investment company, which investors should read and consider carefully before investing. To obtain a prospectus, contact a registered representative or visit www.doubleline.com. The Fund’s adviser waived a portion of its management fee and/or reimbursed Fund expenses during the period shown. Had the adviser not done so, the Fund’s total returns would have been lower. The inception date of Class I shares of DoubleLine Flexible Income Fund was 4/7/2014, while the inception date of Class R6 shares was 7/31/2019. The returns of Class R6 shares shown for periods prior to its inception date reflect the returns of Class I shares. The returns shown do not reflect taxes a shareholder would pay on distributions or redemptions. Total investment return and principal value of your investment will fluctuate, and your shares, when redeemed, may be worth more or less than their original cost. Current performance may be higher or lower than the performance data quoted. Call 877-DLine11 or visit www.doubleline.com for performance results current to the most recent month-end. |
| 2 | Performance of other classes will be greater or less than the line shown based on the differences in loads and fees paid by shareholders investing in the different classes. |
| | LIBOR USD 3 Month —London Interbank Offered Rate (LIBOR) is an indicative average interest rate at which a selection of banks known as the panel banks are prepared to lend one another unsecured funds on the London money market. |
| | ICE Bank of America/Merrill Lynch 1-3 Year Eurodollar Index—The index is a subset of The BofA Merrill Lynch Eurodollar Index including all securities with a remaining term to final maturity less than 3 years. The BofA Merrill Lynch Eurodollar Index tracks the performance of US dollar-denominated investment grade quasigovernment, corporate, securitized and collateralized debt publicly issued in the eurobond markets. Qualifying securities must have an investment grade rating (based on an average of Moody’s, S&P and Fitch). The Fund’s investments likely will diverge widely from the components of the benchmark Index which could lead to performance dispersion between the Fund and the benchmark Index, meaning that the Fund could outperform or underperform the Index at any given time. |
| | | | | | |
| 168 | | DoubleLine Funds Trust | | | | |
| | |
| | | (Unaudited) March 31, 2020 |
DoubleLine Low Duration Emerging Markets Fixed Income Fund
Value of a $100,000 Investment
Class I Shares1

Average Annual Total Returns1
As of March 31, 2020
| | | | | | | | | | | | | | | | | | | | |
| | | | |
| | | | | 1 Year | | 5 Year | | Since Inception (4/7/2014) |
| | | | |
DoubleLine Low Duration Emerging Markets Fixed Income Fund Class I | | | | | | | | | (0.62 | )% | | | | 2.37% | | | | | 2.30% | |
| | | | |
JP Morgan CEMBI Broad Diversified 1-3 Year index | | | | | | | | | (2.81 | )% | | | | 2.45% | | | | | 2.38% | |
| | | | |
DoubleLine Low Duration Emerging Markets Fixed Income Fund Class N | | | | | | | | | (0.77 | )% | | | | 2.13% | | | | | 2.08% | |
| 1 | Past performance is not an indication of future results. Returns represent past performance and reflect changes in share prices, the reinvestment of all dividends and capital gains, expense limitations and the effects of compounding. The prospectus contains more complete information on the investment objectives, risks, charges and expenses of the investment company, which investors should read and consider carefully before investing. To obtain a prospectus, contact a registered representative or visit www.doubleline.com. The Fund’s adviser waived a portion of its management fee and/or reimbursed Fund expenses during the period shown. Had the adviser not done so, the Fund’s total returns would have been lower. The returns shown do not reflect taxes a shareholder would pay on distributions or redemptions. Total investment return and principal value of your investment will fluctuate, and your shares, when redeemed, may be worth more or less than their original cost. Current performance may be higher or lower than the performance data quoted. Call 877-DLine11 or visit www.doubleline.com for performance results current to the most recent month-end. |
| 2 | Performance of other classes will be greater or less than the line shown based on the differences in loads and fees paid by shareholders investing in the different classes. |
| | JP Morgan CEMBI Broad Diversified 1-3 Year Index—This index is a market capitalization weighted index consisting of US denominated emerging market corporate bonds with 1-3 year maturity. It is a liquid global corporate benchmark representing Asia, Latin America, Europe and the Middle East/Africa. The Fund’s investments likely will diverge widely from the components of the benchmark Index which could lead to performance dispersion between the Fund and the benchmark Index, meaning that the Fund could outperform or underperform the Index at any given time. |
| | | | | | |
| | Annual Report | | March 31, 2020 | | 169 |
| | |
| Growth of Investment (Cont.) | | (Unaudited) March 31, 2020 |
DoubleLine Long Duration Total Return Bond Fund
Value of a $100,000 Investment
Class I Shares1
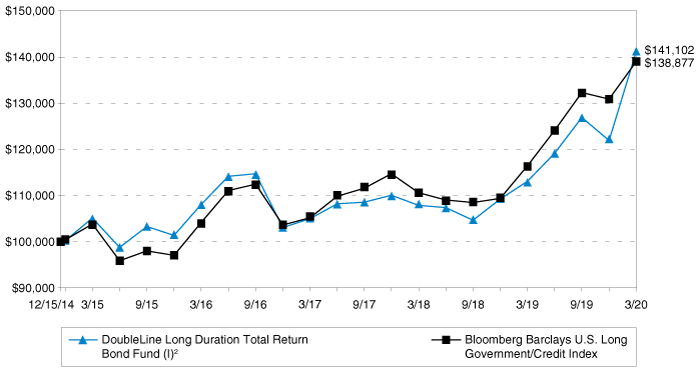
Average Annual Total Returns1
As of March 31, 2020
| | | | | | | | | | | | | | | | | | | | |
| | | | |
| | | | | 1 Year | | 5 Year | | Since Inception (12/15/2014) |
| | | | |
DoubleLine Long Duration Total Return Bond Fund Class I | | | | | | | | | 24.85% | | | | | 6.06% | | | | | 6.72% | |
| | | | |
Bloomberg Barclays U.S. Long Government/Credit Index | | | | | | | | | 19.32% | | | | | 5.99% | | | | | 6.40% | |
| | | | |
DoubleLine Long Duration Total Return Bond Fund Class N | | | | | | | | | 24.44% | | | | | 5.80% | | | | | 6.45% | |
| 1 | Past performance is not an indication of future results. Returns represent past performance and reflect changes in share prices, the reinvestment of all dividends and capital gains, expense limitations and the effects of compounding. The prospectus contains more complete information on the investment objectives, risks, charges and expenses of the investment company, which investors should read and consider carefully before investing. To obtain a prospectus, contact a registered representative or visit www.doubleline.com. The Fund’s adviser waived a portion of its management fee and/or reimbursed Fund expenses during the period shown. Had the adviser not done so, the Fund’s total returns would have been lower. The returns shown do not reflect taxes a shareholder would pay on distributions or redemptions. Total investment return and principal value of your investment will fluctuate, and your shares, when redeemed, may be worth more or less than their original cost. Current performance may be higher or lower than the performance data quoted. Call 877-DLine11 or visit www.doubleline.com for performance results current to the most recent month-end. |
| 2 | Performance of other classes will be greater or less than the line shown based on the differences in loads and fees paid by shareholders investing in the different classes. |
| | Bloomberg Barclays U.S. Long Government/Credit Index—This index includes publicly issued U.S. Treasury debt, U.S. government agency debt, taxable debt issued by U.S. states and territories and their political subdivisions, debt issued by U.S. and non-U.S. corporations, non-U.S. government debt and supranational debt. The Fund’s investments likely will diverge widely from the components of the benchmark Index which could lead to performance dispersion between the Fund and the benchmark Index, meaning that the Fund could outperform or underperform the Index at any given time. |
| | | | | | |
| 170 | | DoubleLine Funds Trust | | | | |
| | |
| | | (Unaudited) March 31, 2020 |
DoubleLine Strategic Commodity Fund
Value of a $100,000 Investment
Class I Shares1
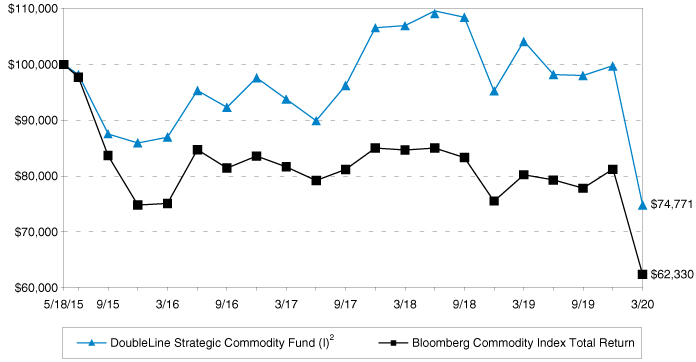
Average Annual Total Returns1
As of March 31, 2020
| | | | | | | | | | | | | | | |
| | | |
| | | | | 1 Year | | Since Inception (5/18/2015) |
| | | |
DoubleLine Strategic Commodity Fund Class I | | | | | | | | | (28.25 | )% | | | | (5.79 | )% |
| | | |
Bloomberg Commodity Index Total Return | | | | | | | | | (22.31 | )% | | | | (9.25 | )% |
| | | |
DoubleLine Strategic Commodity Fund Class N | | | | | | | | | (28.28 | )% | | | | (6.03 | )% |
| 1 | Past performance is not an indication of future results. Returns represent past performance and reflect changes in share prices, the reinvestment of all dividends and capital gains, expense limitations and the effects of compounding. The prospectus contains more complete information on the investment objectives, risks, charges and expenses of the investment company, which investors should read and consider carefully before investing. To obtain a prospectus, contact a registered representative or visit www.doubleline.com. The Fund’s adviser waived a portion of its management fee and/or reimbursed Fund expenses during the period shown. Had the adviser not done so, the Fund’s total returns would have been lower. The returns shown do not reflect taxes a shareholder would pay on distributions or redemptions. Total investment return and principal value of your investment will fluctuate, and your shares, when redeemed, may be worth more or less than their original cost. Current performance may be higher or lower than the performance data quoted. Call 877-DLine11 or visit www.doubleline.com for performance results current to the most recent month-end. |
| 2 | Performance of other classes will be greater or less than the line shown based on the differences in loads and fees paid by shareholders investing in the different classes. |
| | Bloomberg Commodity Index Total Return—This index is calculated on an excess return basis and reflects commodity futures price movements. The index rebalances annually weighted 2/3 by trading volume and 1/3 by world production and weight-caps are applied at the commodity, sector and group level for diversification. Roll period typically occurs from 6th-10th business day based on the roll schedule. The Fund’s investments likely will diverge widely from the components of the benchmark Index which could lead to performance dispersion between the Fund and the benchmark Index, meaning that the Fund could outperform or underperform the Index at any given time. |
| | | | | | |
| | Annual Report | | March 31, 2020 | | 171 |
| | |
| Growth of Investment (Cont.) | | (Unaudited) March 31, 2020 |
DoubleLine Global Bond Fund
Value of a $100,000 Investment
Class I Shares1
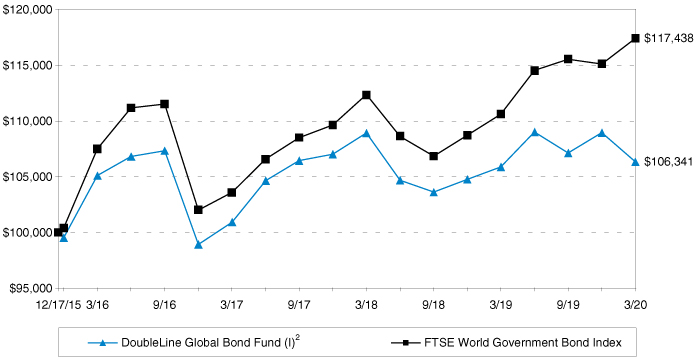
Average Annual Total Returns1
As of March 31, 2020
| | | | | | | | | | | | | | | |
| | | |
| | | | | 1 Year | | Since Inception (12/17/2015) |
| | | |
DoubleLine Global Bond Fund Class I | | | | | | | | | 0.43% | | | | | 1.44% | |
| | | |
FTSE World Government Bond Index | | | | | | | | | 6.17% | | | | | 3.82% | |
| | | |
DoubleLine Global Bond Fund Class N | | | | | | | | | 0.23% | | | | | 1.21% | |
| 1 | Past performance is not an indication of future results. Returns represent past performance and reflect changes in share prices, the reinvestment of all dividends and capital gains, expense limitations and the effects of compounding. The prospectus contains more complete information on the investment objectives, risks, charges and expenses of the investment company, which investors should read and consider carefully before investing. To obtain a prospectus, contact a registered representative or visit www.doubleline.com. The Fund’s adviser waived a portion of its management fee and/or reimbursed Fund expenses during the period shown. Had the adviser not done so, the Fund’s total returns would have been lower. The returns shown do not reflect taxes a shareholder would pay on distributions or redemptions. Total investment return and principal value of your investment will fluctuate, and your shares, when redeemed, may be worth more or less than their original cost. Current performance may be higher or lower than the performance data quoted. Call 877-DLine11 or visit www.doubleline.com for performance results current to the most recent month-end. |
| 2 | Performance of other classes will be greater or less than the line shown based on the differences in loads and fees paid by shareholders investing in the different classes. |
| | FTSE World Government Bond Index—This index measures the performance of fixed-rate, local currency and investment grade sovereign bonds. The Fund’s investments likely will diverge widely from the components of the benchmark Index which could lead to performance dispersion between the Fund and the benchmark Index, meaning that the Fund could outperform or underperform the Index at any given time. |
| | | | | | |
| 172 | | DoubleLine Funds Trust | | | | |
| | |
| | | (Unaudited) March 31, 2020 |
DoubleLine Infrastructure Income Fund
Value of a $100,000 Investment
Class I Shares1
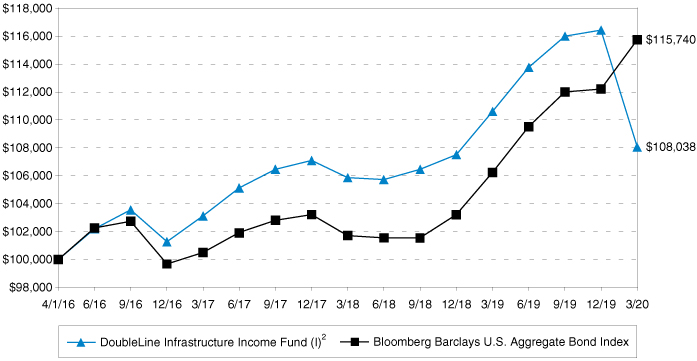
Average Annual Total Returns1
As of March 31, 2020
| | | | | | | | | | | | | | | |
| | | |
| | | | | 1 Year | | Since Inception
(4/1/2016) |
| | | |
DoubleLine Infrastructure Income Fund Class I | | | | | | | | | (2.32)% | | | | | 1.95% | |
| | | |
Bloomberg Barclays U.S. Aggregate Bond Index | | | | | | | | | 8.93% | | | | | 3.72% | |
| | | |
DoubleLine Infrastructure Income Fund Class N | | | | | | | | | (2.55)% | | | | | 1.70% | |
| 1 | Past performance is not an indication of future results. Returns represent past performance and reflect changes in share prices, the reinvestment of all dividends and capital gains, expense limitations and the effects of compounding. The prospectus contains more complete information on the investment objectives, risks, charges and expenses of the investment company, which investors should read and consider carefully before investing. To obtain a prospectus, contact a registered representative or visit www.doubleline.com. The Fund’s adviser waived a portion of its management fee and/or reimbursed Fund expenses during the period shown. Had the adviser not done so, the Fund’s total returns would have been lower. The returns shown do not reflect taxes a shareholder would pay on distributions or redemptions. Total investment return and principal value of your investment will fluctuate, and your shares, when redeemed, may be worth more or less than their original cost. Current performance may be higher or lower than the performance data quoted. Call 877-DLine11 or visit www.doubleline.com for performance results current to the most recent month-end. |
| 2 | Performance of other classes will be greater or less than the line shown based on the differences in loads and fees paid by shareholders investing in the different classes. |
| | Bloomberg Barclays U.S. Aggregate Bond Index—This index represents securities that are SEC-registered, taxable, and dollar denominated. The index covers the US investment grade fixed rate bond market, with index components for government and corporate securities, mortgage pass-through securities, and asset-backed securities. These major sectors are subdivided into more specific indices that are calculated and reported on a regular basis. The Fund’s investments likely will diverge widely from the components of the benchmark Index which could lead to performance dispersion between the Fund and the benchmark Index, meaning that the Fund could outperform or underperform the Index at any given time. |
| | | | | | |
| | Annual Report | | March 31, 2020 | | 173 |
| | |
| Growth of Investment (Cont.) | | (Unaudited) March 31, 2020 |
DoubleLine Ultra Short Bond Fund
Value of a $100,000 Investment
Class I Shares1
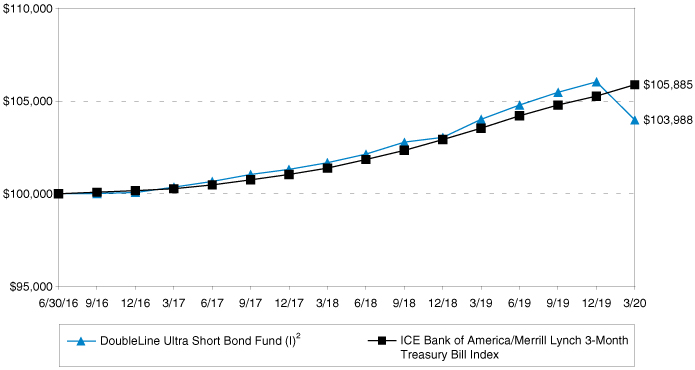
Average Annual Total Returns1
As of March 31, 2020
| | | | | | | | | | | | | | | |
| | | |
| | | | | 1 Year | | Since Inception (6/30/2016) |
| | | |
DoubleLine Ultra Short Bond Fund Class I | | | | | | | | | (0.04)% | | | | | 1.05% | |
| | | |
ICE Bank of America/Merrill Lynch 3-Month Treasury Bill Index | | | | | | | | | 2.25% | | | | | 1.54% | |
| | | |
DoubleLine Ultra Short Bond Fund Class N | | | | | | | | | (0.19)% | | | | | 0.83% | |
| 1 | Past performance is not an indication of future results. Returns represent past performance and reflect changes in share prices, the reinvestment of all dividends and capital gains, expense limitations and the effects of compounding. The prospectus contains more complete information on the investment objectives, risks, charges and expenses of the investment company, which investors should read and consider carefully before investing. To obtain a prospectus, contact a registered representative or visit www.doubleline.com. The Fund’s adviser waived a portion of its management fee and/or reimbursed Fund expenses during the period shown. Had the adviser not done so, the Fund’s total returns would have been lower. The returns shown do not reflect taxes a shareholder would pay on distributions or redemptions. Total investment return and principal value of your investment will fluctuate, and your shares, when redeemed, may be worth more or less than their original cost. Current performance may be higher or lower than the performance data quoted. Call 877-DLine11 or visit www.doubleline.com for performance results current to the most recent month-end. |
| 2 | Performance of other classes will be greater or less than the line shown based on the differences in loads and fees paid by shareholders investing in the different classes. |
| | ICE Bank of America/Merrill Lynch 3-Month Treasury Bill Index—This index is an unmanaged market index of U.S. Treasury securities maturing in 90 days that assumes reinvestment of all income. The Fund’s investments likely will diverge widely from the components of the benchmark Index which could lead to performance dispersion between the Fund and the benchmark Index, meaning that the Fund could outperform or underperform the Index at any given time. |
| | | | | | |
| 174 | | DoubleLine Funds Trust | | | | |
| | |
| | | (Unaudited) March 31, 2020 |
DoubleLine Shiller Enhanced International CAPE®
Value of a $100,000 Investment
Class I Shares1
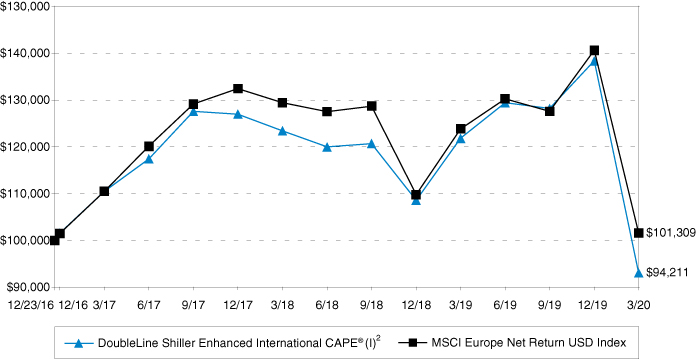
Average Annual Total Returns1
As of March 31, 2020
| | | | | | | | | | | | |
| | | |
| | | | | | 1 Year | | | Since Inception (12/23/2016) | |
| | | |
DoubleLine Shiller Enhanced International CAPE® Class I | | | | | | | (20.29 | )% | | | (1.81)% | |
| | | |
MSCI Europe Net Return USD Index | | | | | | | (15.50 | )% | | | 0.40% | |
| | | |
DoubleLine Shiller Enhanced International CAPE® Class N | | | | | | | (20.50 | )% | | | (2.04)% | |
| 1 | Past performance is not an indication of future results. Returns represent past performance and reflect changes in share prices, the reinvestment of all dividends and capital gains, expense limitations and the effects of compounding. The prospectus contains more complete information on the investment objectives, risks, charges and expenses of the investment company, which investors should read and consider carefully before investing. To obtain a prospectus, contact a registered representative or visit www.doubleline.com. The Fund’s adviser waived a portion of its management fee and/or reimbursed Fund expenses during the period shown. Had the adviser not done so, the Fund’s total returns would have been lower. The returns shown do not reflect taxes a shareholder would pay on distributions or redemptions. Total investment return and principal value of your investment will fluctuate, and your shares, when redeemed, may be worth more or less than their original cost. Current performance may be higher or lower than the performance data quoted. Call 877-DLine11 or visit www.doubleline.com for performance results current to the most recent month-end. |
| 2 | Performance of other classes will be greater or less than the line shown based on the differences in loads and fees paid by shareholders investing in the different classes. |
| | MSCI Europe Net Return USD Index—This index captures large and mid cap representation across 15 Developed Markets (DM) countries in Europe. With 446 constituents, the index covers approximately 85% of the free float-adjusted market capitalization across the European Developed Markets equity universe. The Fund’s investments likely will diverge widely from the components of the benchmark Index which could lead to performance dispersion between the Fund and the benchmark Index, meaning that the Fund could outperform or underperform the Index at any given time. |
| | | | | | |
| | Annual Report | | March 31, 2020 | | 175 |
| | |
| Growth of Investment (Cont.) | | (Unaudited) March 31, 2020 |
DoubleLine Colony Real Estate and Income Fund
Value of a $100,000 Investment
Class I Shares1
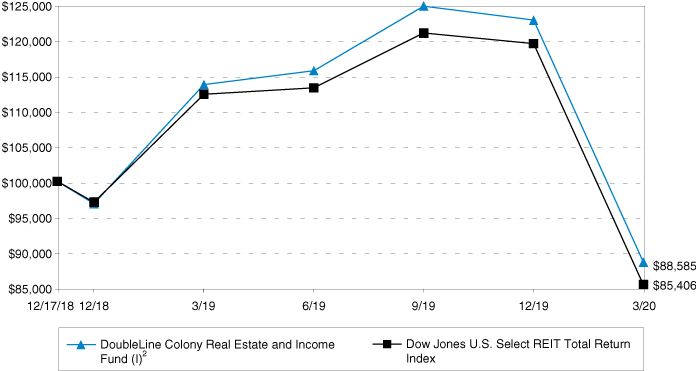
Average Annual Total Returns1
As of March 31, 2020
| | | | | | | | | | | | | | | |
| | | |
| | | | | 1 Year | | Since Inception (12/17/2018) |
| | | |
DoubleLine Colony Real Estate and Income Fund Class I | | | | | | | | | (22.08 | )% | | | | (9.00 | )% |
| | | |
Dow Jones U.S. Select REIT Total Return Index | | | | | | | | | (23.96 | )% | | | | (11.55 | )% |
| | | |
DoubleLine Colony Real Estate and Income Fund Class N | | | | | | | | | (22.21 | )% | | | | (9.21 | )% |
| 1 | Past performance is not an indication of future results. Returns represent past performance and reflect changes in share prices, the reinvestment of all dividends and capital gains, expense limitations and the effects of compounding. The prospectus contains more complete information on the investment objectives, risks, charges and expenses of the investment company, which investors should read and consider carefully before investing. To obtain a prospectus, contact a registered representative or visit www.doubleline.com. The Fund’s adviser waived a portion of its management fee and/or reimbursed Fund expenses during the period shown. Had the adviser not done so, the Fund’s total returns would have been lower. The returns shown do not reflect taxes a shareholder would pay on distributions or redemptions. Total investment return and principal value of your investment will fluctuate, and your shares, when redeemed, may be worth more or less than their original cost. Current performance may be higher or lower than the performance data quoted. Call 877-DLine11 or visit www.doubleline.com for performance results current to the most recent month-end. |
| 2 | Performance of other classes will be greater or less than the line shown based on the differences in loads and fees paid by shareholders investing in the different classes. |
| | Dow Jones U.S. Select REIT Total Return Index—This index is designed to measure the performance of publicly traded real estate securities. The index is designed to serve as a proxy for direct real estate investment, in part by excluding companies whose performance may be driven by factors other than the value of real estate. The Dow Jones U.S. Select Real Estate Securities Index (RESI) seeks to measure equity real estate investment trusts (REITs) and real estate operating companies (REOCs) traded in the U.S. The Fund’s investments likely will diverge widely from the components of the benchmark Index which could lead to performance dispersion between the Fund and the benchmark Index, meaning that the Fund could outperform or underperform the Index at any given time. |
| | | | | | |
| 176 | | DoubleLine Funds Trust | | | | |
| | |
| | | (Unaudited) March 31, 2020 |
DoubleLine Emerging Markets Local Currency Bond
Value of a $100,000 Investment
Class I Shares1
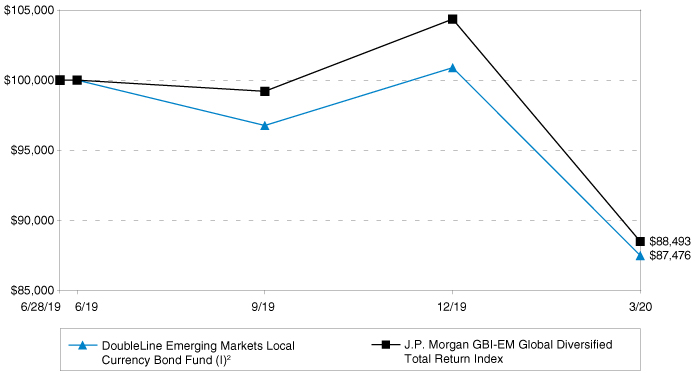
Since Inception Total Returns1
As of March 31, 2020
| | | | | | | | | | |
| | |
| | | | | Since Inception (6/28/2019) |
| | |
DoubleLine Emerging Markets Local Currency Bond Fund Class I | | | | | | | | | (12.52 | )% |
| | |
J.P. Morgan GBI-EM Global Diversified Total Return Index | | | | | | | | | (11.51 | )% |
| | |
DoubleLine Emerging Markets Local Currency Bond Fund Class N | | | | | | | | | (12.69 | )% |
| 1 | Past performance is not an indication of future results. Returns represent past performance and reflect changes in share prices, the reinvestment of all dividends and capital gains, expense limitations and the effects of compounding. The prospectus contains more complete information on the investment objectives, risks, charges and expenses of the investment company, which investors should read and consider carefully before investing. To obtain a prospectus, contact a registered representative or visit www.doubleline.com. The Fund’s adviser waived a portion of its management fee and/or reimbursed Fund expenses during the period shown. Had the adviser not done so, the Fund’s total returns would have been lower. The returns shown do not reflect taxes a shareholder would pay on distributions or redemptions. Total investment return and principal value of your investment will fluctuate, and your shares, when redeemed, may be worth more or less than their original cost. Current performance may be higher or lower than the performance data quoted. Call 877-DLine11 or visit www.doubleline.com for performance results current to the most recent month-end. |
| 2 | Performance of other classes will be greater or less than the line shown based on the differences in loads and fees paid by shareholders investing in the different classes. |
| | J.P. Morgan GBI-EM Global Diversified Total Return Index—This index is an unmanaged, market-capitalization weighted, total-return index tracking the traded market for U.S.-dollar-denominated Brady bonds, Eurobonds, traded loans, and local market debt instruments issued by sovereign and quasi-sovereign entities. The Fund’s investments likely will diverge widely from the components of the benchmark Index which could lead to performance dispersion between the Fund and the benchmark Index, meaning that the Fund could outperform or underperform the Index at any given time. |
| | | | | | |
| | Annual Report | | March 31, 2020 | | 177 |
| | |
| Growth of Investment (Cont.) | | (Unaudited) March 31, 2020 |
DoubleLine Income Fund
Value of a $100,000 Investment
Class I Shares1
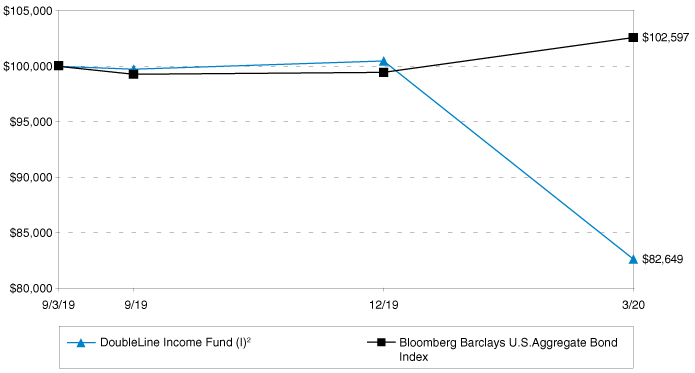
Since Inception Total Returns1
As of March 31, 2020
| | | | | | | | | | |
| | |
| | | | | Since Inception (9/3/2019) |
| | |
DoubleLine Income Fund Class I | | | | | | | | | (17.35 | )% |
| | |
Bloomberg Barclays U.S. Aggregate Bond Index | | | | | | | | | 2.60% | |
| | |
DoubleLine Income Fund Class N | | | | | | | | | (17.46 | )% |
| 1 | Past performance is not an indication of future results. Returns represent past performance and reflect changes in share prices, the reinvestment of all dividends and capital gains, expense limitations and the effects of compounding. The prospectus contains more complete information on the investment objectives, risks, charges and expenses of the investment company, which investors should read and consider carefully before investing. To obtain a prospectus, contact a registered representative or visit www.doubleline.com. The Fund’s adviser waived a portion of its management fee and/or reimbursed Fund expenses during the period shown. Had the adviser not done so, the Fund’s total returns would have been lower. The returns shown do not reflect taxes a shareholder would pay on distributions or redemptions. Total investment return and principal value of your investment will fluctuate, and your shares, when redeemed, may be worth more or less than their original cost. Current performance may be higher or lower than the performance data quoted. Call 877-DLine11 or visit www.doubleline.com for performance results current to the most recent month-end. |
| 2 | Performance of other classes will be greater or less than the line shown based on the differences in loads and fees paid by shareholders investing in the different classes. |
| | Bloomberg Barclays U.S. Aggregate Bond Index—This index represents securities that are SEC-registered, taxable, and dollar denominated. The index covers the US investment grade fixed rate bond market, with index components for government and corporate securities, mortgage pass-through securities, and asset-backed securities. These major sectors are subdivided into more specific indices that are calculated and reported on a regular basis. The Fund’s investments likely will diverge widely from the components of the benchmark Index which could lead to performance dispersion between the Fund and the benchmark Index, meaning that the Fund could outperform or underperform the Index at any given time. |
| | | | | | |
| 178 | | DoubleLine Funds Trust | | | | |
| | |
| Evaluation of Advisory Agreement by the Board of Trustees | | (Unaudited) March 31, 2020 |
DoubleLine Total Return Bond Fund
DoubleLine Core Fixed Income Fund
DoubleLine Emerging Markets Fixed Income Fund
DoubleLine Multi-Asset Growth Fund
DoubleLine Cayman Multi-Asset Growth Fund I Ltd.
DoubleLine Low Duration Bond Fund
DoubleLine Floating Rate Fund
DoubleLine Shiller Enhanced CAPE®
DoubleLine Flexible Income Fund
DoubleLine Low Duration Emerging Markets Fixed Income Fund
DoubleLine Long Duration Total Return Bond Fund
DoubleLine Selective Credit Fund
DoubleLine Strategic Commodity Fund
DoubleLine Strategic Commodity Ltd.
DoubleLine Global Bond Fund
DoubleLine Infrastructure Income Fund
DoubleLine Ultra Short Bond Fund
DoubleLine Shiller Enhanced International CAPE®
DoubleLine Colony Real Estate and Income Fund
DoubleLine Opportunistic Credit Fund
DoubleLine Income Solutions Fund
Atan in-person meeting in February 2020, the Boards of Trustees (the “Board” or the “Trustees”) of the DoubleLineopen-end mutual fundsand closed-end funds (the “Funds”) approved the continuation of the investment advisory andsub-advisory agreements (the “Advisory Agreements”) between DoubleLine and those Funds. That approval included approval by the Trustees who are not “interested persons” (as defined in the Investment Company Act of 1940, as amended) of the Funds (the “Independent Trustees”) voting separately. When used in this summary, “DoubleLine” refers collectively to DoubleLine Capital LP and to DoubleLine Alternatives LP.
The Trustees’ determination to approve the continuation of each Advisory Agreement was made on the basis of each Trustee’s business judgment after an evaluation of all of the information provided to the Trustees, including information provided for their consideration at their February 2020 meeting with management and at meetings held in preparation for that February 2020 meeting, including portions held outside the presence of management, specifically to review and consider materials related to the proposed continuation of each Advisory Agreement. The Trustees meet over the course of the year with investment advisory, compliance, and other personnel from DoubleLine and regularly review detailed information, presented both orally and in writing, regarding the services performed by DoubleLine for the benefit of the Funds and the investment program, performance, and operations of each Fund. In considering whether to approve the continuation of the Advisory Agreements, the Trustees took into account information presented to them over the course of the past year.
This summary describes a number, but not necessarily all, of the most important factors considered by the Board and the Independent Trustees. Individual Trustees may have given different weights to certain factors and assigned various degrees of materiality to information received in connection with the approval process. No single factor was determined to be decisive. In all of their deliberations, the Independent Trustees were advised by independent counsel.
The Trustees considered the nature, extent, and quality of the services, including the expertise and experience of investment personnel, provided and expected to be provided by DoubleLine to each Fund. In this regard, the Trustees considered that DoubleLine provides a full investment program for the Funds, and noted DoubleLine’s representation that it seeks to provide attractive returns with a strong emphasis on risk management. The Board considered in particular the difficulty of managing debt related portfolios, noting that managing such portfolios requires a portfolio management team to balance a number of factors, which may include, among others, securities of varying maturities and durations, actual and anticipated interest rate changes and volatility, prepayments, collateral management, counterpartymanagement, pay-downs, credit events, workouts, and net new issuances. In their evaluation of the services provided by DoubleLine and the Funds’ contractual relationships with DoubleLine, the Trustees considered generally the long-term performance record of the firm’s portfolio management personnel, including among others Mr. Jeffrey Gundlach, and the strong overall demand for products managed by DoubleLine.
The Trustees reviewed reports (the “Strategic Insight Reports”) provided by Strategic Insight, an Asset International Company (“Strategic Insight”), that comparedeach open-end Fund’s net management fee ratio and net total expense ratio (Class I shares)
| | | | | | |
| | Annual Report | | March 31, 2020 | | 179 |
| | |
| Evaluation of Advisory Agreement by the Board of Trustees (Cont.) | | (Unaudited) March 31, 2020 |
against its Strategic Insight peer group, andeach open-end Fund’s performance records (Class I shares) for theone-year, three-year (where applicable) and five-year (where applicable) periods ended December 31, 2019 against its Morningstar category. The Independent Trustees met with Strategic Insight representatives to review Strategic Insight’s selection of peer groups, including the factors Strategic Insight considers in assembling peer groups of funds for the various Funds.
With respect to the comparative performance information in the Strategic Insight Reports, the Trustees noted in particular thateach open-end Fund, other than DoubleLine Floating Rate Fund (“Floating Rate”), DoubleLine Low Duration Emerging Markets Fixed Income Fund (“Low Duration EMFI”), DoubleLine Global Bond Fund (“Global Bond”), DoubleLine Ultra Short Fund (“Ultra Short”), and DoubleLine Shiller Enhanced International CAPE (“International CAPE”), was in the first or second performance quartile relative to its respective Morningstar category for the longest period ended December 31, 2019 for which comparative performance information was presented by Strategic Insight. The Trustees considered specific factors cited by DoubleLine for any relative underperformance of theopen-end Funds, which in most cases resulted from decisions of the Funds’ portfolio management team as to risk management and the overall positioning and strategy of the Funds. In respect of Low Duration EMFI and Ultra Short, the Trustees considered DoubleLine’s explanation that conservative credit and duration positioning contributed significantly to the relative performance of those Funds. In respect of Floating Rate, the Trustees considered DoubleLine’s representation that conservative credit positioning contributed to the relative underperformance of that Fund. The Trustees also considered information Strategic Insight and DoubleLine provided regarding peer group construction issues and differences in investment mandate in their evaluations of the relative performance of Low Duration EMFI, Global Bond and International CAPE.
The Trustees considered the portion of the Strategic Insight Reports coveringthe open-end Funds’ expenses and advisory fees, noting that the reports showed thateach open-end Fund, other than DoubleLine Emerging Markets Fixed Income Fund (“EMFI”), DoubleLine Multi-Asset Growth Fund (“MAG”), DoubleLine Long Duration Total Return Fund (“Long Duration Total Return”), DoubleLine Strategic Commodity Fund (“Strategic Commodity”), and DoubleLine Infrastructure Income Fund (“Infrastructure Income”), had a net total expense ratio in the first or second quartile of its peer group. The Trustees noted that none of the Funds had a net total expense ratio that was in the fourth comparative quartile of its peer group and that EMFI and Infrastructure Income were within four basis points (or less) of its expense group median.
The Trustees consideredeach open-end Fund’s net management fee ratio relative to its expense peer group and, in respect of those Funds with a net management fee ratio above the median of its peer group, the Trustees considered DoubleLine’s pricing policy for its advisory fees and that DoubleLine does not seek to be a lowest cost provider, nor does it have a policy to set its advisory fees below the median of a Fund’s peers. In respect of MAG, Long Duration Total Return, Strategic Commodity and Infrastructure Income, each of which had a net management fee that fell in the fourth quartile of its expense peer group, the Trustees considered the long-term relative performance of those Funds and that each had performed in either the first or second quartile of its Morningstar category over the longest-period of performance shown in the Strategic Insight report. The Trustees also considered information provided by DoubleLine that reflected differences in investment mandate, approach or flexibility between each of those Funds and the bulk of their peers generally, as well as DoubleLine’s undertaking to reduce the management fee of Long Duration Total Return to a level that would have been below the median of its expense peer group had it been in effect at the time the comparative information was compiled.
As to the Opportunistic Credit Fund (“DBL”), the Trustees noted that DBL’s net management fee ratio and net total expense ratio were shown in the Strategic Insight Reports to be higher than the median of the Fund’s peer group. The Trustees noted DBL’s favorable relative long-term performance, with its performance ranking in the second quartile of its Morningstar peer group for the five-year period ended December 31, 2019. They also noted its less favorable performance over the three-and one-year periods ended December 31, 2019. The Trustees considered DoubleLine’s explanation for DBL’s recent underperformance, including its greater focus on investment in mortgage-backed securities and its more limited exposure to credit risk than many of its more diversified peers.
As to the Income Solutions Fund (“DSL”), the Trustees noted that, although DSL was shown in the Strategic Insight Reports to have performed in the fourth quartile of its peers overthe one-year period ended December 31, 2019, it performed in the first quartile of its Morningstar peer group over the three- and five-year periods ended December 31, 2019. They noted that DSL’s net management fee ratio and net total expense ratio were higher than the median of its peer group, though both were in the third quartile of the peer group. In evaluating the comparative net management fee and net total expense ratio of DSL, the Trustees considered DSL’s favorable relative performance and DoubleLine’s statement that the Fund’s fees reflect the experience and expertise DoubleLine brings to managing the Fund. The Trustees noted that both DBL and DSL had employed leverage for the period shown in the Strategic Insight Reports, and considered information from DoubleLine intended to show that each Fund’s use of leverage was accretive to the Fund’s investment performance, after taking into account any expenses related to the leverage.
| | | | | | |
| 180 | | DoubleLine Funds Trust | | | | |
| | |
| | | (Unaudited) March 31, 2020 |
The Trustees considered that DoubleLine provides a variety of other services to the Funds in addition to investment advisory services, including, among others, a number of back-office services, valuation services, compliance services, certain forms of information technology services (such as internal reporting), assistance with accounting and distribution services, and supervision and monitoring of the Funds’ other service providers. The Trustees considered DoubleLine’s ongoing efforts to keep the Trustees informed about matters relevant to the Funds and their shareholders. The Trustees also considered the nature and structure of the Funds’ compliance program, including the policies and procedures of the Funds and their various service providers (including DoubleLine). The Trustees considered the quality ofthose non-investment advisory services and determined that their quality appeared to support the continuation of the Funds’ arrangements with DoubleLine.
The Trustees considered DoubleLine’s reports, provided at the Board’s regular meetings, that it had continued to hire additional resources and to invest in technology enhancements to support DoubleLine’s ability to provide services to the Funds. The Trustees concluded that it appeared that DoubleLine continued to have sufficient quality and depth of personnel, resources, and investment methods.
The Trustees considered materials relating to the fees charged by DoubleLineto non-Fund clients for which DoubleLine employs investment strategies substantially similar to one or more Funds’ investment strategies, including institutional separate accounts advised by DoubleLine and mutual funds for which DoubleLine serves as subadviser. The Trustees noted the information DoubleLine provided regarding certain institutional separate accounts advised by it and funds subadvised by it that are subject to fee schedules that differ from, including those that are lower than, the rates paid by a Fund with substantially similar investment strategies. The Trustees noted DoubleLine’s representations that administrative, compliance, operational, legal, and other burdens of providing investment advice to mutual funds exceed in many respects those required to provide advisory servicesto non-mutual fund clients, such as institutional accounts for retirement or pension plans, which may have differing contractual requirements. The Trustees noted DoubleLine’s representations that DoubleLine bears substantially greater legal and other responsibilities and risks in managing and sponsoring mutual funds than in managing private accounts or in subadvising mutual funds sponsored by others, and that the services and resources required of DoubleLine when it subadvises mutual funds sponsored by others generally are less extensive than those required of DoubleLine to serve the Funds, because, where DoubleLine serves as a subadviser, many of the sponsorship, operational, and compliance responsibilities related to the advisory function are retained by the primary adviser.
The Trustees reviewed information as to general estimates of DoubleLine’s profitability with respect to each Fund, taking into account both the direct and the indirect benefits to DoubleLine from managing the Funds. The Trustees considered information provided by DoubleLine as to the methods it uses, and the assumptions it makes, in calculating its profitability. The Trustees considered representations from DoubleLine that its compensation and incentive policies and practices enable DoubleLine to attract, retain, and motivate highly qualified and experienced employees. The Trustees noted that DoubleLine experienced significant profitability in respect of certain of the Funds, but noted that in those cases it would be appropriate to consider that profitability in light of various other considerations such as the nature, extent, and quality of the services provided by DoubleLine, the relative performance of the Funds, and the competitiveness of the management fees and total operating expenses of the Funds. The Trustees separately considered DoubleLine’s statement that it is continuing to invest in its business to maintain its ability to provide high-quality services to the Funds, and noted DoubleLine’s need to invest in technology, infrastructure, and staff to continue to provide services and accommodate rapidly changing regulatory requirements.
In their evaluation of economies of scale, the Trustees considered, among other things, the pricing of the Funds, DoubleLine’s reported profitability and that a number ofthe open-end Funds had achieved significant size. They noted also that none of the Funds has breakpoints in its advisory fee schedule, though the Trustees considered management’s view that the fee schedules for the Funds remained consistent with DoubleLine’s original pricing philosophy of proposing an initial management fee rate that generally reflects reasonably foreseeable economies of scale instead of relying on breakpoints in a Fund’s management fee rate. In this regard, the Trustees noted also that the information provided by Strategic Insight supported the view that the largest open-end Funds’ net management fees remained fairly priced, with all but two of theopen-end Funds with $1 billion in assets under management or more having net management fees below the median of their peer groups. The Trustees noted that, although DoubleLine Total Return Bond Fund and EMFI had net management fees above their median, their net management fees were within 4 and 2 basis points, respectively, of their respective medians. The Trustees further noted that DoubleLine was subsidizing the expenses of a number of other Funds with less scale, with the prospect of recouping those fees at a later date. In evaluating economics of scale more generally, the Trustees also noted DoubleLine’s continued growth and ongoing changes to the regulatory environment, each of which required DoubleLineto re-invest in its business and infrastructure. On the basis of these factors and others, the Trustees concluded that it was not necessary at the present time to implement breakpoints for any of the Funds, although they would continue to consider the question periodically in the future.
| | | | | | |
| | Annual Report | | March 31, 2020 | | 181 |
| | |
| Evaluation of Advisory Agreement by the Board of Trustees (Cont.) | | (Unaudited) March 31, 2020 |
With regard to DBL and DSL, the Trustees noted that these Funds have not increased in assets significantly from their initial offerings due principally to their statusas closed-end investment companies and that there were therefore no substantial increases in economies of scale realized with respect to these Funds since their inception. They noted DoubleLine’s view that the levels of its profitability in respect of DBL and DSL are appropriate in light of the investment it has made in these Funds, the quality of the investment management and other teams provided by it, and its continued investments in its own business.
On the basis of these considerations as well as others and in the exercise of their business judgment, the Trustees determined that they were satisfied with the nature, extent, and quality of the services provided to each Fund under its Advisory Agreement(s); that it appeared that the management fees paid by each Fund to DoubleLine were generally within the range of management fees paid by its peer funds, and, with respect to a number of Funds, lower than the median management fees paid by their peer funds, and generally reasonable in light of the services provided, the quality of the portfolio management teams, and each Fund’s performance to date; that the fees paid by each Fund did not appear inappropriate in light of the fee schedules charged to DoubleLine’s other clients with substantially similar investment strategies (where applicable) in light of the differences in the services provided and the risks borne by DoubleLine; that the profitability of each Fund to DoubleLine did not appear excessive or such as to preclude continuation of the Fund’s Advisory Agreement; that absence of breakpoints in any Fund’s management fee did not render that Fund’s fee unreasonable or inappropriate under the circumstances, although the Trustees would continue to consider the topic over time; and that it would be appropriate to approve each Advisory Agreement for anadditional one-year period.
| | | | | | |
| 182 | | DoubleLine Funds Trust | | | | |
| | |
| Statement Regarding the Funds’ Liquidity Risk Management Program | | (Unaudited) March 31, 2020 |
The Funds have adopted a liquidity risk management program. The program’s principal objectives include mitigating the risk that a Fund is unable to meet its redemption obligations timely and supporting each Fund’s compliance with its limits on investments in illiquid assets. Since the program’s inception through the end of the period covered by this report, the program administrator determined that the program supported the Fund’s ability to honor redemption requests timely and the Adviser’s management of each Fund’s liquidity profile. The program includes a number of elements that support the assessment and management of liquidity risk, including the periodic classification and re-classification of a Fund’s investments into groupings based on the Adviser’s view of their liquidity. There can be no assurance that the program will achieve its objectives. Please refer to your Fund’s prospectus for more information regarding the Fund’s exposure to liquidity risk and other risks to which an investment in the Fund may be subject.
* * * * *
| | | | | | |
| | Annual Report | | March 31, 2020 | | 183 |
| | |
| Federal Tax Information | | (Unaudited) March 31, 2020 |
For the fiscal year ended March 31, 2020, certain dividends paid by the Funds may be subject to a maximum tax rate of 15% (20% for taxpayers with taxable income greater than $425,800 for single individuals and $479,000 for married couples filing jointly), as provided for by the Jobs and Growth Tax Relief Reconciliation Act of 2003 and The Tax Cuts and Jobs Act of 2017. The percentage of dividends declared from ordinary income designated as qualified dividend income was as follows:
| | | | | | | | | | |
| | |
| Qualified Dividend Income | | | | |
| | |
DoubleLine Total Return Bond Fund | | | | | | | | | 0.00% | |
| | |
DoubleLine Core Fixed Income Fund | | | | | | | | | 0.03% | |
| | |
DoubleLine Emerging Markets Fixed Income Fund | | | | | | | | | 0.40% | |
| | |
DoubleLine Multi-Asset Growth Fund (Consolidated) | | | | | | | | | 14.38% | |
| | |
DoubleLine Low Duration Bond Fund | | | | | | | | | 0.04% | |
| | |
DoubleLine Floating Rate Fund | | | | | | | | | 0.00% | |
| | |
DoubleLine Shiller Enhanced CAPE® | | | | | | | | | 0.00% | |
| | |
DoubleLine Flexible Income Fund | | | | | | | | | 0.01% | |
| | |
DoubleLine Low Duration Emerging Markets Fixed Income Fund | | | | | | | | | 0.23% | |
| | |
DoubleLine Long Duration Total Return Bond Fund | | | | | | | | | 0.00% | |
| | |
DoubleLine Strategic Commodity Fund (Consolidated) | | | | | | | | | 0.00% | |
| | |
DoubleLine Global Bond Fund | | | | | | | | | 0.00% | |
| | |
DoubleLine Infrastructure Income Fund | | | | | | | | | 0.00% | |
| | |
DoubleLine Ultra Short Bond Fund | | | | | | | | | 0.00% | |
| | |
DoubleLine Shiller Enhanced International CAPE® | | | | | | | | | 0.00% | |
| | |
DoubleLine Colony Real Estate and Income Fund | | | | | | | | | 0.00% | |
| | |
DoubleLine Emerging Markets Local Currency Bond Fund | | | | | | | | | 0.00% | |
| | |
DoubleLine Income Fund | | | | | | | | | 0.00% | |
For corporate shareholders, the percent of ordinary income distributions qualifying for the corporate dividends received deduction for the fiscal year ended March 31, 2020 was as follows:
| | | | | | | | | | |
| | |
| Dividends Received Deduction | | | | |
| | |
DoubleLine Total Return Bond Fund | | | | | | | | | 0.00% | |
| | |
DoubleLine Core Fixed Income Fund | | | | | | | | | 0.00% | |
| | |
DoubleLine Emerging Markets Fixed Income Fund | | | | | | | | | 0.00% | |
| | |
DoubleLine Multi-Asset Growth Fund (Consolidated) | | | | | | | | | 4.91% | |
| | |
DoubleLine Low Duration Bond Fund | | | | | | | | | 0.00% | |
| | |
DoubleLine Floating Rate Fund | | | | | | | | | 0.00% | |
| | |
DoubleLine Shiller Enhanced CAPE® | | | | | | | | | 0.00% | |
| | |
DoubleLine Flexible Income Fund | | | | | | | | | 0.00% | |
| | |
DoubleLine Low Duration Emerging Markets Fixed Income Fund | | | | | | | | | 0.00% | |
| | |
DoubleLine Long Duration Total Return Bond Fund | | | | | | | | | 0.00% | |
| | |
DoubleLine Strategic Commodity Fund (Consolidated) | | | | | | | | | 0.00% | |
| | |
DoubleLine Global Bond Fund | | | | | | | | | 0.00% | |
| | |
DoubleLine Infrastructure Income Fund | | | | | | | | | 0.00% | |
| | |
DoubleLine Ultra Short Bond Fund | | | | | | | | | 0.00% | |
| | |
DoubleLine Shiller Enhanced International CAPE® | | | | | | | | | 0.00% | |
| | |
DoubleLine Colony Real Estate and Income Fund | | | | | | | | | 0.00% | |
| | |
DoubleLine Emerging Markets Local Currency Bond Fund | | | | | | | | | 0.00% | |
| | |
DoubleLine Income Fund | | | | | | | | | 0.00% | |
| | | | | | |
| 184 | | DoubleLine Funds Trust | | | | |
| | |
| | | (Unaudited) March 31, 2020 |
The percentage of taxable ordinary income distributions that are designated as short-term capital gain distributions under Internal Revenue Section 871(k)(2)(c) for the fiscal year ended March 31, 2020 for each Fund was as follows:
| | | | | | | | | | |
| | |
| Qualified Short-Term Gains | | | | |
| | |
DoubleLine Total Return Bond Fund | | | | | | | | | 0.00% | |
| | |
DoubleLine Core Fixed Income Fund | | | | | | | | | 0.00% | |
| | |
DoubleLine Emerging Markets Fixed Income Fund | | | | | | | | | 0.00% | |
| | |
DoubleLine Multi-Asset Growth Fund (Consolidated) | | | | | | | | | 0.00% | |
| | |
DoubleLine Low Duration Bond Fund | | | | | | | | | 0.00% | |
| | |
DoubleLine Floating Rate Fund | | | | | | | | | 0.00% | |
| | |
DoubleLine Shiller Enhanced CAPE® | | | | | | | | | 0.00% | |
| | |
DoubleLine Flexible Income Fund | | | | | | | | | 0.00% | |
| | |
DoubleLine Low Duration Emerging Markets Fixed Income Fund | | | | | | | | | 19.39% | |
| | |
DoubleLine Long Duration Total Return Bond Fund | | | | | | | | | 0.00% | |
| | |
DoubleLine Strategic Commodity Fund (Consolidated) | | | | | | | | | 0.00% | |
| | |
DoubleLine Global Bond Fund | | | | | | | | | 0.00% | |
| | |
DoubleLine Infrastructure Income Fund | | | | | | | | | 0.00% | |
| | |
DoubleLine Ultra Short Bond Fund | | | | | | | | | 0.00% | |
| | |
DoubleLine Shiller Enhanced International CAPE® | | | | | | | | | 0.09% | |
| | |
DoubleLine Colony Real Estate and Income Fund | | | | | | | | | 28.33% | |
| | |
DoubleLine Emerging Markets Local Currency Bond Fund | | | | | | | | | 0.00% | |
| | |
DoubleLine Income Fund | | | | | | | | | 0.00% | |
The percentage of taxable ordinary income distributions that are designated as interest related dividends under Internal Revenue Section 871(k)(1)(c) for the fiscal year ended March 31, 2020 for each Fund was as follows:
| | | | | | | | | | |
| | |
| Qualified Interest Income | | | | |
| | |
DoubleLine Total Return Bond Fund | | | | | | | | | 100.00% | |
| | |
DoubleLine Core Fixed Income Fund | | | | | | | | | 85.90% | |
| | |
DoubleLine Emerging Markets Fixed Income Fund | | | | | | | | | 4.04% | |
| | |
DoubleLine Multi-Asset Growth Fund (Consolidated) | | | | | | | | | 49.65% | |
| | |
DoubleLine Low Duration Bond Fund | | | | | | | | | 72.02% | |
| | |
DoubleLine Floating Rate Fund | | | | | | | | | 96.41% | |
| | |
DoubleLine Shiller Enhanced CAPE® | | | | | | | | | 79.15% | |
| | |
DoubleLine Flexible Income Fund | | | | | | | | | 63.59% | |
| | |
DoubleLine Low Duration Emerging Markets Fixed Income Fund | | | | | | | | | 26.03% | |
| | |
DoubleLine Long Duration Total Return Bond Fund | | | | | | | | | 56.74% | |
| | |
DoubleLine Strategic Commodity Fund (Consolidated) | | | | | | | | | 95.52% | |
| | |
DoubleLine Global Bond Fund | | | | | | | | | 23.49% | |
| | |
DoubleLine Infrastructure Income Fund | | | | | | | | | 66.64% | |
| | |
DoubleLine Ultra Short Bond Fund | | | | | | | | | 76.67% | |
| | |
DoubleLine Shiller Enhanced International CAPE® | | | | | | | | | 72.08% | |
| | |
DoubleLine Colony Real Estate and Income Fund | | | | | | | | | 68.76% | |
| | |
DoubleLine Emerging Markets Local Currency Bond Fund | | | | | | | | | 9.38% | |
| | |
DoubleLine Income Fund | | | | | | | | | 96.82% | |
| | | | | | |
| | Annual Report | | March 31, 2020 | | 185 |
| | |
| Federal Tax Information (Cont.) | | (Unaudited) March 31, 2020 |
For the year ended March 31, 2020, each fund earned foreign source income and paid foreign taxes, which each intend to pass through to its shareholders pursuant to Section 853 of the Internal Revenue Code as follows:
| | | | | | | | | | | | | | | |
| | | |
| | | | | Foreign Source
Income Earned | | Foreign Taxes Paid |
| | | |
DoubleLine Global Bond Fund | | | | | | | | $ | 23,771,337 | | | | $ | 13,787 | |
| | | |
DoubleLine Emerging Markets Fixed Income Fund | | | | | | | | $ | 68,226,206 | | | | $ | 34,078 | |
Shareholders are advised to consult their own tax adviser with respect to the tax consequences of their investment in the Funds.
| | | | | | |
| 186 | | DoubleLine Funds Trust | | | | |
| | |
| Trustees and Officers | | (Unaudited) March 31, 2020 |
| | | | | | | | | | |
Name, Address, and
Year of Birth(1) | | Position with Trust | | Term of Office
and Length of
Time Served | | Principal Occupation(s) During Past 5 Years | | Number of
Portfolios
Overseen(2) | | Other Directorships
Held by Trustee
During Past 5 Years |
| | | | | |
Independent Trustees | | | | | | | | | | |
| | | | | |
| Joseph J. Ciprari, 1964 | | Trustee | | Indefinite/Since March 2010 | | President, Remo Consultants, a real estate financial consulting firm. Formerly, Managing Director, UBS AG. Formerly, Managing Director, Ally Securities LLC. | | 22 | | None |
| | | | | |
| John C. Salter, 1957 | | Trustee | | Indefinite/Since March 2010 | | Partner, Stark Municipal Brokers. Formerly, Managing Director, Municipals, Tullet Prebon Financial Services LLC (d/b/a Chapdelaine). Formerly, Partner, Stark, Salter & Smith, a securities brokerage firm specializing in tax exempt bonds. | | 22 | | None |
| | | | | |
| Raymond B. Woolson, 1958 | | Trustee | | Indefinite/Since March 2010 | | President, Apogee Group, Inc., a company providing financial consulting services. | | 22 | | Independent
Trustee,
Advisors
Series Trust
(an open-end
investment
company
with 39
portfolios)(3) |
(1) The address of each Independent Trustee is c/o DoubleLine Funds, 333 South Grand Avenue, Suite 1800, Los Angeles, CA 90071.
(2) Includes each series of DoubleLine Funds Trust, DoubleLine Opportunistic Credit Fund, DoubleLine Income Solutions Fund and DoubleLine Yield Opportunities Fund.
(3) Quasar Distributors, LLC serves as the principal underwriter of DoubleLine Funds Trust and Advisors Series Trust.
Each of the following Trustees is an interested person of the Trust as defined in the 1940 Act because they are officers of the Advisers and hold direct or indirect ownership interests in DoubleLine Capital LP and DoubleLine Alternatives LP. Additionally, Mr. Redell is an officer of the Trust.
| | | | | | | | | | |
Name, Address, and
Year of Birth(1) | | Position with Trust | | Term of Office
and Length of
Time Served | | Principal Occupation(s) During Past 5 Years | | Number of
Portfolios
Overseen(2) | | Other Directorships
Held by Trustee
During Past 5 Years |
| | | | | |
Interested Trustees | | | | | | | | | | |
| | | | | |
| Jeffrey E. Gundlach, 1959 | | Trustee | | Indefinite/Since January 2010 | | Chief Executive Officer and Chief Investment Officer, DoubleLine Capital (since December 2009). | | 19 | | None |
| | | | | |
Ronald R. Redell, 1970 | | President and Trustee | | Indefinite/Since Inception | | Trustee, Chairman, President and Chief Executive Officer, DoubleLine Yield Opportunities Fund (since November 2019); Trustee, Chairman, President and Chief Executive Officer, DoubleLine Income Solutions Fund (since January 2013); Executive, DoubleLine Group LP (since January 2013); Trustee, Chairman, President and Chief Executive Officer, DoubleLine Opportunistic Credit Fund (since July 2011); Executive, DoubleLine Capital (since July 2010); President, DoubleLine Funds Trust (since January 2010). | | 22 | | None |
(1) The address of each Interested Trustee is c/o DoubleLine Funds, 333 South Grand Avenue, Suite 1800, Los Angeles, CA 90071.
(2) Includes each series of DoubleLine Funds Trust, DoubleLine Opportunistic Credit Fund, DoubleLine Income Solutions Fund and DoubleLine Yield Opportunities Fund.
| | | | | | |
| | Annual Report | | March 31, 2020 | | 187 |
| | |
| Trustees and Officers (Cont.) | | (Unaudited) March 31, 2020 |
Officers
The officers of the Trust who are not also Trustees of the Trust are:
| | | | | | |
Name, Address, and
Year of Birth(1) | | Position(s)
Held with Trust | | Term of Office
and Length of
Time Served | | Principal Occupation(s) During Past 5 Years |
| | | |
| Henry V. Chase, 1949 | | Treasurer and Principal Financial and Accounting Officer | | Indefinite/Since January 2020; | | Treasurer and Principal Financial and Accounting Officer, DoubleLine Funds Trust (since January 2020); Treasurer and Principal Financial and Accounting Officer, Doubleline Yield Opportunities Fund (since January 2020); Treasurer and Principal Financial and Accounting Officer, DoubleLine Income Solutions Fund (since January 2020); Treasurer and Principal Financial and Accounting Officer, DoubleLine Opportunistic Credit Fund (since January 2020); Treasurer and Principal Financial and Accounting Officer, DoubleLine Yield Opportunities Fund (since January 2020); Chief Financial Officer, DoubleLine Capital (since January 2013); Vice President, DoubleLine Yield Opportunities Fund (since Inception); Vice President, DoubleLine Income Solutions Fund (since May 2019); Vice President, DoubleLine Funds Trust (since May 2019); Vice President, DoubleLine Opportunistic Credit Fund (since May 2019). |
| | | |
| Youse Guia, 1972 | | Chief Compliance Officer | | Indefinite/Since March 2018 | | Chief Compliance Officer, DoubleLine Yield Opportunities Fund (since November 2019); Chief Compliance Officer, DoubleLine Capital (since March 2018); Chief Compliance Officer, DoubleLine Equity LP (since March 2018); Chief Compliance Officer, DoubleLine Funds Trust (since March 2018); Chief Compliance Officer, DoubleLine Opportunistic Credit Fund (since March 2018); Chief Compliance Officer, DoubleLine Income Solutions Fund (since March 2018). Formerly, Executive Vice President and Deputy Chief Compliance Officer, Pacific Investment Management Company LLC (“PIMCO”) (from April 2014 to February 2018); Chief Compliance Officer, PIMCO Managed Accounts Trust (from September 2014 to February 2018); Chief Compliance Officer, PIMCO-sponsoredclosed-end funds (from September 2014 to February 2018); Chief Compliance Officer, PIMCO Flexible Credit Income Fund (from February 2017 to February 2018). Formerly, Head of Compliance, Allianz Global Investors U.S. Holdings LLC (from October 2012 to March 2014); Chief Compliance Officer, Allianz Funds, Allianz Multi-Strategy Trust, Allianz Global Investors SponsoredClosed-End Funds, Premier Multi-Series VIT and The Korea Fund, Inc. (from October 2004 to December 2013). |
| | | |
| Winnie Han, 1988 | | Assistant Treasurer | | Indefinite/Since May 2017 | | Assistant Treasurer, DoubleLine Yield Opportunities Fund (since November 2019); Assistant Treasurer, DoubleLine Income Solutions Fund (since May 2017); Assistant Treasurer, DoubleLine Funds Trust (since May 2017); Assistant Treasurer, DoubleLine Opportunistic Credit Fund (since May 2017); Assistant Treasurer, DoubleLine Capital (since March 2017); Formerly, Investment Accounting Supervisor, Alexandria Real Estate Equities, Inc. (June 2016 to March 2017); Formerly, Manager, PricewaterhouseCoopers (January 2011 to June 2016). |
| | | |
| Cris Santa Ana, 1965 | | Vice President and Secretary | | Indefinite/Vice President Since April 2011; Indefinite/Secretary Since July 2018 | | Vice President and Secretary, DoubleLine Yield Opportunities Fund (since November 2019); Secretary, DoubleLine Income Solutions Fund (since July 2018); Secretary, DoubleLine Opportunistic Credit Fund (since July 2018); Secretary, DoubleLine Funds Trust (since July 2018); Vice President, DoubleLine Income Solutions Fund (since January 2013); Vice President, DoubleLine Opportunistic Credit Fund (since July 2011); Vice President, DoubleLine Funds Trust (since April 2011); Chief Risk Officer, DoubleLine Capital (since June 2010). Formerly, Chief Operating Officer, DoubleLine Capital (from December 2009 through May 2010). |
| | | |
| Earl A. Lariscy, 1966 | | Vice President | | Indefinite/Since May 2012 | | Vice President, DoubleLine Yield Opportunities Fund (since November 2019); Vice President and Assistant Secretary, DoubleLine Income Solutions Fund (since January 2013); Vice President, DoubleLine Funds Trust (since May 2012); Vice President and Assistant Secretary, DoubleLine Opportunistic Credit Fund (since May 2012 and inception, respectively); General Counsel, DoubleLine Capital (since April 2010). |
| | | |
| David Kennedy, 1964 | | Vice President | | Indefinite/Since May 2012 | | Vice President, DoubleLine Yield Opportunities Fund (since November 2019); Vice President, DoubleLine Income Solutions Fund (since January 2013); Vice President, DoubleLine Funds Trust (since May 2012); Vice President, DoubleLine Opportunistic Credit Fund (since May 2012); Manager, Trading and Settlements, DoubleLine Capital (since December 2009). |
| | | | | | |
| 188 | | DoubleLine Funds Trust | | | | |
| | |
| | | (Unaudited) March 31, 2020 |
| | | | | | |
Name, Address, and
Year of Birth(1) | | Position(s)
Held with Trust | | Term of Office
and Length of
Time Served | | Principal Occupation(s) During Past 5 Years |
| | | |
| Patrick A. Townzen, 1978 | | Vice President | | Indefinite/Since September 2012 | | Vice President, DoubleLine Yield Opportunities Fund (since November 2019); Vice President, DoubleLine Income Solutions Fund (since January 2013); Vice President, DoubleLine Funds Trust (since September 2012); Vice President, DoubleLine Opportunistic Credit Fund (since September 2012); Director of Operations, DoubleLine Capital (since March 2018). Formerly, Manager of Operations, DoubleLine Capital (from September 2012 to March 2018). |
| | | |
| Brady J. Femling, 1987 | | Vice President | | Indefinite/Since May 2017 | | Vice President, DoubleLine Yield Opportunities Fund (since November 2019); Vice President, DoubleLine Income Solutions Fund (since May 2017); Vice President, DoubleLine Opportunistic Credit Fund (since May 2017); Vice President, DoubleLine Funds Trust (since May 2017); Senior Fund Accountant, DoubleLine Capital (Since April 2013). Fund Accounting Supervisor, ALPS Fund Services (From October 2009 to April 2013). |
| | | |
| Neal L. Zalvan, 1973 | | AML Officer and Vice President | | Indefinite/AML Officer Since May 2016; Indefinite/Vice President Since May 2017 | | Anti-Money Laundering Officer and Vice President, DoubleLine Yield Opportunities Fund (since November 2019); Anti-Money Laundering Officer, DoubleLine Funds Trust (since May 2016); Anti-Money Laundering Officer, DoubleLine Capital, DoubleLine Equity LP and DoubleLine Alternatives (since March 2016); Legal/Compliance, DoubleLine Group LP (since January 2013); Legal/Compliance, Batterymarch Financial Management, Inc. (From June 2011 to December 2012). |
| | | |
| Adam D. Rossetti, 1978 | | Vice President | | Indefinite/Since February 2019 | | Vice President, DoubleLine Yield Opportunities Fund (since November 2019); Vice President, DoubleLine Funds Trust (since February 2019); Vice President, DoubleLine Income Solutions Fund (since February 2019); Vice President, DoubleLine Opportunistic Credit Fund (since February 2019); Chief Compliance Officer, DoubleLine Alternatives LP (since June 2015); Legal/Compliance, DoubleLine Group LP (since April 2015). Formerly, Chief Compliance Officer, DoubleLine Capital (from August 2017 to March 2018); Chief Compliance Officer, DoubleLine Equity LP (from August 2017 to March 2018); Chief Compliance Officer, DoubleLine Funds Trust (from August 2017 to March 2018); Chief Compliance Officer, DoubleLine Income Solutions Fund (from August 2017 to March 2018); Chief Compliance Officer, DoubleLine Opportunistic Credit Fund (from August 2017 to March 2018); Vice President and Counsel, PIMCO (from April 2012 to April 2015). |
| | | |
| Gheorghe Rotar, 1984 | | Vice President | | Indefinite/Since February 2019 | | Vice President, DoubleLine Funds Trust (since February 2019); U.S. Funds Operations Manager, DoubleLine Group LP (since January 2018). Formerly, Operations Specialist, DoubleLine Group LP (from April 2014 to December 2017); Fund Operations, PIMCO (from September 2007 to April 2014). |
| | | |
| Grace Walker, 1970 | | Assistant Treasuer | | Indefinite/Since January 2020 | | Assistant Treasuer, DoubleLine Funds Trust (since January 2020); Assistant Treasuer, DoubleLine Income Solutions Fund (since January 2020); Assistant Treasuer, DoubleLine Opportunistic Credit Fund (since January 2020); Assistant Treasuer, DoubleLine Yield Opportunities Fund (since January 2020); Treasurer, DoubleLine Funds (Luxembourg) and DoubleLine Cayman Unit Trust (since March 2017). Formerly, Assistant Treasurer, DoubleLine Income Solutions Fund (from January 2013 to May 2017); Assistant Treasurer, DoubleLine Opportunistic Credit Fund (from March 2012 to May 2017); Assistant Treasurer, DoubleLine Funds Trust (from March 2012 to May 2017). |
| | | |
| Dawn Oswald, 1980 | | Vice President | | Indefinite/Since January 2020 | | Vice President, DoubleLine Funds Trust (since January 2020); Vice President, DoubleLine Yield Opportunities Fund (since January 2020); Vice President, DoubleLine Income Solutions Fund (since January 2020); Vice President, DoubleLine Opportunistic Credit Fund (since January 2020); Pricing Manager, DoubleLine Capital (since January 2018). Formerly, Operations Specialist, DoubleLine Capital (from July 2016 to January 2018). Global Securities Fixed Income Valuation Senior Analyst, Capital Group (from April 2015 to July 2016). Global Securities Fair Valuation Analyst, Capital Group (from January 2010 to April 2015). |
(1) The address of each officer is c/o DoubleLine Funds, 333 South Grand Avenue, Suite 1800, Los Angeles, CA 90071.
The Statement of Additional Information includes additional information about the Trustees and is available, without charge, upon request, by calling877-DLine11 (877-354-6311).
| | | | | | |
| | Annual Report | | March 31, 2020 | | 189 |
| | |
| Information About Proxy Voting | | (Unaudited) March 31, 2020 |
Information about how a Fund voted proxies relating to portfolio securities held during the most recent twelve month period ended June 30th is available no later than the following August 31st without charge, upon request, by calling877-DLine11(877-354-6311) and on the Securities and Exchange Commission’s (the “SEC”) website at www.sec.gov.
A description of the Funds’ proxy voting policies and procedures is available (i) without charge, upon request, by calling877-DLine11(877-354-6311); and (ii) on the SEC’s website at www.sec.gov.
Information About Portfolio Holdings
It is the policy of the Trust to provide certain unaudited information regarding the portfolio composition of the Funds as ofmonth-end to shareholders and others upon request to the Funds, beginning on the 15th calendar day after the end of the month (or, if not a business day, the next business day thereafter).
Shareholders and others who wish to obtain portfolio holdings for a particular month may make a request by contacting the Funds at no charge at877-DLine11(877-354-6311) between the hours of 7:00 a.m. and 5:00 p.m. Pacific time, Monday through Friday, beginning on the 15th day following the end of that month (or, if not a business day, the next business day thereafter). Requests for portfolio holdings may be made on a monthly basis pursuant to this procedure, or standing requests for portfolio holdings may be accepted.
The Trust is required to file its complete schedule of portfolio holdings with the SEC for its first and third fiscal quarters on Part F of Form N-PORT. When available, Part F of Form N-PORT (and Form N-Q prior to March 31, 2019) is available on the SEC website at www.sec.gov.
This report includes summary Schedules of Investments for the DoubleLine Total Return Bond Fund, DoubleLine Core Fixed Income Fund, DoubleLine Shiller Enhanced CAPE® and DoubleLine Flexible Income Fund. A complete Schedule of Investments for each Fund may be obtained, without charge, upon request, by calling877-DLine11 (877-354-6311) and on the SEC website at www.sec.gov.
Householding — Important Notice Regarding Delivery of Shareholder Documents
In an effort to conserve resources, the Funds intend to reduce the number of duplicate Prospectuses and Annual and Semi-Annual Reports you receive by sending only one copy of each to addresses where we reasonably believe two or more accounts are from the same family. If you would like to discontinue householding of your accounts, please call toll-free877-DLine11(877-354-6311) to request individual copies of these documents. We will begin sending individual copies thirty days after receiving your request to stop householding.
| | | | | | |
| 190 | | DoubleLine Funds Trust | | | | |
| | |
| Privacy Policy | | (Unaudited) March 31, 2020 |
What Does DoubleLine Do With Your Personal Information?
This notice provides information about how DoubleLine (“we” and “our”) collects, shares, and protects your personal information, and how you might choose to limit our ability to share certain information about you. Please read this notice carefully.
Why do we need your personal information?
All financial companies need to share customers’ personal information to run their everyday businesses, to appropriately tailor the services offered to you (where applicable), and to comply with our regulatory obligations. Accordingly, information, confidential and proprietary, plays an important role in the success of our business. However, we recognize that you have entrusted us with your personal and financial data, and we recognize our obligation to keep this information secure. Maintaining your privacy is important to us, and we hold ourselves to a high standard in its safekeeping and use. Most importantly, DoubleLine does not sell its customers’non-public personal information to any third parties. DoubleLine uses its customers’non-public personal information primarily to complete financial transactions that its customers request (where applicable), to make its customers aware of other financial products and services offered by a DoubleLine affiliated company, and to satisfy obligations we owe to regulatory bodies.
Information we may collect
We may collect various types of personal data about you, including:
| | • | Your personal identification information, which may include your name and passport information, your IP address, politically exposed person (“PEP”) status, and such other information as may be necessary for us to provide our services to you and to complete our customer due diligence process and discharge anti-money laundering obligations; |
| | • | Your contact information, which may include postal address ande-mail address and your home and mobile telephone numbers; |
| | • | Your family relationships, which may include your marital status, the identity of your spouse and the number of children that you have; |
| | • | Your professional and employment information, which may include your level of education and professional qualifications, your employment, employer’s name and details of directorships and other offices which you may hold; and |
| | • | Financial information, risk tolerance, sources of wealth and your assets, which may include details of shareholdings and beneficial interests in financial instruments, your bank details and your credit history. |
Where we obtain your personal information
DoubleLine may collectnon-public information about you from the following sources:
| | • | Information we receive about you on applications or other forms; |
| | • | Information you may give us orally; |
| | • | Information about your transactions with us or others; |
| | • | Information you submit to us in correspondence, including emails or other electronic communications; and |
| | • | Information about any bank account you use for transfers between your bank account and any Fund account, including information provided when effecting wire transfers. |
Information Collected from Websites
Websites maintained by DoubleLine or its service providers may use a variety of technologies to collect information that help DoubleLine and its service providers understand how the website is used. Information collected from your web browser (including small files stored on your device that are commonly referred to as “cookies”) allow the websites to recognize your web browser and help to personalize and improve your user experience and enhance navigation of the website. You can change your cookie preferences by changing the setting on your web browser to delete or reject cookies. If you delete or reject cookies, some website pages may not function properly. Our websites may contain links that are maintained or controlled by third parties, each of which has privacy policies which may differ, in some cases significantly, from the privacy policies described in this notice. Please read the privacy policies of such third parties and understand that accessing their website is at your own risk. Please contact your DoubleLine representative if you would like to receive more information about the privacy policies of third parties.
We also use web analytics services, which currently include but are not limited to Google Analytics and Adobe Analytics. Such web analytics services use cookies and similar technologies to evaluate visitor’s use of the domain, compile statistical reports on domain activity, and provide other services related to our websites. For more information about Google Analytics, or to opt out of Google Analytics, please go to https://tools.google. com/dlpage/gaoptout. For more information about Adobe Analytics, or to opt out of Adobe Analytics, please go to:http://www.adobe.com/privacy/opt-out.html.
| | | | | | |
| | Annual Report | | March 31, 2020 | | 191 |
| | |
| Privacy Policy (Cont.) | | (Unaudited) March 31, 2020 |
How and why we may share your information
DoubleLine does not disclose anynon-public personal information about our customers or former customers without the customer’s authorization, except that we may disclose the information listed above, as follows:
| | • | It may be necessary for DoubleLine to provide information to nonaffiliated third parties in connection with our performance of the services we have agreed to provide to the Funds or you. For example, it might be necessary to do so in order to process transactions and maintain accounts. |
| | • | DoubleLine will release any of thenon-public information listed above about a customer if directed to do so by that customer or if DoubleLine is authorized by law to do so, such as in the case of a court order, legal investigation, or other properly executed governmental request. |
| | • | In order to alert a customer to other financial products and services offered by an affiliate, DoubleLine may share information with an affiliate, including companies using the DoubleLine name. Such products and services may include, for example, other investment products offered by a DoubleLine company. If you prefer that we not disclosenon-public personal information about you to our affiliates for this purpose, you may direct us not to make such disclosures (other than disclosures permitted by law) by calling 1 (213)633-8200. If you limit this sharing and you have a joint account, your decision will be applied to all owners of the account. |
We will limit access to your personal account information to those agents and vendors who need to know that information to provide products and services to you. Your information is not provided by us to nonaffiliated third parties for marketing purposes. We maintain physical, electronic, and procedural safeguards to guard yournon-public personal information.
Notice related to the California Consumer Privacy Act (CCPA) and to “natural persons” residing in the State of California
DoubleLine collects and uses information that identifies, describes, references, links or relates to, or is associated with, a particular consumer or device (“Personal Information”). Personal Information we collect from our customers, website visitors and consumers is covered under the Gramm-Leach-Bliley Act and is therefore excluded from the scope of the California Consumer Privacy Act.
Notice to “natural persons” residing in the European Economic Area (the “EEA”)
If you reside in the EEA, we may transfer your personal information outside the EEA, and will ensure that it is protected and transferred in a manner consistent with legal requirements applicable to the information. This can be done in a number of different ways, for instance:
| | • | the country to which we send the personal information may have been assessed by the European Commission as providing an “adequate” level of protection for personal data; |
| | • | the recipient may have signed a contract based on standard contractual clauses approved by the European Commission; or |
| | • | where the recipient is located in the U.S., it may be a certified member of theEU-U.S. Privacy Shield scheme. |
In other circumstances, the law may permit us to otherwise transfer your personal information outside the EEA. In all cases, however, any transfer of your personal information will be compliant with applicable data protection law.
Retention of personal information and security
Your personal information will be retained for as long as required:
| | • | for the purposes for which the personal information was collected; |
| | • | in order to establish or defend legal rights or obligations or to satisfy any reporting or accounting obligations; and/or |
| | • | as required by data protection laws and any other applicable laws or regulatory requirements, including, but not limited to, U.S. laws and regulations applicable to our business. |
We will undertake commercially reasonable efforts to protect the personal information that we hold with appropriate security measures.
Access To and Control of Your Personal Information
Depending on your country of domicile, you may have the following rights in respect of the personal information about you that we process:
| | • | the right to access and port personal information; |
| | • | the right to rectify personal information; |
| | • | the right to restrict the use of personal information; |
| | • | the right to request that personal information is erased; and |
| | • | the right to object to processing of personal information. |
| | | | | | |
| 192 | | DoubleLine Funds Trust | | | | |
| | |
| | | (Unaudited) March 31, 2020 |
Although you have the right to request that your personal information be deleted at any time, applicable laws or regulatory requirements may prohibit us from doing so. If you are an investor in the DoubleLine funds, certain of the rights described above that may apply to direct clients of DoubleLine domiciled or resident outside the United States will not apply to you. In addition, if you invest in a DoubleLine fund through a financial intermediary, DoubleLine may not have access to personal information about you.
If you wish to exercise any of the rights set out above, please contact privacy@doubleline.com.
Changes to DoubleLine’s Privacy Policy
As required by U.S. federal law, DoubleLine will notify customers of DoubleLine’s Privacy Policy annually. DoubleLine reserves the right to modify its privacy policy at any time, but in the event that there is a change, that affects the content of this notice materially, DoubleLine will promptly inform its customers of that change, in accordance with applicable law.
| | | | | | |
| | Annual Report | | March 31, 2020 | | 193 |
Investment Advisers:
DoubleLine Capital LP and
DoubleLine Alternatives LP
333 South Grand Avenue
18th Floor
Los Angeles, CA 90071
Distributor:
Quasar Distributors, LLC
111 East Kilbourn Avenue
Suite 1250
Milwaukee, WI 53202
Administrator and Transfer Agent:
U.S. Bancorp Fund Services, LLC
P.O. Box 701
Milwaukee, WI 53201
Custodians:
U.S. Bank National Association
1555 North Rivercenter Drive
Suite 302
Milwaukee, WI 53212
State Street Bank and Trust Company
Channel Center
1 Iron Street
Boston, MA 02210
Independent Registered Public Accounting Firm:
PricewaterhouseCoopers LLP
601 South Figueroa Street
Los Angeles, CA 90017
Legal Counsel:
Ropes & Gray LLP
Prudential Tower
800 Boylston Street Boston, MA 02199
Contact Information:
doublelinefunds.com
fundinfo@doubleline.com
(877) DLine11 or (877)354-6311
DL-ANNUAL-DFT
DoubleLine Capital LP & DoubleLine Alternatives LP || 333 South Grand Avenue, 18th Floor || Los Angeles, CA 90071 || (213) 633-8200
fundinfo@doubleline.com|| www.doubleline.com
Item 2. Code of Ethics.
The registrant has adopted a code of ethics that applies to the registrant’s principal executive officer and principal financial officer. The registrant has not made any amendments to its code of ethics during the period covered by this report. The registrant has not granted any waivers from any provisions of the code of ethics during the period covered by this report. A copy of the registrant’s Code of Ethics is filed herewith.
Item 3. Audit Committee Financial Expert.
The registrant’s board of trustees has determined that there is at least one audit committee financial expert serving on its audit committee. Raymond B. Woolson is the “audit committee financial expert” and is considered to be “independent” as each term is defined in Item 3 ofForm N-CSR.
Item 4. Principal Accountant Fees and Services.
The registrant has engaged its principal accountant to perform audit services, audit-related services, tax services and other services during the past two fiscal years. “Audit services” refer to performing an audit of the registrant’s annual financial statements or services that are normally provided by the accountant in connection with statutory and regulatory filings or engagements for those fiscal years. “Audit-related services” refer to the assurance and related services by the principal accountant that are reasonably related to the performance of the audit. “Tax services” refer to professional services rendered by the principal accountant for tax compliance, tax advice, and tax planning. There were no “Other services” provided by the principal accountant. The following table details the aggregate fees billed or expected to be billed for each of the last two fiscal years for audit fees, audit-related fees, tax fees and other fees by the principal accountant.
| | | | | | | | |
| | | FYE 3/31/2020 | | | FYE 3/31/2019 | |
Audit Fees | | $ | 1,050,255 | | | $ | 1,004,260 | |
Audit-Related Fees | | $ | 900 | | | $ | 900 | |
Tax Fees | | $ | 243,003 | | | $ | 209,136 | |
All Other Fees | | | N/A | | | | N/A | |
The audit committee has adoptedpre-approval policies and procedures that require the audit committee topre-approve all audit andnon-audit services of the registrant, including services provided to any entity affiliated with the registrant.
The percentage of fees billed by PricewaterhouseCoopersLLP applicable tonon-audit services pursuant to waiver ofpre-approval requirement were as follows:
| | | | | | | | |
| | | FYE 3/31/2020 | | | FYE 3/31/2019 | |
Audit-Related Fees | | | 0 | % | | | 0 | % |
Tax Fees | | | 0 | % | | | 0 | % |
All Other Fees | | | 0 | % | | | 0 | % |
1
All of the principal accountant’s hours spent on auditing the registrant’s financial statements were attributed to work performed byfull-time permanent employees of the principal accountant. (If more than 50 percent of the accountant’s hours were spent to audit the registrant’s financial statements for the most recent fiscal year, state how many hours were attributed to work performed by persons other than the principal accountant’s full-time, permanent employees.)
The following table indicates thenon-audit fees billed or expected to be billed by the registrant’s accountant for services to the registrant and to the registrant’s investment adviser (and any other controlling entity, etc.—notsub-adviser) for the last two years. The audit committee of the board of trustees/directors has considered whether the provision ofnon-audit services that were rendered to the registrant’s investment adviser is compatible with maintaining the principal accountant’s independence and has concluded that the provision of suchnon-audit services by the accountant has not compromised the accountant’s independence.
| | | | | | | | |
Non-Audit Related Fees | | FYE 3/31/2020 | | | FYE 3/31/2019 | |
Registrant | | $ | 243,003 | | | $ | 209,136 | |
Registrant’s Investment Adviser | | $ | 1,093,738 | | | $ | 1,034,479 | |
Item 5. Audit Committee of Listed Registrants.
Not applicable to registrants who are not listed issuers (as defined in Rule10A-3 under the Securities Exchange Act of 1934).
Item 6. Investments.
The information required by this Item 6 (except with respect to the DoubleLine Total Return Bond Fund, DoubleLine Core Fixed Income Fund, DoubleLine Shiller Enhanced CAPE Fund, and DoubleLine Flexible Income Fund) is included as part of the annual report to shareholders filed under Item 1 of this FormN-CSR.
Please note that the Registrant has included a summary schedule of portfolio securities of the DoubleLine Total Return Bond Fund, DoubleLine Core Fixed Income Fund, DoubleLine Shiller Enhanced CAPE Fund, and DoubleLine Flexible Income Fund in its annual report to shareholders, a copy of which is included under Item 1, for this reporting period. The DoubleLine Total Return Bond Fund’s, DoubleLine Core Fixed Income Fund’s, DoubleLine Shiller Enhanced CAPE Fund’s, and DoubleLine Flexible Income Fund’s complete schedule of investments in securities of unaffiliated issuers as of the close of this period as set forth inSection 210.12-12 of RegulationS-X is set forth below:
2
DoubleLine Total Return Bond Fund
Schedule of Investments
March 31, 2020
| | | | | | | | | | | | | | | | |
Principal Amount
$/Shares | | | Security Description | | Rate | | | Maturity | | | Value $ | |
| | Asset Backed Obligations - 3.5% | | | | | | | | | | | | |
| | 38,574,028 | | | AASET Ltd., Series2019-2-A | | | 3.38 | % ^ | | | 10/16/2039 | | | | 27,635,668 | |
| | 25,467,160 | | | AASET Trust, Series2020-1A-A | | | 3.35 | % ^ | | | 01/16/2040 | | | | 18,174,308 | |
| | 14,250,000 | | | Applebee’s Funding LLC, Series2019-1A-A2I | | | 4.19 | % ^ | | | 06/07/2049 | | | | 12,978,187 | |
| | 11,709,402 | | | Aqua Finance Trust, Series2017-A-A | | | 3.72 | % ^ | | | 11/15/2035 | | | | 11,737,699 | |
| | 15,793,750 | | | CAL Funding Ltd., Series2018-1A-A | | | 3.96 | % ^ | | | 02/25/2043 | | | | 15,681,390 | |
| | 20,408,644 | | | Castlelake Aircraft Securitization Trust, Series2016-1-A | | | 4.45 | % | | | 08/15/2041 | | | | 15,583,285 | |
| | 37,051,449 | | | Castlelake Aircraft Securitization Trust, Series2017-1-A | | | 3.97 | % | | | 07/15/2042 | | | | 28,143,873 | |
| | 9,079,983 | | | Castlelake Aircraft Securitization Trust, Series2018-1-A | | | 4.13 | % ^ | | | 06/15/2043 | | | | 6,531,422 | |
| | 29,917,005 | | | CLI Funding LLC, Series2018-1A-A | | | 4.03 | % ^ | | | 04/18/2043 | | | | 28,655,144 | |
| | 30,319,524 | | | CLI Funding LLC, Series2019-1A-A | | | 3.71 | % ^ | | | 05/18/2044 | | | | 28,444,249 | |
| | 12,443,138 | | | Coinstar Funding LLC, Series2017-1A-A2 | | | 5.22 | % ^ | | | 04/25/2047 | | | | 11,799,017 | |
| | 3,088,336 | | | Commonbond Student Loan Trust, Series2015-A-A | | | 3.20 | % ^ | | | 06/25/2032 | | | | 3,087,945 | |
| | 8,656,954 | | | Commonbond Student Loan Trust, Series2016-A-A1 | | | 3.32 | % ^ | | | 05/25/2040 | | | | 8,866,561 | |
| | 6,230,697 | | | Consumer Installment Loan Trust, Series2018-6-PT | | | 8.67 | % # ^ | | | 06/17/2041 | | | | 5,679,828 | |
| | 10,983,808 | | | Credit Acceptance Auto Loan Trust, Series2017-3A-A | | | 2.65 | % ^ | | | 06/15/2026 | | | | 10,931,513 | |
| | 36,383,528 | | | Credit Acceptance Auto Loan Trust, Series2018-1A-A | | | 3.01 | % ^ | | | 02/16/2027 | | | | 36,425,139 | |
| | 7,940,000 | | | DB Master Finance LLC, Series2019-1A-A2I | | | 3.79 | % ^ | | | 05/20/2049 | | | | 7,799,297 | |
| | 32,046,593 | | | Dividend SLR, Series2019-1-A | | | 3.67 | % ^ | | | 08/22/2039 | | | | 30,376,795 | |
| | 47,131,875 | | | Domino’s Pizza Master Issuer LLC, Series2019-1A-A2 | | | 3.67 | % ^ | | | 10/25/2049 | | | | 42,092,064 | |
| | 5,093,957 | | | Earnest Student Loan Program LLC, Series2016-B-A2 | | | 3.02 | % ^ | | | 05/25/2034 | | | | 5,071,110 | |
| | 6,542,742 | | | Earnest Student Loan Program LLC, Series2016-D-A2 | | | 2.72 | % ^ | | | 01/25/2041 | | | | 6,601,346 | |
| | 34,526,312 | | | ECAF Ltd., Series2015-1A-A2 | | | 4.95 | % ^ | | | 06/15/2040 | | | | 28,667,611 | |
| | 4,757,685 | | | Falcon Aerospace Ltd., Series2017-1-A | | | 4.58 | % ^ | | | 02/15/2042 | | | | 3,775,918 | |
| | 3,127,717 | | | Foundation Finance Trust, Series2016-1A-A | | | 3.96 | % ^ | | | 06/15/2035 | | | | 3,145,787 | |
| | 9,392,404 | | | Foundation Finance Trust, Series2019-1A-A | | | 3.86 | % ^ | | | 11/15/2034 | | | | 8,992,349 | |
| | 38,757,700 | | | GAIA Aviation Ltd., Series2019-1-A | | | 3.97 | % ^§ | | | 12/15/2044 | | | | 26,060,716 | |
| | 23,140,605 | | | Global SC Finance Ltd., Series2018-1A-A | | | 4.29 | % ^ | | | 05/17/2038 | | | | 22,553,146 | |
| | 23,283,384 | | | Harbour Aircraft Investments Ltd., Series2017-1-A | | | 4.00 | % | | | 11/15/2037 | | | | 19,525,912 | |
| | 5,838,156 | | | HERO Funding Trust, Series2016-3A-A2 | | | 3.91 | % ^ | | | 09/20/2042 | | | | 6,118,163 | |
| | 14,552,499 | | | HERO Funding Trust, Series2016-4A-A2 | | | 4.29 | % ^ | | | 09/20/2047 | | | | 15,473,814 | |
| | 12,446,535 | | | Horizon Aircraft Finance Ltd., Series2018-1-A | | | 4.46 | % ^ | | | 12/15/2038 | | | | 8,473,950 | |
| | 27,038,460 | | | Horizon Aircraft Finance Ltd., Series2019-1-A | | | 3.72 | % ^ | | | 07/15/2039 | | | | 18,440,744 | |
| | 47,880,000 | | | JACK, Series2019-1A-A23 | | | 4.97 | % ^ | | | 08/25/2049 | | | | 39,720,290 | |
| | 62,205,000 | | | Jimmy Johns Funding LLC, Series2017-1A-A2II | | | 4.85 | % ^ | | | 07/30/2047 | | | | 62,896,601 | |
| | 22,321,258 | | | JOL Air Ltd., Series2019-1-A | | | 3.97 | % ^ | | | 04/15/2044 | | | | 16,096,506 | |
| | 12,000,000 | | | Kabbage Funding LLC, Series2019-1-A | | | 3.83 | % ^ | | | 03/15/2024 | | | | 11,695,750 | |
| | 21,750,000 | | | Kabbage Funding LLC, Series2019-1-B | | | 4.07 | % ^ | | | 03/15/2024 | | | | 21,085,490 | |
| | 7,673,185 | | | Kestrel Aircraft Funding Ltd., Series2018-1A-A | | | 4.25 | % ^ | | | 12/15/2038 | | | | 5,515,624 | |
| | 75,395,833 | | | Labrador Aviation Finance Ltd., Series2016-1A-A1 | | | 4.30 | % ^ | | | 01/15/2042 | | | | 56,963,135 | |
| | 23,331,999 | | | LendingClub Receivables Trust, Series2020-3-A | | | 3.50 | % ^ | | | 01/16/2046 | | | | 22,712,768 | |
| | 31,098,000 | | | LendingClub Receivables Trust, Series2020-5A-A | | | 3.50 | % ^ | | | 03/15/2046 | | | | 28,364,330 | |
| | 30,500,000 | | | Lunar Aircraft Ltd., Series2020-1A-A | | | 3.38 | % ^ | | | 02/15/2045 | | | | 20,420,451 | |
| | 5,218,661 | | | Marlette Funding Trust, Series2018-4A-A | | | 3.71 | % ^ | | | 12/15/2028 | | | | 5,084,166 | |
| | 26,944,400 | | | Mosaic Solar Loan Trust, Series2017-2A-A | | | 3.82 | % ^ | | | 06/22/2043 | | | | 26,961,919 | |
| | 15,474,744 | | | Mosaic Solar Loan Trust, Series2018-1A-A | | | 4.01 | % ^ | | | 06/22/2043 | | | | 14,877,583 | |
| | 19,619,311 | | | Mosaic Solar Loan Trust, Series2018-2GS-A | | | 4.20 | % ^ | | | 02/22/2044 | | | | 19,810,393 | |
| | 3,375,421 | | | Mosaic Solar Loan Trust, Series2019-1A-A | | | 4.37 | % ^ | | | 12/21/2043 | | | | 3,344,030 | |
| | 23,000,000 | | | Navient Private Education Loan Trust, Series2017-A-B | | | 3.91 | % ^ | | | 12/16/2058 | | | | 24,362,462 | |
| | 30,000,000 | | | Navient Private Education Loan Trust, Series2018-BA-B | | | 4.13 | % ^ | | | 12/15/2059 | | | | 32,254,920 | |
| | 7,645,436 | | | Newtek Small Business Loan Trust, Series2018-1-A (1 Month LIBOR USD + 1.70%) | | | 2.65 | % ^ | | | 02/25/2044 | | | | 7,414,102 | |
| | 45,909,737 | | | OneMain Financial Issuance Trust, Series2017-1A-A1 | | | 2.37 | % ^ | | | 09/14/2032 | | | | 45,167,344 | |
| | 5,143,473 | | | Oxford Finance Funding LLC, Series2016-1A-A | | | 3.97 | % ^ | | | 06/17/2024 | | | | 5,133,628 | |
| | 12,500,000 | | | Oxford Finance Funding LLC, Series2019-1A-A2 | | | 4.46 | % ^ | | | 02/15/2027 | | | | 12,664,907 | |
| | 49,687,502 | | | Pioneer Aircraft Finance Ltd., Series2019-1-A | | | 3.97 | % ^ | | | 06/15/2044 | | | | 34,090,992 | |
| | 11,221,875 | | | Primose Funding LLC, Series2019-1A-A2 | | | 4.48 | % ^ | | | 07/30/2049 | | | | 10,362,412 | |
| | 37,157,269 | | | Prosper Trust, Series2019-ST1-A | | | 4.50 | % ^ | | | 07/15/2025 | | | | 36,682,064 | |
| | 20,776,806 | | | Raptor Aircraft Finance LLC, Series2019-1-A | | | 4.21 | % ^ | | | 08/23/2044 | | | | 14,448,876 | |
| | 15,059,008 | | | Renew, Series2017-2A-A | | | 3.22 | % ^ | | | 09/22/2053 | | | | 14,378,220 | |
| | 1,192,958 | | | Santander Drive Auto Receivables Trust2018-1, Series2018-1-B | | | 2.63 | % | | | 07/15/2022 | | | | 1,192,580 | |
| | 52,000,000 | | | Sapphire Aviation Finance Ltd., Series2020-1A-A | | | 3.23 | % ^ | | | 03/15/2040 | | | | 32,765,928 | |
| | 18,000,000 | | | Sapphire Aviation Finance Ltd., Series2020-1A-B | | | 4.34 | % ^ | | | 03/15/2040 | | | | 10,088,046 | |
| | 12,952,835 | | | SCF Equipment Leasing LLC, Series2017-2A-A | | | 3.41 | % ^ | | | 12/20/2023 | | | | 12,885,767 | |
| | 28,374,910 | | | Shenton Aircraft Investment Ltd., Series2015-1A-A | | | 4.75 | % ^ | | | 10/15/2042 | | | | 22,646,271 | |
| | 9,041,144 | | | SLM Private Credit Student Loan Trust, Series2006-A-A5 (3 Month LIBOR USD + 0.29%, 0.29% Floor) | | | 1.03 | % | | | 06/15/2039 | | | | 8,728,401 | |
| | 6,934,017 | | | SLM Private Credit Student Loan Trust, Series2006-B-A5 (3 Month LIBOR USD + 0.27%, 0.27% Floor) | | | 1.01 | % | | | 12/15/2039 | | | | 6,630,227 | |
| | 35,102,564 | | | SLVRR, Series2019-1-A | | | 3.97 | % ^ | | | 07/15/2044 | | | | 24,156,918 | |
| | 1,134,206 | | | SoFi Consumer Loan Program LLC, Series2016-1-A | | | 3.26 | % ^ | | | 08/25/2025 | | | | 1,098,683 | |
| | 1,070,914 | | | SoFi Consumer Loan Program Trust, Series2016-2-A | | | 3.09 | % ^ | | | 10/27/2025 | | | | 1,052,470 | |
| | 6,328,889 | | | SoFi Consumer Loan Program Trust, Series2017-2-A | | | 3.28 | % ^ | | | 02/25/2026 | | | | 6,306,494 | |
| | 5,976,704 | | | SoFi Consumer Loan Program Trust, Series2017-5-A2 | | | 2.78 | % ^ | | | 09/25/2026 | | | | 5,662,883 | |
| | 3,630,056 | | | SoFi Consumer Loan Program Trust, Series2018-4-A | | | 3.54 | % ^ | | | 11/26/2027 | | | | 3,598,115 | |
| | 7,248,374 | | | SoFi Professional Loan Program, Series2016-A-A2 | | | 2.76 | % ^ | | | 12/26/2036 | | | | 7,327,613 | |
| | 20,000,000 | | | SoFi Professional Loan Program, Series2017-E-B | | | 3.49 | % ^ | | | 11/26/2040 | | | | 20,638,740 | |
| | 13,000,000 | | | SoFi Professional Loan Program, Series2017-E-C | | | 4.16 | % ^ | | | 11/26/2040 | | | | 13,689,257 | |
| | 22,800,000 | | | SoFi Professional Loan Program, Series2018-A-B | | | 3.61 | % ^ | | | 02/25/2042 | | | | 22,168,064 | |
| | 18,000,000 | | | SoFi Professional Loan Program, Series2018-B-BFX | | | 3.83 | % ^ | | | 08/25/2047 | | | | 16,883,390 | |
| | 4,506,558 | | | SoFi Professional Loan Program, Series2019-A-A1FX | | | 3.18 | % ^ | | | 06/15/2048 | | | | 4,505,744 | |
| | | | | | | | | | | | | | | | |
| | | | | | | | | | | | | |
| | 1,417,850 | | | Springleaf Funding Trust, Series2016-AA-A | | | 2.90 | % ^ | | | 11/15/2029 | | | | 1,406,295 | |
| | 71,750,000 | | | Springleaf Funding Trust, Series2017-AA-A | | | 2.68 | % ^ | | | 07/15/2030 | | | | 68,888,438 | |
| | 24,889,632 | | | Sprite Ltd., Series2017-1-A | | | 4.25 | % ^ | | | 12/15/2037 | | | | 17,460,401 | |
| | 1,293,114 | | | Spruce Asset Backed Securities Trust, Series2016-E1-A | | | 4.32 | % ^ | | | 06/15/2028 | | | | 1,275,761 | |
| | 23,429,090 | | | Start Ltd., Series2018-1-A | | | 4.09 | % ^ | | | 05/15/2043 | | | | 16,920,606 | |
| | 53,312,605 | | | Sunbird Engine Finance LLC, Series2020-1A-A | | | 3.67 | % ^ | | | 02/15/2045 | | | | 32,596,766 | |
| | 14,182,498 | | | Sunnova Helios Issuer LLC, Series2018-1A-A | | | 4.87 | % ^ | | | 07/20/2048 | | | | 12,869,511 | |
| | 17,784,285 | | | Sunnova Helios Issuer LLC, Series2019-AA-A | | | 3.75 | % ^ | | | 06/20/2046 | | | | 17,810,680 | |
| | 48,500,000 | | | Sunnova Sol LLC, Series2020-1A-A | | | 3.35 | % ^ | | | 02/01/2055 | | | | 35,983,023 | |
| | 987,500 | | | Taco Bell Funding LLC, Series2018-1A-A2I | | | 4.32 | % ^ | | | 11/25/2048 | | | | 964,057 | |
| | 3,058,000 | | | TAL Advantage LLC, Series2013-2A-A | | | 3.55 | % ^ | | | 11/20/2038 | | | | 2,971,477 | |
| | 4,037,667 | | | Textainer Marine Containers Ltd., Series2017-1A-A | | | 3.72 | % ^ | | | 05/20/2042 | | | | 3,656,055 | |
| | 3,637,403 | | | Triton Container Finance LLC, Series2017-1A-A | | | 3.52 | % ^ | | | 06/20/2042 | | | | 3,476,087 | |
| | 20,800,000 | | | Triton Container Finance LLC, Series2018-1A-A | | | 3.95 | % ^ | | | 03/20/2043 | | | | 20,628,015 | |
| | 30,442,500 | | | Triton Container Finance LLC, Series2018-2A-A | | | 4.19 | % ^ | | | 06/22/2043 | | | | 30,302,233 | |
| | 11,544,631 | | | Upgrade Master Pass-Thru Trust, Series2019-ST2-A | | | 3.90 | % ^ | | | 09/15/2025 | | | | 11,319,684 | |
| | 2,035,505 | | | Upgrade Receivables Trust, Series2018-1A-A | | | 3.76 | % ^ | | | 11/15/2024 | | | | 2,016,345 | |
| | 1,125,182 | | | Upstart Securitization Trust, Series2019-1-A | | | 3.45 | % ^ | | | 04/20/2026 | | | | 1,117,901 | |
| | 18,867,389 | | | Upstart Securitization Trust, Series2019-2-A | | | 2.90 | % ^ | | | 09/20/2029 | | | | 17,516,012 | |
| | 17,722,917 | | | Vantage Data Centers Issuer LLC, Series2018-1A-A2 | | | 4.07 | % ^ | | | 02/16/2043 | | | | 17,678,414 | |
| | 18,640,625 | | | Vantage Data Centers Issuer LLC, Series2019-1A-A2 | | | 3.19 | % ^ | | | 07/15/2044 | | | | 18,038,425 | |
| | 18,390,820 | | | Vivint Colar Financing LLC, Series2018-1A-A | | | 4.73 | % ^ | | | 04/30/2048 | | | | 15,227,858 | |
| | 48,817,959 | | | Waterfall Commercial Mortgage Trust, Series2015-SBC5-A | | | 4.10 | % # ^ | | | 09/14/2022 | | | | 48,517,953 | |
| | 20,737,500 | | | Wendy’s Funding LLC, Series2019-1A-A2II | | | 4.08 | % ^ | | | 06/15/2049 | | | | 18,337,964 | |
| | 8,215,058 | | | Westlake Automobile Receivables Trust, Series2019-2A-A2A | | | 2.57 | % ^ | | | 02/15/2023 | | | | 8,189,269 | |
| | 53,250,000 | | | Willis Engine Structured Trust, Series2020-A-A | | | 3.23 | % ^ | | | 03/15/2045 | | | | 30,136,305 | |
| | 9,885,382 | | | Zephyrus Capital Aviation Partners Ltd., Series2018-1-A | | | 4.61 | % ^ | | | 10/15/2038 | | | | 8,097,779 | |
| | | | | | | | | | | | | | | | |
| | Total Asset Backed Obligations (Cost $2,081,617,206) | | | | | | | | | | | 1,801,461,818 | |
| | | | | | | | | | | | | |
| | Collateralized Loan Obligations - 4.1% | | | | | | | | | | | | |
| | 12,000,000 | | | 522 Funding Ltd., Series2019-1A-A1 (3 Month LIBOR USD + 1.39%, 1.39% Floor) | | | 0.01 | % ^ | | | 01/15/2033 | | | | 11,280,000 | |
| | 44,500,000 | | | AIMCO, Series2015-AA-AR (3 Month LIBOR USD + 0.85%, 0.85% Floor) | | | 2.68 | % ^ | | | 01/15/2028 | | | | 43,686,376 | |
| | 37,500,000 | | | Anchorage Capital Ltd., Series2016-9A-AR (3 Month LIBOR USD + 1.37%) | | | 3.20 | % ^ | | | 07/15/2032 | | | | 35,575,008 | |
| | 36,000,000 | | | Anchorage Capital Ltd., Series2018-10A-A1A (3 Month LIBOR USD + 1.20%, 1.20% Floor) | | | 3.03 | % ^ | | | 10/15/2031 | | | | 33,979,438 | |
| | 35,000,000 | | | Assurant Ltd., Series2018-2A-A (3 Month LIBOR USD + 1.23%, 1.23% Floor) | | | 3.05 | % ^ | | | 10/20/2031 | | | | 32,025,422 | |
| | 20,000,000 | | | Assurant Ltd., Series2019-1A-A (3 Month LIBOR USD + 1.35%, 1.35% Floor) | | | 3.17 | % ^ | | | 04/20/2030 | | | | 19,013,313 | |
| | 7,500,000 | | | Battalion Ltd., Series2019-16A-A (3 Month LIBOR USD + 1.37%, 1.37% Floor) | | | 3.27 | % ^ | | | 12/19/2032 | | | | 7,198,310 | |
| | 25,000,000 | | | Birch Grove Ltd., Series19A-A (3 Month LIBOR USD + 1.49%) | | | 2.23 | % ^ | | | 06/15/2031 | | | | 22,567,526 | |
| | 31,500,000 | | | Catamaran Ltd., Series2018-1A-A1 (3 Month LIBOR USD + 1.25%, 1.25% Floor) | | | 3.04 | % ^ | | | 10/25/2031 | | | | 29,863,109 | |
| | 3,000,000 | | | CFIP Ltd., Series2014-1A-AR (3 Month LIBOR USD + 1.32%) | | | 3.17 | % ^ | | | 07/13/2029 | | | | 2,882,639 | |
| | 98,000,000 | | | CVP Ltd., Series2017-1A-A (3 Month LIBOR USD + 1.34%) | | | 3.16 | % ^ | | | 07/20/2030 | | | | 91,984,964 | |
| | 61,250,000 | | | CVP Ltd., Series2017-2A-A (3 Month LIBOR USD + 1.19%, 1.19% Floor) | | | 3.01 | % ^ | | | 01/20/2031 | | | | 56,616,806 | |
| | 35,250,000 | | | Elevation Ltd., Series2014-2A-A1R (3 Month LIBOR USD + 1.23%) | | | 3.06 | % ^ | | | 10/15/2029 | | | | 33,983,704 | |
| | 25,500,000 | | | Elevation Ltd., Series2018-9A-A1 (3 Month LIBOR USD + 1.12%, 1.12% Floor) | | | 2.95 | % ^ | | | 07/15/2031 | | | | 24,023,966 | |
| | 40,000,000 | | | Elmwood Ltd., Series2019-2A-A (3 Month LIBOR USD + 1.45%, 1.45% Floor) | | | 3.27 | % ^ | | | 04/20/2031 | | | | 39,340,873 | |
| | 5,500,000 | | | Elmwood Ltd., Series2019-2A-B (3 Month LIBOR USD + 2.10%, 2.10% Floor) | | | 3.92 | % ^ | | | 04/20/2031 | | | | 5,030,332 | |
| | 32,000,000 | | | Elmwood Ltd., Series2019-3A-A1 (3 Month LIBOR USD + 1.37%, 1.37% Floor) | | | 3.23 | % ^ | | | 10/15/2032 | | | | 30,127,683 | |
| | 20,250,000 | | | Fort Washington, Series2019-1A-A (3 Month LIBOR USD + 1.42%, 1.42% Floor) | | | 3.33 | % ^ | | | 10/20/2032 | | | | 18,185,022 | |
| | 49,300,000 | | | Greywolf Ltd., Series2018-1A-A1 (3 Month LIBOR USD + 1.03%) | | | 2.82 | % ^ | | | 04/26/2031 | | | | 46,370,997 | |
| | 43,500,000 | | | Greywolf Ltd., Series2018-2A-A1 (3 Month LIBOR USD + 1.18%, 1.18% Floor) | | | 3.00 | % ^ | | | 10/20/2031 | | | | 40,129,998 | |
| | 17,500,000 | | | Gulf Stream Meridian Ltd., Series2020-IA-A1 (3 Month LIBOR USD + 1.37%, 1.37% Floor) | | | 0.01 | % ^ | | | 04/15/2033 | | | | 16,444,136 | |
| | 1,750,000 | | | Halcyon Loan Advisors Funding Ltd., Series2014-2A-D (3 Month LIBOR USD + 5.00%) | | | 6.80 | % ^ Þ | | | 04/28/2025 | | | | 1,262,832 | |
| | 5,000,000 | | | Halcyon Loan Advisors Funding Ltd., Series2014-3A-D (3 Month LIBOR USD + 3.65%) | | | 5.45 | % ^ | | | 10/22/2025 | | | | 4,162,080 | |
| | 74,105,117 | | | Halcyon Loan Advisors Funding Ltd., Series2015-3A-A1R (3 Month LIBOR USD + 0.90%) | | | 2.72 | % ^ | | | 10/18/2027 | | | | 73,102,093 | |
| | 25,000,000 | | | Halsey Point Ltd., Series2019-1A-A1A1 (3 Month LIBOR USD + 1.35%, 1.35% Floor) | | | 3.26 | % ^ | | | 01/20/2033 | | | | 23,043,507 | |
| | 13,000,000 | | | Halsey Point Ltd., Series2019-1A-B1 (3 Month LIBOR USD + 2.20%, 2.20% Floor) | | | 4.11 | % ^ | | | 01/20/2033 | | | | 11,315,730 | |
| | 31,000,000 | | | Harbourview Ltd., Series7RA-A1 (3 Month LIBOR USD + 1.13%, 1.13% Floor) | | | 2.95 | % ^ | | | 07/18/2031 | | | | 28,228,966 | |
| | 10,528,221 | | | Jamestown Ltd., Series2014-4A-A1AR (3 Month LIBOR USD + 0.69%) | | | 2.52 | % ^ | | | 07/15/2026 | | | | 10,062,435 | |
| | 56,695,000 | | | Jamestown Ltd., Series2018-6RA-A1 (3 Month LIBOR USD + 1.15%, 1.15% Floor) | | | 2.94 | % ^ | | | 04/25/2030 | | | | 52,839,168 | |
| | 20,000,000 | | | Jamestown Ltd., Series2019-14A-A1 (3 Month LIBOR USD + 1.38%, 1.38% Floor) | | | 3.29 | % ^ | | | 10/20/2032 | | | | 18,634,946 | |
| | 9,500,000 | | | Jamestown Ltd., Series2019-14A-A2 (3 Month LIBOR USD + 2.20%, 2.20% Floor) | | | 4.11 | % ^ | | | 10/20/2032 | | | | 8,336,142 | |
| | 13,600,000 | | | Kayne Ltd., Series2019-5A-A (3 Month LIBOR USD + 1.35%, 1.35% Floor) | | | 3.15 | % ^ | | | 07/24/2032 | | | | 12,886,210 | |
| | 12,950,000 | | | Kayne Ltd., Series2019-5A-B1 (3 Month LIBOR USD + 2.00%, 2.00% Floor) | | | 3.80 | % ^ | | | 07/24/2032 | | | | 11,532,703 | |
| | 30,000,000 | | | LCM LP, Series17A-A2RR (3 Month LIBOR USD + 1.15%, 1.15% Floor) | | | 2.98 | % ^ | | | 10/15/2031 | | | | 28,230,643 | |
| | 25,000,000 | | | LCM LP, Series19A-AR (3 Month LIBOR USD + 1.24%, 1.24% Floor) | | | 3.07 | % ^ | | | 07/15/2027 | | | | 24,504,043 | |
| | 2,181,000 | | | Madison Park Funding Ltd. | | | 3.29 | % ^ �� | | | 01/27/2026 | | | | 2,088,308 | |
| | 20,000,000 | | | Madison Park Funding Ltd., Series2013-11A-AR (3 Month LIBOR USD + 1.16%) | | | 2.97 | % ^ | | | 07/23/2029 | | | | 19,416,699 | |
| | 5,500,000 | | | Madison Park Funding Ltd., Series2014-15A-CR (3 Month LIBOR USD + 3.45%) | | | 5.24 | % ^ | | | 01/27/2026 | | | | 5,070,015 | |
| | 5,000,000 | | | Madison Park Funding Ltd., Series2014-15A-DR (3 Month LIBOR USD + 5.44%) | | | 7.23 | % ^ | | | 01/27/2026 | | | | 3,537,942 | |
| | 19,780,079 | | | Marathon Ltd., Series2014-7A-A1R (3 Month LIBOR USD + 1.32%) | | | 3.12 | % ^ | | | 10/28/2025 | | | | 19,749,084 | |
| | 25,000,000 | | | Marble Point Ltd., Series2018-2A-A1 (3 Month LIBOR USD + 1.33%, 1.33% Floor) | | | 3.15 | % ^ | | | 01/20/2032 | | | | 23,396,044 | |
| | 16,000,000 | | | Marble Point Ltd., Series2019-1A-A1 (3 Month LIBOR USD + 1.42%) | | | 3.23 | % ^ | | | 07/23/2032 | | | | 15,225,562 | |
| | 54,500,000 | | | Midocean Credit Partners, Series2018-9A-A1 (3 Month LIBOR USD + 1.15%, 1.15% Floor) | | | 2.97 | % ^ | | | 07/20/2031 | | | | 49,845,731 | |
| | 65,000,000 | | | MP Ltd., Series2013-1A-AR (3 Month LIBOR USD + 1.25%) | | | 3.07 | % ^ | | | 10/20/2030 | | | | 60,064,896 | |
| | 55,000,000 | | | MP Ltd., Series2013-2A-ARR (3 Month LIBOR USD + 1.28%) | | | 3.07 | % ^ | | | 07/25/2029 | | | | 53,225,457 | |
| | 25,553,247 | | | MP Ltd., Series2015-2A-AR (3 Month LIBOR USD + 0.91%) | | | 2.71 | % ^ | | | 10/28/2027 | | | | 25,017,993 | |
| | 30,000,000 | | | Nassau Ltd., Series2018-IA-A (3 Month LIBOR USD + 1.15%) | | | 2.98 | % ^ | | | 07/15/2031 | | | | 27,367,326 | |
| | 19,500,000 | | | Northwoods Capital Ltd., Series2017-16A-A (3 Month LIBOR USD + 1.27%) | | | 2.96 | % ^ | | | 11/15/2030 | | | | 18,163,138 | |
| | 39,250,000 | | | Northwoods Capital Ltd., Series2018-11BA-A1 (3 Month LIBOR USD + 1.10%, 1.10% Floor) | | | 2.92 | % ^ | | | 04/19/2031 | | | | 36,710,373 | |
| | 20,000,000 | | | Ocean Trails, Series2019-7A-A1 (3 Month LIBOR USD + 1.40%, 1.40% Floor) | | | 3.24 | % ^ | | | 04/17/2030 | | | | 18,183,572 | |
| | 50,000,000 | | | OFSI Fund Ltd., Series2018-1A-A (3 Month LIBOR USD + 1.15%, 1.15% Floor) | | | 2.98 | % ^ | | | 07/15/2031 | | | | 47,309,921 | |
| | 38,000,000 | | | Park Avenue Institutional Advisers Ltd., Series2016-1A-A1R (3 Month LIBOR USD + 1.20%) | | | 2.88 | % ^ | | | 08/23/2031 | | | | 36,249,472 | |
| | 10,500,000 | | | PPM Ltd., Series2019-3A-A (3 Month LIBOR USD + 1.40%) | | | 3.24 | % ^ | | | 07/17/2030 | | | | 9,642,479 | |
| | 28,000,000 | | | Prudential PLC, Series2018-1A-A (3 Month LIBOR USD + 1.15%) | | | 2.98 | % ^ | | | 07/15/2031 | | | | 24,962,517 | |
| | 2,500,000 | | | Regatta Funding Ltd., Series2018-1A-B (3 Month LIBOR USD + 1.65%) | | | 3.49 | % ^ | | | 07/17/2031 | | | | 2,208,407 | |
| | 20,000,000 | | | Regatta Funding Ltd., Series2018-3A-A (3 Month LIBOR USD + 1.19%) | | | 2.98 | % ^ | | | 10/25/2031 | | | | 17,630,448 | |
| | 25,500,000 | | | Rockford Tower Ltd., Series2017-3A-A (3 Month LIBOR USD + 1.19%) | | | 3.01 | % ^ | | | 10/20/2030 | | | | 23,239,314 | |
| | 39,000,000 | | | Rockford Tower Ltd., Series2018-1A-A (3 Month LIBOR USD + 1.10%) | | | 2.79 | % ^ | | | 05/20/2031 | | | | 36,787,021 | |
| | 50,000,000 | | | Sound Point Ltd., Series2013-3RA-A (3 Month LIBOR USD + 1.15%, 1.15% Floor) | | | 2.97 | % ^ | | | 04/18/2031 | | | | 47,336,627 | |
| | | | | | | | | | | | | | | | |
| | | | | | | | | | | | | |
| | 36,500,000 | | | Sound Point Ltd., Series2015-2A-ARR (3 Month LIBOR USD + 1.39%, 1.39% Floor) | | | 3.21 | % ^ | | | 07/20/2032 | | | | 34,973,535 | |
| | 28,000,000 | | | Sound Point Ltd., Series2018-3A-A1A (3 Month LIBOR USD + 1.18%, 1.18% Floor) | | | 2.97 | % ^ | | | 10/26/2031 | | | | 26,535,935 | |
| | 25,750,000 | | | Sound Point Ltd., Series2019-4A-A1A (3 Month LIBOR USD + 1.40%, 1.40% Floor) | | | 3.23 | % ^ | | | 01/15/2033 | | | | 25,123,939 | |
| | 30,000,000 | | | Steele Creek Ltd., Series2014-1RA-A (3 Month LIBOR USD + 1.07%, 1.07% Floor) | | | 2.89 | % ^ | | | 04/21/2031 | | | | 27,992,900 | |
| | 20,000,000 | | | Steele Creek Ltd., Series2015-1A-AR (3 Month LIBOR USD + 1.26%) | | | 2.96 | % ^ | | | 05/21/2029 | | | | 19,101,230 | |
| | 34,000,000 | | | Steele Creek Ltd., Series2016-1A-AR (3 Month LIBOR USD + 1.12%, 1.12% Floor) | | | 1.86 | % ^ | | | 06/15/2031 | | | | 31,019,414 | |
| | 10,000,000 | | | Steele Creek Ltd., Series2019-1A-B (3 Month LIBOR USD + 2.20%, 2.20% Floor) | | | 4.03 | % ^ | | | 04/15/2032 | | | | 8,810,673 | |
| | 10,000,000 | | | Symphony Ltd., Series2014-15A-AR2 (3 Month LIBOR USD + 1.26%, 1.26% Floor) | | | 3.10 | % ^ | | | 01/17/2032 | | | | 9,570,275 | |
| | 30,000,000 | | | TCI-Flatiron Ltd., Series2016-1A-AR (3 Month LIBOR USD + 1.22%, 1.22% Floor) | | | 3.06 | % ^ | | | 07/17/2028 | | | | 29,243,836 | |
| | 20,000,000 | | | Venture Ltd., Series2013-15A-A1R2 (3 Month LIBOR USD + 13.70%) | | | 3.20 | % ^ | | | 07/15/2032 | | | | 18,964,933 | |
| | 25,000,000 | | | Venture Ltd., Series2014-19A-ARR (3 Month LIBOR USD + 1.26%, 1.26% Floor) | | | 3.09 | % ^ | | | 01/15/2032 | | | | 23,692,989 | |
| | 49,039,359 | | | Venture Ltd., Series2015-20A-AR (3 Month LIBOR USD + 0.82%) | | | 2.65 | % ^ | | | 04/15/2027 | | | | 47,889,397 | |
| | 75,000,000 | | | Vibrant Ltd., Series2018-10A-A1 (3 Month LIBOR USD + 1.20%, 1.20% Floor) | | | 3.02 | % ^ | | | 10/20/2031 | | | | 70,992,246 | |
| | 46,000,000 | | | Wellfleet Ltd., Series2018-2A-A1 (3 Month LIBOR USD + 1.20%, 1.20% Floor) | | | 3.02 | % ^ | | | 10/20/2031 | | | | 43,667,038 | |
| | 2,370,409 | | | WhiteHorse Ltd., Series2014-1A-AR (3 Month LIBOR USD + 0.90%) | | | 2.66 | % ^ | | | 05/01/2026 | | | | 2,368,422 | |
| | 10,361,278 | | | WhiteHorse Ltd., Series2015-10A-A1R (3 Month LIBOR USD + 0.93%, 0.93% Floor) | | | 2.77 | % ^ | | | 04/17/2027 | | | | 10,257,869 | |
| | 4,000,000 | | | Wind River Ltd., Series2013-2A-AR (3 Month LIBOR USD + 1.23%) | | | 3.05 | % ^ | | | 10/18/2030 | | | | 3,723,605 | |
| | 40,000,000 | | | Wind River Ltd., Series2014-2A-AR (3 Month LIBOR USD + 1.14%, 1.14% Floor) | | | 2.97 | % ^ | | | 01/15/2031 | | | | 37,762,426 | |
| | 30,000,000 | | | York Ltd., Series2019-1A-A1 (3 Month LIBOR USD + 1.35%) | | | 3.15 | % ^ | | | 07/22/2032 | | | | 28,137,000 | |
| | 8,297,616 | | | Zais Ltd., Series2014-2A-A1AR (3 Month LIBOR USD + 1.20%) | | | 2.99 | % ^ | | | 07/25/2026 | | | | 8,289,700 | |
| | 2,500,000 | | | Zais Ltd., Series2016-2A-A1 (3 Month LIBOR USD + 1.53%) | | | 3.36 | % ^ | | | 10/15/2028 | | | | 2,434,667 | |
| | | | | | | | | | | | | | | | |
| | Total Collateralized Loan Obligations (Cost $2,209,340,503) | | | | | | | | | | | 2,081,431,495 | |
| | | | | | | | | | | | | |
| | Non-Agency Commercial Mortgage Backed Obligations - 7.6% | | | | | | | | | | | | |
| | 10,139,000 | | | 20 Times Square Trust, Series2018-20TS-F | | | 3.10 | % # ^ | | | 05/15/2035 | | | | 8,682,159 | |
| | 7,727,000 | | | 20 Times Square Trust, Series2018-20TS-G | | | 3.10 | % # ^ | | | 05/15/2035 | | | | 6,508,688 | |
| | 2,837,533 | | | Ashford Hospitality Trust, Series2018-ASHF-A (1 Month LIBOR USD + 0.90%, 0.90% Floor) | | | 1.60 | % ^ | | | 04/15/2035 | | | | 2,358,994 | |
| | 11,007,000 | | | Atrium Hotel Portfolio Trust, Series2017-ATRM-E (1 Month LIBOR USD + 3.05%, 3.05% Floor) | | | 3.75 | % ^ | | | 12/15/2036 | | | | 8,819,863 | |
| | 29,257,000 | | | Atrium Hotel Portfolio Trust, Series2018-ATRM-A (1 Month LIBOR USD + 0.95%, 0.95% Floor) | | | 1.65 | % ^ | | | 06/15/2035 | | | | 24,326,201 | |
| | 28,877,000 | | | Atrium Hotel Portfolio Trust, Series2018-ATRM-D (1 Month LIBOR USD + 2.30%, 2.30% Floor) | | | 3.00 | % ^ | | | 06/15/2035 | | | | 21,021,442 | |
| | 13,685,000 | | | Atrium Hotel Portfolio Trust, Series2018-ATRM-E (1 Month LIBOR USD + 3.40%, 3.40% Floor) | | | 4.10 | % ^ | | | 06/15/2035 | | | | 10,339,866 | |
| | 35,435,000 | | | BAMLL Commercial Mortgage Securities Trust, Series2020-BOC-D | | | 3.18 | % ^ | | | 01/15/2032 | | | | 26,988,111 | |
| | 7,505,000 | | | BAMLL Commercial Mortgage Securities Trust, Series2020-BOC-E | | | 3.18 | % ^ | | | 01/15/2032 | | | | 5,476,729 | |
| | 12,461,017 | | | Banc of America Commercial Mortgage Trust, Series2007-5-XW | | | 0.00 | % # ^ I/O | | | 02/10/2051 | | | | 125 | |
| | 4,000,000 | | | Banc of America Commercial Mortgage Trust, Series2015-UBS7-B | | | 4.36 | % # | | | 09/15/2048 | | | | 4,037,096 | |
| | 56,446,613 | | | Banc of America Commercial Mortgage Trust, Series2015-UBS7-XA | | | 0.81 | % # I/O | | | 09/15/2048 | | | | 1,887,812 | |
| | 5,018,000 | | | Bancorp Commercial Mortgage Trust, Series2018-CRE4-D (1 Month LIBOR USD + 2.10%, 0.25% Floor) | | | 2.80 | % ^ | | | 09/15/2035 | | | | 3,871,780 | |
| | 6,530,000 | | | Bancorp Commercial Mortgage Trust, Series2019-CRE5-B (1 Month LIBOR USD + 1.50%, 1.50% Floor) | | | 2.20 | % ^ | | | 03/15/2036 | | | | 6,435,829 | |
| | 1,057,000 | | | Bancorp Commercial Mortgage Trust, Series2019-CRE5-D (1 Month LIBOR USD + 2.35%, 2.35% Floor) | | | 3.05 | % ^ | | | 03/15/2036 | | | | 930,290 | |
| | 39,339,551 | | | BANK, Series2017-BNK4-XA | | | 1.42 | % # I/O | | | 05/15/2050 | | | | 2,668,366 | |
| | 88,465,093 | | | BANK, Series2017-BNK5-XA | | | 1.08 | % # I/O | | | 06/15/2060 | | | | 4,624,822 | |
| | 1,750,000 | | | BANK, Series2018-BN10-AS | | | 3.90 | % # | | | 02/15/2061 | | | | 1,817,374 | |
| | 151,251,091 | | | BANK, Series2018-BN10-XA | | | 0.74 | % # I/O | | | 02/15/2061 | | | | 7,290,635 | |
| | 94,833,058 | | | BANK, Series2019-BN16-XA | | | 0.97 | % # I/O | | | 02/15/2052 | | | | 6,226,587 | |
| | 43,097,000 | | | BANK, Series2019-BN19-AS | | | 3.45 | % | | | 08/15/2061 | | | | 43,652,141 | |
| | 1,099,000 | | | BANK, Series2019-BN20-AS | | | 3.24 | % # | | | 09/15/2062 | | | | 1,070,102 | |
| | 3,495,000 | | | BANK, Series2020-BN25-ASB | | | 2.61 | % | | | 01/15/2063 | | | | 3,610,424 | |
| | 10,035,000 | | | BANK, Series2020-BN26-AS | | | 2.69 | % | | | 03/15/2063 | | | | 9,593,337 | |
| | 11,924,000 | | | BANK, Series2020-BN26-ASB | | | 2.31 | % | | | 03/15/2063 | | | | 12,080,712 | |
| | 27,365,000 | | | Barclays Commercial Mortgage Securities LLC, Series2015-STP-D | | | 4.28 | % # ^ | | | 09/10/2028 | | | | 27,126,976 | |
| | 12,089,000 | | | Barclays Commercial Mortgage Securities LLC, Series2017-DELC-C (1 Month LIBOR USD + 1.20%, 1.20% Floor) | | | 1.90 | % ^ | | | 08/15/2036 | | | | 9,271,084 | |
| | 13,777,000 | | | Barclays Commercial Mortgage Securities LLC, Series2017-DELC-D (1 Month LIBOR USD + 1.70%, 1.70% Floor) | | | 2.40 | % ^ | | | 08/15/2036 | | | | 10,351,120 | |
| | 28,585,000 | | | Barclays Commercial Mortgage Securities LLC, Series2017-DELC-E (1 Month LIBOR USD + 2.50%, 2.50% Floor) | | | 3.20 | % ^ | | | 08/15/2036 | | | | 21,022,029 | |
| | 30,209,000 | | | Barclays Commercial Mortgage Securities LLC, Series2017-DELC-F (1 Month LIBOR USD + 3.50%, 3.50% Floor) | | | 4.20 | % ^ | | | 08/15/2036 | | | | 18,617,686 | |
| | 187,238,635 | | | Barclays Commercial Mortgage Trust, Series2019-C4-XA | | | 1.60 | % # I/O | | | 08/15/2052 | | | | 20,794,011 | |
| | 75,066,178 | | | Barclays Commercial Mortgage Trust, Series2019-C5-XA | | | 0.90 | % # I/O | | | 11/15/2052 | | | | 4,556,224 | |
| | 13,279,071 | | | BBCMS Mortgage Trust, Series2018-BXH-A (1 Month LIBOR USD + 1.00%, 1.00% Floor) | | | 1.70 | % ^ | | | 10/15/2037 | | | | 10,597,283 | |
| | 67,548,000 | | | BBCMS Mortgage Trust, Series2018-CBM-A (1 Month LIBOR USD + 1.00%, 1.00% Floor) | | | 1.70 | % ^ | | | 07/15/2037 | | | | 60,350,261 | |
| | 21,385,000 | | | BBCMS Mortgage Trust, Series2018-CBM-E (1 Month LIBOR USD + 3.15%, 3.15% Floor) | | | 3.85 | % ^ | | | 07/15/2037 | | | | 19,025,845 | |
| | 9,135,000 | | | BBCMS Mortgage Trust, Series2018-TALL-A (1 Month LIBOR USD + 0.72%, 0.72% Floor) | | | 1.43 | % ^ | | | 03/15/2037 | | | | 8,634,763 | |
| | 5,775,000 | | | BBCMS Mortgage Trust, Series2018-TALL-F (1 Month LIBOR USD + 3.24%, 3.24% Floor) | | | 3.94 | % ^ | | | 03/15/2037 | | | | 4,354,290 | |
| | 12,992,000 | | | BBCMS Mortgage Trust, Series2020-C6-A4 | | | 2.64 | % | | | 02/15/2053 | | | | 12,968,069 | |
| | 7,466,000 | | | BBCMS Mortgage Trust, Series2020-C6-ASB | | | 2.60 | % | | | 02/15/2053 | | | | 6,752,803 | |
| | 11,799,000 | | | BBCMS Mortgage Trust, Series2020-C6-F5TB | | | 3.69 | % # ^ | | | 02/15/2053 | | | | 7,385,395 | |
| | 12,284,000 | | | BBCMS Mortgage Trust, Series2020-C6-F5TC | | | 3.69 | % # ^ | | | 02/15/2053 | | | | 7,439,805 | |
| | 189,713,709 | | | BBCMS Mortgage Trust, Series2020-C6-XA | | | 1.06 | % # I/O | | | 02/15/2053 | | | | 14,479,519 | |
| | 37,631,705 | | | Benchmark Mortgage Trust, Series2018-B7-XA | | | 0.45 | % # I/O | | | 05/15/2053 | | | | 1,096,351 | |
| | 28,169,045 | | | Benchmark Mortgage Trust, Series2019-B13-A4 | | | 2.95 | % | | | 08/15/2057 | | | | 29,908,810 | |
| | 10,916,000 | | | Benchmark Mortgage Trust, Series2019-B15-A5 | | | 2.93 | % | | | 12/15/2072 | | | | 11,569,445 | |
| | 80,868,707 | | | Benchmark Mortgage Trust, Series2019-B9-XA | | | 1.05 | % # I/O | | | 03/15/2052 | | | | 6,027,193 | |
| | 8,753,000 | | | Benchmark Mortgage Trust, Series2020-B16-ASB | | | 2.70 | % | | | 02/15/2053 | | | | 8,057,802 | |
| | 3,953,000 | | | Benchmark Mortgage Trust, Series2020-B16-B | | | 3.18 | % | | | 02/15/2053 | | | | 2,427,960 | |
| | 75,397,607 | | | Benchmark Mortgage Trust, Series2020-B16-XA | | | 0.93 | % # I/O | | | 02/15/2053 | | | | 5,332,345 | |
| | 34,680,000 | | | Benchmark Mortgage Trust, Series2020-IG1-A3 | | | 2.69 | % | | | 09/15/2043 | | | | 35,653,225 | |
| | 276,099,000 | | | Benchmark Mortgage Trust, Series2020-IG1-XA | | | 0.51 | % # I/O | | | 09/15/2043 | | | | 10,848,482 | |
| | 6,223,000 | | | BFLD, Series2019-DPLO-E (1 Month LIBOR USD + 2.24%, 2.24% Floor) | | | 2.94 | % ^ | | | 10/15/2034 | | | | 4,721,037 | |
| | 75,399,000 | | | BHMS Trust, Series2018-ATLS-A (1 Month LIBOR USD + 1.25%, 1.25% Floor) | | | 1.95 | % ^ | | | 07/15/2035 | | | | 64,962,662 | |
| | 14,591,000 | | | BHMS Trust, Series2018-ATLS-C (1 Month LIBOR USD + 1.90%, 1.90% Floor) | | | 2.60 | % ^ | | | 07/15/2035 | | | | 10,564,307 | |
| | 27,680,000 | | | Bremar Hotels and Resorts Trust, Series2018-PRME-A (1 Month LIBOR USD + 0.82%, 0.82% Floor) | | | 1.52 | % ^ | | | 06/15/2035 | | | | 23,323,384 | |
| | 6,663,000 | | | BX Commercial Mortgage Trust, Series2018-BIOA-D (1 Month LIBOR USD + 1.32%, 1.35% Floor) | | | 2.03 | % ^ | | | 03/15/2037 | | | | 5,762,272 | |
| | 35,415,000 | | | BX Commercial Mortgage Trust, Series2018-BIOA-E (1 Month LIBOR USD + 1.95%, 1.98% Floor) | | | 2.66 | % ^ | | | 03/15/2037 | | | | 29,209,754 | |
| | 21,611,049 | | | BX Trust, Series2017-APPL-E (1 Month LIBOR USD + 3.15%, 3.15% Floor) | | | 3.85 | % ^ | | | 07/15/2034 | | | | 17,764,939 | |
| | 34,505,750 | | | BX Trust, Series2017-SLCT-D (1 Month LIBOR USD + 2.05%, 2.05% Floor) | | | 2.75 | % ^ | | | 07/15/2034 | | | | 27,086,541 | |
| | 63,983,750 | | | BX Trust, Series2017-SLCT-E (1 Month LIBOR USD + 3.15%, 3.15% Floor) | | | 3.85 | % ^ | | | 07/15/2034 | | | | 50,335,632 | |
| | 41,318,786 | | | BX Trust, Series2018-EXCL-A (1 Month LIBOR USD + 1.09%, 1.09% Floor) | | | 1.79 | % ^ | | | 09/15/2037 | | | | 37,113,120 | |
| | 2,447,000 | | | BX Trust, Series2018-GW-D (1 Month LIBOR USD + 1.77%, 1.77% Floor) | | | 2.47 | % ^ | | | 05/15/2035 | | | | 2,068,432 | |
| | 4,437,000 | | | BX Trust, Series2018-GW-E (1 Month LIBOR USD + 1.97%, 1.97% Floor) | | | 2.67 | % ^ | | | 05/15/2035 | | | | 3,661,431 | |
| | 7,481,000 | | | BX Trust, Series2018-GW-F (1 Month LIBOR USD + 2.42%, 2.42% Floor) | | | 3.12 | % ^ | | | 05/15/2035 | | | | 6,185,443 | |
| | 2,014,000 | | | BX Trust, Series2019-ATL-E (1 Month LIBOR USD + 2.24%, 2.24% Floor) | | | 2.94 | % ^ | | | 10/15/2036 | | | | 1,590,067 | |
| | | | | | | | | | | | | | | | |
| | | | | | | | | | | | | |
| | 8,644,000 | | | BX Trust, Series2019-MMP-D (1 Month LIBOR USD + 1.60%, 1.60% Floor) | | | 2.30 | % ^ | | | 08/15/2036 | | | | 8,323,192 | |
| | 180,761,000 | | | BX Trust, Series2019-OC11-E | | | 4.08 | % # ^ | | | 12/09/2041 | | | | 121,439,759 | |
| | 326,679,000 | | | BX Trust, Series2019-OC11-XB | | | 0.32 | % # ^ I/O | | | 12/09/2041 | | | | 6,498,952 | |
| | 49,266,980 | | | CD Commercial Mortgage Trust, Series2017-CD6-XA | | | 0.96 | % # I/O | | | 11/13/2050 | | | | 2,396,297 | |
| | 5,394,250 | | | CF Trust, Series2019-MF1-A (1 Month LIBOR USD + 1.05%, 1.05% Floor) | | | 2.05 | % ^ | | | 08/21/2032 | | | | 5,256,499 | |
| | 4,517,000 | | | CFCRE Commercial Mortgage Trust2016-C4, Series2016-C4-AM | | | 3.69 | % | | | 05/10/2058 | | | | 4,651,196 | |
| | 7,155,000 | | | CFCRE Commercial Mortgage Trust, Series2016-C4-C | | | 4.87 | % # | | | 05/10/2058 | | | | 6,298,164 | |
| | 59,814,956 | | | CFCRE Commercial Mortgage Trust, Series2016-C4-XA | | | 1.70 | % # I/O | | | 05/10/2058 | | | | 4,665,746 | |
| | 43,826,952 | | | CFCRE Commercial Mortgage Trust, Series2017-C8-XA | | | 1.61 | % # I/O | | | 06/15/2050 | | | | 3,463,973 | |
| | 3,128,000 | | | CFCRE Commercial Mortgage Trust, Series2018-TAN-B | | | 4.69 | % ^ | | | 02/15/2033 | | | | 3,005,712 | |
| | 3,128,000 | | | CFCRE Commercial Mortgage Trust, Series2018-TAN-C | | | 5.29 | % ^ | | | 02/15/2033 | | | | 2,991,101 | |
| | 1,877,000 | | | CFCRE Commercial Mortgage Trust, Series2018-TAN-D | | | 6.10 | % ^ | | | 02/15/2033 | | | | 1,760,378 | |
| | 6,952,979 | | | CGDBB Commercial Mortgage Trust, Series2017-BIOC-E (1 Month LIBOR USD + 2.15%, 2.25% Floor) | | | 2.85 | % ^ | | | 07/15/2032 | | | | 5,998,655 | |
| | 43,737,000 | | | CHT Mortgage Trust, Series2017-CSMO-E (1 Month LIBOR USD + 3.00%, 3.00% Floor) | | | 3.70 | % ^ | | | 11/15/2036 | | | | 34,805,454 | |
| | 21,782,000 | | | CHT Mortgage Trust, Series2017-CSMO-F (1 Month LIBOR USD + 3.74%, 3.74% Floor) | | | 4.45 | % ^ | | | 11/15/2036 | | | | 16,814,508 | |
| | 185,681,560 | | | Citigroup Commercial Mortgage Trust, Series2012-GC8-XA | | | 1.77 | % # ^ I/O | | | 09/10/2045 | | | | 6,389,711 | |
| | 148,734,501 | | | Citigroup Commercial Mortgage Trust, Series2014-GC19-XA | | | 1.15 | % # I/O | | | 03/10/2047 | | | | 5,545,640 | |
| | 79,317,973 | | | Citigroup Commercial Mortgage Trust, Series2014-GC21-XA | | | 1.18 | % # I/O | | | 05/10/2047 | | | | 3,186,679 | |
| | 185,861,416 | | | Citigroup Commercial Mortgage Trust, Series2014-GC25-XA | | | 0.99 | % # I/O | | | 10/10/2047 | | | | 6,967,517 | |
| | 6,265,000 | | | Citigroup Commercial Mortgage Trust, Series2015-GC27-B | | | 3.77 | % | | | 02/10/2048 | | | | 6,172,513 | |
| | 7,278,000 | | | Citigroup Commercial Mortgage Trust, Series2015-GC27-C | | | 4.42 | % # | | | 02/10/2048 | | | | 6,470,750 | |
| | 3,685,000 | | | Citigroup Commercial Mortgage Trust, Series2015-GC27-D | | | 4.42 | % # ^ | | | 02/10/2048 | | | | 3,087,172 | |
| | 203,731,909 | | | Citigroup Commercial Mortgage Trust, Series2015-GC27-XA | | | 1.35 | % # I/O | | | 02/10/2048 | | | | 9,854,472 | |
| | 14,310,000 | | | Citigroup Commercial Mortgage Trust, Series2015-GC33-C | | | 4.57 | % # | | | 09/10/2058 | | | | 12,588,518 | |
| | 171,316,333 | | | Citigroup Commercial Mortgage Trust, Series2015-GC33-XA | | | 0.89 | % # I/O | | | 09/10/2058 | | | | 6,823,992 | |
| | 20,725,000 | | | Citigroup Commercial Mortgage Trust, Series2015-GC35-C | | | 4.50 | % # | | | 11/10/2048 | | | | 18,037,117 | |
| | 105,194,245 | | | Citigroup Commercial Mortgage Trust, Series2016-C1-XA | | | 1.88 | % # I/O | | | 05/10/2049 | | | | 9,337,851 | |
| | 210,999,596 | | | Citigroup Commercial Mortgage Trust, Series2016-GC36-XA | | | 1.27 | % # I/O | | | 02/10/2049 | | | | 11,927,280 | |
| | 43,107,960 | | | Citigroup Commercial Mortgage Trust, Series2016-GC37-XA | | | 1.75 | % # I/O | | | 04/10/2049 | | | | 3,427,143 | |
| | 104,141,332 | | | Citigroup Commercial Mortgage Trust, Series2016-P3-XA | | | 1.70 | % # I/O | | | 04/15/2049 | | | | 7,676,039 | |
| | 59,771,551 | | | Citigroup Commercial Mortgage Trust, Series2016-P4-XA | | | 1.97 | % # I/O | | | 07/10/2049 | �� | | | 5,199,940 | |
| | 37,342,605 | | | Citigroup Commercial Mortgage Trust, Series2016-P5-XA | | | 1.52 | % # I/O | | | 10/10/2049 | | | | 2,493,556 | |
| | 46,560,695 | | | Citigroup Commercial Mortgage Trust, Series2017-P7-XA | | | 1.12 | % # I/O | | | 04/14/2050 | | | | 2,713,078 | |
| | 23,804,000 | | | Citigroup Commercial Mortgage Trust, Series2020-555-E | | | 3.62 | % ^ | | | 12/10/2041 | | | | 16,123,877 | |
| | 4,175,000 | | | Citigroup Commercial Mortgage Trust, Series2020-555-F | | | 3.62 | % ^ | | | 12/10/2041 | | | | 2,497,832 | |
| | 63,849,000 | | | CLNC Ltd., Series2019-FL1-A (1 Month LIBOR USD + 1.25%, 1.25% Floor) | | | 2.00 | % ^ | | | 08/20/2035 | | | | 57,944,181 | |
| | 1,384,509 | | | Commercial Mortgage Pass Through Certificates, Series2014-CR14-A2 | | | 3.15 | % | | | 02/10/2047 | | | | 1,383,458 | |
| | 31,251,456 | | | Commercial Mortgage Pass-Through Certificates, Series2012-CR2-XA | | | 1.63 | % # I/O | | | 08/15/2045 | | | | 954,079 | |
| | 138,643,292 | | | Commercial Mortgage Pass-Through Certificates, Series2012-CR3-XA | | | 1.86 | % # I/O | | | 10/15/2045 | | | | 5,087,169 | |
| | 105,527,026 | | | Commercial Mortgage Pass-Through Certificates, Series2012-LC4-XA | | | 2.10 | % # ^ I/O | | | 12/10/2044 | | | | 2,948,784 | |
| | 144,311,657 | | | Commercial Mortgage Pass-Through Certificates, Series2013-CR10-XA | | | 0.66 | % # I/O | | | 08/10/2046 | | | | 2,836,590 | |
| | 188,909,988 | | | Commercial Mortgage Pass-Through Certificates, Series2013-CR12-XA | | | 1.13 | % # I/O | | | 10/10/2046 | | | | 6,345,373 | |
| | 843,000 | | | Commercial Mortgage Pass-Through Certificates, Series2013-CR13-C | | | 4.89 | % # | | | 11/10/2046 | | | | 784,863 | |
| | 7,635,000 | | | Commercial Mortgage Pass-Through Certificates, Series2014-CR19-C | | | 4.73 | % # | | | 08/10/2047 | | | | 6,951,762 | |
| | 30,400,000 | | | Commercial Mortgage Pass-Through Certificates, Series2014-CR20-C | | | 4.51 | % # | | | 11/10/2047 | | | | 27,317,759 | |
| | 95,440,768 | | | Commercial Mortgage Pass-Through Certificates, Series2014-UBS3-XA | | | 1.08 | % # I/O | | | 06/10/2047 | | | | 3,569,723 | |
| | 186,821,479 | | | Commercial Mortgage Pass-Through Certificates, Series2015-CR22-XA | | | 0.89 | % # I/O | | | 03/10/2048 | | | | 6,053,838 | |
| | 9,110,000 | | | Commercial Mortgage Pass-Through Certificates, Series2015-CR26-B | | | 4.48 | % # | | | 10/10/2048 | | | | 8,734,953 | |
| | 84,199,587 | | | Commercial Mortgage Pass-Through Certificates, Series2015-CR26-XA | | | 0.95 | % # I/O | | | 10/10/2048 | | | | 3,491,378 | |
| | 17,822,000 | | | Commercial Mortgage Pass-Through Certificates, Series2015-DC1-C | | | 4.31 | % # | | | 02/10/2048 | | | | 15,814,706 | |
| | 339,334,560 | | | Commercial Mortgage Pass-Through Certificates, Series2015-DC1-XA | | | 1.03 | % # I/O | | | 02/10/2048 | | | | 12,676,080 | |
| | 26,930,000 | | | Commercial Mortgage Pass-Through Certificates, Series2016-CR28-C | | | 4.65 | % # | | | 02/10/2049 | | | | 23,604,234 | |
| | 20,355,000 | | | Commercial Mortgage Pass-Through Certificates, Series2016-GCT-E | | | 3.46 | % # ^ | | | 08/10/2029 | | | | 19,084,535 | |
| | 1,617,000 | | | Commercial Mortgage Pass-Through Certificates, Series2017-PANW-D | | | 3.93 | % # ^ | | | 10/10/2029 | | | | 1,455,403 | |
| | 5,524,000 | | | Commercial Mortgage Pass-Through Certificates, Series2017-PANW-E | | | 3.81 | % # ^ | | | 10/10/2029 | | | | 4,361,787 | |
| | 18,570,000 | | | Commercial Mortgage Pass-Through Certificates, Series2018-HCLV-A (1 Month LIBOR USD + 1.00%, 1.00% Floor) | | | 1.70 | % ^ | | | 09/15/2033 | | | | 17,565,538 | |
| | 833,000 | | | Commercial Mortgage Trust, Series2015-3BP-F | | | 3.24 | % # ^ | | | 02/10/2035 | | | | 693,253 | |
| | 1,782,000 | | | Core Mortgage Trust, Series2019-CORE-E (1 Month LIBOR USD + 1.90%, 1.90% Floor) | | | 2.60 | % ^ | | | 12/15/2031 | | | | 1,395,355 | |
| | 150,822,000 | | | Credit Suisse Mortgage Capital Certificates, Series2014-USA-X1 | | | 0.55 | % # ^ I/O | | | 09/15/2037 | | | | 3,748,485 | |
| | 21,821,000 | | | Credit Suisse Mortgage Capital Certificates, Series2019-ICE4-A (1 Month LIBOR USD + 0.98%, 0.98% Floor) | | | 1.68 | % ^ | | | 05/15/2036 | | | | 20,858,563 | |
| | 21,723,000 | | | Credit Suisse Mortgage Capital Certificates, Series2019-ICE4-E (1 Month LIBOR USD + 2.15%, 2.15% Floor) | | | 2.85 | % ^ | | | 05/15/2036 | | | | 18,785,429 | |
| | 4,606,000 | | | CSAIL Commercial Mortgage Trust, Series2015-C1-C | | | 4.27 | % # | | | 04/15/2050 | | | | 4,051,555 | |
| | 13,360,000 | | | CSAIL Commercial Mortgage Trust, Series2015-C2-AS | | | 3.85 | % # | | | 06/15/2057 | | | | 13,853,049 | |
| | 9,205,000 | | | CSAIL Commercial Mortgage Trust, Series2015-C3-B | | | 4.10 | % # | | | 08/15/2048 | | | | 9,080,035 | |
| | 12,154,000 | | | CSAIL Commercial Mortgage Trust, Series2015-C3-C | | | 4.35 | % # | | | 08/15/2048 | | | | 10,596,365 | |
| | 9,759,000 | | | CSAIL Commercial Mortgage Trust, Series2015-C4-C | | | 4.58 | % # | | | 11/15/2048 | | | | 8,538,941 | |
| | 304,188,008 | | | CSAIL Commercial Mortgage Trust, Series2015-C4-XA | | | 0.86 | % # I/O | | | 11/15/2048 | | | | 11,221,921 | |
| | 2,085,000 | | | CSAIL Commercial Mortgage Trust, Series2016-C7-C | | | 4.39 | % # | | | 11/15/2049 | | | | 1,883,193 | |
| | 186,437,863 | | | CSAIL Commercial Mortgage Trust, Series2017-C8-XA | | | 1.24 | % # I/O | | | 06/15/2050 | | | | 9,774,769 | |
| | 5,511,000 | | | CSAIL Commercial Mortgage Trust, Series2017-CX10-C | | | 4.11 | % # | | | 11/15/2050 | | | | 4,460,909 | |
| | 91,333,194 | | | CSAIL Commercial Mortgage Trust, Series2017-CX10-XA | | | 0.72 | % # I/O | | | 11/15/2050 | | | | 3,795,698 | |
| | 1,677,000 | | | CSAIL Commercial Mortgage Trust, Series2018-C14-C | | | 4.89 | % # | | | 11/15/2051 | | | | 1,399,030 | |
| | 4,393,000 | | | CSAIL Commercial Mortgage Trust, Series2019-C16-AS | | | 3.61 | % | | | 06/15/2052 | | | | 4,457,677 | |
| | 15,894,000 | | | CSAIL Commercial Mortgage Trust, Series2019-C16-B | | | 3.88 | % | | | 06/15/2052 | | | | 15,021,744 | |
| | 27,678,000 | | | CSAIL Commercial Mortgage Trust, Series2019-C17-A5 | | | 3.02 | % | | | 09/15/2052 | | | | 29,069,096 | |
| | 12,500,000 | | | CSAIL Commercial Mortgage Trust, Series2019-C18-A4 | | | 2.97 | % | | | 12/15/2052 | | | | 13,077,115 | |
| | 7,924,000 | | | CSAIL Commercial Mortgage Trust, Series2019-C18-B | | | 3.59 | % | | | 12/15/2052 | | | | 7,267,964 | |
| | 255,915,630 | | | CSAIL Commercial Mortgage Trust, Series2019-C18-XA | | | 1.09 | % # I/O | | | 12/15/2052 | | | | 18,514,216 | |
| | 65,609,000 | | | CSAIL Commercial Mortgage Trust, Series2020-C19-A3 | | | 2.56 | % | | | 03/15/2053 | | | | 63,763,681 | |
| | 7,050,000 | | | CSMC Trust, Series2017-CALI-E | | | 3.78 | % # ^ | | | 11/10/2032 | | | | 6,279,473 | |
| | 6,050,000 | | | CSMC Trust, Series2017-CALI-F | | | 3.78 | % # ^ | | | 11/10/2032 | | | | 4,869,574 | |
| | 12,164,000 | | | CSMC Trust, Series2017-CHOP-D (1 Month LIBOR USD + 1.90%, 1.90% Floor) | | | 2.60 | % ^ | | | 07/15/2032 | | | | 10,029,532 | |
| | 21,321,000 | | | CSMC Trust, Series2017-CHOP-E (1 Month LIBOR USD + 3.30%, 3.30% Floor) | | | 4.00 | % ^ | | | 07/15/2032 | | | | 18,281,990 | |
| | 3,818,000 | | | CSMC Trust, Series2017-MOON-D | | | 3.20 | % # ^ | | | 07/10/2034 | | | | 3,661,162 | |
| | 4,673,000 | | | CSMC Trust, Series2017-MOON-E | | | 3.20 | % # ^ | | | 07/10/2034 | | | | 4,339,920 | |
| | 38,345,659 | | | CSWF Trust, Series2018-TOP-A (1 Month LIBOR USD + 1.00%, 1.00% Floor) | | | 1.70 | % ^ | | | 08/15/2035 | | | | 34,659,364 | |
| | 99,847,220 | | | DBUBS Mortgage Trust, Series2011-LC2A-XA | | | 1.02 | % # ^ I/O | | | 07/10/2044 | | | | 711,262 | |
| | 2,996,000 | | | DBUBS Mortgage Trust, Series2011-LC3A-PM2 | | | 4.93 | % # ^ | | | 05/10/2044 | | | | 3,027,524 | |
| | 121,091,427 | | | Deutsche Bank Commercial Mortgage Trust, Series2016-C1-XA | | | 1.45 | % # I/O | | | 05/10/2049 | | | | 7,814,841 | |
| | | | | | | | | | | | | | | | |
| | | | | | | | | | | | | |
| | 49,109,694 | | | Exantas Capital Corporation Ltd., Series2019-RSO7-A (1 Month LIBOR USD + 1.00%, 1.00% Floor) | | | 1.80 | % ^ | | | 04/15/2036 | | | | 40,524,337 | |
| | 28,473,000 | | | Fontainebleau Miami Beach Trust, Series2019-FBLU-E | | | 4.10 | % ^ | | | 12/10/2036 | | | | 22,233,768 | |
| | 9,232,000 | | | Fontainebleau Miami Beach Trust, Series2019-FBLU-F | | | 4.10 | % ^ | | | 12/10/2036 | | | | 6,149,376 | |
| | 9,232,000 | | | Fontainebleau Miami Beach Trust, Series2019-FBLU-G | | | 4.10 | % # ^ | | | 12/10/2036 | | | | 5,945,472 | |
| | 73,900,846 | | | FREMF Mortgage Trust, Series2010-K8-C | | | 0.00 | % ^ P/O | | | 09/25/2043 | | | | 72,009,649 | |
| | 86,165,686 | | | FREMF Mortgage Trust, Series2013-K713-D | | | 0.00 | % ^ P/O | | | 04/25/2046 | | | | 84,888,452 | |
| | 127,970,804 | | | FREMF Mortgage Trust, Series2013-K713-X2B | | | 0.10 | % ^ I/O | | | 04/25/2046 | | | | 1,280 | |
| | 68,881,000 | | | Great Wolf Trust, Series2019-WOLF-E (1 Month LIBOR USD + 2.73%, 2.73% Floor) | | | 3.44 | % ^ | | | 12/15/2036 | | | | 56,811,423 | |
| | 75,048,000 | | | Great Wolf Trust, Series2019-WOLF-F (1 Month LIBOR USD + 3.13%, 3.13% Floor) | | | 3.84 | % ^ | | | 12/15/2036 | | | | 50,952,219 | |
| | 1,957,532 | | | Greenwich Capital Commercial Funding Corporation, Series2006-GG7-AM | | | 5.51 | % # | | | 07/10/2038 | | | | 1,949,265 | |
| | 7,561,000 | | | GS Mortgage Securities Corporation Trust, Series2020-UPTN-D | | | 3.25 | % # ^ | | | 02/10/2037 | | | | 6,217,062 | |
| | 8,967,000 | | | GS Mortgage Securities Corporation Trust, Series2020-UPTN-E | | | 3.25 | % # ^ | | | 02/10/2037 | | | | 7,171,295 | |
| | 6,760,500 | | | GS Mortgage Securities Corporation Trust, Series2020-UPTN-F | | | 3.25 | % # ^ | | | 02/10/2037 | | | | 4,523,937 | |
| | 17,931,782 | | | GS Mortgage Securities Corporation, Series2011-GC3-X | | | 0.65 | % # ^ I/O | | | 03/10/2044 | | | | 49,694 | |
| | 21,908,284 | | | GS Mortgage Securities Corporation, Series2013-GC10-XA | | | 1.50 | % # I/O | | | 02/10/2046 | | | | 758,443 | |
| | 218,790,127 | | | GS Mortgage Securities Corporation, Series2015-GC28-XA | | | 1.01 | % # I/O | | | 02/10/2048 | | | | 8,617,071 | |
| | 229,411,908 | | | GS Mortgage Securities Corporation, Series2015-GC32-XA | | | 0.76 | % # I/O | | | 07/10/2048 | | | | 7,323,264 | |
| | 164,552,916 | | | GS Mortgage Securities Corporation, Series2015-GC34-XA | | | 1.27 | % # I/O | | | 10/10/2048 | | | | 8,785,727 | |
| | 206,352,728 | | | GS Mortgage Securities Corporation, Series2018-GS9-XA | | | 0.45 | % # I/O | | | 03/10/2051 | | | | 6,038,954 | |
| | 16,399,000 | | | GS Mortgage Securities Corporation, Series2018-LUAU-A (1 Month LIBOR USD + 1.00%, 1.00% Floor) | | | 1.70 | % ^ | | | 11/15/2032 | | | | 13,200,308 | |
| | 34,121,000 | | | GS Mortgage Securities Corporation, Series2018-TWR-A (1 Month LIBOR USD + 0.90%, 0.85% Floor) | | | 1.60 | % ^ | | | 07/15/2031 | | | | 29,763,151 | |
| | 3,897,000 | | | GS Mortgage Securities Corporation, Series2018-TWR-D (1 Month LIBOR USD + 1.60%, 1.50% Floor) | | | 2.30 | % ^ | | | 07/15/2031 | | | | 3,040,453 | |
| | 11,950,000 | | | GS Mortgage Securities Corporation, Series2018-TWR-E (1 Month LIBOR USD + 2.10%, 2.10% Floor) | | | 2.80 | % ^ | | | 07/15/2031 | | | | 8,959,477 | |
| | 11,242,000 | | | GS Mortgage Securities Corporation, Series2018-TWR-F (1 Month LIBOR USD + 2.80%, 2.80% Floor) | | | 3.50 | % ^ | | | 07/15/2031 | | | | 8,407,052 | |
| | 4,648,000 | | | GS Mortgage Securities Corporation, Series2018-TWR-G (1 Month LIBOR USD + 3.92%, 3.98% Floor) | | | 4.63 | % ^ | | | 07/15/2031 | | | | 3,481,642 | |
| | 23,022,000 | | | GS Mortgage Securities Corporation, Series2019-SOHO-E (1 Month LIBOR USD + 1.87%, 1.88% Floor) | | | 2.58 | % ^ | | | 06/15/2036 | | | | 22,198,188 | |
| | 91,390,356 | | | GS Mortgage Securities Trust, Series2012-GC6-XA | | | 1.93 | % # ^ I/O | | | 01/10/2045 | | | | 2,113,758 | |
| | 3,500,000 | | | GS Mortgage Securities Trust, Series2015-GC28-C | | | 4.32 | % # | | | 02/10/2048 | | | | 3,097,410 | |
| | 67,153,191 | | | GS Mortgage Securities Trust, Series2015-GS1-XA | | | 0.78 | % # I/O | | | 11/10/2048 | | | | 2,496,964 | |
| | 55,056,579 | | | GS Mortgage Securities Trust, Series2016-GS2-XA | | | 1.65 | % # I/O | | | 05/10/2049 | | | | 3,751,170 | |
| | 306,186,096 | | | GS Mortgage Securities Trust, Series2016-GS3-XA | | | 1.25 | % # I/O | | | 10/10/2049 | | | | 17,823,276 | |
| | 68,789,452 | | | GS Mortgage Securities Trust, Series2016-GS4-XA | | | 0.57 | % # I/O | | | 11/10/2049 | | | | 1,716,022 | |
| | 189,912,211 | | | GS Mortgage Securities Trust, Series2017-GS7-XA | | | 1.13 | % # I/O | | | 08/10/2050 | | | | 11,807,488 | |
| | 98,700,000 | | | GS Mortgage Securities Trust, Series2017-GS7-XB | | | 0.35 | % # I/O | | | 08/10/2050 | | | | 2,261,533 | |
| | 3,443,000 | | | GS Mortgage Securities Trust, Series 2018-GS10-WLSA | | | 4.74 | % # ^ | | | 03/10/2033 | | | | 3,093,966 | |
| | 6,834,000 | | | GS Mortgage Securities Trust, Series 2018-GS10-WLSB | | | 4.74 | % # ^ | | | 03/10/2033 | | | | 5,799,103 | |
| | 9,287,000 | | | GS Mortgage Securities Trust, Series 2018-GS10-WLSC | | | 4.74 | % # ^ | | | 03/10/2033 | | | | 7,599,560 | |
| | 8,990,000 | | | GS Mortgage Securities Trust, Series 2018-GS10-WLSD | | | 4.74 | % # ^ | | | 03/10/2033 | | | | 7,155,421 | |
| | 11,236,750 | | | GS Mortgage Securities Trust, Series 2018-GS10-WLSE | | | 4.74 | % # ^ | | | 03/10/2033 | | | | 8,807,358 | |
| | 61,017,213 | | | GS Mortgage Securities Trust, Series2019-GC38-XA | | | 0.96 | % # I/O | | | 02/10/2052 | | | | 4,129,791 | |
| | 17,211,490 | | | GS Mortgage Securities Trust, Series2019-GC39-XA | | | 1.14 | % # I/O | | | 05/10/2052 | | | | 1,293,304 | |
| | 89,831,997 | | | GS Mortgage Securities Trust, Series2020-GC45-XA | | | 0.68 | % # I/O | | | 02/13/2053 | | | | 4,550,718 | |
| | 7,037,000 | | | Hilton Orlando Trust, Series2018-ORL-E (1 Month LIBOR USD + 2.65%, 2.65% Floor) | | | 3.35 | % ^ | | | 12/15/2034 | | | | 5,415,172 | |
| | 5,692,000 | | | Hilton USA Trust, Series2016-SFP-A | | | 2.83 | % ^ | | | 11/05/2035 | | | | 5,492,802 | |
| | 35,738,186 | | | HPLY Trust, Series2019-HIT-F (1 Month LIBOR USD + 3.15%, 3.15% Floor) | | | 3.85 | % ^ | | | 11/15/2036 | | | | 21,409,461 | |
| | 8,420,221 | | | IMT Trust, Series2017-APTS-BFL (1 Month LIBOR USD + 0.95%, 0.95% Floor) | | | 1.65 | % ^ | | | 06/15/2034 | | | | 7,580,857 | |
| | 2,636,233 | | | IMT Trust, Series2017-APTS-CFL (1 Month LIBOR USD + 1.10%, 0.95% Floor) | | | 1.80 | % ^ | | | 06/15/2034 | | | | 2,308,292 | |
| | 522,893 | | | JP Morgan Chase Commercial Mortgage Securities Corporation, Series2004-CBX-X1 | | | 0.93 | % # ^ I/O | | | 01/12/2037 | | | | 6,585 | |
| | 1,092,405 | | | JP Morgan Chase Commercial Mortgage Securities Corporation, Series2006-LDP8-X | | | 0.29 | % # I/O | | | 05/15/2045 | | | | 169 | |
| | 18,431,759 | | | JP Morgan Chase Commercial Mortgage Securities Corporation, Series2007-CB18-X | | | 0.40 | % # I/O | | | 06/12/2047 | | | | 184 | |
| | 47,503,432 | | | JP Morgan Chase Commercial Mortgage Securities Corporation, Series2007-CB20-X1 | | | 0.00 | % # ^ I/O | | | 02/12/2051 | | | | 475 | |
| | 131,482,148 | | | JP Morgan Chase Commercial Mortgage Securities Corporation, Series2012-C6-XA | | | 1.57 | % # I/O | | | 05/15/2045 | | | | 3,345,103 | |
| | 260,839,799 | | | JP Morgan Chase Commercial Mortgage Securities Corporation, Series2012-C8-XA | | | 1.78 | % # I/O | | | 10/15/2045 | | | | 9,319,154 | |
| | 106,370,443 | | | JP Morgan Chase Commercial Mortgage Securities Corporation, Series2012-CBX-XA | | | 1.48 | % # I/O | | | 06/15/2045 | | | | 1,925,837 | |
| | 77,269,458 | | | JP Morgan Chase Commercial Mortgage Securities Corporation, Series2015-JP1-XA | | | 1.08 | % # I/O | | | 01/15/2049 | | | | 2,660,310 | |
| | 1,130,205 | | | JP Morgan Chase Commercial Mortgage Securities Corporation, Series2017-FL10-D (1 Month LIBOR USD + 1.90%, 1.90% Floor) | | | 2.60 | % ^ | | | 06/15/2032 | | | | 1,054,086 | |
| | 63,195,557 | | | JP Morgan Chase Commercial Mortgage Securities Corporation, Series2018-LAQ-A (1 Month LIBOR USD + 1.00%, 1.00% Floor) | | | 1.70 | % ^ | | | 06/15/2032 | | | | 60,444,276 | |
| | 9,343,000 | | | JP Morgan Chase Commercial Mortgage Securities Corporation, Series2018-MINN-E (1 Month LIBOR USD + 2.50%, 2.50% Floor) | | | 4.16 | % ^ | | | 11/15/2035 | | | | 7,853,527 | |
| | 103,312,500 | | | JP Morgan Chase Commercial Mortgage Securities Corporation, Series2019-EMBS-AB (1 Month LIBOR USD + 2.32%, 2.32% Floor) | | | 3.32 | % ^ | | | 02/07/2024 | | | | 98,204,213 | |
| | 4,857,000 | | | JP Morgan Chase Commercial Mortgage Securities Trust, Series2016-WIKI-E | | | 4.01 | % # ^ | | | 10/05/2031 | | | | 4,054,504 | |
| | 428,000 | | | JP Morgan Chase Commercial Mortgage Securities Trust, Series2017-C5-AS | | | 3.86 | % # | | | 03/15/2050 | | | | 446,403 | |
| | 6,954,000 | | | JP Morgan Chase Commercial Mortgage Securities Trust, Series2018-ASH8-B (1 Month LIBOR USD + 1.10%, 1.14% Floor) | | | 1.80 | % ^ | | | 02/15/2035 | | | | 6,524,928 | |
| | 905,000 | | | JP Morgan Chase Commercial Mortgage Securities Trust, Series2018-ASH8-C (1 Month LIBOR USD + 1.30%, 1.34% Floor) | | | 2.00 | % ^ | | | 02/15/2035 | | | | 827,339 | |
| | 1,145,000 | | | JP Morgan Chase Commercial Mortgage Securities Trust, Series2018-BCON-E | | | 3.76 | % # ^ | | | 01/05/2031 | | | | 1,054,816 | |
| | 5,831,000 | | | JP Morgan Chase Commercial Mortgage Securities Trust, Series2018-WPT-EFX | | | 5.54 | % ^ | | | 07/05/2033 | | | | 4,976,809 | |
| | 6,097,000 | | | JP Morgan Chase Commercial Mortgage Securities Trust, Series2018-WPT-FFX | | | 5.54 | % ^ | | | 07/05/2033 | | | | 4,697,776 | |
| | 27,547,000 | | | JP Morgan Chase Commercial Mortgage Securities Trust, Series2019-COR5-A4 | | | 3.39 | % | | | 06/13/2052 | | | | 29,301,997 | |
| | 20,257,000 | | | JP Morgan Chase Commercial Mortgage Securities Trust, Series2019-COR6-A4 | | | 3.06 | % | | | 11/13/2052 | | | | 21,517,188 | |
| | 13,604,000 | | | JP Morgan Chase Commercial Mortgage Securities Trust, Series2019-COR6-AS | | | 3.41 | % | | | 11/13/2052 | | | | 13,621,840 | |
| | 10,822,000 | | | JP Morgan Chase Commercial Mortgage Securities Trust, Series2020-ACE-C | | | 3.69 | % # ^ | | | 01/10/2037 | | | | 9,228,904 | |
| | 40,424,000 | | | JP Morgan Chase Commercial Mortgage Securities Trust, Series2020-NNN-EFX | | | 3.97 | % ^ | | | 01/16/2037 | | | | 33,887,641 | |
| | 81,128,480 | | | JPMBB Commercial Mortgage Securities Trust, Series2014-C18-XA | | | 0.82 | % # I/O | | | 02/15/2047 | | | | 2,096,360 | |
| | 3,396,000 | | | JPMBB Commercial Mortgage Securities Trust, Series2014-C21-C | | | 4.66 | % # | | | 08/15/2047 | | | | 3,086,421 | |
| | 184,578,926 | | | JPMBB Commercial Mortgage Securities Trust, Series2014-C25-XA | | | 0.85 | % # I/O | | | 11/15/2047 | | | | 5,886,351 | |
| | 6,499,000 | | | JPMBB Commercial Mortgage Securities Trust, Series2014-C26-C | | | 4.38 | % # | | | 01/15/2048 | | | | 5,774,067 | |
| | 190,336,348 | | | JPMBB Commercial Mortgage Securities Trust, Series2014-C26-XA | | | 0.97 | % # I/O | | | 01/15/2048 | | | | 6,970,441 | |
| | 12,055,000 | | | JPMBB Commercial Mortgage Securities Trust, Series2015-C27-C | | | 4.31 | % # | | | 02/15/2048 | | | | 10,623,035 | |
| | 10,425,000 | | | JPMBB Commercial Mortgage Securities Trust, Series2015-C27-D | | | 3.81 | % # ^ | | | 02/15/2048 | | | | 8,444,388 | |
| | 305,000 | | | JPMBB Commercial Mortgage Securities Trust, Series2015-C28-B | | | 3.99 | % | | | 10/15/2048 | | | | 301,000 | |
| | 20,569,088 | | | JPMBB Commercial Mortgage Securities Trust, Series2015-C28-C | | | 4.20 | % # | | | 10/15/2048 | | | | 18,493,661 | |
| | 37,642,179 | | | JPMBB Commercial Mortgage Securities Trust, Series2015-C28-XA | | | 1.06 | % # I/O | | | 10/15/2048 | | | | 1,315,436 | |
| | 46,186,919 | | | JPMBB Commercial Mortgage Securities Trust, Series2015-C29-XA | | | 0.74 | % # I/O | | | 05/15/2048 | | | | 1,182,667 | |
| | 148,607,070 | | | JPMBB Commercial Mortgage Securities Trust, Series2015-C30-XA | | | 0.51 | % # I/O | | | 07/15/2048 | | | | 3,394,275 | |
| | 23,865,000 | | | JPMBB Commercial Mortgage Securities Trust, Series2015-C32-C | | | 4.66 | % # | | | 11/15/2048 | | | | 20,994,024 | |
| | 86,874,407 | | | JPMBB Commercial Mortgage Securities Trust, Series2015-C32-XA | | | 1.33 | % # I/O | | | 11/15/2048 | | | | 2,879,044 | |
| | 17,630,000 | | | JPMBB Commercial Mortgage Securities Trust, Series2015-C33-C | | | 4.62 | % # | | | 12/15/2048 | | | | 15,454,962 | |
| | 32,345,000 | | | JPMBB Commercial Mortgage Securities Trust, Series2016-C1-C | | | 4.74 | % # | | | 03/15/2049 | | | | 28,326,111 | |
| | 145,794,526 | | | JPMBB Commercial Mortgage Securities Trust, Series2016-C2-XA | | | 1.67 | % # I/O | | | 06/15/2049 | | | | 8,896,192 | |
| | 160,751,731 | | | JPMBB Commercial Mortgage Securities Trust, Series2017-C5-XA | | | 0.94 | % # I/O | | | 03/15/2050 | | | | 8,286,141 | |
| | | | | | | | | | | | | | | | |
| | | | | | | | | | | | | |
| | 93,112,297 | | | JPMCC Commercial Mortgage Securities Trust, Series2019-COR5-XA | | | 1.50 | % # I/O | | | 06/13/2052 | | | | 9,310,485 | |
| | 8,363,193 | | | LB-UBS Commercial Mortgage Trust, Series2006-C7-XCL | | | 0.60 | % # ^ I/O | | | 11/15/2038 | | | | 2,026 | |
| | 45,101,000 | | | LoanCore Issuer Ltd., Series2019-CRE2-AS (1 Month LIBOR USD + 1.50%, 1.50% Floor) | | | 2.20 | % ^ | | | 05/15/2036 | | | | 38,599,961 | |
| | 20,592,964 | | | LSTAR Commercial Mortgage Trust, Series2017-5-X | | | 1.00 | % # ^ I/O | | | 03/10/2050 | | | | 774,143 | |
| | 11,794,177 | | | Merrill Lynch Mortgage Investors Trust, Series1998-C1-IO | | | 1.14 | % # I/O | | | 11/15/2026 | | | | 52,335 | |
| | 12,625,000 | | | MFT Trust, Series2020-ABC-A | | | 3.36 | % ^ | | | 02/06/2030 | | | | 12,479,055 | |
| | 5,326,000 | | | MFT Trust, Series2020-ABC-B | | | 3.48 | % # ^ | | | 02/06/2030 | | | | 4,945,841 | |
| | 1,000,000 | | | MKT Mortgage Trust, Series2020-525M-F | | | 2.94 | % # ^ | | | 02/12/2040 | | | | 536,081 | |
| | 11,401,000 | | | Morgan Stanley Bank of America Merrill Lynch Trust, Series2012-CKSV-CK | | | 4.30 | % ^ | | | 10/15/2030 | | | | 9,075,834 | |
| | 143,437,202 | | | Morgan Stanley Bank of America Merrill Lynch Trust, Series2013-C12-XA | | | 0.60 | % # I/O | | | 10/15/2046 | | | | 2,445,834 | |
| | 31,035,939 | | | Morgan Stanley Bank of America Merrill Lynch Trust, Series2013-C7-XA | | | 1.34 | % # I/O | | | 02/15/2046 | | | | 957,738 | |
| | 13,450,000 | | | Morgan Stanley Bank of America Merrill Lynch Trust, Series2014-C18-C | | | 4.52 | % # | | | 10/15/2047 | | | | 12,094,344 | |
| | 37,950,000 | | | Morgan Stanley Bank of America Merrill Lynch Trust, Series2014-C19-C | | | 4.00 | % | | | 12/15/2047 | | | | 33,066,146 | |
| | 20,087,700 | | | Morgan Stanley Bank of America Merrill Lynch Trust, Series2015-C20-B | | | 4.16 | % | | | 02/15/2048 | | | | 20,131,126 | |
| | 5,457,500 | | | Morgan Stanley Bank of America Merrill Lynch Trust, Series2015-C20-C | | | 4.46 | % # | | | 02/15/2048 | | | | 4,853,712 | |
| | 226,739,016 | | | Morgan Stanley Bank of America Merrill Lynch Trust, Series2015-C20-XA | | | 1.31 | % # I/O | | | 02/15/2048 | | | | 10,226,859 | |
| | 10,616,000 | | | Morgan Stanley Bank of America Merrill Lynch Trust, Series2015-C23-C | | | 4.16 | % # | | | 07/15/2050 | | | | 9,194,709 | |
| | 8,460,000 | | | Morgan Stanley Bank of America Merrill Lynch Trust, Series2015-C25-C | | | 4.53 | % # | | | 10/15/2048 | | | | 7,416,134 | |
| | 19,422,000 | | | Morgan Stanley Bank of America Merrill Lynch Trust, Series2015-C27-C | | | 4.53 | % # | | | 12/15/2047 | | | | 16,950,156 | |
| | 1,517,000 | | | Morgan Stanley Bank of America Merrill Lynch Trust, Series2015-C27-D | | | 3.24 | % # ^ | | | 12/15/2047 | | | | 1,106,766 | |
| | 152,988,364 | | | Morgan Stanley Bank of America Merrill Lynch Trust, Series2016-C28-XA | | | 1.20 | % # I/O | | | 01/15/2049 | | | | 7,811,662 | |
| | 2,314,000 | | | Morgan Stanley Bank of America Merrill Lynch Trust, Series2016-C31-C | | | 4.31 | % # | | | 11/15/2049 | | | | 1,942,794 | |
| | 51,564,063 | | | Morgan Stanley Bank of America Merrill Lynch Trust, Series2017-C33-XA | | | 1.42 | % # I/O | | | 05/15/2050 | | | | 3,229,849 | |
| | 19,975,066 | | | Morgan Stanley Capital Trust, Series2006-HQ10-X1 | | | 0.36 | % # ^ I/O | | | 11/12/2041 | | | | 200 | |
| | 7,137,000 | | | Morgan Stanley Capital Trust, Series2015-UBS8-B | | | 4.32 | % # | | | 12/15/2048 | | | | 7,061,402 | |
| | 26,646,952 | | | Morgan Stanley Capital Trust, Series2015-UBS8-XA | | | 0.88 | % # I/O | | | 12/15/2048 | | | | 1,073,632 | |
| | 12,140,000 | | | Morgan Stanley Capital Trust, Series2017-ASHF-D (1 Month LIBOR USD + 2.20%, 2.20% Floor) | | | 2.90 | % ^ | | | 11/15/2034 | | | | 8,026,616 | |
| | 17,935,000 | | | Morgan Stanley Capital Trust, Series2017-ASHF-E (1 Month LIBOR USD + 3.15%, 3.15% Floor) | | | 3.85 | % ^ | | | 11/15/2034 | | | | 9,702,351 | |
| | 13,586,000 | | | Morgan Stanley Capital Trust, Series2017-ASHF-F (1 Month LIBOR USD + 4.35%, 4.35% Floor) | | | 5.05 | % ^ | | | 11/15/2034 | | | | 7,315,898 | |
| | 146,740,882 | | | Morgan Stanley Capital Trust, Series2017-H1-XA | | | 1.43 | % # I/O | | | 06/15/2050 | | | | 9,989,371 | |
| | 8,000,000 | | | Morgan Stanley Capital Trust, Series2018-MP-E | | | 4.28 | % # ^ | | | 07/11/2040 | | | | 5,424,054 | |
| | 11,392,000 | | | Morgan Stanley Capital Trust, Series2018-SUN-D (1 Month LIBOR USD + 1.65%, 1.65% Floor) | | | 2.35 | % ^ | | | 07/15/2035 | | | | 8,744,709 | |
| | 20,425,000 | | | Morgan Stanley Capital Trust, Series2018-SUN-F (1 Month LIBOR USD + 2.55%, 2.55% Floor) | | | 3.25 | % ^ | | | 07/15/2035 | | | | 15,436,496 | |
| | 10,748,000 | | | Morgan Stanley Capital Trust, Series2018-SUN-G (1 Month LIBOR USD + 3.05%, 3.05% Floor) | | | 3.75 | % ^ | | | 07/15/2035 | | | | 8,081,242 | |
| | 5,305,000 | | | Morgan Stanley Capital Trust, Series2019-H7-AS | | | 3.52 | % | | | 07/15/2052 | | | | 5,244,176 | |
| | 79,239,215 | | | Morgan Stanley Capital Trust, Series2019-L2-XA | | | 1.03 | % # I/O | | | 03/15/2052 | | | | 5,863,987 | |
| | 3,845,000 | | | Morgan Stanley Capital Trust, Series2019-L3-AS | | | 3.49 | % | | | 11/15/2052 | | | | 3,813,095 | |
| | 157,564,327 | | | Morgan Stanley Capital Trust, Series2019-L3-XA | | | 0.65 | % # I/O | | | 11/15/2052 | | | | 7,935,050 | |
| | 1,315,000 | | | Morgan Stanley Capital Trust, Series2019-PLND-B (1 Month LIBOR USD + 1.30%, 1.30% Floor) | | | 2.00 | % ^ | | | 05/15/2036 | | | | 1,110,446 | |
| | 6,002,000 | | | Morgan Stanley Capital Trust, Series2019-PLND-E (1 Month LIBOR USD + 2.15%, 2.15% Floor) | | | 2.85 | % ^ | | | 05/15/2036 | | | | 4,822,437 | |
| | 220,000 | | | Morgan Stanley Capital Trust, Series2020-L4-ASB | | | 2.62 | % | | | 02/15/2053 | | | | 227,516 | |
| | 24,004,000 | | | Morgan Stanley Capital Trust, Series2020-L4-B | | | 3.08 | % | | | 02/15/2053 | | | | 21,252,926 | |
| | 288,536,792 | | | Morgan Stanley Capital Trust, Series2020-L4-XA | | | 1.08 | % # I/O | | | 02/15/2053 | | | | 24,513,163 | |
| | 1,606,672 | | | Motel 6 Trust, Series2017-MTL6-A (1 Month LIBOR USD + 0.92%, 0.92% Floor) | | | 1.62 | % ^ | | | 08/15/2034 | | | | 1,508,910 | |
| | 54,253,000 | | | MRCD Mortgage Trust, Series2019-PARK-G | | | 2.72 | % ^ | | | 12/15/2036 | | | | 45,065,607 | |
| | 14,563,084 | | | Natixis Commercial Mortgage Securities Trust, Series2018-FL1-A (1 Month LIBOR USD + 0.95%, 0.95% Floor) | | | 2.61 | % ^ | | | 06/15/2035 | | | | 13,757,934 | |
| | 13,188,800 | | | Natixis Commercial Mortgage Securities Trust, Series2020-2PAC-D | | | 3.75 | % ^ | | | 12/15/2038 | | | | 10,031,831 | |
| | 14,792,000 | | | NLY Commercial Mortgage Trust, Series2019-FL2-AS (1 Month LIBOR USD + 1.60%, 1.60% Floor) | | | 2.30 | % ^ | | | 02/15/2036 | | | | 13,738,928 | |
| | 3,453,000 | | | One Market Plaza Trust, Series2017-1MKT-E | | | 4.14 | % ^ | | | 02/10/2032 | | | | 2,859,433 | |
| | 14,159,000 | | | Rosslyn Portfolio Trust, Series2017-ROSS-A (1 Month LIBOR USD + 0.95%, 1.94% Floor) | | | 1.94 | % ^ | | | 06/15/2033 | | | | 12,780,211 | |
| | 15,724,000 | | | Rosslyn Portfolio Trust, Series2017-ROSS-B (1 Month LIBOR USD + 1.25%, 2.24% Floor) | | | 2.24 | % ^ | | | 06/15/2033 | | | | 14,073,598 | |
| | 21,159,000 | | | STRU BAML-1563 A | | | 2.08 | % | | | 05/25/2030 | | | | 21,211,898 | |
| | 7,562,909 | | | Tharaldson Hotel Portfolio Trust, Series2018-THL-E (1 Month LIBOR USD + 3.18%, 3.10% Floor) | | | 4.19 | % ^ | | | 11/11/2034 | | | | 6,397,290 | |
| | 31,066,000 | | | TRTX Issuer Ltd., Series2019-FL3-AS (1 Month LIBOR USD + 1.45%, 1.45% Floor) | | | 2.25 | % ^ | | | 09/15/2034 | | | | 25,440,413 | |
| | 76,425,990 | | | UBS Commercial Mortgage Trust, Series2017-C1-XA | | | 1.56 | % # I/O | | | 06/15/2050 | | | | 6,223,002 | |
| | 1,154,000 | | | UBS Commercial Mortgage Trust, Series2017-C2-C | | | 4.30 | % # | | | 08/15/2050 | | | | 943,149 | |
| | 12,654,848 | | | UBS Commercial Mortgage Trust, Series2017-C3-XA | | | 1.11 | % # I/O | | | 08/15/2050 | | | | 726,946 | |
| | 2,886,000 | | | UBS Commercial Mortgage Trust, Series2017-C6-C | | | 4.45 | % # | | | 12/15/2050 | | | | 2,669,099 | |
| | 2,137,000 | | | UBS Commercial Mortgage Trust, Series2018-C12-B | | | 4.79 | % # | | | 08/15/2051 | | | | 2,157,518 | |
| | 8,530,000 | | | UBS Commercial Mortgage Trust, Series2018-C8-C | | | 4.70 | % # | | | 02/15/2051 | | | | 7,112,970 | |
| | 1,500,000 | | | UBS Commercial Mortgage Trust, Series2018-C9-C | | | 4.89 | % # | | | 03/15/2051 | | | | 1,267,682 | |
| | 43,631,029 | | | UBS Commercial Mortgage Trust, Series2018-C9-XA | | | 0.89 | % # I/O | | | 03/15/2051 | | | | 2,521,023 | |
| | 5,213,000 | | | UBS Commercial Mortgage Trust, Series2019-C16-AS | | | 3.89 | % | | | 04/15/2052 | | | | 5,561,975 | |
| | 6,114,000 | | | UBS Commercial Mortgage Trust, Series2019-C16-B | | | 4.32 | % # | | | 04/15/2052 | | | | 6,373,797 | |
| | 8,350,000 | | | UBS Commercial Mortgage Trust, Series2019-C17-AS | | | 3.20 | % | | | 10/15/2052 | | | | 8,037,004 | |
| | 14,858,000 | | | UBS Commercial Mortgage Trust, Series2019-C18-AS | | | 3.38 | % | | | 12/15/2052 | | | | 14,480,325 | |
| | 9,705,000 | | | UBS Commercial Mortgage Trust, Series2019-C18-B | | | 3.68 | % | | | 12/15/2052 | | | | 8,834,721 | |
| | 73,279,226 | | | UBS-Barclays Commercial Mortgage Trust, Series2012-C3-XA | | | 1.82 | % # ^ I/O | | | 08/10/2049 | | | | 2,619,307 | |
| | 3,193,000 | | | Wells Fargo Commercial Mortgage Trust2019-C51, Series2019-C51-B | | | 3.84 | % # | | | 06/15/2052 | | | | 3,093,704 | |
| | 50,675,220 | | | Wells Fargo Commercial Mortgage Trust2019-C51, Series2019-C51-XA | | | 1.38 | % # I/O | | | 06/15/2052 | | | | 4,667,390 | |
| | 4,346,710 | | | Wells Fargo Commercial Mortgage Trust, Series2014-LC18-B | | | 3.96 | % | | | 12/15/2047 | | | | 4,615,259 | |
| | 11,460,000 | | | Wells Fargo Commercial Mortgage Trust, Series2015-C26-C | | | 4.07 | % # | | | 02/15/2048 | | | | 9,965,067 | |
| | 386,867,935 | | | Wells Fargo Commercial Mortgage Trust, Series2015-C26-XA | | | 1.21 | % # I/O | | | 02/15/2048 | | | | 18,245,117 | |
| | 5,450,000 | | | Wells Fargo Commercial Mortgage Trust, Series2015-C27-C | | | 3.89 | % | | | 02/15/2048 | | | | 4,687,778 | |
| | 225,169,706 | | | Wells Fargo Commercial Mortgage Trust, Series2015-C27-XA | | | 0.89 | % # I/O | | | 02/15/2048 | | | | 7,772,723 | |
| | 9,701,000 | | | Wells Fargo Commercial Mortgage Trust, Series2015-C31-C | | | 4.61 | % # | | | 11/15/2048 | | | | 8,506,699 | |
| | 135,415,489 | | | Wells Fargo Commercial Mortgage Trust, Series2015-C31-XA | | | 1.01 | % # I/O | | | 11/15/2048 | | | | 6,167,350 | |
| | 250,163,943 | | | Wells Fargo Commercial Mortgage Trust, Series2015-LC20-XA | | | 1.33 | % # I/O | | | 04/15/2050 | | | | 11,057,421 | |
| | 12,000,000 | | | Wells Fargo Commercial Mortgage Trust, Series2015-LC22-C | | | 4.53 | % # | | | 09/15/2058 | | | | 10,524,415 | |
| | 1,794,000 | | | Wells Fargo Commercial Mortgage Trust, Series2015-NXS4-C | | | 4.67 | % # | | | 12/15/2048 | | | | 1,579,882 | |
| | 127,367,164 | | | Wells Fargo Commercial Mortgage Trust, Series2015-P2-XA | | | 0.98 | % # I/O | | | 12/15/2048 | | | | 4,751,088 | |
| | 11,469,000 | | | Wells Fargo Commercial Mortgage Trust, Series2016-C32-C | | | 4.73 | % # | | | 01/15/2059 | | | | 10,068,611 | |
| | 8,676,000 | | | Wells Fargo Commercial Mortgage Trust, Series2016-C34-C | | | 5.03 | % # | | | 06/15/2049 | | | | 7,704,180 | |
| | 157,708,473 | | | Wells Fargo Commercial Mortgage Trust, Series2017-C39-XA | | | 1.13 | % # I/O | | | 09/15/2050 | | | | 9,606,197 | |
| | 50,438,760 | | | Wells Fargo Commercial Mortgage Trust, Series2017-C42-XA | | | 0.89 | % # I/O | | | 12/15/2050 | | | | 2,814,599 | |
| | 167,099,267 | | | Wells Fargo Commercial Mortgage Trust, Series2018-C43-XA | | | 0.70 | % # I/O | | | 03/15/2051 | | | | 7,323,710 | |
| | 137,762,140 | | | Wells Fargo Commercial Mortgage Trust, Series2019-C50-XA | | | 1.42 | % # I/O | | | 05/15/2052 | | | | 13,147,220 | |
| | 24,972,000 | | | Wells Fargo Commercial Mortgage Trust, Series2019-C52-AS | | | 3.14 | % | | | 08/15/2052 | | | | 23,934,691 | |
| | 82,413,801 | | | Wells Fargo Commercial Mortgage Trust, Series2019-C52-XA | | | 1.62 | % # I/O | | | 08/15/2052 | | | | 8,623,244 | |
| | | | | | | | | | | | | | | | |
| | | | | | | | | | | | | |
| | 5,000,000 | | | Wells Fargo Commercial Mortgage Trust, Series2019-C53-C | | | 3.58 | % # | | | 10/15/2052 | | | | 3,623,609 | |
| | 16,265,000 | | | Wells Fargo Commercial Mortgage Trust, Series2019-C54-A4 | | | 3.15 | % | | | 12/15/2052 | | | | 17,328,575 | |
| | 143,894,579 | | | Wells Fargo Commercial Mortgage Trust, Series2019-C54-XA | | | 0.84 | % # I/O | | | 12/15/2052 | | | | 9,187,007 | |
| | 63,513,500 | | | Wells Fargo Commercial Mortgage Trust, Series2020-C55-A5 | | | 2.73 | % | | | 02/15/2053 | | | | 63,862,380 | |
| | 28,088,000 | | | Wells Fargo Commercial Mortgage Trust, Series2020-C55-AS | | | 2.94 | % | | | 02/15/2053 | | | | 29,224,665 | |
| | 1,999,000 | | | Wells Fargo Commercial Mortgage Trust, Series2020-C55-ASB | | | 2.65 | % | | | 02/15/2053 | | | | 2,009,767 | |
| | 52,886,315 | | | Wells Fargo Commercial Mortgage Trust, Series2020-C55-XB | | | 0.82 | % # I/O | | | 02/15/2053 | | | | 3,486,425 | |
| | 56,014,534 | | | WF-RBS Commercial Mortgage Trust, Series2011-C4-XA | | | 0.32 | % # ^ I/O | | | 06/15/2044 | | | | 171,528 | |
| | 77,422,097 | | | WF-RBS Commercial Mortgage Trust, Series2012-C6-XA | | | 2.06 | % # ^ I/O | | | 04/15/2045 | | | | 1,956,998 | |
| | 90,098,519 | | | WF-RBS Commercial Mortgage Trust, Series2012-C8-XA | | | 1.81 | % # ^ I/O | | | 08/15/2045 | | | | 2,836,391 | |
| | 35,563,152 | | | WF-RBS Commercial Mortgage Trust, Series2012-C9-XA | | | 1.89 | % # ^ I/O | | | 11/15/2045 | | | | 1,353,096 | |
| | 134,464,735 | | | WF-RBS Commercial Mortgage Trust, Series2013-C18-XA | | | 0.73 | % # I/O | | | 12/15/2046 | | | | 2,685,194 | |
| | 158,483,035 | | | WF-RBS Commercial Mortgage Trust, Series2014-C19-XA | | | 1.03 | % # I/O | | | 03/15/2047 | | | | 4,594,819 | |
| | 25,000,000 | | | WF-RBS Commercial Mortgage Trust, Series2014-C25-A5 | | | 3.63 | % | | | 11/15/2047 | | | | 26,302,100 | |
| | 8,000,000 | | | WF-RBS Commercial Mortgage Trust, Series2014-C25-C | | | 4.31 | % # | | | 11/15/2047 | | | | 7,104,365 | |
| | 181,937,185 | | | WF-RBS Commercial Mortgage Trust, Series2014-C25-XA | | | 0.82 | % # I/O | | | 11/15/2047 | | | | 5,556,125 | |
| | 135,770,816 | | | WF-RBS Commercial Mortgage Trust, Series2016-NXS6-XA | | | 1.63 | % # I/O | | | 11/15/2049 | | | | 9,079,225 | |
| | | | | | | | | | | | | | | | |
| | TotalNon-Agency Commercial Mortgage Backed Obligations (Cost $4,728,312,372) | | | | 3,901,674,990 | |
| | | | | | | | | | | | | |
| | Non-Agency Residential Collateralized Mortgage Obligations - 26.4% | | | | | | | | | | | | |
| | 119,652,547 | | | ABFC Trust, Series2007-WMC1-A1A (1 Month LIBOR USD + 1.25%, 1.25% Floor) | | | 2.20 | % | | | 06/25/2037 | | | | 87,015,975 | |
| | 10,000,000 | | | Accredited Mortgage Loan Trust, Series2005-4-M1 (1 Month LIBOR USD + 0.40%, 0.40% Floor) | | | 1.35 | % | | | 12/25/2035 | | | | 9,468,993 | |
| | 12,086,643 | | | ACE Securities Corporation Home Equity Loan Trust, Series2007-HE1-A2B (1 Month LIBOR USD + 0.12%, 0.12% Floor) | | | 1.07 | % | | | 01/25/2037 | | | | 8,437,446 | |
| | 83,976,359 | | | ACE Securities Corporation Home Equity Loan Trust, Series2007-WM1-A1A (1 Month LIBOR USD + 0.14%, 0.14% Floor) | | | 1.09 | % | | | 11/25/2036 | | | | 34,031,058 | |
| | 2,348,648 | | | Adjustable Rate Mortgage Trust, Series2005-10-3A31 | | | 3.55 | % # | | | 01/25/2036 | | | | 2,032,236 | |
| | 29,556,495 | | | Adjustable Rate Mortgage Trust, Series2005-11-4A1 | | | 3.83 | % # | | | 02/25/2036 | | | | 19,876,181 | |
| | 3,995,385 | | | Adjustable Rate Mortgage Trust, Series2005-2-6M2 (1 Month LIBOR USD + 0.98%, 0.48% Floor, 11.00% Cap) | | | 1.93 | % | | | 06/25/2035 | | | | 3,685,093 | |
| | 3,421,215 | | | Adjustable Rate Mortgage Trust, Series2005-4-2A1 | | | 4.13 | % # | | | 08/25/2035 | | | | 3,037,439 | |
| | 724,518 | | | Adjustable Rate Mortgage Trust, Series2005-7-3A1 | | | 4.15 | % # | | | 10/25/2035 | | | | 600,686 | |
| | 7,438,282 | | | Adjustable Rate Mortgage Trust, Series2005-8-3A21 | | | 4.13 | % # | | | 11/25/2035 | | | | 5,942,631 | |
| | 15,114,884 | | | Adjustable Rate Mortgage Trust, Series2006-1-2A1 | | | 4.17 | % # | | | 03/25/2036 | | | | 10,202,164 | |
| | 9,669,935 | | | Adjustable Rate Mortgage Trust, Series2006-2-3A1 | | | 4.27 | % # | | | 05/25/2036 | | | | 8,168,536 | |
| | 13,868,427 | | | Adjustable Rate Mortgage Trust, Series2006-2-5A1 | | | 4.68 | % # | | | 05/25/2036 | | | | 6,710,703 | |
| | 11,086,810 | | | Adjustable Rate Mortgage Trust, Series2007-1-3A1 | | | 4.25 | % # | | | 03/25/2037 | | | | 8,830,127 | |
| | 1,702,310 | | | Adjustable Rate Mortgage Trust, Series2007-3-1A1 | | | 4.92 | % # ^ | | | 11/25/2037 | | | | 1,466,973 | |
| | 219,455 | | | Aegis Asset Backed Securities Trust, Series2003-2-M2 (1 Month LIBOR USD + 2.55%, 1.70% Floor) | | | 3.50 | % | | | 11/25/2033 | | | | 196,850 | |
| | 1,463,886 | | | Aegis Asset Backed Securities Trust, Series2004-1-M2 (1 Month LIBOR USD + 2.03%, 1.35% Floor) | | | 2.98 | % | | | 04/25/2034 | | | | 1,111,555 | |
| | 617,792 | | | Aegis Asset Backed Securities Trust, Series2004-2-M2 (1 Month LIBOR USD + 1.95%, 1.30% Floor) | | | 2.90 | % | | | 06/25/2034 | | | | 512,126 | |
| | 10,083,405 | | | Aegis Asset Backed Securities Trust, Series2004-6-M2 (1 Month LIBOR USD + 1.00%, 1.00% Floor, 15.00% Cap) | | | 1.95 | % | | | 03/25/2035 | | | | 9,274,898 | |
| | 61,041,176 | | | Ajax Master Trust, Series2016-1-PC | | | 4.17 | % # ^ | | | 01/01/2057 | | | | 54,164,930 | |
| | 67,110,502 | | | Ajax Master Trust, Series2016-2-PC | | | 3.10 | % # ^ | | | 10/25/2056 | | | | 54,687,463 | |
| | 77,593,435 | | | Ajax Master Trust, Series2017-1-PC | | | 3.45 | % # ^ | | | 06/25/2057 | | | | 68,687,059 | |
| | 51,237,888 | | | Ajax Mortgage Loan Trust, Series2017-C-A | | | 3.75 | % ^ § | | | 07/25/2060 | | | | 51,405,369 | |
| | 90,957,466 | | | Ajax Mortgage Loan Trust, Series2018-C-A | | | 4.36 | % # ^ | | | 09/25/2065 | | | | 90,204,093 | |
| | 7,309,551 | | | Ajax Mortgage Loan Trust, Series2018-E-A | | | 4.38 | % # ^ | | | 06/25/2058 | | | | 7,378,658 | |
| | 12,848,723 | | | Ajax Mortgage Loan Trust, Series2019-C-A | | | 3.95 | % # ^ | | | 10/25/2058 | | | | 12,571,203 | |
| | 47,130,532 | | | Alternative Loan Trust, Series2005-55CB-1A1 | | | 5.50 | % | | | 11/25/2035 | | | | 39,517,009 | |
| | 4,243,561 | | | Alternative Loan Trust, Series2006-12CB-A8 | | | 6.00 | % | | | 05/25/2036 | | | | 2,679,097 | |
| | 13,444,931 | | | Alternative Loan Trust, Series2006-13T1-A1 | | | 6.00 | % | | | 05/25/2036 | | | | 9,324,173 | |
| | 3,876,711 | | | Alternative Loan Trust, Series2006-16CB-A7 | | | 6.00 | % | | | 06/25/2036 | | | | 2,975,648 | |
| | 2,653,771 | | | Alternative Loan Trust, Series2006-2CB-A9 | | | 6.00 | % | | | 03/25/2036 | | | | 1,848,741 | |
| | 9,772,761 | | | Alternative Loan Trust, Series 2006-41CB-1A15(-1 x 1 Month LIBOR USD + 5.40%, 5.40% Cap) | | | 4.45 | % I/F I/O | | | 01/25/2037 | | | | 2,032,582 | |
| | 9,772,761 | | | Alternative Loan Trust, Series2006-41CB-1A2 (1 Month LIBOR USD + 0.60%, 0.60% Floor, 6.00% Cap) | | | 1.55 | % | | | 01/25/2037 | | | | 4,324,764 | |
| | 4,991,534 | | | Alternative Loan Trust, Series2006-42-1A1 (1 Month LIBOR USD + 0.60%, 0.60% Floor, 6.00% Cap) | | | 1.55 | % | | | 01/25/2047 | | | | 1,998,543 | |
| | 4,991,534 | | | Alternative Loan Trust, Series2006-42-1A2(-1 x 1 Month LIBOR USD + 54.00%) | | | 4.45 | % I/F I/O | | | 01/25/2047 | | | | 1,604,625 | |
| | 7,820,013 | | | Alternative Loan Trust, Series2007-15CB-A2 | | | 5.75 | % | | | 07/25/2037 | | | | 6,200,073 | |
| | 9,381,183 | | | Alternative Loan Trust, Series2007-15CB-A5 | | | 5.75 | % | | | 07/25/2037 | | | | 7,437,841 | |
| | 20,591,379 | | | Alternative Loan Trust, Series2007-5CB-1A31 | | | 5.50 | % | | | 04/25/2037 | | | | 14,810,306 | |
| | 7,328,391 | | | Alternative Loan Trust, Series2007-5CB-2A1 | | | 6.00 | % | | | 04/25/2037 | | | | 4,830,772 | |
| | 6,662,773 | | | Alternative Loan Trust, Series2007-6-A1 | | | 5.75 | % | | | 04/25/2047 | | | | 5,087,278 | |
| | 54,269,214 | | | Alternative Loan Trust, Series2007-HY4-4A1 | | | 3.98 | % # | | | 06/25/2037 | | | | 45,968,168 | |
| | 5,092,847 | | | American Home Assets, Series2006-2-2A1 (1 Month LIBOR USD + 0.19%, 0.19% Floor) | | | 1.14 | % | | | 09/25/2046 | | | | 4,066,681 | |
| | 84,019 | | | American Home Mortgage Investment Trust, Series2005-1-7A2 (6 Month LIBOR USD + 2.00%, 2.00% Floor, 11.00% Cap) | | | 3.67 | % | | | 06/25/2045 | | | | 84,009 | |
| | 5,306,816 | | | American Home Mortgage Investment Trust, Series2005-4-3A1 (1 Month LIBOR USD + 0.30%, 0.30% Floor, 11.00% Cap) | | | 1.25 | % | | | 11/25/2045 | | | | 4,192,286 | |
| | 20,243,152 | | | American Home Mortgage Investment Trust, Series2005-4-5A (6 Month LIBOR USD + 1.75%, 1.75% Floor, 11.00% Cap) | | | 3.28 | % | | | 11/25/2045 | | | | 13,215,189 | |
| | 2,226,572 | | | American Home Mortgage Investment Trust, Series2006-2-3A4 | | | 7.10 | % | | | 06/25/2036 | | | | 654,650 | |
| | 7,714,866 | | | American Home Mortgage Investment Trust, Series2007-A-13A1 | | | 6.60 | % ^ | | | 01/25/2037 | | | | 3,028,254 | |
| | 138,362,819 | | | Ameriquest Mortgage Securities Trust, Series2006-M3-A1 (1 Month LIBOR USD + 0.18%, 0.18% Floor) | | | 1.12 | % | | | 10/25/2036 | | | | 86,032,590 | |
| | 6,862,903 | | | Ameriquest Mortgage Securities, Inc., Series2004-FR1-M1 | | | 4.29 | % | | | 05/25/2034 | | | | 6,588,839 | |
| | 16,500,000 | | | Ameriquest Mortgage Securities, Inc., Series2004-R8-M2 (1 Month LIBOR USD + 1.02%, 0.68% Floor) | | | 1.97 | % | | | 09/25/2034 | | | | 15,574,436 | |
| | 8,045,416 | | | Amortizing Residential Collateral Trust, Series2002-BC7-M1 (1 Month LIBOR USD + 1.20%, 0.80% Floor) | | | 2.15 | % | | | 10/25/2032 | | | | 6,467,436 | |
| | 41,588,000 | | | AMSR Trust, Series2019-SFR1-E | | | 3.47 | % # ^ | | | 01/19/2039 | | | | 31,518,984 | |
| | 13,367,230 | | | Angel Oak Mortgage Trust LLC, Series2018-1-A1 | | | 3.26 | % # ^ | | | 04/27/2048 | | | | 13,178,611 | |
| | 1,502,318 | | | Asset Backed Securities Corporation Home Equity Loan Trust, Series2003-HE6-M1 (1 Month LIBOR USD + 0.98%, 0.65% Floor) | | | 1.92 | % | | | 11/25/2033 | | | | 1,442,492 | |
| | 567,970 | | | Asset Backed Securities Corporation Home Equity Loan Trust, Series2004-HE3-M2 (1 Month LIBOR USD + 1.68%, 1.12% Floor) | | | 2.63 | % | | | 06/25/2034 | | | | 525,143 | |
| | 30,237,959 | | | Asset Backed Securities Corporation Home Equity Loan Trust, Series2006-HE7-A1 (1 Month LIBOR USD + 0.14%, 0.14% Floor) | | | 1.08 | % | | | 11/25/2036 | | | | 24,893,502 | |
| | 1,429,249 | | | Banc of America Alternative Loan Trust, Series2005-10-4A1 | | | 5.75 | % | | | 11/25/2035 | | | | 1,303,441 | |
| | 5,088,383 | | | Banc of America Alternative Loan Trust, Series2005-11-2CB1 | | | 6.00 | % | | | 12/25/2035 | | | | 4,669,210 | |
| | 1,763,298 | | | Banc of America Alternative Loan Trust, Series2005-5-2CB1 | | | 6.00 | % | | | 06/25/2035 | | | | 1,638,917 | |
| | 1,126,735 | | | Banc of America Alternative Loan Trust, Series2005-8-2CB1 | | | 6.00 | % | | | 09/25/2035 | | | | 1,088,640 | |
| | 5,539,804 | | | Banc of America Alternative Loan Trust, Series2006-1-3CB1 | | | 6.50 | % | | | 02/25/2036 | | | | 5,288,980 | |
| | 2,921,789 | | | Banc of America Alternative Loan Trust, Series2006-2-1CB1 | | | 6.00 | % | | | 03/25/2036 | | | | 2,813,726 | |
| | 3,963,332 | | | Banc of America Alternative Loan Trust, Series2006-2-3CB1 | | | 6.50 | % | | | 03/25/2036 | | | | 3,642,099 | |
| | 2,882,801 | | | Banc of America Alternative Loan Trust, Series2006-3-4CB1 | | | 6.50 | % | | | 04/25/2036 | | | | 2,634,926 | |
| | 917,627 | | | Banc of America Alternative Loan Trust, Series2006-5-CB14 (1 Month LIBOR USD + 1.10%, 6.00% Floor, 6.00% Cap) | | | 6.00 | % | | | 06/25/2046 | | | | 819,768 | |
| | 2,000,503 | | | Banc of America Alternative Loan Trust, Series2006-6-CB3 | | | 6.00 | % | | | 07/25/2046 | | | | 1,781,499 | |
| | 10,463,978 | | | Banc of America Alternative Loan Trust, Series2006-7-A4 | | | 6.00 | % ß | | | 10/25/2036 | | | | 4,484,960 | |
| | 2,884,298 | | | Banc of America Alternative Loan Trust, Series2006-8-1A1(-1 x 1 Month LIBOR USD + 6.50%, 6.50% Cap) | | | 5.55 | % I/F I/O | | | 11/25/2036 | | | | 483,189 | |
| | 1,027,947 | | | Banc of America Alternative Loan Trust, Series2006-8-1A2 (1 Month LIBOR USD + 0.45%, 0.45% Floor, 7.00% Cap) | | | 1.40 | % | | | 11/25/2036 | | | | 736,538 | |
| | | | | | | | | | | | | | | | |
| | | | | | | | | | | | | |
| | 4,933,650 | | | Banc of America Alternative Loan Trust, Series2006-9-1CB1 | | | 6.00 | % | | | 01/25/2037 | | | | 4,376,738 | |
| | 840,496 | | | Banc of America Alternative Loan Trust, Series2007-2-2A1 | | | 6.00 | % | | | 06/25/2037 | | | | 772,590 | |
| | 5,267,220 | | | Banc of America Funding Corporation, Series2006-2-3A1 | | | 6.00 | % | | | 03/25/2036 | | | | 5,002,011 | |
| | 162,129 | | | Banc of America Funding Corporation, Series2006-2-4A1(-3 x 1 Month LIBOR USD + 22.80%, 22.80% Cap) | | | 19.96 | % I/F | | | 03/25/2036 | | | | 241,728 | |
| | 416,315 | | | Banc of America Funding Corporation, Series2006-2-6A2 | | | 5.50 | % | | | 03/25/2036 | | | | 364,999 | |
| | 1,368,620 | | | Banc of America Funding Corporation, Series2006-3-1A1 | | | 6.00 | % | | | 03/25/2036 | | | | 1,246,724 | |
| | 621,761 | | | Banc of America Funding Corporation, Series2006-3-6A1 | | | 6.21 | % # | | | 03/25/2036 | | | | 600,986 | |
| | 3,459,410 | | | Banc of America Funding Corporation, Series2006-6-1A7 | | | 6.25 | % | | | 08/25/2036 | | | | 3,156,161 | |
| | 1,029,972 | | | Banc of America Funding Corporation, Series2006-7-T2A5 | | | 6.04 | % | | | 10/25/2036 | | | | 927,997 | |
| | 4,854,570 | | | Banc of America Funding Corporation, Series2006-7-T2A8 | | | 5.91 | % | | | 10/25/2036 | | | | 4,374,441 | |
| | 1,123,575 | | | Banc of America Funding Corporation, Series2006-8T2-A8 | | | 6.10 | % | | | 10/25/2036 | | | | 1,050,559 | |
| | 505,649 | | | Banc of America Funding Corporation, Series2006-B-7A1 | | | 3.75 | % # | | | 03/20/2036 | | | | 424,250 | |
| | 6,603,102 | | | Banc of America Funding Corporation, Series2006-D-6A1 | | | 3.57 | % # | | | 05/20/2036 | | | | 5,756,132 | |
| | 219,654 | | | Banc of America Funding Corporation, Series2006-G-2A1 (1 Month LIBOR USD + 0.22%, 0.22% Floor, 10.50% Cap) | | | 1.21 | % | | | 07/20/2036 | | | | 213,468 | |
| | 242,963 | | | Banc of America Funding Corporation, Series2006-H-3A1 | | | 4.17 | % # | | | 09/20/2046 | | | | 190,915 | |
| | 37,452,178 | | | Banc of America Funding Corporation, Series2006-H-5A1 (1 Month LIBOR USD + 0.18%, 0.18% Floor, 10.50% Cap) | | | 0.95 | % | | | 10/20/2036 | | | | 18,019,767 | |
| | 835,871 | | | Banc of America Funding Corporation, Series2007-1-TA10 | | | 5.84 | % ß | | | 01/25/2037 | | | | 785,251 | |
| | 1,119,056 | | | Banc of America Funding Corporation, Series2007-3-TA1B | | | 5.83 | % # | | | 04/25/2037 | | | | 1,022,192 | |
| | 2,115,762 | | | Banc of America Funding Corporation, Series2007-5-1A1 | | | 5.50 | % | | | 07/25/2037 | | | | 1,874,098 | |
| | 1,788,872 | | | Banc of America Funding Corporation, Series2009-R14A-3A (- 2 x 1 Month LIBOR USD + 16.57%, 5.50% Floor, 16.57% Cap) | | | 12.46 | % ^ I/F | | | 06/26/2035 | | | | 2,236,757 | |
| | 3,277,209 | | | Banc of America Funding Corporation, Series2009-R15A-4A2 | | | 5.75 | % # ^ | | | 12/26/2036 | | | | 3,021,903 | |
| | 1,084,835 | | | Banc of America Funding Corporation, Series2010-R1-3A(-2 x 1 Month LIBOR USD + 14.28%, 6.00% Floor, 14.28% Cap) | | | 11.76 | % ^ I/F | | | 07/26/2036 | | | | 1,331,322 | |
| | 2,403,916 | | | Banc of America Mortgage Securities Trust, Series2006-1-A9 | | | 6.00 | % | | | 05/25/2036 | | | | 2,213,422 | |
| | 243,483 | | | Banc of America Mortgage Securities Trust, Series2007-1-2A5 | | | 5.75 | % | | | 01/25/2037 | | | | 218,467 | |
| | 5,870,713 | | | Banc of America Mortgage Trust, Series2007-3-2A8 | | | 7.00 | % | | | 09/25/2037 | | | | 5,418,014 | |
| | 14,223,506 | | | BankUnited Trust, Series2005-1-2A1 | | | 3.86 | % # | | | 09/25/2045 | | | | 11,987,656 | |
| | 1,444,302 | | | Bayview Commercial Asset Trust, Series2007-3-A2 (1 Month LIBOR USD + 0.29%) | | | 1.24 | % ^ | | | 07/25/2037 | | | | 1,125,259 | |
| | 23,958,244 | | | Bayview Opportunity Master Fund Trust, Series2019-SBR1-A1 | | | 3.47 | % ^ § | | | 06/28/2034 | | | | 23,792,441 | |
| | 4,872,332 | | | BCAP LLC Trust, Series2006-AA2-A1 (1 Month LIBOR USD + 0.17%, 0.17% Floor) | | | 1.12 | % | | | 01/25/2037 | | | | 4,426,836 | |
| | 55,678,931 | | | BCAP LLC Trust, Series2007-AA2-11A (1 Month LIBOR USD + 1.90%, 0.19% Floor) | | | 1.14 | % ^ | | | 05/25/2047 | | | | 48,812,483 | |
| | 2,770,513 | | | BCAP LLC Trust, Series2007-AA2-2A7 | | | 6.00 | % | | | 04/25/2037 | | | | 2,004,051 | |
| | 2,999,422 | | | BCAP LLC Trust, Series2007-AA2-2A8 | | | 5.75 | % | | | 04/25/2037 | | | | 2,148,124 | |
| | 10,913,105 | | | BCAP LLC Trust, Series2008-RR3-A1B | | | 6.67 | % # ^ | | | 10/25/2036 | | | | 6,308,707 | |
| | 2,774,823 | | | BCAP LLC Trust, Series 2009-RR13-18A2 | | | 5.75 | % # ^ | | | 07/26/2037 | | | | 2,258,455 | |
| | 3,622,691 | | | BCAP LLC Trust, Series2009-RR4-4A2 | | | 5.75 | % # ^ | | | 02/26/2036 | | | | 2,569,022 | |
| | 1,654,594 | | | BCAP LLC Trust, Series2010-RR10-5A1 | | | 7.00 | % # ^ | | | 04/27/2037 | | | | 1,715,419 | |
| | 2,743,179 | | | Bear Stearns Adjustable Rate Mortgage Trust, Series2005-12-13A1 | | | 4.19 | % # | | | 02/25/2036 | | | | 2,498,650 | |
| | 4,592,876 | | | Bear Stearns Adjustable Rate Mortgage Trust, Series2006-4-4A1 | | | 3.95 | % # | | | 10/25/2046 | | | | 3,662,094 | |
| | 4,568,305 | | | Bear Stearns Adjustable Rate Mortgage Trust, Series2007-1-2A1 | | | 4.14 | % # | | | 02/25/2047 | | | | 3,894,587 | |
| | 2,114,141 | | | Bear Stearns Adjustable Rate Mortgage Trust, Series2007-1-3A1 | | | 3.85 | % # | | | 02/25/2047 | | | | 1,796,066 | |
| | 24,041,717 | | | Bear Stearns Adjustable Rate Mortgage Trust, Series2007-2-2A1 (12 Month LIBOR USD + 1.88%, 1.88% Floor, 11.15% Cap) | | | 3.92 | % | | | 12/25/2046 | | | | 18,904,870 | |
| | 1,723,557 | | | Bear StearnsAlt-A Trust, Series2004-11-2A3 | | | 3.78 | % # | | | 11/25/2034 | | | | 1,491,141 | |
| | 8,702,116 | | | Bear StearnsAlt-A Trust, Series2006-1-11A1 (1 Month LIBOR USD + 0.48%, 0.24% Floor, 11.50% Cap) | | | 1.43 | % | | | 02/25/2036 | | | | 7,931,076 | |
| | 19,155,643 | | | Bear StearnsAlt-A Trust, Series2006-3-21A1 | | | 3.64 | % # | | | 05/25/2036 | | | | 15,132,070 | |
| | 7,272,667 | | | Bear StearnsAlt-A Trust, Series2006-5-1A1 (1 Month LIBOR USD + 0.34%, 0.17% Floor, 11.50% Cap) | | | 1.29 | % | | | 08/25/2036 | | | | 5,542,458 | |
| | 9,399,031 | | | Bear StearnsAlt-A Trust, Series2006-6-2A1 | | | 3.97 | % # | | | 11/25/2036 | | | | 7,499,507 | |
| | 4,658,435 | | | Bear StearnsAlt-A Trust, Series2006-8-2A1 | | | 3.65 | % # | | | 08/25/2046 | | | | 4,092,884 | |
| | 9,142,757 | | | Bear StearnsAlt-A Trust, Series2007-1-1A1 (1 Month LIBOR USD + 0.32%, 0.16% Floor, 11.50% Cap) | | | 1.27 | % | | | 01/25/2047 | | | | 7,032,090 | |
| | 4,556,778 | | | Bear Stearns Asset Backed Securities Trust, Series2004-AC4-A2 | | | 6.00 | % | | | 08/25/2034 | | | | 4,714,864 | |
| | 13,796,879 | | | Bear Stearns Asset Backed Securities Trust, Series2005-AC2-1A | | | 5.75 | % | | | 04/25/2035 | | | | 12,472,700 | |
| | 3,604,379 | | | Bear Stearns Asset Backed Securities Trust, Series2005-AC2-2A1 | | | 5.75 | % | | | 04/25/2035 | | | | 3,520,401 | |
| | 46,232,055 | | | Bear Stearns Asset Backed Securities Trust, Series2005-AC6-22A | | | 5.36 | % # | | | 09/25/2035 | | | | 40,605,854 | |
| | 7,084,156 | | | Bear Stearns Asset Backed Securities Trust, Series2005-AC7-A4 | | | 6.00 | % | | | 10/25/2035 | | | | 5,843,836 | |
| | 11,198,792 | | | Bear Stearns Asset Backed Securities Trust, Series2006-AC1-1A1 | | | 6.25 | % | | | 02/25/2036 | | | | 7,482,725 | |
| | 4,395,339 | | | Bear Stearns Asset Backed Securities Trust, Series2006-AC5-A1 | | | 6.25 | % ß | | | 12/25/2036 | | | | 3,817,298 | |
| | 18,370,748 | | | Bear Stearns Asset Backed Securities Trust, Series2007-HE2-2A3 (1 Month LIBOR USD + 0.16%, 0.16% Floor) | | | 1.11 | % | | | 02/25/2037 | | | | 18,033,652 | |
| | 43,832,730 | | | Bear Stearns Asset Backed Securities Trust, Series2007-HE4-2A (1 Month LIBOR USD + 0.22%, 0.22% Floor) | | | 1.17 | % | | | 05/25/2037 | | | | 37,533,191 | |
| | 18,643,837 | | | Bear Stearns Asset Backed Securities Trust, Series2007-HE6-2A (1 Month LIBOR USD + 1.05%, 1.05% Floor) | | | 2.00 | % | | | 08/25/2037 | | | | 14,793,022 | |
| | 15,000,000 | | | Bear Stearns Asset Backed Securities Trust, Series2007-HE7-1A2 (1 Month LIBOR USD + 1.60%, 1.60% Floor) | | | 2.55 | % | | | 10/25/2037 | | | | 12,751,083 | |
| | 1,445,647 | | | Bear Stearns Asset Backed Securities Trust, Series2007-SD1-1A2A | | | 6.00 | % | | | 10/25/2036 | | | | 968,898 | |
| | 1,325,530 | | | Bear Stearns Asset Backed Securities Trust, Series2007-SD1-1A3A | | | 6.50 | % | | | 10/25/2036 | | | | 898,059 | |
| | 2,242,775 | | | Bear Stearns Asset Backed Securities Trust, Series2007-SD1-23A1 | | | 4.14 | % # | | | 10/25/2036 | | | | 1,978,486 | |
| | 14,685,513 | | | Bear Stearns Mortgage Funding Trust, Series2006-AR3-2A1 (1 Month LIBOR USD + 0.20%, 0.20% Floor, 10.50% Cap) | | | 1.15 | % | | | 11/25/2036 | | | | 12,946,699 | |
| | 5,464,355 | | | Bear Stearns Mortgage Funding Trust, Series2006-AR4-A2 (1 Month LIBOR USD + 0.18%, 0.18% Floor, 10.50% Cap) | | | 1.13 | % | | | 12/25/2037 | | | | 4,212,084 | |
| | 12,199,496 | | | Bear Stearns Mortgage Funding Trust, Series2007-AR3-22A1 (1 Month LIBOR USD + 0.16%, 0.16% Floor, 10.50% Cap) | | | 1.11 | % | | | 04/25/2037 | | | | 11,347,156 | |
| | 33,990,400 | | | Bellemeade Ltd., Series2019-2A-M1B (1 Month LIBOR USD + 1.45%, 1.45% Floor) | | | 2.40 | % ^ | | | 04/25/2029 | | | | 33,861,495 | |
| | 19,637,957 | | | BNC Mortgage Loan Trust, Series2006-2-A4 (1 Month LIBOR USD + 0.16%, 0.16% Floor) | | | 1.11 | % | | | 11/25/2036 | | | | 17,808,272 | |
| | 12,792,830 | | | BNC Mortgage Loan Trust, Series2007-1-A4 (1 Month LIBOR USD + 0.16%, 0.16% Floor) | | | 1.11 | % | | | 03/25/2037 | | | | 11,529,741 | |
| | 33,785,574 | | | BNPP Mortgage Securities LLC Trust, Series2009-1-B1 | | | 6.00 | % ^ | | | 08/27/2037 | | | | 24,881,359 | |
| | 5,850,719 | | | Carrington Mortgage Loan Trust, Series2006-FRE2-A2 (1 Month LIBOR USD + 0.12%, 0.12% Floor, 12.50% Cap) | | | 1.07 | % | | | 10/25/2036 | | | | 4,447,888 | |
| | 28,211,437 | | | Carrington Mortgage Loan Trust, Series2006-FRE2-A3 (1 Month LIBOR USD + 0.16%, 0.16% Floor, 12.50% Cap) | | | 1.11 | % | | | 10/25/2036 | | | | 21,545,455 | |
| | 8,683,266 | | | Carrington Mortgage Loan Trust, Series2006-FRE2-A4 (1 Month LIBOR USD + 0.25%, 0.25% Floor, 12.50% Cap) | | | 1.20 | % | | | 10/25/2036 | | | | 6,699,601 | |
| | 97,705,646 | | | Carrington Mortgage Loan Trust, Series2006-NC4-A3 (1 Month LIBOR USD + 0.16%, 0.16% Floor, 12.50% Cap) | | | 1.11 | % | | | 10/25/2036 | | | | 87,389,600 | |
| | 30,594,417 | | | Carrington Mortgage Loan Trust, Series2007-RFC1-A3 (1 Month LIBOR USD + 0.14%, 0.14% Floor, 14.50% Cap) | | | 1.09 | % | | | 12/25/2036 | | | | 25,340,006 | |
| | 24,840,677 | | | Cascade MH Asset Trust, Series2019-MH1-A | | | 4.00 | % # ^ | | | 11/25/2044 | | | | 24,756,862 | |
| | 2,750,000 | | | Centex Home Equity, Series2004-A-AF5 | | | 5.43 | % | | | 01/25/2034 | | | | 2,547,656 | |
| | 605,032 | | | Chase Funding Mortgage Loan Asset-Backed Certificates, Series2003-4-2M1 (1 Month LIBOR USD + 0.90%, 0.60% Floor) | | | 1.85 | % | | | 03/25/2033 | | | | 591,055 | |
| | 5,024,512 | | | Chase Mortgage Finance Trust, Series2005-A1-2A4 | | | 3.80 | % # | | | 12/25/2035 | | | | 4,421,005 | |
| | 9,019,610 | | | Chase Mortgage Finance Trust, Series2006-S1-A5 | | | 6.50 | % | | | 05/25/2036 | | | | 6,363,692 | |
| | 9,931,472 | | | Chase Mortgage Finance Trust, Series2006-S2-1A9 | | | 6.25 | % | | | 10/25/2036 | | | | 6,703,201 | |
| | 5,817,673 | | | Chase Mortgage Finance Trust, Series2006-S3-1A2 | | | 6.00 | % | | | 11/25/2036 | | | | 3,821,724 | |
| | 15,999,300 | | | Chase Mortgage Finance Trust, Series2006-S4-A8 | | | 6.00 | % | | | 12/25/2036 | | | | 10,265,498 | |
| | 5,224,252 | | | Chase Mortgage Finance Trust, Series2007-A2-6A4 | | | 4.11 | % # | | | 07/25/2037 | | | | 4,523,503 | |
| | 5,152,017 | | | Chase Mortgage Finance Trust, Series2007-S1-A7 | | | 6.00 | % | | | 02/25/2037 | | | | 3,210,724 | |
| | 2,964,753 | | | Chase Mortgage Finance Trust, Series2007-S3-1A5 | | | 6.00 | % | | | 05/25/2037 | | | | 2,024,406 | |
| | 1,372,948 | | | Chase Mortgage Finance Trust, Series2007-S3-2A1 | | | 5.50 | % | | | 05/25/2037 | | | | 326,260 | |
| | 2,999,111 | | | Chase Mortgage Finance Trust, Series2007-S5-1A18 | | | 6.00 | % | | | 07/25/2037 | | | | 2,137,708 | |
| | 3,549,432 | | | ChaseFlex Trust, Series2005-1-3A1 | | | 6.00 | % | | | 02/25/2035 | | | | 3,316,169 | |
| | 500,543 | | | ChaseFlex Trust, Series2006-1-A5 | | | 6.16 | % # | | | 06/25/2036 | | | | 449,607 | |
| | | | | | | | | | | | | | | | |
| | | | | | | | | | | | | |
| | 4,211,954 | | | ChaseFlex Trust, Series2006-2-A2B (1 Month LIBOR USD + 0.20%, 0.20% Floor, 11.50% Cap) | | | 1.15 | % | | | 09/25/2036 | | | | 3,124,654 | |
| | 3,935,100 | | | ChaseFlex Trust, Series2007-1-1A1 | | | 6.50 | % | | | 02/25/2037 | | | | 2,059,369 | |
| | 8,515,197 | | | ChaseFlex Trust, Series2007-M1-2F4 | | | 4.17 | % ß | | | 08/25/2037 | | | | 7,541,890 | |
| | 8,856,562 | | | ChaseFlex Trust, Series2007-M1-2F5 | | | 4.17 | % ß | | | 08/25/2037 | | | | 7,843,500 | |
| | 3,978,542 | | | CHL Mortgage Pass Through Trust, Series2005-26-1A12 | | | 5.50 | % | | | 11/25/2035 | | | | 3,265,469 | |
| | 21,009,310 | | | CHL Mortgage Pass-Through Trust, Series2005-17-2A1 | | | 5.50 | % | | | 09/25/2035 | | | | 15,789,081 | |
| | 4,138,697 | | | CHL Mortgage Pass-Through Trust, Series2005-18-A1 | | | 5.50 | % | | | 10/25/2035 | | | | 3,188,079 | |
| | 7,355,581 | | | CHL Mortgage Pass-Through Trust, Series2006-14-A5 | | | 6.25 | % | | | 09/25/2036 | | | | 5,515,040 | |
| | 32,829,379 | | | CHL Mortgage Pass-Through Trust, Series2006-8-1A3 | | | 6.00 | % | | | 05/25/2036 | | | | 26,842,177 | |
| | 2,219,004 | | | CHL Mortgage Pass-Through Trust, Series2007-15-1A2 | | | 6.25 | % | | | 09/25/2037 | | | | 1,800,636 | |
| | 47,372,070 | | | CHL Mortgage Pass-Through Trust, Series2007-21-1A1 | | | 6.25 | % | | | 02/25/2038 | | | | 34,733,396 | |
| | 2,312,022 | | | CHL Mortgage Pass-Through Trust, Series2007-2-A2 | | | 6.00 | % | | | 03/25/2037 | | | | 1,738,396 | |
| | 2,968,110 | | | CHL Mortgage Pass-Through Trust, Series2007-7-A11 | | | 5.50 | % | | | 06/25/2037 | | | | 2,185,439 | |
| | 5,391,827 | | | CHL Mortgage Pass-Through Trust, Series2007-8-1A8 | | | 6.00 | % | | | 01/25/2038 | | | | 3,779,163 | |
| | 14,735,840 | | | CHL Mortgage Pass-Through Trust, Series2007-HYB1-2A1 | | | 3.29 | % # | | | 03/25/2037 | | | | 12,062,094 | |
| | 65,959,595 | | | CIM Trust, Series2016-1RR-B2 | | | 6.96 | % # ^ Þ | | | 07/26/2055 | | | | 60,407,301 | |
| | 75,440,246 | | | CIM Trust, Series2016-2RR-B2 | | | 7.57 | % # ^ Þ | | | 02/25/2056 | | | | 69,828,239 | |
| | 73,074,681 | | | CIM Trust, Series2016-3RR-B2 | | | 7.97 | % # ^ Þ | | | 02/27/2056 | | | | 67,218,505 | |
| | 54,248,672 | | | CIM Trust, Series2017-3RR-B2 | | | 10.50 | % # ^ Þ | | | 01/27/2057 | | | | 53,434,942 | |
| | 45,122,597 | | | CIM Trust, Series2017-6-A1 | | | 3.02 | % # ^ | | | 06/25/2057 | | | | 42,557,495 | |
| | 10,444,110 | | | CIM Trust, Series2017-8-A1 | | | 3.00 | % # ^ | | | 12/25/2065 | | | | 10,122,835 | |
| | 4,921,529 | | | CitiCorporationMortgage Securities, Inc., Series2005-1-1A4 | | | 5.50 | % | | | 02/25/2035 | | | | 5,059,421 | |
| | 1,026,234 | | | CitiCorporationMortgage Securities, Inc., Series2006-7-1A1 | | | 6.00 | % | | | 12/25/2036 | | | | 910,733 | |
| | 4,057,011 | | | CitiCorporationResidential Mortgage Securities, Inc., Series2006-2-A5 | | | 5.29 | % | | | 09/25/2036 | | | | 4,074,656 | |
| | 2,970,946 | | | CitiCorporationResidential Mortgage Securities, Inc., Series2007-1-A4 | | | 5.26 | % ß | | | 03/25/2037 | | | | 2,976,882 | |
| | 1,733,983 | | | Citigroup Mortgage Loan Trust, Inc., Series2005-5-2A2 | | | 5.75 | % | | | 08/25/2035 | | | | 1,309,429 | |
| | 883,459 | | | Citigroup Mortgage Loan Trust, Inc., Series2005-9-21A1 | | | 5.50 | % | | | 11/25/2035 | | | | 798,904 | |
| | 2,425,610 | | | Citigroup Mortgage Loan Trust, Inc., Series2006-4-2A1A | | | 6.00 | % | | | 12/25/2035 | | | | 2,327,593 | |
| | 31,462,149 | | | Citigroup Mortgage Loan Trust, Inc., Series2006-AMC1-A1 (1 Month LIBOR USD + 0.15%, 0.15% Floor) | | | 1.09 | % ^ | | | 09/25/2036 | | | | 28,479,818 | |
| | 8,025,131 | | | Citigroup Mortgage Loan Trust, Inc., Series2006-AR3-1A1A | | | 4.62 | % # | | | 06/25/2036 | | | | 6,755,896 | |
| | 3,169,093 | | | Citigroup Mortgage Loan Trust, Inc., Series2006-FX1-A6 | | | 5.85 | % ß | | | 10/25/2036 | | | | 2,367,245 | |
| | 1,705,513 | | | Citigroup Mortgage Loan Trust, Inc., Series2006-WF1-A2D | | | 4.86 | % ß | | | 03/25/2036 | | | | 1,034,322 | |
| | 11,411,361 | | | Citigroup Mortgage Loan Trust, Inc., Series2006-WF2-A2D | | | 6.16 | % ß | | | 05/25/2036 | | | | 5,575,569 | |
| | 1,957,094 | | | Citigroup Mortgage Loan Trust, Inc., Series2006-WFH3-M1 (1 Month LIBOR USD + 0.29%, 0.29% Floor) | | | 1.24 | % | | | 10/25/2036 | | | | 1,952,557 | |
| | 3,904,682 | | | Citigroup Mortgage Loan Trust, Inc., Series2007-10-1A1A | | | 5.53 | % # | | | 04/25/2037 | | | | 3,756,804 | |
| | 730,531 | | | Citigroup Mortgage Loan Trust, Inc., Series2007-12-2A1 | | | 6.50 | % ^ | | | 10/25/2036 | | | | 561,209 | |
| | 112,924 | | | Citigroup Mortgage Loan Trust, Inc., Series2007-2-2A | | | 6.00 | % | | | 11/25/2036 | | | | 112,545 | |
| | 20,843,710 | | | Citigroup Mortgage Loan Trust, Inc., Series2007-9-1A1 | | | 5.75 | % ^ | | | 04/25/2047 | | | | 16,727,238 | |
| | 1,140,113 | | | Citigroup Mortgage Loan Trust, Inc., Series2007-9-2A2 | | | 6.50 | % # ^ Þ | | | 05/25/2037 | | | | 1,073,734 | |
| | 70,504,981 | | | Citigroup Mortgage Loan Trust, Inc., Series2007-AMC2-A1 (1 Month LIBOR USD + 0.14%, 0.14% Floor) | | | 1.09 | % ^ | | | 01/25/2037 | | | | 57,967,081 | |
| | 1,599,800 | | | Citigroup Mortgage Loan Trust, Inc., Series2007-AR5-1A3A | | | 3.99 | % # | | | 04/25/2037 | | | | 1,347,666 | |
| | 4,114,592 | | | Citigroup Mortgage Loan Trust, Inc., Series2007-AR8-1A1A | | | 3.84 | % # | | | 08/25/2047 | | | | 3,366,284 | |
| | 4,673,691 | | | Citigroup Mortgage Loan Trust, Inc., Series2007-OPX1-A3A | | | 5.97 | % ß | | | 01/25/2037 | | | | 2,474,047 | |
| | 10,302,497 | | | Citigroup Mortgage Loan Trust, Inc., Series2007-OPX1-A5A | | | 5.76 | % ß | | | 01/25/2037 | | | | 5,455,471 | |
| | 5,829,745 | | | Citigroup Mortgage Loan Trust, Inc., Series2010-7-9A4 | | | 6.00 | % # ^ | | | 10/25/2037 | | | | 5,256,579 | |
| | 41,268,405 | | | Citigroup Mortgage Loan Trust, Inc., Series2010-8-7A4 | | | 6.00 | % # ^ | | | 06/25/2037 | | | | 40,069,191 | |
| | 21,682,848 | | | Citigroup Mortgage Loan Trust, Inc., Series2014-J2-A1 | | | 3.50 | % # ^ | | | 11/25/2044 | | | | 22,025,095 | |
| | 182,617,278 | | | Citigroup Mortgage Loan Trust, Inc., Series2017-RP2-A1A | | | 3.93 | % # ^ | | | 07/25/2067 | | | | 185,829,059 | |
| | 15,808,179 | | | Citigroup Mortgage Loan Trust, Inc., Series2018-A-A1 | | | 4.00 | % # ^ | | | 01/25/2068 | | | | 14,801,962 | |
| | 22,564,088 | | | Citigroup Mortgage Loan Trust, Inc., Series2018-C-A1 | | | 4.13 | % ^ § | | | 03/25/2059 | | | | 20,977,124 | |
| | 4,748,105 | | | Citigroup Mortgage Loan Trust, Series2007-OPX1-A2 (1 Month LIBOR USD + 2.00%, 0.20% Floor) | | | 1.15 | % | | | 01/25/2037 | | | | 2,463,287 | |
| | 178,091,086 | | | Citigroup Mortgage Loan Trust, Series2019-A-PT1 | | | 3.92 | % ^ | | | 10/25/2058 | | | | 170,849,938 | |
| | 34,757,568 | | | Citigroup Mortgage Loan Trust, Series2019-B-A1 | | | 3.26 | % # ^ | | | 04/25/2066 | | | | 34,512,670 | |
| | 89,031,412 | | | Citigroup Mortgage Loan Trust, Series2019-C-A1 | | | 3.23 | % ^ § | | | 09/25/2059 | | | | 88,436,932 | |
| | 263,772,011 | | | Citigroup Mortgage Loan Trust, Series2019-D-PT1 | | | 3.34 | % ^ | | | 04/25/2064 | | | | 245,626,633 | |
| | 3,204,700 | | | CitiMortgage Alternative Loan Trust, Series2006-A1-1A5 | | | 5.50 | % | | | 04/25/2036 | | | | 2,961,115 | |
| | 3,363,725 | | | CitiMortgage Alternative Loan Trust, Series2006-A2-A2 | | | 6.00 | % | | | 05/25/2036 | | | | 3,024,009 | |
| | 3,349,806 | | | CitiMortgage Alternative Loan Trust, Series2006-A3-1A13 | | | 6.00 | % | | | 07/25/2036 | | | | 3,057,180 | |
| | 2,307,030 | | | CitiMortgage Alternative Loan Trust, Series2006-A4-1A8 | | | 6.00 | % | | | 09/25/2036 | | | | 2,000,032 | |
| | 621,204 | | | CitiMortgage Alternative Loan Trust, Series2006-A5-2A1 | | | 5.50 | % | | | 10/25/2021 | | | | 602,759 | |
| | 2,569,006 | | | CitiMortgage Alternative Loan Trust, Series2006-A5-3A3 | | | 6.00 | % | | | 10/25/2036 | | | | 2,171,890 | |
| | 7,262,665 | | | CitiMortgage Alternative Loan Trust, Series2006-A6-1A2 (1 Month LIBOR USD + 0.50%, 6.00% Floor, 6.00% Cap) | | | 6.00 | % | | | 11/25/2036 | | | | 6,724,285 | |
| | 3,893,533 | | | CitiMortgage Alternative Loan Trust, Series2007-A1-1A5 | | | 6.00 | % | | | 01/25/2037 | | | | 3,596,473 | |
| | 1,898,355 | | | CitiMortgage Alternative Loan Trust, Series2007-A1-1A7 | | | 6.00 | % | | | 01/25/2037 | | | | 1,753,519 | |
| | 5,147,444 | | | CitiMortgage Alternative Loan Trust, Series2007-A1-1A8 (1 Month LIBOR USD + 0.60%, 0.60% Floor, 6.00% Cap) | | | 1.55 | % | | | 01/25/2037 | | | | 3,837,898 | |
| | 4,857,185 | | | CitiMortgage Alternative Loan Trust, Series2007-A1-1A9(-1 x 1 Month LIBOR USD + 5.40%, 5.40% Cap) | | | 4.45 | % I/F I/O | | | 01/25/2037 | | | | 850,426 | |
| | 4,067,693 | | | CitiMortgage Alternative Loan Trust, Series2007-A3-1A1 (4.00% Floor, 6.00% Cap) | | | 6.00 | % | | | 03/25/2037 | | | | 3,896,542 | |
| | 9,361,065 | | | CitiMortgage Alternative Loan Trust, Series2007-A3-1A3(-1 x 1 Month LIBOR USD + 5.40%, 5.40% Cap) | | | 4.45 | % I/F I/O | | | 03/25/2037 | | | | 1,940,939 | |
| | 3,668,401 | | | CitiMortgage Alternative Loan Trust, Series2007-A3-1A4 | | | 5.75 | % | | | 03/25/2037 | | | | 3,382,041 | |
| | 6,457,733 | | | CitiMortgage Alternative Loan Trust, Series2007-A4-1A3 (1 Month LIBOR USD + 0.33%, 0.33% Floor, 7.00% Cap) | | | 1.28 | % | | | 04/25/2037 | | | | 4,548,169 | |
| | 6,457,733 | | | CitiMortgage Alternative Loan Trust, Series2007-A4-1A4(-1 x 1 Month LIBOR USD + 6.67%, 6.67% Cap) | | | 5.72 | % I/F I/O | | | 04/25/2037 | | | | 1,269,364 | |
| | 6,839,109 | | | CitiMortgage Alternative Loan Trust, Series2007-A4-1A5 | | | 5.75 | % | | | 04/25/2037 | | | | 6,143,543 | |
| | 939,314 | | | CitiMortgage Alternative Loan Trust, Series2007-A5-1A11 | | | 6.00 | % | | | 05/25/2037 | | | | 747,754 | |
| | 12,384,169 | | | CitiMortgage Alternative Loan Trust, Series2007-A5-1A8 | | | 6.00 | % | | | 05/25/2037 | | | | 9,858,601 | |
| | 411,454 | | | CitiMortgage Alternative Loan Trust, Series2007-A8-A1 | | | 6.00 | % | | | 10/25/2037 | | | | 368,390 | |
| | 5,355,795 | | | Colony American Finance Ltd., Series2016-1-A | | | 2.54 | % ^ | | | 06/15/2048 | | | | 5,334,550 | |
| | 80,000,000 | | | Connecticut Avenue Securities Trust, Series2020-R02-2M2 (1 Month LIBOR USD + 20.00%) | | | 2.95 | % ^ | | | 01/25/2040 | | | | 53,006,032 | |
| | 41,985,047 | | | Countrywide Alternative Loan Trust, Series2004-36CB-1A1 | | | 6.00 | % | | | 02/25/2035 | | | | 37,169,236 | |
| | 4,704,200 | | | Countrywide Alternative Loan Trust, Series2005-13CB-A3 | | | 5.50 | % | | | 05/25/2035 | | | | 4,308,475 | |
| | 3,442,095 | | | Countrywide Alternative Loan Trust, Series2005-20CB-2A1 (1 Month LIBOR USD + 0.50%, 0.50% Floor, 5.50% Cap) | | | 1.45 | % | | | 07/25/2035 | | | | 2,297,752 | |
| | 7,027,610 | | | Countrywide Alternative Loan Trust, Series2005-20CB-2A2(-1 x 1 Month LIBOR USD + 5.00%, 5.00% Cap) | | | 4.05 | % I/F I/O | | | 07/25/2035 | | | | 998,915 | |
| | 102,282 | | | Countrywide Alternative Loan Trust, Series2005-20CB-4A1 | | | 5.25 | % | | | 07/25/2020 | | | | 102,235 | |
| | 2,551,756 | | | Countrywide Alternative Loan Trust, Series2005-26CB-A11(-2 x 1 Month LIBOR USD + 13.05%, 13.05% Cap) | | | 11.33 | % I/F | | | 07/25/2035 | | | | 2,728,972 | |
| | 3,563,173 | | | Countrywide Alternative Loan Trust, Series2005-28CB-1A2 (1 Month LIBOR USD + 0.75%, 0.75% Floor, 5.50% Cap) | | | 1.70 | % | | | 08/25/2035 | | | | 2,718,387 | |
| | 1,423,841 | | | Countrywide Alternative Loan Trust, Series2005-28CB-3A6 | | | 6.00 | % | | | 08/25/2035 | | | | 916,488 | |
| | 1,818,282 | | | Countrywide Alternative Loan Trust, Series2005-46CB-A20 | | | 5.50 | % | | | 10/25/2035 | | | | 1,354,342 | |
| | 6,045,814 | | | Countrywide Alternative Loan Trust, Series2005-48T1-A2 | | | 5.50 | % | | | 11/25/2035 | | | | 4,737,614 | |
| | 2,194,617 | | | Countrywide Alternative Loan Trust, Series2005-54CB-3A4 | | | 5.50 | % | | | 11/25/2035 | | | | 1,699,014 | |
| | 19,673,793 | | | Countrywide Alternative Loan Trust, Series2005-57CB-1A1 | | | 5.50 | % | | | 12/25/2035 | | | | 16,486,843 | |
| | | | | | | | | | | | | | | | |
| | | | | | | | | | | | | |
| | 489,312 | | | Countrywide Alternative Loan Trust, Series2005-60T1-A7(-7 x 1 Month LIBOR USD + 35.93%, 35.93% Cap) | | | 28.99 | % I/F | | | 12/25/2035 | | | | 955,814 | |
| | 643,327 | | | Countrywide Alternative Loan Trust, Series 2005-64CB-1A14 | | | 5.50 | % | | | 12/25/2035 | | | | 595,113 | |
| | 9,337,093 | | | Countrywide Alternative Loan Trust, Series2005-64CB-1A4 | | | 5.50 | % | | | 12/25/2035 | | | | 8,637,315 | |
| | 1,663,852 | | | Countrywide Alternative Loan Trust, Series2005-73CB-1A5 (1 Month LIBOR USD + 0.80%, 0.80% Floor, 5.50% Cap) | | | 1.75 | % | | | 01/25/2036 | | | | 1,286,699 | |
| | 4,185,906 | | | Countrywide Alternative Loan Trust, Series2005-73CB-1A6(-1 x 1 Month LIBOR USD + 4.70%, 4.70% Cap) | | | 3.75 | % I/F I/O | | | 01/25/2036 | | | | 682,980 | |
| | 40,444,326 | | | Countrywide Alternative Loan Trust, Series2005-77T1-1A1 | | | 6.00 | % | | | 02/25/2036 | | | | 27,252,398 | |
| | 786,871 | | | Countrywide Alternative Loan Trust, Series2005-79CB-A5 | | | 5.50 | % | | | 01/25/2036 | | | | 636,598 | |
| | 26,707,954 | | | Countrywide Alternative Loan Trust, Series2005-85CB-1A1 | | | 6.00 | % | | | 02/25/2036 | | | | 17,890,966 | |
| | 2,072,269 | | | Countrywide Alternative Loan Trust, Series2005-85CB-2A6(-4 x 1 Month LIBOR USD + 21.63%, 21.63% Cap) | | | 18.16 | % I/F | | | 02/25/2036 | | | | 2,898,695 | |
| | 1,314,188 | | | Countrywide Alternative Loan Trust, Series2005-86CB-A5 | | | 5.50 | % | | | 02/25/2036 | | | | 1,048,825 | |
| | 2,350,624 | | | Countrywide Alternative Loan Trust, Series2005-J10-1A11 | | | 5.50 | % | | | 10/25/2035 | | | | 2,024,605 | |
| | 534,947 | | | Countrywide Alternative Loan Trust, Series2005-J10-1A13 (1 Month LIBOR USD + 0.70%, 0.70% Floor, 5.50% Cap) | | | 1.65 | % | | | 10/25/2035 | | | | 379,423 | |
| | 250,593 | | | Countrywide Alternative Loan Trust, Series2005-J10-1A15 | | | 5.50 | % | | | 10/25/2035 | | | | 215,837 | |
| | 590,107 | | | Countrywide Alternative Loan Trust, Series2005-J11-1A3 | | | 5.50 | % | | | 11/25/2035 | | | | 446,616 | |
| | 948,281 | | | Countrywide Alternative Loan Trust, Series2005-J11-6A1 | | | 6.50 | % | | | 09/25/2032 | | | | 872,513 | |
| | 738,688 | | | Countrywide Alternative Loan Trust, Series2005-J13-2A5 (1 Month LIBOR USD + 0.48%, 0.48% Floor, 5.50% Cap) | | | 1.43 | % | | | 11/25/2035 | | | | 408,857 | |
| | 1,477,377 | | | Countrywide Alternative Loan Trust, Series2005-J13-2A6(-1 x 1 Month LIBOR USD + 5.02%, 5.02% Cap) | | | 4.07 | % I/F I/O | | | 11/25/2035 | | | | 199,817 | |
| | 3,891,000 | | | Countrywide Alternative Loan Trust, Series2005-J1-5A3 | | | 5.50 | % | | | 02/25/2035 | | | | 3,719,900 | |
| | 19,924 | | | Countrywide Alternative Loan Trust, Series2005-J1-7A1 | | | 5.50 | % | | | 01/25/2020 | | | | 17,874 | |
| | 769,201 | | | Countrywide Alternative Loan Trust, Series2005-J2-1A5 (1 Month LIBOR USD + 0.50%, 0.50% Floor, 5.50% Cap) | | | 1.45 | % | | | 04/25/2035 | | | | 600,783 | |
| | 2,366,772 | | | Countrywide Alternative Loan Trust, Series2005-J2-1A6(-1 x 1 Month LIBOR USD + 5.00%, 5.00% Cap) | | | 4.05 | % I/F I/O | | | 04/25/2035 | | | | 231,775 | |
| | 6,393,934 | | | Countrywide Alternative Loan Trust, Series2005-J3-2A8 (1 Month LIBOR USD + 0.30%, 0.30% Floor, 5.50% Cap) | | | 1.25 | % | | | 05/25/2035 | | | | 5,152,316 | |
| | 6,393,934 | | | Countrywide Alternative Loan Trust, Series2005-J3-2A9(-1 x 1 Month LIBOR USD + 5.20%, 5.20% Cap) | | | 4.25 | % I/F I/O | | | 05/25/2035 | | | | 763,401 | |
| | 3,443,124 | | | Countrywide Alternative Loan Trust, Series2006-12CB-A3 (1 Month LIBOR USD + 5.75%, 5.75% Floor) | | | 5.75 | % | | | 05/25/2036 | | | | 2,125,755 | |
| | 37,074,360 | | | Countrywide Alternative Loan Trust, Series2006-15CB-A1 | | | 6.50 | % | | | 06/25/2036 | | | | 24,393,617 | |
| | 1,058,787 | | | Countrywide Alternative Loan Trust, Series2006-18CB-A12 (1 Month LIBOR USD + 0.60%, 0.60% Floor, 6.00% Cap) | | | 1.55 | % | | | 07/25/2036 | | | | 501,832 | |
| | 1,058,787 | | | Countrywide Alternative Loan Trust, Series2006-18CB-A13(-1 x 1 Month LIBOR USD + 5.50%, 5.50% Cap) | | | 4.55 | % I/F I/O | | | 07/25/2036 | | | | 220,631 | |
| | 5,180,070 | | | Countrywide Alternative Loan Trust, Series2006-19CB-A12 (1 Month LIBOR USD + 0.40%, 0.40% Floor, 6.00% Cap) | | | 1.35 | % | | | 08/25/2036 | | | | 2,758,566 | |
| | 7,024,485 | | | Countrywide Alternative Loan Trust, Series2006-19CB-A13(-1 x 1 Month LIBOR USD + 5.60%, 5.60% Cap) | | | 4.65 | % I/F I/O | | | 08/25/2036 | | | | 1,201,769 | |
| | 1,081,362 | | | Countrywide Alternative Loan Trust, Series2006-19CB-A15 | | | 6.00 | % | | | 08/25/2036 | | | | 858,570 | |
| | 1,868,922 | | | Countrywide Alternative Loan Trust, Series2006-24CB-A11 | | | 5.75 | % | | | 08/25/2036 | | | | 1,285,865 | |
| | 5,470,105 | | | Countrywide Alternative Loan Trust, Series2006-24CB-A14(-1 x 1 Month LIBOR USD + 7.15%, 7.15% Cap) | | | 6.20 | % I/F I/O | | | 08/25/2036 | | | | 1,539,789 | |
| | 4,386,312 | | | Countrywide Alternative Loan Trust, Series2006-24CB-A22 | | | 6.00 | % | | | 08/25/2036 | | | | 3,075,816 | |
| | 4,707,830 | | | Countrywide Alternative Loan Trust, Series2006-24CB-A5 (1 Month LIBOR USD + 0.60%, 0.06% Floor, 6.00% Cap) | | | 1.55 | % | | | 08/25/2036 | | | | 2,305,390 | |
| | 1,744,723 | | | Countrywide Alternative Loan Trust, Series2006-26CB-A17 | | | 6.25 | % | | | 09/25/2036 | | | | 1,208,139 | |
| | 2,239,500 | | | Countrywide Alternative Loan Trust, Series2006-26CB-A9 | | | 6.50 | % | | | 09/25/2036 | | | | 1,589,165 | |
| | 4,198,396 | | | Countrywide Alternative Loan Trust, Series2006-29T1-1A2 | | | 6.25 | % | | | 10/25/2036 | | | | 3,169,929 | |
| | 569,510 | | | Countrywide Alternative Loan Trust, Series 2006-29T1-2A12(-7 x 1 Month LIBOR USD + 46.15%, 46.15% Cap) | | | 40.00 | % I/F | | | 10/25/2036 | | | | 1,391,876 | |
| | 348,837 | | | Countrywide Alternative Loan Trust, Series 2006-29T1-2A23(-4 x 1 Month LIBOR USD + 33.37%, 33.37% Cap) | | | 29.26 | % I/F | | | 10/25/2036 | | | | 655,126 | |
| | 3,837,326 | | | Countrywide Alternative Loan Trust, Series2006-30T1-1A2 | | | 6.25 | % | | | 11/25/2036 | | | | 3,101,641 | |
| | 2,866,776 | | | Countrywide Alternative Loan Trust, Series2006-32CB-A1 (1 Month LIBOR USD + 0.67%, 0.67% Floor, 6.00% Cap) | | | 1.62 | % | | | 11/25/2036 | | | | 1,313,194 | |
| | 4,781,783 | | | Countrywide Alternative Loan Trust, Series2006-32CB-A2(-1 x 1 Month LIBOR USD + 5.33%, 5.33% Cap) | | | 4.38 | % I/F I/O | | | 11/25/2036 | | | | 1,101,219 | |
| | 5,132,032 | | | Countrywide Alternative Loan Trust, Series2006-36T2-2A1 | | | 6.25 | % | | | 12/25/2036 | | | | 3,256,820 | |
| | 1,354,524 | | | Countrywide Alternative Loan Trust, Series 2006-39CB-1A10 | | | 6.00 | % | | | 01/25/2037 | | | | 1,282,120 | |
| | 14,455,753 | | | Countrywide Alternative Loan Trust, Series2006-39CB-2A2(-1 x 1 Month LIBOR USD + 6.55%, 6.55% Cap) | | | 5.60 | % I/F I/O | | | 01/25/2037 | | | | 3,593,404 | |
| | 4,922,866 | | | Countrywide Alternative Loan Trust, Series2006-39CB-2A4 (1 Month LIBOR USD + 0.45%, 0.45% Floor, 7.00% Cap) | | | 1.40 | % | | | 01/25/2037 | | | | 363,724 | |
| | 1,958,447 | | | Countrywide Alternative Loan Trust, Series 2006-40T1-1A11 | | | 6.00 | % | | | 01/25/2037 | | | | 1,630,266 | |
| | 3,333,229 | | | Countrywide Alternative Loan Trust, Series2006-40T1-1A4(-1 x 1 Month LIBOR USD + 5.45%, 5.45% Cap) | | | 4.50 | % I/F I/O | | | 01/25/2037 | | | | 544,499 | |
| | 3,995,933 | | | Countrywide Alternative Loan Trust, Series 2006-41CB-1A10 | | | 6.00 | % | | | 01/25/2037 | | | | 2,923,286 | |
| | 4,207,803 | | | Countrywide Alternative Loan Trust, Series2006-41CB-1A9 | | | 6.00 | % | | | 01/25/2037 | | | | 3,078,283 | |
| | 4,138,879 | | | Countrywide Alternative Loan Trust, Series2006-45T1-1A4 (1 Month LIBOR USD + 0.60%, 0.60% Floor, 6.00% Cap) | | | 1.55 | % | | | 02/25/2037 | | | | 951,240 | |
| | 4,138,879 | | | Countrywide Alternative Loan Trust, Series2006-45T1-1A5(-1 x 1 Month LIBOR USD + 5.40%, 5.40% Cap) | | | 4.45 | % I/F I/O | | | 02/25/2037 | | | | 852,294 | |
| | 1,086,147 | | | Countrywide Alternative Loan Trust, Series2006-6CB-1A4 | | | 5.50 | % | | | 05/25/2036 | | | | 1,005,992 | |
| | 3,265,905 | | | Countrywide Alternative Loan Trust, Series2006-J1-1A10 | | | 5.50 | % | | | 02/25/2036 | | | | 2,698,977 | |
| | 6,626,395 | | | Countrywide Alternative Loan Trust, Series2006-J1-1A3 | | | 5.50 | % | | | 02/25/2036 | | | | 5,476,121 | |
| | 1,316,032 | | | Countrywide Alternative Loan Trust, Series2006-J4-2A2 | | | 6.00 | % | | | 07/25/2036 | | | | 929,077 | |
| | 811,931 | | | Countrywide Alternative Loan Trust, Series2007-11T1-A24(-6 x 1 Month LIBOR USD + 39.90%, 39.90% Cap) | | | 34.22 | % I/F | | | 05/25/2037 | | | | 1,799,153 | |
| | 13,120,783 | | | Countrywide Alternative Loan Trust, Series2007-15CB-A1 | | | 6.00 | % | | | 07/25/2037 | | | | 10,736,220 | |
| | 9,452,443 | | | Countrywide Alternative Loan Trust, Series2007-16CB-2A1 (1 Month LIBOR USD + 0.45%, 0.45% Floor, 7.00% Cap) | | | 1.40 | % | | | 08/25/2037 | | | | 3,489,732 | |
| | 2,737,191 | | | Countrywide Alternative Loan Trust, Series2007-16CB-2A2(-8 x 1 Month LIBOR USD + 54.58%, 54.58% Cap) | | | 46.69 | % I/F | | | 08/25/2037 | | | | 7,215,588 | |
| | 4,442,717 | | | Countrywide Alternative Loan Trust, Series2007-16CB-4A7 | | | 6.00 | % | | | 08/25/2037 | | | | 4,001,571 | |
| | 7,157,384 | | | Countrywide Alternative Loan Trust, Series 2007-17CB-1A10(-5 x 1 Month LIBOR USD + 29.90%, 29.90% Cap) | | | 25.55 | % I/F | | | 08/25/2037 | | | | 13,588,476 | |
| | 1,127,079 | | | Countrywide Alternative Loan Trust, Series 2007-18CB-2A25 | | | 6.00 | % | | | 08/25/2037 | | | | 956,128 | |
| | 791,341 | | | Countrywide Alternative Loan Trust, Series2007-19-1A10(-6 x 1 Month LIBOR USD + 39.00%, 39.00% Cap) | | | 33.32 | % I/F | | | 08/25/2037 | | | | 1,917,376 | |
| | 11,631,020 | | | Countrywide Alternative Loan Trust, Series2007-19-1A4 | | | 6.00 | % | | | 08/25/2037 | | | | 8,210,047 | |
| | 31,559,953 | | | Countrywide Alternative Loan Trust, Series2007-19-2A1 | | | 6.50 | % | | | 08/25/2037 | | | | 19,442,869 | |
| | 3,732,228 | | | Countrywide Alternative Loan Trust, Series2007-21CB-2A2(-4 x 1 Month LIBOR USD + 28.40%, 28.40% Cap) | | | 24.61 | % I/F | | | 09/25/2037 | | | | 4,702,801 | |
| | 21,420,232 | | | Countrywide Alternative Loan Trust, Series2007-22-2A16 | | | 6.50 | % | | | 09/25/2037 | | | | 12,535,356 | |
| | 9,300,861 | | | Countrywide Alternative Loan Trust, Series2007-23CB-A3 (1 Month LIBOR USD + 0.50%, 0.50% Floor, 7.00% Cap) | | | 1.45 | % | | | 09/25/2037 | | | | 3,681,258 | |
| | 13,199,851 | | | Countrywide Alternative Loan Trust, Series2007-23CB-A4(-1 x 1 Month LIBOR USD + 6.50%, 6.50% Cap) | | | 5.55 | % I/F I/O | | | 09/25/2037 | | | | 4,294,214 | |
| | 15,421,376 | | | Countrywide Alternative Loan Trust, Series2007-4CB-2A1 | | | 7.00 | % | | | 03/25/2037 | | | | 3,037,097 | |
| | 5,169,843 | | | Countrywide Alternative Loan Trust, Series2007-5CB-1A18(-1 x 1 Month LIBOR USD + 5.65%, 5.65% Cap) | | | 4.70 | % I/F I/O | | | 04/25/2037 | | | | 1,369,993 | |
| | 5,169,843 | | | Countrywide Alternative Loan Trust, Series2007-5CB-1A23 (1 Month LIBOR USD + 0.55%, 0.55% Floor, 6.00% Cap) | | | 1.50 | % | | | 04/25/2037 | | | | 2,306,318 | |
| | 4,396,999 | | | Countrywide Alternative Loan Trust, Series2007-6-A4 | | | 5.75 | % | | | 04/25/2047 | | | | 3,357,274 | |
| | 348,869 | | | Countrywide Alternative Loan Trust, Series2007-8CB-A12(-6 x 1 Month LIBOR USD + 40.20%, 40.20% Cap) | | | 34.52 | % I/F | | | 05/25/2037 | | | | 830,236 | |
| | 372,412 | | | Countrywide Alternative Loan Trust, Series2007-8CB-A8(-6 x 1 Month LIBOR USD + 40.08%, 40.08% Cap) | | | 34.40 | % I/F | | | 05/25/2037 | | | | 883,372 | |
| | 532,345 | | | Countrywide Alternative Loan Trust, Series2007-9T1-1A4 (1 Month LIBOR USD + 0.50%, 0.50% Floor, 6.00% Cap) | | | 1.45 | % | | | 05/25/2037 | | | | 172,745 | |
| | 532,345 | | | Countrywide Alternative Loan Trust, Series2007-9T1-1A5(-1 x 1 Month LIBOR USD + 5.50%, 5.50% Cap) | | | 4.55 | % I/F I/O | | | 05/25/2037 | | | | 127,848 | |
| | 1,591,794 | | | Countrywide Alternative Loan Trust, Series2007-9T1-2A1 | | | 6.00 | % | | | 05/25/2037 | | | | 754,517 | |
| | 34,354,889 | | | Countrywide Alternative Loan Trust, Series2007-HY2-1A | | | 3.61 | % # | | | 03/25/2047 | | | | 29,533,586 | |
| | 2,512,322 | | | Countrywide Asset Backed Certificates, Series2003-BC6-M1 (1 Month LIBOR USD + 0.83%, 0.55% Floor) | | | 1.77 | % | | | 11/25/2033 | | | | 2,335,989 | |
| | 12,622,883 | | | Countrywide Asset Backed Certificates, Series2005-4-AF5B | | | 5.15 | % | | | 10/25/2035 | | | | 12,936,591 | |
| | 32,747,932 | | | Countrywide Asset Backed Certificates, Series2006-25-1A (1 Month LIBOR USD + 0.14%, 0.14% Floor) | | | 1.09 | % | | | 06/25/2047 | | | | 27,560,404 | |
| | 9,082,067 | | | Countrywide Asset Backed Certificates, Series2006-26-1A (1 Month LIBOR USD + 0.14%, 0.14% Floor) | | | 1.09 | % | | | 06/25/2037 | | | | 7,426,748 | |
| | 17,960,776 | | | Countrywide Asset Backed Certificates, Series2007-BC1-1A (1 Month LIBOR USD + 0.14%, 0.14% Floor) | | | 1.09 | % | | | 05/25/2037 | | | | 14,591,751 | |
| | 4,110,264 | | | Countrywide Asset Backed Certificates, Series2007-BC3-2A3 (1 Month LIBOR USD + 0.18%, 0.18% Floor) | | | 1.13 | % | | | 11/25/2047 | | | | 3,674,932 | |
| | 333,165 | | | Countrywide Asset-Backed Certificates, Series2005-13-AF3 | | | 5.43 | % # | | | 02/25/2033 | | | | 284,472 | |
| | 1,020,281 | | | Countrywide Home Loans, Series2003-60-4A1 | | | 3.89 | % # | | | 02/25/2034 | | | | 988,164 | |
| | 1,786,295 | | | Countrywide Home Loans, Series2004-R2-1AF1 (1 Month LIBOR USD + 0.42%, 0.42% Floor, 9.50% Cap) | | | 2.00 | % ^ | | | 11/25/2034 | | | | 1,544,412 | |
| | | | | | | | | | | | | | | | |
| | | | | | | | | | | | | |
| | 1,738,061 | | | Countrywide Home Loans, Series2004-R2-1AS | | | 4.51 | % # ^ I/O | | | 11/25/2034 | | | | 141,872 | |
| | 4,005,953 | | | Countrywide Home Loans, Series2005-20-A5 | | | 5.50 | % | | | 10/25/2035 | | | | 3,245,607 | |
| | 2,963,644 | | | Countrywide Home Loans, Series2005-20-A8 | | | 5.25 | % | | | 10/25/2035 | | | | 2,432,844 | |
| | 9,590,362 | | | Countrywide Home Loans, Series2005-23-A1 | | | 5.50 | % | | | 11/25/2035 | | | | 7,134,886 | |
| | 2,564,786 | | | Countrywide Home Loans, Series2005-24-A8 | | | 5.50 | % | | | 11/25/2035 | | | | 1,983,615 | |
| | 760,465 | | | Countrywide Home Loans, Series2005-27-2A1 | | | 5.50 | % | | | 12/25/2035 | | | | 551,173 | |
| | 1,487,412 | | | Countrywide Home Loans, Series2005-28-A7 | | | 5.25 | % | | | 01/25/2019 | | | | 1,140,789 | |
| | 13,483,698 | | | Countrywide Home Loans, Series2005-HYB1-4A1 | | | 3.70 | % # | | | 03/25/2035 | | | | 12,503,918 | |
| | 1,190,438 | | | Countrywide Home Loans, Series2005-HYB8-1A1 | | | 3.77 | % # | | | 12/20/2035 | | | | 947,130 | |
| | 2,063,908 | | | Countrywide Home Loans, Series2005-J3-2A4 | | | 4.50 | % | | | 09/25/2035 | | | | 1,865,161 | |
| | 1,322,131 | | | Countrywide Home Loans, Series2005-J4-A5 | | | 5.50 | % | | | 11/25/2035 | | | | 1,208,558 | |
| | 571,325 | | | Countrywide Home Loans, Series2005-R1-1AF1 (1 Month LIBOR USD + 0.36%, 0.36% Floor, 9.50% Cap) | | | 1.31 | %^ | | | 03/25/2035 | | | | 497,265 | |
| | 559,409 | | | Countrywide Home Loans, Series2005-R1-1AS | | | 4.57 | % # ^ I/O | | | 03/25/2035 | | | | 74,899 | |
| | 4,840,524 | | | Countrywide Home Loans, Series2006-16-2A1 | | | 6.50 | % | | | 11/25/2036 | | | | 2,965,013 | |
| | 4,871,973 | | | Countrywide Home Loans, Series2006-1-A2 | | | 6.00 | % | | | 03/25/2036 | | | | 3,664,922 | |
| | 1,997,658 | | | Countrywide Home Loans, Series2006-20-1A21 | | | 6.00 | % | | | 02/25/2037 | | | | 1,488,677 | |
| | 1,320,050 | | | Countrywide Home Loans, Series2006-J3-A4 | | | 5.50 | % | | | 05/25/2036 | | | | 1,264,124 | |
| | 5,783,583 | | | Countrywide Home Loans, Series2007-10-A7 | | | 6.00 | % | | | 07/25/2037 | | | | 4,262,305 | |
| | 17,426,957 | | | Countrywide Home Loans, Series2007-11-A1 | | | 6.00 | % | | | 08/25/2037 | | | | 12,479,852 | |
| | 10,571,800 | | | Countrywide Home Loans, Series2007-12-A9 | | | 5.75 | % | | | 08/25/2037 | | | | 8,305,335 | |
| | 4,261,849 | | | Countrywide Home Loans, Series2007-13-A1 | | | 6.00 | % | | | 08/25/2037 | | | | 3,174,665 | |
| | 6,983,274 | | | Countrywide Home Loans, Series2007-13-A10 | | | 6.00 | % | | | 08/25/2037 | | | | 5,201,864 | |
| | 5,516,374 | | | Countrywide Home Loans, Series2007-15-1A1 | | | 6.25 | % | | | 09/25/2037 | | | | 4,484,947 | |
| | 770,512 | | | Countrywide Home Loans, Series2007-15-1A16 | | | 6.25 | % | | | 09/25/2037 | | | | 626,445 | |
| | 2,710,666 | | | Countrywide Home Loans, Series2007-15-1A29 | | | 6.25 | % | | | 09/25/2037 | | | | 2,203,685 | |
| | 6,020,706 | | | Countrywide Home Loans, Series2007-17-1A2 | | | 6.00 | % | | | 10/25/2037 | | | | 5,096,093 | |
| | 748,946 | | | Countrywide Home Loans, Series2007-18-1A1 | | | 6.00 | % | | | 11/25/2037 | | | | 565,035 | |
| | 5,609,791 | | | Countrywide Home Loans, Series2007-3-A1 | | | 6.00 | % | | | 04/25/2037 | | | | 4,190,366 | |
| | 2,160,529 | | | Countrywide Home Loans, Series2007-3-A12 | | | 6.00 | % | | | 04/25/2037 | | | | 1,613,858 | |
| | 4,526,332 | | | Countrywide Home Loans, Series2007-4-1A39 | | | 6.00 | % | | | 05/25/2037 | | | | 3,151,849 | |
| | 1,917,418 | | | Countrywide Home Loans, Series2007-5-A2 | | | 5.75 | % | | | 05/25/2037 | | | | 1,415,291 | |
| | 6,604,410 | | | Countrywide Home Loans, Series2007-7-A1 | | | 6.00 | % | | | 06/25/2037 | | | | 5,034,333 | |
| | 1,979,777 | | | Countrywide Home Loans, Series2007-7-A2 | | | 5.75 | % | | | 06/25/2037 | | | | 1,483,474 | |
| | 6,338,990 | | | Countrywide Home Loans, Series2007-8-1A4 | | | 6.00 | % | | | 01/25/2038 | | | | 4,443,036 | |
| | 3,326,679 | | | Countrywide Home Loans, Series2007-8-1A5 | | | 5.44 | % | | | 01/25/2038 | | | | 2,186,573 | |
| | 7,723,848 | | | Countrywide Home Loans, Series2007-8-1A9 (1 Month LIBOR USD + 6.00%, 4.00% Floor, 6.00% Cap) | | | 6.00 | % | | | 01/25/2038 | | | | 5,368,301 | |
| | 1,287,946 | | | Countrywide Home Loans, Series2007-9-A11 | | | 5.75 | % | | | 07/25/2037 | | | | 965,142 | |
| | 7,523,031 | | | Countrywide Home Loans, Series2007-HY1-1A1 | | | 3.73 | % # | | | 04/25/2037 | | | | 6,421,829 | |
| | 19,398,922 | | | Countrywide Home Loans, Series2007-J1-2A1 | | | 6.00 | % | | | 02/25/2037 | | | | 11,904,422 | |
| | 489,612 | | | Countrywide Home Loans, Series2007-J3-A1 (1 Month LIBOR USD + 0.50%, 0.50% Floor, 6.00% Cap) | | | 1.45 | % | | | 07/25/2037 | | | | 184,840 | |
| | 2,448,061 | | | Countrywide Home Loans, Series2007-J3-A2(-1 x 1 Month LIBOR USD + 5.50%, 5.50% Cap) | | | 4.55 | % I/F I/O | | | 07/25/2037 | | | | 554,320 | |
| | 4,490,940 | | | Credit Suisse First Boston Mortgage Backed Trust, Series2006-3-A4B | | | 6.61 | % | | | 11/25/2036 | | | | 1,236,918 | |
| | 2,721,445 | | | Credit Suisse First Boston Mortgage Backed Trust, Series2006-4-A6A | | | 5.68 | % | | | 12/25/2036 | | | | 898,013 | |
| | 9,755,344 | | | Credit Suisse First Boston Mortgage Backed Trust, Series2007-1-1A1A | | | 5.90 | % # | | | 05/25/2037 | | | | 3,543,297 | |
| | 37,145 | | | Credit Suisse First Boston Mortgage Securities Corporation, Series2004-AR8-2A1 | | | 3.99 | % # | | | 09/25/2034 | | | | 36,813 | |
| | 3,217,127 | | | Credit Suisse First Boston Mortgage Securities Corporation, Series2005-10-5A4 | | | 5.50 | % | | | 11/25/2035 | | | | 2,719,369 | |
| | 677,238 | | | Credit Suisse First Boston Mortgage Securities Corporation, Series2005-10-5A5 | | | 5.50 | % | | | 11/25/2035 | | | | 572,454 | |
| | 9,045,460 | | | Credit Suisse First Boston Mortgage Securities Corporation, Series2005-12-5A1 | | | 5.25 | % | | | 01/25/2036 | | | | 8,468,711 | |
| | 9,721,832 | | | Credit Suisse First Boston Mortgage Securities Corporation, Series2005-12-7A1 | | | 7.00 | % | | | 01/25/2036 | | | | 2,197,223 | |
| | 4,673,925 | | | Credit Suisse First Boston Mortgage Securities Corporation, Series2005-8-3A10 | | | 5.50 | % | | | 09/25/2035 | | | | 4,387,203 | |
| | 4,263,679 | | | Credit Suisse First Boston Mortgage Securities Corporation, Series2005-8-7A1 | | | 7.00 | % | | | 09/25/2035 | | | | 2,942,816 | |
| | 1,581,525 | | | Credit Suisse Mortgage Capital Certificates, Series2005-1R-2A5 | | | 5.75 | % ^ | | | 12/26/2035 | | | | 1,387,769 | |
| | 13,955,156 | | | Credit Suisse Mortgage Capital Certificates, Series2006-1-2A1 | | | 6.00 | % | | | 02/25/2036 | | | | 7,837,768 | |
| | 2,478,572 | | | Credit Suisse Mortgage Capital Certificates, Series2006-2-3A1 | | | 6.50 | % | | | 03/25/2036 | | | | 1,110,022 | |
| | 2,936,005 | | | Credit Suisse Mortgage Capital Certificates, Series2006-2-5A1 (1 Month LIBOR USD + 0.70%, 0.70% Floor, 6.00% Cap) | | | 1.65 | % | | | 03/25/2036 | | | | 1,013,816 | |
| | 16,410,916 | | | Credit Suisse Mortgage Capital Certificates, Series2006-2-5A2(-1 x 1 Month LIBOR USD + 5.30%, 5.30% Cap) | | | 4.35 | % I/F I/O | | | 03/25/2036 | | | | 3,996,911 | |
| | 3,418,371 | | | Credit Suisse Mortgage Capital Certificates, Series2006-2-5A3 | | | 6.25 | % | | | 03/25/2036 | | | | 2,303,257 | |
| | 9,251,479 | | | Credit Suisse Mortgage Capital Certificates, Series2006-2-5A4 | | | 6.00 | % | | | 03/25/2036 | | | | 6,074,167 | |
| | 2,512,578 | | | Credit Suisse Mortgage Capital Certificates, Series2006-3-4A3 | | | 5.50 | % | | | 04/25/2036 | | | | 2,066,318 | |
| | 1,518,917 | | | Credit Suisse Mortgage Capital Certificates, Series2006-3-4A4 | | | 5.50 | % | | | 04/25/2036 | | | | 1,251,130 | |
| | 3,387,595 | | | Credit Suisse Mortgage Capital Certificates, Series2006-4-1A8 (1 Month LIBOR USD + 1.00%, 6.00% Floor, 6.00% Cap) | | | 6.00 | % | | | 05/25/2036 | | | | 2,429,002 | |
| | 20,313,066 | | | Credit Suisse Mortgage Capital Certificates, Series2006-4-4A1 | | | 7.00 | % | | | 05/25/2036 | | | | 6,078,522 | |
| | 8,781,247 | | | Credit Suisse Mortgage Capital Certificates, Series2006-6-1A4 | | | 6.00 | % | | | 07/25/2036 | | | | 6,445,822 | |
| | 10,177,031 | | | Credit Suisse Mortgage Capital Certificates, Series2006-6-3A1 | | | 7.00 | % | | | 07/25/2036 | | | | 2,016,377 | |
| | 175,950 | | | Credit Suisse Mortgage Capital Certificates, Series2006-7-3A11 | | | 6.00 | % | | | 08/25/2036 | | | | 115,969 | |
| | 2,550,140 | | | Credit Suisse Mortgage Capital Certificates, Series2006-7-7A5 | | | 6.00 | % | | | 08/25/2036 | | | | 2,265,011 | |
| | 5,399,600 | | | Credit Suisse Mortgage Capital Certificates, Series2006-9-2A1 | | | 5.50 | % | | | 11/25/2036 | | | | 4,683,593 | |
| | 18,992,340 | | | Credit Suisse Mortgage Capital Certificates, Series2006-9-3A1 | | | 6.00 | % | | | 11/25/2036 | | | | 16,337,507 | |
| | 5,582,021 | | | Credit Suisse Mortgage Capital Certificates, Series2006-9-4A1 | | | 6.00 | % | | | 11/25/2036 | | | | 4,068,329 | |
| | 3,563,854 | | | Credit Suisse Mortgage Capital Certificates, Series2006-9-6A14 | | | 6.00 | % | | | 11/25/2036 | | | | 3,270,397 | |
| | 579,052 | | | Credit Suisse Mortgage Capital Certificates, Series2006-9-6A15(-6 x 1 Month LIBOR USD + 39.90%, 39.90% Cap) | | | 30.14 | % I/F | | | 11/25/2036 | | | | 1,247,960 | |
| | 10,187,637 | | | Credit Suisse Mortgage Capital Certificates, Series2007-1-1A4 | | | 6.13 | % # | | | 02/25/2037 | | | | 4,007,347 | |
| | 4,718,730 | | | Credit Suisse Mortgage Capital Certificates, Series2007-1-5A14 | | | 6.00 | % | | | 02/25/2037 | | | | 3,660,269 | |
| | 7,131,949 | | | Credit Suisse Mortgage Capital Certificates, Series2007-3-2A10 | | | 6.00 | % | | | 04/25/2037 | | | | 4,596,150 | |
| | 5,120,185 | | | Credit Suisse Mortgage Capital Certificates, Series2007-5-2A5 | | | 5.00 | % | | | 08/25/2037 | | | | 4,239,278 | |
| | 41,131,181 | | | Credit Suisse Mortgage Capital Certificates, Series2007-5-3A19 | | | 6.00 | % | | | 08/25/2037 | | | | 32,395,202 | |
| | 18,233,056 | | | Credit Suisse Mortgage Capital Certificates, Series2007-5-3A9 | | | 6.00 | % | | | 08/25/2037 | | | | 14,357,106 | |
| | 6,409,482 | | | Credit Suisse Mortgage Capital Certificates, Series2008-2R-1A1 | | | 6.00 | % ^ | | | 07/25/2037 | | | | 5,911,100 | |
| | 962,934 | | | Credit Suisse Mortgage Capital Certificates, Series2009-1R-4A2 | | | 4.28 | % # ^ | | | 07/20/2035 | | | | 889,275 | |
| | 3,002,715 | | | Credit Suisse Mortgage Capital Certificates, Series2010-13R-1A2 | | | 5.50 | % # ^ | | | 12/26/2035 | | | | 2,903,110 | |
| | 57,889,836 | | | Credit Suisse Mortgage Capital Certificates, Series2010-17R-6A1 | | | 3.72 | % # ^ | | | 06/26/2037 | | | | 55,981,764 | |
| | 1,566,839 | | | Credit Suisse Mortgage Capital Certificates, Series2010-2R-4A17 | | | 6.00 | % # ^ | | | 03/26/2037 | | | | 1,564,729 | |
| | 9,067,835 | | | Credit Suisse Mortgage Capital Certificates, Series2010-4R-8A17 | | | 6.00 | % # ^ | | | 06/26/2037 | | | | 8,877,200 | |
| | 10,754,544 | | | Credit Suisse Mortgage Capital Certificates, Series2012-10R-4A2 | | | 3.65 | % # ^ | | | 08/26/2046 | | | | 8,906,136 | |
| | 20,156,341 | | | Credit Suisse Mortgage Capital Certificates, Series2013-6-1A1 | | | 2.50 | % # ^ | | | 07/25/2028 | | | | 19,932,765 | |
| | 36,661,753 | | | Credit Suisse Mortgage Capital Certificates, Series2013-9R-A1 | | | 3.00 | % # ^ | | | 05/27/2043 | | | | 33,388,712 | |
| | 17,629,265 | | | Credit Suisse Mortgage Capital Certificates, Series2013-IVR4-A2 | | | 3.00 | % # ^ | | | 07/25/2043 | | | | 17,329,481 | |
| | 3,172,106 | | | Credit Suisse Mortgage Capital Certificates, Series2014-WIN1-2A4 | | | 3.00 | % # ^ | | | 09/25/2044 | | | | 3,122,460 | |
| | 51,426,676 | | | Credit Suisse Mortgage Capital Certificates, Series2015-1-A1 | | | 2.50 | % # ^ | | | 01/25/2045 | | | | 49,990,998 | |
| | | | | | | | | | | | | | | | |
| | | | | | | | | | | | | |
| | 16,695,012 | | | Credit Suisse Mortgage Capital Certificates, Series2020-BPL1-A2 | | | 4.52 | % ^§ | | | 02/25/2024 | | | | 16,532,722 | |
| | 11,686,855 | | | Credit-Based Asset Servicing and Securitization LLC, Series2006-CB4-AV3 (1 Month LIBOR USD + 0.15%, 0.15% Floor) | | | 1.10 | % | | | 05/25/2036 | | | | 9,049,026 | |
| | 4,586,519 | | | Credit-Based Asset Servicing and Securitization LLC, Series2007-MX1-A3 | | | 5.83 | % ^ß | | | 12/25/2036 | | | | 4,623,751 | |
| | 10,681,196 | | | CSMC Mortgage-Backed Trust, Series2006-4-6A1 | | | 6.00 | % | | | 05/25/2036 | | | | 6,544,482 | |
| | 5,710,005 | | | CSMC Mortgage-Backed Trust, Series2007-1-3A1 | | | 6.00 | % | | | 02/25/2022 | | | | 1,818,677 | |
| | 64,604 | | | CSMC Mortgage-Backed Trust, Series2007-2-2A1 | | | 5.00 | % | | | 03/25/2037 | | | | 58,967 | |
| | 12,106,994 | | | CSMC Mortgage-Backed Trust, Series 2019-RPL6-CERT | | | 4.10 | % ^ | | | 11/25/2058 | | | | 10,602,015 | |
| | 287,917,744 | | | CSMC Mortgage-Backed Trust, Series2019-RPL6-PT1 | | | 3.98 | % # ^ | | | 11/25/2058 | | | | 268,635,979 | |
| | 24,437,671 | | | CSMC Mortgage-Backed Trust, Series2019-RPL8-A1 | | | 3.32 | % # ^ | | | 10/25/2058 | | | | 25,541,122 | |
| | 9,043,610 | | | CSMC Trust, Series2009-12R-5A1 | | | 6.00 | % ^ | | | 06/27/2036 | | | | 8,351,057 | |
| | 18,365,632 | | | CSMC Trust, Series2010-4R-3A17 | | | 6.00 | %# ^ | | | 06/26/2037 | | | | 17,660,759 | |
| | 52,217,823 | | | CSMC Trust, Series2018-RPL2-A1 | | | 4.03 | % ^§ | | | 08/25/2062 | | | | 48,572,215 | |
| | 167,697,593 | | | CSMC Trust, Series2018-RPL7-A1 | | | 4.00 | % ^ | | | 08/26/2058 | | | | 174,877,549 | |
| | 74,911,300 | | | CSMC Trust, Series2018-RPL8-A1 | | | 4.13 | % # ^ | | | 07/25/2058 | | | | 69,968,997 | |
| | 58,244,384 | | | CSMC Trust, Series2019-6R-1A1 (1 Month LIBOR USD + 1.40%, 1.40% Floor) | | | 2.76 | % ^ | | | 10/25/2046 | | | | 54,697,481 | |
| | 130,324,607 | | | CSMC Trust, Series2019-JR1-A1 | | | 4.10 | % # ^ | | | 09/27/2066 | | | | 129,960,897 | |
| | 66,851,881 | | | CSMC Trust, Series2019-RPL2-A1 | | | 3.88 | % # ^ | | | 11/25/2058 | | | | 69,066,985 | |
| | 4,227,000 | | | CSMC Trust, Series2020-AFC1-B1 | | | 3.45 | % # ^ | | | 02/25/2050 | | | | 2,979,620 | |
| | 14,864,824 | | | CSMC Trust, Series 2020-RPL1-CERT | | | 3.23 | % ^ | | | 01/25/2046 | | | | 13,754,659 | |
| | 284,411,669 | | | CSMC Trust, Series2020-RPL1-PT1 | | | 3.47 | % ^ | | | 10/25/2069 | | | | 244,671,680 | |
| | 102,104,276 | | | CSMCM Trust, Series 2017-RPL2-CERT | | | 0.01 | % ^ | | | 02/25/2056 | | | | 86,130,542 | |
| | 11,576,068 | | | CSMCM Trust, Series2018-RPL7-A1 | | | 3.90 | % ^ I/O | | | 09/25/2048 | | | | 11,563,798 | |
| | 20,130,158 | | | CSMCM Trust, Series2018-RPL8-A1 | | | 4.07 | % ^ I/O | | | 07/25/2058 | | | | 19,572,726 | |
| | 5,752,134 | | | CSMLT Trust, Series2015-3-1A2 | | | 3.50 | % # ^ | | | 11/25/2045 | | | | 5,815,836 | |
| | 4,049,762 | | | Deephaven Residential Mortgage Trust, Series2018-3A-A2 | | | 3.89 | % # ^ | | | 08/25/2058 | | | | 3,992,608 | |
| | 3,942,204 | | | Deephaven Residential Mortgage Trust, Series2018-3A-A3 | | | 3.96 | % # ^ | | | 08/25/2058 | | | | 3,884,682 | |
| | 27,216,736 | | | DeutscheAlt-A Securities Mortgage Loan Trust, Series2007-OA3-A2 (1 Month LIBOR USD + 2.50%, 0.25% Floor) | | | 1.20 | % | | | 07/25/2047 | | | | 20,424,293 | |
| | 12,817,772 | | | DeutscheALT-A Securities, Inc. Mortgage Loan Trust, Series2005-4-A5 | | | 5.50 | % # | | | 09/25/2035 | | | | 11,798,273 | |
| | 726,827 | | | DeutscheALT-A Securities, Inc. Mortgage Loan Trust, Series2005-5-1A6(-7 x 1 Month LIBOR USD + 35.93%, 35.93% Cap) | | | 24.00 | % I/F | | | 11/25/2035 | | | | 1,234,853 | |
| | 866,251 | | | DeutscheALT-A Securities, Inc. Mortgage Loan Trust, Series2005-5-2A1 (1 Month LIBOR USD + 0.20%, 0.20% Floor, 5.50% Cap) | | | 1.15 | % | | | 11/25/2035 | | | | 437,128 | |
| | 2,614,439 | | | DeutscheALT-A Securities, Inc. Mortgage Loan Trust, Series2005-5-2A2(-1 x 1 Month LIBOR USD + 5.30%, 5.30% Cap) | | | 4.35 | % I/F I/O | | | 11/25/2035 | | | | 330,370 | |
| | 21,084,052 | | | DeutscheALT-A Securities, Inc. Mortgage Loan Trust, Series2007-2-2A1 (1 Month LIBOR USD + 0.30%, 0.30% Floor) | | | 1.25 | % | | | 09/25/2047 | | | | 16,496,630 | |
| | 13,842,373 | | | DeutscheALT-A Securities, Inc. Mortgage Loan Trust, Series2007-OA5-A1B (1 Month LIBOR USD + 0.22%, 0.22% Floor) | | | 1.17 | % | | | 08/25/2047 | | | | 10,741,018 | |
| | 5,310,899 | | | DeutscheALT-B Securities Mortgage Loan Trust, Series2006-AB1-A1C | | | 5.67 | % # | | | 02/25/2036 | | | | 4,871,278 | |
| | 714,468 | | | DeutscheALT-B Securities, Inc. Mortgage Loan Trust, Series2006-AB2-A2 | | | 5.15 | % # | | | 06/25/2036 | | | | 636,107 | |
| | 18,216,364 | | | DeutscheALT-B Securities, Inc. Mortgage Loan Trust, Series2006-AB4-A2 | | | 5.65 | % # | | | 10/25/2036 | | | | 15,930,946 | |
| | 1,297,697 | | | DeutscheALT-B Securities, Inc. Mortgage Loan Trust, Series2006-AB4-A3 | | | 5.90 | % # | | | 10/25/2036 | | | | 1,134,626 | |
| | 1,903,536 | | | DeutscheALT-B Securities, Inc. Mortgage Loan Trust, Series2006-AB4-A3A1 | | | 5.90 | % # | | | 10/25/2036 | | | | 1,663,858 | |
| | 3,778,937 | | | DeutscheALT-B Securities, Inc. Mortgage Loan Trust, Series2006-AB4-A6A1 | | | 5.87 | % ß | | | 10/25/2036 | | | | 3,302,879 | |
| | 6,398,791 | | | Deutsche Mortgage Securities, Inc., Series2006-PR1-3A1
(-1 x 1 Month LIBOR USD + 12.12%, 12.12% Cap) | | | 11.14 | % ^I/F | | | 04/15/2036 | | | | 5,948,992 | |
| | 4,170,616 | | | Deutsche Mortgage Securities, Inc., Series2006-PR1-4AI1
(-1 x 1 Month LIBOR USD + 12.11%, 12.11% Cap) | | | 11.12 | % ^I/F | | | 04/15/2036 | | | | 4,112,992 | |
| | 6,779,854 | | | Deutsche Mortgage Securities, Inc., Series2006-PR1-4AI2
(-2 x 1 Month LIBOR USD + 14.60%, 14.61% Cap) | | | 13.26 | % ^I/F | | | 04/15/2036 | | | | 6,973,523 | |
| | 486,802 | | | Deutsche Mortgage Securities, Inc., Series2006-PR1-5AI1
(-3 x 1 Month LIBOR USD + 19.35%, 19.35% Cap) | | | 17.24 | % ^I/F | | | 04/15/2036 | | | | 591,193 | |
| | 4,261,461 | | | Deutsche Mortgage Securities, Inc., Series2006-PR1-5AI3
(-1 x 1 Month LIBOR USD + 12.57%, 12.57% Cap) | | | 11.58 | % ^I/F | | | 04/15/2036 | | | | 4,234,192 | |
| | 70,580,840 | | | Deutsche Mortgage Securities, Inc., Series2006-PR1-5AI4
(-1 x 1 Month LIBOR USD + 12.12%, 12.12% Cap) | | | 11.14 | % ^I/F | | | 04/15/2036 | | | | 69,755,087 | |
| | 7,981,495 | | | Deutsche Securities, Inc., Series2005-6-2A1 | | | 5.50 | % | | | 12/25/2035 | | | | 7,136,225 | |
| | 1,304,507 | | | Deutsche Securities, Inc., Series2006-AB4-A1A | | | 6.01 | % # | | | 10/25/2036 | | | | 1,140,470 | |
| | 39,393,038 | | | Eagle Ltd., Series2019-1-M1B (1 Month LIBOR USD + 1.80%) | | | 2.75 | % ^ | | | 04/25/2029 | | | | 39,264,703 | |
| | 16,856,062 | | | Equifirst Loan Securitization Trust, Series2007-1-A2B (1 Month LIBOR USD + 0.19%, 0.19% Floor) | | | 1.14 | % | | | 04/25/2037 | | | | 14,832,239 | |
| | 76,931,937 | | | Figure Line of Credit Trust, Series2020-1-A | | | 4.04 | % # ^ | | | 09/25/2049 | | | | 73,313,443 | |
| | 4,118,224 | | | First Franklin Mortgage Loan Trust, Series2006-FF3-A2B (1 Month LIBOR USD + 0.20%, 0.20% Floor) | | | 1.15 | % | | | 02/25/2036 | | | | 4,072,562 | |
| | 5,887,401 | | | First Horizon Alternative Mortgage Securities Trust, Series2005-AA4-1A1 | | | 3.61 | % # | | | 05/25/2035 | | | | 4,189,881 | |
| | 5,931,013 | | | First Horizon Alternative Mortgage Securities Trust, Series2005-FA8-1A4 | | | 5.50 | % | | | 11/25/2035 | | | | 4,317,873 | |
| | 321,099 | | | First Horizon Alternative Mortgage Securities Trust, Series2005-FA8-2A1 | | | 5.00 | % | | | 11/25/2020 | | | | 326,045 | |
| | 2,565,204 | | | First Horizon Alternative Mortgage Securities Trust, Series2006-AA3-A1 | | | 3.77 | % # | | | 06/25/2036 | | | | 2,117,719 | |
| | 2,562,506 | | | First Horizon Alternative Mortgage Securities Trust, Series2006-FA1-1A12 | | | 6.00 | % | | | 04/25/2036 | | | | 1,732,170 | |
| | 8,598,804 | | | First Horizon Alternative Mortgage Securities Trust, Series2006-FA1-1A3 | | | 5.75 | % | | | 04/25/2036 | | | | 5,681,342 | |
| | 1,928,172 | | | First Horizon Alternative Mortgage Securities Trust, Series2006-FA2-1A5 | | | 6.00 | % | | | 05/25/2036 | | | | 1,299,481 | |
| | 2,620,541 | | | First Horizon Alternative Mortgage Securities Trust, Series2006-FA8-1A5 | | | 6.00 | % | | | 02/25/2037 | | | | 1,713,419 | |
| | 5,186,256 | | | First Horizon Alternative Mortgage Securities Trust, Series2006-RE1-A1 | | | 5.50 | % | | | 05/25/2035 | | | | 4,386,328 | |
| | 14,918,868 | | | First Horizon Alternative Mortgage Securities Trust, Series2007-FA3-A3 | | | 6.00 | % | | | 06/25/2037 | | | | 9,522,229 | |
| | 767,652 | | | First Horizon Alternative Mortgage Securities Trust, Series2007-FA3-A4 | | | 6.00 | % | | | 06/25/2037 | | | | 489,967 | |
| | 877,597 | | | First Horizon Alternative Mortgage Securities Trust, Series2007-FA4-1A13 | | | 6.25 | % | | | 08/25/2037 | | | | 586,252 | |
| | 2,709,208 | | | First Horizon Alternative Mortgage Securities Trust, Series2007-FA4-1A4 | | | 6.25 | % | | | 08/25/2037 | | | | 1,809,803 | |
| | 1,272,939 | | | First Horizon Alternative Mortgage Securities Trust, Series2007-FA4-1A5 | | | 6.25 | % | | | 08/25/2037 | | | | 850,348 | |
| | 1,599,995 | | | First Horizon Mortgage Pass-Through Trust, Series2006-1-1A2 | | | 6.00 | % | | | 05/25/2036 | | | | 1,181,755 | |
| | 4,165,885 | | | First Horizon Mortgage Pass-Through Trust, Series2007-1-A3 | | | 6.00 | % | | | 03/25/2037 | | | | 3,012,808 | |
| | 2,815,716 | | | First Horizon Mortgage Pass-Through Trust, Series2007-4-1A1 | | | 6.00 | % | | | 08/25/2037 | | | | 2,015,906 | |
| | 72,500,000 | | | FMC GMSR Issuer Trust, Series2019-GT1-A | | | 5.07 | % # ^ | | | 05/25/2024 | | | | 73,580,308 | |
| | 75,700,000 | | | FMC GMSR Issuer Trust, Series2019-GT2-A | | | 4.23 | % # ^ | | | 09/25/2024 | | | | 47,644,051 | |
| | 153,548,077 | | | Fremont Home Loan Trust, Series2006-D-1A1 (1 Month LIBOR USD + 0.14%, 0.14% Floor) | | | 1.09 | % | | | 11/25/2036 | | | | 90,288,434 | |
| | 55,423,892 | | | GCAT LLC, Series2019-2-A1 | | | 3.47 | % ^§ | | | 06/25/2024 | | | | 55,244,679 | |
| | 2,751,000 | | | GCAT LLC, Series2019-NQM3-M1 | | | 3.45 | % # ^ | | | 11/25/2059 | | | | 2,363,500 | |
| | 24,792,419 | | | GCAT LLC, Series2020-1-A1 | | | 2.98 | % ^§ | | | 01/26/2060 | | | | 24,808,259 | |
| | 46,273,000 | | | GE-WMC Asset-Backed Pass-Through Certificates, Series2005-2-A2D (1 Month LIBOR USD + 0.32%, 0.32% Floor) | | | 1.27 | % | | | 12/25/2035 | | | | 39,749,502 | |
| | 40,698,887 | | | GE-WMC Mortgage Securities Trust, Series2006-1-A2B (1 Month LIBOR USD + 0.15%, 0.15% Floor) | | | 1.10 | % | | | 08/25/2036 | | | | 20,436,909 | |
| | 3,606,362 | | | GMACM Mortgage Loan Trust, Series2005-AR5-3A1 | | | 3.98 | % # | | | 09/19/2035 | | | | 3,008,136 | |
| | 29,056,771 | | | GreenPoint Mortgage Funding Trust, Series2005-AR3-2A1 (1 Month LIBOR USD + 0.26%, 0.26% Floor, 10.50% Cap) | | | 1.21 | % | | | 08/25/2045 | | | | 17,168,728 | |
| | 18,131,173 | | | GreenPoint Mortgage Funding Trust, Series2006-AR7-2A1 (1 Month LIBOR USD + 0.20%, 0.20% Floor) | | | 1.15 | % | | | 12/25/2046 | | | | 15,494,763 | |
| | 29,734,795 | | | GreenPoint Mortgage Funding Trust, Series2007-AR2-1A3 (1 Month LIBOR USD + 0.24%, 0.24% Floor) | | | 1.19 | % | | | 04/25/2047 | | | | 23,694,267 | |
| | 1,139,228 | | | GS Mortgage Securities Corporation, Series2008-2R-1A1 | | | 7.50 | % # ^ | | | 09/25/2036 | | | | 783,510 | |
| | 175,342 | | | GSAA Home Equity Trust, Series2005-12-AF3 | | | 5.07 | % # | | | 09/25/2035 | | | | 140,281 | |
| | 9,443,331 | | | GSAA Home Equity Trust, Series2006-10-AF3 | | | 5.98 | % # | | | 06/25/2036 | | | | 3,761,907 | |
| | 6,758,754 | | | GSAA Home Equity Trust, Series2006-10-AF4 | | | 6.30 | % ß | | | 06/25/2036 | | | | 2,690,685 | |
| | 12,835,516 | | | GSAA Home Equity Trust, Series2006-15-AF4 | | | 5.96 | % ß | | | 09/25/2036 | | | | 4,987,510 | |
| | 2,129,558 | | | GSAA Home Equity Trust, Series2006-18-AF3A | | | 5.77 | % # | | | 11/25/2036 | | | | 865,371 | |
| | 4,749,100 | | | GSAA Home Equity Trust, Series2006-18-AF6 | | | 5.68 | % ß | | | 11/25/2036 | | | | 1,706,590 | |
| | 8,845,965 | | | GSAA Home Equity Trust, Series2006-19-A1 (1 Month LIBOR USD + 0.09%, 0.09% Floor) | | | 1.04 | % | | | 12/25/2036 | | | | 3,415,638 | |
| | 5,315,149 | | | GSAA Home Equity Trust, Series2007-10-A1A | | | 6.00 | % | | | 11/25/2037 | | | | 4,031,695 | |
| | | | | | | | | | | | | | | | |
| | | | | | | | | | | | | |
| | 2,948,864 | | | GSAA Home Equity Trust, Series2007-10-A2A | | | 6.50 | % | | | 11/25/2037 | | | | 1,806,520 | |
| | 23,182,925 | | | GSAMP Trust, Series2006-HE6-A3 (1 Month LIBOR USD + 0.15%, 0.15% Floor) | | | 1.10 | % | | | 08/25/2036 | | | | 19,279,095 | |
| | 10,207,496 | | | GSMPS Mortgage Loan Trust, Series2005-RP2-1AF (1 Month LIBOR USD + 0.35%, 0.35% Floor) | | | 1.30 | % ^ | | | 03/25/2035 | | | | 8,664,288 | |
| | 10,207,496 | | | GSMPS Mortgage Loan Trust, Series2005-RP2-1AS | | | 3.01 | % # ^ I/O | | | 03/25/2035 | | | | 1,459,270 | |
| | 6,148,416 | | | GSMPS Mortgage Loan Trust, Series2005-RP3-1AF (1 Month LIBOR USD + 0.35%, 0.35% Floor, 9.50% Cap) | | | 1.30 | % ^ | | | 09/25/2035 | | | | 4,939,939 | |
| | 6,148,416 | | | GSMPS Mortgage Loan Trust, Series2005-RP3-1AS | | | 2.83 | % # ^ I/O | | | 09/25/2035 | | | | 888,467 | |
| | 23,395,135 | | | GSMPS Mortgage Loan Trust, Series2006-RP1-1AF1 (1 Month LIBOR USD + 0.35%, 0.35% Floor, 9.15% Cap) | | | 1.30 | % ^ | | | 01/25/2036 | | | | 18,003,862 | |
| | 23,395,135 | | | GSMPS Mortgage Loan Trust, Series2006-RP1-1AS | | | 2.73 | % # ^ I/O | | | 01/25/2036 | | | | 2,778,465 | |
| | 24,456,830 | | | GSMSC Resecuritization Trust, Series2014-3R-2B (1 Month LIBOR USD + 0.18%, 0.18% Floor) | | | 1.81 | % ^ | | | 09/26/2036 | | | | 16,301,884 | |
| | 1,488,593 | | | GSR Mortgage Loan Trust, Series2005-1F-1A2 | | | 5.50 | % | | | 02/25/2035 | | | | 1,458,729 | |
| | 2,746,036 | | | GSR Mortgage Loan Trust, Series2005-1F-3A3 | | | 6.00 | % | | | 01/25/2035 | | | | 2,704,334 | |
| | 440,919 | | | GSR Mortgage Loan Trust, Series2005-6F-3A5 | | | 6.00 | % | | | 07/25/2035 | | | | 444,418 | |
| | 4,447,250 | | | GSR Mortgage Loan Trust, Series2005-6F-3A9(-1 x 1 Month LIBOR USD + 6.90%, 6.90% Cap) | | | 5.95 | % I/F I/O | | | 07/25/2035 | | | | 472,893 | |
| | 357,082 | | | GSR Mortgage Loan Trust, Series2005-6F-4A1 (1 Month LIBOR USD + 0.50%, 0.50% Floor, 6.00% Cap) | | | 1.45 | % | | | 07/25/2035 | | | | 310,074 | |
| | 233,742 | | | GSR Mortgage Loan Trust, Series2005-7F-3A1 (1 Month LIBOR USD + 0.50%, 0.50% Floor, 6.00% Cap) | | | 1.45 | % | | | 09/25/2035 | | | | 213,041 | |
| | 9,082,397 | | | GSR Mortgage Loan Trust, Series2005-8F-3A5 | | | 6.00 | % | | | 11/25/2035 | | | | 5,817,583 | |
| | 2,553,796 | | | GSR Mortgage Loan Trust, Series2005-8F-4A1 | | | 6.00 | % | | | 11/25/2035 | | | | 1,737,380 | |
| | 667,888 | | | GSR Mortgage Loan Trust, Series2006-1F-1A2 | | | 5.50 | % | | | 02/25/2036 | | | | 751,859 | |
| | 592,514 | | | GSR Mortgage Loan Trust, Series2006-2F-2A3 | | | 5.75 | % | | | 02/25/2036 | | | | 544,797 | |
| | 2,547,066 | | | GSR Mortgage Loan Trust, Series2006-2F-3A3 | | | 6.00 | % | | | 02/25/2036 | | | | 1,803,821 | |
| | 3,059,007 | | | GSR Mortgage Loan Trust, Series2006-2F-3A6 | | | 6.00 | % | | | 02/25/2036 | | | | 2,166,429 | |
| | 23,763,503 | | | GSR Mortgage Loan Trust, Series2006-5F-3A1 | | | 6.50 | % | | | 06/25/2036 | | | | 16,765,893 | |
| | 9,323,455 | | | GSR Mortgage Loan Trust, Series2006-6F-2A3 | | | 6.00 | % | | | 07/25/2036 | | | | 7,298,890 | |
| | 4,631,947 | | | GSR Mortgage Loan Trust, Series2006-7F-3A4 | | | 6.25 | % | | | 08/25/2036 | | | | 2,476,403 | |
| | 1,168,762 | | | GSR Mortgage Loan Trust, Series2006-9F-2A1 | | | 6.00 | % | | | 10/25/2036 | | | | 1,079,152 | |
| | 14,665,119 | | | GSR Mortgage Loan Trust, Series2006-9F-4A1 | | | 6.50 | % | | | 10/25/2036 | | | | 10,568,317 | |
| | 803,548 | | | GSR Mortgage Loan Trust, Series2007-1F-2A2 | | | 5.50 | % | | | 01/25/2037 | | | | 948,314 | |
| | 1,502,905 | | | GSR Mortgage Loan Trust, Series2007-4F-1A1 | | | 5.00 | % | | | 07/25/2037 | | | | 1,705,260 | |
| | 19,880,387 | | | GSR Mortgage Loan Trust, Series2007-4F-3A11 | | | 6.00 | % | | | 07/25/2037 | | | | 16,134,742 | |
| | 924,580 | | | HarborView Mortgage Loan Trust, Series2005-14-3A1A | | | 4.26 | % # | | | 12/19/2035 | | | | 796,354 | |
| | 27,685,152 | | | HarborView Mortgage Loan Trust, Series2005-8-1A1A (1 Month LIBOR USD + 0.62%, 0.31% Floor, 11.00% Cap) | | | 1.37 | % | | | 09/19/2035 | | | | 17,051,761 | |
| | 52,315,560 | | | HarborView Mortgage Loan Trust, Series2005-8-2A1A (12 Month US Treasury Average + 1.55%, 1.55% Floor) | | | 3.52 | % | | | 09/19/2035 | | | | 32,978,353 | |
| | 5,938,176 | | | HarborView Mortgage Loan Trust, Series2006-10-2A1A (1 Month LIBOR USD + 0.18%, 0.18% Floor) | | | 0.93 | % | | | 11/19/2036 | | | | 5,046,837 | |
| | 11,058,709 | | | HarborView Mortgage Loan Trust, Series2006-11-A1A (1 Month LIBOR USD + 0.17%, 0.17% Floor) | | | 0.92 | % | | | 12/19/2036 | | | | 9,054,987 | |
| | 51,964,199 | | | HarborView Mortgage Loan Trust, Series2006-14-1A1A (1 Month LIBOR USD + 0.18%, 0.18% Floor) | | | 0.93 | % | | | 01/25/2047 | | | | 40,880,277 | |
| | 84,830,669 | | | HarborView Mortgage Loan Trust, Series2006-8-1A1 (1 Month LIBOR USD + 0.20%) | | | 1.12 | % | | | 07/21/2036 | | | | 48,836,812 | |
| | 16,581,788 | | | HarborView Mortgage Loan Trust, Series2006-BU1-1A1A (1 Month LIBOR USD + 0.21%, 0.21% Floor, 10.50% Cap) | | | 0.96 | % | | | 02/19/2046 | | | | 13,316,983 | |
| | 14,303,296 | | | HarborView Mortgage Loan Trust, Series2007-4-1A1 (1 Month LIBOR USD + 0.22%, 10.00% Cap) | | | 0.97 | % | | | 07/19/2047 | | | | 12,358,069 | |
| | 22,430,727 | | | HarborView Mortgage Loan Trust, Series2007-7-1A1 (1 Month LIBOR USD + 1.00%, 10.50% Cap) | | | 1.95 | % | | | 10/25/2037 | | | | 17,701,829 | |
| | 12,941,374 | | | HMIR, Series2019-1-M1 (1 Month LIBOR USD + 1.65%) | | | 2.60 | % ^ | | | 05/25/2029 | | | | 12,893,611 | |
| | 888,304 | | | Home Equity Asset Trust, Series2003-3-M1 (1 Month LIBOR USD + 1.29%, 0.86% Floor) | | | 2.24 | % | | | 08/25/2033 | | | | 839,588 | |
| | 1,001,644 | | | Home Equity Asset Trust, Series2004-7-M2 (1 Month LIBOR USD + 0.99%, 0.66% Floor) | | | 1.94 | % | | | 01/25/2035 | | | | 966,131 | |
| | 12,182,000 | | | Home Equity Mortgage Loan Asset Backed Trust, Series2006-B-2A4 (1 Month LIBOR USD + 0.28%, 0.28% Floor) | | | 1.23 | % | | | 06/25/2036 | | | | 9,409,613 | |
| | 9,545,425 | | | Home Equity Mortgage Loan Asset Backed Trust, Series2006-D-2A4 (1 Month LIBOR USD + 0.24%, 0.24% Floor) | | | 1.19 | % | | | 11/25/2036 | | | | 7,052,774 | |
| | 3,987,912 | | | Home Partners of America Trust, Series2019-2-C | | | 3.02 | % ^ | | | 10/19/2039 | | | | 3,667,232 | |
| | 4,242,460 | | | Home Partners of America Trust, Series2019-2-D | | | 3.12 | % ^ | | | 10/19/2039 | | | | 3,796,815 | |
| | 7,985,807 | | | Home Partners of America Trust, Series2019-2-E | | | 3.32 | % ^ | | | 10/19/2039 | | | | 6,716,455 | |
| | 837,121 | | | HomeBanc Mortgage Trust, Series2005-1-M2 (1 Month LIBOR USD + 0.49%, 0.49% Floor, 11.50% Cap) | | | 1.44 | % | | | 03/25/2035 | | | | 671,138 | |
| | 5,725,733 | | | HomeBanc Mortgage Trust, Series2005-3-A1 (1 Month LIBOR USD + 0.24%, 0.24% Floor, 11.50% Cap) | | | 1.19 | % | | | 07/25/2035 | | | | 5,621,866 | |
| | 23,803,997 | | | HSI Asset Loan Obligation Trust, Series2007-2-3A6 | | | 6.00 | % | | | 09/25/2037 | | | | 13,738,517 | |
| | 1,389,225 | | | HSI Asset Loan Obligation Trust, Series2007-AR1-3A1 | | | 4.14 | % # | | | 01/25/2037 | | | | 1,208,294 | |
| | 16,761,850 | | | HSI Asset Loan Obligation Trust, Series2007-WF1-A3 | | | 4.87 | % ß | | | 12/25/2036 | | | | 8,132,335 | |
| | 33,273,974 | | | HSI Asset Securitization Corporation, Series2006-HE1-1A1 (1 Month LIBOR USD + 1.40%, 0.14% Floor) | | | 1.09 | % | | | 10/25/2036 | | | | 13,229,453 | |
| | 10,212,490 | | | Impac Secured Assets Trust, Series2007-1-A2 (1 Month LIBOR USD + 0.16%, 0.16% Floor, 11.50% Cap) | | | 1.11 | % | | | 03/25/2037 | | | | 9,389,761 | |
| | 463,997 | | | Impac Trust, Series2002-9F-A1 | | | 5.22 | % | | | 12/25/2032 | | | | 459,926 | |
| | 4,861,486 | | | IndyMac IMSC Mortgage Loan Trust, Series2007-HOA1-A11 (1 Month LIBOR USD + 0.18%, 0.18% Floor) | | | 1.13 | % | | | 07/25/2047 | | | | 3,573,592 | |
| | 9,284,857 | | | IndyMac Mortgage Loan Trust , Series2007-AR21-8A1 | | | 3.78 | % # | | | 09/25/2037 | | | | 8,086,191 | |
| | 1,531,093 | | | IndyMac Mortgage Loan Trust, Series2006-AR2-1A1 | | | 3.96 | % # | | | 09/25/2036 | | | | 1,142,688 | |
| | 1,987,173 | | | IndyMac Mortgage Loan Trust, Series2006-AR2-4A1 | | | 3.95 | % # | | | 09/25/2036 | | | | 1,628,912 | |
| | 14,889,317 | | | IndyMac Mortgage Loan Trust, Series2006-AR3-1A1 | | | 3.83 | % # | | | 12/25/2036 | | | | 12,289,233 | |
| | 4,606,292 | | | IndyMac Mortgage Loan Trust, Series2006-AR7-3A1 | | | 3.64 | % # | | | 05/25/2036 | | | | 3,783,351 | |
| | 3,970,251 | | | IndyMac Mortgage Loan Trust, Series2007-A1-A1 | | | 6.00 | % | | | 08/25/2037 | | | | 2,408,309 | |
| | 2,906,534 | | | IndyMac Mortgage Loan Trust, Series2007-A1-A7 | | | 6.00 | % | | | 08/25/2037 | | | | 1,763,071 | |
| | 12,638,399 | | | IndyMac Mortgage Loan Trust, Series2007-A2-1A1 | | | 6.00 | % | | | 10/25/2037 | | | | 10,210,431 | |
| | 13,761,305 | | | IndyMac Mortgage Loan Trust, Series2007-A2-2A3 | | | 6.50 | % | | | 10/25/2037 | | | | 10,685,740 | |
| | 20,051,350 | | | IndyMac Mortgage Loan Trust, Series2007-A2-3A1 | | | 7.00 | % | | | 10/25/2037 | | | | 9,948,772 | |
| | 20,146,630 | | | IndyMac Mortgage Loan Trust, Series2007-A3-A1 | | | 6.25 | % | | | 11/25/2037 | | | | 13,073,980 | |
| | 6,194,516 | | | IndyMac Mortgage Loan Trust, Series2007-AR13-2A1 | | | 3.86 | % # | | | 07/25/2037 | | | | 4,500,649 | |
| | 5,047,551 | | | IndyMac Mortgage Loan Trust, Series2007-AR1-3A1 | | | 3.12 | % # | | | 03/25/2037 | | | | 4,325,306 | |
| | 3,437,185 | | | IndyMac Mortgage Loan Trust, Series2007-AR3-3A1 | | | 3.55 | % # | | | 07/25/2037 | | | | 2,948,055 | |
| | 32,149,381 | | | IndyMac Mortgage Loan Trust, Series2007-F1-2A1 | | | 6.50 | % | | | 06/25/2037 | | | | 11,644,567 | |
| | 397,933 | | | IndyMac Mortgage Loan Trust, Series2007-F2-1A2 | | | 6.00 | % | | | 07/25/2037 | | | | 341,489 | |
| | 25,616,776 | | | IndyMac Mortgage Loan Trust, Series2007-F2-2A1 | | | 6.50 | % | | | 07/25/2037 | | | | 12,685,876 | |
| | 8,947,445 | | | JP Morgan Alternative Loan Trust, Series2005-S1-2A11 | | | 6.00 | % | | | 12/25/2035 | | | | 7,704,302 | |
| | 2,868,360 | | | JP Morgan Alternative Loan Trust, Series2005-S1-2A9 | | | 6.00 | % | | | 12/25/2035 | | | | 2,469,835 | |
| | 5,362,301 | | | JP Morgan Alternative Loan Trust, Series2006-A2-1A1 (1 Month LIBOR USD + 0.18%, 0.18% Floor, 11.50% Cap) | | | 1.13 | % | | | 05/25/2036 | | | | 4,423,572 | |
| | 3,146,954 | | | JP Morgan Alternative Loan Trust, Series2006-S1-1A8 | | | 5.75 | % | | | 03/25/2036 | | | | 2,263,119 | |
| | 12,902,380 | | | JP Morgan Alternative Loan Trust, Series2006-S2-A4 | | | 6.19 | % | | | 05/25/2036 | | | | 12,428,768 | |
| | 20,738,481 | | | JP Morgan Alternative Loan Trust, Series2006-S4-A4 | | | 5.96 | % ß | | | 12/25/2036 | | | | 19,473,658 | |
| | 8,978,626 | | | JP Morgan Mortgage Acquisition Trust, Series2006-CH2-AF3 | | | 5.46 | % ß | | | 09/25/2029 | | | | 6,898,212 | |
| | 15,766,949 | | | JP Morgan Mortgage Acquisition Trust, Series2006-HE3-A1 (1 Month LIBOR USD + 0.14%, 0.14% Floor) | | | 1.09 | % | | | 11/25/2036 | | | | 13,118,420 | |
| | 28,346,928 | | | JP Morgan Mortgage Acquisition Trust, Series2006-RM1-A3 (1 Month LIBOR USD + 0.12%, 0.12% Floor) | | | 1.07 | % | | | 08/25/2036 | | | | 13,562,472 | |
| | 26,199,495 | | | JP Morgan Mortgage Acquisition Trust, Series2006-RM1-A4 (1 Month LIBOR USD + 0.18%, 0.18% Floor) | | | 1.13 | % | | | 08/25/2036 | | | | 12,778,989 | |
| | 3,660,880 | | | JP Morgan Mortgage Acquisition Trust, Series2006-WF1-A5 | | | 6.41 | % ß | | | 07/25/2036 | | | | 1,627,628 | |
| | 5,693,881 | | | JP Morgan Mortgage Acquisition Trust, Series2006-WMC4-A1A (1 Month LIBOR USD + 1.30%, 0.13% Floor) | | | 1.08 | % | | | 12/25/2036 | | | | 3,639,981 | |
| | 23,000,000 | | | JP Morgan Mortgage Acquisition Trust, Series2007-CH1-AF5 | | | 4.89 | % ß | | | 11/25/2036 | | | | 22,822,339 | |
| | 9,690,000 | | | JP Morgan Mortgage Acquisition Trust, Series2007-CH3-M2 (1 Month LIBOR USD + 0.32%, 0.32% Floor) | | | 1.27 | % | | | 03/25/2037 | | | | 6,553,480 | |
| | 954,777 | | | JP Morgan Mortgage Trust, Series2005-A6-5A1 | | | 4.04 | % # | | | 08/25/2035 | | | | 816,986 | |
| | 6,435,906 | | | JP Morgan Mortgage Trust, Series2005-S1-1A2 | | | 6.50 | % | | | 01/25/2035 | | | | 6,691,947 | |
| | | | | | | | | | | | | | | | |
| | | | | | | | | | | | | |
| | 658,697 | | | JP Morgan Mortgage Trust, Series2005-S2-2A13 | | | 5.50 | % | | | 09/25/2035 | | | | 598,651 | |
| | 1,325,639 | | | JP Morgan Mortgage Trust, Series2006-S2-3A3 | | | 6.00 | % | | | 07/25/2036 | | | | 824,066 | |
| | 4,390,447 | | | JP Morgan Mortgage Trust, Series2006-S2-3A5 | | | 6.25 | % | | | 07/25/2036 | | | | 2,902,907 | |
| | 3,092,453 | | | JP Morgan Mortgage Trust, Series2006-S3-1A2 | | | 6.00 | % | | | 08/25/2036 | | | | 2,230,682 | |
| | 8,192,009 | | | JP Morgan Mortgage Trust, Series2006-S3-1A21 (1 Month LIBOR USD + 0.38%, 0.38% Floor, 7.50% Cap) | | | 1.33 | % | | | 08/25/2036 | | | | 1,672,156 | |
| | 8,192,009 | | | JP Morgan Mortgage Trust, Series2006-S3-1A22
(-1 x 1 Month LIBOR USD + 7.12%, 7.12% Cap) | | | 6.17 | % I/F I/O | | | 08/25/2036 | | | | 2,913,746 | |
| | 1,440,997 | | | JP Morgan Mortgage Trust, Series2006-S3-1A9 | | | 6.00 | % | | | 08/25/2036 | | | | 1,039,439 | |
| | 7,748,057 | | | JP Morgan Mortgage Trust, Series2006-S4-A3 | | | 6.00 | % | | | 01/25/2037 | | | | 5,207,983 | |
| | 3,225,794 | | | JP Morgan Mortgage Trust, Series2006-S4-A5 | | | 6.00 | % | | | 01/25/2037 | | | | 2,218,518 | |
| | 7,131,041 | | | JP Morgan Mortgage Trust, Series2006-S4-A8 (1 Month LIBOR USD + 0.38%, 0.38% Floor, 7.00% Cap) | | | 1.33 | % | | | 01/25/2037 | | | | 2,440,108 | |
| | 7,131,041 | | | JP Morgan Mortgage Trust, Series2006-S4-A9(-1 x 1 Month LIBOR USD + 6.62%, 6.62% Cap) | | | 5.67 | % I/F I/O | | | 01/25/2037 | | | | 2,353,477 | |
| | 1,412,543 | | | JP Morgan Mortgage Trust, Series2007-A2-2A1 | | | 4.02 | % # | | | 04/25/2037 | | | | 1,169,431 | |
| | 8,416,280 | | | JP Morgan Mortgage Trust, Series2007-S1-2A6 | | | 6.00 | % | | | 03/25/2037 | | | | 5,463,115 | |
| | 2,729,752 | | | JP Morgan Mortgage Trust, Series2007-S3-1A1 | | | 5.50 | % | | | 08/25/2037 | | | | 1,940,309 | |
| | 5,565,670 | | | JP Morgan Mortgage Trust, Series2007-S3-1A35 | | | 6.00 | % | | | 08/25/2037 | | | | 3,990,217 | |
| | 2,014,648 | | | JP Morgan Mortgage Trust, Series2007-S3-1A64 | | | 7.50 | % | | | 08/25/2037 | | | | 1,236,104 | |
| | 937,919 | | | JP Morgan Mortgage Trust, Series2007-S3-1A9 | | | 6.00 | % | | | 08/25/2037 | | | | 669,948 | |
| | 5,131,816 | | | JP Morgan Mortgage Trust, Series2007-S3-1A96 | | | 6.00 | % | | | 08/25/2037 | | | | 3,674,551 | |
| | 5,848,834 | | | JP Morgan Mortgage Trust, Series2007-S3-1A97 | | | 6.00 | % | | | 08/25/2037 | | | | 4,189,270 | |
| | 380,968 | | | JP Morgan Mortgage Trust, Series2007-S3-2A2 | | | 5.50 | % | | | 08/25/2022 | | | | 367,848 | |
| | 7,345,104 | | | JP Morgan Resecuritization Trust, Series2009-4-3A2 | | | 6.00 | % ^ | | | 02/26/2037 | | | | 5,493,070 | |
| | 16,566,666 | | | JP Morgan Resecuritization Trust, Series2009-7-7A1 | | | 7.00 | % # ^ Þ | | | 09/27/2037 | | | | 10,208,612 | |
| | 13,578,419 | | | JP Morgan Resecuritization Trust, Series2010-1-1A4 | | | 6.00 | % ^ | | | 02/26/2037 | | | | 10,678,287 | |
| | 6,272,411 | | | JP Morgan Resecuritization Trust, Series2010-1-2A11 | | | 7.10 | % ^ | | | 01/26/2037 | | | | 4,435,615 | |
| | 51,877,610 | | | Legacy Mortgage Asset Trust, Series2018-GS3-A1 | | | 4.00 | % ^§ | | | 06/25/2058 | | | | 50,485,017 | |
| | 16,861,768 | | | Legacy Mortgage Asset Trust, Series2018-SL1-A | | | 4.00 | % # ^ | | | 02/25/2058 | | | | 16,942,816 | |
| | 45,519,184 | | | Legacy Mortgage Asset Trust, Series2019-GS1-A1 | | | 4.00 | % ^§ | | | 01/25/2059 | | | | 41,757,060 | |
| | 42,804,780 | | | Legacy Mortgage Asset Trust, Series2019-GS2-A1 | | | 3.75 | % ^§ | | | 01/25/2059 | | | | 36,225,686 | |
| | 27,407,287 | | | Legacy Mortgage Asset Trust, Series2019-GS5-A1 | | | 3.20 | % ^§ | | | 05/25/2059 | | | | 27,452,893 | |
| | 194,840,441 | | | Legacy Mortgage Asset Trust, Series2019-RPL3-PT1 | | | 4.30 | % ^ | | | 06/25/2058 | | | | 173,116,706 | |
| | 54,716,112 | | | Legacy Mortgage Asset Trust, Series2019-SL1-A | | | 4.00 | % # ^ | | | 12/28/2054 | | | | 54,986,289 | |
| | 123,516,228 | | | Legacy Mortgage Asset Trust, Series2019-SL3-A | | | 3.47 | % ^§ | | | 11/25/2061 | | | | 122,085,206 | |
| | 2,325,415 | | | Lehman Mortgage Trust, Series2005-2-3A5 | | | 5.50 | % | | | 12/25/2035 | | | | 1,748,948 | |
| | 2,049,638 | | | Lehman Mortgage Trust, Series2005-2-5A5 | | | 5.75 | % | | | 12/25/2035 | | | | 1,813,066 | |
| | 2,736,218 | | | Lehman Mortgage Trust, Series2005-3-2A1 | | | 6.00 | % | | | 01/25/2036 | | | | 2,712,575 | |
| | 232,999 | | | Lehman Mortgage Trust, Series2005-3-2A3 | | | 5.50 | % | | | 01/25/2036 | | | | 224,944 | |
| | 1,251,425 | | | Lehman Mortgage Trust, Series2005-3-2A7 | | | 6.00 | % | | | 01/25/2036 | | | | 1,239,984 | |
| | 1,383,747 | | | Lehman Mortgage Trust, Series2006-1-1A1 (1 Month LIBOR USD + 0.75%, 0.75% Floor, 5.50% Cap) | | | 1.70 | % | | | 02/25/2036 | | | | 702,342 | |
| | 4,151,240 | | | Lehman Mortgage Trust, Series2006-1-1A2(-1 x 1 Month LIBOR USD + 4.75%, 4.75% Cap) | | | 3.80 | % I/F I/O | | | 02/25/2036 | | | | 884,333 | |
| | 4,635,283 | | | Lehman Mortgage Trust, Series2006-1-3A1 (1 Month LIBOR USD + 0.75%, 0.75% Floor, 5.50% Cap) | | | 1.70 | % | | | 02/25/2036 | | | | 3,709,848 | |
| | 4,635,283 | | | Lehman Mortgage Trust, Series2006-1-3A2(-1 x 1 Month LIBOR USD + 4.75%, 4.75% Cap) | | | 3.80 | % I/F I/O | | | 02/25/2036 | | | | 582,735 | |
| | 2,986,473 | | | Lehman Mortgage Trust, Series2006-1-3A4 | | | 5.50 | % | | | 02/25/2036 | | | | 2,758,103 | |
| | 3,117,019 | | | Lehman Mortgage Trust, Series2006-4-1A3(-1 x 1 Month LIBOR USD + 5.40%, 5.40% Cap) | | | 4.45 | % I/F I/O | | | 08/25/2036 | | | | 589,471 | |
| | 1,981,110 | | | Lehman Mortgage Trust, Series2006-4-1A4 | | | 6.00 | % | | | 08/25/2036 | | | | 1,750,229 | |
| | 6,175,621 | | | Lehman Mortgage Trust, Series2006-5-2A1 (1 Month LIBOR USD + 0.35%, 0.35% Floor, 7.50% Cap) | | | 1.30 | % | | | 09/25/2036 | | | | 645,432 | |
| | 12,863,751 | | | Lehman Mortgage Trust, Series2006-5-2A2(-1 x 1 Month LIBOR USD + 7.15%, 7.15% Cap) | | | 6.20 | % I/F I/O | | | 09/25/2036 | | | | 3,779,540 | |
| | 8,754,976 | | | Lehman Mortgage Trust, Series2006-6-3A9 | | | 5.50 | % | | | 10/25/2036 | | | | 6,649,538 | |
| | 1,993,719 | | | Lehman Mortgage Trust, Series2006-6-4A5 | | | 6.00 | % | | | 12/25/2036 | | | | 1,824,832 | |
| | 3,383,040 | | | Lehman Mortgage Trust, Series2006-7-2A2 (1 Month LIBOR USD + 0.45%, 0.45% Floor, 7.00% Cap) | | | 1.40 | % | | | 11/25/2036 | | | | 749,546 | |
| | 12,032,506 | | | Lehman Mortgage Trust, Series2006-7-2A5(-1 x 1 Month LIBOR USD + 6.55%, 6.55% Cap) | | | 5.60 | % I/F I/O | | | 11/25/2036 | | | | 3,906,336 | |
| | 2,481,058 | | | Lehman Mortgage Trust, Series2006-9-1A19(-5 x 1 Month LIBOR USD + 30.68%, 30.68% Cap) | | | 26.33 | % I/F | | | 01/25/2037 | | | | 4,337,069 | |
| | 2,718,816 | | | Lehman Mortgage Trust, Series2006-9-1A5 (1 Month LIBOR USD + 0.60%, 0.60% Floor, 5.75% Cap) | | | 1.55 | % | | | 01/25/2037 | | | | 1,616,373 | |
| | 8,108,065 | | | Lehman Mortgage Trust, Series2006-9-1A6(-1 x 1 Month LIBOR USD + 5.15%, 5.15% Cap) | | | 4.20 | % I/F I/O | | | 01/25/2037 | | | | 1,461,205 | |
| | 4,094,711 | | | Lehman Mortgage Trust, Series2006-9-2A1 (1 Month LIBOR USD + 0.38%, 0.38% Floor, 7.00% Cap) | | | 1.33 | % | | | 01/25/2037 | | | | 734,581 | |
| | 7,576,833 | | | Lehman Mortgage Trust, Series2006-9-2A2(-1 x 1 Month LIBOR USD + 6.62%, 6.62% Cap) | | | 5.67 | % I/F I/O | | | 01/25/2037 | | | | 2,308,459 | |
| | 7,421,323 | | | Lehman Mortgage Trust, Series2007-10-2A1 | | | 6.50 | % | | | 01/25/2038 | | | | 4,138,271 | |
| | 2,133,600 | | | Lehman Mortgage Trust, Series2007-2-1A1 | | | 5.75 | % | | | 02/25/2037 | | | | 1,699,781 | |
| | 2,603,788 | | | Lehman Mortgage Trust, Series2007-4-2A11 (1 Month LIBOR USD + 0.33%, 0.33% Floor, 7.00% Cap) | | | 1.28 | % | | | 05/25/2037 | | | | 623,982 | |
| | 12,528,585 | | | Lehman Mortgage Trust, Series2007-4-2A8(-1 x 1 Month LIBOR USD + 6.67%, 6.67% Cap) | | | 5.72 | % I/F I/O | | | 05/25/2037 | | | | 3,904,093 | |
| | 878,795 | | | Lehman Mortgage Trust, Series2007-4-2A9 (1 Month LIBOR USD + 0.33%, 0.33% Floor, 7.00% Cap) | | | 1.28 | % | | | 05/25/2037 | | | | 252,652 | |
| | 10,157,093 | | | Lehman Mortgage Trust, Series2007-5-11A1 | | | 5.11 | % # | | | 06/25/2037 | | | | 7,231,291 | |
| | 800,066 | | | Lehman Mortgage Trust, Series2007-5-3A4 | | | 5.00 | % | | | 12/25/2035 | | | | 726,624 | |
| | 1,117,670 | | | Lehman Mortgage Trust, Series2007-5-4A3(-6 x 1 Month LIBOR USD + 40.08%, 40.08% Cap) | | | 34.40 | % I/F | | | 08/25/2036 | | | | 1,761,818 | |
| | 801,639 | | | Lehman Mortgage Trust, Series2007-5-7A3 | | | 7.50 | % | | | 10/25/2036 | | | | 547,791 | |
| | 272,537 | | | Lehman Mortgage Trust, Series2007-6-1A8 | | | 6.00 | % | | | 07/25/2037 | | | | 234,312 | |
| | 7,105,417 | | | Lehman Mortgage Trust, Series2007-9-2A2 | | | 6.50 | % | | | 10/25/2037 | | | | 3,867,162 | |
| | 4,403,438 | | | Lehman Mortgage Trust, Series2008-2-1A6 | | | 6.00 | % | | | 03/25/2038 | | | | 2,691,918 | |
| | 17,881 | | | Lehman Trust, Series2005-10-2A3B | | | 5.23 | % ß | | | 01/25/2036 | | | | 34,455 | |
| | 5,574,068 | | | Lehman Trust, Series2005-4-2A3A | | | 5.00 | % ß | | | 10/25/2035 | | | | 5,747,769 | |
| | 11,508,187 | | | Lehman Trust, Series2005-9N-2A1 (12 Month US Treasury Average + 1.06%, 1.06% Floor) | | | 3.03 | % | | | 02/25/2036 | | | | 9,452,873 | |
| | 4,678,430 | | | Lehman Trust, Series2006-17-1A2 (1 Month LIBOR USD + 0.17%, 0.17% Floor) | | | 1.12 | % | | | 08/25/2046 | | | | 4,810,527 | |
| | 11,109,171 | | | Lehman Trust, Series2006-5-1A1A (1 Month LIBOR USD + 0.21%, 0.21% Floor) | | | 1.16 | % | | | 04/25/2036 | | | | 9,135,773 | |
| | 235,505 | | | Lehman Trust, Series2006-5-2A4A | | | 5.89 | % | | | 04/25/2036 | | | | 225,615 | |
| | 12,278,387 | | | Lehman Trust, Series2006-GP3-1A1 (1 Month LIBOR USD + 0.20%, 0.20% Floor) | | | 1.15 | % | | | 06/25/2046 | | | | 10,038,071 | |
| | 11,165,672 | | | Lehman Trust, Series2007-1-2A1 | | | 7.00 | % # | | | 02/25/2037 | | | | 9,978,162 | |
| | 18,509,573 | | | Lehman Trust, Series2007-12N-1A3A (1 Month LIBOR USD + 0.20%, 0.20% Floor) | | | 1.15 | % | | | 07/25/2047 | | | | 15,426,029 | |
| | 7,808,522 | | | Lehman XS Trust, Series2005-2-2A3B | | | 4.74 | % | | | 08/25/2035 | | | | 7,183,244 | |
| | 19,200,000 | | | LHOME Mortgage Trust 2019-RTL3, Series2019-RTL3-A1 | | | 3.87 | % ^ | | | 07/25/2024 | | | | 17,675,349 | |
| | 86,200,000 | | | LHOME Mortgage Trust, Series2019-RTL2-A1 | | | 3.84 | % ^ | | | 03/25/2024 | | | | 80,209,746 | |
| | 19,200,000 | | | LHOME Mortgage Trust, Series2020-RTL1-A1 | | | 3.23 | % ^ | | | 10/25/2024 | | | | 17,416,500 | |
| | 34,396,474 | | | Long Beach Mortgage Loan Trust, Series2006-3-2A3 (1 Month LIBOR USD + 0.18%, 0.18% Floor) | | | 1.13 | % | | | 05/25/2046 | | | | 12,585,546 | |
| | 5,602,024 | | | Long Beach Mortgage Loan Trust, Series2006-3-2A4 (1 Month LIBOR USD + 0.27%, 0.27% Floor) | | | 1.22 | % | | | 05/25/2046 | | | | 2,134,642 | |
| | 37,250,577 | | | Long Beach Mortgage Loan Trust, Series2006-6-1A (1 Month LIBOR USD + 0.15%, 0.15% Floor) | | | 1.09 | % | | | 07/25/2036 | | | | 25,979,860 | |
| | 5,908,811 | | | Luminent Mortgage Trust, Series2005-1-A1 (1 Month LIBOR USD + 0.26%, 0.26% Floor, 11.50% Cap) | | | 1.21 | % | | | 11/25/2035 | | | | 5,036,765 | |
| | 3,636,844 | | | MASTR Adjustable Rate Mortgages Trust, Series2005-2-2A1 | | | 3.43 | % # | | | 03/25/2035 | | | | 2,581,493 | |
| | 1,465,513 | | | MASTR Adjustable Rate Mortgages Trust, Series2005-6-5A1 | | | 3.36 | % # | | | 07/25/2035 | | | | 1,259,843 | |
| | 9,477,049 | | | MASTR Adjustable Rate Mortgages Trust, Series2007-1-2A1 | | | 3.87 | % # | | | 11/25/2036 | | | | 9,929,142 | |
| | 1,543,444 | | | MASTR Alternative Loans Trust, Series2005-2-3A1 | | | 6.00 | % | | | 03/25/2035 | | | | 1,409,319 | |
| | 262,623 | | | MASTR Alternative Loans Trust, Series2005-5-2A3 | | | 5.50 | % | | | 07/25/2025 | | | | 254,157 | |
| | | | | | | | | | | | | | | | |
| | | | | | | | | | | | | |
| | 8,967,203 | | | MASTR Alternative Loans Trust, Series2005-5-3A1 | | | 5.75 | % | | | 08/25/2035 | | | | 6,481,838 | |
| | 2,712,384 | | | MASTR Alternative Loans Trust, Series2005-6-1A5 | | | 5.50 | % | | | 12/25/2035 | | | | 2,340,076 | |
| | 1,796,701 | | | MASTR Alternative Loans Trust, Series2006-3-1A2 | | | 6.25 | % | | | 07/25/2036 | | | | 1,311,811 | |
| | 2,837,738 | | | MASTR Alternative Loans Trust, Series2007-1-1A5 | | | 5.75 | % | | | 10/25/2036 | | | | 2,581,361 | |
| | 4,639,584 | | | MASTR Alternative Loans Trust, Series2007-1-2A7 | | | 6.00 | % | | | 10/25/2036 | | | | 2,440,172 | |
| | 3,930,660 | | | MASTR Asset Backed Securities Trust, Series2003-OPT1-M3 (1 Month LIBOR USD + 4.13%, 2.75% Floor) | | | 5.07 | % | | | 12/25/2032 | | | | 3,684,752 | |
| | 10,186,546 | | | MASTR Asset Backed Securities Trust, Series2006-AM2-A3 (1 Month LIBOR USD + 0.17%, 0.17% Floor) | | | 1.12 | % | | | 06/25/2036 | | | | 9,010,448 | |
| | 21,650,911 | | | MASTR Asset Backed Securities Trust, Series2007-HE1-A3 (1 Month LIBOR USD + 0.21%, 0.21% Floor) | | | 1.16 | % | | | 05/25/2037 | | | | 19,605,953 | |
| | 3,237,413 | | | MASTR Asset Securitization Trust, Series2006-1-1A4 | | | 5.75 | % | | | 05/25/2036 | | | | 2,771,682 | |
| | 2,315,314 | | | MASTR Asset Securitization Trust, Series2006-2-1A11 (1 Month LIBOR USD + 6.00%, 6.00% Floor) | | | 6.00 | % | | | 06/25/2036 | | | | 2,022,444 | |
| | 3,259,904 | | | MASTR Asset Securitization Trust, Series2007-1-1A3 | | | 6.25 | % | | | 11/25/2037 | | | | 2,238,448 | |
| | 22,292,725 | | | MASTR Resecuritization Trust, Series2008-1-A1 | | | 6.00 | % # ^ | | | 09/27/2037 | | | | 20,516,296 | |
| | 12,742,537 | | | MASTR Resecuritization Trust, Series2008-4-A1 | | | 6.00 | % # ^ | | | 06/27/2036 | | | | 11,155,005 | |
| | 2,367,672 | | | MASTR Seasoned Securitization Trust, Series2005-2-1A4 | | | 6.00 | %D | | | 10/25/2032 | | | | 2,325,086 | |
| | 892,787 | | | MASTR Seasoned Securitization Trust, Series2005-2-2A1 (1 Month LIBOR USD + 0.40%, 0.40% Floor, 7.50% Cap) | | | 1.35 | % | | | 10/25/2032 | | | | 764,012 | |
| | 17,055,189 | | | Merrill Lynch Alternative Note Asset Trust, Series2007-F1-2A4 (1 Month LIBOR USD + 0.32%, 0.32% Floor, 7.00% Cap) | | | 1.27 | % | | | 03/25/2037 | | | | 4,937,099 | |
| | 17,055,189 | | | Merrill Lynch Alternative Note Asset Trust, Series2007-F1-2A5(-1 x 1 Month LIBOR USD + 6.68%, 6.68% Cap) | | | 5.73 | % I/F I/O | | | 03/25/2037 | | | | 5,349,926 | |
| | 2,290,495 | | | Merrill Lynch Mortgage Investors Trust, Series2006-3-1A | | | 3.78 | % # | | | 10/25/2036 | | | | 1,932,964 | |
| | 1,304,842 | | | Merrill Lynch Mortgage Investors Trust, Series2006-F1-1A2 | | | 6.00 | % | | | 04/25/2036 | | | | 937,869 | |
| | 110,474,116 | | | Merrill Lynch Mortgage Investors Trust, Series2007-HE2-A1 (1 Month LIBOR USD + 0.25%, 0.25% Floor) | | | 1.20 | % | | | 02/25/2037 | | | | 60,387,063 | |
| | 24,825,423 | | | MFA LLC, Series2017-NPL1-A1 | | | 3.35 | % ^§ | | | 11/25/2047 | | | | 25,310,794 | |
| | 59,754,874 | | | MFA LLC, Series2018-NPL1-A1 | | | 3.88 | % ^§ | | | 05/25/2048 | | | | 61,638,628 | |
| | 64,218,368 | | | MFA LLC, Series2018-NPL2-A1 | | | 4.16 | % ^§ | | | 07/25/2048 | | | | 64,013,029 | |
| | 13,065,321 | | | Morgan Stanley Capital Trust, Series2006-NC2-M1 (1 Month LIBOR USD + 3.60%, 0.36% Floor) | | | 1.31 | % | | | 02/25/2036 | | | | 9,479,338 | |
| | 32,379,633 | | | Morgan Stanley Home Equity Loan Trust, Series2007-1-A4 (1 Month LIBOR USD + 0.22%, 0.22% Floor) | | | 1.17 | % | | | 12/25/2036 | | | | 16,745,212 | |
| | 1,072,331 | | | Morgan Stanley Mortgage Loan Trust, Series2005-10-1A1 (1 Month LIBOR USD + 0.70%, 0.70% Floor, 5.75% Cap) | | | 1.65 | % | | | 12/25/2035 | | | | 774,426 | |
| | 2,686,683 | | | Morgan Stanley Mortgage Loan Trust, Series2005-10-1A6 | | | 5.75 | % | | | 12/25/2035 | | | | 2,369,461 | |
| | 3,860,861 | | | Morgan Stanley Mortgage Loan Trust, Series2005-10-2A1 | | | 5.49 | % # | | | 12/25/2035 | | | | 3,637,383 | |
| | 5,340,953 | | | Morgan Stanley Mortgage Loan Trust, Series2006-11-1A6 | | | 6.23 | % | | | 08/25/2036 | | | | 1,688,702 | |
| | 9,358,854 | | | Morgan Stanley Mortgage Loan Trust, Series2006-11-2A1 | | | 6.00 | % | | | 08/25/2036 | | | | 6,450,879 | |
| | 6,323,997 | | | Morgan Stanley Mortgage Loan Trust, Series2006-17XS-A3A | | | 5.65 | % ß | | | 10/25/2046 | | | | 2,553,989 | |
| | 2,090,100 | | | Morgan Stanley Mortgage Loan Trust, Series2006-17XS-A6 | | | 5.58 | % ß | | | 10/25/2046 | | | | 730,261 | |
| | 3,996,650 | | | Morgan Stanley Mortgage Loan Trust, Series2006-2-2A3 | | | 5.75 | % | | | 02/25/2036 | | | | 3,805,464 | |
| | 23,247,310 | | | Morgan Stanley Mortgage Loan Trust, Series2006-7-3A | | | 5.03 | % # | | | 06/25/2036 | | | | 17,988,555 | |
| | 2,398,292 | | | Morgan Stanley Mortgage Loan Trust, Series2006-7-4A4 | | | 6.00 | % | | | 06/25/2036 | | | | 1,839,237 | |
| | 2,427,856 | | | Morgan Stanley Mortgage Loan Trust, Series2006-7-4A7 | | | 6.00 | % | | | 06/25/2036 | | | | 1,861,901 | |
| | 3,343,174 | | | Morgan Stanley Mortgage Loan Trust, Series2007-13-6A1 | | | 6.00 | % | | | 10/25/2037 | | | | 2,359,431 | |
| | 7,805,594 | | | Morgan Stanley Mortgage Loan Trust, Series2007-14AR-2A3 | | | 3.67 | % # | | | 10/25/2037 | | | | 5,963,005 | |
| | 3,450,684 | | | Morgan Stanley Mortgage Loan Trust, Series2007-1XS-2A3 | | | 5.92 | % ß | | | 09/25/2046 | | | | 1,270,789 | |
| | 2,400,090 | | | Morgan Stanley Mortgage Loan Trust, Series2007-1XS-2A4A | | | 6.08 | % ß | | | 09/25/2046 | | | | 1,033,793 | |
| | 793,397 | | | Morgan Stanley Mortgage Loan Trust, Series2007-3XS-1A2A | | | 5.62 | % ß | | | 01/25/2047 | | | | 700,760 | |
| | 6,584,218 | | | Morgan Stanley Mortgage Loan Trust, Series2007-3XS-2A3S | | | 5.86 | % ß | | | 01/25/2047 | | | | 3,266,121 | |
| | 3,851,146 | | | Morgan Stanley Mortgage Loan Trust, Series2007-3XS-2A4S | | | 5.96 | % ß | | | 01/25/2047 | | | | 1,910,030 | |
| | 7,880,172 | | | Morgan StanleyRe-Remic Trust, Series2010-R5-4B | | | 3.90 | % ^ | | | 06/26/2036 | | | | 6,981,923 | |
| | 12,884,462 | | | Morgan StanleyRe-Remic Trust, Series2010-R5-5B | | | 3.08 | % ^ | | | 01/26/2037 | | | | 10,904,098 | |
| | 18,799,083 | | | Morgan StanleyRe-Remic Trust, Series2010-R9-3C | | | 6.00 | % # ^ | | | 11/26/2036 | | | | 18,272,406 | |
| | 2,769,873 | | | Morgan StanleyRe-Remic Trust, Series2011-R1-1A | | | 5.94 | % # ^ Þ | | | 02/26/2037 | | | | 2,843,949 | |
| | 13,748,132 | | | Morgan StanleyRe-Remic Trust, Series2013-R2-1B | | | 3.39 | % # ^ | | | 10/26/2036 | | | | 11,600,775 | |
| | 12,620,614 | | | New Century Alternative Mortgage Loan Trust, Series2006-ALT1-AF3 | | | 6.17 | % # | | | 07/25/2036 | | | | 5,346,859 | |
| | 14,990,567 | | | New Century Alternative Mortgage Loan Trust, Series2006-ALT2-AF5 | | | 5.05 | % | | | 10/25/2036 | | | | 5,536,583 | |
| | 12,500,000 | | | New Century Home Equity Loan Trust, Series2006-1-A2C (1 Month LIBOR USD + 0.28%, 0.28% Floor, 12.50% Cap) | | | 1.23 | % | | | 05/25/2036 | | | | 7,910,341 | |
| | 8,674,168 | | | New Residential Mortgage Loan Trust, Series2014-2A-A3 | | | 3.75 | % # ^ | | | 05/25/2054 | | | | 8,963,343 | |
| | 27,828,600 | | | New Residential Mortgage Loan Trust, Series2015-2A-A1 | | | 3.75 | % # ^ | | | 08/25/2055 | | | | 28,867,375 | |
| | 61,254,589 | | | New Residential Mortgage Loan Trust, Series2018-FNT1-A | | | 3.61 | % ^ | | | 05/25/2023 | | | | 60,404,810 | |
| | 20,652,272 | | | New Residential Mortgage Loan Trust, Series2018-FNT2-A | | | 3.79 | % ^ | | | 07/25/2054 | | | | 20,628,388 | |
| | 458,648 | | | New York Mortgage Trust, Series2005-2-A (1 Month LIBOR USD + 0.66%, 0.33% Floor, 10.50% Cap) | | | 1.61 | % | | | 08/25/2035 | | | | 397,948 | |
| | 127,407 | | | Nomura Asset Acceptance Corporation, Series2005-AP1-2A5 | | | 4.86 | % | | | 02/25/2035 | | | | 125,509 | |
| | 14,640,331 | | | Nomura Asset Acceptance Corporation, Series2006-AF1-1A2 | | | 6.16 | % # | | | 05/25/2036 | | | | 4,900,966 | |
| | 2,975,177 | | | Nomura Asset Acceptance Corporation, Series2006-AF1-1A3 | | | 6.41 | % # | | | 05/25/2036 | | | | 996,812 | |
| | 16,813,069 | | | Nomura Asset Acceptance Corporation, Series2006-AP1-A2 | | | 5.52 | % # | | | 01/25/2036 | | | | 7,236,041 | |
| | 2,841,763 | | | Nomura Asset Acceptance Corporation, Series2006-AP1-A3 | | | 5.65 | % # | | | 01/25/2036 | | | | 1,222,859 | |
| | 1,428,981 | | | Nomura Asset Acceptance Corporation, Series2006-WF1-A2 | | | 5.76 | % # | | | 06/25/2036 | | | | 582,808 | |
| | 16,878,094 | | | Nomura Home Equity Loan, Inc., Series2006-AF1-A2 | | | 5.80 | % ß | | | 10/25/2036 | | | | 6,573,991 | |
| | 2,966,705 | | | Nomura Home Equity Loan, Inc., Series2007-1-1A1 | | | 6.06 | % ß | | | 02/25/2037 | | | | 1,166,562 | |
| | 14,786,743 | | | Nomura Home Equity Loan, Inc., Series2007-1-1A3 | | | 5.99 | % ß | | | 02/25/2037 | | | | 5,815,237 | |
| | 5,787,624 | | | Nomura Resecuritization Trust, Series2014-2R-4A9 | | | 4.31 | % ^ | | | 07/26/2036 | | | | 4,969,971 | |
| | 51,410,001 | | | Nomura Resecuritization Trust, Series2015-4R-1A14 (1 Month LIBOR USD + 0.19%, 0.19% Floor) | | | 1.84 | % ^ | | | 03/26/2047 | | | | 39,523,129 | |
| | 9,470,059 | | | NovaStar Mortgage Funding Trust Series, Series2006-3-A2C (1 Month LIBOR USD + 0.16%, 0.16% Floor) | | | 1.11 | % | | | 10/25/2036 | | | | 6,082,404 | |
| | 21,237,601 | | | NRPL Trust, Series2018-2A-A1 | | | 4.25 | % ^§ | | | 07/25/2067 | | | | 21,903,115 | |
| | 37,733,756 | | | NRZ Excess Spread-Collateralized Notes, Series2018-PLS2-A | | | 3.27 | % ^ | | | 02/25/2023 | | | | 37,626,249 | |
| | 36,176,839 | | | OBX Trust, Series2018-1-A2 (1 Month LIBOR USD + 0.65%) | | | 1.60 | % ^ | | | 06/25/2057 | | | | 34,138,987 | |
| | 830,701 | | | Option One Mortgage Loan Trust, Series2004-3-M3 (1 Month LIBOR USD + 0.98%, 0.65% Floor) | | | 1.92 | % | | | 11/25/2034 | | | | 754,104 | |
| | 7,595,148 | | | Option One Mortgage Loan Trust, Series2007-1-2A3 (1 Month LIBOR USD + 0.14%, 0.14% Floor) | | | 1.09 | % | | | 01/25/2037 | | | | 4,871,433 | |
| | 81,644,707 | | | Option One Mortgage Loan Trust, Series2007-6-1A1 (1 Month LIBOR USD + 0.19%, 0.19% Floor) | | | 1.14 | % | | | 07/25/2037 | | | | 65,456,333 | |
| | 103,651,873 | | | OSAT Trust, Series2020-RPL1-A1 | | | 3.07 | % ^§ | | | 12/26/2059 | | | | 104,617,992 | |
| | 13,000,000 | | | Park Place Securities, Inc., Series2005-WHQ4-M2 (1 Month LIBOR USD + 0.49%, 0.49% Floor) | | | 1.44 | % | | | 09/25/2035 | | | | 11,848,352 | |
| | 5,382,820 | | | PHH Alternative Mortgage Trust, Series2007-1-1A1 (1 Month LIBOR USD + 0.16%, 0.16% Floor, 10.10% Cap) | | | 1.11 | % | | | 02/25/2037 | | | | 3,848,654 | |
| | 15,155,724 | | | PHH Alternative Mortgage Trust, Series2007-2-2A1 | | | 6.00 | % | | | 05/25/2037 | | | | 13,727,609 | |
| | 7,071,907 | | | PHH Alternative Mortgage Trust, Series2007-2-2A2 | | | 6.00 | % | | | 05/25/2037 | | | | 6,405,526 | |
| | 554,303 | | | PHH Alternative Mortgage Trust, Series2007-2-3A1 | | | 6.00 | % | | | 05/25/2037 | | | | 476,446 | |
| | 130,938,829 | | | PMT Credit Risk Transfer Trust2019-2R, Series2019-2R-A (1 Month LIBOR USD + 2.75%, 2.75% Floor) | | | 4.36 | % ^ | | | 05/27/2023 | | | | 123,896,559 | |
| | 13,741,218 | | | PMT Credit Risk Transfer Trust, Series2019-1R-A (1 Month LIBOR USD + 2.00%, 2.00% Floor) | | | 3.61 | % ^ | | | 03/27/2024 | | | | 13,220,813 | |
| | 49,815,930 | | | PMT Credit Risk Transfer Trust, Series2019-3R-A (1 Month LIBOR USD + 2.70%, 2.70% Floor) | | | 3.66 | % ^ | | | 10/27/2022 | | | | 48,307,583 | |
| | 150,102,379 | | | PMT Credit Risk Transfer Trust, Series2020-1R-A (1 Month LIBOR USD + 2.35%, 2.35% Floor) | | | 4.00 | % ^ | | | 02/27/2023 | | | | 141,905,589 | |
| | 189,235,615 | | | PR Mortgage Loan Trust, Series2014-1-APT | | | 5.91 | % # ^ | | | 10/25/2049 | | | | 188,252,725 | |
| | 27,433,318 | | | Pretium Mortgage Credit Partners LLC, Series2019-1A-A1 | | | 4.50 | % ^§ | | | 01/25/2024 | | | | 27,862,710 | |
| | 74,012,129 | | | Pretium Mortgage Credit Partners LLC, Series2019-CFL1-A1 | | | 3.72 | % ^§ | | | 01/25/2059 | | | | 64,869,899 | |
| | 105,086,565 | | | Pretium Mortgage Credit Partners LLC, Series2019-NPL2-A1 | | | 3.84 | % ^§ | | | 12/25/2058 | | | | 91,243,743 | |
| | 60,101,664 | | | Pretium Mortgage Credit Partners LLC, Series2019-NPL3-A1 | | | 3.10 | % ^§ | | | 07/27/2059 | | | | 53,071,163 | |
| | | | | | | | | | | | | | | | |
| | | | | | | | | | | | | |
| | 71,070,864 | | | Pretium Mortgage Credit Partners LLC, Series2020-CFL1-A1 | | | 3.10 | % ^§ | | | 02/27/2060 | | | | 66,364,977 | |
| | 75,779,435 | | | Pretium Mortgage Credit Partners LLC, Series2020-NPL1-A1 | | | 2.86 | % ^§ | | | 05/27/2059 | | | | 57,284,857 | |
| | 8,802,969 | | | Prime Mortgage Trust, Series2006-DR1-2A1 | | | 5.50 | % ^ | | | 05/25/2035 | | | | 5,096,741 | |
| | 4,263,834 | | | Prime Mortgage Trust, Series2006-DR1-2A2 | | | 6.00 | % ^ | | | 05/25/2035 | | | | 2,441,390 | |
| | 129,162,409 | | | PRPM LLC, Series2019-2A-A1 | | | 3.97 | % ^§ | | | 04/25/2024 | | | | 115,693,276 | |
| | 59,223,233 | | | PRPM LLC, Series2019-3A-A1 | | | 3.35 | % ^§ | | | 07/25/2024 | | | | 58,853,905 | |
| | 119,946,302 | | | PRPM LLC, Series2019-4A-A1 | | | 3.35 | % ^§ | | | 11/25/2024 | | | | 118,987,391 | |
| | 91,568,452 | | | PRPM LLC, Series2019-GS1-A1 | | | 3.50 | % # ^ | | | 10/25/2024 | | | | 91,159,755 | |
| | 119,709,584 | | | PRPM LLC, Series2020-1A-A1 | | | 2.98 | % ^§ | | | 02/25/2025 | | | | 96,497,262 | |
| | 36,710,939 | | | RALI Trust, Series2007-QA5-1A1 | | | 5.61 | % # | | | 09/25/2037 | | | | 27,842,945 | |
| | 18,529,615 | | | RALI Trust, Series2007-QH7-2A1 (1 Month LIBOR USD + 0.30%, 0.30% Floor) | | | 1.25 | % | | | 08/25/2037 | | | | 14,560,401 | |
| | 42,103,539 | | | RALI Trust, Series2007-QS10-A1 | | | 6.50 | % | | | 09/25/2037 | | | | 37,795,552 | |
| | 21,179,961 | | | RAMP Series Trust, Series2006-RS3-A4 (1 Month LIBOR USD + 0.30%, 0.30% Floor, 14.00% Cap) | | | 1.25 | % | | | 05/25/2036 | | | | 18,401,330 | |
| | 22,263,570 | | | RBSGC Structured Trust, Series2008-B-A1 | | | 6.00 | % ^ | | | 06/25/2037 | | | | 21,057,847 | |
| | 29,557,303 | | | RBSSP Resecuritization Trust , Series2009-12-20A2 | | | 3.93 | % # ^ | | | 12/25/2035 | | | | 26,304,765 | |
| | 8,402,251 | | | RBSSP Resecuritization Trust, Series2009-12-17A2 | | | 4.10 | % # ^ | | | 10/25/2035 | | | | 7,150,037 | |
| | 4,396,442 | | | RBSSP Resecuritization Trust, Series2010-4-7A2 | | | 6.00 | % ^ | | | 07/26/2037 | | | | 3,324,134 | |
| | 80,488,169 | | | Redwood Funding Trust, Series2019-1-PT | | | 4.21 | % ^§ | | | 09/27/2024 | | | | 73,966,374 | |
| | 1,135,143 | | | Renaissance Home Equity Loan Trust, Series2006-1-AF6 | | | 5.75 | % ß | | | 05/25/2036 | | | | 700,899 | |
| | 10,340,045 | | | Renaissance Home Equity Loan Trust, Series2006-4-AF4 | | | 5.47 | % ß | | | 01/25/2037 | | | | 4,715,842 | |
| | 20,361,654 | | | Renaissance Home Equity Loan Trust, Series2006-4-AF5 | | | 5.69 | % ß | | | 01/25/2037 | | | | 9,646,415 | |
| | 8,192,822 | | | Renaissance Home Equity Loan Trust, Series2007-1-AF1 | | | 5.74 | % ß | | | 04/25/2037 | | | | 2,073,822 | |
| | 5,779,950 | | | Renaissance Home Equity Loan Trust, Series2007-1-AF1Z | | | 5.35 | % ß | | | 04/25/2037 | | | | 1,384,599 | |
| | 3,486,895 | | | Renaissance Home Equity Loan Trust, Series2007-1-AF2 | | | 5.51 | % ß | | | 04/25/2037 | | | | 847,799 | |
| | 5,072,268 | | | Renaissance Home Equity Loan Trust, Series2007-1-AF3 | | | 5.61 | % ß | | | 04/25/2037 | | | | 1,255,286 | |
| | 8,232,817 | | | Renaissance Home Equity Loan Trust, Series2007-1-AF5 | | | 5.91 | % ß | | | 04/25/2037 | | | | 2,143,699 | |
| | 17,696,892 | | | Renaissance Home Equity Loan Trust, Series2007-2-AF2 | | | 5.68 | % ß | | | 06/25/2037 | | | | 5,026,935 | |
| | 9,571,061 | | | Renaissance Home Equity Loan Trust, Series2007-2-AF5 | | | 6.20 | % ß | | | 06/25/2037 | | | | 2,985,176 | |
| | 24,122,243 | | | Residential Accredit Loans, Inc., Series2005-QA11-4A1 | | | 4.42 | % # | | | 10/25/2035 | | | | 17,987,749 | |
| | 13,296,478 | | | Residential Accredit Loans, Inc., Series2005-QA13-2A1 | | | 4.56 | % # | | | 12/25/2035 | | | | 10,715,592 | |
| | 10,511,817 | | | Residential Accredit Loans, Inc., Series2005-QA3-CB1 | | | 4.09 | % # | | | 03/25/2035 | | | | 5,437,501 | |
| | 390,322 | | | Residential Accredit Loans, Inc., Series2005-QS12-A11(-11 x 1 Month LIBOR USD + 51.15%, 51.15% Cap) | | | 40.74 | % I/F | | | 08/25/2035 | | | | 922,109 | |
| | 1,419,654 | | | Residential Accredit Loans, Inc., Series2005-QS13-1A6 | | | 5.50 | % | | | 09/25/2035 | | | | 1,265,820 | |
| | 2,923,912 | | | Residential Accredit Loans, Inc., Series2005-QS13-2A1 (1 Month LIBOR USD + 0.70%, 0.70% Floor, 5.75% Cap) | | | 1.65 | % | | | 09/25/2035 | | | | 2,201,177 | |
| | 11,988,037 | | | Residential Accredit Loans, Inc., Series2005-QS13-2A2
(-1 x 1 Month LIBOR USD + 5.05%, 5.05% Cap) | | | 4.10 | % I/F I/O | | | 09/25/2035 | | | | 1,700,569 | |
| | 6,712,982 | | | Residential Accredit Loans, Inc., Series2005-QS14-2A1 | | | 6.00 | % | | | 09/25/2035 | | | | 3,840,169 | |
| | 2,424,750 | | | Residential Accredit Loans, Inc., Series2005-QS15-2A | | | 6.00 | % | | | 10/25/2035 | | | | 1,979,011 | |
| | 2,858,896 | | | Residential Accredit Loans, Inc., Series2005-QS15-3A | | | 6.00 | % | | | 10/25/2035 | | | | 2,611,545 | |
| | 2,918,563 | | | Residential Accredit Loans, Inc., Series2005-QS16-A1 (1 Month LIBOR USD + 0.70%, 0.70% Floor, 5.50% Cap) | | | 1.65 | % | | | 11/25/2035 | | | | 2,151,687 | |
| | 2,918,058 | | | Residential Accredit Loans, Inc., Series2005-QS16-A2(-1 x 1 Month LIBOR USD + 4.80%, 4.80% Cap) | | | 3.85 | % I/F I/O | | | 11/25/2035 | | | | 400,449 | |
| | 1,510,999 | | | Residential Accredit Loans, Inc., Series2005-QS17-A1 | | | 6.00 | % | | | 12/25/2035 | | | | 1,367,861 | |
| | 1,047,045 | | | Residential Accredit Loans, Inc., Series2005-QS17-A10 | | | 6.00 | % | | | 12/25/2035 | | | | 947,857 | |
| | 4,379,195 | | | Residential Accredit Loans, Inc., Series2005-QS17-A11 | | | 6.00 | % | | | 12/25/2035 | | | | 3,964,351 | |
| | 3,112,594 | | | Residential Accredit Loans, Inc., Series2005-QS17-A2 (1 Month LIBOR USD + 0.85%, 0.85% Floor, 6.00% Cap) | | | 1.80 | % | | | 12/25/2035 | | | | 2,245,887 | |
| | 3,112,594 | | | Residential Accredit Loans, Inc., Series2005-QS17-A4
(-1 x 1 Month LIBOR USD + 5.15%, 5.15% Cap) | | | 4.20 | % I/F I/O | | | 12/25/2035 | | | | 467,203 | |
| | 2,504,489 | | | Residential Accredit Loans, Inc., Series2005-QS17-A6 | | | 6.00 | % | | | 12/25/2035 | | | | 2,267,237 | |
| | 1,225,110 | | | Residential Accredit Loans, Inc., Series2005-QS5-A3 | | | 5.70 | % | | | 04/25/2035 | | | | 1,167,663 | |
| | 1,178,719 | | | Residential Accredit Loans, Inc., Series2006-QS10-A4 | | | 5.75 | % | | | 08/25/2036 | | | | 1,044,913 | |
| | 7,799,370 | | | Residential Accredit Loans, Inc., Series2006-QS11-1A1 | | | 6.50 | % | | | 08/25/2036 | | | | 6,663,214 | |
| | 1,638,011 | | | Residential Accredit Loans, Inc., Series2006-QS12-1A1 | | | 6.50 | % | | | 09/25/2036 | | | | 1,114,836 | |
| | 3,310,740 | | | Residential Accredit Loans, Inc., Series 2006-QS12-2A18 | | | 5.75 | % | | | 09/25/2036 | | | | 2,901,567 | |
| | 4,993,775 | | | Residential Accredit Loans, Inc., Series2006-QS14-A18 | | | 6.25 | % | | | 11/25/2036 | | | | 4,149,764 | |
| | 2,299,808 | | | Residential Accredit Loans, Inc., Series2006-QS15-A1 | | | 6.50 | % | | | 10/25/2036 | | | | 2,021,324 | |
| | 1,037,118 | | | Residential Accredit Loans, Inc., Series2006-QS16-A10 | | | 6.00 | % | | | 11/25/2036 | | | | 893,796 | |
| | 3,687,829 | | | Residential Accredit Loans, Inc., Series2006-QS16-A11 | | | 6.00 | % | | | 11/25/2036 | | | | 3,208,628 | |
| | 1,076,518 | | | Residential Accredit Loans, Inc., Series2006-QS16-A7 | | | 6.00 | % | | | 11/25/2036 | | | | 927,751 | |
| | 1,163,305 | | | Residential Accredit Loans, Inc., Series2006-QS16-A8 | | | 6.00 | % | | | 11/25/2036 | | | | 988,377 | |
| | 460,342 | | | Residential Accredit Loans, Inc., Series2006-QS16-A9 | | | 6.00 | % | | | 11/25/2036 | | | | 391,119 | |
| | 2,069,133 | | | Residential Accredit Loans, Inc., Series2006-QS17-A4 | | | 6.00 | % | | | 12/25/2036 | | | | 1,805,025 | |
| | 11,495,208 | | | Residential Accredit Loans, Inc., Series2006-QS17-A5 | | | 6.00 | % | | | 12/25/2036 | | | | 10,027,937 | |
| | 1,273,047 | | | Residential Accredit Loans, Inc., Series2006-QS1-A6(-8 x 1 Month LIBOR USD + 42.86%, 42.86% Cap) | | | 35.60 | % I/F | | | 01/25/2036 | | | | 2,672,566 | |
| | 7,951,299 | | | Residential Accredit Loans, Inc., Series2006-QS3-1A11 | | | 6.00 | % | | | 03/25/2036 | | | | 7,251,861 | |
| | 1,902,227 | | | Residential Accredit Loans, Inc., Series2006-QS4-A8(-790 x 1 Month LIBOR USD + 5143.00%, 0.10% Floor, 8.00% Cap) | | | 8.00 | % I/F | | | 04/25/2036 | | | | 1,746,760 | |
| | 5,100,057 | | | Residential Accredit Loans, Inc., Series2006-QS5-A3 | | | 6.00 | % | | | 05/25/2036 | | | | 4,509,327 | |
| | 15,200,088 | | | Residential Accredit Loans, Inc., Series2006-QS5-A4 | | | 6.00 | % | | | 05/25/2036 | | | | 13,439,492 | |
| | 2,082,958 | | | Residential Accredit Loans, Inc., Series2006-QS6-1A16 | | | 6.00 | % | | | 06/25/2036 | | | | 1,832,051 | |
| | 3,426,032 | | | Residential Accredit Loans, Inc., Series2006-QS6-1A2 | | | 6.00 | % | | | 06/25/2036 | | | | 3,013,342 | |
| | 6,917,161 | | | Residential Accredit Loans, Inc., Series2006-QS8-A1 | | | 6.00 | % | | | 08/25/2036 | | | | 6,107,057 | |
| | 11,995,367 | | | Residential Accredit Loans, Inc., Series2006-QS8-A5
(-1 x 1 Month LIBOR USD + 5.55%, 5.55% Cap) | | | 4.60 | % I/F I/O | | | 08/25/2036 | | | | 1,952,559 | |
| | 4,383,592 | | | Residential Accredit Loans, Inc., Series2006-QS9-1A6
(-1 x 1 Month LIBOR USD + 5.30%, 5.30% Cap) | | | 4.35 | % I/F I/O | | | 07/25/2036 | | | | 783,294 | |
| | 29,176,444 | | | Residential Accredit Loans, Inc., Series2007-QH5-AII (1 Month LIBOR USD + 0.23%, 0.23% Floor) | | | 1.18 | % | | | 06/25/2037 | | | | 13,383,915 | |
| | 4,118,700 | | | Residential Accredit Loans, Inc., Series2007-QS11-A1 | | | 7.00 | % | | | 10/25/2037 | | | | 3,426,276 | |
| | 13,701,589 | | | Residential Accredit Loans, Inc., Series2007-QS1-1A2
(-1 x 1 Month LIBOR USD + 5.45%, 5.45% Cap) | | | 4.50 | % I/F I/O | | | 01/25/2037 | | | | 2,062,092 | |
| | 1,379,210 | | | Residential Accredit Loans, Inc., Series2007-QS1-1A4 | | | 6.00 | % | | | 01/25/2037 | | | | 1,201,038 | |
| | 3,380,476 | | | Residential Accredit Loans, Inc., Series2007-QS1-2A10 | | | 6.00 | % | | | 01/25/2037 | | | | 2,859,581 | |
| | 5,047,234 | | | Residential Accredit Loans, Inc., Series2007-QS2-A6 | | | 6.25 | % | | | 01/25/2037 | | | | 4,300,503 | |
| | 23,103,406 | | | Residential Accredit Loans, Inc., Series2007-QS3-A1 | | | 6.50 | % | | | 02/25/2037 | | | | 19,977,451 | |
| | 3,683,982 | | | Residential Accredit Loans, Inc., Series2007-QS3-A4 | | | 6.25 | % | | | 02/25/2037 | | | | 3,138,874 | |
| | 6,118,334 | | | Residential Accredit Loans, Inc., Series2007-QS4-3A3 | | | 6.00 | % | | | 03/25/2037 | | | | 5,149,190 | |
| | 2,640,948 | | | Residential Accredit Loans, Inc., Series2007-QS5-A1 | | | 5.50 | % | | | 03/25/2037 | | | | 2,211,867 | |
| | 1,089,499 | | | Residential Accredit Loans, Inc., Series2007-QS5-A5 (1 Month LIBOR USD + 0.30%, 0.30% Floor, 7.00% Cap) | | | 1.25 | % | | | 03/25/2037 | | | | 722,253 | |
| | 3,618,474 | | | Residential Accredit Loans, Inc., Series2007-QS5-A8
(-1 x 1 Month LIBOR USD + 6.70%, 6.70% Cap) | | | 5.75 | % I/F I/O | | | 03/25/2037 | | | | 744,780 | |
| | 2,858,465 | | | Residential Accredit Loans, Inc., Series2007-QS6-A102 | | | 5.75 | % | | | 04/25/2037 | | | | 2,453,449 | |
| | 919,080 | | | Residential Accredit Loans, Inc., Series2007-QS6-A13(-8 x 1 Month LIBOR USD + 55.00%, 55.00% Cap) | | | 47.11 | % I/F | | | 04/25/2037 | | | | 2,192,244 | |
| | 4,093,098 | | | Residential Accredit Loans, Inc., Series2007-QS6-A45 | | | 5.75 | % | | | 04/25/2037 | | | | 3,513,119 | |
| | 6,523,134 | | | Residential Accredit Loans, Inc., Series2007-QS6-A6 | | | 6.25 | % | | | 04/25/2037 | | | | 5,762,666 | |
| | 450,532 | | | Residential Accredit Loans, Inc., Series2007-QS6-A77(-8 x 1 Month LIBOR USD + 55.83%, 55.83% Cap) | | | 47.94 | % I/F | | | 04/25/2037 | | | | 1,086,881 | |
| | 6,905,761 | | | Residential Accredit Loans, Inc., Series2007-QS7-2A1 | | | 6.75 | % | | | 06/25/2037 | | | | 4,107,272 | |
| | 23,141,224 | | | Residential Accredit Loans, Inc., Series2007-QS9-A33 | | | 6.50 | % | | | 07/25/2037 | | | | 20,818,998 | |
| | | | | | | | | | | | | | | | |
| | | | | | | | | | | | | |
| | 2,659,572 | | | Residential Asset Mortgage Products, Inc., Series2004-RS7-A3 | | | 4.40 | % # | | | 07/25/2034 | | | | 2,282,219 | |
| | 2,025,499 | | | Residential Asset Mortgage Products, Inc., Series2005-RS1-AI5 | | | 5.91 | % | | | 01/25/2035 | | | | 2,024,438 | |
| | 20,553,720 | | | Residential Asset Mortgage Products, Inc., Series2006-RS2-A3A (1 Month LIBOR USD + 0.30%, 0.30% Floor, 14.00% Cap) | | | 1.25 | % | | | 03/25/2036 | | | | 19,084,818 | |
| | 1,645,929 | | | Residential Asset Mortgage Products, Inc., Series2006-RZ3-A3 (1 Month LIBOR USD + 0.29%, 0.29% Floor, 14.00% Cap) | | | 1.24 | % | | | 08/25/2036 | | | | 1,644,176 | |
| | 6,422,441 | | | Residential Asset Mortgage Products, Inc., Series2006-RZ5-A3 (1 Month LIBOR USD + 0.25%, 0.25% Floor, 14.00% Cap) | | | 1.20 | % | | | 08/25/2046 | | | | 6,293,795 | |
| | 2,334,355 | | | Residential Asset Securities Corporation, Series2006-EMX5-A3 (1 Month LIBOR USD + 0.16%, 0.16% Floor, 14.00% Cap) | | | 1.11 | % | | | 07/25/2036 | | | | 2,267,804 | |
| | 26,217,759 | | | Residential Asset Securities Corporation, Series2007-EMX1-A13 (1 Month LIBOR USD + 0.20%, 0.20% Floor, 14.00% Cap) | | | 1.15 | % | | | 01/25/2037 | | | | 22,532,889 | |
| | 12,428,115 | | | Residential Asset Securities Corporation, Series2007-KS3-AI3 (1 Month LIBOR USD + 0.25%, 0.25% Floor, 14.00% Cap) | | | 1.20 | % | | | 04/25/2037 | | | | 12,165,149 | |
| | 5,330,352 | | | Residential Asset Securitization Trust, Series2005-A11-2A4 | | | 6.00 | % | | | 10/25/2035 | | | | 3,580,190 | |
| | 2,445,940 | | | Residential Asset Securitization Trust, Series2005-A12-A7(-1 x 1 Month LIBOR USD + 5.00%, 5.00% Cap) | | | 4.05 | % I/F I/O | | | 11/25/2035 | | | | 484,608 | |
| | 2,207,823 | | | Residential Asset Securitization Trust, Series2005-A12-A8 (1 Month LIBOR USD + 0.55%, 0.55% Floor, 5.50% Cap) | | | 1.50 | % | | | 11/25/2035 | | | | 1,198,387 | |
| | 19,266,337 | | | Residential Asset Securitization Trust, Series2005-A13-2A1 | | | 5.50 | % | | | 10/25/2035 | | | | 12,080,658 | |
| | 3,199,139 | | | Residential Asset Securitization Trust, Series2005-A15-1A7 | | | 6.00 | % | | | 02/25/2036 | | | | 3,064,799 | |
| | 9,007,436 | | | Residential Asset Securitization Trust, Series2005-A15-5A3 | | | 5.75 | % | | | 02/25/2036 | | | | 5,477,374 | |
| | 9,519,871 | | | Residential Asset Securitization Trust, Series2005-A16-A1 | | | 5.00 | % | | | 02/25/2036 | | | | 5,755,276 | |
| | 1,658,830 | | | Residential Asset Securitization Trust, Series2005-A7-A3 | | | 5.50 | % | | | 06/25/2035 | | | | 1,216,459 | |
| | 4,198,604 | | | Residential Asset Securitization Trust, Series2005-A8CB-A11 | | | 6.00 | % | | | 07/25/2035 | | | | 3,426,244 | |
| | 4,219,216 | | | Residential Asset Securitization Trust, Series2005-A8CB-A2(-1 x 1 Month LIBOR USD + 5.00%, 5.00% Cap) | | | 4.05 | % I/F I/O | | | 07/25/2035 | | | | 682,411 | |
| | 5,315,137 | | | Residential Asset Securitization Trust, Series2006-A10-A5 | | | 6.50 | % | | | 09/25/2036 | | | | 3,153,884 | |
| | 774,257 | | | Residential Asset Securitization Trust, Series2006-A1-1A3 | | | 6.00 | % | | | 04/25/2036 | | | | 507,592 | |
| | 7,681,993 | | | Residential Asset Securitization Trust, Series2006-A12-A1 | | | 6.25 | % | | | 11/25/2036 | | | | 4,223,678 | |
| | 7,693,484 | | | Residential Asset Securitization Trust, Series2006-A13-A1 | | | 6.25 | % | | | 12/25/2036 | | | | 4,029,792 | |
| | 12,971,248 | | | Residential Asset Securitization Trust, Series2006-A1-3A2 | | | 6.00 | % | | | 04/25/2036 | | | | 9,063,645 | |
| | 14,508,660 | | | Residential Asset Securitization Trust, Series2006-A14C-2A6 (1 Month LIBOR USD + 0.45%, 0.45% Floor, 7.00% Cap) | | | 1.40 | % | | | 12/25/2036 | | | | 1,553,815 | |
| | 32,018,437 | | | Residential Asset Securitization Trust, Series2006-A14C-2A7(-1 x 1 Month LIBOR USD + 6.55%, 6.55% Cap) | | | 5.60 | % I/F I/O | | | 12/25/2036 | | | | 9,804,292 | |
| | 6,516,151 | | | Residential Asset Securitization Trust, Series2006-A2-A11 | | | 6.00 | % | | | 01/25/2046 | | | | 4,101,488 | |
| | 4,515,488 | | | Residential Asset Securitization Trust, Series2006-A2-A4 | | | 6.00 | % | | | 01/25/2046 | | | | 2,787,279 | |
| | 455,368 | | | Residential Asset Securitization Trust, Series2006-A4-2A5 | | | 6.00 | % | | | 05/25/2036 | | | | 423,437 | |
| | 3,467,783 | | | Residential Asset Securitization Trust, Series2006-A4-2A9 | | | 6.00 | % | | | 05/25/2036 | | | | 3,224,616 | |
| | 3,313,421 | | | Residential Asset Securitization Trust, Series2006-A8-1A1 | | | 6.00 | % | | | 08/25/2036 | | | | 2,590,580 | |
| | 5,487,094 | | | Residential Asset Securitization Trust, Series2006-R1-A1
(-4 x 1 Month LIBOR USD + 28.40%, 28.40% Cap) | | | 24.61 | % I/F Þ | | | 01/25/2046 | | | | 6,931,611 | |
| | 27,390,244 | | | Residential Asset Securitization Trust, Series2007-A2-1A2 | | | 6.00 | % | | | 04/25/2037 | | | | 21,532,073 | |
| | 898,528 | | | Residential Asset Securitization Trust, Series2007-A3-1A2(-8 x 1 Month LIBOR USD + 46.38%, 46.38% Cap) | | | 39.13 | % I/F | | | 04/25/2037 | | | | 2,424,877 | |
| | 22,832,104 | | | Residential Asset Securitization Trust, Series2007-A5-1A4(-1 x 1 Month LIBOR USD + 6.10%, 6.10% Cap) | | | 5.15 | % I/F I/O | | | 05/25/2037 | | | | 4,923,823 | |
| | 5,877,291 | | | Residential Asset Securitization Trust, Series2007-A5-1A6 (1 Month LIBOR USD + 0.40%, 0.40% Floor, 6.50% Cap) | | | 1.35 | % | | | 05/25/2037 | | | | 343,961 | |
| | 5,526,894 | | | Residential Asset Securitization Trust, Series2007-A5-2A3 | | | 6.00 | % | | | 05/25/2037 | | | | 3,982,550 | |
| | 2,422,155 | | | Residential Asset Securitization Trust, Series2007-A5-2A5 | | | 6.00 | % | | | 05/25/2037 | | | | 1,745,348 | |
| | 10,128,799 | | | Residential Asset Securitization Trust, Series2007-A6-1A2 | | | 6.00 | % | | | 06/25/2037 | | | | 7,753,500 | |
| | 8,321,530 | | | Residential Asset Securitization Trust, Series2007-A7-A1 | | | 6.00 | % | | | 07/25/2037 | | | | 4,364,975 | |
| | 36,603,436 | | | Residential Asset Securitization Trust, Series2007-A7-A2 | | | 6.00 | % | | | 07/25/2037 | | | | 19,397,226 | |
| | 16,218,210 | | | Residential Asset Securitization Trust, Series2007-A7-A6 | | | 6.00 | % | | | 07/25/2037 | | | | 8,594,502 | |
| | 7,481,258 | | | Residential Funding Mortgage Securities Trust, Series2006-S10-1A1 | | | 6.00 | % | | | 10/25/2036 | | | | 6,567,031 | |
| | 13,006,527 | | | Residential Funding Mortgage Securities Trust, Series2006-S11-A1 | | | 6.00 | % | | | 11/25/2036 | | | | 12,121,882 | |
| | 2,432,780 | | | Residential Funding Mortgage Securities Trust, Series2006-S5-A12 | | | 6.00 | % | | | 06/25/2036 | | | | 2,212,670 | |
| | 166,558 | | | Residential Funding Mortgage Securities Trust, Series2006-S5-A15 | | | 6.00 | % | | | 06/25/2036 | | | | 151,489 | |
| | 4,173,465 | | | Residential Funding Mortgage Securities Trust, Series2006-S9-A1 | | | 6.25 | % | | | 09/25/2036 | | | | 3,722,157 | |
| | 5,641,113 | | | Residential Funding Mortgage Securities Trust, Series2007-S1-A7 | | | 6.00 | % | | | 01/25/2037 | | | | 5,088,245 | |
| | 2,855,948 | | | Residential Funding Mortgage Securities Trust, Series2007-S2-A1 | | | 6.00 | % | | | 02/25/2037 | | | | 2,482,506 | |
| | 3,217,539 | | | Residential Funding Mortgage Securities Trust, Series2007-S2-A4 | | | 6.00 | % | | | 02/25/2037 | | | | 2,796,817 | |
| | 6,006,778 | | | Residential Funding Mortgage Securities Trust, Series2007-S2-A5 | | | 6.00 | % | | | 02/25/2037 | | | | 5,221,337 | |
| | 938,659 | | | Residential Funding Mortgage Securities Trust, Series2007-S2-A9 | | | 6.00 | % | | | 02/25/2037 | | | | 815,921 | |
| | 2,594,746 | | | Residential Funding Mortgage Securities Trust, Series2007-S3-1A4 | | | 6.00 | % | | | 03/25/2037 | | | | 2,204,545 | |
| | 3,253,348 | | | Residential Funding Mortgage Securities Trust, Series2007-S4-A1 | | | 6.00 | % | | | 04/25/2037 | | | | 2,903,802 | |
| | 1,821,971 | | | Residential Funding Mortgage Securities Trust, Series2007-S4-A2 | | | 6.00 | % | | | 04/25/2037 | | | | 1,626,128 | |
| | 19,667,088 | | | Residential Funding Mortgage Securities Trust, Series2007-S5-A1 | | | 6.00 | % | | | 05/25/2037 | | | | 18,531,595 | |
| | 5,699,600 | | | Residential Funding Mortgage Securities Trust, Series2007-S5-A8 | | | 6.00 | % | | | 05/25/2037 | | | | 5,372,019 | |
| | 2,946,590 | | | Residential Funding Mortgage Securities Trust, Series2007-S6-2A4 | | | 6.00 | % | | | 06/25/2037 | | | | 2,654,526 | |
| | 15,346,591 | | | Residential Funding Mortgage Securities Trust, Series2007-S7-A20 | | | 6.00 | % | | | 07/25/2037 | | | | 13,713,186 | |
| | 7,674,249 | | | Residential Funding Mortgage Securities Trust, Series2007-S8-1A1 | | | 6.00 | % | | | 09/25/2037 | | | | 6,411,018 | |
| | 643,786 | | | Residential Funding Mortgage Securities Trust, Series2007-SA1-4A | | | 5.31 | % # | | | 02/25/2037 | | | | 565,168 | |
| | 5,500,096 | | | Residential Funding Mortgage Securities Trust, Series2007-SA2-2A1 | | | 4.37 | % # | | | 04/25/2037 | | | | 4,558,042 | |
| | 12,486,591 | | | RMAT LLC, Series2015-PR2-A1 | | | 9.85 | % ^ | | | 11/25/2035 | | | | 12,288,424 | |
| | 38,961,000 | | | RSFR, Series2020-1-PT | | | 4.21 | % ^§ | | | 02/17/2025 | | | | 39,112,636 | |
| | 29,297,103 | | | Saxon Asset Securities Trust, Series2006-3-A3 (1 Month LIBOR USD + 0.17%, 0.17% Floor, 12.25% Cap) | | | 1.12 | % | | | 10/25/2046 | | | | 27,769,218 | |
| | 278,474,393 | | | Securitized Mortgage Asset Loan Trust, Series2015-1-PC | | | 2.92 | % # ^ | | | 02/25/2054 | | | | 228,594,283 | |
| | 53,878,331 | | | Securitized Mortgage Asset Loan Trust, Series2015-2-PC | | | 3.38 | % # ^ | | | 12/26/2059 | | | | 47,249,702 | |
| | 70,116,380 | | | Securitized Mortgage Asset Loan Trust, Series2015-3-PC | | | 3.63 | % # ^ | | | 10/25/2044 | | | | 62,530,222 | |
| | 132,644 | | | Sequoia Mortgage Trust, Series2003-4-2A1 (1 Month LIBOR USD + 0.35%, 0.35% Floor, 11.50% Cap) | | | 1.12 | % | | | 07/20/2033 | | | | 113,215 | |
| | 6,978,597 | | | Sequoia Mortgage Trust, Series2013-2-A | | | 1.87 | % # | | | 02/25/2043 | | | | 6,678,227 | |
| | 11,891,173 | | | SG Mortgage Securities Trust, Series2006-FRE1-A1A (1 Month LIBOR USD + 0.17%, 0.17% Floor) | | | 1.12 | % | | | 02/25/2036 | | | | 11,008,514 | |
| | 20,097,778 | | | Soundview Home Loan Trust, Series2007-NS1-A3 (1 Month LIBOR USD + 0.20%, 0.20% Floor) | | | 1.15 | % | | | 01/25/2037 | | | | 19,073,396 | |
| | 4,689,552 | | | Soundview Home Loan Trust, Series2007-OPT1-2A2 (1 Month LIBOR USD + 0.15%, 0.15% Floor) | | | 1.10 | % | | | 06/25/2037 | | | | 3,339,539 | |
| | 8,687,760 | | | Soundview Home Loan Trust, Series2007-OPT3-1A1 (1 Month LIBOR USD + 0.17%, 0.17% Floor) | | | 1.12 | % | | | 08/25/2037 | | | | 6,905,593 | |
| | 25,970,903 | | | Soundview Home Loan Trust, Series2007-OPT4-1A1 (1 Month LIBOR USD + 1.00%, 1.00% Floor) | | | 1.95 | % | | | 09/25/2037 | | | | 18,105,903 | |
| | 46,597,881 | | | Soundview Home Loan Trust, Series2007-WM1W-2A1 (1 Month LIBOR USD + 1.80%, 0.18% Floor) | | | 1.84 | % | | | 02/25/2037 | | | | 33,118,936 | |
| | 9,826,000 | | | Spruce Hill Mortgage Loan Trust, Series2020-SH1-M1 | | | 3.22 | % # ^ | | | 01/28/2050 | | | | 8,926,724 | |
| | 110,285,632 | | | Stanwich Mortgage Loan Company, Series2019-NPB1-A1 | | | 3.38 | % ^§ | | | 08/15/2024 | | | | 110,178,158 | |
| | 72,567,894 | | | Stanwich Mortgage Loan Company, Series2019-RPL1-A | | | 3.72 | % ^§ | | | 03/15/2049 | | | | 71,634,620 | |
| | 5,820,737 | | | STARM Mortgage Loan Trust, Series2007-2-1A1 | | | 3.69 | % # | | | 04/25/2037 | | | | 3,435,798 | |
| | 2,448,125 | | | STARM Mortgage Loan Trust, Series2007-3-1A1 | | | 4.70 | % # | | | 06/25/2037 | | | | 1,956,931 | |
| | 1,788,667 | | | Structured Adjustable Rate Mortgage Loan Trust, Series2004-12-8A | | | 3.84 | % # | | | 09/25/2034 | | | | 1,547,198 | |
| | 3,617,189 | | | Structured Adjustable Rate Mortgage Loan Trust, Series2005-22-4A1 | | | 4.04 | % # | | | 12/25/2035 | | | | 3,156,672 | |
| | 3,789,054 | | | Structured Adjustable Rate Mortgage Loan Trust, Series2006-12-2A1 | | | 4.02 | % # | | | 01/25/2037 | | | | 3,043,434 | |
| | 1,886,700 | | | Structured Adjustable Rate Mortgage Loan Trust, Series2006-1-8A1 | | | 3.80 | % # | | | 02/25/2036 | | | | 1,261,614 | |
| | 7,109,818 | | | Structured Adjustable Rate Mortgage Loan Trust, Series2006-8-4A4 | | | 4.51 | % # | | | 09/25/2036 | | | | 6,101,969 | |
| | 12,283,135 | | | Structured Adjustable Rate Mortgage Loan Trust, Series2007-7-1A1 (1 Month LIBOR USD + 0.30%, 0.30% Floor) | | | 1.25 | % | | | 08/25/2037 | | | | 10,584,601 | |
| | 100,495,050 | | | Structured Asset Investment Loan Trust, Series2006-3-A1 (1 Month LIBOR USD + 0.16%, 0.16% Floor) | | | 1.11 | % | | | 06/25/2036 | | | | 66,972,946 | |
| | 15,709,383 | | | Structured Asset Mortgage Investments Trust, Series2006-AR3-12A2 (1 Month LIBOR USD + 0.20%, 0.20% Floor, 10.50% Cap) | | | 1.15 | % | | | 05/25/2036 | | | | 13,825,391 | |
| | 98,029,599 | | | Structured Asset Securities Corporation Mortgage Loan Trust, Series2006-BC4-A1 (1 Month LIBOR USD + 0.16%, 0.16% Floor) | | | 1.11 | % | | | 12/25/2036 | | | | 64,889,477 | |
| | | | | | | | | | | | | | | | |
| | | | | | | | | | | | | |
| | 1,968,045 | | | Structured Asset Securities Corporation, Series2003-24A-1A3 | | | 3.73 | % # | | | 07/25/2033 | | | | 1,760,602 | |
| | 11,226,346 | | | Structured Asset Securities Corporation, Series2005-5-3A1 | | | 6.00 | % | | | 04/25/2035 | | | | 8,537,724 | |
| | 33,873,156 | | | Structured Asset Securities Corporation, Series2006-BC4-A4 (1 Month LIBOR USD + 0.17%, 0.17% Floor) | | | 1.12 | % | | | 12/25/2036 | | | | 31,500,904 | |
| | 80,129,082 | | | Structured Asset Securities Corporation, Series2007-4-1A3(-1 x 1 Month LIBOR USD + 6.25%, 6.25% Cap) | | | 5.31 | % ^ I/F I/O Þ | | | 03/28/2045 | | | | 15,062,032 | |
| | 21,579,677 | | | Structured Asset Securities Corporation, Series2007-RF1-1A (1 Month LIBOR USD + 0.19%, 0.19% Floor) | | | 1.14 | % ^ | | | 03/25/2037 | | | | 16,590,445 | |
| | 502,179 | | | Suntrust Alternative Loan Trust, Series2005-1F-2A3 | | | 5.75 | % | | | 12/25/2035 | | | | 469,442 | |
| | 776,487 | | | Suntrust Alternative Loan Trust, Series2006-1F-1A3 | | | 6.00 | % | | | 04/25/2036 | | | | 620,731 | |
| | 320,835 | | | Thornburg Mortgage Securities Trust, Series2003-6-A2 (1 Month LIBOR USD + 0.50%, 0.50% Floor, 11.50% Cap) | | | 1.45 | % | | | 12/25/2033 | | | | 279,209 | |
| | 4,375,402 | | | Thornburg Mortgage Securities Trust, Series2004-4-5A | | | 3.46 | % # | | | 12/25/2044 | | | | 3,733,161 | |
| | 12,829,403 | | | Thornburg Mortgage Securities Trust, Series2007-1-A1 (12 Month LIBOR USD + 1.30%, 0.11% Floor, 10.75% Cap) | | | 2.24 | % | | | 03/25/2037 | | | | 11,084,151 | |
| | 2,722,634 | | | Thornburg Mortgage Securities Trust, Series2007-1-A2A (12 Month LIBOR USD + 1.30%, 0.11% Floor, 10.75% Cap) | | | 2.24 | % | | | 03/25/2037 | | | | 2,199,005 | |
| | 65,000,000 | | | Toorak Mortgage Corporation Ltd., Series2019-1-A1 | | | 4.46 | % ^§ | | | 03/25/2022 | | | | 56,810,390 | |
| | 70,000,000 | | | Toorak Mortgage Corporation Ltd., Series2019-2-A1 | | | 3.72 | %§ | | | 09/25/2022 | | | | 63,444,122 | |
| | 1,807,018 | | | Towd Point Mortgage Trust, Series2015-1-AES | | | 3.00 | % # ^ | | | 10/25/2053 | | | | 1,817,902 | |
| | 2,761,642 | | | Towd Point Mortgage Trust, Series2015-2-1A12 | | | 2.75 | % # ^ | | | 11/25/2060 | | | | 2,766,374 | |
| | 100,424,282 | | | Towd Point Mortgage Trust, Series2019-1-A1 | | | 3.75 | % # ^ | | | 03/25/2058 | | | | 103,220,475 | |
| | 5,000,000 | | | Tricon American Homes Trust, Series2019-SFR1-E | | | 3.40 | % ^ | | | 03/17/2038 | | | | 4,207,120 | |
| | 20,800,000 | | | TVC Mortgage Trust, Series2020-RTL1-A1 | | | 3.47 | % ^ | | | 09/25/2024 | | | | 16,843,794 | |
| | 35,054,319 | | | VCAT LLC, Series2019-NPL2-A1 | | | 3.57 | % ^§ | | | 11/25/2049 | | | | 34,623,400 | |
| | 26,097,700 | | | Velocity Commercial Capital Loan Trust, Series2017-2-AFX | | | 3.07 | % # ^ | | | 11/25/2047 | | | | 25,422,255 | |
| | 28,901,351 | | | Velocity Commercial Capital Loan Trust, Series2018-2-A | | | 4.05 | % # ^ | | | 10/26/2048 | | | | 29,239,387 | |
| | 73,170,401 | | | Velocity Commercial Capital Loan Trust, Series2019-1-A | | | 3.76 | % # ^ | | | 03/25/2049 | | | | 73,126,923 | |
| | 4,961,588 | | | Velocity Commercial Capital Loan Trust, Series2019-1-M4 | | | 4.61 | % # ^ | | | 03/25/2049 | | | | 4,064,077 | |
| | 26,415,928 | | | Velocity Commercial Capital Loan Trust, Series2019-2-A | | | 3.13 | % # ^ | | | 07/25/2049 | | | | 24,760,027 | |
| | 9,213,245 | | | Velocity Commercial Capital Loan Trust, Series2019-2-M1 | | | 3.26 | % # ^ | | | 07/25/2049 | | | | 7,820,170 | |
| | 3,231,611 | | | Velocity Commercial Capital Loan Trust, Series2020-1-M4 | | | 3.54 | % # ^ | | | 02/25/2050 | | | | 2,764,617 | |
| | 15,600,798 | | | Vericrest Opportunity Loan Trust, Series2019-NPL4-A1A | | | 3.35 | % ^§ | | | 08/25/2049 | | | | 14,539,179 | |
| | 48,437,471 | | | Vericrest Opportunity Loan Trust, Series2019-NPL5-A1A | | | 3.35 | % ^§ | | | 09/25/2049 | | | | 42,028,191 | |
| | 44,183,746 | | | Vericrest Opportunity Loan Trust, Series2019-NPL8-A1A | | | 3.28 | % ^§ | | | 11/25/2049 | | | | 40,418,420 | |
| | 97,261,104 | | | Vericrest Opportunity Loan Trust, Series2020-NPL2-A1A | | | 2.98 | % ^§ | | | 02/25/2050 | | | | 86,252,314 | |
| | 32,157,808 | | | Vericrest Opportunity Loan Trust, Series2020-NPL5-A1A | | | 2.98 | % ^§ | | | 03/25/2050 | | | | 29,239,107 | |
| | 26,759,070 | | | VOLT LLC, Series2019-NP10-A1A | | | 3.43 | % ^§ | | | 12/27/2049 | | | | 25,276,034 | |
| | 185,295,477 | | | VOLT LLC, Series2019-NPL6-A1A | | | 3.23 | % ^§ | | | 10/25/2049 | | | | 174,247,604 | |
| | 108,066,497 | | | VOLT LLC, Series2019-NPL9-A1A | | | 3.33 | % ^§ | | | 11/26/2049 | | | | 98,301,003 | |
| | 44,517,891 | | | VOLT LLC, Series2020-NPL1-A1A | | | 3.23 | % ^§ | | | 01/25/2050 | | | | 40,331,108 | |
| | 87,875,402 | | | VOLT LLC, Series2020-NPL3-A1A | | | 2.98 | % ^§ | | | 02/25/2050 | | | | 64,457,749 | |
| | 10,229,057 | | | WaMu Asset-Backed Certificates Trust, Series2007-HE1-2A2 (1 Month LIBOR USD + 1.10%, 0.11% Floor) | | | 1.06 | % | | | 01/25/2037 | | | | 5,451,901 | |
| | 16,397,273 | | | WaMu Asset-Backed Certificates Trust, Series2007-HE4-1A (1 Month LIBOR USD + 0.17%, 0.17% Floor) | | | 1.12 | % | | | 07/25/2047 | | | | 11,669,413 | |
| | 5,686,506 | | | Washington Mutual Mortgage Pass-Through Certificates, Series2005-1-2A | | | 6.00 | % | | | 03/25/2035 | | | | 5,281,395 | |
| | 1,824,492 | | | Washington Mutual Mortgage Pass-Through Certificates, Series2005-4-5A1 | | | 5.50 | % | | | 06/25/2035 | | | | 1,490,785 | |
| | 752,526 | | | Washington Mutual Mortgage Pass-Through Certificates, Series2005-5-CB12(-11 x 1 Month LIBOR USD + 50.60%, 50.60% Cap) | | | 40.19 | % I/F | | | 07/25/2035 | | | | 1,704,161 | |
| | 2,436,863 | | | Washington Mutual Mortgage Pass-Through Certificates, Series2005-5-CB6 (1 Month LIBOR USD + 0.60%, 0.60% Floor, 7.50% Cap) | | | 1.55 | % | | | 07/25/2035 | | | | 1,980,488 | |
| | 631,591 | | | Washington Mutual Mortgage Pass-Through Certificates, Series2005-6-2A7 | | | 5.50 | % | | | 08/25/2035 | | | | 583,904 | |
| | 9,329,703 | | | Washington Mutual Mortgage Pass-Through Certificates, Series2005-7-2CB6 (1 Month LIBOR USD + 1.45%, 1.45% Floor, 6.00% Cap) | | | 2.40 | % | | | 08/25/2035 | | | | 7,988,679 | |
| | 848,155 | | | Washington Mutual Mortgage Pass-Through Certificates, Series2005-7-2CB7(-11 x 1 Month LIBOR USD + 50.05%, 50.05% Cap) | | | 39.64 | % I/F | | | 08/25/2035 | | | | 1,727,589 | |
| | 3,431,400 | | | Washington Mutual Mortgage Pass-Through Certificates, Series2005-7-3CB | | | 6.50 | % | | | 08/25/2035 | | | | 2,970,649 | |
| | 9,522,274 | | | Washington Mutual Mortgage Pass-Through Certificates, Series2005-8-1A2 | | | 5.50 | % | | | 10/25/2035 | | | | 8,805,591 | |
| | 8,141,177 | | | Washington Mutual Mortgage Pass-Through Certificates, Series2005-9-2A2 | | | 5.50 | % | | | 11/25/2035 | | | | 7,521,525 | |
| | 2,098,439 | | | Washington Mutual Mortgage Pass-Through Certificates, Series2005-9-CX | | | 5.50 | % I/O | | | 11/25/2035 | | | | 390,424 | |
| | 2,871,045 | | | Washington Mutual Mortgage Pass-Through Certificates, Series2006-1-3A1 | | | 5.75 | % | | | 02/25/2036 | | | | 2,504,640 | |
| | 1,453,609 | | | Washington Mutual Mortgage Pass-Through Certificates, Series2006-1-3A2 | | | 5.75 | % | | | 02/25/2036 | | | | 1,259,602 | |
| | 1,234,699 | | | Washington Mutual Mortgage Pass-Through Certificates, Series2006-1-3A7 | | | 5.75 | % | | | 02/25/2036 | | | | 1,072,314 | |
| | 3,367,593 | | | Washington Mutual Mortgage Pass-Through Certificates, Series2006-3-3CB4 | | | 6.00 | % | | | 04/25/2036 | | | | 2,967,222 | |
| | 1,971,126 | | | Washington Mutual Mortgage Pass-Through Certificates, Series2006-5-1A8 | | | 5.75 | % | | | 07/25/2036 | | | | 1,692,632 | |
| | 3,697,118 | | | Washington Mutual Mortgage Pass-Through Certificates, Series2006-5-2CB1 | | | 6.00 | % | | | 07/25/2036 | | | | 3,046,954 | |
| | 6,715,522 | | | Washington Mutual Mortgage Pass-Through Certificates, Series2006-5-2CB6 | | | 6.00 | % | | | 07/25/2036 | | | | 5,534,551 | |
| | 15,623,149 | | | Washington Mutual Mortgage Pass-Through Certificates, Series2006-5-3A3 | | | 6.22 | % ß | | | 07/25/2036 | | | | 5,675,601 | |
| | 6,510,547 | | | Washington Mutual Mortgage Pass-Through Certificates, Series2006-5-3A5 | | | 6.45 | % ß | | | 07/25/2036 | | | | 2,363,907 | |
| | 9,652,807 | | | Washington Mutual Mortgage Pass-Through Certificates, Series2006-8-A4 | | | 4.31 | % ß | | | 10/25/2036 | | | | 4,895,032 | |
| | 3,441,670 | | | Washington Mutual Mortgage Pass-Through Certificates, Series2006-9-A7 | | | 4.60 | % | | | 10/25/2036 | | | | 1,209,227 | |
| | 6,770,208 | | | Washington Mutual Mortgage Pass-Through Certificates, Series2006-AR10-1A1 | | | 3.73 | % # | | | 09/25/2036 | | | | 5,798,969 | |
| | 6,076,658 | | | Washington Mutual Mortgage Pass-Through Certificates, Series2006-AR10-A1 (1 Month LIBOR USD + 0.10%, 0.10% Floor) | | | 1.05 | % | | | 12/25/2036 | | | | 3,669,538 | |
| | 11,128,705 | | | Washington Mutual Mortgage Pass-Through Certificates, Series2006-AR15-1A (12 Month US Treasury Average + 0.84%, 0.84% Floor) | | | 2.81 | % | | | 11/25/2046 | | | | 8,941,287 | |
| | 7,897,483 | | | Washington Mutual Mortgage Pass-Through Certificates, Series2006-AR4-2A (12 Month US Treasury Average + 0.95%, 0.95% Floor) | | | 2.92 | % | | | 06/25/2046 | | | | 5,877,170 | |
| | 6,870,217 | | | Washington Mutual Mortgage Pass-Through Certificates, Series2006-AR5-4A (12 Month US Treasury Average + 0.99%, 0.99% Floor) | | | 2.96 | % | | | 06/25/2046 | | | | 5,061,087 | |
| | 895,205 | | | Washington Mutual Mortgage Pass-Through Certificates, Series2006-AR6-2A3 | | | 3.84 | % # | | | 08/25/2036 | | | | 719,691 | |
| | 10,947,961 | | | Washington Mutual Mortgage Pass-Through Certificates, Series2007-2-1A6 | | | 6.00 | % | | | 04/25/2037 | | | | 8,425,212 | |
| | 5,102,933 | | | Washington Mutual Mortgage Pass-Through Certificates, Series2007-3-A2 | | | 6.00 | % | | | 04/25/2037 | | | | 4,576,085 | |
| | 6,935,952 | | | Washington Mutual Mortgage Pass-Through Certificates, Series2007-3-A3 | | | 6.00 | % | | | 04/25/2037 | | | | 6,220,359 | |
| | 5,269,076 | | | Washington Mutual Mortgage Pass-Through Certificates, Series2007-4-1A1 | | | 5.50 | % | | | 06/25/2037 | | | | 5,065,681 | |
| | 318,533 | | | Washington Mutual Mortgage Pass-Through Certificates, Series2007-5-A11(-6 x 1 Month LIBOR USD + 39.48%, 39.48% Cap) | | | 33.80 | % I/F | | | 06/25/2037 | | | | 689,841 | |
| | 7,963,316 | | | Washington Mutual Mortgage Pass-Through Certificates, Series2007-5-A6 | | | 6.00 | % | | | 06/25/2037 | | | | 7,591,449 | |
| | 10,088,394 | | | Washington Mutual Mortgage Pass-Through Certificates, Series2007-HY3-4A1 | | | 3.98 | % # | | | 03/25/2037 | | | | 9,092,685 | |
| | 12,243,676 | | | Washington Mutual Mortgage Pass-Through Certificates, Series2007-HY5-1A1 | | | 3.64 | % # | | | 05/25/2037 | | | | 10,387,406 | |
| | 9,002,248 | | | Washington Mutual Mortgage Pass-Through Certificates, Series2007-OC1-A2 (1 Month LIBOR USD + 0.12%, 0.12% Floor) | | | 1.07 | % | | | 01/25/2047 | | | | 7,263,354 | |
| | 1,151,840 | | | Wells Fargo Alternative Loan Trust, Series2007-PA1-A10 | | | 6.00 | % | | | 03/25/2037 | | | | 1,072,931 | |
| | 5,057,476 | | | Wells Fargo Alternative Loan Trust, Series2007-PA1-A3 | | | 6.00 | % | | | 03/25/2037 | | | | 4,711,003 | |
| | 4,360,650 | | | Wells Fargo Alternative Loan Trust, Series2007-PA1-A5 | | | 6.00 | % | | | 03/25/2037 | | | | 4,061,915 | |
| | 7,146,887 | | | Wells Fargo Alternative Loan Trust, Series2007-PA1-A6 | | | 6.00 | % | | | 03/25/2037 | | | | 6,657,275 | |
| | 27,380,931 | | | Wells Fargo Alternative Loan Trust, Series2007-PA2-1A1 | | | 6.00 | % | | | 06/25/2037 | | | | 26,372,935 | |
| | 4,350,344 | | | Wells Fargo Alternative Loan Trust, Series2007-PA2-3A1 (1 Month LIBOR USD + 0.35%, 0.35% Floor, 7.00% Cap) | | | 1.30 | % | | | 06/25/2037 | | | | 3,474,330 | |
| | 6,408,730 | | | Wells Fargo Alternative Loan Trust, Series2007-PA2-3A2(-1 x 1 Month LIBOR USD + 6.65%, 6.65% Cap) | | | 5.70 | % I/F I/O | | | 06/25/2037 | | | | 954,619 | |
| | 416,096 | | | Wells Fargo Alternative Loan Trust, Series2007-PA3-1A4 | | | 5.75 | % | | | 07/25/2037 | | | | 362,817 | |
| | 9,123,838 | | | Wells Fargo Alternative Loan Trust, Series2007-PA3-2A1 | | | 6.00 | % | | | 07/25/2037 | | | | 8,604,955 | |
| | 3,624,959 | | | Wells Fargo Alternative Loan Trust, Series2007-PA3-2A4 | | | 6.00 | % | | | 07/25/2037 | | | | 3,418,804 | |
| | 8,047,852 | | | Wells Fargo Alternative Loan Trust, Series2007-PA3-3A1 | | | 6.25 | % | | | 07/25/2037 | | | | 7,442,614 | |
| | 51,030,346 | | | Wells Fargo Alternative Loan Trust, Series2007-PA5-1A1 | | | 6.25 | % | | | 11/25/2037 | | | | 47,905,089 | |
| | 9,691,759 | | | Wells Fargo Alternative Loan Trust, Series2007-PA6-A1 | | | 4.48 | % # | | | 12/28/2037 | | | | 8,730,871 | |
| | 4,266,882 | | | Wells Fargo Mortgage Backed Securities Trust, Series2006-AR12-1A1 | | | 4.71 | % # | | | 09/25/2036 | | | | 3,897,736 | |
| | | | | | | | | | | | | | | | |
| | | | | | | | | | | | | |
| | 1,524,556 | | | Wells Fargo Mortgage Backed Securities Trust, Series2006-AR13-A2 | | | 4.81 | % # | | | 09/25/2036 | | | | 1,393,504 | |
| | 2,230,683 | | | Wells Fargo Mortgage Backed Securities Trust, Series2006-AR4-2A1 | | | 4.09 | % # | | | 04/25/2036 | | | | 2,177,073 | |
| | 3,279,394 | | | Wells Fargo Mortgage Backed Securities Trust, Series2007-7-A1 | | | 6.00 | % | | | 06/25/2037 | | | | 3,179,357 | |
| | 228,075 | | | Wells Fargo Mortgage Backed Securities Trust, Series2007-7-A32 | | | 5.75 | % | | | 06/25/2037 | | | | 221,414 | |
| | 7,384,953 | | | Wells Fargo Mortgage Backed Securities Trust, Series2007-7-A34 | | | 6.00 | % | | | 06/25/2037 | | | | 7,171,555 | |
| | 2,000,205 | | | Wells Fargo Mortgage Backed Securities Trust, Series2007-7-A36 | | | 6.00 | % | | | 06/25/2037 | | | | 1,942,407 | |
| | 680,238 | | | Wells Fargo Mortgage Backed Securities Trust, Series2007-7-A43 (1 Month LIBOR USD + 0.50%, 0.50% Floor, 7.00% Cap) | | | 1.45 | % | | | 06/25/2037 | | | | 548,606 | |
| | 1,858,396 | | | Wells Fargo Mortgage Backed Securities Trust, Series2007-7-A49 | | | 6.00 | % | | | 06/25/2037 | | | | 1,651,047 | |
| | 786,747 | | | Wells Fargo Mortgage Backed Securities Trust, Series2007-7-A8 (1 Month LIBOR USD + 0.50%, 0.50% Floor, 7.00% Cap) | | | 1.45 | % | | | 06/25/2037 | | | | 671,730 | |
| | 354,915 | | | Wells Fargo Mortgage Backed Securities Trust, Series2007-7-A9(-6 x 1 Month LIBOR USD + 39.00%, 39.00% Cap) | | | 33.32 | % I/F | | | 06/25/2037 | | | | 628,112 | |
| | 27,846,948 | | | Wells Fargo Mortgage Backed Securities Trust, Series2007-AR9-A1 | | | 4.40 | % # | | | 12/28/2037 | | | | 26,110,841 | |
| | 6,738,999 | | | WinWater Mortgage Loan Trust, Series2015-4-A5 | | | 3.50 | % # ^ | | | 06/20/2045 | | | | 6,725,054 | |
| | | | | | | | | | | | | | | | |
| TotalNon-Agency Residential Collateralized Mortgage Obligations
(Cost $14,798,366,614) | | | | | | | | | | | 13,516,569,504 | |
| | | | | | | | | | | | | |
| | US Government and Agency Mortgage Backed Obligations - 47.9% | | | | | | | | | | | | |
| | 5,736,193 | | | Federal Home Loan Mortgage Corporation, Pool C03490 | | | 4.50 | % | | | 08/01/2040 | | | | 6,288,977 | |
| | 37,189,160 | | | Federal Home Loan Mortgage Corporation, Pool C91388 | | | 3.50 | % | | | 02/01/2032 | | | | 40,080,785 | |
| | 19,591,469 | | | Federal Home Loan Mortgage Corporation, Pool C91403 | | | 3.50 | % | | | 03/01/2032 | | | | 21,108,943 | |
| | 19,109,602 | | | Federal Home Loan Mortgage Corporation, Pool C91413 | | | 3.50 | % | | | 12/01/2031 | | | | 20,587,388 | |
| | 9,615,317 | | | Federal Home Loan Mortgage Corporation, Pool C91417 | | | 3.50 | % | | | 01/01/2032 | | | | 10,362,248 | |
| | 40,240,800 | | | Federal Home Loan Mortgage Corporation, Pool C91447 | | | 3.50 | % | | | 05/01/2032 | | | | 43,379,111 | |
| | 46,361,079 | | | Federal Home Loan Mortgage Corporation, Pool C91594 | | | 3.00 | % | | | 01/01/2033 | | | | 49,453,643 | |
| | 13,672,742 | | | Federal Home Loan Mortgage Corporation, Pool C91596 | | | 3.00 | % | | | 02/01/2033 | | | | 14,583,927 | |
| | 7,209,598 | | | Federal Home Loan Mortgage Corporation, Pool D98901 | | | 3.50 | % | | | 01/01/2032 | | | | 7,771,766 | |
| | 19,155,544 | | | Federal Home Loan Mortgage Corporation, Pool D98923 | | | 3.50 | % | | | 01/01/2032 | | | | 20,636,720 | |
| | 18,024,721 | | | Federal Home Loan Mortgage Corporation, Pool D99724 | | | 3.00 | % | | | 11/01/2032 | | | | 19,227,097 | |
| | 14,629,768 | | | Federal Home Loan Mortgage Corporation, Pool G01840 | | | 5.00 | % | | | 07/01/2035 | | | | 16,251,799 | |
| | 2,972,538 | | | Federal Home Loan Mortgage Corporation, Pool G04817 | | | 5.00 | % | | | 09/01/2038 | | | | 3,313,589 | |
| | 14,975,900 | | | Federal Home Loan Mortgage Corporation, Pool G07801 | | | 4.00 | % | | | 10/01/2044 | | | | 16,248,122 | |
| | 28,665,561 | | | Federal Home Loan Mortgage Corporation, Pool G07862 | | | 4.00 | % | | | 01/01/2044 | | | | 31,126,509 | |
| | 33,709,970 | | | Federal Home Loan Mortgage Corporation, Pool G07905 | | | 4.00 | % | | | 01/01/2042 | | | | 36,537,558 | |
| | 61,189,980 | | | Federal Home Loan Mortgage Corporation, Pool G08534 | | | 3.00 | % | | | 06/01/2043 | | | | 64,826,437 | |
| | 19,791,121 | | | Federal Home Loan Mortgage Corporation, Pool G08537 | | | 3.00 | % | | | 07/01/2043 | | | | 20,966,409 | |
| | 46,150,834 | | | Federal Home Loan Mortgage Corporation, Pool G08614 | | | 3.00 | % | | | 11/01/2044 | | | | 48,846,667 | |
| | 54,862,383 | | | Federal Home Loan Mortgage Corporation, Pool G08619 | | | 3.00 | % | | | 12/01/2044 | | | | 58,076,640 | |
| | 73,351,868 | | | Federal Home Loan Mortgage Corporation, Pool G08622 | | | 3.00 | % | | | 01/01/2045 | | | | 77,645,337 | |
| | 139,202,431 | | | Federal Home Loan Mortgage Corporation, Pool G08626 | | | 3.00 | % | | | 02/01/2045 | | | | 147,380,405 | |
| | 75,795,986 | | | Federal Home Loan Mortgage Corporation, Pool G08631 | | | 3.00 | % | | | 03/01/2045 | | | | 80,280,295 | |
| | 195,602,395 | | | Federal Home Loan Mortgage Corporation, Pool G08635 | | | 3.00 | % | | | 04/01/2045 | | | | 207,159,161 | |
| | 57,803,270 | | | Federal Home Loan Mortgage Corporation, Pool G08640 | | | 3.00 | % | | | 05/01/2045 | | | | 61,221,447 | |
| | 302,079,306 | | | Federal Home Loan Mortgage Corporation, Pool G08648 | | | 3.00 | % | | | 06/01/2045 | | | | 319,924,626 | |
| | 58,182,696 | | | Federal Home Loan Mortgage Corporation, Pool G08653 | | | 3.00 | % | | | 07/01/2045 | | | | 61,666,017 | |
| | 32,170,072 | | | Federal Home Loan Mortgage Corporation, Pool G08658 | | | 3.00 | % | | | 08/01/2045 | | | | 34,059,755 | |
| | 38,685,410 | | | Federal Home Loan Mortgage Corporation, Pool G08670 | | | 3.00 | % | | | 10/01/2045 | | | | 40,953,945 | |
| | 459,133,785 | | | Federal Home Loan Mortgage Corporation, Pool G08675 | | | 3.00 | % | | | 11/01/2045 | | | | 486,100,361 | |
| | 193,021,162 | | | Federal Home Loan Mortgage Corporation, Pool G08680 | | | 3.00 | % | | | 12/01/2045 | | | | 204,364,720 | |
| | 78,387,257 | | | Federal Home Loan Mortgage Corporation, Pool G08686 | | | 3.00 | % | | | 01/01/2046 | | | | 83,008,048 | |
| | 180,347,480 | | | Federal Home Loan Mortgage Corporation, Pool G08692 | | | 3.00 | % | | | 02/01/2046 | | | | 190,947,396 | |
| | 59,787,469 | | | Federal Home Loan Mortgage Corporation, Pool G08705 | | | 3.00 | % | | | 05/01/2046 | | | | 63,290,087 | |
| | 66,945,678 | | | Federal Home Loan Mortgage Corporation, Pool G08715 | | | 3.00 | % | | | 08/01/2046 | | | | 70,780,114 | |
| | 6,125,722 | | | Federal Home Loan Mortgage Corporation, Pool G08741 | | | 3.00 | % | | | 01/01/2047 | | | | 6,476,557 | |
| | 5,078,594 | | | Federal Home Loan Mortgage Corporation, Pool G08800 | | | 3.50 | % | | | 02/01/2048 | | | | 5,397,003 | |
| | 27,262,868 | | | Federal Home Loan Mortgage Corporation, Pool G16072 | | | 3.00 | % | | | 02/01/2032 | | | | 28,843,005 | |
| | 56,033,384 | | | Federal Home Loan Mortgage Corporation, Pool G60251 | | | 3.50 | % | | | 10/01/2045 | | | | 60,169,160 | |
| | 168,457,631 | | | Federal Home Loan Mortgage Corporation, Pool G60393 | | | 3.50 | % | | | 01/01/2046 | | | | 180,287,632 | |
| | 25,368,688 | | | Federal Home Loan Mortgage Corporation, Pool J22834 | | | 2.50 | % | | | 03/01/2028 | | | | 26,401,688 | |
| | 53,879,015 | | | Federal Home Loan Mortgage Corporation, Pool Q13637 | | | 3.00 | % | | | 11/01/2042 | | | | 57,079,973 | |
| | 52,979,068 | | | Federal Home Loan Mortgage Corporation, Pool Q13638 | | | 3.00 | % | | | 11/01/2042 | | | | 56,125,829 | |
| | 84,045,112 | | | Federal Home Loan Mortgage Corporation, Pool Q16672 | | | 3.00 | % | | | 03/01/2043 | | | | 89,034,569 | |
| | 4,975,023 | | | Federal Home Loan Mortgage Corporation, Pool Q23595 | | | 4.00 | % | | | 12/01/2043 | | | | 5,445,593 | |
| | 6,831,926 | | | Federal Home Loan Mortgage Corporation, Pool Q24052 | | | 4.00 | % | | | 01/01/2044 | | | | 7,478,218 | |
| | 5,313,621 | | | Federal Home Loan Mortgage Corporation, Pool Q24172 | | | 4.00 | % | | | 01/01/2044 | | | | 5,815,717 | |
| | 4,698,561 | | | Federal Home Loan Mortgage Corporation, Pool Q24979 | | | 4.00 | % | | | 02/01/2044 | | | | 5,142,609 | |
| | 35,873,743 | | | Federal Home Loan Mortgage Corporation, Pool Q31596 | | | 3.50 | % | | | 02/01/2045 | | | | 38,317,464 | |
| | 13,532,988 | | | Federal Home Loan Mortgage Corporation, Pool Q32861 | | | 3.50 | % | | | 04/01/2045 | | | | 14,467,820 | |
| | 36,124,865 | | | Federal Home Loan Mortgage Corporation, Pool Q32921 | | | 3.50 | % | | | 04/01/2045 | | | | 38,589,098 | |
| | 23,882,292 | | | Federal Home Loan Mortgage Corporation, Pool Q39502 | | | 3.50 | % | | | 03/01/2046 | | | | 25,560,650 | |
| | 78,174,044 | | | Federal Home Loan Mortgage Corporation, Pool Q44073 | | | 3.00 | % | | | 09/01/2046 | | | | 82,649,838 | |
| | 9,516,810 | | | Federal Home Loan Mortgage Corporation, Pool QA2310 | | | 3.00 | % | | | 09/01/2044 | | | | 10,079,252 | |
| | 86,723,354 | | | Federal Home Loan Mortgage Corporation, Pool QA4681 | | | 2.50 | % | | | 11/01/2049 | | | | 90,039,711 | |
| | 25,992,394 | | | Federal Home Loan Mortgage Corporation, Pool QA5100 | | | 3.00 | % | | | 12/01/2044 | | | | 27,528,548 | |
| | 13,963,212 | | | Federal Home Loan Mortgage Corporation, Pool QA5290 | | | 2.50 | % | | | 12/01/2049 | | | | 14,497,185 | |
| | 45,671,016 | | | Federal Home Loan Mortgage Corporation, Pool RB5011 | | | 3.00 | % | | | 10/01/2039 | | | | 48,311,583 | |
| | 153,271,475 | | | Federal Home Loan Mortgage Corporation, Pool RB5022 | | | 3.00 | % | | | 11/01/2039 | | | | 161,076,235 | |
| | 65,374,096 | | | Federal Home Loan Mortgage Corporation, Pool RB5026 | | | 2.50 | % | | | 11/01/2039 | | | | 68,153,652 | |
| | 14,273,767 | | | Federal Home Loan Mortgage Corporation, Pool SB0039 | | | 2.50 | % | | | 04/01/2033 | | | | 14,874,410 | |
| | 100,671,233 | | | Federal Home Loan Mortgage Corporation, Pool SB8031 | | | 2.50 | % | | | 02/01/2035 | | | | 104,693,117 | |
| | 53,370,271 | | | Federal Home Loan Mortgage Corporation, Pool SD0035 | | | 3.00 | % | | | 04/01/2047 | | | | 56,273,055 | |
| | 107,816,859 | | | Federal Home Loan Mortgage Corporation, Pool SD0184 | | | 2.50 | % | | | 12/01/2049 | | | | 111,531,110 | |
| | 5,544,263 | | | Federal Home Loan Mortgage Corporation, Pool T60392 | | | 4.00 | % | | | 10/01/2041 | | | | 5,981,741 | |
| | 5,044,859 | | | Federal Home Loan Mortgage Corporation, Pool T60681 | | | 4.00 | % | | | 05/01/2042 | | | | 5,458,984 | |
| | 17,675,459 | | | Federal Home Loan Mortgage Corporation, Pool T60782 | | | 3.50 | % | | | 07/01/2042 | | | | 18,752,382 | |
| | 28,446,419 | | | Federal Home Loan Mortgage Corporation, Pool T60853 | | | 3.50 | % | | | 09/01/2042 | | | | 30,180,280 | |
| | 22,437,756 | | | Federal Home Loan Mortgage Corporation, Pool T60854 | | | 3.50 | % | | | 09/01/2042 | | | | 23,808,487 | |
| | 2,708,818 | | | Federal Home Loan Mortgage Corporation, Pool T65110 | | | 3.50 | % | | | 10/01/2042 | | | | 2,875,324 | |
| | 47,249,446 | | | Federal Home Loan Mortgage Corporation, Pool T65492 | | | 3.00 | % | | | 06/01/2048 | | | | 49,142,541 | |
| | 3,114,179 | | | Federal Home Loan Mortgage Corporation, Pool T69016 | | | 5.00 | % | | | 06/01/2041 | | | | 3,366,812 | |
| | 22,373,333 | | | Federal Home Loan Mortgage Corporation, Pool T69050 | | | 3.50 | % | | | 05/01/2046 | | | | 24,050,476 | |
| | 515,188 | | | Federal Home Loan Mortgage Corporation, Pool U60299 | | | 4.00 | % | | | 11/01/2040 | | | | 566,210 | |
| | | | | | | | | | | | | | | | |
| | | | | | | | | | | | | |
| | 3,083,689 | | | Federal Home Loan Mortgage Corporation, Pool U99125 | | | 3.00 | % | | | 01/01/2043 | | | | 3,287,899 | |
| | 53,597,808 | | | Federal Home Loan Mortgage Corporation, Pool U99193 | | | 3.50 | % | | | 03/01/2044 | | | | 57,377,173 | |
| | 118,222,396 | | | Federal Home Loan Mortgage Corporation, Pool V81821 | | | 3.00 | % | | | 08/01/2045 | | | | 125,240,139 | |
| | 32,457,113 | | | Federal Home Loan Mortgage Corporation, Pool V82117 | | | 3.00 | % | | | 12/01/2045 | | | | 34,377,973 | |
| | 35,103,377 | | | Federal Home Loan Mortgage Corporation, Pool V82209 | | | 3.50 | % | | | 02/01/2046 | | | | 37,564,848 | |
| | 13,327,438 | | | Federal Home Loan Mortgage Corporation, Pool V82248 | | | 3.50 | % | | | 03/01/2046 | | | | 14,312,633 | |
| | 190,234,977 | | | Federal Home Loan Mortgage Corporation, Pool Z40117 | | | 3.00 | % | | | 04/01/2045 | | | | 201,102,007 | |
| | 27,040,374 | | | Federal Home Loan Mortgage Corporation, Pool ZS4750 | | | 3.00 | % | | | 01/01/2048 | | | | 28,589,231 | |
| | 43,338,725 | | | Federal Home Loan Mortgage Corporation, Pool ZT1827 | | | 3.00 | % | | | 07/01/2047 | | | | 45,797,287 | |
| | 53,599,892 | | | Federal Home Loan Mortgage Corporation, Series2015-SC02-1A | | | 3.00 | % | | | 09/25/2045 | | | | 53,534,039 | |
| | 33,172,409 | | | Federal Home Loan Mortgage Corporation, Series2016-SC01-1A | | | 3.00 | % | | | 07/25/2046 | | | | 33,075,098 | |
| | 65,800,000 | | | Federal Home Loan Mortgage Corporation, Series2020-DNA2-M2 (1 Month LIBOR USD + 18.50%, 1.85% Floor) | | | 2.80 | % ^ | | | 02/25/2050 | | | | 42,806,605 | |
| | 947,080 | | | Federal Home Loan Mortgage Corporation, Series2519-ZD | | | 5.50 | % | | | 11/15/2032 | | | | 1,079,391 | |
| | 554,639 | | | Federal Home Loan Mortgage Corporation, Series2596-ZL | | | 5.00 | % | | | 04/15/2033 | | | | 615,455 | |
| | 34,927,576 | | | Federal Home Loan Mortgage Corporation, Series267-30 | | | 3.00 | % | | | 08/15/2042 | | | | 37,905,347 | |
| | 342,927 | | | Federal Home Loan Mortgage Corporation, Series2684-ZN | | | 4.00 | % | | | 10/15/2033 | | | | 378,112 | |
| | 64,936,839 | | | Federal Home Loan Mortgage Corporation, Series269-30 | | | 3.00 | % | | | 08/15/2042 | | | | 69,006,048 | |
| | 25,015,502 | | | Federal Home Loan Mortgage Corporation, Series274-30 | | | 3.00 | % | | | 08/15/2042 | | | | 26,574,112 | |
| | 2,228,838 | | | Federal Home Loan Mortgage Corporation, Series2750-ZT | | | 5.00 | % | | | 02/15/2034 | | | | 2,450,995 | |
| | 81,535,456 | | | Federal Home Loan Mortgage Corporation, Series280-30 | | | 3.00 | % | | | 09/15/2042 | | | | 88,347,603 | |
| | 5,754,939 | | | Federal Home Loan Mortgage Corporation, Series2825-PZ | | | 5.50 | % | | | 07/15/2034 | | | | 6,710,225 | |
| | 18,887,823 | | | Federal Home Loan Mortgage Corporation, Series284-300 | | | 3.00 | % | | | 10/15/2042 | | | | 20,290,632 | |
| | 3,596,814 | | | Federal Home Loan Mortgage Corporation, Series2898-JZ | | | 5.00 | % | | | 12/15/2034 | | | | 4,089,737 | |
| | 8,312,368 | | | Federal Home Loan Mortgage Corporation, Series2899-AZ | | | 5.00 | % | | | 12/15/2034 | | | | 9,470,329 | |
| | 5,868,069 | | | Federal Home Loan Mortgage Corporation, Series2909-Z | | | 5.00 | % | | | 12/15/2034 | | | | 6,702,434 | |
| | 9,860,286 | | | Federal Home Loan Mortgage Corporation, Series2932-Z | | | 5.00 | % | | | 02/15/2035 | | | | 11,286,536 | |
| | 669,751 | | | Federal Home Loan Mortgage Corporation, Series2990-JL(-1 x 1 Month LIBOR USD + 6.65%, 6.65% Cap) | | | 5.95 | % I/F I/O | | | 03/15/2035 | | | | 57,846 | |
| | 3,664,961 | | | Federal Home Loan Mortgage Corporation, Series3002-SN(-1 x 1 Month LIBOR USD + 6.50%, 6.50% Cap) | | | 5.80 | % I/F I/O | | | 07/15/2035 | | | | 745,822 | |
| | 2,424,830 | | | Federal Home Loan Mortgage Corporation, Series3030-SL(-1 x 1 Month LIBOR USD + 6.10%, 6.10% Cap) | | | 5.40 | % I/F I/O | | | 09/15/2035 | | | | 368,840 | |
| | 766,543 | | | Federal Home Loan Mortgage Corporation, Series3045-DI(-1 x 1 Month LIBOR USD + 6.73%, 6.73% Cap) | | | 6.03 | % I/F I/O | | | 10/15/2035 | | | | 136,372 | |
| | 5,780,378 | | | Federal Home Loan Mortgage Corporation, Series3116-Z | | | 5.50 | % | | | 02/15/2036 | | | | 6,623,396 | |
| | 1,109,890 | | | Federal Home Loan Mortgage Corporation, Series3117-ZN | | | 4.50 | % | | | 02/15/2036 | | | | 1,184,795 | |
| | 2,987,417 | | | Federal Home Loan Mortgage Corporation, Series3174-PZ | | | 5.00 | % | | | 01/15/2036 | | | | 3,419,181 | |
| | 744,213 | | | Federal Home Loan Mortgage Corporation, Series3187-JZ | | | 5.00 | % | | | 07/15/2036 | | | | 845,090 | |
| | 1,989,279 | | | Federal Home Loan Mortgage Corporation, Series3188-ZK | | | 5.00 | % | | | 07/15/2036 | | | | 2,275,745 | |
| | 3,191,605 | | | Federal Home Loan Mortgage Corporation, Series3203-SE(-1 x 1 Month LIBOR USD + 6.50%, 6.50% Cap) | | | 5.80 | % I/F I/O | | | 08/15/2036 | | | | 649,222 | |
| | 4,404,878 | | | Federal Home Loan Mortgage Corporation, Series3203-Z | | | 5.00 | % | | | 07/15/2036 | | | | 5,037,819 | |
| | 6,979,560 | | | Federal Home Loan Mortgage Corporation, Series3203-ZC | | | 5.00 | % | | | 07/15/2036 | | | | 7,982,459 | |
| | 4,035,220 | | | Federal Home Loan Mortgage Corporation, Series3261-SA(-1 x 1 Month LIBOR USD + 6.43%, 6.43% Cap) | | | 5.73 | % I/F I/O | | | 01/15/2037 | | | | 896,226 | |
| | 15,265,441 | | | Federal Home Loan Mortgage Corporation, Series326-300 | | | 3.00 | % | | | 03/15/2044 | | | | 16,523,793 | |
| | 4,608,121 | | | Federal Home Loan Mortgage Corporation, Series3275-SC(-1 x 1 Month LIBOR USD + 6.08%, 6.08% Cap) | | | 5.38 | % I/F I/O | | | 02/15/2037 | | | | 730,358 | |
| | 1,220,267 | | | Federal Home Loan Mortgage Corporation, Series3315-HZ | | | 6.00 | % | | | 05/15/2037 | | | | 1,388,259 | |
| | 3,417,253 | | | Federal Home Loan Mortgage Corporation, Series3326-GS(-1 x 1 Month LIBOR USD + 6.65%, 6.65% Cap) | | | 5.95 | % I/F I/O | | | 06/15/2037 | | | | 516,404 | |
| | 740,525 | | | Federal Home Loan Mortgage Corporation, Series3351-ZC | | | 5.50 | % | | | 07/15/2037 | | | | 865,611 | |
| | 8,434,570 | | | Federal Home Loan Mortgage Corporation, Series3355-BI(-1 x 1 Month LIBOR USD + 6.05%, 6.05% Cap) | | | 5.35 | % I/F I/O | | | 08/15/2037 | | | | 1,590,324 | |
| | 341,089 | | | Federal Home Loan Mortgage Corporation, Series3369-Z | | | 6.00 | % | | | 09/15/2037 | | | | 389,216 | |
| | 905,188 | | | Federal Home Loan Mortgage Corporation, Series3405-ZG | | | 5.50 | % | | | 01/15/2038 | | | | 1,010,911 | |
| | 1,767,362 | | | Federal Home Loan Mortgage Corporation, Series3417-SI
(-1 x 1 Month LIBOR USD + 6.18%, 6.18% Cap) | | | 5.48 | % I/F I/O | | | 02/15/2038 | | | | 260,383 | |
| | 2,181,143 | | | Federal Home Loan Mortgage Corporation, Series3423-GS(-1 x 1 Month LIBOR USD + 5.65%, 5.65% Cap) | | | 4.95 | % I/F I/O | | | 03/15/2038 | | | | 237,077 | |
| | 358,167 | | | Federal Home Loan Mortgage Corporation, Series3423-SG(-1 x 1 Month LIBOR USD + 5.65%, 5.65% Cap) | | | 4.95 | % I/F I/O | | | 03/15/2038 | | | | 42,616 | |
| | 565,241 | | | Federal Home Loan Mortgage Corporation, Series3451-S
(-1 x 1 Month LIBOR USD + 6.03%, 6.03% Cap) | | | 5.33 | % I/F I/O | | | 02/15/2037 | | | | 71,957 | |
| | 446,015 | | | Federal Home Loan Mortgage Corporation, Series3455-SC(-1 x 1 Month LIBOR USD + 6.06%, 6.06% Cap) | | | 5.36 | % I/F I/O | | | 06/15/2038 | | | | 60,808 | |
| | 263,349 | | | Federal Home Loan Mortgage Corporation, Series3473-SM(-1 x 1 Month LIBOR USD + 6.07%, 6.07% Cap) | | | 5.37 | % I/F I/O | | | 07/15/2038 | | | | 35,303 | |
| | 3,630,452 | | | Federal Home Loan Mortgage Corporation, Series3484-SE(-1 x 1 Month LIBOR USD + 5.85%, 5.85% Cap) | | | 5.15 | % I/F I/O | | | 08/15/2038 | | | | 669,507 | |
| | 4,332,827 | | | Federal Home Loan Mortgage Corporation, Series3519-SD(-1 x 1 Month LIBOR USD + 5.55%, 5.55% Cap) | | | 4.85 | % I/F I/O | | | 02/15/2038 | | | | 802,042 | |
| | 1,424,646 | | | Federal Home Loan Mortgage Corporation, Series3524-LB | | | 3.59 | % I/O | | | 06/15/2038 | | | | 1,526,080 | |
| | 75,436 | | | Federal Home Loan Mortgage Corporation, Series3530-GZ | | | 4.50 | % > | | | 05/15/2039 | | | | 80,714 | |
| | 5,295,304 | | | Federal Home Loan Mortgage Corporation, Series3541-EI
(-1 x 1 Month LIBOR USD + 6.75%, 6.75% Cap) | | | 6.05 | % I/F I/O | | | 06/15/2039 | | | | 1,119,349 | |
| | 605,059 | | | Federal Home Loan Mortgage Corporation, Series3545-SA(-1 x 1 Month LIBOR USD + 6.15%, 6.15% Cap) | | | 5.45 | % I/F I/O | | | 06/15/2039 | | | | 86,897 | |
| | 251,703 | | | Federal Home Loan Mortgage Corporation, Series3549-SA(-1 x 1 Month LIBOR USD + 5.80%, 5.80% Cap) | | | 5.10 | % I/F I/O | | | 07/15/2039 | | | | 33,225 | |
| | 5,739,870 | | | Federal Home Loan Mortgage Corporation, Series3577-LS(-1 x 1 Month LIBOR USD + 7.20%, 7.20% Cap) | | | 6.50 | % I/F I/O | | | 08/15/2035 | | | | 1,106,791 | |
| | 1,241,615 | | | Federal Home Loan Mortgage Corporation, Series3582-SA(-1 x 1 Month LIBOR USD + 6.00%, 6.00% Cap) | | | 5.30 | % I/F I/O | | | 10/15/2049 | | | | 224,009 | |
| | 33,240,011 | | | Federal Home Loan Mortgage Corporation, Series358-300 | | | 3.00 | % | | | 10/15/2047 | | | | 35,807,963 | |
| | 1,827,462 | | | Federal Home Loan Mortgage Corporation, Series3583-GB | | | 4.50 | % | | | 10/15/2039 | | | | 1,971,761 | |
| | 3,495,742 | | | Federal Home Loan Mortgage Corporation, Series3616-SG(-1 x 1 Month LIBOR USD + 6.35%, 6.35% Cap) | | | 5.65 | % I/F I/O | | | 03/15/2032 | | | | 575,909 | |
| | 4,867,552 | | | Federal Home Loan Mortgage Corporation, Series3626-AZ | | | 5.50 | % | | | 08/15/2036 | | | | 5,628,776 | |
| | 6,890,091 | | | Federal Home Loan Mortgage Corporation, Series3641-Z | | | 5.50 | % | | | 02/15/2036 | | | | 7,977,989 | |
| | 6,715,505 | | | Federal Home Loan Mortgage Corporation, Series3654-ZB | | | 5.50 | % | | | 11/15/2037 | | | | 7,598,189 | |
| | 15,562,548 | | | Federal Home Loan Mortgage Corporation, Series3666-VZ | | | 5.50 | % | | | 08/15/2036 | | | | 17,822,762 | |
| | 771,992 | | | Federal Home Loan Mortgage Corporation, Series3667-SB(-1 x 1 Month LIBOR USD + 6.45%, 6.45% Cap) | | | 5.75 | % I/F I/O | | | 05/15/2040 | | | | 75,513 | |
| | 6,236,102 | | | Federal Home Loan Mortgage Corporation, Series3702-SG(-1 x 1 Month LIBOR USD + 6.05%, 6.05% Cap) | | | 5.35 | % I/F I/O | | | 08/15/2032 | | | | 948,752 | |
| | 1,552,817 | | | Federal Home Loan Mortgage Corporation, Series3704-EI | | | 5.00 | % I/O | | | 12/15/2036 | | | | 412,751 | |
| | 2,866,662 | | | Federal Home Loan Mortgage Corporation, Series3712-SG(-5 x 1 Month LIBOR USD + 25.00%, 25.00% Cap) | | | 18.22 | % I/F | | | 08/15/2040 | | | | 4,306,131 | |
| | 3,949,624 | | | Federal Home Loan Mortgage Corporation, Series3724-CM | | | 5.50 | % | | | 06/15/2037 | | | | 4,628,967 | |
| | 13,174,096 | | | Federal Home Loan Mortgage Corporation, Series3726-SA(-1 x 1 Month LIBOR USD + 6.05%, 6.05% Cap) | | | 5.35 | % I/F I/O | | | 09/15/2040 | | | | 2,348,482 | |
| | 2,464,710 | | | Federal Home Loan Mortgage Corporation, Series3741-SC(-2 x 1 Month LIBOR USD + 10.00%, 10.00% Cap) | | | 8.59 | % I/F | | | 10/15/2040 | | | | 3,283,586 | |
| | 16,274,498 | | | Federal Home Loan Mortgage Corporation, Series3752-BS(-2 x 1 Month LIBOR USD + 10.00%, 10.00% Cap) | | | 7.29 | % I/F | | | 11/15/2040 | | | | 20,332,374 | |
| | 19,038,167 | | | Federal Home Loan Mortgage Corporation, Series3768-ZX | | | 5.00 | % > | | | 12/15/2040 | | | | 22,989,806 | |
| | 4,864,255 | | | Federal Home Loan Mortgage Corporation, Series3771-AL | | | 4.00 | % | | | 12/15/2030 | | | | 5,304,615 | |
| | 13,638,937 | | | Federal Home Loan Mortgage Corporation, Series3779-BY | | | 3.50 | % | | | 12/15/2030 | | | | 14,690,770 | |
| | 26,636,366 | | | Federal Home Loan Mortgage Corporation, Series3779-DZ | | | 4.50 | % > | | | 12/15/2040 | | | | 28,501,572 | |
| | 14,144,055 | | | Federal Home Loan Mortgage Corporation, Series3779-LB | | | 4.00 | % | | | 12/15/2030 | | | | 15,515,074 | |
| | 3,500,000 | | | Federal Home Loan Mortgage Corporation, Series3779-YA | | | 3.50 | % | | | 12/15/2030 | | | | 3,800,613 | |
| | 12,127,960 | | | Federal Home Loan Mortgage Corporation, Series3783-AC | | | 4.00 | % | | | 01/15/2031 | | | | 13,387,453 | |
| | 8,689,698 | | | Federal Home Loan Mortgage Corporation, Series3786-SG(-2 x 1 Month LIBOR USD + 9.50%, 9.50% Cap) | | | 8.09 | % I/F | | | 01/15/2041 | | | | 11,354,353 | |
| | 10,520,820 | | | Federal Home Loan Mortgage Corporation, Series3788-AY | | | 3.50 | % | | | 01/15/2031 | | | | 11,339,184 | |
| | 3,804,680 | | | Federal Home Loan Mortgage Corporation, Series3790-Z | | | 4.00 | % | | | 01/15/2041 | | | | 4,138,732 | |
| | 11,771,662 | | | Federal Home Loan Mortgage Corporation, Series3795-VZ | | | 4.00 | % | | | 01/15/2041 | | | | 13,053,212 | |
| | 11,092,713 | | | Federal Home Loan Mortgage Corporation, Series3798-FG (1 Month LIBOR USD + 0.51%, 0.51% Floor, 7.00% Cap) | | | 1.21 | % | | | 01/15/2041 | | | | 11,043,569 | |
| | | | | | | | | | | | | | | | |
| | | | | | | | | | | | | |
| | 419,734 | | | Federal Home Loan Mortgage Corporation, Series3798-SD(-2 x 1 Month LIBOR USD + 9.60%, 9.60% Cap) | | | 8.19 | % I/F | | | 12/15/2040 | | | | 565,594 | |
| | 23,356,794 | | | Federal Home Loan Mortgage Corporation, Series3800-VZ | | | 4.50 | % > | | | 02/15/2041 | | | | 27,301,388 | |
| | 5,218,375 | | | Federal Home Loan Mortgage Corporation, Series3803-ZM | | | 4.00 | % | | | 02/15/2041 | | | | 5,639,946 | |
| | 33,593,167 | | | Federal Home Loan Mortgage Corporation, Series3806-CZ | | | 5.50 | % | | | 07/15/2034 | | | | 38,854,099 | |
| | 14,631,867 | | | Federal Home Loan Mortgage Corporation, Series3808-DB | | | 3.50 | % | | | 02/15/2031 | | | | 15,684,510 | |
| | 12,244,970 | | | Federal Home Loan Mortgage Corporation, Series3812-EY | | | 3.50 | % | | | 02/15/2031 | | | | 13,185,027 | |
| | 4,975,655 | | | Federal Home Loan Mortgage Corporation, Series3818-CZ | | | 4.50 | % | | | 03/15/2041 | | | | 5,620,718 | |
| | 6,702,579 | | | Federal Home Loan Mortgage Corporation, Series3819-MS(-1 x 1 Month LIBOR USD + 6.47%, 6.47% Cap) | | | 5.77 | % I/F I/O | | | 06/15/2040 | | | | 619,669 | |
| | 7,932,164 | | | Federal Home Loan Mortgage Corporation, Series3819-ZU | | | 5.50 | % | | | 07/15/2034 | | | | 9,221,511 | |
| | 28,802,467 | | | Federal Home Loan Mortgage Corporation, Series3824-EY | | | 3.50 | % | | | 03/15/2031 | | | | 31,081,906 | |
| | 3,350,433 | | | Federal Home Loan Mortgage Corporation, Series3828-SW(-3 x 1 Month LIBOR USD + 13.20%, 13.20% Cap) | | | 11.09 | % I/F | | | 02/15/2041 | | | | 5,769,371 | |
| | 11,614,237 | | | Federal Home Loan Mortgage Corporation, Series3829-VZ | | | 4.00 | % | | | 03/15/2041 | | | | 13,096,597 | |
| | 7,801,726 | | | Federal Home Loan Mortgage Corporation, Series3843-PZ | | | 5.00 | % > | | | 04/15/2041 | | | | 9,419,874 | |
| | 22,554,069 | | | Federal Home Loan Mortgage Corporation, Series3863-ZA | | | 5.50 | % | | | 08/15/2034 | | | | 25,645,700 | |
| | 8,185,535 | | | Federal Home Loan Mortgage Corporation, Series3870-PB | | | 4.50 | % | | | 06/15/2041 | | | | 9,017,774 | |
| | 36,122,322 | | | Federal Home Loan Mortgage Corporation, Series3871-LZ | | | 5.50 | % | | | 06/15/2041 | | | | 42,029,608 | |
| | 10,984,112 | | | Federal Home Loan Mortgage Corporation, Series3872-BA | | | 4.00 | % | | | 06/15/2041 | | | | 11,808,039 | |
| | 8,654,556 | | | Federal Home Loan Mortgage Corporation, Series3877-EY | | | 4.50 | % | | | 06/15/2041 | | | | 9,348,182 | |
| | 4,888,994 | | | Federal Home Loan Mortgage Corporation, Series3877-GY | | | 4.50 | % | | | 06/15/2041 | | | | 5,509,103 | |
| | 17,906,062 | | | Federal Home Loan Mortgage Corporation, Series3877-ZU | | | 4.50 | % | | | 06/15/2041 | | | | 19,779,219 | |
| | 23,614,461 | | | Federal Home Loan Mortgage Corporation, Series3888-ZU | | | 4.50 | % > | | | 06/15/2041 | | | | 27,926,677 | |
| | 4,755,285 | | | Federal Home Loan Mortgage Corporation, Series3900-SB(-1 x 1 Month LIBOR USD + 5.97%, 5.97% Cap) | | | 5.27 | % I/F I/O | | | 07/15/2041 | | | | 737,003 | |
| | 25,989,191 | | | Federal Home Loan Mortgage Corporation, Series3901-VZ | | | 4.00 | % | | | 07/15/2041 | | | | 28,793,898 | |
| | 27,106,423 | | | Federal Home Loan Mortgage Corporation, Series3910-GZ | | | 5.00 | % | | | 08/15/2041 | | | | 31,996,692 | |
| | 4,968,461 | | | Federal Home Loan Mortgage Corporation, Series3910-ZE | | | 5.00 | % | | | 10/15/2034 | | | | 5,681,009 | |
| | 7,894,037 | | | Federal Home Loan Mortgage Corporation, Series3919-KL | | | 4.50 | % | | | 09/15/2041 | | | | 8,863,170 | |
| | 30,233,837 | | | Federal Home Loan Mortgage Corporation, Series3919-ZJ | | | 4.00 | % | | | 09/15/2041 | | | | 33,663,540 | |
| | 2,230,563 | | | Federal Home Loan Mortgage Corporation, Series3942-JZ | | | 4.00 | % | | | 10/15/2041 | | | | 2,393,645 | |
| | 8,732,582 | | | Federal Home Loan Mortgage Corporation, Series3944-AZ | | | 4.00 | % | | | 10/15/2041 | | | | 9,491,705 | |
| | 2,973,918 | | | Federal Home Loan Mortgage Corporation, Series3946-SM(-3 x 1 Month LIBOR USD + 14.70%, 14.70% Cap) | | | 12.59 | % I/F | | | 10/15/2041 | | | | 5,110,068 | |
| | 5,276,977 | | | Federal Home Loan Mortgage Corporation, Series3957-DZ | | | 3.50 | % | | | 11/15/2041 | | | | 5,728,476 | |
| | 22,846,167 | | | Federal Home Loan Mortgage Corporation, Series3969-AB | | | 4.00 | % | | | 10/15/2033 | | | | 24,803,010 | |
| | 10,533,734 | | | Federal Home Loan Mortgage Corporation, Series3982-AZ | | | 3.50 | % | | | 01/15/2042 | | | | 11,431,712 | |
| | 66,840,450 | | | Federal Home Loan Mortgage Corporation, Series3990-ZA | | | 3.50 | % > | | | 01/15/2042 | | | | 74,473,189 | |
| | 12,298,635 | | | Federal Home Loan Mortgage Corporation, Series3999-EZ | | | 4.00 | % | | | 02/15/2042 | | | | 13,432,571 | |
| | 58,001,290 | | | Federal Home Loan Mortgage Corporation, Series3999-ZB | | | 4.00 | % > | | | 02/15/2042 | | | | 64,491,292 | |
| | 32,886,633 | | | Federal Home Loan Mortgage Corporation, Series4016-KZ | | | 4.00 | % > | | | 03/15/2042 | | | | 37,023,218 | |
| | 10,597,439 | | | Federal Home Loan Mortgage Corporation, Series4050-BC | | | 2.00 | % | | | 05/15/2041 | | | | 10,820,289 | |
| | 5,965,895 | | | Federal Home Loan Mortgage Corporation, Series4050-ND | | | 2.50 | % | | | 09/15/2041 | | | | 6,147,193 | |
| | 81,763,345 | | | Federal Home Loan Mortgage Corporation, Series4057-ZA | | | 4.00 | % > | | | 06/15/2042 | | | | 93,310,897 | |
| | 81,464,542 | | | Federal Home Loan Mortgage Corporation, Series4084-TZ | | | 4.00 | % > | | | 07/15/2042 | | | | 91,663,846 | |
| | 3,916,325 | | | Federal Home Loan Mortgage Corporation, Series4097-TG | | | 2.00 | % | | | 05/15/2039 | | | | 3,994,986 | |
| | 44,898,857 | | | Federal Home Loan Mortgage Corporation, Series4097-ZA | | | 3.50 | % > | | | 08/15/2042 | | | | 48,637,536 | |
| | 97,063,000 | | | Federal Home Loan Mortgage Corporation, Series4109-GE | | | 4.50 | % | | | 10/15/2041 | | | | 108,131,142 | |
| | 619,562 | | | Federal Home Loan Mortgage Corporation, Series4109-KD | | | 3.00 | % | | | 05/15/2032 | | | | 620,447 | |
| | 33,765,665 | | | Federal Home Loan Mortgage Corporation, Series4116-AP | | | 1.35 | % | | | 08/15/2042 | | | | 33,758,794 | |
| | 4,506,906 | | | Federal Home Loan Mortgage Corporation, Series4121-AV | | | 3.00 | % | | | 12/15/2035 | | | | 4,853,985 | |
| | 33,042,429 | | | Federal Home Loan Mortgage Corporation, Series4160-HP | | | 2.50 | % | | | 01/15/2033 | | | | 34,592,324 | |
| | 31,456,648 | | | Federal Home Loan Mortgage Corporation, Series4162-ZJ | | | 3.00 | % > | | | 02/15/2033 | | | | 33,709,960 | |
| | 6,624,200 | | | Federal Home Loan Mortgage Corporation, Series4165-ZT | | | 3.00 | % > | | | 02/15/2043 | | | | 6,697,272 | |
| | 46,048,909 | | | Federal Home Loan Mortgage Corporation, Series4174-Z | | | 3.50 | % > | | | 03/15/2043 | | | | 49,810,856 | |
| | 116,779,918 | | | Federal Home Loan Mortgage Corporation, Series4179-AZ | | | 4.00 | % > | | | 01/15/2041 | | | | 132,849,477 | |
| | 33,282,303 | | | Federal Home Loan Mortgage Corporation, Series4183-ZB | | | 3.00 | % > | | | 03/15/2043 | | | | 34,222,405 | |
| | 16,600,249 | | | Federal Home Loan Mortgage Corporation, Series4186-ZJ | | | 3.00 | % | | | 03/15/2033 | | | | 17,893,840 | |
| | 13,000,000 | | | Federal Home Loan Mortgage Corporation, Series4189-ML | | | 3.00 | % | | | 04/15/2038 | | | | 14,052,737 | |
| | 153,292,200 | | | Federal Home Loan Mortgage Corporation, Series4212-US(-1 x 1 Month LIBOR USD + 5.40%, 5.40% Cap) | | | 3.77 | % I/F | | | 06/15/2043 | | | | 170,214,218 | |
| | 2,982,476 | | | Federal Home Loan Mortgage Corporation, Series4215-KC | | | 2.25 | % | | | 03/15/2038 | | | | 3,011,887 | |
| | 67,879,621 | | | Federal Home Loan Mortgage Corporation, Series4223-US(-1 x 1 Month LIBOR USD + 5.43%, 5.43% Cap) | | | 3.79 | % I/F | | | 07/15/2043 | | | | 76,272,773 | |
| | 26,100,526 | | | Federal Home Loan Mortgage Corporation, Series4223-ZV | | | 4.00 | % > | | | 07/15/2043 | | | | 29,425,566 | |
| | 31,193,433 | | | Federal Home Loan Mortgage Corporation, Series4229-TZ | | | 3.00 | % > | | | 06/15/2043 | | | | 33,184,566 | |
| | 32,625,658 | | | Federal Home Loan Mortgage Corporation, Series4229-ZA | | | 4.00 | % > | | | 07/15/2043 | | | | 36,703,924 | |
| | 20,666,461 | | | Federal Home Loan Mortgage Corporation, Series4249-CS(-1 x 1 Month LIBOR USD + 4.65%, 4.65% Cap) | | | 3.63 | % I/F | | | 09/15/2043 | | | | 22,958,770 | |
| | 23,191,731 | | | Federal Home Loan Mortgage Corporation, Series4250-BZ | | | 3.00 | % > | | | 09/15/2033 | | | | 25,096,722 | |
| | 24,124,863 | | | Federal Home Loan Mortgage Corporation, Series4267-BZ | | | 4.00 | % > | | | 10/15/2040 | | | | 26,992,470 | |
| | 22,913,013 | | | Federal Home Loan Mortgage Corporation, Series4283-ZL | | | 3.00 | % > | | | 08/15/2033 | | | | 25,149,680 | |
| | 38,280,653 | | | Federal Home Loan Mortgage Corporation, Series4323-GA | | | 3.00 | % | | | 06/15/2040 | | | | 39,418,534 | |
| | 20,129,899 | | | Federal Home Loan Mortgage Corporation, Series4355-ZX | | | 4.00 | % > | | | 05/15/2044 | | | | 22,750,693 | |
| | 18,515,313 | | | Federal Home Loan Mortgage Corporation, Series4360-KA | | | 3.00 | % | | | 05/15/2040 | | | | 19,486,478 | |
| | 27,705,856 | | | Federal Home Loan Mortgage Corporation, Series4375-CG | | | 3.00 | % | | | 04/15/2039 | | | | 28,717,890 | |
| | 15,958,325 | | | Federal Home Loan Mortgage Corporation, Series4376-GZ | | | 3.00 | % > | | | 08/15/2044 | | | | 16,512,548 | |
| | 50,735,374 | | | Federal Home Loan Mortgage Corporation, Series4377-LZ | | | 3.00 | % > | | | 08/15/2044 | | | | 52,499,565 | |
| | 53,082,786 | | | Federal Home Loan Mortgage Corporation, Series4377-UZ | | | 3.00 | % | | | 08/15/2044 | | | | 52,598,416 | |
| | 3,632,018 | | | Federal Home Loan Mortgage Corporation, Series4379-KA | | | 3.00 | % | | | 08/15/2044 | | | | 3,877,987 | |
| | 15,176,246 | | | Federal Home Loan Mortgage Corporation, Series4384-A | | | 3.00 | % | | | 12/15/2040 | | | | 15,927,280 | |
| | 27,732,798 | | | Federal Home Loan Mortgage Corporation, Series4384-ZY | | | 3.00 | % > | | | 09/15/2044 | | | | 28,698,887 | |
| | 1,544,242 | | | Federal Home Loan Mortgage Corporation, Series4386-US(-2 x 1 Month LIBOR USD + 8.14%, 8.14% Cap) | | | 5.76 | % I/F | | | 09/15/2044 | | | | 1,600,976 | |
| | 127,494,137 | | | Federal Home Loan Mortgage Corporation, Series4390-NY | | | 3.00 | % | | | 06/15/2040 | | | | 133,566,147 | |
| | 140,554,716 | | | Federal Home Loan Mortgage Corporation, Series4390-NZ | | | 3.00 | % > | | | 09/15/2044 | | | | 145,777,673 | |
| | 32,948,335 | | | Federal Home Loan Mortgage Corporation, Series4391-MA | | | 3.00 | % | | | 07/15/2040 | | | | 34,518,079 | |
| | 48,041,747 | | | Federal Home Loan Mortgage Corporation, Series4408-PB | | | 3.00 | % | | | 04/15/2044 | | | | 50,557,837 | |
| | 57,868,832 | | | Federal Home Loan Mortgage Corporation, Series4427-CE | | | 3.00 | % | | | 02/15/2034 | | | | 60,992,395 | |
| | 40,243,828 | | | Federal Home Loan Mortgage Corporation, Series4427-MA | | | 3.00 | % | | | 02/15/2034 | | | | 42,620,025 | |
| | 24,747,295 | | | Federal Home Loan Mortgage Corporation, Series4427-PS(-1 x 1 Month LIBOR USD + 5.60%, 5.60% Cap) | | | 4.90 | % I/F I/O | | | 07/15/2044 | | | | 3,573,477 | |
| | 32,834,570 | | | Federal Home Loan Mortgage Corporation, Series4429-HA | | | 3.00 | % | | | 04/15/2034 | | | | 35,534,264 | |
| | 26,783,979 | | | Federal Home Loan Mortgage Corporation, Series4434-LZ | | | 3.00 | % > | | | 02/15/2045 | | | | 27,694,425 | |
| | 7,429,008 | | | Federal Home Loan Mortgage Corporation, Series4438-B | | | 3.00 | % | | | 10/15/2043 | | | | 7,824,614 | |
| | 10,014,879 | | | Federal Home Loan Mortgage Corporation, Series4441-VZ | | | 3.00 | % > | | | 02/15/2045 | | | | 10,354,367 | |
| | 36,024,623 | | | Federal Home Loan Mortgage Corporation, Series4444-CH | | | 3.00 | % | | | 01/15/2041 | | | | 37,345,163 | |
| | 29,113,021 | | | Federal Home Loan Mortgage Corporation, Series4444-CZ | | | 3.00 | % > | | | 02/15/2045 | | | | 30,799,136 | |
| | | | | | | | | | | | | | | | |
| | | | | | | | | | | | | |
| | 34,800,913 | | | Federal Home Loan Mortgage Corporation, Series4447-A | | | 3.00 | % | | | 06/15/2041 | | | | 36,617,639 | |
| | 28,082,922 | | | Federal Home Loan Mortgage Corporation, Series4447-YZ | | | 4.00 | % > | | | 08/15/2043 | | | | 31,580,790 | |
| | 8,712,126 | | | Federal Home Loan Mortgage Corporation, Series4450-JZ | | | 3.00 | % > | | | 03/15/2045 | | | | 8,871,265 | |
| | 7,576,366 | | | Federal Home Loan Mortgage Corporation, Series4461-LZ | | | 3.00 | % > | | | 03/15/2045 | | | | 7,983,232 | |
| | 8,936,048 | | | Federal Home Loan Mortgage Corporation, Series4462-ZA | | | 3.00 | % > | | | 04/15/2045 | | | | 9,237,631 | |
| | 52,142,399 | | | Federal Home Loan Mortgage Corporation, Series4463-ZC | | | 3.00 | % > | | | 04/15/2045 | | | | 53,897,700 | |
| | 28,968,000 | | | Federal Home Loan Mortgage Corporation, Series4467-ZA | | | 3.00 | % > | | | 04/15/2045 | | | | 29,935,907 | |
| | 116,147,471 | | | Federal Home Loan Mortgage Corporation, Series4471-BA | | | 3.00 | % | | | 12/15/2041 | | | | 122,873,827 | |
| | 100,996,668 | | | Federal Home Loan Mortgage Corporation, Series4471-BC | | | 3.00 | % | | | 12/15/2041 | | | | 106,845,608 | |
| | 94,713,556 | | | Federal Home Loan Mortgage Corporation, Series4471-GA | | | 3.00 | % | | | 02/15/2044 | | | | 101,204,806 | |
| | 42,051,822 | | | Federal Home Loan Mortgage Corporation, Series4481-B | | | 3.00 | % | | | 12/15/2042 | | | | 45,239,119 | |
| | 166,769,743 | | | Federal Home Loan Mortgage Corporation, Series4483-CA | | | 3.00 | % | | | 06/15/2044 | | | | 177,698,948 | |
| | 70,701,252 | | | Federal Home Loan Mortgage Corporation, Series4483-PA | | | 2.50 | % | | | 06/15/2045 | | | | 73,481,182 | |
| | 17,294,221 | | | Federal Home Loan Mortgage Corporation, Series4484-ZL | | | 3.00 | % > | | | 06/15/2045 | | | | 17,887,973 | |
| | 9,417,194 | | | Federal Home Loan Mortgage Corporation, Series4492-GZ | | | 3.50 | % > | | | 07/15/2045 | | | | 10,591,137 | |
| | 26,445,540 | | | Federal Home Loan Mortgage Corporation, Series4498-PD | | | 2.50 | % | | | 08/15/2042 | | | | 27,438,015 | |
| | 23,678,463 | | | Federal Home Loan Mortgage Corporation, Series4499-AB | | | 3.00 | % | | | 06/15/2042 | | | | 25,378,377 | |
| | 38,450,066 | | | Federal Home Loan Mortgage Corporation, Series4504-CA | | | 3.00 | % | | | 04/15/2044 | | | | 41,037,701 | |
| | 35,701,376 | | | Federal Home Loan Mortgage Corporation, Series4510-HB | | | 2.00 | % | | | 03/15/2040 | | | | 36,146,751 | |
| | 18,363,409 | | | Federal Home Loan Mortgage Corporation, Series4511-QA | | | 3.00 | % | | | 01/15/2041 | | | | 18,984,562 | |
| | 18,686,978 | | | Federal Home Loan Mortgage Corporation, Series4511-QC | | | 3.00 | % | | | 12/15/2040 | | | | 19,403,666 | |
| | 113,240,699 | | | Federal Home Loan Mortgage Corporation, Series4527-CA | | | 3.00 | % | | | 02/15/2044 | | | | 120,971,913 | |
| | 50,213,671 | | | Federal Home Loan Mortgage Corporation, Series4527-GA | | | 3.00 | % | | | 02/15/2044 | | | | 53,427,406 | |
| | 107,951,348 | | | Federal Home Loan Mortgage Corporation, Series4533-AB | | | 3.00 | % | | | 06/15/2044 | | | | 116,554,962 | |
| | 100,169,507 | | | Federal Home Loan Mortgage Corporation, Series4543-HG | | | 2.70 | % | | | 04/15/2044 | | | | 105,437,842 | |
| | 156,479,275 | | | Federal Home Loan Mortgage Corporation, Series4573-CA | | | 3.00 | % | | | 11/15/2044 | | | | 171,968,626 | |
| | 48,614,706 | | | Federal Home Loan Mortgage Corporation, Series4573-DA | | | 3.00 | % | | | 03/15/2045 | | | | 53,430,333 | |
| | 109,657,522 | | | Federal Home Loan Mortgage Corporation, Series4582-HA | | | 3.00 | % | | | 09/15/2045 | | | | 117,695,934 | |
| | 63,799,783 | | | Federal Home Loan Mortgage Corporation, Series4588-DA | | | 3.00 | % | | | 02/15/2044 | | | | 66,076,249 | |
| | 58,306,276 | | | Federal Home Loan Mortgage Corporation, Series4629-KA | | | 3.00 | % | | | 03/15/2045 | | | | 60,780,468 | |
| | 44,190,794 | | | Federal Home Loan Mortgage Corporation, Series4738-LA | | | 3.00 | % | | | 11/15/2043 | | | | 45,558,225 | |
| | 35,972,345 | | | Federal Home Loan Mortgage Corporation, Series4744-KA | | | 3.00 | % | | | 08/15/2046 | | | | 37,943,719 | |
| | 47,777,365 | | | Federal Home Loan Mortgage Corporation, Series4750-PA | | | 3.00 | % | | | 07/15/2046 | | | | 51,047,391 | |
| | 72,775,096 | | | Federal Home Loan Mortgage Corporation, Series4752-PL | | | 3.00 | % | | | 09/15/2046 | | | | 76,787,798 | |
| | 52,970,730 | | | Federal Home Loan Mortgage Corporation, Series4763-QA | | | 3.00 | % | | | 06/15/2043 | | | | 55,009,192 | |
| | 55,377,032 | | | Federal Home Loan Mortgage Corporation, Series4766-JA | | | 3.00 | % | | | 07/15/2044 | | | | 57,485,324 | |
| | 30,749,264 | | | Federal Home Loan Mortgage Corporation, Series4778-NA | | | 4.50 | % | | | 06/15/2044 | | | | 31,809,237 | |
| | 24,961,080 | | | Federal Home Loan Mortgage Corporation, Series4791-IO | | | 3.00 | % I/O | | | 05/15/2048 | | | | 1,819,433 | |
| | 203,269,409 | | | Federal Home Loan Mortgage Corporation, Series4791-JT | | | 3.00 | % | | | 05/15/2048 | | | | 213,580,128 | |
| | 25,851,025 | | | Federal Home Loan Mortgage Corporation, Series4791-LI | | | 3.00 | % I/O | | | 05/15/2048 | | | | 1,932,421 | |
| | 25,851,025 | | | Federal Home Loan Mortgage Corporation, Series4791-LO | | | 0.00 | % P/O | | | 05/15/2048 | | | | 25,484,207 | |
| | 80,519,613 | | | Federal Home Loan Mortgage Corporation, Series4791-PO | | | 0.00 | % P/O | | | 05/15/2048 | | | | 76,218,827 | |
| | 79,153,470 | | | Federal Home Loan Mortgage Corporation, Series4792-A | | | 3.00 | % | | | 05/15/2048 | | | | 82,900,437 | |
| | 36,137,146 | | | Federal Home Loan Mortgage Corporation, Series4793-C | | | 3.00 | % | | | 06/15/2048 | | | | 37,971,677 | |
| | 39,232,815 | | | Federal Home Loan Mortgage Corporation, Series4795-AO | | | 0.00 | % P/O | | | 05/15/2048 | | | | 38,601,379 | |
| | 27,599,041 | | | Federal Home Loan Mortgage Corporation, Series4800-MZ | | | 4.00 | % > | | | 06/15/2048 | | | | 30,943,096 | |
| | 42,633,549 | | | Federal Home Loan Mortgage Corporation, Series4801-OG | | | 0.00 | % P/O | | | 06/15/2048 | | | | 42,054,867 | |
| | 47,694,792 | | | Federal Home Loan Mortgage Corporation, Series4827-KA | | | 4.00 | % | | | 06/15/2044 | | | | 49,410,808 | |
| | 4,000,609 | | | Federal Home Loan Mortgage Corporation, Series4868-Z | | | 4.00 | % > | | | 03/15/2049 | | | | 4,452,964 | |
| | 26,843,655 | | | Federal Home Loan Mortgage Corporation, Series4901-BD | | | 3.00 | % | | | 07/25/2049 | | | | 28,504,389 | |
| | 51,011,349 | | | Federal Home Loan Mortgage Corporation, SeriesR003-ZA | | | 5.50 | % | | | 10/15/2035 | | | | 60,809,987 | |
| | 7,252,408 | | | Federal National Mortgage Association Pass-Thru, Pool 555743 | | | 5.00 | % | | | 09/01/2033 | | | | 8,054,453 | |
| | 5,430,719 | | | Federal National Mortgage Association Pass-Thru, Pool 735382 | | | 5.00 | % | | | 04/01/2035 | | | | 6,042,625 | |
| | 8,946,467 | | | Federal National Mortgage Association Pass-Thru, Pool 735402 | | | 5.00 | % | | | 04/01/2035 | | | | 9,953,689 | |
| | 6,288,374 | | | Federal National Mortgage Association Pass-Thru, Pool 735484 | | | 5.00 | % | | | 05/01/2035 | | | | 7,001,420 | |
| | 2,473,873 | | | Federal National Mortgage Association Pass-Thru, Pool 735667 | | | 5.00 | % | | | 07/01/2035 | | | | 2,747,557 | |
| | 2,034,091 | | | Federal National Mortgage Association Pass-Thru, Pool 735893 | | | 5.00 | % | | | 10/01/2035 | | | | 2,269,654 | |
| | 5,057,638 | | | Federal National Mortgage Association Pass-Thru, Pool 745275 | | | 5.00 | % | | | 02/01/2036 | | | | 5,644,195 | |
| | 197,160 | | | Federal National Mortgage Association Pass-Thru, Pool 888695 | | | 5.00 | % | | | 08/01/2037 | | | | 219,628 | |
| | 1,174,287 | | | Federal National Mortgage Association Pass-Thru, Pool 888968 | | | 5.00 | % | | | 08/01/2035 | | | | 1,305,417 | |
| | 10,252,441 | | | Federal National Mortgage Association Pass-Thru, Pool 890549 | | | 4.00 | % | | | 11/01/2043 | | | | 11,216,043 | |
| | 12,970,705 | | | Federal National Mortgage Association Pass-Thru, Pool 890565 | | | 3.00 | % | | | 11/01/2043 | | | | 13,738,752 | |
| | 644,455 | | | Federal National Mortgage Association Pass-Thru, Pool 931104 | | | 5.00 | % | | | 05/01/2039 | | | | 713,595 | |
| | 163,743 | | | Federal National Mortgage Association Pass-Thru, Pool 975116 | | | 5.00 | % | | | 05/01/2038 | | | | 182,518 | |
| | 1,359,880 | | | Federal National Mortgage Association Pass-Thru, Pool 986864 | | | 6.50 | % | | | 08/01/2038 | | | | 1,660,015 | |
| | 1,031,928 | | | Federal National Mortgage Association Pass-Thru, Pool 987316 | | | 6.50 | % | | | 09/01/2038 | | | | 1,271,835 | |
| | 9,757,583 | | | Federal National Mortgage Association Pass-Thru, Pool 995203 | | | 5.00 | % | | | 07/01/2035 | | | | 10,837,239 | |
| | 16,226,537 | | | Federal National Mortgage Association Pass-Thru, Pool 995849 | | | 5.00 | % | | | 08/01/2036 | | | | 18,023,323 | |
| | 14,495,812 | | | Federal National Mortgage Association Pass-Thru, Pool AB2123 | | | 4.00 | % | | | 01/01/2031 | | | | 15,849,614 | |
| | 199,949 | | | Federal National Mortgage Association Pass-Thru, Pool AB2370 | | | 4.50 | % | | | 09/01/2035 | | | | 212,654 | |
| | 1,372,249 | | | Federal National Mortgage Association Pass-Thru, Pool AB3713 | | | 4.00 | % | | | 10/01/2031 | | | | 1,500,573 | |
| | 8,002,017 | | | Federal National Mortgage Association Pass-Thru, Pool AB3796 | | | 3.50 | % | | | 11/01/2031 | | | | 8,615,661 | |
| | 3,499,119 | | | Federal National Mortgage Association Pass-Thru, Pool AB3850 | | | 4.00 | % | | | 11/01/2041 | | | | 3,725,267 | |
| | 5,111,005 | | | Federal National Mortgage Association Pass-Thru, Pool AB3923 | | | 4.00 | % | | | 11/01/2041 | | | | 5,448,310 | |
| | 27,206,294 | | | Federal National Mortgage Association Pass-Thru, Pool AB4167 | | | 3.50 | % | | | 01/01/2032 | | | | 29,330,556 | |
| | 26,109,624 | | | Federal National Mortgage Association Pass-Thru, Pool AB4261 | | | 3.50 | % | | | 01/01/2032 | | | | 28,148,254 | |
| | 4,796,793 | | | Federal National Mortgage Association Pass-Thru, Pool AB5084 | | | 3.50 | % | | | 05/01/2032 | | | | 5,170,027 | |
| | 8,718,086 | | | Federal National Mortgage Association Pass-Thru, Pool AB5156 | | | 3.50 | % | | | 05/01/2032 | | | | 9,397,874 | |
| | 15,819,488 | | | Federal National Mortgage Association Pass-Thru, Pool AB5212 | | | 3.50 | % | | | 05/01/2032 | | | | 17,054,898 | |
| | 7,573,364 | | | Federal National Mortgage Association Pass-Thru, Pool AB5243 | | | 4.00 | % | | | 05/01/2042 | | | | 8,076,316 | |
| | 23,599,778 | | | Federal National Mortgage Association Pass-Thru, Pool AB5911 | | | 3.00 | % | | | 08/01/2032 | | | | 25,158,812 | |
| | 7,136,481 | | | Federal National Mortgage Association Pass-Thru, Pool AB6280 | | | 3.00 | % | | | 09/01/2042 | | | | 7,606,361 | |
| | 10,123,029 | | | Federal National Mortgage Association Pass-Thru, Pool AB6349 | | | 3.00 | % | | | 10/01/2032 | | | | 10,795,765 | |
| | 29,939,240 | | | Federal National Mortgage Association Pass-Thru, Pool AB6750 | | | 3.00 | % | | | 10/01/2032 | | | | 31,922,522 | |
| | 14,888,720 | | | Federal National Mortgage Association Pass-Thru, Pool AB6751 | | | 3.00 | % | | | 10/01/2032 | | | | 15,821,664 | |
| | 96,502,886 | | | Federal National Mortgage Association Pass-Thru, Pool AB6854 | | | 3.00 | % | | | 11/01/2042 | | | | 102,219,793 | |
| | 67,830,440 | | | Federal National Mortgage Association Pass-Thru, Pool AB7077 | | | 3.00 | % | | | 11/01/2042 | | | | 71,848,943 | |
| | 50,825,481 | | | Federal National Mortgage Association Pass-Thru, Pool AB7344 | | | 3.00 | % | | | 12/01/2032 | | | | 54,203,399 | |
| | 25,696,482 | | | Federal National Mortgage Association Pass-Thru, Pool AB7776 | | | 3.00 | % | | | 02/01/2043 | | | | 27,398,981 | |
| | | | | | | | | | | | | | | | |
| | | | | | | | | | | | | |
| | 29,789,016 | | | Federal National Mortgage Association Pass-Thru, Pool AB7877 | | | 3.00 | % | | | 02/01/2043 | | | | 31,749,896 | |
| | 13,046,107 | | | Federal National Mortgage Association Pass-Thru, Pool AB8418 | | | 3.00 | % | | | 02/01/2033 | | | | 13,913,352 | |
| | 18,329,546 | | | Federal National Mortgage Association Pass-Thru, Pool AB8520 | | | 3.00 | % | | | 02/01/2033 | | | | 19,547,985 | |
| | 23,910,980 | | | Federal National Mortgage Association Pass-Thru, Pool AB8703 | | | 3.00 | % | | | 03/01/2038 | | | | 25,326,326 | |
| | 10,662,392 | | | Federal National Mortgage Association Pass-Thru, Pool AB8858 | | | 3.00 | % | | | 04/01/2033 | | | | 11,371,062 | |
| | 21,133,444 | | | Federal National Mortgage Association Pass-Thru, Pool AB9020 | | | 3.00 | % | | | 04/01/2038 | | | | 22,384,378 | |
| | 16,365,603 | | | Federal National Mortgage Association Pass-Thru, Pool AB9197 | | | 3.00 | % | | | 05/01/2033 | | | | 17,453,674 | |
| | 51,862,554 | | | Federal National Mortgage Association Pass-Thru, Pool AB9406 | | | 3.00 | % | | | 05/01/2033 | | | | 55,310,715 | |
| | 9,831,695 | | | Federal National Mortgage Association Pass-Thru, Pool AB9409 | | | 3.00 | % | | | 05/01/2033 | | | | 10,485,339 | |
| | 785,431 | | | Federal National Mortgage Association Pass-Thru, Pool AD2177 | | | 4.50 | % | | | 06/01/2030 | | | | 856,593 | |
| | 810,897 | | | Federal National Mortgage Association Pass-Thru, Pool AD6438 | | | 5.00 | % | | | 06/01/2040 | | | | 895,707 | |
| | 610,620 | | | Federal National Mortgage Association Pass-Thru, Pool AD7859 | | | 5.00 | % | | | 06/01/2040 | | | | 674,395 | |
| | 7,292,663 | | | Federal National Mortgage Association Pass-Thru, Pool AH0607 | | | 4.00 | % | | | 12/01/2040 | | | | 7,905,147 | |
| | 769,934 | | | Federal National Mortgage Association Pass-Thru, Pool AH1140 | | | 4.50 | % | | | 12/01/2040 | | | | 826,598 | |
| | 6,990,127 | | | Federal National Mortgage Association Pass-Thru, Pool AH4437 | | | 4.00 | % | | | 01/01/2041 | | | | 7,452,802 | |
| | 1,514,209 | | | Federal National Mortgage Association Pass-Thru, Pool AH7309 | | | 4.00 | % | | | 02/01/2031 | | | | 1,655,688 | |
| | 5,407,337 | | | Federal National Mortgage Association Pass-Thru, Pool AH9323 | | | 4.00 | % | | | 04/01/2026 | | | | 5,715,061 | |
| | 3,380,728 | | | Federal National Mortgage Association Pass-Thru, Pool AI9831 | | | 4.00 | % | | | 09/01/2041 | | | | 3,597,035 | |
| | 885,239 | | | Federal National Mortgage Association Pass-Thru, Pool AJ1265 | | | 4.00 | % | | | 09/01/2041 | | | | 944,175 | |
| | 1,620,003 | | | Federal National Mortgage Association Pass-Thru, Pool AJ1399 | | | 4.00 | % | | | 09/01/2041 | | | | 1,724,812 | |
| | 3,515,507 | | | Federal National Mortgage Association Pass-Thru, Pool AJ1467 | | | 4.00 | % | | | 10/01/2041 | | | | 3,741,838 | |
| | 3,334,749 | | | Federal National Mortgage Association Pass-Thru, Pool AJ3392 | | | 4.00 | % | | | 10/01/2041 | | | | 3,554,173 | |
| | 1,798,263 | | | Federal National Mortgage Association Pass-Thru, Pool AJ3854 | | | 4.00 | % | | | 10/01/2041 | | | | 1,917,996 | |
| | 17,465,737 | | | Federal National Mortgage Association Pass-Thru, Pool AJ4118 | | | 4.00 | % | | | 11/01/2041 | | | | 18,595,374 | |
| | 4,312,087 | | | Federal National Mortgage Association Pass-Thru, Pool AJ4131 | | | 4.00 | % | | | 10/01/2041 | | | | 4,596,556 | |
| | 1,167,120 | | | Federal National Mortgage Association Pass-Thru, Pool AJ5172 | | | 4.00 | % | | | 11/01/2041 | | | | 1,244,811 | |
| | 24,457,798 | | | Federal National Mortgage Association Pass-Thru, Pool AJ5322 | | | 4.00 | % | | | 11/01/2041 | | | | 26,517,716 | |
| | 14,562,384 | | | Federal National Mortgage Association Pass-Thru, Pool AJ7677 | | | 3.50 | % | | | 12/01/2041 | | | | 15,449,918 | |
| | 2,232,940 | | | Federal National Mortgage Association Pass-Thru, Pool AJ8334 | | | 4.00 | % | | | 12/01/2041 | | | | 2,380,217 | |
| | 25,347,857 | | | Federal National Mortgage Association Pass-Thru, Pool AK0713 | | | 3.50 | % | | | 01/01/2032 | | | | 27,313,710 | |
| | 6,179,664 | | | Federal National Mortgage Association Pass-Thru, Pool AK4039 | | | 4.00 | % | | | 02/01/2042 | | | | 6,590,063 | |
| | 5,224,628 | | | Federal National Mortgage Association Pass-Thru, Pool AK4763 | | | 4.00 | % | | | 02/01/2042 | | | | 5,572,494 | |
| | 5,401,928 | | | Federal National Mortgage Association Pass-Thru, Pool AK9438 | | | 4.00 | % | | | 03/01/2042 | | | | 5,760,643 | |
| | 6,062,775 | | | Federal National Mortgage Association Pass-Thru, Pool AK9439 | | | 4.00 | % | | | 03/01/2042 | | | | 6,466,028 | |
| | 599,570 | | | Federal National Mortgage Association Pass-Thru, Pool AK9446 | | | 4.50 | % | | | 03/01/2042 | | | | 638,985 | |
| | 102,815,259 | | | Federal National Mortgage Association Pass-Thru, Pool AL3699 | | | 3.00 | % | | | 06/01/2043 | | | | 109,624,975 | |
| | 51,036,165 | | | Federal National Mortgage Association Pass-Thru, Pool AL3883 | | | 3.00 | % | | | 07/01/2043 | | | | 54,413,150 | |
| | 2,326,667 | | | Federal National Mortgage Association Pass-Thru, Pool AL4292 | | | 4.50 | % | | | 04/01/2026 | | | | 2,480,239 | |
| | 8,098,687 | | | Federal National Mortgage Association Pass-Thru, Pool AL4312 | | | 4.00 | % | | | 10/01/2043 | | | | 8,861,313 | |
| | 20,031,826 | | | Federal National Mortgage Association Pass-Thru, Pool AL6075 | | | 3.50 | % | | | 09/01/2053 | | | | 20,932,486 | |
| | 27,812,041 | | | Federal National Mortgage Association Pass-Thru, Pool AL6076 | | | 3.00 | % | | | 06/01/2053 | | | | 28,781,880 | |
| | 67,539,579 | | | Federal National Mortgage Association Pass-Thru, Pool AL6141 | | | 4.00 | % | | | 04/01/2042 | | | | 73,226,552 | |
| | 52,246,992 | | | Federal National Mortgage Association Pass-Thru, Pool AL6325 | | | 3.00 | % | | | 10/01/2044 | | | | 55,334,562 | |
| | 19,233,779 | | | Federal National Mortgage Association Pass-Thru, Pool AL6486 | | | 4.50 | % | | | 02/01/2045 | | | | 21,002,788 | |
| | 56,215,729 | | | Federal National Mortgage Association Pass-Thru, Pool AL6538 | | | 4.50 | % | | | 06/01/2044 | | | | 61,701,053 | |
| | 51,138,862 | | | Federal National Mortgage Association Pass-Thru, Pool AL8304 | | | 3.50 | % | | | 03/01/2046 | | | | 54,900,447 | |
| | 22,612,393 | | | Federal National Mortgage Association Pass-Thru, Pool AO2980 | | | 4.00 | % | | | 05/01/2042 | | | | 24,118,649 | |
| | 55,093,230 | | | Federal National Mortgage Association Pass-Thru, Pool AP4787 | | | 3.50 | % | | | 09/01/2042 | | | | 58,444,262 | |
| | 51,755,285 | | | Federal National Mortgage Association Pass-Thru, Pool AP4789 | | | 3.50 | % | | | 09/01/2042 | | | | 54,860,714 | |
| | 14,390,700 | | | Federal National Mortgage Association Pass-Thru, Pool AQ5541 | | | 3.00 | % | | | 12/01/2042 | | | | 15,242,897 | |
| | 16,149,713 | | | Federal National Mortgage Association Pass-Thru, Pool AR9856 | | | 3.00 | % | | | 04/01/2043 | | | | 17,101,973 | |
| | 19,611,000 | | | Federal National Mortgage Association Pass-Thru, Pool AS1927 | | | 4.50 | % | | | 03/01/2044 | | | | 21,422,725 | |
| | 18,687,086 | | | Federal National Mortgage Association Pass-Thru, Pool AS2038 | | | 4.50 | % | | | 03/01/2044 | | | | 20,399,739 | |
| | 16,936,344 | | | Federal National Mortgage Association Pass-Thru, Pool AS2517 | | | 4.50 | % | | | 05/01/2044 | | | | 18,499,506 | |
| | 8,389,484 | | | Federal National Mortgage Association Pass-Thru, Pool AS2551 | | | 4.50 | % | | | 06/01/2044 | | | | 9,166,190 | |
| | 6,060,882 | | | Federal National Mortgage Association Pass-Thru, Pool AS2765 | | | 4.50 | % | | | 07/01/2044 | | | | 6,586,352 | |
| | 28,085,556 | | | Federal National Mortgage Association Pass-Thru, Pool AS3201 | | | 3.00 | % | | | 08/01/2034 | | | | 29,934,160 | |
| | 13,439,085 | | | Federal National Mortgage Association Pass-Thru, Pool AS3456 | | | 3.00 | % | | | 10/01/2034 | | | | 14,324,599 | |
| | 26,579,194 | | | Federal National Mortgage Association Pass-Thru, Pool AS3666 | | | 3.00 | % | | | 10/01/2034 | | | | 28,333,947 | |
| | 120,719,791 | | | Federal National Mortgage Association Pass-Thru, Pool AS3961 | | | 3.00 | % | | | 12/01/2044 | | | | 127,794,039 | |
| | 39,088,777 | | | Federal National Mortgage Association Pass-Thru, Pool AS4154 | | | 3.00 | % | | | 12/01/2044 | | | | 41,383,774 | |
| | 22,020,477 | | | Federal National Mortgage Association Pass-Thru, Pool AS4212 | | | 3.00 | % | | | 01/01/2035 | | | | 23,473,907 | |
| | 34,277,251 | | | Federal National Mortgage Association Pass-Thru, Pool AS4281 | | | 3.00 | % | | | 01/01/2035 | | | | 36,539,448 | |
| | 24,426,578 | | | Federal National Mortgage Association Pass-Thru, Pool AS4345 | | | 3.50 | % | | | 01/01/2045 | | | | 26,224,328 | |
| | 25,937,929 | | | Federal National Mortgage Association Pass-Thru, Pool AS4360 | | | 3.00 | % | | | 01/01/2035 | | | | 27,647,303 | |
| | 242,430,108 | | | Federal National Mortgage Association Pass-Thru, Pool AS4625 | | | 3.00 | % | | | 03/01/2045 | | | | 256,721,496 | |
| | 100,793,076 | | | Federal National Mortgage Association Pass-Thru, Pool AS4645 | | | 3.00 | % | | | 03/01/2045 | | | | 106,738,946 | |
| | 34,137,695 | | | Federal National Mortgage Association Pass-Thru, Pool AS4779 | | | 3.00 | % | | | 04/01/2035 | | | | 36,268,579 | |
| | 31,385,554 | | | Federal National Mortgage Association Pass-Thru, Pool AS4780 | | | 3.00 | % | | | 04/01/2035 | | | | 33,346,976 | |
| | 42,905,140 | | | Federal National Mortgage Association Pass-Thru, Pool AS4840 | | | 3.00 | % | | | 04/01/2035 | | | | 45,586,726 | |
| | 21,524,916 | | | Federal National Mortgage Association Pass-Thru, Pool AS4881 | | | 3.00 | % | | | 05/01/2035 | | | | 22,949,266 | |
| | 23,178,625 | | | Federal National Mortgage Association Pass-Thru, Pool AS4882 | | | 3.00 | % | | | 05/01/2035 | | | | 24,626,229 | |
| | 48,898,833 | | | Federal National Mortgage Association Pass-Thru, Pool AX9696 | | | 3.00 | % | | | 07/01/2045 | | | | 51,528,401 | |
| | 58,538,875 | | | Federal National Mortgage Association Pass-Thru, Pool AY3974 | | | 3.00 | % | | | 03/01/2045 | | | | 61,987,545 | |
| | 17,842,027 | | | Federal National Mortgage Association Pass-Thru, Pool AY4295 | | | 3.00 | % | | | 02/01/2045 | | | | 18,794,174 | |
| | 9,992,202 | | | Federal National Mortgage Association Pass-Thru, Pool AY4296 | | | 3.00 | % | | | 01/01/2045 | | | | 10,526,465 | |
| | 11,583,860 | | | Federal National Mortgage Association Pass-Thru, Pool AY5471 | | | 3.00 | % | | | 03/01/2045 | | | | 12,203,353 | |
| | 18,505,784 | | | Federal National Mortgage Association Pass-Thru, Pool BC0785 | | | 3.50 | % | | | 04/01/2046 | | | | 19,865,585 | |
| | 44,705,690 | | | Federal National Mortgage Association Pass-Thru, Pool BC9003 | | | 3.00 | % | | | 11/01/2046 | | | | 47,256,768 | |
| | 1,848,743 | | | Federal National Mortgage Association Pass-Thru, Pool MA0264 | | | 4.50 | % | | | 12/01/2029 | | | | 2,016,041 | |
| | 6,788,470 | | | Federal National Mortgage Association Pass-Thru, Pool MA0353 | | | 4.50 | % | | | 03/01/2030 | | | | 7,407,686 | |
| | 1,464,813 | | | Federal National Mortgage Association Pass-Thru, Pool MA0406 | | | 4.50 | % | | | 05/01/2030 | | | | 1,598,510 | |
| | 98,289 | | | Federal National Mortgage Association Pass-Thru, Pool MA0445 | | | 5.00 | % | | | 06/01/2040 | | | | 104,378 | |
| | 14,575 | | | Federal National Mortgage Association Pass-Thru, Pool MA0459 | | | 4.00 | % | | | 07/01/2020 | | | | 15,346 | |
| | 172,529 | | | Federal National Mortgage Association Pass-Thru, Pool MA0468 | | | 5.00 | % | | | 07/01/2040 | | | | 182,943 | |
| | 63,032 | | | Federal National Mortgage Association Pass-Thru, Pool MA0502 | | | 4.00 | % | | | 08/01/2020 | | | | 66,366 | |
| | 42,298 | | | Federal National Mortgage Association Pass-Thru, Pool MA0517 | | | 4.00 | % | | | 09/01/2020 | | | | 44,536 | |
| | 2,152,957 | | | Federal National Mortgage Association Pass-Thru, Pool MA0534 | | | 4.00 | % | | | 10/01/2030 | | | | 2,354,321 | |
| | 290,441 | | | Federal National Mortgage Association Pass-Thru, Pool MA0536 | | | 4.00 | % | | | 10/01/2020 | | | | 305,804 | |
| | | | | | | | | | | | | | | | |
| | | | | | | | | | | | | |
| | 464,220 | | | Federal National Mortgage Association Pass-Thru, Pool MA0580 | | | 4.00 | % | | | 11/01/2020 | | | | 488,774 | |
| | 473,245 | | | Federal National Mortgage Association Pass-Thru, Pool MA0587 | | | 4.00 | % | | | 12/01/2030 | | | | 517,549 | |
| | 11,698,053 | | | Federal National Mortgage Association Pass-Thru, Pool MA0616 | | | 4.00 | % | | | 01/01/2031 | | | | 12,793,731 | |
| | 4,580,618 | | | Federal National Mortgage Association Pass-Thru, Pool MA0896 | | | 4.00 | % | | | 11/01/2041 | | | | 4,883,700 | |
| | 90,777,044 | | | Federal National Mortgage Association Pass-Thru, Pool MA0919 | | | 3.50 | % | | | 12/01/2031 | | | | 97,841,586 | |
| | 38,976,488 | | | Federal National Mortgage Association Pass-Thru, Pool MA0949 | | | 3.50 | % | | | 01/01/2032 | | | | 42,008,497 | |
| | 46,941,934 | | | Federal National Mortgage Association Pass-Thru, Pool MA0976 | | | 3.50 | % | | | 02/01/2032 | | | | 50,587,244 | |
| | 23,350,708 | | | Federal National Mortgage Association Pass-Thru, Pool MA1010 | | | 3.50 | % | | | 03/01/2032 | | | | 25,167,517 | |
| | 7,436,921 | | | Federal National Mortgage Association Pass-Thru, Pool MA1039 | | | 3.50 | % | | | 04/01/2042 | | | | 7,887,742 | |
| | 31,923,020 | | | Federal National Mortgage Association Pass-Thru, Pool MA1059 | | | 3.50 | % | | | 05/01/2032 | | | | 34,404,700 | |
| | 4,738,325 | | | Federal National Mortgage Association Pass-Thru, Pool MA1068 | | | 3.50 | % | | | 05/01/2042 | | | | 5,024,934 | |
| | 67,594,229 | | | Federal National Mortgage Association Pass-Thru, Pool MA1084 | | | 3.50 | % | | | 06/01/2032 | | | | 72,818,393 | |
| | 10,473,643 | | | Federal National Mortgage Association Pass-Thru, Pool MA1093 | | | 3.50 | % | | | 06/01/2042 | | | | 11,110,653 | |
| | 7,219,760 | | | Federal National Mortgage Association Pass-Thru, Pool MA1094 | | | 4.00 | % | | | 06/01/2042 | | | | 7,699,233 | |
| | 41,002,228 | | | Federal National Mortgage Association Pass-Thru, Pool MA1107 | | | 3.50 | % | | | 07/01/2032 | | | | 44,185,203 | |
| | 104,454,350 | | | Federal National Mortgage Association Pass-Thru, Pool MA1117 | | | 3.50 | % | | | 07/01/2042 | | | | 110,812,112 | |
| | 121,470,188 | | | Federal National Mortgage Association Pass-Thru, Pool MA1136 | | | 3.50 | % | | | 08/01/2042 | | | | 128,876,742 | |
| | 27,610,119 | | | Federal National Mortgage Association Pass-Thru, Pool MA1138 | | | 3.50 | % | | | 08/01/2032 | | | | 29,762,813 | |
| | 32,046,769 | | | Federal National Mortgage Association Pass-Thru, Pool MA1179 | | | 3.50 | % | | | 09/01/2042 | | | | 33,997,418 | |
| | 5,317,255 | | | Federal National Mortgage Association Pass-Thru, Pool MA1201 | | | 3.50 | % | | | 10/01/2032 | | | | 5,731,638 | |
| | 68,908,141 | | | Federal National Mortgage Association Pass-Thru, Pool MA1209 | | | 3.50 | % | | | 10/01/2042 | | | | 73,086,263 | |
| | 35,517,601 | | | Federal National Mortgage Association Pass-Thru, Pool MA1237 | | | 3.00 | % | | | 11/01/2032 | | | | 38,129,095 | |
| | 4,623,542 | | | Federal National Mortgage Association Pass-Thru, Pool MA1242 | | | 3.50 | % | | | 11/01/2042 | | | | 4,907,461 | |
| | 19,671,470 | | | Federal National Mortgage Association Pass-Thru, Pool MA1338 | | | 3.00 | % | | | 02/01/2033 | | | | 20,978,614 | |
| | 76,839,967 | | | Federal National Mortgage Association Pass-Thru, Pool MA1366 | | | 3.00 | % | | | 03/01/2033 | | | | 81,947,802 | |
| | 46,895,264 | | | Federal National Mortgage Association Pass-Thru, Pool MA1401 | | | 3.00 | % | | | 04/01/2033 | | | | 49,850,917 | |
| | 81,346,265 | | | Federal National Mortgage Association Pass-Thru, Pool MA1459 | | | 3.00 | % | | | 06/01/2033 | | | | 86,451,648 | |
| | 10,343,132 | | | Federal National Mortgage Association Pass-Thru, Pool MA1490 | | | 3.00 | % | | | 07/01/2033 | | | | 11,030,519 | |
| | 57,216,829 | | | Federal National Mortgage Association Pass-Thru, Pool MA2018 | | | 3.50 | % | | | 09/01/2034 | | | | 60,609,261 | |
| | 22,471,712 | | | Federal National Mortgage Association Pass-Thru, Pool MA2114 | | | 3.50 | % | | | 12/01/2044 | | | | 23,819,448 | |
| | 17,992,548 | | | Federal National Mortgage Association Pass-Thru, Pool MA2151 | | | 3.50 | % | | | 01/01/2045 | | | | 19,072,022 | |
| | 33,965,385 | | | Federal National Mortgage Association Pass-Thru, Pool MA2164 | | | 3.50 | % | | | 02/01/2035 | | | | 36,604,507 | |
| | 70,323,947 | | | Federal National Mortgage Association Pass-Thru, Pool MA2166 | | | 3.50 | % | | | 02/01/2045 | | | | 74,536,293 | |
| | 78,100,956 | | | Federal National Mortgage Association Pass-Thru, Pool MA2248 | | | 3.00 | % | | | 04/01/2045 | | | | 82,284,593 | |
| | 79,365,050 | | | Federal National Mortgage Association Pass-Thru, Pool MA2270 | | | 3.00 | % | | | 05/01/2045 | | | | 83,612,164 | |
| | 87,715,370 | | | Federal National Mortgage Association Pass-Thru, Pool MA2650 | | | 3.50 | % | | | 06/01/2046 | | | | 92,674,072 | |
| | 38,500,324 | | | Federal National Mortgage Association Pass-Thru, Pool MA2833 | | | 3.00 | % | | | 12/01/2046 | | | | 40,683,845 | |
| | 6,220,253 | | | Federal National Mortgage Association Pass-Thru, Pool MA3894 | | | 4.00 | % | | | 09/01/2031 | | | | 6,801,338 | |
| | 26,900,334 | | | Federal National Mortgage Association, Pool AL9220 | | | 3.00 | % | | | 06/01/2045 | | | | 28,491,808 | |
| | 42,379,414 | | | Federal National Mortgage Association, Pool AL9445 | | | 3.00 | % | | | 07/01/2031 | | | | 44,870,827 | |
| | 14,617,105 | | | Federal National Mortgage Association, Pool AN1210 | | | 2.85 | % | | | 05/01/2031 | | | | 16,396,626 | |
| | 10,026,000 | | | Federal National Mortgage Association, Pool AN7452 | | | 3.12 | % | | | 11/01/2032 | | | | 11,486,849 | |
| | 63,074,529 | | | Federal National Mortgage Association, Pool AS7473 | | | 3.00 | % | | | 07/01/2046 | | | | 65,632,416 | |
| | 141,589,691 | | | Federal National Mortgage Association, Pool AS7661 | | | 3.00 | % | | | 08/01/2046 | | | | 148,798,221 | |
| | 60,605,374 | | | Federal National Mortgage Association, Pool AS8056 | | | 3.00 | % | | | 10/01/2046 | | | | 64,062,820 | |
| | 79,592,249 | | | Federal National Mortgage Association, Pool AS8111 | | | 3.00 | % | | | 10/01/2041 | | | | 84,303,268 | |
| | 51,056,809 | | | Federal National Mortgage Association, Pool AS8269 | | | 3.00 | % | | | 11/01/2046 | | | | 54,153,302 | |
| | 53,260,379 | | | Federal National Mortgage Association, Pool AS8306 | | | 3.00 | % | | | 11/01/2041 | | | | 56,411,939 | |
| | 79,230,027 | | | Federal National Mortgage Association, Pool AS8356 | | | 3.00 | % | | | 11/01/2046 | | | | 82,665,403 | |
| | 16,287,633 | | | Federal National Mortgage Association, Pool AZ0576 | | | 3.50 | % | | | 04/01/2042 | | | | 17,528,180 | |
| | 14,268,765 | | | Federal National Mortgage Association, Pool BC9081 | | | 3.00 | % | | | 12/01/2046 | | | | 15,113,912 | |
| | 123,108,926 | | | Federal National Mortgage Association, Pool BF0314 | | | 3.00 | % | | | 01/01/2053 | | | | 130,765,253 | |
| | 106,271,502 | | | Federal National Mortgage Association, Pool BF0353 | | | 3.00 | % | | | 05/01/2053 | | | | 112,881,188 | |
| | 59,272,417 | | | Federal National Mortgage Association, Pool BF0391 | | | 3.00 | % | | | 09/01/2053 | | | | 62,958,799 | |
| | 28,551,000 | | | Federal National Mortgage Association, Pool BL1781 | | | 3.40 | % | | | 04/01/2031 | | | | 33,399,788 | |
| | 21,708,000 | | | Federal National Mortgage Association, Pool BL2087 | | | 3.40 | % | | | 04/01/2031 | | | | 25,308,831 | |
| | 8,250,000 | | | Federal National Mortgage Association, Pool BL2998 | | | 2.97 | % | | | 07/01/2029 | | | | 9,047,345 | |
| | 9,964,500 | | | Federal National Mortgage Association, Pool BL3358 | | | 2.64 | % | | | 08/01/2029 | | | | 10,923,943 | |
| | 41,755,800 | | | Federal National Mortgage Association, Pool BL3480 | | | 2.75 | % | | | 08/01/2029 | | | | 45,189,471 | |
| | 10,600,000 | | | Federal National Mortgage Association, Pool BL3538 | | | 2.69 | % | | | 08/01/2029 | | | | 11,667,282 | |
| | 31,140,176 | | | Federal National Mortgage Association, Pool BL3647 | | | 2.69 | % | | | 08/01/2030 | | | | 34,107,257 | |
| | 12,937,500 | | | Federal National Mortgage Association, Pool BL3671 | | | 2.59 | % | | | 08/01/2029 | | | | 14,104,508 | |
| | 50,173,000 | | | Federal National Mortgage Association, Pool BL4008 | | | 2.37 | % | | | 10/01/2031 | | | | 53,997,521 | |
| | 27,690,000 | | | Federal National Mortgage Association, Pool BL4098 | | | 2.27 | % | | | 09/01/2029 | | | | 29,589,227 | |
| | 13,075,000 | | | Federal National Mortgage Association, Pool BL4198 | | | 2.31 | % | | | 10/01/2031 | | | | 13,976,981 | |
| | 25,800,000 | | | Federal National Mortgage Association, Pool BL4214 | | | 2.37 | % | | | 10/01/2031 | | | | 27,766,429 | |
| | 3,206,000 | | | Federal National Mortgage Association, Pool BL4339 | | | 2.29 | % | | | 10/01/2031 | | | | 3,416,243 | |
| | 6,496,000 | | | Federal National Mortgage Association, Pool BL4354 | | | 2.37 | % | | | 10/01/2031 | | | | 6,980,515 | |
| | 107,000,000 | | | Federal National Mortgage Association, Pool BL4468 | | | 2.41 | % | | | 10/01/2029 | | | | 115,221,975 | |
| | 24,380,000 | | | Federal National Mortgage Association, Pool BL4656 | | | 2.29 | % | | | 10/01/2029 | | | | 26,082,523 | |
| | 63,966,000 | | | Federal National Mortgage Association, Pool BL4808 | | | 2.80 | % | | | 11/01/2039 | | | | 70,028,360 | |
| | 75,725,000 | | | Federal National Mortgage Association, Pool BL4881 | | | 2.31 | % | | | 12/01/2029 | | | | 81,194,837 | |
| | 73,850,000 | | | Federal National Mortgage Association, Pool BL4937 | | | 2.32 | % | | | 12/01/2029 | | | | 79,288,849 | |
| | 34,160,000 | | | Federal National Mortgage Association, Pool BL4938 | | | 2.32 | % | | | 12/01/2029 | | | | 36,675,790 | |
| | 14,220,000 | | | Federal National Mortgage Association, Pool BL4939 | | | 2.32 | % | | | 12/01/2029 | | | | 15,267,264 | |
| | 65,121,000 | | | Federal National Mortgage Association, Pool BL4969 | | | 2.35 | % | | | 11/01/2029 | | | | 70,101,627 | |
| | 21,686,000 | | | Federal National Mortgage Association, Pool BL5111 | | | 2.41 | % | | | 01/01/2030 | | | | 23,354,532 | |
| | 17,125,000 | | | Federal National Mortgage Association, Pool BL5256 | | | 2.28 | % | | | 02/01/2032 | | | | 18,266,518 | |
| | 30,200,000 | | | Federal National Mortgage Association, Pool BL5315 | | | 2.44 | % | | | 01/01/2032 | | | | 32,588,854 | |
| | 46,800,000 | | | Federal National Mortgage Association, Pool BL5400 | | | 2.54 | % | | | 02/01/2030 | | | | 49,769,424 | |
| | 103,889,000 | | | Federal National Mortgage Association, Pool BL5401 | | | 2.54 | % | | | 02/01/2030 | | | | 110,480,678 | |
| | 24,557,000 | | | Federal National Mortgage Association, Pool BL5833 | | | 2.60 | % | | | 03/01/2030 | | | | 26,323,136 | |
| | 8,190,000 | | | Federal National Mortgage Association, Pool BL5840 | | | 2.73 | % | | | 02/01/2035 | | | | 8,960,093 | |
| | 22,828,000 | | | Federal National Mortgage Association, Pool BL5870 | | | 2.30 | % | | | 02/01/2032 | | | | 24,389,441 | |
| | 60,000,000 | | | Federal National Mortgage Association, Pool BL5953 | | | 2.15 | % | | | 03/01/2030 | | | | 63,570,689 | |
| | 89,226,569 | | | Federal National Mortgage Association, Pool BM5112 | | | 3.00 | % | | | 11/01/2033 | | | | 93,659,713 | |
| | 52,312,229 | | | Federal National Mortgage Association, Pool BM5299 | | | 3.00 | % | | | 12/01/2046 | | | | 55,285,279 | |
| | 79,507,740 | | | Federal National Mortgage Association, Pool BM5633 | | | 3.00 | % | | | 07/01/2047 | | | | 84,002,995 | |
| | 22,146,737 | | | Federal National Mortgage Association, Pool BM5834 | | | 3.00 | % | | | 04/01/2048 | | | | 23,031,932 | |
| | | | | | | | | | | | | | | | |
| | | | | | | | | | | | | |
| | 162,564,864 | | | Federal National Mortgage Association, Pool BO4657 | | | 2.50 | % | | | 11/01/2049 | | | | 168,781,348 | |
| | 87,506,315 | | | Federal National Mortgage Association, Pool BO6208 | | | 2.50 | % | | | 12/01/2049 | | | | 90,851,099 | |
| | 36,110,986 | | | Federal National Mortgage Association, Pool CA0862 | | | 3.50 | % | | | 09/01/2047 | | | | 38,361,189 | |
| | 14,531,454 | | | Federal National Mortgage Association, Pool CA3898 | | | 3.00 | % | | | 07/01/2034 | | | | 15,371,330 | |
| | 9,599,086 | | | Federal National Mortgage Association, Pool CA4413 | | | 3.00 | % | | | 10/01/2049 | | | | 10,100,038 | |
| | 139,677,869 | | | Federal National Mortgage Association, Pool FM1000 | | | 3.00 | % | | | 04/01/2047 | | | | 146,911,237 | |
| | 93,315,015 | | | Federal National Mortgage Association, Pool MA2259 | | | 3.00 | % | | | 05/01/2035 | | | | 99,142,588 | |
| | 85,511,787 | | | Federal National Mortgage Association, Pool MA2621 | | | 3.50 | % | | | 05/01/2046 | | | | 90,353,625 | |
| | 88,626,749 | | | Federal National Mortgage Association, Pool MA2649 | | | 3.00 | % | | | 06/01/2046 | | | | 92,211,341 | |
| | 31,900,842 | | | Federal National Mortgage Association, Pool MA2673 | | | 3.00 | % | | | 07/01/2046 | | | | 33,188,674 | |
| | 96,046,642 | | | Federal National Mortgage Association, Pool MA2711 | | | 3.00 | % | | | 08/01/2046 | | | | 99,924,026 | |
| | 8,958,993 | | | Federal National Mortgage Association, Pool MA2743 | | | 3.00 | % | | | 09/01/2046 | | | | 9,320,218 | |
| | 126,367,465 | | | Federal National Mortgage Association, Pool MA2806 | | | 3.00 | % | | | 11/01/2046 | | | | 133,558,239 | |
| | 44,959,026 | | | Federal National Mortgage Association, Pool MA2895 | | | 3.00 | % | | | 02/01/2047 | | | | 47,272,412 | |
| | 13,832,633 | | | Federal National Mortgage Association, Pool MA3830 | | | 2.50 | % | | | 11/01/2039 | | | | 14,399,882 | |
| | 34,912,511 | | | Federal National Mortgage Association, Pool MA3889 | | | 2.50 | % | | | 01/01/2040 | | | | 36,393,148 | |
| | 81,052,774 | | | Federal National Mortgage Association, Pool MA3930 | | | 2.50 | % | | | 02/01/2035 | | | | 84,286,795 | |
| | 629,677 | | | Federal National Mortgage Association, Series2002-70-QZ | | | 5.50 | % | | | 11/25/2032 | | | | 717,823 | |
| | 926,137 | | | Federal National Mortgage Association, Series2002-75-ZG | | | 5.50 | % | | | 11/25/2032 | | | | 1,031,632 | |
| | 13,024,245 | | | Federal National Mortgage Association, Series2003-129-ZT | | | 5.50 | % | | | 01/25/2034 | | | | 14,707,512 | |
| | 2,540,504 | | | Federal National Mortgage Association, Series2003-29-ZL | | | 5.00 | % | | | 04/25/2033 | | | | 2,890,618 | |
| | 1,288,811 | | | Federal National Mortgage Association, Series2003-64-ZG | | | 5.50 | % | | | 07/25/2033 | | | | 1,475,241 | |
| | 10,001,372 | | | Federal National Mortgage Association, Series2003-84-PZ | | | 5.00 | % | | | 09/25/2033 | | | | 11,466,287 | |
| | 8,787,506 | | | Federal National Mortgage Association, Series2003-W17-1A7 | | | 5.75 | % | | | 08/25/2033 | | | | 9,899,121 | |
| | 2,394,531 | | | Federal National Mortgage Association, Series2004-46-PJ
(-1 x 1 Month LIBOR USD + 6.00%, 6.00% Cap) | | | 5.05 | % I/F I/O | | | 03/25/2034 | | | | 263,903 | |
| | 2,437,460 | | | Federal National Mortgage Association, Series2004-51-XP(-1 x 1 Month LIBOR USD + 7.70%, 7.70% Cap) | | | 6.75 | % I/F I/O | | | 07/25/2034 | | | | 512,702 | |
| | 3,878,454 | | | Federal National Mortgage Association, Series2004-W10-A6 | | | 5.75 | % | | | 08/25/2034 | | | | 4,446,638 | |
| | 76,517 | | | Federal National Mortgage Association, Series2004-W4-A5 | | | 5.50 | % | | | 06/25/2034 | | | | 76,778 | |
| | 174,201 | | | Federal National Mortgage Association, Series2005-107-EG | | | 4.50 | % | | | 01/25/2026 | | | | 185,941 | |
| | 645,777 | | | Federal National Mortgage Association, Series2005-37-ZK | | | 4.50 | % | | | 05/25/2035 | | | | 709,801 | |
| | 4,424,656 | | | Federal National Mortgage Association, Series2005-87-SG(-1 x 1 Month LIBOR USD + 6.70%, 6.70% Cap) | | | 5.75 | % I/F I/O | | | 10/25/2035 | | | | 892,208 | |
| | 3,795,690 | | | Federal National Mortgage Association, Series2006-101-SA(-1 x 1 Month LIBOR USD + 6.58%, 6.58% Cap) | | | 5.63 | % I/F I/O | | | 10/25/2036 | | | | 825,609 | |
| | 1,545,514 | | | Federal National Mortgage Association, Series2006-123-LI(-1 x 1 Month LIBOR USD + 6.32%, 6.32% Cap) | | | 5.37 | % I/F I/O | | | 01/25/2037 | | | | 328,318 | |
| | 928,773 | | | Federal National Mortgage Association, Series2006-16-HZ | | | 5.50 | % | | | 03/25/2036 | | | | 1,071,020 | |
| | 6,288,583 | | | Federal National Mortgage Association, Series2006-56-SM(-1 x 1 Month LIBOR USD + 6.75%, 6.75% Cap) | | | 5.80 | % I/F I/O | | | 07/25/2036 | | | | 1,074,580 | |
| | 835,154 | | | Federal National Mortgage Association, Series2006-93-SN(-1 x 1 Month LIBOR USD + 6.60%, 6.60% Cap) | | | 5.65 | % I/F I/O | | | 10/25/2036 | | | | 126,844 | |
| | 8,944,140 | | | Federal National Mortgage Association, Series2007-109-VZ | | | 5.00 | % | | | 10/25/2035 | | | | 10,197,952 | |
| | 886,879 | | | Federal National Mortgage Association, Series2007-116-BI(-1 x 1 Month LIBOR USD + 6.25%, 6.25% Cap) | | | 5.30 | % I/F I/O | | | 05/25/2037 | | | | 122,785 | |
| | 6,034,588 | | | Federal National Mortgage Association, Series2007-14-PS(-1 x 1 Month LIBOR USD + 6.81%, 6.81% Cap) | | | 5.86 | % I/F I/O | | | 03/25/2037 | | | | 1,163,921 | |
| | 2,905,308 | | | Federal National Mortgage Association, Series2007-30-OI
(-1 x 1 Month LIBOR USD + 6.44%, 6.44% Cap) | | | 5.49 | % I/F I/O | | | 04/25/2037 | | | | 625,648 | |
| | 391,231 | | | Federal National Mortgage Association, Series2007-30-SI
(-1 x 1 Month LIBOR USD + 6.11%, 6.11% Cap) | | | 5.16 | % I/F I/O | | | 04/25/2037 | | | | 57,596 | |
| | 2,851,136 | | | Federal National Mortgage Association, Series2007-32-SG(-1 x 1 Month LIBOR USD + 6.10%, 6.10% Cap) | | | 5.15 | % I/F I/O | | | 04/25/2037 | | | | 509,272 | |
| | 2,452,178 | | | Federal National Mortgage Association, Series2007-57-SX(-1 x 1 Month LIBOR USD + 6.62%, 6.62% Cap) | | | 5.67 | % I/F I/O | | | 10/25/2036 | | | | 464,352 | |
| | 3,525,104 | | | Federal National Mortgage Association, Series2007-60-VZ | | | 6.00 | % | | | 07/25/2037 | | | | 4,092,334 | |
| | 2,022,112 | | | Federal National Mortgage Association, Series2007-71-GZ | | | 6.00 | % | | | 07/25/2047 | | | | 2,178,289 | |
| | 3,061,295 | | | Federal National Mortgage Association, Series2007-75-ID
(-1 x 1 Month LIBOR USD + 5.87%, 5.87% Cap) | | | 4.92 | % I/F I/O | | | 08/25/2037 | | | | 655,318 | |
| | 807,056 | | | Federal National Mortgage Association, Series2007-9-SD
(-1 x 1 Month LIBOR USD + 6.65%, 6.65% Cap) | | | 5.70 | % I/F I/O | | | 03/25/2037 | | | | 164,086 | |
| | 494,060 | | | Federal National Mortgage Association, Series2008-27-B | | | 5.50 | % | | | 04/25/2038 | | | | 563,385 | |
| | 3,598,527 | | | Federal National Mortgage Association, Series2008-29-ZA | | | 4.50 | % | | | 04/25/2038 | | | | 3,917,284 | |
| | 6,975,946 | | | Federal National Mortgage Association, Series2008-48-BE | | | 5.00 | % | | | 06/25/2034 | | | | 8,046,078 | |
| | 675,185 | | | Federal National Mortgage Association, Series2008-48-SD(-1 x 1 Month LIBOR USD + 6.00%, 6.00% Cap) | | | 5.05 | % I/F I/O | | | 06/25/2037 | | | | 91,391 | |
| | 1,030,577 | | | Federal National Mortgage Association, Series2008-53-LI
(-1 x 1 Month LIBOR USD + 6.15%, 6.15% Cap) | | | 5.20 | % I/F I/O | | | 07/25/2038 | | | | 126,764 | |
| | 662,785 | | | Federal National Mortgage Association, Series2008-57-SE
(-1 x 1 Month LIBOR USD + 6.00%, 6.00% Cap) | | | 5.05 | % I/F I/O | | | 02/25/2037 | | | | 90,287 | |
| | 1,139,359 | | | Federal National Mortgage Association, Series2008-5-MS(-1 x 1 Month LIBOR USD + 6.25%, 6.25% Cap) | | | 5.30 | % I/F I/O | | | 02/25/2038 | | | | 221,758 | |
| | 686,390 | | | Federal National Mortgage Association, Series2008-61-SC(-1 x 1 Month LIBOR USD + 6.00%, 6.00% Cap) | | | 5.05 | % I/F I/O | | | 07/25/2038 | | | | 88,059 | |
| | 622,401 | | | Federal National Mortgage Association, Series2008-62-SC(-1 x 1 Month LIBOR USD + 6.00%, 6.00% Cap) | | | 5.05 | % I/F I/O | | | 07/25/2038 | | | | 88,439 | |
| | 1,696,411 | | | Federal National Mortgage Association, Series2008-65-SA(-1 x 1 Month LIBOR USD + 6.00%, 6.00% Cap) | | | 5.05 | % I/F I/O | | | 08/25/2038 | | | | 331,597 | |
| | 552,292 | | | Federal National Mortgage Association, Series2008-81-LP | | | 5.50 | % | | | 09/25/2038 | | | | 620,700 | |
| | 5,541,893 | | | Federal National Mortgage Association, Series2009-106-EZ | | | 4.50 | % | | | 01/25/2040 | | | | 6,021,728 | |
| | 761,003 | | | Federal National Mortgage Association, Series2009-111-SE(-1 x 1 Month LIBOR USD + 6.25%, 6.25% Cap) | | | 5.30 | % I/F I/O | | | 01/25/2040 | | | | 109,675 | |
| | 503,024 | | | Federal National Mortgage Association, Series2009-16-MZ | | | 5.00 | % | | | 03/25/2029 | | | | 544,577 | |
| | 1,710,011 | | | Federal National Mortgage Association, Series2009-42-SI
(-1 x 1 Month LIBOR USD + 6.00%, 6.00% Cap) | | | 5.05 | % I/F I/O | | | 06/25/2039 | | | | 275,705 | |
| | 1,054,663 | | | Federal National Mortgage Association, Series2009-42-SX(-1 x 1 Month LIBOR USD + 6.00%, 6.00% Cap) | | | 5.05 | % I/F I/O | | | 06/25/2039 | | | | 140,679 | |
| | 726,959 | | | Federal National Mortgage Association, Series2009-47-SA(-1 x 1 Month LIBOR USD + 6.10%, 6.10% Cap) | | | 5.15 | % I/F I/O | | | 07/25/2039 | | | | 69,805 | |
| | 484,701 | | | Federal National Mortgage Association, Series2009-48-WS(-1 x 1 Month LIBOR USD + 5.95%, 5.95% Cap) | | | 5.00 | % I/F I/O | | | 07/25/2039 | | | | 70,143 | |
| | 4,543,466 | | | Federal National Mortgage Association, Series2009-49-S
(-1 x 1 Month LIBOR USD + 6.75%, 6.75% Cap) | | | 5.80 | % I/F I/O | | | 07/25/2039 | | | | 823,859 | |
| | 594,312 | | | Federal National Mortgage Association, Series2009-51-BZ | | | 4.50 | % | | | 07/25/2039 | | | | 645,580 | |
| | 1,643,560 | | | Federal National Mortgage Association, Series2009-54-EZ | | | 5.00 | % | | | 07/25/2039 | | | | 1,820,146 | |
| | 707,474 | | | Federal National Mortgage Association, Series2009-70-SA(-1 x 1 Month LIBOR USD + 5.80%, 5.80% Cap) | | | 4.85 | % I/F I/O | | | 09/25/2039 | | | | 97,539 | |
| | 3,705,791 | | | Federal National Mortgage Association, Series2009-80-PM | | | 4.50 | % | | | 10/25/2039 | | | | 4,202,466 | |
| | 2,738,890 | | | Federal National Mortgage Association, Series2009-83-Z | | | 4.50 | % | | | 10/25/2039 | | | | 2,984,732 | |
| | 10,559,937 | | | Federal National Mortgage Association, Series2009-85-ES(-1 x 1 Month LIBOR USD + 7.23%, 7.23% Cap) | | | 6.28 | % I/F I/O | | | 01/25/2036 | | | | 2,265,958 | |
| | 13,950,104 | | | Federal National Mortgage Association, Series2009-85-JS
(-1 x 1 Month LIBOR USD + 6.75%, 6.75% Cap) | | | 5.80 | % I/F I/O | | | 10/25/2039 | | | | 3,291,636 | |
| | 1,101,929 | | | Federal National Mortgage Association, Series2009-90-IB
(-1 x 1 Month LIBOR USD + 5.72%, 5.72% Cap) | | | 4.77 | % I/F I/O | | | 04/25/2037 | | | | 159,200 | |
| | 1,146,274 | | | Federal National Mortgage Association, Series2009-94-BC | | | 5.00 | % | | | 11/25/2039 | | | | 1,213,766 | |
| | 13,221,776 | | | Federal National Mortgage Association, Series2010-101-SA(-1 x 1 Month LIBOR USD + 4.48%, 4.48% Cap) | | | 3.53 | % I/F I/O | | | 09/25/2040 | | | | 2,301,348 | |
| | 7,157,115 | | | Federal National Mortgage Association, Series2010-101-ZC | | | 4.50 | % | | | 09/25/2040 | | | | 8,081,000 | |
| | 16,577,230 | | | Federal National Mortgage Association, Series2010-101-ZH | | | 4.50 | % | | | 07/25/2040 | | | | 18,445,103 | |
| | 3,745,803 | | | Federal National Mortgage Association, Series2010-10-SA(-1 x 1 Month LIBOR USD + 6.35%, 6.35% Cap) | | | 5.40 | % I/F I/O | | | 02/25/2040 | | | | 752,161 | |
| | 1,859,140 | | | Federal National Mortgage Association, Series2010-10-ZA | | | 4.50 | % | | | 02/25/2040 | | | | 1,950,222 | |
| | 1,129,174 | | | Federal National Mortgage Association, Series2010-111-S
(-1 x 1 Month LIBOR USD + 5.95%, 5.95% Cap) | | | 5.00 | % I/F I/O | | | 10/25/2050 | | | | 154,714 | |
| | 3,372,526 | | | Federal National Mortgage Association, Series2010-116-Z | | | 4.00 | % | | | 10/25/2040 | | | | 3,721,940 | |
| | 789,593 | | | Federal National Mortgage Association, Series2010-117-SA(-1 x 1 Month LIBOR USD + 4.50%, 4.50% Cap) | | | 3.55 | % I/F I/O | | | 10/25/2040 | | | | 73,521 | |
| | 2,632,812 | | | Federal National Mortgage Association, Series2010-120-KD | | | 4.00 | % | | | 10/25/2040 | | | | 2,922,263 | |
| | 22,035,548 | | | Federal National Mortgage Association, Series2010-121-SD(-1 x 1 Month LIBOR USD + 4.50%, 4.50% Cap) | | | 3.55 | % I/F I/O | | | 10/25/2040 | | | | 2,642,380 | |
| | 242,685 | | | Federal National Mortgage Association, Series2010-126-SU(-11 x 1 Month LIBOR USD + 55.00%, 55.00% Cap) | | | 37.61 | % I/F | | | 11/25/2040 | | | | 1,067,575 | |
| | 178,693 | | | Federal National Mortgage Association, Series2010-126-SX(-3 x 1 Month LIBOR USD + 15.00%, 15.00% Cap) | | | 10.26 | % I/F | | | 11/25/2040 | | | | 333,016 | |
| | 5,245,299 | | | Federal National Mortgage Association, Series2010-128-HZ | | | 4.00 | % | | | 11/25/2040 | | | | 5,717,252 | |
| | 3,002,614 | | | Federal National Mortgage Association, Series2010-132-Z | | | 4.50 | % | | | 11/25/2040 | | | | 3,207,938 | |
| | | | | | | | | | | | | | | | |
| | | | | | | | | | | | | |
| | 88,008 | | | Federal National Mortgage Association, Series2010-137-VS(-3 x 1 Month LIBOR USD + 15.00%, 15.00% Cap) | | | 10.26 | % I/F | | | 12/25/2040 | | | | 141,469 | |
| | 9,784,308 | | | Federal National Mortgage Association, Series2010-142-AZ | | | 4.00 | % | | | 12/25/2040 | | | | 10,615,082 | |
| | 7,940,819 | | | Federal National Mortgage Association, Series2010-148-SA(-1 x 1 Month LIBOR USD + 6.65%, 6.65% Cap) | | | 5.70 | % I/F I/O | | | 01/25/2026 | | | | 800,815 | |
| | 10,148,172 | | | Federal National Mortgage Association, Series2010-150-FD (1 Month LIBOR USD + 0.51%, 0.51% Floor, 7.00% Cap) | | | 1.46 | % | | | 01/25/2041 | | | | 10,051,732 | |
| | 23,616,812 | | | Federal National Mortgage Association, Series2010-150-ZA | | | 4.00 | % | | | 01/25/2041 | | | | 26,063,818 | |
| | 8,392,374 | | | Federal National Mortgage Association, Series2010-16-SA(-1 x 1 Month LIBOR USD + 5.45%, 5.45% Cap) | | | 4.50 | % I/F I/O | | | 03/25/2040 | | | | 1,402,450 | |
| | 2,490,803 | | | Federal National Mortgage Association, Series2010-21-DZ | | | 5.00 | % | | | 03/25/2040 | | | | 2,867,057 | |
| | 1,227,918 | | | Federal National Mortgage Association, Series2010-21-KS(-1 x 1 Month LIBOR USD + 4.95%, 4.95% Cap) | | | 4.00 | % I/F I/O | | | 03/25/2040 | | | | 125,783 | |
| | 419,708 | | | Federal National Mortgage Association, Series2010-2-GS(-1 x 1 Month LIBOR USD + 6.45%, 6.45% Cap) | | | 5.50 | % I/F I/O | | | 12/25/2049 | | | | 30,739 | |
| | 1,821,557 | | | Federal National Mortgage Association, Series2010-2-MS(-1 x 1 Month LIBOR USD + 6.25%, 6.25% Cap) | | | 5.30 | % I/F I/O | | | 02/25/2050 | | | | 347,320 | |
| | 1,437,395 | | | Federal National Mortgage Association, Series2010-31-SA(-1 x 1 Month LIBOR USD + 5.00%, 5.00% Cap) | | | 4.05 | % I/F I/O | | | 04/25/2040 | | | | 109,007 | |
| | 4,775,856 | | | Federal National Mortgage Association, Series2010-31-VZ | | | 4.00 | % | | | 04/25/2040 | | | | 5,044,903 | |
| | 3,506,849 | | | Federal National Mortgage Association, Series2010-34-PS(-1 x 1 Month LIBOR USD + 4.93%, 4.93% Cap) | | | 3.98 | % I/F I/O | | | 04/25/2040 | | | | 388,474 | |
| | 615,742 | | | Federal National Mortgage Association, Series2010-35-ES(-1 x 1 Month LIBOR USD + 6.45%, 6.45% Cap) | | | 5.50 | % I/F I/O | | | 04/25/2040 | | | | 89,805 | |
| | 602,368 | | | Federal National Mortgage Association, Series2010-35-SV(-1 x 1 Month LIBOR USD + 6.45%, 6.45% Cap) | | | 5.50 | % I/F I/O | | | 04/25/2040 | | | | 80,275 | |
| | 1,229,412 | | | Federal National Mortgage Association, Series2010-46-MS(-1 x 1 Month LIBOR USD + 4.95%, 4.95% Cap) | | | 4.00 | % I/F I/O | | | 05/25/2040 | | | | 105,652 | |
| | 8,570,743 | | | Federal National Mortgage Association, Series2010-49-ZW | | | 4.50 | % | | | 05/25/2040 | | | | 9,460,660 | |
| | 2,065,110 | | | Federal National Mortgage Association, Series2010-4-SK(-1 x 1 Month LIBOR USD + 6.23%, 6.23% Cap) | | | 5.28 | % I/F I/O | | | 02/25/2040 | | | | 378,926 | |
| | 793,078 | | | Federal National Mortgage Association, Series2010-58-ES(-3 x 1 Month LIBOR USD + 12.47%, 12.47% Cap) | | | 10.04 | % I/F | | | 06/25/2040 | | | | 1,004,837 | |
| | 5,882,216 | | | Federal National Mortgage Association, Series2010-59-MS(-1 x 1 Month LIBOR USD + 5.77%, 5.77% Cap) | | | 4.82 | % I/F I/O | | | 06/25/2040 | | | | 1,235,935 | |
| | 2,833,115 | | | Federal National Mortgage Association, Series2010-59-PS(-1 x 1 Month LIBOR USD + 6.45%, 6.45% Cap) | | | 5.50 | % I/F I/O | | | 03/25/2039 | | | | 77,189 | |
| | 6,042,109 | | | Federal National Mortgage Association, Series2010-59-SC(-1 x 1 Month LIBOR USD + 5.00%, 5.00% Cap) | | | 4.05 | % I/F I/O | | | 01/25/2040 | | | | 961,099 | |
| | 745,954 | | | Federal National Mortgage Association, Series2010-60-VZ | | | 5.00 | % | | | 10/25/2039 | | | | 844,582 | |
| | 537,212 | | | Federal National Mortgage Association, Series2010-61-EL | | | 4.50 | % | | | 06/25/2040 | | | | 609,593 | |
| | 6,496,362 | | | Federal National Mortgage Association, Series2010-64-EZ | | | 5.00 | % | | | 06/25/2040 | | | | 7,449,972 | |
| | 14,173,334 | | | Federal National Mortgage Association, Series2010-64-FC (1 Month LIBOR USD + 0.50%, 0.50% Floor, 7.00% Cap) | | | 1.45 | % | | | 06/25/2040 | | | | 14,092,091 | |
| | 26,730,043 | | | Federal National Mortgage Association, Series2010-76-ZK | | | 4.50 | % | | | 07/25/2040 | | | | 29,957,412 | |
| | 4,887,863 | | | Federal National Mortgage Association, Series2010-79-CZ | | | 4.00 | % | | | 07/25/2040 | | | | 5,257,027 | |
| | 19,224,184 | | | Federal National Mortgage Association, Series2010-79-VZ | | | 4.50 | % | | | 07/25/2040 | | | | 21,497,218 | |
| | 2,890,774 | | | Federal National Mortgage Association, Series2010-84-ZC | | | 4.50 | % | | | 08/25/2040 | | | | 3,268,169 | |
| | 5,781,535 | | | Federal National Mortgage Association, Series2010-84-ZD | | | 4.50 | % | | | 08/25/2040 | | | | 6,536,323 | |
| | 7,390,379 | | | Federal National Mortgage Association, Series2010-84-ZG | | | 4.50 | % | | | 08/25/2040 | | | | 8,196,603 | |
| | 532,357 | | | Federal National Mortgage Association, Series2010-90-SA(-1 x 1 Month LIBOR USD + 5.85%, 5.85% Cap) | | | 4.90 | % I/F I/O | | | 08/25/2040 | | | | 70,585 | |
| | 1,673,654 | | | Federal National Mortgage Association, Series2010-94-Z | | | 4.50 | % | | | 08/25/2040 | | | | 1,806,226 | |
| | 8,668,587 | | | Federal National Mortgage Association, Series2010-99-SG(-5 x 1 Month LIBOR USD + 25.00%, 25.00% Cap) | | | 17.09 | % I/F | | | 09/25/2040 | | | | 15,948,165 | |
| | 1,277,149 | | | Federal National Mortgage Association, Series2010-9-DS(-1 x 1 Month LIBOR USD + 5.30%, 0.50% Floor, 5.30% Cap) | | | 4.35 | % I/F I/O | | | 02/25/2040 | | | | 183,199 | |
| | 38,477,687 | | | Federal National Mortgage Association, Series2011-106-LZ | | | 3.50 | % > | | | 10/25/2041 | | | | 42,007,569 | |
| | 520,021 | | | Federal National Mortgage Association, Series2011-110-LS(-2 x 1 Month LIBOR USD + 10.10%, 10.10% Cap) | | | 6.94 | % I/F | | | 11/25/2041 | | | | 788,681 | |
| | 7,323,941 | | | Federal National Mortgage Association, Series2011-111-CZ | | | 4.00 | % | | | 11/25/2041 | | | | 8,003,889 | |
| | 9,745,641 | | | Federal National Mortgage Association, Series2011-111-EZ | | | 5.00 | % | | | 11/25/2041 | | | | 11,238,707 | |
| | 3,728,687 | | | Federal National Mortgage Association, Series2011-111-VZ | | | 4.00 | % | | | 11/25/2041 | | | | 4,129,909 | |
| | 30,000,000 | | | Federal National Mortgage Association, Series2011-131-PB | | | 4.50 | % | | | 12/25/2041 | | | | 35,994,582 | |
| | 24,264,409 | | | Federal National Mortgage Association, Series2011-16-AL | | | 3.50 | % | | | 03/25/2031 | | | | 26,143,658 | |
| | 38,800,000 | | | Federal National Mortgage Association, Series2011-17-NY | | | 3.50 | % | | | 03/25/2031 | | | | 42,104,681 | |
| | 702,986 | | | Federal National Mortgage Association, Series2011-17-SA(-1 x 1 Month LIBOR USD + 6.47%, 6.47% Cap) | | | 5.52 | % I/F I/O | | | 03/25/2041 | | | | 107,236 | |
| | 6,816,075 | | | Federal National Mortgage Association, Series2011-25-KY | | | 3.00 | % | | | 04/25/2026 | | | | 7,092,719 | |
| | 4,744,126 | | | Federal National Mortgage Association, Series2011-27-BS(-2 x 1 Month LIBOR USD + 9.00%, 9.00% Cap) | | | 5.84 | % I/F | | | 04/25/2041 | | | | 5,544,391 | |
| | 48,072,361 | | | Federal National Mortgage Association, Series2011-29-AL | | | 3.50 | % | | | 04/25/2031 | | | | 51,369,548 | |
| | 9,284,816 | | | Federal National Mortgage Association, Series2011-2-GZ | | | 4.00 | % | | | 02/25/2041 | | | | 10,163,470 | |
| | 27,519,212 | | | Federal National Mortgage Association, Series2011-32-ZG | | | 4.00 | % | | | 04/25/2041 | | | | 30,211,361 | |
| | 4,807,957 | | | Federal National Mortgage Association, Series2011-36-VZ | | | 4.50 | % | | | 05/25/2041 | | | | 5,153,940 | |
| | 11,175,070 | | | Federal National Mortgage Association, Series2011-37-Z | | | 4.50 | % | | | 05/25/2041 | | | | 12,666,262 | |
| | 9,008,851 | | | Federal National Mortgage Association, Series2011-38-BZ | | | 4.00 | % | | | 05/25/2041 | | | | 9,829,870 | |
| | 6,350,825 | | | Federal National Mortgage Association, Series2011-39-CB | | | 3.00 | % | | | 05/25/2026 | | | | 6,608,512 | |
| | 13,457,114 | | | Federal National Mortgage Association, Series2011-39-ZD | | | 4.00 | % | | | 02/25/2041 | | | | 14,763,883 | |
| | 3,346,125 | | | Federal National Mortgage Association, Series2011-40-LZ | | | 4.50 | % | | | 05/25/2041 | | | | 3,590,392 | |
| | 7,330,195 | | | Federal National Mortgage Association, Series2011-42-MZ | | | 4.50 | % | | | 05/25/2041 | | | | 8,313,476 | |
| | 21,378,568 | | | Federal National Mortgage Association, Series2011-45-ZA | | | 4.00 | % > | | | 05/25/2031 | | | | 23,518,904 | |
| | 10,364,790 | | | Federal National Mortgage Association, Series2011-45-ZB | | | 4.50 | % | | | 05/25/2041 | | | | 11,655,924 | |
| | 2,092,693 | | | Federal National Mortgage Association, Series2011-48-SC(-2 x 1 Month LIBOR USD + 9.20%, 9.20% Cap) | | | 7.31 | % I/F | | | 06/25/2041 | | | | 2,601,121 | |
| | 20,625,770 | | | Federal National Mortgage Association, Series2011-51-FJ (1 Month LIBOR USD + 0.45%, 0.45% Floor, 7.00% Cap) | | | 1.40 | % | | | 06/25/2041 | | | | 20,469,410 | |
| | 1,300,160 | | | Federal National Mortgage Association, Series2011-59-MA | | | 4.50 | % | | | 07/25/2041 | | | | 1,445,054 | |
| | 11,079,367 | | | Federal National Mortgage Association, Series2011-60-EL | | | 3.00 | % | | | 07/25/2026 | | | | 11,529,393 | |
| | 13,971,093 | | | Federal National Mortgage Association, Series2011-64-DB | | | 4.00 | % | | | 07/25/2041 | | | | 15,531,259 | |
| | 5,672,205 | | | Federal National Mortgage Association, Series2011-74-KL | | | 5.00 | % | | | 06/25/2040 | | | | 6,363,941 | |
| | 21,754,173 | | | Federal National Mortgage Association, Series2011-77-Z | | | 3.50 | % | | | 08/25/2041 | | | | 23,569,815 | |
| | 29,297,930 | | | Federal National Mortgage Association, Series2011-99-CZ | | | 4.50 | % > | | | 10/25/2041 | | | | 34,350,270 | |
| | 73,738,941 | | | Federal National Mortgage Association, Series2011-99-DZ | | | 5.00 | % | | | 10/25/2041 | | | | 84,056,516 | |
| | 13,427,538 | | | Federal National Mortgage Association, Series2012-104-Z | | | 3.50 | % > | | | 09/25/2042 | | | | 14,466,425 | |
| | 9,431,877 | | | Federal National Mortgage Association, Series2012-111-LB | | | 3.50 | % | | | 05/25/2041 | | | | 9,981,421 | |
| | 33,279,976 | | | Federal National Mortgage Association, Series2012-111-MJ | | | 4.00 | % | | | 04/25/2042 | | | | 37,250,214 | |
| | 6,687,611 | | | Federal National Mortgage Association, Series2012-114-DC | | | 2.00 | % | | | 08/25/2039 | | | | 6,736,163 | |
| | 46,367,996 | | | Federal National Mortgage Association, Series2012-122-AD | | | 2.00 | % | | | 02/25/2040 | | | | 47,307,875 | |
| | 48,149,253 | | | Federal National Mortgage Association, Series2012-122-DB | | | 3.00 | % | | | 11/25/2042 | | | | 51,274,496 | |
| | 53,604,683 | | | Federal National Mortgage Association, Series2012-125-LA | | | 3.00 | % | | | 11/25/2042 | | | | 57,090,584 | |
| | 28,978,325 | | | Federal National Mortgage Association, Series2012-132-KH | | | 1.75 | % | | | 12/25/2032 | | | | 29,498,358 | |
| | 28,524,720 | | | Federal National Mortgage Association, Series2012-144-PT | | | 4.21 | % # | | | 11/25/2049 | | | | 31,475,323 | |
| | 11,738,356 | | | Federal National Mortgage Association, Series2012-14-BZ | | | 4.00 | % > | | | 03/25/2042 | | | | 13,137,007 | |
| | 26,826,739 | | | Federal National Mortgage Association, Series2012-15-PZ | | | 4.00 | % > | | | 03/25/2042 | | | | 31,244,620 | |
| | 19,896,724 | | | Federal National Mortgage Association, Series2012-20-ZT | | | 3.50 | % > | | | 03/25/2042 | | | | 22,072,930 | |
| | 61,937,780 | | | Federal National Mortgage Association, Series2012-30-DZ | | | 4.00 | % > | | | 04/25/2042 | | | | 67,029,501 | |
| | 50,926,619 | | | Federal National Mortgage Association, Series2012-31-Z | | | 4.00 | % > | | | 04/25/2042 | | | | 56,625,532 | |
| | 5,365,831 | | | Federal National Mortgage Association, Series2012-63-EB | | | 2.00 | % | | | 08/25/2040 | | | | 5,436,272 | |
| | 21,615,712 | | | Federal National Mortgage Association, Series2012-70-FY (1 Month LIBOR USD + 0.45%, 0.45% Floor, 7.00% Cap) | | | 1.40 | % | | | 07/25/2042 | | | | 21,386,717 | |
| | 36,588,390 | | | Federal National Mortgage Association, Series2012-74-Z | | | 4.00 | % > | | | 07/25/2042 | | | | 41,016,434 | |
| | 6,543,162 | | | Federal National Mortgage Association, Series2012-80-EA | | | 2.00 | % | | | 04/25/2042 | | | | 6,614,965 | |
| | 26,417,359 | | | Federal National Mortgage Association, Series2012-86-ZC | | | 3.50 | % > | | | 08/25/2042 | | | | 30,171,990 | |
| | 36,806,302 | | | Federal National Mortgage Association, Series2012-96-VZ | | | 3.50 | % > | | | 09/25/2042 | | | | 39,508,393 | |
| | 23,212,128 | | | Federal National Mortgage Association, Series2012-98-BG | | | 4.50 | % | | | 08/25/2040 | | | | 26,030,721 | |
| | | | | | | | | | | | | | | | |
| | | | | | | | | | | | | |
| | 39,696,103 | | | Federal National Mortgage Association, Series2012-99-QE | | | 3.00 | % | | | 09/25/2042 | | | | 42,819,754 | |
| | 19,840,884 | | | Federal National Mortgage Association, Series2013-100-PJ | | | 3.00 | % | | | 03/25/2043 | | | | 21,073,670 | |
| | 27,063,886 | | | Federal National Mortgage Association, Series2013-130-ZE | | | 3.00 | % > | | | 01/25/2044 | | | | 27,836,825 | |
| | 24,316,736 | | | Federal National Mortgage Association, Series2013-133-ZT | | | 3.00 | % > | | | 01/25/2039 | | | | 26,257,601 | |
| | 12,950,225 | | | Federal National Mortgage Association, Series2013-36-Z | | | 3.00 | % > | | | 04/25/2043 | | | | 13,475,272 | |
| | 20,050,428 | | | Federal National Mortgage Association, Series2013-41-ZH | | | 3.00 | % > | | | 05/25/2033 | | | | 21,613,467 | |
| | 19,292,416 | | | Federal National Mortgage Association, Series2013-51-HS(-1 x 1 Month LIBOR USD + 5.40%, 5.40% Cap) | | | 4.26 | % I/F | | | 04/25/2043 | | | | 20,002,878 | |
| | 3,250,814 | | | Federal National Mortgage Association, Series2013-53-AB | | | 1.50 | % | | | 03/25/2028 | | | | 3,295,918 | |
| | 7,059,931 | | | Federal National Mortgage Association, Series2013-58-SC(-2 x 1 Month LIBOR USD + 6.00%, 6.00% Cap) | | | 4.58 | % I/F | | | 06/25/2043 | | | | 7,352,368 | |
| | 122,055,567 | | | Federal National Mortgage Association, Series2013-81-ZQ | | | 3.00 | % > | | | 08/25/2043 | | | | 129,919,315 | |
| | 19,943,395 | | | Federal National Mortgage Association, Series2013-82-SH(-1 x 1 Month LIBOR USD + 6.05%, 6.05% Cap) | | | 5.10 | % I/F I/O | | | 12/25/2042 | | | | 2,548,086 | |
| | 27,842,456 | | | Federal National Mortgage Association, Series2013-8-Z | | | 3.00 | % > | | | 02/25/2043 | | | | 27,804,426 | |
| | 24,737,963 | | | Federal National Mortgage Association, Series2014-12-GZ | | | 3.50 | % > | | | 03/25/2044 | | | | 26,715,358 | |
| | 26,332,866 | | | Federal National Mortgage Association, Series2014-21-GZ | | | 3.00 | % > | | | 04/25/2044 | | | | 27,082,837 | |
| | 30,808,081 | | | Federal National Mortgage Association, Series2014-37-ZY | | | 2.50 | % > | | | 07/25/2044 | | | | 31,364,980 | |
| | 49,896,674 | | | Federal National Mortgage Association, Series2014-39-ZA | | | 3.00 | % > | | | 07/25/2044 | | | | 51,343,718 | |
| | 12,907,198 | | | Federal National Mortgage Association, Series2014-46-NZ | | | 3.00 | % | | | 06/25/2043 | | | | 13,658,583 | |
| | 32,308,562 | | | Federal National Mortgage Association, Series2014-55-MA | | | 3.00 | % | | | 10/25/2039 | | | | 33,539,234 | |
| | 880,302 | | | Federal National Mortgage Association, Series2014-56-AD | | | 3.00 | % | | | 01/25/2040 | | | | 884,360 | |
| | 59,802,965 | | | Federal National Mortgage Association, Series2014-60-EZ | | | 3.00 | % > | | | 10/25/2044 | | | | 62,341,074 | |
| | 42,214,072 | | | Federal National Mortgage Association, Series2014-61-ZV | | | 3.00 | % > | | | 10/25/2044 | | | | 44,205,323 | |
| | 35,599,137 | | | Federal National Mortgage Association, Series2014-64-NZ | | | 3.00 | % > | | | 10/25/2044 | | | | 37,275,387 | |
| | 72,424,113 | | | Federal National Mortgage Association, Series2014-65-CD | | | 3.00 | % | | | 06/25/2040 | | | | 75,640,062 | |
| | 12,535,107 | | | Federal National Mortgage Association, Series2014-67-DZ | | | 3.00 | % > | | | 10/25/2044 | | | | 13,127,662 | |
| | 66,036,661 | | | Federal National Mortgage Association, Series2014-68-MA | | | 3.00 | % | | | 11/25/2040 | | | | 69,086,030 | |
| | 40,072,733 | | | Federal National Mortgage Association, Series2014-68-MZ | | | 3.00 | % > | | | 11/25/2044 | | | | 41,981,153 | |
| | 27,995,958 | | | Federal National Mortgage Association, Series2014-6-Z | | | 2.50 | % > | | | 02/25/2044 | | | | 28,484,901 | |
| | 27,545,393 | | | Federal National Mortgage Association, Series2014-73-CQ | | | 3.00 | % | | | 06/25/2040 | | | | 28,739,409 | |
| | 22,621,478 | | | Federal National Mortgage Association, Series2014-77-VZ | | | 3.00 | % > | | | 11/25/2044 | | | | 23,695,362 | |
| | 17,170,681 | | | Federal National Mortgage Association, Series2014-82-YA | | | 3.00 | % | | | 04/25/2041 | | | | 18,101,816 | |
| | 29,051,917 | | | Federal National Mortgage Association, Series2014-84-KZ | | | 3.00 | % > | | | 12/25/2044 | | | | 30,430,660 | |
| | 75,353,827 | | | Federal National Mortgage Association, Series2014-95-NA | | | 3.00 | % | | | 04/25/2041 | | | | 79,036,572 | |
| | 135,549,428 | | | Federal National Mortgage Association, Series2014-M11-1A | | | 3.11 | % # | | | 08/25/2024 | | | | 145,702,514 | |
| | 26,287,547 | | | Federal National Mortgage Association, Series2015-11-A | | | 3.00 | % | | | 05/25/2034 | | | | 27,749,944 | |
| | 72,176,222 | | | Federal National Mortgage Association, Series2015-21-G | | | 3.00 | % | | | 02/25/2042 | | | | 75,899,635 | |
| | 15,294,365 | | | Federal National Mortgage Association, Series2015-42-CA | | | 3.00 | % | | | 03/25/2044 | | | | 16,410,425 | |
| | 48,777,833 | | | Federal National Mortgage Association, Series2015-49-A | | | 3.00 | % | | | 03/25/2044 | | | | 53,607,404 | |
| | 9,315,034 | | | Federal National Mortgage Association, Series2015-63-KD | | | 3.00 | % | | | 07/25/2041 | | | | 9,572,000 | |
| | 44,987,476 | | | Federal National Mortgage Association, Series2015-88-AC | | | 3.00 | % | | | 04/25/2043 | | | | 48,735,175 | |
| | 129,166,320 | | | Federal National Mortgage Association, Series2015-88-BA | | | 3.00 | % | | | 04/25/2044 | | | | 146,780,305 | |
| | 35,372,512 | | | Federal National Mortgage Association, Series2015-8-AP | | | 2.00 | % | | | 03/25/2045 | | | | 36,149,420 | |
| | 16,365,826 | | | Federal National Mortgage Association, Series2015-94-MA | | | 3.00 | % | | | 01/25/2046 | | | | 17,317,645 | |
| | 50,965,672 | | | Federal National Mortgage Association, Series2015-9-HA | | | 3.00 | % | | | 01/25/2045 | | | | 54,277,900 | |
| | 32,379,885 | | | Federal National Mortgage Association, Series2016-2-JA | | | 2.50 | % | | | 02/25/2046 | | | | 33,720,166 | |
| | 80,808,612 | | | Federal National Mortgage Association, Series2016-32-LA | | | 3.00 | % | | | 10/25/2044 | | | | 88,700,979 | |
| | 13,304,426 | | | Federal National Mortgage Association, Series2016-71-ZQ | | | 3.00 | % | | | 10/25/2046 | | | | 13,279,178 | |
| | 86,883,282 | | | Federal National Mortgage Association, Series2016-72-PA | | | 3.00 | % | | | 07/25/2046 | | | | 89,900,599 | |
| | 67,971,806 | | | Federal National Mortgage Association, Series2016-74-PA | | | 3.00 | % | | | 12/25/2044 | | | | 72,327,032 | |
| | 31,905,449 | | | Federal National Mortgage Association, Series2016-79-EP | | | 3.00 | % | | | 01/25/2044 | | | | 33,277,071 | |
| | 82,423,681 | | | Federal National Mortgage Association, Series2016-81-PA | | | 3.00 | % | | | 02/25/2044 | | | | 88,427,439 | |
| | 44,636,312 | | | Federal National Mortgage Association, Series2016-94-PA | | | 3.00 | % | | | 03/25/2044 | | | | 46,591,712 | |
| | 45,503,323 | | | Federal National Mortgage Association, Series2017-13-ML | | | 3.00 | % | | | 08/25/2041 | | | | 47,582,697 | |
| | 21,301,037 | | | Federal National Mortgage Association, Series2017-2-HA | | | 3.00 | % | | | 09/25/2041 | | | | 22,084,975 | |
| | 12,281,993 | | | Federal National Mortgage Association, Series2017-4-CH | | | 3.00 | % | | | 06/25/2042 | | | | 12,460,660 | |
| | 15,630,311 | | | Federal National Mortgage Association, Series2017-51-EA | | | 3.00 | % | | | 11/25/2042 | | | | 16,715,927 | |
| | 24,033,082 | | | Federal National Mortgage Association, Series2017-61-TA | | | 3.00 | % | | | 02/25/2043 | | | | 24,954,568 | |
| | 49,716,144 | | | Federal National Mortgage Association, Series2018-21-IO | | | 3.00 | % I/O | | | 04/25/2048 | | | | 4,363,233 | |
| | 82,114,373 | | | Federal National Mortgage Association, Series2018-21-PO | | | 0.00 | % P/O | | | 04/25/2048 | | | | 76,261,179 | |
| | 7,792,777 | | | Federal National Mortgage Association, Series2018-23-CG | | | 2.75 | % | | | 12/25/2043 | | | | 7,960,900 | |
| | 105,656,573 | | | Federal National Mortgage Association, Series2018-27-AO | | | 0.00 | % P/O | | | 05/25/2048 | | | | 103,019,575 | |
| | 45,332,792 | | | Federal National Mortgage Association, Series2018-27-JA | | | 3.00 | % | | | 12/25/2047 | | | | 48,094,158 | |
| | 54,676,334 | | | Federal National Mortgage Association, Series2018-33-A | | | 3.00 | % | | | 05/25/2048 | | | | 57,950,571 | |
| | 23,306,851 | | | Federal National Mortgage Association, Series2018-33-C | | | 3.00 | % | | | 05/25/2048 | | | | 24,608,185 | |
| | 157,056,999 | | | Federal National Mortgage Association, Series2018-36-A | | | 3.00 | % | | | 06/25/2048 | | | | 165,206,718 | |
| | 54,915,358 | | | Federal National Mortgage Association, Series2018-38-JB | | | 3.00 | % | | | 06/25/2048 | | | | 58,212,827 | |
| | 171,760,471 | | | Federal National Mortgage Association, Series2018-39-AB | | | 3.00 | % | | | 06/25/2048 | | | | 182,143,598 | |
| | 39,493,419 | | | Federal National Mortgage Association, Series2018-64-A | | | 3.00 | % | | | 09/25/2048 | | | | 41,433,043 | |
| �� | 87,418,545 | | | Federal National Mortgage Association, Series2018-85-PO | | | 0.00 | % P/O | | | 12/25/2048 | | | | 83,562,583 | |
| | 62,466,572 | | | Federal National Mortgage Association, Series2019-12-BA | | | 3.00 | % | | | 04/25/2049 | | | | 66,499,338 | |
| | 25,881,409 | | | Federal National Mortgage Association, Series2019-64-D | | | 2.50 | % | | | 11/25/2049 | | | | 27,058,699 | |
| | 7,332,736 | | | Federal National Mortgage Association, Series400-S4
(-1 x 1 Month LIBOR USD + 5.45%, 5.45% Cap) | | | 4.50 | % I/F I/O | | | 11/25/2039 | | | | 1,201,284 | |
| | 77,778,727 | | | Federal National Mortgage Association, Series412-A3 | | | 3.00 | % | | | 08/25/2042 | | | | 84,061,404 | |
| | 3,280,240 | | | Government National Mortgage Association, Pool MA2511 | | | 3.50 | % | | | 01/20/2045 | | | | 3,443,603 | |
| | 10,414,200 | | | Government National Mortgage Association, Series2003-67-SP(-1 x 1 Month LIBOR USD + 7.10%, 7.10% Cap) | | | 6.33 | % I/F I/O | | | 08/20/2033 | | | | 1,869,065 | |
| | 4,291,208 | | | Government National Mortgage Association, Series2003-86-ZK | | | 5.00 | % | | | 10/20/2033 | | | | 4,842,033 | |
| | 2,280,854 | | | Government National Mortgage Association, Series2004-49-Z | | | 6.00 | % | | | 06/20/2034 | | | | 2,628,099 | |
| | 4,707,012 | | | Government National Mortgage Association, Series2004-83-CS(-1 x 1 Month LIBOR USD + 6.08%, 6.08% Cap) | | | 5.31 | % I/F I/O | | | 10/20/2034 | | | | 926,851 | |
| | 1,169,472 | | | Government National Mortgage Association, Series2005-21-Z | | | 5.00 | % | | | 03/20/2035 | | | | 1,337,418 | |
| | 12,745,595 | | | Government National Mortgage Association, Series2005-39-ZB | | | 5.00 | % | | | 07/20/2034 | | | | 14,471,111 | |
| | 887,956 | | | Government National Mortgage Association, Series2006-24-CX(-7 x 1 Month LIBOR USD + 39.97%, 39.97% Cap) | | | 34.30 | % I/F | | | 05/20/2036 | | | | 1,670,477 | |
| | 5,446,233 | | | Government National Mortgage Association, Series2007-26-SJ(-1 x 1 Month LIBOR USD + 4.69%, 4.69% Cap) | | | 3.92 | % I/F I/O | | | 04/20/2037 | | | | 581,635 | |
| | 3,988,806 | | | Government National Mortgage Association, Series2008-2-SM(-1 x 1 Month LIBOR USD + 6.50%, 6.50% Cap) | | | 5.80 | % I/F I/O | | | 01/16/2038 | | | | 912,530 | |
| | 6,968,648 | | | Government National Mortgage Association, Series2008-42-AI(-1 x 1 Month LIBOR USD + 7.69%, 7.69% Cap) | | | 6.99 | % I/F I/O | | | 05/16/2038 | | | | 1,945,853 | |
| | 2,798,926 | | | Government National Mortgage Association, Series2008-43-SH(-1 x 1 Month LIBOR USD + 6.34%, 6.34% Cap) | | | 5.56 | % I/F I/O | | | 05/20/2038 | | | | 363,847 | |
| | 3,171,538 | | | Government National Mortgage Association, Series2008-51-SC(-1 x 1 Month LIBOR USD + 6.25%, 6.25% Cap) | | | 5.48 | % I/F I/O | | | 06/20/2038 | | | | 620,314 | |
| | 2,300,345 | | | Government National Mortgage Association, Series2008-51-SE(-1 x 1 Month LIBOR USD + 6.25%, 6.25% Cap) | | | 5.55 | % I/F I/O | | | 06/16/2038 | | | | 509,792 | |
| | 1,004,028 | | | Government National Mortgage Association, Series2008-82-SM(-1 x 1 Month LIBOR USD + 6.05%, 6.05% Cap) | | | 5.28 | % I/F I/O | | | 09/20/2038 | | | | 126,283 | |
| | 2,213,552 | | | Government National Mortgage Association, Series2008-83-SD(-1 x 1 Month LIBOR USD + 6.56%, 6.56% Cap) | | | 5.86 | % I/F I/O | | | 11/16/2036 | | | | 426,951 | |
| | 8,340,599 | | | Government National Mortgage Association, Series2009-106-VZ | | | 4.50 | % | | | 11/20/2039 | | | | 9,270,234 | |
| | | | | | | | | | | | | | | | |
| | | | | | | | | | | | | |
| | 4,818,163 | | | Government National Mortgage Association, Series2009-10-NS(-1 x 1 Month LIBOR USD + 6.65%, 6.65% Cap) | | | 5.95 | % I/F I/O | | | 02/16/2039 | | | | 905,828 | |
| | 1,602,422 | | | Government National Mortgage Association, Series2009-24-SN(-1 x 1 Month LIBOR USD + 6.10%, 6.10% Cap) | | | 5.33 | % I/F I/O | | | 09/20/2038 | | | | 224,680 | |
| | 4,572,969 | | | Government National Mortgage Association, Series2009-32-ZE | | | 4.50 | % | | | 05/16/2039 | | | | 5,141,000 | |
| | 26,263,335 | | | Government National Mortgage Association, Series2009-35-DZ | | | 4.50 | % | | | 05/20/2039 | | | | 29,530,704 | |
| | 7,937 | | | Government National Mortgage Association, Series2009-41-ZQ | | | 4.50 | % > | | | 06/16/2039 | | | | 9,979 | |
| | 2,823,200 | | | Government National Mortgage Association, Series2009-48-Z | | | 5.00 | % | | | 06/16/2039 | | | | 3,237,604 | |
| | 569,637 | | | Government National Mortgage Association, Series2009-50-KP | | | 4.50 | % | | | 06/20/2039 | | | | 622,625 | |
| | 2,237,898 | | | Government National Mortgage Association, Series2009-69-TS(-1 x 1 Month LIBOR USD + 6.20%, 6.20% Cap) | | | 5.50 | % I/F I/O | | | 04/16/2039 | | | | 311,862 | |
| | 3,893,012 | | | Government National Mortgage Association, Series2009-75-GZ | | | 4.50 | % | | | 09/20/2039 | | | | 4,327,047 | |
| | 2,781,697 | | | Government National Mortgage Association, Series2009-87-IG(-1 x 1 Month LIBOR USD + 6.74%, 6.74% Cap) | | | 5.97 | % I/F I/O | | | 03/20/2037 | | | | 289,291 | |
| | 19,398,788 | | | Government National Mortgage Association, Series2010-106-PS(-1 x 1 Month LIBOR USD + 6.05%, 6.05% Cap) | | | 5.28 | % I/F I/O | | | 03/20/2040 | | | | 2,339,946 | |
| | 6,112,739 | | | Government National Mortgage Association, Series2010-1-SA(-1 x 1 Month LIBOR USD + 5.75%, 5.75% Cap) | | | 5.05 | % I/F I/O | | | 01/16/2040 | | | | 1,234,245 | |
| | 4,035,644 | | | Government National Mortgage Association, Series2010-25-ZB | | | 4.50 | % > | | | 02/16/2040 | | | | 4,583,878 | |
| | 53,921,860 | | | Government National Mortgage Association, Series2010-26-QS(-1 x 1 Month LIBOR USD + 6.25%, 6.25% Cap) | | | 5.48 | % I/F I/O | | | 02/20/2040 | | | | 10,447,096 | |
| | 4,521,453 | | | Government National Mortgage Association, Series2010-42-AY | | | 5.00 | % | | | 11/20/2039 | | | | 5,179,622 | |
| | 4,573,754 | | | Government National Mortgage Association, Series2010-42-ES(-1 x 1 Month LIBOR USD + 5.68%, 5.68% Cap) | | | 4.91 | % I/F I/O | | | 04/20/2040 | | | | 801,981 | |
| | 1,370,863 | | | Government National Mortgage Association, Series2010-61-AS(-1 x 1 Month LIBOR USD + 6.55%, 6.55% Cap) | | | 5.78 | % I/F I/O | | | 09/20/2039 | | | | 244,517 | |
| | 13,881,141 | | | Government National Mortgage Association, Series2010-62-SB(-1 x 1 Month LIBOR USD + 5.75%, 5.75% Cap) | | | 4.98 | % I/F I/O | | | 05/20/2040 | | | | 2,605,562 | |
| | 10,859,064 | | | Government National Mortgage Association, Series2010-62-ZG | | | 5.50 | % | | | 05/16/2040 | | | | 12,722,745 | |
| | 7,276,376 | | | Government National Mortgage Association, Series2011-18-SN(-2 x 1 Month LIBOR USD + 9.50%, 9.50% Cap) | | | 7.95 | % I/F | | | 12/20/2040 | | | | 8,205,778 | |
| | 7,285,142 | | | Government National Mortgage Association, Series2011-18-YS(-2 x 1 Month LIBOR USD + 9.50%, 9.50% Cap) | | | 7.95 | % I/F | | | 12/20/2040 | | | | 8,161,096 | |
| | 3,203,578 | | | Government National Mortgage Association, Series2011-51-UZ | | | 4.50 | % | | | 04/20/2041 | | | | 3,565,522 | |
| | 2,068,014 | | | Government National Mortgage Association, Series2011-69-OC | | | 0.00 | % P/O | | | 05/20/2041 | | | | 2,023,531 | |
| | 20,036,627 | | | Government National Mortgage Association, Series2011-69-SB(-1 x 1 Month LIBOR USD + 5.35%, 5.35% Cap) | | | 4.58 | % I/F I/O | | | 05/20/2041 | | | | 3,461,031 | |
| | 18,991,175 | | | Government National Mortgage Association, Series2011-71-ZA | | | 4.50 | % | | | 02/20/2041 | | | | 21,124,766 | |
| | 7,315,599 | | | Government National Mortgage Association, Series2011-72-AS(-1 x 1 Month LIBOR USD + 5.38%, 5.38% Cap) | | | 4.61 | % I/F I/O | | | 05/20/2041 | | | | 1,270,114 | |
| | 5,536,857 | | | Government National Mortgage Association, Series2011-72-SK(-1 x 1 Month LIBOR USD + 6.15%, 6.15% Cap) | | | 5.38 | % I/F I/O | | | 05/20/2041 | | | | 1,106,959 | |
| | 2,968,740 | | | Government National Mortgage Association, Series2012-105-SE(-1 x 1 Month LIBOR USD + 6.20%, 6.20% Cap) | | | 5.43 | % I/F I/O | | | 01/20/2041 | | | | 124,305 | |
| | 5,510,540 | | | Government National Mortgage Association, Series2012-52-PN | | | 2.00 | % | | | 12/20/2039 | | | | 5,599,955 | |
| | 19,471,974 | | | Government National Mortgage Association, Series2013-116-LS(-1 x 1 Month LIBOR USD + 6.15%, 6.15% Cap) | | | 5.38 | % I/F I/O | | | 08/20/2043 | | | | 3,702,269 | |
| | 20,997,673 | | | Government National Mortgage Association, Series2013-136-CS(-1 x 1 Month LIBOR USD + 6.20%, 6.20% Cap) | | | 5.50 | % I/F I/O | | | 09/16/2043 | | | | 3,938,000 | |
| | 19,871,783 | | | Government National Mortgage Association, Series2013-182-WZ | | | 2.50 | % > | | | 12/20/2043 | | | | 20,587,905 | |
| | 61,255,805 | | | Government National Mortgage Association, Series2013-182-ZW | | | 2.50 | % > | | | 12/20/2043 | | | | 63,463,286 | |
| | 13,620,135 | | | Government National Mortgage Association, Series2013-186-SG(-1 x 1 Month LIBOR USD + 6.25%, 6.25% Cap) | | | 5.55 | % I/F I/O | | | 02/16/2043 | | | | 2,007,695 | |
| | 13,325,040 | | | Government National Mortgage Association, Series2013-26-MS(-1 x 1 Month LIBOR USD + 6.25%, 6.25% Cap) | | | 5.48 | % I/F I/O | | | 02/20/2043 | | | | 2,639,717 | |
| | 27,885,496 | | | Government National Mortgage Association, Series2013-34-PL | | | 3.00 | % | | | 03/20/2042 | | | | 29,556,891 | |
| | 25,142,933 | | | Government National Mortgage Association, Series2014-163-PS(-1 x 1 Month LIBOR USD + 5.60%, 5.60% Cap) | | | 4.83 | % I/F I/O | | | 11/20/2044 | | | | 3,949,726 | |
| | 26,401,083 | | | Government National Mortgage Association, Series2014-167-SA(-1 x 1 Month LIBOR USD + 5.60%, 5.60% Cap) | | | 4.83 | % I/F I/O | | | 11/20/2044 | | | | 4,658,709 | |
| | 40,647,026 | | | Government National Mortgage Association, Series2014-21-SE(-1 x 1 Month LIBOR USD + 5.55%, 5.55% Cap) | | | 4.78 | % I/F I/O | | | 02/20/2044 | | | | 7,311,636 | |
| | 22,691,228 | | | Government National Mortgage Association, Series2014-39-SK(-1 x 1 Month LIBOR USD + 6.20%, 6.20% Cap) | | | 5.43 | % I/F I/O | | | 03/20/2044 | | | | 4,648,278 | |
| | 21,126,237 | | | Government National Mortgage Association, Series2014-59-DS(-1 x 1 Month LIBOR USD + 6.25%, 6.25% Cap) | | | 5.55 | % I/F I/O | | | 04/16/2044 | | | | 4,464,255 | |
| | 9,070,053 | | | Government National Mortgage Association, Series2016-99-TL | | | 2.00 | % | | | 04/16/2044 | | | | 9,045,901 | |
| | | | | | | | | | | | | | | | |
| Total US Government and Agency Mortgage Backed Obligations
(Cost $22,997,540,432) | | | | | | | | | | | 24,555,598,048 | |
| | | | | | | | | | | | | |
| | US Government and Agency Obligations - 9.0% | | | | | | | | | | | | |
| | 59,900,000 | | | Tennessee Valley Authority | | | 4.25 | % | | | 09/15/2065 | | | | 95,387,800 | |
| | 400,000,000 | | | United States Treasury Notes | | | 1.13 | % | | | 02/28/2025 | | | | 415,000,000 | |
| | 500,000,000 | | | United States Treasury Notes | | | 2.25 | % | | | 02/15/2027 | | | | 557,988,280 | |
| | 470,000,000 | | | United States Treasury Notes | | | 2.88 | % | | | 05/15/2028 | | | | 554,489,841 | |
| | 300,000,000 | | | United States Treasury Notes | | | 2.88 | % | | | 08/15/2028 | | | | 354,937,500 | |
| | 500,000,000 | | | United States Treasury Notes | | | 3.13 | % | | | 11/15/2028 | | | | 603,945,310 | |
| | 310,800,000 | | | United States Treasury Notes | | | 2.63 | % | | | 02/15/2029 | | | | 363,490,313 | |
| | 608,200,000 | | | United States Treasury Notes | | | 2.38 | % | | | 05/15/2029 | | | | 700,047,700 | |
| | 700,000,000 | | | United States Treasury Notes | | | 1.75 | % | | | 11/15/2029 | | | | 769,617,184 | |
| | 200,000,000 | | | United States Treasury Notes | | | 1.50 | % | | | 02/15/2030 | | | | 215,636,718 | |
| | | | | | | | | | | | | | | | |
| | Total US Government and Agency Obligations (Cost $4,107,380,257) | | | | | | | | | | | 4,630,540,646 | |
| | | | | | | | | | | | | |
| | Affiliated Mutual Funds - 0.1% | | | | | | | | | | | | |
| | 7,034,138 | | | Doubleline Income Fund (Class I) | | | | | | | | | | | 56,624,814 | |
| | | | | | | | | | | | | | | | |
| | Total Affiliated Mutual Funds (Cost $70,059,642) | | | | | | | | | | | 56,624,814 | |
| | | | | | | | | | | | | |
| | Short Term Investments - 1.1% | | | | | | | | | | | | |
| | 187,856,750 | | | First American Government Obligations Fund - Class U | | | 0.47 | %◆ | | | | | | | 187,856,750 | |
| | 188,050,075 | | | JP Morgan U.S. Government Money Market Fund - Institutional Share Class | | | 0.36 | %◆ | | | | | | | 188,050,075 | |
| | 188,050,075 | | | Morgan Stanley Institutional Liquidity Funds Government Portfolio - Institutional Share Class | | | 0.26 | %◆ | | | | | | | 188,050,075 | |
| | | | | | | | | | | | | | | | |
| | Total Short Term Investments (Cost $563,956,900) | | | | | | | | | | | 563,956,900 | |
| | | | | | | | | | | | | |
| | Total Investments - 99.7% (Cost $51,556,573,926) | | | | | | | | | | | 51,107,858,215 | |
| | Other Assets in Excess of Liabilities - 0.3% | | | | | | | | | | | 134,064,638 | |
| | | | | | | | | | | | | |
| | NET ASSETS - 100.0% | | | | | | | | | | $ | 51,241,922,853 | |
| | | | | | | | | | | | | |
| ^ | Security exempt from registration under Rule 144A of the Securities Act of 1933. These securities may be resold in transactions exempt from registration to qualified institutional buyers. |
| # | Coupon rate is variable based on the weighted average coupon of the underlying collateral. To the extent the weighted average coupon of the underlying assets which comprise the collateral increases or decreases, the coupon rate of this security will increase or decrease correspondingly. The rate disclosed is as of March 31, 2020. |
| ± | Coupon rate is variable or floats based on components including but not limited to reference rate and spread. These securities may not indicate a reference rate and/or spread in their description. The rate disclosed is as of March 31, 2020. |
| § | The interest rate will step up if the issuer does not redeem the bond on or before a scheduled redemption date in accordance with the terms of the instrument. The interest rate shown is the rate in effect as of March 31, 2020. |
| Þ | Value determined using significant unobservable inputs. |
| I/O | Interest only security |
| P/O | Principal only security |
| I/F | Inverse floating rate security whose interest rate moves in the opposite direction of reference interest rates. Reference interest rates are typically based on a negative multiplier or slope. Interest rate may also be subject to a cap or floor. |
| ß | The interest rate may step up conditioned upon the aggregate remaining principal balance of the underlying mortgage loans being reduced below a targeted percentage of the aggregate original principal balance of the mortgage loans. The interest rate shown is the rate in effect as of March 31, 2020. |
| > | This U.S. Agency bond accrues interest which is added to the outstanding principal balance. The interest payment will be deferred until all other tranches in the structure are paid off. The rate disclosed is as of March 31, 2020. |
| D | This mortgage-backed bond accrues interest which is added to the outstanding principal balance. The interest payment will be deferred until all other tranches in the structure are paid off. The rate disclosed is as of March 31, 2020. |
| ◆ | Seven-day yield as of March 31, 2020 |
DoubleLine Core Fixed Income Fund
Schedule of Investments
March 31, 2020
| | | | | | | | | | | | | | | | |
Principal Amount
$/Shares | | | Security Description | | Rate | | | Maturity | | | Value $ | |
| | Asset Backed Obligations - 2.5% | | | | | | | | | | | | |
| | 6,268,280 | | | AASET Ltd., Series2019-2-A | | | 3.38 | % ^ | | | 10/16/2039 | | | | 4,490,796 | |
| | 7,000,000 | | | Applebee’s Funding LLC, Series2019-1A-A2I | | | 4.19 | % ^ | | | 06/07/2049 | | | | 6,375,250 | |
| | 3,958,333 | | | CAL Funding Ltd., Series2018-1A-A | | | 3.96 | % ^ | | | 02/25/2043 | | | | 3,930,173 | |
| | 5,591,968 | | | Castlelake Aircraft Securitization Trust, Series2016-1-A | | | 4.45 | % | | | 08/15/2041 | | | | 4,269,820 | |
| | 3,900,153 | | | Castlelake Aircraft Securitization Trust, Series2017-1-A | | | 3.97 | % | | | 07/15/2042 | | | | 2,962,513 | |
| | 4,127,265 | | | Castlelake Aircraft Securitization Trust, Series2018-1-A | | | 4.13 | % ^ | | | 06/15/2043 | | | | 2,968,828 | |
| | 6,943,677 | | | Castlelake Aircraft Securitization Trust, Series2019-1A-A | | | 3.97 | % ^ | | | 04/15/2039 | | | | 4,924,380 | |
| | 4,194,221 | | | CLI Funding LLC, Series2017-1A-A | | | 3.62 | % ^ | | | 05/18/2042 | | | | 4,106,276 | |
| | 10,371,228 | | | CLI Funding LLC, Series2018-1A-A | | | 4.03 | % ^ | | | 04/18/2043 | | | | 9,933,783 | |
| | 7,809,574 | | | CLI Funding LLC, Series2019-1A-A | | | 3.71 | % ^ | | | 05/18/2044 | | | | 7,326,549 | |
| | 3,896,517 | | | CLUB Credit Trust, Series2018-P3-A | | | 3.82 | % ^ | | | 01/15/2026 | | | | 3,790,998 | |
| | 9,396,526 | | | College Ave Student Loans LLC, Series2018-A-A1 (1 Month LIBOR USD + 1.20%) | | | 2.15 | % ^ | | | 12/26/2047 | | | | 8,989,683 | |
| | 1,488,750 | | | DB Master Finance LLC, Series2019-1A-A2I | | | 3.79 | % ^ | | | 05/20/2049 | | | | 1,462,368 | |
| | 5,300,000 | | | Element Rail Leasing LLC, Series2014-1A-A2 | | | 3.67 | % ^ | | | 04/19/2044 | | | | 5,278,520 | |
| | 4,282,619 | | | GAIA Aviation Ltd., Series2019-1-A | | | 3.97 | % ^§ | | | 12/15/2044 | | | | 2,879,637 | |
| | 14,538,600 | | | Global SC Finance Ltd., Series2018-1A-A | | | 4.29 | % ^ | | | 05/17/2038 | | | | 14,169,516 | |
| | 5,250,000 | | | GLS Auto Receivables Trust, Series2018-2A-B | | | 3.71 | % ^ | | | 03/15/2023 | | | | 5,045,274 | |
| | 7,761,128 | | | Harbour Aircraft Investments Ltd., Series2017-1-A | | | 4.00 | % | | | 11/15/2037 | | | | 6,508,637 | |
| | 8,604,822 | | | Helios Issuer LLC, Series2017-1A-A | | | 4.94 | % ^ | | | 09/20/2049 | | | | 8,136,868 | |
| | 3,688,409 | | | HERO Funding Trust, Series2016-1A-A | | | 4.05 | % ^ | | | 09/20/2041 | | | | 3,859,685 | |
| | 13,813,096 | | | Horizon Aircraft Finance Ltd., Series2019-2-A | | | 3.43 | % ^ | | | 11/15/2039 | | | | 9,139,614 | |
| | 4,875,000 | | | Jimmy Johns Funding LLC, Series2017-1A-A2II | | | 4.85 | % ^ | | | 07/30/2047 | | | | 4,929,201 | |
| | 2,733,215 | | | JOL Air Ltd., Series2019-1-A | | | 3.97 | % ^ | | | 04/15/2044 | | | | 1,971,001 | |
| | 16,881,966 | | | MACH 1 Cayman2019-1 Ltd., Series2019-1-A | | | 3.47 | % ^ | | | 10/15/2039 | | | | 11,279,466 | |
| | 1,975,499 | | | Mosaic Solar Loan Trust, Series2018-1A-A | | | 4.01 | % ^ | | | 06/22/2043 | | | | 1,899,266 | |
| | 3,000,000 | | | Mosaic Solar Loan Trust, Series2019-2A-B | | | 3.28 | % ^ | | | 09/20/2040 | | | | 2,584,428 | |
| | 7,500,000 | | | Navient Private Education Loan Trust, Series2018-A-B | | | 3.68 | % ^ | | | 02/18/2042 | | | | 7,755,447 | |
| | 9,364,134 | | | NP SPE LLC, Series2016-1A-A1 | | | 4.16 | % ^ | | | 04/20/2046 | | | | 9,529,312 | |
| | 5,000,000 | | | NP SPE LLC, Series2019-1A-A2 | | | 3.24 | % ^ | | | 09/20/2049 | | | | 4,733,805 | |
| | 4,732,143 | | | Pioneer Aircraft Finance Ltd., Series2019-1-A | | | 3.97 | % ^ | | | 06/15/2044 | | | | 3,246,761 | |
| | 19,950,000 | | | Primose Funding LLC, Series2019-1A-A2 | | | 4.48 | % ^ | | | 07/30/2049 | | | | 18,422,065 | |
| | 5,000,000 | | | Sapphire Aviation Finance Ltd., Series2020-1A-A | | | 3.23 | % ^ | | | 03/15/2040 | | | | 3,150,570 | |
| | 6,000,000 | | | SBA Tower Trust | | | 3.17 | % ^ | | | 04/11/2022 | | | | 5,971,504 | |
| | 2,493,750 | | | SERVPRO Master Issuer LLC, Series2019-1A-A2 | | | 3.88 | % ^ | | | 10/25/2049 | | | | 2,351,211 | |
| | 5,249,266 | | | Shenton Aircraft Investment Ltd., Series2015-1A-A | | | 4.75 | % ^ | | | 10/15/2042 | | | | 4,189,487 | |
| | 194,712 | | | SoFi Consumer Loan Program Trust, Series2016-2-A | | | 3.09 | % ^ | | | 10/27/2025 | | | | 191,358 | |
| | 320,884 | | | SoFi Consumer Loan Program Trust, Series2017-1-A | | | 3.28 | % ^ | | | 01/26/2026 | | | | 315,337 | |
| | 500,000 | | | SoFi Consumer Loan Program Trust, Series2017-1-B | | | 4.73 | % # ^ | | | 01/26/2026 | | | | 479,361 | |
| | 119,979 | | | SoFi Consumer Loan Program Trust, Series2017-2-A | | | 3.28 | % ^ | | | 02/25/2026 | | | | 119,554 | |
| | 2,988,352 | | | SoFi Consumer Loan Program Trust, Series2017-5-A2 | | | 2.78 | % ^ | | | 09/25/2026 | | | | 2,831,441 | |
| | 2,588,705 | | | SoFi Professional Loan Program, Series2016-A-A2 | | | 2.76 | % ^ | | | 12/26/2036 | | | | 2,617,005 | |
| | 5,000,000 | | | SoFi Professional Loan Program, Series2017-B-BFX | | | 3.70 | % # ^ | | | 05/25/2040 | | | | 5,248,030 | |
| | 2,000,000 | | | SoFi Professional Loan Program, Series2017-C-C | | | 4.21 | % # ^ | | | 07/25/2040 | | | | 2,093,424 | |
| | 431,038 | | | Spruce Asset Backed Securities Trust, Series2016-E1-A | | | 4.32 | % ^ | | | 06/15/2028 | | | | 425,254 | |
| | 3,000,000 | | | Stack Infrastructure Issuer LLC, Series2019-2A-A2 | | | 3.08 | % ^ | | | 10/25/2044 | | | | 2,852,643 | |
| | 3,714,286 | | | START Ireland, Series2019-1-A | | | 4.09 | % ^ | | | 03/15/2044 | | | | 2,532,470 | |
| | 3,660,795 | | | Start Ltd., Series2018-1-A | | | 4.09 | % ^ | | | 05/15/2043 | | | | 2,643,845 | |
| | 7,808,000 | | | Start Ltd., Series2019-2-A | | | 3.54 | % ^ | | | 11/15/2044 | | | | 5,050,246 | |
| | 4,727,499 | | | Sunnova Helios Issuer LLC, Series2018-1A-A | | | 4.87 | % ^ | | | 07/20/2048 | | | | 4,289,837 | |
| | 5,500,000 | | | Sunnova Sol LLC, Series2020-1A-A | | | 3.35 | % ^ | | | 02/01/2055 | | | | 4,080,549 | |
| | 4,968,911 | | | Sunrun Atlas Issuer LLC, Series2019-2-A | | | 3.61 | % ^ | | | 02/01/2055 | | | | 4,372,930 | |
| | 2,214,443 | | | Textainer Marine Containers Ltd., Series2017-1A-A | | | 3.72 | % ^ | | | 05/20/2042 | | | | 2,005,149 | |
| | 9,266,667 | | | Textainer Marine Containers Ltd., Series2019-1A-A | | | 3.96 | % ^ | | | 04/20/2044 | | | | 8,728,630 | |
| | 3,354,043 | | | USQ Rail LLC, Series2018-1-A1 | | | 3.78 | % ^ | | | 04/25/2048 | | | | 3,383,767 | |
| | 12,729,167 | | | Vantage Data Centers Issuer LLC, Series2018-1A-A2 | | | 4.07 | % ^ | | | 02/16/2043 | | | | 12,697,204 | |
| | 5,000,000 | | | VB-S1 Issuer LLC, Series2018-1A-C | | | 3.41 | % ^ | | | 02/15/2048 | | | | 4,386,818 | |
| | 13,018,050 | | | Wave LLC, Series2019-1-A | | | 3.60 | % ^ | | | 09/15/2044 | | | | 8,360,153 | |
| | | | | | | | | | | | | | | | |
| | Total Asset Backed Obligations (Cost $325,697,729) | | | | | | | | | | | 282,267,697 | |
| | | | | | | | | | | | | |
| | | | | | | | | | | | | | | | |
| | | | | | | | | | | | | |
| | Bank Loans - 3.1% | | | | | | | | | | | | |
| | 3,024,091 | | | 1011778 B.C. Unlimited Liability Company, Senior Secured First Lien Term Loan (1 Month LIBOR USD + 1.75%) | | | 2.67 | % | | | 11/19/2026 | | | | 2,804,845 | |
| | 1,300,249 | | | Access CIG LLC, Senior Secured First Lien Term Loan (1 Month LIBOR USD + 3.75%) | | | 5.53 | % | | | 02/27/2025 | | | | 1,071,080 | |
| | 1,579,404 | | | Achilles Acquisition LLC, Senior Secured First Lien Term Loan (1 Month LIBOR USD + 4.00%) | | | 5.00 | % | | | 10/13/2025 | | | | 1,401,721 | |
| | 1,938,216 | | | Acrisure, LLC, Senior Secured First Lien Term Loan (3 Month LIBOR USD + 3.50%) | | | 5.21 | % | | | 02/16/2027 | | | | 1,734,703 | |
| | 523,230 | | | Advanced Drainage Systems, Inc., Senior Secured First Lien Term Loan (1 Month LIBOR USD + 2.25%) | | | 3.23 | % | | | 07/31/2026 | | | | 489,220 | |
| | 2,731,128 | | | Agiliti Health, Inc., Senior Secured First Lien Term Loan (1 Month LIBOR USD + 3.00%) | | | 4.44 | % | | | 01/05/2026 | | | | 2,635,539 | |
| | 1,666,243 | | | Air Medical Group Holdings, Inc., Senior Secured First Lien Term Loan (1 Month LIBOR USD + 3.25%, 1.00% Floor) | | | 4.93 | % | | | 04/28/2022 | | | | 1,557,937 | |
| | 1,569,359 | | | Air Methods Corporation, Senior Secured First Lien Term Loan (3 Month LIBOR USD + 3.50%, 1.00% Floor) | | | 4.95 | % | | | 04/22/2024 | | | | 1,121,221 | |
| | 1,790,000 | | | Aldevron LLC, Senior Secured First Lien Term Loan (1 Month LIBOR USD + 4.25%, 1.00% Floor) | | | 5.70 | % | | | 10/13/2026 | | | | 1,691,550 | |
| | 2,268,681 | | | Alera Group Intermediate Holdings, Inc., Senior Secured First Lien Term Loan (1 Month LIBOR USD + 4.00%) | | | 4.99 | % | | | 08/01/2025 | | | | 1,996,439 | |
| | 1,595,627 | | | Aleris International, Inc., Senior Secured First Lien Term Loan (1 Month LIBOR USD + 4.75%) | | | 5.74 | % | | | 02/27/2023 | | | | 1,446,037 | |
| | 1,249,470 | | | AlixPartners LLP, Senior Secured First Lien Term Loan (1 Month LIBOR USD + 2.75%, 1.00% Floor) | | | 3.50 | % | | | 04/04/2024 | | | | 1,202,614 | |
| | 1,768,130 | | | Alliant Holdings Intermediate LLC, Senior Secured First Lien Term Loan (1 Month LIBOR USD + 3.25%) | | | 3.86 | % | | | 05/09/2025 | | | | 1,624,027 | |
| | 2,716,451 | | | Allied Universal Holdco LLC, Senior Secured First Lien Term Loan (6 Month LIBOR USD + 4.25%) | | | 5.24 | % | | | 07/10/2026 | | | | 2,526,300 | |
| | 1,648,245 | | | Almonde, Inc., Senior Secured First Lien Term Loan (6 Month LIBOR USD + 3.50%, 1.00% Floor) | | | 5.28 | % | | | 06/13/2024 | | | | 1,424,356 | |
| | 680,000 | | | Almonde, Inc., Senior Secured Second Lien Term Loan (6 Month LIBOR USD + 7.25%, 1.00% Floor) | | | 9.03 | % | | | 06/16/2025 | | | | 522,240 | |
| | 1,963,034 | | | Alterra Mountain Company, Senior Secured First Lien Term Loan (1 Month LIBOR USD + 3.00%, 1.00% Floor) | | | 3.75 | % | | | 07/31/2024 | | | | 1,796,176 | |
| | 330,000 | | | Amentum Holdings LLC, Senior Secured First Lien Term Loan (1 Month LIBOR USD + 4.00%) | | | 4.99 | % | | | 02/01/2027 | | | | 308,550 | |
| | 335,000 | | | American Airlines, Inc., Senior Secured First Lien Term Loan (1 Month LIBOR USD + 1.75%) | | | 2.69 | % | | | 01/29/2027 | | | | 278,259 | |
| | 697,806 | | | American Airlines, Inc., Senior Secured First Lien Term Loan (1 Month LIBOR USD + 2.00%) | | | 2.70 | % | | | 12/15/2023 | | | | 564,874 | |
| | | | American Tire Distributors, Inc., Senior Secured First Lien Term Loan | | | | | | | | | | | | |
| | 805,345 | | | (1 Month LIBOR USD + 7.50%, 1.00% Floor, 8.00% PIK) | | | 8.50 | % | | | 09/02/2024 | | | | 543,608 | |
| | 101,633 | | | (3 Month LIBOR USD + 7.50%, 1.00% Floor, 8.00% PIK) | | | 8.95 | % | | | 09/02/2024 | | | | 68,602 | |
| | 2,730,405 | | | Applied Systems, Inc., Senior Secured First Lien Term Loan (3 Month LIBOR USD + 3.00%, 1.00% Floor) | | | 4.70 | % | | | 09/19/2024 | | | | 2,543,823 | |
| | 1,645,000 | | | Aramark Services, Inc., Senior Secured First Lien Term Loan (1 Month LIBOR USD + 1.75%) | | | 2.74 | % | | | 03/11/2025 | | | | 1,551,786 | |
| | 730,000 | | | Aramark Services, Inc., Senior Secured First Lien Term Loan (1 Month LIBOR USD + 1.75%) | | | 2.74 | % | | | 01/15/2027 | | | | 682,550 | |
| | 810,000 | | | Arconic Corporation, Senior Secured First Lien Term Loan | | | 4.66 | % ± | | | 02/04/2027 | | | | 741,150 | |
| | 653,175 | | | Arctic Glacier, Inc., Senior Secured First Lien Term Loan (1 Month LIBOR USD + 3.50%, 1.00% Floor) | | | 4.95 | % | | | 03/20/2024 | | | | 538,870 | |
| | 2,744,712 | | | Ascend Learning LLC, Senior Secured First Lien Term Loan (1 Month LIBOR USD + 3.00%, 1.00% Floor) | | | 4.00 | % | | | 07/12/2024 | | | | 2,490,826 | |
| | 2,482,364 | | | AssuredPartners, Inc., Senior Secured First Lien Term Loan (1 Month LIBOR USD + 3.50%) | | | 4.49 | % | | | 02/12/2027 | | | | 2,190,686 | |
| | 3,187,176 | | | Asurion LLC, Senior Secured First Lien Term Loan (1 Month LIBOR USD + 3.00%) | | | 3.99 | % | | | 11/03/2023 | | | | 3,075,625 | |
| | 1,575,095 | | | Asurion LLC, Senior Secured Second Lien Term Loan (1 Month LIBOR USD + 6.50%) | | | 7.49 | % | | | 08/04/2025 | | | | 1,459,916 | |
| | 2,750,532 | | | Athenahealth, Inc., Senior Secured First Lien Term Loan (3 Month LIBOR USD + 4.50%) | | | 5.28 | % | | | 02/11/2026 | | | | 2,585,500 | |
| | 1,501,944 | | | Auris Luxembourg III Sarl, Senior Secured First Lien Term Loan (1 Month LIBOR USD + 3.75%) | | | 4.74 | % | | | 02/27/2026 | | | | 1,152,742 | |
| | 728,534 | | | Avantor, Inc., Senior Secured First Lien Term Loan (1 Month LIBOR USD + 3.00%, 1.00% Floor) | | | 3.25 | % | | | 11/21/2024 | | | | 693,928 | |
| | 1,890,927 | | | Avaya, Inc., Senior Secured First Lien Term Loan (1 Month LIBOR USD + 4.25%) | | | 4.95 | % | | | 12/16/2024 | | | | 1,630,925 | |
| | 2,754,834 | | | Azalea TopCo, Inc., Senior Secured First Lien Term Loan (1 Month LIBOR USD + 3.50%) | | | 4.49 | % | | | 07/24/2026 | | | | 2,555,108 | |
| | 462,879 | | | Bass Pro Group LLC, Senior Secured First Lien Term Loan (1 Month LIBOR USD + 5.00%, 0.75% Floor) | | | 6.07 | % | | | 09/25/2024 | | | | 391,133 | |
| | 1,423,750 | | | Bausch Health Companies, Inc., Senior Secured First Lien Term Loan (1 Month LIBOR USD + 2.75%) | | | 3.36 | % | | | 11/27/2025 | | | | 1,359,681 | |
| | 486,750 | | | Bausch Health Companies, Inc., Senior Secured First Lien Term Loan (1 Month LIBOR USD + 3.00%) | | | 3.61 | % | | | 06/02/2025 | | | | 465,861 | |
| | 900,250 | | | BellRing Brands LLC, Senior Secured First Lien Term Loan (1 Month LIBOR USD + 5.00%, 1.00% Floor) | | | 6.00 | % | | | 10/21/2024 | | | | 848,486 | |
| | 235,867 | | | Berry Global, Inc., Senior Secured First Lien Term Loan (1 Month LIBOR USD + 2.00%) | | | 2.86 | % | | | 10/03/2022 | | | | 227,512 | |
| | 2,317,488 | | | Berry Global, Inc., Senior Secured First Lien Term Loan (1 Month LIBOR USD + 2.00%) | | | 2.86 | % | | | 07/01/2026 | | | | 2,215,136 | |
| | 1,635,199 | | | BJ’s Wholesale Club, Inc., Senior Secured First Lien Term Loan (1 Month LIBOR USD + 2.75%) | | | 3.05 | % | | | 02/02/2024 | | | | 1,578,989 | |
| | 1,883,740 | | | Blackhawk Network Holdings, Inc., Senior Secured First Lien Term Loan (1 Month LIBOR USD + 3.00%) | | | 3.99 | % | | | 06/16/2025 | | | | 1,559,463 | |
| | 1,646,004 | | | Blackstone CQP Holdco LP, Senior Secured First Lien Term Loan (3 Month LIBOR USD + 3.50%) | | | 4.62 | % | | | 09/30/2024 | | | | 1,314,334 | |
| | 1,859,987 | | | Boxer Parent Company, Inc., Senior Secured First Lien Term Loan (1 Month LIBOR USD + 4.25%) | | | 5.85 | % | | | 10/02/2025 | | | | 1,564,017 | |
| | 837,846 | | | Brand Energy & Infrastructure Services, Inc., Senior Secured First Lien Term Loan (3 Month LIBOR USD + 4.25%, 1.00% Floor) | | | 6.06 | % | | | 06/21/2024 | | | | 679,569 | |
| | 1,657,743 | | | Brazos Delaware LLC, Senior Secured First Lien Term Loan (1 Month LIBOR USD + 4.00%) | | | 4.92 | % | | | 05/21/2025 | | | | 874,459 | |
| | 1,137,360 | | | Bright Bidco B.V., Senior Secured First Lien Term Loan (6 Month LIBOR USD + 3.50%, 1.00% Floor) | | | 4.57 | % | | | 06/28/2024 | | | | 430,775 | |
| | 1,174,570 | | | Brookfield WEC Holdings Inc., Senior Secured First Lien Term Loan (1 Month LIBOR USD + 3.00%, 0.75% Floor) | | | 3.99 | % | | | 08/01/2025 | | | | 1,120,246 | |
| | 1,840,000 | | | Buckeye Partners LP, Senior Secured First Lien Term Loan (1 Month LIBOR USD + 2.75%) | | | 3.77 | % | | | 11/02/2026 | | | | 1,702,920 | |
| | 2,591,743 | | | Caesars Resort Collection LLC, Senior Secured First Lien Term Loan (1 Month LIBOR USD + 2.75%) | | | 3.74 | % | | | 12/23/2024 | | | | 2,125,229 | |
| | 218,900 | | | Calpine Corporation, Senior Secured First Lien Term Loan (1 Month LIBOR USD + 2.50%) | | | 2.99 | % | | | 08/12/2026 | | | | 209,050 | |
| | 3,221,884 | | | Calpine Corporation, Senior Secured First Lien Term Loan (3 Month LIBOR USD + 2.75%) | | | 3.24 | % | | | 04/06/2026 | | | | 3,084,954 | |
| | 2,743,125 | | | Camelot US Acquisition Company, Senior Secured First Lien Term Loan (1 Month LIBOR USD + 3.25%) | | | 4.24 | % | | | 10/30/2026 | | | | 2,619,684 | |
| | 2,332,233 | | | Capri Acquisitions BidCo Ltd., Senior Secured First Lien Term Loan (3 Month LIBOR USD + 3.00%) | | | 4.78 | % | | | 11/01/2024 | | | | 2,023,212 | |
| | 2,840,000 | | | Castle US Holding Corporation, Senior Secured First Lien Term Loan (1 Month LIBOR USD + 3.75%) | | | 5.20 | % | | | 01/27/2027 | | | | 2,314,614 | |
| | 960,668 | | | Catalent Pharma Solutions, Inc., Senior Secured First Lien Term Loan (1 Month LIBOR USD + 2.25%) | | | 3.24 | % | | | 05/18/2026 | | | | 936,651 | |
| | 1,961,014 | | | Cengage Learning, Inc., Senior Secured First Lien Term Loan (1 Month LIBOR USD + 4.25%, 1.00% Floor) | | | 5.25 | % | | | 06/07/2023 | | | | 1,608,031 | |
| | 2,310,000 | | | CenturyLink, Inc., Senior Secured First Lien Term Loan (1 Month LIBOR USD + 2.25%) | | | 3.24 | % | | | 03/15/2027 | | | | 2,169,968 | |
| | 2,525,512 | | | CEOC LLC, Senior Secured First Lien Term Loan (1 Month LIBOR USD + 2.00%) | | | 2.99 | % | | | 10/04/2024 | | | | 2,083,547 | |
| | 2,710,000 | | | Change Healthcare Holdings, Inc., Senior Secured First Lien Term Loan (1 Month LIBOR USD + 2.50%, 1.00% Floor) | | | 3.50 | % | | | 03/01/2024 | | | | 2,588,050 | |
| | 977,445 | | | Charter NEX US, Inc., Senior Secured First Lien Term Loan (1 Month LIBOR USD + 3.50%) | | | 4.49 | % | | | 05/16/2024 | | | | 861,779 | |
| | 817,032 | | | CHG Healthcare Services, Inc., Senior Secured First Lien Term Loan (1 Month LIBOR USD + 3.00%, 1.00% Floor) | | | 4.07 | % | | | 06/07/2023 | | | | 736,689 | |
| | | | | | | | | | | | | | | | |
| | | | | | | | | | | | | |
| | 2,301,063 | | | CHG PPC Parent LLC, Senior Secured First Lien Term Loan (1 Month LIBOR USD + 2.75%) | | | 3.74 | % | | | 03/31/2025 | | | | 2,082,462 | |
| | 802,772 | | | Cincinnati Bell, Inc., Senior Secured First Lien Term Loan (1 Month LIBOR USD + 3.25%, 1.00% Floor) | | | 4.25 | % | | | 10/02/2024 | | | | 776,051 | |
| | 318,400 | | | Clear Channel Outdoor Holdings, Inc., Senior Secured First Lien Term Loan (1 Month LIBOR USD + 3.50%) | | | 4.49 | % | | | 08/21/2026 | | | | 270,640 | |
| | 1,011,411 | | | ClubCorporationHoldings, Inc., Senior Secured First Lien Term Loan (3 Month LIBOR USD + 2.75%) | | | 4.20 | % | | | 09/18/2024 | | | | 647,808 | |
| | 2,152,182 | | | Compass Power Generation LLC, Senior Secured First Lien Term Loan (1 Month LIBOR USD + 3.50%, 1.00% Floor) | | | 4.50 | % | | | 12/20/2024 | | | | 1,958,485 | |
| | 800,000 | | | Connect U.S. Finco LLC, Senior Secured First Lien Term Loan (1 Month LIBOR USD + 4.50%, 1.00% Floor) | | | 5.50 | % | | | 12/11/2026 | | | | 645,000 | |
| | 764,278 | | | Covia Holdings Corporation, Senior Secured First Lien Term Loan (1 Week LIBOR USD + 3.75%, 1.00% Floor) | | | 5.39 | % | | | 06/02/2025 | | | | 361,744 | |
| | 832,821 | | | CPM Holdings, Inc., Senior Secured First Lien Term Loan (6 Month LIBOR USD + 3.75%) | | | 4.84 | % | | | 11/17/2025 | | | | 690,408 | |
| | 1,176,081 | | | CSC Holdings LLC, Senior Secured First Lien Term Loan (1 Month LIBOR USD + 2.25%) | | | 2.86 | % | | | 07/17/2025 | | | | 1,131,002 | |
| | 524,700 | | | CSC Holdings LLC, Senior Secured First Lien Term Loan (1 Month LIBOR USD + 2.25%) | | | 2.86 | % | | | 01/15/2026 | | | | 506,335 | |
| | 1,436,400 | | | CSC Holdings LLC, Senior Secured First Lien Term Loan (1 Month LIBOR USD + 2.50%) | | | 3.11 | % | | | 04/15/2027 | | | | 1,390,909 | |
| | 1,335,280 | | | CSM Bakery Solutions LLC, Senior Secured First Lien Term Loan (3 Month LIBOR USD + 4.00%, 1.00% Floor) | | | 5.87 | % | | | 07/03/2020 | | | | 1,104,944 | |
| | 1,634,021 | | | Cvent, Inc., Senior Secured First Lien Term Loan (1 Month LIBOR USD + 3.75%, 1.00% Floor) | | | 4.75 | % | | | 11/29/2024 | | | | 1,190,115 | |
| | 487,458 | | | Cyanco Intermediate Corporation, Senior Secured First Lien Term Loan (1 Month LIBOR USD + 3.50%) | | | 4.49 | % | | | 03/17/2025 | | | | 419,217 | |
| | 1,332,443 | | | Cyxtera DC Holdings, Inc., Senior Secured First Lien Term Loan (1 Month LIBOR USD + 3.00%, 1.00% Floor) | | | 4.00 | % | | | 05/01/2024 | | | | 890,738 | |
| | 194,513 | | | Dealer Tire, LLC, Senior Secured First Lien Term Loan (1 Month LIBOR USD + 4.25%) | | | 5.24 | % | | | 12/12/2025 | | | | 161,769 | |
| | 1,710,000 | | | Deerfield Holdings Corporation, Senior Secured First Lien Term Loan | | | 4.75 | % ± | | | 02/25/2027 | | | | 1,470,600 | |
| | 1,303,170 | | | Deerfield Holdings Corporation, Senior Secured First Lien Term Loan (1 Month LIBOR USD + 3.25%, 1.00% Floor) | | | 4.25 | % | | | 02/13/2025 | | | | 1,286,880 | |
| | 3,060,231 | | | Dell International LLC, Senior Secured First Lien Term Loan (1 Month LIBOR USD + 2.00%, 0.75% Floor) | | | 2.99 | % | | | 09/19/2025 | | | | 2,940,698 | |
| | 2,286,489 | | | DentalCorporationPerfect Smile ULC, Senior Secured First Lien Term Loan (1 Month LIBOR USD + 3.75%, 1.00% Floor) | | | 4.75 | % | | | 06/06/2025 | | | | 1,817,759 | |
| | 2,136,559 | | | Diamond B.V., Senior Secured First Lien Term Loan (3 Month LIBOR USD + 3.00%) | | | 4.78 | % | | | 09/06/2024 | | | | 1,630,910 | |
| | 358,200 | | | Diamond Sports Group LLC, Senior Secured First Lien Term Loan (1 Month LIBOR USD + 3.25%) | | | 4.18 | % | | | 08/24/2026 | | | | 281,187 | |
| | 704,217 | | | Digicel International Finance Ltd., Senior Secured First Lien Term Loan (6 Month LIBOR USD + 3.25%) | | | 4.87 | % | | | 05/27/2024 | | | | 557,652 | |
| | 1,220,000 | | | DigiCert Holdings, Inc., Senior Secured First Lien Term Loan (3 Month LIBOR USD + 4.00%) | | | 4.99 | % | | | 10/16/2026 | | | | 1,096,987 | |
| | 2,735,947 | | | Dun & Bradstreet Corporation, Senior Secured First Lien Term Loan (1 Month LIBOR USD + 5.00%) | | | 4.96 | % | | | 02/06/2026 | | | | 2,486,292 | |
| | 339,466 | | | Dynasty Acquisition Company, Inc., Senior Secured First Lien Term Loan (3 Month LIBOR USD + 3.50%) | | | 4.95 | % | | | 04/06/2026 | | | | 275,392 | |
| | 631,407 | | | Dynasty Acquisition Company, Inc., Senior Secured First Lien Term Loan (3 Month LIBOR USD + 3.50%) | | | 4.95 | % | | | 04/06/2026 | | | | 512,229 | |
| | 530,450 | | | Dynatrace LLC, Senior Secured First Lien Term Loan (1 Month LIBOR USD + 3.25%) | | | 3.24 | % | | | 08/22/2025 | | | | 503,928 | |
| | 2,741,880 | | | E.W. Scripps Company, Senior Secured First Lien Term Loan (1 Month LIBOR USD + 2.50%) | | | 3.49 | % | | | 05/01/2026 | | | | 2,618,495 | |
| | 2,305,507 | | | EAB Global, Inc., Senior Secured First Lien Term Loan (6 Month LIBOR USD + 3.75%, 1.00% Floor) | | | 5.74 | % | | | 11/15/2024 | | | | 1,885,328 | |
| | 826,735 | | | EG America LLC, Senior Secured First Lien Term Loan (3 Month LIBOR USD + 4.00%) | | | 5.07 | % | | | 02/06/2025 | | | | 615,091 | |
| | 790,000 | | | Elanco Animal Health, Inc., Senior Secured First Lien Term Loan | | | 3.55 | % ± | | | 02/26/2027 | | | | 756,425 | |
| | 1,528,267 | | | Envision Healthcare Corporation, Senior Secured First Lien Term Loan (1 Month LIBOR USD + 3.75%) | | | 4.74 | % | | | 10/10/2025 | | | | 818,899 | |
| | 981,512 | | | Equinox Holdings, Inc., Senior Secured First Lien Term Loan (1 Month LIBOR USD + 3.00%, 1.00% Floor) | | | 4.07 | % | | | 03/08/2024 | | | | 729,082 | |
| | 848,751 | | | ESH Hospitality, Inc., Senior Secured First Lien Term Loan (1 Month LIBOR USD + 2.00%) | | | 2.99 | % | | | 09/18/2026 | | | | 763,876 | |
| | 1,874,846 | | | Excelitas Technologies Corporation, Senior Secured First Lien Term Loan (3 Month LIBOR USD + 3.50%, 1.00% Floor) | | | 4.95 | % | | | 12/02/2024 | | | | 1,640,490 | |
| | 331,965 | | | Exgen Renewables IV LLC, Senior Secured First Lien Term Loan (3 Month LIBOR USD + 3.00%, 1.00% Floor) | | | 4.62 | % | | | 11/29/2024 | | | | 301,258 | |
| | 1,904,575 | | | Filtration Group Corporation, Senior Secured First Lien Term Loan (1 Month LIBOR USD + 3.00%) | | | 3.99 | % | | | 03/31/2025 | | | | 1,683,168 | |
| | 4,587,760 | | | Financial & Risk US Holdings, Inc., Senior Secured First Lien Term Loan (1 Month LIBOR USD + 3.75%) | | | 4.24 | % | | | 10/01/2025 | | | | 4,429,092 | |
| | 820,000 | | | Flex Acquisition Company Inc, Senior Secured First Lien Term Loan (3 Month LIBOR USD + 3.00%, 1.00% Floor) | | | 4.43 | % | | | 12/29/2023 | | | | 754,400 | |
| | 835,000 | | | Flex Acquisition Company, Inc., Senior Secured First Lien Term Loan (3 Month LIBOR USD + 3.25%) | | | 4.68 | % | | | 06/30/2025 | | | | 768,200 | |
| | 783,282 | | | Flexential Intermediate Corporation, Senior Secured First Lien Term Loan (3 Month LIBOR USD + 3.50%) | | | 4.95 | % | | | 08/01/2024 | | | | 562,984 | |
| | 1,310,029 | | | Flexera Software LLC, Senior Secured First Lien Term Loan (1 Month LIBOR USD + 3.25%, 1.00% Floor) | | | 4.50 | % | | | 02/26/2025 | | | | 1,195,401 | |
| | 222,699 | | | Foresight Energy LLC, Senior Secured First Lien Delayed-Draw Term Loan (1 Month LIBOR USD + 11.00%, 2.00% Floor) | | | 13.00 | % & | | | 09/10/2020 | | | | 216,018 | |
| | 2,394,784 | | | Foresight Energy LLC, Senior Secured First Lien Term Loan (3 Month LIBOR USD + 5.75%, 1.00% Floor) | | | 7.36 | % W | | | 03/28/2022 | | | | 407,113 | |
| | 1,584,938 | | | Forest City Enterprises L.P., Senior Secured First Lien Term Loan (1 Month LIBOR USD + 3.50%) | | | 4.49 | % | | | 12/08/2025 | | | | 1,378,896 | |
| | 2,378,258 | | | Formula One Management Ltd., Senior Secured First Lien Term Loan (1 Month LIBOR USD + 2.50%, 1.00% Floor) | | | 3.50 | % | | | 02/01/2024 | | | | 2,147,234 | |
| | 1,016,558 | | | Forterra Finance, LLC, Senior Secured First Lien Term Loan (1 Month LIBOR USD + 3.00%, 1.00% Floor) | | | 4.00 | % | | | 10/25/2023 | | | | 850,519 | |
| | 975,000 | | | Froneri US, Inc., Senior Secured First Lien Term Loan (1 Month LIBOR USD + 2.25%) | | | 3.24 | % | | | 01/29/2027 | | | | 936,000 | |
| | 657,471 | | | Frontdoor, Inc., Senior Secured First Lien Term Loan (1 Month LIBOR USD + 2.50%) | | | 3.50 | % | | | 08/18/2025 | | | | 634,460 | |
| | 801,484 | | | Frontera Generation Holdings LLC, Senior Secured First Lien Term Loan (1 Month LIBOR USD + 4.25%, 1.00% Floor) | | | 5.25 | % | | | 05/02/2025 | | | | 597,106 | |
| | 2,195,000 | | | Garda World Security Corporation, Senior Secured First Lien Term Loan | | | 6.39 | % ± | | | 10/23/2026 | | | | 2,096,225 | |
| | 555,000 | | | Gardner Denver, Inc., Senior Secured First Lien Term Loan (1 Month LIBOR USD + 1.75%) | | | 2.74 | % | | | 03/01/2027 | | | | 525,169 | |
| | 495,000 | | | Gates Global LLC, Senior Secured First Lien Term Loan (1 Month LIBOR USD + 2.75%, 1.00% Floor) | | | 3.75 | % | | | 04/01/2024 | | | | 436,095 | |
| | 535,000 | | | Gavilan Resources LLC, Senior Secured Second Lien Term Loan (1 Month LIBOR USD + 6.00%, 1.00% Floor) | | | 6.99 | % | | | 03/01/2024 | | | | 64,200 | |
| | 1,160,000 | | | Genesee & Wyoming, Inc., Senior Secured First Lien Term Loan (1 Month LIBOR USD + 2.00%) | | | 3.45 | % | | | 12/30/2026 | | | | 1,119,406 | |
| | 2,743,545 | | | Genesys Telecommunications Laboratories, Inc., Senior Secured First Lien Term Loan (1 Month LIBOR USD + 3.25%) | | | 4.24 | % | | | 12/01/2023 | | | | 2,592,650 | |
| | 2,749,012 | | | Gentiva Health Services, Inc., Senior Secured First Lien Term Loan (1 Month LIBOR USD + 3.25%) | | | 4.25 | % | | | 07/02/2025 | | | | 2,597,816 | |
| | 1,389,408 | | | Getty Images, Inc., Senior Secured First Lien Term Loan (1 Month LIBOR USD + 4.50%) | | | 5.50 | % | | | 02/19/2026 | | | | 1,128,894 | |
| | 1,795,508 | | | Go Daddy Operating Company LLC, Senior Secured First Lien Term Loan (1 Month LIBOR USD + 2.00%) | | | 3.35 | % | | | 02/15/2024 | | | | 1,728,176 | |
| | 2,760,397 | | | GOBP Holdings Inc, Senior Secured First Lien Term Loan (3 Month LIBOR USD + 2.75%) | | | 3.74 | % | | | 10/22/2025 | | | | 2,594,773 | |
| | | | Golden Nugget, Inc., Senior Secured First Lien Term Loan | | | | | | | | | | | | |
| | 851,770 | | | (3 Month LIBOR USD + 2.50%, 0.75% Floor) | | | 3.70 | % | | | 10/04/2023 | | | | 668,640 | |
| | 997,864 | | | (1 Month LIBOR USD + 2.50%, 0.75% Floor) | | | 4.10 | % | | | 10/04/2023 | | | | 783,323 | |
| | 1,631,745 | | | GoodRX, Inc., Senior Secured First Lien Term Loan (1 Month LIBOR USD + 3.00%) | | | 3.74 | % | | | 10/10/2025 | | | | 1,541,999 | |
| | 1,474,316 | | | GrafTech Finance, Inc., Senior Secured First Lien Term Loan (1 Month LIBOR USD + 3.50%, 1.00% Floor) | | | 4.50 | % | | | 02/12/2025 | | | | 1,290,027 | |
| | 2,420,332 | | | Gray Television, Inc., Senior Secured First Lien Term Loan (1 Month LIBOR USD + 2.50%) | | | 3.49 | % | | | 01/02/2026 | | | | 2,277,533 | |
| | 54,863 | | | Grifols Worldwide Operations USA, Inc., Senior Secured First Lien Term Loan (1 Month LIBOR USD + 2.00%) | | | 2.50 | % | | | 11/15/2027 | | | | 52,348 | |
| | | | | | | | | | | | | | | | |
| | | | | | | | | | | | | |
| | 992,703 | | | GTT Communications, Inc., Senior Secured First Lien Term Loan (1 Month LIBOR USD + 2.75%) | | | 3.74 | % | | | 06/02/2025 | | | | 722,192 | |
| | | | Gulf Finance LLC, Senior Secured First Lien Term Loan | | | | | | | | | | | | |
| | 587,513 | | | (3 Month LIBOR USD + 5.25%, 1.00% Floor) | | | 6.71 | % | | | 08/25/2023 | | | | 306,094 | |
| | 976,118 | | | (1 Month LIBOR USD + 5.25%, 1.00% Floor) | | | 6.25 | % | | | 08/25/2023 | | | | 508,558 | |
| | 801,951 | | | Harbor Freight Tools USA, Inc., Senior Secured First Lien Term Loan (1 Month LIBOR USD + 2.50%, 0.75% Floor) | | | 3.49 | % | | | 08/18/2023 | | | | 736,191 | |
| | 482,050 | | | Hayward Industries, Inc., Senior Secured First Lien Term Loan (1 Month LIBOR USD + 3.50%) | | | 4.49 | % | | | 08/05/2024 | | | | 385,640 | |
| | 1,810,463 | | | HC Group Holdings, Inc., Senior Secured First Lien Term Loan (1 Month LIBOR USD + 4.50% | | | 5.49 | % | | | 08/06/2026 | | | | 1,529,841 | |
| | 664,875 | | | HD Supply, Inc., Senior Secured First Lien Term Loan (1 Month LIBOR USD + 1.75%) | | | 2.74 | % | | | 10/17/2023 | | | | 627,200 | |
| | 774,150 | | | Hexion, Inc., Senior Secured First Lien Term Loan (3 Month LIBOR USD + 3.50%) | | | 4.94 | % | | | 07/01/2026 | | | | 657,304 | |
| | 1,159,922 | | | H-Food Holdings, LLC, Senior Secured First Lien Term Loan (1 Month LIBOR USD + 3.69%) | | | 4.68 | % | | | 05/23/2025 | | | | 984,002 | |
| | 3,148,995 | | | Hilton Worldwide Finance LLC, Senior Secured First Lien Term Loan (3 Month LIBOR USD + 1.75%) | | | 2.70 | % | | | 06/22/2026 | | | | 2,999,417 | |
| | 830,772 | | | Houston Foods, Inc., Senior Secured First Lien Term Loan (1 Month LIBOR USD + 3.75%) | | | 4.74 | % | | | 07/21/2025 | | | | 702,002 | |
| | 2,287,128 | | | Hyland Software, Inc., Senior Secured First Lien Term Loan (1 Month LIBOR USD + 3.50%, 0.75% Floor) | | | 4.85 | % | | | 07/01/2024 | | | | 2,147,041 | |
| | 488,254 | | | Hyland Software, Inc., Senior Secured Second Lien Term Loan (1 Month LIBOR USD + 7.00%, 0.75% Floor) | | | 7.99 | % | | | 07/07/2025 | | | | 447,973 | |
| | 440,213 | | | IAA, Inc., Senior Secured First Lien Term Loan (1 Month LIBOR USD + 2.25%) | | | 3.25 | % | | | 06/29/2026 | | | | 422,604 | |
| | 1,586,025 | | | IHeartCommunications, Inc., Senior Secured First Lien Term Loan (1 Month LIBOR USD + 3.00%) | | | 3.99 | % | | | 05/01/2026 | | | | 1,350,603 | |
| | 1,795,000 | | | Informatica LLC, Senior Secured First Lien Term Loan (1 Month LIBOR USD + 3.25%) | | | 4.24 | % | | | 02/25/2027 | | | | 1,573,623 | |
| | 2,739,533 | | | Intelsat Jackson Holdings S.A., Senior Secured First Lien Term Loan (1 Month LIBOR USD + 3.75%, 1.00% Floor) | | | 5.68 | % | | | 11/27/2023 | | | | 2,539,204 | |
| | 1,421,128 | | | ION Trading Technologies SARL, Senior Secured First Lien Term Loan (3 Month LIBOR USD + 4.00%, 1.00% Floor) | | | 5.07 | % | | | 11/21/2024 | | | | 1,184,275 | |
| | 1,821,646 | | | IQVIA, Inc., Senior Secured First Lien Term Loan (3 Month LIBOR USD + 2.00%) | | | 2.74 | % | | | 01/17/2025 | | | | 1,681,989 | |
| | 2,081,435 | | | IRB Holding Corporation, Senior Secured First Lien Term Loan (6 Month LIBOR USD + 2.75%, 1.00% Floor) | | | 3.75 | % | | | 02/05/2025 | | | | 1,629,701 | |
| | 784,849 | | | IRI Holdings, Inc., Senior Secured First Lien Term Loan (3 Month LIBOR USD + 4.50%) | | | 6.11 | % | | | 12/01/2025 | | | | 628,860 | |
| | 2,571,878 | | | Iron Mountain Information Management LLC, Senior Secured First Lien Term Loan (1 Month LIBOR USD + 1.75%) | | | 2.74 | % | | | 01/02/2026 | | | | 2,456,144 | |
| | 1,839,961 | | | Jaguar Holding Company, Senior Secured First Lien Term Loan (1 Month LIBOR USD + 2.50%, 1.00% Floor) | | | 3.50 | % | | | 08/18/2022 | | | | 1,772,278 | |
| | 2,460,150 | | | JBS USA Lux S.A., Senior Secured First Lien Term Loan (1 Month LIBOR USD + 2.50%) | | | 3.07 | % | | | 05/01/2026 | | | | 2,321,324 | |
| | 640,958 | | | Jo-Ann Stores LLC, Senior Secured First Lien Term Loan (3 Month LIBOR USD + 5.00%, 1.00% Floor) | | | 6.00 | % | | | 10/20/2023 | | | | 250,890 | |
| | 581,815 | | | KAR Auction Services, Inc., Senior Secured First Lien Term Loan (1 Month LIBOR USD + 2.25%) | | | 3.19 | % | | | 09/19/2026 | | | | 541,088 | |
| | 972,429 | | | KBR, Inc., Senior Secured First Lien Term Loan (1 Month LIBOR USD + 2.75%) | | | 3.74 | % | | | 02/05/2027 | | | | 872,346 | |
| | 1,426,425 | | | Kestrel Bidco, Inc., Senior Secured First Lien Term Loan (3 Month LIBOR USD + 3.00%, 1.00% Floor) | | | 4.00 | % | | | 12/11/2026 | | | | 1,122,119 | |
| | 1,247,051 | | | Kindred Healthcare, Inc., Senior Secured First Lien Term Loan (1 Month LIBOR USD + 5.00%) | | | 6.00 | % | | | 07/02/2025 | | | | 1,059,994 | |
| | 1,296,866 | | | Klockner-Pentaplast of America, Inc., Senior Secured First Lien Term Loan (1 Month LIBOR USD + 4.25%, 1.00% Floor) | | | 5.25 | % | | | 06/30/2022 | | | | 918,259 | |
| | 1,676,199 | | | Kronos Acquisition Holdings, Inc., Senior Secured First Lien Term Loan (3 Month LIBOR USD + 4.00%, 1.00% Floor) | | | 5.00 | % | | | 05/15/2023 | | | | 1,516,264 | |
| | 2,286,651 | | | Kronos, Inc., Senior Secured First Lien Term Loan (3 Month LIBOR USD + 3.00%, 1.00% Floor) | | | 4.76 | % | | | 11/01/2023 | | | | 2,106,932 | |
| | 499,245 | | | Level 3 Financing, Inc., Senior Secured First Lien Term Loan (1 Month LIBOR USD + 1.75%) | | | 2.74 | % | | | 03/01/2027 | | | | 470,851 | |
| | 1,841,582 | | | Life Time Fitness, Inc., Senior Secured First Lien Term Loan (3 Month LIBOR USD + 2.75%, 1.00% Floor) | | | 4.36 | % | | | 06/10/2022 | | | | 1,385,790 | |
| | 458,830 | | | Lineage Logistics, LLC, Senior Secured First Lien Term Loan (1 Month LIBOR USD + 3.00%, 1.00% Floor) | | | 4.00 | % | | | 02/27/2025 | | | | 435,315 | |
| | 445,013 | | | Lions Gate Capital Holdings LLC, Senior Secured First Lien Term Loan (1 Month LIBOR USD + 2.25%) | | | 3.24 | % | | | 03/24/2025 | | | | 406,074 | |
| | 1,568,395 | | | Lower Cadence Holdings LLC, Senior Secured First Lien Term Loan (1 Month LIBOR USD + 4.00%) | | | 4.99 | % | | | 05/22/2026 | | | | 956,721 | |
| | 1,628,397 | | | Lucid Energy Group II Borrower LLC, Senior Secured First Lien Term Loan (1 Month LIBOR USD + 3.00%, 1.00% Floor) | | | 4.00 | % | | | 02/18/2025 | | | | 943,111 | |
| | 994,969 | | | Marriott Ownership Resorts, Inc., Senior Secured First Lien Term Loan (1 Month LIBOR USD + 1.75%) | | | 3.35 | % | | | 08/29/2025 | | | | 885,522 | |
| | 1,858,618 | | | Mavis Tire Express Services Corporation, Senior Secured First Lien Term Loan (1 Month LIBOR USD + 3.25%) | | | 4.70 | % | | | 03/20/2025 | | | | 1,507,804 | |
| | 553,890 | | | McDermott International, Inc., Senior Secured First Lien Term Loan (3 Month LIBOR USD + 5.00%, 1.00% Floor) | | | 2.00 | % W | | | 05/12/2025 | | | | 170,473 | |
| | 275,372 | | | MED ParentCo LP, Senior Secured First Lien Term Loan (1 Month LIBOR USD + 4.25%) | | | 5.24 | % & | | | 08/31/2026 | | | | 231,313 | |
| | 1,099,791 | | | MED ParentCo LP, Senior Secured First Lien Term Loan (1 Month LIBOR USD + 4.25%) | | | 5.24 | % | | | 08/31/2026 | | | | 923,830 | |
| | 642,865 | | | Messer Industries LLC, Senior Secured First Lien Term Loan (3 Month LIBOR USD + 2.50%) | | | 3.95 | % | | | 03/02/2026 | | | | 575,364 | |
| | 2,288,655 | | | Millennium Trust Company LLC, Senior Secured First Lien Term Loan (1 Month LIBOR USD + 5.00%) | | | 5.99 | % | | | 03/27/2026 | | | | 1,941,534 | |
| | 19,201 | | | Mister Car Wash Holdings, Inc., Senior Secured First Lien Term Loan | | | 5.19 | % ± | | | 05/14/2026 | | | | 16,115 | |
| | 1,586,002 | | | Mister Car Wash Holdings, Inc., Senior Secured First Lien Term Loan (3 Month LIBOR USD + 3.50%) | | | 3.86 | % | | | 05/14/2026 | | | | 1,331,108 | |
| | 1,483,733 | | | Mitchell International, Inc., Senior Secured First Lien Term Loan (1 Month LIBOR USD + 3.25%) | | | 4.24 | % | | | 11/29/2024 | | | | 1,246,336 | |
| | 335,000 | | | Mitchell International, Inc., Senior Secured Second Lien Term Loan (1 Month LIBOR USD + 7.25%) | | | 8.24 | % | | | 12/01/2025 | | | | 263,533 | |
| | 809,899 | | | MLN US HoldCo LLC, Senior Secured First Lien Term Loan (1 Month LIBOR USD + 4.50%) | | | 5.49 | % | | | 11/28/2025 | | | | 579,078 | |
| | 58,515 | | | Motion Finco, LLC, Senior Secured First Lien Term Loan (3 Month LIBOR USD + 3.25%) | | | 4.70 | % | | | 11/04/2026 | | | | 48,372 | |
| | 445,223 | | | Motion Finco, LLC, Senior Secured First Lien Term Loan (6 Month LIBOR USD + 3.25%) | | | 4.32 | % | | | 11/04/2026 | | | | 368,050 | |
| | 1,372,840 | | | MPH Acquisition Holdings LLC, Senior Secured First Lien Term Loan (3 Month LIBOR USD + 2.75%, 1.00% Floor) | | | 4.20 | % | | | 06/07/2023 | | | | 1,235,556 | |
| | 769,048 | | | Nascar Holdings, Inc., Senior Secured First Lien Term Loan (3 Month LIBOR USD + 2.75%) | | | 3.67 | % | | | 10/19/2026 | | | | 684,453 | |
| | 537,300 | | | NCR Corporation, Senior Secured First Lien Term Loan (1 Month LIBOR USD + 2.50%) | | | 3.49 | % | | | 08/28/2026 | | | | 491,630 | |
| | 2,673,219 | | | Nexstar Broadcasting, Inc., Senior Secured First Lien Term Loan (1 Month LIBOR USD + 2.75%) | | | 3.73 | % | | | 09/18/2026 | | | | 2,520,845 | |
| | 2,274,622 | | | Numericable U.S. LLC, Senior Secured First Lien Term Loan (1 Month LIBOR USD + 4.00%) | | | 4.70 | % | | | 08/14/2026 | | | | 2,177,951 | |
| | 532,325 | | | ON Semiconductor Corporation, Senior Secured First Lien Term Loan (1 Month LIBOR USD + 2.00%) | | | 2.99 | % | | | 09/18/2026 | | | | 503,713 | |
| | 395,000 | | | Outcomes Group Holdings, Inc., Senior Secured First Lien Term Loan (3 Month LIBOR USD + 3.50%) | | | 5.11 | % | | | 10/24/2025 | | | | 325,875 | |
| | 644,994 | | | Panther BF Aggregator LP, Senior Secured First Lien Term Loan (1 Month LIBOR USD + 3.50%) | | | 4.44 | % | | | 04/30/2026 | | | | 593,394 | |
| | 2,119,628 | | | Parexel International Corporation, Senior Secured First Lien Term Loan (1 Month LIBOR USD + 2.75%) | | | 3.74 | % | | | 09/27/2024 | | | | 1,830,828 | |
| | 500,613 | | | PCI Gaming Authority, Senior Secured First Lien Term Loan (1 Month LIBOR USD + 3.00%) | | | 3.49 | % | | | 05/29/2026 | | | | 415,009 | |
| | 1,289,418 | | | Penn National Gaming, Inc., Senior Secured First Lien Term Loan (1 Month LIBOR USD + 2.25%, 0.75% Floor) | | | 3.24 | % | | | 10/15/2025 | | | | 989,048 | |
| | 2,758,428 | | | PetSmart, Inc., Senior Secured First Lien Term Loan (1 Month LIBOR USD + 3.00%, 1.00% Floor) | | | 5.00 | % | | | 03/11/2022 | | | | 2,652,587 | |
| | 493,740 | | | Phoenix Services International LLC, Senior Secured First Lien Term Loan (1 Month LIBOR USD + 3.75%, 1.00% Floor) | | | 4.75 | % | | | 03/03/2025 | | | | 407,336 | |
| | 1,364,172 | | | Pike Corporation, Senior Secured First Lien Term Loan (1 Month LIBOR USD + 3.25%) | | | 4.24 | % | | | 07/24/2026 | | | | 1,280,050 | |
| | 808,363 | | | Pisces Midco, Inc., Senior Secured First Lien Term Loan (1 Month LIBOR USD + 3.75%) | | | 4.56 | % | | | 04/12/2025 | | | | 693,172 | |
| | | | | | | | | | | | | | | | |
| | | | | | | | | | | | | |
| | 824,512 | | | Playa Resorts Holding B.V., Senior Secured First Lien Term Loan (1 Month LIBOR USD + 2.75%, 1.00% Floor) | | | 3.75 | % | | | 04/29/2024 | | | | 573,861 | |
| | 2,769,206 | | | PODS LLC, Senior Secured First Lien Term Loan (3 Month LIBOR USD + 2.75%, 1.00% Floor) | | | 3.75 | % | | | 12/06/2024 | | | | 2,478,439 | |
| | 959,380 | | | PowerTeam Services LLC, Senior Secured First Lien Term Loan (3 Month LIBOR USD + 3.25%, 1.00% Floor) | | | 4.70 | % | | | 03/06/2025 | | | | 807,476 | |
| | 661,586 | | | Prairie ECI Acquiror LP, Senior Secured First Lien Term Loan (3 Month LIBOR USD + 4.75%) | | | 6.20 | % | | | 03/11/2026 | | | | 352,129 | |
| | 1,622,125 | | | Pregis Topco LLC, Senior Secured First Lien Term Loan (3 Month LIBOR USD + 4.00%) | | | 4.99 | % | | | 07/31/2026 | | | | 1,427,470 | |
| | 285,000 | | | Presidio Holdings, Inc., Senior Secured First Lien Term Loan (3 Month LIBOR USD + 3.50%) | | | 5.28 | % | | | 01/22/2027 | | | | 267,900 | |
| | 2,053,925 | | | Prime Security Services Borrower, LLC, Senior Secured First Lien Term Loan (1 Month LIBOR USD + 3.25%, 1.00% Floor) | | | 4.27 | % | | | 09/23/2026 | | | | 1,865,991 | |
| | 971,498 | | | Pro Mach Group, Inc., Senior Secured First Lien Term Loan (1 Month LIBOR USD + 3.00%) | | | 3.68 | % | | | 03/07/2025 | | | | 782,056 | |
| | 2,103,449 | | | Project Alpha Intermediate Holding, Inc., Senior Secured First Lien Term Loan (6 Month LIBOR USD + 3.50%, 1.00% Floor) | | | 5.38 | % | | | 04/26/2024 | | | | 1,914,138 | |
| | 493,763 | | | Pug LLC, Senior Secured First Lien Term Loan (1 Month LIBOR USD + 3.50%) | | | 4.49 | % | | | 02/12/2027 | | | | 429,573 | |
| | 2,284,406 | | | Radiate Finance, Inc., Senior Secured First Lien Term Loan (1 Month LIBOR USD + 3.00%, 0.75% Floor) | | | 3.99 | % | | | 02/01/2024 | | | | 2,135,920 | |
| | | | Radiology Partners, Inc., Senior Secured First Lien Term Loan | | | | | | | | | | | | |
| | 1,058,714 | | | (2 Month LIBOR USD + 4.25%) | | | 5.98 | % | | | 07/09/2025 | | | | 887,203 | |
| | 1,234,797 | | | (12 Month LIBOR USD + 4.25%) | | | 5.99 | % | | | 07/09/2025 | | | | 1,034,760 | |
| | 1,533,035 | | | RegionalCare Hospital Partners Holdings, Inc., Senior Secured First Lien Term Loan (1 Month LIBOR USD + 4.50%) | | | 4.74 | % | | | 11/14/2025 | | | | 1,431,479 | |
| | 2,079,524 | | | Renaissance Holding Corporation, Senior Secured First Lien Term Loan (1 Month LIBOR USD + 3.25%) | | | 4.24 | % | | | 05/30/2025 | | | | 1,762,396 | |
| | 1,629,122 | | | RentPath, Inc., Senior Secured First Lien Term Loan (1 Month LIBOR USD + 4.75%, 1.00% Floor) | | | 7.00 | % W | | | 12/17/2021 | | | | 1,248,111 | |
| | 282,896 | | | RentPath, Inc., Senior Secured First Lien Term Loan (1 Month LIBOR USD + 7.00%, 1.00% Floor) | | | 8.00 | % | | | 08/31/2020 | | | | 270,166 | |
| | 630,000 | | | Reynolds Consumer Products LLC, Senior Secured First Lien Term Loan (3 Month LIBOR USD + 1.75%) | | | 3.50 | % | | | 02/04/2027 | | | | 598,185 | |
| | 2,289,257 | | | Reynolds Group Holdings, Inc., Senior Secured First Lien Term Loan (1 Month LIBOR USD + 2.75%) | | | 3.74 | % | | | 02/06/2023 | | | | 2,180,517 | |
| | 55,000 | | | Rockwood Service Corporation, Senior Secured First Lien Term Loan (3 Month LIBOR USD + 4.25%) | | | 5.70 | % | | | 01/23/2027 | | | | 47,575 | |
| | 872,813 | | | RPI Intermediate Finance Trust, Senior Secured First Lien Term Loan (1 Month LIBOR USD + 1.75%) | | | 2.74 | % | | | 02/11/2027 | | | | 816,080 | |
| | 864,063 | | | RPI Intermediate Finance Trust, Senior Secured First Lien Term Loan (1 Month LIBOR USD + 1.75%) | | | 2.74 | % | | | 02/11/2027 | | | | 811,139 | |
| | 1,629,375 | | | Science Applications International Corporation, Senior Secured First Lien Term Loan (1 Month LIBOR USD + 1.75%) | | | 2.86 | % | | | 10/31/2025 | | | | 1,538,749 | |
| | 1,000,000 | | | Science Applications International Corporation, Senior Secured First Lien Term Loan (1 Month LIBOR USD + 2.25%) | | | 3.24 | % | | | 03/12/2027 | | | | 947,500 | |
| | | | Scientific Games International, Inc., Senior Secured First Lien Term Loan | | | | | | | | | | | | |
| | 1,525,312 | | | (2 Month LIBOR USD + 2.75%) | | | 4.37 | % | | | 08/14/2024 | | | | 1,238,043 | |
| | 370,776 | | | (1 Month LIBOR USD + 2.75%) | | | 3.74 | % | | | 08/14/2024 | | | | 300,946 | |
| | 1,476,939 | | | Securus Technologies Holdings, Inc., Senior Secured First Lien Term Loan (6 Month LIBOR USD + 4.50%, 1.00% Floor) | | | 5.50 | % | | | 11/01/2024 | | | | 1,174,167 | |
| | 1,923,410 | | | Sedgwick Claims Management Services, Inc., Senior Secured First Lien Term Loan (1 Month LIBOR USD + 3.25%) | | | 4.24 | % | | | 12/31/2025 | | | | 1,720,654 | |
| | 503,738 | | | ServiceMaster Company LLC, Senior Secured First Lien Term Loan (1 Month LIBOR USD + 1.75%) | | | 2.74 | % | | | 11/05/2026 | | | | 485,099 | |
| | 2,784,585 | | | Severin Acquisition LLC, Senior Secured First Lien Term Loan (3 Month LIBOR USD + 3.25%) | | | 4.74 | % | | | 08/01/2025 | | | | 2,445,799 | |
| | 2,557,150 | | | Sinclair Television Group, Inc., Senior Secured First Lien Term Loan (1 Month LIBOR USD + 2.50%) | | | 3.21 | % | | | 09/30/2026 | | | | 2,442,078 | |
| | 596,962 | | | SIWF Holdings, Inc., Senior Secured First Lien Term Loan (1 Month LIBOR USD + 4.25%) | | | 5.32 | % | | | 06/13/2025 | | | | 537,266 | |
| | 1,553,263 | | | Six Flags Theme Parks, Inc., Senior Secured First Lien Term Loan (1 Month LIBOR USD + 1.75%) | | | 2.74 | % | | | 04/17/2026 | | | | 1,378,132 | |
| | 1,439,802 | | | SMG US Midco 2, Inc., Senior Secured First Lien Term Loan (1 Month LIBOR USD + 2.50%) | | | 4.13 | % | | | 01/23/2025 | | | | 1,241,829 | |
| | 2,738,667 | | | SolarWinds Holdings, Inc., Senior Secured First Lien Term Loan (1 Month LIBOR USD + 2.75%) | | | 3.74 | % | | | 02/05/2024 | | | | 2,569,787 | |
| | 1,496,732 | | | Solenis International LP, Senior Secured First Lien Term Loan (3 Month LIBOR USD + 4.00%) | | | 5.61 | % | | | 06/26/2025 | | | | 1,207,369 | |
| | 80,000 | | | Solenis International LP, Senior Secured Second Lien Term Loan (3 Month LIBOR USD + 8.50%) | | | 10.11 | % | | | 06/26/2026 | | | | 55,600 | |
| | 1,963,236 | | | Solera LLC, Senior Secured First Lien Term Loan (1 Month LIBOR USD + 2.75%) | | | 4.36 | % | | | 03/03/2023 | | | | 1,855,258 | |
| | 2,746,313 | | | Sophia LP, Senior Secured First Lien Term Loan (3 Month LIBOR USD + 3.25%, 1.00% Floor) | | | 4.70 | % | | | 09/30/2022 | | | | 2,636,460 | |
| | 2,745,000 | | | Sotera Health Holdings LLC, Senior Secured First Lien Term Loan (1 Month LIBOR USD + 4.50%, 1.00% Floor) | | | 5.50 | % | | | 12/11/2026 | | | | 2,425,043 | |
| | 2,763,107 | | | Sound Inpatient Physicians, Inc., Senior Secured First Lien Term Loan (1 Month LIBOR USD + 2.75%) | | | 3.74 | % | | | 06/27/2025 | | | | 2,477,595 | |
| | 750,463 | | | Southern Graphics, Inc., Senior Secured First Lien Term Loan (1 Month LIBOR USD + 3.25%) | | | 4.70 | % | | | 12/30/2022 | | | | 403,374 | |
| | 923,521 | | | Speedcast International Ltd., Senior Secured First Lien Term Loan (3 Month LIBOR USD + 2.75%) | | | 5.00 | % W | | | 05/15/2025 | | | | 233,189 | |
| | 4,495,930 | | | Sprint Communications, Inc., Senior Secured First Lien Term Loan (1 Month LIBOR USD + 2.50%, 0.75% Floor) | | | 3.49 | % | | | 02/02/2024 | | | | 4,479,070 | |
| | 1,634,272 | | | SS&C Technologies, Inc., Senior Secured First Lien Term Loan (1 Month LIBOR USD + 2.25%) | | | 2.74 | % | | | 04/16/2025 | | | | 1,545,923 | |
| | 975,719 | | | Staples, Inc., Senior Secured First Lien Term Loan (2 Month LIBOR USD + 5.00%) | | | 6.02 | % | | | 04/16/2026 | | | | 779,600 | |
| | 782,341 | | | Starfruit US Holdco LLC, Senior Secured First Lien Term Loan (1 Month LIBOR USD + 3.25%) | | | 3.86 | % | | | 10/01/2025 | | | | 709,975 | |
| | 1,878,021 | | | Stars Group Holdings B.V., Senior Secured First Lien Term Loan (3 Month LIBOR USD + 3.50%) | | | 4.95 | % | | | 07/10/2025 | | | | 1,809,942 | |
| | 340,000 | | | STG-Fairway Holdings, LLC, Senior Secured First Lien Term Loan (6 Month LIBOR USD + 3.50%) | | | 4.57 | % | | | 02/01/2027 | | | | 294,100 | |
| | 458,850 | | | Sunshine Luxembourg VII SARL, Senior Secured First Lien Term Loan (3 Month LIBOR USD + 4.25%) | | | 5.32 | % | | | 10/01/2026 | | | | 417,554 | |
| | 2,305,000 | | | Surf Holdings LLC, Senior Secured First Lien Term Loan (3 Month LIBOR USD + 3.50%) | | | 4.81 | % | | | 03/05/2027 | | | | 2,068,738 | |
| | 260,348 | | | Syncreon Group Holdings B.V., Senior Secured First Lien Term Loan (1 Month LIBOR USD + 5.00%) | | | 6.07 | % | | | 10/01/2024 | | | | 225,201 | |
| | 465,705 | | | Syncreon Group Holdings B.V., Senior Secured First Lien Term Loan (1 Month LIBOR USD + 6.00%) | | | 7.45 | % | | | 04/01/2025 | | | | 314,351 | |
| | | | TAMKO Building Products LLC, Senior Secured First Lien Term Loan | | | | | | | | | | | | |
| | 955,179 | | | (1 Month LIBOR USD + 3.25%) | | | 4.24 | % | | | 05/29/2026 | | | | 902,645 | |
| | 185,305 | | | (1 Month LIBOR USD + 3.25%) | | | 4.25 | % | | | 05/29/2026 | | | | 175,113 | |
| | 811,754 | | | Team Health Holdings, Inc., Senior Secured First Lien Term Loan (1 Month LIBOR USD + 2.75%, 1.00% Floor) | | | 3.75 | % | | | 02/06/2024 | | | | 523,581 | |
| | 1,790,513 | | | Telesat LLC, Senior Secured First Lien Term Loan (3 Month LIBOR USD + 2.75%) | | | 3.74 | % | | | 12/07/2026 | | | | 1,718,892 | |
| | 2,752,430 | | | Tempo Acquisition LLC, Senior Secured First Lien Term Loan (1 Month LIBOR USD + 3.00%) | | | 3.74 | % | | | 05/01/2024 | | | | 2,499,206 | |
| | 1,603,625 | | | Terrier Media Buyer, Inc., Senior Secured First Lien Term Loan (3 Month LIBOR USD + 4.25%) | | | 5.70 | % | | | 12/17/2026 | | | | 1,455,290 | |
| | 1,640,341 | | | The Edelman Financial Center LLC, Senior Secured First Lien Term Loan (1 Month LIBOR USD + 3.25%) | | | 4.18 | % | | | 07/21/2025 | | | | 1,412,744 | |
| | 2,309,373 | | | TIBCO Software Inc, Senior Secured First Lien Term Loan (1 Month LIBOR USD + 3.75%) | | | 4.74 | % | | | 06/30/2026 | | | | 2,193,905 | |
| | 155,000 | | | TIBCO Software Inc, Senior Secured Second Lien Term Loan (1 Month LIBOR USD + 7.25%) | | | 8.66 | % | | | 03/03/2028 | | | | 148,025 | |
| | 1,163,382 | | | Titan Acquisition Ltd., Senior Secured First Lien Term Loan (1 Month LIBOR USD + 3.00%) | | | 4.45 | % | | | 03/28/2025 | | | | 968,178 | |
| | | | | | | | | | | | | | | | |
| | | | | | | | | | | | | |
| | 1,916,269 | | | TKC Holdings, Inc., Senior Secured First Lien Term Loan (1 Month LIBOR USD + 3.75%, 1.00% Floor) | | | 4.75 | % | | | 02/01/2023 | �� | | | 1,566,071 | |
| | 461,650 | | | Trans Union LLC, Senior Secured First Lien Term Loan (1 Month LIBOR USD + 1.75%) | | | 2.74 | % | | | 11/13/2026 | | | | 445,031 | |
| | 1,909 | | | TransDigm, Inc., Senior Secured First Lien Term Loan (1 Month LIBOR USD + 2.25%) | | | 3.24 | % | | | 05/30/2025 | | | | 1,760 | |
| | 2,539,273 | | | TransDigm, Inc., Senior Secured First Lien Term Loan (1 Month LIBOR USD + 2.25%) | | | 3.24 | % | | | 12/09/2025 | | | | 2,340,359 | |
| | 781,025 | | | Travel Leaders Group LLC, Senior Secured First Lien Term Loan (1 Month LIBOR USD + 4.00%) | | | 4.96 | % | | | 01/25/2024 | | | | 600,089 | |
| | 1,054,384 | | | Travelport Finance SARL, Senior Secured First Lien Term Loan (3 Month LIBOR USD + 5.00%) | | | 6.07 | % | | | 05/29/2026 | | | | 691,676 | |
| | 825,776 | | | Trident TPI Holdings, Inc., Senior Secured First Lien Term Loan (6 Month LIBOR USD + 3.25%, 1.00% Floor) | | | 4.32 | % | | | 10/17/2024 | | | | 693,652 | |
| | 2,009,545 | | | Uber Technologies, Inc., Senior Secured First Lien Term Loan (1 Month LIBOR USD + 4.00%, 1.00% Floor) | | | 5.00 | % | | | 04/04/2025 | | | | 1,890,640 | |
| | 64,499 | | | Uber Technologies, Inc., Senior Secured First Lien Term Loan (3 Month LIBOR USD + 3.50%) | | | 4.49 | % | | | 07/13/2023 | | | | 60,951 | |
| | 2,546,239 | | | UFC Holdings LLC, Senior Secured First Lien Term Loan (1 Month LIBOR USD + 3.25%) | | | 4.25 | % | | | 04/29/2026 | | | | 2,269,336 | |
| | 793,614 | | | UGI Energy Services LLC, Senior Secured First Lien Term Loan (1 Month LIBOR USD + 3.75%) | | | 4.74 | % | | | 08/13/2026 | | | | 686,476 | |
| | 2,275,750 | | | Ultimate Software Group, Senior Secured First Lien Term Loan (1 Month LIBOR USD + 3.75%) | | | 4.74 | % | | | 05/04/2026 | | | | 2,142,994 | |
| | 773,048 | | | United Natural Foods, Inc., Senior Secured First Lien Term Loan (1 Month LIBOR USD + 4.25%) | | | 5.24 | % | | | 10/22/2025 | | | | 669,653 | |
| | 827,400 | | | United Rentals North America, Inc., Senior Secured First Lien Term Loan (1 Month LIBOR USD + 1.75%) | | | 2.74 | % | | | 10/31/2025 | | | | 779,824 | |
| | 334,163 | | | Univar Solutions USA, Inc., Senior Secured First Lien Term Loan (1 Month LIBOR USD + 2.00%) | | | 3.45 | % | | | 07/01/2026 | | | | 297,248 | |
| | 622,125 | | | Universal Health Services, Inc., Senior Secured First Lien Term Loan (1 Month LIBOR USD + 1.75%) | | | 2.74 | % | | | 10/31/2025 | | | | 597,240 | |
| | 486,747 | | | Univision Communications Inc., Senior Secured First Lien Term Loan (1 Month LIBOR USD + 2.75%, 1.00% Floor) | | | 3.75 | % | | | 03/15/2024 | | | | 418,907 | |
| | 680,000 | | | Upstream Newco, Inc., Senior Secured First Lien Term Loan (1 Month LIBOR USD + 4.50%) | | | 5.49 | % | | | 11/20/2026 | | | | 567,800 | |
| | 2,557,150 | | | US Foods, Inc., Senior Secured First Lien Term Loan (3 Month LIBOR USD + 2.00%, 0.75% Floor) | | | 3.07 | % | | | 09/14/2026 | | | | 2,357,692 | |
| | 1,248,266 | | | USIC Holdings, Inc., Senior Secured First Lien Term Loan (1 Month LIBOR USD + 3.25%, 1.00% Floor) | | | 4.25 | % | | | 12/08/2023 | | | | 1,064,147 | |
| | 952,635 | | | Vantage Specialty Chemicals, Inc., Senior Secured First Lien Term Loan | | | | | | | | | | | 726,679 | |
| | 455,617 | | | (3 Month LIBOR USD + 3.50%, 1.00% Floor) | | | 5.28 | % | | | 10/28/2024 | | | | 347,549 | |
| | 497,018 | | | (3 Month LIBOR USD + 3.50%, 1.00% Floor) | | | 4.95 | % | | | 10/28/2024 | | | | 379,130 | |
| | 2,729,902 | | | Verscend Holding Corporation, Senior Secured First Lien Term Loan (1 Month LIBOR USD + 4.50%) | | | 5.49 | % | | | 08/27/2025 | | | | 2,593,407 | |
| | 1,330,668 | | | Vertafore, Inc., Senior Secured First Lien Term Loan (1 Month LIBOR USD + 3.25%) | | | 4.24 | % | | | 07/02/2025 | | | | 1,187,096 | |
| | 2,569,644 | | | VICI Properties LLC, Senior Secured First Lien Term Loan (1 Month LIBOR USD + 2.00%) | | | 2.67 | % | | | 12/20/2024 | | | | 2,391,375 | |
| | 598,255 | | | Victory Capital Holdings, Inc., Senior Secured First Lien Term Loan (3 Month LIBOR USD + 2.50%) | | | 3.94 | % | | | 07/01/2026 | | | | 529,455 | |
| | 500,000 | | | Virgin Media Bristol LLC, Senior Secured First Lien Term Loan (1 Month LIBOR USD + 2.50%) | | | 3.20 | % | | | 01/31/2028 | | | | 466,250 | |
| | | | Vistra Operations Company LLC, Senior Secured First Lien Term Loan | | | | | | | | | | | | |
| | 605,583 | | | (1 Month LIBOR USD + 1.75%) | | | 2.55 | % | | | 12/31/2025 | | | | 578,710 | |
| | 2,530,177 | | | (1 Month LIBOR USD + 1.75%) | | | 2.74 | % | | | 12/31/2025 | | | | 2,417,901 | |
| | 2,300,000 | | | VS Buyer, LLC, Senior Secured First Lien Term Loan (3 Month LIBOR USD + 3.25%) | | | 4.86 | % | | | 02/26/2027 | | | | 2,219,500 | |
| | | | Wand NewCo 3, Inc., Senior Secured First Lien Term Loan | | | | | | | | | | | | |
| | 194,897 | | | (3 Month LIBOR USD + 3.00%) | | | 4.07 | % | | | 02/05/2026 | | | | 176,382 | |
| | 1,234,795 | | | (6 Month LIBOR USD + 3.00%) | | | 4.07 | % | | | 02/05/2026 | | | | 1,117,489 | |
| | 821,356 | | | Web.Com Group, Inc., Senior Secured First Lien Term Loan (1 Month LIBOR USD + 3.75%) | | | 4.95 | % | | | 10/10/2025 | | | | 681,726 | |
| | 1,288,533 | | | Whatabrands LLC, Senior Secured First Lien Term Loan (1 Month LIBOR USD + 2.75%) | | | 3.73 | % | | | 07/31/2026 | | | | 1,080,087 | |
| | 2,767,982 | | | Wink Holdco, Inc., Senior Secured First Lien Term Loan (1 Month LIBOR USD + 3.00%, 1.00% Floor) | | | 4.45 | % | | | 12/02/2024 | | | | 2,363,857 | |
| | 1,945,908 | | | WP CPP Holdings LLC, Senior Secured First Lien Term Loan (1 Month LIBOR USD + 3.75%, 1.00% Floor) | | | 5.36 | % | | | 04/30/2025 | | | | 1,483,755 | |
| | 2,285,000 | | | Zayo Group Holdings, Inc., Senior Secured First Lien Term Loan (1 Month LIBOR USD + 3.00%) | | | 3.99 | % | | | 03/09/2027 | | | | 2,170,750 | |
| | 483,788 | | | Zelis Cost Management Buyer, Inc., Senior Secured First Lien Term Loan (1 Month LIBOR USD + 4.75%) | | | 5.74 | % | | | 09/30/2026 | | | | 449,922 | |
| | 230,000 | | | Ziggo Financing Partnership, Senior Secured First Lien Term Loan (1 Month LIBOR USD + 2.50%) | | | 3.20 | % | | | 04/28/2028 | | | | 219,650 | |
| | | | | | | | | | | | | | | | |
| | Total Bank Loans (Cost $408,888,740) | | | | | | | | | | | 360,936,086 | |
| | | | | | | | | | | | | |
| | Collateralized Loan Obligations - 2.1% | | | | | | | | | | | | |
| | 875,000 | | | Adams Mill Ltd., Series2014-1A-D1 (3 Month LIBOR USD + 3.50%) | | | 5.33 | % ^ | | | 07/15/2026 | | | | 787,616 | |
| | 1,000,000 | | | AIMCO, Series2018-AA-D (3 Month LIBOR USD + 2.55%) | | | 4.39 | % ^ | | | 04/17/2031 | | | | 732,021 | |
| | 3,000,000 | | | ALM LLC, Series2013-7RA-CR (3 Month LIBOR USD + 4.04%) | | | 5.87 | % ^ | | | 10/15/2028 | | | | 2,530,241 | |
| | 7,500,000 | | | Anchorage Capital Ltd, Series2019-13A-B (3 Month LIBOR USD + 2.00%, 2.00% Floor) | | | 3.83 | % ^ | | | 04/15/2032 | | | | 6,923,117 | |
| | 1,000,000 | | | Apidos Ltd., Series2013-12A-DR (3 Month LIBOR USD + 2.60%) | | | 4.43 | % ^ | | | 04/15/2031 | | | | 754,410 | |
| | 1,500,000 | | | Apidos Ltd., Series2015-20A-CR (3 Month LIBOR USD + 2.95%) | | | 4.79 | % ^ | | | 07/16/2031 | | | | 1,159,940 | |
| | 5,000,000 | | | Atrium Corporation, Series9A-DR (3 Month LIBOR USD + 3.60%) | | | 5.21 | % ^ | | | 05/28/2030 | | | | 3,998,551 | |
| | 4,500,000 | | | Avery Point Ltd., Series2015-7A-DR (3 Month LIBOR USD + 3.60%) | | | 5.43 | % ^ | | | 01/15/2028 | | | | 3,544,841 | |
| | 5,000,000 | | | Babson Ltd., Series2015-2A-DR (3 Month LIBOR USD + 2.95%) | | | 4.77 | % ^ | | | 10/20/2030 | | | | 3,883,717 | |
| | 3,400,000 | | | Babson Ltd., Series2015-IA-DR (3 Month LIBOR USD + 2.60%, 2.60% Floor) | | | 4.42 | % ^ | | | 01/20/2031 | | | | 2,652,000 | |
| | 3,250,000 | | | Babson Ltd., Series2017-1A-D (3 Month LIBOR USD + 3.60%) | | | 5.42 | % ^ | | | 07/18/2029 | | | | 2,678,083 | |
| | 2,000,000 | | | Barings Ltd., Series2018-1A-C (3 Month LIBOR USD + 2.60%) | | | 4.43 | % ^ | | | 04/15/2031 | | | | 1,401,498 | |
| | 5,100,000 | | | Barings Ltd., Series2018-3A-D (3 Month LIBOR USD + 2.90%) | | | 4.72 | % ^ | | | 07/20/2029 | | | | 4,171,900 | |
| | 2,000,000 | | | Barings Ltd., Series2018-4A-D (3 Month LIBOR USD + 2.90%, 2.90% Floor) | | | 4.73 | % ^ | | | 10/15/2030 | | | | 1,506,459 | |
| | 3,000,000 | | | Barings Ltd., Series2019-1A-D (3 Month LIBOR USD + 3.85%, 3.85% Floor) | | | 5.68 | % ^ | | | 04/15/2031 | | | | 2,354,859 | |
| | 2,250,000 | | | Barings Ltd., Series2019-2A-C (3 Month LIBOR USD + 3.85%, 3.85% Floor) | | | 5.68 | % ^ | | | 04/15/2031 | | | | 1,757,979 | |
| | 3,000,000 | | | BlueMountain Ltd., Series2013-1A-CR (3 Month LIBOR USD + 4.15%, 4.15% Floor) | | | 5.97 | % ^ | | | 01/20/2029 | | | | 2,545,110 | |
| | 4,000,000 | | | BlueMountain Ltd., Series2015-3A-CR (3 Month LIBOR USD + 2.60%) | | | 4.42 | % ^ | | | 04/20/2031 | | | | 2,794,369 | |
| | 2,000,000 | | | BlueMountain Ltd., Series2016-3A-DR (3 Month LIBOR USD + 3.10%, 3.10% Floor) | | | 4.79 | % ^ | | | 11/15/2030 | | | | 1,377,629 | |
| | 4,500,000 | | | Canyon Capital Ltd., Series2012-1RA-D (3 Month LIBOR USD + 3.00%) | | | 4.83 | % ^ | | | 07/15/2030 | | | | 3,481,314 | |
| | 2,750,000 | | | Canyon Capital Ltd., Series2014-1A-CR (3 Month LIBOR USD + 2.75%, 2.75% Floor) | | | 4.52 | % ^ | | | 01/30/2031 | | | | 2,047,879 | |
| | 1,500,000 | | | Canyon Capital Ltd., Series2014-2A-DR (3 Month LIBOR USD + 3.65%) | | | 5.48 | % ^ | | | 04/15/2029 | | | | 1,232,160 | |
| | | | | | | | | | | | | | | | |
| | | | | | | | | | | | | |
| | 3,000,000 | | | Canyon Capital Ltd., Series2016-1A-DR (3 Month LIBOR USD + 2.80%) | | | 4.63 | % ^ | | | 07/15/2031 | | | | 2,313,919 | |
| | 1,500,000 | | | Canyon Capital Ltd., Series2017-1A-D (3 Month LIBOR USD + 3.60%) | | | 5.43 | % ^ | | | 07/15/2030 | | | | 1,222,573 | |
| | 4,000,000 | | | Canyon Capital Ltd., Series2018-1A-D (3 Month LIBOR USD + 2.90%, 2.90% Floor) | | | 4.73 | % ^ | | | 07/15/2031 | | | | 3,083,783 | |
| | 2,500,000 | | | Carlyle US Ltd., Series2016-4A-CR (3 Month LIBOR USD + 2.80%, 2.80% Floor) | | | 4.62 | % ^ | | | 10/20/2027 | | | | 1,997,181 | |
| | 5,000,000 | | | CBAM Ltd., Series2019-10A-A1A (3 Month LIBOR USD + 1.42%, 1.42% Floor) | | | 3.24 | % ^ | | | 04/20/2032 | | | | 4,710,050 | |
| | 3,250,000 | | | Cook Park Ltd., Series2018-1A-D (3 Month LIBOR USD + 2.60%) | | | 4.44 | % ^ | | | 04/17/2030 | | | | 2,404,434 | |
| | 2,150,000 | | | CRMN Mortgage Trust, Series2016-1A-C (3 Month LIBOR USD + 3.85%) | | | 5.67 | % ^ | | | 01/18/2029 | | | | 1,815,056 | |
| | 10,000,000 | | | CVP Ltd., Series2017-1A-A (3 Month LIBOR USD + 1.34%) | | | 3.16 | % ^ | | | 07/20/2030 | | | | 9,386,221 | |
| | 10,000,000 | | | Dryden Senior Loan Fund, Series2014-33A-DR2 (3 Month LIBOR USD + 3.85%, 3.85% Floor) | | | 5.68 | % ^ | | | 04/15/2029 | | | | 8,629,589 | |
| | 3,000,000 | | | Dryden Senior Loan Fund, Series2015-40A-DR (3 Month LIBOR USD + 3.10%, 3.10% Floor) | | | 4.79 | % ^ | | | 08/15/2031 | | | | 2,286,722 | |
| | 2,200,000 | | | Dryden Senior Loan Fund, Series2016-43A-DRR (3 Month LIBOR USD + 3.55%, 3.55% Floor) | | | 5.37 | % ^ | | | 07/20/2029 | | | | 1,741,818 | |
| | 2,000,000 | | | Dryden Senior Loan Fund, Series2018-57A-D (3 Month LIBOR USD + 2.55%, 2.55% Floor) | | | 4.24 | % ^ | | | 05/15/2031 | | | | 1,461,959 | |
| | 5,000,000 | | | Elmwood Ltd., Series2019-2A-B (3 Month LIBOR USD + 2.10%, 2.10% Floor) | | | 3.92 | % ^ | | | 04/20/2031 | | | | 4,573,029 | |
| | 2,250,000 | | | Fillmore Park Ltd., Series2018-1A-D (3 Month LIBOR USD + 2.90%) | | | 4.73 | % ^ | | | 07/15/2030 | | | | 1,701,159 | |
| | 2,000,000 | | | Gilbert Park Ltd., Series2017-1A-D (3 Month LIBOR USD + 2.95%) | | | 4.78 | % ^ | | | 10/15/2030 | | | | 1,504,174 | |
| | 4,000,000 | | | Gilbert Park Ltd., Series2017-1A-E (3 Month LIBOR USD + 6.40%) | | | 8.23 | % ^ | | | 10/15/2030 | | | | 2,642,452 | |
| | 5,000,000 | | | GoldenTree Loan Management Ltd., Series2018-3A-D (3 Month LIBOR USD + 2.85%) | | | 4.67 | % ^ | | | 04/20/2030 | | | | 3,772,341 | |
| | 3,500,000 | | | GoldenTree Loan Opportunities Ltd., Series2015-11A-DR2 (3 Month LIBOR USD + 2.40%) | | | 4.22 | % ^ | | | 01/18/2031 | | | | 2,570,815 | |
| | 2,000,000 | | | Grippen Park Ltd., Series2017-1A-D (3 Month LIBOR USD + 3.30%) | | | 5.12 | % ^ | | | 01/20/2030 | | | | 1,656,627 | |
| | 740,000 | | | Halcyon Loan Advisors Funding Ltd., Series2013-2A-C (3 Month LIBOR USD + 2.70%) | | | 4.46 | % ^ | | | 08/01/2025 | | | | 712,600 | |
| | 1,500,000 | | | Halcyon Loan Advisors Funding Ltd., Series2014-3A-D (3 Month LIBOR USD + 3.65%) | | | 5.45 | % ^ | | | 10/22/2025 | �� | | | 1,248,624 | |
| | 5,000,000 | | | Hayfin Kingsland Ltd., Series2018-9A-BR (3 Month LIBOR USD + 1.80%) | | | 3.60 | % ^ | | | 04/28/2031 | | | | 4,476,165 | |
| | 1,481,500 | | | Highbridge Loan Management Ltd., Series4A-2014-A2R (3 Month LIBOR USD + 1.50%) | | | 3.30 | % ^ | | | 01/28/2030 | | | | 1,311,827 | |
| | 2,500,000 | | | Highbridge Loan Management Ltd., Series8A-2016-DR (3 Month LIBOR USD + 2.90%, 2.90% Floor) | | | 4.72 | % ^ | | | 07/20/2030 | | | | 1,791,778 | |
| | 1,500,000 | | | HPS Loan Management Ltd., Series13A-18-D (3 Month LIBOR USD + 3.00%, 3.00% Floor) | | | 4.83 | % ^ | | | 10/15/2030 | | | | 1,121,322 | |
| | 4,000,000 | | | LCM LP, Series14A-DR (3 Month LIBOR USD + 2.75%) | | | 4.57 | % ^ | | | 07/20/2031 | | | | 2,704,451 | |
| | 2,000,000 | | | LCM LP, Series19A-D (3 Month LIBOR USD + 3.45%, 3.45% Floor) | | | 5.28 | % ^ | | | 07/15/2027 | | | | 1,716,240 | |
| | 2,000,000 | | | LCM LP, Series20A-DR (3 Month LIBOR USD + 2.80%, 2.80% Floor) | | | 4.62 | % ^ | | | 10/20/2027 | | | | 1,650,259 | |
| | 3,250,000 | | | LCM Ltd., Series28A-D (3 Month LIBOR USD + 2.95%, 2.95% Floor) | | | 4.77 | % ^ | | | 10/20/2030 | | | | 2,319,310 | |
| | 4,000,000 | | | LCM Ltd., Series30A-D (3 Month LIBOR USD + 3.75%, 3.75% Floor) | | | 5.57 | % ^ | | | 04/20/2031 | | | | 2,852,600 | |
| | 4,000,000 | | | Madison Park Funding Ltd., Series2014-14A-DRR (3 Month LIBOR USD + 2.95%, 2.95% Floor) | | | 4.75 | % ^ | | | 10/22/2030 | | | | 2,983,532 | |
| | 2,000,000 | | | Madison Park Funding Ltd., Series2014-15A-CR (3 Month LIBOR USD + 3.45%) | | | 5.24 | % ^ | | | 01/27/2026 | | | | 1,843,642 | |
| | 1,250,000 | | | Madison Park Funding Ltd., Series2014-15A-DR (3 Month LIBOR USD + 5.44%) | | | 7.23 | % ^ | | | 01/27/2026 | | | | 884,485 | |
| | 1,000,000 | | | Madison Park Funding Ltd., Series2015-16A-D (3 Month LIBOR USD + 5.50%) | | | 7.32 | % ^ | | | 04/20/2026 | | | | 751,966 | |
| | 5,000,000 | | | Madison Park Funding Ltd., Series2015-18A-DR (3 Month LIBOR USD + 2.95%) | | | 4.77 | % ^ | | | 10/21/2030 | | | | 3,826,000 | |
| | 3,750,000 | | | Madison Park Funding Ltd., Series2019-34A-D (3 Month LIBOR USD + 3.70%, 3.70% Floor) | | | 5.49 | % ^ | | | 04/25/2031 | | | | 2,957,709 | |
| | 4,000,000 | | | Magnetite Ltd., Series2015-14RA-D (3 Month LIBOR USD + 2.85%) | | | 4.67 | % ^ | | | 10/18/2031 | | | | 3,000,714 | |
| | 1,500,000 | | | Magnetite Ltd., Series2016-18A-DR (3 Month LIBOR USD + 2.70%) | | | 4.39 | % ^ | | | 11/15/2028 | | | | 1,108,280 | |
| | 2,500,000 | | | Marble Point Ltd., Series2017-1A-B (3 Month LIBOR USD + 1.80%) | | | 3.63 | % ^ | | | 10/15/2030 | | | | 2,256,577 | |
| | 2,000,000 | | | MDPK, Series2018-32A-D (3 Month LIBOR USD + 4.10%, 4.10% Floor) | | | 5.90 | % ^ | | | 01/22/2031 | | | | 1,606,927 | |
| | 1,000,000 | | | Myers Park Ltd., Series2018-1A-D (3 Month LIBOR USD + 3.05%, 3.05% Floor) | | | 4.87 | % ^ | | | 10/20/2030 | | | | 758,329 | |
| | 3,500,000 | | | Neuberger Berman Loan Advisers Ltd., Series2016-23A-DR (3 Month LIBOR USD + 2.90%, 2.90% Floor) | | | 4.74 | % ^ | | | 10/17/2027 | | | | 2,862,867 | |
| | 2,500,000 | | | Neuberger Berman Loan Advisers Ltd., Series2018-29A-D (3 Month LIBOR USD + 3.10%, 3.10% Floor) | | | 4.92 | % ^ | | | 10/19/2031 | | | | 1,792,366 | |
| | 2,000,000 | | | Neuberger Berman Loan Advisers Ltd., Series2019-32A-D (3 Month LIBOR USD + 3.85%, 3.85% Floor) | | | 5.67 | % ^ | | | 01/19/2032 | | | | 1,535,800 | |
| | 2,000,000 | | | Newark BSL Ltd., Series2017-1A-C (3 Month LIBOR USD + 3.65%) | | | 5.44 | % ^ | | | 07/25/2030 | | | | 1,625,886 | |
| | 6,000,000 | | | Oak Hill Credit Partners Ltd., Series2014-10RA-D (3 Month LIBOR USD + 3.15%, 3.15% Floor) | | | 4.98 | % ^ | | | 12/12/2030 | | | | 4,586,690 | |
| | 5,600,000 | | | Octagon Investment Partners Ltd., Series2012-1A-CR (3 Month LIBOR USD + 4.00%) | | | 5.83 | % ^ | | | 07/15/2029 | | | | 4,431,305 | |
| | 2,000,000 | | | Octagon Investment Partners Ltd., Series2013-1A-DR (3 Month LIBOR USD + 3.00%, 3.00% Floor) | | | 4.84 | % ^ | | | 07/17/2030 | | | | 1,467,859 | |
| | 6,900,000 | | | Octagon Investment Partners Ltd., Series2013-1A-DR (3 Month LIBOR USD + 3.70%) | | | 5.52 | % ^ | | | 07/19/2030 | | | | 5,613,643 | |
| | 2,250,000 | | | Octagon Investment Partners Ltd., Series2014-1A-CRR (3 Month LIBOR USD + 3.95%, 3.95% Floor) | | | 5.65 | % ^ | | | 02/14/2031 | | | | 1,715,310 | |
| | 2,500,000 | | | Octagon Investment Partners Ltd., Series2014-1A-ERR (3 Month LIBOR USD + 5.45%, 5.45% Floor) | | | 7.25 | % ^ | | | 01/22/2030 | | | | 1,476,034 | |
| | 10,000,000 | | | Octagon Investment Partners Ltd., Series2016-1A-DR (3 Month LIBOR USD + 2.95%) | | | 4.78 | % ^ | | | 07/15/2030 | | | | 7,503,283 | |
| | 4,000,000 | | | Octagon Investment Partners Ltd., Series2017-1A-C (3 Month LIBOR USD + 3.50%) | | | 5.32 | % ^ | | | 03/17/2030 | | | | 3,464,031 | |
| | 1,760,000 | | | Octagon Investment Partners Ltd., Series2017-1A-D (3 Month LIBOR USD + 6.20%) | | | 8.02 | % ^ | | | 03/17/2030 | | | | 1,110,568 | |
| | 2,500,000 | | | Octagon Investment Partners Ltd., Series2018-2A-C (3 Month LIBOR USD + 2.85%) | | | 4.64 | % ^ | | | 07/25/2030 | | | | 1,772,573 | |
| | 2,000,000 | | | OHA Credit Funding Ltd., Series2018-1A-D (3 Month LIBOR USD + 3.05%, 3.05% Floor) | | | 4.87 | % ^ | | | 10/20/2030 | | | | 1,518,471 | |
| | 10,000,000 | | | Stewart Park Ltd., Series2015-1A-DR (3 Month LIBOR USD + 2.60%, 2.60% Floor) | | | 4.43 | % ^ | | | 01/15/2030 | | | | 7,446,670 | |
| | 3,000,000 | | | Symphony Ltd., Series2015-16A-DR (3 Month LIBOR USD + 3.05%, 3.05% Floor) | | | 4.88 | % ^ | | | 10/15/2031 | | | | 2,170,336 | |
| | 2,500,000 | | | Symphony Ltd., Series2016-17A-DR (3 Month LIBOR USD + 2.65%) | | | 4.48 | % ^ | | | 04/15/2028 | | | | 2,143,575 | |
| | 2,000,000 | | | Thacher Park Ltd., Series2014-1A-D1R (3 Month LIBOR USD + 3.40%) | | | 5.22 | % ^ | | | 10/20/2026 | | | | 1,717,685 | |
| | 1,000,000 | | | VERDE, Series2019-1A-D (3 Month LIBOR USD + 3.80%, 3.80% Floor) | | | 5.63 | % ^ | | | 04/15/2032 | | | | 721,105 | |
| | 3,000,000 | | | Voya Ltd., Series2014-1A-CR2 (3 Month LIBOR USD + 2.80%) | | | 4.62 | % ^ | | | 04/18/2031 | | | | 2,134,293 | |
| | 2,000,000 | | | Voya Ltd., Series2017-3A-C (3 Month LIBOR USD + 3.55%) | | | 5.37 | % ^ | | | 07/20/2030 | | | | 1,605,924 | |
| | 4,000,000 | | | Voya Ltd., Series2018-2A-D (3 Month LIBOR USD + 2.75%, 2.75% Floor) | | | 4.58 | % ^ | | | 07/15/2031 | | | | 2,950,772 | |
| | 2,250,000 | | | Wind River Ltd., Series2014-1A-DRR (3 Month LIBOR USD + 3.00%, 3.00% Floor) | | | 4.82 | % ^ | | | 07/18/2031 | | | | 1,560,793 | |
| | 1,000,000 | | | Wind River Ltd., Series2014-2A-ER (3 Month LIBOR USD + 5.75%, 5.75% Floor) | | | 7.58 | % ^ | | | 01/15/2031 | | | | 576,978 | |
| | 3,000,000 | | | Wind River Ltd., Series2016-1A-DR (3 Month LIBOR USD + 2.85%) | | | 4.68 | % ^ | | | 07/15/2028 | | | | 2,149,398 | |
| | 3,000,000 | | | Wind River Ltd., Series2017-1A-D (3 Month LIBOR USD + 3.75%) | | | 5.57 | % ^ | | | 04/18/2029 | | | | 2,254,854 | |
| | | | | | | | | | | | | | | | |
| | | | | | | | | | | | | |
| | 3,000,000 | | | Wind River Ltd., Series2017-3A-D (3 Month LIBOR USD + 3.15%) | | | 4.98 | % ^ | | | 10/15/2030 | | | | 2,050,843 | |
| | 4,000,000 | | | Wind River Ltd., Series2018-1A-D (3 Month LIBOR USD + 2.90%) | | | 4.73 | % ^ | | | 07/15/2030 | | | | 2,789,835 | |
| | 2,500,000 | | | Wind River Ltd., Series2018-2A-D (3 Month LIBOR USD + 3.00%) | | | 4.83 | % ^ | | | 07/15/2030 | | | | 1,723,631 | |
| | 3,000,000 | | | Wind River Ltd., Series2018-3A-D (3 Month LIBOR USD + 2.95%, 2.95% Floor) | | | 4.77 | % ^ | | | 01/20/2031 | | | | 1,961,406 | |
| | 10,000,000 | | | Wind River Ltd., Series2019-3A-B (3 Month LIBOR USD + 2.10%) | | | 3.93 | % ^ | | | 04/15/2031 | | | | 8,727,808 | |
| | | | | | | | | | | | | | | | |
| | Total Collateralized Loan Obligations (Cost $310,937,608) | | | | | | | | | | | 244,835,524 | |
| | | | | | | | | | | | | |
| | Foreign Corporate Bonds - 10.5% | | | | | | | | | | | | |
| | 3,900,000 | | | Adani Ports & Special Economic Zone Ltd. | | | 3.95 | % | | | 01/19/2022 | | | | 3,607,422 | |
| | 500,000 | | | Adani Ports & Special Economic Zone Ltd. | | | 3.38 | % | | | 07/24/2024 | | | | 430,175 | |
| | 437,000 | | | Adecoagro S.A. | | | 6.00 | % | | | 09/21/2027 | | | | 341,100 | |
| | 16,915,000 | | | AerCap Global Aviation Trust | | | 3.50 | % | | | 01/15/2025 | | | | 14,398,260 | |
| | 200,000 | | | Aeropuerto Internacional de Tocumen S.A. | | | 5.63 | % | | | 05/18/2036 | | | | 205,002 | |
| | 6,200,000 | | | AES Andres B.V. | | | 7.95 | % ^ | | | 05/11/2026 | | | | 5,806,300 | |
| | 5,850,000 | | | AES Dominicana | | | 7.95 | % | | | 05/11/2026 | | | | 5,478,525 | |
| | 1,700,000 | | | AES Gener S.A. | | | 5.00 | % | | | 07/14/2025 | | | | 1,579,814 | |
| | 2,600,000 | | | AES Gener S.A. (5 Year CMT Rate + 4.92%) | | | 6.35 | % ^ | | | 10/07/2079 | | | | 1,987,700 | |
| | 4,200,000 | | | AES Gener S.A. (5 Year CMT Rate + 4.92%) | | | 6.35 | % | | | 10/07/2079 | | | | 3,210,900 | |
| | 3,900,000 | | | AES Gener S.A. (5 Year Swap Rate USD + 4.64%) | | | 7.13 | % | | | 03/26/2079 | | | | 3,073,695 | |
| | 9,300,000 | | | AES Gener S.A. (5 Year Swap Rate USD + 4.64%) | | | 7.13 | % ^ | | | 03/26/2079 | | | | 7,329,580 | |
| | 1,050,000 | | | AI Candelaria Spain SLU | | | 7.50 | % ^ | | | 12/15/2028 | | | | 785,970 | |
| | 3,450,000 | | | AI Candelaria Spain SLU | | | 7.50 | % | | | 12/15/2028 | | | | 2,582,472 | |
| | 1,700,000 | | | AJE Corporation B.V. | | | 6.50 | % | | | 05/14/2022 | | | | 1,350,966 | |
| | 1,170,000 | | | Aker BP ASA | | | 4.75 | % ^ | | | 06/15/2024 | | | | 984,364 | |
| | 1,750,000 | | | Alcoa Nederland Holding B.V. | | | 6.13 | % ^ | | | 05/15/2028 | | | | 1,602,212 | |
| | 800,000 | | | Altice Financing S.A. | | | 5.00 | % ^ | | | 01/15/2028 | | | | 714,000 | |
| | 1,305,000 | | | Altice France Holding S.A. | | | 6.00 | % ^ | | | 02/15/2028 | | | | 1,157,770 | |
| | 2,275,000 | | | Altice France S.A. | | | 7.38 | % ^ | | | 05/01/2026 | | | | 2,310,376 | |
| | 15,120,000 | | | Anglo American Capital PLC | | | 4.50 | % ^ | | | 03/15/2028 | | | | 15,025,107 | |
| | 540,000 | | | ARD Finance S.A. (PIK 9.13%) | | | 6.50 | % ^ | | | 06/30/2027 | | | | 466,803 | |
| | 1,445,000 | | | Ardagh Packaging Finance, Inc. | | | 6.00 | % ^ | | | 02/15/2025 | | | | 1,459,883 | |
| | 490,000 | | | Ardagh Packaging Finance, Inc. | | | 4.13 | % ^ | | | 08/15/2026 | | | | 490,305 | |
| | 975,000 | | | Ardagh Packaging Finance, Inc. | | | 5.25 | % ^ | | | 08/15/2027 | | | | 1,004,786 | |
| | 11,249,000 | | | AstraZeneca PLC | | | 6.45 | % | | | 09/15/2037 | | | | 16,170,049 | |
| | 1,775,000 | | | Avation Capital S.A. | | | 6.50 | % ^ | | | 05/15/2021 | | | | 1,630,692 | |
| | 12,170,000 | | | Avolon Holdings Funding Ltd. | | | 3.25 | % ^ | | | 02/15/2027 | | | | 9,593,794 | |
| | 9,000,000 | | | Axiata SPV2 BHD | | | 3.47 | % | | | 11/19/2020 | | | | 9,015,435 | |
| | 4,300,000 | | | Banco Bradesco S.A. | | | 5.75 | % | | | 03/01/2022 | | | | 4,363,150 | |
| | 15,500,000 | | | Banco BTG Pactual S.A. (5 Year CMT Rate + 5.26%) | | | 7.75 | % ^ | | | 02/15/2029 | | | | 13,330,000 | |
| | 3,000,000 | | | Banco de Bogota S.A. | | | 5.38 | % | | | 02/19/2023 | | | | 2,936,265 | |
| | 1,000,000 | | | Banco de Reservas de la Republica Dominicana | | | 7.00 | % ^ | | | 02/01/2023 | | | | 957,500 | |
| | 4,100,000 | | | Banco de Reservas de la Republica Dominicana | | | 7.00 | % | | | 02/01/2023 | | | | 3,925,750 | |
| | 17,500,000 | | | Banco do Brasil S.A. (10 Year CMT Rate + 4.40%) | | | 6.25 | % † | | | 04/15/2024 | | | | 13,829,375 | |
| | 2,660,000 | | | Banco International del Peru S.A.A. (3 Month LIBOR USD + 5.76%) | | | 6.63 | % | | | 03/19/2029 | | | | 2,704,003 | |
| | 3,500,000 | | | Banco International del Peru S.A.A. (3 Month LIBOR USD + 6.74%) | | | 8.50 | % | | | 04/23/2070 | | | | 3,430,000 | |
| | 10,203,000 | | | Banco Macro S.A. (5 Year Swap Rate USD + 5.46%) | | | 6.75 | % | | | 11/04/2026 | | | | 6,223,932 | |
| | 2,247,000 | | | Banco Macro S.A. (5 Year Swap Rate USD + 5.46%) | | | 6.75 | % ^ | | | 11/04/2026 | | | | 1,370,692 | |
| | 13,423,000 | | | Banco Mercantil del Norte S.A. (10 Year CMT Rate + 5.35%) | | | 7.63 | % † | | | 01/10/2028 | | | | 10,306,515 | |
| | 2,521,000 | | | Banco Mercantil del Norte S.A. (10 Year CMT Rate + 5.47%) | | | 7.50 | % ^† | | | 06/27/2029 | | | | 1,925,439 | |
| | 1,000,000 | | | Banco Mercantil del Norte S.A. (10 Year CMT Rate + 5.47%) | | | 7.50 | % † | | | 06/27/2029 | | | | 763,760 | |
| | 1,500,000 | | | Banco Mercantil del Norte S.A. (5 Year CMT Rate + 4.45%) | | | 5.75 | % | | | 10/04/2031 | | | | 1,287,814 | |
| | 6,100,000 | | | Banco Mercantil del Norte S.A. (5 Year CMT Rate + 5.04%) | | | 6.88 | % † | | | 07/06/2022 | | | | 4,912,361 | |
| | 4,500,000 | | | Banco Nacional de Desenvolvimento Economico e Social | | | 4.75 | % | | | 05/09/2024 | | | | 4,338,023 | |
| | 13,400,000 | | | Banco Santander (3 Month LIBOR USD + 1.09%) | | | 2.77 | % | | | 02/23/2023 | | | | 12,699,689 | |
| | 3,000,000 | | | Banco Santander (5 Year CMT Rate + 3.00%) | | | 5.95 | % ^ | | | 10/01/2028 | | | | 2,794,372 | |
| | 2,700,000 | | | Bancolombia S.A. | | | 3.00 | % | | | 01/29/2025 | | | | 2,429,352 | |
| | 5,842,000 | | | Bancolombia S.A. (5 Year CMT Rate + 2.93%) | | | 4.88 | % | | | 10/18/2027 | | | | 5,319,492 | |
| | 8,400,000 | | | Bancolombia S.A. (5 Year CMT Rate + 2.94%) | | | 4.63 | % | | | 12/18/2029 | | | | 7,413,000 | |
| | 2,500,000 | | | Banistmo S.A. | | | 3.65 | % ^ | | | 09/19/2022 | | | | 2,316,410 | |
| | 1,500,000 | | | Banistmo S.A. | | | 3.65 | % | | | 09/19/2022 | | | | 1,389,846 | |
| | 3,850,000 | | | Bank of Montreal (5 Year Swap Rate USD + 1.43%) | | | 3.80 | % | | | 12/15/2032 | | | | 3,742,662 | |
| | 16,320,000 | | | Bank of New Zealand | | | 3.50 | % ^ | | | 02/20/2024 | | | | 17,152,442 | |
| | 9,675,000 | | | Bank of Nova Scotia | | | 3.40 | % | | | 02/11/2024 | | | | 10,142,213 | |
| | 1,250,000 | | | Bantrab Senior Trust | | | 9.00 | % | | | 11/14/2020 | | | | 1,225,000 | |
| | 17,510,000 | | | Barclays PLC (3 Month LIBOR USD + 1.38%) | | | 3.07 | % | | | 05/16/2024 | | | | 15,429,441 | |
| | 1,100,000 | | | BBVA Banco Continental S.A. | | | 5.00 | % | | | 08/26/2022 | | | | 1,098,291 | |
| | 21,500,000 | | | BBVA Bancomer S.A. (5 Year CMT Rate + 2.65%) | | | 5.13 | % | | | 01/18/2033 | | | | 17,964,863 | |
| | 1,200,000 | | | BBVA Bancomer S.A. (5 Year CMT Rate + 3.00%) | | | 5.35 | % | | | 11/12/2029 | | | | 1,102,251 | |
| | | | | | | | | | | | | | | | |
| | | | | | | | | | | | | |
| | 700,000 | | | BBVA Bancomer S.A. (5 Year CMT Rate + 4.31%) | | | 5.88 | % ^ | | | 09/13/2034 | | | | 588,035 | |
| | 8,150,000 | | | BBVA Colombia S.A. | | | 4.88 | % | | | 04/21/2025 | | | | 7,758,841 | |
| | 800,000 | | | BDO Unibank, Inc. | | | 2.63 | % | | | 10/24/2021 | | | | 798,023 | |
| | 16,900,000 | | | BDO Unibank, Inc. | | | 2.95 | % | | | 03/06/2023 | | | | 16,773,250 | |
| | 9,680,000 | | | BNP Paribas S.A. (Secured Overnight Financing Rate + 15.07%) | | | 3.05 | % ^ | | | 01/13/2031 | | | | 9,207,144 | |
| | 13,405,000 | | | BOC Aviation Ltd. (3 Month LIBOR USD + 1.13%) | | | 2.36 | % ^ | | | 09/26/2023 | | | | 13,365,790 | |
| | 1,010,000 | | | Bombardier, Inc. | | | 6.00 | % ^ | | | 10/15/2022 | | | | 765,075 | |
| | 1,120,000 | | | Bombardier, Inc. | | | 7.88 | % ^ | | | 04/15/2027 | | | | 781,284 | |
| | 7,000,000 | | | Braskem Idesa SAPI | | | 7.45 | % ^ | | | 11/15/2029 | | | | 4,964,680 | |
| | 2,000,000 | | | C&W Senior Financing DAC | | | 7.50 | % ^ | | | 10/15/2026 | | | | 1,846,065 | |
| | 2,450,000 | | | C&W Senior Financing DAC | | | 7.50 | % | | | 10/15/2026 | | | | 2,261,430 | |
| | 15,500,000 | | | C&W Senior Financing DAC | | | 6.88 | % | | | 09/15/2027 | | | | 13,476,746 | |
| | 1,000,000 | | | Cable Onda S.A. | | | 4.50 | % ^ | | | 01/30/2030 | | | | 885,550 | |
| | 400,000 | | | Camelot Finance S.A. | | | 4.50 | % ^ | | | 11/01/2026 | | | | 390,249 | |
| | 11,400,000 | | | Canacol Energy Ltd. | | | 7.25 | % | | | 05/03/2025 | | | | 9,903,807 | |
| | 1,200,000 | | | Canacol Energy Ltd. | | | 7.25 | % ^ | | | 05/03/2025 | | | | 1,042,506 | |
| | 2,100,000 | | | Cemex S.A.B. de C.V. | | | 6.13 | % | | | 05/05/2025 | | | | 1,876,865 | |
| | 3,300,000 | | | Cemex S.A.B. de C.V. | | | 7.75 | % | | | 04/16/2026 | | | | 2,971,848 | |
| | 1,185,000 | | | CIMB Bank BHD (3 Month LIBOR USD + 0.78%) | | | 2.66 | % | | | 10/09/2024 | | | | 1,135,200 | |
| | 15,800,000 | | | CNOOC Finance Ltd. | | | 3.75 | % | | | 05/02/2023 | | | | 16,531,290 | |
| | 6,000,000 | | | CNOOC Finance Ltd. | | | 3.00 | % | | | 05/09/2023 | | | | 6,127,188 | |
| | 900,000 | | | CNPC General Capital Ltd. | | | 3.95 | % | | | 04/19/2022 | | | | 931,371 | |
| | 2,000,000 | | | CNPC Overseas Capital Ltd. | | | 4.50 | % | | | 04/28/2021 | | | | 2,071,629 | |
| | 4,100,000 | | | Comcel Trust | | | 6.88 | % | | | 02/06/2024 | | | | 4,002,686 | |
| | 18,701,700 | | | Cometa Energia S.A. de C.V. | | | 6.38 | % | | | 04/24/2035 | | | | 17,462,712 | |
| | 14,755,000 | | | Commonwealth Bank of Australia | | | 4.32 | % ^ | | | 01/10/2048 | | | | 14,545,247 | |
| | 2,475,000 | | | Connect Finco LLC | | | 6.75 | % ^ | | | 10/01/2026 | | | | 2,054,250 | |
| | 4,000,000 | | | Controladora Mabe S.A. de C.V. | | | 5.60 | % | | | 10/23/2028 | | | | 3,814,170 | |
| | 6,610,000 | | | Cosan Overseas Ltd. | | | 8.25 | % † | | | 05/05/2020 | | | | 5,960,997 | |
| | 15,665,000 | | | Credit Agricole S.A. | | | 3.75 | % ^ | | | 04/24/2023 | | | | 15,984,477 | |
| | 15,120,000 | | | Credit Suisse Group AG (3 Month LIBOR USD + 1.24%) | | | 2.02 | % ^ | | | 06/12/2024 | | | | 13,365,658 | |
| | 8,800,000 | | | Credito Real S.A.B. de C.V. | | | 9.50 | % ^ | | | 02/07/2026 | | | | 7,258,966 | |
| | 6,550,000 | | | Credito Real S.A.B. de C.V. (5 Year CMT Rate + 7.03%) | | | 9.13 | % † | | | 11/29/2022 | | | | 5,045,563 | |
| | 6,793,000 | | | CSN Islands Corporation | | | 7.00 | % † | | | 06/23/2020 | | | | 4,077,872 | |
| | 2,600,000 | | | CSN Resources S.A. | | | 7.63 | % | | | 02/13/2023 | | | | 1,823,263 | |
| | 500,000 | | | CSN Resources S.A. | | | 7.63 | % | | | 04/17/2026 | | | | 328,378 | |
| | 6,800,000 | | | CSN Resources S.A. | | | 7.63 | % ^ | | | 04/17/2026 | | | | 4,465,934 | |
| | 3,000,000 | | | DBS Group Holdings Ltd. (3 Month LIBOR USD + 0.62%) | | | 2.41 | % | | | 07/25/2022 | | | | 2,993,128 | |
| | 2,000,000 | | | DBS Group Holdings Ltd. (5 Year Mid Swap Rate USD + 1.59%) | | | 4.52 | % | | | 12/11/2028 | | | | 2,081,819 | |
| | 12,650,000 | | | DBS Group Holdings Ltd. (5 Year Swap Rate USD + 2.39%) | | | 3.60 | % † | | | 09/07/2021 | | | | 11,726,676 | |
| | 785,000 | | | Delek & Avner Tamar Bond Ltd. | | | 5.08 | % ^ | | | 12/30/2023 | | | | 769,852 | |
| | 1,760,000 | | | Delek & Avner Tamar Bond Ltd. | | | 5.41 | % ^ | | | 12/30/2025 | | | | 1,685,515 | |
| | 11,157,526 | | | Digicel Group Ltd. (PIK 9.13%) | | | 9.13 | % ^ | | | 04/01/2024 | | | | 1,209,699 | |
| | 5,400,000 | | | Docuformas SAPI de C.V. | | | 10.25 | % ^ | | | 07/24/2024 | | | | 3,719,277 | |
| | 2,060,000 | | | eG Global Finance PLC | | | 8.50 | % ^ | | | 10/30/2025 | | | | 1,846,285 | |
| | 3,000,000 | | | El Puerto de Liverpool S.A.B. de C.V. | | | 3.95 | % | | | 10/02/2024 | | | | 2,942,265 | |
| | 1,844,000 | | | Embotelladora Andina S.A. | | | 5.00 | % | | | 10/01/2023 | | | | 1,869,346 | |
| | 3,500,000 | | | Empresa de Transmision Electrica S.A. | | | 5.13 | % ^ | | | 05/02/2049 | | | | 3,571,067 | |
| | 3,001,684 | | | Empresa Electrica Angamos S.A. | | | 4.88 | % | | | 05/25/2029 | | | | 2,892,250 | |
| | 8,500,000 | | | Empresa Electrica Guacolda S.A. | | | 4.56 | % | | | 04/30/2025 | | | | 6,039,973 | |
| | 2,141,000 | | | Empresa Nacional de Telecomunicaciones S.A. | | | 4.88 | % | | | 10/30/2024 | | | | 2,065,199 | |
| | 5,101,937 | | | ENA Norte Trust | | | 4.95 | % | | | 04/25/2023 | | | | 5,095,585 | |
| | 2,450,000 | | | Energuate Trust | | | 5.88 | % | | | 05/03/2027 | | | | 2,450,024 | |
| | 2,400,000 | | | Engie Energia Chile S.A. | | | 4.50 | % | | | 01/29/2025 | | | | 2,375,458 | |
| | 8,200,000 | | | ENTEL Chile S.A. | | | 4.75 | % | | | 08/01/2026 | | | | 7,799,282 | |
| | 1,682,000 | | | Export Import Bank of Thailand (3 Month LIBOR USD + 0.90%) | | | 2.59 | % | | | 11/20/2023 | | | | 1,669,965 | |
| | 1,600,000 | | | Export-Import Bank of India | | | 4.00 | % | | | 01/14/2023 | | | | 1,580,951 | |
| | 2,100,000 | | | Fideicomiso Pacifico Tres | | | 8.25 | % | | | 01/15/2035 | | | | 2,047,500 | |
| | 10,248,000 | | | Freeport-McMoRan, Inc. | | | 5.40 | % | | | 11/14/2034 | | | | 9,550,803 | |
| | 12,252,000 | | | Freeport-McMoRan, Inc. | | | 5.45 | % | | | 03/15/2043 | | | | 11,061,106 | |
| | 1,500,000 | | | Fresnillo PLC | | | 5.50 | % | | | 11/13/2023 | | | | 1,498,118 | |
| | 2,136,000 | | | Garda World Security Corporation | | | 8.75 | % ^ | | | 05/15/2025 | | | | 1,981,076 | |
| | 2,050,000 | | | Garda World Security Corporation | | | 4.63 | % ^ | | | 02/15/2027 | | | | 1,850,125 | |
| | 15,175,000 | | | Geopark Ltd. | | | 6.50 | % | | | 09/21/2024 | | | | 8,744,518 | |
| | 1,535,000 | | | GFL Environmental, Inc. | | | 5.13 | % ^ | | | 12/15/2026 | | | | 1,508,137 | |
| | 558,000 | | | GFL Environmental, Inc. | | | 8.50 | % ^ | | | 05/01/2027 | | | | 563,719 | |
| | 1,600,000 | | | Gilex Holding Sarl | | | 8.50 | % ^ | | | 05/02/2023 | | | | 1,374,792 | |
| | 4,250,000 | | | Gilex Holding Sarl | | | 8.50 | % | | | 05/02/2023 | | | | 3,651,791 | |
| | | | | | | | | | | | | | | | |
| | | | | | | | | | | | | |
| | 2,900,000 | | | Global Bank Corporation | | | 4.50 | % | | | 10/20/2021 | | | | 2,842,000 | |
| | 1,500,000 | | | Global Bank Corporation | | | 4.50 | % ^ | | | 10/20/2021 | | | | 1,470,000 | |
| | 8,000,000 | | | Global Bank Corporation (3 Month LIBOR USD + 3.30%) | | | 5.25 | % ^ | | | 04/16/2029 | | | | 7,800,000 | |
| | 2,600,000 | | | Globo Comunicacao e Participacoes S.A. | | | 4.84 | % | | | 06/08/2025 | | | | 2,379,663 | |
| | 3,800,000 | | | Globo Comunicacao e Participacoes S.A. | | | 4.88 | % ^ | | | 01/22/2030 | | | | 3,267,050 | |
| | 2,565,000 | | | GNL Quintero S.A. | | | 4.63 | % | | | 07/31/2029 | | | | 2,458,662 | |
| | 10,000,000 | | | Gohl Capital Ltd. | | | 4.25 | % | | | 01/24/2027 | | | | 8,300,730 | |
| | 300,000 | | | Gran Tierra Energy International Holdings Ltd. | | | 6.25 | % ^ | | | 02/15/2025 | | | | 77,625 | |
| | 10,498,000 | | | Gran Tierra Energy International Holdings Ltd. | | | 6.25 | % | | | 02/15/2025 | | | | 2,716,358 | |
| | 3,500,000 | | | Gran Tierra Energy, Inc. | | | 7.75 | % ^ | | | 05/23/2027 | | | | 914,375 | |
| | 2,900,000 | | | Grupo Aval Ltd. | | | 4.75 | % | | | 09/26/2022 | | | | 2,752,286 | |
| | 3,400,000 | | | Grupo Aval Ltd. | | | 4.38 | % ^ | | | 02/04/2030 | | | | 2,741,250 | |
| | 200,000 | | | Grupo Aval Ltd. | | | 4.38 | % | | | 02/04/2030 | | | | 161,250 | |
| | 5,000,000 | | | Grupo Bimbo S.A.B. de C.V. (5 Year CMT Rate + 3.28%) | | | 5.95 | % † | | | 04/17/2023 | | | | 4,711,000 | |
| | 3,600,000 | | | Grupo Idesa S.A. de C.V. | | | 7.88 | % | | | 12/18/2020 | | | | 1,658,700 | |
| | 2,490,000 | | | Grupo Idesa S.A. de C.V. | | | 7.88 | % ^ | | | 12/18/2020 | | | | 1,147,267 | |
| | 600,000 | | | Guatemala Energuate Trust | | | 5.88 | % ^ | | | 05/03/2027 | | | | 600,006 | |
| | 21,080,000 | | | HSBC Holdings PLC (3 Month LIBOR USD + 1.38%) | | | 2.16 | % | | | 09/12/2026 | | | | 20,084,346 | |
| | 1,000,000 | | | Hutchison Whampoa International Ltd. | | | 3.25 | % | | | 11/08/2022 | | | | 1,029,953 | |
| | 8,000,000 | | | Imperial Brands Finance PLC | | | 3.50 | % ^ | | | 07/26/2026 | | | | 7,401,805 | |
| | 3,108,000 | | | Indian Oil Corporation Ltd. | | | 5.63 | % | | | 08/02/2021 | | | | 3,135,008 | |
| | 12,867,000 | | | Indian Oil Corporation Ltd. | | | 5.75 | % | | | 08/01/2023 | | | | 12,654,233 | |
| | 5,084,000 | | | Industrial Senior Trust | | | 5.50 | % | | | 11/01/2022 | | | | 4,955,629 | |
| | 6,000,000 | | | Inkia Energy Ltd. | | | 5.88 | % | | | 11/09/2027 | | | | 5,310,000 | |
| | 1,585,000 | | | Intelsat Jackson Holdings S.A. | | | 5.50 | % | | | 08/01/2023 | | | | 984,689 | |
| | 1,260,000 | | | Intelsat Jackson Holdings S.A. | | | 8.50 | % ^ | | | 10/15/2024 | | | | 801,303 | |
| | 3,732,775 | | | Interoceanica Finance Ltd. | | | | | | | 11/30/2025 | | | | 3,387,494 | |
| | 1,192,690 | | | Invepar Holdings | | | | W Þ | | | 12/30/2028 | | | | 51,002 | |
| | 3,000,000 | | | Inversiones CMPC S.A. | | | 4.50 | % | | | 04/25/2022 | | | | 2,920,557 | |
| | 5,000,000 | | | Inversiones CMPC S.A. | | | 4.75 | % | | | 09/15/2024 | | | | 4,853,337 | |
| | 1,200,000 | | | Israel Electric Corporation Ltd. | | | 5.00 | % ^ | | | 11/12/2024 | | | | 1,260,006 | |
| | 2,500,000 | | | Itau Unibanco Holding S.A. | | | 6.20 | % | | | 12/21/2021 | | | | 2,546,750 | |
| | 9,500,000 | | | Itau Unibanco Holding S.A. (5 Year CMT Rate + 3.86%) | | | 6.50 | % † | | | 03/19/2023 | | | | 9,073,545 | |
| | 1,800,000 | | | Itau Unibanco Holding S.A. (5 Year CMT Rate + 32.22%) | | | 4.63 | % ^† | | | 02/27/2025 | | | | 1,476,900 | |
| | 7,000,000 | | | JBS Investments GMBH | | | 7.00 | % ^ | | | 01/15/2026 | | | | 7,014,280 | |
| | 2,500,000 | | | JBS Investments GMBH | | | 5.75 | % ^ | | | 01/15/2028 | | | | 2,440,125 | |
| | 12,190,000 | | | JSL Europe S.A. | | | 7.75 | % | | | 07/26/2024 | | | | 8,868,774 | |
| | 1,655,000 | | | Kronos Acquisition Holdings, Inc. | | | 9.00 | % ^ | | | 08/15/2023 | | | | 1,371,573 | |
| | 3,049,000 | | | Latam Finance Ltd. | | | 6.88 | % | | | 04/11/2024 | | | | 1,374,504 | |
| | 8,000,000 | | | Latam Finance Ltd. | | | 7.00 | % ^ | | | 03/01/2026 | | | | 3,688,200 | |
| | 2,177,307 | | | Lima Metro Finance Ltd. | | | 5.88 | % | | | 07/05/2034 | | | | 2,342,897 | |
| | 15,040,000 | | | Lloyds Banking Group PLC (3 Month LIBOR USD + 1.21%) | | | 3.57 | % | | | 11/07/2028 | | | | 14,955,632 | |
| | 7,690,400 | | | LLPL Capital Pte Ltd. | | | 6.88 | % ^ | | | 02/04/2039 | | | | 7,567,777 | |
| | 7,150,000 | | | Macquarie Group Ltd. (3 Month LIBOR USD + 1.02%) | | | 3.19 | % ^ | | | 11/28/2023 | | | | 7,337,808 | |
| | 7,884,000 | | | Macquarie Group Ltd. (3 Month LIBOR USD + 1.33%) | | | 4.15 | % ^ | | | 03/27/2024 | | | | 8,259,891 | |
| | 1,300,000 | | | Malayan Banking BHD (3 Month LIBOR USD + 0.80%) | | | 2.49 | % | | | 08/16/2024 | | | | 1,242,007 | |
| | 15,000,000 | | | Malayan Banking BHD (5 Year Swap Rate USD + 2.54%) | | | 3.91 | % | | | 10/29/2026 | | | | 15,255,000 | |
| | 400,000 | | | MARB BondCo PLC | | | 7.00 | % | | | 03/15/2024 | | | | 359,498 | |
| | 15,910,000 | | | MARB BondCo PLC | | | 6.88 | % | | | 01/19/2025 | | | | 14,438,405 | |
| | 1,340,000 | | | Mattamy Group Corporation | | | 4.63 | % ^ | | | 03/01/2030 | | | | 1,159,937 | |
| | 2,400,000 | | | Medco Bell Pte Ltd. | | | 6.38 | % ^ | | | 01/30/2027 | | | | 1,421,986 | |
| | 634,000 | | | MEG Energy Corporation | | | 7.00 | % ^ | | | 03/31/2024 | | | | 296,398 | |
| | 2,050,000 | | | MEG Energy Corporation | | | 7.13 | % ^ | | | 02/01/2027 | | | | 1,035,250 | |
| | 4,429,728 | | | Mexico Generadora de Energia | | | 5.50 | % | | | 12/06/2032 | | | | 4,273,768 | |
| | 3,000,000 | | | Millicom International Cellular S.A. | | | 6.00 | % | | | 03/15/2025 | | | | 2,925,015 | |
| | 1,300,000 | | | Millicom International Cellular S.A. | | | 6.63 | % ^ | | | 10/15/2026 | | | | 1,240,785 | |
| | 1,900,000 | | | Millicom International Cellular S.A. | | | 6.63 | % | | | 10/15/2026 | | | | 1,813,455 | |
| | 4,500,000 | | | Millicom International Cellular S.A. | | | 5.13 | % | | | 01/15/2028 | | | | 3,953,441 | |
| | 7,250,000 | | | Millicom International Cellular S.A. | | | 6.25 | % ^ | | | 03/25/2029 | | | | 6,528,987 | |
| | 8,715,000 | | | Minejesa Capital B.V. | | | 4.63 | % | | | 08/10/2030 | | | | 7,856,202 | |
| | 5,000,000 | | | Minejesa Capital B.V. | | | 5.63 | % | | | 08/10/2037 | | | | 4,451,525 | |
| | 7,000,000 | | | Minerva Luxembourg S.A. | | | 6.50 | % | | | 09/20/2026 | | | | 6,432,703 | |
| | 8,311,000 | | | Minerva Luxembourg S.A. | | | 5.88 | % | | | 01/19/2028 | | | | 7,346,508 | |
| | 16,165,000 | | | Mitsubishi UFJ Financial Group, Inc. (3 Month LIBOR USD + 0.74%) | | | 2.32 | % | | | 03/02/2023 | | | | 15,373,974 | |
| | 2,210,000 | | | Multibank, Inc. | | | 4.38 | % | | | 11/09/2022 | | | | 2,051,866 | |
| | 1,000,000 | | | NBM US Holdings, Inc. | | | 7.00 | % ^ | | | 05/14/2026 | | | | 914,617 | |
| | 5,200,000 | | | Network i2i Ltd. (5 Year CMT Rate + 4.28%) | | | 5.65 | % ^† | | | 01/15/2025 | | | | 4,209,400 | |
| | 10,969,000 | | | Nutrien Ltd. | | | 4.20 | % | | | 04/01/2029 | | | | 11,643,358 | |
| | | | | | | | | | | | | | | | |
| | | | | | | | | | | | | |
| | 7,465,000 | | | NXP Funding LLC | | | 3.88 | % ^ | | | 06/18/2026 | | | | 7,276,419 | |
| | 13,300,000 | | | ONGC Videsh Ltd. | | | 3.75 | % | | | 07/27/2026 | | | | 11,996,562 | |
| | 4,800,000 | | | Operadora de Servicios Mega S.A. | | | 8.25 | % ^ | | | 02/11/2025 | | | | 3,306,000 | |
| | 4,000,000 | | | Orazul Energy Egenor S en C por A | | | 5.63 | % | | | 04/28/2027 | | | | 3,554,170 | |
| | 3,000,000 | | | Orbia Advance Corporation S.A.B. de C.V. | | | 4.88 | % | | | 09/19/2022 | | | | 2,890,308 | |
| | 500,000 | | | Oversea-Chinese Banking Corporation | | | 4.25 | % | | | 06/19/2024 | | | | 515,593 | |
| | 11,600,000 | | | Pampa Energia S.A. | | | 7.50 | % | | | 01/24/2027 | | | | 7,826,108 | |
| | 150,000 | | | Pampa Energia S.A. | | | 9.13 | % | | | 04/15/2029 | | | | 101,033 | |
| | 5,072,968 | | | Panama Metro Line SP | | | 0.00 | % ^ | | | 12/05/2022 | | | | 4,709,926 | |
| | 7,129,423 | | | Panama Metro Line SP | | | 0.00 | % | | | 12/05/2022 | | | | 6,619,213 | |
| | 1,160,000 | | | Parkland Fuel Corporation | | | 5.88 | % ^ | | | 07/15/2027 | | | | 1,093,822 | |
| | 1,500,000 | | | Pertamina Persero PT | | | 4.30 | % | | | 05/20/2023 | | | | 1,499,942 | |
| | 11,000,000 | | | Petrobras Global Finance B.V. | | | 5.75 | % | | | 02/01/2029 | | | | 10,434,050 | |
| | 7,850,000 | | | Petrobras Global Finance B.V. | | | 6.90 | % | | | 03/19/2049 | | | | 7,694,766 | |
| | 4,600,000 | | | Petronas Capital Ltd. | | | 3.50 | % | | | 03/18/2025 | | | | 4,688,299 | |
| | 8,100,000 | | | Radiant Access Ltd. | | | 4.60 | % † | | | 05/18/2020 | | | | 7,607,925 | |
| | 12,400,000 | | | Reliance Holdings, Inc. | | | 5.40 | % | | | 02/14/2022 | | | | 12,649,358 | |
| | 9,230,000 | | | Royal Bank of Scotland Group PLC (3 Month LIBOR USD + 1.48%) | | | 3.50 | % | | | 05/15/2023 | | | | 9,121,010 | |
| | 5,300,000 | | | SACI Falabella | | | 3.75 | % | | | 04/30/2023 | | | | 5,068,341 | |
| | 2,290,000 | | | Scotiabank Peru S.A. (3 Month LIBOR USD + 3.86%) | | | 4.50 | % | | | 12/13/2027 | | | | 2,172,185 | |
| | 13,839,000 | | | Shire Acquisitions Investments Ireland DAC | | | 2.88 | % | | | 09/23/2023 | | | | 14,145,674 | |
| | 900,000 | | | Sociedad Quimica y Minera S.A. | | | 4.38 | % | | | 01/28/2025 | | | | 868,730 | |
| | 11,490,800 | | | Star Energy Geothermal Wayang Windu Ltd. | | | 6.75 | % | | | 04/24/2033 | | | | 10,447,481 | |
| | 184,000 | | | Star Energy Geothermal Wayang Windu Ltd. | | | 6.75 | % ^ | | | 04/24/2033 | | | | 167,294 | |
| | 530,000 | | | Starfruit Finco B.V. | | | 8.00 | % ^ | | | 10/01/2026 | | | | 507,064 | |
| | 2,165,000 | | | Stars Group Holdings B.V. | | | 7.00 | % ^ | | | 07/15/2026 | | | | 2,047,549 | |
| | 9,829,971 | | | Stoneway Capital Corporation | | | 10.00 | % W | | | 03/01/2027 | | | | 1,474,594 | |
| | 3,000,000 | | | SUAM Finance B.V. | | | 4.88 | % | | | 04/17/2024 | | | | 2,958,735 | |
| | 22,810,000 | | | Sumitomo Mitsui Financial Group, Inc. (3 Month LIBOR USD + 0.74%) | | | 2.58 | % | | | 01/17/2023 | | | | 20,477,849 | |
| | 2,805,000 | | | Superior Plus LP | | | 7.00 | % ^ | | | 07/15/2026 | | | | 2,758,837 | |
| | 350,000 | | | Sydney Airport Finance Company Pty Ltd. | | | 3.63 | % ^ | | | 04/28/2026 | | | | 375,940 | |
| | 550,000 | | | Syngenta Finance N.V. | | | 4.38 | % | | | 03/28/2042 | | | | 413,627 | |
| | 500,000 | | | Syngenta Finance N.V. | | | 5.68 | % ^ | | | 04/24/2048 | | | | 403,640 | |
| | 15,967,000 | | | Syngenta Finance N.V. | | | 5.68 | % | | | 04/24/2048 | | | | 12,889,840 | |
| | 2,335,000 | | | Takeda Pharmaceutical Ltd. | | | 4.40 | % | | | 11/26/2023 | | | | 2,462,016 | |
| | 1,200,000 | | | Tecnoglass, Inc. | | | 8.20 | % | | | 01/31/2022 | | | | 1,018,051 | |
| | 4,150,000 | | | Telefonica Celular del Paragu | | | 5.88 | % ^ | | | 04/15/2027 | | | | 3,778,399 | |
| | 4,000,000 | | | Telefonica Chile S.A. | | | 3.88 | % | | | 10/12/2022 | | | | 3,883,784 | |
| | 1,230,000 | | | Telesat LLC | | | 4.88 | % ^ | | | 06/01/2027 | | | | 1,183,629 | |
| | 934,000 | | | Telesat LLC | | | 6.50 | % ^ | | | 10/15/2027 | | | | 901,824 | |
| | 3,350,000 | | | Tervita Escrow Corporation | | | 7.63 | % ^ | | | 12/01/2021 | | | | 2,367,612 | |
| | 500,000 | | | Titan Acquisition Ltd. | | | 7.75 | % ^ | | | 04/15/2026 | | | | 420,984 | |
| | 5,000,000 | | | TransCanada PipeLines Ltd. | | | 4.25 | % | | | 05/15/2028 | | | | 5,117,715 | |
| | 4,330,000 | | | Transelec S.A. | | | 4.63 | % | | | 07/26/2023 | | | | 4,412,292 | |
| | 600,000 | | | Transelec S.A. | | | 4.25 | % | | | 01/14/2025 | | | | 575,247 | |
| | 500,000 | | | Transelec S.A. | | | 3.88 | % | | | 01/12/2029 | | | | 454,651 | |
| | 650,000 | | | Transportadora de Gas del Sur S.A. | | | 6.75 | % | | | 05/02/2025 | | | | 473,369 | |
| | 1,120,000 | | | Trivium Packaging Finance BV | | | 5.50 | % ^ | | | 08/15/2026 | | | | 1,120,697 | |
| | 4,500,000 | | | Unifin Financiera S.A.B. de C.V. | | | 7.38 | % | | | 02/12/2026 | | | | 2,738,486 | |
| | 13,900,000 | | | Unifin Financiera S.A.B. de C.V. (5 Year CMT Rate + 6.31%) | | | 8.88 | % † | | | 01/29/2025 | | | | 8,472,328 | |
| | 1,418,000 | | | Union Bank of the Philippines | | | 3.37 | % | | | 11/29/2022 | | | | 1,407,006 | |
| | 9,083,000 | | | United Overseas Bank Ltd. (5 Year Swap Rate USD + 1.79%) | | | 3.88 | % † | | | 10/19/2023 | | | | 8,662,451 | |
| | 8,000,000 | | | United Overseas Bank Ltd. (5 Year Swap Rate USD + 2.24%) | | | 3.50 | % | | | 09/16/2026 | | | | 8,016,400 | |
| | 9,500,000 | | | UPL Corporation | | | 3.25 | % | | | 10/13/2021 | | | | 8,787,253 | |
| | 5,600,000 | | | Vedanta Resources Finance PLC | | | 9.25 | % ^ | | | 04/23/2026 | | | | 2,380,000 | |
| | 2,500,000 | | | Vedanta Resources Ltd. | | | 7.13 | % | | | 05/31/2023 | | | | 971,863 | |
| | 15,000,000 | | | Vedanta Resources Ltd. | | | 6.13 | % | | | 08/09/2024 | | | | 5,688,936 | |
| | 14,829,000 | | | VTR Finance B.V. | | | 6.88 | % | | | 01/15/2024 | | | | 13,865,115 | |
| | 1,813,000 | | | VTR Finance B.V. | | | 6.88 | % ^ | | | 01/15/2024 | | | | 1,695,155 | |
| | 8,900,000 | | | YPF S.A. | | | 8.50 | % | | | 07/28/2025 | | | | 4,670,231 | |
| | 4,200,000 | | | YPF S.A. | | | 6.95 | % | | | 07/21/2027 | | | | 2,200,139 | |
| | 1,000,000 | | | YPF S.A. | | | 8.50 | % ^ | | | 06/27/2029 | | | | 528,542 | |
| | 1,010,000 | | | Ziggo B.V. | | | 4.88 | % ^ | | | 01/15/2030 | | | | 990,712 | |
| | | | | | | | | | | | | | | | |
| | Total Foreign Corporate Bonds (Cost $1,376,267,079) | | | | | | | | | | | 1,208,853,796 | |
| | | | | | | | | | | | | |
| Foreign Government Bonds, Foreign Agencies and Foreign Government Sponsored
Corporations - 0.4% | | | | | | | | | | | | |
| | 4,150,000 | | | Dominican Republic International Bond | | | 4.50 | % ^ | | | 01/30/2030 | | | | 3,629,175 | |
| | 8,000,000 | | | Malaysia Sovereign Sukuk BHD | | | 3.04 | % | | | 04/22/2025 | | | | 8,372,492 | |
| | | | | | | | | | | | | | | | |
| | | | | | | | | | | | | |
| | 500,000 | | | Malaysia Sukuk Global BHD | | | 3.18 | % | | | 04/27/2026 | | | | 521,940 | |
| | 7,121,000 | | | Mexico Government International Bond | | | 4.15 | % | | | 03/28/2027 | | | | 7,309,706 | |
| | 14,415,000 | | | Mexico Government International Bond | | | 3.75 | % | | | 01/11/2028 | | | | 14,404,333 | |
| | 6,000,000 | | | Panama Government International Bond | | | 4.00 | % | | | 09/22/2024 | | | | 6,246,000 | |
| | 200,000 | | | Perusahaan Penerbit | | | 3.40 | % | | | 03/29/2022 | | | | 199,602 | |
| | 720,000 | | | Perusahaan Penerbit | | | 3.75 | % | | | 03/01/2023 | | | | 721,141 | |
| | 2,600,000 | | | Perusahaan Penerbit | | | 4.15 | % | | | 03/29/2027 | | | | 2,615,054 | |
| | | | | | | | | | | | | | | | |
| Total Foreign Government Bonds, Foreign Agencies and Foreign Government
Sponsored Corporations (Cost $43,749,526) | | | | | | | | | | | 44,019,443 | |
| | | | | | | | | | | | | |
| | Municipal Bonds - 0.1% | | | | | | | | | | | | |
| | 3,290,000 | | | Missouri Highway & Transportation Commission | | | 5.06 | % | | | 05/01/2024 | | | | 3,733,229 | |
| | 4,430,000 | | | State of California | | | 7.55 | % | | | 04/01/2039 | | | | 7,205,927 | |
| | | | | | | | | | | | | | | | |
| | Total Municipal Bonds (Cost $9,940,675) | | | | | | | | | | | 10,939,156 | |
| | | | | | | | | | | | | |
| | Non-Agency Commercial Mortgage Backed Obligations - 5.3% | | | | | | | | | | | | |
| | 12,071,000 | | | Atrium Hotel Portfolio Trust, Series2018-ATRM-D (1 Month LIBOR USD + 2.30%, 2.30% Floor) | | | 3.00 | % ^ | | | 06/15/2035 | | | | 8,787,264 | |
| | 2,638,666 | | | BAMLL Commercial Mortgage Securities Trust, Series2016-ISQ-C | | | 3.61 | % # ^ | | | 08/14/2034 | | | | 2,380,858 | |
| | 4,259,000 | | | Bancorp Commercial Mortgage Trust, Series2019-CRE5-D (1 Month LIBOR USD + 2.35%, 2.35% Floor) | | | 3.05 | % ^ | | | 03/15/2036 | | | | 3,748,445 | |
| | 4,986,541 | | | BANK, Series2017-BNK8-XA | | | 0.74 | % # I/O | | | 11/15/2050 | | | | 228,204 | |
| | 1,821,000 | | | BANK, Series2018-BN10-B | | | 4.08 | % # | | | 02/15/2061 | | | | 1,765,251 | |
| | 405,000 | | | BANK, Series2018-BN13-B | | | 4.55 | % # | | | 08/15/2061 | | | | 406,227 | |
| | 1,508,000 | | | Barclays Commercial Mortgage Securities LLC, Series2017-DELC-C (1 Month LIBOR USD + 1.20%, 1.20% Floor) | | | 1.90 | % ^ | | | 08/15/2036 | | | | 1,156,489 | |
| | 1,719,000 | | | Barclays Commercial Mortgage Securities LLC, Series2017-DELC-D (1 Month LIBOR USD + 1.70%, 1.70% Floor) | | | 2.40 | % ^ | | | 08/15/2036 | | | | 1,291,542 | |
| | 1,355,000 | | | Barclays Commercial Mortgage Securities LLC, Series2017-DELC-E (1 Month LIBOR USD + 2.50%, 2.50% Floor) | | | 3.20 | % ^ | | | 08/15/2036 | | | | 996,496 | |
| | 3,451,000 | | | Barclays Commercial Mortgage Securities LLC, Series2017-DELC-F (1 Month LIBOR USD + 3.50%, 3.50% Floor) | | | 4.20 | % ^ | | | 08/15/2036 | | | | 2,126,837 | |
| | 13,951,000 | | | Barclays Commercial Mortgage Trust, Series2019-C3-B | | | 4.10 | % | | | 05/15/2052 | | | | 13,209,718 | |
| | 3,318,000 | | | Benchmark Mortgage Trust, Series2019-B10-C | | | 3.75 | % | | | 03/15/2062 | | | | 2,485,307 | |
| | 14,713,000 | | | BFLD, Series2019-DPLO-E (1 Month LIBOR USD + 2.24%, 2.24% Floor) | | | 2.94 | % ^ | | | 10/15/2034 | | | | 11,161,919 | |
| | 11,000,000 | | | BHMS Trust, Series2018-ATLS-C (1 Month LIBOR USD + 1.90%, 1.90% Floor) | | | 2.60 | % ^ | | | 07/15/2035 | | | | 7,964,319 | |
| | 3,283,000 | | | BX Commercial Mortgage Trust, Series2018-BIOA-D (1 Month LIBOR USD + 1.32%, 1.35% Floor) | | | 2.03 | % ^ | | | 03/15/2037 | | | | 2,839,192 | |
| | 8,207,000 | | | BX Commercial Mortgage Trust, Series2018-BIOA-E (1 Month LIBOR USD + 1.95%, 1.98% Floor) | | | 2.66 | % ^ | | | 03/15/2037 | | | | 6,769,009 | |
| | 3,163,700 | | | BX Trust, Series2017-SLCT-D (1 Month LIBOR USD + 2.05%, 2.05% Floor) | | | 2.75 | % ^ | | | 07/15/2034 | | | | 2,483,461 | |
| | 5,361,800 | | | BX Trust, Series2017-SLCT-E (1 Month LIBOR USD + 3.15%, 3.15% Floor) | | | 3.85 | % ^ | | | 07/15/2034 | | | | 4,218,096 | |
| | 12,349,000 | | | BX Trust, Series2019-OC11-E | | | 4.08 | % # ^ | | | 12/09/2041 | | | | 8,296,367 | |
| | 72,320,504 | | | CFCRE Commercial Mortgage Trust, Series2016-C3-XA | | | 1.02 | % # I/O | | | 01/10/2048 | | | | 3,511,001 | |
| | 3,267,000 | | | CFCRE Commercial Mortgage Trust, Series2017-C8-B | | | 4.20 | % # | | | 06/15/2050 | | | | 3,215,878 | |
| | 7,196,000 | | | CHT Mortgage Trust, Series2017-CSMO-E (1 Month LIBOR USD + 3.00%, 3.00% Floor) | | | 3.70 | % ^ | | | 11/15/2036 | | | | 5,726,503 | |
| | 3,401,000 | | | CHT Mortgage Trust, Series2017-CSMO-F (1 Month LIBOR USD + 3.74%, 3.74% Floor) | | | 4.45 | % ^ | | | 11/15/2036 | | | | 2,625,385 | |
| | 7,235,552 | | | Citigroup Commercial Mortgage Trust, Series2012-GC8-XA | | | 1.77 | % # ^ I/O | | | 09/10/2045 | | | | 248,991 | |
| | 1,898,500 | | | Citigroup Commercial Mortgage Trust, Series2015-GC27-D | | | 4.42 | % # ^ | | | 02/10/2048 | | | | 1,590,501 | |
| | 3,888,377 | | | Citigroup Commercial Mortgage Trust, Series2015-GC27-XA | | | 1.35 | % # I/O | | | 02/10/2048 | | | | 188,080 | |
| | 7,840,000 | | | Citigroup Commercial Mortgage Trust, Series2015-GC35-C | | | 4.50 | % # | | | 11/10/2048 | | | | 6,823,208 | |
| | 71,881,936 | | | Citigroup Commercial Mortgage Trust, Series2015-GC35-XA | | | 0.85 | % # I/O | | | 11/10/2048 | | | | 2,188,855 | |
| | 6,030,000 | | | Citigroup Commercial Mortgage Trust, Series2016-GC36-D | | | 2.85 | % ^ | | | 02/10/2049 | | | | 4,285,549 | |
| | 41,807,129 | | | Citigroup Commercial Mortgage Trust, Series2016-P3-XA | | | 1.70 | % # I/O | | | 04/15/2049 | | | | 3,081,516 | |
| | 44,206,063 | | | Citigroup Commercial Mortgage Trust, Series2016-P4-XA | | | 1.97 | % # I/O | | | 07/10/2049 | | | | 3,845,790 | |
| | 81,982,985 | | | Citigroup Commercial Mortgage Trust, Series2016-P5-XA | | | 1.52 | % # I/O | | | 10/10/2049 | | | | 5,474,422 | |
| | 9,490,000 | | | Citigroup Commercial Mortgage Trust, Series2017-C4-B | | | 4.10 | % # | | | 10/12/2050 | | | | 9,133,396 | |
| | 321,000 | | | Citigroup Commercial Mortgage Trust, Series2018-B2-B | | | 4.28 | % # | | | 03/10/2051 | | | | 311,385 | |
| | 1,977,000 | | | Citigroup Commercial Mortgage Trust, Series2018-C5-C | | | 4.72 | % # | | | 06/10/2051 | | | | 1,648,928 | |
| | 8,478,000 | | | Citigroup Commercial Mortgage Trust, Series2020-555-F | | | 3.62 | % ^ | | | 12/10/2041 | | | | 5,072,243 | |
| | 7,003,000 | | | Citigroup Commercial Mortgage Trust, Series2020-555-G | | | 3.62 | % ^ | | | 12/10/2041 | | | | 3,892,800 | |
| | 21,731,264 | | | Commercial Mortgage Pass-Through Certificates, Series2012-CR3-XA | | | 1.86 | % # I/O | | | 10/15/2045 | | | | 797,374 | |
| | 8,626,000 | | | Commercial Mortgage Pass-Through Certificates, Series2012-CR4-D | | | 4.59 | % # ^ Þ | | | 10/15/2045 | | | | 3,227,418 | |
| | 3,239,728 | | | Commercial Mortgage Pass-Through Certificates, Series2012-LC4-XA | | | 2.10 | % # ^ I/O | | | 12/10/2044 | | | | 90,529 | |
| | 56,600,762 | | | Commercial Mortgage Pass-Through Certificates, Series2015-CR26-XA | | | 0.95 | % # I/O | | | 10/10/2048 | | | | 2,346,979 | |
| | 4,310,000 | | | Commercial Mortgage Pass-Through Certificates, Series2015-LC21-C | | | 4.36 | % # | | | 07/10/2048 | | | | 3,772,781 | |
| | 5,579,000 | | | Commercial Mortgage Pass-Through Certificates, Series2015-LC23-C | | | 4.65 | % # | | | 10/10/2048 | | | | 4,896,786 | |
| | 5,997,000 | | | Commercial Mortgage Pass-Through Certificates, Series2016-CR28-C | | | 4.65 | % # | | | 02/10/2049 | | | | 5,256,390 | |
| | 57,459,607 | | | Commercial Mortgage Pass-Through Certificates, Series2016-DC2-XA | | | 1.00 | % # I/O | | | 02/10/2049 | | | | 2,586,188 | |
| | 9,383,000 | | | Commercial Mortgage Pass-Through Certificates, Series2016-GCT-E | | | 3.46 | % # ^ | | | 08/10/2029 | | | | 8,797,356 | |
| | 2,808,000 | | | Commercial Mortgage Pass-Through Certificates, Series2016-GCT-F | | | 3.46 | % # ^ | | | 08/10/2029 | | | | 2,504,833 | |
| | 12,424,000 | | | Commercial Mortgage Pass-Through Certificates, Series2018-HCLV-C (1 Month LIBOR USD + 1.70%, 1.70% Floor) | | | 2.40 | % ^ | | | 09/15/2033 | | | | 11,517,703 | |
| | 8,464,000 | | | Core Mortgage Trust, Series2019-CORE-E (1 Month LIBOR USD + 1.90%, 1.90% Floor) | | | 2.60 | % ^ | | | 12/15/2031 | | | | 6,627,545 | |
| | 2,064,000 | | | Core Mortgage Trust, Series2019-CORE-F (1 Month LIBOR USD + 2.35%, 2.35% Floor) | | | 3.05 | % ^ | | | 12/15/2031 | | | | 1,537,853 | |
| | 5,597,000 | | | CSAIL Commercial Mortgage Trust, Series2015-C4-C | | | 4.58 | % # | | | 11/15/2048 | | | | 4,897,269 | |
| | 3,461,000 | | | CSAIL Commercial Mortgage Trust, Series2016-C6-D | | | 4.92 | % # ^ | | | 01/15/2049 | | | | 2,418,498 | |
| | 44,607,162 | | | CSAIL Commercial Mortgage Trust, Series2016-C6-XA | | | 1.90 | % # I/O | | | 01/15/2049 | | | | 3,542,991 | |
| | | | | | | | | | | | | | | | |
| | | | | | | | | | | | | |
| | 11,488,000 | | | CSAIL Commercial Mortgage Trust, Series2018-C14-C | | | 4.89 | % # | | | 11/15/2051 | | | | 9,583,812 | |
| | 3,800,000 | | | CSAIL Commercial Mortgage Trust, Series2018-CX12-C | | | 4.77 | % # | | | 08/15/2051 | | | | 3,166,758 | |
| | 9,269,000 | | | CSAIL Commercial Mortgage Trust, Series2019-C16-AS | | | 3.61 | % | | | 06/15/2052 | | | | 9,405,466 | |
| | 9,269,000 | | | CSAIL Commercial Mortgage Trust, Series2019-C16-B | | | 3.88 | % | | | 06/15/2052 | | | | 8,760,321 | |
| | 798,000 | | | CSMC Trust, Series2017-CALI-D | | | 3.78 | % # ^ | | | 11/10/2032 | | | | 735,079 | |
| | 4,944,000 | | | CSMC Trust, Series2017-CHOP-D (1 Month LIBOR USD + 1.90%, 1.90% Floor) | | | 2.60 | % ^ | | | 07/15/2032 | | | | 4,076,456 | |
| | 4,944,000 | | | CSMC Trust, Series2017-CHOP-E (1 Month LIBOR USD + 3.30%, 3.30% Floor) | | | 4.00 | % ^ | | | 07/15/2032 | | | | 4,239,302 | |
| | 4,503,000 | | | DBGS Mortgage Trust, Series2018-5BP-D (1 Month LIBOR USD + 1.35%, 1.35% Floor) | | | 2.05 | % ^ | | | 06/15/2033 | | | | 4,245,756 | |
| | 186,000 | | | DBGS Mortgage Trust, Series2018-5BP-F (1 Month LIBOR USD + 2.45%, 2.45% Floor) | | | 3.15 | % ^ | | | 06/15/2033 | | | | 138,435 | |
| | 2,891,906 | | | DBUBS Mortgage Trust, Series2011-LC2A-XA | | | 1.02 | % # ^ I/O | | | 07/10/2044 | | | | 20,600 | |
| | 4,475,000 | | | Deutsche Bank Commercial Mortgage Trust, Series2016-C1-C | | | 3.35 | % # | | | 05/10/2049 | | | | 3,624,769 | |
| | 59,970,978 | | | Deutsche Bank Commercial Mortgage Trust, Series2016-C1-XA | | | 1.45 | % # I/O | | | 05/10/2049 | | | | 3,870,329 | |
| | 8,242,000 | | | Fontainebleau Miami Beach Trust, Series2019-FBLU-E | | | 4.10 | % ^ | | | 12/10/2036 | | | | 6,435,947 | |
| | 8,242,000 | | | Fontainebleau Miami Beach Trust, Series2019-FBLU-F | | | 4.10 | % ^ | | | 12/10/2036 | | | | 5,489,943 | |
| | 8,242,000 | | | Fontainebleau Miami Beach Trust, Series2019-FBLU-G | | | 4.10 | % # ^ | | | 12/10/2036 | | | | 5,307,905 | |
| | 1,163,839 | | | FREMF Mortgage Trust, Series2016-KF22-B (1 Month LIBOR USD + 5.05%, 5.05% Floor) | | | 6.57 | % ^ | | | 07/25/2023 | | | | 1,015,327 | |
| | 4,000,000 | | | Great Wolf Trust, Series2019-WOLF-F (1 Month LIBOR USD + 3.13%, 3.13% Floor) | | | 3.84 | % ^ | | | 12/15/2036 | | | | 2,715,714 | |
| | 2,762,767 | | | GS Mortgage Securities Trust, Series2011-GC5-XA | | | 1.33 | % # ^ I/O | | | 08/10/2044 | | | | 33,319 | |
| | 4,619,172 | | | GS Mortgage Securities Trust, Series2012-GC6-XA | | | 1.93 | % # ^ I/O | | | 01/10/2045 | | | | 106,836 | |
| | 3,741,000 | | | GS Mortgage Securities Trust, Series2014-GC26-C | | | 4.51 | % # | | | 11/10/2047 | | | | 3,355,483 | |
| | 9,506,000 | | | GS Mortgage Securities Trust, Series2014-GC26-D | | | 4.51 | % # ^ | | | 11/10/2047 | | | | 7,185,307 | |
| | 559,000 | | | GS Mortgage Securities Trust, Series2015-GC34-D | | | 2.98 | % | | | 10/10/2048 | | | | 389,829 | |
| | 96,155,662 | | | GS Mortgage Securities Trust, Series2015-GS1-XA | | | 0.78 | % # I/O | | | 11/10/2048 | | | | 3,575,366 | |
| | 61,017,900 | | | GS Mortgage Securities Trust, Series2016-GS2-XA | | | 1.65 | % # I/O | | | 05/10/2049 | | | | 4,157,333 | |
| | 5,801,000 | | | GS Mortgage Securities Trust, Series2017-GS6-B | | | 3.87 | % | | | 05/10/2050 | | | | 5,524,596 | |
| | 10,779,000 | | | GS Mortgage Securities Trust, Series2019-GC39-B | | | 3.97 | % | | | 05/10/2052 | | | | 10,321,837 | |
| | 9,879,000 | | | GSCG Trust, Series2019-600C-D | | | 3.76 | % ^ | | | 09/06/2034 | | | | 8,872,464 | |
| | 791,000 | | | GSCG Trust, Series2019-600C-E | | | 4.12 | % # ^ | | | 09/06/2034 | | | | 647,229 | |
| | 11,793,030 | | | HPLY Trust, Series2019-HIT-F (1 Month LIBOR USD + 3.15%, 3.15% Floor) | | | 3.85 | % ^ | | | 11/15/2036 | | | | 7,064,780 | |
| | 300,162 | | | JP Morgan Chase Commercial Mortgage Securities Corporation,Series 2006-LDP8-X | | | 0.29 | % # I/O | | | 05/15/2045 | | | | 47 | |
| | 843,871 | | | JP Morgan Chase Commercial Mortgage Securities Corporation,Series 2011-C4-XA | | | 1.18 | % # ^ I/O | | | 07/15/2046 | | | | 7,484 | |
| | 18,380,169 | | | JP Morgan Chase Commercial Mortgage Securities Corporation,Series 2012-C8-XA | | | 1.78 | % # I/O | | | 10/15/2045 | | | | 656,677 | |
| | 4,716,161 | | | JP Morgan Chase Commercial Mortgage Securities Corporation,Series 2012-CBX-XA | | | 1.48 | % # I/O | | | 06/15/2045 | | | | 85,386 | |
| | 76,395,531 | | | JP Morgan Chase Commercial Mortgage Securities Corporation,Series 2015-JP1-XA | | | 1.08 | % # I/O | | | 01/15/2049 | | | | 2,630,222 | |
| | 3,166,373 | | | JP Morgan Chase Commercial Mortgage Securities Corporation,Series 2018-LAQ-D (1 Month LIBOR USD + 2.10%, 2.30% Floor) | | | 2.80 | % ^ | | | 06/15/2032 | | | | 2,618,768 | |
| | 2,704,000 | | | JP Morgan Chase Commercial Mortgage Securities Trust,Series 2016-JP2-B | | | 3.46 | % | | | 08/15/2049 | | | | 2,539,522 | |
| | 592,000 | | | JP Morgan Chase Commercial Mortgage Securities Trust,Series 2016-JP3-C | | | 3.46 | % # | | | 08/15/2049 | | | | 472,285 | |
| | 1,000,000 | | | JP Morgan Chase Commercial Mortgage Securities Trust,Series 2019-COR4-C | | | 4.94 | % # | | | 03/10/2052 | | | | 829,630 | |
| | 7,958,000 | | | JP Morgan Chase Commercial Mortgage Securities Trust,Series 2020-LOOP-E | | | 3.86 | % ^ | | | 12/05/2038 | | | | 6,382,970 | |
| | 44,352,700 | | | JPMBB Commercial Mortgage Securities Trust, Series2014-C18-XA | | | 0.82 | % # I/O | | | 02/15/2047 | | | | 1,146,074 | |
| | 3,000,000 | | | JPMBB Commercial Mortgage Securities Trust, Series2014-C21-C | | | 4.66 | % # | | | 08/15/2047 | | | | 2,726,521 | |
| | 2,766,125 | | | JPMBB Commercial Mortgage Securities Trust, Series2014-C23-C | | | 4.47 | % # | | | 09/15/2047 | | | | 2,484,546 | |
| | 3,766,500 | | | JPMBB Commercial Mortgage Securities Trust, Series2014-C25-C | | | 4.45 | % # | | | 11/15/2047 | | | | 3,365,083 | |
| | 48,638,902 | | | JPMBB Commercial Mortgage Securities Trust, Series2014-C25-XA | | | 0.85 | % # I/O | | | 11/15/2047 | | | | 1,551,129 | |
| | 37,584,785 | | | JPMBB Commercial Mortgage Securities Trust, Series2014-C26-XA | | | 0.97 | % # I/O | | | 01/15/2048 | | | | 1,376,419 | |
| | 12,131,110 | | | JPMBB Commercial Mortgage Securities Trust, Series2015-C27-D | | | 3.81 | % # ^ | | | 02/15/2048 | | | | 9,826,359 | |
| | 1,846,000 | | | JPMBB Commercial Mortgage Securities Trust, Series2015-C28-B | | | 3.99 | % | | | 10/15/2048 | | | | 1,821,792 | |
| | 9,974,000 | | | JPMBB Commercial Mortgage Securities Trust, Series2015-C29-C | | | 4.18 | % # | | | 05/15/2048 | | | | 8,671,473 | |
| | 48,151,775 | | | JPMBB Commercial Mortgage Securities Trust, Series2015-C31-XA | | | 0.88 | % # I/O | | | 08/15/2048 | | | | 1,690,763 | |
| | 4,138,000 | | | JPMBB Commercial Mortgage Securities Trust, Series2015-C32-C | | | 4.66 | % # | | | 11/15/2048 | | | | 3,640,196 | |
| | 6,470,000 | | | JPMBB Commercial Mortgage Securities Trust, Series2015-C33-C | | | 4.62 | % # | | | 12/15/2048 | | | | 5,671,787 | |
| | 5,023,000 | | | JPMBB Commercial Mortgage Securities Trust, Series2016-C1-C | | | 4.74 | % # | | | 03/15/2049 | | | | 4,398,889 | |
| | 62,055,409 | | | JPMBB Commercial Mortgage Securities Trust, Series2016-C2-XA | | | 1.67 | % # I/O | | | 06/15/2049 | | | | 3,786,540 | |
| | 1,638,000 | | | JPMCC Commercial Mortgage Securities Trust, Series2019-COR4-B | | | 4.44 | % # | | | 03/10/2052 | | | | 1,608,530 | |
| | 501,187 | | | LB-UBS Commercial Mortgage Trust, Series2006-C7-XCL | | | 0.60 | % # ^ I/O | | | 11/15/2038 | | | | 121 | |
| | 404,200 | | | LB-UBS Commercial Mortgage Trust, Series2006-C7-XW | | | 0.60 | % # ^ I/O | | | 11/15/2038 | | | | 98 | |
| | 5,425,000 | | | LSTAR Commercial Mortgage Trust, Series2016-4-C | | | 4.56 | % # ^ | | | 03/10/2049 | | | | 4,485,520 | |
| | 13,184,000 | | | MBRT, Series2019-MBR-F (1 Month LIBOR USD + 2.55%, 2.55% Floor) | | | 3.25 | % ^ | | | 11/15/2036 | | | | 10,676,232 | |
| | 4,500,000 | | | MKT Mortgage Trust, Series2020-525M-F | | | 2.94 | % # ^ | | | 02/12/2040 | | | | 2,412,364 | |
| | 1,893,409 | | | Morgan Stanley Bank of America Merrill Lynch Trust,Series 2012-C5-XA | | | 1.43 | % # ^ I/O | | | 08/15/2045 | | | | 48,329 | |
| | 3,000,000 | | | Morgan Stanley Bank of America Merrill Lynch Trust,Series 2014-C18-C | | | 4.52 | % # | | | 10/15/2047 | | | | 2,697,623 | |
| | 1,508,500 | | | Morgan Stanley Bank of America Merrill Lynch Trust,Series 2014-C19-C | | | 4.00 | % | | | 12/15/2047 | | | | 1,314,368 | |
| | 35,895,984 | | | Morgan Stanley Bank of America Merrill Lynch Trust,Series 2015-C20-XA | | | 1.31 | % # I/O | | | 02/15/2048 | | | | 1,619,056 | |
| | 2,957,000 | | | Morgan Stanley Bank of America Merrill Lynch Trust,Series 2015-C25-C | | | 4.53 | % # | | | 10/15/2048 | | | | 2,592,140 | |
| | 4,674,000 | | | Morgan Stanley Bank of America Merrill Lynch Trust,Series 2015-C27-C | | | 4.53 | % # | | | 12/15/2047 | | | | 4,079,139 | |
| | 6,710,000 | | | Morgan Stanley Bank of America Merrill Lynch Trust,Series 2015-C27-D | | | 3.24 | % # ^ | | | 12/15/2047 | | | | 4,895,452 | |
| | 48,301,582 | | | Morgan Stanley Bank of America Merrill Lynch Trust,Series 2016-C30-XA | | | 1.42 | % # I/O | | | 09/15/2049 | | | | 3,293,897 | |
| | 6,907,000 | | | Morgan Stanley Bank of America Merrill Lynch Trust,Series 2016-C32-A4 | | | 3.72 | % | | | 12/15/2049 | | | | 7,435,405 | |
| | | | | | | | | | | | | | | | |
| | | | | | | | | | | | | |
| | 565,000 | | | Morgan Stanley Bank of America Merrill Lynch Trust,Series 2016-C32-AS | | | 3.99 | % # | | | 12/15/2049 | | | | 590,572 | |
| | 3,322,240 | | | Morgan Stanley Capital Trust, Series2011-C1-XA | | | 0.34 | % # ^ I/O | | | 09/15/2047 | | | | 5,343 | |
| | 30,369,298 | | | Morgan Stanley Capital Trust, Series2016-UB11-XA | | | 1.61 | % # I/O | | | 08/15/2049 | | | | 2,093,529 | |
| | 3,022,000 | | | Morgan Stanley Capital Trust, Series2017-ASHF-D (1 Month LIBOR USD + 2.20%, 2.20% Floor) | | | 2.90 | % ^ | | | 11/15/2034 | | | | 1,998,059 | |
| | 4,533,000 | | | Morgan Stanley Capital Trust, Series2017-ASHF-E (1 Month LIBOR USD + 3.15%, 3.15% Floor) | | | 3.85 | % ^ | | | 11/15/2034 | | | | 2,452,231 | |
| | 3,434,000 | | | Morgan Stanley Capital Trust, Series2017-ASHF-F (1 Month LIBOR USD + 4.35%, 4.35% Floor) | | | 5.05 | % ^ | | | 11/15/2034 | | | | 1,849,168 | |
| | 7,831,050 | | | MSCG Trust, Series2016-SNR-C | | | 5.21 | % ^ | | | 11/15/2034 | | | | 7,707,102 | |
| | 11,179,000 | | | MSCG Trust, Series2018-SELF-F (1 Month LIBOR USD + 3.05%, 3.05% Floor) | | | 3.75 | % ^ | | | 10/15/2037 | | | | 8,417,871 | |
| | 2,108,000 | | | Natixis Commercial Mortgage Securities Trust, Series2018-FL1-C (1 Month LIBOR USD + 2.20%, 2.20% Floor) | | | 3.86 | % ^ | | | 06/15/2035 | | | | 1,869,817 | |
| | 53,172,515 | | | SG Commercial Mortgage Securities Trust, Series2016-C5-XA | | | 1.97 | % # I/O | | | 10/10/2048 | | | | 4,299,561 | |
| | 1,374,000 | | | UBS Commercial Mortgage Trust, Series2013-C5-D | | | 4.10 | % # ^ | | | 03/10/2046 | | | | 1,186,935 | |
| | 2,491,000 | | | UBS Commercial Mortgage Trust, Series2017-C6-B | | | 4.15 | % # | | | 12/15/2050 | | | | 2,417,630 | |
| | 6,958,000 | | | UBS Commercial Mortgage Trust, Series2017-C7-C | | | 4.58 | % # | | | 12/15/2050 | | | | 5,754,943 | |
| | 7,293,000 | | | UBS Commercial Mortgage Trust, Series2018-C11-C | | | 4.90 | % # | | | 06/15/2051 | | | | 6,137,915 | |
| | 2,896,000 | | | UBS Commercial Mortgage Trust, Series2018-C12-C | | | 4.96 | % # | | | 08/15/2051 | | | | 2,446,745 | |
| | 5,698,000 | | | UBS Commercial Mortgage Trust, Series2018-C8-C | | | 4.70 | % # | | | 02/15/2051 | | | | 4,751,431 | |
| | 9,992,622 | | | UBS-Barclays Commercial Mortgage Trust, Series2012-C3-XA | | | 1.82 | % # ^ I/O | | | 08/10/2049 | | | | 357,178 | |
| | 418,710 | | | Wachovia Bank Commercial Mortgage Trust, Series2006-C29-IO | | | 0.12 | % # I/O | | | 11/15/2048 | | | | 4 | |
| | 9,344,000 | | | Wells Fargo Commercial Mortgage Trust2019-C51, Series2019-C51-B | | | 3.84 | % # | | | 06/15/2052 | | | | 9,053,421 | |
| | 2,031,000 | | | Wells Fargo Commercial Mortgage Trust, Series2014-LC16-D | | | 3.94 | % ^ | | | 08/15/2050 | | | | 1,259,058 | |
| | 2,200,000 | | | Wells Fargo Commercial Mortgage Trust, Series2015-C28-C | | | 4.11 | % # | | | 05/15/2048 | | | | 1,905,409 | |
| | 4,891,000 | | | Wells Fargo Commercial Mortgage Trust, Series2015-C31-C | | | 4.61 | % # | | | 11/15/2048 | | | | 4,288,864 | |
| | 21,025,429 | | | Wells Fargo Commercial Mortgage Trust, Series2015-C31-XA | | | 1.01 | % # I/O | | | 11/15/2048 | | | | 957,580 | |
| | 43,358,931 | | | Wells Fargo Commercial Mortgage Trust, Series2015-NXS1-XA | | | 1.11 | % # I/O | | | 05/15/2048 | | | | 1,893,493 | |
| | 6,848,000 | | | Wells Fargo Commercial Mortgage Trust, Series2015-NXS4-C | | | 4.67 | % # | | | 12/15/2048 | | | | 6,030,675 | |
| | 76,606,205 | | | Wells Fargo Commercial Mortgage Trust, Series2015-P2-XA | | | 0.98 | % # I/O | | | 12/15/2048 | | | | 2,857,588 | |
| | 8,252,000 | | | Wells Fargo Commercial Mortgage Trust, Series2015-SG1-AS | | | 4.05 | % | | | 09/15/2048 | | | | 8,642,396 | |
| | 4,650,000 | | | Wells Fargo Commercial Mortgage Trust, Series2016-C32-C | | | 4.73 | % # | | | 01/15/2059 | | | | 4,082,225 | |
| | 4,483,000 | | | Wells Fargo Commercial Mortgage Trust, Series2016-C33-C | | | 3.90 | % | | | 03/15/2059 | | | | 3,731,396 | |
| | 5,040,000 | | | Wells Fargo Commercial Mortgage Trust, Series2016-LC25-AS | | | 3.95 | % # | | | 12/15/2059 | | | | 5,329,827 | |
| | 2,574,000 | | | Wells Fargo Commercial Mortgage Trust, Series2016-LC25-B | | | 4.42 | % # | | | 12/15/2059 | | | | 2,586,691 | |
| | 2,638,000 | | | Wells Fargo Commercial Mortgage Trust, Series2018-C45-C | | | 4.73 | % | | | 06/15/2051 | | | | 2,175,691 | |
| | 7,228,000 | | | Wells Fargo Commercial Mortgage Trust, Series2018-C46-C | | | 4.98 | % # | | | 08/15/2051 | | | | 6,076,974 | |
| | 12,408,000 | | | Wells Fargo Commercial Mortgage Trust, Series2018-C47-C | | | 4.94 | % # | | | 09/15/2061 | | | | 10,363,827 | |
| | 2,871,000 | | | Wells Fargo Commercial Mortgage Trust, Series2018-C48-C | | | 5.12 | % # | | | 01/15/2052 | | | | 2,426,902 | |
| | 2,558,000 | | | Wells Fargo Commercial Mortgage Trust, Series2019-C49-B | | | 4.55 | % | | | 03/15/2052 | | | | 2,509,194 | |
| | 10,776,000 | | | Wells Fargo Commercial Mortgage Trust, Series2019-C50-B | | | 4.19 | % | | | 05/15/2052 | | | | 10,285,490 | |
| | 10,776,000 | | | Wells Fargo Commercial Mortgage Trust, Series2019-C50-C | | | 4.35 | % | | | 05/15/2052 | | | | 9,310,950 | |
| | 12,814,627 | | | WF-RBS Commercial Mortgage Trust, Series2012-C9-XA | | | 1.89 | % # ^ I/O | | | 11/15/2045 | | | | 487,567 | |
| | 70,424,735 | | | WF-RBS Commercial Mortgage Trust, Series2014-C21-XA | | | 1.04 | % # I/O | | | 08/15/2047 | | | | 2,486,958 | |
| | 49,401,403 | | | WF-RBS Commercial Mortgage Trust, Series2014-C22-XA | | | 0.81 | % # I/O | | | 09/15/2057 | | | | 1,390,605 | |
| | 79,681,368 | | | WF-RBS Commercial Mortgage Trust, Series2016-NXS6-XA | | | 1.63 | % # I/O | | | 11/15/2049 | | | | 5,328,429 | |
| | | | | | | | | | | | | | | | |
| | TotalNon-Agency Commercial Mortgage Backed Obligations (Cost $750,297,532) | | | | | | | | | | | 609,400,303 | |
| | | | | | | | | | | | | |
| | Non-Agency Residential Collateralized Mortgage Obligations - 8.6% | | | | | | | | | | | | |
| | 9,001,115 | | | Adjustable Rate Mortgage Trust, Series2007-1-4A1 | | | 4.92 | % # | | | 03/25/2037 | | | | 6,646,030 | |
| | 38,277 | | | Adjustable Rate Mortgage Trust, Series2007-3-1A1 | | | 4.92 | % # ^ | | | 11/25/2037 | | | | 32,986 | |
| | 12,937,599 | | | Alternative Loan Trust, Series2005-49CB-A2 | | | 5.50 | % | | | 11/25/2035 | | | | 10,683,181 | |
| | 8,567,441 | | | Alternative Loan Trust, Series2007-8CB-A1 | | | 5.50 | % | | | 05/25/2037 | | | | 6,319,948 | |
| | 9,324,284 | | | Alternative Loan Trust, Series2007-OA8-2A1 (1 Month LIBOR USD + 0.18%, 0.18% Floor) | | | 1.13 | % | | | 06/25/2047 | | | | 6,368,825 | |
| | 3,100,000 | | | AMSR Trust, Series2019-SFR1-E | | | 3.47 | % # ^ | | | 01/19/2039 | | | | 2,349,448 | |
| | 4,941,574 | | | Angel Oak Mortgage Trust LLC, Series2018-3-A1 | | | 3.65 | % # ^ | | | 09/25/2048 | | | | 4,870,289 | |
| | 5,380,792 | | | Angel Oak Mortgage Trust LLC, Series2018-3-A2 | | | 3.75 | % # ^ | | | 09/25/2048 | | | | 5,303,889 | |
| | 5,119,991 | | | Angel Oak Mortgage Trust LLC, Series2018-3-A3 | | | 3.85 | % # ^ | | | 09/25/2048 | | | | 5,048,136 | |
| | 603,800 | | | Banc of America Funding Corporation, Series2005-G-A3 | | | 3.64 | % # | | | 10/20/2035 | | | | 497,017 | |
| | 272,458 | | | Banc of America Funding Corporation, Series2006-2-6A2 | | | 5.50 | % | | | 03/25/2036 | | | | 238,874 | |
| | 226,228 | | | Banc of America Funding Corporation, Series2006-6-1A2 | | | 6.25 | % | | | 08/25/2036 | | | | 206,397 | |
| | 2,053,564 | | | Bayview Opportunity Master Fund Trust, Series2019-SBR1-A1 | | | 3.47 | % ^§ | | | 06/28/2034 | | | | 2,039,352 | |
| | 256,554 | | | Bear Stearns Asset Backed Securities Trust, Series2007-SD1-1A3A | | | 6.50 | % | | | 10/25/2036 | | | �� | 173,818 | |
| | 2,326,670 | | | Chase Mortgage Finance Trust, Series2007-A2-6A4 | | | 4.11 | % # | | | 07/25/2037 | | | | 2,014,585 | |
| | 1,015,898 | | | Chase Mortgage Finance Trust, Series2007-S3-2A1 | | | 5.50 | % | | | 05/25/2037 | | | | 241,413 | |
| | 20,000,000 | | | CIM Trust, Series2016-2RR-B2 | | | 7.57 | % # ^ Þ | | | 02/25/2056 | | | | 18,512,198 | |
| | 20,000,000 | | | CIM Trust, Series2016-3RR-B2 | | | 7.97 | % # ^ Þ | | | 02/27/2056 | | | | 18,397,208 | |
| | 59,459 | | | CitiCorporationMortgage Securities, Inc., Series2005-1-1A4 | | | 5.50 | % | | | 02/25/2035 | | | | 61,125 | |
| | 1,107,464 | | | CitiCorporationResidential Mortgage Securities, Inc., Series2006-2-A5 | | | 5.29 | % | | | 09/25/2036 | | | | 1,112,281 | |
| | 245,502 | | | Citigroup Mortgage Loan Trust, Inc., Series2006-WF2-A2C | | | 5.85 | % ß | | | 05/25/2036 | | | | 120,016 | |
| | 1,221,108 | | | Citigroup Mortgage Loan Trust, Inc., Series2008-AR4-2A1B | | | 4.26 | % # ^ | | | 11/25/2038 | | | | 1,207,796 | |
| | 5,361,793 | | | Citigroup Mortgage Loan Trust, Series2007-OPX1-A1A (1 Month LIBOR USD + 0.07%, 0.07% Floor) | | | 1.02 | % | | | 01/25/2037 | | | | 2,826,530 | |
| | | | | | | | | | | | | | | | |
| | | | | | | | | | | | | |
| | 11,046,916 | | | Citigroup Mortgage Loan Trust, Series2009-3-5A3 | | | 6.00 | % # ^ | | | 02/25/2037 | | | | 9,819,380 | |
| | 42,184,855 | | | Citigroup Mortgage Loan Trust, Series2019-A-PT1 | | | 3.92 | % ^ | | | 10/25/2058 | | | | 40,469,628 | |
| | 4,771,244 | | | Citigroup Mortgage Loan Trust, Series2019-C-A1 | | | 3.23 | % ^§ | | | 09/25/2059 | | | | 4,739,385 | |
| | 110,162 | | | CitiMortgage Alternative Loan Trust, Series2006-A2-A2 | | | 6.00 | % | | | 05/25/2036 | | | | 99,036 | |
| | 58,316 | | | CitiMortgage Alternative Loan Trust, Series2006-A5-3A3 | | | 6.00 | % | | | 10/25/2036 | | | | 49,302 | |
| | 426,161 | | | CitiMortgage Alternative Loan Trust, Series2007-A1-1A7 | | | 6.00 | % | | | 01/25/2037 | | | | 393,647 | |
| | 6,451,479 | | | CitiMortgage Alternative Loan Trust, Series2007-A5-1A10 | | | 5.75 | % | | | 05/25/2037 | | | | 5,058,029 | |
| | 1,191,467 | | | Countrywide Alternative Loan Trust, Series2004-22CB-1A1 | | | 6.00 | % | | | 10/25/2034 | | | | 1,227,155 | |
| | 135,094 | | | Countrywide Alternative Loan Trust, Series2005-20CB-1A1 | | | 5.50 | % | | | 07/25/2035 | | | | 117,152 | |
| | 187,133 | | | Countrywide Alternative Loan Trust, Series2005-28CB-3A6 | | | 6.00 | % | | | 08/25/2035 | | | | 120,453 | |
| | 791,141 | | | Countrywide Alternative Loan Trust, Series2005-46CB-A22 | | | 5.25 | % | | | 10/25/2035 | | | | 581,210 | |
| | 133,737 | | | Countrywide Alternative Loan Trust, Series2005-J10-1A13 (1 Month LIBOR USD + 0.70%, 0.70% Floor, 5.50% Cap) | | | 1.65 | % | | | 10/25/2035 | | | | 94,856 | |
| | 306,513 | | | Countrywide Alternative Loan Trust, Series2006-26CB-A9 | | | 6.50 | % | | | 09/25/2036 | | | | 217,504 | |
| | 8,445,558 | | | Countrywide Alternative Loan Trust, Series2006-42-1A8 | | | 6.00 | % | | | 01/25/2047 | | | | 6,461,951 | |
| | 1,265,360 | | | Countrywide Alternative Loan Trust, Series2007-12T1-A1 | | | 6.00 | % | | | 06/25/2037 | | | | 759,978 | |
| | 1,318,946 | | | Countrywide Alternative Loan Trust, Series2007-16CB-2A1 (1 Month LIBOR USD + 0.45%, 0.45% Floor, 7.00% Cap) | | | 1.40 | % | | | 08/25/2037 | | | | 486,939 | |
| | 381,934 | | | Countrywide Alternative Loan Trust, Series2007-16CB-2A2(-8 x 1 Month LIBOR USD + 54.58%, 54.58% Cap) | | | 46.69 | % I/F | | | 08/25/2037 | | | | 1,006,826 | |
| | 81,334 | | | Countrywide Alternative Loan Trust, Series 2007-17CB-1A10(-5 x 1 Month LIBOR USD + 29.90%, 29.90% Cap) | | | 25.55 | % I/F | | | 08/25/2037 | | | | 154,414 | |
| | 393,111 | | | Countrywide Alternative Loan Trust, Series 2007-18CB-2A17 | | | 6.00 | % | | | 08/25/2037 | | | | 333,486 | |
| | 1,821,050 | | | Countrywide Alternative Loan Trust, Series2007-23CB-A3 (1 Month LIBOR USD + 0.50%, 0.50% Floor, 7.00% Cap) | | | 1.45 | % | | | 09/25/2037 | | | | 720,767 | |
| | 1,788,872 | | | Countrywide Alternative Loan Trust, Series2007-23CB-A4(-1 x 1 Month LIBOR USD + 6.50%, 6.50% Cap) | | | 5.55 | % I/F I/O | | | 09/25/2037 | | | | 581,961 | |
| | 722,076 | | | Countrywide Alternative Loan Trust, Series2007-4CB-2A1 | | | 7.00 | % | | | 03/25/2037 | | | | 142,206 | |
| | 21,266 | | | Countrywide Asset-Backed Certificates, Series2005-13-AF3 | | | 5.43 | % # | | | 02/25/2033 | | | | 18,158 | |
| | 281,323 | | | Countrywide Home Loans, Series2005-28-A7 | | | 5.25 | % | | | 01/25/2019 | | | | 215,764 | |
| | 612,750 | | | Countrywide Home Loans, Series2007-10-A5 | | | 6.00 | % | | | 07/25/2037 | | | | 451,576 | |
| | 252,444 | | | Countrywide Home Loans, Series2007-15-1A16 | | | 6.25 | % | | | 09/25/2037 | | | | 205,243 | |
| | 674,963 | | | Countrywide Home Loans, Series2007-3-A17 | | | 6.00 | % | | | 04/25/2037 | | | | 504,179 | |
| | 91,958 | | | Credit Suisse First Boston Mortgage Securities Corporation,Series 2005-10-5A5 | | | 5.50 | % | | | 11/25/2035 | | | | 77,730 | |
| | 1,046,387 | | | Credit Suisse First Boston Mortgage Securities Corporation,Series 2005-8-1A3 | | | 5.25 | % | | | 09/25/2035 | | | | 974,722 | |
| | 4,458,151 | | | Credit Suisse Mortgage Capital Certificates, Series2009-3R-19A2 | | | 6.00 | % ^ | | | 01/27/2038 | | | | 3,257,264 | |
| | 9,139,432 | | | Credit-Based Asset Servicing & Securitization LLC, Series2007-RP1-A (1 Month LIBOR USD + 0.31%, 0.31% Floor) | | | 2.02 | % ^ | | | 05/25/2046 | | | | 7,584,963 | |
| | 3,560,399 | | | CSMC Mortgage-Backed Trust, Series2006-4-6A1 | | | 6.00 | % | | | 05/25/2036 | | | | 2,181,494 | |
| | 36,023 | | | CSMC Mortgage-Backed Trust, Series2006-4-7A1 | | | 5.50 | % | | | 05/25/2021 | | | | 30,315 | |
| | 64,666 | | | CSMC Mortgage-Backed Trust, Series2007-1-3A1 | | | 6.00 | % | | | 02/25/2022 | | | | 20,597 | |
| | 25,429 | | | CSMC Mortgage-Backed Trust, Series2007-2-2A1 | | | 5.00 | % | | | 03/25/2037 | | | | 23,210 | |
| | 6,867,435 | | | CSMC Mortgage-Backed Trust, Series2019-RPL8-A1 | | | 3.32 | % # ^ | | | 10/25/2058 | | | | 7,177,525 | |
| | 1,885,589 | | | CSMC Trust, Series2010-4R-3A17 | | | 6.00 | % # ^ | | | 06/26/2037 | | | | 1,813,220 | |
| | 6,448,540 | | | CSMC Trust, Series2013-IVR1-A1 | | | 2.50 | % # ^ | | | 03/25/2043 | | | | 6,182,489 | |
| | 19,610,543 | | | CSMC Trust, Series2018-RPL7-A1 | | | 4.00 | % ^ | | | 08/26/2058 | | | | 20,450,166 | |
| | 39,846,436 | | | CSMC Trust, Series2018-RPL8-A1 | | | 4.13 | % # ^ | | | 07/25/2058 | | | | 37,217,552 | |
| | 26,659,037 | | | CSMC Trust, Series2019-JR1-A1 | | | 4.10 | % # ^ | | | 09/27/2066 | | | | 26,584,637 | |
| | 49,124,373 | | | CSMC Trust, Series2020-RPL1-PT1 | | | 3.47 | % ^ | | | 10/25/2069 | | | | 42,260,371 | |
| | 591,193 | | | Deutsche Mortgage Securities, Inc., Series2006-PR1-3A1(-1 x 1 Month LIBOR USD + 12.12%, 12.12% Cap) | | | 11.14 | % ^I/F | | | 04/15/2036 | | | | 549,635 | |
| | 118,057 | | | Deutsche Mortgage Securities, Inc., Series2006-PR1-4AI2(-2 x 1 Month LIBOR USD + 14.60%, 14.61% Cap) | | | 13.26 | % ^I/F | | | 04/15/2036 | | | | 121,430 | |
| | 1,150,328 | | | Deutsche Mortgage Securities, Inc., Series2006-PR1-5AI4(-1 x 1 Month LIBOR USD + 12.12%, 12.12% Cap) | | | 11.14 | % ^I/F | | | 04/15/2036 | | | | 1,136,870 | |
| | 7,506,873 | | | Deutsche Securities, Inc., Series2005-6-2A1 | | | 5.50 | % | | | 12/25/2035 | | | | 6,711,867 | |
| | 314,292 | | | First Horizon Alternative Mortgage Securities Trust,Series 2006-FA2-1A5 | | | 6.00 | % | | | 05/25/2036 | | | | 211,815 | |
| | 3,584,983 | | | First Horizon Alternative Mortgage Securities Trust,Series 2006-FA8-1A1 | | | 6.25 | % | | | 02/25/2037 | | | | 2,392,296 | |
| | 66,451 | | | First Horizon Alternative Mortgage Securities Trust,Series 2006-RE1-A1 | | | 5.50 | % | | | 05/25/2035 | | | | 56,201 | |
| | 19,200,000 | | | FMC GMSR Issuer Trust, Series2019-GT2-A | | | 4.23 | % # ^ | | | 09/25/2024 | | | | 12,084,092 | |
| | 4,876,843 | | | GCAT LLC, Series2019-2-A1 | | | 3.47 | % ^§ | | | 06/25/2024 | | | | 4,861,074 | |
| | 2,960,422 | | | GMACM Mortgage Loan Trust, Series2006-J1-A6 | | | 5.75 | % | | | 04/25/2036 | | | | 2,753,204 | |
| | 45,716 | | | GSAA Home Equity Trust, Series2005-7-AF5 | | | 4.61 | % | | | 05/25/2035 | | | | 45,112 | |
| | 1,270,830 | | | GSAA Home Equity Trust, Series2007-10-A1A | | | 6.00 | % | | | 11/25/2037 | | | | 963,962 | |
| | 1,107,555 | | | GSAA Home Equity Trust, Series2007-10-A2A | | | 6.50 | % | | | 11/25/2037 | | | | 678,505 | |
| | 2,582,974 | | | GSR Mortgage Loan Trust, Series2006-3F-4A1 | | | 6.00 | % | | | 03/25/2036 | | | | 2,468,709 | |
| | 333,472 | | | GSR Mortgage Loan Trust, Series2007-1F-2A2 | | | 5.50 | % | | | 01/25/2037 | | | | 393,550 | |
| | 19,200,000 | | | Headlands Residential LLC, Series 2019-RPL1-NOTE | | | 3.97 | % ^§ | | | 06/25/2024 | | | | 16,927,523 | |
| | 26,619,179 | | | HSI Asset Securitization Corporation, Series2006-HE1-1A1 (1 Month LIBOR USD + 0.14%, 0.14% Floor) | | | 1.09 | % | | | 10/25/2036 | | | | 10,583,562 | |
| | 35,000,192 | | | Impac Secured Assets Trust, Series2006-5-1A1C (1 Month LIBOR USD + 0.27%, 0.27% Floor, 11.50% Cap) | | | 1.22 | % | | | 02/25/2037 | | | | 29,148,251 | |
| | 330,830 | | | JP Morgan Alternative Loan Trust, Series2006-S2-A4 | | | 6.19 | % | | | 05/25/2036 | | | | 318,686 | |
| | 7,130,724 | | | JP Morgan Alternative Loan Trust, Series2006-S3-A4 | | | 6.31 | % ß | | | 08/25/2036 | | | | 6,306,360 | |
| | 200,287 | | | JP Morgan Alternative Loan Trust, Series2006-S3-A6 | | | 6.12 | % ß | | | 08/25/2036 | | | | 184,084 | |
| | 199,754 | | | JP Morgan Alternative Loan Trust, Series2006-S4-A6 | | | 5.71 | % ß | | | 12/25/2036 | | | | 190,655 | |
| | 4,376,768 | | | JP Morgan Mortgage Trust, Series2006-S1-2A9 | | | 6.50 | % | | | 04/25/2036 | | | | 4,493,836 | |
| | 228,683 | | | JP Morgan Mortgage Trust, Series2007-S3-1A7 | | | 6.00 | % | | | 08/25/2037 | | | | 163,346 | |
| | 35,063,334 | | | Legacy Mortgage Asset Trust, Series2018-GS2-A1 | | | 4.00 | % ^§ | | | 04/25/2058 | | | | 32,012,000 | |
| | 38,091,344 | | | Legacy Mortgage Asset Trust, Series2018-SL1-A | | | 4.00 | % # ^ | | | 02/25/2058 | | | | 38,274,434 | |
| | | | | | | | | | | | | | | | |
| | | | | | | | | | | | | |
| | 1,431,044 | | | Legacy Mortgage Asset Trust, Series2019-GS5-A1 | | | 3.20 | % ^§ | | | 05/25/2059 | | | | 1,433,426 | |
| | 37,021,102 | | | Legacy Mortgage Asset Trust, Series2019-RPL3-PT1 | | | 4.30 | % ^ | | | 06/25/2058 | | | | 32,893,434 | |
| | 5,830,777 | | | Legacy Mortgage Asset Trust, Series2019-SL3-A | | | 3.47 | % ^§ | | | 11/25/2061 | | | | 5,763,224 | |
| | 518,500 | | | Lehman Mortgage Trust, Series2006-3-1A5 | | | 6.00 | % | | | 07/25/2036 | | | | 358,446 | |
| | 37,521 | | | Lehman Mortgage Trust, Series2006-9-1A19(-5 x 1 Month LIBOR USD + 30.68%, 30.68% Cap) | | | 26.33 | % I/F | | | 01/25/2037 | | | | 65,589 | |
| | 645,332 | | | Lehman Mortgage Trust, Series2007-10-2A1 | | | 6.50 | % | | | 01/25/2038 | | | | 359,850 | |
| | 134,222 | | | Lehman Mortgage Trust, Series2007-2-1A1 | | | 5.75 | % | | | 02/25/2037 | | | | 106,931 | |
| | 5,303,886 | | | Lehman Trust, Series2005-9N-1A1 (1 Month LIBOR USD + 0.27%, 0.27% Floor) | | | 1.22 | % | | | 02/25/2036 | | | | 4,563,533 | |
| | 102,415 | | | MASTR Alternative Loans Trust, Series2005-2-3A1 | | | 6.00 | % | | | 03/25/2035 | | | | 93,516 | |
| | 6,485,160 | | | MASTR Alternative Loans Trust, Series2006-1-A5 | | | 6.00 | % | | | 02/25/2036 | | | | 4,517,305 | |
| | 40,527 | | | MASTR Alternative Loans Trust, Series2007-1-2A7 | | | 6.00 | % | | | 10/25/2036 | | | | 21,315 | |
| | 1,624,782 | | | MASTR Asset Securitization Trust, Series2006-2-1A11 (1 Month LIBOR USD + 6.00%, 6.00% Floor) | | | 6.00 | % | | | 06/25/2036 | | | | 1,419,259 | |
| | 14,577,301 | | | Merrill Lynch Alternative Asset Trust, Series2007-OAR4-A1 (1 Month LIBOR USD + 0.25%, 0.25% Floor) | | | 1.20 | % | | | 08/25/2037 | | | | 11,578,502 | |
| | 2,163,700 | | | Merrill Lynch Alternative Note Asset Trust, Series2007-F1-2A8 | | | 6.00 | % | | | 03/25/2037 | | | | 1,337,368 | |
| | 17,557,749 | | | MFA LLC, Series2018-NPL1-A1 | | | 3.88 | % ^§ | | | 05/25/2048 | | | | 18,111,252 | |
| | 20,239 | | | Morgan Stanley Mortgage Loan Trust, Series2004-1-1A1 | | | 5.00 | % | | | 11/25/2018 | | | | 19,106 | |
| | 813,472 | | | Morgan Stanley Mortgage Loan Trust, Series2005-7-7A4 | | | 5.50 | % | | | 11/25/2035 | | | | 798,634 | |
| | 2,479,713 | | | Morgan Stanley Mortgage Loan Trust, Series2006-7-3A | | | 5.03 | % # | | | 06/25/2036 | | | | 1,918,779 | |
| | 758,563 | | | Morgan StanleyRe-Remic Trust, Series2010-R6-5C | | | 5.75 | %# ^ | | | 05/26/2037 | | | | 724,227 | |
| | 193,708 | | | Nomura Asset Acceptance Corporation, Series2006-AP1-A2 | | | 5.52 | % # | | | 01/25/2036 | | | | 83,368 | |
| | 570,179 | | | Nomura Home Equity Loan, Inc., Series2006-AF1-A2 | | | 5.80 | % ß | | | 10/25/2036 | | | | 222,084 | |
| | 988,902 | | | Nomura Home Equity Loan, Inc., Series2007-1-1A1 | | | 6.06 | % ß | | | 02/25/2037 | | | | 388,854 | |
| | 49,386 | | | Option One Mortgage Loan Trust, Series2004-3-M3 (1 Month LIBOR USD + 0.98%, 0.65% Floor) | | | 1.92 | % | | | 11/25/2034 | | | | 44,832 | |
| | 26,815,647 | | | Option One Mortgage Loan Trust, Series2007-6-1A1 (1 Month LIBOR USD + 0.19%, 0.19% Floor) | | | 1.14 | % | | | 07/25/2037 | | | | 21,498,686 | |
| | 23,235,662 | | | PMT Credit Risk Transfer Trust, Series2020-1R-A (1 Month LIBOR USD + 2.35%, 2.35% Floor) | | | 4.00 | % ^ | | | 02/27/2023 | | | | 21,966,809 | |
| | 8,592,586 | | | PR Mortgage Loan Trust, Series2014-1-APT | | | 5.91 | % # ^ | | | 10/25/2049 | | | | 8,547,956 | |
| | 3,494,054 | | | Pretium Mortgage Credit Partners LLC, Series2019-CFL1-A1 | | | 3.72 | % ^§ | | | 01/25/2059 | | | | 3,062,456 | |
| | 6,766,858 | | | PRPM LLC, Series2019-2A-A1 | | | 3.97 | % ^§ | | | 04/25/2024 | | | | 6,061,206 | |
| | 10,340,763 | | | PRPM LLC, Series2019-3A-A1 | | | 3.35 | % ^§ | | | 07/25/2024 | | | | 10,276,276 | |
| | 15,355,037 | | | PRPM LLC, Series2019-GS1-A1 | | | 3.50 | % # ^ | | | 10/25/2024 | | | | 15,286,503 | |
| | 8,558,826 | | | RBSGC Mortgage Loan Trust, Series2005-A-3A | | | 6.00 | % | | | 04/25/2035 | | | | 5,667,895 | |
| | 29,634,092 | | | Redwood Funding Trust, Series2019-1-PT | | | 4.21 | % ^§ | | | 09/27/2024 | | | | 27,232,901 | |
| | 264,505 | | | Residential Accredit Loans, Inc., Series2005-QS14-3A3 | | | 6.00 | % | | | 09/25/2035 | | | | 236,496 | |
| | 311,556 | | | Residential Accredit Loans, Inc., Series2006-QS10-A4 | | | 5.75 | % | | | 08/25/2036 | | | | 276,189 | |
| | 3,399,690 | | | Residential Accredit Loans, Inc., Series2006-QS10-A9 | | | 6.50 | % | | | 08/25/2036 | | | | 3,120,383 | |
| | 3,352,718 | | | Residential Accredit Loans, Inc., Series2006-QS4-A10 | | | 6.00 | % | | | 04/25/2036 | | | | 2,990,167 | |
| | 666,216 | | | Residential Accredit Loans, Inc., Series2006-QS6-1A15 | | | 6.00 | % | | | 06/25/2036 | | | | 585,965 | |
| | 45,517 | | | Residential Accredit Loans, Inc., Series2006-QS6-2A1 | | | 6.00 | % | | | 06/25/2021 | | | | 44,572 | |
| | 1,096,423 | | | Residential Accredit Loans, Inc., Series2007-QS3-A4 | | | 6.25 | % | | | 02/25/2037 | | | | 934,189 | |
| | 3,889,281 | | | Residential Accredit Loans, Inc., Series2007-QS9-A33 | | | 6.50 | % | | | 07/25/2037 | | | | 3,498,991 | |
| | 147,553 | | | Residential Asset Mortgage Products, Inc., Series2005-RS1-AI5 | | | 5.91 | % | | | 01/25/2035 | | | | 147,476 | |
| | 213,722 | | | Residential Asset Securitization Trust, Series2005-A10-A3 | | | 5.50 | % | | | 09/25/2035 | | | | 157,401 | |
| | 266,518 | | | Residential Asset Securitization Trust, Series2005-A11-2A4 | | | 6.00 | % | | | 10/25/2035 | | | | 179,009 | |
| | 51,304 | | | Residential Asset Securitization Trust, Series2005-A7-A3 | | | 5.50 | % | | | 06/25/2035 | | | | 37,622 | |
| | 1,609,111 | | | Residential Asset Securitization Trust, Series2006-A6-1A1 | | | 6.50 | % | | | 07/25/2036 | | | | 643,342 | |
| | 134,929 | | | Residential Asset Securitization Trust, Series2006-R1-A1(-4 x 1 Month LIBOR USD + 28.40%, 28.40% Cap) | | | 24.61 | % I/F Þ | | | 01/25/2046 | | | | 170,449 | |
| | 79,753 | | | Residential Funding Mortgage Securities Trust,Series 2006-S10-1A2 | | | 6.00 | % | | | 10/25/2036 | | | | 70,007 | |
| | 405,111 | | | Residential Funding Mortgage Securities Trust, Series2006-S11-A3 | | | 6.00 | % | | | 11/25/2036 | | | | 377,557 | |
| | 804,385 | | | Residential Funding Mortgage Securities Trust, Series2007-S2-A4 | | | 6.00 | % | | | 02/25/2037 | | | | 699,204 | |
| | 518,949 | | | Residential Funding Mortgage Securities Trust, Series2007-S3-1A4 | | | 6.00 | % | | | 03/25/2037 | | | | 440,909 | |
| | 5,154,000 | | | Residential Mortgage Loan Trust, Series2020-1-M1 | | | 3.24 | % # ^ | | | 02/25/2024 | | | | 4,666,038 | |
| | 8,745,833 | | | Seasoned Credit Risk Transfer Trust, Series2018-2-HV | | | 3.00 | % # | | | 11/25/2057 | | | | 9,173,634 | |
| | 26,016,199 | | | Seasoned Credit Risk Transfer Trust, Series2019-4-M55D | | | 4.00 | % | | | 02/25/2059 | | | | 28,188,105 | |
| | 34,923,949 | | | Securitized Mortgage Asset Loan Trust, Series2015-1-PC | | | 2.92 | % # ^ | | | 02/25/2054 | | | | 28,668,399 | |
| | 6,326,112 | | | Securitized Mortgage Asset Loan Trust, Series2015-2-PC | | | 3.38 | % # ^ | | | 12/26/2059 | | | | 5,547,813 | |
| | 7,739,605 | | | Securitized Mortgage Asset Loan Trust, Series2015-3-PC | | | 3.63 | % # ^ | | | 10/25/2044 | | | | 6,902,228 | |
| | 7,096,250 | | | Sequoia Mortgage Trust, Series2007-3-2AA1 | | | 3.98 | % # | | | 07/20/2037 | | | | 5,832,751 | |
| | 17,080,867 | | | ShellpointCo-Originator Trust, Series2016-1-1A10 | | | 3.50 | % # ^ | | | 11/25/2046 | | | | 17,213,267 | |
| | 9,183,641 | | | Soundview Home Loan Trust, Series2007-OPT4-1A1 (1 Month LIBOR USD + 1.00%, 1.00% Floor) | | | 1.95 | % | | | 09/25/2037 | | | | 6,402,477 | |
| | 5,910,000 | | | Starwood Mortgage Residential Trust, Series2020-1-B1 | | | 3.73 | % # ^ | | | 02/25/2050 | | | | 5,003,929 | |
| | 4,326,825 | | | Structured Asset Investment Loan Trust, Series2006-BNC3-A1 (1 Month LIBOR USD + 0.18%, 0.18% Floor) | | | 1.13 | % | | | 09/25/2036 | | | | 2,947,257 | |
| | 1,149,196 | | | Structured Asset Securities Corporation, Series2005-RF1-A (1 Month LIBOR USD + 0.35%, 0.35% Floor) | | | 1.30 | %^ | | | 03/25/2035 | | | | 940,053 | |
| | 1,149,196 | | | Structured Asset Securities Corporation, Series2005-RF1-AIO | | | 3.26 | % # ^ I/O | | | 03/25/2035 | | | | 199,507 | |
| | 14,000,000 | | | Toorak Mortgage Corporation Ltd., Series2019-2-A1 | | | 3.72 | % § | | | 09/25/2022 | | | | 12,688,824 | |
| | 25,625,922 | | | Velocity Commercial Capital Loan Trust, Series2018-1-A | | | 3.59 | % ^ | | | 04/25/2048 | | | | 25,992,747 | |
| | 3,751,365 | | | Velocity Commercial Capital Loan Trust, Series2018-1-M1 | | | 3.91 | % ^ | | | 04/25/2048 | | | | 3,646,469 | |
| | 1,492,240 | | | Velocity Commercial Capital Loan Trust, Series2018-1-M2 | | | 4.26 | % ^ | | | 04/25/2048 | | | | 1,310,725 | |
| | 998,019 | | | Velocity Commercial Capital Loan Trust, Series2018-1-M3 | | | 4.41 | % ^ | | | 04/25/2048 | | | | 837,102 | |
| | | | | | | | | | | | | | | | |
| | | | | | | | | | | | | |
| | 14,051,951 | | | Velocity Commercial Capital Loan Trust, Series2018-2-A | | | 4.05 | % # ^ | | | 10/26/2048 | | | | 14,216,306 | |
| | 4,852,861 | | | Velocity Commercial Capital Loan Trust, Series2019-1-M1 | | | 3.94 | % # ^ | | | 03/25/2049 | | | | 4,608,509 | |
| | 1,309,464 | | | Velocity Commercial Capital Loan Trust, Series2019-1-M2 | | | 4.01 | % # ^ | | | 03/25/2049 | | | | 1,132,314 | |
| | 1,478,948 | | | Velocity Commercial Capital Loan Trust, Series2019-1-M3 | | | 4.12 | % # ^ | | | 03/25/2049 | | | | 1,232,939 | |
| | 2,681,121 | | | Vericrest Opportunity Loan Trust, Series2019-NPL5-A1A | | | 3.35 | % ^§ | | | 09/25/2049 | | | | 2,326,353 | |
| | 12,517,191 | | | Vericrest Opportunity Loan Trust, Series2020-NPL5-A1A | | | 2.98 | % ^§ | | | 03/25/2050 | | | | 11,381,108 | |
| | 2,658,754 | | | VOLT LLC, Series2019-NP10-A1A | | | 3.43 | % ^§ | | | 12/27/2049 | | | | 2,511,401 | |
| | 16,511,069 | | | VOLT LLC, Series2019-NPL6-A1A | | | 3.23 | % ^§ | | | 10/25/2049 | | | | 15,526,630 | |
| | 24,000,132 | | | VOLT LLC, Series2020-NPL1-A1A | | | 3.23 | % ^§ | | | 01/25/2050 | | | | 21,742,987 | |
| | 13,542,548 | | | VOLT LLC, Series2020-NPL3-A1A | | | 2.98 | % ^§ | | | 02/25/2050 | | | | 9,933,635 | |
| | 8,957,367 | | | Washington Mutual Mortgage Pass-Through Certificates Trust, Series2006-8-A5 | | | 4.31 | % ß | | | 10/25/2036 | | | | 4,543,641 | |
| | 112,901 | | | Washington Mutual Mortgage Pass-Through Certificates, Series2005-1-2A | | | 6.00 | % | | | 03/25/2035 | | | | 104,858 | |
| | 738,333 | | | Washington Mutual Mortgage Pass-Through Certificates, Series2006-1-3A1 | | | 5.75 | % | | | 02/25/2036 | | | | 644,106 | |
| | 1,902,083 | | | Washington Mutual Mortgage Pass-Through Certificates, Series2006-2-4CB | | | 6.00 | % | | | 03/25/2036 | | | | 1,814,206 | |
| | 3,980,734 | | | Washington Mutual Mortgage Pass-Through Certificates, Series2006-8-A6 | | | 4.31 | % ß | | | 10/25/2036 | | | | 2,018,461 | |
| | 2,522,125 | | | Washington Mutual Mortgage Pass-Through Certificates, Series2006-AR19-2A (11th District Cost of Funds Index + 1.25%, 1.25% Floor) | | | 2.23 | % | | | 01/25/2047 | | | | 2,123,702 | |
| | 7,504,414 | | | Washington Mutual Mortgage Pass-Through Certificates, Series2007-2-1A3 | | | 6.00 | % | | | 04/25/2037 | | | | 5,763,850 | |
| | 1,490,891 | | | Washington Mutual Mortgage Pass-Through Certificates, Series2007-3-A6 | | | 6.00 | % | | | 04/25/2037 | | | | 1,347,975 | |
| | 102,514 | | | Washington Mutual Mortgage Pass-Through Certificates, Series2007-5-A11(-6 x 1 Month LIBOR USD + 39.48%, 39.48% Cap) | | | 33.80 | % I/F | | | 06/25/2037 | | | | 222,014 | |
| | 8,724,475 | | | Washington Mutual Mortgage Pass-Through Certificates, Series2007-5-A3 | | | 7.00 | % | | | 06/25/2037 | | | | 5,653,349 | |
| | 755,096 | | | Wells Fargo Alternative Loan Trust, Series2007-PA5-1A1 | | | 6.25 | % | | | 11/25/2037 | | | | 708,852 | |
| | 25,043 | | | Wells Fargo Mortgage Backed Securities Trust, Series2005-AR14-A6 | | | 4.84 | % # | | | 08/25/2035 | | | | 25,019 | |
| | 586,896 | | | Wells Fargo Mortgage Backed Securities Trust, Series2006-7-2A1 | | | 6.00 | % | | | 06/25/2036 | | | | 564,260 | |
| | 53,649 | | | Wells Fargo Mortgage Backed Securities Trust, Series2007-7-A1 | | | 6.00 | % | | | 06/25/2037 | | | | 52,012 | |
| | | | | | | | | | | | | | | | |
| TotalNon-Agency Residential Collateralized Mortgage Obligations
(Cost $1,072,146,764) | | | | | | | | | | | 997,562,103 | |
| | | | | | | | | | | | | | | | |
| | US Corporate Bonds - 12.2% | | | | | | | | | | | | |
| | 14,766,000 | | | AbbVie, Inc. | | | 4.70 | % | | | 05/14/2045 | | | | 16,664,136 | |
| | 1,720,000 | | | Acrisure LLC | | | 8.13 | % ^ | | | 02/15/2024 | | | | 1,685,041 | |
| | 1,235,000 | | | Advanced Drainage Systems, Inc. | | | 5.00 | % ^ | | | 09/30/2027 | | | | 1,109,700 | |
| | 3,315,000 | | | AECOM | | | 5.13 | % | | | 03/15/2027 | | | | 3,011,818 | |
| | 12,868,000 | | | Air Lease Corporation | | | 3.75 | % | | | 02/01/2022 | | | | 11,915,087 | |
| | 1,620,000 | | | Air Lease Corporation | | | 2.30 | % | | | 02/01/2025 | | | | 1,239,585 | |
| | 1,495,000 | | | Air Medical Merger Sub Corporation | | | 6.38 | % ^ | | | 05/15/2023 | | | | 1,339,886 | |
| | 1,285,000 | | | Albertsons LLC | | | 4.63 | % ^ | | | 01/15/2027 | | | | 1,285,707 | |
| | 12,430,000 | | | Alexandria Real Estate Equities, Inc. | | | 4.00 | % | | | 01/15/2024 | | | | 12,723,256 | |
| | 1,235,000 | | | Alliant Holdings Intermediate LLC | | | 6.75 | % ^ | | | 10/15/2027 | | | | 1,163,308 | |
| | 1,750,000 | | | Allied Universal Holding Company | | | 6.63 | % ^ | | | 07/15/2026 | | | | 1,722,661 | |
| | 1,460,000 | | | Allied Universal Holding Company | | | 9.75 | % ^ | | | 07/15/2027 | | | | 1,386,077 | |
| | 2,985,000 | | | Allison Transmission, Inc. | | | 5.00 | % ^ | | | 10/01/2024 | | | | 2,917,748 | |
| | 14,655,000 | | | Altria Group, Inc. | | | 4.80 | % | | | 02/14/2029 | | | | 15,366,397 | |
| | 1,541,000 | | | AMC Merger, Inc. | | | 8.00 | % ^ | | | 05/15/2025 | | | | 899,551 | |
| | 1,085,000 | | | American Axle & Manufacturing, Inc. | | | 6.25 | % | | | 03/15/2026 | | | | 844,719 | |
| | 15,490,000 | | | American Express Credit Corporation | | | 2.50 | % | | | 08/01/2022 | | | | 15,778,349 | |
| | 4,433,000 | | | American Tower Corporation | | | 3.38 | % | | | 10/15/2026 | | | | 4,444,087 | |
| | 14,172,000 | | | American Tower Corporation | | | 3.60 | % | | | 01/15/2028 | | | | 14,196,513 | |
| | 6,100,000 | | | Anheuser-Busch InBev Worldwide, Inc. | | | 4.90 | % | | | 02/01/2046 | | | | 6,688,104 | |
| | 8,205,000 | | | Anheuser-Busch InBev Worldwide, Inc. | | | 4.60 | % | | | 04/15/2048 | | | | 8,733,349 | |
| | 989,000 | | | Antero Midstream Partners LP | | | 5.75 | % ^ | | | 03/01/2027 | | | | 640,452 | |
| | 2,000,000 | | | Arconic Corporation | | | 6.13 | % ^ | | | 02/15/2028 | | | | 2,060,000 | |
| | 1,875,000 | | | Argos Merger Sub, Inc. | | | 7.13 | % ^ | | | 03/15/2023 | | | | 1,780,312 | |
| | 7,320,000 | | | Arrow Electronics, Inc. | | | 3.88 | % | | | 01/12/2028 | | | | 7,034,502 | |
| | 340,000 | | | Asbury Automotive Group, Inc. | | | 4.50 | % ^ | | | 03/01/2028 | | | | 291,550 | |
| | 340,000 | | | Asbury Automotive Group, Inc. | | | 4.75 | % ^ | | | 03/01/2030 | | | | 291,550 | |
| | 2,655,000 | | | Ascend Learning LLC | | | 6.88 | % ^ | | | 08/01/2025 | | | | 2,598,568 | |
| | 690,000 | | | Ascend Learning LLC | | | 6.88 | % ^ | | | 08/01/2025 | | | | 675,334 | |
| | 1,000,000 | | | ASGN, Inc. | | | 4.63 | % ^ | | | 05/15/2028 | | | | 943,050 | |
| | 2,980,000 | | | AssuredPartners, Inc. | | | 7.00 | % ^ | | | 08/15/2025 | | | | 2,704,261 | |
| | 20,665,000 | | | AT&T, Inc. | | | 5.25 | % | | | 03/01/2037 | | | | 24,141,142 | |
| | 15,884,000 | | | Athene Global Funding | | | 3.00 | % ^ | | | 07/01/2022 | | | | 15,650,035 | |
| | 2,740,000 | | | Avantor, Inc. | | | 9.00 | % ^ | | | 10/01/2025 | | | | 2,901,537 | |
| | 15,208,000 | | | AXA Equitable Holdings, Inc. | | | 3.90 | % | | | 04/20/2023 | | | | 15,173,011 | |
| | 990,000 | | | B&G Foods, Inc. | | | 5.25 | % | | | 04/01/2025 | | | | 972,096 | |
| | 785,000 | | | B&G Foods, Inc. | | | 5.25 | % | | | 09/15/2027 | | | | 768,319 | |
| | 865,000 | | | Banff Merger Sub, Inc. | | | 9.75 | % ^ | | | 09/01/2026 | | | | 767,752 | |
| | 14,305,000 | | | Bank of America Corporation (3 Month LIBOR USD + 1.21%) | | | 3.97 | % | | | 02/07/2030 | | | | 15,475,344 | |
| | 25,525,000 | | | BAT Capital Corporation | | | 3.46 | % | | | 09/06/2029 | | | | 23,777,804 | |
| | 1,090,000 | | | Bausch Health Companies, Inc. | | | 7.00 | % ^ | | | 03/15/2024 | | | | 1,124,068 | |
| | | | | | | | | | | | | | | | |
| | | | | | | | | | | | | |
| | 2,355,000 | | | Bausch Health Companies, Inc. | | | 7.00 | % ^ | | | 01/15/2028 | | | | 2,455,205 | |
| | 1,285,000 | | | Bausch Health Companies, Inc. | | | 5.00 | % ^ | | | 01/30/2028 | | | | 1,226,147 | |
| | 1,315,000 | | | Bausch Health Companies, Inc. | | | 5.25 | % ^ | | | 01/30/2030 | | | | 1,239,387 | |
| | 2,045,000 | | | Beacon Roofing Supply, Inc. | | | 4.88 | % ^ | | | 11/01/2025 | | | | 1,858,404 | |
| | 820,000 | | | Beacon Roofing Supply, Inc. | | | 4.50 | % ^ | | | 11/15/2026 | | | | 759,771 | |
| | 23,535,000 | | | Becton Dickinson and Company | | | 2.89 | % | | | 06/06/2022 | | | | 23,573,407 | |
| | 15,215,000 | | | Boston Properties LP | | | 3.40 | % | | | 06/21/2029 | | | | 15,833,283 | |
| | 2,065,000 | | | Boyd Gaming Corporation | | | 4.75 | % ^ | | | 12/01/2027 | | | | 1,715,086 | |
| | 3,465,000 | | | Boyne USA, Inc. | | | 7.25 | % ^ | | | 05/01/2025 | | | | 3,339,376 | |
| | 14,005,000 | | | Bristol-Myers Squibb Company | | | 4.35 | % ^ | | | 11/15/2047 | | | | 17,667,167 | |
| | 13,630,000 | | | Brooklyn Union Gas Company | | | 4.49 | % ^ | | | 03/04/2049 | | | | 14,530,702 | |
| | 599,000 | | | Builders FirstSource, Inc. | | | 6.75 | % ^ | | | 06/01/2027 | | | | 592,137 | |
| | 1,300,000 | | | Builders FirstSource, Inc. | | | 5.00 | % ^ | | | 03/01/2030 | | | | 1,177,312 | |
| | 1,200,000 | | | Calpine Corporation | | | 5.75 | % | | | 01/15/2025 | | | | 1,119,000 | |
| | 1,185,000 | | | Calpine Corporation | | | 5.25 | % ^ | | | 06/01/2026 | | | | 1,134,006 | |
| | 890,000 | | | Calpine Corporation | | | 4.50 | % ^ | | | 02/15/2028 | | | | 865,970 | |
| | 555,000 | | | Calpine Corporation | | | 5.13 | % ^ | | | 03/15/2028 | | | | 514,762 | |
| | 4,050,000 | | | Capital One Financial Corporation (3 Month LIBOR USD + 0.72%) | | | 2.49 | % | | | 01/30/2023 | | | | 3,786,911 | |
| | 9,920,000 | | | Carrier Global Corporation | | | 3.38 | % ^ | | | 04/05/2040 | | | | 8,799,286 | |
| | 705,000 | | | Carvana Company | | | 8.88 | % ^ | | | 10/01/2023 | | | | 671,491 | |
| | 580,000 | | | Castle US Holding Corporation | | | 9.50 | % ^ | | | 02/15/2028 | | | | 554,262 | |
| | 2,165,000 | | | Catalent Pharma Solutions, Inc. | | | 5.00 | % ^ | | | 07/15/2027 | | | | 2,112,066 | |
| | 4,771,000 | | | CCO Holdings LLC | | | 5.75 | % ^ | | | 02/15/2026 | | | | 4,847,097 | |
| | 1,255,000 | | | CCO Holdings LLC | | | 5.00 | % ^ | | | 02/01/2028 | | | | 1,266,998 | |
| | 2,520,000 | | | CCO Holdings LLC | | | 4.75 | % ^ | | | 03/01/2030 | | | | 2,527,686 | |
| | 1,275,000 | | | CCO Holdings LLC | | | 4.50 | % ^ | | | 08/15/2030 | | | | 1,256,672 | |
| | 860,000 | | | CDK Global, Inc. | | | 5.88 | % | | | 06/15/2026 | | | | 913,363 | |
| | 202,000 | | | CDK Global, Inc. | | | 5.25 | % ^ | | | 05/15/2029 | | | | 206,797 | |
| | 1,830,000 | | | Cedar Fair LP | | | 5.25 | % ^ | | | 07/15/2029 | | | | 1,556,506 | |
| | 1,165,000 | | | Cengage Learning, Inc. | | | 9.50 | % ^ | | | 06/15/2024 | | | | 872,288 | |
| | 1,580,000 | | | Centene Corporation | | | 4.25 | % ^ | | | 12/15/2027 | | | | 1,591,771 | |
| | 1,195,000 | | | Centene Corporation | | | 3.38 | % ^ | | | 02/15/2030 | | | | 1,115,831 | |
| | 1,165,000 | | | Century Communities, Inc. | | | 6.75 | % | | | 06/01/2027 | | | | 951,033 | |
| | 1,305,000 | | | CenturyLink, Inc. | | | 5.13 | % ^ | | | 12/15/2026 | | | | 1,308,262 | |
| | 1,170,000 | | | CenturyLink, Inc. | | | 4.00 | % ^ | | | 02/15/2027 | | | | 1,126,125 | |
| | 1,645,000 | | | CFX Escrow Corporation | | | 6.38 | % ^ | | | 02/15/2026 | | | | 1,626,494 | |
| | 1,230,000 | | | Charles River Laboratories International, Inc. | | | 4.25 | % ^ | | | 05/01/2028 | | | | 1,192,423 | |
| | 14,165,000 | | | Charles Schwab Corporation | | | 3.55 | % | | | 02/01/2024 | | | | 14,903,367 | |
| | 14,746,000 | | | Charter Communications Operating LLC | | | 4.91 | % | | | 07/23/2025 | | | | 15,914,143 | |
| | 2,670,000 | | | Cheniere Energy Partners LP | | | 5.25 | % | | | 10/01/2025 | | | | 2,503,045 | |
| | 390,000 | | | Cheniere Energy Partners LP | | | 5.63 | % | | | 10/01/2026 | | | | 364,893 | |
| | 825,000 | | | Cheniere Energy Partners LP | | | 4.50 | % ^ | | | 10/01/2029 | | | | 738,829 | |
| | 7,380,000 | | | Cigna Corporation | | | 4.90 | % | | | 12/15/2048 | | | | 8,964,310 | |
| | 7,655,000 | | | Cigna Corporation (3 Month LIBOR USD + 0.89%) | | | 2.72 | % | | | 07/15/2023 | | | | 7,122,156 | |
| | 1,765,000 | | | Cincinnati Bell, Inc. | | | 7.00 | % ^ | | | 07/15/2024 | | | | 1,789,216 | |
| | 23,400,000 | | | Citigroup, Inc. (3 Month LIBOR USD + 1.10%) | | | 2.79 | % | | | 05/17/2024 | | | | 22,364,927 | |
| | 2,140,000 | | | Clean Harbors, Inc. | | | 4.88 | % ^ | | | 07/15/2027 | | | | 2,106,723 | |
| | 460,000 | | | Clean Harbors, Inc. | | | 5.13 | % ^ | | | 07/15/2029 | | | | 431,730 | |
| | 1,284,000 | | | Clear Channel Worldwide Holdings, Inc. | | | 9.25 | % ^ | | | 02/15/2024 | | | | 1,112,271 | |
| | 1,265,000 | | | Clearway Energy Operating LLC | | | 4.75 | % ^ | | | 03/15/2028 | | | | 1,178,031 | |
| | 1,710,000 | | | CNX Midstream Partners LP | | | 6.50 | % ^ | | | 03/15/2026 | | | | 1,194,508 | |
| | 13,505,000 | | | Comcast Corporation | | | 3.95 | % | | | 10/15/2025 | | | | 14,897,945 | |
| | 1,320,000 | | | CommScope Finance LLC | | | 5.50 | % ^ | | | 03/01/2024 | | | | 1,344,097 | |
| | 625,000 | | | CommScope Finance LLC | | | 6.00 | % ^ | | | 03/01/2026 | | | | 627,576 | |
| | 3,895,000 | | | Constellation Brands, Inc. | | | 3.15 | % | | | 08/01/2029 | | | | 3,653,195 | |
| | 1,380,000 | | | Constellation Merger Sub, Inc. | | | 8.50 | % ^ | | | 09/15/2025 | | | | 840,068 | |
| | 7,722,000 | | | Corning, Inc. | | | 4.38 | % | | | 11/15/2057 | | | | 8,065,431 | |
| | 3,130,000 | | | Cott Holdings, Inc. | | | 5.50 | % ^ | | | 04/01/2025 | | | | 3,055,678 | |
| | 1,810,000 | | | CRC Issuer LLC | | | 5.25 | % ^ | | | 10/15/2025 | | | | 1,320,757 | |
| | 2,255,000 | | | Credit Acceptance Corporation | | | 6.63 | % | | | 03/15/2026 | | | | 2,142,250 | |
| | 1,940,000 | | | Crown Americas LLC | | | 4.50 | % | | | 01/15/2023 | | | | 2,001,071 | |
| | 2,820,000 | | | Crown Americas LLC | | | 4.75 | % | | | 02/01/2026 | | | | 2,913,744 | |
| | 12,420,000 | | | Crown Castle International Corporation | | | 3.65 | % | | | 09/01/2027 | | | | 12,402,123 | |
| | 815,000 | | | Crown Castle International Corporation | | | 3.80 | % | | | 02/15/2028 | | | | 818,262 | |
| | 1,988,000 | | | CSC Holdings LLC | | | 5.25 | % | | | 06/01/2024 | | | | 2,005,385 | |
| | 2,940,000 | | | CSC Holdings LLC | | | 5.75 | % ^ | | | 01/15/2030 | | | | 2,975,897 | |
| | 2,325,000 | | | CSI Compressco LP | | | 7.50 | % ^ | | | 04/01/2025 | | | | 1,578,105 | |
| | 15,465,000 | | | CSX Corporation | | | 3.80 | % | | | 11/01/2046 | | | | 15,619,904 | |
| | | | | | | | | | | | | | | | |
| | | | | | | | | | | | | |
| | 5,420,000 | | | CVS Health Corporation | | | 5.05 | % | | | 03/25/2048 | | | | 6,179,042 | |
| | 2,200,000 | | | Dana Financing Ltd. | | | 5.75 | % ^ | | | 04/15/2025 | | | | 1,933,239 | |
| | 410,000 | | | Dana, Inc. | | | 5.38 | % | | | 11/15/2027 | | | | 335,175 | |
| | 575,000 | | | Dealer Tire LLC | | | 8.00 | % ^ | | | 02/01/2028 | | | | 464,312 | |
| | 16,060,000 | | | Delta Air Lines, Inc. | | | 3.80 | % | | | 04/19/2023 | | | | 15,124,398 | |
| | 1,565,000 | | | Diamond Sports Group LLC | | | 5.38 | % ^ | | | 08/15/2026 | | | | 1,280,392 | |
| | 3,690,000 | | | Diamondback Energy, Inc. | | | 2.88 | % | | | 12/01/2024 | | | | 2,585,805 | |
| | 3,500,000 | | | Digital Realty Trust | | | 3.70 | % | | | 08/15/2027 | | | | 3,389,861 | |
| | 3,000,000 | | | Digital Realty Trust | | | 3.60 | % | | | 07/01/2029 | | | | 2,934,075 | |
| | 17,835,000 | | | Discover Financial Services | | | 4.10 | % | | | 02/09/2027 | | | | 17,196,670 | |
| | 1,330,000 | | | DISH DBS Corporation | | | 5.88 | % | | | 11/15/2024 | | | | 1,303,513 | |
| | 890,000 | | | Dollar Tree, Inc. | | | 4.00 | % | | | 05/15/2025 | | | | 913,287 | |
| | 4,400,000 | | | DTE Energy Company | | | 2.95 | % | | | 03/01/2030 | | | | 4,243,286 | |
| | 3,615,000 | | | Duke Energy Corporation | | | 3.75 | % | | | 09/01/2046 | | | | 3,482,540 | |
| | 7,615,000 | | | Duke Energy Corporation | | | 3.95 | % | | | 08/15/2047 | | | | 7,383,966 | |
| | 11,590,000 | | | Duke Energy Progress, Inc. | | | 4.15 | % | | | 12/01/2044 | | | | 13,134,142 | |
| | 940,000 | | | Dun & Bradstreet Corporation | | | 6.88 | % ^ | | | 08/15/2026 | | | | 982,887 | |
| | 670,000 | | | Dun & Bradstreet Corporation | | | 10.25 | % ^ | | | 02/15/2027 | | | | 713,918 | |
| | 6,505,000 | | | DuPont de Nemours, Inc. | | | 5.42 | % | | | 11/15/2048 | | | | 7,192,974 | |
| | 1,180,000 | | | EES Finance Corporation | | | 8.13 | % | | | 05/01/2025 | | | | 784,700 | |
| | 1,710,000 | | | Eldorado Resorts, Inc. | | | 6.00 | % | | | 04/01/2025 | | | | 1,549,696 | |
| | 1,256,000 | | | Embarq Corporation | | | 8.00 | % | | | 06/01/2036 | | | | 1,250,128 | |
| | 7,425,000 | | | Enable Midstream Partners LP | | | 4.40 | % | | | 03/15/2027 | | | | 3,607,711 | |
| | 620,000 | | | Encompass Health Corporation | | | 4.50 | % | | | 02/01/2028 | | | | 611,506 | |
| | 215,000 | | | Encompass Health Corporation | | | 4.75 | % | | | 02/01/2030 | | | | 212,968 | |
| | 2,310,000 | | | Energizer Holdings, Inc. | | | 7.75 | % ^ | | | 01/15/2027 | | | | 2,400,667 | |
| | 13,325,000 | | | Energy Transfer Operating LP | | | 4.75 | % | | | 01/15/2026 | | | | 11,800,205 | |
| | 1,250,000 | | | Energy Transfer Operating LP | | | 4.20 | % | | | 04/15/2027 | | | | 1,014,803 | |
| | 880,000 | | | Envision Healthcare Corporation | | | 8.75 | % ^ | | | 10/15/2026 | | | | 220,917 | |
| | 1,125,000 | | | EP Energy LLC | | | | ^ W | | | 05/15/2026 | | | | 163,125 | |
| | 2,551,000 | | | ESH Hospitality, Inc. | | | 5.25 | % ^ | | | 05/01/2025 | | | | 2,158,797 | |
| | 825,000 | | | ESH Hospitality, Inc. | | | 4.63 | % ^ | | | 10/01/2027 | | | | 648,079 | |
| | 3,954,000 | | | Exelon Corporation | | | 3.40 | % | | | 04/15/2026 | | | | 3,841,886 | |
| | 7,820,000 | | | Expedia Group, Inc. | | | 3.80 | % | | | 02/15/2028 | | | | 6,781,299 | |
| | 755,000 | | | Extraction Oil & Gas, Inc. | | | 5.63 | % ^ | | | 02/01/2026 | | | | 131,025 | |
| | 7,447,000 | | | FedEx Corporation | | | 4.75 | % | | | 11/15/2045 | | | | 7,181,003 | |
| | 1,520,000 | | | Financial & Risk US Holdings, Inc. | | | 6.25 | % ^ | | | 05/15/2026 | | | | 1,577,836 | |
| | 1,560,000 | | | Financial & Risk US Holdings, Inc. | | | 8.25 | % ^ | | | 11/15/2026 | | | | 1,649,700 | |
| | 2,125,000 | | | Flex Acquisition Company, Inc. | | | 6.88 | % ^ | | | 01/15/2025 | | | | 2,002,749 | |
| | 1,015,000 | | | Ford Motor Company | | | 7.45 | % | | | 07/16/2031 | | | | 735,875 | |
| | 2,220,000 | | | Foresight Energy LLC | | | 11.50 | % ^ W | | | 04/01/2023 | | | | 8,325 | |
| | 1,535,000 | | | Front Range BidCo, Inc. | | | 4.00 | % ^ | | | 03/01/2027 | | | | 1,477,438 | |
| | 720,000 | | | Front Range BidCo, Inc. | | | 6.13 | % ^ | | | 03/01/2028 | | | | 688,050 | |
| | 2,535,000 | | | Frontdoor, Inc. | | | 6.75 | % ^ | | | 08/15/2026 | | | | 2,448,918 | |
| | 525,000 | | | Frontier Communications Corporation | | | 8.50 | % W | | | 04/15/2020 | | | | 141,750 | |
| | 945,000 | | | Frontier Communications Corporation | | | 7.13 | % W | | | 01/15/2023 | | | | 226,800 | |
| | 765,000 | | | Frontier Communications Corporation | | | 8.50 | % ^ | | | 04/01/2026 | | | | 703,379 | |
| | 1,335,000 | | | Frontier Communications Corporation | | | 8.00 | % ^ | | | 04/01/2027 | | | | 1,324,093 | |
| | 1,068,000 | | | FTS International, Inc. | | | 6.25 | % | | | 05/01/2022 | | | | 380,140 | |
| | 1,685,000 | | | Gates Global LLC | | | 6.25 | % ^ | | | 01/15/2026 | | | | 1,500,501 | |
| | 6,426,000 | | | General Electric Company | | | 5.88 | % | | | 01/14/2038 | | | | 7,564,752 | |
| | 6,205,000 | | | General Motors Financial Company | | | 3.95 | % | | | 04/13/2024 | | | | 5,633,961 | |
| | 4,265,000 | | | General Motors Financial Company (3 Month LIBOR USD + 0.80%) | | | 2.54 | % | | | 08/07/2020 | | | | 4,191,953 | |
| | 13,645,000 | | | General Motors Financial Company (3 Month LIBOR USD + 0.99%) | | | 2.89 | % | | | 01/05/2023 | | | | 11,050,909 | |
| | 3,440,000 | | | Genesys Telecommunications Laboratories, Inc. | | | 10.00 | % ^ | | | 11/30/2024 | | | | 3,539,915 | |
| | 16,260,000 | | | Georgia Power Company | | | 2.20 | % | | | 09/15/2024 | | | | 15,283,758 | |
| | 2,250,000 | | | Global Aircraft Leasing Company (PIK 7.25%) | | | 6.50 | % ^ | | | 09/15/2024 | | | | 1,465,875 | |
| | 1,035,000 | | | Golden Entertainment, Inc. | | | 7.63 | % ^ | | | 04/15/2026 | | | | 690,467 | |
| | 3,290,000 | | | Golden Nugget, Inc. | | | 6.75 | % ^ | | | 10/15/2024 | | | | 2,096,914 | |
| | 500,000 | | | Golden Nugget, Inc. | | | 8.75 | % ^ | | | 10/01/2025 | | | | 261,860 | |
| | 19,888,000 | | | Goldman Sachs Group, Inc. (3 Month LIBOR USD + 1.17%) | | | 2.86 | % | | | 05/15/2026 | | | | 18,296,989 | |
| | 860,000 | | | Gray Television, Inc. | | | 5.13 | % ^ | | | 10/15/2024 | | | | 836,354 | |
| | 1,510,000 | | | Gray Television, Inc. | | | 7.00 | % ^ | | | 05/15/2027 | | | | 1,510,830 | |
| | 1,295,000 | | | Griffon Corporation | | | 5.75 | % ^ | | | 03/01/2028 | | | | 1,224,584 | |
| | 740,000 | | | GrubHub Holdings, Inc. | | | 5.50 | % ^ | | | 07/01/2027 | | | | 659,007 | |
| | 1,315,000 | | | GTT Communications, Inc. | | | 7.88 | % ^ | | | 12/31/2024 | | | | 858,037 | |
| | 1,695,000 | | | Gulfport Energy Corporation | | | 6.38 | % | | | 05/15/2025 | | | | 425,860 | |
| | 8,305,000 | | | Halliburton Company | | | 2.92 | % | | | 03/01/2030 | | | | 6,518,045 | |
| | | | | | | | | | | | | | | | |
| | | | | | | | | | | | | |
| | 15,892,000 | | | Hasbro, Inc. | | | 3.50 | % | | | 09/15/2027 | | | | 14,662,623 | |
| | 3,225,000 | | | HCA, Inc. | | | 5.38 | % | | | 09/01/2026 | | | | 3,346,179 | |
| | 2,755,000 | | | HCA, Inc. | | | 4.13 | % | | | 06/15/2029 | | | | 2,783,985 | |
| | 2,035,000 | | | HCA, Inc. | | | 3.50 | % | | | 09/01/2030 | | | | 1,854,641 | |
| | 1,540,000 | | | Hess Midstream Operations LP | | | 5.63 | % ^ | | | 02/15/2026 | | | | 1,098,070 | |
| | 1,975,000 | | | Hess Midstream Operations LP | | | 5.13 | % ^ | | | 06/15/2028 | | | | 1,395,436 | |
| | 985,000 | | | Hexion, Inc. | | | 7.88 | % ^ | | | 07/15/2027 | | | | 844,711 | |
| | 1,797,000 | | | HilCorporationEnergy LP | | | 6.25 | % ^ | | | 11/01/2028 | | | | 806,031 | |
| | 440,000 | | | Hillman Group, Inc. | | | 6.38 | % ^ | | | 07/15/2022 | | | | 345,262 | |
| | 975,000 | | | Hill-Rom Holdings, Inc. | | | 4.38 | % ^ | | | 09/15/2027 | | | | 968,704 | |
| | 7,260,000 | | | Home Depot, Inc. | | | 3.90 | % | | | 06/15/2047 | | | | 8,199,916 | |
| | 2,410,000 | | | Horizon Pharma USA, Inc. | | | 5.50 | % ^ | | | 08/01/2027 | | | | 2,432,774 | |
| | 15,475,000 | | | Hyundai Capital America | | | 2.65 | % ^ | | | 02/10/2025 | | | | 14,795,798 | |
| | 1,890,000 | | | IAA, Inc. | | | 5.50 | % ^ | | | 06/15/2027 | | | | 1,839,064 | |
| | 2,405,000 | | | Icahn Enterprises LP | | | 6.25 | % | | | 05/15/2026 | | | | 2,286,246 | |
| | 1,300,000 | | | Icahn Enterprises LP | | | 5.25 | % | | | 05/15/2027 | | | | 1,210,625 | |
| | 230,000 | | | iHeartCommunications, Inc. | | | 8.38 | % | | | 05/01/2027 | | | | 197,098 | |
| | 1,000,000 | | | iHeartCommunications, Inc. | | | 5.25 | % ^ | | | 08/15/2027 | | | | 876,950 | |
| | 875,000 | | | Indigo Natural Resources LLC | | | 6.88 | % ^ | | | 02/15/2026 | | | | 584,128 | |
| | 1,435,000 | | | Installed Building Products, Inc. | | | 5.75 | % ^ | | | 02/01/2028 | | | | 1,379,096 | |
| | 2,045,000 | | | IQVIA, Inc. | | | 5.00 | % ^ | | | 05/15/2027 | | | | 2,105,261 | |
| | 2,314,000 | | | IRB Holding Corporation | | | 6.75 | % ^ | | | 02/15/2026 | | | | 1,843,003 | |
| | 1,740,000 | | | Iron Mountain, Inc. | | | 4.88 | % ^ | | | 09/15/2029 | | | | 1,646,645 | |
| | 1,000,000 | | | iStar, Inc. | | | 4.75 | % | | | 10/01/2024 | | | | 846,255 | |
| | 430,000 | | | JBS Finance, Inc. | | | 5.88 | % ^ | | | 07/15/2024 | | | | 436,988 | |
| | 275,000 | | | JBS Finance, Inc. | | | 5.75 | % ^ | | | 06/15/2025 | | | | 280,155 | |
| | 1,140,000 | | | JBS Finance, Inc. | | | 6.50 | % ^ | | | 04/15/2029 | | | | 1,229,205 | |
| | 600,000 | | | JBS Finance, Inc. | | | 5.50 | % ^ | | | 01/15/2030 | | | | 622,830 | |
| | 2,795,000 | | | JELD-WEN, Inc. | | | 4.63 | % ^ | | | 12/15/2025 | | | | 2,484,042 | |
| | 8,015,000 | | | John Deere Capital Corporation | | | 3.45 | % | | | 01/10/2024 | | | | 8,468,970 | |
| | 2,465,000 | | | KAR Auction Services, Inc. | | | 5.13 | % ^ | | | 06/01/2025 | | | | 2,369,494 | |
| | 11,824,000 | | | Kinder Morgan Energy Partners LP | | | 6.95 | % | | | 01/15/2038 | | | | 12,340,159 | |
| | 1,955,000 | | | Kraft Heinz Foods Company | | | 3.95 | % | | | 07/15/2025 | | | | 1,925,715 | |
| | 1,445,000 | | | Kraft Heinz Foods Company | | | 5.00 | % | | | 07/15/2035 | | | | 1,446,304 | |
| | 4,000,000 | | | Kraft Heinz Foods Company | | | 5.20 | % | | | 07/15/2045 | | | | 3,868,483 | |
| | 1,525,000 | | | Kraton Polymers LLC | | | 7.00 | % ^ | | | 04/15/2025 | | | | 1,362,481 | |
| | 1,475,000 | | | Kratos Defense & Security Solutions, Inc. | | | 6.50 | % ^ | | | 11/30/2025 | | | | 1,362,524 | |
| | 15,245,000 | | | Kroger Company | | | 3.40 | % | | | 04/15/2022 | | | | 15,614,109 | |
| | 1,525,000 | | | Level 3 Financing, Inc. | | | 4.63 | % ^ | | | 09/15/2027 | | | | 1,524,161 | |
| | 21,364,000 | | | Liberty Mutual Group, Inc. | | | 3.95 | % ^ | | | 10/15/2050 | | | | 19,917,726 | |
| | 1,320,000 | | | LifePoint Health, Inc. | | | 4.38 | % ^ | | | 02/15/2027 | | | | 1,253,340 | |
| | 1,690,000 | | | Lions Gate Capital Holdings LLC | | | 6.38 | % ^ | | | 02/01/2024 | | | | 1,499,824 | |
| | 2,990,000 | | | Live Nation Entertainment, Inc. | | | 5.63 | % ^ | | | 03/15/2026 | | | | 2,686,642 | |
| | 13,037,000 | | | Lockheed Martin Corporation | | | 4.70 | % | | | 05/15/2046 | | | | 16,124,069 | |
| | 2,835,000 | | | LTF Merger Sub, Inc. | | | 8.50 | % ^ | | | 06/15/2023 | | | | 2,349,492 | |
| | 1,235,000 | | | M/I Homes, Inc. | | | 4.95 | % ^ | | | 02/01/2028 | | | | 1,057,469 | |
| | 13,619,000 | | | Marathon Petroleum Corporation | | | 5.13 | % | | | 12/15/2026 | | | | 13,516,449 | |
| | 1,925,000 | | | Marriott Ownership Resorts, Inc. | | | 6.50 | % | | | 09/15/2026 | | | | 1,685,572 | |
| | 15,510,000 | | | Marvell Technology Group Ltd. | | | 4.20 | % | | | 06/22/2023 | | | | 15,883,595 | |
| | 2,250,000 | | | Masonite International Corporation | | | 5.75 | % ^ | | | 09/15/2026 | | | | 2,224,221 | |
| | 2,535,000 | | | Match Group, Inc. | | | 5.00 | % ^ | | | 12/15/2027 | | | | 2,442,580 | |
| | 1,520,000 | | | Matterhorn Merger Sub LLC | | | 8.50 | % ^ | | | 06/01/2026 | | | | 1,215,490 | |
| | 7,020,000 | | | McDonald’s Corporation | | | 4.45 | % | | | 03/01/2047 | | | | 7,633,061 | |
| | 50,000 | | | Metropolitan Edison Company | | | 4.00 | % ^ | | | 04/15/2025 | | | | 54,152 | |
| | 1,710,000 | | | MGM Growth Properties Operating Partnership LP | | | 5.75 | % | | | 02/01/2027 | | | | 1,494,113 | |
| | 755,000 | | | MGM Resorts International | | | 5.75 | % | | | 06/15/2025 | | | | 681,365 | |
| | 6,255,000 | | | Monongahela Power Company | | | 5.40 | % ^ | | | 12/15/2043 | | | | 7,009,255 | |
| | 14,609,000 | | | Morgan Stanley (3 Month LIBOR USD + 1.34%) | | | 3.59 | % | | | 07/22/2028 | | | | 15,340,940 | |
| | 1,272,000 | | | Moss Creek Resources Holdings, Inc. | | | 7.50 | % ^ | | | 01/15/2026 | | | | 379,746 | |
| | 1,735,000 | | | MPH Acquisition Holdings LLC | | | 7.13 | % ^ | | | 06/01/2024 | | | | 1,522,515 | |
| | 1,250,000 | | | MPLX LP | | | 4.00 | % | | | 03/15/2028 | | | | 1,066,650 | |
| | 3,720,000 | | | MPT Operating Partnership LP | | | 5.00 | % | | | 10/15/2027 | | | | 3,636,579 | |
| | 380,000 | | | MSCI, Inc. | | | 3.63 | % ^ | | | 09/01/2030 | | | | 362,663 | |
| | 940,000 | | | Murphy Oil USA, Inc. | | | 4.75 | % | | | 09/15/2029 | | | | 886,467 | |
| | 1,020,000 | | | Nabors Industries Ltd. | | | 7.25 | % ^ | | | 01/15/2026 | | | | 354,450 | |
| | 3,675,000 | | | National Retail Properties, Inc. | | | 2.50 | % | | | 04/15/2030 | | | | 3,286,313 | |
| | 235,000 | | | Nationstar Mortgage Holdings, Inc. | | | 6.00 | % ^ | | | 01/15/2027 | | | | 201,072 | |
| | 2,795,000 | | | Navient Corporation | | | 6.50 | % | | | 06/15/2022 | | | | 2,732,727 | |
| | | | | | | | | | | | | | | | |
| | | | | | | | | | | | | |
| | 955,000 | | | Navient Corporation | | | 5.00 | % | | | 03/15/2027 | | | | 828,176 | |
| | 2,060,000 | | | NCL Corporation | | | 3.63 | % ^ | | | 12/15/2024 | | | | 1,329,318 | |
| | 860,000 | | | Netflix, Inc. | | | 5.88 | % | | | 02/15/2025 | | | | 913,539 | |
| | 765,000 | | | Netflix, Inc. | | | 5.38 | % ^ | | | 11/15/2029 | | | | 803,671 | |
| | 550,000 | | | Netflix, Inc. | | | 4.88 | % ^ | | | 06/15/2030 | | | | 561,385 | |
| | 1,025,000 | | | Nexstar Broadcasting, Inc. | | | 5.63 | % ^ | | | 07/15/2027 | | | | 1,007,626 | |
| | 7,092,000 | | | NextEra Energy Capital Holdings, Inc. | | | 3.55 | % | | | 05/01/2027 | | | | 7,335,705 | |
| | 3,207,000 | | | NFP Corporation | | | 6.88 | % ^ | | | 07/15/2025 | | | | 3,182,851 | |
| | 840,000 | | | NGL Energy Partners LP | | | 7.50 | % | | | 04/15/2026 | | | | 299,979 | |
| | 775,000 | | | Novelis Corporation | | | 4.75 | % ^ | | | 01/30/2030 | | | | 694,109 | |
| | 1,650,000 | | | NuStar Logistics LP | | | 6.00 | % | | | 06/01/2026 | | | | 1,230,276 | |
| | 1,610,000 | | | Oasis Petroleum, Inc. | | | 6.88 | % | | | 03/15/2022 | | | | 330,050 | |
| | 1,055,000 | | | Oasis Petroleum, Inc. | | | 6.25 | % ^ | | | 05/01/2026 | | | | 176,792 | |
| | 1,050,000 | | | Occidental Petroleum Corporation | | | 2.70 | % | | | 08/15/2022 | | | | 749,646 | |
| | 148,000 | | | Oncor Electric Delivery Company LLC | | | 2.95 | % | | | 04/01/2025 | | | | 150,831 | |
| | 15,668,000 | | | Oncor Electric Delivery Company LLC | | | 3.10 | % | | | 09/15/2049 | | | | 15,292,722 | |
| | 4,060,000 | | | ONEOK, Inc. | | | 3.40 | % | | | 09/01/2029 | | | | 3,051,249 | |
| | 265,000 | | | OPE KAG Finance Sub, Inc. | | | 7.88 | % ^ | | | 07/31/2023 | | | | 224,752 | |
| | 9,455,000 | | | ORACLE Corporation | | | 3.85 | % | | | 04/01/2060 | | | | 9,560,743 | |
| | 1,275,000 | | | Ortho-Clinical Diagnostics Inc. | | | 7.25 | % ^ | | | 02/01/2028 | | | | 1,105,935 | |
| | 8,405,000 | | | Owens Corning | | | 4.40 | % | | | 01/30/2048 | | | | 7,212,064 | |
| | 6,235,000 | | | Packaging Corporation of America | | | 3.40 | % | | | 12/15/2027 | | | | 6,271,187 | |
| | 1,445,000 | | | Panther BF Aggregator LP | | | 6.25 | % ^ | | | 05/15/2026 | | | | 1,373,649 | |
| | 745,000 | | | Panther BF Aggregator LP | | | 8.50 | % ^ | | | 05/15/2027 | | | | 654,073 | |
| | 2,520,000 | | | Par Petroleum Finance Corporation | | | 7.75 | % ^ | | | 12/15/2025 | | | | 1,603,337 | |
| | 1,985,000 | | | Parsley Energy LLC | | | 5.63 | % ^ | | | 10/15/2027 | | | | 1,410,442 | |
| | 775,000 | | | PBF Holding LLC | | | 6.00 | % ^ | | | 02/15/2028 | | | | 527,000 | |
| | 1,260,000 | | | Peabody Securities Finance Corporation | | | 6.00 | % ^ | | | 03/31/2022 | | | | 866,250 | |
| | 2,085,000 | | | Penn National Gaming, Inc. | | | 5.63 | % ^ | | | 01/15/2027 | | | | 1,564,610 | |
| | 6,620,000 | | | Penske Truck Leasing Company | | | 4.20 | % ^ | | | 04/01/2027 | | | | 6,819,046 | |
| | 1,915,000 | | | Performance Food Group, Inc. | | | 5.50 | % ^ | | | 10/15/2027 | | | | 1,790,669 | |
| | 1,018,000 | | | PetSmart, Inc. | | | 5.88 | % ^ | | | 06/01/2025 | | | | 1,010,365 | |
| | 2,095,000 | | | Pilgrim’s Pride Corporation | | | 5.88 | % ^ | | | 09/30/2027 | | | | 2,099,085 | |
| | 1,670,000 | | | Polaris Intermediate Corporation (PIK 9.25%) | | | 8.50 | % ^ | | | 12/01/2022 | | | | 1,306,742 | |
| | 1,785,000 | | | Polaris Intermediate Corporation (PIK 9.25%) | | | 9.88 | % ^ | | | 05/01/2024 | | | | 1,421,315 | |
| | 430,000 | | | Post Holdings, Inc. | | | 5.50 | % ^ | | | 12/15/2029 | | | | 448,426 | |
| | 1,785,000 | | | Post Holdings, Inc. | | | 4.63 | % ^ | | | 04/15/2030 | | | | 1,722,525 | |
| | 1,095,000 | | | Prime Security Services Borrower LLC | | | 6.25 | % ^ | | | 01/15/2028 | | | | 952,650 | |
| | 7,705,000 | | | Prudential Financial, Inc. | | | 3.91 | % | | | 12/07/2047 | | | | 7,481,886 | |
| | 11,955,000 | | | PSEG Power LLC | | | 3.85 | % | | | 06/01/2023 | | | | 12,176,180 | |
| | 14,460,000 | | | Public Storage | | | 3.39 | % | | | 05/01/2029 | | | | 14,543,338 | |
| | 1,280,000 | | | QEP Resources, Inc. | | | 5.25 | % | | | 05/01/2023 | | | | 483,200 | |
| | 1,175,000 | | | QEP Resources, Inc. | | | 5.63 | % | | | 03/01/2026 | | | | 437,776 | |
| | 380,000 | | | Radiate Finance, Inc. | | | 6.88 | % ^ | | | 02/15/2023 | | | | 349,123 | |
| | 1,695,000 | | | Radiate Finance, Inc. | | | 6.63 | % ^ | | | 02/15/2025 | | | | 1,455,573 | |
| | 1,520,000 | | | Radiology Partners, Inc. | | | 9.25 | % ^ | | | 02/01/2028 | | | | 1,327,339 | |
| | 2,150,000 | | | Resideo Funding, Inc. | | | 6.13 | % ^ | | | 11/01/2026 | | | | 1,892,161 | |
| | 1,073,000 | | | Riverbed Technology, Inc. | | | 8.88 | % ^ | | | 03/01/2023 | | | | 686,720 | |
| | 3,300,000 | | | Royal Caribbean Cruises Ltd. | | | 3.70 | % | | | 03/15/2028 | | | | 2,082,962 | |
| | 14,675,000 | | | Sabine Pass Liquefaction LLC | | | 5.00 | % | | | 03/15/2027 | | | | 12,507,115 | |
| | 1,580,000 | | | Schweitzer-Mauduit International, Inc. | | | 6.88 | % ^ | | | 10/01/2026 | | | | 1,585,597 | |
| | 590,000 | | | Science Applications International Corporation | | | 4.88 | % ^ | | | 04/01/2028 | | | | 569,719 | |
| | 1,820,000 | | | Scientific Games International, Inc. | | | 5.00 | % ^ | | | 10/15/2025 | | | | 1,597,050 | |
| | 735,000 | | | Scientific Games International, Inc. | | | 8.25 | % ^ | | | 03/15/2026 | | | | 474,613 | |
| | 1,450,000 | | | ScottsMiracle-Gro Company | | | 4.50 | % | | | 10/15/2029 | | | | 1,392,109 | |
| | 1,145,000 | | | Scripps Escrow, Inc. | | | 5.88 | % ^ | | | 07/15/2027 | | | | 1,013,955 | |
| | 2,895,000 | | | Select Medical Corporation | | | 6.25 | % ^ | | | 08/15/2026 | | | | 2,910,937 | |
| | 767,000 | | | Silgan Holdings, Inc. | | | 4.13 | % ^ | | | 02/01/2028 | | | | 713,310 | |
| | 1,722,000 | | | Simon Property Group LP | | | 2.45 | % | | | 09/13/2029 | | | | 1,594,095 | |
| | 2,195,000 | | | Sirius XM Radio, Inc. | | | 5.38 | % ^ | | | 07/15/2026 | | | | 2,238,406 | |
| | 1,100,000 | | | Sirius XM Radio, Inc. | | | 5.50 | % ^ | | | 07/01/2029 | | | | 1,128,105 | |
| | 3,020,000 | | | Six Flags Entertainment Corporation | | | 4.88 | % ^ | | | 07/31/2024 | | | | 2,578,340 | |
| | 15,691,000 | | | Smithfield Foods, Inc. | | | 4.25 | % ^ | | | 02/01/2027 | | | | 14,642,382 | |
| | 1,230,000 | | | Spectrum Brands, Inc. | | | 5.00 | % ^ | | | 10/01/2029 | | | | 1,056,007 | |
| | 850,000 | | | Springleaf Finance Corporation | | | 6.88 | % | | | 03/15/2025 | | | | 862,402 | |
| | 280,000 | | | Springleaf Finance Corporation | | | 7.13 | % | | | 03/15/2026 | | | | 275,625 | |
| | 390,000 | | | Springleaf Finance Corporation | | | 6.63 | % | | | 01/15/2028 | | | | 367,361 | |
| | 825,000 | | | Springleaf Finance Corporation | | | 5.38 | % | | | 11/15/2029 | | | | 759,883 | |
| | | | | | | | | | | | | | | | |
| | | | | | | | | | | | | |
| | 3,965,000 | | | Sprint Capital Corporation | | | 6.88 | % | | | 11/15/2028 | | | | 4,550,829 | |
| | 3,815,000 | | | Sprint Corporation | | | 7.13 | % | | | 06/15/2024 | | | | 4,215,518 | |
| | 1,175,000 | | | Staples, Inc. | | | 7.50 | % ^ | | | 04/15/2026 | | | | 1,034,738 | |
| | 500,000 | | | Staples, Inc. | | | 10.75 | % ^ | | | 04/15/2027 | | | | 386,425 | |
| | 1,745,000 | | | Stevens Holding Company, Inc. | | | 6.13 | % ^ | | | 10/01/2026 | | | | 1,738,818 | |
| | 2,908,000 | | | SunCoke Energy Partners Finance Corporation | | | 7.50 | % ^ | | | 06/15/2025 | | | | 2,115,483 | |
| | 1,910,000 | | | Sunoco LP | | | 5.50 | % | | | 02/15/2026 | | | | 1,669,001 | |
| | 1,010,000 | | | Sunoco LP | | | 6.00 | % | | | 04/15/2027 | | | | 875,637 | |
| | 15,110,000 | | | Synchrony Financial | | | 3.95 | % | | | 12/01/2027 | | | | 13,468,684 | |
| | 8,910,000 | | | Sysco Corporation | | | 3.30 | % | | | 02/15/2050 | | | | 6,543,249 | |
| | 1,095,000 | | | Talen Energy Supply LLC | | | 6.63 | % ^ | | | 01/15/2028 | | | | 926,871 | |
| | 925,000 | | | Tapstone Energy Finance Corporation | | | 9.75 | % ^ W | | | 06/01/2022 | | | | 10,638 | |
| | 1,990,000 | | | Targa Resources Partners Finance Corporation | | | 5.88 | % | | | 04/15/2026 | | | | 1,667,863 | |
| | 800,000 | | | Targa Resources Partners Finance Corporation | | | 6.50 | % | | | 07/15/2027 | | | | 688,000 | |
| | 825,000 | | | Targa Resources Partners Finance Corporation | | | 5.50 | % ^ | | | 03/01/2030 | | | | 644,531 | |
| | 3,600,000 | | | Tempo Acquisition LLC | | | 6.75 | % ^ | | | 06/01/2025 | | | | 3,321,108 | |
| | 3,115,000 | | | Tempur Sealy International, Inc. | | | 5.50 | % | | | 06/15/2026 | | | | 2,743,381 | |
| | 1,760,000 | | | Tenet Healthcare Corporation | | | 7.00 | % | | | 08/01/2025 | | | | 1,533,409 | |
| | 1,800,000 | | | Tenet Healthcare Corporation | | | 4.88 | % ^ | | | 01/01/2026 | | | | 1,721,250 | |
| | 1,930,000 | | | Tenet Healthcare Corporation | | | 6.25 | % ^ | | | 02/01/2027 | | | | 1,888,988 | |
| | 750,000 | | | Tenet Healthcare Corporation | | | 5.13 | % ^ | | | 11/01/2027 | | | | 719,063 | |
| | 1,940,000 | | | TerraForm Power Operating LLC | | | 4.25 | % ^ | | | 01/31/2023 | | | | 1,939,942 | |
| | 520,000 | | | Terrier Media Buyer, Inc. | | | 8.88 | % ^ | | | 12/15/2027 | | | | 440,700 | |
| | 12,150,000 | | | The Interpublic Group of Companies, Inc. | | | 5.40 | % | | | 10/01/2048 | | | | 12,818,097 | |
| | 2,525,000 | | | The ServiceMaster Company LLC | | | 5.13 | % ^ | | | 11/15/2024 | | | | 2,509,231 | |
| | 1,600,000 | | | The William Carter Company | | | 5.63 | % ^ | | | 03/15/2027 | | | | 1,544,852 | |
| | 2,205,000 | | | TransDigm, Inc. | | | 6.25 | % ^ | | | 03/15/2026 | | | | 2,206,372 | |
| | 1,365,000 | | | TransDigm, Inc. | | | 6.38 | % | | | 06/15/2026 | | | | 1,314,563 | |
| | 1,190,000 | | | TransDigm, Inc. | | | 5.50 | % ^ | | | 11/15/2027 | | | | 1,074,630 | |
| | 818,300 | | | Transocean Guardian Ltd. | | | 5.88 | % ^ | | | 01/15/2024 | | | | 660,753 | |
| | 2,120,000 | | | Transocean Poseidon Ltd. | | | 6.88 | % ^ | | | 02/01/2027 | | | | 1,731,971 | |
| | 1,498,000 | | | Transocean Proteus Ltd. | | | 6.25 | % ^ | | | 12/01/2024 | | | | 1,211,500 | |
| | 1,045,000 | | | Transocean, Inc. | | | 8.00 | % ^ | | | 02/01/2027 | | | | 500,294 | |
| | 1,320,000 | | | Trident TPI Holdings, Inc. | | | 6.63 | % ^ | | | 11/01/2025 | | | | 1,070,857 | |
| | 495,000 | | | Triumph Group, Inc. | | | 6.25 | % ^ | | | 09/15/2024 | | | | 444,295 | |
| | 1,332,000 | | | Triumph Group, Inc. | | | 7.75 | % | | | 08/15/2025 | | | | 957,368 | |
| | 2,240,000 | | | Twin River Worldwide Holdings, Inc. | | | 6.75 | % ^ | | | 06/01/2027 | | | | 1,699,135 | |
| | 1,265,000 | | | Uber Technologies, Inc. | | | 8.00 | % ^ | | | 11/01/2026 | | | | 1,256,186 | |
| | 700,000 | | | Uber Technologies, Inc. | | | 7.50 | % ^ | | | 09/15/2027 | | | | 696,343 | |
| | 1,185,000 | | | United Rentals North America, Inc. | | | 6.50 | % | | | 12/15/2026 | | | | 1,209,352 | |
| | 300,000 | | | United Rentals North America, Inc. | | | 5.25 | % | | | 01/15/2030 | | | | 301,575 | |
| | 1,270,000 | | | United Rentals North America, Inc. | | | 4.00 | % | | | 07/15/2030 | | | | 1,141,413 | |
| | 510,000 | | | Univision Communications, Inc. | | | 5.13 | % ^ | | | 05/15/2023 | | | | 455,175 | |
| | 3,040,000 | | | USA Compression Partners LP | | | 6.88 | % | | | 09/01/2027 | | | | 1,901,672 | |
| | 14,757,000 | | | Verizon Communications, Inc. | | | 4.40 | % | | | 11/01/2034 | | | | 17,332,721 | |
| | 2,365,000 | | | Verscend Escrow Corporation | | | 9.75 | % ^ | | | 08/15/2026 | | | | 2,378,469 | |
| | 220,000 | | | VICI Properties LP | | | 3.75 | % ^ | | | 02/15/2027 | | | | 208,588 | |
| | 260,000 | | | VICI Properties LP | | | 4.13 | % ^ | | | 08/15/2030 | | | | 247,813 | |
| | 3,450,000 | | | Viking Cruises Ltd. | | | 5.88 | % ^ | | | 09/15/2027 | | | | 2,037,777 | |
| | 600,000 | | | Vine Oil & Gas Finance Corporation | | | 8.75 | % ^ | | | 04/15/2023 | | | | 147,000 | |
| | 1,215,000 | | | Viper Energy Partners LP | | | 5.38 | % ^ | | | 11/01/2027 | | | | 1,027,343 | |
| | 1,320,000 | | | Vizient, Inc. | | | 6.25 | % ^ | | | 05/15/2027 | | | | 1,328,524 | |
| | 18,495,000 | | | Volkswagen Group of America Finance LLC | | | 4.25 | % ^ | | | 11/13/2023 | | | | 18,306,929 | |
| | 1,990,000 | | | Wand Merger Corporation | | | 8.13 | % ^ | | | 07/15/2023 | | | | 1,958,269 | |
| | 14,740,000 | | | Waste Management, Inc. | | | 4.00 | % | | | 07/15/2039 | | | | 16,088,276 | |
| | 1,255,000 | | | Waste Pro, Inc. | | | 5.50 | % ^ | | | 02/15/2026 | | | | 1,173,133 | |
| | 68,000 | | | Weatherford International Ltd. | | | 11.00 | % ^ | | | 12/01/2024 | | | | 41,514 | |
| | 6,905,000 | | | Wells Fargo & Company (3 Month LIBOR USD + 1.17%) | | | 3.20 | % | | | 06/17/2027 | | | | 7,124,114 | |
| | 5,900,000 | | | Wells Fargo & Company (3 Month LIBOR USD + 1.17%) | | | 2.88 | % | | | 10/30/2030 | | | | 5,862,781 | |
| | 15,115,000 | | | Welltower, Inc. | | | 3.95 | % | | | 09/01/2023 | | | | 14,997,875 | |
| | 1,625,000 | | | West Street Merger Sub, Inc. | | | 6.38 | % ^ | | | 09/01/2025 | | | | 1,428,651 | |
| | 725,000 | | | WeWork Cos, Inc. | | | 7.88 | % ^ | | | 05/01/2025 | | | | 273,666 | |
| | 2,430,000 | | | Whiting Petroleum Corporation | | | 6.63 | % | | | 01/15/2026 | | | | 182,432 | |
| | 13,740,000 | | | Willis North America, Inc. | | | 4.50 | % | | | 09/15/2028 | | | | 15,115,965 | |
| | 1,250,000 | | | Wolverine Escrow LLC | | | 9.00 | % ^ | | | 11/15/2026 | | | | 1,022,506 | |
| | 1,430,000 | | | WPX Energy, Inc. | | | 5.25 | % | | | 10/15/2027 | | | | 794,437 | |
| | 1,590,000 | | | WPX Energy, Inc. | | | 4.50 | % | | | 01/15/2030 | | | | 869,333 | |
| | 15,140,000 | | | WRKCo, Inc. | | | 3.75 | % | | | 03/15/2025 | | | | 15,248,942 | |
| | | | | | | | | | | | | | | | |
| | | | | | | | | | | | | |
| | 610,000 | | | Yum! Brands, Inc. | | | 7.75 | % ^ | | | 04/01/2025 | | | | 642,025 | |
| | 1,245,000 | | | Yum! Brands, Inc. | | | 4.75 | % ^ | | | 01/15/2030 | | | | 1,166,503 | |
| | | | | | | | | | | | | | | | |
| | Total US Corporate Bonds(Cost $1,470,479,996) | | | | | | | | | | | 1,411,631,571 | |
| | | | | | | | | | | | | | | | |
| | US Government and Agency Mortgage Backed Obligations - 18.1% | | | | | | | | | | | | |
| | 547,715 | | | Federal Home Loan Mortgage Corporation, Pool G01840 | | | 5.00 | % | | | 07/01/2035 | | | | 608,442 | |
| | 294,459 | | | Federal Home Loan Mortgage Corporation, Pool G04817 | | | 5.00 | % | | | 09/01/2038 | | | | 328,244 | |
| | 13,020,474 | | | Federal Home Loan Mortgage Corporation, Pool G08537 | | | 3.00 | % | | | 07/01/2043 | | | | 13,793,690 | |
| | 9,611,624 | | | Federal Home Loan Mortgage Corporation, Pool G08622 | | | 3.00 | % | | | 01/01/2045 | | | | 10,174,217 | |
| | 8,922,127 | | | Federal Home Loan Mortgage Corporation, Pool G08686 | | | 3.00 | % | | | 01/01/2046 | | | | 9,448,071 | |
| | 38,065,331 | | | Federal Home Loan Mortgage Corporation, Pool G08701 | | | 3.00 | % | | | 04/01/2046 | | | | 40,304,413 | |
| | 2,093,606 | | | Federal Home Loan Mortgage Corporation, Pool G08737 | | | 3.00 | % | | | 12/01/2046 | | | | 2,209,696 | |
| | 47,980,457 | | | Federal Home Loan Mortgage Corporation, Pool G61645 | | | 4.00 | % | | | 10/01/2048 | | | | 51,277,316 | |
| | 1,813,019 | | | Federal Home Loan Mortgage Corporation, Pool N70081 | | | 5.50 | % | | | 07/01/2038 | | | | 2,058,782 | |
| | 8,314,813 | | | Federal Home Loan Mortgage Corporation, Pool Q33789 | | | 3.50 | % | | | 06/01/2045 | | | | 8,929,349 | |
| | 48,477,687 | | | Federal Home Loan Mortgage Corporation, Pool RB5022 | | | 3.00 | % | | | 11/01/2039 | | | | 50,946,226 | |
| | 9,314,238 | | | Federal Home Loan Mortgage Corporation, Pool RC1060 | | | 2.50 | % | | | 09/01/2034 | | | | 9,743,390 | |
| | 16,956,524 | | | Federal Home Loan Mortgage Corporation, Pool SB0048 | | | 3.00 | % | | | 08/01/2034 | | | | 17,822,441 | |
| | 3,940,166 | | | Federal Home Loan Mortgage Corporation, Pool SB8031 | | | 2.50 | % | | | 02/01/2035 | | | | 4,097,578 | |
| | 50,020,924 | | | Federal Home Loan Mortgage Corporation, Pool SD0035 | | | 3.00 | % | | | 04/01/2047 | | | | 52,741,538 | |
| | 2,800,518 | | | Federal Home Loan Mortgage Corporation, Pool T60854 | | | 3.50 | % | | | 09/01/2042 | | | | 2,971,603 | |
| | 530,024 | | | Federal Home Loan Mortgage Corporation, Pool U60299 | | | 4.00 | % | | | 11/01/2040 | | | | 582,515 | |
| | 13,043,473 | | | Federal Home Loan Mortgage Corporation, Pool V83144 | | | 4.00 | % | | | 04/01/2047 | | | | 14,012,747 | |
| | 32,504,044 | | | Federal Home Loan Mortgage Corporation, Pool ZT1827 | | | 3.00 | % | | | 07/01/2047 | | | | 34,347,965 | |
| | 57,826 | | | Federal Home Loan Mortgage Corporation, Series2692-SC(-2 x 1 Month LIBOR USD + 13.29%, 13.29% Cap) | | | 11.88 | % I/F | | | 07/15/2033 | | | | 78,869 | |
| | 1,679,068 | | | Federal Home Loan Mortgage Corporation, Series2722-PS(-1 x 1 Month LIBOR USD + 9.89%, 9.89% Cap) | | | 9.11 | % I/F | | | 12/15/2033 | | | | 2,175,037 | |
| | 76,857 | | | Federal Home Loan Mortgage Corporation, Series2750-ZT | | | 5.00 | % | | | 02/15/2034 | | | | 84,517 | |
| | 166,589 | | | Federal Home Loan Mortgage Corporation, Series3002-SN(-1 x 1 Month LIBOR USD + 6.50%, 6.50% Cap) | | | 5.80 | % I/F I/O | | | 07/15/2035 | | | | 33,901 | |
| | 75,313 | | | Federal Home Loan Mortgage Corporation, Series3045-DI(-1 x 1 Month LIBOR USD + 6.73%, 6.73% Cap) | | | 6.03 | % I/F I/O | | | 10/15/2035 | | | | 13,399 | |
| | 260,117 | | | Federal Home Loan Mortgage Corporation, Series3116-Z | | | 5.50 | % | | | 02/15/2036 | | | | 298,053 | |
| | 23,879 | | | Federal Home Loan Mortgage Corporation, Series3117-ZN | | | 4.50 | % | | | 02/15/2036 | | | | 25,491 | |
| | 310,203 | | | Federal Home Loan Mortgage Corporation, Series3203-ZC | | | 5.00 | % | | | 07/15/2036 | | | | 354,776 | |
| | 94,043 | | | Federal Home Loan Mortgage Corporation, Series3275-SC(-1 x 1 Month LIBOR USD + 6.08%, 6.08% Cap) | | | 5.38 | % I/F I/O | | | 02/15/2037 | | | | 14,905 | |
| | 267,277 | | | Federal Home Loan Mortgage Corporation, Series3382-SB(-1 x 1 Month LIBOR USD + 6.00%, 6.00% Cap) | | | 5.30 | % I/F I/O | | | 11/15/2037 | | | | 36,549 | |
| | 299,644 | | | Federal Home Loan Mortgage Corporation, Series3384-S(-1 x 1 Month LIBOR USD + 6.39%, 6.39% Cap) | | | 5.69 | % I/F I/O | | | 11/15/2037 | | | | 45,535 | |
| | 379,983 | | | Federal Home Loan Mortgage Corporation, Series3417-SX(-1 x 1 Month LIBOR USD + 6.18%, 6.18% Cap) | | | 5.48 | % I/F I/O | | | 02/15/2038 | | | | 44,222 | |
| | 36,735 | | | Federal Home Loan Mortgage Corporation, Series3423-GS(-1 x 1 Month LIBOR USD + 5.65%, 5.65% Cap) | | | 4.95 | % I/F I/O | | | 03/15/2038 | | | | 3,993 | |
| | 36,735 | | | Federal Home Loan Mortgage Corporation, Series3423-SG(-1 x 1 Month LIBOR USD + 5.65%, 5.65% Cap) | | | 4.95 | % I/F I/O | | | 03/15/2038 | | | | 4,371 | |
| | 117,413 | | | Federal Home Loan Mortgage Corporation, Series3524-LB | | | 3.59 | % I/O P/O | | | 06/15/2038 | | | | 125,772 | |
| | 16,356,007 | | | Federal Home Loan Mortgage Corporation, Series355-300 | | | 3.00 | % | | | 08/15/2047 | | | | 16,377,503 | |
| | 114,608 | | | Federal Home Loan Mortgage Corporation, Series3562-WS(-1 x 1 Month LIBOR USD + 4.95%, 4.95% Cap) | | | 4.25 | % I/F I/O | | | 08/15/2039 | | | | 14,178 | |
| | 161,950 | | | Federal Home Loan Mortgage Corporation, Series3582-SA(-1 x 1 Month LIBOR USD + 6.00%, 6.00% Cap) | | | 5.30 | % I/F I/O | | | 10/15/2049 | | | | 29,219 | |
| | 53,612,921 | | | Federal Home Loan Mortgage Corporation, Series358-300 | | | 3.00 | % | | | 10/15/2047 | | | | 57,754,780 | |
| | 213,480 | | | Federal Home Loan Mortgage Corporation, Series3616-SG(-1 x 1 Month LIBOR USD + 6.35%, 6.35% Cap) | | | 5.65 | % I/F I/O | | | 03/15/2032 | | | | 35,170 | |
| | 876,159 | | | Federal Home Loan Mortgage Corporation, Series3626-AZ | | | 5.50 | % | | | 08/15/2036 | | | | 1,013,180 | |
| | 315,959 | | | Federal Home Loan Mortgage Corporation, Series3666-SC(-1 x 1 Month LIBOR USD + 5.77%, 5.77% Cap) | | | 5.07 | % I/F I/O | | | 05/15/2040 | | | | 60,865 | |
| | 224,416 | | | Federal Home Loan Mortgage Corporation, Series3666-VZ | | | 5.50 | % | | | 08/15/2036 | | | | 257,009 | |
| | 2,394,177 | | | Federal Home Loan Mortgage Corporation, Series3779-DZ | | | 4.50 | % > | | | 12/15/2040 | | | | 2,561,828 | |
| | 1,400,000 | | | Federal Home Loan Mortgage Corporation, Series3779-YA | | | 3.50 | % | | | 12/15/2030 | | | | 1,520,245 | |
| | 473,984 | | | Federal Home Loan Mortgage Corporation, Series3786-SG(-2 x 1 Month LIBOR USD + 9.50%, 9.50% Cap) | | | 8.09 | % I/F | | | 01/15/2041 | | | | 619,328 | |
| | 4,906,417 | | | Federal Home Loan Mortgage Corporation, Series3792-SE(-2 x 1 Month LIBOR USD + 9.86%, 9.86% Cap) | | | 8.45 | % I/F | | | 01/15/2041 | | | | 7,178,621 | |
| | 2,354,332 | | | Federal Home Loan Mortgage Corporation, Series3795-VZ | | | 4.00 | % | | | 01/15/2041 | | | | 2,610,642 | |
| | 52,467 | | | Federal Home Loan Mortgage Corporation, Series3798-SD(-2 x 1 Month LIBOR USD + 9.60%, 9.60% Cap) | | | 8.19 | % I/F | | | 12/15/2040 | | | | 70,699 | |
| | 884,031 | | | Federal Home Loan Mortgage Corporation, Series3806-CZ | | | 5.50 | % | | | 07/15/2034 | | | | 1,022,476 | |
| | 940,207 | | | Federal Home Loan Mortgage Corporation, Series3808-DB | | | 3.50 | % | | | 02/15/2031 | | | | 1,007,847 | |
| | 1,809,329 | | | Federal Home Loan Mortgage Corporation, Series3818-CZ | | | 4.50 | % | | | 03/15/2041 | | | | 2,043,897 | |
| | 984,066 | | | Federal Home Loan Mortgage Corporation, Series3819-ZU | | | 5.50 | % | | | 07/15/2034 | | | | 1,144,023 | |
| | 3,031,790 | | | Federal Home Loan Mortgage Corporation, Series3824-EY | | | 3.50 | % | | | 03/15/2031 | | | | 3,271,727 | |
| | 251,282 | | | Federal Home Loan Mortgage Corporation, Series3828-SW(-3 x 1 Month LIBOR USD + 13.20%, 13.20% Cap) | | | 11.09 | % I/F | | | 02/15/2041 | | | | 432,703 | |
| | 1,455,101 | | | Federal Home Loan Mortgage Corporation, Series3863-ZA | | | 5.50 | % | | | 08/15/2034 | | | | 1,654,561 | |
| | 8,601,954 | | | Federal Home Loan Mortgage Corporation, Series3889-VZ | | | 4.00 | % | | | 07/15/2041 | | | | 9,313,863 | |
| | 3,273,218 | | | Federal Home Loan Mortgage Corporation, Series3910-GZ | | | 5.00 | % | | | 08/15/2041 | | | | 3,863,739 | |
| | 23,808,260 | | | Federal Home Loan Mortgage Corporation, Series3967-ZP | | | 4.00 | % > | | | 09/15/2041 | | | | 27,706,377 | |
| | 3,987,443 | | | Federal Home Loan Mortgage Corporation, Series3972-AZ | | | 3.50 | % | | | 12/15/2041 | | | | 4,326,926 | |
| | 9,738,582 | | | Federal Home Loan Mortgage Corporation, Series4096-DZ | | | 3.50 | % > | | | 08/15/2042 | | | | 10,532,125 | |
| | 30,250,511 | | | Federal Home Loan Mortgage Corporation, Series4165-ZT | | | 3.00 | % > | | | 02/15/2043 | | | | 30,584,211 | |
| | 4,785,145 | | | Federal Home Loan Mortgage Corporation, Series4291-MS(-1 x 1 Month LIBOR USD + 5.90%, 5.90% Cap) | | | 5.20 | % I/F I/O | | | 01/15/2054 | | | | 856,851 | |
| | 19,615,349 | | | Federal Home Loan Mortgage Corporation, Series4341-AZ | | | 3.00 | % > | | | 05/15/2044 | | | | 20,190,875 | |
| | | | | | | | | | | | | | | | |
| | | | | | | | | | | | | |
| | 9,432,795 | | | Federal Home Loan Mortgage Corporation, Series4377-A | | | 3.00 | % | | | 06/15/2039 | | | | 9,804,511 | |
| | 7,665,523 | | | Federal Home Loan Mortgage Corporation, Series4391-MA | | | 3.00 | % | | | 07/15/2040 | | | | 8,030,729 | |
| | 14,458,777 | | | Federal Home Loan Mortgage Corporation, Series4413-AZ | | | 3.50 | % > | | | 11/15/2044 | | | | 15,522,937 | |
| | 12,013,940 | | | Federal Home Loan Mortgage Corporation, Series4423-Z | | | 3.50 | % > | | | 12/15/2044 | | | | 13,269,942 | |
| | 11,268,272 | | | Federal Home Loan Mortgage Corporation, Series4427-MA | | | 3.00 | % | | | 02/15/2034 | | | | 11,933,607 | |
| | 18,120,974 | | | Federal Home Loan Mortgage Corporation, Series4471-BA | | | 3.00 | % | | | 12/15/2041 | | | | 19,170,399 | |
| | 27,061,016 | | | Federal Home Loan Mortgage Corporation, Series4471-GA | | | 3.00 | % | | | 02/15/2044 | | | | 28,915,659 | |
| | 16,173,778 | | | Federal Home Loan Mortgage Corporation, Series4481-B | | | 3.00 | % | | | 12/15/2042 | | | | 17,399,661 | |
| | 7,345,363 | | | Federal Home Loan Mortgage Corporation, Series4511-QA | | | 3.00 | % | | | 01/15/2041 | | | | 7,593,825 | |
| | 43,115,788 | | | Federal Home Loan Mortgage Corporation, Series4542-AC | | | 2.70 | % | | | 01/15/2045 | | | | 45,259,923 | |
| | 71,728,112 | | | Federal Home Loan Mortgage Corporation, Series4750-PA | | | 3.00 | % | | | 07/15/2046 | | | | 76,637,399 | |
| | 54,020,588 | | | Federal Home Loan Mortgage Corporation, Series4752-PL | | | 3.00 | % | | | 09/15/2046 | | | | 56,999,197 | |
| | 2,881,368 | | | Federal Home Loan Mortgage Corporation, Series4951-EA | | | 2.50 | % | | | 09/15/2044 | | | | 3,012,923 | |
| | 352,045 | | | Federal Home Loan Mortgage Corporation, SeriesR003-ZA | | | 5.50 | % | | | 10/15/2035 | | | | 419,669 | |
| | 106,340 | | | Federal National Mortgage Association Pass-Thru, Pool 555743 | | | 5.00 | % | | | 09/01/2033 | | | | 118,100 | |
| | 90,512 | | | Federal National Mortgage Association Pass-Thru, Pool 735382 | | | 5.00 | % | | | 04/01/2035 | | | | 100,710 | |
| | 740,952 | | | Federal National Mortgage Association Pass-Thru, Pool 735383 | | | 5.00 | % | | | 04/01/2035 | | | | 824,077 | |
| | 372,769 | | | Federal National Mortgage Association Pass-Thru, Pool 735402 | | | 5.00 | % | | | 04/01/2035 | | | | 414,737 | |
| | 535,136 | | | Federal National Mortgage Association Pass-Thru, Pool 735484 | | | 5.00 | % | | | 05/01/2035 | | | | 595,815 | |
| | 107,409 | | | Federal National Mortgage Association Pass-Thru, Pool 931104 | | | 5.00 | % | | | 05/01/2039 | | | | 118,932 | |
| | 626,203 | | | Federal National Mortgage Association Pass-Thru, Pool 995203 | | | 5.00 | % | | | 07/01/2035 | | | | 695,491 | |
| | 598,933 | | | Federal National Mortgage Association Pass-Thru, Pool AB2123 | | | 4.00 | % | | | 01/01/2031 | | | | 654,869 | |
| | 38,603 | | | Federal National Mortgage Association Pass-Thru, Pool AB2370 | | | 4.50 | % | | | 09/01/2035 | | | | 41,055 | |
| | 22,183 | | | Federal National Mortgage Association Pass-Thru, Pool AD2177 | | | 4.50 | % | | | 06/01/2030 | | | | 24,193 | |
| | 908,526 | | | Federal National Mortgage Association Pass-Thru, Pool AH7309 | | | 4.00 | % | | | 02/01/2031 | | | | 993,413 | |
| | 23,611,284 | | | Federal National Mortgage Association Pass-Thru, Pool AS4645 | | | 3.00 | % | | | 03/01/2045 | | | | 25,004,134 | |
| | 10,824,029 | | | Federal National Mortgage Association Pass-Thru, Pool BC0785 | | | 3.50 | % | | | 04/01/2046 | | | | 11,619,377 | |
| | 443,698 | | | Federal National Mortgage Association Pass-Thru, Pool MA0264 | | | 4.50 | % | | | 12/01/2029 | | | | 483,850 | |
| | 308,386 | | | Federal National Mortgage Association Pass-Thru, Pool MA0353 | | | 4.50 | % | | | 03/01/2030 | | | | 336,516 | |
| | 11,042 | | | Federal National Mortgage Association Pass-Thru, Pool MA0468 | | | 5.00 | % | | | 07/01/2040 | | | | 11,709 | |
| | 10,290,545 | | | Federal National Mortgage Association Pass-Thru, Pool MA2151 | | | 3.50 | % | | | 01/01/2045 | | | | 10,907,933 | |
| | 7,810,096 | | | Federal National Mortgage Association Pass-Thru, Pool MA2248 | | | 3.00 | % | | | 04/01/2045 | | | | 8,228,459 | |
| | 12,817,821 | | | Federal National Mortgage Association, Pool AL9238 | | | 3.00 | % | | | 10/01/2041 | | | | 13,571,387 | |
| | 2,548,756 | | | Federal National Mortgage Association, Pool AL9445 | | | 3.00 | % | | | 07/01/2031 | | | | 2,698,592 | |
| | 38,869,054 | | | Federal National Mortgage Association, Pool AS7661 | | | 3.00 | % | | | 08/01/2046 | | | | 40,847,932 | |
| | 7,856,063 | | | Federal National Mortgage Association, Pool AS7724 | | | 2.50 | % | | | 08/01/2046 | | | | 8,195,263 | |
| | 20,353,974 | | | Federal National Mortgage Association, Pool BC9081 | | | 3.00 | % | | | 12/01/2046 | | | | 21,559,552 | |
| | 19,378,761 | | | Federal National Mortgage Association, Pool BD8013 | | | 2.50 | % | | | 09/01/2046 | | | | 20,215,462 | |
| | 4,800,000 | | | Federal National Mortgage Association, Pool BL3973 | | | 2.32 | % | | | 10/01/2031 | | | | 5,127,771 | |
| | 3,060,000 | | | Federal National Mortgage Association, Pool BL4357 | | | 2.31 | % | | | 10/01/2029 | | | | 3,270,833 | |
| | 12,425,000 | | | Federal National Mortgage Association, Pool BL4409 | | | 2.39 | % | | | 10/01/2031 | | | | 13,369,806 | |
| | 15,640,000 | | | Federal National Mortgage Association, Pool BL4419 | | | 2.14 | % | | | 10/01/2029 | | | | 16,525,163 | |
| | 39,950,000 | | | Federal National Mortgage Association, Pool BL4421 | | | 2.14 | % | | | 10/01/2029 | | | | 42,211,015 | |
| | 25,972,000 | | | Federal National Mortgage Association, Pool BL4424 | | | 2.14 | % | | | 10/01/2029 | | | | 27,441,914 | |
| | 28,707,000 | | | Federal National Mortgage Association, Pool BL4425 | | | 2.14 | % | | | 10/01/2029 | | | | 30,331,705 | |
| | 32,930,000 | | | Federal National Mortgage Association, Pool BL4592 | | | 2.28 | % | | | 11/01/2029 | | | | 35,240,197 | |
| | 49,345,000 | | | Federal National Mortgage Association, Pool BL5156 | | | 2.37 | % | | | 12/01/2029 | | | | 53,226,382 | |
| | 18,090,000 | | | Federal National Mortgage Association, Pool BL5484 | | | 2.26 | % | | | 01/01/2030 | | | | 19,337,766 | |
| | 6,275,100 | | | Federal National Mortgage Association, Pool BM4094 | | | 3.00 | % | | | 03/01/2043 | | | | 6,644,903 | |
| | 29,402,294 | | | Federal National Mortgage Association, Pool BM6089 | | | 3.50 | % | | | 12/01/2044 | | | | 31,468,262 | |
| | 14,801,981 | | | Federal National Mortgage Association, Pool BN7712 | | | 2.50 | % | | | 08/01/2034 | | | | 15,446,699 | |
| | 24,823,343 | | | Federal National Mortgage Association, Pool CA3903 | | | 3.00 | % | | | 07/01/2034 | | | | 26,083,180 | |
| | 14,325,702 | | | Federal National Mortgage Association, Pool CA4508 | | | 2.50 | % | | | 11/01/2034 | | | | 14,968,848 | |
| | 31,626,868 | | | Federal National Mortgage Association, Pool FM1000 | | | 3.00 | % | | | 04/01/2047 | | | | 33,264,700 | |
| | 10,686,337 | | | Federal National Mortgage Association, Pool MA2621 | | | 3.50 | % | | | 05/01/2046 | | | | 11,291,417 | |
| | 21,546,159 | | | Federal National Mortgage Association, Pool MA2649 | | | 3.00 | % | | | 06/01/2046 | | | | 22,417,614 | |
| | 8,351,091 | | | Federal National Mortgage Association, Pool MA2711 | | | 3.00 | % | | | 08/01/2046 | | | | 8,688,223 | |
| | 31,666,650 | | | Federal National Mortgage Association, Pool MA2806 | | | 3.00 | % | | | 11/01/2046 | | | | 33,468,598 | |
| | 14,136,931 | | | Federal National Mortgage Association, Pool MA3681 | | | 3.00 | % | | | 06/01/2034 | | | | 14,803,198 | |
| | 42,953,525 | | | Federal National Mortgage Association, Pool MA3867 | | | 2.50 | % | | | 12/01/2039 | | | | 44,925,047 | |
| | 225,321 | | | Federal National Mortgage Association, Series2003-W17-1A7 | | | 5.75 | % | | | 08/25/2033 | | | | 253,824 | |
| | 1,750,269 | | | Federal National Mortgage Association, Series2005-20-QH | | | 5.00 | % | | | 03/25/2035 | | | | 2,000,729 | |
| | 316,516 | | | Federal National Mortgage Association, Series2006-101-SA(-1 x 1 Month LIBOR USD + 6.58%, 6.58% Cap) | | | 5.63 | % I/F I/O | | | 10/25/2036 | | | | 68,846 | |
| | 134,276 | | | Federal National Mortgage Association, Series2006-56-SM(-1 x 1 Month LIBOR USD + 6.75%, 6.75% Cap) | | | 5.80 | % I/F I/O | | | 07/25/2036 | | | | 22,945 | |
| | 95,506 | | | Federal National Mortgage Association, Series2007-116-BI(-1 x 1 Month LIBOR USD + 6.25%, 6.25% Cap) | | | 5.30 | % I/F I/O | | | 05/25/2037 | | | | 13,222 | |
| | 1,280,892 | | | Federal National Mortgage Association, Series2007-30-FS(-5 x 1 Month LIBOR USD + 29.83%, 29.83% Cap) | | | 25.44 | % I/F | | | 04/25/2037 | | | | 2,220,575 | |
| | 498,053 | | | Federal National Mortgage Association, Series2007-30-OI(-1 x 1 Month LIBOR USD + 6.44%, 6.44% Cap) | | | 5.49 | % I/F I/O | | | 04/25/2037 | | | | 107,254 | |
| | 87,464 | | | Federal National Mortgage Association, Series2008-29-ZA | | | 4.50 | % | | | 04/25/2038 | | | | 95,212 | |
| | | | | | | | | | | | | | | | |
| | | | | | | | | | | | | |
| | 41,493 | | | Federal National Mortgage Association, Series2008-62-SC(-1 x 1 Month LIBOR USD + 6.00%, 6.00% Cap) | | | 5.05 | % I/F I/O | | | 07/25/2038 | | | | 5,896 | |
| | 470,620 | | | Federal National Mortgage Association, Series2009-111-EZ | | | 5.00 | % | | | 01/25/2040 | | | | 535,814 | |
| | 13,429 | | | Federal National Mortgage Association, Series2009-111-SE(-1 x 1 Month LIBOR USD + 6.25%, 6.25% Cap) | | | 5.30 | % I/F I/O | | | 01/25/2040 | | | | 1,935 | |
| | 57,869 | | | Federal National Mortgage Association, Series2009-16-MZ | | | 5.00 | % | | | 03/25/2029 | | | | 62,649 | |
| | 57,024 | | | Federal National Mortgage Association, Series2009-48-WS(-1 x 1 Month LIBOR USD + 5.95%, 5.95% Cap) | | | 5.00 | % I/F I/O | | | 07/25/2039 | | | | 8,252 | |
| | 171,628 | | | Federal National Mortgage Association, Series2009-62-PS(-1 x 1 Month LIBOR USD + 6.10%, 6.10% Cap) | | | 5.15 | % I/F I/O | | | 08/25/2039 | | | | 20,501 | |
| | 945,938 | | | Federal National Mortgage Association, Series2009-77-ZA | | | 4.50 | % | | | 10/25/2039 | | | | 1,029,521 | |
| | 243,457 | | | Federal National Mortgage Association, Series2009-83-Z | | | 4.50 | % | | | 10/25/2039 | | | | 265,310 | |
| | 89,919 | | | Federal National Mortgage Association, Series2010-101-ZH | | | 4.50 | % | | | 07/25/2040 | | | | 100,050 | |
| | 391,150 | | | Federal National Mortgage Association, Series2010-112-ZA | | | 4.00 | % | | | 10/25/2040 | | | | 411,950 | |
| | 221,579 | | | Federal National Mortgage Association, Series2010-121-SD(-1 x 1 Month LIBOR USD + 4.50%, 4.50% Cap) | | | 3.55 | % I/F I/O | | | 10/25/2040 | | | | 26,570 | |
| | 29,336 | | | Federal National Mortgage Association, Series2010-137-VS(-3 x 1 Month LIBOR USD + 15.00%, 15.00% Cap) | | | 10.26 | % I/F | | | 12/25/2040 | | | | 47,156 | |
| | 42,276 | | | Federal National Mortgage Association, Series2010-31-SA(-1 x 1 Month LIBOR USD + 5.00%, 5.00% Cap) | | | 4.05 | % I/F I/O | | | 04/25/2040 | | | | 3,206 | |
| | 67,874 | | | Federal National Mortgage Association, Series2010-34-PS(-1 x 1 Month LIBOR USD + 4.93%, 4.93% Cap) | | | 3.98 | % I/F I/O | | | 04/25/2040 | | | | 7,519 | |
| | 157,084 | | | Federal National Mortgage Association, Series2010-35-SP(-1 x 1 Month LIBOR USD + 6.35%, 6.35% Cap) | | | 5.40 | % I/F I/O | | | 04/25/2050 | | | | 24,740 | |
| | 27,746 | | | Federal National Mortgage Association, Series2010-35-SV(-1 x 1 Month LIBOR USD + 6.45%, 6.45% Cap) | | | 5.50 | % I/F I/O | | | 04/25/2040 | | | | 3,698 | |
| | 1,690,680 | | | Federal National Mortgage Association, Series2010-37-MY | | | 4.50 | % | | | 04/25/2040 | | | | 1,888,283 | |
| | 43,945 | | | Federal National Mortgage Association, Series2010-59-PS(-1 x 1 Month LIBOR USD + 6.45%, 6.45% Cap) | | | 5.50 | % I/F I/O | | | 03/25/2039 | | | | 1,197 | |
| | 202,755 | | | Federal National Mortgage Association, Series2010-59-SC(-1 x 1 Month LIBOR USD + 5.00%, 5.00% Cap) | | | 4.05 | % I/F I/O | | | 01/25/2040 | | | | 32,252 | |
| | 666,881 | | | Federal National Mortgage Association, Series2010-60-VZ | | | 5.00 | % | | | 10/25/2039 | | | | 755,054 | |
| | 179,020 | | | Federal National Mortgage Association, Series2010-64-EZ | | | 5.00 | % | | | 06/25/2040 | | | | 205,299 | |
| | 287,187 | | | Federal National Mortgage Association, Series2010-7-PE | | | 5.00 | % | | | 02/25/2040 | | | | 326,998 | |
| | 101,759 | | | Federal National Mortgage Association, Series2010-90-GS(-1 x 1 Month LIBOR USD + 6.00%, 6.00% Cap) | | | 5.05 | % I/F I/O | | | 08/25/2040 | | | | 13,686 | |
| | 57,791 | | | Federal National Mortgage Association, Series2010-99-SG(-5 x 1 Month LIBOR USD + 25.00%, 25.00% Cap) | | | 17.09 | % I/F | | | 09/25/2040 | | | | 106,321 | |
| | 4,833,495 | | | Federal National Mortgage Association, Series2011-141-PZ | | | 4.00 | % | | | 01/25/2042 | | | | 5,318,337 | |
| | 11,114,811 | | | Federal National Mortgage Association, Series2011-18-UZ | | | 4.00 | % | | | 03/25/2041 | | | | 12,210,708 | |
| | 950,482 | | | Federal National Mortgage Association, Series2011-25-KY | | | 3.00 | % | | | 04/25/2026 | | | | 989,059 | |
| | 858,435 | | | Federal National Mortgage Association, Series2011-29-AL | | | 3.50 | % | | | 04/25/2031 | | | | 917,313 | |
| | 901,745 | | | Federal National Mortgage Association, Series2011-59-MA | | | 4.50 | % | | | 07/25/2041 | | | | 1,002,239 | |
| | 26,388,822 | | | Federal National Mortgage Association, Series2013-45-LZ | | | 3.00 | % > | | | 05/25/2043 | | | | 27,470,666 | |
| | 33,884,922 | | | Federal National Mortgage Association, Series2013-6-ZB | | | 3.00 | % > | | | 02/25/2043 | | | | 35,981,270 | |
| | 6,801,803 | | | Federal National Mortgage Association, Series2014-55-MA | | | 3.00 | % | | | 10/25/2039 | | | | 7,060,891 | |
| | 27,150,450 | | | Federal National Mortgage Association, Series2014-70-VZ | | | 3.00 | % > | | | 11/25/2044 | | | | 28,420,190 | |
| | 9,088,260 | | | Federal National Mortgage Association, Series2014-73-CZ | | | 3.00 | % > | | | 11/25/2044 | | | | 10,091,139 | |
| | 17,786,677 | | | Federal National Mortgage Association, Series2015-9-HA | | | 3.00 | % | | | 01/25/2045 | | | | 18,942,623 | |
| | 7,688,377 | | | Federal National Mortgage Association, Series2016-55-EA | | | 1.75 | % | | | 07/25/2043 | | | | 7,807,097 | |
| | 5,180,395 | | | Federal National Mortgage Association, Series2017-46-ZL | | | 3.50 | % > | | | 06/25/2057 | | | | 5,935,197 | |
| | 2,921,278 | | | Federal National Mortgage Association, Series2017-86-MA | | | 3.00 | % | | | 04/25/2046 | | | | 3,114,548 | |
| | 49,716,144 | | | Federal National Mortgage Association, Series2018-21-IO | | | 3.00 | % I/O | | | 04/25/2048 | | | | 4,363,233 | |
| | 78,220,028 | | | Federal National Mortgage Association, Series2018-21-PO | | | 0.00 | % P/O | | | 04/25/2048 | | | | 72,644,426 | |
| | 47,828,397 | | | Federal National Mortgage Association, Series2018-27-JA | | | 3.00 | % | | | 12/25/2047 | | | | 50,741,778 | |
| | 24,532,865 | | | Federal National Mortgage Association, Series2018-35-IO | | | 3.00 | % I/O | | | 05/25/2048 | | | | 1,497,832 | |
| | 141,325,797 | | | Federal National Mortgage Association, Series2018-35-PO | | | 0.00 | % P/O | | | 05/25/2048 | | | | 133,614,355 | |
| | 45,689,309 | | | Federal National Mortgage Association, Series2018-36-A | | | 3.00 | % | | | 06/25/2048 | | | | 48,060,136 | |
| | 28,426,773 | | | Federal National Mortgage Association, Series2018-39-AB | | | 3.00 | % | | | 06/25/2048 | | | | 30,145,206 | |
| | 11,990,616 | | | Federal National Mortgage Association, Series2019-67-GA | | | 3.00 | % | | | 02/25/2045 | | | | 12,637,393 | �� |
| | 249,980 | | | Federal National Mortgage Association, Series400-S4(-1 x 1 Month LIBOR USD + 5.45%, 5.45% Cap) | | | 4.50 | % I/F I/O | | | 11/25/2039 | | | | 40,953 | |
| | 165,383 | | | Government National Mortgage Association, Pool 752494, Pool 752494 | | | 5.50 | % | | | 09/20/2039 | | | | 179,270 | |
| | 192,610 | | | Government National Mortgage Association, Series2003-67-SP(-1 x 1 Month LIBOR USD + 7.10%, 7.10% Cap) | | | 6.33 | % I/F I/O | | | 08/20/2033 | | | | 34,568 | |
| | 100,403 | | | Government National Mortgage Association, Series2008-82-SM(-1 x 1 Month LIBOR USD + 6.05%, 6.05% Cap) | | | 5.28 | % I/F I/O | | | 09/20/2038 | | | | 12,628 | |
| | 1,455,036 | | | Government National Mortgage Association, Series2009-32-ZE | | | 4.50 | % | | | 05/16/2039 | | | | 1,635,773 | |
| | 1,671,303 | | | Government National Mortgage Association, Series2009-35-DZ | | | 4.50 | % | | | 05/20/2039 | | | | 1,879,227 | |
| | 1,703,193 | | | Government National Mortgage Association, Series2009-75-GZ | | | 4.50 | % | | | 09/20/2039 | | | | 1,893,083 | |
| | 2,042,991 | | | Government National Mortgage Association, Series2009-75-HZ | | | 5.00 | % | | | 09/20/2039 | | | | 2,350,005 | |
| | 5,324,725 | | | Government National Mortgage Association, Series2010-113-SM(-1 x 1 Month LIBOR USD + 6.05%, 6.05% Cap) | | | 5.28 | % I/F I/O | | | 09/20/2040 | | | | 1,060,784 | |
| | 139,508 | | | Government National Mortgage Association, Series2010-25-ZB | | | 4.50 | % > | | | 02/16/2040 | | | | 158,459 | |
| | 3,647,798 | | | Government National Mortgage Association, Series2011-45-GZ | | | 4.50 | % | | | 03/20/2041 | | | | 4,040,435 | |
| | 9,101,058 | | | Government National Mortgage Association, Series2011-71-ZA | | | 4.50 | % | | | 02/20/2041 | | | | 10,123,529 | |
| | 9,473,475 | | | Government National Mortgage Association, Series2013-117-MS(-1 x 1 Month LIBOR USD + 6.15%, 6.15% Cap) | | | 5.38 | % I/F I/O | | | 02/20/2043 | | | | 1,290,454 | |
| | 4,914,074 | | | Government National Mortgage Association, Series2013-122-SB(-1 x 1 Month LIBOR USD + 6.10%, 6.10% Cap) | | | 5.40 | % I/F I/O | | | 08/16/2043 | | | | 938,445 | |
| | 21,830,439 | | | Government National Mortgage Association, Series2013-169-SE(-1 x 1 Month LIBOR USD + 6.05%, 6.05% Cap) | | | 5.35 | % I/F I/O | | | 11/16/2043 | | | | 4,232,132 | |
| | 7,573,587 | | | Government National Mortgage Association, Series2014-102-TS(-1 x 1 Month LIBOR USD + 5.60%, 5.60% Cap) | | | 4.83 | % I/F I/O | | | 07/20/2044 | | | | 1,364,145 | |
| | 5,998,260 | | | Government National Mortgage Association, Series2014-118-PS(-1 x 1 Month LIBOR USD + 6.20%, 6.20% Cap) | | | 5.43 | % I/F I/O | | | 08/20/2044 | | | | 1,001,274 | |
| | 5,248,477 | | | Government National Mortgage Association, Series2014-118-SA(-1 x 1 Month LIBOR USD + 6.20%, 6.20% Cap) | | | 5.43 | % I/F I/O | | | 08/20/2044 | | | | 876,115 | |
| | | | | | | | | | | | | | | | |
| Total US Government and Agency Mortgage Backed Obligations
(Cost $1,951,095,824) | | | | | | | | | | | 2,092,321,640 | |
| | | | | | | | | | | | | | | | |
| | US Government and Agency Obligations - 21.9% | | | | | | | | | | | | |
| | 24,519,840 | | | United States Treasury Inflation Indexed Bonds | | | 0.88 | % | | | 01/15/2029 | | | | 26,671,312 | |
| | | | | | | | | | | | | | | | |
| | 15,400,000 | | | United States Treasury Notes | | | 2.88 | % | | | 10/15/2021 | | | | 16,029,535 | |
| | 201,350,000 | | | United States Treasury Notes | | | 1.75 | % | | | 11/30/2021 | | | | 206,517,458 | |
| | 82,100,000 | | | United States Treasury Notes | | | 1.38 | % | | | 01/31/2022 | | | | 83,836,607 | |
| | 114,950,000 | | | United States Treasury Notes | | | 2.63 | % | | | 02/28/2023 | | | | 122,789,949 | |
| | 120,200,000 | | | United States Treasury Notes | | | 2.50 | % | | | 03/31/2023 | | | | 128,163,250 | |
| | 110,800,000 | | | United States Treasury Notes | | | 2.75 | % | | | 04/30/2023 | | | | 119,196,563 | |
| | 72,900,000 | | | United States Treasury Notes | | | 1.63 | % | | | 05/31/2023 | | | | 75,938,449 | |
| | 124,100,000 | | | United States Treasury Notes | | | 2.13 | % | | | 09/30/2024 | | | | 133,892,266 | |
| | 105,273,756 | | | United States Treasury Notes | | | 0.13 | % | | | 10/15/2024 | | | | 106,577,169 | |
| | 135,400,000 | | | United States Treasury Notes | | | 2.25 | % | | | 10/31/2024 | | | | 146,993,625 | |
| | 71,700,000 | | | United States Treasury Notes | | | 2.75 | % | | | 02/28/2025 | | | | 79,956,703 | |
| | 46,200,000 | | | United States Treasury Notes | | | 0.50 | % | | | 03/31/2025 | | | | 46,490,552 | |
| | 124,450,000 | | | United States Treasury Notes | | | 3.00 | % | | | 09/30/2025 | | | | 141,629,934 | |
| | 23,950,000 | | | United States Treasury Notes | | | 2.63 | % | | | 01/31/2026 | | | | 26,912,877 | |
| | 121,500,000 | | | United States Treasury Notes | | | 1.63 | % | | | 10/31/2026 | | | | 130,095,176 | |
| | 139,550,000 | | | United States Treasury Notes | | | 2.25 | % | | | 08/15/2027 | | | | 156,677,583 | |
| | 121,100,000 | | | United States Treasury Notes | | | 2.25 | % | | | 11/15/2027 | | | | 136,261,152 | |
| | 106,400,000 | | | United States Treasury Notes | | | 2.38 | % | | | 05/15/2029 | | | | 122,468,062 | |
| | 13,500,000 | | | United States Treasury Notes | | | 2.75 | % | | | 11/15/2042 | | | | 17,444,004 | |
| | 74,350,000 | | | United States Treasury Notes | | | 3.13 | % | | | 02/15/2043 | | | | 101,708,477 | |
| | 59,250,000 | | | United States Treasury Notes | | | 3.63 | % | | | 08/15/2043 | | | | 87,384,492 | |
| | 58,600,000 | | | United States Treasury Notes | | | 3.75 | % | | | 11/15/2043 | | | | 88,128,906 | |
| | 166,100,000 | | | United States Treasury Notes | | | 2.75 | % | | | 11/15/2047 | | | | 219,907,316 | |
| | 5,800,000 | | | United States Treasury Notes | | | 2.00 | % | | | 02/15/2050 | | | | 6,726,074 | |
| | | | | | | | | | | | | | | | |
| | Total US Government and Agency Obligations(Cost $2,277,415,885) | | | | | | | | | | | 2,528,397,491 | |
| | | | | | | | | | | | | | | | |
| | Affiliated Mutual Funds - 12.4% | | | | | | | | | | | | |
| | 91,647,117 | | | DoubleLine Global Bond Fund (Class I) | | | | | | | | | | | 935,717,064 | |
| | 45,674,545 | | | DoubleLine Infrastructure Income Fund (Class I) | | | | | | | | | | | 436,648,648 | |
| | 5,000,000 | | | DoubleLine Long Duration Total Return Bond Fund (Class I) | | | | | | | | | | | 58,750,000 | |
| | | | | | | | | | | | | | | | |
| | Total Affiliated Mutual Funds(Cost $1,450,400,000) | | | | | | | | | | | 1,431,115,712 | |
| | | | | | | | | | | | | | | | |
| | Exchange Traded Funds and Common Stocks - 0.0% | | | | | | | | | | | | |
| | 135,690 | | | Frontera Energy Corporation | | | | | | | | | | | 335,154 | |
| | 9,463 | | | Weatherford International PLC | | | | | | | | | | | 56,305 | |
| | | | | | | | | | | | | | | | |
| | Total Exchange Traded Funds and Common Stocks(Cost $12,623,486) | | | | | | | | | | | 391,459 | |
| | | | | | | | | | | | | | | | |
| | Warrants - 0.0% | | | | | | | | | | | | |
| | 995,158 | | | OAS S.A., Expiration 5/16/2039, Strike Price BRL 1.00*Þ | | | | | | | | | | | — | |
| | | | | | | | | | | | | | | | |
| | Total Warrants(Cost $–) | | | | | | | | | | | 0 | |
| | | | | | | | | | | | | | | | |
| | Short Term Investments - 2.3% | | | | | | | | | | | | |
| | 85,527,617 | | | First American Government Obligations Fund - Class U | | | 0.47 | % ¨ | | | | | | | 85,527,617 | |
| | 85,527,618 | | | JP Morgan U.S. Government Money Market Fund - Institutional Share Class | | | 0.36 | % ¨ | | | | | | | 85,527,618 | |
| | 85,527,617 | | | Morgan Stanley Institutional Liquidity Funds Government Portfolio - Institutional Share Class | | | 0.26 | % ¨ | | | | | | | 85,527,617 | |
| | 4,150,000 | | | United States Treasury Bills | | | 0.00 | % | | | 11/05/2020 | | | | 4,147,544 | |
| | | | | | | | | | | | | | | | |
| | Total Short Term Investments(Cost $260,694,277) | | | | 260,730,396 | |
| | | | | | | | | | | | | | | | |
| | Total Investments - 99.5% (Cost $11,720,635,121) | | | | 11,483,402,377 | |
| | Other Assets in Excess of Liabilities - 0.5% | | | | | | | | | | | 60,888,204 | |
| | | | | | | | | | | | | | | | |
| | NET ASSETS - 100.0% | | | | | | | | | | $ | 11,544,290,581 | |
| | | | | | | | | | | | | | | | |
| ^ | Security exempt from registration under Rule 144A of the Securities Act of 1933. These securities may be resold in transactions exempt from registration to qualified institutional buyers. |
| § | The interest rate will step up if the issuer does not redeem the bond on or before a scheduled redemption date in accordance with the terms of the instrument. The interest rate shown is the rate in effect as of March 31, 2020. |
| # | Coupon rate is variable based on the weighted average coupon of the underlying collateral. To the extent the weighted average coupon of the underlying assets which comprise the collateral increases or decreases, the coupon rate of this security will increase or decrease correspondingly. The rate disclosed is as of March 31, 2020. |
| ± | Coupon rate is variable or floats based on components including but not limited to reference rate and spread. These securities may not indicate a reference rate and/or spread in their description. The rate disclosed is as of March 31, 2020. |
| & | Unfunded or partially unfunded loan commitment. At March 31, 2020, the value of these securities amounted to $447,331 or 0.0% of net assets. |
| Þ | Value determined using significant unobservable inputs. |
| W | Security is in default or has failed to make a scheduled payment. Income is not being accrued. |
| I/O | Interest only security |
| ß | The interest rate may step up conditioned upon the aggregate remaining principal balance of the underlying mortgage loans being reduced below a targeted percentage of the aggregate original principal balance of the mortgage loans. The interest rate shown is the rate in effect as of March 31, 2020. |
| I/F | Inverse floating rate security whose interest rate moves in the opposite direction of reference interest rates. Reference interest rates are typically based on a negative multiplier or slope. Interest rate may also be subject to a cap or floor. |
| > | This U.S. Agency bond accrues interest which is added to the outstanding principal balance. The interest payment will be deferred until all other tranches in the structure are paid off. The rate disclosed is as of March 31, 2020. |
| P/O | Principal only security |
| PIK | Apayment-in-kind security in which the issuer may make interest or dividend payments in cash or additional securities. These additional securities generally have the same terms as the original holdings. |
| ¨ | Seven-day yield as of March 31, 2020 |
| * | Non-income producing security |
| ~ | Represents less than 0.05% of net assets |
DoubleLine Shiller Enhanced CAPE ®
Schedule of Investments
March 31, 2020
| | | | | | | | | | | | | | | | |
Principal Amount
$/Shares | | | Security Description | | Rate | | | Maturity | | | Value $ | |
| | Asset Backed Obligations - 7.6% | | | | | | | | | | | | |
| | 3,359,344 | | | AASET Ltd., Series2018-1A-A | | | 3.84 | % ^ | | | 01/16/2038 | | | | 2,747,460 | |
| | 10,607,858 | | | AASET Ltd., Series2019-2-A | | | 3.38 | % ^ | | | 10/16/2039 | | | | 7,599,809 | |
| | 628,676 | | | Avant Loans Funding Trust, Series2018-B-A | | | 3.42 | % ^ | | | 01/18/2022 | | | | 619,324 | |
| | 2,243,613 | | | Avant Loans Funding Trust, Series2019-A-A | | | 3.48 | % ^ | | | 07/15/2022 | | | | 2,184,602 | |
| | 9,893,571 | | | Avant Loans Funding Trust, Series2019-B-A | | | 2.72 | % ^ | | | 10/15/2026 | | | | 9,639,563 | |
| | 4,339,798 | | | Castlelake Aircraft Securitization Trust, Series2019-1A-A | | | 3.97 | % ^ | | | 04/15/2039 | | | | 3,077,737 | |
| | 5,512,641 | | | CLI Funding LLC, Series2019-1A-A | | | 3.71 | % ^ | | | 05/18/2044 | | | | 5,171,682 | |
| | 2,250,000 | | | College Ave Student Loans LLC, Series2017-A-B | | | 4.50 | % ^ | | | 11/26/2046 | | | | 2,344,277 | |
| | 2,229,435 | | | CPS Auto Receivables Trust, Series2019-B-A | | | 2.89 | % ^ | | | 05/16/2022 | | | | 2,221,079 | |
| | 1,653,316 | | | DRB Prime Student Loan Trust, Series2017-A-B | | | 3.10 | % # ^ | | | 05/27/2042 | | | | 1,676,741 | |
| | 2,246,035 | | | DT Auto Owner Trust, Series2019-2A-A | | | 2.85 | % ^ | | | 09/15/2022 | | | | 2,240,747 | |
| | 3,041,377 | | | Earnest Student Loan Program, Series2017-A-A2 | | | 2.65 | % ^ | | | 01/25/2041 | | | | 3,039,433 | |
| | 6,707,897 | | | Flagship Credit Auto Trust, Series2016-4-C | | | 2.71 | % ^ | | | 11/15/2022 | | | | 6,670,359 | |
| | 6,850,000 | | | Flagship Credit Auto Trust, Series2017-1-C | | | 3.22 | % ^ | | | 05/15/2023 | | | | 6,829,300 | |
| | 6,650,000 | | | Flagship Credit Auto Trust, Series2017-4-B | | | 2.66 | % ^ | | | 10/17/2022 | | | | 6,608,433 | |
| | 6,830,839 | | | Foundation Finance Trust, Series2019-1A-A | | | 3.86 | % ^ | | | 11/15/2034 | | | | 6,539,890 | |
| | 3,042,605 | | | Freed Trust, Series2019-1-A | | | 3.42 | % ^ | | | 06/18/2026 | | | | 2,990,045 | |
| | 17,130,475 | | | GAIA Aviation Ltd., Series2019-1-A | | | 3.97 | % ^ § | | | 12/15/2044 | | | | 11,518,549 | |
| | 4,038,500 | | | Global SC Finance Ltd., Series2018-1A-A | | | 4.29 | % ^ | | | 05/17/2038 | | | | 3,935,977 | |
| | 5,775,904 | | | GLS Auto Receivables Issuer Trust, Series2019-2A-A | | | 3.06 | % ^ | | | 04/17/2023 | | | | 5,653,901 | |
| | 9,850,000 | | | Hardee’s Funding LLC, Series2018-1A-A2I | | | 4.25 | % ^ | | | 06/20/2048 | | | �� | 9,466,244 | |
| | 4,947,773 | | | Helios Issuer LLC, Series2017-1A-A | | | 4.94 | % ^ | | | 09/20/2049 | | | | 4,678,699 | |
| | 2,213,045 | | | HERO Funding Trust, Series2016-1A-A | | | 4.05 | % ^ | | | 09/20/2041 | | | | 2,315,811 | |
| | 4,445,191 | | | Horizon Aircraft Finance Ltd., Series2018-1-A | | | 4.46 | % ^ | | | 12/15/2038 | | | | 3,026,411 | |
| | 20,500,001 | | | Horizon Aircraft Finance Ltd., Series2019-2-A | | | 3.43 | % ^ | | | 11/15/2039 | | | | 13,564,092 | |
| | 18,573,750 | | | Jimmy Johns Funding LLC, Series2017-1A-A2II | | | 4.85 | % ^ | | | 07/30/2047 | | | | 18,780,255 | |
| | 12,000,000 | | | Kabbage Funding LLC, Series2019-1-A | | | 3.83 | % ^ | | | 03/15/2024 | | | | 11,695,750 | |
| | 574,548 | | | Laurel Road Prime Student Loan Trust, Series2017-B-CFX | | | 3.61 | % ^ | | | 08/25/2042 | | | | 554,110 | |
| | 18,651,061 | | | LendingClub Receivables Trust, Series2020-3-A | | | 3.50 | % ^ | | | 01/16/2046 | | | | 18,156,062 | |
| | 15,000,000 | | | LendingClub Receivables Trust, Series2020-5A-A | | | 3.50 | % ^ | | | 03/15/2046 | | | | 13,681,425 | |
| | 7,170,265 | | | Lendingpoint Asset Securitization Trust, Series2019-1-A | | | 3.15 | % ^ | | | 08/15/2025 | | | | 7,035,909 | |
| | 10,000,000 | | | Lunar Aircraft Ltd., Series2020-1A-A | | | 3.38 | % ^ | | | 02/15/2045 | | | | 6,695,230 | |
| | 3,131,197 | | | Marlette Funding Trust, Series2018-4A-A | | | 3.71 | % ^ | | | 12/15/2028 | | | | 3,050,500 | |
| | 3,967,012 | | | Marlette Funding Trust, Series2019-2A-A | | | 3.13 | % ^ | | | 07/16/2029 | | | | 3,814,031 | |
| | 4,324,166 | | | Marlette Funding Trust, Series2019-3A-A | | | 2.69 | % ^ | | | 09/17/2029 | | | | 4,189,842 | |
| | 1,594,096 | | | Mosaic Solar Loan Trust, Series2017-1A-A | | | 4.45 | % ^ | | | 06/20/2042 | | | | 1,571,034 | |
| | 4,500,000 | | | Navient Private Education Loan Trust, Series2018-A-B | | | 3.68 | % ^ | | | 02/18/2042 | | | | 4,653,268 | |
| | 2,363,036 | | | Navient Private Education Refinance Loan Trust, Series2019-CA-A1 | | | 2.82 | % ^ | | | 02/15/2068 | | | | 2,367,062 | |
| | 16,000,000 | | | Oxford Finance Funding LLC, Series2020-1A-A2 | | | 3.10 | % ^ | | | 02/15/2028 | | | | 15,450,224 | |
| | 7,571,286 | | | Pagaya AI Debt Selection Trust, Series2019-2-A1 | | | 3.93 | % ^ | | | 09/15/2026 | | | | 7,055,119 | |
| | 12,547,790 | | | Pagaya AI Debt Selection Trust, Series2019-3-A | | | 3.82 | % ^ | | | 11/16/2026 | | | | 11,688,781 | |
| | 22,500,000 | | | Sapphire Aviation Finance Ltd., Series2020-1A-A | | | 3.23 | % ^ | | | 03/15/2040 | | | | 14,177,565 | |
| | 20,000,000 | | | SBA Tower Trust | | | 3.17 | % ^ | | | 04/11/2022 | | | | 19,905,014 | |
| | 1,402,341 | | | SCF Equipment Leasing LLC, Series2017-1A-A | | | 3.77 | % ^ | | | 01/20/2023 | | | | 1,406,199 | |
| | 1,796,773 | | | Sierra Timeshare Receivables Funding LLC, Series2016-3A-A | | | 2.43 | % ^ | | | 10/20/2033 | | | | 1,773,936 | |
| | 5,991,921 | | | SLM Private Credit Student Loan Trust, Series2006-A-A5 (3 Month LIBOR USD + 0.29%, 0.29% Floor) | | | 1.03 | % | | | 06/15/2039 | | | | 5,784,654 | |
| | 523,480 | | | SoFi Consumer Loan Program LLC, Series2016-1-A | | | 3.26 | % ^ | | | 08/25/2025 | | | | 507,084 | |
| | 177,253 | | | SoFi Consumer Loan Program LLC, Series2016-3-A | | | 3.05 | % ^ | | | 12/26/2025 | | | | 175,618 | |
| | 97,356 | | | SoFi Consumer Loan Program Trust, Series2016-2-A | | | 3.09 | % ^ | | | 10/27/2025 | | | | 95,679 | |
| | 1,069,612 | | | SoFi Consumer Loan Program Trust, Series2017-1-A | | | 3.28 | % ^ | | | 01/26/2026 | | | | 1,051,123 | |
| | 599,895 | | | SoFi Consumer Loan Program Trust, Series2017-2-A | | | 3.28 | % ^ | | | 02/25/2026 | | | | 597,772 | |
| | 354,721 | | | SoFi Consumer Loan Program Trust, Series2017-3-A | | | 2.77 | % ^ | | | 05/25/2026 | | | | 352,227 | |
| | 298,835 | | | SoFi Consumer Loan Program Trust, Series2017-5-A2 | | | 2.78 | % ^ | | | 09/25/2026 | | | | 283,144 | |
| | 3,547,445 | | | SoFi Consumer Loan Program Trust, Series2019-1-A | | | 3.24 | % ^ | | | 02/25/2028 | | | | 3,442,968 | |
| | 9,645,272 | | | SoFi Consumer Loan Program Trust, Series2019-F-PT1 | | | 1.87 | % # ^ | | | 02/15/2045 | | | | 9,575,502 | |
| | 3,664,034 | | | SoFi Professional Loan Program, Series2017-A-A2B | | | 2.40 | % ^ | | | 03/26/2040 | | | | 3,587,229 | |
| | 911,475 | | | Springleaf Funding Trust, Series2016-AA-A | | | 2.90 | % ^ | | | 11/15/2029 | | | | 904,047 | |
| | 20,000,000 | | | Springleaf Funding Trust, Series2017-AA-A | | | 2.68 | % ^ | | | 07/15/2030 | | | | 19,202,352 | |
| | 517,245 | | | Spruce Asset Backed Securities Trust, Series2016-E1-A | | | 4.32 | % ^ | | | 06/15/2028 | | | | 510,305 | |
| | 2,553,571 | | | START Ireland, Series2019-1-A | | | 4.09 | % ^ | | | 03/15/2044 | | | | 1,741,073 | |
| | 3,660,795 | | | Start Ltd., Series2018-1-A | | | 4.09 | % ^ | | | 05/15/2043 | | | | 2,643,845 | |
| | 16,954,564 | | | TAL Advantage LLC, Series2017-1A-A | | | 4.50 | % ^ | | | 04/20/2042 | | | | 16,471,805 | |
| | 3,200,000 | | | Tesla Auto Lease Trust, Series2019-A-D | | | 3.37 | % ^ | | | 01/20/2023 | | | | 3,134,675 | |
| | 12,723,214 | | | Thunderbolt Aircraft Lease Ltd., Series2018-A-A | | | 4.15 | % ^ § | | | 09/15/2038 | | | | 8,919,851 | |
| | 1,339,286 | | | Thunderbolt Aircraft Lease Ltd., Series2018-A-B | | | 5.07 | % ^ § | | | 09/15/2038 | | | | 838,039 | |
| | 6,547,325 | | | Triton Container Finance LLC, Series2017-1A-A | | | 3.52 | % ^ | | | 06/20/2042 | | | | 6,256,956 | |
| | | | | | | | | | | | | | | | |
| | | | | | | | | | | | | |
| | 437,743 | | | Upgrade Receivables Trust, Series2018-1A-A | | | 3.76 | % ^ | | | 11/15/2024 | | | | 433,623 | |
| | 1,765,056 | | | Upgrade Receivables Trust, Series2019-1A-A | | | 3.48 | % ^ | | | 03/15/2025 | | | | 1,751,664 | |
| | 14,214,425 | | | Upstart Pass-Through Trust Series, Series2020-ST2-A | | | 3.50 | % ^ | | | 03/20/2028 | | | | 11,094,359 | |
| | 4,000,000 | | | Upstart Securitization Trust, Series2019-1-B | | | 4.19 | % ^ | | | 04/20/2026 | | | | 3,747,740 | |
| | 6,987,922 | | | Upstart Securitization Trust, Series2019-2-A | | | 2.90 | % ^ | | | 09/20/2029 | | | | 6,487,412 | |
| | 13,000,000 | | | Upstart Securitization Trust, Series2020-1-A | | | 2.32 | % ^ | | | 04/22/2030 | | | | 12,281,203 | |
| | 5,250,000 | | | Upstart Securitization Trust, Series2020-1-B | | | 3.09 | % ^ | | | 04/22/2030 | | | | 4,408,891 | |
| | 7,953,333 | | | Vantage Data Centers Issuer LLC, Series2019-1A-A2 | | | 3.19 | % ^ | | | 07/15/2044 | | | | 7,696,394 | |
| | 17,357,400 | | | Wave LLC, Series2019-1-A | | | 3.60 | % ^ | | | 09/15/2044 | | | | 11,146,870 | |
| | 6,939,567 | | | Westlake Automobile Receivables Trust, Series2017-2A-C | | | 2.59 | % ^ | | | 12/15/2022 | | | | 6,932,277 | |
| | 7,500,000 | | | Willis Engine Structured Trust, Series2020-A-A | | | 3.23 | % ^ | | | 03/15/2045 | | | | 4,244,550 | |
| | | | | | | | | | | | | | | | |
| | Total Asset Backed Obligations (Cost $510,093,987) | | | | | | | | | | | 450,362,412 | |
| | | | | | | | | | | | | |
| | Bank Loans - 4.2% | | | | | | | | | | | | |
| | 3,045,621 | | | 1011778 B.C. Unlimited Liability Company, Senior Secured First Lien Term Loan (1 Month LIBOR USD + 1.75%) | | | 2.67 | % | | | 11/19/2026 | | | | 2,824,813 | |
| | 816,371 | | | Acadia Healthcare Company, Inc., Senior Secured First Lien Term Loan (1 Month LIBOR USD + 2.50%) | | | 3.70 | % | | | 02/16/2023 | | | | 756,980 | |
| | 1,318,279 | | | Access CIG LLC, Senior Secured First Lien Term Loan (1 Month LIBOR USD + 3.75%) | | | 5.53 | % | | | 02/27/2025 | | | | 1,085,932 | |
| | 872,077 | | | Achilles Acquisition LLC, Senior Secured First Lien Term Loan (1 Month LIBOR USD + 4.00%) | | | 5.00 | % | | | 10/13/2025 | | | | 773,968 | |
| | 490,818 | | | Advanced Drainage Systems, Inc., Senior Secured First Lien Term Loan (1 Month LIBOR USD + 2.25%) | | | 3.23 | % | | | 07/31/2026 | | | | 458,915 | |
| | 996,334 | | | Agiliti Health, Inc., Senior Secured First Lien Term Loan (1 Month LIBOR USD + 3.00%) | | | 4.44 | % | | | 01/05/2026 | | | | 961,462 | |
| | 1,510,974 | | | Air Methods Corporation, Senior Secured First Lien Term Loan (3 Month LIBOR USD + 3.50%, 1.00% Floor) | | | 4.95 | % | | | 04/22/2024 | | | | 1,079,508 | |
| | 1,890,000 | | | Aldevron LLC, Senior Secured First Lien Term Loan (1 Month LIBOR USD + 4.25%, 1.00% Floor) | | | 5.70 | % | | | 10/13/2026 | | | | 1,786,050 | |
| | 1,642,239 | | | Alera Group Intermediate Holdings, Inc., Senior Secured First Lien Term Loan (1 Month LIBOR USD + 4.00%) | | | 4.99 | % | | | 08/01/2025 | | | | 1,445,170 | |
| | 1,566,714 | | | Aleris International, Inc., Senior Secured First Lien Term Loan (1 Month LIBOR USD + 4.75%) | | | 5.74 | % | | | 02/27/2023 | | | | 1,419,835 | |
| | 1,202,150 | | | AlixPartners LLP, Senior Secured First Lien Term Loan (1 Month LIBOR USD + 2.75%, 1.00% Floor) | | | 3.50 | % | | | 04/04/2024 | | | | 1,157,069 | |
| | 1,807,793 | | | Alliant Holdings Intermediate LLC, Senior Secured First Lien Term Loan (1 Month LIBOR USD + 3.25%) | | | 3.86 | % | | | 05/09/2025 | | | | 1,660,458 | |
| | 1,361,895 | | | Allied Universal Holdco LLC, Senior Secured First Lien Term Loan (6 Month LIBOR USD + 4.25%) | | | 5.24 | % | | | 07/10/2026 | | | | 1,266,562 | |
| | 705,000 | | | Almonde, Inc., Senior Secured Second Lien Term Loan (6 Month LIBOR USD + 7.25%, 1.00% Floor) | | | 9.03 | % | | | 06/16/2025 | | | | 541,440 | |
| | 1,979,215 | | | Alterra Mountain Company, Senior Secured First Lien Term Loan (1 Month LIBOR USD + 3.00%, 1.00% Floor) | | | 3.75 | % | | | 07/31/2024 | | | | 1,810,982 | |
| | 345,000 | | | Amentum Holdings LLC, Senior Secured First Lien Term Loan (1 Month LIBOR USD + 4.00%) | | | 4.99 | % | | | 02/01/2027 | | | | 322,575 | |
| | 350,000 | | | American Airlines, Inc., Senior Secured First Lien Term Loan (1 Month LIBOR USD + 1.75%) | | | 2.69 | % | | | 01/29/2027 | | | | 290,719 | |
| | 1,460,000 | | | American Airlines, Inc., Senior Secured First Lien Term Loan (1 Month LIBOR USD + 2.00%) | | | 2.94 | % | | | 04/28/2023 | | | | 1,211,800 | |
| | 554,286 | | | American Airlines, Inc., Senior Secured First Lien Term Loan (1 Month LIBOR USD + 2.00%) | | | 2.70 | % | | | 12/15/2023 | | | | 448,694 | |
| | 870,620 | | | American Tire Distributors, Inc., Senior Secured First Lien Term Loan (1 Month LIBOR USD + 7.50%, 1.00% Floor, 8.00% PIK) | | | 8.50 | % | | | 09/02/2024 | | | | 587,668 | |
| | 1,725,000 | | | Aramark Services, Inc., Senior Secured First Lien Term Loan (1 Month LIBOR USD + 1.75%) | | | 2.74 | % | | | 03/11/2025 | | | | 1,627,253 | |
| | 745,000 | | | Aramark Services, Inc., Senior Secured First Lien Term Loan (1 Month LIBOR USD + 1.75%) | | | 2.74 | % | | | 01/15/2027 | | | | 696,575 | |
| | 855,000 | | | Arconic Corporation, Senior Secured First Lien Term Loan | | | 4.66 | % ± | | | 02/04/2027 | | | | 782,325 | |
| | 539,033 | | | Arctic Glacier, Inc., Senior Secured First Lien Term Loan (1 Month LIBOR USD + 3.50%, 1.00% Floor) | | | 4.95 | % | | | 03/20/2024 | | | | 444,702 | |
| | 411,397 | | | Asurion LLC, Senior Secured Second Lien Term Loan (1 Month LIBOR USD + 6.50%) | | | 7.49 | % | | | 08/04/2025 | | | | 381,313 | |
| | 1,370,665 | | | Athenahealth, Inc., Senior Secured First Lien Term Loan (3 Month LIBOR USD + 4.50%) | | | 5.28 | % | | | 02/11/2026 | | | | 1,288,425 | |
| | 1,603,278 | | | Auris Luxembourg III Sarl, Senior Secured First Lien Term Loan (1 Month LIBOR USD + 3.75%) | | | 4.74 | % | | | 02/27/2026 | | | | 1,230,516 | |
| | 743,571 | | | Avantor, Inc., Senior Secured First Lien Term Loan (1 Month LIBOR USD + 3.00%, 1.00% Floor) | | | 3.25 | % | | | 11/21/2024 | | | | 708,251 | |
| | 1,201,570 | | | Avaya, Inc., Senior Secured First Lien Term Loan (1 Month LIBOR USD + 4.25%) | | | 4.95 | % | | | 12/16/2024 | | | | 1,036,354 | |
| | 2,124,275 | | | Azalea TopCo, Inc., Senior Secured First Lien Term Loan (1 Month LIBOR USD + 3.50%) | | | 4.49 | % | | | 07/24/2026 | | | | 1,970,265 | |
| | 413,636 | | | Bass Pro Group LLC, Senior Secured First Lien Term Loan (1 Month LIBOR USD + 5.00%, 0.75% Floor) | | | 6.07 | % | | | 09/25/2024 | | | | 349,523 | |
| | 1,287,750 | | | Bausch Health Companies, Inc., Senior Secured First Lien Term Loan (1 Month LIBOR USD + 2.75%) | | | 3.36 | % | | | 11/27/2025 | | | | 1,229,801 | |
| | 383,625 | | | Bausch Health Companies, Inc., Senior Secured First Lien Term Loan (1 Month LIBOR USD + 3.00%) | | | 3.61 | % | | | 06/02/2025 | | | | 367,162 | |
| | 189,225 | | | Berry Global, Inc., Senior Secured First Lien Term Loan (1 Month LIBOR USD + 2.00%) | | | 2.86 | % | | | 10/03/2022 | | | | 182,523 | |
| | 1,666,252 | | | Blackhawk Network Holdings, Inc., Senior Secured First Lien Term Loan (1 Month LIBOR USD + 3.00%) | | | 3.99 | % | | | 06/16/2025 | | | | 1,379,415 | |
| | 1,750,341 | | | Blackstone CQP Holdco LP, Senior Secured First Lien Term Loan (3 Month LIBOR USD + 3.50%) | | | 4.62 | % | | | 09/30/2024 | | | | 1,397,647 | |
| | 877,744 | | | Brand Energy & Infrastructure Services, Inc., Senior Secured First Lien Term Loan (3 Month LIBOR USD + 4.25%, 1.00% Floor) | | | 6.06 | % | | | 06/21/2024 | | | | 711,929 | |
| | 1,472,222 | | | Brazos Delaware LLC, Senior Secured First Lien Term Loan (1 Month LIBOR USD + 4.00%) | | | 4.92 | % | | | 05/21/2025 | | | | 776,597 | |
| | 1,027,850 | | | Bright Bidco B.V., Senior Secured First Lien Term Loan (6 Month LIBOR USD + 3.50%, 1.00% Floor) | | | 4.57 | % | | | 06/28/2024 | | | | 389,298 | |
| | 1,070,000 | | | Buckeye Partners LP, Senior Secured First Lien Term Loan (1 Month LIBOR USD + 2.75%) | | | 3.77 | % | | | 11/02/2026 | | | | 990,285 | |
| | 159,200 | | | Calpine Corporation, Senior Secured First Lien Term Loan (1 Month LIBOR USD + 2.50%) | | | 2.99 | % | | | 08/12/2026 | | | | 152,036 | |
| | 2,114,700 | | | Camelot US Acquisition Company, Senior Secured First Lien Term Loan (1 Month LIBOR USD + 3.25%) | | | 4.24 | % | | | 10/30/2026 | | | | 2,019,538 | |
| | 1,766,908 | | | Capri Acquisitions BidCo Ltd., Senior Secured First Lien Term Loan (3 Month LIBOR USD + 3.00%) | | | 4.78 | % | | | 11/01/2024 | | | | 1,532,793 | |
| | 991,308 | | | Catalent Pharma Solutions, Inc., Senior Secured First Lien Term Loan (1 Month LIBOR USD + 2.25%) | | | 3.24 | % | | | 05/18/2026 | | | | 966,526 | |
| | 1,390,572 | | | Cengage Learning, Inc., Senior Secured First Lien Term Loan (1 Month LIBOR USD + 4.25%, 1.00% Floor) | | | 5.25 | % | | | 06/07/2023 | | | | 1,140,269 | |
| | 1,057,350 | | | CenturyLink, Inc., Senior Secured First Lien Term Loan (1 Month LIBOR USD + 2.25%) | | | 3.24 | % | | | 03/15/2027 | | | | 993,253 | |
| | 2,497,607 | | | CEOC LLC, Senior Secured First Lien Term Loan (1 Month LIBOR USD + 2.00%) | | | 2.99 | % | | | 10/04/2024 | | | | 2,060,526 | |
| | 1,038,587 | | | Charter NEX US, Inc., Senior Secured First Lien Term Loan (1 Month LIBOR USD + 3.50%) | | | 4.49 | % | | | 05/16/2024 | | | | 915,686 | |
| | 831,612 | | | CHG Healthcare Services, Inc., Senior Secured First Lien Term Loan (1 Month LIBOR USD + 3.00%, 1.00% Floor) | | | 4.07 | % | | | 06/07/2023 | | | | 749,835 | |
| | 1,798,498 | | | CHG PPC Parent LLC, Senior Secured First Lien Term Loan (1 Month LIBOR USD + 2.75%) | | | 3.74 | % | | | 03/31/2025 | | | | 1,627,641 | |
| | 736,347 | | | Cincinnati Bell, Inc., Senior Secured First Lien Term Loan (1 Month LIBOR USD + 3.25%, 1.00% Floor) | | | 4.25 | % | | | 10/02/2024 | | | | 711,838 | |
| | 318,400 | | | Clear Channel Outdoor Holdings, Inc., Senior Secured First Lien Term Loan (1 Month LIBOR USD + 3.50%) | | | 4.49 | % | | | 08/21/2026 | | | | 270,640 | |
| | 894,702 | | | ClubCorporationHoldings, Inc., Senior Secured First Lien Term Loan (3 Month LIBOR USD + 2.75%) | | | 4.20 | % | | | 09/18/2024 | | | | 573,057 | |
| | 1,612,097 | | | Compass Power Generation LLC, Senior Secured First Lien Term Loan (1 Month LIBOR USD + 3.50%, 1.00% Floor) | | | 4.50 | % | | | 12/20/2024 | | | | 1,467,008 | |
| | 750,000 | | | Connect U.S. Finco LLC, Senior Secured First Lien Term Loan (1 Month LIBOR USD + 4.50%, 1.00% Floor) | | | 5.50 | % | | | 12/11/2026 | | | | 604,687 | |
| | 669,953 | | | Covia Holdings Corporation, Senior Secured First Lien Term Loan (1 Week LIBOR USD + 3.75%, 1.00% Floor) | | | 5.39 | % | | | 06/02/2025 | | | | 317,099 | |
| | 853,018 | | | CPM Holdings, Inc., Senior Secured First Lien Term Loan (6 Month LIBOR USD + 3.75%) | | | 4.84 | % | | | 11/17/2025 | | | | 707,152 | |
| | 1,175,713 | | | CSC Holdings LLC, Senior Secured First Lien Term Loan (1 Month LIBOR USD + 2.25%) | | | 2.86 | % | | | 07/17/2025 | | | | 1,130,648 | |
| | | | | | | | | | | | | | | | |
| | | | | | | | | | | | | |
| | 460,350 | | | CSC Holdings LLC, Senior Secured First Lien Term Loan (1 Month LIBOR USD + 2.25%) | | | 2.86 | % | | | 01/15/2026 | | | | 444,238 | |
| | 1,157,100 | | | CSC Holdings LLC, Senior Secured First Lien Term Loan (1 Month LIBOR USD + 2.50%) | | | 3.11 | % | | | 04/15/2027 | | | | 1,120,455 | |
| | 1,363,003 | | | CSM Bakery Solutions LLC, Senior Secured First Lien Term Loan (3 Month LIBOR USD + 4.00%, 1.00% Floor) | | | 5.87 | % | | | 07/03/2020 | | | | 1,127,885 | |
| | 1,807,709 | | | Cvent, Inc., Senior Secured First Lien Term Loan (1 Month LIBOR USD + 3.75%, 1.00% Floor) | | | 4.75 | % | | | 11/29/2024 | | | | 1,316,617 | |
| | 512,329 | | | Cyanco Intermediate Corporation, Senior Secured First Lien Term Loan (1 Month LIBOR USD + 3.50%) | | | 4.49 | % | | | 03/17/2025 | | | | 440,605 | |
| | 1,192,942 | | | Cyxtera DC Holdings, Inc., Senior Secured First Lien Term Loan (1 Month LIBOR USD + 3.00%, 1.00% Floor) | | | 4.00 | % | | | 05/01/2024 | | | | 797,482 | |
| | 209,475 | | | Dealer Tire, LLC, Senior Secured First Lien Term Loan (1 Month LIBOR USD + 4.25%) | | | 5.24 | % | | | 12/12/2025 | | | | 174,213 | |
| | 1,315,000 | | | Deerfield Holdings Corporation, Senior Secured First Lien Term Loan | | | 4.75 | % ± | | | 02/25/2027 | | | | 1,130,900 | |
| | 1,347,197 | | | Deerfield Holdings Corporation, Senior Secured First Lien Term Loan (1 Month LIBOR USD + 3.25%, 1.00% Floor) | | | 4.25 | % | | | 02/13/2025 | | | | 1,330,357 | |
| | 1,761,435 | | | DentalCorporationPerfect Smile ULC, Senior Secured First Lien Term Loan (1 Month LIBOR USD + 3.75%, 1.00% Floor) | | | 4.75 | % | | | 06/06/2025 | | | | 1,400,341 | |
| | 1,193,893 | | | Diamond B.V., Senior Secured First Lien Term Loan (3 Month LIBOR USD + 3.00%) | | | 4.78 | % | | | 09/06/2024 | | | | 911,340 | |
| | 328,350 | | | Diamond Sports Group LLC, Senior Secured First Lien Term Loan (1 Month LIBOR USD + 3.25%) | | | 4.18 | % | | | 08/24/2026 | | | | 257,755 | |
| | 625,407 | | | Digicel International Finance Ltd., Senior Secured First Lien Term Loan (6 Month LIBOR USD + 3.25%) | | | 4.87 | % | | | 05/27/2024 | | | | 495,244 | |
| | 1,752,423 | | | Dun & Bradstreet Corporation, Senior Secured First Lien Term Loan (1 Month LIBOR USD + 5.00%) | | | 4.96 | % | | | 02/06/2026 | | | | 1,592,514 | |
| | 276,796 | | | Dynasty Acquisition Company, Inc., Senior Secured First Lien Term Loan (3 Month LIBOR USD + 3.50%) | | | 4.95 | % | | | 04/06/2026 | | | | 224,551 | |
| | 514,840 | | | Dynasty Acquisition Company, Inc., Senior Secured First Lien Term Loan (3 Month LIBOR USD + 3.50%) | | | 4.95 | % | | | 04/06/2026 | | | | 417,664 | |
| | 452,556 | | | Dynatrace LLC, Senior Secured First Lien Term Loan (1 Month LIBOR USD + 3.25%) | | | 3.24 | % | | | 08/22/2025 | | | | 429,928 | |
| | 1,661,523 | | | EAB Global, Inc., Senior Secured First Lien Term Loan (6 Month LIBOR USD + 3.75%, 1.00% Floor) | | | 5.74 | % | | | 11/15/2024 | | | | 1,358,710 | |
| | 842,301 | | | EG America LLC, Senior Secured First Lien Term Loan (3 Month LIBOR USD + 4.00%) | | | 5.07 | % | | | 02/06/2025 | | | | 626,672 | |
| | 845,000 | | | Elanco Animal Health, Inc., Senior Secured First Lien Term Loan | | | 3.55 | % ± | | | 02/26/2027 | | | | 809,087 | |
| | 1,611,583 | | | Envision Healthcare Corporation, Senior Secured First Lien Term Loan (1 Month LIBOR USD + 3.75%) | | | 4.74 | % | | | 10/10/2025 | | | | 863,543 | |
| | 1,034,174 | | | Equinox Holdings, Inc., Senior Secured First Lien Term Loan (1 Month LIBOR USD + 3.00%, 1.00% Floor) | | | 4.07 | % | | | 03/08/2024 | | | | 768,200 | |
| | 1,750,173 | | | ESH Hospitality, Inc., Senior Secured First Lien Term Loan (1 Month LIBOR USD + 2.00%) | | | 2.99 | % | | | 09/18/2026 | | | | 1,575,156 | |
| | 1,645,669 | | | Excelitas Technologies Corporation, Senior Secured First Lien Term Loan (3 Month LIBOR USD + 3.50%, 1.00% Floor) | | | 4.95 | % | | | 12/02/2024 | | | | 1,439,960 | |
| | 661,835 | | | Exgen Renewables IV LLC, Senior Secured First Lien Term Loan (3 Month LIBOR USD + 3.00%, 1.00% Floor) | | | 4.62 | % | | | 11/29/2024 | | | | 600,615 | |
| | 1,599,704 | | | Filtration Group Corporation, Senior Secured First Lien Term Loan (1 Month LIBOR USD + 3.00%) | | | 3.99 | % | | | 03/31/2025 | | | | 1,413,739 | |
| | 1,419,968 | | | Financial & Risk US Holdings, Inc., Senior Secured First Lien Term Loan (1 Month LIBOR USD + 3.75%) | | | 4.24 | % | | | 10/01/2025 | | | | 1,370,859 | |
| | 925,000 | | | Flex Acquisition Company Inc, Senior Secured First Lien Term Loan (3 Month LIBOR USD + 3.00%, 1.00% Floor) | | | 4.43 | % | | | 12/29/2023 | | | | 851,000 | |
| | 785,000 | | | Flex Acquisition Company, Inc., Senior Secured First Lien Term Loan (3 Month LIBOR USD + 3.25%) | | | 4.68 | % | | | 06/30/2025 | | | | 722,200 | |
| | 813,682 | | | Flexential Intermediate Corporation, Senior Secured First Lien Term Loan (3 Month LIBOR USD + 3.50%) | | | 4.95 | % | | | 08/01/2024 | | | | 584,834 | |
| | 1,397,203 | | | Flexera Software LLC, Senior Secured First Lien Term Loan (1 Month LIBOR USD + 3.25%, 1.00% Floor) | | | 4.50 | % | | | 02/26/2025 | | | | 1,274,948 | |
| | 181,636 | | | Foresight Energy LLC, Senior Secured First Lien Delayed-Draw Term Loan (1 Month LIBOR USD + 11.00%, 2.00% Floor) | | | 13.00 | % & | | | 09/10/2020 | | | | 176,186 | |
| | 2,202,827 | | | Foresight Energy LLC, Senior Secured First Lien Term Loan (3 Month LIBOR USD + 5.75%, 1.00% Floor) | | | 7.36 | % W | | | 03/28/2022 | | | | 374,481 | |
| | 1,417,063 | | | Forest City Enterprises L.P., Senior Secured First Lien Term Loan (1 Month LIBOR USD + 3.50%) | | | 4.49 | % | | | 12/08/2025 | | | | 1,232,844 | |
| | 919,062 | | | Forterra Finance, LLC, Senior Secured First Lien Term Loan (1 Month LIBOR USD + 3.00%, 1.00% Floor) | | | 4.00 | % | | | 10/25/2023 | | | | 768,947 | |
| | 1,040,000 | | | Froneri US, Inc., Senior Secured First Lien Term Loan (1 Month LIBOR USD + 2.25%) | | | 3.24 | % | | | 01/29/2027 | | | | 998,400 | |
| | 684,649 | | | Frontdoor, Inc., Senior Secured First Lien Term Loan (1 Month LIBOR USD + 2.50%) | | | 3.50 | % | | | 08/18/2025 | | | | 660,687 | |
| | 590,000 | | | Gardner Denver, Inc., Senior Secured First Lien Term Loan (1 Month LIBOR USD + 1.75%) | | | 2.74 | % | | | 03/01/2027 | | | | 558,287 | |
| | 530,000 | | | Gates Global LLC, Senior Secured First Lien Term Loan (1 Month LIBOR USD + 2.75%, 1.00% Floor) | | | 3.75 | % | | | 04/01/2024 | | | | 466,930 | |
| | 480,000 | | | Gavilan Resources LLC, Senior Secured Second Lien Term Loan (1 Month LIBOR USD + 6.00%, 1.00% Floor) | | | 6.99 | % | | | 03/01/2024 | | | | 57,600 | |
| | 1,170,000 | | | Genesee & Wyoming, Inc., Senior Secured First Lien Term Loan (1 Month LIBOR USD + 2.00%) | | | 3.45 | % | | | 12/30/2026 | | | | 1,129,056 | |
| | 2,103,908 | | | Genesys Telecommunications Laboratories, Inc., Senior Secured First Lien Term Loan (1 Month LIBOR USD + 3.25%) | | | 4.24 | % | | | 12/01/2023 | | | | 1,988,193 | |
| | 1,185,172 | | | Getty Images, Inc., Senior Secured First Lien Term Loan (1 Month LIBOR USD + 4.50%) | | | 5.50 | % | | | 02/19/2026 | | | | 962,952 | |
| | 2,131,552 | | | GOBP Holdings Inc, Senior Secured First Lien Term Loan (3 Month LIBOR USD + 2.75%) | | | 3.74 | % | | | 10/22/2025 | | | | 2,003,659 | |
| | 1,878,842 | | | Golden Nugget, Inc., Senior Secured First Lien Term Loan (3 Month LIBOR USD + 2.50%, 0.75% Floor) | | | 3.70 | % | | | 10/04/2023 | | | | 1,474,891 | |
| | 1,741,092 | | | GoodRX, Inc., Senior Secured First Lien Term Loan (1 Month LIBOR USD + 3.00%) | | | 3.74 | % | | | 10/10/2025 | | | | 1,645,332 | |
| | 1,522,830 | | | GrafTech Finance, Inc., Senior Secured First Lien Term Loan (1 Month LIBOR USD + 3.50%, 1.00% Floor) | | | 4.50 | % | | | 02/12/2025 | | | | 1,332,476 | |
| | 2,378,074 | | | Gray Television, Inc., Senior Secured First Lien Term Loan (1 Month LIBOR USD + 2.50%) | | | 3.49 | % | | | 01/02/2026 | | | | 2,237,767 | |
| | 2,124,675 | | | Grifols Worldwide Operations USA, Inc., Senior Secured First Lien Term Loan (1 Month LIBOR USD + 2.00%) | | | 2.50 | % | | | 11/15/2027 | | | | 2,027,291 | |
| | 958,654 | | | GTT Communications, Inc., Senior Secured First Lien Term Loan (1 Month LIBOR USD + 2.75%) | | | 3.74 | % | | | 06/02/2025 | | | | 697,421 | |
| | 1,427,865 | | | Gulf Finance LLC, Senior Secured First Lien Term Loan (3 Month LIBOR USD + 5.25%, 1.00% Floor) | | | 6.71 | % | | | 08/25/2023 | | | | 743,917 | |
| | 702,077 | | | Harbor Freight Tools USA, Inc., Senior Secured First Lien Term Loan (1 Month LIBOR USD + 2.50%, 0.75% Floor) | | | 3.49 | % | | | 08/18/2023 | | | | 644,507 | |
| | 543,820 | | | Harsco Corporation, Senior Secured First Lien Term Loan (1 Month LIBOR USD + 2.25%, 1.00% Floor) | | | 3.25 | % | | | 12/06/2024 | | | | 500,315 | |
| | 463,927 | | | Hayward Industries, Inc., Senior Secured First Lien Term Loan (1 Month LIBOR USD + 3.50%) | | | 4.49 | % | | | 08/05/2024 | | | | 371,142 | |
| | 1,880,288 | | | HC Group Holdings, Inc., Senior Secured First Lien Term Loan (1 Month LIBOR USD + 4.50% | | | 5.49 | % | | | 08/06/2026 | | | | 1,588,843 | |
| | 674,900 | | | Hexion, Inc., Senior Secured First Lien Term Loan (3 Month LIBOR USD + 3.50%) | | | 4.94 | % | | | 07/01/2026 | | | | 573,034 | |
| | 1,204,745 | | | H-Food Holdings, LLC, Senior Secured First Lien Term Loan (1 Month LIBOR USD + 3.69%) | | | 4.68 | % | | | 05/23/2025 | | | | 1,022,027 | |
| | 2,840,886 | | | Hilton Worldwide Finance LLC, Senior Secured First Lien Term Loan (3 Month LIBOR USD + 1.75%) | | | 2.70 | % | | | 06/22/2026 | | | | 2,705,944 | |
| | 850,671 | | | Houston Foods, Inc., Senior Secured First Lien Term Loan (1 Month LIBOR USD + 3.75%) | | | 4.74 | % | | | 07/21/2025 | | | | 718,817 | |
| | 1,570,767 | | | Hyland Software, Inc., Senior Secured First Lien Term Loan (1 Month LIBOR USD + 3.50%, 0.75% Floor) | | | 4.85 | % | | | 07/01/2024 | | | | 1,474,558 | |
| | 512,560 | | | Hyland Software, Inc., Senior Secured Second Lien Term Loan (1 Month LIBOR USD + 7.00%, 0.75% Floor) | | | 7.99 | % | | | 07/07/2025 | | | | 470,274 | |
| | 454,725 | | | IAA, Inc., Senior Secured First Lien Term Loan (1 Month LIBOR USD + 2.25%) | | | 3.25 | % | | | 06/29/2026 | | | | 436,536 | |
| | 1,216,950 | | | IHeartCommunications, Inc., Senior Secured First Lien Term Loan (1 Month LIBOR USD + 3.00%) | | | 3.99 | % | | | 05/01/2026 | | | | 1,036,312 | |
| | 665,000 | | | Informatica LLC, Senior Secured First Lien Term Loan (1 Month LIBOR USD + 3.25%) | | | 4.24 | % | | | 02/25/2027 | | | | 582,986 | |
| | 1,060,545 | | | Intelsat Jackson Holdings S.A., Senior Secured First Lien Term Loan (1 Month LIBOR USD + 3.75%, 1.00% Floor) | | | 5.68 | % | | | 11/27/2023 | | | | 982,993 | |
| | 698,917 | | | ION Trading Technologies SARL, Senior Secured First Lien Term Loan (3 Month LIBOR USD + 4.00%, 1.00% Floor) | | | 5.07 | % | | | 11/21/2024 | | | | 582,432 | |
| | 1,792,025 | | | IQVIA, Inc., Senior Secured First Lien Term Loan (3 Month LIBOR USD + 2.00%) | | | 2.74 | % | | | 01/17/2025 | | | | 1,654,640 | |
| | 1,481,368 | | | IRB Holding Corporation, Senior Secured First Lien Term Loan (6 Month LIBOR USD + 2.75%, 1.00% Floor) | | | 3.75 | % | | | 02/05/2025 | | | | 1,159,867 | |
| | 709,280 | | | IRI Holdings, Inc., Senior Secured First Lien Term Loan (3 Month LIBOR USD + 4.50%) | | | 6.11 | % | | | 12/01/2025 | | | | 568,310 | |
| | 2,611,675 | | | Iron Mountain Information Management LLC, Senior Secured First Lien Term Loan (1 Month LIBOR USD + 1.75%) | | | 2.74 | % | | | 01/02/2026 | | | | 2,494,150 | |
| | 2,394,761 | | | Jaguar Holding Company, Senior Secured First Lien Term Loan (1 Month LIBOR USD + 2.50%, 1.00% Floor) | | | 3.50 | % | | | 08/18/2022 | | | | 2,306,670 | |
| | 2,618,550 | | | JBS USA Lux S.A., Senior Secured First Lien Term Loan (1 Month LIBOR USD + 2.50%) | | | 3.07 | % | | | 05/01/2026 | | | | 2,470,785 | |
| | 614,727 | | | Jo-Ann Stores LLC, Senior Secured First Lien Term Loan (3 Month LIBOR USD + 5.00%, 1.00% Floor) | | | 6.00 | % | | | 10/20/2023 | | | | 240,623 | |
| | | | | | | | | | | | | | | | |
| | | | | | | | | | | | | |
| | 553,024 | | | KAR Auction Services, Inc., Senior Secured First Lien Term Loan (1 Month LIBOR USD + 2.25%) | | | 3.19 | % | | | 09/19/2026 | | | | 514,312 | |
| | 903,084 | | | KBR, Inc., Senior Secured First Lien Term Loan (1 Month LIBOR USD + 2.75%) | | | 3.74 | % | | | 02/05/2027 | | | | 810,138 | |
| | 1,291,763 | | | Kestrel Bidco, Inc., Senior Secured First Lien Term Loan (3 Month LIBOR USD + 3.00%, 1.00% Floor) | | | 4.00 | % | | | 12/11/2026 | | | | 1,016,184 | |
| | 1,201,078 | | | Kindred Healthcare, Inc., Senior Secured First Lien Term Loan (1 Month LIBOR USD + 5.00%) | | | 6.00 | % | | | 07/02/2025 | | | | 1,020,916 | |
| | 793,797 | | | Klockner-Pentaplast of America, Inc., Senior Secured First Lien Term Loan (1 Month LIBOR USD + 4.25%, 1.00% Floor) | | | 5.25 | % | | | 06/30/2022 | | | | 562,056 | |
| | 1,514,806 | | | Kronos Acquisition Holdings, Inc., Senior Secured First Lien Term Loan (3 Month LIBOR USD + 4.00%, 1.00% Floor) | | | 5.00 | % | | | 05/15/2023 | | | | 1,370,271 | |
| | 1,723,279 | | | Kronos, Inc., Senior Secured First Lien Term Loan (3 Month LIBOR USD + 3.00%, 1.00% Floor) | | | 4.76 | % | | | 11/01/2023 | | | | 1,587,838 | |
| | 2,639,245 | | | Level 3 Financing, Inc., Senior Secured First Lien Term Loan (1 Month LIBOR USD + 1.75%) | | | 2.74 | % | | | 03/01/2027 | | | | 2,489,138 | |
| | 1,713,961 | | | Life Time Fitness, Inc., Senior Secured First Lien Term Loan (3 Month LIBOR USD + 2.75%, 1.00% Floor) | | | 4.36 | % | | | 06/10/2022 | | | | 1,289,755 | |
| | 473,791 | | | Lineage Logistics, LLC, Senior Secured First Lien Term Loan (1 Month LIBOR USD + 3.00%, 1.00% Floor) | | | 4.00 | % | | | 02/27/2025 | | | | 449,510 | |
| | 445,473 | | | Lions Gate Capital Holdings LLC, Senior Secured First Lien Term Loan (1 Month LIBOR USD + 2.25%) | | | 3.24 | % | | | 03/24/2025 | | | | 406,494 | |
| | 1,414,938 | | | Lower Cadence Holdings LLC, Senior Secured First Lien Term Loan (1 Month LIBOR USD + 4.00%) | | | 4.99 | % | | | 05/22/2026 | | | | 863,112 | |
| | 1,471,989 | | | Lucid Energy Group II Borrower LLC, Senior Secured First Lien Term Loan (1 Month LIBOR USD + 3.00%, 1.00% Floor) | | | 4.00 | % | | | 02/18/2025 | | | | 852,524 | |
| | 846,466 | | | Marriott Ownership Resorts, Inc., Senior Secured First Lien Term Loan (1 Month LIBOR USD + 1.75%) | | | 3.35 | % | | | 08/29/2025 | | | | 753,355 | |
| | 1,222,309 | | | Mavis Tire Express Services Corporation, Senior Secured First Lien Term Loan (1 Month LIBOR USD + 3.25%) | | | 4.70 | % | | | 03/20/2025 | | | | 991,598 | |
| | 547,133 | | | McDermott International, Inc., Senior Secured First Lien Term Loan (3 Month LIBOR USD + 5.00%, 1.00% Floor) | | | 2.00 | % W | | | 05/12/2025 | | | | 168,394 | |
| | 210,470 | | | MED ParentCo LP, Senior Secured First Lien Term Loan (1 Month LIBOR USD + 4.25%) | | | 5.24 | % & | | | 08/31/2026 | | | | 176,796 | |
| | 840,584 | | | MED ParentCo LP, Senior Secured First Lien Term Loan (1 Month LIBOR USD + 4.25%) | | | 5.24 | % | | | 08/31/2026 | | | | 706,095 | |
| | 621,802 | | | Messer Industries LLC, Senior Secured First Lien Term Loan (3 Month LIBOR USD + 2.50%) | | | 3.95 | % | | | 03/02/2026 | | | | 556,513 | |
| | 2,086,823 | | | Millennium Trust Company LLC, Senior Secured First Lien Term Loan (1 Month LIBOR USD + 5.00%) | | | 5.99 | % | | | 03/27/2026 | | | | 1,770,315 | |
| | 48,345 | | | Mission Broadcasting, Inc., Senior Secured First Lien Term Loan (1 Month LIBOR USD + 2.25%) | | | 3.23 | % | | | 01/17/2024 | | | | 45,686 | |
| | 19,439 | | | Mister Car Wash Holdings, Inc., Senior Secured First Lien Term Loan | | | 5.19 | % ± | | | 05/14/2026 | | | | 16,315 | |
| | 1,605,619 | | | Mister Car Wash Holdings, Inc., Senior Secured First Lien Term Loan (3 Month LIBOR USD + 3.50%) | | | 3.86 | % | | | 05/14/2026 | | | | 1,347,572 | |
| | 360,000 | | | Mitchell International, Inc., Senior Secured Second Lien Term Loan (1 Month LIBOR USD + 7.25%) | | | 8.24 | % | | | 12/01/2025 | | | | 283,199 | |
| | 716,392 | | | MLN US HoldCo LLC, Senior Secured First Lien Term Loan (1 Month LIBOR USD + 4.50%) | | | 5.49 | % | | | 11/28/2025 | | | | 512,220 | |
| | 57,356 | | | Motion Finco, LLC, Senior Secured First Lien Term Loan (3 Month LIBOR USD + 3.25%) | | | 4.70 | % | | | 11/04/2026 | | | | 47,414 | |
| | 436,406 | | | Motion Finco, LLC, Senior Secured First Lien Term Loan (6 Month LIBOR USD + 3.25%) | | | 4.32 | % | | | 11/04/2026 | | | | 360,762 | |
| | 1,394,205 | | | MPH Acquisition Holdings LLC, Senior Secured First Lien Term Loan (3 Month LIBOR USD + 2.75%, 1.00% Floor) | | | 4.20 | % | | | 06/07/2023 | | | | 1,254,785 | |
| | 693,559 | | | Nascar Holdings, Inc., Senior Secured First Lien Term Loan (3 Month LIBOR USD + 2.75%) | | | 3.67 | % | | | 10/19/2026 | | | | 617,267 | |
| | 482,575 | | | NCR Corporation, Senior Secured First Lien Term Loan (1 Month LIBOR USD + 2.50%) | | | 3.49 | % | | | 08/28/2026 | | | | 441,556 | |
| | 187,448 | | | Nexstar Broadcasting, Inc., Senior Secured First Lien Term Loan (1 Month LIBOR USD + 2.25%) | | | 3.19 | % | | | 01/17/2024 | | | | 177,139 | |
| | 904,148 | | | Numericable U.S. LLC, Senior Secured First Lien Term Loan (1 Month LIBOR USD + 4.00%) | | | 4.70 | % | | | 08/14/2026 | | | | 865,722 | |
| | 502,475 | | | ON Semiconductor Corporation, Senior Secured First Lien Term Loan (1 Month LIBOR USD + 2.00%) | | | 2.99 | % | | | 09/18/2026 | | | | 475,467 | |
| | 350,563 | | | Outcomes Group Holdings, Inc., Senior Secured First Lien Term Loan (3 Month LIBOR USD + 3.50%) | | | 5.11 | % | | | 10/24/2025 | | | | 289,214 | |
| | 660,475 | | | Panther BF Aggregator LP, Senior Secured First Lien Term Loan (1 Month LIBOR USD + 3.50%) | | | 4.44 | % | | | 04/30/2026 | | | | 607,637 | |
| | 1,428,129 | | | Parexel International Corporation, Senior Secured First Lien Term Loan (1 Month LIBOR USD + 2.75%) | | | 3.74 | % | | | 09/27/2024 | | | | 1,233,546 | |
| | 522,570 | | | PCI Gaming Authority, Senior Secured First Lien Term Loan (1 Month LIBOR USD + 3.00%) | | | 3.49 | % | | | 05/29/2026 | | | | 433,211 | |
| | 1,156,155 | | | Penn National Gaming, Inc., Senior Secured First Lien Term Loan (1 Month LIBOR USD + 2.25%, 0.75% Floor) | | | 3.24 | % | | | 10/15/2025 | | | | 886,828 | |
| | 528,651 | | | Phoenix Services International LLC, Senior Secured First Lien Term Loan (1 Month LIBOR USD + 3.75%, 1.00% Floor) | | | 4.75 | % | | | 03/03/2025 | | | | 436,137 | |
| | 1,118,172 | | | Pike Corporation, Senior Secured First Lien Term Loan (1 Month LIBOR USD + 3.25%) | | | 4.24 | % | | | 07/24/2026 | | | | 1,049,220 | |
| | 738,770 | | | Pisces Midco, Inc., Senior Secured First Lien Term Loan (1 Month LIBOR USD + 3.75%) | | | 4.56 | % | | | 04/12/2025 | | | | 633,495 | |
| | 752,922 | | | Playa Resorts Holding B.V., Senior Secured First Lien Term Loan (1 Month LIBOR USD + 2.75%, 1.00% Floor) | | | 3.75 | % | | | 04/29/2024 | | | | 524,033 | |
| | 2,134,399 | | | PODS LLC, Senior Secured First Lien Term Loan (3 Month LIBOR USD + 2.75%, 1.00% Floor) | | | 3.75 | % | | | 12/06/2024 | | | | 1,910,287 | |
| | 915,869 | | | PowerTeam Services LLC, Senior Secured First Lien Term Loan (3 Month LIBOR USD + 3.25%, 1.00% Floor) | | | 4.70 | % | | | 03/06/2025 | | | | 770,855 | |
| | 696,782 | | | Prairie ECI Acquiror LP, Senior Secured First Lien Term Loan (3 Month LIBOR USD + 4.75%) | | | 6.20 | % | | | 03/11/2026 | | | | 370,862 | |
| | 1,253,488 | | | Pregis Topco LLC, Senior Secured First Lien Term Loan (3 Month LIBOR USD + 4.00%) | | | 4.99 | % | | | 07/31/2026 | | | | 1,103,069 | |
| | 295,000 | | | Presidio Holdings, Inc., Senior Secured First Lien Term Loan (3 Month LIBOR USD + 3.50%) | | | 5.28 | % | | | 01/22/2027 | | | | 277,300 | |
| | 1,579,275 | | | Prime Security Services Borrower, LLC, Senior Secured First Lien Term Loan (1 Month LIBOR USD + 3.25%, 1.00% Floor) | | | 4.27 | % | | | 09/23/2026 | | | | 1,434,771 | |
| | 877,957 | | | Pro Mach Group, Inc., Senior Secured First Lien Term Loan (1 Month LIBOR USD + 3.00%) | | | 3.68 | % | | | 03/07/2025 | | | | 706,756 | |
| | 518,700 | | | Pug LLC, Senior Secured First Lien Term Loan (1 Month LIBOR USD + 3.50%) | | | 4.49 | % | | | 02/12/2027 | | | | 451,269 | |
| | 1,760,916 | | | Radiate Finance, Inc., Senior Secured First Lien Term Loan (1 Month LIBOR USD + 3.00%, 0.75% Floor) | | | 3.99 | % | | | 02/01/2024 | | | | 1,646,456 | |
| | 1,309,636 | | | Radiology Partners, Inc., Senior Secured First Lien Term Loan (2 Month LIBOR USD + 4.25%) | | | 5.98 | % | | | 07/09/2025 | | | | 1,097,475 | |
| | 563,174 | | | RegionalCare Hospital Partners Holdings, Inc., Senior Secured First Lien Term Loan (1 Month LIBOR USD + 4.50%) | | | 4.74 | % | | | 11/14/2025 | | | | 525,867 | |
| | 1,999,292 | | | Renaissance Holding Corporation, Senior Secured First Lien Term Loan (1 Month LIBOR USD + 3.25%) | | | 4.24 | % | | | 05/30/2025 | | | | 1,694,400 | |
| | 1,737,730 | | | RentPath, Inc., Senior Secured First Lien Term Loan (1 Month LIBOR USD + 4.75%, 1.00% Floor) | | | 7.00 | % W | | | 12/17/2021 | | | | 1,331,319 | |
| | 301,756 | | | RentPath, Inc., Senior Secured First Lien Term Loan (1 Month LIBOR USD + 7.00%, 1.00% Floor) | | | 8.00 | % | | | 08/31/2020 | | | | 288,177 | |
| | 680,000 | | | Reynolds Consumer Products LLC, Senior Secured First Lien Term Loan (3 Month LIBOR USD + 1.75%) | | | 3.50 | % | | | 02/04/2027 | | | | 645,660 | |
| | 55,000 | | | Rockwood Service Corporation, Senior Secured First Lien Term Loan (3 Month LIBOR USD + 4.25%) | | | 5.70 | % | | | 01/23/2027 | | | | 47,575 | |
| | 937,650 | | | RPI Intermediate Finance Trust, Senior Secured First Lien Term Loan (1 Month LIBOR USD + 1.75%) | | | 2.74 | % | | | 02/11/2027 | | | | 876,703 | |
| | 928,250 | | | RPI Intermediate Finance Trust, Senior Secured First Lien Term Loan (1 Month LIBOR USD + 1.75%) | | | 2.74 | % | | | 02/11/2027 | | | | 871,395 | |
| | 1,436,813 | | | Science Applications International Corporation, Senior Secured First Lien Term Loan (1 Month LIBOR USD + 1.75%) | | | 2.86 | % | | | 10/31/2025 | | | | 1,356,897 | |
| | 770,000 | | | Science Applications International Corporation, Senior Secured First Lien Term Loan (1 Month LIBOR USD + 2.25%) | | | 3.24 | % | | | 03/12/2027 | | | | 729,575 | |
| | 1,569,571 | | | Securus Technologies Holdings, Inc., Senior Secured First Lien Term Loan (6 Month LIBOR USD + 4.50%, 1.00% Floor) | | | 5.50 | % | | | 11/01/2024 | | | | 1,247,809 | |
| | 1,664,961 | | | Sedgwick Claims Management Services, Inc., Senior Secured First Lien Term Loan (1 Month LIBOR USD + 3.25%) | | | 4.24 | % | | | 12/31/2025 | | | | 1,489,449 | |
| | 1,079,034 | | | Select Medical Corporation, Senior Secured First Lien Term Loan (6 Month LIBOR USD + 2.50%) | | | 3.43 | % | | | 03/06/2025 | | | | 1,030,477 | |
| | 488,775 | | | ServiceMaster Company LLC, Senior Secured First Lien Term Loan (1 Month LIBOR USD + 1.75%) | | | 2.74 | % | | | 11/05/2026 | | | | 470,690 | |
| | 1,734,701 | | | Severin Acquisition LLC, Senior Secured First Lien Term Loan (3 Month LIBOR USD + 3.25%) | | | 4.74 | % | | | 08/01/2025 | | | | 1,523,648 | |
| | 2,616,850 | | | Sinclair Television Group, Inc., Senior Secured First Lien Term Loan (1 Month LIBOR USD + 2.50%) | | | 3.21 | % | | | 09/30/2026 | | | | 2,499,092 | |
| | 606,911 | | | SIWF Holdings, Inc., Senior Secured First Lien Term Loan (1 Month LIBOR USD + 4.25%) | | | 5.32 | % | | | 06/13/2025 | | | | 546,220 | |
| | 1,538,375 | | | Six Flags Theme Parks, Inc., Senior Secured First Lien Term Loan (1 Month LIBOR USD + 1.75%) | | | 2.74 | % | | | 04/17/2026 | | | | 1,364,923 | |
| | 1,431,774 | | | SMG US Midco 2, Inc., Senior Secured First Lien Term Loan (1 Month LIBOR USD + 2.50%) | | | 4.13 | % | | | 01/23/2025 | | | | 1,234,905 | |
| | 1,566,685 | | | Solenis International LP, Senior Secured First Lien Term Loan (3 Month LIBOR USD + 4.00%) | | | 5.61 | % | | | 06/26/2025 | | | | 1,263,798 | |
| | 85,000 | | | Solenis International LP, Senior Secured Second Lien Term Loan (3 Month LIBOR USD + 8.50%) | | | 10.11 | % | | | 06/26/2026 | | | | 59,075 | |
| | | | | | | | | | | | | | | | |
| | | | | | | | | | | | | |
| | 1,576,736 | | | Sophia LP, Senior Secured First Lien Term Loan (3 Month LIBOR USD + 3.25%, 1.00% Floor) | | | 4.70 | % | | | 09/30/2022 | | | | 1,513,666 | |
| | 1,710,000 | | | Sotera Health Holdings LLC, Senior Secured First Lien Term Loan (1 Month LIBOR USD + 4.50%, 1.00% Floor) | | | 5.50 | % | | | 12/11/2026 | | | | 1,510,682 | |
| | 1,936,769 | | | Sound Inpatient Physicians, Inc., Senior Secured First Lien Term Loan (1 Month LIBOR USD + 2.75%) | | | 3.74 | % | | | 06/27/2025 | | | | 1,736,643 | |
| | 678,655 | | | Southern Graphics, Inc., Senior Secured First Lien Term Loan (1 Month LIBOR USD + 3.25%) | | | 4.70 | % | | | 12/30/2022 | | | | 364,777 | |
| | 795,714 | | | Speedcast International Ltd., Senior Secured First Lien Term Loan (3 Month LIBOR USD + 2.75%) | | | 5.00 | % W | | | 05/15/2025 | | | | 200,918 | |
| | 1,610,219 | | | SS&C Technologies, Inc., Senior Secured First Lien Term Loan (1 Month LIBOR USD + 2.25%) | | | 2.74 | % | | | 04/16/2025 | | | | 1,523,171 | |
| | 863,067 | | | Staples, Inc., Senior Secured First Lien Term Loan (2 Month LIBOR USD + 5.00%) | | | 6.02 | % | | | 04/16/2026 | | | | 689,591 | |
| | 818,871 | | | Starfruit US Holdco LLC, Senior Secured First Lien Term Loan (1 Month LIBOR USD + 3.25%) | | | 3.86 | % | | | 10/01/2025 | | | | 743,125 | |
| | 1,286,120 | | | Stars Group Holdings B.V., Senior Secured First Lien Term Loan (3 Month LIBOR USD + 3.50%) | | | 4.95 | % | | | 07/10/2025 | | | | 1,239,498 | |
| | 360,000 | | | STG-Fairway Holdings, LLC, Senior Secured First Lien Term Loan (6 Month LIBOR USD + 3.50%) | | | 4.57 | % | | | 02/01/2027 | | | | 311,400 | |
| | 403,988 | | | Sunshine Luxembourg VII SARL, Senior Secured First Lien Term Loan (3 Month LIBOR USD + 4.25%) | | | 5.32 | % | | | 10/01/2026 | | | | 367,629 | |
| | 1,740,000 | | | Surf Holdings LLC, Senior Secured First Lien Term Loan (3 Month LIBOR USD + 3.50%) | | | 4.81 | % | | | 03/05/2027 | | | | 1,561,650 | |
| | 284,868 | | | Syncreon Group Holdings B.V., Senior Secured First Lien Term Loan (1 Month LIBOR USD + 5.00%) | | | 6.07 | % | | | 10/01/2024 | | | | 246,411 | |
| | 509,567 | | | Syncreon Group Holdings B.V., Senior Secured First Lien Term Loan (1 Month LIBOR USD + 6.00%) | | | 7.45 | % | | | 04/01/2025 | | | | 343,958 | |
| | 876,099 | | | TAMKO Building Products LLC, Senior Secured First Lien Term Loan (1 Month LIBOR USD + 3.25%) | | | 4.24 | % | | | 05/29/2026 | | | | 827,913 | |
| | 841,639 | | | Team Health Holdings, Inc., Senior Secured First Lien Term Loan (1 Month LIBOR USD + 2.75%, 1.00% Floor) | | | 3.75 | % | | | 02/06/2024 | | | | 542,857 | |
| | 882,788 | | | Telesat LLC, Senior Secured First Lien Term Loan (3 Month LIBOR USD + 2.75%) | | | 3.74 | % | | | 12/07/2026 | | | | 847,476 | |
| | 568,575 | | | Terrier Media Buyer, Inc., Senior Secured First Lien Term Loan (3 Month LIBOR USD + 4.25%) | | | 5.70 | % | | | 12/17/2026 | | | | 515,982 | |
| | 1,644,200 | | | The Edelman Financial Center LLC, Senior Secured First Lien Term Loan (1 Month LIBOR USD + 3.25%) | | | 4.18 | % | | | 07/21/2025 | | | | 1,416,067 | |
| | 664,273 | | | TIBCO Software Inc, Senior Secured First Lien Term Loan (1 Month LIBOR USD + 3.75%) | | | 4.74 | % | | | 06/30/2026 | | | | 631,060 | |
| | 165,000 | | | TIBCO Software Inc, Senior Secured Second Lien Term Loan (1 Month LIBOR USD + 7.25%) | | | 8.66 | % | | | 03/03/2028 | | | | 157,575 | |
| | 1,184,304 | | | Titan Acquisition Ltd., Senior Secured First Lien Term Loan (1 Month LIBOR USD + 3.00%) | | | 4.45 | % | | | 03/28/2025 | | | | 985,589 | |
| | 1,735,692 | | | TKC Holdings, Inc., Senior Secured First Lien Term Loan (1 Month LIBOR USD + 3.75%, 1.00% Floor) | | | 4.75 | % | | | 02/01/2023 | | | | 1,418,495 | |
| | 469,797 | | | Trans Union LLC, Senior Secured First Lien Term Loan (1 Month LIBOR USD + 1.75%) | | | 2.74 | % | | | 11/13/2026 | | | | 452,884 | |
| | 2,239,446 | | | TransDigm, Inc., Senior Secured First Lien Term Loan (1 Month LIBOR USD + 2.25%) | | | 3.24 | % | | | 05/30/2025 | | | | 2,064,029 | |
| | 1,159,350 | | | Travel Leaders Group LLC, Senior Secured First Lien Term Loan (1 Month LIBOR USD + 4.00%) | | | 4.96 | % | | | 01/25/2024 | | | | 890,769 | |
| | 1,079,225 | | | Travelport Finance SARL, Senior Secured First Lien Term Loan (3 Month LIBOR USD + 5.00%) | | | 6.07 | % | | | 05/29/2026 | | | | 707,971 | |
| | 840,700 | | | Trident TPI Holdings, Inc., Senior Secured First Lien Term Loan (6 Month LIBOR USD + 3.25%, 1.00% Floor) | | | 4.32 | % | | | 10/17/2024 | | | | 706,188 | |
| | 778,914 | | | UGI Energy Services LLC, Senior Secured First Lien Term Loan (1 Month LIBOR USD + 3.75%) | | | 4.74 | % | | | 08/13/2026 | | | | 673,760 | |
| | 1,253,700 | | | Ultimate Software Group, Senior Secured First Lien Term Loan (1 Month LIBOR USD + 3.75%) | | | 4.74 | % | | | 05/04/2026 | | | | 1,180,565 | |
| | 797,985 | | | United Natural Foods, Inc., Senior Secured First Lien Term Loan (1 Month LIBOR USD + 4.25%) | | | 5.24 | % | | | 10/22/2025 | | | | 691,254 | |
| | 728,900 | | | United Rentals North America, Inc., Senior Secured First Lien Term Loan (1 Month LIBOR USD + 1.75%) | | | 2.74 | % | | | 10/31/2025 | | | | 686,988 | |
| | 344,138 | | | Univar Solutions USA, Inc., Senior Secured First Lien Term Loan (1 Month LIBOR USD + 2.00%) | | | 3.45 | % | | | 07/01/2026 | | | | 306,121 | |
| | 553,000 | | | Universal Health Services, Inc., Senior Secured First Lien Term Loan (1 Month LIBOR USD + 1.75%) | | | 2.74 | % | | | 10/31/2025 | | | | 530,880 | |
| | 496,581 | | | Univision Communications Inc., Senior Secured First Lien Term Loan (1 Month LIBOR USD + 2.75%, 1.00% Floor) | | | 3.75 | % | | | 03/15/2024 | | | | 427,370 | |
| | 665,000 | | | Upstream Newco, Inc., Senior Secured First Lien Term Loan (1 Month LIBOR USD + 4.50%) | | | 5.49 | % | | | 11/20/2026 | | | | 555,275 | |
| | 2,611,875 | | | US Foods, Inc., Senior Secured First Lien Term Loan (3 Month LIBOR USD + 2.00%, 0.75% Floor) | | | 3.07 | % | | | 09/14/2026 | | | | 2,408,149 | |
| | 1,313,496 | | | USIC Holdings, Inc., Senior Secured First Lien Term Loan (1 Month LIBOR USD + 3.25%, 1.00% Floor) | | | 4.25 | % | | | 12/08/2023 | | | | 1,119,755 | |
| | 870,402 | | | Vantage Specialty Chemicals, Inc., Senior Secured First Lien Term Loan (3 Month LIBOR USD + 3.50%, 1.00% Floor) | | | 5.28 | % | | | 10/28/2024 | | | | 663,951 | |
| | 1,847,762 | | | Verscend Holding Corporation, Senior Secured First Lien Term Loan (1 Month LIBOR USD + 4.50%) | | | 5.49 | % | | | 08/27/2025 | | | | 1,755,374 | |
| | 1,405,873 | | | Vertafore, Inc., Senior Secured First Lien Term Loan (1 Month LIBOR USD + 3.25%) | | | 4.24 | % | | | 07/02/2025 | | | | 1,254,186 | |
| | 2,625,000 | | | VICI Properties LLC, Senior Secured First Lien Term Loan (1 Month LIBOR USD + 2.00%) | | | 2.67 | % | | | 12/20/2024 | | | | 2,442,891 | |
| | 614,873 | | | Victory Capital Holdings, Inc., Senior Secured First Lien Term Loan (3 Month LIBOR USD + 2.50%) | | | 3.94 | % | | | 07/01/2026 | | | | 544,162 | |
| | 2,694,290 | | | Virgin Media Bristol LLC, Senior Secured First Lien Term Loan (1 Month LIBOR USD + 2.50%) | | | 3.20 | % | | | 01/31/2028 | | | | 2,512,425 | |
| | 2,785,657 | | | Vistra Operations Company LLC, Senior Secured First Lien Term Loan (1 Month LIBOR USD + 1.75%) | | | 2.55 | % | | | 12/31/2025 | | | | 2,662,044 | |
| | 720,000 | | | VS Buyer, LLC, Senior Secured First Lien Term Loan (3 Month LIBOR USD + 3.25%) | | | 4.86 | % | | | 02/26/2027 | | | | 694,800 | |
| | 1,146,726 | | | Wand NewCo 3, Inc., Senior Secured First Lien Term Loan (6 Month LIBOR USD + 3.00%) | | | 4.07 | % | | | 02/05/2026 | | | | 1,037,787 | |
| | 876,776 | | | Web.Com Group, Inc., Senior Secured First Lien Term Loan (1 Month LIBOR USD + 3.75%) | | | 4.95 | % | | | 10/10/2025 | | | | 727,724 | |
| | 1,308,433 | | | Whatabrands LLC, Senior Secured First Lien Term Loan (1 Month LIBOR USD + 2.75%) | | | 3.73 | % | | | 07/31/2026 | | | | 1,096,768 | |
| | 2,130,983 | | | Wink Holdco, Inc., Senior Secured First Lien Term Loan (1 Month LIBOR USD + 3.00%, 1.00% Floor) | | | 4.45 | % | | | 12/02/2024 | | | | 1,819,860 | |
| | 1,978,097 | | | WP CPP Holdings LLC, Senior Secured First Lien Term Loan (1 Month LIBOR USD + 3.75%, 1.00% Floor) | | | 5.36 | % | | | 04/30/2025 | | | | 1,508,299 | |
| | 488,775 | | | Zelis Cost Management Buyer, Inc., Senior Secured First Lien Term Loan (1 Month LIBOR USD + 4.75%) | | | 5.74 | % | | | 09/30/2026 | | | | 454,561 | |
| | 235,000 | | | Ziggo Financing Partnership, Senior Secured First Lien Term Loan (1 Month LIBOR USD + 2.50%) | | | 3.20 | % | | | 04/28/2028 | | | | 224,425 | |
| | | | | | | | | | | | | | | | |
| | Total Bank Loans(Cost $284,909,977) | | | | | | | | | | | 246,023,526 | |
| | | | | | | | | | | | | |
| | Collateralized Loan Obligations - 14.4% | | | | | | | | | | | | |
| | 6,500,000 | | | 522 Funding Ltd., Series2019-1A-A1 (3 Month LIBOR USD + 1.39%, 1.39% Floor) | | | 0.01 | % ^ | | | 01/15/2033 | | | | 6,110,000 | |
| | 250,000 | | | Adams Mill Ltd., Series2014-1A-D1 (3 Month LIBOR USD + 3.50%) | | | 5.33 | % ^ | | | 07/15/2026 | | | | 225,033 | |
| | 14,000,000 | | | AGL Ltd., Series2020-3A-A (3 Month LIBOR USD + 13.00%, 1.30% Floor) | | | 2.19 | % ^ | | | 01/15/2033 | | | | 12,589,956 | |
| | 12,250,000 | | | Allegro Ltd., Series2018-1A-A (3 Month LIBOR USD + 1.10%, 1.10% Floor) | | | 2.93 | % ^ | | | 06/13/2031 | | | | 11,515,821 | |
| | 2,250,000 | | | Anchorage Capital Ltd., Series2014-3RA-A (3 Month LIBOR USD + 1.05%) | | | 2.85 | % ^ | | | 01/28/2031 | | | | 2,158,897 | |
| | 7,165,000 | | | Anchorage Capital Ltd., Series2015-6A-AR (3 Month LIBOR USD + 1.27%) | | | 3.10 | % ^ | | | 07/15/2030 | | | | 6,862,324 | |
| | 25,000,000 | | | Anchorage Capital Ltd., Series2016-9A-AR (3 Month LIBOR USD + 1.37%) | | | 3.20 | % ^ | | | 07/15/2032 | | | | 23,716,672 | |
| | 7,500,000 | | | Anchorage Capital Ltd., Series2018-1RA-A1 (3 Month LIBOR USD + 0.99%, 0.99% Floor) | | | 2.84 | % ^ | | | 04/13/2031 | | | | 7,055,832 | |
| | 12,500,000 | | | Assurant Ltd., Series2018-2A-A (3 Month LIBOR USD + 1.23%, 1.23% Floor) | | | 3.05 | % ^ | | | 10/20/2031 | | | | 11,437,651 | |
| | 17,323,347 | | | Atlas Senior Loan Fund Ltd., Series2013-1A-AR (3 Month LIBOR USD + 0.83%) | | | 2.52 | % ^ | | | 11/17/2027 | | | | 16,797,711 | |
| | 2,850,000 | | | Atlas Senior Loan Fund Ltd., Series2018-10A-A (3 Month LIBOR USD + 1.09%) | | | 2.92 | % ^ | | | 01/15/2031 | | | | 2,615,024 | |
| | 6,500,000 | | | Avery Point Ltd., Series2015-6A-AR (3 Month LIBOR USD + 1.05%) | | | 2.79 | % ^ | | | 08/05/2027 | | | | 6,360,250 | |
| | 2,500,000 | | | Babson Ltd., Series2015-2A-DR (3 Month LIBOR USD + 2.95%) | | | 4.77 | % ^ | | | 10/20/2030 | | | | 1,941,858 | |
| | 15,000,000 | | | Ballyrock Ltd., Series2019-2A-A2 (3 Month LIBOR USD + 2.00%, 2.00% Floor) | | | 3.90 | % ^ | | | 11/20/2030 | | | | 13,269,770 | |
| | 5,000,000 | | | Battalion Ltd., Series2019-16A-B (3 Month LIBOR USD + 2.00%, 2.00% Floor) | | | 3.90 | % ^ | | | 12/19/2032 | | | | 4,529,721 | |
| | 18,000,000 | | | Battalion Ltd., Series2020-15A-A1 (3 Month LIBOR USD + 13.50%, 1.35% Floor) | | | 3.01 | % ^ | | | 01/17/2033 | | | | 17,192,427 | |
| | | | | | | | | | | | | | | | |
| | | | | | | | | | | | | |
| | 7,005,000 | | | Benefit Street Partners Ltd., Series2013-IIIA-A1R (3 Month LIBOR USD + 1.25%) | | | 3.07 | % ^ | | | 07/20/2029 | | | | 6,764,808 | |
| | 10,000,000 | | | Birch Grove Ltd., Series19A-A (3 Month LIBOR USD + 1.49%) | | | 2.23 | % ^ | | | 06/15/2031 | | | | 9,027,010 | |
| | 10,000,000 | | | Carbone Ltd., Series2017-1A-A1 (3 Month LIBOR USD + 1.14%) | | | 2.97 | % ^ | | | 01/20/2031 | | | | 9,474,752 | |
| | 6,000,000 | | | Carlyle Global Market Strategies Ltd., Series2017-1A-A1A (3 Month LIBOR USD + 1.30%) | | | 3.12 | % ^ | | | 04/20/2031 | | | | 5,759,505 | |
| | 30,000,000 | | | CarVal Ltd., Series2019-2A-A (3 Month LIBOR USD + 1.35%, 1.35% Floor) | | | 3.17 | % ^ | | | 07/20/2032 | | | | 27,346,107 | |
| | 8,350,000 | | | Cathedral Lake Ltd., Series2015-2A-A1R (3 Month LIBOR USD + 1.31%) | | | 3.14 | % ^ | | | 07/16/2029 | | | | 7,926,243 | |
| | 8,350,000 | | | Cathedral Lake Ltd., Series2015-3A-AR (3 Month LIBOR USD + 1.32%, 1.32% Floor) | | | 3.15 | % ^ | | | 07/16/2029 | | | | 8,023,872 | |
| | 2,500,000 | | | CBAM Ltd., Series2019-10A-B (3 Month LIBOR USD + 2.05%, 2.05% Floor) | | | 3.87 | % ^ | | | 04/20/2032 | | | | 2,224,671 | |
| | 386,380 | | | Cent Ltd., Series2013-19A-A1A (3 Month LIBOR USD + 1.33%) | | | 3.10 | % ^ | | | 10/29/2025 | | | | 374,948 | |
| | 22,000,000 | | | CFIP Ltd., Series2014-1A-AR (3 Month LIBOR USD + 1.32%) | | | 3.17 | % ^ | | | 07/13/2029 | | | | 21,139,354 | |
| | 10,350,000 | | | CFIP Ltd., Series2017-1A-A (3 Month LIBOR USD + 1.22%) | | | 3.04 | % ^ | | | 01/18/2030 | | | | 9,721,967 | |
| | 2,000,000 | | | CFIP Ltd., Series2017-1A-B (3 Month LIBOR USD + 1.65%) | | | 3.47 | % ^ | | | 01/18/2030 | | | | 1,766,186 | |
| | 15,000,000 | | | Crown Point Ltd., Series2018-6A-A1 (3 Month LIBOR USD + 1.17%, 1.17% Floor) | | | 2.99 | % ^ | | | 10/20/2028 | | | | 14,475,218 | |
| | 25,000,000 | | | CVP Ltd., Series2017-1A-A (3 Month LIBOR USD + 1.34%) | | | 3.16 | % ^ | | | 07/20/2030 | | | | 23,465,552 | |
| | 6,500,000 | | | CVP Ltd., Series2017-2A-A (3 Month LIBOR USD + 1.19%, 1.19% Floor) | | | 3.01 | % ^ | | | 01/20/2031 | | | | 6,008,314 | |
| | 5,000,000 | | | Dryden Senior Loan Fund, Series2013-28A-A1LR (3 Month LIBOR USD + 1.20%, 1.20% Floor) | | | 2.89 | % ^ | | | 08/15/2030 | | | | 4,826,728 | |
| | 20,000,000 | | | Elevation Ltd., Series2018-9A-A1 (3 Month LIBOR USD + 1.12%, 1.12% Floor) | | | 2.95 | % ^ | | | 07/15/2031 | | | | 18,842,326 | |
| | 9,000,000 | | | Elmwood Ltd., Series2019-2A-B (3 Month LIBOR USD + 2.10%, 2.10% Floor) | | | 3.92 | % ^ | | | 04/20/2031 | | | | 8,231,453 | |
| | 6,000,000 | | | Elmwood Ltd., Series2020-1A-A (3 Month LIBOR USD + 12.40%, 1.24% Floor) | | | 0.01 | % ^ | | | 04/15/2033 | | | | 5,725,534 | |
| | 8,000,000 | | | Galaxy Ltd., Series2016-22A-A2R (3 Month LIBOR USD + 0.85%, 0.85% Floor) | | | 2.69 | % ^ | | | 07/16/2028 | | | | 7,770,996 | |
| | 10,000,000 | | | Greywolf Ltd., Series2018-2A-A1 (3 Month LIBOR USD + 1.18%, 1.18% Floor) | | | 3.00 | % ^ | | | 10/20/2031 | | | | 9,225,287 | |
| | 500,000 | | | Halcyon Loan Advisors Funding Ltd., Series2013-2A-C (3 Month LIBOR USD + 2.70%) | | | 4.46 | % ^ | | | 08/01/2025 | | | | 481,486 | |
| | 250,000 | | | Halcyon Loan Advisors Funding Ltd., Series2013-2A-D (3 Month LIBOR USD + 3.80%) | | | 5.56 | % ^ | | | 08/01/2025 | | | | 227,940 | |
| | 182,617 | | | Halcyon Loan Advisors Funding Ltd., Series2014-1A-A1R (3 Month LIBOR USD + 1.13%) | | | 2.95 | % ^ | | | 04/18/2026 | | | | 182,647 | |
| | 21,668,163 | | | Halcyon Loan Advisors Funding Ltd., Series2015-3A-A1R (3 Month LIBOR USD + 0.90%) | | | 2.72 | % ^ | | | 10/18/2027 | | | | 21,374,881 | |
| | 6,500,000 | | | Hayfin Kingsland Ltd., Series2018-8A-B (3 Month LIBOR USD + 1.48%, 1.48% Floor) | | | 3.30 | % ^ | | | 04/20/2031 | | | | 5,586,023 | |
| | 966,877 | | | Jamestown Ltd., Series2014-4A-A1AR (3 Month LIBOR USD + 0.69%) | | | 2.52 | % ^ | | | 07/15/2026 | | | | 924,101 | |
| | 1,755,000 | | | Jamestown Ltd., Series2018-6RA-A1 (3 Month LIBOR USD + 1.15%, 1.15% Floor) | | | 2.94 | % ^ | | | 04/25/2030 | | | | 1,635,642 | |
| | 10,000,000 | | | Kayne Ltd., Series2020-7A-A1 (3 Month LIBOR USD + 12.00%) | | | 0.01 | % ^ | | | 04/17/2033 | | | | 9,104,230 | |
| | 9,500,000 | | | Kingsland Ltd., Series2018-8A-A (3 Month LIBOR USD + 1.12%, 1.12% Floor) | | | 2.94 | % ^ | | | 04/20/2031 | | | | 8,954,306 | |
| | 3,500,000 | | | KVK Ltd., Series2018-1A-A (3 Month LIBOR USD + 0.93%) | | | 2.62 | % ^ | | | 05/20/2029 | | | | 3,383,132 | |
| | 20,000,000 | | | LCM LP, Series17A-A2RR (3 Month LIBOR USD + 1.15%, 1.15% Floor) | | | 2.98 | % ^ | | | 10/15/2031 | | | | 18,820,428 | |
| | 10,595,000 | | | Madison Park Funding Ltd., Series2013-11A-AR (3 Month LIBOR USD + 1.16%) | | | 2.97 | % ^ | | | 07/23/2029 | | | | 10,285,996 | |
| | 1,000,000 | | | Madison Park Funding Ltd., Series2014-15A-CR (3 Month LIBOR USD + 3.45%) | | | 5.24 | % ^ | | | 01/27/2026 | | | | 921,821 | |
| | 24,684,298 | | | Marathon Ltd., Series2013-5A-A1R (3 Month LIBOR USD + 0.87%) | | | 2.57 | % ^ | | | 11/21/2027 | | | | 24,038,009 | |
| | 7,236,614 | | | Marathon Ltd., Series2014-7A-A1R (3 Month LIBOR USD + 1.32%) | | | 3.12 | % ^ | | | 10/28/2025 | | | | 7,225,275 | |
| | 8,625,000 | | | Marathon Ltd., Series2017-9A-A2 (3 Month LIBOR USD + 1.75%) | | | 3.58 | % ^ | | | 04/15/2029 | | | | 7,450,415 | |
| | 4,500,000 | | | Marble Point Ltd., Series2017-2A-A (3 Month LIBOR USD + 1.18%, 1.18% Floor) | | | 3.00 | % ^ | | | 12/18/2030 | | | | 4,275,103 | |
| | 29,500,000 | | | Marble Point Ltd., Series2020-1A-A (3 Month LIBOR USD + 13.00%, 1.30% Floor) | | | 2.20 | % ^ | | | 04/20/2033 | | | | 26,896,883 | |
| | 2,000,000 | | | MP Ltd., Series2013-1A-AR (3 Month LIBOR USD + 1.25%) | | | 3.07 | % ^ | | | 10/20/2030 | | | | 1,848,151 | |
| | 25,000,000 | | | MP Ltd., Series2013-2A-ARR (3 Month LIBOR USD + 1.28%) | | | 3.07 | % ^ | | | 07/25/2029 | | | | 24,193,390 | |
| | 9,871,896 | | | MP Ltd., Series2015-2A-AR (3 Month LIBOR USD + 0.91%) | | | 2.71 | % ^ | | | 10/28/2027 | | | | 9,665,113 | |
| | 20,000,000 | | | Nassau Ltd., Series2018-IA-A (3 Month LIBOR USD + 1.15%) | | | 2.98 | % ^ | | | 07/15/2031 | | | | 18,244,884 | |
| | 9,000,000 | | | Northwoods Capital Ltd., Series2017-16A-A (3 Month LIBOR USD + 1.27%) | | | 2.96 | % ^ | | | 11/15/2030 | | | | 8,382,987 | |
| | 5,000,000 | | | Ocean Trails, Series2014-5A-ARR (3 Month LIBOR USD + 1.28%, 1.28% Floor) | | | 3.13 | % ^ | | | 10/13/2031 | | | | 4,588,424 | |
| | 15,000,000 | | | OFSI Fund Ltd., Series2018-1A-A (3 Month LIBOR USD + 1.15%, 1.15% Floor) | | | 2.98 | % ^ | | | 07/15/2031 | | | | 14,192,976 | |
| | 15,000,000 | | | Park Avenue Institutional Advisers Ltd., Series2016-1A-A1R (3 Month LIBOR USD + 1.20%) | | | 2.88 | % ^ | | | 08/23/2031 | | | | 14,309,002 | |
| | 10,000,000 | | | Race Point Ltd., Series2015-9A-A1AR (3 Month LIBOR USD + 1.21%) | | | 3.04 | % ^ | | | 10/15/2030 | | | | 9,183,152 | |
| | 3,000,000 | | | Sound Point Ltd., Series2013-3RA-A (3 Month LIBOR USD + 1.15%, 1.15% Floor) | | | 2.97 | % ^ | | | 04/18/2031 | | | | 2,840,198 | |
| | 10,100,000 | | | Sound Point Ltd., Series2018-3A-A1A (3 Month LIBOR USD + 1.18%, 1.18% Floor) | | | 2.97 | % ^ | | | 10/26/2031 | | | | 9,571,891 | |
| | 10,000,000 | | | Steele Creek Ltd., Series2014-1RA-A (3 Month LIBOR USD + 1.07%, 1.07% Floor) | | | 2.89 | % ^ | | | 04/21/2031 | | | | 9,330,967 | |
| | 10,000,000 | | | Steele Creek Ltd., Series2015-1A-AR (3 Month LIBOR USD + 1.26%) | | | 2.96 | % ^ | | | 05/21/2029 | | | | 9,550,615 | |
| | 8,000,000 | | | Steele Creek Ltd., Series2016-1A-AR (3 Month LIBOR USD + 1.12%, 1.12% Floor) | | | 1.86 | % ^ | | | 06/15/2031 | | | | 7,298,686 | |
| | 10,000,000 | | | Steele Creek Ltd., Series2017-1A-A (3 Month LIBOR USD + 12.50%) | | | 3.08 | % ^ | | | 01/15/2030 | | | | 9,516,429 | |
| | 6,000,000 | | | Steele Creek Ltd., Series2018-2A-A (3 Month LIBOR USD + 1.20%, 1.20% Floor) | | | 2.89 | % ^ | | | 08/18/2031 | | | | 5,504,310 | |
| | 10,000,000 | | | Steele Creek Ltd., Series2019-1A-B (3 Month LIBOR USD + 2.20%, 2.20% Floor) | | | 4.03 | % ^ | | | 04/15/2032 | | | | 8,810,673 | |
| | 18,000,000 | | | Steele Creek Ltd., Series2019-2A-A1 (3 Month LIBOR USD + 1.36%, 1.36% Floor) | | | 3.19 | % ^ | | | 07/15/2032 | | | | 16,446,090 | |
| | 9,000,000 | | | Steele Creek Ltd., Series2019-2A-B (3 Month LIBOR USD + 2.25%, 2.25% Floor) | | | 4.08 | % ^ | | | 07/15/2032 | | | | 7,939,913 | |
| | 10,000,000 | | | Symphony Ltd., Series2014-15A-AR2 (3 Month LIBOR USD + 1.26%, 1.26% Floor) | | | 3.10 | % ^ | | | 01/17/2032 | | | | 9,570,275 | |
| | 10,000,000 | | | Venture Ltd., Series2014-19A-ARR (3 Month LIBOR USD + 1.26%, 1.26% Floor) | | | 3.09 | % ^ | | | 01/15/2032 | | | | 9,477,196 | |
| | 15,581,654 | | | Venture Ltd., Series2015-20A-AR (3 Month LIBOR USD + 0.82%) | | | 2.65 | % ^ | | | 04/15/2027 | | | | 15,216,267 | |
| | 8,500,000 | | | Venture Ltd., Series2017-29A-A (3 Month LIBOR USD + 1.28%) | | | 2.97 | % ^ | | | 09/07/2030 | | | | 8,138,506 | |
| | 10,000,000 | | | Venture Ltd., Series2018-34A-A (3 Month LIBOR USD + 1.23%, 1.23% Floor) | | | 3.06 | % ^ | | | 10/15/2031 | | | | 9,479,551 | |
| | 4,000,000 | | | Vibrant Ltd., Series2015-3A-A1RR (3 Month LIBOR USD + 1.25%) | | | 3.07 | % ^ | | | 10/20/2031 | | | | 3,795,733 | |
| | 3,500,000 | | | Vibrant Ltd., Series2016-5A-B (3 Month LIBOR USD + 2.10%) | | | 3.92 | % ^ | | | 01/20/2029 | | | | 3,282,837 | |
| | 10,000,000 | | | Vibrant Ltd., Series2018-10A-A1 (3 Month LIBOR USD + 1.20%, 1.20% Floor) | | | 3.02 | % ^ | | | 10/20/2031 | | | | 9,465,633 | |
| | 15,000,000 | | | Wellfleet Ltd., Series2018-2A-A1 (3 Month LIBOR USD + 1.20%, 1.20% Floor) | | | 3.02 | % ^ | | | 10/20/2031 | | | | 14,239,251 | |
| | 10,000,000 | | | Wellfleet Ltd., Series2018-3A-A1A (3 Month LIBOR USD + 1.25%, 1.25% Floor) | | | 3.07 | % ^ | | | 01/20/2032 | | | | 9,547,427 | |
| | 17,500,000 | | | Wellfleet Ltd., Series2020-1A-A1A (3 Month LIBOR USD + 13.10%, 1.31% Floor) | | | 0.01 | % ^ | | | 04/15/2033 | | | | 16,196,810 | |
| | 1,481,505 | | | WhiteHorse Ltd., Series2014-1A-AR (3 Month LIBOR USD + 0.90%) | | | 2.66 | % ^ | | | 05/01/2026 | | | | 1,480,264 | |
| | | | | | | | | | | | | | | | |
| | | | | | | | | | | | | |
| | 13,103,969 | | | WhiteHorse Ltd., Series2015-10A-A1R (3 Month LIBOR USD + 0.93%, 0.93% Floor) | | | 2.77 | % ^ | | | 04/17/2027 | | | | 12,973,187 | |
| | 6,000,000 | | | Whitehorse Ltd., Series2018-12A-A (3 Month LIBOR USD + 12.50%, 1.25% Floor) | | | 3.08 | % ^ | | | 10/15/2031 | | | | 5,502,395 | |
| | 14,500,000 | | | Wind River Ltd., Series2014-2A-AR (3 Month LIBOR USD + 1.14%, 1.14% Floor) | | | 2.97 | % ^ | | | 01/15/2031 | | | | 13,688,879 | |
| | 4,000,000 | | | Wind River Ltd., Series2019-3A-B (3 Month LIBOR USD + 2.10%) | | | 3.93 | % ^ | | | 04/15/2031 | | | | 3,491,123 | |
| | 4,148,808 | | | Zais Ltd., Series2014-2A-A1AR (3 Month LIBOR USD + 1.20%) | | | 2.99 | % ^ | | | 07/25/2026 | | | | 4,144,850 | |
| | | | | | | | | | | | | | | | |
| | Total Collateralized Loan Obligations (Cost $898,377,465) | | | | | | | | | | | 845,376,131 | |
| | | | | | | | | | | | | |
| | Foreign Corporate Bonds - 9.6% | | | | | | | | | | | | |
| | 6,700,000 | | | Adani Ports & Special Economic Zone Ltd. | | | 3.95 | % | | | 01/19/2022 | | | | 6,197,366 | |
| | 1,700,000 | | | Adani Ports & Special Economic Zone Ltd. | | | 3.38 | % | | | 07/24/2024 | | | | 1,462,595 | |
| | 5,140,000 | | | AerCap Global Aviation Trust | | | 4.63 | % | | | 10/30/2020 | | | | 4,986,538 | |
| | 1,245,000 | | | AerCap Global Aviation Trust | | | 3.95 | % | | | 02/01/2022 | | | | 1,085,364 | |
| | 900,000 | | | AES Dominicana | | | 7.95 | % | | | 05/11/2026 | | | | 842,850 | |
| | 400,000 | | | AES Gener S.A. | | | 5.00 | % | | | 07/14/2025 | | | | 371,721 | |
| | 2,500,000 | | | AES Gener S.A. (5 Year Swap Rate USD + 4.64%) | | | 7.13 | % | | | 03/26/2079 | | | | 1,970,317 | |
| | 1,400,000 | | | AES Gener S.A. (5 Year Swap Rate USD + 4.64%) | | | 7.13 | % ^ | | | 03/26/2079 | | | | 1,103,378 | |
| | 5,455,000 | | | ANZ New Zealand International Ltd. | | | 1.90 | % ^ | | | 02/13/2023 | | | | 5,495,152 | |
| | 4,185,000 | | | AstraZeneca PLC | | | 2.38 | % | | | 11/16/2020 | | | | 4,175,270 | |
| | 1,325,000 | | | AstraZeneca PLC | | | 2.38 | % | | | 06/12/2022 | | | | 1,335,910 | |
| | 1,460,000 | | | AstraZeneca PLC | | | 3.50 | % | | | 08/17/2023 | | | | 1,533,377 | |
| | 5,926,000 | | | Avolon Holdings Funding Ltd. | | | 3.63 | % ^ | | | 05/01/2022 | | | | 5,259,575 | |
| | 13,750,000 | | | Axiata SPV2 BHD | | | 3.47 | % | | | 11/19/2020 | | | | 13,773,582 | |
| | 8,680,000 | | | Banco Bradesco S.A. | | | 5.90 | % | | | 01/16/2021 | | | | 8,760,290 | |
| | 3,600,000 | | | Banco Bradesco S.A. | | | 2.85 | % ^ | | | 01/27/2023 | | | | 3,408,336 | |
| | 2,400,000 | | | Banco BTG Pactual S.A. (5 Year CMT Rate + 5.26%) | | | 7.75 | % ^ | | | 02/15/2029 | | | | 2,064,000 | |
| | 1,500,000 | | | Banco de Reservas de la Republica Dominicana | | | 7.00 | % | | | 02/01/2023 | | | | 1,436,250 | |
| | 6,300,000 | | | Banco do Brasil S.A. (10 Year CMT Rate + 7.78%) | | | 8.50 | % † | | | 10/20/2020 | | | | 6,317,671 | |
| | 1,000,000 | | | Banco Internacional del Peru S.A.A. | | | 3.38 | % | | | 01/18/2023 | | | | 953,745 | |
| | 6,500,000 | | | Banco International del Peru S.A.A. (3 Month LIBOR USD + 6.74%) | | | 8.50 | % | | | 04/23/2070 | | | | 6,370,000 | |
| | 8,800,000 | | | Banco Mercantil del Norte S.A. (5 Year CMT Rate + 5.04%) | | | 6.88 | % † | | | 07/06/2022 | | | | 7,086,684 | |
| | 11,500,000 | | | Banco Nacional de Comercio Exterior S.N.C. (5 Year CMT Rate + 3.00%) | | | 3.80 | % | | | 08/11/2026 | | | | 10,485,729 | |
| | 2,400,000 | | | Banco Santander | | | 4.13 | % | | | 11/09/2022 | | | | 2,344,800 | |
| | 1,500,000 | | | Banco Santander (5 Year CMT Rate + 3.00%) | | | 5.95 | % ^ | | | 10/01/2028 | | | | 1,397,186 | |
| | 400,000 | | | Banco Santander Chile | | | 2.50 | % | | | 12/15/2020 | | | | 400,480 | |
| | 4,350,000 | | | Bangkok Bank PCL | | | 4.80 | % | | | 10/18/2020 | | | | 4,418,733 | |
| | 2,900,000 | | | Bangkok Bank PCL | | | 3.88 | % | | | 09/27/2022 | | | | 3,026,031 | |
| | 800,000 | | | Banistmo S.A. | | | 3.65 | % ^ | | | 09/19/2022 | | | | 741,251 | |
| | 9,900,000 | | | Banistmo S.A. | | | 3.65 | % | | | 09/19/2022 | | | | 9,172,984 | |
| | 2,870,000 | | | Bank of the Philippine Islands | | | 2.50 | % | | | 09/10/2024 | | | | 2,759,730 | |
| | 12,095,000 | | | Barclays Bank PLC | | | 2.65 | % | | | 01/11/2021 | | | | 12,063,115 | |
| | 5,300,000 | | | BBVA Banco Continental S.A. | | | 5.00 | % | | | 08/26/2022 | | | | 5,291,764 | |
| | 4,000,000 | | | BBVA Bancomer S.A. | | | 7.25 | % | | | 04/22/2020 | | | | 3,984,320 | |
| | 2,400,000 | | | BBVA Bancomer S.A. | | | 6.75 | % | | | 09/30/2022 | | | | 2,394,816 | |
| | 2,530,000 | | | BBVA Bancomer S.A. (5 Year CMT Rate + 3.00%) | | | 5.35 | % | | | 11/12/2029 | | | | 2,323,913 | |
| | 2,000,000 | | | BDO Unibank, Inc. | | | 2.63 | % | | | 10/24/2021 | | | | 1,995,059 | |
| | 6,550,000 | | | BDO Unibank, Inc. | | | 2.95 | % | | | 03/06/2023 | | | | 6,500,875 | |
| | 4,320,000 | | | BPCE S.A. | | | 2.38 | % ^ | | | 01/14/2025 | | | | 4,019,710 | |
| | 3,400,000 | | | Brasil Bolsa Balcao S.A. | | | 5.50 | % | | | 07/16/2020 | | | | 3,380,484 | |
| | 5,800,000 | | | C&W Senior Financing DAC | | | 7.50 | % | | | 10/15/2026 | | | | 5,353,588 | |
| | 7,200,000 | | | Cemex S.A.B. de C.V. | | | 6.13 | % | | | 05/05/2025 | | | | 6,434,964 | |
| | 1,750,000 | | | Cemex S.A.B. de C.V. | | | 7.75 | % | | | 04/16/2026 | | | | 1,575,980 | |
| | 2,600,000 | | | CIMB Bank BHD (3 Month LIBOR USD + 0.78%) | | | 2.66 | % | | | 10/09/2024 | | | | 2,490,735 | |
| | 300,000 | | | CK Hutchison International Ltd. | | | 2.25 | % | | | 09/29/2020 | | | | 300,273 | |
| | 15,100,000 | | | CNAC HK Finbridge Company Ltd., | | | 3.50 | % | | | 07/19/2022 | | | | 15,009,569 | |
| | 6,000,000 | | | CNOOC Finance Ltd. | | | 2.63 | % | | | 05/05/2020 | | | | 6,002,280 | |
| | 1,100,000 | | | CNOOC Finance Ltd. | | | 4.25 | % | | | 01/26/2021 | | | | 1,119,151 | |
| | 9,000,000 | | | CNPC General Capital Ltd. | | | 3.95 | % | | | 04/19/2022 | | | | 9,313,710 | |
| | 2,100,000 | | | CNPC Overseas Capital Ltd. | | | 4.50 | % | | | 04/28/2021 | | | | 2,175,210 | |
| | 900,000 | | | Colbun S.A. | | | 4.50 | % | | | 07/10/2024 | | | | 920,535 | |
| | 2,450,000 | | | Colombia Telecomunicaciones S.A. | | | 5.38 | % | | | 09/27/2022 | | | | 2,356,312 | |
| | 210,000 | | | Comcel Trust | | | 6.88 | % | | | 02/06/2024 | | | | 205,016 | |
| | 3,125,000 | | | Commonwealth Bank of Australia | | | 2.05 | % ^ | | | 09/18/2020 | | | | 3,092,804 | |
| | 3,275,000 | | | Commonwealth Bank of Australia | | | 2.75 | % ^ | | | 03/10/2022 | | | | 3,287,074 | |
| | 400,000 | | | Corp Nacional del Cobre de Chile | | | 3.88 | % | | | 11/03/2021 | | | | 407,414 | |
| | 6,295,000 | | | Credit Suisse Group AG (3 Month LIBOR USD + 1.24%) | | | 2.02 | % ^ | | | 06/12/2024 | | | | 5,564,604 | |
| | 750,000 | | | DBS Group Holdings Ltd. | | | 2.85 | % | | | 04/16/2022 | | | | 770,453 | |
| | 700,000 | | | DBS Group Holdings Ltd. (3 Month LIBOR USD + 0.62%) | | | 2.41 | % | | | 07/25/2022 | | | | 698,396 | |
| | 900,000 | | | DBS Group Holdings Ltd. (5 Year Mid Swap Rate USD + 1.59%) | | | 4.52 | % | | | 12/11/2028 | | | | 936,819 | |
| | 9,500,000 | | | DBS Group Holdings Ltd. (5 Year Swap Rate USD + 2.39%) | | | 3.60 | % † | | | 09/07/2021 | | | | 8,806,595 | |
| | 3,840,000 | | | Delek & Avner Tamar Bond Ltd. | | | 4.44 | % ^ | | | 12/30/2020 | | | | 3,818,849 | |
| | | | | | | | | | | | | | | | |
| | | | | | | | | | | | | |
| | 1,200,000 | | | Digicel Group Ltd. | | | 8.25 | % ^ | | | 09/30/2022 | | | | 210,000 | |
| | 811,456 | | | Digicel Group Ltd. (PIK 9.13%) | | | 9.13 | % ^ | | | 04/01/2024 | | | | 87,978 | |
| | 660,800 | | | Empresa Electrica Angamos S.A. | | | 4.88 | % | | | 05/25/2029 | | | | 636,709 | |
| | 1,500,000 | | | Empresa Electrica Guacolda S.A. | | | 4.56 | % | | | 04/30/2025 | | | | 1,065,878 | |
| | 3,992,126 | | | ENA Norte Trust | | | 4.95 | % | | | 04/25/2023 | | | | 3,987,156 | |
| | 500,000 | | | Export Import Bank of Thailand (3 Month LIBOR USD + 0.85%) | | | 2.53 | % | | | 05/23/2024 | | | | 494,895 | |
| | 3,100,000 | | | Export Import Bank of Thailand (3 Month LIBOR USD + 0.90%) | | | 2.59 | % | | | 11/20/2023 | | | | 3,077,819 | |
| | 850,000 | | | Fomento Economico Mexicano S.A.B. de C.V. | | | 2.88 | % | | | 05/10/2023 | | | | 849,606 | |
| | 184,000 | | | Fondo Mivivienda S.A. | | | 3.50 | % | | | 01/31/2023 | | | | 175,077 | |
| | 3,500,000 | | | Freeport-McMoRan, Inc. | | | 3.55 | % | | | 03/01/2022 | | | | 3,376,310 | |
| | 5,200,000 | | | Freeport-McMoRan, Inc. | | | 4.55 | % | | | 11/14/2024 | | | | 4,943,146 | |
| | 650,000 | | | GlaxoSmithKline Capital PLC | | | 3.13 | % | | | 05/14/2021 | | | | 659,045 | |
| | 5,810,000 | | | GlaxoSmithKline Capital PLC | | | 2.88 | % | | | 06/01/2022 | | | | 5,949,700 | |
| | 9,650,000 | | | Global Bank Corporation | | | 4.50 | % | | | 10/20/2021 | | | | 9,457,000 | |
| | 300,000 | | | Global Bank Corporation | | | 4.50 | % ^ | | | 10/20/2021 | | | | 294,000 | |
| | 3,500,000 | | | Grupo Aval Ltd. | | | 4.75 | % | | | 09/26/2022 | | | | 3,321,724 | |
| | 1,216,000 | | | Grupo Bimbo S.A.B. de C.V. | | | 4.88 | % | | | 06/30/2020 | | | | 1,229,459 | |
| | 3,700,000 | | | Grupo Bimbo S.A.B. de C.V. | | | 4.50 | % | | | 01/25/2022 | | | | 3,724,981 | |
| | 5,800,000 | | | Grupo Bimbo S.A.B. de C.V. (5 Year CMT Rate + 3.28%) | | | 5.95 | % † | | | 04/17/2023 | | | | 5,464,760 | |
| | 7,710,000 | | | GrupoSura Finance S.A. | | | 5.70 | % | | | 05/18/2021 | | | | 7,746,314 | |
| | 6,078,000 | | | HPHT Finance Ltd. | | | 2.88 | % | | | 11/05/2024 | | | | 6,306,958 | |
| | 5,789,000 | | | HSBC Holdings PLC (3 Month LIBOR USD + 1.00%) | | | 2.69 | % | | | 05/18/2024 | | | | 5,402,196 | |
| | 350,000 | | | Indian Oil Corporation Ltd. | | | 5.63 | % | | | 08/02/2021 | | | | 353,041 | |
| | 3,000,000 | | | Indian Oil Corporation Ltd. | | | 5.75 | % | | | 08/01/2023 | | | | 2,950,392 | |
| | 500,000 | | | Indian Oil Corporation Ltd. | | | 4.75 | % | | | 01/16/2024 | | | | 476,819 | |
| | 1,599,761 | | | Interoceanica Finance Ltd. | | | 0.00 | % | | | 11/30/2025 | | | | 1,451,783 | |
| | 35,034 | | | Invepar Holdings | | | 0.00 | % W Þ | | | 12/30/2028 | | | | 1,498 | |
| | 6,650,000 | | | Inversiones CMPC S.A. | | | 4.50 | % | | | 04/25/2022 | | | | 6,473,902 | |
| | 700,000 | | | Israel Electric Corporation Ltd. | | | 6.88 | % | | | 06/21/2023 | | | | 771,267 | |
| | 600,000 | | | Itau Unibanco Holding S.A. | | | 6.20 | % | | | 12/21/2021 | | | | 611,220 | |
| | 1,000,000 | | | Itau Unibanco Holding S.A. (5 Year CMT Rate + 3.98%) | | | 6.13 | % † | | | 12/12/2022 | | | | 947,000 | |
| | 822,000 | | | JBS Investments GMBH | | | 6.25 | % | | | 02/05/2023 | | | | 813,784 | |
| | 500,000 | | | JBS Investments GMBH | | | 7.00 | % ^ | | | 01/15/2026 | | | | 501,020 | |
| | 4,150,000 | | | Latam Finance Ltd. | | | 6.88 | % | | | 04/11/2024 | | | | 1,870,841 | |
| | 6,505,000 | | | Macquarie Bank Ltd. | | | 2.10 | % ^ | | | 10/17/2022 | | | | 6,468,228 | |
| | 3,000,000 | | | Malayan Banking BHD (3 Month LIBOR USD + 0.80%) | | | 2.49 | % | | | 08/16/2024 | | | | 2,866,170 | |
| | 8,700,000 | | | Malayan Banking BHD (5 Year Swap Rate USD + 2.54%) | | | 3.91 | % | | | 10/29/2026 | | | | 8,847,900 | |
| | 8,600,000 | | | MARB BondCo PLC | | | 7.00 | % | | | 03/15/2024 | | | | 7,729,207 | |
| | 4,000,000 | | | Millicom International Cellular S.A. | | | 6.00 | % | | | 03/15/2025 | | | | 3,900,020 | |
| | 1,000,000 | | | Millicom International Cellular S.A. | | | 6.63 | % | | | 10/15/2026 | | | | 954,450 | |
| | 11,920,000 | | | Mitsubishi UFJ Financial Group, Inc. (3 Month LIBOR USD + 0.86%) | | | 2.65 | % | | | 07/26/2023 | | | | 10,952,503 | |
| | 11,738,000 | | | Mizuho Financial Group, Inc. (3 Month LIBOR USD + 0.79%) | | | 2.10 | % | | | 03/05/2023 | | | | 10,957,307 | |
| | 3,200,000 | | | Multibank, Inc. | | | 4.38 | % | | | 11/09/2022 | | | | 2,971,027 | |
| | 1,110,000 | | | Nacional Financiera S.N.C. | | | 3.38 | % | | | 11/05/2020 | | | | 1,089,557 | |
| | 7,884,000 | | | Oleoducto Central S.A. | | | 4.00 | % | | | 05/07/2021 | | | | 7,558,391 | |
| | 8,561,000 | | | ONGC Videsh Ltd. | | | 2.88 | % | | | 01/27/2022 | | | | 8,375,997 | |
| | 3,700,000 | | | ONGC Videsh Ltd. | | | 3.75 | % | | | 05/07/2023 | | | | 3,610,079 | |
| | 2,600,000 | | | Oversea-Chinese Banking Corporation | | | 4.25 | % | | | 06/19/2024 | | | | 2,681,085 | |
| | 1,300,000 | | | Pampa Energia S.A. | | | 7.38 | % | | | 07/21/2023 | | | | 874,256 | |
| | 8,034,947 | | | Panama Metro Line SP | | | 0.00 | % | | | 12/05/2022 | | | | 7,459,934 | |
| | 2,029,187 | | | Panama Metro Line SP | | | 0.00 | % ^ | | | 12/05/2022 | | | | 1,883,971 | |
| | 2,579,754 | | | Peru Enhanced Pass-Through Finance Ltd. | | | 0.00 | % | | | 06/02/2025 | | | | 2,360,475 | |
| | 1,766,000 | | | Perusahaan Listrik Negara PT | | | 5.50 | % | | | 11/22/2021 | | | | 1,790,194 | |
| | 3,200,000 | | | Petrobras Global Finance B.V. | | | 5.38 | % | | | 01/27/2021 | | | | 3,211,968 | |
| | 10,600,000 | | | Petrobras Global Finance B.V. | | | 4.38 | % | | | 05/20/2023 | | | | 10,239,600 | |
| | 1,500,000 | | | Reliance Holdings, Inc. | | | 4.50 | % | | | 10/19/2020 | | | | 1,511,147 | |
| | 10,250,000 | | | Reliance Holdings, Inc. | | | 5.40 | % | | | 02/14/2022 | | | | 10,456,123 | |
| | 5,520,000 | | | Royal Bank of Scotland Group PLC (3 Month LIBOR USD + 1.55%) | | | 2.77 | % | | | 06/25/2024 | | | | 5,002,827 | |
| | 7,775,000 | | | Santander UK PLC | | | 2.50 | % | | | 01/05/2021 | | | | 7,569,313 | |
| | 1,320,000 | | | Santander UK PLC | | | 2.10 | % | | | 01/13/2023 | | | | 1,281,825 | |
| | 10,500,000 | | | Scotiabank Peru S.A. (3 Month LIBOR USD + 3.86%) | | | 4.50 | % | | | 12/13/2027 | | | | 9,959,801 | |
| | 5,250,000 | | | Sinochem Overseas Capital Ltd. | | | 4.50 | % | | | 11/12/2020 | | | | 5,242,790 | |
| | 7,200,000 | | | Sinopec Group Overseas Development Ltd. | | | 2.50 | % | | | 04/28/2020 | | | | 7,208,706 | |
| | 900,000 | | | Sinopec Group Overseas Development Ltd. | | | 2.25 | % | | | 09/13/2020 | | | | 900,243 | |
| | 2,500,000 | | | Sinopec Group Overseas Development Ltd. | | | 2.00 | % | | | 09/29/2021 | | | | 2,484,212 | |
| | 1,500,000 | | | Sociedad Quimica y Minera S.A. | | | 5.50 | % | | | 04/21/2020 | | | | 1,513,479 | |
| | 4,258,000 | | | Southern Copper Corporation | | | 5.38 | % | | | 04/16/2020 | | | | 4,239,897 | |
| | 12,115,000 | | | Sumitomo Mitsui Financial Group, Inc. | | | 2.06 | % | | | 07/14/2021 | | | | 12,024,775 | |
| | 248,000 | | | Syngenta Finance N.V. | | | 3.70 | % | | | 04/24/2020 | | | | 247,526 | |
| | 5,645,000 | | | Takeda Pharmaceutical Ltd. | | | 4.00 | % | | | 11/26/2021 | | | | 5,721,753 | |
| | 2,600,000 | | | Tecnoglass, Inc. | | | 8.20 | % | | | 01/31/2022 | | | | 2,205,778 | |
| | 7,050,000 | | | Telefonica Chile S.A. | | | 3.88 | % | | | 10/12/2022 | | | | 6,845,169 | |
| | 6,002,000 | | | Toronto-Dominion Bank | | | 3.25 | % | | | 06/11/2021 | | | | 6,128,912 | |
| | | | | | | | | | | | | | | | |
| | | | | | | | | | | | | |
| | 5,800,000 | | | UBS AG | | | 2.45 | % ^ | | | 12/01/2020 | | | | 5,785,970 | |
| | 4,150,000 | | | Unifin Financiera S.A.B. de C.V. | | | 7.25 | % | | | 09/27/2023 | | | | 2,920,583 | |
| | 1,900,000 | | | Union Bank of the Philippines | | | 3.37 | % | | | 11/29/2022 | | | | 1,885,269 | |
| | 200,000 | | | United Overseas Bank Ltd. (3 Month LIBOR USD + 0.48%) | | | 2.29 | % | | | 04/23/2021 | | | | 193,369 | |
| | 4,250,000 | | | United Overseas Bank Ltd. (5 Year CMT Rate + 1.50%) | | | 3.75 | % | | | 04/15/2029 | | | | 4,413,124 | |
| | 4,350,000 | | | United Overseas Bank Ltd. (5 Year Swap Rate USD + 1.65%) | | | 2.88 | % | | | 03/08/2027 | | | | 4,289,491 | |
| | 5,200,000 | | | United Overseas Bank Ltd. (5 Year Swap Rate USD + 2.24%) | | | 3.50 | % | | | 09/16/2026 | | | | 5,210,660 | |
| | 3,900,000 | | | UPL Corporation | | | 3.25 | % | | | 10/13/2021 | | | | 3,607,399 | |
| | 1,500,000 | | | Vedanta Resources Ltd. | | | 7.13 | % | | | 05/31/2023 | | | | 583,117 | |
| | 200,000 | | | Vedanta Resources Ltd. | | | 6.13 | % | | | 08/09/2024 | | | | 75,852 | |
| | 7,800,000 | | | VTR Finance B.V. | | | 6.88 | % | | | 01/15/2024 | | | | 7,293,000 | |
| | | | | | | | | | | | | | | | |
| | Total Foreign Corporate Bonds (Cost $593,275,487) | | | | | | | | | | | 562,598,989 | |
| | | | | | | | | | | | | |
| Foreign Government Bonds, Foreign Agencies and Foreign Government
Sponsored Corporations - 0.2% | | | | | | | | | | | | |
| | 8,733,333 | | | Dominican Republic International Bond | | | 7.50 | % | | | 05/06/2021 | | | | 8,759,621 | |
| | 1,700,000 | | | Wakala Global Sukuk BHD | | | 4.65 | % | | | 07/06/2021 | | | | 1,751,815 | |
| | | | | | | | | | | | | | | | |
| Total Foreign Government Bonds, Foreign Agencies and Foreign Government
Sponsored Corporations (Cost $10,757,603) | | | | | | | | | | | 10,511,436 | |
| | | | | | | | | | | | | |
| | Non-Agency Commercial Mortgage Backed Obligations - 13.2% | | | | | | | | | | | | |
| | 4,721,000 | | | 20 Times Square Trust, Series2018-20TS-F | | | 3.10 | % # ^ | | | 05/15/2035 | | | | 4,042,654 | |
| | 4,721,000 | | | 20 Times Square Trust, Series2018-20TS-G | | | 3.10 | % # ^ | | | 05/15/2035 | | | | 3,976,642 | |
| | 12,000,000 | | | AREIT Trust, Series2019-CRE3-C (1 Month LIBOR USD + 1.90%, 1.90% Floor) | | | 2.60 | % ^ | | | 09/14/2036 | | | | 9,491,676 | |
| | 4,913,000 | | | AREIT Trust, Series2019-CRE3-D (1 Month LIBOR USD + 2.65%, 2.65% Floor) | | | 3.35 | % ^ | | | 09/14/2036 | | | | 3,494,504 | |
| | 9,763,000 | | | Atrium Hotel Portfolio Trust, Series2018-ATRM-E (1 Month LIBOR USD + 3.40%, 3.40% Floor) | | | 4.10 | % ^ | | | 06/15/2035 | | | | 7,376,552 | |
| | 10,000,000 | | | Austin Fairmont Hotel Trust, Series2019-FAIR-F (1 Month LIBOR USD + 2.80%, 2.80% Floor) | | | 3.50 | % ^ | | | 09/15/2032 | | | | 7,648,190 | |
| | 7,231,000 | | | BAMLL Commercial Mortgage Securities Trust, Series2019-AHT-D (1 Month LIBOR USD + 2.50%, 2.50% Floor) | | | 3.20 | % ^ | | | 03/15/2034 | | | | 6,589,466 | |
| | 4,952,000 | | | Bancorp Commercial Mortgage Trust, Series2018-CRE4-D (1 Month LIBOR USD + 2.10%, 0.25% Floor) | | | 2.80 | % ^ | | | 09/15/2035 | | | | 3,820,856 | |
| | 3,711,000 | | | Bancorp Commercial Mortgage Trust, Series2019-CRE5-D (1 Month LIBOR USD + 2.35%, 2.35% Floor) | | | 3.05 | % ^ | | | 03/15/2036 | | | | 3,266,138 | |
| | 3,705,000 | | | Bancorp Commercial Mortgage Trust, Series2019-CRE6-E (1 Month LIBOR USD + 2.85%, 2.85% Floor) | | | 3.55 | % ^ | | | 09/15/2036 | | | | 3,102,786 | |
| | 1,174,000 | | | Barclays Commercial Mortgage Securities LLC, Series2017-DELC-C (1 Month LIBOR USD + 1.20%, 1.20% Floor) | | | 1.90 | % ^ | | | 08/15/2036 | | | | 900,344 | |
| | 1,338,000 | | | Barclays Commercial Mortgage Securities LLC, Series2017-DELC-D (1 Month LIBOR USD + 1.70%, 1.70% Floor) | | | 2.40 | % ^ | | | 08/15/2036 | | | | 1,005,284 | |
| | 17,543,000 | | | Barclays Commercial Mortgage Securities LLC, Series2017-DELC-F (1 Month LIBOR USD + 3.50%, 3.50% Floor) | | | 4.20 | % ^ | | | 08/15/2036 | | | | 10,811,681 | |
| | 4,779,000 | | | BBCMS Mortgage Trust, Series2018-BXH-C (1 Month LIBOR USD + 1.50%, 1.50% Floor) | | | 2.20 | % ^ | | | 10/15/2037 | | | | 3,515,287 | |
| | 10,250,000 | | | BBCMS Mortgage Trust, Series2018-CBM-E (1 Month LIBOR USD + 3.15%, 3.15% Floor) | | | 3.85 | % ^ | | | 07/15/2037 | | | | 9,119,238 | |
| | 15,176,000 | | | BBCMS Mortgage Trust, Series2018-TALL-F (1 Month LIBOR USD + 3.24%, 3.24% Floor) | | | 3.94 | % ^ | | | 03/15/2037 | | | | 11,442,546 | |
| | 11,001,000 | | | BBCMS Mortgage Trust, Series2019-BWAY-E (1 Month LIBOR USD + 2.85%, 2.85% Floor) | | | 3.55 | % ^ | | | 11/25/2034 | | | | 10,608,870 | |
| | 7,538,000 | | | BB-UBS Trust, Series2012-TFT-TE | | | 3.56 | % # ^ | | | 06/05/2030 | | | | 7,405,897 | |
| | 21,618,000 | | | BFLD, Series2019-DPLO-F (1 Month LIBOR USD + 2.54%, 2.54% Floor) | | | 3.24 | % ^ | | | 10/15/2034 | | | | 12,970,800 | |
| | 10,202,000 | | | BHMS Trust, Series2018-ATLS-C (1 Month LIBOR USD + 1.90%, 1.90% Floor) | | | 2.60 | % ^ | | | 07/15/2035 | | | | 7,386,544 | |
| | 165,041,500 | | | BHMS Trust, Series2018-ATLS-XCP | | | 0.39 | % # ^ I/O | | | 07/15/2035 | | | | 1,650 | |
| | 6,531,000 | | | BHP Trust, Series2019-BXHP-D (1 Month LIBOR USD + 1.77%, 1.77% Floor) | | | 2.48 | % ^ | | | 08/15/2036 | | | | 5,478,164 | |
| | 10,613,000 | | | Braemar Hotels & Resorts Trust, Series2018-PRME-E (1 Month LIBOR USD + 2.40%, 2.40% Floor) | | | 3.10 | % ^ | | | 06/15/2035 | | | | 8,211,592 | |
| | 2,608,000 | | | BX Commercial Mortgage Trust, Series2018-BIOA-D (1 Month LIBOR USD + 1.32%, 1.35% Floor) | | | 2.03 | % ^ | | | 03/15/2037 | | | | 2,255,441 | |
| | 12,515,000 | | | BX Commercial Mortgage Trust, Series2019-IMC-D (1 Month LIBOR USD + 1.90%, 1.90% Floor) | | | 2.60 | % ^ | | | 04/15/2034 | | | | 11,219,994 | |
| | 7,834,000 | | | BX Commercial Mortgage Trust, Series2019-IMC-F (1 Month LIBOR USD + 2.90%, 2.90% Floor) | | | 3.60 | % ^ | | | 04/15/2034 | | | | 6,776,357 | |
| | | | | | | | | | | | | | | | |
| | | | | | | | | | | | | |
| | 2,940,107 | | | BX Trust, Series2017-APPL-E (1 Month LIBOR USD + 3.15%, 3.15% Floor) | | | 3.85 | % ^ | | | 07/15/2034 | | | | 2,416,857 | |
| | 2,430,150 | | | BX Trust, Series2017-SLCT-D (1 Month LIBOR USD + 2.05%, 2.05% Floor) | | | 2.75 | % ^ | | | 07/15/2034 | | | | 1,907,634 | |
| | 4,119,100 | | | BX Trust, Series2017-SLCT-E (1 Month LIBOR USD + 3.15%, 3.15% Floor) | | | 3.85 | % ^ | | | 07/15/2034 | | | | 3,240,471 | |
| | 3,159,000 | | | BX Trust, Series2018-GW-E (1 Month LIBOR USD + 1.97%, 1.97% Floor) | | | 2.67 | % ^ | | | 05/15/2035 | | | | 2,606,820 | |
| | 3,434,000 | | | BX Trust, Series2018-GW-F (1 Month LIBOR USD + 2.42%, 2.42% Floor) | | | 3.12 | % ^ | | | 05/15/2035 | | | | 2,839,301 | |
| | 1,414,000 | | | BX Trust, Series2018-GW-G (1 Month LIBOR USD + 2.92%, 2.92% Floor) | | | 3.62 | % ^ | | | 05/15/2035 | | | | 1,077,688 | |
| | 14,456,000 | | | BX Trust, Series2019-MMP-E (1 Month LIBOR USD + 1.90%, 1.90% Floor) | | | 2.60 | % ^ | | | 08/15/2036 | | | | 13,996,740 | |
| | 9,594,000 | | | BX Trust, Series2019-OC11-E | | | 4.08 | % # ^ | | | 12/09/2041 | | | | 6,445,489 | |
| | 11,389,000 | | | Carbon Capital Commercial Mortgage Trust, Series2019-FL2-B (1 Month LIBOR USD + 2.85%, 2.85% Floor) | | | 3.55 | % ^ | | | 10/15/2035 | | | | 9,869,133 | |
| | 48,665,464 | | | CD Commercial Mortgage Trust, Series2017-CD3-XA | | | 1.02 | % # I/O | | | 02/10/2050 | | | | 2,370,466 | |
| | 66,835,555 | | | CD Commercial Mortgage Trust, Series2017-CD4-XA | | | 1.31 | % # I/O | | | 05/10/2050 | | | | 4,336,752 | |
| | 3,553,000 | | | CF Trust, Series2019-MF1-E (1 Month LIBOR USD + 2.20%, 2.20% Floor) | | | 3.20 | % ^ | | | 08/21/2032 | | | | 3,491,158 | |
| | 21,321,129 | | | CFCRE Commercial Mortgage Trust, Series2016-C3-XA | | | 1.02 | % # I/O | | | 01/10/2048 | | | | 1,035,094 | |
| | 22,782,984 | | | CFCRE Commercial Mortgage Trust, Series2016-C4-XA | | | 1.70 | % # I/O | | | 05/10/2058 | | | | 1,777,141 | |
| | 56,967,074 | | | CFCRE Commercial Mortgage Trust, Series2017-C8-XA | | | 1.61 | % # I/O | | | 06/15/2050 | | | | 4,502,535 | |
| | 16,201,000 | | | CFCRE Commercial Mortgage Trust, Series2017-C8-XB | | | 0.95 | % # I/O | | | 06/15/2050 | | | | 940,862 | |
| | 39,410,000 | | | CFCRE Commercial Mortgage Trust, Series2018-TAN-X | | | 1.63 | % # ^ I/O | | | 02/15/2033 | | | | 1,638,550 | |
| | 736,000 | | | CHT Mortgage Trust, Series2017-CSMO-E (1 Month LIBOR USD + 3.00%, 3.00% Floor) | | | 3.70 | % ^ | | | 11/15/2036 | | | | 585,701 | |
| | 921,000 | | | CHT Mortgage Trust, Series2017-CSMO-F (1 Month LIBOR USD + 3.74%, 3.74% Floor) | | | 4.45 | % ^ | | | 11/15/2036 | | | | 710,961 | |
| | 7,713,449 | | | Citigroup Commercial Mortgage Trust, Series2014-GC25-XA | | | 0.99 | % # I/O | | | 10/10/2047 | | | | 289,159 | |
| | 641,000 | | | Citigroup Commercial Mortgage Trust, Series2015-GC27-D | | | 4.42 | % # ^ | | | 02/10/2048 | | | | 537,009 | |
| | 5,444,636 | | | Citigroup Commercial Mortgage Trust, Series2015-GC27-XA | | | 1.35 | % # I/O | | | 02/10/2048 | | | | 263,356 | |
| | 1,750,000 | | | Citigroup Commercial Mortgage Trust, Series2015-GC31-C | | | 4.06 | % # | | | 06/10/2048 | | | | 1,510,401 | |
| | 19,184,294 | | | Citigroup Commercial Mortgage Trust, Series2016-GC36-XA | | | 1.27 | % # I/O | | | 02/10/2049 | | | | 1,084,440 | |
| | 13,140,445 | | | Citigroup Commercial Mortgage Trust, Series2016-P3-XA | | | 1.70 | % # I/O | | | 04/15/2049 | | | | 968,555 | |
| | 13,534,406 | | | Citigroup Commercial Mortgage Trust, Series2016-P4-XA | | | 1.97 | % # I/O | | | 07/10/2049 | | | | 1,177,451 | |
| | 13,598,516 | | | Citigroup Commercial Mortgage Trust, Series2017-P7-XA | | | 1.12 | % # I/O | | | 04/14/2050 | | | | 792,381 | |
| | 4,865,000 | | | Citigroup Commercial Mortgage Trust, Series2019-SST2-D (1 Month LIBOR USD + 1.60%, 1.60% Floor) | | | 2.30 | % ^ | | | 12/15/2036 | | | | 4,710,859 | |
| | 7,736,000 | | | Citigroup Commercial Mortgage Trust, Series2019-SST2-E (1 Month LIBOR USD + 2.00%, 2.00% Floor) | | | 2.70 | % ^ | | | 12/15/2036 | | | | 7,500,531 | |
| | 19,958,000 | | | CLNC Ltd., Series2019-FL1-D (1 Month LIBOR USD + 2.90%, 2.90% Floor) | | | 3.65 | % ^ | | | 08/20/2035 | | | | 14,521,521 | |
| | 5,636,000 | | | Commercial Mortgage Pass-Through Certificates, Series2012-CR4-D | | | 4.59 | % # ^ Þ | | | 10/15/2045 | | | | 2,108,709 | |
| | 8,178,750 | | | Commercial Mortgage Pass-Through Certificates, Series2013-CR10-XA | | | 0.66 | % # I/O | | | 08/10/2046 | | | | 160,762 | |
| | 24,793,886 | | | Commercial Mortgage Pass-Through Certificates, Series2013-CR12-XA | | | 1.13 | % # I/O | | | 10/10/2046 | | | | 832,812 | |
| | 2,423,759 | | | Commercial Mortgage Pass-Through Certificates, Series2014-CR17-XA | | | 0.97 | % # I/O | | | 05/10/2047 | | | | 79,735 | |
| | 233,000 | | | Commercial Mortgage Pass-Through Certificates, Series2014-CR19-C | | | 4.73 | % # | | | 08/10/2047 | | | | 212,149 | |
| | 1,876,000 | | | Commercial Mortgage Pass-Through Certificates, Series2014-FL5-D (1 Month LIBOR USD + 4.00%, 4.00% Floor) | | | 3.05 | % ^ | | | 10/15/2031 | | | | 1,782,036 | |
| | 18,537,555 | | | Commercial Mortgage Pass-Through Certificates, Series2015-CR22-XA | | | 0.89 | % # I/O | | | 03/10/2048 | | | | 600,698 | |
| | 34,450,904 | | | Commercial Mortgage Pass-Through Certificates, Series2015-CR25-XA | | | 0.84 | % # I/O | | | 08/10/2048 | | | | 1,239,633 | |
| | 41,557,486 | | | Commercial Mortgage Pass-Through Certificates, Series2015-CR27-XA | | | 1.09 | % # I/O | | | 10/10/2048 | | | | 1,613,677 | |
| | 5,373,000 | | | Commercial Mortgage Pass-Through Certificates, Series2015-DC1-C | | | 4.31 | % # | | | 02/10/2048 | | | | 4,767,838 | |
| | 10,294,820 | | | Commercial Mortgage Pass-Through Certificates, Series2015-DC1-XA | | | 1.03 | % # I/O | | | 02/10/2048 | | | | 384,570 | |
| | 49,180,722 | | | Commercial Mortgage Pass-Through Certificates, Series2015-LC21-XA | | | 0.75 | % # I/O | | | 07/10/2048 | | | | 1,353,965 | |
| | 1,470,000 | | | Commercial Mortgage Pass-Through Certificates, Series2015-LC23-C | | | 4.65 | % # | | | 10/10/2048 | | | | 1,290,245 | |
| | 1,769,000 | | | Commercial Mortgage Pass-Through Certificates, Series2016-CR28-C | | | 4.65 | % # | | | 02/10/2049 | | | | 1,550,534 | |
| | 17,115,140 | | | Commercial Mortgage Pass-Through Certificates, Series2016-DC2-XA | | | 1.00 | % # I/O | | | 02/10/2049 | | | | 770,332 | |
| | 11,396,000 | | | Commercial Mortgage Pass-Through Certificates, Series2018-HCLV-D (1 Month LIBOR USD + 2.18%, 2.25% Floor) | | | 2.88 | % ^ | | | 09/15/2033 | | | | 10,804,221 | |
| | 12,389 | | | Credit Suisse Commercial Mortgage Trust, Series2007-C1-AM | | | 5.42 | % | | | 02/15/2040 | | | | 12,172 | |
| | 10,092,000 | | | Credit Suisse Mortgage Capital Certificates, Series2014-USA-X1 | | | 0.55 | % # ^ I/O | | | 09/15/2037 | | | | 250,824 | |
| | 27,610,559 | | | CSAIL Commercial Mortgage Trust, Series2015-C1-XA | | | 0.84 | % # I/O | | | 04/15/2050 | | | | 917,756 | |
| | 3,619,408 | | | CSAIL Commercial Mortgage Trust, Series2016-C6-XA | | | 1.90 | % # I/O | | | 01/15/2049 | | | | 287,477 | |
| | 1,538,000 | | | CSAIL Commercial Mortgage Trust, Series2020-C19-C | | | 3.73 | % | | | 03/15/2053 | | | | 777,228 | |
| | 7,370,000 | | | CSMC Trust, Series2017-CHOP-E (1 Month LIBOR USD + 3.30%, 3.30% Floor) | | | 4.00 | % ^ | | | 07/15/2032 | | | | 6,319,510 | |
| | 6,650,000 | | | CSMC Trust, Series2017-LSTK-E | | | 3.33 | % # ^ | | | 04/05/2033 | | | | 6,427,726 | |
| | 3,750,000 | | | DBCG Mortgage Trust, Series2017-BBG-C (1 Month LIBOR USD + 1.00%, 1.10% Floor) | | | 1.70 | % ^ | | | 06/15/2034 | | | | 3,257,498 | |
| | 9,876,000 | | | DBGS Mortgage Trust, Series2018-5BP-F (1 Month LIBOR USD + 2.45%, 2.45% Floor) | | | 3.15 | % ^ | | | 06/15/2033 | | | | 7,350,468 | |
| | 18,961,936 | | | Deutsche Bank Commercial Mortgage Trust, Series2016-C1-XA | | | 1.45 | % # I/O | | | 05/10/2049 | | | | 1,223,741 | |
| | 16,254,000 | | | Fontainebleau Miami Beach Trust, Series2019-FBLU-F | | | 4.10 | % ^ | | | 12/10/2036 | | | | 10,826,685 | |
| | 16,254,000 | | | Fontainebleau Miami Beach Trust, Series2019-FBLU-G | | | 4.10 | % ^ | | | 12/10/2036 | | | | 10,467,688 | |
| | 13,000,000 | | | FREMF Mortgage Trust, Series2010-K8-C | | | 0.00 | % ^ P/O | | | 09/25/2043 | | | | 12,667,317 | |
| | 13,000,000 | | | FREMF Mortgage Trust, Series2013-K713-D | | | 0.00 | % ^ P/O | | | 04/25/2046 | | | | 12,807,301 | |
| | 19,355,957 | | | FREMF Mortgage Trust, Series2013-K713-X2B | | | 0.10 | % ^ I/O | | | 04/25/2046 | | | | 194 | |
| | 735,136 | | | FREMF Mortgage Trust, Series2016-KF22-B (1 Month LIBOR USD + 5.05%, 5.05% Floor) | | | 6.57 | % ^ | | | 07/25/2023 | | | | 641,328 | |
| | 7,349,000 | | | GPMT Ltd., Series2019-FL2-D (1 Month LIBOR USD + 2.95%, 2.95% Floor) | | | 3.65 | % ^ | | | 02/22/2036 | | | | 6,183,111 | |
| | 350,000 | | | Grace Mortgage Trust, Series2014-GRCE-A | | | 3.37 | % ^ | | | 06/10/2028 | | | | 352,620 | |
| | 13,636,000 | | | Great Wolf Trust, Series2019-WOLF-F (1 Month LIBOR USD + 3.13%, 3.13% Floor) | | | 3.84 | % ^ | | | 12/15/2036 | | | | 9,257,868 | |
| | | | | | | | | | | | | | | | |
| | | | | | | | | | | | | |
| | 3,903,000 | | | Greystone Commercial Real Estate Notes, Series2019-FL2-D (1 Month LIBOR USD + 2.40%, 2.40% Floor) | | | 3.10 | % ^ | | | 09/15/2037 | | | | 2,893,212 | |
| | 3,941,984 | | | GS Mortgage Securities Corporation, Series2014-GC24-XA | | | 0.74 | % # I/O | | | 09/10/2047 | | | | 98,576 | |
| | 33,924,259 | | | GS Mortgage Securities Corporation, Series2015-GC32-XA | | | 0.76 | % # I/O | | | 07/10/2048 | | | | 1,082,927 | |
| | 9,329,044 | | | GS Mortgage Securities Corporation, Series2015-GC34-XA | | | 1.27 | % # I/O | | | 10/10/2048 | | | | 498,092 | |
| | 1,518,000 | | | GS Mortgage Securities Corporation, Series2018-LUAU-E (1 Month LIBOR USD + 2.55%, 2.55% Floor) | | | 3.25 | % ^ | | | 11/15/2032 | | | | 1,147,789 | |
| | 5,000,000 | | | GS Mortgage Securities Corporation, Series2018-TWR-E (1 Month LIBOR USD + 2.10%, 2.10% Floor) | | | 2.80 | % ^ | | | 07/15/2031 | | | | 3,748,735 | |
| | 5,000,000 | | | GS Mortgage Securities Corporation, Series2018-TWR-F (1 Month LIBOR USD + 2.80%, 2.80% Floor) | | | 3.50 | % ^ | | | 07/15/2031 | | | | 3,739,127 | |
| | 5,000,000 | | | GS Mortgage Securities Corporation, Series2018-TWR-G (1 Month LIBOR USD + 3.92%, 3.98% Floor) | | | 4.63 | % ^ | | | 07/15/2031 | | | | 3,745,312 | |
| | 13,059,000 | | | GS Mortgage Securities Corporation, Series2019-SOHO-E (1 Month LIBOR USD + 1.87%, 1.88% Floor) | | | 2.58 | % ^ | | | 06/15/2036 | | | | 12,591,701 | |
| | 8,000,000 | | | GS Mortgage Securities Corporation, Series2019-SOHO-F (1 Month LIBOR USD + 2.20%, 2.20% Floor) | | | 2.90 | % ^ | | | 06/15/2036 | | | | 6,338,534 | |
| | 2,030,000 | | | GS Mortgage Securities Trust, Series2014-GC26-D | | | 4.51 | % # ^ | | | 11/10/2047 | | | | 1,534,418 | |
| | 8,894,399 | | | GS Mortgage Securities Trust, Series2015-GS1-XA | | | 0.78 | % # I/O | | | 11/10/2048 | | | | 330,721 | |
| | 19,516,042 | | | GS Mortgage Securities Trust, Series2016-GS2-XA | | | 1.65 | % # I/O | | | 05/10/2049 | | | | 1,329,686 | |
| | 29,267,918 | | | GS Mortgage Securities Trust, Series2016-GS3-XA | | | 1.25 | % # I/O | | | 10/10/2049 | | | | 1,703,703 | |
| | 887,000 | | | GS Mortgage Securities Trust, Series 2018-GS10-WLSA | | | 4.74 | % # ^ | | | 03/10/2033 | | | | 797,080 | |
| | 1,760,000 | | | GS Mortgage Securities Trust, Series 2018-GS10-WLSB | | | 4.74 | % # ^ | | | 03/10/2033 | | | | 1,493,477 | |
| | 2,391,000 | | | GS Mortgage Securities Trust, Series 2018-GS10-WLSC | | | 4.74 | % # ^ | | | 03/10/2033 | | | | 1,956,557 | |
| | 2,314,000 | | | GS Mortgage Securities Trust, Series 2018-GS10-WLSD | | | 4.74 | % # ^ | | | 03/10/2033 | | | | 1,841,785 | |
| | 2,893,000 | | | GS Mortgage Securities Trust, Series 2018-GS10-WLSE | | | 4.74 | % # ^ | | | 03/10/2033 | | | | 2,267,532 | |
| | 12,284,000 | | | GS Mortgage Securities Trust, Series2019-SMP-E (1 Month LIBOR USD + 2.60%, 2.60% Floor) | | | 3.30 | % ^ | | | 08/15/2032 | | | | 9,991,587 | |
| | 6,838,000 | | | GS Mortgage Securities Trust, Series2019-SMP-F (1 Month LIBOR USD + 3.10%, 3.10% Floor) | | | 3.80 | % ^ | | | 08/15/2032 | | | | 5,459,151 | |
| | 14,505,000 | | | GSCG Trust, Series2019-600C-E | | | 4.12 | % # ^ | | | 09/06/2034 | | | | 11,868,593 | |
| | 17,540,000 | | | Hawaii Hotel Trust, Series2019-MAUI-G (1 Month LIBOR USD + 31.50%, 3.15% Floor) | | | 3.85 | % ^ | | | 05/15/2038 | | | | 12,544,638 | |
| | 1,988,000 | | | Hilton USA Trust, Series2016-SFP-D | | | 4.93 | % ^ | | | 11/05/2035 | | | | 1,881,855 | |
| | 3,000,000 | | | Hilton USA Trust, Series2016-SFP-F | | | 6.16 | % ^ | | | 11/05/2035 | | | | 2,445,644 | |
| | 1,124,011 | | | HPLY Trust, Series2019-HIT-D (1 Month LIBOR USD + 20.00%, 2.00% Floor) | | | 2.70 | % ^ | | | 11/15/2036 | | | | 873,856 | |
| | 2,053,332 | | | HPLY Trust, Series2019-HIT-E (1 Month LIBOR USD + 2.35%, 2.35% Floor) | | | 3.05 | % ^ | | | 11/15/2036 | | | | 1,598,527 | |
| | 11,201,172 | | | HPLY Trust, Series2019-HIT-F (1 Month LIBOR USD + 3.15%, 3.15% Floor) | | | 3.85 | % ^ | | | 11/15/2036 | | | | 6,710,219 | |
| | 8,000,000 | | | Hunt Ltd., Series2017-FL1-C (1 Month LIBOR USD + 2.40%) | | | 3.10 | % ^ | | | 08/15/2034 | | | | 7,038,832 | |
| | 4,916,390 | | | IMT Trust, Series2017-APTS-EFL (1 Month LIBOR USD + 2.15%, 2.15% Floor) | | | 2.85 | % ^ | | | 06/15/2034 | | | | 4,040,054 | |
| | 275,643 | | | IMT Trust, Series2017-APTS-FFL (1 Month LIBOR USD + 2.85%, 2.85% Floor) | | | 3.55 | % ^ | | | 06/15/2034 | | | | 225,787 | |
| | 22,041,103 | | | JP Morgan Chase Commercial Mortgage Securities Corporation, Series2015-JP1-XA | | | 1.08 | % # I/O | | | 01/15/2049 | | | | 758,853 | |
| | 291,022 | | | JP Morgan Chase Commercial Mortgage Securities Corporation, Series2017-FL10-D (1 Month LIBOR USD + 1.90%, 1.90% Floor) | | | 2.60 | % ^ | | | 06/15/2032 | | | | 271,422 | |
| | 5,246,086 | | | JP Morgan Chase Commercial Mortgage Securities Corporation, Series2018-LAQ-C (1 Month LIBOR USD + 1.60%, 1.60% Floor) | | | 2.30 | % ^ | | | 06/15/2032 | | | | 4,504,308 | |
| | 734,367 | | | JP Morgan Chase Commercial Mortgage Securities Corporation, Series2018-LAQ-D (1 Month LIBOR USD + 2.10%, 2.30% Floor) | | | 2.80 | % ^ | | | 06/15/2032 | | | | 607,363 | |
| | 1,942,711 | | | JP Morgan Chase Commercial Mortgage Securities Corporation, Series2018-LAQ-E (1 Month LIBOR USD + 3.00%, 3.35% Floor) | | | 3.70 | % ^ | | | 06/15/2035 | | | | 1,523,311 | |
| | 1,595,754 | | | JP Morgan Chase Commercial Mortgage Securities Trust, Series2006-LDP9-AMS | | | 5.34 | % | | | 05/15/2047 | | | | 1,575,714 | |
| | 38,272,597 | | | JP Morgan Chase Commercial Mortgage Securities Trust, Series2016-JP4-XA | | | 0.73 | % # I/O | | | 12/15/2049 | | | | 1,109,278 | |
| | 3,776,000 | | | JP Morgan Chase Commercial Mortgage Securities Trust, Series2016-WIKI-E | | | 4.01 | % # ^ | | | 10/05/2031 | | | | 3,152,112 | |
| | 5,245,000 | | | JP Morgan Chase Commercial Mortgage Securities Trust, Series2018-WPT-EFX | | | 5.54 | % ^ | | | 07/05/2033 | | | | 4,476,653 | |
| | 4,216,000 | | | JP Morgan Chase Commercial Mortgage Securities Trust, Series2019-UES-C | | | 4.34 | % ^ | | | 05/05/2032 | | | | 3,727,720 | |
| | 4,314,000 | | | JP Morgan Chase Commercial Mortgage Securities Trust, Series2019-UES-D | | | 4.45 | % # ^ | | | 05/05/2032 | | | | 3,666,745 | |
| | 5,040,000 | | | JP Morgan Chase Commercial Mortgage Securities Trust, Series2019-UES-E | | | 4.45 | % # ^ | | | 05/05/2032 | | | | 4,231,196 | |
| | 5,287,000 | | | JP Morgan Chase Commercial Mortgage Securities Trust, Series2019-UES-F | | | 4.45 | % # ^ | | | 05/05/2032 | | | | 4,130,231 | |
| | 5,775,000 | | | JP Morgan Chase Commercial Mortgage Securities Trust, Series2019-UES-G | | | 4.45 | % # ^ | | | 05/05/2032 | | | | 4,040,739 | |
| | 11,575,000 | | | JP Morgan Chase Commercial Mortgage Securities Trust, Series2020-NNN-EFX | | | 3.97 | % ^ | | | 01/16/2037 | | | | 9,703,380 | |
| | 5,544,087 | | | JPMBB Commercial Mortgage Securities Trust, Series2014-C18-XA | | | 0.82 | % # I/O | | | 02/15/2047 | | | | 143,259 | |
| | 500,000 | | | JPMBB Commercial Mortgage Securities Trust, Series2014-C23-C | | | 4.47 | % # | | | 09/15/2047 | | | | 449,102 | |
| | 360,000 | | | JPMBB Commercial Mortgage Securities Trust, Series2014-C23-D | | | 3.97 | % # ^ | | | 09/15/2047 | | | | 298,939 | |
| | 19,356,264 | | | JPMBB Commercial Mortgage Securities Trust, Series2014-C25-XA | | | 0.85 | % # I/O | | | 11/15/2047 | | | | 617,285 | |
| | 1,303,000 | | | JPMBB Commercial Mortgage Securities Trust, Series2014-C26-C | | | 4.38 | % # | | | 01/15/2048 | | | | 1,157,656 | |
| | 5,674,812 | | | JPMBB Commercial Mortgage Securities Trust, Series2014-C26-XA | | | 0.97 | % # I/O | | | 01/15/2048 | | | | 207,821 | |
| | 5,287,890 | | | JPMBB Commercial Mortgage Securities Trust, Series2015-C27-D | | | 3.81 | % # ^ | | | 02/15/2048 | | | | 4,283,261 | |
| | 125,000 | | | JPMBB Commercial Mortgage Securities Trust, Series2015-C29-C | | | 4.18 | % # | | | 05/15/2048 | | | | 108,676 | |
| | 21,193,141 | | | JPMBB Commercial Mortgage Securities Trust, Series2015-C29-XA | | | 0.74 | % # I/O | | | 05/15/2048 | | | | 542,674 | |
| | 26,456,054 | | | JPMBB Commercial Mortgage Securities Trust, Series2015-C30-XA | | | 0.51 | % # I/O | | | 07/15/2048 | | | | 604,272 | |
| | 12,139,103 | | | JPMBB Commercial Mortgage Securities Trust, Series2015-C31-XA | | | 0.88 | % # I/O | | | 08/15/2048 | | | | 426,243 | |
| | 22,417,400 | | | JPMBB Commercial Mortgage Securities Trust, Series2015-C32-XA | | | 1.33 | % # I/O | | | 11/15/2048 | | | | 742,919 | |
| | 580,000 | | | JPMBB Commercial Mortgage Securities Trust, Series2015-C33-C | | | 4.62 | % # | | | 12/15/2048 | | | | 508,445 | |
| | 9,040,000 | | | JPMCC Commercial Mortgage Securities Trust, Series2019-MFP-E (1 Month LIBOR USD + 2.10%, 2.16% Floor) | | | 2.86 | % ^ | | | 07/15/2036 | | | | 7,747,151 | |
| | 10,000,000 | | | LCCM, Series2017-LC26-C | | | 4.71 | % ^ | | | 07/12/2050 | | | | 8,442,887 | |
| | 1,000,000 | | | LoanCore Issuer Ltd., Series2018-CRE1-C (1 Month LIBOR USD + 25.50%, 2.55% Floor) | | | 3.25 | % ^ | | | 05/15/2028 | | | | 863,462 | |
| | | | | | | | | | | | | | | | |
| | | | | | | | | | | | | |
| | 1,000,000 | | | LoanCore Issuer Ltd., Series2018-CRE1-D (1 Month LIBOR USD + 2.95%, 2.95% Floor) | | | 3.65 | % ^ | | | 05/15/2028 | | | | 792,590 | |
| | 2,500,000 | | | LoanCore Issuer Ltd., Series2019-CRE3-D (1 Month LIBOR USD + 2.50%, 2.50% Floor) | | | 3.20 | % ^ | | | 04/15/2034 | | | | 1,866,983 | |
| | 10,236,410 | | | LSTAR Commercial Mortgage Trust, Series2016-4-XA | | | 1.84 | % # ^ I/O | | | 03/10/2049 | | | | 543,430 | |
| | 81,111,323 | | | LSTAR Commercial Mortgage Trust, Series2017-5-X | | | 1.00 | % # ^ I/O | | | 03/10/2050 | | | | 3,049,186 | |
| | 300,000 | | | Madison Avenue Trust, Series2013-650M-D | | | 4.03 | % # ^ | | | 10/12/2032 | | | | 297,337 | |
| | 2,080,000 | | | Madison Avenue Trust, Series2013-650M-E | | | 4.03 | % # ^ | | | 10/12/2032 | | | | 2,061,538 | |
| | 2,366,000 | | | Marathon CRE, Series2018-FL1-AS (1 Month LIBOR USD + 1.55%, 1.55% Floor) | | | 2.25 | % ^ | | | 06/15/2028 | | | | 2,259,781 | |
| | 2,512,000 | | | Marathon CRE, Series2018-FL1-C (1 Month LIBOR USD + 2.60%, 2.60% Floor) | | | 3.30 | % ^ | | | 06/15/2028 | | | | 2,287,937 | |
| | 15,958,000 | | | MBRT, Series2019-MBR-F (1 Month LIBOR USD + 2.55%, 2.55% Floor) | | | 3.25 | % ^ | | | 11/15/2036 | | | | 12,922,581 | |
| | 11,933,000 | | | MFT Trust, Series2020-ABC-D | | | 3.48 | % # ^ | | | 02/06/2030 | | | | 6,592,302 | |
| | 3,575,000 | | | MKT Mortgage Trust, Series2020-525M-F | | | 2.94 | % # ^ | | | 02/12/2040 | | | | 1,916,489 | |
| | 10,600,000 | | | Morgan Stanley Bank of America Merrill Lynch Trust, Series2012-CKSV-CK | | | 4.30 | % ^ | | | 10/15/2030 | | | | 8,438,194 | |
| | 3,585,930 | | | Morgan Stanley Bank of America Merrill Lynch Trust, Series2013-C12-XA | | | 0.60 | % # I/O | | | 10/15/2046 | | | | 61,146 | |
| | 15,265,245 | | | Morgan Stanley Bank of America Merrill Lynch Trust, Series2013-C7-XA | | | 1.34 | % # I/O | | | 02/15/2046 | | | | 471,070 | |
| | 5,924,929 | | | Morgan Stanley Bank of America Merrill Lynch Trust, Series2014-C14-XA | | | 1.00 | % # I/O | | | 02/15/2047 | | | | 142,054 | |
| | 500,000 | | | Morgan Stanley Bank of America Merrill Lynch Trust, Series2014-C18-C | | | 4.52 | % # | | | 10/15/2047 | | | | 449,604 | |
| | 120,000 | | | Morgan Stanley Bank of America Merrill Lynch Trust, Series2015-C20-C | | | 4.46 | % # | | | 02/15/2048 | | | | 106,724 | |
| | 1,072,000 | | | Morgan Stanley Bank of America Merrill Lynch Trust, Series2015-C20-D | | | 3.07 | % ^ | | | 02/15/2048 | | | | 839,168 | |
| | 18,948,565 | | | Morgan Stanley Bank of America Merrill Lynch Trust, Series2016-C28-XA | | | 1.20 | % # I/O | | | 01/15/2049 | | | | 967,523 | |
| | 2,330,000 | | | Morgan Stanley Capital Trust, Series2017-ASHF-D (1 Month LIBOR USD + 2.20%, 2.20% Floor) | | | 2.90 | % ^ | | | 11/15/2034 | | | | 1,540,528 | |
| | 8,494,000 | | | Morgan Stanley Capital Trust, Series2017-ASHF-E (1 Month LIBOR USD + 3.15%, 3.15% Floor) | | | 3.85 | % ^ | | | 11/15/2034 | | | | 4,595,025 | |
| | 2,647,000 | | | Morgan Stanley Capital Trust, Series2017-ASHF-F (1 Month LIBOR USD + 4.35%, 4.35% Floor) | | | 5.05 | % ^ | | | 11/15/2034 | | | | 1,425,378 | |
| | 2,935,000 | | | Morgan Stanley Capital Trust, Series2018-SUN-D (1 Month LIBOR USD + 1.65%, 1.65% Floor) | | | 2.35 | % ^ | | | 07/15/2035 | | | | 2,252,960 | |
| | 4,380,000 | | | Morgan Stanley Capital Trust, Series2018-SUN-F (1 Month LIBOR USD + 2.55%, 2.55% Floor) | | | 3.25 | % ^ | | | 07/15/2035 | | | | 3,310,250 | |
| | 2,935,000 | | | Morgan Stanley Capital Trust, Series2018-SUN-G (1 Month LIBOR USD + 3.05%, 3.05% Floor) | | | 3.75 | % ^ | | | 07/15/2035 | | | | 2,206,777 | |
| | 711,000 | | | Morgan Stanley Capital Trust, Series2019-NUGS-F (1 Month LIBOR USD + 2.84%, 4.34% Floor) | | | 4.34 | % ^ | | | 12/15/2036 | | | | 570,553 | |
| | 13,327,000 | | | Morgan Stanley Capital Trust, Series2019-PLND-E (1 Month LIBOR USD + 2.15%, 2.15% Floor) | | | 2.85 | % ^ | | | 05/15/2036 | | | | 10,707,867 | |
| | 1,331,000 | | | Morgan Stanley Capital Trust, Series2019-PLND-F (1 Month LIBOR USD + 2.80%, 2.80% Floor) | | | 3.50 | % ^ | | | 05/15/2036 | | | | 1,070,486 | |
| | 5,166,962 | | | Motel 6 Trust, Series2017-MTL6-D (1 Month LIBOR USD + 2.15%, 2.15% Floor) | | | 2.85 | % ^ | | | 08/15/2034 | | | | 4,600,839 | |
| | 3,119,917 | | | Motel 6 Trust, Series2017-MTL6-F (1 Month LIBOR USD + 4.25%, 4.25% Floor) | | | 4.95 | % ^ | | | 08/15/2034 | | | | 1,660,302 | |
| | 1,192,550 | | | MSCG Trust, Series2016-SNR-C | | | 5.21 | % ^ | | | 11/15/2034 | | | | 1,173,675 | |
| | 9,940,000 | | | Natixis Commercial Mortgage Securities Trust, Series2018-FL1-C (1 Month LIBOR USD + 2.20%, 2.20% Floor) | | | 3.86 | % ^ | | | 06/15/2035 | | | | 8,816,880 | |
| | 8,191,000 | | | Natixis Commercial Mortgage Securities Trust, Series 2020-2PAC-AMZ1 | | | 3.50 | % # ^ | | | 01/15/2037 | | | | 6,634,135 | |
| | 4,742,000 | | | Natixis Commercial Mortgage Securities Trust, Series 2020-2PAC-AMZ2 | | | 3.50 | % # ^ | | | 01/15/2037 | | | | 3,776,233 | |
| | 4,426,000 | | | Natixis Commercial Mortgage Securities Trust, Series 2020-2PAC-AMZ3 | | | 3.50 | % # ^ | | | 01/15/2037 | | | | 3,248,041 | |
| | 4,665,000 | | | Natixis Commercial Mortgage Securities Trust, Series 2020-2PAC-MSK1 | | | 3.25 | % # ^ | | | 12/15/2036 | | | | 3,868,866 | |
| | 4,414,000 | | | Natixis Commercial Mortgage Securities Trust, Series 2020-2PAC-MSK2 | | | 3.25 | % # ^ | | | 12/15/2036 | | | | 3,402,324 | |
| | 2,623,000 | | | Natixis Commercial Mortgage Securities Trust, Series 2020-2PAC-MSK3 | | | 3.25 | % # ^ | | | 12/15/2036 | | | | 1,869,550 | |
| | 11,120,000 | | | NLY Commercial Mortgage Trust, Series2019-FL2-B (1 Month LIBOR USD + 1.90%, 1.90% Floor) | | | 2.60 | % ^ | | | 02/15/2036 | | | | 10,028,572 | |
| | 7,608,000 | | | One Market Plaza Trust, Series2017-1MKT-E | | | 4.14 | % ^ | | | 02/10/2032 | | | | 6,300,192 | |
| | 2,120,000 | | | PFP Ltd., Series2019-5-B (1 Month LIBOR USD + 1.65%, 1.65% Floor) | | | 2.35 | % ^ | | | 04/14/2036 | | | | 1,503,072 | |
| | 11,060,906 | | | SLIDE, Series2018-FUN-F (1 Month LIBOR USD + 3.00%, 3.00% Floor) | | | 3.70 | % ^ | | | 06/15/2031 | | | | 9,441,505 | |
| | 34,124,215 | | | SLIDE, Series2018-FUN-XCP | | | 0.98 | % # ^ I/O | | | 12/15/2020 | | | | 233,642 | |
| | 459,000 | | | STWD Ltd., Series2019-FL1-C (1 Month LIBOR USD + 1.95%) | | | 2.65 | % ^ | | | 07/15/2038 | | | | 363,906 | |
| | 14,307,000 | | | STWD Ltd., Series2019-FL1-D (1 Month LIBOR USD + 2.35%) | | | 3.05 | % ^ | | | 07/15/2038 | | | | 10,188,959 | |
| | 8,426,455 | | | Tharaldson Hotel Portfolio Trust, Series2018-THL-E (1 Month LIBOR USD + 3.18%, 3.10% Floor) | | | 4.19 | % ^ | | | 11/11/2034 | | | | 7,127,743 | |
| | 10,153,000 | | | TPG Finance Ltd., Series2018-FL2-D (1 Month LIBOR USD + 2.70%) | | | 3.50 | % ^ | | | 11/15/2037 | | | | 6,822,247 | |
| | 9,838,000 | | | TRTX Issuer Ltd., Series2019-FL3-D (1 Month LIBOR USD + 2.45%, 2.45% Floor) | | | 3.25 | % ^ | | | 09/15/2034 | | | | 7,213,389 | |
| | 2,034,000 | | | UBS Commercial Mortgage Trust, Series2017-C1-XB | | | 0.89 | % # I/O | | | 06/15/2050 | | | | 116,496 | |
| | 84,902,419 | | | UBS Commercial Mortgage Trust, Series2018-C13-XA | | | 0.74 | % # I/O | | | 10/15/2051 | | | | 4,220,253 | |
| | 6,009,000 | | | UBS Commercial Mortgage Trust, Series2018-C8-C | | | 4.70 | %# | | | 02/15/2051 | | | | 5,010,766 | |
| | 86,865,353 | | | UBS Commercial Mortgage Trust, Series2018-C8-XA | | | 0.88 | % # I/O | | | 02/15/2051 | | | | 4,649,312 | |
| | 500,000 | | | UBS Commercial Mortgage Trust, Series2018-NYCH-G (1 Month LIBOR USD + 4.84%, 4.84% Floor) | | | 5.54 | % ^ | | | 02/15/2032 | | | | 390,203 | |
| | 6,197,940 | | | VMC Finance LLC, Series2019-FL3-D (1 Month LIBOR USD + 2.65%, 2.65% Floor) | | | 3.45 | % ^ | | | 09/15/2036 | | | | 4,367,087 | |
| | 572,000 | | | Wells Fargo Commercial Mortgage Trust, Series2014-LC16-D | | | 3.94 | % ^ | | | 08/15/2050 | | | | 354,594 | |
| | 540,000 | | | Wells Fargo Commercial Mortgage Trust, Series2014-LC18-B | | | 3.96 | % | | | 12/15/2047 | | | | 573,362 | |
| | 11,732,157 | | | Wells Fargo Commercial Mortgage Trust, Series2015-C27-XA | | | 0.89 | % # I/O | | | 02/15/2048 | | | | 404,987 | |
| | 53,678,894 | | | Wells Fargo Commercial Mortgage Trust, Series2015-C30-XA | | | 0.89 | % # I/O | | | 09/15/2058 | | | | 2,120,515 | |
| | 20,699,814 | | | Wells Fargo Commercial Mortgage Trust, Series2015-C31-XA | | | 1.01 | % # I/O | | | 11/15/2048 | | | | 942,750 | |
| | 26,172,727 | | | Wells Fargo Commercial Mortgage Trust, Series2015-NXS2-XA | | | 0.71 | % # I/O | | | 07/15/2058 | | | | 771,391 | |
| | 1,150,000 | | | Wells Fargo Commercial Mortgage Trust, Series2015-NXS4-E | | | 3.67 | % # ^ | | | 12/15/2048 | | | | 775,680 | |
| | | | | | | | | | | | | | | | |
| | | | | | | | | | | | | |
| | 954,000 | | | Wells Fargo Commercial Mortgage Trust, Series2016-C32-C | | | 4.73 | % # | | | 01/15/2059 | | | | 837,515 | |
| | 4,381,000 | | | Wells Fargo Commercial Mortgage Trust, Series2016-C33-D | | | 3.12 | % ^ | | | 03/15/2059 | | | | 3,237,815 | |
| | 13,878,987 | | | Wells Fargo Commercial Mortgage Trust, Series2016-C33-XA | | | 1.72 | % # I/O | | | 03/15/2059 | | | | 936,958 | |
| | 76,409,105 | | | Wells Fargo Commercial Mortgage Trust, Series2017-C38-XA | | | 1.06 | % # I/O | | | 07/15/2050 | | | | 4,316,106 | |
| | 15,708,124 | | | Wells Fargo Commercial Mortgage Trust, Series2017-RC1-XA | | | 1.50 | % # I/O | | | 01/15/2060 | | | | 1,130,974 | |
| | 3,305,087 | | | WF-RBS Commercial Mortgage Trust, Series2014-C19-XA | | | 1.03 | % # I/O | | | 03/15/2047 | | | | 95,823 | |
| | 7,864,468 | | | WF-RBS Commercial Mortgage Trust, Series2014-C21-XA | | | 1.04 | % # I/O | | | 08/15/2047 | | | | 277,723 | |
| | 28,619,648 | | | WF-RBS Commercial Mortgage Trust, Series2016-NXS6-XA | | | 1.63 | % # I/O | | | 11/15/2049 | | | | 1,913,845 | |
| | | | | | | | | | | | | | | | |
| TotalNon-Agency Commercial Mortgage Backed Obligations
(Cost $981,955,750) | | | | | | | | | | | 778,549,069 | |
| | | | | | | | | | | | | |
| | Non-Agency Residential Collateralized Mortgage Obligations - 14.0% | | | | | | | | | | | | |
| | 5,912,656 | | | Ajax Mortgage Loan Trust, Series2018-C-A | | | 4.36 | % # ^ | | | 09/25/2065 | | | | 5,863,683 | |
| | 19,835,330 | | | Ajax Mortgage Loan Trust, Series2019-C-A | | | 3.95 | % # ^ | | | 10/25/2058 | | | | 19,406,906 | |
| | 7,371,440 | | | Alternative Loan Trust, Series2005-49CB-A6 | | | 5.50 | % | | | 11/25/2035 | | | | 6,086,943 | |
| | 10,200,761 | | | Alternative Loan Trust, Series2005-62-1A1 (1 Month LIBOR USD + 0.30%, 0.30% Floor) | | | 1.25 | % | | | 12/25/2035 | | | | 7,684,085 | |
| | 7,601,655 | | | Alternative Loan Trust, Series2006-36T2-1A3 | | | 5.75 | % | | | 12/25/2036 | | | | 4,608,923 | |
| | 9,644,921 | | | Alternative Loan Trust, Series2007-12T1-A5 | | | 6.00 | % | | | 06/25/2037 | | | | 5,792,762 | |
| | 6,300,828 | | | Alternative Loan Trust, Series2007-8CB-A1 | | | 5.50 | % | | | 05/25/2037 | | | | 4,647,935 | |
| | 3,806,985 | | | Arroyo Mortgage Trust, Series2019-1-A1 | | | 3.81 | % # ^ | | | 01/25/2049 | | | | 3,701,703 | |
| | 2,424,046 | | | Arroyo Mortgage Trust, Series2019-2-A2 | | | 3.50 | % # ^ | | | 04/25/2049 | | | | 2,334,667 | |
| | 15,399,842 | | | Arroyo Mortgage Trust, Series2019-3-A3 | | | 3.42 | % # ^ | | | 10/25/2048 | | | | 14,702,742 | |
| | 1,690,438 | | | Banc of America Funding Corporation, Series2005-B-3M1 (1 Month LIBOR USD + 0.68%, 0.45% Floor, 11.00% Cap) | | | 1.45 | % | | | 04/20/2035 | | | | 1,629,346 | |
| | 2,137,490 | | | Banc of America Funding Corporation, Series2006-7-T2A1 | | | 5.88 | % # | | | 10/25/2036 | | | | 1,927,036 | |
| | 2,232,961 | | | Banc of America Mortgage Securities Trust, Series2005-I-2A5 | | | 3.98 | % # | | | 10/25/2035 | | | | 2,018,794 | |
| | 5,678,813 | | | Banc of America Mortgage Securities Trust, Series2007-3-1A1 | | | 6.00 | % | | | 09/25/2037 | | | | 5,262,849 | |
| | 907,088 | | | Bayview Koitere Fund Trust, Series2019-RN3-A1 | | | 3.97 | % ^ § | | | 07/28/2033 | | | | 818,123 | |
| | 16,616,576 | | | Bayview Opportunity Master Fund Trust, Series2019-SBR2-A1 | | | 3.43 | % ^ § | | | 06/28/2034 | | | | 16,456,779 | |
| | 3,367,940 | | | Bayview Opportunity Master Fund Trust, Series2020-RN1-A1 | | | 3.23 | % ^ § | | | 02/28/2035 | | | | 3,327,882 | |
| | 2,072,148 | | | BCAP LLC Trust, Series2012-RR1-3A4 | | | 5.50 | % # ^ | | | 10/26/2035 | | | | 1,811,098 | |
| | 1,809,260 | | | Bellemeade Ltd., Series2018-3A-M1B (1 Month LIBOR USD + 1.85%, 1.85% Floor) | | | 2.80 | % ^ | | | 10/25/2028 | | | | 1,804,080 | |
| | 3,406,068 | | | BRAVO Residential Funding Trust, Series2019-NQM1-A2 | | | 2.89 | % # ^ | | | 07/25/2059 | | | | 3,362,322 | |
| | 5,838,982 | | | Bunker Hill Loan Depositary Trust, Series2019-1-A1 | | | 3.61 | % ^ § | | | 10/26/2048 | | | | 5,750,905 | |
| | 151,943 | | | CitiCorporationResidential Mortgage Securities, Inc., Series2007-1-A4 | | | 5.26 | % ß | | | 03/25/2037 | | | | 152,247 | |
| | 26,966,894 | | | Citigroup Mortgage Loan Trust, Inc., Series2018-A-A1 | | | 4.00 | % # ^ | | | 01/25/2068 | | | | 25,250,405 | |
| | 4,696,969 | | | Citigroup Mortgage Loan Trust, Series2019-B-A1 | | | 3.26 | % # ^ | | | 04/25/2066 | | | | 4,663,874 | |
| | 31,920,229 | | | Citigroup Mortgage Loan Trust, Series2019-E-A1 | | | 3.23 | % ^ § | | | 11/25/2070 | | | | 33,015,552 | |
| | 1,172,996 | | | CitiMortgage Alternative Loan Trust, Series2007-A5-1A10 | | | 5.75 | % | | | 05/25/2037 | | | | 919,642 | |
| | 144,751 | | | Colony American Finance Ltd., Series2016-1-A | | | 2.54 | % ^ | | | 06/15/2048 | | | | 144,177 | |
| | 23,911 | | | Countrywide Alternative Loan Trust, Series2004-33-1A1 | | | 4.12 | % # | | | 12/25/2034 | | | | 22,680 | |
| | 555,480 | | | Countrywide Alternative Loan Trust, Series2005-23CB-A15 | | | 5.50 | % | | | 07/25/2035 | | | | 505,336 | |
| | 1,893,494 | | | Countrywide Alternative Loan Trust, Series2005-28CB-1A6 | | | 5.50 | % | | | 08/25/2035 | | | | 1,762,472 | |
| | 1,989,884 | | | Countrywide Alternative Loan Trust, Series2006-J6-A5 | | | 6.00 | % | | | 09/25/2036 | | | | 1,477,689 | |
| | 445,452 | | | Countrywide Alternative Loan Trust, Series2007-15CB-A7 | | | 6.00 | % | | | 07/25/2037 | | | | 360,106 | |
| | 1,411,704 | | | Countrywide Home Loans, Series2005-10-A2 | | | 5.50 | % | | | 05/25/2035 | | | | 1,286,992 | |
| | 793,292 | | | Countrywide Home Loans, Series2007-14-A15 | | | 6.50 | % | | | 09/25/2037 | | | | 630,135 | |
| | 2,452 | | | Credit Suisse First Boston Mortgage Securities Corporation, Series2004-8-6A1 | | | 4.50 | % | | | 12/25/2019 | | | | 2,453 | |
| | 2,163,081 | | | Credit Suisse First Boston Mortgage Securities Corporation, Series2005-11-2A1 | | | 6.00 | % | | | 12/25/2035 | | | | 1,908,069 | |
| | 92,138 | | | Credit Suisse First Boston Mortgage Securities Corporation, Series2005-11-8A5 | | | 6.00 | % | | | 12/25/2035 | | | | 87,379 | |
| | 846,451 | | | Credit Suisse First Boston Mortgage Securities Corporation, Series2005-9-5A9 | | | 5.50 | % | | | 10/25/2035 | | | | 667,936 | |
| | 1,000,000 | | | Credit Suisse Mortgage Capital Certificates, Series2011-12R-3A5 | | | 4.17 | % # ^ | | | 07/27/2036 | | | | 933,996 | |
| | 458,760 | | | Credit Suisse Mortgage Capital Certificates, Series2011-5R-6A9 | | | 3.82 | % # ^ | | | 11/27/2037 | | | | 446,413 | |
| | 18,697,964 | | | Credit Suisse Mortgage Capital Certificates, Series2019-RPL4-A1 | | | 3.55 | % ^ | | | 08/26/2058 | | | | 19,441,384 | |
| | 55,414,794 | | | Credit Suisse Mortgage Capital Certificates, Series2020-BPL1-A1 | | | 3.39 | % ^ § | | | 02/25/2024 | | | | 54,897,575 | |
| | 10,696,660 | | | CSMC Trust, Series2018-RPL7-A1 | | | 4.00 | % ^ | | | 08/26/2058 | | | | 11,154,636 | |
| | 12,153,163 | | | CSMC Trust, Series2018-RPL8-A1 | | | 4.13 | % # ^ | | | 07/25/2058 | | | | 11,351,353 | |
| | 3,884,603 | | | CSMC Trust, Series2019-JR1-A1 | | | 4.10 | % # ^ | | | 09/27/2066 | | | | 3,873,761 | |
| | 62,409,459 | | | CSMC Trust, Series2019-RP10-A1 | | | 3.32 | % # ^ | | | 12/26/2059 | | | | 64,120,976 | |
| | 18,457,097 | | | CSMC Trust, Series2019-RPL2-A1 | | | 3.88 | % # ^ | | | 11/25/2058 | | | | 19,068,663 | |
| | 24,082,498 | | | CSMC Trust, Series2019-RPL9-A1 | | | 3.32 | % # ^ | | | 10/27/2059 | | | | 23,653,252 | |
| | 1,194,905 | | | Deephaven Residential Mortgage Trust, Series2017-1A-A1 | | | 2.73 | % # ^ | | | 12/26/2046 | | | | 1,174,357 | |
| | 602,324 | | | Deutsche Mortgage & Asset Receiving Corporation, Series2014-RS1-1A2 | | | 6.50 | % # ^ | | | 07/27/2037 | | | | 523,469 | |
| | 726,744 | | | Deutsche Securities, Inc., Series2006-AB4-A1A | | | 6.01 | % # | | | 10/25/2036 | | | | 635,359 | |
| | 5,737,463 | | | GCAT LLC, Series2019-2-A1 | | | 3.47 | % ^ § | | | 06/25/2024 | | | | 5,718,911 | |
| | 9,510,972 | | | GCAT LLC, Series2019-3-A1 | | | 3.35 | % ^ § | | | 10/25/2049 | | | | 9,490,799 | |
| | 9,453,918 | | | GCAT LLC, Series2020-1-A1 | | | 2.98 | % ^ § | | | 01/26/2060 | | | | 9,459,959 | |
| | | | | | | | | | | | | | | | |
| | | | | | | | | | | | | |
| | 6,343,820 | | | GS Mortgage-Backed Securities Trust, Series2019-SL1-A1 | | | 2.63 | % # ^ | | | 01/25/2059 | | | | 6,265,324 | |
| | 1,085,107 | | | GSAA Home Equity Trust, Series2005-11-2A1 (1 Month LIBOR USD + 0.28%, 0.28% Floor) | | | 1.23 | % | | | 10/25/2035 | | | | 1,080,683 | |
| | 542,635 | | | GSR Mortgage Loan Trust, Series2006-2F-3A4 | | | 6.00 | % | | | 02/25/2036 | | | | 384,301 | |
| | 1,076,929 | | | Impac Secured Assets Trust, Series2006-5-1A1C (1 Month LIBOR USD + 0.27%, 0.27% Floor, 11.50% Cap) | | | 1.22 | % | | | 02/25/2037 | | | | 896,869 | |
| | 1,453,633 | | | IndyMac Mortgage Loan Trust, Series2006-AR5-2A1 | | | 3.68 | % # | | | 05/25/2036 | | | | 1,207,768 | |
| | 8,325,335 | | | JP Morgan Alternative Loan Trust, Series2007-S1-A2 (1 Month LIBOR USD + 0.34%, 0.34% Floor, 11.50% Cap) | | | 1.29 | % | | | 04/25/2047 | | | | 7,294,600 | |
| | 13,550,661 | | | Legacy Mortgage Asset Trust2019-GS4, Series2019-GS4-A1 | | | 3.44 | % ^ § | | | 05/25/2059 | | | | 13,756,298 | |
| | 14,599,892 | | | Legacy Mortgage Asset Trust, Series2017-GS1-A1 | | | 3.50 | % ^ § | | | 01/25/2057 | | | | 14,320,230 | |
| | 19,910,891 | | | Legacy Mortgage Asset Trust, Series2019-GS3-A1 | | | 3.75 | % ^ § | | | 04/25/2059 | | | | 19,498,300 | |
| | 1,223,822 | | | Legacy Mortgage Asset Trust, Series2019-GS5-A1 | | | 3.20 | % ^ § | | | 05/25/2059 | | | | 1,225,858 | |
| | 9,416,870 | | | Legacy Mortgage Asset Trust, Series2019-GS6-A1 | | | 3.00 | % ^ § | | | 06/25/2059 | | | | 8,443,544 | |
| | 4,103,708 | | | Legacy Mortgage Asset Trust, Series2019-SL1-A | | | 4.00 | % # ^ | | | 12/28/2054 | | | | 4,123,972 | |
| | 278,630 | | | Lehman Mortgage Trust, Series2006-1-1A3 | | | 5.50 | % | | | 02/25/2036 | | | | 208,097 | |
| | 129,793 | | | MASTR Adjustable Rate Mortgages Trust, Series2006-2-2A1 | | | 4.30 | % # | | | 04/25/2036 | | | | 101,912 | |
| | 442,742 | | | Merrill Lynch Alternative Note Asset Trust, Series2007-F1-2A6 | | | 6.00 | % | | | 03/25/2037 | | | | 273,655 | |
| | 1,586,182 | | | Merrill Lynch Mortgage Investors Trust, Series2006-AF1-AF2C | | | 6.25 | % | | | 08/25/2036 | | | | 1,014,681 | |
| | 329,490 | | | Morgan Stanley Mortgage Loan Trust, Series2006-2-7A1 | | | 5.63 | % # | | | 02/25/2036 | | | | 257,735 | |
| | 39,200,317 | | | Park Avenue Funding Trust, Series2019-1-PT (1 Month LIBOR USD + 15.00%, 1.50% Floor) | | | 2.46 | % ^ | | | 11/27/2020 | | | | 37,778,757 | |
| | 406,099 | | | Pretium Mortgage Credit Partners LLC, Series2019-NPL2-A1 | | | 3.84 | % ^ § | | | 12/25/2058 | | | | 352,605 | |
| | 14,361,210 | | | Pretium Mortgage Credit Partners LLC, Series2019-NPL3-A1 | | | 3.10 | % ^ § | | | 07/27/2059 | | | | 12,681,282 | |
| | 6,141,609 | | | PRPM LLC, Series2018-1A-A1 | | | 3.75 | % # ^ | | | 04/25/2023 | | | | 6,232,908 | |
| | 5,981,903 | | | PRPM LLC, Series2019-2A-A1 | | | 3.97 | % ^ § | | | 04/25/2024 | | | | 5,358,106 | |
| | 10,122,498 | | | PRPM LLC, Series2019-3A-A1 | | | 3.35 | % ^ § | | | 07/25/2024 | | | | 10,059,372 | |
| | 16,057,328 | | | PRPM LLC, Series2019-4A-A1 | | | 3.35 | % ^ § | | | 11/25/2024 | | | | 15,928,957 | |
| | 5,711,325 | | | PRPM LLC, Series2019-GS1-A1 | | | 3.50 | % # ^ | | | 10/25/2024 | | | | 5,685,833 | |
| | 13,742,162 | | | PRPM LLC, Series2020-1A-A1 | | | 2.98 | % ^ § | | | 02/25/2025 | | | | 11,077,484 | |
| | 7,901,220 | | | Radnor Ltd., Series2019-2-M1A (1 Month LIBOR USD + 1.20%, 1.20% Floor) | | | 2.15 | % ^ | | | 06/25/2029 | | | | 7,882,005 | |
| | 3,994,197 | | | RCO Trust, Series2017-INV1-A | | | 3.20 | % # ^ | | | 11/25/2052 | | | | 3,857,849 | |
| | 2,267,491 | | | RCO Trust, Series2017-INV1-M1 | | | 3.90 | % # ^ | | | 11/25/2052 | | | | 2,218,197 | |
| | 956,989 | | | Residential Accredit Loans, Inc., Series2006-QS12-2A3 | | | 6.00 | % | | | 09/25/2036 | | | | 849,094 | |
| | 1,282,102 | | | Residential Accredit Loans, Inc., Series2007-QS9-A33 | | | 6.50 | % | | | 07/25/2037 | | | | 1,153,442 | |
| | 821,502 | | | Residential Asset Securitization Trust, Series2006-A2-A11 | | | 6.00 | % | | | 01/25/2046 | | | | 517,081 | |
| | 3,846,056 | | | Soundview Home Loan Trust, Series2007-OPT3-2A3 (1 Month LIBOR USD + 0.18%, 0.18% Floor) | | | 1.13 | % | | | 08/25/2037 | | | | 3,556,043 | |
| | 9,840,576 | | | Starwood Mortgage Residential Trust, Series2018-IMC1-A3 | | | 3.98 | % # ^ | | | 03/25/2048 | | | | 9,652,837 | |
| | 3,447,043 | | | Structured Adjustable Rate Mortgage Loan Trust, Series2005-22-4A1 | | | 4.04 | % # | | | 12/25/2035 | | | | 3,008,188 | |
| | 40,000,000 | | | Toorak Mortgage Corporation Ltd., Series2020-1-A1 | | | 2.73 | % ^ § | | | 03/25/2023 | | | | 40,171,280 | |
| | 7,159,635 | | | VCAT LLC, Series2019-NPL2-A1 | | | 3.57 | % ^ § | | | 11/25/2049 | | | | 7,071,623 | |
| | 9,133,768 | | | Velocity Commercial Capital Loan Trust, Series2018-2-A | | | 4.05 | % # ^ | | | 10/26/2048 | | | | 9,240,599 | |
| | 4,573,972 | | | Velocity Commercial Capital Loan Trust, Series2020-1-M2 | | | 2.98 | % # ^ | | | 02/25/2050 | | | | 4,113,584 | |
| | 4,837,925 | | | Vericrest Opportunity Loan Trust, Series2019-NPL2-A1 | | | 3.97 | % ^ § | | | 02/25/2049 | | | | 4,403,199 | |
| | 21,760,129 | | | Vericrest Opportunity Loan Trust, Series2019-NPL4-A1A | | | 3.35 | % ^ § | | | 08/25/2049 | | | | 20,279,374 | |
| | 15,721,052 | | | Vericrest Opportunity Loan Trust, Series2019-NPL7-A1A | | | 3.18 | % ^ § | | | 10/25/2049 | | | | 14,309,948 | |
| | 10,577,065 | | | Vericrest Opportunity Loan Trust, Series2019-NPL8-A1A | | | 3.28 | % ^ § | | | 11/25/2049 | | | | 9,675,691 | |
| | 32,688,827 | | | Vericrest Opportunity Loan Trust, Series2020-NPL2-A1A | | | 2.98 | % ^ § | | | 02/25/2050 | | | | 28,988,844 | |
| | 1,204,060 | | | Verus Securitization Trust, Series2018-2-A2 | | | 3.78 | % # ^ | | | 06/01/2058 | | | | 1,178,432 | |
| | 1,397,716 | | | Verus Securitization Trust, Series2018-2-A3 | | | 3.83 | % # ^ | | | 06/01/2058 | | | | 1,366,939 | |
| | 4,545,611 | | | VOLT LLC, Series2019-NP10-A1A | | | 3.43 | % ^ § | | | 12/27/2049 | | | | 4,293,685 | |
| | 1,774,940 | | | VOLT LLC, Series2019-NPL6-A1A | | | 3.23 | % ^ § | | | 10/25/2049 | | | | 1,669,113 | |
| | 5,961,115 | | | VOLT LLC, Series2019-NPL9-A1A | | | 3.33 | % ^ § | | | 11/26/2049 | | | | 5,422,435 | |
| | 9,411,816 | | | VOLT LLC, Series2020-NPL1-A1A | | | 3.23 | % ^ § | | | 01/25/2050 | | | | 8,526,661 | |
| | 9,455,926 | | | VOLT LLC, Series2020-NPL3-A1A | | | 2.98 | % ^ § | | | 02/25/2050 | | | | 6,936,045 | |
| | 2,470,732 | | | Washington Mutual Mortgage Pass-Through Certificates Trust, Series2005-8-2CB3 (1 Month LIBOR USD + 0.41%, 0.41% Floor, 5.50% Cap) | | | 1.36 | % | | | 10/25/2035 | | | | 2,083,162 | |
| | 127,382 | | | Washington Mutual Mortgage Pass-Through Certificates, Series2006-5-1A5 | | | 6.00 | % | | | 07/25/2036 | | | | 111,438 | |
| | 4,848,788 | | | Washington Mutual Mortgage Pass-Through Certificates, Series2006-AR10-2A1 | | | 3.81 | % # | | | 09/25/2036 | | | | 4,040,149 | |
| | 1,144,912 | | | Wells Fargo Alternative Loan Trust, Series2007-PA5-1A1 | | | 6.25 | % | | | 11/25/2037 | | | | 1,074,794 | |
| | | | | | | | | | | | | | | | |
| TotalNon-Agency Residential Collateralized Mortgage Obligations
(Cost $855,699,211) | | | | | | | | | | | 820,962,432 | |
| | | | | | | | | | | | | |
| | US Corporate Bonds - 5.8% | | | | | | | | | | | | |
| | 5,640,000 | | | AbbVie, Inc. | | | 3.38 | % | | | 11/14/2021 | | | | 5,753,542 | |
| | 3,540,000 | | | AbbVie, Inc. | | | 2.30 | % ^ | | | 11/21/2022 | | | | 3,541,695 | |
| | 6,090,000 | | | American Express Company (3 Month LIBOR USD + 0.65%) | | | 2.29 | % | | | 02/27/2023 | | | | 5,828,872 | |
| | 270,000 | | | Amgen, Inc. | | | 2.70 | % | | | 05/01/2022 | | | | 276,666 | |
| | 1,425,000 | | | Amgen, Inc. | | | 2.65 | % | | | 05/11/2022 | | | | 1,442,655 | |
| | 3,705,000 | | | Amgen, Inc. | | | 3.63 | % | | | 05/15/2022 | | | | 3,843,050 | |
| | | | | | | | | | | | | | | | |
| | | | | | | | | | | | | |
| | 3,170,000 | | | Amgen, Inc. | | | 1.90 | % | | | 02/21/2025 | | | | 3,201,337 | |
| | 5,945,000 | | | Analog Devices, Inc. | | | 2.95 | % | | | 01/12/2021 | | | | 5,954,391 | |
| | 9,750,000 | | | Anthem, Inc. | | | 2.50 | % | | | 11/21/2020 | | | | 9,716,366 | |
| | 12,530,000 | | | AT&T, Inc. | | | 2.80 | % | | | 02/17/2021 | | | | 12,588,929 | |
| | 4,170,000 | | | BAT Capital Corporation | | | 2.76 | % | | | 08/15/2022 | | | | 4,112,113 | |
| | 4,670,000 | | | BB&T Corporation | | | 2.20 | % | | | 03/16/2023 | | | | 4,685,206 | |
| | 3,870,000 | | | Bristol-Myers Squibb Company | | | 2.88 | % ^ | | | 08/15/2020 | | | | 3,883,843 | |
| | 1,975,000 | | | Bristol-Myers Squibb Company | | | 2.60 | % ^ | | | 05/16/2022 | | | | 2,016,899 | |
| | 5,415,000 | | | Capital One Financial Corporation | | | 2.40 | % | | | 10/30/2020 | | | | 5,404,345 | |
| | 550,000 | | | Capital One Financial Corporation | | | 3.20 | % | | | 01/30/2023 | | | | 544,328 | |
| | 12,140,000 | | | Cardinal Health, Inc. | | | 2.62 | % | | | 06/15/2022 | | | | 12,202,316 | |
| | 6,385,000 | | | Carrier Global Corporation | | | 1.92 | % ^ | | | 02/15/2023 | | | | 6,298,559 | |
| | 3,710,000 | | | Cigna Corporation | | | 3.40 | % | | | 09/17/2021 | | | | 3,768,353 | |
| | 6,070,000 | | | Cintas Corporation | | | 2.90 | % | | | 04/01/2022 | | | | 6,074,539 | |
| | 3,965,000 | | | Citigroup, Inc. | | | 2.75 | % | | | 04/25/2022 | | | | 3,988,651 | |
| | 3,705,000 | | | Citigroup, Inc. (3 Month LIBOR USD + 1.02%) | | | 2.60 | % | | | 06/01/2024 | | | | 3,455,568 | |
| | 1,845,000 | | | Citigroup, Inc. (Secured Overnight Financing Rate + 8.67%) | | | 2.31 | % | | | 11/04/2022 | | | | 1,835,673 | |
| | 2,850,000 | | | Consolidated Edison, Inc. | | | 2.00 | % | | | 05/15/2021 | | | | 2,816,400 | |
| | 5,985,000 | | | Continental Resources, Inc. | | | 4.50 | % | | | 04/15/2023 | | | | 3,298,060 | |
| | 2,105,000 | | | CVS Health Corporation | | | 3.70 | % | | | 03/09/2023 | | | | 2,193,951 | |
| | 4,400,000 | | | Daimler Finance North America LLC | | | 2.30 | % ^ | | | 02/12/2021 | | | | 4,290,132 | |
| | 850,000 | | | Daimler Finance North America LLC | | | 3.40 | % ^ | | | 02/22/2022 | | | | 826,724 | |
| | 5,877,000 | | | Delta Air Lines, Inc. | | | 3.40 | % | | | 04/19/2021 | | | | 5,355,096 | |
| | 2,720,000 | | | DTE Energy Company | | | 2.25 | % | | | 11/01/2022 | | | | 2,695,722 | |
| | 3,450,000 | | | DTE Energy Company | | | 2.53 | % | | | 10/01/2024 | | | | 3,359,938 | |
| | 3,580,000 | | | DuPont de Nemours, Inc. | | | 3.77 | % | | | 11/15/2020 | | | | 3,591,784 | |
| | 700,000 | | | DuPont de Nemours, Inc. | | | 4.21 | % | | | 11/15/2023 | | | | 735,817 | |
| | 6,230,000 | | | eBay, Inc. | | | 2.75 | % | | | 01/30/2023 | | | | 6,117,877 | |
| | 4,095,000 | | | Energy Transfer Operating LP | | | 4.25 | % | | | 03/15/2023 | | | | 3,674,958 | |
| | 1,800,000 | | | Energy Transfer Operating LP | | | 2.90 | % | | | 05/15/2025 | | | | 1,525,162 | |
| | 5,965,000 | | | General Electric Company | | | 2.70 | % | | | 10/09/2022 | | | | 5,874,888 | |
| | 1,930,000 | | | General Mills, Inc. | | | 3.20 | % | | | 04/16/2021 | | | | 1,948,775 | |
| | 4,195,000 | | | General Mills, Inc. | | | 3.15 | % | | | 12/15/2021 | | | | 4,251,603 | |
| | 3,325,000 | | | Goldman Sachs Group, Inc. | | | 3.20 | % | | | 06/05/2020 | | | | 3,325,703 | |
| | 9,615,000 | | | Goldman Sachs Group, Inc. | | | 2.35 | % | | | 11/15/2021 | | | | 9,609,077 | |
| | 6,270,000 | | | Hyundai Capital America | | | 2.85 | % ^ | | | 11/01/2022 | | | | 6,129,338 | |
| | 7,265,000 | | | Kinder Morgan Energy Partners LP | | | 3.95 | % | | | 09/01/2022 | | | | 7,207,460 | |
| | 4,005,000 | | | Kinder Morgan, Inc. | | | 3.15 | % | | | 01/15/2023 | | | | 3,971,412 | |
| | 5,785,000 | | | Marathon Petroleum Corporation | | | 4.75 | % | | | 12/15/2023 | | | | 5,487,476 | |
| | 4,465,000 | | | Marsh & McLennan Companies, Inc. (3 Month LIBOR USD + 1.20%) | | | 2.57 | % | | | 12/29/2021 | | | | 4,469,130 | |
| | 6,200,000 | | | Microchip Technology, Inc. | | | 3.92 | % | | | 06/01/2021 | | | | 6,045,453 | |
| | 9,545,000 | | | Mondelez International, Inc. | | | 3.00 | % | | | 05/07/2020 | | | | 9,449,734 | |
| | 2,843,000 | | | Mondelez International, Inc. | | | 3.63 | % | | | 05/07/2023 | | | | 2,986,785 | |
| | 12,983,000 | | | Morgan Stanley (3 Month LIBOR USD + 0.93%) | | | 2.73 | % | | | 07/22/2022 | | | | 12,637,988 | |
| | 4,660,000 | | | NextEra Energy Capital Holdings, Inc. | | | 3.34 | % | | | 09/01/2020 | | | | 4,665,174 | |
| | 5,411,000 | | | Northrop Grumman Corporation | | | 2.08 | % | | | 10/15/2020 | | | | 5,390,653 | |
| | 295,000 | | | Northrop Grumman Corporation | | | 3.25 | % | | | 08/01/2023 | | | | 302,893 | |
| | 3,305,000 | | | ORACLE Corporation | | | 2.50 | % | | | 04/01/2025 | | | | 3,377,869 | |
| | 4,970,000 | | | PayPal Holdings, Inc. | | | 2.20 | % | | | 09/26/2022 | | | | 4,952,276 | |
| | 5,995,000 | | | Penske Truck Leasing Company | | | 2.70 | % ^ | | | 11/01/2024 | | | | 5,605,578 | |
| | 1,545,000 | | | PNC Bank | | | 2.45 | % | | | 11/05/2020 | | | | 1,548,007 | |
| | 1,775,000 | | | PNC Bank (3 Month LIBOR USD + 0.42%) | | | 2.03 | % | | | 12/09/2022 | | | | 1,780,589 | |
| | 2,500,000 | | | PNC Funding Corporation | | | 3.30 | % | | | 03/08/2022 | | | | 2,543,140 | |
| | 2,220,000 | | | Prudential Financial, Inc. | | | 4.50 | % | | | 11/15/2020 | | | | 2,235,657 | |
| | 865,000 | | | Prudential Financial, Inc. | | | 4.50 | % | | | 11/16/2021 | | | | 873,122 | |
| | 8,410,000 | | | Prudential Financial, Inc. | | | 3.50 | % | | | 05/15/2024 | | | | 8,763,950 | |
| | 6,210,000 | | | PSEG Power LLC | | | 3.85 | % | | | 06/01/2023 | | | | 6,324,892 | |
| | 6,065,000 | | | Republic Services, Inc. | | | 2.50 | % | | | 08/15/2024 | | | | 6,118,702 | |
| | 2,715,000 | | | Reynolds American, Inc. | | | 3.25 | % | | | 06/12/2020 | | | | 2,706,952 | |
| | 3,035,000 | | | Reynolds American, Inc. | | | 4.00 | % | | | 06/12/2022 | | | | 3,076,188 | |
| | 5,765,000 | | | Schlumberger Holdings Corporation | | | 3.75 | % ^ | | | 05/01/2024 | | | | 5,466,207 | |
| | 6,095,000 | | | Simon Property Group LP | | | 2.00 | % | | | 09/13/2024 | | | | 5,860,605 | |
| | 5,000,000 | | | Synchrony Financial | | | 3.75 | % | | | 08/15/2021 | | | | 5,025,450 | |
| | 755,000 | | | Synchrony Financial | | | 2.85 | % | | | 07/25/2022 | | | | 720,183 | |
| | 5,925,000 | | | Union Pacific Corporation | | | 3.20 | % | | | 06/08/2021 | | | | 5,983,878 | |
| | 6,705,000 | | | Volkswagen Group of America Finance LLC | | | 4.00 | % ^ | | | 11/12/2021 | | | | 6,636,757 | |
| | 12,774,000 | | | Wells Fargo & Company | | | 2.60 | % | | | 01/15/2021 | | | | 12,836,203 | |
| | 5,820,000 | | | Welltower, Inc. | | | 3.63 | % | | | 03/15/2024 | | | | 5,723,475 | |
| | | | | | | | | | | | | | | | |
| | Total US Corporate Bonds (Cost $350,585,392) | | | | | | | | | | | 342,812,739 | |
| | | | | | | | | | | | | |
| | | | | | | | | | | | | | | | |
| | | | | | | | | | | | | |
| | US Government and Agency Mortgage Backed Obligations - 6.0% | | | | | | | | | | | | |
| | 31,331,822 | | | Federal Home Loan Mortgage Corporation Pass-Thru, SeriesK722-X1 | | | 1.31 | % # ± I/O | | | 03/25/2023 | | | | 951,331 | |
| | 4,752,764 | | | Federal Home Loan Mortgage Corporation, Pool 2B1122 (12 Month LIBOR USD + 1.65%, 1.65% Floor, 7.14% Cap) | | | 3.65 | % | | | 02/01/2043 | | | | 4,834,578 | |
| | 1,565,902 | | | Federal Home Loan Mortgage Corporation, Pool G08626 | | | 3.00 | % | | | 02/01/2045 | | | | 1,657,896 | |
| | 1,659,766 | | | Federal Home Loan Mortgage Corporation, Pool G08631 | | | 3.00 | % | | | 03/01/2045 | | | | 1,757,963 | |
| | 13,603,006 | | | Federal Home Loan Mortgage Corporation, Series317-F3 (1 Month LIBOR USD + 0.52%, 0.52% Floor 6.50% Cap) | | | 1.22 | % | | | 11/15/2043 | | | | 13,692,332 | |
| | 492,666 | | | Federal Home Loan Mortgage Corporation, Series3417-SM(-1 x 1 Month LIBOR USD + 6.28%, 6.28% Cap) | | | 5.58 | % I/F I/O | | | 02/15/2038 | | | | 105,069 | |
| | 10,333,936 | | | Federal Home Loan Mortgage Corporation, Series356-F5 (1 Month LIBOR USD + 0.50%, 0.50% Floor, 6.50% Cap) | | | 1.20 | % | | | 09/15/2047 | | | | 10,429,504 | |
| | 7,258,745 | | | Federal Home Loan Mortgage Corporation, Series4060-QA | | | 1.50 | % | | | 09/15/2026 | | | | 7,315,955 | |
| | 7,823,002 | | | Federal Home Loan Mortgage Corporation, Series4125-FA (1 Month LIBOR USD + 0.35%, 0.35% Floor, 6.50% Cap) | | | 1.05 | % | | | 11/15/2042 | | | | 7,725,543 | |
| | 1,508,027 | | | Federal Home Loan Mortgage Corporation, Series4471-GA | | | 3.00 | % | | | 02/15/2044 | | | | 1,611,381 | |
| | 13,029,232 | | | Federal Home Loan Mortgage Corporation, Series4718-FA (1 Month LIBOR USD + 0.35%, 0.35% Floor, 6.50% Cap) | | | 1.05 | % | | | 09/15/2047 | | | | 12,845,177 | |
| | 12,566,722 | | | Federal Home Loan Mortgage Corporation, Series4734-A | | | 3.00 | % | | | 07/15/2042 | | | | 13,300,322 | |
| | 15,611,031 | | | Federal Home Loan Mortgage Corporation, Series4738-LA | | | 3.00 | % | | | 11/15/2043 | | | | 16,094,096 | |
| | 9,431,346 | | | Federal Home Loan Mortgage Corporation, Series4771-NA | | | 4.00 | % | | | 11/15/2042 | | | | 9,691,571 | |
| | 8,244,752 | | | Federal Home Loan Mortgage Corporation, Series4773-EA | | | 4.00 | % | | | 10/15/2042 | | | | 8,573,572 | |
| | 7,767,778 | | | Federal Home Loan Mortgage Corporation, Series4824-EA | | | 4.50 | % | | | 02/15/2045 | | | | 8,033,885 | |
| | 2,999,718 | | | Federal National Mortgage Association Pass-Thru, Pool AL2987 (12 Month LIBOR USD + 1.63%, 1.63% Floor, 7.33% Cap) | | | 3.89 | % | | | 11/01/2042 | | | | 3,047,467 | |
| | 5,643,702 | | | Federal National Mortgage Association Pass-Thru, Pool AP7870 (12 Month LIBOR USD + 1.70%, 1.70% Floor, 7.49% Cap) | | | 4.31 | % | | | 07/01/2042 | | | | 5,748,941 | |
| | 2,361,128 | | | Federal National Mortgage Association Pass-Thru, Pool AS4645 | | | 3.00 | % | | | 03/01/2045 | | | | 2,500,413 | |
| | 432,080 | | | Federal National Mortgage Association Pass-Thru, Pool MA1200 | | | 3.00 | % | | | 10/01/2032 | | | | 460,762 | |
| | 4,049,246 | | | Federal National Mortgage Association Pass-Thru, Pool MA2270 | | | 3.00 | % | | | 05/01/2045 | | | | 4,265,936 | |
| | 2,758,167 | | | Federal National Mortgage Association, Pool BM3520 (12 Month LIBOR USD + 1.56%, 1.56% Floor, 7.00% Cap) | | | 2.05 | % | | | 05/01/2045 | | | | 2,778,048 | |
| | 12,597,990 | | | Federal National Mortgage Association, Pool BM4513 (12 Month LIBOR USD + 1.67%, 1.67% Floor, 7.72% Cap) | | | 2.71 | % | | | 05/01/2044 | | | | 12,877,354 | |
| | 5,836,345 | | | Federal National Mortgage Association, Series2010-72-FA (1 Month LIBOR USD + 0.72%, 0.72% Floor, 6.50% Cap) | | | 1.67 | % | | | 07/25/2040 | | | | 5,834,601 | |
| | 8,155,337 | | | Federal National Mortgage Association, Series2011-63-FX (1 Month LIBOR USD + 0.35%, 0.35% Floor, 7.00% Cap) | | | 1.30 | % | | | 07/25/2041 | | | | 8,059,655 | |
| | 845,701 | | | Federal National Mortgage Association, Series2012-134-FT (1 Month LIBOR USD + 0.35%, 0.35% Floor, 6.50% Cap) | | | 1.30 | % | | | 12/25/2042 | | | | 835,841 | |
| | 2,403,818 | | | Federal National Mortgage Association, Series2012-32-DA | | | 2.00 | % | | | 11/25/2026 | | | | 2,443,930 | |
| | 9,267,489 | | | Federal National Mortgage Association, Series2013-20-FE (1 Month LIBOR USD + 0.35%, 0.35% Floor, 6.50% Cap) | | | 1.30 | % | | | 03/25/2043 | | | | 9,160,838 | |
| | 4,027,412 | | | Federal National Mortgage Association, Series2013-40-KP | | | 3.50 | % | | | 04/25/2042 | | | | 4,278,147 | |
| | 1,163,049 | | | Federal National Mortgage Association, Series2014-66-QE | | | 2.00 | % | | | 01/25/2040 | | | | 1,165,534 | |
| | 3,828,467 | | | Federal National Mortgage Association, Series2015-59-A | | | 3.00 | % | | | 06/25/2041 | | | | 3,948,648 | |
| | 2,394,360 | | | Federal National Mortgage Association, Series2015-9-HA | | | 3.00 | % | | | 01/25/2045 | | | | 2,549,969 | |
| | 6,643,894 | | | Federal National Mortgage Association, Series2016-72-PA | | | 3.00 | % | | | 07/25/2046 | | | | 6,874,625 | |
| | 3,375,847 | | | Federal National Mortgage Association, Series2017-116-FB (1 Month LIBOR USD + 0.25%, 0.25% Floor, 6.50% Cap) | | | 1.02 | % | | | 05/20/2044 | | | | 3,333,951 | |
| | 6,951,487 | | | Federal National Mortgage Association, Series2017-13-ML | | | 3.00 | % | | | 08/25/2041 | | | | 7,269,151 | |
| | 6,012,656 | | | Federal National Mortgage Association, Series2017-2-HA | | | 3.00 | % | | | 09/25/2041 | | | | 6,233,939 | |
| | 5,013,058 | | | Federal National Mortgage Association, Series2017-4-CH | | | 3.00 | % | | | 06/25/2042 | | | | 5,085,984 | |
| | 12,256,510 | | | Federal National Mortgage Association, Series2018-15-JF (1 Month LIBOR USD + 0.30%, 0.30% Floor, 6.50% Cap) | | | 1.25 | % | | | 03/25/2048 | | | | 11,861,110 | |
| | 8,576,443 | | | Federal National Mortgage Association, Series2018-16-FN (1 Month LIBOR USD + 0.25%, 0.25% Floor, 6.50% Cap) | | | 1.20 | % | | | 03/25/2048 | | | | 8,422,436 | |
| | 9,716,616 | | | Federal National Mortgage Association, Series2018-31-FD (1 Month LIBOR USD + 0.30%, 0.30% Floor, 6.50% Cap) | | | 1.25 | % | | | 05/25/2048 | | | | 9,556,001 | |
| | 9,940,905 | | | Federal National Mortgage Association, Series2018-49-FB (1 Month LIBOR USD + 0.30%, 0.30% Floor, 6.50% Cap) | | | 1.25 | % | | | 07/25/2048 | | | | 9,653,114 | |
| | 14,306,191 | | | Federal National Mortgage Association, Series2018-57-FA (1 Month LIBOR USD + 0.30%, 0.30% Floor, 6.50% Cap) | | | 1.25 | % | | | 08/25/2048 | | | | 14,190,052 | |
| | 6,243,213 | | | Federal National Mortgage Association, Series2018-63-FC (1 Month LIBOR USD + 0.30%, 0.30% Floor, 6.50% Cap) | | | 1.25 | % | | | 09/25/2048 | | | | 6,185,408 | |
| | 10,714,397 | | | Federal National Mortgage Association, Series2018-64-FA (1 Month LIBOR USD + 0.35%, 0.35% Floor, 6.50% Cap) | | | 1.30 | % | | | 09/25/2048 | | | | 10,578,502 | |
| | 15,833,240 | | | Federal National Mortgage Association, Series2018-77-FA (1 Month LIBOR USD + 0.30%, 0.30% Floor, 6.50% Cap) | | | 1.25 | % | | | 10/25/2048 | | | | 15,613,030 | |
| | 6,653,996 | | | Federal National Mortgage Association, Series2018-80-FG (1 Month LIBOR USD + 0.35%, 0.35% Floor, 6.50% Cap) | | | 1.30 | % | | | 10/25/2048 | | | | 6,606,277 | |
| | 8,609,247 | | | Government National Mortgage Association, Series2010-116-FA (1 Month LIBOR USD + 0.60%, 0.60% Floor, 6.50% Cap) | | | 1.37 | % | | | 09/20/2040 | | | | 8,548,759 | |
| | 8,163,729 | | | Government National Mortgage Association, Series2011-156-FJ (1 Month LIBOR USD + 0.40%, 0.40% Floor, 7.00% Cap) | | | 1.17 | % | | | 04/20/2040 | | | | 8,048,343 | |
| | 11,229,450 | | | Government National Mortgage Association, Series2011-28-FG (1 Month LIBOR USD + 0.50%, 0.50% Floor, 6.50% Cap) | | | 1.27 | % | | | 12/20/2040 | | | | 11,119,591 | |
| | | | | | | | | | | | | | | | |
| | | | | | | | | | | | | |
| | 6,892,221 | | | Government National Mortgage Association, Series2013-129-FN (1 Month LIBOR USD + 0.35%, 0.35% Floor, 6.50% Cap) | | | 1.12 | % | | | 09/20/2043 | | | | 6,789,246 | |
| | 9,127,209 | | | Government National Mortgage Association, Series2019-42-FK (1 Month LIBOR USD + 0.45%, 0.45% Floor, 6.50% Cap) | | | 1.22 | % | | | 04/20/2049 | | | | 9,036,545 | |
| | | | | | | | | | | | | | | | |
| Total US Government and Agency Mortgage Backed Obligations
(Cost $351,318,338) | | | | | | | | | | | 353,582,323 | |
| | | | | | | | | | | | | |
| | US Government and Agency Obligations - 24.9% | | | | | | | | | | | | |
| | 88,750,000 | | | United States Treasury Notes | | | 1.38 | % | | | 09/15/2020 | | | | 89,259,619 | |
| | 173,700,000 | | | United States Treasury Notes | | | 2.88 | % | | | 10/31/2020 | | | | 176,464,951 | |
| | 202,950,000 | | | United States Treasury Notes | | | 2.75 | % | | | 11/30/2020 | | | | 206,473,878 | |
| | 200,900,000 | | | United States Treasury Notes | | | 2.75 | % | | | 09/15/2021 | | | | 208,284,644 | |
| | 232,150,000 | | | United States Treasury Notes | | | 1.50 | % | | | 10/31/2021 | | | | 236,870,081 | |
| | 241,850,000 | | | United States Treasury Notes | | | 1.63 | % | | | 04/30/2023 | | | | 251,788,524 | |
| | 276,850,000 | | | United States Treasury Notes | | | 2.25 | % | | | 12/31/2023 | | | | 296,770,221 | |
| | | | | | | | | | | | | | | | |
| | Total US Government and Agency Obligations (Cost $1,422,660,193) | | | | | | | | | | | 1,465,911,918 | |
| | | | | | | | | | | | | |
| | Affiliated Mutual Funds - 3.3% | | | | | | | | | | | | |
| | 19,895,522 | | | DoubleLine Ultra Short Bond Fund (Class I) | | | | | | | | | | | 195,175,073 | |
| | | | | | | | | | | | | | | | |
| | Total Affiliated Mutual Funds (Cost $199,501,692) | | | | | | | | | | | 195,175,073 | |
| | | | | | | | | | | | | |
| | Warrants - 0.0% | | | | | | | | | | | | |
| | 29,232 | | | OAS S.A., Expiration 5/16/2039, Strike Price BRL 1.00* Þ | | | | | | | | | | | — | |
| | | | | | | | | | | | | | | | |
| | Total Warrants (Cost $–) | | | | | | | | | | | — | |
| | | | | | | | | | | | | |
| | Short Term Investments - 13.5% | | | | | | | | | | | | |
| | 263,710,739 | | | First American Government Obligations Fund - Class U | | | 0.47 | % ¨ | | | | | | | 263,710,739 | |
| | 263,710,739 | | | JP Morgan U.S. Government Money Market Fund - Institutional Share Class | | | 0.36 | % ¨ | | | | | | | 263,710,739 | |
| | 263,710,739 | | | Morgan Stanley Institutional Liquidity Funds Government Portfolio - Institutional Share Class | | | 0.26 | % ¨ | | | | | | | 263,710,739 | |
| | | | | | | | | | | | | | | | |
| | Total Short Term Investments (Cost $791,132,217) | | | | | | | | | | | 791,132,217 | |
| | | | | | | | | | | | | |
| | Total Investments - 116.7%(Cost $7,250,267,312) | | | | | | | | | | | 6,862,998,265 | |
| | Liabilities in Excess of Other Assets - (16.7)% | | | | | | | | | | | (982,302,825 | ) |
| | | | | | | | | | | | | |
| | NET ASSETS - 100.0% | | | | | | | | | | $ | 5,880,695,440 | |
| | | | | | | | | | | | | |
| ^ | Security exempt from registration under Rule 144A of the Securities Act of 1933. These securities may be resold in transactions exempt from registration to qualified institutional buyers. |
| # | Coupon rate is variable based on the weighted average coupon of the underlying collateral. To the extent the weighted average coupon of the underlying assets which comprise the collateral increases or decreases, the coupon rate of this security will increase or decrease correspondingly. The rate disclosed is as of March 31, 2020. |
| ± | Coupon rate is variable or floats based on components including but not limited to reference rate and spread. These securities may not indicate a reference rate and/or spread in their description. The rate disclosed is as of March 31, 2020. |
| § | The interest rate will step up if the issuer does not redeem the bond on or before a scheduled redemption date in accordance with the terms of the instrument. The interest rate shown is the rate in effect as of March 31, 2020. |
| Þ | Value determined using significant unobservable inputs. |
| W | Security is in default or has failed to make a scheduled payment. Income is not being accrued. |
| I/O | Interest only security |
| P/O | Principal only security |
| ß | The interest rate may step up conditioned upon the aggregate remaining principal balance of the underlying mortgage loans being reduced below a targeted percentage of the aggregate original principal balance of the mortgage loans. The interest rate shown is the rate in effect as of March 31, 2020. |
| I/F | Inverse floating rate security whose interest rate moves in the opposite direction of reference interest rates. Reference interest rates are typically based on a negative multiplier or slope. Interest rate may also be subject to a cap or floor. |
| & | Unfunded or partially unfunded loan commitment. At March 31, 2020, the value of these securities amounted to $352,982 or 0.0% of net assets. |
| PIK | Apayment-in-kind security in which the issuer may make interest or dividend payments in cash or additional securities. These additional securities generally have the same terms as the original holdings. |
| * | Non-income producing security |
| ¨ | Seven-day yield as of March 31, 2020 |
| ~ | Represents less than 0.05% of net assets |
DoubleLine Flexible Income Fund
Schedule of Investments
March 31, 2020
| | | | | | | | | | | | | | | | |
Principal Amount
$/Shares | | | Security Description | | Rate | | | Maturity | | | Value $ | |
| | Asset Backed Obligations - 4.3% | | | | | | | | | | | | |
| | 2,889,085 | | | Castlelake Aircraft Securitization Trust, Series2018-1-B | | | 5.30 | % ^ | | | 06/15/2043 | | | | 1,983,915 | |
| | 2,454,942 | | | Castlelake Aircraft Securitization Trust, Series2019-1A-C | | | 6.90 | % ^ | | | 04/15/2039 | | | | 1,755,176 | |
| | 6,250,000 | | | ExteNet Issuer LLC, Series2019-1A-C | | | 5.22 | % ^ | | | 07/26/2049 | | | | 5,484,487 | |
| | 1,706,388 | | | GAIA Aviation Ltd., Series2019-1-C | | | 7.00 | % ^§ | | | 12/15/2044 | | | | 1,107,258 | |
| | 4,434,311 | | | Harley Marine Financing LLC, Series2018-1A-A2 | | | 5.68 | % ^ | | | 05/15/2043 | | | | 3,998,285 | |
| | 2,667,495 | | | Helios Issuer LLC, Series2017-1A-A | | | 4.94 | % ^ | | | 09/20/2049 | | | | 2,522,429 | |
| | 1,856,589 | | | Horizon Aircraft Finance Ltd., Series2019-1-C | | | 6.90 | % ^ | | | 07/15/2039 | | | | 1,253,274 | |
| | 1,950,000 | | | Jimmy Johns Funding LLC, Series2017-1A-A2II | | | 4.85 | % ^ | | | 07/30/2047 | | | | 1,971,680 | |
| | 1,138,840 | | | JOL Air Ltd., Series2019-1-B | | | 4.95 | % ^ | | | 04/15/2044 | | | | 744,027 | |
| | 5,162,637 | | | Mosaic Solar Loan Trust, Series2018-1A-C | | | 0.00 | % ^ P/O | | | 06/22/2043 | | | | 4,286,955 | |
| | 24,339 | | | SoFi Consumer Loan Program Trust, Series2016-2-A | | | 3.09 | % ^ | | | 10/27/2025 | | | | 23,920 | |
| | 213,922 | | | SoFi Consumer Loan Program Trust, Series2017-1-A | | | 3.28 | % ^ | | | 01/26/2026 | | | | 210,225 | |
| | 500,000 | | | SoFi Consumer Loan Program Trust, Series2017-1-B | | | 4.73 | % # ^ | | | 01/26/2026 | | | | 479,361 | |
| | 239,958 | | | SoFi Consumer Loan Program Trust, Series2017-2-A | | | 3.28 | % ^ | | | 02/25/2026 | | | | 239,109 | |
| | 597,670 | | | SoFi Consumer Loan Program Trust, Series2017-5-A2 | | | 2.78 | % ^ | | | 09/25/2026 | | | | 566,288 | |
| | 101,275 | | | Springleaf Funding Trust, Series2016-AA-A | | | 2.90 | % ^ | | | 11/15/2029 | | | | 100,450 | |
| | 2,000,000 | | | Springleaf Funding Trust, Series2017-AA-A | | | 2.68 | % ^ | | | 07/15/2030 | | | | 1,920,235 | |
| | 1,911,811 | | | Sunnova Helios Issuer LLC, Series2019-AA-B | | | 4.49 | % ^ | | | 06/20/2046 | | | | 1,695,427 | |
| | 2,917,500 | | | Taco Bell Funding LLC, Series2016-1A-A2II | | | 4.38 | % ^ | | | 05/25/2046 | | | | 2,856,515 | |
| | 4,904,219 | | | Vivint Colar Financing LLC, Series2018-1A-A | | | 4.73 | % ^ | | | 04/30/2048 | | | | 4,060,762 | |
| | 8,203,125 | | | Wave LLC, Series2019-1-C | | | 6.41 | % ^ | | | 09/15/2044 | | | | 5,099,177 | |
| | 1,354,237 | | | Willis Engine Structured Trust, Series2018-A-A | | | 4.75 | % ^§ | | | 09/15/2043 | | | | 912,452 | |
| | 4,530,800 | | | Zephyrus Capital Aviation Partners Ltd., Series2018-1-A | | | 4.61 | % ^ | | | 10/15/2038 | | | | 3,711,482 | |
| | | | | | | | | | | | | | | | |
| | Total Asset Backed Obligations(Cost $57,159,915) | | | | | | | | | | | 46,982,889 | |
| | | | | | | | | | | | | | | | |
| | Bank Loans - 4.9% | | | | | | | | | | | | |
| | 705,928 | | | 1011778 B.C. Unlimited Liability Company, Senior Secured First Lien Term Loan (1 Month LIBOR USD + 1.75%) | | | 2.67 | % | | | 11/19/2026 | | | | 654,748 | |
| | 300,033 | | | Access CIG LLC, Senior Secured First Lien Term Loan (1 Month LIBOR USD + 3.75%) | | | 5.53 | % | | | 02/27/2025 | | | | 247,152 | |
| | 252,717 | | | Achilles Acquisition LLC, Senior Secured First Lien Term Loan (1 Month LIBOR USD + 4.00%) | | | 5.00 | % | | | 10/13/2025 | | | | 224,286 | |
| | 115,759 | | | Advanced Drainage Systems, Inc., Senior Secured First Lien Term Loan (1 Month LIBOR USD + 2.25%) | | | 3.23 | % | | | 07/31/2026 | | | | 108,235 | |
| | | | | | | | | | | | | | | | |
| | | | | | | | | | | | | |
| | 227,663 | | | Agiliti Health, Inc., Senior Secured First Lien Term Loan (1 Month LIBOR USD + 3.00%) | | | 4.44 | % | | | 01/05/2026 | | | | 219,694 | |
| | 349,606 | | | Air Methods Corporation, Senior Secured First Lien Term Loan (3 Month LIBOR USD + 3.50%, 1.00% Floor) | | | 4.95 | % | | | 04/22/2024 | | | | 249,774 | |
| | 410,000 | | | Aldevron LLC, Senior Secured First Lien Term Loan (1 Month LIBOR USD + 4.25%, 1.00% Floor) | | | 5.70 | % | | | 10/13/2026 | | | | 387,450 | |
| | 371,985 | | | Alera Group Intermediate Holdings, Inc., Senior Secured First Lien Term Loan (1 Month LIBOR USD + 4.00%) | | | 4.99 | % | | | 08/01/2025 | | | | 327,347 | |
| | 370,651 | | | Aleris International, Inc., Senior Secured First Lien Term Loan (1 Month LIBOR USD + 4.75%) | | | 5.74 | % | | | 02/27/2023 | | | | 335,902 | |
| | 279,171 | | | AlixPartners LLP, Senior Secured First Lien Term Loan (1 Month LIBOR USD + 2.75%, 1.00% Floor) | | | 3.50 | % | | | 04/04/2024 | | | | 268,702 | |
| | 407,298 | | | Alliant Holdings Intermediate LLC, Senior Secured First Lien Term Loan (1 Month LIBOR USD + 3.25%) | | | 3.86 | % | | | 05/09/2025 | | | | 374,103 | |
| | 349,204 | | | Allied Universal Holdco LLC, Senior Secured First Lien Term Loan (6 Month LIBOR USD + 4.25%) | | | 5.24 | % | | | 07/10/2026 | | | | 324,760 | |
| | 150,000 | | | Almonde, Inc., Senior Secured Second Lien Term Loan (6 Month LIBOR USD + 7.25%, 1.00% Floor) | | | 9.03 | % | | | 06/16/2025 | | | | 115,200 | |
| | 445,080 | | | Alterra Mountain Company, Senior Secured First Lien Term Loan (1 Month LIBOR USD + 3.00%, 1.00% Floor) | | | 3.75 | % | | | 07/31/2024 | | | | 407,248 | |
| | 75,000 | | | Amentum Holdings LLC, Senior Secured First Lien Term Loan (1 Month LIBOR USD + 4.00%) | | | 4.99 | % | | | 02/01/2027 | | | | 70,125 | |
| | 75,000 | | | American Airlines, Inc., Senior Secured First Lien Term Loan (1 Month LIBOR USD + 1.75%) | | | 2.69 | % | | | 01/29/2027 | | | | 62,297 | |
| | 445,408 | | | American Airlines, Inc., Senior Secured First Lien Term Loan (1 Month LIBOR USD + 2.00%) | | | 2.70 | % | | | 12/15/2023 | | | | 360,558 | |
| | | | American Tire Distributors, Inc., Senior Secured First Lien Term Loan | | | | | | | | | | | | |
| | 177,819 | | | (1 Month LIBOR USD + 7.50%, 1.00% Floor, 8.00% PIK) | | | 8.50 | % | | | 09/02/2024 | | | | 120,028 | |
| | 22,713 | | | (3 Month LIBOR USD + 7.50%, 1.00% Floor, 8.00% PIK) | | | 8.95 | % | | | 09/02/2024 | | | | 15,331 | |
| | 2,155 | | | (1 Month LIBOR USD + 7.50%, 1.00% Floor, 8.00% PIK) | | | 8.50 | % | | | 09/02/2024 | | | | 1,455 | |
| | 370,000 | | | Aramark Services, Inc., Senior Secured First Lien Term Loan (1 Month LIBOR USD + 1.75%) | | | 2.74 | % | | | 03/11/2025 | | | | 349,034 | |
| | 170,000 | | | Aramark Services, Inc., Senior Secured First Lien Term Loan (1 Month LIBOR USD + 1.75%) | | | 2.74 | % | | | 01/15/2027 | | | | 158,950 | |
| | 185,000 | | | Arconic Corporation, Senior Secured First Lien Term Loan | | | 4.66 | % ± | | | 02/04/2027 | | | | 169,275 | |
| | 144,885 | | | Arctic Glacier, Inc., Senior Secured First Lien Term Loan (1 Month LIBOR USD + 3.50%, 1.00% Floor) | | | 4.95 | % | | | 03/20/2024 | | | | 119,530 | |
| | 20,957 | | | Asurion LLC, Senior Secured First Lien Term Loan (1 Month LIBOR USD + 3.00%) | | | 3.99 | % | | | 11/04/2024 | | | | 20,224 | |
| | 102,881 | | | Asurion LLC, Senior Secured Second Lien Term Loan (1 Month LIBOR USD + 6.50%) | | | 7.49 | % | | | 08/04/2025 | | | | 95,358 | |
| | 345,323 | | | Athenahealth, Inc., Senior Secured First Lien Term Loan (3 Month LIBOR USD + 4.50%) | | | 5.28 | % | | | 02/11/2026 | | | | 324,603 | |
| | 339,891 | | | Auris Luxembourg III Sarl, Senior Secured First Lien Term Loan (1 Month LIBOR USD + 3.75%) | | | 4.74 | % | | | 02/27/2026 | | | | 260,867 | |
| | 168,974 | | | Avantor, Inc., Senior Secured First Lien Term Loan (1 Month LIBOR USD + 3.00%, 1.00% Floor) | | | 3.25 | % | | | 11/21/2024 | | | | 160,948 | |
| | 267,126 | | | Avaya, Inc., Senior Secured First Lien Term Loan (1 Month LIBOR USD + 4.25%) | | | 4.95 | % | | | 12/16/2024 | | | | 230,396 | |
| | 468,675 | | | Azalea TopCo, Inc., Senior Secured First Lien Term Loan (1 Month LIBOR USD + 3.50%) | | | 4.49 | % | | | 07/24/2026 | | | | 434,696 | |
| | 113,258 | | | Bass Pro Group LLC, Senior Secured First Lien Term Loan (1 Month LIBOR USD + 5.00%, 0.75% Floor) | | | 6.07 | % | | | 09/25/2024 | | | | 95,703 | |
| | 335,750 | | | Bausch Health Companies, Inc., Senior Secured First Lien Term Loan (1 Month LIBOR USD + 2.75%) | | | 3.36 | % | | | 11/27/2025 | | | | 320,641 | |
| | 115,500 | | | Bausch Health Companies, Inc., Senior Secured First Lien Term Loan (1 Month LIBOR USD + 3.00%) | | | 3.61 | % | | | 06/02/2025 | | | | 110,543 | |
| | 53,400 | | | Berry Global, Inc., Senior Secured First Lien Term Loan (1 Month LIBOR USD + 2.00%) | | | 2.86 | % | | | 10/03/2022 | | | | 51,509 | |
| | | | | | | | | | | | | | | | |
| | | | | | | | | | | | | |
| | 416,691 | | | Blackhawk Network Holdings, Inc., Senior Secured First Lien Term Loan (1 Month LIBOR USD + 3.00%) | | | 3.99 | % | | | 06/16/2025 | | | | 344,959 | |
| | 376,876 | | | Blackstone CQP Holdco LP, Senior Secured First Lien Term Loan (3 Month LIBOR USD + 3.50%) | | | 4.62 | % | | | 09/30/2024 | | | | 300,935 | |
| | 189,513 | | | Brand Energy & Infrastructure Services, Inc., Senior Secured First Lien Term Loan (3 Month LIBOR USD + 4.25%, 1.00% Floor) | | | 6.06 | % | | | 06/21/2024 | | | | 153,712 | |
| | 366,222 | | | Brazos Delaware LLC, Senior Secured First Lien Term Loan (1 Month LIBOR USD + 4.00%) | | | 4.92 | % | | | 05/21/2025 | | | | 193,182 | |
| | 252,828 | | | Bright Bidco B.V., Senior Secured First Lien Term Loan (6 Month LIBOR USD + 3.50%, 1.00% Floor) | | | 4.57 | % | | | 06/28/2024 | | | | 95,758 | |
| | 245,000 | | | Buckeye Partners LP, Senior Secured First Lien Term Loan (1 Month LIBOR USD + 2.75%) | | | 3.77 | % | | | 11/02/2026 | | | | 226,747 | |
| | 49,750 | | | Calpine Corporation, Senior Secured First Lien Term Loan (1 Month LIBOR USD + 2.50%) | | | 2.99 | % | | | 08/12/2026 | | | | 47,511 | |
| | 463,838 | | | Camelot US Acquisition Company, Senior Secured First Lien Term Loan (1 Month LIBOR USD + 3.25%) | | | 4.24 | % | | | 10/30/2026 | | | | 442,965 | |
| | 377,632 | | | Capri Acquisitions BidCo Ltd., Senior Secured First Lien Term Loan (3 Month LIBOR USD + 3.00%) | | | 4.78 | % | | | 11/01/2024 | | | | 327,596 | |
| | 219,596 | | | Catalent Pharma Solutions, Inc., Senior Secured First Lien Term Loan (1 Month LIBOR USD + 2.25%) | | | 3.24 | % | | | 05/18/2026 | | | | 214,106 | |
| | 322,474 | | | Cengage Learning, Inc., Senior Secured First Lien Term Loan (1 Month LIBOR USD + 4.25%, 1.00% Floor) | | | 5.25 | % | | | 06/07/2023 | | | | 264,428 | |
| | 239,400 | | | CenturyLink, Inc., Senior Secured First Lien Term Loan (1 Month LIBOR USD + 2.25%) | | | 3.24 | % | | | 03/15/2027 | | | | 224,888 | |
| | 589,778 | | | CEOC LLC, Senior Secured First Lien Term Loan (1 Month LIBOR USD + 2.00%) | | | 2.99 | % | | | 10/04/2024 | | | | 486,567 | |
| | 223,374 | | | Charter NEX US, Inc., Senior Secured First Lien Term Loan (1 Month LIBOR USD + 3.50%) | | | 4.49 | % | | | 05/16/2024 | | | | 196,941 | |
| | 188,495 | | | CHG Healthcare Services, Inc., Senior Secured First Lien Term Loan (1 Month LIBOR USD + 3.00%, 1.00% Floor) | | | 4.07 | % | | | 06/07/2023 | | | | 169,959 | |
| | 407,446 | | | CHG PPC Parent LLC, Senior Secured First Lien Term Loan (1 Month LIBOR USD + 2.75%) | | | 3.74 | % | | | 03/31/2025 | | | | 368,739 | |
| | 177,697 | | | Cincinnati Bell, Inc., Senior Secured First Lien Term Loan (1 Month LIBOR USD + 3.25%, 1.00% Floor) | | | 4.25 | % | | | 10/02/2024 | | | | 171,782 | |
| | 74,625 | | | Clear Channel Outdoor Holdings, Inc., Senior Secured First Lien Term Loan (1 Month LIBOR USD + 3.50%) | | | 4.49 | % | | | 08/21/2026 | | | | 63,431 | |
| | 223,715 | | | ClubCorporationHoldings, Inc., Senior Secured First Lien Term Loan (3 Month LIBOR USD + 2.75%) | | | 4.20 | % | | | 09/18/2024 | | | | 143,290 | |
| | 380,230 | | | Compass Power Generation LLC, Senior Secured First Lien Term Loan (1 Month LIBOR USD + 3.50%, 1.00% Floor) | | | 4.50 | % | | | 12/20/2024 | | | | 346,010 | |
| | 175,000 | | | Connect U.S. Finco LLC, Senior Secured First Lien Term Loan (1 Month LIBOR USD + 4.50%, 1.00% Floor) | | | 5.50 | % | | | 12/11/2026 | | | | 141,094 | |
| | 168,876 | | | Covia Holdings Corporation, Senior Secured First Lien Term Loan (1 Week LIBOR USD + 3.75%, 1.00% Floor) | | | 5.39 | % | | | 06/02/2025 | | | | 79,931 | |
| | 188,334 | | | CPM Holdings, Inc., Senior Secured First Lien Term Loan (6 Month LIBOR USD + 3.75%) | | | 4.84 | % | | | 11/17/2025 | | | | 156,129 | |
| | 253,119 | | | CSC Holdings LLC, Senior Secured First Lien Term Loan (1 Month LIBOR USD + 2.25%) | | | 2.86 | % | | | 07/17/2025 | | | | 243,417 | |
| | 133,650 | | | CSC Holdings LLC, Senior Secured First Lien Term Loan (1 Month LIBOR USD + 2.25%) | | | 2.86 | % | | | 01/15/2026 | | | | 128,972 | |
| | 309,225 | | | CSC Holdings LLC, Senior Secured First Lien Term Loan (1 Month LIBOR USD + 2.50%) | | | 3.11 | % | | | 04/15/2027 | | | | 299,432 | |
| | 311,457 | | | CSM Bakery Solutions LLC, Senior Secured First Lien Term Loan (3 Month LIBOR USD + 4.00%, 1.00% Floor) | | | 5.87 | % | | | 07/03/2020 | | | | 257,731 | |
| | 361,885 | | | Cvent, Inc., Senior Secured First Lien Term Loan (1 Month LIBOR USD + 3.75%, 1.00% Floor) | | | 4.75 | % | | | 11/29/2024 | | | | 263,574 | |
| | 114,404 | | | Cyanco Intermediate Corporation, Senior Secured First Lien Term Loan (1 Month LIBOR USD + 3.50%) | | | 4.49 | % | | | 03/17/2025 | | | | 98,388 | |
| | 296,750 | | | Cyxtera DC Holdings, Inc., Senior Secured First Lien Term Loan (1 Month LIBOR USD + 3.00%, 1.00% Floor) | | | 4.00 | % | | | 05/01/2024 | | | | 198,377 | |
| | | | | | | | | | | | | | | | |
| | | | | | | | | | | | | |
| | 44,888 | | | Dealer Tire, LLC, Senior Secured First Lien Term Loan (1 Month LIBOR USD + 4.25%) | | | 5.24 | % | | | 12/12/2025 | | | | 37,331 | |
| | 280,000 | | | Deerfield Holdings Corporation, Senior Secured First Lien Term Loan | | | 4.75 | % ± | | | 02/25/2027 | | | | 240,800 | |
| | 295,496 | | | Deerfield Holdings Corporation, Senior Secured First Lien Term Loan (1 Month LIBOR USD + 3.25%, 1.00% Floor) | | | 4.25 | % | | | 02/13/2025 | | | | 291,803 | |
| | 389,324 | | | DentalCorporationPerfect Smile ULC, Senior Secured First Lien Term Loan (1 Month LIBOR USD + 3.75%, 1.00% Floor) | | | 4.75 | % | | | 06/06/2025 | | | | 309,513 | |
| | 268,626 | | | Diamond B.V., Senior Secured First Lien Term Loan (3 Month LIBOR USD + 3.00%) | | | 4.78 | % | | | 09/06/2024 | | | | 205,052 | |
| | 79,600 | | | Diamond Sports Group LLC, Senior Secured First Lien Term Loan (1 Month LIBOR USD + 3.25%) | | | 4.18 | % | | | 08/24/2026 | | | | 62,486 | |
| | 155,573 | | | Digicel International Finance Ltd., Senior Secured First Lien Term Loan (6 Month LIBOR USD + 3.25%) | | | 4.87 | % | | | 05/27/2024 | | | | 123,194 | |
| | 377,742 | | | Dun & Bradstreet Corporation, Senior Secured First Lien Term Loan (1 Month LIBOR USD + 5.00%) | | | 4.96 | % | | | 02/06/2026 | | | | 343,273 | |
| | 78,339 | | | Dynasty Acquisition Company, Inc., Senior Secured First Lien Term Loan (3 Month LIBOR USD + 3.50%) | | | 4.95 | % | | | 04/06/2026 | | | | 63,553 | |
| | 145,711 | | | Dynasty Acquisition Company, Inc., Senior Secured First Lien Term Loan (3 Month LIBOR USD + 3.50%) | | | 4.95 | % | | | 04/06/2026 | | | | 118,208 | |
| | 54,855 | | | Dynatrace LLC, Senior Secured First Lien Term Loan (1 Month LIBOR USD + 3.25%) | | | 3.24 | % | | | 08/22/2025 | | | | 52,113 | |
| | 421,590 | | | EAB Global, Inc., Senior Secured First Lien Term Loan (6 Month LIBOR USD + 3.75%, 1.00% Floor) | | | 5.74 | % | | | 11/15/2024 | | | | 344,756 | |
| | 190,166 | | | EG America LLC, Senior Secured First Lien Term Loan (3 Month LIBOR USD + 4.00%) | | | 5.07 | % | | | 02/06/2025 | | �� | | 141,483 | |
| | 180,000 | | | Elanco Animal Health, Inc., Senior Secured First Lien Term Loan | | | 3.55 | % ± | | | 02/26/2027 | | | | 172,350 | |
| | 351,131 | | | Envision Healthcare Corporation, Senior Secured First Lien Term Loan (1 Month LIBOR USD + 3.75%) | | | 4.74 | % | | | 10/10/2025 | | | | 188,148 | |
| | 222,304 | | | Equinox Holdings, Inc., Senior Secured First Lien Term Loan (1 Month LIBOR USD + 3.00%, 1.00% Floor) | | | 4.07 | % | | | 03/08/2024 | | | | 165,131 | |
| | 183,215 | | | ESH Hospitality, Inc., Senior Secured First Lien Term Loan (1 Month LIBOR USD + 2.00%) | | | 2.99 | % | | | 09/18/2026 | | | | 164,893 | |
| | 414,606 | | | Excelitas Technologies Corporation, Senior Secured First Lien Term Loan (3 Month LIBOR USD + 3.50%, 1.00% Floor) | | | 4.95 | % | | | 12/02/2024 | | | | 362,781 | |
| | 73,711 | | | Exgen Renewables IV LLC, Senior Secured First Lien Term Loan (3 Month LIBOR USD + 3.00%, 1.00% Floor) | | | 4.62 | % | | | 11/29/2024 | | | | 66,893 | |
| | 378,330 | | | Filtration Group Corporation, Senior Secured First Lien Term Loan (1 Month LIBOR USD + 3.00%) | | | 3.99 | % | | | 03/31/2025 | | | | 334,349 | |
| | 355,101 | | | Financial & Risk US Holdings, Inc., Senior Secured First Lien Term Loan (1 Month LIBOR USD + 3.75%) | | | 4.24 | % | | | 10/01/2025 | | | | 342,820 | |
| | 195,000 | | | Flex Acquisition Company Inc, Senior Secured First Lien Term Loan (3 Month LIBOR USD + 3.00%, 1.00% Floor) | | | 4.43 | % | | | 12/29/2023 | | | | 179,400 | |
| | 185,000 | | | Flex Acquisition Company, Inc., Senior Secured First Lien Term Loan (3 Month LIBOR USD + 3.25%) | | | 4.68 | % | | | 06/30/2025 | | | | 170,200 | |
| | 179,877 | | | Flexential Intermediate Corporation, Senior Secured First Lien Term Loan (3 Month LIBOR USD + 3.50%) | | | 4.95 | % | | | 08/01/2024 | | | | 129,286 | |
| | 297,593 | | | Flexera Software LLC, Senior Secured First Lien Term Loan (1 Month LIBOR USD + 3.25%, 1.00% Floor) | | | 4.50 | % | | | 02/26/2025 | | | | 271,554 | |
| | 48,694 | | | Foresight Energy LLC, Senior Secured First Lien Delayed-Draw Term Loan (1 Month LIBOR USD + 11.00%, 2.00% Floor) | | | 13.00 | % & | | | 09/10/2020 | | | | 47,233 | |
| | 531,271 | | | Foresight Energy LLC, Senior Secured First Lien Term Loan (3 Month LIBOR USD + 5.75%, 1.00% Floor) | | | 7.36 | % W | | | 03/28/2022 | | | | 90,316 | |
| | 390,063 | | | Forest City Enterprises L.P., Senior Secured First Lien Term Loan (1 Month LIBOR USD + 3.50%) | | | 4.49 | % | | | 12/08/2025 | | | | 339,354 | |
| | 226,079 | | | Forterra Finance, LLC, Senior Secured First Lien Term Loan (1 Month LIBOR USD + 3.00%, 1.00% Floor) | | | 4.00 | % | | | 10/25/2023 | | | | 189,152 | |
| | 225,000 | | | Froneri US, Inc., Senior Secured First Lien Term Loan (1 Month LIBOR USD + 2.25%) | | | 3.24 | % | | | 01/29/2027 | | | | 216,000 | |
| | 148,609 | | | Frontdoor, Inc., Senior Secured First Lien Term Loan (1 Month LIBOR USD + 2.50%) | | | 3.50 | % | | | 08/18/2025 | | | | 143,408 | |
| | | | | | | | | | | | | | | | |
| | | | | | | | | | | | | |
| | 178,291 | | | Frontera Generation Holdings LLC, Senior Secured First Lien Term Loan (1 Month LIBOR USD + 4.25%, 1.00% Floor) | | | 5.25 | % | | | 05/02/2025 | | | | 132,827 | |
| | 125,000 | | | Gardner Denver, Inc., Senior Secured First Lien Term Loan (1 Month LIBOR USD + 1.75%) | | | 2.74 | % | | | 03/01/2027 | | | | 118,281 | |
| | 110,000 | | | Gates Global LLC, Senior Secured First Lien Term Loan (1 Month LIBOR USD + 2.75%, 1.00% Floor) | | | 3.75 | % | | | 04/01/2024 | | | | 96,910 | |
| | 175,000 | | | Gavilan Resources LLC, Senior Secured Second Lien Term Loan (1 Month LIBOR USD + 6.00%, 1.00% Floor) | | | 6.99 | % | | | 03/01/2024 | | | | 21,000 | |
| | 270,000 | | | Genesee & Wyoming, Inc., Senior Secured First Lien Term Loan (1 Month LIBOR USD + 2.00%) | | | 3.45 | % | | | 12/30/2026 | | | | 260,551 | |
| | 463,212 | | | Genesys Telecommunications Laboratories, Inc., Senior Secured First Lien Term Loan (1 Month LIBOR USD + 3.25%) | | | 4.24 | % | | | 12/01/2023 | | | | 437,736 | |
| | 254,689 | | | Getty Images, Inc., Senior Secured First Lien Term Loan (1 Month LIBOR USD + 4.50%) | | | 5.50 | % | | | 02/19/2026 | | | | 206,934 | |
| | 467,254 | | | GOBP Holdings Inc, Senior Secured First Lien Term Loan (3 Month LIBOR USD + 2.75%) | | | 3.74 | % | | | 10/22/2025 | | | | 439,218 | |
| | | | Golden Nugget, Inc., Senior Secured First Lien Term Loan | | | | | | | | | | | | |
| | 201,756 | | | (3 Month LIBOR USD + 2.50%, 0.75% Floor) | | | 3.70 | % | | | 10/04/2023 | | | | 158,378 | |
| | 236,360 | | | (1 Month LIBOR USD + 2.50%, 0.75% Floor) | | | 4.10 | % | | | 10/04/2023 | | | | 185,543 | |
| | 370,605 | | | GoodRX, Inc., Senior Secured First Lien Term Loan (1 Month LIBOR USD + 3.00%) | | | 3.74 | % | | | 10/10/2025 | | | | 350,222 | |
| | 338,548 | | | GrafTech Finance, Inc., Senior Secured First Lien Term Loan (1 Month LIBOR USD + 3.50%, 1.00% Floor) | | | 4.50 | % | | | 02/12/2025 | | | | 296,230 | |
| | 601,856 | | | Gray Television, Inc., Senior Secured First Lien Term Loan (1 Month LIBOR USD + 2.50%) | | | 3.49 | % | | | 01/02/2026 | | | | 566,346 | |
| | 483,788 | | | Grifols Worldwide Operations USA, Inc., Senior Secured First Lien Term Loan (1 Month LIBOR USD + 2.00%) | | | 2.50 | % | | | 11/15/2027 | | | | 461,613 | |
| | 222,598 | | | GTT Communications, Inc., Senior Secured First Lien Term Loan (1 Month LIBOR USD + 2.75%) | | | 3.74 | % | | | 06/02/2025 | | | | 161,940 | |
| | | | Gulf Finance LLC, Senior Secured First Lien Term Loan | | | | | | | | | | | | |
| | 131,231 | | | Gulf Finance LLC, Senior Secured First Lien Term Loan (3 Month LIBOR USD + 5.25%, 1.00% Floor) | | | 6.71 | % | | | 08/25/2023 | | | | 68,372 | |
| | 218,033 | | | Gulf Finance LLC, Senior Secured First Lien Term Loan (3 Month LIBOR USD + 5.25%, 1.00% Floor) | | | 6.25 | % | | | 08/25/2023 | | | | 113,595 | |
| | 177,088 | | | Harbor Freight Tools USA, Inc., Senior Secured First Lien Term Loan (1 Month LIBOR USD + 2.50%, 0.75% Floor) | | | 3.49 | % | | | 08/18/2023 | | | | 162,567 | |
| | 108,202 | | | Hayward Industries, Inc., Senior Secured First Lien Term Loan (1 Month LIBOR USD + 3.50%) | | | 4.49 | % | | | 08/05/2024 | | | | 86,562 | |
| | 413,963 | | | HC Group Holdings, Inc., Senior Secured First Lien Term Loan (1 Month LIBOR USD + 4.50% | | | 5.49 | % | | | 08/06/2026 | | | | 349,798 | |
| | 173,688 | | | Hexion, Inc., Senior Secured First Lien Term Loan (3 Month LIBOR USD + 3.50%) | | | 4.94 | % | | | 07/01/2026 | | | | 147,472 | |
| | 263,835 | | | H-Food Holdings, LLC, Senior Secured First Lien Term Loan (1 Month LIBOR USD + 3.69%) | | | 4.68 | % | | | 05/23/2025 | | | | 223,820 | |
| | 696,560 | | | Hilton Worldwide Finance LLC, Senior Secured First Lien Term Loan (3 Month LIBOR USD + 1.75%) | | | 2.70 | % | | | 06/22/2026 | | | | 663,474 | |
| | 189,038 | | | Houston Foods, Inc., Senior Secured First Lien Term Loan (1 Month LIBOR USD + 3.75%) | | | 4.74 | % | | | 07/21/2025 | | | | 159,737 | |
| | 336,215 | | | Hyland Software, Inc., Senior Secured First Lien Term Loan (1 Month LIBOR USD + 3.50%, 0.75% Floor) | | | 4.85 | % | | | 07/01/2024 | | | | 315,622 | |
| | 106,771 | | | Hyland Software, Inc., Senior Secured Second Lien Term Loan (1 Month LIBOR USD + 7.00%, 0.75% Floor) | | | 7.99 | % | | | 07/07/2025 | | | | 97,962 | |
| | 96,750 | | | IAA, Inc., Senior Secured First Lien Term Loan (1 Month LIBOR USD + 2.25%) | | | 3.25 | % | | | 06/29/2026 | | | | 92,880 | |
| | 264,338 | | | IHeartCommunications, Inc., Senior Secured First Lien Term Loan (1 Month LIBOR USD + 3.00%) | | | 3.99 | % | | | 05/01/2026 | | | | 225,101 | |
| | 140,000 | | | Informatica LLC, Senior Secured First Lien Term Loan (1 Month LIBOR USD + 3.25%) | | | 4.24 | % | | | 02/25/2027 | | | | 122,734 | |
| | | | | | | | | | | | | | | | |
| | | | | | | | | | | | | |
| | 227,473 | | | Intelsat Jackson Holdings S.A., Senior Secured First Lien Term Loan (1 Month LIBOR USD + 3.75%, 1.00% Floor) | | | 5.68 | % | | | 11/27/2023 | | | | 210,839 | |
| | 157,169 | | | ION Trading Technologies SARL, Senior Secured First Lien Term Loan (3 Month LIBOR USD + 4.00%, 1.00% Floor) | | | 5.07 | % | | | 11/21/2024 | | | | 130,974 | |
| | 698,479 | | | IQVIA, Inc., Senior Secured First Lien Term Loan (3 Month LIBOR USD + 2.00%) | | | 2.74 | % | | | 01/17/2025 | | | | 644,930 | |
| | 348,108 | | | IRB Holding Corporation, Senior Secured First Lien Term Loan (6 Month LIBOR USD + 2.75%, 1.00% Floor) | | | 3.75 | % | | | 02/05/2025 | | | | 272,558 | |
| | 174,467 | | | IRI Holdings, Inc., Senior Secured First Lien Term Loan (3 Month LIBOR USD + 4.50%) | | | 6.11 | % | | | 12/01/2025 | | | | 139,791 | |
| | 601,929 | | | Iron Mountain Information Management LLC, Senior Secured First Lien Term Loan (1 Month LIBOR USD + 1.75%) | | | 2.74 | % | | | 01/02/2026 | | | | 574,842 | |
| | 564,588 | | | Jaguar Holding Company, Senior Secured First Lien Term Loan (1 Month LIBOR USD + 2.50%, 1.00% Floor) | | | 3.50 | % | | | 08/18/2022 | | | | 543,820 | |
| | 539,550 | | | JBS USA Lux S.A., Senior Secured First Lien Term Loan (1 Month LIBOR USD + 2.50%) | | | 3.07 | % | | | 05/01/2026 | | | | 509,103 | |
| | 146,380 | | | Jo-Ann Stores LLC, Senior Secured First Lien Term Loan (3 Month LIBOR USD + 5.00%, 1.00% Floor) | | | 6.00 | % | | | 10/20/2023 | | | | 57,298 | |
| | 362,379 | | | KAR Auction Services, Inc., Senior Secured First Lien Term Loan (1 Month LIBOR USD + 2.25%) | | | 3.19 | % | | | 09/19/2026 | | | | 337,013 | |
| | 214,553 | | | KBR, Inc., Senior Secured First Lien Term Loan (1 Month LIBOR USD + 2.75%) | | | 3.74 | % | | | 02/05/2027 | | | | 192,471 | |
| | 319,200 | | | Kestrel Bidco, Inc., Senior Secured First Lien Term Loan (3 Month LIBOR USD + 3.00%, 1.00% Floor) | | | 4.00 | % | | | 12/11/2026 | | | | 251,103 | |
| | 281,183 | | | Kindred Healthcare, Inc., Senior Secured First Lien Term Loan (1 Month LIBOR USD + 5.00%) | | | 6.00 | % | | | 07/02/2025 | | | | 239,006 | |
| | 195,256 | | | Klockner-Pentaplast of America, Inc., Senior Secured First Lien Term Loan (1 Month LIBOR USD + 4.25%, 1.00% Floor) | | | 5.25 | % | | | 06/30/2022 | | | | 138,253 | |
| | 372,608 | | | Kronos Acquisition Holdings, Inc., Senior Secured First Lien Term Loan (3 Month LIBOR USD + 4.00%, 1.00% Floor) | | | 5.00 | % | | | 05/15/2023 | | | | 337,055 | |
| | 394,502 | | | Kronos, Inc., Senior Secured First Lien Term Loan (3 Month LIBOR USD + 3.00%, 1.00% Floor) | | | 4.76 | % | | | 11/01/2023 | | | | 363,496 | |
| | 107,945 | | | Level 3 Financing, Inc., Senior Secured First Lien Term Loan (1 Month LIBOR USD + 1.75%) | | | 2.74 | % | | | 03/01/2027 | | | | 101,806 | |
| | 391,300 | | | Life Time Fitness, Inc., Senior Secured First Lien Term Loan (3 Month LIBOR USD + 2.75%, 1.00% Floor) | | | 4.36 | % | | | 06/10/2022 | | | | 294,453 | |
| | 104,733 | | | Lineage Logistics, LLC, Senior Secured First Lien Term Loan (1 Month LIBOR USD + 3.00%, 1.00% Floor) | | | 4.00 | % | | | 02/27/2025 | | | | 99,365 | |
| | 106,616 | | | Lions Gate Capital Holdings LLC, Senior Secured First Lien Term Loan (1 Month LIBOR USD + 2.25%) | | | 3.24 | % | | | 03/24/2025 | | | | 97,287 | |
| | 346,930 | | | Lower Cadence Holdings LLC, Senior Secured First Lien Term Loan (1 Month LIBOR USD + 4.00%) | | | 4.99 | % | | | 05/22/2026 | | | | 211,627 | |
| | 360,198 | | | Lucid Energy Group II Borrower LLC, Senior Secured First Lien Term Loan (1 Month LIBOR USD + 3.00%, 1.00% Floor) | | | 4.00 | % | | | 02/18/2025 | | | | 208,614 | |
| | 284,758 | | | Mavis Tire Express Services Corporation, Senior Secured First Lien Term Loan (1 Month LIBOR USD + 3.25%) | | | 4.70 | % | | | 03/20/2025 | | | | 231,010 | |
| | 125,936 | | | McDermott International, Inc., Senior Secured First Lien Term Loan (3 Month LIBOR USD + 5.00%, 1.00% Floor) | | | 2.00 | % W | | | 05/12/2025 | | | | 38,760 | |
| | 45,877 | | | MED ParentCo LP, Senior Secured First Lien Term Loan (1 Month LIBOR USD + 4.25%) | | | 5.24 | % & | | | 08/31/2026 | | | | 38,537 | |
| | 183,224 | | | MED ParentCo LP, Senior Secured First Lien Term Loan (1 Month LIBOR USD + 4.25%) | | | 5.24 | % | | | 08/31/2026 | | | | 153,909 | |
| | 142,827 | | | Messer Industries LLC, Senior Secured First Lien Term Loan (3 Month LIBOR USD + 2.50%) | | | 3.95 | % | | | 03/02/2026 | | | | 127,830 | |
| | 452,270 | | | Millennium Trust Company LLC, Senior Secured First Lien Term Loan (1 Month LIBOR USD + 5.00%) | | | 5.99 | % | | | 03/27/2026 | | | | 383,674 | |
| | 4,454 | | | Mister Car Wash Holdings, Inc., Senior Secured First Lien Term Loan | | | 5.19 | % ± | | | 05/14/2026 | | | | 3,738 | |
| | 367,870 | | | Mister Car Wash Holdings, Inc., Senior Secured First Lien Term Loan (3 Month LIBOR USD + 3.50%) | | | 3.86 | % | | | 05/14/2026 | | | | 308,748 | |
| | | | | | | | | | | | | | | | |
| | | | | | | | | | | | | |
| | 75,000 | | | Mitchell International, Inc., Senior Secured Second Lien Term Loan (1 Month LIBOR USD + 7.25%) | | | 8.24 | % | | | 12/01/2025 | | | | 59,000 | |
| | 179,153 | | | MLN US HoldCo LLC, Senior Secured First Lien Term Loan (1 Month LIBOR USD + 4.50%) | | | 5.49 | % | | | 11/28/2025 | | | | 128,094 | |
| | 13,325 | | | Motion Finco, LLC, Senior Secured First Lien Term Loan (3 Month LIBOR USD + 3.25%) | | | 4.70 | % | | | 11/04/2026 | | | | 11,015 | |
| | 101,387 | | | Motion Finco, LLC, Senior Secured First Lien Term Loan (6 Month LIBOR USD + 3.25%) | | | 4.32 | % | | | 11/04/2026 | | | | 83,813 | |
| | 319,130 | | | MPH Acquisition Holdings LLC, Senior Secured First Lien Term Loan (3 Month LIBOR USD + 2.75%, 1.00% Floor) | | | 4.20 | % | | | 06/07/2023 | | | | 287,217 | |
| | 169,851 | | | Nascar Holdings, Inc., Senior Secured First Lien Term Loan (3 Month LIBOR USD + 2.75%) | | | 3.67 | % | | | 10/19/2026 | | | | 151,167 | |
| | 119,400 | | | NCR Corporation, Senior Secured First Lien Term Loan (1 Month LIBOR USD + 2.50%) | | | 3.49 | % | | | 08/28/2026 | | | | 109,251 | |
| | 211,177 | | | Numericable U.S. LLC, Senior Secured First Lien Term Loan (1 Month LIBOR USD + 4.00%) | | | 4.70 | % | | | 08/14/2026 | | | | 202,202 | |
| | 119,400 | | | ON Semiconductor Corporation, Senior Secured First Lien Term Loan (1 Month LIBOR USD + 2.00%) | | | 2.99 | % | | | 09/18/2026 | | | | 112,982 | |
| | 98,750 | | | Outcomes Group Holdings, Inc., Senior Secured First Lien Term Loan (3 Month LIBOR USD + 3.50%) | | | 5.11 | % | | | 10/24/2025 | | | | 81,469 | |
| | 148,981 | | | Panther BF Aggregator LP, Senior Secured First Lien Term Loan (1 Month LIBOR USD + 3.50%) | | | 4.44 | % | | | 04/30/2026 | | | | 137,062 | |
| | 305,912 | | | Parexel International Corporation, Senior Secured First Lien Term Loan (1 Month LIBOR USD + 2.75%) | | | 3.74 | % | | | 09/27/2024 | | | | 264,232 | |
| | 109,784 | | | PCI Gaming Authority, Senior Secured First Lien Term Loan (1 Month LIBOR USD + 3.00%) | | | 3.49 | % | | | 05/29/2026 | | | | 91,011 | |
| | 94,048 | | | Penn National Gaming, Inc., Senior Secured First Lien Term Loan (1 Month LIBOR USD + 2.25%, 0.75% Floor) | | | 3.24 | % | | | 10/15/2025 | | | | 72,139 | |
| | 109,720 | | | Phoenix Services International LLC, Senior Secured First Lien Term Loan (1 Month LIBOR USD + 3.75%, 1.00% Floor) | | | 4.75 | % | | | 03/03/2025 | | | | 90,519 | |
| | 257,201 | | | Pike Corporation, Senior Secured First Lien Term Loan (1 Month LIBOR USD + 3.25%) | | | 4.24 | % | | | 07/24/2026 | | | | 241,341 | |
| | 180,707 | | | Pisces Midco, Inc., Senior Secured First Lien Term Loan (1 Month LIBOR USD + 3.75%) | | | 4.56 | % | | | 04/12/2025 | | | | 154,957 | |
| | 184,169 | | | Playa Resorts Holding B.V., Senior Secured First Lien Term Loan (1 Month LIBOR USD + 2.75%, 1.00% Floor) | | | 3.75 | % | | | 04/29/2024 | | | | 128,182 | |
| | 468,228 | | | PODS LLC, Senior Secured First Lien Term Loan (3 Month LIBOR USD + 2.75%, 1.00% Floor) | | | 3.75 | % | | | 12/06/2024 | | | | 419,064 | |
| | 212,484 | | | PowerTeam Services LLC, Senior Secured First Lien Term Loan (3 Month LIBOR USD + 3.25%, 1.00% Floor) | | | 4.70 | % | | | 03/06/2025 | | | | 178,840 | |
| | 150,500 | | | Prairie ECI Acquiror LP, Senior Secured First Lien Term Loan (3 Month LIBOR USD + 4.75%) | | | 6.20 | % | | | 03/11/2026 | | | | 80,104 | |
| | 274,338 | | | Pregis Topco LLC, Senior Secured First Lien Term Loan (3 Month LIBOR USD + 4.00%) | | | 4.99 | % | | | 07/31/2026 | | | | 241,417 | |
| | 65,000 | | | Presidio Holdings, Inc., Senior Secured First Lien Term Loan (3 Month LIBOR USD + 3.50%) | | | 5.28 | % | | | 01/22/2027 | | | | 61,100 | |
| | 348,650 | | | Prime Security Services Borrower, LLC, Senior Secured First Lien Term Loan (1 Month LIBOR USD + 3.25%, 1.00% Floor) | | | 4.27 | % | | | 09/23/2026 | | | | 316,749 | |
| | 215,958 | | | Pro Mach Group, Inc., Senior Secured First Lien Term Loan (1 Month LIBOR USD + 3.00%) | | | 3.68 | % | | | 03/07/2025 | | | | 173,846 | |
| | 109,725 | | | Pug LLC, Senior Secured First Lien Term Loan (1 Month LIBOR USD + 3.50%) | | | 4.49 | % | | | 02/12/2027 | | | | 95,461 | |
| | 386,900 | | | Radiate Finance, Inc., Senior Secured First Lien Term Loan (1 Month LIBOR USD + 3.00%, 0.75% Floor) | | | 3.99 | % | | | 02/01/2024 | | | | 361,752 | |
| | | | Radiology Partners, Inc., Senior Secured First Lien Term Loan | | | | | | | | | | | | |
| | 148,697 | | | Radiology Partners, Inc., Senior Secured First Lien Term Loan (2 Month LIBOR USD + 4.25%) | | | 5.98 | % | | | 07/09/2025 | | | | 124,608 | |
| | 173,427 | | | Radiology Partners, Inc., Senior Secured First Lien Term Loan (2 Month LIBOR USD + 4.25%) | | | 5.99 | % | | | 07/09/2025 | | | | 145,332 | |
| | | | | | | | | | | | | | | | |
| | | | | | | | | | | | | |
| | 134,924 | | | RegionalCare Hospital Partners Holdings, Inc., Senior Secured First Lien Term Loan (1 Month LIBOR USD + 4.50%) | | | 4.74 | % | | | 11/14/2025 | | | | 125,986 | |
| | 459,492 | | | Renaissance Holding Corporation, Senior Secured First Lien Term Loan (1 Month LIBOR USD + 3.25%) | | | 4.24 | % | | | 05/30/2025 | | | | 389,419 | |
| | 383,336 | | | RentPath, Inc., Senior Secured First Lien Term Loan (1 Month LIBOR USD + 4.75%, 1.00% Floor) | | | 7.00 | % W | | | 12/17/2021 | | | | 293,684 | |
| | 66,566 | | | RentPath, Inc., Senior Secured First Lien Term Loan (1 Month LIBOR USD + 7.00%, 1.00% Floor) | | | 8.00 | % | | | 08/31/2020 | | | | 63,571 | |
| | 145,000 | | | Reynolds Consumer Products LLC, Senior Secured First Lien Term Loan (3 Month LIBOR USD + 1.75%) | | | 3.50 | % | | | 02/04/2027 | | | | 137,677 | |
| | 10,000 | | | Rockwood Service Corporation, Senior Secured First Lien Term Loan (3 Month LIBOR USD + 4.25%) | | | 5.70 | % | | | 01/23/2027 | | | | 8,650 | |
| | 197,500 | | | RPI Intermediate Finance Trust, Senior Secured First Lien Term Loan (1 Month LIBOR USD + 1.75%) | | | 2.74 | % | | | 02/11/2027 | | | | 185,403 | |
| | 199,500 | | | RPI Intermediate Finance Trust, Senior Secured First Lien Term Loan (1 Month LIBOR USD + 1.75%) | | | 2.74 | % | | | 02/11/2027 | | | | 186,532 | |
| | 165,000 | | | Science Applications International Corporation, Senior Secured First Lien Term Loan (1 Month LIBOR USD + 2.25%) | | | 3.24 | % | | | 03/12/2027 | | | | 156,337 | |
| | 332,757 | | | Securus Technologies Holdings, Inc., Senior Secured First Lien Term Loan (6 Month LIBOR USD + 4.50%, 1.00% Floor) | | | 5.50 | % | | | 11/01/2024 | | | | 264,542 | |
| | 419,250 | | | Sedgwick Claims Management Services, Inc., Senior Secured First Lien Term Loan (1 Month LIBOR USD + 3.25%) | | | 4.24 | % | | | 12/31/2025 | | | | 375,054 | |
| | 114,713 | | | ServiceMaster Company LLC, Senior Secured First Lien Term Loan (1 Month LIBOR USD + 1.75%) | | | 2.74 | % | | | 11/05/2026 | | | | 110,468 | |
| | 374,018 | | | Severin Acquisition LLC, Senior Secured First Lien Term Loan (3 Month LIBOR USD + 3.25%) | | | 4.74 | % | | | 08/01/2025 | | | | 328,513 | |
| | 587,050 | | | Sinclair Television Group, Inc., Senior Secured First Lien Term Loan (1 Month LIBOR USD + 2.50%) | | | 3.21 | % | | | 09/30/2026 | | | | 560,633 | |
| | 139,291 | | | SIWF Holdings, Inc., Senior Secured First Lien Term Loan (1 Month LIBOR USD + 4.25%) | | | 5.32 | % | | | 06/13/2025 | | | | 125,362 | |
| | 337,450 | | | Six Flags Theme Parks, Inc., Senior Secured First Lien Term Loan (1 Month LIBOR USD + 1.75%) | | | 2.74 | % | | | 04/17/2026 | | | | 299,403 | |
| | 313,676 | | | SMG US Midco 2, Inc., Senior Secured First Lien Term Loan (1 Month LIBOR USD + 2.50%) | | | 4.13 | % | | | 01/23/2025 | | | | 270,546 | |
| | 340,198 | | | Solenis International LP, Senior Secured First Lien Term Loan (3 Month LIBOR USD + 4.00%) | | | 5.61 | % | | | 06/26/2025 | | | | 274,427 | |
| | 20,000 | | | Solenis International LP, Senior Secured Second Lien Term Loan (3 Month LIBOR USD + 8.50%) | | | 10.11 | % | | | 06/26/2026 | | | | 13,900 | |
| | 397,240 | | | Sophia LP, Senior Secured First Lien Term Loan (3 Month LIBOR USD + 3.25%, 1.00% Floor) | | | 4.70 | % | | | 09/30/2022 | | | | 381,350 | |
| | 375,000 | | | Sotera Health Holdings LLC, Senior Secured First Lien Term Loan (1 Month LIBOR USD + 4.50%, 1.00% Floor) | | | 5.50 | % | | | 12/11/2026 | | | | 331,290 | |
| | 484,341 | | | Sound Inpatient Physicians, Inc., Senior Secured First Lien Term Loan (1 Month LIBOR USD + 2.75%) | | | 3.74 | % | | | 06/27/2025 | | | | 434,294 | |
| | 166,942 | | | Southern Graphics, Inc., Senior Secured First Lien Term Loan (1 Month LIBOR USD + 3.25%) | | | 4.70 | % | | | 12/30/2022 | | | | 89,731 | |
| | 230,865 | | | Speedcast International Ltd., Senior Secured First Lien Term Loan (3 Month LIBOR USD + 2.75%) | | | 5.00 | % W | | | 05/15/2025 | | | | 58,293 | |
| | 369,234 | | | SS&C Technologies, Inc., Senior Secured First Lien Term Loan (1 Month LIBOR USD + 2.25%) | | | 2.74 | % | | | 04/16/2025 | | | | 349,273 | |
| | 215,833 | | | Staples, Inc., Senior Secured First Lien Term Loan (2 Month LIBOR USD + 5.00%) | | | 6.02 | % | | | 04/16/2026 | | | | 172,450 | |
| | 189,672 | | | Starfruit US Holdco LLC, Senior Secured First Lien Term Loan (1 Month LIBOR USD + 3.25%) | | | 3.86 | % | | | 10/01/2025 | | | | 172,127 | |
| | 334,313 | | | Stars Group Holdings B.V., Senior Secured First Lien Term Loan (3 Month LIBOR USD + 3.50%) | | | 4.95 | % | | | 07/10/2025 | | | | 322,194 | |
| | 75,000 | | | STG-Fairway Holdings, LLC, Senior Secured First Lien Term Loan (6 Month LIBOR USD + 3.50%) | | | 4.57 | % | | | 02/01/2027 | | | | 64,875 | |
| | 99,750 | | | Sunshine Luxembourg VII SARL, Senior Secured First Lien Term Loan (3 Month LIBOR USD + 4.25%) | | | 5.32 | % | | | 10/01/2026 | | | | 90,772 | |
| | | | | | | | | | | | | | | | |
| | | | | | | | | | | | | |
| | 375,000 | | | Surf Holdings LLC, Senior Secured First Lien Term Loan (3 Month LIBOR USD + 3.50%) | | | 4.81 | % | | | 03/05/2027 | | | | 336,562 | |
| | 80,779 | | | Syncreon Group Holdings B.V., Senior Secured First Lien Term Loan (1 Month LIBOR USD + 5.00%) | | | 6.07 | % | | | 10/01/2024 | | | | 69,874 | |
| | 144,496 | | | Syncreon Group Holdings B.V., Senior Secured First Lien Term Loan (1 Month LIBOR USD + 6.00%) | | | 7.45 | % | | | 04/01/2025 | | | | 97,535 | |
| | 194,150 | | | TAMKO Building Products LLC, Senior Secured First Lien Term Loan (1 Month LIBOR USD + 3.25%) | | | 4.24 | % | | | 05/29/2026 | | | | 183,471 | |
| | 184,256 | | | Team Health Holdings, Inc., Senior Secured First Lien Term Loan (1 Month LIBOR USD + 2.75%, 1.00% Floor) | | | 3.75 | % | | | 02/06/2024 | | | | 118,845 | |
| | 219,450 | | | Telesat LLC, Senior Secured First Lien Term Loan (3 Month LIBOR USD + 2.75%) | | | 3.74 | % | | | 12/07/2026 | | | | 210,672 | |
| | 124,688 | | | Terrier Media Buyer, Inc., Senior Secured First Lien Term Loan (3 Month LIBOR USD + 4.25%) | | | 5.70 | % | | | 12/17/2026 | | | | 113,154 | |
| | 321,532 | | | The Edelman Financial Center LLC, Senior Secured First Lien Term Loan (1 Month LIBOR USD + 3.25%) | | | 4.18 | % | | | 07/21/2025 | | | | 276,919 | |
| | 139,850 | | | TIBCO Software Inc, Senior Secured First Lien Term Loan (1 Month LIBOR USD + 3.75%) | | | 4.74 | % | | | 06/30/2026 | | | | 132,857 | |
| | 35,000 | | | TIBCO Software Inc, Senior Secured Second Lien Term Loan (1 Month LIBOR USD + 7.25%) | | | 8.66 | % | | | 03/03/2028 | | | | 33,425 | |
| | 270,064 | | | Titan Acquisition Ltd., Senior Secured First Lien Term Loan (1 Month LIBOR USD + 3.00%) | | | 4.45 | % | | | 03/28/2025 | | | | 224,750 | |
| | 426,943 | | | TKC Holdings, Inc., Senior Secured First Lien Term Loan (1 Month LIBOR USD + 3.75%, 1.00% Floor) | | | 4.75 | % | | | 02/01/2023 | | | | 348,920 | |
| | 106,552 | | | Trans Union LLC, Senior Secured First Lien Term Loan (1 Month LIBOR USD + 1.75%) | | | 2.74 | % | | | 11/13/2026 | | | | 102,716 | |
| | 561,539 | | | TransDigm, Inc., Senior Secured First Lien Term Loan (1 Month LIBOR USD + 2.25%) | | | 3.24 | % | | | 12/09/2025 | | | | 517,551 | |
| | 297,268 | | | Travel Leaders Group LLC, Senior Secured First Lien Term Loan (1 Month LIBOR USD + 4.00%) | | | 4.96 | % | | | 01/25/2024 | | | | 228,401 | |
| | 240,818 | | | Travelport Finance SARL, Senior Secured First Lien Term Loan (3 Month LIBOR USD + 5.00%) | | | 6.07 | % | | | 05/29/2026 | | | | 157,977 | |
| | 194,008 | | | Trident TPI Holdings, Inc., Senior Secured First Lien Term Loan (6 Month LIBOR USD + 3.25%, 1.00% Floor) | | | 4.32 | % | | | 10/17/2024 | | | | 162,966 | |
| | 183,538 | | | UGI Energy Services LLC, Senior Secured First Lien Term Loan (1 Month LIBOR USD + 3.75%) | | | 4.74 | % | | | 08/13/2026 | | | | 158,760 | |
| | 288,550 | | | Ultimate Software Group, Senior Secured First Lien Term Loan (1 Month LIBOR USD + 3.75%) | | | 4.74 | % | | | 05/04/2026 | | | | 271,717 | |
| | 184,534 | | | United Natural Foods, Inc., Senior Secured First Lien Term Loan (1 Month LIBOR USD + 4.25%) | | | 5.24 | % | | | 10/22/2025 | | | | 159,853 | |
| | 79,800 | | | Univar Solutions USA, Inc., Senior Secured First Lien Term Loan (1 Month LIBOR USD + 2.00%) | | | 3.45 | % | | | 07/01/2026 | | | | 70,984 | |
| | 113,083 | | | Univision Communications Inc., Senior Secured First Lien Term Loan (1 Month LIBOR USD + 2.75%, 1.00% Floor) | | | 3.75 | % | | | 03/15/2024 | | | | 97,322 | |
| | 155,000 | | | Upstream Newco, Inc., Senior Secured First Lien Term Loan (1 Month LIBOR USD + 4.50%) | | | 5.49 | % | | | 11/20/2026 | | | | 129,425 | |
| | 592,025 | | | US Foods, Inc., Senior Secured First Lien Term Loan (3 Month LIBOR USD + 2.00%, 0.75% Floor) | | | 3.07 | % | | | 09/14/2026 | | | | 545,847 | |
| | 276,260 | | | USIC Holdings, Inc., Senior Secured First Lien Term Loan (1 Month LIBOR USD + 3.25%, 1.00% Floor) | | | 4.25 | % | | | 12/08/2023 | | | | 235,512 | |
| | 190,883 | | | Vantage Specialty Chemicals, Inc., Senior Secured First Lien Term Loan (3 Month LIBOR USD + 3.50%, 1.00% Floor) | | | 5.28 | % | | | 10/28/2024 | | | | 145,608 | |
| | 454,489 | | | Verscend Holding Corporation, Senior Secured First Lien Term Loan (1 Month LIBOR USD + 4.50%) | | | 5.49 | % | | | 08/27/2025 | | | | 431,765 | |
| | 303,409 | | | Vertafore, Inc., Senior Secured First Lien Term Loan (1 Month LIBOR USD + 3.25%) | | | 4.24 | % | | | 07/02/2025 | | | | 270,673 | |
| | 595,000 | | | VICI Properties LLC, Senior Secured First Lien Term Loan (1 Month LIBOR USD + 2.00%) | | | 2.67 | % | | | 12/20/2024 | | | | 553,722 | |
| | 132,945 | | | Victory Capital Holdings, Inc., Senior Secured First Lien Term Loan (3 Month LIBOR USD + 2.50%) | | | 3.94 | % | | | 07/01/2026 | | | | 117,657 | |
| | | | | | | | | | | | | | | | |
| | | | | | | | | | | | | |
| | 110,000 | | | Virgin Media Bristol LLC, Senior Secured First Lien Term Loan (1 Month LIBOR USD + 2.50%) | | | 3.2 | % | | | 01/31/2028 | | | | 102,575 | |
| | 693,447 | | | Vistra Operations Company LLC, Senior Secured First Lien Term Loan (1 Month LIBOR USD + 1.75%) | | | 2.55 | % | | | 12/31/2025 | | | | 662,708 | |
| | 154,531 | | | VS Buyer, LLC, Senior Secured First Lien Term Loan (3 Month LIBOR USD + 3.25%) | | | 4.86 | % | | | 02/26/2027 | | | | 149,123 | |
| | | | Wand NewCo 3, Inc., Senior Secured First Lien Term Loan | | | | | | | | | | | | |
| | 278,680 | | | (6 Month LIBOR USD + 3.00%) | | | 4.07 | % | | | 02/05/2026 | | | | 252,206 | |
| | 43,986 | | | (3 Month LIBOR USD + 3.00%) | | | 4.07 | % | | | 02/05/2026 | | | | 39,807 | |
| | 185,000 | | | Web.Com Group, Inc., Senior Secured First Lien Term Loan (1 Month LIBOR USD + 3.75%) | | | 4.95 | % | | | 10/10/2025 | | | | 153,550 | |
| | 298,502 | | | Whatabrands LLC, Senior Secured First Lien Term Loan (1 Month LIBOR USD + 2.75%) | | | 3.73 | % | | | 07/31/2026 | | | | 250,213 | |
| | 469,166 | | | Wink Holdco, Inc., Senior Secured First Lien Term Loan (1 Month LIBOR USD + 3.00%, 1.00% Floor) | | | 4.45 | % | | | 12/02/2024 | | | | 400,668 | |
| | 446,025 | | | WP CPP Holdings LLC, Senior Secured First Lien Term Loan (1 Month LIBOR USD + 3.75%, 1.00% Floor) | | | 5.36 | % | | | 04/30/2025 | | | | 340,094 | |
| | 109,725 | | | Zelis Cost Management Buyer, Inc., Senior Secured First Lien Term Loan (1 Month LIBOR USD + 4.75%) | | | 5.74 | % | | | 09/30/2026 | | | | 102,044 | |
| | 50,000 | | | Ziggo Financing Partnership, Senior Secured First Lien Term Loan (1 Month LIBOR USD + 2.50%) | | | 3.2 | % | | | 04/28/2028 | | | | 47,750 | |
| | | | | | | | | | | | | | | | |
| | Total Bank Loans(Cost $63,571,459) | | | | | | | | | | | 54,546,251 | |
| | | | | | | | | | | | | | | | |
| | Collateralized Loan Obligations - 15.4% | | | | | | | | | | | | |
| | 250,000 | | | Adams Mill Ltd., Series2014-1A-D1 (3 Month LIBOR USD + 3.50%) | | | 5.33 | % ^ | | | 07/15/2026 | | | | 225,033 | |
| | 2,500,000 | | | AIMCO, Series2015-AA-DR (3 Month LIBOR USD + 2.45%, 2.45% Floor) | | | 4.28 | % ^ | | | 01/15/2028 | | | | 2,087,500 | |
| | 2,000,000 | | | Apidos Ltd., Series2013-12A-DR (3 Month LIBOR USD + 2.60%) | | | 4.43 | % ^ | | | 04/15/2031 | | | | 1,508,820 | |
| | 1,500,000 | | | Apidos Ltd., Series2015-21A-CR (3 Month LIBOR USD + 2.45%, 2.45% Floor) | | | 4.27 | % ^ | | | 07/18/2027 | | | | 1,233,896 | |
| | 2,500,000 | | | Apidos Ltd., Series2016-24A-CR (3 Month LIBOR USD + 3.05%) | | | 4.87 | % ^ | | | 10/20/2030 | | | | 1,923,568 | |
| | 2,500,000 | | | Apidos Ltd., Series2018-29A-C (3 Month LIBOR USD + 2.75%) | | | 4.54 | % ^ | | | 07/25/2030 | | | | 1,892,394 | |
| | 2,500,000 | | | Atrium Corporation, Series13A-D (3 Month LIBOR USD + 2.70%) | | | 4.51 | % ^ | | | 11/21/2030 | | | | 1,822,016 | |
| | 1,000,000 | | | Atrium Corporation, Series14A-D (3 Month LIBOR USD + 2.95%, 2.95% Floor) | | | 4.79 | % ^ | | | 08/23/2030 | | | | 760,321 | |
| | 3,000,000 | | | Atrium Corporation, Series9A-DR (3 Month LIBOR USD + 3.60%) | | | 5.21 | % ^ | | | 05/28/2030 | | | | 2,399,130 | |
| | 1,500,000 | | | Babson Ltd., Series2015-2A-DR (3 Month LIBOR USD + 2.95%) | | | 4.77 | % ^ | | | 10/20/2030 | | | | 1,165,115 | |
| | 1,737,500 | | | Babson Ltd., Series2015-2A-ER (3 Month LIBOR USD + 6.45%) | | | 8.27 | % ^ | | | 10/20/2030 | | | | 1,175,244 | |
| | 4,000,000 | | | Barings Ltd., Series2018-3A-D (3 Month LIBOR USD + 2.90%) | | | 4.72 | % ^ | | | 07/20/2029 | | | | 3,272,078 | |
| | 2,000,000 | | | Barings Ltd., Series2019-2A-C (3 Month LIBOR USD + 3.85%, 3.85% Floor) | | | 5.68 | % ^ | | | 04/15/2031 | | | | 1,562,648 | |
| | 3,770,000 | | | BlueMountain Ltd., Series2013-2A-DR (3 Month LIBOR USD + 2.90%) | | | 4.70 | % ^ | | | 10/22/2030 | | | | 2,869,655 | |
| | 1,750,000 | | | BlueMountain Ltd., Series2015-2A-DR (3 Month LIBOR USD + 2.75%, 2.75% Floor) | | | 4.57 | % ^ | | | 07/18/2027 | | | | 1,390,270 | |
| | 500,000 | | | BlueMountain Ltd., Series2015-3A-CR (3 Month LIBOR USD + 2.60%) | | | 4.42 | % ^ | | | 04/20/2031 | | | | 349,296 | |
| | 1,000,000 | | | BlueMountain Ltd., Series2016-3A-DR (3 Month LIBOR USD + 3.10%, 3.10% Floor) | | | 4.79 | % ^ | | | 11/15/2030 | | | | 688,815 | |
| | 1,000,000 | | | BlueMountain Ltd., Series2017-2A-C (3 Month LIBOR USD + 3.00%) | | | 4.82 | % ^ | | | 10/20/2030 | | | | 767,416 | |
| | 2,000,000 | | | Canyon Capital Ltd., Series2012-1RA-D (3 Month LIBOR USD + 3.00%) | | | 4.83 | % ^ | | | 07/15/2030 | | | | 1,547,251 | |
| | | | | | | | | | | | | | | | |
| | | | | | | | | | | | | |
| | 2,000,000 | | | Canyon Capital Ltd., Series2014-1A-CR (3 Month LIBOR USD + 2.75%, 2.75% Floor) | | | 4.52 | % ^ | | | 01/30/2031 | | | | 1,489,366 | |
| | 2,000,000 | | | Canyon Capital Ltd., Series2014-2A-DR (3 Month LIBOR USD + 3.65%) | | | 5.48 | % ^ | | | 04/15/2029 | | | | 1,642,880 | |
| | 10,000,000 | | | Canyon Capital Ltd., Series2017-1A-B (3 Month LIBOR USD + 1.70%) | | | 3.53 | % ^ | | | 07/15/2030 | | | | 8,993,362 | |
| | 2,500,000 | | | Canyon Capital Ltd., Series2018-1A-D (3 Month LIBOR USD + 2.90%, 2.90% Floor) | | | 4.73 | % ^ | | | 07/15/2031 | | | | 1,927,365 | |
| | 1,250,000 | | | Carlyle Global Market Strategies Ltd., Series2013-2A-DR (3 Month LIBOR USD + 2.40%) | | | 4.22 | % ^ | | | 01/18/2029 | | | | 946,475 | |
| | 1,500,000 | | | Chenango Park Ltd., Series2018-1A-C (3 Month LIBOR USD + 3.00%, 3.00% Floor) | | | 4.83 | % ^ | | | 04/15/2030 | | | | 1,141,122 | |
| | 3,000,000 | | | CVP Ltd., Series2017-1A-A (3 Month LIBOR USD + 1.34%) | | | 3.16 | % ^ | | | 07/20/2030 | | | | 2,815,866 | |
| | 2,500,000 | | | Dryden Senior Loan Fund, Series2013-28A-B1LR (3 Month LIBOR USD + 3.15%) | | | 4.84 | % ^ | | | 08/15/2030 | | | | 1,953,639 | |
| | 3,900,000 | | | Dryden Senior Loan Fund, Series2014-33A-DR2 (3 Month LIBOR USD + 3.85%, 3.85% Floor) | | | 5.68 | % ^ | | | 04/15/2029 | | | | 3,365,540 | |
| | 3,000,000 | | | Dryden Senior Loan Fund, Series2015-37A-DR (3 Month LIBOR USD + 2.50%, 2.50% Floor) | | | 4.33 | % ^ | | | 01/15/2031 | | | | 2,141,695 | |
| | 1,000,000 | | | Dryden Senior Loan Fund, Series2016-45A-DR (3 Month LIBOR USD + 3.15%, 3.15% Floor) | | | 4.98 | % ^ | | | 10/15/2030 | | | | 730,676 | |
| | 1,000,000 | | | Dryden Senior Loan Fund, Series2017-50A-D (3 Month LIBOR USD + 3.25%) | | | 5.08 | % ^ | | | 07/15/2030 | | | | 793,259 | |
| | 5,500,000 | | | GoldenTree Loan Management Ltd., Series2017-2A-D (3 Month LIBOR USD + 2.65%) | | | 4.47 | % ^ | | | 11/28/2030 | | | | 4,174,215 | |
| | 2,500,000 | | | GoldenTree Loan Opportunities Ltd., Series2016-12A-DR (3 Month LIBOR USD + 2.90%) | | | 4.72 | % ^ | | | 07/21/2030 | | | | 1,883,850 | |
| | 1,500,000 | | | Greenwood Park Ltd., Series2018-1A-D (3 Month LIBOR USD + 2.50%) | | | 4.33 | % ^ | | | 04/15/2031 | | | | 1,099,201 | |
| | 250,000 | | | Halcyon Loan Advisors Funding Ltd., Series2013-2A-C (3 Month LIBOR USD + 2.70%) | | | 4.46 | % ^ | | | 08/01/2025 | | | | 240,743 | |
| | 250,000 | | | Halcyon Loan Advisors Funding Ltd., Series2014-2A-D (3 Month LIBOR USD + 5.00%) | | | 6.80 | % ^Þ | | | 04/28/2025 | | | | 180,404 | |
| | 2,000,000 | | | Hayfin Kingsland Ltd., Series2018-8A-B (3 Month LIBOR USD + 1.48%, 1.48% Floor) | | | 3.30 | % ^ | | | 04/20/2031 | | | | 1,718,776 | |
| | 2,000,000 | | | Highbridge Loan Management Ltd., Series2013-2A-CR (3 Month LIBOR USD + 2.90%) | | | 4.72 | % ^ | | | 10/20/2029 | | | | 1,453,539 | |
| | 1,500,000 | | | HPS Loan Management Ltd., Series13A-18-D (3 Month LIBOR USD + 3.00%, 3.00% Floor) | | | 4.83 | % ^ | | | 10/15/2030 | | | | 1,121,322 | |
| | 3,175,000 | | | LCM LP, Series14A-DR (3 Month LIBOR USD + 2.75%) | | | 4.57 | % ^ | | | 07/20/2031 | | | | 2,146,658 | |
| | 1,250,000 | | | LCM LP, Series19A-E2 (3 Month LIBOR USD + 5.70%, 5.70% Floor) | | | 7.53 | % ^ | | | 07/15/2027 | | | | 861,745 | |
| | 2,000,000 | | | LCM LP, Series20A-DR (3 Month LIBOR USD + 2.80%, 2.80% Floor) | | | 4.62 | % ^ | | | 10/20/2027 | | | | 1,650,259 | |
| | 5,000,000 | | | LCM Ltd., Series26A-D (3 Month LIBOR USD + 2.50%, 2.50% Floor) | | | 4.32 | % ^ | | | 01/20/2031 | | | | 3,434,403 | |
| | 1,500,000 | | | LCM Ltd., Series27A-D (3 Month LIBOR USD + 2.95%) | | | 4.79 | % ^ | | | 07/16/2031 | | | | 1,080,300 | |
| | 1,000,000 | | | Madison Park Funding Ltd., Series2014-15A-CR (3 Month LIBOR USD + 3.45%) | | | 5.24 | % ^ | | | 01/27/2026 | | | | 921,821 | |
| | 2,500,000 | | | Madison Park Funding Ltd., Series2014-15A-DR (3 Month LIBOR USD + 5.44%) | | | 7.23 | % ^ | | | 01/27/2026 | | | | 1,768,971 | |
| | 1,000,000 | | | Madison Park Funding Ltd., Series2015-16A-D (3 Month LIBOR USD + 5.50%) | | | 7.32 | % ^ | | | 04/20/2026 | | | | 751,966 | |
| | 500,000 | | | Madison Park Funding Ltd., Series2015-18A-DR (3 Month LIBOR USD + 2.95%) | | | 4.77 | % ^ | | | 10/21/2030 | | | | 382,600 | |
| | 3,000,000 | | | Madison Park Funding Ltd., Series2017-25A-C (3 Month LIBOR USD + 3.60%) | | | 5.39 | % ^ | | | 04/25/2029 | | | | 2,554,240 | |
| | 1,000,000 | | | Madison Park Funding Ltd., Series2018-30A-D (3 Month LIBOR USD + 2.50%, 2.50% Floor) | | | 4.33 | % ^ | | | 04/15/2029 | | | | 772,163 | |
| | 3,500,000 | | | Magnetite Ltd., Series2018-20A-D (3 Month LIBOR USD + 2.50%) | | | 4.32 | % ^ | | | 04/20/2031 | | | | 2,590,576 | |
| | 1,000,000 | | | Marathon Ltd., Series2017-9A-A2 (3 Month LIBOR USD + 1.75%) | | | 3.58 | % ^ | | | 04/15/2029 | | | | 863,816 | |
| | | | | | | | | | | | | | | | |
| | | | | | | | | | | | | |
| | 6,500,000 | | | Marble Point Ltd., Series2019-1A-B (3 Month LIBOR USD + 2.15%) | | | 3.96 | % ^ | | | 07/23/2032 | | | | 5,923,190 | |
| | 1,000,000 | | | Myers Park Ltd., Series2018-1A-D (3 Month LIBOR USD + 3.05%, 3.05% Floor) | | | 4.87 | % ^ | | | 10/20/2030 | | | | 758,329 | |
| | 1,000,000 | | | Neuberger Berman Loan Advisers Ltd., Series2016-21A-DR (3 Month LIBOR USD + 2.40%, 2.40% Floor) | | | 4.22 | % ^ | | | 04/20/2027 | | | | 841,026 | |
| | 4,000,000 | | | Neuberger Berman Loan Advisers Ltd., Series2017-16SA-D (3 Month LIBOR USD + 2.50%) | | | 4.33 | % ^ | | | 01/15/2028 | | | | 3,374,178 | |
| | 1,500,000 | | | Neuberger Berman Loan Advisers Ltd., Series2017-25A-D (3 Month LIBOR USD + 3.25%) | | | 5.07 | % ^ | | | 10/18/2029 | | | | 1,128,291 | |
| | 1,000,000 | | | Neuberger Berman Loan Advisers Ltd., Series2017-26A-D (3 Month LIBOR USD + 2.65%, 2.65% Floor) | | | 4.47 | % ^ | | | 10/18/2030 | | | | 755,199 | |
| | 1,500,000 | | | Neuberger Berman Loan Advisers Ltd., Series2018-28A-D (3 Month LIBOR USD + 2.85%) | | | 4.67 | % ^ | | | 04/20/2030 | | | | 1,122,838 | |
| | 4,500,000 | | | Octagon Investment Partners Ltd., Series2012-1A-CR (3 Month LIBOR USD + 4.00%) | | | 5.83 | % ^ | | | 07/15/2029 | | | | 3,560,870 | |
| | 500,000 | | | Octagon Investment Partners Ltd., Series2014-1A-CRR (3 Month LIBOR USD + 3.95%, 3.95% Floor) | | | 5.65 | % ^ | | | 02/14/2031 | | | | 381,180 | |
| | 2,500,000 | | | Octagon Investment Partners Ltd., Series2017-1A-C (3 Month LIBOR USD + 3.50%) | | | 5.32 | % ^ | | | 03/17/2030 | | | | 2,165,019 | |
| | 2,000,000 | | | Octagon Investment Partners Ltd., Series2017-1A-D (3 Month LIBOR USD + 3.70%) | | | 5.52 | % ^ | | | 07/20/2030 | | | | 1,689,888 | |
| | 1,250,000 | | | Octagon Investment Partners Ltd., Series2017-1A-D (3 Month LIBOR USD + 6.20%) | | | 8.02 | % ^ | | | 03/17/2030 | | | | 788,756 | |
| | 4,000,000 | | | Octagon Investment Partners Ltd., Series2018-1A-C (3 Month LIBOR USD + 2.60%, 2.60% Floor) | | | 4.42 | % ^ | | | 01/20/2031 | | | | 3,165,645 | |
| | 3,000,000 | | | Octagon Investment Partners Ltd., Series2018-2A-C (3 Month LIBOR USD + 2.85%) | | | 4.64 | % ^ | | | 07/25/2030 | | | | 2,127,088 | |
| | 1,000,000 | | | OHA Credit Funding Ltd., Series2018-1A-D (3 Month LIBOR USD + 3.05%, 3.05% Floor) | | | 4.87 | % ^ | | | 10/20/2030 | | | | 759,236 | |
| | 3,000,000 | | | RRAM Ltd., Series2018-4A-C (3 Month LIBOR USD + 2.95%) | | | 4.78 | % ^ | | | 04/15/2030 | | | | 2,355,000 | |
| | 5,000,000 | | | Steele Creek Ltd., Series2019-2A-B (3 Month LIBOR USD + 2.25%, 2.25% Floor) | | | 4.08 | % ^ | | | 07/15/2032 | | | | 4,411,063 | |
| | 3,500,000 | | | Stewart Park Ltd., Series2015-1A-DR (3 Month LIBOR USD + 2.60%, 2.60% Floor) | | | 4.43 | % ^ | | | 01/15/2030 | | | | 2,606,334 | |
| | 1,500,000 | | | Symphony Ltd., Series2015-16A-DR (3 Month LIBOR USD + 3.05%, 3.05% Floor) | | | 4.88 | % ^ | | | 10/15/2031 | | | | 1,085,168 | |
| | 1,000,000 | | | Symphony Ltd., Series2016-17A-DR (3 Month LIBOR USD + 2.65%) | | | 4.48 | % ^ | | | 04/15/2028 | | | | 857,430 | |
| | 3,000,000 | | | Thacher Park Ltd., Series2014-1A-D1R (3 Month LIBOR USD + 3.40%) | | | 5.22 | % ^ | | | 10/20/2026 | | | | 2,576,527 | |
| | 6,000,000 | | | Trimaran CAVU LLC, Series2019-1A-B (3 Month LIBOR USD + 2.20%, 2.20% Floor) | | | 4.02 | % ^ | | | 07/20/2032 | | | | 5,520,347 | |
| | 5,000,000 | | | Venture Ltd., Series2018-34A-A (3 Month LIBOR USD + 1.23%, 1.23% Floor) | | | 3.06 | % ^ | | | 10/15/2031 | | | | 4,739,775 | |
| | 3,900,000 | | | Voya Ltd., Series2013-1A-CR (3 Month LIBOR USD + 2.95%) | | | 4.78 | % ^ | | | 10/15/2030 | | | | 2,858,537 | |
| | 1,500,000 | | | Voya Ltd., Series2017-3A-C (3 Month LIBOR USD + 3.55%) | | | 5.37 | % ^ | | | 07/20/2030 | | | | 1,204,443 | |
| | 1,000,000 | | | Westcott Park Ltd., Series2016-1A-DR (3 Month LIBOR USD + 3.25%) | | | 5.07 | % ^ | | | 07/20/2028 | | | | 851,611 | |
| | 2,000,000 | | | Wind River Ltd., Series2013-2A-E1R (3 Month LIBOR USD + 6.75%) | | | 8.57 | % ^ | | | 10/18/2030 | | | | 1,265,353 | |
| | 2,000,000 | | | Wind River Ltd., Series2014-1A-DRR (3 Month LIBOR USD + 3.00%, 3.00% Floor) | | | 4.82 | % ^ | | | 07/18/2031 | | | | 1,387,371 | |
| | 4,000,000 | | | Wind River Ltd., Series2014-2A-DR (3 Month LIBOR USD + 2.90%, 2.90% Floor) | | | 4.73 | % ^ | | | 01/15/2031 | | | | 2,802,780 | |
| | 2,000,000 | | | Wind River Ltd., Series2014-2A-ER (3 Month LIBOR USD + 5.75%, 5.75% Floor) | | | 7.58 | % ^ | | | 01/15/2031 | | | | 1,153,956 | |
| | 7,975,000 | | | Wind River Ltd., Series2015-2A-ER (3 Month LIBOR USD + 5.55%) | | | 7.38 | % ^ | | | 10/15/2027 | | | | 5,590,298 | |
| | 3,500,000 | | | Wind River Ltd., Series2016-1A-DR (3 Month LIBOR USD + 2.85%) | | | 4.68 | % ^ | | | 07/15/2028 | | | | 2,507,631 | |
| | 2,000,000 | | | Wind River Ltd., Series2017-1A-D (3 Month LIBOR USD + 3.75%) | | | 5.57 | % ^ | | | 04/18/2029 | | | | 1,503,236 | |
| | | | | | | | | | | | | | | | |
| | | | | | | | | | | | | |
| | 1,750,000 | | | Wind River Ltd., Series2017-1A-E (3 Month LIBOR USD + 6.42%) | | | 8.24 | % ^ | | | 04/18/2029 | | | | 1,082,579 | |
| | 1,500,000 | | | Wind River Ltd., Series2017-4A-D (3 Month LIBOR USD + 2.65%) | | | 4.34 | % ^ | | | 11/20/2030 | | | | 1,058,634 | |
| | 1,500,000 | | | Wind River Ltd., Series2018-1A-D (3 Month LIBOR USD + 2.90%) | | | 4.73 | % ^ | | | 07/15/2030 | | | | 1,046,188 | |
| | 3,500,000 | | | Wind River Ltd., Series2018-2A-D (3 Month LIBOR USD + 3.00%) | | | 4.83 | % ^ | | | 07/15/2030 | | | | 2,413,084 | |
| | 2,500,000 | | | York Ltd., Series2019-1A-B (3 Month LIBOR USD + 2.05%) | | | 3.85 | % ^ | | | 07/22/2032 | | | | 2,176,498 | |
| | | | | | | | | | | | | | | | |
| | Total Collateralized Loan Obligations(Cost $216,176,245) | | | | | | | | | | | 169,827,855 | |
| | | | | | | | | | | | | | | | |
| | Foreign Corporate Bonds - 15.1% | | | | | | | | | | | | |
| | 1,200,000 | | | Adani Ports & Special Economic Zone Ltd. | | | 3.95 | % | | | 01/19/2022 | | | | 1,109,976 | |
| | 500,000 | | | Adani Ports & Special Economic Zone Ltd. | | | 3.38 | % | | | 07/24/2024 | | | | 430,175 | |
| | 150,000 | | | Adecoagro S.A. | | | 6.00 | % | | | 09/21/2027 | | | | 117,083 | |
| | 500,000 | | | AES Andres B.V. | | | 7.95 | % ^ | | | 05/11/2026 | | | | 468,250 | |
| | 2,200,000 | | | AES Dominicana | | | 7.95 | % | | | 05/11/2026 | | | | 2,060,300 | |
| | 600,000 | | | AES Gener S.A. | | | 5.00 | % | | | 07/14/2025 | | | | 557,581 | |
| | 200,000 | | | AES Gener S.A. (5 Year CMT Rate + 4.92%) | | | 6.35 | % ^ | | | 10/07/2079 | | | | 152,900 | |
| | 1,000,000 | | | AES Gener S.A. (5 Year CMT Rate + 4.92%) | | | 6.35 | % | | | 10/07/2079 | | | | 764,500 | |
| | 1,300,000 | | | AES Gener S.A. (5 Year Swap Rate USD + 4.64%) | | | 7.13 | % | | | 03/26/2079 | | | | 1,024,565 | |
| | 1,800,000 | | | AES Gener S.A. (5 Year Swap Rate USD + 4.64%) | | | 7.13 | % ^ | | | 03/26/2079 | | | | 1,418,628 | |
| | 500,000 | | | AI Candelaria Spain SLU | | | 7.50 | % | | | 12/15/2028 | | | | 374,271 | |
| | 400,000 | | | AI Candelaria Spain SLU | | | 7.50 | % ^ | | | 12/15/2028 | | | | 299,417 | |
| | 270,000 | | | Aker BP ASA | | | 4.75 | % ^ | | | 06/15/2024 | | | | 227,161 | |
| | 320,000 | | | Alcoa Nederland Holding B.V. | | | 6.13 | % ^ | | | 05/15/2028 | | | | 292,976 | |
| | 200,000 | | | Altice Financing S.A. | | | 5.00 | % ^ | | | 01/15/2028 | | | | 178,500 | |
| | 200,000 | | | Altice France Holding S.A. | | | 6.00 | % ^ | | | 02/15/2028 | | | | 177,436 | |
| | 615,000 | | | Altice France S.A. | | | 7.38 | % ^ | | | 05/01/2026 | | | | 624,563 | |
| | 200,000 | | | ARD Finance S.A. (PIK 9.13%) | | | 6.50 | % ^ | | | 06/30/2027 | | | | 172,890 | |
| | 445,000 | | | Ardagh Packaging Finance, Inc. | | | 6.00 | % ^ | | | 02/15/2025 | | | | 449,583 | |
| | 225,000 | | | Ardagh Packaging Finance, Inc. | | | 5.25 | % ^ | | | 08/15/2027 | | | | 231,874 | |
| | 400,000 | | | Avation Capital S.A. | | | 6.50 | % ^ | | | 05/15/2021 | | | | 367,480 | |
| | 1,000,000 | | | Banco Bradesco S.A. | | | 5.75 | % | | | 03/01/2022 | | | | 1,014,686 | |
| | 3,200,000 | | | Banco BTG Pactual S.A. (5 Year CMT Rate + 5.26%) | | | 7.75 | % ^ | | | 02/15/2029 | | | | 2,752,000 | |
| | 500,000 | | | Banco de Bogota S.A. | | | 5.38 | % | | | 02/19/2023 | | | | 489,378 | |
| | 200,000 | | | Banco de Bogota S.A. | | | 6.25 | % | | | 05/12/2026 | | | | 190,792 | |
| | 200,000 | | | Banco de Reservas de la Republica Dominicana | | | 7.00 | % ^ | | | 02/01/2023 | | | | 191,500 | |
| | 650,000 | | | Banco de Reservas de la Republica Dominicana | | | 7.00 | % | | | 02/01/2023 | | | | 622,375 | |
| | 3,900,000 | | | Banco do Brasil S.A. (10 Year CMT Rate + 4.40%) | | | 6.25 | % † | | | 04/15/2024 | | | | 3,081,975 | |
| | 300,000 | | | Banco GNB Sudameris S.A. (5 Year CMT Rate + 4.56%) | | | 6.50 | % | | | 04/03/2027 | | | | 281,191 | |
| | 100,000 | | | Banco International del Peru S.A.A. (3 Month LIBOR USD + 6.74%) | | | 8.50 | % | | | 04/23/2070 | | | | 98,000 | |
| | 200,000 | | | Banco Macro S.A. (5 Year Swap Rate USD + 5.46%) | | | 6.75 | % ^ | | | 11/04/2026 | | | | 122,002 | |
| | 2,100,000 | | | Banco Macro S.A. (5 Year Swap Rate USD + 5.46%) | | | 6.75 | % | | | 11/04/2026 | | | | 1,281,021 | |
| | | | | | | | | | | | | | | | |
| | | | | | | | | | | | | |
| | 2,400,000 | | | Banco Mercantil del Norte S.A. (10 Year CMT Rate + 5.35%) | | | 7.63 | % † | | | 01/10/2028 | | | | 1,842,780 | |
| | 200,000 | | | Banco Mercantil del Norte S.A. (10 Year CMT Rate + 5.47%) | | | 7.50 | % ^† | | | 06/27/2029 | | | | 152,752 | |
| | 200,000 | | | Banco Mercantil del Norte S.A. (10 Year CMT Rate + 5.47%) | | | 7.50 | % † | | | 06/27/2029 | | | | 152,752 | |
| | 1,200,000 | | | Banco Mercantil del Norte S.A. (5 Year CMT Rate + 5.04%) | | | 6.88 | % † | | | 07/06/2022 | | | | 966,366 | |
| | 700,000 | | | Banco Nacional de Comercio Exterior S.N.C. (5 Year CMT Rate + 3.00%) | | | 3.80 | % | | | 08/11/2026 | | | | 638,262 | |
| | 1,200,000 | | | Banco Nacional de Desenvolvimento Economico e Social | | | 4.75 | % | | | 05/09/2024 | | | | 1,156,806 | |
| | 1,450,000 | | | Banco Santander (5 Year CMT Rate + 3.00%) | | | 5.95 | % ^ | | | 10/01/2028 | | | | 1,350,613 | |
| | 1,500,000 | | | Bancolombia S.A. (5 Year CMT Rate + 2.93%) | | | 4.88 | % | | | 10/18/2027 | | | | 1,365,840 | |
| | 1,700,000 | | | Bancolombia S.A. (5 Year CMT Rate + 2.94%) | | | 4.63 | % | | | 12/18/2029 | | | | 1,500,250 | |
| | 200,000 | | | Banistmo S.A. | | | 3.65 | % ^ | | | 09/19/2022 | | | | 185,313 | |
| | 1,100,000 | | | Banistmo S.A. | | | 3.65 | % | | | 09/19/2022 | | | | 1,019,220 | |
| | 4,400,000 | | | BBVA Bancomer S.A. (5 Year CMT Rate + 2.65%) | | | 5.13 | % | | | 01/18/2033 | | | | 3,676,530 | |
| | 200,000 | | | BBVA Bancomer S.A. (5 Year CMT Rate + 3.00%) | | | 5.35 | % | | | 11/12/2029 | | | | 183,709 | |
| | 200,000 | | | BBVA Bancomer S.A. (5 Year CMT Rate + 4.31%) | | | 5.88 | % ^ | | | 09/13/2034 | | | | 168,010 | |
| | 1,650,000 | | | BBVA Colombia S.A. | | | 4.88 | % | | | 04/21/2025 | | | | 1,570,808 | |
| | 3,150,000 | | | BDO Unibank, Inc. | | | 2.95 | % | | | 03/06/2023 | | | | 3,126,375 | |
| | 220,000 | | | Bombardier, Inc. | | | 6.00 | % ^ | | | 10/15/2022 | | | | 166,650 | |
| | 265,000 | | | Bombardier, Inc. | | | 7.88 | % ^ | | | 04/15/2027 | | | | 184,857 | |
| | 1,500,000 | | | Braskem Idesa SAPI | | | 7.45 | % ^ | | | 11/15/2029 | | | | 1,063,860 | |
| | 1,200,000 | | | C&W Senior Financing DAC | | | 7.50 | % ^ | | | 10/15/2026 | | | | 1,107,639 | |
| | 3,260,000 | | | C&W Senior Financing DAC | | | 6.88 | % | | | 09/15/2027 | | | | 2,834,464 | |
| | 100,000 | | | Camelot Finance S.A. | | | 4.50 | % ^ | | | 11/01/2026 | | | | 97,562 | |
| | 2,950,000 | | | Canacol Energy Ltd. | | | 7.25 | % | | | 05/03/2025 | | | | 2,562,827 | |
| | 300,000 | | | Canacol Energy Ltd. | | | 7.25 | % ^ | | | 05/03/2025 | | | | 260,626 | |
| | 200,000 | | | Cemex S.A.B. de C.V. | | | 6.13 | % | | | 05/05/2025 | | | | 178,749 | |
| | 2,200,000 | | | Cemex S.A.B. de C.V. | | | 7.75 | % | | | 04/16/2026 | | | | 1,981,232 | |
| | 1,000,000 | | | Comcel Trust | | | 6.88 | % | | | 02/06/2024 | | | | 976,265 | |
| | 3,246,150 | | | Cometa Energia S.A. de C.V. | | | 6.38 | % | | | 04/24/2035 | | | | 3,031,093 | |
| | 725,000 | | | Connect Finco LLC | | | 6.75 | % ^ | | | 10/01/2026 | | | | 601,750 | |
| | 500,000 | | | Controladora Mabe S.A. de C.V. | | | 5.60 | % | | | 10/23/2028 | | | | 476,771 | |
| | 400,000 | | | Cosan Overseas Ltd. | | | 8.25 | % † | | | 05/05/2020 | | | | 360,726 | |
| | 200,000 | | | Cosan Overseas Ltd. | | | 7.00 | % | | | 01/20/2027 | | | | 187,861 | |
| | 1,400,000 | | | Credito Real S.A.B. de C.V. | | | 9.50 | % ^ | | | 02/07/2026 | | | | 1,154,835 | |
| | 1,650,000 | | | Credito Real S.A.B. de C.V. (5 Year CMT Rate + 7.03%) | | | 9.13 | % † | | | 11/29/2022 | | | | 1,271,020 | |
| | 1,550,000 | | | CSN Islands Corporation | | | 7.00 | % † | | | 06/23/2020 | | | | 930,473 | |
| | 400,000 | | | CSN Resources S.A. | | | 7.63 | % | | | 02/13/2023 | | | | 280,502 | |
| | 1,600,000 | | | CSN Resources S.A. | | | 7.63 | % ^ | | | 04/17/2026 | | | | 1,050,808 | |
| | 400,000 | | | DBS Group Holdings Ltd. (5 Year Mid Swap Rate USD + 1.59%) | | | 4.52 | % | | | 12/11/2028 | | | | 416,364 | |
| | 2,500,000 | | | DBS Group Holdings Ltd. (5 Year Swap Rate USD + 2.39%) | | | 3.60 | % † | | | 09/07/2021 | | | | 2,317,525 | |
| | 300,000 | | | Delek & Avner Tamar Bond Ltd. | | | 5.08 | % ^ | | | 12/30/2023 | | | | 294,211 | |
| | 520,000 | | | Delek & Avner Tamar Bond Ltd. | | | 5.41 | % ^ | | | 12/30/2025 | | | | 497,993 | |
| | 300,000 | | | Digicel Group Ltd. | | | 8.25 | % ^ | | | 09/30/2022 | | | | 52,500 | |
| | 2,028,641 | | | Digicel Group Ltd. (PIK 9.13%) | | | 9.13 | % ^ | | | 04/01/2024 | | | | 219,945 | |
| | 1,000,000 | | | Docuformas SAPI de C.V. | | | 10.25 | % ^ | | | 07/24/2024 | | | | 688,755 | |
| | 485,000 | | | eG Global Finance PLC | | | 8.50 | % ^ | | | 10/30/2025 | | | | 434,684 | |
| | 1,300,000 | | | Empresa de Transmision Electrica S.A. | | | 5.13 | % ^ | | | 05/02/2049 | | | | 1,326,396 | |
| | | | | | | | | | | | | | | | |
| | | | | | | | | | | | | |
| | 908,600 | | | Empresa Electrica Angamos S.A. | | | 4.88 | % | | | 05/25/2029 | | | | 875,475 | |
| | 1,600,000 | | | Empresa Electrica Guacolda S.A. | | | 4.56 | % | | | 04/30/2025 | | | | 1,136,936 | |
| | 1,000,000 | | | Empresa Nacional de Telecomunicaciones S.A. | | | 4.88 | % | | | 10/30/2024 | | | | 964,595 | |
| | 500,000 | | | Empresas Publicas de Medellin ESP | | | 4.25 | % ^ | | | 07/18/2029 | | | | 430,521 | |
| | 969,516 | | | ENA Norte Trust | | | 4.95 | % | | | 04/25/2023 | | | | 968,309 | |
| | 1,000,000 | | | ENTEL Chile S.A. | | | 4.75 | % | | | 08/01/2026 | | | | 951,132 | |
| | 400,000 | | | Fideicomiso Pacifico Tres | | | 8.25 | % | | | 01/15/2035 | | | | 390,000 | |
| | 500,000 | | | Fomento Economico Mexicano S.A.B. de C.V. | | | 2.88 | % | | | 05/10/2023 | | | | 499,769 | |
| | 2,200,000 | | | Freeport-McMoRan, Inc. | | | 5.40 | % | | | 11/14/2034 | | | | 2,050,328 | |
| | 1,500,000 | | | Freeport-McMoRan, Inc. | | | 5.45 | % | | | 03/15/2043 | | | | 1,354,200 | |
| | 1,500,000 | | | Fresnillo PLC | | | 5.50 | % | | | 11/13/2023 | | | | 1,498,118 | |
| | 490,000 | | | GW Honos Security Corporation | | | 8.75 | % ^ | | | 05/15/2025 | | | | 454,460 | |
| | 475,000 | | | Garda World Security Corporation | | | 4.63 | % ^ | | | 02/15/2027 | | | | 428,687 | |
| | 2,900,000 | | | Geopark Ltd. | | | 6.50 | % | | | 09/21/2024 | | | | 1,671,111 | |
| | 300,000 | | | Geopark Ltd. | | | 5.50 | % ^ | | | 01/17/2027 | | | | 144,750 | |
| | 365,000 | | | GFL Environmental, Inc. | | | 5.13 | % ^ | | | 12/15/2026 | | | | 358,612 | |
| | 132,000 | | | GFL Environmental, Inc. | | | 8.50 | % ^ | | | 05/01/2027 | | | | 133,353 | |
| | 400,000 | | | Gilex Holding Sarl | | | 8.50 | % ^ | | | 05/02/2023 | | | | 343,698 | |
| | 750,000 | | | Gilex Holding Sarl | | | 8.50 | % | | | 05/02/2023 | | | | 644,434 | |
| | 1,500,000 | | | Global Bank Corporation | | | 4.50 | % | | | 10/20/2021 | | | | 1,470,000 | |
| | 700,000 | | | Global Bank Corporation | | | 4.50 | % ^ | | | 10/20/2021 | | | | 686,000 | |
| | 500,000 | | | Global Bank Corporation (3 Month LIBOR USD + 3.30%) | | | 5.25 | % ^ | | | 04/16/2029 | | | | 487,500 | |
| | 500,000 | | | Globo Comunicacao e Participacoes S.A. | | | 4.84 | % | | | 06/08/2025 | | | | 457,628 | |
| | 900,000 | | | Globo Comunicacao e Participacoes S.A. | | | 4.88 | % ^ | | | 01/22/2030 | | | | 773,775 | |
| | 600,000 | | | GNL Quintero S.A. | | | 4.63 | % | | | 07/31/2029 | | | | 575,126 | |
| | 1,500,000 | | | Gohl Capital Ltd. | | | 4.25 | % | | | 01/24/2027 | | | | 1,245,110 | |
| | 2,600,000 | | | Gran Tierra Energy International Holdings Ltd. | | | 6.25 | % | | | 02/15/2025 | | | | 672,750 | |
| | 200,000 | | | Gran Tierra Energy, Inc. | | | 7.75 | % ^ | | | 05/23/2027 | | | | 52,250 | |
| | 600,000 | | | Grupo Aval Ltd. | | | 4.75 | % | | | 09/26/2022 | | | | 569,438 | |
| | 200,000 | | | Grupo Aval Ltd. | | | 4.38 | % | | | 02/04/2030 | | | | 161,250 | |
| | 900,000 | | | Grupo Aval Ltd. | | | 4.38 | % ^ | | | 02/04/2030 | | | | 725,625 | |
| | 1,200,000 | | | Grupo Bimbo S.A.B. de C.V. (5 Year CMT Rate + 3.28%) | | | 5.95 | % † | | | 04/17/2023 | | | | 1,130,640 | |
| | 200,000 | | | Grupo Idesa S.A. de C.V. | | | 7.88 | % | | | 12/18/2020 | | | | 92,150 | |
| | 800,000 | | | Indian Oil Corporation Ltd. | | | 5.75 | % | | | 08/01/2023 | | | | 786,771 | |
| | 700,000 | | | Industrial Senior Trust | | | 5.50 | % | | | 11/01/2022 | | | | 682,325 | |
| | 2,500,000 | | | Inkia Energy Ltd. | | | 5.88 | % | | | 11/09/2027 | | | | 2,212,500 | |
| | 380,000 | | | Intelsat Jackson Holdings S.A. | | | 5.50 | % | | | 08/01/2023 | | | | 236,077 | |
| | 300,000 | | | Intelsat Jackson Holdings S.A. | | | 8.50 | % ^ | | | 10/15/2024 | | | | 190,786 | |
| | 35,079 | | | Invepar Holdings | | | 0.00 | % W Þ | | | 12/30/2028 | | | | 1,500 | |
| | 150,000 | | | Inversiones CMPC S.A. | | | 4.50 | % | | | 04/25/2022 | | | | 146,028 | |
| | 1,200,000 | | | Inversiones CMPC S.A. | | | 4.75 | % | | | 09/15/2024 | | | | 1,164,801 | |
| | 400,000 | | | Israel Electric Corporation Ltd. | | | 5.00 | % ^ | | | 11/12/2024 | | | | 420,002 | |
| | 2,000,000 | | | Itau Unibanco Holding S.A. (5 Year CMT Rate + 3.86%) | | | 6.50 | % † | | | 03/19/2023 | | | | 1,910,220 | |
| | 600,000 | | | Itau Unibanco Holding S.A. (5 Year CMT Rate + 3.98%) | | | 6.13 | % † | | | 12/12/2022 | | | | 568,200 | |
| | 900,000 | | | Itau Unibanco Holding S.A. (5 Year CMT Rate + 32.22%) | | | 4.63 | % ^† | | | 02/27/2025 | | | | 738,450 | |
| | 306,000 | | | JBS Investments GMBH | | | 6.25 | % | | | 02/05/2023 | | | | 302,942 | |
| | 1,400,000 | | | JBS Investments GMBH | | | 7.00 | % ^ | | | 01/15/2026 | | | | 1,402,856 | |
| | | | | | | | | | | | | | | | |
| | | | | | | | | | | | | |
| | 600,000 | | | JBS Investments GMBH | | | 5.75 | % ^ | | | 01/15/2028 | | | | 585,630 | |
| | 2,250,000 | | | JSL Europe S.A. | | | 7.75 | % | | | 07/26/2024 | | | | 1,636,976 | |
| | 385,000 | | | Kronos Acquisition Holdings, Inc. | | | 9.00 | % ^ | | | 08/15/2023 | | | | 319,067 | |
| | 1,307,000 | | | Latam Finance Ltd. | | | 6.88 | % | | | 04/11/2024 | | | | 589,202 | |
| | 1,000,000 | | | Latam Finance Ltd. | | | 7.00 | % ^ | | | 03/01/2026 | | | | 461,025 | |
| | 1,249,690 | | | LLPL Capital Pte Ltd. | | | 6.88 | % ^ | | | 02/04/2039 | | | | 1,229,764 | |
| | 3,500,000 | | | Malayan Banking BHD (5 Year Swap Rate USD + 2.54%) | | | 3.91 | % | | | 10/29/2026 | | | | 3,559,500 | |
| | 300,000 | | | MARB BondCo PLC | | | 7.00 | % | | | 03/15/2024 | | | | 269,624 | |
| | 1,000,000 | | | MARB BondCo PLC | | | 7.00 | % ^ | | | 03/15/2024 | | | | 898,745 | |
| | 1,800,000 | | | MARB BondCo PLC | | | 6.88 | % | | | 01/19/2025 | | | | 1,633,509 | |
| | 330,000 | | | Mattamy Group Corporation | | | 4.63 | % ^ | | | 03/01/2030 | | | | 285,656 | |
| | 500,000 | | | Medco Bell Pte Ltd. | | | 6.38 | % ^ | | | 01/30/2027 | | | | 296,247 | |
| | 142,000 | | | MEG Energy Corporation | | | 7.00 | % ^ | | | 03/31/2024 | | | | 66,386 | |
| | 480,000 | | | MEG Energy Corporation | | | 7.13 | % ^ | | | 02/01/2027 | | | | 242,400 | |
| | 1,400,000 | | | Millicom International Cellular S.A. | | | 6.00 | % | | | 03/15/2025 | | | | 1,365,007 | |
| | 200,000 | | | Millicom International Cellular S.A. | | | 6.63 | % ^ | | | 10/15/2026 | | | | 190,890 | |
| | 800,000 | | | Millicom International Cellular S.A. | | | 5.13 | % | | | 01/15/2028 | | | | 702,834 | |
| | 1,400,000 | | | Millicom International Cellular S.A. | | | 6.25 | % ^ | | | 03/25/2029 | | | | 1,260,770 | |
| | 1,800,000 | | | Minejesa Capital B.V. | | | 4.63 | % | | | 08/10/2030 | | | | 1,622,624 | |
| | 1,200,000 | | | Minejesa Capital B.V. | | | 5.63 | % | | | 08/10/2037 | | | | 1,068,366 | |
| | 2,400,000 | | | Minerva Luxembourg S.A. | | | 6.50 | % | | | 09/20/2026 | | | | 2,205,498 | |
| | 200,000 | | | Minerva Luxembourg S.A. | | | 5.88 | % | | | 01/19/2028 | | | | 176,790 | |
| | 400,000 | | | NBM US Holdings, Inc. | | | 7.00 | % ^ | | | 05/14/2026 | | | | 365,847 | |
| | 700,000 | | | Network i2i Ltd. (5 Year CMT Rate + 4.28%) | | | 5.65 | % ^† | | | 01/15/2025 | | | | 566,650 | |
| | 700,000 | | | Nexa Resources S.A. | | | 5.38 | % | | | 05/04/2027 | | | | 544,992 | |
| | 200,000 | | | Oleoducto Central S.A. | | | 4.00 | % | | | 05/07/2021 | | | | 191,740 | |
| | 800,000 | | | ONGC Videsh Ltd. | | | 2.88 | % | | | 01/27/2022 | | | | 782,712 | |
| | 200,000 | | | ONGC Videsh Ltd. | | | 3.75 | % | | | 07/27/2026 | | | | 180,399 | |
| | 1,000,000 | | | Operadora de Servicios Mega S.A. | | | 8.25 | % ^ | | | 02/11/2025 | | | | 688,750 | |
| | 800,000 | | | Orazul Energy Egenor S en C por A | | | 5.63 | % | | | 04/28/2027 | | | | 710,834 | |
| | 400,000 | | | Oversea-Chinese Banking Corporation | | | 4.25 | % | | | 06/19/2024 | | | | 412,475 | |
| | 2,300,000 | | | Pampa Energia S.A. | | | 7.50 | % | | | 01/24/2027 | | | | 1,551,728 | |
| | 150,000 | | | Pampa Energia S.A. | | | 9.13 | % | | | 04/15/2029 | | | | 101,033 | |
| | 1,334,825 | | | Panama Metro Line SP | | | 0.00 | % ^ | | | 12/05/2022 | | | | 1,239,299 | |
| | 1,331,654 | | | Panama Metro Line SP | | | 0.00 | % | | | 12/05/2022 | | | | 1,236,356 | |
| | 415,000 | | | Parkland Fuel Corporation | | | 5.88 | % ^ | | | 07/15/2027 | | | | 391,324 | |
| | 2,800,000 | | | Petrobras Global Finance B.V. | | | 5.75 | % | | | 02/01/2029 | | | | 2,655,940 | |
| | 500,000 | | | Petrobras Global Finance B.V. | | | 7.25 | % | | | 03/17/2044 | | | | 510,552 | |
| | 300,000 | | | Petrobras Global Finance B.V. | | | 6.90 | % | | | 03/19/2049 | | | | 294,067 | |
| | 2,200,000 | | | Radiant Access Ltd. | | | 4.60 | % † | | | 05/18/2020 | | | | 2,066,350 | |
| | 900,000 | | | SACI Falabella | | | 3.75 | % | | | 04/30/2023 | | | | 860,662 | |
| | 200,000 | | | Sociedad Quimica y Minera S.A. | | | 4.38 | % | | | 01/28/2025 | | | | 193,051 | |
| | 2,300,000 | | | Star Energy Geothermal Wayang Windu Ltd. | | | 6.75 | % | | | 04/24/2033 | | | | 2,091,169 | �� |
| | 150,000 | | | Starfruit Finco B.V. | | | 8.00 | % ^ | | | 10/01/2026 | | | | 143,509 | |
| | 500,000 | | | Stars Group Holdings B.V. | | | 7.00 | % ^ | | | 07/15/2026 | | | | 472,875 | |
| | 1,726,887 | | | Stoneway Capital Corporation | | | 0.00 | % W | | | 03/01/2027 | | | | 259,050 | |
| | 1,300,000 | | | SUAM Finance B.V. | | | 4.88 | % | | | 04/17/2024 | | | | 1,282,119 | |
| | | | | | | | | | | | | | | | |
| | | | | | | | | | | | | |
| | 585,000 | | | Superior Plus LP | | | 7.00 | % ^ | | | 07/15/2026 | | | | 575,372 | |
| | 3,000,000 | | | Syngenta Finance N.V. | | | 5.68 | % | | | 04/24/2048 | | | | 2,421,840 | |
| | 200,000 | | | Syngenta Finance N.V. | | | 5.68 | % ^ | | | 04/24/2048 | | | | 161,456 | |
| | 200,000 | | | Tecnoglass, Inc. | | | 8.20 | % | | | 01/31/2022 | | | | 169,675 | |
| | 900,000 | | | Telefonica Celular del Paragu | | | 5.88 | % ^ | | | 04/15/2027 | | | | 819,412 | |
| | 1,000,000 | | | Telefonica Chile S.A. | | | 3.88 | % | | | 10/12/2022 | | | | 970,946 | |
| | 300,000 | | | Telesat LLC | | | 4.88 | % ^ | | | 06/01/2027 | | | | 288,690 | |
| | 750,000 | | | Tervita Escrow Corporation | | | 7.63 | % ^ | | | 12/01/2021 | | | | 530,063 | |
| | 125,000 | | | Titan Acquisition Ltd. | | | 7.75 | % ^ | | | 04/15/2026 | | | | 105,246 | |
| | 1,000,000 | | | Transelec S.A. | | | 4.63 | % | | | 07/26/2023 | | | | 1,019,005 | |
| | 200,000 | | | Transelec S.A. | | | 4.25 | % | | | 01/14/2025 | | | | 191,749 | |
| | 800,000 | | | Transportadora de Gas del Peru S.A. | | | 4.25 | % | | | 04/30/2028 | | | | 762,042 | |
| | 400,000 | | | Trivium Packaging Finance BV | | | 5.50 | % ^ | | | 08/15/2026 | | | | 400,249 | |
| | 400,000 | | | Unifin Financiera S.A.B. de C.V. | | | 7.38 | % | | | 02/12/2026 | | | | 243,421 | |
| | 3,200,000 | | | Unifin Financiera S.A.B. de C.V. (5 Year CMT Rate + 6.31%) | | | 8.88 | % † | | | 01/29/2025 | | | | 1,950,464 | |
| | 1,100,000 | | | United Overseas Bank Ltd. (5 Year Swap Rate USD + 1.65%) | | | 2.88 | % | | | 03/08/2027 | | | | 1,084,699 | |
| | 3,241,000 | | | United Overseas Bank Ltd. (5 Year Swap Rate USD + 1.79%) | | | 3.88 | % † | | | 10/19/2023 | | | | 3,090,940 | |
| | 3,000,000 | | | UPL Corporation | | | 3.25 | % | | | 10/13/2021 | | | | 2,774,922 | |
| | 1,100,000 | | | Vedanta Resources Finance PLC | | | 9.25 | % ^ | | | 04/23/2026 | | | | 467,500 | |
| | 2,700,000 | | | Vedanta Resources Ltd. | | | 6.13 | % | | | 08/09/2024 | | | | 1,024,008 | |
| | 453,000 | | | VTR Finance B.V. | | | 6.88 | % ^ | | | 01/15/2024 | | | | 423,555 | |
| | 3,250,000 | | | VTR Finance B.V. | | | 6.88 | % | | | 01/15/2024 | | | | 3,038,750 | |
| | 1,850,000 | | | YPF S.A. | | | 8.50 | % | | | 07/28/2025 | | | | 970,778 | |
| | 600,000 | | | YPF S.A. | | | 6.95 | % | | | 07/21/2027 | | | | 314,306 | |
| | | | | | | | | | | | | | | | |
| | Total Foreign Corporate Bonds(Cost $196,776,203) | | | | | | | | | | | 167,110,627 | |
| | | | | | | | | | | | | | | | |
| Foreign Government Bonds, Foreign Agencies and Foreign Government Sponsored
Corporations - 0.2% | | | | | | | | | | | | |
| | 1,200,000 | | | Dominican Republic International Bond | | | 4.50 | % ^ | | | 01/30/2030 | | | | 1,049,400 | |
| | 800,000 | | | Dominican Republic International Bond | | | 6.40 | % ^ | | | 06/05/2049 | | | | 712,244 | |
| | | | | | | | | | | | | | | | |
| Total Foreign Government Bonds, Foreign Agencies and Foreign Government Sponsored Corporations
(Cost $1,980,800) |
| | | 1,761,644 | |
| | | | | | | | | | | | | | | | |
| | | | | | | | | | | | | | | | |
| | | | | | | | | | | | | |
| | Non-Agency Commercial Mortgage Backed Obligations - 10.8% | | | | | | | | | | | | |
| | 916,000 | | | 20 Times Square Trust, Series2018-20TS-F | | | 3.10 | % # ^ | | | 05/15/2035 | | | | 784,383 | |
| | 916,000 | | | 20 Times Square Trust, Series2018-20TS-G | | | 3.10 | % # ^ | | | 05/15/2035 | | | | 771,575 | |
| | 1,017,000 | | | AREIT Trust, Series2019-CRE3-D (1 Month LIBOR USD + 2.65%, 2.65% Floor) | | | 3.35 | % ^ | | | 09/14/2036 | | | | 723,369 | |
| | 1,532,000 | | | Atrium Hotel Portfolio Trust, Series2017-ATRM-E (1 Month LIBOR USD + 3.05%, 3.05% Floor) | | | 3.75 | % ^ | | | 12/15/2036 | | | | 1,227,585 | |
| | 1,898,000 | | | Atrium Hotel Portfolio Trust, Series2018-ATRM-E (1 Month LIBOR USD + 3.40%, 3.40% Floor) | | | 4.10 | % ^ | | | 06/15/2035 | | | | 1,434,057 | |
| | 1,399,000 | | | Bancorp Commercial Mortgage Trust, Series2019-CRE5-D (1 Month LIBOR USD + 2.35%, 2.35% Floor) | | | 3.05 | % ^ | | | 03/15/2036 | | | | 1,231,293 | |
| | 11,801,548 | | | BANK, Series2017-BNK5-XA | | | 1.08 | % # I/O | | | 06/15/2060 | | | | 616,967 | |
| | 61,275,014 | | | BANK, Series2018-BN11-XA | | | 0.49 | % # I/O | | | 03/15/2061 | | | | 1,925,953 | |
| | 465,000 | | | Barclays Commercial Mortgage Securities LLC, Series2017-DELC-F (1 Month LIBOR USD + 3.50%, 3.50% Floor) | | | 4.20 | % ^ | | | 08/15/2036 | | | | 286,578 | |
| | 240,000 | | | BBCMS Mortgage Trust, Series2018-CBM-D (1 Month LIBOR USD + 2.39%, 2.39% Floor) | | | 3.10 | % ^ | | | 07/15/2037 | | | | 221,785 | |
| | 1,958,000 | | | BBCMS Mortgage Trust, Series2018-CBM-E (1 Month LIBOR USD + 3.15%, 3.15% Floor) | | | 3.85 | % ^ | | | 07/15/2037 | | | | 1,741,997 | |
| | 956,000 | | | BBCMS Mortgage Trust, Series2018-TALL-E (1 Month LIBOR USD + 2.44%, 2.44% Floor) | | | 3.14 | % ^ | | | 03/15/2037 | | | | 788,973 | |
| | 1,675,000 | | | BBCMS Mortgage Trust, Series2019-BWAY-E (1 Month LIBOR USD + 2.85%, 2.85% Floor) | | | 3.55 | % ^ | | | 11/25/2034 | | | | 1,615,295 | |
| | 1,430,000 | | | BB-UBS Trust, Series2012-TFT-TE | | | 3.56 | % # ^ | | | 06/05/2030 | | | | 1,404,939 | |
| | 2,424,000 | | | BFLD, Series2019-DPLO-F (1 Month LIBOR USD + 2.54%, 2.54% Floor) | | | 3.24 | % ^ | | | 10/15/2034 | | | | 1,454,400 | |
| | 1,944,000 | | | BHMS Trust, Series2018-ATLS-C (1 Month LIBOR USD + 1.90%, 1.90% Floor) | | | 2.60 | % ^ | | | 07/15/2035 | | | | 1,407,512 | |
| | 2,373,000 | | | BHP Trust, Series2019-BXHP-D (1 Month LIBOR USD + 1.77%, 1.77% Floor) | | | 2.48 | % ^ | | | 08/15/2036 | | | | 1,990,458 | |
| | 925,000 | | | Bsprt Issuer Ltd., Series2018-FL4-D (1 Month LIBOR USD + 2.75%, 2.75% Floor) | | | 3.45 | % ^ | | | 09/15/2035 | | | | 614,525 | |
| | 487,000 | | | BX Commercial Mortgage Trust, Series2018-BIOA-D (1 Month LIBOR USD + 1.32%, 1.35% Floor) | | | 2.03 | % ^ | | | 03/15/2037 | | | | 421,166 | |
| | 2,000,000 | | | BX Commercial Mortgage Trust, Series2019-IMC-D (1 Month LIBOR USD + 1.90%, 1.90% Floor) | | | 2.60 | % ^ | | | 04/15/2034 | | | | 1,793,047 | |
| | 2,538,000 | | | BX Commercial Mortgage Trust, Series2019-IMC-F (1 Month LIBOR USD + 2.90%, 2.90% Floor) | | | 3.60 | % ^ | | | 04/15/2034 | | | | 2,195,353 | |
| | 505,302 | | | BX Trust, Series2017-APPL-E (1 Month LIBOR USD + 3.15%, 3.15% Floor) | | | 3.85 | % ^ | | | 07/15/2034 | | | | 415,374 | |
| | 419,050 | | | BX Trust, Series2017-SLCT-D (1 Month LIBOR USD + 2.05%, 2.05% Floor) | | | 2.75 | % ^ | | | 07/15/2034 | | | | 328,949 | |
| | 710,600 | | | BX Trust, Series2017-SLCT-E (1 Month LIBOR USD + 3.15%, 3.15% Floor) | | | 3.85 | % ^ | | | 07/15/2034 | | | | 559,025 | |
| | 611,000 | | | BX Trust, Series2018-GW-E (1 Month LIBOR USD + 1.97%, 1.97% Floor) | | | 2.67 | % ^ | | | 05/15/2035 | | | | 504,200 | |
| | 530,000 | | | BX Trust, Series2018-GW-F (1 Month LIBOR USD + 2.42%, 2.42% Floor) | | | 3.12 | % ^ | | | 05/15/2035 | | | | 438,215 | |
| | 367,000 | | | BX Trust, Series2018-GW-G (1 Month LIBOR USD + 2.92%, 2.92% Floor) | | | 3.62 | % ^ | | | 05/15/2035 | | | | 279,711 | |
| | 2,372,000 | | | BX Trust, Series2019-MMP-E (1 Month LIBOR USD + 1.90%, 1.90% Floor) | | | 2.60 | % ^ | | | 08/15/2036 | | | | 2,296,643 | |
| | 2,115,000 | | | Carbon Capital Commercial Mortgage Trust, Series2019-FL2-B (1 Month LIBOR USD + 2.85%, 2.85% Floor) | | | 3.55 | % ^ | | | 10/15/2035 | | | | 1,832,752 | |
| | | | | | | | | | | | | | | | |
| | | | | | | | | | | | | |
| | 9,437,448 | | | CD Commercial Mortgage Trust, Series2017-CD3-XA | | | 1.02 | % # I/O | | | 02/10/2050 | | | | 459,692 | |
| | 4,468,027 | | | CFCRE Commercial Mortgage Trust, Series2016-C4-XA | | | 1.70 | % # I/O | | | 05/10/2058 | | | | 348,520 | |
| | 9,313,983 | | | CFCRE Commercial Mortgage Trust, Series2017-C8-XA | | | 1.61 | % # I/O | | | 06/15/2050 | | | | 736,154 | |
| | 22,058,000 | | | CFCRE Commercial Mortgage Trust, Series2018-TAN-X | | | 1.63 | % # ^ I/O | | | 02/15/2033 | | | | 917,105 | |
| | 454,031 | | | CGDBB Commercial Mortgage Trust, Series2017-BIOC-E (1 Month LIBOR USD + 2.15%, 2.25% Floor) | | | 2.85 | % ^ | | | 07/15/2032 | | | | 391,714 | |
| | 444,000 | | | CHT Mortgage Trust, Series2017-CSMO-F (1 Month LIBOR USD + 3.74%, 3.74% Floor) | | | 4.45 | % ^ | | | 11/15/2036 | | | | 342,744 | |
| | 1,753,331 | | | Citigroup Commercial Mortgage Trust, Series2014-GC25-XA | | | 0.99 | % # I/O | | | 10/10/2047 | | | | 65,728 | |
| | 90,000 | | | Citigroup Commercial Mortgage Trust, Series2015-GC27-D | | | 4.42 | % # ^ | | | 02/10/2048 | | | | 75,399 | |
| | 2,502,998 | | | Citigroup Commercial Mortgage Trust, Series2016-P4-XA | | | 1.97 | % # I/O | | | 07/10/2049 | | | | 217,753 | |
| | 530,000 | | | Citigroup Commercial Mortgage Trust, Series2018-TBR-E (1 Month LIBOR USD + 2.80%, 2.90% Floor) | | | 3.50 | % ^ | | | 12/15/2036 | | | | 350,855 | |
| | 1,040,000 | | | Citigroup Commercial Mortgage Trust, Series2018-TBR-F (1 Month LIBOR USD + 3.65%, 3.75% Floor) | | | 4.35 | % ^ | | | 12/15/2036 | | | | 660,220 | |
| | 2,051,000 | | | Citigroup Commercial Mortgage Trust, Series2019-SST2-E (1 Month LIBOR USD + 2.00%, 2.00% Floor) | | | 2.70 | % ^ | | | 12/15/2036 | | | | 1,988,571 | |
| | 1,187,000 | | | Commercial Mortgage Pass-Through Certificates, Series2012-CR4-D | | | 4.59 | % # ^Þ | | | 10/15/2045 | | | | 444,116 | |
| | 2,516,538 | | | Commercial Mortgage Pass-Through Certificates, Series2013-CR10-XA | | | 0.66 | % # I/O | | | 08/10/2046 | | | | 49,465 | |
| | 1,006,792 | | | Commercial Mortgage Pass-Through Certificates, Series2014-CR17-XA | | | 0.97 | % # I/O | | | 05/10/2047 | | | | 33,121 | |
| | 12,020,738 | | | Commercial Mortgage Pass-Through Certificates, Series2015-CR25-XA | | | 0.84 | % # I/O | | | 08/10/2048 | | | | 432,537 | |
| | 7,928,624 | | | Commercial Mortgage Pass-Through Certificates, Series2015-CR27-XA | | | 1.09 | % # I/O | | | 10/10/2048 | | | | 307,869 | |
| | 1,227,000 | | | Commercial Mortgage Pass-Through Certificates, Series2015-DC1-C | | | 4.31 | % # | | | 02/10/2048 | | | | 1,088,803 | |
| | 2,058,964 | | | Commercial Mortgage Pass-Through Certificates, Series2015-DC1-XA | | | 1.03 | % # I/O | | | 02/10/2048 | | | | 76,914 | |
| | 815,000 | | | Commercial Mortgage Pass-Through Certificates, Series2015-LC21-C | | | 4.36 | % # | | | 07/10/2048 | | | | 713,415 | |
| | 11,020,033 | | | Commercial Mortgage Pass-Through Certificates, Series2015-LC21-XA | | | 0.75 | % # I/O | | | 07/10/2048 | | | | 303,386 | |
| | 406,000 | | | Commercial Mortgage Pass-Through Certificates, Series2015-LC23-C | | | 4.65 | % # | | | 10/10/2048 | | | | 356,353 | |
| | 3,482,632 | | | Commercial Mortgage Pass-Through Certificates, Series2016-DC2-XA | | | 1.00 | % # I/O | | | 02/10/2049 | | | | 156,749 | |
| | 2,228,000 | | | Commercial Mortgage Pass-Through Certificates, Series2018-HCLV-D (1 Month LIBOR USD + 2.18%, 2.25% Floor) | | | 2.88 | % ^ | | | 09/15/2033 | | | | 2,112,303 | |
| | 2,692 | | | Credit Suisse Commercial Mortgage Trust, Series2007-C1-AM | | | 5.42 | % | | | 02/15/2040 | | | | 2,645 | |
| | 2,018,458 | | | Credit Suisse Mortgage Capital Certificates, Series2014-USA-X1 | | | 0.55 | % # ^ I/O | | | 09/15/2037 | | | | 50,166 | |
| | 2,446,089 | | | CSAIL Commercial Mortgage Trust, Series2015-C1-XA | | | 0.84 | % # I/O | | | 04/15/2050 | | | | 81,306 | |
| | 45,511,912 | | | CSAIL Commercial Mortgage Trust, Series2018-CX12-XA | | | 0.62 | % # I/O | | | 08/15/2051 | | | | 1,826,825 | |
| | 1,229,000 | | | CSMC Trust, Series2017-CHOP-E (1 Month LIBOR USD + 3.30%, 3.30% Floor) | | | 4.00 | % ^ | | | 07/15/2032 | | | | 1,053,823 | |
| | 1,898,000 | | | DBGS Mortgage Trust, Series2018-5BP-F (1 Month LIBOR USD + 2.45%, 2.45% Floor) | | | 3.15 | % ^ | | | 06/15/2033 | | | | 1,412,635 | |
| | 2,518,000 | | | Fontainebleau Miami Beach Trust, Series2019-FBLU-G | | | 4.10 | % # ^ | | | 12/10/2036 | | | | 1,621,609 | |
| | 123,569 | | | FREMF Mortgage Trust, Series2016-KF22-B (1 Month LIBOR USD + 5.05%, 5.05% Floor) | | | 6.57 | % ^ | | | 07/25/2023 | | | | 107,801 | |
| | 100,000 | | | Grace Mortgage Trust, Series2014-GRCE-A | | | 3.37 | % ^ | | | 06/10/2028 | | | | 100,749 | |
| | 2,488,000 | | | Great Wolf Trust, Series2019-WOLF-F (1 Month LIBOR USD + 3.13%, 3.13% Floor) | | | 3.84 | % ^ | | | 12/15/2036 | | | | 1,689,174 | |
| | 2,370,000 | | | Greystone Commercial Real Estate Notes, Series2019-FL2-D (1 Month LIBOR USD + 2.40%, 2.40% Floor) | | | 3.10 | % ^ | | | 09/15/2037 | | | | 1,756,831 | |
| | 2,521,506 | | | GS Mortgage Securities Corporation, Series2013-GC10-XA | | | 1.50 | % # I/O | | | 02/10/2046 | | | | 87,292 | |
| | 8,111,256 | | | GS Mortgage Securities Corporation, Series2014-GC24-XA | | | 0.74 | % # I/O | | | 09/10/2047 | | | | 202,836 | |
| | | | | | | | | | | | | | | | |
| | | | | | | | | | | | | |
| | 850,000 | | | GS Mortgage Securities Corporation, Series2018-TWR-E (1 Month LIBOR USD + 2.10%, 2.10% Floor) | | | 2.80 | % ^ | | | 07/15/2031 | | | | 637,285 | |
| | 850,000 | | | GS Mortgage Securities Corporation, Series2018-TWR-F (1 Month LIBOR USD + 2.80%, 2.80% Floor) | | | 3.50 | % ^ | | | 07/15/2031 | | | | 635,652 | |
| | 850,000 | | | GS Mortgage Securities Corporation, Series2018-TWR-G (1 Month LIBOR USD + 3.92%, 3.98% Floor) | | | 4.63 | % ^ | | | 07/15/2031 | | | | 636,703 | |
| | 2,302,000 | | | GS Mortgage Securities Corporation, Series2019-SOHO-E (1 Month LIBOR USD + 1.87%, 1.88% Floor) | | | 2.58 | % ^ | | | 06/15/2036 | | | | 2,219,626 | |
| | 165,000 | | | GS Mortgage Securities Trust, Series2014-GC26-D | | | 4.51 | % # ^ | | | 11/10/2047 | | | | 124,719 | |
| | 7,211,675 | | | GS Mortgage Securities Trust, Series2015-GS1-XA | | | 0.78 | % # I/O | | | 11/10/2048 | | | | 268,152 | |
| | 7,307,934 | | | GS Mortgage Securities Trust, Series2016-GS2-XA | | | 1.65 | % # I/O | | | 05/10/2049 | | | | 497,911 | |
| | 169,000 | | | GS Mortgage Securities Trust, Series 2018-GS10-WLSA | | | 4.74 | % # ^ | | | 03/10/2033 | | | | 151,868 | |
| | 336,000 | | | GS Mortgage Securities Trust, Series 2018-GS10-WLSB | | | 4.74 | % # ^ | | | 03/10/2033 | | | | 285,118 | |
| | 457,000 | | | GS Mortgage Securities Trust, Series 2018-GS10-WLSC | | | 4.74 | % # ^ | | | 03/10/2033 | | | | 373,963 | |
| | 442,000 | | | GS Mortgage Securities Trust, Series 2018-GS10-WLSD | | | 4.74 | % # ^ | | | 03/10/2033 | | | | 351,802 | |
| | 553,000 | | | GS Mortgage Securities Trust, Series 2018-GS10-WLSE | | | 4.74 | % # ^ | | | 03/10/2033 | | | | 433,441 | |
| | 725,000 | | | GS Mortgage Securities Trust, Series2019-SMP-E (1 Month LIBOR USD + 2.60%, 2.60% Floor) | | | 3.30 | % ^ | | | 08/15/2032 | | | | 589,702 | |
| | 2,377,000 | | | GSCG Trust, Series2019-600C-E | | | 4.12 | % # ^ | | | 09/06/2034 | | | | 1,944,960 | |
| | 1,390,000 | | | Hilton Orlando Trust, Series2018-ORL-E (1 Month LIBOR USD + 2.65%, 2.65% Floor) | | | 3.35 | % ^ | | | 12/15/2034 | | | | 1,069,645 | |
| | 1,971,129 | | | HPLY Trust, Series2019-HIT-F (1 Month LIBOR USD + 3.15%, 3.15% Floor) | | | 3.85 | % ^ | | | 11/15/2036 | | | | 1,180,833 | |
| | 1,263,000 | | | Hunt Ltd., Series2017-FL1-C (1 Month LIBOR USD + 2.40%) | | | 3.10 | % ^ | | | 08/15/2034 | | | | 1,111,256 | |
| | 502,484 | | | IMT Trust, Series2017-APTS-EFL (1 Month LIBOR USD + 2.15%, 2.15% Floor) | | | 2.85 | % ^ | | | 06/15/2034 | | | | 412,917 | |
| | 502,484 | | | IMT Trust, Series2017-APTS-FFL (1 Month LIBOR USD + 2.85%, 2.85% Floor) | | | 3.55 | % ^ | | | 06/15/2034 | | | | 411,598 | |
| | 49,966 | | | JP Morgan Chase Commercial Mortgage Securities Corporation, Series2017-FL10-D (1 Month LIBOR USD + 1.90%, 1.90% Floor) | | | 2.60 | % ^ | | | 06/15/2032 | | | | 46,601 | |
| | 536,096 | | | JP Morgan Chase Commercial Mortgage Securities Corporation, Series2018-LAQ-C (1 Month LIBOR USD + 1.60%, 1.60% Floor) | | | 2.30 | % ^ | | | 06/15/2032 | | | | 460,294 | |
| | 212,737 | | | JP Morgan Chase Commercial Mortgage Securities Corporation, Series2018-LAQ-D (1 Month LIBOR USD + 2.10%, 2.30% Floor) | | | 2.80 | % ^ | | | 06/15/2032 | | | | 175,945 | |
| | 68,076 | | | JP Morgan Chase Commercial Mortgage Securities Corporation, Series2018-LAQ-E (1 Month LIBOR USD + 3.00%, 3.35% Floor) | | | 3.70 | % ^ | | | 06/15/2035 | | | | 53,379 | |
| | 265,832 | | | JP Morgan Chase Commercial Mortgage Securities Trust, Series2006-LDP9-AMS | | | 5.34 | % | | | 05/15/2047 | | | | 262,493 | |
| | 6,149,695 | | | JP Morgan Chase Commercial Mortgage Securities Trust, Series2016-JP4-XA | | | 0.73 | % # I/O | | | 12/15/2049 | | | | 178,240 | |
| | 1,431,000 | | | JP Morgan Chase Commercial Mortgage Securities Trust, Series2016-WIKI-E | | | 4.01 | % # ^ | | | 10/05/2031 | | | | 1,194,564 | |
| | 1,957,000 | | | JP Morgan Chase Commercial Mortgage Securities Trust, Series2018-WPT-EFX | | | 5.54 | % ^ | | | 07/05/2033 | | | | 1,670,316 | |
| | 766,000 | | | JP Morgan Chase Commercial Mortgage Securities Trust, Series2019-UES-C | | | 4.34 | % ^ | | | 05/05/2032 | | | | 677,285 | |
| | 784,000 | | | JP Morgan Chase Commercial Mortgage Securities Trust, Series2019-UES-D | | | 4.45 | % # ^ | | | 05/05/2032 | | | | 666,372 | |
| | 915,000 | | | JP Morgan Chase Commercial Mortgage Securities Trust, Series2019-UES-E | | | 4.45 | % # ^ | | | 05/05/2032 | | | | 768,164 | |
| | 960,000 | | | JP Morgan Chase Commercial Mortgage Securities Trust, Series2019-UES-F | | | 4.45 | % # ^ | | | 05/05/2032 | | | | 749,957 | |
| | 1,049,000 | | | JP Morgan Chase Commercial Mortgage Securities Trust, Series2019-UES-G | | | 4.45 | % # ^ | | | 05/05/2032 | | | | 733,980 | |
| | 1,685,000 | | | JP Morgan Chase Commercial Mortgage Securities Trust, Series2020-NNN-EFX | | | 3.97 | % ^ | | | 01/16/2037 | | | | 1,412,544 | |
| | 1,663,226 | | | JPMBB Commercial Mortgage Securities Trust, Series2014-C18-XA | | | 0.82 | % # I/O | | | 02/15/2047 | | | | 42,978 | |
| | | | | | | | | | | | | | | | |
| | | | | | | | | | | | | |
| | 100,000 | | | JPMBB Commercial Mortgage Securities Trust, Series2014-C23-C | | | 4.47 | % # | | | 09/15/2047 | | | | 89,820 | |
| | 150,000 | | | JPMBB Commercial Mortgage Securities Trust, Series2014-C25-C | | | 4.45 | % # | | | 11/15/2047 | | | | 134,014 | |
| | 425,000 | | | JPMBB Commercial Mortgage Securities Trust, Series2014-C26-C | | | 4.38 | % # | | | 01/15/2048 | | | | 377,593 | |
| | 2,230,000 | | | JPMBB Commercial Mortgage Securities Trust, Series2015-C29-C | | | 4.18 | % # | | | 05/15/2048 | | | | 1,938,779 | |
| | 4,945,066 | | | JPMBB Commercial Mortgage Securities Trust, Series2015-C29-XA | | | 0.74 | % # I/O | | | 05/15/2048 | | | | 126,624 | |
| | 5,327,717 | | | JPMBB Commercial Mortgage Securities Trust, Series2015-C31-XA | | | 0.88 | % # I/O | | | 08/15/2048 | | | | 187,073 | |
| | 470,000 | | | JPMBB Commercial Mortgage Securities Trust, Series2015-C33-C | | | 4.62 | % # | | | 12/15/2048 | | | | 412,015 | |
| | 2,555,000 | | | JPMCC Commercial Mortgage Securities Trust, Series2019-MFP-F (1 Month LIBOR USD + 3.10%, 3.00% Floor) | | | 3.70 | % ^ | | | 07/15/2036 | | | | 1,583,371 | |
| | 2,532,000 | | | LCCM, Series2017-LC26-C | | | 4.71 | % ^ | | | 07/12/2050 | | | | 2,137,739 | |
| | 3,978,719 | | | LSTAR Commercial Mortgage Trust, Series2016-4-XA | | | 1.84 | % # ^ I/O | | | 03/10/2049 | | | | 211,222 | |
| | 15,298,667 | | | LSTAR Commercial Mortgage Trust, Series2017-5-X | | | 1.00 | % # ^ I/O | | | 03/10/2050 | | | | 575,117 | |
| | 2,957,000 | | | Madison Avenue Trust, Series2013-650M-E | | | 4.03 | % # ^ | | | 10/12/2032 | | | | 2,930,753 | |
| | 2,538,000 | | | MFT Trust, Series2020-ABC-D | | | 3.48 | % # ^ | | | 02/06/2030 | | | | 1,402,100 | |
| | 2,500,000 | | | MKT Mortgage Trust, Series2020-525M-F | | | 2.94 | % # ^ | | | 02/12/2040 | | | | 1,340,202 | |
| | 100,000 | | | Morgan Stanley Bank of America Merrill Lynch Trust, Series2014-C18-C | | | 4.52 | % # | | | 10/15/2047 | | | | 89,921 | |
| | 301,000 | | | Morgan Stanley Bank of America Merrill Lynch Trust, Series2015-C20-D | | | 3.07 | % ^ | | | 02/15/2048 | | | | 235,625 | |
| | 360,000 | | | Morgan Stanley Bank of America Merrill Lynch Trust, Series2015-C23-C | | | 4.16 | % # | | | 07/15/2050 | | | | 311,803 | |
| | 274,000 | | | Morgan Stanley Bank of America Merrill Lynch Trust, Series2015-C27-C | | | 4.53 | % # | | | 12/15/2047 | | | | 239,128 | |
| | 393,000 | | | Morgan Stanley Capital Trust, Series2017-ASHF-D (1 Month LIBOR USD + 2.20%, 2.20% Floor) | | | 2.90 | % ^ | | | 11/15/2034 | | | | 259,840 | |
| | 590,000 | | | Morgan Stanley Capital Trust, Series2017-ASHF-E (1 Month LIBOR USD + 3.15%, 3.15% Floor) | | | 3.85 | % ^ | | | 11/15/2034 | | | | 319,174 | |
| | 447,000 | | | Morgan Stanley Capital Trust, Series2017-ASHF-F (1 Month LIBOR USD + 4.35%, 4.35% Floor) | | | 5.05 | % ^ | | | 11/15/2034 | | | | 240,704 | |
| | 561,000 | | | Morgan Stanley Capital Trust, Series2018-SUN-D (1 Month LIBOR USD + 1.65%, 1.65% Floor) | | | 2.35 | % ^ | | | 07/15/2035 | | | | 430,634 | |
| | 837,000 | | | Morgan Stanley Capital Trust, Series2018-SUN-F (1 Month LIBOR USD + 2.55%, 2.55% Floor) | | | 3.25 | % ^ | | | 07/15/2035 | | | | 632,575 | |
| | 561,000 | | | Morgan Stanley Capital Trust, Series2018-SUN-G (1 Month LIBOR USD + 3.05%, 3.05% Floor) | | | 3.75 | % ^ | | | 07/15/2035 | | | | 421,807 | |
| | 2,489,000 | | | Morgan Stanley Capital Trust, Series2019-NUGS-F (1 Month LIBOR USD + 2.84%, 4.34% Floor) | | | 4.34 | % ^ | | | 12/15/2036 | | | | 1,997,335 | |
| | 935,654 | | | Motel 6 Trust, Series2017-MTL6-D (1 Month LIBOR USD + 2.15%, 2.15% Floor) | | | 2.85 | % ^ | | | 08/15/2034 | | | | 833,138 | |
| | 550,800 | | | MSCG Trust, Series2016-SNR-C | | | 5.21 | % ^ | | | 11/15/2034 | | | | 542,082 | |
| | 1,919,000 | | | Natixis Commercial Mortgage Securities Trust, Series2018-FL1-C (1 Month LIBOR USD + 2.20%, 2.20% Floor) | | | 3.86 | % ^ | | | 06/15/2035 | | | | 1,702,172 | |
| | 71,041,072 | | | Natixis Commercial Mortgage Securities Trust, Series2018-FL1-XCP | | | 0.62 | % # ^ I/O | | | 06/15/2021 | | | | 280,612 | |
| | 1,183,000 | | | Natixis Commercial Mortgage Securities Trust, Series 2020-2PAC-AMZ1 | | | 3.50 | % # ^ | | | 01/15/2037 | | | | 958,147 | |
| | 685,000 | | | Natixis Commercial Mortgage Securities Trust, Series 2020-2PAC-AMZ2 | | | 3.50 | % # ^ | | | 01/15/2037 | | | | 545,491 | |
| | 639,000 | | | Natixis Commercial Mortgage Securities Trust, Series 2020-2PAC-AMZ3 | | | 3.50 | % # ^ | | | 01/15/2037 | | | | 468,933 | |
| | 2,047,000 | | | NLY Commercial Mortgage Trust, Series2019-FL2-B (1 Month LIBOR USD + 1.90%, 1.90% Floor) | | | 2.60 | % ^ | | | 02/15/2036 | | | | 1,846,087 | |
| | 2,221,000 | | | One Market Plaza Trust, Series2017-1MKT-E | | | 4.14 | % ^ | | | 02/10/2032 | | | | 1,839,212 | |
| | 680,000 | | | PFP Ltd., Series2019-5-B (1 Month LIBOR USD + 1.65%, 1.65% Floor) | | | 2.35 | % ^ | | | 04/14/2036 | | | | 482,117 | |
| | 1,573,000 | | | STWD Ltd., Series2019-FL1-D (1 Month LIBOR USD + 2.35%) | | | 3.05 | % ^ | | | 07/15/2038 | | | | 1,120,237 | |
| | | | | | | | | | | | | | | | |
| | | | | | | | | | | | | |
| | 1,283,167 | | | Tharaldson Hotel Portfolio Trust, Series2018-THL-E (1 Month LIBOR USD + 3.18%, 3.10% Floor) | | | 4.19 | % ^ | | | 11/11/2034 | | | | 1,085,401 | |
| | 1,541,000 | | | TPG Finance Ltd., Series2018-FL2-D (1 Month LIBOR USD + 2.70%) | | | 3.50 | % ^ | | | 11/15/2037 | | | | 1,035,466 | |
| | 1,800,000 | | | TRTX Issuer Ltd., Series2019-FL3-D (1 Month LIBOR USD + 2.45%, 2.45% Floor) | | | 3.25 | % ^ | | | 09/15/2034 | | | | 1,319,791 | |
| | 1,097,000 | | | UBS Commercial Mortgage Trust, Series2018-C8-C | | | 4.70 | % # | | | 02/15/2051 | | | | 914,763 | |
| | 15,858,095 | | | UBS Commercial Mortgage Trust, Series2018-C8-XA | | | 0.88 | % # I/O | | | 02/15/2051 | | | | 848,776 | |
| | 1,389,673 | | | VMC Finance LLC, Series2019-FL3-D (1 Month LIBOR USD + 2.65%, 2.65% Floor) | | | 3.45 | % ^ | | | 09/15/2036 | | | | 979,168 | |
| | 150,000 | | | Wells Fargo Commercial Mortgage Trust, Series2014-LC16-D | | | 3.94 | % ^ | | | 08/15/2050 | | | | 92,988 | |
| | 200,000 | | | Wells Fargo Commercial Mortgage Trust, Series2015-C27-C | | | 3.89 | % | | | 02/15/2048 | | | | 172,029 | |
| | 400,000 | | | Wells Fargo Commercial Mortgage Trust, Series2015-C28-C | | | 4.11 | % # | | | 05/15/2048 | | | | 346,438 | |
| | 10,305,878 | | | Wells Fargo Commercial Mortgage Trust, Series2015-C30-XA | | | 0.89 | % # I/O | | | 09/15/2058 | | | | 407,120 | |
| | 5,581,972 | | | Wells Fargo Commercial Mortgage Trust, Series2015-C31-XA | | | 1.01 | % # I/O | | | 11/15/2048 | | | | 254,225 | |
| | 2,109,702 | | | Wells Fargo Commercial Mortgage Trust, Series2015-NXS1-XA | | | 1.11 | % # I/O | | | 05/15/2048 | | | | 92,131 | |
| | 7,138,017 | | | Wells Fargo Commercial Mortgage Trust, Series2015-NXS2-XA | | | 0.71 | % # I/O | | | 07/15/2058 | | | | 210,380 | |
| | 2,517,295 | | | Wells Fargo Commercial Mortgage Trust, Series2016-C33-XA | | | 1.72 | % # I/O | | | 03/15/2059 | | | | 169,940 | |
| | 15,423,270 | | | Wells Fargo Commercial Mortgage Trust, Series2017-C38-XA | | | 1.06 | % # I/O | | | 07/15/2050 | | | | 871,211 | |
| | 2,423,000 | | | Wells Fargo Commercial Mortgage Trust, Series2017-C41-C | | | 4.51 | % # | | | 11/15/2050 | | | | 2,002,921 | |
| | 3,017,115 | | | Wells Fargo Commercial Mortgage Trust, Series2017-RC1-XA | | | 1.50 | % # I/O | | | 01/15/2060 | | | | 217,230 | |
| | 2,267,000 | | | Wells Fargo Commercial Mortgage Trust, Series2018-C47-C | | | 4.94 | % # | | | 09/15/2061 | | | | 1,893,520 | |
| | 3,342,399 | | | WF-RBS Commercial Mortgage Trust, Series2014-C21-XA | | | 1.04 | % # I/O | | | 08/15/2047 | | | | 118,032 | |
| | 4,896,329 | | | WF-RBS Commercial Mortgage Trust, Series2016-NXS6-XA | | | 1.63 | % # I/O | | | 11/15/2049 | | | | 327,426 | |
| | | | | | | | | | | | | | | | |
| | TotalNon-Agency Commercial Mortgage Backed Obligations(Cost $149,065,154) | | | | | | | | | | | 118,961,672 | |
| | | | | | | | | | | | | |
| | Non-Agency Residential Collateralized Mortgage Obligations - 24.0% | | | | | | | | | | | | |
| | 4,161,821 | | | ACE Securities Corporation Home Equity Loan Trust, Series2007-HE1-A2A (1 Month LIBOR USD + 0.09%, 0.09% Floor) | | | 1.04 | % | | | 01/25/2037 | | | | 2,889,357 | |
| | 4,902,544 | | | Ajax Mortgage Loan Trust, Series2017-C-A | | | 3.75 | % ^§ | | | 07/25/2060 | | | | 4,918,569 | |
| | 8,260,406 | | | APS Resecuritization Trust, Series2015-3-1MZ (12 Month US Treasury Average + 0.96%, 0.96% Floor) | | | 2.19 | % ^ D | | | 10/27/2046 | | | | 5,754,475 | |
| | 724,474 | | | Banc of America Funding Corporation, Series2005-B-3M1 (1 Month LIBOR USD + 0.68%, 0.45% Floor, 11.00% Cap) | | | 1.45 | % | | | 04/20/2035 | | | | 698,291 | |
| | 5,888,077 | | | Bayview Koitere Fund Trust, Series2018-SBR4-A1 | | | 4.38 | % ^§ | | | 06/28/2033 | | | | 5,923,459 | |
| | 1,974,354 | | | Bear Stearns Adjustable Rate Mortgage Trust, Series2006-2-2A1 | | | 4.08 | % # | | | 07/25/2036 | | | | 1,680,453 | |
| | 1,139,503 | | | Bear StearnsAlt-A Trust, Series2006-4-22A1 | | | 3.89 | % # | | | 08/25/2036 | | | | 962,164 | |
| | 2,647,638 | | | Chase Mortgage Finance Trust, Series2007-S4-A4 (1 Month LIBOR USD + 0.60%, 0.60% Floor, 6.00% Cap) | | | 1.55 | % | | | 06/25/2037 | | | | 938,428 | |
| | 7,101,712 | | | CHL Mortgage Pass-Through Trust, Series2007-14-A19 | | | 6.00 | % | | | 09/25/2037 | | | | 5,399,693 | |
| | 6,390,161 | | | CHL Mortgage Pass-Through Trust, Series2007-9-A1 | | | 5.75 | % | | | 07/25/2037 | | | | 4,788,566 | |
| | 5,711,078 | | | CHL Mortgage Pass-Through Trust, Series2007-9-A13 | | | 5.75 | % | | | 07/25/2037 | | | | 4,289,858 | |
| | | | | | | | | | | | | | | | |
| | | | | | | | | | | | | |
| | 8,688,000 | | | CHL Mortgage Pass-Through Trust, Series2018-GT1-A (1 Month LIBOR USD + 2.75%) | | | 3.70 | % ^ | | | 05/25/2023 | | | | 8,077,990 | |
| | 13,420,000 | | | CIM Trust, Series2017-3RR-B2 | | | 10.50 | % # ^Þ | | | 01/27/2057 | | | | 13,218,700 | |
| | 2,852,435 | | | Citigroup Mortgage Loan Trust, Inc., Series2006-AMC1-A1 (1 Month LIBOR USD + 0.15%, 0.15% Floor) | | | 1.09 | % ^ | | | 09/25/2036 | | | | 2,582,049 | |
| | 4,020,428 | | | Citigroup Mortgage Loan Trust, Inc., Series2006-AR6-2A3 (1 Month LIBOR USD + 0.25%, 0.25% Floor) | | | 1.20 | % | | | 09/25/2036 | | | | 3,437,371 | |
| | 1,172,996 | | | CitiMortgage Alternative Loan Trust, Series2007-A5-1A10 | | | 5.75 | % | | | 05/25/2037 | | | | 919,642 | |
| | 1,059,963 | | | Civic Mortgage LLC, Series2018-2-A2 | | | 5.32 | % ^§ | | | 11/25/2022 | | | | 1,055,126 | |
| | 12,300,000 | | | Connecticut Avenue Securities Trust, Series2020-R01-1M2 (1 Month LIBOR USD + 20.50%) | | | 3.00 | % ^ | | | 01/25/2040 | | | | 7,486,228 | |
| | 422,144 | | | Countrywide Alternative Loan Trust, Series2005-75CB-A3 | | | 5.50 | % | | | 01/25/2036 | | | | 359,925 | |
| | 628,262 | | | Countrywide Alternative Loan Trust, Series2006-23CB-2A2 | | | 6.50 | % | | | 08/25/2036 | | | | 335,691 | |
| | 445,452 | | | Countrywide Alternative Loan Trust, Series2007-15CB-A7 | | | 6.00 | % | | | 07/25/2037 | | | | 360,106 | |
| | 631,379 | | | Countrywide Alternative Loan Trust, Series2008-1R-2A3 | | | 6.00 | % | | | 08/25/2037 | | | | 458,870 | |
| | 364,802 | | | Countrywide Home Loans, Series 2005-HYB9-3A2A (12 Month LIBOR USD + 1.75%, 1.75% Floor, 11.00% Cap) | | | 3.71 | % | | | 02/20/2036 | | | | 288,483 | |
| | 362,648 | | | Countrywide Home Loans, Series2007-14-A15 | | | 6.50 | % | | | 09/25/2037 | | | | 288,062 | |
| | 770,825 | | | Countrywide Home Loans, Series2007-HY1-1A1 | | | 3.73 | % # | | | 04/25/2037 | | | | 657,993 | |
| | 352,650 | | | Credit Suisse First Boston Mortgage Backed Trust, Series2006-2-A5A | | | 6.08 | % | | | 09/25/2036 | | | | 175,291 | |
| | 615,584 | | | Credit Suisse First Boston Mortgage Securities Corporation, Series2005-10-6A9 | | | 5.50 | % | | | 11/25/2035 | | | | 434,745 | |
| | 304,118 | | | Credit Suisse First Boston Mortgage Securities Corporation, Series2005-9-5A9 | | | 5.50 | % | | | 10/25/2035 | | | | 239,980 | |
| | 1,500,000 | | | Credit Suisse Mortgage Capital Certificates, Series2011-12R-3A5 | | | 4.17 | % # ^ | | | 07/27/2036 | | | | 1,400,995 | |
| | 184,421 | | | Credit Suisse Mortgage Capital Certificates, Series2011-5R-6A9 | | | 3.82 | % # ^ | | | 11/27/2037 | | | | 179,458 | |
| | 184,385 | | | Deutsche Mortgage & Asset Receiving Corporation, Series2014-RS1-1A2 | | | 6.50 | % # ^ | | | 07/27/2037 | | | | 160,246 | |
| | 337,518 | | | Deutsche Securities, Inc., Series2006-AB4-A1A | | | 6.01 | % # | | | 10/25/2036 | | | | 295,076 | |
| | 15,000,000 | | | FMC GMSR Issuer Trust, Series2019-GT1-A | | | 5.07 | % # ^ | | | 05/25/2024 | | | | 15,223,512 | |
| | 500,000 | | | GCAT LLC, Series2019-NQM3-B1 | | | 3.95 | % # ^ | | | 11/25/2059 | | | | 414,494 | |
| | 13,951,379 | | | Home Partners of America Trust, Series2019-2-F | | | 3.87 | % ^ | | | 10/19/2039 | | | | 11,555,718 | |
| | 1,076,929 | | | Impac Secured Assets Trust, Series2006-5-1A1C (1 Month LIBOR USD + 0.27%, 0.27% Floor, 11.50% Cap) | | | 1.22 | % | | | 02/25/2037 | | | | 896,869 | |
| | 1,986,688 | | | IndyMac Mortgage Loan Trust, Series2004-AR4-3A | | | 4.12 | % # | | | 08/25/2034 | | | | 1,834,391 | |
| | 2,052,558 | | | IndyMac Mortgage Loan Trust, Series2006-AR19-2A1 | | | 3.76 | % # | | | 08/25/2036 | | | | 1,673,096 | |
| | 555,810 | | | JP Morgan Mortgage Trust, Series2005-S3-1A2 | | | 5.75 | % | | | 01/25/2036 | | | | 376,705 | |
| | 661,923 | | | JP Morgan Mortgage Trust, Series2007-A2-4A1M | | | 3.76 | % # | | | 04/25/2037 | | | | 541,309 | |
| | 159,217 | | | Lehman Mortgage Trust, Series2006-1-1A3 | | | 5.50 | % | | | 02/25/2036 | | | | 118,913 | |
| | 8,131,102 | | | Lehman Trust, Series2006-GP3-1A1 (1 Month LIBOR USD + 0.20%, 0.20% Floor) | | | 1.15 | % | | | 06/25/2046 | | | | 6,647,500 | |
| | 3,000,000 | | | loanDepot GMSR Master Trust, Series2018-GT1-A (1 Month LIBOR USD + 2.80%, 2.80% Floor) | | | 3.50 | % ^ | | | 10/16/2023 | | | | 2,897,880 | |
| | 129,793 | | | MASTR Adjustable Rate Mortgages Trust, Series2006-2-2A1 | | | 4.30 | % # | | | 04/25/2036 | | | | 101,912 | |
| | 2,690,000 | | | Mello Warehouse Securitization Trust, Series2019-1-F (1 Month LIBOR USD + 3.50%, 3.50% Floor) | | | 4.45 | % ^ | | | 06/25/2052 | | | | 2,600,124 | |
| | 345,246 | | | Merrill Lynch Alternative Note Asset Trust,Series 2007-F1-2A7 | | | 6.00 | % | | | 03/25/2037 | | | | 213,394 | |
| | 729,838 | | | Merrill Lynch Mortgage Investors Trust, Series2006-AF1-AF2C | | | 6.25 | % | | | 08/25/2036 | | | | 466,878 | |
| | 8,787,777 | | | MFA LLC, Series2018-NPL2-A1 | | | 4.16 | % ^§ | | | 07/25/2048 | | | | 8,759,678 | |
| | 129,765 | | | Morgan Stanley Mortgage Loan Trust, Series2005-7-4A1 | | | 5.50 | % | | | 11/25/2035 | | | | 108,225 | |
| | 109,952 | | | Morgan Stanley Mortgage Loan Trust, Series2006-2-2A4 | | | 5.75 | % | | | 02/25/2036 | | | | 104,692 | |
| | 411,862 | | | Morgan Stanley Mortgage Loan Trust, Series2006-2-7A1 | | | 5.63 | % # | | | 02/25/2036 | | | | 322,169 | |
| | | | | | | | | | | | | | | | |
| | | | | | | | | | | | | |
| | 607,303 | | | Morgan Stanley Mortgage Loan Trust, Series2007-8XS-A1 | | | 5.75 | % # | | | 04/25/2037 | | | | 358,219 | |
| | 10,575,554 | | | Morgan Stanley Resecuritization Trust, Series2013-R7-8B (12 Month US Treasury Average + 0.96%, 0.96% Floor) | | | 3.01 | % ^Þ | | | 12/26/2046 | | | | 7,299,303 | |
| | 3,642,827 | | | New Century Home Equity Loan Trust, Series2006-1-A2B (1 Month LIBOR USD + 0.18%, 0.18% Floor, 12.50% Cap) | | | 1.13 | % | | | 05/25/2036 | | | | 2,898,260 | |
| | 5,835,807 | | | New Residential Mortgage Loan Trust, Series2018-FNT2-B | | | 4.09 | % ^ | | | 07/25/2054 | | | | 5,833,547 | |
| | 12,366,400 | | | NovaStar Mortgage Funding Trust Series, Series2006-3-A2C (1 Month LIBOR USD + 0.16%, 0.16% Floor) | | | 1.11 | % | | | 10/25/2036 | | | | 7,942,658 | |
| | 19,729,164 | | | PMT Credit Risk Transfer Trust2019-2R, Series2019-2R-A (1 Month LIBOR USD + 2.75%, 2.75% Floor) | | | 4.36 | % ^ | | | 05/27/2023 | | | | 18,668,072 | |
| | 2,533,013 | | | PMT Credit Risk Transfer Trust, Series2019-3R-A (1 Month LIBOR USD + 2.70%, 2.70% Floor) | | | 3.66 | % ^ | | | 10/27/2022 | | | | 2,456,318 | |
| | 17,600,000 | | | PNMAC GMSR Trust, Series2018-FT1-A (1 Month LIBOR USD + 2.35%) | | | 3.30 | % ^ | | | 04/25/2023 | | | | 15,771,152 | |
| | 900,000 | | | Pretium Mortgage Credit Partners LLC, Series2019-NPL3-A2 | | | 4.58 | % ^§ | | | 07/27/2059 | | | | 627,507 | |
| | 3,100,000 | | | Progress Residential Trust, Series2019-SFR4-F | | | 3.68 | % ^ | | | 10/17/2036 | | | | 2,564,915 | |
| | 5,425,196 | | | PRPM LLC, Series2018-1A-A1 | | | 3.75 | % # ^ | | | 04/25/2023 | | | | 5,505,846 | |
| | 7,677,518 | | | PRPM LLC, Series2019-GS1-A2 | | | 4.75 | % # ^ | | | 10/25/2024 | | | | 7,677,760 | |
| | 228,438 | | | Residential Accredit Loans, Inc., Series2006-QS10-A9 | | | 6.50 | % | | | 08/25/2036 | | | | 209,670 | |
| | 513,506 | | | Residential Accredit Loans, Inc., Series2006-QS12-2A3 | | | 6.00 | % | | | 09/25/2036 | | | | 455,611 | |
| | 1,935,903 | | | Residential Asset Securitization Trust, Series2005-A15-5A2 | | | 5.75 | % | | | 02/25/2036 | | | | 1,177,213 | |
| | 410,751 | | | Residential Asset Securitization Trust, Series2006-A2-A11 | | | 6.00 | % | | | 01/25/2046 | | | | 258,541 | |
| | 5,928,246 | | | Residential Funding Mortgage Securities Trust, Series2006-S8-A10 | | | 6.00 | % | | | 09/25/2036 | | | | 5,118,808 | |
| | 5,750,000 | | | Residential Mortgage Loan Trust, Series2020-1-B1 | | | 3.95 | % # ^ | | | 02/25/2024 | | | | 4,929,924 | |
| | 6,386,425 | | | Soundview Home Loan Trust, Series2007-OPT1-2A2 (1 Month LIBOR USD + 0.15%, 0.15% Floor) | | | 1.10 | % | | | 06/25/2037 | | | | 4,547,922 | |
| | 1,700,541 | | | Structured Adjustable Rate Mortgage Loan Trust, Series2005-22-4A1 | | | 4.04 | % # | | | 12/25/2035 | | | | 1,484,039 | |
| | 7,523,770 | | | Structured Asset Securities Corporation, Series2007-RF1-1A (1 Month LIBOR USD + 0.19%, 0.19% Floor) | | | 1.14 | % ^ | | | 03/25/2037 | | | | 5,784,271 | |
| | 13,570,229 | | | TBW Mortgage Backed Pass Through, Series2006-3-4A1 (1 Month LIBOR USD + 0.40%, 0.40% Floor, 7.50% Cap) | | | 1.35 | % | | | 07/25/2036 | | | | 697,221 | |
| | 13,570,317 | | | TBW Mortgage Backed Pass Through, Series2006-3-4A3(-1 x 1 Month LIBOR USD + 7.10%, 7.10% Cap) | | | 6.15 | % I/F I/O | | | 07/25/2036 | | | | 3,026,067 | |
| | 5,000,000 | | | Toorak Mortgage Corporation Ltd., Series2019-1-A1 | | | 4.46 | % ^§ | | | 03/25/2022 | | | | 4,370,030 | |
| | 5,000,000 | | | Tricon American Homes Trust, Series2019-SFR1-F | | | 3.75 | % ^ | | | 03/17/2038 | | | | 3,778,436 | |
| | 2,117,331 | | | Velocity Commercial Capital Loan Trust, Series2018-2-M1 | | | 4.26 | % # ^ | | | 10/26/2048 | | | | 2,059,174 | |
| | 3,123,809 | | | Velocity Commercial Capital Loan Trust, Series2018-2-M2 | | | 4.51 | % # ^ | | | 10/26/2048 | | | | 2,807,412 | |
| | 782,779 | | | Velocity Commercial Capital Loan Trust, Series2018-2-M3 | | | 4.72 | % # ^ | | | 10/26/2048 | | | | 698,404 | |
| | 1,615,702 | | | Velocity Commercial Capital Loan Trust, Series2019-1-M5 | | | 5.70 | % # ^ | | | 03/25/2049 | | | | 1,085,406 | |
| | 3,258,906 | | | Velocity Commercial Capital Loan Trust, Series2019-2-M4 | | | 3.99 | % # ^ | | | 07/25/2049 | | | | 2,394,809 | |
| | 822,939 | | | Verus Securitization Trust, Series2017-1A-A3 | | | 3.72 | % # ^ | | | 01/25/2047 | | | | 809,762 | |
| | 3,100,000 | | | Verus Securitization Trust, Series2019-INV3-B1 | | | 3.73 | % # ^ | | | 11/25/2059 | | | | 2,620,301 | |
| | 864,583 | | | Washington Mutual Mortgage Pass-Through Certificates,Series 2006-2-4CB | | | 6.00 | % | | | 03/25/2036 | | | | 824,639 | |
| | 545,196 | | | Wells Fargo Alternative Loan Trust, Series2007-PA5-1A1 | | | 6.25 | % | | | 11/25/2037 | | | | 511,806 | |
| | 4,534,286 | | | Wells Fargo Home Equity Asset-Backed Securities Trust,Series 2007-2-A4 (1 Month LIBOR USD + 0.30%, 0.30% Floor) | | | 1.25 | % | | | 04/25/2037 | | | | 2,699,988 | |
| | | | | | | | | | | | | | | | |
| | Total Non-Agency Residential Collateralized Mortgage Obligations(Cost $302,796,229) | | | | | | | | | | | 265,465,810 | |
| | | | | | | | | | | | | |
| | | | | | | | | | | | | | | | |
| | | | | | | | | | | | | |
| | US Corporate Bonds - 7.2% | | | | | | | | | | | | |
| | 565,000 | | | Acrisure LLC | | | 8.13 | % ^ | | | 02/15/2024 | | | | 553,516 | |
| | 435,000 | | | Advanced Drainage Systems, Inc. | | | 5.00 | % ^ | | | 09/30/2027 | | | | 390,866 | |
| | 565,000 | | | AECOM | | | 5.13 | % | | | 03/15/2027 | | | | 513,327 | |
| | 350,000 | | | Air Medical Merger Sub Corporation | | | 6.38 | % ^ | | | 05/15/2023 | | | | 313,686 | |
| | 305,000 | | | Albertsons LLC | | | 4.63 | % ^ | | | 01/15/2027 | | | | 305,168 | |
| | 275,000 | | | Alliant Holdings Intermediate LLC | | | 6.75 | % ^ | | | 10/15/2027 | | | | 259,036 | |
| | 410,000 | | | Allied Universal Holding Company | | | 6.63 | % ^ | | | 07/15/2026 | | | | 403,595 | |
| | 345,000 | | | Allied Universal Holding Company | | | 9.75 | % ^ | | | 07/15/2027 | | | | 327,532 | |
| | 800,000 | | | Allison Transmission, Inc. | | | 5.00 | % ^ | | | 10/01/2024 | | | | 781,976 | |
| | 325,000 | | | AMC Merger, Inc. | | | 8.00 | % ^ | | | 05/15/2025 | | | | 189,717 | |
| | 250,000 | | | American Axle & Manufacturing, Inc. | | | 6.25 | % | | | 03/15/2026 | | | | 194,636 | |
| | 239,000 | | | Antero Midstream Partners LP | | | 5.75 | % ^ | | | 03/01/2027 | | | | 154,770 | |
| | 600,000 | | | Arconic Corporation | | | 6.13 | % ^ | | | 02/15/2028 | | | | 618,000 | |
| | 435,000 | | | Argos Merger Sub, Inc. | | | 7.13 | % ^ | | | 03/15/2023 | | | | 413,032 | |
| | 86,000 | | | Asbury Automotive Group, Inc. | | | 4.50 | % ^ | | | 03/01/2028 | | | | 73,745 | |
| | 86,000 | | | Asbury Automotive Group, Inc. | | | 4.75 | % ^ | | | 03/01/2030 | | | | 73,745 | |
| | 185,000 | | | Ascend Learning LLC | | | 6.88 | % ^ | | | 08/01/2025 | | | | 181,068 | |
| | 580,000 | | | Ascend Learning LLC | | | 6.88 | % ^ | | | 08/01/2025 | | | | 567,672 | |
| | 675,000 | | | AssuredPartners, Inc. | | | 7.00 | % ^ | | | 08/15/2025 | | | | 612,542 | |
| | 240,000 | | | B&G Foods, Inc. | | | 5.25 | % | | | 04/01/2025 | | | | 235,660 | |
| | 185,000 | | | B&G Foods, Inc. | | | 5.25 | % | | | 09/15/2027 | | | | 181,069 | |
| | 195,000 | | | Banff Merger Sub, Inc. | | | 9.75 | % ^ | | | 09/01/2026 | | | | 173,077 | |
| | 545,000 | | | Bausch Health Companies, Inc. | | | 7.00 | % ^ | | | 01/15/2028 | | | | 568,190 | |
| | 310,000 | | | Bausch Health Companies, Inc. | | | 5.00 | % ^ | | | 01/30/2028 | | | | 295,802 | |
| | 315,000 | | | Bausch Health Companies, Inc. | | | 5.25 | % ^ | | | 01/30/2030 | | | | 296,887 | |
| | 495,000 | | | Beacon Roofing Supply, Inc. | | | 4.88 | % ^ | | | 11/01/2025 | | | | 449,834 | |
| | 190,000 | | | Beacon Roofing Supply, Inc. | | | 4.50 | % ^ | | | 11/15/2026 | | | | 176,044 | |
| | 515,000 | | | Boyd Gaming Corporation | | | 4.75 | % ^ | | | 12/01/2027 | | | | 427,733 | |
| | 785,000 | | | Boyne USA, Inc. | | | 7.25 | % ^ | | | 05/01/2025 | | | | 756,540 | |
| | 139,000 | | | Builders FirstSource, Inc. | | | 6.75 | % ^ | | | 06/01/2027 | | | | 137,407 | |
| | 320,000 | | | Builders FirstSource, Inc. | | | 5.00 | % ^ | | | 03/01/2030 | | | | 289,800 | |
| | 275,000 | | | Calpine Corporation | | | 5.25 | % ^ | | | 06/01/2026 | | | | 263,166 | |
| | 210,000 | | | Calpine Corporation | | | 4.50 | % ^ | | | 02/15/2028 | | | | 204,330 | |
| | 130,000 | | | Calpine Corporation | | | 5.13 | % ^ | | | 03/15/2028 | | | | 120,575 | |
| | 150,000 | | | Carvana Company | | | 8.88 | % ^ | | | 10/01/2023 | | | | 142,870 | |
| | 135,000 | | | Castle US Holding Corporation | | | 9.50 | % ^ | | | 02/15/2028 | | | | 129,009 | |
| | 505,000 | | | Catalent Pharma Solutions, Inc. | | | 5.00 | % ^ | | | 07/15/2027 | | | | 492,653 | |
| | 1,520,000 | | | CCO Holdings LLC | | | 5.75 | % ^ | | | 02/15/2026 | | | | 1,544,244 | |
| | | | | | | | | | | | | | | | |
| | | | | | | | | | | | | |
| | 605,000 | | | CCO Holdings LLC | | | 4.75 | % ^ | | | 03/01/2030 | | | | 606,845 | |
| | 295,000 | | | CCO Holdings LLC | | | 4.50 | % ^ | | | 08/15/2030 | | | | 290,759 | |
| | 275,000 | | | CDK Global, Inc. | | | 5.88 | % | | | 06/15/2026 | | | | 292,064 | |
| | 35,000 | | | CDK Global, Inc. | | | 5.25 | % ^ | | | 05/15/2029 | | | | 35,831 | |
| | 420,000 | | | Cedar Fair LP | | | 5.25 | % ^ | | | 07/15/2029 | | | | 357,231 | |
| | 285,000 | | | Cengage Learning, Inc. | | | 9.50 | % ^ | | | 06/15/2024 | | | | 213,392 | |
| | 370,000 | | | Centene Corporation | | | 4.25 | % ^ | | | 12/15/2027 | | | | 372,756 | |
| | 285,000 | | | Centene Corporation | | | 3.38 | % ^ | | | 02/15/2030 | | | | 266,119 | |
| | 270,000 | | | Century Communities, Inc. | | | 6.75 | % | | | 06/01/2027 | | | | 220,411 | |
| | 310,000 | | | CenturyLink, Inc. | | | 5.13 | % ^ | | | 12/15/2026 | | | | 310,775 | |
| | 280,000 | | | CenturyLink, Inc. | | | 4.00 | % ^ | | | 02/15/2027 | | | | 269,500 | |
| | 300,000 | | | Charles River Laboratories International, Inc. | | | 4.25 | % ^ | | | 05/01/2028 | | | | 290,835 | |
| | 610,000 | | | Cheniere Energy Partners LP | | | 5.25 | % | | | 10/01/2025 | | | | 571,857 | |
| | 315,000 | | | Cheniere Energy Partners LP | | | 5.63 | % | | | 10/01/2026 | | | | 294,721 | |
| | 190,000 | | | Cheniere Energy Partners LP | | | 4.50 | % ^ | | | 10/01/2029 | | | | 170,154 | |
| | 490,000 | | | Clean Harbors, Inc. | | | 4.88 | % ^ | | | 07/15/2027 | | | | 482,380 | |
| | 110,000 | | | Clean Harbors, Inc. | | | 5.13 | % ^ | | | 07/15/2029 | | | | 103,240 | |
| | 302,000 | | | Clear Channel Worldwide Holdings, Inc. | | | 9.25 | % ^ | | | 02/15/2024 | | | | 261,609 | |
| | 305,000 | | | Clearway Energy Operating LLC | | | 4.75 | % ^ | | | 03/15/2028 | | | | 284,031 | |
| | 407,000 | | | CNX Midstream Partners LP | | | 6.50 | % ^ | | | 03/15/2026 | | | | 284,307 | |
| | 320,000 | | | CommScope Finance LLC | | | 5.50 | % ^ | | | 03/01/2024 | | | | 325,842 | |
| | 130,000 | | | CommScope Finance LLC | | | 6.00 | % ^ | | | 03/01/2026 | | | | 130,536 | |
| | 310,000 | | | Constellation Merger Sub, Inc. | | | 8.50 | % ^ | | | 09/15/2025 | | | | 188,711 | |
| | 780,000 | | | Cott Holdings, Inc. | | | 5.50 | % ^ | | | 04/01/2025 | | | | 761,479 | |
| | 380,000 | | | CRC Issuer LLC | | | 5.25 | % ^ | | | 10/15/2025 | | | | 277,286 | |
| | 510,000 | | | Credit Acceptance Corporation | | | 6.63 | % | | | 03/15/2026 | | | | 484,500 | |
| | 410,000 | | | Crown Americas LLC | | | 4.50 | % | | | 01/15/2023 | | | | 422,907 | |
| | 515,000 | | | CSC Holdings LLC | | | 5.25 | % | | | 06/01/2024 | | | | 519,504 | |
| | 645,000 | | | CSC Holdings LLC | | | 5.75 | % ^ | | | 01/15/2030 | | | | 652,875 | |
| | 495,000 | | | CSI Compressco LP | | | 7.50 | % ^ | | | 04/01/2025 | | | | 335,984 | |
| | 230,000 | | | Dana Financing Ltd. | | | 5.75 | % ^ | | | 04/15/2025 | | | | 202,111 | |
| | 100,000 | | | Dana, Inc. | | | 5.38 | % | | | 11/15/2027 | | | | 81,750 | |
| | 135,000 | | | Dealer Tire LLC | | | 8.00 | % ^ | | | 02/01/2028 | | | | 109,012 | |
| | 365,000 | | | Diamond Sports Group LLC | | | 5.38 | % ^ | | | 08/15/2026 | | | | 298,622 | |
| | 300,000 | | | DISH DBS Corporation | | | 5.88 | % | | | 11/15/2024 | | | | 294,025 | |
| | 230,000 | | | Dun & Bradstreet Corporation | | | 6.88 | % ^ | | | 08/15/2026 | | | | 240,494 | |
| | 160,000 | | | Dun & Bradstreet Corporation | | | 10.25 | % ^ | | | 02/15/2027 | | | | 170,488 | |
| | 300,000 | | | EES Finance Corporation | | | 8.13 | % | | | 05/01/2025 | | | | 199,500 | |
| | 390,000 | | | Eldorado Resorts, Inc. | | | 6.00 | % | | | 04/01/2025 | | | | 353,439 | |
| | 295,000 | | | Embarq Corporation | | | 8.00 | % | | | 06/01/2036 | | | | 293,621 | |
| | 140,000 | | | Encompass Health Corporation | | | 4.50 | % | | | 02/01/2028 | | | | 138,082 | |
| | 45,000 | | | Encompass Health Corporation | | | 4.75 | % | | | 02/01/2030 | | | | 44,575 | |
| | 540,000 | | | Energizer Holdings, Inc. | | | 7.75 | % ^ | | | 01/15/2027 | | | | 561,195 | |
| | 215,000 | | | Envision Healthcare Corporation | | | 8.75 | % ^ | | | 10/15/2026 | | | | 53,974 | |
| | 255,000 | | | EP Energy LLC | | | 0.00 | % ^ W | | | 05/15/2026 | | | | 36,975 | |
| | 901,000 | | | ESH Hospitality, Inc. | | | 5.25 | % ^ | | | 05/01/2025 | | | | 762,476 | |
| | 185,000 | | | ESH Hospitality, Inc. | | | 4.63 | % ^ | | | 10/01/2027 | | | | 145,327 | |
| | | | | | | | | | | | | | | | |
| | | | | | | | | | | | | |
| | 155,000 | | | Extraction Oil & Gas, Inc. | | | 5.63 | % ^ | | | 02/01/2026 | | | | 26,899 | |
| | 345,000 | | | Financial & Risk US Holdings, Inc. | | | 6.25 | % ^ | | | 05/15/2026 | | | | 358,127 | |
| | 355,000 | | | Financial & Risk US Holdings, Inc. | | | 8.25 | % ^ | | | 11/15/2026 | | | | 375,412 | |
| | 310,000 | | | Flex Acquisition Company, Inc. | | | 6.88 | % ^ | | | 01/15/2025 | | | | 292,166 | |
| | 220,000 | | | Ford Motor Company | | | 7.45 | % | | | 07/16/2031 | | | | 159,500 | |
| | 430,000 | | | Foresight Energy LLC | | | 0.00 | % ^ W | | | 04/01/2023 | | | | 1,612 | |
| | 365,000 | | | Front Range BidCo, Inc. | | | 4.00 | % ^ | | | 03/01/2027 | | | | 351,313 | |
| | 165,000 | | | Front Range BidCo, Inc. | | | 6.13 | % ^ | | | 03/01/2028 | | | | 157,678 | |
| | 590,000 | | | Frontdoor, Inc. | | | 6.75 | % ^ | | | 08/15/2026 | | | | 569,965 | |
| | 120,000 | | | Frontier Communications Corporation | | | 8.50 | % W | | | 04/15/2020 | | | | 32,400 | |
| | 220,000 | | | Frontier Communications Corporation | | | 7.13 | % W | | | 01/15/2023 | | | | 52,800 | |
| | 175,000 | | | Frontier Communications Corporation | | | 8.50 | % ^ | | | 04/01/2026 | | | | 160,904 | |
| | 175,000 | | | Frontier Communications Corporation | | | 8.00 | % ^ | | | 04/01/2027 | | | | 173,570 | |
| | 237,000 | | | FTS International, Inc. | | | 6.25 | % | | | 05/01/2022 | | | | 84,357 | |
| | 385,000 | | | Gates Global LLC | | | 6.25 | % ^ | | | 01/15/2026 | | | | 342,844 | |
| | 775,000 | | | Genesys Telecommunications Laboratories, Inc. | | | 10.00 | % ^ | | | 11/30/2024 | | | | 797,510 | |
| | 515,000 | | | Global Aircraft Leasing Company (PIK 7.25%) | | | 6.50 | % ^ | | | 09/15/2024 | | | | 335,522 | |
| | 240,000 | | | Golden Entertainment, Inc. | | | 7.63 | % ^ | | | 04/15/2026 | | | | 160,108 | |
| | 695,000 | | | Golden Nugget, Inc. | | | 6.75 | % ^ | | | 10/15/2024 | | | | 442,965 | |
| | 185,000 | | | Golden Nugget, Inc. | | | 8.75 | % ^ | | | 10/01/2025 | | | | 96,888 | |
| | 200,000 | | | Gray Television, Inc. | | | 5.13 | % ^ | | | 10/15/2024 | | | | 194,501 | |
| | 225,000 | | | Gray Television, Inc. | | | 7.00 | % ^ | | | 05/15/2027 | | | | 225,124 | |
| | 305,000 | | | Griffon Corporation | | | 5.75 | % ^ | | | 03/01/2028 | | | | 288,416 | |
| | 180,000 | | | GrubHub Holdings, Inc. | | | 5.50 | % ^ | | | 07/01/2027 | | | | 160,299 | |
| | 300,000 | | | GTT Communications, Inc. | | | 7.88 | % ^ | | | 12/31/2024 | | | | 195,750 | |
| | 400,000 | | | Gulfport Energy Corporation | | | 6.38 | % | | | 05/15/2025 | | | | 100,498 | |
| | 765,000 | | | HCA, Inc. | | | 5.38 | % | | | 09/01/2026 | | | | 793,745 | |
| | 480,000 | | | HCA, Inc. | | | 3.50 | % | | | 09/01/2030 | | | | 437,458 | |
| | 374,000 | | | Hess Midstream Operations LP | | | 5.63 | % ^ | | | 02/15/2026 | | | | 266,674 | |
| | 475,000 | | | Hess Midstream Operations LP | | | 5.13 | % ^ | | | 06/15/2028 | | | | 335,611 | |
| | 225,000 | | | Hexion, Inc. | | | 7.88 | % ^ | | | 07/15/2027 | | | | 192,954 | |
| | 425,000 | | | HilCorporationEnergy LP | | | 6.25 | % ^ | | | 11/01/2028 | | | | 190,631 | |
| | 105,000 | | | Hillman Group, Inc. | | | 6.38 | % ^ | | | 07/15/2022 | | | | 82,392 | |
| | 230,000 | | | Hill-Rom Holdings, Inc. | | | 4.38 | % ^ | | | 09/15/2027 | | | | 228,515 | |
| | 600,000 | | | Horizon Pharma USA, Inc. | | | 5.50 | % ^ | | | 08/01/2027 | | | | 605,670 | |
| | 585,000 | | | IAA, Inc. | | | 5.50 | % ^ | | | 06/15/2027 | | | | 569,234 | |
| | 300,000 | | | Icahn Enterprises LP | | | 5.25 | % | | | 05/15/2027 | | | | 279,375 | |
| | 55,000 | | | iHeartCommunications, Inc. | | | 8.38 | % | | | 05/01/2027 | | | | 47,132 | |
| | 235,000 | | | iHeartCommunications, Inc. | | | 5.25 | % ^ | | | 08/15/2027 | | | | 206,083 | |
| | 205,000 | | | Indigo Natural Resources LLC | | | 6.88 | % ^ | | | 02/15/2026 | | | | 136,853 | |
| | 335,000 | | | Installed Building Products, Inc. | | | 5.75 | % ^ | | | 02/01/2028 | | | | 321,949 | |
| | 675,000 | | | IRB Holding Corporation | | | 6.75 | % ^ | | | 02/15/2026 | | | | 537,609 | |
| | 185,000 | | | Iron Mountain, Inc. | | | 4.88 | % ^ | | | 09/15/2029 | | | | 175,074 | |
| | 235,000 | | | iStar, Inc. | | | 4.75 | % | | | 10/01/2024 | | | | 198,870 | |
| | 95,000 | | | JBS Finance, Inc. | | | 5.88 | % ^ | | | 07/15/2024 | | | | 96,544 | |
| | 65,000 | | | JBS Finance, Inc. | | | 5.75 | % ^ | | | 06/15/2025 | | | | 66,218 | |
| | 260,000 | | | JBS Finance, Inc. | | | 6.50 | % ^ | | | 04/15/2029 | | | | 280,345 | |
| | | | | | | | | | | | | | | | |
| | | | | | | | | | | | | |
| | 165,000 | | | JBS Finance, Inc. | | | 5.50 | % ^ | | | 01/15/2030 | | | | 171,278 | |
| | 390,000 | | | JBS USA Finance, Inc. | | | 6.75 | % ^ | | | 02/15/2028 | | | | 418,489 | |
| | 635,000 | | | JELD-WEN, Inc. | | | 4.63 | % ^ | | | 12/15/2025 | | | | 564,353 | |
| | 560,000 | | | KAR Auction Services, Inc. | | | 5.13 | % ^ | | | 06/01/2025 | | | | 538,303 | |
| | 465,000 | | | Kraft Heinz Foods Company | | | 3.95 | % | | | 07/15/2025 | | | | 458,035 | |
| | 345,000 | | | Kraft Heinz Foods Company | | | 5.00 | % | | | 07/15/2035 | | | | 345,311 | |
| | 935,000 | | | Kraft Heinz Foods Company | | | 5.20 | % | | | 07/15/2045 | | | | 904,258 | |
| | 350,000 | | | Kraton Polymers LLC | | | 7.00 | % ^ | | | 04/15/2025 | | | | 312,701 | |
| | 335,000 | | | Kratos Defense & Security Solutions, Inc. | | | 6.50 | % ^ | | | 11/30/2025 | | | | 309,455 | |
| | 350,000 | | | Level 3 Financing, Inc. | | | 4.63 | % ^ | | | 09/15/2027 | | | | 349,808 | |
| | 320,000 | | | LifePoint Health, Inc. | | | 4.38 | % ^ | | | 02/15/2027 | | | | 303,840 | |
| | 365,000 | | | Lions Gate Capital Holdings LLC | | | 6.38 | % ^ | | | 02/01/2024 | | | | 323,927 | |
| | 680,000 | | | Live Nation Entertainment, Inc. | | | 5.63 | % ^ | | | 03/15/2026 | | | | 611,009 | |
| | 720,000 | | | LTF Merger Sub, Inc. | | | 8.50 | % ^ | | | 06/15/2023 | | | | 596,696 | |
| | 285,000 | | | M/I Homes, Inc. | | | 4.95 | % ^ | | | 02/01/2028 | | | | 244,031 | |
| | 440,000 | | | Marriott Ownership Resorts, Inc. | | | 6.50 | % | | | 09/15/2026 | | | | 385,274 | |
| | 470,000 | | | Masonite International Corporation | | | 5.75 | % ^ | | | 09/15/2026 | | | | 464,615 | |
| | 590,000 | | | Match Group, Inc. | | | 5.00 | % ^ | | | 12/15/2027 | | | | 568,490 | |
| | 360,000 | | | Matterhorn Merger Sub LLC | | | 8.50 | % ^ | | | 06/01/2026 | | | | 287,879 | |
| | 430,000 | | | MGM Growth Properties Operating Partnership LP | | | 5.75 | % | | | 02/01/2027 | | | | 375,713 | |
| | 335,000 | | | MGM Resorts International | | | 5.75 | % | | | 06/15/2025 | | | | 302,327 | |
| | 290,000 | | | Moss Creek Resources Holdings, Inc. | | | 7.50 | % ^ | | | 01/15/2026 | | | | 86,577 | |
| | 465,000 | | | MPH Acquisition Holdings LLC | | | 7.13 | % ^ | | | 06/01/2024 | | | | 408,051 | |
| | 110,000 | | | MPT Operating Partnership LP | | | 5.25 | % | | | 08/01/2026 | | | | 110,216 | |
| | 695,000 | | | MPT Operating Partnership LP | | | 5.00 | % | | | 10/15/2027 | | | | 679,415 | |
| | 90,000 | | | MSCI, Inc. | | | 3.63 | % ^ | | | 09/01/2030 | | | | 85,894 | |
| | 570,000 | | | Murphy Oil USA, Inc. | | | 4.75 | % | | | 09/15/2029 | | | | 537,539 | |
| | 240,000 | | | Nabors Industries Ltd. | | | 7.25 | % ^ | | | 01/15/2026 | | | | 83,400 | |
| | 50,000 | | | Nationstar Mortgage Holdings, Inc. | | | 6.00 | % ^ | | | 01/15/2027 | | | | 42,781 | |
| | 640,000 | | | Navient Corporation | | | 6.50 | % | | | 06/15/2022 | | | | 625,741 | |
| | 225,000 | | | Navient Corporation | | | 5.00 | % | | | 03/15/2027 | | | | 195,120 | |
| | 495,000 | | | NCL Corporation | | | 3.63 | % ^ | | | 12/15/2024 | | | | 319,424 | |
| | 175,000 | | | Netflix, Inc. | | | 5.38 | % ^ | | | 11/15/2029 | | | | 183,846 | |
| | 245,000 | | | Nexstar Broadcasting, Inc. | | | 5.63 | % ^ | | | 07/15/2027 | | | | 240,847 | |
| | 425,000 | | | NFP Corporation | | | 6.88 | % ^ | | | 07/15/2025 | | | | 421,800 | |
| | 205,000 | | | NGL Energy Partners LP | | | 7.50 | % | | | 04/15/2026 | | | | 73,209 | |
| | 185,000 | | | Novelis Corporation | | | 4.75 | % ^ | | | 01/30/2030 | | | | 165,691 | |
| | 590,000 | | | NuStar Logistics LP | | | 6.00 | % | | | 06/01/2026 | | | | 439,917 | |
| | 360,000 | | | Oasis Petroleum, Inc. | | | 6.88 | % | | | 03/15/2022 | | | | 73,800 | |
| | 260,000 | | | Oasis Petroleum, Inc. | | | 6.25 | % ^ | | | 05/01/2026 | | | | 43,570 | |
| | 220,000 | | | Occidental Petroleum Corporation | | | 2.70 | % | | | 08/15/2022 | | | | 157,069 | |
| | 70,000 | | | OPE KAG Finance Sub, Inc. | | | 7.88 | % ^ | | | 07/31/2023 | | | | 59,368 | |
| | 305,000 | | | Ortho-Clinical Diagnostics Inc. | | | 7.25 | % ^ | | | 02/01/2028 | | | | 264,557 | |
| | 335,000 | | | Panther BF Aggregator LP | | | 6.25 | % ^ | | | 05/15/2026 | | | | 318,458 | |
| | 240,000 | | | Panther BF Aggregator LP | | | 8.50 | % ^ | | | 05/15/2027 | | | | 210,708 | |
| | 595,000 | | | Par Petroleum Finance Corporation | | | 7.75 | % ^ | | | 12/15/2025 | | | | 378,566 | |
| | 475,000 | | | Parsley Energy LLC | | | 5.63 | % ^ | | | 10/15/2027 | | | | 337,511 | |
| | | | | | | | | | | | | | | | |
| | | | | | | | | | | | | |
| | 180,000 | | | PBF Holding LLC | | | 6.00 | % ^ | | | 02/15/2028 | | | | 122,400 | |
| | 305,000 | | | Peabody Securities Finance Corporation | | | 6.00 | % ^ | | | 03/31/2022 | | | | 209,688 | |
| | 605,000 | | | Penn National Gaming, Inc. | | | 5.63 | % ^ | | | 01/15/2027 | | | | 454,000 | |
| | 595,000 | | | Performance Food Group, Inc. | | | 5.50 | % ^ | | | 10/15/2027 | | | | 556,370 | |
| | 245,000 | | | PetSmart, Inc. | | | 5.88 | % ^ | | | 06/01/2025 | | | | 243,163 | |
| | 440,000 | | | Pilgrim’s Pride Corporation | | | 5.88 | % ^ | | | 09/30/2027 | | | | 440,858 | |
| | 285,000 | | | Polaris Intermediate Corporation (PIK 9.25%) | | | 8.50 | % ^ | | | 12/01/2022 | | | | 223,007 | |
| | 420,000 | | | Polaris Intermediate Corporation (PIK 9.25%) | | | 9.88 | % ^ | | | 05/01/2024 | | | | 334,427 | |
| | 105,000 | | | Post Holdings, Inc. | | | 5.50 | % ^ | | | 12/15/2029 | | | | 109,499 | |
| | 420,000 | | | Post Holdings, Inc. | | | 4.63 | % ^ | | | 04/15/2030 | | | | 405,300 | |
| | 255,000 | | | Prime Security Services Borrower LLC | | | 6.25 | % ^ | | | 01/15/2028 | | | | 221,850 | |
| | 315,000 | | | QEP Resources, Inc. | | | 5.25 | % | | | 05/01/2023 | | | | 118,913 | |
| | 245,000 | | | QEP Resources, Inc. | | | 5.63 | % | | | 03/01/2026 | | | | 91,281 | |
| | 120,000 | | | Radiate Finance, Inc. | | | 6.88 | % ^ | | | 02/15/2023 | | | | 110,249 | |
| | 365,000 | | | Radiology Partners, Inc. | | | 9.25 | % ^ | | | 02/01/2028 | | | | 318,736 | |
| | 520,000 | | | Resideo Funding, Inc. | | | 6.13 | % ^ | | | 11/01/2026 | | | | 457,639 | |
| | 255,000 | | | Riverbed Technology, Inc. | | | 8.88 | % ^ | | | 03/01/2023 | | | | 163,200 | |
| | 360,000 | | | Schweitzer-Mauduit International, Inc. | | | 6.88 | % ^ | | | 10/01/2026 | | | | 361,275 | |
| | 410,000 | | | Scientific Games International, Inc. | | | 5.00 | % ^ | | | 10/15/2025 | | | | 359,775 | |
| | 175,000 | | | Scientific Games International, Inc. | | | 8.25 | % ^ | | | 03/15/2026 | | | | 113,003 | |
| | 335,000 | | | Scotts Miracle-Gro Company | | | 4.50 | % | | | 10/15/2029 | | | | 321,625 | |
| | 240,000 | | | Scripps Escrow, Inc. | | | 5.88 | % ^ | | | 07/15/2027 | | | | 212,532 | |
| | 685,000 | | | Select Medical Corporation | | | 6.25 | % ^ | | | 08/15/2026 | | | | 688,771 | |
| | 190,000 | | | Silgan Holdings, Inc. | | | 4.13 | % ^ | | | 02/01/2028 | | | | 176,700 | |
| | 260,000 | | | Sirius XM Radio, Inc. | | | 5.50 | % ^ | | | 07/01/2029 | | | | 266,643 | |
| | 700,000 | | | Six Flags Entertainment Corporation | | | 4.88 | % ^ | | | 07/31/2024 | | | | 597,629 | |
| | 285,000 | | | Spectrum Brands, Inc. | | | 5.00 | % ^ | | | 10/01/2029 | | | | 244,685 | |
| | 210,000 | | | Springleaf Finance Corporation | | | 6.88 | % | | | 03/15/2025 | | | | 213,064 | |
| | 60,000 | | | Springleaf Finance Corporation | | | 7.13 | % | | | 03/15/2026 | | | | 59,063 | |
| | 95,000 | | | Springleaf Finance Corporation | | | 6.63 | % | | | 01/15/2028 | | | | 89,485 | |
| | 200,000 | | | Springleaf Finance Corporation | | | 5.38 | % | | | 11/15/2029 | | | | 184,214 | |
| | 900,000 | | | Sprint Capital Corporation | | | 6.88 | % | | | 11/15/2028 | | | | 1,032,975 | |
| | 865,000 | | | Sprint Corporation | | | 7.13 | % | | | 06/15/2024 | | | | 955,812 | |
| | 185,000 | | | Sprint Corporation | | | 7.25 | % ^ | | | 02/01/2028 | | | | 186,619 | |
| | 245,000 | | | Staples, Inc. | | | 7.50 | % ^ | | | 04/15/2026 | | | | 215,754 | |
| | 115,000 | | | Staples, Inc. | | | 10.75 | % ^ | | | 04/15/2027 | | | | 88,878 | |
| | 675,000 | | | SunCoke Energy Partners Finance Corporation | | | 7.50 | % ^ | | | 06/15/2025 | | | | 491,042 | |
| | 430,000 | | | Sunoco LP | | | 5.50 | % | | | 02/15/2026 | | | | 375,744 | |
| | 230,000 | | | Sunoco LP | | | 6.00 | % | | | 04/15/2027 | | | | 199,403 | |
| | 250,000 | | | Talen Energy Supply LLC | | | 6.63 | % ^ | | | 01/15/2028 | | | | 211,614 | |
| | 220,000 | | | Tapstone Energy Finance Corporation | | | 0.00 | % ^ W | | | 06/01/2022 | | | | 2,530 | |
| | 395,000 | | | Targa Resources Partners Finance Corporation | | | 5.88 | % | | | 04/15/2026 | | | | 331,058 | |
| | 180,000 | | | Targa Resources Partners Finance Corporation | | | 6.50 | % | | | 07/15/2027 | | | | 154,800 | |
| | 200,000 | | | Targa Resources Partners Finance Corporation | | | 5.50 | % ^ | | | 03/01/2030 | | | | 156,250 | |
| | 459,000 | | | Tempo Acquisition LLC | | | 6.75 | % ^ | | | 06/01/2025 | | | | 423,441 | |
| | 395,000 | | | Tenet Healthcare Corporation | | | 7.00 | % | | | 08/01/2025 | | | | 344,146 | |
| | 410,000 | | | Tenet Healthcare Corporation | | | 4.88 | % ^ | | | 01/01/2026 | | | | 392,063 | |
| | | | | | | | | | | | | | | | |
| | | | | | | | | | | | | |
| | 435,000 | | | Tenet Healthcare Corporation | | | 6.25 | % ^ | | | 02/01/2027 | | | | 425,756 | |
| | 175,000 | | | Tenet Healthcare Corporation | | | 5.13 | % ^ | | | 11/01/2027 | | | | 167,781 | |
| | 125,000 | | | Terrier Media Buyer, Inc. | | | 8.88 | % ^ | | | 12/15/2027 | | | | 105,938 | |
| | 365,000 | | | The William Carter Company | | | 5.63 | % ^ | | | 03/15/2027 | | | | 352,419 | |
| | 610,000 | | | TransDigm, Inc. | | | 6.25 | % ^ | | | 03/15/2026 | | | | 610,379 | |
| | 305,000 | | | TransDigm, Inc. | | | 6.38 | % | | | 06/15/2026 | | | | 293,730 | |
| | 285,000 | | | TransDigm, Inc. | | | 5.50 | % ^ | | | 11/15/2027 | | | | 257,369 | |
| | 162,827 | | | Transocean Guardian Ltd. | | | 5.88 | % ^ | | | 01/15/2024 | | | | 131,478 | |
| | 535,000 | | | Transocean Poseidon Ltd. | | | 6.88 | % ^ | | | 02/01/2027 | | | | 437,078 | |
| | 315,000 | | | Transocean Proteus Ltd. | | | 6.25 | % ^ | | | 12/01/2024 | | | | 254,755 | |
| | 245,000 | | | Transocean, Inc. | | | 8.00 | % ^ | | | 02/01/2027 | | | | 117,294 | |
| | 305,000 | | | Trident TPI Holdings, Inc. | | | 6.63 | % ^ | | | 11/01/2025 | | | | 247,433 | |
| | 120,000 | | | Triumph Group, Inc. | | | 6.25 | % ^ | | | 09/15/2024 | | | | 107,708 | |
| | 315,000 | | | Triumph Group, Inc. | | | 7.75 | % | | | 08/15/2025 | | | | 226,405 | |
| | 535,000 | | | Twin River Worldwide Holdings, Inc. | | | 6.75 | % ^ | | | 06/01/2027 | | | | 405,820 | |
| | 295,000 | | | Uber Technologies, Inc. | | | 8.00 | % ^ | | | 11/01/2026 | | | | 292,945 | |
| | 160,000 | | | Uber Technologies, Inc. | | | 7.50 | % ^ | | | 09/15/2027 | | | | 159,164 | |
| | 285,000 | | | United Rentals North America, Inc. | | | 6.50 | % | | | 12/15/2026 | | | | 290,857 | |
| | 85,000 | | | United Rentals North America, Inc. | | | 5.25 | % | | | 01/15/2030 | | | | 85,446 | |
| | 295,000 | | | United Rentals North America, Inc. | | | 4.00 | % | | | 07/15/2030 | | | | 265,131 | |
| | 175,000 | | | Univision Communications, Inc. | | | 5.13 | % ^ | | | 05/15/2023 | | | | 156,188 | |
| | 535,000 | | | USA Compression Partners LP | | | 6.88 | % | | | 09/01/2027 | | | | 334,669 | |
| | 538,000 | | | Verscend Escrow Corporation | | | 9.75 | % ^ | | | 08/15/2026 | | | | 541,064 | |
| | 55,000 | | | VICI Properties LP | | | 3.75 | % ^ | | | 02/15/2027 | | | | 52,147 | |
| | 65,000 | | | VICI Properties LP | | | 4.13 | % ^ | | | 08/15/2030 | | | | 61,953 | |
| | 825,000 | | | Viking Cruises Ltd. | | | 5.88 | % ^ | | | 09/15/2027 | | | | 487,295 | |
| | 140,000 | | | Vine Oil & Gas Finance Corporation | | | 8.75 | % ^ | | | 04/15/2023 | | | | 34,300 | |
| | 300,000 | | | Viper Energy Partners LP | | | 5.38 | % ^ | | | 11/01/2027 | | | | 253,665 | |
| | 285,000 | | | Vizient, Inc. | | | 6.25 | % ^ | | | 05/15/2027 | | | | 286,840 | |
| | 450,000 | | | Wand Merger Corporation | | | 8.13 | % ^ | | | 07/15/2023 | | | | 442,825 | |
| | 295,000 | | | Waste Pro, Inc. | | | 5.50 | % ^ | | | 02/15/2026 | | | | 275,756 | |
| | 14,000 | | | Weatherford International Ltd. | | | 11.00 | % ^ | | | 12/01/2024 | | | | 8,547 | |
| | 395,000 | | | West Street Merger Sub, Inc. | | | 6.38 | % ^ | | | 09/01/2025 | | | | 347,272 | |
| | 165,000 | | | WeWork Cos, Inc. | | | 7.88 | % ^ | | | 05/01/2025 | | | | 62,283 | |
| | 560,000 | | | Whiting Petroleum Corporation | | | 6.63 | % | | | 01/15/2026 | | | | 42,042 | |
| | 290,000 | | | Wolverine Escrow LLC | | | 9.00 | % ^ | | | 11/15/2026 | | | | 237,221 | |
| | 335,000 | | | WPX Energy, Inc. | | | 5.25 | % | | | 10/15/2027 | | | | 186,109 | |
| | 370,000 | | | WPX Energy, Inc. | | | 4.50 | % | | | 01/15/2030 | | | | 202,298 | |
| | 120,000 | | | Yum! Brands, Inc. | | | 7.75 | % ^ | | | 04/01/2025 | | | | 126,300 | |
| | 285,000 | | | Yum! Brands, Inc. | | | 4.75 | % ^ | | | 01/15/2030 | | | | 267,031 | |
| | | | | | | | | | | | | | | | |
| | Total US Corporate Bonds(Cost $91,899,975) | | | | | | | | | | | 79,113,421 | |
| | | | | | | | | | | | | |
| | | | | | | | | | | | | | | | |
| | | | | | | | | | | | | |
| | US Government and Agency Mortgage Backed Obligations - 0.6% | | | | | | | | | | | | |
| | 6,050,354 | | | Federal Home Loan Mortgage Corporation Pass-Thru, SeriesK722-X1 | | | 1.31 | % # I/O | | | 03/25/2023 | | | | 183,707 | |
| | 7,100,000 | | | Federal Home Loan Mortgage Corporation, Series2020-DNA2-B1 (1 Month LIBOR USD + 25.00%, 2.50% Floor) | | | 3.45 | % ^ | | | 02/25/2050 | | | | 2,471,989 | |
| | 2,064,959 | | | Federal Home Loan Mortgage Corporation, Series3926-HS(-1 x 1 Month LIBOR USD + 6.45%, 6.45% Cap) | | | 5.75 | % I/F I/O | | | 09/15/2041 | | | | 343,940 | |
| | 394,719 | | | Federal Home Loan Mortgage Corporation, Series4390-NY | | | 3.00 | % | | | 06/15/2040 | | | | 413,517 | |
| | 541,220 | | | Federal Home Loan Mortgage Corporation, Series4471-GA | | | 3.00 | % | | | 02/15/2044 | | | | 578,313 | |
| | 765,693 | | | Federal National Mortgage Association, Series2015-59-A | | | 3.00 | % | | | 06/25/2041 | | | | 789,730 | |
| | 101,726,383 | | | Government National Mortgage Association, Series2013-155-IB | | | 0.20 | % # I/O | | | 09/16/2053 | | | | 1,662,789 | |
| | | | | | | | | | | | | | | | |
| | Total US Government and Agency Mortgage Backed Obligations(Cost $11,673,986) | | | | | | | | | | | 6,443,985 | |
| | | | | | | | | | | | | |
| | US Government and Agency Obligations - 3.4% | | | | | | | | | | | | |
| | 32,507,241 | | | United States Treasury Inflation Indexed Bonds | | | 0.63 | % | | | 04/15/2023 | | | | 32,757,922 | |
| | 5,216,535 | | | United States Treasury Inflation Indexed Bonds | | | 0.50 | % | | | 04/15/2024 | | | | 5,293,378 | |
| | | | | | | | | | | | | | | | |
| | Total US Government and Agency Obligations(Cost $37,934,511) | | | | | | | | | | | 38,051,300 | |
| | | | | | | | | | | | | |
| | Affiliated Mutual Funds - 9.6% | | | | | | | | | | | | |
| | 10,365,365 | | | DoubleLine Global Bond Fund (Class I) | | | | | | | | | | | 105,830,380 | |
| | | | | | | | | | | | | | | | |
| | Total Affiliated Mutual Funds(Cost $106,418,043) | | | | | | | | | | | 105,830,380 | |
| | | | | | | | | | | | | |
| | Exchange Traded Funds and Common Stocks - 0.0% | | | | | | | | | | | | |
| | 5,568 | | | Frontera Energy Corporation | | | | | | | | | | | 13,754 | |
| | 1,977 | | | Weatherford International PLC * | | | | | | | | | | | 11,763 | |
| | | | | | | | | | | | | | | | |
| | Total Exchange Traded Funds and Common Stocks(Cost $631,863) | | | | | | | | | | | 25,517 | |
| | | | | | | | | | | | | |
| | | | | | | | | | | | | | | | |
| | | | | | | | | | | | | |
| | Warrants - –% | | | | | | | | | | | | |
| | 29,269 | | | OAS S.A., Expiration 5/16/2039, Strike Price BRL 1.00* Þ | | | | | | | | | | | 0 | |
| | | | | | | | | | | | | | | | |
| | Total Warrants(Cost $–) | | | | | | | | | | | 0 | |
| | | | | | | | | | | | | |
| | Short Term Investments - 2.7% | | | | | | | | | | | | |
| | 10,141,547 | | | First American Government Obligations Fund - Class U | | | 0.47 | % ¨ | | | | | | | 10,141,547 | |
| | 10,141,547 | | | JP Morgan U.S. Government Money Market Fund - Institutional Share Class | | | 0.36 | % ¨ | | | | | | | 10,141,547 | |
| | 10,141,547 | | | Morgan Stanley Institutional Liquidity Funds Government Portfolio - Institutional Share Class | | | 0.26 | % ¨ | | | | | | | 10,141,547 | |
| | | | | | | | | | | | | | | | |
| | Total Short Term Investments(Cost $30,424,641) | | | | | | | | | | | 30,424,641 | |
| | | | | | | | | | | | | |
| | Total Investments - 98.2%(Cost $1,266,509,024) | | | | | | | | | | | 1,084,545,992 | |
| | Other Assets in Excess of Liabilities - 1.8% | | | | | | | | | | | 20,168,928 | |
| | | | | | | | | | | | | |
| | NET ASSETS - 100.0% | | | | | | | | | | $ | 1,104,714,920 | |
| | | | | | | | | | | | | |
| ^ | Security exempt from registration under Rule 144A of the Securities Act of 1933. These securities may be resold in transactions exempt from registration to qualified institutional buyers. |
| § | The interest rate will step up if the issuer does not redeem the bond on or before a scheduled redemption date in accordance with the terms of the instrument. The interest rate shown is the rate in effect as of March 31, 2020. |
| P/O | Principal only security |
| # | Coupon rate is variable based on the weighted average coupon of the underlying collateral. To the extent the weighted average coupon of the underlying assets which comprise the collateral increases or decreases, the coupon rate of this security will increase or decrease correspondingly. The rate disclosed is as of March 31, 2020. |
| ± | Coupon rate is variable or floats based on components including but not limited to reference rate and spread. These securities may not indicate a reference rate and/or spread in their description. The rate disclosed is as of March 31, 2020. |
| Þ | Value determined using significant unobservable inputs. |
| W | Security is in default or has failed to make a scheduled payment. Income is not being accrued. |
| I/O | Interest only security |
| D | This mortgage-backed bond accrues interest which is added to the outstanding principal balance. The interest payment will be deferred until all other tranches in the structure are paid off. The rate disclosed is as of March 31, 2020. |
| I/F | Inverse floating rate security whose interest rate moves in the opposite direction of reference interest rates. Reference interest rates are typically based on a negative multiplier or slope. Interest rate may also be subject to a cap or floor. |
| ¨ | Seven-day yield as of March 31, 2020 |
| & | Unfunded or partially unfunded loan commitment. At March 31, 2020, the value of these securities amounted to $85,770 or 0.0% of net assets. |
| * | Non-income producing security |
| ~ | Represents less than 0.05% of net assets |
| PIK | Apayment-in-kind security in which the issuer may make interest or dividend payments in cash or additional securities. These additional securities generally have the same terms as the original holdings. |

Report of Independent Registered Public Accounting Firm
To the Board of Trustees of DoubleLine Funds Trust and Shareholders of DoubleLine Total Return Bond Fund, DoubleLine Core Fixed Income Fund, DoubleLine Shiller Enhanced CAPE®, and DoubleLine Flexible Income Fund
Opinions on the Financial Statements
We have audited the accompanying statements of assets and liabilities, including the schedules of investments - summary, of DoubleLine Total Return Bond Fund, DoubleLine Core Fixed Income Fund, DoubleLine Shiller Enhanced CAPE®, and DoubleLine Flexible Income Fund (four of the funds constituting DoubleLine Funds Trust, herein collectively referred to as the “Funds”) as of March 31, 2020, the related statements of operations for the year ended March 31, 2020, the statements of changes in net assets for each of the two years in the period ended March 31, 2020, including the related notes, and the financial highlights for each of the periods indicated therein (included in Item 1 of this Form N-CSR) and the schedules of investments (included in Item 6 of this Form N-CSR) as of March 31, 2020 (collectively referred to as the “financial statements”). In our opinion, the financial statements present fairly, in all material respects, the financial position of each of the Funds as of March 31, 2020, the results of each of their operations for the year then ended, the changes in each of their net assets for each of the two years in the period ended March 31, 2020 and each of the financial highlights for each of the periods indicated therein in conformity with accounting principles generally accepted in the United States of America.
Basis for Opinions
These financial statements are the responsibility of the Funds’ management. Our responsibility is to express an opinion on the Funds’ financial statements based on our audits. We are a public accounting firm registered with the Public Company Accounting Oversight Board (United States) (PCAOB) and are required to be independent with respect to the Funds in accordance with the U.S. federal securities laws and the applicable rules and regulations of the Securities and Exchange Commission and the PCAOB.
We conducted our audits of these financial statements in accordance with the standards of the PCAOB. Those standards require that we plan and perform the audits to obtain reasonable assurance about whether the financial statements are free of material misstatement, whether due to error or fraud.
Our audits included performing procedures to assess the risks of material misstatement of the financial statements, whether due to error or fraud, and performing procedures that respond to those risks. Such procedures included examining, on a test basis, evidence regarding the amounts and disclosures in the financial statements. Our audits also included evaluating the accounting principles used and significant estimates made by management, as well as evaluating the overall presentation of the financial statements. Our procedures included confirmation of securities owned as of March 31, 2020 by correspondence with the custodian and brokers; when replies were not received from brokers, we performed other auditing procedures. We believe that our audits provide a reasonable basis for our opinions.

Los Angeles, California
May 21, 2020
We have served as the auditor of one or more investment companies in the DoubleLine Investment Company Complex since 2010.

Item 7. Disclosure of Proxy Voting Policies and Procedures forClosed-End Management Investment Companies.
Not applicable toopen-end investment companies.
Item 8. Portfolio Managers ofClosed-End Management Investment Companies.
Not applicable toopen-end investment companies.
Item 9. Purchases of Equity Securities by Closed-End Management Investment Company and Affiliated Purchasers.
Not applicable toopen-end investment companies.
Item 10. Submission of Matters to a Vote of Security Holders.
There have been no material changes to the procedures by which shareholders may recommend nominees to the registrant’s board of trustees.
Item 11. Controls and Procedures.
| (a) | The Registrant’s principal executive and principal financial officers have reviewed the Registrant’s disclosure controls and procedures (as defined in Rule30a-3(c) under the Investment Company Act of 1940 (the “Act”)) as of a date within 90 days of the filing of this report, as required by Rule30a-3(b) under the Act and Rules13a-15(b) or15d-15(b) under the Securities Exchange Act of 1934. Based on their review, such officers have concluded that the disclosure controls and procedures are effective in ensuring that information required to be disclosed in this report is appropriately recorded, processed, summarized and reported and made known to them by others within the Registrant and by the Registrant’s service provider. |
| (b) | There were no changes in the Registrant’s internal control over financial reporting (as defined in Rule30a-3(d) under the Act) that occurred during the period covered by this report that has materially affected, or is reasonably likely to materially affect, the Registrant’s internal control over financial reporting. |
Item 12. Disclosure of Securities Lending Activities forClosed-End Management Investment Companies
Not applicable toopen-end investment companies.
Item 13. Exhibits.
(2) A separate certification for each principal executive and principal financial officer pursuant to Section 302 of the Sarbanes-Oxley Act of 2002. Filed herewith.
3
(3) Any written solicitation to purchase securities under Rule23c-1 under the Act sent or given during the period covered by the report by or on behalf of the registrant to 10 or more persons. Not applicable toopen-end investment companies.
(4) Change in the registrant’s independent public accountant. There was no change in the registrant’s independent public accountant for the period covered by this report.
4
SIGNATURES
Pursuant to the requirements of the Securities Exchange Act of 1934 and the Investment Company Act of 1940, the registrant has duly caused this report to be signed on its behalf by the undersigned, thereunto duly authorized.
| | | | |
| (Registrant) | | DoubleLine Funds Trust | | |
| | | | |
| | |
By (Signature and Title) | | /s/ Ronald R. Redell | | |
| | Ronald R. Redell, President | | |
Pursuant to the requirements of the Securities Exchange Act of 1934 and the Investment Company Act of 1940, this report has been signed below by the following persons on behalf of the registrant and in the capacities and on the dates indicated.
| | | | |
| | |
By (Signature and Title) | | /s/ Ronald R. Redell | | |
| | Ronald R. Redell, President | | |
| | | | |
| | |
By (Signature and Title) | | /s/ Henry V. Chase | | |
| | Henry V. Chase, Treasurer and Principal Financial and Accounting Officer | | |
5