Washington, D.C. 20549
On behalf of the DoubleLine Funds, I am pleased to deliver the Annual Report for the 12-month period ended March 31, 2018. On the following pages, you will find specific information regarding each Fund’s operations and holdings. In addition, we discuss each Fund’s investment performance and the main drivers of that performance during the reporting period.
If you have any questions regarding the DoubleLine Funds, please don’t hesitate to call us at 877-DLine11 (877-354-6311) or visit our website www.doublelinefunds.com where our investment management team offers deeper insights and analysis on relevant capital market activity impacting investors today. We value the trust that you have placed with us, and we will continue to strive to offer thoughtful investment solutions to our shareholders.
Ronald R. Redell, CFA
requirements to be in place permanently and managers had created solutions to address them. Deals issued prior to February 2018 were generally designed to be risk retention compliant. The court’s decision appears to have allowed managers that had struggled with risk retention compliance to reenter the market.
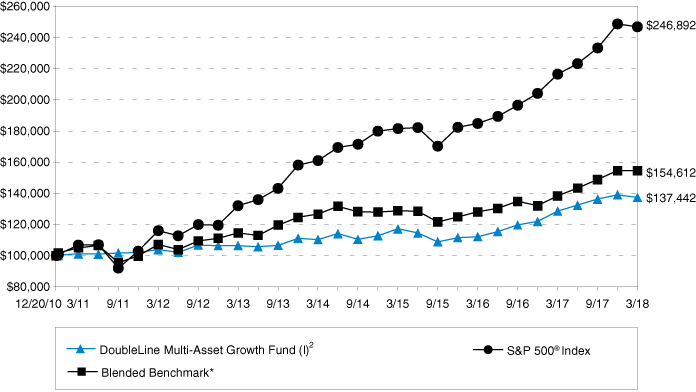
given this sector’s outperformance. The small positions in HY bonds and CLO liabilities were accretive to performance and were driven by credit selection, while the small cash position was dilutive to overall performance.
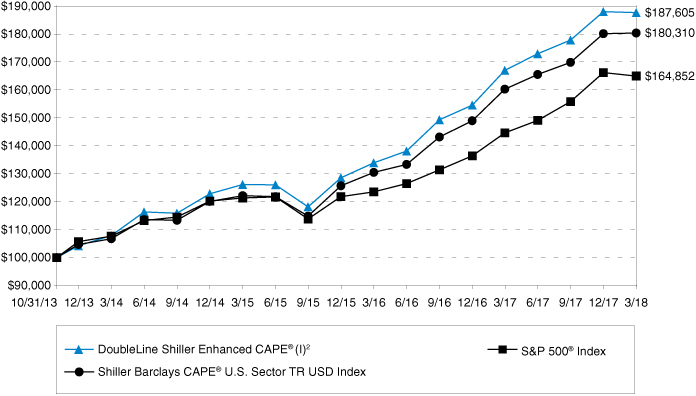
Telecommunications. The Utilities sector was a constituent of the Shiller Barclays CAPE® Europe Sector Net Total Return Index for the entire period, while the other six sectors were constituents for a portion of the period. The fixed income collateral portfolio provided positive returns during the period.
Opinions expressed herein are as of March 31, 2018 and are subject to change at any time, are not guaranteed and should not be considered investment advice. This report is for the information of shareholders of the Funds. It may also be used as sales literature when preceded or accompanied by the current prospectus.
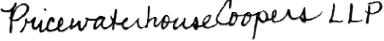
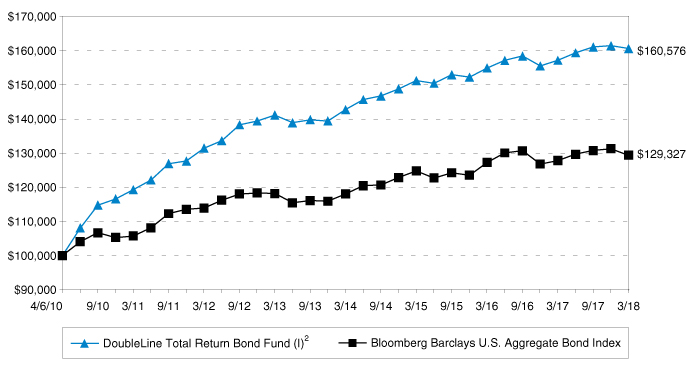
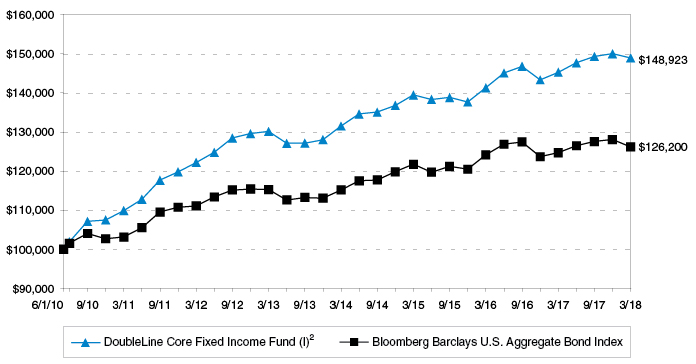
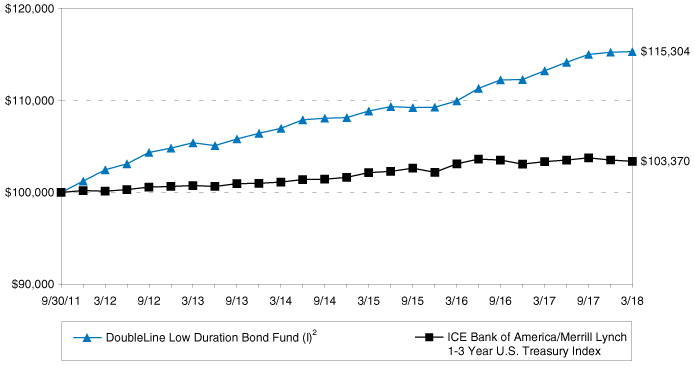
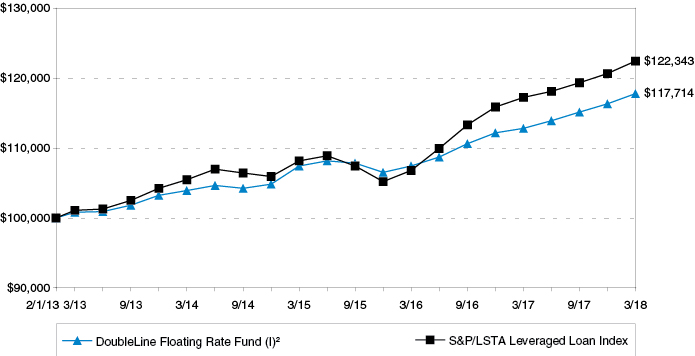
The performance shown assumes the reinvestment of all dividends and distributions and does not reflect any reductions for taxes. Investment performance reflects fee waivers in effect. In the absence of such waivers, total return would be reduced.
Fund holdings and sector allocations are subject to change at any time and are not recommendations to buy or sell any security. Please refer to the Schedules of Investments for a complete list of Fund holdings.
A direct investment cannot be made in an index. The performance of any index mentioned in this commentary has not been adjusted for ongoing management, distribution and operating expenses applicable to mutual fund investments.
The DoubleLine Funds are distributed by Quasar Distributors, LLC.
This commentary may include statements that constitute “forward-looking statements” under the U.S. securities laws. Forward-looking statements include, among other things, projections, estimates, and information about possible or future results related to a Fund and market or regulatory developments. The views expressed above are not guarantees of future performance or economic results and involve certain risks, uncertainties and assumptions that could cause actual outcomes and results to differ materially from the views expressed herein.
DoubleLine has no obligation to provide revised assessments in the event of changed circumstances. While we have gathered this information from sources believed to be reliable, DoubleLine cannot guarantee the accuracy of the information provided. Securities discussed are not recommendations and are presented as examples of issue selection or portfolio management processes. They have been picked for comparison or illustration purposes only. No security presented within is either offered for sale or purchase. DoubleLine reserves the right to change its investment perspective and outlook without notice as market conditions dictate or as additional information becomes available.
Investment strategies may not achieve the desired results due to implementation lag, other timing factors, portfolio management decision making, economic or market conditions or other unanticipated factors. The views and forecasts expressed in this material are as of the date indicated, are subject to change without notice, may not come to pass and do not represent a recommendation or offer of any particular security, strategy, or investment. Past performance is no guarantee of future results.
A summary of the DoubleLine Core Fixed Income Fund’s investments in affiliated mutual funds for the year ended March 31, 2018 is as follows:
A summary of the DoubleLine Multi-Asset Growth Fund’s (Consolidated) investments in affiliated mutual funds for the year ended March 31, 2018 is as follows:
A summary of the DoubleLine Low Duration Bond Fund’s investments in affiliated mutual funds for the year ended March 31, 2018 is as follows:
A summary of the DoubleLine Flexible Income Fund’s investments in affiliated mutual funds for the year ended March 31, 2018 is as follows:
Each Fund is classified as a diversified fund under the 1940 Act, except the Global Bond Fund, Infrastructure Income Fund, and Strategic Commodity Fund, which are classified as non-diversified Funds. Currently under the 1940 Act, a diversified fund generally may not, with respect to 75% of its total assets, invest more than 5% of its total assets in the securities of any one issuer or own more than 10% of the outstanding voting securities of such issuer (except, in each case, U.S. Government securities, cash, cash items and the securities of other investment companies). The remaining 25% of a fund’s total assets is not subject to this limitation.
The Funds’ investment objectives and commencement of operations of each share class are as follows:
Each Fund is an investment company that applies the accounting and reporting guidance issued in Topic 946, “Financial Services—Investment Companies”, by the Financial Accounting Standards Board (“FASB”). The following is a summary of the significant accounting policies of the Funds. These policies are in conformity with accounting principles generally accepted in the United States of America (“US GAAP”).
Assets and liabilities may be transferred between levels. The Funds use end of period timing recognition to account for any transfers.
Market values for domestic and foreign fixed income securities are normally determined on the basis of valuations provided by independent pricing services. Vendors typically value such securities based on one or more inputs described in the following table which is not intended to be a complete list. The table provides examples of inputs that are commonly relevant for valuing particular classes of fixed income securities in which the Funds are authorized to invest. However, these classifications are not exclusive, and any of the inputs may be used to value any other class of fixed-income securities. Securities that use similar valuation techniques and inputs as described in the following table are categorized as Level 2 of the fair value hierarchy. To the extent the significant inputs are unobservable, the values generally would be categorized as Level 3.
Investments in registered open-end management investment companies will be valued based upon the net asset value (“NAV”) of such investments and are categorized as Level 1 of the fair value hierarchy.
Common stocks, exchange-traded funds and financial derivative instruments, such as futures contracts or options contracts, that are traded on a national securities or commodities exchange, are typically valued at the last reported sales price, in the case of common stocks and exchange-traded funds, or, in the case of futures contracts or options contracts, the settlement price determined by the relevant exchange. To the extent these securities are actively traded and valuation adjustments are not applied, they are categorized as Level 1 of the fair value hierarchy.
Securities may be fair valued by the Adviser in accordance with the fair valuation procedures approved by the Board of Trustees (the “Board”). The Adviser’s valuation committee is generally responsible for overseeing the day to day valuation processes and reports periodically to the Board. The Adviser’s valuation committee and the pricing group are authorized to make all necessary determinations of the fair values of portfolio securities and other assets for which market quotations or third party vendor prices are not readily available or if it is deemed that the prices obtained from brokers and dealers or independent pricing services are deemed to be unreliable indicators of market or fair value.
The following is a summary of the fair valuations according to the inputs used to value the Funds’ investments as of March 31, 2018:
The following amounts were transferred between Level 1 to Level 2 as of March 31, 2018. Transfers between Level 1 and Level 2 were due to adjustments made to quoted market prices, such as foreign currency translation, to measure the fair value of those instruments.
The following is a reconciliation of investments in which significant unobservable inputs (Level 3) were used in determining fair value:
The following is a summary of quantitative information about Level 3 Fair Value Measurements:
The Funds may be subject to a nondeductible 4% excise tax calculated as a percentage of certain undistributed amounts of net investment income and net capital gains.
The Funds have adopted financial reporting rules that require the Funds to analyze all open tax years, as defined by the applicable statute of limitations, for all major jurisdictions. Open tax years, 2017, 2016 and 2015 for the Funds, are those that are open for exam by taxing authorities. As of March 31, 2018, the Funds have no examinations in progress.
Management has analyzed the Funds’ tax positions, and has concluded that no liability should be recorded related to uncertain tax positions expected to be taken on the tax return for the fiscal year-ended March 31, 2018. The Funds identify their major tax jurisdictions as U.S. Federal, the State of Delaware and the State of California. The Funds are not aware of any tax positions for which it is reasonably possible that the total amounts of unrecognized tax benefits will significantly change in the next twelve months.
Income and capital gain distributions are determined in accordance with income tax regulations which may differ from US GAAP. Permanent book and tax basis differences relating to shareholder distributions will result in reclassifications between paid-in capital, undistributed (accumulated) net investment income (loss), and/or undistributed (accumulated) realized gain (loss). Undistributed (accumulated) net investment income or loss may include temporary book and tax basis differences which will reverse in a subsequent period. Any taxable income or capital gain remaining at fiscal year end is distributed in the following year.
Distributions from investment companies will be classified as investment income or realized gains in the Statements of Operations based on the U.S. income tax characteristics of the distribution if such information is available. In cases where the tax characteristics are not available, such distributions are generally classified as investment income.
As of March 31, 2018, the relationship of the Subsidiary to each respective Fund was as follows:
DoubleLine Capital LP and DoubleLine Alternatives LP (formerly DoubleLine Commodity LP) (each, an “Adviser” and, collectively, the “Advisers”), provide the Funds with investment management services under Investment Management Agreements (the “Agreements”). Under the Agreements, each Adviser manages the investment of the assets of the applicable Fund, places orders for the purchase and sale of its portfolio securities and is responsible for providing certain resources to assist with the day-to-day management of the Trust’s business affairs. As compensation for its services, each Adviser is entitled to a monthly fee at the annual rates of the average daily net assets of the Funds (the “Advisory Fee”) in the following table. Each Adviser has arrangements with DoubleLine Group LP to provide personnel and other resources to the Funds.
Each Adviser has contractually agreed to limit certain of the Funds’ ordinary operating expenses so that its ratio of such expenses to average net assets will not exceed the following ratios (the “Expense Caps”). For the purposes of the expense limitation agreement between each Adviser and the Funds, “ordinary operating expenses” excludes taxes, commissions, mark-ups, litigation expenses, indemnification expenses, interest expenses, acquired fund fees and expenses, and any extraordinary expenses. Each Fund’s expense limitation is expected to apply until at least July 31, 2019. Each may be terminated during the term only by a majority vote of the disinterested Trustees of the Board.
Other than described above, to the extent that an Adviser waives its investment advisory fee and/or reimburses a Fund for other ordinary operating expenses, it may seek reimbursement of a portion or all of such amounts at any time within three fiscal years after the fiscal year in which such amounts were waived or reimbursed. Each Fund must pay its current ordinary operating expenses before each Adviser is entitled to any recoupment. Any such recoupment would be subject to review by the Board and will be subject to the Fund’s expense limitations in place when the fees were waived or the expenses were reimbursed.
Each Adviser, as applicable, contractually waived a portion of its fees or reimbursed certain operating expenses and may recapture a portion of the amounts no later than the dates as stated in the following table:
For the year ended March 31, 2018, each Adviser recouped the amounts shown from the following Funds:
If a Fund invested in other investment vehicles sponsored by an Adviser (“other DoubleLine Funds”) during the period, such Adviser waived its advisory fee to the Fund in an amount equal to the advisory fees paid to the Adviser by the other DoubleLine Funds in respect of Fund assets so invested. Accordingly, the Adviser waived the following fees for the year ended March 31, 2018.
As of March 31, 2018 , greater than 5% of the following DoubleLine Funds was held by other DoubleLine Funds as follows:
DoubleLine Capital LP and certain DoubleLine affiliated advisers provide investment advisory, sub-advisory, or consulting services to a variety of investors, including investment program sponsors, separate accounts, and mutual funds sponsored by third parties (collectively “third-party accounts”). Those services may result, directly or indirectly, in investments by the third-party accounts in one or more of the Funds. At times, the third-party accounts’ investments, individually or in the aggregate, may represent material interests in one or more of the Funds. The third-party accounts’ transaction activity in a Fund may cause a Fund to incur material transaction costs, to realize taxable gains distributable to shareholders, and/or to buy or sell assets at a time when the Fund might not otherwise do so, each of which may adversely affect a Fund’s performance. See the description of Large Shareholder Risk in the Principal Risks Note for more information. Records available to the Funds reflect that greater than 25% of the following Funds were held by third-party accounts as of March 31, 2018:
Class N shares and Class A shares of the Funds make payments under a distribution plan (the “Distribution Plan”) adopted pursuant to Rule 12b-1 under the 1940 Act. Pursuant to the Distribution Plan, each Fund compensates the Fund’s distributor for distribution and related services at an annual rate equal to 0.25% of the average daily net assets of the Fund attributable to its Class N and Class A shares. The fees may be used to pay the Fund’s distributor for distribution services and sales support services provided in connection with Class N and Class A shares.
The Class A shares of DoubleLine Multi-Asset Growth Fund have a maximum sales charge imposed on purchases of 4.25% of the offering price and a maximum contingent deferred sales charge of 0.75% that applies to purchases of $1 million or more of Class A shares if the shares are redeemed within 18 months of purchase.
The DoubleLine Multi-Asset Growth Fund and the DoubleLine Floating Rate Fund each impose redemption fees. Redemption fees are paid to and retained by the Funds to limit the opportunity to market time these Funds and to help offset estimated portfolio transaction costs and other related costs incurred by the Funds as a result of short-term trading. Subject to the exceptions discussed in the Funds’ prospectus, the Funds will apply a redemption fee equal to 1% of the value of any shares redeemed within 90 days of purchase.
Investment transactions (excluding short-term investments and in-kind transactions) for the year ended March 31, 2018 were as follows:
Purchases and sales related to in-kind transactions for the DoubleLine Low Duration Emerging Markets Fixed Income Fund for the year ended March 31, 2018 were $0 and $127,291,182, respectively. There were no purchases or sales related to in-kind transactions for any of the other Funds.
The Funds designated as long-term capital gain dividend, pursuant to Internal Revenue Code Section 852(b)(3), the amount necessary to reduce the earnings and profits of the Funds related to net capital gain to zero.
The cost basis of investments for federal income tax purposes as of March 31, 2018, was as follows:
As of March 31, 2018, the components of accumulated earnings (losses) for income tax purposes were as follows:
Under the Regulated Investment Company Modernization Act of 2010, capital losses incurred by the Funds after January 1, 2011 will not be subject to expiration. In addition, such losses must be utilized prior to the losses incurred in the years preceding enactment.
Additionally, US GAAP requires that certain components of net assets relating to permanent differences be reclassified between financial and tax reporting. These reclassifications have no effect on net assets or NAV per share. The permanent differences primarily relate to paydown losses, accretion of discount on certain debt instruments, foreign currency gains (losses) and consent fee income. For the period ended March 31, 2018, the following table shows the reclassifications made:
Trustees who are not affiliated with each Adviser and its affiliates receive fees from the Trust. These trustees may elect to defer the cash payment of part or all of their compensation. These deferred amounts, which remain as liabilities of the Funds, are treated as if invested in shares of each respective Fund or other funds managed by each Adviser and its affiliates. These amounts represent general, unsecured liabilities of each Fund and vary according to the total returns of the selected funds. Trustees Fees in the Statements of Operations include current fees (either paid in cash or deferred) and an increase (decrease) in the value of the deferred amounts. Certain trustees and officers of the Funds are also officers of each Adviser; such trustees and officers are not compensated by the Funds.
The following disclosures provide information on the Funds’ use of derivatives and certain related risks. The location and fair value amounts of these instruments on the Statements of Assets and Liabilities and the realized gains and losses and changes in unrealized gains and losses on the Statements of Operations, each categorized by type of derivative contract, are included in the following tables.
The average volume of derivative activity during the year ended March 31, 2018 is as follows:
change in value (“variation margin”) is made or received by or for the accounts of the Funds. The variation margin is recorded on the Statements of Assets and Liabilities. The cumulative change in value of futures contracts is recorded in net unrealized appreciation (depreciation) on futures on the Statements of Assets and Liabilities. Gains or losses are recognized but not considered realized until the contracts expire or are closed and are recorded in net realized gain (loss) on futures on the Statements of Operations. Futures contracts involve, to varying degrees, risk of loss in excess of the variation margin disclosed on the Statements of Assets and Liabilities.
If a Fund is a seller of protection and a credit event occurs, as defined under the terms of that particular swap agreement, the Fund typically will either (i) pay to the buyer of protection an amount equal to the notional amount of the swap and take delivery of the referenced obligation, other deliverable obligations or the affected securities in the referenced index or (ii) pay a net settlement amount in the form of cash or securities equal to the notional amount of the swap less the recovery value of the referenced obligation or the affected securities in the referenced index. If a Fund is a buyer of protection and a credit event occurs, as defined under the terms of that particular swap agreement, the Fund typically will either (i) receive from the seller of protection an amount equal to the notional amount of the swap and deliver the referenced obligation, other deliverable obligations or the affected securities in the referenced index or (ii) receive a net settlement amount in the form of cash or securities equal to the notional amount of the swap less the recovery value of the referenced obligation or the affected securities in the referenced index. Recovery values are typically estimated by market makers considering either industry standard recovery rates or entity specific factors and considerations until a credit event occurs. An index credit default swap references all the names in the index, and if there is a default with respect to a single name in the index, the credit event is settled based on that name’s weight in the index.
Credit default swaps are considered to have credit risk related contingent features since they require payment by the protection seller to the protection buyer upon occurrence of a defined credit event. A Fund’s maximum risk of loss from counterparty risk, as the protection buyer, is the fair value of the contract, which may be mitigated by the posting of collateral by the counterparty to a Fund to cover a Fund’s exposure to the counterparty. Upfront premiums (received) paid including accretion (amortization) less any collateral held at the counterparty are reflected in deposit at broker for swaps on the Statements of Assets and Liabilities. The marked-to-market value less a financing rate, if any, is included in net unrealized appreciation (depreciation) on swaps on the Statements of Assets and Liabilities. At termination or maturity of the swap, the cumulative marked-to-market on the value less a financing rate, if any, is recorded in realized gain (loss) on swaps on the Statements of Operations.
under which two parties can exchange variable interest rates based on different segments of money markets. The value is marked to market and is recorded in net unrealized appreciation (depreciation) on swaps on the Statements of Assets and Liabilities. At termination or maturity date, the interest on the notional amount of principal is exchanged and is recorded in net realized gain (loss) on swaps on the Statements of Operations.
The Funds’ derivative instrument holdings are summarized in the following tables.
The effect of derivative instruments on the Statements of Assets and Liabilities for the year ended March 31, 2018 was as follows:
The effect of derivative instruments on the Statements of Operations for the year ended March 31, 2018 was as follows:
The Funds are subject to various Master Netting Arrangements, which govern the terms of certain transactions with select counterparties. The Master Netting Arrangements allow the Funds to close out and net their total exposure to a counterparty in the event of a default with respect to all the transactions governed under a single agreement with a counterparty. The Master Netting Arrangements also specify collateral posting arrangements at pre-arranged exposure levels. Under the Master Netting Arrangements, collateral is routinely transferred if the total net exposure to certain transactions (net of existing collateral already in place) governed under the relevant Master Netting Arrangement with a counterparty in a given account exceeds a specified threshold depending on the counterparty and the type of Master Netting Arrangement.
As of March 31, 2018 the Trust held the following derivative instruments that were subject to offsetting on the Statements of Assets and Liabilities:
The Funds may make loans directly to borrowers and may acquire or invest in loans made by others (“loans”). The Funds may acquire a loan interest directly by acting as a member of the original lending syndicate. Alternatively, the Funds may acquire some or all of the interest of a bank or other lending institution in a loan to a particular borrower by means of a novation, an assignment or a participation. The loans in which the Funds may invest include those that pay fixed rates of interest and those that pay floating rates—i.e., rates that adjust periodically based on a known lending rate, such as a bank’s prime rate. The Funds may purchase and sell interests in bank loans on a when-issued and delayed delivery basis, with payment delivery scheduled for a future date. Securities purchased on a delayed delivery basis are marked to market daily and no income accrues to the Funds prior to the date the Funds actually take delivery of such securities. These transactions are subject to market fluctuations and are subject, among other risks, to the risk that the value at delivery may be more or less than the trade purchase price.
U.S. Bank, N.A. (the “Bank”) has made available to the Trust (the “DoubleLine Funds”) an uncommitted $600,000,000 credit facility for short term liquidity in connection with shareholder redemptions. Under the terms of the credit facility, borrowings for each DoubleLine Fund are limited to one-third of the total assets (including the amount borrowed) of such DoubleLine Fund. Fifty percent of the credit facility is available to all of the DoubleLine Funds, on a first come, first served basis. The remaining 50% of the credit facility is allocated among the DoubleLine Funds in accordance with procedures adopted by the Board. Borrowings under this credit facility bear interest at the Bank’s prime rate less 0.50% annually (weighted average rate of 3.78% for the year ended March 31, 2018).
The Bank has also made available to the DoubleLine Floating Rate Fund a committed credit facility. Prior to February 11, 2018, borrowings under this credit facility were made available up to $40,000,000. Effective February 11, 2018, the amount made available increased to $50,000,000. Borrowings under this credit facility bear interest at the Bank’s prime rate less 0.50% annually and the credit facility bears an unused commitment fee equal to 0.12% annually on the unused portion of the credit facility.
For the year ended March 31, 2018, the Funds’ credit facility activity is as follows:
As of March 31, 2018, shareholders affiliated with the Funds and/or Advisers (other than other DoubleLine Funds) owned shares of the Funds as follows:
Investment activities of these shareholders could have a material affect on each Fund. See the description of Large Shareholder Risk in the following Principal Risks Note. For information on greater than 5% holders of certain Funds by other DoubleLine Funds, see the Related and Other Party Transactions Note.
Below are summaries of some, but not all, of the principal risks of investing in one or more of the Funds, each of which could adversely affect a Fund’s NAV, yield and total return. Each risk listed below does not necessarily apply to each Fund, and you should read each Fund’s prospectus carefully for a description of the principal risks associated with investing in a particular Fund.
In preparing these financial statements, the Funds have evaluated events and transactions for potential recognition or disclosure through the date the financial statements were issued. The Funds have determined there are no additional subsequent events that would need to be disclosed in the Funds’ financial statements.
We have audited the accompanying statements of assets and liabilities, including schedules of investments—summary of DoubleLine Total Return Bond Fund and DoubleLine Core Fixed Income Fund and schedules of investments of DoubleLine Emerging Markets Fixed Income Fund, DoubleLine Multi-Asset Growth Fund (Consolidated), DoubleLine Low Duration Bond Fund, DoubleLine Floating Rate Fund, DoubleLine Shiller Enhanced CAPE®, DoubleLine Flexible Income Fund, DoubleLine Low Duration Emerging Markets Fixed Income Fund, DoubleLine Long Duration Total Return Bond Fund, DoubleLine Strategic Commodity Fund (Consolidated), DoubleLine Global Bond Fund, DoubleLine Infrastructure Income Fund, DoubleLine Ultra Short Bond Fund, and DoubleLine Shiller Enhanced International CAPE® (fifteen of the funds constituting DoubleLine Funds Trust, hereafter collectively referred to as the “Funds”) as of March 31, 2018, the related statements of operations for the year ended March 31, 2018, the statements of changes in net assets for each of the two years in the period ended March 31, 2018, including the related notes, and the financial highlights for each of periods indicated therein (collectively referred to as the “financial statements”). In our opinion, the financial statements present fairly, in all material respects, the financial position of each of the Funds as of March 31, 2018, the results of each of their operations for the year then ended, the changes in each of their net assets for each of the two years in the period ended March 31, 2018 and each of the financial highlights for each of the periods indicated therein in conformity with accounting principles generally accepted in the United States of America.
These financial statements are the responsibility of the Funds’ management. Our responsibility is to express an opinion on the Funds’ financial statements based on our audits. We are a public accounting firm registered with the Public Company Accounting Oversight Board (United States) (“PCAOB”) and are required to be independent with respect to the Funds in accordance with the U.S. federal securities laws and the applicable rules and regulations of the Securities and Exchange Commission and the PCAOB.
We conducted our audits of these financial statements in accordance with the standards of the PCAOB. Those standards require that we plan and perform the audit to obtain reasonable assurance about whether the financial statements are free of material misstatement, whether due to error or fraud.
Our audits included performing procedures to assess the risks of material misstatement of the financial statements, whether due to error or fraud, and performing procedures that respond to those risks. Such procedures included examining, on a test basis, evidence regarding the amounts and disclosures in the financial statements. Our audits also included evaluating the accounting principles used and significant estimates made by management, as well as evaluating the overall presentation of the financial statements. Our procedures included confirmation of securities owned as of March 31, 2018 by correspondence with the custodian, transfer agent, and brokers. We believe that our audits provide a reasonable basis for our opinions.
We have served as the auditor of one or more investment companies in the DoubleLine Investment Company Complex since 2010.
As a shareholder of the Funds, you incur two basic types of costs: (1) transaction costs , including sales charges (loads) on purchase payments, reinvested dividends, or other distributions; redemption fees; and exchange fees; and (2) ongoing costs, including management fees; distribution (12b-1) fees and other Fund expenses.
This Example is intended to help you understand your ongoing costs (in dollars) of investing in each Fund and to compare these costs with the ongoing costs of investing in other mutual funds. The Example is based on an investment of $1,000 invested at the beginning of the period and held for the entire period 10/1/17 through 3/31/18.*
The actual return columns in the following table provide information about account values based on actual returns and actual expenses. You may use the information in these columns, together with the amount you invested, to estimate the expenses that you paid over the period. Simply divide your account value by $1,000 (for example, an $8,600 account value divided by $1,000 = 8.6), then multiply the result by the number in the respective line under the heading entitled “Expenses Paid During Period” to estimate the expenses you paid on your account during this period. In addition to the expenses shown below in the table, as a shareholder you will be assessed fees for outgoing wire transfers, returned checks and stop payment orders at prevailing rates charged by U.S. Bancorp Fund Services, LLC, the Fund’s transfer agent. Currently, if you request a redemption be made by wire, a $15.00 fee is charged by the Fund’s transfer agent. You will be charged a redemption fee equal to 1.00% of the net amount of the redemption if you redeem shares that have been held for less than 90 days in the DoubleLine Multi-Asset Growth Fund and the DoubleLine Floating Rate Fund. An Individual Retirement Account (“IRA”) will be charged a $15.00 annual maintenance fee. The transfer agent charges a transaction fee of $25.00 on returned checks and stop payment orders. If you paid a transaction fee, you would add the fee amount to the expenses paid on your account this period to obtain your total expenses paid.
The hypothetical return columns in the following table provide information about hypothetical account values and hypothetical expenses based on a Fund’s actual expense ratio and an assumed rate of return of 5% per year before expenses, which is not a Fund’s actual return. The hypothetical account values and expenses may not be used to estimate the actual ending account balance or expenses you paid for the period. You may use this information to compare the ongoing costs of investing in a Fund and other funds. To do so, compare this 5% hypothetical example with the 5% hypothetical examples that appear in the shareholder reports of the other funds. Please note that the expenses shown in the table are meant to highlight your ongoing costs only and do not reflect the transaction fees discussed above. Therefore, those columns are useful in comparing ongoing costs only, and will not help you determine the relative total costs of owning different funds. In addition, if these transactional costs were included, your costs would have been higher.
The Trustees’ determination to approve the continuation of each Advisory Agreement was made on the basis of each Trustee’s business judgment after an evaluation of all of the information provided to the Trustees, including information provided for their consideration at their February 2018 meeting with management and at meetings held earlier in February outside the presence of management specifically to review and consider materials related to the proposed continuation of each Advisory Agreement. The Trustees meet over the course of the year with investment advisory personnel from DoubleLine and regularly review detailed information, presented both orally and in writing, regarding the services performed by DoubleLine for the benefit of the Funds and the investment program, performance, and operations of each Fund. In considering whether to approve the continuation of the Advisory Agreements, the Trustees took into account information presented to them over the course of the past year.
This summary describes a number, but not necessarily all, of the most important factors considered by the Board and the Independent Trustees. Individual Trustees may have given different weights to certain factors and assigned various degrees of materiality to information received in connection with the approval process. No single factor was determined to be decisive. In all of their deliberations, the Independent Trustees were advised by independent counsel.
The Trustees considered the nature, extent, and quality of the services, including the expertise and experience of investment personnel, provided and expected to be provided by DoubleLine to each Fund. In this regard, the Trustees considered that DoubleLine provides a full investment program for the Funds, and noted DoubleLine’s representation that it seeks to provide attractive returns with a strong emphasis on risk management. The Board considered in particular the difficulty of managing debt-related portfolios, noting that managing such portfolios requires a portfolio management team to balance a number of factors, which may include, among others, securities of varying maturities and durations, actual and anticipated interest rate changes and volatility, prepayments, collateral management, counterparty management, pay-downs, credit events, workouts, and net new issuances.
The Trustees reviewed reports (the “Strategic Insight Reports”) provided by Strategic Insight, an Asset International Company (“Strategic Insight”), that compared each open-end Fund’s net management fee ratio and net total expense ratio (Class I shares) against its Strategic Insight peer group, and each open-end Fund’s performance records (Class I shares) for the three-month, six-month, and one-year periods and, where applicable, the three- and five-year periods ended December 31, 2017 against its Morningstar category. The Independent Trustees met with Strategic Insight representatives to review Strategic Insight’s selection of peer groups, including the views of Strategic Insight regarding the challenges it encountered in assembling a peer group of funds with investment strategies substantially similar to those of certain open-end Funds.
With respect to the comparative performance information in the Strategic Insight Reports, the Trustees noted in particular that each open-end Fund, other than the Emerging Markets Fixed Income Fund (“EMFI”), Long Duration Total Return Bond Fund (“LD Total Return”), Low Duration Emerging Markets Fixed Income Fund (“LDEMFI”), Shiller Enhanced International CAPE (“International CAPE”), and Ultra Short Bond Fund (“Ultra Short”), was in the first or second performance quartile relative to its respective Morningstar category for the one-year period ended December 31, 2017; and each open-end Fund with a sufficiently long track record was in the first or second performance quartile relative to its respective Morningstar category for the three- and five-year periods ended December 31, 2017, other than EMFI and the Floating Rate Fund, which were in the third performance quartile for the three-year period, and LDEMFI, which was in the fourth performance quartile for the three-year period. The Trustees considered specific factors cited by DoubleLine for the relative underperformance of certain of the open-end Funds, which in most cases resulted from decisions of the Funds’ portfolio management team as to the overall positioning and strategy of the Funds. In addition, the Trustees considered management’s statements that International CAPE and Ultra Short have short operating histories, limiting the usefulness of peer group comparisons, and that the unusual long-duration strategy of LDEMFI limits the number of similar peer funds for comparison. Concerning EMFI and LD Total Return, the Trustees noted that each Fund’s performance was in the first quartile of its Morningstar category for longer-term periods (the five-year period ended December 31, 2017 in the case of EMFI, and the three-year period ended December 31, 2017 in the case of LD Total Return).
The Trustees considered the portion of the Strategic Insight Reports covering the open-end Funds’ expenses and advisory fees, noting that the reports showed that each open-end Fund, other than LD Total Return, the Strategic Commodity Fund, and Ultra Short, had a net total expense ratio in the first or second quartile of its peer group. The Trustees noted that the net total expense ratios of LD Total Return and the Strategic Commodity Fund were nonetheless below those of several of their respective peers, and that each of those Funds had achieved favorable relative performance over the longest period shown in its Strategic Insight Report notwithstanding its net expense ratio. The Trustees noted that, although Ultra Short’s net total expense ratio was in the third comparative quartile, it was within one-tenth of one basis point of the peer group median.
As to the Opportunistic Credit Fund (“DBL”), the Trustees noted that DBL’s net management fee ratio based on managed assets (generally, including the assets attributable to the Fund’s leverage) was shown in the Strategic Insight Reports to be slightly above the median of its peer group, and that its net management fee ratio based on net assets (generally, excluding the assets attributable to the Fund’s leverage) was below the median of its peer group. The Trustees noted that DBL had performed in the second quartile of its Morningstar category for the five-year period ended December 31, 2017, but that its performance had been in the third quartile for the three-year period and the fourth quartile for the one-year period ended December 31, 2017. The Trustees considered DoubleLine’s explanation for DBL’s recent underperformance, including its conservative positioning and its focus on investment in mortgage-backed securities by contrast to many peers that had more diversified exposure to segments of the debt securities markets. They also noted the information in the Strategic Insight Report showing that DBL had employed comparatively less leverage than its peers as of the date of the information in that report.
As to the Income Solutions Fund (“DSL”), the Trustees noted that DSL was shown in the Strategic Insight Reports to have performed in the first or second quartile of its Morningstar category for all periods shown. They noted the information in the Strategic Insight Report showing that DSL had employed comparatively less leverage than the median of its peer group as of the date of the information in that report. They noted that DSL’s net management fee ratios and net total expense ratios were just above the median of its peer group.
In evaluating the comparative net management fee ratios of DBL and DSL, the Trustees also considered DoubleLine’s statement that it had attempted to set each Fund’s fees at its inception at rates that reflected competitive market levels, but that also reflected the experience and expertise DoubleLine brings to managing the Funds.
The Trustees noted that both DBL and DSL had employed leverage for the period shown in the Strategic Insight Reports, and considered information from DoubleLine intended to show that each Fund’s use of leverage was accretive to the Fund’s investment performance, after taking into account any expenses related to the leverage.
The Trustees considered that DoubleLine provides a variety of other services to the Funds in addition to investment advisory services, including, among others, a number of back-office services, valuation services, compliance services, certain forms of information technology services (such as internal reporting), assistance with accounting and distribution services, and supervision and monitoring of the Funds’ other service providers. The Trustees reviewed DoubleLine’s ongoing efforts to keep the Trustees informed about matters relevant to the Funds and their shareholders. The Trustees also considered the nature, extent, and structure of the Funds’ compliance program, including the policies and procedures of the Funds and their various service providers (including DoubleLine). The Trustees considered the quality of those non-investment advisory services and determined that their quality supported the continuation of the Funds’ arrangements with DoubleLine.
The Trustees considered DoubleLine’s reports, provided at the Board’s regular meetings, that it had continued to hire additional resources to support DoubleLine’s ability to provide services to the Funds. The Trustees concluded that it appeared that DoubleLine continued to have sufficient quality and depth of personnel, resources, and investment methods.
The Trustees reviewed information as to general estimates of DoubleLine’s profitability with respect to each Fund, taking into account both the direct and the indirect benefits to DoubleLine from managing the Funds. The Trustees considered information provided by DoubleLine as to the methods it uses, and the assumptions it makes, in calculating its profitability. The Trustees considered representations from DoubleLine that its compensation and incentive policies and practices enable DoubleLine to attract, retain, and motivate highly qualified and experienced employees. The Trustees noted that DoubleLine had significant profitability in respect of certain of the Funds, but noted that in those cases it would be appropriate to consider that profitability in light of various other considerations such as the nature, extent, and quality of the services provided by DoubleLine, the relative performance of the Funds, and the competitiveness of the management fees and total operating expenses of the Funds.
The Trustees separately considered DoubleLine’s statement that it is continuing to invest in its business to maintain its ability to provide high quality services to the Funds, and noted DoubleLine’s need to invest in technology, infrastructure, and staff to continue to provide services and accommodate rapidly changing regulatory requirements.
With regard to DBL and DSL, the Trustees noted that these Funds have not increased in assets significantly from their initial offerings due principally to their status as closed-end investment companies and that there were therefore no substantial increases in economies of scale realized with respect to these Funds since their inception. They noted DoubleLine’s view that the levels of its
profitability in respect of DBL and DSL are appropriate in light of the investment it has made in these Funds, the quality of the investment management and other teams provided by it, and its continued investments in its own business.
On the basis of these considerations as well as others and in the exercise of their business judgment, the Trustees determined that they were satisfied with the nature, extent, and quality of the services provided to each Fund under its Advisory Agreement; that it appeared that the management fees paid by each Fund to DoubleLine were generally within the range of management fees paid by its peer funds, and, with respect to some Funds, lower than the median management fees paid by their peer funds, and generally reasonable in light of the services provided, the quality of the portfolio management teams, and each Fund’s performance to date; that the fees paid by each Fund did not appear inappropriate in light of the fee schedules charged to DoubleLine’s other clients with substantially similar investment strategies (where applicable) in light of the differences in the services provided and the risks borne by DoubleLine; that the profitability of each Fund to DoubleLine did not appear excessive or such as to preclude continuation of the Fund’s Advisory Agreement; that absence of breakpoints in any Fund’s management fee did not render that Fund’s fee unreasonable or inappropriate under the circumstances, although the Trustees would continue to consider the topic over time; and that it would be appropriate to approve each Advisory Agreement for an additional one-year period.
For the fiscal year ended March 31, 2018, certain dividends paid by the Funds may be subject to a maximum tax rate of 15% (20% for taxpayers with taxable income greater than $425,800 for single individuals and $479,000 for married couples filing jointly), as provided for by the Jobs and Growth Tax Relief Reconciliation Act of 2003 and The Tax Cuts and Jobs Act of 2017. Prior to January 1, 2018, certain dividends paid by the Funds may have been subject to a maximum tax rate of 15% (20% for taxpayers with taxable income greater than $400,000 for single individuals and $450,000 for married couples filing jointly). The percentage of dividends declared from ordinary income designated as qualified dividend income was as follows:
For corporate shareholders, the percent of ordinary income distributions qualifying for the corporate dividends received deduction for the fiscal year ended March 31, 2018 was as follows:
The percentage of taxable ordinary income distributions that are designated as short-term capital gain distributions under Internal Revenue Section 871(k)(2)(c) for the fiscal year ended March 31, 2018 for each Fund was as follows:
The percentage of taxable ordinary income distributions that are designated as interest related dividends under Internal Revenue Section 871(k)(1)(c) for the fiscal year ended March 31, 2018 for each Fund was as follows:
Shareholders are advised to consult their own tax adviser with respect to the tax consequences of their investment in the Funds.
The following Trustees are “interested persons” of the Trust as defined in the 1940 Act because they are officers of the Advisers, and indirect shareholders in the Advisers.
Information about how a Fund voted proxies relating to portfolio securities held during the most recent twelve month period ended June 30th is available no later than the following August 31st without charge, upon request, by calling 877-DLine11 (877-354-6311) and on the Securities and Exchange Commission’s (the “SEC”) website at http://www.sec.gov.
A description of the Funds’ proxy voting policies and procedures is available (i) without charge, upon request, by calling 877-DLine11 (877-354-6311); and (ii) on the commission’s website at http://www.sec.gov.
It is the policy of the Trust to provide certain unaudited information regarding the portfolio composition of the Funds as of month-end to shareholders and others upon request to the Funds, beginning on the 15th calendar day after the end of the month (or, if not a business day, the next business day thereafter).
Shareholders and others who wish to obtain portfolio holdings for a particular month may make a request by contacting the Funds at no charge at 877-DLine11 (877-354-6311) between the hours of 7:00 a.m. and 5:00 p.m. Pacific time, Monday through Friday, beginning on the 15th day following the end of that month (or, if not a business day, the next business day thereafter). Requests for portfolio holdings may be made on a monthly basis pursuant to this procedure, or standing requests for portfolio holdings may be accepted.
The Trust is required to file its complete schedule of portfolio holdings with the SEC for its first and third fiscal quarters on Form N-Q. The Trust’s Forms N-Q are available on the SEC website at www.sec.gov. You can also review and obtain copies of the Forms N-Q at the SEC Public Reference Room in Washington, DC (information on the operation of Public Reference Room may be obtained by calling 1-800-SEC-0330).
This report includes summary Schedules of Investments for the DoubleLine Total Return Bond Fund and DoubleLine Core Fixed Income Fund. A complete Schedule of Investments for each Fund may be obtained, without charge, upon request, by calling 877-DLine11 (877-354-6311) and on the SEC website at www.sec.gov.
In an effort to conserve resources, the Funds intend to reduce the number of duplicate Prospectuses and Annual and Semi-Annual Reports you receive by sending only one copy of each to addresses where we reasonably believe two or more accounts are from the same family. If you would like to discontinue householding of your accounts, please call toll-free 877-DLine11 (877-354-6311) to request individual copies of these documents. We will begin sending individual copies thirty days after receiving your request to stop householding.
Financial companies choose how they share your personal information. This notice provides information about how we collect, share, and protect your personal information, and how you might choose to limit our ability to share certain information about you. Please read this notice carefully.
All financial companies need to share customers’ personal information to run their everyday businesses. Accordingly, information, confidential and proprietary, plays an important role in the success of our business. However, we recognize that you have entrusted us with your personal and financial data, and we recognize our obligation to keep this information secure. Maintaining your privacy is important to us, and we hold ourselves to a high standard in its safekeeping and use. Most importantly, DoubleLine does not sell its customers’ non-public personal information to any third parties. DoubleLine uses its customers’ non-public personal information primarily to complete financial transactions that its customers request or to make its customers aware of other financial products and services offered by a DoubleLine affiliated company.
DoubleLine may collect non-public information about you from the following sources:
The types of personal information DoubleLine collects and shares depend on the product or service you have with us. This information may include:
DoubleLine does not disclose any non-public personal information about our customers or former customers without the customer’s authorization, except that we may disclose the information listed above, as follows:
We have procedures designed to limit access to your personal account information to those agents and vendors who need to know that information to provide products and services to you. Your information is not provided by us to nonaffiliated third parties for marketing purposes. We seek to maintain physical, electronic, and procedural safeguards to guard your non-public personal information.
As required by federal law, DoubleLine will notify customers of DoubleLine’s Privacy Policy annually. DoubleLine reserves the right to modify this policy at any time, but in the event that there is a change, DoubleLine will promptly inform its customers of that change.
U.S. Bancorp Fund Services, LLC
P.O. Box 701
U.S. Bank, N.A.
The registrant has adopted a code of ethics that applies to the registrant’s principal executive officer and principal financial officer. The registrant has not made any amendments to its code of ethics during the period covered by this report. The registrant has not granted any waivers from any provisions of the code of ethics during the period covered by this report. A copy of the registrant’s Code of Ethics is filed herewith.
The registrant’s board of trustees has determined that there is at least one audit committee financial expert serving on its audit committee. Raymond B. Woolson is the “audit committee financial expert” and is considered to be “independent” as each term is defined in Item 3 of Form N-CSR.
The registrant has engaged its principal accountant to perform audit services, audit-related services, tax services and other services during the past two fiscal years. “Audit services” refer to performing an audit of the registrant’s annual financial statements or services that are normally provided by the accountant in connection with statutory and regulatory filings or engagements for those fiscal years. “Audit-related services” refer to the assurance and related services by the principal accountant that are reasonably related to the performance of the audit. “Tax services” refer to professional services rendered by the principal accountant for tax compliance, tax advice, and tax planning. There were no “Other services” provided by the principal accountant. The following table details the aggregate fees billed or expected to be billed for each of the last two fiscal years for audit fees, audit-related fees, tax fees and other fees by the principal accountant.
All of the principal accountant’s hours spent on auditing the registrant’s financial statements were attributed to work performed by full-time permanent employees of the principal accountant. (If more than 50 percent of the accountant’s hours were spent to audit the registrant’s financial
statements for the most recent fiscal year, state how many hours were attributed to work performed by persons other than the principal accountant’s full-time, permanent employees.)
The information required by this Item 6 (except with respect to the DoubleLine Total Return Bond Fund and DoubleLine Core Fixed Income Fund) is included as part of the annual report to shareholders filed under Item 1 of this Form N-CSR.
Please note that the Registrant has included a summary schedule of portfolio securities of the DoubleLine Total Return Bond Fund and DoubleLine Core Fixed Income Fund in its annual report to shareholders, a copy of which is included under Item 1, for this reporting period. The DoubleLine Total Return Bond Fund’s and DoubleLine Core Fixed Income Fund’s complete schedule of investments in securities of unaffiliated issuers as of the close of this period as set forth in Section 210.12-12 of Regulation S-X is set forth below:
| | | | | | | | | | | | | | |
Principal Amount $/Shares | | Security Description | | Rate | | | Maturity | | | Value $ | |
Asset Backed Obligations - 3.7% | | | | | | | | | |
23,076,982 | | Aqua Finance Trust, Series 2017-A-A | | | 3.72% | ^ | | | 11/15/2035 | | | | 22,773,520 | |
8,952,882 | | Arcadia Receivables Credit Trust, Series 2017-1-A | | | 3.25% | ^ | | | 06/15/2023 | | | | 8,992,225 | |
4,528,580 | | AVANT Loans Funding Trust, Series 2017-B-A | | | 2.29% | ^ | | | 06/15/2020 | | | | 4,520,686 | |
19,783,750 | | CAL Funding Ltd., Series 2018-1A-A | | | 3.96% | ^ | | | 02/25/2043 | | | | 19,975,842 | |
27,107,833 | | Castlelake Aircraft Securitization Trust, Series 2015-1A-A | | | 4.70% | ^ § | | | 12/15/2040 | | | | 27,252,237 | |
40,622,934 | | Castlelake Aircraft Securitization Trust, Series 2016-1-A | | | 4.45% | | | | 08/15/2041 | | | | 40,687,322 | |
53,449,761 | | Castlelake Aircraft Securitization Trust, Series 2017-1-A | | | 3.97% | | | | 07/15/2042 | | | | 53,228,907 | |
6,493,165 | | Citi Held For Asset Issuance, Series 2015-PM1-C | | | 5.01% | ^ | | | 12/15/2021 | | | | 6,523,368 | |
281,201 | | Citi Held For Asset Issuance, Series 2015-PM2-B | | | 4.00% | ^ | | | 03/15/2022 | | | | 281,340 | |
30,000,000 | | Citi Held For Asset Issuance, Series 2015-PM2-C | | | 5.96% | ^ | | | 03/15/2022 | | | | 30,275,040 | |
2,544,558 | | Citi Held For Asset Issuance, Series 2016-MF1-A | | | 4.48% | ^ | | | 08/15/2022 | | | | 2,549,985 | |
72,948,750 | | Coinstar Funding LLC, Series 2017-1A-A2 | | | 5.22% | ^ | | | 04/25/2047 | | | | 75,010,355 | |
28,439,303 | | Colony American Finance Ltd., Series 2016-1-A | | | 2.54% | ^ | | | 06/15/2048 | | | | 27,973,760 | |
9,392,820 | | Commonbond Student Loan Trust, Series 2015-A-A | | | 3.20% | ^ | | | 06/25/2032 | | | | 9,383,092 | |
16,080,201 | | Commonbond Student Loan Trust, Series 2016-A-A1 | | | 3.32% | ^ | | | 05/25/2040 | | | | 15,619,154 | |
12,076,159 | | Consumer Installment Loan Trust, Series 2016-LD1-A | | | 3.96% | ^ | | | 07/15/2022 | | | | 12,079,811 | |
21,000,000 | | Credit Acceptance Auto Loan Trust, Series 2017-3A-A | | | 2.65% | ^ | | | 06/15/2026 | | | | 20,807,758 | |
41,000,000 | | Credit Acceptance Auto Loan Trust, Series 2018-1A-A | | | 3.01% | ^ | | | 02/16/2027 | | | | 40,768,321 | |
16,490,000 | | DB Master Finance LLC, Series 2015-1A-A2II | | | 3.98% | ^ | | | 02/20/2045 | | | | 16,653,782 | |
11,878,265 | | Eaglewood Consumer Loan Trust, Series 2014-1-A | | | 3.50% | ^ ¥ Þ | | | 10/15/2019 | | | | 11,874,191 | |
13,884,029 | | Earnest Student Loan Program LLC, Series 2016-B-A2 | | | 3.02% | ^ | | | 05/25/2034 | | | | 13,798,977 | |
17,554,511 | | Earnest Student Loan Program LLC, Series 2016-D-A2 | | | 2.72% | ^ | | | 01/25/2041 | | | | 17,279,894 | |
69,308,404 | | ECAF Ltd., Series 2015-1A-A2 | | | 4.95% | ^ | | | 06/15/2040 | | | | 70,277,058 | |
7,363,463 | | Element Rail Leasing LLC, Series 2016-1A-A1 | | | 3.97% | ^ | | | 03/19/2046 | | | | 7,392,279 | |
9,278,000 | | Falcon Aerospace Ltd., Series 2017-1-A | | | 4.58% | ^ | | | 02/15/2042 | | | | 9,386,395 | |
9,952,927 | | Foundation Finance Trust, Series 2016-1A-A | | | 3.96% | ^ | | | 06/15/2035 | | | | 9,979,989 | |
47,000,000 | | GM Financial Automobile Leasing Trust, Series 2018-1-A2A | | | 2.39% | | | | 04/20/2020 | | | | 46,902,226 | |
43,800,000 | | Harbour Aircraft Investments Ltd., Series 2017-1-A | | | 4.00% | | | | 11/15/2037 | | | | 43,768,157 | |
10,156,679 | | HERO Funding Trust, Series 2016-3A-A2 | | | 3.91% | ^ | | | 09/20/2042 | | | | 10,415,910 | |
24,530,537 | | HERO Funding Trust, Series 2016-4A-A2 | | | 4.29% | ^ | | | 09/20/2047 | | | | 25,040,519 | |
28,135,000 | | Invitation Homes Trust, Series 2015-SFR1-E (1 Month LIBOR USD + 4.20%, 4.20% Floor) | | | 5.95% | ^ | | | 03/17/2032 | | | | 28,279,479 | |
63,481,000 | | Jimmy Johns Funding LLC, Series 2017-1A-A2II | | | 4.85% | ^ | | | 07/30/2047 | | | | 65,041,706 | |
92,708,333 | | Labrador Aviation Finance Ltd., Series 2016-1A-A1 | | | 4.30% | ^ | | | 01/15/2042 | | | | 94,708,794 | |
1,215,052 | | LendingClub Issuance Trust, Series 2016-NP1-A | | | 3.75% | ^ | | | 06/15/2022 | | | | 1,217,492 | |
368,793 | | LendingClub Issuance Trust, Series 2016-NP2-A | | | 3.00% | ^ | | | 01/17/2023 | | | | 368,441 | |
11,000,000 | | Lendmark Funding Trust, Series 2017-2A-A | | | 2.80% | ^ | | | 05/20/2026 | | | | 10,945,723 | |
11,750,000 | | Longtrain Leasing LLC, Series 2015-1A-A2 | | | 4.06% | ^ | | | 01/15/2045 | | | | 11,940,497 | |
23,000,000 | | Mariner Finance Issuance Trust, Series 2017-AA-A | | | 3.62% | ^ | | | 02/20/2029 | | | | 23,111,283 | |
4,520,722 | | MarketPlace Loan Trust, Series 2015-CB1-A | | | 4.00% | ^ | | | 07/15/2021 | | | | 4,519,709 | |
7,656,802 | | MarketPlace Loan Trust, Series 2015-LD1-A | | | 4.00% | ^ | | | 12/15/2021 | | | | 7,654,558 | |
8,193,761 | | MarketPlace Loan Trust, Series 2016-LD1-A | | | 5.25% | ^ | | | 03/15/2022 | | | | 8,234,574 | |
13,768,612 | | Marlette Funding Trust, Series 2017-2A-A | | | 2.39% | ^ | | | 07/15/2024 | | | | 13,737,876 | |
7,043,951 | | Marlette Funding Trust, Series 2017-3A-A | | | 2.36% | ^ | | | 12/15/2024 | | | | 7,018,665 | |
19,661,748 | | Marlette Funding Trust, Series 2018-1A-A | | | 2.61% | ^ | | | 03/15/2028 | | | | 19,633,820 | |
41,698,579 | | Mosaic Solar Loans LLC, Series 2017-2A-A | | | 3.82% | ^ | | | 09/20/2042 | | | | 41,398,445 | |
23,000,000 | | Navient Private Education Loan Trust, Series 2017-A-B | | | 3.91% | ^ | | | 12/16/2058 | | | | 22,260,619 | |
62,561,232 | | NRZ Excess Spread-Collateralized Notes, Series 2018-PLS2-A | | | 3.27% | ^ | | | 02/25/2023 | | | | 62,430,342 | |
5,883,908 | | OneMain Direct Auto Receivables Trust, Series 2016-1A-A | | | 2.04% | ^ | | | 01/15/2021 | | | | 5,880,527 | |
4,319,524 | | OneMain Financial Issuance Trust, Series 2015-2A-A | | | 2.57% | ^ | | | 07/18/2025 | | | | 4,319,081 | |
85,619,086 | | OneMain Financial Issuance Trust, Series 2016-2A-A | | | 4.10% | ^ | | | 03/20/2028 | | | | 86,337,815 | |
75,000,000 | | OneMain Financial Issuance Trust, Series 2017-1A-A1 | | | 2.37% | ^ | | | 09/14/2032 | | | | 73,768,192 | |
17,000,000 | | Oportun Funding LLC, Series 2016-B-A | | | 3.69% | ^ | | | 07/08/2021 | | | | 16,983,891 | |
25,000,000 | | Oxford Finance Funding LLC, Series 2016-1A-A | | | 3.97% | ^ | | | 06/17/2024 | | | | 24,950,565 | |
4,000,000 | | Progress Residential Trust, Series 2016-SFR2-D (1 Month LIBOR USD + 2.50%, 2.50% Floor) | | | 4.31% | ^ | | | 01/17/2034 | | | | 4,047,368 | |
6,000,000 | | Prosper Marketplace Issuance Trust, Series 2018-1A-A | | | 3.11% | ^ | | | 06/17/2024 | | | | 6,001,306 | |
22,323,168 | | Renew, Series 2017-2A-A | | | 3.22% | ^ | | | 09/22/2053 | | | | 21,918,426 | |
30,804,843 | | SCF Equipment Leasing LLC, Series 2017-2A-A | | | 3.41% | ^ | | | 12/20/2023 | | | | 30,409,891 | |
40,721,930 | | Shenton Aircraft Investment Ltd., Series 2015-1A-A | | | 4.75% | ^ | | | 10/15/2042 | | | | 41,955,112 | |
3,321,823 | | SoFi Consumer Loan Program LLC, Series 2016-1-A | | | 3.26% | ^ | | | 08/25/2025 | | | | 3,323,632 | |
25,378,445 | | SoFi Consumer Loan Program LLC, Series 2017-6-A1 | | | 2.20% | ^ | | | 11/25/2026 | | | | 25,257,176 | |
18,750,000 | | SoFi Consumer Loan Program LLC, Series 2017-6-A2 | | | 2.82% | ^ | | | 11/25/2026 | | | | 18,553,618 | |
9,477,562 | | SoFi Consumer Loan Program Trust, Series 2016-2-A | | | 3.09% | ^ | | | 10/27/2025 | | | | 9,494,166 | |
31,168,393 | | SoFi Consumer Loan Program Trust, Series 2017-2-A | | | 3.28% | ^ | | | 02/25/2026 | | | | 31,251,731 | |
17,754,876 | | SoFi Consumer Loan Program Trust, Series 2017-5-A1 | | | 2.14% | ^ | | | 09/25/2026 | | | | 17,658,091 | |
10,000,000 | | SoFi Consumer Loan Program Trust, Series 2017-5-A2 | | | 2.78% | ^ | | | 09/25/2026 | | | | 9,859,832 | |
11,238,791 | | SoFi Consumer Loan Program Trust, Series 2018-1-A1 | | | 2.55% | ^ | | | 02/25/2027 | | | | 11,206,345 | |
15,423,515 | | SoFi Professional Loan Program, Series 2016-A-A2 | | | 2.76% | ^ | | | 12/26/2036 | | | | 15,298,106 | |
20,000,000 | | SoFi Professional Loan Program, Series 2017-E-B | | | 3.49% | ^ | | | 11/26/2040 | | | | 19,748,828 | |
13,000,000 | | SoFi Professional Loan Program, Series 2017-E-C | | | 4.16% | ^ | | | 11/26/2040 | | | | 12,861,121 | |
22,800,000 | | SoFi Professional Loan Program, Series 2018-A-B | | | 3.61% | ^ | | | 02/25/2042 | | | | 22,715,667 | |
18,000,000 | | SoFi Professional Loan Program, Series 2018-B-BFX | | | 3.83% | ^ | | | 08/25/2047 | | | | 18,199,969 | |
74,554,775 | | SpringCastle America Funding LLC, Series 2016-AA-A | | | 3.05% | ^ | | | 04/25/2029 | | | | 74,549,594 | |
14,000,000 | | Springleaf Funding Trust, Series 2016-AA-A | | | 2.90% | ^ | | | 11/15/2029 | | | | 13,942,918 | |
71,750,000 | | Springleaf Funding Trust, Series 2017-AA-A | | | 2.68% | ^ | | | 07/15/2030 | | | | 70,676,878 | |
41,438,800 | | Sprite Ltd., Series 2017-1-A | | | 4.25% | ^ | | | 12/15/2037 | | | | 40,677,776 | |
3,939,312 | | Spruce Asset Backed Securities Trust, Series 2016-E1-A | | | 4.32% | ^ | | | 06/15/2028 | | | | 3,987,206 | |
4,726,000 | | TAL Advantage LLC, Series 2013-2A-A | | | 3.55% | ^ | | | 11/20/2038 | | | | 4,703,558 | |
5,017,631 | | Textainer Marine Containers Ltd., Series 2017-1A-A | | | 3.72% | ^ | | | 05/20/2042 | | | | 5,019,543 | |
26,000,000 | | Triton Container Finance LLC, Series 2018-1A-A | | | 3.95% | ^ | | | 03/20/2043 | | | | 26,151,580 | |
5,822,878 | | Upstart Securitization Trust, Series 2017-2-A | | | 2.51% | ^ | | | 03/20/2025 | | | | 5,806,372 | |
18,084,917 | | Vantage Data Centers Issuer LLC, Series 2018-1A-A2 | | | 4.07% | ^ | | | 02/16/2043 | | | | 18,271,889 | |
| | | | | | | | | | | | | | |
Total Asset Backed Obligations (Cost $1,914,985,629) | | | | | | | | 1,919,761,893 | |
| | | | | | | | | | | | | | |
| | | |
Collateralized Loan Obligations - 4.9% | | | | | | | | | | | | |
17,289,041 | | Acacia Ltd., Series 5A-A (3 Month LIBOR USD + 0.38%) | | | 1.56% | ^ | | | 11/08/2039 | | | | 16,837,797 | |
10,000,000 | | Adams Mill Ltd., Series 2014-1A-C1R (3 Month LIBOR USD + 2.35%) | | | 4.07% | ^ | | | 07/15/2026 | | | | 10,014,444 | |
68,250,000 | | AIMCO, Series 2015-AA-AR (3 Month LIBOR USD + 0.85%, 0.85% Floor) | | | 2.57% | ^ | | | 01/15/2028 | | | | 68,239,006 | |
25,000,000 | | ALM LLC, Series 2016-19A-A1 (3 Month LIBOR USD + 1.55%) | | | 3.27% | ^ | | | 07/15/2028 | | | | 25,143,750 | |
18,760,000 | | Anchorage Capital Ltd., Series 2014-5RA-A (3 Month LIBOR USD + 0.99%) | | | 2.71% | ^ | | | 01/15/2030 | | | | 18,757,950 | |
43,900,000 | | Apidos Ltd., Series 2013-16A-A1R (3 Month LIBOR USD + 0.98%) | | | 2.72% | ^ | | | 01/19/2025 | | | | 43,909,648 | |
23,000,000 | | Apidos Ltd., Series 2015-20A-A1R (3 Month LIBOR USD + 1.33%) | | | 3.05% | ^ | | | 01/16/2027 | | | | 23,019,044 | |
75,000,000 | | Arrowpoint Ltd., Series 2013-1A-A1R (3 Month LIBOR USD + 1.52%, 1.52% Floor) | | | 3.36% | ^ | | | 11/15/2028 | | | | 75,929,917 | |
31,500,000 | | Babson Ltd., Series 2014-3A-AR (3 Month LIBOR USD + 1.32%) | | | 3.04% | ^ | | | 01/15/2026 | | | | 31,500,000 | |
4,500,000 | | Babson Ltd., Series 2014-3A-D2 (1 Month LIBOR USD + 4.40%) | | | 6.12% | ^ | | | 01/15/2026 | | | | 4,500,000 | |
3,750,000 | | Babson Ltd., Series 2014-IIA-D (3 Month LIBOR USD + 3.60%) | | | 5.33% | ^ | | | 10/17/2026 | | | | 3,754,537 | |
75,000,000 | | BlueMountain Ltd., Series 2012-2A-AR (3 Month LIBOR USD + 1.42%, 1.42% Floor) | | | 3.30% | ^ | | | 11/20/2028 | | | | 75,290,206 | |
33,150,000 | | BlueMountain Ltd., Series 2013-1A-A1R (3 Month LIBOR USD + 1.40%) | | | 3.14% | ^ | | | 01/20/2029 | | | | 33,339,015 | |
58,250,000 | | BlueMountain Ltd., Series 2015-3A-A1 (3 Month LIBOR USD + 1.48%) | | | 3.22% | ^ | | | 10/20/2027 | | | | 58,250,000 | |
34,500,000 | | BlueMountain Ltd., Series 2015-4A-B (3 Month LIBOR USD + 2.25%) | | | 3.99% | ^ | | | 01/20/2027 | | | | 34,533,869 | |
9,250,000 | | BlueMountain Ltd., Series 2015-4A-C (3 Month LIBOR USD + 3.20%) | | | 4.94% | ^ | | | 01/20/2027 | | | | 9,265,062 | |
8,750,000 | | BlueMountain Ltd., Series 2015-4A-D1 (3 Month LIBOR USD + 4.60%) | | | 6.34% | ^ | | | 01/20/2027 | | | | 8,768,512 | |
22,500,000 | | BlueMountain Ltd., Series 2016-2A-A2 (3 Month LIBOR USD + 2.00%) | | | 3.88% | ^ | | | 08/20/2028 | | | | 23,002,363 | |
20,000,000 | | Carlyle Global Market Strategies Ltd., Series 2015-5A-A1A (3 Month LIBOR USD + 1.55%) | | | 3.29% | ^ | | | 01/20/2028 | | | | 20,142,345 | |
8,000,000 | | Carlyle Global Market Strategies Ltd., Series 2015-5A-A2A (3 Month LIBOR USD + 2.25%) | | | 3.99% | ^ | | | 01/20/2028 | | | | 8,079,594 | |
4,000,000 | | Carlyle Global Market Strategies Ltd., Series 2015-5A-B2 (3 Month LIBOR USD + 3.25%) | | | 4.99% | ^ | | | 01/20/2028 | | | | 4,064,764 | |
43,000,000 | | Cathedral Lake Ltd., Series 2016-4A-A (3 Month LIBOR USD + 1.65%) | | | 3.39% | ^ | | | 10/20/2028 | | | | 43,744,628 | |
11,000,000 | | Cent Ltd., Series 2014-21A-A1AR (3 Month LIBOR USD + 1.21%) | | | 2.97% | ^ | | | 07/27/2026 | | | | 11,009,229 | |
7,250,000 | | Cent Ltd., Series 2014-22A-C (3 Month LIBOR USD + 3.75%) | | | 5.54% | ^ | | | 11/07/2026 | | | | 7,271,526 | |
98,000,000 | | CVP Ltd., Series 2017-1A-A (3 Month LIBOR USD + 1.34%) | | | 3.08% | ^ | | | 07/20/2030 | | | | 98,758,265 | |
61,250,000 | | CVP Ltd., Series 2017-2A-A (3 Month LIBOR USD + 1.19%, 1.19% Floor) | | | 3.12% | ^ | | | 01/20/2031 | | | | 61,569,436 | |
35,250,000 | | Elevation Ltd., Series 2014-2A-A1R (3 Month LIBOR USD + 1.23%) | | | 2.58% | ^ | | | 10/15/2029 | | | | 35,463,957 | |
50,000,000 | | Galaxy Ltd., Series 2016-22A-A1 (3 Month LIBOR USD + 1.58%) | | | 3.30% | ^ | | | 07/16/2028 | | | | 50,100,358 | |
24,152,233 | | GLG Ore Hill Ltd., Series 2013-1A-A (3 Month LIBOR USD + 1.12%) | | | 2.84% | ^ | | | 07/15/2025 | | | | 24,173,952 | |
46,000,000 | | Greywolf Ltd., Series 2018-1A-A1 (3 Month LIBOR USD + 1.03%) | | | 0.00% | ^ | | | 04/26/2031 | | | | 46,000,000 | |
6,500,000 | | Halcyon Loan Advisors Funding Ltd., Series 2014-2A-C (3 Month LIBOR USD + 3.50%) | | | 5.26% | ^ | | | 04/28/2025 | | | | 6,516,542 | |
1,750,000 | | Halcyon Loan Advisors Funding Ltd., Series 2014-2A-D (3 Month LIBOR USD + 5.00%) | | | 6.76% | ^ | | | 04/28/2025 | | | | 1,665,265 | |
5,000,000 | | Halcyon Loan Advisors Funding Ltd., Series 2014-3A-D (3 Month LIBOR USD + 3.65%) | | | 5.39% | ^ | | | 10/22/2025 | | | | 5,006,770 | |
14,350,000 | | Halcyon Loan Advisors Funding Ltd., Series 2015-2A-A (3 Month LIBOR USD + 1.39%) | | | 3.14% | ^ | | | 07/25/2027 | | | | 14,358,000 | |
85,500,000 | | Halcyon Loan Advisors Funding Ltd., Series 2015-3A-A1R (3 Month LIBOR USD + 0.90%) | | | 2.63% | ^ | | | 10/18/2027 | | | | 85,047,447 | |
30,000,000 | | Harbourview Ltd., Series 7A-A1R (3 Month LIBOR USD + 1.25%) | | | 3.13% | ^ | | | 11/18/2026 | | | | 30,030,807 | |
25,000,000 | | Hildene Ltd., Series 2014-2A-AR (3 Month LIBOR USD + 1.18%) | | | 2.92% | ^ | | | 07/19/2026 | | | | 25,023,177 | |
39,000,000 | | Hildene Ltd., Series 2014-3A-AR (3 Month LIBOR USD + 1.20%) | | | 2.94% | ^ | | | 10/20/2026 | | | | 39,012,023 | |
5,000,000 | | Hildene Ltd., Series 2015-4A-A1A (3 Month LIBOR USD + 1.50%) | | | 3.24% | ^ | | | 07/23/2027 | | | | 5,012,394 | |
10,867,159 | | ICE Global Credit Ltd., Series 2013-1A-A1 (3 Month LIBOR USD + 1.75%, 1.75% Floor) | | | 3.49% | ^ Þ | | | 04/20/2024 | | | | 10,876,636 | |
50,000,000 | | Jamestown Ltd., Series 2013-3A-A1AR (3 Month LIBOR USD + 1.14%) | | | 2.86% | ^ | | | 01/15/2026 | | | | 50,045,296 | |
49,000,000 | | Jamestown Ltd., Series 2014-4A-A1AR (3 Month LIBOR USD + 0.69%) | | | 2.41% | ^ | | | 07/15/2026 | | | | 48,877,765 | |
28,750,000 | | Jamestown Ltd., Series 2015-6A-A1AR (3 Month LIBOR USD + 1.15%) | | | 3.03% | ^ | | | 02/20/2027 | | | | 28,757,188 | |
20,000,000 | | Jamestown Ltd., Series 2016-9A-A1A (3 Month LIBOR USD + 1.57%) | | | 3.31% | ^ | | | 10/20/2028 | | | | 20,072,400 | |
20,000,000 | | KVK Ltd., Series 2013-1A-AR (3 Month LIBOR USD + 0.90%) | | | 2.62% | ^ | | | 01/15/2028 | | | | 19,998,574 | |
25,000,000 | | KVK Ltd., Series 2015-1A-AR (3 Month LIBOR USD + 1.25%) | | | 3.14% | ^ | | | 05/20/2027 | | | | 25,019,976 | |
7,825,000 | | LCM LP, Series 14A-D (3 Month LIBOR USD + 3.50%) | | | 5.22% | ^ | | | 07/15/2025 | | | | 7,836,095 | |
22,200,000 | | LCM LP, Series 16A-AR (3 Month LIBOR USD + 1.03%) | | | 2.75% | ^ | | | 07/15/2026 | | | | 22,208,907 | |
2,750,000 | | LCM LP, Series 16A-DR (3 Month LIBOR USD + 3.00%) | | | 4.72% | ^ | | | 07/15/2026 | | | | 2,756,846 | |
20,000,000 | | Madison Park Funding Ltd., Series 2013-11A-AR (3 Month LIBOR USD + 1.16%) | | | 2.90% | ^ | | | 07/23/2029 | | | | 20,025,000 | |
5,500,000 | | Madison Park Funding Ltd., Series 2014-15A-CR (3 Month LIBOR USD + 3.45%) | | | 5.21% | ^ | | | 01/27/2026 | | | | 5,508,574 | |
5,000,000 | | Madison Park Funding Ltd., Series 2014-15A-DR (3 Month LIBOR USD + 5.44%) | | | 7.20% | ^ | | | 01/27/2026 | | | | 5,003,924 | |
24,000,000 | | Magnetite Ltd., Series 2015-12A-AR (3 Month LIBOR USD + 1.33%) | | | 3.05% | ^ | | | 04/15/2027 | | | | 24,039,169 | |
64,500,000 | | Marathon Ltd., Series 2013-5A-A1R (3 Month LIBOR USD + 0.87%) | | | 2.76% | ^ | | | 11/21/2027 | | | | 64,371,000 | |
41,000,000 | | Marathon Ltd., Series 2014-7A-A1R (3 Month LIBOR USD + 1.32%) | | | 3.08% | ^ | | | 10/28/2025 | | | | 41,019,313 | |
75,000,000 | | Midocean Credit, Series 2017-7A-A1 (3 Month LIBOR USD + 1.32%) | | | 3.04% | ^ | | | 07/15/2029 | | | | 75,454,178 | |
55,000,000 | | MP Ltd., Series 2013-1A-AR (3 Month LIBOR USD + 1.25%) | | | 2.99% | ^ | | | 10/20/2030 | | | | 55,186,036 | |
52,000,000 | | MP Ltd., Series 2013-2A-ARR (3 Month LIBOR USD + 1.28%) | | | 3.03% | ^ | | | 07/25/2029 | | | | 52,333,529 | |
2,250,000 | | Neuberger Berman Ltd., Series 2017-16SA-A (3 Month LIBOR USD + 0.85%) | | | 2.57% | ^ | | | 01/15/2028 | | | | 2,255,547 | |
14,426,299 | | NewMark Capital Funding Ltd., Series 2013-1A-A2 (3 Month LIBOR USD + 1.12%) | | | 3.14% | ^ | | | 06/02/2025 | | | | 14,441,381 | |
19,500,000 | | Northwoods Capital Ltd., Series 2017-16A-A (3 Month LIBOR USD + 1.27%) | | | 2.69% | ^ | | | 11/15/2030 | | | | 19,644,252 | |
50,000,000 | | Ocean Trails, Series 2014-5A-A2R (3 Month LIBOR USD + 1.22%) | | | 2.94% | ^ | | | 10/13/2026 | | | | 50,059,984 | |
36,000,000 | | OCP Ltd., Series 2015-9A-A1R (3 Month LIBOR USD + 0.80%) | | | 2.52% | ^ | | | 07/15/2027 | | | | 36,040,491 | |
60,000,000 | | OCP Ltd., Series 2016-12A-A1 (3 Month LIBOR USD + 1.57%) | | | 3.30% | ^ | | | 10/18/2028 | | | | 60,311,321 | |
5,500,000 | | Octagon Investment Partners Ltd., Series 2014-1A-C (3 Month LIBOR USD + 3.65%) | | | 5.48% | ^ | | | 11/14/2026 | | | | 5,544,166 | |
20,000,000 | | Octagon Loan Funding Ltd., Series 2014-1A-A1R (3 Month LIBOR USD + 1.14%) | | | 3.02% | ^ | | | 11/18/2026 | | | | 20,037,690 | |
40,349,949 | | Palmer Square Loan Funding Ltd., Series 2017-1A-A1 (3 Month LIBOR USD + 0.74%) | | | 2.46% | ^ | | | 10/15/2025 | | | | 40,354,194 | |
35,000,000 | | Regatta Funding Ltd., Series 2016-1A-A1 (3 Month LIBOR USD + 1.52%) | | | 3.72% | ^ | | | 12/20/2028 | | | | 35,140,701 | |
19,000,000 | | Rockford Tower Ltd., Series 2017-3A-A (3 Month LIBOR USD + 1.19%) | | | 2.86% | ^ | | | 10/20/2030 | | | | 19,098,370 | |
24,590,000 | | Sound Harbor Loan Fund Ltd., Series 2014-1A-A1R (3 Month LIBOR USD + 1.20%) | | | 2.97% | ^ | | | 10/30/2026 | | | | 24,607,555 | |
20,000,000 | | Steele Creek Ltd., Series 2015-1A-AR (3 Month LIBOR USD + 1.26%) | | | 3.15% | ^ | | | 05/21/2029 | | | | 20,022,741 | |
17,000,000 | | TCI-Cent Ltd., Series 2016-1A-A1 (3 Month LIBOR USD + 1.52%) | | | 3.28% | ^ | | | 12/21/2029 | | | | 17,312,497 | |
10,000,000 | | TCI-Cent Ltd., Series 2016-1A-A2 (3 Month LIBOR USD + 2.20%) | | | 3.96% | ^ | | | 12/21/2029 | | | | 10,103,831 | |
30,000,000 | | TCI-Flatiron Ltd., Series 2016-1A-A (3 Month LIBOR USD + 1.55%) | | | 3.28% | ^ | | | 07/17/2028 | | | | 30,195,624 | |
47,950,000 | | Venture Ltd., Series 2014-17A-AR (3 Month LIBOR USD + 1.08%) | | | 2.80% | ^ | | | 07/15/2026 | | | | 48,005,115 | |
3,500,000 | | Venture Ltd., Series 2014-17A-B2R (3 Month LIBOR USD + 1.60%) | | | 3.32% | ^ | | | 07/15/2026 | | | | 3,503,734 | |
62,945,000 | | Venture Ltd., Series 2015-20A-AR (3 Month LIBOR USD + 0.82%) | | | 2.54% | ^ | | | 04/15/2027 | | | | 62,915,140 | |
13,000,000 | | Venture Ltd., Series 2016-23A-A (3 Month LIBOR USD + 1.65%) | | | 3.39% | ^ | | | 07/19/2028 | | | | 13,032,603 | |
30,500,000 | | Vibrant Ltd., Series 2016-5A-A (3 Month LIBOR USD + 1.55%) | | | 3.29% | ^ | | | 01/20/2029 | | | | 30,733,622 | |
35,000,000 | | Voya Ltd., Series 2014-4A-A1R (3 Month LIBOR USD + 0.95%) | | | 2.67% | ^ | | | 10/14/2026 | | | | 35,037,440 | |
25,000,000 | | Wellfleet Ltd., Series 2017-2A-A1 (3 Month LIBOR USD + 1.25%) | | | 2.63% | ^ | | | 10/20/2029 | | | | 25,174,658 | |
10,000,000 | | WhiteHorse Ltd., Series 2014-1A-AR (3 Month LIBOR USD + 0.90%) | | | 2.28% | ^ | | | 05/01/2026 | | | | 9,996,476 | |
40,000,000 | | Wind River Ltd., Series 2014-2A-AR (3 Month LIBOR USD + 1.14%, 1.14% Floor) | | | 2.86% | ^ | | | 01/15/2031 | | | | 40,202,009 | |
45,000,000 | | Wind River Ltd., Series 2016-2A-A (3 Month LIBOR USD + 1.50%) | | | 3.27% | ^ | | | 11/01/2028 | | | | 45,207,234 | |
10,000,000 | | York Ltd., Series 2016-2A-A (3 Month LIBOR USD + 1.63%) | | | 3.37% | ^ | | | 01/20/2030 | | | | 10,118,444 | |
30,000,000 | | Zais Ltd., Series 2014-2A-A1AR (3 Month LIBOR USD + 1.20%) | | | 2.95% | ^ | | | 07/25/2026 | | | | 30,030,636 | |
2,500,000 | | Zais Ltd., Series 2016-2A-A1 (3 Month LIBOR USD + 1.53%) | | | 3.25% | ^ | | | 10/15/2028 | | | | 2,511,190 | |
| | | | | | | | | | | | | | |
Total Collateralized Loan Obligations (Cost $2,517,254,624) | | | | | | | | 2,527,134,651 | |
| | | | | | | | | | | | | | |
| | | |
Commercial Paper - 0.3% | | | | | | | | | | | | |
12,500,000 | | ABN Funding LLC | | | 0.00% | ^ | | | 11/19/2018 | | | | 12,296,088 | |
2,500,000 | | American Honda Finance Corporation | | | 0.00% | | | | 04/23/2018 | | | | 2,496,774 | |
7,900,000 | | American Honda Finance Corporation | | | 0.00% | | | | 06/25/2018 | | | | 7,860,818 | |
5,000,000 | | Apple, Inc. | | | 0.00% | ^ | | | 07/30/2018 | | | | 4,963,715 | |
12,500,000 | | BMW US Capital LLC | | | 0.00% | ^ | | | 05/22/2018 | | | | 12,463,156 | |
10,000,000 | | BPCE, Inc. | | | 0.00% | ^ | | | 03/20/2019 | | | | 9,738,142 | |
2,500,000 | | Canadian National Railway Company | | | 0.00% | ^ | | | 04/24/2018 | | | | 2,496,588 | |
10,000,000 | | Chevron Corporation | | | 0.00% | ^ | | | 04/23/2018 | | | | 9,987,507 | |
12,500,000 | | Coca Cola Company | | | 0.00% | ^ | | | 05/07/2018 | | | | 12,474,135 | |
3,000,000 | | Credit Suisse First Boston LLC | | | 0.00% | | | | 07/17/2018 | | | | 2,979,238 | |
9,500,000 | | Credit Suisse First Boston LLC | | | 0.00% | | | | 07/26/2018 | | | | 9,428,307 | |
6,000,000 | | General Electric Company | | | 0.00% | | | | 06/29/2018 | | | | 5,969,471 | |
12,500,000 | | Macquarie Bank Ltd. | | | 0.00% | ^ | | | 10/11/2018 | | | | 12,340,886 | |
9,000,000 | | Nestle Capital Corporation | | | 0.00% | ^ | | | 10/09/2018 | | | | 8,891,021 | |
3,000,000 | | Nestle Capital Corporation | | | 0.00% | ^ | | | 10/16/2018 | | | | 2,962,178 | |
1,575,000 | | Province of British Columbia | | | 0.00% | | | | 04/06/2018 | | | | 1,574,395 | |
12,500,000 | | Toyota Motor Credit Corporation | | | 0.00% | | | | 07/20/2018 | | | | 12,410,228 | |
13,000,000 | | Walt Disney Company | | | 0.00% | ^ | | | 06/22/2018 | | | | 12,937,997 | |
4,500,000 | | Westpac Banking Corporation | | | 0.00% | ^ | | | 04/23/2018 | | | | 4,494,594 | |
3,000,000 | | Westpac Banking Corporation | | | 0.00% | ^ | | | 01/03/2019 | | | | 2,943,510 | |
| | | | | | | | | | | | | | |
Total Commercial Paper (Cost $151,898,601) | | | | | | | | 151,708,748 | |
| | | | | | | | | | | | | | |
| | | |
Foreign Corporate Bonds - 0.0% | | | | | | | | | | | | |
2,000,000 | | National Australia Bank Ltd. (3 Month LIBOR USD + 0.51%) | | | 2.41% | ^ | | | 05/22/2020 | | | | 2,008,017 | |
3,128,000 | | Royal Bank of Canada (3 Month LIBOR USD + 0.71%) | | | 2.43% | | | | 04/15/2019 | | | | 3,143,794 | |
9,000,000 | | Royal Bank of Canada (3 Month LIBOR USD + 0.38%) | | | 2.40% | | | | 03/02/2020 | | | | 9,028,028 | |
2,100,000 | | Shell International Finance B.V. (3 Month LIBOR USD + 0.45%) | | | 2.26% | | | | 05/11/2020 | | | | 2,112,591 | |
5,000,000 | | UBS AG (3 Month LIBOR USD + 0.58%) | | | 2.63% | ^ | | | 06/08/2020 | | | | 5,021,075 | |
3,000,000 | | Westpac Banking Corporation (3 Month LIBOR USD + 0.43%) | | | 2.46% | | | | 03/06/2020 | | | | 3,012,558 | |
| | | | | | | | | | | | | | |
Total Foreign Corporate Bonds (Cost $24,270,788) | | | | | | | | 24,326,063 | |
| | | | | | | | | | | | | | |
Non-Agency Commercial Mortgage Backed Obligations - 7.0% | | | | | | | | | |
3,500,000 | | Arbor Realty Ltd., Series 2017-FL2-AS (1 Month LIBOR USD + 1.25%) | | | 3.03% | ^ | | | 08/15/2027 | | | | 3,530,079 | |
5,500,000 | | Arbor Realty Ltd., Series 2017-FL2-B (1 Month LIBOR USD + 1.55%) | | | 3.33% | ^ | | | 08/15/2027 | | | | 5,513,744 | |
2,602,000 | | AREIT Trust, Series 2018-CRE1-AS (1 Month LIBOR USD + 1.25%, 1.25% Floor) | | | 2.75% | ^ | | | 02/15/2035 | | | | 2,608,123 | |
1,706,000 | | AREIT Trust, Series 2018-CRE1-B (1 Month LIBOR USD + 1.65%, 1.65% Floor) | | | 3.15% | ^ | | | 02/15/2035 | | | | 1,712,247 | |
11,007,000 | | Atrium Hotel Portfolio Trust, Series 2017-ATRM-E (1 Month LIBOR USD + 3.05%) | | | 4.83% | ^ | | | 12/15/2036 | | | | 10,926,163 | |
8,350,000 | | BAMLL Commercial Mortgage Securities Trust, Series 2014-IP-E | | | 2.72% | # ^ | | | 06/15/2028 | | | | 8,308,796 | |
44,017,778 | | Banc of America Commercial Mortgage Trust, Series 2007-5-XW | | | 0.00% | # ^ I/O | | | 02/10/2051 | | | | 440 | |
4,000,000 | | Banc of America Commercial Mortgage Trust, Series 2015-UBS7-B | | | 4.37% | # | | | 09/15/2048 | | | | 4,115,829 | |
58,958,798 | | Banc of America Commercial Mortgage Trust, Series 2015-UBS7-XA | | | 0.89% | # I/O | | | 09/15/2048 | | | | 2,982,496 | |
66,825,154 | | Banc of America Commercial Mortgage Trust, Series 2016-UB10-XA | | | 1.99% | # I/O | | | 07/15/2049 | | | | 6,883,846 | |
40,132,324 | | BANK, Series 2017-BNK4-XA | | | 1.45% | # I/O | | | 05/15/2050 | | | | 3,740,236 | |
192,002,293 | | BANK, Series 2017-BNK5-XA | | | 1.10% | # I/O | | | 06/15/2060 | | | | 13,470,170 | |
1,750,000 | | BANK, Series 2018-BN10-AS | | | 3.90% | | | | 02/15/2061 | | | | 1,792,376 | |
153,109,800 | | BANK, Series 2018-BN10-XA | | | 0.75% | # I/O | | | 02/15/2061 | | | | 9,029,574 | |
27,365,000 | | Barclays Commercial Mortgage Securities LLC, Series 2015-STP-D | | | 4.29% | # ^ | | | 09/10/2028 | | | | 27,245,746 | |
12,089,000 | | Barclays Commercial Mortgage Securities LLC, Series 2017-DELC-C (1 Month LIBOR USD + 1.20%) | | | 2.98% | ^ | | | 08/15/2036 | | | | 12,080,458 | |
13,777,000 | | Barclays Commercial Mortgage Securities LLC, Series 2017-DELC-D (1 Month LIBOR USD + 1.70%) | | | 3.48% | ^ | | | 08/15/2036 | | | | 13,744,638 | |
29,711,000 | | Barclays Commercial Mortgage Securities LLC, Series 2017-DELC-E (1 Month LIBOR USD + 2.50%) | | | 4.28% | ^ | | | 08/15/2036 | | | | 29,677,768 | |
30,209,000 | | Barclays Commercial Mortgage Securities LLC, Series 2017-DELC-F (1 Month LIBOR USD + 3.50%) | | | 5.28% | ^ | | | 08/15/2036 | | | | 30,233,231 | |
14,259,000 | | BBCMS Mortgage Trust, Series 2017-GLKS-E (1 Month LIBOR USD + 2.85%, 2.75% Floor) | | | 4.63% | ^ | | | 11/15/2034 | | | | 14,262,777 | |
4,500,000 | | Bear Stearns Commercial Mortgage Securities, Inc., Series 2007-T26-AJ | | | 5.52% | # | | | 01/12/2045 | | | | 4,262,205 | |
8,643,000 | | Bsprt Issuer Ltd., Series 2017-FL2-A (1 Month LIBOR USD + 0.82%, 0.82% Floor) | | | 2.60% | ^ | | | 10/15/2034 | | | | 8,667,701 | |
3,025,000 | | Bsprt Issuer Ltd., Series 2017-FL2-AS (1 Month LIBOR USD + 1.10%, 1.10% Floor) | | | 2.88% | ^ | | | 10/15/2034 | | | | 3,033,196 | |
3,025,000 | | Bsprt Issuer Ltd., Series 2017-FL2-B (1 Month LIBOR USD + 1.40%, 1.40% Floor) | | | 3.18% | ^ | | | 10/15/2034 | | | | 3,033,709 | |
6,663,000 | | BX Commercial Mortgage Trust, Series 2018-BIOA-D (1 Month LIBOR USD + 1.32%, 1.35% Floor) | | | 2.97% | ^ | | | 03/15/2037 | | | | 6,634,901 | |
35,415,000 | | BX Commercial Mortgage Trust, Series 2018-BIOA-E (1 Month LIBOR USD + 1.95%, 1.98% Floor) | | | 3.60% | ^ | | | 03/15/2037 | | | | 35,253,929 | |
18,462,782 | | BX Trust, Series 2017-APPL-D (1 Month LIBOR USD + 2.05%, 2.05% Floor) | | | 3.83% | ^ | | | 07/15/2034 | | | | 18,556,220 | |
31,755,261 | | BX Trust, Series 2017-APPL-E (1 Month LIBOR USD + 3.15%, 3.15% Floor) | | | 4.93% | ^ | | | 07/15/2034 | | | | 32,016,706 | |
7,369,000 | | BX Trust, Series 2017-IMC-D (1 Month LIBOR USD + 2.25%, 2.25% Floor) | | | 4.03% | ^ | | | 10/15/2032 | | | | 7,397,298 | |
12,055,000 | | BX Trust, Series 2017-IMC-E (1 Month LIBOR USD + 3.25%, 3.25% Floor) | | | 5.03% | ^ | | | 10/15/2032 | | | | 12,126,766 | |
41,842,000 | | BX Trust, Series 2017-SLCT-D (1 Month LIBOR USD + 2.05%) | | | 3.83% | ^ | | | 07/15/2034 | | | | 41,986,811 | |
75,275,000 | | BX Trust, Series 2017-SLCT-E (1 Month LIBOR USD + 3.15%) | | | 4.93% | ^ | | | 07/15/2034 | | | | 75,746,959 | |
50,228,019 | | CD Mortgage Trust, Series 2017-CD6-XA | | | 0.98% | # I/O | | | 11/13/2050 | | | | 3,253,018 | |
7,155,000 | | CFCRE Commercial Mortgage Trust, Series 2016-C4-C | | | 4.88% | # | | | 05/10/2058 | | | | 7,348,447 | |
100,729,136 | | CFCRE Commercial Mortgage Trust, Series 2016-C4-XA | | | 1.75% | # I/O | | | 05/10/2058 | | | | 10,284,002 | |
33,492,000 | | CFCRE Commercial Mortgage Trust, Series 2016-C7-A3 | | | 3.84% | | | | 12/10/2054 | | | | 34,049,803 | |
45,414,723 | | CFCRE Commercial Mortgage Trust, Series 2017-C8-XA | | | 1.67% | # I/O | | | 06/15/2050 | | | | 4,780,599 | |
3,128,000 | | CFCRE Commercial Mortgage Trust, Series 2018-TAN-B | | | 4.69% | ^ | | | 02/15/2033 | | | | 3,218,760 | |
3,128,000 | | CFCRE Commercial Mortgage Trust, Series 2018-TAN-C | | | 5.29% | ^ | | | 02/15/2033 | | | | 3,225,921 | |
1,877,000 | | CFCRE Commercial Mortgage Trust, Series 2018-TAN-D | | | 6.10% | ^ | | | 02/15/2033 | | | | 1,937,516 | |
5,436,000 | | CGDBB Commercial Mortgage Trust, Series 2017-BIOC-D (1 Month LIBOR USD + 1.60%, 1.60% Floor) | | | 3.38% | ^ | | | 07/15/2032 | | | | 5,447,051 | |
7,611,000 | | CGDBB Commercial Mortgage Trust, Series 2017-BIOC-E (1 Month LIBOR USD + 2.15%, 2.25% Floor) | | | 3.93% | ^ | | | 07/15/2032 | | | | 7,609,584 | |
43,737,000 | | CHT Mortgage Trust, Series 2017-CSMO-E (1 Month LIBOR USD + 3.00%, 3.00% Floor) | | | 4.78% | ^ | | | 11/15/2036 | | | | 44,092,009 | |
24,582,000 | | CHT Mortgage Trust, Series 2017-CSMO-F (1 Month LIBOR USD + 3.74%, 3.80% Floor) | | | 5.52% | ^ | | | 11/15/2036 | | | | 24,790,293 | |
4,996,926 | | Citigroup Commercial Mortgage Trust, Series 2008-C7-AM | | | 6.19% | # | | | 12/10/2049 | | | | 4,992,716 | |
7,708,000 | | Citigroup Commercial Mortgage Trust, Series 2008-C7-AMA | | | 6.19% | # | | | 12/10/2049 | | | | 7,697,661 | |
213,073,626 | | Citigroup Commercial Mortgage Trust, Series 2012-GC8-XA | | | 1.81% | # ^ I/O | | | 09/10/2045 | | | | 13,182,290 | |
218,777,063 | | Citigroup Commercial Mortgage Trust, Series 2014-GC19-XA | | | 1.19% | # I/O | | | 03/10/2047 | | | | 10,840,228 | |
113,818,610 | | Citigroup Commercial Mortgage Trust, Series 2014-GC21-XA | | | 1.23% | # I/O | | | 05/10/2047 | | | | 6,500,386 | |
9,011,000 | | Citigroup Commercial Mortgage Trust, Series 2014-GC25-A4 | | | 3.64% | | | | 10/10/2047 | | | | 9,151,094 | |
193,086,022 | | Citigroup Commercial Mortgage Trust, Series 2014-GC25-XA | | | 1.03% | # I/O | | | 10/10/2047 | | | | 10,428,228 | |
50,000,000 | | Citigroup Commercial Mortgage Trust, Series 2015-GC27-A5 | | | 3.14% | | | | 02/10/2048 | | | | 49,258,575 | |
6,265,000 | | Citigroup Commercial Mortgage Trust, Series 2015-GC27-B | | | 3.77% | | | | 02/10/2048 | | | | 6,156,788 | |
8,216,000 | | Citigroup Commercial Mortgage Trust, Series 2015-GC27-D | | | 4.43% | # ^ | | | 02/10/2048 | | | | 7,001,208 | |
216,859,616 | | Citigroup Commercial Mortgage Trust, Series 2015-GC27-XA | | | 1.41% | # I/O | | | 02/10/2048 | | | | 15,734,033 | |
14,310,000 | | Citigroup Commercial Mortgage Trust, Series 2015-GC33-C | | | 4.57% | # | | | 09/10/2058 | | | | 13,730,097 | |
178,104,300 | | Citigroup Commercial Mortgage Trust, Series 2015-GC33-XA | | | 0.96% | # I/O | | | 09/10/2058 | | | | 9,844,092 | |
20,725,000 | | Citigroup Commercial Mortgage Trust, Series 2015-GC35-C | | | 4.50% | # | | | 11/10/2048 | | | | 20,459,053 | |
151,962,947 | | Citigroup Commercial Mortgage Trust, Series 2016-C1-XA | | | 1.93% | # I/O | | | 05/10/2049 | | | | 17,662,836 | |
217,980,490 | | Citigroup Commercial Mortgage Trust, Series 2016-GC36-XA | | | 1.33% | # I/O | | | 02/10/2049 | | | | 16,673,960 | |
114,273,968 | | Citigroup Commercial Mortgage Trust, Series 2016-P3-XA | | | 1.71% | # I/O | | | 04/15/2049 | | | | 11,151,414 | |
78,876,029 | | Citigroup Commercial Mortgage Trust, Series 2016-P4-XA | | | 2.00% | # I/O | | | 07/10/2049 | | | | 9,273,739 | |
38,172,009 | | Citigroup Commercial Mortgage Trust, Series 2016-P5-XA | | | 1.55% | # I/O | | | 10/10/2049 | | | | 3,484,517 | |
119,605,336 | | Citigroup Commercial Mortgage Trust, Series 2017-P7-XA | | | 1.13% | # I/O | | | 04/14/2050 | | | | 9,258,864 | |
86,444,867 | | Citigroup Mortgage Loan Trust, Inc., Series 2016-GC37-XA | | | 1.80% | # I/O | | | 04/10/2049 | | | | 9,366,440 | |
13,806,000 | | CLNS Trust, Series 2017-IKPR-D (1 Month LIBOR USD + 2.05%, 2.05% Floor) | | | 3.79% | ^ | | | 06/11/2032 | | | | 13,857,090 | |
88,477,000 | | CLNS Trust, Series 2017-IKPR-E (1 Month LIBOR USD + 3.50%, 3.50% Floor) | | | 5.24% | ^ | | | 06/11/2032 | | | | 89,164,148 | |
28,027,000 | | CLNS Trust, Series 2017-IKPR-F (1 Month LIBOR USD + 4.50%, 4.50% Floor) | | | 6.24% | ^ | | | 06/11/2032 | | | | 28,300,314 | |
15,385,625 | | COBALT Commercial Mortgage Trust, Series 2007-C2-AJFX | | | 5.57% | # | | | 04/15/2047 | | | | 15,538,439 | |
34,234,000 | | Cold Storage Trust, Series 2017-ICE3-A (1 Month LIBOR USD + 1.00%, 1.00% Floor) | | | 2.78% | ^ | | | 04/15/2036 | | | | 34,407,594 | |
41,768,000 | | Cold Storage Trust, Series 2017-ICE3-C (1 Month LIBOR USD + 1.35%, 1.35% Floor) | | | 3.13% | ^ | | | 04/15/2036 | | | | 41,997,749 | |
33,199,592 | | Commercial Mortgage Pass-Through Certificates, Series 2012-CR2-XA | | | 1.66% | # I/O | | | 08/15/2045 | | | | 1,959,931 | |
147,110,895 | | Commercial Mortgage Pass-Through Certificates, Series 2012-CR3-XA | | | 1.88% | # I/O | | | 10/15/2045 | | | | 10,237,300 | |
122,491,453 | | Commercial Mortgage Pass-Through Certificates, Series 2012-LC4-XA | | | 2.21% | # ^ I/O | | | 12/10/2044 | | | | 7,520,583 | |
175,945,314 | | Commercial Mortgage Pass-Through Certificates, Series 2013-CR10-XA | | | 0.87% | # I/O | | | 08/10/2046 | | | | 4,988,982 | |
225,181,783 | | Commercial Mortgage Pass-Through Certificates, Series 2013-CR12-XA | | | 1.28% | # I/O | | | 10/10/2046 | | | | 10,812,216 | |
9,850,000 | | Commercial Mortgage Pass-Through Certificates, Series 2014-CR19-C | | | 4.72% | # | | | 08/10/2047 | | | | 9,907,524 | |
5,211,000 | | Commercial Mortgage Pass-Through Certificates, Series 2014-CR20-A4 | | | 3.59% | | | | 11/10/2047 | | | | 5,281,454 | |
30,400,000 | | Commercial Mortgage Pass-Through Certificates, Series 2014-CR20-C | | | 4.50% | # | | | 11/10/2047 | | | | 30,513,477 | |
71,378,000 | | Commercial Mortgage Pass-Through Certificates, Series 2014-CR21-A3 | | | 3.53% | | | | 12/10/2047 | | | | 72,053,700 | |
15,011,000 | | Commercial Mortgage Pass-Through Certificates, Series 2014-UBS3-A4 | | | 3.82% | | | | 06/10/2047 | | | | 15,468,286 | |
118,873,357 | | Commercial Mortgage Pass-Through Certificates, Series 2014-UBS3-XA | | | 1.29% | # I/O | | | 06/10/2047 | | | | 5,931,887 | |
8,215,000 | | Commercial Mortgage Pass-Through Certificates, Series 2015-CALW-D | | | 3.85% | # ^ | | | 02/10/2034 | | | | 8,207,776 | |
20,970,000 | | Commercial Mortgage Pass-Through Certificates, Series 2015-CR22-D | | | 4.12% | # ^ | | | 03/10/2048 | | | | 17,576,817 | |
220,125,693 | | Commercial Mortgage Pass-Through Certificates, Series 2015-CR22-XA | | | 0.99% | # I/O | | | 03/10/2048 | | | | 9,816,946 | |
9,230,000 | | Commercial Mortgage Pass-Through Certificates, Series 2015-CR23-D | | | 4.25% | # | | | 05/10/2048 | | | | 7,613,582 | |
9,110,000 | | Commercial Mortgage Pass-Through Certificates, Series 2015-CR26-B | | | 4.49% | # | | | 10/10/2048 | | | | 9,520,451 | |
90,298,827 | | Commercial Mortgage Pass-Through Certificates, Series 2015-CR26-XA | | | 1.04% | # I/O | | | 10/10/2048 | | | | 4,991,557 | |
50,000,000 | | Commercial Mortgage Pass-Through Certificates, Series 2015-DC1-A5 | | | 3.35% | | | | 02/10/2048 | | | | 49,655,560 | |
8,715,000 | | Commercial Mortgage Pass-Through Certificates, Series 2015-DC1-C | | | 4.35% | # | | | 02/10/2048 | | | | 8,557,575 | |
13,275,000 | | Commercial Mortgage Pass-Through Certificates, Series 2015-DC1-D | | | 4.35% | # ^ | | | 02/10/2048 | | | | 11,066,794 | |
399,811,868 | | Commercial Mortgage Pass-Through Certificates, Series 2015-DC1-XA | | | 1.14% | # I/O | | | 02/10/2048 | | | | 20,513,627 | |
35,000,000 | | Commercial Mortgage Pass-Through Certificates, Series 2015-LC19-A4 | | | 3.18% | | | | 02/10/2048 | | | | 34,512,688 | |
29,922,000 | | Commercial Mortgage Pass-Through Certificates, Series 2016-CR28-C | | | 4.65% | # | | | 02/10/2049 | | | | 30,818,828 | |
20,355,000 | | Commercial Mortgage Pass-Through Certificates, Series 2016-GCT-E | | | 3.46% | # ^ | | | 08/10/2029 | | | | 19,598,850 | |
1,617,000 | | Commercial Mortgage Pass-Through Certificates, Series 2017-PANW-D | | | 3.93% | # ^ | | | 10/10/2029 | | | | 1,585,820 | |
5,524,000 | | Commercial Mortgage Pass-Through Certificates, Series 2017-PANW-E | | | 3.81% | # ^ | | | 10/10/2029 | | | | 5,206,311 | |
150,822,000 | | Credit Suisse Mortgage Capital Certificates, Series 2014-USA-X1 | | | 0.55% | # ^ I/O | | | 09/15/2037 | | | | 5,016,008 | |
4,606,000 | | CSAIL Commercial Mortgage Trust, Series 2015-C1-C | | | 4.30% | # | | | 04/15/2050 | | | | 4,635,364 | |
13,360,000 | | CSAIL Commercial Mortgage Trust, Series 2015-C2-AS | | | 3.85% | # | | | 06/15/2057 | | | | 13,528,804 | |
22,320,000 | | CSAIL Commercial Mortgage Trust, Series 2015-C3-C | | | 4.36% | # | | | 08/15/2048 | | | | 22,131,715 | |
9,759,000 | | CSAIL Commercial Mortgage Trust, Series 2015-C4-C | | | 4.58% | # | | | 11/15/2048 | | | | 9,762,189 | |
316,152,879 | | CSAIL Commercial Mortgage Trust, Series 2015-C4-XA | | | 0.93% | # I/O | | | 11/15/2048 | | | | 16,151,492 | |
2,085,000 | | CSAIL Commercial Mortgage Trust, Series 2016-C7-C | | | 4.39% | # | | | 11/15/2049 | | | | 1,949,538 | |
188,353,910 | | CSAIL Commercial Mortgage Trust, Series 2017-C8-XA | | | 1.26% | # I/O | | | 06/15/2050 | | | | 14,436,743 | |
5,511,000 | | CSAIL Commercial Mortgage Trust, Series 2017-CX10-C | | | 4.11% | # | | | 11/15/2050 | | | | 5,517,880 | |
91,990,654 | | CSAIL Commercial Mortgage Trust, Series 2017-CX10-XA | | | 0.73% | # I/O | | | 11/15/2050 | | | | 4,983,704 | |
7,185,000 | | CSMC Mortgage Securities Trust, Series 2017-HD-B (1 Month LIBOR USD + 1.35%, 1.35% Floor) | | | 3.13% | ^ | | | 02/15/2031 | | | | 7,199,071 | |
3,450,000 | | CSMC Mortgage Securities Trust, Series 2017-HD-C (1 Month LIBOR USD + 1.70%, 1.70% Floor) | | | 3.48% | ^ | | | 02/15/2031 | | | | 3,456,908 | |
7,444,000 | | CSMC Mortgage Securities Trust, Series 2017-HD-D (1 Month LIBOR USD + 2.50%, 2.50% Floor) | | | 4.28% | ^ | | | 02/15/2031 | | | | 7,462,023 | |
7,050,000 | | CSMC Trust, Series 2017-CALI-E | | | 3.78% | # ^ | | | 11/10/2032 | | | | 6,630,319 | |
6,050,000 | | CSMC Trust, Series 2017-CALI-F | | | 3.78% | # ^ | | | 11/10/2032 | | | | 5,539,503 | |
12,164,000 | | CSMC Trust, Series 2017-CHOP-D (1 Month LIBOR USD + 1.90%, 1.90% Floor) | | | 3.68% | ^ | | | 07/15/2032 | | | | 12,197,840 | |
21,321,000 | | CSMC Trust, Series 2017-CHOP-E (1 Month LIBOR USD + 3.30%, 3.30% Floor) | | | 5.08% | ^ | | | 07/15/2032 | | | | 21,408,175 | |
106,233,834 | | DBUBS Mortgage Trust, Series 2011-LC2A-XA | | | 1.11% | # ^ I/O | | | 07/10/2044 | | | | 2,926,997 | |
2,996,000 | | DBUBS Mortgage Trust, Series 2011-LC3A-PM2 | | | 4.76% | # ^ | | | 05/10/2044 | | | | 3,105,163 | |
124,354,533 | | Deutsche Bank Commercial Mortgage Trust, Series 2016-C1-XA | | | 1.49% | # I/O | | | 05/10/2049 | | | | 11,058,650 | |
11,417,000 | | GE Commercial Mortgage Corporation Trust, Series 2007-C1-AM | | | 5.61% | # | | | 12/10/2049 | | | | 11,524,015 | |
15,417,000 | | Great Wolf Trust, Series 2017-WOLF-D (1 Month LIBOR USD + 2.10%, 1.00% Floor) | | | 4.03% | ^ | | | 09/15/2034 | | | | 15,509,400 | |
31,606,000 | | Great Wolf Trust, Series 2017-WOLF-E (1 Month LIBOR USD + 3.10%, 1.00% Floor) | | | 5.03% | ^ | | | 09/15/2034 | | | | 31,890,988 | |
16,823,000 | | Great Wolf Trust, Series 2017-WOLF-F (1 Month LIBOR USD + 4.07%, 1.00% Floor) | | | 6.00% | ^ | | | 09/15/2034 | | | | 16,993,515 | |
4,410,107 | | Greenwich Capital Commercial Funding Corporation, Series 2006-GG7-AM | | | 5.74% | # | | | 07/10/2038 | | | | 4,465,685 | |
18,685,152 | | GS Mortgage Securities Corporation, Series 2011-GC3-X | | | 0.67% | # ^ I/O | | | 03/10/2044 | | | | 303,041 | |
25,696,628 | | GS Mortgage Securities Corporation, Series 2013-GC10-XA | | | 1.55% | # I/O | | | 02/10/2046 | | | | 1,489,819 | |
37,554,613 | | GS Mortgage Securities Corporation, Series 2014-GC20-XA | | | 1.00% | # I/O | | | 04/10/2047 | | | | 1,737,239 | |
60,850,000 | | GS Mortgage Securities Corporation, Series 2014-GC26-A5 | | | 3.63% | | | | 11/10/2047 | | | | 61,751,748 | |
35,000,000 | | GS Mortgage Securities Corporation, Series 2015-GC28-A5 | | | 3.40% | | | | 02/10/2048 | | | | 34,977,498 | |
284,855,886 | | GS Mortgage Securities Corporation, Series 2015-GC28-XA | | | 1.13% | # I/O | | | 02/10/2048 | | | | 14,046,842 | |
248,182,811 | | GS Mortgage Securities Corporation, Series 2015-GC32-XA | | | 0.85% | # I/O | | | 07/10/2048 | | | | 10,976,878 | |
173,452,586 | | GS Mortgage Securities Corporation, Series 2015-GC34-XA | | | 1.35% | # I/O | | | 10/10/2048 | | | | 12,946,813 | |
207,678,000 | | GS Mortgage Securities Corporation, Series 2018-GS9-XA | | | 0.60% | # I/O | | | 03/10/2051 | | | | 7,603,299 | |
96,561,173 | | GS Mortgage Securities Trust, Series 2012-GC6-XA | | | 1.95% | # ^ I/O | | | 01/10/2045 | | | | 5,735,367 | |
3,500,000 | | GS Mortgage Securities Trust, Series 2015-GC28-C | | | 4.33% | # | | | 02/10/2048 | | | | 3,425,525 | |
68,716,528 | | GS Mortgage Securities Trust, Series 2015-GS1-XA | | | 0.82% | # I/O | | | 11/10/2048 | | | | 3,412,573 | |
55,609,855 | | GS Mortgage Securities Trust, Series 2016-GS2-XA | | | 1.67% | # I/O | | | 05/10/2049 | | | | 5,243,943 | |
358,489,675 | | GS Mortgage Securities Trust, Series 2016-GS3-XA | | | 1.27% | # I/O | | | 10/10/2049 | | | | 27,845,757 | |
69,947,464 | | GS Mortgage Securities Trust, Series 2016-GS4-XA | | | 0.60% | # I/O | | | 11/10/2049 | | | | 2,482,135 | |
191,156,902 | | GS Mortgage Securities Trust, Series 2017-GS7-XA | | | 1.14% | # I/O | | | 08/10/2050 | | | | 15,508,808 | |
98,700,000 | | GS Mortgage Securities Trust, Series 2017-GS7-XB | | | 0.35% | # I/O | | | 08/10/2050 | | | | 2,912,074 | |
1,971,180 | | JP Morgan Chase Commercial Mortgage Securities Corporation,
Series 2004-CBX-X1 | | | 0.80% | # ^ I/O | | | 01/12/2037 | | | | 24,952 | |
3,855,888 | | JP Morgan Chase Commercial Mortgage Securities Corporation,
Series 2005-CB12-AJ | | | 4.99% | # | | | 09/12/2037 | | | | 3,920,908 | |
2,130,674 | | JP Morgan Chase Commercial Mortgage Securities Corporation,
Series 2005-LDP4-X1 | | | 0.13% | # ^ I/O | | | 10/15/2042 | | | | 5 | |
2,853,846 | | JP Morgan Chase Commercial Mortgage Securities Corporation,
Series 2006-LDP8-X | | | 0.29% | # I/O | | | 05/15/2045 | | | | 45 | |
24,387,973 | | JP Morgan Chase Commercial Mortgage Securities Corporation,
Series 2006-LDP9-AM | | | 5.37% | | | | 05/15/2047 | | | | 24,558,099 | |
8,142,320 | | JP Morgan Chase Commercial Mortgage Securities Corporation,
Series 2007-C1-AM | | | 5.75% | # | | | 02/15/2051 | | | | 8,126,430 | |
7,120,429 | | JP Morgan Chase Commercial Mortgage Securities Corporation,
Series 2007-CB18-AM | | | 5.47% | # | | | 06/12/2047 | | | | 7,104,743 | |
6,946,647 | | JP Morgan Chase Commercial Mortgage Securities Corporation,
Series 2007-CB18-AMFX | | | 5.40% | | | | 06/12/2047 | | | | 6,931,435 | |
31,997,264 | | JP Morgan Chase Commercial Mortgage Securities Corporation,
Series 2007-CB18-X | | | 0.27% | # I/O | | | 06/12/2047 | | | | 37,114 | |
72,033,780 | | JP Morgan Chase Commercial Mortgage Securities Corporation,
Series 2007-CB20-X1 | | | 0.00% | # ^ I/O | | | 02/12/2051 | | | | 720 | |
158,571,242 | | JP Morgan Chase Commercial Mortgage Securities Corporation,
Series 2012-C6-XA | | | 1.58% | # I/O | | | 05/15/2045 | | | | 8,420,545 | |
334,553,831 | | JP Morgan Chase Commercial Mortgage Securities Corporation,
Series 2012-C8-XA | | | 1.80% | # I/O | | | 10/15/2045 | | | | 21,244,503 | |
121,220,515 | | JP Morgan Chase Commercial Mortgage Securities Corporation,
Series 2012-CBX-XA | | | 1.65% | # I/O | | | 06/15/2045 | | | | 5,322,538 | |
5,425,000 | | JP Morgan Chase Commercial Mortgage Securities Corporation,
Series 2014-DSTY-A | | | 3.43% | ^ | | | 06/10/2027 | | | | 5,428,515 | |
24,200,000 | | JP Morgan Chase Commercial Mortgage Securities Corporation,
Series 2014-PHH-D (1 Month LIBOR USD + 2.65%) | | | 4.43% | ^ | | | 08/15/2027 | | | | 24,227,232 | |
14,406,000 | | JP Morgan Chase Commercial Mortgage Securities Corporation,
Series 2014-PHH-E (1 Month LIBOR USD + 3.55%) | | | 5.33% | ^ | | | 08/15/2027 | | | | 14,431,000 | |
79,588,098 | | JP Morgan Chase Commercial Mortgage Securities Corporation,
Series 2015-JP1-XA | | | 1.13% | # I/O | | | 01/15/2049 | | | | 4,035,268 | |
7,271,000 | | JP Morgan Chase Commercial Mortgage Securities Corporation,
Series 2017-FL10-B (1 Month LIBOR USD + 1.00%, 1.00% Floor) | | | 2.78% | ^ | | | 06/15/2032 | | | | 7,335,671 | |
5,488,000 | | JP Morgan Chase Commercial Mortgage Securities Corporation,
Series 2017-FL10-C (1 Month LIBOR USD + 1.25%, 1.25% Floor) | | | 3.03% | ^ | | | 06/15/2032 | | | | 5,552,164 | |
17,779,000 | | JP Morgan Chase Commercial Mortgage Securities Corporation,
Series 2017-FL10-D (1 Month LIBOR USD + 1.90%, 1.90% Floor) | | | 3.68% | ^ | | | 06/15/2032 | | | | 17,916,595 | |
325,375,000 | | JP Morgan Chase Commercial Mortgage Securities Corporation,
Series 2017-FL10-XCP | | | 0.71% | # ^ I/O | | | 04/15/2019 | | | | 1,207,532 | |
1,361,000 | | JP Morgan Chase Commercial Mortgage Securities Corporation,
Series 2017-MAUI-C (1 Month LIBOR USD + 1.25%, 1.25% Floor) | | | 2.97% | ^ | | | 07/15/2034 | | | | 1,366,003 | |
1,285,000 | | JP Morgan Chase Commercial Mortgage Securities Corporation,
Series 2017-MAUI-D (1 Month LIBOR USD + 1.95%, 1.95% Floor) | | | 3.67% | ^ | | | 07/15/2034 | | | | 1,292,598 | |
3,198,000 | | JP Morgan Chase Commercial Mortgage Securities Corporation,
Series 2017-MAUI-E (1 Month LIBOR USD + 2.95%, 2.95% Floor) | | | 4.67% | ^ | | | 07/15/2034 | | | | 3,223,355 | |
4,506,000 | | JP Morgan Chase Commercial Mortgage Securities Corporation,
Series 2017-MAUI-F (1 Month LIBOR USD + 3.75%, 3.75% Floor) | | | 5.47% | ^ | | | 07/15/2034 | | | | 4,550,423 | |
12,206,230 | | JP Morgan Chase Commercial Mortgage Securities Trust,
Series 2007-LD11-AM | | | 5.95% | # | | | 06/15/2049 | | | | 12,421,594 | |
3,274,435 | | JP Morgan Chase Commercial Mortgage Securities Trust,
Series 2007-LDPX-AM | | | 5.46% | # | | | 01/15/2049 | | | | 3,271,056 | |
18,205,537 | | JP Morgan Chase Commercial Mortgage Securities Trust, Series 2016-ASH-B
(1 Month LIBOR USD + 2.15%, 2.15% Floor) | | | 3.93% | ^ | | | 10/15/2034 | | | | 18,245,365 | |
10,277,478 | | JP Morgan Chase Commercial Mortgage Securities Trust, Series 2016-ASH-C
(1 Month LIBOR USD + 2.75%, 2.75% Floor) | | | 4.53% | ^ | | | 10/15/2034 | | | | 10,310,594 | |
4,857,000 | | JP Morgan Chase Commercial Mortgage Securities Trust, Series 2016-WIKI-E | | | 4.01% | # ^ | | | 10/05/2031 | | | | 4,731,406 | |
6,678,000 | | JP Morgan Chase Commercial Mortgage Securities Trust, Series 2018-ASH8-A
(1 Month LIBOR USD + 0.80%, 0.84% Floor) | | | 2.58% | ^ | | | 02/15/2035 | | | | 6,693,411 | |
6,954,000 | | JP Morgan Chase Commercial Mortgage Securities Trust, Series 2018-ASH8-B
(1 Month LIBOR USD + 1.10%, 1.14% Floor) | | | 2.88% | ^ | | | 02/15/2035 | | | | 6,970,039 | |
905,000 | | JP Morgan Chase Commercial Mortgage Securities Trust, Series 2018-ASH8-C
(1 Month LIBOR USD + 1.30%, 1.34% Floor) | | | 3.08% | ^ | | | 02/15/2035 | | | | 907,380 | |
1,462,000 | | JP Morgan Chase Commercial Mortgage Securities Trust, Series 2018-ASH8-D
(1 Month LIBOR USD + 2.05%, 1.84% Floor) | | | 3.83% | ^ | | | 02/15/2035 | | | | 1,467,282 | |
95,878,153 | | JPMBB Commercial Mortgage Securities Trust, Series 2014-C18-XA | | | 0.96% | # I/O | | | 02/15/2047 | | | | 3,761,933 | |
3,396,000 | | JPMBB Commercial Mortgage Securities Trust, Series 2014-C21-C | | | 4.66% | # | | | 08/15/2047 | | | | 3,406,114 | |
56,683,785 | | JPMBB Commercial Mortgage Securities Trust, Series 2014-C22-XA | | | 0.91% | # I/O | | | 09/15/2047 | | | | 2,495,793 | |
217,359,544 | | JPMBB Commercial Mortgage Securities Trust, Series 2014-C25-XA | | | 0.96% | # I/O | | | 11/15/2047 | | | | 9,583,600 | |
32,031,000 | | JPMBB Commercial Mortgage Securities Trust, Series 2014-C26-A4 | | | 3.49% | | | | 01/15/2048 | | | | 32,238,490 | |
6,499,000 | | JPMBB Commercial Mortgage Securities Trust, Series 2014-C26-C | | | 4.42% | # | | | 01/15/2048 | | | | 6,408,264 | |
249,253,325 | | JPMBB Commercial Mortgage Securities Trust, Series 2014-C26-XA | | | 1.13% | # I/O | | | 01/15/2048 | | | | 11,407,776 | |
12,055,000 | | JPMBB Commercial Mortgage Securities Trust, Series 2015-C27-C | | | 4.34% | # | | | 02/15/2048 | | | | 11,794,786 | |
10,425,000 | | JPMBB Commercial Mortgage Securities Trust, Series 2015-C27-D | | | 3.84% | # ^ | | | 02/15/2048 | | | | 8,373,858 | |
57,929,172 | | JPMBB Commercial Mortgage Securities Trust, Series 2015-C27-XA | | | 1.35% | # I/O | | | 02/15/2048 | | | | 3,303,388 | |
15,238,000 | | JPMBB Commercial Mortgage Securities Trust, Series 2015-C28-C | | | 4.24% | # | | | 10/15/2048 | | | | 14,650,052 | |
43,515,036 | | JPMBB Commercial Mortgage Securities Trust, Series 2015-C28-XA | | | 1.16% | # I/O | | | 10/15/2048 | | | | 2,133,768 | |
63,519,034 | | JPMBB Commercial Mortgage Securities Trust, Series 2015-C29-XA | | | 0.92% | # I/O | | | 05/15/2048 | | | | 2,083,450 | |
6,762,000 | | JPMBB Commercial Mortgage Securities Trust, Series 2015-C30-B | | | 4.31% | # | | | 07/15/2048 | | | | 6,837,865 | |
170,164,783 | | JPMBB Commercial Mortgage Securities Trust, Series 2015-C30-XA | | | 0.67% | # I/O | | | 07/15/2048 | | | | 5,118,557 | |
27,395,000 | | JPMBB Commercial Mortgage Securities Trust, Series 2015-C32-C | | | 4.67% | # | | | 11/15/2048 | | | | 27,247,527 | |
97,815,809 | | JPMBB Commercial Mortgage Securities Trust, Series 2015-C32-XA | | | 1.47% | # I/O | | | 11/15/2048 | | | | 5,615,322 | |
17,630,000 | | JPMBB Commercial Mortgage Securities Trust, Series 2015-C33-C | | | 4.62% | # | | | 12/15/2048 | | | | 17,848,693 | |
32,345,000 | | JPMBB Commercial Mortgage Securities Trust, Series 2016-C1-C | | | 4.75% | # | | | 03/15/2049 | | | | 33,134,231 | |
148,407,633 | | JPMBB Commercial Mortgage Securities Trust, Series 2016-C2-XA | | | 1.70% | # I/O | | | 06/15/2049 | | | | 13,003,269 | |
170,270,152 | | JPMBB Commercial Mortgage Securities Trust, Series 2017-C5-XA | | | 1.02% | # I/O | | | 03/15/2050 | | | | 11,459,573 | |
10,561,408 | | LB-UBS Commercial Mortgage Trust, Series 2006-C7-XCL | | | 0.49% | # ^ I/O | | | 11/15/2038 | | | | 11,959 | |
25,233,926 | | LSTAR Commercial Mortgage Trust, Series 2017-5-X | | | 1.23% | # ^ I/O | | | 03/10/2050 | | | | 1,204,577 | |
66,630,639 | | Merrill Lynch Mortgage Investors Trust, Series 1998-C1-IO | | | 0.59% | # I/O | | | 11/15/2026 | | | | 579,580 | |
892,055 | | Merrill Lynch Mortgage Trust, Series 2006-C1-AJ | | | 5.43% | # | | | 05/12/2039 | | | | 893,413 | |
56,203,000 | | Merrill Lynch Mortgage Trust, Series 2007-C1-AM | | | 5.81% | # | | | 06/12/2050 | | | | 56,760,475 | |
11,401,000 | | Morgan Stanley Bank of America Merrill Lynch Trust, Series 2012-CKSV-CK | | | 4.30% | ^ | | | 10/15/2030 | | | | 10,003,110 | |
202,841,605 | | Morgan Stanley Bank of America Merrill Lynch Trust, Series 2013-C12-XA | | | 0.85% | # I/O | | | 10/15/2046 | | | | 4,968,260 | |
34,350,348 | | Morgan Stanley Bank of America Merrill Lynch Trust, Series 2013-C7-XA | | | 1.39% | # I/O | | | 02/15/2046 | | | | 1,862,438 | |
11,700,000 | | Morgan Stanley Bank of America Merrill Lynch Trust, Series 2014-C18-C | | | 4.49% | # | | | 10/15/2047 | | | | 11,453,474 | |
45,025,000 | | Morgan Stanley Bank of America Merrill Lynch Trust, Series 2014-C19-A4 | | | 3.53% | | | | 12/15/2047 | | | | 45,373,246 | |
37,950,000 | | Morgan Stanley Bank of America Merrill Lynch Trust, Series 2014-C19-C | | | 4.00% | | | | 12/15/2047 | | | | 36,476,284 | |
56,050,000 | | Morgan Stanley Bank of America Merrill Lynch Trust, Series 2015-C20-A4 | | | 3.25% | | | | 02/15/2048 | | | | 55,438,007 | |
20,087,700 | | Morgan Stanley Bank of America Merrill Lynch Trust, Series 2015-C20-B | | | 4.16% | | | | 02/15/2048 | | | | 20,314,394 | |
5,457,500 | | Morgan Stanley Bank of America Merrill Lynch Trust, Series 2015-C20-C | | | 4.46% | # | | | 02/15/2048 | | | | 5,339,009 | |
243,144,423 | | Morgan Stanley Bank of America Merrill Lynch Trust, Series 2015-C20-XA | | | 1.38% | # I/O | | | 02/15/2048 | | | | 15,751,820 | |
10,616,000 | | Morgan Stanley Bank of America Merrill Lynch Trust, Series 2015-C23-C | | | 4.13% | # | | | 07/15/2050 | | | | 10,368,547 | |
8,460,000 | | Morgan Stanley Bank of America Merrill Lynch Trust, Series 2015-C25-C | | | 4.53% | # | | | 10/15/2048 | | | | 8,606,473 | |
19,422,000 | | Morgan Stanley Bank of America Merrill Lynch Trust, Series 2015-C27-C | | | 4.53% | # | | | 12/15/2047 | | | | 18,566,999 | |
1,517,000 | | Morgan Stanley Bank of America Merrill Lynch Trust, Series 2015-C27-D | | | 3.24% | # ^ | | | 12/15/2047 | | | | 1,137,746 | |
174,788,511 | | Morgan Stanley Bank of America Merrill Lynch Trust, Series 2016-C28-XA | | | 1.28% | # I/O | | | 01/15/2049 | | | | 12,528,071 | |
2,314,000 | | Morgan Stanley Bank of America Merrill Lynch Trust, Series 2016-C31-C | | | 4.32% | # | | | 11/15/2049 | | | | 2,284,622 | |
52,743,640 | | Morgan Stanley Bank of America Merrill Lynch Trust, Series 2017-C33-XA | | | 1.45% | # I/O | | | 05/15/2050 | | | | 4,543,437 | |
12,140,000 | | Morgan Stanley Capital Trust, Series 2017-ASHF-D (1 Month LIBOR USD + 2.20%, 2.20% Floor) | | | 3.98% | ^ | | | 11/15/2034 | | | | 12,206,661 | |
17,935,000 | | Morgan Stanley Capital Trust, Series 2017-ASHF-E (1 Month LIBOR USD + 3.15%, 3.15% Floor) | | | 4.93% | ^ | | | 11/15/2034 | | | | 17,915,020 | |
13,586,000 | | Morgan Stanley Capital Trust, Series 2017-ASHF-F (1 Month LIBOR USD + 4.35%, 4.35% Floor) | | | 6.13% | ^ | | | 11/15/2034 | | | | 13,680,368 | |
37,549,099 | | Morgan Stanley Capital, Inc., Series 2006-HQ10-X1 | | | 0.18% | # ^ I/O | | | 11/12/2041 | | | | 1,468 | |
16,734,563 | | Morgan Stanley Capital, Inc., Series 2007-HQ11-AJ | | | 5.51% | # | | | 02/12/2044 | | | | 16,718,458 | |
2,575,000 | | Morgan Stanley Capital, Inc., Series 2014-CPT-E | | | 3.45% | # ^ | | | 07/13/2029 | | | | 2,534,604 | |
2,325,000 | | Morgan Stanley Capital, Inc., Series 2014-CPT-F | | | 3.45% | # ^ | | | 07/13/2029 | | | | 2,279,511 | |
12,400,000 | | Morgan Stanley Capital, Inc., Series 2014-MP-D | | | 3.69% | # ^ | | | 08/11/2033 | | | | 12,331,202 | |
11,000,000 | | Morgan Stanley Capital, Inc., Series 2014-MP-E | | | 3.69% | # ^ | | | 08/11/2033 | | | | 10,804,573 | |
27,736,750 | | Morgan Stanley Capital, Inc., Series 2015-UBS8-XA | | | 0.95% | # I/O | | | 12/15/2048 | | | | 1,539,434 | |
149,213,914 | | Morgan Stanley Capital, Inc., Series 2017-H1-XA | | | 1.46% | # I/O | | | 06/15/2050 | | | | 13,623,738 | |
3,555,940 | | Morgan Stanley Capital, Inc., Series 2017-PRME-A (1 Month LIBOR USD + 0.90%, 0.90% Floor) | | | 2.68% | ^ | | | 02/15/2034 | | | | 3,561,699 | |
11,733,000 | | Morgan Stanley Capital, Inc., Series 2017-PRME-B (1 Month LIBOR USD + 1.35%, 1.35% Floor) | | | 3.13% | ^ | | | 02/15/2034 | | | | 11,771,048 | |
5,738,000 | | Morgan Stanley Capital, Inc., Series 2017-PRME-C (1 Month LIBOR USD + 1.65%, 1.65% Floor) | | | 3.43% | ^ | | | 02/15/2034 | | | | 5,754,880 | |
1,156,000 | | Morgan Stanley Capital, Inc., Series 2017-PRME-D (1 Month LIBOR USD + 3.40%, 3.40% Floor) | | | 5.18% | ^ | | | 02/15/2034 | | | | 1,160,822 | |
3,638,400 | | Morgan Stanley Re-Remic Trust, Series 2013-AJ-AJA | | | 0.50% | ^ | | | 12/17/2049 | | | | 3,584,661 | |
2,097,560 | | PFP Ltd., Series 2017-3-A (1 Month LIBOR USD + 1.05%) | | | 2.83% | ^ | | | 01/14/2035 | | | | 2,104,089 | |
2,270,000 | | PFP Ltd., Series 2017-3-AS (1 Month LIBOR USD + 1.30%) | | | 3.08% | ^ | | | 01/14/2035 | | | | 2,287,506 | |
1,306,000 | | PFP Ltd., Series 2017-3-B (1 Month LIBOR USD + 1.75%) | | | 3.53% | ^ | | | 01/14/2035 | | | | 1,314,506 | |
1,360,000 | | PFP Ltd., Series 2017-3-C (1 Month LIBOR USD + 2.50%) | | | 4.28% | ^ | | | 01/14/2035 | | | | 1,370,182 | |
4,216,039 | | RAIT Trust, Series 2017-FL7-A (1 Month LIBOR USD + 0.95%, 0.95% Floor) | | | 2.73% | ^ | | | 06/15/2037 | | | | 4,221,011 | |
1,243,000 | | RAIT Trust, Series 2017-FL7-AS (1 Month LIBOR USD + 1.30%, 1.30% Floor) | | | 3.08% | ^ | | | 06/15/2037 | | | | 1,243,572 | |
12,447,000 | | Rosslyn Portfolio Trust, Series 2017-ROSS-A (1 Month LIBOR USD + 0.95%, 1.94% Floor) | | | 2.54% | ^ | | | 06/15/2033 | | | | 12,490,720 | |
15,724,000 | | Rosslyn Portfolio Trust, Series 2017-ROSS-B (1 Month LIBOR USD + 1.25%, 2.24% Floor) | | | 2.84% | ^ | | | 06/15/2033 | | | | 15,756,505 | |
9,336,000 | | Tharaldson Hotel Portfolio Trust, Series 2018-THL-E (1 Month LIBOR USD + 3.18%, 3.10% Floor) | | | 4.92% | ^ | | | 11/11/2034 | | | | 9,390,888 | |
2,064,697 | | TIAA Seasoned Commercial Mortgage Trust, Series 2007-C4-AJ | | | 5.48% | # | | | 08/15/2039 | | | | 2,069,292 | |
95,400,766 | | UBS Commercial Mortgage Trust, Series 2017-C1-XA | | | 1.61% | # I/O | | | 06/15/2050 | | | | 10,210,162 | |
12,893,526 | | UBS Commercial Mortgage Trust, Series 2017-C3-XA | | | 1.14% | # I/O | | | 08/15/2050 | | | | 977,818 | |
2,886,000 | | UBS Commercial Mortgage Trust, Series 2017-C6-C | | | 4.45% | # | | | 12/15/2050 | | | | 2,881,302 | |
8,530,000 | | UBS Commercial Mortgage Trust, Series 2018-C8-C | | | 4.71% | # | | | 02/15/2051 | | | | 8,508,636 | |
44,066,000 | | UBS Commercial Mortgage Trust, Series 2018-C9-XA | | | 1.07% | # I/O | | | 03/15/2051 | | | | 3,165,040 | |
83,676,983 | | UBS-Barclays Commercial Mortgage Trust, Series 2012-C3-XA | | | 1.89% | # ^ I/O | | | 08/10/2049 | | | | 5,747,638 | |
1,461,113 | | VSD LLC, Series 2017-PLT1-A1 | | | 3.60% | ^ | | | 12/25/2043 | | | | 1,459,140 | |
803,699 | | Wachovia Bank Commercial Mortgage Trust, Series 2006-C27-AJ | | | 5.83% | # | | | 07/15/2045 | | | | 806,081 | |
21,352,886 | | Wachovia Bank Commercial Mortgage Trust, Series 2006-C28-AJ | | | 5.63% | # | | | 10/15/2048 | | | | 21,601,453 | |
30,694,707 | | Wachovia Bank Commercial Mortgage Trust, Series 2007-C30-AJ | | | 5.41% | # | | | 12/15/2043 | | | | 31,012,241 | |
6,640,477 | | Wachovia Bank Commercial Mortgage Trust, Series 2007-C33-AM | | | 6.01% | # | | | 02/15/2051 | | | | 6,818,110 | |
86,858,048 | | Waterfall Commercial Mortgage Trust, Series 2015-SBC5-A | | | 4.10% | # ^ | | | 09/14/2022 | | | | 85,340,612 | |
38,265,000 | | Wells Fargo Commercial Mortgage Trust, Series 2014-LC18-A5 | | | 3.41% | | | | 12/15/2047 | | | | 38,266,416 | |
4,346,710 | | Wells Fargo Commercial Mortgage Trust, Series 2014-LC18-B | | | 3.96% | | | | 12/15/2047 | | | | 4,364,464 | |
30,000,000 | | Wells Fargo Commercial Mortgage Trust, Series 2015-C26-A4 | | | 3.17% | | | | 02/15/2048 | | | | 29,481,558 | |
11,460,000 | | Wells Fargo Commercial Mortgage Trust, Series 2015-C26-C | | | 4.07% | # | | | 02/15/2048 | | | | 11,097,590 | |
437,110,828 | | Wells Fargo Commercial Mortgage Trust, Series 2015-C26-XA | | | 1.28% | # I/O | | | 02/15/2048 | | | | 28,189,102 | |
28,000,000 | | Wells Fargo Commercial Mortgage Trust, Series 2015-C27-A5 | | | 3.45% | | | | 02/15/2048 | | | | 27,994,770 | |
5,450,000 | | Wells Fargo Commercial Mortgage Trust, Series 2015-C27-C | | | 3.89% | | | | 02/15/2048 | | | | 5,143,761 | |
252,583,991 | | Wells Fargo Commercial Mortgage Trust, Series 2015-C27-XA | | | 0.91% | # I/O | | | 02/15/2048 | | | | 12,275,026 | |
9,701,000 | | Wells Fargo Commercial Mortgage Trust, Series 2015-C31-C | | | 4.61% | # | | | 11/15/2048 | | | | 9,860,118 | |
142,630,699 | | Wells Fargo Commercial Mortgage Trust, Series 2015-C31-XA | | | 1.09% | # I/O | | | 11/15/2048 | | | | 8,655,430 | |
274,448,777 | | Wells Fargo Commercial Mortgage Trust, Series 2015-LC20-XA | | | 1.38% | # I/O | | | 04/15/2050 | | | | 17,295,131 | |
12,000,000 | | Wells Fargo Commercial Mortgage Trust, Series 2015-LC22-C | | | 4.54% | # | | | 09/15/2058 | | | | 12,071,224 | |
1,794,000 | | Wells Fargo Commercial Mortgage Trust, Series 2015-NXS4-C | | | 4.60% | # | | | 12/15/2048 | | | | 1,830,287 | |
5,405,000 | | Wells Fargo Commercial Mortgage Trust, Series 2015-P2-A4 | | | 3.81% | | | | 12/15/2048 | | | | 5,548,117 | |
130,059,343 | | Wells Fargo Commercial Mortgage Trust, Series 2015-P2-XA | | | 1.02% | # I/O | | | 12/15/2048 | | | | 7,012,787 | |
11,469,000 | | Wells Fargo Commercial Mortgage Trust, Series 2016-C32-C | | | 4.72% | # | | | 01/15/2059 | | | | 11,381,035 | |
8,676,000 | | Wells Fargo Commercial Mortgage Trust, Series 2016-C34-C | | | 5.03% | # | | | 06/15/2049 | | | | 8,931,442 | |
159,538,382 | | Wells Fargo Commercial Mortgage Trust, Series 2017-C39-XA | | | 1.15% | # I/O | | | 09/15/2050 | | | | 12,769,356 | |
50,905,560 | | Wells Fargo Commercial Mortgage Trust, Series 2017-C42-XA | | | 0.90% | # I/O | | | 12/15/2050 | | | | 3,533,299 | |
11,003,000 | | Wells Fargo Commercial Mortgage Trust, Series 2017-SMP-A (1 Month LIBOR USD + 0.75%, 0.75% Floor) | | | 2.65% | ^ | | | 12/15/2034 | | | | 11,014,481 | |
12,048,000 | | Wells Fargo Commercial Mortgage Trust, Series 2017-SMP-C (1 Month LIBOR USD + 1.20%, 1.20% Floor) | | | 3.10% | ^ | | | 12/15/2034 | | | | 12,064,213 | |
7,229,000 | | Wells Fargo Commercial Mortgage Trust, Series 2017-SMP-D (1 Month LIBOR USD + 1.65%, 1.65% Floor) | | | 3.55% | ^ | | | 12/15/2034 | | | | 7,245,593 | |
22,851,000 | | Wells Fargo Commercial Mortgage Trust, Series 2017-SMP-E (1 Month LIBOR USD + 2.25%, 2.25% Floor) | | | 4.15% | ^ | | | 12/15/2034 | | | | 22,905,884 | |
169,234,159 | | Wells Fargo Commercial Mortgage Trust, Series 2018-C43-XA | | | 0.87% | # I/O | | | 03/15/2051 | | | | 9,415,004 | |
59,968,243 | | WF-RBS Commercial Mortgage Trust, Series 2011-C4-XA | | | 0.38% | # ^ I/O | | | 06/15/2044 | | | | 630,662 | |
84,828,302 | | WF-RBS Commercial Mortgage Trust, Series 2012-C6-XA | | | 2.09% | # ^ I/O | | | 04/15/2045 | | | | 5,303,338 | |
98,907,825 | | WF-RBS Commercial Mortgage Trust, Series 2012-C8-XA | | | 1.85% | # ^ I/O | | | 08/15/2045 | | | | 6,242,637 | |
41,766,551 | | WF-RBS Commercial Mortgage Trust, Series 2012-C9-XA | | | 1.91% | # ^ I/O | | | 11/15/2045 | | | | 2,941,723 | |
159,044,364 | | WF-RBS Commercial Mortgage Trust, Series 2013-C18-XA | | | 0.83% | # I/O | | | 12/15/2046 | | | | 4,748,174 | |
175,387,033 | | WF-RBS Commercial Mortgage Trust, Series 2014-C19-XA | | | 1.12% | # I/O | | | 03/15/2047 | | | | 7,923,846 | |
55,000,000 | | WF-RBS Commercial Mortgage Trust, Series 2014-C25-A5 | | | 3.63% | | | | 11/15/2047 | | | | 55,704,270 | |
8,000,000 | | WF-RBS Commercial Mortgage Trust, Series 2014-C25-C | | | 4.32% | # | | | 11/15/2047 | | | | 7,977,081 | |
200,824,238 | | WF-RBS Commercial Mortgage Trust, Series 2014-C25-XA | | | 0.92% | # I/O | | | 11/15/2047 | | | | 8,673,016 | |
138,888,241 | | WF-RBS Commercial Mortgage Trust, Series 2016-NXS6-XA | | | 1.65% | # I/O | | | 11/15/2049 | | | | 12,942,523 | |
| | | | | | | | | | | | | | |
Total Non-Agency Commercial Mortgage Backed Obligations (Cost $3,767,805,367) | | | | | | | | 3,560,852,043 | |
| | | | | | | | | | | | | | |
| | | |
Non-Agency Residential Collateralized Mortgage Obligations - 25.9% | | | | | | | | | | | | |
10,000,000 | | Accredited Mortgage Loan Trust, Series 2005-4-M1 (1 Month LIBOR USD + 0.40%, 0.40% Floor) | | | 2.27% | | | | 12/25/2035 | | | | 9,785,916 | |
94,843,354 | | Accredited Mortgage Loan Trust, Series 2006-2-A4 (1 Month LIBOR USD + 0.26%, 0.26% Floor) | | | 2.13% | | | | 09/25/2036 | | | | 92,614,099 | |
14,706,925 | | ACE Securities Corporation Home Equity Loan Trust, Series 2007-HE1-A2B
(1 Month LIBOR USD + 0.12%, 0.12% Floor) | | | 1.99% | | | | 01/25/2037 | | | | 10,884,116 | |
3,962,713 | | Adjustable Rate Mortgage Trust, Series 2005-10-3A31 | | | 3.46% | # | | | 01/25/2036 | | | | 3,826,068 | |
40,804,197 | | Adjustable Rate Mortgage Trust, Series 2005-11-4A1 | | | 3.42% | # | | | 02/25/2036 | | | | 34,767,506 | |
5,749,103 | | Adjustable Rate Mortgage Trust, Series 2005-2-6M2 (1 Month LIBOR USD + 0.98%, 0.48% Floor, 11.00% Cap) | | | 2.85% | | | | 06/25/2035 | | | | 5,601,149 | |
2,049,361 | | Adjustable Rate Mortgage Trust, Series 2005-7-3A1 | | | 3.67% | # | | | 10/25/2035 | | | | 1,833,609 | |
22,762,023 | | Adjustable Rate Mortgage Trust, Series 2006-1-2A1 | | | 3.87% | # | | | 03/25/2036 | | | | 19,097,046 | |
16,932,791 | | Adjustable Rate Mortgage Trust, Series 2006-2-3A1 | | | 3.79% | # | | | 05/25/2036 | | | | 15,792,739 | |
17,828,685 | | Adjustable Rate Mortgage Trust, Series 2006-2-5A1 | | | 4.52% | # | | | 05/25/2036 | | | | 12,376,174 | |
18,090,944 | | Adjustable Rate Mortgage Trust, Series 2007-1-3A1 | | | 3.91% | # | | | 03/25/2037 | | | | 16,518,421 | |
3,062,811 | | Adjustable Rate Mortgage Trust, Series 2007-3-1A1 | | | 4.53% | # ^ | | | 11/25/2037 | | | | 3,157,446 | |
290,098 | | Aegis Asset Backed Securities Trust, Series 2003-2-M2 (1 Month LIBOR USD + 2.55%, 1.70% Floor) | | | 4.42% | | | | 11/25/2033 | | | | 288,286 | |
1,532,585 | | Aegis Asset Backed Securities Trust, Series 2004-1-M2 (1 Month LIBOR USD + 2.03%, 1.35% Floor) | | | 3.90% | | | | 04/25/2034 | | | | 1,472,419 | |
617,792 | | Aegis Asset Backed Securities Trust, Series 2004-2-M2 (1 Month LIBOR USD + 1.95%, 1.30% Floor) | | | 3.82% | | | | 06/25/2034 | | | | 598,318 | |
14,302,148 | | Aegis Asset Backed Securities Trust, Series 2004-6-M2 (1 Month LIBOR USD + 1.00%, 1.00% Floor, 15.00% Cap) | | | 2.87% | | | | 03/25/2035 | | | | 13,393,883 | |
53,012,034 | | Agate Bay Mortgage Trust, Series 2015-6-A3 | | | 3.50% | # ^ | | | 09/25/2045 | | | | 52,389,752 | |
78,209,758 | | Ajax Master Trust, Series 2016-1-PC | | | 0.00% | # ^ ¥ | | | 01/01/2057 | | | | 70,498,706 | |
85,218,658 | | Ajax Master Trust, Series 2016-2-PC | | | 0.00% | # ^ ¥ | | | 10/25/2056 | | | | 68,296,465 | |
99,296,345 | | Ajax Master Trust, Series 2017-1-PC | | | 0.00% | # ^ | | | 06/25/2057 | | | | 88,554,308 | |
48,269,372 | | Ajax Mortgage Loan Trust, Series 2016-A-A | | | 4.25% | ^ § | | | 08/25/2064 | | | | 48,855,222 | |
10,251,943 | | Ajax Mortgage Loan Trust, Series 2016-C-A | | | 4.00% | ^ § | | | 10/25/2057 | | | | 10,307,959 | |
70,471,483 | | Ajax Mortgage Loan Trust, Series 2017-C-A | | | 3.75% | ^ § | | | 07/25/2060 | | | | 69,632,752 | |
11,626,008 | | Alternative Loan Trust, Series 2007-15CB-A5 | | | 5.75% | | | | 07/25/2037 | | | | 10,432,755 | |
66,962,161 | | Alternative Loan Trust, Series 2005-55CB-1A1 | | | 5.50% | | | | 11/25/2035 | | | | 65,517,298 | |
17,222,076 | | Alternative Loan Trust, Series 2006-13T1-A1 | | | 6.00% | | | | 05/25/2036 | | | | 13,905,246 | |
12,807,117 | | Alternative Loan Trust, Series 2006-41CB-1A15 (-1 x 1 Month LIBOR USD + 5.40%, 5.40% Cap) | | | 3.53% | I/F I/O | | | 01/25/2037 | | | | 1,679,463 | |
12,807,117 | | Alternative Loan Trust, Series 2006-41CB-1A2 (1 Month LIBOR USD + 0.60%, 0.60% Floor, 6.00% Cap) | | | 2.47% | | | | 01/25/2037 | | | | 8,822,436 | |
8,193,304 | | Alternative Loan Trust, Series 2007-15CB-A2 | | | 5.75% | | | | 07/25/2037 | | | | 7,352,372 | |
25,933,845 | | Alternative Loan Trust, Series 2007-5CB-1A31 | | | 5.50% | | | | 04/25/2037 | | | | 21,658,827 | |
8,662,350 | | Alternative Loan Trust, Series 2007-5CB-2A1 | | | 6.00% | | | | 04/25/2037 | | | | 6,915,532 | |
8,351,612 | | Alternative Loan Trust, Series 2007-6-A1 | | | 5.75% | | | | 04/25/2047 | | | | 7,242,584 | |
76,654,003 | | Alternative Loan Trust, Series 2007-HY4-4A1 | | | 3.49% | # | | | 06/25/2047 | | | | 71,310,468 | |
106,950,733 | | Alternative Loan Trust, Series 2007-HY9-A2 (1 Month LIBOR USD + 0.27%, 0.27% Floor) | | | 2.14% | | | | 08/25/2047 | | | | 93,534,020 | |
1,127,989 | | American Home Mortgage Investment Trust, Series 2005-1-7A2 (6 Month LIBOR USD + 2.00%, 2.00% Floor, 11.00% Cap) | | | 4.17% | | | | 06/25/2045 | | | | 1,137,845 | |
7,328,897 | | American Home Mortgage Investment Trust, Series 2005-4-3A1 (1 Month LIBOR USD + 0.30%, 0.30% Floor, 11.00% Cap) | | | 2.17% | | | | 11/25/2045 | | | | 6,661,655 | |
27,878,741 | | American Home Mortgage Investment Trust, Series 2005-4-5A (6 Month LIBOR USD + 1.75%, 1.75% Floor, 11.00% Cap) | | | 3.96% | | | | 11/25/2045 | | | | 22,026,589 | |
2,271,087 | | American Home Mortgage Investment Trust, Series 2006-2-3A4 | | | 6.60% | | | | 06/25/2036 | | | | 922,176 | |
7,984,881 | | American Home Mortgage Investment Trust, Series 2007-A-13A1 | | | 6.60% | ^ | | | 01/25/2037 | | | | 3,822,589 | |
6,862,903 | | Ameriquest Mortgage Securities, Inc., Series 2004-FR1-M1 | | | 4.54% | ß | | | 05/25/2034 | | | | 6,979,938 | |
16,500,000 | | Ameriquest Mortgage Securities, Inc., Series 2004-R8-M2 (1 Month LIBOR USD + 1.02%, 0.68% Floor) | | | 2.89% | | | | 09/25/2034 | | | | 16,428,332 | |
10,604,451 | | Amortizing Residential Collateral Trust, Series 2002-BC7-M1 (1 Month LIBOR USD + 1.20%, 0.80% Floor) | | | 3.07% | | | | 10/25/2032 | | | | 9,193,283 | |
36,000,000 | | Angel Oak Mortgage Trust, Series 2018-1-A | | | 3.26% | # ^ | | | 04/25/2048 | | | | 36,000,000 | |
143,341 | | Argent Securities, Inc., Series 2004-W6-M1 (1 Month LIBOR USD + 0.83%, 0.55% Floor) | | | 2.70% | | | | 05/25/2034 | | | | 143,317 | |
2,699,629 | | Asset Backed Securities Corporation Home Equity Loan Trust, Series 2003-HE6-M1 (1 Month LIBOR USD + 0.98%, 0.65% Floor) | | | 2.85% | | | | 11/25/2033 | | | | 2,674,003 | |
692,908 | | Asset Backed Securities Corporation Home Equity Loan Trust, Series 2004-HE3-M2 (1 Month LIBOR USD + 1.68%, 1.12% Floor) | | | 3.55% | | | | 06/25/2034 | | | | 676,947 | |
34,576,440 | | Asset Backed Securities Corporation Home Equity Loan Trust, Series 2006-HE7-A1 (1 Month LIBOR USD + 0.14%, 0.14% Floor) | | | 2.01% | | | | 11/25/2036 | | | | 31,329,242 | |
14,661,376 | | Banc of America Alternative Loan Trust, Series 2005-10-2CB1 | | | 6.00% | | | | 11/25/2035 | | | | 14,885,173 | |
2,021,484 | | Banc of America Alternative Loan Trust, Series 2005-10-4A1 | | | 5.75% | | | | 11/25/2035 | | | | 1,937,815 | |
7,604,057 | | Banc of America Alternative Loan Trust, Series 2005-11-2CB1 | | | 6.00% | | | | 12/25/2035 | | | | 7,616,344 | |
2,781,470 | | Banc of America Alternative Loan Trust, Series 2005-5-2CB1 | | | 6.00% | | | | 06/25/2035 | | | | 2,735,577 | |
4,185,393 | | Banc of America Alternative Loan Trust, Series 2005-6-2CB2 | | | 6.00% | | | | 07/25/2035 | | | | 4,185,747 | |
2,623,657 | | Banc of America Alternative Loan Trust, Series 2005-6-4CB1 | | | 6.50% | | | | 07/25/2035 | | | | 2,538,009 | |
1,667,799 | | Banc of America Alternative Loan Trust, Series 2005-8-2CB1 | | | 6.00% | | | | 09/25/2035 | | | | 1,676,094 | |
7,991,942 | | Banc of America Alternative Loan Trust, Series 2006-1-3CB1 | | | 6.50% | | | | 02/25/2036 | | | | 8,011,239 | |
4,278,768 | | Banc of America Alternative Loan Trust, Series 2006-2-1CB1 | | | 6.00% | | | | 03/25/2036 | | | | 4,231,571 | |
5,262,605 | | Banc of America Alternative Loan Trust, Series 2006-2-3CB1 | | | 6.50% | | | | 03/25/2036 | | | | 4,725,069 | |
4,382,797 | | Banc of America Alternative Loan Trust, Series 2006-3-4CB1 | | | 6.50% | | | | 04/25/2036 | | | | 4,060,322 | |
1,302,877 | | Banc of America Alternative Loan Trust, Series 2006-5-CB14 (1 Month LIBOR USD + 1.10%, 6.00% Floor, 6.00% Cap) | | | 6.00% | | | | 06/25/2046 | | | | 1,209,492 | |
2,885,216 | | Banc of America Alternative Loan Trust, Series 2006-6-CB3 | | | 6.00% | | | | 07/25/2046 | | | | 2,604,287 | |
12,856,723 | | Banc of America Alternative Loan Trust, Series 2006-7-A4 | | | 6.00% | ß | | | 10/25/2036 | | | | 7,882,978 | |
4,062,273 | | Banc of America Alternative Loan Trust, Series 2006-8-1A1 (-1 x 1 Month LIBOR USD + 6.50%, 6.50% Cap) | | | 4.63% | I/F I/O | | | 11/25/2036 | | | | 546,557 | |
1,447,770 | | Banc of America Alternative Loan Trust, Series 2006-8-1A2 (1 Month LIBOR USD + 0.45%, 0.45% Floor, 7.00% Cap) | | | 2.32% | | | | 11/25/2036 | | | | 1,213,120 | |
6,858,149 | | Banc of America Alternative Loan Trust, Series 2006-9-1CB1 | | | 6.00% | | | | 01/25/2037 | | | | 6,201,085 | |
966,735 | | Banc of America Alternative Loan Trust, Series 2007-2-2A1 | | | 6.00% | | | | 06/25/2037 | | | | 898,495 | |
7,139,936 | | Banc of America Funding Corporation, Series 2006-2-3A1 | | | 6.00% | | | | 03/25/2036 | | | | 7,192,234 | |
232,785 | | Banc of America Funding Corporation, Series 2006-2-4A1 (-3 x 1 Month LIBOR USD + 22.80%) | | | 17.19% | I/F | | | 03/25/2036 | | | | 297,403 | |
894,277 | | Banc of America Funding Corporation, Series 2006-2-6A2 | | | 5.50% | | | | 03/25/2036 | | | | 882,965 | |
4,491,779 | | Banc of America Funding Corporation, Series 2006-3-1A1 | | | 6.00% | | | | 03/25/2036 | | | | 4,330,041 | |
712,376 | | Banc of America Funding Corporation, Series 2006-3-6A1 | | | 6.21% | # | | | 03/25/2036 | | | | 720,427 | |
5,598,573 | | Banc of America Funding Corporation, Series 2006-6-1A7 | | | 6.25% | | | | 08/25/2036 | | | | 5,437,749 | |
1,688,248 | | Banc of America Funding Corporation, Series 2006-7-T2A5 | | | 6.04% | ß | | | 10/25/2036 | | | | 1,572,690 | |
7,957,223 | | Banc of America Funding Corporation, Series 2006-7-T2A8 | | | 5.91% | ß | | | 10/25/2036 | | | | 7,405,250 | |
1,668,595 | | Banc of America Funding Corporation, Series 2006-8T2-A8 | | | 6.10% | ß | | | 10/25/2036 | | | | 1,541,021 | |
704,260 | | Banc of America Funding Corporation, Series 2006-B-7A1 | | | 3.78% | # | | | 03/20/2036 | | | | 663,638 | |
9,884,087 | | Banc of America Funding Corporation, Series 2006-D-6A1 | | | 3.50% | # | | | 05/20/2036 | | | | 9,160,116 | |
605,694 | | Banc of America Funding Corporation, Series 2006-G-2A1 (1 Month LIBOR USD + 0.22%, 0.22% Floor, 10.50% Cap) | | | 2.04% | | | | 07/20/2036 | | | | 607,742 | |
352,319 | | Banc of America Funding Corporation, Series 2006-H-3A1 | | | 3.52% | # | | | 09/20/2046 | | | | 327,714 | |
1,129,619 | | Banc of America Funding Corporation, Series 2007-1-TA10 | | | 5.84% | ß | | | 01/25/2037 | | | | 1,049,067 | |
1,623,125 | | Banc of America Funding Corporation, Series 2007-3-TA1B | | | 5.83% | # | | | 04/25/2037 | | | | 1,518,142 | |
2,539,611 | | Banc of America Funding Corporation, Series 2007-5-1A1 | | | 5.50% | | | | 07/25/2037 | | | | 2,249,059 | |
2,731,765 | | Banc of America Funding Corporation, Series 2009-R14A-3A (-2 x 1 Month LIBOR USD + 16.57%, 5.50% Floor, 16.57% Cap) | | | 12.47% | ^ I/F | | | 06/26/2035 | | | | 2,981,599 | |
4,278,623 | | Banc of America Funding Corporation, Series 2009-R15A-4A2 | | | 5.75% | # ^ | | | 12/26/2036 | | | | 4,286,802 | |
1,564,599 | | Banc of America Funding Corporation, Series 2010-R1-3A (-2 x 1 Month LIBOR USD + 14.28%, 6.00% Floor, 14.28% Cap) | | | 11.77% | ^ I/F | | | 07/26/2036 | | | | 1,679,975 | |
567,784 | | Banc of America Mortgage Securities, Inc., Series 2004-K-4A1 | | | 3.39% | # | | | 12/25/2034 | | | | 571,334 | |
3,367,202 | | Banc of America Mortgage Securities, Inc., Series 2006-1-A9 | | | 6.00% | | | | 05/25/2036 | | | | 3,118,274 | |
386,718 | | Banc of America Mortgage Securities, Inc., Series 2007-1-2A5 | | | 5.75% | | | | 01/25/2037 | | | | 362,345 | |
19,760,966 | | BankUnited Trust, Series 2005-1-2A1 | | | 3.63% | # | | | 09/25/2045 | | | | 18,324,260 | |
9,226,242 | | Bayview Opportunity Master Fund Trust, Series 2017-RN2-A1 | | | 3.47% | # ^ | | | 04/28/2032 | | | | 9,236,131 | |
89,000,000 | | Bayview Opportunity Master Fund Trust, Series 2018-RN2-A1 | | | 3.60% | ^ § | | | 02/25/2033 | | | | 89,074,920 | |
65,000,000 | | Bayview Opportunity Master Fund Trust, Series 2018-RN4-A1 | | | 3.62% | ^ § | | | 03/28/2033 | | | | 65,000,000 | |
45,961,080 | | Bayview Opportunity Master Fund Trust, Series 2018-SBR1-A1 | | | 3.72% | ^ § | | | 02/28/2033 | | | | 46,000,331 | |
3,327,708 | | BCAP LLC Trust, Series 2007-AA2-2A7 | | | 6.00% | | | | 04/25/2037 | | | | 2,871,608 | |
3,602,692 | | BCAP LLC Trust, Series 2007-AA2-2A8 | | | 5.75% | | | | 04/25/2037 | | | | 3,061,297 | |
11,387,095 | | BCAP LLC Trust, Series 2008-RR3-A1B | | | 6.66% | # ^ | | | 10/25/2036 | | | | 7,266,365 | |
3,663,532 | | BCAP LLC Trust, Series 2009-RR13-18A2 | | | 5.75% | # ^ | | | 07/26/2037 | | | | 3,251,578 | |
9,143,223 | | BCAP LLC Trust, Series 2009-RR1-3A3 | | | 6.00% | # ^ Þ | | | 08/26/2037 | | | | 9,343,775 | |
5,159,257 | | BCAP LLC Trust, Series 2009-RR4-4A2 | | | 5.75% | # ^ | | | 02/26/2036 | | | | 3,895,335 | |
3,674,601 | | BCAP LLC Trust, Series 2010-RR10-5A1 | | | 7.00% | # ^ | | | 04/27/2037 | | | | 3,935,663 | |
4,255,873 | | BCAP LLC Trust, Series 2010-RR12-3A15 | | | 6.00% | # ^ | | | 08/26/2037 | | | | 4,319,863 | |
1,139,342 | | BCAP LLC Trust, Series 2010-RR5-2A3 | | | 6.10% | # ^ | | | 04/26/2037 | | | | 1,150,900 | |
6,202,985 | | Bear Stearns Adjustable Rate Mortgage Trust, Series 2005-12-13A1 | | | 3.97% | # | | | 02/25/2036 | | | | 6,072,967 | |
6,672,597 | | Bear Stearns Adjustable Rate Mortgage Trust, Series 2006-4-4A1 | | | 3.66% | # | | | 10/25/2046 | | | | 6,241,513 | |
8,549,342 | | Bear Stearns Adjustable Rate Mortgage Trust, Series 2007-1-2A1 | | | 3.84% | # | | | 02/25/2047 | | | | 8,139,450 | |
3,822,989 | | Bear Stearns Adjustable Rate Mortgage Trust, Series 2007-1-3A1 | | | 3.66% | # | | | 02/25/2047 | | | | 3,375,337 | |
2,912,770 | | Bear Stearns Alt-A Trust, Series 2004-11-2A3 | | | 3.63% | # | | | 11/25/2034 | | | | 2,903,145 | |
10,497,623 | | Bear Stearns Alt-A Trust, Series 2006-1-11A1 (1 Month LIBOR USD + 0.48%, 0.24% Floor, 11.50% Cap) | | | 2.35% | | | | 02/25/2036 | | | | 10,044,550 | |
24,859,070 | | Bear Stearns Alt-A Trust, Series 2006-3-21A1 | | | 3.42% | # | | | 05/25/2036 | | | | 20,379,958 | |
10,087,528 | | Bear Stearns Alt-A Trust, Series 2006-5-1A1 (1 Month LIBOR USD + 0.34%, 0.17% Floor, 11.50% Cap) | | | 2.21% | | | | 08/25/2036 | | | | 9,862,616 | |
12,030,445 | | Bear Stearns Alt-A Trust, Series 2006-6-2A1 | | | 3.47% | # | | | 11/25/2036 | | | | 10,986,893 | |
6,702,245 | | Bear Stearns Alt-A Trust, Series 2006-8-2A1 | | | 3.43% | # | | | 08/25/2046 | | | | 6,324,620 | |
38,386,280 | | Bear Stearns Alt-A Trust, Series 2007-2-2A1 (12 Month LIBOR USD + 1.88%, 1.88% Floor, 11.15% Cap) | | | 3.66% | | | | 12/25/2046 | | | | 38,799,677 | |
6,730,646 | | Bear Stearns Asset Backed Securities Trust, Series 2004-AC4-A2 | | | 6.00% | | | | 08/25/2034 | | | | 6,901,363 | |
18,945,366 | | Bear Stearns Asset Backed Securities Trust, Series 2005-AC2-1A | | | 5.75% | | | | 04/25/2035 | | | | 18,751,174 | |
5,198,433 | | Bear Stearns Asset Backed Securities Trust, Series 2005-AC2-2A1 | | | 5.75% | | | | 04/25/2035 | | | | 5,299,026 | |
67,246,192 | | Bear Stearns Asset Backed Securities Trust, Series 2005-AC6-22A | | | 5.52% | # | | | 09/25/2035 | | | | 64,905,984 | |
10,474,173 | | Bear Stearns Asset Backed Securities Trust, Series 2005-AC7-A4 | | | 6.00% | | | | 10/25/2035 | | | | 10,177,400 | |
13,301,635 | | Bear Stearns Asset Backed Securities Trust, Series 2006-AC1-1A1 | | | 6.25% | | | | 02/25/2036 | | | | 10,590,006 | |
7,328,724 | | Bear Stearns Asset Backed Securities Trust, Series 2006-AC5-A1 | | | 6.25% | ß | | | 12/25/2036 | | | | 7,361,812 | |
19,605,685 | | Bear Stearns Asset Backed Securities Trust, Series 2007-HE2-2A3 (1 Month LIBOR USD + 0.16%, 0.16% Floor) | | | 2.03% | | | | 02/25/2037 | | | | 19,340,114 | |
22,141,091 | | Bear Stearns Asset Backed Securities Trust, Series 2007-HE6-2A (1 Month LIBOR USD + 1.05%, 1.05% Floor) | | | 2.92% | | | | 08/25/2037 | | | | 20,439,332 | |
1,807,044 | | Bear Stearns Asset Backed Securities Trust, Series 2007-SD1-1A2A | | | 6.00% | | | | 10/25/2036 | | | | 1,461,310 | |
1,431,832 | | Bear Stearns Asset Backed Securities Trust, Series 2007-SD1-1A3A | | | 6.50% | | | | 10/25/2036 | | | | 1,126,842 | |
3,181,498 | | Bear Stearns Asset Backed Securities Trust, Series 2007-SD1-23A1 | | | 3.78% | # | | | 10/25/2036 | | | | 3,026,711 | |
18,792,987 | | Bear Stearns Mortgage Funding Trust, Series 2006-AR3-2A1 (1 Month LIBOR USD + 0.20%, 0.20% Floor, 10.50% Cap) | | | 2.07% | | | | 11/25/2036 | | | | 18,846,739 | |
17,548,990 | | Bear Stearns Mortgage Funding Trust, Series 2007-AR3-22A1 (1 Month LIBOR USD + 0.16%, 0.16% Floor, 10.50% Cap) | | | 2.03% | | | | 04/25/2037 | | | | 18,960,242 | |
31,231,043 | | BNC Mortgage Loan Trust, Series 2006-2-A4 (1 Month LIBOR USD + 0.16%, 0.16% Floor) | | | 2.03% | | | | 11/25/2036 | | | | 30,106,426 | |
18,500,000 | | BNC Mortgage Loan Trust, Series 2007-1-A4 (1 Month LIBOR USD + 0.16%, 0.16% Floor) | | | 2.03% | | | | 03/25/2037 | | | | 17,889,816 | |
7,044,056 | | CAM Mortgage Trust, Series 2016-2-A1 | | | 3.25% | ^ § | | | 06/15/2057 | | | | 7,114,489 | |
30,594,417 | | Carrington Mortgage Loan Trust, Series 2007-RFC1-A3 (1 Month LIBOR USD + 0.14%, 0.14% Floor, 14.50% Cap) | | | 2.01% | | | | 12/25/2036 | | | | 27,453,628 | |
2,750,000 | | Centex Home Equity, Series 2004-A-AF5 | | | 5.43% | | | | 01/25/2034 | | | | 2,812,460 | |
1,364,874 | | Chase Funding Mortgage Loan Asset-Backed Certificates, Series 2003-4-2M1 (1 Month LIBOR USD + 0.90%, 0.60% Floor) | | | 2.77% | | | | 03/25/2033 | | | | 1,325,106 | |
7,781,760 | | Chase Mortgage Finance Trust, Series 2005-A1-2A4 | | | 3.48% | # | | | 12/25/2035 | | | | 7,721,915 | |
12,482,415 | | Chase Mortgage Finance Trust, Series 2006-S2-1A9 | | | 6.25% | | | | 10/25/2036 | | | | 10,493,625 | |
7,548,570 | | Chase Mortgage Finance Trust, Series 2006-S3-1A2 | | | 6.00% | | | | 11/25/2036 | | | | 6,254,162 | |
19,735,204 | | Chase Mortgage Finance Trust, Series 2006-S4-A8 | | | 6.00% | | | | 12/25/2036 | | | | 16,665,008 | |
7,178,359 | | Chase Mortgage Finance Trust, Series 2007-A2-6A4 | | | 3.56% | # | | | 07/25/2037 | | | | 6,965,469 | |
3,687,977 | | Chase Mortgage Finance Trust, Series 2007-S3-1A5 | | | 6.00% | | | | 05/25/2037 | | | | 2,952,372 | |
1,888,666 | | Chase Mortgage Finance Trust, Series 2007-S3-2A1 | | | 5.50% | | | | 05/25/2037 | | | | 1,529,615 | |
3,739,431 | | Chase Mortgage Finance Trust, Series 2007-S5-1A18 | | | 6.00% | | | | 07/25/2037 | | | | 3,366,961 | |
5,962,324 | | ChaseFlex Trust, Series 2005-1-3A1 | | | 6.00% | | | | 02/25/2035 | | | | 6,036,259 | |
1,146,622 | | ChaseFlex Trust, Series 2006-1-A5 | | | 6.16% | # | | | 06/25/2036 | | | | 1,158,825 | |
5,372,645 | | ChaseFlex Trust, Series 2006-2-A2B (1 Month LIBOR USD + 0.20%, 0.20% Floor, 11.50% Cap) | | | 2.07% | | | | 09/25/2036 | | | | 4,881,470 | |
4,670,443 | | ChaseFlex Trust, Series 2007-1-1A1 | | | 6.50% | | | | 02/25/2037 | | | | 3,603,385 | |
11,445,299 | | ChaseFlex Trust, Series 2007-M1-2F4 | | | 4.37% | ß | | | 08/25/2037 | | | | 11,030,694 | |
11,904,129 | | ChaseFlex Trust, Series 2007-M1-2F5 | | | 4.37% | ß | | | 08/25/2037 | | | | 11,472,093 | |
27,431,724 | | CHL Mortgage Pass-Through Trust, Series 2005-17-2A1 | | | 5.50% | | | | 09/25/2035 | | | | 24,656,912 | |
58,751,533 | | CHL Mortgage Pass-Through Trust, Series 2007-21-1A1 | | | 6.25% | | | | 02/25/2038 | | | | 49,913,423 | |
18,498,998 | | CHL Mortgage Pass-Through Trust, Series 2007-HYB1-2A1 | | | 3.19% | # | | | 03/25/2037 | | | | 17,081,716 | |
65,959,595 | | CIM Trust, Series 2016-1RR-B2 | | | 8.29% | # ^ Þ | | | 07/26/2055 | | | | 64,992,007 | |
75,440,246 | | CIM Trust, Series 2016-2RR-B2 | | | 8.15% | # ^ Þ | | | 02/25/2056 | | | | 73,262,437 | |
23,965,531 | | CIM Trust, Series 2016-3RR-B2 (1 Month LIBOR USD + 2.50%) | | | 4.16% | ^ | | | 02/25/2056 | | | | 24,780,999 | |
73,074,681 | | CIM Trust, Series 2016-3RR-B2 | | | 8.33% | # ^ Þ | | | 02/27/2056 | | | | 70,549,922 | |
50,188,672 | | CIM Trust, Series 2017-3RR-B2 | | | 12.40% | # ^ Þ | | | 01/29/2057 | | | | 54,511,196 | |
199,571,252 | | CIM Trust, Series 2017-6-A1 | | | 3.02% | # ^ | | | 06/25/2057 | | | | 196,576,346 | |
170,549,654 | | CIM Trust, Series 2017-8-A1 | | | 3.00% | # ^ | | | 12/25/2065 | | | | 170,383,316 | |
6,954,554 | | Citicorp Mortgage Securities, Inc., Series 2005-1-1A4 | | | 5.50% | | | | 02/25/2035 | | | | 7,096,168 | |
1,574,683 | | Citicorp Mortgage Securities, Inc., Series 2006-7-1A1 | | | 6.00% | | | | 12/25/2036 | | | | 1,421,476 | |
6,594,000 | | Citicorp Residential Mortgage Securities, Inc., Series 2006-2-A5 | | | 5.52% | ß | | | 09/25/2036 | | | | 6,849,860 | |
21,740,689 | | Citicorp Residential Mortgage Securities, Inc., Series 2007-1-A4 | | | 5.48% | ß | | | 03/25/2037 | | | | 22,564,539 | |
13,549,592 | | Citigroup Mortgage Loan Trust, Series 2006-AR3-1A1A | | | 3.50% | # | | | 06/25/2036 | | | | 13,547,333 | |
2,425,807 | | Citigroup Mortgage Loan Trust, Inc., Series 2005-5-2A2 | | | 5.75% | | | | 08/25/2035 | | | | 1,984,980 | |
1,230,928 | | Citigroup Mortgage Loan Trust, Inc., Series 2005-9-21A1 | | | 5.50% | | | | 11/25/2035 | | | | 1,180,437 | |
3,522,871 | | Citigroup Mortgage Loan Trust, Inc., Series 2006-4-2A1A | | | 6.00% | | | | 12/25/2035 | | | | 3,534,951 | |
43,753,652 | | Citigroup Mortgage Loan Trust, Inc., Series 2006-AMC1-A1 (1 Month LIBOR USD + 0.15%, 0.15% Floor) | | | 2.02% | ^ | | | 09/25/2036 | | | | 42,293,702 | |
3,798,875 | | Citigroup Mortgage Loan Trust, Inc., Series 2006-FX1-A6 | | | 5.85% | ß | | | 10/25/2036 | | | | 3,069,939 | |
2,087,488 | | Citigroup Mortgage Loan Trust, Inc., Series 2006-WF1-A2D | | | 4.98% | ß | | | 03/25/2036 | | | | 1,526,630 | |
12,849,590 | | Citigroup Mortgage Loan Trust, Inc., Series 2006-WF2-A2D | | | 6.16% | ß | | | 05/25/2036 | | | | 7,770,617 | |
7,580,000 | | Citigroup Mortgage Loan Trust, Inc., Series 2006-WFH3-M1 (1 Month LIBOR USD + 0.29%, 0.29% Floor) | | | 2.16% | | | | 10/25/2036 | | | | 7,564,263 | |
5,331,657 | | Citigroup Mortgage Loan Trust, Inc., Series 2007-10-1A1A | | | 5.53% | # | | | 04/25/2037 | | | | 5,363,766 | |
865,568 | | Citigroup Mortgage Loan Trust, Inc., Series 2007-12-2A1 | | | 6.50% | ^ | | | 10/25/2036 | | | | 703,998 | |
259,103 | | Citigroup Mortgage Loan Trust, Inc., Series 2007-2-2A | | | 6.00% | | | | 11/25/2036 | | | | 265,104 | |
26,256,716 | | Citigroup Mortgage Loan Trust, Inc., Series 2007-9-1A1 | | | 5.75% | ^ | | | 04/25/2047 | | | | 22,162,969 | |
1,374,927 | | Citigroup Mortgage Loan Trust, Inc., Series 2007-9-2A2 | | | 6.50% | # ^ | | | 05/25/2037 | | | | 1,339,854 | |
89,141,521 | | Citigroup Mortgage Loan Trust, Inc., Series 2007-AMC2-A1 (1 Month LIBOR USD + 0.14%, 0.14% Floor) | | | 2.01% | ^ | | | 01/25/2037 | | | | 80,042,801 | |
4,179,247 | | Citigroup Mortgage Loan Trust, Inc., Series 2007-AR5-1A3A | | | 4.10% | # | | | 04/25/2037 | | | | 3,970,129 | |
5,338,200 | | Citigroup Mortgage Loan Trust, Inc., Series 2007-OPX1-A3A | | | 5.97% | ß | | | 01/25/2037 | | | | 3,796,356 | |
11,767,313 | | Citigroup Mortgage Loan Trust, Inc., Series 2007-OPX1-A5A | | | 5.76% | ß | | | 01/25/2037 | | | | 8,370,439 | |
5,150,934 | | Citigroup Mortgage Loan Trust, Inc., Series 2007-WFH3-A2 (1 Month LIBOR USD + 0.16%, 0.16% Floor) | | | 2.03% | | | | 06/25/2037 | | | | 5,161,198 | |
12,334,972 | | Citigroup Mortgage Loan Trust, Inc., Series 2008-AR4-1A1B | | | 3.76% | # ^ | | | 11/25/2038 | | | | 12,416,024 | |
8,198,593 | | Citigroup Mortgage Loan Trust, Inc., Series 2010-7-9A4 | | | 6.00% | # ^ | | | 10/25/2037 | | | | 7,639,241 | |
121,589,163 | | Citigroup Mortgage Loan Trust, Inc., Series 2010-8-5A4 | | | 6.00% | # ^ | | | 11/25/2036 | | | | 121,315,672 | |
98,589,822 | | Citigroup Mortgage Loan Trust, Inc., Series 2010-8-6A4 | | | 6.00% | # ^ | | | 12/25/2036 | | | | 97,716,632 | |
70,713,295 | | Citigroup Mortgage Loan Trust, Inc., Series 2010-8-7A4 | | | 6.00% | # ^ | | | 06/25/2037 | | | | 71,235,866 | |
30,492,316 | | Citigroup Mortgage Loan Trust, Inc., Series 2014-J2-A1 | | | 3.50% | # ^ | | | 11/25/2044 | | | | 30,344,611 | |
4,515,451 | | CitiMortgage Alternative Loan Trust, Series 2006-A2-A2 | | | 6.00% | | | | 05/25/2036 | | | | 4,322,265 | |
4,485,383 | | CitiMortgage Alternative Loan Trust, Series 2006-A3-1A13 | | | 6.00% | | | | 07/25/2036 | | | | 4,353,074 | |
3,149,681 | | CitiMortgage Alternative Loan Trust, Series 2006-A4-1A8 | | | 6.00% | | | | 09/25/2036 | | | | 3,051,068 | |
1,010,940 | | CitiMortgage Alternative Loan Trust, Series 2006-A5-2A1 | | | 5.50% | | | | 10/25/2021 | | | | 1,040,438 | |
3,256,197 | | CitiMortgage Alternative Loan Trust, Series 2006-A5-3A3 | | | 6.00% | | | | 10/25/2036 | | | | 3,061,989 | |
5,248,078 | | CitiMortgage Alternative Loan Trust, Series 2007-A1-1A5 | | | 6.00% | | | | 01/25/2037 | | | | 4,940,774 | |
2,558,785 | | CitiMortgage Alternative Loan Trust, Series 2007-A1-1A7 | | | 6.00% | | | | 01/25/2037 | | | | 2,408,954 | |
6,546,981 | | CitiMortgage Alternative Loan Trust, Series 2007-A1-1A9 (-1 x 1 Month LIBOR USD + 5.40%, 5.40% Cap) | | | 3.53% | I/F I/O | | | 01/25/2037 | | | | 641,735 | |
5,454,046 | | CitiMortgage Alternative Loan Trust, Series 2007-A3-1A1 | | | 6.00% | ± | | | 03/25/2037 | | | | 5,214,291 | |
12,551,507 | | CitiMortgage Alternative Loan Trust, Series 2007-A3-1A3 (-1 x 1 Month LIBOR USD + 5.40%, 5.40% Cap) | | | 3.53% | I/F I/O | | | 03/25/2037 | | | | 1,215,886 | |
4,918,666 | | CitiMortgage Alternative Loan Trust, Series 2007-A3-1A4 | | | 5.75% | | | | 03/25/2037 | | | | 4,657,613 | |
9,107,097 | | CitiMortgage Alternative Loan Trust, Series 2007-A4-1A3 (1 Month LIBOR USD + 0.33%, 0.33% Floor, 7.00% Cap) | | | 2.20% | | | | 04/25/2037 | | | | 7,426,400 | |
9,107,097 | | CitiMortgage Alternative Loan Trust, Series 2007-A4-1A4 (-1 x 1 Month LIBOR USD + 6.67%, 6.67% Cap) | | | 4.80% | I/F I/O | | | 04/25/2037 | | | | 1,334,655 | |
1,317,014 | | CitiMortgage Alternative Loan Trust, Series 2007-A5-1A11 | | | 6.00% | | | | 05/25/2037 | | | | 1,265,437 | |
17,363,872 | | CitiMortgage Alternative Loan Trust, Series 2007-A5-1A8 | | | 6.00% | | | | 05/25/2037 | | | | 16,683,859 | |
578,643 | | CitiMortgage Alternative Loan Trust, Series 2007-A8-A1 | | | 6.00% | | | | 10/25/2037 | | | | 547,787 | |
2,297,015 | | COLT Funding LLC, Series 2015-1-A1F | | | 4.00% | # ^ | | | 12/26/2045 | | | | 2,307,221 | |
53,138,096 | | Countrywide Alternative Loan Trust, Series 2004-36CB-1A1 | | | 6.00% | | | | 02/25/2035 | | | | 50,847,509 | |
6,490,714 | | Countrywide Alternative Loan Trust, Series 2005-13CB-A3 | | | 5.50% | | | | 05/25/2035 | | | | 6,489,540 | |
4,940,646 | | Countrywide Alternative Loan Trust, Series 2005-20CB-2A1 (1 Month LIBOR USD + 0.50%, 0.50% Floor, 5.50% Cap) | | | 2.37% | | | | 07/25/2035 | | | | 3,911,954 | |
10,087,152 | | Countrywide Alternative Loan Trust, Series 2005-20CB-2A2 (-1 x 1 Month LIBOR USD + 5.00%, 5.00% Cap) | | | 3.13% | I/F I/O | | | 07/25/2035 | | | | 924,910 | |
514,877 | | Countrywide Alternative Loan Trust, Series 2005-20CB-4A1 | | | 5.25% | | | | 07/25/2020 | | | | 510,443 | |
3,596,341 | | Countrywide Alternative Loan Trust, Series 2005-26CB-A11 (-2 x 1 Month LIBOR USD + 13.05%, 13.05% Cap) | | | 9.66% | I/F | | | 07/25/2035 | | | | 3,614,341 | |
5,064,638 | | Countrywide Alternative Loan Trust, Series 2005-28CB-1A2 (1 Month LIBOR USD + 0.75%, 0.75% Floor, 5.50% Cap) | | | 2.62% | | | | 08/25/2035 | | | | 4,330,296 | |
1,871,889 | | Countrywide Alternative Loan Trust, Series 2005-28CB-3A6 | | | 6.00% | | | | 08/25/2035 | | | | 1,492,467 | |
2,538,321 | | Countrywide Alternative Loan Trust, Series 2005-46CB-A20 | | | 5.50% | | | | 10/25/2035 | | | | 2,457,900 | |
8,424,818 | | Countrywide Alternative Loan Trust, Series 2005-48T1-A2 | | | 5.50% | | | | 11/25/2035 | | | | 7,696,616 | |
3,092,426 | | Countrywide Alternative Loan Trust, Series 2005-54CB-3A4 | | | 5.50% | | | | 11/25/2035 | | | | 2,744,105 | |
28,873,106 | | Countrywide Alternative Loan Trust, Series 2005-57CB-1A1 | | | 5.50% | | | | 12/25/2035 | | | | 26,609,882 | |
653,273 | | Countrywide Alternative Loan Trust, Series 2005-60T1-A7 (-7 x 1 Month LIBOR USD + 35.93%, 35.93% Cap) | | | 22.21% | I/F | | | 12/25/2035 | | | | 865,019 | |
960,419 | | Countrywide Alternative Loan Trust, Series 2005-64CB-1A14 | | | 5.50% | | | | 12/25/2035 | | | | 958,882 | |
13,939,275 | | Countrywide Alternative Loan Trust, Series 2005-64CB-1A4 | | | 5.50% | | | | 12/25/2035 | | | | 13,916,974 | |
2,259,654 | | Countrywide Alternative Loan Trust, Series 2005-73CB-1A5 (1 Month LIBOR USD + 0.80%, 0.80% Floor, 5.50% Cap) | | | 2.67% | | | | 01/25/2036 | | | | 1,975,491 | |
5,684,823 | | Countrywide Alternative Loan Trust, Series 2005-73CB-1A6 (-1 x 1 Month LIBOR USD + 4.70%, 4.70% Cap) | | | 2.83% | I/F I/O | | | 01/25/2036 | | | | 379,481 | |
50,135,213 | | Countrywide Alternative Loan Trust, Series 2005-77T1-1A1 | | | 6.00% | | | | 02/25/2036 | | | | 39,761,510 | |
1,148,999 | | Countrywide Alternative Loan Trust, Series 2005-79CB-A5 | | | 5.50% | | | | 01/25/2036 | | | | 1,004,430 | |
35,585,871 | | Countrywide Alternative Loan Trust, Series 2005-85CB-1A1 | | | 6.00% | | | | 02/25/2036 | | | | 28,533,560 | |
2,957,867 | | Countrywide Alternative Loan Trust, Series 2005-85CB-2A6 (-4 x 1 Month LIBOR USD + 21.63%, 21.63% Cap) | | | 14.77% | I/F | | | 02/25/2036 | | | | 3,443,762 | |
1,731,554 | | Countrywide Alternative Loan Trust, Series 2005-86CB-A5 | | | 5.50% | | | | 02/25/2036 | | | | 1,548,777 | |
3,274,501 | | Countrywide Alternative Loan Trust, Series 2005-J10-1A11 | | | 5.50% | | | | 10/25/2035 | | | | 3,001,545 | |
745,200 | | Countrywide Alternative Loan Trust, Series 2005-J10-1A13 (1 Month LIBOR USD + 0.70%, 0.70% Floor, 5.50% Cap) | | | 2.57% | | | | 10/25/2035 | | | | 606,305 | |
349,084 | | Countrywide Alternative Loan Trust, Series 2005-J10-1A15 | | | 5.50% | | | | 10/25/2035 | | | | 319,985 | |
864,180 | | Countrywide Alternative Loan Trust, Series 2005-J11-1A3 | | | 5.50% | | | | 11/25/2035 | | | | 755,259 | |
1,186,494 | | Countrywide Alternative Loan Trust, Series 2005-J11-6A1 | | | 6.50% | | | | 09/25/2032 | | | | 1,163,134 | |
1,114,176 | | Countrywide Alternative Loan Trust, Series 2005-J13-2A5 (1 Month LIBOR USD + 0.48%, 0.48% Floor, 5.50% Cap) | | | 2.35% | | | | 11/25/2035 | | | | 901,744 | |
2,228,351 | | Countrywide Alternative Loan Trust, Series 2005-J13-2A6 (-1 x 1 Month LIBOR USD + 5.02%, 5.02% Cap) | | | 3.15% | I/F I/O | | | 11/25/2035 | | | | 187,241 | |
3,891,000 | | Countrywide Alternative Loan Trust, Series 2005-J1-5A3 | | | 5.50% | | | | 02/25/2035 | | | | 3,871,041 | |
1,154,427 | | Countrywide Alternative Loan Trust, Series 2005-J1-7A1 | | | 5.50% | | | | 01/25/2020 | | | | 1,156,290 | |
1,053,725 | | Countrywide Alternative Loan Trust, Series 2005-J2-1A5 (1 Month LIBOR USD + 0.50%, 0.50% Floor, 5.50% Cap) | | | 2.37% | | | | 04/25/2035 | | | | 940,559 | |
3,242,231 | | Countrywide Alternative Loan Trust, Series 2005-J2-1A6 (-1 x 1 Month LIBOR USD + 5.00%, 5.00% Cap) | | | 3.13% | I/F I/O | | | 04/25/2035 | | | | 226,148 | |
10,124,089 | | Countrywide Alternative Loan Trust, Series 2005-J3-2A8 (1 Month LIBOR USD + 0.30%, 0.30% Floor, 5.50% Cap) | | | 2.17% | | | | 05/25/2035 | | | | 9,360,378 | |
10,124,089 | | Countrywide Alternative Loan Trust, Series 2005-J3-2A9 (-1 x 1 Month LIBOR USD + 5.20%, 5.20% Cap) | | | 3.33% | I/F I/O | | | 05/25/2035 | | | | 775,256 | |
4,285,987 | | Countrywide Alternative Loan Trust, Series 2006-12CB-A3 (1 Month LIBOR USD + 5.75%, 5.75% Floor) | | | 5.75% | | | | 05/25/2036 | | | | 3,512,228 | |
44,591,114 | | Countrywide Alternative Loan Trust, Series 2006-15CB-A1 | | | 6.50% | | | | 06/25/2036 | | | | 35,108,840 | |
1,381,550 | | Countrywide Alternative Loan Trust, Series 2006-18CB-A12 (1 Month LIBOR USD + 0.60%, 0.60% Floor, 6.00% Cap) | | | 2.47% | | | | 07/25/2036 | | | | 984,458 | |
1,381,550 | | Countrywide Alternative Loan Trust, Series 2006-18CB-A13 (-1 x 1 Month LIBOR USD + 5.50%, 5.50% Cap) | | | 3.63% | I/F I/O | | | 07/25/2036 | | | | 188,829 | |
6,897,751 | | Countrywide Alternative Loan Trust, Series 2006-19CB-A12 (1 Month LIBOR USD + 0.40%, 0.40% Floor, 6.00% Cap) | | | 2.27% | | | | 08/25/2036 | | | | 5,095,116 | |
9,353,765 | | Countrywide Alternative Loan Trust, Series 2006-19CB-A13 (-1 x 1 Month LIBOR USD + 5.60%, 5.60% Cap) | | | 3.73% | I/F I/O | | | 08/25/2036 | | | | 1,353,200 | |
1,439,957 | | Countrywide Alternative Loan Trust, Series 2006-19CB-A15 | | | 6.00% | | | | 08/25/2036 | | | | 1,283,919 | |
2,349,335 | | Countrywide Alternative Loan Trust, Series 2006-24CB-A11 | | | 5.75% | | | | 06/25/2036 | | | | 2,055,510 | |
6,876,217 | | Countrywide Alternative Loan Trust, Series 2006-24CB-A14 (-1 x 1 Month LIBOR USD + 7.15%, 7.15% Cap) | | | 5.28% | I/F I/O | | | 06/25/2036 | | | | 1,569,057 | |
5,513,830 | | Countrywide Alternative Loan Trust, Series 2006-24CB-A22 | | | 6.00% | | | | 06/25/2036 | | | | 4,910,160 | |
5,917,996 | | Countrywide Alternative Loan Trust, Series 2006-24CB-A5 (1 Month LIBOR USD + 0.60%, 0.06% Floor, 6.00% Cap) | | | 2.47% | | | | 06/25/2036 | | | | 3,974,921 | |
2,233,948 | | Countrywide Alternative Loan Trust, Series 2006-26CB-A17 | | | 6.25% | | | | 09/25/2036 | | | | 1,852,688 | |
2,867,463 | | Countrywide Alternative Loan Trust, Series 2006-26CB-A9 | | | 6.50% | | | | 09/25/2036 | | | | 2,424,614 | |
5,174,276 | | Countrywide Alternative Loan Trust, Series 2006-29T1-1A2 | | | 6.25% | | | | 10/25/2036 | | | | 4,420,869 | |
752,416 | | Countrywide Alternative Loan Trust, Series 2006-29T1-2A12 (-7 x 1 Month LIBOR USD + 46.15%, 46.15% Cap) | | | 33.99% | I/F | | | 10/25/2036 | | | | 1,400,020 | |
460,870 | | Countrywide Alternative Loan Trust, Series 2006-29T1-2A23 (-4 x 1 Month LIBOR USD + 33.37%, 33.37% Cap) | | | 25.26% | I/F | | | 10/25/2036 | | | | 699,614 | |
5,329,456 | | Countrywide Alternative Loan Trust, Series 2006-30T1-1A2 | | | 6.25% | | | | 11/25/2036 | | | | 4,786,960 | |
3,636,613 | | Countrywide Alternative Loan Trust, Series 2006-32CB-A1 (1 Month LIBOR USD + 0.67%, 0.67% Floor, 6.00% Cap) | | | 2.54% | | | | 11/25/2036 | | | | 2,624,600 | |
6,065,871 | | Countrywide Alternative Loan Trust, Series 2006-32CB-A2 (-1 x 1 Month LIBOR USD + 5.33%, 5.33% Cap) | | | 3.46% | I/F I/O | | | 11/25/2036 | | | | 912,514 | |
6,322,118 | | Countrywide Alternative Loan Trust, Series 2006-36T2-2A1 | | | 6.25% | | | | 12/25/2036 | | | | 4,621,440 | |
1,856,871 | | Countrywide Alternative Loan Trust, Series 2006-39CB-1A10 | | | 6.00% | | | | 01/25/2037 | | | | 1,823,263 | |
16,917,000 | | Countrywide Alternative Loan Trust, Series 2006-39CB-2A2 (-1 x 1 Month LIBOR USD + 6.55%, 6.55% Cap) | | | 4.68% | I/F I/O | | | 01/25/2037 | | | | 3,795,069 | |
5,761,037 | | Countrywide Alternative Loan Trust, Series 2006-39CB-2A4 (1 Month LIBOR USD + 0.45%, 0.45% Floor, 7.00% Cap) | | | 2.32% | | | | 01/25/2037 | | | | 1,374,083 | |
2,726,941 | | Countrywide Alternative Loan Trust, Series 2006-40T1-1A11 | | | 6.00% | | | | 01/25/2037 | | | | 2,517,127 | |
4,641,158 | | Countrywide Alternative Loan Trust, Series 2006-40T1-1A4 (-1 x 1 Month LIBOR USD + 5.45%, 5.45% Cap) | | | 3.58% | I/F I/O | | | 01/25/2037 | | | | 548,007 | |
5,236,633 | | Countrywide Alternative Loan Trust, Series 2006-41CB-1A10 | | | 6.00% | | | | 01/25/2037 | | | | 4,509,109 | |
5,514,287 | | Countrywide Alternative Loan Trust, Series 2006-41CB-1A9 | | | 6.00% | | | | 01/25/2037 | | | | 4,748,190 | |
4,655,687 | | Countrywide Alternative Loan Trust, Series 2006-45T1-1A4 (1 Month LIBOR USD + 0.60%, 0.60% Floor, 6.00% Cap) | | | 2.47% | | | | 02/25/2037 | | | | 2,012,473 | |
4,655,687 | | Countrywide Alternative Loan Trust, Series 2006-45T1-1A5 (-1 x 1 Month LIBOR USD + 5.40%, 5.40% Cap) | | | 3.53% | I/F I/O | | | 02/25/2037 | | | | 581,970 | |
1,530,386 | | Countrywide Alternative Loan Trust, Series 2006-6CB-1A4 | | | 5.50% | | | | 05/25/2036 | | | | 1,430,891 | |
4,518,553 | | Countrywide Alternative Loan Trust, Series 2006-J1-1A10 | | | 5.50% | | | | 02/25/2036 | | | | 4,157,198 | |
9,167,971 | | Countrywide Alternative Loan Trust, Series 2006-J1-1A3 | | | 5.50% | | | | 02/25/2036 | | | | 8,434,795 | |
1,732,983 | | Countrywide Alternative Loan Trust, Series 2006-J4-2A2 | | | 6.00% | | | | 07/25/2036 | | | | 1,516,064 | |
1,047,246 | | Countrywide Alternative Loan Trust, Series 2007-11T1-A24 (-6 x 1 Month LIBOR USD + 39.90%, 39.90% Cap) | | | 28.67% | I/F | | | 05/25/2037 | | | | 1,721,796 | |
16,260,457 | | Countrywide Alternative Loan Trust, Series 2007-15CB-A1 | | | 6.00% | | | | 07/25/2037 | | | | 15,254,110 | |
11,552,105 | | Countrywide Alternative Loan Trust, Series 2007-16CB-2A1 (1 Month LIBOR USD + 0.45%, 0.45% Floor, 7.00% Cap) | | | 2.32% | | | | 08/25/2037 | | | | 6,440,018 | |
3,345,201 | | Countrywide Alternative Loan Trust, Series 2007-16CB-2A2 (-8 x 1 Month LIBOR USD + 54.58%, 54.58% Cap) | | | 38.99% | I/F | | | 08/25/2037 | | | | 6,363,933 | |
6,200,416 | | Countrywide Alternative Loan Trust, Series 2007-16CB-4A7 | | | 6.00% | | | | 08/25/2037 | | | | 6,090,490 | |
9,551,689 | | Countrywide Alternative Loan Trust, Series 2007-17CB-1A10 (-5 x 1 Month LIBOR USD + 29.90%, 29.90% Cap) | | | 21.29% | I/F | | | 08/25/2037 | | | | 14,119,608 | |
1,493,616 | | Countrywide Alternative Loan Trust, Series 2007-18CB-2A25 | | | 6.00% | | | | 08/25/2037 | | | | 1,370,241 | |
988,903 | | Countrywide Alternative Loan Trust, Series 2007-19-1A10 (-6 x 1 Month LIBOR USD + 39.00%, 39.00% Cap) | | | 27.77% | I/F | | | 08/25/2037 | | | | 1,758,861 | |
14,534,760 | | Countrywide Alternative Loan Trust, Series 2007-19-1A4 | | | 6.00% | | | | 08/25/2037 | | | | 11,943,873 | |
35,456,022 | | Countrywide Alternative Loan Trust, Series 2007-19-2A1 | | | 6.50% | | | | 08/25/2037 | | | | 26,918,003 | |
4,760,364 | | Countrywide Alternative Loan Trust, Series 2007-21CB-2A2 (-4 x 1 Month LIBOR USD + 28.40%, 28.40% Cap) | | | 20.91% | I/F | | | 09/25/2037 | | | | 6,224,956 | |
23,793,133 | | Countrywide Alternative Loan Trust, Series 2007-22-2A16 | | | 6.50% | | | | 09/25/2037 | | | | 17,149,683 | |
12,156,809 | | Countrywide Alternative Loan Trust, Series 2007-23CB-A3 (1 Month LIBOR USD + 0.50%, 0.50% Floor, 7.00% Cap) | | | 2.37% | | | | 09/25/2037 | | | | 8,101,824 | |
17,253,032 | | Countrywide Alternative Loan Trust, Series 2007-23CB-A4 (-1 x 1 Month LIBOR USD + 6.50%, 6.50% Cap) | | | 4.63% | I/F I/O | | | 09/25/2037 | | | | 3,338,777 | |
16,261,694 | | Countrywide Alternative Loan Trust, Series 2007-4CB-2A1 | | | 7.00% | | | | 03/25/2037 | | | | 4,981,198 | |
6,511,167 | | Countrywide Alternative Loan Trust, Series 2007-5CB-1A18 (-1 x 1 Month LIBOR USD + 5.65%, 5.65% Cap) | | | 3.78% | I/F I/O | | | 04/25/2037 | | | | 892,197 | |
6,511,167 | | Countrywide Alternative Loan Trust, Series 2007-5CB-1A23 (1 Month LIBOR USD + 0.55%, 0.55% Floor, 6.00% Cap) | | | 2.42% | | | | 04/25/2037 | | | | 4,472,232 | |
5,511,524 | | Countrywide Alternative Loan Trust, Series 2007-6-A4 | | | 5.75% | | | | 04/25/2047 | | | | 4,779,637 | |
440,317 | | Countrywide Alternative Loan Trust, Series 2007-8CB-A12 (-6 x 1 Month LIBOR USD + 40.20%, 40.20% Cap) | | | 28.97% | I/F | | | 05/25/2037 | | | | 794,244 | |
470,032 | | Countrywide Alternative Loan Trust, Series 2007-8CB-A8 (-6 x 1 Month LIBOR USD + 40.08%, 40.08% Cap) | | | 28.85% | I/F | | | 05/25/2037 | | | | 844,761 | |
715,715 | | Countrywide Alternative Loan Trust, Series 2007-9T1-1A4 (1 Month LIBOR USD + 0.50%, 0.50% Floor, 6.00% Cap) | | | 2.37% | | | | 05/25/2037 | | | | 373,321 | |
715,715 | | Countrywide Alternative Loan Trust, Series 2007-9T1-1A5 (-1 x 1 Month LIBOR USD + 5.50%, 5.50% Cap) | | | 3.63% | I/F I/O | | | 05/25/2037 | | | | 112,786 | |
19,604,403 | | Countrywide Alternative Loan Trust, Series 2007-9T1-1A6 | | | 6.00% | | | | 05/25/2037 | | | | 14,761,888 | |
2,027,544 | | Countrywide Alternative Loan Trust, Series 2007-9T1-2A1 | | | 6.00% | | | | 05/25/2037 | | | | 1,501,506 | |
244,251 | | Countrywide Alternative Loan Trust, Series 2007-9T1-3A1 | | | 5.50% | | | | 05/25/2022 | | | | 185,393 | |
52,330,825 | | Countrywide Alternative Loan Trust, Series 2007-HY2-1A | | | 3.47% | # | | | 03/25/2047 | | | | 48,519,948 | |
2,732,870 | | Countrywide Alternative Loan Trust, Series 2007-HY5R-2A1B | | | 3.28% | # | | | 03/25/2047 | | | | 2,754,155 | |
39,965,831 | | Countrywide Asset Backed Certificates, Series 2006-25-1A (1 Month LIBOR USD + 0.14%, 0.14% Floor) | | | 2.01% | | | | 06/25/2047 | | | | 37,692,099 | |
3,639,372 | | Countrywide Asset-Backed Certificates, Series 2003-BC6-M1 (1 Month LIBOR USD + 0.83%, 0.55% Floor) | | | 2.70% | | | | 11/25/2033 | | | | 3,537,543 | |
776,583 | | Countrywide Asset-Backed Certificates, Series 2005-13-AF3 | | | 4.66% | # | | | 04/25/2036 | | | | 712,039 | |
20,839,545 | | Countrywide Asset-Backed Certificates, Series 2005-4-AF5B | | | 4.57% | | | | 10/25/2035 | | | | 21,302,921 | |
2,225,601 | | Countrywide Home Loans, Series 2003-60-4A1 | | | 3.66% | # | | | 02/25/2034 | | | | 2,265,743 | |
2,755,013 | | Countrywide Home Loans, Series 2004-R2-1AF1 (1 Month LIBOR USD + 0.42%, 0.42% Floor, 9.50% Cap) | | | 2.29% | ^ | | | 11/25/2034 | | | | 2,493,109 | |
2,680,621 | | Countrywide Home Loans, Series 2004-R2-1AS | | | 4.53% | # ^ I/O | | | 11/25/2034 | | | | 227,575 | |
5,718,600 | | Countrywide Home Loans, Series 2005-20-A5 | | | 5.50% | | | | 10/25/2035 | | | | 5,542,228 | |
4,154,910 | | Countrywide Home Loans, Series 2005-20-A8 | | | 5.25% | | | | 10/25/2035 | | | | 4,079,152 | |
13,338,484 | | Countrywide Home Loans, Series 2005-23-A1 | | | 5.50% | | | | 11/25/2035 | | | | 11,870,235 | |
3,492,488 | | Countrywide Home Loans, Series 2005-24-A8 | | | 5.50% | | | | 11/25/2035 | | | | 3,117,751 | |
980,595 | | Countrywide Home Loans, Series 2005-27-2A1 | | | 5.50% | | | | 12/25/2035 | | | | 845,261 | |
1,774,969 | | Countrywide Home Loans, Series 2005-28-A7 | | | 5.25% | | | | 01/25/2019 | | | | 1,569,180 | |
21,368,918 | | Countrywide Home Loans, Series 2005-HYB1-4A1 | | | 3.46% | # | | | 03/25/2035 | | | | 20,699,684 | |
2,866,835 | | Countrywide Home Loans, Series 2005-HYB8-1A1 | | | 3.51% | # | | | 12/20/2035 | | | | 2,528,283 | |
3,830,908 | | Countrywide Home Loans, Series 2005-J3-2A4 | | | 4.50% | | | | 09/25/2035 | | | | 3,706,088 | |
2,453,149 | | Countrywide Home Loans, Series 2005-J4-A5 | | | 5.50% | | | | 11/25/2035 | | | | 2,410,422 | |
845,576 | | Countrywide Home Loans, Series 2005-R1-1AF1 (1 Month LIBOR USD + 0.36%, 0.36% Floor, 9.50% Cap) | | | 2.23% | ^ | | | 03/25/2035 | | | | 792,477 | |
829,228 | | Countrywide Home Loans, Series 2005-R1-1AS | | | 4.59% | # ^ I/O | | | 03/25/2035 | | | | 65,275 | |
6,751,706 | | Countrywide Home Loans, Series 2006-16-2A1 | | | 6.50% | | | | 11/25/2036 | | | | 5,598,020 | |
6,774,668 | | Countrywide Home Loans, Series 2006-1-A2 | | | 6.00% | | | | 03/25/2036 | | | | 5,893,835 | |
2,702,247 | | Countrywide Home Loans, Series 2006-20-1A21 | | | 6.00% | | | | 02/25/2037 | | | | 2,337,552 | |
1,643,698 | | Countrywide Home Loans, Series 2006-J3-A4 | | | 5.50% | | | | 05/25/2036 | | | | 1,662,310 | |
7,204,837 | | Countrywide Home Loans, Series 2007-10-A7 | | | 6.00% | | | | 07/25/2037 | | | | 6,124,059 | |
23,469,776 | | Countrywide Home Loans, Series 2007-11-A1 | | | 6.00% | | | | 08/25/2037 | | | | 19,888,131 | |
14,176,073 | | Countrywide Home Loans, Series 2007-12-A9 | | | 5.75% | | | | 08/25/2037 | | | | 13,010,221 | |
6,245,976 | | Countrywide Home Loans, Series 2007-13-A1 | | | 6.00% | | | | 08/25/2037 | | | | 5,549,442 | |
7,315,988 | | Countrywide Home Loans, Series 2007-13-A10 | | | 6.00% | | | | 08/25/2037 | | | | 6,500,129 | |
7,292,205 | | Countrywide Home Loans, Series 2007-15-1A1 | | | 6.25% | | | | 09/25/2037 | | | | 6,785,697 | |
804,122 | | Countrywide Home Loans, Series 2007-15-1A16 | | | 6.25% | | | | 09/25/2037 | | | | 748,269 | |
3,583,272 | | Countrywide Home Loans, Series 2007-15-1A29 | | | 6.25% | | | | 09/25/2037 | | | | 3,328,662 | |
7,830,406 | | Countrywide Home Loans, Series 2007-17-1A2 | | | 6.00% | | | | 10/25/2037 | | | | 7,488,024 | |
1,029,408 | | Countrywide Home Loans, Series 2007-18-1A1 | | | 6.00% | | | | 11/25/2037 | | | | 903,419 | |
7,585,487 | | Countrywide Home Loans, Series 2007-3-A1 | | | 6.00% | | | | 04/25/2037 | | | | 6,465,049 | |
2,921,439 | | Countrywide Home Loans, Series 2007-3-A12 | | | 6.00% | | | | 04/25/2037 | | | | 2,489,919 | |
5,789,715 | | Countrywide Home Loans, Series 2007-4-1A39 | | | 6.00% | | | | 05/25/2037 | | | | 4,753,717 | |
2,765,909 | | Countrywide Home Loans, Series 2007-5-A2 | | | 5.75% | | | | 05/25/2037 | | | | 2,501,182 | |
9,060,933 | | Countrywide Home Loans, Series 2007-7-A1 | | | 6.00% | | | | 06/25/2037 | | | | 8,122,384 | |
2,716,158 | | Countrywide Home Loans, Series 2007-7-A2 | | | 5.75% | | | | 06/25/2037 | | | | 2,405,211 | |
8,180,373 | | Countrywide Home Loans, Series 2007-8-1A4 | | | 6.00% | | | | 01/25/2038 | | | | 6,844,905 | |
4,293,030 | | Countrywide Home Loans, Series 2007-8-1A5 | | | 5.44% | | | | 01/25/2038 | | | | 3,450,655 | |
9,967,512 | | Countrywide Home Loans, Series 2007-8-1A9 (1 Month LIBOR USD + 6.00%, 4.00% Floor, 6.00% Cap) | | | 6.00% | | | | 01/25/2038 | | | | 8,340,288 | |
1,700,443 | | Countrywide Home Loans, Series 2007-9-A11 | | | 5.75% | | | | 07/25/2037 | | | | 1,566,487 | |
10,872,174 | | Countrywide Home Loans, Series 2007-HY1-1A1 | | | 3.70% | # | | | 04/25/2037 | | | | 10,722,160 | |
25,417,824 | | Countrywide Home Loans, Series 2007-J1-2A1 | | | 6.00% | | | | 02/25/2037 | | | | 19,806,186 | |
674,367 | | Countrywide Home Loans, Series 2007-J3-A1 (1 Month LIBOR USD + 0.50%, 0.50% Floor, 6.00% Cap) | | | 2.37% | | | | 07/25/2037 | | | | 425,444 | |
3,371,834 | | Countrywide Home Loans, Series 2007-J3-A2 (-1 x 1 Month LIBOR USD + 5.50%, 5.50% Cap) | | | 3.63% | I/F I/O | | | 07/25/2037 | | | | 359,637 | |
4,917,282 | | Credit Suisse First Boston Mortgage Backed Trust, Series 2006-3-A4B | | | 6.11% | ß | | | 11/25/2036 | | | | 1,852,337 | |
3,130,734 | | Credit Suisse First Boston Mortgage Backed Trust, Series 2006-4-A6A | | | 5.68% | ß | | | 12/25/2036 | | | | 1,464,680 | |
10,831,655 | | Credit Suisse First Boston Mortgage Backed Trust, Series 2007-1-1A1A | | | 5.90% | # | | | 05/25/2037 | | | | 5,263,134 | |
87,432 | | Credit Suisse First Boston Mortgage Securities Corporation, Series 2004-AR8-2A1 | | | 3.52% | # | | | 09/25/2034 | | | | 87,724 | |
3,982,187 | | Credit Suisse First Boston Mortgage Securities Corporation, Series 2005-10-5A4 | | | 5.50% | | | | 11/25/2035 | | | | 3,906,469 | |
838,298 | | Credit Suisse First Boston Mortgage Securities Corporation, Series 2005-10-5A5 | | | 5.50% | | | | 11/25/2035 | | | | 822,359 | |
12,915,390 | | Credit Suisse First Boston Mortgage Securities Corporation, Series 2005-12-5A1 | | | 5.25% | | | | 01/25/2036 | | | | 12,496,752 | |
10,310,384 | | Credit Suisse First Boston Mortgage Securities Corporation, Series 2005-12-7A1 | | | 7.00% | | | | 01/25/2036 | | | | 4,052,173 | |
5,769,390 | | Credit Suisse First Boston Mortgage Securities Corporation, Series 2005-8-3A10 | | | 5.50% | | | | 09/25/2035 | | | | 5,795,769 | |
4,968,781 | | Credit Suisse First Boston Mortgage Securities Corporation, Series 2005-8-7A1 | | | 7.00% | | | | 09/25/2035 | | | | 4,172,819 | |
2,248,640 | | Credit Suisse Mortgage Capital Certificates, Series 2005-1R-2A5 | | | 5.75% | ^ | | | 12/26/2035 | | | | 2,055,314 | |
18,086,865 | | Credit Suisse Mortgage Capital Certificates, Series 2006-1-2A1 | | | 6.00% | | | | 02/25/2036 | | | | 13,718,324 | |
2,930,785 | | Credit Suisse Mortgage Capital Certificates, Series 2006-2-3A1 | | | 6.50% | | | | 03/25/2036 | | | | 1,800,911 | |
3,314,188 | | Credit Suisse Mortgage Capital Certificates, Series 2006-2-5A1 (1 Month LIBOR USD + 0.70%, 0.70% Floor, 6.00% Cap) | | | 2.57% | | | | 03/25/2036 | | | | 1,892,494 | |
18,524,786 | | Credit Suisse Mortgage Capital Certificates, Series 2006-2-5A2 (-1 x 1 Month LIBOR USD + 5.30%, 5.30% Cap) | | | 3.43% | I/F I/O | | | 03/25/2036 | | | | 2,778,948 | |
3,858,687 | | Credit Suisse Mortgage Capital Certificates, Series 2006-2-5A3 | | | 6.25% | | | | 03/25/2036 | | | | 2,943,130 | |
10,443,150 | | Credit Suisse Mortgage Capital Certificates, Series 2006-2-5A4 | | | 6.00% | | | | 03/25/2036 | | | | 7,828,872 | |
3,973,458 | | Credit Suisse Mortgage Capital Certificates, Series 2006-3-4A3 | | | 5.50% | | | | 04/25/2036 | | | | 3,717,284 | |
2,402,057 | | Credit Suisse Mortgage Capital Certificates, Series 2006-3-4A4 | | | 5.50% | | | | 04/25/2036 | | | | 2,251,552 | |
4,038,666 | | Credit Suisse Mortgage Capital Certificates, Series 2006-4-1A8 (1 Month LIBOR USD + 1.00%, 6.00% Floor, 6.00% Cap) | | | 6.00% | | | | 05/25/2036 | | | | 3,569,721 | |
20,895,187 | | Credit Suisse Mortgage Capital Certificates, Series 2006-4-4A1 | | | 7.00% | | | | 05/25/2036 | | | | 9,588,408 | |
11,475,108 | | Credit Suisse Mortgage Capital Certificates, Series 2006-6-1A4 | | | 6.00% | | | | 07/25/2036 | | | | 9,688,912 | |
10,695,053 | | Credit Suisse Mortgage Capital Certificates, Series 2006-6-3A1 | | | 7.00% | | | | 07/25/2036 | | | | 3,121,887 | |
225,197 | | Credit Suisse Mortgage Capital Certificates, Series 2006-7-3A11 | | | 6.00% | | | | 08/25/2036 | | | | 185,295 | |
3,758,460 | | Credit Suisse Mortgage Capital Certificates, Series 2006-7-7A5 | | | 6.00% | | | | 08/25/2036 | | | | 3,715,924 | |
7,458,123 | | Credit Suisse Mortgage Capital Certificates, Series 2006-9-2A1 | | | 5.50% | | | | 11/25/2036 | | | | 7,089,230 | |
24,965,005 | | Credit Suisse Mortgage Capital Certificates, Series 2006-9-3A1 | | | 6.00% | | | | 11/25/2036 | | | | 23,236,543 | |
6,744,540 | | Credit Suisse Mortgage Capital Certificates, Series 2006-9-4A1 | | | 6.00% | | | | 11/25/2036 | | | | 5,278,727 | |
5,329,720 | | Credit Suisse Mortgage Capital Certificates, Series 2006-9-6A14 | | | 6.00% | | | | 11/25/2036 | | | | 5,077,758 | |
865,983 | | Credit Suisse Mortgage Capital Certificates, Series 2006-9-6A15 (-6 x 1 Month LIBOR USD + 39.90%) | | | 30.18% | I/F | | | 11/25/2036 | | | | 1,459,828 | |
11,220,503 | | Credit Suisse Mortgage Capital Certificates, Series 2007-1-1A4 | | | 6.13% | # | | | 02/25/2037 | | | | 5,273,374 | |
5,664,900 | | Credit Suisse Mortgage Capital Certificates, Series 2007-1-5A14 | | | 6.00% | | | | 02/25/2037 | | | | 5,158,837 | |
8,547,951 | | Credit Suisse Mortgage Capital Certificates, Series 2007-3-2A10 | | | 6.00% | | | | 04/25/2037 | | | | 6,506,465 | |
6,158,924 | | Credit Suisse Mortgage Capital Certificates, Series 2007-5-2A5 | | | 5.00% | | | | 08/25/2037 | | | | 5,068,431 | |
49,411,004 | | Credit Suisse Mortgage Capital Certificates, Series 2007-5-3A19 | | | 6.00% | | | | 08/25/2037 | | | | 40,069,300 | |
22,268,790 | | Credit Suisse Mortgage Capital Certificates, Series 2007-5-3A9 | | | 6.00% | | | | 08/25/2037 | | | | 17,162,136 | |
9,415,332 | | Credit Suisse Mortgage Capital Certificates, Series 2008-2R-1A1 | | | 6.00% | ^ | | | 07/25/2037 | | | | 8,820,537 | |
2,357,165 | | Credit Suisse Mortgage Capital Certificates, Series 2009-1R-4A2 | | | 3.60% | # ^ | | | 07/20/2035 | | | | 2,265,644 | |
4,576,513 | | Credit Suisse Mortgage Capital Certificates, Series 2010-13R-1A2 | | | 5.50% | # ^ | | | 12/26/2035 | | | | 4,433,947 | |
91,579,924 | | Credit Suisse Mortgage Capital Certificates, Series 2010-17R-6A1 | | | 3.11% | # ^ | | | 06/26/2037 | | | | 90,955,450 | |
14,877,523 | | Credit Suisse Mortgage Capital Certificates, Series 2010-2R-4A17 | | | 6.00% | # ^ | | | 03/26/2037 | | | | 14,626,403 | |
15,537,837 | | Credit Suisse Mortgage Capital Certificates, Series 2010-4R-8A17 | | | 6.00% | # ^ | | | 06/26/2037 | | | | 15,556,687 | |
12,578,246 | | Credit Suisse Mortgage Capital Certificates, Series 2010-7R-4A17 | | | 6.00% | # ^ | | | 04/26/2037 | | | | 12,500,453 | |
19,598,134 | | Credit Suisse Mortgage Capital Certificates, Series 2010-9R-2A5 | | | 4.00% | ^ | | | 02/27/2038 | | | | 19,655,390 | |
14,191,857 | | Credit Suisse Mortgage Capital Certificates, Series 2012-10R-4A2 | | | 3.43% | # ^ | | | 08/26/2046 | | | | 13,112,243 | |
48,774,391 | | Credit Suisse Mortgage Capital Certificates, Series 2013-6-1A1 | | | 2.50% | # ^ | | | 07/25/2028 | | | | 47,765,093 | |
46,038,702 | | Credit Suisse Mortgage Capital Certificates, Series 2013-9R-A1 | | | 3.00% | # ^ | | | 05/27/2043 | | | | 42,293,118 | |
22,098,179 | | Credit Suisse Mortgage Capital Certificates, Series 2013-IVR4-A2 | | | 3.00% | # ^ | | | 07/25/2043 | | | | 21,546,750 | |
5,416,769 | | Credit Suisse Mortgage Capital Certificates, Series 2014-WIN1-2A4 | | | 3.00% | # ^ | | | 09/25/2044 | | | | 5,271,648 | |
80,098,820 | | Credit Suisse Mortgage Capital Certificates, Series 2015-1-A1 | | | 2.50% | # ^ | | | 01/25/2045 | | | | 76,793,230 | |
83,784,897 | | Credit Suisse Mortgage Capital Certificates, Series 2015-RPL2-A1A | | | 3.75% | ^ § | | | 11/25/2057 | | | | 84,044,714 | |
65,008,634 | | Credit Suisse Mortgage Trust, Series 2017-1A-A | | | 4.50% | ^ | | | 03/25/2021 | | | | 65,307,277 | |
57,086,919 | | Credit Suisse Mortgage Trust, Series 2017-6R1-A1 (1 Month LIBOR USD + 2.55%) | | | 3.21% | ^ | | | 03/06/2047 | | | | 57,716,034 | |
70,328,650 | | Credit Suisse Mortgage Trust, Series 2018-RPL2-A1 | | | 4.03% | ^ § | | | 08/25/2062 | | | | 70,856,115 | |
91,406 | | Credit-Based Asset Servicing and Securitization LLC, Series 2005-CB6-A4 | | | 3.71% | | | | 06/25/2035 | | | | 91,349 | |
13,755,271 | | Credit-Based Asset Servicing and Securitization LLC, Series 2006-CB4-AV3 (1 Month LIBOR USD + 0.15%, 0.15% Floor) | | | 2.02% | | | | 05/25/2036 | | | | 11,326,838 | |
9,750,000 | | Credit-Based Asset Servicing and Securitization LLC, Series 2007-MX1-A3 | | | 5.83% | ^ ß | | | 12/25/2036 | | | | 9,938,099 | |
12,048,245 | | CSMC Trust, Series 2006-4-6A1 | | | 6.00% | | | | 05/25/2036 | | | | 9,320,888 | |
7,876,646 | | CSMC Trust, Series 2007-1-3A1 | | | 6.00% | | | | 02/25/2022 | | | | 4,508,480 | |
86,444 | | CSMC Trust, Series 2007-2-2A1 | | | 5.00% | | | | 03/25/2037 | | | | 85,895 | |
12,293,312 | | CSMC Trust, Series 2009-12R-5A1 | | | 6.00% | ^ | | | 06/27/2036 | | | | 12,041,138 | |
31,470,111 | | CSMC Trust, Series 2010-4R-3A17 | | | 6.00% | # ^ | | | 06/26/2037 | | | | 32,380,532 | |
929,110 | | CSMC Trust, Series 2010-9R-70A3 | | | 3.75% | ^ | | | 12/27/2036 | | | | 931,594 | |
1,904,000 | | CSMC Trust, Series 2010-9R-70A4 | | | 3.75% | ^ | | | 12/27/2036 | | | | 1,905,064 | |
6,047,000 | | CSMC Trust, Series 2010-9R-70A5 | | | 4.00% | ^ | | | 12/27/2036 | | | | 5,961,111 | |
31,238,264 | | CSMC Trust, Series 2013-IVR4-A11 | | | 3.48% | # ^ | | | 07/27/2043 | | | | 31,204,089 | |
133,948,380 | | CSMC Trust, Series 2015-PR2-A1 | | | 4.25% | ^ § | | | 07/26/2055 | | | | 132,227,853 | |
23,132,268 | | CSMC Trust, Series 2015-RPL3-A1 | | | 3.75% | ^ § | | | 12/25/2056 | | | | 23,182,669 | |
29,320,132 | | CSMC Trust, Series 2016-PR1-A1 | | | 5.50% | ^ § | | | 07/25/2056 | | | | 28,839,742 | |
63,404,023 | | CSMC Trust, Series 2017-12R-A1 (1 Month LIBOR USD + 1.45%) | | | 3.02% | ^ | | | 10/29/2046 | | | | 64,063,571 | |
7,724,231 | | CSMLT Trust, Series 2015-1-A9 | | | 3.50% | # ^ | | | 05/25/2045 | | | | 7,677,159 | |
39,563,908 | | CSMLT Trust, Series 2015-2-A7 | | | 3.50% | # ^ | | | 08/25/2045 | | | | 39,382,152 | |
12,607,345 | | CSMLT Trust, Series 2015-3-1A2 | | | 3.50% | # ^ | | | 11/25/2045 | | | | 12,745,931 | |
17,025,083 | | Deutsche ALT-A Securities, Inc. Mortgage Loan Trust, Series 2005-4-A5 | | | 5.50% | | | | 09/25/2035 | | | | 16,504,916 | |
1,068,110 | | Deutsche ALT-A Securities, Inc. Mortgage Loan Trust, Series 2005-5-1A6
(-7 x 1 Month LIBOR USD + 35.93%) | | | 22.21% | I/F | | | 11/25/2035 | | | | 1,422,216 | |
1,119,820 | | Deutsche ALT-A Securities, Inc. Mortgage Loan Trust, Series 2005-5-2A1
(1 Month LIBOR USD + 0.20%, 0.20% Floor, 5.50% Cap) | | | 2.07% | | | | 11/25/2035 | | | | 761,333 | |
3,379,739 | | Deutsche ALT-A Securities, Inc. Mortgage Loan Trust, Series 2005-5-2A2
(-1 x 1 Month LIBOR USD + 5.30%, 5.30% Cap) | | | 3.43% | I/F I/O | | | 11/25/2035 | | | | 404,528 | |
3,483,402 | | Deutsche ALT-A Securities, Inc. Mortgage Loan Trust, Series 2007-1-1A3A
(1 Month LIBOR USD + 0.21%, 0.21% Floor) | | | 2.08% | | | | 08/25/2037 | | | | 3,480,405 | |
29,604,909 | | Deutsche ALT-A Securities, Inc. Mortgage Loan Trust, Series 2007-2-2A1
(1 Month LIBOR USD + 0.30%, 0.30% Floor) | | | 2.17% | | | | 09/25/2047 | | | | 26,076,425 | |
16,628,462 | | Deutsche ALT-A Securities, Inc. Mortgage Loan Trust, Series 2007-OA5-A1B
(1 Month LIBOR USD + 0.22%, 0.22% Floor) | | | 2.09% | | | | 08/25/2047 | | | | 15,714,101 | |
960,672 | | Deutsche ALT-B Securities, Inc. Mortgage Loan Trust, Series 2006-AB2-A2 | | | 5.63% | # | | | 06/25/2036 | | | | 931,085 | |
25,492,812 | | Deutsche ALT-B Securities, Inc. Mortgage Loan Trust, Series 2006-AB4-A2 | | | 5.65% | # | | | 10/25/2036 | | | | 24,257,767 | |
1,816,056 | | Deutsche ALT-B Securities, Inc. Mortgage Loan Trust, Series 2006-AB4-A3 | | | 5.90% | # | | | 10/25/2036 | | | | 1,727,724 | |
2,668,040 | | Deutsche ALT-B Securities, Inc. Mortgage Loan Trust, Series 2006-AB4-A3A1 | | | 5.90% | # | | | 10/25/2036 | | | | 2,538,268 | |
5,303,593 | | Deutsche ALT-B Securities, Inc. Mortgage Loan Trust, Series 2006-AB4-A6A1 | | | 5.87% | ß | | | 10/25/2036 | | | | 5,045,756 | |
12,290,406 | | Deutsche Mortgage Securities, Inc., Series 2006-PR1-3A1 (-1 x 1 Month LIBOR USD + 12.12%, 12.12% Cap) | | | 9.64% | ^ I/F | | | 04/15/2036 | | | | 12,151,156 | |
5,972,995 | | Deutsche Mortgage Securities, Inc., Series 2006-PR1-4AI1 (-1 x 1 Month LIBOR USD + 12.11%, 12.11% Cap) | | | 9.62% | ^ I/F | | | 04/15/2036 | | | | 5,838,622 | |
9,726,073 | | Deutsche Mortgage Securities, Inc., Series 2006-PR1-4AI2 (-2 x 1 Month LIBOR USD + 14.60%, 14.61% Cap) | | | 11.21% | ^ I/F | | | 04/15/2036 | | | | 9,651,583 | |
588,130 | | Deutsche Mortgage Securities, Inc., Series 2006-PR1-5AI1 (-3 x 1 Month LIBOR USD + 19.35%, 19.35% Cap) | | | 14.02% | ^ I/F | | | 04/15/2036 | | | | 614,025 | |
5,139,942 | | Deutsche Mortgage Securities, Inc., Series 2006-PR1-5AI3 (-1 x 1 Month LIBOR USD + 12.57%, 12.57% Cap) | | | 10.08% | ^ I/F | | | 04/15/2036 | | | | 4,783,730 | |
85,124,440 | | Deutsche Mortgage Securities, Inc., Series 2006-PR1-5AI4 (-1 x 1 Month LIBOR USD + 12.12%, 12.12% Cap) | | | 9.64% | ^ I/F | | | 04/15/2036 | | | | 78,486,283 | |
11,672,911 | | Deutsche Securities, Inc., Series 2005-6-2A1 | | | 5.50% | | | | 12/25/2035 | | | | 10,616,757 | |
1,825,587 | | Deutsche Securities, Inc., Series 2006-AB4-A1A | | | 6.01% | # | | | 10/25/2036 | | | | 1,736,644 | |
21,008,856 | | Equifirst Loan Securitization Trust, Series 2007-1-A2B (1 Month LIBOR USD + 0.19%, 0.19% Floor) | | | 2.06% | | | | 04/25/2037 | | | | 20,213,767 | |
9,055,059 | | First Franklin Mortgage Loan Trust, Series 2006-FF3-A2B (1 Month LIBOR USD + 0.20%, 0.20% Floor) | | | 2.07% | | | | 02/25/2036 | | | | 9,020,546 | |
10,099,733 | | First Horizon Alternative Mortgage Securities, Series 2005-AA4-1A1 | | | 3.25% | # | | | 05/25/2035 | | | | 8,749,519 | |
5,338,297 | | First Horizon Alternative Mortgage Securities, Series 2005-FA5-1A4 | | | 5.50% | | | | 08/25/2035 | | | | 5,011,181 | |
7,818,141 | | First Horizon Alternative Mortgage Securities, Series 2005-FA8-1A4 | | | 5.50% | | | | 11/25/2035 | | | | 6,682,089 | |
552,561 | | First Horizon Alternative Mortgage Securities, Series 2005-FA8-2A1 | | | 5.00% | | | | 11/25/2020 | | | | 555,853 | |
5,742,767 | | First Horizon Alternative Mortgage Securities, Series 2005-FA9-A4A | | | 5.50% | | | | 12/25/2035 | | | | 5,024,601 | |
4,148,051 | | First Horizon Alternative Mortgage Securities, Series 2006-AA3-A1 | | | 3.36% | # | | | 06/25/2036 | | | | 3,849,936 | |
3,429,799 | | First Horizon Alternative Mortgage Securities, Series 2006-FA1-1A12 | | | 6.00% | | | | 04/25/2036 | | | | 2,881,746 | |
104,633 | | First Horizon Alternative Mortgage Securities, Series 2006-FA1-1A6 (1 Month LIBOR USD + 0.75%, 0.75% Floor, 5.75% Cap) | | | 2.62% | | | | 04/25/2036 | | | | 104,788 | |
2,409,102 | | First Horizon Alternative Mortgage Securities, Series 2006-FA2-1A5 | | | 6.00% | | | | 05/25/2036 | | | | 1,909,328 | |
633,486 | | First Horizon Alternative Mortgage Securities, Series 2006-FA7-A8 | | | 6.25% | | | | 12/25/2036 | | | | 544,621 | |
3,407,372 | | First Horizon Alternative Mortgage Securities, Series 2006-FA8-1A5 | | | 6.00% | | | | 02/25/2037 | | | | 2,752,407 | |
7,021,406 | | First Horizon Alternative Mortgage Securities, Series 2006-RE1-A1 | | | 5.50% | | | | 05/25/2035 | | | | 6,406,821 | |
18,915,281 | | First Horizon Alternative Mortgage Securities, Series 2007-FA3-A3 | | | 6.00% | | | | 06/25/2037 | | | | 14,998,666 | |
973,288 | | First Horizon Alternative Mortgage Securities, Series 2007-FA3-A4 | | | 6.00% | | | | 06/25/2037 | | | | 771,758 | |
1,109,050 | | First Horizon Alternative Mortgage Securities, Series 2007-FA4-1A13 | | | 6.25% | | | | 08/25/2037 | | | | 901,878 | |
3,423,722 | | First Horizon Alternative Mortgage Securities, Series 2007-FA4-1A4 | | | 6.25% | | | | 08/25/2037 | | | | 2,784,164 | |
1,608,658 | | First Horizon Alternative Mortgage Securities, Series 2007-FA4-1A5 | | | 6.25% | | | | 08/25/2037 | | | | 1,308,158 | |
2,006,641 | | First Horizon Asset Securities, Inc., Series 2006-1-1A2 | | | 6.00% | | | | 05/25/2036 | | | | 1,832,586 | |
5,263,583 | | First Horizon Asset Securities, Inc., Series 2007-1-A3 | | | 6.00% | | | | 03/25/2037 | | | | 4,609,951 | |
3,584,379 | | First Horizon Asset Securities, Inc., Series 2007-4-1A1 | | | 6.00% | | | | 08/25/2037 | | | | 3,043,570 | |
4,387,289 | | First Horizon Mortgage Pass-Through Trust, Series 2005-8-1A11 | | | 5.75% | | | | 02/25/2036 | | | | 3,915,782 | |
171,989,569 | | Fremont Home Loan Trust, Series 2006-D-1A1 (1 Month LIBOR USD + 0.14%, 0.14% Floor) | | | 2.01% | | | | 11/25/2036 | | | | 115,385,119 | |
7,490,365 | | GCAT LLC, Series 2017-1-A1 | | | 3.38% | ^ § | | | 03/25/2047 | | | | 7,459,226 | |
46,273,000 | | GE-WMC Asset-Backed Pass-Through Certificates, Series 2005-2-A2D (1 Month LIBOR USD + 0.32%, 0.32% Floor) | | | 2.19% | | | | 12/25/2035 | | | | 44,304,695 | |
5,799,593 | | GMACM Mortgage Loan Trust, Series 2005-AR5-3A1 | | | 3.93% | # | | | 09/19/2035 | | | | 5,559,028 | |
7,982,975 | | GMACM Mortgage Loan Trust, Series 2005-J1-A14 | | | 5.50% | | | | 12/25/2035 | | | | 7,762,311 | |
38,355,927 | | GreenPoint Mortgage Funding Trust, Series 2005-AR3-2A1 (1 Month LIBOR USD + 0.26%, 0.26% Floor, 10.50% Cap) | | | 2.13% | | | | 08/25/2045 | | | | 27,621,852 | |
39,554,284 | | GreenPoint Mortgage Funding Trust, Series 2007-AR2-1A3 (1 Month LIBOR USD + 0.24%, 0.24% Floor) | | | 2.11% | | | | 04/25/2047 | | | | 36,903,850 | |
1,427,774 | | GS Mortgage Securities Corporation, Series 2008-2R-1A1 | | | 7.50% | # ^ | | | 09/25/2036 | | | | 1,015,446 | |
4,294,019 | | GS Mortgage Securities Corporation, Series 2009-3R-1A2 | | | 6.00% | # ^ | | | 04/25/2037 | | | | 4,313,555 | |
223,072 | | GSAA Home Equity Trust, Series 2005-12-AF3 | | | 5.07% | # | | | 09/25/2035 | | | | 186,245 | |
14,252,857 | | GSAA Home Equity Trust, Series 2005-7-AF3 | | | 4.75% | # | | | 05/25/2035 | | | | 14,323,663 | |
10,636,866 | | GSAA Home Equity Trust, Series 2006-10-AF3 | | | 5.98% | # | | | 06/25/2036 | | | | 5,371,818 | |
7,612,987 | | GSAA Home Equity Trust, Series 2006-10-AF4 | | | 6.30% | ß | | | 06/25/2036 | | | | 3,842,849 | |
14,350,897 | | GSAA Home Equity Trust, Series 2006-15-AF4 | | | 5.96% | ß | | | 09/25/2036 | | | | 7,595,871 | |
2,452,388 | | GSAA Home Equity Trust, Series 2006-18-AF3A | | | 5.77% | # | | | 11/25/2036 | | | | 1,365,633 | |
5,344,721 | | GSAA Home Equity Trust, Series 2006-18-AF6 | | | 5.68% | ß | | | 11/25/2036 | | | | 2,796,805 | |
5,795,347 | | GSAA Home Equity Trust, Series 2007-10-A1A | | | 6.00% | | | | 11/25/2037 | | | | 5,055,272 | |
3,524,371 | | GSAA Home Equity Trust, Series 2007-10-A2A | | | 6.50% | | | | 11/25/2037 | | | | 2,609,038 | |
27,516,613 | | GSAMP Trust, Series 2006-HE6-A3 (1 Month LIBOR USD + 0.15%, 0.15% Floor) | | | 2.02% | | | | 08/25/2036 | | | | 23,445,987 | |
13,013,169 | | GSMPS Mortgage Loan Trust, Series 2005-RP2-1AF (1 Month LIBOR USD + 0.35%, 0.35% Floor) | | | 2.22% | ^ | | | 03/25/2035 | | | | 12,257,518 | |
13,013,169 | | GSMPS Mortgage Loan Trust, Series 2005-RP2-1AS | | | 3.11% | # ^ I/O | | | 03/25/2035 | | | | 751,098 | |
7,532,046 | | GSMPS Mortgage Loan Trust, Series 2005-RP3-1AF (1 Month LIBOR USD + 0.35%, 0.35% Floor, 9.50% Cap) | | | 2.22% | ^ | | | 09/25/2035 | | | | 6,829,472 | |
7,532,046 | | GSMPS Mortgage Loan Trust, Series 2005-RP3-1AS | | | 2.97% | # ^ I/O | | | 09/25/2035 | | | | 608,924 | |
28,958,675 | | GSMPS Mortgage Loan Trust, Series 2006-RP1-1AF1 (1 Month LIBOR USD + 0.35%, 0.35% Floor, 9.15% Cap) | | | 2.22% | ^ | | | 01/25/2036 | | | | 25,183,793 | |
28,958,675 | | GSMPS Mortgage Loan Trust, Series 2006-RP1-1AS | | | 2.86% | # ^ I/O | | | 01/25/2036 | | | | 1,972,981 | |
7,379,256 | | GSMSC Pass-Through Trust, Series 2009-3R-3A2 | | | 5.75% | # ^ | | | 04/25/2037 | | | | 7,370,653 | |
2,128,648 | | GSR Mortgage Loan Trust, Series 2005-1F-1A2 | | | 5.50% | | | | 02/25/2035 | | | | 2,157,295 | |
4,546,271 | | GSR Mortgage Loan Trust, Series 2005-1F-3A3 | | | 6.00% | | | | 01/25/2035 | | | | 4,576,291 | |
668,982 | | GSR Mortgage Loan Trust, Series 2005-6F-3A5 | | | 6.00% | | | | 07/25/2035 | | | | 709,316 | |
6,604,508 | | GSR Mortgage Loan Trust, Series 2005-6F-3A9 (-1 x 1 Month LIBOR USD + 6.90%, 6.90% Cap) | | | 5.03% | I/F I/O | | | 07/25/2035 | | | | 677,154 | |
453,914 | | GSR Mortgage Loan Trust, Series 2005-6F-4A1 (1 Month LIBOR USD + 0.50%, 0.50% Floor, 6.00% Cap) | | | 2.37% | | | | 07/25/2035 | | | | 427,179 | |
332,549 | | GSR Mortgage Loan Trust, Series 2005-7F-3A1 (1 Month LIBOR USD + 0.50%, 0.50% Floor, 6.00% Cap) | | | 2.37% | | | | 09/25/2035 | | | | 321,867 | |
10,747,796 | | GSR Mortgage Loan Trust, Series 2005-8F-3A5 | | | 6.00% | | | | 11/25/2035 | | | | 8,759,340 | |
3,818,650 | | GSR Mortgage Loan Trust, Series 2005-8F-4A1 | | | 6.00% | | | | 11/25/2035 | | | | 3,415,523 | |
1,106,332 | | GSR Mortgage Loan Trust, Series 2006-1F-1A2 | | | 5.50% | | | | 02/25/2036 | | | | 1,223,891 | |
858,048 | | GSR Mortgage Loan Trust, Series 2006-2F-2A3 | | | 5.75% | | | | 02/25/2036 | | | | 831,991 | |
3,232,474 | | GSR Mortgage Loan Trust, Series 2006-2F-3A3 | | | 6.00% | | | | 02/25/2036 | | | | 2,707,662 | |
3,882,039 | | GSR Mortgage Loan Trust, Series 2006-2F-3A6 | | | 6.00% | | | | 02/25/2036 | | | | 3,251,766 | |
12,454,273 | | GSR Mortgage Loan Trust, Series 2006-6F-2A3 | | | 6.00% | | | | 07/25/2036 | | | | 10,813,762 | |
6,228,101 | | GSR Mortgage Loan Trust, Series 2006-7F-3A4 | | | 6.25% | | | | 08/25/2036 | | | | 4,212,867 | |
4,707,851 | | GSR Mortgage Loan Trust, Series 2006-9F-2A1 | | | 6.00% | | | | 10/25/2036 | | | | 4,579,759 | |
20,420,791 | | GSR Mortgage Loan Trust, Series 2006-9F-4A1 | | | 6.50% | | | | 10/25/2036 | | | | 18,182,458 | |
78,569 | | GSR Mortgage Loan Trust, Series 2006-9F-8A1 | | | 5.50% | | | | 08/25/2021 | | | | 75,623 | |
1,347,606 | | GSR Mortgage Loan Trust, Series 2007-1F-2A2 | | | 5.50% | | | | 01/25/2037 | | | | 1,582,793 | |
2,197,095 | | GSR Mortgage Loan Trust, Series 2007-4F-1A1 | | | 5.00% | | | | 07/25/2037 | | | | 2,505,579 | |
28,307,524 | | GSR Mortgage Loan Trust, Series 2007-4F-3A11 | | | 6.00% | | | | 07/25/2037 | | | | 26,119,545 | |
1,494,325 | | HarborView Mortgage Loan Trust, Series 2005-14-3A1A | | | 3.87% | # | | | 12/19/2035 | | | | 1,482,520 | |
7,938,485 | | HarborView Mortgage Loan Trust, Series 2006-10-2A1A (1 Month LIBOR USD + 0.18%, 0.18% Floor) | | | 1.99% | | | | 11/19/2036 | | | | 7,740,423 | |
16,715,036 | | HarborView Mortgage Loan Trust, Series 2006-11-A1A (1 Month LIBOR USD + 0.17%, 0.17% Floor) | | | 1.98% | | | | 12/19/2036 | | | | 15,233,559 | |
69,042,889 | | HarborView Mortgage Loan Trust, Series 2006-14-1A1A (1 Month LIBOR USD + 0.18%, 0.18% Floor) | | | 1.99% | | | | 01/25/2047 | | | | 62,915,153 | |
100,371,643 | | HarborView Mortgage Loan Trust, Series 2006-8-1A1 (1 Month LIBOR USD + 0.20%) | | | 2.04% | | | | 07/21/2036 | | | | 77,284,790 | |
25,156,573 | | HarborView Mortgage Loan Trust, Series 2006-BU1-1A1A (1 Month LIBOR USD + 0.21%, 0.21% Floor, 10.50% Cap) | | | 2.02% | | | | 02/19/2046 | | | | 22,801,829 | |
62,893,541 | | HarborView Mortgage Loan Trust, Series 2007-3-1A1A (1 Month LIBOR USD + 0.20%) | | | 2.01% | | | | 05/19/2047 | | | | 58,373,647 | |
19,492,205 | | HarborView Mortgage Loan Trust, Series 2007-4-1A1 (1 Month LIBOR USD + 0.22%, 10.00% Cap) | | | 2.03% | | | | 07/19/2047 | | | | 18,914,142 | |
32,299,802 | | HarborView Mortgage Loan Trust, Series 2007-7-1A1 (1 Month LIBOR USD + 1.00%, 10.50% Cap) | | | 2.87% | | | | 10/25/2037 | | | | 30,021,138 | |
1,217,412 | | Home Equity Asset Trust, Series 2003-3-M1 (1 Month LIBOR USD + 1.29%, 0.86% Floor) | | | 3.16% | | | | 08/25/2033 | | | | 1,225,845 | |
487,889 | | Home Equity Asset Trust, Series 2004-7-M2 (1 Month LIBOR USD + 0.99%, 0.66% Floor) | | | 2.86% | | | | 01/25/2035 | | | | 484,766 | |
12,182,000 | | Home Equity Loan Trust, Series 2006-B-2A4 (1 Month LIBOR USD + 0.28%, 0.28% Floor) | | | 2.15% | | | | 06/25/2036 | | | | 11,159,805 | |
13,866,004 | | Home Equity Loan Trust, Series 2007-FRE1-2AV2 (1 Month LIBOR USD + 0.16%, 0.16% Floor) | | | 2.03% | | | | 04/25/2037 | | | | 13,742,940 | |
1,369,165 | | HomeBanc Mortgage Trust, Series 2005-1-M2 (1 Month LIBOR USD + 0.49%, 0.49% Floor, 11.50% Cap) | | | 2.36% | | | | 03/25/2035 | | | | 1,201,314 | |
16,975,031 | | HomeBanc Mortgage Trust, Series 2005-3-A1 (1 Month LIBOR USD + 0.24%, 0.24% Floor, 11.50% Cap) | | | 2.11% | | | | 07/25/2035 | | | | 16,893,230 | |
757,886 | | HomeBanc Mortgage Trust, Series 2006-1-3A1 | | | 3.35% | # | | | 04/25/2037 | | | | 766,597 | |
29,496,350 | | HSI Asset Loan Obligation Trust, Series 2007-2-3A6 | | | 6.00% | | | | 09/25/2037 | | | | 20,947,942 | |
3,255,684 | | HSI Asset Loan Obligation Trust, Series 2007-AR1-3A1 | | | 3.64% | # | | | 01/25/2037 | | | | 2,999,019 | |
20,558,042 | | Impac Secured Assets Trust, Series 2007-1-A2 (1 Month LIBOR USD + 0.16%, 0.16% Floor, 11.50% Cap) | | | 2.03% | | | | 03/25/2037 | | | | 18,806,415 | |
751,672 | | Impac Trust, Series 2002-9F-A1 | | | 5.22% | | | | 12/25/2032 | | | | 756,666 | |
34,140,955 | | IndyMac IMSC Mortgage Loan Trust, Series 2007-F1-2A1 | | | 6.50% | | | | 06/25/2037 | | | | 19,094,664 | |
7,745,477 | | IndyMac INDX Mortgage Loan Trust, Series 2007-AR13-2A1 | | | 3.56% | # | | | 07/25/2037 | | | | 6,394,932 | |
1,924,213 | | IndyMac Mortgage Loan Trust, Series 2006-AR2-1A1 | | | 3.61% | # | | | 09/25/2036 | | | | 1,768,509 | |
5,426,442 | | IndyMac Mortgage Loan Trust, Series 2006-AR2-4A1 | | | 3.66% | # | | | 09/25/2036 | | | | 5,262,439 | |
21,012,094 | | IndyMac Mortgage Loan Trust, Series 2006-AR3-1A1 | | | 3.69% | # | | | 12/25/2036 | | | | 20,193,026 | |
7,327,187 | | IndyMac Mortgage Loan Trust, Series 2006-AR7-3A1 | | | 3.59% | # | | | 05/25/2036 | | | | 6,589,200 | |
4,943,265 | | IndyMac Mortgage Loan Trust, Series 2007-A1-A1 | | | 6.00% | | | | 08/25/2037 | | | | 4,156,098 | |
3,618,856 | | IndyMac Mortgage Loan Trust, Series 2007-A1-A7 | | | 6.00% | | | | 08/25/2037 | | | | 3,042,589 | |
22,881,808 | | IndyMac Mortgage Loan Trust, Series 2007-A3-A1 | | | 6.25% | | | | 11/25/2037 | | | | 18,687,083 | |
9,565,788 | | IndyMac Mortgage Loan Trust, Series 2007-AR1-3A1 | | | 3.47% | # | | | 03/25/2037 | | | | 9,130,763 | |
5,512,593 | | IndyMac Mortgage Loan Trust, Series 2007-AR3-3A1 | | | 3.41% | # | | | 07/25/2037 | | | | 5,172,736 | |
528,252 | | IndyMac Mortgage Loan Trust, Series 2007-F2-1A2 | | | 6.00% | | | | 07/25/2037 | | | | 491,198 | |
25,635,460 | | IndyMac Mortgage Loan Trust, Series 2007-F2-2A1 | | | 6.50% | | | | 07/25/2037 | | | | 16,779,778 | |
119,737 | | Jefferies & Company, Inc., Series 2010-R1-1A1 (1 Month LIBOR USD + 6.00%) | | | 6.00% | # ^ | | | 03/26/2037 | | | | 120,105 | |
6,449,282 | | Jefferies & Company, Inc., Series 2010-R4-1A4 | | | 6.00% | # ^ Þ | | | 10/26/2036 | | | | 6,439,334 | |
11,773,409 | | JP Morgan Alternative Loan Trust, Series 2005-S1-2A11 | | | 6.00% | | | | 12/25/2035 | | | | 11,413,096 | |
3,774,304 | | JP Morgan Alternative Loan Trust, Series 2005-S1-2A9 | | | 6.00% | | | | 12/25/2035 | | | | 3,658,795 | |
3,906,013 | | JP Morgan Alternative Loan Trust, Series 2006-S1-1A8 | | | 5.75% | | | | 03/25/2036 | | | | 3,482,929 | |
14,824,611 | | JP Morgan Alternative Loan Trust, Series 2006-S2-A4 | | | 6.19% | ß | | | 05/25/2036 | | | | 14,066,774 | |
2,448,142 | | JP Morgan Alternative Loan Trust, Series 2006-S4-A3A | | | 5.78% | ß | | | 12/25/2036 | | | | 2,740,242 | |
25,041,971 | | JP Morgan Alternative Loan Trust, Series 2006-S4-A4 | | | 5.96% | ß | | | 12/25/2036 | | | | 24,384,329 | |
10,978,833 | | JP Morgan Mortgage Acquisition Trust, Series 2006-CH2-AF3 | | | 5.46% | ß | | | 09/25/2029 | | | | 9,110,841 | |
4,174,266 | | JP Morgan Mortgage Acquisition Trust, Series 2006-WF1-A5 | | | 6.41% | ß | | | 07/25/2036 | | | | 2,160,889 | |
23,000,000 | | JP Morgan Mortgage Acquisition Trust, Series 2007-CH1-AF5 | | | 4.96% | ß | | | 11/25/2036 | | | | 22,659,851 | |
9,690,000 | | JP Morgan Mortgage Acquisition Trust, Series 2007-CH3-M2 (1 Month LIBOR USD + 0.32%, 0.32% Floor) | | | 2.19% | | | | 03/25/2037 | | | | 8,212,323 | |
1,376,256 | | JP Morgan Mortgage Trust, Series 2005-A6-5A1 | | | 3.46% | # | | | 08/25/2035 | | | | 1,371,862 | |
8,290,388 | | JP Morgan Mortgage Trust, Series 2005-S1-1A2 | | | 6.50% | | | | 01/25/2035 | | | | 9,047,967 | |
1,172,308 | | JP Morgan Mortgage Trust, Series 2005-S2-2A13 | | | 5.50% | | | | 09/25/2035 | | | | 1,171,323 | |
1,516,667 | | JP Morgan Mortgage Trust, Series 2006-S2-3A3 | | | 6.00% | | | | 07/25/2036 | | | | 1,229,790 | |
5,021,537 | | JP Morgan Mortgage Trust, Series 2006-S2-3A5 | | | 6.25% | | | | 07/25/2036 | | | | 4,037,508 | |
3,846,740 | | JP Morgan Mortgage Trust, Series 2006-S3-1A2 | | | 6.00% | | | | 08/25/2036 | | | | 3,429,414 | |
9,934,503 | | JP Morgan Mortgage Trust, Series 2006-S3-1A21 (1 Month LIBOR USD + 0.38%, 0.38% Floor, 7.50% Cap) | | | 2.25% | | | | 08/25/2036 | | | | 4,592,747 | |
9,934,503 | | JP Morgan Mortgage Trust, Series 2006-S3-1A22 (-1 x 1 Month LIBOR USD + 7.12%, 7.12% Cap) | | | 5.25% | I/F I/O | | | 08/25/2036 | | | | 2,840,853 | |
1,792,444 | | JP Morgan Mortgage Trust, Series 2006-S3-1A9 | | | 6.00% | | | | 08/25/2036 | | | | 1,597,994 | |
8,512,648 | | JP Morgan Mortgage Trust, Series 2006-S4-A8 (1 Month LIBOR USD + 0.38%, 0.38% Floor, 7.00% Cap) | | | 2.25% | | | | 01/25/2037 | | | | 5,110,582 | |
8,512,648 | | JP Morgan Mortgage Trust, Series 2006-S4-A9 (-1 x 1 Month LIBOR USD + 6.62%, 6.62% Cap) | | | 4.75% | I/F I/O | | | 01/25/2037 | | | | 1,818,668 | |
2,286,343 | | JP Morgan Mortgage Trust, Series 2007-A2-2A1 | | | 3.74% | # | | | 04/25/2037 | | | | 2,235,124 | |
10,351,481 | | JP Morgan Mortgage Trust, Series 2007-S1-2A6 | | | 6.00% | | | | 03/25/2037 | | | | 8,382,711 | |
3,754,453 | | JP Morgan Mortgage Trust, Series 2007-S3-1A1 | | | 5.50% | | | | 08/25/2037 | | | | 3,288,361 | |
7,282,443 | | JP Morgan Mortgage Trust, Series 2007-S3-1A35 | | | 6.00% | | | | 08/25/2037 | | | | 6,407,428 | |
1,233,672 | | JP Morgan Mortgage Trust, Series 2007-S3-1A9 | | | 6.00% | | | | 08/25/2037 | | | | 1,080,413 | |
6,714,783 | | JP Morgan Mortgage Trust, Series 2007-S3-1A96 | | | 6.00% | | | | 08/25/2037 | | | | 5,907,981 | |
7,647,815 | | JP Morgan Mortgage Trust, Series 2007-S3-1A97 | | | 6.00% | | | | 08/25/2037 | | | | 6,732,933 | |
760,940 | | JP Morgan Mortgage Trust, Series 2007-S3-2A2 | | | 5.50% | | | | 08/25/2022 | | | | 790,914 | |
9,935,775 | | JP Morgan Resecuritization Trust, Series 2009-4-3A2 | | | 6.00% | ^ | | | 02/26/2037 | | | | 8,198,333 | |
16,903,727 | | JP Morgan Resecuritization Trust, Series 2009-7-7A1 | | | 7.00% | # ^ | | | 09/27/2037 | | | | 12,896,159 | |
18,336,658 | | JP Morgan Resecuritization Trust, Series 2010-1-1A4 | | | 6.00% | ^ | | | 02/26/2037 | | | | 15,650,068 | |
14,996,674 | | JP Morgan Resecuritization Trust, Series 2010-2-3A9 | | | 6.00% | ^ | | | 07/26/2036 | | | | 15,077,501 | |
10,322 | | JP Morgan Resecuritization Trust, Series 2012-2-3A3 | | | 3.32% | # ^ | | | 10/26/2036 | | | | 10,352 | |
3,265,238 | | Lehman Mortgage Trust, Series 2005-2-3A5 | | | 5.50% | | | | 12/25/2035 | | | | 3,004,923 | |
2,914,212 | | Lehman Mortgage Trust, Series 2005-2-5A5 | | | 5.75% | | | | 12/25/2035 | | | | 2,890,683 | |
4,351,297 | | Lehman Mortgage Trust, Series 2005-3-2A1 | | | 6.00% | | | | 01/25/2036 | | | | 4,314,106 | |
370,530 | | Lehman Mortgage Trust, Series 2005-3-2A3 | | | 5.50% | | | | 01/25/2036 | | | | 358,898 | |
1,990,093 | | Lehman Mortgage Trust, Series 2005-3-2A7 | | | 6.00% | | | | 01/25/2036 | | | | 1,972,373 | |
1,781,975 | | Lehman Mortgage Trust, Series 2006-1-1A1 (1 Month LIBOR USD + 0.75%, 0.75% Floor, 5.50% Cap) | | | 2.62% | | | | 02/25/2036 | | | | 1,353,093 | |
5,345,925 | | Lehman Mortgage Trust, Series 2006-1-1A2 (-1 x 1 Month LIBOR USD + 4.75%, 4.75% Cap) | | | 2.88% | I/F I/O | | | 02/25/2036 | | | | 754,360 | |
6,915,674 | | Lehman Mortgage Trust, Series 2006-1-3A1 (1 Month LIBOR USD + 0.75%, 0.75% Floor, 5.50% Cap) | | | 2.62% | | | | 02/25/2036 | | | | 6,408,029 | |
6,915,674 | | Lehman Mortgage Trust, Series 2006-1-3A2 (-1 x 1 Month LIBOR USD + 4.75%, 4.75% Cap) | | | 2.88% | I/F I/O | | | 02/25/2036 | | | | 445,864 | |
4,455,710 | | Lehman Mortgage Trust, Series 2006-1-3A4 | | | 5.50% | | | | 02/25/2036 | | | | 4,670,795 | |
3,787,738 | | Lehman Mortgage Trust, Series 2006-4-1A3 (-1 x 1 Month LIBOR USD + 5.40%, 5.40% Cap) | | | 3.53% | I/F I/O | | | 08/25/2036 | | | | 509,316 | |
2,407,404 | | Lehman Mortgage Trust, Series 2006-4-1A4 | | | 6.00% | | | | 08/25/2036 | | | | 2,353,520 | |
7,049,902 | | Lehman Mortgage Trust, Series 2006-5-2A1 (1 Month LIBOR USD + 0.35%, 0.35% Floor, 7.50% Cap) | | | 2.22% | | | | 09/25/2036 | | | | 2,341,676 | |
14,684,869 | | Lehman Mortgage Trust, Series 2006-5-2A2 (-1 x 1 Month LIBOR USD + 7.15%, 7.15% Cap) | | | 5.28% | I/F I/O | | | 09/25/2036 | | | | 3,506,930 | |
11,034,162 | | Lehman Mortgage Trust, Series 2006-6-3A9 | | | 5.50% | | | | 10/25/2036 | | | | 9,952,119 | |
3,368,187 | | Lehman Mortgage Trust, Series 2006-6-4A5 | | | 6.00% | | | | 12/25/2036 | | | | 3,192,868 | |
3,727,567 | | Lehman Mortgage Trust, Series 2006-7-2A2 (1 Month LIBOR USD + 0.45%, 0.45% Floor, 7.00% Cap) | | | 2.32% | | | | 11/25/2036 | | | | 1,823,705 | |
12,930,876 | | Lehman Mortgage Trust, Series 2006-7-2A5 (-1 x 1 Month LIBOR USD + 6.55%, 6.55% Cap) | | | 4.68% | I/F I/O | | | 11/25/2036 | | | | 2,985,719 | |
3,069,549 | | Lehman Mortgage Trust, Series 2006-9-1A19 (-5 x 1 Month LIBOR USD + 30.68%, 30.68% Cap) | | | 22.07% | I/F | | | 01/25/2037 | | | | 4,121,928 | |
3,383,277 | | Lehman Mortgage Trust, Series 2006-9-1A5 (1 Month LIBOR USD + 0.60%, 0.60% Floor, 5.75% Cap) | | | 2.47% | | | | 01/25/2037 | | | | 2,572,956 | |
10,072,602 | | Lehman Mortgage Trust, Series 2006-9-1A6 (-1 x 1 Month LIBOR USD + 5.15%, 5.15% Cap) | | | 3.28% | I/F I/O | | | 01/25/2037 | | | | 1,133,014 | |
4,596,575 | | Lehman Mortgage Trust, Series 2006-9-2A1 (1 Month LIBOR USD + 0.38%, 0.38% Floor, 7.00% Cap) | | | 2.25% | | | | 01/25/2037 | | | | 2,225,326 | |
8,783,722 | | Lehman Mortgage Trust, Series 2006-9-2A2 (-1 x 1 Month LIBOR USD + 6.62%, 6.62% Cap) | | | 4.75% | I/F I/O | | | 01/25/2037 | | | | 2,106,878 | |
8,753,309 | | Lehman Mortgage Trust, Series 2007-10-2A1 | | | 6.50% | | | | 01/25/2038 | | | | 6,612,608 | |
2,792,697 | | Lehman Mortgage Trust, Series 2007-2-1A1 | | | 5.75% | | | | 02/25/2037 | | | | 2,529,012 | |
3,090,041 | | Lehman Mortgage Trust, Series 2007-4-2A11 (1 Month LIBOR USD + 0.33%, 0.33% Floor, 7.00% Cap) | | | 2.20% | | | | 05/25/2037 | | | | 1,571,707 | |
13,392,503 | | Lehman Mortgage Trust, Series 2007-4-2A8 (-1 x 1 Month LIBOR USD + 6.67%, 6.67% Cap) | | | 4.80% | I/F I/O | | | 05/25/2037 | | | | 3,450,415 | |
1,303,201 | | Lehman Mortgage Trust, Series 2007-4-2A9 (1 Month LIBOR USD + 0.33%, 0.33% Floor, 7.00% Cap) | | | 2.20% | | | | 05/25/2037 | | | | 699,646 | |
12,209,250 | | Lehman Mortgage Trust, Series 2007-5-11A1 | | | 5.30% | # | | | 06/25/2037 | | | | 10,476,103 | |
2,314,176 | | Lehman Mortgage Trust, Series 2007-5-3A4 | | | 5.00% | | | | 12/25/2035 | | | | 2,132,779 | |
1,546,604 | | Lehman Mortgage Trust, Series 2007-5-4A3 (-6 x 1 Month LIBOR USD + 40.08%, 40.08% Cap) | | | 28.85% | I/F | | | 08/25/2036 | | | | 2,630,866 | |
951,466 | | Lehman Mortgage Trust, Series 2007-5-7A3 | | | 7.50% | | | | 10/25/2036 | | | | 778,926 | |
422,399 | | Lehman Mortgage Trust, Series 2007-6-1A8 | | | 6.00% | | | | 07/25/2037 | | | | 409,350 | |
5,527,720 | | Lehman Mortgage Trust, Series 2008-2-1A6 | | | 6.00% | | | | 03/25/2038 | | | | 4,299,462 | |
710,674 | | Lehman XS Trust, Series 2005-10-2A3B | | | 5.33% | ß | | | 01/25/2036 | | | | 765,240 | |
10,056,659 | | Lehman XS Trust, Series 2005-4-2A3A | | | 5.00% | ß | | | 10/25/2035 | | | | 10,252,486 | |
15,695,168 | | Lehman XS Trust, Series 2006-5-1A1A (1 Month LIBOR USD + 0.21%, 0.21% Floor) | | | 2.08% | | | | 04/25/2036 | | | | 16,062,560 | |
682,094 | | Lehman XS Trust, Series 2006-5-2A4A | | | 5.89% | ß | | | 04/25/2036 | | | | 801,677 | |
16,199,954 | | Lehman XS Trust, Series 2006-GP3-1A1 (1 Month LIBOR USD + 0.20%, 0.20% Floor) | | | 2.07% | | | | 06/25/2046 | | | | 15,620,809 | |
16,993,779 | | Lehman XS Trust, Series 2007-1-2A1 | | | 4.94% | # | | | 02/25/2037 | | | | 17,426,000 | |
25,337,465 | | Lehman XS Trust, Series 2007-12N-1A3A (1 Month LIBOR USD + 0.20%, 0.20% Floor) | | | 1.82% | | | | 07/25/2047 | | | | 23,512,432 | |
2,507,098 | | Long Beach Mortgage Loan Trust, Series 2006-WL1-2A3 (1 Month LIBOR USD + 0.24%, 0.24% Floor) | | | 2.11% | | | | 01/25/2046 | | | | 2,514,291 | |
8,390,073 | | Luminent Mortgage Trust, Series 2005-1-A1 (1 Month LIBOR USD + 0.26%, 0.26% Floor, 11.50% Cap) | | | 2.13% | | | | 11/25/2035 | | | | 8,159,984 | |
4,010,770 | | MASTR Adjustable Rate Mortgages Trust, Series 2005-2-2A1 | | | 3.53% | # | | | 03/25/2035 | | | | 3,171,270 | |
2,950,283 | | MASTR Adjustable Rate Mortgages Trust, Series 2005-6-5A1 | | | 3.18% | # | | | 07/25/2035 | | | | 2,679,302 | |
14,544,892 | | MASTR Adjustable Rate Mortgages Trust, Series 2007-1-2A1 | | | 3.67% | # | | | 11/25/2036 | | | | 13,421,385 | |
1,761,763 | | MASTR Alternative Loans Trust, Series 2005-2-3A1 | | | 6.00% | | | | 03/25/2035 | | | | 1,688,943 | |
419,954 | | MASTR Alternative Loans Trust, Series 2005-5-2A3 | | | 5.50% | | | | 07/25/2025 | | | | 401,051 | |
3,768,714 | | MASTR Alternative Loans Trust, Series 2005-6-1A5 | | | 5.50% | | | | 12/25/2035 | | | | 3,642,121 | |
2,388,124 | | MASTR Alternative Loans Trust, Series 2006-3-1A2 | | | 6.25% | | | | 07/25/2036 | | | | 2,154,328 | |
3,820,586 | | MASTR Alternative Loans Trust, Series 2007-1-1A5 | | | 5.75% | | | | 10/25/2036 | | | | 3,679,575 | |
5,210,470 | | MASTR Alternative Loans Trust, Series 2007-1-2A7 | | | 6.00% | | | | 10/25/2036 | | | | 3,530,392 | |
4,732,343 | | MASTR Asset Backed Securities Trust, Series 2003-OPT1-M3 (1 Month LIBOR USD + 4.13%, 2.75% Floor) | | | 6.00% | | | | 12/25/2032 | | | | 4,964,653 | |
13,623,546 | | MASTR Asset Backed Securities Trust, Series 2006-AM2-A3 (1 Month LIBOR USD + 0.17%, 0.17% Floor) | | | 2.04% | | | | 06/25/2036 | | | | 12,053,995 | |
30,096,143 | | MASTR Asset Backed Securities Trust, Series 2007-HE1-A3 (1 Month LIBOR USD + 0.21%, 0.21% Floor) | | | 2.08% | | | | 05/25/2037 | | | | 28,660,584 | |
4,786,645 | | MASTR Asset Securitization Trust, Series 2006-1-1A4 | | | 5.75% | | | | 05/25/2036 | | | | 4,515,217 | |
3,191,719 | | MASTR Asset Securitization Trust, Series 2006-2-1A11 (1 Month LIBOR USD + 6.00%, 6.00% Floor) | | | 6.00% | | | | 06/25/2036 | | | | 3,128,900 | |
3,633,312 | | MASTR Asset Securitization Trust, Series 2007-1-1A3 | | | 6.25% | | | | 11/25/2037 | | | | 2,942,150 | |
17,220,144 | | MASTR Resecuritization Trust, Series 2008-4-A1 | | | 6.00% | # ^ | | | 06/27/2036 | | | | 14,901,336 | |
2,100,565 | | MASTR Seasoned Securitization Trust, Series 2005-2-1A4 | | | 6.00% | | | | 10/25/2032 | | | | 2,172,737 | |
1,202,939 | | MASTR Seasoned Securitization Trust, Series 2005-2-2A1 (1 Month LIBOR USD + 0.40%, 0.40% Floor, 7.50% Cap) | | | 2.27% | | | | 10/25/2032 | | | | 1,134,636 | |
20,736,192 | | Merrill Lynch Alternative Note Asset Trust, Series 2007-F1-2A4 (1 Month LIBOR USD + 0.32%, 0.32% Floor, 7.00% Cap) | | | 2.19% | | | | 03/25/2037 | | | | 11,499,529 | |
20,736,192 | | Merrill Lynch Alternative Note Asset Trust, Series 2007-F1-2A5 (-1 x 1 Month LIBOR USD + 6.68%, 6.68% Cap) | | | 4.81% | I/F I/O | | | 03/25/2037 | | | | 5,064,033 | |
3,944,285 | | Merrill Lynch Mortgage Investors Trust, Series 2006-3-1A | | | 3.52% | # | | | 10/25/2036 | | | | 3,869,178 | |
1,921,679 | | Merrill Lynch Mortgage Investors Trust, Series 2006-F1-1A2 | | | 6.00% | | | | 04/25/2036 | | | | 1,690,986 | |
38,426,908 | | MFA Trust, Series 2017-NPL1-A1 | | | 3.35% | ^ § | | | 11/25/2047 | | | | 38,275,802 | |
65,626,006 | | Morgan Stanley Capital Trust, Series 2007-NC3-A1 (1 Month LIBOR USD + 0.20%, 0.20% Floor) | | | 2.07% | ^ | | | 05/25/2037 | | | | 46,356,360 | |
36,363,072 | | Morgan Stanley Home Equity Loan Trust, Series 2007-1-A4 (1 Month LIBOR USD + 0.22%, 0.22% Floor) | | | 2.09% | | | | 12/25/2036 | | | | 22,607,249 | |
1,520,374 | | Morgan Stanley Mortgage Loan Trust, Series 2005-10-1A1 (1 Month LIBOR USD + 0.70%, 0.70% Floor, 5.75% Cap) | | | 2.57% | | | | 12/25/2035 | | | | 1,248,775 | |
3,809,236 | | Morgan Stanley Mortgage Loan Trust, Series 2005-10-1A6 | | | 5.75% | | | | 12/25/2035 | | | | 3,606,930 | |
5,511,471 | | Morgan Stanley Mortgage Loan Trust, Series 2005-10-2A1 | | | 5.52% | # | | | 12/25/2035 | | | | 5,503,464 | |
262,039 | | Morgan Stanley Mortgage Loan Trust, Series 2005-6AR-1A1 (1 Month LIBOR USD + 0.28%, 0.28% Floor) | | | 2.15% | | | | 11/25/2035 | | | | 263,855 | |
5,797,422 | | Morgan Stanley Mortgage Loan Trust, Series 2006-11-1A6 | | | 6.23% | ß | | | 08/25/2036 | | | | 2,594,124 | |
11,416,321 | | Morgan Stanley Mortgage Loan Trust, Series 2006-11-2A1 | | | 6.00% | | | | 08/25/2036 | | | | 9,555,221 | |
7,278,055 | | Morgan Stanley Mortgage Loan Trust, Series 2006-17XS-A3A | | | 5.65% | ß | | | 10/25/2046 | | | | 4,051,461 | |
2,344,930 | | Morgan Stanley Mortgage Loan Trust, Series 2006-17XS-A6 | | | 5.58% | ß | | | 10/25/2046 | | | | 1,144,020 | |
5,060,527 | | Morgan Stanley Mortgage Loan Trust, Series 2006-2-2A3 | | | 5.75% | | | | 02/25/2036 | | | | 5,079,725 | |
30,631,464 | | Morgan Stanley Mortgage Loan Trust, Series 2006-7-3A | | | 5.05% | # | | | 06/25/2036 | | | | 27,046,115 | |
2,905,042 | | Morgan Stanley Mortgage Loan Trust, Series 2006-7-4A4 | | | 6.00% | | | | 06/25/2036 | | | | 2,571,140 | |
2,940,852 | | Morgan Stanley Mortgage Loan Trust, Series 2006-7-4A7 | | | 6.00% | | | | 06/25/2036 | | | | 2,602,834 | |
3,857,189 | | Morgan Stanley Mortgage Loan Trust, Series 2007-13-6A1 | | | 6.00% | | | | 10/25/2037 | | | | 3,471,461 | |
11,962,178 | | Morgan Stanley Mortgage Loan Trust, Series 2007-14AR-2A3 | | | 3.37% | # | | | 10/25/2037 | | | | 10,878,397 | |
3,828,860 | | Morgan Stanley Mortgage Loan Trust, Series 2007-1XS-2A3 | | | 5.92% | ß | | | 09/25/2046 | | | | 1,847,021 | |
2,723,358 | | Morgan Stanley Mortgage Loan Trust, Series 2007-1XS-2A4A | | | 6.08% | ß | | | 09/25/2046 | | | | 1,503,095 | |
1,099,498 | | Morgan Stanley Mortgage Loan Trust, Series 2007-3XS-1A2A | | | 5.62% | ß | | | 01/25/2047 | | | | 1,022,807 | |
7,615,267 | | Morgan Stanley Mortgage Loan Trust, Series 2007-3XS-2A3S | | | 5.86% | ß | | | 01/25/2047 | | | | 4,523,081 | |
4,454,213 | | Morgan Stanley Mortgage Loan Trust, Series 2007-3XS-2A4S | | | 5.96% | ß | | | 01/25/2047 | | | | 2,645,211 | |
4,799,959 | | Morgan Stanley Re-Remic Trust, Series 2010-R9-1B | | | 6.00% | # ^ | | | 08/26/2036 | | | | 3,634,173 | |
28,107,005 | | Morgan Stanley Re-Remic Trust, Series 2010-R9-3C | | | 6.00% | # ^ | | | 11/26/2036 | | | | 28,014,033 | |
4,272,627 | | Morgan Stanley Re-Remic Trust, Series 2011-R1-1A | | | 5.94% | # ^ | | | 02/26/2037 | | | | 4,500,476 | |
14,945,183 | | New Century Alternative Mortgage Loan Trust, Series 2006-ALT1-AF3 | | | 6.17% | # | | | 07/25/2036 | | | | 8,717,757 | |
33,589,250 | | New Century Home Equity Loan Trust, Series 2005-2-M3 (1 Month LIBOR USD + 0.74%, 0.49% Floor) | | | 2.61% | | | | 06/25/2035 | | | | 33,675,057 | |
12,500,000 | | New Century Home Equity Loan Trust, Series 2006-1-A2C (1 Month LIBOR USD + 0.28%, 0.28% Floor, 12.50% Cap) | | | 2.15% | | | | 05/25/2036 | | | | 10,430,747 | |
13,261,895 | | New Residential Mortgage Loan Trust, Series 2014-2A-A3 | | | 3.75% | # ^ | | | 05/25/2054 | | | | 13,464,577 | |
42,749,108 | | New Residential Mortgage Loan Trust, Series 2015-2A-A1 | | | 3.75% | # ^ | | | 08/25/2055 | | | | 43,289,029 | |
10,330,987 | | New Residential Mortgage Loan Trust, Series 2017-RPL1-A1 | | | 3.60% | ^ § | | | 04/25/2022 | | | | 10,432,768 | |
717,519 | | New York Mortgage Trust, Series 2005-2-A (1 Month LIBOR USD + 0.66%, 0.33% Floor, 10.50% Cap) | | | 2.53% | | | | 08/25/2035 | | | | 692,498 | |
256,785 | | Nomura Asset Acceptance Corporation, Series 2005-AP1-2A5 | | | 4.86% | ß | | | 02/25/2035 | | | | 259,954 | |
16,196,503 | | Nomura Asset Acceptance Corporation, Series 2006-AF1-1A2 | | | 6.16% | # | | | 05/25/2036 | | | | 6,833,928 | |
3,291,419 | | Nomura Asset Acceptance Corporation, Series 2006-AF1-1A3 | | | 6.41% | # | | | 05/25/2036 | | | | 1,388,134 | |
19,674,934 | | Nomura Asset Acceptance Corporation, Series 2006-AP1-A2 | | | 5.52% | # | | | 01/25/2036 | | | | 10,836,610 | |
3,325,478 | | Nomura Asset Acceptance Corporation, Series 2006-AP1-A3 | | | 5.65% | # | | | 01/25/2036 | | | | 1,834,897 | |
1,613,912 | | Nomura Asset Acceptance Corporation, Series 2006-WF1-A2 | | | 5.76% | # | | | 06/25/2036 | | | | 906,673 | |
18,164,171 | | Nomura Home Equity Loan, Inc., Series 2006-AF1-A2 | | | 5.80% | ß | | | 10/25/2036 | | | | 7,846,613 | |
3,324,243 | | Nomura Home Equity Loan, Inc., Series 2007-1-1A1 | | | 6.06% | ß | | | 02/25/2037 | | | | 1,743,970 | |
16,568,796 | | Nomura Home Equity Loan, Inc., Series 2007-1-1A3 | | | 5.99% | ß | | | 02/25/2037 | | | | 8,693,198 | |
58,503,385 | | Oak Hill Advisors Residential Loan Trust, Series 2017-NPL2-A1 | | | 3.00% | ^ § | | | 07/25/2057 | | | | 58,169,606 | |
48,099,880 | | Oaks Mortgage Trust, Series 2015-2-A3 | | | 3.50% | # ^ | | | 10/25/2045 | | | | 47,629,959 | |
89,000,000 | | OBX Trust, Series 2018-1-A2 (1 Month LIBOR USD + 0.65%) | | | 2.53% | ^ | | | 06/25/2057 | | | | 89,223,844 | |
1,044,141 | | Option One Mortgage Loan Trust, Series 2004-3-M3 (1 Month LIBOR USD + 0.98%, 0.65% Floor) | | | 2.85% | | | | 11/25/2034 | | | | 1,054,243 | |
98,331,261 | | Option One Mortgage Loan Trust, Series 2007-6-1A1 (1 Month LIBOR USD + 0.19%, 0.19% Floor) | | | 2.06% | | | | 07/25/2037 | | | | 85,141,764 | |
13,000,000 | | Park Place Securities, Inc., Series 2005-WHQ4-M2 (1 Month LIBOR USD + 0.49%, 0.49% Floor) | | | 2.36% | | | | 09/25/2035 | | | | 12,993,496 | |
8,116,316 | | PHH Alternative Mortgage Trust, Series 2007-1-1A1 (1 Month LIBOR USD + 0.16%, 0.16% Floor, 10.10% Cap) | | | 2.03% | | | | 02/25/2037 | | | | 7,103,204 | |
22,037,267 | | PHH Alternative Mortgage Trust, Series 2007-2-2A1 | | | 6.00% | | | | 05/25/2037 | | | | 20,367,135 | |
923,751 | | PHH Alternative Mortgage Trust, Series 2007-2-3A1 | | | 6.00% | | | | 05/25/2037 | | | | 837,771 | |
236,275,250 | | PR Mortgage Loan Trust, Series 2014-1-APT | | | 5.91% | # ^ | | | 10/25/2049 | | | | 210,119,840 | |
39,866,181 | | Preston Ridge Partners Mortgage Trust, Series 2017-2A-A1 | | | 3.47% | ^ § | | | 09/25/2022 | | | | 39,814,996 | |
89,946,361 | | Pretium Mortgage Credit Partners LLC, Series 2017-NPL1-A1 | | | 3.50% | ^ § | | | 04/29/2032 | | | | 90,090,796 | |
74,925,579 | | Pretium Mortgage Credit Partners LLC, Series 2017-NPL2-A1 | | | 3.25% | ^ § | | | 03/28/2057 | | | | 74,677,913 | |
26,439,462 | | Pretium Mortgage Credit Partners LLC, Series 2017-NPL3-A1 | | | 3.25% | ^ § | | | 06/29/2032 | | | | 26,373,369 | |
15,086,850 | | Pretium Mortgage Credit Partners LLC, Series 2017-NPL5-A1 | | | 3.33% | # ^ | | | 12/30/2032 | | | | 15,093,228 | |
91,185,354 | | Pretium Mortgage Credit Partners LLC, Series 2018-NPL1-A1 | | | 3.38% | ^ § | | | 01/27/2033 | | | | 91,135,229 | |
11,107,574 | | Prime Mortgage Trust, Series 2006-DR1-2A1 | | | 5.50% | ^ | | | 05/25/2035 | | | | 8,118,406 | |
5,243,639 | | Prime Mortgage Trust, Series 2006-DR1-2A2 | | | 6.00% | ^ | | | 05/25/2035 | | | | 3,911,687 | |
57,332,646 | | PRPM LLC, Series 2017-3A-A1 | | | 3.47% | # ^ | | | 11/25/2022 | | | | 57,392,914 | |
30,082,870 | | RBSGC Structured Trust, Series 2008-B-A1 | | | 6.00% | ^ | | | 06/25/2037 | | | | 27,808,578 | |
5,476,821 | | RBSSP Resecuritization Trust, Series 2010-4-7A2 | | | 6.00% | ^ | | | 07/27/2037 | | | | 4,613,224 | |
29,990,674 | | RCO Trust, Series 2016-SFR1-A | | | 3.75% | # ^ | | | 11/25/2051 | | | | 30,087,754 | |
9,151,985 | | RCO Trust, Series 2016-SFR1-M1 | | | 4.50% | # ^ | | | 11/25/2051 | | | | 9,095,764 | |
1,211,776 | | Renaissance Home Equity Loan Trust, Series 2006-1-AF6 | | | 5.75% | ß | | | 05/25/2036 | | | | 885,962 | |
10,438,341 | | Renaissance Home Equity Loan Trust, Series 2006-4-AF4 | | | 5.47% | ß | | | 01/25/2037 | | | | 6,025,207 | |
20,555,219 | | Renaissance Home Equity Loan Trust, Series 2006-4-AF5 | | | 5.69% | ß | | | 01/25/2037 | | | | 12,289,941 | |
8,248,908 | | Renaissance Home Equity Loan Trust, Series 2007-1-AF1 | | | 5.74% | ß | | | 04/25/2037 | | | | 4,282,166 | |
5,819,518 | | Renaissance Home Equity Loan Trust, Series 2007-1-AF1Z | | | 5.35% | ß | | | 04/25/2037 | | | | 2,846,601 | |
261,370 | | Renaissance Home Equity Loan Trust, Series 2007-1-AF2 | | | 5.51% | ß | | | 04/25/2037 | | | | 130,609 | |
5,106,992 | | Renaissance Home Equity Loan Trust, Series 2007-1-AF3 | | | 5.61% | ß | | | 04/25/2037 | | | | 2,595,255 | |
8,289,177 | | Renaissance Home Equity Loan Trust, Series 2007-1-AF5 | | | 5.91% | ß | | | 04/25/2037 | | | | 4,419,631 | |
17,696,892 | | Renaissance Home Equity Loan Trust, Series 2007-2-AF2 | | | 5.68% | ß | | | 06/25/2037 | | | | 8,454,513 | |
9,571,061 | | Renaissance Home Equity Loan Trust, Series 2007-2-AF5 | | | 6.20% | ß | | | 06/25/2037 | | | | 5,024,042 | |
34,992,255 | | Residential Accredit Loans, Inc., Series 2005-QA11-4A1 | | | 4.16% | # | | | 10/25/2035 | | | | 30,164,279 | |
19,475,394 | | Residential Accredit Loans, Inc., Series 2005-QA13-2A1 | | | 4.35% | # | | | 12/25/2035 | | | | 17,828,308 | |
13,814,318 | | Residential Accredit Loans, Inc., Series 2005-QA3-CB1 | | | 4.10% | # | | | 03/25/2035 | | | | 9,293,015 | |
517,483 | | Residential Accredit Loans, Inc., Series 2005-QS12-A11 (-11 x 1 Month LIBOR USD + 51.15%, 51.15% Cap) | | | 30.56% | I/F | | | 08/25/2035 | | | | 798,070 | |
2,102,604 | | Residential Accredit Loans, Inc., Series 2005-QS13-1A6 | | | 5.50% | | | | 09/25/2035 | | | | 1,979,638 | |
4,035,251 | | Residential Accredit Loans, Inc., Series 2005-QS13-2A1 (1 Month LIBOR USD + 0.70%, 0.70% Floor, 5.75% Cap) | | | 2.57% | | | | 09/25/2035 | | | | 3,499,948 | |
16,544,527 | | Residential Accredit Loans, Inc., Series 2005-QS13-2A2 (-1 x 1 Month LIBOR USD + 5.05%, 5.05% Cap) | | | 3.18% | I/F I/O | | | 09/25/2035 | | | | 1,553,745 | |
8,136,131 | | Residential Accredit Loans, Inc., Series 2005-QS14-2A1 | | | 6.00% | | | | 09/25/2035 | | | | 5,835,477 | |
3,221,231 | | Residential Accredit Loans, Inc., Series 2005-QS15-2A | | | 6.00% | | | | 10/25/2035 | | | | 2,905,960 | |
4,040,711 | | Residential Accredit Loans, Inc., Series 2005-QS15-3A | | | 6.00% | | | | 10/25/2035 | | | | 3,922,149 | |
4,157,112 | | Residential Accredit Loans, Inc., Series 2005-QS16-A1 (1 Month LIBOR USD + 0.70%, 0.70% Floor, 5.50% Cap) | | | 2.57% | | | | 11/25/2035 | | | | 3,470,139 | |
4,156,393 | | Residential Accredit Loans, Inc., Series 2005-QS16-A2 (-1 x 1 Month LIBOR USD + 4.80%, 4.80% Cap) | | | 2.93% | I/F I/O | | | 11/25/2035 | | | | 358,937 | |
2,011,208 | | Residential Accredit Loans, Inc., Series 2005-QS17-A1 | | | 6.00% | | | | 12/25/2035 | | | | 1,968,074 | |
1,393,664 | | Residential Accredit Loans, Inc., Series 2005-QS17-A10 | | | 6.00% | | | | 12/25/2035 | | | | 1,363,774 | |
5,828,906 | | Residential Accredit Loans, Inc., Series 2005-QS17-A11 | | | 6.00% | | | | 12/25/2035 | | | | 5,703,895 | |
4,143,003 | | Residential Accredit Loans, Inc., Series 2005-QS17-A2 (1 Month LIBOR USD + 0.85%, 0.85% Floor, 6.00% Cap) | | | 2.72% | | | | 12/25/2035 | | | | 3,410,406 | |
4,143,003 | | Residential Accredit Loans, Inc., Series 2005-QS17-A4 (-1 x 1 Month LIBOR USD + 5.15%, 5.15% Cap) | | | 3.28% | I/F I/O | | | 12/25/2035 | | | | 422,025 | |
3,333,588 | | Residential Accredit Loans, Inc., Series 2005-QS17-A6 | | | 6.00% | | | | 12/25/2035 | | | | 3,262,094 | |
254,906 | | Residential Accredit Loans, Inc., Series 2005-QS1-A5 | | | 5.50% | | | | 01/25/2035 | | | | 255,796 | |
1,633,540 | | Residential Accredit Loans, Inc., Series 2005-QS5-A3 | | | 5.70% | | | | 04/25/2035 | | | | 1,641,739 | |
1,346,878 | | Residential Accredit Loans, Inc., Series 2005-QS9-A1 (1 Month LIBOR USD + 0.50%, 0.50% Floor, 5.50% Cap) | | | 2.37% | | | | 06/25/2035 | | | | 1,172,839 | |
3,270,857 | | Residential Accredit Loans, Inc., Series 2005-QS9-A4 (-1 x 1 Month LIBOR USD + 5.00%, 5.00% Cap) | | | 3.13% | I/F I/O | | | 06/25/2035 | | | | 285,793 | |
1,666,391 | | Residential Accredit Loans, Inc., Series 2006-QS10-A4 | | | 5.75% | | | | 08/25/2036 | | | | 1,502,748 | |
10,784,738 | | Residential Accredit Loans, Inc., Series 2006-QS11-1A1 | | | 6.50% | | | | 08/25/2036 | | | | 9,909,689 | |
1,956,005 | | Residential Accredit Loans, Inc., Series 2006-QS12-1A1 | | | 6.50% | | | | 09/25/2036 | | | | 1,493,879 | |
4,474,319 | | Residential Accredit Loans, Inc., Series 2006-QS12-2A18 | | | 5.75% | | | | 09/25/2036 | | | | 4,208,654 | |
6,667,639 | | Residential Accredit Loans, Inc., Series 2006-QS14-A18 | | | 6.25% | | | | 11/25/2036 | | | | 6,005,407 | |
3,194,170 | | Residential Accredit Loans, Inc., Series 2006-QS15-A1 | | | 6.50% | | | | 10/25/2036 | | | | 2,996,897 | |
1,407,852 | | Residential Accredit Loans, Inc., Series 2006-QS16-A10 | | | 6.00% | | | | 11/25/2036 | | | | 1,266,559 | |
5,006,099 | | Residential Accredit Loans, Inc., Series 2006-QS16-A11 | | | 6.00% | | | | 11/25/2036 | | | | 4,503,683 | |
1,461,336 | | Residential Accredit Loans, Inc., Series 2006-QS16-A7 | | | 6.00% | | | | 11/25/2036 | | | | 1,314,675 | |
1,579,146 | | Residential Accredit Loans, Inc., Series 2006-QS16-A8 | | | 6.00% | | | | 11/25/2036 | | | | 1,420,662 | |
624,898 | | Residential Accredit Loans, Inc., Series 2006-QS16-A9 | | | 6.00% | | | | 11/25/2036 | | | | 562,183 | |
3,011,466 | | Residential Accredit Loans, Inc., Series 2006-QS17-A4 | | | 6.00% | | | | 12/25/2036 | | | | 2,789,325 | |
16,730,404 | | Residential Accredit Loans, Inc., Series 2006-QS17-A5 | | | 6.00% | | | | 12/25/2036 | | | | 15,496,284 | |
1,777,343 | | Residential Accredit Loans, Inc., Series 2006-QS1-A6 (-8 x 1 Month LIBOR USD + 42.86%, 42.86% Cap) | | | 28.51% | I/F | | | 01/25/2036 | | | | 2,743,185 | |
11,160,572 | | Residential Accredit Loans, Inc., Series 2006-QS3-1A11 | | | 6.00% | | | | 03/25/2036 | | | | 10,650,534 | |
2,678,024 | | Residential Accredit Loans, Inc., Series 2006-QS4-A8 (-8 x 1 Month LIBOR USD + 5,143.00%, 8.00% Cap) | | | 8.00% | I/F | | | 04/25/2036 | | | | 2,611,528 | |
7,366,848 | | Residential Accredit Loans, Inc., Series 2006-QS5-A3 | | | 6.00% | | | | 05/25/2036 | | | | 6,913,462 | |
21,955,979 | | Residential Accredit Loans, Inc., Series 2006-QS5-A4 | | | 6.00% | | | | 05/25/2036 | | | | 20,604,716 | |
2,814,890 | | Residential Accredit Loans, Inc., Series 2006-QS6-1A16 | | | 6.00% | | | | 06/25/2036 | | | | 2,595,217 | |
4,629,908 | | Residential Accredit Loans, Inc., Series 2006-QS6-1A2 | | | 6.00% | | | | 06/25/2036 | | | | 4,268,592 | |
9,831,989 | | Residential Accredit Loans, Inc., Series 2006-QS8-A1 | | | 6.00% | | | | 08/25/2036 | | | | 9,070,169 | |
17,050,104 | | Residential Accredit Loans, Inc., Series 2006-QS8-A5 (-1 x 1 Month LIBOR USD + 5.55%, 5.55% Cap) | | | 3.68% | I/F I/O | | | 08/25/2036 | | | | 2,003,212 | |
5,787,320 | | Residential Accredit Loans, Inc., Series 2006-QS9-1A6 (-1 x 1 Month LIBOR USD + 5.30%, 5.30% Cap) | | | 3.43% | I/F I/O | | | 07/25/2036 | | | | 699,478 | |
33,584,939 | | Residential Accredit Loans, Inc., Series 2007-QH5-AII (1 Month LIBOR USD + 0.23%, 0.23% Floor) | | | 2.10% | | | | 06/25/2037 | | | | 19,099,298 | |
5,627,500 | | Residential Accredit Loans, Inc., Series 2007-QS11-A1 | | | 7.00% | | | | 10/25/2037 | | | | 4,974,069 | |
18,404,606 | | Residential Accredit Loans, Inc., Series 2007-QS1-1A2 (-1 x 1 Month LIBOR USD + 5.45%, 5.45% Cap) | | | 3.58% | I/F I/O | | | 01/25/2037 | | | | 1,871,629 | |
1,852,619 | | Residential Accredit Loans, Inc., Series 2007-QS1-1A4 | | | 6.00% | | | | 01/25/2037 | | | | 1,742,466 | |
4,597,179 | | Residential Accredit Loans, Inc., Series 2007-QS1-2A10 | | | 6.00% | | | | 01/25/2037 | | | | 4,185,272 | |
800,515 | | Residential Accredit Loans, Inc., Series 2007-QS2-A6 | | | 6.25% | | | | 01/25/2037 | | | | 746,367 | |
31,000,367 | | Residential Accredit Loans, Inc., Series 2007-QS3-A1 | | | 6.50% | | | | 02/25/2037 | | | | 28,217,229 | |
4,943,202 | | Residential Accredit Loans, Inc., Series 2007-QS3-A4 | | | 6.25% | | | | 02/25/2037 | | | | 4,443,567 | |
7,937,732 | | Residential Accredit Loans, Inc., Series 2007-QS4-3A3 | | | 6.00% | | | | 03/25/2037 | | | | 7,260,178 | |
3,620,540 | | Residential Accredit Loans, Inc., Series 2007-QS5-A1 | | | 5.50% | | | | 03/25/2037 | | | | 3,281,194 | |
1,493,620 | | Residential Accredit Loans, Inc., Series 2007-QS5-A5 (1 Month LIBOR USD + 0.30%, 0.30% Floor, 7.00% Cap) | | | 2.17% | | | | 03/25/2037 | | | | 1,151,883 | |
4,960,654 | | Residential Accredit Loans, Inc., Series 2007-QS5-A8 (-1 x 1 Month LIBOR USD + 6.70%, 6.70% Cap) | | | 4.83% | I/F I/O | | | 03/25/2037 | | | | 820,846 | |
3,934,583 | | Residential Accredit Loans, Inc., Series 2007-QS6-A102 | | | 5.75% | | | | 04/25/2037 | | | | 3,713,211 | |
1,265,083 | | Residential Accredit Loans, Inc., Series 2007-QS6-A13 (-8 x 1 Month LIBOR USD + 55.00%, 55.00% Cap) | | | 39.40% | I/F | | | 04/25/2037 | | | | 2,252,710 | |
5,634,015 | | Residential Accredit Loans, Inc., Series 2007-QS6-A45 | | | 5.75% | | | | 04/25/2037 | | | | 5,317,028 | |
8,978,879 | | Residential Accredit Loans, Inc., Series 2007-QS6-A6 | | | 6.25% | | | | 04/25/2037 | | | | 8,659,782 | |
620,143 | | Residential Accredit Loans, Inc., Series 2007-QS6-A77 (-8 x 1 Month LIBOR USD + 55.83%, 55.83% Cap) | | | 40.24% | I/F | | | 04/25/2037 | | | | 1,122,844 | |
7,956,163 | | Residential Accredit Loans, Inc., Series 2007-QS7-2A1 | | | 6.75% | | | | 06/25/2037 | | | | 5,236,601 | |
31,970,412 | | Residential Accredit Loans, Inc., Series 2007-QS9-A33 | | | 6.50% | | | | 07/25/2037 | | | | 29,400,716 | |
4,185,346 | | Residential Asset Mortgage Products, Inc., Series 2004-RS7-A3 | | | 3.86% | # | | | 07/25/2034 | | | | 3,930,306 | |
4,245,989 | | Residential Asset Mortgage Products, Inc., Series 2005-RS1-AI5 | | | 5.41% | ß | | | 01/25/2035 | | | | 4,272,986 | |
40,413,306 | | Residential Asset Mortgage Products, Inc., Series 2005-RS9-AI4 (1 Month LIBOR USD + 0.32%, 0.32% Floor) | | | 2.19% | | | | 11/25/2035 | | | | 37,677,285 | |
29,768,345 | | Residential Asset Mortgage Products, Inc., Series 2006-RS2-A3A (1 Month LIBOR USD + 0.30%, 0.30% Floor, 14.00% Cap) | | | 2.17% | | | | 03/25/2036 | | | | 29,257,125 | |
8,368,540 | | Residential Asset Mortgage Products, Inc., Series 2006-RZ3-A3 (1 Month LIBOR USD + 0.29%, 0.29% Floor, 14.00% Cap) | | | 2.16% | | | | 08/25/2036 | | | | 8,368,141 | |
12,760,000 | | Residential Asset Mortgage Products, Inc., Series 2006-RZ5-A3 (1 Month LIBOR USD + 0.25%, 0.25% Floor, 14.00% Cap) | | | 2.12% | | | | 08/25/2046 | | | | 12,770,268 | |
27,100,365 | | Residential Asset Securities Corporation, Series 2005-KS11-M2 (1 Month LIBOR USD + 0.42%, 0.42% Floor, 14.00% Cap) | | | 2.29% | | | | 12/25/2035 | | | | 27,011,630 | |
6,919,340 | | Residential Asset Securities Corporation, Series 2006-EMX5-A3 (1 Month LIBOR USD + 0.16%, 0.16% Floor, 14.00% Cap) | | | 2.03% | | | | 07/25/2036 | | | | 6,539,415 | |
36,019,539 | | Residential Asset Securities Corporation, Series 2007-EMX1-A13 (1 Month LIBOR USD + 0.20%, 0.20% Floor, 14.00% Cap) | | | 1.82% | | | | 01/25/2037 | | | | 31,752,178 | |
23,129,619 | | Residential Asset Securities Corporation, Series 2007-KS3-AI3 (1 Month LIBOR USD + 0.25%, 0.25% Floor, 14.00% Cap) | | | 2.12% | | | | 04/25/2037 | | | | 22,804,509 | |
6,138,823 | | Residential Asset Securitization Trust, Series 2005-A11-2A4 | | | 6.00% | | | | 10/25/2035 | | | | 4,954,844 | |
2,877,804 | | Residential Asset Securitization Trust, Series 2005-A12-A7 (-1 x 1 Month LIBOR USD + 5.00%, 5.00% Cap) | | | 3.13% | I/F I/O | | | 11/25/2035 | | | | 358,740 | |
2,604,900 | | Residential Asset Securitization Trust, Series 2005-A12-A8 (1 Month LIBOR USD + 0.55%, 0.55% Floor, 5.50% Cap) | | | 2.42% | | | | 11/25/2035 | | | | 1,975,631 | |
11,141,749 | | Residential Asset Securitization Trust, Series 2005-A13-2A1 | | | 5.50% | | | | 10/25/2035 | | | | 8,199,316 | |
10,690,238 | | Residential Asset Securitization Trust, Series 2005-A15-5A3 | | | 5.75% | | | | 02/25/2036 | | | | 8,375,953 | |
1,963,936 | | Residential Asset Securitization Trust, Series 2005-A7-A3 | | | 5.50% | | | | 06/25/2035 | | | | 1,723,768 | |
5,059,412 | | Residential Asset Securitization Trust, Series 2005-A8CB-A11 | | | 6.00% | | | | 07/25/2035 | | | | 4,751,847 | |
5,053,193 | | Residential Asset Securitization Trust, Series 2005-A8CB-A2 (-1 x 1 Month LIBOR USD + 5.00%, 5.00% Cap) | | | 3.13% | I/F I/O | | | 07/25/2035 | | | | 637,710 | |
6,117,659 | | Residential Asset Securitization Trust, Series 2006-A10-A5 | | | 6.50% | | | | 09/25/2036 | | | | 4,353,651 | |
901,058 | | Residential Asset Securitization Trust, Series 2006-A1-1A3 | | | 6.00% | | | | 04/25/2036 | | | | 712,607 | |
7,959,335 | | Residential Asset Securitization Trust, Series 2006-A12-A1 | | | 6.25% | | | | 11/25/2036 | | | | 5,418,568 | |
8,523,497 | | Residential Asset Securitization Trust, Series 2006-A13-A1 | | | 6.25% | | | | 12/25/2036 | | | | 5,797,175 | |
15,124,630 | | Residential Asset Securitization Trust, Series 2006-A1-3A2 | | | 6.00% | | | | 04/25/2036 | | | | 12,950,560 | |
15,352,866 | | Residential Asset Securitization Trust, Series 2006-A14C-2A6 (1 Month LIBOR USD + 0.45%, 0.45% Floor, 7.00% Cap) | | | 2.32% | | | | 12/25/2036 | | | | 5,181,110 | |
33,881,473 | | Residential Asset Securitization Trust, Series 2006-A14C-2A7 (-1 x 1 Month LIBOR USD + 6.55%, 6.55% Cap) | | | 4.68% | I/F I/O | | | 12/25/2036 | | | | 8,198,320 | |
7,474,750 | | Residential Asset Securitization Trust, Series 2006-A2-A11 | | | 6.00% | | | | 01/25/2046 | | | | 5,690,166 | |
5,175,067 | | Residential Asset Securitization Trust, Series 2006-A2-A4 | | | 6.00% | | | | 01/25/2046 | | | | 3,939,537 | |
684,533 | | Residential Asset Securitization Trust, Series 2006-A4-2A5 | | | 6.00% | | | | 05/25/2036 | | | | 670,317 | |
5,212,967 | | Residential Asset Securitization Trust, Series 2006-A4-2A9 | | | 6.00% | | | | 05/25/2036 | | | | 5,104,707 | |
4,333,543 | | Residential Asset Securitization Trust, Series 2006-A8-1A1 | | | 6.00% | | | | 08/25/2036 | | | | 3,884,586 | |
6,186,386 | | Residential Asset Securitization Trust, Series 2006-R1-A1 (-4 x 1 Month LIBOR USD + 28.40%, 28.40% Cap) | | | 20.91% | I/F | | | 01/25/2046 | | | | 9,083,449 | |
32,273,351 | | Residential Asset Securitization Trust, Series 2007-A2-1A2 | | | 6.00% | | | | 04/25/2037 | | | | 29,197,426 | |
996,532 | | Residential Asset Securitization Trust, Series 2007-A3-1A2 (-8 x 1 Month LIBOR USD + 46.38%, 46.38% Cap) | | | 32.04% | I/F | | | 04/25/2037 | | | | 1,868,000 | |
23,540,721 | | Residential Asset Securitization Trust, Series 2007-A5-1A4 (-1 x 1 Month LIBOR USD + 6.10%, 6.10% Cap) | | | 4.23% | I/F I/O | | | 05/25/2037 | | | | 4,397,237 | |
6,063,075 | | Residential Asset Securitization Trust, Series 2007-A5-1A6 (1 Month LIBOR USD + 0.40%, 0.40% Floor, 6.50% Cap) | | | 2.27% | | | | 05/25/2037 | | | | 1,087,383 | |
6,785,160 | | Residential Asset Securitization Trust, Series 2007-A5-2A3 | | | 6.00% | | | | 05/25/2037 | | | | 6,011,534 | |
2,973,589 | | Residential Asset Securitization Trust, Series 2007-A5-2A5 | | | 6.00% | | | | 05/25/2037 | | | | 2,634,548 | |
12,785,191 | | Residential Asset Securitization Trust, Series 2007-A6-1A2 | | | 6.00% | | | | 06/25/2037 | | | | 11,660,391 | |
9,127,574 | | Residential Asset Securitization Trust, Series 2007-A7-A1 | | | 6.00% | | | | 07/25/2037 | | | | 6,662,683 | |
40,148,932 | | Residential Asset Securitization Trust, Series 2007-A7-A2 | | | 6.00% | | | | 07/25/2037 | | | | 29,306,761 | |
17,789,144 | | Residential Asset Securitization Trust, Series 2007-A7-A6 | | | 6.00% | | | | 07/25/2037 | | | | 12,985,207 | |
208,494 | | Residential Funding Mortgage Securities Trust, Series 2003-S16-A1 | | | 4.75% | | | | 09/25/2018 | | | | 208,957 | |
3,302,518 | | Residential Funding Mortgage Securities Trust, Series 2005-S9-A10 | | | 6.25% | | | | 12/25/2035 | | | | 3,221,018 | |
8,833,034 | | Residential Funding Mortgage Securities Trust, Series 2005-S9-A6 | | | 5.75% | | | | 12/25/2035 | | | | 8,609,715 | |
657,871 | | Residential Funding Mortgage Securities Trust, Series 2005-S9-A8 | | | 5.50% | | | | 12/25/2035 | | | | 633,054 | |
10,738,348 | | Residential Funding Mortgage Securities Trust, Series 2006-S10-1A1 | | | 6.00% | | | | 10/25/2036 | | | | 10,225,106 | |
18,777,927 | | Residential Funding Mortgage Securities Trust, Series 2006-S11-A1 | | | 6.00% | | | | 11/25/2036 | | | | 17,714,822 | |
3,480,265 | | Residential Funding Mortgage Securities Trust, Series 2006-S5-A12 | | | 6.00% | | | | 06/25/2036 | | | | 3,453,928 | |
238,274 | | Residential Funding Mortgage Securities Trust, Series 2006-S5-A15 | | | 6.00% | | | | 06/25/2036 | | | | 236,470 | |
6,115,272 | | Residential Funding Mortgage Securities Trust, Series 2006-S9-A1 | | | 6.25% | | | | 09/25/2036 | | | | 5,967,777 | |
8,185,757 | | Residential Funding Mortgage Securities Trust, Series 2007-S1-A7 | | | 6.00% | | | | 01/25/2037 | | | | 7,901,039 | |
4,034,211 | | Residential Funding Mortgage Securities Trust, Series 2007-S2-A1 | | | 6.00% | | | | 02/25/2037 | | | | 3,862,328 | |
4,544,983 | | Residential Funding Mortgage Securities Trust, Series 2007-S2-A4 | | | 6.00% | | | | 02/25/2037 | | | | 4,351,338 | |
8,484,963 | | Residential Funding Mortgage Securities Trust, Series 2007-S2-A5 | | | 6.00% | | | | 02/25/2037 | | | | 8,123,451 | |
1,325,917 | | Residential Funding Mortgage Securities Trust, Series 2007-S2-A9 | | | 6.00% | | | | 02/25/2037 | | | | 1,269,425 | |
3,901,411 | | Residential Funding Mortgage Securities Trust, Series 2007-S3-1A4 | | | 6.00% | | | | 03/25/2037 | | | | 3,731,092 | |
1,214,916 | | Residential Funding Mortgage Securities Trust, Series 2007-S4-A1 | | | 6.00% | | | | 04/25/2037 | | | | 1,148,771 | |
3,243,187 | | Residential Funding Mortgage Securities Trust, Series 2007-S4-A2 | | | 6.00% | | | | 04/25/2037 | | | | 3,066,613 | |
27,587,993 | | Residential Funding Mortgage Securities Trust, Series 2007-S5-A1 | | | 6.00% | | | | 05/25/2037 | | | | 26,484,233 | |
7,995,109 | | Residential Funding Mortgage Securities Trust, Series 2007-S5-A8 | | | 6.00% | | | | 05/25/2037 | | | | 7,675,235 | |
4,438,976 | | Residential Funding Mortgage Securities Trust, Series 2007-S6-2A4 | | | 6.00% | | | | 06/25/2037 | | | | 4,222,130 | |
21,438,307 | | Residential Funding Mortgage Securities Trust, Series 2007-S7-A20 | | | 6.00% | | | | 07/25/2037 | | | | 20,474,704 | |
10,117,829 | | Residential Funding Mortgage Securities Trust, Series 2007-S8-1A1 | | | 6.00% | | | | 09/25/2037 | | | | 9,328,200 | |
2,609,506 | | Residential Funding Mortgage Securities Trust, Series 2007-SA1-4A | | | 4.98% | # | | | 02/25/2037 | | | | 2,196,123 | |
8,857,507 | | Residential Funding Mortgage Securities Trust, Series 2007-SA2-2A1 | | | 4.16% | # | | | 04/25/2037 | | | | 8,527,406 | |
27,991,563 | | RMAT LLC, Series 2015-PR2-A1 | | | 8.85% | ^ § | | | 11/25/2035 | | | | 26,979,920 | |
42,970,287 | | Saxon Asset Securities Trust, Series 2006-3-A3 (1 Month LIBOR USD + 0.17%, 0.17% Floor, 12.25% Cap) | | | 2.04% | | | | 10/25/2046 | | | | 42,112,781 | |
337,355,344 | | Securitized Mortgage Asset Loan Trust, Series 2015-1-PC | | | 2.41% | # ^ ¥ | | | 02/25/2054 | | | | 284,977,183 | |
66,173,321 | | Securitized Mortgage Asset Loan Trust, Series 2015-2-PC | | | 0.00% | # ^ ¥ | | | 12/26/2059 | | | | 62,093,603 | |
101,456,744 | | Securitized Mortgage Asset Loan Trust, Series 2015-3-PC | | | 0.00% | # ^ ¥ | | | 10/25/2044 | | | | 97,456,517 | |
174,968 | | Sequoia Mortgage Trust, Series 2003-4-2A1 (1 Month LIBOR USD + 0.35%, 0.35% Floor, 11.50% Cap) | | | 2.17% | | | | 07/20/2033 | | | | 169,426 | |
9,612,592 | | Sequoia Mortgage Trust, Series 2013-2-A | | | 1.87% | # | | | 02/25/2043 | | | | 8,811,892 | |
11,491,810 | | Sequoia Mortgage Trust, Series 2013-6-A2 | | | 3.00% | # | | | 05/25/2043 | | | | 11,224,203 | |
74,011,690 | | Sequoia Mortgage Trust, Series 2015-4-A1 | | | 3.00% | # ^ | | | 11/25/2030 | | | | 73,514,406 | |
132,469,497 | | Sequoia Mortgage Trust, Series 2016-1-A1 | | | 3.50% | # ^ | | | 06/25/2046 | | | | 131,821,324 | |
208,004,434 | | Sequoia Mortgage Trust, Series 2016-2-A1 | | | 3.50% | # ^ | | | 08/25/2046 | | | | 206,612,052 | |
15,720,129 | | SG Mortgage Securities Trust, Series 2006-FRE1-A1A (1 Month LIBOR USD + 0.17%, 0.17% Floor) | | | 2.04% | | | | 02/25/2036 | | | | 14,550,304 | |
30,100,089 | | SG Mortgage Securities Trust, Series 2017-1-A1 | | | 3.71% | # ^ | | | 04/25/2047 | | | | 29,864,150 | |
55,102,465 | | Shellpoint Co-Originator Trust, Series 2015-1-A3 | | | 3.50% | # ^ | | | 08/25/2045 | | | | 54,455,645 | |
50,402,990 | | Sofi Mortgage Trust, Series 2016-1A-1A4 | | | 3.00% | # ^ | | | 11/25/2046 | | | | 48,458,246 | |
30,571,921 | | Soundview Home Loan Trust, Series 2007-NS1-A3 (1 Month LIBOR USD + 0.20%, 0.20% Floor) | | | 2.07% | | | | 01/25/2037 | | | | 30,043,849 | |
5,456,995 | | Soundview Home Loan Trust, Series 2007-OPT1-2A2 (1 Month LIBOR USD + 0.15%, 0.15% Floor) | | | 2.02% | | | | 06/25/2037 | | | | 4,007,893 | |
30,043,668 | | Soundview Home Loan Trust, Series 2007-OPT4-1A1 (1 Month LIBOR USD + 1.00%, 1.00% Floor) | | | 2.87% | | | | 09/25/2037 | | | | 23,915,571 | |
12,311,285 | | STARM Mortgage Loan Trust, Series 2007-2-1A1 | | | 3.80% | # | | | 04/25/2037 | | | | 9,986,464 | |
5,067,475 | | STARM Mortgage Loan Trust, Series 2007-3-1A1 | | | 3.71% | # | | | 06/25/2037 | | | | 4,801,508 | |
4,269,451 | | Structured Adjustable Rate Mortgage Loan Trust, Series 2004-12-8A | | | 3.50% | # | | | 09/25/2034 | | | | 4,226,007 | |
8,274,684 | | Structured Adjustable Rate Mortgage Loan Trust, Series 2005-22-4A1 | | | 3.73% | # | | | 12/25/2035 | | | | 7,965,877 | |
5,618,598 | | Structured Adjustable Rate Mortgage Loan Trust, Series 2006-12-2A1 | | | 3.69% | # | | | 01/25/2037 | | | | 5,181,500 | |
2,405,721 | | Structured Adjustable Rate Mortgage Loan Trust, Series 2006-1-8A1 | | | 3.74% | # | | | 02/25/2036 | | | | 2,075,244 | |
4,065,946 | | Structured Adjustable Rate Mortgage Loan Trust, Series 2006-6-3A1 | | | 3.64% | # | | | 07/25/2036 | | | | 3,598,352 | |
14,494 | | Structured Asset Securities Corporation, Series 2003-18XS-A6 | | | 4.54% | | | | 06/25/2033 | | | | 14,578 | |
2,871,919 | | Structured Asset Securities Corporation, Series 2003-24A-1A3 | | | 3.53% | # | | | 07/25/2033 | | | | 2,899,081 | |
5,639,483 | | Structured Asset Securities Corporation, Series 2003-35-1A1 | | | 5.17% | # | | | 12/25/2033 | | | | 5,808,559 | |
1,222,838 | | Structured Asset Securities Corporation, Series 2004-11XS-2A2 | | | 5.40% | | | | 06/25/2034 | | | | 1,857,985 | |
17,772,576 | | Structured Asset Securities Corporation, Series 2005-10-1A1 | | | 5.75% | | | | 06/25/2035 | | | | 17,264,355 | |
812,481 | | Structured Asset Securities Corporation, Series 2005-10-6A1 | | | 5.00% | | | | 06/25/2020 | | | | 825,126 | |
1,268,923 | | Structured Asset Securities Corporation, Series 2005-14-1A1 (1 Month LIBOR USD + 0.30%, 0.30% Floor, 7.25% Cap) | | | 2.17% | | | | 07/25/2035 | | | | 1,038,292 | |
505,050 | | Structured Asset Securities Corporation, Series 2005-14-1A4 (-4 x 1 Month LIBOR USD + 24.53%, 24.53% Cap) | | | 16.18% | I/F | | | 07/25/2035 | | | | 564,617 | |
22,782,430 | | Structured Asset Securities Corporation, Series 2005-14-4A1 | | | 5.75% | | | | 07/25/2035 | | | | 22,975,292 | |
1,722,839 | | Structured Asset Securities Corporation, Series 2005-15-1A1 | | | 5.50% | | | | 08/25/2035 | | | | 1,811,176 | |
4,687,320 | | Structured Asset Securities Corporation, Series 2005-15-2A7 | | | 5.50% | | | | 08/25/2035 | | | | 4,711,073 | |
6,701,198 | | Structured Asset Securities Corporation, Series 2005-15-3A1 | | | 4.78% | # | | | 08/25/2035 | | | | 6,576,489 | |
5,072,945 | | Structured Asset Securities Corporation, Series 2005-16-1A2 | | | 5.50% | | | | 09/25/2035 | | | | 5,088,089 | |
4,632,406 | | Structured Asset Securities Corporation, Series 2005-16-3A1 | | | 6.00% | | | | 09/25/2035 | | | | 3,750,350 | |
5,937,788 | | Structured Asset Securities Corporation, Series 2005-3-1A6 | | | 5.75% | | | | 03/25/2035 | | | | 5,697,258 | |
49,990,125 | | Structured Asset Securities Corporation, Series 2006-BC4-A4 (1 Month LIBOR USD + 0.17%, 0.17% Floor) | | | 2.04% | | | | 12/25/2036 | | | | 48,583,428 | |
105,699,106 | | Structured Asset Securities Corporation, Series 2007-4-1A3 (-1 x 1 Month LIBOR USD + 6.25%, 6.25% Cap) | | | 4.69% | ^ I/F I/O Þ | | | 03/28/2045 | | | | 13,120,060 | |
721,625 | | Suntrust Alternative Loan Trust, Series 2005-1F-2A3 | | | 5.75% | | | | 12/25/2035 | | | | 711,695 | |
1,153,416 | | Suntrust Alternative Loan Trust, Series 2006-1F-1A3 | | | 6.00% | | | | 04/25/2036 | | | | 1,070,358 | |
631,628 | | Thornburg Mortgage Securities Trust, Series 2003-6-A2 (1 Month LIBOR USD + 0.50%, 0.50% Floor, 11.50% Cap) | | | 2.37% | | | | 12/25/2033 | | | | 582,758 | |
5,772,295 | | Thornburg Mortgage Securities Trust, Series 2004-4-5A | | | 3.12% | # | | | 12/25/2044 | | | | 5,705,095 | |
17,169,441 | | Thornburg Mortgage Securities Trust, Series 2007-1-A1 (12 Month LIBOR USD + 1.30%, 0.11% Floor, 10.75% Cap) | | | 3.98% | | | | 03/25/2037 | | | | 16,445,261 | |
3,578,951 | | Thornburg Mortgage Securities Trust, Series 2007-1-A2A (12 Month LIBOR USD + 1.30%, 0.11% Floor, 10.75% Cap) | | | 3.98% | | | | 03/25/2037 | | | | 3,118,330 | |
10,615,682 | | Towd Point Mortgage Trust, Series 2015-1-AE | | | 3.00% | ^ | | | 10/25/2053 | | | | 10,571,975 | |
8,562,219 | | Towd Point Mortgage Trust, Series 2015-1-AES | | | 3.00% | # ^ | | | 10/25/2053 | | | | 8,559,343 | |
6,694,455 | | Towd Point Mortgage Trust, Series 2015-2-1A12 | | | 2.75% | # ^ | | | 11/25/2060 | | | | 6,634,995 | |
17,837,017 | | Towd Point Mortgage Trust, Series 2015-2-1A13 | | | 2.50% | # ^ | | | 11/25/2060 | | | | 17,581,887 | |
50,732,991 | | Towd Point Mortgage Trust, Series 2015-5-A1B | | | 2.75% | # ^ | | | 05/25/2055 | | | | 50,459,180 | |
63,411,579 | | Towd Point Mortgage Trust, Series 2015-6-A1B | | | 2.75% | # ^ | | | 04/25/2055 | | | | 62,894,293 | |
37,276,194 | | US Residential Opportunity Fund Trust, Series 2017-1II-A | | | 3.35% | ^ § | | | 11/27/2037 | | | | 37,045,414 | |
193,798,343 | | US Residential Opportunity Fund Trust, Series 2017-1III-A | | | 3.35% | ^ § | | | 11/27/2037 | | | | 193,784,099 | |
66,480,718 | | US Residential Opportunity Fund Trust, Series 2017-1IV-A | | | 3.35% | ^ § | | | 11/27/2037 | | | | 66,045,103 | |
20,137,588 | | Velocity Commercial Capital Loan Trust, Series 2016-1-AFX | | | 3.53% | # ^ | | | 04/25/2046 | | | | 20,071,812 | |
46,119,817 | | Velocity Commercial Capital Loan Trust, Series 2017-2-AFX | | | 3.07% | # ^ | | | 11/25/2047 | | | | 45,843,145 | |
28,481,884 | | VOLT LLC, Series 2017-NP10-A1 | | | 3.00% | ^ § | | | 10/25/2047 | | | | 28,286,971 | |
5,991,671 | | VOLT LLC, Series 2017-NPL1-A1 | | | 3.50% | ^ § | | | 02/25/2047 | | | | 5,993,204 | |
67,140,565 | | VOLT LLC, Series 2017-NPL2-A1 | | | 3.50% | ^ § | | | 03/25/2047 | | | | 67,186,248 | |
153,548,713 | | VOLT LLC, Series 2017-NPL3-A1 | | | 3.50% | ^ § | | | 03/25/2047 | | | | 153,957,276 | |
92,656,196 | | VOLT LLC, Series 2017-NPL4-A1 | | | 3.38% | ^ § | | | 04/25/2047 | | | | 92,693,945 | |
106,426,498 | | VOLT LLC, Series 2017-NPL5-A1 | | | 3.38% | ^ § | | | 05/28/2047 | | | | 106,514,364 | |
52,286,451 | | VOLT LLC, Series 2017-NPL6-A1 | | | 3.25% | ^ § | | | 05/25/2047 | | | | 52,174,161 | |
116,360,947 | | VOLT LLC, Series 2017-NPL7-A1 | | | 3.25% | ^ § | | | 06/25/2047 | | | | 116,157,013 | |
72,692,990 | | VOLT LLC, Series 2017-NPL8-A1 | | | 3.13% | ^ § | | | 06/25/2047 | | | | 72,500,346 | |
71,740,563 | | VOLT LLC, Series 2017-NPL9-A1 | | | 3.13% | ^ § | | | 09/25/2047 | | | | 71,526,260 | |
6,992,134 | | Washington Mutual Mortgage Pass-Through Certificates, Series 2005-1-2A | | | 6.00% | | | | 03/25/2035 | | | | 6,598,063 | |
2,641,211 | | Washington Mutual Mortgage Pass-Through Certificates, Series 2005-4-5A1 | | | 5.50% | | | | 06/25/2035 | | | | 2,587,196 | |
1,072,610 | | Washington Mutual Mortgage Pass-Through Certificates, Series 2005-5-CB12 (-11 x 1 Month LIBOR USD + 50.60%, 50.60% Cap) | | | 30.01% | I/F | | | 07/25/2035 | | | | 1,658,743 | |
3,473,375 | | Washington Mutual Mortgage Pass-Through Certificates, Series 2005-5-CB6 (1 Month LIBOR USD + 0.60%, 0.60% Floor, 7.50% Cap) | | | 2.47% | | | | 07/25/2035 | | | | 3,082,069 | |
1,082,336 | | Washington Mutual Mortgage Pass-Through Certificates, Series 2005-6-2A7 | | | 5.50% | | | | 08/25/2035 | | | | 1,058,406 | |
13,538,209 | | Washington Mutual Mortgage Pass-Through Certificates, Series 2005-7-2CB6 (1 Month LIBOR USD + 1.45%, 1.45% Floor, 6.00% Cap) | | | 3.32% | | | | 08/25/2035 | | | | 12,916,632 | |
1,230,746 | | Washington Mutual Mortgage Pass-Through Certificates, Series 2005-7-2CB7 (-11 x 1 Month LIBOR USD + 50.05%, 50.05% Cap) | | | 29.46% | I/F | | | 08/25/2035 | | | | 1,722,545 | |
1,429,977 | | Washington Mutual Mortgage Pass-Through Certificates, Series 2005-7-3CB | | | 6.50% | | | | 08/25/2035 | | | | 1,250,620 | |
13,365,853 | | Washington Mutual Mortgage Pass-Through Certificates, Series 2005-8-1A2 | | | 5.50% | | | | 10/25/2035 | | | | 12,846,245 | |
10,451,281 | | Washington Mutual Mortgage Pass-Through Certificates, Series 2005-9-2A2 | | | 5.50% | | | | 11/25/2035 | | | | 9,759,956 | |
2,837,615 | | Washington Mutual Mortgage Pass-Through Certificates, Series 2005-9-CX | | | 5.50% | I/O | | | 11/25/2035 | | | | 601,008 | |
4,112,858 | | Washington Mutual Mortgage Pass-Through Certificates, Series 2006-1-3A1 | | | 5.75% | | | | 02/25/2036 | | | | 3,941,994 | |
2,082,583 | | Washington Mutual Mortgage Pass-Through Certificates, Series 2006-1-3A2 | | | 5.75% | | | | 02/25/2036 | | | | 1,996,065 | |
1,768,881 | | Washington Mutual Mortgage Pass-Through Certificates, Series 2006-1-3A7 | | | 5.75% | | | | 02/25/2036 | | | | 1,695,395 | |
4,360,234 | | Washington Mutual Mortgage Pass-Through Certificates, Series 2006-3-3CB4 | | | 6.00% | | | | 04/25/2036 | | | | 4,028,110 | |
2,628,050 | | Washington Mutual Mortgage Pass-Through Certificates, Series 2006-5-1A8 | | | 5.75% | | | | 07/25/2036 | | | | 2,368,426 | |
4,918,215 | | Washington Mutual Mortgage Pass-Through Certificates, Series 2006-5-2CB1 | | | 6.00% | | | | 07/25/2036 | | | | 4,070,477 | |
8,933,549 | | Washington Mutual Mortgage Pass-Through Certificates, Series 2006-5-2CB6 | | | 6.00% | | | | 07/25/2036 | | | | 7,393,700 | |
7,163,804 | | Washington Mutual Mortgage Pass-Through Certificates, Series 2006-5-3A5 | | | 6.45% | ß | | | 07/25/2036 | | | | 3,237,084 | |
4,022,282 | | Washington Mutual Mortgage Pass-Through Certificates, Series 2006-9-A7 | | | 4.81% | ß | | | 10/25/2036 | | | | 2,194,848 | |
9,994,400 | | Washington Mutual Mortgage Pass-Through Certificates, Series 2006-AR10-1A1 | | | 3.27% | # | | | 09/25/2036 | | | | 9,729,258 | |
16,797,850 | | Washington Mutual Mortgage Pass-Through Certificates, Series 2006-AR15-1A (12 Month US Treasury Average + 0.84%, 0.84% Floor) | | | 2.12% | | | | 11/25/2046 | | | | 14,600,268 | |
1,277,979 | | Washington Mutual Mortgage Pass-Through Certificates, Series 2006-AR6-2A3 | | | 3.32% | # | | | 08/25/2036 | | | | 1,238,975 | |
13,987,106 | | Washington Mutual Mortgage Pass-Through Certificates, Series 2007-2-1A2 | | | 6.00% | | | | 04/25/2037 | | | | 12,301,888 | |
14,310,232 | | Washington Mutual Mortgage Pass-Through Certificates, Series 2007-2-1A6 | | | 6.00% | | | | 04/25/2037 | | | | 12,586,083 | |
6,917,589 | | Washington Mutual Mortgage Pass-Through Certificates, Series 2007-3-A2 | | | 6.00% | | | | 04/25/2037 | | | | 6,726,396 | |
9,376,862 | | Washington Mutual Mortgage Pass-Through Certificates, Series 2007-3-A3 | | | 6.00% | | | | 04/25/2037 | | | | 9,117,697 | |
7,991,166 | | Washington Mutual Mortgage Pass-Through Certificates, Series 2007-4-1A1 | | | 5.50% | | | | 06/25/2037 | | | | 7,974,142 | |
397,192 | | Washington Mutual Mortgage Pass-Through Certificates, Series 2007-5-A11 (-6 x 1 Month LIBOR USD + 39.48%, 39.48% Cap) | | | 28.25% | I/F | | | 06/25/2037 | | | | 673,302 | |
9,929,792 | | Washington Mutual Mortgage Pass-Through Certificates, Series 2007-5-A6 | | | 6.00% | | | | 06/25/2037 | | | | 9,926,059 | |
17,051,771 | | Washington Mutual Mortgage Pass-Through Certificates, Series 2007-HY3-4A1 | | | 3.46% | # | | | 03/25/2037 | | | | 16,963,477 | |
19,627,851 | | Washington Mutual Mortgage Pass-Through Certificates, Series 2007-HY5-1A1 | | | 3.01% | # | | | 05/25/2037 | | | | 18,091,822 | |
15,850,974 | | Washington Mutual Mortgage Pass-Through Certificates, Series 2007-HY6-2A3 | | | 3.16% | # | | | 06/25/2037 | | | | 15,250,498 | |
11,754,209 | | Washington Mutual Mortgage Pass-Through Certificates, Series 2007-OC1-A2 (1 Month LIBOR USD + 0.12%, 0.12% Floor) | | | 1.99% | | | | 01/25/2047 | | | | 10,702,298 | |
1,772,054 | | Wells Fargo Alternative Loan Trust, Series 2007-PA1-A10 | | | 6.00% | | | | 03/25/2037 | | | | 1,684,191 | |
7,780,698 | | Wells Fargo Alternative Loan Trust, Series 2007-PA1-A3 | | | 6.00% | | | | 03/25/2037 | | | | 7,394,911 | |
6,708,664 | | Wells Fargo Alternative Loan Trust, Series 2007-PA1-A5 | | | 6.00% | | | | 03/25/2037 | | | | 6,376,031 | |
10,995,164 | | Wells Fargo Alternative Loan Trust, Series 2007-PA1-A6 | | | 6.00% | | | | 03/25/2037 | | | | 10,449,995 | |
45,623,683 | | Wells Fargo Alternative Loan Trust, Series 2007-PA2-1A1 | | | 6.00% | | | | 06/25/2037 | | | | 45,750,390 | |
6,778,546 | | Wells Fargo Alternative Loan Trust, Series 2007-PA2-3A1 (1 Month LIBOR USD + 0.35%, 0.35% Floor, 7.00% Cap) | | | 2.22% | | | | 06/25/2037 | | | | 4,993,498 | |
9,985,847 | | Wells Fargo Alternative Loan Trust, Series 2007-PA2-3A2 (-1 x 1 Month LIBOR USD + 6.65%, 6.65% Cap) | | | 4.78% | I/F I/O | | | 06/25/2037 | | | | 1,845,085 | |
640,013 | | Wells Fargo Alternative Loan Trust, Series 2007-PA3-1A4 | | | 5.75% | | | | 07/25/2037 | | | | 601,287 | |
14,442,965 | | Wells Fargo Alternative Loan Trust, Series 2007-PA3-2A1 | | | 6.00% | | | | 07/25/2037 | | | | 14,242,336 | |
5,738,283 | | Wells Fargo Alternative Loan Trust, Series 2007-PA3-2A4 | | | 6.00% | | | | 07/25/2037 | | | | 5,658,572 | |
11,822,047 | | Wells Fargo Alternative Loan Trust, Series 2007-PA3-3A1 | | | 6.25% | | | | 07/25/2037 | | | | 11,210,400 | |
5,501,929 | | Wells Fargo Alternative Loan Trust, Series 2007-PA3-4A3 | | | 6.50% | | | | 07/25/2037 | | | | 5,162,430 | |
82,169,750 | | Wells Fargo Alternative Loan Trust, Series 2007-PA5-1A1 | | | 6.25% | | | | 11/25/2037 | | | | 80,046,393 | |
7,280,834 | | Wells Fargo Alternative Loan Trust, Series 2007-PA6-A1 | | | 3.67% | # | | | 12/28/2037 | | | | 7,183,465 | |
11,932,625 | | Wells Fargo Mortgage Backed Securities Trust, Series 2004-Y-3A3 | | | 3.74% | # | | | 11/25/2034 | | | | 12,293,175 | |
18,972,359 | | Wells Fargo Mortgage Backed Securities Trust, Series 2005-17-1A1 | | | 5.50% | | | | 01/25/2036 | | | | 18,766,717 | |
26,790 | | Wells Fargo Mortgage Backed Securities Trust, Series 2005-4-A7 (-4 x 1 Month LIBOR USD + 23.89%, 23.89% Cap) | | | 16.44% | I/F | | | 04/25/2035 | | | | 28,450 | |
1,895,121 | | Wells Fargo Mortgage Backed Securities Trust, Series 2005-8-A1 | | | 5.50% | | | | 10/25/2035 | | | | 1,957,168 | |
1,351,742 | | Wells Fargo Mortgage Backed Securities Trust, Series 2005-AR16-6A4 | | | 3.49% | # | | | 10/25/2035 | | | | 1,361,014 | |
3,664,365 | | Wells Fargo Mortgage Backed Securities Trust, Series 2006-12-A3 | | | 6.00% | | | | 10/25/2036 | | | | 3,691,190 | |
4,590,254 | | Wells Fargo Mortgage Backed Securities Trust, Series 2006-14-A1 | | | 6.00% | | | | 10/25/2036 | | | | 4,576,743 | |
5,469,166 | | Wells Fargo Mortgage Backed Securities Trust, Series 2006-15-A1 | | | 6.00% | | | | 11/25/2036 | | | | 5,484,857 | |
66,169 | | Wells Fargo Mortgage Backed Securities Trust, Series 2006-2-1A4 (-3 x 1 Month LIBOR USD + 19.39%, 19.39% Cap) | | | 14.24% | I/F | | | 03/25/2036 | | | | 75,249 | |
2,983,124 | | Wells Fargo Mortgage Backed Securities Trust, Series 2006-2-3A1 | | | 5.75% | | | | 03/25/2036 | | | | 2,941,326 | |
16,128,543 | | Wells Fargo Mortgage Backed Securities Trust, Series 2006-3-A11 | | | 5.50% | | | | 03/25/2036 | | | | 16,559,643 | |
3,659,988 | | Wells Fargo Mortgage Backed Securities Trust, Series 2006-3-A6 | | | 5.50% | | | | 03/25/2036 | | | | 3,610,741 | |
201,551 | | Wells Fargo Mortgage Backed Securities Trust, Series 2006-4-2A2 | | | 5.50% | | | | 04/25/2036 | | | | 197,267 | |
2,312,710 | | Wells Fargo Mortgage Backed Securities Trust, Series 2006-6-2A1 (1 Month LIBOR USD + 0.40%, 0.40% Floor, 7.50% Cap) | | | 2.27% | | | | 05/25/2036 | | | | 2,088,203 | |
2,312,710 | | Wells Fargo Mortgage Backed Securities Trust, Series 2006-6-2A2 (-1 x 1 Month LIBOR USD + 7.10%, 7.10% Cap) | | | 5.23% | I/F I/O | | | 05/25/2036 | | | | 337,182 | |
1,876,715 | | Wells Fargo Mortgage Backed Securities Trust, Series 2006-9-2A1 | | | 0.00% | P/O | | | 08/25/2036 | | | | 1,255,011 | |
1,876,715 | | Wells Fargo Mortgage Backed Securities Trust, Series 2006-9-2A2 | | | 6.00% | I/O | | | 08/25/2036 | | | | 407,774 | |
7,673,389 | | Wells Fargo Mortgage Backed Securities Trust, Series 2006-AR12-1A1 | | | 3.75% | # | | | 09/25/2036 | | | | 7,682,788 | |
4,119,390 | | Wells Fargo Mortgage Backed Securities Trust, Series 2006-AR13-A2 | | | 3.53% | # | | | 09/25/2036 | | | | 4,100,156 | |
4,445,841 | | Wells Fargo Mortgage Backed Securities Trust, Series 2006-AR4-2A1 | | | 4.15% | # | | | 04/25/2036 | | | | 4,151,684 | |
1,289,471 | | Wells Fargo Mortgage Backed Securities Trust, Series 2007-10-1A18 | | | 6.00% | | | | 07/25/2037 | | | | 1,289,965 | |
2,432,698 | | Wells Fargo Mortgage Backed Securities Trust, Series 2007-10-2A11 | | | 6.00% | | | | 07/25/2037 | | | | 2,384,150 | |
1,322,007 | | Wells Fargo Mortgage Backed Securities Trust, Series 2007-11-A14 | | | 6.00% | | | | 08/25/2037 | | | | 1,298,822 | |
2,638,588 | | Wells Fargo Mortgage Backed Securities Trust, Series 2007-11-A36 | | | 6.00% | | | | 08/25/2037 | | | | 2,592,314 | |
1,875,163 | | Wells Fargo Mortgage Backed Securities Trust, Series 2007-11-A96 | | | 6.00% | | | | 08/25/2037 | | | | 1,842,277 | |
24,122,016 | | Wells Fargo Mortgage Backed Securities Trust, Series 2007-14-1A1 | | | 6.00% | | | | 10/25/2037 | | | | 23,924,788 | |
14,193,573 | | Wells Fargo Mortgage Backed Securities Trust, Series 2007-2-1A1 | | | 6.00% | | | | 03/25/2037 | | | | 14,182,187 | |
821,426 | | Wells Fargo Mortgage Backed Securities Trust, Series 2007-2-1A18 | | | 5.75% | | | | 03/25/2037 | | | | 815,546 | |
1,850,068 | | Wells Fargo Mortgage Backed Securities Trust, Series 2007-2-1A9 | | | 6.00% | | | | 03/25/2037 | | | | 1,848,584 | |
412,733 | | Wells Fargo Mortgage Backed Securities Trust, Series 2007-2-3A2 | | | 5.25% | | | | 03/25/2037 | | | | 423,110 | |
1,534,919 | | Wells Fargo Mortgage Backed Securities Trust, Series 2007-3-1A3 | | | 6.00% | | | | 04/25/2037 | | | | 1,540,144 | |
1,418,736 | | Wells Fargo Mortgage Backed Securities Trust, Series 2007-4-A11 | | | 6.50% | | | | 04/25/2037 | | | | 1,453,673 | |
5,449,852 | | Wells Fargo Mortgage Backed Securities Trust, Series 2007-4-A15 | | | 6.00% | | | | 04/25/2037 | | | | 5,504,554 | |
3,214,570 | | Wells Fargo Mortgage Backed Securities Trust, Series 2007-4-A3 | | | 6.00% | | | | 04/25/2037 | | | | 3,246,835 | |
3,390,195 | | Wells Fargo Mortgage Backed Securities Trust, Series 2007-4-A8 | | | 6.00% | | | | 04/25/2037 | | | | 3,424,223 | |
3,570,284 | | Wells Fargo Mortgage Backed Securities Trust, Series 2007-6-A4 | | | 6.00% | | | | 05/25/2037 | | | | 3,583,910 | |
1,706,055 | | Wells Fargo Mortgage Backed Securities Trust, Series 2007-6-A6 | | | 6.00% | | | | 05/25/2037 | | | | 1,712,567 | |
5,619,232 | | Wells Fargo Mortgage Backed Securities Trust, Series 2007-7-A1 | | | 6.00% | | | | 06/25/2037 | | | | 5,598,888 | |
390,807 | | Wells Fargo Mortgage Backed Securities Trust, Series 2007-7-A32 | | | 5.75% | | | | 06/25/2037 | | | | 386,093 | |
12,654,097 | | Wells Fargo Mortgage Backed Securities Trust, Series 2007-7-A34 | | | 6.00% | | | | 06/25/2037 | | | | 12,608,283 | |
3,427,346 | | Wells Fargo Mortgage Backed Securities Trust, Series 2007-7-A36 | | | 6.00% | | | | 06/25/2037 | | | | 3,414,937 | |
1,165,586 | | Wells Fargo Mortgage Backed Securities Trust, Series 2007-7-A43 (1 Month LIBOR USD + 0.50% , 0.50% Floor, 7.00% Cap) | | | 2.37% | | | | 06/25/2037 | | | | 1,001,051 | |
3,184,357 | | Wells Fargo Mortgage Backed Securities Trust, Series 2007-7-A49 | | | 6.00% | | | | 06/25/2037 | | | | 3,172,828 | |
1,348,088 | | Wells Fargo Mortgage Backed Securities Trust, Series 2007-7-A8 (1 Month LIBOR USD + 0.50% , 0.50% Floor, 7.00% Cap) | | | 2.37% | | | | 06/25/2037 | | | | 1,157,790 | |
608,146 | | Wells Fargo Mortgage Backed Securities Trust, Series 2007-7-A9 (-6 x 1 Month LIBOR USD + 39.00% , 39.00% Cap) | | | 27.77% | I/F | | | 06/25/2037 | | | | 918,553 | |
983,016 | | Wells Fargo Mortgage Backed Securities Trust, Series 2007-8-1A13 (1 Month LIBOR USD + 0.37% , 0.37% Floor, 7.00% Cap) | | | 2.24% | | | | 07/25/2037 | | | | 909,929 | |
983,016 | | Wells Fargo Mortgage Backed Securities Trust, Series 2007-8-1A14 (-6 x 1 Month LIBOR USD + 39.78%, 39.78% Cap) | | | 28.55% | I/F | | | 07/25/2037 | | | | 1,333,125 | |
15,974,010 | | Wells Fargo Mortgage Backed Securities Trust, Series 2007-8-1A16 | | | 6.00% | | | | 07/25/2037 | | | | 15,976,147 | |
10,659,211 | | Wells Fargo Mortgage Backed Securities Trust, Series 2007-8-1A2 | | | 6.00% | | | | 07/25/2037 | | | | 10,660,637 | |
1,506,903 | | Wells Fargo Mortgage Backed Securities Trust, Series 2007-8-1A20 | | | 6.00% | | | | 07/25/2037 | | | | 1,507,105 | |
13,463,187 | | Wells Fargo Mortgage Backed Securities Trust, Series 2007-8-1A22 | | | 6.00% | | | | 07/25/2037 | | | | 13,465,001 | |
4,685,702 | | Wells Fargo Mortgage Backed Securities Trust, Series 2007-8-1A3 | | | 6.00% | | | | 07/25/2037 | | | | 4,686,331 | |
6,099,693 | | Wells Fargo Mortgage Backed Securities Trust, Series 2007-8-2A9 | | | 6.00% | | | | 07/25/2037 | | | | 6,608,270 | |
40,743,637 | | Wells Fargo Mortgage Backed Securities Trust, Series 2007-AR9-A1 | | | 3.69% | # | | | 12/28/2037 | | | | 38,672,915 | |
17,861,601 | | WinWater Mortgage Loan Trust, Series 2015-4-A5 | | | 3.50% | # ^ | | | 06/20/2045 | | | | 17,936,959 | |
131,801,176 | | WinWater Mortgage Loan Trust, Series 2015-5-A3 | | | 3.50% | # ^ | | | 08/20/2045 | | | | 131,121,543 | |
21,310,416 | | WinWater Mortgage Loan Trust, Series 2016-1-1A5 | | | 3.50% | # ^ | | | 01/20/2046 | | | | 21,106,989 | |
| | | | | | | | | | | | | | |
Total Non-Agency Residential Collateralized Mortgage Obligations (Cost $13,277,132,943) | | | | | | | | 13,325,205,289 | |
| | | | | | | | | | | | | | |
| | | |
US Corporate Bonds - 0.1% | | | | | | | | | | | | |
4,915,000 | | American Express Credit Corporation (3 Month LIBOR USD + 0.55%) | | | 2.73% | | | | 03/18/2019 | | | | 4,929,294 | |
5,000,000 | | American Express Credit Corporation (3 Month LIBOR USD + 0.33%) | | | 2.12% | | | | 05/03/2019 | | | | 5,006,592 | |
2,085,000 | | American Express Credit Corporation (3 Month LIBOR USD + 0.43%) | | | 2.45% | | | | 03/03/2020 | | | | 2,093,404 | |
5,915,000 | | BB&T Corporation (3 Month LIBOR USD + 0.57%) | | | 2.69% | | | | 06/15/2020 | | | | 5,941,877 | |
2,000,000 | | Chevron Corporation (3 Month LIBOR USD + 0.41%) | | | 2.25% | | | | 11/15/2019 | | | | 2,010,219 | |
3,150,000 | | Citibank N.A. (3 Month LIBOR USD + 0.34%) | | | 2.54% | | | | 03/20/2019 | | | | 3,154,156 | |
2,600,000 | | Citibank N.A. (3 Month LIBOR USD + 0.50%) | | | 2.57% | | | | 06/12/2020 | | | | 2,615,235 | |
12,500,000 | | Consolidated Edison, Inc. | | | 5.85% | | | | 04/01/2018 | | | | 12,500,000 | |
1,500,000 | | Daimler Finance North America LLC (3 Month LIBOR USD + 0.74%) | | | 2.44% | ^ | | | 07/05/2019 | | | | 1,509,879 | |
5,000,000 | | Daimler Finance North America LLC (3 Month LIBOR USD + 0.43%) | | | 2.24% | ^ | | | 02/12/2021 | | | | 5,003,872 | |
12,500,000 | | JPMorgan Chase & Company (3 Month LIBOR USD + 0.84%) | | | 3.09% | | | | 03/22/2019 | | | | 12,567,120 | |
3,040,000 | | Medtronic, Inc. (3 Month LIBOR USD + 0.80%) | | | 2.92% | | | | 03/15/2020 | | | | 3,077,136 | |
6,000,000 | | Morgan Stanley (3 Month LIBOR USD + 0.55%) | | | 2.29% | | | | 02/10/2021 | | | | 6,004,920 | |
5,000,000 | | Oracle Corporation | | | 5.75% | | | | 04/15/2018 | | | | 5,004,669 | |
3,000,000 | | PepsiCo, Inc. (3 Month LIBOR USD + 0.04%) | | | 1.82% | | | | 05/02/2019 | | | | 2,998,833 | |
411,000 | | Wells Fargo & Company (3 Month LIBOR USD + 0.88%) | | | 2.62% | | | | 07/22/2020 | | | | 414,927 | |
1,000,000 | | Wells Fargo & Company (3 Month LIBOR USD + 1.01%) | | | 3.04% | | | | 12/07/2020 | | | | 1,012,386 | |
| | | | | | | | | | | | | | |
Total US Corporate Bonds (Cost $75,816,463) | | | | | | | | 75,844,519 | |
| | | | | | | | | | | | | | |
| | | |
US Government and Agency Mortgage Backed Obligations - 47.6% | | | | | | | | | | | | |
74,375,000 | | Federal Home Loan Mortgage Corporation | | | 1.00% | | | | 10/11/2018 | | | | 73,994,646 | |
8,464,252 | | Federal Home Loan Mortgage Corporation, Pool C0-3490 | | | 4.50% | | | | 08/01/2040 | | | | 8,956,686 | |
51,813,402 | | Federal Home Loan Mortgage Corporation, Pool C9-1388 | | | 3.50% | | | | 02/01/2032 | | | | 52,935,573 | |
27,386,738 | | Federal Home Loan Mortgage Corporation, Pool C9-1403 | | | 3.50% | | | | 03/01/2032 | | | | 27,980,610 | |
26,559,793 | | Federal Home Loan Mortgage Corporation, Pool C9-1413 | | | 3.50% | | | | 12/01/2031 | | | | 27,135,622 | |
13,425,092 | | Federal Home Loan Mortgage Corporation, Pool C9-1417 | | | 3.50% | | | | 01/01/2032 | | | | 13,716,178 | |
55,960,126 | | Federal Home Loan Mortgage Corporation, Pool C9-1447 | | | 3.50% | | | | 05/01/2032 | | | | 57,173,697 | |
62,894,523 | | Federal Home Loan Mortgage Corporation, Pool C9-1594 | | | 3.00% | | | | 01/01/2033 | | | | 63,079,753 | |
18,732,313 | | Federal Home Loan Mortgage Corporation, Pool C9-1596 | | | 3.00% | | | | 02/01/2033 | | | | 18,787,515 | |
9,466,266 | | Federal Home Loan Mortgage Corporation, Pool D9-8901 | | | 3.50% | | | | 01/01/2032 | | | | 9,671,506 | |
25,060,082 | | Federal Home Loan Mortgage Corporation, Pool D9-8923 | | | 3.50% | | | | 01/01/2032 | | | | 25,601,643 | |
23,702,533 | | Federal Home Loan Mortgage Corporation, Pool D9-9724 | | | 3.00% | | | | 11/01/2032 | | | | 23,772,356 | |
21,052,257 | | Federal Home Loan Mortgage Corporation, Pool G0-1840 | | | 5.00% | | | | 07/01/2035 | | | | 22,705,361 | |
4,339,672 | | Federal Home Loan Mortgage Corporation, Pool G0-4817 | | | 5.00% | | | | 09/01/2038 | | | | 4,677,946 | |
21,234,774 | | Federal Home Loan Mortgage Corporation, Pool G0-7801 | | | 4.00% | | | | 10/01/2044 | | | | 21,934,338 | |
41,303,142 | | Federal Home Loan Mortgage Corporation, Pool G0-7862 | | | 4.00% | | | | 01/01/2044 | | | | 42,674,518 | |
46,982,377 | | Federal Home Loan Mortgage Corporation, Pool G0-7905 | | | 4.00% | | | | 01/01/2042 | | | | 48,641,220 | |
77,408,727 | | Federal Home Loan Mortgage Corporation, Pool G0-8534 | | | 3.00% | | | | 06/01/2043 | | | | 76,034,760 | |
25,044,378 | | Federal Home Loan Mortgage Corporation, Pool G0-8537 | | | 3.00% | | | | 07/01/2043 | | | | 24,586,684 | |
59,390,819 | | Federal Home Loan Mortgage Corporation, Pool G0-8614 | | | 3.00% | | | | 11/01/2044 | | | | 58,167,324 | |
69,732,614 | | Federal Home Loan Mortgage Corporation, Pool G0-8619 | | | 3.00% | | | | 12/01/2044 | | | | 68,296,043 | |
93,950,733 | | Federal Home Loan Mortgage Corporation, Pool G0-8622 | | | 3.00% | | | | 01/01/2045 | | | | 92,015,219 | |
179,902,400 | | Federal Home Loan Mortgage Corporation, Pool G0-8626 | | | 3.00% | | | | 02/01/2045 | | | | 176,196,716 | |
98,038,595 | | Federal Home Loan Mortgage Corporation, Pool G0-8631 | | | 3.00% | | | | 03/01/2045 | | | | 95,992,592 | |
250,985,060 | | Federal Home Loan Mortgage Corporation, Pool G0-8635 | | | 3.00% | | | | 04/01/2045 | | | | 245,678,827 | |
74,162,686 | | Federal Home Loan Mortgage Corporation, Pool G0-8640 | | | 3.00% | | | | 05/01/2045 | | | | 72,574,476 | |
384,708,684 | | Federal Home Loan Mortgage Corporation, Pool G0-8648 | | | 3.00% | | | | 06/01/2045 | | | | 376,366,545 | |
74,554,438 | | Federal Home Loan Mortgage Corporation, Pool G0-8653 | | | 3.00% | | | | 07/01/2045 | | | | 72,897,519 | |
41,363,339 | | Federal Home Loan Mortgage Corporation, Pool G0-8658 | | | 3.00% | | | | 08/01/2045 | | | | 40,443,835 | |
49,404,434 | | Federal Home Loan Mortgage Corporation, Pool G0-8670 | | | 3.00% | | | | 10/01/2045 | | | | 48,266,166 | |
582,202,658 | | Federal Home Loan Mortgage Corporation, Pool G0-8675 | | | 3.00% | | | | 11/01/2045 | | | | 568,628,178 | |
253,280,402 | | Federal Home Loan Mortgage Corporation, Pool G0-8680 | | | 3.00% | | | | 12/01/2045 | | | | 247,309,970 | |
175,849,070 | | Federal Home Loan Mortgage Corporation, Pool G0-8686 | | | 3.00% | | | | 01/01/2046 | | | | 171,654,377 | |
230,521,798 | | Federal Home Loan Mortgage Corporation, Pool G0-8692 | | | 3.00% | | | | 02/01/2046 | | | | 225,022,228 | |
462,163,987 | | Federal Home Loan Mortgage Corporation, Pool G0-8697 | | | 3.00% | | | | 03/01/2046 | | | | 451,145,609 | |
632,931,514 | | Federal Home Loan Mortgage Corporation, Pool G0-8705 | | | 3.00% | | | | 05/01/2046 | | | | 617,840,977 | |
165,096,559 | | Federal Home Loan Mortgage Corporation, Pool G0-8721 | | | 3.00% | | | | 09/01/2046 | | | | 161,157,393 | |
89,234,579 | | Federal Home Loan Mortgage Corporation, Pool G0-8741 | | | 3.00% | | | | 01/01/2047 | | | | 87,021,210 | |
10,252,706 | | Federal Home Loan Mortgage Corporation, Pool G0-8747 | | | 3.00% | | | | 02/01/2047 | | | | 10,002,804 | |
67,489,324 | | Federal Home Loan Mortgage Corporation, Pool G6-0251 | | | 3.50% | | | | 10/01/2045 | | | | 67,664,646 | |
227,144,488 | | Federal Home Loan Mortgage Corporation, Pool G6-0393 | | | 3.50% | | | | 01/01/2046 | | | | 228,284,910 | |
95,206,207 | | Federal Home Loan Mortgage Corporation, Pool J2-2834 | | | 2.50% | | | | 03/01/2028 | | | | 93,909,661 | |
66,803,224 | | Federal Home Loan Mortgage Corporation, Pool Q1-3637 | | | 3.00% | | | | 11/01/2042 | | | | 65,634,440 | |
67,634,514 | | Federal Home Loan Mortgage Corporation, Pool Q1-3638 | | | 3.00% | | | | 11/01/2042 | | | | 66,451,628 | |
111,857,190 | | Federal Home Loan Mortgage Corporation, Pool Q1-6672 | | | 3.00% | | | | 03/01/2043 | | | | 109,899,611 | |
6,811,399 | | Federal Home Loan Mortgage Corporation, Pool Q2-3595 | | | 4.00% | | | | 12/01/2043 | | | | 7,049,739 | |
9,014,629 | | Federal Home Loan Mortgage Corporation, Pool Q2-4052 | | | 4.00% | | | | 01/01/2044 | | | | 9,330,072 | |
7,678,387 | | Federal Home Loan Mortgage Corporation, Pool Q2-4172 | | | 4.00% | | | | 01/01/2044 | | | | 7,947,000 | |
6,313,400 | | Federal Home Loan Mortgage Corporation, Pool Q2-4979 | | | 4.00% | | | | 02/01/2044 | | | | 6,532,183 | |
52,996,720 | | Federal Home Loan Mortgage Corporation, Pool Q3-1596 | | | 3.50% | | | | 02/01/2045 | | | | 53,196,855 | |
19,072,393 | | Federal Home Loan Mortgage Corporation, Pool Q3-2861 | | | 3.50% | | | | 04/01/2045 | | | | 19,156,349 | |
51,196,831 | | Federal Home Loan Mortgage Corporation, Pool Q3-2921 | | | 3.50% | | | | 04/01/2045 | | | | 51,390,159 | |
31,954,386 | | Federal Home Loan Mortgage Corporation, Pool Q3-9502 | | | 3.50% | | | | 03/01/2046 | | | | 32,114,711 | |
98,221,149 | | Federal Home Loan Mortgage Corporation, Pool Q4-4073 | | | 3.00% | | | | 09/01/2046 | | | | 95,878,147 | |
68,225,619 | | Federal Home Loan Mortgage Corporation, Pool Q4-4452 | | | 3.00% | | | | 11/01/2046 | | | | 66,576,605 | |
59,054,686 | | Federal Home Loan Mortgage Corporation, Pool Q4-4665 | | | 3.00% | | | | 11/01/2046 | | | | 57,642,626 | |
7,627,707 | | Federal Home Loan Mortgage Corporation, Pool T6-0392 | | | 4.00% | | | | 10/01/2041 | | | | 7,716,811 | |
6,524,403 | | Federal Home Loan Mortgage Corporation, Pool T6-0681 | | | 4.00% | | | | 05/01/2042 | | | | 6,600,666 | |
21,781,262 | | Federal Home Loan Mortgage Corporation, Pool T6-0782 | | | 3.50% | | | | 07/01/2042 | | | | 21,796,195 | |
37,173,338 | | Federal Home Loan Mortgage Corporation, Pool T6-0853 | | | 3.50% | | | | 09/01/2042 | | | | 37,198,903 | |
30,037,293 | | Federal Home Loan Mortgage Corporation, Pool T6-0854 | | | 3.50% | | | | 09/01/2042 | | | | 30,057,952 | |
3,097,736 | | Federal Home Loan Mortgage Corporation, Pool T6-5110 | | | 3.50% | | | | 10/01/2042 | | | | 3,099,846 | |
4,710,374 | | Federal Home Loan Mortgage Corporation, Pool T6-9016 | | | 5.00% | | | | 06/01/2041 | | | | 4,934,912 | |
27,694,611 | | Federal Home Loan Mortgage Corporation, Pool T6-9050 | | | 3.50% | | | | 05/01/2046 | | | | 27,713,619 | |
613,521 | | Federal Home Loan Mortgage Corporation, Pool U6-0299 | | | 4.00% | | | | 11/01/2040 | | | | 635,885 | |
154,242,469 | | Federal Home Loan Mortgage Corporation, Pool V8-1821 | | | 3.00% | | | | 08/01/2045 | | | | 150,855,639 | |
41,475,026 | | Federal Home Loan Mortgage Corporation, Pool V8-2117 | | | 3.00% | | | | 12/01/2045 | | | | 40,522,463 | |
47,824,140 | | Federal Home Loan Mortgage Corporation, Pool V8-2209 | | | 3.50% | | | | 02/01/2046 | | | | 48,064,258 | |
15,681,343 | | Federal Home Loan Mortgage Corporation, Pool V8-2248 | | | 3.50% | | | | 03/01/2046 | | | | 15,743,082 | |
123,644,380 | | Federal Home Loan Mortgage Corporation, Pool V8-2851 | | | 3.00% | | | | 01/01/2047 | | | | 120,681,526 | |
66,206,485 | | Federal Home Loan Mortgage Corporation, Series 2015-SC02-1A | | | 3.00% | | | | 09/25/2045 | | | | 63,453,249 | |
44,264,045 | | Federal Home Loan Mortgage Corporation, Series 2016-SC01-1A | | | 3.00% | | | | 07/25/2046 | | | | 42,561,181 | |
1,479,187 | | Federal Home Loan Mortgage Corporation, Series 2519-ZD | | | 5.50% | | | | 11/15/2032 | | | | 1,581,243 | |
894,471 | | Federal Home Loan Mortgage Corporation, Series 2596-ZL | | | 5.00% | | | | 04/15/2033 | | | | 957,769 | |
47,546,354 | | Federal Home Loan Mortgage Corporation, Series 267-30 | | | 3.00% | | | | 08/15/2042 | | | | 46,878,278 | |
456,711 | | Federal Home Loan Mortgage Corporation, Series 2684-ZN | | | 4.00% | | | | 10/15/2033 | | | | 468,076 | |
89,483,343 | | Federal Home Loan Mortgage Corporation, Series 269-30 | | | 3.00% | | | | 08/15/2042 | | | | 88,277,860 | |
38,424,018 | | Federal Home Loan Mortgage Corporation, Series 274-30 | | | 3.00% | | | | 08/15/2042 | | | | 37,927,784 | |
3,260,217 | | Federal Home Loan Mortgage Corporation, Series 2750-ZT | | | 5.00% | | | | 02/15/2034 | | | | 3,504,624 | |
113,838,154 | | Federal Home Loan Mortgage Corporation, Series 280-30 | | | 3.00% | | | | 09/15/2042 | | | | 112,348,128 | |
12,193,546 | | Federal Home Loan Mortgage Corporation, Series 3819-MS (-1 x 1 Month LIBOR USD + 6.47%, 6.47% Cap) | | | 4.69% | I/F I/O | | | 06/15/2040 | | | | 1,279,996 | |
8,342,984 | | Federal Home Loan Mortgage Corporation, Series 2825-PZ | | | 5.50% | | | | 07/15/2034 | | | | 9,078,275 | |
26,641,533 | | Federal Home Loan Mortgage Corporation, Series 284-300 | | | 3.00% | | | | 10/15/2042 | | | | 26,354,838 | |
5,217,826 | | Federal Home Loan Mortgage Corporation, Series 2898-JZ | | | 5.00% | | | | 12/15/2034 | | | | 5,629,035 | |
11,846,574 | | Federal Home Loan Mortgage Corporation, Series 2899-AZ | | | 5.00% | | | | 12/15/2034 | | | | 12,742,924 | |
8,686,754 | | Federal Home Loan Mortgage Corporation, Series 2909-Z | | | 5.00% | | | | 12/15/2034 | | | | 9,343,007 | |
14,412,717 | | Federal Home Loan Mortgage Corporation, Series 2932-Z | | | 5.00% | | | | 02/15/2035 | | | | 15,513,687 | |
1,491,097 | | Federal Home Loan Mortgage Corporation, Series 2990-JL (-1 x 1 Month LIBOR USD + 6.65%, 6.65% Cap) | | | 4.87% | I/F I/O | | | 03/15/2035 | | | | 114,137 | |
5,202,196 | | Federal Home Loan Mortgage Corporation, Series 3002-SN (-1 x 1 Month LIBOR USD + 6.50%, 6.50% Cap) | | | 4.72% | I/F I/O | | | 07/15/2035 | | | | 639,464 | |
3,495,950 | | Federal Home Loan Mortgage Corporation, Series 3030-SL (-1 x 1 Month LIBOR USD + 6.10%, 6.10% Cap) | | | 4.32% | I/F I/O | | | 09/15/2035 | | | | 419,059 | |
1,037,961 | | Federal Home Loan Mortgage Corporation, Series 3045-DI (-1 x 1 Month LIBOR USD + 6.73%, 6.73% Cap) | | | 4.95% | I/F I/O | | | 10/15/2035 | | | | 137,419 | |
8,520,389 | | Federal Home Loan Mortgage Corporation, Series 3116-Z | | | 5.50% | | | | 02/15/2036 | | | | 9,426,162 | |
1,531,157 | | Federal Home Loan Mortgage Corporation, Series 3117-ZN | | | 4.50% | | | | 02/15/2036 | | | | 1,583,079 | |
4,288,361 | | Federal Home Loan Mortgage Corporation, Series 3174-PZ | | | 5.00% | | | | 01/15/2036 | | | | 4,567,819 | |
1,022,296 | | Federal Home Loan Mortgage Corporation, Series 3187-JZ | | | 5.00% | | | | 07/15/2036 | | | | 1,107,133 | |
2,744,270 | | Federal Home Loan Mortgage Corporation, Series 3188-ZK | | | 5.00% | | | | 07/15/2036 | | | | 2,952,038 | |
4,558,642 | | Federal Home Loan Mortgage Corporation, Series 3203-SE (-1 x 1 Month LIBOR USD + 6.50%, 6.50% Cap) | | | 4.72% | I/F I/O | | | 08/15/2036 | | | | 735,135 | |
6,192,006 | | Federal Home Loan Mortgage Corporation, Series 3203-Z | | | 5.00% | | | | 07/15/2036 | | | | 6,616,183 | |
9,811,278 | | Federal Home Loan Mortgage Corporation, Series 3203-ZC | | | 5.00% | | | | 07/15/2036 | | | | 10,483,388 | |
5,316,953 | | Federal Home Loan Mortgage Corporation, Series 3261-SA (-1 x 1 Month LIBOR USD + 6.43%, 6.43% Cap) | | | 4.65% | I/F I/O | | | 01/15/2037 | | | | 776,103 | |
21,230,883 | | Federal Home Loan Mortgage Corporation, Series 326-300 | | | 3.00% | | | | 03/15/2044 | | | | 21,006,212 | |
70,676 | | Federal Home Loan Mortgage Corporation, Series 3267-BA | | | 5.80% | | | | 11/15/2036 | | | | 71,027 | |
6,544,749 | | Federal Home Loan Mortgage Corporation, Series 3275-SC (-1 x 1 Month LIBOR USD + 6.08%, 6.08% Cap) | | | 4.30% | I/F I/O | | | 02/15/2037 | | | | 775,824 | |
2,104,082 | | Federal Home Loan Mortgage Corporation, Series 3315-HZ | | | 6.00% | | | | 05/15/2037 | | | | 2,140,623 | |
5,285,354 | | Federal Home Loan Mortgage Corporation, Series 3326-GS (-1 x 1 Month LIBOR USD + 6.65%, 6.65% Cap) | | | 4.87% | I/F I/O | | | 06/15/2037 | | | | 560,185 | |
1,052,978 | | Federal Home Loan Mortgage Corporation, Series 3351-ZC | | | 5.50% | | | | 07/15/2037 | | | | 1,152,188 | |
11,724,522 | | Federal Home Loan Mortgage Corporation, Series 3355-BI (-1 x 1 Month LIBOR USD + 6.05%, 6.05% Cap) | | | 4.27% | I/F I/O | | | 08/15/2037 | | | | 1,505,165 | |
766,093 | | Federal Home Loan Mortgage Corporation, Series 3369-Z | | | 6.00% | | | | 09/15/2037 | | | | 809,672 | |
1,549,269 | | Federal Home Loan Mortgage Corporation, Series 3405-ZG | | | 5.50% | | | | 01/15/2038 | | | | 1,659,459 | |
3,387,990 | | Federal Home Loan Mortgage Corporation, Series 3417-SI (-1 x 1 Month LIBOR USD + 6.18%, 6.18% Cap) | | | 4.40% | I/F I/O | | | 02/15/2038 | | | | 380,755 | |
3,890,623 | | Federal Home Loan Mortgage Corporation, Series 3423-GS (-1 x 1 Month LIBOR USD + 5.65%, 5.65% Cap) | | | 3.87% | I/F I/O | | | 03/15/2038 | | | | 355,357 | |
638,881 | | Federal Home Loan Mortgage Corporation, Series 3423-SG (-1 x 1 Month LIBOR USD + 5.65%, 5.65% Cap) | | | 3.87% | I/F I/O | | | 03/15/2038 | | | | 50,569 | |
813,405 | | Federal Home Loan Mortgage Corporation, Series 3451-S (-1 x 1 Month LIBOR USD + 6.03%, 6.03% Cap) | | | 4.25% | I/F I/O | | | 02/15/2037 | | | | 77,180 | |
907,144 | | Federal Home Loan Mortgage Corporation, Series 3455-SC (-1 x 1 Month LIBOR USD + 6.06%, 6.06% Cap) | | | 4.28% | I/F I/O | | | 06/15/2038 | | | | 95,061 | |
785,530 | | Federal Home Loan Mortgage Corporation, Series 3473-SM (-1 x 1 Month LIBOR USD + 6.07%, 6.07% Cap) | | | 4.29% | I/F I/O | | | 07/15/2038 | | | | 69,794 | |
5,854,332 | | Federal Home Loan Mortgage Corporation, Series 3484-SE (-1 x 1 Month LIBOR USD + 5.85%, 5.85% Cap) | | | 4.07% | I/F I/O | | | 08/15/2038 | | | | 708,815 | |
5,823,744 | | Federal Home Loan Mortgage Corporation, Series 3519-SD (-1 x 1 Month LIBOR USD + 5.55%, 5.55% Cap) | | | 3.77% | I/F I/O | | | 02/15/2038 | | | | 724,471 | |
1,996,316 | | Federal Home Loan Mortgage Corporation, Series 3524-LB | | | 3.86% | | | | 06/15/2038 | | | | 2,010,537 | |
145,297 | | Federal Home Loan Mortgage Corporation, Series 3530-GZ | | | 4.50% | | | | 05/15/2039 | | | | 140,222 | |
7,344,529 | | Federal Home Loan Mortgage Corporation, Series 3541-EI (-1 x 1 Month LIBOR USD + 6.75%, 6.75% Cap) | | | 4.97% | I/F I/O | | | 06/15/2039 | | | | 1,111,198 | |
1,183,474 | | Federal Home Loan Mortgage Corporation, Series 3545-SA (-1 x 1 Month LIBOR USD + 6.15%, 6.15% Cap) | | | 4.37% | I/F I/O | | | 06/15/2039 | | | | 126,887 | |
492,321 | | Federal Home Loan Mortgage Corporation, Series 3549-SA (-1 x 1 Month LIBOR USD + 5.80%, 5.80% Cap) | | | 4.02% | I/F I/O | | | 07/15/2039 | | | | 50,254 | |
8,379,744 | | Federal Home Loan Mortgage Corporation, Series 3577-LS (-1 x 1 Month LIBOR USD + 7.20%, 7.20% Cap) | | | 5.42% | I/F I/O | | | 08/15/2035 | | | | 1,439,848 | |
1,580,056 | | Federal Home Loan Mortgage Corporation, Series 3582-SA (-1 x 1 Month LIBOR USD + 6.00%, 6.00% Cap) | | | 4.22% | I/F I/O | | | 10/15/2049 | | | | 163,431 | |
44,224,272 | | Federal Home Loan Mortgage Corporation, Series 358-300 | | | 3.00% | | | | 10/15/2047 | | | | 43,393,518 | |
2,580,779 | | Federal Home Loan Mortgage Corporation, Series 3583-GB | | | 4.50% | | | | 10/15/2039 | | | | 2,704,051 | |
18,902,484 | | Federal Home Loan Mortgage Corporation, Series 3606-CS (-1 x 1 Month LIBOR USD + 6.35%, 6.35% Cap) | | | 4.57% | I/F I/O | | | 12/15/2039 | | | | 2,810,654 | |
5,073,697 | | Federal Home Loan Mortgage Corporation, Series 3616-SG (-1 x 1 Month LIBOR USD + 6.35%, 6.35% Cap) | | | 4.57% | I/F I/O | | | 03/15/2032 | | | | 617,939 | |
7,061,933 | | Federal Home Loan Mortgage Corporation, Series 3626-AZ | | | 5.50% | | | | 08/15/2036 | | | | 7,486,518 | |
78,523 | | Federal Home Loan Mortgage Corporation, Series 3631-SE (-1 x 1 Month LIBOR USD + 6.40%, 6.40% Cap) | | | 4.62% | I/F I/O | | | 05/15/2039 | | | | 162 | |
9,949,803 | | Federal Home Loan Mortgage Corporation, Series 3641-Z | | | 5.50% | | | | 02/15/2036 | | | | 10,726,560 | |
10,042,513 | | Federal Home Loan Mortgage Corporation, Series 3654-ZB | | | 5.50% | | | | 11/15/2037 | | | | 10,589,909 | |
22,573,515 | | Federal Home Loan Mortgage Corporation, Series 3666-VZ | | | 5.50% | | | | 08/15/2036 | | | | 24,083,793 | |
1,967,061 | | Federal Home Loan Mortgage Corporation, Series 3667-SB (-1 x 1 Month LIBOR USD + 6.45%, 6.45% Cap) | | | 4.67% | I/F I/O | | | 05/15/2040 | | | | 229,882 | |
9,153,458 | | Federal Home Loan Mortgage Corporation, Series 3702-SG (-1 x 1 Month LIBOR USD + 6.05%, 6.05% Cap) | | | 4.27% | I/F I/O | | | 08/15/2032 | | | | 1,164,099 | |
2,016,898 | | Federal Home Loan Mortgage Corporation, Series 3704-EI | | | 5.00% | I/O | | | 12/15/2036 | | | | 613,204 | |
3,741,293 | | Federal Home Loan Mortgage Corporation, Series 3712-SG (-5 x 1 Month LIBOR USD + 25.00%, 25.00% Cap) | | | 16.68% | I/F | | | 08/15/2040 | | | | 4,540,392 | |
5,765,041 | | Federal Home Loan Mortgage Corporation, Series 3724-CM | | | 5.50% | | | | 06/15/2037 | | | | 6,271,464 | |
61,382,960 | | Federal Home Loan Mortgage Corporation, Series 3725-CS (-1 x 1 Month LIBOR USD + 6.00%, 6.00% Cap) | | | 4.22% | I/F I/O | | | 05/15/2040 | | | | 6,882,902 | |
18,783,574 | | Federal Home Loan Mortgage Corporation, Series 3726-SA (-1 x 1 Month LIBOR USD + 6.05%, 6.05% Cap) | | | 4.27% | I/F I/O | | | 09/15/2040 | | | | 2,374,452 | |
52,243,300 | | Federal Home Loan Mortgage Corporation, Series 3738-BP | | | 4.00% | | | | 12/15/2038 | | | | 53,551,990 | |
2,464,710 | | Federal Home Loan Mortgage Corporation, Series 3741-SC (-2 x 1 Month LIBOR USD + 10.00%, 10.00% Cap) | | | 6.45% | I/F | | | 10/15/2040 | | | | 2,568,371 | |
17,664,665 | | Federal Home Loan Mortgage Corporation, Series 3752-BS (-2 x 1 Month LIBOR USD + 10.00%, 10.00% Cap) | | | 6.67% | I/F | | | 11/15/2040 | | | | 16,083,473 | |
17,230,026 | | Federal Home Loan Mortgage Corporation, Series 3768-ZX | | | 5.00% | | | | 12/15/2040 | | | | 18,772,774 | |
7,041,084 | | Federal Home Loan Mortgage Corporation, Series 3771-AL | | | 4.00% | | | | 12/15/2030 | | | | 7,334,758 | |
18,761,630 | | Federal Home Loan Mortgage Corporation, Series 3779-BY | | | 3.50% | | | | 12/15/2030 | | | | 19,327,104 | |
28,013,615 | | Federal Home Loan Mortgage Corporation, Series 3779-DZ | | | 4.50% | | | | 12/15/2040 | | | | 28,401,806 | |
20,542,269 | | Federal Home Loan Mortgage Corporation, Series 3779-LB | | | 4.00% | | | | 12/15/2030 | | | | 21,410,628 | |
3,500,000 | | Federal Home Loan Mortgage Corporation, Series 3779-YA | | | 3.50% | | | | 12/15/2030 | | | | 3,571,963 | |
15,000,000 | | Federal Home Loan Mortgage Corporation, Series 3783-AC | | | 4.00% | | | | 01/15/2031 | | | | 15,681,804 | |
8,689,698 | | Federal Home Loan Mortgage Corporation, Series 3786-SG (-2 x 1 Month LIBOR USD + 9.50%, 9.50% Cap) | | | 5.95% | I/F | | | 01/15/2041 | | | | 8,700,027 | |
11,731,674 | | Federal Home Loan Mortgage Corporation, Series 3788-AY | | | 3.50% | | | | 01/15/2031 | | | | 11,871,087 | |
5,462,425 | | Federal Home Loan Mortgage Corporation, Series 3790-Z | | | 4.00% | | | | 01/15/2041 | | | | 5,644,029 | |
13,313,453 | | Federal Home Loan Mortgage Corporation, Series 3795-VZ | | | 4.00% | | | | 01/15/2041 | | | | 13,728,274 | |
419,735 | | Federal Home Loan Mortgage Corporation, Series 3798-SD (-2 x 1 Month LIBOR USD + 9.60%, 9.60% Cap) | | | 6.05% | I/F | | | 12/15/2040 | | | | 386,920 | |
21,350,096 | | Federal Home Loan Mortgage Corporation, Series 3800-VZ | | | 4.50% | | | | 02/15/2041 | | | | 22,867,808 | |
8,580,397 | | Federal Home Loan Mortgage Corporation, Series 3803-ZM | | | 4.00% | | | | 02/15/2041 | | | | 8,563,963 | |
48,489,937 | | Federal Home Loan Mortgage Corporation, Series 3806-CZ | | | 5.50% | | | | 07/15/2034 | | | | 52,417,835 | |
18,000,000 | | Federal Home Loan Mortgage Corporation, Series 3808-DB | | | 3.50% | | | | 02/15/2031 | | | | 18,070,571 | |
15,277,557 | | Federal Home Loan Mortgage Corporation, Series 3812-EY | | | 3.50% | | | | 02/15/2031 | | | | 15,427,871 | |
6,602,040 | | Federal Home Loan Mortgage Corporation, Series 3818-CZ | | | 4.50% | | | | 03/15/2041 | | | | 7,006,662 | |
11,416,232 | | Federal Home Loan Mortgage Corporation, Series 3819-ZU | | | 5.50% | | | | 07/15/2034 | | | | 12,203,270 | |
35,500,000 | | Federal Home Loan Mortgage Corporation, Series 3824-EY | | | 3.50% | | | | 03/15/2031 | | | | 36,506,326 | |
3,350,433 | | Federal Home Loan Mortgage Corporation, Series 3828-SW (-3 x 1 Month LIBOR USD + 13.20%, 13.20% Cap) | | | 7.87% | I/F | | | 02/15/2041 | | | | 3,748,939 | |
15,282,011 | | Federal Home Loan Mortgage Corporation, Series 3829-VZ | | | 4.00% | | | | 03/15/2041 | | | | 15,969,081 | |
7,060,760 | | Federal Home Loan Mortgage Corporation, Series 3843-PZ | | | 5.00% | | | | 04/15/2041 | | | | 7,831,072 | |
34,141,678 | | Federal Home Loan Mortgage Corporation, Series 3863-ZA | | | 5.50% | | | | 08/15/2034 | | | | 36,273,311 | |
10,229,000 | | Federal Home Loan Mortgage Corporation, Series 3870-PB | | | 4.50% | | | | 06/15/2041 | | | | 10,614,172 | |
51,771,830 | | Federal Home Loan Mortgage Corporation, Series 3871-LZ | | | 5.50% | | | | 06/15/2041 | | | | 57,487,693 | |
16,148,946 | | Federal Home Loan Mortgage Corporation, Series 3872-BA | | | 4.00% | | | | 06/15/2041 | | | | 16,189,483 | |
11,798,756 | | Federal Home Loan Mortgage Corporation, Series 3877-EY | | | 4.50% | | | | 06/15/2041 | | | | 12,403,624 | |
6,889,380 | | Federal Home Loan Mortgage Corporation, Series 3877-GY | | | 4.50% | | | | 06/15/2041 | | | | 7,188,502 | |
30,897,721 | | Federal Home Loan Mortgage Corporation, Series 3877-ZU | | | 4.50% | | | | 06/15/2041 | | | | 31,244,999 | |
28,745,683 | | Federal Home Loan Mortgage Corporation, Series 3888-ZG | | | 4.00% | | | | 07/15/2041 | | | | 29,886,840 | |
21,585,626 | | Federal Home Loan Mortgage Corporation, Series 3888-ZU | | | 4.50% | | | | 06/15/2041 | | | | 23,484,427 | |
6,935,633 | | Federal Home Loan Mortgage Corporation, Series 3900-SB (-1 x 1 Month LIBOR USD + 5.97%, 5.97% Cap) | | | 4.19% | I/F I/O | | | 07/15/2041 | | | | 780,424 | |
36,676,408 | | Federal Home Loan Mortgage Corporation, Series 3901-VZ | | | 4.00% | | | | 07/15/2041 | | | | 38,317,743 | |
24,999,468 | | Federal Home Loan Mortgage Corporation, Series 3910-GZ | | | 5.00% | | | | 08/15/2041 | | | | 27,713,766 | |
7,098,673 | | Federal Home Loan Mortgage Corporation, Series 3910-ZE | | | 5.00% | | | | 10/15/2034 | | | | 7,563,670 | |
11,682,087 | | Federal Home Loan Mortgage Corporation, Series 3919-KL | | | 4.50% | | | | 09/15/2041 | | | | 12,120,076 | |
31,262,137 | | Federal Home Loan Mortgage Corporation, Series 3919-ZJ | | | 4.00% | | | | 09/15/2041 | | | | 32,151,620 | |
3,326,653 | | Federal Home Loan Mortgage Corporation, Series 3942-JZ | | | 4.00% | | | | 10/15/2041 | | | | 3,375,673 | |
11,532,871 | | Federal Home Loan Mortgage Corporation, Series 3944-AZ | | | 4.00% | | | | 10/15/2041 | | | | 11,468,290 | |
2,973,918 | | Federal Home Loan Mortgage Corporation, Series 3946-SM (-3 x 1 Month LIBOR USD + 14.70%, 14.70% Cap) | | | 9.37% | I/F | | | 10/15/2041 | | | | 3,558,743 | |
6,572,434 | | Federal Home Loan Mortgage Corporation, Series 3957-DZ | | | 3.50% | | | | 11/15/2041 | | | | 6,528,397 | |
10,000,000 | | Federal Home Loan Mortgage Corporation, Series 3964-VM | | | 4.00% | | | | 11/15/2034 | | | | 10,390,823 | |
33,131,007 | | Federal Home Loan Mortgage Corporation, Series 3969-AB | | | 4.00% | | | | 10/15/2033 | | | | 33,428,205 | |
12,405,058 | | Federal Home Loan Mortgage Corporation, Series 3982-AZ | | | 3.50% | | | | 01/15/2042 | | | | 12,574,491 | |
62,327,974 | | Federal Home Loan Mortgage Corporation, Series 3990-ZA | | | 3.50% | | | | 01/15/2042 | | | | 61,983,749 | |
16,483,347 | | Federal Home Loan Mortgage Corporation, Series 3999-EZ | | | 4.00% | | | | 02/15/2042 | | | | 16,825,706 | |
53,549,064 | | Federal Home Loan Mortgage Corporation, Series 3999-ZB | | | 4.00% | | | | 02/15/2042 | | | | 55,430,676 | |
30,362,228 | | Federal Home Loan Mortgage Corporation, Series 4016-KZ | | | 4.00% | | | | 03/15/2042 | | | | 31,763,466 | |
15,173,225 | | Federal Home Loan Mortgage Corporation, Series 4050-BC | | | 2.00% | | | | 05/15/2041 | | | | 14,669,107 | |
75,487,124 | | Federal Home Loan Mortgage Corporation, Series 4057-ZA | | | 4.00% | | | | 06/15/2042 | | | | 79,104,407 | |
75,211,258 | | Federal Home Loan Mortgage Corporation, Series 4084-TZ | | | 4.00% | | | | 07/15/2042 | | | | 78,457,255 | |
7,270,810 | | Federal Home Loan Mortgage Corporation, Series 4097-TG | | | 2.00% | | | | 05/15/2039 | | | | 7,055,536 | |
41,867,683 | | Federal Home Loan Mortgage Corporation, Series 4097-ZA | | | 3.50% | | | | 08/15/2042 | | | | 41,113,508 | |
97,063,000 | | Federal Home Loan Mortgage Corporation, Series 4109-GE | | | 4.50% | | | | 10/15/2041 | | | | 99,512,346 | |
4,780,972 | | Federal Home Loan Mortgage Corporation, Series 4109-KD | | | 3.00% | | | | 05/15/2032 | | | | 4,770,788 | |
4,942,741 | | Federal Home Loan Mortgage Corporation, Series 4121-AV | | | 3.00% | | | | 12/15/2035 | | | | 4,744,750 | |
49,765,515 | | Federal Home Loan Mortgage Corporation, Series 4160-HP | | | 2.50% | | | | 01/15/2033 | | | | 48,991,671 | |
29,626,975 | | Federal Home Loan Mortgage Corporation, Series 4162-ZJ | | | 3.00% | | | | 02/15/2033 | | | | 28,185,231 | |
6,238,903 | | Federal Home Loan Mortgage Corporation, Series 4165-ZT | | | 3.00% | | | | 02/15/2043 | | | | 5,717,333 | |
42,940,093 | | Federal Home Loan Mortgage Corporation, Series 4174-Z | | | 3.50% | | | | 03/15/2043 | | | | 43,049,418 | |
107,815,795 | | Federal Home Loan Mortgage Corporation, Series 4179-AZ | | | 4.00% | | | | 01/15/2041 | | | | 111,784,419 | |
31,346,440 | | Federal Home Loan Mortgage Corporation, Series 4183-ZB | | | 3.00% | | | | 03/15/2043 | | | | 28,166,045 | |
17,385,122 | | Federal Home Loan Mortgage Corporation, Series 4186-ZJ | | | 3.00% | | | | 03/15/2033 | | | | 16,113,098 | |
13,000,000 | | Federal Home Loan Mortgage Corporation, Series 4189-ML | | | 3.00% | | | | 04/15/2038 | | | | 12,324,812 | |
166,391,745 | | Federal Home Loan Mortgage Corporation, Series 4212-US (-1 x 1 Month LIBOR USD + 5.40%, 5.40% Cap) | | | 3.40% | I/F | | | 06/15/2043 | | | | 144,374,490 | |
9,311,826 | | Federal Home Loan Mortgage Corporation, Series 4215-KC | | | 2.25% | | | | 03/15/2038 | | | | 9,196,100 | |
73,240,441 | | Federal Home Loan Mortgage Corporation, Series 4223-US (-1 x 1 Month LIBOR USD + 5.43%, 5.43% Cap) | | | 3.42% | I/F | | | 07/15/2043 | | | | 59,277,986 | |
24,097,028 | | Federal Home Loan Mortgage Corporation, Series 4223-ZV | | | 4.00% | | | | 07/15/2043 | | | | 25,149,572 | |
29,379,069 | | Federal Home Loan Mortgage Corporation, Series 4229-TZ | | | 3.00% | | | | 06/15/2043 | | | | 27,246,031 | |
30,121,285 | | Federal Home Loan Mortgage Corporation, Series 4229-ZA | | | 4.00% | | | | 07/15/2043 | | | | 31,499,027 | |
21,608,385 | | Federal Home Loan Mortgage Corporation, Series 4249-CS (-1 x 1 Month LIBOR USD + 4.65% , 4.65% Cap) | | | 3.40% | I/F | | | 09/15/2043 | | | | 19,377,712 | |
21,842,785 | | Federal Home Loan Mortgage Corporation, Series 4250-BZ | | | 3.00% | | | | 09/15/2033 | | | | 20,435,048 | |
22,273,018 | | Federal Home Loan Mortgage Corporation, Series 4267-BZ | | | 4.00% | | | | 10/15/2040 | | | | 22,925,480 | |
65,041,021 | | Federal Home Loan Mortgage Corporation, Series 4323-GA | | | 3.00% | | | | 06/15/2040 | | | | 65,298,688 | |
18,584,711 | | Federal Home Loan Mortgage Corporation, Series 4355-ZX | | | 4.00% | | | | 05/15/2044 | | | | 19,460,330 | |
28,296,400 | | Federal Home Loan Mortgage Corporation, Series 4360-KA | | | 3.00% | | | | 05/15/2040 | | | | 28,163,826 | |
45,681,104 | | Federal Home Loan Mortgage Corporation, Series 4375-CG | | | 3.00% | | | | 04/15/2039 | | | | 45,659,808 | |
15,030,110 | | Federal Home Loan Mortgage Corporation, Series 4376-GZ | | | 3.00% | | | | 08/15/2044 | | | | 13,763,879 | |
47,784,354 | | Federal Home Loan Mortgage Corporation, Series 4377-LZ | | | 3.00% | | | | 08/15/2044 | | | | 43,752,076 | |
58,106,588 | | Federal Home Loan Mortgage Corporation, Series 4377-UZ | | | 3.00% | | | | 08/15/2044 | | | | 55,283,305 | |
5,724,022 | | Federal Home Loan Mortgage Corporation, Series 4379-KA | | | 3.00% | | | | 08/15/2044 | | | | 5,706,883 | |
22,227,975 | | Federal Home Loan Mortgage Corporation, Series 4384-A | | | 3.00% | | | | 12/15/2040 | | | | 21,973,838 | |
26,119,721 | | Federal Home Loan Mortgage Corporation, Series 4384-ZY | | | 3.00% | | | | 09/15/2044 | | | | 23,973,518 | |
1,586,844 | | Federal Home Loan Mortgage Corporation, Series 4386-US (-2 x 1 Month LIBOR USD + 8.14% , 8.14% Cap) | | | 5.23% | I/F | | | 09/15/2044 | | | | 1,443,402 | |
193,194,255 | | Federal Home Loan Mortgage Corporation, Series 4390-NY | | | 3.00% | | | | 06/15/2040 | | | | 192,949,730 | |
132,379,358 | | Federal Home Loan Mortgage Corporation, Series 4390-NZ | | | 3.00% | | | | 09/15/2044 | | | | 121,145,301 | |
50,157,146 | | Federal Home Loan Mortgage Corporation, Series 4391-MA | | | 3.00% | | | | 07/15/2040 | | | | 49,892,592 | |
64,899,673 | | Federal Home Loan Mortgage Corporation, Series 4408-PB | | | 3.00% | | | | 04/15/2044 | | | | 63,226,599 | |
1,996,099 | | Federal Home Loan Mortgage Corporation, Series 4419-TB | | | 3.00% | | | | 02/15/2040 | | | | 1,995,307 | |
88,195,055 | | Federal Home Loan Mortgage Corporation, Series 4427-CE | | | 3.00% | | | | 02/15/2034 | | | | 88,614,264 | |
57,474,456 | | Federal Home Loan Mortgage Corporation, Series 4427-MA | | | 3.00% | | | | 02/15/2034 | | | | 57,548,816 | |
34,790,975 | | Federal Home Loan Mortgage Corporation, Series 4427-PS (-1 x 1 Month LIBOR USD + 5.60%, 5.60% Cap) | | | 3.82% | I/F I/O | | | 07/15/2044 | | | | 4,656,097 | |
47,475,372 | | Federal Home Loan Mortgage Corporation, Series 4429-HA | | | 3.00% | | | | 04/15/2034 | | | | 47,346,082 | |
25,226,090 | | Federal Home Loan Mortgage Corporation, Series 4434-LZ | | | 3.00% | | | | 02/15/2045 | | | | 22,951,103 | |
11,426,550 | | Federal Home Loan Mortgage Corporation, Series 4438-B | | | 3.00% | | | | 10/15/2043 | | | | 11,334,641 | |
9,432,364 | | Federal Home Loan Mortgage Corporation, Series 4441-VZ | | | 3.00% | | | | 02/15/2045 | | | | 8,568,173 | |
53,031,088 | | Federal Home Loan Mortgage Corporation, Series 4444-CH | | | 3.00% | | | | 01/15/2041 | | | | 53,015,937 | |
27,419,663 | | Federal Home Loan Mortgage Corporation, Series 4444-CZ | | | 3.00% | | | | 02/15/2045 | | | | 25,036,738 | |
50,679,914 | | Federal Home Loan Mortgage Corporation, Series 4447-A | | | 3.00% | | | | 06/15/2041 | | | | 50,338,534 | |
25,927,253 | | Federal Home Loan Mortgage Corporation, Series 4447-YZ | | | 4.00% | | | | 08/15/2043 | | | | 27,168,894 | |
8,205,385 | | Federal Home Loan Mortgage Corporation, Series 4450-JZ | | | 3.00% | | | | 03/15/2045 | | | | 7,555,472 | |
7,135,687 | | Federal Home Loan Mortgage Corporation, Series 4461-LZ | | | 3.00% | | | | 03/15/2045 | | | | 6,460,809 | |
8,416,284 | | Federal Home Loan Mortgage Corporation, Series 4462-ZA | | | 3.00% | | | | 04/15/2045 | | | | 7,723,451 | |
49,109,539 | | Federal Home Loan Mortgage Corporation, Series 4463-ZC | | | 3.00% | | | | 04/15/2045 | | | | 45,219,970 | |
27,283,077 | | Federal Home Loan Mortgage Corporation, Series 4467-ZA | | | 3.00% | | | | 04/15/2045 | | | | 24,867,671 | |
158,608,720 | | Federal Home Loan Mortgage Corporation, Series 4471-BA | | | 3.00% | | | | 12/15/2041 | | | | 155,348,565 | |
137,919,079 | | Federal Home Loan Mortgage Corporation, Series 4471-BC | | | 3.00% | | | | 12/15/2041 | | | | 136,567,665 | |
124,577,947 | | Federal Home Loan Mortgage Corporation, Series 4471-GA | | | 3.00% | | | | 02/15/2044 | | | | 123,517,290 | |
56,270,653 | | Federal Home Loan Mortgage Corporation, Series 4481-B | | | 3.00% | | | | 12/15/2042 | | | | 55,314,755 | |
219,382,301 | | Federal Home Loan Mortgage Corporation, Series 4483-CA | | | 3.00% | | | | 06/15/2044 | | | | 215,181,612 | |
111,644,239 | | Federal Home Loan Mortgage Corporation, Series 4483-PA | | | 2.50% | | | | 06/15/2045 | | | | 108,513,322 | |
16,288,303 | | Federal Home Loan Mortgage Corporation, Series 4484-ZL | | | 3.00% | | | | 06/15/2045 | | | | 15,170,587 | |
8,781,428 | | Federal Home Loan Mortgage Corporation, Series 4492-GZ | | | 3.50% | | | | 07/15/2045 | | | | 8,541,388 | |
37,984,224 | | Federal Home Loan Mortgage Corporation, Series 4498-PD | | | 2.50% | | | | 08/15/2042 | | | | 37,138,278 | |
32,096,089 | | Federal Home Loan Mortgage Corporation, Series 4499-AB | | | 3.00% | | | | 06/15/2042 | | | | 31,601,502 | |
55,035,994 | | Federal Home Loan Mortgage Corporation, Series 4504-CA | | | 3.00% | | | | 04/15/2044 | | | | 54,282,898 | |
32,620,269 | | Federal Home Loan Mortgage Corporation, Series 4511-QA | | | 3.00% | | | | 01/15/2041 | | | | 32,446,742 | |
25,516,377 | | Federal Home Loan Mortgage Corporation, Series 4511-QC | | | 3.00% | | | | 12/15/2040 | | | | 25,326,030 | |
151,486,783 | | Federal Home Loan Mortgage Corporation, Series 4527-CA | | | 3.00% | | | | 02/15/2044 | | | | 149,803,734 | |
66,477,585 | | Federal Home Loan Mortgage Corporation, Series 4527-GA | | | 3.00% | | | | 02/15/2044 | | | | 64,983,448 | |
144,586,504 | | Federal Home Loan Mortgage Corporation, Series 4533-AB | | | 3.00% | | | | 06/15/2044 | | | | 140,722,430 | |
131,902,831 | | Federal Home Loan Mortgage Corporation, Series 4543-HG | | | 2.70% | | | | 04/15/2044 | | | | 127,595,755 | |
206,448,963 | | Federal Home Loan Mortgage Corporation, Series 4573-CA | | | 3.00% | | | | 11/15/2044 | | | | 204,626,597 | |
66,192,050 | | Federal Home Loan Mortgage Corporation, Series 4573-DA | | | 3.00% | | | | 03/15/2045 | | | | 63,576,200 | |
147,787,555 | | Federal Home Loan Mortgage Corporation, Series 4582-HA | | | 3.00% | | | | 09/15/2045 | | | | 145,878,317 | |
78,623,162 | | Federal Home Loan Mortgage Corporation, Series 4588-DA | | | 3.00% | | | | 02/15/2044 | | | | 77,283,589 | |
76,852,940 | | Federal Home Loan Mortgage Corporation, Series 4629-KA | | | 3.00% | | | | 03/15/2045 | | | | 75,567,605 | |
63,858,437 | | Federal Home Loan Mortgage Corporation, Series 4738-LA | | | 3.00% | | | | 11/15/2043 | | | | 63,223,333 | |
49,491,845 | | Federal Home Loan Mortgage Corporation, Series 4744-KA | | | 3.00% | | | | 08/15/2046 | | | | 49,096,158 | |
66,003,261 | | Federal Home Loan Mortgage Corporation, Series 4750-PA | | | 3.00% | | | | 07/15/2046 | | | | 65,524,915 | |
100,015,408 | | Federal Home Loan Mortgage Corporation, Series 4752-PL | | | 3.00% | | | | 09/15/2046 | | | | 99,206,683 | |
71,699,834 | | Federal Home Loan Mortgage Corporation, Series R003-ZA | | | 5.50% | | | | 10/15/2035 | | | | 77,849,930 | |
239,282,725 | | Federal Home Loan Mortgage Corporation Pass-Thru, Pool Z4-0117 | | | 3.00% | | | | 04/01/2045 | | | | 234,355,631 | |
6,583,000 | | Federal Home Loan Mortgage Corporation Pass-Thru, Series K054-A2 | | | 2.75% | | | | 01/25/2026 | | | | 6,421,769 | |
34,546,511 | | Federal National Mortgage Association, Pool AL9220 | | | 3.00% | | | | 06/01/2045 | | | | 33,995,475 | |
78,675,259 | | Federal National Mortgage Association, Pool AS7473 | | | 3.00% | | | | 07/01/2046 | | | | 76,250,460 | |
11,390,683 | | Federal National Mortgage Association, Pool AS7610 | | | 2.50% | | | | 07/01/2046 | | | | 10,664,558 | |
173,455,529 | | Federal National Mortgage Association, Pool AS7661 | | | 3.00% | | | | 08/01/2046 | | | | 168,107,347 | |
14,228,426 | | Federal National Mortgage Association, Pool AS7909 | | | 3.00% | | | | 09/01/2046 | | | | 13,882,222 | |
99,095,358 | | Federal National Mortgage Association, Pool AS8111 | | | 3.00% | | | | 10/01/2041 | | | | 97,513,766 | |
67,707,318 | | Federal National Mortgage Association, Pool AS8306 | | | 3.00% | | | | 11/01/2041 | | | | 66,626,680 | |
92,466,562 | | Federal National Mortgage Association, Pool AS8356 | | | 3.00% | | | | 11/01/2046 | | | | 89,853,260 | |
42,739,954 | | Federal National Mortgage Association, Pool AS8522 | | | 3.00% | | | | 12/01/2046 | | | | 41,699,723 | |
20,953,975 | | Federal National Mortgage Association, Pool AZ0576 | | | 3.50% | | | | 04/01/2042 | | | | 21,108,776 | |
25,714,330 | | Federal National Mortgage Association, Pool BC9081 | | | 3.00% | | | | 12/01/2046 | | | | 25,088,475 | |
136,904,721 | | Federal National Mortgage Association, Pool MA2621 | | | 3.50% | | | | 05/01/2046 | | | | 136,558,310 | |
116,633,639 | | Federal National Mortgage Association, Pool MA2649 | | | 3.00% | | | | 06/01/2046 | | | | 113,039,733 | |
41,481,939 | | Federal National Mortgage Association, Pool MA2673 | | | 3.00% | | | | 07/01/2046 | | | | 40,203,253 | |
123,339,358 | | Federal National Mortgage Association, Pool MA2711 | | | 3.00% | | | | 08/01/2046 | | | | 119,540,834 | |
71,188,002 | | Federal National Mortgage Association, Pool MA2737 | | | 3.00% | | | | 09/01/2046 | | | | 69,457,288 | |
11,551,558 | | Federal National Mortgage Association, Pool MA2743 | | | 3.00% | | | | 09/01/2046 | | | | 11,195,360 | |
917,330 | | Federal National Mortgage Association, Series 2002-70-QZ | | | 5.50% | | | | 11/25/2032 | | | | 982,194 | |
1,392,618 | | Federal National Mortgage Association, Series 2002-75-ZG | | | 5.50% | | | | 11/25/2032 | | | | 1,527,118 | |
129,230,770 | | Federal National Mortgage Association, Series 2018-27-A0 | | | 0.00% | P/O | | | 03/21/2048 | | | | 99,224,677 | |
122,947 | | Federal National Mortgage Association, Series 2003-117-KS (-1 x 1 Month LIBOR USD + 7.10%, 7.10% Cap) | | | 5.23% | I/F I/O | | | 08/25/2033 | | | | 708 | |
18,916,904 | | Federal National Mortgage Association, Series 2003-129-ZT | | | 5.50% | | | | 01/25/2034 | | | | 21,123,807 | |
3,608,710 | | Federal National Mortgage Association, Series 2003-29-ZL | | | 5.00% | | | | 04/25/2033 | | | | 3,877,680 | |
1,684,917 | | Federal National Mortgage Association, Series 2003-64-ZG | | | 5.50% | | | | 07/25/2033 | | | | 1,798,181 | |
14,335,067 | | Federal National Mortgage Association, Series 2003-84-PZ | | | 5.00% | | | | 09/25/2033 | | | | 15,197,381 | |
13,289,415 | | Federal National Mortgage Association, Series 2003-W17-1A7 | | | 5.75% | | | | 08/25/2033 | | | | 14,518,984 | |
3,842,556 | | Federal National Mortgage Association, Series 2004-46-PJ (-1 x 1 Month LIBOR USD + 6.00%, 6.00% Cap) | | | 4.13% | I/F I/O | | | 03/25/2034 | | | | 342,347 | |
3,421,172 | | Federal National Mortgage Association, Series 2004-51-XP (-1 x 1 Month LIBOR USD + 7.70%, 7.70% Cap) | | | 5.83% | I/F I/O | | | 07/25/2034 | | | | 617,308 | |
5,000,000 | | Federal National Mortgage Association, Series 2004-W10-A6 | | | 5.75% | | | | 08/25/2034 | | | | 5,500,099 | |
843,362 | | Federal National Mortgage Association, Series 2004-W4-A5 | | | 5.50% | | | | 06/25/2034 | | | | 860,463 | |
275,165 | | Federal National Mortgage Association, Series 2005-107-EG | | | 4.50% | | | | 01/25/2026 | | | | 285,695 | |
764,912 | | Federal National Mortgage Association, Series 2005-37-ZK | | | 4.50% | | | | 05/25/2035 | | | | 788,353 | |
8,064,310 | | Federal National Mortgage Association, Series 2005-87-SE (-1 x 1 Month LIBOR USD + 6.05%, 6.05% Cap) | | | 4.18% | I/F I/O | | | 10/25/2035 | | | | 1,025,905 | |
6,558,324 | | Federal National Mortgage Association, Series 2005-87-SG (-1 x 1 Month LIBOR USD + 6.70%, 6.70% Cap) | | | 4.83% | I/F I/O | | | 10/25/2035 | | | | 994,595 | |
5,385,270 | | Federal National Mortgage Association, Series 2006-101-SA (-1 x 1 Month LIBOR USD + 6.58%, 6.58% Cap) | | | 4.71% | I/F I/O | | | 10/25/2036 | | | | 917,774 | |
2,250,629 | | Federal National Mortgage Association, Series 2006-123-LI (-1 x 1 Month LIBOR USD + 6.32%, 6.32% Cap) | | | 4.45% | I/F I/O | | | 01/25/2037 | | | | 343,727 | |
1,418,002 | | Federal National Mortgage Association, Series 2006-16-HZ | | | 5.50% | | | | 03/25/2036 | | | | 1,523,016 | |
9,180,336 | | Federal National Mortgage Association, Series 2006-56-SM (-1 x 1 Month LIBOR USD + 6.75%, 6.75% Cap) | | | 4.88% | I/F I/O | | | 07/25/2036 | | | | 1,220,505 | |
15,566,813 | | Federal National Mortgage Association, Series 2006-60-YI (-1 x 1 Month LIBOR USD + 6.57%, 6.57% Cap) | | | 4.70% | I/F I/O | | | 07/25/2036 | | | | 2,682,464 | |
1,127,503 | | Federal National Mortgage Association, Series 2006-93-SN (-1 x 1 Month LIBOR USD + 6.60%, 6.60% Cap) | | | 4.73% | I/F I/O | | | 10/25/2036 | | | | 136,550 | |
13,767,365 | | Federal National Mortgage Association, Series 2007-109-VZ | | | 5.00% | | | | 10/25/2035 | | | | 14,843,820 | |
1,345,726 | | Federal National Mortgage Association, Series 2007-116-BI (-1 x 1 Month LIBOR USD + 6.25%, 6.25% Cap) | | | 4.38% | I/F I/O | | | 05/25/2037 | | | | 159,621 | |
8,016,234 | | Federal National Mortgage Association, Series 2007-14-PS (-1 x 1 Month LIBOR USD + 6.81% , 6.81% Cap) | | | 4.94% | I/F I/O | | | 03/25/2037 | | | | 1,201,770 | |
4,129,739 | | Federal National Mortgage Association, Series 2007-30-OI (-1 x 1 Month LIBOR USD + 6.44%, 6.44% Cap) | | | 4.57% | I/F I/O | | | 04/25/2037 | | | | 694,150 | |
751,204 | | Federal National Mortgage Association, Series 2007-30-SI (-1 x 1 Month LIBOR USD + 6.11%, 6.11% Cap) | | | 4.24% | I/F I/O | | | 04/25/2037 | | | | 90,922 | |
4,612,507 | | Federal National Mortgage Association, Series 2007-32-SG (-1 x 1 Month LIBOR USD + 6.10%, 6.10% Cap) | | | 4.23% | I/F I/O | | | 04/25/2037 | | | | 599,005 | |
3,584,398 | | Federal National Mortgage Association, Series 2007-57-SX (-1 x 1 Month LIBOR USD + 6.62%, 6.62% Cap) | | | 4.75% | I/F I/O | | | 10/25/2036 | | | | 509,854 | |
5,033,873 | | Federal National Mortgage Association, Series 2007-60-VZ | | | 6.00% | | | | 07/25/2037 | | | | 5,590,649 | |
2,511,350 | | Federal National Mortgage Association, Series 2007-71-GZ | | | 6.00% | | | | 07/25/2047 | | | | 2,713,309 | |
4,414,139 | | Federal National Mortgage Association, Series 2007-75-ID (-1 x 1 Month LIBOR USD + 5.87%, 5.87% Cap) | | | 4.00% | I/F I/O | | | 08/25/2037 | | | | 590,212 | |
1,110,680 | | Federal National Mortgage Association, Series 2007-9-SD (-1 x 1 Month LIBOR USD + 6.65%, 6.65% Cap) | | | 4.78% | I/F I/O | | | 03/25/2037 | | | | 125,901 | |
693,783 | | Federal National Mortgage Association, Series 2008-27-B | | | 5.50% | | | | 04/25/2038 | | | | 744,829 | |
5,204,614 | | Federal National Mortgage Association, Series 2008-29-ZA | | | 4.50% | | | | 04/25/2038 | | | | 5,462,164 | |
9,959,873 | | Federal National Mortgage Association, Series 2008-48-BE | | | 5.00% | | | | 06/25/2034 | | | | 10,558,799 | |
1,254,628 | | Federal National Mortgage Association, Series 2008-48-SD (-1 x 1 Month LIBOR USD + 6.00%, 6.00% Cap) | | | 4.13% | I/F I/O | | | 06/25/2037 | | | | 114,371 | |
1,250,048 | | Federal National Mortgage Association, Series 2008-53-LI (-1 x 1 Month LIBOR USD + 6.15%, 6.15% Cap) | | | 4.28% | I/F I/O | | | 07/25/2038 | | | | 138,361 | |
1,358,265 | | Federal National Mortgage Association, Series 2008-57-SE (-1 x 1 Month LIBOR USD + 6.00%, 6.00% Cap) | | | 4.13% | I/F I/O | | | 02/25/2037 | | | | 164,462 | |
1,398,384 | | Federal National Mortgage Association, Series 2008-5-MS (-1 x 1 Month LIBOR USD + 6.25%, 6.25% Cap) | | | 4.38% | I/F I/O | | | 02/25/2038 | | | | 158,292 | |
1,328,747 | | Federal National Mortgage Association, Series 2008-61-SC (-1 x 1 Month LIBOR USD + 6.00%, 6.00% Cap) | | | 4.13% | I/F I/O | | | 07/25/2038 | | | | 141,276 | |
1,148,303 | | Federal National Mortgage Association, Series 2008-62-SC (-1 x 1 Month LIBOR USD + 6.00%, 6.00% Cap) | | | 4.13% | I/F I/O | | | 07/25/2038 | | | | 107,170 | |
2,440,411 | | Federal National Mortgage Association, Series 2008-65-SA (-1 x 1 Month LIBOR USD + 6.00%, 6.00% Cap) | | | 4.13% | I/F I/O | | | 08/25/2038 | | | | 250,089 | |
2,462,932 | | Federal National Mortgage Association, Series 2008-81-LP | | | 5.50% | | | | 09/25/2038 | | | | 2,598,263 | |
8,622,761 | | Federal National Mortgage Association, Series 2009-106-EZ | | | 4.50% | | | | 01/25/2040 | | | | 8,902,744 | |
1,613,768 | | Federal National Mortgage Association, Series 2009-111-SE (-1 x 1 Month LIBOR USD + 6.25%, 6.25% Cap) | | | 4.38% | I/F I/O | | | 01/25/2040 | | | | 171,102 | |
721,984 | | Federal National Mortgage Association, Series 2009-16-MZ | | | 5.00% | | | | 03/25/2029 | | | | 773,308 | |
3,543,325 | | Federal National Mortgage Association, Series 2009-42-SI (-1 x 1 Month LIBOR USD + 6.00%, 6.00% Cap) | | | 4.13% | I/F I/O | | | 06/25/2039 | | | | 423,366 | |
2,026,451 | | Federal National Mortgage Association, Series 2009-42-SX (-1 x 1 Month LIBOR USD + 6.00%, 6.00% Cap) | | | 4.13% | I/F I/O | | | 06/25/2039 | | | | 197,479 | |
1,279,820 | | Federal National Mortgage Association, Series 2009-47-SA (-1 x 1 Month LIBOR USD + 6.10%, 6.10% Cap) | | | 4.23% | I/F I/O | | | 07/25/2039 | | | | 123,482 | |
764,351 | | Federal National Mortgage Association, Series 2009-48-WS (-1 x 1 Month LIBOR USD + 5.95%, 5.95% Cap) | | | 4.08% | I/F I/O | | | 07/25/2039 | | | | 78,149 | |
6,778,047 | | Federal National Mortgage Association, Series 2009-49-S (-1 x 1 Month LIBOR USD + 6.75%, 6.75% Cap) | | | 4.88% | I/F I/O | | | 07/25/2039 | | | | 964,079 | |
791,163 | | Federal National Mortgage Association, Series 2009-51-BZ | | | 4.50% | | | | 07/25/2039 | | | | 817,997 | |
2,168,049 | | Federal National Mortgage Association, Series 2009-54-EZ | | | 5.00% | | | | 07/25/2039 | | | | 2,279,161 | |
1,478,169 | | Federal National Mortgage Association, Series 2009-70-SA (-1 x 1 Month LIBOR USD + 5.80%, 5.80% Cap) | | | 3.93% | I/F I/O | | | 09/25/2039 | | | | 135,597 | |
6,219,031 | | Federal National Mortgage Association, Series 2009-80-PM | | | 4.50% | | | | 10/25/2039 | | | | 6,511,162 | |
3,357,042 | | Federal National Mortgage Association, Series 2009-83-Z | | | 4.50% | | | | 10/25/2039 | | | | 3,463,719 | |
14,863,086 | | Federal National Mortgage Association, Series 2009-85-ES (-1 x 1 Month LIBOR USD + 7.23%, 7.23% Cap) | | | 5.36% | I/F I/O | | | 01/25/2036 | | | | 2,392,946 | |
21,485,822 | | Federal National Mortgage Association, Series 2009-85-JS (-1 x 1 Month LIBOR USD + 6.75%, 6.75% Cap) | | | 4.88% | I/F I/O | | | 10/25/2039 | | | | 3,944,515 | |
2,127,110 | | Federal National Mortgage Association, Series 2009-90-IB (-1 x 1 Month LIBOR USD + 5.72%, 5.72% Cap) | | | 3.85% | I/F I/O | | | 04/25/2037 | | | | 203,056 | |
1,440,606 | | Federal National Mortgage Association, Series 2009-94-BC | | | 5.00% | | | | 11/25/2039 | | | | 1,494,652 | |
18,708,024 | | Federal National Mortgage Association, Series 2010-101-SA (-1 x 1 Month LIBOR USD + 4.48%, 4.48% Cap) | | | 2.61% | I/F I/O | | | 09/25/2040 | | | | 1,906,316 | |
9,179,571 | | Federal National Mortgage Association, Series 2010-101-ZC | | | 4.50% | | | | 09/25/2040 | | | | 9,575,479 | |
24,841,578 | | Federal National Mortgage Association, Series 2010-101-ZH | | | 4.50% | | | | 07/25/2040 | | | | 25,757,911 | |
6,050,444 | | Federal National Mortgage Association, Series 2010-10-SA (-1 x 1 Month LIBOR USD + 6.35%, 6.35% Cap) | | | 4.48% | I/F I/O | | | 02/25/2040 | | | | 874,344 | |
2,490,655 | | Federal National Mortgage Association, Series 2010-10-ZA | | | 4.50% | | | | 02/25/2040 | | | | 2,529,961 | |
1,505,348 | | Federal National Mortgage Association, Series 2010-111-S (-1 x 1 Month LIBOR USD + 5.95%, 5.95% Cap) | | | 4.08% | I/F I/O | | | 10/25/2050 | | | | 218,293 | |
4,924,601 | | Federal National Mortgage Association, Series 2010-116-Z | | | 4.00% | | | | 10/25/2040 | | | | 5,117,467 | |
1,599,638 | | Federal National Mortgage Association, Series 2010-117-SA (-1 x 1 Month LIBOR USD + 4.50%, 4.50% Cap) | | | 2.63% | I/F I/O | | | 10/25/2040 | | | | 92,023 | |
4,111,145 | | Federal National Mortgage Association, Series 2010-120-KD | | | 4.00% | | | | 10/25/2040 | | | | 4,293,233 | |
30,762,676 | | Federal National Mortgage Association, Series 2010-121-SD (-1 x 1 Month LIBOR USD + 4.50%, 4.50% Cap) | | | 2.63% | I/F I/O | | | 10/25/2040 | | | | 2,326,095 | |
242,685 | | Federal National Mortgage Association, Series 2010-126-SU (-11 x 1 Month LIBOR USD + 55.00%, 55.00% Cap) | | | 36.69% | I/F | | | 11/25/2040 | | | | 804,760 | |
178,693 | | Federal National Mortgage Association, Series 2010-126-SX (-3 x 1 Month LIBOR USD + 15.00%, 15.00% Cap) | | | 10.01% | I/F | | | 11/25/2040 | | | | 246,334 | |
7,496,079 | | Federal National Mortgage Association, Series 2010-128-HZ | | | 4.00% | | | | 11/25/2040 | | | | 7,572,851 | |
5,376,792 | | Federal National Mortgage Association, Series 2010-132-Z | | | 4.50% | | | | 11/25/2040 | | | | 5,561,683 | |
88,008 | | Federal National Mortgage Association, Series 2010-137-VS (-3 x 1 Month LIBOR USD + 15.00%, 15.00% Cap) | | | 10.01% | I/F | | | 12/25/2040 | | | | 108,373 | |
14,211,286 | | Federal National Mortgage Association, Series 2010-142-AZ | | | 4.00% | | | | 12/25/2040 | | | | 14,252,257 | |
14,914,677 | | Federal National Mortgage Association, Series 2010-148-SA (-1 x 1 Month LIBOR USD + 6.65%, 6.65% Cap) | | | 4.78% | I/F I/O | | | 01/25/2026 | | | | 1,501,340 | |
31,978,229 | | Federal National Mortgage Association, Series 2010-150-ZA | | | 4.00% | | | | 01/25/2041 | | | | 32,296,739 | |
11,710,959 | | Federal National Mortgage Association, Series 2010-16-SA (-1 x 1 Month LIBOR USD + 5.45%, 5.45% Cap) | | | 3.58% | I/F I/O | | | 03/25/2040 | | | | 1,522,197 | |
3,899,301 | | Federal National Mortgage Association, Series 2010-21-DZ | | | 5.00% | | | | 03/25/2040 | | | | 4,177,049 | |
1,744,997 | | Federal National Mortgage Association, Series 2010-21-KS (-1 x 1 Month LIBOR USD + 4.95%, 4.95% Cap) | | | 3.08% | I/F I/O | | | 03/25/2040 | | | | 113,097 | |
714,977 | | Federal National Mortgage Association, Series 2010-2-GS (-1 x 1 Month LIBOR USD + 6.45%, 6.45% Cap) | | | 4.58% | I/F I/O | | | 12/25/2049 | | | | 64,041 | |
2,497,648 | | Federal National Mortgage Association, Series 2010-2-MS (-1 x 1 Month LIBOR USD + 6.25%, 6.25% Cap) | | | 4.38% | I/F I/O | | | 02/25/2050 | | | | 291,116 | |
2,200,608 | | Federal National Mortgage Association, Series 2010-31-SA (-1 x 1 Month LIBOR USD + 5.00%, 5.00% Cap) | | | 3.13% | I/F I/O | | | 04/25/2040 | | | | 152,893 | |
6,501,569 | | Federal National Mortgage Association, Series 2010-31-VZ | | | 4.00% | | | | 04/25/2040 | | | | 6,568,426 | |
5,555,556 | | Federal National Mortgage Association, Series 2010-34-PS (-1 x 1 Month LIBOR USD + 4.93%, 4.93% Cap) | | | 3.06% | I/F I/O | | | 04/25/2040 | | | | 500,807 | |
866,162 | | Federal National Mortgage Association, Series 2010-35-ES (-1 x 1 Month LIBOR USD + 6.45%, 6.45% Cap) | | | 4.58% | I/F I/O | | | 04/25/2040 | | | | 70,120 | |
1,285,482 | | Federal National Mortgage Association, Series 2010-35-SV (-1 x 1 Month LIBOR USD + 6.45%, 6.45% Cap) | | | 4.58% | I/F I/O | | | 04/25/2040 | | | | 111,466 | |
1,585,885 | | Federal National Mortgage Association, Series 2010-46-MS (-1 x 1 Month LIBOR USD + 4.95%, 4.95% Cap) | | | 3.08% | I/F I/O | | | 05/25/2040 | | | | 130,893 | |
12,479,064 | | Federal National Mortgage Association, Series 2010-49-ZW | | | 4.50% | | | | 05/25/2040 | | | | 12,792,834 | |
3,120,323 | | Federal National Mortgage Association, Series 2010-4-SK (-1 x 1 Month LIBOR USD + 6.23%, 6.23% Cap) | | | 4.36% | I/F I/O | | | 02/25/2040 | | | | 374,080 | |
1,164,630 | | Federal National Mortgage Association, Series 2010-58-ES (-3 x 1 Month LIBOR USD + 12.47%, 12.47% Cap) | | | 7.66% | I/F | | | 06/25/2040 | | | | 1,213,871 | |
8,688,315 | | Federal National Mortgage Association, Series 2010-59-MS (-1 x 1 Month LIBOR USD + 5.77%, 5.77% Cap) | | | 3.90% | I/F I/O | | | 06/25/2040 | | | | 1,156,472 | |
8,752,920 | | Federal National Mortgage Association, Series 2010-59-PS (-1 x 1 Month LIBOR USD + 6.45%, 6.45% Cap) | | | 4.58% | I/F I/O | | | 03/25/2039 | | | | 532,243 | |
8,584,844 | | Federal National Mortgage Association, Series 2010-59-SC (-1 x 1 Month LIBOR USD + 5.00%, 5.00% Cap) | | | 3.13% | I/F I/O | | | 01/25/2040 | | | | 748,549 | |
1,166,837 | | Federal National Mortgage Association, Series 2010-60-VZ | | | 5.00% | | | | 10/25/2039 | | | | 1,184,748 | |
753,179 | | Federal National Mortgage Association, Series 2010-61-EL | | | 4.50% | | | | 06/25/2040 | | | | 790,472 | |
9,326,009 | | Federal National Mortgage Association, Series 2010-64-EZ | | | 5.00% | | | | 06/25/2040 | | | | 9,965,525 | |
31,969,795 | | Federal National Mortgage Association, Series 2010-76-ZK | | | 4.50% | | | | 07/25/2040 | | | | 33,294,316 | |
7,655,484 | | Federal National Mortgage Association, Series 2010-79-CZ | | | 4.00% | | | | 07/25/2040 | | | | 7,713,422 | |
27,052,318 | | Federal National Mortgage Association, Series 2010-79-VZ | | | 4.50% | | | | 07/25/2040 | | | | 28,415,064 | |
4,171,805 | | Federal National Mortgage Association, Series 2010-84-ZC | | | 4.50% | | | | 08/25/2040 | | | | 4,351,640 | |
8,343,592 | | Federal National Mortgage Association, Series 2010-84-ZD | | | 4.50% | | | | 08/25/2040 | | | | 8,703,260 | |
10,441,569 | | Federal National Mortgage Association, Series 2010-84-ZG | | | 4.50% | | | | 08/25/2040 | | | | 10,807,606 | |
1,168,469 | | Federal National Mortgage Association, Series 2010-90-SA (-1 x 1 Month LIBOR USD + 5.85%, 5.85% Cap) | | | 3.98% | I/F I/O | | | 08/25/2040 | | | | 128,455 | |
2,141,288 | | Federal National Mortgage Association, Series 2010-94-Z | | | 4.50% | | | | 08/25/2040 | | | | 2,211,633 | |
8,668,587 | | Federal National Mortgage Association, Series 2010-99-SG (-5 x 1 Month LIBOR USD + 25.00%, 25.00% Cap) | | | 16.68% | I/F | | | 09/25/2040 | | | | 12,545,046 | |
2,342,484 | | Federal National Mortgage Association, Series 2010-9-DS (-1 x 1 Month LIBOR USD + 5.30%, 0.50% Floor, 5.30% Cap) | | | 3.43% | I/F I/O | | | 02/25/2040 | | | | 218,779 | |
35,880,013 | | Federal National Mortgage Association, Series 2011-106-LZ | | | 3.50% | | | | 10/25/2041 | | | | 35,857,620 | |
520,021 | | Federal National Mortgage Association, Series 2011-110-LS (-2 x 1 Month LIBOR USD + 10.10%, 10.10% Cap) | | | 6.77% | I/F | | | 11/25/2041 | | | | 585,298 | |
8,245,831 | | Federal National Mortgage Association, Series 2011-111-CZ | | | 4.00% | | | | 11/25/2041 | | | | 8,320,027 | |
9,160,273 | | Federal National Mortgage Association, Series 2011-111-EZ | | | 5.00% | | | | 11/25/2041 | | | | 9,966,243 | |
6,355,993 | | Federal National Mortgage Association, Series 2011-111-VZ | | | 4.00% | | | | 11/25/2041 | | | | 6,328,882 | |
30,000,000 | | Federal National Mortgage Association, Series 2011-131-PB | | | 4.50% | | | | 12/25/2041 | | | | 32,139,399 | |
29,500,000 | | Federal National Mortgage Association, Series 2011-16-AL | | | 3.50% | | | | 03/25/2031 | | | | 30,047,688 | |
38,800,000 | | Federal National Mortgage Association, Series 2011-17-NY | | | 3.50% | | | | 03/25/2031 | | | | 39,080,842 | |
1,529,939 | | Federal National Mortgage Association, Series 2011-17-SA (-1 x 1 Month LIBOR USD + 6.47%, 6.47% Cap) | | | 4.60% | I/F I/O | | | 03/25/2041 | | | | 154,148 | |
11,000,000 | | Federal National Mortgage Association, Series 2011-25-KY | | | 3.00% | | | | 04/25/2026 | | | | 11,070,102 | |
4,744,126 | | Federal National Mortgage Association, Series 2011-27-BS (-2 x 1 Month LIBOR USD + 9.00%, 9.00% Cap) | | | 5.67% | I/F | | | 04/25/2041 | | | | 4,359,904 | |
56,000,000 | | Federal National Mortgage Association, Series 2011-29-AL | | | 3.50% | | | | 04/25/2031 | | | | 55,908,832 | |
14,572,188 | | Federal National Mortgage Association, Series 2011-2-GZ | | | 4.00% | | | | 02/25/2041 | | | | 15,085,275 | |
39,676,511 | | Federal National Mortgage Association, Series 2011-32-ZG | | | 4.00% | | | | 04/25/2041 | | | | 40,497,917 | |
6,768,055 | | Federal National Mortgage Association, Series 2011-36-VZ | | | 4.50% | | | | 05/25/2041 | | | | 7,035,663 | |
16,642,308 | | Federal National Mortgage Association, Series 2011-37-Z | | | 4.50% | | | | 05/25/2041 | | | | 17,468,210 | |
8,776,460 | | Federal National Mortgage Association, Series 2011-38-BZ | | | 4.00% | | | | 05/25/2041 | | | | 9,032,371 | |
8,748,233 | | Federal National Mortgage Association, Series 2011-39-CB | | | 3.00% | | | | 05/25/2026 | | | | 8,770,770 | |
19,481,246 | | Federal National Mortgage Association, Series 2011-39-ZD | | | 4.00% | | | | 02/25/2041 | | | | 20,452,250 | |
4,466,213 | | Federal National Mortgage Association, Series 2011-40-LZ | | | 4.50% | | | | 05/25/2041 | | | | 4,643,712 | |
9,390,916 | | Federal National Mortgage Association, Series 2011-42-MZ | | | 4.50% | | | | 05/25/2041 | | | | 9,845,448 | |
19,737,531 | | Federal National Mortgage Association, Series 2011-45-ZA | | | 4.00% | | | | 05/25/2031 | | | | 20,003,417 | |
16,081,453 | | Federal National Mortgage Association, Series 2011-45-ZB | | | 4.50% | | | | 05/25/2041 | | | | 17,208,544 | |
3,049,235 | | Federal National Mortgage Association, Series 2011-48-SC (-2 x 1 Month LIBOR USD + 9.20% , 9.20% Cap) | | | 5.46% | I/F | | | 06/25/2041 | | | | 2,937,419 | |
13,220,935 | | Federal National Mortgage Association, Series 2011-58-SA (-1 x 1 Month LIBOR USD + 6.55%, 6.55% Cap) | | | 4.68% | I/F I/O | | | 07/25/2041 | | | | 2,180,037 | |
1,945,999 | | Federal National Mortgage Association, Series 2011-59-MA | | | 4.50% | | | | 07/25/2041 | | | | 2,032,701 | |
13,969,748 | | Federal National Mortgage Association, Series 2011-60-EL | | | 3.00% | | | | 07/25/2026 | | | | 14,121,591 | |
20,370,346 | | Federal National Mortgage Association, Series 2011-64-DB | | | 4.00% | | | | 07/25/2041 | | | | 20,918,234 | |
9,126,123 | | Federal National Mortgage Association, Series 2011-74-KL | | | 5.00% | | | | 06/25/2040 | | | | 9,545,206 | |
26,357,774 | | Federal National Mortgage Association, Series 2011-77-Z | | | 3.50% | | | | 08/25/2041 | | | | 27,776,492 | |
5,219,017 | | Federal National Mortgage Association, Series 2011-8-AV | | | 4.00% | | | | 01/25/2030 | | | | 5,216,948 | |
26,780,800 | | Federal National Mortgage Association, Series 2011-99-CZ | | | 4.50% | | | | 10/25/2041 | | | | 28,869,081 | |
106,895,938 | | Federal National Mortgage Association, Series 2011-99-DZ | | | 5.00% | | | | 10/25/2041 | | | | 115,483,765 | |
12,521,029 | | Federal National Mortgage Association, Series 2012-104-Z | | | 3.50% | | | | 09/25/2042 | | | | 12,395,125 | |
10,394,457 | | Federal National Mortgage Association, Series 2012-111-LB | | | 3.50% | | | | 05/25/2041 | | | | 10,341,747 | |
39,040,199 | | Federal National Mortgage Association, Series 2012-111-MJ | | | 4.00% | | | | 04/25/2042 | | | | 39,739,409 | |
16,657,506 | | Federal National Mortgage Association, Series 2012-114-DC | | | 2.00% | | | | 08/25/2039 | | | | 16,374,258 | |
82,394,153 | | Federal National Mortgage Association, Series 2012-122-AD | | | 2.00% | | | | 02/25/2040 | | | | 79,879,475 | |
69,042,288 | | Federal National Mortgage Association, Series 2012-122-DB | | | 3.00% | | | | 11/25/2042 | | | | 66,939,356 | |
76,278,525 | | Federal National Mortgage Association, Series 2012-125-LA | | | 3.00% | | | | 11/25/2042 | | | | 73,254,043 | |
41,570,479 | | Federal National Mortgage Association, Series 2012-144-PT | | | 4.31% | # | | | 11/25/2049 | | | | 43,974,591 | |
10,837,310 | | Federal National Mortgage Association, Series 2012-14-BZ | | | 4.00% | | | | 03/25/2042 | | | | 11,302,996 | |
24,767,496 | | Federal National Mortgage Association, Series 2012-15-PZ | | | 4.00% | | | | 03/25/2042 | | | | 26,135,160 | |
18,553,472 | | Federal National Mortgage Association, Series 2012-20-ZT | | | 3.50% | | | | 03/25/2042 | | | | 18,449,165 | |
57,183,385 | | Federal National Mortgage Association, Series 2012-30-DZ | | | 4.00% | | | | 04/25/2042 | | | | 59,334,566 | |
47,017,450 | | Federal National Mortgage Association, Series 2012-31-Z | | | 4.00% | | | | 04/25/2042 | | | | 48,949,303 | |
9,511,615 | | Federal National Mortgage Association, Series 2012-63-EB | | | 2.00% | | | | 08/25/2040 | | | | 9,272,591 | |
33,779,834 | | Federal National Mortgage Association, Series 2012-74-Z | | | 4.00% | | | | 07/25/2042 | | | | 34,712,171 | |
8,994,268 | | Federal National Mortgage Association, Series 2012-80-EA | | | 2.00% | | | | 04/25/2042 | | | | 8,326,023 | |
24,633,892 | | Federal National Mortgage Association, Series 2012-86-ZC | | | 3.50% | | | | 08/25/2042 | | | | 24,196,047 | |
34,321,466 | | Federal National Mortgage Association, Series 2012-96-VZ | | | 3.50% | | | | 09/25/2042 | | | | 34,139,164 | |
33,073,713 | | Federal National Mortgage Association, Series 2012-98-BG | | | 4.50% | | | | 08/25/2040 | | | | 34,586,941 | |
60,450,389 | | Federal National Mortgage Association, Series 2012-99-QE | | | 3.00% | | | | 09/25/2042 | | | | 58,838,123 | |
25,489,717 | | Federal National Mortgage Association, Series 2013-130-ZE | | | 3.00% | | | | 01/25/2044 | | | | 23,711,189 | |
22,902,355 | | Federal National Mortgage Association, Series 2013-133-ZT | | | 3.00% | | | | 01/25/2039 | | | | 20,963,448 | |
12,196,976 | | Federal National Mortgage Association, Series 2013-36-Z | | | 3.00% | | | | 04/25/2043 | | | | 11,479,816 | |
20,467,323 | | Federal National Mortgage Association, Series 2013-41-ZH | | | 3.00% | | | | 05/25/2033 | | | | 19,100,577 | |
19,292,416 | | Federal National Mortgage Association, Series 2013-51-HS (-1 x 1 Month LIBOR USD + 5.40%, 5.40% Cap) | | | 3.15% | I/F | | | 04/25/2043 | | | | 16,634,436 | |
5,345,463 | | Federal National Mortgage Association, Series 2013-53-AB | | | 1.50% | | | | 03/25/2028 | | | | 5,117,060 | |
7,059,931 | | Federal National Mortgage Association, Series 2013-58-SC (-2 x 1 Month LIBOR USD + 6.00%, 6.00% Cap) | | | 3.19% | I/F | | | 06/25/2043 | | | | 6,002,226 | |
114,956,211 | | Federal National Mortgage Association, Series 2013-81-ZQ | | | 3.00% | | | | 08/25/2043 | | | | 104,600,266 | |
27,857,413 | | Federal National Mortgage Association, Series 2013-82-SH (-1 x 1 Month LIBOR USD + 6.05%, 6.05% Cap) | | | 4.18% | I/F I/O | | | 12/25/2042 | | | | 4,227,605 | |
26,223,000 | | Federal National Mortgage Association, Series 2013-8-Z | | | 3.00% | | | | 02/25/2043 | | | | 24,741,668 | |
23,067,874 | | Federal National Mortgage Association, Series 2014-12-GZ | | | 3.50% | | | | 03/25/2044 | | | | 23,169,465 | |
24,801,216 | | Federal National Mortgage Association, Series 2014-21-GZ | | | 3.00% | | | | 04/25/2044 | | | | 22,901,381 | |
29,307,077 | | Federal National Mortgage Association, Series 2014-37-ZY | | | 2.50% | | | | 07/25/2044 | | | | 25,171,503 | |
46,994,437 | | Federal National Mortgage Association, Series 2014-39-ZA | | | 3.00% | | | | 07/25/2044 | | | | 44,058,276 | |
12,762,851 | | Federal National Mortgage Association, Series 2014-46-NZ | | | 3.00% | | | | 06/25/2043 | | | | 11,957,520 | |
51,476,387 | | Federal National Mortgage Association, Series 2014-55-MA | | | 3.00% | | | | 10/25/2039 | | | | 51,483,284 | |
3,373,642 | | Federal National Mortgage Association, Series 2014-56-AD | | | 3.00% | | | | 01/25/2040 | | | | 3,331,344 | |
56,324,528 | | Federal National Mortgage Association, Series 2014-60-EZ | | | 3.00% | | | | 10/25/2044 | | | | 52,333,462 | |
39,758,693 | | Federal National Mortgage Association, Series 2014-61-ZV | | | 3.00% | | | | 10/25/2044 | | | | 36,517,692 | |
33,528,515 | | Federal National Mortgage Association, Series 2014-64-NZ | | | 3.00% | | | | 10/25/2044 | | | | 30,621,325 | |
106,371,985 | | Federal National Mortgage Association, Series 2014-65-CD | | | 3.00% | | | | 06/25/2040 | | | | 105,935,668 | |
11,806,003 | | Federal National Mortgage Association, Series 2014-67-DZ | | | 3.00% | | | | 10/25/2044 | | | | 10,809,441 | |
101,742,602 | | Federal National Mortgage Association, Series 2014-68-MA | | | 3.00% | | | | 11/25/2040 | | | | 100,832,627 | |
37,741,904 | | Federal National Mortgage Association, Series 2014-68-MZ | | | 3.00% | | | | 11/25/2044 | | | | 34,485,488 | |
26,631,964 | | Federal National Mortgage Association, Series 2014-6-Z | | | 2.50% | | | | 02/25/2044 | | | | 22,728,581 | |
44,218,383 | | Federal National Mortgage Association, Series 2014-73-CQ | | | 3.00% | | | | 06/25/2040 | | | | 43,995,430 | |
21,305,701 | | Federal National Mortgage Association, Series 2014-77-VZ | | | 3.00% | | | | 11/25/2044 | | | | 19,487,664 | |
25,037,919 | | Federal National Mortgage Association, Series 2014-82-YA | | | 3.00% | | | | 04/25/2041 | | | | 24,798,682 | |
27,362,114 | | Federal National Mortgage Association, Series 2014-84-KZ | | | 3.00% | | | | 12/25/2044 | | | | 25,085,304 | |
116,969,087 | | Federal National Mortgage Association, Series 2014-95-NA | | | 3.00% | | | | 04/25/2041 | | | | 115,843,997 | |
194,782,304 | | Federal National Mortgage Association, Series 2014-M11-1A | | | 3.12% | # | | | 08/25/2024 | | | | 197,906,846 | |
38,372,049 | | Federal National Mortgage Association, Series 2015-11-A | | | 3.00% | | | | 05/25/2034 | | | | 38,727,197 | |
101,616,267 | | Federal National Mortgage Association, Series 2015-21-G | | | 3.00% | | | | 02/25/2042 | | | | 101,652,697 | |
20,180,129 | | Federal National Mortgage Association, Series 2015-42-CA | | | 3.00% | | | | 03/25/2044 | | | | 19,923,006 | |
64,790,982 | | Federal National Mortgage Association, Series 2015-49-A | | | 3.00% | | | | 03/25/2044 | | | | 63,911,516 | |
14,619,855 | | Federal National Mortgage Association, Series 2015-63-KD | | | 3.00% | | | | 07/25/2041 | | | | 14,573,823 | |
59,845,290 | | Federal National Mortgage Association, Series 2015-88-AC | | | 3.00% | | | | 04/25/2043 | | | | 59,055,554 | |
172,457,745 | | Federal National Mortgage Association, Series 2015-88-BA | | | 3.00% | | | | 04/25/2044 | | | | 177,051,364 | |
22,035,722 | | Federal National Mortgage Association, Series 2015-94-MA | | | 3.00% | | | | 01/25/2046 | | | | 21,836,453 | |
75,522,068 | | Federal National Mortgage Association, Series 2015-9-HA | | | 3.00% | | | | 01/25/2045 | | | | 75,169,184 | |
50,989,161 | | Federal National Mortgage Association, Series 2016-2-JA | | | 2.50% | | | | 02/25/2046 | | | | 49,629,759 | |
113,603,996 | | Federal National Mortgage Association, Series 2016-32-LA | | | 3.00% | | | | 10/25/2044 | | | | 112,637,692 | |
23,826,345 | | Federal National Mortgage Association, Series 2016-71-ZQ | | | 3.00% | | | | 10/25/2046 | | | | 21,254,865 | |
117,464,050 | | Federal National Mortgage Association, Series 2016-72-PA | | | 3.00% | | | | 07/25/2046 | | | | 115,369,372 | |
92,035,321 | | Federal National Mortgage Association, Series 2016-74-PA | | | 3.00% | | | | 12/25/2044 | | | | 90,588,857 | |
44,912,121 | | Federal National Mortgage Association, Series 2016-79-EP | | | 3.00% | | | | 01/25/2044 | | | | 44,832,618 | |
116,493,614 | | Federal National Mortgage Association, Series 2016-81-PA | | | 3.00% | | | | 02/25/2044 | | | | 115,374,565 | |
61,691,813 | | Federal National Mortgage Association, Series 2016-94-PA | | | 3.00% | | | | 03/25/2044 | | | | 60,759,736 | |
60,620,760 | | Federal National Mortgage Association, Series 2017-13-ML | | | 3.00% | | | | 08/25/2041 | | | | 60,269,596 | |
21,118,317 | | Federal National Mortgage Association, Series 2017-26-DA | | | 3.00% | | | | 06/25/2043 | | | | 20,809,259 | |
31,652,063 | | Federal National Mortgage Association, Series 2017-2-HA | | | 3.00% | | | | 09/25/2041 | | | | 31,385,296 | |
20,500,463 | | Federal National Mortgage Association, Series 2017-4-CH | | | 3.00% | | | | 06/25/2042 | | | | 20,473,031 | |
21,376,975 | | Federal National Mortgage Association, Series 2017-51-EA | | | 3.00% | | | | 11/25/2042 | | | | 21,115,772 | |
29,585,987 | | Federal National Mortgage Association, Series 2017-61-TA | | | 3.00% | | | | 02/25/2043 | | | | 29,077,212 | |
104,978,706 | | Federal National Mortgage Association, Series 2018-21-PO | | | 0.00% | P/O | | | 04/25/2048 | | | | 83,392,460 | |
10,232,310 | | Federal National Mortgage Association, Series 400-S4 (-1 x 1 Month LIBOR USD + 5.45%, 5.45% Cap) | | | 3.58% | I/F I/O | | | 11/25/2039 | | | | 1,268,610 | |
107,564,038 | | Federal National Mortgage Association, Series 412-A3 | | | 3.00% | | | | 08/25/2042 | | | | 105,849,112 | |
10,499,751 | | Federal National Mortgage Association Pass-Thru, Pool 555743 | | | 5.00% | | | | 09/01/2033 | | | | 11,341,573 | |
8,009,739 | | Federal National Mortgage Association Pass-Thru, Pool 735382 | | | 5.00% | | | | 04/01/2035 | | | | 8,649,576 | |
12,981,433 | | Federal National Mortgage Association Pass-Thru, Pool 735402 | | | 5.00% | | | | 04/01/2035 | | | | 14,018,747 | |
9,134,305 | | Federal National Mortgage Association Pass-Thru, Pool 735484 | | | 5.00% | | | | 05/01/2035 | | | | 9,864,939 | |
3,561,211 | | Federal National Mortgage Association Pass-Thru, Pool 735667 | | | 5.00% | | | | 07/01/2035 | | | | 3,846,160 | |
2,947,276 | | Federal National Mortgage Association Pass-Thru, Pool 735893 | | | 5.00% | | | | 10/01/2035 | | | | 3,182,874 | |
7,292,427 | | Federal National Mortgage Association Pass-Thru, Pool 745275 | | | 5.00% | | | | 02/01/2036 | | | | 7,875,151 | |
86,173 | | Federal National Mortgage Association Pass-Thru, Pool 745571 | | | 4.00% | | | | 01/01/2019 | | | | 88,682 | |
310,539 | | Federal National Mortgage Association Pass-Thru, Pool 888695 | | | 5.00% | | | | 08/01/2037 | | | | 333,687 | |
1,585,493 | | Federal National Mortgage Association Pass-Thru, Pool 888968 | | | 5.00% | | | | 08/01/2035 | | | | 1,712,505 | |
14,181,230 | | Federal National Mortgage Association Pass-Thru, Pool 890549 | | | 4.00% | | | | 11/01/2043 | | | | 14,659,271 | |
16,470,964 | | Federal National Mortgage Association Pass-Thru, Pool 890565 | | | 3.00% | | | | 11/01/2043 | | | | 16,208,142 | |
828,708 | | Federal National Mortgage Association Pass-Thru, Pool 931104 | | | 5.00% | | | | 05/01/2039 | | | | 881,799 | |
225,958 | | Federal National Mortgage Association Pass-Thru, Pool 975116 | | | 5.00% | | | | 05/01/2038 | | | | 242,140 | |
1,716,152 | | Federal National Mortgage Association Pass-Thru, Pool 986864 | | | 6.50% | | | | 08/01/2038 | | | | 1,924,995 | |
1,694,695 | | Federal National Mortgage Association Pass-Thru, Pool 987316 | | | 6.50% | | | | 09/01/2038 | | | | 1,893,055 | |
14,152,265 | | Federal National Mortgage Association Pass-Thru, Pool 995203 | | | 5.00% | | | | 07/01/2035 | | | | 15,284,537 | |
24,327,198 | | Federal National Mortgage Association Pass-Thru, Pool 995849 | | | 5.00% | | | | 08/01/2036 | | | | 26,269,748 | |
20,712,185 | | Federal National Mortgage Association Pass-Thru, Pool AB2123 | | | 4.00% | | | | 01/01/2031 | | | | 21,413,888 | |
238,057 | | Federal National Mortgage Association Pass-Thru, Pool AB2370 | | | 4.50% | | | | 09/01/2035 | | | | 245,647 | |
2,162,914 | | Federal National Mortgage Association Pass-Thru, Pool AB3713 | | | 4.00% | | | | 10/01/2031 | | | | 2,235,990 | |
10,989,283 | | Federal National Mortgage Association Pass-Thru, Pool AB3796 | | | 3.50% | | | | 11/01/2031 | | | | 11,224,439 | |
4,509,739 | | Federal National Mortgage Association Pass-Thru, Pool AB3850 | | | 4.00% | | | | 11/01/2041 | | | | 4,612,394 | |
6,659,396 | | Federal National Mortgage Association Pass-Thru, Pool AB3923 | | | 4.00% | | | | 11/01/2041 | | | | 6,810,776 | |
36,585,140 | | Federal National Mortgage Association Pass-Thru, Pool AB4167 | | | 3.50% | | | | 01/01/2032 | | | | 37,368,075 | |
34,449,914 | | Federal National Mortgage Association Pass-Thru, Pool AB4261 | | | 3.50% | | | | 01/01/2032 | | | | 35,184,913 | |
6,195,840 | | Federal National Mortgage Association Pass-Thru, Pool AB5084 | | | 3.50% | | | | 05/01/2032 | | | | 6,328,467 | |
12,959,938 | | Federal National Mortgage Association Pass-Thru, Pool AB5156 | | | 3.50% | | | | 05/01/2032 | | | | 13,237,324 | |
22,048,393 | | Federal National Mortgage Association Pass-Thru, Pool AB5212 | | | 3.50% | | | | 05/01/2032 | | | | 22,520,327 | |
8,673,015 | | Federal National Mortgage Association Pass-Thru, Pool AB5243 | | | 4.00% | | | | 05/01/2042 | | | | 8,868,444 | |
33,152,913 | | Federal National Mortgage Association Pass-Thru, Pool AB5911 | | | 3.00% | | | | 08/01/2032 | | | | 33,034,849 | |
9,157,173 | | Federal National Mortgage Association Pass-Thru, Pool AB6280 | | | 3.00% | | | | 09/01/2042 | | | | 8,996,946 | |
13,767,225 | | Federal National Mortgage Association Pass-Thru, Pool AB6349 | | | 3.00% | | | | 10/01/2032 | | | | 13,718,179 | |
40,845,704 | | Federal National Mortgage Association Pass-Thru, Pool AB6750 | | | 3.00% | | | | 10/01/2032 | | | | 40,700,198 | |
20,166,384 | | Federal National Mortgage Association Pass-Thru, Pool AB6751 | | | 3.00% | | | | 10/01/2032 | | | | 20,094,816 | |
120,886,074 | | Federal National Mortgage Association Pass-Thru, Pool AB6854 | | | 3.00% | | | | 11/01/2042 | | | | 118,956,368 | |
86,879,082 | | Federal National Mortgage Association Pass-Thru, Pool AB7077 | | | 3.00% | | | | 11/01/2042 | | | | 85,492,022 | |
68,209,180 | | Federal National Mortgage Association Pass-Thru, Pool AB7344 | | | 3.00% | | | | 12/01/2032 | | | | 67,966,462 | |
31,775,313 | | Federal National Mortgage Association Pass-Thru, Pool AB7776 | | | 3.00% | | | | 02/01/2043 | | | | 31,219,771 | |
40,419,970 | | Federal National Mortgage Association Pass-Thru, Pool AB7877 | | | 3.00% | | | | 02/01/2043 | | | | 39,713,289 | |
17,021,710 | | Federal National Mortgage Association Pass-Thru, Pool AB8418 | | | 3.00% | | | | 02/01/2033 | | | | 16,961,198 | |
24,897,750 | | Federal National Mortgage Association Pass-Thru, Pool AB8520 | | | 3.00% | | | | 02/01/2033 | | | | 24,809,049 | |
29,875,556 | | Federal National Mortgage Association Pass-Thru, Pool AB8703 | | | 3.00% | | | | 03/01/2038 | | | | 29,602,326 | |
14,770,218 | | Federal National Mortgage Association Pass-Thru, Pool AB8858 | | | 3.00% | | | | 04/01/2033 | | | | 14,717,613 | |
26,196,515 | | Federal National Mortgage Association Pass-Thru, Pool AB9020 | | | 3.00% | | | | 04/01/2038 | | | | 25,648,793 | |
24,133,541 | | Federal National Mortgage Association Pass-Thru, Pool AB9197 | | | 3.00% | | | | 05/01/2033 | | | | 24,047,551 | |
69,531,847 | | Federal National Mortgage Association Pass-Thru, Pool AB9406 | | | 3.00% | | | | 05/01/2033 | | | | 69,284,096 | |
14,138,683 | | Federal National Mortgage Association Pass-Thru, Pool AB9409 | | | 3.00% | | | | 05/01/2033 | | | | 14,088,308 | |
924,863 | | Federal National Mortgage Association Pass-Thru, Pool AD2177 | | | 4.50% | | | | 06/01/2030 | | | | 971,951 | |
1,154,161 | | Federal National Mortgage Association Pass-Thru, Pool AD6438 | | | 5.00% | | | | 06/01/2040 | | | | 1,248,259 | |
898,437 | | Federal National Mortgage Association Pass-Thru, Pool AD7859 | | | 5.00% | | | | 06/01/2040 | | | | 971,771 | |
9,813,606 | | Federal National Mortgage Association Pass-Thru, Pool AH0607 | | | 4.00% | | | | 12/01/2040 | | | | 10,143,033 | |
1,050,257 | | Federal National Mortgage Association Pass-Thru, Pool AH1140 | | | 4.50% | | | | 12/01/2040 | | | | 1,084,321 | |
9,229,086 | | Federal National Mortgage Association Pass-Thru, Pool AH4437 | | | 4.00% | | | | 01/01/2041 | | | | 9,437,910 | |
2,182,120 | | Federal National Mortgage Association Pass-Thru, Pool AH7309 | | | 4.00% | | | | 02/01/2031 | | | | 2,256,027 | |
9,441,663 | | Federal National Mortgage Association Pass-Thru, Pool AH9323 | | | 4.00% | | | | 04/01/2026 | | | | 9,719,880 | |
510,856 | | Federal National Mortgage Association Pass-Thru, Pool AI8889 | | | 4.00% | | | | 08/01/2041 | | | | 522,500 | |
4,925,155 | | Federal National Mortgage Association Pass-Thru, Pool AI9831 | | | 4.00% | | | | 09/01/2041 | | | | 5,037,143 | |
1,413,616 | | Federal National Mortgage Association Pass-Thru, Pool AJ1265 | | | 4.00% | | | | 09/01/2041 | | | | 1,445,821 | |
2,368,077 | | Federal National Mortgage Association Pass-Thru, Pool AJ1399 | | | 4.00% | | | | 09/01/2041 | | | | 2,421,430 | |
6,167,480 | | Federal National Mortgage Association Pass-Thru, Pool AJ1467 | | | 4.00% | | | | 10/01/2041 | | | | 6,306,446 | |
4,739,335 | | Federal National Mortgage Association Pass-Thru, Pool AJ3392 | | | 4.00% | | | | 10/01/2041 | | | | 4,847,206 | |
1,896,202 | | Federal National Mortgage Association Pass-Thru, Pool AJ3854 | | | 4.00% | | | | 10/01/2041 | | | | 1,939,428 | |
25,590,611 | | Federal National Mortgage Association Pass-Thru, Pool AJ4118 | | | 4.00% | | | | 11/01/2041 | | | | 26,167,165 | |
6,365,205 | | Federal National Mortgage Association Pass-Thru, Pool AJ4131 | | | 4.00% | | | | 10/01/2041 | | | | 6,509,930 | |
1,229,773 | | Federal National Mortgage Association Pass-Thru, Pool AJ5172 | | | 4.00% | | | | 11/01/2041 | | | | 1,257,810 | |
33,213,548 | | Federal National Mortgage Association Pass-Thru, Pool AJ5322 | | | 4.00% | | | | 11/01/2041 | | | | 34,335,615 | |
17,437,182 | | Federal National Mortgage Association Pass-Thru, Pool AJ7677 | | | 3.50% | | | | 12/01/2041 | | | | 17,392,905 | |
2,964,067 | | Federal National Mortgage Association Pass-Thru, Pool AJ8334 | | | 4.00% | | | | 12/01/2041 | | | | 3,031,474 | |
37,018,165 | | Federal National Mortgage Association Pass-Thru, Pool AK0713 | | | 3.50% | | | | 01/01/2032 | | | | 37,810,395 | |
8,786,463 | | Federal National Mortgage Association Pass-Thru, Pool AK4039 | | | 4.00% | | | | 02/01/2042 | | | | 8,986,098 | |
6,620,846 | | Federal National Mortgage Association Pass-Thru, Pool AK4763 | | | 4.00% | | | | 02/01/2042 | | | | 6,771,676 | |
7,081,041 | | Federal National Mortgage Association Pass-Thru, Pool AK9438 | | | 4.00% | | | | 03/01/2042 | | | | 7,242,158 | |
8,391,178 | | Federal National Mortgage Association Pass-Thru, Pool AK9439 | | | 4.00% | | | | 03/01/2042 | | | | 8,582,143 | |
1,112,403 | | Federal National Mortgage Association Pass-Thru, Pool AK9446 | | | 4.50% | | | | 03/01/2042 | | | | 1,148,561 | |
80,740,880 | | Federal National Mortgage Association Pass-Thru, Pool AL3038 | | | 3.00% | | | | 01/01/2033 | | | | 80,487,601 | |
130,413,919 | | Federal National Mortgage Association Pass-Thru, Pool AL3699 | | | 3.00% | | | | 06/01/2043 | | | | 128,135,209 | |
67,195,331 | | Federal National Mortgage Association Pass-Thru, Pool AL3883 | | | 3.00% | | | | 07/01/2043 | | | | 66,018,055 | |
4,269,184 | | Federal National Mortgage Association Pass-Thru, Pool AL4292 | | | 4.50% | | | | 04/01/2026 | | | | 4,443,936 | |
11,660,243 | | Federal National Mortgage Association Pass-Thru, Pool AL4312 | | | 4.00% | | | | 10/01/2043 | | | | 12,054,855 | |
24,555,957 | | Federal National Mortgage Association Pass-Thru, Pool AL6075 | | | 3.50% | | | | 09/01/2053 | | | | 24,246,422 | |
31,848,768 | | Federal National Mortgage Association Pass-Thru, Pool AL6076 | | | 3.00% | | | | 06/01/2053 | | | | 30,566,088 | |
91,511,773 | | Federal National Mortgage Association Pass-Thru, Pool AL6141 | | | 4.00% | | | | 04/01/2042 | | | | 94,647,049 | |
66,166,084 | | Federal National Mortgage Association Pass-Thru, Pool AL6325 | | | 3.00% | | | | 10/01/2044 | | | | 65,110,740 | |
33,404,412 | | Federal National Mortgage Association Pass-Thru, Pool AL6486 | | | 4.50% | | | | 02/01/2045 | | | | 35,083,448 | |
79,195,523 | | Federal National Mortgage Association Pass-Thru, Pool AL6538 | | | 4.50% | | | | 06/01/2044 | | | | 83,752,169 | |
62,019,447 | | Federal National Mortgage Association Pass-Thru, Pool AL8304 | | | 3.50% | | | | 03/01/2046 | | | | 62,261,954 | |
29,652,329 | | Federal National Mortgage Association Pass-Thru, Pool AO2980 | | | 4.00% | | | | 05/01/2042 | | | | 30,329,330 | |
71,676,383 | | Federal National Mortgage Association Pass-Thru, Pool AP4787 | | | 3.50% | | | | 09/01/2042 | | | | 71,494,572 | |
64,618,643 | | Federal National Mortgage Association Pass-Thru, Pool AP4789 | | | 3.50% | | | | 09/01/2042 | | | | 64,454,515 | |
17,813,784 | | Federal National Mortgage Association Pass-Thru, Pool AQ5541 | | | 3.00% | | | | 12/01/2042 | | | | 17,529,393 | |
21,018,395 | | Federal National Mortgage Association Pass-Thru, Pool AR9856 | | | 3.00% | | | | 04/01/2043 | | | | 20,682,804 | |
29,629,181 | | Federal National Mortgage Association Pass-Thru, Pool AS1927 | | | 4.50% | | | | 03/01/2044 | | | | 31,113,701 | |
30,268,738 | | Federal National Mortgage Association Pass-Thru, Pool AS2038 | | | 4.50% | | | | 03/01/2044 | | | | 31,797,851 | |
24,768,469 | | Federal National Mortgage Association Pass-Thru, Pool AS2517 | | | 4.50% | | | | 05/01/2044 | | | | 26,014,035 | |
13,036,856 | | Federal National Mortgage Association Pass-Thru, Pool AS2551 | | | 4.50% | | | | 06/01/2044 | | | | 13,737,924 | |
11,457,884 | | Federal National Mortgage Association Pass-Thru, Pool AS2765 | | | 4.50% | | | | 07/01/2044 | | | | 12,066,119 | |
38,160,349 | | Federal National Mortgage Association Pass-Thru, Pool AS3201 | | | 3.00% | | | | 08/01/2034 | | | | 38,024,449 | |
17,596,769 | | Federal National Mortgage Association Pass-Thru, Pool AS3456 | | | 3.00% | | | | 10/01/2034 | | | | 17,534,077 | |
38,076,070 | | Federal National Mortgage Association Pass-Thru, Pool AS3666 | | | 3.00% | | | | 10/01/2034 | | | | 37,940,441 | |
159,269,305 | | Federal National Mortgage Association Pass-Thru, Pool AS3961 | | | 3.00% | | | | 12/01/2044 | | | | 156,324,799 | |
49,121,136 | | Federal National Mortgage Association Pass-Thru, Pool AS4154 | | | 3.00% | | | | 12/01/2044 | | | | 48,124,210 | |
30,994,297 | | Federal National Mortgage Association Pass-Thru, Pool AS4212 | | | 3.00% | | | | 01/01/2035 | | | | 30,883,928 | |
47,239,476 | | Federal National Mortgage Association Pass-Thru, Pool AS4281 | | | 3.00% | | | | 01/01/2035 | | | | 47,071,220 | |
30,762,218 | | Federal National Mortgage Association Pass-Thru, Pool AS4345 | | | 3.50% | | | | 01/01/2045 | | | | 30,915,959 | |
35,897,357 | | Federal National Mortgage Association Pass-Thru, Pool AS4360 | | | 3.00% | | | | 01/01/2035 | | | | 35,769,466 | |
303,287,268 | | Federal National Mortgage Association Pass-Thru, Pool AS4625 | | | 3.00% | | | | 03/01/2045 | | | | 296,928,389 | |
126,917,653 | | Federal National Mortgage Association Pass-Thru, Pool AS4645 | | | 3.00% | | | | 03/01/2045 | | | | 124,256,220 | |
45,121,357 | | Federal National Mortgage Association Pass-Thru, Pool AS4779 | | | 3.00% | | | | 04/01/2035 | | | | 44,960,636 | |
43,008,404 | | Federal National Mortgage Association Pass-Thru, Pool AS4780 | | | 3.00% | | | | 04/01/2035 | | | | 42,855,172 | |
57,290,409 | | Federal National Mortgage Association Pass-Thru, Pool AS4840 | | | 3.00% | | | | 04/01/2035 | | | | 57,086,316 | |
28,465,905 | | Federal National Mortgage Association Pass-Thru, Pool AS4881 | | | 3.00% | | | | 05/01/2035 | | | | 28,364,477 | |
29,909,367 | | Federal National Mortgage Association Pass-Thru, Pool AS4882 | | | 3.00% | | | | 05/01/2035 | | | | 29,802,803 | |
58,922,721 | | Federal National Mortgage Association Pass-Thru, Pool AX9696 | | | 3.00% | | | | 07/01/2045 | | | | 57,105,153 | |
77,262,270 | | Federal National Mortgage Association Pass-Thru, Pool AY3974 | | | 3.00% | | | | 03/01/2045 | | | | 75,642,695 | |
26,632,576 | | Federal National Mortgage Association Pass-Thru, Pool AY4295 | | | 3.00% | | | | 02/01/2045 | | | | 25,845,645 | |
12,542,425 | | Federal National Mortgage Association Pass-Thru, Pool AY4296 | | | 3.00% | | | | 01/01/2045 | | | | 12,171,715 | |
12,601,113 | | Federal National Mortgage Association Pass-Thru, Pool AY5471 | | | 3.00% | | | | 03/01/2045 | | | | 12,228,726 | |
22,194,046 | | Federal National Mortgage Association Pass-Thru, Pool BC0785 | | | 3.50% | | | | 04/01/2046 | | | | 22,280,743 | |
2,759,469 | | Federal National Mortgage Association Pass-Thru, Pool MA0264 | | | 4.50% | | | | 12/01/2029 | | | | 2,899,175 | |
14,904 | | Federal National Mortgage Association Pass-Thru, Pool MA0315 | | | 4.50% | | | | 01/01/2025 | | | | 14,734 | |
10,065,071 | | Federal National Mortgage Association Pass-Thru, Pool MA0353 | | | 4.50% | | | | 03/01/2030 | | | | 10,576,712 | |
2,186,243 | | Federal National Mortgage Association Pass-Thru, Pool MA0406 | | | 4.50% | | | | 05/01/2030 | | | | 2,297,366 | |
147,759 | | Federal National Mortgage Association Pass-Thru, Pool MA0445 | | | 5.00% | | | | 06/01/2040 | | | | 154,442 | |
337,231 | | Federal National Mortgage Association Pass-Thru, Pool MA0459 | | | 4.00% | | | | 07/01/2020 | | | | 347,051 | |
395,283 | | Federal National Mortgage Association Pass-Thru, Pool MA0468 | | | 5.00% | | | | 07/01/2040 | | | | 412,176 | |
1,111,131 | | Federal National Mortgage Association Pass-Thru, Pool MA0502 | | | 4.00% | | | | 08/01/2020 | | | | 1,143,485 | |
536,697 | | Federal National Mortgage Association Pass-Thru, Pool MA0517 | | | 4.00% | | | | 09/01/2020 | | | | 552,324 | |
3,135,952 | | Federal National Mortgage Association Pass-Thru, Pool MA0534 | | | 4.00% | | | | 10/01/2030 | | | | 3,241,956 | |
3,394,187 | | Federal National Mortgage Association Pass-Thru, Pool MA0536 | | | 4.00% | | | | 10/01/2020 | | | | 3,493,020 | |
4,235,731 | | Federal National Mortgage Association Pass-Thru, Pool MA0580 | | | 4.00% | | | | 11/01/2020 | | | | 4,359,068 | |
687,428 | | Federal National Mortgage Association Pass-Thru, Pool MA0587 | | | 4.00% | | | | 12/01/2030 | | | | 710,719 | |
16,989,942 | | Federal National Mortgage Association Pass-Thru, Pool MA0616 | | | 4.00% | | | | 01/01/2031 | | | | 17,564,461 | |
6,388,505 | | Federal National Mortgage Association Pass-Thru, Pool MA0896 | | | 4.00% | | | | 11/01/2041 | | | | 6,533,969 | |
129,113,993 | | Federal National Mortgage Association Pass-Thru, Pool MA0919 | | | 3.50% | | | | 12/01/2031 | | | | 131,877,019 | |
54,410,091 | | Federal National Mortgage Association Pass-Thru, Pool MA0949 | | | 3.50% | | | | 01/01/2032 | | | | 55,574,448 | |
66,421,162 | | Federal National Mortgage Association Pass-Thru, Pool MA0976 | | | 3.50% | | | | 02/01/2032 | | | | 67,842,624 | |
32,528,673 | | Federal National Mortgage Association Pass-Thru, Pool MA1010 | | | 3.50% | | | | 03/01/2032 | | | | 33,224,568 | |
9,633,433 | | Federal National Mortgage Association Pass-Thru, Pool MA1039 | | | 3.50% | | | | 04/01/2042 | | | | 9,609,052 | |
44,704,010 | | Federal National Mortgage Association Pass-Thru, Pool MA1059 | | | 3.50% | | | | 05/01/2032 | | | | 45,660,276 | |
6,292,933 | | Federal National Mortgage Association Pass-Thru, Pool MA1068 | | | 3.50% | | | | 05/01/2042 | | | | 6,276,953 | |
94,701,072 | | Federal National Mortgage Association Pass-Thru, Pool MA1084 | | | 3.50% | | | | 06/01/2032 | | | | 96,727,381 | |
14,296,528 | | Federal National Mortgage Association Pass-Thru, Pool MA1093 | | | 3.50% | | | | 06/01/2042 | | | | 14,260,260 | |
11,568,942 | | Federal National Mortgage Association Pass-Thru, Pool MA1094 | | | 4.00% | | | | 06/01/2042 | | | | 11,829,621 | |
56,906,704 | | Federal National Mortgage Association Pass-Thru, Pool MA1107 | | | 3.50% | | | | 07/01/2032 | | | | 58,124,355 | |
132,430,456 | | Federal National Mortgage Association Pass-Thru, Pool MA1117 | | | 3.50% | | | | 07/01/2042 | | | | 132,094,129 | |
155,861,754 | | Federal National Mortgage Association Pass-Thru, Pool MA1136 | | | 3.50% | | | | 08/01/2042 | | | | 155,466,591 | |
38,392,561 | | Federal National Mortgage Association Pass-Thru, Pool MA1138 | | | 3.50% | | | | 08/01/2032 | | | | 39,213,588 | |
42,009,742 | | Federal National Mortgage Association Pass-Thru, Pool MA1179 | | | 3.50% | | | | 09/01/2042 | | | | 41,903,409 | |
7,600,439 | | Federal National Mortgage Association Pass-Thru, Pool MA1201 | | | 3.50% | | | | 10/01/2032 | | | | 7,763,026 | |
90,964,329 | | Federal National Mortgage Association Pass-Thru, Pool MA1209 | | | 3.50% | | | | 10/01/2042 | | | | 90,734,229 | |
146,773,753 | | Federal National Mortgage Association Pass-Thru, Pool MA1237 | | | 3.00% | | | | 11/01/2032 | | | | 146,251,424 | |
5,887,210 | | Federal National Mortgage Association Pass-Thru, Pool MA1242 | | | 3.50% | | | | 11/01/2042 | | | | 5,872,313 | |
26,345,337 | | Federal National Mortgage Association Pass-Thru, Pool MA1338 | | | 3.00% | | | | 02/01/2033 | | | | 26,251,594 | |
103,677,081 | | Federal National Mortgage Association Pass-Thru, Pool MA1366 | | | 3.00% | | | | 03/01/2033 | | | | 103,307,984 | |
63,575,758 | | Federal National Mortgage Association Pass-Thru, Pool MA1401 | | | 3.00% | | | | 04/01/2033 | | | | 63,349,569 | |
110,498,026 | | Federal National Mortgage Association Pass-Thru, Pool MA1459 | | | 3.00% | | | | 06/01/2033 | | | | 110,105,285 | |
14,071,616 | | Federal National Mortgage Association Pass-Thru, Pool MA1490 | | | 3.00% | | | | 07/01/2033 | | | | 14,021,552 | |
80,877,005 | | Federal National Mortgage Association Pass-Thru, Pool MA2018 | | | 3.50% | | | | 09/01/2034 | | | | 82,355,291 | |
30,998,844 | | Federal National Mortgage Association Pass-Thru, Pool MA2114 | | | 3.50% | | | | 12/01/2044 | | | | 30,920,413 | |
25,104,482 | | Federal National Mortgage Association Pass-Thru, Pool MA2151 | | | 3.50% | | | | 01/01/2045 | | | | 25,040,964 | |
48,218,090 | | Federal National Mortgage Association Pass-Thru, Pool MA2164 | | | 3.50% | | | | 02/01/2035 | | | | 49,099,413 | |
99,719,089 | | Federal National Mortgage Association Pass-Thru, Pool MA2166 | | | 3.50% | | | | 02/01/2045 | | | | 99,466,602 | |
102,019,731 | | Federal National Mortgage Association Pass-Thru, Pool MA2248 | | | 3.00% | | | | 04/01/2045 | | | | 98,939,070 | |
103,117,748 | | Federal National Mortgage Association Pass-Thru, Pool MA2270 | | | 3.00% | | | | 05/01/2045 | | | | 100,003,367 | |
137,698,780 | | Federal National Mortgage Association Pass-Thru, Pool MA2650 | | | 3.50% | | | | 06/01/2046 | | | | 137,350,350 | |
8,989,435 | | Federal National Mortgage Association Pass-Thru, Pool MA3894 | | | 4.00% | | | | 09/01/2031 | | | | 9,360,626 | |
5,011,795 | | Government National Mortgage Association, Pool MA2511M | | | 3.50% | | | | 01/20/2045 | | | | 5,011,734 | |
14,700,000 | | Government National Mortgage Association, Series 2003-67-SP (-1 x 1 Month LIBOR USD + 7.10%, 7.10% Cap) | | | 5.28% | I/F I/O | | | 08/20/2033 | | | | 2,413,600 | |
6,169,298 | | Government National Mortgage Association, Series 2003-86-ZK | | | 5.00% | | | | 10/20/2033 | | | | 6,701,062 | |
3,147,645 | | Government National Mortgage Association, Series 2004-49-Z | | | 6.00% | | | | 06/20/2034 | | | | 3,428,854 | |
993,002 | | Government National Mortgage Association, Series 2004-80-PH | | | 5.00% | | | | 07/20/2034 | | | | 1,011,427 | |
6,519,588 | | Government National Mortgage Association, Series 2004-83-CS (-1 x 1 Month LIBOR USD + 6.08%, 6.08% Cap) | | | 4.26% | I/F I/O | | | 10/20/2034 | | | | 794,566 | |
1,667,583 | | Government National Mortgage Association, Series 2005-21-Z | | | 5.00% | | | | 03/20/2035 | | | | 1,812,637 | |
17,927,928 | | Government National Mortgage Association, Series 2005-39-ZB | | | 5.00% | | | | 07/20/2034 | | | | 19,069,449 | |
906,579 | | Government National Mortgage Association, Series 2006-24-CX (-7 x 1 Month LIBOR USD + 39.97%, 39.97% Cap) | | | 26.60% | I/F | | | 05/20/2036 | | | | 1,620,705 | |
8,308,830 | | Government National Mortgage Association, Series 2007-26-SJ (-1 x 1 Month LIBOR USD + 4.69%, 4.69% Cap) | | | 2.87% | I/F I/O | | | 04/20/2037 | | | | 519,805 | |
5,367,727 | | Government National Mortgage Association, Series 2008-2-SM (-1 x 1 Month LIBOR USD + 6.50%, 6.50% Cap) | | | 4.71% | I/F I/O | | | 01/16/2038 | | | | 938,293 | |
9,076,955 | | Government National Mortgage Association, Series 2008-42-AI (-1 x 1 Month LIBOR USD + 7.69%, 7.69% Cap) | | | 5.90% | I/F I/O | | | 05/16/2038 | | | | 2,085,698 | |
3,837,671 | | Government National Mortgage Association, Series 2008-43-SH (-1 x 1 Month LIBOR USD + 6.34%, 6.34% Cap) | | | 4.51% | I/F I/O | | | 05/20/2038 | | | | 503,414 | |
4,352,492 | | Government National Mortgage Association, Series 2008-51-SC (-1 x 1 Month LIBOR USD + 6.25%, 6.25% Cap) | | | 4.43% | I/F I/O | | | 06/20/2038 | | | | 536,983 | |
2,895,379 | | Government National Mortgage Association, Series 2008-51-SE (-1 x 1 Month LIBOR USD + 6.25%, 6.25% Cap) | | | 4.46% | I/F I/O | | | 06/16/2038 | | | | 405,195 | |
1,507,782 | | Government National Mortgage Association, Series 2008-82-SM (-1 x 1 Month LIBOR USD + 6.05%, 6.05% Cap) | | | 4.23% | I/F I/O | | | 09/20/2038 | | | | 191,936 | |
3,227,389 | | Government National Mortgage Association, Series 2008-83-SD (-1 x 1 Month LIBOR USD + 6.56%, 6.56% Cap) | | | 4.77% | I/F I/O | | | 11/16/2036 | | | | 512,159 | |
12,129,094 | | Government National Mortgage Association, Series 2009-106-VZ | | | 4.50% | | | | 11/20/2039 | | | | 12,779,063 | |
6,448,267 | | Government National Mortgage Association, Series 2009-10-NS (-1 x 1 Month LIBOR USD + 6.65%, 6.65% Cap) | | | 4.86% | I/F I/O | | | 02/16/2039 | | | | 1,064,939 | |
2,397,737 | | Government National Mortgage Association, Series 2009-24-SN (-1 x 1 Month LIBOR USD + 6.10%, 6.10% Cap) | | | 4.28% | I/F I/O | | | 09/20/2038 | | | | 225,884 | |
6,733,420 | | Government National Mortgage Association, Series 2009-32-ZE | | | 4.50% | | | | 05/16/2039 | | | | 7,093,920 | |
37,381,025 | | Government National Mortgage Association, Series 2009-35-DZ | | | 4.50% | | | | 05/20/2039 | | | | 39,449,586 | |
7,255 | | Government National Mortgage Association, Series 2009-41-ZQ | | | 4.50% | | | | 06/16/2039 | | | | 7,705 | |
4,280,050 | | Government National Mortgage Association, Series 2009-48-Z | | | 5.00% | | | | 06/16/2039 | | | | 4,520,271 | |
940,830 | | Government National Mortgage Association, Series 2009-50-KP | | | 4.50% | | | | 06/20/2039 | | | | 972,396 | |
3,486,987 | | Government National Mortgage Association, Series 2009-69-TS (-1 x 1 Month LIBOR USD + 6.20%, 6.20% Cap) | | | 4.41% | I/F I/O | | | 04/16/2039 | | | | 362,119 | |
5,712,050 | | Government National Mortgage Association, Series 2009-75-GZ | | | 4.50% | | | | 09/20/2039 | | | | 5,926,250 | |
4,559,873 | | Government National Mortgage Association, Series 2009-87-IG (-1 x 1 Month LIBOR USD + 6.74%, 6.74% Cap) | | | 4.92% | I/F I/O | | | 03/20/2037 | | | | 512,909 | |
33,234,955 | | Government National Mortgage Association, Series 2010-106-PS (-1 x 1 Month LIBOR USD + 6.05%, 6.05% Cap) | | | 4.23% | I/F I/O | | | 03/20/2040 | | | | 3,608,209 | |
8,468,483 | | Government National Mortgage Association, Series 2010-1-SA (-1 x 1 Month LIBOR USD + 5.75%, 5.75% Cap) | | | 3.96% | I/F I/O | | | 01/16/2040 | | | | 837,817 | |
3,688,922 | | Government National Mortgage Association, Series 2010-25-ZB | | | 4.50% | | | | 02/16/2040 | | | | 3,886,688 | |
78,078,027 | | Government National Mortgage Association, Series 2010-26-QS (-1 x 1 Month LIBOR USD + 6.25%, 6.25% Cap) | | | 4.43% | I/F I/O | | | 02/20/2040 | | | | 11,882,656 | |
6,586,430 | | Government National Mortgage Association, Series 2010-42-AY | | | 5.00% | | | | 11/20/2039 | | | | 7,108,642 | |
6,660,642 | | Government National Mortgage Association, Series 2010-42-ES (-1 x 1 Month LIBOR USD + 5.68% , 5.68% Cap) | | | 3.86% | I/F I/O | | | 04/20/2040 | | | | 887,567 | |
2,038,281 | | Government National Mortgage Association, Series 2010-61-AS (-1 x 1 Month LIBOR USD + 6.55%, 6.55% Cap) | | | 4.73% | I/F I/O | | | 09/20/2039 | | | | 245,026 | |
20,357,405 | | Government National Mortgage Association, Series 2010-62-SB (-1 x 1 Month LIBOR USD + 5.75%, 5.75% Cap) | | | 3.93% | I/F I/O | | | 05/20/2040 | | | | 2,453,338 | |
10,189,552 | | Government National Mortgage Association, Series 2010-62-ZG | | | 5.50% | | | | 05/16/2040 | | | | 11,404,599 | |
7,833,334 | | Government National Mortgage Association, Series 2011-18-SN (-2 x 1 Month LIBOR USD + 9.50%, 9.50% Cap) | | | 5.86% | I/F | | | 12/20/2040 | | | | 8,175,305 | |
8,333,334 | | Government National Mortgage Association, Series 2011-18-YS (-2 x 1 Month LIBOR USD + 9.50%, 9.50% Cap) | | | 5.86% | I/F | | | 12/20/2040 | | | | 8,277,200 | |
4,891,763 | | Government National Mortgage Association, Series 2011-51-UZ | | | 4.50% | | | | 04/20/2041 | | | | 5,095,623 | |
3,129,402 | | Government National Mortgage Association, Series 2011-69-OC | | | 0.00% | P/O | | | 05/20/2041 | | | | 2,512,817 | |
28,987,422 | | Government National Mortgage Association, Series 2011-69-SB (-1 x 1 Month LIBOR USD + 5.35%, 5.35% Cap) | | | 3.53% | I/F I/O | | | 05/20/2041 | | | | 3,148,912 | |
27,162,619 | | Government National Mortgage Association, Series 2011-71-ZA | | | 4.50% | | | | 02/20/2041 | | | | 28,287,673 | |
10,637,081 | | Government National Mortgage Association, Series 2011-72-AS (-1 x 1 Month LIBOR USD + 5.38%, 5.38% Cap) | | | 3.56% | I/F I/O | | | 05/20/2041 | | | | 1,238,066 | |
8,163,208 | | Government National Mortgage Association, Series 2011-72-SK (-1 x 1 Month LIBOR USD + 6.15%, 6.15% Cap) | | | 4.33% | I/F I/O | | | 05/20/2041 | | | | 1,037,188 | |
4,777,177 | | Government National Mortgage Association, Series 2012-105-SE (-1 x 1 Month LIBOR USD + 6.20%, 6.20% Cap) | | | 4.38% | I/F I/O | | | 01/20/2041 | | | | 298,738 | |
11,299,086 | | Government National Mortgage Association, Series 2012-52-PN | | | 2.00% | | | | 12/20/2039 | | | | 11,195,520 | |
28,429,893 | | Government National Mortgage Association, Series 2013-116-LS (-1 x 1 Month LIBOR USD + 6.15%, 6.15% Cap) | | | 4.33% | I/F I/O | | | 08/20/2043 | | | | 4,402,554 | |
28,574,812 | | Government National Mortgage Association, Series 2013-136-CS (-1 x 1 Month LIBOR USD + 6.20%, 6.20% Cap) | | | 4.41% | I/F I/O | | | 09/16/2043 | | | | 4,198,546 | |
18,903,608 | | Government National Mortgage Association, Series 2013-182-WZ | | | 2.50% | | | | 12/20/2043 | | | | 16,848,143 | |
58,271,355 | | Government National Mortgage Association, Series 2013-182-ZW | | | 2.50% | | | | 12/20/2043 | | | | 51,935,277 | |
19,919,165 | | Government National Mortgage Association, Series 2013-186-SG (-1 x 1 Month LIBOR USD + 6.25%, 6.25% Cap) | | | 4.46% | I/F I/O | | | 02/16/2043 | | | | 2,295,588 | |
19,187,657 | | Government National Mortgage Association, Series 2013-26-MS (-1 x 1 Month LIBOR USD + 6.25%, 6.25% Cap) | | | 4.43% | I/F I/O | | | 02/20/2043 | | | | 3,218,290 | |
40,490,040 | | Government National Mortgage Association, Series 2013-34-PL | | | 3.00% | | | | 03/20/2042 | | | | 39,921,374 | |
37,416,004 | | Government National Mortgage Association, Series 2014-163-PS (-1 x 1 Month LIBOR USD + 5.60% , 5.60% Cap) | | | 3.78% | I/F I/O | | | 11/20/2044 | | | | 4,571,364 | |
38,595,551 | | Government National Mortgage Association, Series 2014-167-SA (-1 x 1 Month LIBOR USD + 5.60%, 5.60% Cap) | | | 3.78% | I/F I/O | | | 11/20/2044 | | | | 4,376,851 | |
57,954,222 | | Government National Mortgage Association, Series 2014-21-SE (-1 x 1 Month LIBOR USD + 5.55%, 5.55% Cap) | | | 3.73% | I/F I/O | | | 02/20/2044 | | | | 7,712,444 | |
32,488,778 | | Government National Mortgage Association, Series 2014-39-SK (-1 x 1 Month LIBOR USD + 6.20%, 6.20% Cap) | | | 4.38% | I/F I/O | | | 03/20/2044 | | | | 4,304,240 | |
28,661,395 | | Government National Mortgage Association, Series 2014-59-DS (-1 x 1 Month LIBOR USD + 6.25%, 6.25% Cap) | | | 4.46% | I/F I/O | | | 04/16/2044 | | | | 4,102,374 | |
9,070,053 | | Government National Mortgage Association, Series 2016-99-TL | | | 2.00% | | | | 04/16/2044 | | | | 7,517,486 | |
| | | | | | | | | | | | | | |
Total US Government and Agency Mortgage Backed Obligations (Cost $24,872,089,110) | | | | | | | | 24,474,003,074 | |
| | | | | | | | | | | | | | |
| | | |
US Government and Agency Obligations - 5.4% | | | | | | | | | | | | |
59,900,000 | | Tennessee Valley Authority | | | 4.25% | | | | 09/15/2065 | | | | 69,688,475 | |
509,605,000 | | United States Treasury Inflation Indexed Bonds | | | 0.13% | | | | 04/15/2022 | | | | 502,306,534 | |
250,000,000 | | United States Treasury Notes | | | 1.38% | | | | 09/30/2019 | | | | 246,809,295 | |
250,000,000 | | United States Treasury Notes | | | 1.50% | | | | 10/31/2019 | | | | 247,079,500 | |
1,050,000,000 | | United States Treasury Notes | | | 1.63% | | | | 11/15/2022 | | | | 1,007,862,240 | |
700,000,000 | | United States Treasury Notes | | | 2.00% | | | | 02/15/2023 | | | | 681,972,998 | |
| | | | | | | | | | | | | | |
Total US Government and Agency Obligations (Cost $2,800,492,324) | | | | | | | | 2,755,719,042 | |
| | | | | | | | | | | | | | |
| | | |
Short Term Investments - 5.2% | | | | | | | | | | | | |
144,796,359 | | BlackRock Liquidity Funds FedFund - Institutional Shares | | | 1.53% | ◆ | | | | | | | 144,796,359 | |
144,796,359 | | Fidelity Institutional Money Market Government Portfolio - Class I | | | 1.47% | ◆ | | | | | | | 144,796,359 | |
144,796,359 | | Morgan Stanley Institutional Liquidity Funds Government Portfolio - Institutional Share Class | | | 1.56% | ◆ | | | | | | | 144,796,359 | |
250,000,000 | | United States Treasury Bills | | | 0.00% | | | | 04/12/2018 | | �� | | 249,886,740 | |
250,000,000 | | United States Treasury Bills | | | 0.00% | | | | 04/26/2018 | | | | 249,735,000 | |
250,000,000 | | United States Treasury Bills | | | 0.00% | | | | 05/17/2018 | | | | 249,488,542 | |
500,000,000 | | United States Treasury Bills | | | 0.00% | | | | 05/31/2018 | | | | 498,637,005 | |
250,000,000 | | United States Treasury Bills | | | 0.00% | | | | 06/21/2018 | | | | 249,063,195 | |
250,000,000 | | United States Treasury Bills | | | 0.00% | | | | 07/26/2018 | | | | 248,597,032 | |
250,000,000 | | United States Treasury Bills | | | 0.00% | | | | 08/16/2018 | | | | 248,263,535 | |
250,000,000 | | United States Treasury Bills | | | 0.00% | | | | 09/13/2018 | | | | 247,888,637 | |
| | | | | | | | | | | | | | |
Total Short Term Investments (Cost $2,676,565,438) | | | | | | | | 2,675,948,763 | |
| | | | | | | | | | | | | | |
| | |
Total Investments - 100.1% (Cost $52,078,311,287) | | | | | | | | 51,490,504,085 | |
Liabilities in Excess of Other Assets - (0.1)% | | | | | | | | (70,539,490 | ) |
| | | | | | | | | | | | | | |
NET ASSETS - 100.0% | | | | | | | $ | 51,419,964,595 | |
| | | | | | | | | | | | | | |
| | | | |
| | ^ Security exempt from registration under Rule 144A of the Securities Act of 1933. These securities may be resold in transactions exempt from registration to qualified institutional buyers. These securities are determined to be liquid by the Adviser, unless otherwise noted, under procedures established by the Fund’s Board of Trustees. At March 31, 2018, the value of these securities amounted to $12,514,952,538 or 24.3% of net assets. | | | | | | | | | | | | |
| | | | |
| | # Coupon rate is variable based on the weighted average coupon of the underlying collateral. To the extent the weighted average coupon of the underlying assets which comprise the collateral increases or decreases, the coupon rate of this security will increase or decrease correspondingly. The rate disclosed is as of March 31, 2018. | | | | | | | | | | | | |
| | | | |
| | ± Coupon rate is variable or floats based on components including but not limited to reference rate and spread. These securities may not indicate a reference rate and/or spread in their description. The rate desclosed is as of March 31, 2018. | | | | | | | | | | | | |
| | I/O Interest only security | | | | | | | | | | | | |
| | I/F Inverse floating rate security whose interest rate moves in the opposite direction of reference interest rates. Reference interest rates are typically based on a negative multiplier or slope. Interest rate may also be subject to a cap or floor. | | | | | | | | | | | | |
| | P/O Principal only security | | | | | | | | | | | | |
| | ß The interest rate may step up conditioned upon the aggregate remaining principal balance of the underlying mortgage loans being reduced below a targeted percentage of the aggregate original principal balance of the mortgage loans. The interest rate shown is the rate in effect as of March 31, 2018. | | | | | | | | | | | | |
| | | | |
| | § The interest rate will step up if the issuer does not redeem the bond by an expected redemption date. The interest rate shown is the rate in effect as of March 31, 2018. | | | | | | | | | | | | |
| | | | |
| | Þ Value determined using significant unobservable inputs. | | | | | | | | | | | | |
| | ¥ Illiquid security | | | | | | | | | | | | |
| | ◆ Seven-day yield as of March 31, 2018 | | | | | | | | | | | | |
| | ~ Represents less than 0.05% of net assets. | | | | | | | | | | | | |
| | | | | | | | | | | | | | |
Principal Amount
$/Shares | | Security Description | | Rate | | | Maturity | | | Value $ | |
Asset Backed Obligations - 1.9% | | | | | | | | | | | | |
4,958,333 | | CAL Funding Ltd., Series 2018-1A-A | | | 3.96% | ^ | | | 02/25/2043 | | | | 5,006,477 | |
4,433,524 | | Castlelake Aircraft Securitization Trust, Series 2015-1A-A | | | 4.70% | ^ § | | | 12/15/2040 | | | | 4,457,142 | |
11,130,684 | | Castlelake Aircraft Securitization Trust, Series 2016-1-A | | | 4.45% | | | | 08/15/2041 | | | | 11,148,326 | |
5,626,291 | | Castlelake Aircraft Securitization Trust, Series 2017-1-A | | | 3.97% | | | | 07/15/2042 | | | | 5,603,043 | |
5,448,129 | | CLI Funding LLC, Series 2017-1A-A | | | 3.62% | ^ | | | 05/18/2042 | | | | 5,413,915 | |
14,738,625 | | Coinstar Funding LLC, Series 2017-1A-A2 | | | 5.22% | ^ | | | 04/25/2047 | | | | 15,155,153 | |
2,910,000 | | DB Master Finance LLC, Series 2015-1A-A2II | | | 3.98% | ^ | | | 02/20/2045 | | | | 2,938,903 | |
14,600,000 | | Harbour Aircraft Investments Ltd., Series 2017-1-A | | | 4.00% | | | | 11/15/2037 | | | | 14,589,386 | |
9,507,925 | | Helios Issuer LLC, Series 2017-1A-A | | | 4.94% | ^ | | | 09/20/2049 | | | | 9,691,942 | |
6,356,727 | | HERO Funding Trust, Series 2016-1A-A | | | 4.05% | ^ | | | 09/20/2041 | | | | 6,358,931 | |
4,975,000 | | Jimmy Johns Funding LLC, Series 2017-1A-A2II | | | 4.85% | ^ | | | 07/30/2047 | | | | 5,097,312 | |
708,065 | | MarketPlace Loan Trust, Series 2015-CB1-A | | | 4.00% | ^ | | | 07/15/2021 | | | | 707,906 | |
7,500,000 | | Navient Private Education Loan Trust, Series 2018-A-B | | | 3.68% | ^ | | | 02/18/2042 | | | | 7,524,515 | |
12,309,699 | | NP SPE II LLC, Series 2016-1A-A1 | | | 4.16% | ^ | | | 04/20/2046 | | | | 12,373,704 | |
11,235,850 | | OneMain Financial Issuance Trust, Series 2015-1A-A | | | 3.19% | ^ | | | 03/18/2026 | | | | 11,274,168 | |
7,533,425 | | Shenton Aircraft Investment Ltd., Series 2015-1A-A | | | 4.75% | ^ | | | 10/15/2042 | | | | 7,761,560 | |
1,723,193 | | SoFi Consumer Loan Program Trust, Series 2016-2-A | | | 3.09% | ^ | | | 10/27/2025 | | | | 1,726,212 | |
1,680,212 | | SoFi Consumer Loan Program Trust, Series 2017-1-A | | | 3.28% | ^ | | | 01/26/2026 | | | | 1,683,773 | |
500,000 | | SoFi Consumer Loan Program Trust, Series 2017-1-B | | | 4.73% | # ^ | | | 01/26/2026 | | | | 516,904 | |
590,870 | | SoFi Consumer Loan Program Trust, Series 2017-2-A | | | 3.28% | ^ | | | 02/25/2026 | | | | 592,450 | |
5,000,000 | | SoFi Consumer Loan Program Trust, Series 2017-5-A2 | | | 2.78% | ^ | | | 09/25/2026 | | | | 4,929,916 | |
5,508,398 | | SoFi Professional Loan Program, Series 2016-A-A2 | | | 2.76% | ^ | | | 12/26/2036 | | | | 5,463,609 | |
5,000,000 | | SoFi Professional Loan Program, Series 2017-B-BFX | | | 3.70% | # ^ | | | 05/25/2040 | | | | 5,021,841 | |
2,000,000 | | SoFi Professional Loan Program, Series 2017-C-C | | | 4.21% | # ^ | | | 07/25/2040 | | | | 1,982,728 | |
13,510,195 | | Springleaf Funding Trust, Series 2015-AA-A | | | 3.16% | ^ | | | 11/15/2024 | | | | 13,524,000 | |
1,313,104 | | Spruce Asset Backed Securities Trust, Series 2016-E1-A | | | 4.32% | ^ | | | 06/15/2028 | | | | 1,329,069 | |
2,751,900 | | Textainer Marine Containers Ltd., Series 2017-1A-A | | | 3.72% | ^ | | | 05/20/2042 | | | | 2,752,949 | |
12,989,167 | | Vantage Data Centers Issuer LLC, Series 2018-1A-A2 | | | 4.07% | ^ | | | 02/16/2043 | | | | 13,123,456 | |
5,000,000 | | VB-S1 Issuer LLC, Series 2018-1A-C | | | 3.41% | ^ | | | 02/15/2048 | | | | 5,004,353 | |
23,492 | | Westlake Automobile Receivables Trust, Series 2016-1A-B | | | 2.68% | ^ | | | 09/15/2021 | | | | 23,523 | |
15,445,108 | | Wildcat LLC, Series 2017-1A-A | | | 4.12% | ¥ Þ | | | 06/30/2027 | | | | 15,417,307 | |
| | | | | | | | | | | | | | |
Total Asset Backed Obligations (Cost $196,669,506) | | | | | | | | | | | 198,194,473 | |
| | | | | | | | | | | | | | |
| | | |
Bank Loans - 3.5% | | | | | | | | | | | | |
2,451,772 | | Acadia Healthcare Company, Guaranteed Senior Secured 1st Lien Term Loan, Tranche B2 (1 Month LIBOR USD + 2.50%) | | | 4.38% | | | | 02/16/2023 | | | | 2,475,272 | |
311,655 | | Access CIG LLC, Senior Secured 1st Lien Delayed-Draw Term Loan (1 Month LIBOR USD + 3.75%) | | | 0.50% | & | | | 02/27/2025 | | | | 315,550 | |
1,493,345 | | Access CIG LLC, Senior Secured 1st Lien Term Loan (1 Month LIBOR USD + 3.75%) | | | 5.63% | | | | 02/27/2025 | | | | 1,512,012 | |
3,520,832 | | Acrisure LLC, Guaranteed Senior Secured 1st Lien Term Loan, Tranche B (3 Month LIBOR USD + 4.25%, 1.00% Floor) | | | 5.99% | | | | 11/22/2023 | | | | 3,571,004 | |
1,660,770 | | Air Medical Group Holdings, Inc., Senior Secured 1st Lien Term Loan, Tranche B (1 Month LIBOR USD + 3.25%, 1.00% Floor) | | | 4.94% | | | | 04/28/2022 | | | | 1,669,879 | |
24,706 | | A-L Parent LLC, Senior Secured 1st Lien Term Loan (1 Month LIBOR USD + 3.25%, 1.00% Floor) | | | 5.13% | | | | 12/01/2023 | | | | 24,984 | |
1,839,538 | | Albertson’s Holdings LLC, Guaranteed Senior Secured 1st Lien Term Loan, Tranche B4 (1 Month LIBOR USD + 2.75%, 0.75% Floor) | | | 4.63% | | | | 08/25/2021 | | | | 1,819,579 | |
791,090 | | AlixPartners LLP, Guaranteed Senior Secured 1st Lien Term Loan, Tranche B (3 Month LIBOR USD + 2.75%, 1.00% Floor) | | | 5.05% | | | | 04/04/2024 | | | | 795,761 | |
1,810,000 | | Almonde, Inc., Secured 2nd Lien Term Loan (3 Month LIBOR USD + 7.25%, 1.00% Floor) | | | 9.23% | | | | 06/16/2025 | | | | 1,797,411 | |
1,871,271 | | Almonde, Inc., Senior Secured 1st Lien Term Loan, Tranche B (3 Month LIBOR USD + 3.50%, 1.00% Floor) | | | 5.48% | | | | 06/13/2024 | | | | 1,871,626 | |
2,035,690 | | American Renal Holdings, Inc., Guaranteed Senior Secured 1st Lien Term Loan, Tranche B (1 Month LIBOR USD + 3.25%) | | | 5.13% | | | | 06/21/2024 | | | | 2,040,138 | |
3,245,178 | | American Tire Distributors, Inc., Guaranteed Senior Secured 1st Lien Term Loan, Tranche B (2 Month LIBOR USD + 4.25%, 1.00% Floor) | | | 6.24% | | | | 09/01/2021 | | | | 3,291,828 | |
2,820,000 | | Amneal Pharmaceuticals LLC, Senior Secured 1st Lien Term Loan, Tranche B (3 Month LIBOR USD + 3.50%) | | | 5.53% | | | | 03/23/2025 | | | | 2,825,288 | |
2,895,450 | | Applied Systems, Inc., Senior Secured 1st Lien Term Loan, Tranche B (3 Month LIBOR USD + 3.25%, 1.00% Floor) | | | 5.55% | | | | 09/19/2024 | | | | 2,920,003 | |
2,034,625 | | Arctic LNG Carriers Ltd., Senior Secured 1st Lien Term Loan, Tranche B (1 Month LIBOR USD + 4.50%, 1.00% Floor) | | | 6.38% | | | | 05/18/2023 | | | | 2,055,612 | |
683,283 | | Ascend Learning LLC, Senior Secured 1st Lien Term Loan, Tranche B (1 Month LIBOR USD + 3.00%, 1.00% Floor) | | | 4.88% | | | | 07/12/2024 | | | | 686,167 | |
1,837,523 | | ASP AMC Merger Sub, Inc., Senior Secured 1st Lien Term Loan (3 Month LIBOR USD + 3.50%, 1.00% Floor) | | | 5.80% | | | | 04/22/2024 | | | | 1,844,993 | |
215,000 | | ASP Prince Merger Sub, Inc., Senior Secured 1st Lien Term Loan (1 Month LIBOR USD + 3.50%, 1.00% Floor) | | | 5.16% | | | | 03/20/2025 | | | | 216,680 | |
375,000 | | AssuredPartners, Inc., Senior Secured 1st Lien Term Loan, Tranche B (3 Month LIBOR USD + 3.25%) | | | 5.26% | | | | 10/22/2024 | | | | 375,000 | |
2,930,275 | | AssuredPartners, Inc., Senior Secured 1st Lien Term Loan, Tranche B (1 Month LIBOR USD + 3.50%) | | | 5.38% | | | | 10/22/2024 | | | | 2,941,630 | |
2,831,798 | | Asurion LLC, Senior Secured 1st Lien Term Loan, Tranche B6 (1 Month LIBOR USD + 2.75%) | | | 4.63% | | | | 11/03/2023 | | | | 2,854,155 | |
2,418,844 | | Avantor Inc., Guaranteed Senior Secured 1st Lien Term Loan (1 Month LIBOR USD + 4.00%, 1.00% Floor) | | | 5.88% | | | | 11/21/2024 | | | | 2,447,314 | |
2,555,000 | | Avatar Purchaser Inc., Guaranteed Senior Secured 1st Lien Term Loan (3 Month LIBOR USD + 3.75%, 1.00% Floor) | | | 5.48% | | | | 11/15/2024 | | | | 2,562,461 | |
2,593,500 | | Avaya, Inc., Senior Secured 1st Lien Term Loan, Tranche B (1 Month LIBOR USD + 4.75%, 1.00% Floor) | | | 6.54% | | | | 12/16/2024 | | | | 2,615,272 | |
2,919,022 | | BJ’s Wholesale Club, Inc., Senior Secured 1st Lien Term Loan, Tranche B (1 Month LIBOR USD + 3.50%, 1.00% Floor) | | | 5.19% | | | | 02/02/2024 | | | | 2,920,190 | |
1,460,000 | | Blackstone Group, Senior Secured 1st Lien Term Loan, Tranche B (3 Month LIBOR USD + 4.00%, 1.00% Floor) | | | 5.77% | | | | 10/31/2024 | | | | 1,469,125 | |
745,000 | | Blount International, Inc., Senior Secured 1st Lien Term Loan, Tranche B (1 Month LIBOR USD + 4.25%, 1.00% Floor) | | | 5.92% | | | | 04/12/2023 | | | | 755,896 | |
3,535,700 | | Brand Energy & Infrastructure Services, Inc., Senior Secured 1st Lien Term Loan (3 Month LIBOR USD + 4.25%, 1.00% Floor) | | | 5.99% | | | | 06/21/2024 | | | | 3,571,287 | |
2,466,363 | | Bright Bidco B.V.,Senior Secured 1st Lien Term Loan, Tranche B (3 Month LIBOR USD + 3.50%, 1.00% Floor) | | | 5.80% | | | | 06/28/2024 | | | | 2,505,282 | |
2,914,098 | | BWAY Corporation, Senior Secured 1st Lien Term Loan, Tranche B (3 Month LIBOR USD + 3.25%) | | | 4.96% | | | | 04/03/2024 | | | | 2,932,049 | |
2,389,013 | | Caesars Resort Collection LLC, Guaranteed Senior Secured 1st Lien Term Loan, Tranche B (1 Month LIBOR USD + 2.75%) | | | 4.63% | | | | 12/23/2024 | | | | 2,407,599 | |
2,429,950 | | Canyon Valor Companies, Inc., Guaranteed Senior Secured 1st Lien Term Loan, Tranche B (1 Month LIBOR USD + 3.25%) | | | 5.13% | | | | 06/16/2023 | | | | 2,455,768 | |
214,721 | | Capital Automotive LP, Guaranteed Secured 2nd Lien Term Loan (1 Month LIBOR USD + 6.00%, 1.00% Floor) | | | 7.88% | | | | 03/24/2025 | | | | 217,541 | |
3,420,000 | | Capri Acquisitions Bidco Ltd, Senior Secured 1st Lien Term Loan, Tranche B (3 Month LIBOR USD + 3.25%) | | | 5.02% | | | | 11/01/2024 | | | | 3,426,412 | |
1,411,463 | | CBS Radio, Inc., Guaranteed Senior Secured 1st Lien Term Loan, Tranche B (3 Month LIBOR USD + 2.75%) | | | 4.62% | | | | 11/18/2024 | | | | 1,420,284 | |
2,921,353 | | Cengage Learning, Inc., Guaranteed Senior Secured 1st Lien Term Loan, Tranche B (1 Month LIBOR USD + 4.25%, 1.00% Floor) | | | 6.04% | | | | 06/07/2023 | | | | 2,670,044 | |
2,144,625 | | CenturyLink, Inc., Guaranteed Senior Secured 1st Lien Term Loan, Tranche B (1 Month LIBOR USD + 2.75%) | | | 4.63% | | | | 01/31/2025 | | | | 2,113,131 | |
979,262 | | Ceva Group PLC, Guaranteed Senior Secured 1st Lien Synthetic Letter Of Credit (3 Month LIBOR USD + 5.50%, 1.00% Floor) | | | 2.21% | | | | 03/19/2021 | | | | 964,270 | |
156,497 | | Ceva Group PLC, Guaranteed Senior Secured 1st Lien Term Loan (3 Month LIBOR USD + 5.50%, 1.00% Floor) | | | 7.27% | | | | 03/19/2021 | | | | 154,101 | |
1,326,260 | | Ceva Group PLC, Guaranteed Senior Secured 1st Lien Term Loan (3 Month LIBOR USD + 5.50%, 1.00% Floor) | | | 7.27% | | | | 03/19/2021 | | | | 1,305,955 | |
910,240 | | Ceva Intercompany BV, Guaranteed Senior Secured 1st Lien Term Loan (3 Month LIBOR USD + 5.50%, 1.00% Floor) | | | 7.27% | | | | 03/19/2021 | | | | 896,304 | |
1,646,460 | | CH Hold Corporation, Senior Secured 1st Lien Term Loan (1 Month LIBOR USD + 3.00%, 1.00% Floor) | | | 4.88% | | | | 02/01/2024 | | | | 1,659,327 | |
2,467,922 | | Change Healthcare Holdings LLC, Senior Secured 1st Lien Term Loan, Tranche B (1 Month LIBOR USD + 2.75%, 1.00% Floor) | | | 4.63% | | | | 03/01/2024 | | | | 2,476,720 | |
3,238,510 | | CHG Healthcare Services, Inc., Guaranteed Senior Secured 1st Lien Term Loan (3 Month LIBOR USD + 3.00%, 1.00% Floor) | | | 4.77% | | | | 06/07/2023 | | | | 3,266,863 | |
340,000 | | CHG PPC Parent LLC, Senior Secured 1st Lien Term Loan, Tranche B (3 Month LIBOR USD + 2.75%) | | | 4.76% | | | | 03/21/2025 | | | | 341,275 | |
950,755 | | Chill Merger Sub, Inc., Senior Secured 1st Lien Term Loan, Tranche B (1 Month LIBOR USD + 3.50%, 1.00% Floor) | | | 5.38% | | | | 03/20/2024 | | | | 960,410 | |
2,245,000 | | Cincinnati Bell, Inc., Guaranteed Senior Secured 1st Lien Term Loan, Tranche B (3 Month LIBOR USD + 3.75%, 1.00% Floor) | | | 5.44% | | | | 10/02/2024 | | | | 2,265,575 | |
3,531,150 | | Compass Power Generation LLC, Guaranteed Senior Secured 1st Lien Term Loan, Tranche B (3 Month LIBOR USD + 3.75%, 1.00% Floor) | | | 6.05% | | | | 12/20/2024 | | | | 3,584,117 | |
2,509,234 | | Compuware Corporation, Guaranteed Senior Secured 1st Lien Term Loan, Tranche B3 (1 Month LIBOR USD + 3.50%, 1.00% Floor) | | | 5.38% | | | | 12/15/2021 | | | | 2,543,736 | |
425,000 | | Concentra, Inc., Guaranteed Senior Secured 1st Lien Term Loan (3 Month LIBOR USD + 2.75%, 1.00% Floor) | | | 4.53% | | | | 06/01/2022 | | | | 428,719 | |
2,134,804 | | Constellation Merger Sub, Inc., Guaranteed Senior Secured 1st Lien Term Loan, Tranche B (3 Month LIBOR USD + 3.25%) | | | 5.55% | | | | 09/18/2024 | | | | 2,151,200 | |
3,045,510 | | Constellis Holdings LLC, Senior Secured 1st Lien Term Loan (3 Month LIBOR USD + 5.00%, 1.00% Floor) | | | 7.30% | | | | 04/19/2024 | | | | 3,078,828 | |
667,857 | | Coronado Australian Holdings Ltd., Senior Secured 1st Lien Term Loan, Tranche B (3 Month LIBOR USD + 6.50%, 1.00% Floor) | | | 8.51% | | | | 03/21/2025 | | | | 661,179 | |
182,143 | | Coronado Australian Holdings Pty Ltd., Senior Secured 1st Lien Term Loan, Tranche C (3 Month LIBOR USD + 6.50%, 1.00% Floor) | | | 8.51% | | | | 03/21/2025 | | | | 180,321 | |
423,938 | | CP VI Bella Topco LLC, Guaranteed Senior Secured 1st Lien Term Loan (1 Month LIBOR USD + 3.00%) | | | 4.88% | | | | 12/27/2024 | | | | 423,410 | |
1,154,486 | | CPI Holdco LLC, Senior Secured 1st Lien Term Loan (3 Month LIBOR USD + 3.50%, 1.00% Floor) | | | 5.80% | | | | 03/21/2024 | | | | 1,163,144 | |
2,881,878 | | CSM Bakery Supplies LLC, Senior Secured 1st Lien Term Loan, Tranche B (3 Month LIBOR USD + 4.00%, 1.00% Floor) | | | 5.70% | | | | 07/03/2020 | | | | 2,855,221 | |
3,615,000 | | Cvent, Inc., Guaranteed Senior Secured 1st Lien Term Loan, Tranche B (1 Month LIBOR USD + 3.75%, 1.00% Floor) | | | 5.63% | | | | 11/29/2024 | | | | 3,640,612 | |
1,347,000 | | CVS Holdings LP, Senior Secured 1st Lien Term Loan (3 Month LIBOR USD + 3.00%, 1.00% Floor) | | | 4.79% | | | | 02/06/2025 | | | | 1,341,955 | |
3,595,000 | | Deerfield Holdings Corporation, Guaranteed Senior Secured 1st Lien Term Loan, Tranche B (1 Month LIBOR USD + 3.25%, 1.00% Floor) | | | 5.55% | | | | 02/13/2025 | | | | 3,612,076 | |
2,421,258 | | Delta 2 Lux Sarl, Senior Secured 1st Lien Term Loan, Tranche B3 (1 Month LIBOR USD + 2.50%, 1.00% Floor) | | | 4.38% | | | | 02/01/2024 | | | | 2,419,744 | |
379,050 | | Dexko Global, Inc., Guaranteed Senior Secured 1st Lien Term Loan (1 Month LIBOR USD + 3.50%, 1.00% Floor) | | | 5.80% | | | | 07/24/2024 | | | | 383,256 | |
135,000 | | Dexko Global, Inc., Guaranteed Senior Secured 1st Lien Term Loan (3 Month LIBOR USD + 3.50%, 1.00% Floor) | | | 5.80% | & | | | 07/24/2024 | | | | 136,351 | |
1,460,440 | | Digicel International Finance Ltd., Guaranteed Senior Secured 1st Lien Term Loan, Tranche B (3 Month LIBOR USD + 3.25%) | | | 5.02% | | | | 05/27/2024 | | | | 1,455,423 | |
255,938 | | Diplomat Pharmacy, Inc., Guaranteed Senior Secured 1st Lien Term Loan, Tranche B (1 Month LIBOR USD + 4.50%, 1.00% Floor) | | | 6.10% | | | | 12/20/2024 | | | | 258,657 | |
1,995,000 | | EG America LLC, Guaranteed Senior Secured 1st Lien Term Loan, Tranche B (3 Month LIBOR USD + 4.00%) | | | 6.01% | | | | 02/01/2025 | | | | 1,993,005 | |
640,000 | | EG Finco Ltd., Guaranteed Senior Secured 1st Lien Term Loan, Tranche B1 (3 Month LIBOR USD + 4.00%) | | | 5.69% | | | | 02/07/2025 | | | | 639,360 | |
948,270 | | Envision Healthcare Corporation, Guaranteed Senior Secured 1st Lien Term Loan, Tranche C (1 Month LIBOR USD + 3.00%, 0.75% Floor) | | | 4.88% | | | | 12/01/2023 | | | | 953,367 | |
2,560,147 | | EOC Group, Inc., Senior Secured 1st Lien Term Loan (1 Month LIBOR USD + 3.25%) | | | 5.07% | | | | 03/20/2025 | | | | 2,564,947 | |
409,853 | | EOC Group, Inc., Senior Secured 1st Lien Delayed-Draw Term Loan (1 Month LIBOR USD + 3.25%) | | | 5.56% | & | | | 03/20/2025 | | | | 410,622 | |
3,266,875 | | Equian Buyer Corporation, Senior Secured 1st Lien Term Loan, Tranche B (3 Month LIBOR USD + 3.25%, 1.00% Floor) | | | 5.15% | | | | 05/20/2024 | | | | 3,289,335 | |
2,564,165 | | Equinox Holdings, Inc., Senior Secured 1st Lien Term Loan (1 Month LIBOR USD + 3.00%, 1.00% Floor) | | | 4.88% | | | | 03/08/2024 | | | | 2,586,063 | |
952,399 | | Evergreen Skills, Senior Secured 1st Lien Term Loan (1 Month LIBOR USD + 4.75%, 1.00% Floor) | | | 6.63% | | | | 04/28/2021 | | | | 922,242 | |
1,799,221 | | Excelitas Technologies Corporation, Guaranteed Senior Secured 1st Lien Term Loan (6 Month LIBOR USD + 3.50%, 1.00% Floor) | | | 5.16% | | | | 12/02/2024 | | | | 1,818,706 | |
902,738 | | Exgen Renewables LLC, Senior Secured 1st Lien Term Loan, Tranche B (3 Month LIBOR USD + 3.00%, 1.00% Floor) | | | 4.99% | | | | 11/29/2024 | | | | 914,026 | |
2,096,413 | | Federal-Mogul Holdings Corporation, Guaranteed Senior Secured 1st Lien Term Loan, Tranche C (1 Month LIBOR USD + 3.75%, 1.00% Floor) | | | 5.63% | | | | 04/15/2021 | | | | 2,112,534 | |
1,410,000 | | Filtration Group Corporation, Guaranteed Senior Secured 1st Lien Term Loan, Tranche B (1 Month LIBOR USD + 3.00%) | | | 4.66% | | | | 04/30/2025 | | | | 1,406,475 | |
2,291,355 | | Flexera Software LLC, Guaranteed Senior Secured 1st Lien Term Loan (1 Month LIBOR USD + 3.25%, 1.00% Floor) | | | 5.13% | | | | 02/26/2025 | | | | 2,308,071 | |
2,835,631 | | Foresight Energy LLC, Guaranteed Senior Secured 1st Lien Term Loan, Tranche B (3 Month LIBOR USD + 5.75%, 1.00% Floor) | | | 7.44% | | | | 03/28/2022 | | | | 2,799,888 | |
963,340 | | Forterra Finance LLC, Guaranteed Senior Secured 1st Lien Term Loan (1 Month LIBOR USD + 3.00%, 1.00% Floor) | | | 4.88% | | | | 10/25/2023 | | | | 892,597 | |
2,961,527 | | FTS International, Inc., Guaranteed Senior Secured 1st Lien Term Loan, Tranche B (1 Month LIBOR USD + 4.75%, 1.00% Floor) | | | 6.63% | | | | 04/16/2021 | | | | 2,978,926 | |
3,531,636 | | Garda World Security Corporation, Senior Secured 1st Lien Term Loan, Tranche B (3 Month LIBOR USD + 3.50%, 1.00% Floor) | | | 5.51% | | | | 05/24/2024 | | | | 3,570,272 | |
2,688,824 | | Gates Global LLC, Guaranteed Senior Secured 1st Lien Term Loan, Tranche B2 (3 Month LIBOR USD + 2.75%, 1.00% Floor) | | | 5.05% | | | | 04/01/2024 | | | | 2,706,893 | |
510,000 | | Gavilan Resources LLC, Secured 2nd Lien Term Loan (1 Month LIBOR USD + 6.00%, 1.00% Floor) | | | 7.79% | | | | 03/01/2024 | | | | 512,553 | |
2,152,480 | | Goldcup Merger Sub, Inc., Senior Secured 1st Lien Term Loan, Tranche B (3 Month LIBOR USD + 3.75%, 1.00% Floor) | | | 5.52% | | | | 05/02/2023 | | | | 2,172,670 | |
372,164 | | Golden Nugget, Inc., Guaranteed Senior Secured 1st Lien Term Loan (2 Month LIBOR USD + 3.25%, 0.75% Floor) | | | 5.04% | | | | 10/04/2023 | | | | 375,910 | |
1,495,000 | | Gopher Resource LLC, Senior Secured 1st Lien Term Loan (3 Month LIBOR USD + 3.25%, 1.00% Floor) | | | 5.48% | | | | 03/06/2025 | | | | 1,510,884 | |
3,260,000 | | GrafTech Finance, Inc., Guaranteed Senior Secured 1st Lien Term Loan, Tranche B (1 Month LIBOR USD + 3.50%, 1.00% Floor) | | | 5.24% | | | | 02/12/2025 | | | | 3,266,113 | |
2,006,699 | | Greektown Holdings LLC, Guaranteed Senior Secured 1st Lien Term Loan, Tranche B (1 Month LIBOR USD + 3.00%, 0.75% Floor) | | | 4.88% | | | | 04/25/2024 | | | | 2,011,716 | |
2,808,565 | | Greeneden US Holdings LLC, Senior Secured 1st Lien Term Loan, Tranche B3 (3 Month LIBOR USD + 3.50%) | | | 5.80% | | | | 12/01/2023 | | | | 2,828,099 | |
913,438 | | GTT Communications, Inc., Guaranteed Senior Secured 1st Lien Term Loan, Tranche B (1 Month LIBOR USD + 3.25%, 1.00% Floor) | | | 5.19% | | | | 01/09/2024 | | | | 916,520 | |
1,025,000 | | GVC Holdings PLC, Guaranteed Senior Secured 1st Lien Term Loan, Tranche B2 (3 Month LIBOR USD + 2.50%, 1.00% Floor) | | | 4.51% | | | | 03/15/2024 | | | | 1,028,736 | |
1,994,361 | | Harbor Freight Tools USA, Inc., Senior Secured 1st Lien Term Loan (1 Month LIBOR USD + 2.50%, 0.75% Floor) | | | 4.38% | | | | 08/18/2023 | | | | 1,999,915 | |
2,259,148 | | Hargray Corporation, Senior Secured 1st Lien Term Loan, Tranche B (1 Month LIBOR USD + 3.00%, 1.00% Floor) | | | 4.88% | | | | 05/16/2024 | | | | 2,269,032 | |
1,168,222 | | Harsco Corporation, Guaranteed Senior Secured 1st Lien Term Loan, Tranche B1 (1 Month LIBOR USD + 3.00%, 1.00% Floor) | | | 4.94% | | | | 12/06/2024 | | | | 1,185,307 | |
2,892,750 | | Hawk Merger Sub, Inc., Senior Secured 1st Lien Term Loan, Tranche B1 (1 Month LIBOR USD + 3.25%, 1.00% Floor) | | | 5.13% | | | | 07/31/2024 | | | | 2,912,638 | |
3,059,625 | | Hayward Acquisition Corporation, Senior Secured 1st Lien Term Loan, Tranche B (1 Month LIBOR USD + 3.50%) | | | 5.38% | | | | 08/05/2024 | | | | 3,075,688 | |
513,713 | | HVSC Merger Sub Corporation, Guaranteed Senior Secured 1st Lien Term Loan, Tranche B (3 Month LIBOR USD + 4.00%, 1.00% Floor) | | | 6.30% | | | | 10/28/2024 | | | | 519,063 | |
2,568,149 | | Hyland Software, Inc., Senior Secured 1st Lien Term Loan (1 Month LIBOR USD + 3.25%, 0.75% Floor) | | | 5.13% | | | | 07/01/2022 | | | | 2,593,381 | |
3,615,938 | | Impala Private Holdings LLC, Guaranteed Senior Secured 1st Lien Term Loan (1 Month LIBOR USD + 4.00%, 1.00% Floor) | | | 5.88% | | | | 11/14/2024 | | | | 3,637,036 | |
897,606 | | Informatica LLC, Senior Secured 1st Lien Term Loan, Tranche B (1 Month LIBOR USD + 3.25%) | | | 5.13% | | | | 08/05/2022 | | | | 903,988 | |
2,905,000 | | Intelsat Jackson Holdings S.A., Guaranteed Senior Secured 1st Lien Term Loan, Tranche B3 (3 Month LIBOR USD + 3.75%, 1.00% Floor) | | | 5.71% | | | | 11/30/2023 | | | | 2,911,260 | |
1,798,217 | | IRB Holding Corporation, Senior Secured 1st Lien Term Loan, Tranche B (1 Month LIBOR USD + 3.25%, 1.00% Floor) | | | 4.94% | | | | 02/05/2025 | | | | 1,819,571 | |
1,833,328 | | Jo-Ann Stores LLC, Senior Secured 1st Lien Term Loan, Tranche B (6 Month LIBOR USD + 5.00%, 1.00% Floor) | | | 6.55% | | | | 10/20/2023 | | | | 1,827,608 | |
1,595,000 | | KBR Inc., Guaranteed Senior Secured 1st Lien Term Loan, Tranche B (3 Month LIBOR USD + 3.25%) | | | 5.26% | | | | 04/30/2025 | | | | 1,587,025 | |
2,475,399 | | Kenan Advantage Group, Inc., Senior Secured 1st Lien Term Loan, Tranche B1 (1 Month LIBOR USD + 3.00%, 1.00% Floor) | | | 4.88% | | | | 08/01/2022 | | | | 2,490,871 | |
2,416,905 | | KIK Custom Products, Inc., Guaranteed Senior Secured 1st Lien Term Loan, Tranche B (1 Month LIBOR USD + 4.00%, 1.00% Floor) | | | 5.88% | | | | 05/15/2023 | | | | 2,443,914 | |
3,229,199 | | Kloeckner Pentaplast, Guaranteed Senior Secured 1st Lien Term Loan, Tranche B (1 Month LIBOR USD + 4.25%, 1.00% Floor) | | | 6.13% | | | | 06/30/2022 | | | | 3,116,193 | |
1,188,374 | | Kraton Polymers LLC, Guaranteed Senior Secured 1st Lien Term Loan, Tranche B (1 Month LIBOR USD + 2.50%, 1.00% Floor) | | | 4.38% | | | | 03/05/2025 | | | | 1,197,436 | |
3,066,403 | | Kronos Inc., Senior Secured 1st Lien Term Loan, Tranche B (1 Month LIBOR USD + 3.00%, 1.00% Floor) | | | 4.88% | | | | 11/01/2023 | | | | 3,089,569 | |
1,460,231 | | Learfield Communications, Senior Secured 1st Lien Term Loan (3 Month LIBOR USD + 3.25%) | | | 5.56% | & | | | 12/01/2023 | | | | 1,473,008 | |
3,572,461 | | Life Time Fitness, Inc., Guaranteed Senior Secured 1st Lien Term Loan, Tranche B (3 Month LIBOR USD + 2.75%, 1.00% Floor) | | | 4.73% | | | | 06/10/2022 | | | | 3,583,625 | |
915,000 | | Lions Gate Capital Holdings LLC, Guaranteed Senior Secured 1st Lien Term Loan, Tranche B (1 Month LIBOR USD + 2.25%) | | | 4.10% | | | | 03/24/2025 | | | | 919,003 | |
1,385,000 | | Lucid Energy Group II Borrower LLC, Senior Secured 1st Lien Term Loan (1 Month LIBOR USD + 3.00%, 1.00% Floor) | | | 4.79% | | | | 02/18/2025 | | | | 1,380,243 | |
430,000 | | LUX HOLDCO III, Senior Secured 1st Lien Term Loan (3 Month LIBOR USD + 3.00%) | | | 4.77% | | | | 02/14/2025 | | | | 433,765 | |
410,000 | | Marketo, Inc., Senior Secured 1st Lien Term Loan, Tranche B (1 Month LIBOR USD + 3.25%) | | | 5.04% | | | | 02/07/2025 | | | | 409,680 | |
1,350,000 | | Meredith Corporation, Guaranteed Senior Secured 1st Lien Term Loan, Tranche B (1 Month LIBOR USD + 3.00%) | | | 4.88% | | | | 01/31/2025 | | | | 1,359,787 | |
2,986,937 | | Micron Technology, Inc., Guaranteed Senior Secured 1st Lien Term Loan, Tranche B (1 Month LIBOR USD + 2.50%) | | | 4.38% | | | | 09/28/2023 | | | | 3,000,004 | |
336,628 | | Mission Broadcasting, Inc., Guaranteed Senior Secured 1st Lien Term Loan, Tranche B2 (1 Month LIBOR USD + 2.50%) | | | 4.16% | | | | 01/17/2024 | | | | 338,065 | |
575,000 | | Mitchell International, Inc., Guaranteed Secured 2nd Lien Term Loan (1 Month LIBOR USD + 7.25%) | | | 9.14% | | | | 12/01/2025 | | | | 579,744 | |
214,179 | | Mitchell International, Inc., Guaranteed Senior Secured 1st Lien Term Loan (1 Month LIBOR USD + 3.25%) | | | 0.00% | & | | | 11/29/2024 | | | | 214,500 | |
2,655,821 | | Mitchell International, Inc., Guaranteed Senior Secured 1st Lien Term Loan, Tranche B (1 Month LIBOR USD + 3.25%) | | | 5.13% | | | | 11/29/2024 | | | | 2,659,805 | |
2,963,454 | | Mohegan Tribal Gaming Authority, Guaranteed Senior Secured 1st Lien Term Loan, Tranche B (1 Month LIBOR USD + 4.00%, 1.00% Floor) | | | 5.88% | | | | 10/13/2023 | | | | 2,962,535 | |
2,793,885 | | MPH Acquisition Holdings LLC, Senior Secured 1st Lien Term Loan, Tranche B (3 Month LIBOR USD + 2.75%, 1.00% Floor) | | | 5.05% | | | | 06/07/2023 | | | | 2,809,433 | |
3,070,617 | | National Vision, Inc., Senior Secured 1st Lien Term Loan (1 Month LIBOR USD + 2.75%) | | | 4.63% | | | | 11/20/2024 | | | | 3,094,276 | |
2,614,774 | | Nexstar Broadcasting, Inc., Guaranteed Senior Secured 1st Lien Term Loan, Tranche B2 (1 Month LIBOR USD + 2.50%) | | | 4.16% | | | | 01/17/2024 | | | | 2,625,939 | |
2,037,380 | | Optiv Security, Inc., Senior Secured 1st Lien Term Loan (1 Month LIBOR USD + 3.25%, 1.00% Floor) | | | 5.13% | | | | 02/01/2024 | | | | 1,971,165 | |
3,255,000 | | Oryx Southern Delaware Holdings LLC, Senior Secured 1st Lien Term Loan, Tranche B (1 Month LIBOR USD + 3.25%, 1.00% Floor) | | | 5.13% | | | | 02/28/2025 | | | | 3,263,138 | |
2,741,225 | | Peak 10 Holding Corporation, Senior Secured 1st Lien Term Loan (3 Month LIBOR USD + 3.50%) | | | 5.80% | | | | 08/01/2024 | | | | 2,753,862 | |
1,275,000 | | PetSmart, Inc., Guaranteed Senior Secured 1st Lien Term Loan, Tranche B (1 Month LIBOR USD + 3.00%, 1.00% Floor) | | | 4.68% | | | | 03/11/2022 | | | | 1,026,522 | |
2,677,512 | | Pharmaceutical Product Development LLC, Senior Secured 1st Lien Term Loan (3 Month LIBOR USD + 2.50%) | | | 4.77% | | | | 08/18/2022 | | | | 2,689,923 | |
535,000 | | Phoenix Services Merger Sub LLC, Senior Secured 1st Lien Term Loan (1 Month LIBOR USD + 3.75%, 1.00% Floor) | | | 5.41% | | | | 03/03/2025 | | | | 541,019 | |
1,130,000 | | Pike Corporation, Guaranteed Senior Secured 1st Lien Term Loan, Tranche B (1 Month LIBOR USD + 3.50%, 1.00% Floor) | | | 5.39% | | | | 03/12/2025 | | | | 1,142,006 | |
3,417,791 | | Playa Resorts Holding BV, Guaranteed Senior Secured 1st Lien Term Loan, Tranche B (3 Month LIBOR USD + 3.25%, 1.00% Floor) | | | 5.00% | | | | 04/29/2024 | | | | 3,441,715 | |
2,020,000 | | Ply Gem Holdings, Senior Secured 1st Lien Term Loan, Tranche B (3 Month LIBOR USD + 3.75%) | | | 5.76% | | | | 04/30/2025 | | | | 2,009,900 | |
3,532,250 | | PODS LLC, Guaranteed Senior Secured 1st Lien Term Loan, Tranche B3 (1 Month LIBOR USD + 3.00%, 1.00% Floor) | | | 4.71% | | | | 12/06/2024 | | | | 3,560,950 | |
1,110,896 | | Polycom, Inc., Senior Secured 1st Lien Term Loan (1 Month LIBOR USD + 5.25%, 1.00% Floor) | | | 7.13% | | | | 09/27/2023 | | | | 1,122,004 | |
3,495,000 | | PowerTeam Services LLC, Senior Secured 1st Lien Term Loan (3 Month LIBOR USD + 3.25%, 1.00% Floor) | | | 5.55% | | | | 03/06/2025 | | | | 3,503,738 | |
1,226,720 | | Precyse Acquisition Corporation, Senior Secured 1st Lien Term Loan, Tranche B (1 Month LIBOR USD + 4.50%, 1.00% Floor) | | | 6.38% | | | | 10/20/2022 | | | | 1,231,897 | |
2,872,161 | | Prime Security Services Borrower LLC, Guaranteed Senior Secured 1st Lien Term Loan, Tranche B (1 Month LIBOR USD + 2.75%, 1.00% Floor) | | | 4.63% | | | | 05/02/2022 | | | | 2,897,465 | |
1,830,000 | | Pro Mach Group, Inc., Senior Secured 1st Lien Term Loan, Tranche B (3 Month LIBOR USD + 3.00%) | | | 5.03% | | | | 03/07/2025 | | | | 1,835,719 | |
3,057,970 | | Project Alpha Intermediate Holding, Inc., Guaranteed Senior Secured 1st Lien Term Loan, Tranche B (6 Month LIBOR USD + 3.50%, 1.00% Floor) | | | 5.04% | | | | 04/26/2024 | | | | 3,022,925 | |
2,524,054 | | Quest Software US Holdings, Inc., Senior Secured 1st Lien Term Loan (3 Month LIBOR USD + 5.50%, 1.00% Floor) | | | 7.27% | | | | 10/31/2022 | | | | 2,574,548 | |
1,784,730 | | RCN Corporation, Senior Secured 1st Lien Term Loan, Tranche B (1 Month LIBOR USD + 3.00%, 0.75% Floor) | | | 4.88% | | | | 02/01/2024 | | | | 1,776,681 | |
2,887,058 | | RentPath LLC, Senior Secured 1st Lien Term Loan, Tranche B1 (1 Month LIBOR USD + 4.75%, 1.00% Floor) | | | 6.63% | | | | 12/17/2021 | | | | 2,896,080 | |
2,470,350 | | Reynolds Group, Guaranteed Senior Secured 1st Lien Term Loan, Tranche B (1 Month LIBOR USD + 2.75%) | | | 4.63% | | | | 02/06/2023 | | | | 2,485,456 | |
1,791,017 | | Robertshaw US Holding Corporation, Senior Secured 1st Lien Term Loan (1 Month LIBOR USD + 3.50%, 1.00% Floor) | | | 5.44% | | | | 02/28/2025 | | | | 1,809,482 | |
2,963,188 | | Scientific Games International, Inc., Guaranteed Senior Secured 1st Lien Term Loan, Tranche B5 (2 Month LIBOR USD + 2.75%) | | | 4.74% | | | | 08/14/2024 | | | | 2,977,322 | |
2,964,702 | | SCS Holdings, Inc., Senior Secured 1st Lien Term Loan (1 Month LIBOR USD + 4.25%, 1.00% Floor) | | | 6.13% | | | | 10/31/2022 | | | | 2,999,285 | |
3,488,489 | | Securus Technologies Holdings, Inc., Senior Secured 1st Lien Term Loan (1 Month LIBOR USD + 4.50%, 1.00% Floor) | | | 6.38% | | | | 11/01/2024 | | | | 3,535,375 | |
2,648,250 | | Select Medical Corporation, Guaranteed Senior Secured 1st Lien Term Loan, Tranche B (3 Month LIBOR USD + 2.75%, 1.00% Floor) | | | 4.46% | | | | 03/01/2021 | | | | 2,676,401 | |
915,000 | | Shutterfly, Inc., Guaranteed Senior Secured 1st Lien Term Loan, Tranche B2 (3 Month LIBOR USD + 2.75%) | | | 4.52% | | | | 08/19/2024 | | | | 920,719 | |
1,805,000 | | SMG US Midco 2, Inc., Guaranteed Senior Secured 1st Lien Term Loan (1 Month LIBOR USD + 3.25%) | | | 5.14% | | | | 01/23/2025 | | | | 1,823,050 | |
2,259,338 | | SolarWinds Holdings, Inc., Guaranteed Senior Secured 1st Lien Term Loan (1 Month LIBOR USD + 3.00%) | | | 4.88% | | | | 02/05/2024 | | | | 2,272,046 | |
1,468,956 | | Solenis International LP, Guaranteed Secured 2nd Lien Term Loan (3 Month LIBOR USD + 6.75%, 1.00% Floor) | | | 8.73% | | | | 07/29/2022 | | | | 1,400,649 | |
2,547,214 | | Solera LLC, Guaranteed Senior Secured 1st Lien Term Loan, Tranche B (1 Month LIBOR USD + 2.75%, 1.00% Floor) | | | 4.63% | | | | 03/03/2023 | | | | 2,557,047 | |
3,616,159 | | Sophia LP, Senior Secured 1st Lien Term Loan, Tranche B (3 Month LIBOR USD + 3.25%, 1.00% Floor) | | | 5.55% | | | | 09/30/2022 | | | | 3,630,678 | |
3,013,697 | | Southern Graphics, Inc., Senior Secured 1st Lien Term Loan (1 Month LIBOR USD + 3.50%) | | | 5.38% | | | | 12/30/2022 | | | | 3,041,318 | |
1,147,059 | | StandardAero Aviation Holdings, Inc., Senior Secured 1st Lien Term Loan (1 Month LIBOR USD + 3.75%, 1.00% Floor) | | | 5.63% | | | | 07/07/2022 | | | | 1,159,160 | |
987,525 | | Staples, Inc., Senior Secured 1st Lien Term Loan (3 Month LIBOR USD + 4.00%, 1.00% Floor) | | | 5.79% | | | | 09/12/2024 | | | | 979,995 | |
1,428,394 | | Syncreon Group BV, Senior Secured 1st Lien Term Loan, Tranche B (3 Month LIBOR USD + 4.25%, 1.00% Floor) | | | 6.02% | | | | 10/28/2020 | | | | 1,340,547 | |
1,185,999 | | TCH-2 Holdings LLC, Senior Secured 1st Lien Term Loan (1 Month LIBOR USD + 4.00%, 1.00% Floor) | | | 5.88% | | | | 05/06/2021 | | | | 1,191,929 | |
3,061,836 | | Team Health Holdings, Inc., Guaranteed Senior Secured 1st Lien Term Loan, Tranche B (1 Month LIBOR USD + 2.75%, 1.00% Floor) | | | 4.63% | | | | 02/06/2024 | | | | 2,935,535 | |
1,894,222 | | Telesat Canada, Guaranteed Senior Secured 1st Lien Term Loan, Tranche B4 (3 Month LIBOR USD + 3.00%, 0.75% Floor) | | | 5.31% | | | | 11/17/2023 | | | | 1,905,872 | |
3,236,847 | | Tempo Acquisition LLC, Guaranteed Senior Secured 1st Lien Term Loan, Tranche B (1 Month LIBOR USD + 3.00%) | | | 4.88% | | | | 05/01/2024 | | | | 3,256,575 | |
3,295,000 | | Titan Acquisition Ltd., Senior Secured 1st Lien Term Loan (1 Month LIBOR USD + 3.00%) | | | 4.66% | | | | 03/14/2025 | | | | 3,292,941 | |
2,997,063 | | TKC Holdings, Inc., Senior Secured 1st Lien Term Loan (3 Month LIBOR USD + 4.25%, 1.00% Floor) | | | 6.03% | | | | 02/01/2023 | | | | 3,030,406 | |
2,864,438 | | TransDigm, Inc., Guaranteed Senior Secured 1st Lien Term Loan, Tranche F (1 Month LIBOR USD + 2.75%) | | | 5.05% | | | | 06/09/2023 | | | | 2,875,852 | |
193,540 | | TransDigm, Inc., Guaranteed Senior Secured 1st Lien Term Loan, Tranche G (3 Month LIBOR USD + 2.50%) | | | 4.80% | | | | 08/22/2024 | | | | 194,387 | |
1,025,141 | | Travel Leaders Group LLC, Guaranteed Senior Secured 1st Lien Term Loan, Tranche B (3 Month LIBOR USD + 4.50%) | | | 6.35% | | | | 01/25/2024 | | | | 1,040,087 | |
280,585 | | TravelClick Holdings Corporation, Senior Secured 1st Lien Term Loan (3 Month LIBOR USD + 3.50%, 1.00% Floor) | | | 5.51% | | | | 05/06/2021 | | | | 280,585 | |
1,470,000 | | Traverse Midstream Partners LLC, Guaranteed Senior Secured 1st Lien Term Loan, Tranche B (6 Month LIBOR USD + 4.00%, 1.00% Floor) | | | 5.85% | | | | 09/27/2024 | | | | 1,480,334 | |
119,685 | | Tribune Media Company, Guaranteed Senior Secured 1st Lien Term Loan, Tranche B (1 Month LIBOR USD + 3.00%, 0.75% Floor) | | | 4.88% | | | | 12/24/2020 | | | | 119,959 | |
2,243,594 | | Tribune Media Company, Guaranteed Senior Secured 1st Lien Term Loan, Tranche C (1 Month LIBOR USD + 3.00%, 0.75% Floor) | | | 4.88% | | | | 01/26/2024 | | | | 2,248,272 | |
2,503,239 | | UFC Holdings LLC, Senior Secured 1st Lien Term Loan, Tranche B (1 Month LIBOR USD + 3.25%, 1.00% Floor) | | | 5.13% | | | | 08/18/2023 | | | | 2,519,860 | |
1,535,888 | | Ultra Resources, Inc., Guaranteed Senior Secured 1st Lien Term Loan (1 Month LIBOR USD + 3.00%, 1.00% Floor) | | | 4.76% | | | | 04/12/2024 | | | | 1,524,852 | |
1,194,877 | | Univar USA, Inc., Guaranteed Senior Secured 1st Lien Term Loan, Tranche B3
(1 Month LIBOR USD + 2.50%) | | | 4.38% | | | | 07/01/2024 | | | | 1,204,305 | |
2,393,547 | | US Renal Care, Inc., Senior Secured 1st Lien Term Loan (3 Month LIBOR USD + 4.25%, 1.00% Floor) | | | 5.94% | | | | 12/30/2022 | | | | 2,407,501 | |
2,016,936 | | USAGM HoldCo LLC, Senior Secured 1st Lien Term Loan (3 Month LIBOR USD + 3.75%, 1.00% Floor) | | | 6.05% | | | | 07/28/2022 | | | | 1,992,017 | |
2,205,395 | | VF Holdings Corporation, Senior Secured 1st Lien Term Loan (1 Month LIBOR USD + 3.25%, 1.00% Floor) | | | 5.13% | | | | 06/30/2023 | | | | 2,226,996 | |
196,423 | | Vizient, Inc., Senior Secured 1st Lien Term Loan, Tranche B3 (1 Month LIBOR USD + 2.75%, 1.00% Floor) | | | 4.63% | | | | 02/13/2023 | | | | 198,388 | |
3,027,413 | | West Corporation, Guaranteed Senior Secured 1st Lien Term Loan (1 Month LIBOR USD + 4.00%, 1.00% Floor) | | | 5.88% | | | | 10/10/2024 | | | | 3,059,579 | |
375,000 | | West Corporation, Guaranteed Senior Secured 1st Lien Term Loan, Tranche B1 (3 Month LIBOR USD + 3.50%, 1.00% Floor) | | | 5.51% | | | | 10/10/2024 | | | | 376,014 | |
3,577,885 | | West Street Merger Sub, Inc., Guaranteed Senior Secured 1st Lien Term Loan, Tranche B (1 Month LIBOR USD + 2.75%) | | | 4.63% | | | | 09/27/2024 | | | | 3,583,252 | |
3,546,113 | | Wink Holdco, Inc., Senior Secured 1st Lien Term Loan, Tranche B (1 Month LIBOR USD + 3.00%, 1.00% Floor) | | | 4.66% | | | | 12/02/2024 | | | | 3,536,698 | |
2,770,593 | | York Risk Services Group, Inc., Guaranteed Senior Secured 1st Lien Term Loan, Tranche B (1 Month LIBOR USD + 3.75%, 1.00% Floor) | | | 5.63% | | | | 10/01/2021 | | | | 2,720,030 | |
2,972,770 | | Zodiac Pool Solutions LLC, Guaranteed Senior Secured 1st Lien Term Loan (3 Month LIBOR USD + 4.00%, 1.00% Floor) | | | 6.30% | | | | 12/20/2023 | | | | 2,982,075 | |
| | | | | | | | | | | | | | |
| Total Bank Loans (Cost $365,615,757) | | | | | | | | | | | 366,970,501 | |
| | | | | | | | | | | | | | |
| | | |
Collateralized Loan Obligations - 2.6% | | | | | | | | | | | | |
875,000 | | Adams Mill Ltd., Series 2014-1A-D1 (3 Month LIBOR USD + 3.50%) | | | 5.22% | ^ | | | 07/15/2026 | | | | 876,305 | |
1,000,000 | | AIMCO, Series 2018-AA-D (3 Month LIBOR USD + 2.55%) | | | 0.00% | ^ | | | 04/17/2031 | | | | 1,000,000 | |
3,000,000 | | ALM LLC, Series 2013-7RA-CR (3 Month LIBOR USD + 4.04%) | | | 5.76% | ^ | | | 10/15/2028 | | | | 3,085,663 | |
3,800,000 | | ALM LLC, Series 2013-8A-CR (3 Month LIBOR USD + 3.95%, 3.95% Floor) | | | 5.67% | ^ | | | 10/15/2028 | | | | 3,847,086 | |
2,700,000 | | ALM LLC, Series 2016-19A-B (3 Month LIBOR USD + 3.00%) | | | 4.72% | ^ | | | 07/15/2028 | | | | 2,737,621 | |
2,000,000 | | ALM LLC, Series 2016-19A-C (3 Month LIBOR USD + 4.35%) | | | 6.07% | ^ | | | 07/15/2028 | | | | 2,037,566 | |
1,000,000 | | Apidos Ltd., Series 2013-12A-DR (3 Month LIBOR USD + 2.60%) | | | 4.64% | ^ | | | 04/15/2031 | | | | 999,913 | |
2,000,000 | | Apidos Ltd., Series 2013-16A-A1R (3 Month LIBOR USD + 0.98%) | | | 2.72% | ^ | | | 01/19/2025 | | | | 2,000,440 | |
2,950,000 | | Apidos Ltd., Series 2013-16A-BR (3 Month LIBOR USD + 1.95%) | | | 3.69% | ^ | | | 01/19/2025 | | | | 2,948,205 | |
1,000,000 | | Apidos Ltd., Series 2014-18A-D (3 Month LIBOR USD + 5.20%) | | | 6.94% | ^ | | | 07/22/2026 | | | | 1,000,857 | |
1,500,000 | | Apidos Ltd., Series 2015-20A-C (3 Month LIBOR USD + 3.70%) | | | 5.42% | ^ | | | 01/16/2027 | | | | 1,504,054 | |
2,250,000 | | Apidos Ltd., Series 2015-21A-C (3 Month LIBOR USD + 3.55%, 3.55% Floor) | | | 5.28% | ^ | | | 07/18/2027 | | | | 2,258,400 | |
5,000,000 | | Atrium Corporation, Series 9A-DR (3 Month LIBOR USD + 3.60%) | | | 5.58% | ^ | | | 05/28/2030 | | | | 5,077,578 | |
1,000,000 | | Babson Ltd., Series 2014-3A-D2 (1 Month LIBOR USD + 4.40%) | | | 6.12% | ^ | | | 01/15/2026 | | | | 1,000,000 | |
5,000,000 | | Babson Ltd., Series 2015-2A-DR (3 Month LIBOR USD + 2.95%) | | | 4.69% | ^ | | | 10/20/2030 | | | | 5,044,936 | |
3,400,000 | | Babson Ltd., Series 2015-IA-DR (3 Month LIBOR USD + 2.60%, 2.60% Floor) | | | 4.33% | ^ | | | 01/20/2031 | | | | 3,384,020 | |
3,250,000 | | Babson Ltd., Series 2017-1A-D (3 Month LIBOR USD + 3.60%) | | | 5.33% | ^ | | | 07/18/2029 | | | | 3,291,202 | |
2,250,000 | | Barings Ltd., Series 2016-3A-C (3 Month LIBOR USD + 3.95%, 3.95% Floor) | | | 5.67% | ^ | | | 01/15/2028 | | | | 2,284,414 | |
2,000,000 | | Barings Ltd., Series 2018-1A-C (3 Month LIBOR USD + 2.60%) | | | 0.00% | ^ | | | 04/15/2031 | | | | 2,000,000 | |
3,000,000 | | Betony Ltd., Series 2015-1A-D (3 Month LIBOR USD + 3.60%, 3.60% Floor) | | | 5.32% | ^ | | | 04/15/2027 | | | | 3,004,253 | |
1,000,000 | | Birchwood Park Ltd., Series 2014-1A-E2 (3 Month LIBOR USD + 6.40%) | | | 8.12% | ^ | | | 07/15/2026 | | | | 1,001,316 | |
10,100,000 | | BlueMountain Ltd., Series 2012-2A-DR (3 Month LIBOR USD + 4.15%) | | | 6.03% | ^ | | | 11/20/2028 | | | | 10,265,278 | |
3,000,000 | | BlueMountain Ltd., Series 2013-1A-CR (3 Month LIBOR USD + 4.15%) | | | 5.89% | ^ | | | 01/20/2029 | | | | 3,056,925 | |
5,000,000 | | BlueMountain Ltd., Series 2015-2A-D (3 Month LIBOR USD + 3.55%, 3.55% Floor) | | | 5.28% | ^ | | | 07/18/2027 | | | | 5,034,720 | |
4,000,000 | | BlueMountain Ltd., Series 2015-3A-B (3 Month LIBOR USD + 3.10%) | | | 4.84% | ^ | | | 10/20/2027 | | | | 4,000,000 | |
4,000,000 | | BlueMountain Ltd., Series 2015-3A-C (3 Month LIBOR USD + 3.55%) | | | 5.29% | ^ | | | 10/20/2027 | | | | 4,000,000 | |
4,000,000 | | BlueMountain Ltd., Series 2015-3A-CR (3 Month LIBOR USD + 2.60%, 2.60% Floor) | | | 0.00% | ^ | | | 04/20/2031 | | | | 4,000,000 | |
5,000,000 | | BlueMountain Ltd., Series 2015-4A-C (3 Month LIBOR USD + 3.20%) | | | 4.94% | ^ | | | 01/20/2027 | | | | 5,008,142 | |
4,000,000 | | BlueMountain Ltd., Series 2015-4A-D1 (3 Month LIBOR USD + 4.60%) | | | 6.34% | ^ | | | 01/20/2027 | | | | 4,008,463 | |
2,000,000 | | BlueMountain Ltd., Series 2016-3A-D (3 Month LIBOR USD + 3.85%) | | | 5.69% | ^ | | | 11/15/2027 | | | | 2,021,059 | |
2,000,000 | | Bristol Park Ltd., Series 2016-1A-D (3 Month LIBOR USD + 4.10%) | | | 5.82% | ^ | | | 04/15/2029 | | | | 2,049,611 | |
5,000,000 | | California Street LP, Series 2012-9A-DR (3 Month LIBOR USD + 3.96%) | | | 5.68% | ^ | | | 10/16/2028 | | | | 5,041,293 | |
2,750,000 | | Canyon Capital Ltd., Series 2014-1A-CR (3 Month LIBOR USD + 2.75%, 2.75% Floor) | | | 4.52% | ^ | | | 01/30/2031 | | | | 2,740,375 | |
1,500,000 | | Canyon Capital Ltd., Series 2014-2A-DR (3 Month LIBOR USD + 3.65%) | | | 5.37% | ^ | | | 04/15/2029 | | | | 1,516,323 | |
1,500,000 | | Canyon Capital Ltd., Series 2017-1A-D (3 Month LIBOR USD + 3.60%) | | | 5.32% | ^ | | | 07/15/2030 | | | | 1,519,923 | |
2,000,000 | | Carlyle Ltd., Series 2016-4A-C (3 Month LIBOR USD + 3.90%) | | | 5.64% | ^ | | | 10/20/2027 | | | | 2,021,224 | |
2,000,000 | | Cent Ltd., Series 2013-18A-D (3 Month LIBOR USD + 3.45%) | | | 5.19% | ^ | | | 07/23/2025 | | | | 2,001,407 | |
1,500,000 | | Cent Ltd., Series 2013-18A-E (3 Month LIBOR USD + 4.60%) | | | 6.34% | ^ | | | 07/23/2025 | | | | 1,480,236 | |
5,000,000 | | Cent Ltd., Series 2014-21A-D (3 Month LIBOR USD + 5.00%) | | | 6.76% | ^ | | | 07/27/2026 | | | | 4,924,382 | |
1,000,000 | | Cent Ltd., Series 2014-22A-C (3 Month LIBOR USD + 3.75%) | | | 5.54% | ^ | | | 11/07/2026 | | | | 1,002,969 | |
3,250,000 | | Cook Park Ltd., Series 2018-1A-D (3 Month LIBOR USD + 2.60%) | | | 0.00% | ^ | | | 04/17/2030 | | | | 3,250,000 | |
10,000,000 | | CVP Ltd., Series 2017-1A-A (3 Month LIBOR USD + 1.34%) | | | 3.08% | ^ | | | 07/20/2030 | | | | 10,077,374 | |
2,000,000 | | Dorchester Park Ltd., Series 2015-1A-C (3 Month LIBOR USD + 3.20%) | | | 4.94% | ^ | | | 01/20/2027 | | | | 2,002,257 | |
1,000,000 | | Dorchester Park Ltd., Series 2015-1A-D (3 Month LIBOR USD + 3.55%) | | | 5.29% | ^ | | | 01/20/2027 | | | | 1,001,125 | |
10,000,000 | | Dryden Senior Loan Fund, Series 2014-33A-DR (3 Month LIBOR USD + 4.35%) | | | 6.07% | ^ | | | 10/15/2028 | | | | 10,161,894 | |
2,000,000 | | Dryden Senior Loan Fund, Series 2018-57A-D (3 Month LIBOR USD + 2.55%, 2.55% Floor) | | | 4.44% | ^ | | | 05/15/2031 | | | | 2,000,412 | |
2,000,000 | | Gilbert Park Ltd., Series 2017-1A-D (3 Month LIBOR USD + 2.95%) | | | 4.31% | ^ | | | 10/15/2030 | | | | 2,020,410 | |
4,000,000 | | Gilbert Park Ltd., Series 2017-1A-E (3 Month LIBOR USD + 6.40%) | | | 7.76% | ^ | | | 10/15/2030 | | | | 4,077,937 | |
2,000,000 | | GoldenTree Loan Management Ltd., Series 2017-1A-D (3 Month LIBOR USD + 3.35%) | | | 5.09% | ^ | | | 04/20/2029 | | | | 2,023,309 | |
3,750,000 | | GoldenTree Loan Opportunities Ltd., Series 2015-10A-D (3 Month LIBOR USD + 3.35%, 3.35% Floor) | | | 5.09% | ^ | | | 07/20/2027 | | | | 3,766,033 | |
3,500,000 | | GoldenTree Loan Opportunities Ltd., Series 2015-11A-DR2 (3 Month LIBOR USD + 2.40%) | | | 4.13% | ^ | | | 01/18/2031 | | | | 3,499,192 | |
740,000 | | Halcyon Loan Advisors Funding Ltd., Series 2013-2A-C (3 Month LIBOR USD + 2.70%) | | | 4.47% | ^ | | | 08/01/2025 | | | | 740,918 | |
1,500,000 | | Halcyon Loan Advisors Funding Ltd., Series 2014-3A-D (3 Month LIBOR USD + 3.65%) | | | 5.39% | ^ | | | 10/22/2025 | | | | 1,502,031 | |
3,000,000 | | INGIM, Series 2014-1A-CR2 (3 Month LIBOR USD + 2.80%) | | | 0.00% | ^ | | | 04/18/2031 | | | | 3,000,000 | |
2,000,000 | | Jamestown Ltd., Series 2015-6A-A1AR (3 Month LIBOR USD + 1.15%) | | | 3.03% | ^ | | | 02/20/2027 | | | | 2,000,500 | |
3,500,000 | | Jay Park Ltd., Series 2016-1A-C (3 Month LIBOR USD + 3.85%) | | | 5.59% | ^ | | | 10/20/2027 | | | | 3,536,178 | |
2,850,000 | | LCM LP, Series 14A-D (3 Month LIBOR USD + 3.50%) | | | 5.22% | ^ | | | 07/15/2025 | | | | 2,854,041 | |
1,000,000 | | LCM LP, Series 16A-DR (3 Month LIBOR USD + 3.00%) | | | 4.72% | ^ | | | 07/15/2026 | | | | 1,002,489 | |
2,000,000 | | LCM LP, Series 19A-D (3 Month LIBOR USD + 3.45%, 3.45% Floor) | | | 5.17% | ^ | | | 07/15/2027 | | | | 2,011,972 | |
750,000 | | Madison Park Funding Ltd., Series 2014-14A-E (3 Month LIBOR USD + 4.75%) | | | 6.49% | ^ | | | 07/20/2026 | | | | 751,847 | |
2,000,000 | | Madison Park Funding Ltd., Series 2014-15A-CR (3 Month LIBOR USD + 3.45%) | | | 5.21% | ^ | | | 01/27/2026 | | | | 2,003,118 | |
1,250,000 | | Madison Park Funding Ltd., Series 2014-15A-DR (3 Month LIBOR USD + 5.44%) | | | 7.20% | ^ | | | 01/27/2026 | | | | 1,250,981 | |
1,000,000 | | Madison Park Funding Ltd., Series 2015-16A-D (3 Month LIBOR USD + 5.50%) | | | 7.24% | ^ | | | 04/20/2026 | | | | 1,003,144 | |
5,000,000 | | Madison Park Funding Ltd., Series 2015-18A-DR (3 Month LIBOR USD + 2.95%) | | | 4.69% | ^ | | | 10/21/2030 | | | | 5,077,453 | |
1,000,000 | | MP Ltd., Series 2014-2A-DR (3 Month LIBOR USD + 3.50%) | | | 5.22% | ^ | | | 01/15/2027 | | | | 1,002,559 | |
5,600,000 | | Octagon Investment Partners Ltd., Series 2012-1A-CR (3 Month LIBOR USD + 4.00%) | | | 5.72% | ^ | | | 07/15/2029 | | | | 5,689,663 | |
2,000,000 | | Octagon Investment Partners Ltd., Series 2013-1A-D (3 Month LIBOR USD + 3.35%) | | | 5.08% | ^ | | | 07/17/2025 | | | | 2,002,520 | |
6,900,000 | | Octagon Investment Partners Ltd., Series 2013-1A-DR (3 Month LIBOR USD + 3.70%) | | | 5.44% | ^ | | | 07/19/2030 | | | | 6,997,038 | |
2,000,000 | | Octagon Investment Partners Ltd., Series 2013-1A-E (3 Month LIBOR USD + 4.50%) | | | 6.23% | ^ | | | 07/17/2025 | | | | 1,971,344 | |
2,500,000 | | Octagon Investment Partners Ltd., Series 2014-1A-ERR (3 Month LIBOR USD + 5.45%, 5.45% Floor) | | | 7.19% | ^ | | | 01/22/2030 | | | | 2,489,337 | |
3,500,000 | | Octagon Investment Partners Ltd., Series 2016-1A-C (3 Month LIBOR USD + 3.00%) | | | 4.72% | ^ | | | 07/15/2027 | | | | 3,514,851 | |
10,000,000 | | Octagon Investment Partners Ltd., Series 2016-1A-D (3 Month LIBOR USD + 4.75%) | | | 6.47% | ^ | | | 07/15/2027 | | | | 10,069,375 | |
4,000,000 | | Octagon Investment Partners Ltd., Series 2017-1A-C (3 Month LIBOR USD + 3.50%) | | | 5.24% | ^ | | | 03/17/2030 | | | | 4,033,983 | |
1,760,000 | | Octagon Investment Partners Ltd., Series 2017-1A-D (3 Month LIBOR USD + 6.20%) | | | 7.94% | ^ | | | 03/17/2030 | | | | 1,783,022 | |
10,000,000 | | Stewart Park Ltd., Series 2015-1A-DR (3 Month LIBOR USD + 2.60%, 2.60% Floor) | | | 4.32% | ^ | | | 01/15/2030 | | | | 9,959,881 | |
4,000,000 | | TCI-Cent Ltd., Series 2016-1A-C (3 Month LIBOR USD + 4.00%) | | | 5.76% | ^ | | | 12/21/2029 | | | | 4,084,338 | |
2,000,000 | | TCI-Cent Ltd., Series 2017-1A-C (3 Month LIBOR USD + 3.65%) | | | 5.40% | ^ | | | 07/25/2030 | | | | 2,032,373 | |
5,000,000 | | TCI-Flatiron Ltd., Series 2016-1A-C (3 Month LIBOR USD + 3.05%) | | | 4.78% | ^ | | | 07/17/2028 | | | | 5,063,841 | |
5,000,000 | | TCI-Symphony Ltd., Series 2016-1A-D (3 Month LIBOR USD + 3.80%, 3.80% Floor) | | | 5.52% | ^ | | | 10/13/2029 | | | | 5,054,203 | |
2,000,000 | | Thacher Park Ltd., Series 2014-1A-D1R (3 Month LIBOR USD + 3.40%) | | | 5.14% | ^ | | | 10/20/2026 | | | | 2,005,372 | |
2,500,000 | | Venture Ltd., Series 2014-17A-CR (3 Month LIBOR USD + 2.20%) | | | 3.92% | ^ | | | 07/15/2026 | | | | 2,502,613 | |
2,000,000 | | Wind River Ltd., Series 2012-1A-DR (3 Month LIBOR USD + 4.10%) | | | 5.82% | ^ | | | 01/15/2026 | | | | 2,027,123 | |
2,810,000 | | Wind River Ltd., Series 2013-1A-CR (3 Month LIBOR USD + 3.65%) | | | 5.39% | ^ | | | 07/20/2030 | | | | 2,847,968 | |
2,000,000 | | Wind River Ltd., Series 2014-1A-DR (3 Month LIBOR USD + 3.50%) | | | 5.23% | ^ | | | 04/18/2026 | | | | 2,002,143 | |
1,000,000 | | Wind River Ltd., Series 2014-2A-ER (3 Month LIBOR USD + 5.75%, 5.75% Floor) | | | 7.47% | ^ | | | 01/15/2031 | | | | 992,691 | |
4,100,000 | | Wind River Ltd., Series 2016-1A-C (3 Month LIBOR USD + 3.20%) | | | 4.92% | ^ | | | 07/15/2028 | | | | 4,122,663 | |
2,000,000 | | Wind River Ltd., Series 2016-1A-D (3 Month LIBOR USD + 4.65%) | | | 6.37% | ^ | | | 07/15/2028 | | | | 2,013,508 | |
3,000,000 | | Wind River Ltd., Series 2017-3A-D (3 Month LIBOR USD + 3.15%) | | | 4.87% | ^ | | | 10/15/2030 | | | | 3,018,124 | |
| | | | | | | | | | | | | | |
| Total Collateralized Loan Obligations (Cost $270,387,017) | | | | | | | | | | | 273,971,307 | |
| | | | | | | | | | | | | | |
| | | |
Foreign Corporate Bonds - 9.5% | | | | | | | | | | | | |
1,000,000 | | Adani Ports & Special Economic Zone Ltd. | | | 3.50% | | | | 07/29/2020 | | | | 995,460 | |
3,700,000 | | Adani Ports & Special Economic Zone Ltd. | | | 3.95% | | | | 01/19/2022 | | | | 3,690,243 | |
13,060,000 | | AerCap Global Aviation Trust | | | 3.50% | | | | 01/15/2025 | | | | 12,604,242 | |
6,200,000 | | AES Andres B.V. | | | 7.95% | ^ | | | 05/11/2026 | | | | 6,650,492 | |
1,700,000 | | Ajecorp B.V. | | | 6.50% | | | | 05/14/2022 | | | | 1,547,000 | |
1,295,000 | | Aker BP ASA | | | 5.88% | ^ | | | 03/31/2025 | | | | 1,314,425 | |
4,700,000 | | Alibaba Group Holding Ltd. | | | 3.13% | | | | 11/28/2021 | | | | 4,690,856 | |
500,000 | | Alibaba Group Holding Ltd. | | | 2.80% | | | | 06/06/2023 | | | | 483,649 | |
2,000,000 | | America Movil S.A.B. de C.V. | | | 5.00% | | | | 03/30/2020 | | | | 2,068,765 | |
3,000,000 | | America Movil S.A.B. de C.V. | | | 3.13% | | | | 07/16/2022 | | | | 2,954,858 | |
13,020,000 | | Anglo American Capital PLC | | | 4.50% | ^ | | | 03/15/2028 | | | | 13,014,587 | |
3,150,000 | | Ardagh Packaging Finance, Inc. | | | 6.00% | ^ | | | 02/15/2025 | | | | 3,173,625 | |
13,375,000 | | AstraZeneca Plc | | | 2.38% | | | | 06/12/2022 | | | | 12,926,120 | |
12,745,000 | | Australia and New Zealand Banking Group Ltd. | | | 4.88% | ^ | | | 01/12/2021 | | | | 13,339,585 | |
11,430,000 | | Axiata SPV2 BHD | | | 3.47% | | | | 11/19/2020 | | | | 11,472,668 | |
2,000,000 | | Banco de Costa Rica | | | 5.25% | ^ | | | 08/12/2018 | | | | 2,017,400 | |
200,000 | | Banco de Costa Rica | | | 5.25% | | | | 08/12/2018 | | | | 201,740 | |
15,640,000 | | Banco de Credito del Peru | | | 2.25% | | | | 10/25/2019 | | | | 15,459,358 | |
3,300,000 | | Banco de Credito del Peru | | | 5.38% | | | | 09/16/2020 | | | | 3,468,069 | |
6,200,000 | | Banco de Credito e Inversiones | | | 4.00% | | | | 02/11/2023 | | | | 6,272,766 | |
4,100,000 | | Banco de Reservas de la Republica Dominicana | | | 7.00% | | | | 02/01/2023 | | | | 4,305,000 | |
1,000,000 | | Banco de Reservas de la Republica Dominicana | | | 7.00% | ^ | | | 02/01/2023 | | | | 1,050,000 | |
4,820,000 | | Banco del Estado de Chile | | | 4.13% | | | | 10/07/2020 | | | | 4,919,157 | |
4,000,000 | | Banco del Estado de Chile | | | 2.67% | ^ | | | 01/08/2021 | | | | 3,925,339 | |
3,250,000 | | Banco del Estado de Chile | | | 3.88% | | | | 02/08/2022 | | | | 3,287,304 | |
12,450,000 | | Banco International del Peru S.A.A. | | | 5.75% | | | | 10/07/2020 | | | | 13,072,500 | |
1,000,000 | | Banco International del Peru S.A.A. (3 Month LIBOR USD + 6.74%) | | | 8.50% | | | | 04/23/2070 | | | | 1,077,500 | |
2,050,000 | | Banco Latinoamericano do Comercio Exterior S.A. | | | 3.25% | | | | 05/07/2020 | | | | 2,042,313 | |
800,000 | | Banco Nacional de Costa Rica | | | 4.88% | | | | 11/01/2018 | | | | 802,000 | |
5,300,000 | | Banco Nacional de Costa Rica | | | 5.88% | ^ | | | 04/25/2021 | | | | 5,495,437 | |
300,000 | | Banco Santander | | | 3.88% | | | | 09/20/2022 | | | | 303,159 | |
13,000,000 | | Banco Santander (3 Month LIBOR USD + 1.09%) | | | 3.01% | | | | 02/23/2023 | | | | 13,114,528 | |
10,305,000 | | Banco Santander (5 Year CMT Rate + 4.58%) | | | 5.95% | | | | 01/30/2024 | | | | 10,531,710 | |
2,640,000 | | Bancolombia S.A. | | | 6.13% | | | | 07/26/2020 | | | | 2,801,700 | |
2,500,000 | | Banistmo S.A. | | | 3.65% | ^ | | | 09/19/2022 | | | | 2,403,125 | |
10,205,000 | | Bank of Montreal (5 Year Swap Rate USD + 1.43%) | | | 3.80% | | | | 12/15/2032 | | | | 9,680,667 | |
1,250,000 | | Bantrab Senior Trust | | | 9.00% | | | | 11/14/2020 | | | | 1,276,562 | |
9,880,000 | | Barclays Bank Plc (3 Month LIBOR USD + 0.46%) | | | 2.16% | | | | 01/11/2021 | | | | 9,876,216 | |
1,800,000 | | BBVA Banco Continental S.A. | | | 5.00% | | | | 08/26/2022 | | | | 1,890,360 | |
3,450,000 | | BDO Unibank, Inc. | | | 2.63% | | | | 10/24/2021 | | | | 3,358,099 | |
16,900,000 | | BDO Unibank, Inc. | | | 2.95% | | | | 03/06/2023 | | | | 16,260,098 | |
2,100,000 | | Bharat Petroleum Corporation Ltd. | | | 4.63% | | | | 10/25/2022 | | | | 2,173,920 | |
11,900,000 | | Bharti Airtel Ltd. | | | 5.13% | | | | 03/11/2023 | | | | 12,129,432 | |
7,300,000 | | Bharti Airtel Ltd. | | | 4.38% | | | | 06/10/2025 | | | | 7,091,552 | |
13,195,000 | | BNP Paribas S.A. | | | 3.38% | ^ | | | 01/09/2025 | | | | 12,775,551 | |
12,300,000 | | BPRL International Singapore Pte Ltd. | | | 4.38% | | | | 01/18/2027 | | | | 12,139,817 | |
1,250,000 | | Camposol S.A. | | | 10.50% | ^ | | | 07/15/2021 | | | | 1,340,625 | |
20,517,000 | | Canadian Natural Resources Ltd. | | | 2.95% | | | | 01/15/2023 | | | | 19,937,342 | |
95,000 | | Canadian Pacific Railway Company | | | 2.90% | | | | 02/01/2025 | | | | 91,414 | |
2,587,000 | | Celulosa Arauco y Constitucion S.A. | | | 4.75% | | | | 01/11/2022 | | | | 2,671,546 | |
3,685,000 | | CEVA Group PLC | | | 7.00% | ^ | | | 03/01/2021 | | | | 3,629,725 | |
400,000 | | CK Hutchison International Ltd. | | | 2.25% | ^ | | | 09/29/2020 | | | | 391,519 | |
2,954,000 | | CK Hutchison International Ltd. | | | 2.88% | | | | 04/05/2022 | | | | 2,898,491 | |
1,000,000 | | CK Hutchison International Ltd. | | | 2.75% | ^ | | | 03/29/2023 | | | | 964,412 | |
8,200,000 | | CK Hutchison International Ltd. | | | 3.50% | ^ | | | 04/05/2027 | | | | 7,948,500 | |
1,200,000 | | CNOOC Finance Ltd. | | | 4.25% | | | | 01/26/2021 | | | | 1,229,868 | |
3,500,000 | | CNOOC Finance Ltd. | | | 3.88% | | | | 05/02/2022 | | | | 3,530,236 | |
15,000,000 | | CNOOC Finance Ltd. | | | 3.50% | | | | 05/05/2025 | | | | 14,514,930 | |
300,000 | | CNPC General Capital Ltd. | | | 2.75% | | | | 05/14/2019 | | | | 299,342 | |
200,000 | | CNPC General Capital Ltd. | | | 2.70% | | | | 11/25/2019 | | | | 198,840 | |
2,000,000 | | CNPC General Capital Ltd. | | | 3.95% | | | | 04/19/2022 | | | | 2,036,816 | |
3,100,000 | | CNPC General Capital Ltd. | | | 3.40% | | | | 04/16/2023 | | | | 3,069,252 | |
13,488,000 | | CNPC Overseas Capital Ltd. | | | 4.50% | | | | 04/28/2021 | | | | 13,970,368 | |
650,000 | | Coca-Cola Femsa S.A.B. de C.V. | | | 3.88% | | | | 11/26/2023 | | | | 665,473 | |
18,900,000 | | Commonwealth Bank of Australia | | | 2.75% | ^ | | | 03/10/2022 | | | | 18,584,659 | |
18,755,000 | | Corpbanca S.A. | | | 3.88% | | | | 09/22/2019 | | | | 18,923,712 | |
1,030,000 | | Corporacion Financiera de Desarrollo S.A. | | | 3.25% | | | | 07/15/2019 | | | | 1,031,288 | |
6,610,000 | | Cosan Overseas Ltd. | | | 8.25% | † | | | 05/05/2018 | | | | 6,704,193 | |
12,685,000 | | Credit Suisse Group (3 Month LIBOR USD + 1.20%) | | | 3.31% | ^ | | | 12/14/2023 | | | | 12,867,693 | |
2,350,000 | | DBS Group Holdings Ltd. (3 Month LIBOR USD + 0.49%) | | | 2.54% | | | | 06/08/2020 | | | | 2,352,740 | |
9,600,000 | | DBS Group Holdings Ltd. (3 Month LIBOR USD + 0.62%) | | | 2.37% | ^ | | | 07/25/2022 | | | | 9,652,224 | |
2,000,000 | | DBS Group Holdings Ltd. (3 Month LIBOR USD + 0.62%) | | | 2.37% | | | | 07/25/2022 | | | | 2,010,880 | |
5,700,000 | | DBS Group Holdings Ltd. (5 Year Swap Rate USD + 2.39%) | | | 3.60% | † | | | 09/07/2021 | | | | 5,525,973 | |
1,460,000 | | Delek & Avner Tamar Bond Ltd. | | | 5.41% | ^ | | | 12/30/2025 | | | | 1,489,945 | |
3,900,000 | | Digicel Ltd. | | | 7.13% | ^ | | | 04/01/2022 | | | | 3,056,625 | |
7,100,000 | | Digicel Ltd. | | | 7.13% | | | | 04/01/2022 | | | | 5,564,625 | |
3,300,000 | | ECL S.A. | | | 5.63% | | | | 01/15/2021 | | | | 3,481,338 | |
11,000,000 | | Ecopetrol SA | | | 7.63% | | | | 07/23/2019 | | | | 11,649,000 | |
11,034,000 | | Embotelladora Andina S.A. | | | 5.00% | | | | 10/01/2023 | | | | 11,638,831 | |
6,662,540 | | ENA Norte Trust | | | 4.95% | | | | 04/25/2023 | | | | 6,847,425 | |
200,000 | | Export-Import Bank of India | | | 2.75% | | | | 04/01/2020 | | | | 197,872 | |
4,150,000 | | Export-Import Bank of India | | | 3.13% | | | | 07/20/2021 | | | | 4,104,130 | |
3,400,000 | | Export-Import Bank of India (3 Month LIBOR USD + 1.00%) | | | 2.89% | | | | 08/21/2022 | | | | 3,396,175 | |
6,000,000 | | Export-Import Bank of India | | | 4.00% | | | | 01/14/2023 | | | | 6,008,370 | |
2,415,000 | | FMG Resources Ltd. | | | 4.75% | ^ | | | 05/15/2022 | | | | 2,393,869 | |
700,000 | | Fomento Economico Mexicano S.A.B. de C.V. | | | 2.88% | | | | 05/10/2023 | | | | 682,618 | |
2,200,000 | | Fondo Mivivienda S.A. | | | 3.38% | | | | 04/02/2019 | | | | 2,206,600 | |
2,000,000 | | Fondo Mivivienda S.A. | | | 3.50% | ^ | | | 01/31/2023 | | | | 1,965,000 | |
2,000,000 | | Fondo Mivivienda S.A. | | | 3.50% | | | | 01/31/2023 | | | | 1,965,000 | |
14,200,000 | | Fortis, Inc. | | | 2.10% | | | | 10/04/2021 | | | | 13,583,012 | |
1,810,000 | | GFL Environmental, Inc. | | | 5.38% | ^ | | | 03/01/2023 | | | | 1,782,850 | |
12,700,000 | | Global Bank Corporation | | | 5.13% | | | | 10/30/2019 | | | | 12,969,240 | |
1,500,000 | | Global Bank Corporation | | | 4.50% | ^ | | | 10/20/2021 | | | | 1,514,400 | |
10,500,000 | | Gohl Capital Ltd. | | | 4.25% | | | | 01/24/2027 | | | | 10,341,870 | |
2,890,000 | | Grupo Idesa S.A. de C.V. | | | 7.88% | ^ | | | 12/18/2020 | | | | 2,820,101 | |
5,000,000 | | Grupo Idesa S.A. de C.V. | | | 7.88% | | | | 12/18/2020 | | | | 4,879,068 | |
7,511,320 | | Guanay Finance Ltd. | | | 6.00% | | | | 12/15/2020 | | | | 7,701,684 | |
1,200,000 | | Guatemala Energuate Trust | | | 5.88% | ^ | | | 05/03/2027 | | | | 1,213,500 | |
3,336,000 | | GW Honos Security Corporation | | | 8.75% | ^ | | | 05/15/2025 | | | | 3,502,800 | |
7,700,000 | | Hutchison Whampoa International Ltd. | | | 3.25% | | | | 11/08/2022 | | | | 7,641,117 | |
3,908,000 | | Indian Oil Corporation Ltd. | | | 5.63% | | | | 08/02/2021 | | | | 4,157,854 | |
12,867,000 | | Indian Oil Corporation Ltd. | | | 5.75% | | | | 08/01/2023 | | | | 13,954,455 | |
5,884,000 | | Industrial Senior Trust | | | 5.50% | | | | 11/01/2022 | | | | 5,879,587 | |
2,350,000 | | Intelsat Jackson Holdings S.A. | | | 5.50% | | | | 08/01/2023 | | | | 1,909,375 | |
1,000,000 | | Intelsat Jackson Holdings S.A. | | | 9.75% | ^ | | | 07/15/2025 | | | | 936,250 | |
1,200,000 | | Inversiones CMPC S.A. | | | 6.13% | | | | 11/05/2019 | | | | 1,255,633 | |
5,500,000 | | Inversiones CMPC S.A. | | | 4.50% | | | | 04/25/2022 | | | | 5,659,620 | |
3,515,000 | | Kronos Acquisition Holdings, Inc. | | | 9.00% | ^ | | | 08/15/2023 | | | | 3,348,037 | |
5,000,000 | | Lima Metro Finance Ltd. | | | 5.88% | | | | 07/05/2034 | | | | 5,181,250 | |
13,685,000 | | Lloyds Banking Group PLC (3 Month LIBOR USD + 1.21%) | | | 3.57% | | | | 11/07/2028 | | | | 12,933,306 | |
7,150,000 | | Macquarie Group Ltd. (3 Month LIBOR USD + 1.02%) | | | 3.19% | ^ | | | 11/28/2023 | | | | 6,902,109 | |
6,305,000 | | Macquarie Group Ltd. (3 Month LIBOR USD + 1.33%) | | | 4.15% | ^ | | | 03/27/2024 | | | | 6,334,770 | |
1,152,000 | | Magnesita Finance Ltd. | | | 8.63% | † | | | 04/30/2018 | | | | 1,160,352 | |
16,139,000 | | Malayan Banking BHD (5 Year Swap Rate USD + 2.54%) | | | 3.91% | | | | 10/29/2026 | | | | 16,188,547 | |
2,000,000 | | MARB BondCo PLC | | | 7.00% | ^ | | | 03/15/2024 | | | | 1,887,500 | |
1,000,000 | | Marfrig Holdings Europe B.V. | | | 8.00% | ^ | | | 06/08/2023 | | | | 1,010,000 | |
3,305,000 | | MEG Energy Corporation | | | 7.00% | ^ | | | 03/31/2024 | | | | 2,743,150 | |
19,695,000 | | Mitsubishi UFJ Financial Group, Inc. (3 Month LIBOR USD + 0.74%) | | | 2.76% | | | | 03/02/2023 | | | | 19,678,744 | |
8,450,000 | | Mizuho Financial Group, Inc. (3 Month LIBOR USD + 0.88%) | | | 2.95% | | | | 09/11/2022 | | | | 8,502,359 | |
3,665,000 | | New Red Finance, Inc. | | | 5.00% | ^ | | | 10/15/2025 | | | | 3,508,138 | |
5,300,000 | | OAS Financial Ltd. (5 Year CMT Rate + 8.19%) | | | 8.88% | ^ † W | | | 04/30/2018 | | | | 556,500 | |
1,500,000 | | OAS Financial Ltd. (5 Year CMT Rate + 8.19%) | | | 8.88% | † W | | | 04/30/2018 | | | | 157,500 | |
1,700,000 | | Odebrecht Finance Ltd. | | | 7.13% | | | | 06/26/2042 | | | | 578,000 | |
1,587,000 | | ONGC Videsh Ltd. | | | 2.88% | | | | 01/27/2022 | | | | 1,535,013 | |
16,500,000 | | ONGC Videsh Ltd. | | | 3.75% | | | | 07/27/2026 | | | | 15,794,872 | |
10,189,000 | | Orange S.A. | | | 2.75% | | | | 02/06/2019 | | | | 10,187,354 | |
695,000 | | Orange S.A. | | | 5.38% | | | | 07/08/2019 | | | | 716,840 | |
827,000 | | Orange S.A. | | | 1.63% | | | | 11/03/2019 | | | | 810,117 | |
15,880,000 | | Oversea-Chinese Banking Corporation (5 Year Swap Rate USD + 2.20%) | | | 4.00% | | | | 10/15/2024 | | | | 16,001,673 | |
9,300,000 | | Panama Metro Line SP | | | 0.00% | ^ | | | 12/05/2022 | | | | 8,411,850 | |
11,243,000 | | Panama Metro Line SP | | | 0.00% | | | | 12/05/2022 | | | | 10,169,293 | |
1,000,000 | | Pesquera Exalmar S.A.A. | | | 7.38% | | | | 01/31/2020 | | | | 973,995 | |
1,800,000 | | Pesquera Exalmar S.A.A. | | | 7.38% | ^ | | | 01/31/2020 | | | | 1,753,191 | |
6,245,000 | | Petroleos Mexicanos | | | 6.75% | | | | 09/21/2047 | | | | 6,334,803 | |
6,535,000 | | Petroleos Mexicanos | | | 6.35% | ^ | | | 02/12/2048 | | | | 6,347,119 | |
8,500,000 | | Petronas Capital Ltd. | | | 3.50% | | | | 03/18/2025 | | | | 8,406,160 | |
10,310,000 | | Petronas Global Sukuk Ltd. | | | 2.71% | | | | 03/18/2020 | | | | 10,241,954 | |
3,280,000 | | Precision Drilling Corporation | | | 7.13% | ^ | | | 01/15/2026 | | | | 3,255,400 | |
3,600,000 | | PSA International Ltd. | | | 3.88% | | | | 02/11/2021 | | | | 3,703,784 | |
2,000,000 | | Reliance Holdings, Inc. | | | 4.50% | | | | 10/19/2020 | | | | 2,054,538 | |
16,450,000 | | Reliance Holdings, Inc. | | | 5.40% | | | | 02/14/2022 | | | | 17,392,223 | |
19,690,000 | | Royal Bank of Scotland Group PLC (3 Month LIBOR USD + 1.48%) | | | 3.50% | | | | 05/15/2023 | | | | 19,361,310 | |
2,300,000 | | SACI Falabella | | | 3.75% | | | | 04/30/2023 | | | | 2,283,898 | |
11,662,000 | | Shire Acquisitions Investments Ireland DAC | | | 2.88% | | | | 09/23/2023 | | | | 11,143,124 | |
3,800,000 | | Singtel Group Treasury | | | 4.50% | | | | 09/08/2021 | | | | 3,976,437 | |
3,500,000 | | Sinopec Group Overseas Development Ltd. | | | 2.25% | ^ | | | 09/13/2020 | | | | 3,423,367 | |
1,372,000 | | Sinopec Group Overseas Development Ltd. | | | 2.75% | | | | 05/03/2021 | | | | 1,350,991 | |
14,800,000 | | Sinopec Group Overseas Development Ltd. | | | 2.75% | | | | 09/29/2026 | | | | 13,451,054 | |
500,000 | | Sinopec Group Overseas Development Ltd. | | | 3.63% | ^ | | | 04/12/2027 | | | | 484,598 | |
500,000 | | Sixsigma Networks Mexico S.A. de C.V. | | | 8.25% | ^ | | | 11/07/2021 | | | | 528,750 | |
600,000 | | Sixsigma Networks Mexico S.A. de C.V. | | | 8.25% | | | | 11/07/2021 | | | | 634,500 | |
6,500,000 | | SP PowerAssets Ltd. | | | 2.70% | | | | 09/14/2022 | | | | 6,381,598 | |
19,655,000 | | Sumitomo Mitsui Financial Group, Inc. (3 Month LIBOR USD + 0.74%) | | | 2.47% | | | | 01/17/2023 | | | | 19,704,090 | |
350,000 | | Sydney Airport Finance Company Pty Ltd. | | | 3.63% | ^ | | | 04/28/2026 | | | | 341,525 | |
4,675,000 | | Telefonica Chile S.A. | | | 3.88% | | | | 10/12/2022 | | | | 4,673,782 | |
2,310,000 | | Telesat LLC | | | 8.88% | ^ | | | 11/15/2024 | | | | 2,541,000 | |
20,250,000 | | Temasek Financial Ltd. | | | 2.38% | | | | 01/23/2023 | | | | 19,634,717 | |
1,200,000 | | Tencent Holdings Ltd. | | | 3.38% | | | | 05/02/2019 | | | | 1,206,854 | |
700,000 | | Tencent Holdings Ltd. | | | 2.88% | | | | 02/11/2020 | | | | 698,933 | |
7,300,000 | | Tencent Holdings Ltd. (3 Month LIBOR USD + 0.61%) | | | 2.34% | ^ | | | 01/19/2023 | | | | 7,312,922 | |
1,980,000 | | Teva Pharmaceutical Finance B.V. | | | 6.75% | ^ | | | 03/01/2028 | | | | 1,957,070 | |
18,260,000 | | Teva Pharmaceutical Finance Netherlands B.V. | | | 2.80% | | | | 07/21/2023 | | | | 15,484,178 | |
900,000 | | Transelec S.A. | | | 4.63% | | | | 07/26/2023 | | | | 941,071 | |
400,000 | | Transelec S.A. | | | 3.88% | | | | 01/12/2029 | | | | 386,000 | |
7,300,000 | | Transportadora de Gas del Peru S.A. | | | 4.25% | | | | 04/30/2028 | | | | 7,290,875 | |
2,900,000 | | Transportadora de Gas Internacional S.A. | | | 5.70% | | | | 03/20/2022 | | | | 2,950,750 | |
1,415,000 | | Travelport Corporate Finance PLC | | | 6.00% | ^ | | | 03/15/2026 | | | | 1,423,844 | |
1,418,000 | | Union Bank of the Philippines | | | 3.37% | | | | 11/29/2022 | | | | 1,381,296 | |
9,800,000 | | United Overseas Bank Ltd. (5 Year Swap Rate USD + 2.00%) | | | 3.75% | | | | 09/19/2024 | | | | 9,873,206 | |
9,895,000 | | United Overseas Bank Ltd. (5 Year Swap Rate USD + 2.24%) | | | 3.50% | | | | 09/16/2026 | | | | 9,814,247 | |
6,700,000 | | UPL Corporation | | | 3.25% | | | | 10/13/2021 | | | | 6,573,203 | |
| | | | | | | | | | | | | | |
| Total Foreign Corporate Bonds (Cost $1,019,213,955) | | | | | | | | | | | 993,490,485 | |
| | | | | | | | | | | | | | |
| | | |
Foreign Government Bonds, Foreign Agencies and Foreign Government Sponsored Corporations - 1.7% | | | | | | | | | | | | |
2,550,000 | | Chile Government International Bond | | | 2.25% | | | | 10/30/2022 | | | | 2,449,275 | |
12,300,000 | | Chile Government International Bond | | | 3.13% | | | | 03/27/2025 | | | | 12,084,750 | |
13,800,000 | | Chile Government International Bond | | | 3.13% | | | | 01/21/2026 | | | | 13,537,800 | |
8,140,000 | | Costa Rica Government International Bond | | | 10.00% | | | | 08/01/2020 | | | | 9,122,905 | |
13,350,000 | | Indonesia Government International Bond | | | 4.88% | | | | 05/05/2021 | | | | 13,946,518 | |
7,700,000 | | Israel Government International Bond | | | 4.00% | | | | 06/30/2022 | | | | 7,977,393 | |
3,100,000 | | Israel Government International Bond | | | 3.15% | | | | 06/30/2023 | | | | 3,098,211 | |
9,400,000 | | Israel Government International Bond | | | 2.88% | | | | 03/16/2026 | | | | 9,061,318 | |
11,000,000 | | Malaysia Sovereign Sukuk BHD | | | 3.04% | | | | 04/22/2025 | | | | 10,803,430 | |
3,239,000 | | Malaysia Sukuk Global BHD | | | 3.18% | | | | 04/27/2026 | | | | 3,174,301 | |
6,700,000 | | Mexico Government International Bond | | | 4.00% | | | | 10/02/2023 | | | | 6,873,363 | |
11,621,000 | | Mexico Government International Bond | | | 4.15% | | | | 03/28/2027 | | | | 11,763,357 | |
14,260,000 | | Mexico Government International Bond | | | 3.75% | | | | 01/11/2028 | | | | 13,807,245 | |
8,000,000 | | Panama Government International Bond | | | 4.00% | | | | 09/22/2024 | | | | 8,232,000 | |
4,000,000 | | Panama Government International Bond | | | 3.88% | | | | 03/17/2028 | | | | 4,040,000 | |
3,000,000 | | Perusahaan Penerbit | | | 4.15% | | | | 03/29/2027 | | | | 2,973,750 | |
12,000,000 | | Perusahaan Penerbit | | | 4.15% | ^ | | | 03/29/2027 | | | | 11,895,000 | |
7,600,000 | | Philippine Government International Bond | | | 4.00% | | | | 01/15/2021 | | | | 7,794,583 | |
17,600,000 | | Philippine Government International Bond | | | 4.20% | | | | 01/21/2024 | | | | 18,351,344 | |
3,000,000 | | Republic of Poland Government International Bond | | | 5.13% | | | | 04/21/2021 | | | | 3,191,100 | |
1,000,000 | | Wakala Global Sukuk BHD | | | 4.65% | | | | 07/06/2021 | | | | 1,056,110 | |
| | | | | | | | | | | | | | |
Total Foreign Government Bonds, Foreign Agencies and Foreign Government Sponsored Corporations (Cost $179,307,541) | | | | | | | | | | | 175,233,753 | |
| | | | | | | | | | | | | | |
| | | |
Municipal Bonds - 0.1% | | | | | | | | | | | | |
4,250,000 | | North Texas Municipal Water District Water System Revenue | | | 5.00% | | | | 09/01/2035 | | | | 4,894,683 | |
| | | | | | | | | | | | | | |
| Total Municipal Bonds (Cost $4,776,759) | | | | | | | | | | | 4,894,683 | |
| | | | | | | | | | | | | | |
| | | |
Non-Agency Commercial Mortgage Backed Obligations - 7.1% | | | | | | | | | | | | |
11,235,000 | | Atrium Hotel Portfolio Trust, Series 2017-ATRM-E (1 Month LIBOR USD + 3.05%) | | | 4.83% | ^ | | | 12/15/2036 | | | | 11,152,489 | |
2,000,000 | | BAMLL Commercial Mortgage Securities Trust, Series 2014-IP-E | | | 2.72% | # ^ | | | 06/15/2028 | | | | 1,990,131 | |
118,650,000 | | BAMLL Commercial Mortgage Securities Trust, Series 2015-200P-XA | | | 0.38% | # ^ I/O | | | 04/14/2033 | | | | 2,941,772 | |
191,686,328 | | BANK, Series 2018-BN10-XA | |
| 0.75%
| # I/
O | | | 02/15/2061 | | | | 11,304,605 | |
7,616,346 | | BANK, Series 2017-BNK8-XA | |
| 0.75%
| # I/
O | | | 11/15/2050 | | | | 440,741 | |
76,860,790 | | Barclays Commercial Mortgage Securities LLC, Series 2017-C1-XA | |
| 1.52%
| # I/
O | | | 02/15/2050 | | | | 7,748,567 | |
1,508,000 | | Barclays Commercial Mortgage Securities LLC, Series 2017-DELC-C (1 Month LIBOR USD + 1.20%) | | | 2.98% | ^ | | | 08/15/2036 | | | | 1,506,934 | |
1,719,000 | | Barclays Commercial Mortgage Securities LLC, Series 2017-DELC-D (1 Month LIBOR USD + 1.70%) | | | 3.48% | ^ | | | 08/15/2036 | | | | 1,714,962 | |
3,600,000 | | Barclays Commercial Mortgage Securities LLC, Series 2017-DELC-E (1 Month LIBOR USD + 2.50%) | | | 4.28% | ^ | | | 08/15/2036 | | | | 3,595,973 | |
3,451,000 | | Barclays Commercial Mortgage Securities LLC, Series 2017-DELC-F (1 Month LIBOR USD + 3.50%) | | | 5.28% | ^ | | | 08/15/2036 | | | | 3,453,768 | |
11,646,000 | | BBCMS Mortgage Trust, Series 2018-TALL-A (1 Month LIBOR USD + 0.72%) | | | 2.50% | ^ | | | 03/15/2037 | | | | 11,604,971 | |
3,775,000 | | Bear Stearns Commercial Mortgage Securities, Inc., Series 2007-T26-AJ | | | 5.52% | # | | | 01/12/2045 | | | | 3,575,516 | |
3,283,000 | | BX Commercial Mortgage Trust, Series 2018-BIOA-D (1 Month LIBOR USD + 1.32%, 1.35% Floor) | | | 2.97% | ^ | | | 03/15/2037 | | | | 3,269,155 | |
8,207,000 | | BX Commercial Mortgage Trust, Series 2018-BIOA-E (1 Month LIBOR USD + 1.95%, 1.98% Floor) | | | 3.60% | ^ | | | 03/15/2037 | | | | 8,169,674 | |
4,128,000 | | BX Trust, Series 2017-IMC-D (1 Month LIBOR USD + 2.25%, 2.25% Floor) | | | 4.03% | ^ | | | 10/15/2032 | | | | 4,143,852 | |
6,657,000 | | BX Trust, Series 2017-IMC-E (1 Month LIBOR USD + 3.25%, 3.25% Floor) | | | 5.03% | ^ | | | 10/15/2032 | | | | 6,696,630 | |
3,836,000 | | BX Trust, Series 2017-SLCT-D (1 Month LIBOR USD + 2.05%) | | | 3.83% | ^ | | | 07/15/2034 | | | | 3,849,276 | |
6,308,000 | | BX Trust, Series 2017-SLCT-E (1 Month LIBOR USD + 3.15%) | | | 4.93% | ^ | | | 07/15/2034 | | | | 6,347,550 | |
1,564,000 | | Caesars Palace Las Vegas Trust, Series 2017-VICI-D | | | 4.35% | # ^ | | | 10/15/2034 | | | | 1,588,778 | |
4,617,000 | | Caesars Palace Las Vegas Trust, Series 2017-VICI-E | | | 4.35% | # ^ | | | 10/15/2034 | | | | 4,524,666 | |
509,000 | | CFCRE Commercial Mortgage Trust, Series 2016-C3-D | | | 3.05% | # ^ | | | 01/10/2048 | | | | 385,832 | |
74,166,544 | | CFCRE Commercial Mortgage Trust, Series 2016-C3-XA | |
| 1.07%
| # I/
O | | | 01/10/2048 | | | | 4,757,413 | |
9,279,000 | | CFCRE Commercial Mortgage Trust, Series 2016-C7-A3 | | | 3.84% | | | | 12/10/2054 | | | | 9,433,540 | |
3,214,000 | | CGCMT Commercial Mortgage Trust, Series 2016-SMPL-D | | | 3.52% | ^ | | | 09/10/2031 | | | | 3,176,422 | |
11,498,000 | | CGGS Commercial Mortgage Trust, Series 2018-WSS-D (1 Month LIBOR USD + 2.30%) | | | 4.05% | ^ | | | 02/15/2037 | | | | 11,549,235 | |
7,196,000 | | CHT Mortgage Trust, Series 2017-CSMO-E (1 Month LIBOR USD + 3.00%, 3.00% Floor) | | | 4.78% | ^ | | | 11/15/2036 | | | | 7,254,409 | |
3,838,000 | | CHT Mortgage Trust, Series 2017-CSMO-F (1 Month LIBOR USD + 3.74%, 3.80% Floor) | | | 5.52% | ^ | | | 11/15/2036 | | | | 3,870,521 | |
8,302,953 | | Citigroup Commercial Mortgage Trust, Series 2012-GC8-XA | | | 1.81% | # ^ I/O | | | 09/10/2045 | | | | 513,681 | |
4,234,500 | | Citigroup Commercial Mortgage Trust, Series 2015-GC27-D | | | 4.43% | # ^ | | | 02/10/2048 | | | | 3,608,400 | |
4,138,929 | | Citigroup Commercial Mortgage Trust, Series 2015-GC27-XA | |
| 1.41%
| # I/
O | | | 02/10/2048 | | | | 300,296 | |
5,572,000 | | Citigroup Commercial Mortgage Trust, Series 2015-GC35-C | | | 4.50% | # | | | 11/10/2048 | | | | 5,500,499 | |
73,248,368 | | Citigroup Commercial Mortgage Trust, Series 2015-GC35-XA | |
| 0.89%
| # I/
O | | | 11/10/2048 | | | | 3,300,850 | |
2,605,000 | | Citigroup Commercial Mortgage Trust, Series 2016-GC36-D | | | 2.85% | ^ | | | 02/10/2049 | | | | 2,006,106 | |
45,874,836 | | Citigroup Commercial Mortgage Trust, Series 2016-P3-XA | |
| 1.71%
| # I/
O | | | 04/15/2049 | | | | 4,476,691 | |
8,530,000 | | Citigroup Commercial Mortgage Trust, Series 2016-P4-A4 | | | 2.90% | | | | 07/10/2049 | | | | 8,208,781 | |
58,333,314 | | Citigroup Commercial Mortgage Trust, Series 2016-P4-XA | |
| 2.00%
| # I/
O | | | 07/10/2049 | | | | 6,858,458 | |
83,803,882 | | Citigroup Commercial Mortgage Trust, Series 2016-P5-XA | |
| 1.55%
| # I/
O | | | 10/10/2049 | | | | 7,650,004 | |
6,303,000 | | Citigroup Commercial Mortgage Trust, Series 2016-P6-A5 | | | 3.72% | # | | | 12/10/2049 | | | | 6,417,836 | |
3,224,000 | | CLNS Trust, Series 2017-IKPR-D (1 Month LIBOR USD + 0.00%, 2.05% Floor) | | | 3.79% | ^ | | | 06/11/2032 | | | | 3,235,931 | |
3,224,000 | | CLNS Trust, Series 2017-IKPR-E (1 Month LIBOR USD + 3.50%, 3.50% Floor) | | | 5.24% | ^ | | | 06/11/2032 | | | | 3,249,039 | |
3,224,000 | | CLNS Trust, Series 2017-IKPR-F (1 Month LIBOR USD + 4.50%, 4.50% Floor) | | | 6.24% | ^ | | | 06/11/2032 | | | | 3,255,440 | |
2,301,371 | | COBALT Commercial Mortgage Trust, Series 2007-C2-AJFX | | | 5.57% | # | | | 04/15/2047 | | | | 2,324,229 | |
23,058,495 | | Commercial Mortgage Pass-Through Certificates, Series 2012-CR3-XA | |
| 1.88%
| # I/
O | | | 10/15/2045 | | | | 1,604,618 | |
8,626,000 | | Commercial Mortgage Pass-Through Certificates, Series 2012-CR4-D | | | 4.57% | # ^ | | | 10/15/2045 | | | | 5,099,060 | |
3,760,544 | | Commercial Mortgage Pass-Through Certificates, Series 2012-LC4-XA | | | 2.21% | # ^ I/O | | | 12/10/2044 | | | | 230,885 | |
7,910,000 | | Commercial Mortgage Pass-Through Certificates, Series 2013-CR11-D | | | 5.17% | # ^ | | | 08/10/2050 | | | | 7,458,609 | |
3,500,000 | | Commercial Mortgage Pass-Through Certificates, Series 2014-CR20-C | | | 4.50% | # | | | 11/10/2047 | | | | 3,513,065 | |
5,000,000 | | Commercial Mortgage Pass-Through Certificates, Series 2015-CR23-D | | | 4.25% | # | | | 05/10/2048 | | | | 4,124,367 | |
1,400,000 | | Commercial Mortgage Pass-Through Certificates, Series 2015-CR25-C | | | 4.55% | # | | | 08/10/2048 | | | | 1,404,131 | |
60,700,802 | | Commercial Mortgage Pass-Through Certificates, Series 2015-CR26-XA | |
| 1.04%
| # I/
O | | | 10/10/2048 | | | | 3,355,431 | |
4,310,000 | | Commercial Mortgage Pass-Through Certificates, Series 2015-LC21-C | | | 4.31% | # | | | 07/10/2048 | | | | 4,226,686 | |
5,579,000 | | Commercial Mortgage Pass-Through Certificates, Series 2015-LC23-C | | | 4.65% | # | | | 10/10/2048 | | | | 5,498,335 | |
6,664,000 | | Commercial Mortgage Pass-Through Certificates, Series 2016-CR28-C | | | 4.65% | # | | | 02/10/2049 | | | | 6,863,735 | |
3,786,000 | | Commercial Mortgage Pass-Through Certificates, Series 2016-DC2-C | | | 4.64% | # | | | 02/10/2049 | | | | 3,663,382 | |
59,135,911 | | Commercial Mortgage Pass-Through Certificates, Series 2016-DC2-XA | |
| 1.06%
| # I/
O | | | 02/10/2049 | | | | 3,559,367 | |
9,247,000 | | Commercial Mortgage Pass-Through Certificates, Series 2016-GCT-E | | | 3.46% | # ^ | | | 08/10/2029 | | | | 8,903,491 | |
5,597,000 | | CSAIL Commercial Mortgage Trust, Series 2015-C4-C | | | 4.58% | # | | | 11/15/2048 | | | | 5,598,829 | |
58,648,438 | | CSAIL Commercial Mortgage Trust, Series 2016-C6-XA | |
| 1.81%
| # I/
O | | | 01/15/2049 | | | | 5,883,658 | |
116,547,338 | | CSAIL Commercial Mortgage Trust, Series 2017-C8-XA | |
| 1.26%
| # I/
O | | | 06/15/2050 | | | | 8,932,992 | |
4,944,000 | | CSMC Trust, Series 2017-CHOP-D (1 Month LIBOR USD + 1.90%, 1.90% Floor) | | | 3.68% | ^ | | | 07/15/2032 | | | | 4,957,754 | |
4,944,000 | | CSMC Trust, Series 2017-CHOP-E (1 Month LIBOR USD + 3.30%, 3.30% Floor) | | | 5.08% | ^ | | | 07/15/2032 | | | | 4,964,215 | |
3,076,883 | | DBUBS Mortgage Trust, Series 2011-LC2A-XA | | | 1.11% | # ^ I/O | | | 07/10/2044 | | | | 84,775 | |
61,587,043 | | Deutsche Bank Commercial Mortgage Trust, Series 2016-C1-XA | |
| 1.49%
| # I/
O | | | 05/10/2049 | | | | 5,476,837 | |
4,475,000 | | Deutsche Bank Mortgage Trust, Series 2016-C1-C | | | 3.35% | # | | | 05/10/2049 | | | | 4,177,006 | |
3,547,963 | | FREMF Mortgage Trust, Series 2016-KF22-B (1 Month LIBOR USD + 5.05%, 5.05% Floor) | | | 6.72% | ^ | | | 07/25/2023 | | | | 3,581,758 | |
4,078,000 | | GE Commercial Mortgage Corporation Trust, Series 2007-C1-AM | | | 5.61% | # | | | 12/10/2049 | | | | 4,116,224 | |
5,296,000 | | Great Wolf Trust, Series 2017-WOLF-D (1 Month LIBOR USD + 2.10%, 1.00% Floor) | | | 4.03% | ^ | | | 09/15/2034 | | | | 5,327,741 | |
8,210,000 | | Great Wolf Trust, Series 2017-WOLF-E (1 Month LIBOR USD + 3.10%, 1.00% Floor) | | | 5.03% | ^ | | | 09/15/2034 | | | | 8,284,029 | |
4,370,000 | | Great Wolf Trust, Series 2017-WOLF-F (1 Month LIBOR USD + 4.07%, 1.00% Floor) | | | 6.00% | ^ | | | 09/15/2034 | | | | 4,414,293 | |
2,928,556 | | GS Mortgage Securities Trust, Series 2011-GC5-XA | | | 1.35% | # ^ I/O | | | 08/10/2044 | | | | 104,762 | |
4,880,522 | | GS Mortgage Securities Trust, Series 2012-GC6-XA | | | 1.95% | # ^ I/O | | | 01/10/2045 | | | | 289,884 | |
3,741,000 | | GS Mortgage Securities Trust, Series 2014-GC26-C | | | 4.51% | # | | | 11/10/2047 | | | | 3,713,782 | |
10,957,000 | | GS Mortgage Securities Trust, Series 2014-GC26-D | | | 4.51% | # ^ | | | 11/10/2047 | | | | 9,548,191 | |
98,394,181 | | GS Mortgage Securities Trust, Series 2015-GS1-XA | |
| 0.82%
| # I/
O | | | 11/10/2048 | | | | 4,886,412 | |
61,631,082 | | GS Mortgage Securities Trust, Series 2016-GS2-XA | |
| 1.67%
| # I/
O | | | 05/10/2049 | | | | 5,811,737 | |
118,835,709 | | GS Mortgage Securities Trust, Series 2017-GS7-XA | |
| 1.14%
| # I/
O | | | 08/10/2050 | | | | 9,641,296 | |
10,897,000 | | GS Mortgage Securities Trust, Series 2017-GS8-C | | | 4.34% | # | | | 11/10/2050 | | | | 11,011,329 | |
47,110,027 | | GS Mortgage Securities Trust, Series 2017-GS8-XA | |
| 0.98%
| # I/
O | | | 11/10/2050 | | | | 3,440,742 | |
784,156 | | JP Morgan Chase Commercial Mortgage Securities Corporation,
Series 2006-LDP8-X | |
| 0.29%
| # I/
O | | | 05/15/2045 | | | | 12 | |
1,228,844 | | JP Morgan Chase Commercial Mortgage Securities Corporation,
Series 2006-LDP9-AM | | | 5.37% | | | | 05/15/2047 | | | | 1,237,416 | |
289,444 | | JP Morgan Chase Commercial Mortgage Securities Corporation,
Series 2007-CB18-AMFX | | | 5.40% | | | | 06/12/2047 | | | | 288,810 | |
12,050,000 | | JP Morgan Chase Commercial Mortgage Securities Corporation,
Series 2009-IWST-XB | | | 0.30% | # ^ I/O | | | 12/05/2027 | | | | 74,632 | |
5,905,213 | | JP Morgan Chase Commercial Mortgage Securities Corporation,
Series 2011-C4-XA | | | 1.47% | # ^ I/O | | | 07/15/2046 | | | | 86,168 | |
23,574,454 | | JP Morgan Chase Commercial Mortgage Securities Corporation,
Series 2012-C8-XA | |
| 1.80%
| # I/
O | | | 10/15/2045 | | | | 1,497,001 | |
5,374,571 | | JP Morgan Chase Commercial Mortgage Securities Corporation,
Series 2012-CBX-XA | |
| 1.65%
| # I/
O | | | 06/15/2045 | | | | 235,986 | |
78,687,947 | | JP Morgan Chase Commercial Mortgage Securities Corporation,
Series 2015-JP1-XA | |
| 1.13%
| # I/
O | | | 01/15/2049 | | | | 3,989,628 | |
2,577,000 | | JP Morgan Chase Commercial Mortgage Securities Corporation,
Series 2017-MAUI-C (1 Month LIBOR USD + 1.25%, 1.25% Floor) | | | 2.97% | ^ | | | 07/15/2034 | | | | 2,586,474 | |
2,418,000 | | JP Morgan Chase Commercial Mortgage Securities Corporation,
Series 2017-MAUI-D (1 Month LIBOR USD + 1.95%, 1.95% Floor) | | | 3.67% | ^ | | | 07/15/2034 | | | | 2,432,297 | |
2,141,000 | | JP Morgan Chase Commercial Mortgage Securities Corporation,
Series 2017-MAUI-E (1 Month LIBOR USD + 2.95%, 2.95% Floor) | | | 4.67% | ^ | | | 07/15/2034 | | | | 2,157,975 | |
3,013,000 | | JP Morgan Chase Commercial Mortgage Securities Corporation,
Series 2017-MAUI-F (1 Month LIBOR USD + 3.75%, 3.75% Floor) | | | 5.47% | ^ | | | 07/15/2034 | | | | 3,042,704 | |
1,905,456 | | JP Morgan Chase Commercial Mortgage Securities Trust, Series 2007-LD11-AM | | | 5.95% | # | | | 06/15/2049 | | | | 1,939,075 | |
3,811,452 | | JP Morgan Chase Commercial Mortgage Securities Trust, Series 2007-LDPX-AM | | | 5.46% | # | | | 01/15/2049 | | | | 3,807,519 | |
2,704,000 | | JP Morgan Chase Commercial Mortgage Securities Trust, Series 2016-JP2-B | | | 3.46% | | | | 08/15/2049 | | | | 2,615,826 | |
2,080,000 | | JP Morgan Chase Commercial Mortgage Securities Trust, Series 2016-JP2-C | | | 3.79% | # | | | 08/15/2049 | | | | 1,999,564 | |
59,978,229 | | JP Morgan Chase Commercial Mortgage Securities Trust, Series 2016-JP2-XA | |
| 1.85%
| # I/
O | | | 08/15/2049 | | | | 6,985,802 | |
9,281,000 | | JP Morgan Chase Commercial Mortgage Securities Trust, Series 2016-WIKI-E | | | 4.01% | # ^ | | | 10/05/2031 | | | | 9,041,009 | |
9,287,000 | | JP Morgan Chase Commercial Mortgage Securities Trust, Series 2016-WPT-E (1 Month LIBOR USD + 5.00%) | | | 6.78% | ^ | | | 10/15/2033 | | | | 9,397,135 | |
52,416,302 | | JPMBB Commercial Mortgage Securities Trust, Series 2014-C18-XA | |
| 0.96%
| # I/
O | | | 02/15/2047 | | | | 2,056,637 | |
3,000,000 | | JPMBB Commercial Mortgage Securities Trust, Series 2014-C21-C | | | 4.66% | # | | | 08/15/2047 | | | | 3,008,935 | |
2,766,125 | | JPMBB Commercial Mortgage Securities Trust, Series 2014-C23-C | | | 4.46% | # | | | 09/15/2047 | | | | 2,794,030 | |
3,766,500 | | JPMBB Commercial Mortgage Securities Trust, Series 2014-C25-C | | | 4.45% | # | | | 11/15/2047 | | | | 3,727,425 | |
57,277,013 | | JPMBB Commercial Mortgage Securities Trust, Series 2014-C25-XA | |
| 0.96%
| # I/
O | | | 11/15/2047 | | | | 2,525,401 | |
49,218,832 | | JPMBB Commercial Mortgage Securities Trust, Series 2014-C26-XA | |
| 1.13%
| # I/
O | | | 01/15/2048 | | | | 2,252,638 | |
12,131,110 | | JPMBB Commercial Mortgage Securities Trust, Series 2015-C27-D | | | 3.84% | # ^ | | | 02/15/2048 | | | | 9,744,287 | |
33,876,709 | | JPMBB Commercial Mortgage Securities Trust, Series 2015-C27-XA | |
| 1.35%
| # I/
O | | | 02/15/2048 | | | | 1,931,806 | |
4,500,000 | | JPMBB Commercial Mortgage Securities Trust, Series 2015-C30-B | | | 4.31% | # | | | 07/15/2048 | | | | 4,550,487 | |
50,818,001 | | JPMBB Commercial Mortgage Securities Trust, Series 2015-C31-XA | |
| 0.98%
| # I/
O | | | 08/15/2048 | | | | 2,556,618 | |
4,750,000 | | JPMBB Commercial Mortgage Securities Trust, Series 2015-C32-C | | | 4.67% | # | | | 11/15/2048 | | | | 4,724,430 | |
6,470,000 | | JPMBB Commercial Mortgage Securities Trust, Series 2015-C33-C | | | 4.62% | # | | | 12/15/2048 | | | | 6,550,258 | |
6,122,000 | | JPMBB Commercial Mortgage Securities Trust, Series 2016-C1-C | | | 4.75% | # | | | 03/15/2049 | | | | 6,271,379 | |
63,167,641 | | JPMBB Commercial Mortgage Securities Trust, Series 2016-C2-XA | |
| 1.70%
| # I/
O | | | 06/15/2049 | | | | 5,534,660 | |
632,921 | | LB-UBS Commercial Mortgage Trust, Series 2006-C7-XCL | | | 0.49% | # ^ I/O | | | 11/15/2038 | | | | 717 | |
510,441 | | LB-UBS Commercial Mortgage Trust, Series 2006-C7-XW | | | 0.49% | # ^ I/O | | | 11/15/2038 | | | | 578 | |
5,425,000 | | LSTAR Commercial Mortgage Trust, Series 2016-4-C | | | 4.55% | # ^ | | | 03/10/2049 | | | | 4,879,884 | |
278,853 | | Merrill Lynch Mortgage Trust, Series 2006-C1-AJ | | | 5.43% | # | | | 05/12/2039 | | | | 279,277 | |
2,085,350 | | Morgan Stanley Bank of America Merrill Lynch Trust, Series 2012-C5-XA | | | 1.48% | # ^ I/O | | | 08/15/2045 | | | | 104,472 | |
3,000,000 | | Morgan Stanley Bank of America Merrill Lynch Trust, Series 2014-C18-C | | | 4.49% | # | | | 10/15/2047 | | | | 2,936,788 | |
4,000,000 | | Morgan Stanley Bank of America Merrill Lynch Trust, Series 2014-C19-C | | | 4.00% | | | | 12/15/2047 | | | | 3,844,668 | |
38,493,191 | | Morgan Stanley Bank of America Merrill Lynch Trust, Series 2015-C20-XA | |
| 1.38%
| # I/
O | | | 02/15/2048 | | | | 2,493,735 | |
4,600,000 | | Morgan Stanley Bank of America Merrill Lynch Trust, Series 2015-C25-C | | | 4.53% | # | | | 10/15/2048 | | | | 4,679,643 | |
7,500,000 | | Morgan Stanley Bank of America Merrill Lynch Trust, Series 2015-C26-D | | | 3.06% | ^ | | | 10/15/2048 | | | | 6,046,251 | |
4,674,000 | | Morgan Stanley Bank of America Merrill Lynch Trust, Series 2015-C27-C | | | 4.53% | # | | | 12/15/2047 | | | | 4,468,240 | |
6,710,000 | | Morgan Stanley Bank of America Merrill Lynch Trust, Series 2015-C27-D | | | 3.24% | # ^ | | | 12/15/2047 | | | | 5,032,481 | |
74,682,669 | | Morgan Stanley Bank of America Merrill Lynch Trust, Series 2016-C30-XA | |
| 1.46%
| # I/
O | | | 09/15/2049 | | | | 6,828,498 | |
6,907,000 | | Morgan Stanley Bank of America Merrill Lynch Trust, Series 2016-C32-A4 | | | 3.72% | | | | 12/15/2049 | | | | 7,019,144 | |
3,022,000 | | Morgan Stanley Capital Trust, Series 2017-ASHF-D (1 Month LIBOR USD + 2.20%, 2.20% Floor) | | | 3.98% | ^ | | | 11/15/2034 | | | | 3,038,594 | |
4,533,000 | | Morgan Stanley Capital Trust, Series 2017-ASHF-E (1 Month LIBOR USD + 3.15%, 3.15% Floor) | | | 4.93% | ^ | | | 11/15/2034 | | | | 4,527,950 | |
3,434,000 | | Morgan Stanley Capital Trust, Series 2017-ASHF-F (1 Month LIBOR USD + 4.35%, 4.35% Floor) | | | 6.13% | ^ | | | 11/15/2034 | | | | 3,457,853 | |
856,605 | | Morgan Stanley Capital, Inc., Series 2007-HQ11-AJ | | | 5.51% | # | | | 02/12/2044 | | | | 855,781 | |
56,821 | | Morgan Stanley Capital, Inc., Series 2007-IQ16-AMA | | | 6.12% | # | | | 12/12/2049 | | | | 56,773 | |
10,319,686 | | Morgan Stanley Capital, Inc., Series 2011-C1-XA | | | 0.40% | # ^ I/O | | | 09/15/2047 | | | | 83,666 | |
4,000,000 | | Morgan Stanley Capital, Inc., Series 2014-CPT-G | | | 3.45% | # ^ | | | 07/13/2029 | | | | 3,872,129 | |
4,000,000 | | Morgan Stanley Capital, Inc., Series 2014-MP-D | | | 3.69% | # ^ | | | 08/11/2033 | | | | 3,977,807 | |
91,803,013 | | Morgan Stanley Capital, Inc., Series 2015-UBS8-XA | |
| 0.95%
| # I/
O | | | 12/15/2048 | | | | 5,095,214 | |
5,617,000 | | Morgan Stanley Capital, Inc., Series 2015-XLF2-AFSC (1 Month LIBOR USD + 3.00%, 2.90% Floor) | | | 4.74% | ^ | | | 08/15/2026 | | | | 5,599,136 | |
31,555,369 | | Morgan Stanley Capital, Inc., Series 2016-UB11-XA | |
| 1.66%
| # I/
O | | | 08/15/2049 | | | | 2,932,674 | |
7,347,000 | | Morgan Stanley Capital, Inc., Series 2017-PRME-D (1 Month LIBOR USD + 3.40%, 3.40% Floor) | | | 5.18% | ^ | | | 02/15/2034 | | | | 7,377,644 | |
9,213,000 | | MSCG Trust, Series 2016-SNR-C | | | 5.21% | ^ | | | 11/15/2034 | | | | 9,242,576 | |
3,155,564 | | PFP Ltd., Series 2017-3-A (1 Month LIBOR USD + 1.05%) | | | 2.83% | ^ | | | 01/14/2035 | | | | 3,165,387 | |
2,851,000 | | PFP Ltd., Series 2017-3-AS (1 Month LIBOR USD + 1.30%) | | | 3.08% | ^ | | | 01/14/2035 | | | | 2,872,987 | |
1,639,000 | | PFP Ltd., Series 2017-3-B (1 Month LIBOR USD + 1.75%) | | | 3.53% | ^ | | | 01/14/2035 | | | | 1,649,675 | |
1,710,000 | | PFP Ltd., Series 2017-3-C (1 Month LIBOR USD + 2.50%) | | | 4.28% | ^ | | | 01/14/2035 | | | | 1,722,803 | |
7,620,996 | | RAIT Trust, Series 2017-FL7-A (1 Month LIBOR USD + 0.95%, 0.95% Floor) | | | 2.73% | ^ | | | 06/15/2037 | | | | 7,629,983 | |
2,152,000 | | RAIT Trust, Series 2017-FL7-AS (1 Month LIBOR USD + 1.30%, 1.30% Floor) | | | 3.08% | ^ | | | 06/15/2037 | | | | 2,152,990 | |
54,447,855 | | SG Commercial Mortgage Securities Trust, Series 2016-C5-XA | |
| 2.01%
| # I/
O | | | 10/10/2048 | | | | 6,154,138 | |
1,852,131 | | Sutherland Commercial Mortgage Loans LLC, Series 2015-SBC4-A | | | 4.00% | ^ | | | 06/25/2039 | | | | 1,841,840 | |
123,295 | | TIAA Seasoned Commercial Mortgage Trust, Series 2007-C4-AJ | | | 5.48% | # | | | 08/15/2039 | | | | 123,569 | |
126,954,013 | | UBS Commercial Mortgage Trust, Series 2017-C3-XA | |
| 1.14%
| # I/
O | | | 08/15/2050 | | | | 9,627,926 | |
11,033,000 | | UBS Commercial Mortgage Trust, Series 2017-C6-C | | | 4.45% | # | | | 12/15/2050 | | | | 11,015,042 | |
5,698,000 | | UBS Commercial Mortgage Trust, Series 2018-C8-C | | | 4.71% | # | | | 02/15/2051 | | | | 5,683,729 | |
163,900,000 | | UBS Commercial Mortgage Trust, Series 2018-C9-XA | |
| 1.07%
| # I/
O | | | 03/15/2051 | | | | 11,772,117 | |
11,410,498 | | UBS-Barclays Commercial Mortgage Trust, Series 2012-C3-XA | | | 1.89% | # ^ I/O | | | 08/10/2049 | | | | 783,769 | |
654,784 | | Wachovia Bank Commercial Mortgage Trust, Series 2006-C28-AJ | | | 5.63% | # | | | 10/15/2048 | | | | 662,407 | |
788,265 | | Wachovia Bank Commercial Mortgage Trust, Series 2006-C29-IO | |
| 0.16%
| # I/
O | | | 11/15/2048 | | | | 16 | |
104,943 | | Wachovia Bank Commercial Mortgage Trust, Series 2007-C30-AJ | | | 5.41% | # | | | 12/15/2043 | | | | 106,028 | |
2,806,034 | | Wachovia Bank Commercial Mortgage Trust, Series 2007-C33-AM | | | 6.01% | # | | | 02/15/2051 | | | | 2,881,096 | |
6,750,000 | | Wells Fargo Commercial Mortgage Trust, Series 2014-LC16-D | | | 3.94% | ^ | | | 08/15/2050 | | | | 5,571,151 | |
2,200,000 | | Wells Fargo Commercial Mortgage Trust, Series 2015-C28-C | | | 4.13% | # | | | 05/15/2048 | | | | 2,110,956 | |
5,403,000 | | Wells Fargo Commercial Mortgage Trust, Series 2015-C31-C | | | 4.61% | # | | | 11/15/2048 | | | | 5,491,621 | |
77,411,982 | | Wells Fargo Commercial Mortgage Trust, Series 2015-C31-XA | |
| 1.09%
| # I/
O | | | 11/15/2048 | | | | 4,697,684 | |
4,610,000 | | Wells Fargo Commercial Mortgage Trust, Series 2015-LC22-C | | | 4.54% | # | | | 09/15/2058 | | | | 4,637,362 | |
55,051,906 | | Wells Fargo Commercial Mortgage Trust, Series 2015-NXS1-XA | |
| 1.17%
| # I/
O | | | 05/15/2048 | | | | 2,998,595 | |
4,000,000 | | Wells Fargo Commercial Mortgage Trust, Series 2015-NXS3-C | | | 4.64% | # | | | 09/15/2057 | | | | 3,923,874 | |
5,672,000 | | Wells Fargo Commercial Mortgage Trust, Series 2015-NXS4-C | | | 4.60% | # | | | 12/15/2048 | | | | 5,786,725 | |
5,613,000 | | Wells Fargo Commercial Mortgage Trust, Series 2015-P2-A4 | | | 3.81% | | | | 12/15/2048 | | | | 5,761,624 | |
78,225,442 | | Wells Fargo Commercial Mortgage Trust, Series 2015-P2-XA | |
| 1.02%
| # I/
O | | | 12/15/2048 | | | | 4,217,908 | |
4,650,000 | | Wells Fargo Commercial Mortgage Trust, Series 2016-C32-C | | | 4.72% | # | | | 01/15/2059 | | | | 4,614,335 | |
4,483,000 | | Wells Fargo Commercial Mortgage Trust, Series 2016-C33-C | | | 3.90% | | | | 03/15/2059 | | | | 4,339,806 | |
17,486,813 | | Wells Fargo Commercial Mortgage Trust, Series 2016-LC24-XA | |
| 1.73%
| # I/
O | | | 10/15/2049 | | | | 1,806,424 | |
117,959,538 | | Wells Fargo Commercial Mortgage Trust, Series 2017-C39-XA | |
| 1.15%
| # I/
O | | | 09/15/2050 | | | | 9,441,411 | |
15,049,925 | | WF-RBS Commercial Mortgage Trust, Series 2012-C9-XA | | | 1.91% | # ^ I/O | | | 11/15/2045 | | | | 1,060,004 | |
85,289,988 | | WF-RBS Commercial Mortgage Trust, Series 2014-C21-XA | |
| 1.11%
| # I/
O | | | 08/15/2047 | | | | 4,158,032 | |
54,927,220 | | WF-RBS Commercial Mortgage Trust, Series 2014-C22-XA | |
| 0.90%
| # I/
O | | | 09/15/2057 | | | | 2,256,789 | |
81,510,927 | | WF-RBS Commercial Mortgage Trust, Series 2016-NXS6-XA | |
| 1.65%
| # I/
O | | | 11/15/2049 | | | | 7,595,726 | |
| | | | | | | | | | | | | | |
| Total Non-Agency Commercial Mortgage Backed Obligations (Cost $758,486,089) | | | | | | | | | | | 735,398,757 | |
| | | | | | | | | | | | | | |
| | | |
Non-Agency Residential Collateralized Mortgage Obligations - 8.5% | | | | | | | | | | | | |
10,638,650 | | Adjustable Rate Mortgage Trust, Series 2007-1-4A1 | | | 4.64% | # | | | 03/25/2037 | | | | 9,574,655 | |
68,869 | | Adjustable Rate Mortgage Trust, Series 2007-3-1A1 | | | 4.53% | # ^ | | | 11/25/2037 | | | | 70,997 | |
18,987,431 | | Alternative Loan Trust, Series 2005-49CB-A2 | | | 5.50% | | | | 11/25/2035 | | | | 17,991,358 | |
12,886,950 | | Alternative Loan Trust, Series 2007-OA8-2A1 (1 Month LIBOR USD + 0.18%, 0.18% Floor) | | | 2.05% | | | | 06/25/2047 | | | | 10,252,212 | |
963,307 | | Banc of America Funding Corporation, Series 2005-G-A3 | | | 3.31% | # | | | 10/20/2035 | | | | 961,527 | |
585,260 | | Banc of America Funding Corporation, Series 2006-2-6A2 | | | 5.50% | | | | 03/25/2036 | | | | 577,857 | |
366,119 | | Banc of America Funding Corporation, Series 2006-6-1A2 | | | 6.25% | | | | 08/25/2036 | | | | 355,602 | |
3,586,506 | | Bayview Opportunity Master Fund Trust, Series 2017-RN5-A1 | | | 3.10% | ^ § | | | 08/28/2032 | | | | 3,554,757 | |
14,722,810 | | Bayview Opportunity Master Fund Trust, Series 2017-RN6-A1 | | | 3.10% | ^ § | | | 08/28/2032 | | | | 14,673,814 | |
4,408,905 | | Bayview Opportunity Master Fund Trust, Series 2017-RPL1-A1 | | | 3.10% | ^ § | | | 07/28/2032 | | | | 4,390,993 | |
277,129 | | Bear Stearns Asset Backed Securities Trust, Series 2007-SD1-1A3A | | | 6.50% | | | | 10/25/2036 | | | | 218,098 | |
3,196,951 | | Chase Mortgage Finance Trust, Series 2007-A2-6A4 | | | 3.56% | # | | | 07/25/2037 | | | | 3,102,138 | |
1,397,497 | | Chase Mortgage Finance Trust, Series 2007-S3-2A1 | | | 5.50% | | | | 05/25/2037 | | | | 1,131,821 | |
20,000,000 | | CIM Trust, Series 2016-2RR-B2 | | | 8.15% | # ^ Þ | | | 02/25/2056 | | | | 19,422,640 | |
20,000,000 | | CIM Trust, Series 2016-3RR-B2 | | | 8.33% | # ^ Þ | | | 02/27/2056 | | | | 19,308,992 | |
36,451,370 | | CIM Trust, Series 2017-6-A1 | | | 3.02% | # ^ | | | 06/25/2057 | | | | 35,904,355 | |
84,020 | | Citicorp Mortgage Securities, Inc., Series 2005-1-1A4 | | | 5.50% | | | | 02/25/2035 | | | | 85,731 | |
1,800,000 | | Citicorp Residential Mortgage Securities, Inc., Series 2006-2-A5 | | | 5.52% | ß | | | 09/25/2036 | | | | 1,869,844 | |
276,444 | | Citigroup Mortgage Loan Trust, Inc., Series 2006-WF2-A2C | | | 5.85% | ß | | | 05/25/2036 | | | | 167,243 | |
4,791,194 | | Citigroup Mortgage Loan Trust, Inc., Series 2008-AR4-2A1B | | | 3.86% | # ^ | | | 11/25/2038 | | | | 4,917,674 | |
1,779,354 | | Citigroup Mortgage Loan Trust, Inc., Series 2010-8-5A4 | | | 6.00% | # ^ | | | 11/25/2036 | | | | 1,775,351 | |
9,224,779 | | Citigroup Mortgage Loan Trust, Inc., Series 2010-8-6A4 | | | 6.00% | # ^ | | | 12/25/2036 | | | | 9,143,077 | |
147,881 | | CitiMortgage Alternative Loan Trust, Series 2006-A2-A2 | | | 6.00% | | | | 05/25/2036 | | | | 141,554 | |
73,916 | | CitiMortgage Alternative Loan Trust, Series 2006-A5-3A3 | | | 6.00% | | | | 10/25/2036 | | | | 69,507 | |
156,660 | | CitiMortgage Alternative Loan Trust, Series 2007-A1-1A7 | | | 6.00% | | | | 01/25/2037 | | | | 147,487 | |
9,045,634 | | CitiMortgage Alternative Loan Trust, Series 2007-A5-1A10 | | | 5.75% | | | | 05/25/2037 | | | | 8,598,083 | |
1,643,268 | | Countrywide Alternative Loan Trust, Series 2004-22CB-1A1 | | | 6.00% | | | | 10/25/2034 | | | | 1,699,285 | |
189,670 | | Countrywide Alternative Loan Trust, Series 2005-20CB-1A1 | | | 5.50% | | | | 07/25/2035 | | | | 182,197 | |
246,020 | | Countrywide Alternative Loan Trust, Series 2005-28CB-3A6 | | | 6.00% | | | | 08/25/2035 | | | | 196,153 | |
1,104,721 | | Countrywide Alternative Loan Trust, Series 2005-46CB-A22 | | | 5.25% | | | | 10/25/2035 | | | | 1,058,619 | |
186,300 | | Countrywide Alternative Loan Trust, Series 2005-J10-1A13 (1 Month LIBOR USD + 0.70%, 0.70% Floor, 5.50% Cap) | | | 2.57% | | | | 10/25/2035 | | | | 151,576 | |
392,460 | | Countrywide Alternative Loan Trust, Series 2006-26CB-A9 | | | 6.50% | | | | 09/25/2036 | | | | 331,849 | |
9,958,209 | | Countrywide Alternative Loan Trust, Series 2006-42-1A8 | | | 6.00% | | | | 01/25/2047 | | | | 8,472,848 | |
1,575,359 | | Countrywide Alternative Loan Trust, Series 2007-12T1-A1 | | | 6.00% | | | | 06/25/2037 | | | | 1,271,258 | |
1,611,922 | | Countrywide Alternative Loan Trust, Series 2007-16CB-2A1 (1 Month LIBOR USD + 0.45%, 0.45% Floor, 7.00% Cap) | | | 2.32% | | | | 08/25/2037 | | | | 898,607 | |
466,772 | | Countrywide Alternative Loan Trust, Series 2007-16CB-2A2 (-8 x 1 Month LIBOR USD + 54.58%, 54.58% Floor, 54.58% Cap) | | | 38.99% | I/F | | | 08/25/2037 | | | | 887,991 | |
108,542 | | Countrywide Alternative Loan Trust, Series 2007-17CB-1A10 (-5 x 1 Month LIBOR USD + 29.90%, 29.90% Cap) | | | 21.29% | I/F | | | 08/25/2037 | | | | 160,450 | |
520,955 | | Countrywide Alternative Loan Trust, Series 2007-18CB-2A17 | | | 6.00% | | | | 08/25/2037 | | | | 477,923 | |
2,380,226 | | Countrywide Alternative Loan Trust, Series 2007-23CB-A3 (1 Month LIBOR USD + 0.50%, 0.50% Floor, 7.00% Cap) | | | 2.37% | | | | 09/25/2037 | | | | 1,586,286 | |
2,338,167 | | Countrywide Alternative Loan Trust, Series 2007-23CB-A4 (-1 x 1 Month LIBOR USD + 6.50%, 6.50% Cap) | |
| 4.63%
| I/
F I/O | | | 09/25/2037 | | | | 452,478 | |
761,422 | | Countrywide Alternative Loan Trust, Series 2007-4CB-2A1 | | | 7.00% | | | | 03/25/2037 | | | | 233,235 | |
49,569 | | Countrywide Asset-Backed Certificates, Series 2005-13-AF3 | | | 4.66% | # | | | 04/25/2036 | | | | 45,449 | |
385,863 | | Countrywide Home Loans, Series 2005-28-A7 | | | 5.25% | | | | 01/25/2019 | | | | 341,126 | |
763,327 | | Countrywide Home Loans, Series 2007-10-A5 | | | 6.00% | | | | 07/25/2037 | | | | 648,822 | |
333,711 | | Countrywide Home Loans, Series 2007-15-1A16 | | | 6.25% | | | | 09/25/2037 | | | | 310,532 | |
912,676 | | Countrywide Home Loans, Series 2007-3-A17 | | | 6.00% | | | | 04/25/2037 | | | | 777,866 | |
113,827 | | Credit Suisse First Boston Mortgage Securities Corporation,
Series 2005-10-5A5 | | | 5.50% | | | | 11/25/2035 | | | | 111,663 | |
1,422,125 | | Credit Suisse First Boston Mortgage Securities Corporation,
Series 2005-8-1A3 | | | 5.25% | | | | 09/25/2035 | | | | 1,318,005 | |
4,016,082 | | CSMC Trust, Series 2006-4-6A1 | | | 6.00% | | | | 05/25/2036 | | | | 3,106,963 | |
75,488 | | CSMC Trust, Series 2006-4-7A1 | | | 5.50% | | | | 05/25/2021 | | | | 71,030 | |
89,203 | | CSMC Trust, Series 2007-1-3A1 | | | 6.00% | | | | 02/25/2022 | | | | 51,059 | |
34,025 | | CSMC Trust, Series 2007-2-2A1 | | | 5.00% | | | | 03/25/2037 | | | | 33,809 | |
3,231,018 | | CSMC Trust, Series 2010-4R-3A17 | | | 6.00% | # ^ | | | 06/26/2037 | | | | 3,324,490 | |
8,325,595 | | CSMC Trust, Series 2013-IVR1-A1 | | | 2.50% | # ^ | | | 03/25/2043 | | | | 7,988,017 | |
17,354,591 | | CSMC Trust, Series 2013-IVR4-A11 | | | 3.48% | # ^ | | | 07/27/2043 | | | | 17,335,605 | |
34,890,185 | | CSMC Trust, Series 2014-WIN2-A3 | | | 3.50% | # ^ | | | 10/25/2044 | | | | 34,633,952 | |
16,743,548 | | CSMC Trust, Series 2015-PR2-A1 | | | 4.25% | ^ § | | | 07/26/2055 | | | | 16,528,482 | |
38,243,808 | | CSMC Trust, Series 2015-RPL3-A1 | | | 3.75% | ^ § | | | 12/25/2056 | | | | 38,327,133 | |
11,475,889 | | CSMC Trust, Series 2016-PR1-A1 | | | 5.50% | ^ § | | | 07/25/2056 | | | | 11,287,865 | |
1,135,527 | | Deutsche Mortgage Securities, Inc., Series 2006-PR1-3A1 (-1 x 1 Month LIBOR USD + 12.12%, 12.12% Cap, 12.12% Cap) | |
| 9.64%
| ^ I/
F | | | 04/15/2036 | | | | 1,122,661 | |
169,359 | | Deutsche Mortgage Securities, Inc., Series 2006-PR1-4AI2 (-2 x 1 Month LIBOR USD + 14.60%, 14.60% Cap, 14.61% Cap) | | | 11.21% | ^ I/F | | | 04/15/2036 | | | | 168,062 | |
1,387,360 | | Deutsche Mortgage Securities, Inc., Series 2006-PR1-5AI4 (-1 x 1 Month LIBOR USD + 12.12%, 12.12% Cap, 12.12% Cap) | |
| 9.64%
| ^ I/
F | | | 04/15/2036 | | | | 1,279,171 | |
10,978,777 | | Deutsche Securities, Inc., Series 2005-6-2A1 | | | 5.50% | | | | 12/25/2035 | | | | 9,985,429 | |
392,684 | | First Horizon Alternative Mortgage Securities, Series 2006-FA2-1A5 | | | 6.00% | | | | 05/25/2036 | | | | 311,220 | |
3,654,349 | | First Horizon Alternative Mortgage Securities, Series 2006-FA8-1A1 | | | 6.25% | | | | 02/25/2037 | | | | 3,008,163 | |
89,964 | | First Horizon Alternative Mortgage Securities, Series 2006-RE1-A1 | | | 5.50% | | | | 05/25/2035 | | | | 82,090 | |
8,999,547 | | FirstKey Mortgage Trust, Series 2014-1-A8 | | | 3.50% | # ^ | | | 11/25/2044 | | | | 8,939,124 | |
14,088,959 | | GCAT LLC, Series 2017-2-A1 | | | 3.50% | ^ § | | | 04/25/2047 | | | | 14,030,291 | |
4,304,429 | | GMACM Mortgage Loan Trust, Series 2006-J1-A6 | | | 5.75% | | | | 04/25/2036 | | | | 4,243,611 | |
139,347 | | GSAA Home Equity Trust, Series 2005-7-AF5 | | | 4.61% | ß | | | 05/25/2035 | | | | 140,935 | |
1,385,643 | | GSAA Home Equity Trust, Series 2007-10-A1A | | | 6.00% | | | | 11/25/2037 | | | | 1,208,694 | |
1,323,708 | | GSAA Home Equity Trust, Series 2007-10-A2A | | | 6.50% | | | | 11/25/2037 | | | | 979,920 | |
4,728,767 | | GSR Mortgage Loan Trust, Series 2006-3F-4A1 | | | 6.00% | | | | 03/25/2036 | | | | 4,758,104 | |
559,257 | | GSR Mortgage Loan Trust, Series 2007-1F-2A2 | | | 5.50% | | | | 01/25/2037 | | | | 656,859 | |
36,251,445 | | Impac Secured Assets Trust, Series 2006-5-1A1C (1 Month LIBOR USD + 0.27%, 0.27% Floor, 11.50% Cap) | | | 2.14% | | | | 02/25/2037 | | | | 31,017,867 | |
380,118 | | JP Morgan Alternative Loan Trust, Series 2006-S2-A4 | | | 6.19% | ß | | | 05/25/2036 | | | | 360,686 | |
8,657,339 | | JP Morgan Alternative Loan Trust, Series 2006-S3-A4 | | | 6.31% | ß | | | 08/25/2036 | | | | 8,044,445 | |
503,331 | | JP Morgan Alternative Loan Trust, Series 2006-S3-A6 | | | 6.12% | ß | | | 08/25/2036 | | | | 514,311 | |
479,595 | | JP Morgan Alternative Loan Trust, Series 2006-S4-A6 | | | 5.71% | ß | | | 12/25/2036 | | | | 512,460 | |
300,793 | | JP Morgan Mortgage Trust, Series 2007-S3-1A7 | | | 6.00% | | | | 08/25/2037 | | | | 263,425 | |
1,580,446 | | Lehman Mortgage Trust, Series 2005-1-2A4 | | | 5.50% | | | | 11/25/2035 | | | | 1,543,154 | |
664,181 | | Lehman Mortgage Trust, Series 2006-3-1A5 | | | 6.00% | | | | 07/25/2036 | | | | 528,977 | |
46,420 | | Lehman Mortgage Trust, Series 2006-9-1A19 (-5 x 1 Month LIBOR USD + 30.68%, 30.68% Cap) | | | 22.07% | I/F | | | 01/25/2037 | | | | 62,335 | |
761,157 | | Lehman Mortgage Trust, Series 2007-10-2A1 | | | 6.50% | | | | 01/25/2038 | | | | 575,009 | |
175,685 | | Lehman Mortgage Trust, Series 2007-2-1A1 | | | 5.75% | | | | 02/25/2037 | | | | 159,097 | |
116,902 | | MASTR Alternative Loans Trust, Series 2005-2-3A1 | | | 6.00% | | | | 03/25/2035 | | | | 112,070 | |
45,514 | | MASTR Alternative Loans Trust, Series 2007-1-2A7 | | | 6.00% | | | | 10/25/2036 | | | | 30,839 | |
2,239,803 | | MASTR Asset Securitization Trust, Series 2006-2-1A11 (1 Month LIBOR USD + 6.00%, 6.00% Floor) | | | 6.00% | | | | 06/25/2036 | | | | 2,195,719 | |
22,969 | | Morgan Stanley Mortgage Loan Trust, Series 2004-1-1A1 | | | 5.00% | | | | 11/25/2018 | | | | 24,806 | |
1,100,158 | | Morgan Stanley Mortgage Loan Trust, Series 2005-7-7A4 | | | 5.50% | | | | 11/25/2035 | | | | 1,138,247 | |
3,267,356 | | Morgan Stanley Mortgage Loan Trust, Series 2006-7-3A | | | 5.05% | # | | | 06/25/2036 | | | | 2,884,919 | |
1,595,719 | | Morgan Stanley Re-Remic Trust, Series 2010-R6-5C | | | 5.75% | # ^ | | | 05/26/2037 | | | | 1,541,269 | |
13,956,241 | | New Residential Mortgage Loan Trust, Series 2017-RPL1-A1 | | | 3.60% | ^ § | | | 04/25/2022 | | | | 14,093,738 | |
226,680 | | Nomura Asset Acceptance Corporation, Series 2006-AP1-A2 | | | 5.52% | # | | | 01/25/2036 | | | | 124,851 | |
613,625 | | Nomura Home Equity Loan, Inc., Series 2006-AF1-A2 | | | 5.80% | ß | | | 10/25/2036 | | | | 265,076 | |
1,108,081 | | Nomura Home Equity Loan, Inc., Series 2007-1-1A1 | | | 6.06% | ß | | | 02/25/2037 | | | | 581,323 | |
20,534,445 | | Oak Hill Advisors Residential Loan Trust, Series 2017-NPL1-A1 | | | 3.00% | ^ § | | | 06/25/2057 | | | | 20,465,404 | |
38,050,982 | | Oak Hill Advisors Residential Loan Trust, Series 2017-NPL2-A1 | | | 3.00% | ^ § | | | 07/25/2057 | | | | 37,833,890 | |
62,075 | | Option One Mortgage Loan Trust, Series 2004-3-M3 (1 Month LIBOR USD + 0.98%, 0.65% Floor) | | | 2.85% | | | | 11/25/2034 | | | | 62,676 | |
32,296,232 | | Option One Mortgage Loan Trust, Series 2007-6-1A1 (1 Month LIBOR USD + 0.19%, 0.19% Floor) | | | 2.06% | | | | 07/25/2037 | | | | 27,964,232 | |
83,207 | | PHH Alternative Mortgage Trust, Series 2007-2-4A1 | | | 6.00% | | | | 05/25/2022 | | | | 81,735 | |
10,728,506 | | PR Mortgage Loan Trust, Series 2014-1-APT | | | 5.91% | # ^ | | | 10/25/2049 | | | | 9,540,872 | |
35,101,966 | | Preston Ridge Partners Mortgage Trust, Series 2017-2A-A1 | | | 3.47% | ^ § | | | 09/25/2022 | | | | 35,056,899 | |
18,628,936 | | Pretium Mortgage Credit Partners LLC, Series 2017-NPL2-A1 | | | 3.25% | ^ § | | | 03/28/2057 | | | | 18,567,358 | |
367,768 | | Residential Accredit Loans, Inc., Series 2005-QS14-3A3 | | | 6.00% | | | | 09/25/2035 | | | | 353,865 | |
14,636 | | Residential Accredit Loans, Inc., Series 2005-QS1-A5 | | | 5.50% | | | | 01/25/2035 | | | | 14,687 | |
440,456 | | Residential Accredit Loans, Inc., Series 2006-QS10-A4 | | | 5.75% | | | | 08/25/2036 | | | | 397,202 | |
4,806,247 | | Residential Accredit Loans, Inc., Series 2006-QS10-A9 | | | 6.50% | | | | 08/25/2036 | | | | 4,521,705 | |
4,720,077 | | Residential Accredit Loans, Inc., Series 2006-QS4-A10 | | | 6.00% | | | | 04/25/2036 | | | | 4,357,882 | |
900,318 | | Residential Accredit Loans, Inc., Series 2006-QS6-1A15 | | | 6.00% | | | | 06/25/2036 | | | | 830,057 | |
157,104 | | Residential Accredit Loans, Inc., Series 2006-QS6-2A1 | | | 6.00% | | | | 06/25/2021 | | | | 155,272 | |
1,471,191 | | Residential Accredit Loans, Inc., Series 2007-QS3-A4 | | | 6.25% | | | | 02/25/2037 | | | | 1,322,490 | |
5,373,178 | | Residential Accredit Loans, Inc., Series 2007-QS9-A33 | | | 6.50% | | | | 07/25/2037 | | | | 4,941,297 | |
309,310 | | Residential Asset Mortgage Products, Inc., Series 2005-RS1-AI5 | | | 5.41% | ß | | | 01/25/2035 | | | | 311,277 | |
204,685 | | Residential Asset Securitization Trust, Series 2005-A10-A3 | | | 5.50% | | | | 09/25/2035 | | | | 191,713 | |
306,941 | | Residential Asset Securitization Trust, Series 2005-A11-2A4 | | | 6.00% | | | | 10/25/2035 | | | | 247,742 | |
60,740 | | Residential Asset Securitization Trust, Series 2005-A7-A3 | | | 5.50% | | | | 06/25/2035 | | | | 53,312 | |
1,813,031 | | Residential Asset Securitization Trust, Series 2006-A6-1A1 | | | 6.50% | | | | 07/25/2036 | | | | 1,039,742 | |
152,124 | | Residential Asset Securitization Trust, Series 2006-R1-A1 (-4 x 1 Month LIBOR USD + 28.40%, 28.40% Cap) | | | 20.91% | I/F | | | 01/25/2046 | | | | 223,363 | |
114,475 | | Residential Funding Mortgage Securities Trust, Series 2006-S10-1A2 | | | 6.00% | | | | 10/25/2036 | | | | 109,004 | |
584,871 | | Residential Funding Mortgage Securities Trust, Series 2006-S11-A3 | | | 6.00% | | | | 11/25/2036 | | | | 545,136 | |
1,136,246 | | Residential Funding Mortgage Securities Trust, Series 2007-S2-A4 | | | 6.00% | | | | 02/25/2037 | | | | 1,087,835 | |
780,282 | | Residential Funding Mortgage Securities Trust, Series 2007-S3-1A4 | | | 6.00% | | | | 03/25/2037 | | | | 746,218 | |
42,308,309 | | Securitized Mortgage Asset Loan Trust, Series 2015-1-PC | | | 2.41% | # ^ ¥ | | | 02/25/2054 | | | | 35,739,475 | |
7,769,726 | | Securitized Mortgage Asset Loan Trust, Series 2015-2-PC | | | 0.00% | # ^ ¥ | | | 12/26/2059 | | | | 7,290,707 | |
11,199,025 | | Securitized Mortgage Asset Loan Trust, Series 2015-3-PC | | | 0.00% | # ^ ¥ | | | 10/25/2044 | | | | 10,757,471 | |
6,168,666 | | SGR Residential Mortgage Trust, Series 2016-1-A1 | | | 3.75% | # ^ | | | 11/25/2046 | | | | 6,282,148 | |
26,071,815 | | Shellpoint Co-Originator Trust, Series 2016-1-1A10 | | | 3.50% | # ^ | | | 11/25/2046 | | | | 26,194,457 | |
786,110 | | Structured Asset Securities Corporation, Series 2003-35-1A1 | | | 5.17% | # | | | 12/25/2033 | | | | 809,678 | |
1,167,409 | | Structured Asset Securities Corporation, Series 2005-14-1A1 (1 Month LIBOR USD + 0.30%, 0.30% Floor, 7.25% Cap) | | | 2.17% | | | | 07/25/2035 | | | | 955,229 | |
1,103,685 | | Structured Asset Securities Corporation, Series 2005-16-1A3 | | | 5.50% | | | | 09/25/2035 | | | | 1,106,980 | |
1,431,899 | | Structured Asset Securities Corporation, Series 2005-RF1-A (1 Month LIBOR USD + 0.35%, 0.35% Floor) | | | 1.97% | ^ | | | 03/25/2035 | | | | 1,283,551 | |
1,431,899 | | Structured Asset Securities Corporation, Series 2005-RF1-AIO | | | 5.29% | # ^ I/O | | | 03/25/2035 | | | | 164,005 | |
24,984,108 | | VOLT LLC, Series 2017-NP10-A1 | | | 3.00% | ^ § | | | 10/25/2047 | | | | 24,813,132 | |
21,453,859 | | VOLT LLC, Series 2017-NPL2-A1 | | | 3.50% | ^ § | | | 03/25/2047 | | | | 21,468,456 | |
19,321,303 | | VOLT LLC, Series 2017-NPL3-A1 | | | 3.50% | ^ § | | | 03/25/2047 | | | | 19,372,713 | |
19,424,779 | | VOLT LLC, Series 2017-NPL4-A1 | | | 3.38% | ^ § | | | 04/25/2047 | | | | 19,432,693 | |
11,951,189 | | VOLT LLC, Series 2017-NPL6-A1 | | | 3.25% | ^ § | | | 05/25/2047 | | | | 11,925,523 | |
6,067,854 | | VOLT LLC, Series 2017-NPL8-A1 | | | 3.13% | ^ § | | | 06/25/2047 | | | | 6,051,774 | |
35,427,438 | | VOLT LLC, Series 2017-NPL9-A1 | | | 3.13% | ^ § | | | 09/25/2047 | | | | 35,321,610 | |
138,824 | | Washington Mutual Mortgage Pass-Through Certificates, Series 2005-1-2A | | | 6.00% | | | | 03/25/2035 | | | | 131,000 | |
1,057,684 | | Washington Mutual Mortgage Pass-Through Certificates, Series 2006-1-3A1 | | | 5.75% | | | | 02/25/2036 | | | | 1,013,744 | |
2,620,022 | | Washington Mutual Mortgage Pass-Through Certificates, Series 2006-2-4CB | | | 6.00% | | | | 03/25/2036 | | | | 2,553,226 | |
4,601,612 | | Washington Mutual Mortgage Pass-Through Certificates, Series 2006-8-A6 | | | 4.52% | ß | | | 10/25/2036 | | | | 2,936,061 | |
3,260,863 | | Washington Mutual Mortgage Pass-Through Certificates, Series 2006-AR19-2A (11th District Cost of Funds Index + 1.25%, 1.25% Floor) | | | 2.03% | | | | 01/25/2047 | | | | 3,235,979 | |
2,018,670 | | Washington Mutual Mortgage Pass-Through Certificates, Series 2007-3-A6 | | | 6.00% | | | | 04/25/2037 | | | | 1,962,877 | |
127,829 | | Washington Mutual Mortgage Pass-Through Certificates, Series 2007-5-A11 (-6 x 1 Month LIBOR USD + 39.48%, 39.48% Cap) | | | 28.25% | I/F | | | 06/25/2037 | | | | 216,691 | |
10,669,766 | | Washington Mutual Mortgage Pass-Through Certificates, Series 2007-5-A3 | | | 7.00% | | | | 06/25/2037 | | | | 7,538,798 | |
1,215,866 | | Wells Fargo Alternative Loan Trust, Series 2007-PA5-1A1 | | | 6.25% | | | | 11/25/2037 | | | | 1,184,447 | |
932,681 | | Wells Fargo Mortgage Backed Securities Trust, Series 2005-17-1A1 | | | 5.50% | | | | 01/25/2036 | | | | 922,572 | |
57,864 | | Wells Fargo Mortgage Backed Securities Trust, Series 2005-AR14-A6 | | | 3.46% | # | | | 08/25/2035 | | | | 55,849 | |
75,097 | | Wells Fargo Mortgage Backed Securities Trust, Series 2005-AR16-6A4 | | | 3.49% | # | | | 10/25/2035 | | | | 75,612 | |
343,770 | | Wells Fargo Mortgage Backed Securities Trust, Series 2006-2-3A1 | | | 5.75% | | | | 03/25/2036 | | | | 338,953 | |
997,986 | | Wells Fargo Mortgage Backed Securities Trust, Series 2006-7-2A1 | | | 6.00% | | | | 06/25/2036 | | | | 973,901 | |
822,452 | | Wells Fargo Mortgage Backed Securities Trust, Series 2007-10-1A5 | | | 6.00% | | | | 07/25/2037 | | | | 822,767 | |
1,005,829 | | Wells Fargo Mortgage Backed Securities Trust, Series 2007-10-2A11 | | | 6.00% | | | | 07/25/2037 | | | | 985,756 | |
1,396,398 | | Wells Fargo Mortgage Backed Securities Trust, Series 2007-11-A96 | | | 6.00% | | | | 08/25/2037 | | | | 1,371,908 | |
1,701,680 | | Wells Fargo Mortgage Backed Securities Trust, Series 2007-14-1A1 | | | 6.00% | | | | 10/25/2037 | | | | 1,687,767 | |
401,855 | | Wells Fargo Mortgage Backed Securities Trust, Series 2007-4-A16 | | | 5.50% | | | | 04/25/2037 | | | | 400,568 | |
91,927 | | Wells Fargo Mortgage Backed Securities Trust, Series 2007-7-A1 | | | 6.00% | | | | 06/25/2037 | | | | 91,594 | |
18,013,828 | | WinWater Mortgage Loan Trust, Series 2015-5-A3 | | | 3.50% | # ^ | | | 08/20/2045 | | | | 17,920,940 | |
| | | | | | | | | | | | | | |
| Total Non-Agency Residential Collateralized Mortgage Obligations (Cost $879,140,040) | | | | | | | | | | | 886,612,424 | |
| | | | | | | | | | | | | | |
| | | |
US Corporate Bonds - 12.6% | | | | | | | | | | | | |
11,596,000 | | AbbVie, Inc. | | | 4.70% | | | | 05/14/2045 | | | | 11,983,489 | |
12,868,000 | | Air Lease Corporation | | | 3.75% | | | | 02/01/2022 | | | | 12,990,254 | |
3,415,000 | | AK Steel Corporation | | | 6.38% | | | | 10/15/2025 | | | | 3,235,712 | |
2,522,000 | | Albertson’s Holdings LLC | | | 5.75% | | | | 03/15/2025 | | | | 2,163,372 | |
3,225,000 | | Alliant Holdings Intermediate LLC | | | 8.25% | ^ | | | 08/01/2023 | | | | 3,329,812 | |
9,017,000 | | Ally Financial, Inc. | | | 4.13% | | | | 03/30/2020 | | | | 9,073,356 | |
2,420,000 | | Ally Financial, Inc. | | | 4.25% | | | | 04/15/2021 | | | | 2,441,175 | |
3,585,000 | | Altice US Finance Corporation | | | 5.38% | ^ | | | 07/15/2023 | | | | 3,640,567 | |
3,370,000 | | AMC Merger, Inc. | | | 8.00% | ^ | | | 05/15/2025 | | | | 3,176,225 | |
2,785,000 | | American Axle & Manufacturing, Inc. | | | 6.63% | | | | 10/15/2022 | | | | 2,885,956 | |
2,175,000 | | American Axle & Manufacturing, Inc. | | | 6.25% | | | | 03/15/2026 | | | | 2,163,472 | |
2,100,000 | | American Electric Power Company | | | 3.20% | | | | 11/13/2027 | | | | 2,003,888 | |
27,000,000 | | American Express Credit Corporation | | | 2.50% | | | | 08/01/2022 | | | | 26,062,238 | |
13,032,000 | | American Tower Corporation | | | 3.60% | | | | 01/15/2028 | | | | 12,389,692 | |
6,100,000 | | Anheuser-Busch InBev Finance, Inc. | | | 4.90% | | | | 02/01/2046 | | | | 6,593,086 | |
6,540,000 | | Anheuser-Busch InBev Worldwide, Inc. | | | 4.60% | | | | 04/15/2048 | | | | 6,769,408 | |
5,025,000 | | Anthem, Inc. | | | 2.95% | | | | 12/01/2022 | | | | 4,902,454 | |
6,305,000 | | Applied Materials, Inc. | | | 4.35% | | | | 04/01/2047 | | | | 6,709,966 | |
3,170,000 | | Argos Merger Sub, Inc. | | | 7.13% | ^ | | | 03/15/2023 | | | | 1,814,825 | |
6,690,000 | | Arrow Electronics, Inc. | | | 3.88% | | | | 01/12/2028 | | | | 6,482,684 | |
3,460,000 | | Ascend Learning LLC | | | 6.88% | ^ | | | 08/01/2025 | | | | 3,563,800 | |
4,705,000 | | AssuredPartners, Inc. | | | 7.00% | ^ | | | 08/15/2025 | | | | 4,657,950 | |
20,665,000 | | AT&T, Inc. | | | 5.25% | | | | 03/01/2037 | | | | 21,897,304 | |
13,216,000 | | Athene Global Funding | | | 3.00% | ^ | | | 07/01/2022 | | | | 12,876,220 | |
2,690,000 | | Avantor, Inc. | | | 6.00% | ^ | | | 10/01/2024 | | | | 2,683,275 | |
1,665,000 | | Avantor, Inc. | | | 9.00% | ^ | | | 10/01/2025 | | | | 1,634,822 | |
3,475,000 | | B&G Foods, Inc. | | | 5.25% | | | | 04/01/2025 | | | | 3,244,781 | |
14,025,000 | | Baker Hughes, a GE company, LLC | | | 4.08% | | | | 12/15/2047 | | | | 13,270,156 | |
8,520,000 | | Bank of America Corporation | | | 2.50% | | | | 10/21/2022 | | | | 8,188,123 | |
8,355,000 | | Bank of America Corporation (3 Month LIBOR USD + 1.02%) | | | 2.88% | | | | 04/24/2023 | | | | 8,186,458 | |
2,205,000 | | BAT Capital Corporation (3 Month LIBOR USD + 0.88%) | | | 2.72% | ^ | | | 08/15/2022 | | | | 2,219,574 | |
3,385,000 | | Beacon Escrow Corporation | | | 4.88% | ^ | | | 11/01/2025 | | | | 3,241,137 | |
20,635,000 | | Becton Dickinson and Company | | | 2.89% | | | | 06/06/2022 | | | | 20,034,810 | |
3,345,000 | | BlueLine Rental Finance Corporation | | | 9.25% | ^ | | | 03/15/2024 | | | | 3,594,805 | |
7,742,000 | | Boeing Company | | | 6.88% | | | | 03/15/2039 | | | | 10,919,801 | |
10,208,000 | | Boston Properties LP | | | 4.13% | | | | 05/15/2021 | | | | 10,475,699 | |
750,000 | | Boston Properties LP | | | 3.20% | | | | 01/15/2025 | | | | 724,677 | |
6,470,000 | | Boston Scientific Corporation | | | 4.00% | | | | 03/01/2028 | | | | 6,477,127 | |
3,785,000 | | Boyne USA, Inc. | | | 7.25% | ^ | | | 05/01/2025 | | | | 3,903,281 | |
2,240,000 | | Brand Energy & Infrastructure Services, Inc. | | | 8.50% | ^ | | | 07/15/2025 | | | | 2,346,400 | |
15,160,000 | | Brighthouse Financial, Inc. | | | 3.70% | ^ | | | 06/22/2027 | | | | 14,082,806 | |
3,505,000 | | Builders FirstSource, Inc. | | | 5.63% | ^ | | | 09/01/2024 | | | | 3,535,669 | |
11,594,000 | | Burlington Northern Santa Fe LLC | | | 4.55% | | | | 09/01/2044 | | | | 12,498,065 | |
2,385,000 | | BWAY Holding Company | | | 5.50% | ^ | | | 04/15/2024 | | | | 2,405,869 | |
765,000 | | Calpine Corporation | | | 5.75% | | | | 01/15/2025 | | | | 701,887 | |
8,620,000 | | Capital One Financial Corporation (3 Month LIBOR USD + 0.72%) | | | 2.49% | | | | 01/30/2023 | | | | 8,563,308 | |
1,860,000 | | CB Escrow Corporation | | | 8.00% | ^ | | | 10/15/2025 | | | | 1,741,425 | |
14,005,000 | | Celgene Corporation | | | 4.35% | | | | 11/15/2047 | | | | 13,299,679 | |
2,825,000 | | Cengage Learning, Inc. | | | 9.50% | ^ | | | 06/15/2024 | | | | 2,182,312 | |
3,470,000 | | Centene Corporation | | | 4.75% | | | | 01/15/2025 | | | | 3,391,925 | |
12,706,000 | | Charter Communications Operating LLC | | | 4.91% | | | | 07/23/2025 | | | | 12,996,849 | |
3,565,000 | | Cheniere Energy Partners LP | | | 5.25% | ^ | | | 10/01/2025 | | | | 3,524,894 | |
2,190,000 | | Cincinnati Bell, Inc. | | | 7.00% | ^ | | | 07/15/2024 | | | | 1,971,000 | |
19,670,000 | | Citigroup, Inc. (3 Month LIBOR USD + 1.10%) | | | 2.98% | | | | 05/17/2024 | | | | 19,860,683 | |
3,615,000 | | CNX Midstream Partners LP | | | 6.50% | ^ | | | 03/15/2026 | | | | 3,574,331 | |
1,663,000 | | CommScope, Inc. | | | 5.00% | ^ | | | 06/15/2021 | | | | 1,692,102 | |
1,720,000 | | Constellation Merger Sub, Inc. | | | 8.50% | ^ | | | 09/15/2025 | | | | 1,672,700 | |
12,890,000 | | Corning, Inc. | | | 4.38% | | | | 11/15/2057 | | | | 11,899,656 | |
3,625,000 | | COTY, Inc. | | | 6.50% | ^ | | | 04/15/2026 | | | | 3,652,187 | |
3,385,000 | | CRC Issuer LLC | | | 5.25% | ^ | | | 10/15/2025 | | | | 3,253,594 | |
2,215,000 | | CRH America Finance, Inc. | | | 3.95% | ^ | | | 04/04/2028 | | | | 2,210,978 | |
815,000 | | Crown Castle International Corp. | | | 3.80% | | | | 02/15/2028 | | | | 784,875 | |
12,600,000 | | Crown Castle International Corporation | | | 3.65% | | | | 09/01/2027 | | | | 12,020,948 | |
1,500,000 | | CSI Compressco LP | | | 7.50% | ^ | | | 04/01/2025 | | | | 1,518,750 | |
14,520,000 | | CSX Corporation | | | 3.80% | | | | 11/01/2046 | | | | 13,381,094 | |
12,780,000 | | CVS Health Corporation | | | 5.05% | | | | 03/25/2048 | | | | 13,467,096 | |
1,765,000 | | Dana Financing Ltd. | | | 5.75% | ^ | | | 04/15/2025 | | | | 1,802,506 | |
6,185,000 | | Delta Air Lines, Inc. | | | 3.63% | | | | 03/15/2022 | | | | 6,181,299 | |
16,370,000 | | Discover Financial Services | | | 4.10% | | | | 02/09/2027 | | | | 16,257,831 | |
1,880,000 | | DJO Finance, LLC | | | 8.13% | ^ | | | 06/15/2021 | | | | 1,894,100 | |
3,615,000 | | Duke Energy Corporation | | | 3.75% | | | | 09/01/2046 | | | | 3,285,109 | |
4,915,000 | | Duke Energy Corporation | | | 3.95% | | | | 08/15/2047 | | | | 4,623,697 | |
8,955,000 | | Duke Energy Progress, Inc. | | | 4.15% | | | | 12/01/2044 | | | | 9,199,752 | |
13,690,000 | | eBay, Inc. | | | 2.75% | | | | 01/30/2023 | | | | 13,228,761 | |
13,290,000 | | Edison International | | | 4.13% | | | | 03/15/2028 | | | | 13,392,443 | |
3,305,000 | | Eldorado Resorts, Inc. | | | 6.00% | | | | 04/01/2025 | | | | 3,371,100 | |
2,861,000 | | Embarq Corporation | | | 8.00% | | | | 06/01/2036 | | | | 2,710,797 | |
11,575,000 | | Enable Midstream Partners LP | | | 4.40% | | | | 03/15/2027 | | | | 11,341,911 | |
12,005,000 | | Energy Transfer Partners LP | | | 4.75% | | | | 01/15/2026 | | | | 12,150,640 | |
1,250,000 | | Energy Transfer Partners LP | | | 4.20% | | | | 04/15/2027 | | | | 1,208,190 | |
3,200,000 | | Ensemble S Merger Sub, Inc. | | | 9.00% | ^ | | | 09/30/2023 | | | | 3,376,000 | |
605,000 | | EP Energy LLC | | | 9.38% | ^ | | | 05/01/2024 | | | | 433,331 | |
13,570,000 | | EQT Corporation | | | 3.90% | | | | 10/01/2027 | | | | 13,022,043 | |
3,486,000 | | ESH Hospitality, Inc. | | | 5.25% | ^ | | | 05/01/2025 | | | | 3,399,896 | |
14,245,000 | | Expedia Group, Inc. | | | 3.80% | | | | 02/15/2028 | | | | 13,256,615 | |
1,585,000 | | Exterran Energy Solutions LP | | | 8.13% | ^ | | | 05/01/2025 | | | | 1,684,062 | |
1,860,000 | | Extraction Oil & Gas, Inc. | | | 5.63% | ^ | | | 02/01/2026 | | | | 1,760,025 | |
12,323,000 | | FedEx Corporation | | | 4.75% | | | | 11/15/2045 | | | | 12,900,072 | |
9,960,000 | | Fidelity National Information Services, Inc. | | | 3.63% | | | | 10/15/2020 | | | | 10,089,574 | |
1,670,000 | | First Data Corporation | | | 7.00% | ^ | | | 12/01/2023 | | | | 1,759,762 | |
1,660,000 | | First Data Corporation | | | 5.75% | ^ | | | 01/15/2024 | | | | 1,676,600 | |
3,540,000 | | Flex Acquisition Company, Inc. | | | 6.88% | ^ | | | 01/15/2025 | | | | 3,511,237 | |
10,945,000 | | Ford Motor Company | | | 7.45% | | | | 07/16/2031 | | | | 13,268,957 | |
2,105,000 | | Foresight Energy LLC | | | 11.50% | ^ | | | 04/01/2023 | | | | 1,715,575 | |
915,000 | | Frontier Communications Corporation | | | 8.50% | | | | 04/15/2020 | | | | 923,006 | |
1,060,000 | | Frontier Communications Corporation | | | 8.50% | ^ | | | 04/01/2026 | | | | 1,030,850 | |
3,543,000 | | FTS International, Inc. | | | 6.25% | | | | 05/01/2022 | | | | 3,569,572 | |
1,200,000 | | Gannett Company, Inc. | | | 4.88% | ^ | | | 09/15/2021 | | | | 1,212,000 | |
4,265,000 | | General Motors Financial Company (3 Month LIBOR USD + 0.80%) | | | 2.59% | | | | 08/07/2020 | | | | 4,270,506 | |
11,555,000 | | General Motors Financial Company (3 Month LIBOR USD + 0.99%) | | | 2.69% | | | | 01/05/2023 | | | | 11,618,632 | |
6,205,000 | | General Motors Financial Company | | | 3.95% | | | | 04/13/2024 | | | | 6,157,974 | |
3,225,000 | | Genesys Telecommunications Laboratories, Inc. | | | 10.00% | ^ | | | 11/30/2024 | | | | 3,587,812 | |
14,437,000 | | Georgia-Pacific LLC | | | 3.60% | ^ | | | 03/01/2025 | | | | 14,529,080 | |
435,000 | | GLP Capital LP | | | 5.38% | | | | 04/15/2026 | | | | 442,612 | |
2,620,000 | | Golden Nugget, Inc. | | | 6.75% | ^ | | | 10/15/2024 | | | | 2,646,200 | |
16,480,000 | | Goldman Sachs Group, Inc. (3 Month LIBOR USD + 0.78%) | | | 2.55% | | | | 10/31/2022 | | | | 16,460,268 | |
3,390,000 | | GTT Communications, Inc. | | | 7.88% | ^ | | | 12/31/2024 | | | | 3,415,425 | |
3,715,000 | | Gulfport Energy Corporation | | | 6.38% | | | | 05/15/2025 | | | | 3,589,619 | |
3,630,000 | | Hasbro, Inc. | | | 3.50% | | | | 09/15/2027 | | | | 3,404,466 | |
3,655,000 | | Hess Infrastructure Partners LP | | | 5.63% | ^ | | | 02/15/2026 | | | | 3,609,312 | |
3,415,000 | | Hexion, Inc. | | | 10.38% | ^ | | | 02/01/2022 | | | | 3,321,087 | |
2,545,000 | | Icahn Enterprises Finance Corporation | | | 6.25% | | | | 02/01/2022 | | | | 2,595,900 | |
2,695,000 | | Icahn Enterprises Finance Corporation | | | 6.38% | | | | 12/15/2025 | | | | 2,715,212 | |
2,125,000 | | Indigo Natural Resources LLC | | | 6.88% | ^ | | | 02/15/2026 | | | | 2,013,437 | |
3,320,000 | | Informatica LLC | | | 7.13% | ^ | | | 07/15/2023 | | | | 3,328,300 | |
3,575,000 | | IRB Holding Corporation | | | 6.75% | ^ | | | 02/15/2026 | | | | 3,512,795 | |
1,760,000 | | Iridium Communications, Inc. | | | 10.25% | ^ | | | 04/15/2023 | | | | 1,812,800 | |
1,980,000 | | Jabil, Inc. | | | 3.95% | | | | 01/12/2028 | | | | 1,922,144 | |
1,450,000 | | JBS USA Finance, Inc. | | | 6.75% | ^ | | | 02/15/2028 | | | | 1,393,812 | |
1,730,000 | | Jeld-Wen, Inc. | | | 4.63% | ^ | | | 12/15/2025 | | | | 1,665,125 | |
1,485,000 | | KAR Auction Services, Inc. | | | 5.13% | ^ | | | 06/01/2025 | | | | 1,481,287 | |
2,910,000 | | Kennedy-Wilson, Inc. | | | 5.88% | ^ | | | 04/01/2024 | | | | 2,899,087 | |
13,659,000 | | Kinder Morgan Energy Partners LP | | | 6.95% | | | | 01/15/2038 | | | | 16,554,987 | |
5,703,000 | | Kraft Heinz Foods Company | | | 2.00% | | | | 07/02/2018 | | | | 5,697,645 | |
7,540,000 | | Kraft Heinz Foods Company | | | 2.80% | | | | 07/02/2020 | | | | 7,490,856 | |
2,005,000 | | Kratos Defense & Security Solutions, Inc. | | | 6.50% | ^ | | | 11/30/2025 | | | | 2,077,681 | |
13,715,000 | | Kroger Company | | | 3.40% | | | | 04/15/2022 | | | | 13,651,720 | |
1,382,000 | | Level 3 Communications, Inc. | | | 5.75% | | | | 12/01/2022 | | | | 1,384,598 | |
3,385,000 | | Level 3 Financing, Inc. | | | 5.38% | | | | 01/15/2024 | | | | 3,306,739 | |
15,309,000 | | Liberty Mutual Group, Inc. | | | 6.50% | ^ | | | 05/01/2042 | | | | 19,305,638 | |
1,095,000 | | Live Nation Entertainment, Inc. | | | 5.63% | ^ | | | 03/15/2026 | | | | 1,111,425 | |
11,527,000 | | Lockheed Martin Corporation | | | 4.70% | | | | 05/15/2046 | | | | 12,536,811 | |
3,290,000 | | LTF Merger Sub, Inc. | | | 8.50% | ^ | | | 06/15/2023 | | | | 3,458,612 | |
3,400,000 | | Match Group, Inc. | | | 5.00% | ^ | | | 12/15/2027 | | | | 3,357,500 | |
5,220,000 | | McDonald’s Corporation | | | 4.45% | | | | 03/01/2047 | | | | 5,411,265 | |
50,000 | | Metropolitan Edison Company | | | 4.00% | ^ | | | 04/15/2025 | | | | 50,495 | |
3,765,000 | | MGM Growth Properties LP | | | 4.50% | | | | 01/15/2028 | | | | 3,549,642 | |
13,350,000 | | Morgan Stanley | | | 2.75% | | | | 05/19/2022 | | | | 13,022,868 | |
13,545,000 | | Morgan Stanley (3 Month LIBOR USD + 1.34%) | | | 3.59% | | | | 07/22/2028 | | | | 13,107,933 | |
14,215,000 | | Mosaic Company | | | 4.05% | | | | 11/15/2027 | | | | 13,881,805 | |
1,570,000 | | Moss Creek Resources Holdings, Inc. | | | 7.50% | ^ | | | 01/15/2026 | | | | 1,589,154 | |
4,585,000 | | MPH Acquisition Holdings LLC | | | 7.13% | ^ | | | 06/01/2024 | | | | 4,745,475 | |
3,720,000 | | MPT Operating Partnership LP | | | 5.00% | | | | 10/15/2027 | | | | 3,656,016 | |
6,565,000 | | MUFG Americas Holdings Corporation | | | 2.25% | | | | 02/10/2020 | | | | 6,465,319 | |
2,195,000 | | Nabors Industries, Inc. | | | 5.75% | ^ | | | 02/01/2025 | | | | 2,074,275 | |
7,660,000 | | National Rural Utilities Cooperative Finance Corporation | | | 2.00% | | | | 01/27/2020 | | | | 7,553,058 | |
3,430,000 | | Navient Corporation | | | 6.50% | | | | 06/15/2022 | | | | 3,550,050 | |
13,775,000 | | New York Life Global Funding | | | 2.30% | ^ | | | 06/10/2022 | | | | 13,315,662 | |
11,570,000 | | Newell Brands, Inc. | | | 5.50% | | | | 04/01/2046 | | | | 12,234,459 | |
1,590,000 | | Nexstar Escrow Corporation | | | 5.63% | ^ | | | 08/01/2024 | | | | 1,561,698 | |
6,015,000 | | NextEra Energy Capital Holdings, Inc. | | | 3.55% | | | | 05/01/2027 | | | | 5,852,551 | |
3,300,000 | | NextEra Energy Operating Partners LP | | | 4.50% | ^ | | | 09/15/2027 | | | | 3,122,625 | |
3,375,000 | | NFP Corporation | | | 6.88% | ^ | | | 07/15/2025 | | | | 3,366,562 | |
1,645,000 | | NGL Energy Finance Corporation | | | 7.50% | | | | 11/01/2023 | | | | 1,657,337 | |
875,000 | | Noble Holding International Ltd. | | | 7.88% | ^ | | | 02/01/2026 | | | | 862,969 | |
3,485,000 | | NVA Holdings, Inc. | | | 6.88% | ^ | | | 04/01/2026 | | | | 3,519,850 | |
13,167,000 | | Omnicom Group, Inc. | | | 3.60% | | | | 04/15/2026 | | | | 12,778,156 | |
148,000 | | Oncor Electric Delivery Company LLC | | | 2.95% | | | | 04/01/2025 | | | | 142,831 | |
995,000 | | OPE KAG Finance Sub, Inc. | | | 7.88% | ^ | | | 07/31/2023 | | | | 1,024,850 | |
11,745,000 | | Oracle Corporation | | | 4.13% | | | | 05/15/2045 | | | | 11,848,203 | |
7,005,000 | | Owens Corning | | | 4.40% | | | | 01/30/2048 | | | | 6,483,056 | |
6,355,000 | | Packaging Corporation of America | | | 3.40% | | | | 12/15/2027 | | | | 6,087,369 | |
1,790,000 | | Par Petroleum Finance Corporation | | | 7.75% | ^ | | | 12/15/2025 | | | | 1,798,950 | |
3,430,000 | | Peabody Securities Finance Corporation | | | 6.00% | ^ | | | 03/31/2022 | | | | 3,511,462 | |
6,620,000 | | Penske Truck Leasing Company | | | 4.20% | ^ | | | 04/01/2027 | | | | 6,681,404 | |
475,000 | | PetSmart, Inc. | | | 5.88% | ^ | | | 06/01/2025 | | | | 345,562 | |
4,462,000 | | Phillips 66 | | | 5.88% | | | | 05/01/2042 | | | | 5,372,625 | |
320,000 | | Phillips 66 | | | 4.88% | | | | 11/15/2044 | | | | 341,936 | |
3,600,000 | | Pilgrim’s Pride Corporation | | | 5.75% | ^ | | | 03/15/2025 | | | | 3,505,500 | |
575,000 | | PISCES MIDCO, Inc. | | | 8.00% | ^ | | | 04/15/2026 | | | | 575,000 | |
1,765,000 | | Plastipak Holdings, Inc. | | | 6.25% | ^ | | | 10/15/2025 | | | | 1,769,413 | |
2,865,000 | | Platform Specialty Products Corporation | | | 5.88% | ^ | | | 12/01/2025 | | | | 2,804,119 | |
1,670,000 | | Polaris Intermediate Corporation (PIK 9.25%) | | | 8.50% | ^ | | | 12/01/2022 | | | | 1,707,592 | |
3,215,000 | | Post Holdings, Inc. | | | 5.50% | ^ | | | 03/01/2025 | | | | 3,174,813 | |
2,379,000 | | Prime Security Services Borrower LLC | | | 9.25% | ^ | | | 05/15/2023 | | | | 2,584,189 | |
1,800,000 | | QEP Resources, Inc. | | | 5.25% | | | | 05/01/2023 | | | | 1,741,572 | |
1,800,000 | | QEP Resources, Inc. | | | 5.63% | | | | 03/01/2026 | | | | 1,705,500 | |
1,695,000 | | Radiate Finance, Inc. | | | 6.63% | ^ | | | 02/15/2025 | | | | 1,580,588 | |
13,450,000 | | Republic Services, Inc. | | | 3.38% | | | | 11/15/2027 | | | | 13,004,149 | |
13,525,000 | | Reynolds, Inc. | | | 4.00% | | | | 06/12/2022 | | | | 13,768,233 | |
2,588,000 | | Riverbed Technology, Inc. | | | 8.88% | ^ | | | 03/01/2023 | | | | 2,468,305 | |
6,480,000 | | Royal Caribbean Cruises Ltd. | | | 3.70% | | | | 03/15/2028 | | | | 6,219,943 | |
6,175,000 | | S&P Global, Inc. | | | 4.40% | | | | 02/15/2026 | | | | 6,490,275 | |
16,060,000 | | Sabine Pass Liquefaction LLC | | | 5.00% | | | | 03/15/2027 | | | | 16,686,331 | |
1,830,000 | | Sanchez Energy Corporation | | | 6.13% | | | | 01/15/2023 | | | | 1,343,906 | |
6,000,000 | | SBA Tower Trust | | | 3.17% | ^ | | | 04/11/2022 | | | | 5,944,805 | |
5,025,000 | | Schlumberger Holdings Corporation | | | 2.35% | ^ | | | 12/21/2018 | | | | 5,012,073 | |
3,265,000 | | Select Medical Corporation | | | 6.38% | | | | 06/01/2021 | | | | 3,326,219 | |
2,335,000 | | Sirius XM Radio, Inc. | | | 5.38% | ^ | | | 07/15/2026 | | | | 2,311,650 | |
1,745,000 | | Six Flags Entertainment Corporation | | | 4.88% | ^ | | | 07/31/2024 | | | | 1,703,556 | |
13,206,000 | | Smithfield Foods, Inc. | | | 4.25% | ^ | | | 02/01/2027 | | | | 13,087,146 | |
2,220,000 | | Solera Finance, Inc. | | | 10.50% | ^ | | | 03/01/2024 | | | | 2,480,850 | |
14,121,000 | | Southern Company | | | 2.45% | | | | 09/01/2018 | | | | 14,106,633 | |
5,413,000 | | Southern Company | | | 1.85% | | | | 07/01/2019 | | | | 5,341,488 | |
1,905,000 | | Springleaf Finance Corporation | | | 6.88% | | | | 03/15/2025 | | | | 1,916,906 | |
1,775,000 | | Sprint Capital Corporation | | | 6.88% | | | | 11/15/2028 | | | | 1,661,844 | |
2,610,000 | | Sprint Corporation | | | 7.13% | | | | 06/15/2024 | | | | 2,551,275 | |
6,595,000 | | Sprint Spectrum Company LLC | | | 4.74% | ^ | | | 03/20/2025 | | | | 6,644,463 | |
1,200,000 | | SRC Energy, Inc. | | | 6.25% | ^ | | | 12/01/2025 | | | | 1,209,000 | |
335,000 | | Staples, Inc. | | | 8.50% | ^ | | | 09/15/2025 | | | | 310,712 | |
1,633,000 | | SunCoke Energy Partners Finance Corporation | | | 7.50% | ^ | | | 06/15/2025 | | | | 1,690,155 | |
1,810,000 | | Sunoco LP | | | 5.50% | ^ | | | 02/15/2026 | | | | 1,751,175 | |
10,459,000 | | Synchrony Financial | | | 3.00% | | | | 08/15/2019 | | | | 10,430,096 | |
2,265,000 | | Synchrony Financial | | | 3.95% | | | | 12/01/2027 | | | | 2,144,702 | |
14,180,000 | | Sysco Corporation | | | 3.25% | | | | 07/15/2027 | | | | 13,574,948 | |
2,005,000 | | Tapstone Energy Finance Corporation | | | 9.75% | ^ | | | 06/01/2022 | | | | 1,674,175 | |
3,530,000 | | Team Health Holdings, Inc. | | | 6.38% | ^ | | | 02/01/2025 | | | | 3,044,978 | |
3,565,000 | | Tempo Acquisition Finance Corporation | | | 6.75% | ^ | | | 06/01/2025 | | | | 3,569,456 | |
3,680,000 | | Tempur Sealy International, Inc. | | | 5.50% | | | | 06/15/2026 | | | | 3,551,200 | |
910,000 | | Tenet Healthcare Corporation | | | 8.13% | | | | 04/01/2022 | | | | 952,088 | |
1,710,000 | | Tesla, Inc. | | | 5.30% | ^ | | | 08/15/2025 | | | | 1,498,388 | |
2,730,000 | | THC Escrow Corporation | | | 7.00% | ^ | | | 08/01/2025 | | | | 2,695,875 | |
1,240,000 | | The ServiceMaster Company LLC | | | 5.13% | ^ | | | 11/15/2024 | | | | 1,202,800 | |
11,911,000 | | TIAA Asset Management Finance Company LLC | | | 2.95% | ^ | | | 11/01/2019 | | | | 11,885,064 | |
1,115,000 | | T-Mobile USA, Inc. | | | 4.50% | | | | 02/01/2026 | | | | 1,071,794 | |
3,335,000 | | TransDigm, Inc. | | | 6.38% | | | | 06/15/2026 | | | | 3,368,350 | |
1,635,000 | | TransMontaigne Partners LP | | | 6.13% | | | | 02/15/2026 | | | | 1,647,263 | |
2,628,000 | | Transocean Proteus Ltd. | | | 6.25% | ^ | | | 12/01/2024 | | | | 2,683,845 | |
1,700,000 | | Trident Merger Sub, Inc. | | | 6.63% | ^ | | | 11/01/2025 | | | | 1,661,750 | |
2,395,000 | | Triumph Group, Inc. | | | 7.75% | | | | 08/15/2025 | | | | 2,460,863 | |
2,703,000 | | Universal Hospital Services, Inc. | | | 7.63% | | | | 08/15/2020 | | | | 2,736,788 | |
2,685,000 | | USA Compression Partners LP | | | 6.88% | ^ | | | 04/01/2026 | | | | 2,731,988 | |
1,090,000 | | Valeant Pharmaceuticals International, Inc. | | | 7.00% | ^ | | | 03/15/2024 | | | | 1,140,413 | |
870,000 | | Valeant Pharmaceuticals International, Inc. | | | 5.50% | ^ | | | 11/01/2025 | | | | 850,208 | |
1,825,000 | | Valeant Pharmaceuticals International, Inc. | | | 9.25% | ^ | | | 04/01/2026 | | | | 1,822,719 | |
10,747,000 | | Verizon Communications, Inc. | | | 4.40% | | | | 11/01/2034 | | | | 10,630,968 | |
4,630,000 | | Viking Cruises Ltd. | | | 5.88% | ^ | | | 09/15/2027 | | | | 4,398,500 | |
1,500,000 | | Vine Oil & Gas Finance Corporation | | | 8.75% | ^ | | | 04/15/2023 | | | | 1,402,500 | |
3,025,000 | | Vizient, Inc. | | | 10.38% | ^ | | | 03/01/2024 | | | | 3,365,313 | |
2,215,000 | | Waste Pro, Inc. | | | 5.50% | ^ | | | 02/15/2026 | | | | 2,192,850 | |
1,000,000 | | Weatherford International Ltd. | | | 9.88% | | | | 02/15/2024 | | | | 917,500 | |
165,000 | | Weatherford International Ltd. | | | 9.88% | ^ | | | 03/01/2025 | | | | 149,276 | |
2,415,000 | | WellCare Health Plans, Inc. | | | 5.25% | | | | 04/01/2025 | | | | 2,430,094 | |
8,254,000 | | WellPoint, Inc. | | | 2.30% | | | | 07/15/2018 | | | | 8,247,487 | |
13,740,000 | | WestRock Company | | | 3.75% | ^ | | | 03/15/2025 | | | | 13,721,477 | |
3,570,000 | | Whiting Petroleum Corporation | | | 6.63% | ^ | | | 01/15/2026 | | | | 3,601,238 | |
6,200,000 | | Williams Partners LP | | | 3.75% | | | | 06/15/2027 | | | | 5,934,815 | |
885,000 | | Xerium Technologies, Inc. | | | 9.50% | | | | 08/15/2021 | | | | 913,763 | |
13,056,000 | | Zimmer Holdings, Inc. | | | 2.70% | | | | 04/01/2020 | | | | 12,918,967 | |
| | | | | | | | | | | | | | |
Total US Corporate Bonds (Cost $1,328,649,455) | | | | | | | | | | | 1,308,372,279 | |
| | | | | | | | | | | | | | |
| | | |
US Government and Agency Mortgage Backed Obligations - 15.6% | | | | | | | | | | | | |
788,163 | | Federal Home Loan Mortgage Corporation, Pool G0-1840 | | | 5.00% | | | | 07/01/2035 | | | | 850,053 | |
429,887 | | Federal Home Loan Mortgage Corporation, Pool G0-4817 | | | 5.00% | | | | 09/01/2038 | | | | 463,397 | |
16,476,565 | | Federal Home Loan Mortgage Corporation, Pool G0-8537 | | | 3.00% | | | | 07/01/2043 | | | | 16,175,450 | |
12,310,786 | | Federal Home Loan Mortgage Corporation, Pool G0-8622 | | | 3.00% | | | | 01/01/2045 | | | | 12,057,167 | |
11,293,060 | | Federal Home Loan Mortgage Corporation, Pool G0-8686 | | | 3.00% | | | | 01/01/2046 | | | | 11,023,676 | |
49,532,443 | | Federal Home Loan Mortgage Corporation, Pool G0-8701 | | | 3.00% | | | | 04/01/2046 | | | | 48,351,545 | |
58,453,106 | | Federal Home Loan Mortgage Corporation, Pool G0-8721 | | | 3.00% | | | | 09/01/2046 | | | | 57,058,428 | |
2,769,403 | | Federal Home Loan Mortgage Corporation, Pool N7-0081 | | | 5.50% | | | | 07/01/2038 | | | | 3,056,619 | |
9,599,943 | | Federal Home Loan Mortgage Corporation, Pool Q3-3789 | | | 3.50% | | | | 06/01/2045 | | | | 9,637,443 | |
48,921,022 | | Federal Home Loan Mortgage Corporation, Pool Q5-1461 | | | 3.50% | | | | 10/01/2047 | | | | 49,052,675 | |
3,749,037 | | Federal Home Loan Mortgage Corporation, Pool T6-0854 | | | 3.50% | | | | 09/01/2042 | | | | 3,751,616 | |
631,189 | | Federal Home Loan Mortgage Corporation, Pool U6-0299 | | | 4.00% | | | | 11/01/2040 | | | | 654,196 | |
43,663,927 | | Federal Home Loan Mortgage Corporation, Pool V8-2851 | | | 3.00% | | | | 01/01/2047 | | | | 42,617,621 | |
20,400,441 | | Federal Home Loan Mortgage Corporation, Pool V8-3144 | | | 4.00% | | | | 04/01/2047 | | | | 20,992,851 | |
71,283 | | Federal Home Loan Mortgage Corporation, Series 2692-SC (-2 x 1 Month LIBOR USD + 13.29%, 13.29% Cap) | | | 9.73% I/F | | | | 07/15/2033 | | | | 81,308 | |
2,328,668 | | Federal Home Loan Mortgage Corporation, Series 2722-PS (-1 x 1 Month LIBOR USD + 9.89%, 9.89% Cap) | | | 7.91% I/F | | | | 12/15/2033 | | | | 2,523,863 | |
112,421 | | Federal Home Loan Mortgage Corporation, Series 2750-ZT | | | 5.00% | | | | 02/15/2034 | | | | 120,849 | |
236,463 | | Federal Home Loan Mortgage Corporation, Series 3002-SN (-1 x 1 Month LIBOR USD + 6.50%, 6.50% Cap) | |
| 4.72% I/
F I/O |
| | | 07/15/2035 | | | | 29,067 | |
101,980 | | Federal Home Loan Mortgage Corporation, Series 3045-DI (-1 x 1 Month LIBOR USD + 6.73%, 6.73% Cap) | |
| 4.95% I/
F I/O |
| | | 10/15/2035 | | | | 13,501 | |
21,704,324 | | Federal Home Loan Mortgage Corporation, Series 355-300 | | | 3.00% | | | | 08/15/2047 | | | | 21,300,226 | |
383,418 | | Federal Home Loan Mortgage Corporation, Series 3116-Z | | | 5.50% | | | | 02/15/2036 | | | | 424,177 | |
32,942 | | Federal Home Loan Mortgage Corporation, Series 3117-ZN | | | 4.50% | | | | 02/15/2036 | | | | 34,060 | |
436,057 | | Federal Home Loan Mortgage Corporation, Series 3203-ZC | | | 5.00% | | | | 07/15/2036 | | | | 465,928 | |
133,566 | | Federal Home Loan Mortgage Corporation, Series 3275-SC (-1 x 1 Month LIBOR USD + 6.08%, 6.08% Cap) | |
| 4.30% I/
F I/O |
| | | 02/15/2037 | | | | 15,833 | |
530,338 | | Federal Home Loan Mortgage Corporation, Series 3382-SB (-1 x 1 Month LIBOR USD + 6.00%, 6.00% Cap) | |
| 4.22% I/
F I/O |
| | | 11/15/2037 | | | | 48,739 | |
529,756 | | Federal Home Loan Mortgage Corporation, Series 3384-S (-1 x 1 Month LIBOR USD + 6.39%, 6.39% Cap) | |
| 4.61% I/
F I/O |
| | | 11/15/2037 | | | | 51,723 | |
728,418 | | Federal Home Loan Mortgage Corporation, Series 3417-SX (-1 x 1 Month LIBOR USD + 6.18%, 6.18% Cap) | |
| 4.40% I/
F I/O |
| | | 02/15/2038 | | | | 66,543 | |
65,526 | | Federal Home Loan Mortgage Corporation, Series 3423-GS (-1 x 1 Month LIBOR USD + 5.65%, 5.65% Cap) | |
| 3.87% I/
F I/O |
| | | 03/15/2038 | | | | 5,985 | |
65,526 | | Federal Home Loan Mortgage Corporation, Series 3423-SG (-1 x 1 Month LIBOR USD + 5.65%, 5.65% Cap) | |
| 3.87% I/
F I/O |
| | | 03/15/2038 | | | | 5,187 | |
164,527 | | Federal Home Loan Mortgage Corporation, Series 3524-LB | |
| 3.86% I/
O P/O |
| | | 06/15/2038 | | | | 165,699 | |
184,517 | | Federal Home Loan Mortgage Corporation, Series 3562-WS (-1 x 1 Month LIBOR USD + 4.95%, 4.95% Cap) | |
| 3.17% I/
F I/O |
| | | 08/15/2039 | | | | 11,169 | |
206,094 | | Federal Home Loan Mortgage Corporation, Series 3582-SA (-1 x 1 Month LIBOR USD + 6.00%, 6.00% Cap) | |
| 4.22% I/
F I/O |
| | | 10/15/2049 | | | | 21,317 | |
71,329,472 | | Federal Home Loan Mortgage Corporation, Series 358-300 | | | 3.00% | | | | 10/15/2047 | | | | 69,989,546 | |
540,071 | | Federal Home Loan Mortgage Corporation, Series 3606-CS (-1 x 1 Month LIBOR USD + 6.35%, 6.35% Cap) | |
| 4.57% I/
F I/O |
| | | 12/15/2039 | | | | 80,304 | |
309,844 | | Federal Home Loan Mortgage Corporation, Series 3616-SG (-1 x 1 Month LIBOR USD + 6.35%, 6.35% Cap) | |
| 4.57% I/
F I/O |
| | | 03/15/2032 | | | | 37,737 | |
1,271,148 | | Federal Home Loan Mortgage Corporation, Series 3626-AZ | | | 5.50% | | | | 08/15/2036 | | | | 1,347,573 | |
478,559 | | Federal Home Loan Mortgage Corporation, Series 3666-SC (-1 x 1 Month LIBOR USD + 5.77%, 5.77% Cap) | |
| 3.99% I/
F I/O |
| | | 05/15/2040 | | | | 55,245 | |
325,516 | | Federal Home Loan Mortgage Corporation, Series 3666-VZ | | | 5.50% | | | | 08/15/2036 | | | | 347,295 | |
2,517,969 | | Federal Home Loan Mortgage Corporation, Series 3779-DZ | | | 4.50% | | | | 12/15/2040 | | | | 2,552,861 | |
1,400,000 | | Federal Home Loan Mortgage Corporation, Series 3779-YA | | | 3.50% | | | | 12/15/2030 | | | | 1,428,785 | |
473,984 | | Federal Home Loan Mortgage Corporation, Series 3786-SG (-2 x 1 Month LIBOR USD + 9.50%, 9.50% Cap) | | | 5.95% I/F | | | | 01/15/2041 | | | | 474,547 | |
4,906,417 | | Federal Home Loan Mortgage Corporation, Series 3792-SE (-2 x 1 Month LIBOR USD + 9.86%, 9.86% Cap) | | | 6.31% I/F | | | | 01/15/2041 | | | | 4,734,927 | |
2,662,691 | | Federal Home Loan Mortgage Corporation, Series 3795-VZ | | | 4.00% | | | | 01/15/2041 | | | | 2,745,655 | |
52,467 | | Federal Home Loan Mortgage Corporation, Series 3798-SD (-2 x 1 Month LIBOR USD + 9.60%, 9.60% Cap) | | | 6.05% I/F | | | | 12/15/2040 | | | | 48,365 | |
1,276,051 | | Federal Home Loan Mortgage Corporation, Series 3806-CZ | | | 5.50% | | | | 07/15/2034 | | | | 1,379,417 | |
1,156,635 | | Federal Home Loan Mortgage Corporation, Series 3808-DB | | | 3.50% | | | | 02/15/2031 | | | | 1,161,170 | |
2,400,742 | | Federal Home Loan Mortgage Corporation, Series 3818-CZ | | | 4.50% | | | | 03/15/2041 | | | | 2,547,877 | |
1,416,301 | | Federal Home Loan Mortgage Corporation, Series 3819-ZU | | | 5.50% | | | | 07/15/2034 | | | | 1,513,941 | |
3,736,782 | | Federal Home Loan Mortgage Corporation, Series 3824-EY | | | 3.50% | | | | 03/15/2031 | | | | 3,842,709 | |
251,282 | | Federal Home Loan Mortgage Corporation, Series 3828-SW (-3 x 1 Month LIBOR USD + 13.20%, 13.20% Cap) | | | 7.87% I/F | | | | 02/15/2041 | | | | 281,170 | |
2,202,689 | | Federal Home Loan Mortgage Corporation, Series 3863-ZA | | | 5.50% | | | | 08/15/2034 | | | | 2,340,214 | |
3,254,228 | | Federal Home Loan Mortgage Corporation, Series 3888-ZG | | | 4.00% | | | | 07/15/2041 | | | | 3,383,416 | |
14,092,888 | | Federal Home Loan Mortgage Corporation, Series 3889-VZ | | | 4.00% | | | | 07/15/2041 | | | | 14,608,650 | |
3,018,794 | | Federal Home Loan Mortgage Corporation, Series 3910-GZ | | | 5.00% | | | | 08/15/2041 | | | | 3,346,557 | |
21,980,719 | | Federal Home Loan Mortgage Corporation, Series 3967-ZP | | | 4.00% | | | | 09/15/2041 | | | | 23,099,049 | |
4,790,205 | | Federal Home Loan Mortgage Corporation, Series 3972-AZ | | | 3.50% | | | | 12/15/2041 | | | | 4,714,594 | |
25,162,375 | | Federal Home Loan Mortgage Corporation, Series 4057-ZA | | | 4.00% | | | | 06/15/2042 | | | | 26,368,136 | |
9,081,119 | | Federal Home Loan Mortgage Corporation, Series 4096-DZ | | | 3.50% | | | | 08/15/2042 | | | | 8,924,016 | |
28,490,992 | | Federal Home Loan Mortgage Corporation, Series 4165-ZT | | | 3.00% | | | | 02/15/2043 | | | | 26,109,153 | |
6,815,680 | | Federal Home Loan Mortgage Corporation, Series 4291-MS (-1 x 1 Month LIBOR USD + 5.90%, 5.90% Cap) | |
| 4.12% I/
F I/O |
| | | 01/15/2054 | | | | 999,793 | |
18,474,423 | | Federal Home Loan Mortgage Corporation, Series 4341-AZ | | | 3.00% | | | | 05/15/2044 | | | | 17,114,698 | |
15,349,280 | | Federal Home Loan Mortgage Corporation, Series 4377-A | | | 3.00% | | | | 06/15/2039 | | | | 15,280,345 | |
11,669,202 | | Federal Home Loan Mortgage Corporation, Series 4391-MA | | | 3.00% | | | | 07/15/2040 | | | | 11,607,652 | |
13,482,648 | | Federal Home Loan Mortgage Corporation, Series 4413-AZ | | | 3.50% | | | | 11/15/2044 | | | | 13,174,554 | |
798,440 | | Federal Home Loan Mortgage Corporation, Series 4419-TB | | | 3.00% | | | | 02/15/2040 | | | | 798,123 | |
11,202,865 | | Federal Home Loan Mortgage Corporation, Series 4423-Z | | | 3.50% | | | | 12/15/2044 | | | | 10,955,253 | |
16,092,848 | | Federal Home Loan Mortgage Corporation, Series 4427-MA | | | 3.00% | | | | 02/15/2034 | | | | 16,113,669 | |
24,745,648 | | Federal Home Loan Mortgage Corporation, Series 4471-BA | | | 3.00% | | | | 12/15/2041 | | | | 24,237,009 | |
35,593,699 | | Federal Home Loan Mortgage Corporation, Series 4471-GA | | | 3.00% | | | | 02/15/2044 | | | | 35,290,654 | |
21,642,559 | | Federal Home Loan Mortgage Corporation, Series 4481-B | | | 3.00% | | | | 12/15/2042 | | | | 21,274,906 | |
13,048,108 | | Federal Home Loan Mortgage Corporation, Series 4511-QA | | | 3.00% | | | | 01/15/2041 | | | | 12,978,697 | |
58,103,772 | | Federal Home Loan Mortgage Corporation, Series 4542-AC | | | 2.70% | | | | 01/15/2045 | | | | 56,255,828 | |
99,090,631 | | Federal Home Loan Mortgage Corporation, Series 4750-PA | | | 3.00% | | | | 07/15/2046 | | | | 98,372,491 | |
74,240,935 | | Federal Home Loan Mortgage Corporation, Series 4752-PL | | | 3.00% | | | | 09/15/2046 | | | | 73,640,623 | |
37,288,547 | | Federal Home Loan Mortgage Corporation, Series 4768-CA | | | 3.50% | | | | 03/15/2044 | | | | 37,614,017 | |
4,781,000 | | Federal Home Loan Mortgage Corporation, Series K050-A2 | | | 3.33% | # | | | 08/25/2025 | | | | 4,861,764 | |
6,528,000 | | Federal Home Loan Mortgage Corporation, Series K053-A2 | | | 3.00% | | | | 12/25/2025 | | | | 6,484,242 | |
494,823 | | Federal Home Loan Mortgage Corporation, Series R003-ZA | | | 5.50% | | | | 10/15/2035 | | | | 537,267 | |
6,720,000 | | Federal Home Loan Mortgage Corporation Pass-Thru, Series K054-A2 | | | 2.75% | | | | 01/25/2026 | | | | 6,555,414 | |
105,505,649 | | Federal Home Loan Mortgage Corporation Pass-Thru, Series K722-X1 | |
| 1.31%
| # I/
O | | | 03/25/2023 | | | | 5,565,201 | |
16,842,148 | | Federal National Mortgage Association, Pool AL9238 | | | 3.00% | | | | 10/01/2041 | | | | 16,567,479 | |
47,616,830 | | Federal National Mortgage Association, Pool AS7661 | | | 3.00% | | | | 08/01/2046 | | | | 46,148,653 | |
9,801,520 | | Federal National Mortgage Association, Pool AS7724 | | | 2.50% | | | | 08/01/2046 | | | | 9,237,431 | |
38,940,847 | | Federal National Mortgage Association, Pool AS8522 | | | 3.00% | | | | 12/01/2046 | | | | 37,993,081 | |
23,095,278 | | Federal National Mortgage Association, Pool BC9081 | | | 3.00% | | | | 12/01/2046 | | | | 22,533,168 | |
22,339,267 | | Federal National Mortgage Association, Pool BD8013 | | | 2.50% | | | | 09/01/2046 | | | | 21,054,023 | |
17,108,869 | | Federal National Mortgage Association, Pool MA2621 | | | 3.50% | | | | 05/01/2046 | | | | 17,065,578 | |
28,354,949 | | Federal National Mortgage Association, Pool MA2649 | | | 3.00% | | | | 06/01/2046 | | | | 27,481,230 | |
63,845,340 | | Federal National Mortgage Association, Pool MA2737 | | | 3.00% | | | | 09/01/2046 | | | | 62,293,140 | |
6,659,130 | | Federal National Mortgage Association, Pool MA2863 | | | 3.00% | | | | 01/01/2047 | | | | 6,502,646 | |
5,965 | | Federal National Mortgage Association, Series 2003-117-KS (-1 x 1 Month LIBOR USD + 7.10%, 7.10% Cap) | | | 5.23% I/F I/O | | | | 08/25/2033 | | | | 34 | |
340,754 | | Federal National Mortgage Association, Series 2003-W17-1A7 | | | 5.75% | | | | 08/25/2033 | | | | 372,282 | |
2,565,257 | | Federal National Mortgage Association, Series 2005-20-QH | | | 5.00% | | | | 03/25/2035 | | | | 2,722,195 | |
449,069 | | Federal National Mortgage Association, Series 2006-101-SA (-1 x 1 Month LIBOR USD + 6.58%, 6.58% Cap) | | | 4.71% I/F I/O | | | | 10/25/2036 | | | | 76,532 | |
196,021 | | Federal National Mortgage Association, Series 2006-56-SM (-1 x 1 Month LIBOR USD + 6.75%, 6.75% Cap) | | | 4.88% I/F I/O | | | | 07/25/2036 | | | | 26,061 | |
144,918 | | Federal National Mortgage Association, Series 2007-116-BI (-1 x 1 Month LIBOR USD + 6.25%, 6.25% Cap) | | | 4.38% I/F I/O | | | | 05/25/2037 | | | | 17,189 | |
1,820,718 | | Federal National Mortgage Association, Series 2007-30-FS (-5 x 1 Month LIBOR USD + 29.83%, 29.83% Cap) | |
| 21.16% I/
F |
| | | 04/25/2037 | | | | 2,498,870 | |
707,955 | | Federal National Mortgage Association, Series 2007-30-OI (-1 x 1 Month LIBOR USD + 6.44%, 6.44% Cap) | | | 4.57% I/F I/O | | | | 04/25/2037 | | | | 118,997 | |
126,501 | | Federal National Mortgage Association, Series 2008-29-ZA | | | 4.50% | | | | 04/25/2038 | | | | 132,761 | |
76,554 | | Federal National Mortgage Association, Series 2008-62-SC (-1 x 1 Month LIBOR USD + 6.00%, 6.00% Cap) | | | 4.13% I/F I/O | | | | 07/25/2038 | | | | 7,145 | |
717,020 | | Federal National Mortgage Association, Series 2009-111-EZ | | | 5.00% | | | | 01/25/2040 | | | | 736,461 | |
28,478 | | Federal National Mortgage Association, Series 2009-111-SE (-1 x 1 Month LIBOR USD + 6.25%, 6.25% Cap) | | | 4.38% I/F I/O | | | | 01/25/2040 | | | | 3,019 | |
83,058 | | Federal National Mortgage Association, Series 2009-16-MZ | | | 5.00% | | | | 03/25/2029 | | | | 88,963 | |
89,924 | | Federal National Mortgage Association, Series 2009-48-WS (-1 x 1 Month LIBOR USD + 5.95%, 5.95% Cap) | | | 4.08% I/F I/O | | | | 07/25/2039 | | | | 9,194 | |
370,900 | | Federal National Mortgage Association, Series 2009-62-PS (-1 x 1 Month LIBOR USD + 6.10%, 6.10% Cap) | | | 4.23% I/F I/O | | | | 08/25/2039 | | | | 29,754 | |
1,312,486 | | Federal National Mortgage Association, Series 2009-77-ZA | | | 4.50% | | | | 10/25/2039 | | | | 1,377,060 | |
298,404 | | Federal National Mortgage Association, Series 2009-83-Z | | | 4.50% | | | | 10/25/2039 | | | | 307,886 | |
134,746 | | Federal National Mortgage Association, Series 2010-101-ZH | | | 4.50% | | | | 07/25/2040 | | | | 139,717 | |
55,491 | | Federal National Mortgage Association, Series 2010-109-BS (-11 x 1 Month LIBOR USD + 55.00%, 55.00% Cap) | | | 36.69% I/F | | | | 10/25/2040 | | | | 178,649 | |
503,101 | | Federal National Mortgage Association, Series 2010-112-ZA | | | 4.00% | | | | 10/25/2040 | | | | 506,985 | |
309,334 | | Federal National Mortgage Association, Series 2010-121-SD (-1 x 1 Month LIBOR USD + 4.50%, 4.50% Cap) | | | 2.63% I/F I/O | | | | 10/25/2040 | | | | 23,390 | |
29,336 | | Federal National Mortgage Association, Series 2010-137-VS (-3 x 1 Month LIBOR USD + 15.00%, 15.00% Cap) | | | 10.01% I/F | | | | 12/25/2040 | | | | 36,124 | |
2,368,758 | | Federal National Mortgage Association, Series 2010-150-ZA | | | 4.00% | | | | 01/25/2041 | | | | 2,392,351 | |
64,724 | | Federal National Mortgage Association, Series 2010-31-SA (-1 x 1 Month LIBOR USD + 5.00%, 5.00% Cap) | | | 3.13% I/F I/O | | | | 04/25/2040 | | | | 4,497 | |
107,527 | | Federal National Mortgage Association, Series 2010-34-PS (-1 x 1 Month LIBOR USD + 4.93%, 4.93% Cap) | | | 3.06% I/F I/O | | | | 04/25/2040 | | | | 9,693 | |
214,620 | | Federal National Mortgage Association, Series 2010-35-SP (-1 x 1 Month LIBOR USD + 6.35%, 6.35% Cap) | | | 4.48% I/F I/O | | | | 04/25/2050 | | | | 25,726 | |
59,212 | | Federal National Mortgage Association, Series 2010-35-SV (-1 x 1 Month LIBOR USD + 6.45%, 6.45% Cap) | | | 4.58% I/F I/O | | | | 04/25/2040 | | | | 5,134 | |
2,308,043 | | Federal National Mortgage Association, Series 2010-37-MY | | | 4.50% | | | | 04/25/2040 | | | | 2,396,422 | |
135,769 | | Federal National Mortgage Association, Series 2010-59-PS (-1 x 1 Month LIBOR USD + 6.45%, 6.45% Cap) | | | 4.58% I/F I/O | | | | 03/25/2039 | | | | 8,256 | |
288,082 | | Federal National Mortgage Association, Series 2010-59-SC (-1 x 1 Month LIBOR USD + 5.00%, 5.00% Cap) | | | 3.13% I/F I/O | | | | 01/25/2040 | | | | 25,119 | |
1,043,149 | | Federal National Mortgage Association, Series 2010-60-VZ | | | 5.00% | | | | 10/25/2039 | | | | 1,059,161 | |
256,996 | | Federal National Mortgage Association, Series 2010-64-EZ | | | 5.00% | | | | 06/25/2040 | | | | 274,620 | |
525,665 | | Federal National Mortgage Association, Series 2010-7-PE | | | 5.00% | | | | 02/25/2040 | | | | 559,720 | |
223,351 | | Federal National Mortgage Association, Series 2010-90-GS (-1 x 1 Month LIBOR USD + 6.00%, 6.00% Cap) | | | 4.13% I/F I/O | | | | 08/25/2040 | | | | 25,715 | |
57,791 | | Federal National Mortgage Association, Series 2010-99-SG (-5 x 1 Month LIBOR USD + 25.00%, 25.00% Cap) | | | 16.68% I/F | | | | 09/25/2040 | | | | 83,634 | |
6,716,107 | | Federal National Mortgage Association, Series 2011-141-PZ | | | 4.00% | | | | 01/25/2042 | | | | 6,869,791 | |
16,719,220 | | Federal National Mortgage Association, Series 2011-18-UZ | | | 4.00% | | | | 03/25/2041 | | | | 17,574,699 | |
1,533,918 | | Federal National Mortgage Association, Series 2011-25-KY | | | 3.00% | | | | 04/25/2026 | | | | 1,543,694 | |
1,000,000 | | Federal National Mortgage Association, Series 2011-29-AL | | | 3.50% | | | | 04/25/2031 | | | | 998,372 | |
1,349,676 | | Federal National Mortgage Association, Series 2011-59-MA | | | 4.50% | | | | 07/25/2041 | | | | 1,409,810 | |
24,853,918 | | Federal National Mortgage Association, Series 2013-45-LZ | | | 3.00% | | | | 05/25/2043 | | | | 23,305,052 | |
31,914,007 | | Federal National Mortgage Association, Series 2013-6-ZB | | | 3.00% | | | | 02/25/2043 | | | | 29,258,117 | |
10,837,134 | | Federal National Mortgage Association, Series 2014-55-MA | | | 3.00% | | | | 10/25/2039 | | | | 10,838,586 | |
25,571,246 | | Federal National Mortgage Association, Series 2014-70-VZ | | | 3.00% | | | | 11/25/2044 | | | | 23,552,659 | |
8,559,642 | | Federal National Mortgage Association, Series 2014-73-CZ | | | 3.00% | | | | 11/25/2044 | | | | 7,864,311 | |
26,356,695 | | Federal National Mortgage Association, Series 2015-9-HA | | | 3.00% | | | | 01/25/2045 | | | | 26,233,541 | |
6,348,000 | | Federal National Mortgage Association, Series 2016-M3-A2 | | | 2.70% | | | | 02/25/2026 | | | | 6,162,054 | |
3,883,207 | | Federal National Mortgage Association, Series 2017-86-MA | | | 3.00% | | | | 04/25/2046 | | | | 3,852,927 | |
100,000,000 | | Federal National Mortgage Association, Series 2018-21-PO | | | 0.00% P/O | | | | 04/25/2048 | | | | 79,437,500 | |
348,829 | | Federal National Mortgage Association, Series 400-S4 (-1 x 1 Month LIBOR USD + 5.45%, 5.45% Cap) | | | 3.58% I/F I/O | | | | 11/25/2039 | | | | 43,248 | |
153,955 | | Federal National Mortgage Association Pass-Thru, Pool 555743 | | | 5.00% | | | | 09/01/2033 | | | | 166,299 | |
133,496 | | Federal National Mortgage Association Pass-Thru, Pool 735382 | | | 5.00% | | | | 04/01/2035 | | | | 144,160 | |
1,047,790 | | Federal National Mortgage Association Pass-Thru, Pool 735383 | | | 5.00% | | | | 04/01/2035 | | | | 1,131,629 | |
540,893 | | Federal National Mortgage Association Pass-Thru, Pool 735402 | | | 5.00% | | | | 04/01/2035 | | | | 584,114 | |
777,322 | | Federal National Mortgage Association Pass-Thru, Pool 735484 | | | 5.00% | | | | 05/01/2035 | | | | 839,499 | |
138,118 | | Federal National Mortgage Association Pass-Thru, Pool 931104 | | | 5.00% | | | | 05/01/2039 | | | | 146,966 | |
908,236 | | Federal National Mortgage Association Pass-Thru, Pool 995203 | | | 5.00% | | | | 07/01/2035 | | | | 980,901 | |
855,779 | | Federal National Mortgage Association Pass-Thru, Pool AB2123 | | | 4.00% | | | | 01/01/2031 | | | | 884,772 | |
45,960 | | Federal National Mortgage Association Pass-Thru, Pool AB2370 | | | 4.50% | | | | 09/01/2035 | | | | 47,425 | |
26,121 | | Federal National Mortgage Association Pass-Thru, Pool AD2177 | | | 4.50% | | | | 06/01/2030 | | | | 27,451 | |
1,309,272 | | Federal National Mortgage Association Pass-Thru, Pool AH7309 | | | 4.00% | | | | 02/01/2031 | | | | 1,353,616 | |
29,731,097 | | Federal National Mortgage Association Pass-Thru, Pool AS4645 | | | 3.00% | | | | 03/01/2045 | | | | 29,107,643 | |
12,981,293 | | Federal National Mortgage Association Pass-Thru, Pool BC0785 | | | 3.50% | | | | 04/01/2046 | | | | 13,032,002 | |
662,273 | | Federal National Mortgage Association Pass-Thru, Pool MA0264 | | | 4.50% | | | | 12/01/2029 | | | | 695,802 | |
40,904 | | Federal National Mortgage Association Pass-Thru, Pool MA0282 | | | 5.00% | | | | 12/01/2039 | | | | 43,845 | |
457,235 | | Federal National Mortgage Association Pass-Thru, Pool MA0353 | | | 4.50% | | | | 03/01/2030 | | | | 480,478 | |
25,299 | | Federal National Mortgage Association Pass-Thru, Pool MA0468 | | | 5.00% | | | | 07/01/2040 | | | | 26,380 | |
14,358,100 | | Federal National Mortgage Association Pass-Thru, Pool MA2151 | | | 3.50% | | | | 01/01/2045 | | | | 14,321,772 | |
10,201,973 | | Federal National Mortgage Association Pass-Thru, Pool MA2248 | | | 3.00% | | | | 04/01/2045 | | | | 9,893,907 | |
340,423 | | Government National Mortgage Association, Pool 752494C | | | 5.50% | | | | 09/20/2039 | | | | 364,508 | |
271,875 | | Government National Mortgage Association, Series 2003-67-SP (-1 x 1 Month LIBOR USD + 7.10%, 7.10% Cap) | | | 5.28% I/F I/O | | | | 08/20/2033 | | | | 44,639 | |
150,778 | | Government National Mortgage Association, Series 2008-82-SM (-1 x 1 Month LIBOR USD + 6.05%, 6.05% Cap) | | | 4.23% I/F I/O | | | | 09/20/2038 | | | | 19,194 | |
2,142,452 | | Government National Mortgage Association, Series 2009-32-ZE | | | 4.50% | | | | 05/16/2039 | | | | 2,257,156 | |
2,378,793 | | Government National Mortgage Association, Series 2009-35-DZ | | | 4.50% | | | | 05/20/2039 | | | | 2,510,428 | |
2,499,022 | | Government National Mortgage Association, Series 2009-75-GZ | | | 4.50% | | | | 09/20/2039 | | | | 2,592,735 | |
3,021,525 | | Government National Mortgage Association, Series 2009-75-HZ | | | 5.00% | | | | 09/20/2039 | | | | 3,192,426 | |
7,787,834 | | Government National Mortgage Association, Series 2010-113-SM (-1 x 1 Month LIBOR USD + 6.05%, 6.05% Cap) | | | 4.23% I/F I/O | | | | 09/20/2040 | | | | 1,070,368 | |
127,522 | | Government National Mortgage Association, Series 2010-25-ZB | | | 4.50% | | | | 02/16/2040 | | | | 134,358 | |
4,671,886 | | Government National Mortgage Association, Series 2011-45-GZ | | | 4.50% | | | | 03/20/2041 | | | | 4,825,417 | |
7,310,799 | | Government National Mortgage Association, Series 2011-70-WS (-2 x 1 Month LIBOR USD + 9.70%, 9.70% Cap) | | | 6.06% I/F | | | | 12/20/2040 | | | | 7,468,884 | |
13,017,024 | | Government National Mortgage Association, Series 2011-71-ZA | | | 4.50% | | | | 02/20/2041 | | | | 13,556,178 | |
14,816,234 | | Government National Mortgage Association, Series 2013-117-MS (-1 x 1 Month LIBOR USD + 6.15%, 6.15% Cap) | | | 4.33% I/F I/O | | | | 02/20/2043 | | | | 1,677,184 | |
7,002,628 | | Government National Mortgage Association, Series 2013-122-SB (-1 x 1 Month LIBOR USD + 6.10%, 6.10% Cap) | | | 4.31% I/F I/O | | | | 08/16/2043 | | | | 1,039,012 | |
31,662,429 | | Government National Mortgage Association, Series 2013-169-SE (-1 x 1 Month LIBOR USD + 6.05%, 6.05% Cap) | | | 4.26% I/F I/O | | | | 11/16/2043 | | | | 3,903,452 | |
10,941,275 | | Government National Mortgage Association, Series 2014-102-TS (-1 x 1 Month LIBOR USD + 5.60%, 5.60% Cap) | | | 3.78% I/F I/O | | | | 07/20/2044 | | | | 1,219,993 | |
8,672,542 | | Government National Mortgage Association, Series 2014-118-PS (-1 x 1 Month LIBOR USD + 6.20%, 6.20% Cap) | | | 4.38% I/F I/O | | | | 08/20/2044 | | | | 1,319,134 | |
7,588,474 | | Government National Mortgage Association, Series 2014-118-SA (-1 x 1 Month LIBOR USD + 6.20%, 6.20% Cap) | | | 4.38% I/F I/O | | | | 08/20/2044 | | | | 1,022,493 | |
| | | | | | | | | | | | | | |
Total US Government and Agency Mortgage Backed Obligations (Cost $1,645,722,953) | | | | | | | | | | | 1,622,529,346 | |
| | | | | | | | | | | | | | |
| | | |
US Government and Agency Obligations - 22.2% | | | | | | | | | | | | |
142,587,479 | | United States Treasury Inflation Indexed Bonds | | | 0.13% | | | | 04/15/2022 | | | | 140,545,368 | |
47,928,144 | | United States Treasury Inflation Indexed Bonds | | | 0.38% | | | | 07/15/2027 | | | | 46,727,137 | |
100,150,000 | | United States Treasury Notes | | | 2.75% | | | | 11/15/2042 | | | | 96,497,149 | |
45,500,000 | | United States Treasury Notes | | | 3.38% | | | | 05/15/2044 | | | | 48,843,907 | |
139,900,000 | | United States Treasury Notes | | | 2.88% | | | | 08/15/2045 | | | | 137,126,691 | |
83,900,000 | | United States Treasury Notes | | | 2.88% | | | | 11/15/2046 | | | | 82,121,115 | |
9,050,000 | | United States Treasury Notes | | | 0.75% | | | | 08/31/2018 | | | | 9,007,936 | |
141,100,000 | | United States Treasury Notes | | | 1.13% | | | | 01/15/2019 | | | | 140,047,261 | |
22,400,000 | | United States Treasury Notes | | | 1.13% | | | | 01/31/2019 | | | | 22,223,326 | |
145,700,000 | | United States Treasury Notes | | | 0.75% | | | | 02/15/2019 | | | | 144,005,003 | |
116,600,000 | | United States Treasury Notes | | | 2.00% | | | | 05/31/2021 | | | | 115,072,765 | |
133,000,000 | | United States Treasury Notes | | | 1.13% | | | | 06/30/2021 | | | | 127,579,453 | |
120,800,000 | | United States Treasury Notes | | | 1.25% | | | | 10/31/2021 | | | | 115,765,887 | |
118,200,000 | | United States Treasury Notes | | | 1.75% | | | | 11/30/2021 | | | | 115,182,634 | |
117,000,000 | | United States Treasury Notes | | | 2.00% | | | | 12/31/2021 | | | | 114,919,802 | |
24,350,000 | | United States Treasury Notes | | | 1.88% | | | | 01/31/2022 | | | | 23,796,168 | |
142,300,000 | | United States Treasury Notes | | | 1.88% | | | | 08/31/2024 | | | | 135,704,880 | |
119,100,000 | | United States Treasury Notes | | | 2.13% | | | | 09/30/2024 | | | | 115,197,792 | |
133,100,000 | | United States Treasury Notes | | | 2.25% | | | | 10/31/2024 | | | | 129,642,496 | |
128,100,000 | | United States Treasury Notes | | | 2.25% | | | | 08/15/2027 | | | | 122,755,233 | |
241,600,000 | | United States Treasury Notes | | | 2.25% | | | | 11/15/2027 | | | | 231,290,025 | |
83,900,000 | | United States Treasury Notes | | | 3.63% | | | | 08/15/2043 | | | | 93,760,834 | |
| | | | | | | | | | | | | | |
Total US Government and Agency Obligations (Cost $2,329,162,596) | | | | | | | | | | | 2,307,812,862 | |
| | | | | | | | | | | | | | |
| | | |
Affiliated Mutual Funds - 9.8% | | | | | | | | | | | | |
48,342,264 | | DoubleLine Global Bond Fund (Class I) | | | | | | | | | | | 517,745,649 | |
45,674,545 | | DoubleLine Infrastructure Income Fund (Class I) | | | | | | | | | | | 456,745,448 | |
5,000,000 | | DoubleLine Long Duration Total Return Bond Fund (Class I) | | | | | | | | | | | 48,650,000 | |
| | | | | | | | | | | | | | |
Total Affiliated Mutual Funds (Cost $1,002,400,000) | | | | | | | | | | | 1,023,141,097 | |
| | | | | | | | | | | | | | |
| | | |
Exchange Traded Funds and Common Stocks - 0.0% | | | | | | | | | | | | |
67,847 | | Frontera Energy Corporation * | | | | | | | | | | | 1,896,346 | |
7,893 | | SandRidge Energy, Inc. * | | | | | | | | | | | 114,527 | |
| | | | | | | | | | | | | | |
Total Exchange Traded Funds and Common Stocks (Cost $12,119,535) | | | | | | | | | | | 2,010,873 | |
| | | | | | | | | | | | | | |
| | | |
Short Term Investments - 4.9% | | | | | | | | | | | | |
143,241,777 | | BlackRock Liquidity Funds FedFund - Institutional Shares | | | 1.53% | ◆ | | | | | | | 143,241,777 | |
143,241,776 | | Fidelity Institutional Money Market Government Portfolio - Class I | | | 1.47% | ◆ | | | | | | | 143,241,776 | |
143,241,776 | | Morgan Stanley Institutional Liquidity Funds Government Portfolio - Institutional Share Class | | | 1.56% | ◆ | | | | | | | 143,241,776 | |
32,300,000 | | United States Treasury Bills | | | 0.00% | | | | 06/07/2018 | | | | 32,201,893 | |
46,300,000 | | United States Treasury Bills | | | 0.00% | | | | 09/06/2018 | | | | 45,926,910 | |
| | | | | | | | | | | | | | |
Total Short Term Investments (Cost $507,866,271) | | | | | | | | | | | 507,854,132 | |
| | | | | | | | | | | | | | |
| | | |
Total Investments - 100.0% (Cost $10,499,517,474) | | | | | | | | | | | 10,406,486,972 | |
Other Assets in Excess of Liabilities - 0.0% | | | | | | | | | | | 339,152 | |
| | | | | | | | | | | | | | |
NET ASSETS - 100.0% | | | | | | | | | | $ | 10,406,826,124 | |
| | | | | | | | | | | | | | |
| | | | |
| | ^ Security exempt from registration under Rule 144A of the Securities Act of 1933. These securities may be resold in transactions exempt from registration to qualified institutional buyers. These securities are determined to be liquid by the Adviser, unless otherwise noted, under procedures established by the Fund’s Board of Trustees. At March 31, 2018, the value of these securities amounted to $1,976,656,040 or 19.0% of net assets. | | | | | | | | | | | | |
| | | | |
| | # Coupon rate is variable based on the weighted average coupon of the underlying collateral. To the extent the weighted average coupon of the underlying assets which comprise the collateral increases or decreases, the coupon rate of this security will increase or decrease correspondingly. The rate disclosed is as of March 31, 2018. | | | | | | | | | | | | |
| | | | |
| | † Perpetual Maturity | | | | | | | | | | | | |
| | I/O Interest only security | | | | | | | | | | | | |
| | I/F Inverse floating rate security whose interest rate moves in the opposite direction of reference interest rates. Reference interest rates are typically based on a negative multiplier or slope. Interest rate may also be subject to a cap or floor. | | | | | | | | | | | | |
| | P/O Principal only security | | | | | | | | | | | | |
| | | | |
| | * Non-income producing security | | | | | | | | | | | | |
| | ◆ Seven-day yield as of March 31, 2018 | | | | | | | | | | | | |
| | ¥ Illiquid security | | | | | | | | | | | | |
| | & Unfunded or partially unfunded loan commitment. At March 31, 2018, the value of these securities amounted to $2,550,031 or 0.0% of net assets. | | | | | | | | | | | | |
| | ß The interest rate may step up conditioned upon the aggregate remaining principal balance of the underlying mortgage loans being reduced below a targeted percentage of the aggregate original principal balance of the mortgage loans. The interest rate shown is the rate in effect as of March 31, 2018. | | | | | | | | | | | | |
| | | | |
| | § The interest rate will step up if the issuer does not redeem the bond by an expected redemption date. The interest rate shown is the rate in effect as of March 31, 2018. | | | | | | | | | | | | |
| | | | |
| | Þ Value determined using significant unobservable inputs. | | | | | | | | | | | | |
| | W Security is in default or has failed to make a scheduled payment. Income is not being accrued. | | | | | | | | | | | | |
| | ~ Represents less than 0.05% of net assets. | | | | | | | | | | | | |
A summary of the DoubleLine Core Fixed Income Fund’s investments in affiliated mutual funds for the year ended March 31, 2018 is as follows:
To the Board of Trustees of DoubleLine Funds Trust and Shareholders of DoubleLine Total Return Bond Fund and DoubleLine Core Fixed Income Fund
We have audited the accompanying statements of assets and liabilities, including the schedules of investments - summary, of DoubleLine Total Return Bond Fund and DoubleLine Core Fixed Income Fund (two of the funds constituting DoubleLine Funds Trust, herein collectively referred to as the “Funds”) as of March 31, 2018 , the related statements of operations for the year ended March 31, 2018 , the statements of changes in net assets for each of the two years in the period ended March 31, 2018 , including the related notes, and the financial highlights for each of the periods indicated therein (included in Item 1 of this Form N-CSR) and the schedule of investments (included in Item 6 of this Form N-CSR) as of March 31, 2018 (collectively referred to as the “financial statements”). In our opinion, the financial statements present fairly, in all material respects, the financial position of each of the Funds as of March 31, 2018, the results of each of their operations for the year then ended, the changes in each of their net assets for each of the two years in the period ended March 31, 2018 and each of the financial highlights for each of the periods indicated therein in conformity with accounting principles generally accepted in the United States of America.
These financial statements are the responsibility of the Funds’ management. Our responsibility is to express an opinion on the Funds’ financial statements based on our audits. We are a public accounting firm registered with the Public Company Accounting Oversight Board (United States) (“PCAOB”) and are required to be independent with respect to the Funds in accordance with the U.S. federal securities laws and the applicable rules and regulations of the Securities and Exchange Commission and the PCAOB.
We conducted our audits of these financial statements in accordance with the standards of the PCAOB. Those standards require that we plan and perform the audits to obtain reasonable assurance about whether the financial statements are free of material misstatement, whether due to error or fraud.
Our audits included performing procedures to assess the risks of material misstatement of the financial statements, whether due to error or fraud, and performing procedures that respond to those risks. Such procedures included examining, on a test basis, evidence regarding the amounts and disclosures in the financial statements. Our audits also included evaluating the accounting principles used and significant estimates made by management, as well as evaluating the overall presentation of the financial statements. Our procedures included confirmation of securities owned as of March 31, 2018 by correspondence with the custodian, transfer agent, and brokers. We believe that our audits provide a reasonable basis for our opinions.
We have served as the auditor of one or more investment companies in the DoubleLine Investment Company Complex since 2010.
There have been no material changes to the procedures by which shareholders may recommend nominees to the registrant’s board of trustees.
(2) A separate certification for each principal executive and principal financial officer pursuant to Section 302 of the Sarbanes-Oxley Act of 2002. Filed herewith.
(4) Change in the registrant’s independent public accountant. There was no change in the registrant’s independent public accountant for the period covered by this report.
Pursuant to the requirements of the Securities Exchange Act of 1934 and the Investment Company Act of 1940, the registrant has duly caused this report to be signed on its behalf by the undersigned, thereunto duly authorized.
Pursuant to the requirements of the Securities Exchange Act of 1934 and the Investment Company Act of 1940, this report has been signed below by the following persons on behalf of the registrant and in the capacities and on the dates indicated.