Washington, D.C. 20549
On behalf of the DoubleLine Funds, I am pleased to deliver the Annual Report for the12-month period ended March 31, 2019. On the following pages, you will find specific information regarding each Fund’s operations and holdings. In addition, we discuss each Fund’s investment performance and the main drivers of that performance during the reporting period.
If you have any questions regarding the DoubleLine Funds please don’t hesitate to call us at877-DLine11(877-354-6311), or visit our website www.doublelinefunds.com where our investment management team offers deeper insights and analysis on relevant capital market activity impacting investors today. We value the trust that you have placed with us, and we will continue to strive to offer thoughtful investment solutions to our shareholders.
Ronald R. Redell, CFA
sentiment shifted dramatically in November and December of 2018. The synchronized global growth narrative gave way to increasing concern about signs of decelerating growth and the possibility of recession. U.S. interest rates dropped sharply as equity prices fell and credit spreads widened. Yields nose-dived in late December 2018 and early 2019 on the heels of a hawkish December FOMC meeting, as expected growth fell. The10-year UST yield fell 57 bps from the November 2018 peak to 2.67% in early January 2019. Yields headed lower again inmid-March as the FOMC delivered a second dovish shift, removing any expectation of rate hikes in 2019 and announcing an early end to the balance sheet reduction program. The10-year UST yield fell to a12-month low in late March and ended the period at 2.41%. The curve continued to flatten, with the3-month to10-year spread turning negative for the first time since 2007. The yield curve inversion—seen by many as a warning of an approaching recession—was brief, but remains a focus for investors. The Bloomberg Barclays U.S. Treasury index returned 5.23% from 10/31/18 through 03/29/19, or 13.03% annualized. TIPS were unable to keep pace with nominal bonds in the face of falling inflation expectations. The Bloomberg Barclays U.S. TIPS Total Return Index returned 4.25% (10.52% annualized) over the same period. Over the full 12 months, the Bloomberg Barclays U.S. Treasury Index returned 4.22%, while the Bloomberg Barclays U.S. TIPS Total Return Index posted a return of 2.70%.
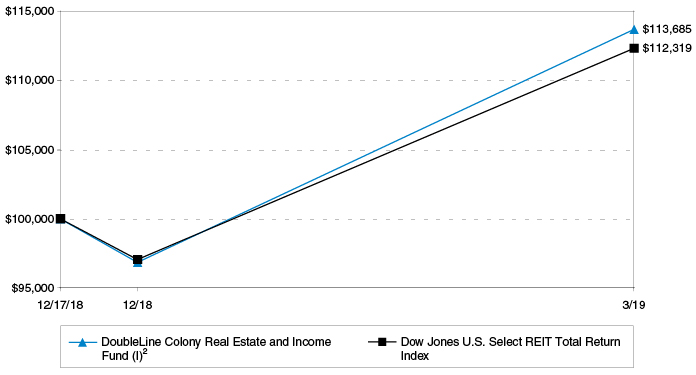
For the period since inception on December 17, 2018 through March 31, 2019, the DoubleLine Colony Real Estate and Income Fund outperformed the Dow Jones U.S. Select REIT Total Return Index return of 12.32%. Exposure to the Real Estate Investment Trust (REIT) sector of the U.S. equity market was obtained through exposure to the Colony Capital Fundamental U.S. Real Estate Index. The Fund gained exposure to the Colony Capital Fundamental U.S. Real Estate Index through the use of swap contracts. The fixed income collateral portfolio has increased in value since inception, with all sectors delivering positive returns. The Bank Loan sector has provided the highest returns and, while positive, theNon-Agency MBS sector provided the lowest returns.
Opinions expressed herein are as of March 31, 2019 and are subject to change at any time, are not guaranteed and should not be considered investment advice. This report is for the information of shareholders of the Funds. It may also be used as sales literature when preceded or accompanied by the current prospectus.
The performance shown assumes the reinvestment of all dividends and distributions and does not reflect any reductions for taxes. Investment performance reflects fee waivers in effect. In the absence of such waivers, total return would be reduced.
Fund holdings and sector allocations are subject to change at any time and are not recommendations to buy or sell any security. Please refer to the Schedules of Investments for a complete list of Fund holdings.
The Colony Capital Fundamental US Real Estate Index (the “Index”) has been licensed by Barclays for use by DoubleLine Alternatives LP. Colony Capital is a registered trademark of Colony Capital QIS, LLC or its affiliates and has beensub-licensed for use for certain purposes by DoubleLine Alternatives LP. DoubleLine Colony Real Estate
and Income Fund (the “Fund”) is not sponsored, endorsed, sold, or promoted by Colony Capital QIS, LLC or any of its affiliates. Neither Colony Capital QIS, LLC nor any of its affiliates make any representation or warranty, express or implied, to the owners of the Fund or any member of the public regarding the advisability of investing in securities generally or in the Fund particularly or the ability of the Index to track market performance. Colony Capital QIS, LLC’s and its affiliates’ only relationship to DoubleLine Alternatives LP with respect to the Index is through the sublicensing of certain rules incorporated in the Index and certain trademarks, service marks, and/or trade names owned by Colony Capital QIS, LLC and its affiliates through Barclays and/or its affiliates to DoubleLine Alternatives LP. The Index is not determined, composed, or calculated by Colony Capital QIS, LLC. Neither Colony Capital QIS, LLC nor its affiliates are responsible for and have not participated in the determination of the prices or amount of shares of the Fund or the timing of the issuance or sale of shares of the Fund or in the determination or calculation of the equation by which shares of the Fund are to be converted into cash, surrendered, or redeemed, as the case may be. Colony Capital QIS, LLC and its affiliates have no obligation or liability in connection with the administration, marketing, or trading of the Fund. There is no assurance that investment products based on the Index shall accurately track index performance or provide positive investment returns. Colony Capital QIS, LLC and its affiliates are not investment advisors with respect to investors in the Fund. Inclusion of a security within an index is not a recommendation by Colony Capital QIS, LLC or its affiliates to buy, sell, or hold such security, nor is it considered to be investment advice.
NEITHER COLONY CAPITAL QIS, LLC NOR ITS AFFILIATES GUARANTEE THE ADEQUACY, ACCURACY, TIMELINESS, AND/OR COMPLETENESS OF THE INDEX, ANY DATA RELATED THERETO, OR ANY COMMUNICATIONS, INCLUDING BUT NOT LIMITED TO, ORAL, WRITTEN, OR ELECTRONIC COMMUNICATIONS WITH RESPECT THERETO AND LICENSOR AND ITS AFFILIATES SHALL NOT BE SUBJECT TO ANY DAMAGES OR LIABILITY FOR ANY ERRORS, OMISSIONS, OR DELAYS THEREIN. COLONY CAPITAL QIS, LLC AND ITS AFFILIATES MAKE NO EXPRESS OR IMPLIED WARRANTIES, AND EXPRESSLY DISCLAIM ALL WARRANTIES OF MERCHANTABILITY, FITNESS FOR A PARTICULAR PURPOSE, OR USE, OR AS TO RESULTS TO BE OBTAINED BY DOUBLELINE ALTERNATIVES LP, INVESTORS IN THE FUND, OR ANY OTHER PERSON OR ENTITY FROM THE USE OF THE INDEX OR WITH RESPECT TO ANY DATA RELATED THERETO. WITHOUT LIMITING ANY OF THE FOREGOING, IN NO EVENT WHATSOEVER SHALL LICENSOR OR ITS AFFILIATES BE LIABLE, WHETHER IN CONTRACT, TORT, STRICT LIABILITY, OR OTHERWISE, FOR ANY INDIRECT, SPECIAL, INCIDENTAL, PUNITIVE, OR CONSEQUENTIAL DAMAGES OR FOR LOSS OF PROFITS, TRADING LOSSES, LOST TIME, OR GOODWILL, EVEN IF THEY HAVE BEEN ADVISED OF THE POSSIBILITY OF SUCH DAMAGES.
©Barclays Bank PLC, its wholly-owned subsidiary ©Barclays Capital Inc. or an affiliate (collectively “Barclays”) owns the intellectual property and licensing rights in and to the Colony Capital Fundamental US Real Estate Index (the “Index”) and either entity may act as licensor of the Index. All rights reserved.
Neither Barclays nor the Index Sponsor, as defined below, make any representation or warranty, express or implied, to DoubleLine Colony Real Estate and Income Fund (the “Fund”) or any member of the public regarding the advisability of investing in transactions generally or other instruments or related derivatives or in the Index particularly or the ability of the Barclays indices, including without limitation, the Index, to track the performance of any market or underlying assets or data. Neither Barclays nor the Index Sponsor has any obligation to take the needs of the Fund into consideration in determining, composing or calculating the Index.
Barclays’ indices are administered, calculated and published by the Index Sponsor. The Index Sponsor role is performed by Barclays Index Administration (“BINDA”), a distinct function within the Investment Bank of Barclays Bank PLC. As the administrator of the Barclays family of indices, BINDA operates independently from Barclays Investment Bank’s sales, trading, structuring and banking departments. Notwithstanding the foregoing, potential conflicts of interest may exist where: (i) Barclays acts in multiple capacities with respect to a particular Barclays index, including but not limited to functioning as index sponsor, index administrator, calculation agent, licensing agent, and/or publisher; (ii) sales, trading or structuring desks in Barclays Investment Bank launch products linked to the performance of a Barclays index, which are typically hedged by Barclays’ trading desks. In hedging an index, a trading desk may purchase or sell constituents of that index. These purchases or sales may affect the prices of the index constituents which could in turn affect the level of that index; and (iii) Barclays may use price contributions from trading desks in Barclays Investment Bank as a pricing source for a Barclays index. Barclays has in place policies and governance procedures (including separation of reporting lines) that are designed to avoid or otherwise appropriately manage such conflicts of interest and ensure the independence of BINDA and the integrity of Barclays indices. Where permitted and subject to appropriate restrictions, BINDA personnel regularly interact with trading and structuring desk personnel in Barclays Investment Bank regarding current market conditions and prices although decisions made by BINDA are independent and not influenced by trading and structuring desk personnel. Additional information about Barclays indices together with copies of the BINDA IOSCO Compliance Statement and Control Framework are available at: https://index.barcap.com/Home/BINDA.
The Index Sponsor is under no obligation to continue the calculation, publication and dissemination of the Index or the level of the Index. While the Index Sponsor currently employs the methodology ascribed to the Index (and application of such methodology shall be conclusive and binding), no assurance can be given that market, regulatory, juridical, financial, fiscal or other circumstances (including, but not limited to, any changes to or any suspension or termination of or any other events affecting any constituent within the Index) will not arise that would, in the view of the Index Sponsor, necessitate an adjustment, modification or change of such methodology. In certain circumstances, the Index Sponsor may suspend or terminate the Index.
BARCLAYS AND THE INDEX SPONSOR DO NOT GUARANTEE, AND SHALL HAVE NO LIABILITY TO THE PURCHASERS OR TRADERS, AS THE CASE MAY BE, OF THE FUND OR TO THIRD PARTIES FOR, THE QUALITY, ACCURACY AND/OR COMPLETENESS OF THE BARCLAYS INDICES, OR ANY DATA INCLUDED THEREIN, OR FOR INTERRUPTIONS IN THE DELIVERY OF THE BARCLAYS INDICES. BARCLAYS AND THE INDEX SPONSOR MAKE NO EXPRESS OR IMPLIED WARRANTIES, AND HEREBY EXPRESSLY DISCLAIM ALL WARRANTIES OF MERCHANTABILITY OR FITNESS FOR A PARTICULAR PURPOSE OR USE WITH RESPECT TO THE BARCLAYS INDICES, INCLUDING WITHOUT LIMITATION, THE INDEX, OR ANY DATA INCLUDED THEREIN. WITHOUT LIMITING ANY OF THE FOREGOING, IN NO EVENT SHALL BARCLAYS OR THE INDEX SPONSOR HAVE ANY LIABILITY FOR ANY SPECIAL, PUNITIVE, INDIRECT, OR CONSEQUENTIAL DAMAGES (INCLUDING LOST PROFITS), EVEN IF NOTIFIED OF THE POSSIBILITY OF SUCH DAMAGES SAVE TO THE EXTENT THAT SUCH EXCLUSION OF LIABILITY IS PROHIBITED BY LAW.
A direct investment cannot be made in an index. The performance of any index mentioned in this commentary has not been adjusted for ongoing management, distribution and operating expenses applicable to mutual fund investments.
This commentary may include statements that constitute “forward-looking statements” under the U.S. securities laws.
Forward-looking statements include, among other things, projections, estimates, and information about possible or future results related to a Fund and market or regulatory developments. The views expressed above are not guarantees of future performance or economic results and involve certain risks, uncertainties and assumptions that could cause actual outcomes and results to differ materially from the views expressed herein.
DoubleLine has no obligation to provide revised assessments in the event of changed circumstances. While we have gathered this information from sources believed to be reliable, DoubleLine cannot guarantee the accuracy of the information provided. Securities discussed are not recommendations and are presented as examples of issue selection or portfolio management processes. They have been picked for comparison or illustration purposes only. No security presented within is either offered for sale or purchase. DoubleLine reserves the right to change its investment perspective and outlook without notice as market conditions dictate or as additional information becomes available.
Investment strategies may not achieve the desired results due to implementation lag, other timing factors, portfolio management decision making, economic or market conditions or other unanticipated factors. The views and forecasts expressed in this material are as of the date indicated, are subject to change without notice, may not come to pass and do not represent a recommendation or offer of any particular security, strategy, or investment. Past performance is no guarantee of future results.
The DoubleLine Funds are distributed by Quasar Distributors, LLC.
The performance information shown assumes the reinvestment of all dividends and distributions. Returns over 1 year are average annual returns. Performance data quoted represents past performance;past performance does not guarantee future results. The investment return and principal value of an investment will fluctuate so that an investor’s shares, when redeemed, may be worth more or less than the original cost. Current performance of the Fund may be lower or higher than the performance quoted. The Funds’ gross and net expense ratios shown are from the most recent prospectus and may change over time. See the financial highlights section of the financial statements for more recent expense ratios. The Funds’ gross and net expense ratios also include “acquired fund fees and expenses,” which are expenses incurred indirectly as a result of a Fund’s investments in one or more underlying funds, including ETFs and money market funds. Because these costs are indirect, the expense ratios will not correlate to the expense ratios in the Funds’ financial statements, since financial statements only include direct costs of the Funds and not indirect costs of investing in the underlying funds. Performance data current to the most recentmonth-end may be obtained by calling (213)633-8200 or by visiting www.doublelinefunds.com.
A summary of the DoubleLine Core Fixed Income Fund’s investments in affiliated mutual funds for the year ended March 31, 2019 is as follows:
A summary of the DoubleLine Low Duration Bond Fund’s investments in affiliated mutual funds for the year ended March 31, 2019 is as follows:
A summary of the DoubleLine Flexible Income Fund’s investments in affiliated mutual funds for the year ended March 31, 2019 is as follows:
A summary of the DoubleLine Colony Real Estate and Income Fund’s investments in affiliated mutual funds for the period ended March 31, 2019 is as follows:
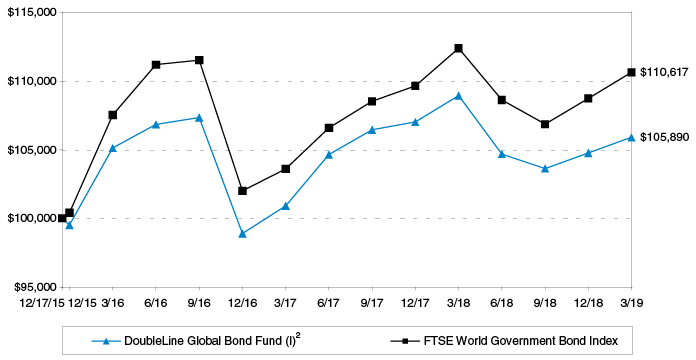
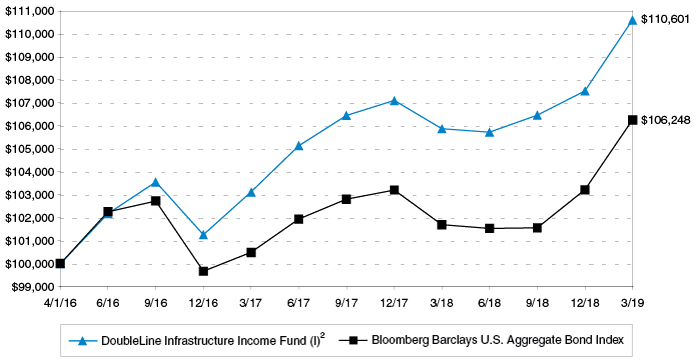
Each Fund is classified as a diversified fund under the 1940 Act, except the Global Bond Fund, Infrastructure Income Fund, and Strategic Commodity Fund, which are classified as non-diversified Funds. Currently under the 1940 Act, a diversified fund generally may not, with respect to 75% of its total assets, invest more than 5% of its total assets in the securities of any one issuer or own more than 10% of the outstanding voting securities of such issuer (except, in each case, U.S. Government securities, cash, cash items and the securities of other investment companies). The remaining 25% of a fund’s total assets is not subject to this limitation.
The Funds’ investment objectives and commencement of operations of each share class are as follows:
Each Fund is an investment company that applies the accounting and reporting guidance issued in Topic 946, “Financial Services—Investment Companies”, by the Financial Accounting Standards Board (“FASB”). The following is a summary of the significant accounting policies of the Funds. These policies are in conformity with accounting principles generally accepted in the United States of America (“US GAAP”).
Market values for domestic and foreign fixed income securities are normally determined on the basis of valuations provided by independent pricing services. Vendors typically value such securities based on one or more inputs described in the following table which is not intended to be a complete list. The table provides examples of inputs that are commonly relevant for valuing particular classes of fixed income securities in which the Funds are authorized to invest. However, these classifications are not exclusive, and any of the inputs may be used to value any other class of fixed-income securities. Securities that use similar valuation techniques and inputs as described in the following table are categorized as Level 2 of the fair value hierarchy. To the extent the significant inputs are unobservable, the values generally would be categorized as Level 3. Assets and liabilities may be transferred between levels.
Investments in registered open-end management investment companies will be valued based upon the net asset value (“NAV”) of such investments and are categorized as Level 1 of the fair value hierarchy.
Common stocks, exchange-traded funds and financial derivative instruments, such as futures contracts or options contracts, that are traded on a national securities or commodities exchange, are typically valued at the last reported sales price, in the case of common stocks and exchange-traded funds, or, in the case of futures contracts or options contracts, the settlement price determined by the relevant exchange. To the extent these securities are actively traded and valuation adjustments are not applied, they are categorized as Level 1 of the fair value hierarchy.
Securities may be fair valued by the Adviser in accordance with the fair valuation procedures approved by the Board of Trustees (the “Board”). The Adviser’s valuation committee is generally responsible for overseeing the day to day valuation processes and reports periodically to the Board. The Adviser’s valuation committee and the pricing group are authorized to make all necessary determinations of the fair values of portfolio securities and other assets for which market quotations or third party vendor prices are not readily available or if it is deemed that the prices obtained from brokers and dealers or independent pricing services are deemed to be unreliable indicators of market or fair value.
The following is a summary of the fair valuations according to the inputs used to value the Funds’ investments as of March 31, 20191:
The following is a reconciliation of investments in which significant unobservable inputs (Level 3) were used in determining fair value:
The following is a summary of quantitative information about Level 3 Fair Value Measurements:
The Funds may be subject to a nondeductible 4% excise tax calculated as a percentage of certain undistributed amounts of net investment income and net capital gains.
The Funds have adopted financial reporting rules that require the Funds to analyze all open tax years, as defined by the applicable statute of limitations, for all major jurisdictions. Open tax years, 2019, 2018 and 2017 for the Funds, are those that are open for exam by taxing authorities to the extent that each Fund operated within those respective tax years. As of March 31, 2019, the Funds have no examinations in progress.
Management has analyzed the Funds’ tax positions, and has concluded that no liability should be recorded related to uncertain tax positions expected to be taken on the tax return for the fiscalyear-ended March 31, 2019. The Funds identify their major tax jurisdictions as U.S. Federal, the State of Delaware and the State of California. The Funds are not aware of any tax positions for which it is reasonably possible that the total amounts of unrecognized tax benefits will significantly change in the next twelve months.
Income and capital gain distributions are determined in accordance with income tax regulations which may differ from US GAAP. Permanent book and tax basis differences relating to shareholder distributions will result in reclassifications betweenpaid-in capital, undistributed (accumulated) net investment income (loss), and/or undistributed (accumulated) realized gain (loss). Undistributed (accumulated) net investment income or loss may include temporary book and tax basis differences which will reverse in a subsequent period. Any taxable income or capital gain remaining at fiscal year end is distributed in the following year.
Distributions from investment companies will be classified as investment income or realized gains in the Statements of Operations based on the U.S. income tax characteristics of the distribution if such information is available. In cases where the tax characteristics are not available, such distributions are generally classified as investment income.
typically calculated on days when the New York Stock Exchange opens for regular trading (except that the Funds, other than DoubleLine Strategic Commodity Fund, do not calculate their NAV on holidays when the principal U.S. bond markets are closed, such as Columbus Day and Veterans Day).
As of March 31, 2019, the relationship of the Subsidiary to each respective Fund was as follows:
DoubleLine Capital LP and DoubleLine Alternatives LP (formerly DoubleLine Commodity LP) (each, an “Adviser” and, collectively, the “Advisers”), provide the Funds with investment management services under Investment Management Agreements (the “Agreements”). Under the Agreements, each Adviser manages the investment of the assets of the applicable Fund, places orders for the purchase and sale of its portfolio securities and is responsible for providing certain resources to assist with the day-to-day management of the Trust’s business affairs. As compensation for its services, each Adviser is entitled to a monthly fee at the annual rates of the average daily net assets of the Funds (the “Advisory Fee”) in the following table. Each Adviser has arrangements with DoubleLine Group LP to provide personnel and other resources to the Funds. On December 11, 2018, DoubleLine Alternatives LP, the investment adviser of the DoubleLine Colony Real Estate and Income Fund (the “Fund”), engaged DoubleLine Capital LP to serve as sub-adviser to the Fund to manage its investment in debt instruments.
Each Adviser has contractually agreed to limit certain of the Funds’ ordinary operating expenses so that its ratio of such expenses to average net assets will not exceed the following ratios (the “Expense Caps”). For the purposes of the expense limitation agreement
between each Adviser and the Funds, “ordinary operating expenses” excludes taxes, commissions, mark-ups, litigation expenses, indemnification expenses, interest expenses, acquired fund fees and expenses, and any extraordinary expenses. With the exception of DoubleLine Colony Real Estate and Income Fund, each Fund’s expense limitation is expected to apply until at least July 31, 2020. DoubleLine Colony Real Estate and Income Fund’s expense limitation is expected to apply until at least December 11, 2020. Each may be terminated during the term only by a majority vote of the disinterested Trustees of the Board.
Other than described above, to the extent that an Adviser waives its investment advisory fee and/or reimburses a Fund for other ordinary operating expenses, it may seek reimbursement of a portion or all of such amounts at any time within three fiscal years after the fiscal year in which such amounts were waived or reimbursed. Each Fund must pay its current ordinary operating expenses before each Adviser is entitled to any recoupment. Any such recoupment would be subject to review by the Board and will be subject to the Fund’s expense limitations in place when the fees were waived or the expenses were reimbursed.
Each Adviser, as applicable, contractually waived a portion of its fees or reimbursed certain operating expenses and may recapture a portion of the amounts no later than the dates as stated in the following table:
For the year ended March 31, 2019, each Adviser recouped the amounts shown from the following Funds:
If a Fund invested in other investment vehicles sponsored by an Adviser (“other DoubleLine Funds”) during the period, such Adviser waived its advisory fee to the Fund in an amount equal to the advisory fees paid to the Adviser by the other DoubleLine Funds in respect of Fund assets so invested. Accordingly, the Adviser waived the following fees for the year ended March 31, 2019.
As of March 31, 2019, greater than 5% of the following DoubleLine Funds was held by other DoubleLine Funds as follows:
DoubleLine Capital LP and certain DoubleLine affiliated advisers provide investment advisory, sub-advisory, or consulting services to a variety of investors, including investment program sponsors, separate accounts, and mutual funds sponsored by third parties (collectively “third-party accounts”). Those services may result, directly or indirectly, in investments by the third-party accounts in one or more of the Funds. At times, the third-party accounts’ investments, individually or in the aggregate, may represent material interests in one or more of the Funds. The third-party accounts’ transaction activity in a Fund may cause a Fund to incur material transaction costs, to realize taxable gains distributable to shareholders, and/or to buy or sell assets at a time when the Fund might not otherwise do so, each of which may adversely affect a Fund’s performance. See the description of Large Shareholder Risk in the Principal Risks Note for more information. Records available to the Funds reflect that greater than 25% of the following Funds were held by third-party accounts as of March 31, 2019:
Class N shares and Class A shares of the Funds make payments under a distribution plan (the “Distribution Plan”) adopted pursuant to Rule 12b-1 under the 1940 Act. Pursuant to the Distribution Plan, each Fund compensates the Fund’s distributor for distribution and related services at an annual rate equal to 0.25% of the average daily net assets of the Fund attributable to its Class N and Class A shares. The fees may be used to pay the Fund’s distributor for distribution services and sales support services provided in connection with Class N and Class A shares.
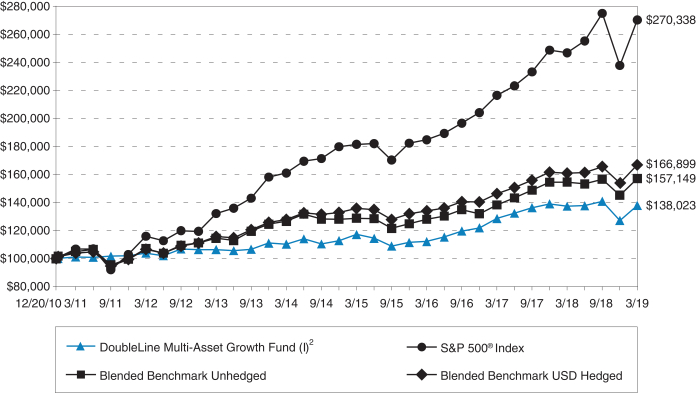
The Class A shares of DoubleLine Multi-Asset Growth Fund have a maximum sales charge imposed on purchases of 4.25% of the offering price and a maximum contingent deferred sales charge of 0.75% that applies to purchases of $1 million or more of Class A shares if the shares are redeemed within 18 months of purchase.
The DoubleLine Floating Rate Fund imposes redemption fees. Effective July 31, 2018 the DoubleLine Multi-Asset Growth Fund no longer imposes redemption fees. Redemption fees are paid to and retained by the Fund to limit the opportunity to market time the Fund and to help offset estimated portfolio transaction costs and other related costs incurred by the Fund as a result of short-term trading. Subject to the exceptions discussed in the Fund’s prospectus, the Fund will apply a redemption fee equal to 1% of the value of any shares redeemed within 90 days of purchase.
Investment transactions (excluding short-term investments and in-kind transactions) for the year ended March 31, 2019 were as follows:
Purchases and sales related to in-kind transactions for the DoubleLine Low Duration Emerging Markets Fixed Income Fund for the year ended March 31, 2019 were $0 and $31,712,846, respectively. There were no purchases or sales related to in-kind transactions for any of the other Funds.
The Funds designated as long-term capital gain dividend, pursuant to Internal Revenue Code Section 852(b)(3), the amount necessary to reduce the earnings and profits of the Funds related to net capital gain to zero.
The cost basis of investments for federal income tax purposes as of March 31, 2019, was as follows:
Under the Regulated Investment Company Modernization Act of 2010, capital losses incurred by the Funds after January 1, 2011 will not be subject to expiration. In addition, such losses must be utilized prior to the losses incurred in the years preceding enactment.
Additionally, US GAAP requires that certain components of net assets relating to permanent differences be reclassified between financial and tax reporting. These reclassifications have no effect on net assets or NAV per share. The permanent differences primarily relate to paydown losses, accretion of discount on certain debt instruments, foreign currency gains (losses), consent fee income and equalization. For the period ended March 31, 2019, the following table shows the reclassifications made:
Trustees who are not affiliated with each Adviser and its affiliates receive fees from the Trust. These trustees may elect to defer the cash payment of part or all of their compensation. These deferred amounts, which remain as liabilities of the Funds, are treated as if invested in shares of each respective Fund or other funds managed by each Adviser and its affiliates. These amounts represent general, unsecured liabilities of each Fund and vary according to the total returns of the selected funds. Trustees Fees in the Statements of Operations include current fees (either paid in cash or deferred) and an increase (decrease) in the value of the deferred amounts. Certain trustees and officers of the Funds are also officers of each Adviser; such trustees and officers are not compensated by the Funds.
The following disclosures provide information on the Funds’ use of derivatives and certain related risks. The location and fair value amounts of these instruments on the Statements of Assets and Liabilities and the realized gains and losses and changes in unrealized gains and losses on the Statements of Operations, each categorized by type of derivative contract, are included in the following tables.
The average volume of derivative activity during the year ended March 31, 2019 is as follows:
If a Fund is a seller of protection and a credit event occurs, as defined under the terms of that particular swap agreement, the Fund typically will either (i) pay to the buyer of protection an amount equal to the notional amount of the swap and take delivery of the referenced obligation, other deliverable obligations or the affected securities in the referenced index or (ii) pay a net settlement amount in the form of cash or securities equal to the notional amount of the swap less the recovery value of the referenced obligation or the affected securities in the referenced index. If a Fund is a buyer of protection and a credit event occurs, as defined under the terms of that particular swap agreement, the Fund typically will either (i) receive from the seller of protection an amount equal to the notional amount of the swap and deliver the referenced obligation, other deliverable obligations or the affected securities in the referenced index or (ii) receive a net settlement amount in the form of cash or securities equal to the notional amount of the swap less the recovery value of the referenced obligation or the affected securities in the referenced index. Recovery values are typically estimated by market makers considering either industry standard recovery rates or entity specific factors and considerations until a credit event occurs. An index credit default swap references all the names in the index, and if there is a default with respect to a single name in the index, the credit event is settled based on that name’s weight in the index.
Credit default swaps are considered to have credit risk related contingent features since they require payment by the protection seller to the protection buyer upon occurrence of a defined credit event. A Fund’s maximum risk of loss from counterparty risk, as the protection buyer, is the fair value of the contract, which may be mitigated by the posting of collateral by the counterparty to a Fund to cover a Fund’s exposure to the counterparty. Upfront premiums (received) paid including accretion (amortization) less any collateral held at the counterparty are reflected in deposit at broker for swaps on the Statements of Assets and Liabilities. The marked-to-market value less a financing rate, if any, is included in net unrealized appreciation (depreciation) on swaps on the Statements of Assets and Liabilities. At termination or maturity of the swap, the cumulative marked-to-market on the value less a financing rate, if any, is recorded in realized gain (loss) on swaps on the Statements of Operations.
rate, if any, is recorded in net unrealized appreciation (depreciation) on swaps on the Statements of Assets and Liabilities. At termination or maturity date, a net cash flow is exchanged where the total return is equivalent to the return of the underlying reference asset less a financing rate, if any, and is recorded in net realized gain (loss) on swaps on the Statements of Operations. To the extent the marked-to-market value of an excess return swap appreciates to the benefit of a Fund and exceeds certain contractual thresholds, a Fund’s counterparty may be contractually required to provide collateral. If the marked-to-market value of an excess return swap depreciates in value to the benefit of a counterparty and exceeds certain contractual thresholds, a Fund would generally be required to provide collateral for the benefit of its counterparty. Assets provided by the Funds as collateral are reflected as a component of investments in unaffiliated securities at value on the Statements of Assets and Liabilities and are noted on the Schedules of Investments. Assets provided to a Fund by a counterparty as collateral are not assets of the Fund and are not a component of a Fund’s net asset value.
The Funds’ derivative instrument holdings are summarized in the following tables.
The effect of derivative instruments on the Statements of Assets and Liabilities for the year ended March 31, 2019 was as follows:
The effect of derivative instruments on the Statements of Operations for the year ended March 31, 2019 was as follows:
The Funds are subject to various Master Netting Arrangements, which govern the terms of certain transactions with select counterparties. The Master Netting Arrangements allow the Funds to close out and net their total exposure to a counterparty in the event of a default with respect to all the transactions governed under a single agreement with a counterparty. The Master Netting Arrangements also specify collateral posting arrangements at pre-arranged exposure levels. Under the Master Netting Arrangements, collateral is routinely transferred if the total net exposure to certain transactions (net of existing collateral already in place) governed under the relevant Master Netting Arrangement with a counterparty in a given account exceeds a specified threshold depending on the counterparty and the type of Master Netting Arrangement.
As of March 31, 2019 the Trust held the following derivative instruments that were subject to offsetting on the Statements of Assets and Liabilities:
The Funds may make loans directly to borrowers and may acquire or invest in loans made by others (“loans”). The Funds may acquire a loan interest directly by acting as a member of the original lending syndicate. Alternatively, the Funds may acquire some or all of the interest of a bank or other lending institution in a loan to a particular borrower by means of a novation, an assignment or a participation. The loans in which the Funds may invest include those that pay fixed rates of interest and those that pay floating rates—i.e., rates that adjust periodically based on a known lending rate, such as a bank’s prime rate. The Funds may purchase and sell interests in bank loans on a when-issued and delayed delivery basis, with payment delivery scheduled for a future date. Securities purchased on a delayed delivery basis are marked to market daily and no income accrues to the Funds prior to the date the Funds actually take delivery of such securities. These transactions are subject to market fluctuations and are subject, among other risks, to the risk that the value at delivery may be more or less than the trade purchase price.
U.S. Bank, N.A. (the “Bank”) has made available to the Trust (the “DoubleLine Funds”) an uncommitted $725,000,000 credit facility for short term liquidity in connection with shareholder redemptions. Prior to December 14, 2018, borrowings under this credit facility were made available up to $600,000,000. Under the terms of the credit facility, borrowings for each DoubleLine Fund are limited to one-third of the total assets (including the amount borrowed) of such DoubleLine Fund. Fifty percent of the credit facility is available to all of the DoubleLine Funds, on a first come, first served basis. The remaining 50% of the credit facility is allocated among the DoubleLine Funds in accordance with procedures adopted by the Board. Borrowings under this credit facility bear interest at the Bank’s prime rate less 0.50% annually (weighted average rate of 4.65% for the year ended March 31, 2019).
The Bank has also made available to the DoubleLine Floating Rate Fund a committed credit facility. Prior to June 18, 2018, borrowings under this credit facility were made available up to $50,000,000. Effective June 18, 2018, the amount made available increased to $65,000,000. Subsequently, the amount made available increased to $100,000,000 on June 28, 2018. Borrowings under this credit facility bear interest at the Bank’s prime rate less 0.50% annually and the credit facility bears an unused commitment fee equal to 0.12% annually on the unused portion of the credit facility.
For the year ended March 31, 2019, the Funds’ credit facility activity is as follows:
As of March 31, 2019 , a single beneficial shareholder otherwise unaffiliated with the Funds held 92% of the outstanding Class I shares of DoubleLine Colony Real Estate and Income Fund and 89% of DoubleLine Colony Real Estate and Income Fund’s total outstanding shares. That shareholder may be deemed to control the DoubleLine Colony Real Estate and Income Fund and a redemption of all or a substantial portion of that shareholder’s investment in DoubleLine Colony Real Estate and Income Fund may adversely affect its investment performance.
Investment activities of these shareholders could have a material affect on each Fund. See the description of Large Shareholder Risk in the following Principal Risks Note. For information on greater than 5% holders of certain Funds by other DoubleLine Funds, see the Related and Other Party Transactions Note.
Below are summaries of some, but not all, of the principal risks of investing in one or more of the Funds, each of which could adversely affect a Fund’s NAV, yield and total return. Each risk listed below does not necessarily apply to each Fund, and you should read each Fund’s prospectus carefully for a description of the principal risks associated with investing in a particular Fund.
In March 2017, the FASB issued Accounting Standards Update (ASU) No. 2017-08,Receivables—Nonrefundable Fees and Other Costs (Subtopic 310-20): Premium Amortization on Purchased Callable Debt Securities. The amendments in the ASU shorten the
amortization period for certain callable debt securities acquired at a premium, to be amortized to the earliest call date. The ASU does not require an accounting change for securities acquired at a discount, which continues to be amortized to maturity. The ASU is effective for fiscal years and interim periods within those fiscal years beginning after December 15, 2018. Management is currently evaluating the impact of this guidance to the Funds.
In preparing these financial statements, the Funds have evaluated events and transactions for potential recognition or disclosure through the date the financial statements were issued. The Funds have determined there are no additional subsequent events that would need to be disclosed in the Funds’ financial statements.
Tothe Board of Trustees of DoubleLine Funds Trust and Shareholders of DoubleLine Total Return Bond Fund, DoubleLine Core Fixed Income Fund, DoubleLine Emerging Markets Fixed Income Fund, DoubleLine Multi-Asset Growth Fund (Consolidated), DoubleLine Low Duration Bond Fund, DoubleLine Floating Rate Fund, DoubleLine Shiller Enhanced CAPE®, DoubleLine Flexible Income Fund, DoubleLine Low Duration Emerging Markets Fixed Income Fund, DoubleLine Long Duration Total Return Bond Fund, DoubleLine Strategic Commodity Fund (Consolidated), DoubleLine Global Bond Fund, DoubleLine Infrastructure Income Fund, DoubleLine Ultra Short Bond Fund, DoubleLine Shiller Enhanced International CAPE® and DoubleLine Colony Real Estate and Income Fund
We have audited the accompanying statements of assets and liabilities, including schedules of investments—summary for DoubleLine Total Return Bond Fund and DoubleLine Core Fixed Income Fund, and schedules of investments for DoubleLine Emerging Markets Fixed Income Fund, DoubleLine Multi-Asset Growth Fund (Consolidated), DoubleLine Low Duration Bond Fund, DoubleLine Floating Rate Fund, DoubleLine Shiller Enhanced CAPE®, DoubleLine Flexible Income Fund, DoubleLine Low Duration Emerging Markets Fixed Income Fund, DoubleLine Long Duration Total Return Bond Fund, DoubleLine Strategic Commodity Fund (Consolidated), DoubleLine Global Bond Fund, DoubleLine Infrastructure Income Fund, DoubleLine Ultra Short Bond Fund, DoubleLine Shiller Enhanced International CAPE® and DoubleLine Colony Real Estate and Income Fund (sixteen of the funds constituting DoubleLine Funds Trust, hereafter collectively referred to as the “Funds”) as of March 31, 2019, the related statements of operations and of changes in net assets for each of the periods indicated in the table below, including the related notes,and the financial highlights for each of the periods indicated therein (collectively referred to as the “financial statements”). In our opinion, the financial statements present fairly, in all material respects, the financial position of each of the Funds as of March 31, 2019, the results of each of their operations and the changes in each of their net assets for the periods indicated in the table below, and each of the financial highlights for each of the periods indicated therein, in conformity with accounting principles generally accepted in the United States of America.
These financial statements are the responsibility of the Funds’ management. Our responsibility is to express an opinion on the Funds’ financial statements based on our audits. We are a public accounting firm registered with the Public Company Accounting Oversight Board (United States) (“PCAOB”) and are required to be independent with respect to the Funds in accordance with the U.S. federal securities laws and the applicable rules and regulations of the Securities and Exchange Commission and the PCAOB.
We conducted our audits of these financial statements in accordance with the standards of the PCAOB. Those standards require that we plan and perform the audit to obtain reasonable assurance about whether the financial statements are free of material misstatement, whether due to error or fraud.
Our audits included performing procedures to assess the risks of material misstatement of the financial statements, whether due to error or fraud, and performing procedures that respond to those risks. Such procedures included examining, on a test basis, evidence regarding the amounts and disclosures in the financial statements. Our audits also included evaluating the accounting principles used and significant estimates made by management, as well as evaluating the overall presentation of the financial statements. Our procedures included confirmation of securities owned as of March 31, 2019 by correspondence with the custodian and brokers; when replies were not received from brokers, we performed other auditing procedures. We believe that our audits provide a reasonable basis for our opinions.
We have served as the auditor of one or more investment companies in the DoubleLine Investment Company Complex since 2010.
As a shareholder of the Funds, you incur two basic types of costs: (1) transaction costs , including sales charges (loads) on purchase payments, reinvested dividends, or other distributions; redemption fees; and exchange fees; and (2) ongoing costs, including management fees; distribution(12b-1) fees and other Fund expenses.
This Example is intended to help you understand your ongoing costs (in dollars) of investing in each Fund and to compare these costs with the ongoing costs of investing in other mutual funds. The Example is based on an investment of $1,000 invested at the beginning of the period and held for the entire period 10/1/18 through 3/31/2019. Expenses paid during the period are equal to the net annualized expense ratio for the class, multiplied by the average account value over the period, multiplied by 183/365 (to reflect the one-half year period). The actual dollar amounts shown as expenses paid during the period for the DoubleLine Colony Real Estate and Income Fund are multiplied by 104/365, which is based on the date of inception (December 17, 2018).
The actual return columns in the following table provide information about account values based on actual returns and actual expenses. You may use the information in these columns, together with the amount you invested, to estimate the expenses that you paid over the period. Simply divide your account value by $1,000 (for example, an $8,600 account value divided by $1,000 = 8.6), then multiply the result by the number in the respective line under the heading entitled “Expenses Paid During Period” to estimate the expenses you paid on your account during this period. In addition to the expenses shown below in the table, as a shareholder you will be assessed fees for outgoing wire transfers, returned checks and stop payment orders at prevailing rates charged by U.S. Bancorp Fund Services, LLC, the Fund’s transfer agent. Currently, if you request a redemption be made by wire, a $15.00 fee is charged by the Fund’s transfer agent. You will be charged a redemption fee equal to 1.00% of the net amount of the redemption if you redeem shares that have been held for less than 90 days in the DoubleLine Floating Rate Fund. An Individual Retirement Account (“IRA”) will be charged a $15.00 annual maintenance fee. The transfer agent charges a transaction fee of $25.00 on returned checks and stop payment orders. If you paid a transaction fee, you would add the fee amount to the expenses paid on your account this period to obtain your total expenses paid.
The hypothetical return columns in the following table provide information about hypothetical account values and hypothetical expenses based on a Fund’s actual expense ratio and an assumed rate of return of 5% per year before expenses, which is not a Fund’s actual return. The hypothetical account values and expenses may not be used to estimate the actual ending account balance or expenses you paid for the period. You may use this information to compare the ongoing costs of investing in a Fund and other funds. To do so, compare this 5% hypothetical example with the 5% hypothetical examples that appear in the shareholder reports of the other funds. Please note that the expenses shown in the table are meant to highlight your ongoing costs only and do not reflect the transaction fees discussed above. Therefore, those columns are useful in comparing ongoing costs only, and will not help you determine the relative total costs of owning different funds. In addition, if these transactional costs were included, your costs would have been higher.
The Trustees’ determination to approve the continuation of each Advisory Agreement was made on the basis of each Trustee’s business judgment after an evaluation of all of the information provided to the Trustees, including information provided for their consideration at their February 2019 meeting with management and at meetings held earlier in February outside the presence of management specifically to review and consider materials related to the proposed continuation of each Advisory Agreement. The Trustees meet over the course of the year with investment advisory, compliance, and other personnel from DoubleLine and regularly review detailed information, presented both orally and in writing, regarding the services performed by DoubleLine for the benefit of the Funds and the investment program, performance, and operations of each Fund. In considering whether to approve the continuation of the Advisory Agreements, the Trustees took into account information presented to them over the course of the past year.
This summary describes a number, but not necessarily all, of the most important factors considered by the Board and the Independent Trustees. Individual Trustees may have given different weights to certain factors and assigned various degrees of materiality to information received in connection with the approval process. No single factor was determined to be decisive. In all of their deliberations, the Independent Trustees were advised by independent counsel.
The Trustees considered the nature, extent, and quality of the services, including the expertise and experience of investment personnel, provided and expected to be provided by DoubleLine to each Fund. In this regard, the Trustees considered that DoubleLine provides a full investment program for the Funds, and noted DoubleLine’s representation that it seeks to provide attractive returns with a strong emphasis on risk management. The Board considered in particular the difficulty of managing debt related portfolios, noting that managing such portfolios requires a portfolio management team to balance a number of factors, which may include, among others, securities of varying maturities and durations, actual and anticipated interest rate changes and volatility, prepayments, collateral management, counterparty management,pay-downs, credit events, workouts, and net new issuances. In their evaluation of the services provided by DoubleLine and the Funds’ contractual relationships with DoubleLine, the Trustees considered generally the long-term performance record of the firm’s portfolio management personnel, including among others Mr. Jeffrey Gundlach, and the strong overall demand for products managed by DoubleLine.
The Trustees reviewed reports (the “Strategic Insight Reports”) provided by Strategic Insight, an Asset International Company (“Strategic Insight”), that compared eachopen-end Fund’s net management fee ratio and net total expense ratio (Class I shares)
With respect to the comparative performance information in the Strategic Insight Reports, the Trustees noted in particular that eachopen-end Fund with a sufficiently long track record, other than DoubleLine Floating Rate Fund, DoubleLine Global Bond Fund (“Global Bond”), DoubleLine Long Duration Total Return Bond Fund (“Long Duration Total Return”), and DoubleLine Low Duration Emerging Markets Fixed Income Fund (“Low Duration EMFI”), was in the first or second performance quartile relative to its respective Morningstar category for the three-year period ended December 31, 2018. The performance of all of the Funds that did not achieve that level of performance for the three-year period improved to the first or second quartile for theone-year period ended December 31, 2018, with the exception of Global Bond, which was in the third performance quartile for theone-year period. The Trustees considered specific factors cited by DoubleLine for any relative underperformance of theopen-end Funds, which in most cases resulted from decisions of the Funds’ portfolio management team as to the overall positioning and strategy of the Funds. The Trustees also considered information Strategic Insight provided regarding challenges it encountered in assembling a peer group of funds with similar investment strategies for Long Duration Total Return, in light of its focus on mortgage-related securities, and Low Duration EMFI, in light of the very limited number of other funds with principal investment strategies calling for investing in a portfolio of emerging market debt with a low duration.
The Trustees considered the portion of the Strategic Insight Reports covering theopen-end Funds’ expenses and advisory fees, noting that the reports showed that eachopen-end Fund, other than DoubleLine Emerging Markets Fixed Income Fund (“EMFI”), DoubleLine Multi-Asset Growth Fund (“MAG”), Long Duration Total Return, and DoubleLine Strategic Commodity Fund (“Strategic Commodity”), had a net total expense ratio in the first or second quartile of its peer group. The Trustees noted that, although EMFI’s net total expense ratio was in the third comparative quartile, it was within two basis points of its peer group median, and that the net total expense ratios of MAG, Long Duration Total Return, and Strategic Commodity were below those of several of their respective peers.
As to the Opportunistic Credit Fund (“DBL”), the Trustees noted that DBL’s net management fee ratio and net total expense ratio were shown in the Strategic Insight Reports to be higher than the median of the Fund’s peer group. The Trustees noted DBL’s favorable relative long-term performance, with its performance ranking in the second quartile of its Morningstar peer group for the five-year period ended December 31, 2018. They also noted its less favorable performance over the three- andone-year periods ending December 31, 2018. The Trustees considered DoubleLine’s explanation for DBL’s recent underperformance, including its focus on investment in mortgage-backed securities and its more limited exposure to credit risk than many of its more diversified peers.
As to the Income Solutions Fund (“DSL”), the Trustees noted that DSL was shown in the Strategic Insight Reports to have performed in the first quartile of its Morningstar peer group over theone-, three-, and five-year periods ended December 31, 2018. They noted that DSL’s net management fee ratio and net total expense ratio were higher than the median of its peer group. In evaluating the comparative net management fee and net total expense ratio of DSL, the Trustees considered DSL’s favorable relative performance and DoubleLine’s statement that the Fund’s fees reflect the experience and expertise DoubleLine brings to managing the Fund. The Trustees noted that both DBL and DSL had employed leverage for the period shown in the Strategic Insight Reports, and considered information from DoubleLine intended to show that each Fund’s use of leverage was accretive to the Fund’s investment performance, after taking into account any expenses related to the leverage.
The Trustees considered that DoubleLine provides a variety of other services to the Funds in addition to investment advisory services, including, among others, a number of back-office services, valuation services, compliance services, certain forms of information technology services (such as internal reporting), assistance with accounting and distribution services, and supervision and monitoring of the Funds’ other service providers. The Trustees considered DoubleLine’s ongoing efforts to keep the Trustees informed about matters relevant to the Funds and their shareholders. The Trustees also considered the nature, extent, and
structure of the Funds’ compliance program, including the policies and procedures of the Funds and their various service providers (including DoubleLine). The Trustees considered the quality of thosenon-investment advisory services and determined that their quality supported the continuation of the Funds’ arrangements with DoubleLine.
The Trustees considered DoubleLine’s reports, provided at the Board’s regular meetings, that it had continued to hire additional resources to support DoubleLine’s ability to provide services to the Funds. The Trustees concluded that it appeared that DoubleLine continued to have sufficient quality and depth of personnel, resources, and investment methods.
The Trustees reviewed information as to general estimates of DoubleLine’s profitability with respect to each Fund, taking into account both the direct and the indirect benefits to DoubleLine from managing the Funds. The Trustees considered information provided by DoubleLine as to the methods it uses, and the assumptions it makes, in calculating its profitability. The Trustees considered representations from DoubleLine that its compensation and incentive policies and practices enable DoubleLine to attract, retain, and motivate highly qualified and experienced employees. The Trustees noted that DoubleLine experienced significant profitability in respect of certain of the Funds, but noted that in those cases it would be appropriate to consider that profitability in light of various other considerations such as the nature, extent, and quality of the services provided by DoubleLine, the relative performance of the Funds, and the competitiveness of the management fees and total operating expenses of the Funds. The Trustees separately considered DoubleLine’s statement that it is continuing to invest in its business to maintain its ability to provide high-quality services to the Funds, and noted DoubleLine’s need to invest in technology, infrastructure, and staff to continue to provide services and accommodate rapidly changing regulatory requirements.
With regard to DBL and DSL, the Trustees noted that these Funds have not increased in assets significantly from their initial offerings due principally to their status asclosed-end investment companies and that there were therefore no substantial increases in economies of scale realized with respect to these Funds since their inception. They noted DoubleLine’s view that the levels of its profitability in respect of DBL and DSL are appropriate in light of the investment it has made in these Funds, the quality of the investment management and other teams provided by it, and its continued investments in its own business.
On the basis of these considerations as well as others and in the exercise of their business judgment, the Trustees determined that they were satisfied with the nature, extent, and quality of the services provided to each Fund under its Advisory Agreement; that it appeared that the management fees paid by each Fund to DoubleLine were generally within the range of management fees paid by its peer funds, and, with respect to a number of Funds, lower than the median management fees paid by their peer funds, and generally reasonable in light of the services provided, the quality of the portfolio management teams, and each Fund’s
performance to date; that the fees paid by each Fund did not appear inappropriate in light of the fee schedules charged to DoubleLine’s other clients with substantially similar investment strategies (where applicable) in light of the differences in the services provided and the risks borne by DoubleLine; that the profitability of each Fund to DoubleLine did not appear excessive or such as to preclude continuation of the Fund’s Advisory Agreement; that absence of breakpoints in any Fund’s management fee did not render that Fund’s fee unreasonable or inappropriate under the circumstances, although the Trustees would continue to consider the topic over time; and that it would be appropriate to approve each Advisory Agreement for an additionalone-year period.
At the November 15, 2018 meeting of the Board of Trustees (the “Trustees”) of DoubleLine Funds Trust (the “Trust”), the Trustees, including the Trustees who are not “interested persons” (as defined in the Investment Company Act of 1940, as amended) of the Trust (the “Independent Trustees”) voting separately, approved the Investment Management Agreement (the “Advisory Agreement”) between the Trust, on behalf of DoubleLine Colony Real Estate and Income Fund (the “Fund”), and DoubleLine Alternatives LP (“DoubleLine Alternatives”), and the InvestmentSub-Advisory Agreement (the“Sub-Advisory Agreement”) between DoubleLine Capital LP (“DoubleLine Capital”), DoubleLine Alternatives, and, solely with respect to Section 7 thereof, the Trust on behalf of the Fund. This summary describes a number, but not necessarily all, of the most important factors considered by the Trustees and the Independent Trustees. In this summary, theSub-Advisory Agreement and the Advisory Agreement are sometimes referred to collectively as the “Agreements”; DoubleLine Capital and DoubleLine Alternatives are sometimes referred to collectively as the “Advisers” or “DoubleLine.”
The Trustees considered a wide range of materials, including information provided to the Trustees in connection with their duties as Trustees of the other funds within the Trust and in connection with their consideration of the renewal of the advisory contracts between the Advisers and the other funds within the Trust, which at that time had last occurred at the February 2018 meeting. The Trustees noted that they would consider the Agreements and any information presented anew, but that their deliberations and conclusions may be informed, at least in part, by their other recent deliberations, as well as the information gathered over the course of the year. Individual Trustees may have given different weights to certain factors and assigned various degrees of materiality to information received in connection with the approval process. No single factor was determined to be decisive. In all of their deliberations, the Independent Trustees were advised by independent counsel.
The Trustees’ determination to approve the Agreements was based on an evaluation of all of the information provided to them. The Trustees noted that the Trust was proposed to be a party to theSub-Advisory Agreement solely for purposes of providing the same indemnification by the Fund that DoubleLine Capital receives from other funds within the Trust when it serves directly as investment adviser to such funds. The Trustees noted that thenon-fee terms of the Agreements were substantially similar to the investment management agreements in effect for the most recently launched funds within the Trust. The Trustees considered that, under theSub-Advisory Agreement, DoubleLine Capital would manage the Fund’s fixed income portfolio assub-adviser and provide other services related to that portion of the portfolio, and DoubleLine Alternatives would perform all other functions contemplated by the Advisory Agreement. In their evaluation of the services provided by DoubleLine and the Fund’s contractual relationships with DoubleLine, the Trustees considered generally the long-term performance record of the firm’s portfolio management personnel, including among others Mr. Jeffrey Gundlach, and the strong overall demand for products managed by DoubleLine.
The Trustees considered that, similar to the design of DoubleLine Shiller Enhanced CAPE® (“CAPE”) and DoubleLine Shiller Enhanced International CAPE®(together with CAPE, the “CAPE Funds”), the Fund would consist of a fixed income component combined with investment exposure to an equity index – the Colony Capital Fundamental US Real Estate Index (the “Index”) – that DoubleLine Alternatives expected to achieve through swaps. The Trustees considered DoubleLine’s experience in managing the CAPE Funds and noted that the proposed portfolio managers of the Fund were the same as those of the CAPE Funds. The Trustees considered the qualifications, experience, and responsibilities of the proposed portfolio management team of the Fund and other key personnel who would be involved in theday-to-day investment activities of the Fund. The Trustees considered DoubleLine Capital’s experience in managing fixed income portfolios generally. They also considered the portfolio management team’s experience managing swaps, including index-based swaps, and DoubleLine’s experience more generally trading and valuing those instruments.
The Trustees considered that DoubleLine Alternatives would provide a variety of services to the Fund in addition to investment advisory services, including, among others, a number of back-office services, valuation services, compliance services, certain forms of information technology services (such as internal reporting), assistance with accounting and distribution services, and supervision and monitoring of the Fund’s other service providers. The Trustees also considered the nature, extent, and structure of
the compliance procedures and the trading capabilities of DoubleLine Alternatives and DoubleLine Capital. The Trustees concluded that it appeared that the Advisers would have, or have available to them, sufficient quality and depth of personnel, resources, and investment methods, and would have compliance policies and procedures essential to performing their duties under the proposed Agreements and that the nature, overall quality, and extent of the management services to be provided to the Fund appeared likely to be satisfactory and reliable. They also considered the possible effects of adding an additional fund to the Trust on the capacities of the Advisers.
The Trustees then turned to the proposed structure and level of the advisory fee to be paid under the Advisory Agreement and of thesub-advisory fee to be paid under theSub-Advisory Agreement. The Trustees noted that the latter would be paid to DoubleLine Capital by DoubleLine Alternatives, not by the Fund directly. The Trustees considered that DoubleLine Alternatives anticipated launching the Fund with two classes of shares and noted the overall fee structure and expense caps proposed for the Fund. The Trustees considered relative expense information (Class I shares) provided by Strategic Insight, an Asset International Company (“Strategic Insight”). In considering the expense peer group information presented, the Trustees took into account the information orally provided during the meeting by representatives of Strategic Insight who participated in the analysis of the peer funds selected by Strategic Insight. In this regard, the Trustees considered Strategic Insight’s representation that it is somewhat difficult to develop an entirely suitable expense peer group for the Fund, because of the limited number of other funds that focus on investments related to real estate investment trusts (“REITs”). However, the Trustees noted that the information provided by Strategic Insight indicated that the Fund’s proposed advisory fee under the Advisory Agreement was, on a contractual basis, the lowest in the peer group, and, on a net basis, after taking into account management fee waivers and/or fund expense reimbursements, was in the first quartile of the peer group. The Trustees also noted that the information showed that the Fund’s anticipated net expense ratio for Class I shares, based on the expense cap DoubleLine Alternatives proposed for the Fund, was the lowest in the peer group.
The Trustees reviewed information as to general estimates of the Advisers’ profitability from managing the Fund during the proposed initial term, taking into account both the direct and the indirect benefits to the Advisers. The Trustees considered information provided by the Advisers as to the methods they use, and the assumptions they make, in calculating their profitability. The Trustees also considered in this regard DoubleLine Alternatives’ significant investment in sponsoring, forming, registering, and promoting the Fund during itsstart-up period and the related risks of those activities. The Trustees noted other benefits that could potentially be received by the Advisers and their affiliates as a result of the Advisers’ relationship with the Fund, including possible ancillary benefits to the Advisers’ institutional investment management business due to the reputation and market penetration of the Fund. The Trustees considered DoubleLine Alternatives’ representation that it had proposed an advisory fee designed to cause the Fund to have a competitive fee structure even at low asset levels and that, in DoubleLine Alternatives’ belief, the proposed advisory fee reflected reasonably foreseeable economies of scale that the Advisers might experience as the Fund’s assets grow during the proposed initial term. The Trustees considered that DoubleLine Alternatives was also implementing an expense cap for each share class of the Fund that would limit the overall expense ratio of the Fund during the proposed initial term of the Agreements. In light of all of the information evaluated, including relevant information received from the Advisers in prior meetings concerning other funds within the Trust, the Trustees concluded that the Advisers’ profit from managing the Fund would likely not be excessive in thestart-up period and that it did not appear appropriate at this time to consider the implementation of breakpoints in the advisory fee.
On the basis of these considerations and others and in the exercise of their business judgment, the Trustees determined to approve the Agreements for the proposed initial term.
For the fiscal year ended March 31, 2019, certain dividends paid by the Funds may be subject to a maximum tax rate of 15% (20% for taxpayers with taxable income greater than $425,800 for single individuals and $479,000 for married couples filing jointly), as provided for by the Jobs and Growth Tax Relief Reconciliation Act of 2003 and The Tax Cuts and Jobs Act of 2017. The percentage of dividends declared from ordinary income designated as qualified dividend income was as follows:
For corporate shareholders, the percent of ordinary income distributions qualifying for the corporate dividends received deduction for the fiscal year ended March 31, 2019 was as follows:
The percentage of taxable ordinary income distributions that are designated as short-term capital gain distributions under Internal Revenue Section 871(k)(2)(c) for the fiscal year ended March 31, 2019 for each Fund was as follows:
The percentage of taxable ordinary income distributions that are designated as interest related dividends under Internal Revenue Section 871(k)(1)(c) for the fiscal year ended March 31, 2019 for each Fund was as follows:
Shareholders are advised to consult their own tax adviser with respect to the tax consequences of their investment in the Funds.
Each of the following Trustees is an interested person of the Trust as defined in the 1940 Act because they are officers of the Adviser and hold direct or indirect ownership interests in DoubleLine Capital LP and DoubleLine Alternatives LP. Additionally, Mr. Redell is an officer of the Trust.
Information about how a Fund voted proxies relating to portfolio securities held during the most recent twelve month period ended June 30th is available no later than the following August 31st without charge, upon request, by calling877-DLine11(877-354-6311) and on the Securities and Exchange Commission’s (the “SEC”) website at www.sec.gov.
A description of the Funds’ proxy voting policies and procedures is available (i) without charge, upon request, by calling877-DLine11(877-354-6311); and (ii) on the SEC’s website at www.sec.gov.
It is the policy of the Trust to provide certain unaudited information regarding the portfolio composition of the Funds as ofmonth-end to shareholders and others upon request to the Funds, beginning on the 15th calendar day after the end of the month (or, if not a business day, the next business day thereafter).
Shareholders and others who wish to obtain portfolio holdings for a particular month may make a request by contacting the Funds at no charge at877-DLine11(877-354-6311) between the hours of 7:00 a.m. and 5:00 p.m. Pacific time, Monday through Friday, beginning on the 15th day following the end of that month (or, if not a business day, the next business day thereafter). Requests for portfolio holdings may be made on a monthly basis pursuant to this procedure, or standing requests for portfolio holdings may be accepted.
The Trust is required to file its complete schedule of portfolio holdings with the SEC for its first and third fiscal quarters on Part F of Form N-PORT. When available, Part F of Form N-PORT (and Form N-Q prior to March 31, 2019) is available on the SEC website at www.sec.gov.
This report includes summary Schedules of Investments for the DoubleLine Total Return Bond Fund and DoubleLine Core Fixed Income Fund. A complete Schedule of Investments for each Fund may be obtained, without charge, upon request, by calling877-DLine11 (877-354-6311) and on the SEC website at www.sec.gov.
In an effort to conserve resources, the Funds intend to reduce the number of duplicate Prospectuses and Annual and Semi-Annual Reports you receive by sending only one copy of each to addresses where we reasonably believe two or more accounts are from the same family. If you would like to discontinue householding of your accounts, please call toll-free877-DLine11(877-354-6311) to request individual copies of these documents. We will begin sending individual copies thirty days after receiving your request to stop householding.
This notice provides information about how DoubleLine collects, shares, and protects your personal information, and how you might choose to limit our ability to share certain information about you. Please read this notice carefully.
All financial companies need to share customers’ personal information to run their everyday businesses, to appropriately tailor the services offered to you (where applicable), and to comply with our regulatory obligations. Accordingly, information, confidential and proprietary, plays an important role in the success of our business. However, we recognize that you have entrusted us with your personal and financial data, and we recognize our obligation to keep this information secure. Maintaining your privacy is important to us, and we hold ourselves to a high standard in its safekeeping and use. Most importantly, DoubleLine does not sell its customers’non-public personal information to any third parties. DoubleLine uses its customers’non-public personal information primarily to complete financial transactions that its customers request (where applicable), to make its customers aware of other financial products and services offered by a DoubleLine affiliated company, and to satisfy obligations we owe to regulatory bodies.
Websites maintained by DoubleLine or its service providers may use a variety of technologies to collect information that help DoubleLine and its service providers understand how the website is used. Information collected from your web browser (including small files stored on your device that are commonly referred to as “cookies”) allow the websites to recognize your web browser and help to personalize and improve your user experience and enhance navigation of the website. You can change your cookie preferences by changing the setting on your web browser to delete or reject cookies. If you delete or reject cookies, some website pages may not function properly. Certain portions ofdoublelinefunds.com are maintained or controlled by third parties, each of which has privacy policies which may differ, in some cases significantly, from the privacy policies described in this notice. Please contact your DoubleLine representative if you would like to receive more information about the privacy policies of third parties.
We will limit access to your personal account information to those agents and vendors who need to know that information to provide products and services to you. Your information is not provided by us to nonaffiliated third parties for marketing purposes. We maintain physical, electronic, and procedural safeguards to guard yournon-public personal information.
If you reside in the EEA, we may transfer your personal information outside the EEA, and will ensure that it is protected and transferred in a manner consistent with legal requirements applicable to the information. This can be done in a number of different ways, for instance:
In other circumstances, the law may permit us to otherwise transfer your personal information outside the EEA. In all cases, however, any transfer of your personal information will be compliant with applicable data protection law.
We will undertake commercially reasonable efforts to protect the personal information that we hold with appropriate security measures.
Depending on your country of domicile, you may have the following rights in respect of the personal information about you that we process:
Although you have the right to request that your personal information be deleted at any time, applicable laws or regulatory requirements may prohibit us from doing so. If you are an investor in the DoubleLine funds, certain of the rights described above that may apply to direct clients of DoubleLine domiciled or resident outside the United States will not apply to you. In addition, if you invest in a DoubleLine fund through a financial intermediary, DoubleLine may not have access to personal information about you.
If you wish to exercise any of the rights set out above, please contact privacy@doubleline.com.
As required by U.S. federal law, DoubleLine will notify customers of DoubleLine’s Privacy Policy annually. DoubleLine reserves the right to modify its privacy policy at any time, but in the event that there is a change that affects the content of this notice materially, DoubleLine will promptly inform its customers of that change, in accordance with applicable law.
U.S. Bancorp Fund Services, LLC
P.O. Box 701
U.S. Bank, N.A.
The registrant has adopted a code of ethics that applies to the registrant’s principal executive officer and principal financial officer. The registrant has not made any amendments to its code of ethics during the period covered by this report. The registrant has not granted any waivers from any provisions of the code of ethics during the period covered by this report. A copy of the registrant’s Code of Ethics is filed herewith.
The registrant’s board of trustees has determined that there is at least one audit committee financial expert serving on its audit committee. Raymond B. Woolson is the “audit committee financial expert” and is considered to be “independent” as each term is defined in Item 3 ofForm N-CSR.
The registrant has engaged its principal accountant to perform audit services, audit-related services, tax services and other services during the past two fiscal years. “Audit services” refer to performing an audit of the registrant’s annual financial statements or services that are normally provided by the accountant in connection with statutory and regulatory filings or engagements for those fiscal years. “Audit-related services” refer to the assurance and related services by the principal accountant that are reasonably related to the performance of the audit. “Tax services” refer to professional services rendered by the principal accountant for tax compliance, tax advice, and tax planning. There were no “Other services” provided by the principal accountant. The following table details the aggregate fees billed or expected to be billed for each of the last two fiscal years for audit fees, audit-related fees, tax fees and other fees by the principal accountant.
All of the principal accountant’s hours spent on auditing the registrant’s financial statements were attributed to work performed byfull-time permanent employees of the principal accountant. (If more than 50 percent of the accountant’s hours were spent to audit the registrant’s financial statements for the most recent fiscal year, state how many hours were attributed to work performed by persons other than the principal accountant’s full-time, permanent employees.)
The information required by this Item 6 (except with respect to the DoubleLine Total Return Bond Fund and DoubleLine Core Fixed Income Fund) is included as part of the annual report to shareholders filed under Item 1 of this FormN-CSR.
Please note that the Registrant has included a summary schedule of portfolio securities of the DoubleLine Total Return Bond Fund and DoubleLine Core Fixed Income Fund in its annual report to shareholders, a copy of which is included under Item 1, for this reporting period. The DoubleLine Total Return Bond Fund’s and DoubleLine Core Fixed Income Fund’s complete schedule of investments in securities of unaffiliated issuers as of the close of this period as set forth inSection 210.12-12 of RegulationS-X is set forth below:
| | | | | | | | | | | | |
Principal Amount
$/Shares | | Security Description | | Rate | | | Maturity | | Value $ | |
Asset Backed Obligations - 3.9% | | | | | | | | | | |
| 3,418,387 | | Americredit Automobile Receivables Trust, Series 2018-3-A1 | | | 2.71% | | | 11/18/2019 | | | 3,418,249 | |
| 20,000,000 | | Americredit Automobile Receivables Trust, Series 2019-1-A1 | | | 2.66% | | | 03/18/2020 | | | 19,999,136 | |
| 31,846,875 | | Applebee's Funding LLC, Series 2014-1-A2 | | | 4.28% | ^ | | 09/05/2044 | | | 32,005,568 | |
| 16,676,972 | | Aqua Finance Trust, Series 2017-A-A | | | 3.72% | ^ | | 11/15/2035 | | | 16,545,473 | |
| 17,788,750 | | CAL Funding Ltd., Series 2018-1A-A | | | 3.96% | ^ | | 02/25/2043 | | | 17,945,077 | |
| 3,952,244 | | Capital Auto Receivables Asset Trust, Series 2018-2-A1 | | | 2.70% | ^ | | 11/20/2019 | | | 3,951,458 | |
| 14,000,000 | | Carvana Auto Receivables Trust, Series 2019-1A-A1 | | | 2.71% | ^ | | 03/16/2020 | | | 14,035,994 | |
| 32,609,382 | | Castlelake Aircraft Securitization Trust, Series 2016-1-A | | | 4.45% | | | 08/15/2041 | | | 32,810,810 | |
| 46,019,262 | | Castlelake Aircraft Securitization Trust, Series 2017-1-A | | | 3.97% | | | 07/15/2042 | | | 46,098,875 | |
| 17,608,599 | | Castlelake Aircraft Securitization Trust, Series 2018-1-A | | | 4.13% | ^ | | 06/15/2043 | | | 17,863,025 | |
| 1,535,755 | | Citi Held For Asset Issuance, Series 2015-PM1-C | | | 5.01% | ^ | | 12/15/2021 | | | 1,536,478 | |
| 7,304,466 | | Citi Held For Asset Issuance, Series 2015-PM2-C | | | 5.96% | ^ | | 03/15/2022 | | | 7,313,116 | |
| 33,953,698 | | CLI Funding LLC, Series 2018-1A-A | | | 4.03% | ^ | | 04/18/2043 | | | 34,242,906 | |
| 27,308,588 | | Coinstar Funding LLC, Series 2017-1A-A2 | | | 5.22% | ^ | | 04/25/2047 | | | 27,860,032 | |
| 13,068,867 | | Colony American Finance Ltd., Series 2016-1-A | | | 2.54% | ^ | | 06/15/2048 | | | 12,903,237 | |
| 5,855,345 | | Commonbond Student Loan Trust, Series 2015-A-A | | | 3.20% | ^ | | 06/25/2032 | | | 5,862,371 | |
| 11,872,795 | | Commonbond Student Loan Trust, Series 2016-A-A1 | | | 3.32% | ^ | | 05/25/2040 | | | 11,909,856 | |
| 15,693,000 | | Consumer Installment Loan Trust, Series 2018-6-PT | | | 10.37% | # ^ | | 06/17/2041 | | | 15,730,143 | |
| 21,000,000 | | Credit Acceptance Auto Loan Trust, Series 2017-3A-A | | | 2.65% | ^ | | 06/15/2026 | | | 20,937,817 | |
| 41,000,000 | | Credit Acceptance Auto Loan Trust, Series 2018-1A-A | | | 3.01% | ^ | | 02/16/2027 | | | 41,047,277 | |
| 16,320,000 | | DB Master Finance LLC, Series 2015-1A-A2II | | | 3.98% | ^ | | 02/20/2045 | | | 16,338,350 | |
| 8,000,000 | | DB Master Finance LLC, Series 2019-1A-A2I | | | 3.79% | ^ | | 05/20/2049 | | | 8,089,736 | |
| 13,610,000 | | Drive Auto Receivables Trust, Series 2017-3-C | | | 2.80% | | | 07/15/2022 | | | 13,609,996 | |
| 6,559,288 | | Drive Auto Receivables Trust, Series 2019-1-A1 | | | 2.78% | | | 01/15/2020 | | | 6,559,137 | |
| 23,000,000 | | Drive Auto Receivables Trust, Series 2019-2-A1 | | | 2.65% | | | 03/16/2020 | | | 22,998,480 | |
| 3,072,435 | | DT Auto Owner Trust, Series 2017-3A-B | | | 2.40% | ^ | | 05/17/2021 | | | 3,070,941 | |
| 8,996,308 | | Earnest Student Loan Program LLC, Series 2016-B-A2 | | | 3.02% | ^ | | 05/25/2034 | | | 8,965,928 | |
| 11,690,014 | | Earnest Student Loan Program LLC, Series 2016-D-A2 | | | 2.72% | ^ | | 01/25/2041 | | | 11,642,036 | |
| 59,236,662 | | ECAF Ltd., Series 2015-1A-A2 | | | 4.95% | ^ | | 06/15/2040 | | | 60,259,324 | |
| 5,916,573 | | Element Rail Leasing LLC, Series 2016-1A-A1 | | | 3.97% | ^ | | 03/19/2046 | | | 5,993,476 | |
| 16,000,000 | | Enterprise Fleet Financing LLC, Series 2019-1-A1 | | | 2.70% | ^ | | 03/23/2020 | | | 16,026,928 | |
| 6,640,049 | | Falcon Aerospace Ltd., Series 2017-1-A | | | 4.58% | ^ | | 02/15/2042 | | | 6,708,468 | |
| 2,491,468 | | Ford Credit Auto Lease Trust, Series 2017-A-A3 | | | 1.88% | | | 04/15/2020 | | | 2,489,956 | |
| 6,013,090 | | Foundation Finance Trust, Series 2016-1A-A | | | 3.96% | ^ | | 06/15/2035 | | | 6,036,175 | |
| 13,750,000 | | Foundation Finance Trust, Series 2019-1A-A | | | 3.86% | ^ | | 11/15/2034 | | | 13,814,859 | |
| 805,299 | | Foursight Capital Automobile Receivables Trust, Series 2018-2-A1 | | | 2.74% | ^ | | 11/15/2019 | | | 805,164 | |
| 25,999,875 | | Global SC Finance Ltd., Series 2018-1A-A | | | 4.29% | ^ | | 05/17/2038 | | | 26,548,275 | |
| 27,156,566 | | GM Financial Automobile Leasing Trust, Series 2018-1-A2A | | | 2.39% | | | 04/20/2020 | | | 27,133,288 | |
| 39,373,273 | | Harbour Aircraft Investments Ltd., Series 2017-1-A | | | 4.00% | | | 11/15/2037 | | | 39,283,896 | |
| 7,627,040 | | HERO Funding Trust, Series 2016-3A-A2 | | | 3.91% | ^ | | 09/20/2042 | | | 7,755,027 | |
| 18,690,468 | | HERO Funding Trust, Series 2016-4A-A2 | | | 4.29% | ^ | | 09/20/2047 | | | 19,098,315 | |
| 13,730,769 | | Horizon Aircraft Finance Ltd., Series 2018-1-A | | | 4.46% | ^ | | 12/15/2038 | | | 14,090,213 | |
| 62,843,000 | | Jimmy Johns Funding LLC, Series 2017-1A-A2II | | | 4.85% | ^ | | 07/30/2047 | | | 64,793,244 | |
| 12,000,000 | | Kabbage Funding LLC, Series 2019-1-A | | | 3.83% | ^ | | 03/15/2024 | | | 12,081,352 | |
| 21,750,000 | | Kabbage Funding LLC, Series 2019-1-B | | | 4.07% | ^ | | 03/15/2024 | | | 21,852,506 | |
| 8,335,619 | | Kestrel Aircraft Funding Ltd., Series 2018-1A-A | | | 4.25% | ^ | | 12/15/2038 | | | 8,343,929 | |
| 82,135,417 | | Labrador Aviation Finance Ltd., Series 2016-1A-A1 | | | 4.30% | ^ | | 01/15/2042 | | | 83,169,419 | |
| 11,000,000 | | Lendmark Funding Trust, Series 2017-2A-A | | | 2.80% | ^ | | 05/20/2026 | | | 10,933,177 | |
| 20,200,517 | | Mariner Finance Issuance Trust, Series 2017-AA-A | | | 3.62% | ^ | | 02/20/2029 | | | 20,247,255 | |
| 88,793 | | MarketPlace Loan Trust, Series 2015-CB1-A | | | 4.00% | ^ | | 07/15/2021 | | | 88,779 | |
| 873,176 | | MarketPlace Loan Trust, Series 2015-LD1-A | | | 4.00% | ^ | | 12/15/2021 | | | 873,386 | |
| 473,379 | | Marlette Funding Trust, Series 2017-2A-A | | | 2.39% | ^ | | 07/15/2024 | | | 473,275 | |
| 1,698,589 | | Marlette Funding Trust, Series 2017-3A-A | | | 2.36% | ^ | | 12/15/2024 | | | 1,696,281 | |
| 6,715,176 | | Marlette Funding Trust, Series 2018-1A-A | | | 2.61% | ^ | | 03/15/2028 | | | 6,703,955 | |
| 12,608,331 | | Marlette Funding Trust, Series 2018-4A-A | | | 3.71% | ^ | | 12/15/2028 | | | 12,698,259 | |
| 31,870,093 | | Mosaic Solar Loan Trust, Series 2017-2A-A | | | 3.82% | ^ | | 06/22/2043 | | | 31,798,803 | |
| 19,509,351 | | Mosaic Solar Loan Trust, Series 2018-1A-A | | | 4.01% | ^ | | 06/22/2043 | | | 19,618,057 | |
| 25,094,718 | | Mosaic Solar Loan Trust, Series 2018-2GS-A | | | 4.20% | ^ | | 02/22/2044 | | | 25,464,351 | |
| 4,500,000 | | Mosaic Solar Loan Trust, Series 2019-1A-A | | | 4.37% | ^ | | 12/21/2043 | | | 4,590,495 | |
| 23,000,000 | | Navient Private Education Loan Trust, Series 2017-A-B | | | 3.91% | ^ | | 12/16/2058 | | | 22,949,954 | |
| 30,000,000 | | Navient Private Education Loan Trust, Series 2018-BA-B | | | 4.13% | ^ | | 12/15/2059 | | | 30,763,998 | |
| 9,351,368 | | Newtek Small Business Loan Trust, Series 2018-1-A (1 Month LIBOR USD + 1.70%) | | | 4.19% | ^ | | 02/25/2044 | | | 9,357,628 | |
| 9,301,564 | | OneMain Financial Issuance Trust, Series 2016-2A-A | | | 4.10% | ^ | | 03/20/2028 | | | 9,327,278 | |
| 75,000,000 | | OneMain Financial Issuance Trust, Series 2017-1A-A1 | | | 2.37% | ^ | | 09/14/2032 | | | 74,436,622 | |
| 16,767,492 | | Oxford Finance Funding LLC, Series 2016-1A-A | | | 3.97% | ^ | | 06/17/2024 | | | 16,846,376 | |
| 12,500,000 | | Oxford Finance Funding LLC, Series 2019-1A-A2 | | | 4.46% | ^ | | 02/15/2027 | | | 12,655,770 | |
| 4,000,000 | | Progress Residential Trust, Series 2016-SFR2-D (1 Month LIBOR USD + 2.50%, 2.50% Floor) | | | 4.98% | ^ | | 01/17/2034 | | | 4,009,045 | |
| 1,653,744 | | Prosper Marketplace Issuance Trust, Series 2018-1A-A | | | 3.11% | ^ | | 06/17/2024 | | | 1,654,392 | |
| 18,674,974 | | Renew, Series 2017-2A-A | | | 3.22% | ^ | | 09/22/2053 | | | 18,530,280 | |
| 11,879,225 | | Santander Drive Auto Receivables Trust, Series 2017-2-B | | | 2.21% | | | 10/15/2021 | | | 11,866,153 | |
| 505,682 | | Santander Drive Auto Receivables Trust, Series 2018-5-A1 | | | 2.63% | | | 11/15/2019 | | | 505,604 | |
| 16,588,084 | | Santander Drive Auto Receivables Trust, Series 2019-1-A1 | | | 2.72% | | | 02/18/2020 | | | 16,588,969 | |
| 20,328,524 | | SCF Equipment Leasing LLC, Series 2017-2A-A | | | 3.41% | ^ | | 12/20/2023 | | | 20,382,125 | |
| 32,796,573 | | Shenton Aircraft Investment Ltd., Series 2015-1A-A | | | 4.75% | ^ | | 10/15/2042 | | | 33,209,744 | |
| 2,040,450 | | SoFi Consumer Loan Program LLC, Series 2016-1-A | | | 3.26% | ^ | | 08/25/2025 | | | 2,046,828 | |
| 18,750,000 | | SoFi Consumer Loan Program LLC, Series 2017-6-A2 | | | 2.82% | ^ | | 11/25/2026 | | | 18,680,704 | |
| 4,511,401 | | SoFi Consumer Loan Program Trust, Series 2016-2-A | | | 3.09% | ^ | | 10/27/2025 | | | 4,516,844 | |
| 17,386,782 | | SoFi Consumer Loan Program Trust, Series 2017-2-A | | | 3.28% | ^ | | 02/25/2026 | | | 17,437,626 | |
| 4,162,590 | | SoFi Consumer Loan Program Trust, Series 2017-5-A1 | | | 2.14% | ^ | | 09/25/2026 | | | 4,152,121 | |
| 10,000,000 | | SoFi Consumer Loan Program Trust, Series 2017-5-A2 | | | 2.78% | ^ | | 09/25/2026 | | | 9,972,118 | |
| 6,161,215 | | SoFi Consumer Loan Program Trust, Series 2017-6-A1 | | | 2.20% | ^ | | 11/25/2026 | | | 6,144,880 | |
| 3,651,968 | | SoFi Consumer Loan Program Trust, Series 2018-1-A1 | | | 2.55% | ^ | | 02/25/2027 | | | 3,642,724 | |
| 4,259,011 | | SoFi Consumer Loan Program Trust, Series 2018-2-A1 | | | 2.93% | ^ | | 04/26/2027 | | | 4,255,487 | |
| 8,484,234 | | SoFi Consumer Loan Program Trust, Series 2018-4-A | | | 3.54% | ^ | | 11/26/2027 | | | 8,544,734 | |
| 11,253,438 | | SoFi Professional Loan Program, Series 2016-A-A2 | | | 2.76% | ^ | | 12/26/2036 | | | 11,182,666 | |
| 20,000,000 | | SoFi Professional Loan Program, Series 2017-E-B | | | 3.49% | ^ | | 11/26/2040 | | | 19,784,194 | |
| 13,000,000 | | SoFi Professional Loan Program, Series 2017-E-C | | | 4.16% | ^ | | 11/26/2040 | | | 13,234,406 | |
| 22,800,000 | | SoFi Professional Loan Program, Series 2018-A-B | | | 3.61% | ^ | | 02/25/2042 | | | 23,008,438 | |
| 18,000,000 | | SoFi Professional Loan Program, Series 2018-B-BFX | | | 3.83% | ^ | | 08/25/2047 | | | 18,349,103 | |
| 9,759,837 | | SoFi Professional Loan Program, Series 2019-A-A1FX | | | 3.18% | ^ | | 06/15/2048 | | | 9,795,491 | |
| 51,981,436 | | SpringCastle America Funding LLC, Series 2016-AA-A | | | 3.05% | ^ | | 04/25/2029 | | | 51,980,781 | |
| 10,573,647 | | Springleaf Funding Trust, Series 2016-AA-A | | | 2.90% | ^ | | 11/15/2029 | | | 10,559,741 | |
| 71,750,000 | | Springleaf Funding Trust, Series 2017-AA-A | | | 2.68% | ^ | | 07/15/2030 | | | 71,216,273 | |
| 33,634,553 | | Sprite Ltd., Series 2017-1-A | | | 4.25% | ^ | | 12/15/2037 | | | 33,836,327 | |
| 2,626,661 | | Spruce Asset Backed Securities Trust, Series 2016-E1-A | | | 4.32% | ^ | | 06/15/2028 | | | 2,663,306 | |
| 25,354,769 | | STARR Ltd., Series 2018-1-A | | | 4.09% | ^ | | 05/15/2043 | | | 25,520,158 | |
| 14,862,256 | | Sunnova Helios II Issuer LLC, Series 2018-1A-A | | | 4.87% | ^ | | 07/20/2048 | | | 15,518,930 | |
| 28,927,500 | | Taco Bell Funding LLC, Series 2018-1A-A2I | | | 4.32% | ^ | | 11/25/2048 | | | 29,799,664 | |
| 3,892,000 | | TAL Advantage LLC, Series 2013-2A-A | | | 3.55% | ^ | | 11/20/2038 | | | 3,890,367 | |
| 4,520,851 | | Textainer Marine Containers Ltd., Series 2017-1A-A | | | 3.72% | ^ | | 05/20/2042 | | | 4,519,423 | |
| 4,139,113 | | Triton Container Finance LLC, Series 2017-1A-A | | | 3.52% | ^ | | 06/20/2042 | | | 4,126,513 | |
| 23,400,000 | | Triton Container Finance LLC, Series 2018-1A-A | | | 3.95% | ^ | | 03/20/2043 | | | 23,694,671 | |
| 41,625,000 | | Triton Container Finance LLC, Series 2018-2A-A | | | 4.19% | ^ | | 06/22/2043 | | | 42,312,687 | |
| 17,212,443 | | Upgrade Receivables Trust, Series 2018-1A-A | | | 3.76% | ^ | | 11/15/2024 | | | 17,263,536 | |
| 18,000,000 | | Upstart Securitization Trust 2019-1, Series 2019-1-A | | | 3.45% | ^ | | 04/20/2026 | | | 18,030,217 | |
| 565,091 | | Upstart Securitization Trust, Series 2017-2-A | | | 2.51% | ^ | | 03/20/2025 | | | 564,746 | |
| 17,903,917 | | Vantage Data Centers Issuer LLC, Series 2018-1A-A2 | | | 4.07% | ^ | | 02/16/2043 | | | 18,191,131 | |
| 21,926,667 | | Vantage Data Centers Issuer LLC, Series 2018-2A-A2 | | | 4.20% | ^ | | 11/16/2043 | | | 22,447,798 | |
| 18,723,503 | | Vivint Colar Financing LLC, Series 2018-1A-A | | | 4.73% | ^ | | 04/30/2048 | | | 19,437,003 | |
| 307,249 | | Westlake Automobile Receivables Trust, Series 2018-3A-A1 | | | 2.53% | ^ | | 09/16/2019 | | | 307,195 | |
| 23,533,922 | | Westlake Automobile Receivables Trust, Series 2019-1A-A1 | | | 2.77% | ^ | | 02/18/2020 | | | 23,536,720 | |
| 5,908,528 | | World Omni Select Auto Trust, Series 2018-1A-A1 | | | 2.78% | ^ | | 11/15/2019 | | | 5,908,985 | |
| 11,400,000 | | Zephyrus Capital Aviation Partners Ltd., Series 2018-1-A | | | 4.61% | ^ | | 10/15/2038 | | | 11,397,583 | |
| | | | | | | | | | | | |
Total Asset Backed Obligations(Cost $1,944,936,920) | | | 1,961,317,446 | |
| | | | | | | | | | | | |
| |
Collateralized Loan Obligations - 5.1% | | | | |
| 10,000,000 | | Adams Mill Ltd., Series 2014-1A-C1R (3 Month LIBOR USD + 2.35%) | | | 5.14% | ^ | | 07/15/2026 | | | 10,003,965 | |
| 12,097,836 | | AIMCO, Series 2014-AA-AR (3 Month LIBOR USD + 1.10%) | | | 3.86% | ^ | | 07/20/2026 | | | 12,103,530 | |
| 68,250,000 | | AIMCO, Series 2015-AA-AR (3 Month LIBOR USD + 0.85%, 0.85% Floor) | | | 3.64% | ^ | | 01/15/2028 | | | 67,860,247 | |
| 18,760,000 | | Anchorage Capital Ltd., Series 2014-5RA-A (3 Month LIBOR USD + 0.99%) | | | 3.78% | ^ | | 01/15/2030 | | | 18,610,922 | |
| 36,000,000 | | Anchorage Capital Ltd., Series 2018-10A-A1A (3 Month LIBOR USD + 1.20%, 1.20% Floor) | | | 3.63% | ^ | | 10/15/2031 | | | 35,729,555 | |
| 11,836,990 | | Apidos Ltd., Series 2013-16A-A1R (3 Month LIBOR USD + 0.98%) | | | 3.74% | ^ | | 01/19/2025 | | | 11,839,751 | |
| 75,000,000 | | Arrowpoint Ltd., Series 2013-1A-A1R (3 Month LIBOR USD + 1.52%, 1.52% Floor) | | | 4.20% | ^ | | 11/15/2028 | | | 75,051,277 | |
| 35,000,000 | | Assurant Ltd., Series 2018-2A-A (3 Month LIBOR USD + 1.23%, 1.23% Floor) | | | 3.99% | ^ | | 10/20/2031 | | | 34,651,681 | |
| 20,000,000 | | Assurant Ltd., Series 2019-1A-A (3 Month LIBOR USD + 1.35%, 1.35% Floor) | | | 3.91% | ^ | | 04/20/2030 | | | 19,995,160 | |
| 33,150,000 | | BlueMountain Ltd., Series 2013-1A-A1R (3 Month LIBOR USD + 1.40%) | | | 4.16% | ^ | | 01/20/2029 | | | 33,167,659 | |
| 22,500,000 | | BlueMountain Ltd., Series 2016-2A-A2 (3 Month LIBOR USD + 2.00%) | | | 4.64% | ^ | | 08/20/2028 | | | 22,618,657 | |
| 43,000,000 | | Cathedral Lake Ltd., Series 2016-4A-A (3 Month LIBOR USD + 1.65%) | | | 4.41% | ^ | | 10/20/2028 | | | 43,063,918 | |
| 50,000,000 | | CBAM Ltd., Series 2018-6A-A (3 Month LIBOR USD + 0.94%) | | | 3.73% | ^ | | 07/15/2031 | | | 49,533,894 | |
| 3,000,000 | | CFIP Ltd., Series 2014-1A-AR (3 Month LIBOR USD + 1.32%) | | | 4.12% | ^ | | 07/13/2029 | | | 2,998,548 | |
| 31,500,000 | | CRMN Mortgage Trust, Series 2018-1A-A1 (3 Month LIBOR USD + 1.25%, 1.25% Floor) | | | 4.02% | ^ | | 10/25/2031 | | | 31,168,392 | |
| 98,000,000 | | CVP Ltd., Series 2017-1A-A (3 Month LIBOR USD + 1.34%) | | | 4.10% | ^ | | 07/20/2030 | | | 98,037,674 | |
| 61,250,000 | | CVP Ltd., Series 2017-2A-A (3 Month LIBOR USD + 1.19%, 1.19% Floor) | | | 3.95% | ^ | | 01/20/2031 | | | 60,759,398 | |
| 35,250,000 | | Elevation Ltd., Series 2014-2A-A1R (3 Month LIBOR USD + 1.23%) | | | 4.02% | ^ | | 10/15/2029 | | | 35,124,540 | |
| 25,500,000 | | Elevation Ltd., Series 2018-9A-A1 (3 Month LIBOR USD + 1.12%, 1.12% Floor) | | | 3.91% | ^ | | 07/15/2031 | | | 25,245,991 | |
| 7,796,904 | | GLG Ore Hill Ltd., Series 2013-1A-A (3 Month LIBOR USD + 1.12%) | | | 3.91% | ^ | | 07/15/2025 | | | 7,802,006 | |
| 49,300,000 | | Greywolf Ltd., Series 2018-1A-A1 (3 Month LIBOR USD + 1.03%) | | | 3.79% | ^ | | 04/26/2031 | | | 48,483,145 | |
| 50,000,000 | | Greywolf Ltd., Series 2018-2A-A1 (3 Month LIBOR USD + 1.18%, 1.18% Floor) | | | 3.74% | ^ | | 10/20/2031 | | | 49,549,970 | |
| 6,500,000 | | Halcyon Loan Advisors Funding Ltd., Series 2014-2A-C (3 Month LIBOR USD + 3.50%) | | | 6.26% | ^ | | 04/28/2025 | | | 6,428,289 | |
| 1,750,000 | | Halcyon Loan Advisors Funding Ltd., Series 2014-2A-D (3 Month LIBOR USD + 5.00%) | | | 7.76% | ^ | | 04/28/2025 | | | 1,643,727 | |
| 5,000,000 | | Halcyon Loan Advisors Funding Ltd., Series 2014-3A-D (3 Month LIBOR USD + 3.65%) | | | 6.41% | ^ | | 10/22/2025 | | | 4,987,074 | |
| 85,500,000 | | Halcyon Loan Advisors Funding Ltd., Series 2015-3A-A1R (3 Month LIBOR USD + 0.90%) | | | 3.68% | ^ | | 10/18/2027 | | | 84,773,993 | |
| 31,000,000 | | Harbourview Ltd., Series 7RA-A1 (3 Month LIBOR USD + 1.13%, 1.13% Floor) | | | 3.91% | ^ | | 07/18/2031 | | | 30,580,561 | |
| 26,366,328 | | Jamestown Ltd., Series 2014-4A-A1AR (3 Month LIBOR USD + 0.69%) | | | 3.48% | ^ | | 07/15/2026 | | | 26,283,273 | |
| 20,000,000 | | Jamestown Ltd., Series 2016-9A-A1A (3 Month LIBOR USD + 1.57%) | | | 4.33% | ^ | | 10/20/2028 | | | 20,010,836 | |
| 56,695,000 | | Jamestown Ltd., Series 2018-6RA-A1 (3 Month LIBOR USD + 1.15%, 1.15% Floor) | | | 3.92% | ^ | | 04/25/2030 | | | 56,271,295 | |
| 20,000,000 | | KVK Ltd., Series 2013-1A-AR (3 Month LIBOR USD + 0.90%) | | | 3.70% | ^ | | 01/14/2028 | | | 19,841,336 | |
| 30,000,000 | | LCM LP, Series 17A-A2RR (3 Month LIBOR USD + 1.15%, 1.15% Floor) | | | 3.94% | ^ | | 10/15/2031 | | | 29,775,001 | |
| 50,000,000 | | LCM LP, Series 19A-AR (3 Month LIBOR USD + 1.24%, 1.24% Floor) | | | 0.00% | ^ | | 07/15/2027 | | | 50,000,000 | |
| 20,000,000 | | Madison Park Funding Ltd., Series 2013-11A-AR (3 Month LIBOR USD + 1.16%) | | | 3.93% | ^ | | 07/23/2029 | | | 20,019,388 | |
| 5,500,000 | | Madison Park Funding Ltd., Series 2014-15A-CR (3 Month LIBOR USD + 3.45%) | | | 6.21% | ^ | | 01/27/2026 | | | 5,502,804 | |
| 5,000,000 | | Madison Park Funding Ltd., Series 2014-15A-DR (3 Month LIBOR USD + 5.44%) | | | 8.20% | ^ | | 01/27/2026 | | | 5,001,075 | |
| 64,500,000 | | Marathon Ltd., Series 2013-5A-A1R (3 Month LIBOR USD + 0.87%) | | | 3.51% | ^ | | 11/21/2027 | | | 64,019,437 | |
| 41,000,000 | | Marathon Ltd., Series 2014-7A-A1R (3 Month LIBOR USD + 1.32%) | | | 4.08% | ^ | | 10/28/2025 | | | 41,039,005 | |
| 25,000,000 | | Marble Point Ltd., Series 2018-2A-A1 (3 Month LIBOR USD + 1.33%, 1.33% Floor) | | | 4.05% | ^ | | 01/20/2032 | | | 25,004,724 | |
| 75,000,000 | | Midocean Credit, Series 2017-7A-A1 (3 Month LIBOR USD + 1.32%) | | | 4.11% | ^ | | 07/15/2029 | | | 75,046,682 | |
| 54,500,000 | | Midocean Credit, Series 2018-9A-A1 (3 Month LIBOR USD + 1.15%, 1.15% Floor) | | | 3.91% | ^ | | 07/20/2031 | | | 53,858,140 | |
| 65,000,000 | | MP Ltd., Series 2013-1A-AR (3 Month LIBOR USD + 1.25%) | | | 4.01% | ^ | | 10/20/2030 | | | 64,664,986 | |
| 52,000,000 | | MP Ltd., Series 2013-2A-ARR (3 Month LIBOR USD + 1.28%) | | | 4.05% | ^ | | 07/25/2029 | | | 51,916,063 | |
| 40,000,000 | | MP Ltd., Series 2015-2A-AR (3 Month LIBOR USD + 0.91%) | | | 3.67% | ^ | | 10/28/2027 | | | 39,854,421 | |
| 30,000,000 | | Nassau Ltd., Series 2018-IA-A (3 Month LIBOR USD + 1.15%) | | | 3.94% | ^ | | 07/15/2031 | | | 29,535,237 | |
| 2,250,000 | | Neuberger Berman Ltd., Series 2017-16SA-A (3 Month LIBOR USD + 0.85%) | | | 3.64% | ^ | | 01/15/2028 | | | 2,234,700 | |
| 19,500,000 | | Northwoods Capital Ltd., Series 2017-16A-A (3 Month LIBOR USD + 1.27%) | | | 3.95% | ^ | | 11/15/2030 | | | 19,387,643 | |
| 39,250,000 | | Northwoods Capital Ltd., Series 2018-11BA-A1 (3 Month LIBOR USD + 1.10%, 1.10% Floor) | | | 3.86% | ^ | | 04/19/2031 | | | 38,566,681 | |
| 36,000,000 | | OCP Ltd., Series 2015-9A-A1R (3 Month LIBOR USD + 0.80%) | | | 3.59% | ^ | | 07/15/2027 | | | 35,703,515 | |
| 25,000,000 | | OFSI Fund Ltd., Series 2018-1A-A (3 Month LIBOR USD + 1.15%, 1.15% Floor) | | | 3.94% | ^ | | 07/15/2031 | | | 24,748,411 | |
| 28,732,567 | | Palmer Square Loan Funding Ltd., Series 2017-1A-A1 (3 Month LIBOR USD + 0.74%) | | | 3.53% | ^ | | 10/15/2025 | | | 28,695,551 | |
| 38,000,000 | | Park Avenue Institutional Advisers Ltd., Series 2016-1A-A1R (3 Month LIBOR USD + 1.20%) | | | 3.85% | ^ | | 08/23/2031 | | | 37,657,215 | |
| 28,500,000 | | Pikes Peak, Series 2019-3A-A | | | 0.00% | ^ ± | | 04/25/2030 | | | 28,475,291 | |
| 28,000,000 | | Prudential PLC, Series 2018-1A-A (3 Month LIBOR USD + 1.15%) | | | 3.94% | ^ | | 07/15/2031 | | | 27,834,633 | |
| 2,500,000 | | Regatta Funding Ltd., Series 2018-1A-B (3 Month LIBOR USD + 1.65%) | | | 4.42% | ^ | | 07/17/2031 | | | 2,445,853 | |
| 20,000,000 | | Regatta Funding Ltd., Series 2018-3A-A (3 Month LIBOR USD + 1.19%) | | | 3.96% | ^ | | 10/25/2031 | | | 19,764,386 | |
| 25,500,000 | | Rockford Tower Ltd., Series 2017-3A-A (3 Month LIBOR USD + 1.19%) | | | 3.95% | ^ | | 10/20/2030 | | | 25,269,545 | |
| 39,000,000 | | Rockford Tower Ltd., Series 2018-1A-A (3 Month LIBOR USD + 1.10%) | | | 3.74% | ^ | | 05/20/2031 | | | 38,467,084 | |
| 50,000,000 | | Sound Point Ltd., Series 2013-3RA-A (3 Month LIBOR USD + 1.15%, 1.15% Floor) | | | 3.93% | ^ | | 04/18/2031 | | | 49,450,527 | |
| 28,000,000 | | Sound Point Ltd., Series 2018-3A-A1A (3 Month LIBOR USD + 1.18%, 1.18% Floor) | | | 3.59% | ^ | | 10/26/2031 | | | 27,686,321 | |
| 30,000,000 | | Steele Creek Ltd., Series 2014-1RA-A (3 Month LIBOR USD + 1.07%, 1.07% Floor) | | | 3.83% | ^ | | 04/21/2031 | | | 29,929,886 | |
| 20,000,000 | | Steele Creek Ltd., Series 2015-1A-AR (3 Month LIBOR USD + 1.26%) | | | 3.90% | ^ | | 05/21/2029 | | | 19,998,407 | |
| 34,000,000 | | Steele Creek Ltd., Series 2016-1A-AR (3 Month LIBOR USD + 1.12%, 1.12% Floor) | | | 3.73% | ^ | | 06/15/2031 | | | 33,672,105 | |
| 10,000,000 | | Steele Creek Ltd., Series 2019-1A-B (3 Month LIBOR USD + 2.20%, 2.20% Floor) | | | 0.00% | ^ | | 04/15/2032 | | | 10,000,000 | |
| 10,000,000 | | Symphony Ltd., Series 2014-15A-AR2 (3 Month LIBOR USD + 1.26%, 1.26% Floor) | | | 4.10% | ^ | | 01/17/2032 | | | 10,015,086 | |
| 17,000,000 | | TCI-Cent Ltd., Series 2016-1A-A1 (3 Month LIBOR USD + 1.52%) | | | 4.28% | ^ | | 12/21/2029 | | | 17,195,866 | |
| 10,000,000 | | TCI-Cent Ltd., Series 2016-1A-A2 (3 Month LIBOR USD + 2.20%) | | | 4.96% | ^ | | 12/21/2029 | | | 10,006,672 | |
| 30,000,000 | | TCI-Flatiron Ltd., Series 2016-1A-AR (3 Month LIBOR USD + 1.22%, 1.22% Floor) | | | 3.73% | ^ | | 07/17/2028 | | | 30,035,526 | |
| 25,000,000 | | Venture Ltd., Series 2014-19A-ARR (3 Month LIBOR USD + 1.26%, 1.26% Floor) | | | 4.05% | ^ | | 01/15/2032 | | | 24,832,890 | |
| 62,945,000 | | Venture Ltd., Series 2015-20A-AR (3 Month LIBOR USD + 0.82%) | | | 3.61% | ^ | | 04/15/2027 | | | 62,614,435 | |
| 30,500,000 | | Vibrant Ltd., Series 2016-5A-A (3 Month LIBOR USD + 1.55%) | | | 4.31% | ^ | | 01/20/2029 | | | 30,556,088 | |
| 75,000,000 | | Vibrant Ltd., Series 2018-10A-A1 (3 Month LIBOR USD + 1.20%, 1.20% Floor) | | | 3.64% | ^ | | 10/20/2031 | | | 74,450,220 | |
| 20,000,000 | | Wellfleet Ltd., Series 2016-2A-A1R (3 Month LIBOR USD + 1.14%, 1.14% Floor) | | | 3.90% | ^ | | 10/20/2028 | | | 19,919,999 | |
| 25,000,000 | | Wellfleet Ltd., Series 2017-2A-A1 (3 Month LIBOR USD + 1.25%) | | | 4.01% | ^ | | 10/20/2029 | | | 24,984,246 | |
| 46,000,000 | | Wellfleet Ltd., Series 2018-2A-A1 (3 Month LIBOR USD + 1.20%, 1.20% Floor) | | | 3.64% | ^ | | 10/20/2031 | | | 45,682,538 | |
| 6,634,894 | | WhiteHorse Ltd., Series 2014-1A-AR (3 Month LIBOR USD + 0.90%) | | | 3.64% | ^ | | 05/01/2026 | | | 6,623,981 | |
| 17,000,000 | | WhiteHorse Ltd., Series 2015-10A-A1R (3 Month LIBOR USD + 0.93%, 0.93% Floor) | | | 3.70% | ^ | | 04/17/2027 | | | 16,941,651 | |
| 4,000,000 | | Wind River Ltd., Series 2013-2A-AR (3 Month LIBOR USD + 1.23%) | | | 4.01% | ^ | | 10/18/2030 | | | 3,970,868 | |
| 40,000,000 | | Wind River Ltd., Series 2014-2A-AR (3 Month LIBOR USD + 1.14%, 1.14% Floor) | | | 3.93% | ^ | | 01/15/2031 | | | 39,519,135 | |
| 10,000,000 | | York Ltd., Series 2016-2A-A (3 Month LIBOR USD + 1.63%) | | | 4.39% | ^ | | 01/20/2030 | | | 10,034,248 | |
| 25,969,033 | | Zais Ltd., Series 2014-2A-A1AR (3 Month LIBOR USD + 1.20%) | | | 3.97% | ^ | | 07/25/2026 | | | 25,967,587 | |
| 2,500,000 | | Zais Ltd., Series 2016-2A-A1 (3 Month LIBOR USD + 1.53%) | | | 4.32% | ^ | | 10/15/2028 | | | 2,498,416 | |
| | | | | | | | | | | | |
Total Collateralized Loan Obligations(Cost $2,568,307,679) | | | 2,555,294,433 | |
| | | | | | | | | | | | |
| |
Non-Agency Commercial Mortgage Backed Obligations - 7.3% | | | | |
| 10,139,000 | | 20 Times Square Trust, Series 2018-20TS-F | | | 3.10% | # ^ | | 05/15/2035 | | | 9,587,428 | |
| 7,727,000 | | 20 Times Square Trust, Series 2018-20TS-G | | | 3.10% | # ^ | | 05/15/2035 | | | 7,153,242 | |
| 3,500,000 | | Arbor Realty Ltd., Series 2017-FL2-AS (1 Month LIBOR USD + 1.25%) | | | 3.73% | ^ | | 08/15/2027 | | | 3,494,313 | |
| 5,500,000 | | Arbor Realty Ltd., Series 2017-FL2-B (1 Month LIBOR USD + 1.55%) | | | 4.03% | ^ | | 08/15/2027 | | | 5,496,563 | |
| 18,093,000 | | Arbor Realty Ltd., Series 2018-FL1-A (1 Month LIBOR USD + 1.15%) | | | 3.63% | ^ | | 06/15/2028 | | | 18,101,826 | |
| 2,602,000 | | AREIT Trust, Series 2018-CRE1-AS (1 Month LIBOR USD + 1.25%, 1.25% Floor) | | | 3.73% | ^ | | 02/14/2035 | | | 2,602,286 | |
| 1,706,000 | | AREIT Trust, Series 2018-CRE1-B (1 Month LIBOR USD + 1.65%, 1.65% Floor) | | | 4.13% | ^ | | 02/14/2035 | | | 1,710,065 | |
| 3,483,290 | | Ashford Hospitality Trust, Series 2018-ASHF-A (1 Month LIBOR USD + 0.90%, 0.90% Floor) | | | 3.38% | ^ | | 04/15/2035 | | | 3,465,432 | |
| 11,007,000 | | Atrium Hotel Portfolio Trust, Series 2017-ATRM-E (1 Month LIBOR USD + 3.05%) | | | 5.53% | ^ | | 12/15/2036 | | | 11,085,245 | |
| 29,257,000 | | Atrium Hotel Portfolio Trust, Series 2018-ATRM-A (1 Month LIBOR USD + 0.95%, 0.95% Floor) | | | 3.43% | ^ | | 06/15/2035 | | | 29,236,728 | |
| 28,877,000 | | Atrium Hotel Portfolio Trust, Series 2018-ATRM-D (1 Month LIBOR USD + 2.30%, 2.30% Floor) | | | 4.78% | ^ | | 06/15/2035 | | | 28,949,510 | |
| 13,685,000 | | Atrium Hotel Portfolio Trust, Series 2018-ATRM-E (1 Month LIBOR USD + 3.40%, 3.40% Floor) | | | 5.88% | ^ | | 06/15/2035 | | | 13,795,194 | |
| 414,531 | | BAMLL Commercial Mortgage Securities Trust, Series 2014-FL1-A (1 Month LIBOR USD + 1.40%, 1.40% Floor) | | | 3.89% | ^ | | 12/15/2031 | | | 414,546 | |
| 41,267,031 | | Banc of America Commercial Mortgage Trust, Series 2007-5-XW | | | 0.00% | # ^ I/O | | 02/10/2051 | | | 413 | |
| 4,000,000 | | Banc of America Commercial Mortgage Trust, Series 2015-UBS7-B | | | 4.36% | # | | 09/15/2048 | | | 4,232,686 | |
| 57,520,909 | | Banc of America Commercial Mortgage Trust, Series 2015-UBS7-XA | | | 0.84% | # I/O | | 09/15/2048 | | | 2,465,743 | |
| 5,018,000 | | Bancorp Commercial Mortgage Trust, Series 2018-CRE4-D (1 Month LIBOR USD + 2.10%, 0.25% Floor) | | | 4.58% | ^ | | 09/15/2035 | | | 4,973,006 | |
| 16,609,000 | | Bancorp Commercial Mortgage Trust, Series 2019-CRE5-A (1 Month LIBOR USD + 1.00%, 1.00% Floor) | | | 3.49% | ^ | | 03/15/2036 | | | 16,646,154 | |
| 6,530,000 | | Bancorp Commercial Mortgage Trust, Series 2019-CRE5-B (1 Month LIBOR USD + 1.50%, 1.50% Floor) | | | 3.99% | ^ | | 03/15/2036 | | | 6,555,049 | |
| 1,057,000 | | Bancorp Commercial Mortgage Trust, Series 2019-CRE5-D (1 Month LIBOR USD + 2.35%, 2.35% Floor) | | | 4.84% | ^ | | 03/15/2036 | | | 1,063,719 | |
| 1,044,823 | | Bancorp Commercial Mortgage, Series 2018-CRE4-A (1 Month LIBOR USD + 0.90%, 0.95% Floor) | | | 3.38% | ^ | | 09/15/2035 | | | 1,042,634 | |
| 39,791,001 | | BANK, Series 2017-BNK4-XA | | | 1.44% | # I/O | | 05/15/2050 | | | 3,259,949 | |
| 89,197,178 | | BANK, Series 2017-BNK5-XA | | | 1.09% | # I/O | | 06/15/2060 | | | 5,538,396 | |
| 1,750,000 | | BANK, Series 2018-BN10-AS | | | 3.90% | # | | 02/15/2061 | | | 1,803,578 | |
| 152,200,638 | | BANK, Series 2018-BN10-XA | | | 0.75% | # I/O | | 02/15/2061 | | | 8,117,849 | |
| 95,332,281 | | BANK, Series 2019-BN16-XA | | | 0.97% | # I/O | | 02/15/2052 | | | 7,060,213 | |
| 27,365,000 | | Barclays Commercial Mortgage Securities LLC, Series 2015-STP-D | | | 4.29% | # ^ | | 09/10/2028 | | | 27,371,825 | |
| 12,089,000 | | Barclays Commercial Mortgage Securities LLC, Series 2017-DELC-C (1 Month LIBOR USD + 1.20%) | | | 3.68% | ^ | | 08/15/2036 | | | 12,025,054 | |
| 13,777,000 | | Barclays Commercial Mortgage Securities LLC, Series 2017-DELC-D (1 Month LIBOR USD + 1.70%) | | | 4.18% | ^ | | 08/15/2036 | | | 13,756,618 | |
| 28,585,000 | | Barclays Commercial Mortgage Securities LLC, Series 2017-DELC-E (1 Month LIBOR USD + 2.50%) | | | 4.98% | ^ | | 08/15/2036 | | | 28,375,535 | |
| 30,209,000 | | Barclays Commercial Mortgage Securities LLC, Series 2017-DELC-F (1 Month LIBOR USD + 3.50%) | | | 5.98% | ^ | | 08/15/2036 | | | 30,030,332 | |
| 15,911,000 | | BBCMS Mortgage Trust, Series 2018-BXH-A (1 Month LIBOR USD + 1.00%, 1.00% Floor) | | | 3.48% | ^ | | 10/15/2037 | | | 15,821,601 | |
| 67,548,000 | | BBCMS Mortgage Trust, Series 2018-CBM-A (1 Month LIBOR USD + 1.00%, 1.00% Floor) | | | 3.48% | ^ | | 07/15/2037 | | | 67,330,110 | |
| 21,385,000 | | BBCMS Mortgage Trust, Series 2018-CBM-E (1 Month LIBOR USD + 3.15%, 3.15% Floor) | | | 5.63% | ^ | | 07/15/2037 | | | 21,640,991 | |
| 9,135,000 | | BBCMS Mortgage Trust, Series 2018-TALL-A (1 Month LIBOR USD + 0.72%) | | | 3.21% | ^ | | 03/15/2037 | | | 9,064,180 | |
| 4,500,000 | | Bear Stearns Commercial Mortgage Securities, Inc., Series 2007-T26-AJ | | | 5.46% | # | | 01/12/2045 | | | 4,208,740 | |
| 37,758,018 | | Benchmark Mortgage Trust, Series 2018-B7-XA | | | 0.45% | # I/O | | 05/15/2053 | | | 1,269,953 | |
| 81,090,269 | | Benchmark Mortgage Trust, Series 2019-B9-XA | | | 1.05% | # I/O | | 03/15/2052 | | | 6,759,863 | |
| 75,399,000 | | BHMS Trust, Series 2018-ATLS-A (1 Month LIBOR USD + 1.25%, 1.25% Floor) | | | 3.73% | ^ | | 07/15/2035 | | | 75,416,146 | |
| 9,394,000 | | BHMS Trust, Series 2018-ATLS-C (1 Month LIBOR USD + 1.90%, 1.90% Floor) | | | 4.38% | ^ | | 07/15/2035 | | | 9,393,777 | |
| 28,680,000 | | Bremar Hotels and Resorts Trust, Series 2018-PRME-A (1 Month LIBOR USD + 0.82%, 0.82% Floor) | | | 3.30% | ^ | | 06/15/2035 | | | 28,628,158 | |
| 2,623,135 | | Bsprt Issuer Ltd., Series 2017-FL2-AS (1 Month LIBOR USD + 1.10%, 1.10% Floor) | | | 3.58% | ^ | | 10/15/2034 | | | 2,620,349 | |
| 3,025,000 | | Bsprt Issuer Ltd., Series 2017-FL2-B (1 Month LIBOR USD + 1.40%, 1.40% Floor) | | | 3.88% | ^ | | 10/15/2034 | | | 3,025,349 | |
| 6,663,000 | | BX Commercial Mortgage Trust, Series 2018-BIOA-D (1 Month LIBOR USD + 1.32%, 1.35% Floor) | | | 3.80% | ^ | | 03/15/2037 | | | 6,657,426 | |
| 35,415,000 | | BX Commercial Mortgage Trust, Series 2018-BIOA-E (1 Month LIBOR USD + 1.95%, 1.98% Floor) | | | 4.43% | ^ | | 03/15/2037 | | | 35,477,872 | |
| 14,263,512 | | BX Commercial Mortgage Trust, Series 2018-IND-A (1 Month LIBOR USD + 0.75%, 0.75% Floor) | | | 3.23% | ^ | | 11/15/2035 | | | 14,243,424 | |
| 17,352,750 | | BX Trust, Series 2017-APPL-D (1 Month LIBOR USD + 2.05%, 2.05% Floor) | | | 4.53% | ^ | | 07/15/2034 | | | 17,381,733 | |
| 29,846,050 | | BX Trust, Series 2017-APPL-E (1 Month LIBOR USD + 3.15%, 3.15% Floor) | | | 5.63% | ^ | | 07/15/2034 | | | 30,016,250 | |
| 7,369,000 | | BX Trust, Series 2017-IMC-D (1 Month LIBOR USD + 2.25%, 2.25% Floor) | | | 4.73% | ^ | | 10/15/2032 | | | 7,347,697 | |
| 12,055,000 | | BX Trust, Series 2017-IMC-E (1 Month LIBOR USD + 3.25%, 3.25% Floor) | | | 5.73% | ^ | | 10/15/2032 | | | 12,044,060 | |
| 34,505,750 | | BX Trust, Series 2017-SLCT-D (1 Month LIBOR USD + 2.05%) | | | 4.53% | ^ | | 07/15/2034 | | | 34,505,291 | |
| 63,983,750 | | BX Trust, Series 2017-SLCT-E (1 Month LIBOR USD + 3.15%) | | | 5.63% | ^ | | 07/15/2034 | | | 64,348,624 | |
| 20,102,000 | | BX Trust, Series 2018-BILT-A (1 Month LIBOR USD + 0.80%, 0.80% Floor) | | | 3.28% | ^ | | 05/15/2030 | | | 19,991,489 | |
| 42,971,538 | | BX Trust, Series 2018-EXCL-A (1 Month LIBOR USD + 1.09%) | | | 3.57% | ^ | | 09/15/2037 | | | 42,782,519 | |
| 43,522,000 | | BX Trust, Series 2018-GW-A (1 Month LIBOR USD + 0.80%, 0.80% Floor) | | | 3.28% | ^ | | 05/15/2035 | | | 43,237,606 | |
| 2,447,000 | | BX Trust, Series 2018-GW-D (1 Month LIBOR USD + 1.77%, 1.77% Floor) | | | 4.25% | ^ | | 05/15/2035 | | | 2,451,329 | |
| 4,437,000 | | BX Trust, Series 2018-GW-E (1 Month LIBOR USD + 1.97%, 1.97% Floor) | | | 4.45% | ^ | | 05/15/2035 | | | 4,450,655 | |
| 7,481,000 | | BX Trust, Series 2018-GW-F (1 Month LIBOR USD + 2.42%, 2.42% Floor) | | | 4.90% | ^ | | 05/15/2035 | | | 7,519,158 | |
| 16,882,000 | | BX Trust, Series 2018-MCSF-F (1 Month LIBOR USD + 2.65%, 2.65% Floor) | | | 5.13% | ^ | | 04/15/2035 | | | 16,789,806 | |
| 49,783,375 | | CD Mortgage Trust, Series 2017-CD6-XA | | | 0.97% | # I/O | | 11/13/2050 | | | 2,854,210 | |
| 7,155,000 | | CFCRE Commercial Mortgage Trust, Series 2016-C4-C | | | 4.87% | # | | 05/10/2058 | | | 7,437,425 | |
| 60,650,822 | | CFCRE Commercial Mortgage Trust, Series 2016-C4-XA | | | 1.73% | # I/O | | 05/10/2058 | | | 5,602,256 | |
| 45,007,628 | | CFCRE Commercial Mortgage Trust, Series 2017-C8-XA | | | 1.66% | # I/O | | 06/15/2050 | | | 4,281,351 | |
| 3,128,000 | | CFCRE Commercial Mortgage Trust, Series 2018-TAN-B | | | 4.69% | ^ | | 02/15/2033 | | | 3,230,378 | |
| 3,128,000 | | CFCRE Commercial Mortgage Trust, Series 2018-TAN-C | | | 5.29% | ^ | | 02/15/2033 | | | 3,231,810 | |
| 1,877,000 | | CFCRE Commercial Mortgage Trust, Series 2018-TAN-D | | | 6.10% | ^ | | 02/15/2033 | | | 1,947,102 | |
| 5,436,000 | | CGDBB Commercial Mortgage Trust, Series 2017-BIOC-D (1 Month LIBOR USD + 1.60%, 1.60% Floor) | | | 4.08% | ^ | | 07/15/2032 | | | 5,447,486 | |
| 7,611,000 | | CGDBB Commercial Mortgage Trust, Series 2017-BIOC-E (1 Month LIBOR USD + 2.15%, 2.25% Floor) | | | 4.63% | ^ | | 07/15/2032 | | | 7,619,048 | |
| 43,737,000 | | CHT Mortgage Trust, Series 2017-CSMO-E (1 Month LIBOR USD + 3.00%, 3.00% Floor) | | | 5.48% | ^ | | 11/15/2036 | | | 43,986,681 | |
| 24,582,000 | | CHT Mortgage Trust, Series 2017-CSMO-F (1 Month LIBOR USD + 3.74%, 3.74% Floor) | | | 6.22% | ^ | | 11/15/2036 | | | 24,752,783 | |
| 204,408,190 | | Citigroup Commercial Mortgage Trust, Series 2012-GC8-XA | | | 1.79% | # ^ I/O | | 09/10/2045 | | | 9,488,730 | |
| 152,435,649 | | Citigroup Commercial Mortgage Trust, Series 2014-GC19-XA | | | 1.16% | # I/O | | 03/10/2047 | | | 7,332,886 | |
| 83,857,323 | | Citigroup Commercial Mortgage Trust, Series 2014-GC21-XA | | | 1.21% | # I/O | | 05/10/2047 | | | 4,199,633 | |
| 190,343,357 | | Citigroup Commercial Mortgage Trust, Series 2014-GC25-XA | | | 1.00% | # I/O | | 10/10/2047 | | | 8,823,347 | |
| 6,265,000 | | Citigroup Commercial Mortgage Trust, Series 2015-GC27-B | | | 3.77% | | | 02/10/2048 | | | 6,336,214 | |
| 3,685,000 | | Citigroup Commercial Mortgage Trust, Series 2015-GC27-D | | | 4.43% | # ^ | | 02/10/2048 | | | 3,421,071 | |
| 213,990,309 | | Citigroup Commercial Mortgage Trust, Series 2015-GC27-XA | | | 1.38% | # I/O | | 02/10/2048 | | | 13,366,926 | |
| 14,310,000 | | Citigroup Commercial Mortgage Trust, Series 2015-GC33-C | | | 4.57% | # | | 09/10/2058 | | | 14,550,577 | |
| 176,162,701 | | Citigroup Commercial Mortgage Trust, Series 2015-GC33-XA | | | 0.94% | # I/O | | 09/10/2058 | | | 8,079,509 | |
| 20,725,000 | | Citigroup Commercial Mortgage Trust, Series 2015-GC35-C | | | 4.50% | # | | 11/10/2048 | | | 21,012,733 | |
| 106,890,839 | | Citigroup Commercial Mortgage Trust, Series 2016-C1-XA | | | 1.90% | # I/O | | 05/10/2049 | | | 11,237,284 | |
| 213,962,012 | | Citigroup Commercial Mortgage Trust, Series 2016-GC36-XA | | | 1.29% | # I/O | | 02/10/2049 | | | 14,554,188 | |
| 44,024,110 | | Citigroup Commercial Mortgage Trust, Series 2016-GC37-XA | | | 1.78% | # I/O | | 04/10/2049 | | | 4,242,036 | |
| 113,610,905 | | Citigroup Commercial Mortgage Trust, Series 2016-P3-XA | | | 1.70% | # I/O | | 04/15/2049 | | | 9,714,255 | |
| 60,497,715 | | Citigroup Commercial Mortgage Trust, Series 2016-P4-XA | | | 1.99% | # I/O | | 07/10/2049 | | | 6,332,719 | |
| 37,792,530 | | Citigroup Commercial Mortgage Trust, Series 2016-P5-XA | | | 1.53% | # I/O | | 10/10/2049 | | | 3,011,883 | |
| 46,840,926 | | Citigroup Commercial Mortgage Trust, Series 2017-P7-XA | | | 1.13% | # I/O | | 04/14/2050 | | | 3,240,305 | |
| 13,806,000 | | CLNS Trust, Series 2017-IKPR-D (1 Month LIBOR USD + 2.05%, 2.05% Floor) | | | 4.54% | ^ | | 06/11/2032 | | | 13,836,558 | |
| 88,477,000 | | CLNS Trust, Series 2017-IKPR-E (1 Month LIBOR USD + 3.50%, 3.50% Floor) | | | 5.99% | ^ | | 06/11/2032 | | | 89,003,527 | |
| 28,027,000 | | CLNS Trust, Series 2017-IKPR-F (1 Month LIBOR USD + 4.50%, 4.50% Floor) | | | 6.99% | ^ | | 06/11/2032 | | | 28,209,983 | |
| 23,586,000 | | Cloverleaf Cold Storage Trust, Series 2019-CHL2-A (1 Month LIBOR USD + 1.08%, 1.08% Floor) | | | 3.56% | ^ | | 03/15/2036 | | | 23,615,671 | |
| 31,473,000 | | Cloverleaf Cold Storage Trust, Series 2019-CHL2-E (1 Month LIBOR USD + 2.30%, 2.30% Floor) | | | 4.78% | ^ | | 03/15/2036 | | | 31,551,903 | |
| 2,378,000 | | Cloverleaf Cold Storage Trust, Series 2019-CHL2-F (1 Month LIBOR USD + 2.75%, 2.75% Floor) | | | 5.23% | ^ | | 03/15/2036 | | | 2,383,962 | |
| 54,154 | | COBALT Commercial Mortgage Trust, Series 2007-C2-AJFX | | | 5.57% | # | | 04/15/2047 | | | 54,343 | |
| 29,234,000 | | Cold Storage Trust, Series 2017-ICE3-A (1 Month LIBOR USD + 1.00%, 1.00% Floor) | | | 3.48% | ^ | | 04/15/2036 | | | 29,272,378 | |
| 41,768,000 | | Cold Storage Trust, Series 2017-ICE3-C (1 Month LIBOR USD + 1.35%, 1.35% Floor) | | | 3.83% | ^ | | 04/15/2036 | | | 41,823,238 | |
| 32,337,800 | | Commercial Mortgage Pass-Through Certificates, Series 2012-CR2-XA | | | 1.65% | # I/O | | 08/15/2045 | | | 1,456,744 | |
| 141,975,988 | | Commercial Mortgage Pass-Through Certificates, Series 2012-CR3-XA | | | 1.87% | # I/O | | 10/15/2045 | | | 7,712,391 | |
| 108,181,678 | | Commercial Mortgage Pass-Through Certificates, Series 2012-LC4-XA | | | 2.11% | # ^ I/O | | 12/10/2044 | | | 5,327,461 | |
| 148,997,409 | | Commercial Mortgage Pass-Through Certificates, Series 2013-CR10-XA | | | 0.68% | # I/O | | 08/10/2046 | | | 3,917,932 | |
| 200,395,092 | | Commercial Mortgage Pass-Through Certificates, Series 2013-CR12-XA | | | 1.17% | # I/O | | 10/10/2046 | | | 8,519,316 | |
| 843,000 | | Commercial Mortgage Pass-Through Certificates, Series 2013-CR13-C | | | 4.90% | # | | 11/10/2046 | | | 879,117 | |
| 7,635,000 | | Commercial Mortgage Pass-Through Certificates, Series 2014-CR19-C | | | 4.71% | # | | 08/10/2047 | | | 7,922,589 | |
| 5,211,000 | | Commercial Mortgage Pass-Through Certificates, Series 2014-CR20-A4 | | | 3.59% | | | 11/10/2047 | | | 5,371,409 | |
| 30,400,000 | | Commercial Mortgage Pass-Through Certificates, Series 2014-CR20-C | | | 4.50% | # | | 11/10/2047 | | | 31,457,014 | |
| 116,477,428 | | Commercial Mortgage Pass-Through Certificates, Series 2014-UBS3-XA | | | 1.25% | # I/O | | 06/10/2047 | | | 4,739,257 | |
| 8,215,000 | | Commercial Mortgage Pass-Through Certificates, Series 2015-CALW-D | | | 3.85% | # ^ | | 02/10/2034 | | | 8,308,439 | |
| 13,025,000 | | Commercial Mortgage Pass-Through Certificates, Series 2015-CR22-D | | | 4.12% | # ^ | | 03/10/2048 | | | 12,369,648 | |
| 215,896,651 | | Commercial Mortgage Pass-Through Certificates, Series 2015-CR22-XA | | | 0.95% | # I/O | | 03/10/2048 | | | 8,072,484 | |
| 9,110,000 | | Commercial Mortgage Pass-Through Certificates, Series 2015-CR26-B | | | 4.48% | # | | 10/10/2048 | | | 9,537,713 | |
| 86,348,328 | | Commercial Mortgage Pass-Through Certificates, Series 2015-CR26-XA | | | 0.96% | # I/O | | 10/10/2048 | | | 4,176,522 | |
| 8,715,000 | | Commercial Mortgage Pass-Through Certificates, Series 2015-DC1-C | | | 4.35% | # | | 02/10/2048 | | | 8,733,929 | |
| 395,519,180 | | Commercial Mortgage Pass-Through Certificates, Series 2015-DC1-XA | | | 1.13% | # I/O | | 02/10/2048 | | | 16,840,099 | |
| 26,930,000 | | Commercial Mortgage Pass-Through Certificates, Series 2016-CR28-C | | | 4.65% | # | | 02/10/2049 | | | 28,288,128 | |
| 20,355,000 | | Commercial Mortgage Pass-Through Certificates, Series 2016-GCT-E | | | 3.46% | # ^ | | 08/10/2029 | | | 20,101,552 | |
| 1,617,000 | | Commercial Mortgage Pass-Through Certificates, Series 2017-PANW-D | | | 3.93% | # ^ | | 10/10/2029 | | | 1,609,114 | |
| 5,524,000 | | Commercial Mortgage Pass-Through Certificates, Series 2017-PANW-E | | | 3.81% | # ^ | | 10/10/2029 | | | 5,243,532 | |
| 18,570,000 | | Commercial Mortgage Pass-Through Certificates, Series 2018-HCLV-A (1 Month LIBOR USD + 1.00%, 1.00% Floor) | | | 3.48% | ^ | | 09/15/2033 | | | 18,633,847 | |
| 1,889,000 | | Core Industrial Trust, Series 2015-CALW-C | | | 3.56% | ^ | | 02/10/2034 | | | 1,906,391 | |
| 1,782,000 | | Core Mortgage Trust, Series 2019-CORE-E (1 Month LIBOR USD + 1.90%, 1.90% Floor) | | | 4.40% | ^ | | 12/15/2031 | | | 1,784,288 | |
| 150,822,000 | | Credit Suisse Mortgage Capital Certificates, Series 2014-USA-X1 | | | 0.55% | # ^ I/O | | 09/15/2037 | | | 4,344,036 | |
| 4,606,000 | | CSAIL Commercial Mortgage Trust, Series 2015-C1-C | | | 4.30% | # | | 04/15/2050 | | | 4,673,436 | |
| 13,360,000 | | CSAIL Commercial Mortgage Trust, Series 2015-C2-AS | | | 3.85% | # | | 06/15/2057 | | | 13,761,773 | |
| 12,154,000 | | CSAIL Commercial Mortgage Trust, Series 2015-C3-C | | | 4.36% | # | | 08/15/2048 | | | 12,096,716 | |
| 9,759,000 | | CSAIL Commercial Mortgage Trust, Series 2015-C4-C | | | 4.58% | # | | 11/15/2048 | | | 10,053,207 | |
| 311,864,904 | | CSAIL Commercial Mortgage Trust, Series 2015-C4-XA | | | 0.90% | # I/O | | 11/15/2048 | | | 13,909,986 | |
| 2,085,000 | | CSAIL Commercial Mortgage Trust, Series 2016-C7-C | | | 4.38% | # | | 11/15/2049 | | | 2,092,849 | |
| 187,700,733 | | CSAIL Commercial Mortgage Trust, Series 2017-C8-XA | | | 1.25% | # I/O | | 06/15/2050 | | | 12,327,546 | |
| 5,511,000 | | CSAIL Commercial Mortgage Trust, Series 2017-CX10-C | | | 4.11% | # | | 11/15/2050 | | | 5,562,649 | |
| 91,675,570 | | CSAIL Commercial Mortgage Trust, Series 2017-CX10-XA | | | 0.73% | # I/O | | 11/15/2050 | | | 4,453,673 | |
| 7,050,000 | | CSMC Trust, Series 2017-CALI-E | | | 3.78% | # ^ | | 11/10/2032 | | | 6,697,787 | |
| 6,050,000 | | CSMC Trust, Series 2017-CALI-F | | | 3.78% | # ^ | | 11/10/2032 | | | 5,586,431 | |
| 12,164,000 | | CSMC Trust, Series 2017-CHOP-D (1 Month LIBOR USD + 1.90%, 1.90% Floor) | | | 4.38% | ^ | | 07/15/2032 | | | 12,182,319 | |
| 21,321,000 | | CSMC Trust, Series 2017-CHOP-E (1 Month LIBOR USD + 3.30%, 3.30% Floor) | | | 5.78% | ^ | | 07/15/2032 | | | 21,418,330 | |
| 4,673,000 | | CSMC Trust, Series 2017-MOON-E | | | 3.20% | ^ # | | 07/12/2034 | | | 4,539,957 | |
| 43,750,000 | | CSWF Trust, Series 2018-TOP-A (1 Month LIBOR USD + 1.00%, 1.00% Floor) | | | 3.48% | ^ | | 08/15/2035 | | | 43,709,015 | |
| 69,289,284 | | DBGS Mortgage Trust, Series 2018-BIOD-A (1 Month LIBOR USD + 0.80%, 0.80% Floor) | | | 3.29% | ^ | | 05/15/2035 | | | 69,277,602 | |
| 103,066,152 | | DBUBS Mortgage Trust, Series 2011-LC2A-XA | | | 1.05% | # ^ I/O | | 07/10/2044 | | | 1,822,508 | |
| 2,996,000 | | DBUBS Mortgage Trust, Series 2011-LC3A-PM2 | | | 4.76% | # ^ | | 05/10/2044 | | | 3,091,651 | |
| 123,040,297 | | Deutsche Bank Commercial Mortgage Trust, Series 2016-C1-XA | | | 1.48% | # I/O | | 05/10/2049 | | | 9,630,586 | |
| 73,900,846 | | FREMF Mortgage Trust, Series 2010-K8-C | | | 0.00% | ^ P/O | | 09/25/2043 | | | 69,423,268 | |
| 6,237,368 | | FREMF Mortgage Trust, Series 2012-K708-D | | | 0.00% | ^ P/O | | 02/25/2045 | | | 6,239,295 | |
| 6,237,368 | | FREMF Mortgage Trust, Series 2012-K708-X2B | | | 0.20% | ^ I/O | | 02/25/2045 | | | 52 | |
| 86,165,686 | | FREMF Mortgage Trust, Series 2013-K713-D | | | 0.00% | ^ P/O | | 04/25/2046 | | | 80,789,981 | |
| 186,442,686 | | FREMF Mortgage Trust, Series 2013-K713-X2B | | | 0.10% | ^ I/O | | 04/25/2046 | | | 160,154 | |
| 41,214,120 | | FREMF Mortgage Trust, Series 2014-K503-D | | | 0.00% | ^ P/O | | 10/25/2047 | | | 40,110,282 | |
| 155,908,477 | | FREMF Mortgage Trust, Series 2014-K503-X2A | | | 0.10% | # ^ I/O | | 10/25/2047 | | | 11,241 | |
| 98,913,520 | | FREMF Mortgage Trust, Series 2014-K503-X2B | | | 0.10% | ^ I/O | | 10/25/2047 | | | 34,105 | |
| 1,923,324 | | GE Commercial Mortgage Corporation Trust, Series 2007-C1-AM | | | 5.44% | # | | 12/10/2049 | | | 1,740,468 | |
| 36,323,732 | | GPMT Ltd., Series 2018-FL1-A (1 Month LIBOR USD + 0.90%, 0.90% Floor) | | | 3.39% | ^ | | 11/21/2035 | | | 36,307,060 | |
| 17,094,000 | | GPMT Ltd., Series 2019-FL2-A (1 Month LIBOR USD + 1.30%, 1.30% Floor) | | | 3.78% | ^ | | 02/22/2036 | | | 17,185,880 | |
| 4,639,834 | | GPT Mortgage Trust, Series 2018-GPP-B (1 Month LIBOR USD + 1.28%, 1.28% Floor) | | | 3.76% | ^ | | 06/15/2035 | | | 4,610,285 | |
| 15,417,000 | | Great Wolf Trust, Series 2017-WOLF-D (1 Month LIBOR USD + 2.10%, 1.00% Floor) | | | 4.73% | ^ | | 09/15/2034 | | | 15,444,199 | |
| 31,606,000 | | Great Wolf Trust, Series 2017-WOLF-E (1 Month LIBOR USD + 3.10%, 1.00% Floor) | | | 5.73% | ^ | | 09/15/2034 | | | 31,711,532 | |
| 16,823,000 | | Great Wolf Trust, Series 2017-WOLF-F (1 Month LIBOR USD + 4.07%, 1.00% Floor) | | | 6.70% | ^ | | 09/15/2034 | | | 16,909,871 | |
| 3,476,649 | | Greenwich Capital Commercial Funding Corporation, Series 2006-GG7-AM | | | 5.61% | # | | 07/10/2038 | | | 3,496,345 | |
| 16,399,000 | | GS Mortgage Securities Corp Trust, Series 2018-LUAU-A (1 Month LIBOR USD + 1.00%, 1.00% Floor) | | | 3.48% | ^ | | 11/15/2032 | | | 16,390,891 | |
| 18,318,189 | | GS Mortgage Securities Corporation, Series 2011-GC3-X | | | 0.66% | # ^ I/O | | 03/10/2044 | | | 203,674 | |
| 23,972,529 | | GS Mortgage Securities Corporation, Series 2013-GC10-XA | | | 1.52% | # I/O | | 02/10/2046 | | | 1,162,761 | |
| 279,560,506 | | GS Mortgage Securities Corporation, Series 2015-GC28-XA | | | 1.10% | # I/O | | 02/10/2048 | | | 11,214,905 | |
| 243,692,889 | | GS Mortgage Securities Corporation, Series 2015-GC32-XA | | | 0.81% | # I/O | | 07/10/2048 | | | 9,304,195 | |
| 171,496,991 | | GS Mortgage Securities Corporation, Series 2015-GC34-XA | | | 1.33% | # I/O | | 10/10/2048 | | | 11,002,561 | |
| 19,232,000 | | GS Mortgage Securities Corporation, Series 2018-3PCK-A (1 Month LIBOR USD + 1.45%, 1.45% Floor) | | | 3.93% | ^ | | 09/15/2031 | | | 19,285,138 | |
| 59,522,000 | | GS Mortgage Securities Corporation, Series 2018-FBLU-F (1 Month LIBOR USD + 3.25%, 3.25% Floor) | | | 5.73% | ^ | | 11/15/2035 | | | 59,666,377 | |
| 207,084,583 | | GS Mortgage Securities Corporation, Series 2018-GS9-XA | | | 0.45% | # I/O | | 03/10/2051 | | | 6,979,703 | |
| 34,121,000 | | GS Mortgage Securities Corporation, Series 2018-TWR-A (1 Month LIBOR USD + 0.90%, 0.85% Floor) | | | 3.38% | ^ | | 07/15/2031 | | | 34,122,884 | |
| 3,897,000 | | GS Mortgage Securities Corporation, Series 2018-TWR-D (1 Month LIBOR USD + 1.60%, 1.50% Floor) | | | 4.08% | ^ | | 07/15/2031 | | | 3,868,002 | |
| 11,950,000 | | GS Mortgage Securities Corporation, Series 2018-TWR-E (1 Month LIBOR USD + 2.10%, 2.10% Floor) | | | 4.58% | ^ | | 07/15/2031 | | | 11,799,460 | |
| 11,242,000 | | GS Mortgage Securities Corporation, Series 2018-TWR-F (1 Month LIBOR USD + 2.80%, 2.80% Floor) | | | 5.28% | ^ | | 07/15/2031 | | | 11,090,557 | |
| 4,648,000 | | GS Mortgage Securities Corporation, Series 2018-TWR-G (1 Month LIBOR USD + 3.92%, 3.98% Floor) | | | 6.41% | ^ | | 07/15/2031 | | | 4,588,394 | |
| 94,041,971 | | GS Mortgage Securities Trust, Series 2012-GC6-XA | | | 1.94% | # ^ I/O | | 01/10/2045 | | | 3,999,050 | |
| 3,500,000 | | GS Mortgage Securities Trust, Series 2015-GC28-C | | | 4.32% | # | | 02/10/2048 | | | 3,476,236 | |
| 67,977,077 | | GS Mortgage Securities Trust, Series 2015-GS1-XA | | | 0.80% | # I/O | | 11/10/2048 | | | 2,972,481 | |
| 55,372,657 | | GS Mortgage Securities Trust, Series 2016-GS2-XA | | | 1.66% | # I/O | | 05/10/2049 | | | 4,572,214 | |
| 309,564,831 | | GS Mortgage Securities Trust, Series 2016-GS3-XA | | | 1.26% | # I/O | | 10/10/2049 | | | 21,496,182 | |
| 69,484,135 | | GS Mortgage Securities Trust, Series 2016-GS4-XA | | | 0.58% | # I/O | | 11/10/2049 | | | 2,118,029 | |
| 190,606,766 | | GS Mortgage Securities Trust, Series 2017-GS7-XA | | | 1.14% | # I/O | | 08/10/2050 | | | 13,780,183 | |
| 98,700,000 | | GS Mortgage Securities Trust, Series 2017-GS7-XB | | | 0.35% | # I/O | | 08/10/2050 | | | 2,614,622 | |
| 3,443,000 | | GS Mortgage Securities Trust, Series 2018-GS10-WLSA | | | 4.58% | # ^ | | 03/10/2033 | | | 3,679,614 | |
| 6,834,000 | | GS Mortgage Securities Trust, Series 2018-GS10-WLSB | | | 4.58% | # ^ | | 03/10/2033 | | | 7,292,519 | |
| 9,287,000 | | GS Mortgage Securities Trust, Series 2018-GS10-WLSC | | | 4.58% | # ^ | | 03/10/2033 | | | 9,657,018 | |
| 8,990,000 | | GS Mortgage Securities Trust, Series 2018-GS10-WLSD | | | 4.58% | # ^ | | 03/10/2033 | | | 9,033,540 | |
| 11,236,750 | | GS Mortgage Securities Trust, Series 2018-GS10-WLSE | | | 4.58% | # ^ | | 03/10/2033 | | | 10,762,142 | |
| 61,178,473 | | GS Mortgage Securities Trust, Series 2019-GC38-XA | | | 0.97% | # I/O | | 02/10/2052 | | | 4,718,977 | |
| 7,037,000 | | Hilton Orlando Trust, Series 2018-ORL-E (1 Month LIBOR USD + 2.65%) | | | 5.13% | ^ | | 12/15/2034 | | | 7,095,943 | |
| 5,692,000 | | Hilton USA Trust 2016-SFP, Series 2016-SFP-A | | | 2.83% | ^ | | 11/05/2035 | | | 5,659,520 | |
| 9,317,000 | | IMT Trust, Series 2017-APTS-BFL (1 Month LIBOR USD + 0.95%) | | | 3.43% | ^ | | 06/15/2034 | | | 9,292,545 | |
| 2,917,000 | | IMT Trust, Series 2017-APTS-CFL (1 Month LIBOR USD + 1.10%) | | | 3.58% | ^ | | 06/15/2034 | | | 2,906,753 | |
| 1,086,926 | | JP Morgan Chase Commercial Mortgage Securities Corporation, Series 2004-CBX-X1 | | | 1.01% | # ^ I/O | | 01/12/2037 | | | 12,931 | |
| 1,845,906 | | JP Morgan Chase Commercial Mortgage Securities Corporation, Series 2005-CB12-AJ | | | 4.99% | # | | 09/12/2037 | | | 1,868,495 | |
| 2,808,850 | | JP Morgan Chase Commercial Mortgage Securities Corporation, Series 2006-LDP8-X | | | 0.29% | # I/O | | 05/15/2045 | | | 3,319 | |
| 4,049,751 | | JP Morgan Chase Commercial Mortgage Securities Corporation, Series 2006-LDP9-AM | | | 5.37% | | | 05/15/2047 | | | 4,050,110 | |
| 32,957 | | JP Morgan Chase Commercial Mortgage Securities Corporation, Series 2007-CB18-AM | | | 5.47% | # | | 06/12/2047 | | | 33,048 | |
| 32,152 | | JP Morgan Chase Commercial Mortgage Securities Corporation, Series 2007-CB18-AMFX | | | 5.40% | | | 06/12/2047 | | | 32,241 | |
| 18,525,114 | | JP Morgan Chase Commercial Mortgage Securities Corporation, Series 2007-CB18-X | | | 0.35% | # I/O | | 06/12/2047 | | | 632 | |
| 55,206,459 | | JP Morgan Chase Commercial Mortgage Securities Corporation, Series 2007-CB20-X1 | | | 0.00% | # ^ I/O | | 02/12/2051 | | | 552 | |
| 142,582,709 | | JP Morgan Chase Commercial Mortgage Securities Corporation, Series 2012-C6-XA | | | 1.59% | # I/O | | 05/15/2045 | | | 5,769,567 | |
| 292,656,806 | | JP Morgan Chase Commercial Mortgage Securities Corporation, Series 2012-C8-XA | | | 1.78% | # I/O | | 10/15/2045 | | | 14,142,904 | |
| 112,483,583 | | JP Morgan Chase Commercial Mortgage Securities Corporation, Series 2012-CBX-XA | | | 2.07% | # I/O | | 06/15/2045 | | | 3,669,170 | |
| 78,788,086 | | JP Morgan Chase Commercial Mortgage Securities Corporation, Series 2015-JP1-XA | | | 1.12% | # I/O | | 01/15/2049 | | | 3,442,448 | |
| 7,271,000 | | JP Morgan Chase Commercial Mortgage Securities Corporation, Series 2017-FL10-B (1 Month LIBOR USD + 1.00%, 1.00% Floor) | | | 3.48% | ^ | | 06/15/2032 | | | 7,223,072 | |
| 5,488,000 | | JP Morgan Chase Commercial Mortgage Securities Corporation, Series 2017-FL10-C (1 Month LIBOR USD + 1.25%, 1.25% Floor) | | | 3.73% | ^ | | 06/15/2032 | | | 5,437,212 | |
| 17,779,000 | | JP Morgan Chase Commercial Mortgage Securities Corporation, Series 2017-FL10-D (1 Month LIBOR USD + 1.90%, 1.90% Floor) | | | 4.38% | ^ | | 06/15/2032 | | | 17,466,148 | |
| 49,875,000 | | JP Morgan Chase Commercial Mortgage Securities Corporation, Series 2017-FL10-XCP | | | 0.00% | # ^ I/O | | 04/15/2019 | | | 499 | |
| 1,361,000 | | JP Morgan Chase Commercial Mortgage Securities Corporation, Series 2017-MAUI-C (1 Month LIBOR USD + 1.25%, 1.25% Floor) | | | 3.74% | ^ | | 07/15/2034 | | | 1,361,205 | |
| 1,285,000 | | JP Morgan Chase Commercial Mortgage Securities Corporation, Series 2017-MAUI-D (1 Month LIBOR USD + 1.95%, 1.95% Floor) | | | 4.44% | ^ | | 07/15/2034 | | | 1,287,765 | |
| 3,198,000 | | JP Morgan Chase Commercial Mortgage Securities Corporation, Series 2017-MAUI-E (1 Month LIBOR USD + 2.95%, 2.95% Floor) | | | 5.44% | ^ | | 07/15/2034 | | | 3,211,544 | |
| 4,506,000 | | JP Morgan Chase Commercial Mortgage Securities Corporation, Series 2017-MAUI-F (1 Month LIBOR USD + 3.75%, 3.75% Floor) | | | 6.24% | ^ | | 07/15/2034 | | | 4,475,712 | |
| 73,948,917 | | JP Morgan Chase Commercial Mortgage Securities Corporation, Series 2018-LAQ-A (1 Month LIBOR USD + 1.00%, 1.00% Floor) | | | 3.48% | ^ | | 06/15/2032 | | | 73,753,929 | |
| 836,456 | | JP Morgan Chase Commercial Mortgage Securities Trust, Series 2007-LDPX-AM | | | 5.32% | # | | 01/15/2049 | | | 837,516 | |
| 2,305,126 | | JP Morgan Chase Commercial Mortgage Securities Trust, Series 2014-FL6-B (1 Month LIBOR USD + 2.28%, 2.28% Floor) | | | 4.76% | ^ | | 11/15/2031 | | | 2,311,412 | |
| 4,857,000 | | JP Morgan Chase Commercial Mortgage Securities Trust, Series 2016-WIKI-E | | | 4.01% | # ^ | | 10/05/2031 | | | 4,804,325 | |
| 6,954,000 | | JP Morgan Chase Commercial Mortgage Securities Trust, Series 2018-ASH8-B (1 Month LIBOR USD + 1.10%, 1.14% Floor) | | | 3.58% | ^ | | 02/15/2035 | | | 6,930,444 | |
| 905,000 | | JP Morgan Chase Commercial Mortgage Securities Trust, Series 2018-ASH8-C (1 Month LIBOR USD + 1.30%, 1.34% Floor) | | | 3.78% | ^ | | 02/15/2035 | | | 904,216 | |
| 5,831,000 | | JP Morgan Chase Commercial Mortgage Securities Trust, Series 2018-WPT-EFX | | | 5.54% | ^ | | 07/05/2033 | | | 6,109,852 | |
| 87,068,323 | | JPMBB Commercial Mortgage Securities Trust, Series 2014-C18-XA | | | 0.87% | # I/O | | 02/15/2047 | | | 3,000,522 | |
| 3,396,000 | | JPMBB Commercial Mortgage Securities Trust, Series 2014-C21-C | | | 4.65% | # | | 08/15/2047 | | | 3,441,256 | |
| 214,662,439 | | JPMBB Commercial Mortgage Securities Trust, Series 2014-C25-XA | | | 0.94% | # I/O | | 11/15/2047 | | | 7,567,216 | |
| 6,499,000 | | JPMBB Commercial Mortgage Securities Trust, Series 2014-C26-C | | | 4.42% | # | | 01/15/2048 | | | 6,686,848 | |
| 227,838,517 | | JPMBB Commercial Mortgage Securities Trust, Series 2014-C26-XA | | | 1.06% | # I/O | | 01/15/2048 | | | 9,148,195 | |
| 12,055,000 | | JPMBB Commercial Mortgage Securities Trust, Series 2015-C27-C | | | 4.34% | # | | 02/15/2048 | | | 12,270,070 | |
| 10,425,000 | | JPMBB Commercial Mortgage Securities Trust, Series 2015-C27-D | | | 3.84% | # ^ | | 02/15/2048 | | | 9,840,953 | |
| 15,238,000 | | JPMBB Commercial Mortgage Securities Trust, Series 2015-C28-C | | | 4.22% | # | | 10/15/2048 | | | 15,302,077 | |
| 41,885,025 | | JPMBB Commercial Mortgage Securities Trust, Series 2015-C28-XA | | | 1.12% | # I/O | | 10/15/2048 | | | 1,740,729 | |
| 57,921,387 | | JPMBB Commercial Mortgage Securities Trust, Series 2015-C29-XA | | | 0.80% | # I/O | | 05/15/2048 | | | 1,635,393 | |
| 154,550,644 | | JPMBB Commercial Mortgage Securities Trust, Series 2015-C30-XA | | | 0.55% | # I/O | | 07/15/2048 | | | 4,327,356 | |
| 23,865,000 | | JPMBB Commercial Mortgage Securities Trust, Series 2015-C32-C | | | 4.67% | # | | 11/15/2048 | | | 24,577,377 | |
| 93,566,421 | | JPMBB Commercial Mortgage Securities Trust, Series 2015-C32-XA | | | 1.40% | # I/O | | 11/15/2048 | | | 4,193,694 | |
| 17,630,000 | | JPMBB Commercial Mortgage Securities Trust, Series 2015-C33-C | | | 4.62% | # | | 12/15/2048 | | | 18,223,539 | |
| 32,345,000 | | JPMBB Commercial Mortgage Securities Trust, Series 2016-C1-C | | | 4.74% | # | | 03/15/2049 | | | 33,662,735 | |
| 147,189,398 | | JPMBB Commercial Mortgage Securities Trust, Series 2016-C2-XA | | | 1.69% | # I/O | | 06/15/2049 | | | 11,065,567 | |
| 167,598,094 | | JPMBB Commercial Mortgage Securities Trust, Series 2017-C5-XA | | | 0.99% | # I/O | | 03/15/2050 | | | 9,965,299 | |
| 11,508,000 | | KREF Ltd., Series 2018-FL1-A (1 Month LIBOR USD + 1.10%, 1.10% Floor) | | | 3.58% | ^ | | 06/15/2036 | | | 11,550,073 | |
| 9,538,533 | | LB-UBS Commercial Mortgage Trust, Series 2006-C7-XCL | | | 0.49% | # ^ I/O | | 11/15/2038 | | | 2,848 | |
| 31,939,000 | | LoanCore Issuer Ltd., Series 2018-CRE1-AS (1 Month LIBOR USD + 1.50%, 1.50% Floor) | | | 3.98% | ^ | | 05/15/2028 | | | 31,999,786 | |
| 22,511,522 | | LSTAR Commercial Mortgage Trust, Series 2017-5-X | | | 1.11% | # ^ I/O | | 03/10/2050 | | | 1,023,660 | |
| 44,839,099 | | Merrill Lynch Mortgage Investors Trust, Series 1998-C1-IO | | | 0.61% | # I/O | | 11/15/2026 | | | 267,689 | |
| 775,521 | | Merrill Lynch Mortgage Trust, Series 2006-C1-AJ | | | 5.43% | # | | 05/12/2039 | | | 779,740 | |
| 11,401,000 | | Morgan Stanley Bank of America Merrill Lynch Trust, Series 2012-CKSV-CK | | | 4.30% | ^ | | 10/15/2030 | | | 9,785,985 | |
| 149,517,021 | | Morgan Stanley Bank of America Merrill Lynch Trust, Series 2013-C12-XA | | | 0.62% | # I/O | | 10/15/2046 | | | 3,452,423 | |
| 32,434,292 | | Morgan Stanley Bank of America Merrill Lynch Trust, Series 2013-C7-XA | | | 1.35% | # I/O | | 02/15/2046 | | | 1,390,059 | |
| 11,700,000 | | Morgan Stanley Bank of America Merrill Lynch Trust, Series 2014-C18-C | | | 4.49% | # | | 10/15/2047 | | | 11,871,001 | |
| 37,950,000 | | Morgan Stanley Bank of America Merrill Lynch Trust, Series 2014-C19-C | | | 4.00% | | | 12/15/2047 | | | 37,787,195 | |
| 20,087,700 | | Morgan Stanley Bank of America Merrill Lynch Trust, Series 2015-C20-B | | | 4.16% | | | 02/15/2048 | | | 20,680,813 | |
| 5,457,500 | | Morgan Stanley Bank of America Merrill Lynch Trust, Series 2015-C20-C | | | 4.46% | # | | 02/15/2048 | | | 5,570,439 | |
| 237,014,250 | | Morgan Stanley Bank of America Merrill Lynch Trust, Series 2015-C20-XA | | | 1.33% | # I/O | | 02/15/2048 | | | 13,136,918 | |
| 10,616,000 | | Morgan Stanley Bank of America Merrill Lynch Trust, Series 2015-C23-C | | | 4.13% | # | | 07/15/2050 | | | 10,721,003 | |
| 8,460,000 | | Morgan Stanley Bank of America Merrill Lynch Trust, Series 2015-C25-C | | | 4.53% | # | | 10/15/2048 | | | 8,808,780 | |
| 19,422,000 | | Morgan Stanley Bank of America Merrill Lynch Trust, Series 2015-C27-C | | | 4.53% | # | | 12/15/2047 | | | 19,577,197 | |
| 1,517,000 | | Morgan Stanley Bank of America Merrill Lynch Trust, Series 2015-C27-D | | | 3.24% | # ^ | | 12/15/2047 | | | 1,342,489 | |
| 172,668,308 | | Morgan Stanley Bank of America Merrill Lynch Trust, Series 2016-C28-XA | | | 1.26% | # I/O | | 01/15/2049 | | | 10,794,532 | |
| 2,314,000 | | Morgan Stanley Bank of America Merrill Lynch Trust, Series 2016-C31-C | | | 4.32% | # | | 11/15/2049 | | | 2,310,360 | |
| 52,290,468 | | Morgan Stanley Bank of America Merrill Lynch Trust, Series 2017-C33-XA | | | 1.43% | # I/O | | 05/15/2050 | | | 3,943,491 | |
| 1,772,353 | | Morgan Stanley Capital Trust, Series 2007-T27-AJ | | | 5.95% | # | | 06/11/2042 | | | 1,871,932 | |
| 12,140,000 | | Morgan Stanley Capital Trust, Series 2017-ASHF-D (1 Month LIBOR USD + 2.20%) | | | 4.68% | ^ | | 11/15/2034 | | | 12,147,527 | |
| 17,935,000 | | Morgan Stanley Capital Trust, Series 2017-ASHF-E (1 Month LIBOR USD + 3.15%) | | | 5.63% | ^ | | 11/15/2034 | | | 17,945,976 | |
| 13,586,000 | | Morgan Stanley Capital Trust, Series 2017-ASHF-F (1 Month LIBOR USD + 4.35%) | | | 6.83% | ^ | | 11/15/2034 | | | 13,602,942 | |
| 34,376,000 | | Morgan Stanley Capital Trust, Series 2018-SUN-A (1 Month LIBOR USD + 0.90%, 0.90% Floor) | | | 3.38% | ^ | | 07/15/2035 | | | 34,092,917 | |
| 11,392,000 | | Morgan Stanley Capital Trust, Series 2018-SUN-D (1 Month LIBOR USD + 1.65%, 1.65% Floor) | | | 4.13% | ^ | | 07/15/2035 | | | 11,312,997 | |
| 20,425,000 | | Morgan Stanley Capital Trust, Series 2018-SUN-F (1 Month LIBOR USD + 2.55%, 2.55% Floor) | | | 5.03% | ^ | | 07/15/2035 | | | 20,350,236 | |
| 10,748,000 | | Morgan Stanley Capital Trust, Series 2018-SUN-G (1 Month LIBOR USD + 3.05%, 3.05% Floor) | | | 5.53% | ^ | | 07/15/2035 | | | 10,718,005 | |
| 79,479,000 | | Morgan Stanley Capital Trust, Series 2019-L2-XA | | | 1.20% | # I/O | | 03/15/2052 | | | 6,617,533 | |
| 23,227,906 | | Morgan Stanley Capital, Inc., Series 2006-HQ10-X1 | | | 0.17% | # ^ I/O | | 11/12/2041 | | | 890 | |
| 2,575,000 | | Morgan Stanley Capital, Inc., Series 2014-CPT-E | | | 3.45% | # ^ | | 07/13/2029 | | | 2,570,915 | |
| 2,325,000 | | Morgan Stanley Capital, Inc., Series 2014-CPT-F | | | 3.45% | # ^ | | 07/13/2029 | | | 2,303,875 | |
| 27,049,332 | | Morgan Stanley Capital, Inc., Series 2015-UBS8-XA | | | 0.91% | # I/O | | 12/15/2048 | | | 1,288,292 | |
| 148,109,216 | | Morgan Stanley Capital, Inc., Series 2017-H1-XA | | | 1.45% | # I/O | | 06/15/2050 | | | 11,815,442 | |
| 4,091,752 | | Motel 6 Trust, Series 2017-MTL6-A (1 Month LIBOR USD + 0.92%, 0.92% Floor) | | | 3.40% | ^ | | 08/15/2034 | | | 4,079,567 | |
| 15,588,500 | | Natixis Commercial Mortgage Securities Trust, Series 2018-FL1-A (1 Month LIBOR USD + 0.95%, 0.95% Floor) | | | 3.44% | ^ | | 06/15/2035 | | | 15,442,695 | |
| 14,792,000 | | NLY Commercial Mortgage Trust, Series 2019-FL2-AS (1 Month LIBOR USD + 1.60%, 1.60% Floor) | | | 4.08% | ^ | | 02/15/2036 | | | 14,862,055 | |
| 917,923 | | PFP Ltd., Series 2017-3-C (1 Month LIBOR USD + 2.50%) | | | 4.98% | ^ | | 01/14/2035 | | | 917,501 | |
| 1,243,000 | | RAIT Trust, Series 2017-FL7-AS (1 Month LIBOR USD + 1.30%, 1.30% Floor) | | | 3.78% | ^ | | 06/15/2037 | | | 1,236,290 | |
| 5,840,000 | | RCM Trust, Series 2019-FL3-A | | | 3.50% | ^ ± | | 03/25/2034 | | | 5,840,000 | |
| 12,447,000 | | Rosslyn Portfolio Trust, Series 2017-ROSS-A (1 Month LIBOR USD + 0.95%, 1.94% Floor) | | | 3.43% | ^ | | 06/15/2033 | | | 12,454,299 | |
| 15,724,000 | | Rosslyn Portfolio Trust, Series 2017-ROSS-B (1 Month LIBOR USD + 1.25%, 2.24% Floor) | | | 3.73% | ^ | | 06/15/2033 | | | 15,681,518 | |
| 9,846,000 | | STWD Mortgage Trust, Series 2018-URB-A (1 Month LIBOR USD + 1.00%, 1.00% Floor) | | | 3.48% | ^ | | 05/15/2035 | | | 9,832,509 | |
| 7,863,036 | | Tharaldson Hotel Portfolio Trust, Series 2018-THL-E (1 Month LIBOR USD + 3.18%, 3.10% Floor) | | | 5.66% | ^ | | 11/11/2034 | | | 7,914,578 | |
| 777,970 | | TIAA Seasoned Commercial Mortgage Trust, Series 2007-C4-AJ | | | 5.48% | # | | 08/15/2039 | | | 779,764 | |
| 77,939,523 | | UBS Commercial Mortgage Trust, Series 2017-C1-XA | | | 1.59% | # I/O | | 06/15/2050 | | | 7,446,638 | |
| 12,781,859 | | UBS Commercial Mortgage Trust, Series 2017-C3-XA | | | 1.13% | # I/O | | 08/15/2050 | | | 869,319 | |
| 2,886,000 | | UBS Commercial Mortgage Trust, Series 2017-C6-C | | | 4.45% | # | | 12/15/2050 | | | 2,926,663 | |
| 8,530,000 | | UBS Commercial Mortgage Trust, Series 2018-C8-C | | | 4.70% | # | | 02/15/2051 | | | 8,727,748 | |
| 1,500,000 | | UBS Commercial Mortgage Trust, Series 2018-C9-C | | | 4.89% | # | | 03/15/2051 | | | 1,558,795 | |
| 43,861,792 | | UBS Commercial Mortgage Trust, Series 2018-C9-XA | | | 0.90% | # I/O | | 03/15/2051 | | | 2,929,112 | |
| 2,080,000 | | UBS Commercial Mortgage Trust, Series 2019-C16-B | | | 4.32% | | | 04/15/2052 | | | 2,132,763 | |
| 75,570,465 | | UBS-Barclays Commercial Mortgage Trust, Series 2012-C3-XA | | | 1.83% | # ^ I/O | | 08/10/2049 | | | 3,975,082 | |
| 59,925,325 | | Waterfall Commercial Mortgage Trust, Series 2015-SBC5-A | | | 4.10% | # ^ | | 09/14/2022 | | | 60,765,994 | |
| 4,346,710 | | Wells Fargo Commercial Mortgage Trust, Series 2014-LC18-B | | | 3.96% | | | 12/15/2047 | | | 4,431,000 | |
| 11,460,000 | | Wells Fargo Commercial Mortgage Trust, Series 2015-C26-C | | | 4.07% | # | | 02/15/2048 | | | 11,228,926 | |
| 422,392,983 | | Wells Fargo Commercial Mortgage Trust, Series 2015-C26-XA | | | 1.23% | # I/O | | 02/15/2048 | | | 23,083,692 | |
| 5,450,000 | | Wells Fargo Commercial Mortgage Trust, Series 2015-C27-C | | | 3.89% | | | 02/15/2048 | | | 5,301,831 | |
| 233,461,887 | | Wells Fargo Commercial Mortgage Trust, Series 2015-C27-XA | | | 0.90% | # I/O | | 02/15/2048 | | | 9,910,597 | |
| 9,701,000 | | Wells Fargo Commercial Mortgage Trust, Series 2015-C31-C | | | 4.61% | # | | 11/15/2048 | | | 9,923,151 | |
| 140,605,033 | | Wells Fargo Commercial Mortgage Trust, Series 2015-C31-XA | | | 1.06% | # I/O | | 11/15/2048 | | | 7,714,281 | |
| 265,687,941 | | Wells Fargo Commercial Mortgage Trust, Series 2015-LC20-XA | | | 1.35% | # I/O | | 04/15/2050 | | | 14,346,857 | |
| 12,000,000 | | Wells Fargo Commercial Mortgage Trust, Series 2015-LC22-C | | | 4.54% | # | | 09/15/2058 | | | 12,289,602 | |
| 1,794,000 | | Wells Fargo Commercial Mortgage Trust, Series 2015-NXS4-C | | | 4.60% | # | | 12/15/2048 | | | 1,867,466 | |
| 5,405,000 | | Wells Fargo Commercial Mortgage Trust, Series 2015-P2-A4 | | | 3.81% | | | 12/15/2048 | | | 5,650,469 | |
| 128,908,599 | | Wells Fargo Commercial Mortgage Trust, Series 2015-P2-XA | | | 1.00% | # I/O | | 12/15/2048 | | | 5,995,462 | |
| 11,469,000 | | Wells Fargo Commercial Mortgage Trust, Series 2016-C32-C | | | 4.72% | # | | 01/15/2059 | | | 11,707,103 | |
| 8,676,000 | | Wells Fargo Commercial Mortgage Trust, Series 2016-C34-C | | | 5.03% | # | | 06/15/2049 | | | 9,086,522 | |
| 158,763,446 | | Wells Fargo Commercial Mortgage Trust, Series 2017-C39-XA | | | 1.14% | # I/O | | 09/15/2050 | | | 11,284,906 | |
| 50,693,725 | | Wells Fargo Commercial Mortgage Trust, Series 2017-C42-XA | | | 0.90% | # I/O | | 12/15/2050 | | | 3,217,140 | |
| 168,293,031 | | Wells Fargo Commercial Mortgage Trust, Series 2018-C43-XA | | | 0.71% | # I/O | | 03/15/2051 | | | 8,479,815 | |
| 57,682,541 | | WF-RBS Commercial Mortgage Trust, Series 2011-C4-XA | | | 0.34% | # ^ I/O | | 06/15/2044 | | | 402,515 | |
| 81,117,981 | | WF-RBS Commercial Mortgage Trust, Series 2012-C6-XA | | | 2.08% | # ^ I/O | | 04/15/2045 | | | 3,676,526 | |
| 95,159,179 | | WF-RBS Commercial Mortgage Trust, Series 2012-C8-XA | | | 1.83% | # ^ I/O | | 08/15/2045 | | | 4,728,593 | |
| 40,469,230 | | WF-RBS Commercial Mortgage Trust, Series 2012-C9-XA | | | 1.88% | # ^ I/O | | 11/15/2045 | | | 2,239,895 | |
| 137,439,831 | | WF-RBS Commercial Mortgage Trust, Series 2013-C18-XA | | | 0.74% | # I/O | | 12/15/2046 | | | 3,670,166 | |
| 163,596,822 | | WF-RBS Commercial Mortgage Trust, Series 2014-C19-XA | | | 1.06% | # I/O | | 03/15/2047 | | | 6,393,495 | |
| 55,000,000 | | WF-RBS Commercial Mortgage Trust, Series 2014-C25-A5 | | | 3.63% | | | 11/15/2047 | | | 56,770,956 | |
| 8,000,000 | | WF-RBS Commercial Mortgage Trust, Series 2014-C25-C | | | 4.32% | # | | 11/15/2047 | | | 8,150,514 | |
| 197,868,913 | | WF-RBS Commercial Mortgage Trust, Series 2014-C25-XA | | | 0.89% | # I/O | | 11/15/2047 | | | 7,300,116 | |
| 137,403,087 | | WF-RBS Commercial Mortgage Trust, Series 2016-NXS6-XA | | | 1.64% | # I/O | | 11/15/2049 | | | 11,212,587 | |
| | | | | | | | | | | | |
Total Non-Agency Commercial Mortgage Backed Obligations (Cost $3,918,046,751) | | | 3,706,705,864 | |
| | | | | | | | | | | | |
| |
Non-Agency Residential Collateralized Mortgage Obligations - 26.4% | | | | |
| 10,000,000 | | Accredited Mortgage Loan Trust, Series 2005-4-M1 (1 Month LIBOR USD + 0.40%, 0.40% Floor) | | | 2.89% | | | 12/25/2035 | | | 9,674,729 | |
| 78,915,540 | | Accredited Mortgage Loan Trust, Series 2006-2-A4 (1 Month LIBOR USD + 0.26%, 0.26% Floor) | | | 2.75% | | | 09/25/2036 | | | 77,261,525 | |
| 13,378,925 | | ACE Securities Corporation Home Equity Loan Trust, Series 2007-HE1-A2B (1 Month LIBOR USD + 0.12%, 0.12% Floor) | | | 2.61% | | | 01/25/2037 | | | 9,692,840 | |
| 3,121,268 | | Adjustable Rate Mortgage Trust, Series 2005-10-3A31 | | | 3.91% | # | | 01/25/2036 | | | 2,964,309 | |
| 33,416,859 | | Adjustable Rate Mortgage Trust, Series 2005-11-4A1 | | | 4.02% | # | | 02/25/2036 | | | 26,929,885 | |
| 4,589,549 | | Adjustable Rate Mortgage Trust, Series 2005-2-6M2 (1 Month LIBOR USD + 0.98%, 0.48% Floor, 11.00% Cap) | | | 3.47% | | | 06/25/2035 | | | 4,494,115 | |
| 5,417,460 | | Adjustable Rate Mortgage Trust, Series 2005-4-2A1 | | | 4.77% | # | | 08/25/2035 | | | 5,322,580 | |
| 921,870 | | Adjustable Rate Mortgage Trust, Series 2005-7-3A1 | | | 4.31% | # | | 10/25/2035 | | | 815,517 | |
| 8,961,008 | | Adjustable Rate Mortgage Trust, Series 2005-8-3A21 | | | 4.11% | # | | 11/25/2035 | | | 8,149,999 | |
| 18,382,566 | | Adjustable Rate Mortgage Trust, Series 2006-1-2A1 | | | 4.50% | # | | 03/25/2036 | | | 14,880,241 | |
| 12,399,591 | | Adjustable Rate Mortgage Trust, Series 2006-2-3A1 | | | 4.62% | # | | 05/25/2036 | | | 11,593,728 | |
| 14,314,883 | | Adjustable Rate Mortgage Trust, Series 2006-2-5A1 | | | 5.08% | # | | 05/25/2036 | | | 8,521,142 | |
| 15,745,697 | | Adjustable Rate Mortgage Trust, Series 2007-1-3A1 | | | 4.56% | # | | 03/25/2037 | | | 14,345,510 | |
| 2,602,279 | | Adjustable Rate Mortgage Trust, Series 2007-3-1A1 | | | 5.12% | # ^ | | 11/25/2037 | | | 2,701,422 | |
| 247,157 | | Aegis Asset Backed Securities Trust, Series 2003-2-M2 (1 Month LIBOR USD + 2.55%, 1.70% Floor) | | | 5.04% | | | 11/25/2033 | | | 244,225 | |
| 1,463,886 | | Aegis Asset Backed Securities Trust, Series 2004-1-M2 (1 Month LIBOR USD + 2.03%, 1.35% Floor) | | | 4.52% | | | 04/25/2034 | | | 1,416,606 | |
| 617,792 | | Aegis Asset Backed Securities Trust, Series 2004-2-M2 (1 Month LIBOR USD + 1.95%, 1.30% Floor) | | | 4.44% | | | 06/25/2034 | | | 617,531 | |
| 11,915,064 | | Aegis Asset Backed Securities Trust, Series 2004-6-M2 (1 Month LIBOR USD + 1.00%, 1.00% Floor, 15.00% Cap) | | | 3.49% | | | 03/25/2035 | | | 11,085,104 | |
| 70,092,478 | | Ajax Master Trust, Series 2016-1-PC | | | 0.00% | # ^ | | 01/01/2057 | | | 62,903,548 | |
| 76,197,887 | | Ajax Master Trust, Series 2016-2-PC | | | 0.00% | # ^ | | 10/25/2056 | | | 66,494,368 | |
| 90,706,304 | | Ajax Master Trust, Series 2017-1-PC | | | 0.00% | # ^ | | 06/25/2057 | | | 81,947,540 | |
| 8,091,154 | | Ajax Mortgage Loan Trust, Series 2016-C-A | | | 4.00% | ^ § | | 10/25/2057 | | | 8,112,316 | |
| 31,704,492 | | Ajax Mortgage Loan Trust, Series 2017-A-A | | | 3.47% | ^ § | | 04/25/2057 | | | 31,639,796 | |
| 59,468,979 | | Ajax Mortgage Loan Trust, Series 2017-C-A | | | 3.75% | ^ § | | 07/25/2060 | | | 59,556,279 | |
| 105,161,359 | | Ajax Mortgage Loan Trust, Series 2018-C-A | | | 4.36% | # ^ | | 09/25/2065 | | | 107,036,922 | |
| 7,913,553 | | Ajax Mortgage Loan Trust, Series 2018-E-A | | | 4.38% | # ^ | | 06/25/2058 | | | 7,994,765 | |
| 57,643,158 | | Alternative Loan Trust, Series 2005-55CB-1A1 | | | 5.50% | | | 11/25/2035 | | | 55,056,329 | |
| 15,962,820 | | Alternative Loan Trust, Series 2006-13T1-A1 | | | 6.00% | | | 05/25/2036 | | | 12,206,533 | |
| 4,481,244 | | Alternative Loan Trust, Series 2006-16CB-A7 | | | 6.00% | | | 06/25/2036 | | | 3,746,940 | |
| 11,259,776 | | Alternative Loan Trust, Series 2006-41CB-1A15 (-1 x 1 Month LIBOR USD + 5.40%, 5.40% Cap) | | | 2.91% | I/F I/O | | 01/25/2037 | | | 1,891,910 | |
| 11,259,776 | | Alternative Loan Trust, Series 2006-41CB-1A2 (1 Month LIBOR USD + 0.60%, 0.60% Floor, 6.00% Cap) | | | 3.09% | | | 01/25/2037 | | | 7,360,958 | |
| 7,320,002 | | Alternative Loan Trust, Series 2007-15CB-A2 | | | 5.75% | | | 07/25/2037 | | | 6,200,344 | |
| 10,386,825 | | Alternative Loan Trust, Series 2007-15CB-A5 | | | 5.75% | | | 07/25/2037 | | | 8,798,069 | |
| 23,232,997 | | Alternative Loan Trust, Series 2007-5CB-1A31 | | | 5.50% | | | 04/25/2037 | | | 18,372,022 | |
| 7,787,427 | | Alternative Loan Trust, Series 2007-5CB-2A1 | | | 6.00% | | | 04/25/2037 | | | 5,859,279 | |
| 7,371,172 | | Alternative Loan Trust, Series 2007-6-A1 | | | 5.75% | | | 04/25/2047 | | | 6,330,752 | |
| 65,746,443 | | Alternative Loan Trust, Series 2007-HY4-4A1 | | | 3.86% | # | | 06/25/2037 | | | 61,305,126 | |
| 91,737,583 | | Alternative Loan Trust, Series 2007-HY9-A2 (1 Month LIBOR USD + 0.27%, 0.27% Floor) | | | 2.76% | | | 08/25/2047 | | | 78,878,983 | |
| 6,079,238 | | American Home Assets, Series 2006-2-2A1 (1 Month LIBOR USD + 0.19%, 0.19% Floor) | | | 2.68% | | | 09/25/2046 | | | 5,670,772 | |
| 462,342 | | American Home Mortgage Investment Trust, Series 2005-1-7A2 (6 Month LIBOR USD + 2.00%, 2.00% Floor, 11.00% Cap) | | | 4.70% | | | 06/25/2045 | | | 464,037 | |
| 6,406,651 | | American Home Mortgage Investment Trust, Series 2005-4-3A1 (1 Month LIBOR USD + 0.30%, 0.30% Floor, 11.00% Cap) | | | 2.79% | | | 11/25/2045 | | | 5,831,297 | |
| 23,020,084 | | American Home Mortgage Investment Trust, Series 2005-4-5A (6 Month LIBOR USD + 1.75%, 1.75% Floor, 11.00% Cap) | | | 4.44% | | | 11/25/2045 | | | 17,134,763 | |
| 2,252,559 | | American Home Mortgage Investment Trust, Series 2006-2-3A4 | | | 7.10% | | | 06/25/2036 | | | 820,603 | |
| 7,816,509 | | American Home Mortgage Investment Trust, Series 2007-A-13A1 | | | 6.60% | ^ | | 01/25/2037 | | | 3,217,526 | |
| 6,862,903 | | Ameriquest Mortgage Securities, Inc., Series 2004-FR1-M1 | | | 4.43% | ß | | 05/25/2034 | | | 6,986,154 | |
| 16,500,000 | | Ameriquest Mortgage Securities, Inc., Series 2004-R8-M2 (1 Month LIBOR USD + 1.02%, 0.68% Floor) | | | 3.51% | | | 09/25/2034 | | | 16,498,096 | |
| 9,678,452 | | Amortizing Residential Collateral Trust, Series 2002-BC7-M1 (1 Month LIBOR USD + 1.20%, 0.80% Floor) | | | 3.69% | | | 10/25/2032 | | | 8,404,117 | |
| 22,614,801 | | Angel Oak Mortgage Trust, Series 2018-1-A1 | | | 3.26% | # ^ | | 04/27/2048 | | | 22,592,736 | |
| 108,402 | | Argent Securities, Inc., Series 2004-W6-M1 (1 Month LIBOR USD + 0.83%, 0.55% Floor) | | | 3.31% | | | 05/25/2034 | | | 108,108 | |
| 2,007,831 | | Asset Backed Securities Corporation Home Equity Loan Trust, Series 2003-HE6-M1 (1 Month LIBOR USD + 0.98%, 0.65% Floor) | | | 3.46% | | | 11/25/2033 | | | 1,990,058 | |
| 613,057 | | Asset Backed Securities Corporation Home Equity Loan Trust, Series 2004-HE3-M2 (1 Month LIBOR USD + 1.68%, 1.12% Floor) | | | 4.17% | | | 06/25/2034 | | | 613,438 | |
| 32,158,515 | | Asset Backed Securities Corporation Home Equity Loan Trust, Series 2006-HE7-A1 (1 Month LIBOR USD + 0.14%, 0.14% Floor) | | | 2.62% | | | 11/25/2036 | | | 29,558,898 | |
| 11,327,242 | | Banc of America Alternative Loan Trust, Series 2005-10-2CB1 | | | 6.00% | | | 11/25/2035 | | | 11,445,943 | |
| 1,955,475 | | Banc of America Alternative Loan Trust, Series 2005-10-4A1 | | | 5.75% | | | 11/25/2035 | | | 1,897,005 | |
| 6,198,750 | | Banc of America Alternative Loan Trust, Series 2005-11-2CB1 | | | 6.00% | | | 12/25/2035 | | | 6,176,374 | |
| 2,268,429 | | Banc of America Alternative Loan Trust, Series 2005-5-2CB1 | | | 6.00% | | | 06/25/2035 | | | 2,292,355 | |
| 3,510,461 | | Banc of America Alternative Loan Trust, Series 2005-6-2CB2 | | | 6.00% | | | 07/25/2035 | | | 3,503,878 | |
| 2,239,049 | | Banc of America Alternative Loan Trust, Series 2005-6-4CB1 | | | 6.50% | | | 07/25/2035 | | | 2,151,456 | |
| 1,473,486 | | Banc of America Alternative Loan Trust, Series 2005-8-2CB1 | | | 6.00% | | | 09/25/2035 | | | 1,494,345 | |
| 6,664,669 | | Banc of America Alternative Loan Trust, Series 2006-1-3CB1 | | | 6.50% | | | 02/25/2036 | | | 6,683,886 | |
| 3,699,397 | | Banc of America Alternative Loan Trust, Series 2006-2-1CB1 | | | 6.00% | | | 03/25/2036 | | | 3,650,367 | |
| 4,439,977 | | Banc of America Alternative Loan Trust, Series 2006-2-3CB1 | | | 6.50% | | | 03/25/2036 | | | 3,943,706 | |
| 3,417,259 | | Banc of America Alternative Loan Trust, Series 2006-3-4CB1 | | | 6.50% | | | 04/25/2036 | | | 3,134,412 | |
| 1,079,065 | | Banc of America Alternative Loan Trust, Series 2006-5-CB14 (1 Month LIBOR USD + 1.10%, 6.00% Floor, 6.00% Cap) | | | 6.00% | | | 06/25/2046 | | | 1,016,236 | |
| 2,433,924 | | Banc of America Alternative Loan Trust, Series 2006-6-CB3 | | | 6.00% | | | 07/25/2046 | | | 2,167,614 | |
| 11,554,699 | | Banc of America Alternative Loan Trust, Series 2006-7-A4 | | | 6.00% | ß | | 10/25/2036 | | | 6,440,680 | |
| 3,375,370 | | Banc of America Alternative Loan Trust, Series 2006-8-1A1 (-1 x 1 Month LIBOR USD + 6.50%, 6.50% Cap) | | | 4.01% | I/F I/O | | 11/25/2036 | | | 469,163 | |
| 1,202,962 | | Banc of America Alternative Loan Trust, Series 2006-8-1A2 (1 Month LIBOR USD + 0.45%, 0.45% Floor, 7.00% Cap) | | | 2.94% | | | 11/25/2036 | | | 1,057,635 | |
| 5,819,225 | | Banc of America Alternative Loan Trust, Series 2006-9-1CB1 | | | 6.00% | | | 01/25/2037 | | | 5,583,321 | |
| 775,834 | | Banc of America Alternative Loan Trust, Series 2007-2-2A1 | | | 6.00% | | | 06/25/2037 | | | 715,040 | |
| 6,466,165 | | Banc of America Funding Corporation, Series 2006-2-3A1 | | | 6.00% | | | 03/25/2036 | | | 6,485,695 | |
| 200,459 | | Banc of America Funding Corporation, Series 2006-2-4A1 (-3 x 1 Month LIBOR USD + 22.80%) | | | 15.34% | I/F | | 03/25/2036 | | | 266,599 | |
| 562,675 | | Banc of America Funding Corporation, Series 2006-2-6A2 | | | 5.50% | | | 03/25/2036 | | | 545,669 | |
| 2,781,755 | | Banc of America Funding Corporation, Series 2006-3-1A1 | | | 6.00% | | | 03/25/2036 | | | 2,677,732 | |
| 661,007 | | Banc of America Funding Corporation, Series 2006-3-6A1 | | | 6.21% | # | | 03/25/2036 | | | 666,647 | |
| 4,426,281 | | Banc of America Funding Corporation, Series 2006-6-1A7 | | | 6.25% | | | 08/25/2036 | | | 4,379,794 | |
| 1,312,792 | | Banc of America Funding Corporation, Series 2006-7-T2A5 | | | 6.04% | | | 10/25/2036 | | | 1,244,237 | |
| 6,187,586 | | Banc of America Funding Corporation, Series 2006-7-T2A8 | | | 5.91% | | | 10/25/2036 | | | 5,865,066 | |
| 1,343,059 | | Banc of America Funding Corporation, Series 2006-8T2-A8 | | | 6.10% | ß | | 10/25/2036 | | | 1,268,515 | |
| 682,274 | | Banc of America Funding Corporation, Series 2006-B-7A1 | | | 4.51% | # | | 03/20/2036 | | | 645,569 | |
| 8,750,931 | | Banc of America Funding Corporation, Series 2006-D-6A1 | | | 4.14% | # | | 05/20/2036 | | | 8,520,465 | |
| 367,225 | | Banc of America Funding Corporation, Series 2006-G-2A1 (1 Month LIBOR USD + 0.22%, 0.22% Floor, 10.50% Cap) | | | 2.71% | | | 07/20/2036 | | | 366,273 | |
| 322,344 | | Banc of America Funding Corporation, Series 2006-H-3A1 | | | 4.25% | # | | 09/20/2046 | | | 298,615 | |
| 967,012 | | Banc of America Funding Corporation, Series 2007-1-TA10 | | | 5.84% | ß | | 01/25/2037 | | | 951,032 | |
| 1,328,664 | | Banc of America Funding Corporation, Series 2007-3-TA1B | | | 5.83% | # | | 04/25/2037 | | | 1,240,286 | |
| 2,285,319 | | Banc of America Funding Corporation, Series 2007-5-1A1 | | | 5.50% | | | 07/25/2037 | | | 2,031,903 | |
| 2,270,959 | | Banc of America Funding Corporation, Series 2009-R14A-3A (- 2 x 1 Month LIBOR USD + 16.57%, 5.50% Floor, 16.57% Cap) | | | 10.54% | ^I/F | | 06/26/2035 | | | 2,625,213 | |
| 3,874,747 | | Banc of America Funding Corporation, Series 2009-R15A-4A2 | | | 5.75% | # ^ | | 12/26/2036 | | | 3,816,798 | |
| 1,319,871 | | Banc of America Funding Corporation, Series 2010-R1-3A (-2 x 1 Month LIBOR USD + 14.28%, 6.00% Floor, 14.28% Cap) | | | 10.43% | ^I/F | | 07/26/2036 | | | 1,525,086 | |
| 370,041 | | Banc of America Mortgage Securities, Inc., Series 2004-K-4A1 | | | 4.21% | # | | 12/25/2034 | | | 370,183 | |
| 3,088,397 | | Banc of America Mortgage Securities, Inc., Series 2006-1-A9 | | | 6.00% | | | 05/25/2036 | | | 3,062,776 | |
| 328,439 | | Banc of America Mortgage Securities, Inc., Series 2007-1-2A5 | | | 5.75% | | | 01/25/2037 | | | 312,386 | |
| 16,763,566 | | BankUnited Trust, Series 2005-1-2A1 | | | 4.26% | # | | 09/25/2045 | | | 16,531,614 | |
| 1,631,035 | | Bayview Commercial Asset Trust, Series 2007-3-A2 (1 Month LIBOR USD + 0.29%) | | | 2.78% | ^ | | 07/25/2037 | | | 1,544,784 | |
| 13,126,906 | | Bayview Opportunity Master Fund IIIa Trust 2018-RN8, Series 2018-RN8-A1 | | | 4.07% | ^ § | | 09/28/2033 | | | 13,215,716 | |
| 20,455,232 | | Bayview Opportunity Master Fund Trust, Series 2018-RN4-A1 | | | 3.62% | ^ § | | 03/28/2033 | | | 20,555,108 | |
| 25,141,469 | | Bayview Opportunity Master Fund Trust, Series 2018-SBR1-A1 | | | 3.72% | ^ § | | 02/28/2033 | | | 25,138,432 | |
| 13,281,836 | | Bayview Opportunity Master Fund Trust, Series 2018-SBR3-A1 | | | 4.09% | ^ § | | 05/28/2033 | | | 13,303,844 | |
| 5,776,808 | | BCAP LLC Trust, Series 2006-AA2-A1 (1 Month LIBOR USD + 0.17%, 0.17% Floor) | | | 2.66% | | | 01/25/2037 | | | 5,446,409 | |
| 3,011,129 | | BCAP LLC Trust, Series 2007-AA2-2A7 | | | 6.00% | | | 04/25/2037 | | | 2,385,782 | |
| 3,259,922 | | BCAP LLC Trust, Series 2007-AA2-2A8 | | | 5.75% | | | 04/25/2037 | | | 2,548,022 | |
| 11,129,630 | | BCAP LLC Trust, Series 2008-RR3-A1B | | | 6.66% | # ^ | | 10/25/2036 | | | 6,834,531 | |
| 3,161,091 | | BCAP LLC Trust, Series 2009-RR13-18A2 | | | 5.75% | # ^ | | 07/26/2037 | | | 2,745,889 | |
| 6,984,167 | | BCAP LLC Trust, Series 2009-RR1-3A3 | | | 6.00% | # ^ | | 08/26/2037 | | | 6,876,038 | |
| 4,361,538 | | BCAP LLC Trust, Series 2009-RR4-4A2 | | | 5.75% | # ^ | | 02/26/2036 | | | 3,394,219 | |
| 2,735,937 | �� | BCAP LLC Trust, Series 2010-RR10-5A1 | | | 7.00% | # ^ | | 04/27/2037 | | | 2,895,753 | |
| 1,497,443 | | BCAP LLC Trust, Series 2010-RR12-3A15 | | | 6.86% | # ^ | | 08/26/2037 | | | 1,507,914 | |
| 4,114,823 | | Bear Stearns Adjustable Rate Mortgage Trust, Series 2005-12-13A1 | | | 4.67% | # | | 02/25/2036 | | | 3,945,531 | |
| 5,551,668 | | Bear Stearns Adjustable Rate Mortgage Trust, Series 2006-4-4A1 | | | 4.21% | # | | 10/25/2046 | | | 5,162,397 | |
| 6,012,508 | | Bear Stearns Adjustable Rate Mortgage Trust, Series 2007-1-2A1 | | | 4.91% | # | | 02/25/2047 | | | 5,876,839 | |
| 2,777,351 | | Bear Stearns Adjustable Rate Mortgage Trust, Series 2007-1-3A1 | | | 4.38% | # | | 02/25/2047 | | | 2,654,041 | |
| 2,346,471 | | Bear Stearns Alt-A Trust, Series 2004-11-2A3 | | | 4.39% | # | | 11/25/2034 | | | 2,322,095 | |
| 10,869,697 | | Bear Stearns Alt-A Trust, Series 2006-1-11A1 (1 Month LIBOR USD + 0.48%, 0.24% Floor, 11.50% Cap) | | | 2.97% | | | 02/25/2036 | | | 10,404,733 | |
| 22,173,923 | | Bear Stearns Alt-A Trust, Series 2006-3-21A1 | | | 4.07% | # | | 05/25/2036 | | | 17,850,050 | |
| 8,316,860 | | Bear Stearns Alt-A Trust, Series 2006-5-1A1 (1 Month LIBOR USD + 0.34%, 0.17% Floor, 11.50% Cap) | | | 2.83% | | | 08/25/2036 | | | 6,756,426 | |
| 10,681,154 | | Bear Stearns Alt-A Trust, Series 2006-6-2A1 | | | 3.98% | # | | 11/25/2036 | | | 9,572,147 | |
| 5,442,921 | | Bear Stearns Alt-A Trust, Series 2006-8-2A1 | | | 3.94% | # | | 08/25/2046 | | | 5,218,352 | |
| 29,840,642 | | Bear Stearns Alt-A Trust, Series 2007-2-2A1 (12 Month LIBOR USD + 1.88%, 1.88% Floor, 11.15% Cap) | | | 4.79% | | | 12/25/2046 | | | 27,390,182 | |
| 5,423,886 | | Bear Stearns Asset Backed Securities Trust, Series 2004-AC4-A2 | | | 6.00% | | | 08/25/2034 | | | 5,519,114 | |
| 15,655,455 | | Bear Stearns Asset Backed Securities Trust, Series 2005-AC2-1A | | | 5.75% | | | 04/25/2035 | | | 15,288,009 | |
| 4,198,153 | | Bear Stearns Asset Backed Securities Trust, Series 2005-AC2-2A1 | | | 5.75% | | | 04/25/2035 | | | 4,276,148 | |
| 55,498,922 | | Bear Stearns Asset Backed Securities Trust, Series 2005-AC6-22A | | | 5.46% | # | | 09/25/2035 | | | 52,604,309 | |
| 8,555,562 | | Bear Stearns Asset Backed Securities Trust, Series 2005-AC7-A4 | | | 6.00% | | | 10/25/2035 | | | 7,760,144 | |
| 12,212,620 | | Bear Stearns Asset Backed Securities Trust, Series 2006-AC1-1A1 | | | 6.25% | | | 02/25/2036 | | | 9,168,851 | |
| 5,357,847 | | Bear Stearns Asset Backed Securities Trust, Series 2006-AC5-A1 | | | 6.25% | ß | | 12/25/2036 | | | 4,874,288 | |
| 19,200,915 | | Bear Stearns Asset Backed Securities Trust, Series 2007-HE2-2A3 (1 Month LIBOR USD + 0.16%, 0.16% Floor) | | | 2.65% | | | 02/25/2037 | | | 19,175,861 | |
| 49,023,664 | | Bear Stearns Asset Backed Securities Trust, Series 2007-HE4-2A (1 Month LIBOR USD + 0.22%, 0.22% Floor) | | | 2.71% | | | 05/25/2037 | | | 45,424,709 | |
| 20,415,150 | | Bear Stearns Asset Backed Securities Trust, Series 2007-HE6-2A (1 Month LIBOR USD + 1.05%, 1.05% Floor) | | | 3.54% | | | 08/25/2037 | | | 18,007,438 | |
| 1,622,948 | | Bear Stearns Asset Backed Securities Trust, Series 2007-SD1-1A2A | | | 6.00% | | | 10/25/2036 | | | 1,224,734 | |
| 1,340,692 | | Bear Stearns Asset Backed Securities Trust, Series 2007-SD1-1A3A | | | 6.50% | | | 10/25/2036 | | | 1,010,996 | |
| 2,443,314 | | Bear Stearns Asset Backed Securities Trust, Series 2007-SD1-23A1 | | | 4.85% | # | | 10/25/2036 | | | 2,314,839 | |
| 16,418,658 | | Bear Stearns Mortgage Funding Trust, Series 2006-AR3-2A1 (1 Month LIBOR USD + 0.20%, 0.20% Floor, 10.50% Cap) | | | 2.69% | | | 11/25/2036 | | | 17,396,340 | |
| 5,936,069 | | Bear Stearns Mortgage Funding Trust, Series 2006-AR4-A2 (1 Month LIBOR USD + 0.18%, 0.18% Floor, 10.50% Cap) | | | 2.67% | | | 12/25/2037 | | | 5,707,720 | |
| 14,654,376 | | Bear Stearns Mortgage Funding Trust, Series 2007-AR3-22A1 (1 Month LIBOR USD + 0.16%, 0.16% Floor, 10.50% Cap) | | | 2.65% | | | 04/25/2037 | | | 16,264,898 | |
| 23,334,609 | | BNC Mortgage Loan Trust, Series 2006-2-A4 (1 Month LIBOR USD + 0.16%, 0.16% Floor) | | | 2.65% | | | 11/25/2036 | | | 22,312,320 | |
| 15,255,738 | | BNC Mortgage Loan Trust, Series 2007-1-A4 (1 Month LIBOR USD + 0.16%, 0.16% Floor) | | | 2.65% | | | 03/25/2037 | | | 14,579,901 | |
| 13,597,300 | | Carrington Mortgage Loan Trust, Series 2006-FRE2-A3 (1 Month LIBOR USD + 0.16%, 0.16% Floor, 12.50% Cap) | | | 2.65% | | | 10/25/2036 | | | 10,391,823 | |
| 9,711,623 | | Carrington Mortgage Loan Trust, Series 2006-FRE2-A4 (1 Month LIBOR USD + 0.25%, 0.25% Floor, 12.50% Cap) | | | 2.74% | | | 10/25/2036 | | | 7,496,443 | |
| 30,594,417 | | Carrington Mortgage Loan Trust, Series 2007-RFC1-A3 (1 Month LIBOR USD + 0.14%, 0.14% Floor, 14.50% Cap) | | | 2.63% | | | 12/25/2036 | | | 28,073,572 | |
| 2,750,000 | | Centex Home Equity, Series 2004-A-AF5 | | | 5.43% | | | 01/25/2034 | | | 2,855,260 | |
| 1,232,401 | | Chase Funding Mortgage Loan Asset-Backed Certificates, Series 2003-4-2M1 (1 Month LIBOR USD + 0.90%, 0.60% Floor) | | | 3.39% | | | 03/25/2033 | | | 1,194,190 | |
| 6,343,415 | | Chase Mortgage Finance Trust, Series 2005-A1-2A4 | | | 4.28% | # | | 12/25/2035 | | | 6,215,369 | |
| 9,564,169 | | Chase Mortgage Finance Trust, Series 2006-S1-A5 | | | 6.50% | | | 05/25/2036 | | | 7,784,352 | |
| 11,280,332 | | Chase Mortgage Finance Trust, Series 2006-S2-1A9 | | | 6.25% | | | 10/25/2036 | | | 8,619,919 | |
| 6,685,923 | | Chase Mortgage Finance Trust, Series 2006-S3-1A2 | | | 6.00% | | | 11/25/2036 | | | 4,697,158 | |
| 17,828,221 | | Chase Mortgage Finance Trust, Series 2006-S4-A8 | | | 6.00% | | | 12/25/2036 | | | 13,330,628 | |
| 6,054,910 | | Chase Mortgage Finance Trust, Series 2007-A2-6A4 | | | 4.38% | # | | 07/25/2037 | | | 5,843,881 | |
| 3,330,501 | | Chase Mortgage Finance Trust, Series 2007-S3-1A5 | | | 6.00% | | | 05/25/2037 | | | 2,379,275 | |
| 1,652,027 | | Chase Mortgage Finance Trust, Series 2007-S3-2A1 | | | 5.50% | | | 05/25/2037 | | | 503,037 | |
| 3,398,029 | | Chase Mortgage Finance Trust, Series 2007-S5-1A18 | | | 6.00% | | | 07/25/2037 | | | 2,564,412 | |
| 4,369,114 | | ChaseFlex Trust, Series 2005-1-3A1 | | | 6.00% | | | 02/25/2035 | | | 4,324,862 | |
| 743,532 | | ChaseFlex Trust, Series 2006-1-A5 | | | 6.16% | # | | 06/25/2036 | | | 700,702 | |
| 4,760,021 | | ChaseFlex Trust, Series 2006-2-A2B (1 Month LIBOR USD + 0.20%, 0.20% Floor, 11.50% Cap) | | | 2.69% | | | 09/25/2036 | | | 3,959,607 | |
| 4,283,883 | | ChaseFlex Trust, Series 2007-1-1A1 | | | 6.50% | | | 02/25/2037 | | | 2,526,585 | |
| 10,055,150 | | ChaseFlex Trust, Series 2007-M1-2F4 | | | 4.25% | ß | | 08/25/2037 | | | 9,728,195 | |
| 10,458,250 | | ChaseFlex Trust, Series 2007-M1-2F5 | | | 4.25% | ß | | 08/25/2037 | | | 10,117,476 | |
| 25,024,625 | | CHL Mortgage Pass-Through Trust, Series 2005-17-2A1 | | | 5.50% | | | 09/25/2035 | | | 21,472,089 | |
| 41,076,641 | | CHL Mortgage Pass-Through Trust, Series 2006-8-1A3 | | | 6.00% | | | 05/25/2036 | | | 37,903,376 | |
| 51,784,148 | | CHL Mortgage Pass-Through Trust, Series 2007-21-1A1 | | | 6.25% | | | 02/25/2038 | | | 41,743,067 | |
| 2,647,655 | | CHL Mortgage Pass-Through Trust, Series 2007-2-A2 | | | 6.00% | | | 03/25/2037 | | | 2,169,675 | |
| 3,429,946 | | CHL Mortgage Pass-Through Trust, Series 2007-7-A11 | | | 5.50% | | | 06/25/2037 | | | 2,842,574 | |
| 16,750,743 | | CHL Mortgage Pass-Through Trust, Series 2007-HYB1-2A1 | | | 3.59% | # | | 03/25/2037 | | | 15,523,074 | |
| 65,959,595 | | CIM Trust, Series 2016-1RR-B2 | | | 6.90% | # ^ Þ | | 07/26/2055 | | | 66,991,144 | |
| 75,440,246 | | CIM Trust, Series 2016-2RR-B2 | | | 6.86% | # ^ Þ | | 02/25/2056 | | | 77,712,672 | |
| 18,517,632 | | CIM Trust, Series 2016-3-A1 (1 Month LIBOR USD + 2.50%, 2.50% Floor) | | | 4.99% | ^ | | 02/25/2056 | | | 19,035,170 | |
| 73,074,681 | | CIM Trust, Series 2016-3RR-B2 | | | 6.44% | # ^ Þ | | 02/27/2056 | | | 75,042,721 | |
| 50,188,672 | | CIM Trust, Series 2017-3RR-B2 | | | 10.09% | # ^ Þ | | 01/27/2057 | | | 57,477,061 | |
| 187,381,929 | | CIM Trust, Series 2017-6-A1 | | | 3.02% | # ^ | | 06/25/2057 | | | 184,041,771 | |
| 138,873,109 | | CIM Trust, Series 2017-8-A1 | | | 3.00% | # ^ | | 12/25/2065 | | | 137,040,776 | |
| 5,794,269 | | Citicorp Mortgage Securities, Inc., Series 2005-1-1A4 | | | 5.50% | | | 02/25/2035 | | | 5,921,580 | |
| 1,295,917 | | Citicorp Mortgage Securities, Inc., Series 2006-7-1A1 | | | 6.00% | | | 12/25/2036 | | | 1,149,346 | |
| 5,507,238 | | Citicorp Residential Mortgage Securities, Inc., Series 2006-2-A5 | | | 5.41% | ß | | 09/25/2036 | | | 5,672,263 | |
| 10,903,739 | | Citicorp Residential Mortgage Securities, Inc., Series 2007-1-A4 | | | 5.35% | ß | | 03/25/2037 | | | 11,139,604 | |
| 2,146,805 | | Citigroup Mortgage Loan Trust, Inc., Series 2005-5-2A2 | | | 5.75% | | | 08/25/2035 | | | 1,677,792 | |
| 1,054,502 | | Citigroup Mortgage Loan Trust, Inc., Series 2005-9-21A1 | | | 5.50% | | | 11/25/2035 | | | 1,005,645 | |
| 2,900,675 | | Citigroup Mortgage Loan Trust, Inc., Series 2006-4-2A1A | | | 6.00% | | | 12/25/2035 | | | 2,909,982 | |
| 37,188,050 | | Citigroup Mortgage Loan Trust, Inc., Series 2006-AMC1-A1 (1 Month LIBOR USD + 0.15%, 0.15% Floor) | | | 2.63% | ^ | | 09/25/2036 | | | 35,965,203 | |
| 10,411,915 | | Citigroup Mortgage Loan Trust, Inc., Series 2006-AR3-1A1A | | | 4.35% | # | | 06/25/2036 | | | 10,444,290 | |
| 3,413,255 | | Citigroup Mortgage Loan Trust, Inc., Series 2006-FX1-A6 | | | 5.85% | ß | | 10/25/2036 | | | 2,762,955 | |
| 1,875,219 | | Citigroup Mortgage Loan Trust, Inc., Series 2006-WF1-A2D | | | 4.92% | ß | | 03/25/2036 | | | 1,258,412 | |
| 11,977,553 | | Citigroup Mortgage Loan Trust, Inc., Series 2006-WF2-A2D | | | 6.16% | ß | | 05/25/2036 | | | 6,821,824 | |
| 5,270,044 | | Citigroup Mortgage Loan Trust, Inc., Series 2006-WFH3-M1 (1 Month LIBOR USD + 0.29%, 0.29% Floor) | | | 2.78% | | | 10/25/2036 | | | 5,268,648 | |
| 5,139,074 | | Citigroup Mortgage Loan Trust, Inc., Series 2007-10-1A1A | �� | | 5.48% | # | | 04/25/2037 | | | 5,215,884 | |
| 800,893 | | Citigroup Mortgage Loan Trust, Inc., Series 2007-12-2A1 | | | 6.50% | ^ | | 10/25/2036 | | | 647,869 | |
| 174,314 | | Citigroup Mortgage Loan Trust, Inc., Series 2007-2-2A | | | 6.00% | | | 11/25/2036 | | | 176,595 | |
| 23,117,389 | | Citigroup Mortgage Loan Trust, Inc., Series 2007-9-1A1 | | | 5.75% | ^ | | 04/25/2047 | | | 19,395,626 | |
| 1,232,668 | | Citigroup Mortgage Loan Trust, Inc., Series 2007-9-2A2 | | | 6.50% | # ^ | | 05/25/2037 | | | 1,246,294 | |
| 78,782,884 | | Citigroup Mortgage Loan Trust, Inc., Series 2007-AMC2-A1 (1 Month LIBOR USD + 0.14%, 0.14% Floor) | | | 2.63% | ^ | | 01/25/2037 | | | 72,038,691 | |
| 3,001,312 | | Citigroup Mortgage Loan Trust, Inc., Series 2007-AR5-1A3A | | | 4.76% | # | | 04/25/2037 | | | 2,856,657 | |
| 11,467,041 | | Citigroup Mortgage Loan Trust, Inc., Series 2007-FS1-2A1A (1 Month LIBOR USD + 1.00%, 1.00% Floor, 5.75% Cap) | | | 3.49% | ^ | | 10/25/2037 | | | 10,805,409 | |
| 4,968,308 | | Citigroup Mortgage Loan Trust, Inc., Series 2007-OPX1-A3A | | | 5.97% | ß | | 01/25/2037 | | | 3,316,885 | |
| 10,951,939 | | Citigroup Mortgage Loan Trust, Inc., Series 2007-OPX1-A5A | | | 5.76% | ß | | 01/25/2037 | | | 7,313,379 | |
| 3,340,453 | | Citigroup Mortgage Loan Trust, Inc., Series 2008-AR4-1A1B | | | 4.61% | # ^ | | 11/25/2038 | | | 3,348,102 | |
| 7,062,498 | | Citigroup Mortgage Loan Trust, Inc., Series 2010-7-9A4 | | | 6.00% | # ^ | | 10/25/2037 | | | 6,578,624 | |
| 94,742,867 | | Citigroup Mortgage Loan Trust, Inc., Series 2010-8-5A4 | | | 6.00% | # ^ | | 11/25/2036 | | | 93,396,827 | |
| 77,258,350 | | Citigroup Mortgage Loan Trust, Inc., Series 2010-8-6A4 | | | 6.00% | # ^ | | 12/25/2036 | | | 75,568,208 | |
| 55,005,285 | | Citigroup Mortgage Loan Trust, Inc., Series 2010-8-7A4 | | | 6.00% | # ^ | | 06/25/2037 | | | 55,202,611 | |
| 27,510,975 | | Citigroup Mortgage Loan Trust, Inc., Series 2014-J2-A1 | | | 3.50% | # ^ | | 11/25/2044 | | | 27,579,584 | |
| 213,741,083 | | Citigroup Mortgage Loan Trust, Inc., Series 2017-RP2-A1A | | | 3.93% | # ^ | | 07/25/2067 | | | 217,068,947 | |
| 16,649,239 | | Citigroup Mortgage Loan Trust, Inc., Series 2018-A-A1 | | | 4.00% | # ^ | | 01/25/2068 | | | 16,794,062 | |
| 24,065,965 | | Citigroup Mortgage Loan Trust, Inc., Series 2018-C-A1 | | | 4.13% | ^ § | | 03/25/2059 | | | 24,229,043 | |
| 200,896,160 | | Citigroup Mortgage Loan Trust, Series 2019-A-PT1 | | | 3.92% | ^ | | 10/25/2058 | | | 193,959,999 | |
| 3,817,634 | | CitiMortgage Alternative Loan Trust, Series 2006-A2-A2 | | | 6.00% | | | 05/25/2036 | | | 3,663,166 | |
| 3,878,014 | | CitiMortgage Alternative Loan Trust, Series 2006-A3-1A13 | | | 6.00% | | | 07/25/2036 | | | 3,757,799 | |
| 2,655,931 | | CitiMortgage Alternative Loan Trust, Series 2006-A4-1A8 | | | 6.00% | | | 09/25/2036 | | | 2,506,437 | |
| 829,117 | | CitiMortgage Alternative Loan Trust, Series 2006-A5-2A1 | | | 5.50% | | | 10/25/2021 | | | 849,217 | |
| 3,162,931 | | CitiMortgage Alternative Loan Trust, Series 2006-A5-3A3 | | | 6.00% | | | 10/25/2036 | | | 2,847,489 | |
| 8,308,467 | | CitiMortgage Alternative Loan Trust, Series 2006-A6-1A2 (1 Month LIBOR USD + 0.50%, 6.00% Floor, 6.00% Cap) | | | 6.00% | | | 11/25/2036 | | | 8,139,764 | |
| 4,546,735 | | CitiMortgage Alternative Loan Trust, Series 2007-A1-1A5 | | | 6.00% | | | 01/25/2037 | | | 4,370,029 | |
| 2,216,834 | | CitiMortgage Alternative Loan Trust, Series 2007-A1-1A7 | | | 6.00% | | | 01/25/2037 | | | 2,130,678 | |
| 6,011,009 | | CitiMortgage Alternative Loan Trust, Series 2007-A1-1A8 (1 Month LIBOR USD + 0.60%, 0.60% Floor, 6.00% Cap) | | | 3.09% | | | 01/25/2037 | | | 5,007,167 | |
| 5,672,055 | | CitiMortgage Alternative Loan Trust, Series 2007-A1-1A9 (-1 x 1 Month LIBOR USD + 5.40%, 5.40% Cap) | | | 2.91% | I/F I/O | | 01/25/2037 | | | 695,263 | |
| 4,720,382 | | CitiMortgage Alternative Loan Trust, Series 2007-A3-1A1 (4.00% Floor, 6.00% Cap) | | | 6.00% | | | 03/25/2037 | | | 4,641,169 | |
| 10,863,112 | | CitiMortgage Alternative Loan Trust, Series 2007-A3-1A3 (-1 x 1 Month LIBOR USD + 5.40%, 5.40% Cap) | | | 2.91% | I/F I/O | | 03/25/2037 | | | 1,117,118 | |
| 4,257,020 | | CitiMortgage Alternative Loan Trust, Series 2007-A3-1A4 | | | 5.75% | | | 03/25/2037 | | | 4,130,118 | |
| 7,844,714 | | CitiMortgage Alternative Loan Trust, Series 2007-A4-1A3 (1 Month LIBOR USD + 0.33%, 0.33% Floor, 7.00% Cap) | | | 2.82% | | | 04/25/2037 | | | 6,245,773 | |
| 7,844,714 | | CitiMortgage Alternative Loan Trust, Series 2007-A4-1A4 (-1 x 1 Month LIBOR USD + 6.67%, 6.67% Cap) | | | 4.18% | I/F I/O | | 04/25/2037 | | | 1,223,157 | |
| 8,308,042 | | CitiMortgage Alternative Loan Trust, Series 2007-A4-1A5 | | | 5.75% | | | 04/25/2037 | | | 7,970,646 | |
| 1,135,293 | | CitiMortgage Alternative Loan Trust, Series 2007-A5-1A11 | | | 6.00% | | | 05/25/2037 | | | 1,102,534 | |
| 14,968,012 | | CitiMortgage Alternative Loan Trust, Series 2007-A5-1A8 | | | 6.00% | | | 05/25/2037 | | | 14,536,110 | |
| 498,459 | | CitiMortgage Alternative Loan Trust, Series 2007-A8-A1 | | | 6.00% | | | 10/25/2037 | | | 473,806 | |
| 5,750,000 | | COLT Mortgage Loan Trust, Series 2016-2-M1 | | | 5.50% | # ^ | | 09/25/2046 | | | 5,812,818 | |
| 46,959,238 | | Countrywide Alternative Loan Trust, Series 2004-36CB-1A1 | | | 6.00% | | | 02/25/2035 | | | 44,557,075 | |
| 5,552,130 | | Countrywide Alternative Loan Trust, Series 2005-13CB-A3 | | | 5.50% | | | 05/25/2035 | | | 5,521,981 | |
| 4,108,489 | | Countrywide Alternative Loan Trust, Series 2005-20CB-2A1 (1 Month LIBOR USD + 0.50%, 0.50% Floor, 5.50% Cap) | | | 2.99% | | | 07/25/2035 | | | 3,103,513 | |
| 8,388,165 | | Countrywide Alternative Loan Trust, Series 2005-20CB-2A2 (-1 x 1 Month LIBOR USD + 5.00%, 5.00% Cap) | | | 2.51% | I/F I/O | | 07/25/2035 | | | 763,867 | |
| 295,504 | | Countrywide Alternative Loan Trust, Series 2005-20CB-4A1 | | | 5.25% | | | 07/25/2020 | | | 292,917 | |
| 3,052,288 | | Countrywide Alternative Loan Trust, Series 2005-26CB-A11 (-2 x 1 Month LIBOR USD + 13.05%, 13.05% Cap) | | | 8.55% | I/F | | 07/25/2035 | | | 3,159,652 | |
| 4,325,902 | | Countrywide Alternative Loan Trust, Series 2005-28CB-1A2 (1 Month LIBOR USD + 0.75%, 0.75% Floor, 5.50% Cap) | | | 3.24% | | | 08/25/2035 | | | 3,622,857 | |
| 1,639,891 | | Countrywide Alternative Loan Trust, Series 2005-28CB-3A6 | | | 6.00% | | | 08/25/2035 | | | 1,186,107 | |
| 2,149,115 | | Countrywide Alternative Loan Trust, Series 2005-46CB-A20 | | | 5.50% | | | 10/25/2035 | | | 2,022,302 | |
| 7,235,842 | | Countrywide Alternative Loan Trust, Series 2005-48T1-A2 | | | 5.50% | | | 11/25/2035 | | | 6,374,670 | |
| 2,453,744 | | Countrywide Alternative Loan Trust, Series 2005-54CB-3A4 | | | 5.50% | | | 11/25/2035 | | | 2,095,494 | |
| 23,993,210 | | Countrywide Alternative Loan Trust, Series 2005-57CB-1A1 | | | 5.50% | | | 12/25/2035 | | | 21,852,454 | |
| 568,634 | | Countrywide Alternative Loan Trust, Series 2005-60T1-A7 (-7 x 1 Month LIBOR USD + 35.93%, 35.93% Cap) | | | 17.71% | I/F | | 12/25/2035 | | | 824,559 | |
| 797,148 | | Countrywide Alternative Loan Trust, Series 2005-64CB-1A14 | | | 5.50% | | | 12/25/2035 | | | 779,379 | |
| 11,569,600 | | Countrywide Alternative Loan Trust, Series 2005-64CB-1A4 | | | 5.50% | | | 12/25/2035 | | | 11,311,715 | |
| 1,960,173 | | Countrywide Alternative Loan Trust, Series 2005-73CB-1A5 (1 Month LIBOR USD + 0.80%, 0.80% Floor, 5.50% Cap) | | | 3.29% | | | 01/25/2036 | | | 1,688,466 | |
| 4,931,389 | | Countrywide Alternative Loan Trust, Series 2005-73CB-1A6 (-1 x 1 Month LIBOR USD + 4.70%, 4.70% Cap) | | | 2.21% | I/F I/O | | 01/25/2036 | | | 338,408 | |
| 45,716,332 | | Countrywide Alternative Loan Trust, Series 2005-77T1-1A1 | | | 6.00% | | | 02/25/2036 | | | 34,220,091 | |
| 940,209 | | Countrywide Alternative Loan Trust, Series 2005-79CB-A5 | | | 5.50% | | | 01/25/2036 | | | 816,032 | |
| 30,756,080 | | Countrywide Alternative Loan Trust, Series 2005-85CB-1A1 | | | 6.00% | | | 02/25/2036 | | | 23,280,593 | |
| 2,489,797 | | Countrywide Alternative Loan Trust, Series 2005-85CB-2A6 (-4 x 1 Month LIBOR USD + 21.63%, 21.63% Cap) | | | 12.52% | I/F | | 02/25/2036 | | | 3,040,157 | |
| 1,531,201 | | Countrywide Alternative Loan Trust, Series 2005-86CB-A5 | | | 5.50% | | | 02/25/2036 | | | 1,326,817 | |
| 2,803,329 | | Countrywide Alternative Loan Trust, Series 2005-J10-1A11 | | | 5.50% | | | 10/25/2035 | | | 2,516,154 | |
| 637,972 | | Countrywide Alternative Loan Trust, Series 2005-J10-1A13 (1 Month LIBOR USD + 0.70%, 0.70% Floor, 5.50% Cap) | | | 3.19% | | | 10/25/2035 | | | 524,160 | |
| 298,854 | | Countrywide Alternative Loan Trust, Series 2005-J10-1A15 | | | 5.50% | | | 10/25/2035 | | | 268,239 | |
| 742,863 | | Countrywide Alternative Loan Trust, Series 2005-J11-1A3 | | | 5.50% | | | 11/25/2035 | | | 623,153 | |
| 1,005,010 | | Countrywide Alternative Loan Trust, Series 2005-J11-6A1 | | | 6.50% | | | 09/25/2032 | | | 982,604 | |
| 859,638 | | Countrywide Alternative Loan Trust, Series 2005-J13-2A5 (1 Month LIBOR USD + 0.48%, 0.48% Floor, 5.50% Cap) | | | 2.97% | | | 11/25/2035 | | | 671,242 | |
| 1,719,277 | | Countrywide Alternative Loan Trust, Series 2005-J13-2A6 (-1 x 1 Month LIBOR USD + 5.02%, 5.02% Cap) | | | 2.53% | I/F I/O | | 11/25/2035 | | | 145,683 | |
| 3,891,000 | | Countrywide Alternative Loan Trust, Series 2005-J1-5A3 | | | 5.50% | | | 02/25/2035 | | | 3,923,707 | |
| 165,616 | | Countrywide Alternative Loan Trust, Series 2005-J1-7A1 | | | 5.50% | | | 01/25/2020 | | | 165,601 | |
| 867,776 | | Countrywide Alternative Loan Trust, Series 2005-J2-1A5 (1 Month LIBOR USD + 0.50%, 0.50% Floor, 5.50% Cap) | | | 2.99% | | | 04/25/2035 | | | 755,900 | |
| 2,670,081 | | Countrywide Alternative Loan Trust, Series 2005-J2-1A6 (-1 x 1 Month LIBOR USD + 5.00%, 5.00% Cap) | | | 2.51% | I/F I/O | | 04/25/2035 | | | 173,250 | |
| 8,246,176 | | Countrywide Alternative Loan Trust, Series 2005-J3-2A8 (1 Month LIBOR USD + 0.30%, 0.30% Floor, 5.50% Cap) | | | 2.79% | | | 05/25/2035 | | | 7,369,157 | |
| 8,246,176 | | Countrywide Alternative Loan Trust, Series 2005-J3-2A9 (-1 x 1 Month LIBOR USD + 5.20%, 5.20% Cap) | | | 2.71% | I/F I/O | | 05/25/2035 | | | 713,405 | |
| 3,887,904 | | Countrywide Alternative Loan Trust, Series 2006-12CB-A3 (1 Month LIBOR USD + 5.75%, 5.75% Floor) | | | 5.75% | | | 05/25/2036 | | | 3,165,076 | |
| 39,768,256 | | Countrywide Alternative Loan Trust, Series 2006-15CB-A1 | | | 6.50% | | | 06/25/2036 | | | 30,185,996 | |
| 1,203,378 | | Countrywide Alternative Loan Trust, Series 2006-18CB-A12 (1 Month LIBOR USD + 0.60%, 0.60% Floor, 6.00% Cap) | | | 3.09% | | | 07/25/2036 | | | 807,435 | |
| 1,203,378 | | Countrywide Alternative Loan Trust, Series 2006-18CB-A13 (-1 x 1 Month LIBOR USD + 5.50%, 5.50% Cap) | | | 3.01% | I/F I/O | | 07/25/2036 | | | 179,961 | |
| 5,920,310 | | Countrywide Alternative Loan Trust, Series 2006-19CB-A12 (1 Month LIBOR USD + 0.40%, 0.40% Floor, 6.00% Cap) | | | 2.89% | | | 08/25/2036 | | | 4,068,313 | |
| 8,028,296 | | Countrywide Alternative Loan Trust, Series 2006-19CB-A13 (-1 x 1 Month LIBOR USD + 5.60%, 5.60% Cap) | | | 3.11% | I/F I/O | | 08/25/2036 | | | 1,195,113 | |
| 1,235,905 | | Countrywide Alternative Loan Trust, Series 2006-19CB-A15 | | | 6.00% | | | 08/25/2036 | | | 1,070,711 | |
| 2,050,880 | | Countrywide Alternative Loan Trust, Series 2006-24CB-A11 | | | 5.75% | | | 08/01/2036 | | | 1,696,903 | |
| 6,002,676 | | Countrywide Alternative Loan Trust, Series 2006-24CB-A14 (-1 x 1 Month LIBOR USD + 7.15%, 7.15% Cap) | | | 4.66% | I/F I/O | | 08/01/2036 | | | 1,428,852 | |
| 4,813,364 | | Countrywide Alternative Loan Trust, Series 2006-24CB-A22 | | | 6.00% | | | 08/01/2036 | | | 4,062,286 | |
| 5,166,186 | | Countrywide Alternative Loan Trust, Series 2006-24CB-A5 (1 Month LIBOR USD + 0.60%, 0.06% Floor, 6.00% Cap) | | | 3.09% | | | 08/01/2036 | | | 3,426,526 | |
| 1,941,203 | | Countrywide Alternative Loan Trust, Series 2006-26CB-A17 | | | 6.25% | | | 09/25/2036 | | | 1,529,384 | |
| 2,491,700 | | Countrywide Alternative Loan Trust, Series 2006-26CB-A9 | | | 6.50% | | | 09/25/2036 | | | 2,005,786 | |
| 4,852,491 | | Countrywide Alternative Loan Trust, Series 2006-29T1-1A2 | | | 6.25% | | | 10/25/2036 | | | 4,028,135 | |
| 663,968 | | Countrywide Alternative Loan Trust, Series 2006-29T1-2A12 (-7 x 1 Month LIBOR USD + 46.15%, 46.15% Cap) | | | 29.99% | I/F | | 10/25/2036 | | | 1,323,359 | |
| 406,694 | | Countrywide Alternative Loan Trust, Series 2006-29T1-2A23 (-4 x 1 Month LIBOR USD + 33.37%, 33.37% Cap) | | | 22.60% | I/F | | 10/25/2036 | | | 652,862 | |
| 4,656,008 | | Countrywide Alternative Loan Trust, Series 2006-30T1-1A2 | | | 6.25% | | | 11/25/2036 | | | 4,055,987 | |
| 3,274,687 | | Countrywide Alternative Loan Trust, Series 2006-32CB-A1 (1 Month LIBOR USD + 0.67%, 0.67% Floor, 6.00% Cap) | | | 3.16% | | | 11/25/2036 | | | 2,239,587 | |
| 5,462,179 | | Countrywide Alternative Loan Trust, Series 2006-32CB-A2 (-1 x 1 Month LIBOR USD + 5.33%, 5.33% Cap) | | | 2.84% | I/F I/O | | 11/25/2036 | | | 914,384 | |
| 5,799,470 | | Countrywide Alternative Loan Trust, Series 2006-36T2-2A1 | | | 6.25% | | | 12/25/2036 | | | 4,005,588 | |
| 1,620,978 | | Countrywide Alternative Loan Trust, Series 2006-39CB-1A10 | | | 6.00% | | | 01/25/2037 | | | 1,589,806 | |
| 15,295,714 | | Countrywide Alternative Loan Trust, Series 2006-39CB-2A2 (-1 x 1 Month LIBOR USD + 6.55%, 6.55% Cap) | | | 4.06% | I/F I/O | | 01/25/2037 | | | 3,468,888 | |
| 5,208,913 | | Countrywide Alternative Loan Trust, Series 2006-39CB-2A4 (1 Month LIBOR USD + 0.45%, 0.45% Floor, 7.00% Cap) | | | 2.94% | | | 01/25/2037 | | | 1,053,141 | |
| 2,264,608 | | Countrywide Alternative Loan Trust, Series 2006-40T1-1A11 | | | 6.00% | | | 01/25/2037 | | | 2,074,876 | |
| 3,854,283 | | Countrywide Alternative Loan Trust, Series 2006-40T1-1A4 (-1 x 1 Month LIBOR USD + 5.45%, 5.45% Cap) | | | 2.96% | I/F I/O | | 01/25/2037 | | | 468,127 | |
| 4,603,950 | | Countrywide Alternative Loan Trust, Series 2006-41CB-1A10 | | | 6.00% | | | 01/25/2037 | | | 3,820,500 | |
| 4,848,059 | | Countrywide Alternative Loan Trust, Series 2006-41CB-1A9 | | | 6.00% | | | 01/25/2037 | | | 4,023,069 | |
| 4,498,267 | | Countrywide Alternative Loan Trust, Series 2006-45T1-1A4 (1 Month LIBOR USD + 0.60%, 0.60% Floor, 6.00% Cap) | | | 3.09% | | | 02/25/2037 | | | 2,032,061 | |
| 4,498,267 | | Countrywide Alternative Loan Trust, Series 2006-45T1-1A5 (-1 x 1 Month LIBOR USD + 5.40%, 5.40% Cap) | | | 2.91% | I/F I/O | | 02/25/2037 | | | 619,714 | |
| 1,299,887 | | Countrywide Alternative Loan Trust, Series 2006-6CB-1A4 | | | 5.50% | | | 05/25/2036 | | | 1,205,852 | |
| 3,870,359 | | Countrywide Alternative Loan Trust, Series 2006-J1-1A10 | | | 5.50% | | | 02/25/2036 | | | 3,485,936 | |
| 7,852,811 | | Countrywide Alternative Loan Trust, Series 2006-J1-1A3 | | | 5.50% | | | 02/25/2036 | | | 7,072,831 | |
| 1,465,164 | | Countrywide Alternative Loan Trust, Series 2006-J4-2A2 | | | 6.00% | | | 07/25/2036 | | | 1,243,550 | |
| 903,306 | | Countrywide Alternative Loan Trust, Series 2007-11T1-A24 (-6 x 1 Month LIBOR USD + 39.90%, 39.90% Cap) | | | 24.99% | I/F | | 05/25/2037 | | | 1,583,433 | |
| 14,527,300 | | Countrywide Alternative Loan Trust, Series 2007-15CB-A1 | | | 6.00% | | | 07/25/2037 | | | 13,131,928 | |
| 10,464,085 | | Countrywide Alternative Loan Trust, Series 2007-16CB-2A1 (1 Month LIBOR USD + 0.45%, 0.45% Floor, 7.00% Cap) | | | 2.94% | | | 08/25/2037 | | | 5,912,961 | |
| 3,030,138 | | Countrywide Alternative Loan Trust, Series 2007-16CB-2A2 (-8 x 1 Month LIBOR USD + 54.58%, 54.58% Cap) | | | 33.87% | I/F | | 08/25/2037 | | | 6,175,887 | |
| 5,244,437 | | Countrywide Alternative Loan Trust, Series 2007-16CB-4A7 | | | 6.00% | | | 08/25/2037 | | | 5,144,311 | |
| 8,297,014 | | Countrywide Alternative Loan Trust, Series 2007-17CB-1A10 (-5 x 1 Month LIBOR USD + 29.90%, 29.90% Cap) | | | 18.47% | I/F | | 08/25/2037 | | | 12,877,083 | |
| 1,276,704 | | Countrywide Alternative Loan Trust, Series 2007-18CB-2A25 | | | 6.00% | | | 08/25/2037 | | | 1,171,105 | |
| 885,663 | | Countrywide Alternative Loan Trust, Series 2007-19-1A10 (-6 x 1 Month LIBOR USD + 39.00%, 39.00% Cap) | | | 24.09% | I/F | | 08/25/2037 | | | 1,686,007 | |
| 13,017,345 | | Countrywide Alternative Loan Trust, Series 2007-19-1A4 | | | 6.00% | | | 08/25/2037 | | | 10,193,724 | |
| 33,286,200 | | Countrywide Alternative Loan Trust, Series 2007-19-2A1 | | | 6.50% | | | 08/25/2037 | | | 23,956,308 | |
| 4,212,158 | | Countrywide Alternative Loan Trust, Series 2007-21CB-2A2 (-4 x 1 Month LIBOR USD + 28.40%, 28.40% Cap) | | | 18.46% | I/F | | 09/25/2037 | | | 5,737,522 | |
| 22,554,917 | | Countrywide Alternative Loan Trust, Series 2007-22-2A16 | | | 6.50% | | | 09/25/2037 | | | 15,295,698 | |
| 10,683,358 | | Countrywide Alternative Loan Trust, Series 2007-23CB-A3 (1 Month LIBOR USD + 0.50%, 0.50% Floor, 7.00% Cap) | | | 2.99% | | | 09/25/2037 | | | 6,668,360 | |
| 15,161,900 | | Countrywide Alternative Loan Trust, Series 2007-23CB-A4 (-1 x 1 Month LIBOR USD + 6.50%, 6.50% Cap) | | | 4.01% | I/F I/O | | 09/25/2037 | | | 2,979,632 | |
| 15,581,278 | | Countrywide Alternative Loan Trust, Series 2007-4CB-2A1 | | | 7.00% | | | 03/25/2037 | | | 3,872,455 | |
| 5,833,070 | | Countrywide Alternative Loan Trust, Series 2007-5CB-1A18 (-1 x 1 Month LIBOR USD + 5.65%, 5.65% Cap) | | | 3.16% | I/F I/O | | 04/25/2037 | | | 946,634 | |
| 5,833,070 | | Countrywide Alternative Loan Trust, Series 2007-5CB-1A23 (1 Month LIBOR USD + 0.55%, 0.55% Floor, 6.00% Cap) | | | 3.04% | | | 04/25/2037 | | | 3,881,871 | |
| 4,864,496 | | Countrywide Alternative Loan Trust, Series 2007-6-A4 | | | 5.75% | | | 04/25/2047 | | | 4,177,887 | |
| 386,172 | | Countrywide Alternative Loan Trust, Series 2007-8CB-A12 (-6 x 1 Month LIBOR USD + 40.20%, 40.20% Cap) | | | 25.29% | I/F | | 05/25/2037 | | | 739,058 | |
| 412,233 | | Countrywide Alternative Loan Trust, Series 2007-8CB-A8 (-6 x 1 Month LIBOR USD + 40.08%, 40.08% Cap) | | | 25.17% | I/F | | 05/25/2037 | | | 785,845 | |
| 630,229 | | Countrywide Alternative Loan Trust, Series 2007-9T1-1A4 (1 Month LIBOR USD + 0.50%, 0.50% Floor, 6.00% Cap) | | | 2.99% | | | 05/25/2037 | | | 308,394 | |
| 630,229 | | Countrywide Alternative Loan Trust, Series 2007-9T1-1A5 (-1 x 1 Month LIBOR USD + 5.50%, 5.50% Cap) | | | 3.01% | I/F I/O | | 05/25/2037 | | | 108,890 | |
| 17,262,836 | | Countrywide Alternative Loan Trust, Series 2007-9T1-1A6 | | | 6.00% | | | 05/25/2037 | | | 12,016,446 | |
| 1,864,030 | | Countrywide Alternative Loan Trust, Series 2007-9T1-2A1 | | | 6.00% | | | 05/25/2037 | | | 1,330,073 | |
| 72,075 | | Countrywide Alternative Loan Trust, Series 2007-9T1-3A1 | | | 5.50% | | | 05/25/2022 | | | 64,378 | |
| 41,759,615 | | Countrywide Alternative Loan Trust, Series 2007-HY2-1A | | | 4.20% | # | | 03/25/2047 | | | 39,500,215 | |
| 1,021,157 | | Countrywide Alternative Loan Trust, Series 2007-HY5R-2A1B | | | 3.62% | # | | 03/25/2047 | | | 1,077,220 | |
| 3,157,425 | | Countrywide Asset Backed Certificates, Series 2003-BC6-M1 (1 Month LIBOR USD + 0.83%, 0.55% Floor) | | | 3.31% | | | 11/25/2033 | | | 3,081,888 | |
| 17,111,031 | | Countrywide Asset Backed Certificates, Series 2005-4-AF5B | | | 5.15% | | | 10/25/2035 | | | 17,460,044 | |
| 36,197,440 | | Countrywide Asset Backed Certificates, Series 2006-25-1A (1 Month LIBOR USD + 0.14%, 0.14% Floor) | | | 2.63% | | | 06/25/2047 | | | 33,828,777 | |
| 9,940,934 | | Countrywide Asset Backed Certificates, Series 2006-26-1A (1 Month LIBOR USD + 0.14%, 0.14% Floor) | | | 2.63% | | | 06/25/2037 | | | 9,413,563 | |
| 19,567,580 | | Countrywide Asset Backed Certificates, Series 2007-BC1-1A (1 Month LIBOR USD + 0.14%, 0.14% Floor) | | | 2.63% | | | 05/25/2037 | | | 18,171,840 | |
| 5,486,592 | | Countrywide Asset Backed Certificates, Series 2007-BC3-2A3 (1 Month LIBOR USD + 0.18%, 0.18% Floor) | | | 2.67% | | | 11/25/2047 | | | 4,900,670 | |
| 416,883 | | Countrywide Asset-Backed Certificates, Series 2005-13-AF3 | | | 5.43% | # | | 02/25/2033 | | | 382,851 | |
| 1,609,375 | | Countrywide Home Loans, Series 2003-60-4A1 | | | 4.87% | # | | 02/25/2034 | | | 1,648,105 | |
| 2,229,701 | | Countrywide Home Loans, Series 2004-R2-1AF1 (1 Month LIBOR USD + 0.42%, 0.42% Floor, 9.50% Cap) | | | 2.91% | ^ | | 11/25/2034 | | | 2,059,322 | |
| 2,169,494 | | Countrywide Home Loans, Series 2004-R2-1AS | | | 3.64% | # ^ I/O | | 11/25/2034 | | | 162,365 | |
| 4,749,222 | | Countrywide Home Loans, Series 2005-20-A5 | | | 5.50% | | | 10/25/2035 | | | 4,373,287 | |
| 3,487,478 | | Countrywide Home Loans, Series 2005-20-A8 | | | 5.25% | | | 10/25/2035 | | | 3,306,534 | |
| 11,754,067 | | Countrywide Home Loans, Series 2005-23-A1 | | | 5.50% | | | 11/25/2035 | | | 9,994,943 | |
| 3,070,268 | | Countrywide Home Loans, Series 2005-24-A8 | | | 5.50% | | | 11/25/2035 | | | 2,676,336 | |
| 882,905 | | Countrywide Home Loans, Series 2005-27-2A1 | | | 5.50% | | | 12/25/2035 | | | 709,557 | |
| 1,481,808 | | Countrywide Home Loans, Series 2005-28-A7 | | | 5.25% | | | 01/25/2019 | | | 1,270,333 | |
| 18,553,014 | | Countrywide Home Loans, Series 2005-HYB1-4A1 | | | 4.35% | # | | 03/25/2035 | | | 18,022,699 | |
| 1,755,328 | | Countrywide Home Loans, Series 2005-HYB8-1A1 | | | 4.32% | # | | 12/20/2035 | | | 1,558,115 | |
| 2,788,850 | | Countrywide Home Loans, Series 2005-J3-2A4 | | | 4.50% | | | 09/25/2035 | | | 2,684,722 | |
| 1,788,466 | | Countrywide Home Loans, Series 2005-J4-A5 | | | 5.50% | | | 11/25/2035 | | | 1,707,691 | |
| 673,629 | | Countrywide Home Loans, Series 2005-R1-1AF1 (1 Month LIBOR USD + 0.36%, 0.36% Floor, 9.50% Cap) | | | 2.85% | ^ | | 03/25/2035 | | | 630,087 | |
| 661,195 | | Countrywide Home Loans, Series 2005-R1-1AS | | | 3.72% | # ^ I/O | | 03/25/2035 | | | 76,920 | |
| 5,759,386 | | Countrywide Home Loans, Series 2006-16-2A1 | | | 6.50% | | | 11/25/2036 | | | 4,023,237 | |
| 5,753,038 | | Countrywide Home Loans, Series 2006-1-A2 | | | 6.00% | | | 03/25/2036 | | | 4,710,023 | |
| 2,312,513 | | Countrywide Home Loans, Series 2006-20-1A21 | | | 6.00% | | | 02/25/2037 | | | 1,881,727 | |
| 1,509,215 | | Countrywide Home Loans, Series 2006-J3-A4 | | | 5.50% | | | 05/25/2036 | | | 1,519,347 | |
| 6,470,442 | | Countrywide Home Loans, Series 2007-10-A7 | | | 6.00% | | | 07/25/2037 | | | 5,275,042 | |
| 20,442,773 | | Countrywide Home Loans, Series 2007-11-A1 | | | 6.00% | | | 08/25/2037 | | | 16,213,055 | |
| 12,622,483 | | Countrywide Home Loans, Series 2007-12-A9 | | | 5.75% | | | 08/25/2037 | | | 11,042,683 | |
| 5,069,867 | | Countrywide Home Loans, Series 2007-13-A1 | | | 6.00% | | | 08/25/2037 | | | 4,156,753 | |
| 8,307,256 | | Countrywide Home Loans, Series 2007-13-A10 | | | 6.00% | | | 08/25/2037 | | | 6,811,068 | |
| 6,547,521 | | Countrywide Home Loans, Series 2007-15-1A1 | | | 6.25% | | | 09/25/2037 | | | 5,969,375 | |
| 722,005 | | Countrywide Home Loans, Series 2007-15-1A16 | | | 6.25% | | | 09/25/2037 | | | 658,252 | |
| 3,217,355 | | Countrywide Home Loans, Series 2007-15-1A29 | | | 6.25% | | | 09/25/2037 | | | 2,933,262 | |
| 7,183,657 | | Countrywide Home Loans, Series 2007-17-1A2 | | | 6.00% | | | 10/25/2037 | | | 6,428,681 | |
| 869,756 | | Countrywide Home Loans, Series 2007-18-1A1 | | | 6.00% | | | 11/25/2037 | | | 743,539 | |
| 6,589,836 | | Countrywide Home Loans, Series 2007-3-A1 | | | 6.00% | | | 04/25/2037 | | | 5,404,986 | |
| 2,537,979 | | Countrywide Home Loans, Series 2007-3-A12 | | | 6.00% | | | 04/25/2037 | | | 2,081,651 | |
| 5,111,451 | | Countrywide Home Loans, Series 2007-4-1A39 | | | 6.00% | | | 05/25/2037 | | | 3,940,959 | |
| 2,245,468 | | Countrywide Home Loans, Series 2007-5-A2 | | | 5.75% | | | 05/25/2037 | | | 1,870,616 | |
| 7,632,052 | | Countrywide Home Loans, Series 2007-7-A1 | | | 6.00% | | | 06/25/2037 | | | 6,535,238 | |
| 2,287,828 | | Countrywide Home Loans, Series 2007-7-A2 | | | 5.75% | | | 06/25/2037 | | | 1,927,542 | |
| 6,979,675 | | Countrywide Home Loans, Series 2007-8-1A4 | | | 6.00% | | | 01/25/2038 | | | 5,451,413 | |
| 3,662,908 | | Countrywide Home Loans, Series 2007-8-1A5 | | | 5.44% | | | 01/25/2038 | | | 2,741,312 | |
| 8,504,502 | | Countrywide Home Loans, Series 2007-8-1A9 (1 Month LIBOR USD + 6.00%, 4.00% Floor, 6.00% Cap) | | | 6.00% | | | 01/25/2038 | | | 6,642,365 | |
| 1,467,234 | | Countrywide Home Loans, Series 2007-9-A11 | | | 5.75% | | | 07/25/2037 | | | 1,232,644 | |
| 9,124,029 | | Countrywide Home Loans, Series 2007-HY1-1A1 | | | 4.46% | # | | 04/25/2037 | | | 8,897,505 | |
| 23,015,012 | | Countrywide Home Loans, Series 2007-J1-2A1 | | | 6.00% | | | 02/25/2037 | | | 16,555,283 | |
| 563,103 | | Countrywide Home Loans, Series 2007-J3-A1 (1 Month LIBOR USD + 0.50%, 0.50% Floor, 6.00% Cap) | | | 2.99% | | | 07/25/2037 | | | 313,295 | |
| 2,815,516 | | Countrywide Home Loans, Series 2007-J3-A2 (-1 x 1 Month LIBOR USD + 5.50%, 5.50% Cap) | | | 3.01% | I/F I/O | | 07/25/2037 | | | 522,984 | |
| 4,698,829 | | Credit Suisse First Boston Mortgage Backed Trust, Series 2006-3-A4B | | | 6.11% | ß | | 11/25/2036 | | | 1,488,654 | |
| 2,916,248 | | Credit Suisse First Boston Mortgage Backed Trust, Series 2006-4-A6A | | | 5.68% | | | 12/25/2036 | | | 1,209,253 | |
| 10,239,437 | | Credit Suisse First Boston Mortgage Backed Trust, Series 2007-1-1A1A | | | 5.90% | # | | 05/25/2037 | | | 4,403,541 | |
| 61,245 | | Credit Suisse First Boston Mortgage Securities Corporation, Series 2004-AR8-2A1 | | | 4.31% | # | | 09/25/2034 | | | 61,392 | |
| 3,485,084 | | Credit Suisse First Boston Mortgage Securities Corporation, Series 2005-10-5A4 | | | 5.50% | | | 11/25/2035 | | | 3,298,644 | |
| 733,668 | | Credit Suisse First Boston Mortgage Securities Corporation, Series 2005-10-5A5 | | | 5.50% | | �� | 11/25/2035 | | | 694,402 | |
| 10,475,780 | | Credit Suisse First Boston Mortgage Securities Corporation, Series 2005-12-5A1 | | | 5.25% | | | 01/25/2036 | | | 10,009,289 | |
| 9,936,936 | | Credit Suisse First Boston Mortgage Securities Corporation, Series 2005-12-7A1 | | | 7.00% | | | 01/25/2036 | | | 3,281,140 | |
| 4,990,606 | | Credit Suisse First Boston Mortgage Securities Corporation, Series 2005-8-3A10 | | | 5.50% | | | 09/25/2035 | | | 4,933,094 | |
| 4,379,109 | | Credit Suisse First Boston Mortgage Securities Corporation, Series 2005-8-7A1 | | | 7.00% | | | 09/25/2035 | | | 3,435,969 | |
| 1,925,242 | | Credit Suisse Mortgage Capital Certificates, Series 2005-1R-2A5 | | | 5.75% | ^ | | 12/26/2035 | | | 1,842,545 | |
| 15,679,912 | | Credit Suisse Mortgage Capital Certificates, Series 2006-1-2A1 | | | 6.00% | | | 02/25/2036 | | | 10,888,620 | |
| 2,601,200 | | Credit Suisse Mortgage Capital Certificates, Series 2006-2-3A1 | | | 6.50% | | | 03/25/2036 | | | 1,360,403 | |
| 3,045,997 | | Credit Suisse Mortgage Capital Certificates, Series 2006-2-5A1 (1 Month LIBOR USD + 0.70%, 0.70% Floor, 6.00% Cap) | | | 3.19% | | | 03/25/2036 | | | 1,641,808 | |
| 17,025,720 | | Credit Suisse Mortgage Capital Certificates, Series 2006-2-5A2 (-1 x 1 Month LIBOR USD + 5.30%, 5.30% Cap) | | | 2.81% | I/F I/O | | 03/25/2036 | | | 2,907,933 | |
| 3,546,434 | | Credit Suisse Mortgage Capital Certificates, Series 2006-2-5A3 | | | 6.25% | | | 03/25/2036 | | | 2,657,398 | |
| 9,598,068 | | Credit Suisse Mortgage Capital Certificates, Series 2006-2-5A4 | | | 6.00% | | | 03/25/2036 | | | 7,008,626 | |
| 3,468,012 | | Credit Suisse Mortgage Capital Certificates, Series 2006-3-4A3 | | | 5.50% | | | 04/25/2036 | | | 3,165,855 | |
| 2,096,502 | | Credit Suisse Mortgage Capital Certificates, Series 2006-3-4A4 | | | 5.50% | | | 04/25/2036 | | | 1,917,377 | |
| 3,571,000 | | Credit Suisse Mortgage Capital Certificates, Series 2006-4-1A8 (1 Month LIBOR USD + 1.00%, 6.00% Floor, 6.00% Cap) | | | 6.00% | | | 05/25/2036 | | | 3,054,165 | |
| 20,420,856 | | Credit Suisse Mortgage Capital Certificates, Series 2006-4-4A1 | | | 7.00% | | | 05/25/2036 | | | 8,866,932 | |
| 10,132,539 | | Credit Suisse Mortgage Capital Certificates, Series 2006-6-1A4 | | | 6.00% | | | 07/25/2036 | | | 8,300,409 | |
| 10,177,031 | | Credit Suisse Mortgage Capital Certificates, Series 2006-6-3A1 | | | 7.00% | | | 07/25/2036 | | | 2,426,601 | |
| 202,472 | | Credit Suisse Mortgage Capital Certificates, Series 2006-7-3A11 | | | 6.00% | | | 08/25/2036 | | | 162,786 | |
| 2,816,611 | | Credit Suisse Mortgage Capital Certificates, Series 2006-7-7A5 | | | 6.00% | | | 08/25/2036 | | | 2,830,544 | |
| 6,518,701 | | Credit Suisse Mortgage Capital Certificates, Series 2006-9-2A1 | | | 5.50% | | | 11/25/2036 | | | 5,473,529 | |
| 21,697,811 | | Credit Suisse Mortgage Capital Certificates, Series 2006-9-3A1 | | | 6.00% | | | 11/25/2036 | | | 18,699,809 | |
| 6,128,400 | | Credit Suisse Mortgage Capital Certificates, Series 2006-9-4A1 | | | 6.00% | | | 11/25/2036 | | | 3,951,448 | |
| 4,368,081 | | Credit Suisse Mortgage Capital Certificates, Series 2006-9-6A14 | | | 6.00% | | | 11/25/2036 | | | 4,213,923 | |
| 709,733 | | Credit Suisse Mortgage Capital Certificates, Series 2006-9-6A15 (-6 x 1 Month LIBOR USD + 39.90%, 39.90% Cap) | | | 24.96% | I/F | | 11/25/2036 | | | 1,263,654 | |
| 10,712,237 | | Credit Suisse Mortgage Capital Certificates, Series 2007-1-1A4 | | | 6.13% | # | | 02/25/2037 | | | 4,922,815 | |
| 4,965,078 | | Credit Suisse Mortgage Capital Certificates, Series 2007-1-5A14 | | | 6.00% | | | 02/25/2037 | | | 4,337,420 | |
| 7,838,166 | | Credit Suisse Mortgage Capital Certificates, Series 2007-3-2A10 | | | 6.00% | | | 04/25/2037 | | | 5,501,689 | |
| 5,559,378 | | Credit Suisse Mortgage Capital Certificates, Series 2007-5-2A5 | | | 5.00% | | | 08/25/2037 | | | 4,425,254 | |
| 45,507,327 | | Credit Suisse Mortgage Capital Certificates, Series 2007-5-3A19 | | | 6.00% | | | 08/25/2037 | | | 38,039,771 | |
| 20,183,980 | | Credit Suisse Mortgage Capital Certificates, Series 2007-5-3A9 | | | 6.00% | | | 08/25/2037 | | | 16,862,958 | |
| 7,709,793 | | Credit Suisse Mortgage Capital Certificates, Series 2008-2R-1A1 | | | 6.00% | ^ | | 07/25/2037 | | | 7,209,287 | |
| 1,481,940 | | Credit Suisse Mortgage Capital Certificates, Series 2009-1R-4A2 | | | 4.44% | # ^ | | 07/20/2035 | | | 1,501,734 | |
| 3,636,053 | | Credit Suisse Mortgage Capital Certificates, Series 2010-13R-1A2 | | | 5.50% | # ^ | | 12/26/2035 | | | 3,695,774 | |
| 71,740,877 | | Credit Suisse Mortgage Capital Certificates, Series 2010-17R-6A1 | | | 3.55% | # ^ | | 06/26/2037 | | | 71,676,447 | |
| 8,779,796 | | Credit Suisse Mortgage Capital Certificates, Series 2010-2R-4A17 | | | 6.00% | # ^ | | 03/26/2037 | | | 8,842,371 | |
| 12,086,275 | | Credit Suisse Mortgage Capital Certificates, Series 2010-4R-8A17 | | | 6.00% | # ^ | | 06/26/2037 | | | 12,127,926 | |
| 9,962,868 | | Credit Suisse Mortgage Capital Certificates, Series 2010-7R-4A17 | | | 6.00% | # ^ | | 04/26/2037 | | | 9,885,995 | |
| 14,738,017 | | Credit Suisse Mortgage Capital Certificates, Series 2010-9R-2A5 | | | 4.00% | # ^ | | 02/27/2038 | | | 14,761,141 | |
| 12,565,623 | | Credit Suisse Mortgage Capital Certificates, Series 2012-10R-4A2 | | | 3.94% | # ^ | | 08/26/2046 | | | 11,885,495 | |
| 42,214,334 | | Credit Suisse Mortgage Capital Certificates, Series 2013-6-1A1 | | | 2.50% | # ^ | | 07/25/2028 | | | 41,764,743 | |
| 42,566,292 | | Credit Suisse Mortgage Capital Certificates, Series 2013-9R-A1 | | | 3.00% | # ^ | | 05/27/2043 | | | 39,435,065 | |
| 20,299,549 | | Credit Suisse Mortgage Capital Certificates, Series 2013-IVR4-A2 | | | 3.00% | # ^ | | 07/25/2043 | | | 19,846,129 | |
| 4,806,498 | | Credit Suisse Mortgage Capital Certificates, Series 2014-WIN1-2A4 | | | 3.00% | # ^ | | 09/25/2044 | | | 4,704,587 | |
| 68,766,865 | | Credit Suisse Mortgage Capital Certificates, Series 2015-1-A1 | | | 2.50% | # ^ | | 01/25/2045 | | | 66,046,777 | |
| 32,370 | | Credit-Based Asset Servicing and Securitization LLC, Series 2005-CB6-A4 | | | 3.66% | | | 06/25/2035 | | | 32,353 | |
| 12,563,342 | | Credit-Based Asset Servicing and Securitization LLC, Series 2006-CB4-AV3 (1 Month LIBOR USD + 0.15%, 0.15% Floor) | | | 2.64% | | | 05/25/2036 | | | 10,221,598 | |
| 9,750,000 | | Credit-Based Asset Servicing and Securitization LLC, Series 2007-MX1-A3 | | | 5.83% | ^ ß | | 12/25/2036 | | | 10,039,726 | |
| 11,458,916 | | CSMC Trust, Series 2006-4-6A1 | | | 6.00% | | | 05/25/2036 | | | 8,325,748 | |
| 6,534,941 | | CSMC Trust, Series 2007-1-3A1 | | | 6.00% | | | 02/25/2022 | | | 2,889,997 | |
| 74,906 | | CSMC Trust, Series 2007-2-2A1 | | | 5.00% | | | 03/25/2037 | | | 72,451 | |
| 10,233,275 | | CSMC Trust, Series 2009-12R-5A1 | | | 6.00% | ^ | | 06/27/2036 | | | 9,751,347 | |
| 24,479,245 | | CSMC Trust, Series 2010-4R-3A17 | | | 6.00% | # ^ | | 06/26/2037 | | | 24,563,603 | |
| 124,734,671 | | CSMC Trust, Series 2015-PR2-A1 | | | 7.25% | ^ § | | 07/26/2055 | | | 132,415,358 | |
| 23,858,926 | | CSMC Trust, Series 2016-PR1-A1 | | | 5.50% | ^ § | | 07/25/2056 | | | 24,214,476 | |
| 40,371,007 | | CSMC Trust, Series 2017-1A-A | | | 4.50% | ^ | | 03/25/2021 | | | 40,612,426 | |
| 77,345,785 | | CSMC Trust, Series 2018-5R-1A1 (1 Month LIBOR USD + 1.30%, 1.30% Floor) | | | 3.81% | ^ | | 10/30/2046 | | | 78,146,546 | |
| 64,362,466 | | CSMC Trust, Series 2018-RPL2-A1 | | | 4.03% | ^ § | | 08/25/2062 | | | 64,413,776 | |
| 181,726,821 | | CSMC Trust, Series 2018-RPL7-A1 | | | 4.00% | ^ | | 08/26/2058 | | | 182,354,069 | |
| 89,343,003 | | CSMC Trust, Series 2018-RPL8-A1 | | | 4.13% | # ^ | | 07/25/2058 | | | 89,844,342 | |
| 111,041,000 | | CSMC Trust, Series 2019-3R-1A1 (1 Month LIBOR USD + 1.40%, 1.40% Floor) | | | 3.89% | ^ | | 06/02/2047 | | | 111,812,957 | |
| 72,440,300 | | CSMC Trust, Series 2019-RPL2-A1 | | | 4.34% | ^ | | 07/25/2058 | | | 72,974,518 | |
| 9,703,059 | | CSMLT Trust, Series 2015-3-1A2 | | | 3.50% | # ^ | | 11/25/2045 | | | 9,802,694 | |
| 7,804,814 | | Deephaven Residential Mortgage Trust, Series 2018-3A-A2 | | | 3.89% | # ^ | | 08/25/2058 | | | 7,871,212 | |
| 7,597,525 | | Deephaven Residential Mortgage Trust, Series 2018-3A-A3 | | | 3.96% | # ^ | | 08/25/2058 | | | 7,641,661 | |
| 14,596,895 | | Deutsche ALT-A Securities, Inc. Mortgage Loan Trust, Series 2005-4-A5 | | | 5.50% | # | | 09/25/2035 | | | 14,344,593 | |
| 890,083 | | Deutsche ALT-A Securities, Inc. Mortgage Loan Trust, Series 2005-5-1A6 (-7 x 1 Month LIBOR USD + 35.93%, 35.93% Cap) | | | 17.71% | I/F | | 11/25/2035 | | | 1,238,995 | |
| 961,976 | | Deutsche ALT-A Securities, Inc. Mortgage Loan Trust, Series 2005-5-2A1 (1 Month LIBOR USD + 0.20%, 0.20% Floor, 5.50% Cap) | | | 2.69% | | | 11/25/2035 | | | 584,578 | |
| 2,903,349 | | Deutsche ALT-A Securities, Inc. Mortgage Loan Trust, Series 2005-5-2A2 (-1 x 1 Month LIBOR USD + 5.30%, 5.30% Cap) | | | 2.81% | I/F I/O | | 11/25/2035 | | | 338,325 | |
| 24,926,203 | | Deutsche ALT-A Securities, Inc. Mortgage Loan Trust, Series 2007-2-2A1 (1 Month LIBOR USD + 0.30%, 0.30% Floor) | | | 2.79% | | | 09/25/2047 | | | 22,206,879 | |
| 15,021,887 | | Deutsche ALT-A Securities, Inc. Mortgage Loan Trust, Series 2007-OA5-A1B (1 Month LIBOR USD + 0.22%, 0.22% Floor) | | | 2.71% | | | 08/25/2047 | | | 14,159,861 | |
| 6,045,910 | | Deutsche Alt-B Securities Mortgage Loan Trust, Series 2006-AB1-A1C | | | 5.67% | # | | 02/25/2036 | | | 5,922,189 | |
| 814,573 | | Deutsche ALT-B Securities, Inc. Mortgage Loan Trust, Series 2006-AB2-A2 | | | 5.28% | # | | 06/25/2036 | | | 777,436 | |
| 21,704,435 | | Deutsche ALT-B Securities, Inc. Mortgage Loan Trust, Series 2006-AB4-A2 | | | 5.65% | # | | 10/25/2036 | | | 20,352,854 | |
| 1,546,180 | | Deutsche ALT-B Securities, Inc. Mortgage Loan Trust, Series 2006-AB4-A3 | | | 5.90% | # | | 10/25/2036 | | | 1,449,603 | |
| 2,269,778 | | Deutsche ALT-B Securities, Inc. Mortgage Loan Trust, Series 2006-AB4-A3A1 | | | 5.90% | # | | 10/25/2036 | | | 2,128,005 | |
| 4,508,946 | | Deutsche ALT-B Securities, Inc. Mortgage Loan Trust, Series 2006-AB4-A6A1 | | | 5.87% | ß | | 10/25/2036 | | | 4,227,420 | |
| 8,800,933 | | Deutsche Mortgage Securities, Inc., Series 2006-PR1-3A1 (-1 x 1 Month LIBOR USD + 12.12%, 12.12% Cap) | | | 8.65% | ^I/F | | 04/15/2036 | | | 8,520,586 | |
| 5,081,342 | | Deutsche Mortgage Securities, Inc., Series 2006-PR1-4AI1 (-1 x 1 Month LIBOR USD + 12.11%, 12.11% Cap) | | | 8.63% | ^I/F | | 04/15/2036 | | | 4,893,596 | |
| 8,250,977 | | Deutsche Mortgage Securities, Inc., Series 2006-PR1-4AI2 (-2 x 1 Month LIBOR USD + 14.60%, 14.61% Cap) | | | 9.86% | ^I/F | | 04/15/2036 | | | 8,079,763 | |
| 545,234 | | Deutsche Mortgage Securities, Inc., Series 2006-PR1-5AI1 (-3 x 1 Month LIBOR USD + 19.35%, 19.35% Cap) | | | 11.90% | ^I/F | | 04/15/2036 | | | 576,659 | |
| 4,773,321 | | Deutsche Mortgage Securities, Inc., Series 2006-PR1-5AI3 (-1 x 1 Month LIBOR USD + 12.57%, 12.57% Cap) | | | 9.09% | ^I/F | | 04/15/2036 | | | 4,422,005 | |
| 79,058,835 | | Deutsche Mortgage Securities, Inc., Series 2006-PR1-5AI4 (-1 x 1 Month LIBOR USD + 12.12%, 12.12% Cap) | | | 8.65% | ^I/F | | 04/15/2036 | | | 72,485,298 | |
| 9,543,718 | | Deutsche Securities, Inc., Series 2005-6-2A1 | | | 5.50% | | | 12/25/2035 | | | 8,605,312 | |
| 1,554,295 | | Deutsche Securities, Inc., Series 2006-AB4-A1A | | | 6.01% | # | | 10/25/2036 | | | 1,457,088 | |
| 18,771,563 | | Equifirst Loan Securitization Trust, Series 2007-1-A2B (1 Month LIBOR USD + 0.19%, 0.19% Floor) | | | 2.68% | | | 04/25/2037 | | | 17,998,401 | |
| 6,340,123 | | First Franklin Mortgage Loan Trust, Series 2006-FF3-A2B (1 Month LIBOR USD + 0.20%, 0.20% Floor) | | | 2.69% | | | 02/25/2036 | | | 6,336,754 | |
| 7,697,353 | | First Horizon Alternative Mortgage Securities, Series 2005-AA4-1A1 | | | 3.95% | # | | 05/25/2035 | | | 6,289,580 | |
| 6,965,786 | | First Horizon Alternative Mortgage Securities, Series 2005-FA8-1A4 | | | 5.50% | | | 11/25/2035 | | | 5,737,423 | |
| 373,678 | | First Horizon Alternative Mortgage Securities, Series 2005-FA8-2A1 | | | 5.00% | | | 11/25/2020 | | | 374,380 | |
| 5,060,291 | | First Horizon Alternative Mortgage Securities, Series 2005-FA9-A4A | | | 5.50% | | | 12/25/2035 | | | 4,288,343 | |
| 3,282,584 | | First Horizon Alternative Mortgage Securities, Series 2006-AA3-A1 | | | 4.17% | # | | 06/25/2036 | | | 3,026,911 | |
| 2,921,318 | | First Horizon Alternative Mortgage Securities, Series 2006-FA1-1A12 | | | 6.00% | | | 04/25/2036 | | | 2,290,805 | |
| 17,030 | | First Horizon Alternative Mortgage Securities, Series 2006-FA1-1A6 (1 Month LIBOR USD + 0.75%, 0.75% Floor, 5.75% Cap) | | | 3.24% | | | 04/25/2036 | | | 17,055 | |
| 2,201,699 | | First Horizon Alternative Mortgage Securities, Series 2006-FA2-1A5 | | | 6.00% | | | 05/25/2036 | | | 1,666,825 | |
| 560,008 | | First Horizon Alternative Mortgage Securities, Series 2006-FA7-A8 | | | 6.25% | | | 12/25/2036 | | | 455,256 | |
| 2,988,375 | | First Horizon Alternative Mortgage Securities, Series 2006-FA8-1A5 | | | 6.00% | | | 02/25/2037 | | | 2,281,024 | |
| 5,817,516 | | First Horizon Alternative Mortgage Securities, Series 2006-RE1-A1 | | | 5.50% | | | 05/25/2035 | | | 5,287,962 | |
| 16,900,606 | | First Horizon Alternative Mortgage Securities, Series 2007-FA3-A3 | | | 6.00% | | | 06/25/2037 | | | 12,416,047 | |
| 869,623 | | First Horizon Alternative Mortgage Securities, Series 2007-FA3-A4 | | | 6.00% | | | 06/25/2037 | | | 638,869 | |
| 976,088 | | First Horizon Alternative Mortgage Securities, Series 2007-FA4-1A13 | | | 6.25% | | | 08/25/2037 | | | 742,247 | |
| 3,013,258 | | First Horizon Alternative Mortgage Securities, Series 2007-FA4-1A4 | | | 6.25% | | | 08/25/2037 | | | 2,291,372 | |
| 1,415,799 | | First Horizon Alternative Mortgage Securities, Series 2007-FA4-1A5 | | | 6.25% | | | 08/25/2037 | | | 1,076,616 | |
| 3,699,929 | | First Horizon Asset Securities, Inc., Series 2005-8-1A11 | | | 5.75% | | | 02/25/2036 | | | 3,148,639 | |
| 1,797,313 | | First Horizon Asset Securities, Inc., Series 2006-1-1A2 | | | 6.00% | | | 05/25/2036 | | | 1,471,531 | |
| 4,323,004 | | First Horizon Asset Securities, Inc., Series 2007-1-A3 | | | 6.00% | | | 03/25/2037 | | | 3,530,551 | |
| 3,191,185 | | First Horizon Asset Securities, Inc., Series 2007-4-1A1 | | | 6.00% | | | 08/25/2037 | | | 2,570,914 | |
| 162,522,134 | | Fremont Home Loan Trust, Series 2006-D-1A1 (1 Month LIBOR USD + 0.14%, 0.14% Floor) | | | 2.63% | | | 11/25/2036 | | | 112,650,771 | |
| 89,883,094 | | GCAT LLC, Series 2018-2-A1 | | | 4.09% | ^ § | | 06/26/2023 | | | 90,529,893 | |
| 16,300,000 | | GCAT LLC, Series 2019-1-A1 | | | 4.09% | ^ § | | 04/26/2049 | | | 16,402,315 | |
| 46,273,000 | | GE-WMC Asset-Backed Pass-Through Certificates, Series 2005-2-A2D (1 Month LIBOR USD + 0.32%, 0.32% Floor) | | | 2.81% | | | 12/25/2035 | | | 44,317,156 | |
| 28,260,437 | | GE-WMC Mortgage Securities Trust, Series 2006-1-A2B (1 Month LIBOR USD + 0.15%, 0.15% Floor) | | | 2.64% | | | 08/25/2036 | | | 19,228,938 | |
| 4,393,502 | | GMACM Mortgage Loan Trust, Series 2005-AR5-3A1 | | | 4.23% | # | | 09/19/2035 | | | 4,193,956 | |
| 6,724,273 | | GMACM Mortgage Loan Trust, Series 2005-J1-A14 | | | 5.50% | | | 12/25/2035 | | | 6,660,196 | |
| 34,478,234 | | GreenPoint Mortgage Funding Trust, Series 2005-AR3-2A1 (1 Month LIBOR USD + 0.26%, 0.26% Floor, 10.50% Cap) | | | 2.75% | | | 08/25/2045 | | | 24,661,956 | |
| 22,514,813 | | GreenPoint Mortgage Funding Trust, Series 2006-AR7-2A1 (1 Month LIBOR USD + 0.20%, 0.20% Floor) | | | 2.69% | | | 12/25/2046 | | | 22,060,414 | |
| 34,636,970 | | GreenPoint Mortgage Funding Trust, Series 2007-AR2-1A3 (1 Month LIBOR USD + 0.24%, 0.24% Floor) | | | 2.73% | | | 04/25/2047 | | | 32,172,398 | |
| 1,277,144 | | GS Mortgage Securities Corporation, Series 2008-2R-1A1 | | | 7.50% | # ^ | | 09/25/2036 | | | 914,751 | |
| 3,401,169 | | GS Mortgage Securities Corporation, Series 2009-3R-1A2 | | | 6.00% | # ^ | | 04/25/2037 | | | 3,375,360 | |
| 198,065 | | GSAA Home Equity Trust, Series 2005-12-AF3 | | | 5.07% | # | | 09/25/2035 | | | 171,087 | |
| 2,851,042 | | GSAA Home Equity Trust, Series 2005-7-AF3 | | | 4.75% | # | | 05/25/2035 | | | 2,856,050 | |
| 9,999,172 | | GSAA Home Equity Trust, Series 2006-10-AF3 | | | 5.98% | # | | 06/25/2036 | | | 4,630,858 | |
| 7,156,579 | | GSAA Home Equity Trust, Series 2006-10-AF4 | | | 6.30% | ß | | 06/25/2036 | | | 3,312,642 | |
| 13,516,678 | | GSAA Home Equity Trust, Series 2006-15-AF4 | | | 5.96% | ß | | 09/25/2036 | | | 6,416,031 | |
| 2,253,189 | | GSAA Home Equity Trust, Series 2006-18-AF3A | | | 5.77% | # | | 11/25/2036 | | | 1,188,785 | |
| 4,977,200 | | GSAA Home Equity Trust, Series 2006-18-AF6 | | | 5.68% | ß | | 11/25/2036 | | | 2,299,900 | |
| 5,322,098 | | GSAA Home Equity Trust, Series 2007-10-A1A | | | 6.00% | | | 11/25/2037 | | | 4,479,763 | |
| 3,009,847 | | GSAA Home Equity Trust, Series 2007-10-A2A | | | 6.50% | | | 11/25/2037 | | | 2,126,319 | |
| 25,182,224 | | GSAMP Trust, Series 2006-HE6-A3 (1 Month LIBOR USD + 0.15%, 0.15% Floor) | | | 2.64% | | | 08/25/2036 | | | 21,205,309 | |
| 11,603,140 | | GSMPS Mortgage Loan Trust, Series 2005-RP2-1AF (1 Month LIBOR USD + 0.35%, 0.35% Floor) | | | 2.84% | ^ | | 03/25/2035 | | | 10,876,430 | |
| 11,603,140 | | GSMPS Mortgage Loan Trust, Series 2005-RP2-1AS | | | 2.17% | # ^ I/O | | 03/25/2035 | | | 689,010 | |
| 6,776,757 | | GSMPS Mortgage Loan Trust, Series 2005-RP3-1AF (1 Month LIBOR USD + 0.35%, 0.35% Floor, 9.50% Cap) | | | 2.84% | ^ | | 09/25/2035 | | | 6,064,661 | |
| 6,776,757 | | GSMPS Mortgage Loan Trust, Series 2005-RP3-1AS | | | 2.02% | # ^ I/O | | 09/25/2035 | | | 688,363 | |
| 26,155,943 | | GSMPS Mortgage Loan Trust, Series 2006-RP1-1AF1 (1 Month LIBOR USD + 0.35%, 0.35% Floor, 9.15% Cap) | | | 2.84% | ^ | | 01/25/2036 | | | 23,057,596 | |
| 26,155,943 | | GSMPS Mortgage Loan Trust, Series 2006-RP1-1AS | | | 1.92% | # ^ I/O | | 01/25/2036 | | | 1,894,729 | |
| 5,843,745 | | GSMSC Pass-Through Trust, Series 2009-3R-3A2 | | | 5.75% | # ^ | | 04/25/2037 | | | 5,788,291 | |
| 1,839,316 | | GSR Mortgage Loan Trust, Series 2005-1F-1A2 | | | 5.50% | | | 02/25/2035 | | | 1,866,140 | |
| 3,835,814 | | GSR Mortgage Loan Trust, Series 2005-1F-3A3 | | | 6.00% | | | 01/25/2035 | | | 3,926,114 | |
| 545,609 | | GSR Mortgage Loan Trust, Series 2005-6F-3A5 | | | 6.00% | | | 07/25/2035 | | | 578,693 | |
| 5,442,808 | | GSR Mortgage Loan Trust, Series 2005-6F-3A9 (-1 x 1 Month LIBOR USD + 6.90%, 6.90% Cap) | | | 4.41% | I/F I/O | | 07/25/2035 | | | 471,391 | |
| 374,396 | | GSR Mortgage Loan Trust, Series 2005-6F-4A1 (1 Month LIBOR USD + 0.50%, 0.50% Floor, 6.00% Cap) | | | 2.99% | | | 07/25/2035 | | | 351,533 | |
| 279,049 | | GSR Mortgage Loan Trust, Series 2005-7F-3A1 (1 Month LIBOR USD + 0.50%, 0.50% Floor, 6.00% Cap) | | | 2.99% | | | 09/25/2035 | | | 269,560 | |
| 9,900,555 | | GSR Mortgage Loan Trust, Series 2005-8F-3A5 | | | 6.00% | | | 11/25/2035 | | | 7,513,597 | |
| 3,116,180 | | GSR Mortgage Loan Trust, Series 2005-8F-4A1 | | | 6.00% | | | 11/25/2035 | | | 2,542,455 | |
| 844,609 | | GSR Mortgage Loan Trust, Series 2006-1F-1A2 | | | 5.50% | | | 02/25/2036 | | | 972,799 | |
| 737,600 | | GSR Mortgage Loan Trust, Series 2006-2F-2A3 | | | 5.75% | | | 02/25/2036 | | | 704,274 | |
| 2,734,781 | | GSR Mortgage Loan Trust, Series 2006-2F-3A3 | | | 6.00% | | | 02/25/2036 | | | 2,195,488 | |
| 3,284,451 | | GSR Mortgage Loan Trust, Series 2006-2F-3A6 | | | 6.00% | | | 02/25/2036 | | | 2,696,939 | |
| 27,494,301 | | GSR Mortgage Loan Trust, Series 2006-5F-3A1 | | | 6.50% | | | 06/25/2036 | | | 22,335,939 | |
| 10,098,916 | | GSR Mortgage Loan Trust, Series 2006-6F-2A3 | | | 6.00% | | | 07/25/2036 | | | 8,620,870 | |
| 5,270,901 | | GSR Mortgage Loan Trust, Series 2006-7F-3A4 | | | 6.25% | | | 08/25/2036 | | | 3,191,323 | |
| 2,319,337 | | GSR Mortgage Loan Trust, Series 2006-9F-2A1 | | | 6.00% | | | 10/25/2036 | | | 2,203,650 | |
| 16,983,505 | | GSR Mortgage Loan Trust, Series 2006-9F-4A1 | | | 6.50% | | | 10/25/2036 | | | 13,767,894 | |
| 7,813 | | GSR Mortgage Loan Trust, Series 2006-9F-8A1 | | | 5.50% | | | 08/25/2021 | | | 7,507 | |
| 1,128,804 | | GSR Mortgage Loan Trust, Series 2007-1F-2A2 | | | 5.50% | | | 01/25/2037 | | | 1,322,039 | |
| 1,676,950 | | GSR Mortgage Loan Trust, Series 2007-4F-1A1 | | | 5.00% | | | 07/25/2037 | | | 1,977,650 | |
| 23,484,060 | | GSR Mortgage Loan Trust, Series 2007-4F-3A11 | | | 6.00% | | | 07/25/2037 | | | 20,814,629 | |
| 1,256,287 | | HarborView Mortgage Loan Trust, Series 2005-14-3A1A | | | 4.87% | # | | 12/19/2035 | | | 1,243,977 | |
| 58,871,027 | | HarborView Mortgage Loan Trust, Series 2005-8-2A1A (12 Month US Treasury Average + 1.55%, 1.55% Floor) | | | 3.95% | | | 09/19/2035 | | | 45,315,119 | |
| 6,939,199 | | HarborView Mortgage Loan Trust, Series 2006-10-2A1A (1 Month LIBOR USD + 0.18%, 0.18% Floor) | | | 2.66% | | | 11/19/2036 | | | 6,833,726 | |
| 13,632,569 | | HarborView Mortgage Loan Trust, Series 2006-11-A1A (1 Month LIBOR USD + 0.17%, 0.17% Floor) | | | 2.65% | | | 12/19/2036 | | | 12,512,328 | |
| 61,132,829 | | HarborView Mortgage Loan Trust, Series 2006-14-1A1A (1 Month LIBOR USD + 0.18%, 0.18% Floor) | | | 2.66% | | | 01/25/2047 | | | 56,896,311 | |
| 91,803,249 | | HarborView Mortgage Loan Trust, Series 2006-8-1A1 (1 Month LIBOR USD + 0.20%) | | | 2.69% | | | 07/21/2036 | | | 69,356,694 | |
| 20,039,919 | | HarborView Mortgage Loan Trust, Series 2006-BU1-1A1A (1 Month LIBOR USD + 0.21%, 0.21% Floor, 10.50% Cap) | | | 2.69% | | | 02/19/2046 | | | 18,274,805 | |
| 56,853,763 | | HarborView Mortgage Loan Trust, Series 2007-3-1A1A (1 Month LIBOR USD + 0.20%) | | | 2.68% | | | 05/19/2047 | | | 54,557,166 | |
| 17,177,920 | | HarborView Mortgage Loan Trust, Series 2007-4-1A1 (1 Month LIBOR USD + 0.22%, 10.00% Cap) | | | 2.70% | | | 07/19/2047 | | | 16,469,070 | |
| 26,825,019 | | HarborView Mortgage Loan Trust, Series 2007-7-1A1 (1 Month LIBOR USD + 1.00%, 10.50% Cap) | | | 3.49% | | | 10/25/2037 | | | 25,173,907 | |
| 1,094,832 | | Home Equity Asset Trust, Series 2003-3-M1 (1 Month LIBOR USD + 1.29%, 0.86% Floor) | | | 3.78% | | | 08/25/2033 | | | 1,093,846 | |
| 1,128,906 | | Home Equity Asset Trust, Series 2004-7-M2 (1 Month LIBOR USD + 0.99%, 0.66% Floor) | | | 3.48% | | | 01/25/2035 | | | 1,125,048 | |
| 12,182,000 | | Home Equity Loan Trust, Series 2006-B-2A4 (1 Month LIBOR USD + 0.28%, 0.28% Floor) | | | 2.77% | | | 06/25/2036 | | | 11,207,375 | |
| 5,719,759 | | Home Equity Loan Trust, Series 2007-FRE1-2AV2 (1 Month LIBOR USD + 0.16%, 0.16% Floor) | | | 2.65% | | | 04/25/2037 | | | 5,695,135 | |
| 10,354,097 | | Home Equity Mortgage Loan Asset Backed Trust, Series 2006-D-2A4 (1 Month LIBOR USD + 0.24%, 0.24% Floor) | | | 2.73% | | | 11/25/2036 | | | 8,462,759 | |
| 1,095,376 | | HomeBanc Mortgage Trust, Series 2005-1-M2 (1 Month LIBOR USD + 0.49%, 0.49% Floor, 11.50% Cap) | | | 2.98% | | | 03/25/2035 | | | 916,659 | |
| 10,672,810 | | HomeBanc Mortgage Trust, Series 2005-3-A1 (1 Month LIBOR USD + 0.24%, 0.24% Floor, 11.50% Cap) | | | 2.73% | | | 07/25/2035 | | | 10,604,601 | |
| 27,319,726 | | HSI Asset Loan Obligation Trust, Series 2007-2-3A6 | | | 6.00% | | | 09/25/2037 | | | 18,043,982 | |
| 1,768,746 | | HSI Asset Loan Obligation Trust, Series 2007-AR1-3A1 | | | 4.68% | # | | 01/25/2037 | | | 1,649,807 | |
| 17,354,403 | | HSI Asset Loan Obligation Trust, Series 2007-WF1-A3 | | | 4.95% | ß | | 12/25/2036 | | | 9,336,009 | |
| 15,766,171 | | Impac Secured Assets Trust, Series 2007-1-A2 (1 Month LIBOR USD + 0.16%, 0.16% Floor, 11.50% Cap) | | | 2.65% | | | 03/25/2037 | | | 14,656,195 | |
| 587,669 | | Impac Trust, Series 2002-9F-A1 | | | 5.22% | | | 12/25/2032 | | | 594,280 | |
| 5,874,684 | | IndyMac IMSC Mortgage Loan Trust, Series 2007-HOA1-A11 (1 Month LIBOR USD + 0.18%, 0.18% Floor) | | | 2.67% | | | 07/25/2047 | | | 4,936,407 | |
| 1,685,343 | | IndyMac Mortgage Loan Trust, Series 2006-AR2-1A1 | | | 4.04% | # | | 09/25/2036 | | | 1,521,198 | |
| 3,242,965 | | IndyMac Mortgage Loan Trust, Series 2006-AR2-4A1 | | | 4.23% | # | | 09/25/2036 | | | 3,145,901 | |
| 16,931,222 | | IndyMac Mortgage Loan Trust, Series 2006-AR3-1A1 | | | 4.35% | # | | 12/25/2036 | | | 16,099,889 | |
| 6,142,738 | | IndyMac Mortgage Loan Trust, Series 2006-AR7-3A1 | | | 4.06% | # | | 05/25/2036 | | | 5,406,280 | |
| 4,285,956 | | IndyMac Mortgage Loan Trust, Series 2007-A1-A1 | | | 6.00% | | | 08/25/2037 | | | 3,057,950 | |
| 3,137,655 | | IndyMac Mortgage Loan Trust, Series 2007-A1-A7 | | | 6.00% | | | 08/25/2037 | | | 2,238,658 | |
| 14,084,151 | | IndyMac Mortgage Loan Trust, Series 2007-A2-1A1 | | | 6.00% | | | 10/25/2037 | | | 13,009,716 | |
| 20,426,989 | | IndyMac Mortgage Loan Trust, Series 2007-A2-3A1 | | | 7.00% | | | 10/25/2037 | | | 11,496,916 | |
| 21,030,556 | | IndyMac Mortgage Loan Trust, Series 2007-A3-A1 | | | 6.25% | | | 11/25/2037 | | | 16,066,501 | |
| 7,433,784 | | IndyMac Mortgage Loan Trust, Series 2007-AR13-2A1 | | | 3.84% | # | | 07/25/2037 | | | 6,057,433 | |
| 5,773,558 | | IndyMac Mortgage Loan Trust, Series 2007-AR1-3A1 | | | 3.59% | # | | 03/25/2037 | | | 5,450,265 | |
| 4,403,809 | | IndyMac Mortgage Loan Trust, Series 2007-AR3-3A1 | | | 3.58% | # | | 07/25/2037 | | | 4,068,522 | |
| 32,253,111 | | IndyMac Mortgage Loan Trust, Series 2007-F1-2A1 | | | 6.50% | | | 06/25/2037 | | | 16,183,827 | |
| 437,866 | | IndyMac Mortgage Loan Trust, Series 2007-F2-1A2 | | | 6.00% | | | 07/25/2037 | | | 423,748 | |
| 25,635,516 | | IndyMac Mortgage Loan Trust, Series 2007-F2-2A1 | | | 6.50% | | | 07/25/2037 | | | 15,252,455 | |
| 4,592,793 | | Jefferies Resecuritization Trust, Series 2010-R4-1A4 | | | 6.00% | # ^ Þ | | 10/26/2036 | | | 4,564,378 | |
| 10,495,444 | | JP Morgan Alternative Loan Trust, Series 2005-S1-2A11 | | | 6.00% | | | 12/25/2035 | | | 9,789,403 | |
| 3,364,615 | | JP Morgan Alternative Loan Trust, Series 2005-S1-2A9 | | | 6.00% | | | 12/25/2035 | | | 3,138,274 | |
| 3,496,404 | | JP Morgan Alternative Loan Trust, Series 2006-S1-1A8 | | | 5.75% | | | 03/25/2036 | | | 2,911,965 | |
| 13,967,600 | | JP Morgan Alternative Loan Trust, Series 2006-S2-A4 | | | 6.19% | | | 05/25/2036 | | | 13,094,503 | |
| 193,664 | | JP Morgan Alternative Loan Trust, Series 2006-S4-A3A | | | 5.78% | ß | | 12/25/2036 | | | 193,527 | |
| 25,157,510 | | JP Morgan Alternative Loan Trust, Series 2006-S4-A4 | | | 5.96% | ß | | 12/25/2036 | | | 23,463,524 | |
| 9,896,709 | | JP Morgan Mortgage Acquisition Trust, Series 2006-CH2-AF3 | | | 5.46% | ß | | 09/25/2029 | | | 7,803,937 | |
| 17,588,605 | | JP Morgan Mortgage Acquisition Trust, Series 2006-HE3-A1 (1 Month LIBOR USD + 0.14%, 0.14% Floor) | | | 2.63% | | | 11/25/2036 | | | 15,866,962 | |
| 3,885,223 | | JP Morgan Mortgage Acquisition Trust, Series 2006-WF1-A5 | | | 6.41% | ß | | 07/25/2036 | | | 1,891,523 | |
| 23,000,000 | | JP Morgan Mortgage Acquisition Trust, Series 2007-CH1-AF5 | | | 4.90% | ß | | 11/25/2036 | | | 23,260,125 | |
| 9,690,000 | | JP Morgan Mortgage Acquisition Trust, Series 2007-CH3-M2 (1 Month LIBOR USD + 0.32%, 0.32% Floor) | | | 2.81% | | | 03/25/2037 | | | 8,149,036 | |
| 1,116,541 | | JP Morgan Mortgage Trust, Series 2005-A6-5A1 | | | 4.32% | # | | 08/25/2035 | | | 1,117,475 | |
| 7,183,542 | | JP Morgan Mortgage Trust, Series 2005-S1-1A2 | | | 6.50% | | | 01/25/2035 | | | 7,929,131 | |
| 774,027 | | JP Morgan Mortgage Trust, Series 2005-S2-2A13 | | | 5.50% | | | 09/25/2035 | | | 748,282 | |
| 1,405,088 | | JP Morgan Mortgage Trust, Series 2006-S2-3A3 | | | 6.00% | | | 07/25/2036 | | | 1,000,047 | |
| 4,750,019 | | JP Morgan Mortgage Trust, Series 2006-S2-3A5 | | | 6.25% | | | 07/25/2036 | | | 3,621,091 | |
| 3,304,117 | | JP Morgan Mortgage Trust, Series 2006-S3-1A2 | | | 6.00% | | | 08/25/2036 | | | 2,684,813 | |
| 9,027,380 | | JP Morgan Mortgage Trust, Series 2006-S3-1A21 (1 Month LIBOR USD + 0.38%, 0.38% Floor, 7.50% Cap) | | | 2.87% | | | 08/25/2036 | | | 3,438,355 | |
| 9,027,380 | | JP Morgan Mortgage Trust, Series 2006-S3-1A22 (-1 x 1 Month LIBOR USD + 7.12%, 7.12% Cap) | | | 4.63% | I/F I/O | | 08/25/2036 | | | 2,783,120 | |
| 1,539,623 | | JP Morgan Mortgage Trust, Series 2006-S3-1A9 | | | 6.00% | | | 08/25/2036 | | | 1,251,045 | |
| 7,532,008 | | JP Morgan Mortgage Trust, Series 2006-S4-A8 (1 Month LIBOR USD + 0.38%, 0.38% Floor, 7.00% Cap) | | | 2.87% | | | 01/25/2037 | | | 4,067,010 | |
| 7,532,008 | | JP Morgan Mortgage Trust, Series 2006-S4-A9 (-1 x 1 Month LIBOR USD + 6.62%, 6.62% Cap) | | | 4.13% | I/F I/O | | 01/25/2037 | | | 1,779,210 | |
| 1,767,971 | | JP Morgan Mortgage Trust, Series 2007-A2-2A1 | | | 4.49% | # | | 04/25/2037 | | | 1,682,904 | |
| 9,581,425 | | JP Morgan Mortgage Trust, Series 2007-S1-2A6 | | | 6.00% | | | 03/25/2037 | | | 6,963,887 | |
| 3,252,778 | | JP Morgan Mortgage Trust, Series 2007-S3-1A1 | | | 5.50% | | | 08/25/2037 | | | 2,538,510 | |
| 6,418,264 | | JP Morgan Mortgage Trust, Series 2007-S3-1A35 | | | 6.00% | | | 08/25/2037 | | | 5,104,906 | |
| 1,081,702 | | JP Morgan Mortgage Trust, Series 2007-S3-1A9 | | | 6.00% | | | 08/25/2037 | | | 860,168 | |
| 5,917,949 | | JP Morgan Mortgage Trust, Series 2007-S3-1A96 | | | 6.00% | | | 08/25/2037 | | | 4,705,945 | |
| 6,744,721 | | JP Morgan Mortgage Trust, Series 2007-S3-1A97 | | | 6.00% | | | 08/25/2037 | | | 5,363,392 | |
| 671,204 | | JP Morgan Mortgage Trust, Series 2007-S3-2A2 | | | 5.50% | | | 08/25/2022 | | | 653,945 | |
| 42,117,476 | | JP Morgan Mortgage Trust, Series 2018-7FRB-A2 (1 Month LIBOR USD + 0.75%) | | | 3.24% | ^ | | 04/25/2046 | | | 42,152,577 | |
| 8,502,781 | | JP Morgan Resecuritization Trust, Series 2009-4-3A2 | | | 6.00% | ^ | | 02/26/2037 | | | 6,845,172 | |
| 16,706,960 | | JP Morgan Resecuritization Trust, Series 2009-7-7A1 | | | 7.00% | # ^ Þ | | 09/27/2037 | | | 12,171,744 | |
| 16,380,633 | | JP Morgan Resecuritization Trust, Series 2010-1-1A4 | | | 6.00% | ^ | | 02/26/2037 | | | 13,954,137 | |
| 11,323,525 | | JP Morgan Resecuritization Trust, Series 2010-2-3A9 | | | 6.00% | ^ | | 07/26/2036 | | | 11,461,367 | |
| 50,000,000 | | Legacy Mortgage Asset Trust, Series 2018-GS2-A1 | | | 3.75% | ^ § | | 01/25/2059 | | | 50,408,050 | |
| 56,391,185 | | Legacy Mortgage Asset Trust, Series 2018-GS3-A1 | | | 4.00% | ^ § | | 06/25/2058 | | | 56,365,759 | |
| 26,604,012 | | Legacy Mortgage Asset Trust, Series 2018-SL1-A | | | 4.00% | # ^ | | 02/25/2058 | | | 26,554,547 | |
| 55,237,277 | | Legacy Mortgage Asset Trust, Series 2019-GS1-A1 | | | 4.00% | ^ § | | 01/25/2059 | | | 55,696,884 | |
| 80,000,000 | | Legacy Mortgage Asset Trust, Series 2019-SL1-A | | | 4.00% | # ^ | | 12/28/2054 | | | 80,526,320 | |
| 2,820,985 | | Lehman Mortgage Trust, Series 2005-2-3A5 | | | 5.50% | | | 12/25/2035 | | | 2,403,127 | |
| 2,495,091 | | Lehman Mortgage Trust, Series 2005-2-5A5 | | | 5.75% | | | 12/25/2035 | | | 2,435,176 | |
| 3,749,323 | | Lehman Mortgage Trust, Series 2005-3-2A1 | | | 6.00% | | | 01/25/2036 | | | 3,737,118 | |
| 319,269 | | Lehman Mortgage Trust, Series 2005-3-2A3 | | | 5.50% | | | 01/25/2036 | | | 311,499 | |
| 1,714,774 | | Lehman Mortgage Trust, Series 2005-3-2A7 | | | 6.00% | | | 01/25/2036 | | | 1,708,407 | |
| 1,612,327 | | Lehman Mortgage Trust, Series 2006-1-1A1 (1 Month LIBOR USD + 0.75%, 0.75% Floor, 5.50% Cap) | | | 3.24% | | | 02/25/2036 | | | 1,193,078 | |
| 4,836,980 | | Lehman Mortgage Trust, Series 2006-1-1A2 (-1 x 1 Month LIBOR USD + 4.75%, 4.75% Cap) | | | 2.26% | I/F I/O | | 02/25/2036 | | | 683,983 | |
| 5,479,760 | | Lehman Mortgage Trust, Series 2006-1-3A1 (1 Month LIBOR USD + 0.75%, 0.75% Floor, 5.50% Cap) | | | 3.24% | | | 02/25/2036 | | | 4,689,940 | |
| 5,479,760 | | Lehman Mortgage Trust, Series 2006-1-3A2 (-1 x 1 Month LIBOR USD + 4.75%, 4.75% Cap) | | | 2.26% | I/F I/O | | 02/25/2036 | | | 445,343 | |
| 3,530,563 | | Lehman Mortgage Trust, Series 2006-1-3A4 | | | 5.50% | | | 02/25/2036 | | | 3,366,232 | |
| 3,375,299 | | Lehman Mortgage Trust, Series 2006-4-1A3 (-1 x 1 Month LIBOR USD + 5.40%, 5.40% Cap) | | | 2.91% | I/F I/O | | 08/25/2036 | | | 478,927 | |
| 2,145,267 | | Lehman Mortgage Trust, Series 2006-4-1A4 | | | 6.00% | | | 08/25/2036 | | | 2,040,621 | |
| 6,640,867 | | Lehman Mortgage Trust, Series 2006-5-2A1 (1 Month LIBOR USD + 0.35%, 0.35% Floor, 7.50% Cap) | | | 2.84% | | | 09/25/2036 | | | 2,441,856 | |
| 13,832,854 | | Lehman Mortgage Trust, Series 2006-5-2A2 (-1 x 1 Month LIBOR USD + 7.15%, 7.15% Cap) | | | 4.66% | I/F I/O | | 09/25/2036 | | | 3,513,985 | |
| 9,841,163 | | Lehman Mortgage Trust, Series 2006-6-3A9 | | | 5.50% | | | 10/25/2036 | | | 8,621,856 | |
| 2,816,513 | | Lehman Mortgage Trust, Series 2006-6-4A5 | | | 6.00% | | | 12/25/2036 | | | 2,657,804 | |
| 3,582,016 | | Lehman Mortgage Trust, Series 2006-7-2A2 (1 Month LIBOR USD + 0.45%, 0.45% Floor, 7.00% Cap) | | | 2.94% | | | 11/25/2036 | | | 1,454,378 | |
| 12,521,936 | | Lehman Mortgage Trust, Series 2006-7-2A5 (-1 x 1 Month LIBOR USD + 6.55%, 6.55% Cap) | | | 4.06% | I/F I/O | | 11/25/2036 | | | 4,026,333 | |
| 2,723,644 | | Lehman Mortgage Trust, Series 2006-9-1A19 (-5 x 1 Month LIBOR USD + 30.68%, 30.68% Cap) | | | 19.25% | I/F | | 01/25/2037 | | | 3,864,030 | |
| 2,990,203 | | Lehman Mortgage Trust, Series 2006-9-1A5 (1 Month LIBOR USD + 0.60%, 0.60% Floor, 5.75% Cap) | | | 3.09% | | | 01/25/2037 | | | 2,219,566 | |
| 8,912,567 | | Lehman Mortgage Trust, Series 2006-9-1A6 (-1 x 1 Month LIBOR USD + 5.15%, 5.15% Cap) | | | 2.66% | I/F I/O | | 01/25/2037 | | | 1,101,646 | |
| 4,309,841 | | Lehman Mortgage Trust, Series 2006-9-2A1 (1 Month LIBOR USD + 0.38%, 0.38% Floor, 7.00% Cap) | | | 2.87% | | | 01/25/2037 | | | 1,717,930 | |
| 8,068,732 | | Lehman Mortgage Trust, Series 2006-9-2A2 (-1 x 1 Month LIBOR USD + 6.62%, 6.62% Cap) | | | 4.13% | I/F I/O | | 01/25/2037 | | | 2,058,920 | |
| 7,967,666 | | Lehman Mortgage Trust, Series 2007-10-2A1 | | | 6.50% | | | 01/25/2038 | | | 5,247,184 | |
| 2,566,650 | | Lehman Mortgage Trust, Series 2007-2-1A1 | | | 5.75% | | | 02/25/2037 | | | 2,281,462 | |
| 2,769,629 | | Lehman Mortgage Trust, Series 2007-4-2A11 (1 Month LIBOR USD + 0.33%, 0.33% Floor, 7.00% Cap) | | | 2.82% | | | 05/25/2037 | | | 1,234,524 | |
| 12,843,796 | | Lehman Mortgage Trust, Series 2007-4-2A8 (-1 x 1 Month LIBOR USD + 6.67%, 6.67% Cap) | | | 4.18% | I/F I/O | | 05/25/2037 | | | 3,452,068 | |
| 1,091,486 | | Lehman Mortgage Trust, Series 2007-4-2A9 (1 Month LIBOR USD + 0.33%, 0.33% Floor, 7.00% Cap) | | | 2.82% | | | 05/25/2037 | | | 507,079 | |
| 11,580,854 | | Lehman Mortgage Trust, Series 2007-5-11A1 | | | 5.19% | # | | 06/25/2037 | | | 9,032,437 | |
| 1,491,875 | | Lehman Mortgage Trust, Series 2007-5-3A4 | | | 5.00% | | | 12/25/2035 | | | 1,366,641 | |
| 1,290,509 | | Lehman Mortgage Trust, Series 2007-5-4A3 (-6 x 1 Month LIBOR USD + 40.08%, 40.08% Cap) | | | 25.17% | I/F | | 08/25/2036 | | | 2,331,852 | |
| 884,896 | | Lehman Mortgage Trust, Series 2007-5-7A3 | | | 7.50% | | | 10/25/2036 | | | 680,371 | |
| 335,769 | | Lehman Mortgage Trust, Series 2007-6-1A8 | | | 6.00% | | | 07/25/2037 | | | 315,016 | |
| 7,968,269 | | Lehman Mortgage Trust, Series 2007-9-2A2 | | | 6.50% | | | 10/25/2037 | | | 5,114,997 | |
| 4,978,679 | | Lehman Mortgage Trust, Series 2008-2-1A6 | | | 6.00% | | | 03/25/2038 | | | 3,472,731 | |
| 397,205 | | Lehman Trust, Series 2005-10-2A3B | | | 5.33% | ß | | 01/25/2036 | | | 455,832 | |
| 7,705,457 | | Lehman Trust, Series 2005-4-2A3A | | | 5.00% | ß | | 10/25/2035 | | | 7,919,592 | |
| 13,302,040 | | Lehman Trust, Series 2005-9N-2A1 (12 Month US Treasury Average + 1.06%, 1.06% Floor) | | | 3.46% | | | 02/25/2036 | | | 12,435,053 | |
| 8,524,367 | | Lehman Trust, Series 2006-17-1A2 (1 Month LIBOR USD + 0.17%, 0.17% Floor) | | | 2.66% | | | 08/25/2046 | | | 8,661,649 | |
| 13,442,873 | | Lehman Trust, Series 2006-5-1A1A (1 Month LIBOR USD + 0.21%, 0.21% Floor) | | | 2.70% | | | 04/25/2036 | | | 12,479,203 | |
| 433,448 | | Lehman Trust, Series 2006-5-2A4A | | | 5.89% | | | 04/25/2036 | | | 423,025 | |
| 14,484,994 | | Lehman Trust, Series 2006-GP3-1A1 (1 Month LIBOR USD + 0.20%, 0.20% Floor) | | | 2.69% | | | 06/25/2046 | | | 14,186,386 | |
| 13,752,592 | | Lehman Trust, Series 2007-1-2A1 | | | 7.00% | # | | 02/25/2037 | | | 12,340,437 | |
| 21,640,961 | | Lehman Trust, Series 2007-12N-1A3A (1 Month LIBOR USD + 0.20%, 0.20% Floor) | | | 2.69% | | | 07/25/2047 | | | 20,611,364 | |
| 672,953 | | Long Beach Mortgage Loan Trust, Series 2006-WL1-2A3 (1 Month LIBOR USD + 0.48%, 0.24% Floor) | | | 2.97% | | | 01/25/2046 | | | 674,714 | |
| 6,844,363 | | Luminent Mortgage Trust, Series 2005-1-A1 (1 Month LIBOR USD + 0.26%, 0.26% Floor, 11.50% Cap) | | | 2.75% | | | 11/25/2035 | | | 6,699,049 | |
| 3,759,090 | | MASTR Adjustable Rate Mortgages Trust, Series 2005-2-2A1 | | | 4.14% | # | | 03/25/2035 | | | 2,998,441 | |
| 1,739,213 | | MASTR Adjustable Rate Mortgages Trust, Series 2005-6-5A1 | | | 3.37% | # | | 07/25/2035 | | | 1,650,327 | |
| 12,174,685 | | MASTR Adjustable Rate Mortgages Trust, Series 2007-1-2A1 | | | 4.32% | # | | 11/25/2036 | | | 13,109,864 | |
| 1,603,678 | | MASTR Alternative Loans Trust, Series 2005-2-3A1 | | | 6.00% | | | 03/25/2035 | | | 1,535,622 | |
| 334,980 | | MASTR Alternative Loans Trust, Series 2005-5-2A3 | | | 5.50% | | | 07/25/2025 | | | 337,188 | |
| 3,207,621 | | MASTR Alternative Loans Trust, Series 2005-6-1A5 | | | 5.50% | | | 12/25/2035 | | | 3,033,730 | |
| 2,046,053 | | MASTR Alternative Loans Trust, Series 2006-3-1A2 | | | 6.25% | | | 07/25/2036 | | | 1,739,701 | |
| 3,534,647 | | MASTR Alternative Loans Trust, Series 2007-1-1A5 | | | 5.75% | | | 10/25/2036 | | | 3,380,623 | |
| 5,094,586 | | MASTR Alternative Loans Trust, Series 2007-1-2A7 | | | 6.00% | | | 10/25/2036 | | | 3,169,249 | |
| 4,566,789 | | MASTR Asset Backed Securities Trust, Series 2003-OPT1-M3 (1 Month LIBOR USD + 4.13%, 2.75% Floor) | | | 6.61% | | | 12/25/2032 | | | 4,693,556 | |
| 11,667,548 | | MASTR Asset Backed Securities Trust, Series 2006-AM2-A3 (1 Month LIBOR USD + 0.17%, 0.17% Floor) | | | 2.66% | | | 06/25/2036 | | | 10,407,824 | |
| 25,424,253 | | MASTR Asset Backed Securities Trust, Series 2007-HE1-A3 (1 Month LIBOR USD + 0.21%, 0.21% Floor) | | | 2.70% | | | 05/25/2037 | | | 24,258,622 | |
| 3,971,932 | | MASTR Asset Securitization Trust, Series 2006-1-1A4 | | | 5.75% | | | 05/25/2036 | | | 3,695,436 | |
| 2,757,381 | | MASTR Asset Securitization Trust, Series 2006-2-1A11 (1 Month LIBOR USD + 6.00%, 6.00% Floor) | | | 6.00% | | | 06/25/2036 | | | 2,637,811 | |
| 3,285,732 | | MASTR Asset Securitization Trust, Series 2007-1-1A3 | | | 6.25% | | | 11/25/2037 | | | 2,496,311 | |
| 24,905,394 | | MASTR Resecuritization Trust, Series 2008-1-A1 | | | 6.00% | # ^ | | 09/27/2037 | | | 23,558,595 | |
| 14,608,877 | | MASTR Resecuritization Trust, Series 2008-4-A1 | | | 6.00% | # ^ | | 06/27/2036 | | | 12,944,329 | |
| 2,230,123 | | MASTR Seasoned Securitization Trust, Series 2005-2-1A4 | | | 6.00% | D | | 10/25/2032 | | | 2,296,138 | |
| 1,024,145 | | MASTR Seasoned Securitization Trust, Series 2005-2-2A1 (1 Month LIBOR USD + 0.40%, 0.40% Floor, 7.50% Cap) | | | 2.89% | | | 10/25/2032 | | | 961,714 | |
| 19,113,747 | | Merrill Lynch Alternative Note Asset Trust, Series 2007-F1-2A4 (1 Month LIBOR USD + 0.32%, 0.32% Floor, 7.00% Cap) | | | 2.81% | | | 03/25/2037 | | | 9,263,181 | |
| 19,113,747 | | Merrill Lynch Alternative Note Asset Trust, Series 2007-F1-2A5 (-1 x 1 Month LIBOR USD + 6.68%, 6.68% Cap) | | | 4.19% | I/F I/O | | 03/25/2037 | | | 4,896,730 | |
| 3,345,603 | | Merrill Lynch Mortgage Investors Trust, Series 2006-3-1A | | | 4.62% | # | | 10/25/2036 | | | 3,289,397 | |
| 1,633,861 | | Merrill Lynch Mortgage Investors Trust, Series 2006-F1-1A2 | | | 6.00% | | | 04/25/2036 | | | 1,362,301 | |
| 31,396,683 | | MFA LLC, Series 2017-NPL1-A1 | | | 3.35% | ^ § | | 11/25/2047 | | | 31,442,535 | |
| 60,341,237 | | MFA LLC, Series 2018-NPL1-A1 | | | 3.88% | ^ § | | 05/25/2048 | | | 59,939,189 | |
| 82,915,272 | | MFA LLC, Series 2018-NPL2-A1 | | | 4.16% | ^ § | | 07/25/2048 | | | 83,451,684 | |
| 34,394,162 | | Morgan Stanley Home Equity Loan Trust, Series 2007-1-A4 (1 Month LIBOR USD + 0.22%, 0.22% Floor) | | | 2.71% | | | 12/25/2036 | | | 20,075,993 | |
| 1,306,439 | | Morgan Stanley Mortgage Loan Trust, Series 2005-10-1A1 (1 Month LIBOR USD + 0.70%, 0.70% Floor, 5.75% Cap) | | | 3.19% | | | 12/25/2035 | | | 994,572 | |
| 3,273,231 | | Morgan Stanley Mortgage Loan Trust, Series 2005-10-1A6 | | | 5.75% | | | 12/25/2035 | | | 3,050,974 | |
| 4,248,006 | | Morgan Stanley Mortgage Loan Trust, Series 2005-10-2A1 | | | 5.45% | # | | 12/25/2035 | | | 4,211,221 | |
| 106,897 | | Morgan Stanley Mortgage Loan Trust, Series 2005-6AR-1A1 (1 Month LIBOR USD + 0.28%, 0.28% Floor) | | | 2.77% | | | 11/25/2035 | | | 107,290 | |
| 5,517,134 | | Morgan Stanley Mortgage Loan Trust, Series 2006-11-1A6 | | | 6.23% | ß | | 08/25/2036 | | | 2,076,173 | |
| 10,343,297 | | Morgan Stanley Mortgage Loan Trust, Series 2006-11-2A1 | | | 6.00% | | | 08/25/2036 | | | 8,193,388 | |
| 6,747,523 | | Morgan Stanley Mortgage Loan Trust, Series 2006-17XS-A3A | | | 5.65% | ß | | 10/25/2046 | | | 3,262,601 | |
| 2,203,224 | | Morgan Stanley Mortgage Loan Trust, Series 2006-17XS-A6 | | | 5.58% | ß | | 10/25/2046 | | | 925,863 | |
| 4,639,571 | | Morgan Stanley Mortgage Loan Trust, Series 2006-2-2A3 | | | 5.75% | | | 02/25/2036 | | | 4,640,108 | |
| 26,630,508 | | Morgan Stanley Mortgage Loan Trust, Series 2006-7-3A | | | 5.02% | # | | 06/25/2036 | | | 22,798,983 | |
| 2,563,222 | | Morgan Stanley Mortgage Loan Trust, Series 2006-7-4A4 | | | 6.00% | | | 06/25/2036 | | | 2,160,377 | |
| 2,594,819 | | Morgan Stanley Mortgage Loan Trust, Series 2006-7-4A7 | | | 6.00% | | | 06/25/2036 | | | 2,187,009 | |
| 3,544,413 | | Morgan Stanley Mortgage Loan Trust, Series 2007-13-6A1 | | | 6.00% | | | 10/25/2037 | | | 2,866,210 | |
| 9,030,761 | | Morgan Stanley Mortgage Loan Trust, Series 2007-14AR-2A3 | | | 4.53% | # | | 10/25/2037 | | | 7,983,152 | |
| 3,653,984 | | Morgan Stanley Mortgage Loan Trust, Series 2007-1XS-2A3 | | | 5.92% | ß | | 09/25/2046 | | | 1,531,454 | |
| 2,573,873 | | Morgan Stanley Mortgage Loan Trust, Series 2007-1XS-2A4A | | | 6.08% | ß | | 09/25/2046 | | | 1,247,954 | |
| 891,669 | | Morgan Stanley Mortgage Loan Trust, Series 2007-3XS-1A2A | | | 5.62% | ß | | 01/25/2047 | | | 816,167 | |
| 7,033,278 | | Morgan Stanley Mortgage Loan Trust, Series 2007-3XS-2A3S | | | 5.86% | ß | | 01/25/2047 | | | 3,850,564 | |
| 4,113,804 | | Morgan Stanley Mortgage Loan Trust, Series 2007-3XS-2A4S | | | 5.96% | ß | | 01/25/2047 | | | 2,251,880 | |
| 24,921,026 | | Morgan Stanley Re-Remic Trust, Series 2010-R9-3C | | | 6.00% | # ^ | | 11/26/2036 | | | 25,180,155 | |
| 3,533,150 | | Morgan Stanley Re-Remic Trust, Series 2011-R1-1A | | | 5.94% | # ^ Þ | | 02/26/2037 | | | 3,775,076 | |
| 13,650,095 | | New Century Alternative Mortgage Loan Trust, Series 2006-ALT1-AF3 | | | 6.17% | # | | 07/25/2036 | | | 6,673,642 | |
| 33,589,250 | | New Century Home Equity Loan Trust, Series 2005-2-M3 (1 Month LIBOR USD + 0.74%, 0.49% Floor) | | | 3.22% | | | 06/25/2035 | | | 33,687,364 | |
| 12,500,000 | | New Century Home Equity Loan Trust, Series 2006-1-A2C (1 Month LIBOR USD + 0.28%, 0.28% Floor, 12.50% Cap) | | | 2.77% | | | 05/25/2036 | | | 10,531,119 | |
| 10,690,494 | | New Residential Mortgage Loan Trust, Series 2014-2A-A3 | | | 3.75% | # ^ | | 05/25/2054 | | | 10,800,125 | |
| 34,666,213 | | New Residential Mortgage Loan Trust, Series 2015-2A-A1 | | | 3.75% | # ^ | | 08/25/2055 | | | 35,158,050 | |
| 77,183,756 | | New Residential Mortgage Loan Trust, Series 2018-FNT1-A | | | 3.61% | ^ | | 05/25/2023 | | | 77,929,822 | |
| 34,876,138 | | New Residential Mortgage Loan Trust, Series 2018-FNT2-A | | | 3.79% | ^ | | 07/25/2054 | | | 35,192,126 | |
| 35,405,965 | | New Residential Mortgage Loan Trust, Series 2019-NQM1-A1 | | | 3.67% | # ^ | | 01/25/2049 | | | 35,680,609 | |
| 23,413,664 | | New Residential Mortgage Loan Trust, Series 2019-RPL1-A1 | | | 4.33% | ^ § | | 02/26/2024 | | | 23,664,912 | |
| 576,537 | | New York Mortgage Trust, Series 2005-2-A (1 Month LIBOR USD + 0.66%, 0.33% Floor, 10.50% Cap) | | | 3.15% | | | 08/25/2035 | | | 554,917 | |
| 201,148 | | Nomura Asset Acceptance Corporation, Series 2005-AP1-2A5 | | | 4.86% | | | 02/25/2035 | | | 203,620 | |
| 15,440,714 | | Nomura Asset Acceptance Corporation, Series 2006-AF1-1A2 | | | 6.16% | # | | 05/25/2036 | | | 5,690,218 | |
| 3,137,829 | | Nomura Asset Acceptance Corporation, Series 2006-AF1-1A3 | | | 6.41% | # | | 05/25/2036 | | | 1,155,742 | |
| 18,018,099 | | Nomura Asset Acceptance Corporation, Series 2006-AP1-A2 | | | 5.52% | # | | 01/25/2036 | | | 9,273,521 | |
| 3,045,438 | | Nomura Asset Acceptance Corporation, Series 2006-AP1-A3 | | | 5.65% | # | | 01/25/2036 | | | 1,568,041 | |
| 1,508,435 | | Nomura Asset Acceptance Corporation, Series 2006-WF1-A2 | | | 5.76% | # | | 06/25/2036 | | | 730,107 | |
| 17,422,088 | | Nomura Home Equity Loan, Inc., Series 2006-AF1-A2 | | | 5.80% | ß | | 10/25/2036 | | | 6,792,907 | |
| 3,112,712 | | Nomura Home Equity Loan, Inc., Series 2007-1-1A1 | | | 6.06% | ß | | 02/25/2037 | | | 1,428,602 | |
| 15,514,473 | | Nomura Home Equity Loan, Inc., Series 2007-1-1A3 | | | 5.99% | ß | | 02/25/2037 | | | 7,121,286 | |
| 24,328,961 | | NRPL Trust, Series 2018-2A-A1 | | | 4.25% | # ^ | | 07/25/2067 | | | 24,395,778 | |
| 49,082,073 | | NRZ Excess Spread-Collateralized Notes, Series 2018-PLS2-A | | | 3.27% | ^ | | 02/25/2023 | | | 49,078,049 | |
| 37,167,676 | | Oak Hill Advisors Residential Loan Trust, Series 2017-NPL2-A1 | | | 3.00% | ^ § | | 07/25/2057 | | | 36,789,907 | |
| 59,456,547 | | OBX Trust, Series 2018-1-A2 (1 Month LIBOR USD + 0.65%) | | | 3.14% | ^ | | 06/25/2057 | | | 59,171,167 | |
| 934,175 | | Option One Mortgage Loan Trust, Series 2004-3-M3 (1 Month LIBOR USD + 0.98%, 0.65% Floor) | | | 3.46% | | | 11/25/2034 | | | 938,861 | |
| 8,134,148 | | Option One Mortgage Loan Trust, Series 2007-1-2A3 (1 Month LIBOR USD + 0.14%, 0.14% Floor) | | | 2.63% | | | 01/25/2037 | | | 5,141,873 | |
| 91,202,431 | | Option One Mortgage Loan Trust, Series 2007-6-1A1 (1 Month LIBOR USD + 0.19%, 0.19% Floor) | | | 2.68% | | | 07/25/2037 | | | 82,791,524 | |
| 13,000,000 | | Park Place Securities, Inc., Series 2005-WHQ4-M2 (1 Month LIBOR USD + 0.49%, 0.49% Floor) | | | 2.98% | | | 09/25/2035 | | | 12,968,888 | |
| 6,767,175 | | PHH Alternative Mortgage Trust, Series 2007-1-1A1 (1 Month LIBOR USD + 0.16%, 0.16% Floor, 10.10% Cap) | | | 2.65% | | | 02/25/2037 | | | 5,693,979 | |
| 18,369,214 | | PHH Alternative Mortgage Trust, Series 2007-2-2A1 | | | 6.00% | | | 05/25/2037 | | | 17,767,483 | |
| 8,571,374 | | PHH Alternative Mortgage Trust, Series 2007-2-2A2 | | | 6.00% | | | 05/25/2037 | | | 8,290,597 | |
| 631,895 | | PHH Alternative Mortgage Trust, Series 2007-2-3A1 | | | 6.00% | | | 05/25/2037 | | | 578,660 | |
| 210,600,552 | | PR Mortgage Loan Trust, Series 2014-1-APT | | | 5.91% | # ^ | | 10/25/2049 | | | 197,207,726 | |
| 24,177,005 | | Preston Ridge Partners Mortgage Trust, Series 2017-2A-A1 | | | 3.47% | ^ § | | 09/25/2022 | | | 24,202,848 | |
| 119,130,650 | | Pretium Mortgage Credit Partners LLC, Series 2018-NPL1-A1 | | | 3.38% | ^ § | | 01/27/2033 | | | 118,790,949 | |
| 56,074,053 | | Pretium Mortgage Credit Partners LLC, Series 2018-NPL2-A1 | | | 3.70% | ^ § | | 03/27/2033 | | | 56,016,247 | |
| 69,958,826 | | Pretium Mortgage Credit Partners LLC, Series 2018-NPL4-A1 | | | 4.83% | ^ § | | 09/25/2058 | | | 70,729,926 | |
| 35,298,000 | | Pretium Mortgage Credit Partners LLC, Series 2019-1A-A1 | | | 4.50% | ^ § | | 01/25/2024 | | | 35,668,508 | |
| 28,023,602 | | Pretium Mortgage Credit Partners LLC, Series 2019-NPL1-A1 | | | 4.21% | ^ § | | 07/25/2060 | | | 28,188,711 | |
| 9,908,377 | | Prime Mortgage Trust, Series 2006-DR1-2A1 | | | 5.50% | ^ | | 05/25/2035 | | | 8,073,684 | |
| 4,724,895 | | Prime Mortgage Trust, Series 2006-DR1-2A2 | | | 6.00% | ^ | | 05/25/2035 | | | 3,816,879 | |
| 42,042,147 | | PRPM LLC, Series 2017-3A-A1 | | | 3.47% | # ^ | | 11/25/2022 | | | 42,023,876 | |
| 46,465,006 | | PRPM LLC, Series 2018-2A-A1 | | | 4.00% | # ^ | | 08/25/2023 | | | 46,685,353 | |
| 107,400,333 | | PRPM LLC, Series 2018-3A-A1 | | | 4.48% | # ^ | | 10/25/2023 | | | 108,517,984 | |
| 43,790,838 | | RALI Trust, Series 2007-QA5-1A1 | | | 5.64% | # | | 09/25/2037 | | | 37,508,052 | |
| 47,357,499 | | RALI Trust, Series 2007-QS10-A1 | | | 6.50% | | | 09/25/2037 | | | 45,551,250 | |
| 23,635,591 | | RAMP Series Trust, Series 2006-RS3-A4 (1 Month LIBOR USD + 0.30%, 0.30% Floor, 14.00% Cap) | | | 2.79% | | | 05/25/2036 | | | 22,338,609 | |
| 25,634,062 | | RBSGC Structured Trust, Series 2008-B-A1 | | | 6.00% | ^ | | 06/25/2037 | | | 24,854,387 | |
| 4,918,564 | | RBSSP Resecuritization Trust, Series 2010-4-7A2 | | | 6.00% | ^ | | 07/26/2037 | | | 4,012,420 | |
| 22,481,811 | | RCO Trust, Series 2016-SFR1-A | | | 3.75% | # ^ | | 11/25/2051 | | | 22,609,238 | |
| 6,865,346 | | RCO Trust, Series 2016-SFR1-M1 | | | 4.50% | # ^ | | 11/25/2051 | | | 6,840,253 | |
| 1,171,032 | | Renaissance Home Equity Loan Trust, Series 2006-1-AF6 | | | 5.75% | ß | | 05/25/2036 | | | 792,233 | |
| 10,346,445 | | Renaissance Home Equity Loan Trust, Series 2006-4-AF4 | | | 5.47% | ß | | 01/25/2037 | | | 5,691,398 | |
| 20,374,256 | | Renaissance Home Equity Loan Trust, Series 2006-4-AF5 | | | 5.69% | ß | | 01/25/2037 | | | 11,636,459 | |
| 8,209,714 | | Renaissance Home Equity Loan Trust, Series 2007-1-AF1 | | | 5.74% | ß | | 04/25/2037 | | | 3,722,219 | |
| 5,791,867 | | Renaissance Home Equity Loan Trust, Series 2007-1-AF1Z | | | 5.35% | ß | | 04/25/2037 | | | 2,466,428 | |
| 3,494,084 | | Renaissance Home Equity Loan Trust, Series 2007-1-AF2 | | | 5.51% | ß | | 04/25/2037 | | | 1,521,106 | |
| 5,082,726 | | Renaissance Home Equity Loan Trust, Series 2007-1-AF3 | | | 5.61% | ß | | 04/25/2037 | | | 2,252,573 | |
| 8,249,791 | | Renaissance Home Equity Loan Trust, Series 2007-1-AF5 | | | 5.91% | ß | | 04/25/2037 | | | 3,848,760 | |
| 17,696,892 | | Renaissance Home Equity Loan Trust, Series 2007-2-AF2 | | | 5.68% | ß | | 06/25/2037 | | | 7,691,952 | |
| 9,571,061 | | Renaissance Home Equity Loan Trust, Series 2007-2-AF5 | | | 6.20% | ß | | 06/25/2037 | | | 4,588,738 | |
| 28,095,060 | | Residential Accredit Loans, Inc., Series 2005-QA11-4A1 | | | 4.74% | # | | 10/25/2035 | | | 23,751,452 | |
| 15,977,393 | | Residential Accredit Loans, Inc., Series 2005-QA13-2A1 | | | 4.83% | # | | 12/25/2035 | | | 14,511,841 | |
| 11,774,516 | | Residential Accredit Loans, Inc., Series 2005-QA3-CB1 | | | 4.56% | # | | 03/25/2035 | | | 7,296,621 | |
| 454,308 | | Residential Accredit Loans, Inc., Series 2005-QS12-A11 (-11 x 1 Month LIBOR USD + 51.15%, 51.15% Cap) | | | 23.81% | I/F | | 08/25/2035 | | | 772,904 | |
| 1,709,440 | | Residential Accredit Loans, Inc., Series 2005-QS13-1A6 | | | 5.50% | | | 09/25/2035 | | | 1,592,584 | |
| 3,547,117 | | Residential Accredit Loans, Inc., Series 2005-QS13-2A1 (1 Month LIBOR USD + 0.70%, 0.70% Floor, 5.75% Cap) | | | 3.19% | | | 09/25/2035 | | | 3,012,550 | |
| 14,543,178 | | Residential Accredit Loans, Inc., Series 2005-QS13-2A2 (-1 x 1 Month LIBOR USD + 5.05%, 5.05% Cap) | | | 2.56% | I/F I/O | | 09/25/2035 | | | 1,352,703 | |
| 7,305,707 | | Residential Accredit Loans, Inc., Series 2005-QS14-2A1 | | | 6.00% | | | 09/25/2035 | | | 4,792,337 | |
| 2,731,846 | | Residential Accredit Loans, Inc., Series 2005-QS15-2A | | | 6.00% | | | 10/25/2035 | | | 2,429,622 | |
| 3,392,223 | | Residential Accredit Loans, Inc., Series 2005-QS15-3A | | | 6.00% | | | 10/25/2035 | | | 3,278,271 | |
| 3,411,364 | | Residential Accredit Loans, Inc., Series 2005-QS16-A1 (1 Month LIBOR USD + 0.70%, 0.70% Floor, 5.50% Cap) | | | 3.19% | | | 11/25/2035 | | | 2,795,186 | |
| 3,410,774 | | Residential Accredit Loans, Inc., Series 2005-QS16-A2 (-1 x 1 Month LIBOR USD + 4.80%, 4.80% Cap) | | | 2.31% | I/F I/O | | 11/25/2035 | | | 306,350 | |
| 1,717,149 | | Residential Accredit Loans, Inc., Series 2005-QS17-A1 | | | 6.00% | | | 12/25/2035 | | | 1,662,370 | |
| 1,189,896 | | Residential Accredit Loans, Inc., Series 2005-QS17-A10 | | | 6.00% | | | 12/25/2035 | | | 1,151,937 | |
| 4,976,660 | | Residential Accredit Loans, Inc., Series 2005-QS17-A11 | | | 6.00% | | | 12/25/2035 | | | 4,817,899 | |
| 3,537,253 | | Residential Accredit Loans, Inc., Series 2005-QS17-A2 (1 Month LIBOR USD + 0.85%, 0.85% Floor, 6.00% Cap) | | | 3.34% | | | 12/25/2035 | | | 2,847,078 | |
| 3,537,253 | | Residential Accredit Loans, Inc., Series 2005-QS17-A4 (-1 x 1 Month LIBOR USD + 5.15%, 5.15% Cap) | | | 2.66% | I/F I/O | | 12/25/2035 | | | 374,275 | |
| 2,846,183 | | Residential Accredit Loans, Inc., Series 2005-QS17-A6 | | | 6.00% | | | 12/25/2035 | | | 2,755,387 | |
| 1,424,027 | | Residential Accredit Loans, Inc., Series 2005-QS5-A3 | | | 5.70% | | | 04/25/2035 | | | 1,421,467 | |
| 1,132,049 | | Residential Accredit Loans, Inc., Series 2005-QS9-A1 (1 Month LIBOR USD + 0.50%, 0.50% Floor, 5.50% Cap) | | | 2.99% | | | 06/25/2035 | | | 964,577 | |
| 2,749,150 | | Residential Accredit Loans, Inc., Series 2005-QS9-A4 (-1 x 1 Month LIBOR USD + 5.00%, 5.00% Cap) | | | 2.51% | I/F I/O | | 06/25/2035 | | | 301,221 | |
| 1,419,167 | | Residential Accredit Loans, Inc., Series 2006-QS10-A4 | | | 5.75% | | | 08/25/2036 | | | 1,282,356 | |
| 9,277,354 | | Residential Accredit Loans, Inc., Series 2006-QS11-1A1 | | | 6.50% | | | 08/25/2036 | | | 8,460,556 | |
| 1,742,740 | | Residential Accredit Loans, Inc., Series 2006-QS12-1A1 | | | 6.50% | | | 09/25/2036 | | | 1,265,867 | |
| 3,824,503 | | Residential Accredit Loans, Inc., Series 2006-QS12-2A18 | | | 5.75% | | | 09/25/2036 | | | 3,571,773 | |
| 5,710,893 | | Residential Accredit Loans, Inc., Series 2006-QS14-A18 | | | 6.25% | | | 11/25/2036 | | | 5,091,079 | |
| 2,642,843 | | Residential Accredit Loans, Inc., Series 2006-QS15-A1 | | | 6.50% | | | 10/25/2036 | | | 2,479,999 | |
| 1,214,536 | | Residential Accredit Loans, Inc., Series 2006-QS16-A10 | | | 6.00% | | | 11/25/2036 | | | 1,090,919 | |
| 4,318,697 | | Residential Accredit Loans, Inc., Series 2006-QS16-A11 | | | 6.00% | | | 11/25/2036 | | | 3,879,136 | |
| 1,260,676 | | Residential Accredit Loans, Inc., Series 2006-QS16-A7 | | | 6.00% | | | 11/25/2036 | | | 1,132,363 | |
| 1,362,309 | | Residential Accredit Loans, Inc., Series 2006-QS16-A8 | | | 6.00% | | | 11/25/2036 | | | 1,223,652 | |
| 539,091 | | Residential Accredit Loans, Inc., Series 2006-QS16-A9 | | | 6.00% | | | 11/25/2036 | | | 484,222 | |
| 2,490,420 | | Residential Accredit Loans, Inc., Series 2006-QS17-A4 | | | 6.00% | | | 12/25/2036 | | | 2,294,944 | |
| 13,835,696 | | Residential Accredit Loans, Inc., Series 2006-QS17-A5 | | | 6.00% | | | 12/25/2036 | | | 12,749,717 | |
| 1,476,304 | | Residential Accredit Loans, Inc., Series 2006-QS1-A6 (-8 x 1 Month LIBOR USD + 42.86%, 42.86% Cap) | | | 23.80% | I/F | | 01/25/2036 | | | 2,439,962 | |
| 9,554,221 | | Residential Accredit Loans, Inc., Series 2006-QS3-1A11 | | | 6.00% | | | 03/25/2036 | | | 9,077,936 | |
| 2,215,782 | | Residential Accredit Loans, Inc., Series 2006-QS4-A8 (-790 x 1 Month LIBOR USD + 5143.00%, 0.10% Floor, 8.00% Cap) | | | 8.00% | I/F | | 04/25/2036 | | | 2,176,245 | |
| 6,147,942 | | Residential Accredit Loans, Inc., Series 2006-QS5-A3 | | | 6.00% | | | 05/25/2036 | | | 5,657,092 | |
| 18,323,179 | | Residential Accredit Loans, Inc., Series 2006-QS5-A4 | | | 6.00% | | | 05/25/2036 | | | 16,860,264 | |
| 2,388,039 | | Residential Accredit Loans, Inc., Series 2006-QS6-1A16 | | | 6.00% | | | 06/25/2036 | | | 2,177,682 | |
| 3,927,827 | | Residential Accredit Loans, Inc., Series 2006-QS6-1A2 | | | 6.00% | | | 06/25/2036 | | | 3,581,834 | |
| 7,989,186 | | Residential Accredit Loans, Inc., Series 2006-QS8-A1 | | | 6.00% | | | 08/25/2036 | | | 7,292,147 | |
| 13,854,416 | | Residential Accredit Loans, Inc., Series 2006-QS8-A5 (-1 x 1 Month LIBOR USD + 5.55%, 5.55% Cap) | | | 3.06% | I/F I/O | | 08/25/2036 | | | 1,679,082 | |
| 5,185,386 | | Residential Accredit Loans, Inc., Series 2006-QS9-1A6 (-1 x 1 Month LIBOR USD + 5.30%, 5.30% Cap) | | | 2.81% | I/F I/O | | 07/25/2036 | | | 651,575 | |
| 31,556,995 | | Residential Accredit Loans, Inc., Series 2007-QH5-AII (1 Month LIBOR USD + 0.23%, 0.23% Floor) | | | 2.72% | | | 06/25/2037 | | | 17,670,718 | |
| 4,808,416 | | Residential Accredit Loans, Inc., Series 2007-QS11-A1 | | | 7.00% | | | 10/25/2037 | | | 4,218,177 | |
| 15,876,986 | | Residential Accredit Loans, Inc., Series 2007-QS1-1A2 (-1 x 1 Month LIBOR USD + 5.45%, 5.45% Cap) | | | 2.96% | I/F I/O | | 01/25/2037 | | | 1,691,456 | |
| 1,598,187 | | Residential Accredit Loans, Inc., Series 2007-QS1-1A4 | | | 6.00% | | | 01/25/2037 | | | 1,491,722 | |
| 3,954,391 | | Residential Accredit Loans, Inc., Series 2007-QS1-2A10 | | | 6.00% | | | 01/25/2037 | | | 3,537,096 | |
| 5,840,677 | | Residential Accredit Loans, Inc., Series 2007-QS2-A6 | | | 6.25% | | | 01/25/2037 | | | 5,316,383 | |
| 27,121,992 | | Residential Accredit Loans, Inc., Series 2007-QS3-A1 | | | 6.50% | | | 02/25/2037 | | | 25,189,146 | |
| 4,324,771 | | Residential Accredit Loans, Inc., Series 2007-QS3-A4 | | | 6.25% | | | 02/25/2037 | | | 3,959,456 | |
| 6,944,647 | | Residential Accredit Loans, Inc., Series 2007-QS4-3A3 | | | 6.00% | | | 03/25/2037 | | | 6,381,803 | |
| 3,102,619 | | Residential Accredit Loans, Inc., Series 2007-QS5-A1 | | | 5.50% | | | 03/25/2037 | | | 2,793,017 | |
| 1,279,957 | | Residential Accredit Loans, Inc., Series 2007-QS5-A5 (1 Month LIBOR USD + 0.30%, 0.30% Floor, 7.00% Cap) | | | 2.79% | | | 03/25/2037 | | | 963,888 | |
| 4,251,029 | | Residential Accredit Loans, Inc., Series 2007-QS5-A8 (-1 x 1 Month LIBOR USD + 6.70%, 6.70% Cap) | | | 4.21% | I/F I/O | | 03/25/2037 | | | 689,433 | |
| 3,356,175 | | Residential Accredit Loans, Inc., Series 2007-QS6-A102 | | | 5.75% | | | 04/25/2037 | | | 3,098,565 | |
| 1,079,108 | | Residential Accredit Loans, Inc., Series 2007-QS6-A13 (-8 x 1 Month LIBOR USD + 55.00%, 55.00% Cap) | | | 34.29% | I/F | | 04/25/2037 | | | 2,032,761 | |
| 4,805,779 | | Residential Accredit Loans, Inc., Series 2007-QS6-A45 | | | 5.75% | | | 04/25/2037 | | | 4,436,902 | |
| 7,658,927 | | Residential Accredit Loans, Inc., Series 2007-QS6-A6 | | | 6.25% | | | 04/25/2037 | | | 7,269,458 | |
| 528,978 | | Residential Accredit Loans, Inc., Series 2007-QS6-A77 (-8 x 1 Month LIBOR USD + 55.83%, 55.83% Cap) | | | 35.12% | I/F | | 04/25/2037 | | | 1,012,083 | |
| 7,236,367 | | Residential Accredit Loans, Inc., Series 2007-QS7-2A1 | | | 6.75% | | | 06/25/2037 | | | 4,350,145 | |
| 26,431,219 | | Residential Accredit Loans, Inc., Series 2007-QS9-A33 | | | 6.50% | | | 07/25/2037 | | | 24,370,247 | |
| 3,027,737 | | Residential Asset Mortgage Products, Inc., Series 2004-RS7-A3 | | | 4.57% | # | | 07/25/2034 | | | 2,866,937 | |
| 3,168,792 | | Residential Asset Mortgage Products, Inc., Series 2005-RS1-AI5 | | | 5.91% | | | 01/25/2035 | | | 3,195,075 | |
| 24,394,743 | | Residential Asset Mortgage Products, Inc., Series 2006-RS2-A3A (1 Month LIBOR USD + 0.30%, 0.30% Floor, 14.00% Cap) | | | 2.79% | | | 03/25/2036 | | | 23,902,850 | |
| 4,922,803 | | Residential Asset Mortgage Products, Inc., Series 2006-RZ3-A3 (1 Month LIBOR USD + 0.29%, 0.29% Floor, 14.00% Cap) | | | 2.78% | | | 08/25/2036 | | | 4,929,570 | |
| 9,534,848 | | Residential Asset Mortgage Products, Inc., Series 2006-RZ5-A3 (1 Month LIBOR USD + 0.25%, 0.25% Floor, 14.00% Cap) | | | 2.74% | | | 08/25/2046 | | | 9,506,457 | |
| 27,100,365 | | Residential Asset Securities Corporation, Series 2005-KS11-M2 (1 Month LIBOR USD + 0.42%, 0.42% Floor, 14.00% Cap) | | | 2.91% | | | 12/25/2035 | | | 27,081,544 | |
| 4,562,244 | | Residential Asset Securities Corporation, Series 2006-EMX5-A3 (1 Month LIBOR USD + 0.16%, 0.16% Floor, 14.00% Cap) | | | 2.65% | | | 07/25/2036 | | | 4,368,651 | |
| 31,634,512 | | Residential Asset Securities Corporation, Series 2007-EMX1-A13 (1 Month LIBOR USD + 0.20%, 0.20% Floor, 14.00% Cap) | | | 2.69% | | | 01/25/2037 | | | 28,546,680 | |
| 17,214,364 | | Residential Asset Securities Corporation, Series 2007-KS3-AI3 (1 Month LIBOR USD + 0.25%, 0.25% Floor, 14.00% Cap) | | | 2.74% | | | 04/25/2037 | | | 17,065,894 | |
| 5,586,677 | | Residential Asset Securitization Trust, Series 2005-A11-2A4 | | | 6.00% | | | 10/25/2035 | | | 4,138,407 | |
| 2,604,909 | | Residential Asset Securitization Trust, Series 2005-A12-A7 (-1 x 1 Month LIBOR USD + 5.00%, 5.00% Cap) | | | 2.51% | I/F I/O | | 11/25/2035 | | | 332,339 | |
| 2,390,015 | | Residential Asset Securitization Trust, Series 2005-A12-A8 (1 Month LIBOR USD + 0.55%, 0.55% Floor, 5.50% Cap) | | | 3.04% | | | 11/25/2035 | | | 1,703,007 | |
| 21,297,560 | | Residential Asset Securitization Trust, Series 2005-A13-2A1 | | | 5.50% | | | 10/25/2035 | | | 15,302,938 | |
| 9,592,385 | | Residential Asset Securitization Trust, Series 2005-A15-5A3 | | | 5.75% | | | 02/25/2036 | | | 6,684,111 | |
| 10,347,405 | | Residential Asset Securitization Trust, Series 2005-A16-A1 | | | 5.00% | | | 02/25/2036 | | | 7,141,577 | |
| 1,817,233 | | Residential Asset Securitization Trust, Series 2005-A7-A3 | | | 5.50% | | | 06/25/2035 | | | 1,529,581 | |
| 4,607,400 | | Residential Asset Securitization Trust, Series 2005-A8CB-A11 | | | 6.00% | | | 07/25/2035 | | | 4,113,427 | |
| 4,626,300 | | Residential Asset Securitization Trust, Series 2005-A8CB-A2 (-1 x 1 Month LIBOR USD + 5.00%, 5.00% Cap) | | | 2.51% | I/F I/O | | 07/25/2035 | | | 619,840 | |
| 5,755,357 | | Residential Asset Securitization Trust, Series 2006-A10-A5 | | | 6.50% | | | 09/25/2036 | | | 3,827,659 | |
| 816,354 | | Residential Asset Securitization Trust, Series 2006-A1-1A3 | | | 6.00% | | | 04/25/2036 | | | 592,603 | |
| 7,964,998 | | Residential Asset Securitization Trust, Series 2006-A12-A1 | | | 6.25% | | | 11/25/2036 | | | 5,155,340 | |
| 8,075,669 | | Residential Asset Securitization Trust, Series 2006-A13-A1 | | | 6.25% | | | 12/25/2036 | | | 4,915,350 | |
| 14,034,515 | | Residential Asset Securitization Trust, Series 2006-A1-3A2 | | | 6.00% | | | 04/25/2036 | | | 11,294,400 | |
| 14,727,072 | | Residential Asset Securitization Trust, Series 2006-A14C-2A6 (1 Month LIBOR USD + 0.45%, 0.45% Floor, 7.00% Cap) | | | 2.94% | | | 12/25/2036 | | | 4,297,928 | |
| 32,500,438 | | Residential Asset Securitization Trust, Series 2006-A14C-2A7 (-1 x 1 Month LIBOR USD + 6.55%, 6.55% Cap) | | | 4.06% | I/F I/O | | 12/25/2036 | | | 8,325,920 | |
| 6,955,604 | | Residential Asset Securitization Trust, Series 2006-A2-A11 | | | 6.00% | | | 01/25/2046 | | | 4,965,219 | |
| 4,816,224 | | Residential Asset Securitization Trust, Series 2006-A2-A4 | | | 6.00% | | | 01/25/2046 | | | 3,437,631 | |
| 595,164 | | Residential Asset Securitization Trust, Series 2006-A4-2A5 | | | 6.00% | | | 05/25/2036 | | | 575,557 | |
| 4,532,385 | | Residential Asset Securitization Trust, Series 2006-A4-2A9 | | | 6.00% | | | 05/25/2036 | | | 4,383,074 | |
| 3,962,884 | | Residential Asset Securitization Trust, Series 2006-A8-1A1 | | | 6.00% | | | 08/25/2036 | | | 3,456,254 | |
| 5,794,403 | | Residential Asset Securitization Trust, Series 2006-R1-A1 (-4 x 1 Month LIBOR USD + 28.40%, 28.40% Cap) | | | 18.46% | I/F | | 01/25/2046 | | | 10,260,897 | |
| 29,893,755 | | Residential Asset Securitization Trust, Series 2007-A2-1A2 | | | 6.00% | | | 04/25/2037 | | | 26,099,834 | |
| 933,370 | | Residential Asset Securitization Trust, Series 2007-A3-1A2 (-8 x 1 Month LIBOR USD + 46.38%, 46.38% Cap) | | | 27.33% | I/F | | 04/25/2037 | | | 1,894,827 | |
| 22,970,819 | | Residential Asset Securitization Trust, Series 2007-A5-1A4 (-1 x 1 Month LIBOR USD + 6.10%, 6.10% Cap) | | | 3.61% | I/F I/O | | 05/25/2037 | | | 4,107,316 | |
| 5,913,384 | | Residential Asset Securitization Trust, Series 2007-A5-1A6 (1 Month LIBOR USD + 0.40%, 0.40% Floor, 6.50% Cap) | | | 2.89% | | | 05/25/2037 | | | 971,167 | |
| 6,239,718 | | Residential Asset Securitization Trust, Series 2007-A5-2A3 | | | 6.00% | | | 05/25/2037 | | | 5,370,385 | |
| 2,734,550 | | Residential Asset Securitization Trust, Series 2007-A5-2A5 | | | 6.00% | | | 05/25/2037 | | | 2,353,566 | |
| 11,351,516 | | Residential Asset Securitization Trust, Series 2007-A6-1A2 | | | 6.00% | | | 06/25/2037 | | | 9,893,907 | |
| 8,700,397 | | Residential Asset Securitization Trust, Series 2007-A7-A1 | | | 6.00% | | | 07/25/2037 | | | 5,650,354 | |
| 38,269,935 | | Residential Asset Securitization Trust, Series 2007-A7-A2 | | | 6.00% | | | 07/25/2037 | | | 24,853,889 | |
| 16,956,600 | | Residential Asset Securitization Trust, Series 2007-A7-A6 | | | 6.00% | | | 07/25/2037 | | | 11,012,233 | |
| 2,592,796 | | Residential Funding Mortgage Securities Trust, Series 2005-S9-A10 | | | 6.25% | | | 12/25/2035 | | | 2,584,453 | |
| 6,962,549 | | Residential Funding Mortgage Securities Trust, Series 2005-S9-A6 | | | 5.75% | | | 12/25/2035 | | | 6,800,588 | |
| 516,493 | | Residential Funding Mortgage Securities Trust, Series 2005-S9-A8 | | | 5.50% | | | 12/25/2035 | | | 499,440 | |
| 9,087,851 | | Residential Funding Mortgage Securities Trust, Series 2006-S10-1A1 | | | 6.00% | | | 10/25/2036 | | | 8,494,089 | |
| 15,706,358 | | Residential Funding Mortgage Securities Trust, Series 2006-S11-A1 | | | 6.00% | | | 11/25/2036 | | | 15,796,692 | |
| 2,868,861 | | Residential Funding Mortgage Securities Trust, Series 2006-S5-A12 | | | 6.00% | | | 06/25/2036 | | | 2,834,962 | |
| 196,414 | | Residential Funding Mortgage Securities Trust, Series 2006-S5-A15 | | | 6.00% | | | 06/25/2036 | | | 194,093 | |
| 4,827,750 | | Residential Funding Mortgage Securities Trust, Series 2006-S9-A1 | | | 6.25% | | | 09/25/2036 | | | 4,687,824 | |
| 6,944,647 | | Residential Funding Mortgage Securities Trust, Series 2007-S1-A7 | | | 6.00% | | | 01/25/2037 | | | 6,591,893 | |
| 3,449,045 | | Residential Funding Mortgage Securities Trust, Series 2007-S2-A1 | | | 6.00% | | | 02/25/2037 | | | 3,226,884 | |
| 3,885,728 | | Residential Funding Mortgage Securities Trust, Series 2007-S2-A4 | | | 6.00% | | | 02/25/2037 | | | 3,635,440 | |
| 7,254,211 | | Residential Funding Mortgage Securities Trust, Series 2007-S2-A5 | | | 6.00% | | | 02/25/2037 | | | 6,786,950 | |
| 1,133,591 | | Residential Funding Mortgage Securities Trust, Series 2007-S2-A9 | | | 6.00% | | | 02/25/2037 | | | 1,060,574 | |
| 3,189,233 | | Residential Funding Mortgage Securities Trust, Series 2007-S3-1A4 | | | 6.00% | | | 03/25/2037 | | | 2,872,505 | |
| 955,325 | | Residential Funding Mortgage Securities Trust, Series 2007-S4-A1 | | | 6.00% | | | 04/25/2037 | | | 888,997 | |
| 2,550,214 | | Residential Funding Mortgage Securities Trust, Series 2007-S4-A2 | | | 6.00% | | | 04/25/2037 | | | 2,373,155 | |
| 23,633,411 | | Residential Funding Mortgage Securities Trust, Series 2007-S5-A1 | | | 6.00% | | | 05/25/2037 | | | 23,709,227 | |
| 6,849,056 | | Residential Funding Mortgage Securities Trust, Series 2007-S5-A8 | | | 6.00% | | | 05/25/2037 | | | 6,871,028 | |
| 3,743,790 | | Residential Funding Mortgage Securities Trust, Series 2007-S6-2A4 | | | 6.00% | | | 06/25/2037 | | | 3,457,509 | |
| 18,598,827 | | Residential Funding Mortgage Securities Trust, Series 2007-S7-A20 | | | 6.00% | | | 07/25/2037 | | | 17,483,315 | |
| 8,922,203 | | Residential Funding Mortgage Securities Trust, Series 2007-S8-1A1 | | | 6.00% | | | 09/25/2037 | | | 8,089,602 | |
| 2,424,130 | | Residential Funding Mortgage Securities Trust, Series 2007-SA1-4A | | | 5.34% | # | | 02/25/2037 | | | 2,087,815 | |
| 7,072,468 | | Residential Funding Mortgage Securities Trust, Series 2007-SA2-2A1 | | | 4.88% | # | | 04/25/2037 | | | 6,795,867 | |
| 19,323,078 | | RMAT LLC, Series 2015-PR2-A1 | | | 9.85% | ^ | | 11/25/2035 | | | 18,859,997 | |
| 35,138,851 | | Saxon Asset Securities Trust, Series 2006-3-A3 (1 Month LIBOR USD + 0.17%, 0.17% Floor, 12.25% Cap) | | | 2.66% | | | 10/25/2046 | | | 34,432,658 | |
| 307,023,711 | | Securitized Mortgage Asset Loan Trust, Series 2015-1-PC | | | 2.74% | # ^ | | 02/25/2054 | | | 272,923,969 | |
| 59,741,131 | | Securitized Mortgage Asset Loan Trust, Series 2015-2-PC | | | 0.00% | # ^ | | 12/26/2059 | | | 58,389,834 | |
| 87,871,305 | | Securitized Mortgage Asset Loan Trust, Series 2015-3-PC | | | 0.00% | # ^ | | 10/25/2044 | | | 85,434,423 | |
| 152,783 | | Sequoia Mortgage Trust, Series 2003-4-2A1 (1 Month LIBOR USD + 0.35%, 0.35% Floor, 11.50% Cap) | | | 2.84% | | | 07/20/2033 | | | 148,189 | |
| 8,523,943 | | Sequoia Mortgage Trust, Series 2013-2-A | | | 1.87% | # | | 02/25/2043 | | | 7,835,477 | |
| 58,265,105 | | Sequoia Mortgage Trust, Series 2015-4-A1 | | | 3.00% | # ^ | | 11/25/2030 | | | 58,365,263 | |
| 13,486,188 | | SG Mortgage Securities Trust, Series 2006-FRE1-A1A (1 Month LIBOR USD + 0.17%, 0.17% Floor) | | | 2.66% | | | 02/25/2036 | | | 12,612,247 | |
| 51,990,620 | | Silver Hill Trust, Series 2018-SBC1-A1 | | | 5.19% | ^ § | | 10/28/2033 | | | 53,415,423 | |
| 25,285,337 | | Soundview Home Loan Trust, Series 2007-NS1-A3 (1 Month LIBOR USD + 0.20%, 0.20% Floor) | | | 2.69% | | | 01/25/2037 | | | 24,855,856 | |
| 5,073,959 | | Soundview Home Loan Trust, Series 2007-OPT1-2A2 (1 Month LIBOR USD + 0.15%, 0.15% Floor) | | | 2.64% | | | 06/25/2037 | | | 3,572,743 | |
| 9,618,365 | | Soundview Home Loan Trust, Series 2007-OPT3-1A1 (1 Month LIBOR USD + 0.17%, 0.17% Floor) | | | 2.66% | | | 08/25/2037 | | | 8,711,831 | |
| 27,688,603 | | Soundview Home Loan Trust, Series 2007-OPT4-1A1 (1 Month LIBOR USD + 1.00%, 1.00% Floor) | | | 3.49% | | | 09/25/2037 | | | 21,527,310 | |
| 27,586,650 | | Stanwich Mortgage Loan Trust, Series 2018-NPB1-A1 | | | 4.02% | ^ § | | 05/16/2023 | | | 27,705,049 | |
| 8,150,056 | | STARM Mortgage Loan Trust, Series 2007-2-1A1 | | | 4.55% | # | | 04/25/2037 | | | 6,109,010 | |
| 3,652,943 | | STARM Mortgage Loan Trust, Series 2007-3-1A1 | | | 4.21% | # | | 06/25/2037 | | | 3,387,704 | |
| 2,509,685 | | Structured Adjustable Rate Mortgage Loan Trust, Series 2004-12-8A | | | 4.22% | # | | 09/25/2034 | | | 2,488,295 | |
| 5,153,792 | | Structured Adjustable Rate Mortgage Loan Trust, Series 2005-22-4A1 | | | 4.54% | # | | 12/25/2035 | | | 4,930,604 | |
| 4,699,837 | | Structured Adjustable Rate Mortgage Loan Trust, Series 2006-12-2A1 | | | 4.23% | # | | 01/25/2037 | | | 4,199,605 | |
| 2,149,719 | | Structured Adjustable Rate Mortgage Loan Trust, Series 2006-1-8A1 | | | 4.42% | # | | 02/25/2036 | | | 1,738,851 | |
| 2,681,794 | | Structured Adjustable Rate Mortgage Loan Trust, Series 2006-6-3A1 | | | 4.18% | # | | 07/25/2036 | | | 2,082,926 | |
| 18,751,107 | | Structured Asset Mortgage Investments Trust, Series 2006-AR3-12A2 (1 Month LIBOR USD + 0.20%, 0.20% Floor, 10.50% Cap) | | | 2.69% | | | 05/25/2036 | | | 17,497,434 | |
| 10,184 | | Structured Asset Securities Corporation, Series 2003-18XS-A6 | | | 4.54% | | | 06/25/2033 | | | 10,136 | |
| 2,116,695 | | Structured Asset Securities Corporation, Series 2003-24A-1A3 | | | 4.52% | # | | 07/25/2033 | | | 2,129,296 | |
| 4,770,496 | | Structured Asset Securities Corporation, Series 2003-35-1A1 | | | 5.17% | # | | 12/25/2033 | | | 5,015,087 | |
| 340,882 | | Structured Asset Securities Corporation, Series 2004-11XS-2A2 | | | 4.90% | | | 06/25/2034 | | | 1,048,710 | |
| 14,513,582 | | Structured Asset Securities Corporation, Series 2005-10-1A1 | | | 5.75% | | | 06/25/2035 | | | 14,016,340 | |
| 362,557 | | Structured Asset Securities Corporation, Series 2005-10-6A1 | | | 5.00% | | | 06/25/2020 | | | 366,381 | |
| 1,312,516 | | Structured Asset Securities Corporation, Series 2005-15-1A1 | | | 5.50% | | | 08/25/2035 | | | 1,382,438 | |
| 3,846,011 | | Structured Asset Securities Corporation, Series 2005-15-2A7 | | | 5.50% | | | 08/25/2035 | | | 3,773,219 | |
| 5,407,309 | | Structured Asset Securities Corporation, Series 2005-15-3A1 | | | 4.80% | # | | 08/25/2035 | | | 5,223,878 | |
| 4,258,923 | | Structured Asset Securities Corporation, Series 2005-16-1A2 | | | 5.50% | | | 09/25/2035 | | | 4,237,735 | |
| 4,122,837 | | Structured Asset Securities Corporation, Series 2005-16-3A1 | | | 6.00% | | | 09/25/2035 | | | 3,098,595 | |
| 5,145,289 | | Structured Asset Securities Corporation, Series 2005-3-1A6 | | | 5.75% | | | 03/25/2035 | | | 4,736,124 | |
| 12,267,898 | | Structured Asset Securities Corporation, Series 2005-5-3A1 | | | 6.00% | | | 04/25/2035 | | | 10,780,505 | |
| 43,261,708 | | Structured Asset Securities Corporation, Series 2006-BC4-A4 (1 Month LIBOR USD + 0.17%, 0.17% Floor) | | | 2.66% | | | 12/25/2036 | | | 41,813,453 | |
| 93,250,844 | | Structured Asset Securities Corporation, Series 2007-4-1A3 (-1 x 1 Month LIBOR USD + 6.25%, 6.25% Cap) | | | 3.75% | ^ I/F I/O Þ | | 03/28/2045 | | | 16,298,485 | |
| 23,551,069 | | Structured Asset Securities Corporation, Series 2007-RF1-1A (1 Month LIBOR USD + 0.19%, 0.19% Floor) | | | 2.68% | ^ | | 03/25/2037 | | | 20,930,686 | |
| 598,172 | | Suntrust Alternative Loan Trust, Series 2005-1F-2A3 | | | 5.75% | | | 12/25/2035 | | | 588,324 | |
| 963,322 | | Suntrust Alternative Loan Trust, Series 2006-1F-1A3 | | | 6.00% | | | 04/25/2036 | | | 752,981 | |
| 433,398 | | Thornburg Mortgage Securities Trust, Series 2003-6-A2 (1 Month LIBOR USD + 0.50%, 0.50% Floor, 11.50% Cap) | | | 2.99% | | | 12/25/2033 | | | 405,074 | |
| 4,774,723 | | Thornburg Mortgage Securities Trust, Series 2004-4-5A | | | 3.77% | # | | 12/25/2044 | | | 4,742,739 | |
| 16,048,979 | | Thornburg Mortgage Securities Trust, Series 2007-1-A1 (12 Month LIBOR USD + 1.30%, 0.11% Floor, 10.75% Cap) | | | 4.09% | | | 03/25/2037 | | | 15,404,622 | |
| 3,221,772 | | Thornburg Mortgage Securities Trust, Series 2007-1-A2A (12 Month LIBOR USD + 1.30%, 0.11% Floor, 10.75% Cap) | | | 4.09% | | | 03/25/2037 | | | 2,899,910 | |
| 65,000,000 | | Toorak Mortgage Corporation Ltd., Series 2019-1-A1 | | | 4.46% | ^ § | | 03/25/2022 | | | 65,648,115 | |
| 7,356,928 | | Towd Point Mortgage Trust, Series 2015-1-AE | | | 3.00% | ^ | | 10/25/2053 | | | 7,321,461 | |
| 4,910,109 | | Towd Point Mortgage Trust, Series 2015-1-AES | | | 3.00% | # ^ | | 10/25/2053 | | | 4,898,900 | |
| 4,698,359 | | Towd Point Mortgage Trust, Series 2015-2-1A12 | | | 2.75% | # ^ | | 11/25/2060 | | | 4,667,558 | |
| 12,518,525 | | Towd Point Mortgage Trust, Series 2015-2-1A13 | | | 2.50% | # ^ | | 11/25/2060 | | | 12,363,657 | |
| 37,280,144 | | Towd Point Mortgage Trust, Series 2015-5-A1B | | | 2.75% | # ^ | | 05/25/2055 | | | 37,012,685 | |
| 49,433,873 | | Towd Point Mortgage Trust, Series 2015-6-A1B | | | 2.75% | # ^ | | 04/25/2055 | | | 49,039,880 | |
| 244,937,540 | | Towd Point Mortgage Trust, Series 2019-1-A1 | | | 3.75% | # ^ | | 03/25/2058 | | | 249,558,531 | |
| 39,000,000 | | VCAT LLC, Series 2019-NPL1-A1 | | | 4.36% | ^ § | | 02/25/2049 | | | 39,209,726 | |
| 7,249,480 | | Velocity Commercial Capital Loan Trust, Series 2016-1-AFX | | | 3.53% | # ^ | | 04/25/2046 | | | 7,238,577 | |
| 36,157,025 | | Velocity Commercial Capital Loan Trust, Series 2017-2-AFX | | | 3.07% | # ^ | | 11/25/2047 | | | 36,345,472 | |
| 37,687,626 | | Velocity Commercial Capital Loan Trust, Series 2018-2-A | | | 4.05% | # ^ | | 10/26/2048 | | | 38,325,406 | |
| 86,241,503 | | Velocity Commercial Capital Loan Trust, Series 2019-1-A | | | 3.76% | # ^ | | 03/25/2049 | | | 86,807,540 | |
| 53,300,000 | | Vericrest Opportunity Loan Trust, Series 2019-NPL3-A1 | | | 3.97% | ^ § | | 03/25/2049 | | | 53,491,390 | |
| 30,382,225 | | Verus Securitization Trust, Series 2018-INV1-A1 | | | 3.63% | # ^ | | 03/25/2058 | | | 30,456,066 | |
| 51,175,723 | | VOLT LLC, Series 2017-NPL9-A1 | | | 3.13% | ^ § | | 09/25/2047 | | | 51,111,682 | |
| 104,830,331 | | VOLT LLC, Series 2018-NPL1-A1 | | | 3.75% | ^ § | | 04/25/2048 | | | 104,825,718 | |
| 148,158,505 | | VOLT LLC, Series 2018-NPL5-A1A | | | 4.21% | ^ § | | 08/25/2048 | | | 148,931,211 | |
| 83,906,916 | | VOLT LLC, Series 2018-NPL6-A1A | | | 4.11% | ^ § | | 09/25/2048 | | | 84,447,822 | |
| 176,008,593 | | VOLT LLC, Series 2018-NPL8-A1A | | | 4.21% | ^ § | | 10/26/2048 | | | 177,594,307 | |
| 62,418,142 | | VOLT LLC, Series 2019-NPL1-A1A | | | 4.34% | ^ § | | 01/25/2049 | | | 63,043,584 | |
| 6,354,674 | | Washington Mutual Mortgage Pass-Through Certificates, Series 2005-1-2A | | | 6.00% | | | 03/25/2035 | | | 5,998,686 | |
| 2,281,924 | | Washington Mutual Mortgage Pass-Through Certificates, Series 2005-4-5A1 | | | 5.50% | | | 06/25/2035 | | | 2,196,553 | |
| 899,287 | | Washington Mutual Mortgage Pass-Through Certificates, Series 2005-5-CB12 (-11 x 1 Month LIBOR USD + 50.60%, 50.60% Cap) | | | 23.26% | I/F | | 07/25/2035 | | | 1,515,420 | |
| 2,912,113 | | Washington Mutual Mortgage Pass-Through Certificates, Series 2005-5-CB6 (1 Month LIBOR USD + 0.60%, 0.60% Floor, 7.50% Cap) | | | 3.09% | | | 07/25/2035 | | | 2,608,013 | |
| 825,065 | | Washington Mutual Mortgage Pass-Through Certificates, Series 2005-6-2A7 | | | 5.50% | | | 08/25/2035 | | | 792,809 | |
| 11,331,611 | | Washington Mutual Mortgage Pass-Through Certificates, Series 2005-7-2CB6 (1 Month LIBOR USD + 1.45%, 1.45% Floor, 6.00% Cap) | | | 3.94% | | | 08/25/2035 | | | 10,650,220 | |
| 1,030,147 | | Washington Mutual Mortgage Pass-Through Certificates, Series 2005-7-2CB7 (-11 x 1 Month LIBOR USD + 50.05%, 50.05% Cap) | | | 22.71% | I/F | | 08/25/2035 | | | 1,557,387 | |
| 1,321,885 | | Washington Mutual Mortgage Pass-Through Certificates, Series 2005-7-3CB | | | 6.50% | | | 08/25/2035 | | | 1,164,244 | |
| 11,011,713 | | Washington Mutual Mortgage Pass-Through Certificates, Series 2005-8-1A2 | | | 5.50% | | | 10/25/2035 | | | 10,656,161 | |
| 8,967,064 | | Washington Mutual Mortgage Pass-Through Certificates, Series 2005-9-2A2 | | | 5.50% | | | 11/25/2035 | | | 8,368,120 | |
| 2,403,689 | | Washington Mutual Mortgage Pass-Through Certificates, Series 2005-9-CX | | | 5.50% | I/O | | 11/25/2035 | | | 498,023 | |
| 3,214,212 | | Washington Mutual Mortgage Pass-Through Certificates, Series 2006-1-3A1 | | | 5.75% | | | 02/25/2036 | | | 3,023,940 | |
| 1,627,360 | | Washington Mutual Mortgage Pass-Through Certificates, Series 2006-1-3A2 | | | 5.75% | | | 02/25/2036 | | | 1,531,025 | |
| 1,382,281 | | Washington Mutual Mortgage Pass-Through Certificates, Series 2006-1-3A7 | | | 5.75% | | | 02/25/2036 | | | 1,300,454 | |
| 3,808,889 | | Washington Mutual Mortgage Pass-Through Certificates, Series 2006-3-3CB4 | | | 6.00% | | | 04/25/2036 | | | 3,473,953 | |
| 2,336,805 | | Washington Mutual Mortgage Pass-Through Certificates, Series 2006-5-1A8 | | | 5.75% | | | 07/25/2036 | | | 2,090,234 | |
| 4,246,020 | | Washington Mutual Mortgage Pass-Through Certificates, Series 2006-5-2CB1 | | | 6.00% | | | 07/25/2036 | | | 3,477,481 | |
| 7,712,560 | | Washington Mutual Mortgage Pass-Through Certificates, Series 2006-5-2CB6 | | | 6.00% | | | 07/25/2036 | | | 6,316,569 | |
| 16,318,272 | | Washington Mutual Mortgage Pass-Through Certificates, Series 2006-5-3A3 | | | 6.22% | ß | | 07/25/2036 | | | 7,033,572 | |
| 6,800,221 | | Washington Mutual Mortgage Pass-Through Certificates, Series 2006-5-3A5 | | | 6.45% | ß | | 07/25/2036 | | | 2,929,846 | |
| 3,725,820 | | Washington Mutual Mortgage Pass-Through Certificates, Series 2006-9-A7 | | | 4.75% | ß | | 10/25/2036 | | | 1,831,897 | |
| 8,073,345 | | Washington Mutual Mortgage Pass-Through Certificates, Series 2006-AR10-1A1 | | | 3.86% | # | | 09/25/2036 | | | 7,712,342 | |
| 13,871,894 | | Washington Mutual Mortgage Pass-Through Certificates, Series 2006-AR15-1A (12 Month US Treasury Average + 0.84%, 0.84% Floor) | | | 3.24% | | | 11/25/2046 | | | 12,798,897 | |
| 10,231,418 | | Washington Mutual Mortgage Pass-Through Certificates, Series 2006-AR4-2A (12 Month US Treasury Average + 0.95%, 0.95% Floor) | | | 3.35% | | | 06/25/2046 | | | 8,419,448 | |
| 8,004,916 | | Washington Mutual Mortgage Pass-Through Certificates, Series 2006-AR5-4A (12 Month US Treasury Average + 0.99%, 0.99% Floor) | | | 3.39% | | | 06/25/2046 | | | 6,958,613 | |
| 1,026,040 | | Washington Mutual Mortgage Pass-Through Certificates, Series 2006-AR6-2A3 | | | 3.70% | # | | 08/25/2036 | | | 962,030 | |
| 12,466,074 | | Washington Mutual Mortgage Pass-Through Certificates, Series 2007-2-1A2 | | | 6.00% | | | 04/25/2037 | | | 11,112,631 | |
| 12,754,593 | | Washington Mutual Mortgage Pass-Through Certificates, Series 2007-2-1A6 | | | 6.00% | | | 04/25/2037 | | | 11,369,826 | |
| 5,902,764 | | Washington Mutual Mortgage Pass-Through Certificates, Series 2007-3-A2 | | | 6.00% | | | 04/25/2037 | | | 5,768,864 | |
| 8,003,920 | | Washington Mutual Mortgage Pass-Through Certificates, Series 2007-3-A3 | | | 6.00% | | | 04/25/2037 | | | 7,822,357 | |
| 6,673,703 | | Washington Mutual Mortgage Pass-Through Certificates, Series 2007-4-1A1 | | | 5.50% | | | 06/25/2037 | | | 6,680,483 | |
| 358,488 | | Washington Mutual Mortgage Pass-Through Certificates, Series 2007-5-A11 (-6 x 1 Month LIBOR USD + 39.48%, 39.48% Cap) | | | 24.57% | I/F | | 06/25/2037 | | | 634,554 | |
| 8,962,196 | | Washington Mutual Mortgage Pass-Through Certificates, Series 2007-5-A6 | | | 6.00% | | | 06/25/2037 | | | 9,033,213 | |
| 13,449,920 | | Washington Mutual Mortgage Pass-Through Certificates, Series 2007-HY3-4A1 | | | 4.09% | # | | 03/25/2037 | | | 13,430,803 | |
| 15,108,607 | | Washington Mutual Mortgage Pass-Through Certificates, Series 2007-HY5-1A1 | | | 3.36% | # | | 05/25/2037 | | | 13,755,173 | |
| 13,188,586 | | Washington Mutual Mortgage Pass-Through Certificates, Series 2007-HY6-2A3 | | | 3.63% | # | | 06/25/2037 | | | 12,542,453 | |
| 10,422,241 | | Washington Mutual Mortgage Pass-Through Certificates, Series 2007-OC1-A2 (1 Month LIBOR USD + 0.12%, 0.12% Floor) | | | 2.61% | | | 01/25/2047 | | | 9,349,203 | |
| 1,397,082 | | Wells Fargo Alternative Loan Trust, Series 2007-PA1-A10 | | | 6.00% | | | 03/25/2037 | | | 1,307,203 | |
| 6,134,278 | | Wells Fargo Alternative Loan Trust, Series 2007-PA1-A3 | | | 6.00% | | | 03/25/2037 | | | 5,739,640 | |
| 5,289,089 | | Wells Fargo Alternative Loan Trust, Series 2007-PA1-A5 | | | 6.00% | | | 03/25/2037 | | | 4,948,825 | |
| 8,668,552 | | Wells Fargo Alternative Loan Trust, Series 2007-PA1-A6 | | | 6.00% | | | 03/25/2037 | | | 8,110,876 | |
| 35,850,402 | | Wells Fargo Alternative Loan Trust, Series 2007-PA2-1A1 | | | 6.00% | | | 06/25/2037 | | | 35,966,772 | |
| 4,943,268 | | Wells Fargo Alternative Loan Trust, Series 2007-PA2-3A1 (1 Month LIBOR USD + 0.35%, 0.35% Floor, 7.00% Cap) | | | 2.84% | | | 06/25/2037 | | | 3,551,666 | |
| 7,282,199 | | Wells Fargo Alternative Loan Trust, Series 2007-PA2-3A2 (-1 x 1 Month LIBOR USD + 6.65%, 6.65% Cap) | | | 4.16% | I/F I/O | | 06/25/2037 | | | 930,762 | |
| 493,828 | | Wells Fargo Alternative Loan Trust, Series 2007-PA3-1A4 | | | 5.75% | | | 07/25/2037 | | | 460,056 | |
| 11,986,581 | | Wells Fargo Alternative Loan Trust, Series 2007-PA3-2A1 | | | 6.00% | | | 07/25/2037 | | | 11,747,122 | |
| 4,762,346 | | Wells Fargo Alternative Loan Trust, Series 2007-PA3-2A4 | | | 6.00% | | | 07/25/2037 | | | 4,667,207 | |
| 9,680,544 | | Wells Fargo Alternative Loan Trust, Series 2007-PA3-3A1 | | | 6.25% | | | 07/25/2037 | | | 9,078,221 | |
| 63,515,628 | | Wells Fargo Alternative Loan Trust, Series 2007-PA5-1A1 | | | 6.25% | | | 11/25/2037 | | | 62,546,551 | |
| 12,563,631 | | Wells Fargo Alternative Loan Trust, Series 2007-PA6-A1 | | | 4.70% | # | | 12/28/2037 | | | 12,408,787 | |
| 8,552,161 | | Wells Fargo Mortgage Backed Securities Trust, Series 2004-Y-3A3 | | | 4.91% | # | | 11/25/2034 | | | 8,854,140 | |
| 15,354,573 | | Wells Fargo Mortgage Backed Securities Trust, Series 2005-17-1A1 | | | 5.50% | | | 01/25/2036 | | | 15,123,461 | |
| 1,491,254 | | Wells Fargo Mortgage Backed Securities Trust, Series 2005-8-A1 | | | 5.50% | | | 10/25/2035 | | | 1,536,980 | |
| 932,873 | | Wells Fargo Mortgage Backed Securities Trust, Series 2005-AR16-6A4 | | | 4.53% | # | | 10/25/2035 | | | 945,788 | |
| 2,609,542 | | Wells Fargo Mortgage Backed Securities Trust, Series 2006-12-A3 | | | 6.00% | | | 10/25/2036 | | | 2,613,127 | |
| 3,314,659 | | Wells Fargo Mortgage Backed Securities Trust, Series 2006-14-A1 | | | 6.00% | | | 10/25/2036 | | | 3,278,706 | |
| 4,261,601 | | Wells Fargo Mortgage Backed Securities Trust, Series 2006-15-A1 | | | 6.00% | | | 11/25/2036 | | | 4,243,506 | |
| 48,333 | | Wells Fargo Mortgage Backed Securities Trust, Series 2006-2-1A4 (-3 x 1 Month LIBOR USD + 19.39%, 19.39% Cap) | | | 12.55% | I/F | | 03/25/2036 | | | 56,123 | |
| 2,087,129 | | Wells Fargo Mortgage Backed Securities Trust, Series 2006-2-3A1 | | | 5.75% | | | 03/25/2036 | | | 2,053,340 | |
| 13,307,675 | | Wells Fargo Mortgage Backed Securities Trust, Series 2006-3-A11 | | | 5.50% | | | 03/25/2036 | | | 13,417,729 | |
| 3,003,261 | | Wells Fargo Mortgage Backed Securities Trust, Series 2006-3-A6 | | | 5.50% | | | 03/25/2036 | | | 2,908,722 | |
| 145,311 | | Wells Fargo Mortgage Backed Securities Trust, Series 2006-4-2A2 | | | 5.50% | | | 04/25/2036 | | | 141,809 | |
| 1,910,993 | | Wells Fargo Mortgage Backed Securities Trust, Series 2006-6-2A1 (1 Month LIBOR USD + 0.40%, 0.40% Floor, 7.50% Cap) | | | 2.89% | | | 05/25/2036 | | | 1,717,799 | |
| 1,910,993 | | Wells Fargo Mortgage Backed Securities Trust, Series 2006-6-2A2 (-1 x 1 Month LIBOR USD + 7.10%, 7.10% Cap) | | | 4.61% | I/F I/O | | 05/25/2036 | | | 208,646 | |
| 1,820,231 | | Wells Fargo Mortgage Backed Securities Trust, Series 2006-9-2A1 | | | 0.00% | P/O | | 08/25/2036 | | | 1,276,444 | |
| 1,820,231 | | Wells Fargo Mortgage Backed Securities Trust, Series 2006-9-2A2 | | | 6.00% | I/O | | 08/25/2036 | | | 388,454 | |
| 5,746,829 | | Wells Fargo Mortgage Backed Securities Trust, Series 2006-AR12-1A1 | | | 4.71% | # | | 09/25/2036 | | | 5,802,446 | |
| 2,734,065 | | Wells Fargo Mortgage Backed Securities Trust, Series 2006-AR13-A2 | | | 4.62% | # | | 09/25/2036 | | | 2,752,310 | |
| 3,378,815 | | Wells Fargo Mortgage Backed Securities Trust, Series 2006-AR4-2A1 | | | 5.17% | # | | 04/25/2036 | | | 3,332,078 | |
| 1,026,621 | | Wells Fargo Mortgage Backed Securities Trust, Series 2007-10-1A18 | | | 6.00% | | | 07/25/2037 | | | 1,017,579 | |
| 1,581,613 | | Wells Fargo Mortgage Backed Securities Trust, Series 2007-10-2A11 | | | 6.00% | | | 07/25/2037 | | | 1,533,796 | |
| 1,009,832 | | Wells Fargo Mortgage Backed Securities Trust, Series 2007-11-A14 | | | 6.00% | | | 08/25/2037 | | | 1,008,328 | |
| 2,015,519 | | Wells Fargo Mortgage Backed Securities Trust, Series 2007-11-A36 | | | 6.00% | | | 08/25/2037 | | | 2,012,518 | |
| 1,432,367 | | Wells Fargo Mortgage Backed Securities Trust, Series 2007-11-A96 | | | 6.00% | | | 08/25/2037 | | | 1,430,234 | |
| 19,111,370 | | Wells Fargo Mortgage Backed Securities Trust, Series 2007-14-1A1 | | | 6.00% | | | 10/25/2037 | | | 18,879,301 | |
| 10,760,853 | | Wells Fargo Mortgage Backed Securities Trust, Series 2007-2-1A1 | | | 6.00% | | | 03/25/2037 | | | 10,475,503 | |
| 622,764 | | Wells Fargo Mortgage Backed Securities Trust, Series 2007-2-1A18 | | | 5.75% | | | 03/25/2037 | | | 602,272 | |
| 1,402,629 | | Wells Fargo Mortgage Backed Securities Trust, Series 2007-2-1A9 | | | 6.00% | | | 03/25/2037 | | | 1,365,435 | |
| 305,312 | | Wells Fargo Mortgage Backed Securities Trust, Series 2007-2-3A2 | | | 5.25% | | | 03/25/2037 | | | 313,856 | |
| 1,215,526 | | Wells Fargo Mortgage Backed Securities Trust, Series 2007-3-1A3 | | | 6.00% | | | 04/25/2037 | | | 1,226,164 | |
| 1,123,740 | | Wells Fargo Mortgage Backed Securities Trust, Series 2007-4-A11 | | | 6.50% | | | 04/25/2037 | | | 1,143,248 | |
| 4,316,672 | | Wells Fargo Mortgage Backed Securities Trust, Series 2007-4-A15 | | | 6.00% | | | 04/25/2037 | | | 4,319,858 | |
| 2,546,169 | | Wells Fargo Mortgage Backed Securities Trust, Series 2007-4-A3 | | | 6.00% | | | 04/25/2037 | | | 2,548,048 | |
| 2,685,276 | | Wells Fargo Mortgage Backed Securities Trust, Series 2007-4-A8 | | | 6.00% | | | 04/25/2037 | | | 2,687,258 | |
| 2,543,079 | | Wells Fargo Mortgage Backed Securities Trust, Series 2007-6-A4 | | | 6.00% | | | 05/25/2037 | | | 2,528,849 | |
| 1,215,207 | | Wells Fargo Mortgage Backed Securities Trust, Series 2007-6-A6 | | | 6.00% | | | 05/25/2037 | | | 1,208,407 | |
| 4,370,995 | | Wells Fargo Mortgage Backed Securities Trust, Series 2007-7-A1 | | | 6.00% | | | 06/25/2037 | | | 4,411,930 | |
| 303,994 | | Wells Fargo Mortgage Backed Securities Trust, Series 2007-7-A32 | | | 5.75% | | | 06/25/2037 | | | 304,307 | |
| 9,843,159 | | Wells Fargo Mortgage Backed Securities Trust, Series 2007-7-A34 | | | 6.00% | | | 06/25/2037 | | | 9,935,342 | |
| 2,666,007 | | Wells Fargo Mortgage Backed Securities Trust, Series 2007-7-A36 | | | 6.00% | | | 06/25/2037 | | | 2,690,975 | |
| 906,667 | | Wells Fargo Mortgage Backed Securities Trust, Series 2007-7-A43 (1 Month LIBOR USD + 0.50%, 0.50% Floor, 7.00% Cap) | | | 2.99% | | | 06/25/2037 | | | 801,039 | |
| 2,476,994 | | Wells Fargo Mortgage Backed Securities Trust, Series 2007-7-A49 | | | 6.00% | | | 06/25/2037 | | | 2,500,192 | |
| 1,048,628 | | Wells Fargo Mortgage Backed Securities Trust, Series 2007-7-A8 (1 Month LIBOR USD + 0.50%, 0.50% Floor, 7.00% Cap) | | | 2.99% | | | 06/25/2037 | | | 926,462 | |
| 473,055 | | Wells Fargo Mortgage Backed Securities Trust, Series 2007-7-A9 (-6 x 1 Month LIBOR USD + 39.00%, 39.00% Cap) | | | 24.09% | I/F | | 06/25/2037 | | | 736,580 | |
| 754,740 | | Wells Fargo Mortgage Backed Securities Trust, Series 2007-8-1A13 (1 Month LIBOR USD + 0.37%, 0.37% Floor, 7.00% Cap) | | | 2.86% | | | 07/25/2037 | | | 696,132 | |
| 754,740 | | Wells Fargo Mortgage Backed Securities Trust, Series 2007-8-1A14 (-6 x 1 Month LIBOR USD + 39.78%, 39.78% Cap) | | | 24.87% | I/F | | 07/25/2037 | | | 1,056,071 | |
| 12,264,519 | | Wells Fargo Mortgage Backed Securities Trust, Series 2007-8-1A16 | | | 6.00% | | | 07/25/2037 | | | 12,194,765 | |
| 8,183,925 | | Wells Fargo Mortgage Backed Securities Trust, Series 2007-8-1A2 | | | 6.00% | | | 07/25/2037 | | | 8,137,379 | |
| 1,156,969 | | Wells Fargo Mortgage Backed Securities Trust, Series 2007-8-1A20 | | | 6.00% | | | 07/25/2037 | | | 1,150,390 | |
| 10,336,760 | | Wells Fargo Mortgage Backed Securities Trust, Series 2007-8-1A22 | | | 6.00% | | | 07/25/2037 | | | 10,277,982 | |
| 3,597,586 | | Wells Fargo Mortgage Backed Securities Trust, Series 2007-8-1A3 | | | 6.00% | | | 07/25/2037 | | | 3,577,127 | |
| 5,016,880 | | Wells Fargo Mortgage Backed Securities Trust, Series 2007-8-2A9 | | | 6.00% | | | 07/25/2037 | | | 5,444,179 | |
| 35,056,011 | | Wells Fargo Mortgage Backed Securities Trust, Series 2007-AR9-A1 | | | 4.84% | # | | 12/28/2037 | | | 34,335,060 | |
| 14,181,911 | | WinWater Mortgage Loan Trust, Series 2015-4-A5 | | | 3.50% | # ^ | | 06/20/2045 | | | 14,238,012 | |
| | | | | | | | | | | | |
Total Non-Agency Residential Collateralized Mortgage Obligations(Cost $13,402,650,930) | | | 13,350,885,556 | |
| | | | | | | | | | | | |
| |
US Government and Agency Mortgage Backed Obligations - 46.0% | | | | |
| 7,305,273 | | Federal Home Loan Mortgage Corporation, Pool C03490 | | | 4.50% | | | 08/01/2040 | | | 7,739,899 | |
| 44,580,333 | | Federal Home Loan Mortgage Corporation, Pool C91388 | | | 3.50% | | | 02/01/2032 | | | 45,896,273 | |
| 23,638,203 | | Federal Home Loan Mortgage Corporation, Pool C91403 | | | 3.50% | | | 03/01/2032 | | | 24,335,999 | |
| 22,815,484 | | Federal Home Loan Mortgage Corporation, Pool C91413 | | | 3.50% | | | 12/01/2031 | | | 23,488,910 | |
| 11,543,582 | | Federal Home Loan Mortgage Corporation, Pool C91417 | | | 3.50% | | | 01/01/2032 | | | 11,884,317 | |
| 48,030,233 | | Federal Home Loan Mortgage Corporation, Pool C91447 | | | 3.50% | | | 05/01/2032 | | | 49,448,207 | |
| 54,735,770 | | Federal Home Loan Mortgage Corporation, Pool C91594 | | | 3.00% | | | 01/01/2033 | | | 55,414,807 | |
| 16,179,046 | | Federal Home Loan Mortgage Corporation, Pool C91596 | | | 3.00% | | | 02/01/2033 | | | 16,379,744 | |
| 8,438,860 | | Federal Home Loan Mortgage Corporation, Pool D98901 | | | 3.50% | | | 01/01/2032 | | | 8,687,927 | |
| 22,023,908 | | Federal Home Loan Mortgage Corporation, Pool D98923 | | | 3.50% | | | 01/01/2032 | | | 22,673,925 | |
| 20,823,379 | | Federal Home Loan Mortgage Corporation, Pool D99724 | | | 3.00% | | | 11/01/2032 | | | 21,081,604 | |
| 17,513,140 | | Federal Home Loan Mortgage Corporation, Pool G01840 | | | 5.00% | | | 07/01/2035 | | | 18,885,983 | |
| 3,617,658 | | Federal Home Loan Mortgage Corporation, Pool G04817 | | | 5.00% | | | 09/01/2038 | | | 3,898,923 | |
| 18,294,451 | | Federal Home Loan Mortgage Corporation, Pool G07801 | | | 4.00% | | | 10/01/2044 | | | 19,068,146 | |
| 34,973,677 | | Federal Home Loan Mortgage Corporation, Pool G07862 | | | 4.00% | | | 01/01/2044 | | | 36,449,864 | |
| 39,385,712 | | Federal Home Loan Mortgage Corporation, Pool G07905 | | | 4.00% | | | 01/01/2042 | | | 40,904,710 | |
| 69,592,706 | | Federal Home Loan Mortgage Corporation, Pool G08534 | | | 3.00% | | | 06/01/2043 | | | 69,628,797 | |
| 22,561,270 | | Federal Home Loan Mortgage Corporation, Pool G08537 | | | 3.00% | | | 07/01/2043 | | | 22,590,436 | |
| 54,054,114 | | Federal Home Loan Mortgage Corporation, Pool G08614 | | | 3.00% | | | 11/01/2044 | | | 54,082,143 | |
| 62,964,181 | | Federal Home Loan Mortgage Corporation, Pool G08619 | | | 3.00% | | | 12/01/2044 | | | 62,967,586 | |
| 84,801,746 | | Federal Home Loan Mortgage Corporation, Pool G08622 | | | 3.00% | | | 01/01/2045 | | | 84,793,204 | |
| 162,021,215 | | Federal Home Loan Mortgage Corporation, Pool G08626 | | | 3.00% | | | 02/01/2045 | | | 161,979,807 | |
| 88,543,259 | | Federal Home Loan Mortgage Corporation, Pool G08631 | | | 3.00% | | | 03/01/2045 | | | 88,506,921 | |
| 227,134,371 | | Federal Home Loan Mortgage Corporation, Pool G08635 | | | 3.00% | | | 04/01/2045 | | | 226,970,820 | |
| 66,806,847 | | Federal Home Loan Mortgage Corporation, Pool G08640 | | | 3.00% | | | 05/01/2045 | | | 66,748,398 | |
| 348,371,512 | | Federal Home Loan Mortgage Corporation, Pool G08648 | | | 3.00% | | | 06/01/2045 | | | 348,012,784 | |
| 67,500,865 | | Federal Home Loan Mortgage Corporation, Pool G08653 | | | 3.00% | | | 07/01/2045 | | | 67,420,905 | |
| 37,536,621 | | Federal Home Loan Mortgage Corporation, Pool G08658 | | | 3.00% | | | 08/01/2045 | | | 37,486,343 | |
| 44,984,670 | | Federal Home Loan Mortgage Corporation, Pool G08670 | | | 3.00% | | | 10/01/2045 | | | 44,910,484 | |
| 530,704,013 | | Federal Home Loan Mortgage Corporation, Pool G08675 | | | 3.00% | | | 11/01/2045 | | | 529,746,633 | |
| 222,877,877 | | Federal Home Loan Mortgage Corporation, Pool G08680 | | | 3.00% | | | 12/01/2045 | | | 222,406,782 | |
| 90,320,099 | | Federal Home Loan Mortgage Corporation, Pool G08686 | | | 3.00% | | | 01/01/2046 | | | 90,129,167 | |
| 208,933,577 | | Federal Home Loan Mortgage Corporation, Pool G08692 | | | 3.00% | | | 02/01/2046 | | | 208,459,532 | |
| 69,856,175 | | Federal Home Loan Mortgage Corporation, Pool G08705 | | | 3.00% | | | 05/01/2046 | | | 69,686,858 | |
| 7,023,169 | | Federal Home Loan Mortgage Corporation, Pool G08741 | | | 3.00% | | | 01/01/2047 | | | 6,997,545 | |
| 61,574,587 | | Federal Home Loan Mortgage Corporation, Pool G60251 | | | 3.50% | | | 10/01/2045 | | | 62,883,406 | |
| 199,672,692 | | Federal Home Loan Mortgage Corporation, Pool G60393 | | | 3.50% | | | 01/01/2046 | | | 203,932,186 | |
| 31,876,705 | | Federal Home Loan Mortgage Corporation, Pool J22834 | | | 2.50% | | | 03/01/2028 | | | 31,894,884 | |
| 59,846,625 | | Federal Home Loan Mortgage Corporation, Pool Q13637 | | | 3.00% | | | 11/01/2042 | | | 59,923,987 | |
| 61,017,751 | | Federal Home Loan Mortgage Corporation, Pool Q13638 | | | 3.00% | | | 11/01/2042 | | | 61,096,630 | |
| 98,912,962 | | Federal Home Loan Mortgage Corporation, Pool Q16672 | | | 3.00% | | | 03/01/2043 | | | 99,040,829 | |
| 5,989,429 | | Federal Home Loan Mortgage Corporation, Pool Q23595 | | | 4.00% | | | 12/01/2043 | | | 6,264,998 | |
| 7,631,286 | | Federal Home Loan Mortgage Corporation, Pool Q24052 | | | 4.00% | | | 01/01/2044 | | | 7,982,409 | |
| 6,222,310 | | Federal Home Loan Mortgage Corporation, Pool Q24172 | | | 4.00% | | | 01/01/2044 | | | 6,508,500 | |
| 6,038,423 | | Federal Home Loan Mortgage Corporation, Pool Q24979 | | | 4.00% | | | 02/01/2044 | | | 6,316,188 | |
| 45,582,234 | | Federal Home Loan Mortgage Corporation, Pool Q31596 | | | 3.50% | | | 02/01/2045 | | | 46,424,212 | |
| 16,218,412 | | Federal Home Loan Mortgage Corporation, Pool Q32861 | | | 3.50% | | | 04/01/2045 | | | 16,539,306 | |
| 43,729,664 | | Federal Home Loan Mortgage Corporation, Pool Q32921 | | | 3.50% | | | 04/01/2045 | | | 44,537,427 | |
| 28,196,043 | | Federal Home Loan Mortgage Corporation, Pool Q39502 | | | 3.50% | | | 03/01/2046 | | | 28,797,543 | |
| 87,596,868 | | Federal Home Loan Mortgage Corporation, Pool Q44073 | | | 3.00% | | | 09/01/2046 | | | 87,384,542 | |
| 6,850,242 | | Federal Home Loan Mortgage Corporation, Pool T60392 | | | 4.00% | | | 10/01/2041 | | | 6,997,679 | |
| 6,341,783 | | Federal Home Loan Mortgage Corporation, Pool T60681 | | | 4.00% | | | 05/01/2042 | | | 6,478,288 | |
| 20,183,150 | | Federal Home Loan Mortgage Corporation, Pool T60782 | | | 3.50% | | | 07/01/2042 | | | 20,293,617 | |
| 32,666,510 | | Federal Home Loan Mortgage Corporation, Pool T60853 | | | 3.50% | | | 09/01/2042 | | | 32,845,971 | |
| 26,969,556 | | Federal Home Loan Mortgage Corporation, Pool T60854 | | | 3.50% | | | 09/01/2042 | | | 27,117,726 | |
| 3,001,722 | | Federal Home Loan Mortgage Corporation, Pool T65110 | | | 3.50% | | | 10/01/2042 | | | 3,018,213 | |
| 4,021,015 | | Federal Home Loan Mortgage Corporation, Pool T69016 | | | 5.00% | | | 06/01/2041 | | | 4,179,236 | |
| 25,566,827 | | Federal Home Loan Mortgage Corporation, Pool T69050 | | | 3.50% | | | 05/01/2046 | | | 25,706,355 | |
| 531,058 | | Federal Home Loan Mortgage Corporation, Pool U60299 | | | 4.00% | | | 11/01/2040 | | | 550,616 | |
| 136,885,122 | | Federal Home Loan Mortgage Corporation, Pool V81821 | | | 3.00% | | | 08/01/2045 | | | 136,754,765 | |
| 38,303,960 | | Federal Home Loan Mortgage Corporation, Pool V82117 | | | 3.00% | | | 12/01/2045 | | | 38,267,482 | |
| 41,989,389 | | Federal Home Loan Mortgage Corporation, Pool V82209 | | | 3.50% | | | 02/01/2046 | | | 42,885,150 | |
| 14,343,141 | | Federal Home Loan Mortgage Corporation, Pool V82248 | | | 3.50% | | | 03/01/2046 | | | 14,648,019 | |
| 216,878,463 | | Federal Home Loan Mortgage Corporation, Pool Z40117 | | | 3.00% | | | 04/01/2045 | | | 216,685,918 | |
| 60,512,498 | | Federal Home Loan Mortgage Corporation, Series 2015-SC02-1A | | | 3.00% | | | 09/25/2045 | | | 60,028,277 | |
| 40,674,865 | | Federal Home Loan Mortgage Corporation, Series 2016-SC01-1A | | | 3.00% | | | 07/25/2046 | | | 40,290,414 | |
| 1,139,450 | | Federal Home Loan Mortgage Corporation, Series 2519-ZD | | | 5.50% | | | 11/15/2032 | | | 1,231,910 | |
| 774,801 | | Federal Home Loan Mortgage Corporation, Series 2596-ZL | | | 5.00% | | | 04/15/2033 | | | 827,356 | |
| 39,922,229 | | Federal Home Loan Mortgage Corporation, Series 267-30 | | | 3.00% | | | 08/15/2042 | | | 39,460,756 | |
| 396,371 | | Federal Home Loan Mortgage Corporation, Series 2684-ZN | | | 4.00% | | | 10/15/2033 | | | 411,889 | |
| 77,489,711 | | Federal Home Loan Mortgage Corporation, Series 269-30 | | | 3.00% | | | 08/15/2042 | | | 76,622,599 | |
| 32,298,150 | | Federal Home Loan Mortgage Corporation, Series 274-30 | | | 3.00% | | | 08/15/2042 | | | 32,391,988 | |
| 2,703,406 | | Federal Home Loan Mortgage Corporation, Series 2750-ZT | | | 5.00% | | | 02/15/2034 | | | 2,898,708 | |
| 98,684,534 | | Federal Home Loan Mortgage Corporation, Series 280-30 | | | 3.00% | | | 09/15/2042 | | | 97,592,018 | |
| 6,929,989 | | Federal Home Loan Mortgage Corporation, Series 2825-PZ | | | 5.50% | | | 07/15/2034 | | | 7,640,846 | |
| 23,171,333 | | Federal Home Loan Mortgage Corporation, Series 284-300 | | | 3.00% | | | 10/15/2042 | | | 23,122,555 | |
| 4,340,655 | | Federal Home Loan Mortgage Corporation, Series 2898-JZ | | | 5.00% | | | 12/15/2034 | | | 4,681,584 | |
| 10,017,094 | | Federal Home Loan Mortgage Corporation, Series 2899-AZ | | | 5.00% | | | 12/15/2034 | | | 10,791,867 | |
| 7,122,267 | | Federal Home Loan Mortgage Corporation, Series 2909-Z | | | 5.00% | | | 12/15/2034 | | | 7,650,780 | |
| 12,114,950 | | Federal Home Loan Mortgage Corporation, Series 2932-Z | | | 5.00% | | | 02/15/2035 | | | 13,035,756 | |
| 977,362 | | Federal Home Loan Mortgage Corporation, Series 2990-JL (-1 x 1 Month LIBOR USD + 6.65%, 6.65% Cap) | | | 4.17% | I/F I/O | | 03/15/2035 | | | 68,398 | |
| 4,371,407 | | Federal Home Loan Mortgage Corporation, Series 3002-SN (-1 x 1 Month LIBOR USD + 6.50%, 6.50% Cap) | | | 4.02% | I/F I/O | | 07/15/2035 | | | 622,857 | |
| 2,948,614 | | Federal Home Loan Mortgage Corporation, Series 3030-SL (-1 x 1 Month LIBOR USD + 6.10%, 6.10% Cap) | | | 3.62% | I/F I/O | | 09/15/2035 | | | 337,306 | |
| 884,015 | | Federal Home Loan Mortgage Corporation, Series 3045-DI (-1 x 1 Month LIBOR USD + 6.73%, 6.73% Cap) | | | 4.25% | I/F I/O | | 10/15/2035 | | | 140,197 | |
| 6,941,166 | | Federal Home Loan Mortgage Corporation, Series 3116-Z | | | 5.50% | | | 02/15/2036 | | | 7,651,768 | |
| 1,284,700 | | Federal Home Loan Mortgage Corporation, Series 3117-ZN | | | 4.50% | | | 02/15/2036 | | | 1,329,290 | |
| 3,650,264 | | Federal Home Loan Mortgage Corporation, Series 3174-PZ | | | 5.00% | | | 01/15/2036 | | | 3,951,721 | |
| 859,835 | | Federal Home Loan Mortgage Corporation, Series 3187-JZ | | | 5.00% | | | 07/15/2036 | | | 931,720 | |
| 2,348,151 | | Federal Home Loan Mortgage Corporation, Series 3188-ZK | | | 5.00% | | | 07/15/2036 | | | 2,531,443 | |
| 3,723,257 | | Federal Home Loan Mortgage Corporation, Series 3203-SE (-1 x 1 Month LIBOR USD + 6.50%, 6.50% Cap) | | | 4.02% | I/F I/O | | 08/15/2036 | | | 595,708 | |
| 5,186,921 | | Federal Home Loan Mortgage Corporation, Series 3203-Z | | | 5.00% | | | 07/15/2036 | | | 5,612,604 | |
| 8,218,712 | | Federal Home Loan Mortgage Corporation, Series 3203-ZC | | | 5.00% | | | 07/15/2036 | | | 8,893,211 | |
| 4,653,297 | | Federal Home Loan Mortgage Corporation, Series 3261-SA (-1 x 1 Month LIBOR USD + 6.43%, 6.43% Cap) | | | 3.95% | I/F I/O | | 01/15/2037 | | | 727,294 | |
| 18,431,450 | | Federal Home Loan Mortgage Corporation, Series 326-300 | | | 3.00% | | | 03/15/2044 | | | 18,402,807 | |
| 5,484,923 | | Federal Home Loan Mortgage Corporation, Series 3275-SC (-1 x 1 Month LIBOR USD + 6.08%, 6.08% Cap) | | | 3.60% | I/F I/O | | 02/15/2037 | | | 727,674 | |
| 1,619,040 | | Federal Home Loan Mortgage Corporation, Series 3315-HZ | | | 6.00% | | | 05/15/2037 | | | 1,650,589 | |
| 3,929,663 | | Federal Home Loan Mortgage Corporation, Series 3326-GS (-1 x 1 Month LIBOR USD + 6.65%, 6.65% Cap) | | | 4.17% | I/F I/O | | 06/15/2037 | | | 558,836 | |
| 865,799 | | Federal Home Loan Mortgage Corporation, Series 3351-ZC | | | 5.50% | | | 07/15/2037 | | | 955,701 | |
| 9,848,106 | | Federal Home Loan Mortgage Corporation, Series 3355-BI (-1 x 1 Month LIBOR USD + 6.05%, 6.05% Cap) | | | 3.57% | I/F I/O | | 08/15/2037 | | | 1,394,241 | |
| 445,581 | | Federal Home Loan Mortgage Corporation, Series 3369-Z | | | 6.00% | | | 09/15/2037 | | | 477,210 | |
| 1,072,353 | | Federal Home Loan Mortgage Corporation, Series 3405-ZG | | | 5.50% | | | 01/15/2038 | | | 1,151,015 | |
| 2,434,410 | | Federal Home Loan Mortgage Corporation, Series 3417-SI (-1 x 1 Month LIBOR USD + 6.18%, 6.18% Cap) | | | 3.70% | I/F I/O | | 02/15/2038 | | | 269,318 | |
| 2,756,537 | | Federal Home Loan Mortgage Corporation, Series 3423-GS (-1 x 1 Month LIBOR USD + 5.65%, 5.65% Cap) | | | 3.17% | I/F I/O | | 03/15/2038 | | | 272,931 | |
| 452,652 | | Federal Home Loan Mortgage Corporation, Series 3423-SG (-1 x 1 Month LIBOR USD + 5.65%, 5.65% Cap) | | | 3.17% | I/F I/O | | 03/15/2038 | | | 38,378 | |
| 585,071 | | Federal Home Loan Mortgage Corporation, Series 3451-S (-1 x 1 Month LIBOR USD + 6.03%, 6.03% Cap) | | | 3.55% | I/F I/O | | 02/15/2037 | | | 65,275 | |
| 548,265 | | Federal Home Loan Mortgage Corporation, Series 3455-SC (-1 x 1 Month LIBOR USD + 6.06%, 6.06% Cap) | | | 3.58% | I/F I/O | | 06/15/2038 | | | 53,107 | |
| 394,096 | | Federal Home Loan Mortgage Corporation, Series 3473-SM (-1 x 1 Month LIBOR USD + 6.07%, 6.07% Cap) | | | 3.59% | I/F I/O | | 07/15/2038 | | | 43,043 | |
| 4,508,234 | | Federal Home Loan Mortgage Corporation, Series 3484-SE (-1 x 1 Month LIBOR USD + 5.85%, 5.85% Cap) | | | 3.37% | I/F I/O | | 08/15/2038 | | | 638,889 | |
| 4,951,508 | | Federal Home Loan Mortgage Corporation, Series 3519-SD (-1 x 1 Month LIBOR USD + 5.55%, 5.55% Cap) | | | 3.07% | I/F I/O | | 02/15/2038 | | | 642,434 | |
| 1,686,226 | | Federal Home Loan Mortgage Corporation, Series 3524-LB | | | 3.60% | I/O | | 06/15/2038 | | | 1,704,385 | |
| 90,731 | | Federal Home Loan Mortgage Corporation, Series 3530-GZ | | | 4.50% | | | 05/15/2039 | | | 94,310 | |
| 6,290,750 | | Federal Home Loan Mortgage Corporation, Series 3541-EI (-1 x 1 Month LIBOR USD + 6.75%, 6.75% Cap) | | | 4.27% | I/F I/O | | 06/15/2039 | | | 893,042 | |
| 797,664 | | Federal Home Loan Mortgage Corporation, Series 3545-SA (-1 x 1 Month LIBOR USD + 6.15%, 6.15% Cap) | | | 3.67% | I/F I/O | | 06/15/2039 | | | 95,327 | |
| 331,826 | | Federal Home Loan Mortgage Corporation, Series 3549-SA (-1 x 1 Month LIBOR USD + 5.80%, 5.80% Cap) | | | 3.32% | I/F I/O | | 07/15/2039 | | | 32,974 | |
| 6,959,027 | | Federal Home Loan Mortgage Corporation, Series 3577-LS (-1 x 1 Month LIBOR USD + 7.20%, 7.20% Cap) | | | 4.72% | I/F I/O | | 08/15/2035 | | | 1,182,070 | |
| 1,381,199 | | Federal Home Loan Mortgage Corporation, Series 3582-SA (-1 x 1 Month LIBOR USD + 6.00%, 6.00% Cap) | | | 3.52% | I/F I/O | | 10/15/2049 | | | 195,697 | |
| 38,461,768 | | Federal Home Loan Mortgage Corporation, Series 358-300 | | | 3.00% | | | 10/15/2047 | | | 38,665,031 | |
| 2,133,524 | | Federal Home Loan Mortgage Corporation, Series 3583-GB | | | 4.50% | | | 10/15/2039 | | | 2,230,316 | |
| 15,802,350 | | Federal Home Loan Mortgage Corporation, Series 3606-CS (-1 x 1 Month LIBOR USD + 6.35%, 6.35% Cap) | | | 3.87% | I/F I/O | | 12/15/2039 | | | 2,793,136 | |
| 4,302,817 | | Federal Home Loan Mortgage Corporation, Series 3616-SG (-1 x 1 Month LIBOR USD + 6.35%, 6.35% Cap) | | | 3.87% | I/F I/O | | 03/15/2032 | | | 466,434 | |
| 5,808,471 | | Federal Home Loan Mortgage Corporation, Series 3626-AZ | | | 5.50% | | | 08/15/2036 | | | 6,244,423 | |
| 8,344,622 | | Federal Home Loan Mortgage Corporation, Series 3641-Z | | | 5.50% | | | 02/15/2036 | | | 9,122,329 | |
| 7,972,836 | | Federal Home Loan Mortgage Corporation, Series 3654-ZB | | | 5.50% | | | 11/15/2037 | | | 8,522,548 | |
| 18,539,777 | | Federal Home Loan Mortgage Corporation, Series 3666-VZ | | | 5.50% | | | 08/15/2036 | | | 20,052,794 | |
| 1,237,584 | | Federal Home Loan Mortgage Corporation, Series 3667-SB (-1 x 1 Month LIBOR USD + 6.45%, 6.45% Cap) | | | 3.97% | I/F I/O | | 05/15/2040 | | | 140,947 | |
| 7,576,320 | | Federal Home Loan Mortgage Corporation, Series 3702-SG (-1 x 1 Month LIBOR USD + 6.05%, 6.05% Cap) | | | 3.57% | I/F I/O | | 08/15/2032 | | | 959,245 | |
| 1,665,166 | | Federal Home Loan Mortgage Corporation, Series 3704-EI | | | 5.00% | I/O | | 12/15/2036 | | | 501,575 | |
| 3,427,204 | | Federal Home Loan Mortgage Corporation, Series 3712-SG (-5 x 1 Month LIBOR USD + 25.00%, 25.00% Cap) | | | 12.55% | I/F | | 08/15/2040 | | | 4,164,298 | |
| 4,814,834 | | Federal Home Loan Mortgage Corporation, Series 3724-CM | | | 5.50% | | | 06/15/2037 | | | 5,337,577 | |
| 15,739,492 | | Federal Home Loan Mortgage Corporation, Series 3726-SA (-1 x 1 Month LIBOR USD + 6.05%, 6.05% Cap) | | | 3.57% | I/F I/O | | 09/15/2040 | | | 2,395,001 | |
| 2,464,710 | | Federal Home Loan Mortgage Corporation, Series 3741-SC (-2 x 1 Month LIBOR USD + 10.00%, 10.00% Cap) | | | 5.03% | I/F | | 10/15/2040 | | | 2,717,297 | |
| 17,137,642 | | Federal Home Loan Mortgage Corporation, Series 3752-BS (-2 x 1 Month LIBOR USD + 10.00%, 10.00% Cap) | | | 5.02% | I/F | | 11/15/2040 | | | 16,697,080 | |
| 18,111,546 | | Federal Home Loan Mortgage Corporation, Series 3768-ZX | | | 5.00% | > | | 12/15/2040 | | | 20,110,865 | |
| 5,981,358 | | Federal Home Loan Mortgage Corporation, Series 3771-AL | | | 4.00% | | | 12/15/2030 | | | 6,302,719 | |
| 16,348,337 | | Federal Home Loan Mortgage Corporation, Series 3779-BY | | | 3.50% | | | 12/15/2030 | | | 17,018,894 | |
| 27,917,458 | | Federal Home Loan Mortgage Corporation, Series 3779-DZ | | | 4.50% | > | | 12/15/2040 | | | 29,637,536 | |
| 17,401,690 | | Federal Home Loan Mortgage Corporation, Series 3779-LB | | | 4.00% | | | 12/15/2030 | | | 18,278,819 | |
| 3,500,000 | | Federal Home Loan Mortgage Corporation, Series 3779-YA | | | 3.50% | | | 12/15/2030 | | | 3,626,387 | |
| 14,797,789 | | Federal Home Loan Mortgage Corporation, Series 3783-AC | | | 4.00% | | | 01/15/2031 | | | 15,556,439 | |
| 8,689,698 | | Federal Home Loan Mortgage Corporation, Series 3786-SG (-2 x 1 Month LIBOR USD + 9.50%, 9.50% Cap) | | | 4.53% | I/F | | 01/15/2041 | | | 9,204,056 | |
| 11,731,674 | | Federal Home Loan Mortgage Corporation, Series 3788-AY | | | 3.50% | | | 01/15/2031 | | | 12,063,521 | |
| 4,901,801 | | Federal Home Loan Mortgage Corporation, Series 3790-Z | | | 4.00% | | | 01/15/2041 | | | 5,154,281 | |
| 13,855,864 | | Federal Home Loan Mortgage Corporation, Series 3795-VZ | | | 4.00% | > | | 01/15/2041 | | | 14,271,945 | |
| 13,311,402 | | Federal Home Loan Mortgage Corporation, Series 3798-FG (1 Month LIBOR USD + 0.51%, 0.51% Floor, 7.00% Cap) | | | 2.99% | | | 01/15/2041 | | | 13,395,401 | |
| 419,735 | | Federal Home Loan Mortgage Corporation, Series 3798-SD (-2 x 1 Month LIBOR USD + 9.60%, 9.60% Cap) | | | 4.63% | I/F | | 12/15/2040 | | | 472,089 | |
| 22,330,916 | | Federal Home Loan Mortgage Corporation, Series 3800-VZ | | | 4.50% | > | | 02/15/2041 | | | 24,507,153 | |
| 6,681,173 | | Federal Home Loan Mortgage Corporation, Series 3803-ZM | | | 4.00% | | | 02/15/2041 | | | 6,788,449 | |
| 40,424,532 | | Federal Home Loan Mortgage Corporation, Series 3806-CZ | | | 5.50% | | | 07/15/2034 | | | 44,250,844 | |
| 17,846,910 | | Federal Home Loan Mortgage Corporation, Series 3808-DB | | | 3.50% | | | 02/15/2031 | | | 18,227,239 | |
| 14,469,302 | | Federal Home Loan Mortgage Corporation, Series 3812-EY | | | 3.50% | | | 02/15/2031 | | | 14,850,985 | |
| 6,047,634 | | Federal Home Loan Mortgage Corporation, Series 3818-CZ | | | 4.50% | | | 03/15/2041 | | | 6,527,686 | |
| 9,632,747 | | Federal Home Loan Mortgage Corporation, Series 3819-MS (-1 x 1 Month LIBOR USD + 6.47%, 6.47% Cap) | | | 3.99% | I/F I/O | | 06/15/2040 | | | 913,732 | |
| 9,332,032 | | Federal Home Loan Mortgage Corporation, Series 3819-ZU | | | 5.50% | | | 07/15/2034 | | | 10,101,479 | |
| 35,222,937 | | Federal Home Loan Mortgage Corporation, Series 3824-EY | | | 3.50% | | | 03/15/2031 | | | 36,693,784 | |
| 3,350,433 | | Federal Home Loan Mortgage Corporation, Series 3828-SW (-3 x 1 Month LIBOR USD + 13.20%, 13.20% Cap) | | | 5.75% | I/F | | 02/15/2041 | | | 4,025,281 | |
| 13,688,712 | | Federal Home Loan Mortgage Corporation, Series 3829-VZ | | | 4.00% | | | 03/15/2041 | | | 14,557,360 | |
| 7,422,002 | | Federal Home Loan Mortgage Corporation, Series 3843-PZ | | | 5.00% | > | | 04/15/2041 | | | 8,741,857 | |
| 28,085,944 | | Federal Home Loan Mortgage Corporation, Series 3863-ZA | | | 5.50% | | | 08/15/2034 | | | 30,224,475 | |
| 9,824,184 | | Federal Home Loan Mortgage Corporation, Series 3870-PB | | | 4.50% | | | 06/15/2041 | | | 10,280,036 | |
| 43,124,040 | | Federal Home Loan Mortgage Corporation, Series 3871-LZ | | | 5.50% | | | 06/15/2041 | | | 48,567,536 | |
| 13,086,856 | | Federal Home Loan Mortgage Corporation, Series 3872-BA | | | 4.00% | | | 06/15/2041 | | | 13,280,764 | |
| 10,893,772 | | Federal Home Loan Mortgage Corporation, Series 3877-EY | | | 4.50% | | | 06/15/2041 | | | 11,667,169 | |
| 5,626,431 | | Federal Home Loan Mortgage Corporation, Series 3877-GY | | | 4.50% | | | 06/15/2041 | | | 5,980,813 | |
| 25,186,800 | | Federal Home Loan Mortgage Corporation, Series 3877-ZU | | | 4.50% | | | 06/15/2041 | | | 25,892,675 | |
| 22,577,265 | | Federal Home Loan Mortgage Corporation, Series 3888-ZU | | | 4.50% | > | | 06/15/2041 | | | 25,184,524 | |
| 5,641,594 | | Federal Home Loan Mortgage Corporation, Series 3900-SB (-1 x 1 Month LIBOR USD + 5.97%, 5.97% Cap) | | | 3.49% | I/F I/O | | 07/15/2041 | | | 709,819 | |
| 31,896,730 | | Federal Home Loan Mortgage Corporation, Series 3901-VZ | | | 4.00% | | | 07/15/2041 | | | 33,258,708 | |
| 26,278,489 | | Federal Home Loan Mortgage Corporation, Series 3910-GZ | | | 5.00% | > | | 08/15/2041 | | | 30,064,890 | |
| 5,861,575 | | Federal Home Loan Mortgage Corporation, Series 3910-ZE | | | 5.00% | | | 10/15/2034 | | | 6,343,876 | |
| 10,316,560 | | Federal Home Loan Mortgage Corporation, Series 3919-KL | | | 4.50% | | | 09/15/2041 | | | 10,908,508 | |
| 32,535,805 | | Federal Home Loan Mortgage Corporation, Series 3919-ZJ | | | 4.00% | > | | 09/15/2041 | | | 35,340,111 | |
| 2,306,426 | | Federal Home Loan Mortgage Corporation, Series 3942-JZ | | | 4.00% | | | 10/15/2041 | | | 2,375,094 | |
| 9,886,364 | | Federal Home Loan Mortgage Corporation, Series 3944-AZ | | | 4.00% | | | 10/15/2041 | | | 10,056,688 | |
| 2,973,918 | | Federal Home Loan Mortgage Corporation, Series 3946-SM (-3 x 1 Month LIBOR USD + 14.70%, 14.70% Cap) | | | 7.25% | I/F | | 10/15/2041 | | | 3,749,490 | |
| 6,129,147 | | Federal Home Loan Mortgage Corporation, Series 3957-DZ | | | 3.50% | | | 11/15/2041 | | | 6,204,729 | |
| 27,456,702 | | Federal Home Loan Mortgage Corporation, Series 3969-AB | | | 4.00% | | | 10/15/2033 | | | 28,090,419 | |
| 12,512,975 | | Federal Home Loan Mortgage Corporation, Series 3982-AZ | | | 3.50% | | | 01/15/2042 | | | 13,174,771 | |
| 64,544,790 | | Federal Home Loan Mortgage Corporation, Series 3990-ZA | | | 3.50% | > | | 01/15/2042 | | | 66,649,525 | |
| 14,721,288 | | Federal Home Loan Mortgage Corporation, Series 3999-EZ | | | 4.00% | | | 02/15/2042 | | | 15,338,481 | |
| 55,730,736 | | Federal Home Loan Mortgage Corporation, Series 3999-ZB | | | 4.00% | > | | 02/15/2042 | | | 58,451,511 | |
| 31,599,232 | | Federal Home Loan Mortgage Corporation, Series 4016-KZ | | | 4.00% | > | | 03/15/2042 | | | 33,626,007 | |
| 12,430,926 | | Federal Home Loan Mortgage Corporation, Series 4050-BC | | | 2.00% | | | 05/15/2041 | | | 12,209,412 | |
| 8,000,794 | | Federal Home Loan Mortgage Corporation, Series 4050-ND | | | 2.50% | | | 09/15/2041 | | | 7,830,045 | |
| 78,562,588 | | Federal Home Loan Mortgage Corporation, Series 4057-ZA | | | 4.00% | > | | 06/15/2042 | | | 82,411,149 | |
| 78,275,482 | | Federal Home Loan Mortgage Corporation, Series 4084-TZ | | | 4.00% | > | | 07/15/2042 | | | 82,120,960 | |
| 5,595,179 | | Federal Home Loan Mortgage Corporation, Series 4097-TG | | | 2.00% | | | 05/15/2039 | | | 5,495,001 | |
| 43,356,789 | | Federal Home Loan Mortgage Corporation, Series 4097-ZA | | | 3.50% | > | | 08/15/2042 | | | 43,956,006 | |
| 97,063,000 | | Federal Home Loan Mortgage Corporation, Series 4109-GE | | | 4.50% | | | 10/15/2041 | | | 101,741,961 | |
| 2,747,382 | | Federal Home Loan Mortgage Corporation, Series 4109-KD | | | 3.00% | | | 05/15/2032 | | | 2,740,013 | |
| 4,728,088 | | Federal Home Loan Mortgage Corporation, Series 4121-AV | | | 3.00% | | | 12/15/2035 | | | 4,663,639 | |
| 41,514,809 | | Federal Home Loan Mortgage Corporation, Series 4160-HP | | | 2.50% | | | 01/15/2033 | | | 41,389,032 | |
| 30,528,108 | | Federal Home Loan Mortgage Corporation, Series 4162-ZJ | | | 3.00% | > | | 02/15/2033 | | | 30,046,536 | |
| 6,428,666 | | Federal Home Loan Mortgage Corporation, Series 4165-ZT | | | 3.00% | > | | 02/15/2043 | | | 6,098,762 | |
| 44,467,342 | | Federal Home Loan Mortgage Corporation, Series 4174-Z | | | 3.50% | > | | 03/15/2043 | | | 45,746,294 | |
| 112,208,378 | | Federal Home Loan Mortgage Corporation, Series 4179-AZ | | | 4.00% | > | | 01/15/2041 | | | 117,615,924 | |
| 32,299,871 | | Federal Home Loan Mortgage Corporation, Series 4183-ZB | | | 3.00% | > | | 03/15/2043 | | | 30,437,829 | |
| 17,334,734 | | Federal Home Loan Mortgage Corporation, Series 4186-ZJ | | | 3.00% | > | | 03/15/2033 | | | 16,656,036 | |
| 13,000,000 | | Federal Home Loan Mortgage Corporation, Series 4189-ML | | | 3.00% | | | 04/15/2038 | | | 12,700,604 | |
| 160,468,926 | | Federal Home Loan Mortgage Corporation, Series 4212-US (-1 x 1 Month LIBOR USD + 5.40%, 5.40% Cap) | | | 2.41% | I/F | | 06/15/2043 | | | 139,551,016 | |
| 6,668,536 | | Federal Home Loan Mortgage Corporation, Series 4215-KC | | | 2.25% | | | 03/15/2038 | | | 6,622,536 | |
| 71,207,989 | | Federal Home Loan Mortgage Corporation, Series 4223-US (-1 x 1 Month LIBOR USD + 5.43%, 5.43% Cap) | | | 2.43% | I/F | | 07/15/2043 | | | 62,871,691 | |
| 25,078,779 | | Federal Home Loan Mortgage Corporation, Series 4223-ZV | | | 4.00% | > | | 07/15/2043 | | | 26,730,449 | |
| 30,272,661 | | Federal Home Loan Mortgage Corporation, Series 4229-TZ | | | 3.00% | > | | 06/15/2043 | | | 28,989,718 | |
| 31,348,473 | | Federal Home Loan Mortgage Corporation, Series 4229-ZA | | | 4.00% | > | | 07/15/2043 | | | 33,389,165 | |
| 21,059,784 | | Federal Home Loan Mortgage Corporation, Series 4249-CS (-1 x 1 Month LIBOR USD + 4.65%, 4.65% Cap) | | | 2.78% | I/F | | 09/15/2043 | | | 19,018,032 | |
| 22,507,154 | | Federal Home Loan Mortgage Corporation, Series 4250-BZ | | | 3.00% | > | | 09/15/2033 | | | 21,804,552 | |
| 23,180,456 | | Federal Home Loan Mortgage Corporation, Series 4267-BZ | | | 4.00% | > | | 10/15/2040 | | | 24,330,985 | |
| 22,236,663 | | Federal Home Loan Mortgage Corporation, Series 4283-ZL | | | 3.00% | > | | 08/15/2033 | | | 22,186,368 | |
| 51,411,672 | | Federal Home Loan Mortgage Corporation, Series 4323-GA | | | 3.00% | | | 06/15/2040 | | | 51,781,980 | |
| 19,341,881 | | Federal Home Loan Mortgage Corporation, Series 4355-ZX | | | 4.00% | > | | 05/15/2044 | | | 20,344,566 | |
| 23,743,793 | | Federal Home Loan Mortgage Corporation, Series 4360-KA | | | 3.00% | | | 05/15/2040 | | | 23,949,851 | |
| 37,214,589 | | Federal Home Loan Mortgage Corporation, Series 4375-CG | | | 3.00% | | | 04/15/2039 | | | 37,436,261 | |
| 15,487,265 | | Federal Home Loan Mortgage Corporation, Series 4376-GZ | | | 3.00% | > | | 08/15/2044 | | | 14,717,098 | |
| 49,237,761 | | Federal Home Loan Mortgage Corporation, Series 4377-LZ | | | 3.00% | > | | 08/15/2044 | | | 46,771,274 | |
| 57,846,497 | | Federal Home Loan Mortgage Corporation, Series 4377-UZ | | | 3.00% | | | 08/15/2044 | | | 54,993,074 | |
| 4,492,515 | | Federal Home Loan Mortgage Corporation, Series 4379-KA | | | 3.00% | | | 08/15/2044 | | | 4,531,308 | |
| 19,006,558 | | Federal Home Loan Mortgage Corporation, Series 4384-A | | | 3.00% | | | 12/15/2040 | | | 19,131,024 | |
| 26,914,177 | | Federal Home Loan Mortgage Corporation, Series 4384-ZY | | | 3.00% | > | | 09/15/2044 | | | 25,611,036 | |
| 1,544,244 | | Federal Home Loan Mortgage Corporation, Series 4386-US (-2 x 1 Month LIBOR USD + 8.14%, 8.14% Cap) | | | 3.78% | I/F | | 09/15/2044 | | | 1,522,533 | |
| 161,664,068 | | Federal Home Loan Mortgage Corporation, Series 4390-NY | | | 3.00% | | | 06/15/2040 | | | 163,258,496 | |
| 136,405,802 | | Federal Home Loan Mortgage Corporation, Series 4390-NZ | | | 3.00% | > | | 09/15/2044 | | | 129,509,030 | |
| 42,209,478 | | Federal Home Loan Mortgage Corporation, Series 4391-MA | | | 3.00% | | | 07/15/2040 | | | 42,419,023 | |
| 58,112,125 | | Federal Home Loan Mortgage Corporation, Series 4408-PB | | | 3.00% | | | 04/15/2044 | | | 57,652,626 | |
| 118,434 | | Federal Home Loan Mortgage Corporation, Series 4419-TB | | | 3.00% | | | 02/15/2040 | | | 118,281 | |
| 73,954,255 | | Federal Home Loan Mortgage Corporation, Series 4427-CE | | | 3.00% | | | 02/15/2034 | | | 74,590,824 | |
| 48,177,776 | | Federal Home Loan Mortgage Corporation, Series 4427-MA | | | 3.00% | | | 02/15/2034 | | | 48,368,020 | |
| 29,975,657 | | Federal Home Loan Mortgage Corporation, Series 4427-PS (-1 x 1 Month LIBOR USD + 5.60%, 5.60% Cap) | | | 3.12% | I/F I/O | | 07/15/2044 | | | 3,683,397 | |
| 40,511,272 | | Federal Home Loan Mortgage Corporation, Series 4429-HA | | | 3.00% | | | 04/15/2034 | | | 40,943,917 | |
| 25,993,365 | | Federal Home Loan Mortgage Corporation, Series 4434-LZ | | | 3.00% | > | | 02/15/2045 | | | 24,615,998 | |
| 9,843,909 | | Federal Home Loan Mortgage Corporation, Series 4438-B | | | 3.00% | | | 10/15/2043 | | | 9,896,392 | |
| 9,719,258 | | Federal Home Loan Mortgage Corporation, Series 4441-VZ | | | 3.00% | > | | 02/15/2045 | | | 9,141,540 | |
| 44,924,073 | | Federal Home Loan Mortgage Corporation, Series 4444-CH | | | 3.00% | | | 01/15/2041 | | | 45,371,831 | |
| 28,253,658 | | Federal Home Loan Mortgage Corporation, Series 4444-CZ | | | 3.00% | > | | 02/15/2045 | | | 26,690,417 | |
| 43,224,179 | | Federal Home Loan Mortgage Corporation, Series 4447-A | | | 3.00% | | | 06/15/2041 | | | 43,457,058 | |
| 26,983,569 | | Federal Home Loan Mortgage Corporation, Series 4447-YZ | | | 4.00% | > | | 08/15/2043 | | | 28,839,904 | |
| 8,454,960 | | Federal Home Loan Mortgage Corporation, Series 4450-JZ | | | 3.00% | > | | 03/15/2045 | | | 8,016,987 | |
| 7,352,726 | | Federal Home Loan Mortgage Corporation, Series 4461-LZ | | | 3.00% | > | | 03/15/2045 | | | 7,006,151 | |
| 8,672,273 | | Federal Home Loan Mortgage Corporation, Series 4462-ZA | | | 3.00% | > | | 04/15/2045 | | | 8,247,481 | |
| 50,603,252 | | Federal Home Loan Mortgage Corporation, Series 4463-ZC | | | 3.00% | > | | 04/15/2045 | | | 48,471,251 | |
| 28,112,918 | | Federal Home Loan Mortgage Corporation, Series 4467-ZA | | | 3.00% | > | | 04/15/2045 | | | 26,636,292 | |
| 140,221,733 | | Federal Home Loan Mortgage Corporation, Series 4471-BA | | | 3.00% | | | 12/15/2041 | | | 139,690,853 | |
| 121,930,574 | | Federal Home Loan Mortgage Corporation, Series 4471-BC | | | 3.00% | | | 12/15/2041 | | | 122,681,337 | |
| 111,220,911 | | Federal Home Loan Mortgage Corporation, Series 4471-GA | | | 3.00% | | | 02/15/2044 | | | 111,831,891 | |
| 50,122,900 | | Federal Home Loan Mortgage Corporation, Series 4481-B | | | 3.00% | | | 12/15/2042 | | | 50,176,241 | |
| 193,266,830 | | Federal Home Loan Mortgage Corporation, Series 4483-CA | | | 3.00% | | | 06/15/2044 | | | 194,001,399 | |
| 86,900,540 | | Federal Home Loan Mortgage Corporation, Series 4483-PA | | | 2.50% | | | 06/15/2045 | | | 85,641,733 | |
| 16,783,727 | | Federal Home Loan Mortgage Corporation, Series 4484-ZL | | | 3.00% | > | | 06/15/2045 | | | 16,035,665 | |
| 9,093,756 | | Federal Home Loan Mortgage Corporation, Series 4492-GZ | | | 3.50% | > | | 07/15/2045 | | | 9,294,610 | |
| 33,386,596 | | Federal Home Loan Mortgage Corporation, Series 4498-PD | | | 2.50% | | | 08/15/2042 | | | 32,529,141 | |
| 28,453,429 | | Federal Home Loan Mortgage Corporation, Series 4499-AB | | | 3.00% | | | 06/15/2042 | | | 28,487,545 | |
| 46,059,050 | | Federal Home Loan Mortgage Corporation, Series 4504-CA | | | 3.00% | | | 04/15/2044 | | | 46,335,267 | |
| 48,863,178 | | Federal Home Loan Mortgage Corporation, Series 4510-HB | | | 2.00% | | | 03/15/2040 | | | 47,742,770 | |
| 26,459,375 | | Federal Home Loan Mortgage Corporation, Series 4511-QA | | | 3.00% | | | 01/15/2041 | | | 26,669,954 | |
| 22,894,018 | | Federal Home Loan Mortgage Corporation, Series 4511-QC | | | 3.00% | | | 12/15/2040 | | | 22,950,300 | |
| 133,785,817 | | Federal Home Loan Mortgage Corporation, Series 4527-CA | | | 3.00% | | | 02/15/2044 | | | 134,700,859 | |
| 58,246,414 | | Federal Home Loan Mortgage Corporation, Series 4527-GA | | | 3.00% | | | 02/15/2044 | | | 58,308,039 | |
| 125,049,524 | | Federal Home Loan Mortgage Corporation, Series 4533-AB | | | 3.00% | | | 06/15/2044 | | | 124,372,369 | |
| 116,998,616 | | Federal Home Loan Mortgage Corporation, Series 4543-HG | | | 2.70% | | | 04/15/2044 | | | 115,654,922 | |
| 186,097,051 | | Federal Home Loan Mortgage Corporation, Series 4573-CA | | | 3.00% | | | 11/15/2044 | | | 187,451,893 | |
| 58,290,644 | | Federal Home Loan Mortgage Corporation, Series 4573-DA | | | 3.00% | | | 03/15/2045 | | | 57,291,268 | |
| 129,654,387 | | Federal Home Loan Mortgage Corporation, Series 4582-HA | | | 3.00% | | | 09/15/2045 | | | 130,753,026 | |
| 72,630,724 | | Federal Home Loan Mortgage Corporation, Series 4588-DA | | | 3.00% | | | 02/15/2044 | | | 72,796,250 | |
| 69,355,133 | | Federal Home Loan Mortgage Corporation, Series 4629-KA | | | 3.00% | | | 03/15/2045 | | | 69,229,295 | |
| 58,994,119 | | Federal Home Loan Mortgage Corporation, Series 4738-LA | | | 3.00% | | | 11/15/2043 | | | 58,766,779 | |
| 45,815,762 | | Federal Home Loan Mortgage Corporation, Series 4744-KA | | | 3.00% | | | 08/15/2046 | | | 46,145,149 | |
| 61,360,482 | | Federal Home Loan Mortgage Corporation, Series 4750-PA | | | 3.00% | | | 07/15/2046 | | | 60,864,241 | |
| 92,612,079 | | Federal Home Loan Mortgage Corporation, Series 4752-PL | | | 3.00% | | | 09/15/2046 | | | 93,279,451 | |
| 67,377,276 | | Federal Home Loan Mortgage Corporation, Series 4763-QA | | | 3.00% | | | 06/15/2043 | | | 67,638,430 | |
| 67,887,332 | | Federal Home Loan Mortgage Corporation, Series 4766-JA | | | 3.00% | | | 07/15/2044 | | | 67,913,849 | |
| 519,666,758 | | Federal Home Loan Mortgage Corporation, Series 4791-JT | | | 3.00% | | | 05/15/2048 | | | 514,819,514 | |
| 31,109,135 | | Federal Home Loan Mortgage Corporation, Series 4791-LO | | | 0.00% | P/O | | 05/15/2048 | | | 25,877,954 | |
| 95,021,512 | | Federal Home Loan Mortgage Corporation, Series 4791-PO | | | 0.00% | P/O | | 05/15/2048 | | | 79,019,690 | |
| 113,367,425 | | Federal Home Loan Mortgage Corporation, Series 4792-A | | | 3.00% | | | 05/15/2048 | | | 111,938,326 | |
| 50,078,220 | | Federal Home Loan Mortgage Corporation, Series 4793-C | | | 3.00% | | | 06/15/2048 | | | 49,611,326 | |
| 47,788,325 | | Federal Home Loan Mortgage Corporation, Series 4795-AO | | | 0.00% | P/O | | 05/15/2048 | | | 39,856,361 | |
| 48,554,953 | | Federal Home Loan Mortgage Corporation, Series 4801-OG | | | 0.00% | P/O | | 06/15/2048 | | | 40,472,068 | |
| 60,643,231 | | Federal Home Loan Mortgage Corporation, Series R003-ZA | | | 5.50% | | | 10/15/2035 | | | 66,736,699 | |
| 8,741,109 | | Federal National Mortgage Association Pass-Thru, Pool 555743 | | | 5.00% | | | 09/01/2033 | | | 9,409,568 | |
| 6,581,282 | | Federal National Mortgage Association Pass-Thru, Pool 735382 | | | 5.00% | | | 04/01/2035 | | | 7,083,578 | |
| 10,791,585 | | Federal National Mortgage Association Pass-Thru, Pool 735402 | | | 5.00% | | | 04/01/2035 | | | 11,615,703 | |
| 7,670,265 | | Federal National Mortgage Association Pass-Thru, Pool 735484 | | | 5.00% | | | 05/01/2035 | | | 8,256,226 | |
| 2,982,282 | | Federal National Mortgage Association Pass-Thru, Pool 735667 | | | 5.00% | | | 07/01/2035 | | | 3,210,482 | |
| 2,475,064 | | Federal National Mortgage Association Pass-Thru, Pool 735893 | | | 5.00% | | | 10/01/2035 | | | 2,665,026 | |
| 6,088,658 | | Federal National Mortgage Association Pass-Thru, Pool 745275 | | | 5.00% | | | 02/01/2036 | | | 6,586,717 | |
| 248,587 | | Federal National Mortgage Association Pass-Thru, Pool 888695 | | | 5.00% | | | 08/01/2037 | | | 267,355 | |
| 1,395,115 | | Federal National Mortgage Association Pass-Thru, Pool 888968 | | | 5.00% | | | 08/01/2035 | | | 1,501,851 | |
| 12,258,123 | | Federal National Mortgage Association Pass-Thru, Pool 890549 | | | 4.00% | | | 11/01/2043 | | | 12,811,763 | |
| 14,810,655 | | Federal National Mortgage Association Pass-Thru, Pool 890565 | | | 3.00% | | | 11/01/2043 | | | 14,827,594 | |
| 734,878 | | Federal National Mortgage Association Pass-Thru, Pool 931104 | | | 5.00% | | | 05/01/2039 | | | 793,066 | |
| 196,198 | | Federal National Mortgage Association Pass-Thru, Pool 975116 | | | 5.00% | | | 05/01/2038 | | | 211,240 | |
| 1,653,614 | | Federal National Mortgage Association Pass-Thru, Pool 986864 | | | 6.50% | | | 08/01/2038 | | | 1,943,951 | |
| 1,267,689 | | Federal National Mortgage Association Pass-Thru, Pool 987316 | | | 6.50% | | | 09/01/2038 | | | 1,424,019 | |
| 11,794,867 | | Federal National Mortgage Association Pass-Thru, Pool 995203 | | | 5.00% | | | 07/01/2035 | | | 12,697,644 | |
| 19,608,069 | | Federal National Mortgage Association Pass-Thru, Pool 995849 | | | 5.00% | | | 08/01/2036 | | | 21,107,756 | |
| 17,982,192 | | Federal National Mortgage Association Pass-Thru, Pool AB2123 | | | 4.00% | | | 01/01/2031 | | | 18,703,185 | |
| 219,532 | | Federal National Mortgage Association Pass-Thru, Pool AB2370 | | | 4.50% | | | 09/01/2035 | | | 225,838 | |
| 1,624,392 | | Federal National Mortgage Association Pass-Thru, Pool AB3713 | | | 4.00% | | | 10/01/2031 | | | 1,689,454 | |
| 9,558,052 | | Federal National Mortgage Association Pass-Thru, Pool AB3796 | | | 3.50% | | | 11/01/2031 | | | 9,833,858 | |
| 4,357,795 | | Federal National Mortgage Association Pass-Thru, Pool AB3850 | | | 4.00% | | | 11/01/2041 | | | 4,468,145 | |
| 6,473,408 | | Federal National Mortgage Association Pass-Thru, Pool AB3923 | | | 4.00% | | | 11/01/2041 | | | 6,637,234 | |
| 32,219,265 | | Federal National Mortgage Association Pass-Thru, Pool AB4167 | | | 3.50% | | | 01/01/2032 | | | 33,151,324 | |
| 30,819,385 | | Federal National Mortgage Association Pass-Thru, Pool AB4261 | | | 3.50% | | | 01/01/2032 | | | 31,710,990 | |
| 5,611,479 | | Federal National Mortgage Association Pass-Thru, Pool AB5084 | | | 3.50% | | | 05/01/2032 | | | 5,773,842 | |
| 11,253,507 | | Federal National Mortgage Association Pass-Thru, Pool AB5156 | | | 3.50% | | | 05/01/2032 | | | 11,579,057 | |
| 19,192,181 | | Federal National Mortgage Association Pass-Thru, Pool AB5212 | | | 3.50% | | | 05/01/2032 | | | 19,747,473 | |
| 8,425,606 | | Federal National Mortgage Association Pass-Thru, Pool AB5243 | | | 4.00% | | | 05/01/2042 | | | 8,638,926 | |
| 27,891,533 | | Federal National Mortgage Association Pass-Thru, Pool AB5911 | | | 3.00% | | | 08/01/2032 | | | 28,233,284 | |
| 7,886,146 | | Federal National Mortgage Association Pass-Thru, Pool AB6280 | | | 3.00% | | | 09/01/2042 | | | 7,895,132 | |
| 12,072,466 | | Federal National Mortgage Association Pass-Thru, Pool AB6349 | | | 3.00% | | | 10/01/2032 | | | 12,220,386 | |
| 35,985,317 | | Federal National Mortgage Association Pass-Thru, Pool AB6750 | | | 3.00% | | | 10/01/2032 | | | 36,426,264 | |
| 18,358,378 | | Federal National Mortgage Association Pass-Thru, Pool AB6751 | | | 3.00% | | | 10/01/2032 | | | 18,583,345 | |
| 108,077,024 | | Federal National Mortgage Association Pass-Thru, Pool AB6854 | | | 3.00% | | | 11/01/2042 | | | 108,200,638 | |
| 77,116,715 | | Federal National Mortgage Association Pass-Thru, Pool AB7077 | | | 3.00% | | | 11/01/2042 | | | 77,204,930 | |
| 59,060,191 | | Federal National Mortgage Association Pass-Thru, Pool AB7344 | | | 3.00% | | | 12/01/2032 | | | 59,783,986 | |
| 28,222,125 | | Federal National Mortgage Association Pass-Thru, Pool AB7776 | | | 3.00% | | | 02/01/2043 | | | 28,254,462 | |
| 35,295,464 | | Federal National Mortgage Association Pass-Thru, Pool AB7877 | | | 3.00% | | | 02/01/2043 | | | 35,335,999 | |
| 15,056,895 | | Federal National Mortgage Association Pass-Thru, Pool AB8418 | | | 3.00% | | | 02/01/2033 | | | 15,241,429 | |
| 21,970,945 | | Federal National Mortgage Association Pass-Thru, Pool AB8520 | | | 3.00% | | | 02/01/2033 | | | 22,240,209 | |
| 26,723,216 | | Federal National Mortgage Association Pass-Thru, Pool AB8703 | | | 3.00% | | | 03/01/2038 | | | 26,753,716 | |
| 12,809,868 | | Federal National Mortgage Association Pass-Thru, Pool AB8858 | | | 3.00% | | | 04/01/2033 | | | 12,966,876 | |
| 23,188,760 | | Federal National Mortgage Association Pass-Thru, Pool AB9020 | | | 3.00% | | | 04/01/2038 | | | 23,215,226 | |
| 20,574,780 | | Federal National Mortgage Association Pass-Thru, Pool AB9197 | | | 3.00% | | | 05/01/2033 | | | 20,826,977 | |
| 60,715,757 | | Federal National Mortgage Association Pass-Thru, Pool AB9406 | | | 3.00% | | | 05/01/2033 | | | 61,460,030 | |
| 11,924,647 | | Federal National Mortgage Association Pass-Thru, Pool AB9409 | | | 3.00% | | | 05/01/2033 | | | 12,070,810 | |
| 856,156 | | Federal National Mortgage Association Pass-Thru, Pool AD2177 | | | 4.50% | | | 06/01/2030 | | | 894,808 | |
| 990,787 | | Federal National Mortgage Association Pass-Thru, Pool AD6438 | | | 5.00% | | | 06/01/2040 | | | 1,069,351 | |
| 745,297 | | Federal National Mortgage Association Pass-Thru, Pool AD7859 | | | 5.00% | | | 06/01/2040 | | | 804,271 | |
| 8,640,551 | | Federal National Mortgage Association Pass-Thru, Pool AH0607 | | | 4.00% | | | 12/01/2040 | | | 8,982,805 | |
| 1,013,820 | | Federal National Mortgage Association Pass-Thru, Pool AH1140 | | | 4.50% | | | 12/01/2040 | | | 1,043,440 | |
| 8,174,294 | | Federal National Mortgage Association Pass-Thru, Pool AH4437 | | | 4.00% | | | 01/01/2041 | | | 8,380,928 | |
| 1,883,197 | | Federal National Mortgage Association Pass-Thru, Pool AH7309 | | | 4.00% | | | 02/01/2031 | | | 1,958,709 | |
| 6,917,619 | | Federal National Mortgage Association Pass-Thru, Pool AH9323 | | | 4.00% | | | 04/01/2026 | | | 7,129,772 | |
| 498,463 | | Federal National Mortgage Association Pass-Thru, Pool AI8889 | | | 4.00% | | | 08/01/2041 | | | 511,080 | |
| 4,725,138 | | Federal National Mortgage Association Pass-Thru, Pool AI9831 | | | 4.00% | | | 09/01/2041 | | | 4,844,741 | |
| 1,377,761 | | Federal National Mortgage Association Pass-Thru, Pool AJ1265 | | | 4.00% | | | 09/01/2041 | | | 1,412,637 | |
| 2,302,553 | | Federal National Mortgage Association Pass-Thru, Pool AJ1399 | | | 4.00% | | | 09/01/2041 | | | 2,360,667 | |
| 4,759,439 | | Federal National Mortgage Association Pass-Thru, Pool AJ1467 | | | 4.00% | | | 10/01/2041 | | | 4,879,831 | |
| 4,620,363 | | Federal National Mortgage Association Pass-Thru, Pool AJ3392 | | | 4.00% | | | 10/01/2041 | | | 4,737,378 | |
| 1,848,419 | | Federal National Mortgage Association Pass-Thru, Pool AJ3854 | | | 4.00% | | | 10/01/2041 | | | 1,895,251 | |
| 23,424,584 | | Federal National Mortgage Association Pass-Thru, Pool AJ4118 | | | 4.00% | | | 11/01/2041 | | | 24,016,989 | |
| 5,299,164 | | Federal National Mortgage Association Pass-Thru, Pool AJ4131 | | | 4.00% | | | 10/01/2041 | | | 5,431,448 | |
| 1,199,121 | | Federal National Mortgage Association Pass-Thru, Pool AJ5172 | | | 4.00% | | | 11/01/2041 | | | 1,229,502 | |
| 29,048,998 | | Federal National Mortgage Association Pass-Thru, Pool AJ5322 | | | 4.00% | | | 11/01/2041 | | | 30,145,477 | |
| 16,485,501 | | Federal National Mortgage Association Pass-Thru, Pool AJ7677 | | | 3.50% | | | 12/01/2041 | | | 16,566,358 | |
| 2,891,243 | | Federal National Mortgage Association Pass-Thru, Pool AJ8334 | | | 4.00% | | | 12/01/2041 | | | 2,964,439 | |
| 30,990,516 | | Federal National Mortgage Association Pass-Thru, Pool AK0713 | | | 3.50% | | | 01/01/2032 | | | 31,886,924 | |
| 7,989,208 | | Federal National Mortgage Association Pass-Thru, Pool AK4039 | | | 4.00% | | | 02/01/2042 | | | 8,191,259 | |
| 5,415,803 | | Federal National Mortgage Association Pass-Thru, Pool AK4763 | | | 4.00% | | | 02/01/2042 | | | 5,552,996 | |
| 6,354,404 | | Federal National Mortgage Association Pass-Thru, Pool AK9438 | | | 4.00% | | | 03/01/2042 | | | 6,515,253 | |
| 7,073,630 | | Federal National Mortgage Association Pass-Thru, Pool AK9439 | | | 4.00% | | | 03/01/2042 | | | 7,250,124 | |
| 639,527 | | Federal National Mortgage Association Pass-Thru, Pool AK9446 | | | 4.50% | | | 03/01/2042 | | | 657,020 | |
| 115,522,643 | | Federal National Mortgage Association Pass-Thru, Pool AL3699 | | | 3.00% | | | 06/01/2043 | | | 115,654,928 | |
| 59,275,386 | | Federal National Mortgage Association Pass-Thru, Pool AL3883 | | | 3.00% | | | 07/01/2043 | | | 59,342,783 | |
| 3,099,261 | | Federal National Mortgage Association Pass-Thru, Pool AL4292 | | | 4.50% | | | 04/01/2026 | | | 3,189,264 | |
| 9,570,779 | | Federal National Mortgage Association Pass-Thru, Pool AL4312 | | | 4.00% | | | 10/01/2043 | | | 10,000,218 | |
| 22,300,724 | | Federal National Mortgage Association Pass-Thru, Pool AL6075 | | | 3.50% | | | 09/01/2053 | | | 22,285,563 | |
| 29,992,013 | | Federal National Mortgage Association Pass-Thru, Pool AL6076 | | | 3.00% | | | 06/01/2053 | | | 29,403,761 | |
| 79,511,441 | | Federal National Mortgage Association Pass-Thru, Pool AL6141 | | | 4.00% | | | 04/01/2042 | | | 82,511,184 | |
| 58,699,826 | | Federal National Mortgage Association Pass-Thru, Pool AL6325 | | | 3.00% | | | 10/01/2044 | | | 58,766,929 | |
| 25,757,587 | | Federal National Mortgage Association Pass-Thru, Pool AL6486 | | | 4.50% | | | 02/01/2045 | | | 27,116,036 | |
| 67,883,311 | | Federal National Mortgage Association Pass-Thru, Pool AL6538 | | | 4.50% | | | 06/01/2044 | | | 71,800,570 | |
| 56,564,417 | | Federal National Mortgage Association Pass-Thru, Pool AL8304 | | | 3.50% | | | 03/01/2046 | | | 57,733,336 | |
| 26,655,845 | | Federal National Mortgage Association Pass-Thru, Pool AO2980 | | | 4.00% | | | 05/01/2042 | | | 27,325,560 | |
| 65,919,498 | | Federal National Mortgage Association Pass-Thru, Pool AP4787 | | | 3.50% | | | 09/01/2042 | | | 66,242,835 | |
| 60,643,736 | | Federal National Mortgage Association Pass-Thru, Pool AP4789 | | | 3.50% | | | 09/01/2042 | | | 60,940,742 | |
| 16,630,311 | | Federal National Mortgage Association Pass-Thru, Pool AQ5541 | | | 3.00% | | | 12/01/2042 | | | 16,649,333 | |
| 18,744,348 | | Federal National Mortgage Association Pass-Thru, Pool AR9856 | | | 3.00% | | | 04/01/2043 | | | 18,765,791 | |
| 24,700,552 | | Federal National Mortgage Association Pass-Thru, Pool AS1927 | | | 4.50% | | | 03/01/2044 | | | 26,031,551 | |
| 25,326,640 | | Federal National Mortgage Association Pass-Thru, Pool AS2038 | | | 4.50% | | | 03/01/2044 | | | 26,690,870 | |
| 21,698,321 | | Federal National Mortgage Association Pass-Thru, Pool AS2517 | | | 4.50% | | | 05/01/2044 | | | 22,868,202 | |
| 10,836,434 | | Federal National Mortgage Association Pass-Thru, Pool AS2551 | | | 4.50% | | | 06/01/2044 | | | 11,422,200 | |
| 9,393,905 | | Federal National Mortgage Association Pass-Thru, Pool AS2765 | | | 4.50% | | | 07/01/2044 | | | 9,901,598 | |
| 33,789,422 | | Federal National Mortgage Association Pass-Thru, Pool AS3201 | | | 3.00% | | | 08/01/2034 | | | 34,203,752 | |
| 15,976,071 | | Federal National Mortgage Association Pass-Thru, Pool AS3456 | | | 3.00% | | | 10/01/2034 | | | 16,171,980 | |
| 32,637,502 | | Federal National Mortgage Association Pass-Thru, Pool AS3666 | | | 3.00% | | | 10/01/2034 | | | 33,037,728 | |
| 145,771,950 | | Federal National Mortgage Association Pass-Thru, Pool AS3961 | | | 3.00% | | | 12/01/2044 | | | 145,803,273 | |
| 44,690,848 | | Federal National Mortgage Association Pass-Thru, Pool AS4154 | | | 3.00% | | | 12/01/2044 | | | 44,665,855 | |
| 26,911,762 | | Federal National Mortgage Association Pass-Thru, Pool AS4212 | | | 3.00% | | | 01/01/2035 | | | 27,241,777 | |
| 40,864,772 | | Federal National Mortgage Association Pass-Thru, Pool AS4281 | | | 3.00% | | | 01/01/2035 | | | 41,365,915 | |
| 28,596,651 | | Federal National Mortgage Association Pass-Thru, Pool AS4345 | | | 3.50% | | | 01/01/2045 | | | 29,187,608 | |
| 31,754,716 | | Federal National Mortgage Association Pass-Thru, Pool AS4360 | | | 3.00% | | | 01/01/2035 | | | 32,144,166 | |
| 279,531,208 | | Federal National Mortgage Association Pass-Thru, Pool AS4625 | | | 3.00% | | | 03/01/2045 | | | 279,331,592 | |
| 115,391,042 | | Federal National Mortgage Association Pass-Thru, Pool AS4645 | | | 3.00% | | | 03/01/2045 | | | 115,308,640 | |
| 39,112,527 | | Federal National Mortgage Association Pass-Thru, Pool AS4779 | | | 3.00% | | | 04/01/2035 | | | 39,592,220 | |
| 38,057,053 | | Federal National Mortgage Association Pass-Thru, Pool AS4780 | | | 3.00% | | | 04/01/2035 | | | 38,523,787 | |
| 51,184,987 | | Federal National Mortgage Association Pass-Thru, Pool AS4840 | | | 3.00% | | | 04/01/2035 | | | 51,812,743 | |
| 25,648,224 | | Federal National Mortgage Association Pass-Thru, Pool AS4881 | | | 3.00% | | | 05/01/2035 | | | 25,962,771 | |
| 26,783,417 | | Federal National Mortgage Association Pass-Thru, Pool AS4882 | | | 3.00% | | | 05/01/2035 | | | 27,111,896 | |
| 54,643,619 | | Federal National Mortgage Association Pass-Thru, Pool AX9696 | | | 3.00% | | | 07/01/2045 | | | 54,197,789 | |
| 69,473,438 | | Federal National Mortgage Association Pass-Thru, Pool AY3974 | | | 3.00% | | | 03/01/2045 | | | 69,413,073 | |
| 23,246,572 | | Federal National Mortgage Association Pass-Thru, Pool AY4295 | | | 3.00% | | | 02/01/2045 | | | 23,057,056 | |
| 11,707,551 | | Federal National Mortgage Association Pass-Thru, Pool AY4296 | | | 3.00% | | | 01/01/2045 | | | 11,612,268 | |
| 12,293,310 | | Federal National Mortgage Association Pass-Thru, Pool AY5471 | | | 3.00% | | | 03/01/2045 | | | 12,193,029 | |
| 19,791,364 | | Federal National Mortgage Association Pass-Thru, Pool BC0785 | | | 3.50% | | | 04/01/2046 | | | 20,200,407 | |
| 51,019,125 | | Federal National Mortgage Association Pass-Thru, Pool BC9003 | | | 3.00% | | | 11/01/2046 | | | 50,887,883 | |
| 2,319,366 | | Federal National Mortgage Association Pass-Thru, Pool MA0264 | | | 4.50% | | | 12/01/2029 | | | 2,423,441 | |
| 8,485,218 | | Federal National Mortgage Association Pass-Thru, Pool MA0353 | | | 4.50% | | | 03/01/2030 | | | 8,868,991 | |
| 1,792,069 | | Federal National Mortgage Association Pass-Thru, Pool MA0406 | | | 4.50% | | | 05/01/2030 | | | 1,873,127 | |
| 133,053 | | Federal National Mortgage Association Pass-Thru, Pool MA0445 | | | 5.00% | | | 06/01/2040 | | | 138,063 | |
| 130,261 | | Federal National Mortgage Association Pass-Thru, Pool MA0459 | | | 4.00% | | | 07/01/2020 | | | 134,256 | |
| 291,809 | | Federal National Mortgage Association Pass-Thru, Pool MA0468 | | | 5.00% | | | 07/01/2040 | | | 302,796 | |
| 449,227 | | Federal National Mortgage Association Pass-Thru, Pool MA0502 | | | 4.00% | | | 08/01/2020 | | | 463,004 | |
| 232,753 | | Federal National Mortgage Association Pass-Thru, Pool MA0517 | | | 4.00% | | | 09/01/2020 | | | 239,891 | |
| 2,651,922 | | Federal National Mortgage Association Pass-Thru, Pool MA0534 | | | 4.00% | | | 10/01/2030 | | | 2,758,227 | |
| 1,467,837 | | Federal National Mortgage Association Pass-Thru, Pool MA0536 | | | 4.00% | | | 10/01/2020 | | | 1,512,854 | |
| 1,968,793 | | Federal National Mortgage Association Pass-Thru, Pool MA0580 | | | 4.00% | | | 11/01/2020 | | | 2,029,173 | |
| 581,271 | | Federal National Mortgage Association Pass-Thru, Pool MA0587 | | | 4.00% | | | 12/01/2030 | | | 604,574 | |
| 14,233,193 | | Federal National Mortgage Association Pass-Thru, Pool MA0616 | | | 4.00% | | | 01/01/2031 | | | 14,803,657 | |
| 5,615,077 | | Federal National Mortgage Association Pass-Thru, Pool MA0896 | | | 4.00% | | | 11/01/2041 | | | 5,756,993 | |
| 109,629,153 | | Federal National Mortgage Association Pass-Thru, Pool MA0919 | | | 3.50% | | | 12/01/2031 | | | 112,800,461 | |
| 46,950,451 | | Federal National Mortgage Association Pass-Thru, Pool MA0949 | | | 3.50% | | | 01/01/2032 | | | 48,308,608 | |
| 57,101,030 | | Federal National Mortgage Association Pass-Thru, Pool MA0976 | | | 3.50% | | | 02/01/2032 | | | 58,752,810 | |
| 27,968,937 | | Federal National Mortgage Association Pass-Thru, Pool MA1010 | | | 3.50% | | | 03/01/2032 | | | 28,778,041 | |
| 8,725,974 | | Federal National Mortgage Association Pass-Thru, Pool MA1039 | | | 3.50% | | | 04/01/2042 | | | 8,768,684 | |
| 38,068,524 | | Federal National Mortgage Association Pass-Thru, Pool MA1059 | | | 3.50% | | | 05/01/2032 | | | 39,169,910 | |
| 5,690,834 | | Federal National Mortgage Association Pass-Thru, Pool MA1068 | | | 3.50% | | | 05/01/2042 | | | 5,718,705 | |
| 81,143,086 | | Federal National Mortgage Association Pass-Thru, Pool MA1084 | | | 3.50% | | | 06/01/2032 | | | 83,490,821 | |
| 12,892,110 | | Federal National Mortgage Association Pass-Thru, Pool MA1093 | | | 3.50% | | | 06/01/2042 | | | 12,955,124 | |
| 10,300,275 | | Federal National Mortgage Association Pass-Thru, Pool MA1094 | | | 4.00% | | | 06/01/2042 | | | 10,560,538 | |
| 49,173,059 | | Federal National Mortgage Association Pass-Thru, Pool MA1107 | | | 3.50% | | | 07/01/2032 | | | 50,595,951 | |
| 122,200,013 | | Federal National Mortgage Association Pass-Thru, Pool MA1117 | | | 3.50% | | | 07/01/2042 | | | 122,799,418 | |
| 142,298,974 | | Federal National Mortgage Association Pass-Thru, Pool MA1136 | | | 3.50% | | | 08/01/2042 | | | 142,996,960 | |
| 32,990,951 | | Federal National Mortgage Association Pass-Thru, Pool MA1138 | | | 3.50% | | | 08/01/2032 | | | 33,945,574 | |
| 37,676,143 | | Federal National Mortgage Association Pass-Thru, Pool MA1179 | | | 3.50% | | | 09/01/2042 | | | 37,860,948 | |
| 6,452,940 | | Federal National Mortgage Association Pass-Thru, Pool MA1201 | | | 3.50% | | | 10/01/2032 | | | 6,639,681 | |
| 82,098,883 | | Federal National Mortgage Association Pass-Thru, Pool MA1209 | | | 3.50% | | | 10/01/2042 | | | 82,501,605 | |
| 42,045,682 | | Federal National Mortgage Association Pass-Thru, Pool MA1237 | | | 3.00% | | | 11/01/2032 | | | 42,560,914 | |
| 5,175,542 | | Federal National Mortgage Association Pass-Thru, Pool MA1242 | | | 3.50% | | | 11/01/2042 | | | 5,200,902 | |
| 23,065,643 | | Federal National Mortgage Association Pass-Thru, Pool MA1338 | | | 3.00% | | | 02/01/2033 | | | 23,348,313 | |
| 90,303,070 | | Federal National Mortgage Association Pass-Thru, Pool MA1366 | | | 3.00% | | | 03/01/2033 | | | 91,409,778 | |
| 55,632,473 | | Federal National Mortgage Association Pass-Thru, Pool MA1401 | | | 3.00% | | | 04/01/2033 | | | 56,314,314 | |
| 95,650,349 | | Federal National Mortgage Association Pass-Thru, Pool MA1459 | | | 3.00% | | | 06/01/2033 | | | 96,822,817 | |
| 12,233,428 | | Federal National Mortgage Association Pass-Thru, Pool MA1490 | | | 3.00% | | | 07/01/2033 | | | 12,383,389 | |
| 70,342,074 | | Federal National Mortgage Association Pass-Thru, Pool MA2018 | | | 3.50% | | | 09/01/2034 | | | 72,378,204 | |
| 27,485,801 | | Federal National Mortgage Association Pass-Thru, Pool MA2114 | | | 3.50% | | | 12/01/2044 | | | 27,620,508 | |
| 22,504,659 | | Federal National Mortgage Association Pass-Thru, Pool MA2151 | | | 3.50% | | | 01/01/2045 | | | 22,614,992 | |
| 41,191,279 | | Federal National Mortgage Association Pass-Thru, Pool MA2164 | | | 3.50% | | | 02/01/2035 | | | 42,384,120 | |
| 89,416,514 | | Federal National Mortgage Association Pass-Thru, Pool MA2166 | | | 3.50% | | | 02/01/2045 | | | 89,854,763 | |
| 93,358,091 | | Federal National Mortgage Association Pass-Thru, Pool MA2248 | | | 3.00% | | | 04/01/2045 | | | 92,596,378 | |
| 94,449,537 | | Federal National Mortgage Association Pass-Thru, Pool MA2270 | | | 3.00% | | | 05/01/2045 | | | 93,678,920 | |
| 120,521,645 | | Federal National Mortgage Association Pass-Thru, Pool MA2650 | | | 3.50% | | | 06/01/2046 | | | 121,112,030 | |
| 44,242,179 | | Federal National Mortgage Association Pass-Thru, Pool MA2833 | | | 3.00% | | | 12/01/2046 | | | 44,128,369 | |
| 7,667,540 | | Federal National Mortgage Association Pass-Thru, Pool MA3894 | | | 4.00% | | | 09/01/2031 | | | 7,975,160 | |
| 31,058,866 | | Federal National Mortgage Association, Pool AL9220 | | | 3.00% | | | 06/01/2045 | | | 31,094,387 | |
| 10,026,000 | | Federal National Mortgage Association, Pool AN7452 | | | 3.12% | | | 11/01/2032 | | | 9,977,883 | |
| 73,483,493 | | Federal National Mortgage Association, Pool AS7473 | | | 3.00% | | | 07/01/2046 | | | 73,054,967 | |
| 10,551,750 | | Federal National Mortgage Association, Pool AS7610 | | | 2.50% | | | 07/01/2046 | | | 10,189,432 | |
| 162,775,218 | | Federal National Mortgage Association, Pool AS7661 | | | 3.00% | | | 08/01/2046 | | | 161,825,828 | |
| 92,681,212 | | Federal National Mortgage Association, Pool AS8111 | | | 3.00% | | | 10/01/2041 | | | 92,787,159 | |
| 58,586,846 | | Federal National Mortgage Association, Pool AS8269 | | | 3.00% | | | 11/01/2046 | | | 58,418,567 | |
| 61,292,990 | | Federal National Mortgage Association, Pool AS8306 | | | 3.00% | | | 11/01/2041 | | | 61,180,424 | |
| 87,260,251 | | Federal National Mortgage Association, Pool AS8356 | | | 3.00% | | | 11/01/2046 | | | 86,978,333 | |
| 19,209,147 | | Federal National Mortgage Association, Pool AZ0576 | | | 3.50% | | | 04/01/2042 | | | 19,492,225 | |
| 15,280,343 | | Federal National Mortgage Association, Pool BC9081 | | | 3.00% | | | 12/01/2046 | | | 15,241,035 | |
| 59,898,794 | | Federal National Mortgage Association, Pool BM5299 | | | 3.00% | | | 12/01/2046 | | | 59,742,741 | |
| 90,185,178 | | Federal National Mortgage Association, Pool BM5633 | | | 3.00% | | | 07/01/2047 | | | 89,952,711 | |
| 45,120,909 | | Federal National Mortgage Association, Pool CA0862 | | | 3.50% | | | 09/01/2047 | | | 45,847,097 | |
| 118,101,367 | | Federal National Mortgage Association, Pool MA2621 | | | 3.50% | | | 05/01/2046 | | | 118,679,103 | |
| 107,695,914 | | Federal National Mortgage Association, Pool MA2649 | | | 3.00% | | | 06/01/2046 | | | 107,067,769 | |
| 38,209,537 | | Federal National Mortgage Association, Pool MA2673 | | | 3.00% | | | 07/01/2046 | | | 37,986,680 | |
| 114,428,998 | | Federal National Mortgage Association, Pool MA2711 | | | 3.00% | | | 08/01/2046 | | | 113,761,569 | |
| 10,655,790 | | Federal National Mortgage Association, Pool MA2743 | | | 3.00% | | | 09/01/2046 | | | 10,593,644 | |
| 124,419,796 | | Federal National Mortgage Association, Pool MA2806 | | | 3.00% | | | 11/01/2046 | | | 123,948,163 | |
| 51,098,589 | | Federal National Mortgage Association, Pool MA2895 | | | 3.00% | | | 02/01/2047 | | | 50,967,133 | |
| 774,583 | | Federal National Mortgage Association, Series 2002-70-QZ | | | 5.50% | | | 11/25/2032 | | | 838,235 | |
| 1,158,331 | | Federal National Mortgage Association, Series 2002-75-ZG | | | 5.50% | | | 11/25/2032 | | | 1,250,633 | |
| 15,990,875 | | Federal National Mortgage Association, Series 2003-129-ZT | | | 5.50% | | | 01/25/2034 | | | 17,613,098 | |
| 3,015,678 | | Federal National Mortgage Association, Series 2003-29-ZL | | | 5.00% | | | 04/25/2033 | | | 3,219,064 | |
| 1,471,838 | | Federal National Mortgage Association, Series 2003-64-ZG | | | 5.50% | | | 07/25/2033 | | | 1,584,196 | |
| 12,286,722 | | Federal National Mortgage Association, Series 2003-84-PZ | | | 5.00% | | | 09/25/2033 | | | 13,334,939 | |
| 11,772,475 | | Federal National Mortgage Association, Series 2003-W17-1A7 | | | 5.75% | | | 08/25/2033 | | | 12,865,575 | |
| 3,010,010 | | Federal National Mortgage Association, Series 2004-46-PJ (-1 x 1 Month LIBOR USD + 6.00%, 6.00% Cap) | | | 3.51% | I/F I/O | | 03/25/2034 | | | 283,313 | |
| 2,890,073 | | Federal National Mortgage Association, Series 2004-51-XP (-1 x 1 Month LIBOR USD + 7.70%, 7.70% Cap) | | | 5.21% | I/F I/O | | 07/25/2034 | | | 556,067 | |
| 4,902,608 | | Federal National Mortgage Association, Series 2004-W10-A6 | | | 5.75% | | | 08/25/2034 | | | 5,358,299 | |
| 412,545 | | Federal National Mortgage Association, Series 2004-W4-A5 | | | 5.50% | | | 06/25/2034 | | | 415,763 | |
| 216,121 | | Federal National Mortgage Association, Series 2005-107-EG | | | 4.50% | | | 01/25/2026 | | | 223,552 | |
| 685,671 | | Federal National Mortgage Association, Series 2005-37-ZK | | | 4.50% | | | 05/25/2035 | | | 709,408 | |
| 6,679,115 | | Federal National Mortgage Association, Series 2005-87-SE (-1 x 1 Month LIBOR USD + 6.05%, 6.05% Cap) | | | 3.56% | I/F I/O | | 10/25/2035 | | | 967,567 | |
| 5,431,810 | | Federal National Mortgage Association, Series 2005-87-SG (-1 x 1 Month LIBOR USD + 6.70%, 6.70% Cap) | | | 4.21% | I/F I/O | | 10/25/2035 | | | 925,864 | |
| 4,546,710 | | Federal National Mortgage Association, Series 2006-101-SA (-1 x 1 Month LIBOR USD + 6.58%, 6.58% Cap) | | | 4.09% | I/F I/O | | 10/25/2036 | | | 772,041 | |
| 1,855,783 | | Federal National Mortgage Association, Series 2006-123-LI (-1 x 1 Month LIBOR USD + 6.32%, 6.32% Cap) | | | 3.83% | I/F I/O | | 01/25/2037 | | | 308,144 | |
| 1,109,242 | | Federal National Mortgage Association, Series 2006-16-HZ | | | 5.50% | | | 03/25/2036 | | | 1,208,123 | |
| 7,545,838 | | Federal National Mortgage Association, Series 2006-56-SM (-1 x 1 Month LIBOR USD + 6.75%, 6.75% Cap) | | | 4.26% | I/F I/O | | 07/25/2036 | | | 1,210,339 | |
| 965,716 | | Federal National Mortgage Association, Series 2006-93-SN (-1 x 1 Month LIBOR USD + 6.60%, 6.60% Cap) | | | 4.11% | I/F I/O | | 10/25/2036 | | | 137,716 | |
| 11,153,899 | | Federal National Mortgage Association, Series 2007-109-VZ | | | 5.00% | | | 10/25/2035 | | | 12,037,248 | |
| 1,072,402 | | Federal National Mortgage Association, Series 2007-116-BI (-1 x 1 Month LIBOR USD + 6.25%, 6.25% Cap) | | | 3.76% | I/F I/O | | 05/25/2037 | | | 134,585 | |
| 6,825,268 | | Federal National Mortgage Association, Series 2007-14-PS (-1 x 1 Month LIBOR USD + 6.81%, 6.81% Cap) | | | 4.32% | I/F I/O | | 03/25/2037 | | | 1,235,568 | |
| 3,412,873 | | Federal National Mortgage Association, Series 2007-30-OI (-1 x 1 Month LIBOR USD + 6.44%, 6.44% Cap) | | | 3.95% | I/F I/O | | 04/25/2037 | | | 595,371 | |
| 486,444 | | Federal National Mortgage Association, Series 2007-30-SI (-1 x 1 Month LIBOR USD + 6.11%, 6.11% Cap) | | | 3.62% | I/F I/O | | 04/25/2037 | | | 52,893 | |
| 3,485,063 | | Federal National Mortgage Association, Series 2007-32-SG (-1 x 1 Month LIBOR USD + 6.10%, 6.10% Cap) | | | 3.61% | I/F I/O | | 04/25/2037 | | | 555,035 | |
| 2,940,107 | | Federal National Mortgage Association, Series 2007-57-SX (-1 x 1 Month LIBOR USD + 6.62%, 6.62% Cap) | | | 4.13% | I/F I/O | | 10/25/2036 | | | 405,453 | |
| 3,818,817 | | Federal National Mortgage Association, Series 2007-60-VZ | | | 6.00% | | | 07/25/2037 | | | 4,146,380 | |
| 2,281,694 | | Federal National Mortgage Association, Series 2007-71-GZ | | | 6.00% | | | 07/25/2047 | | | 2,388,124 | |
| 3,664,497 | | Federal National Mortgage Association, Series 2007-75-ID (-1 x 1 Month LIBOR USD + 5.87%, 5.87% Cap) | | | 3.38% | I/F I/O | | 08/25/2037 | | | 546,662 | |
| 1,005,923 | | Federal National Mortgage Association, Series 2007-9-SD (-1 x 1 Month LIBOR USD + 6.65%, 6.65% Cap) | | | 4.16% | I/F I/O | | 03/25/2037 | | | 150,694 | |
| 568,365 | | Federal National Mortgage Association, Series 2008-27-B | | | 5.50% | | | 04/25/2038 | | | 617,131 | |
| 4,351,296 | | Federal National Mortgage Association, Series 2008-29-ZA | | | 4.50% | | | 04/25/2038 | | | 4,593,249 | |
| 8,343,157 | | Federal National Mortgage Association, Series 2008-48-BE | | | 5.00% | | | 06/25/2034 | | | 9,100,914 | |
| 865,449 | | Federal National Mortgage Association, Series 2008-48-SD (-1 x 1 Month LIBOR USD + 6.00%, 6.00% Cap) | | | 3.51% | I/F I/O | | 06/25/2037 | | | 90,194 | |
| 1,065,067 | | Federal National Mortgage Association, Series 2008-53-LI (-1 x 1 Month LIBOR USD + 6.15%, 6.15% Cap) | | | 3.66% | I/F I/O | | 07/25/2038 | | | 123,785 | |
| 1,095,848 | | Federal National Mortgage Association, Series 2008-57-SE (-1 x 1 Month LIBOR USD + 6.00%, 6.00% Cap) | | | 3.51% | I/F I/O | | 02/25/2037 | | | 126,500 | |
| 1,201,403 | | Federal National Mortgage Association, Series 2008-5-MS (-1 x 1 Month LIBOR USD + 6.25%, 6.25% Cap) | | | 3.76% | I/F I/O | | 02/25/2038 | | | 155,839 | |
| 1,017,205 | | Federal National Mortgage Association, Series 2008-61-SC (-1 x 1 Month LIBOR USD + 6.00%, 6.00% Cap) | | | 3.51% | I/F I/O | | 07/25/2038 | | | 93,701 | |
| 809,305 | | Federal National Mortgage Association, Series 2008-62-SC (-1 x 1 Month LIBOR USD + 6.00%, 6.00% Cap) | | | 3.51% | I/F I/O | | 07/25/2038 | | | 95,905 | |
| 2,098,916 | | Federal National Mortgage Association, Series 2008-65-SA (-1 x 1 Month LIBOR USD + 6.00%, 6.00% Cap) | | | 3.51% | I/F I/O | | 08/25/2038 | | | 314,372 | |
| 1,416,129 | | Federal National Mortgage Association, Series 2008-81-LP | | | 5.50% | | | 09/25/2038 | | | 1,515,314 | |
| 7,035,452 | | Federal National Mortgage Association, Series 2009-106-EZ | | | 4.50% | | | 01/25/2040 | | | 7,414,788 | |
| 1,026,155 | | Federal National Mortgage Association, Series 2009-111-SE (-1 x 1 Month LIBOR USD + 6.25%, 6.25% Cap) | | | 3.76% | I/F I/O | | 01/25/2040 | | | 123,676 | |
| 607,313 | | Federal National Mortgage Association, Series 2009-16-MZ | | | 5.00% | | | 03/25/2029 | | | 643,740 | |
| 2,209,245 | | Federal National Mortgage Association, Series 2009-42-SI (-1 x 1 Month LIBOR USD + 6.00%, 6.00% Cap) | | | 3.51% | I/F I/O | | 06/25/2039 | | | 238,397 | |
| 1,266,931 | | Federal National Mortgage Association, Series 2009-42-SX (-1 x 1 Month LIBOR USD + 6.00%, 6.00% Cap) | | | 3.51% | I/F I/O | | 06/25/2039 | | | 132,040 | |
| 901,116 | | Federal National Mortgage Association, Series 2009-47-SA (-1 x 1 Month LIBOR USD + 6.10%, 6.10% Cap) | | | 3.61% | I/F I/O | | 07/25/2039 | | | 116,447 | |
| 587,450 | | Federal National Mortgage Association, Series 2009-48-WS (-1 x 1 Month LIBOR USD + 5.95%, 5.95% Cap) | | | 3.46% | I/F I/O | | 07/25/2039 | | | 60,180 | |
| 5,474,754 | | Federal National Mortgage Association, Series 2009-49-S (-1 x 1 Month LIBOR USD + 6.75%, 6.75% Cap) | | | 4.26% | I/F I/O | | 07/25/2039 | | | 788,727 | |
| 637,833 | | Federal National Mortgage Association, Series 2009-51-BZ | | | 4.50% | | | 07/25/2039 | | | 658,779 | |
| 1,934,551 | | Federal National Mortgage Association, Series 2009-54-EZ | | | 5.00% | | | 07/25/2039 | | | 2,024,509 | |
| 912,545 | | Federal National Mortgage Association, Series 2009-70-SA (-1 x 1 Month LIBOR USD + 5.80%, 5.80% Cap) | | | 3.31% | I/F I/O | | 09/25/2039 | | | 97,460 | |
| 4,989,960 | | Federal National Mortgage Association, Series 2009-80-PM | | | 4.50% | | | 10/25/2039 | | | 5,307,081 | |
| 3,107,744 | | Federal National Mortgage Association, Series 2009-83-Z | | | 4.50% | | | 10/25/2039 | | | 3,204,525 | |
| 12,398,050 | | Federal National Mortgage Association, Series 2009-85-ES (-1 x 1 Month LIBOR USD + 7.23%, 7.23% Cap) | | | 4.74% | I/F I/O | | 01/25/2036 | | | 2,156,247 | |
| 16,072,495 | | Federal National Mortgage Association, Series 2009-85-JS (-1 x 1 Month LIBOR USD + 6.75%, 6.75% Cap) | | | 4.26% | I/F I/O | | 10/25/2039 | | | 3,086,356 | |
| 1,504,509 | | Federal National Mortgage Association, Series 2009-90-IB (-1 x 1 Month LIBOR USD + 5.72%, 5.72% Cap) | | | 3.23% | I/F I/O | | 04/25/2037 | | | 158,480 | |
| 1,312,795 | | Federal National Mortgage Association, Series 2009-94-BC | | | 5.00% | | | 11/25/2039 | | | 1,359,932 | |
| 15,826,587 | | Federal National Mortgage Association, Series 2010-101-SA (-1 x 1 Month LIBOR USD + 4.48%, 4.48% Cap) | | | 1.99% | I/F I/O | | 09/25/2040 | | | 1,581,301 | |
| 8,655,456 | | Federal National Mortgage Association, Series 2010-101-ZC | | | 4.50% | | | 09/25/2040 | | | 9,190,942 | |
| 21,895,256 | | Federal National Mortgage Association, Series 2010-101-ZH | | | 4.50% | | | 07/25/2040 | | | 23,035,944 | |
| 4,673,617 | | Federal National Mortgage Association, Series 2010-10-SA (-1 x 1 Month LIBOR USD + 6.35%, 6.35% Cap) | | | 3.86% | I/F I/O | | 02/25/2040 | | | 829,874 | |
| 2,157,628 | | Federal National Mortgage Association, Series 2010-10-ZA | | | 4.50% | | | 02/25/2040 | | | 2,190,437 | |
| 1,289,489 | | Federal National Mortgage Association, Series 2010-111-S (-1 x 1 Month LIBOR USD + 5.95%, 5.95% Cap) | | | 3.46% | I/F I/O | | 10/25/2050 | | | 151,230 | |
| 4,177,769 | | Federal National Mortgage Association, Series 2010-116-Z | | | 4.00% | | | 10/25/2040 | | | 4,334,567 | |
| 903,556 | | Federal National Mortgage Association, Series 2010-117-SA (-1 x 1 Month LIBOR USD + 4.50%, 4.50% Cap) | | | 2.01% | I/F I/O | | 10/25/2040 | | | 65,486 | |
| 3,271,984 | | Federal National Mortgage Association, Series 2010-120-KD | | | 4.00% | | | 10/25/2040 | | | 3,473,323 | |
| 26,321,231 | | Federal National Mortgage Association, Series 2010-121-SD (-1 x 1 Month LIBOR USD + 4.50%, 4.50% Cap) | | | 2.01% | I/F I/O | | 10/25/2040 | | | 2,024,508 | |
| 242,685 | | Federal National Mortgage Association, Series 2010-126-SU (-11 x 1 Month LIBOR USD + 55.00%, 55.00% Cap) | | | 27.62% | I/F | | 11/25/2040 | | | 737,894 | |
| 178,693 | | Federal National Mortgage Association, Series 2010-126-SX (-3 x 1 Month LIBOR USD + 15.00%, 15.00% Cap) | | | 7.53% | I/F | | 11/25/2040 | | | 260,867 | |
| 6,725,326 | | Federal National Mortgage Association, Series 2010-128-HZ | | | 4.00% | | | 11/25/2040 | | | 6,919,825 | |
| 3,438,480 | | Federal National Mortgage Association, Series 2010-132-Z | | | 4.50% | | | 11/25/2040 | | | 3,553,020 | |
| 88,008 | | Federal National Mortgage Association, Series 2010-137-VS (-3 x 1 Month LIBOR USD + 15.00%, 15.00% Cap) | | | 7.53% | I/F | | 12/25/2040 | | | 110,506 | |
| 12,894,696 | | Federal National Mortgage Association, Series 2010-142-AZ | | | 4.00% | | | 12/25/2040 | | | 13,192,992 | |
| 11,103,388 | | Federal National Mortgage Association, Series 2010-148-SA (-1 x 1 Month LIBOR USD + 6.65%, 6.65% Cap) | | | 4.16% | I/F I/O | | 01/25/2026 | | | 1,007,736 | |
| 11,920,298 | | Federal National Mortgage Association, Series 2010-150-FD (1 Month LIBOR USD + 0.51%, 0.51% Floor, 7.00% Cap) | | | 3.00% | | | 01/25/2041 | | | 12,001,016 | |
| 29,446,570 | | Federal National Mortgage Association, Series 2010-150-ZA | | | 4.00% | | | 01/25/2041 | | | 30,518,755 | |
| 10,088,792 | | Federal National Mortgage Association, Series 2010-16-SA (-1 x 1 Month LIBOR USD + 5.45%, 5.45% Cap) | | | 2.96% | I/F I/O | | 03/25/2040 | | | 1,201,633 | |
| 3,304,463 | | Federal National Mortgage Association, Series 2010-21-DZ | | | 5.00% | | | 03/25/2040 | | | 3,597,094 | |
| 1,508,841 | | Federal National Mortgage Association, Series 2010-21-KS (-1 x 1 Month LIBOR USD + 4.95%, 4.95% Cap) | | | 2.46% | I/F I/O | | 03/25/2040 | | | 86,275 | |
| 537,066 | | Federal National Mortgage Association, Series 2010-2-GS (-1 x 1 Month LIBOR USD + 6.45%, 6.45% Cap) | | | 3.96% | I/F I/O | | 12/25/2049 | | | 32,364 | |
| 2,090,277 | | Federal National Mortgage Association, Series 2010-2-MS (-1 x 1 Month LIBOR USD + 6.25%, 6.25% Cap) | | | 3.76% | I/F I/O | | 02/25/2050 | | | 288,998 | |
| 1,711,953 | | Federal National Mortgage Association, Series 2010-31-SA (-1 x 1 Month LIBOR USD + 5.00%, 5.00% Cap) | | | 2.51% | I/F I/O | | 04/25/2040 | | | 129,050 | |
| 6,077,351 | | Federal National Mortgage Association, Series 2010-31-VZ | | | 4.00% | | | 04/25/2040 | | | 6,192,405 | |
| 4,205,151 | | Federal National Mortgage Association, Series 2010-34-PS (-1 x 1 Month LIBOR USD + 4.93%, 4.93% Cap) | | | 2.44% | I/F I/O | | 04/25/2040 | | | 325,842 | |
| 681,623 | | Federal National Mortgage Association, Series 2010-35-ES (-1 x 1 Month LIBOR USD + 6.45%, 6.45% Cap) | | | 3.96% | I/F I/O | | 04/25/2040 | | | 74,722 | |
| 848,288 | | Federal National Mortgage Association, Series 2010-35-SV (-1 x 1 Month LIBOR USD + 6.45%, 6.45% Cap) | | | 3.96% | I/F I/O | | 04/25/2040 | | | 68,254 | |
| 1,398,479 | | Federal National Mortgage Association, Series 2010-46-MS (-1 x 1 Month LIBOR USD + 4.95%, 4.95% Cap) | | | 2.46% | I/F I/O | | 05/25/2040 | | | 105,577 | |
| 10,489,413 | | Federal National Mortgage Association, Series 2010-49-ZW | | | 4.50% | | | 05/25/2040 | | | 10,915,942 | |
| 2,579,570 | | Federal National Mortgage Association, Series 2010-4-SK (-1 x 1 Month LIBOR USD + 6.23%, 6.23% Cap) | | | 3.74% | I/F I/O | | 02/25/2040 | | | 345,174 | |
| 994,570 | | Federal National Mortgage Association, Series 2010-58-ES (-3 x 1 Month LIBOR USD + 12.47%, 12.47% Cap) | | | 6.08% | I/F | | 06/25/2040 | | | 1,099,040 | |
| 7,015,072 | | Federal National Mortgage Association, Series 2010-59-MS (-1 x 1 Month LIBOR USD + 5.77%, 5.77% Cap) | | | 3.28% | I/F I/O | | 06/25/2040 | | | 1,009,883 | |
| 6,114,950 | | Federal National Mortgage Association, Series 2010-59-PS (-1 x 1 Month LIBOR USD + 6.45%, 6.45% Cap) | | | 3.96% | I/F I/O | | 03/25/2039 | | | 243,615 | |
| 7,135,284 | | Federal National Mortgage Association, Series 2010-59-SC (-1 x 1 Month LIBOR USD + 5.00%, 5.00% Cap) | | | 2.51% | I/F I/O | | 01/25/2040 | | | 666,934 | |
| 955,716 | | Federal National Mortgage Association, Series 2010-60-VZ | | | 5.00% | | | 10/25/2039 | | | 1,016,131 | |
| 660,769 | | Federal National Mortgage Association, Series 2010-61-EL | | | 4.50% | | | 06/25/2040 | | | 708,569 | |
| 7,863,988 | | Federal National Mortgage Association, Series 2010-64-EZ | | | 5.00% | | | 06/25/2040 | | | 8,535,729 | |
| 17,024,435 | | Federal National Mortgage Association, Series 2010-64-FC (1 Month LIBOR USD + 0.50%, 0.50% Floor, 7.00% Cap) | | | 2.99% | | | 06/25/2040 | | | 17,123,089 | |
| 29,984,960 | | Federal National Mortgage Association, Series 2010-76-ZK | | | 4.50% | | | 07/25/2040 | | | 31,705,977 | |
| 6,937,748 | | Federal National Mortgage Association, Series 2010-79-CZ | | | 4.00% | | | 07/25/2040 | | | 7,050,296 | |
| 23,352,058 | | Federal National Mortgage Association, Series 2010-79-VZ | | | 4.50% | | | 07/25/2040 | | | 24,627,823 | |
| 3,576,508 | | Federal National Mortgage Association, Series 2010-84-ZC | | | 4.50% | | | 08/25/2040 | | | 3,791,812 | |
| 7,153,002 | | Federal National Mortgage Association, Series 2010-84-ZD | | | 4.50% | | | 08/25/2040 | | | 7,583,608 | |
| 9,301,056 | | Federal National Mortgage Association, Series 2010-84-ZG | | | 4.50% | | | 08/25/2040 | | | 9,760,588 | |
| 586,513 | | Federal National Mortgage Association, Series 2010-90-SA (-1 x 1 Month LIBOR USD + 5.85%, 5.85% Cap) | | | 3.36% | I/F I/O | | 08/25/2040 | | | 72,676 | |
| 1,964,014 | | Federal National Mortgage Association, Series 2010-94-Z | | | 4.50% | | | 08/25/2040 | | | 2,026,213 | |
| 8,668,587 | | Federal National Mortgage Association, Series 2010-99-SG (-5 x 1 Month LIBOR USD + 25.00%, 25.00% Cap) | | | 12.55% | I/F | | 09/25/2040 | | | 12,247,175 | |
| 1,529,931 | | Federal National Mortgage Association, Series 2010-9-DS (-1 x 1 Month LIBOR USD + 5.30%, 0.50% Floor, 5.30% Cap) | | | 2.81% | I/F I/O | | 02/25/2040 | | | 159,369 | |
| 37,156,156 | | Federal National Mortgage Association, Series 2011-106-LZ | | | 3.50% | > | | 10/25/2041 | | | 38,165,644 | |
| 520,021 | | Federal National Mortgage Association, Series 2011-110-LS (-2 x 1 Month LIBOR USD + 10.10%, 10.10% Cap) | | | 5.12% | I/F | | 11/25/2041 | | | 624,717 | |
| 7,582,084 | | Federal National Mortgage Association, Series 2011-111-CZ | | | 4.00% | | | 11/25/2041 | | | 7,808,736 | |
| 9,628,930 | | Federal National Mortgage Association, Series 2011-111-EZ | | | 5.00% | > | | 11/25/2041 | | | 10,744,565 | |
| 5,448,115 | | Federal National Mortgage Association, Series 2011-111-VZ | | | 4.00% | | | 11/25/2041 | | | 5,666,054 | |
| 30,000,000 | | Federal National Mortgage Association, Series 2011-131-PB | | | 4.50% | | | 12/25/2041 | | | 33,372,765 | |
| 29,411,296 | | Federal National Mortgage Association, Series 2011-16-AL | | | 3.50% | | | 03/25/2031 | | | 30,422,671 | |
| 38,800,000 | | Federal National Mortgage Association, Series 2011-17-NY | | | 3.50% | | | 03/25/2031 | | | 39,759,346 | |
| 985,442 | | Federal National Mortgage Association, Series 2011-17-SA (-1 x 1 Month LIBOR USD + 6.47%, 6.47% Cap) | | | 3.98% | I/F I/O | | 03/25/2041 | | | 103,385 | |
| 9,251,268 | | Federal National Mortgage Association, Series 2011-25-KY | | | 3.00% | | | 04/25/2026 | | | 9,335,180 | |
| 4,744,126 | | Federal National Mortgage Association, Series 2011-27-BS (-2 x 1 Month LIBOR USD + 9.00%, 9.00% Cap) | | | 4.02% | I/F | | 04/25/2041 | | | 4,673,676 | |
| 56,000,000 | | Federal National Mortgage Association, Series 2011-29-AL | | | 3.50% | | | 04/25/2031 | | | 56,982,845 | |
| 12,863,781 | | Federal National Mortgage Association, Series 2011-2-GZ | | | 4.00% | | | 02/25/2041 | | | 13,330,649 | |
| 35,088,560 | | Federal National Mortgage Association, Series 2011-32-ZG | | | 4.00% | | | 04/25/2041 | | | 36,357,927 | |
| 6,234,777 | | Federal National Mortgage Association, Series 2011-36-VZ | | | 4.50% | | | 05/25/2041 | | | 6,474,632 | |
| 13,148,799 | | Federal National Mortgage Association, Series 2011-37-Z | | | 4.50% | | | 05/25/2041 | | | 13,999,735 | |
| 9,134,027 | | Federal National Mortgage Association, Series 2011-38-BZ | | | 4.00% | > | | 05/25/2041 | | | 9,409,261 | |
| 8,625,209 | | Federal National Mortgage Association, Series 2011-39-CB | | | 3.00% | | | 05/25/2026 | | | 8,702,306 | |
| 17,174,628 | | Federal National Mortgage Association, Series 2011-39-ZD | | | 4.00% | | | 02/25/2041 | | | 17,799,671 | |
| 4,104,990 | | Federal National Mortgage Association, Series 2011-40-LZ | | | 4.50% | | | 05/25/2041 | | | 4,263,178 | |
| 8,940,940 | | Federal National Mortgage Association, Series 2011-42-MZ | | | 4.50% | | | 05/25/2041 | | | 9,552,018 | |
| 20,541,668 | | Federal National Mortgage Association, Series 2011-45-ZA | | | 4.00% | > | | 05/25/2031 | | | 21,401,407 | |
| 12,206,487 | | Federal National Mortgage Association, Series 2011-45-ZB | | | 4.50% | | | 05/25/2041 | | | 13,299,568 | |
| 2,811,100 | | Federal National Mortgage Association, Series 2011-48-SC (-2 x 1 Month LIBOR USD + 9.20%, 9.20% Cap) | | | 4.23% | I/F | | 06/25/2041 | | | 2,907,701 | |
| 24,406,767 | | Federal National Mortgage Association, Series 2011-51-FJ (1 Month LIBOR USD + 0.45%, 0.45% Floor, 7.00% Cap) | | | 2.94% | | | 06/25/2041 | | | 24,465,280 | |
| 11,124,073 | | Federal National Mortgage Association, Series 2011-58-SA (-1 x 1 Month LIBOR USD + 6.55%, 6.55% Cap) | | | 4.06% | I/F I/O | | 07/25/2041 | | | 1,990,973 | |
| 1,574,459 | | Federal National Mortgage Association, Series 2011-59-MA | | | 4.50% | | | 07/25/2041 | | | 1,665,818 | |
| 13,969,748 | | Federal National Mortgage Association, Series 2011-60-EL | | | 3.00% | | | 07/25/2026 | | | 14,231,699 | |
| 16,823,888 | | Federal National Mortgage Association, Series 2011-64-DB | | | 4.00% | | | 07/25/2041 | | | 17,556,365 | |
| 8,195,669 | | Federal National Mortgage Association, Series 2011-74-KL | | | 5.00% | | | 06/25/2040 | | | 8,695,116 | |
| 27,295,240 | | Federal National Mortgage Association, Series 2011-77-Z | | | 3.50% | > | | 08/25/2041 | | | 30,140,845 | |
| 28,011,105 | | Federal National Mortgage Association, Series 2011-99-CZ | | | 4.50% | > | | 10/25/2041 | | | 31,371,390 | |
| 89,537,965 | | Federal National Mortgage Association, Series 2011-99-DZ | | | 5.00% | | | 10/25/2041 | | | 98,172,434 | |
| 12,966,363 | | Federal National Mortgage Association, Series 2012-104-Z | | | 3.50% | > | | 09/25/2042 | | | 13,467,398 | |
| 9,947,891 | | Federal National Mortgage Association, Series 2012-111-LB | | | 3.50% | | | 05/25/2041 | | | 10,076,993 | |
| 37,388,541 | | Federal National Mortgage Association, Series 2012-111-MJ | | | 4.00% | | | 04/25/2042 | | | 38,966,509 | |
| 11,940,762 | | Federal National Mortgage Association, Series 2012-114-DC | | | 2.00% | | | 08/25/2039 | | | 11,873,255 | |
| 64,144,037 | | Federal National Mortgage Association, Series 2012-122-AD | | | 2.00% | | | 02/25/2040 | | | 63,169,388 | |
| 59,190,068 | | Federal National Mortgage Association, Series 2012-122-DB | | | 3.00% | | | 11/25/2042 | | | 59,055,488 | |
| 64,745,437 | | Federal National Mortgage Association, Series 2012-125-LA | | | 3.00% | | | 11/25/2042 | | | 64,519,294 | |
| 34,214,630 | | Federal National Mortgage Association, Series 2012-144-PT | | | 4.30% | # | | 11/25/2049 | | | 36,529,557 | |
| 11,278,839 | | Federal National Mortgage Association, Series 2012-14-BZ | | | 4.00% | > | | 03/25/2042 | | | 12,190,929 | |
| 25,776,562 | | Federal National Mortgage Association, Series 2012-15-PZ | | | 4.00% | > | | 03/25/2042 | | | 27,428,040 | |
| 19,213,363 | | Federal National Mortgage Association, Series 2012-20-ZT | | | 3.50% | > | | 03/25/2042 | | | 19,571,834 | |
| 59,513,124 | | Federal National Mortgage Association, Series 2012-30-DZ | | | 4.00% | > | | 04/25/2042 | | | 62,803,366 | |
| 48,933,013 | | Federal National Mortgage Association, Series 2012-31-Z | | | 4.00% | > | | 04/25/2042 | | | 51,773,354 | |
| 7,979,095 | | Federal National Mortgage Association, Series 2012-63-EB | | | 2.00% | | | 08/25/2040 | | | 7,854,318 | |
| 27,498,393 | | Federal National Mortgage Association, Series 2012-70-FY (1 Month LIBOR USD + 0.45%, 0.45% Floor, 7.00% Cap) | | | 2.94% | | | 07/25/2042 | | | 27,510,124 | |
| 35,156,077 | | Federal National Mortgage Association, Series 2012-74-Z | | | 4.00% | > | | 07/25/2042 | | | 37,323,048 | |
| 7,854,152 | | Federal National Mortgage Association, Series 2012-80-EA | | | 2.00% | | | 04/25/2042 | | | 7,490,539 | |
| 25,510,045 | | Federal National Mortgage Association, Series 2012-86-ZC | | | 3.50% | > | | 08/25/2042 | | | 25,677,942 | |
| 35,542,175 | | Federal National Mortgage Association, Series 2012-96-VZ | | | 3.50% | > | | 09/25/2042 | | | 36,532,377 | |
| 27,803,418 | | Federal National Mortgage Association, Series 2012-98-BG | | | 4.50% | | | 08/25/2040 | | | 29,407,331 | |
| 48,999,579 | | Federal National Mortgage Association, Series 2012-99-QE | | | 3.00% | | | 09/25/2042 | | | 48,724,137 | |
| 26,265,011 | | Federal National Mortgage Association, Series 2013-130-ZE | | | 3.00% | > | | 01/25/2044 | | | 25,350,437 | |
| 23,598,952 | | Federal National Mortgage Association, Series 2013-133-ZT | | | 3.00% | > | | 01/25/2039 | | | 22,682,576 | |
| 12,567,959 | | Federal National Mortgage Association, Series 2013-36-Z | | | 3.00% | > | | 04/25/2043 | | | 12,078,817 | |
| 20,644,031 | | Federal National Mortgage Association, Series 2013-41-ZH | | | 3.00% | > | | 05/25/2033 | | | 19,934,060 | |
| 19,292,416 | | Federal National Mortgage Association, Series 2013-51-HS (-1 x 1 Month LIBOR USD + 5.40%, 5.40% Cap) | | | 2.42% | I/F | | 04/25/2043 | | | 16,859,442 | |
| 4,219,906 | | Federal National Mortgage Association, Series 2013-53-AB | | | 1.50% | | | 03/25/2028 | | | 4,074,049 | |
| 7,059,931 | | Federal National Mortgage Association, Series 2013-58-SC (-2 x 1 Month LIBOR USD + 6.00%, 6.00% Cap) | | | 2.27% | I/F | | 06/25/2043 | | | 6,077,113 | |
| 118,452,714 | | Federal National Mortgage Association, Series 2013-81-ZQ | | | 3.00% | > | | 08/25/2043 | | | 112,754,724 | |
| 24,175,097 | | Federal National Mortgage Association, Series 2013-82-SH (-1 x 1 Month LIBOR USD + 6.05%, 6.05% Cap) | | | 3.56% | I/F I/O | | 12/25/2042 | | | 3,596,737 | |
| 27,020,598 | | Federal National Mortgage Association, Series 2013-8-Z | | | 3.00% | > | | 02/25/2043 | | | 25,727,360 | |
| 23,888,328 | | Federal National Mortgage Association, Series 2014-12-GZ | | | 3.50% | > | | 03/25/2044 | | | 24,553,544 | |
| 25,555,569 | | Federal National Mortgage Association, Series 2014-21-GZ | | | 3.00% | > | | 04/25/2044 | | | 24,274,612 | |
| 30,048,208 | | Federal National Mortgage Association, Series 2014-37-ZY | | | 2.50% | > | | 07/25/2044 | | | 26,820,216 | |
| 48,423,818 | | Federal National Mortgage Association, Series 2014-39-ZA | | | 3.00% | > | | 07/25/2044 | | | 47,094,923 | |
| 12,870,604 | | Federal National Mortgage Association, Series 2014-46-NZ | | | 3.00% | > | | 06/25/2043 | | | 12,328,342 | |
| 43,008,842 | | Federal National Mortgage Association, Series 2014-55-MA | | | 3.00% | | | 10/25/2039 | | | 43,320,523 | |
| 2,177,084 | | Federal National Mortgage Association, Series 2014-56-AD | | | 3.00% | | | 01/25/2040 | | | 2,155,131 | |
| 58,037,692 | | Federal National Mortgage Association, Series 2014-60-EZ | | | 3.00% | > | | 10/25/2044 | | | 55,107,137 | |
| 40,967,992 | | Federal National Mortgage Association, Series 2014-61-ZV | | | 3.00% | > | | 10/25/2044 | | | 39,160,148 | |
| 34,548,317 | | Federal National Mortgage Association, Series 2014-64-NZ | | | 3.00% | > | | 10/25/2044 | | | 32,759,609 | |
| 91,280,617 | | Federal National Mortgage Association, Series 2014-65-CD | | | 3.00% | | | 06/25/2040 | | | 91,726,158 | |
| 12,165,094 | | Federal National Mortgage Association, Series 2014-67-DZ | | | 3.00% | > | | 10/25/2044 | | | 11,600,014 | |
| 85,762,913 | | Federal National Mortgage Association, Series 2014-68-MA | | | 3.00% | | | 11/25/2040 | | | 86,628,467 | |
| 38,889,861 | | Federal National Mortgage Association, Series 2014-68-MZ | | | 3.00% | > | | 11/25/2044 | | | 36,885,194 | |
| 27,305,445 | | Federal National Mortgage Association, Series 2014-6-Z | | | 2.50% | > | | 02/25/2044 | | | 24,245,062 | |
| 35,784,989 | | Federal National Mortgage Association, Series 2014-73-CQ | | | 3.00% | | | 06/25/2040 | | | 35,958,546 | |
| 21,953,734 | | Federal National Mortgage Association, Series 2014-77-VZ | | | 3.00% | > | | 11/25/2044 | | | 20,844,164 | |
| 21,377,666 | | Federal National Mortgage Association, Series 2014-82-YA | | | 3.00% | | | 04/25/2041 | | | 21,448,621 | |
| 28,194,359 | | Federal National Mortgage Association, Series 2014-84-KZ | | | 3.00% | > | | 12/25/2044 | | | 26,877,330 | |
| 96,717,562 | | Federal National Mortgage Association, Series 2014-95-NA | | | 3.00% | | | 04/25/2041 | | | 96,957,712 | |
| 140,493,586 | | Federal National Mortgage Association, Series 2014-M11-1A | | | 3.12% | # | | 08/25/2024 | | | 143,545,163 | |
| 32,815,596 | | Federal National Mortgage Association, Series 2015-11-A | | | 3.00% | | | 05/25/2034 | | | 33,417,053 | |
| 87,677,086 | | Federal National Mortgage Association, Series 2015-21-G | | | 3.00% | | | 02/25/2042 | | | 88,912,772 | |
| 17,815,740 | | Federal National Mortgage Association, Series 2015-42-CA | | | 3.00% | | | 03/25/2044 | | | 17,917,348 | |
| 55,959,722 | | Federal National Mortgage Association, Series 2015-49-A | | | 3.00% | | | 03/25/2044 | | | 56,337,999 | |
| 12,683,935 | | Federal National Mortgage Association, Series 2015-63-KD | | | 3.00% | | | 07/25/2041 | | | 12,770,752 | |
| 54,228,238 | | Federal National Mortgage Association, Series 2015-88-AC | | | 3.00% | | | 04/25/2043 | | | 54,448,415 | |
| 154,107,432 | | Federal National Mortgage Association, Series 2015-88-BA | | | 3.00% | | | 04/25/2044 | | | 162,574,927 | |
| 19,171,015 | | Federal National Mortgage Association, Series 2015-94-MA | | | 3.00% | | | 01/25/2046 | | | 19,307,854 | |
| 61,596,861 | | Federal National Mortgage Association, Series 2015-9-HA | | | 3.00% | | | 01/25/2045 | | | 62,290,811 | |
| 41,093,846 | | Federal National Mortgage Association, Series 2016-2-JA | | | 2.50% | | | 02/25/2046 | | | 40,451,603 | |
| 96,632,203 | | Federal National Mortgage Association, Series 2016-32-LA | | | 3.00% | | | 10/25/2044 | | | 97,116,678 | |
| 22,737,722 | | Federal National Mortgage Association, Series 2016-71-ZQ | | | 3.00% | > | | 10/25/2046 | | | 20,990,071 | |
| 106,764,171 | | Federal National Mortgage Association, Series 2016-72-PA | | | 3.00% | | | 07/25/2046 | | | 106,674,286 | |
| 82,256,506 | | Federal National Mortgage Association, Series 2016-74-PA | | | 3.00% | | | 12/25/2044 | | | 82,242,686 | |
| 40,207,905 | | Federal National Mortgage Association, Series 2016-79-EP | | | 3.00% | | | 01/25/2044 | | | 40,669,516 | |
| 104,266,423 | | Federal National Mortgage Association, Series 2016-81-PA | | | 3.00% | | | 02/25/2044 | | | 104,382,763 | |
| 55,499,172 | | Federal National Mortgage Association, Series 2016-94-PA | | | 3.00% | | | 03/25/2044 | | | 55,401,377 | |
| 55,141,798 | | Federal National Mortgage Association, Series 2017-13-ML | | | 3.00% | | | 08/25/2041 | | | 55,288,531 | |
| 19,304,630 | | Federal National Mortgage Association, Series 2017-26-DA | | | 3.00% | | | 06/25/2043 | | | 19,371,582 | |
| 27,563,476 | | Federal National Mortgage Association, Series 2017-2-HA | | | 3.00% | | | 09/25/2041 | | | 27,676,955 | |
| 17,875,840 | | Federal National Mortgage Association, Series 2017-4-CH | | | 3.00% | | | 06/25/2042 | | | 18,054,866 | |
| 19,359,665 | | Federal National Mortgage Association, Series 2017-51-EA | | | 3.00% | | | 11/25/2042 | | | 19,397,207 | |
| 29,165,211 | | Federal National Mortgage Association, Series 2017-61-TA | | | 3.00% | | | 02/25/2043 | | | 29,085,053 | |
| 98,436,501 | | Federal National Mortgage Association, Series 2018-21-PO | | | 0.00% | P/O | | 04/25/2048 | | | 78,283,478 | |
| 13,511,001 | | Federal National Mortgage Association, Series 2018-23-CG | | | 2.75% | | | 12/25/2043 | | | 13,457,488 | |
| 121,220,866 | | Federal National Mortgage Association, Series 2018-27-AO | | | 0.00% | P/O | | 05/25/2048 | | | 99,672,912 | |
| 240,410,603 | | Federal National Mortgage Association, Series 2018-27-JA | | | 3.00% | | | 12/25/2047 | | | 238,655,582 | |
| 71,456,402 | | Federal National Mortgage Association, Series 2018-33-A | | | 3.00% | | | 05/25/2048 | | | 71,015,158 | |
| 30,819,911 | | Federal National Mortgage Association, Series 2018-33-C | | | 3.00% | | | 05/25/2048 | | | 30,632,809 | |
| 211,927,048 | | Federal National Mortgage Association, Series 2018-36-A | | | 3.00% | | | 06/25/2048 | | | 211,641,752 | |
| 73,977,216 | | Federal National Mortgage Association, Series 2018-38-JB | | | 3.00% | | | 06/25/2048 | | | 73,595,435 | |
| 231,380,839 | | Federal National Mortgage Association, Series 2018-39-AB | | | 3.00% | | | 06/25/2048 | | | 230,299,111 | |
| 53,861,026 | | Federal National Mortgage Association, Series 2018-64-A | | | 3.00% | | | 09/25/2048 | | | 53,116,537 | |
| 100,420,111 | | Federal National Mortgage Association, Series 2018-85-PO | | | 0.00% | P/O | | 12/25/2048 | | | 84,448,222 | |
| 74,118,887 | | Federal National Mortgage Association, Series 2019-12-BA | | | 3.00% | | | 04/25/2049 | | | 73,640,501 | |
| 8,814,962 | | Federal National Mortgage Association, Series 400-S4 (-1 x 1 Month LIBOR USD + 5.45%, 5.45% Cap) | | | 2.96% | I/F I/O | | 11/25/2039 | | | 1,005,938 | |
| 93,099,449 | | Federal National Mortgage Association, Series 412-A3 | | | 3.00% | | | 08/25/2042 | | | 92,020,707 | |
| 4,348,600 | | Government National Mortgage Association, Pool MA2511 | | | 3.50% | | | 01/20/2045 | | | 4,400,144 | |
| 12,405,449 | | Government National Mortgage Association, Series 2003-67-SP (-1 x 1 Month LIBOR USD + 7.10%, 7.10% Cap) | | | 4.61% | I/F I/O | | 08/20/2033 | | | 1,944,289 | |
| 5,183,798 | | Government National Mortgage Association, Series 2003-86-ZK | | | 5.00% | | | 10/20/2033 | | | 5,651,406 | |
| 2,695,162 | | Government National Mortgage Association, Series 2004-49-Z | | | 6.00% | | | 06/20/2034 | | | 2,954,927 | |
| 277,107 | | Government National Mortgage Association, Series 2004-80-PH | | | 5.00% | | | 07/20/2034 | | | 278,276 | |
| 5,501,324 | | Government National Mortgage Association, Series 2004-83-CS (-1 x 1 Month LIBOR USD + 6.08%, 6.08% Cap) | | | 3.59% | I/F I/O | | 10/20/2034 | | | 745,825 | |
| 1,439,254 | | Government National Mortgage Association, Series 2005-21-Z | | | 5.00% | | | 03/20/2035 | | | 1,558,173 | |
| 15,166,352 | | Government National Mortgage Association, Series 2005-39-ZB | | | 5.00% | | | 07/20/2034 | | | 16,301,304 | |
| 906,550 | | Government National Mortgage Association, Series 2006-24-CX (-7 x 1 Month LIBOR USD + 39.97%, 39.97% Cap) | | | 21.72% | I/F | | 05/20/2036 | | | 1,579,208 | |
| 6,745,901 | | Government National Mortgage Association, Series 2007-26-SJ (-1 x 1 Month LIBOR USD + 4.69%, 4.69% Cap) | | | 2.20% | I/F I/O | | 04/20/2037 | | | 423,962 | |
| 4,634,511 | | Government National Mortgage Association, Series 2008-2-SM (-1 x 1 Month LIBOR USD + 6.50%, 6.50% Cap) | | | 4.02% | I/F I/O | | 01/16/2038 | | | 811,083 | |
| 7,951,667 | | Government National Mortgage Association, Series 2008-42-AI (-1 x 1 Month LIBOR USD + 7.69%, 7.69% Cap) | | | 5.21% | I/F I/O | | 05/16/2038 | | | 1,862,348 | |
| 3,242,156 | | Government National Mortgage Association, Series 2008-43-SH (-1 x 1 Month LIBOR USD + 6.34%, 6.34% Cap) | | | 3.85% | I/F I/O | | 05/20/2038 | | | 386,456 | |
| 3,635,302 | | Government National Mortgage Association, Series 2008-51-SC (-1 x 1 Month LIBOR USD + 6.25%, 6.25% Cap) | | | 3.76% | I/F I/O | | 06/20/2038 | | | 559,498 | |
| 2,614,077 | | Government National Mortgage Association, Series 2008-51-SE (-1 x 1 Month LIBOR USD + 6.25%, 6.25% Cap) | | | 3.77% | I/F I/O | | 06/16/2038 | | | 378,991 | |
| 1,243,174 | | Government National Mortgage Association, Series 2008-82-SM (-1 x 1 Month LIBOR USD + 6.05%, 6.05% Cap) | | | 3.56% | I/F I/O | | 09/20/2038 | | | 151,436 | |
| 2,635,382 | | Government National Mortgage Association, Series 2008-83-SD (-1 x 1 Month LIBOR USD + 6.56%, 6.56% Cap) | | | 4.08% | I/F I/O | | 11/16/2036 | | | 422,385 | |
| 10,160,950 | | Government National Mortgage Association, Series 2009-106-VZ | | | 4.50% | | | 11/20/2039 | | | 10,891,131 | |
| 5,572,713 | | Government National Mortgage Association, Series 2009-10-NS (-1 x 1 Month LIBOR USD + 6.65%, 6.65% Cap) | | | 4.17% | I/F I/O | | 02/16/2039 | | | 976,563 | |
| 1,964,288 | | Government National Mortgage Association, Series 2009-24-SN (-1 x 1 Month LIBOR USD + 6.10%, 6.10% Cap) | | | 3.61% | I/F I/O | | 09/20/2038 | | | 192,158 | |
| 5,629,014 | | Government National Mortgage Association, Series 2009-32-ZE | | | 4.50% | | | 05/16/2039 | | | 6,037,516 | |
| 31,563,585 | | Government National Mortgage Association, Series 2009-35-DZ | | | 4.50% | | | 05/20/2039 | | | 33,846,920 | |
| 7,588 | | Government National Mortgage Association, Series 2009-41-ZQ | | | 4.50% | > | | 06/16/2039 | | | 8,321 | |
| 3,505,569 | | Government National Mortgage Association, Series 2009-48-Z | | | 5.00% | | | 06/16/2039 | | | 3,746,813 | |
| 740,159 | | Government National Mortgage Association, Series 2009-50-KP | | | 4.50% | | | 06/20/2039 | | | 776,155 | |
| 2,653,632 | | Government National Mortgage Association, Series 2009-69-TS (-1 x 1 Month LIBOR USD + 6.20%, 6.20% Cap) | | | 3.72% | I/F I/O | | 04/16/2039 | | | 245,367 | |
| 4,781,355 | | Government National Mortgage Association, Series 2009-75-GZ | | | 4.50% | | | 09/20/2039 | | | 5,039,156 | |
| 3,631,339 | | Government National Mortgage Association, Series 2009-87-IG (-1 x 1 Month LIBOR USD + 6.74%, 6.74% Cap) | | | 4.25% | I/F I/O | | 03/20/2037 | | | 360,161 | |
| 25,774,122 | | Government National Mortgage Association, Series 2010-106-PS (-1 x 1 Month LIBOR USD + 6.05%, 6.05% Cap) | | | 3.56% | I/F I/O | | 03/20/2040 | | | 2,614,589 | |
| 6,918,930 | | Government National Mortgage Association, Series 2010-1-SA (-1 x 1 Month LIBOR USD + 5.75%, 5.75% Cap) | | | 3.27% | I/F I/O | | 01/16/2040 | | | 726,636 | |
| 3,858,390 | | Government National Mortgage Association, Series 2010-25-ZB | | | 4.50% | > | | 02/16/2040 | | | 4,151,896 | |
| 65,333,592 | | Government National Mortgage Association, Series 2010-26-QS (-1 x 1 Month LIBOR USD + 6.25%, 6.25% Cap) | | | 3.76% | I/F I/O | | 02/20/2040 | | | 10,631,494 | |
| 5,508,841 | | Government National Mortgage Association, Series 2010-42-AY | | | 5.00% | | | 11/20/2039 | | | 6,034,051 | |
| 5,599,880 | | Government National Mortgage Association, Series 2010-42-ES (-1 x 1 Month LIBOR USD + 5.68%, 5.68% Cap) | | | 3.19% | I/F I/O | | 04/20/2040 | | | 786,410 | |
| 1,674,392 | | Government National Mortgage Association, Series 2010-61-AS (-1 x 1 Month LIBOR USD + 6.55%, 6.55% Cap) | | | 4.06% | I/F I/O | | 09/20/2039 | | | 221,649 | |
| 16,966,499 | | Government National Mortgage Association, Series 2010-62-SB (-1 x 1 Month LIBOR USD + 5.75%, 5.75% Cap) | | | 3.26% | I/F I/O | | 05/20/2040 | | | 1,964,722 | |
| 10,764,323 | | Government National Mortgage Association, Series 2010-62-ZG | | | 5.50% | > | | 05/16/2040 | | | 12,026,855 | |
| 8,333,334 | | Government National Mortgage Association, Series 2011-18-SN (-2 x 1 Month LIBOR USD + 9.50%, 9.50% Cap) | | | 4.52% | I/F | | 12/20/2040 | | | 8,629,646 | |
| 8,333,334 | | Government National Mortgage Association, Series 2011-18-YS (-2 x 1 Month LIBOR USD + 9.50%, 9.50% Cap) | | | 4.52% | I/F | | 12/20/2040 | | | 8,507,037 | |
| 4,109,519 | | Government National Mortgage Association, Series 2011-51-UZ | | | 4.50% | | | 04/20/2041 | | | 4,346,644 | |
| 2,611,658 | | Government National Mortgage Association, Series 2011-69-OC | | | 0.00% | P/O | | 05/20/2041 | | | 2,285,848 | |
| 24,383,958 | | Government National Mortgage Association, Series 2011-69-SB (-1 x 1 Month LIBOR USD + 5.35%, 5.35% Cap) | | | 2.86% | I/F I/O | | 05/20/2041 | | | 3,020,868 | |
| 22,932,576 | | Government National Mortgage Association, Series 2011-71-ZA | | | 4.50% | | | 02/20/2041 | | | 24,237,590 | |
| 8,860,247 | | Government National Mortgage Association, Series 2011-72-AS (-1 x 1 Month LIBOR USD + 5.38%, 5.38% Cap) | | | 2.89% | I/F I/O | | 05/20/2041 | | | 1,133,730 | |
| 6,354,943 | | Government National Mortgage Association, Series 2011-72-SK (-1 x 1 Month LIBOR USD + 6.15%, 6.15% Cap) | | | 3.66% | I/F I/O | | 05/20/2041 | | | 738,962 | |
| 3,961,839 | | Government National Mortgage Association, Series 2012-105-SE (-1 x 1 Month LIBOR USD + 6.20%, 6.20% Cap) | | | 3.71% | I/F I/O | | 01/20/2041 | | | 232,098 | |
| 8,345,236 | | Government National Mortgage Association, Series 2012-52-PN | | | 2.00% | | | 12/20/2039 | | | 8,299,892 | |
| 23,800,930 | | Government National Mortgage Association, Series 2013-116-LS (-1 x 1 Month LIBOR USD + 6.15%, 6.15% Cap) | | | 3.66% | I/F I/O | | 08/20/2043 | | | 3,791,912 | |
| 24,518,940 | | Government National Mortgage Association, Series 2013-136-CS (-1 x 1 Month LIBOR USD + 6.20%, 6.20% Cap) | | | 3.72% | I/F I/O | | 09/16/2043 | | | 3,925,899 | |
| 19,381,651 | | Government National Mortgage Association, Series 2013-182-WZ | | | 2.50% | > | | 12/20/2043 | | | 18,195,773 | |
| 59,744,947 | | Government National Mortgage Association, Series 2013-182-ZW | | | 2.50% | > | | 12/20/2043 | | | 56,089,417 | |
| 16,849,359 | | Government National Mortgage Association, Series 2013-186-SG (-1 x 1 Month LIBOR USD + 6.25%, 6.25% Cap) | | | 3.77% | I/F I/O | | 02/16/2043 | | | 2,262,763 | |
| 16,093,402 | | Government National Mortgage Association, Series 2013-26-MS (-1 x 1 Month LIBOR USD + 6.25%, 6.25% Cap) | | | 3.76% | I/F I/O | | 02/20/2043 | | | 2,615,249 | |
| 34,561,004 | | Government National Mortgage Association, Series 2013-34-PL | | | 3.00% | | | 03/20/2042 | | | 34,750,474 | |
| 31,180,894 | | Government National Mortgage Association, Series 2014-163-PS (-1 x 1 Month LIBOR USD + 5.60%, 5.60% Cap) | | | 3.11% | I/F I/O | | 11/20/2044 | | | 3,727,670 | |
| 32,448,354 | | Government National Mortgage Association, Series 2014-167-SA (-1 x 1 Month LIBOR USD + 5.60%, 5.60% Cap) | | | 3.11% | I/F I/O | | 11/20/2044 | | | 4,220,827 | |
| 49,212,463 | | Government National Mortgage Association, Series 2014-21-SE (-1 x 1 Month LIBOR USD + 5.55%, 5.55% Cap) | | | 3.06% | I/F I/O | | 02/20/2044 | | | 6,439,106 | |
| 27,065,583 | | Government National Mortgage Association, Series 2014-39-SK (-1 x 1 Month LIBOR USD + 6.20%, 6.20% Cap) | | | 3.71% | I/F I/O | | 03/20/2044 | | | 3,670,369 | |
| 24,811,940 | | Government National Mortgage Association, Series 2014-59-DS (-1 x 1 Month LIBOR USD + 6.25%, 6.25% Cap) | | | 3.77% | I/F I/O | | 04/16/2044 | | | 3,860,075 | |
| 9,070,053 | | Government National Mortgage Association, Series 2016-99-TL | | | 2.00% | | | 04/16/2044 | | | 7,877,891 | |
| | | | | | | | | | | | |
Total US Government and Agency Mortgage Backed Obligations(Cost $23,082,193,985) | | | 23,247,914,935 | |
| | | | | | | | | | | | |
| |
US Government and Agency Obligations - 4.3% | | | | |
| 59,900,000 | | Tennessee Valley Authority | | | 4.25% | | | 09/15/2065 | | | 71,658,808 | |
| 250,000,000 | | United States Treasury Notes | | | 1.38% | | | 09/30/2019 | | | 248,676,758 | |
| 250,000,000 | | United States Treasury Notes | | | 1.50% | | | 10/31/2019 | | | 248,642,578 | |
| 500,000,000 | | United States Treasury Notes | | | 2.00% | | | 11/15/2026 | | | 488,261,720 | |
| 500,000,000 | | United States Treasury Notes | | | 2.25% | | | 02/15/2027 | | | 496,621,095 | |
| 600,000,000 | | United States Treasury Notes | | | 2.88% | | | 05/15/2028 | | | 623,941,404 | |
| | | | | | | | | | | | |
Total US Government and Agency Obligations(Cost $2,139,774,076) | | | 2,177,802,363 | |
| | | | | | | | | | | | |
| |
Short Term Investments - 6.9% | | | | |
| 326,405,882 | | First American Government Obligations Fund - Class U | | | 2.35% | t | | | | | 326,405,882 | |
| 326,405,882 | | JP Morgan U.S. Government Money Market Fund - Institutional Share Class | | | 2.33% | t | | | | | 326,405,882 | |
| 326,405,882 | | Morgan Stanley Institutional Liquidity Funds Government Portfolio - Institutional Share Class | | | 2.32% | t | | | | | 326,405,882 | |
| 250,000,000 | | United States Treasury Bills | | | 0.00% | | | 04/11/2019 | | | 249,834,515 | |
| 250,000,000 | | United States Treasury Bills | | | 0.00% | | | 04/25/2019 | | | 249,610,832 | |
| 250,000,000 | | United States Treasury Bills | | | 0.00% | | | 05/16/2019 | | | 249,260,155 | |
| 250,000,000 | | United States Treasury Bills | | | 0.00% | | | 05/30/2019 | | | 249,038,177 | |
| 250,000,000 | | United States Treasury Bills | | | 0.00% | | | 06/06/2019 | | | 248,919,480 | |
| 250,000,000 | | United States Treasury Bills | | | 0.00% | | | 06/13/2019 | | | 248,802,260 | |
| 250,000,000 | | United States Treasury Bills | | | 0.00% | | | 07/11/2019 | | | 248,340,337 | |
| 250,000,000 | | United States Treasury Bills | | | 0.00% | | | 07/25/2019 | | | 248,107,293 | |
| 250,000,000 | | United States Treasury Bills | | | 0.00% | | | 08/15/2019 | | | 247,751,985 | |
| 250,000,000 | | United States Treasury Bills | | | 0.00% | | | 08/29/2019 | | | 247,549,218 | |
| | | | | | | | | | | | |
Total Short Term Investments(Cost $3,466,220,260) | | | 3,466,431,898 | |
| | | | | | | | | | | | |
| |
Total Investments - 99.9%(Cost $50,522,130,601) | | | 50,466,352,495 | |
| Other Assets in Excess of Liabilities - 0.1% | | | 47,592,939 | |
| | | | | | | | | | | | |
NET ASSETS - 100.0% | | $ | 50,513,945,434 | |
| | | | | | | | | | | | |
| | | | |
| | ^ Security exempt from registration under Rule 144A of the Securities Act of 1933. These securities may be resold in transactions exempt from registration to qualified institutional buyers. These securities are determined to be liquid by the Adviser, unless otherwise noted, under procedures established by the Fund’s Board of Trustees. At March 31, 2019, the value of these securities amounted to $14,039,428,562 or 27.8% of net assets. | | | | | | | | | | |
| | # Coupon rate is variable based on the weighted average coupon of the underlying collateral. To the extent the weighted average coupon of the underlying assets which comprise the collateral increases or decreases, the coupon rate of this security will increase or decrease correspondingly. The rate disclosed is as of March 31, 2019. | | | | | | | | | | |
| | I/O Interest only security | | | | | | | | | | |
| | P/O Principal only security | | | | | | | | | | |
| | I/F Inverse floating rate security whose interest rate moves in the opposite direction of reference interest rates. Reference interest rates are typically based on a negative multiplier or slope. Interest rate may also be subject to a cap or floor. | | | | | | | | | | |
| | Þ Value determined using significant unobservable inputs. | | | | | | | | | | |
| | ß The interest rate may step up conditioned upon the aggregate remaining principal balance of the underlying mortgage loans being reduced below a targeted percentage of the aggregate original principal balance of the mortgage loans. The interest rate shown is the rate in effect as of March 31, 2019. | | | | | | | | | | |
| | § The interest rate will step up if the issuer does not redeem the bond on or before a scheduled redemption date in accordance with the terms of the instrument. The interest rate shown is the rate in effect as of March 31, 2019. | | | | | | | | | | |
| | ± Coupon rate is variable or floats based on components including but not limited to reference rate and spread. These securities may not indicate a reference rate and/or spread in their description. The rate disclosed is as of March 31, 2019. | | | | | | | | | | |
| | D This mortgage-backed bond accrues interest which is added to the outstanding principal balance. The interest payment will be deferred until all other tranches in the structure are paid off. The rate disclosed is as of March 31, 2019. | | | | | | | | | | |
| | t Seven-day yield as of March 31, 2019 | | | | | | | | | | |
| | | | | | | | | | | | |
Principal Amount
$/Shares | | Security Description | | Rate | | | Maturity | | Value $ | |
Asset Backed Obligations - 2.0% | | | | | | | | | | |
| 14,812,500 | | Applebee's Funding LLC, Series 2014-1-A2 | | | 4.28% | ^ | | 09/05/2044 | | | 14,886,311 | |
| 4,458,333 | | CAL Funding Ltd., Series 2018-1A-A | | | 3.96% | ^ | | 02/25/2043 | | | 4,497,513 | |
| 8,934,971 | | Castlelake Aircraft Securitization Trust, Series 2016-1-A | | | 4.45% | | | 08/15/2041 | | | 8,990,162 | |
| 4,844,133 | | Castlelake Aircraft Securitization Trust, Series 2017-1-A | | | 3.97% | | | 07/15/2042 | | | 4,852,513 | |
| 4,633,842 | | Castlelake Aircraft Securitization Trust, Series 2018-1-A | | | 4.13% | ^ | | 06/15/2043 | | | 4,700,796 | |
| 4,815,431 | | CLI Funding LLC, Series 2017-1A-A | | | 3.62% | ^ | | 05/18/2042 | | | 4,784,696 | |
| 11,770,615 | | CLI Funding LLC, Series 2018-1A-A | | | 4.03% | ^ | | 04/18/2043 | | | 11,870,874 | |
| 10,132,793 | | CLUB Credit Trust, Series 2018-P3-A | | | 3.82% | ^ | | 01/15/2026 | | | 10,198,365 | |
| 10,991,912 | | College Ave Student Loans LLC, Series 2018-A-A1 (1 Month LIBOR USD + 1.20%) | | | 3.69% | ^ | | 12/26/2047 | | | 11,125,899 | |
| 2,880,000 | | DB Master Finance LLC, Series 2015-1A-A2II | | | 3.98% | ^ | | 02/20/2045 | | | 2,883,238 | |
| 1,500,000 | | DB Master Finance LLC, Series 2019-1A-A2I | | | 3.79% | ^ | | 05/20/2049 | | | 1,516,826 | |
| 16,335,000 | | Global SC Finance Ltd., Series 2018-1A-A | | | 4.29% | ^ | | 05/17/2038 | | | 16,679,544 | |
| 5,400,000 | | GLS Auto Receivables Trust, Series 2018-2A-B | | | 3.71% | ^ | | 03/15/2023 | | | 5,444,022 | |
| 13,124,424 | | Harbour Aircraft Investments Ltd., Series 2017-1-A | | | 4.00% | | | 11/15/2037 | | | 13,094,632 | |
| 9,012,604 | | Helios Issuer LLC, Series 2017-1A-A | | | 4.94% | ^ | | 09/20/2049 | | | 9,277,743 | |
| 4,851,829 | | HERO Funding Trust, Series 2016-1A-A | | | 4.05% | ^ | | 09/20/2041 | | | 4,984,981 | |
| 4,925,000 | | Jimmy Johns Funding LLC, Series 2017-1A-A2II | | | 4.85% | ^ | | 07/30/2047 | | | 5,077,841 | |
| 13,907 | | MarketPlace Loan Trust, Series 2015-CB1-A | | | 4.00% | ^ | | 07/15/2021 | | | 13,905 | |
| 2,490,555 | | Mosaic Solar Loan Trust, Series 2018-1A-A | | | 4.01% | ^ | | 06/22/2043 | | | 2,504,433 | |
| 7,500,000 | | Navient Private Education Loan Trust, Series 2018-A-B | | | 3.68% | ^ | | 02/18/2042 | | | 7,649,708 | |
| 10,948,640 | | NP SPE LLC, Series 2016-1A-A1 | | | 4.16% | ^ | | 04/20/2046 | | | 11,212,087 | |
| 887,243 | | OneMain Financial Issuance Trust, Series 2015-1A-A | | | 3.19% | ^ | | 03/18/2026 | | | 888,514 | |
| 6,000,000 | | SBA Tower Trust | | | 3.17% | ^ | | 04/11/2022 | | | 5,997,847 | |
| 6,067,260 | | Shenton Aircraft Investment Ltd., Series 2015-1A-A | | | 4.75% | ^ | | 10/15/2042 | | | 6,143,695 | |
| 820,255 | | SoFi Consumer Loan Program Trust, Series 2016-2-A | | | 3.09% | ^ | | 10/27/2025 | | | 821,244 | |
| 941,213 | | SoFi Consumer Loan Program Trust, Series 2017-1-A | | | 3.28% | ^ | | 01/26/2026 | | | 944,687 | |
| 500,000 | | SoFi Consumer Loan Program Trust, Series 2017-1-B | | | 4.73% | # ^ | | 01/26/2026 | | | 514,527 | |
| 329,607 | | SoFi Consumer Loan Program Trust, Series 2017-2-A | | | 3.28% | ^ | | 02/25/2026 | | | 330,571 | |
| 5,000,000 | | SoFi Consumer Loan Program Trust, Series 2017-5-A2 | | | 2.78% | ^ | | 09/25/2026 | | | 4,986,059 | |
| 4,019,085 | | SoFi Professional Loan Program, Series 2016-A-A2 | | | 2.76% | ^ | | 12/26/2036 | | | 3,993,809 | |
| 5,000,000 | | SoFi Professional Loan Program, Series 2017-B-BFX | | | 3.70% | # ^ | | 05/25/2040 | | | 5,115,794 | |
| 2,000,000 | | SoFi Professional Loan Program, Series 2017-C-C | | | 4.21% | # ^ | | 07/25/2040 | | | 2,035,514 | |
| 1,920,342 | | Springleaf Funding Trust, Series 2015-AA-A | | | 3.16% | ^ | | 11/15/2024 | | | 1,920,538 | |
| 875,554 | | Spruce Asset Backed Securities Trust, Series 2016-E1-A | | | 4.32% | ^ | | 06/15/2028 | | | 887,769 | |
| 3,961,683 | | STARR Ltd., Series 2018-1-A | | | 4.09% | ^ | | 05/15/2043 | | | 3,987,525 | |
| 4,954,085 | | Sunnova Helios II Issuer LLC, Series 2018-1A-A | | | 4.87% | ^ | | 07/20/2048 | | | 5,172,977 | |
| 2,479,443 | | Textainer Marine Containers Ltd., Series 2017-1A-A | | | 3.72% | ^ | | 05/20/2042 | | | 2,478,660 | |
| 3,941,479 | | USQ Rail LLC, Series 2018-1-A1 | | | 3.78% | ^ | | 04/25/2048 | | | 4,017,499 | |
| 12,859,167 | | Vantage Data Centers Issuer LLC, Series 2018-1A-A2 | | | 4.07% | ^ | | 02/16/2043 | | | 13,065,453 | |
| 5,000,000 | | VB-S1 Issuer LLC, Series 2018-1A-C | | | 3.41% | ^ | | 02/15/2048 | | | 4,997,345 | |
| 9,647,485 | | Wildcat LLC, Series 2017-1A-A | | | 4.12% | ± Þ | | 06/30/2027 | | | 9,628,190 | |
| | | | | | | | | | | | |
Total Asset Backed Obligations(Cost $231,276,692) | | | 234,174,306 | |
| | | | | | | | | | | | |
| |
Bank Loans - 4.1% | | | | |
| 234,413 | | 8th Avenue Food & Provisions, Inc., Senior Secured First Lien Term Loan (1 Month LIBOR USD + 3.75%) | | | 6.24% | | | 10/01/2025 | | | 234,823 | |
| 2,032,529 | | Acadia Healthcare Company, Inc., Senior Secured First Lien Term Loan (1 Month LIBOR USD + 2.50%) | | | 5.00% | | | 02/16/2023 | | | 2,019,826 | |
| 2,422,581 | | Access CIG, LLC, Senior Secured First Lien Term Loan (1 Month LIBOR USD + 3.75%) | | | 6.24% | | | 02/27/2025 | | | 2,398,355 | |
| 885,000 | | Achilles Acquisition LLC, Senior Secured First Lien Term Loan (1 Month LIBOR USD + 4.00%) | | | 6.50% | | | 10/13/2025 | | | 880,575 | |
| 798,963 | | Acrisure, LLC, Senior Secured First Lien Term Loan (3 Month LIBOR USD + 3.75%, 1.00% Floor) | | | 6.38% | | | 11/22/2023 | | | 788,975 | |
| 3,826,980 | | Acrisure, LLC, Senior Secured First Lien Term Loan (3 Month LIBOR USD + 4.25%, 1.00% Floor) | | | 6.88% | | | 11/22/2023 | | | 3,809,433 | |
| 930,000 | | Agiliti Health, Inc., Senior Secured First Lien Term Loan (1 Month LIBOR USD + 3.00%) | | | 5.50% | | | 01/05/2026 | | | 928,838 | |
| 2,030,744 | | Air Medical Group Holdings, Inc., Senior Secured First Lien Term Loan (1 Month LIBOR USD + 3.25%, 1.00% Floor) | | | 5.74% | | | 04/28/2022 | | | 1,917,368 | |
| 2,319,231 | | Air Methods Corporation, Senior Secured First Lien Term Loan (3 Month LIBOR USD + 3.50%, 1.00% Floor) | | | 6.10% | | | 04/22/2024 | | | 1,756,098 | |
| 1,363,063 | | Albertson's LLC, Senior Secured First Lien Term Loan (1 Month LIBOR USD + 3.00%, 0.75% Floor) | | | 5.48% | | | 06/22/2023 | | | 1,353,188 | |
| 825,663 | | Alera Group Intermediate Holdings, Inc., Senior Secured First Lien Term Loan (1 Month LIBOR USD + 4.50%) | | | 6.99% | | | 08/01/2025 | | | 831,599 | |
| 2,024,700 | | Aleris International, Inc., Senior Secured First Lien Term Loan (1 Month LIBOR USD + 4.75%) | | | 7.25% | | | 02/27/2023 | | | 2,028,243 | |
| 624,094 | | AlixPartners, LLP, Senior Secured First Lien Term Loan (1 Month LIBOR USD + 2.75%, 1.00% Floor) | | | 5.25% | | | 04/04/2024 | | | 620,818 | |
| 3,418,297 | | Allied Universal Holdco LLC, Senior Secured First Lien Term Loan (1 Month LIBOR USD + 3.75%, 1.00% Floor) | | | 6.25% | | | 07/28/2022 | | | 3,314,039 | |
| 498,948 | | Almonde, Inc., Senior Secured First Lien Term Loan (3 Month LIBOR USD + 3.50%, 1.00% Floor) | | | 6.10% | | | 06/13/2024 | | | 482,291 | |
| 747,732 | | Almonde, Inc., Senior Secured Second Lien Term Loan (3 Month LIBOR USD + 7.25%, 1.00% Floor) | | | 9.85% | | | 06/13/2025 | | | 722,343 | |
| 2,848,010 | | Alterra Mountain Company, Senior Secured First Lien Term Loan (1 Month LIBOR USD + 3.00%, 1.00% Floor) | | | 5.50% | | | 07/31/2024 | | | 2,837,786 | |
| 1,178,396 | | Altra Industrial Motion Corporation, Senior Secured First Lien Term Loan (1 Month LIBOR USD + 2.00%) | | | 4.50% | | | 10/01/2025 | | | 1,159,247 | |
| 705,000 | | American Airlines, Inc., Senior Secured First Lien Term Loan (1 Month LIBOR USD + 2.00%) | | | 4.48% | | | 12/15/2023 | | | 692,839 | |
| 1,373,850 | | American Renal Holdings, Inc., Senior Secured First Lien Term Loan (1 Month LIBOR USD + 3.25%) | | | 5.75% | | | 06/21/2024 | | | 1,310,309 | |
| 1,454,411 | | American Tire Distributors, Inc., Senior Secured First Lien Term Loan (3 Month LIBOR USD + 7.50%, 1.00% Floor, 8.00% PIK) | | | 10.13% | | | 08/30/2024 | | | 1,304,970 | |
| 1,873,059 | | Applied Systems, Inc., Senior Secured First Lien Term Loan (1 Month LIBOR USD + 3.00%, 1.00% Floor) | | | 5.50% | | | 09/19/2024 | | | 1,858,421 | |
| 1,180,000 | | Aramark Services, Inc., Senior Secured First Lien Term Loan (1 Month LIBOR USD + 1.75%) | | | 4.27% | | | 03/11/2025 | | | 1,172,442 | |
| 899,973 | | Arctic Glacier U.S.A., Inc., Senior Secured First Lien Term Loan (1 Month LIBOR USD + 3.50%, 1.00% Floor) | | | 6.00% | | | 03/20/2024 | | | 892,098 | |
| 1,339,109 | | Ascend Learning, LLC, Senior Secured First Lien Term Loan (1 Month LIBOR USD + 3.00%, 1.00% Floor) | | | 5.50% | | | 07/12/2024 | | | 1,314,001 | |
| 4,273,688 | | AssuredPartners, Inc., Senior Secured First Lien Term Loan (1 Month LIBOR USD + 3.25%) | | | 5.75% | | | 10/22/2024 | | | 4,147,614 | |
| 1,852,292 | | Asurion, LLC, Senior Secured First Lien Term Loan (1 Month LIBOR USD + 3.00%) | | | 5.50% | | | 11/03/2023 | | | 1,846,707 | |
| 1,170,000 | | Asurion, LLC, Senior Secured Second Lien Term Loan (1 Month LIBOR USD + 6.50%) | | | 9.00% | | | 08/04/2025 | | | 1,188,890 | |
| 1,825,000 | | Athenahealth, Inc., Senior Secured First Lien Term Loan (3 Month LIBOR USD + 4.50%) | | | 7.20% | | | 02/11/2026 | | | 1,804,469 | |
| 1,990,000 | | Auris Luxembourg III Sarl, Senior Secured First Lien Term Loan (1 Month LIBOR USD + 3.75%) | | | 6.25% | | | 02/27/2026 | | | 1,992,488 | |
| 3,896,203 | | Avantor, Inc., Senior Secured First Lien Term Loan (1 Month LIBOR USD + 3.75%, 1.00% Floor) | | | 6.25% | | | 11/21/2024 | | | 3,907,152 | |
| | Avaya, Inc., Senior Secured First Lien Term Loan | | | | | | | | | | |
| 1,381,936 | | (2 Month LIBOR USD + 4.25%) | | | 6.85% | | | 12/16/2024 | | | 1,378,336 | |
| 2,254,737 | | (1 Month LIBOR USD + 4.25%) | | | 6.73% | | | 12/16/2024 | | | 2,248,863 | |
| 467,626 | | Bass Pro Group, LLC, Senior Secured First Lien Term Loan (1 Month LIBOR USD + 5.00%, 0.75% Floor) | | | 7.50% | | | 09/25/2024 | | | 458,040 | |
| 1,591,250 | | Bausch Health Companies Inc., Senior Secured First Lien Term Loan (1 Month LIBOR USD + 2.75%) | | | 5.23% | | | 11/27/2025 | | | 1,574,972 | |
| 545,750 | | Bausch Health Companies Inc., Senior Secured First Lien Term Loan (1 Month LIBOR USD + 3.00%) | | | 5.48% | | | 06/02/2025 | | | 542,877 | |
| 2,361,053 | | BCP Renaissance Parent L.L.C., Senior Secured First Lien Term Loan (3 Month LIBOR USD + 3.50%, 1.00% Floor) | | | 6.24% | | | 10/31/2024 | | | 2,355,788 | |
| 235,867 | | Berry Global Group, Inc., Senior Secured First Lien Term Loan (2 Month LIBOR USD + 2.00%) | | | 4.61% | | | 10/01/2022 | | | 234,700 | |
| 3,591,750 | | BJ's Wholesale Club, Inc., Senior Secured First Lien Term Loan (1 Month LIBOR USD + 3.00%) | | | 5.50% | | | 02/02/2024 | | | 3,587,674 | |
| 1,872,351 | | Blackhawk Network Holdings Inc., Senior Secured First Lien Term Loan (1 Month LIBOR USD + 3.00%) | | | 5.50% | | | 06/16/2025 | | | 1,843,329 | |
| 2,678,288 | | Boxer Parent Company, Inc., Senior Secured First Lien Term Loan (3 Month LIBOR USD + 4.25%) | | | 6.85% | | | 10/02/2025 | | | 2,628,190 | |
| | Brand Energy & Infrastructure Services, Inc., Senior Secured First Lien Term Loan | | | | | | | | | | |
| 723,014 | | (3 Month LIBOR USD + 4.25%, 1.00% Floor) | | | 7.01% | | | 06/21/2024 | | | 694,495 | |
| 641,163 | | (2 Month LIBOR USD + 4.25%, 1.00% Floor) | | | 6.90% | | | 06/21/2024 | | | 615,872 | |
| 2,699,600 | | Brazos Delaware II, LLC, Senior Secured First Lien Term Loan (1 Month LIBOR USD + 4.00%) | | | 6.49% | | | 05/21/2025 | | | 2,570,019 | |
| 2,338,369 | | Bright Bidco B.V., Senior Secured First Lien Term Loan (3 Month LIBOR USD + 3.50%, 1.00% Floor) | | | 6.10% | | | 06/28/2024 | | | 1,823,928 | |
| 1,057,141 | | Brookfield WEC Holdings Inc., Senior Secured First Lien Term Loan (1 Month LIBOR USD + 3.75%, 0.75% Floor) | | | 6.25% | | | 08/01/2025 | | | 1,056,628 | |
| 1,490,075 | | BWAY Holding Company, Senior Secured First Lien Term Loan (3 Month LIBOR USD + 3.25%) | | | 6.03% | | | 04/03/2024 | | | 1,457,480 | |
| 3,889,271 | | Canyon Valor Companies, Inc., Senior Secured First Lien Term Loan (3 Month LIBOR USD + 2.75%) | | | 5.35% | | | 06/16/2023 | | | 3,866,188 | |
| 204,022 | | Capital Automotive L.P., Senior Secured Second Lien Term Loan (1 Month LIBOR USD + 6.00%, 1.00% Floor) | | | 8.50% | | | 03/24/2025 | | | 204,723 | |
| 4,277,303 | | Capri Acquisitions BidCo Limited, Senior Secured First Lien Term Loan (3 Month LIBOR USD + 3.25%) | | | 5.99% | | | 11/01/2024 | | | 4,221,164 | |
| 1,374,252 | | CBS Radio Inc., Senior Secured First Lien Term Loan (1 Month LIBOR USD + 2.75%) | | | 5.25% | | | 11/18/2024 | | | 1,339,209 | |
| 2,508,947 | | Cengage Learning, Inc., Senior Secured First Lien Term Loan (1 Month LIBOR USD + 4.25%, 1.00% Floor) | | | 6.74% | | | 06/07/2023 | | | 2,264,714 | |
| 675,000 | | CEOC, LLC, Senior Secured First Lien Term Loan (1 Month LIBOR USD + 2.00%) | | | 4.49% | | | 10/04/2024 | | | 660,994 | |
| 2,866,723 | | Change Healthcare Holdings, Inc., Senior Secured First Lien Term Loan (1 Month LIBOR USD + 2.75%, 1.00% Floor) | | | 5.25% | | | 03/01/2024 | | | 2,833,139 | |
| | CHG Healthcare Services, Inc., Senior Secured First Lien Term Loan | | | | | | | | | | |
| 1,845,007 | | (3 Month LIBOR USD + 3.00%, 1.00% Floor) | | | 5.74% | | | 06/07/2023 | | | 1,838,088 | |
| 1,037,816 | | (1 Month LIBOR USD + 3.00%, 1.00% Floor) | | | 5.50% | | | 06/07/2023 | | | 1,033,925 | |
| 2,610,275 | | CHG PPC Parent LLC, Senior Secured First Lien Term Loan (1 Month LIBOR USD + 2.75%) | | | 5.25% | | | 03/31/2025 | | | 2,571,121 | |
| 1,960,150 | | Cincinnati Bell Inc., Senior Secured First Lien Term Loan (1 Month LIBOR USD + 3.25%, 1.00% Floor) | | | 5.75% | | | 10/02/2024 | | | 1,944,047 | |
| 3,104,804 | | ClubCorp Holdings, Inc., Senior Secured First Lien Term Loan (3 Month LIBOR USD + 2.75%) | | | 5.35% | | | 09/18/2024 | | | 2,946,459 | |
| 2,215,000 | | CommScope, Inc., Senior Secured First Lien Term Loan (3 Month LIBOR USD + 3.25%) | | | 6.05% | | | 02/06/2026 | | | 2,216,838 | |
| 2,730,706 | | Compass Power Generation, L.L.C., Senior Secured First Lien Term Loan (1 Month LIBOR USD + 3.50%, 1.00% Floor) | | | 6.00% | | | 12/20/2024 | | | 2,734,693 | |
| 1,257,174 | | Concentra, Inc., Senior Secured First Lien Term Loan (1 Month LIBOR USD + 2.75%) | | | 5.24% | | | 06/01/2022 | | | 1,251,416 | |
| 1,223,971 | | Covia Holdings Corporation, Senior Secured First Lien Term Loan (1 Week LIBOR USD + 3.75%, 1.00% Floor) | | | 6.16% | | | 06/01/2025 | | | 1,049,366 | |
| 1,143,594 | | CPI Holdco, LLC, Senior Secured First Lien Term Loan (3 Month LIBOR USD + 3.50%, 1.00% Floor) | | | 6.24% | | | 03/21/2024 | | | 1,132,158 | |
| 394,013 | | CPM Holdings, Inc., Senior Secured First Lien Term Loan (1 Month LIBOR USD + 3.75%) | | | 6.25% | | | 11/17/2025 | | | 391,550 | |
| 1,355,000 | | CSC Holdings, LLC, Senior Secured First Lien Term Loan (1 Month LIBOR USD + 2.25%) | | | 4.73% | | | 07/17/2025 | | | 1,318,706 | |
| 530,000 | | CSC Holdings, LLC, Senior Secured First Lien Term Loan (1 Month LIBOR USD + 2.25%) | | | 4.73% | | | 01/15/2026 | | | 515,823 | |
| 1,440,000 | | CSC Holdings, LLC, Senior Secured First Lien Term Loan (3 Month LIBOR USD + 3.00%) | | | 5.59% | | | 04/15/2027 | | | 1,435,954 | |
| 2,981,878 | | CSM Bakery Solutions LLC, Senior Secured First Lien Term Loan (3 Month LIBOR USD + 4.00%, 1.00% Floor) | | | 6.80% | | | 07/03/2020 | | | 2,860,113 | |
| 3,899,481 | | Cvent, Inc., Senior Secured First Lien Term Loan (1 Month LIBOR USD + 3.75%, 1.00% Floor) | | | 6.25% | | | 11/29/2024 | | | 3,826,365 | |
| 1,333,530 | | CVS Holdings I, LP, Senior Secured First Lien Term Loan (1 Month LIBOR USD + 2.75%, 1.00% Floor) | | | 5.25% | | | 02/06/2025 | | | 1,291,857 | |
| 3,456,964 | | Cyxtera DC Holdings, Inc., Senior Secured First Lien Term Loan (3 Month LIBOR USD + 3.00%, 1.00% Floor) | | | 5.60% | | | 05/01/2024 | | | 3,356,141 | |
| 540,000 | | Cyxtera DC Holdings, Inc., Senior Secured Second Lien Term Loan (3 Month LIBOR USD + 7.25%, 1.00% Floor) | | | 9.86% | | | 05/01/2025 | | | 494,100 | |
| 2,688,447 | | Deerfield Holdings Corporation, Senior Secured First Lien Term Loan (1 Month LIBOR USD + 3.25%, 1.00% Floor) | | | 5.75% | | | 02/13/2025 | | | 2,640,848 | |
| 1,341,604 | | Dell International L.L.C., Senior Secured First Lien Term Loan (1 Month LIBOR USD + 2.00%, 0.75% Floor) | | | 4.50% | | | 09/07/2023 | | | 1,328,080 | |
| 893,258 | | Delta 2 SARL, Senior Secured First Lien Term Loan (1 Month LIBOR USD + 2.50%, 1.00% Floor) | | | 5.00% | | | 02/01/2024 | | | 862,887 | |
| 526,949 | | Dentalcorp Perfect Smile ULC, Senior Secured First Lien Term Loan (1 Month LIBOR USD + 3.75%, 1.00% Floor) | | | 6.25% | & | | 06/06/2025 | | | 515,092 | |
| 2,100,130 | | Dentalcorp Perfect Smile ULC, Senior Secured First Lien Term Loan (1 Month LIBOR USD + 3.75%, 1.00% Floor) | | | 6.25% | | | 06/06/2025 | | | 2,052,877 | |
| 221,425 | | DexKo Global Inc., Senior Secured First Lien Term Loan (1 Month LIBOR USD + 3.50%, 1.00% Floor) | | | 6.00% | | | 07/24/2024 | | | 218,491 | |
| 1,047,420 | | Digicel International Finance Ltd, Senior Secured First Lien Term Loan (3 Month LIBOR USD + 3.25%) | | | 5.88% | | | 05/27/2024 | | | 933,518 | |
| 438,986 | | Dynasty Acquisition Company, Inc., Senior Secured First Lien Term Loan (3 Month LIBOR USD + 4.00%) | | | 6.80% | | | 01/23/2026 | | | 439,748 | |
| 236,014 | | Dynasty Acquisition Company, Inc., Senior Secured First Lien Term Loan (3 Month LIBOR USD + 4.00%) | | | 6.80% | | | 01/23/2026 | | | 236,423 | |
| 964,583 | | Dynatrace LLC, Senior Secured First Lien Term Loan (1 Month LIBOR USD + 3.25%) | | | 5.75% | | | 08/22/2025 | | | 962,050 | |
| 3,618,450 | | EAB Global, Inc., Senior Secured First Lien Term Loan (6 Month LIBOR USD + 3.75%, 1.00% Floor) | | | 6.41% | | | 11/15/2024 | | | 3,541,558 | |
| 1,964,375 | | Edgewater Generation, L.L.C., Senior Secured First Lien Term Loan (1 Month LIBOR USD + 3.75%) | | | 6.25% | | | 12/12/2025 | | | 1,963,147 | |
| 4,007,024 | | EG America LLC, Senior Secured First Lien Term Loan (3 Month LIBOR USD + 4.00%) | | | 6.60% | | | 02/06/2025 | | | 3,922,877 | |
| 633,600 | | EG Group Limited, Senior Secured First Lien Term Loan (3 Month LIBOR USD + 4.00%) | | | 6.60% | | | 02/07/2025 | | | 620,294 | |
| 4,294,238 | | Envision Healthcare Corporation, Senior Secured First Lien Term Loan (1 Month LIBOR USD + 3.75%) | | | 6.25% | | | 10/10/2025 | | | 4,027,651 | |
| 3,972,249 | | Equian Buyer Corporation, Senior Secured First Lien Term Loan (1 Month LIBOR USD + 3.25%, 1.00% Floor) | | | 5.75% | | | 05/20/2024 | | | 3,907,700 | |
| 1,883,626 | | Equinox Holdings, Inc., Senior Secured First Lien Term Loan (1 Month LIBOR USD + 3.00%, 1.00% Floor) | | | 5.49% | | | 03/08/2024 | | | 1,874,679 | |
| 695,000 | | ESH Hospitality, Inc., Senior Secured First Lien Term Loan (1 Month LIBOR USD + 2.00%) | | | 4.50% | | | 08/30/2023 | | | 691,525 | |
| 3,292,723 | | Excelitas Technologies Corporation, Senior Secured First Lien Term Loan (3 Month LIBOR USD + 3.50%, 1.00% Floor) | | | 6.10% | | | 12/02/2024 | | | 3,282,434 | |
| 347,576 | | Exgen Renewables IV, LLC, Senior Secured First Lien Term Loan (3 Month LIBOR USD + 3.00%, 1.00% Floor) | | | 5.63% | | | 11/29/2024 | | | 326,831 | |
| 3,855,330 | | Explorer Holdings, Inc., Senior Secured First Lien Term Loan (3 Month LIBOR USD + 3.75%, 1.00% Floor) | | | 6.35% | | | 05/02/2023 | | | 3,828,844 | |
| 2,433,800 | | Filtration Group Corporation, Senior Secured First Lien Term Loan (1 Month LIBOR USD + 3.00%) | | | 5.50% | | | 03/31/2025 | | | 2,423,663 | |
| 3,381,525 | | Financial & Risk US Holdings, Inc., Senior Secured First Lien Term Loan (1 Month LIBOR USD + 3.75%) | | | 6.25% | | | 10/01/2025 | | | 3,289,142 | |
| 2,855,000 | | First Data Corporation, Senior Secured First Lien Term Loan (1 Month LIBOR USD + 2.00%) | | | 4.49% | | | 04/26/2024 | | | 2,849,961 | |
| 3,206,193 | | Flexential Intermediate Corporation, Senior Secured First Lien Term Loan (3 Month LIBOR USD + 3.50%) | | | 6.10% | | | 08/01/2024 | | | 2,946,700 | |
| 3,098,371 | | Flexera Software LLC, Senior Secured First Lien Term Loan (1 Month LIBOR USD + 3.25%, 1.00% Floor) | | | 5.75% | | | 02/26/2025 | | | 3,087,527 | |
| 3,743,248 | | Foresight Energy LLC, Senior Secured First Lien Term Loan (3 Month LIBOR USD + 5.75%, 1.00% Floor) | | | 8.38% | | | 03/28/2022 | | | 3,676,169 | |
| 1,600,988 | | Forest City Enterprises, L.P., Senior Secured First Lien Term Loan (1 Month LIBOR USD + 4.00%) | | | 6.48% | | | 12/08/2025 | | | 1,609,993 | |
| 2,320,752 | | Forterra Finance, LLC, Senior Secured First Lien Term Loan (1 Month LIBOR USD + 3.00%, 1.00% Floor) | | | 5.50% | | | 10/25/2023 | | | 2,144,200 | |
| 865,665 | | Frontdoor, Inc., Senior Secured First Lien Term Loan (1 Month LIBOR USD + 2.50%) | | | 5.00% | | | 08/18/2025 | | | 863,505 | |
| 2,957,650 | | Frontera Generation Holdings LLC, Senior Secured First Lien Term Loan (1 Month LIBOR USD + 4.25%, 1.00% Floor) | | | 6.73% | | | 05/02/2025 | | | 2,934,240 | |
| 4,085,058 | | Garda World Security Corporation, Senior Secured First Lien Term Loan (3 Month LIBOR USD + 3.50%, 1.00% Floor) | | | 6.12% | | | 05/24/2024 | | | 4,041,144 | |
| 2,661,800 | | Gates Global LLC, Senior Secured First Lien Term Loan (1 Month LIBOR USD + 2.75%, 1.00% Floor) | | | 5.25% | | | 04/01/2024 | | | 2,631,615 | |
| 535,000 | | Gavilan Resources, LLC, Senior Secured Second Lien Term Loan (1 Month LIBOR USD + 6.00%, 1.00% Floor) | | | 8.49% | | | 03/01/2024 | | | 420,510 | |
| 2,897,807 | | Genesys Telecommunications Laboratories, Inc., Senior Secured First Lien Term Loan (1 Month LIBOR USD + 3.25%) | | | 5.75% | | | 12/01/2023 | | | 2,866,293 | |
| 3,593,325 | | Gentiva Health Services, Inc., Senior Secured First Lien Term Loan (1 Month LIBOR USD + 3.75%) | | | 6.25% | | | 07/02/2025 | | | 3,606,800 | |
| 1,065,000 | | Gentiva Health Services, Inc., Senior Secured Second Lien Term Loan (1 Month LIBOR USD + 7.00%) | | | 9.50% | | | 07/02/2026 | | | 1,091,625 | |
| 443,888 | | Getty Images, Inc., Senior Secured First Lien Term Loan (1 Month LIBOR USD + 4.50%) | | | 7.00% | | | 02/19/2026 | | | 441,322 | |
| 2,562,179 | | GOBP Holdings, Inc., Senior Secured First Lien Term Loan (3 Month LIBOR USD + 3.75%) | | | 6.35% | | | 10/22/2025 | | | 2,543,603 | |
| 2,204,475 | | GoodRX, Inc., Senior Secured First Lien Term Loan (1 Month LIBOR USD + 3.00%) | | | 5.49% | | | 10/10/2025 | | | 2,184,271 | |
| 3,907,639 | | GrafTech Finance, Inc., Senior Secured First Lien Term Loan (1 Month LIBOR USD + 3.50%, 1.00% Floor) | | | 6.00% | | | 02/12/2025 | | | 3,902,754 | |
| 1,386,525 | | Gray Television, Inc., Senior Secured First Lien Term Loan (1 Month LIBOR USD + 2.50%) | | | 4.98% | | | 01/02/2026 | | | 1,373,311 | |
| 4,367,000 | | GTT Communications, Inc., Senior Secured First Lien Term Loan (1 Month LIBOR USD + 2.75%) | | | 5.25% | | | 06/02/2025 | | | 4,127,361 | |
| | Gulf Finance, LLC, Senior Secured First Lien Term Loan | | | | | | | | | | |
| 1,311,658 | | (3 Month LIBOR USD + 5.25%, 1.00% Floor) | | | 7.86% | | | 08/25/2023 | | | 1,050,691 | |
| 2,233,364 | | (1 Month LIBOR USD + 5.25%, 1.00% Floor) | | | 7.75% | | | 08/25/2023 | | | 1,789,014 | |
| 1,945,473 | | Harbor Freight Tools USA, Inc., Senior Secured First Lien Term Loan (1 Month LIBOR USD + 2.50%, 0.75% Floor) | | | 5.00% | | | 08/18/2023 | | | 1,904,939 | |
| 2,893,674 | | Hayward Industries, Inc., Senior Secured First Lien Term Loan (1 Month LIBOR USD + 3.50%) | | | 6.00% | | | 08/05/2024 | | | 2,843,946 | |
| 671,625 | | HD Supply, Inc., Senior Secured First Lien Term Loan (1 Month LIBOR USD + 1.75%) | | | 4.25% | | | 10/17/2023 | | | 664,741 | |
| 3,440,000 | | Hilton Worldwide Finance LLC, Senior Secured First Lien Term Loan (1 Month LIBOR USD + 1.75%) | | | 4.24% | | | 10/25/2023 | | | 3,435,975 | |
| 1,875,124 | | Hyland Software, Inc., Senior Secured First Lien Term Loan (1 Month LIBOR USD + 3.50%, 0.75% Floor) | | | 6.00% | | | 07/01/2024 | | | 1,874,927 | |
| 825,000 | | Hyland Software, Inc., Senior Secured Second Lien Term Loan (1 Month LIBOR USD + 7.00%, 0.75% Floor) | | | 9.50% | | | 07/07/2025 | | | 825,516 | |
| 2,556,694 | | Informatica LLC, Senior Secured First Lien Term Loan (1 Month LIBOR USD + 3.25%) | | | 5.75% | | | 08/05/2022 | | | 2,556,183 | |
| 4,115,000 | | Intelsat Jackson Holdings S.A., Senior Secured First Lien Term Loan (1 Month LIBOR USD + 3.75%, 1.00% Floor) | | | 6.24% | | | 11/30/2023 | | | 4,059,694 | |
| 1,970,452 | | ION Trading Technologies S.a.R.L, Senior Secured First Lien Term Loan (3 Month LIBOR USD + 4.00%, 1.00% Floor) | | | 6.65% | | | 11/21/2024 | | | 1,919,072 | |
| 1,845,000 | | IQVIA Inc., Senior Secured First Lien Term Loan (3 Month LIBOR USD + 2.00%) | | | 4.60% | | | 01/17/2025 | | | 1,842,233 | |
| 1,859,968 | | IRB Holding Corporation, Senior Secured First Lien Term Loan (1 Month LIBOR USD + 3.25%, 1.00% Floor) | | | 5.74% | | | 02/05/2025 | | | 1,817,124 | |
| 1,910,611 | | IRI Holdings, Inc., Senior Secured First Lien Term Loan (3 Month LIBOR USD + 4.50%) | | | 7.13% | | | 12/01/2025 | | | 1,887,445 | |
| 1,859,278 | | Jaguar Holding Company II, Senior Secured First Lien Term Loan (1 Month LIBOR USD + 2.50%, 1.00% Floor) | | | 5.00% | | | 08/18/2022 | | | 1,843,548 | |
| 2,356,694 | | Jo-Ann Stores, LLC, Senior Secured First Lien Term Loan (6 Month LIBOR USD + 5.00%, 1.00% Floor) | | | 7.76% | | | 10/20/2023 | | | 2,350,803 | |
| 685,000 | | KAR Auction Services, Inc., Senior Secured First Lien Term Loan (3 Month LIBOR USD + 2.50%) | | | 5.13% | | | 03/09/2023 | | | 684,144 | |
| 2,317,488 | | KBR, Inc., Senior Secured First Lien Term Loan (1 Month LIBOR USD + 3.75%) | | | 6.25% | | | 04/25/2025 | | | 2,321,114 | |
| 1,635,880 | | Kenan Advantage Group, Inc., Senior Secured First Lien Term Loan (1 Month LIBOR USD + 3.00%, 1.00% Floor) | | | 5.50% | | | 08/01/2022 | | | 1,611,751 | |
| 1,776,075 | | Kindred Healthcare, Inc., Senior Secured First Lien Term Loan (1 Month LIBOR USD + 5.00%) | | | 7.50% | | | 06/23/2025 | | | 1,744,994 | |
| 1,956,188 | | Klockner-Pentaplast of America, Inc., Senior Secured First Lien Term Loan (1 Month LIBOR USD + 4.25%, 1.00% Floor) | | | 6.75% | | | 06/30/2022 | | | 1,722,678 | |
| 3,002,067 | | Kronos Acquisition Holdings Inc., Senior Secured First Lien Term Loan (1 Month LIBOR USD + 4.00%, 1.00% Floor) | | | 6.50% | | | 05/15/2023 | | | 2,811,946 | |
| 1,861,978 | | Kronos Incorporated, Senior Secured First Lien Term Loan (3 Month LIBOR USD + 3.00%, 1.00% Floor) | | | 5.74% | | | 11/01/2023 | | | 1,847,883 | |
| 1,480,962 | | Learfield Communications LLC, Senior Secured First Lien Term Loan (1 Month LIBOR USD + 3.25%, 1.00% Floor) | | | 5.75% | | | 12/01/2023 | | | 1,477,726 | |
| 1,860,470 | | Life Time Fitness, Inc., Senior Secured First Lien Term Loan (3 Month LIBOR USD + 2.75%, 1.00% Floor) | | | 5.38% | | | 06/10/2022 | | | 1,842,191 | |
| 810,690 | | Lions Gate Capital Holdings LLC, Senior Secured First Lien Term Loan (1 Month LIBOR USD + 2.25%) | | | 4.75% | | | 03/24/2025 | | | 802,076 | |
| 679,005 | | LTI Holdings, Inc., Senior Secured First Lien Term Loan (1 Month LIBOR USD + 3.50%) | | | 6.00% | | | 09/08/2025 | | | 654,955 | |
| 2,588,850 | | Lucid Energy Group II Borrower, LLC, Senior Secured First Lien Term Loan (1 Month LIBOR USD + 3.00%, 1.00% Floor) | | | 5.49% | | | 02/18/2025 | | | 2,457,142 | |
| 1,002,488 | | Marriott Ownership Resorts Inc., Senior Secured First Lien Term Loan (1 Month LIBOR USD + 2.25%) | | | 4.75% | | | 08/29/2025 | | | 998,728 | |
| 344,208 | | Mavis Tire Express Services Corporation, Senior Secured First Lien Term Loan (1 Month LIBOR USD + 3.25%) | | | 2.00% | & | | 03/20/2025 | | | 336,463 | |
| 2,599,728 | | Mavis Tire Express Services Corporation, Senior Secured First Lien Term Loan (1 Month LIBOR USD + 3.25%) | | | 5.74% | | | 03/20/2025 | | | 2,541,234 | |
| 1,374,560 | | McDermott International, Inc., Senior Secured First Lien Term Loan (1 Month LIBOR USD + 5.00%, 1.00% Floor) | | | 7.50% | | | 05/10/2025 | | | 1,320,670 | |
| 920,625 | | Meredith Corporation, Senior Secured First Lien Term Loan (1 Month LIBOR USD + 2.75%) | | | 5.25% | | | 01/31/2025 | | | 919,732 | |
| 1,650,000 | | Messer Industries, L.L.C., Senior Secured First Lien Term Loan (3 Month LIBOR USD + 2.50%) | | | 5.10% | | | 03/02/2026 | | | 1,619,071 | |
| 1,250,000 | | MGM Growth Properties Operating Partnership LP, Senior Secured First Lien Term Loan (1 Month LIBOR USD + 2.00%) | | | 4.50% | | | 03/21/2025 | | | 1,234,937 | |
| 3,797,067 | | Milacron LLC, Senior Secured First Lien Term Loan (1 Month LIBOR USD + 2.50%) | | | 5.00% | | | 09/28/2023 | | | 3,721,125 | |
| 3,850,000 | | Millennium Trust Company, LLC, Senior Secured First Lien Term Loan (3 Month LIBOR USD + 5.00%) | | | 7.74% | | | 02/27/2026 | | | 3,804,301 | |
| 4,046,364 | | Mitchell International, Inc., Senior Secured First Lien Term Loan (1 Month LIBOR USD + 3.25%) | | | 5.75% | | | 11/29/2024 | | | 3,900,331 | |
| 383,333 | | Mitchell International, Inc., Senior Secured Second Lien Term Loan (1 Month LIBOR USD + 7.25%) | | | 9.75% | | | 12/01/2025 | | | 374,229 | |
| 3,396,488 | | MLN US HoldCo LLC, Senior Secured First Lien Term Loan (1 Month LIBOR USD + 4.50%) | | | 7.00% | | | 11/30/2025 | | | 3,344,691 | |
| 800,000 | | MLN US HoldCo LLC, Senior Secured Second Lien Term Loan (1 Month LIBOR USD + 8.75%) | | | 11.25% | | | 11/30/2026 | | | 786,668 | |
| 799,769 | | Monitronics International, Inc., Senior Secured First Lien Term Loan (3 Month LIBOR USD + 5.50%, 1.00% Floor) | | | 8.10% | | | 09/30/2022 | | | 672,662 | |
| 1,807,840 | | MPH Acquisition Holdings LLC, Senior Secured First Lien Term Loan (3 Month LIBOR USD + 2.75%, 1.00% Floor) | | | 5.35% | | | 06/07/2023 | | | 1,754,038 | |
| 1,972,363 | | National Vision, Inc., Senior Secured First Lien Term Loan (1 Month LIBOR USD + 2.50%) | | | 5.00% | | | 11/20/2024 | | | 1,965,588 | |
| 1,371,563 | | NEP Group, Inc., Senior Secured First Lien Term Loan (1 Month LIBOR USD + 3.25%) | | | 5.75% | | | 10/20/2025 | | | 1,362,990 | |
| 270,000 | | NEP Group, Inc., Senior Secured Second Lien Term Loan (1 Month LIBOR USD + 7.00%) | | | 9.50% | | | 10/19/2026 | | | 267,300 | |
| 1,402,138 | | Numericable U.S. LLC, Senior Secured First Lien Term Loan (1 Month LIBOR USD + 4.00%) | | | 6.48% | | | 08/14/2026 | | | 1,347,805 | |
| 3,222,450 | | Oryx Southern Delaware Holdings LLC, Senior Secured First Lien Term Loan (1 Month LIBOR USD + 3.25%, 1.00% Floor) | | | 5.75% | | | 02/28/2025 | | | 3,124,439 | |
| 399,000 | | Outcomes Group Holdings, Inc., Senior Secured First Lien Term Loan (1 Month LIBOR USD + 3.50%) | | | 6.00% | | | 10/24/2025 | | | 391,519 | |
| 3,685,000 | | Panther BF Aggregator 2 LP, Senior Secured First Lien Term Loan (3 Month LIBOR USD + 3.50%) | | | 6.12% | | | 03/18/2026 | | | 3,648,113 | |
| 1,986,476 | | Parexel International Corporation, Senior Secured First Lien Term Loan (1 Month LIBOR USD + 2.75%) | | | 5.25% | | | 09/27/2024 | | | 1,918,727 | |
| 1,007,475 | | Penn National Gaming, Inc., Senior Secured First Lien Term Loan (1 Month LIBOR USD + 2.25%, 0.75% Floor) | | | 4.75% | | | 10/15/2025 | | | 998,660 | |
| 1,260,060 | | PetSmart, Inc., Senior Secured First Lien Term Loan (1 Month LIBOR USD + 3.00%, 1.00% Floor) | | | 5.49% | | | 03/11/2022 | | | 1,133,431 | |
| 1,291,950 | | Phoenix Services International LLC, Senior Secured First Lien Term Loan (1 Month LIBOR USD + 3.75%, 1.00% Floor) | | | 6.24% | | | 03/03/2025 | | | 1,285,497 | |
| 1,838,806 | | Pike Corporation, Senior Secured First Lien Term Loan (1 Month LIBOR USD + 3.50%, 1.00% Floor) | | | 6.00% | | | 03/21/2025 | | | 1,839,956 | |
| 4,323,809 | | Pisces Midco, Inc., Senior Secured First Lien Term Loan (3 Month LIBOR USD + 3.75%) | | | 6.55% | | | 04/12/2025 | | | 4,156,262 | |
| 2,577,072 | | Plantronics, Inc., Senior Secured First Lien Term Loan (1 Month LIBOR USD + 2.50%) | | | 5.00% | | | 07/02/2025 | | | 2,535,195 | |
| 2,677,669 | | Playa Resorts Holding B.V., Senior Secured First Lien Term Loan (1 Month LIBOR USD + 2.75%, 1.00% Floor) | | | 5.25% | | | 04/29/2024 | | | 2,580,617 | |
| 1,870,541 | | PODS, LLC, Senior Secured First Lien Term Loan (1 Month LIBOR USD + 2.75%, 1.00% Floor) | | | 5.24% | | | 12/06/2024 | | | 1,838,789 | |
| 648,370 | | Polar US Borrower, LLC, Senior Secured First Lien Term Loan (3 Month LIBOR USD + 4.75%) | | | 7.35% | | | 10/15/2025 | | | 649,180 | |
| 2,443,485 | | PowerTeam Services, LLC, Senior Secured First Lien Term Loan (3 Month LIBOR USD + 3.25%, 1.00% Floor) | | | 5.85% | | | 03/06/2025 | | | 2,342,691 | |
| 935,000 | | Prairie ECI Acquiror LP, Senior Secured First Lien Term Loan (3 Month LIBOR USD + 4.75%) | | | 7.37% | | | 03/11/2026 | | | 938,894 | |
| 3,062,599 | | Prime Security Services Borrower, LLC, Senior Secured First Lien Term Loan (1 Month LIBOR USD + 2.75%, 1.00% Floor) | | | 5.25% | | | 05/02/2022 | | | 3,035,816 | |
| 1,953,687 | | Pro Mach Group, Inc., Senior Secured First Lien Term Loan (1 Month LIBOR USD + 3.00%) | | | 5.49% | | | 03/07/2025 | | | 1,894,676 | |
| 2,805,184 | | Project Alpha Intermediate Holding, Inc., Senior Secured First Lien Term Loan (6 Month LIBOR USD + 3.50%, 1.00% Floor) | | | 6.37% | | | 04/26/2024 | | | 2,742,067 | |
| | Radiology Partners, Inc., Senior Secured First Lien Term Loan | | | | | | | | | | |
| 1,268,139 | | (3 Month LIBOR USD + 4.75%) | | | 7.55% | | | 07/09/2025 | | | 1,272,895 | |
| 1,268,139 | | (3 Month LIBOR USD + 4.75%) | | | 7.37% | | | 07/09/2025 | | | 1,272,895 | |
| 1,193,543 | | (2 Month LIBOR USD + 4.75%) | | | 7.34% | | | 07/09/2025 | | | 1,198,019 | |
| 2,164,575 | | RegionalCare Hospital Partners Holdings, Inc., Senior Secured First Lien Term Loan (1 Month LIBOR USD + 4.50%) | | | 6.98% | | | 11/14/2025 | | | 2,145,299 | |
| 4,116,506 | | Renaissance Holding Corporation, Senior Secured First Lien Term Loan (1 Month LIBOR USD + 3.25%) | | | 5.75% | | | 06/02/2025 | | | 3,956,991 | |
| 1,879,873 | | RentPath, Inc., Senior Secured First Lien Term Loan (1 Month LIBOR USD + 4.75%, 1.00% Floor) | | | 7.25% | | | 12/17/2021 | | | 1,422,961 | |
| 3,332,002 | | Reynolds Group Holdings, Inc., Senior Secured First Lien Term Loan (1 Month LIBOR USD + 2.75%) | | | 5.25% | | | 02/06/2023 | | | 3,299,065 | |
| 1,210,000 | | RPI Finance Trust, Senior Secured First Lien Term Loan (1 Month LIBOR USD + 2.00%) | | | 4.50% | | | 03/27/2023 | | | 1,204,706 | |
| 1,645,875 | | Science Applications International Corporation, Senior Secured First Lien Term Loan (1 Month LIBOR USD + 1.75%) | | | 4.25% | | | 10/31/2025 | | | 1,624,956 | |
| | Scientific Games International, Inc., Senior Secured First Lien Term Loan | | | | | | | | | | |
| 1,511,808 | | (2 Month LIBOR USD + 2.75%) | | | 5.33% | | | 08/14/2024 | | | 1,474,958 | |
| 354,622 | | (1 Month LIBOR USD + 2.75%) | | | 5.25% | | | 08/14/2024 | | | 345,978 | |
| 2,432,163 | | SCS Holdings I Inc., Senior Secured First Lien Term Loan (1 Month LIBOR USD + 4.25%, 1.00% Floor) | | | 6.75% | | | 10/31/2022 | | | 2,443,315 | |
| 620,000 | | Securus Technologies Holdings LLC, Senior Secured First Lien Delayed-Draw Term Loan | | | 7.10% | ± & | | 11/01/2024 | | | 611,088 | |
| 4,235,597 | | Securus Technologies Holdings, Inc., Senior Secured First Lien Term Loan (1 Month LIBOR USD + 4.50%, 1.00% Floor) | | | 7.00% | | | 11/01/2024 | | | 4,215,309 | |
| 842,888 | | Sedgwick Claims Management Services, Inc., Senior Secured First Lien Term Loan (1 Month LIBOR USD + 3.25%) | | | 5.75% | | | 12/31/2025 | | | 826,995 | |
| 3,053,399 | | Select Medical Corporation, Senior Secured First Lien Term Loan (1 Month LIBOR USD + 2.50%) | | | 4.98% | | | 03/01/2021 | | | 3,045,765 | |
| 4,299,225 | | Severin Acquisition, LLC, Senior Secured First Lien Term Loan (3 Month LIBOR USD + 3.25%) | | | 5.99% | | | 08/01/2025 | | | 4,183,683 | |
| 2,674,788 | | SIWF Holdings, Inc., Senior Secured First Lien Term Loan (1 Month LIBOR USD + 4.25%) | | | 6.74% | | | 06/13/2025 | | | 2,648,040 | |
| 1,786,950 | | SMG US Midco 2, Inc., Senior Secured First Lien Term Loan (1 Month LIBOR USD + 3.00%) | | | 5.50% | | | 01/23/2025 | | | 1,768,330 | |
| 1,547,424 | | SolarWinds Holdings, Inc., Senior Secured First Lien Term Loan (1 Month LIBOR USD + 2.75%) | | | 5.25% | | | 02/05/2024 | | | 1,533,884 | |
| 2,889,738 | | Solenis International, L.P., Senior Secured First Lien Term Loan (3 Month LIBOR USD + 4.00%) | | | 6.63% | | | 06/26/2025 | | | 2,851,203 | |
| 570,000 | | Solenis International, L.P., Senior Secured Second Lien Term Loan (3 Month LIBOR USD + 8.50%) | | | 11.13% | | | 06/26/2026 | | | 548,625 | |
| 1,286,499 | | Solera, LLC, Senior Secured First Lien Term Loan (1 Month LIBOR USD + 2.75%) | | | 5.25% | | | 03/03/2023 | | | 1,278,201 | |
| 2,938,379 | | Sophia, L.P., Senior Secured First Lien Term Loan (3 Month LIBOR USD + 3.25%, 1.00% Floor) | | | 5.85% | | | 09/30/2022 | | | 2,924,304 | |
| 3,010,836 | | Sound Inpatient Physicians, Inc., Senior Secured First Lien Term Loan (1 Month LIBOR USD + 2.75%) | | | 5.25% | | | 06/27/2025 | | | 2,982,233 | |
| | Southern Graphics Inc., Senior Secured First Lien Term Loan | | | | | | | | | | |
| 1,581,287 | | (2 Month LIBOR USD + 3.25%) | | | 5.83% | | | 12/30/2022 | | | 1,355,954 | |
| 1,402,273 | | (1 Month LIBOR USD + 3.25%) | | | 5.75% | | | 12/30/2022 | | | 1,202,449 | |
| 1,308,409 | | Speedcast International Limited, Senior Secured First Lien Term Loan (3 Month LIBOR USD + 2.75%) | | | 5.35% | | | 05/15/2025 | | | 1,271,884 | |
| 1,855,523 | | SS&C Technologies, Inc., Senior Secured First Lien Term Loan (1 Month LIBOR USD + 2.25%) | | | 4.75% | | | 04/16/2025 | | | 1,842,284 | |
| 1,531,192 | | StandardAero Aviation Holdings, Inc., Senior Secured First Lien Term Loan (1 Month LIBOR USD + 3.75%, 1.00% Floor) | | | 6.25% | | | 07/07/2022 | | | 1,535,027 | |
| 1,373,615 | | Staples, Inc., Senior Secured First Lien Term Loan (1 Month LIBOR USD + 4.00%, 1.00% Floor) | | | 6.49% | | | 09/12/2024 | | | 1,365,023 | |
| 2,886,370 | | Starfruit US Holdco LLC, Senior Secured First Lien Term Loan (1 Month LIBOR USD + 3.25%) | | | 5.74% | | | 10/01/2025 | | | 2,852,109 | |
| 950,060 | | Stars Group Holdings B.V., Senior Secured First Lien Term Loan (3 Month LIBOR USD + 3.50%) | | | 6.10% | | | 07/10/2025 | | | 949,951 | |
| 1,412,901 | | Syncreon Global Finance Inc., Senior Secured First Lien Term Loan (3 Month LIBOR USD + 4.25%, 1.00% Floor) | | | 6.99% | | | 10/28/2020 | | | 926,863 | |
| 3,305,830 | | Telesat Canada, Senior Secured First Lien Term Loan (3 Month LIBOR USD + 2.50%, 0.75% Floor) | | | 5.10% | | | 11/17/2023 | | | 3,269,466 | |
| 3,204,234 | | Tempo Acquisition, LLC, Senior Secured First Lien Term Loan (1 Month LIBOR USD + 3.00%) | | | 5.50% | | | 05/01/2024 | | | 3,178,616 | |
| 1,528,604 | | Tenneco, Inc., Senior Secured First Lien Term Loan (1 Month LIBOR USD + 2.75%) | | | 5.25% | | | 10/01/2025 | | | 1,461,727 | |
| 735,000 | | The Dun & Bradstreet Corporation, Senior Secured First Lien Term Loan (1 Month LIBOR USD + 5.00%) | | | 7.49% | | | 02/09/2026 | | | 728,109 | |
| 3,301,725 | | The Edelman Financial Center, LLC, Senior Secured First Lien Term Loan (3 Month LIBOR USD + 3.25%) | | | 6.04% | | | 07/21/2025 | | | 3,280,066 | |
| 255,000 | | The Edelman Financial Center, LLC, Senior Secured Second Lien Term Loan (3 Month LIBOR USD + 6.75%) | | | 9.54% | | | 07/20/2026 | | | 256,913 | |
| 2,924,791 | | Titan Acquisition Limited, Senior Secured First Lien Term Loan (1 Month LIBOR USD + 3.00%) | | | 5.50% | | | 03/28/2025 | | | 2,728,099 | |
| 2,920,408 | | TKC Holdings, Inc., Senior Secured First Lien Term Loan (1 Month LIBOR USD + 3.75%, 1.00% Floor) | | | 6.25% | | | 02/01/2023 | | | 2,872,951 | |
| 2,666,811 | | Transdigm, Inc., Senior Secured First Lien Term Loan (1 Month LIBOR USD + 2.50%) | | | 5.00% | | | 06/09/2023 | | | 2,610,141 | |
| 2,005,002 | | Transdigm, Inc., Senior Secured First Lien Term Loan (1 Month LIBOR USD + 2.50%) | | | 5.00% | | | 05/30/2025 | | | 1,956,241 | |
| 1,110,000 | | Travelport Finance S.A.R.L., Senior Secured First Lien Term Loan (3 Month LIBOR USD + 5.00%) | | | 7.59% | | | 03/18/2026 | | | 1,080,863 | |
| 2,890,475 | | Traverse Midstream Partners LLC, Senior Secured First Lien Term Loan (1 Month LIBOR USD + 4.00%, 1.00% Floor) | | | 6.50% | | | 09/27/2024 | | | 2,893,192 | |
| 119,685 | | Tribune Media Company, Senior Secured First Lien Term Loan (1 Month LIBOR USD + 3.00%, 0.75% Floor) | | | 5.50% | | | 12/24/2020 | | | 119,816 | |
| 2,577,994 | | U.S. Renal Care, Inc., Senior Secured First Lien Term Loan (3 Month LIBOR USD + 4.25%, 1.00% Floor) | | | 6.85% | | | 12/30/2022 | | | 2,577,194 | |
| 1,725,791 | | U.S. Silica Company, Senior Secured First Lien Term Loan (1 Month LIBOR USD + 4.00%, 1.00% Floor) | | | 6.50% | | | 05/01/2025 | | | 1,635,998 | |
| 2,686,466 | | Uber Technologies, Inc., Senior Secured First Lien Term Loan (1 Month LIBOR USD + 4.00%, 1.00% Floor) | | | 6.49% | | | 04/04/2025 | | | 2,691,839 | |
| 1,662,394 | | UFC Holdings, LLC, Senior Secured First Lien Term Loan (1 Month LIBOR USD + 3.25%, 1.00% Floor) | | | 5.75% | | | 08/18/2023 | | | 1,654,098 | |
| 1,350,888 | | Ultra Resources, Inc., Senior Secured First Lien Term Loan (3 Month LIBOR USD + 4.00%, 1.00% Floor, 0.25% PIK) | | | 6.49% | | | 04/12/2024 | | | 1,178,231 | |
| 835,800 | | United Rentals, Inc., Senior Secured First Lien Term Loan (1 Month LIBOR USD + 1.75%) | | | 4.25% | | | 10/31/2025 | | | 833,786 | |
| 628,425 | | Universal Health Services, Inc., Senior Secured First Lien Term Loan (1 Month LIBOR USD + 1.75%) | | | 4.25% | | | 10/31/2025 | | | 629,211 | |
| 430,739 | | USIC Holdings, Inc., Senior Secured First Lien Term Loan (1 Month LIBOR USD + 3.25%, 1.00% Floor) | | | 5.75% | | | 12/08/2023 | | | 420,868 | |
| | Vantage Specialty Chemicals, Inc., Senior Secured First Lien Term Loan | | | | | | | | | | |
| 1,738,232 | | (1 Month LIBOR USD + 3.50%, 1.00% Floor) | | | 6.00% | | | 10/28/2024 | | | 1,707,822 | |
| 1,480,716 | | (3 Month LIBOR USD + 3.50%, 1.00% Floor) | | | 6.13% | | | 10/28/2024 | | | 1,454,811 | |
| 1,442,857 | | VeriFone Systems, Inc., Senior Secured First Lien Term Loan (3 Month LIBOR USD + 4.00%) | | | 6.68% | | | 08/20/2025 | | | 1,423,919 | |
| 3,806,870 | | Verscend Holding Corporation, Senior Secured First Lien Term Loan (1 Month LIBOR USD + 4.50%) | | | 7.00% | | | 08/27/2025 | | | 3,787,836 | |
| 3,672,403 | | Vertafore, Inc., Senior Secured First Lien Term Loan (1 Month LIBOR USD + 3.25%) | | | 5.75% | | | 07/02/2025 | | | 3,613,369 | |
| 1,345,000 | | Wand NewCo 3, Inc., Senior Secured First Lien Term Loan (1 Month LIBOR USD + 3.50%) | | | 5.98% | | | 02/05/2026 | | | 1,348,194 | |
| 2,208,082 | | Web.Com Group, Inc., Senior Secured First Lien Term Loan (1 Month LIBOR USD + 3.75%) | | | 6.24% | | | 10/10/2025 | | | 2,181,872 | |
| 679,643 | | Web.Com Group, Inc., Senior Secured Second Lien Term Loan (1 Month LIBOR USD + 7.75%) | | | 10.24% | | | 10/09/2026 | | | 671,147 | |
| 1,914,603 | | Wink Holdco, Inc., Senior Secured First Lien Term Loan (1 Month LIBOR USD + 3.00%, 1.00% Floor) | | | 5.50% | | | 12/02/2024 | | | 1,859,558 | |
| 2,885,382 | | WP CPP Holdings, LLC, Senior Secured First Lien Term Loan (3 Month LIBOR USD + 3.75%, 1.00% Floor) | | | 6.51% | | | 04/30/2025 | | | 2,868,791 | |
| 810,170 | | Yak Access, LLC, Senior Secured First Lien Term Loan (1 Month LIBOR USD + 5.00%) | | | 7.50% | | | 07/11/2025 | | | 692,695 | |
| 2,821,122 | | York Risk Services Holding Corporation, Senior Secured First Lien Term Loan (1 Month LIBOR USD + 3.75%, 1.00% Floor) | | | 6.25% | | | 10/01/2021 | | | 2,655,381 | |
| | | | | | | | | | | | |
Total Bank Loans(Cost $477,967,894) | | | 468,095,154 | |
| | | | | | | | | | | | |
| |
Collateralized Loan Obligations - 2.9% | | | | |
| 875,000 | | Adams Mill Ltd., Series 2014-1A-D1 (3 Month LIBOR USD + 3.50%) | | | 6.29% | ^ | | 07/15/2026 | | | 861,829 | |
| 1,000,000 | | AIMCO, Series 2018-AA-D (3 Month LIBOR USD + 2.55%) | | | 5.32% | ^ | | 04/17/2031 | | | 947,384 | |
| 3,000,000 | | ALM LLC, Series 2013-7RA-CR (3 Month LIBOR USD + 4.04%) | | | 6.83% | ^ | | 10/15/2028 | | | 3,010,678 | |
| 3,800,000 | | ALM LLC, Series 2013-8A-CR (3 Month LIBOR USD + 3.95%, 3.95% Floor) | | | 6.74% | ^ | | 10/15/2028 | | | 3,801,869 | |
| 7,500,000 | | Anchorage Capital LLC, Series 2019-13A-B (3 Month LIBOR USD + 2.00%, 2.00% Floor) | | | 0.00% | ^ | | 04/15/2032 | | | 7,498,143 | |
| 1,000,000 | | Apidos Ltd., Series 2013-12A-DR (3 Month LIBOR USD + 2.60%) | | | 5.39% | ^ | | 04/15/2031 | | | 945,776 | |
| 539,271 | | Apidos Ltd., Series 2013-16A-A1R (3 Month LIBOR USD + 0.98%) | | | 3.74% | ^ | | 01/19/2025 | | | 539,396 | |
| 2,950,000 | | Apidos Ltd., Series 2013-16A-BR (3 Month LIBOR USD + 1.95%) | | | 4.71% | ^ | | 01/19/2025 | | | 2,941,610 | |
| 1,500,000 | | Apidos Ltd., Series 2015-20A-CR (3 Month LIBOR USD + 2.95%) | | | 5.73% | ^ | | 07/16/2031 | | | 1,439,937 | |
| 5,000,000 | | Atrium Corporation, Series 9A-DR (3 Month LIBOR USD + 3.60%) | | | 6.23% | ^ | | 05/28/2030 | | | 5,002,053 | |
| 4,500,000 | | Avery Point Ltd., Series 2015-7A-D (3 Month LIBOR USD + 4.15%) | | | 6.94% | ^ | | 01/15/2028 | | | 4,502,355 | |
| 5,000,000 | | Babson Ltd., Series 2015-2A-DR (3 Month LIBOR USD + 2.95%) | | | 5.71% | ^ | | 10/20/2030 | | | 4,877,972 | |
| 3,400,000 | | Babson Ltd., Series 2015-IA-DR (3 Month LIBOR USD + 2.60%, 2.60% Floor) | | | 5.36% | ^ | | 01/20/2031 | | | 3,263,828 | |
| 3,250,000 | | Babson Ltd., Series 2017-1A-D (3 Month LIBOR USD + 3.60%) | | | 6.38% | ^ | | 07/18/2029 | | | 3,252,200 | |
| 2,250,000 | | Barings Ltd., Series 2016-3A-C (3 Month LIBOR USD + 3.95%, 3.95% Floor) | | | 6.74% | ^ | | 01/15/2028 | | | 2,224,375 | |
| 2,000,000 | | Barings Ltd., Series 2018-1A-C (3 Month LIBOR USD + 2.60%) | | | 5.39% | ^ | | 04/15/2031 | | | 1,892,701 | |
| 5,100,000 | | Barings Ltd., Series 2018-3A-D (3 Month LIBOR USD + 2.90%) | | | 5.66% | ^ | | 07/20/2029 | | | 4,964,698 | |
| 2,000,000 | | Barings Ltd., Series 2018-4A-D (3 Month LIBOR USD + 2.90%, 2.90% Floor) | | | 5.32% | ^ | | 10/15/2030 | | | 1,939,220 | |
| 3,000,000 | | Barings Ltd., Series 2019-1A-D (3 Month LIBOR USD + 3.85%, 3.85% Floor) | | | 0.00% | ^ | | 04/15/2031 | | | 3,000,000 | |
| 2,250,000 | | Barings Ltd., Series 2019-2A-C (3 Month LIBOR USD + 3.85%, 3.85% Floor) | | | 0.00% | ^ | | 04/15/2031 | | | 2,250,000 | |
| 3,000,000 | | BlueMountain Ltd., Series 2013-1A-CR (3 Month LIBOR USD + 4.15%) | | | 6.91% | ^ | | 01/20/2029 | | | 3,001,694 | |
| 4,000,000 | | BlueMountain Ltd., Series 2015-3A-CR (3 Month LIBOR USD + 2.60%) | | | 5.36% | ^ | | 04/20/2031 | | | 3,783,418 | |
| 2,000,000 | | BlueMountain Ltd., Series 2016-3A-DR (3 Month LIBOR USD + 3.10%, 3.10% Floor) | | | 5.78% | ^ | | 11/15/2030 | | | 1,958,669 | |
| 2,000,000 | | Bristol Park Ltd., Series 2016-1A-D (3 Month LIBOR USD + 4.10%) | | | 6.89% | ^ | | 04/15/2029 | | | 2,004,108 | |
| 5,000,000 | | California Street LP, Series 2012-9A-DR (3 Month LIBOR USD + 3.96%) | | | 6.74% | ^ | | 10/16/2028 | | | 5,002,517 | |
| 4,500,000 | | Canyon Capital Ltd., Series 2012-1RA-D (3 Month LIBOR USD + 3.00%) | | | 5.79% | ^ | | 07/15/2030 | | | 4,178,781 | |
| 2,750,000 | | Canyon Capital Ltd., Series 2014-1A-CR (3 Month LIBOR USD + 2.75%, 2.75% Floor) | | | 5.50% | ^ | | 01/30/2031 | | | 2,591,380 | |
| 1,500,000 | | Canyon Capital Ltd., Series 2014-2A-DR (3 Month LIBOR USD + 3.65%) | | | 6.44% | ^ | | 04/15/2029 | | | 1,474,043 | |
| 3,000,000 | | Canyon Capital Ltd., Series 2016-1A-DR (3 Month LIBOR USD + 2.80%) | | | 5.59% | ^ | | 07/15/2031 | | | 2,843,020 | |
| 1,500,000 | | Canyon Capital Ltd., Series 2017-1A-D (3 Month LIBOR USD + 3.60%) | | | 6.39% | ^ | | 07/15/2030 | | | 1,493,567 | |
| 4,000,000 | | Canyon Capital Ltd., Series 2018-1A-D (3 Month LIBOR USD + 2.90%, 2.90% Floor) | | | 5.69% | ^ | | 07/15/2031 | | | 3,786,638 | |
| 2,500,000 | | Carlyle US Ltd., Series 2016-4A-CR (3 Month LIBOR USD + 2.80%, 2.80% Floor) | | | 5.56% | ^ | | 10/20/2027 | | | 2,442,963 | |
| 3,250,000 | | Cook Park Ltd., Series 2018-1A-D (3 Month LIBOR USD + 2.60%) | | | 5.37% | ^ | | 04/17/2030 | | | 3,074,580 | |
| 2,150,000 | | CRMN Mortgage Trust, Series 2016-1A-C (3 Month LIBOR USD + 3.85%) | | | 6.63% | ^ | | 01/18/2029 | | | 2,150,764 | |
| 10,000,000 | | CVP Ltd., Series 2017-1A-A (3 Month LIBOR USD + 1.34%) | | | 4.10% | ^ | | 07/20/2030 | | | 10,003,844 | |
| 10,000,000 | | Dryden Senior Loan Fund, Series 2014-33A-DR2 (3 Month LIBOR USD + 3.85%, 3.85% Floor) | | | 6.64% | ^ | | 04/15/2029 | | | 10,045,218 | |
| 3,000,000 | | Dryden Senior Loan Fund, Series 2015-40A-DR (3 Month LIBOR USD + 3.10%, 3.10% Floor) | | | 5.78% | ^ | | 08/15/2031 | | | 2,934,834 | |
| 2,000,000 | | Dryden Senior Loan Fund, Series 2018-57A-D (3 Month LIBOR USD + 2.55%, 2.55% Floor) | | | 5.23% | ^ | | 05/15/2031 | | | 1,886,106 | |
| 2,250,000 | | Fillmore Park Ltd., Series 2018-1A-D (3 Month LIBOR USD + 2.90%) | | | 5.69% | ^ | | 07/15/2030 | | | 2,185,829 | |
| 2,000,000 | | Gilbert Park Ltd., Series 2017-1A-D (3 Month LIBOR USD + 2.95%) | | | 5.74% | ^ | | 10/15/2030 | | | 1,951,748 | |
| 4,000,000 | | Gilbert Park Ltd., Series 2017-1A-E (3 Month LIBOR USD + 6.40%) | | | 9.19% | ^ | | 10/15/2030 | | | 3,969,470 | |
| 2,000,000 | | GoldenTree Loan Management Ltd., Series 2017-1A-D (3 Month LIBOR USD + 3.35%) | | | 6.11% | ^ | | 04/20/2029 | | | 2,005,150 | |
| 5,000,000 | | GoldenTree Loan Management Ltd., Series 2018-3A-D (3 Month LIBOR USD + 2.85%) | | | 5.61% | ^ | | 04/20/2030 | | | 4,857,657 | |
| 3,500,000 | | GoldenTree Loan Opportunities Ltd., Series 2015-11A-DR2 (3 Month LIBOR USD + 2.40%) | | | 5.18% | ^ | | 01/18/2031 | | | 3,485,603 | |
| 2,000,000 | | Grippen Park Ltd., Series 2017-1A-D (3 Month LIBOR USD + 3.30%) | | | 6.06% | ^ | | 01/20/2030 | | | 1,988,026 | |
| 740,000 | | Halcyon Loan Advisors Funding Ltd., Series 2013-2A-C (3 Month LIBOR USD + 2.70%) | | | 5.44% | ^ | | 08/01/2025 | | | 741,208 | |
| 1,500,000 | | Halcyon Loan Advisors Funding Ltd., Series 2014-3A-D (3 Month LIBOR USD + 3.65%) | | | 6.41% | ^ | | 10/22/2025 | | | 1,496,122 | |
| 5,000,000 | | Hayfin Kingsland Ltd., Series 2018-9A-BR (3 Month LIBOR USD + 1.80%) | | | 4.56% | ^ | | 04/28/2031 | | | 4,998,130 | |
| 1,481,500 | | Highbridge Loan Management Ltd., Series 4A-2014-A2R (3 Month LIBOR USD + 1.50%) | | | 4.26% | ^ | | 01/28/2030 | | | 1,455,928 | |
| 2,500,000 | | Highbridge Loan Management Ltd., Series 8A-2016-DR (3 Month LIBOR USD + 2.90%, 2.90% Floor) | | | 5.66% | ^ | | 07/20/2030 | | | 2,380,196 | |
| 1,500,000 | | HPS Loan Management Ltd., Series 13A-18-D (3 Month LIBOR USD + 3.00%, 3.00% Floor) | | | 5.44% | ^ | | 10/15/2030 | | | 1,435,157 | |
| 4,000,000 | | LCM LP, Series 14A-DR (3 Month LIBOR USD + 2.75%) | | | 5.51% | ^ | | 07/20/2031 | | | 3,822,889 | |
| 2,000,000 | | LCM LP, Series 19A-D (3 Month LIBOR USD + 3.45%, 3.45% Floor) | | | 6.24% | ^ | | 07/15/2027 | | | 2,001,363 | |
| 2,000,000 | | LCM LP, Series 20A-DR (3 Month LIBOR USD + 2.80%, 2.80% Floor) | | | 5.56% | ^ | | 10/20/2027 | | | 1,964,449 | |
| 3,250,000 | | LCM Ltd., Series 28A-D (3 Month LIBOR USD + 2.95%, 2.95% Floor) | | | 5.40% | ^ | | 10/20/2030 | | | 3,148,775 | |
| 4,000,000 | | LCM Ltd., Series 30A-D | | | 0.00% | ±^ | | 04/20/2031 | | | 4,000,000 | |
| 4,000,000 | | Madison Park Funding Ltd., Series 2014-14A-DRR (3 Month LIBOR USD + 2.95%, 2.95% Floor) | | | 5.71% | ^ | | 10/22/2030 | | | 3,892,060 | |
| 2,000,000 | | Madison Park Funding Ltd., Series 2014-15A-CR (3 Month LIBOR USD + 3.45%) | | | 6.21% | ^ | | 01/27/2026 | | | 2,001,020 | |
| 1,250,000 | | Madison Park Funding Ltd., Series 2014-15A-DR (3 Month LIBOR USD + 5.44%) | | | 8.20% | ^ | | 01/27/2026 | | | 1,250,269 | |
| 1,000,000 | | Madison Park Funding Ltd., Series 2015-16A-D (3 Month LIBOR USD + 5.50%) | | | 8.26% | ^ | | 04/20/2026 | | | 999,608 | |
| 5,000,000 | | Madison Park Funding Ltd., Series 2015-18A-DR (3 Month LIBOR USD + 2.95%) | | | 5.71% | ^ | | 10/21/2030 | | | 4,850,739 | |
| 2,000,000 | | Madison Park Funding Ltd., Series 2016-24A-D (3 Month LIBOR USD + 3.85%) | | | 6.61% | ^ | | 01/20/2028 | | | 2,001,937 | |
| 3,750,000 | | Madison Park Funding Ltd., Series 2019-34A-D | | | 0.00% | ±^ | | 04/25/2031 | | | 3,750,000 | |
| 4,000,000 | | Magnetite Ltd., Series 2015-14RA-D (3 Month LIBOR USD + 2.85%) | | | 5.63% | ^ | | 10/18/2031 | | | 3,848,784 | |
| 1,500,000 | | Magnetite Ltd., Series 2016-18A-DR (3 Month LIBOR USD + 2.70%) | | | 5.38% | ^ | | 11/15/2028 | | | 1,451,344 | |
| 2,500,000 | | Marble Point Ltd., Series 2017-1A-B (3 Month LIBOR USD + 1.80%) | | | 4.59% | ^ | | 10/15/2030 | | | 2,488,072 | |
| 2,000,000 | | MDPK, Series 2018-32A-D (3 Month LIBOR USD + 4.10%, 4.10% Floor) | | | 6.82% | ^ | | 01/22/2031 | | | 2,007,578 | |
| 1,000,000 | | Myers Park Ltd., Series 2018-1A-D (3 Month LIBOR USD + 3.05%, 3.05% Floor) | | | 5.47% | ^ | | 10/20/2030 | | | 976,216 | |
| 3,500,000 | | Neuberger Berman Loan Advisers Ltd., Series 2016-23A-DR (3 Month LIBOR USD + 2.90%, 2.90% Floor) | | | 5.67% | ^ | | 10/17/2027 | | | 3,435,264 | |
| 2,500,000 | | Neuberger Berman Loan Advisers Ltd., Series 2018-29A-D (3 Month LIBOR USD + 3.10%, 3.10% Floor) | | | 5.69% | ^ | | 10/19/2031 | | | 2,417,348 | |
| 2,000,000 | | Neuberger Berman Loan Advisers Ltd., Series 2019-32A-D (3 Month LIBOR USD + 3.85%, 3.85% Floor) | | | 0.00% | ^ | | 01/19/2032 | | | 1,998,552 | |
| 6,000,000 | | Oak Hill Credit Partners Ltd., Series 2014-10RA-D (3 Month LIBOR USD + 3.15%, 3.15% Floor) | | | 5.93% | ^ | | 12/12/2030 | | | 5,794,659 | |
| 5,600,000 | | Octagon Investment Partners Ltd., Series 2012-1A-CR (3 Month LIBOR USD + 4.00%) | | | 6.79% | ^ | | 07/15/2029 | | | 5,605,919 | |
| 2,000,000 | | Octagon Investment Partners Ltd., Series 2013-1A-DR (3 Month LIBOR USD + 3.00%, 3.00% Floor) | | | 5.77% | ^ | | 07/17/2030 | | | 1,944,080 | |
| 6,900,000 | | Octagon Investment Partners Ltd., Series 2013-1A-DR (3 Month LIBOR USD + 3.70%) | | | 6.46% | ^ | | 07/19/2030 | | | 6,904,460 | |
| 2,250,000 | | Octagon Investment Partners Ltd., Series 2014-1A-CRR (3 Month LIBOR USD + 3.95%, 3.95% Floor) | | | 6.64% | ^ | | 02/14/2031 | | | 2,263,894 | |
| 2,500,000 | | Octagon Investment Partners Ltd., Series 2014-1A-ERR (3 Month LIBOR USD + 5.45%, 5.45% Floor) | | | 8.21% | ^ | | 01/22/2030 | | | 2,285,266 | |
| 2,193,659 | | Octagon Investment Partners Ltd., Series 2016-1A-D (3 Month LIBOR USD + 4.25%) | | | 7.03% | ^ | | 01/24/2028 | | | 2,194,799 | |
| 10,000,000 | | Octagon Investment Partners Ltd., Series 2016-1A-DR (3 Month LIBOR USD + 2.95%) | | | 5.74% | ^ | | 07/15/2030 | | | 9,663,417 | |
| 4,000,000 | | Octagon Investment Partners Ltd., Series 2017-1A-C (3 Month LIBOR USD + 3.50%) | | | 6.26% | ^ | | 03/17/2030 | | | 4,002,052 | |
| 1,760,000 | | Octagon Investment Partners Ltd., Series 2017-1A-D (3 Month LIBOR USD + 6.20%) | | | 8.96% | ^ | | 03/17/2030 | | | 1,705,039 | |
| 2,500,000 | | Octagon Investment Partners Ltd., Series 2018-2A-C (3 Month LIBOR USD + 2.85%) | | | 5.62% | ^ | | 07/25/2030 | | | 2,404,523 | |
| 2,000,000 | | OHA Credit Funding Ltd., Series 2018-1A-D (3 Month LIBOR USD + 3.05%, 3.05% Floor) | | | 5.69% | ^ | | 10/20/2030 | | | 1,918,588 | |
| 2,500,000 | | Riserva Ltd., Series 2016-3A-D (3 Month LIBOR USD + 3.90%) | | | 6.68% | ^ | | 10/18/2028 | | | 2,503,850 | |
| 10,000,000 | | Stewart Park Ltd., Series 2015-1A-DR (3 Month LIBOR USD + 2.60%, 2.60% Floor) | | | 5.39% | ^ | | 01/15/2030 | | | 9,522,949 | |
| 3,000,000 | | Symphony Ltd., Series 2015-16A-DR (3 Month LIBOR USD + 3.05%, 3.05% Floor) | | | 5.84% | ^ | | 10/15/2031 | | | 2,936,363 | |
| 2,500,000 | | Symphony Ltd., Series 2016-17A-DR (3 Month LIBOR USD + 2.65%) | | | 5.44% | ^ | | 04/15/2028 | | | 2,444,599 | |
| 2,387,318 | | Taconic Park Ltd., Series 2016-1A-C (3 Month LIBOR USD + 4.05%) | | | 6.81% | ^ | | 01/20/2029 | | | 2,394,698 | |
| 4,000,000 | | TCI-Cent Ltd., Series 2016-1A-C (3 Month LIBOR USD + 4.00%) | | | 6.76% | ^ | | 12/21/2029 | | | 4,002,408 | |
| 2,000,000 | | TCI-Cent Ltd., Series 2017-1A-C (3 Month LIBOR USD + 3.65%) | | | 6.42% | ^ | | 07/25/2030 | | | 2,001,371 | |
| 2,000,000 | | Thacher Park Ltd., Series 2014-1A-D1R (3 Month LIBOR USD + 3.40%) | | | 6.16% | ^ | | 10/20/2026 | | | 2,010,114 | |
| 2,505,089 | | Venture Ltd., Series 2006-7A-A1A (3 Month LIBOR USD + 0.23%) | | | 2.99% | ^ | | 01/20/2022 | | | 2,506,790 | |
| 1,000,000 | | VERDE, Series 2019-1A-D (3 Month LIBOR USD + 3.80%, 3.80% Floor) | | | 0.00% | ^ | | 04/15/2032 | | | 1,000,000 | |
| 3,000,000 | | Voya Ltd., Series 2014-1A-CR2 (3 Month LIBOR USD + 2.80%) | | | 5.58% | ^ | | 04/18/2031 | | | 2,877,087 | |
| 4,000,000 | | Voya Ltd., Series 2018-2A-D (3 Month LIBOR USD + 2.75%, 2.75% Floor) | | | 5.54% | ^ | | 07/15/2031 | | | 3,815,718 | |
| 10,250,000 | | Wellfleet Ltd., Series 2018-3A-A1A (3 Month LIBOR USD + 1.25%, 1.25% Floor) | | | 4.07% | ^ | | 01/20/2032 | | | 10,180,419 | |
| 2,000,000 | | Wind River Ltd., Series 2012-1A-DR (3 Month LIBOR USD + 4.10%) | | | 6.89% | ^ | | 01/15/2026 | | | 2,001,982 | |
| 2,810,000 | | Wind River Ltd., Series 2013-1A-CR (3 Month LIBOR USD + 3.65%) | | | 6.41% | ^ | | 07/20/2030 | | | 2,711,981 | |
| 2,250,000 | | Wind River Ltd., Series 2014-1A-DRR (3 Month LIBOR USD + 3.00%, 3.00% Floor) | | | 5.78% | ^ | | 07/18/2031 | | | 2,104,478 | |
| 1,000,000 | | Wind River Ltd., Series 2014-2A-ER (3 Month LIBOR USD + 5.75%, 5.75% Floor) | | | 8.54% | ^ | | 01/15/2031 | | | 925,397 | |
| 3,000,000 | | Wind River Ltd., Series 2016-1A-DR (3 Month LIBOR USD + 2.85%) | | | 5.64% | | | 07/15/2028 | | | 2,902,916 | |
| 3,000,000 | | Wind River Ltd., Series 2017-1A-D (3 Month LIBOR USD + 3.75%) | | | 6.53% | ^ | | 04/18/2029 | | | 2,970,015 | |
| 3,000,000 | | Wind River Ltd., Series 2017-3A-D (3 Month LIBOR USD + 3.15%) | | | 5.94% | ^ | | 10/15/2030 | | | 2,910,001 | |
| 4,000,000 | | Wind River Ltd., Series 2018-1A-D (3 Month LIBOR USD + 2.90%) | | | 5.69% | ^ | | 07/15/2030 | | | 3,661,374 | |
| 2,500,000 | | Wind River Ltd., Series 2018-2A-D (3 Month LIBOR USD + 3.00%) | | | 5.79% | ^ | | 07/15/2030 | | | 2,352,009 | |
| 3,000,000 | | Wind River Ltd., Series 2018-3A-D (3 Month LIBOR USD + 2.95%, 2.95% Floor) | | | 5.78% | ^ | | 01/20/2031 | | | 2,807,464 | |
| | | | | | | | | | | | |
Total Collateralized Loan Obligations(Cost $335,748,070) | | | 329,299,338 | |
| | | | | | | | | | | | |
| |
Foreign Corporate Bonds - 12.9% | | | | |
| 600,000 | | Adani Ports & Special Economic Zone Ltd. | | | 3.50% | | | 07/29/2020 | | | 600,502 | |
| 3,700,000 | | Adani Ports & Special Economic Zone Ltd. | | | 3.95% | | | 01/19/2022 | | | 3,716,364 | |
| 1,789,000 | | Adecoagro S.A. | | | 6.00% | | | 09/21/2027 | | | 1,690,605 | |
| 14,235,000 | | AerCap Global Aviation Trust | | | 3.50% | | | 01/15/2025 | | | 13,745,157 | |
| 200,000 | | Aeropuerto Internacional de Tocumen S.A. | | | 5.63% | | | 05/18/2036 | | | 212,000 | |
| 6,200,000 | | AES Andres B.V. | | | 7.95% | ^ | | 05/11/2026 | | | 6,610,750 | |
| 5,850,000 | | AES Dominicana | | | 7.95% | | | 05/11/2026 | | | 6,237,563 | |
| 500,000 | | AES Gener S.A. | | | 5.00% | | | 07/14/2025 | | | 509,830 | |
| 9,300,000 | | AES Gener S.A. (5 Year Swap Rate USD + 4.64%) | | | 7.13% | ^ | | 03/26/2079 | | | 9,520,875 | |
| 5,700,000 | | AI Candelaria Spain SLU | | | 7.50% | | | 12/15/2028 | | | 5,956,500 | |
| 1,700,000 | | Ajecorp B.V. | | | 6.50% | | | 05/14/2022 | | | 1,430,125 | |
| 3,200,000 | | Alcoa Nederland Holding B.V. | | | 6.13% | ^ | | 05/15/2028 | | | 3,304,000 | |
| 500,000 | | Alibaba Group Holding Ltd. | | | 2.80% | | | 06/06/2023 | | | 496,357 | |
| 2,275,000 | | Altice France S.A. | | | 7.38% | ^ | | 05/01/2026 | | | 2,235,187 | |
| 900,000 | | Altice Luxembourg S.A. | | | 7.75% | ^ | | 05/15/2022 | | | 902,250 | |
| 2,000,000 | | America Movil S.A.B. de C.V. | | | 5.00% | | | 03/30/2020 | | | 2,038,923 | |
| 14,120,000 | | Anglo American Capital PLC | | | 4.50% | ^ | | 03/15/2028 | | | 14,130,647 | |
| 6,100,000 | | Anheuser-Busch InBev Worldwide, Inc. | | | 4.90% | ^ | | 02/01/2046 | | | 6,139,452 | |
| 8,205,000 | | Anheuser-Busch InBev Worldwide, Inc. | | | 4.60% | | | 04/15/2048 | | | 7,920,860 | |
| 3,110,000 | | Ardagh Packaging Finance, Inc. | | | 6.00% | ^ | | 02/15/2025 | | | 3,117,775 | |
| 13,375,000 | | AstraZeneca PLC | | | 2.38% | | | 06/12/2022 | | | 13,186,705 | |
| 1,775,000 | | Avation Capital S.A. | | | 6.50% | ^ | | 05/15/2021 | | | 1,781,656 | |
| 2,095,000 | | Avolon Holdings Funding Ltd. | | | 5.13% | ^ | | 10/01/2023 | | | 2,136,900 | |
| 2,610,000 | | Avolon Holdings Funding Ltd. | | | 5.25% | ^ | | 05/15/2024 | | | 2,694,825 | |
| 9,000,000 | | Axiata SPV2 BHD | | | 3.47% | | | 11/19/2020 | | | 9,052,346 | |
| 16,386,000 | | Banco BTG Pactual S.A. (5 Year CMT Rate + 5.26%) | | | 7.75% | ^ | | 02/15/2029 | | | 16,304,070 | |
| 200,000 | | Banco BTG Pactual S.A. (5 Year CMT Rate + 6.98%) | | | 8.75% | † | | 09/18/2019 | | | 202,302 | |
| 2,000,000 | | Banco de Credito del Peru | | | 2.25% | | | 10/25/2019 | | | 1,995,600 | |
| 1,890,000 | | Banco de Credito del Peru | | | 5.38% | | | 09/16/2020 | | | 1,953,806 | |
| 6,200,000 | | Banco de Credito e Inversiones | | | 4.00% | | | 02/11/2023 | | | 6,311,672 | |
| 1,000,000 | | Banco de Reservas de la Republica Dominicana | | | 7.00% | ^ | | 02/01/2023 | | | 1,030,000 | |
| 4,100,000 | | Banco de Reservas de la Republica Dominicana | | | 7.00% | | | 02/01/2023 | | | 4,223,000 | |
| 1,000,000 | | Banco del Estado de Chile | | | 2.67% | ^ | | 01/08/2021 | | | 988,523 | |
| 20,300,000 | | Banco do Brasil S.A. (10 Year CMT Rate + 4.40%) | | | 6.25% | † | | 04/15/2024 | | | 18,330,900 | |
| 1,705,000 | | Banco General S.A. | | | 4.13% | | | 08/07/2027 | | | 1,681,556 | |
| 800,000 | | Banco GNB Sudameris S.A. (5 Year CMT Rate + 4.56%) | | | 6.50% | | | 04/03/2027 | | | 824,008 | |
| 10,000,000 | | Banco International del Peru S.A.A. | | | 5.75% | | | 10/07/2020 | | | 10,370,100 | |
| 1,000,000 | | Banco International del Peru S.A.A. (3 Month LIBOR USD + 6.74%) | | | 8.50% | | | 04/23/2070 | | | 1,048,750 | |
| 500,000 | | Banco Latinoamericano do Comercio Exterior S.A. | | | 3.25% | | | 05/07/2020 | | | 500,250 | |
| 10,203,000 | | Banco Macro S.A. (5 Year Swap Rate USD + 5.46%) | | | 6.75% | | | 11/04/2026 | | | 8,685,304 | |
| 2,247,000 | | Banco Macro S.A. (5 Year Swap Rate USD + 5.46%) | | | 6.75% | ^ | | 11/04/2026 | | | 1,912,759 | |
| 13,423,000 | | Banco Mercantil del Norte S.A. (10 Year CMT Rate + 5.35%) | | | 7.63% | † | | 01/10/2028 | | | 13,490,115 | |
| 2,500,000 | | Banco Mercantil del Norte S.A. (5 Year CMT Rate + 4.45%) | | | 5.75% | | | 10/04/2031 | | | 2,384,375 | |
| 6,100,000 | | Banco Mercantil del Norte S.A. (5 Year CMT Rate + 5.04%) | | | 6.88% | † | | 07/06/2022 | | | 6,084,811 | |
| 2,293,000 | | Banco Nacional de Costa Rica | | | 5.88% | ^ | | 04/25/2021 | | | 2,307,331 | |
| 300,000 | | Banco Santander | | | 3.88% | | | 09/20/2022 | | | 306,815 | |
| 13,400,000 | | Banco Santander (3 Month LIBOR USD + 1.09%) | | | 3.74% | | | 02/23/2023 | | | 13,230,402 | |
| 5,600,000 | | Banco Santander (5 Year CMT Rate + 3.00%) | | | 5.95% | ^ | | 10/01/2028 | | | 5,747,000 | |
| 1,000,000 | | Bancolombia S.A. | | | 6.13% | | | 07/26/2020 | | | 1,035,010 | |
| 4,742,000 | | Bancolombia S.A. (5 Year CMT Rate + 2.93%) | | | 4.88% | | | 10/18/2027 | | | 4,724,265 | |
| 2,500,000 | | Banistmo S.A. | | | 3.65% | ^ | | 09/19/2022 | | | 2,468,750 | |
| 10,205,000 | | Bank of Montreal (5 Year Swap Rate USD + 1.43%) | | | 3.80% | | | 12/15/2032 | | | 9,877,777 | |
| 13,320,000 | | Bank of New Zealand | | | 3.50% | ^ | | 02/20/2024 | | | 13,507,989 | |
| 9,860,000 | | Bank of Nova Scotia | | | 3.40% | | | 02/11/2024 | | | 10,017,487 | |
| 1,250,000 | | Bantrab Senior Trust | | | 9.00% | | | 11/14/2020 | | | 1,281,250 | |
| 13,415,000 | | Barclays PLC (3 Month LIBOR USD + 1.38%) | | | 4.06% | | | 05/16/2024 | | | 13,028,140 | |
| 2,205,000 | | BAT Capital Corporation (3 Month LIBOR USD + 0.88%) | | | 3.56% | | | 08/15/2022 | | | 2,198,417 | |
| 1,800,000 | | BBVA Banco Continental S.A. | | | 5.00% | | | 08/26/2022 | | | 1,892,268 | |
| 22,896,000 | | BBVA Bancomer S.A. (5 Year CMT Rate + 2.65%) | | | 5.13% | | | 01/18/2033 | | | 21,138,732 | |
| 1,200,000 | | BBVA Bancomer S.A. (5 Year CMT Rate + 3.00%) | | | 5.35% | | | 11/12/2029 | | | 1,156,920 | |
| 1,600,000 | | BBVA Colombia S.A. | | | 4.88% | | | 04/21/2025 | | | 1,663,200 | |
| 2,450,000 | | BDO Unibank, Inc. | | | 2.63% | | | 10/24/2021 | | | 2,418,690 | |
| 16,900,000 | | BDO Unibank, Inc. | | | 2.95% | | | 03/06/2023 | | | 16,650,088 | |
| 2,100,000 | | Bharat Petroleum Corporation Ltd. | | | 4.63% | | | 10/25/2022 | | | 2,178,960 | |
| 11,900,000 | | Bharti Airtel Ltd. | | | 5.13% | | | 03/11/2023 | | | 12,305,761 | |
| 7,300,000 | | Bharti Airtel Ltd. | | | 4.38% | | | 06/10/2025 | | | 7,200,245 | |
| 13,195,000 | | BNP Paribas S.A. | | | 3.38% | ^ | | 01/09/2025 | | | 12,928,076 | |
| 13,405,000 | | BOC Aviation Ltd. (3 Month LIBOR USD + 1.13%) | | | 3.73% | ^ | | 09/26/2023 | | | 13,466,676 | |
| 1,010,000 | | Bombardier, Inc. | | | 6.00% | ^ | | 10/15/2022 | | | 1,023,887 | |
| 660,000 | | Bombardier, Inc. | | | 7.88% | ^ | | 04/15/2027 | | | 681,450 | |
| 12,300,000 | | BPRL International Singapore Pte Ltd. | | | 4.38% | | | 01/18/2027 | | | 12,418,070 | |
| 1,300,000 | | Braskem Finance Ltd. | | | 6.45% | | | 02/03/2024 | | | 1,417,923 | |
| 2,450,000 | | C&W Senior Financing DAC | | | 7.50% | | | 10/15/2026 | | | 2,529,625 | |
| 4,800,000 | | C&W Senior Financing DAC | | | 7.50% | ^ | | 10/15/2026 | | | 4,956,000 | |
| 15,500,000 | | C&W Senior Financing DAC | | | 6.88% | | | 09/15/2027 | | | 15,616,250 | |
| 1,025,000 | | Calfrac Holdings LP | | | 8.50% | ^ | | 06/15/2026 | | | 799,500 | |
| 2,330,000 | | Camelot Finance S.A. | | | 7.88% | ^ | | 10/15/2024 | | | 2,469,800 | |
| 11,400,000 | | Canacol Energy Ltd. | | | 7.25% | | | 05/03/2025 | | | 11,428,500 | |
| 1,200,000 | | Canacol Energy Ltd. | | | 7.25% | ^ | | 05/03/2025 | | | 1,203,000 | |
| 2,587,000 | | Celulosa Arauco y Constitucion S.A. | | | 4.75% | | | 01/11/2022 | | | 2,667,844 | |
| 4,921,000 | | CIMPOR Financial Operations B.V. | | | 5.75% | | | 07/17/2024 | | | 4,361,285 | |
| 5,000,000 | | CK Hutchison International Ltd. | | | 3.50% | ^ | | 04/05/2027 | | | 4,999,160 | |
| 13,665,000 | | CNOOC Finance Ltd. | | | 3.75% | | | 05/02/2023 | | | 13,928,311 | |
| 5,900,000 | | CNOOC Finance Ltd. | | | 3.50% | | | 05/05/2025 | | | 5,974,352 | |
| 900,000 | | CNPC General Capital Ltd. | | | 3.95% | | | 04/19/2022 | | | 919,901 | |
| 2,000,000 | | CNPC Overseas Capital Ltd. | | | 4.50% | | | 04/28/2021 | | | 2,055,902 | |
| 200,000 | | Colbun S.A. | | | 3.95% | | | 10/11/2027 | | | 196,377 | |
| 1,900,000 | | Colombia Telecomunicaciones S.A. (5 Year Swap Rate USD + 6.96%) | | | 8.50% | † | | 03/30/2020 | | | 1,975,715 | |
| 4,100,000 | | Comcel Trust | | | 6.88% | | | 02/06/2024 | | | 4,271,688 | |
| 23,155,020 | | Cometa Energia S.A. de C.V. | | | 6.38% | | | 04/24/2035 | | | 22,801,906 | |
| 15,475,000 | | Commonwealth Bank of Australia (3 Month LIBOR USD + 0.82%) | | | 3.44% | ^ | | 06/04/2024 | | | 15,487,557 | |
| 6,000,000 | | Controladora Mabe S.A. de C.V. | | | 5.60% | | | 10/23/2028 | | | 6,105,000 | |
| 6,610,000 | | Cosan Overseas Ltd. | | | 8.25% | † | | 05/05/2019 | | | 6,758,725 | |
| 2,255,000 | | Cott Holdings, Inc. | | | 5.50% | ^ | | 04/01/2025 | | | 2,283,187 | |
| 13,315,000 | | Credit Agricole S.A. | | | 3.75% | ^ | | 04/24/2023 | | | 13,474,981 | |
| 13,175,000 | | Credit Suisse Group AG (3 Month LIBOR USD + 1.24%) | | | 3.84% | ^ | | 06/12/2024 | | | 13,108,145 | |
| 9,000,000 | | Credito Real S.A.B. de C.V. | | | 9.50% | ^ | | 02/07/2026 | | | 9,508,950 | |
| 6,000,000 | | Credito Real S.A.B. de C.V. (5 Year CMT Rate + 7.03%) | | | 9.13% | † | | 11/29/2022 | | | 5,842,500 | |
| 4,970,000 | | CSN Islands Corporation | | | 7.00% | † | | 06/23/2019 | | | 4,294,080 | |
| 4,900,000 | | CSN Resources S.A. | | | 7.63% | | | 02/13/2023 | | | 4,936,750 | |
| 12,650,000 | | DBS Group Holdings Ltd. (5 Year Swap Rate USD + 2.39%) | | | 3.60% | † | | 09/07/2021 | | | 12,375,394 | |
| 785,000 | | Delek & Avner Tamar Bond Ltd. | | | 5.08% | ^ | | 12/30/2023 | | | 801,154 | |
| 1,760,000 | | Delek & Avner Tamar Bond Ltd. | | | 5.41% | ^ | | 12/30/2025 | | | 1,800,828 | |
| 11,000,000 | | Digicel Group Two Ltd. (7.13% Cash + 2.00% PIK) | | | 9.13% | ^ | | 04/01/2024 | | | 3,025,000 | |
| 3,000,000 | | ECL S.A. | | | 5.63% | | | 01/15/2021 | | | 3,125,471 | |
| 2,500,000 | | Ecopetrol S.A. | | | 5.88% | | | 09/18/2023 | | | 2,736,875 | |
| 200,000 | | El Puerto de Liverpool S.A.B. de C.V. | | | 3.88% | | | 10/06/2026 | | | 191,500 | |
| 5,687,000 | | Embotelladora Andina S.A. | | | 5.00% | | | 10/01/2023 | | | 5,986,229 | |
| 3,135,242 | | Empresa Electrica Angamos S.A. | | | 4.88% | | | 05/25/2029 | | | 3,170,988 | |
| 8,500,000 | | Empresa Electrica Guacolda S.A. | | | 4.56% | | | 04/30/2025 | | | 8,048,188 | |
| 5,983,327 | | ENA Norte Trust | | | 4.95% | | | 04/25/2023 | | | 6,117,952 | |
| 13,430,000 | | Enel Finance International N.V. | | | 4.25% | ^ | | 09/14/2023 | | | 13,738,941 | |
| 2,450,000 | | Energuate Trust | | | 5.88% | | | 05/03/2027 | | | 2,413,887 | |
| 2,400,000 | | Engie Energia Chile S.A. | | | 4.50% | | | 01/29/2025 | | | 2,493,853 | |
| 8,400,000 | | ENTEL Chile S.A. | | | 4.75% | | | 08/01/2026 | | | 8,474,474 | |
| 11,200,000 | | ESAL GmBH | | | 6.25% | | | 02/05/2023 | | | 11,397,680 | |
| 2,900,000 | | Export-Import Bank of India | | | 4.00% | | | 01/14/2023 | | | 2,953,378 | |
| 2,100,000 | | Fideicomiso Pacifico Tres | | | 8.25% | | | 01/15/2035 | | | 2,273,250 | |
| 2,000,000 | | Fondo Mivivienda S.A. | | | 3.50% | ^ | | 01/31/2023 | | | 2,004,000 | |
| 2,000,000 | | Fondo Mivivienda S.A. | | | 3.50% | | | 01/31/2023 | | | 2,004,000 | |
| 14,200,000 | | Fortis, Inc. | | | 2.10% | | | 10/04/2021 | | | 13,899,175 | |
| 10,248,000 | | Freeport-McMoRan Copper & Gold, Inc. | | | 5.40% | | | 11/14/2034 | | | 9,376,920 | |
| 13,252,000 | | Freeport-McMoRan Copper & Gold, Inc. | | | 5.45% | | | 03/15/2043 | | | 11,661,893 | |
| 5,000,000 | | Fresnillo PLC | | | 5.50% | | | 11/13/2023 | | | 5,281,300 | |
| 15,175,000 | | Geopark Ltd. | | | 6.50% | | | 09/21/2024 | | | 15,288,813 | |
| 1,600,000 | | Gilex Holding Sarl | | | 8.50% | ^ | | 05/02/2023 | | | 1,702,000 | |
| 4,250,000 | | Gilex Holding Sarl | | | 8.50% | | | 05/02/2023 | | | 4,520,938 | |
| 12,200,000 | | Global Bank Corporation | | | 5.13% | | | 10/30/2019 | | | 12,367,750 | |
| 1,500,000 | | Global Bank Corporation | | | 4.50% | ^ | | 10/20/2021 | | | 1,517,250 | |
| 1,900,000 | | Global Bank Corporation | | | 4.50% | | | 10/20/2021 | | | 1,921,850 | |
| 365,000 | | GNL Quintero S.A. | | | 4.63% | | | 07/31/2029 | | | 378,596 | |
| 15,200,000 | | Gohl Capital Ltd. | | | 4.25% | | | 01/24/2027 | | | 15,135,500 | |
| 9,822,000 | | Gran Tierra Energy International Holdings Ltd. | | | 6.25% | | | 02/15/2025 | | | 9,416,843 | |
| 300,000 | | Gran Tierra Energy International Holdings Ltd. | | | 6.25% | ^ | | 02/15/2025 | | | 287,625 | |
| 200,000 | | Grupo Aval Ltd. | | | 4.75% | | | 09/26/2022 | | | 202,600 | |
| 5,600,000 | | Grupo Bimbo S.A.B. de C.V. (5 Year CMT Rate + 3.28%) | | | 5.95% | † | | 04/17/2023 | | | 5,784,800 | |
| 5,000,000 | | Grupo Idesa S.A. de C.V. | | | 7.88% | | | 12/18/2020 | | | 3,550,000 | |
| 2,890,000 | | Grupo Idesa S.A. de C.V. | | | 7.88% | ^ | | 12/18/2020 | | | 2,051,900 | |
| 4,922,112 | | Guanay Finance Ltd. | | | 6.00% | | | 12/15/2020 | | | 5,002,097 | |
| 1,200,000 | | Guatemala Energuate Trust | | | 5.88% | ^ | | 05/03/2027 | | | 1,182,312 | |
| 2,136,000 | | GW Honos Security Corporation | | | 8.75% | ^ | | 05/15/2025 | | | 2,045,220 | |
| 19,845,000 | | HSBC Holdings PLC (3 Month LIBOR USD + 1.38%) | | | 3.98% | | | 09/12/2026 | | | 19,888,663 | |
| 1,000,000 | | Hutchison Whampoa International Ltd. | | | 3.25% | | | 11/08/2022 | | | 1,006,146 | |
| 3,908,000 | | Indian Oil Corporation Ltd. | | | 5.63% | | | 08/02/2021 | | | 4,098,477 | |
| 12,867,000 | | Indian Oil Corporation Ltd. | | | 5.75% | | | 08/01/2023 | | | 13,919,630 | |
| 5,084,000 | | Industrial Senior Trust | | | 5.50% | | | 11/01/2022 | | | 5,166,615 | |
| 9,000,000 | | Inkia Energy Ltd. | | | 5.88% | | | 11/09/2027 | | | 8,820,090 | |
| 1,025,000 | | Intelsat Jackson Holdings S.A. | | | 5.50% | | | 08/01/2023 | | | 914,812 | |
| 1,485,000 | | Intelsat Jackson Holdings S.A. | | | 8.50% | ^ | | 10/15/2024 | | | 1,451,587 | |
| 4,550,832 | | Interoceanica Finance Ltd. | | | 0.00% | | | 11/30/2025 | | | 4,016,109 | |
| 4,500,000 | | Inversiones CMPC S.A. | | | 4.50% | | | 04/25/2022 | | | 4,613,658 | |
| 1,200,000 | | Israel Electric Corporation Ltd. | | | 5.00% | ^ | | 11/12/2024 | | | 1,269,000 | |
| 12,000,000 | | Itau Unibanco Holding S.A. (5 Year CMT Rate + 3.86%) | | | 6.50% | † | | 03/19/2023 | | | 11,880,120 | |
| 2,800,000 | | Itau Unibanco Holding S.A. (5 Year CMT Rate + 3.98%) | | | 6.13% | † | | 12/12/2022 | | | 2,755,760 | |
| 3,900,000 | | JBS Investments GmbH | | | 7.25% | | | 04/03/2024 | | | 4,012,125 | |
| 3,400,000 | | JBS Investments GmbH | | | 7.00% | ^ | | 01/15/2026 | | | 3,502,000 | |
| 12,190,000 | | JSL Europe S.A. | | | 7.75% | | | 07/26/2024 | | | 12,070,538 | |
| 1,045,000 | | Kronos Acquisition Holdings, Inc. | | | 9.00% | ^ | | 08/15/2023 | | | 901,312 | |
| 3,049,000 | | Latam Finance Ltd. | | | 6.88% | | | 04/11/2024 | | | 3,136,659 | |
| 8,000,000 | | Latam Finance Ltd. | | | 7.00% | ^ | | 03/01/2026 | | | 8,148,000 | |
| 4,000,000 | | Lima Metro Finance Ltd. | | | 5.88% | | | 07/05/2034 | | | 4,125,700 | |
| 13,685,000 | | Lloyds Banking Group PLC (3 Month LIBOR USD + 1.21%) | | | 3.57% | | | 11/07/2028 | | | 13,164,960 | |
| 9,400,000 | | LLPL Capital Pte Ltd. | | | 6.88% | ^ | | 02/04/2039 | | | 10,190,162 | |
| 7,150,000 | | Macquarie Group Ltd. (3 Month LIBOR USD + 1.02%) | | | 3.19% | ^ | | 11/28/2023 | | | 7,107,422 | |
| 6,305,000 | | Macquarie Group Ltd. (3 Month LIBOR USD + 1.33%) | | | 4.15% | ^ | | 03/27/2024 | | | 6,422,028 | |
| 15,000,000 | | Malayan Banking BHD (5 Year Swap Rate USD + 2.54%) | | | 3.91% | | | 10/29/2026 | | | 15,046,200 | |
| 2,000,000 | | MARB BondCo PLC | | | 7.00% | ^ | | 03/15/2024 | | | 1,985,020 | |
| 400,000 | | MARB BondCo PLC | | | 7.00% | | | 03/15/2024 | | | 397,004 | |
| 13,810,000 | | MARB BondCo PLC | | | 6.88% | | | 01/19/2025 | | | 13,519,092 | |
| 1,000,000 | | Marfrig Holdings Europe B.V. | | | 8.00% | ^ | | 06/08/2023 | | | 1,035,000 | |
| 1,160,000 | | MEG Energy Corporation | | | 7.00% | ^ | | 03/31/2024 | | | 1,087,500 | |
| 2,200,000 | | Mexichem S.A.B. de C.V. | | | 5.88% | | | 09/17/2044 | | | 2,183,236 | |
| 7,746,300 | | Mexico Generadora de Energia | | | 5.50% | | | 12/06/2032 | | | 7,823,840 | |
| 3,000,000 | | Millicom International Cellular S.A. | | | 6.00% | | | 03/15/2025 | | | 3,086,250 | |
| 1,900,000 | | Millicom International Cellular S.A. | | | 6.63% | | | 10/15/2026 | | | 1,997,375 | |
| 1,300,000 | | Millicom International Cellular S.A. | | | 6.63% | ^ | | 10/15/2026 | | | 1,366,625 | |
| 6,100,000 | | Millicom International Cellular S.A. | | | 5.13% | | | 01/15/2028 | | | 5,886,500 | |
| 5,650,000 | | Millicom International Cellular S.A. | | | 6.25% | ^ | | 03/25/2029 | | | 5,761,926 | |
| 4,150,000 | | Minejesa Capital B.V. | | | 4.63% | | | 08/10/2030 | | | 4,037,340 | |
| 6,450,000 | | Minejesa Capital B.V. | | | 5.63% | | | 08/10/2037 | | | 6,424,587 | |
| 9,140,000 | | Minerva Luxembourg S.A. | | | 6.50% | | | 09/20/2026 | | | 9,104,811 | |
| 5,075,000 | | Minerva Luxembourg S.A. | | | 5.88% | | | 01/19/2028 | | | 4,688,031 | |
| 14,205,000 | | Mitsubishi UFJ Financial Group, Inc. (3 Month LIBOR USD + 0.74%) | | | 3.36% | | | 03/02/2023 | | | 14,206,013 | |
| 4,500,000 | | New Red Finance, Inc. | | | 5.00% | ^ | | 10/15/2025 | | | 4,456,350 | |
| 1,500,000 | | Nexa Resources S.A. | | | 5.38% | | | 05/04/2027 | | | 1,545,750 | |
| 13,055,000 | | Nutrien Ltd. | | | 4.20% | | | 04/01/2029 | | | 13,451,119 | |
| 5,300,000 | | OAS Financial Ltd. (5 Year CMT Rate + 8.19%) | | | 8.88% | ^†W | | 04/29/2019 | | | 39,750 | |
| 1,500,000 | | OAS Financial Ltd. (5 Year CMT Rate + 8.19%) | | | 8.88% | †W | | 04/29/2019 | | | 11,250 | |
| 1,700,000 | | Odebrecht Finance Ltd. | | | 7.13% | W | | 06/26/2042 | | | 259,267 | |
| 16,500,000 | | ONGC Videsh Ltd. | | | 3.75% | | | 07/27/2026 | | | 16,170,359 | |
| 12,724,000 | | Ontario Teachers' Cadillac Fairview Properties Trust | | | 4.13% | ^ | | 02/01/2029 | | | 13,366,904 | |
| 4,800,000 | | Orazul Energy Egenor S en C por A | | | 5.63% | | | 04/28/2027 | | | 4,722,000 | |
| 6,000,000 | | Oversea-Chinese Banking Corporation (5 Year Swap Rate USD + 2.20%) | | | 4.00% | | | 10/15/2024 | | | 6,026,197 | |
| 13,050,000 | | Pampa Energia S.A. | | | 7.50% | | | 01/24/2027 | | | 11,584,485 | |
| 6,833,304 | | Panama Metro Line SP | | | 0.00% | ^ | | 12/05/2022 | | | 6,303,723 | |
| 9,603,355 | | Panama Metro Line SP | | | 0.00% | | | 12/05/2022 | | | 8,859,095 | |
| 14,700,000 | | Petrobras Global Finance B.V. | | | 5.75% | | | 02/01/2029 | | | 14,597,100 | |
| 7,850,000 | | Petrobras Global Finance B.V. | | | 6.90% | | | 03/19/2049 | | | 7,782,490 | |
| 5,800,000 | | Petroleos Mexicanos | | | 6.50% | | | 06/02/2041 | | | 5,264,602 | |
| 7,800,000 | | Petronas Capital Ltd. | | | 3.50% | | | 03/18/2025 | | | 7,952,630 | |
| 500,000 | | PSA International Ltd. | | | 3.88% | | | 02/11/2021 | | | 510,890 | |
| 2,013,000 | | PTTEP Treasury Center Company Ltd. (5 Year CMT Rate + 2.72%) | | | 4.60% | † | | 07/17/2022 | | | 2,002,893 | |
| 1,400,000 | | Raizen Fuels Finance S.A. | | | 5.30% | | | 01/20/2027 | | | 1,438,500 | |
| 13,000,000 | | Reliance Holdings, Inc. | | | 5.40% | | | 02/14/2022 | | | 13,645,872 | |
| 13,525,000 | | Reynolds American, Inc. | | | 4.00% | | | 06/12/2022 | | | 13,824,246 | |
| 6,565,000 | | Royal Bank of Scotland Group PLC (3 Month LIBOR USD + 1.48%) | | | 3.50% | | | 05/15/2023 | | | 6,523,573 | |
| 2,300,000 | | SACI Falabella | | | 3.75% | | | 04/30/2023 | | | 2,321,161 | |
| 11,662,000 | | Shire Acquisitions Investments Ireland DAC | | | 2.88% | | | 09/23/2023 | | | 11,530,641 | |
| 10,000,000 | | Sinopec Group Overseas Development Ltd. | | | 2.75% | | | 09/29/2026 | | | 9,514,070 | |
| 900,000 | | Sociedad Quimica y Minera S.A. | | | 4.38% | | | 01/28/2025 | | | 907,875 | |
| 196,600 | | Star Energy Geothermal Wayang Windu Ltd. | | | 6.75% | ^ | | 04/24/2033 | | | 197,561 | |
| 8,100,903 | | Star Energy Geothermal Wayang Windu Ltd. | | | 6.75% | | | 04/24/2033 | | | 8,140,516 | |
| 530,000 | | Starfruit Finco B.V. | | | 8.00% | ^ | | 10/01/2026 | | | 536,625 | |
| 2,165,000 | | Stars Group Holdings B.V. | | | 7.00% | ^ | | 07/15/2026 | | | 2,262,425 | |
| 10,411,931 | | Stoneway Capital Corporation | | | 10.00% | | | 03/01/2027 | | | 10,125,603 | |
| 6,500,000 | | SUAM Finance B.V. | | | 4.88% | | | 04/17/2024 | | | 6,784,375 | |
| 19,655,000 | | Sumitomo Mitsui Financial Group, Inc. (3 Month LIBOR USD + 0.74%) | | | 3.51% | | | 01/17/2023 | | | 19,668,672 | |
| 2,805,000 | | Superior Plus LP | | | 7.00% | ^ | | 07/15/2026 | | | 2,864,606 | |
| 350,000 | | Sydney Airport Finance Company Pty Ltd. | | | 3.63% | ^ | | 04/28/2026 | | | 349,931 | |
| 250,000 | | Syngenta Finance N.V. | | | 4.38% | | | 03/28/2042 | | | 199,851 | |
| 500,000 | | Syngenta Finance N.V. | | | 5.68% | ^ | | 04/24/2048 | | | 475,312 | |
| 14,050,000 | | Syngenta Finance N.V. | | | 5.68% | | | 04/24/2048 | | | 13,356,254 | |
| 2,335,000 | | Takeda Pharmaceutical Company Ltd. | | | 4.40% | ^ | | 11/26/2023 | | | 2,456,267 | |
| 1,200,000 | | Tecnoglass, Inc. | | | 8.20% | | | 01/31/2022 | | | 1,266,000 | |
| 2,650,000 | | Telefonica Celular del Paragu | | | 5.88% | ^ | | 04/15/2027 | | | 2,699,688 | |
| 4,000,000 | | Telefonica Chile S.A. | | | 3.88% | | | 10/12/2022 | | | 4,055,907 | |
| 2,475,000 | | Telesat LLC | | | 8.88% | ^ | | 11/15/2024 | | | 2,673,000 | |
| 16,500,000 | | Temasek Financial Ltd. | | | 2.38% | | | 01/23/2023 | | | 16,338,070 | |
| 3,650,000 | | Tervita Escrow Corporation | | | 7.63% | ^ | | 12/01/2021 | | | 3,640,875 | |
| 900,000 | | Transelec S.A. | | | 4.63% | | | 07/26/2023 | | | 928,809 | |
| 400,000 | | Transelec S.A. | | | 3.88% | | | 01/12/2029 | | | 387,004 | |
| 7,300,000 | | Transportadora de Gas del Peru S.A. | | | 4.25% | | | 04/30/2028 | | | 7,446,000 | |
| 5,300,000 | | Unifin Financiera S.A.B. de C.V. | | | 7.38% | | | 02/12/2026 | | | 5,001,875 | |
| 13,900,000 | | Unifin Financiera S.A.B. de C.V. (5 Year CMT Rate + 6.31%) | | | 8.88% | † | | 01/29/2025 | | | 12,127,889 | |
| 1,418,000 | | Union Bank of the Philippines | | | 3.37% | | | 11/29/2022 | | | 1,408,346 | |
| 9,083,000 | | United Overseas Bank Ltd. (5 Year Swap Rate USD + 1.79%) | | | 3.88% | † | | 10/19/2023 | | | 8,715,030 | |
| 8,000,000 | | United Overseas Bank Ltd. (5 Year Swap Rate USD + 2.24%) | | | 3.50% | | | 09/16/2026 | | | 8,017,584 | |
| 9,500,000 | | UPL Corporation | | | 3.25% | | | 10/13/2021 | | | 9,390,626 | |
| 3,130,000 | | Vedanta Resources PLC | | | 7.13% | | | 05/31/2023 | | | 3,072,878 | |
| 15,000,000 | | Vedanta Resources PLC | | | 6.13% | | | 08/09/2024 | | | 13,746,343 | |
| 17,295,000 | | Volkswagen Group of America Finance LLC | | | 4.25% | ^ | | 11/13/2023 | | | 17,837,618 | |
| 1,900,000 | | Votorantim Cimentos S.A. | | | 7.25% | | | 04/05/2041 | | | 2,187,375 | |
| 1,813,000 | | VTR Finance B.V. | | | 6.88% | ^ | | 01/15/2024 | | | 1,865,124 | |
| 6,353,000 | | VTR Finance B.V. | | | 6.88% | | | 01/15/2024 | | | 6,535,649 | |
| 21,225,000 | | Westpac Banking Corporation (3 Month LIBOR USD + 0.72%) | | | 3.40% | | | 05/15/2023 | | | 21,289,093 | |
| 10,550,000 | | YPF S.A. | | | 8.50% | | | 07/28/2025 | | | 10,391,750 | |
| 4,200,000 | | YPF S.A. | | | 6.95% | | | 07/21/2027 | | | 3,745,350 | |
| | | | | | | | | | | | |
Total Foreign Corporate Bonds(Cost $1,480,018,906) | | | 1,477,641,645 | |
| | | | | | | | | | | | |
| |
Foreign Government Bonds, Foreign Agencies and Foreign Government Sponsored Corporations - 1.2% | | | | |
| 11,200,000 | | Argentine Republic Government International Bond | | | 6.88% | | | 01/26/2027 | | | 9,095,800 | |
| 4,500,000 | | Argentine Republic Government International Bond | | | 5.88% | | | 01/11/2028 | | | 3,465,562 | |
| 3,000,000 | | Argentine Republic Government International Bond | | | 6.63% | | | 07/06/2028 | | | 2,369,280 | |
| 9,000,000 | | Chile Government International Bond | | | 3.13% | | | 03/27/2025 | | | 9,148,140 | |
| 7,900,000 | | Chile Government International Bond | | | 3.13% | | | 01/21/2026 | | | 8,020,041 | |
| 1,400,000 | | Colombia Government International Bond | | | 4.50% | | | 03/15/2029 | | | 1,480,500 | |
| 1,300,000 | | Colombia Government International Bond | | | 5.20% | | | 05/15/2049 | | | 1,400,490 | |
| 8,140,000 | | Costa Rica Government International Bond | | | 10.00% | | | 08/01/2020 | | | 8,567,350 | |
| 5,000,000 | | Indonesia Government International Bond | | | 4.88% | | | 05/05/2021 | | | 5,190,450 | |
| 7,000,000 | | Israel Government International Bond | | | 2.88% | | | 03/16/2026 | | | 7,004,935 | |
| 8,000,000 | | Malaysia Sovereign Sukuk BHD | | | 3.04% | | | 04/22/2025 | | | 8,024,320 | |
| 500,000 | | Malaysia Sukuk Global BHD | | | 3.18% | | | 04/27/2026 | | | 503,191 | |
| 1,000,000 | | Mexico Government International Bond | | | 4.00% | | | 10/02/2023 | | | 1,029,275 | |
| 11,621,000 | | Mexico Government International Bond | | | 4.15% | | | 03/28/2027 | | | 11,832,502 | |
| 16,815,000 | | Mexico Government International Bond | | | 3.75% | | | 01/11/2028 | | | 16,637,602 | |
| 8,000,000 | | Panama Government International Bond | | | 4.00% | | | 09/22/2024 | | | 8,376,000 | |
| 3,000,000 | | Perusahaan Penerbit | | | 4.15% | | | 03/29/2027 | | | 3,036,000 | |
| 10,000,000 | | Perusahaan Penerbit | | | 4.15% | ^ | | 03/29/2027 | | | 10,120,000 | |
| 17,100,000 | | Philippine Government International Bond | | | 4.20% | | | 01/21/2024 | | | 18,055,856 | |
| 12,400,000 | | Provincia de Buenos Aires | | | 7.88% | | | 06/15/2027 | | | 9,083,000 | |
| | | | | | | | | | | | |
Total Foreign Government Bonds, Foreign Agencies and Foreign Government Sponsored Corporations (Cost $147,747,691) | | | | | | | | | 142,440,294 | |
| | | | | | | | | | | | |
| |
Municipal Bonds - 0.1% | | | | |
| 3,290,000 | | Missouri Highway & Transportation Commission | | | 5.06% | | | 05/01/2024 | | | 3,638,806 | |
| 4,430,000 | | State of California | | | 7.55% | | | 04/01/2039 | | | 6,736,125 | |
| | | | | | | | | | | | |
Total Municipal Bonds(Cost $10,051,605) | | | 10,374,931 | |
| | | | | | | | | | | | |
| |
Non-Agency Commercial Mortgage Backed Obligations - 7.4% | | | | |
| 11,235,000 | | Atrium Hotel Portfolio Trust, Series 2017-ATRM-E (1 Month LIBOR USD + 3.05%) | | | 5.53% | ^ | | 12/15/2036 | | | 11,314,866 | |
| 12,071,000 | | Atrium Hotel Portfolio Trust, Series 2018-ATRM-D (1 Month LIBOR USD + 2.30%, 2.30% Floor) | | | 4.78% | ^ | | 06/15/2035 | | | 12,101,310 | |
| 4,259,000 | | Bancorp Commercial Mortgage Trust, Series 2019-CRE5-D (1 Month LIBOR USD + 2.35%, 2.35% Floor) | | | 4.84% | ^ | | 03/15/2036 | | | 4,286,074 | |
| 2,511,000 | | BANK Trust, Series 2019-BN17-C | | | 4.52% | # | | 04/15/2052 | | | 2,597,599 | |
| 5,007,430 | | BANK Trust, Series 2017-BNK8-XA | | | 0.75% | # I/O | | 11/15/2050 | | | 262,746 | |
| 190,548,100 | | BANK Trust, Series 2018-BN10-XA | | | 0.75% | # I/O | | 02/15/2061 | | | 10,163,169 | |
| 76,346,849 | | Barclays Commercial Mortgage Securities LLC, Series 2017-C1-XA | | | 1.51% | # I/O | | 02/15/2050 | | | 6,873,950 | |
| 1,508,000 | | Barclays Commercial Mortgage Securities LLC, Series 2017-DELC-C (1 Month LIBOR USD + 1.20%) | | | 3.68% | ^ | | 08/15/2036 | | | 1,500,023 | |
| 1,719,000 | | Barclays Commercial Mortgage Securities LLC, Series 2017-DELC-D (1 Month LIBOR USD + 1.70%) | | | 4.18% | ^ | | 08/15/2036 | | | 1,716,457 | |
| 3,464,000 | | Barclays Commercial Mortgage Securities LLC, Series 2017-DELC-E (1 Month LIBOR USD + 2.50%) | | | 4.98% | ^ | | 08/15/2036 | | | 3,438,616 | |
| 3,451,000 | | Barclays Commercial Mortgage Securities LLC, Series 2017-DELC-F (1 Month LIBOR USD + 3.50%) | | | 5.98% | ^ | | 08/15/2036 | | | 3,430,589 | |
| 1,610,000 | | BBCMS Mortgage Trust, Series 2018-TALL-B (1 Month LIBOR USD + 0.97%) | | | 3.45% | ^ | | 03/15/2037 | | | 1,602,564 | |
| 3,775,000 | | Bear Stearns Commercial Mortgage Securities, Inc., Series 2007-T26-AJ | | | 5.46% | # | | 01/12/2045 | | | 3,530,665 | |
| 8,011,000 | | Benchmark Mortgage Trust, Series 2019-B10-C | | | 3.75% | | | 03/15/2062 | | | 7,809,876 | |
| 107,052,000 | | BenchmarkMortgage Trust, Series 2019-B10-XA | | | 1.23% | # I/O | | 03/15/2062 | | | 10,065,136 | |
| 11,000,000 | | BHMS Trust, Series 2018-ATLS-C (1 Month LIBOR USD + 1.90%, 1.90% Floor) | | | 4.38% | ^ | | 07/15/2035 | | | 10,999,739 | |
| 3,283,000 | | BX Commercial Mortgage Trust, Series 2018-BIOA-D (1 Month LIBOR USD + 1.32%, 1.35% Floor) | | | 3.80% | ^ | | 03/15/2037 | | | 3,280,253 | |
| 8,207,000 | | BX Commercial Mortgage Trust, Series 2018-BIOA-E (1 Month LIBOR USD + 1.95%, 1.98% Floor) | | | 4.43% | ^ | | 03/15/2037 | | | 8,221,570 | |
| 4,128,000 | | BX Trust, Series 2017-IMC-D (1 Month LIBOR USD + 2.25%, 2.25% Floor) | | | 4.73% | ^ | | 10/15/2032 | | | 4,116,066 | |
| 6,657,000 | | BX Trust, Series 2017-IMC-E (1 Month LIBOR USD + 3.25%, 3.25% Floor) | | | 5.73% | ^ | | 10/15/2032 | | | 6,650,959 | |
| 3,163,700 | | BX Trust, Series 2017-SLCT-D (1 Month LIBOR USD + 2.05%) | | | 4.53% | ^ | | 07/15/2034 | | | 3,163,658 | |
| 5,361,800 | | BX Trust, Series 2017-SLCT-E (1 Month LIBOR USD + 3.15%) | | | 5.63% | ^ | | 07/15/2034 | | | 5,392,376 | |
| 4,177,000 | | BX Trust, Series 2018-BILT-A (1 Month LIBOR USD + 0.80%, 0.80% Floor) | | | 3.28% | ^ | | 05/15/2030 | | | 4,154,037 | |
| 11,731,000 | | BX Trust, Series 2018-MCSF-F (1 Month LIBOR USD + 2.65%, 2.65% Floor) | | | 5.13% | ^ | | 04/15/2035 | | | 11,666,936 | |
| 1,564,000 | | Caesars Palace Las Vegas Trust, Series 2017-VICI-D | | | 4.35% | # ^ | | 10/15/2034 | | | 1,604,805 | |
| 4,617,000 | | Caesars Palace Las Vegas Trust, Series 2017-VICI-E | | | 4.35% | # ^ | | 10/15/2034 | | | 4,676,861 | |
| 73,359,782 | | CFCRE Commercial Mortgage Trust, Series 2016-C3-XA | | | 1.05% | # I/O | | 01/10/2048 | | | 4,244,619 | |
| 11,498,000 | | CGGS Commercial Mortgage Trust, Series 2018-WSS-D (1 Month LIBOR USD + 2.30%, 2.30% Floor) | | | 4.78% | ^ | | 02/15/2037 | | | 11,497,932 | |
| 7,196,000 | | CHT Mortgage Trust, Series 2017-CSMO-E (1 Month LIBOR USD + 3.00%, 3.00% Floor) | | | 5.48% | ^ | | 11/15/2036 | | | 7,237,080 | |
| 3,838,000 | | CHT Mortgage Trust, Series 2017-CSMO-F (1 Month LIBOR USD + 3.74%, 3.74% Floor) | | | 6.22% | ^ | | 11/15/2036 | | | 3,864,664 | |
| 7,965,283 | | Citigroup Commercial Mortgage Trust, Series 2012-GC8-XA | | | 1.79% | # ^ I/O | | 09/10/2045 | | | 369,752 | |
| 1,898,500 | | Citigroup Commercial Mortgage Trust, Series 2015-GC27-D | | | 4.43% | # ^ | | 02/10/2048 | | | 1,762,525 | |
| 4,084,167 | | Citigroup Commercial Mortgage Trust, Series 2015-GC27-XA | | | 1.38% | # I/O | | 02/10/2048 | | | 255,118 | |
| 7,840,000 | | Citigroup Commercial Mortgage Trust, Series 2015-GC35-C | | | 4.50% | # | | 11/10/2048 | | | 7,948,846 | |
| 72,605,557 | | Citigroup Commercial Mortgage Trust, Series 2015-GC35-XA | | | 0.87% | # I/O | | 11/10/2048 | | | 2,837,955 | |
| 8,046,000 | | Citigroup Commercial Mortgage Trust, Series 2016-GC36-D | | | 2.85% | ^ | | 02/10/2049 | | | 6,566,955 | |
| 45,608,652 | | Citigroup Commercial Mortgage Trust, Series 2016-P3-XA | | | 1.70% | # I/O | | 04/15/2049 | | | 3,899,750 | |
| 8,530,000 | | Citigroup Commercial Mortgage Trust, Series 2016-P4-A4 | | | 2.90% | | | 07/10/2049 | | | 8,431,125 | |
| 44,743,122 | | Citigroup Commercial Mortgage Trust, Series 2016-P4-XA | | | 1.99% | # I/O | | 07/10/2049 | | | 4,683,576 | |
| 82,970,764 | | Citigroup Commercial Mortgage Trust, Series 2016-P5-XA | | | 1.53% | # I/O | | 10/10/2049 | | | 6,612,372 | |
| 6,303,000 | | Citigroup Commercial Mortgage Trust, Series 2016-P6-A5 | | | 3.72% | # | | 12/10/2049 | | | 6,566,225 | |
| 1,977,000 | | Citigroup Commercial Mortgage Trust, Series 2018-C5-C | | | 4.72% | # | | 06/10/2051 | | | 2,045,847 | |
| 3,224,000 | | CLNS Trust, Series 2017-IKPR-D (1 Month LIBOR USD + 2.05%, 2.05% Floor) | | | 4.54% | ^ | | 06/11/2032 | | | 3,231,136 | |
| 3,224,000 | | CLNS Trust, Series 2017-IKPR-E (1 Month LIBOR USD + 3.50%, 3.50% Floor) | | | 5.99% | ^ | | 06/11/2032 | | | 3,243,186 | |
| 3,224,000 | | CLNS Trust, Series 2017-IKPR-F (1 Month LIBOR USD + 4.50%, 4.50% Floor) | | | 6.99% | ^ | | 06/11/2032 | | | 3,245,049 | |
| 8,659,000 | | Cloverleaf Cold Storage Trust, Series 2019-CHL2-E (1 Month LIBOR USD + 2.30%, 2.30% Floor) | | | 4.78% | ^ | | 03/15/2036 | | | 8,680,708 | |
| 8,659,000 | | Cloverleaf Cold Storage Trust, Series 2019-CHL2-F (1 Month LIBOR USD + 2.75%, 2.75% Floor) | | | 5.23% | ^ | | 03/15/2036 | | | 8,680,708 | |
| 8,100 | | COBALT Commercial Mortgage Trust, Series 2007-C2-AJFX | | | 5.57% | # | | 04/15/2047 | | | 8,129 | |
| 22,253,638 | | Commercial Mortgage Pass-Through Certificates, Series 2012-CR3-XA | | | 1.87% | # I/O | | 10/15/2045 | | | 1,208,858 | |
| 8,626,000 | | Commercial Mortgage Pass-Through Certificates, Series 2012-CR4-D | | | 4.57% | # ^ Þ | | 10/15/2045 | | | 3,650,066 | |
| 3,321,227 | | Commercial Mortgage Pass-Through Certificates, Series 2012-LC4-XA | | | 2.11% | # ^ I/O | | 12/10/2044 | | | 163,555 | |
| 6,067,000 | | Commercial Mortgage Pass-Through Certificates, Series 2013-CR11-D | | | 5.14% | # ^ | | 08/10/2050 | | | 6,025,399 | |
| 3,500,000 | | Commercial Mortgage Pass-Through Certificates, Series 2014-CR20-C | | | 4.50% | # | | 11/10/2047 | | | 3,621,696 | |
| 58,045,192 | | Commercial Mortgage Pass-Through Certificates, Series 2015-CR26-XA | | | 0.96% | # I/O | | 10/10/2048 | | | 2,807,547 | |
| 4,310,000 | | Commercial Mortgage Pass-Through Certificates, Series 2015-LC21-C | | | 4.30% | # | | 07/10/2048 | | | 4,395,669 | |
| 5,579,000 | | Commercial Mortgage Pass-Through Certificates, Series 2015-LC23-C | | | 4.65% | # | | 10/10/2048 | | | 5,839,826 | |
| 5,997,000 | | Commercial Mortgage Pass-Through Certificates, Series 2016-CR28-C | | | 4.65% | # | | 02/10/2049 | | | 6,299,439 | |
| 3,786,000 | | Commercial Mortgage Pass-Through Certificates, Series 2016-DC2-C | | | 4.64% | # | | 02/10/2049 | | | 3,833,992 | |
| 58,343,434 | | Commercial Mortgage Pass-Through Certificates, Series 2016-DC2-XA | | | 1.03% | # I/O | | 02/10/2049 | | | 3,132,611 | |
| 9,247,000 | | Commercial Mortgage Pass-Through Certificates, Series 2016-GCT-E | | | 3.46% | # ^ | | 08/10/2029 | | | 9,131,862 | |
| 2,808,000 | | Commercial Mortgage Pass-Through Certificates, Series 2016-GCT-F | | | 3.46% | # ^ | | 08/10/2029 | | | 2,748,220 | |
| 12,424,000 | | Commercial Mortgage Pass-Through Certificates, Series 2018-HCLV-C (1 Month LIBOR USD + 1.70%, 1.70% Floor) | | | 4.18% | ^ | | 09/15/2033 | | | 12,494,543 | |
| 8,464,000 | | Core Mortgage Trust, Series 2019-CORE-E (1 Month LIBOR USD + 1.90%, 1.90% Floor) | | | 4.40% | ^ | | 12/15/2031 | | | 8,474,868 | |
| 2,064,000 | | Core Mortgage Trust, Series 2019-CORE-F (1 Month LIBOR USD + 2.35%, 2.35% Floor) | | | 4.85% | ^ | | 12/15/2031 | | | 2,067,630 | |
| 5,597,000 | | CSAIL Commercial Mortgage Trust, Series 2015-C4-C | | | 4.58% | # | | 11/15/2048 | | | 5,765,734 | |
| 58,044,440 | | CSAIL Commercial Mortgage Trust, Series 2016-C6-XA | | | 1.79% | # I/O | | 01/15/2049 | | | 5,022,910 | |
| 116,143,172 | | CSAIL Commercial Mortgage Trust, Series 2017-C8-XA | | | 1.25% | # I/O | | 06/15/2050 | | | 7,627,889 | |
| 11,488,000 | | CSAIL Commercial Mortgage Trust, Series 2018-C14-C | | | 4.89% | # | | 11/15/2051 | | | 11,958,084 | |
| 3,800,000 | | CSAIL Commercial Mortgage Trust, Series 2018-CX12-C | | | 4.77% | # | | 08/15/2051 | | | 4,037,404 | |
| 798,000 | | CSMC Trust, Series 2017-CALI-D | | | 3.78% | # ^ | | 11/10/2032 | | | 799,586 | |
| 4,944,000 | | CSMC Trust, Series 2017-CHOP-D (1 Month LIBOR USD + 1.90%, 1.90% Floor) | | | 4.38% | ^ | | 07/15/2032 | | | 4,951,446 | |
| 4,944,000 | | CSMC Trust, Series 2017-CHOP-E (1 Month LIBOR USD + 3.30%, 3.30% Floor) | | | 5.78% | ^ | | 07/15/2032 | | | 4,966,569 | |
| 4,503,000 | | DBGS Mortgage Trust, Series 2018-5BP-D (1 Month LIBOR USD + 1.35%) | | | 3.83% | ^ | | 06/15/2033 | | | 4,449,011 | |
| 186,000 | | DBGS Mortgage Trust, Series 2018-5BP-F (1 Month LIBOR USD + 2.45%) | | | 4.93% | ^ | | 06/15/2033 | | | 183,387 | |
| 7,354,573 | | DBGS Mortgage Trust, Series 2018-BIOD-B (1 Month LIBOR USD + 0.89%, 0.89% Floor) | | | 3.37% | ^ | | 05/15/2035 | | | 7,295,792 | |
| 2,985,136 | | DBUBS Mortgage Trust, Series 2011-LC2A-XA | | | 1.05% | # ^ I/O | | 07/10/2044 | | | 52,786 | |
| 4,475,000 | | Deutsche Bank Commercial Mortgage Trust, Series 2016-C1-C | | | 3.35% | # | | 05/10/2049 | | | 4,276,876 | |
| 60,936,163 | | Deutsche Bank Commercial Mortgage Trust, Series 2016-C1-XA | | | 1.48% | # I/O | | 05/10/2049 | | | 4,769,583 | |
| 2,517,557 | | FREMF Mortgage Trust, Series 2016-KF22-B (1 Month LIBOR USD + 5.05%, 5.05% Floor) | | | 7.54% | ^ | | 07/25/2023 | | | 2,618,363 | |
| 674,584 | | GE Commercial Mortgage Corporation Trust, Series 2007-C1-AM | | | 5.44% | # | | 12/10/2049 | | | 610,449 | |
| 1,766,000 | | GPMT Ltd., Series 2019-FL2-D (1 Month LIBOR USD + 2.95%, 2.95% Floor) | | | 5.43% | ^ | | 02/22/2036 | | | 1,778,251 | |
| 5,296,000 | | Great Wolf Trust, Series 2017-WOLF-D (1 Month LIBOR USD + 2.10%, 1.00% Floor) | | | 4.73% | ^ | | 09/15/2034 | | | 5,305,343 | |
| 8,210,000 | | Great Wolf Trust, Series 2017-WOLF-E (1 Month LIBOR USD + 3.10%, 1.00% Floor) | | | 5.73% | ^ | | 09/15/2034 | | | 8,237,413 | |
| 4,370,000 | | Great Wolf Trust, Series 2017-WOLF-F (1 Month LIBOR USD + 4.07%, 1.00% Floor) | | | 6.70% | ^ | | 09/15/2034 | | | 4,392,566 | |
| 12,284,000 | | GS Mortgage Securities Corporation, Series 2018-3PCK-A (1 Month LIBOR USD + 1.45%, 1.45% Floor) | | | 3.93% | ^ | | 09/15/2031 | | | 12,317,941 | |
| 2,834,260 | | GS Mortgage Securities Trust, Series 2011-GC5-XA | | | 1.34% | # ^ I/O | | 08/10/2044 | | | 68,368 | |
| 4,753,193 | | GS Mortgage Securities Trust, Series 2012-GC6-XA | | | 1.94% | # ^ I/O | | 01/10/2045 | | | 202,125 | |
| 3,741,000 | | GS Mortgage Securities Trust, Series 2014-GC26-C | | | 4.52% | # | | 11/10/2047 | | | 3,738,651 | |
| 9,506,000 | | GS Mortgage Securities Trust, Series 2014-GC26-D | | | 4.52% | # ^ | | 11/10/2047 | | | 8,123,276 | |
| 97,335,372 | | GS Mortgage Securities Trust, Series 2015-GS1-XA | | | 0.80% | # I/O | | 11/10/2048 | | | 4,256,252 | |
| 61,368,201 | | GS Mortgage Securities Trust, Series 2016-GS2-XA | | | 1.66% | # I/O | | 05/10/2049 | | | 5,067,277 | |
| 118,493,709 | | GS Mortgage Securities Trust, Series 2017-GS7-XA | | | 1.13% | # I/O | | 08/10/2050 | | | 8,566,669 | |
| 13,658,000 | | GS Mortgage Securities Trust, Series 2017-GS8-C | | | 4.34% | # | | 11/10/2050 | | | 14,019,393 | |
| 47,028,940 | | GS Mortgage Securities Trust, Series 2017-GS8-XA | | | 0.98% | # I/O | | 11/10/2050 | | | 3,068,944 | |
| 771,793 | | JP Morgan Chase Commercial Mortgage Securities Corporation, Series 2006-LDP8-X | | | 0.29% | # I/O | | 05/15/2045 | | | 912 | |
| 204,056 | | JP Morgan Chase Commercial Mortgage Securities Corporation, Series 2006-LDP9-AM | | | 5.37% | | | 05/15/2047 | | | 204,074 | |
| 1,340 | | JP Morgan Chase Commercial Mortgage Securities Corporation, Series 2007-CB18-AMFX | | | 5.40% | | | 06/12/2047 | | | 1,343 | |
| 12,050,000 | | JP Morgan Chase Commercial Mortgage Securities Corporation, Series 2009-IWST-XB | | | 0.30% | # ^ I/O | | 12/05/2027 | | | 33,535 | |
| 2,602,689 | | JP Morgan Chase Commercial Mortgage Securities Corporation, Series 2011-C4-XA | | | 1.19% | # ^ I/O | | 07/15/2046 | | | 52,347 | |
| 20,622,165 | | JP Morgan Chase Commercial Mortgage Securities Corporation, Series 2012-C8-XA | | | 1.78% | # I/O | | 10/15/2045 | | | 996,585 | |
| 4,987,200 | | JP Morgan Chase Commercial Mortgage Securities Corporation, Series 2012-CBX-XA | | | 2.07% | # I/O | | 06/15/2045 | | | 162,680 | |
| 77,896,984 | | JP Morgan Chase Commercial Mortgage Securities Corporation, Series 2015-JP1-XA | | | 1.12% | # I/O | | 01/15/2049 | | | 3,403,514 | |
| 2,577,000 | | JP Morgan Chase Commercial Mortgage Securities Corporation, Series 2017-MAUI-C (1 Month LIBOR USD + 1.25%, 1.25% Floor) | | | 3.74% | ^ | | 07/15/2034 | | | 2,577,389 | |
| 2,418,000 | | JP Morgan Chase Commercial Mortgage Securities Corporation, Series 2017-MAUI-D (1 Month LIBOR USD + 1.95%, 1.95% Floor) | | | 4.44% | ^ | | 07/15/2034 | | | 2,423,203 | |
| 2,141,000 | | JP Morgan Chase Commercial Mortgage Securities Corporation, Series 2017-MAUI-E (1 Month LIBOR USD + 2.95%, 2.95% Floor) | | | 5.44% | ^ | | 07/15/2034 | | | 2,150,067 | |
| 3,013,000 | | JP Morgan Chase Commercial Mortgage Securities Corporation, Series 2017-MAUI-F (1 Month LIBOR USD + 3.75%, 3.75% Floor) | | | 6.24% | ^ | | 07/15/2034 | | | 2,992,748 | |
| 11,261,863 | | JP Morgan Chase Commercial Mortgage Securities Corporation, Series 2018-LAQ-C (1 Month LIBOR USD + 1.60%, 1.60% Floor) | | | 4.08% | ^ | | 06/15/2032 | | | 11,303,106 | |
| 3,705,163 | | JP Morgan Chase Commercial Mortgage Securities Corporation, Series 2018-LAQ-D (1 Month LIBOR USD + 2.10%, 2.30% Floor) | | | 4.58% | ^ | | 06/15/2032 | | | 3,724,201 | |
| 973,456 | | JP Morgan Chase Commercial Mortgage Securities Trust, Series 2007-LDPX-AM | | | 5.32% | # | | 01/15/2049 | | | 974,689 | |
| 2,704,000 | | JP Morgan Chase Commercial Mortgage Securities Trust, Series 2016-JP2-B | | | 3.46% | | | 08/15/2049 | | | 2,680,363 | |
| 2,080,000 | | JP Morgan Chase Commercial Mortgage Securities Trust, Series 2016-JP2-C | | | 3.79% | # | | 08/15/2049 | | | 2,056,766 | |
| 9,281,000 | | JP Morgan Chase Commercial Mortgage Securities Trust, Series 2016-WIKI-E | | | 4.01% | # ^ | | 10/05/2031 | | | 9,180,347 | |
| 47,599,994 | | JPMBB Commercial Mortgage Securities Trust, Series 2014-C18-XA | | | 0.87% | # I/O | | 02/15/2047 | | | 1,640,377 | |
| 3,000,000 | | JPMBB Commercial Mortgage Securities Trust, Series 2014-C21-C | | | 4.65% | # | | 08/15/2047 | | | 3,039,979 | |
| 2,766,125 | | JPMBB Commercial Mortgage Securities Trust, Series 2014-C23-C | | | 4.47% | # | | 09/15/2047 | | | 2,855,217 | |
| 3,766,500 | | JPMBB Commercial Mortgage Securities Trust, Series 2014-C25-C | | | 4.44% | # | | 11/15/2047 | | | 3,852,946 | |
| 56,566,291 | | JPMBB Commercial Mortgage Securities Trust, Series 2014-C25-XA | | | 0.94% | # I/O | | 11/15/2047 | | | 1,994,058 | |
| 44,990,155 | | JPMBB Commercial Mortgage Securities Trust, Series 2014-C26-XA | | | 1.06% | # I/O | | 01/15/2048 | | | 1,806,449 | |
| 12,131,110 | | JPMBB Commercial Mortgage Securities Trust, Series 2015-C27-D | | | 3.84% | # ^ | | 02/15/2048 | | | 11,451,480 | |
| 1,846,000 | | JPMBB Commercial Mortgage Securities Trust, Series 2015-C28-B | | | 3.99% | | | 10/15/2048 | | | 1,880,773 | |
| 9,974,000 | | JPMBB Commercial Mortgage Securities Trust, Series 2015-C29-C | | | 4.17% | # | | 05/15/2048 | | | 10,034,608 | |
| 49,887,980 | | JPMBB Commercial Mortgage Securities Trust, Series 2015-C31-XA | | | 0.94% | # I/O | | 08/15/2048 | | | 2,107,543 | |
| 4,138,000 | | JPMBB Commercial Mortgage Securities Trust, Series 2015-C32-C | | | 4.67% | # | | 11/15/2048 | | | 4,261,521 | |
| 6,470,000 | | JPMBB Commercial Mortgage Securities Trust, Series 2015-C33-C | | | 4.62% | # | | 12/15/2048 | | | 6,687,822 | |
| 6,122,000 | | JPMBB Commercial Mortgage Securities Trust, Series 2016-C1-C | | | 4.74% | # | | 03/15/2049 | | | 6,371,410 | |
| 62,649,117 | | JPMBB Commercial Mortgage Securities Trust, Series 2016-C2-XA | | | 1.69% | # I/O | | 06/15/2049 | | | 4,709,904 | |
| 1,638,000 | | JPMCC Commercial Mortgage Securities Trust, Series 2019-COR4-B | | | 4.44% | | | 03/10/2052 | | | 1,734,116 | |
| 93,054,749 | | JPMDB Commercial Mortgage Securities Trust, Series 2018-C8-XA | | | 0.65% | # I/O | | 06/15/2051 | | | 4,003,653 | |
| 571,622 | | LB-UBS Commercial Mortgage Trust, Series 2006-C7-XCL | | | 0.49% | # ^ I/O | | 11/15/2038 | | | 171 | |
| 461,005 | | LB-UBS Commercial Mortgage Trust, Series 2006-C7-XW | | | 0.49% | # ^ I/O | | 11/15/2038 | | | 138 | |
| 5,425,000 | | LSTAR Commercial Mortgage Trust, Series 2016-4-C | | | 4.55% | # ^ | | 03/10/2049 | | | 5,081,618 | |
| 242,425 | | Merrill Lynch Mortgage Trust, Series 2006-C1-AJ | | | 5.43% | # | | 05/12/2039 | | | 243,744 | |
| 2,024,112 | | Morgan Stanley Bank of America Merrill Lynch Trust, Series 2012-C5-XA | | | 1.46% | # ^ I/O | | 08/15/2045 | | | 77,682 | |
| 3,000,000 | | Morgan Stanley Bank of America Merrill Lynch Trust, Series 2014-C18-C | | | 4.49% | # | | 10/15/2047 | | | 3,043,846 | |
| 4,000,000 | | Morgan Stanley Bank of America Merrill Lynch Trust, Series 2014-C19-C | | | 4.00% | | | 12/15/2047 | | | 3,982,840 | |
| 37,522,699 | | Morgan Stanley Bank of America Merrill Lynch Trust, Series 2015-C20-XA | | | 1.33% | # I/O | | 02/15/2048 | | | 2,079,759 | |
| 4,600,000 | | Morgan Stanley Bank of America Merrill Lynch Trust, Series 2015-C25-C | | | 4.53% | # | | 10/15/2048 | | | 4,789,644 | |
| 4,674,000 | | Morgan Stanley Bank of America Merrill Lynch Trust, Series 2015-C27-C | | | 4.53% | # | | 12/15/2047 | | | 4,711,349 | |
| 6,710,000 | | Morgan Stanley Bank of America Merrill Lynch Trust, Series 2015-C27-D | | | 3.24% | # ^ | | 12/15/2047 | | | 5,938,102 | |
| 48,927,118 | | Morgan Stanley Bank of America Merrill Lynch Trust, Series 2016-C30-XA | | | 1.44% | # I/O | | 09/15/2049 | | | 3,956,643 | |
| 6,907,000 | | Morgan Stanley Bank of America Merrill Lynch Trust, Series 2016-C32-A4 | | | 3.72% | | | 12/15/2049 | | | 7,182,833 | |
| 9,300,667 | | Morgan Stanley Capital Trust, Series 2011-C1-XA | | | 0.34% | # ^ I/O | | 09/15/2047 | | | 44,100 | |
| 4,000,000 | | Morgan Stanley Capital Trust, Series 2014-CPT-G | | | 3.45% | # ^ | | 07/13/2029 | | | 3,929,717 | |
| 30,981,094 | | Morgan Stanley Capital Trust, Series 2016-UB11-XA | | | 1.64% | # I/O | | 08/15/2049 | | | 2,562,143 | |
| 3,022,000 | | Morgan Stanley Capital Trust, Series 2017-ASHF-D (1 Month LIBOR USD + 2.20%) | | | 4.68% | ^ | | 11/15/2034 | | | 3,023,874 | |
| 4,533,000 | | Morgan Stanley Capital Trust, Series 2017-ASHF-E (1 Month LIBOR USD + 3.15%) | | | 5.63% | ^ | | 11/15/2034 | | | 4,535,774 | |
| 3,434,000 | | Morgan Stanley Capital Trust, Series 2017-ASHF-F (1 Month LIBOR USD + 4.35%) | | | 6.83% | ^ | | 11/15/2034 | | | 3,438,282 | |
| 7,831,050 | | MSCG Trust, Series 2016-SNR-C | | | 5.21% | ^ | | 11/15/2034 | | | 7,849,747 | |
| 11,179,000 | | MSCG Trust, Series 2018-SELF-F (1 Month LIBOR USD + 3.05%, 3.05% Floor) | | | 5.53% | ^ | | 10/15/2037 | | | 11,183,527 | |
| 8,000,000 | | Natixis Commercial Mortgage Securities Trust, Series 2018-FL1-A (1 Month LIBOR USD + 0.95%, 0.95% Floor) | | | 3.44% | ^ | | 06/15/2035 | | | 7,925,173 | |
| 2,108,000 | | Natixis Commercial Mortgage Securities Trust, Series 2018-FL1-C (1 Month LIBOR USD + 2.20%, 2.20% Floor) | | | 4.69% | ^ | | 06/15/2035 | | | 2,076,120 | |
| 1,154,153 | | PFP Ltd., Series 2017-3-C (1 Month LIBOR USD + 2.50%) | | | 4.98% | ^ | | 01/14/2035 | | | 1,153,622 | |
| 2,152,000 | | RAIT Trust, Series 2017-FL7-AS (1 Month LIBOR USD + 1.30%, 1.30% Floor) | | | 3.78% | ^ | | 06/15/2037 | | | 2,140,383 | |
| 53,844,770 | | SG Commercial Mortgage Securities Trust, Series 2016-C5-XA | | | 2.00% | # I/O | | 10/10/2048 | | | 5,311,437 | |
| 46,457 | | TIAA Seasoned Commercial Mortgage Trust, Series 2007-C4-AJ | | | 5.48% | # | | 08/15/2039 | | | 46,564 | |
| 125,854,501 | | UBS Commercial Mortgage Trust, Series 2017-C3-XA | | | 1.13% | # I/O | | 08/15/2050 | | | 8,559,604 | |
| 11,033,000 | | UBS Commercial Mortgage Trust, Series 2017-C6-C | | | 4.45% | # | | 12/15/2050 | | | 11,188,451 | |
| 3,891,000 | | UBS Commercial Mortgage Trust, Series 2017-C7-C | | | 4.59% | # | | 12/15/2050 | | | 3,954,082 | |
| 7,293,000 | | UBS Commercial Mortgage Trust, Series 2018-C11-C | | | 4.90% | # | | 06/15/2051 | | | 7,563,788 | |
| 2,896,000 | | UBS Commercial Mortgage Trust, Series 2018-C12-C | | | 4.97% | # | | 08/15/2051 | | | 3,026,197 | |
| 5,698,000 | | UBS Commercial Mortgage Trust, Series 2018-C8-C | | | 4.70% | # | | 02/15/2051 | | | 5,830,094 | |
| 163,140,466 | | UBS Commercial Mortgage Trust, Series 2018-C9-XA | | | 0.90% | # I/O | | 03/15/2051 | | | 10,894,602 | |
| 12,852,000 | | UBS Commercial Mortgage Trust, Series 2019-C16-B | | | 4.32% | | | 04/15/2052 | | | 13,178,017 | |
| 10,305,063 | | UBS-Barclays Commercial Mortgage Trust, Series 2012-C3-XA | | | 1.83% | # ^ I/O | | 08/10/2049 | | | 542,057 | |
| 479,948 | | Wachovia Bank Commercial Mortgage Trust, Series 2006-C29-IO | | | 0.05% | # I/O | | 11/15/2048 | | | 14 | |
| 6,750,000 | | Wells Fargo Commercial Mortgage Trust, Series 2014-LC16-D | | | 3.94% | ^ | | 08/15/2050 | | | 5,210,343 | |
| 2,200,000 | | Wells Fargo Commercial Mortgage Trust, Series 2015-C28-C | | | 4.13% | # | | 05/15/2048 | | | 2,165,704 | |
| 5,403,000 | | Wells Fargo Commercial Mortgage Trust, Series 2015-C31-C | | | 4.61% | # | | 11/15/2048 | | | 5,526,728 | |
| 21,831,189 | | Wells Fargo Commercial Mortgage Trust, Series 2015-C31-XA | | | 1.06% | # I/O | | 11/15/2048 | | | 1,197,766 | |
| 4,610,000 | | Wells Fargo Commercial Mortgage Trust, Series 2015-LC22-C | | | 4.54% | # | | 09/15/2058 | | | 4,721,255 | |
| 54,347,071 | | Wells Fargo Commercial Mortgage Trust, Series 2015-NXS1-XA | | | 1.15% | # I/O | | 05/15/2048 | | | 2,455,205 | |
| 4,000,000 | | Wells Fargo Commercial Mortgage Trust, Series 2015-NXS3-C | | | 4.64% | # | | 09/15/2057 | | | 4,038,654 | |
| 5,672,000 | | Wells Fargo Commercial Mortgage Trust, Series 2015-NXS4-C | | | 4.60% | # | | 12/15/2048 | | | 5,904,275 | |
| 5,613,000 | | Wells Fargo Commercial Mortgage Trust, Series 2015-P2-A4 | | | 3.81% | | | 12/15/2048 | | | 5,867,916 | |
| 77,533,316 | | Wells Fargo Commercial Mortgage Trust, Series 2015-P2-XA | | | 1.00% | # I/O | | 12/15/2048 | | | 3,606,028 | |
| 4,650,000 | | Wells Fargo Commercial Mortgage Trust, Series 2016-C32-C | | | 4.72% | # | | 01/15/2059 | | | 4,746,537 | |
| 4,483,000 | | Wells Fargo Commercial Mortgage Trust, Series 2016-C33-C | | | 3.90% | | | 03/15/2059 | | | 4,413,694 | |
| 117,386,565 | | Wells Fargo Commercial Mortgage Trust, Series 2017-C39-XA | | | 1.14% | # I/O | | 09/15/2050 | | | 8,343,837 | |
| 2,638,000 | | Wells Fargo Commercial Mortgage Trust, Series 2018-C45-C | | | 4.73% | | | 06/15/2051 | | | 2,706,931 | |
| 11,490,000 | | Wells Fargo Commercial Mortgage Trust, Series 2018-C46-C | | | 5.15% | | | 08/15/2051 | | | 11,943,637 | |
| 12,408,000 | | Wells Fargo Commercial Mortgage Trust, Series 2018-C47-C | | | 4.94% | # | | 09/15/2061 | | | 12,914,753 | |
| 2,558,000 | | Wells Fargo Commercial Mortgage Trust, Series 2019-C49-B | | | 4.55% | | | 03/15/2052 | | | 2,691,365 | |
| 14,582,455 | | WF-RBS Commercial Mortgage Trust, Series 2012-C9-XA | | | 1.88% | # ^ I/O | | 11/15/2045 | | | 807,111 | |
| 82,663,251 | | WF-RBS Commercial Mortgage Trust, Series 2014-C21-XA | | | 1.07% | # I/O | | 08/15/2047 | | | 3,361,336 | |
| 53,130,893 | | WF-RBS Commercial Mortgage Trust, Series 2014-C22-XA | | | 0.85% | # I/O | | 09/15/2057 | | | 1,808,671 | |
| 80,639,318 | | WF-RBS Commercial Mortgage Trust, Series 2016-NXS6-XA | | | 1.64% | # I/O | | 11/15/2049 | | | 6,580,459 | |
| | | | | | | | | | | | |
Total Non-Agency Commercial Mortgage Backed Obligations(Cost $871,383,026) | | | 850,365,944 | |
| | | | | | | | | | | | |
| |
Non-Agency Residential Collateralized Mortgage Obligations - 8.8% | | | | |
| 9,955,577 | | Adjustable Rate Mortgage Trust, Series 2007-1-4A1 | | | 5.11% | # | | 03/25/2037 | | | 8,633,831 | |
| 58,514 | | Adjustable Rate Mortgage Trust, Series 2007-3-1A1 | | | 5.12% | # ^ | | 11/25/2037 | | | 60,743 | |
| 16,241,598 | | Alternative Loan Trust, Series 2005-49CB-A2 | | | 5.50% | | | 11/25/2035 | | | 14,930,912 | |
| 9,483,530 | | Alternative Loan Trust, Series 2007-8CB-A1 | | | 5.50% | | | 05/25/2037 | | | 7,866,796 | |
| 10,527,925 | | Alternative Loan Trust, Series 2007-OA8-2A1 (1 Month LIBOR USD + 0.18%, 0.18% Floor) | | | 2.67% | | | 06/25/2047 | | | 8,242,992 | |
| 8,635,912 | | Angel Oak Mortgage Trust LLC, Series 2018-3-A1 | | | 3.65% | # ^ | | 09/25/2048 | | | 8,701,938 | |
| 9,403,489 | | Angel Oak Mortgage Trust LLC, Series 2018-3-A2 | | | 3.75% | # ^ | | 09/25/2048 | | | 9,475,246 | |
| 8,947,712 | | Angel Oak Mortgage Trust LLC, Series 2018-3-A3 | | | 3.85% | # ^ | | 09/25/2048 | | | 9,009,040 | |
| 753,252 | | Banc of America Funding Corporation, Series 2005-G-A3 | | | 3.91% | # | | 10/20/2035 | | | 744,264 | |
| 368,243 | | Banc of America Funding Corporation, Series 2006-2-6A2 | | | 5.50% | | | 03/25/2036 | | | 357,113 | |
| 289,457 | | Banc of America Funding Corporation, Series 2006-6-1A2 | | | 6.25% | | | 08/25/2036 | | | 286,417 | |
| 3,355,517 | | Bayview Opportunity Master Fund Trust, Series 2018-SBR3-A1 | | | 4.09% | ^§ | | 05/28/2033 | | | 3,361,077 | |
| 259,489 | | Bear Stearns Asset Backed Securities Trust, Series 2007-SD1-1A3A | | | 6.50% | | | 10/25/2036 | | | 195,677 | |
| 2,696,612 | | Chase Mortgage Finance Trust, Series 2007-A2-6A4 | | | 4.38% | # | | 07/25/2037 | | | 2,602,628 | |
| 1,222,399 | | Chase Mortgage Finance Trust, Series 2007-S3-2A1 | | | 5.50% | | | 05/25/2037 | | | 372,217 | |
| 20,000,000 | | CIM Trust, Series 2016-2RR-B2 | | | 6.86% | # ^ Þ | | 02/25/2056 | | | 20,602,444 | |
| 20,000,000 | | CIM Trust, Series 2016-3RR-B2 | | | 6.44% | # ^ Þ | | 02/27/2056 | | | 20,538,638 | |
| 30,644,250 | | CIM Trust, Series 2017-6-A1 | | | 3.02% | # ^ | | 06/25/2057 | | | 30,098,004 | |
| 70,003 | | Citicorp Mortgage Securities, Inc., Series 2005-1-1A4 | | | 5.50% | | | 02/25/2035 | | | 71,541 | |
| 1,503,341 | | Citicorp Residential Mortgage Securities, Inc., Series 2006-2-A5 | | | 5.41% | ß | | 09/25/2036 | | | 1,548,388 | |
| 257,683 | | Citigroup Mortgage Loan Trust, Inc., Series 2006-WF2-A2C | | | 5.85% | ß | | 05/25/2036 | | | 146,826 | |
| 2,525,759 | | Citigroup Mortgage Loan Trust, Inc., Series 2008-AR4-2A1B | | | 4.60% | # ^ | | 11/25/2038 | | | 2,560,192 | |
| 1,386,481 | | Citigroup Mortgage Loan Trust, Inc., Series 2010-8-5A4 | | | 6.00% | # ^ | | 11/25/2036 | | | 1,366,783 | |
| 7,228,851 | | Citigroup Mortgage Loan Trust, Inc., Series 2010-8-6A4 | | | 6.00% | # ^ | | 12/25/2036 | | | 7,070,710 | |
| 47,586,747 | | Citigroup Mortgage Loan Trust, Series 2019-A-PT1 | | | 3.92% | ^ | | 10/25/2058 | | | 45,943,762 | |
| 125,028 | | CitiMortgage Alternative Loan Trust, Series 2006-A2-A2 | | | 6.00% | | | 05/25/2036 | | | 119,969 | |
| 71,799 | | CitiMortgage Alternative Loan Trust, Series 2006-A5-3A3 | | | 6.00% | | | 10/25/2036 | | | 64,638 | |
| 135,725 | | CitiMortgage Alternative Loan Trust, Series 2007-A1-1A7 | | | 6.00% | | | 01/25/2037 | | | 130,450 | |
| 7,797,521 | | CitiMortgage Alternative Loan Trust, Series 2007-A5-1A10 | | | 5.75% | | | 05/25/2037 | | | 7,476,613 | |
| 14,101,853 | | Civic Mortgage LLC, Series 2018-1-A1 | | | 3.89% | ^§ | | 06/25/2022 | | | 14,073,305 | |
| 1,391,500 | | Countrywide Alternative Loan Trust, Series 2004-22CB-1A1 | | | 6.00% | | | 10/25/2034 | | | 1,463,409 | |
| 158,652 | | Countrywide Alternative Loan Trust, Series 2005-20CB-1A1 | | | 5.50% | | | 07/25/2035 | | | 149,005 | |
| 215,528 | | Countrywide Alternative Loan Trust, Series 2005-28CB-3A6 | | | 6.00% | | | 08/25/2035 | | | 155,888 | |
| 935,226 | | Countrywide Alternative Loan Trust, Series 2005-46CB-A22 | | | 5.25% | | | 10/25/2035 | | | 880,630 | |
| 159,493 | | Countrywide Alternative Loan Trust, Series 2005-J10-1A13 (1 Month LIBOR USD + 0.70%, 0.70% Floor, 5.50% Cap) | | | 3.19% | | | 10/25/2035 | | | 131,040 | |
| 341,031 | | Countrywide Alternative Loan Trust, Series 2006-26CB-A9 | | | 6.50% | | | 09/25/2036 | | | 274,525 | |
| 9,170,241 | | Countrywide Alternative Loan Trust, Series 2006-42-1A8 | | | 6.00% | | | 01/25/2047 | | | 7,540,520 | |
| 1,406,584 | | Countrywide Alternative Loan Trust, Series 2007-12T1-A1 | | | 6.00% | | | 06/25/2037 | | | 1,041,649 | |
| 1,460,105 | | Countrywide Alternative Loan Trust, Series 2007-16CB-2A1 (1 Month LIBOR USD + 0.45%, 0.45% Floor, 7.00% Cap) | | | 2.94% | | | 08/25/2037 | | | 825,064 | |
| 422,810 | | Countrywide Alternative Loan Trust, Series 2007-16CB-2A2 (-8 x 1 Month LIBOR USD + 54.58%, 54.58% Cap) | | | 33.87% | I/F | | 08/25/2037 | | | 861,752 | |
| 94,284 | | Countrywide Alternative Loan Trust, Series 2007-17CB-1A10 (-5 x 1 Month LIBOR USD + 29.90%, 29.90% Cap) | | | 18.47% | I/F | | 08/25/2037 | | | 146,331 | |
| 445,299 | | Countrywide Alternative Loan Trust, Series 2007-18CB-2A17 | | | 6.00% | | | 08/25/2037 | | | 408,467 | |
| 2,091,734 | | Countrywide Alternative Loan Trust, Series 2007-23CB-A3 (1 Month LIBOR USD + 0.50%, 0.50% Floor, 7.00% Cap) | | | 2.99% | | | 09/25/2037 | | | 1,305,623 | |
| 2,054,773 | | Countrywide Alternative Loan Trust, Series 2007-23CB-A4 (-1 x 1 Month LIBOR USD + 6.50%, 6.50% Cap) | | | 4.01% | I/F I/O | | 09/25/2037 | | | 403,806 | |
| 729,563 | | Countrywide Alternative Loan Trust, Series 2007-4CB-2A1 | | | 7.00% | | | 03/25/2037 | | | 181,320 | |
| 26,610 | | Countrywide Asset-Backed Certificates, Series 2005-13-AF3 | | | 5.43% | # | | 02/25/2033 | | | 24,437 | |
| 322,132 | | Countrywide Home Loans, Series 2005-28-A7 | | | 5.25% | | | 01/25/2019 | | | 276,159 | |
| 685,520 | | Countrywide Home Loans, Series 2007-10-A5 | | | 6.00% | | | 07/25/2037 | | | 558,872 | |
| 299,632 | | Countrywide Home Loans, Series 2007-15-1A16 | | | 6.25% | | | 09/25/2037 | | | 273,174 | |
| 792,880 | | Countrywide Home Loans, Series 2007-3-A17 | | | 6.00% | | | 04/25/2037 | | | 650,321 | |
| 99,620 | | Credit Suisse First Boston Mortgage Securities Corporation, Series 2005-10-5A5 | | | 5.50% | | | 11/25/2035 | | | 94,288 | |
| 1,178,901 | | Credit Suisse First Boston Mortgage Securities Corporation, Series 2005-8-1A3 | | | 5.25% | | | 09/25/2035 | | | 1,083,466 | |
| 3,819,639 | | CSMC Trust, Series 2006-4-6A1 | | | 6.00% | | | 05/25/2036 | | | 2,775,249 | |
| 39,685 | | CSMC Trust, Series 2006-4-7A1 | | | 5.50% | | | 05/25/2021 | | | 35,783 | |
| 74,008 | | CSMC Trust, Series 2007-1-3A1 | | | 6.00% | | | 02/25/2022 | | | 32,729 | |
| 29,484 | | CSMC Trust, Series 2007-2-2A1 | | | 5.00% | | | 03/25/2037 | | | 28,517 | |
| 2,513,269 | | CSMC Trust, Series 2010-4R-3A17 | | | 6.00% | # ^ | | 06/26/2037 | | | 2,521,930 | |
| 7,590,409 | | CSMC Trust, Series 2013-IVR1-A1 | | | 2.50% | # ^ | | 03/25/2043 | | | 7,213,629 | |
| 15,591,834 | | CSMC Trust, Series 2015-PR2-A1 | | | 7.25% | ^§ | | 07/26/2055 | | | 16,551,920 | |
| 9,338,375 | | CSMC Trust, Series 2016-PR1-A1 | | | 5.50% | ^§ | | 07/25/2056 | | | 9,477,537 | |
| 21,251,119 | | CSMC Trust, Series 2018-RPL7-A1 | | | 4.00% | ^ | | 08/26/2058 | | | 21,324,470 | |
| 47,522,874 | | CSMC Trust, Series 2018-RPL8-A1 | | | 4.13% | # ^ | | 07/25/2058 | | | 47,789,544 | |
| 20,000,000 | | CSMC Trust, Series 2019-3R-1A1 (1 Month LIBOR USD + 1.40%, 1.40% Floor) | | | 3.89% | ^ | | 06/02/2047 | | | 20,139,040 | |
| 813,130 | | Deutsche Mortgage Securities, Inc., Series 2006-PR1-3A1 (-1 x 1 Month LIBOR USD + 12.12%, 12.12% Cap) | | | 8.65% | ^I/F | | 04/15/2036 | | | 787,228 | |
| 143,674 | | Deutsche Mortgage Securities, Inc., Series 2006-PR1-4AI2 (-2 x 1 Month LIBOR USD + 14.60%, 14.61% Cap) | | | 9.86% | ^I/F | | 04/15/2036 | | | 140,692 | |
| 1,288,503 | | Deutsche Mortgage Securities, Inc., Series 2006-PR1-5AI4 (-1 x 1 Month LIBOR USD + 12.12%, 12.12% Cap) | | | 8.65% | ^I/F | | 04/15/2036 | | | 1,181,367 | |
| 8,976,197 | | Deutsche Securities, Inc., Series 2005-6-2A1 | | | 5.50% | | | 12/25/2035 | | | 8,093,595 | |
| 358,877 | | First Horizon Alternative Mortgage Securities, Series 2006-FA2-1A5 | | | 6.00% | | | 05/25/2036 | | | 271,692 | |
| 3,204,982 | | First Horizon Alternative Mortgage Securities, Series 2006-FA8-1A1 | | | 6.25% | | | 02/25/2037 | | | 2,500,954 | |
| 74,539 | | First Horizon Alternative Mortgage Securities, Series 2006-RE1-A1 | | | 5.50% | | | 05/25/2035 | | | 67,754 | |
| 5,550,733 | | GCAT LLC, Series 2017-2-A1 | | | 3.50% | ^§ | | 04/25/2047 | | | 5,540,260 | |
| 3,574,189 | | GMACM Mortgage Loan Trust, Series 2006-J1-A6 | | | 5.75% | | | 04/25/2036 | | | 3,545,467 | |
| 82,968 | | GSAA Home Equity Trust, Series 2005-7-AF5 | | | 4.61% | ß | | 05/25/2035 | | | 83,671 | |
| 1,272,491 | | GSAA Home Equity Trust, Series 2007-10-A1A | | | 6.00% | | | 11/25/2037 | | | 1,071,093 | |
| 1,130,459 | | GSAA Home Equity Trust, Series 2007-10-A2A | | | 6.50% | | | 11/25/2037 | | | 798,618 | |
| 3,611,868 | | GSR Mortgage Loan Trust, Series 2006-3F-4A1 | | | 6.00% | | | 03/25/2036 | | | 3,595,520 | |
| 468,454 | | GSR Mortgage Loan Trust, Series 2007-1F-2A2 | | | 5.50% | | | 01/25/2037 | | | 548,646 | |
| 36,183,851 | | Impac Secured Assets Trust, Series 2006-5-1A1C (1 Month LIBOR USD + 0.27%, 0.27% Floor, 11.50% Cap) | | | 2.76% | | | 02/25/2037 | | | 30,240,429 | |
| 358,144 | | JP Morgan Alternative Loan Trust, Series 2006-S2-A4 | | | 6.19% | | | 05/25/2036 | | | 335,757 | |
| 8,635,308 | | JP Morgan Alternative Loan Trust, Series 2006-S3-A4 | | | 6.31% | ß | | 08/25/2036 | | | 8,020,435 | |
| 307,802 | | JP Morgan Alternative Loan Trust, Series 2006-S3-A6 | | | 6.12% | ß | | 08/25/2036 | | | 293,514 | |
| 308,125 | | JP Morgan Alternative Loan Trust, Series 2006-S4-A6 | | | 5.71% | ß | | 12/25/2036 | | | 294,165 | |
| 5,445,445 | | JP Morgan Mortgage Trust, Series 2006-S1-2A9 | | | 6.50% | | | 04/25/2036 | | | 5,892,280 | |
| 263,740 | | JP Morgan Mortgage Trust, Series 2007-S3-1A7 | | | 6.00% | | | 08/25/2037 | | | 209,726 | |
| 31,083,008 | | JP Morgan Mortgage Trust, Series 2018-7FRB-A2 (1 Month LIBOR USD + 0.75%) | | | 3.24% | ^ | | 04/25/2046 | | | 31,108,913 | |
| 37,859,511 | | Legacy Mortgage Asset Trust, Series 2018-GS2-A1 | | | 4.00% | ^§ | | 04/25/2058 | | | 37,972,976 | |
| 60,099,424 | | Legacy Mortgage Asset Trust, Series 2018-SL1-A | | | 4.00% | # ^ | | 02/25/2058 | | | 59,987,681 | |
| 1,350,520 | | Lehman Mortgage Trust, Series 2005-1-2A4 | | | 5.50% | | | 11/25/2035 | | | 1,267,222 | |
| 586,408 | | Lehman Mortgage Trust, Series 2006-3-1A5 | | | 6.00% | | | 07/25/2036 | | | 447,432 | |
| 41,189 | | Lehman Mortgage Trust, Series 2006-9-1A19 (-5 x 1 Month LIBOR USD + 30.68%, 30.68% Cap) | | | 19.25% | I/F | | 01/25/2037 | | | 58,435 | |
| 692,840 | | Lehman Mortgage Trust, Series 2007-10-2A1 | | | 6.50% | | | 01/25/2038 | | | 456,277 | |
| 161,465 | | Lehman Mortgage Trust, Series 2007-2-1A1 | | | 5.75% | | | 02/25/2037 | | | 143,524 | |
| 6,303,891 | | Lehman Trust, Series 2005-9N-1A1 (1 Month LIBOR USD + 0.27%, 0.27% Floor) | | | 2.76% | | | 02/25/2036 | | | 6,015,318 | |
| 106,412 | | MASTR Alternative Loans Trust, Series 2005-2-3A1 | | | 6.00% | | | 03/25/2035 | | | 101,896 | |
| 7,102,297 | | MASTR Alternative Loans Trust, Series 2006-1-A5 | | | 6.00% | | | 02/25/2036 | | | 5,539,514 | |
| 44,502 | | MASTR Alternative Loans Trust, Series 2007-1-2A7 | | | 6.00% | | | 10/25/2036 | | | 27,684 | |
| 1,935,004 | | MASTR Asset Securitization Trust, Series 2006-2-1A11 (1 Month LIBOR USD + 6.00%, 6.00% Floor) | | | 6.00% | | | 06/25/2036 | | | 1,851,095 | |
| 19,655,126 | | MFA LLC, Series 2018-NPL1-A1 | | | 3.88% | ^§ | | 05/25/2048 | | | 19,524,166 | |
| 20,239 | | Morgan Stanley Mortgage Loan Trust, Series 2004-1-1A1 | | | 5.00% | | | 11/25/2018 | | | 20,795 | |
| 923,378 | | Morgan Stanley Mortgage Loan Trust, Series 2005-7-7A4 | | | 5.50% | | | 11/25/2035 | | | 952,398 | |
| 2,840,588 | | Morgan Stanley Mortgage Loan Trust, Series 2006-7-3A | | | 5.02% | # | | 06/25/2036 | | | 2,431,891 | |
| 1,195,024 | | Morgan Stanley Re-Remic Trust, Series 2010-R6-5C | | | 5.75% | # ^ | | 05/26/2037 | | | 1,165,069 | |
| 207,591 | | Nomura Asset Acceptance Corporation, Series 2006-AP1-A2 | | | 5.52% | # | | 01/25/2036 | | | 106,843 | |
| 588,556 | | Nomura Home Equity Loan, Inc., Series 2006-AF1-A2 | | | 5.80% | ß | | 10/25/2036 | | | 229,479 | |
| 1,037,571 | | Nomura Home Equity Loan, Inc., Series 2007-1-1A1 | | | 6.06% | ß | | 02/25/2037 | | | 476,201 | |
| 11,177,243 | | Oak Hill Advisors Residential Loan Trust, Series 2017-NPL1-A1 | | | 3.00% | ^§ | | 06/25/2057 | | | 11,189,760 | |
| 24,174,098 | | Oak Hill Advisors Residential Loan Trust, Series 2017-NPL2-A1 | | | 3.00% | ^§ | | 07/25/2057 | | | 23,928,395 | |
| 55,538 | | Option One Mortgage Loan Trust, Series 2004-3-M3 (1 Month LIBOR USD + 0.98%, 0.65% Floor) | | | 3.46% | | | 11/25/2034 | | | 55,816 | |
| 29,954,816 | | Option One Mortgage Loan Trust, Series 2007-6-1A1 (1 Month LIBOR USD + 0.19%, 0.19% Floor) | | | 2.68% | | | 07/25/2037 | | | 27,192,311 | |
| 9,562,699 | | PR Mortgage Loan Trust, Series 2014-1-APT | | | 5.91% | # ^ | | 10/25/2049 | | | 8,954,574 | |
| 21,287,728 | | Preston Ridge Partners Mortgage Trust, Series 2017-2A-A1 | | | 3.47% | ^§ | | 09/25/2022 | | | 21,310,483 | |
| 9,200,017 | | RBSGC Mortgage Loan Trust, Series 2005-A-3A | | | 6.00% | | | 04/25/2035 | | | 6,992,756 | |
| 313,377 | | Residential Accredit Loans, Inc., Series 2005-QS14-3A3 | | | 6.00% | | | 09/25/2035 | | | 296,926 | |
| 375,110 | | Residential Accredit Loans, Inc., Series 2006-QS10-A4 | | | 5.75% | | | 08/25/2036 | | | 338,949 | |
| 4,093,197 | | Residential Accredit Loans, Inc., Series 2006-QS10-A9 | | | 6.50% | | | 08/25/2036 | | | 3,849,281 | |
| 3,905,365 | | Residential Accredit Loans, Inc., Series 2006-QS4-A10 | | | 6.00% | | | 04/25/2036 | | | 3,635,476 | |
| 763,793 | | Residential Accredit Loans, Inc., Series 2006-QS6-1A15 | | | 6.00% | | | 06/25/2036 | | | 696,512 | |
| 91,592 | | Residential Accredit Loans, Inc., Series 2006-QS6-2A1 | | | 6.00% | | | 06/25/2021 | | | 90,397 | |
| 1,287,134 | | Residential Accredit Loans, Inc., Series 2007-QS3-A4 | | | 6.25% | | | 02/25/2037 | | | 1,178,410 | |
| 4,442,222 | | Residential Accredit Loans, Inc., Series 2007-QS9-A33 | | | 6.50% | | | 07/25/2037 | | | 4,095,840 | |
| 230,839 | | Residential Asset Mortgage Products, Inc., Series 2005-RS1-AI5 | | | 5.91% | | | 01/25/2035 | | | 232,754 | |
| 186,974 | | Residential Asset Securitization Trust, Series 2005-A10-A3 | | | 5.50% | | | 09/25/2035 | | | 153,827 | |
| 279,334 | | Residential Asset Securitization Trust, Series 2005-A11-2A4 | | | 6.00% | | | 10/25/2035 | | | 206,920 | |
| 56,203 | | Residential Asset Securitization Trust, Series 2005-A7-A3 | | | 5.50% | | | 06/25/2035 | | | 47,307 | |
| 1,708,379 | | Residential Asset Securitization Trust, Series 2006-A6-1A1 | | | 6.50% | | | 07/25/2036 | | | 875,631 | |
| 142,485 | | Residential Asset Securitization Trust, Series 2006-R1-A1 (-4 x 1 Month LIBOR USD + 28.40%, 28.40% Cap) | | | 18.46% | I/F | | 01/25/2046 | | | 252,317 | |
| 96,880 | | Residential Funding Mortgage Securities Trust, Series 2006-S10-1A2 | | | 6.00% | | | 10/25/2036 | | | 90,551 | |
| 489,201 | | Residential Funding Mortgage Securities Trust, Series 2006-S11-A3 | | | 6.00% | | | 11/25/2036 | | | 492,015 | |
| 971,432 | | Residential Funding Mortgage Securities Trust, Series 2007-S2-A4 | | | 6.00% | | | 02/25/2037 | | | 908,860 | |
| 637,847 | | Residential Funding Mortgage Securities Trust, Series 2007-S3-1A4 | | | 6.00% | | | 03/25/2037 | | | 574,501 | |
| 38,504,367 | | Securitized Mortgage Asset Loan Trust, Series 2015-1-PC | | | 2.74% | # ^ | | 02/25/2054 | | | 34,227,860 | |
| 7,014,492 | | Securitized Mortgage Asset Loan Trust, Series 2015-2-PC | | | 0.00% | # ^ | | 12/26/2059 | | | 6,855,830 | |
| 9,699,434 | | Securitized Mortgage Asset Loan Trust, Series 2015-3-PC | | | 0.00% | # ^ | | 10/25/2044 | | | 9,430,445 | |
| 22,852,853 | | Shellpoint Co-Originator Trust, Series 2016-1-1A10 | | | 3.50% | # ^ | | 11/25/2046 | | | 22,850,431 | |
| 664,978 | | Structured Asset Securities Corporation, Series 2003-35-1A1 | | | 5.17% | # | | 12/25/2033 | | | 699,073 | |
| 926,584 | | Structured Asset Securities Corporation, Series 2005-16-1A3 | | | 5.50% | | | 09/25/2035 | | | 921,974 | |
| 1,294,140 | | Structured Asset Securities Corporation, Series 2005-RF1-A (1 Month LIBOR USD + 0.35%, 0.35% Floor) | | | 2.84% | ^ | | 03/25/2035 | | | 1,206,212 | |
| 1,294,140 | | Structured Asset Securities Corporation, Series 2005-RF1-AIO | | | 2.44% | # ^ I/O | | 03/25/2035 | | | 167,060 | |
| 32,633,985 | | Velocity Commercial Capital Loan Trust, Series 2018-1-A | | | 3.59% | ^ | | 04/25/2048 | | | 33,017,111 | |
| 4,563,644 | | Velocity Commercial Capital Loan Trust, Series 2018-1-M1 | | | 3.91% | ^ | | 04/25/2048 | | | 4,634,414 | |
| 1,639,802 | | Velocity Commercial Capital Loan Trust, Series 2018-1-M2 | | | 4.26% | ^ | | 04/25/2048 | | | 1,667,823 | |
| 1,138,001 | | Velocity Commercial Capital Loan Trust, Series 2018-1-M3 | | | 4.41% | ^ | | 04/25/2048 | | | 1,157,895 | |
| 18,323,873 | | Velocity Commercial Capital Loan Trust, Series 2018-2-A | | | 4.05% | # ^ | | 10/26/2048 | | | 18,633,964 | |
| 5,437,359 | | Velocity Commercial Capital Loan Trust, Series 2019-1-M1 | | | 3.94% | # ^ | | 03/25/2049 | | | 5,476,435 | |
| 1,313,945 | | Velocity Commercial Capital Loan Trust, Series 2019-1-M2 | | | 4.01% | # ^ | | 03/25/2049 | | | 1,323,155 | |
| 1,494,525 | | Velocity Commercial Capital Loan Trust, Series 2019-1-M3 | | | 4.12% | # ^ | | 03/25/2049 | | | 1,505,444 | |
| 30,000,000 | | Vericrest Opportunity Loan Trust, Series 2019-NPL3-A1 | | | 3.97% | ^§ | | 03/25/2049 | | | 30,107,724 | |
| 34,613,111 | | VOLT LLC, Series 2017-NPL9-A1 | | | 3.13% | ^§ | | 09/25/2047 | | | 34,569,796 | |
| 10,403,010 | | VOLT LLC, Series 2018-NPL1-A1 | | | 3.75% | ^§ | | 04/25/2048 | | | 10,402,552 | |
| 22,384,779 | | VOLT LLC, Series 2018-NPL8-A1A | | | 4.21% | ^§ | | 10/26/2048 | | | 22,586,451 | |
| 126,167 | | Washington Mutual Mortgage Pass-Through Certificates, Series 2005-1-2A | | | 6.00% | | | 03/25/2035 | | | 119,100 | |
| 826,584 | | Washington Mutual Mortgage Pass-Through Certificates, Series 2006-1-3A1 | | | 5.75% | | | 02/25/2036 | | | 777,652 | |
| 2,148,102 | | Washington Mutual Mortgage Pass-Through Certificates, Series 2006-2-4CB | | | 6.00% | | | 03/25/2036 | | | 2,070,613 | |
| 4,214,863 | | Washington Mutual Mortgage Pass-Through Certificates, Series 2006-8-A6 | | | 4.48% | ß | | 10/25/2036 | | | 2,433,523 | |
| 2,834,618 | | Washington Mutual Mortgage Pass-Through Certificates, Series 2006-AR19-2A (11th District Cost of Funds Index + 1.25%, 1.25% Floor) | | | 2.38% | | | 01/25/2047 | | | 2,782,958 | |
| 8,742,946 | | Washington Mutual Mortgage Pass-Through Certificates, Series 2007-2-1A3 | | | 6.00% | | | 04/25/2037 | | | 7,793,724 | |
| 1,722,776 | | Washington Mutual Mortgage Pass-Through Certificates, Series 2007-3-A6 | | | 6.00% | | | 04/25/2037 | | | 1,683,696 | |
| 115,373 | | Washington Mutual Mortgage Pass-Through Certificates, Series 2007-5-A11 (-6 x 1 Month LIBOR USD + 39.48%, 39.48% Cap) | | | 24.57% | I/F | | 06/25/2037 | | | 204,220 | |
| 9,410,754 | | Washington Mutual Mortgage Pass-Through Certificates, Series 2007-5-A3 | | | 7.00% | | | 06/25/2037 | | | 6,540,753 | |
| 939,841 | | Wells Fargo Alternative Loan Trust, Series 2007-PA5-1A1 | | | 6.25% | | | 11/25/2037 | | | 925,502 | |
| 754,831 | | Wells Fargo Mortgage Backed Securities Trust, Series 2005-17-1A1 | | | 5.50% | | | 01/25/2036 | | | 743,469 | |
| 37,239 | | Wells Fargo Mortgage Backed Securities Trust, Series 2005-AR14-A6 | | | 4.54% | # | | 08/25/2035 | | | 37,499 | |
| 51,826 | | Wells Fargo Mortgage Backed Securities Trust, Series 2005-AR16-6A4 | | | 4.53% | # | | 10/25/2035 | | | 52,544 | |
| 240,517 | | Wells Fargo Mortgage Backed Securities Trust, Series 2006-2-3A1 | | | 5.75% | | | 03/25/2036 | | | 236,623 | |
| 767,365 | | Wells Fargo Mortgage Backed Securities Trust, Series 2006-7-2A1 | | | 6.00% | | | 06/25/2036 | | | 751,332 | |
| 654,801 | | Wells Fargo Mortgage Backed Securities Trust, Series 2007-10-1A5 | | | 6.00% | | | 07/25/2037 | | | 649,034 | |
| 653,938 | | Wells Fargo Mortgage Backed Securities Trust, Series 2007-10-2A11 | | | 6.00% | | | 07/25/2037 | | | 634,167 | |
| 1,066,656 | | Wells Fargo Mortgage Backed Securities Trust, Series 2007-11-A96 | | | 6.00% | | | 08/25/2037 | | | 1,065,068 | |
| 1,348,206 | | Wells Fargo Mortgage Backed Securities Trust, Series 2007-14-1A1 | | | 6.00% | | | 10/25/2037 | | | 1,331,834 | |
| 318,298 | | Wells Fargo Mortgage Backed Securities Trust, Series 2007-4-A16 | | | 5.50% | | | 04/25/2037 | | | 313,726 | |
| 71,507 | | Wells Fargo Mortgage Backed Securities Trust, Series 2007-7-A1 | | | 6.00% | | | 06/25/2037 | | | 72,177 | |
| | | | | | | | | | | | |
Total Non-Agency Residential Collateralized Mortgage Obligations(Cost $996,630,567) | | | 1,006,972,352 | |
| | | | | | | | | | | | |
| |
US Corporate Bonds - 11.5% | | | | |
| 14,766,000 | | AbbVie, Inc. | | | 4.70% | | | 05/14/2045 | | | 14,262,400 | |
| 1,720,000 | | Acrisure LLC | | | 8.13% | ^ | | 02/15/2024 | | | 1,785,420 | |
| 2,805,000 | | AECOM | | | 5.13% | | | 03/15/2027 | | | 2,724,356 | |
| 12,868,000 | | Air Lease Corporation | | | 3.75% | | | 02/01/2022 | | | 12,988,300 | |
| 1,295,000 | | Air Medical Merger Sub Corporation | | | 6.38% | ^ | | 05/15/2023 | | | 1,094,275 | |
| 655,000 | | AK Steel Corporation | | | 7.63% | | | 10/01/2021 | | | 659,912 | |
| 770,000 | | AK Steel Corporation | | | 6.38% | | | 10/15/2025 | | | 642,950 | |
| 1,817,000 | | Albertson's Holdings LLC | | | 5.75% | | | 03/15/2025 | | | 1,732,964 | |
| 855,000 | | Albertson's Holdings LLC | | | 7.50% | ^ | | 03/15/2026 | | | 883,856 | |
| 9,790,000 | | Alexandria Real Estate Equities, Inc. | | | 4.00% | | | 01/15/2024 | | | 10,135,973 | |
| 3,380,000 | | Alliant Holdings Intermediate LLC | | | 8.25% | ^ | | 08/01/2023 | | | 3,481,400 | |
| 2,290,000 | | Allison Transmission, Inc. | | | 5.00% | ^ | | 10/01/2024 | | | 2,292,862 | |
| 9,017,000 | | Ally Financial, Inc. | | | 4.13% | | | 03/30/2020 | | | 9,098,965 | |
| 4,330,000 | | Ally Financial, Inc. | | | 4.25% | | | 04/15/2021 | | | 4,400,362 | |
| 13,280,000 | | Altria Group, Inc. | | | 4.80% | | | 02/14/2029 | | | 13,716,069 | |
| 1,541,000 | | AMC Merger, Inc. | | | 8.00% | ^ | | 05/15/2025 | | | 701,155 | |
| 1,790,000 | | American Axle & Manufacturing, Inc. | | | 6.25% | | | 03/15/2026 | | | 1,736,300 | |
| 13,860,000 | | American Express Credit Corporation | | | 2.50% | | | 08/01/2022 | | | 13,709,081 | |
| 2,833,000 | | American Tower Corporation | | | 3.38% | | | 10/15/2026 | | | 2,765,991 | |
| 14,172,000 | | American Tower Corporation | | | 3.60% | | | 01/15/2028 | | | 13,993,822 | |
| 2,640,000 | | Antero Midstream Partners LP | | | 5.75% | ^ | | 03/01/2027 | | | 2,686,200 | |
| 2,930,000 | | Aramark Services, Inc. | | | 5.00% | ^ | | 04/01/2025 | | | 3,007,645 | |
| 1,380,000 | | Aramark Services, Inc. | | | 5.00% | ^ | | 02/01/2028 | | | 1,377,764 | |
| 1,635,000 | | Argos Merger Sub, Inc. | | | 7.13% | ^ | | 03/15/2023 | | | 1,226,250 | |
| 7,320,000 | | Arrow Electronics, Inc. | | | 3.88% | | | 01/12/2028 | | | 7,060,241 | |
| 2,655,000 | | Ascend Learning LLC | | | 6.88% | ^ | | 08/01/2025 | | | 2,648,362 | |
| 1,025,000 | | Ascend Learning LLC | | | 6.88% | ^ | | 08/01/2025 | | | 1,022,437 | |
| 5,160,000 | | Ashland, Inc. | | | 4.75% | | | 08/15/2022 | | | 5,327,700 | |
| 2,980,000 | | AssuredPartners, Inc. | | | 7.00% | ^ | | 08/15/2025 | | | 2,771,400 | |
| 20,665,000 | | AT&T, Inc. | | | 5.25% | | | 03/01/2037 | | | 21,812,611 | |
| 15,884,000 | | Athene Global Funding | | | 3.00% | ^ | | 07/01/2022 | | | 15,859,252 | |
| 3,085,000 | | Avantor, Inc. | | | 9.00% | ^ | | 10/01/2025 | | | 3,351,081 | |
| 13,500,000 | | AXA Equitable Holdings, Inc. | | | 3.90% | | | 04/20/2023 | | | 13,842,950 | |
| 2,255,000 | | B&G Foods, Inc. | | | 5.25% | | | 04/01/2025 | | | 2,170,437 | |
| 865,000 | | Banff Merger Sub, Inc. | | | 9.75% | ^ | | 09/01/2026 | | | 841,212 | |
| 13,205,000 | | Bank of America Corporation (3 Month LIBOR USD + 1.21%) | | | 3.97% | | | 02/07/2030 | | | 13,484,044 | |
| 1,090,000 | | Bausch Health Companies, Inc. | | | 7.00% | ^ | | 03/15/2024 | | | 1,155,945 | |
| 580,000 | | Bausch Health Companies, Inc. | | | 5.75% | ^ | | 08/15/2027 | | | 595,950 | |
| 3,485,000 | | Beacon Escrow Corporation | | | 4.88% | ^ | | 11/01/2025 | | | 3,323,819 | |
| 20,635,000 | | Becton Dickinson and Company | | | 2.89% | | | 06/06/2022 | | | 20,535,805 | |
| 12,404,000 | | Boston Properties LP | | | 4.13% | | | 05/15/2021 | | | 12,709,873 | |
| 750,000 | | Boston Properties LP | | | 3.20% | | | 01/15/2025 | | | 744,990 | |
| 3,465,000 | | Boyne USA, Inc. | | | 7.25% | ^ | | 05/01/2025 | | | 3,724,875 | |
| 15,160,000 | | Brighthouse Financial, Inc. | | | 3.70% | | | 06/22/2027 | | | 13,688,206 | |
| 13,630,000 | | Brooklyn Union Gas Company | | | 4.49% | ^ | | 03/04/2049 | | | 14,729,700 | |
| 3,360,000 | | Builders FirstSource, Inc. | | | 5.63% | ^ | | 09/01/2024 | | | 3,322,200 | |
| 765,000 | | Calpine Corporation | | | 5.75% | | | 01/15/2025 | | | 763,087 | |
| 3,265,000 | | Capital One Financial Corporation (3 Month LIBOR USD + 0.72%) | | | 3.47% | | | 01/30/2023 | | | 3,224,732 | |
| 3,256,000 | | CCO Holdings LLC | | | 5.75% | ^ | | 02/15/2026 | | | 3,418,800 | |
| 2,030,000 | | CCO Holdings LLC | | | 5.00% | ^ | | 02/01/2028 | | | 2,012,237 | |
| 860,000 | | CDK Global, Inc. | | | 5.88% | | | 06/15/2026 | | | 903,000 | |
| 14,005,000 | | Celgene Corporation | | | 4.35% | | | 11/15/2047 | | | 13,693,638 | |
| 1,885,000 | | Cengage Learning, Inc. | | | 9.50% | ^ | | 06/15/2024 | | | 1,569,262 | |
| 3,470,000 | | Centene Corporation | | | 4.75% | | | 01/15/2025 | | | 3,548,075 | |
| 835,000 | | Centene Corporation | | | 5.38% | ^ | | 06/01/2026 | | | 872,575 | |
| 1,180,000 | | CFX Escrow Corporation | | | 6.00% | ^ | | 02/15/2024 | | | 1,233,100 | |
| 1,645,000 | | CFX Escrow Corporation | | | 6.38% | ^ | | 02/15/2026 | | | 1,752,945 | |
| 13,285,000 | | Charles Schwab Corporation | | | 3.55% | | | 02/01/2024 | | | 13,826,501 | |
| 13,446,000 | | Charter Communications Operating LLC | | | 4.91% | | | 07/23/2025 | | | 14,191,108 | |
| 3,920,000 | | Cheniere Energy Partners LP | | | 5.25% | | | 10/01/2025 | | | 4,022,900 | |
| 390,000 | | Cheniere Energy Partners LP | | | 5.63% | ^ | | 10/01/2026 | | | 400,725 | |
| 13,295,000 | | Cigna Corporation (3 Month LIBOR USD + 0.89%) | | | 3.68% | ^ | | 07/15/2023 | | | 13,237,964 | |
| 2,170,000 | | Cincinnati Bell, Inc. | | | 7.00% | ^ | | 07/15/2024 | | | 2,008,509 | |
| 20,750,000 | | Citigroup, Inc. (3 Month LIBOR USD + 1.10%) | | | 3.78% | | | 05/17/2024 | | | 20,849,087 | |
| 620,000 | | Clear Channel Worldwide Holdings, Inc. | | | 9.25% | ^ | | 02/15/2024 | | | 658,750 | |
| 3,210,000 | | CNX Midstream Partners LP | | | 6.50% | ^ | | 03/15/2026 | | | 3,121,725 | |
| 13,445,000 | | Comcast Corporation | | | 3.95% | | | 10/15/2025 | | | 14,079,654 | |
| 1,520,000 | | CommScope Finance LLC | | | 5.50% | ^ | | 03/01/2024 | | | 1,558,441 | |
| 625,000 | | CommScope Finance LLC | | | 6.00% | ^ | | 03/01/2026 | | | 648,044 | |
| 1,380,000 | | Constellation Merger Sub, Inc. | | | 8.50% | ^ | | 09/15/2025 | | | 1,255,800 | |
| 6,840,000 | | Continental Resources, Inc. | | | 4.38% | | | 01/15/2028 | | | 7,046,424 | |
| 15,555,000 | | Corning, Inc. | | | 4.38% | | | 11/15/2057 | | | 14,520,106 | |
| 2,060,000 | | CRC Issuer LLC | | | 5.25% | ^ | | 10/15/2025 | | | 1,993,050 | |
| 2,255,000 | | Credit Acceptance Corporation | | | 6.63% | ^ | | 03/15/2026 | | | 2,294,462 | |
| 1,940,000 | | Crown Americas LLC | | | 4.50% | | | 01/15/2023 | | | 1,964,250 | |
| 2,620,000 | | Crown Americas LLC | | | 4.75% | | | 02/01/2026 | | | 2,639,126 | |
| 14,045,000 | | Crown Castle International Corporation | | | 3.65% | | | 09/01/2027 | | | 13,836,391 | |
| 815,000 | | Crown Castle International Corporation | | | 3.80% | | | 02/15/2028 | | | 811,628 | |
| 3,785,000 | | CSC Holdings LLC | | | 5.38% | ^ | | 07/15/2023 | | | 3,865,431 | |
| 1,988,000 | | CSC Holdings LLC | | | 5.25% | | | 06/01/2024 | | | 2,022,790 | |
| 2,700,000 | | CSI Compressco LP | | | 7.50% | ^ | | 04/01/2025 | | | 2,592,000 | |
| 15,465,000 | | CSX Corporation | | | 3.80% | | | 11/01/2046 | | | 14,651,885 | |
| 2,200,000 | | Dana Financing Ltd. | | | 5.75% | ^ | | 04/15/2025 | | | 2,211,000 | |
| 13,200,000 | | Delta Air Lines, Inc. | | | 3.80% | | | 04/19/2023 | | | 13,356,636 | |
| 3,500,000 | | Digital Realty Trust | | | 3.70% | | | 08/15/2027 | | | 3,471,851 | |
| 17,835,000 | | Discover Financial Services | | | 4.10% | | | 02/09/2027 | | | 17,860,473 | |
| 1,035,000 | | DISH DBS Corporation | | | 5.88% | | | 11/15/2024 | | | 873,281 | |
| 14,005,000 | | Dollar Tree, Inc. | | | 4.00% | | | 05/15/2025 | | | 14,178,821 | |
| 11,200,000 | | DowDuPont, Inc. | | | 5.42% | | | 11/15/2048 | | | 12,735,088 | |
| 3,615,000 | | Duke Energy Corporation | | | 3.75% | | | 09/01/2046 | | | 3,393,550 | |
| 7,615,000 | | Duke Energy Corporation | | | 3.95% | | | 08/15/2047 | | | 7,366,008 | |
| 8,955,000 | | Duke Energy Progress, Inc. | | | 4.15% | | | 12/01/2044 | | | 9,356,798 | |
| 1,180,000 | | EES Finance Corporation | | | 8.13% | | | 05/01/2025 | | | 1,209,500 | |
| 1,710,000 | | Eldorado Resorts, Inc. | | | 6.00% | | | 04/01/2025 | | | 1,739,925 | |
| 1,961,000 | | Embarq Corporation | | | 8.00% | | | 06/01/2036 | | | 1,919,329 | |
| 7,425,000 | | Enable Midstream Partners LP | | | 4.40% | | | 03/15/2027 | | | 7,260,370 | |
| 1,230,000 | | Energizer Holdings, Inc. | | | 7.75% | ^ | | 01/15/2027 | | | 1,314,562 | |
| 12,005,000 | | Energy Transfer Partners LP | | | 4.75% | | | 01/15/2026 | | | 12,556,333 | |
| 1,250,000 | | Energy Transfer Partners LP | | | 4.20% | | | 04/15/2027 | | | 1,257,784 | |
| 3,560,000 | | Ensemble S Merger Sub, Inc. | | | 9.00% | ^ | | 09/30/2023 | | | 3,711,300 | |
| 170,000 | | Enterprise Merger Sub, Inc. | | | 8.75% | ^ | | 10/15/2026 | | | 151,937 | |
| 1,125,000 | | EP Energy LLC | | | 7.75% | ^ | | 05/15/2026 | | | 922,500 | |
| 13,820,000 | | EQM Midstream Partners LP | | | 4.75% | | | 07/15/2023 | | | 14,109,091 | |
| 15,345,000 | | EQT Corporation | | | 3.90% | | | 10/01/2027 | | | 14,372,263 | |
| 3,981,000 | | ESH Hospitality, Inc. | | | 5.25% | ^ | | 05/01/2025 | | | 3,966,071 | |
| 14,245,000 | | Expedia Group, Inc. | | | 3.80% | | | 02/15/2028 | | | 13,766,344 | |
| 755,000 | | Extraction Oil & Gas, Inc. | | | 5.63% | ^ | | 02/01/2026 | | | 583,237 | |
| 14,348,000 | | FedEx Corporation | | | 4.75% | | | 11/15/2045 | | | 14,310,955 | |
| 9,960,000 | | Fidelity National Information Services, Inc. | | | 3.63% | | | 10/15/2020 | | | 10,069,344 | |
| 1,520,000 | | Financial & Risk US Holdings, Inc. | | | 6.25% | ^ | | 05/15/2026 | | | 1,544,700 | |
| 1,560,000 | | Financial & Risk US Holdings, Inc. | | | 8.25% | ^ | | 11/15/2026 | | | 1,534,650 | |
| 830,000 | | First Data Corporation | | | 5.75% | ^ | | 01/15/2024 | | | 856,560 | |
| 1,815,000 | | Flex Acquisition Company, Inc. | | | 6.88% | ^ | | 01/15/2025 | | | 1,742,400 | |
| 6,765,000 | | Ford Motor Company | | | 7.45% | | | 07/16/2031 | | | 7,224,103 | |
| 2,220,000 | | Foresight Energy LLC | | | 11.50% | ^ | | 04/01/2023 | | | 1,809,300 | |
| 2,140,000 | | Frontdoor, Inc. | | | 6.75% | ^ | | 08/15/2026 | | | 2,193,500 | |
| 605,000 | | Frontier Communications Corporation | | | 8.50% | | | 04/15/2020 | | | 594,412 | |
| 1,210,000 | | Frontier Communications Corporation | | | 8.50% | ^ | | 04/01/2026 | | | 1,126,812 | |
| 900,000 | | Frontier Communications Corporation | | | 8.00% | ^ | | 04/01/2027 | | | 931,500 | |
| 1,448,000 | | FTS International, Inc. | | | 6.25% | | | 05/01/2022 | | | 1,408,180 | |
| 13,450,000 | | General Electric Company | | | 5.88% | | | 01/14/2038 | | | 14,346,966 | |
| 6,205,000 | | General Motors Financial Company | | | 3.95% | | | 04/13/2024 | | | 6,147,850 | |
| 4,265,000 | | General Motors Financial Company (3 Month LIBOR USD + 0.80%) | | | 3.54% | | | 08/07/2020 | | | 4,260,404 | |
| 11,555,000 | | General Motors Financial Company (3 Month LIBOR USD + 0.99%) | | | 3.79% | | | 01/05/2023 | | | 11,219,072 | |
| 3,440,000 | | Genesys Telecommunications Laboratories, Inc. | | | 10.00% | ^ | | 11/30/2024 | | | 3,758,200 | |
| 3,290,000 | | Golden Nugget, Inc. | | | 6.75% | ^ | | 10/15/2024 | | | 3,314,675 | |
| 8,250,000 | | Goldman Sachs Group, Inc. (3 Month LIBOR USD + 0.78%) | | | 3.52% | | | 10/31/2022 | | | 8,218,774 | |
| 9,855,000 | | Goldman Sachs Group, Inc. (3 Month LIBOR USD + 1.17%) | | | 3.85% | | | 05/15/2026 | | | 9,676,675 | |
| 860,000 | | Gray Television, Inc. | | | 5.13% | ^ | | 10/15/2024 | | | 864,300 | |
| 1,510,000 | | Gray Television, Inc. | | | 7.00% | ^ | | 05/15/2027 | | | 1,608,150 | |
| 2,520,000 | | GTT Communications, Inc. | | | 7.88% | ^ | | 12/31/2024 | | | 2,217,600 | |
| 1,820,000 | | Gulfport Energy Corporation | | | 6.38% | | | 05/15/2025 | | | 1,653,925 | |
| 14,342,000 | | Hasbro, Inc. | | | 3.50% | | | 09/15/2027 | | | 13,829,595 | |
| 1,940,000 | | HCA Healthcare, Inc. | | | 6.25% | | | 02/15/2021 | | | 2,043,499 | |
| 850,000 | | HCA, Inc. | | | 5.25% | | | 04/15/2025 | | | 912,313 | |
| 4,850,000 | | HCA, Inc. | | | 5.38% | | | 09/01/2026 | | | 5,116,750 | |
| 270,000 | | HCA, Inc. | | | 5.88% | | | 02/01/2029 | | | 291,249 | |
| 4,865,000 | | Hess Infrastructure Partners LP | | | 5.63% | ^ | | 02/15/2026 | | | 4,974,462 | |
| 945,000 | | Hexion Finance Corporation | | | 6.63% | | | 04/15/2020 | | | 791,437 | |
| 400,000 | | Hexion, Inc. | | | 10.38% | ^ | | 02/01/2022 | | | 337,000 | |
| 2,472,000 | | Hilcorp Energy LP | | | 6.25% | ^ | | 11/01/2028 | | | 2,490,540 | |
| 4,890,000 | | Hilton Domestic Operating Company, Inc. | | | 4.25% | | | 09/01/2024 | | | 4,893,032 | |
| 1,680,000 | | Icahn Enterprises Finance Corporation | | | 6.25% | | | 02/01/2022 | | | 1,727,628 | |
| 2,695,000 | | Icahn Enterprises Finance Corporation | | | 6.38% | | | 12/15/2025 | | | 2,765,744 | |
| 1,760,000 | | Indigo Natural Resources LLC | | | 6.88% | ^ | | 02/15/2026 | | | 1,566,400 | |
| 3,685,000 | | Informatica LLC | | | 7.13% | ^ | | 07/15/2023 | | | 3,772,519 | |
| 2,314,000 | | IRB Holding Corporation | | | 6.75% | ^ | | 02/15/2026 | | | 2,180,945 | |
| 2,685,000 | | Iridium Communications, Inc. | | | 10.25% | ^ | | 04/15/2023 | | | 2,966,925 | |
| 3,165,000 | | JBS USA Finance, Inc. | | | 6.75% | ^ | | 02/15/2028 | | | 3,287,644 | |
| 2,795,000 | | JELD-WEN, Inc. | | | 4.63% | ^ | | 12/15/2025 | | | 2,662,237 | |
| 6,515,000 | | John Deere Capital Corporation | | | 3.45% | | | 01/10/2024 | | | 6,699,936 | |
| 2,465,000 | | KAR Auction Services, Inc. | | | 5.13% | ^ | | 06/01/2025 | | | 2,449,594 | |
| 11,824,000 | | Kinder Morgan Energy Partners LP | | | 6.95% | | | 01/15/2038 | | | 14,412,579 | |
| 1,475,000 | | Kratos Defense & Security Solutions, Inc. | | | 6.50% | ^ | | 11/30/2025 | | | 1,557,969 | |
| 12,860,000 | | Kroger Company | | | 3.40% | | | 04/15/2022 | | | 13,034,020 | |
| 1,382,000 | | Level 3 Communications, Inc. | | | 5.75% | | | 12/01/2022 | | | 1,399,690 | |
| 3,035,000 | | Level 3 Financing, Inc. | | | 5.38% | | | 01/15/2024 | | | 3,099,038 | |
| 17,379,000 | | Liberty Mutual Group, Inc. | | | 6.50% | ^ | | 05/01/2042 | | | 21,533,843 | |
| 2,230,000 | | Lions Gate Capital Holdings LLC | | | 6.38% | ^ | | 02/01/2024 | | | 2,341,500 | |
| 2,990,000 | | Live Nation Entertainment, Inc. | | | 5.63% | ^ | | 03/15/2026 | | | 3,094,650 | |
| 13,037,000 | | Lockheed Martin Corporation | | | 4.70% | | | 05/15/2046 | | | 14,641,507 | |
| 3,415,000 | | LTF Merger Sub, Inc. | | | 8.50% | ^ | | 06/15/2023 | | | 3,521,719 | |
| 12,519,000 | | Marathon Petroleum Corporation | | | 5.13% | ^ | | 12/15/2026 | | | 13,468,012 | |
| 1,925,000 | | Marriott Ownership Resorts, Inc. | | | 6.50% | ^ | | 09/15/2026 | | | 2,024,041 | |
| 12,985,000 | | Marvell Technology Group Ltd. | | | 4.20% | | | 06/22/2023 | | | 13,252,879 | |
| 850,000 | | Masonite International Corporation | | | 5.63% | ^ | | 03/15/2023 | | | 872,313 | |
| 2,250,000 | | Masonite International Corporation | | | 5.75% | ^ | | 09/15/2026 | | | 2,306,250 | |
| 2,670,000 | | Match Group, Inc. | | | 5.00% | ^ | | 12/15/2027 | | | 2,703,375 | |
| 895,000 | | Matterhorn Merger Sub LLC | | | 8.50% | ^ | | 06/01/2026 | | | 780,888 | |
| 5,220,000 | | McDonald's Corporation | | | 4.45% | | | 03/01/2047 | | | 5,375,320 | |
| 50,000 | | Metropolitan Edison Company | | | 4.00% | ^ | | 04/15/2025 | | | 51,303 | |
| 1,710,000 | | MGM Growth Properties LP | | | 5.75% | ^ | | 02/01/2027 | | | 1,771,987 | |
| 2,155,000 | | MGM Growth Properties LP | | | 4.50% | | | 01/15/2028 | | | 2,036,475 | |
| 1,150,000 | | MGM Resorts International | | | 5.75% | | | 06/15/2025 | | | 1,197,437 | |
| 14,609,000 | | Morgan Stanley (3 Month LIBOR USD + 1.34%) | | | 3.59% | | | 07/22/2028 | | | 14,523,755 | |
| 14,215,000 | | Mosaic Company | | | 4.05% | | | 11/15/2027 | | | 14,215,522 | |
| 1,152,000 | | Moss Creek Resources Holdings, Inc. | | | 7.50% | ^ | | 01/15/2026 | | | 1,068,480 | |
| 1,735,000 | | MPH Acquisition Holdings LLC | | | 7.13% | ^ | | 06/01/2024 | | | 1,735,000 | |
| 1,130,000 | | MPT Operating Partnership LP | | | 5.25% | | | 08/01/2026 | | | 1,168,137 | |
| 3,720,000 | | MPT Operating Partnership LP | | | 5.00% | | | 10/15/2027 | | | 3,794,400 | |
| 1,285,000 | | Nabors Industries, Inc. | | | 5.75% | | | 02/01/2025 | | | 1,158,081 | |
| 2,795,000 | | Navient Corporation | | | 6.50% | | | 06/15/2022 | | | 2,919,902 | |
| 1,845,000 | | NCL Corporation Ltd. | | | 4.75% | ^ | | 12/15/2021 | | | 1,870,369 | |
| 860,000 | | Netflix, Inc. | | | 5.88% | | | 02/15/2025 | | | 931,509 | |
| 6,140,000 | | NextEra Energy Capital Holdings, Inc. | | | 3.55% | | | 05/01/2027 | | | 6,186,776 | |
| 3,477,000 | | NFP Corporation | | | 6.88% | ^ | | 07/15/2025 | | | 3,337,920 | |
| 880,000 | | NVA Holdings, Inc. | | | 6.88% | ^ | | 04/01/2026 | | | 874,500 | |
| 1,010,000 | | Oasis Petroleum, Inc. | | | 6.88% | | | 03/15/2022 | | | 1,022,625 | |
| 148,000 | | Oncor Electric Delivery Company LLC | | | 2.95% | | | 04/01/2025 | | | 148,084 | |
| 8,405,000 | | Owens Corning | | | 4.40% | | | 01/30/2048 | | | 6,940,774 | |
| 7,010,000 | | Packaging Corporation of America | | | 3.40% | | | 12/15/2027 | | | 6,833,731 | |
| 1,440,000 | | Panther BF Aggregator LP | | | 6.25% | ^ | | 05/15/2026 | | | 1,472,400 | |
| 745,000 | | Panther BF Aggregator LP | | | 8.50% | ^ | | 05/15/2027 | | | 748,725 | |
| 1,790,000 | | Par Petroleum Finance Corporation | | | 7.75% | ^ | | 12/15/2025 | | | 1,670,965 | |
| 2,305,000 | | Parsley Energy LLC | | | 5.63% | ^ | | 10/15/2027 | | | 2,310,763 | |
| 3,435,000 | | Peabody Securities Finance Corporation | | | 6.00% | ^ | | 03/31/2022 | | | 3,473,644 | |
| 2,085,000 | | Penn National Gaming, Inc. | | | 5.63% | ^ | | 01/15/2027 | | | 2,032,875 | |
| 6,620,000 | | Penske Truck Leasing Company | | | 4.20% | ^ | | 04/01/2027 | | | 6,596,093 | |
| 560,000 | | PetSmart, Inc. | | | 5.88% | ^ | | 06/01/2025 | | | 471,800 | |
| 3,285,000 | | Pilgrim's Pride Corporation | | | 5.75% | ^ | | 03/15/2025 | | | 3,334,275 | |
| 1,670,000 | | Polaris Intermediate Corporation (PIK 9.25%) | | | 8.50% | ^ | | 12/01/2022 | | | 1,653,718 | |
| 3,290,000 | | Post Holdings, Inc. | | | 5.50% | ^ | | 03/01/2025 | | | 3,339,350 | |
| 3,140,000 | | Prime Security Services Borrower LLC | | | 9.25% | ^ | | 05/15/2023 | | | 3,304,850 | |
| 9,975,000 | | PSEG Power LLC | | | 3.85% | | | 06/01/2023 | | | 10,229,739 | |
| 1,080,000 | | QEP Resources, Inc. | | | 5.25% | | | 05/01/2023 | | | 1,023,300 | |
| 1,175,000 | | QEP Resources, Inc. | | | 5.63% | | | 03/01/2026 | | | 1,069,250 | |
| 380,000 | | Radiate Finance, Inc. | | | 6.88% | ^ | | 02/15/2023 | | | 378,100 | |
| 1,695,000 | | Radiate Finance, Inc. | | | 6.63% | ^ | | 02/15/2025 | | | 1,644,150 | |
| 690,000 | | RegionalCare Hospital Partners Holdings, Inc. | | | 8.25% | ^ | | 05/01/2023 | | | 734,419 | |
| 2,150,000 | | Resideo Funding, Inc. | | | 6.13% | ^ | | 11/01/2026 | | | 2,225,250 | |
| 1,073,000 | | Riverbed Technology, Inc. | | | 8.88% | ^ | | 03/01/2023 | | | 820,845 | |
| 7,435,000 | | Royal Caribbean Cruises Ltd. | | | 3.70% | | | 03/15/2028 | | | 7,179,204 | |
| 13,345,000 | | Sabine Pass Liquefaction LLC | | | 5.00% | | | 03/15/2027 | | | 14,158,899 | |
| 1,580,000 | | Schweitzer-Mauduit International, Inc. | | | 6.88% | ^ | | 10/01/2026 | | | 1,599,750 | |
| 1,820,000 | | Scientific Games International, Inc. | | | 5.00% | ^ | | 10/15/2025 | | | 1,788,150 | |
| 1,760,000 | | Scientific Games International, Inc. | | | 8.25% | ^ | | 03/15/2026 | | | 1,799,600 | |
| 3,265,000 | | Select Medical Corporation | | | 6.38% | | | 06/01/2021 | | | 3,281,325 | |
| 2,195,000 | | Sirius XM Radio, Inc. | | | 5.38% | ^ | | 07/15/2026 | | | 2,241,644 | |
| 1,950,000 | | Six Flags Entertainment Corporation | | | 4.88% | ^ | | 07/31/2024 | | | 1,924,406 | |
| 14,291,000 | | Smithfield Foods, Inc. | | | 4.25% | ^ | | 02/01/2027 | | | 13,598,934 | |
| 1,600,000 | | Solera Finance, Inc. | | | 10.50% | ^ | | 03/01/2024 | | | 1,742,272 | |
| 1,590,000 | | Springleaf Finance Corporation | | | 6.88% | | | 03/15/2025 | | | 1,645,650 | |
| 530,000 | | Springleaf Finance Corporation | | | 7.13% | | | 03/15/2026 | | | 540,597 | |
| 3,965,000 | | Sprint Capital Corporation | | | 6.88% | | | 11/15/2028 | | | 3,821,269 | |
| 3,815,000 | | Sprint Corporation | | | 7.13% | | | 06/15/2024 | | | 3,881,763 | |
| 13,170,000 | | Sprint Spectrum Company LLC | | | 4.74% | ^ | | 03/20/2025 | | | 13,351,088 | |
| 1,920,000 | | SS&C Technologies, Inc. | | | 5.50% | ^ | | 09/30/2027 | | | 1,942,800 | |
| 1,310,000 | | Star Merger Sub, Inc. | | | 6.88% | ^ | | 08/15/2026 | | | 1,341,931 | |
| 1,745,000 | | Stevens Holding Company, Inc. | | | 6.13% | ^ | | 10/01/2026 | | | 1,806,075 | |
| 3,033,000 | | SunCoke Energy Partners Finance Corporation | | | 7.50% | ^ | | 06/15/2025 | | | 3,078,495 | |
| 1,910,000 | | Sunoco LP | | | 5.50% | | | 02/15/2026 | | | 1,895,675 | |
| 1,010,000 | | Sunoco LP | | | 6.00% | ^ | | 04/15/2027 | | | 1,015,050 | |
| 15,110,000 | | Synchrony Financial | | | 3.95% | | | 12/01/2027 | | | 14,301,142 | |
| 925,000 | | Tapstone Energy Finance Corporation | | | 9.75% | ^ | | 06/01/2022 | | | 675,250 | |
| 2,035,000 | | Targa Resources Partners Finance Corporation | | | 5.88% | ^ | | 04/15/2026 | | | 2,161,170 | |
| 800,000 | | Targa Resources Partners Finance Corporation | | | 6.50% | ^ | | 07/15/2027 | | | 865,000 | |
| 3,300,000 | | Tempo Acquisition Finance Corporation | | | 6.75% | ^ | | 06/01/2025 | | | 3,341,250 | |
| 3,115,000 | | Tempur Sealy International, Inc. | | | 5.50% | | | 06/15/2026 | | | 3,128,613 | |
| 1,760,000 | | Tenet Healthcare Corporation | | | 7.00% | | | 08/01/2025 | | | 1,788,600 | |
| 1,930,000 | | Tenet Healthcare Corporation | | | 6.25% | ^ | | 02/01/2027 | | | 2,004,788 | |
| 1,940,000 | | TerraForm Power Operating LLC | | | 4.25% | ^ | | 01/31/2023 | | | 1,926,401 | |
| 14,055,000 | | The Interpublic Group of Companies, Inc. | | | 5.40% | | | 10/01/2048 | | | 14,312,743 | |
| 1,975,000 | | The ServiceMaster Company LLC | | | 5.13% | ^ | | 11/15/2024 | | | 1,987,344 | |
| 1,600,000 | | The William Carter Company | | | 5.63% | ^ | | 03/15/2027 | | | 1,660,000 | |
| 3,580,000 | | T-Mobile USA, Inc. | | | 4.50% | | | 02/01/2026 | | | 3,591,467 | |
| 1,935,000 | | TransDigm, Inc. | | | 6.25% | ^ | | 03/15/2026 | | | 2,012,400 | |
| 1,365,000 | | TransDigm, Inc. | | | 6.38% | | | 06/15/2026 | | | 1,356,264 | |
| 926,100 | | Transocean Guardian Ltd. | | | 5.88% | ^ | | 01/15/2024 | | | 944,622 | |
| 2,120,000 | | Transocean Poseidon Ltd. | | | 6.88% | ^ | | 02/01/2027 | | | 2,210,100 | |
| 1,712,000 | | Transocean Proteus Ltd. | | | 6.25% | ^ | | 12/01/2024 | | | 1,765,500 | |
| 1,155,000 | | Transocean, Inc. | | | 7.25% | ^ | | 11/01/2025 | | | 1,144,894 | |
| 1,700,000 | | Trident Merger Sub, Inc. | | | 6.63% | ^ | | 11/01/2025 | | | 1,598,000 | |
| 2,347,000 | | Triumph Group, Inc. | | | 7.75% | | | 08/15/2025 | | | 2,247,253 | |
| 1,970,000 | | Uber Technologies, Inc. | | | 8.00% | ^ | | 11/01/2026 | | | 2,102,975 | |
| 2,535,000 | | United Rentals North America, Inc. | | | 6.50% | | | 12/15/2026 | | | 2,674,425 | |
| 510,000 | | Univision Communications, Inc. | | | 5.13% | ^ | | 05/15/2023 | | | 487,050 | |
| 2,190,000 | | USA Compression Partners LP | | | 6.88% | | | 04/01/2026 | | | 2,250,225 | |
| 1,265,000 | | USA Compression Partners LP | | | 6.88% | ^ | | 09/01/2027 | | | 1,291,881 | |
| 1,825,000 | | Valeant Pharmaceuticals International, Inc. | | | 9.25% | ^ | | 04/01/2026 | | | 2,001,660 | |
| 2,245,000 | | Valeant Pharmaceuticals International, Inc. | | | 8.50% | ^ | | 01/31/2027 | | | 2,385,313 | |
| 14,757,000 | | Verizon Communications, Inc. | | | 4.40% | | | 11/01/2034 | | | 15,393,937 | |
| 6,735,000 | | Verizon Communications, Inc. | | | 4.27% | | | 01/15/2036 | | | 6,832,029 | |
| 2,365,000 | | Verscend Escrow Corporation | | | 9.75% | ^ | | 08/15/2026 | | | 2,367,956 | |
| 3,415,000 | | Viking Cruises Ltd. | | | 5.88% | ^ | | 09/15/2027 | | | 3,329,625 | |
| 1,235,000 | | Vine Oil & Gas Finance Corporation | | | 8.75% | ^ | | 04/15/2023 | | | 988,000 | |
| 3,020,000 | | Vistra Operations Company LLC | | | 5.63% | ^ | | 02/15/2027 | | | 3,148,350 | |
| 1,685,000 | | Vistra Operations Company LLC | | | 5.50% | ^ | | 09/01/2026 | | | 1,756,613 | |
| 3,415,000 | | Vizient, Inc. | | | 10.38% | ^ | | 03/01/2024 | | | 3,715,691 | |
| 1,990,000 | | Wand Merger Corporation | | | 8.13% | ^ | | 07/15/2023 | | | 2,054,675 | |
| 1,805,000 | | Waste Pro, Inc. | | | 5.50% | ^ | | 02/15/2026 | | | 1,746,338 | |
| 1,005,000 | | Weatherford International Ltd. | | | 9.88% | | | 02/15/2024 | | | 728,625 | |
| 2,415,000 | | WellCare Health Plans, Inc. | | | 5.25% | | | 04/01/2025 | | | 2,508,581 | |
| 1,925,000 | | WellCare Health Plans, Inc. | | | 5.38% | ^ | | 08/15/2026 | | | 2,018,732 | |
| 13,175,000 | | Welltower, Inc. | | | 3.95% | | | 09/01/2023 | | | 13,678,507 | |
| 3,380,000 | | Whiting Petroleum Corporation | | | 6.63% | | | 01/15/2026 | | | 3,329,300 | |
| 13,740,000 | | Willis North America, Inc. | | | 4.50% | | | 09/15/2028 | | | 14,311,098 | |
| 13,740,000 | | WRKCo, Inc. | | | 3.75% | | | 03/15/2025 | | | 13,884,248 | |
| 13,436,000 | | Zimmer Holdings, Inc. | | | 2.70% | | | 04/01/2020 | | | 13,405,641 | |
| | | | | | | | | | | | |
Total US Corporate Bonds(Cost $1,320,581,437) | | | 1,327,741,796 | |
| | | | | | | | | | | | |
| |
US Government and Agency Mortgage Backed Obligations - 14.6% | | | | |
| 101,101,790 | | Federal Home Loan Mortgage Corporation Pass-Thru, Series K722-X1 | | | 1.31% | # I/O | | 03/25/2023 | | | 4,208,908 | |
| 655,664 | | Federal Home Loan Mortgage Corporation, Pool G01840 | | | 5.00% | | | 07/01/2035 | | | 707,061 | |
| 358,365 | | Federal Home Loan Mortgage Corporation, Pool G04817 | | | 5.00% | | | 09/01/2038 | | | 386,227 | |
| 14,842,941 | | Federal Home Loan Mortgage Corporation, Pool G08537 | | | 3.00% | | | 07/01/2043 | | | 14,862,129 | |
| 11,111,953 | | Federal Home Loan Mortgage Corporation, Pool G08622 | | | 3.00% | | | 01/01/2045 | | | 11,110,834 | |
| 10,280,337 | | Federal Home Loan Mortgage Corporation, Pool G08686 | | | 3.00% | | | 01/01/2046 | | | 10,258,604 | |
| 44,855,151 | | Federal Home Loan Mortgage Corporation, Pool G08701 | | | 3.00% | | | 04/01/2046 | | | 44,746,431 | |
| 70,286,709 | | Federal Home Loan Mortgage Corporation, Pool G61645 | | | 4.00% | | | 10/01/2048 | | | 72,559,410 | |
| 2,043,888 | | Federal Home Loan Mortgage Corporation, Pool N70081 | | | 5.50% | | | 07/01/2038 | | | 2,271,697 | |
| 8,776,410 | | Federal Home Loan Mortgage Corporation, Pool Q33789 | | | 3.50% | | | 06/01/2045 | | | 8,962,946 | |
| 46,040,649 | | Federal Home Loan Mortgage Corporation, Pool Q51461 | | | 3.50% | | | 10/01/2047 | | | 46,808,264 | |
| 3,366,144 | | Federal Home Loan Mortgage Corporation, Pool T60854 | | | 3.50% | | | 09/01/2042 | | | 3,384,638 | |
| 546,351 | | Federal Home Loan Mortgage Corporation, Pool U60299 | | | 4.00% | | | 11/01/2040 | | | 566,472 | |
| 18,064,211 | | Federal Home Loan Mortgage Corporation, Pool V83144 | | | 4.00% | | | 04/01/2047 | | | 18,660,722 | |
| 64,935 | | Federal Home Loan Mortgage Corporation, Series 2692-SC (-2 x 1 Month LIBOR USD + 13.29%, 13.29% Cap) | | | 8.32% | I/F | | 07/15/2033 | | | 76,670 | |
| 1,933,992 | | Federal Home Loan Mortgage Corporation, Series 2722-PS (-1 x 1 Month LIBOR USD + 9.89%, 9.89% Cap) | | | 7.13% | I/F | | 12/15/2033 | | | 2,115,137 | |
| 93,221 | | Federal Home Loan Mortgage Corporation, Series 2750-ZT | | | 5.00% | | | 02/15/2034 | | | 99,955 | |
| 198,700 | | Federal Home Loan Mortgage Corporation, Series 3002-SN (-1 x 1 Month LIBOR USD + 6.50%, 6.50% Cap) | | | 4.02% | I/F I/O | | 07/15/2035 | | | 28,312 | |
| 86,854 | | Federal Home Loan Mortgage Corporation, Series 3045-DI (-1 x 1 Month LIBOR USD + 6.73%, 6.73% Cap) | | | 4.25% | I/F I/O | | 10/15/2035 | | | 13,774 | |
| 312,352 | | Federal Home Loan Mortgage Corporation, Series 3116-Z | | | 5.50% | | | 02/15/2036 | | | 344,330 | |
| 27,640 | | Federal Home Loan Mortgage Corporation, Series 3117-ZN | | | 4.50% | | | 02/15/2036 | | | 28,599 | |
| 365,276 | | Federal Home Loan Mortgage Corporation, Series 3203-ZC | | | 5.00% | | | 07/15/2036 | | | 395,254 | |
| 111,937 | | Federal Home Loan Mortgage Corporation, Series 3275-SC (-1 x 1 Month LIBOR USD + 6.08%, 6.08% Cap) | | | 3.60% | I/F I/O | | 02/15/2037 | | | 14,850 | |
| 379,318 | | Federal Home Loan Mortgage Corporation, Series 3382-SB (-1 x 1 Month LIBOR USD + 6.00%, 6.00% Cap) | | | 3.52% | I/F I/O | | 11/15/2037 | | | 32,814 | |
| 380,734 | | Federal Home Loan Mortgage Corporation, Series 3384-S (-1 x 1 Month LIBOR USD + 6.39%, 6.39% Cap) | | | 3.91% | I/F I/O | | 11/15/2037 | | | 40,871 | |
| 523,398 | | Federal Home Loan Mortgage Corporation, Series 3417-SX (-1 x 1 Month LIBOR USD + 6.18%, 6.18% Cap) | | | 3.70% | I/F I/O | | 02/15/2038 | | | 58,554 | |
| 46,426 | | Federal Home Loan Mortgage Corporation, Series 3423-GS (-1 x 1 Month LIBOR USD + 5.65%, 5.65% Cap) | | | 3.17% | I/F I/O | | 03/15/2038 | | | 4,597 | |
| 46,426 | | Federal Home Loan Mortgage Corporation, Series 3423-SG (-1 x 1 Month LIBOR USD + 5.65%, 5.65% Cap) | | | 3.17% | I/F I/O | | 03/15/2038 | | | 3,936 | |
| 138,971 | | Federal Home Loan Mortgage Corporation, Series 3524-LB | | | 3.60% | | | 06/15/2038 | | | 140,467 | |
| 19,185,862 | | Federal Home Loan Mortgage Corporation, Series 355-300 | | | 3.00% | | | 08/15/2047 | | | 19,176,830 | |
| 141,917 | | Federal Home Loan Mortgage Corporation, Series 3562-WS (-1 x 1 Month LIBOR USD + 4.95%, 4.95% Cap) | | | 2.47% | I/F I/O | | 08/15/2039 | | | 10,932 | |
| 180,156 | | Federal Home Loan Mortgage Corporation, Series 3582-SA (-1 x 1 Month LIBOR USD + 6.00%, 6.00% Cap) | | | 3.52% | I/F I/O | | 10/15/2049 | | | 25,526 | |
| 62,035,110 | | Federal Home Loan Mortgage Corporation, Series 358-300 | | | 3.00% | | | 10/15/2047 | | | 62,362,954 | |
| 451,496 | | Federal Home Loan Mortgage Corporation, Series 3606-CS (-1 x 1 Month LIBOR USD + 6.35%, 6.35% Cap) | | | 3.87% | I/F I/O | | 12/15/2039 | | | 79,804 | |
| 262,767 | | Federal Home Loan Mortgage Corporation, Series 3616-SG (-1 x 1 Month LIBOR USD + 6.35%, 6.35% Cap) | | | 3.87% | I/F I/O | | 03/15/2032 | | | 28,484 | |
| 1,045,525 | | Federal Home Loan Mortgage Corporation, Series 3626-AZ | | | 5.50% | | | 08/15/2036 | | | 1,123,996 | |
| 366,628 | | Federal Home Loan Mortgage Corporation, Series 3666-SC (-1 x 1 Month LIBOR USD + 5.77%, 5.77% Cap) | | | 3.29% | I/F I/O | | 05/15/2040 | | | 55,212 | |
| 267,349 | | Federal Home Loan Mortgage Corporation, Series 3666-VZ | | | 5.50% | | | 08/15/2036 | | | 289,167 | |
| 2,509,326 | | Federal Home Loan Mortgage Corporation, Series 3779-DZ | | | 4.50% | > | | 12/15/2040 | | | 2,663,933 | |
| 1,400,000 | | Federal Home Loan Mortgage Corporation, Series 3779-YA | | | 3.50% | | | 12/15/2030 | | | 1,450,555 | |
| 473,984 | | Federal Home Loan Mortgage Corporation, Series 3786-SG (-2 x 1 Month LIBOR USD + 9.50%, 9.50% Cap) | | | 4.53% | I/F | | 01/15/2041 | | | 502,039 | |
| 4,906,417 | | Federal Home Loan Mortgage Corporation, Series 3792-SE (-2 x 1 Month LIBOR USD + 9.86%, 9.86% Cap) | | | 4.89% | I/F | | 01/15/2041 | | | 5,463,623 | |
| 2,771,173 | | Federal Home Loan Mortgage Corporation, Series 3795-VZ | | | 4.00% | > | | 01/15/2041 | | | 2,854,389 | |
| 52,467 | | Federal Home Loan Mortgage Corporation, Series 3798-SD (-2 x 1 Month LIBOR USD + 9.60%, 9.60% Cap) | | | 4.63% | I/F | | 12/15/2040 | | | 59,011 | |
| 1,063,803 | | Federal Home Loan Mortgage Corporation, Series 3806-CZ | | | 5.50% | | | 07/15/2034 | | | 1,164,496 | |
| 1,146,798 | | Federal Home Loan Mortgage Corporation, Series 3808-DB | | | 3.50% | | | 02/15/2031 | | | 1,171,237 | |
| 2,199,140 | | Federal Home Loan Mortgage Corporation, Series 3818-CZ | | | 4.50% | | | 03/15/2041 | | | 2,373,704 | |
| 1,157,734 | | Federal Home Loan Mortgage Corporation, Series 3819-ZU | | | 5.50% | | | 07/15/2034 | | | 1,253,192 | |
| 3,707,618 | | Federal Home Loan Mortgage Corporation, Series 3824-EY | | | 3.50% | | | 03/15/2031 | | | 3,862,441 | |
| 251,282 | | Federal Home Loan Mortgage Corporation, Series 3828-SW (-3 x 1 Month LIBOR USD + 13.20%, 13.20% Cap) | | | 5.75% | I/F | | 02/15/2041 | | | 301,896 | |
| 1,811,996 | | Federal Home Loan Mortgage Corporation, Series 3863-ZA | | | 5.50% | | | 08/15/2034 | | | 1,949,966 | |
| 11,569,560 | | Federal Home Loan Mortgage Corporation, Series 3889-VZ | | | 4.00% | | | 07/15/2041 | | | 12,053,295 | |
| 3,173,241 | | Federal Home Loan Mortgage Corporation, Series 3910-GZ | | | 5.00% | > | | 08/15/2041 | | | 3,630,466 | |
| 22,876,247 | | Federal Home Loan Mortgage Corporation, Series 3967-ZP | | | 4.00% | > | | 09/15/2041 | | | 24,145,733 | |
| 4,481,471 | | Federal Home Loan Mortgage Corporation, Series 3972-AZ | | | 3.50% | | | 12/15/2041 | | | 4,500,426 | |
| 26,187,529 | | Federal Home Loan Mortgage Corporation, Series 4057-ZA | | | 4.00% | > | | 06/15/2042 | | | 27,470,383 | |
| 9,404,106 | | Federal Home Loan Mortgage Corporation, Series 4096-DZ | | | 3.50% | > | | 08/15/2042 | | | 9,514,732 | |
| 29,357,573 | | Federal Home Loan Mortgage Corporation, Series 4165-ZT | | | 3.00% | > | | 02/15/2043 | | | 27,851,013 | |
| 5,707,451 | | Federal Home Loan Mortgage Corporation, Series 4291-MS (-1 x 1 Month LIBOR USD + 5.90%, 5.90% Cap) | | | 3.42% | I/F I/O | | 01/15/2054 | | | 922,297 | |
| 19,036,341 | | Federal Home Loan Mortgage Corporation, Series 4341-AZ | | | 3.00% | > | | 05/15/2044 | | | 18,141,954 | |
| 12,570,977 | | Federal Home Loan Mortgage Corporation, Series 4377-A | | | 3.00% | | | 06/15/2039 | | | 12,618,274 | |
| 9,820,154 | | Federal Home Loan Mortgage Corporation, Series 4391-MA | | | 3.00% | | | 07/15/2040 | | | 9,868,905 | |
| 13,962,184 | | Federal Home Loan Mortgage Corporation, Series 4413-AZ | | | 3.50% | > | | 11/15/2044 | | | 14,253,838 | |
| 47,373 | | Federal Home Loan Mortgage Corporation, Series 4419-TB | | | 3.00% | | | 02/15/2040 | | | 47,313 | |
| 11,601,316 | | Federal Home Loan Mortgage Corporation, Series 4423-Z | | | 3.50% | > | | 12/15/2044 | | | 11,965,746 | |
| 13,489,777 | | Federal Home Loan Mortgage Corporation, Series 4427-MA | | | 3.00% | | | 02/15/2034 | | | 13,543,046 | |
| 21,876,967 | | Federal Home Loan Mortgage Corporation, Series 4471-BA | | | 3.00% | | | 12/15/2041 | | | 21,794,140 | |
| 31,777,403 | | Federal Home Loan Mortgage Corporation, Series 4471-GA | | | 3.00% | | | 02/15/2044 | | | 31,951,969 | |
| 19,278,038 | | Federal Home Loan Mortgage Corporation, Series 4481-B | | | 3.00% | | | 12/15/2042 | | | 19,298,554 | |
| 10,583,750 | | Federal Home Loan Mortgage Corporation, Series 4511-QA | | | 3.00% | | | 01/15/2041 | | | 10,667,982 | |
| 52,161,827 | | Federal Home Loan Mortgage Corporation, Series 4542-AC | | | 2.70% | | | 01/15/2045 | | | 51,444,017 | |
| 92,120,432 | | Federal Home Loan Mortgage Corporation, Series 4750-PA | | | 3.00% | | | 07/15/2046 | | | 91,375,426 | |
| 68,745,482 | | Federal Home Loan Mortgage Corporation, Series 4752-PL | | | 3.00% | | | 09/15/2046 | | | 69,240,868 | |
| 4,781,000 | | Federal Home Loan Mortgage Corporation, Series K050-A2 | | | 3.33% | # | | 08/25/2025 | | | 4,953,213 | |
| 6,528,000 | | Federal Home Loan Mortgage Corporation, Series K053-A2 | | | 3.00% | | | 12/25/2025 | | | 6,631,870 | |
| 418,518 | | Federal Home Loan Mortgage Corporation, Series R003-ZA | | | 5.50% | | | 10/15/2035 | | | 460,571 | |
| 128,169 | | Federal National Mortgage Association Pass-Thru, Pool 555743 | | | 5.00% | | | 09/01/2033 | | | 137,970 | |
| 109,688 | | Federal National Mortgage Association Pass-Thru, Pool 735382 | | | 5.00% | | | 04/01/2035 | | | 118,060 | |
| 889,855 | | Federal National Mortgage Association Pass-Thru, Pool 735383 | | | 5.00% | | | 04/01/2035 | | | 957,851 | |
| 449,649 | | Federal National Mortgage Association Pass-Thru, Pool 735402 | | | 5.00% | | | 04/01/2035 | | | 483,988 | |
| 652,734 | | Federal National Mortgage Association Pass-Thru, Pool 735484 | | | 5.00% | | | 05/01/2035 | | | 702,598 | |
| 122,480 | | Federal National Mortgage Association Pass-Thru, Pool 931104 | | | 5.00% | | | 05/01/2039 | | | 132,178 | |
| 756,948 | | Federal National Mortgage Association Pass-Thru, Pool 995203 | | | 5.00% | | | 07/01/2035 | | | 814,884 | |
| 742,982 | | Federal National Mortgage Association Pass-Thru, Pool AB2123 | | | 4.00% | | | 01/01/2031 | | | 772,772 | |
| 42,383 | | Federal National Mortgage Association Pass-Thru, Pool AB2370 | | | 4.50% | | | 09/01/2035 | | | 43,601 | |
| 24,181 | | Federal National Mortgage Association Pass-Thru, Pool AD2177 | | | 4.50% | | | 06/01/2030 | | | 25,272 | |
| 1,129,918 | | Federal National Mortgage Association Pass-Thru, Pool AH7309 | | | 4.00% | | | 02/01/2031 | | | 1,175,226 | |
| 27,030,931 | | Federal National Mortgage Association Pass-Thru, Pool AS4645 | | | 3.00% | | | 03/01/2045 | | | 27,011,628 | |
| 11,575,965 | | Federal National Mortgage Association Pass-Thru, Pool BC0785 | | | 3.50% | | | 04/01/2046 | | | 11,815,214 | |
| 556,648 | | Federal National Mortgage Association Pass-Thru, Pool MA0264 | | | 4.50% | | | 12/01/2029 | | | 581,626 | |
| 385,466 | | Federal National Mortgage Association Pass-Thru, Pool MA0353 | | | 4.50% | | | 03/01/2030 | | | 402,900 | |
| 18,676 | | Federal National Mortgage Association Pass-Thru, Pool MA0468 | | | 5.00% | | | 07/01/2040 | | | 19,379 | |
| 12,871,174 | | Federal National Mortgage Association Pass-Thru, Pool MA2151 | | | 3.50% | | | 01/01/2045 | | | 12,934,277 | |
| 9,335,809 | | Federal National Mortgage Association Pass-Thru, Pool MA2248 | | | 3.00% | | | 04/01/2045 | | | 9,259,638 | |
| 15,369,087 | | Federal National Mortgage Association, Pool AL9238 | | | 3.00% | | | 10/01/2041 | | | 15,386,656 | |
| 44,684,883 | | Federal National Mortgage Association, Pool AS7661 | | | 3.00% | | | 08/01/2046 | | | 44,424,257 | |
| 8,823,430 | | Federal National Mortgage Association, Pool AS7724 | | | 2.50% | | | 08/01/2046 | | | 8,580,938 | |
| 21,796,959 | | Federal National Mortgage Association, Pool BC9081 | | | 3.00% | | | 12/01/2046 | | | 21,740,889 | |
| 20,928,647 | | Federal National Mortgage Association, Pool BD8013 | | | 2.50% | | | 09/01/2046 | | | 20,353,481 | |
| 14,759,030 | | Federal National Mortgage Association, Pool MA2621 | | | 3.50% | | | 05/01/2046 | | | 14,831,229 | |
| 26,182,088 | | Federal National Mortgage Association, Pool MA2649 | | | 3.00% | | | 06/01/2046 | | | 26,029,378 | |
| 36,578,061 | | Federal National Mortgage Association, Pool MA2806 | | | 3.00% | | | 11/01/2046 | | | 36,439,406 | |
| 301,858 | | Federal National Mortgage Association, Series 2003-W17-1A7 | | | 5.75% | | | 08/25/2033 | | | 329,886 | |
| 2,123,308 | | Federal National Mortgage Association, Series 2005-20-QH | | | 5.00% | | | 03/25/2035 | | | 2,323,440 | |
| 379,143 | | Federal National Mortgage Association, Series 2006-101-SA (-1 x 1 Month LIBOR USD + 6.58%, 6.58% Cap) | | | 4.09% | I/F I/O | | 10/25/2036 | | | 64,379 | |
| 161,121 | | Federal National Mortgage Association, Series 2006-56-SM (-1 x 1 Month LIBOR USD + 6.75%, 6.75% Cap) | | | 4.26% | I/F I/O | | 07/25/2036 | | | 25,843 | |
| 115,485 | | Federal National Mortgage Association, Series 2007-116-BI (-1 x 1 Month LIBOR USD + 6.25%, 6.25% Cap) | | | 3.76% | I/F I/O | | 05/25/2037 | | | 14,493 | |
| 1,504,667 | | Federal National Mortgage Association, Series 2007-30-FS (-5 x 1 Month LIBOR USD + 29.83%, 29.83% Cap) | | | 18.32% | I/F | | 04/25/2037 | | | 2,094,371 | |
| 585,064 | | Federal National Mortgage Association, Series 2007-30-OI (-1 x 1 Month LIBOR USD + 6.44%, 6.44% Cap) | | | 3.95% | I/F I/O | | 04/25/2037 | | | 102,064 | |
| 105,761 | | Federal National Mortgage Association, Series 2008-29-ZA | | | 4.50% | | | 04/25/2038 | | | 111,641 | |
| 53,954 | | Federal National Mortgage Association, Series 2008-62-SC (-1 x 1 Month LIBOR USD + 6.00%, 6.00% Cap) | | | 3.51% | I/F I/O | | 07/25/2038 | | | 6,394 | |
| 597,326 | | Federal National Mortgage Association, Series 2009-111-EZ | | | 5.00% | | | 01/25/2040 | | | 639,919 | |
| 18,109 | | Federal National Mortgage Association, Series 2009-111-SE (-1 x 1 Month LIBOR USD + 6.25%, 6.25% Cap) | | | 3.76% | I/F I/O | | 01/25/2040 | | | 2,182 | |
| 69,866 | | Federal National Mortgage Association, Series 2009-16-MZ | | | 5.00% | | | 03/25/2029 | | | 74,057 | |
| 69,112 | | Federal National Mortgage Association, Series 2009-48-WS (-1 x 1 Month LIBOR USD + 5.95%, 5.95% Cap) | | | 3.46% | I/F I/O | | 07/25/2039 | | | 7,080 | |
| 222,833 | | Federal National Mortgage Association, Series 2009-62-PS (-1 x 1 Month LIBOR USD + 6.10%, 6.10% Cap) | | | 3.61% | I/F I/O | | 08/25/2039 | | | 21,776 | |
| 1,090,578 | | Federal National Mortgage Association, Series 2009-77-ZA | | | 4.50% | | | 10/25/2039 | | | 1,150,364 | |
| 276,244 | | Federal National Mortgage Association, Series 2009-83-Z | | | 4.50% | | | 10/25/2039 | | | 284,847 | |
| 118,765 | | Federal National Mortgage Association, Series 2010-101-ZH | | | 4.50% | | | 07/25/2040 | | | 124,952 | |
| 421,373 | | Federal National Mortgage Association, Series 2010-112-ZA | | | 4.00% | | | 10/25/2040 | | | 428,223 | |
| 264,673 | | Federal National Mortgage Association, Series 2010-121-SD (-1 x 1 Month LIBOR USD + 4.50%, 4.50% Cap) | | | 2.01% | I/F I/O | | 10/25/2040 | | | 20,357 | |
| 29,336 | | Federal National Mortgage Association, Series 2010-137-VS (-3 x 1 Month LIBOR USD + 15.00%, 15.00% Cap) | | | 7.53% | I/F | | 12/25/2040 | | | 36,835 | |
| 50,352 | | Federal National Mortgage Association, Series 2010-31-SA (-1 x 1 Month LIBOR USD + 5.00%, 5.00% Cap) | | | 2.51% | I/F I/O | | 04/25/2040 | | | 3,796 | |
| 81,390 | | Federal National Mortgage Association, Series 2010-34-PS (-1 x 1 Month LIBOR USD + 4.93%, 4.93% Cap) | | | 2.44% | I/F I/O | | 04/25/2040 | | | 6,307 | |
| 190,721 | | Federal National Mortgage Association, Series 2010-35-SP (-1 x 1 Month LIBOR USD + 6.35%, 6.35% Cap) | | | 3.86% | I/F I/O | | 04/25/2050 | | | 23,797 | |
| 39,074 | | Federal National Mortgage Association, Series 2010-35-SV (-1 x 1 Month LIBOR USD + 6.45%, 6.45% Cap) | | | 3.96% | I/F I/O | | 04/25/2040 | | | 3,144 | |
| 2,011,721 | | Federal National Mortgage Association, Series 2010-37-MY | | | 4.50% | | | 04/25/2040 | | | 2,121,934 | |
| 94,851 | | Federal National Mortgage Association, Series 2010-59-PS (-1 x 1 Month LIBOR USD + 6.45%, 6.45% Cap) | | | 3.96% | I/F I/O | | 03/25/2039 | | | 3,779 | |
| 239,439 | | Federal National Mortgage Association, Series 2010-59-SC (-1 x 1 Month LIBOR USD + 5.00%, 5.00% Cap) | | | 2.51% | I/F I/O | | 01/25/2040 | | | 22,380 | |
| 854,408 | | Federal National Mortgage Association, Series 2010-60-VZ | | | 5.00% | | | 10/25/2039 | | | 908,419 | |
| 216,708 | | Federal National Mortgage Association, Series 2010-64-EZ | | | 5.00% | | | 06/25/2040 | | | 235,219 | |
| 435,357 | | Federal National Mortgage Association, Series 2010-7-PE | | | 5.00% | | | 02/25/2040 | | | 457,435 | |
| 112,111 | | Federal National Mortgage Association, Series 2010-90-GS (-1 x 1 Month LIBOR USD + 6.00%, 6.00% Cap) | | | 3.51% | I/F I/O | | 08/25/2040 | | | 13,442 | |
| 57,791 | | Federal National Mortgage Association, Series 2010-99-SG (-5 x 1 Month LIBOR USD + 25.00%, 25.00% Cap) | | | 12.55% | I/F | | 09/25/2040 | | | 81,648 | |
| 6,181,012 | | Federal National Mortgage Association, Series 2011-141-PZ | | | 4.00% | | | 01/25/2042 | | | 6,373,918 | |
| 14,238,418 | | Federal National Mortgage Association, Series 2011-18-UZ | | | 4.00% | | | 03/25/2041 | | | 14,773,171 | |
| 1,290,062 | | Federal National Mortgage Association, Series 2011-25-KY | | | 3.00% | | | 04/25/2026 | | | 1,301,764 | |
| 1,000,000 | | Federal National Mortgage Association, Series 2011-29-AL | | | 3.50% | | | 04/25/2031 | | | 1,017,551 | |
| 1,091,990 | | Federal National Mortgage Association, Series 2011-59-MA | | | 4.50% | | | 07/25/2041 | | | 1,155,353 | |
| 25,609,874 | | Federal National Mortgage Association, Series 2013-45-LZ | | | 3.00% | > | | 05/25/2043 | | | 24,565,895 | |
| 32,884,702 | | Federal National Mortgage Association, Series 2013-6-ZB | | | 3.00% | > | | 02/25/2043 | | | 31,538,205 | |
| 9,054,493 | | Federal National Mortgage Association, Series 2014-55-MA | | | 3.00% | | | 10/25/2039 | | | 9,120,110 | |
| 26,349,020 | | Federal National Mortgage Association, Series 2014-70-VZ | | | 3.00% | > | | 11/25/2044 | | | 25,161,301 | |
| 8,819,992 | | Federal National Mortgage Association, Series 2014-73-CZ | | | 3.00% | > | | 11/25/2044 | | | 8,436,624 | |
| 21,496,891 | | Federal National Mortgage Association, Series 2015-9-HA | | | 3.00% | | | 01/25/2045 | | | 21,739,075 | |
| 6,348,000 | | Federal National Mortgage Association, Series 2016-M3-A2 | | | 2.70% | | | 02/25/2026 | | | 6,316,312 | |
| 3,448,537 | | Federal National Mortgage Association, Series 2017-86-MA | | | 3.00% | | | 04/25/2046 | | | 3,453,561 | |
| 93,768,065 | | Federal National Mortgage Association, Series 2018-21-PO | | | 0.00% | P/O | | 04/25/2048 | | | 74,570,816 | |
| 63,521,688 | | Federal National Mortgage Association, Series 2018-27-JA | | | 3.00% | | | 12/25/2047 | | | 63,057,973 | |
| 167,976,029 | | Federal National Mortgage Association, Series 2018-35-PO | | | 0.00% | P/O | | 05/25/2048 | | | 132,134,396 | |
| 61,651,505 | | Federal National Mortgage Association, Series 2018-36-A | | | 3.00% | | | 06/25/2048 | | | 61,568,510 | |
| 38,294,088 | | Federal National Mortgage Association, Series 2018-39-AB | | | 3.00% | | | 06/25/2048 | | | 38,115,060 | |
| 300,510 | | Federal National Mortgage Association, Series 400-S4 (-1 x 1 Month LIBOR USD + 5.45%, 5.45% Cap) | | | 2.96% | I/F I/O | | 11/25/2039 | | | 34,293 | |
| 174,603 | | Government National Mortgage Association, Pool 752494 | | | 5.50% | | | 09/20/2039 | | | 184,683 | |
| 229,438 | | Government National Mortgage Association, Series 2003-67-SP (-1 x 1 Month LIBOR USD + 7.10%, 7.10% Cap) | | | 4.61% | I/F I/O | | 08/20/2033 | | | 35,959 | |
| 124,317 | | Government National Mortgage Association, Series 2008-82-SM (-1 x 1 Month LIBOR USD + 6.05%, 6.05% Cap) | | | 3.56% | I/F I/O | | 09/20/2038 | | | 15,144 | |
| 1,791,050 | | Government National Mortgage Association, Series 2009-32-ZE | | | 4.50% | | | 05/16/2039 | | | 1,921,028 | |
| 2,008,592 | | Government National Mortgage Association, Series 2009-35-DZ | | | 4.50% | | | 05/20/2039 | | | 2,153,895 | |
| 2,091,843 | | Government National Mortgage Association, Series 2009-75-GZ | | | 4.50% | | | 09/20/2039 | | | 2,204,631 | |
| 2,499,715 | | Government National Mortgage Association, Series 2009-75-HZ | | | 5.00% | | | 09/20/2039 | | | 2,680,489 | |
| 6,499,398 | | Government National Mortgage Association, Series 2010-113-SM (-1 x 1 Month LIBOR USD + 6.05%, 6.05% Cap) | | | 3.56% | I/F I/O | | 09/20/2040 | | | 871,821 | |
| 133,380 | | Government National Mortgage Association, Series 2010-25-ZB | | | 4.50% | > | | 02/16/2040 | | | 143,526 | |
| 4,239,048 | | Government National Mortgage Association, Series 2011-45-GZ | | | 4.50% | | | 03/20/2041 | | | 4,464,930 | |
| 10,989,878 | | Government National Mortgage Association, Series 2011-71-ZA | | | 4.50% | | | 02/20/2041 | | | 11,615,275 | |
| 12,084,423 | | Government National Mortgage Association, Series 2013-117-MS (-1 x 1 Month LIBOR USD + 6.15%, 6.15% Cap) | | | 3.66% | I/F I/O | | 02/20/2043 | | | 1,432,579 | |
| 5,980,229 | | Government National Mortgage Association, Series 2013-122-SB (-1 x 1 Month LIBOR USD + 6.10%, 6.10% Cap) | | | 3.62% | I/F I/O | | 08/16/2043 | | | 898,302 | |
| 26,569,009 | | Government National Mortgage Association, Series 2013-169-SE (-1 x 1 Month LIBOR USD + 6.05%, 6.05% Cap) | | | 3.57% | I/F I/O | | 11/16/2043 | | | 3,829,070 | |
| 9,215,738 | | Government National Mortgage Association, Series 2014-102-TS (-1 x 1 Month LIBOR USD + 5.60%, 5.60% Cap) | | | 3.11% | I/F I/O | | 07/20/2044 | | | 1,250,590 | |
| 7,271,872 | | Government National Mortgage Association, Series 2014-118-PS (-1 x 1 Month LIBOR USD + 6.20%, 6.20% Cap) | | | 3.71% | I/F I/O | | 08/20/2044 | | | 1,188,450 | |
| 6,362,888 | | Government National Mortgage Association, Series 2014-118-SA (-1 x 1 Month LIBOR USD + 6.20%, 6.20% Cap) | | | 3.71% | I/F I/O | | 08/20/2044 | | | 1,039,894 | |
| 9,034,894 | | Seasoned Credit Risk Transfer Trust, Series 2018-2-HV | | | 3.00% | # | | 11/25/2057 | | | 8,926,951 | |
| | | | | | | | | | | | |
Total US Government and Agency Mortgage Backed Obligations(Cost $1,668,523,259) | | | 1,685,672,685 | |
| | | | | | | | | | | | |
| |
US Government and Agency Obligations - 16.3% | | | | |
| 51,438,492 | | United States Treasury Inflation Indexed Bonds | | | 0.88% | | | 01/15/2029 | | | 53,142,929 | |
| 100,389,240 | | United States Treasury Inflation Indexed Bonds | | | 1.00% | | | 02/15/2046 | | | 102,566,988 | |
| 93,100,000 | | United States Treasury Notes | | | 1.38% | | | 02/15/2020 | | | 92,269,010 | |
| 23,490,000 | | United States Treasury Notes | | | 1.63% | | | 11/30/2020 | | | 23,224,820 | |
| 17,900,000 | | United States Treasury Notes | | | 1.88% | | | 01/31/2022 | | | 17,727,293 | |
| 81,500,000 | | United States Treasury Notes | | | 1.88% | | | 03/31/2022 | | | 80,726,386 | |
| 113,300,000 | | United States Treasury Notes | | | 1.88% | | | 04/30/2022 | | | 112,133,806 | |
| 113,300,000 | | United States Treasury Notes | | | 1.75% | | | 05/31/2022 | | | 111,684,590 | |
| 86,200,000 | | United States Treasury Notes | | | 2.63% | | | 02/28/2023 | | | 87,496,367 | |
| 102,800,000 | | United States Treasury Notes | | | 2.50% | | | 03/31/2023 | | | 103,896,265 | |
| 100,700,000 | | United States Treasury Notes | | | 2.75% | | | 04/30/2023 | | | 102,741,535 | |
| 83,000,000 | | United States Treasury Notes | | | 1.63% | | | 05/31/2023 | | | 81,017,402 | |
| 105,900,000 | | United States Treasury Notes | | | 1.88% | | | 08/31/2024 | | | 103,854,392 | |
| 106,100,000 | | United States Treasury Notes | | | 2.13% | | | 09/30/2024 | | | 105,343,623 | |
| 126,790,000 | | United States Treasury Notes | | | 2.25% | | | 10/31/2024 | | | 126,673,611 | |
| 97,500,000 | | United States Treasury Notes | | | 3.00% | | | 09/30/2025 | | | 101,598,047 | |
| 107,390,000 | | United States Treasury Notes | | | 2.25% | | | 08/15/2027 | | | 106,477,605 | |
| 83,700,000 | | United States Treasury Notes | | | 2.25% | | | 11/15/2027 | | | 82,903,869 | |
| 40,000,000 | | United States Treasury Notes | | | 2.88% | | | 05/15/2028 | | | 41,596,094 | |
| 11,990,000 | | United States Treasury Notes | | | 2.75% | | | 11/15/2042 | | | 11,959,791 | |
| 67,500,000 | | United States Treasury Notes | | | 3.13% | | | 02/15/2043 | | | 71,685,791 | |
| 66,400,000 | | United States Treasury Notes | | | 3.63% | | | 08/15/2043 | | | 76,472,828 | |
| 53,400,000 | | United States Treasury Notes | | | 3.75% | | | 11/15/2043 | | | 62,748,129 | |
| 20,800,000 | | United States Treasury Notes | | | 2.75% | | | 11/15/2047 | | | 20,554,625 | |
| | | | | | | | | | | | |
Total US Government and Agency Obligations(Cost $1,837,118,577) | | | 1,880,495,796 | |
| | | | | | | | | | | | |
| |
Affiliated Mutual Funds - 11.2% | | | | |
| 75,799,348 | | DoubleLine Global Bond Fund (Class I) | | | | | | | | | 779,217,300 | |
| 45,674,545 | | DoubleLine Infrastructure Income Fund (Class I) | | | | | | | | | 461,769,648 | |
| 5,000,000 | | DoubleLine Long Duration Total Return Bond Fund (Class I) | | | | | | | | | 49,400,000 | |
| | | | | | | | | | | | |
Total Affiliated Mutual Funds(Cost $1,285,400,000) | | | 1,290,386,948 | |
| | | | | | | | | | | | |
| |
Exchange Traded Funds and Common Stocks - 0.0% | | | | |
| 135,690 | | Frontera Energy Corporation | | | | | | | | | 1,161,601 | |
| | | | | | | | | | | | |
Total Exchange Traded Funds and Common Stocks(Cost $11,867,203) | | | 1,161,601 | |
| | | | | | | | | | | | |
| |
Short Term Investments - 7.0% | | | | |
| 160,036,222 | | First American Government Obligations Fund - Class U | | | 2.35% | ◆ | | | | | 160,036,222 | |
| 160,036,222 | | JP Morgan U.S. Government Money Market Fund - Institutional Share Class | | | 2.33% | ◆ | | | | | 160,036,222 | |
| 160,036,222 | | Morgan Stanley Institutional Liquidity Funds Government Portfolio - Institutional Share Class | | | 2.32% | ◆ | | | | | 160,036,222 | |
| 130,500,000 | | United States Treasury Bills | | | 0.00% | | | 07/11/2019 | | | 129,633,656 | |
| 55,500,000 | | United States Treasury Bills | | | 0.00% | | | 09/05/2019 | | | 54,927,934 | |
| 148,010,000 | | United States Treasury Bills | | | 0.00% | | | 11/07/2019 | | | 145,907,627 | |
| | | | | | | | | | | | |
Total Short Term Investments(Cost $810,376,672) | | | 810,577,883 | |
| | | | | | | | | | | | |
| |
Total Investments - 100.0%(Cost $11,484,691,599) | | | 11,515,400,673 | |
| Liabilities in Excess of Other Assets - 0.0% | | | (2,123,762 | ) |
| | | | | | | | | | | | |
NET ASSETS - 100.0% | | $ | 11,513,276,911 | |
| | | | | | | | | | | | |
| | | | |
| | ^ Security exempt from registration under Rule 144A of the Securities Act of 1933. These securities may be resold in transactions exempt from registration to qualified institutional buyers. These securities are determined to be liquid by the Adviser, unless otherwise noted, under procedures established by the Fund’s Board of Trustees. At March 31, 2019, the value of these securities amounted to $2,394,776,026 or 20.8% of net assets. | | | | | | | | | | |
| | | | |
| | # Coupon rate is variable based on the weighted average coupon of the underlying collateral. To the extent the weighted average coupon of the underlying assets which comprise the collateral increases or decreases, the coupon rate of this security will increase or decrease correspondingly. The rate disclosed is as of March 31, 2019. | | | | | | | | | | |
| | ± Coupon rate is variable or floats based on components including but not limited to reference rate and spread. These securities may not indicate a reference rate and/or spread in their description. The rate disclosed is as of March 31, 2019. | | | | | | | | | | |
| | | | |
| | Þ Value determined using significant unobservable inputs. | | | | | | | | | | |
| | † Perpetual Maturity | | | | | | | | | | |
| | W Security is in default or has failed to make a scheduled payment. Income is not being accrued. | | | | | | | | | | |
| | I/O Interest only security | | | | | | | | | | |
| | § The interest rate will step up if the issuer does not redeem the bond on or before a scheduled redemption date in accordance with the terms of the instrument. The interest rate shown is the rate in effect as of March 31, 2019. | | | | | | | | | | |
| | ß The interest rate may step up conditioned upon the aggregate remaining principal balance of the underlying mortgage loans being reduced below a targeted percentage of the aggregate original principal balance of the mortgage loans. The interest rate shown is the rate in effect as of March 31, 2019. | | | | | | | | | | |
| | & Unfunded or partially unfunded loan commitment. At March 31, 2019, the value of these securities amounted to $1,462,643 or 0.0% of net assets. | | | | | | | | | | |
| | I/F Inverse floating rate security whose interest rate moves in the opposite direction of reference interest rates. Reference interest rates are typically based on a negative multiplier or slope. Interest rate may also be subject to a cap or floor. | | | | | | | | | | |
| | | | |
| | > This U.S. Agency bond accrues interest which is added to the outstanding principal balance. The interest payment will be deferred until all other tranches in the structure are paid off. The rate disclosed is as of March 31, 2019. | | | | | | | | | | |
| | P/O Principal only security | | | | | | | | | | |
| | | | |
| | ◆ Seven-day yield as of March 31, 2019 | | | | | | | | | | |
| | PIK A payment-in-kind security in which the issuer may make interest or dividend payments in cash or additional securities. These additional securities generally have the same terms as the original holdings. | | | | | | | | | | |
| | ~ Represents less than 0.05% of net assets | | | | | | | | | | |
A summary of the DoubleLine Core Fixed Income Fund’s investments in affiliated mutual funds for the year ended March 31, 2019 is as follows:
To the Board of Trustees of DoubleLine Funds Trust and Shareholders of DoubleLine Total Return Bond Fund and DoubleLine Core Fixed Income Fund
We have audited the accompanying statements of assets and liabilities, including the schedules of investments - summary, of DoubleLine Total Return Bond Fund and DoubleLine Core Fixed Income Fund (two of the funds constituting DoubleLine Funds Trust, hereafter collectively referred to as the “Funds”) as of March 31, 2019, the related statements of operations for the year ended March 31, 2019, the statements of changes in net assets for each of the two years in the period ended March 31, 2019, including the related notes, and the financial highlights for each of the five years in the periods ended March 31, 2019 (included in Item 1 of this FormN-CSR) and the schedules of investments (included in Item 6 of this FormN-CSR) as of March 31, 2019 (collectively referred to as the “financial statements”). In our opinion, the financial statements present fairly, in all material respects, the financial position of each of the Funds as of March 31, 2019, the results of each of their operations for the year then ended, the changes in each of their net assets for each of the two years in the period ended March 31, 2019 and each of the financial highlights for each of the five years in the periods ended March 31, 2019 in conformity with accounting principles generally accepted in the United States of America.
These financial statements are the responsibility of the Funds’ management. Our responsibility is to express an opinion on the Funds’ financial statements based on our audits. We are a public accounting firm registered with the Public Company Accounting Oversight Board (United States) (“PCAOB”) and are required to be independent with respect to the Funds in accordance with the U.S. federal securities laws and the applicable rules and regulations of the Securities and Exchange Commission and the PCAOB.
We conducted our audits of these financial statements in accordance with the standards of the PCAOB. Those standards require that we plan and perform the audits to obtain reasonable assurance about whether the financial statements are free of material misstatement, whether due to error or fraud.
Our audits included performing procedures to assess the risks of material misstatement of the financial statements, whether due to error or fraud, and performing procedures that respond to those risks. Such procedures included examining, on a test basis, evidence regarding the amounts and disclosures in the financial statements. Our audits also included evaluating the accounting principles used and significant estimates made by management, as well as evaluating the overall presentation of the financial statements. Our procedures included confirmation of securities owned as of March 31, 2019 by correspondence with the custodian and brokers; when replies were not received from brokers, we performed other auditing procedures. We believe that our audits provide a reasonable basis for our opinion.
We have served as the auditor of one or more investment companies in the DoubleLine Investment Company Complex since 2010.
There have been no material changes to the procedures by which shareholders may recommend nominees to the registrant’s board of trustees.
(2) A separate certification for each principal executive and principal financial officer pursuant to Section 302 of the Sarbanes-Oxley Act of 2002. Filed herewith.
(4) Change in the registrant’s independent public accountant. There was no change in the registrant’s independent public accountant for the period covered by this report.
Pursuant to the requirements of the Securities Exchange Act of 1934 and the Investment Company Act of 1940, the registrant has duly caused this report to be signed on its behalf by the undersigned, thereunto duly authorized.
Pursuant to the requirements of the Securities Exchange Act of 1934 and the Investment Company Act of 1940, this report has been signed below by the following persons on behalf of the registrant and in the capacities and on the dates indicated.