Alderon Iron Ore Corp. NI 43-101 Technical Report – PEA of the Kami Iron Ore Project | | 
|
DATE AND SIGNATURE PAGE
This report is effective as of the 8th day of September, 2011.
‘Angelo Grandillo’ | | September 8, 2011 |
Angelo Grandillo | | Date |
Eng, M.Eng., BBA Inc. | | |
| | |
‘James K. Powell’ | | September 8, 2011 |
James K. Powell | | Date |
P.Eng., M.Eng., Stantec | | |
| | |
‘Michael Kociumbas’ | | September 8, 2011 |
Michael Kociumbas | | Date |
B.Sc., P. Geo, Watts, Griffis and McQuat Limited | | |
| | |
‘Richard W. Risto’ | | September 8, 2011 |
Richard W. Risto | | Date |
M.Sc., P. Geo, Watts, Griffis and McQuat Limited | | |
September 2011
Alderon Iron Ore Corp.
NI 43-101 Technical Report – PEA of the Kami Iron Ore Project | | 
|
TABLE OF CONTENTS
LIST OF ABBREVIATIONS | XV |
UNITS OF MEASURE | XVIII |
1. | SUMMARY | 1-1 |
1.1 | Introduction | 1-1 |
1.2 | Geology and Mineralization | 1-2 |
1.3 | Exploration and Drilling | 1-3 |
1.4 | Mineral Processing and Metallurgical Testwork | 1-4 |
1.5 | Mineral Resource Estimates | 1-7 |
1.6 | Mining Methods | 1-9 |
1.7 | Recovery Methods and Processing Plant Design | 1-11 |
1.8 | Project Infrastructure | 1-11 |
1.9 | Market Studies and Contracts | 1-12 |
1.10 | Environment | 1-12 |
1.11 | Capital Costs | 1-13 |
1.12 | Operating Costs | 1-14 |
1.13 | Economic Analysis | 1-15 |
1.14 | Project Schedule | 1-16 |
1.15 | Conclusions | 1-16 |
2. | INTRODUCTION | 2-1 |
2.1 | Scope of Study | 2-1 |
2.2 | Sources of Information | 2-1 |
2.3 | Terms of Reference | 2-2 |
2.4 | Site Visit | 2-3 |
3. | RELIANCE ON OTHER EXPERTS | 3-1 |
4. | PROPERTY DESCRIPTION AND LOCATION | 4-1 |
4.1 | Property Location | 4-1 |
4.2 | Property Description and Ownership | 4-1 |
4.3 | Property Agreements | 4-6 |
4.4 | Permitting | 4-8 |
5. | ACCESSIBILITY, CLIMATE, LOCAL RESOURCES, INFRASTRUCTURE AND PHYSIOGRAPHY | 5-1 |
| | | |
September 2011
i
Alderon Iron Ore Corp.
NI 43-101 Technical Report – PEA of the Kami Iron Ore Project | |
|
5.1 | Access | 5-1 |
5.2 | Climate | 5-1 |
5.3 | Local Resources and Infrastructure | 5-1 |
5.4 | Physiography | 5-2 |
6. | HISTORY | 6-1 |
7. | GEOLOGICAL SETTING AND MINERALIZATION | 7-1 |
7.1 | Regional Geology | 7-1 |
7.2 | Property Geology | 7-5 |
7.2.1 | General | 7-5 |
7.2.2 | East of Mills Lake | 7-7 |
7.3 | Mineralization and Structure | 7-9 |
7.3.1 | Wabush Basin — Rose Deposits | 7-9 |
7.3.2 | Mills Lake Basin — Mills Lake and Mark Lake Deposits | 7-17 |
7.3.3 | Mineralization by Rock Type and Specific Gravity | 7-20 |
8. | DEPOSIT TYPE | 8-1 |
9. | EXPLORATION | 9-1 |
9.1 | General | 9-1 |
9.2 | Altius Exploration Programs 2006 — 2009 | 9-1 |
9.3 | Alderon’s Summer 2010 Exploration Program | 9-3 |
10. | DRILLING | 10-1 |
10.1 | Historic Drilling | 10-1 |
10.2 | Altius 2008 Drilling Program | 10-1 |
10.2.1 | General | 10-1 |
10.2.2 | 2008 Drillhole Collars and Downhole Surveying | 10-2 |
10.3 | Alderon 2010 Drilling Program | 10-3 |
10.3.1 | General | 10-3 |
10.3.2 | 2010 Drillhole Collars and Downhole Attitude Surveying | 10-7 |
10.3.3 | Geophysical Downhole Surveying | 10-9 |
10.4 | WGM Comments on 2008 and 2010 Drilling | 10-10 |
11. | SAMPLE PREPARATION, ANALYSIS AND SECURITY | 11-1 |
11.1 | Alderon 2010 Drill Core Handling and Logging | 11-1 |
11.2 | Sample Security | 11-2 |
11.3 | Alderon 2010 Sampling Method & Approach | 11-2 |
| | | |
September 2011
ii
Alderon Iron Ore Corp.
NI 43-101 Technical Report – PEA of the Kami Iron Ore Project | |
|
11.4 | WGM’s Comments on 2008 and 2010 Drilling | 11-4 |
11.5 | 2008 Sample Preparation and Assaying | 11-6 |
11.5.1 | 2008 Quality Assurance and Quality Control | 11-6 |
11.6 | 2010 Sample Preparation | 11-8 |
11.7 | 2010 Sample Assaying | 11-8 |
11.7.1 | General | 11-8 |
11.7.2 | 2010 Quality Assurance and Quality Control | 11-10 |
11.8 | WGM Comments on 2008 and 2010 Sampling and Assaying | 11-30 |
12. | DATA VERIFICATION | 12-1 |
13. | MINERAL PROCESSING AND METALLURGICAL TESTING | 13-1 |
13.1 | Historical Testwork | 13-1 |
13.1.1 | Grindability Tests | 13-3 |
13.1.2 | Gravity and Magnetic Separation Tests | 13-4 |
13.2 | PEA Study Metallurgical Testwork | 13-5 |
13.2.1 | Sample Selection and Preparation | 13-8 |
13.2.2 | Head Assays | 13-12 |
13.2.3 | Heavy Liquid Separation and Davis Tube Test Results | 13-13 |
13.2.4 | Mineralogical Analysis (QEMSCAN) | 13-16 |
13.2.5 | Conclusions from the Mineralogical Testwork Results | 13-21 |
13.2.6 | Wilfley Table Testwork | 13-22 |
13.2.7 | Ore Grindability | 13-25 |
13.3 | Process Flowsheet Development | 13-28 |
13.3.1 | Proposed Process Flowsheet | 13-29 |
13.3.2 | Mass Balance Derived from WT Test Results | 13-31 |
13.4 | Recommended Testwork for Feasibility Study | 13-35 |
14. | MINERAL RESOURCE ESTIMATE | 14-1 |
14.1 | WGM Mineral Resource Estimate Statement | 14-1 |
14.2 | General Mineral Resource Estimation Procedures | 14-4 |
14.3 | Database | 14-5 |
14.3.1 | Drillhole Data | 14-5 |
14.3.2 | Data Validation | 14-6 |
14.3.3 | Database Management | 14-6 |
14.4 | Geological Modeling Procedures | 14-7 |
| | | |
September 2011
iii
Alderon Iron Ore Corp.
NI 43-101 Technical Report – PEA of the Kami Iron Ore Project | |
|
14.4.1 | Cross Section Definition | 14-7 |
14.4.2 | Geological Interpretation and 3-D Wireframe Creation | 14-7 |
14.4.3 | Topographic Surface Creation | 14-17 |
14.5 | Statistical Analysis, Compositing, Capping and Specific Gravity | 14-17 |
14.5.1 | Back-Coding of Rock Code Field | 14-17 |
14.5.2 | Statistical Analysis and Compositing | 14-17 |
14.5.3 | Grade Capping | 14-20 |
14.5.4 | Density / Specific Gravity | 14-20 |
14.6 | Block Model Parameters, Grade Interpolation and Categorization of Mineral Resources | 14-20 |
14.6.1 | General | 14-21 |
14.6.2 | Block Model Setup / Parameters | 14-21 |
14.6.3 | Grade Interpolation | 14-22 |
14.6.4 | Mineral Resource Categorization | 14-24 |
15. | MINERAL RESERVE ESTIMATE | 15-1 |
16. | MINING METHOD | 16-1 |
16.1 | Resource Block Model | 16-1 |
16.1.1 | Model Coordinate System | 16-2 |
16.1.2 | Model Densities | 16-3 |
16.2 | Pit Optimization | 16-3 |
16.2.1 | Pit Optimization Parameters | 16-4 |
16.2.2 | Cut-Off Grade Calculation | 16-5 |
16.2.3 | Pit Optimization Results | 16-5 |
16.3 | Engineered Pit Design | 16-8 |
16.3.1 | Pit Slope Design Criteria | 16-8 |
16.3.2 | Engineered Pit Design Results | 16-9 |
16.4 | In-Pit Resource Estimate | 16-16 |
16.5 | Development of the Mine Plan and Mining Operations | 16-18 |
16.5.1 | Waste and Waste Dumps | 16-20 |
16.5.2 | Mine Operations and Mining Equipment Requirements and Selection | 16-21 |
16.6 | Drilling and Blasting | 16-24 |
16.7 | Fuel and Electricity | 16-25 |
16.8 | Manpower Requirements | 16-25 |
| | | |
September 2011
iv
Alderon Iron Ore Corp.
NI 43-101 Technical Report – PEA of the Kami Iron Ore Project | |
|
17. | RECOVERY METHODS | 17-1 |
17.1 | Process Design Basis | 17-1 |
17.2 | Process Flowsheet and Mass and Water Balance | 17-3 |
17.3 | General Process Description and Plant Design | 17-8 |
17.4 | Ore Crushing, Conveying and Storage | 17-9 |
17.5 | Grinding and Screening | 17-10 |
17.5.1 | Primary Grinding Mill Sizing | 17-11 |
17.6 | Gravity Spiral Circuit | 17-12 |
17.7 | Magnetic Concentration Plant | 17-14 |
17.8 | Consolidated Concentrate and Tailings Production | 17-16 |
17.9 | Concentrate Conveying and Load-Out | 17-17 |
17.10 | Tailings Dewatering and Pumping to Tailings Pond | 17-18 |
17.11 | General Concentrator Plant Services | 17-19 |
17.11.1 | Compressed Air | 17-19 |
17.11.2 | Freshwater | 17-19 |
17.11.3 | Process Water | 17-20 |
17.11.4 | Fire Protection | 17-20 |
17.11.5 | Steam | 17-20 |
17.12 | Process Design Criteria | 17-21 |
17.13 | Major Process Equipment List | 17-29 |
18. | PROJECT INFRASTRUCTURE | 18-1 |
18.1 | General Kami Site Plot Plan | 18-1 |
18.2 | Electricity | 18-9 |
18.2.1 | Analysis of Electrical Power Supply Options to the Kami Site | 18-12 |
18.3 | Railway Transportation Options Study | 18-17 |
18.4 | Port Facility | 18-20 |
18.4.1 | Proposed Option Design and Equipment | 18-24 |
19. | MARKET STUDIES AND CONTRACTS | 19-1 |
19.1 | Overview of the Iron Ore Market | 19-2 |
19.2 | Iron Ore Products and Consumption Trends | 19-3 |
19.3 | Iron Ore Pricing System | 19-5 |
19.4 | Iron Ore Price Forecast | 19-7 |
19.5 | Freight | 19-8 |
| | | |
September 2011
v
Alderon Iron Ore Corp.
NI 43-101 Technical Report – PEA of the Kami Iron Ore Project | |
|
19.6 | Iron Ore Quality | 19-8 |
19.7 | Prospects for Alderon Concentrate | 19-9 |
19.8 | Conclusions | 19-10 |
20. | ENVIRONMENTAL STUDIES, PERMITTING AND SOCIAL OR COMMUNITY IMPACT | 20-1 |
20.1 | Environmental Setting | 20-1 |
20.1.1 | Kami Mine Site | 20-1 |
20.1.2 | Pointe Noire Port Facility Site | 20-2 |
20.2 | Jurisdiction, Applicable Laws and Regulations | 20-3 |
20.2.1 | Newfoundland and Labrador Environmental Assessment Process | 20-3 |
20.2.2 | Quebec Environmental Assessment Process | 20-4 |
20.2.3 | The Federal Environmental Assessment Process | 20-5 |
20.2.4 | Law List Triggers for CEAA | 20-6 |
20.2.5 | Major Projects Management Office | 20-7 |
20.3 | Environmental Studies | 20-8 |
20.4 | Environmental Permitting | 20-9 |
20.5 | Tailings Management | 20-12 |
20.5.1 | Tailings Management Facility (TMF) Design Considerations | 20-12 |
20.5.2 | TMF Design Basis | 20-14 |
20.6 | Waste Rock Management | 20-18 |
20.6.1 | Conceptual Design of Waste Rock Dump | 20-19 |
20.7 | Site Geotechnical | 20-21 |
20.8 | Baseline Hydrogeology | 20-25 |
20.9 | Hydrologic Study | 20-27 |
20.9.1 | Hydrology | 20-29 |
20.9.2 | Water Supply and Returns | 20-32 |
20.10 | Rehabilitation and Closure Planning | 20-34 |
20.10.1 | Rehabilitation Planning | 20-34 |
20.10.2 | Objectives and Scope of the Rehabilitation and Closure Plan | 20-36 |
20.10.3 | Proposed Approach to Rehabilitation and Closure | 20-39 |
20.10.4 | Progressive Rehabilitation | 20-41 |
20.10.5 | Closure Rehabilitation | 20-42 |
20.10.6 | Post Closure Monitoring and Treatment | 20-45 |
20.11 | Community Relations | 20-45 |
| | | |
September 2011
vi
Alderon Iron Ore Corp.
NI 43-101 Technical Report – PEA of the Kami Iron Ore Project | |
|
21. | CAPITAL AND OPERATING COSTS | 21-1 |
21.1 | Basis of Estimate and Assumptions | 21-2 |
21.1.1 | Type and Class of Estimate | 21-3 |
21.1.2 | Dates, Currency and Exchange Rates | 21-3 |
21.1.3 | Labour Rates and Labour Productivity Factors | 21-3 |
21.1.4 | General Direct Capital Costs | 21-4 |
21.1.5 | Indirect Costs | 21-6 |
21.1.6 | Contingency | 21-7 |
21.1.7 | Exclusions | 21-7 |
22. | ECONOMIC ANALYSIS | 22-1 |
22.1 | Sensitivity Analysis | 22-4 |
22.2 | Risk Management | 22-6 |
22.2.1 | Scope | 22-6 |
22.2.2 | Risk Assessment Methodology | 22-7 |
23. | ADJACENT PROPERTIES | 23-1 |
24. | OTHER RELEVANT DATA AND INFORMATION | 24-1 |
24.1 | Project Implementation and Execution Plan | 24-1 |
25. | INTERPRETATION AND CONCLUSION | 25-1 |
25.1 | Mineral Resources | 25-1 |
25.2 | Metallurgy and Ore Processing | 25-4 |
25.3 | Environmental Permitting | 25-5 |
25.4 | Conclusions | 25-5 |
26. | RECOMMENDATIONS | 26-1 |
27. | REFERENCES | 27-1 |
| | | |
September 2011
vii
Alderon Iron Ore Corp.
NI 43-101 Technical Report – PEA of the Kami Iron Ore Project | | 
|
LIST OF TABLES |
|
Table 1.1: Categorized Mineral Resource Estimate for Kami Iron Ore Project (COG 20% TFe) | 1-7 |
Table 1.2: Total Estimated Initial Capital Costs (M$) | 1-14 |
Table 1.3: Total Estimated Average Operating Cost ($/t concentrate) | 1-14 |
Table 1.4: Financial Analysis Results | 1-15 |
Table 3.1: Technical Report Section List of Responsibility | 3-2 |
Table 4.1: Kamistiatusset Property in Labrador | 4-2 |
Table 4.2: Kamistiatusset Property in Québec | 4-2 |
Table 4.3: Minimum Cost of Work to be Carried Out on a Québec Claim North of 52° Latitude | 4-6 |
Table 7.1: Regional Stratigraphic Column, Western Labrador Trough | 7-4 |
Table 7.2: Rock/Unit Coding For Kami Property Drill Core Logging | 7-8 |
Table 7.3: Central Rose Deposit — Average Composition of Rock Units from 2008 AND 2010 Drill Core Sample Assays | 7-21 |
Table 7.4: Mills Lake Deposit - Average Composition of Rock Units from 2008 AND 2010 Drill Core Sample Assays | 7-22 |
Table 7.5: North Rose Zone - Average Composition of Rock Units from 2008 and 2010 Drill Core Sample Assays | 7-23 |
Table 7.6: Central Rose Deposit - Averages for Davis Tube Test Results by Rock Type | 7-28 |
Table 7.7: Mills Lake Deposit - Averages for Davis Tube Test Results by Rock Type | 7-28 |
Table 8.1: Deposit Model For Lake Superior-Type Iron Formation After Eckstrand (1984) | 8-2 |
Table 10.1: Drilling Summary — Altius 2008 Program | 10-2 |
Table 10.2: 2010 Drilling Summary by Deposit or Zone | 10-4 |
Table 10.3: Drilling Summary — Alderon 2010 Program | 10-6 |
Table 11.1: Sampling and Analysis Summary, Altius 2008 Drill Program | 11-6 |
Table 11.2: Certified Standard Reference Materials Used for the In-Field QA/QC Program Altius 2008 and Alderon 2010 | 11-7 |
Table 11.3: Sampling and Analysis Summary, Alderon 2010 Drill Program | 11-10 |
Table 11.4: Summary for 2008 and 2010 In-Field Certified Reference Standards | 11-17 |
Table 11.5: Selected Analytical Results for DT Tests Performed on Standard FER-4 | 11-18 |
September 2011
viii
Alderon Iron Ore Corp.
NI 43-101 Technical Report – PEA of the Kami Iron Ore Project | |
|
Table 11.6: Selected Analytical Results for Davis Tube Tests Performed on Eight Duplicate Core Samples | 11-19 |
Table 11.7: Performance of SGS Lakefield Certified Reference Standards %TFE — 2008 and 2010 Programs | 11-25 |
Table 11.8: Performance of SGS Lakefield Certified Reference Standards %FeO — 2008 AND 2010 Programs | 11-25 |
Table 12.1: Summary of WGM Independent Second Half Core Sampling | 12-3 |
Table 12.2: Comparison of Analytical Results - WGM Independent Sample Assays versus 2008 and 2010 Original Sample Assays | 12-4 |
Table 13.1: QEMSCAN Results in Altius SGS Report | 13-3 |
Table 13.2: Summary Description of Composite Sample Selection and Preparation | 13-10 |
Table 13.3: Sample Head Assays | 13-13 |
Table 13.4: HLS and DT Results Summary Table | 13-15 |
Table 13.5: Combined HLS Floats Davis Tube Concentrate Summary | 13-16 |
Table 13.6: Modals Composition within Samples | 13-17 |
Table 13.7: Wilfley Table & Davis Tube Test Result Summary | 13-23 |
Table 13.8: Grindability Test Result Summary | 13-26 |
Table 13.9: JK Tech SMC Test Result Summary | 13-26 |
Table 13.10: Mia Values and the Resulting Wa Values | 13-27 |
Table 13.11: Preliminary Kami Concentrate Analysis | 13-35 |
Table 13.12: Feasibility Testwork Program | 13-36 |
Table 14.1: Categorized Mineral Resource Estimate for Kami Iron Ore Project (Cutoff of 20% TFe) | 14-2 |
Table 14.2: Basic Statistics of 3 m Composites | 14-18 |
Table 14.3: Categorized Mineral Resources by %TFe_H Cutoff Kami Iron Ore Project | 14-28 |
Table 16.1: Block Model Items | 16-1 |
Table 16.2: Pit Optimization Parameters | 16-4 |
Table 16.3: Rose Central Pit Optimization Results | 16-7 |
Table 16.4: Mills Pit Optimization Results | 16-7 |
Table 16.5: Pit Design Parameters | 16-8 |
Table 16.6: Rose Central In-Pit Resource Estimate | 16-17 |
Table 16.7: Mills In-Pit Resource Estimate | 16-17 |
September 2011
ix
Alderon Iron Ore Corp.
NI 43-101 Technical Report – PEA of the Kami Iron Ore Project | |
|
Table 16.8: Tonnages of Material Moved over the LOM for Production of 8.0 Mt/y of Concentrate | 16-19 |
Table 16.9: Mining Equipment List | 16-23 |
Table 16.10: Mining Equipment List | 16-25 |
Table 16.11: Mining Equipment Estimated Fuel Consumption | 16-26 |
Table 16.12: Mining Equipment Estimated Electricity Consumption | 16-26 |
Table 16.13 Mine Area Hourly Personnel | 16-27 |
Table 16.14 Mine Area Salaried Personnel and Total Headcount | 16-28 |
Table 17.1: Concentrate Production Target and Nominal and Design Production Rates | 17-2 |
Table 17.2: Power Requirement Envelope for the Various Operating Conditions | 17-11 |
Table 17.3: Gravity Circuit Summary | 17-13 |
Table 17.4: Design Basis Showing Consolidated Concentrate and Tailings Production | 17-17 |
Table 17.5: Kami Steam Requirement Estimate | 17-21 |
Table 18.1: Kami Power Load Calculation | 18-10 |
Table 18.2: Comparison of Capital Cost of Options | 18-15 |
Table 19.1: Iron Ore Products Seaborne Trade Trend | 19-4 |
Table 19.2: Iron Ore Products Seaborne Trade Trend | 19-5 |
Table 19.3: Brazilian Fines Price Forecast | 19-10 |
Table 20.1: Potential Permits, Approvals, and Authorizations (Preliminary) - Newfoundland and Labrador | 20-9 |
Table 20.2: Potential Permits, Approval and Authorizations (Preliminary) - Quebec | 20-10 |
Table 20.3: Potential Permits, Approval and Authorizations (Preliminary) - Canada | 20-11 |
Table 20.4: Estimated Waste Rock Quantities | 20-18 |
Table 20.5: Waste Rock Dump Design Parameters | 20-20 |
Table 20.6: Estimated Waste Rock Dump Capacities | 20-20 |
Table 20.7: Details of Available Weather and Flow Station Near the Kami Project | 20-28 |
Table 20.8: Sub-Watershed Details — Kami Project | 20-28 |
Table 20.9: Summary of Climate Normals for Wabush Lake Airport | 20-29 |
Table 20.10: IDF Rainfall Amounts for Wabush Lake Airport | 20-30 |
Table 20.11: Water Budget Calculations for the Kami Mine Project | 20-31 |
Table 20.12: Summary of Flow Proration Results for the Kami Mine Project | 20-31 |
Table 21.1: Total Estimated Initial Capital Costs (M$) | 21-1 |
Table 21.2: Total Estimated Average Operating Cost ($/t concentrate) | 21-2 |
September 2011
x
Alderon Iron Ore Corp.
NI 43-101 Technical Report – PEA of the Kami Iron Ore Project | |
|
Table 22.1: Kami Project Table of Undiscounted Cash Flow | 22-2 |
Table 22.2: Financial Analysis Results | 22-3 |
Table 22.3: Sensitivity Analysis Table | 22-5 |
Table 22.4: Classification of Occurrence and Manageability | 22-7 |
Table 22.5: Risk Register | 22-8 |
Table 25.1: Categorized Mineral Resource Estimate for Kami Iron Ore Project | |
(Cutoff of 20% TFe) | 25-1 |
Table 25.2: Rose Central In-Pit Resource Estimate | 25-3 |
Table 25.3: Mills In-Pit Resource Estimate | 25-3 |
Table 26.1: Next Study Phase Cost Estimate | 26-2 |
| |
LIST OF FIGURES |
| |
Figure 4.1: Land Status Map | 4-3 |
Figure 7.1: Regional Geology | 7-3 |
Figure 7.2: Property Geology | 7-6 |
Figure 7.3: Ground Magnetic Survey with 2008 and 2010 Drillhole Locations | 7-13 |
Figure 7.4: Rose Lake Area - Cross Section 20E | 7-14 |
Figure 7.5: Rose Lake Area - Cross Section 16E | 7-15 |
Figure 7.6: Mills Lake Area - Cross Section 36+00S | 7-19 |
Figure 7.7: Comparison of %magFe Determined from Satmagan vs. Determined by Davis Tube | 7-25 |
Figure 7.8: Bulk Density for 0.1 m Samples Intervals vs. %TFe on Routine Samples | 7-29 |
Figure 7.9: SG by Gas Comparison Pycnometer on Pulps vs. %TFe on Routine Assay Samples | 7-30 |
Figure 7.10: SG by Pycnometer on Pulps vs. %TFe for WGM’s Independent Samples | 7-31 |
Figure 11.1: Results for Duplicate ¼ Split Drill Core Samples - %TFe_H — 2008 and 2010 Programs | 11-12 |
Figure 11.2: Results for Duplicate ¼ Split Drill Core Samples — %Fe3O4Satmagan_H — 2008 and 2010 Programs | 11-13 |
Figure 11.3: Results for Duplicate ¼ Split Drill Core Samples - %FeO_H — 2008 and 2010 Programs | 11-13 |
Figure 11.4: Results for Duplicate ¼ Split Drill Core Samples - %Mn_H — 2008 and 2010 Programs | 11-14 |
September 2011
xi
Alderon Iron Ore Corp.
NI 43-101 Technical Report – PEA of the Kami Iron Ore Project | |
|
Figure 11.5: Results for Duplicate ¼ Split Drill Core Samples - %SiO2_H — 2008 and 2010 Programs | 11-14 |
Figure 11.6: Results for In-Field Standards for %TFe — 2008 and 2010 Programs | 11-15 |
Figure 11.7: Results for In-Field Standards for %SiO2_H — 2008 and 2010 Programs | 11-15 |
Figure 11.8: Results for In-Field Standards for %Mn_H — 2008 and 2010 Programs | 11-16 |
Figure 11.9: Results for In-Field Standards for %FeO_H — 2010 Program | 11-16 |
Figure 11.10: Results for In-Field Standards for %magFe_H — 2010 Program | 11-17 |
Figure 11.11: %TFe_H for Preparation Duplicates 2008 and 2010 Results | 11-20 |
Figure 11.12: %magFeSat_H for Preparation Duplicates 2008 and 2010 Results | 11-20 |
Figure 11.13: %FeO_H for Preparation Duplicates 2008 and 2010 Results | 11-21 |
Figure 11.14: %magFeSat_H for Analytical Duplicates 2008 and 2010 Results | 11-21 |
Figure 11.15: Performance of SGS Lakefield Certified Reference Standards - %TFe_H 2010 Program | 11-23 |
Figure 11.16: Performance of SGS Lakefield Certified Reference Standards - %FeO_H 2010 Program | 11-24 |
Figure 11.17: %TFe_H at Inspectorate. vs. SGS Lakefield | 11-27 |
Figure 11.18: %FeO_H by HF-H2SO4 Digestion at Inspectorate. vs. SGS Lakefield | 11-27 |
Figure 11.19: %magFeSat at Inspectorate vs. SGS Lakefield | 11-28 |
Figure 11.20: %MnO_H at Inspectorate. vs. SGS Lakefield | 11-28 |
Figure 11.21: %SiO2_H at Inspectorate vs. SGS Lakefield | 11-29 |
Figure 12.1: %TFe_H for WGM Independent Sample vs. Alderon or Altius Original Sample | 12-6 |
Figure 12.2: %magFe_H (Satmagan) for WGM Independent Sample vs. Alderon or Altius Original Sample Figure | 12-6 |
Figure 12.3: %FeO_H for WGM Independent Sample vs. Alderon or Altius Original Sample | 12-7 |
Figure 12.4: %SiO2_H for WGM Independent Sample vs. Alderon or Altius Original Sample | 12-7 |
Figure 12.5: %Mn_H for WGM Independent Sample vs. Alderon or Altius Original Sample | 12-8 |
Figure 13.1: Altius Testwork Sample Preparation Flowsheet | 13-2 |
Figure 13.2: Bags Sampling Flow Diagram at SGS | 13-11 |
Figure 13.3: Particle Size Distribution of Ground Metallurgical Samples | 13-12 |
Figure 13.4: Iron Deportment within Samples | 13-18 |
Figure 13.5: Mn Deportment within Samples | 13-19 |
Figure 13.6: Mineral Liberation Size Definition | 13-19 |
Figure 13.7: Fe-oxide Liberation Curves | 13-20 |
September 2011
xii
Alderon Iron Ore Corp.
NI 43-101 Technical Report – PEA of the Kami Iron Ore Project | |
|
Figure 13.8: Simplified Process Block Diagram | 13-30 |
Figure 13.9: Hypothetical Spiral Feed PSD Used In Mass Balance Development | 13-31 |
Figure 13.10: Kami PSD Combining Spiral Concentrate and Mag-Plant Concentrate (regrind P50 = 75 microns) Compared to Reference Projects | 13-34 |
Figure 13.11: Feasibility Process Development Test Block Diagram | 13-38 |
Figure 13.12: Feasibility Process Validation Test Block Diagram | 13-39 |
Figure 14.1: Mills Lake 3-D Geological Model | 14-10 |
Figure 14.2: Rose Central 3-D Geological Model — View 1 | 14-11 |
Figure 14.3: Rose Central 3-D Geological Model — View 2 | 14-12 |
Figure 14.4: Rose Central Cross Section 20+00E Showing %TFe Block Grade Model | 14-13 |
Figure 14.5: Rose Central Cross Section 20+00E Showing Mineral Resource Categorization | 14-14 |
Figure 14.6: Mills Lake Cross Section 36+00S Showing %TFe Block Grade Model | 14-15 |
Figure 14.7: Mills Lake Cross Section 36+00S Showing Mineral Resource Categorization | 14-16 |
Figure 14.8: Normal Histogram, %TFe_H — Mills Lake 3 m Magnetite Composites | 14-19 |
Figure 14.9: Normal Histogram, %TFe_H — Rose Central 3 m Magnetite Composites | 14-19 |
Figure 14.10: Rose Central Level Plan 450 m - %TFe Block Grade Model | 14-26 |
Figure 16.1: Block Model Coordinate System | 16-3 |
Figure 16.2: Rose Central Pit Optimization Plan View | 16-6 |
Figure 16.3: Mills Pit Optimization Plan View | 16-6 |
Figure 16.4: Rose Central Engineered Pit Design, Plan View and 3-D View | 16-10 |
Figure 16.5: Rose Central Pit Section View E 400 m | 16-11 |
Figure 16.6: Rose Central Pit Section View E 600 m | 16-11 |
Figure 16.7: Rose Central Pit Section View E 800 m | 16-12 |
Figure 16.8: Rose Central Pit Section View N 1500 m | 16-12 |
Figure 16.9: Mills Engineered Pit Design, Plan View and 3-D View | 16-13 |
Figure 16.10: Mills Pit Section View E 600 m | 16-14 |
Figure 16.11: Mills Pit Section View E 800 m | 16-14 |
Figure 16.12: Mills Pit Section View E 1000 m | 16-15 |
Figure 16.13: Mills Pit Section View N 1500 m | 16-15 |
Figure 16.14: Annual Mine Truck Fleet Requirements | 16-24 |
Figure 17.1: Process Flow Diagram Crushing and Crushed Ore Storage | 17-4 |
Figure 17.2: Process Flow Diagram Grinding, Screening and Gravity Concentration | 17-5 |
September 2011
xiii
Alderon Iron Ore Corp.
NI 43-101 Technical Report – PEA of the Kami Iron Ore Project | |
|
Figure 17.3: Process Flow Diagram Regrind and Magnetic Separation Plant | 17-6 |
Figure 17.4: Process Flow Diagram General Process Water Balance | 17-7 |
Figure 18.1: Site Plan Kami Iron Ore Project | 18-3 |
Figure 18.2: Kami Site Wide Electrical Single Line Diagram and Major Electrical Equipment List | 18-11 |
Figure 18.3: Port Site Plan Showing Land Blocks Considered for the Alderon Port Facility | 18-21 |
Figure 18.4: Port Site Plan Showing Option 2 Proposed General Arrangement | 18-23 |
Figure 20.1: Layout and Location of TMF | 20-17 |
Figure 20.2: Flow Hydrograph for Selected Sub-Watersheds | 20-32 |
Figure 22.1: Sensitivity Analysis Graph | 22-5 |
Figure 24.1: Preliminary Construction Manpower Curve | 24-2 |
Figure 24.2: Simplified Project Execution Schedule | 24-3 |
September 2011
xiv
Alderon Iron Ore Corp.
NI 43-101 Technical Report – PEA of the Kami Iron Ore Project | | 
|
LIST OF ABBREVIATIONS
Two Dimensional | | 2D |
Three Dimensional | | 3D |
Aluminum Conductor- Steel Reinforced | | ACSR |
Autogenous | | AG |
Alderon Resource Corporation, Alderon Iron Ore Corp. | | Alderon |
Altius Minerals Corporation | | Altius |
ArcelorMittal Mines of Canada | | AMMC |
Association of Professional Engineers and Geoscientists of British Columbia | | APEGBC |
All-Terrain Vehicle | | ATV |
Bureau d’Audiences Publiques sur l’Environnement | | BAPE |
Breton, Banville and Associates | | BBA |
Bell Geospace Inc. | | BGI |
Basic Oxygen Furnace | | BOF |
Bond Work Index | | BWI |
Capital Expenditure | | CAPEX |
Canadian Council of Ministers of the Environment | | CCME |
Canadian Environmental Assessment Act | | CEAA |
Chemin de Fer Arnaud | | CFA |
Churchill Falls Labrador Corporation | | CFLco |
Cost and Freight China | | CFR-China |
Converting Magnetic Susceptibility | | CGS |
Council of the Canadian Institute of Mining Metallurgy and Petroleum | | CIM |
Cliffs Natural Resources Inc. | | Cliffs |
Cut-Off Grade | | COG |
Crusher work index | | CWI |
Diamond Drillhole | | DDH |
Digital Elevation Model | | DEM |
Fisheries and Oceans Canada | | DFO |
DGI Geosciences Inc. | | DGI |
Differential Global Positioning System | | DGPS |
Diameter | | dia |
Department of Natural Resources | | DNR |
Direct Reduced Iron | | DRI |
Double Start | | DS |
Davis Tube | | DT, DTT |
Department of Transportation and Works | | DTW |
Environmental Assessment | | EA |
Electric Arc Furnace | | EAF |
Environmental Effects Monitoring | | EEM |
Environmental Impact Assessment | | EIA |
Environmental Impact Statement | | EIS |
September 2011
xv
Alderon Iron Ore Corp. NI 43-101 Technical Report – PEA of the Kami Iron Ore Project | |
|
Ecological Land Classifications | | ELC |
Engineering, Procurement, and Construction Management | | EPCM |
Environmental Preview Report | | EPR |
Evapotranspiration | | ET |
Federal Authority | | FA |
Freight on Board | | FOB |
Feasibility Study | | FS |
General and Administration | | G&A |
General Arrangement | | GA |
Gravity Gradient Instruments | | GGI |
Geographic Information System | | GIS |
Global Positioning System | | GPS |
Government Service Centre | | GSC |
Harmful Alteration, Disruption or Destruction | | HADD |
Hematite | | Hem |
Heavy Liquid Separation | | HLS |
Hematite Iron | | hmFe |
Hydro Québec | | HQ |
Inverse Distance | | ID |
Intensity-Duration-Frequency | | IDF |
Iron Formation | | IF |
Iron Ore Company of Canada | | IOCC |
Internal Rate of Return | | IRR |
Kamistiatusset | | Kami |
Length | | L |
Lerchs-Grossman | | LG |
Low Intensity Magnetic Separation | | LIMS |
Labrador Mining and Exploration Co. Ltd | | LM&E |
Loss on Ignition | | LOI |
Life of Mine | | LOM |
Magnetite | | Mag |
Magnetite Iron | | magFe |
Department of Sustainable Development, Environment and Parks | | MDDEP |
Work Index of Coarse Particle | | Mia |
Work Index of the Fine Particle | | Mib |
Memorandum of Understanding | | MOU |
Major Project Management Office | | MPMO |
Ministère des Ressources Naturelles et de la Faune | | MRNF |
Major Resource Project | | MRP |
Newfoundland and Labrador | | NL |
Newfoundland and Labrador Department of Natural Resources | | NLDNR |
Nearest Neighbour | | NN |
Net Present Value | | NPV |
September 2011
xvi
Alderon Iron Ore Corp.
NI 43-101 Technical Report – PEA of the Kami Iron Ore Project | |
|
Natural Resources Canada | | NRCAN |
Overburden | | OB |
Ordre des Géologues du Québec | | OGQ |
Oxide Iron Formation | | OIF |
Opinions of Probable Costs | | OPC |
Operating Expenditure | | OPEX |
Other Track Material | | OTM |
Optical Televiewer | | OTV |
Project Control Files | | PCF |
Prospectors and Developers Association of Canada | | PDAC |
Preliminary Economic Assessment | | PEA |
Professional Engineers and Geoscientists of Newfoundland and Labrador | | PEGNL |
Process Flowsheet | | PFS |
Particle Size Distribution | | PSD |
Quality Assurance | | QA |
Quality Control | | QC |
Québec Cartier Mining | | QCM |
Quantitative Evaluation of Minerals by Scanning Electron Microscopy | | QEMSCAN |
Quebec, North Shore & Labrador | | QNSL |
Qualified Person | | QP |
Run-of-Mine | | ROM |
Rock Quality Designation | | RQD |
Rod Work Index | | RWI |
Semi Autogenous | | SAG |
Satmagan | | Sat |
Silicate-Carbonate Iron Formation | | SCIF |
Specific Gravity | | SG |
Sales, General, and Administrative Expenses | | SG&A |
SGS Minerals Services | | SGS |
Silicate Iron Formation | | SIF |
Single Line Diagram | | SLD |
SAG Mill Comminution | | SMC |
Spontaneous Potential | | SP |
SAG Power Index | | SPI |
Singlepoint Resistivity | | SPR |
Scoping Study | | SS |
Stassinu Stantec Limited Partnership | | Stantec |
Total Iron Content | | TFe |
Triangulated Irregular Network | | TIN |
Tailings Management Facility | | TMF |
Total Suspended Solids | | TSS |
Toronto Stock Exchange | | TSX |
TSX Venture Exchange | | TSX.V |
September 2011
xvii
Alderon Iron Ore Corp.
NI 43-101 Technical Report – PEA of the Kami Iron Ore Project | |
|
Power Required to Grind the Ore with an AG Mill | | Wa |
Power Required to Grind the Ore from 750 µm (22M) to the Final Product Size | | Wb |
Watts, Griffis and McOuat | | WGM |
Waste Management Plan | | WMP |
Whole Rock | | WR |
Total Operating Grinding Energy | | WT |
Wilfley Table | | WT |
Wabush Terminal Station | | WTS |
X-Ray Diffraction | | XRD |
X-Ray Fluorescence | | XRF |
| | |
UNITS OF MEASURE |
| | |
Foot | | ‘,ft |
Inches | | ”,in |
Dollar | | $ |
Dollar per tonne | | $/t |
Degree | | ° |
Micron | | µm |
Ampere | | A |
Centimeter | | cm |
Canadian Dollars | | CND |
Feet per minute | | fpm |
Gram | | g |
Gram per cubic centimeter | | g/cc, g/cm3 |
Gallons per minute | | GPM |
Giga watt hour | | GWh |
Hectare | | ha |
Horsepower | | hp |
Kilogram | | kg |
Kilometer | | km |
Square kilometer | | km² |
Kilotonne | | kt |
Kilovolt | | kV |
Kilowatt | | kW |
Kilowatt-hours per tonne | | kWh/t |
Pounds per hour | | lb/h |
Meter | | m |
Million | | M |
Million tonnes per year | | M t/y |
Cubic meter per hour | | m3/h |
Meters Above Sea Level | | masl |
Mile | | mi |
September 2011
xviii
Alderon Iron Ore Corp. NI 43-101 Technical Report – PEA of the Kami Iron Ore Project | |
|
Millimeter | | mm |
Million tonnes | | Mt |
Metric tonnes per hour | | mt/h |
Mega Volt Ampere | | MVA |
Mega Watt | | MW |
Standard cubic feet per minute | | scfm |
Tonnes | | t |
tonnes per hour | | t/h |
tonnes per cubic meter | | t/m3 |
tonnes per year | | t/y |
metric tons | | tonnes or t |
short tons | | tons |
September 2011
xix
Alderon Iron Ore Corp.
NI 43-101 Technical Report – PEA of the Kami Iron Ore Project | | 
|
1. SUMMARY
1.1 Introduction
Alderon Iron Ore Corp. (“Alderon”) acquired a 100% interest in the Kamistiatusset Iron Ore Property (the “Property” or “Kami”) on December 6, 2010 from Altius Minerals Corporation (“Altius”). The purchase is subject to a 3% gross sales royalty. The Property is located approximately 10 km from the Town of Wabush and is approximately 6 km south from the Wabush Mines mining lease owned by Cliffs Natural Resources Inc. The Property straddles the Québec-Labrador provincial border, but the majority of it is in Labrador and no mining activities are planned on the Property within Quebec. The Property in Labrador comprises three map-staked licenses (305 claims) covering 7,625 hectares. The Property in Québec consists of five map-staked licenses covering a nominal area of 125 hectares.
Altius initiated exploration of the Property in 2006 and completed geological mapping, geophysical surveys and in 2008, a diamond drilling program comprising 25 drillholes aggregating 6,129.5 m. In 2010, Alderon acquired further claims, performed an airborne gravity survey and initiated a drilling program in the Rose Central and Mills Lake areas aimed at acquiring sufficient data to allow for the estimation of Mineral Resources. This program comprised 82 drillholes aggregating 25,749 m.
Watts, Griffis and McOuat Limited (WGM) produced an NI 43-101 compliant Technical Report, dated May 20, 2011, presenting a Mineral Resource estimate based on the aforementioned drill program for the Rose Central and the Mills deposits. Alderon filed the Report on SEDAR (www.sedar.com).
Alderon retained the services of BBA Inc. to lead and prepare a Preliminary Economic Assessment (PEA) for the potential development of the Kami Property. Alderon also retained the services of Stassinu Stantec Limited Partnership (“Stantec”) to cover railway transportation, port facilities, environmental studies and site characterization studies.
This Report, prepared at the request of Mr. Brian Penney, COO of Alderon, presents the results of the PEA Study.
September 2011
1-1
Alderon Iron Ore Corp.
NI 43-101 Technical Report – PEA of the Kami Iron Ore Project | |
|
1.2 Geology and Mineralization
The Property is situated in the highly metamorphosed and deformed metasedimentary sequence of the Grenville Province, Gagnon Terrane of the Labrador Trough (“Trough”). The Trough is comprised of a sequence of Proterozoic sedimentary rocks, including iron formation, volcanic rocks and mafic intrusions. Trough rocks in the Grenville Province are highly metamorphosed and complexly folded. Iron deposits in the Gagnon Terrane, Grenville part of the Trough, include those on the Property and Lac Jeannine, Fire Lake, Mont-Wright, Mont-Reed, and Bloom Lake in the Manicouagan-Fermont area and the Luce, Humphrey and Scully deposits in the Wabush-Labrador City area. The high-grade metamorphism of the Grenville Province is responsible for recrystallization of both iron oxides and silica in primary iron formation, producing coarse-grained sugary quartz, magnetite, and specular hematite schist or gneiss (meta-taconites) that are of improved quality for concentration and processing. The Property is underlain by folded sequences of the Ferriman Group (previously Knob Lake Group) or Gagnon Group containing Wabush/Sokoman Formation iron formation and underlying and overlying units. The stratigraphic sequence varies in different parts of the Property.
The iron formation on the Property is of the Lake Superior-type. Lake Superior-type iron formation consists of banded sedimentary rocks composed principally of bands of iron oxides, magnetite and hematite within quartz (chert)-rich rock with variable amounts of silicate, carbonate and sulphide lithofacies. Such iron formations have been the principal sources of iron throughout the world (Gross, 1996). Mineralization of economic interest on the Property is oxide facies iron formation.
The oxide iron formation consists mainly of semi-massive bands, or layers, and disseminations of magnetite and/or specular hematite (specularite) in recrystallized chert and interlayered with bands (beds) of chert with minor carbonate and iron silicates. Where iron silicates exceed iron oxides, mineralization is Silicate Iron Formation (“SIF”), or where carbonate is also prevalent, mineralization is Silicate-Carbonate Iron Formation (“SCIF”). SIF and variants consist mainly of amphiboles and chert, often associated with carbonate and contains magnetite or specularite in minor amounts. Grunerite is a prominent member of the silicate iron assemblage on the Property. The OIF assemblage on the Property is mostly magnetite-rich but includes hematite-rich units as well as lean oxide iron formation and SIF and SCIF variants. Some sub-members
September 2011
1-2
Alderon Iron Ore Corp.
NI 43-101 Technical Report – PEA of the Kami Iron Ore Project | |
|
contain increased amounts of hematite (specularite) associated with manganese silicates and carbonates.
In the Mills Lake area, the iron formation consist of a gently east dipping tabular main zone with several parallel ancillary zones. The iron formation in the Rose and Mart Lakes area consists of a series of corrugated gently plunging, northeast-southwest oriented sub-parallel upright to slightly overturned anticlines and synclines. Thickness of oxide and silicate/carbonate iron formation varies widely but is indicated to be up to about 300 m on fold limbs in the Rose Central deposit.
1.3 Exploration and Drilling
All recent exploration and drilling on the Property were completed either by Altius or Alderon. Altius commenced reconnaissance mapping and rock sampling during the summer of 2006 and was completed during the 2007 field season. In 2007, their exploration program also included a high-resolution helicopter airborne magnetic survey and line cutting. The results of the 2007 program were positive and the airborne magnetic survey effectively highlighted the extent of the iron formation. Following the 2007 program, Altius acquired additional property.
The 2008 exploration program conducted by Altius consisted of rock sampling, line cutting, a ground gravity and magnetic survey, a high-resolution satellite imagery survey, an integrated 3-D geological and geophysical inversion model and 6,129 m of diamond drilling in 27 holes (including two abandoned holes which were re-drilled). The drilling program was designed to test three known iron ore occurrences that were targeted through geological mapping and geophysics, namely, Mills Lake, Mart Lake and Rose Lake. Drilling confirmed the presence of iron oxide-rich iron formation and was successful in extending the occurrences along strike and at depth.
Alderon commenced their 2010 drill program on the Property on June 1st. It was focused on the Rose Central and Mills Lake deposits; however, a few drillholes were targeted on the North Rose and South West Rose Zones. An airborne gravity and magnetic survey covering all of the Property in Newfoundland and Labrador was also completed by Bell Geospace Inc.
September 2011
1-3
Alderon Iron Ore Corp.
NI 43-101 Technical Report – PEA of the Kami Iron Ore Project | |
|
The drill program on the Rose Central deposit comprised 51 drillholes aggregating 18,928 m. Drilling was completed along grid lines 200 m apart, filling in between and extending Altius’ 2008 drilling pattern. Distance between holes varied. The holes covered an approximate northeast-southwest strike length of 1.5 km and tested mineralization to a depth of approximately 500 m. Four drillholes were drilled to test the North Rose Zone and several Central Rose drillholes also tested the North Rose Zone at depth to allow for a preliminary assessment. Ten holes aggregating 1,441 m were targeted on the South-West Rose Zone. On the Mills Lake deposit, 16 holes were drilled aggregating 4,121 m over a North-South strike length of 1.2 km on cross sections 200 m apart. The gently dipping iron formation was tested to a depth of approximately 300 m.
1.4 Mineral Processing and Metallurgical Testwork
BBA developed a metallurgical test plan for this PEA Study based on indications from previous testwork performed by Altius as well as on the general mineralogical and geological characteristics of the Rose Central and Mills deposits. SGS Minerals Services (“SGS”) were retained to perform the testwork. The objective of the testwork was to evaluate the ore’s amenability to be processed by gravity separation and/or by magnetic separation in order to produce a commercially acceptable, quality product that would allow for the economical development of the Kami Iron Ore Project. An important part of the testwork consisted of evaluating the iron liberation granulometry with the objective of achieving a concentrate particle size distribution as coarse as possible (while maintaining an acceptable iron recovery and grade), in order to provide a wider range of applications and wider marketing flexibility. The testwork results were used in defining a conceptual Process Flowsheet to be used as the design basis for this Study. A recommended testwork program for subsequent testwork required for the next study phase of this Project was also developed.
Samples were prepared from drill cores from the Rose Central and Mills deposits. Recognizing that Rose Central comprises three distinct mineralogical zones, a composite sample was prepared for each zone. A composite sample of the three aforementioned zones was also prepared. One composite sample was also prepared for Mills. Each composite sample was tested at three particle size fractions; a coarse fraction (-425/+212 microns), an intermediate
September 2011
1-4
Alderon Iron Ore Corp.
NI 43-101 Technical Report – PEA of the Kami Iron Ore Project | |
|
fraction (-212/+75 microns) and a fine fraction (-75/+45 microns). The testwork performed during this Study consisted of a combination of the following tests:
· Complete chemical assay of the head samples;
· Complete assays and distributions of each size fraction;
· Heavy Liquid Separation (HLS) on each size fraction;
· Davis Tube (DT) magnetic separation on each size fraction;
· Quantitative Evaluation of Minerals by Scanning Electron Microscopy (QEMSCAN) test for each size fraction to evaluate elemental deportment, oxide liberation and association of various constituents;
· Optical Microscopy;
· Microprobe analysis;
· Wilfley Table (WT) tests on selected samples and size fractions; and
· Grindability tests.
The general conclusions drawn from the testwork were as follows:
· In all mineralization zones, the main gangue minerals consist of quartz, carbonates and silicates;
· In Rose Central, manganese is present predominantly in carbonates in the hematite-rich mineralization zone and in silicates in the magnetite-rich zones with manganese also being chemically bonded to the magnetite;
· In Rose Central, the magnetite-rich zone contains unrecoverable iron (in carbonates and silicates) in the order of 13%, compared to about 6% in the zones containing more hematite;
· In Rose Central, iron-oxide liberation (>90% liberated) size for the hematite-rich zone is about 300 µm and in the order of 150 µm for the magnetite-rich zone;
· In Mills, iron-oxide liberation is indicated to be less than 100 µm. Considering the fine liberation size for Mills, it was decided that Process Flowsheet development for this PEA
September 2011
1-5
Alderon Iron Ore Corp.
NI 43-101 Technical Report – PEA of the Kami Iron Ore Project | |
|
Study would be done for the Rose Central deposit. Further testwork was therefore focused only on Rose Central;
· Wilfley Table (WT) results for the samples tested from Rose Central indicate an acceptable metallurgical performance;
· Ore grindability results raised the following concerns which will be explored in more detail in the next study phase;
· One of the five samples tested, exhibited an unusually high Drop-Weight Test result which is not typical of ores in the region. This result was considered an outlier and was discarded for this Study;
· After discarding the aforementioned outlier, the ore operating Work Index is between 3.7 kWh/t and 4.0 kWh/t;
· The Drop-Weight Test results revealed some evidence of bimodality in the relative density distribution. The consequence of this could be an accumulation of a dense component in the primary mill circulating, leading to possible power problems which could result in a loss of throughput.
Based on the testwork results obtained, it was concluded that a conventional flowsheet consisting of crushing, autogenous grinding and screening, gravity separation using spirals and cobbing of spiral tails, followed by regrinding and magnetic separation, provides a sound design basis for this PEA Study. The testwork results indicate the following metallurgical performance:
· Combining the concentrates from the spiral circuit (78% of the total concentrate) and from the magnetic circuit (22% of the total concentrate), a concentrate averaging 65.5% Fe, 4.5% SiO2 and 0.75% Mn can be produced with iron recovery in the order of 82.8% and weight recovery in the order of 37.8%;
· The Particle Size Distribution of the final concentrate is indicated to be acceptable for the sinter fines market; however, further testing is required to validate this.
September 2011
1-6
Alderon Iron Ore Corp.
NI 43-101 Technical Report – PEA of the Kami Iron Ore Project | |
|
1.5 Mineral Resource Estimates
WGM developed a Mineral Resource estimate for the Kami Iron Ore Project mineralized areas that have sufficient data to allow for continuity of geology and grades. WGM modeled the Rose Central and Mills Lake deposits. The Rose North Zone or other mineralized areas have not been included since confirmation/infill drilling is required before a Mineral Resource estimate can be completed on these areas. This work is planned as part of the 2011 drilling program.
The classification of Mineral Resources for this Study conforms to the definitions provided in NI 43-101 (revised on June 30th, 2011) and the guidelines adopted by the Council of the Canadian Institute of Mining Metallurgy and Petroleum (“CIM”) Standards. A summary of the Mineral Resources estimate is provided in Table 1.1.
Table 1.1: Categorized Mineral Resource Estimate for Kami Iron Ore Project (COG 20% TFe)
Category | | Zone | | Mt | | TFe% | | Mag
Fe% | | Hm
Fe% | | Mn% | | SiO2% | |
Indicated | | Total Rose Central Zone | | 376.1 | | 29.8 | | 18.6 | | 8.3 | | 1.56 | | 44.9 | |
| | Total Mills Lake Zone | | 114.1 | | 30.5 | | 22.1 | | 5.7 | | 1.02 | | 45.6 | |
| | | | | | | | | | | | | | | |
Inferred | | Total Rose Central Zone | | 46.0 | | 29.8 | | 19.2 | | 8.0 | | 1.61 | | 44.9 | |
| | Total Inferred Mills Lake Zone | | 71.9 | | 30.7 | | 22.2 | | 6.0 | | 1.05 | | 45.4 | |
The data used to generate the Mineral Resource estimate was supplied to WGM by Alderon. The Gemcom drillhole database consisted of 107 diamond drillholes; including “duplicated” hole numbers designated with an “A” nomenclature, meaning the hole was re-drilled in whole or in part, due to lost core/bad recovery. A total of 68 drillholes totaling 24,079 m were used for the current Mineral Resource estimate; 48 holes at Rose Central and 20 holes at Mills Lake. These holes were dispersed along the iron mineralization - approximately 1,600 m of strike length and 700 m of width on Rose Central and 1,400 m by 800 m on Mills Lake. The database tables as originally supplied to WGM contained some errors and these were corrected and confirmed by the Client before proceeding with the Mineral Resource estimate. In general, WGM found the database to be in good order, but it was still a work in progress. After the errors that WGM identified were corrected, there were no additional database issues that would have a material impact on the Mineral Resource estimate, so WGM proceeded to use the most up to date database supplied by Alderon.
September 2011
1-7
Alderon Iron Ore Corp.
NI 43-101 Technical Report – PEA of the Kami Iron Ore Project | |
|
For this Mineral Resource estimate, the holes were drilled on section lines which were spaced 200 m apart for both deposits in the main area of mineralization. Drillholes on cross sections were variably spaced and with variable dips (and directions) leading to mineralized intersections anywhere from less than 50 m to more than 250 m apart on adjacent holes. Most cross sections contained at least three holes and some had as many as ten holes passing through the mineralized zone due to the variable drilling pattern, however, in both deposits, the closest spaced drilling was near the surface (in the first 150 to 200 m). The deeper mineralization, i.e., below 200 m vertical depth, has been tested by fewer holes and both zones are open at depth. WGM’s zone interpretations of the mineralization were digitized into Gemcom and each polyline was “snapped’ to drillhole intervals allowing for the creation of a true 3-D wireframe. Mineralized boundaries were digitized from drillhole to drillhole which showed continuity of strike, dip and grade, generally from 100 m to 200 m in extent, and up to a maximum of about 300 m on the ends of the zones and at depth where there was no/little drillhole information, but only if the interpretation was supported by drillhole information on adjacent cross sections.
The extensions of the mineralization on the ends and at depth took into account the fact that the drilling pattern was irregular and that a proper grid was not complete; hence many drillholes did not penetrate the entire stratigraphy/zone. The 3-D model for Rose Central was continued at depth as long as there was drillhole information, however, this extension was taken into consideration when classifying the Mineral Resources and these areas were given a lower confidence category. Even though the wireframe continued to a maximum depth of -135 m (approximately 750 m vertically below surface and extending 100 m past the deepest drilling), at this time, no Mineral Resources were defined/considered below 150 m elevation.
The Mineral Resource estimate was completed using a block modeling method, and for the purpose of this Study, the grades have been interpolated using an Inverse Distance estimation technique with a set of equal length (3 m) composites generated from the raw drillhole intervals. A 3 m composite length was chosen to ensure that more than one composite would be used for grade interpolation for each block in the model and 3 m is also close to the average length of the raw assay intervals. The grades were well constrained within the wireframes and the results of the interpolation approximated the average grade of the all the composites used for the estimate.
September 2011
1-8
Alderon Iron Ore Corp.
NI 43-101 Technical Report – PEA of the Kami Iron Ore Project | |
|
WGM created a variable density model to estimate tonnage. Most of the iron formation consists of a mix of magnetite and hematite, but there are sections that contain very little hematite and are mostly magnetite, and vice versa. The SG results returned by pycnometer measurements correlate strongly with %total iron on samples, and the DGI probe determined density averaged over the same sample intervals similarly and correlate strongly with %TFe. Using WGM’s variable density model, a 30% total iron gives a SG of approximately 3.56.
The details of the geology and geometry of the Rose Central mineralized body is quite complex and more drilling is required to get a better understanding of the depth potential, dip and internal detail of the hematite-rich and waste units. However, the gross overall mineralization controls appear to be fairly well understood with the current amount of drilling completed to date. Both deposits have undergone various degrees of folding, but at this stage of exploration, the search ellipse size and orientations for the grade interpolation were kept simple. Based on the current geological knowledge; the ellipses sizes were kept the same for both deposits, but the orientation and dips changed based on the geological interpretation. For future Mineral Resource estimates and after more drilling information is available, WGM envisions, that due to folding causing orientation/strike complexity and change, different domains will most likely be defined to better control grade distribution along the limbs and to reflect changes in dip/attitude. Alternately, a technique known as unfolding may be applied during the statistical analysis and the grade interpolation.
1.6 Mining Methods
For studies at the Pre-Feasibility and Feasibility levels, CIM guidelines require that only material categorized as Measured or Indicated be classified as a reserve. Considering that this present Study is a Preliminary Economic Assessment, these guidelines require that all material classified as Measured, Indicated, or Inferred be reported as a Mineral Resource.
The block models for Rose Central and Mills were provided to BBA by WGM. The block models were imported into the MineSight software into two respective Project Control Folders (PCF) (i.e. one for Rose Central and one for Mills), as provided, without modifying any of the information given. The model was checked to ensure the validity, and to ensure that the transfer from the WGM files was successful.
September 2011
1-9
Alderon Iron Ore Corp.
NI 43-101 Technical Report – PEA of the Kami Iron Ore Project | |
|
Pit optimization was carried out using the true pit optimizer algorithm Lerchs-Grossman 3-D (“LG 3-D”) in MineSight. The LG 3-D algorithm is based on the graph theory and calculates the net value of each block in the model, i.e. profit minus loss. With all mining costs, processing costs, processing recoveries, weighted recovery values and overall pit slope, the pit optimizer searches for the pit shell with the highest undiscounted cash flow. For this Study, all blocks with rock classifications of Measured, Indicated and Inferred will be included in the economic calculations and in the pit optimization process.
The break-even cut-off grade (COG) is used to classify the material within the pit limits as ore or waste. The milling cut-off grade used for the Kami Project was strategically taken at 15% total iron. This cut-off grade is slightly higher than the break-even cut-off grade. This is done in order to maximize the NPV for this Project.
The detailed mine design is carried out using the LG 3-D optimized pit shell as a base. In order to estimate in-pit resources, operational factors that are required for a mine are added during the engineered pit design phase. These features include a haulage ramp, safety berms, bench face angles, inter-ramp angles, and bench height. Pit slope parameters as well as waste rock dump design parameters were provided by Stantec.
The mining resources were calculated for both the Rose Central engineered pit design and the Mills engineered pit design at an in-pit cut-off grade of 15% total iron. The total mining resources (Indicated + Inferred) calculated in this Study for the Rose Central pit indicate a total of 335.13 Mt, with an average grade of 29.88 % total iron. The total waste contained in the Rose Central pit is 758.62 Mt, which includes 46.77 Mt of overburden. This results in a stripping ratio of 2.26. The mining resources calculated for the Mills pit indicate a total of 89.52 Mt, with an average grade of 30.66 % total iron. The total waste contained in the Mills pit is 92.70 Mt, which includes 14.87 Mt overburden. This results in a stripping ratio of 1.04.
As part of this Study, a preliminary mine plan was developed in order to develop Capital and Operating Cost Estimates for the Project.
September 2011
1-10
Alderon Iron Ore Corp.
NI 43-101 Technical Report – PEA of the Kami Iron Ore Project | | 
|
1.7 Recovery Methods and Processing Plant Design
The metallurgical testwork for the Rose Central deposit performed during this Study allowed for the development of the process mass balance. BBA’s experience on other similar projects allowed for the development of a preliminary water balance. This was used to develop a preliminary process plant design. Considering a target concentrate production of 8.0 Mt/y, the crushing and grinding areas are required to process 21.2 Mt/y of ore. This generates 13.2 Mt/y of tailings for disposal. Based on the Resource Estimate for Rose Central, the mine life will be approximately 15.3 years. These annual tonnages allow for the development of hourly rates in each area of the plant, therefore, major equipment was sized. A process design criteria and major equipment list has been developed and is used for the processing plant Capital Cost Estimate. Power, fuel, consumables and manpower requirements were also estimated for deriving the processing Operating Cost Estimate.
1.8 Project Infrastructure
As part of this Study, a preliminary site plan was developed for the Kami site. Major site infrastructure consists of the following:
· Rose Central and Mills open pits and associated waste rock dumps;
· Mine infrastructure including employee facilities, mine garage and wash station, warehouse and shops;
· The main processing facilities consisting of the following:
· Crusher area and crushed ore conveyors;
· Crushed ore stockpile, reclaim and conveyors;
· Processing plant including maintenance and service area and employee facilities; and
· Thickener.
· Concentrate conveyors, train loadout and emergency concentrate stockpile,
· Tailings pipeline,
· Tailings Management Facility (TMF) and recycled water pumphouse;
· Kami rail loop and rail spur connecting to the QNSL railway;
· Fuel unloading and tank farm;
September 2011
1-11
Alderon Iron Ore Corp.
NI 43-101 Technical Report – PEA of the Kami Iron Ore Project | |
|
· Access road and on site roadwork;
· Long Lake raw water pumphouse;
· Power transmission line connecting to utility and main electrical substation; and
· Secondary facilities such as fire protection, communication tower, sewage treatment, etc.
Other infrastructure includes Port of Sept-Îles railway loop and spur, car dumper, stacker/reclaimer, concentrate storage and conveyors to common ship loading facility operated by the Port Authority.
1.9 Market Studies and Contracts
BBA understands that Alderon is actively promoting the Project and has engaged in discussions with several potential Clients interested in the concentrate which will be produced at the Kami facility. Alderon has also been in discussions with service Suppliers such as QNSL and Cliffs for rail transportation and with the Port of Sept-Îles for loading concentrate into ships. As of the effective date of this Report, Alderon has not entered into any material commercial agreements with any potential Client or Service Supplier.
Alderon has retained the services of Mr. Jan van Veelen, an independent consultant, to perform a market study. The objective of the study was to determine product marketability and sales strategy with an analysis of target markets and potential end-users for the Kami concentrate. The market study provided an overview of the iron ore seaborne market including historic market trends as well as analysts’ forecasts of demand and pricing for iron ore products. Based on the quality of product expected from the Kami operation, and considering the forecasted growth in sinter fines for Asia and more specifically for China, it was concluded that Alderon should pursue opportunities with potential clients in China.
1.10 Environment
The overall Project is subject to the Environmental Assessment Process of the Province of Newfoundland and Labrador, the Province of Québec as well as the Federal Assessment Process. The requirements for each of these processes are well understood. The environmental
September 2011
1-12
Alderon Iron Ore Corp.
NI 43-101 Technical Report – PEA of the Kami Iron Ore Project | |
|
studies required have been defined and planned. Permit requirements are also well defined and planned. A schedule for Environmental Permitting for the Project has been developed.
A tailings management strategy has been defined and a preliminary design for the Tailings Management Facility (TMF) has been developed. The TMF will be constructed and operated in phases thus allowing for progressive rehabilitation. An appropriate area has been determined and located on the site plan. Dewatered tailings will be pumped from the concentrator to the TMF. Water will be collected within a polishing pond and returned to the processing plant thus minimizing fresh water consumption. It is anticipated that the tailings supernatant will be inert, with negligible metal and chemical levels.
Waste rock from the mining operation will be permanently stored within two waste rock dumps, one to the North-West and one to the South-West of Rose Central pit. The areas identified do not contain any significant mineralization and make use of the natural topography. Preliminary design parameters have been developed to define the waste rock dump profile that is deemed to be “designed for closure”.
1.11 Capital Costs
Capital costs for the Project were estimated and classified as initial capital costs and sustaining capital. The total initial capital cost for the Project, including mining pre-stripping costs, Indirect Costs and contingency was estimated to be in the order of $989M. This Capital Cost Estimate is expressed in constant August 2011 Canadian Dollars, with an exchange rate at par with the US dollar. Initial capital cost excludes the following items which have been treated separately, as indicated:
· Leased equipment (mining equipment and railcars) estimated value at $259.2M which is included in operating costs;
· The portion of rehabilitation and closure costs required to be disbursed prior to production startup estimated by Stantec to be in the order of $25.5M;
September 2011
1-13
Alderon Iron Ore Corp.
NI 43-101 Technical Report – PEA of the Kami Iron Ore Project | |
|
· Sustaining capital (capital expenses incurred in Year 1 of production to the end-of-mine-life) estimated at $198.5M.
Initial capital costs are summarized in Table 1.2.
Table 1.2: Total Estimated Initial Capital Costs (M$)
1.12 Operating Costs
Operating Costs have been estimated and are summarized in Table 1.3 in CAD$ per tonne of concentrate produced. Operating costs were estimated based on the average over the life of the mine. Operating costs include the estimated cost of leased equipment over the life of the lease.
Table 1.3: Total Estimated Average Operating Cost ($/t concentrate)
The total estimated operating costs are in the order of $44.87/t of concentrate produced. Royalties are not included in the Operating Cost Estimate presented but are treated separately in the Project economic analysis.
September 2011
1-14
Alderon Iron Ore Corp.
NI 43-101 Technical Report – PEA of the Kami Iron Ore Project | | 
|
1.13 Economic Analysis
The economic evaluation of the Kami Iron Ore Project was performed using the discounted cash flow model. The Capital and Operating Cost Estimates based on the mine plan developed in this Study to produce 8.0 Mt of concentrate annually were used as input to the model. The following parameters and assumptions were made for the Base Case financial analysis:
· A production life of 15.3 years for the Rose Central deposit from Year 1 to Year 16;
· A constant commodity price of $115/t (CAD$) of concentrate of grading at 65.5% Fe;
· All of the concentrate is sold in the same year of production;
· No escalation or inflation factor has been taken into account (constant 2011 $);
· Financial analysis excludes working capital;
· The financial analysis is carried out on a pre-tax basis;
· US Dollar at par with Canadian Dollar.
The NPV calculation was done at discount rates of 0%, 5%, 8% and 10%. The Base Case NPV was assumed at a discount rate of 8%. Table 1.4 presents the results of the financial analysis.
Table 1.4: Financial Analysis Results
| | Base Case | |
| | 40.2% | |
IRR | | NPV | | Payback | |
0% | | $ | 7 019 M | | 2.3 yrs | |
5% | | $ | 4 135 M | | 2.5 yrs | |
8% | | $ | 3 066 M | | 2.7 yrs | |
10% | | $ | 2 526 M | | 2.8 yrs | |
As can be seen, the Project is forecasted to provide an IRR of 40.2% (before tax). At the Base Case discount rate of 8%, NPV is $3,066M. Payback occurs after 2.7 years. A sensitivity analysis was also performed to show the Project sensitivity to a +/- $100M variation in capital cost, a +/- $50M per year variation in operating costs, a +/- 25% variation in commodity price and the effect of a reduced concentrate production rate considering a lower than expected Fe recovery rate. Commodity selling price showed the biggest impact on project economics.
September 2011
1-15
Alderon Iron Ore Corp.
NI 43-101 Technical Report – PEA of the Kami Iron Ore Project | |
|
A Preliminary Economic Assessment is preliminary in nature and includes Inferred Mineral Resources that are considered too speculative geologically to have economic considerations applied to them that would enable them to be categorized as Mineral Reserves, and there is no certainty that the Preliminary Economic Assessment will be realized.
1.14 Project Schedule
A preliminary project execution schedule was developed. Based on BBA’s understanding of the Environmental Assessment and Permitting process, construction can begin once the required permits are obtained. Construction is expected to begin in early November 2013. Assuming a typical construction schedule lasting about 21 months, the end of construction is estimated to occur in early August 2015. Plant startup is expected for end of October 2015.
1.15 Conclusions
Based on the work accomplished and the results obtained in this PEA Study, it is BBA’s opinion that the Project is sufficiently robust to warrant proceeding with a Feasibility Study.
September 2011
1-16
Alderon Iron Ore Corp.
NI 43-101 Technical Report – PEA of the Kami Iron Ore Project | |
|
2. INTRODUCTION
2.1 Scope of Study
The following Technical Report (the Report) presents the results of the Preliminary Economic Assessment (PEA) for the development of the Kamistiatusset (Kami) Iron Ore Property, in Western Labrador. In December 2010, Alderon Iron Ore Corporation commissioned the engineering consulting group BBA Inc. to perform this Study. This Report was prepared at the request of Mr. Brian Penney, COO of Alderon. Alderon is a Canadian publicly traded company listed on the TSX Venture Exchange (TSX.V) under the symbol ADV, with its head office situated at:
1240–1140 West Pender Street
Vancouver, BC
Canada, V6E 4G1
Tel: (604) 681-8030
This Technical Report titled “Preliminary Economic Assessment for the Development of the Kamistiatusset (Kami) Iron Ore Deposit” was prepared by a Qualified Person following the guidelines of the “Canadian Securities Administrators” National Instrument 43-101 (effective June 30, 2011), and in conformity with the guidelines of the Canadian Mining, Metallurgy and Petroleum (CIM) Standard on Mineral Resources and Reserves.
This Report is considered effective as of September 8, 2011.
2.2 Sources of Information
This Report is based in part on, internal company technical reports, maps, published government reports, company letters and memoranda, and public information, as listed in Section 27 “References” of this Report. Sections from reports authored by other consultants may have been directly quoted or summarized in this Report, and are so indicated where appropriate.
September 2011
2-1
Alderon Iron Ore Corp.
NI 43-101 Technical Report – PEA of the Kami Iron Ore Project | |
|
It should be noted that the authors have relied upon selected portions or excerpts from material contained in the following NI 43-101 compliant Technical Report. This Report is publicly available on SEDAR (www.sedar.com):
“Technical Report and Mineral Resource Estimate on the Kamistiatusset Property”, Newfoundland and Labrador for Alderon Iron Ore Corp. NI 43-101 Technical Report prepared by Watts, Griffis and McOuat Limited (WGM), consulting geologists and engineers, dated May 20, 2011 (Risto, Kociumbas and MacFarlane).
This Preliminary Economic Assessment has been completed using the previously mentioned Technical Report as well as available information contained in, but not limited to the following reports and documents:
· Report of baseline mineralogical, metallurgical and grindability characteristics of the ore from the Rose Central deposit conducted by SGS Minerals Services on behalf of Altius Minerals Corporation;
· Block model provided by WGM;
· SGS Minerals Services testwork results;
· A conceptual process flowsheet developed by BBA based on similar operations;
· Internal and commercially available databases and cost models;
· Canadian Milling Practice, Special Vol. 49, CIM;
· Various reports produced by Stantec concerning rail and port facilities studies, environmental considerations for permitting, site hydrology, hydrogeology and geotechnical, tailings management and site closure plan.
2.3 Terms of Reference
Unless otherwise stated:
· All units of measurement in the Report are in the metric system,
· All costs, revenues and values are expressed in terms of Canadian (CDN) Dollars,
· All metal prices are expressed in terms of US dollars,
· A foreign exchange rate of $1.00US = $1.00CDN was used.
September 2011
2-2
Alderon Iron Ore Corp.
NI 43-101 Technical Report – PEA of the Kami Iron Ore Project | |
|
For reported historical resource estimates, a conversion factor of 0.907 has been used in this Report to convert short tons (tons) to metric tons (tonnes or t).
Grid coordinates for the block model are given in the UTM NAD 27 (Zone 19N) and latitude / longitude system; maps are either in UTM coordinates or latitude / longitude system.
2.4 Site Visit
A site visit was conducted on March 22 and 23, 2011 by BBA, Stantec and Alderon representatives. BBA was represented by Mr. Angelo Grandillo. The purpose of the visit was to provide all key project team members with an overview of the Kami Property and to review project development milestones and planning. Alderon geologists were available to discuss general geological conditions and to provide a tour of the core storage facility with a presentation of select bedrock core material. BBA performed a visual examination of selected drill cores used to compose the composite samples for metallurgical testwork. To provide an overview of the Property terrain, the team members completed a helicopter fly-over.
September 2011
2-3
Alderon Iron Ore Corp.
NI 43-101 Technical Report – PEA of the Kami Iron Ore Project | |
|
3. RELIANCE ON OTHER EXPERTS
BBA prepared this report using reports and documents as noted in Section 27 “References” of this report. Neither BBA nor WGM have verified the legal titles to the property nor any underlying agreement(s) that may exist concerning the licenses or other agreement(s) between third parties, but has relied on Alderon to have conducted the proper legal due diligence. Any statements and opinions expressed in this document are given in good faith and in the belief that such statements and opinions are not false and misleading at the date of this Report.
It should be understood that the mineral resources presented in this study are estimates of the size and grade of the deposits, based on a certain number of drillholes and samples and on assumptions and parameters currently available. The level of confidence in the estimates depends upon a number of uncertainties. These uncertainties include, but are not limited to, future changes in metal prices and/or production costs, differences in size, grade and recovery rates from those expected, and changes in project parameters. In addition, there is no assurance that the project implementation will be realized.
BBA had the responsibility for assuring that this Technical Report meets the guidelines and standards stipulated. Certain sections of this Report however, were contributed by WGM, Stantec or other Alderon consultants. Table 3.1 outlines responsibility for the various sections of the Report.
September 2011
3-1
Alderon Iron Ore Corp.
NI 43-101 Technical Report – PEA of the Kami Iron Ore Project | | 
|
Table 3.1: Technical Report Section List of Responsibility
Section
Number | | Section Title | | Responsibility | | Comments and Exceptions |
1 | | SUMMARY | | BBA | | |
2 | | INTRODUCTION | | BBA | | |
3 | | RELIANCE ON OTHER EXPERTS | | BBA | | |
4 | | PROPERTY DESCRIPTION AND LOCATION | | WGM | | |
5 | | ACCESSIBILITY, CLIMATE, LOCAL RESOURCES, INFRASTRUCTURE AND PHYSIOGRAPHY | | BBA | | |
6 | | HISTORY | | WGM | | |
7 | | GEOLOGICAL SETTING AND MINERALIZATION | | WGM | | |
8 | | DEPOSIT TYPE | | WGM | | |
9 | | EXPLORATION | | WGM | | |
10 | | DRILLING | | WGM | | |
11 | | SAMPLE PREPARATION, ASSAYING AND SECURITY | | WGM | | |
12 | | DATA VERIFICATION | | WGM | | |
13 | | MINERAL PROCESSING AND METALLURGICAL TESTING | | BBA | | |
14 | | MINERAL RESOURCE ESTIMATE | | WGM | | |
15 | | MINERAL RESERVE ESTIMATE | | BBA | | |
16 | | MINING METHODS | | BBA | | Pit slope and waste rock pile design based on geotechnical assessment by Stantec |
17 | | RECOVERY METHODS | | BBA | | |
18 | | PROJECT INFRASTRUCTURE | | BBA/Stantec | | Site infrastructure by BBA, railway and port facilities by Stantec |
19 | | MARKET STUDIES AND CONTRACTS | | BBA | | Source: Alderon independent consultant not considered a QP |
20 | | ENVIRONMENTAL STUDIES, PERMITTING AND SOCIAL OR COMMUNITY IMPACT | | Stantec | | Community relations by Alderon |
21 | | CAPITAL AND OPERATING COSTS | | BBA | | Stantec provided CAPEX and OPEX for railway, port, environmental, tailings management and site closure plan |
22 | | ECONOMIC ANALYSIS | | BBA | | |
| | | | | | | | |
September 2011
3-2
Alderon Iron Ore Corp.
NI 43-101 Technical Report – PEA of the Kami Iron Ore Project | |
|
Section
Number | | Section Title | | Responsibility | | Comments and Exceptions |
23 | | ADJACENT PROPERTIES | | BBA | | |
24 | | OTHER RELEVANT DATA AND INFORMATION | | BBA | | |
25 | | INTERPRETATION AND CONCLUSIONS | | BBA | | |
26 | | RECOMMENDATIONS | | BBA | | |
27 | | REFERENCES | | BBA | | |
| | | | | | | | |
September 2011
3-3
Alderon Iron Ore Corp.
NI 43-101 Technical Report – PEA of the Kami Iron Ore Project | |
|
The following Qualified Persons (QP) have contributed to the writing of this Report and have provided QP certificates included at the end of this Report. The information contained in the certificates outlined the sections in this Report that each of the QPs is responsible for.
· | Angelo Grandillo, | | BBA |
· | James Powell, | | Stantec |
· | Michael Kociumbas, | | WGM |
· | Richard Risto | | WGM |
The individuals listed below, who have contributed to this Preliminary Economic Assessment Study and to this Report, have extensive experience in the mining and metals industry or in a supporting capacity in the industry. They are not considered at QPs for the purpose of this NI 43-101 Report.
· | Nikola Vukovic | | Eng. (Mining Engineering) | | BBA |
· | Sean Robitaille | | Eng. (Rail Transportation) | | Stantec |
· | Dave Traves | | Eng. (Port) | | Stantec |
· | Jeff Foreman | | Eng. (Port) | | Stantec |
· | Paul Deering | | Eng. (Geotechnical/Geological) | | Stantec |
· | Ed Lyons | | Geologist | | Alderon |
· | Jan van Veelen | | Iron Ore Market Specialist | | Alderon Consultant |
Alderon retained the services of an independent consultant, Mr. Jan van Veelen, to perform a market study to evaluate potential target markets for the Kami iron ore concentrate. BBA has reviewed the contents of the market study report and believes that it provides a reasonable overview of the past and current iron ore market as well as projections according to various recognized sources.
Drill core samples collected and prepared by Alderon were submitted by Alderon Altius to SGS Minerals Services, which is an accredited laboratory. Although BBA has reviewed the test work results generated by SGS and believes that they are generally accurate, BBA is relying on SGS as an independent expert.
September 2011
3-4
Alderon Iron Ore Corp.
NI 43-101 Technical Report – PEA of the Kami Iron Ore Project | |
|
4. PROPERTY DESCRIPTION AND LOCATION
4.1 Property Location
The Property is located in Western Labrador and Eastern Québec and overlaps the interprovincial boundary. It is approximately 10 km southwest from the Town of Wabush, Newfoundland and Labrador and immediately adjacent (east) of the town of Fermont in Québec. The Property perimeter is approximately 6 km southwest from the Wabush Mines mining lease. The Property in Labrador consists of two non-contiguous blocks and spans an area that extends about 12 km east-west and 13 km north-south in NTS map areas 23B/14 and 15, and centered at approximately 52°49’N latitude and 67°02’W longitude.
4.2 Property Description and Ownership
The Property is mainly located in Labrador, however, a group of contiguous licenses are also held in Québec in order to cover mineral rights along the provincial borders which cross the west side of the Property. For the purpose of this study, all mining and processing operations will take place in the Province of Newfoundland and Labrador. According to the claim system registries of both the Government of Newfoundland and Labrador and Québec, the Property in Newfoundland and Labrador and Québec is registered to Alderon Iron Ore Corp. The total area of the Property is nominally 7,750 ha, however, some of the claims in Labrador and Québec overlap slightly. The Property in Labrador includes three map-staked licenses, namely 015980M, 017926M and 017948M, totaling 305 claim units covering 7,625 hectares. License 015980M issued in 2009 replaced licenses 014957M, 014962M, 014967M, 014968M and 015037M. Licenses 017926M and 017948M were added to the Property in 2010. Surface rights on the acquired lands are held by the provincial governments, but may be subject to First Nations Rights. Table 4.1 provides details of the current mineral land holdings in Labrador.
September 2011
4-1
Alderon Iron Ore Corp.
NI 43-101 Technical Report – PEA of the Kami Iron Ore Project | |
|
Table 4.1: Kamistiatusset Property in Labrador
License | | Claims | | Area (ha) | | NTS Areas | | Issuance Date | | Renewal Date | | Report Date | |
015980M | | 191 | | 4,775 | | 23B14 23B15 | | Dec 29, 2009 | | Dec 29, 2014 | | February 27, 2012 | |
017926M | | 92 | | 2,300 | | 23B15 | | Aug 30, 2010 | | Aug 30, 2015 | | October 29, 2012 | |
017948M | | 22 | | 550 | | 23B15 | | Sept 10, 2010 | | Sept 10, 2015 | | November 09, 2012 | |
Total | | 305 | | 7,625 | | | | | | | | | |
The Property in Québec consists of five map-staked licenses covering a nominal area of 127.46 ha. Table 4.2 provides details of the mineral land holdings in Québec.
Table 4.2: Kamistiatusset Property in Québec
License | | Area
(ha) | | NTS
Areas | | Registration
Date | | Expiry
Date | | Designation
Date | | Work
Necessary for
Renewal ($) | | Required Fees
for Renewal
($) | |
CDC2156611 | | 25.03 | | 23B14 | | May 29, 2008 | | May 28, 2012 | | Mar 27, 2008 | | 400.00 | | 96.00 | |
CDC2156609 | | 45.31 | | 23B14 | | May 29, 2008 | | May 28, 2012 | | Mar 27, 2008 | | 450.00 | | 107.00 | |
CDC2156607 | | 49.4 | | 23B14 | | May 29, 2008 | | May 28, 2012 | | Mar 27, 2008 | | 450.00 | | 107.00 | |
CDC2156610 | | 3.50 | | 23B14 | | May 29, 2008 | | May 28, 2012 | | Mar 27, 2008 | | 16.00 | | 26.00 | |
CDC2156608 | | 4.22 | | 23B14 | | May 29, 2008 | | May 28, 2012 | | Mar 27, 2008 | | 160.00 | | 26.00 | |
Total | | 127.46 | | | | | | | | | | | | | |
The Property land holdings are depicted on Figure 4.1.
September 2011
4-2
Alderon Iron Ore Corp.
NI 43-101 Technical Report – PEA of the Kami Iron Ore Project | |
|

Figure 4.1: Land Status Map
September 2011
4-3
Alderon Iron Ore Corp.
NI 43-101 Technical Report – PEA of the Kami Iron Ore Project | |
|
The Property has not been legally surveyed but the claims and licenses both in Québec and Labrador were map-staked and are defined by UTM coordinates, so the Property location is accurate.
In Labrador, a mineral exploration license is issued for a term of five years. However, a mineral exploration license may be held for a maximum of twenty years provided the required annual assessment work is completed and reported and the mineral exploration license is renewed every five years. The following is the minimum annual assessment work required to be done on a license:
$200/claim in the first year
$250/claim in the second year
$300/claim in the third year
$350/claim in the fourth year
$400/claim in the fifth year
$600/claim/year for years six to ten, inclusively
$900/claim/year for years eleven to fifteen, inclusively
$1,200/claim/year for years sixteen to twenty, inclusively.
The renewal fees are:
$25/claim for Year five
$50/claim for Year ten
$100/claim for Year fifteen
The minimum annual assessment work must be completed on or before the anniversary date. The assessment report must then be submitted within sixty (60) days after the anniversary date.
License 015980M is now in its 7th year. The license was renewed December 29th, 2009 with a fee payment of $4,775.00. Total expenditures on the 191 claims to date accepted by the Department of Mines and Energy total $7,999,875.31. Government records show that a Work Report for the fifth year was accepted on March 2nd, 2010. To maintain the Property in good standing, through December 29th, 2019, a total of $229,200 of acceptable work expenditures are
September 2011
4-4
Alderon Iron Ore Corp. NI 43-101 Technical Report – PEA of the Kami Iron Ore Project | |
|
required. To date, one Work Report (airborne geophysics) has been filed for each of the two new licenses and these two licenses are now in their second year. Actual expenditures filed for license 017926M totaled $22,615.84 and for license 017948M, $6,348.14. Government records indicate that in order to maintain the licenses in good standing, a total of $18,784.16 needs to be expended on license 017926M by August 30th, 2012, and a total of $3,551.86 is required on license 017948M by September 10th, 2012.
In Québec, the term of a claim is two years from the day the claim is registered, and the claim can be renewed indefinitely, providing the holder meets all the conditions set out in the Mining Act, including the obligation to invest a minimum amount required in exploration work determined by regulation. The Act includes provisions to allow any amount disbursed to perform work in excess of the prescribed requirements, to be applied to subsequent terms of the claim.
The claim holder may renew title for a two year period by:
· submitting an application for renewal prior to the claim expiry date;
· pay the required fees, which vary according to the surface area of the claim, its location, and the date the application is received:
· If it is received 60 days prior to the claim expiry date, the regular fees apply;
· If it is received within 60 days of the claim expiry date, the fees are doubled.
· submitting his assessment Work Report and the work declaration form at least 60 days before the claim expiry date. If the remittance of these documents is made during the 60 days prior to the expiry date, a penalty fee of $100 is applied for the late submission;
Alderon’s Québec claims range in size from approximately 3 ha to 50 ha and fees for renewal vary with claim size (see Table 4.2). If renewals are late, then late fees apply. If the required work was not performed or was insufficient to cover the minimums required, then the claim holder may pay a sum equivalent to the minimum cost of work that should have been performed. Assessment work requirements escalate with renewal term and all fees are subject to revision (Table 4.3). After a claim’s sixth term, which would be at the end of its 12th year of validity, assessment costs are static. All of Alderon’s Québec claims have been renewed once; therefore all are in their second term. WGM understands from Alderon that the claims were renewed by payment in lieu of work and Québec government records indicate no Work Reports
September 2011
4-5
Alderon Iron Ore Corp. NI 43-101 Technical Report – PEA of the Kami Iron Ore Project | | 
|
are registered. Table 4.2 (shown previously) indicates that the required expenditures for renewal for the five claims vary depending on surface area; however, all require filing by early 2012.
Table 4.3: Minimum Cost of Work to be Carried Out on a Québec Claim North of 52° Latitude
Term | | Less than 25 Ha | | Area of Claim
25 to 45 Ha | | Over 45 Ha | |
1 | | $ | 48 | | $ | 120 | | $ | 135 | |
2 | | $ | 160 | | $ | 400 | | $ | 450 | |
3 | | $ | 320 | | $ | 800 | | $ | 900 | |
4 | | $ | 480 | | $ | 1,200 | | $ | 1,350 | |
5 | | $ | 640 | | $ | 1,600 | | $ | 1,800 | |
6 | | $ | 750 | | $ | 1,800 | | $ | 1,800 | |
7 and Over | | $ | 1,000 | | $ | 2,500 | | $ | 2,500 | |
4.3 Property Agreements
On November 2nd, 2009, 0860132 B.C. Ltd. (“Privco”, a company wholly owned by Mr. Mark Morabito) entered into an option agreement (the “Altius Option Agreement”) pursuant to which Privco, or an approved assignee of Privco, had the exclusive right and option (the “Option”) to acquire a 100% title and interest in the Property, subject to the terms and conditions of the Altius Option Agreement. In order to exercise the Option, Privco was required to (i) assign its interest in the Altius Option Agreement to a company acceptable to Altius, acting reasonably, that has its shares listed on the Toronto Stock Exchange or the TSX Venture Exchange (“Pubco”); (ii) fund exploration expenditures on the Property of at least $1,000,000 in the first year, and cumulative expenditures in the first two years of at least $5 million; and (iii) issue to Altius, after the satisfaction of certain financing conditions, shares of Pubco such that upon issuance, Altius would own 50% of Pubco’s issued capital, on a fully diluted basis. In order to exercise the Option, Pubco was required to have initially raised not less than $5,000,000 in capital.
Altius retained a 100% interest in the Property until such time as Privco satisfied all of the conditions to exercise the Option. Privco had until November 2nd, 2011 to satisfy such conditions and exercise the Option. Upon exercise, Altius was required to transfer its 100% interest in the
4-6
Alderon Iron Ore Corp. NI 43-101 Technical Report – PEA of the Kami Iron Ore Project | |
|
Property to Pubco and retained 3% gross sales royalty, in addition to the equity stake in Pubco described above.
The Altius Option Agreement also included a right of first refusal. With certain exceptions, any proposed sale by Altius or its affiliates of interests or rights in any claims, permits or other property interests located in the same western Labrador iron ore mining district as the Property and described in the Altius Option Agreement, must first be offered to Privco (or Pubco on the assignment) at the same price and terms.
Subsequently, Alderon was identified as “Pubco”, and Privco satisfied the first condition of the Altius Option Agreement on December 15, 2009 when it entered into a share exchange agreement (the “Share Exchange Agreement”) whereby Alderon would acquire all of the issued and outstanding shares of Privco from Mr. Morabito in consideration of issuing 5,000,000 shares of Alderon to Mr. Morabito. Also on December 15, 2009, Alderon, Privco and Altius entered into an assignment agreement pursuant to which Alderon assumed the rights and obligations of Privco and Pubco under the Altius Option Agreement.
On January 15th, 2010, Altius, Privco and Alderon amended the terms of the Altius Option Agreement to provide that upon the completion of a private placement by Alderon in February 2010, all financing conditions set forth in the Altius Option Agreement would have been satisfied. The amendment also clarified the calculation and number of Alderon common shares to be issued to Altius and to achieve the ownership of 50% (fully diluted) of the issued and outstanding common shares of Alderon as of the specified date.
On March 3rd, 2010, Alderon completed the acquisition of Privco pursuant to the terms of the Share Exchange Agreement and acquired all of the outstanding common shares of Privco. In consideration, Alderon issued 5,000,000 common shares from treasury to Mr. Morabito.
On December 8, 2010, Altius announced in a press release that Alderon had earned a 100% interest in the Property. In order to complete the exercise of the Option, Alderon issued an aggregate of 32,285,006 common shares from its treasury to Altius. Altius retains a 3% gross sales royalty relating to any potential future mining operations.
4-7
Alderon Iron Ore Corp. NI 43-101 Technical Report – PEA of the Kami Iron Ore Project | |
|
Alderon confirmed that there are no other third party agreements concerning the Property except for a Memorandum of Understanding (“MOU”) signed with the Innu Nation of Labrador dated August 11, 2010. This agreement is summarized in Section 20.
4.4 Permitting
Alderon, for its summer 2010 program, acquired a provincial exploration permit (E100083) from the government of Newfoundland and Labrador that covered drilling, geophysics and land access including a fording permit for five crossings. It also was granted a municipal letter of permission from the town of Labrador City. This permit (No. 10-284) noted that the land is zoned Mining Reserve Rural and mineral exploration is a permitted use in this zone. This permit allowed for exploration and a fuel cache subject to certain conditions outlined in a letter dated June 10, 2010. The Labrador City permit specifies the need to respect wetlands and minimizewaterfowl habitat disturbance. Alderon also was issued a permit allowing cutting of 300 cords of wood.
The provincial exploration permit, the municipal letter of permission and the water use license were renewed to provide for the 2011 winter program.
For the 2011 summer program, Alderon applied for and received provincial exploration permit (E110091) from the Government of Newfoundland and Labrador that covers the drilling, geophysics and land access until December 31st, 2011. The water use license was renewed again for this program. Exploration and fuel cache under specific conditions are allowed in this permit dated May 30, 2011. The need to respect wetland and minimize waterfowl habitat disturbance was again specified.
All exploration work was conducted in Newfoundland and Labrador so no permits were required from Québec.
4-8
Alderon Iron Ore Corp. NI 43-101 Technical Report – PEA of the Kami Iron Ore Project | |
|
5. ACCESSIBILITY, CLIMATE, LOCAL RESOURCES, INFRASTRUCTURE AND PHYSIOGRAPHY
5.1 Access
The Property is accessible from Labrador City/Wabush, Newfoundland via 4x4 vehicle roads. All-Terrain Vehicle (“ATV”) trails enable access to the remainder of the Property. Wabush is serviced daily by commercial airline from Sept-Îles, Montreal and Québec City and also by flights from points east.
5.2 Climate
The climate in the region is typical of north-central Québec/Western Labrador (sub-Arctic climate). Winters are harsh, lasting about six to seven months with heavy snow from December through April. Summers are generally cool and wet; however, extended daylight enhances the summer workday period. Early and late winter conditions are acceptable for ground geophysical surveys and drilling operations. The prevailing winds are from the west and have an average of 14 km per hour, based on 30 years of records at the Wabush Airport.
5.3 Local Resources and Infrastructure
The Property is adjacent to the two towns of Labrador City, 2006 population 7,240 and Wabush, population 1,739. Together these two towns are known as Labrador West. Labrador City was founded in the 1960s to accommodate the employees of the Iron Ore Company of Canada. A qualified work force is located within the general area due to the operating mines and long history of exploration in this region.
Although low cost power from a major hydroelectric development at Churchill Falls to the east is currently transmitted into the region for the existing mines operations, the current availability of additional electric power on the existing infrastructure in the region is limited. Therefore, Alderon has already begun discussions with local utilities to secure electric power for the Project. A study has been done, as part of this Study, to evaluate the options for supplying power to the site. The Kami site is also located in proximity to other key services and infrastructure. The
5-1
Alderon Iron Ore Corp. NI 43-101 Technical Report – PEA of the Kami Iron Ore Project | |
|
Project will include a rail loop and a connection to the QNS&L Railway for transportation of product to port. Fresh water sources on the site are plentiful, although the plan is to maximize recycling and minimize dependence on fresh water. A preliminary site plan has been developed as part of this Study, which indicates that there are enough barren areas on the site to permit permanent storage of waste rock and tailings.
5.4 Physiography
The Property is characterized by gentle rolling hills and valleys that trend northeast-southwest to the north of Molar Lake and trend north-south to the west of Molar Lake, reflecting the structure of the underlying geology. Elevations range from 590 m to 700 m.
The Property area drains east or north into Duley Lake. A part of the Property drains north into the Duley Lake Provincial Park before draining into Duley Lake.
In the central Property area, forest fires have helped to expose outcrops; yet the remainder of the Property has poor outcrop exposure. The cover predominantly consists of various coniferous and deciduous trees with alder growth over burnt areas.
5-2
Alderon Iron Ore Corp. NI 43-101 Technical Report – PEA of the Kami Iron Ore Project | |
|
6. HISTORY
The earliest geological reconnaissance in the southern extension of the Labrador Trough within the Grenville Province was in 1914, by prospectors in their search for gold. Several parties visited the area between 1914 and 1933, but it was not until 1937 that the first geological map and report was published by Gill et al., 1937 (Rivers, 1980).
The metamorphosed iron formation in the vicinity of Wabush Lake was first recognized by Dr. J.E. Gill in 1933. A few years later, the Labrador Mining and Exploration Co. Ltd. (“LM&E”) evaluated the iron formation, but decided it was too lean for immediate consideration (Gross et al., 1972).
In 1949, interest in the Carol Lake area by LM&E was renewed and geological mapping was carried out in the Duley Lake - Wabush Lake area by H.E. Neal for IOCC. The work was done on a scale of 1”=1/2 mi. and covered an area approximately 8 km wide by 40 km long from Mills Lake northward to the middle of Wabush Lake. This work formed part of the systematic mapping and prospecting carried on by LM&E on their concession.
Concentrations of magnetite and specularite were found in many places west of Duley Lake and Wabush Lake during the course of Neal’s geological mapping. Broad exposures of this enrichment, up to 1.2 km long, assayed from 35% to 54% Fe and 17% to 45% SiO2. Ten enriched zones of major dimensions were located and six of these were roughly mapped on a scale of 1”=200 ft. Seventy-four samples were sent to Burnt Creek for analysis. Two bulk samples, each about 68 kg, were taken for ore dressing tests. One was sent to the Hibbing Research Laboratory and the other was sent to the Bureau of Mines, Ottawa. The material was considered to be of economic significance as the metallurgical testing indicated that it could be concentrated.
Geological mapping on a scale of 1”=½ mi. was carried out by H.E. Neal in the Wabush Lake - Shabogamo Lake area in 1950. Neal (1951) also reported numerous occurrences of pyrolusite and psilomelane (botryoidal goethite being frequently associated with the manganese) within the iron formation and quartzite.
6-1
Alderon Iron Ore Corp. NI 43-101 Technical Report – PEA of the Kami Iron Ore Project | |
|
Mills No. 1 was one of the iron deposits discovered in 1950 and was sampled and described at that time. A narrow irregular band of pyrolusite was reported to extend 457 m within a friable magnetite-hematite iron formation located 914 m southwest of the prominent point on the west side of Mills Lake (Neal, 1951).
In 1951, nearly all of the concession held by LM&E within the Labrador Trough was flown with an airborne magnetometer. This survey showed the known deposits to be more extensive than apparent, from surface mapping and suggested further ore zones in drift-covered areas (Hird, 1960).
In 1953, a program of geological mapping in the Mills Lake - Dispute Lake area was conducted by R.A. Crouse of IOCC. Crouse (1954) considered the possibility of beneficiating ores within the iron formation and all high magnetic anomalies and bands of magnetite-specularite iron formation were mapped in considerable detail. Occurrences of friable magnetite-specularite gneiss containing enough iron oxides to be considered as beneficiating ore were found in several places west of Duley Lake and northwest of Canning Lake. Representative samples assayed 18.55% to 43.23% Fe and 26.66% to 71.78% SiO2 (Crouse, 1954). Seven zones of this material were located in the area. Three of these (one of which was Mills No. 1 deposit) were mapped on a scale of 1”=200 ft. On two of these occurrences, dip needle lines were surveyed at 122 m (400 ft) intervals. Forty-two samples were sent to the Burnt Creek Laboratory for analysis. Three samples were sent to Hibbing, Minnesota for magnetic testing (Crouse, 1954). Crouse (1954) reported that at Mills No. 1, the ore was traced for a distance of 488 m along strike, with the minimum width being 107 m.
In 1957, an area of 86.2 km2 to the west of Duley Lake was remapped on a scale of 1”= 1,000 ft and test drilled by IOCC to determine areas for beneficiating ore. Dip needle surveying served as a guide in determining the locations of iron formation in drift-covered areas. According to Hird (1960), 272 holes, for a total of 7,985 m (26,200 ft.) were drilled during the 1957 program (approximately 66 holes are located on the Property). Mathieson (1957) reported that there were no new deposits found as a result of the drilling, however, definite limits were established for the iron formation found during previous geological mapping. Three zones of “ore” were outlined, which included Mills No. 1 and an area of 19.1 km2 was blocked out as the total area to be retained (Mathieson, 1957). According to Mathieson (1957), the Mills No. 1 zone was
6-2
Alderon Iron Ore Corp. NI 43-101 Technical Report – PEA of the Kami Iron Ore Project | |
|
outlined by six drillholes and found to have a maximum length of 3,048 m (10,000 ft) and a maximum width of 610 m (2,000 ft). Mathieson (1957) describes mineralization to be composed of specularite with varying amounts of magnetite, grading on average 32.1% Fe. A search by Altius for the logs and/or core from the 1957 LM&E drilling program has not been successful. From local sources, it is known that all holes drilled in this area were of small diameter and very shallow (~30 m).
Early in 1959, a decision was made by IOCC to proceed with a project designed to open up and produce from the ore bodies lying to the west of Wabush Lake and a major program of construction, development drilling and ore testing was started in the Wabush area (Macdonald, 1960). Also that year, geological mapping (1”=1,000 ft.) and magnetic profiling were conducted by R. Nincheri of LM&E in the Duley - Mills Lake area. Zones of potential beneficiating ores were located to the southwest of Mills Lake (Nincheri, 1959).
In 1972, an extensive airborne electromagnetic survey covered 2,150 km2 of territory, and entailed a 2,736 km line of flying in the Labrador City area. The area covered, extended from the southern extremity of Kissing Lake to north of Sawbill Lake, and from approximately the Québec-Labrador border on the west to the major drainage system, through Duley, Wabush and Shabogamo Lakes on the east. The survey was done by Sander Geophysics Ltd. (for LM&E) using a helicopter equipped with a NPM-4 magnetometer, a fluxgate magnetometer, a modified Sander EM-3 electromagnetic system employing a single coil receiver, and a VLF unit (Stubbins, 1973).
In 1972 to 1973, an airborne magnetic survey was conducted over the area by Survair Ltd., Geoterrex Ltd., and Lockwood Survey Corporation Ltd., for the Geological Survey of Canada (GSC, 1975).
In 1977, geological mapping was initiated by T. Rivers of the Newfoundland Department of Mines and Energy within the Grenville Province, covering the Wabush-Labrador City area. This work was part of the program of 1:50,000 scale mapping and reassessment of the ratio of mineral potential of the Labrador Trough by the Newfoundland Department of Mines and Energy. Mapping was continued by Rivers in western Labrador from 1978 to 1980. As part of an experimental geochemical exploration program in Labrador by LM&E in 1978, many of the lakes
6-3
Alderon Iron Ore Corp. NI 43-101 Technical Report – PEA of the Kami Iron Ore Project | | 
|
in the Labrador City area were sampled, both for lake bottom sediments and lake water (Stubbins, 1978). Lake sediment samples were sent to Barringer Research Ltd., Toronto, Ontario, for a multi-element analysis (Stubbins, 1978). Water samples were tested at Labrador City for acidity, before being acidified for shipment. Some samples were also shipped to Barringer for analysis and some were analyzed in the IOCC Laboratory in Sept-Îles. A sample portion was also sent to the Learch Brothers Laboratory in Hibbing Minnesota for additional analysis (Stubbins, 1978). On Block No. 24 (part of the Property), only one site was sampled. The sediment assay results indicated the sample was statistically “anomalous” in phosphorous. None of the water samples were defined as anomalous (Stubbins, 1978). Stubbins (1978) concluded that the samples, as a group, are widely scattered, and it is difficult to draw any firm conclusion from the results. He added that a further study might indicate that it is worthwhile to take additional samples.
In 1979, a ground magnetometer survey was conducted on Block No. 24 (part of the Property). A total of four lines having a combined length of 3,500 m were surveyed on this block (Price, 1979). The standard interval between successive magnetometer readings was 20 m. Occasionally over magnetically “quiet” terrain, this interval was increased. Whenever an abrupt change in magnetic intensity was encountered, intermediate stations were surveyed. According to Price (1979), the magnetometer profiles and observations of rare outcrops confirm that oxide facies iron formation occurs on Block No. 24 (in the Mills No. 1 area of the Property). Also in 1979, one diamond drillhole was drilled by LM&E near the north end of Elfie Lake on the Property. The hole (No. 57-1) was drilled vertically to a depth of 28 m (Grant, 1979) and did not encounter the iron oxide facies of interest. In 1983, LM&E collared a 51 m deep (168 ft) diamond drillhole 137 m north of Elfie Lake (DDH No. 57-83-1). The drillhole encountered metamorphosed iron formation from 17 m to a depth of 51 m. Of this, only 2 m was oxide facies. Core recovery was very poor (20%) (Avison et al., 1984).
In 1981 and 1982, an aerial photography and topographic mapping program was completed by IOCC to rephotograph the mining areas as part of its program to convert to the metric system. Two scales of aerial photography (1:10,000 and 1:20,000) were flown, and new topographic maps (1:2,000 scale) were made from these photos. The photography was extended to cover all the lease and license blocks in the Labrador City area (Smith et al. 1981; Kelly and Stubbins, 1983).
6-4
Alderon Iron Ore Corp. NI 43-101 Technical Report – PEA of the Kami Iron Ore Project | |
|
During the summers of 1977 and 1978, a lake sediment and water reconnaissance survey was undertaken over about one-half (134,000 km2) of Labrador by the GSC, in conjunction with the Newfoundland Department of Mines and Energy. The survey was designed to provide the exploration industry with data on bedrock composition, and to identify metaliferous areas as large scale prospecting targets (McConnell, 1984). Sampling continued in 1982 in southwestern Labrador. Water and sediments from lakes over an approximate area of 50,000 km2 were sampled at an average density of one sample per 13 km2. Lake sediment samples were analyzed for U, Cu, Pb, Zn, Co, Ni, Ag, Mo, Mn, Fe, F, As, Hg and L.O.I. In addition, U, F and pH were determined on the water samples (Davenport and Butler, 1983).
During 1985, field work by C. McLachlan of LM&E was concentrated on the northern part of Block No. 24. A pace and compass grid was established near Molar Lake. Cross lines were added at 152 m (500 ft) intervals. The grid was used to tie in the sample sites and a systematic radiometric survey was thus performed. There were four soil samples and six rock samples (one analyzed) collected (Simpson et al., 1985). A possible source of dolomite as an additive for the IOCC’s pellet plant was examined near Molar Lake. Simpson concluded from visual examination that the dolomite was high in silica.
In 2001, IOCC staked a considerable portion of the iron formation in the Labrador City area, with the Kamistiatusset area being in the southern extent of the company’s focus. Extensive geophysical testing was conducted over the area using airborne methods. The Kamistiatusset area and the area north of the Property was recommended as a high priority target by SRK Consulting Ltd., as part of the 2001 IOCC Work Report (GSNL open file LAB1369). However, no work was reported for the area. In 2004, Altius staked twenty (20) claims comprising license 10501M. In the spring of 2006, Altius staked another thirty-eight (38) claims to the north, comprising license 11927M.
6-5
Alderon Iron Ore Corp. NI 43-101 Technical Report – PEA of the Kami Iron Ore Project | |
|
7. GEOLOGICAL SETTING AND MINERALIZATION
7.1 Regional Geology
The Property is situated in the highly metamorphosed and deformed metasedimentary sequence of the Grenville Province, Gagnon Terrane of the Labrador Trough (“Trough”), adjacent to and underlain by Archean basement gneiss (Figure 7.1).
The Trough, otherwise known as the Labrador-Québec Fold Belt, extends for more than 1,000 km along the eastern margin of the Superior Craton from Ungava Bay to Lake Pletipi, Québec. The belt is about 100 km wide in its central part and narrows considerably to the north and south. The Trough itself is a component of the Circum-Superior Belt (Ernst, 2004) that surrounds the Archean Superior Craton which includes the iron deposits of Minnesota and Michigan. Iron formation deposits occur throughout the Labrador Trough over much of its length.
The Trough is comprised of a sequence of Proterozoic sedimentary rocks, including iron formation, volcanic rocks and mafic intrusions. The southern part of the Trough is crossed by the Grenville Front representing a metamorphic fold-thrust belt in which Archean basement and Early Proterozoic platformal cover were thrust north-westwards across the southern portion of the southern margin of the North American Craton during the 1,000 Ma Grenvillian orogeny (Brown, Rivers, and Callon, 1992). Trough rocks in the Grenville Province are highly metamorphosed and complexly folded. Iron deposits in the Gagnon Terrane, (the Grenville part of the Trough), include those on the Property and Lac Jeannine, Fire Lake, Mont-Wright, Mont-Reed, and Bloom Lake in the Manicouagan-Fermont area, and the Luce, Humphrey and Scully deposits in the Wabush-Labrador City area. The high-grade metamorphism of the Grenville Province is responsible for recrystallization of both iron oxides and silica in primary iron formation, producing coarse-grained sugary quartz, magnetite, and specular hematite schist or gneiss (meta-taconites) that are of improved quality for concentration and processing.
North of the Grenville Front, the Trough rocks in the Churchill Province have been only subject to greenschist or sub-greenschist grade metamorphism and the principal iron formation unit is known as the Sokoman Formation. The Sokoman Formation is underlain by the Wishart Formation (quartzite) and the Attikamagen Group including the Denault Formation (dolomite)
7-1
Alderon Iron Ore Corp. NI 43-101 Technical Report – PEA of the Kami Iron Ore Project | |
|
and the Dolly/Fleming Formations (shale). In the Grenville part of the Trough, where the Property is located, these same Proterozoic units can be identified, but are more metamorphosed and deformed. In the Grenville portion of the Trough, the Sokoman rocks are known as the Wabush Formation, the Wishart as the Carol Formation (Wabush area) or Wapusakatoo Formation (Gagnon area), the Denault as the Duley Formation and the Fleming as the Katsao Formation. The recent synthesis by Clark and Wares (2005) develops modern lithotectonic and metallogenic models of the Trough north of the Grenville Front. In practice, both sets of nomenclature for the rock formations are often used. Alderon and Altius have used the Menihek, Sokoman, Wishart, Denault, and Attikamagen nomenclature throughout their reports to name rock units on the Property, and WGM, to minimize confusion in this report, has elected to also use these same rock unit names, but often gives reference to the other name (in brackets). The regional stratigraphy is summarized in Table 7.1.
7-2
Alderon Iron Ore Corp. NI 43-101 Technical Report – PEA of the Kami Iron Ore Project | 
|
Figure 7.1: Regional Geology
September 2011
7-3
Alderon Iron Ore Corp.
NI 43-101 Technical Report – PEA of the Kami Iron Ore Project | 
|
Table 7.1: Regional Stratigraphic Column, Western Labrador Trough
Description | |
MIDDLE PROTEROZOIC — Helikian |
Shabogamo Mafic Intrusives -Gabbro, Diabase |
Monzonite-granodiorite |
Intrusive Contact |
| |
PALEOPROTEROZOIC — Aphebian |
Ferriman Group | |
Nault Formation (Menihek Formation) | Graphitic, chloritic and micaceous schist |
Wabush Formation (Sokoman Formation iron formation) | Quartz, magnetite-specularite-silicate-carbonate iron formation |
Carol Formation (Wishart Formation) | Quartzite, quartz-muscovite-garnet schist |
Unconformity? — locally transitional contact? |
Attikamagen Group | |
Duley Formation (Denault Formation) | Meta-dolomite and calcite marble |
Katsao Formation (Fleming/Dolly Formations) | Quartz-biotite-feldspar schist and gneiss |
Unconformity |
| |
ARCHEAN |
Ashuanipi Complex | Granitic and Granodioritic gneiss and mafic intrusives |
Note: The names in brackets provide reference to the equivalent units in the Churchill Province part of the Trough. |
| | |
September 2011
7-4
Alderon Iron Ore Corp. NI 43-101 Technical Report – PEA of the Kami Iron Ore Project |
|
7.2 Property Geology
7.2.1 General
The most comprehensive mapping of this area was done by T. Rivers as part of his Labrador Trough mapping program of the mid-1980s. Several maps of the area were produced, with the most applicable to this area being Maps 85-25 and 85-24 (1:100,000) covering National Topographic System Sheet 23B/14. Figure 7.2, Property Geology, is based mainly on River’s work with modifications made by Alderon and Altius through mapping, drilling and interpretation of geophysical survey results including the 2010 airborne gravity survey.
The Property is underlain by folded sequences of the Ferriman Group containing Sokoman (Wabush) Formation, iron formation and associated lithologies. The stratigraphic sequence varies in different parts of the Property. Altius’ exploration was focussed on three parts of the Property known as the Mills Lake, Rose Lake and the Mart Lake areas. Alderon’s drilling was focussed on the Rose Lake and Mills Lake areas. On some parts of the Property, the Sokoman (Wabush) is directly underlain by Denault (Duley) Formation dolomite and the Wishart (Carol) Formation quartzite is missing. In other places, both the dolomite and quartzite units are present.
Alderon interprets the Property to include two iron oxide hosting basins juxtaposed by thrust faulting. The principal basin, here named the Wabush Basin, contains the majority of the known iron oxide deposits on the Property. Its trend continues NNE from the Rose Lake area 9 km to the Wabush Mine and beyond the Town of Wabush. The second basin called the “Mills Lake Basin”, lies south of the Elfie Lake Thrust Fault and extends southwards, parallel with the west shore of Mills Lake. Each basin has characteristic, lithological assemblages and iron formation variants.
September 2011
7-5
Alderon Iron Ore Corp. NI 43-101 Technical Report – PEA of the Kami Iron Ore Project |
|
Figure 7.2: Property Geology
September 2011
7-6
Alderon Iron Ore Corp. NI 43-101 Technical Report – PEA of the Kami Iron Ore Project |
|
7.2.2 East of Mills Lake
The portion of the Property east of the western shore of Mills Lake is dominated by gently dipping (15°-20°E) Denault Fm marble with quartz bands paralleling crude foliation. This block is interpreted as being thrust from the east onto the two basin complexes above. The marble outcrops across the 8 km width of licenses 017926M and 0179948M with consistent east dips. The thickness exposed suggests that several thrust faults may have repeated the Denault Fm stratigraphy. On license 017948M, large blocks of Wishart quartzite were observed surrounding an elevated plateau that may be an infolded syncline of Sokoman Fm. Another area on license 017926M, interpreted by Rivers (1985), as a syncline with Sokoman and Menihek Fms in the core did not show any airborne magnetic or gravity anomalies. More field evaluation is required to understand these features as part of future project development.
Table 7.2 presents the lithological codes used by Alderon for its 2010 drill core logging. Alderon initiated its 2010 program by relogging Altius’ drill core and replaced Altius’ previous lithological codes with its codes. Amphibolite dikes and sills cut through all other rock units, but are particularly common in the Menihek Formation schists and are a consideration as they may negatively impact the chemistry of iron concentrates made from mineralization containing these rocks that may be difficult to exclude during mining.
September 2011
7-7
Alderon Iron Ore Corp.
NI 43-101 Technical Report – PEA of the Kami Iron Ore Project |
|
Table 7.2: Rock/Unit Coding For Kami Property Drill Core Logging
Lithology Code | | Description | | Formal Unit
Name | | Facies |
NR | | Not Recorded | | MISC | | MISC |
LOST | | Lost Core | | MISC | | MISC |
OB | | Overburden | | MISC | | MISC |
EOH | | End of Hole Marker | | MISC | | MISC |
QV | | Quartz vein with variable accessory minerals | | Post-Iron Fm dyke/sill | | Intrusive |
B_MS_SCH | | Biotite-muscovite quartz schist, often w/ Fe-sulfides | | Menihek Fm | | Menihek Fm |
GF_B_MS_SCH | | Graphitic biotite-muscovite quartz schist, often w/ Fe-sulfides | | Menihek Fm | | Menihek Fm |
GF_SCH | | Graphitic biotite-quartz schist | | Menihek Fm | | Menihek Fm |
MS_B_SCH | | Muscovite-biotite quartz schist | | Menihek Fm | | Menihek Fm |
MS_SCH | | Muscovite-quartz schist | | Menihek Fm | | Menihek Fm |
HBG_GN-Menihek | | Hornblende-biotite-garnet gneiss (+ coronite) | | Menihek Fm | | Menihek Fm |
HBG_GN | | Hornblende-biotite-garnet gneiss (+ coronite) | | Sokoman Fm | | Menihek Fm |
CIF | | Carbonate >50% IF | | Sokoman Fm | | IF-Carbonate |
MCIF | | Magnetite >20% + carbonate IF | | Sokoman Fm | | IF-Carbonate |
LMCIF | | Magnetite 10-20% + carbonate IF | | Sokoman Fm | | IF-Carbonate |
CSIF | | Carbonate > 50% + silicate iron formation | | Sokoman Fm | | IF-Silicate |
HIF | | Hematite >20%-quartzite (minor marble, Ca/Fe silicates) | | Sokoman Fm | | IF-Main |
HMIF | | Hematite>magnetite-quartzite [MT+HM>20%] (minor marble, Ca/Fe silicates) | | Sokoman Fm | | IF-Main |
HMCIF | | Hematite+magnetite >20% carbonate silicate iron formation | | Sokoman Fm | | IF-Carbonate |
HMSIF | | Hematite>magnetite> 20%; silicate >50% iron formation | | Sokoman Fm | | IF-Silicate |
HSIF | | Hematite >20% silicate >50% iron formation | | Sokoman Fm | | IF-Silicate |
LHIF | | Hematite 10-20% + quartz (minor marble, Ca/Fe silicates) | | Sokoman Fm | | IF-Main |
LHMIF | | Hematite>magnetite (HM+MT 10-20%) quartzite (minor marble, Ca/Fe silicates) | | Sokoman Fm | | IF-Main |
LMCSIF | | Magnetite (10-20%) carbonate silicate iron formation | | Sokoman Fm | | IF-Carbonate |
LMIF | | Magnetite(10-20%)-quartzite (minor marble, Ca/Fe-silicates) | | Sokoman Fm | | IF-Main |
LMHIF | | Magnetite>hematite(10-20%)+quartz (minor marble, Ca/Fe-silicates) | | Sokoman Fm | | IF-Main |
LMQCIF | | Magnetite (10-20%) quartz carbonate silicate iron formation | | Sokoman Fm | | IF-Carbonate |
LMQSIF | | Magnetite (10-20%) quartz silicate iron formation | | Sokoman Fm | | IF-Silicate |
LMSIF | | Magnetite (10-20%) silicate iron formation | | Sokoman Fm | | IF-Silicate |
MHIF | | Magnetite>hematite [MT+HM>20%]-quartzite w/minor marble, Ca/Fe silicates | | Sokoman Fm | | IF-Main |
MIF | | Magnetite>20%-quartzite (minor marble, Ca/Fe-silicates) | | Sokoman Fm | | IF-Main |
MCSIF | | Magnetite>20% carbonate silicate iron formation | | Sokoman Fm | | IF-Carbonate |
MHSIF | | Magnetite>hematite> 20%; silicate >50% iron formation | | Sokoman Fm | | IF-Silicate |
MSIF | | Magnetite >20% silicate iron formation | | Sokoman Fm | | IF-Silicate |
QCIF | | Quartz (50-90 qz)% carbonate iron formation | | Sokoman Fm | | IF-Carbonate |
QCSIF | | Quartz (50-90 qz)% carbonate silicate iron formation | | Sokoman Fm | | IF-Carbonate |
QSIF | | Quartz (50-90% qz) + Ca-Fe silicates, + minor Fe oxides | | Sokoman Fm | | IF-Silicate |
SIF | | Fe-Ca silicates >50% w/ qzt, marble, + minor Fe oxide | | Sokoman Fm | | IF-Silicate |
QZT | | Quartzite( >90% qz + mica, carbonate, other) | | Wishart Fm | | Wishart Fm |
CARB_QZ_SCH | | Carbonate (dolomite, calcite) + qz variable micas schist | | Wishart Fm | | Wishart Fm |
QZ_MS_B_CC_SCH | | High quartz w/muscovite>biotite w/calcite schist | | Wishart Fm | | Wishart Fm |
QZ_MS_B_SCH | | High quartz w/muscovite>biotite schist | | Wishart Fm | | Wishart Fm |
QZT-MS | | Quartzite w/ muscovite; can range to 20% mica | | Wishart Fm | | Wishart Fm |
MB | | Duley Fm (Denault Fm) - marble (CT+ DL)>75% w/Ca-silicate, minor Fe oxides | | Attikamagen Gp | | Attikamagen Gp |
September 2011
7-8
Alderon Iron Ore Corp. NI 43-101 Technical Report – PEA of the Kami Iron Ore Project |
|
7.3 Mineralization and Structure
Mineralization of economic interest on the Property is oxide facies iron formation. The oxide iron formation (“OIF”) consists mainly of semi-massive bands, or layers, and disseminations of magnetite and/or specular hematite (specularite) in recrystallized chert and interlayered with bands (beds) of chert with carbonate and iron silicates. Where magnetite or hematite represent minor component of the rock comprised mainly of chert, the rock is lean iron formation. Where silicate or carbonate becomes more prevalent than magnetite and/or hematite, then the rock is silicate iron formation (“SIF”) and or silicate-carbonate iron formation and its variants. SIF consists mainly of amphibole and chert, often associated with carbonate and contains magnetite or specularite in minor amounts. The dominant amphibole on the Kami Property is grunerite. Where carbonate becomes more prevalent, the rock is named silicate-carbonate or carbonate-silicate iron formation, but in practice, infinite variations exist between the OIF and silicate-carbonate iron formation composition end members (see Table 7.2). SIF and its variants and lean iron formation are also often interbedded with OIF.
The OIF on the Property is mostly magnetite-rich and some sub-members contain increased amounts of hematite (specularite). At both Rose Central and Mills Lake, a bright pink mineral, inferred to be a manganese species, is preferentially associated with hematite-rich OIF facies. Bustamite, a calcium manganese silicate, is said to be present. There may be other manganese species not yet positively identified.
7.3.1 Wabush Basin — Rose Deposits
The Wabush Basin on the Property contains (from south to north) the South Rose/Elfie Lake deposit, the Rose Central deposit and the North Rose deposit. These deposits represent different parts of a series of gently plunging NNE-SSW upright to slightly overturned anticlines and synclines. The airborne geophysics anomalies and Rivers’, (1985) maps show the linear trend of this fold system continuing NNE from western end of the North Rose deposit toward Long (Duley) Lake. The Wabush Mine Deposit lies across the lake where the structure opens into a broad open anticline perhaps dipping ENE under Little Wabush Lake.
September 2011
7-9
Alderon Iron Ore Corp. NI 43-101 Technical Report – PEA of the Kami Iron Ore Project |
|
The stratigraphy in the Rose Central area ranges from the Archean granite gneiss, north of the Rose Central syncline, up to the Menihek Formation mica schist. The contact between the Archean basement and the Denault marble is not exposed, nor has it been drilled to date. The Rose Central anticline exposes the Wishart Formation quartzite and drillholes also pass into Denault marble in the anticline core. The contact relationship between the two units appears gradational with increasing quartz at the base of the Wishart. The Wishart includes muscovite + biotite-rich schist and variations in quartzite textures. It appears more variable than the large quartzite exposures near Labrador City.
The upper contact of the Wishart Formation is abrupt. The base of the overlying iron formation often starts with a narrow layer of Fe-silicate—rich iron formation. Alderon’s exploration team correlates this member with the Ruth Fm. Locally this is called the Basal Iron Silicate Unit (Wabush Mines terminology). The thickness of this sub-unit ranges 0 to 15 m.
The Sokoman Formation in the Rose Lake area includes three iron-oxide rich stratigraphic domains or zones separated by two thin low-grade units. This is similar to the sequence observed at the Wabush Mine. At Rose Lake, the low grade units, composed of quartz, Fe-carbonate plus Fe-silicates and minor Fe oxides, are thinner and more erratically distributed than at the Wabush Mine. The three oxide divisions or domains in a gross sense are mineralogically distinct.
The lower stratigraphic level typically has substantially higher specular hematite to magnetite ratio; magnetite content can be minimal to almost absent. The principal gangue mineral is quartz with a little carbonate or Fe-silicate. Crystalline rhodonite and bustamite are locally common. Occasionally, magnetite can be observed replacing the hematite as crystalline clusters to 2 cm with rhodonite coronas. This is interpreted as indicating a broad reduction in Fe oxidation during the peak of metamorphism. The Mn-silicates appear to be cleanly crystallized with little entrainment of Fe oxides.
The middle domain typically is comprised of a series of OIF units where hematite exceeds magnetite, interlayered with units where magnetite exceeds hematite. The mineralization is somewhat enriched in manganese. Gangue minerals include quartz, Fe-carbonate, and modest amounts of Fe-silicate.
September 2011
7-10
Alderon Iron Ore Corp. NI 43-101 Technical Report – PEA of the Kami Iron Ore Project |
|
The upper domain typically has a much higher magnetite: hematite ratio than the other levels, with hematite being uncommon in any quantity. Upwards, this domain grades into assemblages containing less Fe oxide with increasing amounts of Fe-silicate and Fe-carbonate. Magnetite-rich mineralization typically contains less than 0.5% Mn.
The uppermost part of the Sokoman is principally non-oxide facies. The contact with the overlying Menihek Fm is a diachronous transition of interlayered Sokoman chemical sediments and Menihek flysch mud. The contact may locally be tightly folded or faulted by post-metamorphic movement parallel with the foliation, but many of the contacts between the two formations are delicately preserved and appear to be “one-way”, not folded stratigraphy. It is probable that all three contact controls are in play.
The Wabush Basin in the southern part of the Property is bounded to the south by a major SSE-trending thrust fault along Elfie Lake and on its north and west margins by a steeply dipping contact between the Sokoman Formation-Wishart Formation assemblage and the Archean granite gneiss basement. This contact is apparently drag-folded along a NNE trend toward the Wabush Mine. The eastern edge of the assemblage appears to be defined by a late fault (probably a thrust from the east).
Figure 7.3 shows the drilling areas and deposit with reference to ground magnetics. Figure 7.4 and Figure 7.5 are respectively Cross Sections 20E and 16E on the Rose Central deposit, 400 m apart along strike. Both cross sections from north to south show the North Rose, Rose Central and South Rose zones or deposits. The magnetic profile from the ground magnetic survey shows peaks that correlate with magnetite-hematite mineralization intersected in the drillholes. Each of these zones are interpreted as limbs of a series of NE-SW trending, upright to slightly overturned, shallow NE plunging anticlines and synclines but structural stacking may also play a role. Cross Section 20E, 400 m NE of Section 16E, is down plunge of Section 16E. On Section 20E, the anticlinal hinge of the South Rose-Central Rose is mapped out by drilling, but on Section 16E this hinge zone has been eroded away (would be above ground surface) and only the SE and NW limbs, which are respectively the South Rose and Central Rose deposits are present. On both cross sections, it can be seen that Wishart Formation quartzites form the core of the fold (intersected towards the bottoms of drillholes K-10-09, K-08-18, K-10-30 and K-10-35 on Section 20E) and Menihek Formations mica - graphitic schists are the stratigraphic hanging wall above the Sokoman Formation iron formation (mid part of K-08-24,
September 2011
7-11
Alderon Iron Ore Corp. NI 43-101 Technical Report – PEA of the Kami Iron Ore Project |
|
upper portions of K-10-42 on Section 16E and upper parts of K-10-18, K-10-29, K-10-35, K-10-27, K-10-30 K-10-69A etc. on Section 20E). On Section 16E two holes (K-10-51 and K-10-66) are shown partially testing the North Rose Zone. The North Rose Zone is not part of the current Mineral Resource estimate and was the main focus of Alderon’s 2011 winter drill program (results are pending).
September 2011
7-12
Alderon Iron Ore Corp. NI 43-101 Technical Report – PEA of the Kami Iron Ore Project |
|
Figure 7.3: Ground Magnetic Survey with 2008 and 2010 Drillhole Locations
September 2011
7-13
Alderon Iron Ore Corp. NI 43-101 Technical Report — PEA of the Kami Iron Ore Project | | 
|
Figure 7.4: Rose Lake Area - Cross Section 20E
September 2011
7-14
Alderon Iron Ore Corp. NI 43-101 Technical Report — PEA of the Kami Iron Ore Project | | 
|
Figure 7.5: Rose Lake Area - Cross Section 16E
September 2011
7-15
Alderon Iron Ore Corp. NI 43-101 Technical Report — PEA of the Kami Iron Ore Project | | 
|
The true width of the Central Rose deposit as shown by the interpretation is in the order of 220 m wide however, as shown, widths of mineralization rapidly attenuate through the hinge into the South Rose Zone or limb and there is no consistent relationship between drillhole intersection length and true width. There is also likely another narrow highly attenuated, perhaps tightly folded limb of Sokoman between the main Central Rose Zone and the North Rose Zone. The entire Rose system also appears to attenuate along strike to the SSW. WGM believes it likely that considerable second order and third order parasitic folding is also most likely present and is largely responsible for difficulties in tracing narrow layers of SIF, CSIF (variants) and magnetite and hematite-dominant OIF from drillhole intersection to intersection. Such folding would also, in WGM’s opinion, be the main reason for the interlayering between Menihek-Sokoman-Wishart and even Denault formations, but as aforementioned, the relative importance of possible structural stacking also remains unresolved.
On both cross sections, the aforementioned interzone stratigraphy of the Central Rose Zone is apparent. On Section 16E, a hematite-rich layer is obvious on the structural hanging wall (towards the bottom of drillhole K-10-42 and upper most parts of drillholes K-10-34, K-10-39A and K-10-66). Clearly, core logged as hematite-dominant as completed by Alderon’s exploration crew correlates well with estimated %hmFe calculated from assays. It also can be seen that this hematite dominant mineralization is enriched in manganese. In addition to the prominent hematite-rich layer near the stratigraphic base, there are other layers of hematite-rich OIF throughout the zone alternating with magnetite-rich, lean oxide and SIF and variants but these are less prominent and difficult to trace. This difficulty in tracing individual iron formation variants from hole to hole is probably explained by the fact that these other layers are relatively thin. Because they are thinner, the aforementioned second and third order folding has been more effective in shifting them in position and causing them to thicken and thin. The prevalence of down-dip drilling also makes interpretation more difficult.
In the main body of the Central Rose Zone, manganese decreases in concentration from stratigraphic bottom towards the stratigraphic top and hematite also decreases in prevalence as magnetite-rich OIF becomes dominant.
September 2011
7-16
Alderon Iron Ore Corp. NI 43-101 Technical Report — PEA of the Kami Iron Ore Project | |
|
7.3.2 Mills Lake Basin — Mills Lake and Mark Lake Deposits
The Mills Lake Basin is developed south of the Wabush Basin. It is considered to be a separate basin because the amount and distribution of non-oxide facies iron formation is different from the Wabush Basin package at Rose Central and Wabush Mine. Drilling on Section 16E shows the two basin assemblages juxtaposed by the Elfie Lake Thrust Fault.
The oldest lithology in the Mills Lake area is the Denault marble. It forms the core of the syncline in outcrop. The contact with the overlying Wishart is transitional to sharp. The Wishart is predominantly quartzite with lenses of micaceous schist, especially towards the upper contact with the Sokoman Formation. The base of the Sokoman is marked by the discontinuous occurrence of a basal silicate iron formation that ranges from nil to 20 m true thickness that Alderon correlates to the Ruth Formation.
The lower part of the Sokoman is Fe-carbonate-quartz facies IF with scattered zones of disseminated magnetite. The OIF facies forms two coherent lenses traced over 1,400 m on the Mills Lake Deposit and similarly south of Mart Lake, drilled in 2008 (Seymour et al. 2009). In the Mills Lake Deposit, the lower oxide unit is 30-130 m true thickness and the upper one more diffuse and generally less than 25 m thick. In the Mart Zone, the two oxide layers are less than 30 m thick. They are separated by 20 to 50 m of carbonate facies IF. Above the upper oxide lens, more carbonate facies, greater than 50 m thick, cap the exposed stratigraphy. Alderon reports that the carbonate facies units often show zones of Fe-silicates which they interpret as being derived from a decarbonation process during metamorphism leading to replacement textures indicating that, at least in the Mills Lake area, the origin of Fe-silicates is principally metamorphic and not primary. Disseminated magnetite is a common accessory with the Fe-silicates, but isn’t economically significant at this low level of replacement.
The lower oxide facies at the Mills Lake deposit, similar to the Rose Central situation, has three levels or stratigraphic domains: a lower magnetite dominant domain, a specular hematite with rhodonite domain, and an upper magnetite domain. The two magnetite dominant domains show different amounts of manganese in magnetite-OIF with the upper portion being low in manganese and the lower one having moderate manganese enrichment. In the Mart Zone, a similar pattern is apparent, but the two magnetite-dominant OIF domains are more widely
September 2011
7-17
Alderon Iron Ore Corp. NI 43-101 Technical Report — PEA of the Kami Iron Ore Project | |
|
separated stratigraphically, are generally thinner, have lower Fe-oxide grade and the hematite member is less well developed.
Figure 7.6 is Cross Section 36+00S through the Mills Lake Deposit showing the lower and wider lenses of iron formation intersected by three drillholes K-10-95, K-10-96 and K-10-97. The narrower upper lens is intersected only in the top of drillhole K-10-97. Also apparent is the narrow hematite dominant layer which occurs three quarters of the distance towards the top of the lower lens and divides the lower lens into three parts with a magnetic OIF dominant bottom and top. Similar to Rose Central mineralization, the core logging of various facies correlates well with hematitic Fe (%hmFe) calculated from assays. Again, similar to Rose Central, manganese is significantly higher in hematite-rich OIF than the magnetite-rich OIF.
The Mills Lake Basin outcrop is controlled by an ENE trending asymmetrical open syncline overturned from the SSE with a steeper north limb and shallow-dipping (18°E) east-facing limb. The fold plunges moderately to the ENE. The Mills Lake Basin is fault-bounded. The northern limit of the basin is the Elfie Lake Thrust Fault pushed from the SSE where it rides over the Wabush Basin package. The east limit is an (interpreted) thrust fault from the east that pushes Denault marble over the Sokoman Formation. The SSE fault appears to be the older of the two. The details of the basin dimensions are unknown. It may be relatively small, extending only to Fermont, or it may include the Mont-Wright Deposit and several smaller iron deposits west of Fermont.
September 2011
7-18
Alderon Iron Ore Corp.
NI 43-101 Technical Report — PEA of the Kami Iron Ore Project | | 
|

Figure 7.6: Mills Lake Area - Cross Section 36+00S
September 2011
7-19
Alderon Iron Ore Corp.
NI 43-101 Technical Report — PEA of the Kami Iron Ore Project | 
|
7.3.3 Mineralization by Rock Type and Specific Gravity
Table 7.3 to Table 7.5 provides average composition of rock types derived from drill core sample assays for the Rose Central, Mills Lake and North Rose deposits. In these tables, the estimates of %Fe in the form of hematite (%hmFe) have been made by WGM using several different methods depending on the type of assay and testwork data available. The precedence for calculation method follows the order in which the methods are described. For all cases, the distribution of Fe++ and Fe+++ to magnetite was done assuming the iron in magnetite is 33.3% Fe++ and 66.6% Fe+++. The estimation method also assumes all iron in silicates, carbonates and sulphides is Fe++ and there are no other iron oxide species present in mineralization other than hematite and magnetite. This latter assumption is generally believed to be true for the Rose Central and Mills Lake deposits, but not true for the Rose North Zone where extensive deep weathering has resulted in extensive limonite, ±goethite and hematite after magnetite. However, to WGM’s knowledge, no detailed mineralogical studies for any of the mineralization have been completed. TFe was determined by XRF in all Head or Crude samples, and for most samples FeO and magFe were determined by Satmagan. Hematitic Fe, where Satmagan and FeO_H assays are available was estimated by subtracting the iron in magnetite (determined from Satmagan) and the iron from the FeO analysis, in excess of what can be attributed to the iron in the magnetite, from %TFe, and then restating this excess iron as hematite, as below:
%hmFe = %TFe - (Fe+++ (computed from Satmagan) + Fe++ (computed from FeO))
In practice, %otherFe was computed as the first step in the calculation and %hmFe = %TFe - (%magFe+%otherFe), where %otherFe is assumed to represent the Fe in sulphides, carbonates and/or silicates is the iron represented by Fe++ from FeO_H that is not in magnetite. Where Fe++ from magnetite exceeds Fe++ from %FeO_H, negative values accrue. These negative values are often small, less than 2% and represent minor, but reasonably acceptable assay inaccuracy in either FeO_H or Satmagan results. These negative values are replaced with zero in the process of completing the calculations. Where the negative values are greater than 2%, significant assay error for either Satmagan determinations or FeO_H are indicated and there are some samples in this category.
September 2011
7-20
Alderon Iron Ore Corp.
NI 43-101 Technical Report – PEA of the Kami Iron Ore Project | | 
|
Table 7.3: Central Rose Deposit – Average Composition of Rock Units from 2008 AND 2010 Drill Core Sample Assays
Rock Type | | HBG_GN | | HIF | | HMIF | | HMSIF | | HSIF | | MHIF | | MHSIF | | MIF | | MSIF | | MCIF | | LHIF | | LHMIF | | LMCIF | | LMHIF | | LMHSIF | | LMIF | | LMQCIF | | LMQSIF | | LMSIF | | CIF | | CSIF | | QCIF | | QCSIF | | QSIF | | QV | | SIF | | Qtz
Schist
(Wishart) | | Menihek | |
Count_XRF | | 31 | | 336 | | 404 | | 2 | | 4 | | 480 | | 15 | | 1943 | | 164 | | 3 | | 6 | | 2 | | 1 | | 17 | | 5 | | 148 | | 19 | | 3 | | 97 | | 8 | | 45 | | 102 | | 24 | | 109 | | 4 | | 136 | | 46 | | 137 | |
Avg %TFe_H | | 15.13 | | 30.78 | | 31.61 | | 31.65 | | 32.38 | | 30.75 | | 30.22 | | 29.11 | | 31.76 | | 27.07 | | 20.79 | | 21.47 | | 29.24 | | 20.48 | | 26.91 | | 22.34 | | 13.29 | | 24.53 | | 26.51 | | 16.48 | | 14.69 | | 13.59 | | 12.24 | | 17.30 | | 2.86 | | 24.31 | | 8.15 | | 8.85 | |
Avg FeO_H | | 13.34 | | 1.12 | | 5.80 | | 18.89 | | 6.07 | | 9.26 | | 12.50 | | 16.04 | | 22.25 | | | | 14.83 | | 3.03 | | | | 23.11 | | 19.25 | | 17.97 | | | | | | 23.55 | | | | 15.56 | | 16.06 | | 13.16 | | 20.70 | | 2.68 | | 27.24 | | 6.08 | | 8.89 | |
Avg %hmFe | | 1.53 | | 29.24 | | 20.80 | | 11.10 | | 28.03 | | 10.06 | | 5.93 | | 1.42 | | 1.76 | | | | 10.27 | | 11.90 | | | | 5.23 | | 6.32 | | 1.39 | | | | | | 1.36 | | 7.70 | | 1.35 | | 0.60 | | 1.39 | | 0.97 | | 0.00 | | 1.35 | | 2.35 | | 0.48 | |
Avg %magFeSat | | 2.25 | | 0.83 | | 9.91 | | 8.75 | | 0.78 | | 19.77 | | 18.77 | | 23.68 | | 18.10 | | 10.23 | | 0.98 | | 8.60 | | 7.10 | | 5.82 | | 6.96 | | 9.76 | | 4.18 | | 2.90 | | 8.59 | | 2.19 | | 1.75 | | 1.81 | | 0.92 | | 1.99 | | 2.03 | | 2.24 | | 2.23 | | 1.46 | |
Avg %SiO2_H | | 47.42 | | 42.17 | | 43.73 | | 46.95 | | 32.90 | | 44.82 | | 44.77 | | 46.04 | | 42.38 | | 48.57 | | 55.63 | | 57.55 | | 26.90 | | 56.39 | | 50.58 | | 52.68 | | 65.97 | | 45.10 | | 45.66 | | 48.99 | | 54.70 | | 55.26 | | 50.84 | | 55.49 | | 93.18 | | 46.57 | | 70.45 | | 57.85 | |
Avg %Al2O3_H | | 11.35 | | 0.18 | | 0.20 | | 0.89 | | 0.12 | | 0.27 | | 0.22 | | 0.35 | | 0.29 | | 0.84 | | 0.80 | | 0.28 | | 0.29 | | 0.26 | | 0.46 | | 0.59 | | 0.17 | | 0.13 | | 0.50 | | 1.79 | | 1.59 | | 1.32 | | 12.35 | | 1.17 | | 0.61 | | 1.37 | | 4.18 | | 10.72 | |
Avg %TiO2_H | | 1.33 | | 0.01 | | 0.01 | | 0.08 | | 0.01 | | 0.03 | | 0.02 | | 0.03 | | 0.03 | | 0.05 | | 0.04 | | 0.01 | | 0.01 | | 0.02 | | 0.03 | | 0.04 | | 0.01 | | 0.01 | | 0.05 | | 0.12 | | 0.08 | | 0.06 | | 1.32 | | 0.08 | | 0.02 | | 0.16 | | 0.18 | | 0.62 | |
Avg %MgO_H | | 5.25 | | 2.18 | | 1.70 | | 3.83 | | 2.51 | | 1.82 | | 2.01 | | 2.46 | | 2.32 | | 2.95 | | 1.06 | | 2.70 | | 5.87 | | 1.72 | | 3.00 | | 3.51 | | 2.53 | | 4.97 | | 3.90 | | 4.97 | | 4.38 | | 4.42 | | 4.68 | | 4.07 | | 0.44 | | 4.75 | | 2.29 | | 3.19 | |
Avg %CaO_H | | 5.06 | | 2.58 | | 2.64 | | 1.19 | | 3.26 | | 2.96 | | 3.29 | | 3.52 | | 3.47 | | 3.82 | | 0.73 | | 1.84 | | 4.06 | | 2.75 | | 2.05 | | 4.00 | | 4.43 | | 6.10 | | 4.05 | | 7.43 | | 6.85 | | 6.97 | | 4.51 | | 5.51 | | 0.38 | | 4.19 | | 3.24 | | 2.54 | |
Avg %MnH | | 0.57 | | 3.50 | | 1.77 | | 1.56 | | 7.16 | | 1.55 | | 1.55 | | 0.96 | | 1.16 | | 0.25 | | 1.26 | | 2.14 | | 2.97 | | 3.61 | | 1.05 | | 0.63 | | 0.83 | | 0.10 | | 1.27 | | 0.70 | | 0.43 | | 0.59 | | 0.31 | | 0.58 | | 0.29 | | 1.22 | | 0.60 | | 0.17 | |
Avg %Na2O_H | | 1.40 | | 0.34 | | 0.04 | | 0.05 | | 0.55 | | 0.06 | | 0.02 | | 0.07 | | 0.05 | | 0.03 | | 0.04 | | 0.03 | | 0.04 | | 0.06 | | 0.03 | | 0.06 | | 0.03 | | 0.03 | | 0.04 | | 0.10 | | 0.12 | | 0.18 | | 1.51 | | 0.12 | | 0.03 | | 0.10 | | 0.21 | | 1.12 | |
Avg %K2O_H | | 1.38 | | 0.06 | | 0.03 | | 0.08 | | 0.01 | | 0.04 | | 0.03 | | 0.05 | | 0.02 | | 0.17 | | 0.14 | | 0.02 | | 0.01 | | 0.06 | | 0.04 | | 0.12 | | 0.01 | | 0.01 | | 0.09 | | 0.58 | | 0.34 | | 0.31 | | 1.76 | | 0.23 | | 0.05 | | 0.20 | | 1.65 | | 2.78 | |
Avg %P2O5_H | | 0.27 | | 0.02 | | 0.02 | | 0.07 | | 0.03 | | 0.03 | | 0.03 | | 0.04 | | 0.04 | | 0.05 | | 0.11 | | 0.03 | | 0.08 | | 0.02 | | 0.03 | | 0.05 | | 0.01 | | 0.02 | | 0.06 | | 0.08 | | 0.06 | | 0.05 | | 0.29 | | 0.05 | | 0.02 | | 0.09 | | 0.11 | | 0.23 | |
AvgOfLOI | | 3.84 | | 3.65 | | 4.06 | | -0.52 | | 4.40 | | 3.93 | | 4.14 | | 4.46 | | 4.47 | | 4.22 | | 9.98 | | 3.75 | | 17.40 | | 4.58 | | 3.68 | | 5.99 | | 6.83 | | 9.06 | | 5.90 | | 11.09 | | 9.33 | | 10.54 | | 4.21 | | 7.39 | | 0.92 | | 5.78 | | 4.59 | | 6.88 | |
CountOfS_ | | 0.00 | | 0.00 | | 0.00 | �� | 0.00 | | 0.00 | | 0.00 | | 0.00 | | 14.00 | | 0.00 | | 0.00 | | 0.00 | | 0.00 | | 0.00 | | 0.00 | | 0.00 | | 0.00 | | 0.00 | | 0.00 | | 0.00 | | 0.00 | | 0.00 | | 0.00 | | 0.00 | | 0.00 | | 0.00 | | 0.00 | | 0.00 | | 0.00 | |
AvgOfS_ | | | | | | | | | | | | | | | | 1.08 | | | | | | | | | | | | | | | | | | | | | | | | | | | | | | | | | | | | | | | | | |
CountOfSG_Pyc | | 0 | | 2 | | 0 | | 0 | | 0 | | 0 | | 0 | | 12 | | 2 | | 0 | | 0 | | 0 | | 0 | | 0 | | 0 | | 1 | | 0 | | 0 | | 1 | | 2 | | 1 | | 4 | | 0 | | 0 | | 0 | | 3 | | 1 | | 4 | |
AvgOfSG_Pyc | | | | 3.79 | | | | | | | | | | | | 3.53 | | 3.62 | | | | | | | | | | | | | | 3.04 | | | | | | 3.56 | | 3.22 | | 2.94 | | 3.33 | | | | | | | | 3.63 | | 3.46 | | 2.91 | |
Total Samples assayed by XRF represented in this table is 4292; 1 sample not shown in table coded as Overburden.
Assay values below detection limit have been adjusted to 0.5 x DL before averages calculated;
Codes for some rock types such as Menihek and Wishart are grouped;
Averages reported here for magFe are calculated only from Satmagan method. Some samples also had Davis Tube tests;
hmFe (hematitic Fe) estimated using TFe, Satmagan and FeO and Davis Tube results as described in text of report and estimates are based on certain assumptions;
Shaded cells generally represent mineralization that has sufficient oxide Fe components to be of economic importance.
September 2011
7-21
Alderon Iron Ore Corp.
NI 43-101 Technical Report – PEA of the Kami Iron Ore Project | | 
|
Table 7.4: Mills Lake Deposit - Average Composition of Rock Units from 2008 AND 2010 Drill Core Sample Assays
Rock Type | | HIF | | HMIF | | HSIF | | MHIF | | MIF | | MSIF | | LMIF | | LMSIF | | CSIF | | QCIF | | QCSIF | | QSIF | | SIF | | Qtz Schist
(Wishart) | | Carbonate
(Denault) | |
Count_XRF | | 42 | | 16 | | 4 | | 115 | | 393 | | 1 | | 14 | | 1 | | 10 | | 56 | | 4 | | 50 | | 42 | | 10 | | 10 | |
Avg %TFe_H | | 33.34 | | 34.80 | | 33.75 | | 30.14 | | 29.91 | | 38.19 | | 26.30 | | 28.89 | | 19.72 | | 20.41 | | 7.04 | | 24.20 | | 25.72 | | 5.47 | | 2.31 | |
Avg FeO_H | | 1.37 | | 4.44 | | 2.34 | | 9.46 | | 15.77 | | 32.69 | | 22.59 | | 27.48 | | 24.41 | | 24.49 | | 6.56 | | 28.74 | | 30.20 | | 4.44 | | 3.52 | |
Avg %hmFe | | 31.79 | | 23.76 | | 29.83 | | 9.54 | | 0.90 | | 0.30 | | 0.69 | | 0.20 | | 0.01 | | 0.11 | | 0.75 | | 0.16 | | 0.26 | | 9.13 | | 0.00 | |
Avg %magFeSat | | 0.74 | | 10.61 | | 3.15 | | 19.81 | | 25.43 | | 18.75 | | 12.12 | | 10.90 | | 1.34 | | 2.10 | | 1.80 | | 2.96 | | 3.23 | | 0.30 | | 0.30 | |
Avg %SiO2_H | | 35.46 | | 37.42 | | 35.80 | | 48.04 | | 46.38 | | 39.00 | | 43.94 | | 37.60 | | 37.77 | | 42.57 | | 46.30 | | 43.22 | | 43.61 | | 31.67 | | 22.47 | |
Avg %Al2O3_H | | 0.45 | | 0.44 | | 0.35 | | 0.27 | | 0.40 | | 0.10 | | 0.67 | | 0.36 | | 0.24 | | 0.33 | | 11.85 | | 0.35 | | 0.91 | | 5.23 | | 1.44 | |
Avg %TiO2_H | | 0.03 | | 0.02 | | 0.01 | | 0.02 | | 0.02 | | 0.01 | | 0.03 | | 0.03 | | 0.02 | | 0.02 | | 0.58 | | 0.02 | | 0.07 | | 0.21 | | 0.06 | |
Avg %MgO_H | | 1.99 | | 1.81 | | 1.40 | | 3.19 | | 3.18 | | 2.42 | | 3.99 | | 4.63 | | 6.50 | | 5.66 | | 8.09 | | 5.32 | | 4.99 | | 10.18 | | 13.73 | |
Avg %CaO_H | | 2.06 | | 1.81 | | 1.49 | | 2.00 | | 2.75 | | 3.07 | | 4.90 | | 5.46 | | 10.10 | | 7.80 | | 7.39 | | 6.12 | | 4.51 | | 17.06 | | 23.74 | |
Avg %Mn_H | | 5.10 | | 3.10 | | 5.42 | | 0.37 | | 0.65 | | 0.26 | | 0.68 | | 1.20 | | 0.71 | | 0.83 | | 0.19 | | 0.73 | | 1.07 | | 0.29 | | 0.14 | |
Avg %Na2O_H | | 1.19 | | 0.30 | | 0.80 | | 0.14 | | 0.12 | | 0.02 | | 0.14 | | 0.03 | | 0.01 | | 0.03 | | 3.91 | | 0.06 | | 0.03 | | 0.19 | | 0.15 | |
Avg %K2O_H | | 0.08 | | 0.08 | | 0.07 | | 0.06 | | 0.10 | | 0.01 | | 0.10 | | 0.06 | | 0.04 | | 0.04 | | 1.85 | | 0.05 | | 0.16 | | 2.19 | | 0.52 | |
Avg %P2O5_H | | 0.04 | | 0.06 | | 0.04 | | 0.03 | | 0.04 | | 0.06 | | 0.05 | | 0.05 | | 0.04 | | 0.04 | | 0.19 | | 0.04 | | 0.09 | | 0.11 | | 0.13 | |
Avg %LOI | | 4.12 | | 4.12 | | 4.82 | | 2.66 | | 3.32 | | 0.31 | | 7.74 | | 9.15 | | 15.79 | | 13.00 | | 9.00 | | 9.27 | | 7.10 | | 24.34 | | 33.58 | |
Count %S_H | | 0 | | 0 | | 0 | | 0 | | 0 | | 0 | | 0 | | 0 | | 0 | | 0 | | 0 | | 0 | | 0 | | 0 | | 0 | |
Avg %S_H | | | | | | | | | | | | | | | | | | | | | | | | | | | | | | | |
Count %SG_Pyc | | 0 | | 0 | | 0 | | 0 | | 0 | | 0 | | 0 | | 0 | | 0 | | 0 | | 0 | | 0 | | 0 | | 0 | | 0 | |
Avg SG_Pyc | | | | | | | | | | | | | | | | | | | | | | | | | | | | | | | |
Total Samples assayed by XRF represented in this table is 768;
Codes for some rock types such as Wishart are grouped;
Averages reported here for magFe are calculated only from Satmagan method. Some samples also had Davis Tube tests.
Shaded cells generally represent mineralization that has sufficient oxide Fe components to be of economic importance.
September 2011
7-22
Alderon Iron Ore Corp.
NI 43-101 Technical Report – PEA of the Kami Iron Ore Project | | 
|
Table 7.5: North Rose Zone - Average Composition of Rock Units from 2008 and 2010 Drill Core Sample Assays
Rock Type | | HBG_GN | | HIF | | HMIF | | MHIF | | MIF | | MCIF | | MSIF | | LHIF | | LMIF | | LMQCIF | | LMQSIF | | LMSIF | | QCIF | | QCSIF | | QSIF | | SIF | | CIF | | CSIF | | Menihek | |
Count_XRF | | 1 | | 75 | | 71 | | 43 | | 68 | | 5 | | 1 | | 1 | | 4 | | 3 | | 4 | | 2 | | 17 | | 1 | | 7 | | 2 | | 5 | | 1 | | 10 | |
Avg %TFe_H | | 20.63 | | 33.69 | | 32.86 | | 31.48 | | 26.59 | | 23.98 | | 27.49 | | 9.51 | | 34.34 | | 22.01 | | 23.97 | | 27.59 | | 17.03 | | 7.20 | | 21.71 | | 21.47 | | 17.74 | | 16.79 | | 5.82 | |
Avg FeO_H | | | | 0.53 | | 3.44 | | 9.18 | | 19.93 | | | | | | 0.10 | | 26.23 | | | | | | | | 19.05 | | | | | | | | | | 13.58 | | 7.18 | |
Avg %hmFe | | | | 32.12 | | 23.84 | | 11.79 | | 0.80 | | | | | | 8.90 | | 0.90 | | | | | | | | 1.63 | | 0.00 | | | | | | | | 5.20 | | 1.30 | |
Avg %magFeSat | | 1.00 | | 1.47 | | 8.88 | | 18.31 | | 20.82 | | 10.98 | | 6.80 | | 0.60 | | 5.00 | | 3.50 | | 1.43 | | 2.55 | | 1.69 | | 0.60 | | 0.38 | | 1.40 | | 0.49 | | 1.50 | | 0.30 | |
Avg %SiO2_H | | 52.90 | | 48.93 | | 50.20 | | 49.65 | | 48.39 | | 46.72 | | 49.90 | | 85.30 | | 40.33 | | 40.57 | | 47.33 | | 51.25 | | 53.19 | | 60.90 | | 45.46 | | 47.65 | | 45.96 | | 54.10 | | 62.37 | |
Avg %Al2O3_H | | 5.57 | | 0.12 | | 0.17 | | 0.22 | | 0.42 | | 0.27 | | 1.71 | | 0.17 | | 1.33 | | 0.19 | | 0.27 | | 1.15 | | 0.47 | | 13.20 | | 0.14 | | 0.09 | | 0.21 | | 3.58 | | 12.79 | |
Avg %TiO2_H | | 0.27 | | 0.01 | | 0.01 | | 0.01 | | 0.02 | | 0.01 | | 0.21 | | 0.01 | | 0.14 | | 0.01 | | 0.01 | | 0.08 | | 0.02 | | 0.56 | | 0.01 | | 0.01 | | 0.01 | | 0.20 | | 0.66 | |
Avg %MgO_H | | 2.78 | | 0.06 | | 0.43 | | 1.04 | | 2.96 | | 4.08 | | 4.06 | | 0.03 | | 0.40 | | 5.72 | | 5.15 | | 3.38 | | 3.87 | | 2.57 | | 5.88 | | 5.42 | | 5.34 | | 2.62 | | 2.28 | |
Avg %CaO_H | | 2.61 | | 0.03 | | 0.23 | | 0.97 | | 3.55 | | 4.77 | | 3.58 | | 0.01 | | 0.18 | | 7.09 | | 5.24 | | 2.57 | | 5.86 | | 2.03 | | 6.41 | | 5.74 | | 7.61 | | 3.41 | | 1.51 | |
Avg %Mn_H | | 0.62 | | 1.02 | | 0.73 | | 0.62 | | 0.58 | | 0.64 | | 0.67 | | 0.65 | | 0.75 | | 0.43 | | 0.20 | | 0.79 | | 0.26 | | 0.22 | | 0.23 | | 0.32 | | 0.35 | | 0.33 | | 0.11 | |
Avg %Na2O_H | | 0.02 | | 0.05 | | 0.02 | | 0.04 | | 0.07 | | 0.03 | | 0.09 | | 0.02 | | 0.03 | | 0.03 | | 0.01 | | 0.02 | | 0.04 | | 1.18 | | 0.02 | | 0.01 | | 0.01 | | 0.26 | | 1.44 | |
Avg %K2O_H | | 0.81 | | 0.02 | | 0.01 | | 0.02 | | 0.05 | | 0.02 | | 0.01 | | 0.01 | | 0.10 | | 0.01 | | 0.03 | | 0.11 | | 0.08 | | 3.12 | | 0.01 | | 0.01 | | 0.02 | | 1.04 | | 3.30 | |
Avg %P2O5_H | | 0.17 | | 0.04 | | 0.02 | | 0.02 | | 0.03 | | 0.01 | | 0.08 | | 0.02 | | 0.11 | | 0.01 | | 0.02 | | 0.08 | | 0.02 | | 0.19 | | 0.01 | | 0.01 | | 0.01 | | 0.10 | | 0.24 | |
Avg %LOI | | 2.76 | | 1.33 | | 1.02 | | 2.08 | | 5.54 | | 9.15 | | 0.17 | | 0.81 | | 7.62 | | 14.50 | | 6.71 | | 0.04 | | 11.66 | | 4.33 | | 10.84 | | 9.85 | | 14.76 | | 9.11 | | 5.84 | |
Count %S_H | | 0 | | 0 | | 0 | | 0 | | 0 | | 0 | | 0 | | 0 | | 0 | | 0 | | 0 | | 0 | | 0 | | 0 | | 0 | | 0 | | 0 | | 0 | | 0 | |
Count %SG_Pyc | | 0 | | 0 | | 0 | | 0 | | 0 | | 0 | | 0 | | 0 | | 0 | | 0 | | 0 | | 0 | | 0 | | 0 | | 0 | | 0 | | 0 | | 0 | | 0 | |
Total Samples assayed by XRF represented in this table ares 322. One sample not shown in the table is coded as Overburden;
Codes for some rock types such as Menihek are grouped;
Averages reported here for magFe are calculated only from Satmagan method. Some samples also had Davis Tube tests;
Considerable deep weathering of North Rose Zone of Mineralization and lost core. assay averages therefore may not be representative.
September 2011
7-23
Alderon Iron Ore Corp.
NI 43-101 Technical Report – PEA of the Kami Iron Ore Project | 
|
Not all 2010 samples of OIF containing significant hematite were assayed for FeO_H or had magFe determined by Satmagan. The samples that did not have FeO_H and/or Satmagan testwork, often had Davis Tube tests completed. Where Davis Tube tests were completed, the tails from these Davis Tube tests (“DTT”) were generally assayed for FeO.
Where Davis Tube weight recoveries were available for magnetic concentrates and Davis Tube tails had been assayed for FeO, the %hmFe was estimated as follows:
%hmFe = %TFe-(magFeDT+%otherFeDT), where %otherFeDT = weight of Davis Tube tail/Davis Tube feed weight x %Fe++_DTT
Some 2010 samples had Davis Tube tests completed, but there was insufficient magnetic concentrate for assay by XRF. These samples were mostly HIF and variants, or SIF or variants. For these samples, no %DTWR could be calculated and consequently no %magFe from Davis Tube could be calculated. Some of these samples did however have FeO on DTT completed. Where Satmagan determinations of %magFe and FeO on DTT were available, but no %magFe from DT, WGM estimated %hmFe as follows:
%hmFe = %TFe-(magFeSat - %otherFeDT).
Figure 7.7 is a plot of all samples, 2,837 in total, that had both Satmagan determinations of %magFe and sufficient assay data to allow for %magFe to be computed from Davis Tube results. These samples are mostly OIF, but also include carbonate and silicate IF and even amphibolite gneiss (HBG_GN). The results show that both methods for computing magFe produce very similar results with no significant bias. Clearly sample pulverization, 80% passing 70 microns, has resulted in a high degree of magnetite liberation. Hence, the latter two methods for estimation of %hmFe, where the only difference is whether magnetic Fe is computed from Satmagan or Davis Tube results, should in general produce very similar results.
For some OIF samples, %hmFe cannot be calculated because the necessary assay data is not available. Most of these samples were logged as low in hematite, i.e., magnetite-rich OIF or SIF, and the requisite assays to allow for the calculation of %hmFe were not completed because hematite contents were very low and not significant. Many samples of carbonate and silicate IF
September 2011
7-24
Alderon Iron Ore Corp.
NI 43-101 Technical Report – PEA of the Kami Iron Ore Project |
|
were also not assayed completely because they were judged as containing insignificant magnetite or hematite.
Figure 7.7: Comparison of %magFe Determined from Satmagan vs. Determined by Davis Tube
WGM believes it would be useful to be able to compare hematitic Fe estimates computed from assays completed on Crude or Heads, i.e. FeO_H, versus those computed on the basis of FeO data from DTT and Davis Tube product weight distributions. There are few sample results currently available to allow this comparison to be performed and where the necessary results are available, the samples are all very low in hematite content so inference from the results are not very meaningful. WGM has recommended that Alderon proceed with having the necessary assays and testwork completed on a selection of samples so a meaningful comparison of the methods for estimating hematitic iron can be compared. WGM understands that this assay and testwork is in progress.
For OIF, the sums of %hmFe and %magFe approach %TFe (see Table 7.5). The difference between the sum of %hmFe and %magFe and %TFe for OIF samples can be due to minor amounts of iron in silicates and or carbonates, i.e. “otherFe” or also due to the assays for individual iron components (%TFe, %FeO_H or magFe from Satmagan) not being absolutely accurate. The estimates for %hmFe generally appear to be accurate ±2%. For silicate and
September 2011
7-25
Alderon Iron Ore Corp.
NI 43-101 Technical Report – PEA of the Kami Iron Ore Project |
|
carbonate IF lithologies the sum of %hmFe and %magFe is often significantly less than %TFe. The “missing iron” is probably mostly in grunerite, which on the Property is a common iron silicate in IF and/or iron carbonates. Not much of the “otherFe” is likely in sulphides because sulphur levels in mineralization are generally low.
There are a small percentage of samples that from the assay data appear to be misclassified in terms of lithology code. This misclassification may be due to errors in logging or sample sequencing, i.e., sample mix-up problems in the field or in the lab, or could have resulted from acceptable logging misclassification. Acceptable misclassification by lithology code can occur due to samples containing more than one rock type. This can occur, and be acceptable, because of the minimum requisite sample length constraints.
The results in the previous tables show that logging is generally in agreement with rock composition. Samples logged and coded as magnetite-rich are indicated by assay results to contain more magnetic Fe than samples logged as hematite-rich or carbonate and silicate IF. Samples coded as hematite-rich contain more hematitic Fe. At both Rose Central and Mills, hematite-rich samples contain higher levels of manganese. Carbonate IF samples are generally higher in CaO. Mafic intrusive rocks (HBG-GN) contain higher levels of TiO2, Al2O3 and Mg than IF. Quartz Schists (which WGM has regrouped from Alderon individual lithology field codes to facilitate simplification for reporting) which generally represent Wishart Formation are high in SiO2 and Al2O3, as are Menihek Formation samples. Denault Formation samples are high in CaO and MgO as this rock is marble or dolomitic marble.
Over 3,000 Davis Tube tests were completed on 2010 drilling program samples. Most of these were completed on Rose Central with 2,929 tests completed. On Mills Lake mineralization, 167 tests were completed. Davis Tube magnetic concentrates were generally assayed for major elements by XRF. For some samples, Davis Tube tails were analyzed for FeO. For a proportion of these samples, particularly hematite-rich samples, no XRF analysis on products was possible because the magnetic concentrate produced was too small or non-existent.
Preliminary results for the Davis Tube tests results for the Rose Central and Mills Lake deposits are summarized in Table 7.6 and Table 7.7. As expected high iron recoveries were achieved for magnetite-rich samples and lower recoveries for hematite-rich samples. Iron concentrations in
September 2011
7-26
Alderon Iron Ore Corp.
NI 43-101 Technical Report – PEA of the Kami Iron Ore Project |
|
magnetic concentrates are generally high at 67 to 70% and silica values generally range from 2 to 4%. Manganese in magnetic concentrates is weakly to moderately correlated with manganese in Head samples but patterns are irregular.
September 2011
7-27
Alderon Iron Ore Corp.
NI 43-101 Technical Report – PEA of the Kami Iron Ore Project | 
|
Table 7.6: Central Rose Deposit - Averages for Davis Tube Test Results by Rock Type
RockType | | HBG_GN | | MHIF | | MHSIF | | MIF | | MSIF | | MCIF | | HIF | | HMIF | | HMSIF | | HSIF | | LHMIF | | LMHIF | | LMHSIF | |
Count of Samples | | 2 | | 389 | | 4 | | 1464 | | 108 | | 2 | | 34 | | 353 | | 2 | | 1 | | 2 | | 16 | | 5 | |
Avg %Fe_H | | 21.62 | | 30.59 | | 32.67 | | 29.28 | | 32.28 | | 27.00 | | 29.51 | | 31.73 | | 31.66 | | 26.16 | | 21.48 | | 20.47 | | 26.92 | |
Avg %MagFeSat | | 7.70 | | 19.55 | | 13.28 | | 23.76 | | 18.46 | | 12.15 | | 4.51 | | 10.57 | | 8.75 | | 2.50 | | 8.60 | | 5.69 | | 6.96 | |
Avg %SiO2_H | | 47.00 | | 45.54 | | 41.58 | | 45.81 | | 41.63 | | 48.80 | | 48.34 | | 44.34 | | 46.95 | | 47.10 | | 57.55 | | 56.60 | | 50.58 | |
Avg %Mn_H | | 0.62 | | 1.50 | | 1.13 | | 1.00 | | 1.17 | | 0.08 | | 1.01 | | 1.67 | | 1.56 | | 1.56 | | 2.14 | | 3.80 | | 1.05 | |
Avg %P2O5_H | | 0.09 | | 0.03 | | 0.04 | | 0.03 | | 0.04 | | 0.03 | | 0.02 | | 0.02 | | 0.07 | | 0.02 | | 0.03 | | 0.02 | | 0.03 | |
Avg %FeO_H | | | | 3.33 | | 25.15 | | 8.14 | | 20.45 | | | | 1.48 | | 1.63 | | | | | | 2.33 | | 9.39 | | 26.89 | |
Avg %DTWR | | 10.73 | | 27.13 | | 19.35 | | 32.68 | | 25.72 | | 16.58 | | 6.27 | | 15.26 | | 11.21 | | 3.09 | | 11.62 | | 7.96 | | 12.57 | |
Avg %Fe_DTC | | 68.83 | | 68.98 | | 68.32 | | 69.53 | | 68.35 | | 68.90 | | 69.81 | | 68.59 | | 69.11 | | 67.57 | | 68.62 | | 65.05 | | 65.96 | |
Avg %SiO2_DTC | | 2.64 | | 2.23 | | 3.76 | | 2.19 | | 3.51 | | 3.47 | | 1.98 | | 2.53 | | 3.04 | | 4.49 | | 2.80 | | 5.40 | | 6.49 | |
Avg %Mn_DTC | | 0.12 | | 1.03 | | 0.20 | | 0.37 | | 0.21 | | 0.03 | | 0.64 | | 1.23 | | 0.16 | | 0.23 | | 1.27 | | 2.68 | | 0.18 | |
Avg %P2O5_DTC | | 0.005 | | 0.005 | | 0.005 | | 0.005 | | 0.005 | | 0.005 | | 0.005 | | 0.005 | | 0.005 | | 0.005 | | 0.005 | | 0.005 | | 0.006 | |
Avg %MagFe_DT | | 7.40 | | 18.76 | | 13.30 | | 22.73 | | 17.63 | | 11.46 | | 4.51 | | 10.51 | | 7.73 | | 2.09 | | 8.06 | | 5.14 | | 8.29 | |
Avg %FeRec’y | | 32.82 | | 61.08 | | 41.30 | | 76.86 | | 54.08 | | 42.52 | | 16.70 | | 33.58 | | 24.36 | | 7.99 | | 34.07 | | 30.65 | | 31.32 | |
| | LMIF | | LMQCIF | | LMSIF | | CIF | | CSIF | | QCIF | | QCSIF | | QSIF | | QV | | SIF | | Qtz Schist
(Wishart) | | Menihek | |
Count of Samples | | 88 | | 1 | | 58 | | 1 | | 7 | | 15 | | 1 | | 6 | | 1 | | 21 | | 9 | | 5 | |
Avg %Fe_H | | 24.13 | | 18.05 | | 27.88 | | 20.15 | | 16.02 | | 11.26 | | 7.21 | | 22.69 | | 5.22 | | 27.31 | | 13.55 | | 21.64 | |
Avg %MagFeSat | | 11.83 | | 2.70 | | 9.97 | | 12.50 | | 5.33 | | 4.90 | | 0.60 | | 4.73 | | 5.30 | | 4.40 | | 6.80 | | 13.68 | |
Avg %SiO2_H | | 50.73 | | 39.70 | | 44.08 | | 56.60 | | 61.13 | | 63.55 | | 60.90 | | 46.05 | | 86.80 | | 45.49 | | 69.20 | | 53.52 | |
Avg %Mn_H | | 0.71 | | 0.49 | | 1.19 | | 1.67 | | 0.89 | | 1.32 | | 0.22 | | 1.11 | | 0.90 | | 1.32 | | 1.59 | | 0.51 | |
Avg %P2O5_H | | 0.06 | | 0.01 | | 0.04 | | 0.02 | | 0.03 | | 0.03 | | 0.19 | | 0.03 | | 0.01 | | 0.07 | | 0.02 | | 0.06 | |
Avg %FeO_H | | 17.02 | | | | 24.54 | | 1.63 | | 22.98 | | 7.66 | | 8.62 | | 25.68 | | 1.54 | | 32.88 | | 5.22 | | | |
Avg %DTWR | | 16.97 | | 3.61 | | 14.12 | | 16.35 | | 6.56 | | 7.69 | | 0.70 | | 6.13 | | 6.25 | | 6.37 | | 9.50 | | 19.19 | |
Avg %Fe_DTC | | 67.98 | | 61.90 | | 67.20 | | 69.94 | | 68.32 | | 67.90 | | | | 67.36 | | 71.34 | | 64.69 | | 65.80 | | 65.69 | |
Avg %SiO2_DTC | | 3.75 | | 8.24 | | 4.65 | | 1.20 | | 3.96 | | 4.15 | | | | 3.94 | | 1.61 | | 6.68 | | 5.88 | | 4.41 | |
Avg %Mn_DTC | | 0.26 | | 0.14 | | 0.18 | | 0.88 | | 0.15 | | 0.47 | | | | 0.16 | | 0.49 | | 0.22 | | 1.06 | | 0.19 | |
Avg %P2O5_DTC | | 0.006 | | 0.005 | | 0.006 | | 0.005 | | 0.005 | | 0.005 | | | | 0.005 | | 0.005 | | 0.009 | | 0.005 | | 0.008 | |
Avg %MagFe_DT | | 11.61 | | 2.24 | | 9.55 | | 11.44 | | 4.47 | | 5.57 | | | | 4.15 | | 4.46 | | 4.13 | | 6.24 | | 13.18 | |
Avg %FeRec’y | | 48.86 | | 12.40 | | 34.14 | | 56.75 | | 29.51 | | 58.34 | | | | 18.68 | | 85.38 | | 15.24 | | 54.54 | | 55.01 | |
Shaded cells generally represent mineralization that has sufficient oxide Fe components to be of economic importance but details will vary. Avg%P2O5_H in DT concentrates has been corrected in Tables 7.6 and 7.7 from what was reported in the WGM, May 20, 201.
Table 7.7: Mills Lake Deposit - Averages for Davis Tube Test Results by Rock Type
Rock Type | | MIF | | MHIF | | HMIF | | LMIF | | HSIF | | SIF | | QSIF | |
Count of Samples | | 117 | | 35 | | 3 | | 5 | | 1 | | 4 | | 2 | |
Avg %Fe_H | | 30.52 | | 31.12 | | 36.54 | | 26.62 | | 33.37 | | 28.14 | | 27.84 | |
Avg %MagFeSat | | 26.32 | | 22.19 | | 13.77 | | 10.76 | | 9.60 | | 5.03 | | 5.45 | |
Avg %SiO2_H | | 47.19 | | 46.97 | | 31.30 | | 46.22 | | 40.80 | | 41.43 | | 34.70 | |
Avg %Mn_H | | 0.55 | | 0.30 | | 7.42 | | 0.60 | | 2.35 | | 0.84 | | 0.61 | |
Avg %P2O5_H | | 0.04 | | 0.03 | | 0.03 | | 0.05 | | 0.04 | | 0.09 | | 0.02 | |
Avg %FeO_H | | | | | | | | | | | | | | | |
Avg %DTWR | | 37.47 | | 31.62 | | 18.86 | | 14.44 | | 12.19 | | 7.26 | | 6.92 | |
Avg %Fe_DTC | | 68.19 | | 68.33 | | 66.10 | | 67.87 | | 68.34 | | 63.68 | | 68.51 | |
Avg %SiO2_DTC | | 4.54 | | 4.51 | | 1.67 | | 4.75 | | 1.02 | | 7.50 | | 3.22 | |
Avg %Mn_DTC | | 0.24 | | 0.19 | | 5.08 | | 0.10 | | 3.20 | | 0.18 | | 0.08 | |
Avg %P2O5_DTC | | 0.005 | | 0.005 | | 0.005 | | 0.005 | | 0.005 | | 0.011 | | 0.005 | |
Avg %MagFe_DT | | 25.50 | | 21.59 | | 12.56 | | 9.81 | | 8.33 | | 4.64 | | 4.75 | |
Avg %FeRec’y | | 83.15 | | 69.02 | | 33.27 | | 38.06 | | 24.96 | | 16.23 | | 17.03 | |
Shaded cells generally represent mineralization that has sufficient oxide Fe components to be of economic importance but details will vary. Avg%P2O5_H in DT concentrates has been corrected in Tables 7.6 and 7.7 from what was reported in the WGM, May 20, 201.
September 2011
7-28
Alderon Iron Ore Corp.
NI 43-101 Technical Report – PEA of the Kami Iron Ore Project | 
|
For its 2010 program, Alderon completed bulk density determination on 175, 0.1 m length half split core samples for the purposes of calibrating the downhole density probe data. The samples tested spanned a number of rock types. The bulk densities were determined at SGS Lakefield using the weigh-in-water/weigh-in-air method. These 0.1 m samples represent the upper 0.1 m intervals of routine assay samples that are generally 3 m to 4 m long. There are no XRF WR assays for these specific 0.1 m samples as only the routine sample intervals, of which the 0.1 m samples were a part, were assayed. Figure 7.8 shows that bulk densities for these 0.1 m samples correlate poorly with the %TFe from assays on the longer interval routine samples of which they were a part. This poor correlation is not unexpected by WGM since mineralization is rarely consistent over entire sample intervals. Note: Although there were 175 wet bulk density determinations, more than one result for the 0.1 m samples can match with a routine sample interval.
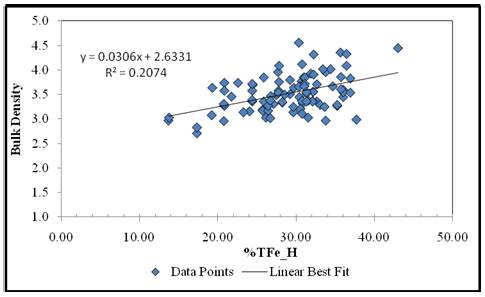
Figure 7.8: Bulk Density for 0.1 m Samples Intervals vs. %TFe on Routine Samples
Alderon also completed SG determinations on the pulps from 33 routine samples at SGS Lakefield using the gas comparison pycnometer method. The SG results for these samples versus XRF WR %TFe results are shown on Figure 7.9. The plot also shows the results of DGI Geosciences Inc. (“DGI”) downhole density results. This plot shows that SG by pycnometer results correlate strongly with %TFe. It also illustrates that probe determined
September 2011
7-29
Alderon Iron Ore Corp.
NI 43-101 Technical Report – PEA of the Kami Iron Ore Project |
|
density averaged over the same sample intervals similarly correlate strongly with both %TFe from assay and with pycnometer determined density.
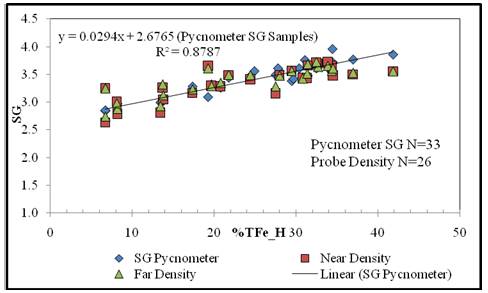
Figure 7.9: SG by Gas Comparison Pycnometer on Pulps vs. %TFe on Routine Assay Samples
WGM’s experience is that there is invariably a strong positive correlation between SG and/or density and %TFe assays for fresh unweathered / un-leached OIF. This occurs because OIF generally has a very simple mineralogy consisting predominantly of hematite and/or magnetite and quartz. Because the iron oxide component is much denser than the quartz and the OIF mineralogy is simple, the Fe concentration of a sample provides an excellent measure of the amount of magnetite and/or hematite present in the sample and hence the density of the sample. Invariably, the relationship between %TFe and SG is much the same from one deposit to the next. Pycnometer determined SG on pulps is not the ideal method for proving the SG to %TFe relationship because any porosity in samples could lead to misleading results. However, where bulk density and pulp density or SG have been determined on fresh unweathered OIF samples, WGM has found that results will be very comparable.
Figure 7.10 is a plot showing helium comparison pycnometer SG results for WGM’s 26 samples it collected from Alderon and Altius drill core during site visits in 2009 and 2010. Also shown are DGI’s density results from downhole probe averaged over the same Tos and Froms as the WGM sample intervals. Pycnometer SG and %TFe correlate well and the Best Fit relationship
September 2011
7-30
Alderon Iron Ore Corp.
NI 43-101 Technical Report – PEA of the Kami Iron Ore Project |
|
line is similar to Alderon’s 33 SG pycnometer results and similar to that for other iron deposits WGM has reviewed. However, the probe densities do not correlate well with either the pycnometer SG or iron assays.
WGM believes the discrepancy between the relationships shown on the previous figures may be due to poor correlation between sample Tos and Froms from sampling, logging and the core meterage blocks and the probe depth indexing. WGM understands that Alderon has been aware of discrepancies between the depth of drillholes as indicated by the drillers and the DGI probe data. WGM further understands that the consensus of opinion is that the driller’s core meterage block errors were not always detected and corrected by Alderon’s geotechnical crew. Consequently, the depth indexing for DGI’s probe does not correspond exactly with Tos and Froms from logging and sampling. The previous figure showing probe density, pycnometer SG and %TFe correlates well because special effort was made to correct the indexing errors.
For the Mineral Resource estimate, WGM has chosen for its modeling to use the relationship between pycnometer SG and %TFe to mitigate the depth indexing issue.
Figure 7.10: SG by Pycnometer on Pulps vs. %TFe for WGM’s Independent Samples
September 2011
7-31
Alderon Iron Ore Corp.
NI 43-101 Technical Report – PEA of the Kami Iron Ore Project |
|
WGM recommends that Alderon complete pycnometer pulp SG and bulk density determinations on whole routine assay sample intervals and compare results to confirm that pycnometer SG and bulk density measurements generate similar results and correlate strongly with %TFe. WGM further recommends that Alderon strengthen its core handling, logging and sampling routines in order to locate and fix core block meterage errors before logging and sampling is completed. The positive consequence of finding and fixing these errors would be to make the probe densities more valuable. WGM would argue however, that for fresh unweathered OIF, probe densities provide little to no advantage over estimating rock density from assay results. However, where rocks are weathered and leached, probe densities would have a distinct advantage.
September 2011
7-32
Alderon Iron Ore Corp.
NI 43-101 Technical Report – PEA of the Kami Iron Ore Project |
|
8. DEPOSIT TYPE
The iron formation on the Property is iron formation of the Lake Superior type. Lake Superior - type iron formations consist of banded sedimentary rock composed principally of bands of iron oxides, magnetite and hematite within quartz (chert)-rich rock with variable amounts of silicate, carbonate and sulphide lithofacies. Such iron formations have been the principal sources of iron throughout the world (Gross, 1996). Table 8.1, after Eckstrand, Editor (1984), presents the salient characteristics of the Lake Superior-type iron deposit model.
Lithofacies that are not highly metamorphosed or altered by weathering and are fine grained are referred to as taconite.
Metamorphosed taconites are known as meta-taconite or itabirite (particularly if hematite-rich). The iron deposits in the Grenville part of the Labrador Trough in the vicinity of Wabush and Mont-Wright, operated by IOC (Rio Tinto), ArcelorMittal and Cliffs Natural Resources (“Cliffs”) (Wabush Mine) are meta-taconite. The Bloom Lake iron deposit acquired with the recent purchase of Consolidated Thompson by Cliffs is also a meta-taconite. The iron formation on the Property is similarly Lake Superior-type meta-taconite.
For non-supergene-enriched iron formation to be mined economically, iron oxide content must be sufficiently high but also, the iron oxides must be amenable to concentration (beneficiation) and the concentrates produced must be low in deleterious elements such as silica, aluminum, phosphorus, manganese, sulphur and alkalis. For bulk mining, the silicate and carbonate lithofacies and other rock types interbedded within the iron formation must be sufficiently segregated from the iron oxides. Folding can be important for repeating iron formation and concentrating iron formation beds to create economic concentrations of iron.
September 2011
8-1
Alderon Iron Ore Corp.
NI 43-101 Technical Report – PEA of the Kami Iron Ore Project |
|
Table 8.1: Deposit Model For Lake Superior-Type Iron Formation After Eckstrand (1984)
Commodities | | Fe (Mn) |
Examples: | | |
| | |
Canadian - Foreign | | Knob Lake, Wabush Lake and Mont-Wright areas, Que. and Lab. - Mesabi Range, Minnesota; Marquette Range, Michigan; Minas Gerais area, Brazil. |
| | |
Importance | | Canada: the major source of iron. World: the major source of iron. |
| | |
Typical Grade, Tonnage | | Up to billions of tonnes, at grades ranging from 15 to 45% Fe, are averaging 30% Fe. |
| | |
Geological Setting | | Continental shelves and slopes possibly contemporaneous with offshore volcanic ridges. Principal development in middle Precambrian shelf sequences marginal to Archean cratons. |
| | |
Host Rocks or Mineralized Rocks | | Iron formations consist mainly of iron and silica-rich beds; common varieties are taconite, itabirite, banded hematite quartzite, and jaspilite; composed of oxide, silicate and carbonate facies and may also include sulphide facies. Commonly intercalated with other shelf sediments: black |
| | |
Associated Rocks | | Bedded chert and chert breccia, dolomite, stromatolitic dolomite and chert, black shale, argillite, siltstone, quartzite, conglomerate, red beds, tuff, lava, volcaniclastic rocks; metamorphic equivalents. |
| | |
Form of Deposit, Distribution of Ore Minerals | | Mineable deposits are sedimentary beds with cumulative thicknesses typically from 30 m to 150 m and strike lengths of several kilometers. In many deposits, repetition of beds caused by isoclinal folding or thrust faulting has produced widths that are economically mineable. Ore mineral distribution is largely determined by primary sedimentary deposition. Granular and oolitic textures are common. |
| | |
Minerals: Principal Ore Minerals - Associated Minerals | | Magnetite, hematite, goethite, pyrolusite, manganite, hollandite. - Finely laminated chert, quartz, Fe-silicates, Fe-carbonates and Fe-sulphides; primary or. metamorphic derivatives |
| | |
Age, Host Rocks | | Precambrian, predominantly early Proterozoic (2.4 to 1.9 Ga). |
| | |
Age, Ore | | Syngenetic, same age as host rocks. In Canada, major deformation during Hudsonian and, in places, Grenvillian orogenies produced mineable thicknesses of iron formation. |
| | |
Genetic Model | | A preferred model invokes chemical, collodial and possibly biochemical precipitates of iron and silica in euxinic to oxidizing environments, derived from hydrothermal effusive sources related to fracture systems and offshore volcanic activity. Deposition may be distal from effusive centers and hot spring activity. Other models derive silica and iron from deeply weathered land masses, or by leaching from euxinic sediments. Sedimentary reworking of beds is common. The greater development of Lake Superior-type iron formation in early Proterozoic time has been considered by some to be related to increased atmospheric oxygen content, resulting from biological evolution. |
September 2011
8-2
Alderon Iron Ore Corp.
NI 43-101 Technical Report – PEA of the Kami Iron Ore Project |
|
Commodities | | Fe (Mn) |
Ore Controls, Guides to Exploration | | 1. Distribution of iron formation is reasonably well known from aeromagnetic surveys. 2. Oxide facies is the most economically important, of the iron formation facies. 3. Thick primary sections of iron formation are desirable. 4. Repetition of favorable beds by folding or faulting may be an essential factor in generating widths that are mineable (30 to 150 m). . 5. Metamorphism increases grain size, improves metallurgical recovery. 6. Metamorphic mineral assemblages reflect the mineralogy of primary sedimentary facies. 7. Basin analysis and sedimentation modeling indicate controls for facies development, and help define location and distribution of different iron formation facies. |
| | |
Author | | G.A. Gross |
September 2011
8-3
Alderon Iron Ore Corp.
NI 43-101 Technical Report – PEA of the Kami Iron Ore Project |
|
9. EXPLORATION
9.1 General
Historic exploration is summarized under the History section of the Report. Altius’ initial exploration was in 2006, culminating in a diamond drilling program in 2008. Alderon acquired the Property in December 2010 and conducted its first exploration program in the summer of 2010.
9.2 Altius Exploration Programs 2006 – 2009
Reconnaissance mapping and rock sampling commenced during the summer of 2006 and was completed during the 2007 field season. Ten 2006 samples of outcrop and boulders were assayed at SGS Lakefield for major elements. Grab samples yielded iron values typical of oxide facies iron formation. Further outcrop sampling was completed during the 2008 program. A total of 63 rock samples were collected, 29 of which were for chemical analysis while the remaining were collected for physical properties testing. The 2007 samples were sent to Activation Laboratories in Ancaster, Ontario and assayed for major elements, FeO and total sulphur. Nine rock samples from the Mills Lake area returned Fe values ranging from 9.7% Fe to 43.6% Fe and manganese values ranging from 0.43% Mn to 13.87% Mn. From the Molar Lake area, five rock samples were collected yielding 13.7% Fe to 23.6% Fe and 0.1% to 0.69% Mn. From the Elfie Lake area, two grab samples were collected that respectively returned assay results of 25.9% Fe and 0.95% Mn and 17.9% Fe and 1.07% Mn. From the Mart Lake area, one sample was collected that yielded 16.3% Fe and 0.15% Mn. From the Rose Lake area, a few outcrops over a strike length of approximately 430 m were grab sampled. Values ranged from 5.6% Fe with 9.73% Mn from a sample near the iron formation – Wishart Formation contact to 29.7% Fe with 1.05% Mn from a magnetite specularite sample of iron formation.
Altius’ 2007 exploration program also included a high resolution helicopter airborne magnetic survey carried out by Mcphar Geosurveys Ltd. The purpose of the airborne survey was to acquire high resolution magnetic data to map the magnetic anomalies and geophysical characteristics of the geology. The survey covered one block. Flight lines were oriented northwest-southeast at a spacing of 100 m. Tie-lines were oriented northeast-southwest at a
September 2011
9-1
Alderon Iron Ore Corp.
NI 43-101 Technical Report – PEA of the Kami Iron Ore Project |
|
spacing of 1,000 m. A total of 905 line km of data were acquired. Data was acquired by using precision differential GPS positioning. The rock samples were collected from the Property and sent for physical properties testing to support interpretation of the airborne magnetic survey results.
The results of the 2007 exploration program were positive with rock samples returning favorable iron values and the airborne magnetic survey effectively highlighting the extent of the iron formation. Following the 2007 exploration program, licenses 013935M, 013937M, 010501M, 011927M, 012853M and 012854M were grouped to form license 15037M and licenses 14957M, 14962M, 14967M and 14968M were staked.
The 2008 exploration program on the Property consisted of physical properties testing of the rock samples collected in 2007, line cutting, a ground gravity and magnetic survey carried out by Géosig of Saint Foy, Québec, a high resolution satellite imagery survey (Quickbird), an integrated 3-D geological and geophysical inversion model and 6,129.49 m of diamond drilling in 25 holes. The drilling program was designed to test three known iron ore occurrences on the Property (namely Mills Lake, Mart Lake and Rose Lake) that were targeted through geological mapping and geophysics.
The ground gravity and total field magnetic surveys were conducted along 69.8 km of cut gridlines spaced from 200 m to 400 m apart oriented northwest-southeast. Gravity surveying and high resolution positional data were collected at 25 m intervals. The magnetic survey stations were spaced at 12.5 m along the lines.
Mira Geoscience (“Mira”) was contracted to create a 3-D geological and geophysical inversion model of the Property. Mira was provided with the geological cross sections, airborne and ground geophysics data and the physical rock properties from each of the different lithologies. The 3-D geological and geophysical model was completed to help with target definition and drillhole planning.
Drilling confirmed (see following sections in this Report) the presence of oxide-rich iron formation at the three iron occurrences and was successful in extending the occurrences along
September 2011
9-2
Alderon Iron Ore Corp.
NI 43-101 Technical Report – PEA of the Kami Iron Ore Project |
|
strike and at depth. Drilling was also fundamental in testing stratigraphy and structure to help refine the geological and structural models for each area to aid in drillhole targeting.
9.3 Alderon’s Summer 2010 Exploration Program
The 2010 exploration program started on June 1st, 2010 and finished December 1st, 2010. The program consisted mainly of a drilling program described under Drilling (Section 10), but also included an airborne geophysical survey covering the three licenses Alderon holds in Newfoundland and Labrador and the relogging and lithology re-coding of Altius’ 2008 drill core. The airborne geophysical survey consisted of 1,079 line km of gravity and magnetic surveying covering a 130 km2 area.
The geophysical survey measuring the gradient of the gravity field and magnetics was carried out by Bell Geospace Inc. (“BGI”) of Houston, Texas and flown over the Property from November 8th through November 11th, 2010 onboard a Cessna Grand Caravan. The crew and equipment were stationed in Wabush. The survey was flown in a north-south direction with perpendicular tie lines. Eighty five survey lines and 13 tie lines were flown. The survey lines were 100 m apart on the western side of the survey area, and 300 m apart on the eastern side. The tie lines were 1,000 m apart. The survey lines vary from 10.3 km to 12.4 km in length, and the tie lines varied in length from 5.5 km to 11.7 km.
The survey plan defines a flight path that maintains a constant distance from the ground for the entire length of each survey line. However, it is not always possible to maintain the constant clearance because of variations in terrain relief. Ground clearance does not vary greatly in this survey due to the lack of severe terrain features and ground clearance ranged from 60 km to 187 m.
Magnetic data was acquired with a cesium vapor sensor. A radar altimeter system is deployed to measure the distance between the airplane and the ground. Along with the plane’s altitude acquired via GPS, radar altimetry data is used to produce a Digital Elevation Model (“DEM”).
The full Tensor Gravity Gradiometry (Air FTG) system contains three Gravity Gradient Instruments (“GGIs”), each consisting of two opposing pairs of accelerometers arranged on a rotating disc.
September 2011
9-3
Alderon Iron Ore Corp.
NI 43-101 Technical Report – PEA of the Kami Iron Ore Project | 
|
Processing of the gravity data includes line leveling, terrain correction and noise reduction. Measured free air and terrain corrected maps for each of the six tensor components are provided.
Minimal data correction is required for magnetics. The majority of erroneous data is removed by the compensation process that corrects the data for the effects of the aircraft, as heading and position changes relative to the magnetic field. A base magnetometer was also used to record and remove the daily variations in the magnetic field due to regional factors. A lag correction is applied to correct the distance between the mag sensor and the GPS antennae. The lag correction is computed based on speed and distance to accurately shift the magnetic data to the GPS reference point and ensure that lines flown in opposite directions are not biased by the distance between the sensor and antennae. The earth’s field is calculated and removed. Only minor line adjustments are required to remove any remnant errors that are apparent at line intersections. The data is then ready for reduction to the magnetic pole to approximate the anomaly directly over the causative body, and other derivative calculations to accentuate the anomalies.
September 2011
9-4
Alderon Iron Ore Corp.
NI 43-101 Technical Report – PEA of the Kami Iron Ore Project |
|
10. DRILLING
10.1 Historic Drilling
In 1957, IOCC remapped an area of 86.2 km2 to the west of Duley Lake on a scale of 1” = 1,000 ft and test drilled shallow holes throughout the area through overburden cover to determine areas underlain by iron formation. Dip needle surveying served as a guide for determining the locations of iron formation in drift-covered areas.
According to Hird (1960), 272 holes aggregating a total of 7,985 m (26,200 ft) were drilled during IOCC’s 1957 program. Approximately 66 of these holes were located on the Property. Mathieson (1957) reported that there were no new deposits found as a result of the drilling, however, definite limits were established for the iron formation outcrops found during previous geological mapping.
In 1979, one diamond drill hole was drilled by LM&E near the north end of Elfie Lake. The hole (No. 57-1) was drilled vertically to a depth of 28 m (Grant, 1979) and did not encounter oxide iron formation. In 1983, as reported by Avison et al., 1984, LM&E collared a 51 m deep (168 ft) diamond drill hole 137 m north of Elfie Lake (DDH No. 57-83-1). The drillhole encountered iron formation from 17 m to a depth of 51 m. Of this, however, only 2 m was oxide facies. Core recovery was very poor, (20%).
10.2 Altius 2008 Drilling Program
10.2.1 General
Altius’ 2008 drilling program consisted of 27 holes totaling 6,129.5 m (including two abandoned holes which were re-drilled) testing the Mills Lake, Mart Lake and Rose Lake iron occurrences (see Figure 7.2). Descriptions of mineralization and estimated true widths are discussed under Mineralization (Section 7 of this Report). Drillhole locations and collar information are given in Table 10.1. Drilling was carried out between June and October by Lantech Drilling Services of Dieppe, New Brunswick, using a Marooka mounted JKS300 drill rig. A second, larger drill rig was added to the program in September, to help complete the program before freeze-up. The
September 2011
10-1
Alderon Iron Ore Corp.
NI 43-101 Technical Report – PEA of the Kami Iron Ore Project |
|
second rig was a skid mounted LDS1000 towed by a Caterpillar D6H dozer. Both drills were equipped for drilling BTW sized core. Drilling took place on a two-shift per day basis, 20 hours per day, and seven days per week. The remaining four hours were used up with travel to and from the drill site and shift change.
Table 10.1: Drilling Summary — Altius 2008 Program
Hole ID | | Zone | | Easting | | Northing | | Elev | | Azimuth | | Dip | | Length
(m) | | Start
Date | | Finish Date | |
K-08-01 | | Central Rose | | 633067.65 | | 5855447.72 | | 615.13 | | 315 | | -45 | | 274.0 | | 06-Jun-08 | | 16-Jun-08 | |
K-08-02 | | Mills Lake | | 634415.60 | | 5851576.78 | | 635.49 | | 240 | | -50 | | 145.2 | | 19-Jun-08 | | 25-Jun-08 | |
K-08-03 | | Mills Lake | | 634416.25 | | 5851576.01 | | 635.32 | | 240 | | -90 | | 186.0 | | 24-Jun-08 | | 28-Jun-08 | |
K-08-04 | | Mills Lake | | 634949.99 | | 5850966.76 | | 588.34 | | 240 | | -50 | | 98.0 | | 30-Jun-08 | | 04-Jul-08 | |
K-08-05 | | Mills Lake | | 634770.00 | | 5850885.00 | | 611.00 | | 240 | | -90 | | 57.0 | | 05-Jul-08 | | 07-Jul-08 | |
K-08-06 | | Mills Lake | | 634531.11 | | 5851191.13 | | 627.57 | | 240 | | -51 | | 170.0 | | 08-Jul-08 | | 11-Jul-08 | |
K-08-07 | | Mills Lake | | 634316.26 | | 5851987.22 | | 620.57 | | 240 | | -51 | | 178.0 | | 12-Jul-08 | | 18-Jul-08 | |
K-08-08 | | Central Rose | | 633337.00 | | 5855208.22 | | 626.87 | | 315 | | -50 | | 241.0 | | 20-Jul-08 | | 28-Jul-08 | |
K-08-09 | | Central Rose | | 633479.77 | | 5855345.66 | | 628.62 | | 315 | | -51 | | 316.0 | | 28-Jul-08 | | 02-Aug-08 | |
K-08-10 | | Central Rose | | 633621.14 | | 5855480.71 | | 637.14 | | 315 | | -50 | | 316.0 | | 02-Aug-08 | | 10-Aug-08 | |
K-08-11 | | Central Rose | | 632925.43 | | 5855079.84 | | 644.68 | | 135 | | -50 | | 38.4 | | 11-Aug-08 | | 12-Aug-08 | |
K-08-11A | | Central Rose | | 632925.43 | | 5855079.84 | | 644.68 | | 135 | | -50 | | 280.0 | | 12-Aug-08 | | 23-Aug-08 | |
K-08-12 | | Central Rose | | 632585.30 | | 5855406.53 | | 585.99 | | 135 | | -50 | | 427.7 | | 28-Aug-08 | | 10-Sep-08 | |
K-08-13 | | Elfie | | 633636.56 | | 5854321.44 | | 686.76 | | 315 | | -50 | | 192.4 | | 04-Sep-08 | | 08-Sep-08 | |
K-08-14 | | Elfie | | 633515.52 | | 5854204.53 | | 684.88 | | 315 | | -50 | | 281.0 | | 08-Sep-08 | | 15-Sep-08 | |
K-08-15 | | Central Rose | | 632228.99 | | 5855196.57 | | 576.98 | | 135 | | -50 | | 316.0 | | 10-Sep-08 | | 17-Sep-08 | |
K-08-16 | | Elfie | | 633184.61 | | 5854381.98 | | 677.22 | | 315 | | -90 | | 351.0 | | 16-Sep-08 | | 25-Sep-08 | |
K-08-17 | | North Rose | | 632226.54 | | 5855198.68 | | 576.46 | | 315 | | -50 | | 208.0 | | 16-Sep-08 | | 21-Sep-08 | |
K-08-18 | | Central Rose | | 633123.23 | | 5855723.46 | | 592.26 | | 135 | | -50 | | 386.0 | | 22-Sep-08 | | 30-Sep-08 | |
K-08-19 | | Elfie | | 633030.76 | | 5854062.66 | | 685.77 | | 315 | | -50 | | 334.8 | | 24-Sep-08 | | 04-Oct-08 | |
K-08-20 | | Central Rose | | 633266.33 | | 5855847.56 | | 601.40 | | 135 | | -50 | | 441.0 | | 30-Sep-08 | | 09-Oct-08 | |
K-08-21 | | Elfie | | 633173.74 | | 5854394.69 | | 679.25 | | 315 | | -50 | | 331.0 | | 04-Oct-08 | | 11-Oct-08 | |
K-08-22 | | Elfie | | 633177.18 | | 5853911.07 | | 658.72 | | 315 | | -50 | | 75.0 | | 11-Oct-08 | | 15-Oct-08 | |
K-08-23 | | Elfie | | 633033.21 | | 5853783.48 | | 645.60 | | 315 | | -50 | | 64.0 | | 15-Oct-08 | | 17-Oct-08 | |
K-08-24 | | Central Rose | | 633296.58 | | 5854963.20 | | 630.36 | | 315 | | -50 | | 305.0 | | 01-Oct-18 | | 24-Oct-08 | |
Total 25 Drillholes | | | | | | | | | | | | 6,009 m | | | | | |
Notes: Coordinates are NAD 27 Zone 19N.
List excludes two drillholes that were abandoned at shallow depth; Total contract drilling was 27 drillholes aggregating 6,129.5 m
10.2.2 2008 Drillhole Collars and Downhole Surveying
Drillhole collars were spotted prior to drilling by chaining in the locations from the closest gridline picket. Drilling azimuths was established by lining up the drill by sight on the cut gridlines. Drill inclinations were established using a compass on the drill head.
Once a drillhole was finished, the Drill Geologist placed a fluorescent orange picket next to the collar labeled with the collar information on an aluminum tag. The X, Y and Z coordinates for these collar markers were surveyed using handheld GPS. Generally, casing was left in the ground where holes were successful in reaching bedrock.
September 2011
10-2
Alderon Iron Ore Corp.
NI 43-101 Technical Report – PEA of the Kami Iron Ore Project |
|
Downhole surveys were systematically performed by the driller every 50 m using a Flexit instrument. Azimuth, inclination and magnetic field data were recorded by the driller in a survey book kept at the drill. A copy of the page is taken from the book, placed in a plastic zip lock bag and placed in the core box and the test was recorded by the geologist.
10.3 Alderon 2010 Drilling Program
10.3.1 General
The 2010 drill program consisted of 25,895 m NQ diamond drilling. The objective of the program was to delineate an Inferred iron oxide Mineral Resource of 400-500 MT on two areas: the Rose Central and Mills Lake deposits. The drilling included testing the North Rose Lake Zone, the South West Rose Lake Zone and the Elfie Lake/South Rose Zone. The 2010 program included: borehole geophysics on many of the 2008 and 2010 holes, detailed 3-D, DGPS surveying of 2008 and 2010 drillhole collars, and logging and sampling of drill core including the relogging of 2008 drillholes.
Landdrill International Ltd. (“Landdrill”) based in Notre-Dame-du-Nord, QC was the Drill Contractor for the entire campaign. Throughout the campaign, between three and five diamond drill rigs were operating. Some rigs were brought in for special purposes, like a heli-supported drill for several holes on North Rose and a track-mounted drill to access an area with a restricted access permit. A total of 82 holes were collared, but only 72 holes were drilled to the desired depths, with the remaining holes being lost during casing or before reaching their target depth because of broken casing, detached rods, bad ground, etc. Table 10.2 provides a summary of 2010 drilling by target zone.
September 2011
10-3
Alderon Iron Ore Corp.
NI 43-101 Technical Report – PEA of the Kami Iron Ore Project |
|
Table 10.2: 2010 Drilling Summary by Deposit or Zone
Deposit or Zone | | Metres | | Number of Holes | |
Central Rose | | 18,928 | | 51 | |
Mills Target | | 4,124 | | 16 | |
North Rose | | 1,419 | | 5 | |
SW Rose | | 1,424 | | 10 | |
Total | | 25,895 | | 82 | |
Several Central Rose Lake drillholes also tested the North Rose Zone at depth, allowing for a preliminary evaluation.
The drill campaign consisted of three continuous and at times, simultaneous phases of exploration:
1. The drilling began on the north-east extent of the Central Rose Lake trend (L22E) and progressed south-west along the established 200 m spaced north-west/south-east oriented gridlines to section L8E. Each section was drilled and interpreted with the interpretation extrapolated and integrated into previous sections.
2. Towards the middle of the program, drilling expanded to test the North Rose and South-West Rose Zones, also following 200 m spaced lines. This expansion was done by increasing the number of drills on the Property to allow focus to continue on the Central Rose Zone. The North Rose and South-West Rose zones were difficult to test due to the topography, thick overburden and swampy terrain.
3. The last phase of exploration focused on the Mills Lake deposit and utilized two drills (one heli-supported, the other self-propelled track driven) over eight weeks.
Drilling on the South-West Rose Zone was limited to two cross sections. Drilling was difficult due to a combination of thick overburden (37-65 m vertical depth) with deep saprolitic weathering. Core recovery ranged from adequate to very poor. The weathering decreased at depths below 170 vertical meters, but most holes did not achieve that depth. Drilling on this target was suspended due to poor production.
September 2011
10-4
Alderon Iron Ore Corp.
NI 43-101 Technical Report – PEA of the Kami Iron Ore Project |
|
Drilling on the North Rose Zone was limited to two sites due to accessibility. The terrain overlying this target is swampy lowland surrounding a shallow lake. Several holes testing the Central Rose deposit were extended to test the deeper portions of this North Zone and indicate this zone requires additional drilling and may significantly contribute to the overall Rose Lake tonnage. This target is best tested during a winter program when the area is frozen and more readily accessible.
Core recovery was generally very good throughout the drilling focused on the Central Rose and Mills Lake deposits and is not a factor of the Mineral Resource estimate. Core recovery is often poor for the drilling on the North Rose Zone due to intensive weathering along fault systems, but neither the South-West Rose, nor the North Rose zones form part of the present Mineral Resource estimate.
The holes drilled in 2010 are listed in Table 10.3.
September 2011
10-5
Alderon Iron Ore Corp.
NI 43-101 Technical Report – PEA of the Kami Iron Ore Project | | 
|
Table 10.3: Drilling Summary — Alderon 2010 Program
Hole ID | | Zone | | Easting | | Northing | | Elevation | | Azimuth | | Dip | | Length (m) | |
K-10-25 | | Central Rose | | 633256.60 | | 5855857.71 | | 599.08 | | 315 | | -80 | | 458.0 | |
K-10-26 | | Central Rose | | 633125.79 | | 5855726.77 | | 592.09 | | 315 | | -80 | | 323.0 | |
K-10-27 | | Central Rose | | 633289.60 | | 5855546.10 | | 618.62 | | 315 | | -80 | | 658.0 | |
K-10-28 | | Central Rose | | 632953.41 | | 5855598.73 | | 586.60 | | 135 | | -80 | | 623.0 | |
K-10-29 | | Central Rose | | 633130.62 | | 5855720.79 | | 593.11 | | 135 | | -67 | | 597.0 | |
K-10-30 | | Central Rose | | 633282.92 | | 5855548.61 | | 617.64 | | 135 | | -65 | | 191.0 | |
K-10-31 | | Central Rose | | 633070.47 | | 5855443.85 | | 615.23 | | 135 | | -45 | | 38.0 | |
K-10-32 | | Central Rose | | 633020.24 | | 5855531.56 | | 600.74 | | 135 | | -50 | | 211.0 | |
K-10-33 | | Central Rose | | 632962.75 | | 5855589.26 | | 588.67 | | 135 | | -45 | | 366.0 | |
K-10-34 | | Central Rose | | 632910.22 | | 5855357.10 | | 627.82 | | 315 | | -80 | | 507.0 | |
K-10-35 | | Central Rose | | 633224.15 | | 5855607.02 | | 609.68 | | 135 | | -50 | | 212.0 | |
K-10-36 | | Central Rose | | 632861.04 | | 5855685.18 | | 576.37 | | 135 | | -50 | | 40.0 | |
K-10-37 | | Central Rose | | 632879.09 | | 5855671.03 | | 577.85 | | 135 | | -45 | | 60.0 | |
K-10-37A | | Central Rose | | 632879.09 | | 5855671.03 | | 577.85 | | 135 | | -50 | | 609.0 | |
K-10-38 | | Central Rose | | 632580.32 | | 5855412.79 | | 585.06 | | 135 | | -70 | | 440.5 | |
K-10-39 | | Central Rose | | 632906.62 | | 5855360.91 | | 627.77 | | 315 | | -60 | | 97.6 | |
K-10-39A | | Central Rose | | 632906.62 | | 5855360.91 | | 627.77 | | 315 | | -60 | | 505.0 | |
K-10-40 | | Central Rose | | 632635.36 | | 5855351.75 | | 601.20 | | 135 | | -45 | | 314.0 | |
K-10-41 | | Central Rose | | 632732.47 | | 5855254.03 | | 635.21 | | 135 | | -75 | | 141.1 | |
K-10-42 | | Central Rose | | 632770.11 | | 5855496.45 | | 587.43 | | 135 | | -55 | | 401.8 | |
K-10-43 | | Central Rose | | 632620.00 | | 5855375.00 | | 595.00 | | 135 | | -60 | | 183.0 | |
K-10-44 | | Central Rose | | 632732.36 | | 5855254.97 | | 635.02 | | 315 | | -80 | | 140.6 | |
K-10-45 | | Central Rose | | 632578.54 | | 5855414.90 | | 584.93 | | 135 | | -80 | | 528.0 | |
K-10-46 | | Central Rose | | 632638.66 | | 5855348.62 | | 601.43 | | 135 | | -65 | | 704.0 | |
K-10-47 | | Central Rose | | 632770.73 | | 5855495.83 | | 587.67 | | 135 | | -82 | | 603.0 | |
K-10-48 | | Central Rose | | 632348.62 | | 5855372.82 | | 574.94 | | 135 | | -45 | | 596.2 | |
K-10-49 | | North Rose | | 632638.57 | | 5855347.04 | | 601.50 | | 315 | | -45 | | 672.0 | |
K-10-50 | | Central Rose | | 632763.92 | | 5855503.72 | | 586.12 | | 315 | | -75 | | 77.0 | |
K-10-51 | | Central Rose | | 632711.77 | | 5855560.20 | | 580.37 | | 315 | | -50 | | 278.0 | |
K-10-52 | | Central Rose | | 632575.59 | | 5855143.64 | | 667.44 | | 315 | | -70 | | 524.0 | |
K-10-53 | | Central Rose | | 632348.22 | | 5855373.24 | | 574.71 | | 135 | | -60 | | 449.0 | |
K-10-54 | | North Rose | | 632220.20 | | 5855205.78 | | 575.46 | | 315 | | -45 | | 196.0 | |
K-10-55 | | Central Rose | | 632536.01 | | 5854887.03 | | 619.66 | | 315 | | -50 | | 558.0 | |
K-10-56 | | Central Rose | | 632429.35 | | 5854993.94 | | 631.63 | | 315 | | -50 | | 324.0 | |
K-10-57 | | Central Rose | | 632266.76 | | 5854864.00 | | 607.24 | | 315 | | -55 | | 362.3 | |
K-10-58 | | Central Rose | | 632347.54 | | 5854779.14 | | 593.11 | | 315 | | -50 | | 65.0 | |
K-10-59 | | Central Rose | | 632482.96 | | 5854635.70 | | 608.11 | | 315 | | -50 | | 569.0 | |
K-10-60 | | Central Rose | | 632750.47 | | 5854669.00 | | 612.90 | | 315 | | -55 | | 131.0 | |
K-10-61 | | Central Rose | | 632483.84 | | 5854938.39 | | 625.87 | | 315 | | -50 | | 377.0 | |
K-10-62 | | Central Rose | | 632918.67 | | 5854785.02 | | 616.90 | | 315 | | -80 | | 24.0 | |
K-10-62A | | Central Rose | | 632918.67 | | 5854785.02 | | 616.90 | | 315 | | -80 | | 235.0 | |
K-10-63 | | Central Rose | | 632917.94 | | 5854785.70 | | 617.04 | | 315 | | -45 | | 292.0 | |
K-10-64 | | Central Rose | | 632830.68 | | 5855159.57 | | 643.90 | | 315 | | -60 | | 518.0 | |
K-10-65 | | SW Rose | | 631158.40 | | 5854298.28 | | 627.34 | | 315 | | -80 | | 150.0 | |
K-10-66 | | Central Rose | | 632905.20 | | 5855359.14 | | 627.53 | | 315 | | -45 | | 708.0 | |
K-10-67 | | North Rose | | 632657.00 | | 5856024.00 | | 571.00 | | 315 | | -45 | | 165.0 | |
K-10-68 | | Central Rose | | 632918.50 | | 5854780.99 | | 616.82 | | 135 | | -45 | | 234.0 | |
K-10-69 | | Central Rose | | 633377.00 | | 5855449.00 | | 625.00 | | 315 | | -45 | | 159.0 | |
K-10-69A | | Central Rose | | 633390.40 | | 5855437.25 | | 625.72 | | 315 | | -45 | | 720.0 | |
K-10-70 | | Central Rose | | 632574.10 | | 5855140.86 | | 667.58 | | 315 | | -45 | | 788.6 | |
K-10-71 | | Central Rose | | 633488.66 | | 5855616.04 | | 629.91 | | 315 | | -50 | | 141.0 | |
K-10-72 | | SW Rose | | 631157.56 | | 5854299.23 | | 627.34 | | 315 | | -45 | | 174.0 | |
K-10-73 | | Mills Lake | | 634530.34 | | 5851192.50 | | 627.63 | | 60 | | -50 | | 349.0 | |
K-10-74 | | North Rose | | 631917.24 | | 5855274.61 | | 578.83 | | 315 | | -45 | | 201.0 | |
K-10-75 | | SW Rose | | 631150.41 | | 5854304.61 | | 628.32 | | 135 | | -45 | | 94.5 | |
K-10-76 | | Central Rose | | 633490.27 | | 5855614.38 | | 630.16 | | 315 | | -50 | | 357.0 | |
K-10-77 | | Mills Lake | | 634529.29 | | 5851191.87 | | 627.50 | | 60 | | -80 | | 236.0 | |
K-10-78 | | North Rose | | 631917.92 | | 5855273.99 | | 578.66 | | 315 | | -70 | | 185.0 | |
K-10-79 | | SW Rose | | 631264.02 | | 5854188.32 | | 613.58 | | 315 | | -45 | | 147.0 | |
K-10-80 | | Mills Lake | | 634679.03 | | 5851048.95 | | 613.85 | | 240 | | -45 | | 218.0 | |
K-10-81 | | SW Rose | | 631263.26 | | 5854189.12 | | 613.61 | | 315 | | -80 | | 10.0 | |
K-10-81A | | SW Rose | | 631263.26 | | 5854189.12 | | 613.61 | | 315 | | -80 | | 384.4 | |
K-10-82 | | Mills Lake | | 634680.49 | | 5851049.67 | | 613.65 | | 240 | | -80 | | 230.0 | |
K-10-83 | | Central Rose | | 633251.10 | | 5855298.41 | | 625.31 | | 315 | | -45 | | 664.0 | |
K-10-84 | | Central Rose | | 633622.65 | | 5855483.39 | | 637.19 | | 315 | | -45 | | 696.0 | |
K-10-85 | | Mills Lake | | 634761.70 | | 5851086.30 | | 607.22 | | 60 | | -80 | | 317.0 | |
K-10-86 | | SW Rose | | 630992.00 | | 5853883.00 | | 623.00 | | 315 | | -80 | | 66.0 | |
K-10-86A | | SW Rose | | 630992.00 | | 5853883.00 | | 620.00 | | 315 | | -75 | | 69.0 | |
K-10-86B | | SW Rose | | 630992.00 | | 5853883.00 | | 623.00 | | 315 | | -85 | | 155.0 | |
K-10-87 | | Mills Lake | | 634848.86 | | 5850914.17 | | 601.61 | | 240 | | -75 | | 81.7 | |
K-10-88 | | SW Rose | | 630907.00 | | 5853975.00 | | 625.00 | | 315 | | -70 | | 174.0 | |
K-10-89 | | Mills Lake | | 634317.16 | | 5851987.84 | | 620.64 | | 240 | | -70 | | 248.0 | |
K-10-90 | | Mills Lake | | 634414.46 | | 5851794.15 | | 617.98 | | 240 | | -50 | | 185.0 | |
K-10-91 | | Mills Lake | | 634318.94 | | 5851988.48 | | 620.67 | | 60 | | -60 | | 284.0 | |
K-10-92 | | Mills Lake | | 634421.37 | | 5851798.60 | | 617.17 | | 60 | | -55 | | 408.0 | |
K-10-93 | | Central Rose | | 633156.97 | | 5855102.13 | | 637.20 | | 315 | | -45 | | 129.0 | |
K-10-94 | | Mills Lake | | 634505.00 | | 5851643.00 | | 618.00 | | 60 | | -80 | | 20.0 | |
K-10-94A | | Mills Lake | | 634516.21 | | 5851639.37 | | 616.16 | | 60 | | -75 | | 309.0 | |
K-10-95 | | Mills Lake | | 634485.21 | | 5851399.88 | | 626.19 | | 240 | | -50 | | 177.0 | |
K-10-96 | | Mills Lake | | 634488.71 | | 5851401.57 | | 625.79 | | 60 | | -80 | | 204.0 | |
K-10-97 | | Mills Lake | | 634565.41 | | 5851459.00 | | 615.05 | | 60 | | -60 | | 427.0 | |
K-10-98 | | Mills Lake | | 634516.63 | | 5851639.64 | | 616.27 | | 60 | | -55 | | 431.0 | |
Total | | 82 Drillholes | | | | | | | | | | | | 25,895 m | |
Notes : Coordinates are NAD 27, UTM Zone 19N.
September 2011
10-6
Alderon Iron Ore Corp.
NI 43-101 Technical Report – PEA of the Kami Iron Ore Project | | 
|
10.3.2 2010 Drillhole Collars and Downhole Attitude Surveying
Prior to drilling, the drillhole collars were spotted with a handheld GPS. The drilling azimuths for inclined drillholes were established by lining up the drill on fore-sight and/or back-sight pickets previously aligned along the desired azimuth, parallel with the previously surveyed gridlines. Drill inclinations were established with a protractor fixed on the drill head. When a hole was completed, a post was placed in the collar of the hole. This post was temporarily surveyed with a handheld GPS. Subsequently, at the end of the drilling campaign, the X, Y and Z coordinates of all the new drillholes and the 2008 drillholes were precisely DGPS surveyed using dual frequency receivers in Real-Time Kinematic mode by the land surveying firm N.E. Parrott Surveys Limited (“Parrott”) of Labrador City, NL, and tied into the federal geodesic benchmark.
Most of the 2008 and 2010 collars were identified and surveyed during the first (October 23rd to 27th) or second (December 5th) surveying campaign. Two collars, K-08-05 and K-10-43 could not be located.
As part of the borehole geophysics program and immediately after the termination of the drillhole, downhole tests were done with a north-seeking gyroscope instrument by DGI while the drill rig was still on site.
The downhole attitude surveys were performed with the rods inside the borehole to prevent the borehole from collapsing, thus minimizing risk to the equipment. Boreholes drilled in 2008 (K-08 designation) only had casing shots completed to eliminate the risk of open-hole logging.
A series of boreholes, including K-08-20, K-10-25, K-10-27, K-10-30 and K-10-35 were revisited later in the program. These boreholes were now open holes and only casing shots were repeated to minimize risk to the gyro. These results were compared to the previous measurements and repeated within the error range of the instrument.
During the program, it was detected that the azimuth information produced by the gyro, did not match the planned azimuths of the boreholes. Parrott was hired by DGI to provide corroboration to either the planned or measured azimuths of the boreholes, and Parrott, during its December 5th visit, surveyed the azimuths of 24 drillholes. These results were received in early November
September 2011
10-7
Alderon Iron Ore Corp.
NI 43-101 Technical Report – PEA of the Kami Iron Ore Project | |
|
2010. The Parrott azimuths for 20 of the 24 drillholes correlated most closely with the planned azimuths. For four drillholes, (K-10-60, K-10-25, K-10-96 and K-10-94A), the planned azimuths departed from the Parrott azimuths by more than 5 degrees. As a result, DGI recommended that the gyro instrument be immediately removed from the field for problem diagnosis at the manufacturer’s facility.
A sensor was replaced and extensive calibration checks were performed at the manufacturer’s facility with DGI’s Vice President of Operations in attendance. The calibration checks demonstrated a high degree of repeatability and accuracy for the instrument. Once tests were completed to the satisfaction of the manufacturer and DGI, the gyro was returned to the Kami Project.
A thorough review of all calibration data, QA/QC tests, and repeat field measurements compared to the Parrott collar surveys and planned drill azimuths, indicated that the gyro information should be treated as relative. That is, prior to having repairs completed by the manufacturer, the instrument measured the correct relative change in azimuth downhole, but not the correct absolute azimuth. This is the same method as used for normal gyro data. The relative accuracy of the instrument throughout the duration of the Project is supported by the manufacturer.
Alderon elected to use the planned azimuths as the collar azimuths of all of the 2008 and 2010 drillholes and adjust the DGI gyro downhole azimuths to the planned collar azimuths. These corrections were also applied to the OTV structure data to compute orientations for the picked structures.
September 2011
10-8
Alderon Iron Ore Corp.
NI 43-101 Technical Report – PEA of the Kami Iron Ore Project | |
|
10.3.3 Geophysical Downhole Surveying
DGI employed a multi-parameter digital logging system designed by Mount Sopris Instrument Co. and along with gyroscopic downhole drillhole attitude surveying included, natural gamma, poly electric, magnetic susceptibility, calliper, and Optical Televiewer (“OTV”) instrumentation.
The Poly Gamma probe measures variations in the presence of natural radioactivity. Changes in natural radioactivity are typically related to concentrations of uranium, thorium and potassium. Data acquired from this parameter is useful in identifying lithological changes.
The Poly-Electric probe measures: normal resistivity, spontaneous potential (“SP”), single-point resistivity (“SPR”), fluid resistivity, fluid temperature and natural gamma radiation. Resistivity measurements can be used to identify lithology changes, often resulting from changes in porosity. Fluid resistivity measurements are often used to correct the resistivity measurements of the rock from the influence of drilling mud and borehole fluid, and can also be indicative of borehole fractures. Temperature contrast data can identify zones of water movement through borehole fractures and faults relative to static water in the borehole column.
The Magnetic Susceptibility probe delineates lithology by analyzing changes in the presence of magnetic minerals. Magnetic susceptibility data can illustrate lithological changes and degree of homogeneity, and can be indicative of alteration zones. The magnetic susceptibility probe is stabilized in the borehole fluid prior to calibration checks and the start of the survey runs. Calibration checks are performed before the deployment run and after the retrieval run using two points of known magnetic susceptibility. Susceptibility data was used in conjunction with assay data to develop an equation converting magnetic susceptibility (CGS units) to a % magnetite content value estimate.
The OTV provides a detailed visualization of the borehole by capturing a high-resolution image of the borehole wall with precise depth control. The OTV captures a high-resolution 360º image perpendicular to the plane of the probe and borehole. This allows borehole bedding and fractures to be inspected by a direct camera angle. This 360° high-resolution image can be used to identify measure and orient bedding, folding, faulting and lithological changes in the borehole. The use of a gyro provides the relative orientation data to correct the image and feature
September 2011
10-9
Alderon Iron Ore Corp.
NI 43-101 Technical Report – PEA of the Kami Iron Ore Project | |
|
orientation. 2-D and 3-D projections of this data provide a variety of interpretive options for analysis.
The OTV data is reported as True Azimuth and as True Dip. It should be noted that Azimuth True for the feature is the azimuth of the dip direction rather than the strike of the feature. The strike azimuth for a feature is 90° from the value reported in the True Azimuth data column.
Sixty-nine boreholes were surveyed during this Project with various probes. Once a final data set was completed, a statistical characterization was performed using the physical properties data.
10.4 WGM Comments on 2008 and 2010 Drilling
Altius’ 2008 and Alderon’s 2010 drilling programs were generally well run. In 2008, drillhole collars were surveyed using handheld GPS. Fortunately, casings were left in the ground so the collars could be resurveyed at a later date. As part of the 2010 program, Alderon resurveyed all of Altius’ collars using DGPS, except for two that could not be located.
In 2008, downhole surveying was done using a Flexit instrument. This instrument determines azimuths based on a magnetic compass. Altius ignored azimuth readings from the instrument and utilized only the inclination information from the survey. WGM agrees that this was acceptable practice. Alderon attempted gyro surveys of the collars of many of these holes as part of the 2010 program, however, it was later concluded that the gyro azimuths were not accurate. The 2008 drillholes consequently only have inclination data, and no azimuth information. The collar and downhole azimuths used in the drillhole database are understood to be the planned azimuths for the drillholes or gyro azimuths for the hole tops adjusted to planned collar azimuths.
Alderon suspected early on in the 2010 program that the gyro azimuths were biased. DGI and investigations led by the probe manufacturer concluded that there was a sensor malfunction in the probe. The result of this sensor problem was that drillhole azimuths, however inaccurate, were precise. Consequently, downhole azimuths and changes in azimuth for the 2008 and 2010 drillholes were adjusted to planned collar azimuths which are likely most accurate within two to
September 2011
10-10
Alderon Iron Ore Corp.
NI 43-101 Technical Report – PEA of the Kami Iron Ore Project | |
|
three degrees. Unfortunately, weather and logistical problems prevented resurveying of the holes with the probe once it was repaired.
In the summer of 2011, Alderon plans to resurvey as many drillhole collars as possible for location and azimuth. WGM agrees this is the best approach. The assumption of drillhole azimuth based on planned collar azimuth, rather than actual accurate measured azimuths, will likely have a minor affect on geological interpretation and the Mineral Resource estimate. However, considering that this is an initial resource estimate and more drillholes are required to fully delineate mineralization, WGM is of the opinion that any adverse effect of inaccurate azimuth is minor.
Drillhole orientation relative to rock structure varies from nearly perpendicular to dip to almost down dip and the rocks and mineralization are folded. Consequently, the relationship between true widths and drillhole intersection length also varies considerably from hole to hole, or even within a hole. WGM encourages Alderon, as much as possible, to avoid drilling down dip.
WGM also suggests that it labels drillhole collars immediately after drill dismount.
WGM has not completed a thorough review of all of the downhole geophysical information.
September 2011
10-11
Alderon Iron Ore Corp.
NI 43-101 Technical Report – PEA of the Kami Iron Ore Project | |
|
11. SAMPLE PREPARATION, ANALYSIS AND SECURITY
11.1 Alderon 2010 Drill Core Handling and Logging
Core logging was conducted by several geologists, including Elsa Hernandez-Lyons, William Strain, Bryan Sparrow (“GIT-PEGNL”) and supervised by Edward Lyons, a member of the Association of Professional Engineers and Geoscientists of British Columbia (“APEGBC”), the professional Engineers and Geoscientists of Newfoundland and Labrador (“PEGNL”), and the Ordre des Géologues du Québec (“OGQ”). Mr. Lyons and Ms. Hernandez-Lyons have recent experience on similar deposits in the Fermont, Fire Lake district.
After the core was placed in the core trays, the geologists checked the core for meterage blocks and continuity of core pieces. The geotechnical logging was done by measuring the core for recovery and rock quality designation (“RQD”). This logging was done on a drill run block to block basis, generally at nominal three meter intervals. Core recovery and rock quality data were measured for all holes. Drill core recovery in most cases was close to 100% with virtually every 3 m run. The RQD was generally higher than 92%. Lower values were observed and measured for the first 3 to 5 m of some holes where the core is slightly broken and occasionally slightly weathered. Near fault shears, RDQ dropped somewhat but was rarely below 65% and this mainly occurs in the schistose stratigraphic hanging wall Menihek Formation, rather than in the iron formation.
The core was logged for lithology, structure, and mineralization, with data entered directly into laptop computers using MS Access forms developed by Alderon geomatics staff. Attention was directed at evaluating the percent content of iron oxides as well as the major constituent gangue components of the iron formation using a quaternary diagram developed by Mr. Lyons. Drillhole locations, sample tables and geotechnical tables were created in MS Access separately and can be merged with the geological tables at will.
Prior to sample cutting, the core was photographed wet and dry. Generally, each photo includes five core boxes. A small white dry erase board with a label is placed at the top of each photo and provides the drillhole number, box numbers and from-to in meters for the group of trays. The core box was labeled with an aluminum tag containing the drillhole number, box number
September 2011
11-1
Alderon Iron Ore Corp.
NI 43-101 Technical Report – PEA of the Kami Iron Ore Project | |
|
and From-To in meters stapled on their left (starting) end. Library samples approximately 0.1 m long of whole core were commonly taken from most drillholes to represent each lithological unit intersected. Once the core logging and the sampling mark-up was completed, the boxes were stacked in core racks inside the core facility. After sampling, the core trays containing the remaining half core and the un-split parts of the drillholes were stored in sequence on pallets in a locked semi-heated warehouse located in the Wabush Industrial Park. The warehouse contains the entire core from Altius’ 2008 and Alderon’s 2010 drilling campaigns.
11.2 Sample Security
The core was brought in twice daily at shift changes to Alderon’s core facility, in a building in Labrador City, NL, in order to reduce the possibility of access by the public near the drill staging area southwest of Labrador City. Public access to the core facility was restricted by signage and generally closed doors. Only Alderon or its Contractor’s employees were allowed to handle core boxes or to visit the logging or sampling areas inside the facility. Split core samples were packed in sealed steel drums and strapped onto wood pallets. The pallets were picked up at the core facility with a forklift and loaded into a closed van and carried by TST Transport to SGS Lakefield, via Baie-Comeau, Québec and Montréal.
11.3 Alderon 2010 Sampling Method & Approach
The 2010 sampling approach was similar to the previous Altius exploration programs with most samples taken to start and stop at the meterage blocks, at 3.0 m intervals, with variation in sample limits adaptable to changes in lithology and mineralization. Samples were therefore generally 3.0 m long and minimum sample length was set at 1.0 m. Zones of unusual gangue, like Mn mineralization, or abnormally high carbonate were treated as separate lithologies for sampling.
The bracket or shoulder sampling of all “ore grade” mineralization by low grade or waste material was promoted. The protocol developed for the program also stated that silicate and silicate iron formation intervals in the zones of oxide iron formation should generally all be sampled unless exceeding 20 m in intersection length. In the abnormal circumstance where
September 2011
11-2
Alderon Iron Ore Corp.
NI 43-101 Technical Report – PEA of the Kami Iron Ore Project | |
|
core lengths for these waste intervals were greater than 20 m, then only the low/nil grade waste intervals marginal to OIF were to be sampled as bracket samples.
In-field Quality Control materials consisting of Blanks, Certified Reference Standards or quarter core Duplicates were inserted into the sample stream with a routine sequential sample numbers at a frequency of one per ten routine samples. The Duplicates were located in the sample number sequence within nine samples of the location of its corresponding “Original”. The Duplicates accordingly, do not necessarily directly follow their corresponding Original.
Similar to the 2008 practice, the 2010 practice entailed the use of three tag sample books. Geologists were encouraged to try and use continuous sequences of sample numbers. The Geologists were instructed to mark the Quality Control (“QC”) sample identifiers in the sample books prior to starting any sampling.
The sample intervals and sample identifiers are marked by the Geologist onto the core with an arrow, an indelible pen or wax marker. The sample limits and sample identifiers are also marked on the core tray.
The book-retained sample tags are marked with the sampling date, drillhole number, the From and To of the sample and the sample type (sawn half core, Blank, Duplicate or Standard) and if Standard, then also record the identity of the Standard. The first detachable ticket recording the From and To of the sample was stapled into the core tray at the start of the sample interval. Quality Control sample tags were are also stapled into the core tray at proper location. Quarter core Duplicates were flagged with flagging tape to alert the core cutters.
The core cutters saw the samples coaxially, as indicated by the markings, and then placed both halves of the core back into the core tray in original order. The sampling technicians completed the sampling procedure which involves bagging the samples.
The second detachable sample tags are placed in the plastic sample bags. These tags do not record sample location. As an extra precaution against damage, the sample number on these tags was covered with small piece of clear packing tape. The sample identifiers were also marked with indelible marker on the sample bags. The bags are then closed with a cable tie or
September 2011
11-3
Alderon Iron Ore Corp.
NI 43-101 Technical Report – PEA of the Kami Iron Ore Project | |
|
stapled and placed in numerical order in the sampling area to facilitate shipping. The samplers inserted the samples designated as Field Blanks before shipping.
Samples are checked and loaded into pails or barrels for shipping. Pails or barrels are individually labeled with the laboratory address and the samples in each shipping container are recorded.
11.4 WGM’s Comments on 2008 and 2010 Drilling
WGM examined sections of Altius’ 2008 drill core during its October 2009 site visit and Alderon’s 2010 drill core during its site visits in July and November 2010 and found the core for both campaigns in good order. The drill logs have also been reviewed and WGM agrees they are comprehensive and generally are of excellent quality. Core descriptions in the logs were found to match the drill core. During WGM’s site visits, sample tickets in the trays were checked and confirmed that they were located as reported in the drill logs.
A drill core sampling approach using 1 m to 5 m long samples respecting lithological contacts is acceptable practice. WGM is unaware of any drilling, sampling or recovery factors that could materially impact the accuracy and reliability of the results. WGM agrees that the Library samples do not materially impact assay reliability and/or accuracy.
Altius’ 2008 and Alderon’s 2010 drilling programs were generally well run. In 2008, drillhole collars were surveyed using a handheld GPS. Fortunately, casings were left in the ground so the collars could be resurveyed at a later date. As part of the 2010 program, Alderon resurveyed all of Altius’ collars using DGPS, except for two that could not be located.
In 2008, downhole surveying was done using a Flexit instrument. This instrument determines azimuths based on a magnetic compass. Altius ignored azimuth readings from the instrument and utilized only the inclination information from the survey. WGM agrees that this was acceptable practice. Alderon attempted gyro surveys of the collars on many of these holes as part of the 2010 program, however, it was later concluded that the gyro azimuths were not accurate. The 2008 drillholes consequently only have inclination data and no azimuth information, and the collar and downhole azimuths used in the drillhole database are taken to be
September 2011
11-4
Alderon Iron Ore Corp.
NI 43-101 Technical Report – PEA of the Kami Iron Ore Project | |
|
the planned azimuths for the drillholes or gyro azimuths for the hole tops adjusted to planned collar azimuths.
Alderon suspected early on in the 2010 program that the gyro azimuths were biased. DGI and investigations by the probe manufacturer concluded that there was a sensor malfunction in the probe. The result of this sensor problem was that drillhole azimuths were inaccurate, but were precise. Consequently, downhole azimuths and changes in azimuth for the 2008 and 2010 drillholes were adjusted to planned collar azimuths which are likely mostly accurate within two to three degrees. Unfortunately, weather and logistical problems prevented resurveying of holes with the probe once it was repaired.
In the summer of 2011, Alderon plans to resurvey as many drillhole collars as possible for location and azimuth. WGM agrees this is the best approach. The assumption of drillhole azimuth based on planned collar azimuth, rather than actual accurate measured azimuths, will likely have a minor affect on geological interpretation and the Mineral Resource estimate, but considering that this is an initial resource estimate and more drillholes are required to fully delineate mineralization, WGM is of the opinion that any adverse effect of inaccurate azimuth is small.
Drillhole orientation relative to rock structure varies from nearly perpendicular to dip to almost down dip and the rocks and mineralization are folded. Accordingly, the relationship between true widths and drillhole intersection length also varies considerably from hole to hole, or even within a hole. WGM encourages Alderon as much as possible to avoid drilling down dip.
WGM also suggests that drillhole collars be labeled immediately after drill dismount.
WGM has not completed a thorough review of all the downhole geophysical information as Alderon has also not yet completed its review.
September 2011
11-5
Alderon Iron Ore Corp.
NI 43-101 Technical Report – PEA of the Kami Iron Ore Project | 
|
11.5 2008 Sample Preparation and Assaying
In-lab sample preparation was performed by SGS Lakefield at its Lakefield, Ontario facility. SGS Lakefield is an accredited laboratory meeting the requirements of ISO 9001 and ISO 17025. Samples were crushed to 9 mesh (2 mm) and 500 g of riffle split sample was pulverized to 200 mesh (75 µm).
All of Altius’ drill core samples were subject to a standard routine analysis including whole rock analysis (“WR”) by lithium metaborate fusion XRF, FeO by H2SO4/HF acid digest-potassium dichromate titration, and magnetic Fe and Fe3O4 by Satmagan. Neither the Satmagan nor the FeO determinations were completed on all in-field QA/QC materials. A group of 14 samples were analyzed for S by LECO, with sample selection based on visual observation of sulphide in the drill core. A total of 676 samples including in-field QC materials were sent for assay. Sample and analysis statistics are summarized in Table 11.1.
Table 11.1: Sampling and Analysis Summary, Altius 2008 Drill Program
Sample Classification | | Analysis | | Number |
Routine | | XRF WR and Satmagan | | 613 |
S | | S | | 14 |
In-Field Blank | | XRF WR and Satmagan | | 19 |
In-Field ¼ Core Duplicate | | XRF WR and Satmagan | | 24 |
In-Field Standards (TBD-1, SCH-1) | | XRF WR and Satmagan | | 20 |
SGS Lakefield Preparation Duplicate | | | | 7 |
SGS Lakefield Replicates Analytical Duplicates | | | | 22 |
SGS Lakefield Certified Standards and Blanks | | Variable | | |
11.5.1 2008 Quality Assurance and Quality Control
Altius conducted an in-field QA/QC program during initial core sampling. SGS Lakefield also conducted its own in-lab internal QA/QC program. Samples and analysis for both these programs are summarized in the table above.
In the field, Standard, Blanks and Duplicate samples were inserted alternately every 10th sample. The material used for Blank was a relatively pure quartzite and was obtained from a quarry outside of Labrador City. Duplicate samples were collected by quarter sawing the predetermined sample intervals and using ¼ core for the Duplicate sample, ¼ for the regular
September 2011
11-6
Alderon Iron Ore Corp.
NI 43-101 Technical Report – PEA of the Kami Iron Ore Project |
|
samples, and the remaining half core was returned to the core tray for reference. The Certified Standard Reference materials used were CANMET’s TBD-1 and SCH-1; CANMET’s FER-4 was used when the TBD-1 material was exhausted in the latter half of the program. This material was pre-packaged in paper envelopes and, as required, a sachet was placed in a regular sample bag and given a routine sequential project sample number. Certified and provisional values for iron and selected other elements for these two standards are listed in Table 11.2.
Table 11.2: Certified Standard Reference Materials Used for the In-Field QA/QC Program Altius 2008 and Alderon 2010
Standard | | Material | | | | Certified Values | |
ID | | | | %Fe | | %FeO | | %SiO2 | | %Mn | | %P | | %S | |
SCH-1 | | Schefferville Hematite IF | | 60.73 | | NA | | 8.087 | | 0.777 | | 0.054 | | 0.007 | |
TDB-1 | | Saskatchewan - Diabase - | | 10.4 | | NA | | 50.2 | | 0.1577 | | 0.08 | | 0.03 | |
FER-4 | | Sherman Mine Ontario — cherty magnetite IF | | 27.96 | | 15.54 | | 50.07 | | 0.147 | | 0.057 | | 0.11 | |
Nineteen field Blanks from the 2008 drilling campaign all returned low values.
Results for %TFe and %Fe3O4Satmagan, FeO, MnO and SiO2 for analysis of Duplicate ¼ drill core samples for both the 2008 and 2010 programs are shown in Section 11.7.2, along with results for 2010 program samples. The results generally indicate that Original and Duplicate assays correlate strongly. There are a few outliers that may represent errors made in the field or in the lab, but generally, the results indicate that assays are precise and minimal sampling mix-ups prevail.
The results for the 2008 program Certified Reference Standards are shown in Section 11.7.2, along with results for Alderon’s 2010 samples. In general, the Standards performed well as indicated by the clustering of results and the concentration averages which are close to the Certified Reference values summarized in the previous tables. The Standards were not however assayed for FeO, nor were any Satmagan determinations completed. Albeit, such analysis would not have generated a great deal of information, as both of the Standards used for the 2008 program contained little magnetite.
SGS Lakefield’s in-laboratory QA/QC program consisted of assays on Preparation Duplicates which it calls Replicates and Analytical Duplicates which are re-assays of the same pulps., SGS Lakefield refers to these re-assays as Duplicates on its Certificates of Analysis.
September 2011
11-7
Alderon Iron Ore Corp.
NI 43-101 Technical Report – PEA of the Kami Iron Ore Project |
|
Preparation Duplicates are second pulps made by splitting off a second portion from a coarse reject. SGS Lakefield prepared and assayed Preparation Duplicates and Preparation Blanks at a rate of one every 50 to 70 routine samples. Analytical Duplicates which involved a new fusion and disc, were prepared and assayed at a frequency of one sample every 20 to 25 routine samples.
Results for Preparation Duplicates (Replicates) and Analytical Duplicates for the 2008 program for selected elements are shown on the figures in the following section of this Report. These figures also show results from the 2010 program.
11.6 2010 Sample Preparation
The Primary laboratory for Alderon’s 2010 exploration program was again SGS Lakefield. Sample preparation for assay included crushing the samples to 75% passing 2 mm. A 250 g (approximate) sub-sample was then riffled out and pulverized in a ring-and-puck pulverizer to 80% passing 200 mesh. Standard SGS Lakefield QA/QC procedures applied. These included crushing and pulverizing screen tests at 50 sample intervals. Davis Tube tests were also performed on selected samples. The material for the David Tube tests was riffled out directly from the pulverized Head samples.
11.7 2010 Sample Assaying
11.7.1 General
Alderon’s 2010 drill core sample assay protocol was similar to the 2008 protocol with WR analysis for major oxides by lithium metaborate fusion XRF requested for all samples and magnetic Fe or Fe3O4 determined by Satmagan. For a proportion, but not for all samples, FeO was determined by H2SO4/HF acid digest - potassium dichromate titration. Generally where FeO on Heads was not completed, Davis Tube tests were performed. Sample selection criteria for Davis Tube testwork included magnetite by Satmagan greater than 5%, or hematite visually observed by the core logging geologists. Where Davis Tube tests were completed, Davis Tube magnetic concentrates were generally analyzed by XRF for WR major elements. During the first
September 2011
11-8
Alderon Iron Ore Corp.
NI 43-101 Technical Report – PEA of the Kami Iron Ore Project |
|
half of the program, FeO was also determined in Davis Tube tails. Alderon made this switch in methodology because it believed Davis Tube tails were being overwashed.
In addition to the “routine” assaying 175, 0.1 m samples of half split core samples were sent to SGS Lakefield for bulk density determination by the weighing-in-water/weighing-in-air method. The purpose of this work was to provide rock density for different rock types and types of mineralization to calibrate DGI’s downhole density probe. These samples were taken from the upper 0.1 m long intervals of routine assay sample intervals, each generally 3 m to 4 m long. After SGS Lakefield completed the bulk density tests, these core pieces were returned to the field so they could be replaced back into the original core trays. In addition to the bulk density testwork, 33 sample pulps had SG determined by the gas comparison pycnometer method.
Alderon also cut 58 new samples from the 2008 drill core that had not been previously sampled and assayed.
Additional determinations of FeO_H on samples where FeO was not originally requested and additional Davis Tube testwork are in progress. The purpose of this work is to provide the data necessary to enable a comparison of methods for estimating %hmFe. Additional assaying was done as part of the QA/QC program and more details concerning the QA/QC program are described in the following section of this Report.
A total of 5,527 samples, including new assays from the 2008 drill core and including in-field QC materials were sent for assay. Sample and analysis statistics are summarized in Table 11.3.
September 2011
11-9
Alderon Iron Ore Corp.
NI 43-101 Technical Report – PEA of the Kami Iron Ore Project |
|
Table 11.3: Sampling and Analysis Summary, Alderon 2010 Drill Program
Sample Classification | | Analysis | | Number |
Routine (2010 program drillholes — excluding 58 samples from the 2008 drill core) | | XRF WR | | 4,944 |
| | Satmagan | | 4,943 |
| | FeO_H | | 2,552 |
| | | | |
Davis Tube Tests (includes field inserted QA/QC materials) | | Weight recovery | | 3,242 |
| | XRF_DTC | | 2,992 |
| | FeO_DTT | | 1,761 |
| | | | |
Assaying and sampling of previously unsampled 2008 core intervals | | XRF WR and Satmagan | | 58 |
| | FeO_H | | 41 |
| | | | |
Re-assay of 2008 pulps | | XRF WR and Satmagan | | 595 |
| | | | |
In-Field Blank | | XRF WR and Satmagan | | 179 |
| | FeO_H | | 82 |
| | | | |
In-Field 1/2 Core Duplicate | | XRF WR and Satmagan | | 167 |
| | FeO_H | | |
| | | | |
In-Field Standards (STD A=FER-4, STD B= SCH-1) | | XRF WR and Satmagan | | 185 |
| | | | |
Secondary lab (Inspectorate) Check Assaying | | XRF WR | | 287 |
| | FeO_H by HCL-H2SO3 | | 287 |
| | FeO_H by HF-H2SO4 | | 85 |
| | Satmagan | | 287 |
SGS Lakefield Preparation Duplicate | | Variable –see text | | |
SGS Lakefield Replicates Analytical Duplicates | | Variable –see text | | |
SGS Lakefield Certified Standards and Blanks | | Variable –see text | | |
11.7.2 2010 Quality Assurance and Quality Control
The 2010, QA/QC program, similar to the 2008 program, included components conducted by Alderon that were initiated during core sampling in the field and also components operated by SGS Lakefield’s as part of its own internal QA/QC program. Samples and analysis for both these components are summarized in the table above. Alderon’s program included in-field components involving the insertion of Blanks, Duplicates and Standards into the sample stream going to SGS Lakefield, plus the re-assaying of a selection of 2008 program pulps and the Check Assaying of a selection of pulps at a secondary laboratory. Inspectorate, located in Vancouver, B.C., was the secondary laboratory for the program. Inspectorate holds a number of international accreditations, including ISO 17025.
September 2011
11-10
Alderon Iron Ore Corp.
NI 43-101 Technical Report – PEA of the Kami Iron Ore Project |
|
Alderon In-field QA/QC
In the field, Standard, Blanks and Duplicate samples were inserted into the sample stream alternately every 10th sample. The Certified Standard Reference materials used were CANMET’s TBD-1, changed later to FER-4 and SCH-1. This material was pre-packaged in transparent bags and, as required, a sachet was placed in a regular sample bag and given a routine sequential project sample number. The certified and provisional values for iron and selected other elements were listed previously in Table 11.2.
Duplicate samples were collected by quarter sawing the predetermined sample intervals and using ¼ core for the Duplicate sample and ¼ for the regular samples, with the remaining half core returned to the core tray for reference. The material used for Blanks was the same material used for the 2008 program being crushed quartzite, located from local outcrops.
In addition to the in-field insertion of Blanks, Duplicates and Standards, a selection of Altius sample pulps originally assayed as part of the 2008 program were retrieved from storage and re-assayed. Initial results from this re-assaying raised some issues concerning Satmagan results for several samples and more assaying to address these issues involving preparation of new pulps from 2008 program rejects is in progress. At the time of generation of the current Mineral Resource estimate, the project database held new WR and Satmagan results for 595, 2008 sample pulps; however, none of these re-assays have been used for the Mineral Resource estimate.
Alderon maintained active monitoring of field-QA/QC results as they were received and undertook re-assaying when assay or sample irregularities were observed. A tracking table was used to track QA/QC issues. WGM recommends that Alderon develop a written protocol specifying the criteria for identifying and selecting questionable sample results (QA/QC failures) and the steps to be taken when dealing with questionable sample results.
September 2011
11-11
Alderon Iron Ore Corp.
NI 43-101 Technical Report – PEA of the Kami Iron Ore Project | 
|
SGS Lakefield’s internal QA/QC for the 2010 program was similar to its practice in 2008, including screen tests for crushing and pulverizing, Preparation Duplicates, Preparation Blanks, Analytical Duplicates, and Blanks and Standards.
Figure 11.1 to Figure 11.5 present assay results for selected elements for 2008 and 2010 core Duplicates.
Figure 11.1: Results for Duplicate ¼ Split Drill Core Samples - %TFe_H — 2008 and 2010 Programs
September 2011
11-12
Alderon Iron Ore Corp.
NI 43-101 Technical Report – PEA of the Kami Iron Ore Project |
|
Figure 11.2: Results for Duplicate ¼ Split Drill Core Samples — %Fe3O4Satmagan_H — 2008 and 2010 Programs
Figure 11.3: Results for Duplicate ¼ Split Drill Core Samples - %FeO_H — 2008 and 2010 Programs
September 2011
11-13
Alderon Iron Ore Corp.
NI 43-101 Technical Report – PEA of the Kami Iron Ore Project |
|
Figure 11.4: Results for Duplicate ¼ Split Drill Core Samples - %Mn_H — 2008 and 2010 Programs
Figure 11.5: Results for Duplicate ¼ Split Drill Core Samples - %SiO2_H — 2008 and 2010 Programs
Generally Duplicate and Original results are strongly correlated. A few outliers can be identified.
Results for field-inserted Certified Reference Standards are shown on Figure 11.6 to Figure 11.10. On these, plots assay values are plotted against certificate date. Table 11.4 compares assay results for the Standards against their certified values where available.
September 2011
11-14
Alderon Iron Ore Corp.
NI 43-101 Technical Report – PEA of the Kami Iron Ore Project |
|

Figure 11.6: Results for In-Field Standards for %TFe — 2008 and 2010 Programs

Figure 11.7: Results for In-Field Standards for %SiO2_H — 2008 and 2010 Programs
September 2011
11-15
Alderon Iron Ore Corp.
NI 43-101 Technical Report – PEA of the Kami Iron Ore Project |
|
Figure 11.8: Results for In-Field Standards for %Mn_H — 2008 and 2010 Programs
Figure 11.9: Results for In-Field Standards for %FeO_H — 2010 Program
September 2011
11-16
Alderon Iron Ore Corp.
NI 43-101 Technical Report – PEA of the Kami Iron Ore Project |
|
Figure 11.10: Results for In-Field Standards for %magFe_H — 2010 Program
Table 11.4: Summary for 2008 and 2010 In-Field Certified Reference Standards
| | | | %TFe | | %SiO2 | | %Mn | | %FeO | | %magFe | |
SCH-1 | | Certified Value | | 60.73 | | 8.087 | | 0.777 | | | | | |
2008 | | Average | | 61.00 | | 8.18 | | 0.77 | | | | | |
2010 | | Average | | 60.54 | | 8.26 | | 0.76 | | | | 2.0 | |
| | | | | | | | | | | | | |
FER-4 | | Certified Value | | 27.96 | | 50.07 | | 0.147 | | 15.54 | | | |
2010 | | Average | | 27.97 | | 50.14 | | 0.15 | | 15.59 | | 23.9 | |
The results indicate that the Certified Reference Standards performed well for both the 2008 and 2010 programs. The averages for the Standards assayed at SGS Lakefield are very close to the Certified Reference values and the charts show that most assays are closely clustered along a constant value line. There are however, occasionally, assays that indicate either a Standard that was misidentified in the field or mixed-up in the lab.
The estimates of %hmFe used for the Mineral Resource estimate were computed from analytical results from the analysis of Head samples, but also from Davis Tube testwork results depending on what type of analytical data was available for any particular sample. QA/QC for the Davis Tube tests and assays of their products is consequently also important.
September 2011
11-17
Alderon Iron Ore Corp.
NI 43-101 Technical Report – PEA of the Kami Iron Ore Project |
|
Davis Tube tests were completed on six samples of CANMET’s FER-4 Certified Reference Standard that was inserted into the sample stream in the field. Only one sample of SCH-1 had a Davis Tube test completed. There were eight field ¼ core Duplicates where Davis Tube tests were performed, but complete analysis of Davis Tube products were not performed on every one of these Duplicate samples.
Table 11.5 summarizes results for the six samples for Standard FER-4 on which Davis Tube tests were completed. The results for Head analysis listed in the table are also a component of the results shown on the previous figures for the performance of Certified Reference Standards. The magFe results listed for Satmagan and DT are also a component. For these six samples, %DTWR ranges from 33% to 37% and Fe_DTC ranges from nearly 63% to nearly 68%. Three of these samples report SiO2 in DTCs ranging from 5% to 6%, while for the other three instances of FER-4, SiO2 concentrations are approximately 10%. In WGM’s opinion, these results for silica are curious. The %DTWR appears reasonable but WGM’s expectation would be that the %TFe assays for the DTCs would be more closely clustered. WGM recommends that Alderon conduct a further review and ascertain any implications.
Table 11.5: Selected Analytical Results for DT Tests Performed on Standard FER-4
Sample | | %TFe_H | | %SiO2_
H | | %Mn_H | | %magFe
Sat | | %magFe
DT | | %DTWR | | %Fe_
DTC | | %FeO_
DTT | | %SiO2_
DTC | | %Mn_DT
C | |
NL00503 | | 27.6 | | 49.90 | | 0.15 | | 23.60 | | 22.02 | | 33.03 | | 66.66 | | 7.87 | | 5.53 | | 0.03 | |
NL00905 | | 27.9 | | 50.10 | | 0.15 | | 24.00 | | 23.28 | | 36.82 | | 63.23 | | 7.97 | | 10.30 | | 0.04 | |
NL00902 | | 28.0 | | 50.20 | | 0.15 | | 24.20 | | 23.41 | | 37.23 | | 62.88 | | 7.24 | | 9.96 | | 0.05 | |
NL00031 | | 27.8 | | 50.10 | | 0.15 | | 24.00 | | 22.10 | | 32.84 | | 67.29 | | 7.18 | | 5.86 | | 0.03 | |
NL00603 | | 27.6 | | 50.00 | | 0.15 | | 23.00 | | 23.44 | | 36.95 | | 63.44 | | 7.20 | | 10.10 | | 0.03 | |
NL00170 | | 27.7 | | 50.00 | | 0.15 | | 22.80 | | 23.50 | | 34.63 | | 67.85 | | 7.55 | | 5.44 | | 0.02 | |
Results for the eight core Duplicates are listed in Table 11.6. Values of %DTWR for corresponding samples (one pair of samples NL00452, NL00453 excepted) are generally close together. %TFe, %SiO2 and %Mn in DTCs and FeO in DTT for corresponding samples are also generally similar indicating excellent quality data.
September 2011
11-18
Alderon Iron Ore Corp.
NI 43-101 Technical Report – PEA of the Kami Iron Ore Project | 
|
Table 11.6: Selected Analytical Results for Davis Tube Tests Performed on Eight Duplicate Core Samples
Sample | | RkType | | %TFe | | Mag
FeSat | | %FeO_
H | | %SiO2_
H | | %Mn_
H | | %DTWR | | %Fe_
DTC | | %SiO2_
DTC | | %Mn_
DTT | | %magFe_
DT | | %FeO_
DTT | |
NL00320 | | MHIF | | 29.5 | | 17.2 | | | | 40.20 | | 1.49 | | 21.7 | | 69.2 | | 0.83 | | 1.12 | | 15.0 | | 1.95 | |
NL00321 | | MHIF | | 32.4 | | 16.6 | | | | 33.00 | | 1.70 | | 22.1 | | 69.0 | | 0.90 | | 1.13 | | 15.3 | | 1.76 | |
| | | | | | | | | | | | | | | | | | | | | | | | | |
NL00903 | | HIF | | 34.3 | | 0.5 | | | | 33.20 | | 3.52 | | 0.0 | | | | | | | | 0.0 | | 0.32 | |
NL00350 | | HIF | | 35.8 | | 0.7 | | | | 31.20 | | 3.91 | | 0.0 | | | | | | | | 0.0 | | 0.31 | |
| | | | | | | | | | | | | | | | | | | | | | | | | |
NL00453 | | MIF | | 41.6 | | 39.9 | | | | 34.30 | | 1.10 | | 57.6 | | 70.6 | | 1.01 | | 0.42 | | 40.7 | | 5.12 | |
NL00452 | | MIF | | 38.7 | | 36.5 | | | | 37.80 | | 1.17 | | 47.6 | | 70.6 | | 1.12 | | 0.40 | | 33.6 | | 5.00 | |
| | | | | | | | | | | | | | | | | | | | | | | | | |
NL00483 | | HIF | | 31.8 | | 0.1 | | | | 28.60 | | 7.47 | | 0.0 | | | | | | | | 0.0 | | 1.71 | |
NL00482 | | HIF | | 31.6 | | 0.1 | | | | 29.80 | | 7.38 | | 0.0 | | | | | | | | 0.0 | | 1.70 | |
| | | | | | | | | | | | | | | | | | | | | | | | | |
NL00513 | | MHIF | | 26.9 | | 17.5 | | | | 46.80 | | 1.50 | | 24.0 | | 69.9 | | 1.16 | | 0.68 | | 16.8 | | 2.60 | |
NL00512 | | MHIF | | 26.4 | | 18.2 | | | | 46.90 | | 1.52 | | 25.2 | | 69.9 | | 1.17 | | 0.7 | | 17.6 | | 2.43 | |
| | | | | | | | | | | | | | | | | | | | | | | | | |
NL00045 | | MIF | | 21.9 | | 19.3 | | | | 47.20 | | 0.50 | | 25.7 | | 70.6 | | 0.86 | | 0.07 | | 18.1 | | 5.05 | |
NL00044 | | MIF | | 22.6 | | 19.6 | | | | 47.10 | | 0.50 | | 26.3 | | 69.9 | | 1.04 | | 0.07 | | 18.4 | | 4.80 | |
| | | | | | | | | | | | | | | | | | | | | | | | | |
NL00793 | | MIF | | 29.2 | | 25.8 | | | | 49.20 | | 0.46 | | 36.5 | | 68.9 | | 2.65 | | 0.29 | | 25.2 | | 4.91 | |
NL00792 | | MIF | | 29.4 | | 26.4 | | | | 48.70 | | 0.46 | | 35.9 | | 68.9 | | 2.24 | | 0.29 | | 24.8 | | 4.59 | |
| | | | | | | | | | | | | | | | | | | | | | | | | |
NL02089 | | HMIF | | 36.3 | | 2.8 | | | | 45.60 | | 1.32 | | 3.9 | | 67.7 | | 4.94 | | 1.1 | | 2.6 | | | |
NL02088 | | HMIF | | 36.7 | | 2.1 | | 0.005 | | 45.10 | | 1.23 | | 2.8 | | | | | | | | | | | |
SGS Lakefield Primary Laboratory QA/QC
As aforementioned, SGS Lakefield is an accredited laboratory and operates its own internal QA/QC program involving Preparation Duplicates (Replicates), Analytical Duplicates, Preparation and Analytical Blanks and Certified Reference Standards.
Results for the Preparation Duplicates for TFe_H, magFe_Sat and FeO_H are shown on Figure 11.11 to Figure 11.13.
September 2011
11-19
Alderon Iron Ore Corp.
NI 43-101 Technical Report – PEA of the Kami Iron Ore Project |
|
Figure 11.11: %TFe_H for Preparation Duplicates 2008 and 2010 Results
Figure 11.12: %magFeSat_H for Preparation Duplicates 2008 and 2010 Results
September 2011
11-20
Alderon Iron Ore Corp.
NI 43-101 Technical Report – PEA of the Kami Iron Ore Project |
|
Figure 11.13: %FeO_H for Preparation Duplicates 2008 and 2010 Results
For most samples, the assay results are strongly positively correlated. The above chart for FeO_H illustrates that for an occasional determination, random irregularities can occur, probably due to sample mix-up in the lab or during reporting of the results.
Assay results for Analytical Duplicates in terms of %magFeSat (Figure 11.14), are strongly correlated except for one 2008 sample where an error has obviously occurred. Assays for Analytical Duplicates are as expected more strongly correlated than for Preparation Duplicates, as Preparation Duplicates include both sub-sampling and analytical variance.
Figure 11.14: %magFeSat_H for Analytical Duplicates 2008 and 2010 Results
September 2011
11-21
Alderon Iron Ore Corp.
NI 43-101 Technical Report – PEA of the Kami Iron Ore Project |
|
SGS Lakefield’s Analytical Blanks, (N=137) for the 2008 and 2010 programs all returned assays of less than 0.01%TFe. Preparation Blanks generally returned approximately 5%TFe, although there were a few higher values indicating some occasional carryover iron during sample preparation.
Figure 11.15 and Figure 11.16 show the results for the Certified Reference Standards SGS Lakefield used during Alderon’s 2010 program to monitor and control Head assays for TFe and FeO_H. Similar plots can be constructed to illustrate the behavior of all other analytes.
September 2011
11-22
Alderon Iron Ore Corp.
NI 43-101 Technical Report – PEA of the Kami Iron Ore Project |
|
Table 11.7 summarizes %TFe results for all Certified Reference Standards used for both the 2008 and 2010 programs.
Figure 11.15: Performance of SGS Lakefield Certified Reference Standards - %TFe_H 2010 Program
September 2011
11-23
Alderon Iron Ore Corp.
NI 43-101 Technical Report – PEA of the Kami Iron Ore Project |
|
Figure 11.16: Performance of SGS Lakefield Certified Reference Standards - %FeO_H 2010 Program
September 2011
11-24
Alderon Iron Ore Corp.
NI 43-101 Technical Report – PEA of the Kami Iron Ore Project |
|
Table 11.7: Performance of SGS Lakefield Certified Reference Standards %TFE — 2008 and 2010 Programs
STD_ID | | %TFe (%)
Certified
Value | | Number
Samples | | %TFe
Avg | | %TFe
Min | | %TFe
Min | | Material | | Provider |
676-1 | | 39.76 | | 2 | | 39.73 | | 39.73 | | 39.73 | | Iron ore Sinter | | LGC Standards |
680-1 | | 59.98 | | 1 | | 59.81 | | 59.81 | | 59.81 | | Iron Ore | | LGC Standards |
681-1 | | 33.21 | | 43 | | 33.23 | | 32.88 | | 33.51 | | Iron Ore Powder | | LGC Standards |
879-1 | | 18.97 | | 2 | | 18.68 | | 18.61 | | 18.75 | | Basic Slag | | LGC Standards |
BCS-313/1 | | | | 2 | | 0.02 | | 0.01 | | 0.02 | | | | |
BCS-369 | | 7.2 | | 2 | | 7.21 | | 7.21 | | 7.21 | | | | |
GBW03114 | | 0.33 | | 1 | | 0.34 | | 0.34 | | 0.34 | | Silica sand | | Beijing International standard material |
GIOP-31 | | 37.4 | | 9 | | 37.49 | | 37.29 | | 37.64 | | Iron Ore | | GEOSTATS PTY LTD |
GIOP-32 | | 30.2 | | 5 | | 30.33 | | 30.22 | | 30.50 | | Iron Ore | | GEOSTATS PTY LTD |
IPT 123 | | 65.1 | | 27 | | 65.00 | | 64.57 | | 65.55 | | Iron ore Pellet | | Instituto de Pesquisas Tecnologicas |
IPT 51 | | 0.83 | | 2 | | 0.84 | | 0.83 | | 0.84 | | Burnt refractory | | Instituto de Pesquisas Tecnologicas |
IPT 72 | | 0.06 | | 3 | | 0.06 | | 0.06 | | 0.06 | | Soda Feldspar | | Instituto de Pesquisas Tecnologicas |
MW-1 | | 66.08 | | 0 | | | | | | | | Specularite Iron ore | | Canmet |
NBS-69b | | | | 1 | | 4.90 | | 4.90 | | 4.90 | | | | |
NCS DC14004a | | 65.58 | | 7 | | 65.56 | | 65.34 | | 66.04 | | Iron ore Pellet | | China National Center for Iron and Steel |
SARM-12 | | 66.6 | | 70 | | 66.64 | | 66.18 | | 67.23 | | Magnetite Ore | | Mintek |
SARM-5 | | 8.84 | | 2 | | 9.02 | | 9.02 | | 9.02 | | Pyroxinite | | Mintek |
SCH-1 | | 60.73 | | 44 | | 60.75 | | 60.37 | | 61.07 | | Hematite iron ore | | Canmet |
SY4 | | 4.34 | | 4 | | 4.35 | | 4.32 | | 4.41 | | Diorite Gneiss | | Canmet |
Table 11.18 and Figure 11.16, as shown previously, show results for one sample labeled FER-2 that returned an assay value for FeO that is out of line with expectations. WGM recommends that Alderon investigate to determine if the error is due to a misentry in the assay database or a lab error.
Table 11.8: Performance of SGS Lakefield Certified Reference Standards %FeO — 2008 AND 2010 Programs
STD_ID | | %FeO (%)
Certified
Value | | Numb
Samples | | %FeO_H
Avg | | %FeO_H
Min | | %FeO_H
Min | | Material | | Provider |
681-1 | | | | 1 | | 17.90 | | 17.9 | | 17.9 | | Iron Ore Powder | | LGC Standards |
FER-1 | | 23.34 | | 59 | | 23.32 | | 23.16 | | 23.56 | | Iron Formation | | CANMET |
FER-2 | | 15.24 | | 17 | | 15.90 | | 15.26 | | 23.48 | | Iron Formation | | CANMET |
FER-4 | | 15.54 | | 45 | | 15.64 | | 15.48 | | 15.79 | | Iron Formation | | CANMET |
GIOP-31 | | | | 1 | | 27.60 | | 27.6 | | 27.6 | | Iron Ore | | GEOSTATS PTY LTD |
MW-1 | | 1.75 | | 57 | | 1.70 | | 1.62 | | 1.79 | | Specularite Iron ore | | CANMET |
SARM-12 | | | | 2 | | 0.37 | | 0.36 | | 0.38 | | Magnetite Ore | | Mintek |
September 2011
11-25
Alderon Iron Ore Corp.
NI 43-101 Technical Report – PEA of the Kami Iron Ore Project |
|
During its 2010 program, Alderon requested SGS Lakefield to supplement its internal QA/QC protocol to help ensure improved quality of iron assays. These measures included:
· checking magnetic iron from Satmagan against %TFe and in the case where the magFe exceeded the TFe, repeat the Satmagan determination; and
· where Davis Tube tests and Satmagan were both completed, check Satmagan results against the Davis Tube results and repeat determinations as required to mitigate any discrepancy.
This modified protocol was not established until part way through the 2010 assay program, but should have led to improved quality of data, particularly helping to mitigate random Satmagan errors. Certainly there are occasional samples in the assay database where %FeO_H, %TFe and/or %magFeSat are out of balance and can be readily spotted where re-assaying might result in better quality data.
Secondary Laboratory — Inspectorate Check Assay Program
Two hundred and eighty-seven pulps from eight different Alderon drillholes representing different lithology and mineralization were forwarded to Inspectorate Labs, Vancouver in January 2011.
Analysis for WR by XRF, S, FeO by potassium dichromate titration and Satmagan were completed. Initially, the FeO analysis was completed using a HCL-H2SO4 digestion. Subsequently, a selection of samples was reanalyzed using a HF-H2SO4 digestion.
The HF - H2SO4 digestion is similar to SGS Lakefield’s digestion and is required in order to break down silicates so near total Fe can be measured. Figure 11.17 to Figure 11.21 show Inspectorate assays versus SGS Lakefield’s original results for corresponding samples.
September 2011
11-26
Alderon Iron Ore Corp.
NI 43-101 Technical Report – PEA of the Kami Iron Ore Project | 
|

Figure 11.17: %TFe_H at Inspectorate. vs. SGS Lakefield
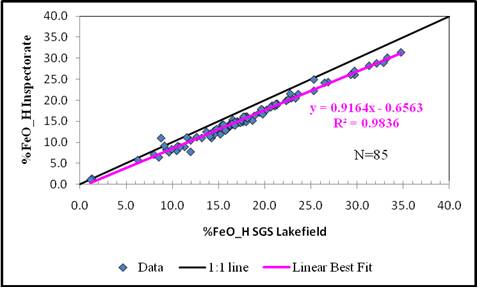
Figure 11.18: %FeO_H by HF-H2SO4 Digestion at Inspectorate. vs. SGS Lakefield
September 2011
11-27
Alderon Iron Ore Corp.
NI 43-101 Technical Report – PEA of the Kami Iron Ore Project |
|
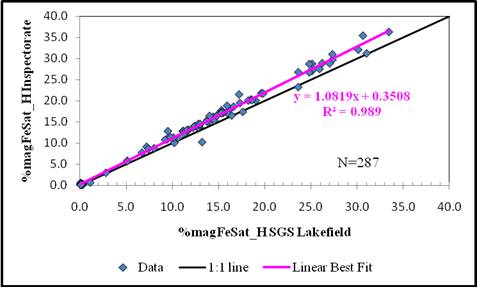
Figure 11.19: %magFeSat at Inspectorate vs. SGS Lakefield
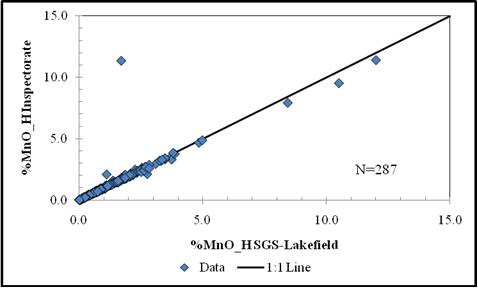
Figure 11.20: %MnO_H at Inspectorate. vs. SGS Lakefield
September 2011
11-28
Alderon Iron Ore Corp.
NI 43-101 Technical Report – PEA of the Kami Iron Ore Project |
|
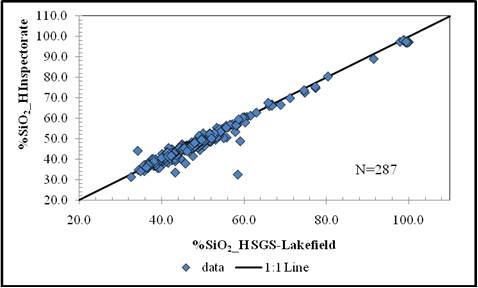
Figure 11.21: %SiO2_H at Inspectorate vs. SGS Lakefield
The WR Check Assaying results indicate that SGS Lakefield’s assays of TFe, SiO2 and MnO are reliable and unbiased. The FeO results from Inspectorate are strongly positively correlated with original SGS Lakefield results, but are biased slightly lower. The Satmagan determinations completed at Inspectorate are also highly correlated with original SGS Lakefield results, but are systematically biased slightly higher. If Inspectorate’s Satmagan and FeO results are more accurate than SGS Lakefield’s, it would mean that estimates of %magFe for the Mineral Resource estimate are perhaps slightly low. Assuming Inspectorate’s FeO and Satmagans are more correct than SGS Lakefield’s, then the estimated %hmFe probably would not change much because Inspectorate’s results are both higher in magnetic Fe and lower in FeO.
The samples at Inspectorate were also assayed for S and only a few samples from the Project have been previously assayed for S. The new S results confirm that mineralization is generally low in S but there are occasional intervals with S at levels of 1% to 3%. WGM recommends that Alderon check these samples against drill logs, and, if required, against archived drill core to confirm if possible, the presence of sulphides in these sample intervals.
September 2011
11-29
Alderon Iron Ore Corp.
NI 43-101 Technical Report – PEA of the Kami Iron Ore Project |
|
11.8 WGM Comments on 2008 and 2010 Sampling and Assaying
Alderon’s programs included credible sampling, assaying and QA/QC components that helped to assure quality exploration data. Its programs included the relogging of Altius’ 2008 core and the re-assaying of a selection of Altius’ samples. QA/QC protocols for both Altius’ and Alderon’s programs included in-field insertion of Standards, Duplicates and Certified Reference Standards. In addition, Alderon supplemented these with Secondary Laboratory Check assaying and the close monitoring of returned assay results and re-assaying of samples where quality control issues were raised.
Some errors in logging, sampling and assaying are identifiable from results returned, but WGM has not identified any material errors that delegitimize logging, sampling and/or assaying results and believes program results are of sufficient quality to support the Mineral Resource estimate.
In WGM’s opinion, areas for improvement include developing more awareness towards:
· Identifying drillers core block meterage errors during logging and reconciling downhole probe depths with drillers hole depths prior to detailed logging and sampling being undertaken;
· More attention to drillhole planning so drillholes better cross cut zones of mineralization;
· Simplifying the assay protocol so that basic determinations are completed on all samples;
· Simplifying the database in terms of the number of data tables by combining related data in the same tables, i.e., combining Davis Tube results (mass recoveries and concentrate analysis) in one table and combining in-lab QA/QC results with assays for routine sample;
· Avoiding repetitive data in assay tables such as certificate dates that can be more simply and better derived from separate tables through table joins;
· Still more aggressive identification and follow-up of QA/QC issues including monitoring of in-lab QA/QC results; and
· Filing retained core on core racks rather than stacking, so logged and sampled core is more readily accessible for review and checking.
September 2011
11-30
Alderon Iron Ore Corp.
NI 43-101 Technical Report – PEA of the Kami Iron Ore Project |
|
12. DATA VERIFICATION
WGM Senior Associate Geologist, Richard Risto, P.Geo., visited the Property twice in 2010 while Alderon’s drilling program was in progress. The first visit was completed between August 3rd and August 6th and the second visit was completed between November 1st and November 3rd, 2010. This initial visit was to initiate the project review process. Alderon’s Chief Geologist, Mr. Edward Lyons, P.Geo., (BC), géo (QC), P.Geo., (NL) and Doris Fox, P.Geo., Kami Project Manager, EGM Exploration Group Management Corp. (an Alderon Associate Company) were hosts for the visit. Mr. Risto reviewed drilling completed to date, proposed drilling strategy, deposit interpretation, logging and sampling procedures and visited the Property to see previous drilling sites and drilling in progress. Mr. Risto reviewed with the Project Manager the details of the planned work program, including the Company’s analytical and testing protocols to facilitate the planned Mineral Resource estimate.
The November site visit was made as the completion of the drilling program was pending with approximately 3,000 m remaining to be drilled. The purpose of this site visit was to review new data and ongoing drilling plans and for the collection of independent samples. Alderon Chief Geologist, Mr. Edward Lyons, was again host for the visit. Mr. Risto reviewed drilling completed to date, proposed drilling strategy for the remainder of the program, discussed deposit interpretation, collected independent drill core samples and again visited the Property to check drilling sites.
In October, 2009, WGM Senior Geologist, David Power-Fardy, P.Geo., accompanied by EGM Representative, Mr. Stewart Wallis, P.Geo., and Altius Representative Ms. Carol Seymour, Geologist, completed a site visit on the Project. Drill core was reviewed at Altius’ core storage facility in Wabush on October 6th and again on October 8th. Facilitated by helicopter, Mr. Power-Fardy, Mr. Wallis and Ms. Seymour visited the Property on October 7th. WGM independently collected fifteen (15) samples from 2008 drillholes and these samples were sent to SGS Lakefield for analysis.
While checking the drill sites during their July 2010 site visit, WGM found that the drill collars were not labeled, therefore it was not possible to confirm individual drillhole identity.
September 2011
12-1
Alderon Iron Ore Corp.
NI 43-101 Technical Report – PEA of the Kami Iron Ore Project |
|
WGM recommended that collars be labeled when the drills dismount, or very shortly thereafter. During its November 2010 site visit, WGM found that the collars were now labeled and capped. WGM validated drillhole locations in the field using a handheld GPS and checked casing inclinations. Mr. Risto found that his Eastings and Northings closely matched those in Alderon’s database within a few meters, and dips closely matched database dips to within ±3o. WGM also validated logging and sampling procedures. Check logging and checking sample locations in core trays validated Alderon’s logging and sampling. Part of the work plan regarding the Mineral Resource estimate was to have WGM check a random selection of assays, Alderon’s database versus SGS Lakefield’s analytical certificates. During this process, some omissions and errors were identified which were communicated to Alderon and were subsequently corrected. Based on data provided by Alderon, assay Quality and Control was completed by WGM, independently of Alderon. WGM also independently completed the calculations leading to the estimates of %hmFe used in the Mineral Resource estimate and formulated the SG model.
Table 12.1 lists locations for WGM’s eleven independent samples collected in 2010, as well as the samples collected from Altius’ drill core during WGM’s 2009 site visit. Table 12.2 provides the analytical results for all of the 2008 and 2010 WGM independent samples and the corresponding Alderon and Altius assay results for the original samples. The Alderon and WGM 2010 samples represent different halves of the split core. WGM’s 2009 samples were quarter core samples. Figure 12.1 to Figure 12.5 illustrate the results graphically.
September 2011
12-2
Alderon Iron Ore Corp.
NI 43-101 Technical Report – PEA of the Kami Iron Ore Project |
|
Table 12.1: Summary of WGM Independent Second Half Core Sampling
WGM ID | | Sample_ID | | Drillhole_ID | | From (m) | | To (m) | | Lith Code |
KWGM-01 | | NL03634 | | K-10-83 | | 306.60 | | | 310.00 | | | HIF |
KWGM-02 | | NL04545 | | K-10-83 | | 592.00 | | | 595.00 | | | MIF |
KWGM-03 | | NL04231 | | K-10-85 | | 230.00 | | | 233.00 | | | MIF |
KWGM-04 | | NL03537 | | K-10-85 | | 44.00 | | | 47.00 | | | QCIF |
KWGM-05 | | NL04229 | | K-10-85 | | 224.00 | | | 227.00 | | | HIF |
KWGM-06 | | NL04133 | | K-10-84 | | 333.00 | | | 336.00 | | | MIF |
KWGM-07 | | NL04974 | | K-10-81A | | 308.00 | | | 310.00 | | | MHIF |
KWGM-08 | | NL01407 | | K-10-37A | | 591.00 | | | 594.00 | | | SIF |
KWGM-09 | | NL00530 | | K-10-27 | | 652.00 | | | 655.00 | | | MIF |
KWGM-10 | | NL02404 | | K-10-63 | | 14.00 | | | 16.00 | | | MIF |
KWGM-11 | | NL02965 | | K-10-46 | | 42.50 | | | 44.60 | | | HMIF |
| | | | | | | | | | | | |
2663 | | 2016 | | K-08-01 | | 74.40 | | | 79.40 | | | MHIF |
2664 | | 2148 | | K-08-07 | | 33.00 | | | 36.40 | | | MIF |
2665 | | 2372 | | K-08-13 | | 75.10 | | | 78.00 | | | MIF |
2666 | | 4510 | | K-08-19 | | 69.23 | | | 71.64 | | | MIF |
2667 | | 4592 | | K-08-21 | | 36.91 | | | 39.60 | | | MIF |
2668 | | 2440 | | K-08-16 | | 306.75 | | | 311.66 | | | MIF |
2669 | | 2121 | | K-08-06 | | 117.00 | | | 122.00 | | | MIF |
2670 | | 2078 | | K-08-02 | | 85.65 | | | 90.65 | | | MIF |
2671 | | 2383 | | K-08-15 | | 115.23 | | | 116.23 | | | MIF |
2672 | | 4614 | | K-08-24 | | 247.50 | | | 249.62 | | | MIF |
2673 | | 4534 | | K-08-20 | | 216.95 | | | 221.95 | | | MIF |
2674 | | 4580 | | K-08-20 | | 400.27 | | | 402.89 | | | MIF |
2675 | | 2139 | | K-08-08 | | 88.95 | | | 93.95 | | | MIF |
2676 | | 2003 | | K-08-01 | | 14.20 | | | 16.60 | | | MIF |
2677 | | 2495 | | K-08-18 | | 286.32 | | | 291.32 | | | HIF |
September 2011
12-3
Alderon Iron Ore Corp.
NI 43-101 Technical Report – PEA of the Kami Iron Ore Project | 
|
Table 12.2: Comparison of Analytical Results - WGM Independent Sample Assays versus 2008 and 2010 Original Sample Assays
Sample
ID | | TFe
(%) | | magFe
(%) | | FeO
(%) | | SiO2
(%) | | TiO2
(%) | | Al2O3
(%) | | MgO
(%) | | CaO
(%) | | Na2O
(%) | | K2O
(%) | | Mn
(%) | | P2O5
(%) | | S
(%) | | SG | |
NL03634 | | 32.17 | | 0.05 | | 0.72 | | 32.20 | | 0.01 | | 0.03 | | 1.46 | | 2.46 | | 1.98 | | 0.01 | | 9.14 | | 0.04 | | | | | |
KWGM-01 | | 31.89 | | 0.10 | | 0.77 | | 32.80 | | 0.01 | | 0.07 | | 1.54 | | 2.46 | | 2.10 | | 0.01 | | 9.37 | | 0.04 | | | | 3.92 | |
| | | | | | | | | | | | | | | | | | | | | | | | | | | | | |
NL04545 | | 33.01 | | 30.10 | | 16.78 | | 38.60 | | 0.01 | | 0.28 | | 2.43 | | 3.21 | | 0.06 | | 0.02 | | 1.84 | | 0.06 | | | | | |
KWGM-02 | | 29.38 | | 27.40 | | 14.75 | | 45.40 | | 0.01 | | 0.27 | | 2.30 | | 2.93 | | 0.07 | | 0.04 | | 1.56 | | 0.06 | | | | 3.44 | |
| | | | | | | | | | | | | | | | | | | | | | | | | | | | | |
NL04231 | | 33.08 | | 27.40 | | 18.96 | | 45.30 | | 0.01 | | 0.15 | | 3.55 | | 1.50 | | 0.01 | | 0.03 | | 0.94 | | 0.05 | | | | | |
KWGM-03 | | 32.45 | | 27.80 | | 18.60 | | 46.20 | | 0.01 | | 0.15 | | 3.61 | | 1.27 | | 0.02 | | 0.03 | | 0.92 | | 0.05 | | | | 3.58 | |
| | | | | | | | | | | | | | | | | | | | | | | | | | | | | |
NL03537 | | 15.53 | | 1.50 | | 19.07 | | 46.20 | | 0.01 | | 0.17 | | 5.44 | | 8.14 | | 0.02 | | 0.01 | | 0.72 | | 0.06 | | | | | |
KWGM-04 | | 14.34 | | 1.40 | | 17.79 | | 50.10 | | 0.01 | | 0.11 | | 4.98 | | 7.81 | | 0.02 | | 0.01 | | 0.65 | | 0.05 | | | | 3.20 | |
| | | | | | | | | | | | | | | | | | | | | | | | | | | | | |
NL04229 | | 36.79 | | 0.60 | | 1.18 | | 36.30 | | 0.02 | | 0.12 | | 1.82 | | 2.36 | | 0.05 | | 0.09 | | 2.08 | | 0.03 | | | | | |
KWGM-05 | | 36.23 | | 1.20 | | 1.26 | | 36.60 | | 0.01 | | 0.09 | | 1.75 | | 2.28 | | 0.07 | | 0.09 | | 1.98 | | 0.03 | | | | 3.75 | |
| | | | | | | | | | | | | | | | | | | | | | | | | | | | | |
NL04133 | | 33.71 | | 32.60 | | 13.80 | | 49.40 | | 0.01 | | 0.10 | | 0.56 | | 1.17 | | 0.01 | | 0.01 | | 0.68 | | 0.03 | | | | | |
KWGM-06 | | 34.34 | | 34.10 | | 14.30 | | 47.70 | | 0.01 | | 0.09 | | 0.51 | | 1.15 | | 0.01 | | 0.01 | | 0.69 | | 0.04 | | | | 3.63 | |
| | | | | | | | | | | | | | | | | | | | | | | | | | | | | |
NL04974 | | 29.94 | | 12.20 | | 5.97 | | 48.60 | | 0.01 | | 0.16 | | 2.04 | | 2.20 | | 0.03 | | 0.02 | | 0.59 | | 0.03 | | | | | |
KWGM-07 | | 28.47 | | 11.90 | | 5.98 | | 51.10 | | 0.01 | | 0.16 | | 2.10 | | 2.22 | | 0.02 | | 0.01 | | 0.58 | | 0.03 | | | | 3.36 | |
| | | | | | | | | | | | | | | | | | | | | | | | | | | | | |
NL01407 | | 23.57 | | 1.10 | | | | 50.90 | | 0.10 | | 0.90 | | 3.50 | | 1.46 | | 0.04 | | 0.13 | | 1.79 | | 0.17 | | | | | |
KWGM-08 | | 21.05 | | 0.90 | | 26.13 | | 58.00 | | 0.09 | | 0.74 | | 3.31 | | 1.11 | | 0.05 | | 0.13 | | 1.53 | | 0.14 | | | | 3.28 | |
| | | | | | | | | | | | | | | | | | | | | | | | | | | | | |
NL00530 | | 28.96 | | 23.50 | | | | 42.60 | | 0.01 | | 0.05 | | 1.78 | | 5.58 | | 0.01 | | 0.01 | | 1.61 | | 0.02 | | | | | |
KWGM-09 | | 28.89 | | 23.10 | | 11.11 | | 43.90 | | 0.01 | | 0.01 | | 1.65 | | 5.15 | | 0.02 | | 0.01 | | 1.46 | | 0.02 | | | | 3.52 | |
| | | | | | | | | | | | | | | | | | | | | | | | | | | | | |
NL02404 | | 31.06 | | 18.40 | | 24.68 | | 46.10 | | 0.01 | | 0.10 | | 2.19 | | 2.32 | | 0.05 | | 0.01 | | 2.62 | | 0.02 | | | | | |
KWGM-10 | | 30.99 | | 18.10 | | 25.05 | | 46.70 | | 0.01 | | 0.08 | | 2.19 | | 2.27 | | 0.04 | | 0.01 | | 2.56 | | 0.01 | | | | 3.57 | |
| | | | | | | | | | | | | | | | | | | | | | | | | | | | | |
NL02965 | | 18.26 | | 2.20 | | | | 58.20 | | 0.04 | | 0.11 | | 0.41 | | 5.47 | | 0.04 | | 0.01 | | 2.88 | | 0.02 | | | | | |
KWGM-11 | | 17.56 | | 2.40 | | 1.47 | | 60.80 | | 0.03 | | 0.04 | | 0.32 | | 4.62 | | 0.06 | | 0.01 | | 2.54 | | 0.02 | | | | 3.20 | |
| | | | | | | | | | | | | | | | | | | | | | | | | | | | | |
02016 | | 36.93 | | 28.00 | | 11.90 | | 36.50 | | 0.01 | | 0.08 | | 1.35 | | 3.79 | | 0.01 | | 0.01 | | 1.19 | | 0.02 | | | | | |
2663 | | 36.16 | | 27.20 | | 11.96 | | 37.30 | | 0.01 | | 0.06 | | 1.34 | | 3.85 | | 0.01 | | 0.01 | | 1.15 | | 0.02 | | 0.01 | | 3.60 | |
| | | | | | | | | | | | | | | | | | | | | | | | | | | | | |
02148 | | 29.10 | | 15.00 | | 25.30 | | 42.80 | | 0.03 | | 0.27 | | 4.00 | | 3.59 | | 0.03 | | 0.04 | | 1.12 | | 0.06 | | | | | |
2664 | | 32.17 | | 22.50 | | 22.99 | | 42.40 | | 0.02 | | 0.26 | | 2.66 | | 2.60 | | 0.03 | | 0.03 | | 1.05 | | 0.05 | | 0.01 | | 3.51 | |
| | | | | | | | | | | | | | | | | | | | | | | | | | | | | |
02372 | | 24.27 | | 22.70 | | 13.05 | | 48.30 | | 0.01 | | 0.12 | | 2.98 | | 5.42 | | 0.10 | | 0.01 | | 0.26 | | 0.03 | | | | | |
2665 | | 24.06 | | 22.00 | | 12.99 | | 48.80 | | 0.01 | | 0.14 | | 3.07 | | 5.48 | | 0.02 | | 0.01 | | 0.23 | | 0.02 | | 0.18 | | 3.19 | |
| | | | | | | | | | | | | | | | | | | | | | | | | | | | | |
04510 | | 25.81 | | 21.90 | | 10.48 | | 48.60 | | 0.01 | | 0.02 | | 2.81 | | 5.27 | | 0.01 | | 0.01 | | 0.22 | | 0.01 | | | | | |
2666 | | 26.65 | | 21.40 | | 10.70 | | 46.60 | | 0.01 | | 0.01 | | 2.81 | | 5.62 | | 0.10 | | 0.01 | | 0.22 | | 0.01 | | 0.01 | | 3.30 | |
| | | | | | | | | | | | | | | | | | | | | | | | | | | | | |
04592 | | 28.26 | | 26.80 | | 14.53 | | 43.40 | | 0.01 | | 0.02 | | 2.35 | | 5.54 | | 0.01 | | 0.01 | | 0.88 | | 0.02 | | | | | |
2667 | | 28.82 | | 27.90 | | 14.49 | | 44.80 | | 0.01 | | 0.01 | | 2.21 | | 4.91 | | 0.01 | | 0.01 | | 0.78 | | 0.01 | | 0.01 | | 3.37 | |
| | | | | | | | | | | | | | | | | | | | | | | | | | | | | |
02440 | | 40.15 | | 40.30 | | 17.73 | | 37.90 | | 0.01 | | 0.18 | | 1.63 | | 1.96 | | 0.07 | | 0.03 | | 0.39 | | 0.04 | | | | | |
2668 | | 40.99 | | 41.10 | | 18.61 | | 35.80 | | 0.01 | | 0.37 | | 1.79 | | 2.20 | | 0.02 | | 0.03 | | 0.42 | | 0.03 | | 0.01 | | 3.70 | |
| | | | | | | | | | | | | | | | | | | | | | | | | | | | | |
02121 | | 32.03 | | 32.00 | | 12.13 | | 46.20 | | 0.02 | | 0.22 | | 3.37 | | 1.31 | | 0.01 | | 0.12 | | 0.74 | | 0.05 | | | | | |
2669 | | 32.94 | | 33.00 | | 14.79 | | 45.60 | | 0.01 | | 0.23 | | 3.35 | | 1.32 | | 0.02 | | 0.13 | | 0.70 | | 0.05 | | 0.01 | | 3.52 | |
| | | | | | | | | | | | | | | | | | | | | | | | | | | | | |
02078 | | 28.40 | | 27.00 | | 14.58 | | 45.60 | | 0.10 | | 1.96 | | 3.61 | | 2.38 | | 0.43 | | 0.48 | | 0.53 | | 0.07 | | | | | |
2670 | | 28.75 | | 27.00 | | 14.67 | | 46.40 | | 0.08 | | 1.71 | | 3.52 | | 2.39 | | 0.34 | | 0.42 | | 0.52 | | 0.08 | | 0.04 | | 3.37 | |
| | | | | | | | | | | | | | | | | | | | | | | | | | | | | |
02383 | | 33.08 | | 29.00 | | 19.23 | | 43.10 | | 0.01 | | 0.18 | | 3.16 | | 2.32 | | 0.07 | | 0.03 | | 0.74 | | 0.04 | | | | | |
2671 | | 30.99 | | 26.40 | | 18.31 | | 46.30 | | 0.01 | | 0.17 | | 3.20 | | 2.30 | | 0.01 | | 0.03 | | 0.72 | | 0.03 | | 0.01 | | 3.42 | |
September 2011
12-4
Alderon Iron Ore Corp.
NI 43-101 Technical Report – PEA of the Kami Iron Ore Project | 
|
Sample
ID | | TFe
(%) | | magFe
(%) | | FeO
(%) | | SiO2
(%) | | TiO2
(%) | | Al2O3
(%) | | MgO
(%) | | CaO
(%) | | Na2O
(%) | | K2O
(%) | | Mn
(%) | | P2O5
(%) | | S
(%) | | SG | |
NL03634 | | 32.17 | | 0.05 | | 0.72 | | 32.20 | | 0.01 | | 0.03 | | 1.46 | | 2.46 | | 1.98 | | 0.01 | | 9.14 | | 0.04 | | | | | |
| | | | | | | | | | | | | | | | | | | | | | | | | | | | | |
04614 | | 32.31 | | 25.90 | | 17.64 | | 40.70 | | 0.06 | | 0.97 | | 1.61 | | 4.19 | | 0.01 | | 0.02 | | 0.72 | | 0.06 | | | | | |
2672 | | 30.92 | | 26.40 | | 15.70 | | 44.80 | | 0.02 | | 0.31 | | 1.50 | | 4.18 | | 0.01 | | 0.01 | | 0.63 | | 0.05 | | 1.77 | | 3.38 | |
| | | | | | | | | | | | | | | | | | | | | | | | | | | | | |
04534 | | 36.30 | | 36.20 | | 15.24 | | 38.50 | | 0.02 | | 0.14 | | 2.34 | | 2.85 | | 0.01 | | 0.02 | | 1.86 | | 0.05 | | | | | |
2673 | | 35.46 | | 36.10 | | 14.70 | | 39.10 | | 0.01 | | 0.15 | | 2.35 | | 2.73 | | 0.13 | | 0.02 | | 1.77 | | 0.04 | | 0.01 | | 3.56 | |
| | | | | | | | | | | | | | | | | | | | | | | | | | | | | |
04580 | | 33.57 | | 31.60 | | 15.87 | | 45.90 | | 0.02 | | 0.26 | | 2.85 | | 1.26 | | 0.01 | | 0.05 | | 0.87 | | 0.05 | | | | | |
2674 | | 32.24 | | 30.80 | | 15.26 | | 46.60 | | 0.02 | | 0.29 | | 2.86 | | 1.30 | | 0.01 | | 0.05 | | 0.81 | | 0.05 | | 0.01 | | 3.39 | |
| | | | | | | | | | | | | | | | | | | | | | | | | | | | | |
02139 | | 21.75 | | 22.00 | | 10.78 | | 52.70 | | 0.01 | | 0.09 | | 2.59 | | 5.00 | | 0.01 | | 0.02 | | 1.57 | | 0.03 | | | | | |
2675 | | 25.60 | | 25.60 | | 11.95 | | 49.10 | | 0.01 | | 0.07 | | 2.29 | | 4.43 | | 0.01 | | 0.01 | | 1.56 | | 0.03 | | 0.01 | | 3.30 | |
| | | | | | | | | | | | | | | | | | | | | | | | | | | | | |
02003 | | 31.41 | | 31.00 | | 15.02 | | 41.40 | | 0.01 | | 0.14 | | 3.40 | | 0.50 | | 0.01 | | 0.01 | | 4.9 | | 0.04 | | | | | |
2676 | | 32.17 | | 31.90 | | 15.42 | | 41.40 | | 0.01 | | 0.12 | | 3.33 | | 0.50 | | 0.01 | | 0.01 | | 4.57 | | 0.03 | | 0.02 | | 3.59 | |
| | | | | | | | | | | | | | | | | | | | | | | | | | | | | |
02495 | | 27.42 | | 0.40 | | 0.76 | | 48.60 | | 0.03 | | 0.47 | | 3.08 | | 2.53 | | 0.01 | | 0.29 | | 0.96 | | 0.03 | | | | | |
2677 | | 27.21 | | 0.50 | | 0.62 | | 50.00 | | 0.02 | | 0.42 | | 2.98 | | 2.59 | | 0.07 | | 0.25 | | 0.96 | | 0.03 | | 0.02 | | 3.35 | |
Notes: | Alderon and Altius samples and results are shaded. |
| WGM 2008 samples were quarter core; 2010 samples were half split core. |
September 2011
12-5
Alderon Iron Ore Corp.
NI 43-101 Technical Report – PEA of the Kami Iron Ore Project | 
|
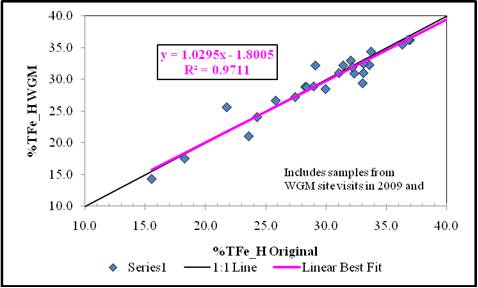
Figure 12.1: %TFe_H for WGM Independent Sample vs. Alderon or Altius Original Sample
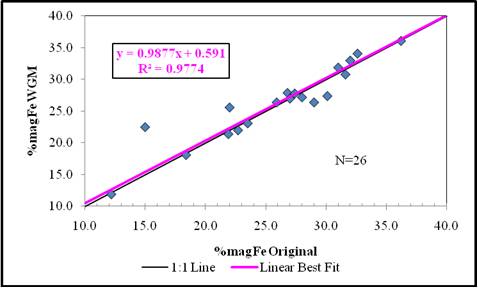
Figure 12.2: %magFe_H (Satmagan) for WGM Independent Sample vs. Alderon or Altius Original Sample Figure
September 2011
12-6
Alderon Iron Ore Corp.
NI 43-101 Technical Report – PEA of the Kami Iron Ore Project |
|
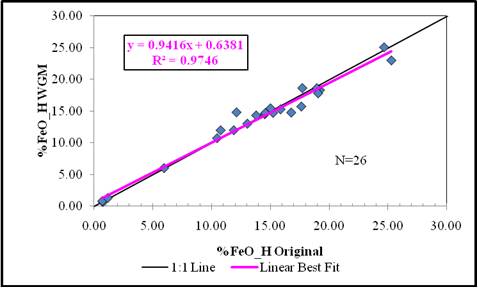
Figure 12.3: %FeO_H for WGM Independent Sample vs. Alderon or Altius Original Sample
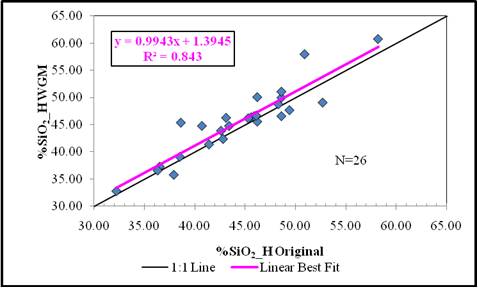
Figure 12.4: %SiO2_H for WGM Independent Sample vs. Alderon or Altius Original Sample
September 2011
12-7
Alderon Iron Ore Corp.
NI 43-101 Technical Report – PEA of the Kami Iron Ore Project |
|
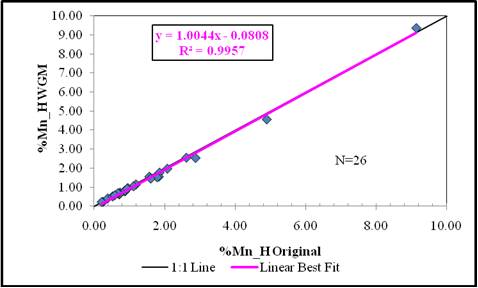
Figure 12.5: %Mn_H for WGM Independent Sample vs. Alderon or Altius Original Sample
Assay results for WGM independent samples and corresponding Alderon samples are generally strongly related, indicating generally reliable and precise assays and the minimal probability of any sample mix-ups in the field or in the lab. Two samples, KWGM-02 and KWGM-08 reported SiO2 assays that differ noticeably from Alderon’s original values, however, assays for other components in these same two samples are generally within 1% to 2% of each other. Similarly, %magFeSat for WGM’s 2009 sample 2664 and corresponding Altius sample 02148 shows more variance than might be expected, however, other assay components are within a close range. WGM concludes Alderon and Altius sampling and assaying as generally reliable.
September 2011
12-8
Alderon Iron Ore Corp.
NI 43-101 Technical Report – PEA of the Kami Iron Ore Project |
|
13. MINERAL PROCESSING AND METALLURGICAL TESTING
One of the main objectives of this PEA Study is to characterize the Kami ore deposit and to develop a Process Flowsheet (PFS) allowing for the economical development of the Project. The PFS should therefore aim to satisfy the following general project criteria;
· Minimize project capital cost,
· Minimize operating costs,
· Maximize marketing flexibility, i.e. produce and sell a concentrate at a quality level that can be used by customers for either sintering applications or pelletizing applications.
The ore mineralogical and metallurgical characteristics will ultimately determine the PFS which in turn will determine the degree of compliance to the aforementioned general project criteria.
This section of the Report describes the metallurgical testwork performed during the course of the study and presents the results of this testwork.
13.1 Historical Testwork
The following section presents a summary of previous testwork that had been done on the Kami iron ore deposit by Altius Resources in 2009 (McKen, Wagner, 2009). A composite sample from two drill cores taken from the Rose Central deposit was sent to SGS and was prepared according to the flowsheet in Figure 13.1.
September 2011
13-1
Alderon Iron Ore Corp.
NI 43-101 Technical Report – PEA of the Kami Iron Ore Project |
|
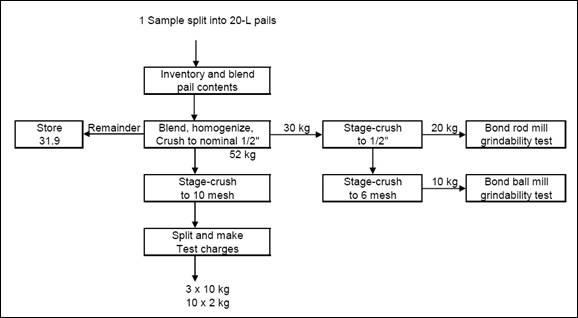
Figure 13.1: Altius Testwork Sample Preparation Flowsheet
The objectives of the test program were as follows:
· To perform a preliminary evaluation of ore grindability;
· To perform baseline beneficiation tests to evaluate the ore’s amenability to magnetic and gravity concentration;
· To recommend a conceptual flowsheet.
The Head assay of the sample tested was as follows:
· Fe grade = 31.0%;
· Satmagan = 26.4% Fe3O4 which corresponds to a proportion of 61.7% of the contained iron as being magnetically sensitive;
· Low sulfur content (below 0.01%);
· S.G. = 3.49 g/cm3;
· MnO = 1.6%.
September 2011
13-2
Alderon Iron Ore Corp.
NI 43-101 Technical Report – PEA of the Kami Iron Ore Project |
|
Based on an X-Ray diffraction (XRD) analysis performed on the sample, the major minerals identified were quartz and magnetite. Quantitative Evaluation of Minerals by Scanning Electron Microscopy (QEMSCAN) analysis indicated the mineral composition shown in Table 13.1.
Table 13.1: QEMSCAN Results in Altius SGS Report
Minerals | | Amount | |
Fe Oxides | | 46.3 | |
Magnetite | | 26.4 | |
Hematite | | 19.9 | |
Quartz | | 37.6 | |
Ankerite | | 6.3 | |
Fe dolomite | | 4.8 | |
Pyroxene/Amphibole | | 2.4 | |
Mn-Co-Fe Carbonate mineral | | 1.6 | |
A size fraction analysis was also performed on the Head sample following stage grinding to 35 mesh. Results indicated that iron based minerals follow the distribution while silica based minerals were coarser and MgO, MnO and CaO were concentrated in the finer fraction. The Loss on Ignition (LOI) increased in the finer fraction. This indicates that carbonates are more present in the finer fraction. Element deportment analysis indicated that 97% of the iron occurs as Fe-oxides. Other iron bearing minerals were found to be in the form of ankerite, Fe-dolomite and Fe-amphibole/pyroxene. These iron bearing gangue mineral report to the tails of both magnetic and gravity separation and thus constitute unrecoverable iron. A mineral liberation analysis was also performed which indicated that Fe-oxides are “fairly well liberated over the entire size range, but liberation increases with decreasing particle size”.
13.1.1 Grindability Tests
Grindability testwork was limited to Bond rod mill and ball mill grindability tests. The rod mill work index, calculated from a F80 = 8 907 µm to P80 = 735 µm, was determined to be 5.7 kWh/t. This value corresponds to a very soft material (1 percentile based on SGS database curve). The ball mill work index, calculated from a F80 = 1 652 µm to P80 = 61 µm, was determined to be 18.5 kWh/t, which is categorized as hard material (84 percentile based on SGS database curve).
September 2011
13-3
Alderon Iron Ore Corp.
NI 43-101 Technical Report – PEA of the Kami Iron Ore Project |
|
13.1.2 Gravity and Magnetic Separation Tests
The objectives of the beneficiation tests were to characterize the ore and to develop a conceptual Process Flowsheet. The following tests were conducted by SGS:
1. Mozley separation by size
2. Davis Tube by size
3. Wet LIMS drum tests
4. Mozley separation on LIMS tails
5. Concentrate analysis
Five products were produced during the Mozley tests: the concentrate, the tails and three middling fractions. Good concentrate grade, from 65.3% Fe to 68.7% Fe, were obtained for each of the size fractions tested. The iron recovery rates ranged from 73% to 91% with an overall of 83%. Manganese in the concentrate varied from 0.54% MnO to 1.10%MnO. Middlings fractions had higher levels of impurities such as Ca, Mn and Mg as well as a higher LOI, especially in the third middling fraction. This suggested that middling have a high carbonate concentration.
Magnetic separation tests were done using either Davis Tube or LIMS on the following target grind (P80): 250 µm, 150 µm, 75 µm, 44 µm and 20 µm. The objective was to establish the grind requirement and concentrate quality at different sizes. The best result was obtained at P80 = 78 µm. The recovery and the iron grade obtained at this size was respectively 61.7% and 69.0% Fe.
Finally, Mozley tests were performed by size on the LIMS tails from the test that had been performed at P80 = 78 µm. A relatively good iron grade was obtained for each size fraction, from 63.0% Fe to 65.1% Fe. Recoveries were also good from 78% to 91%. The Satmagan analysis done on the concentrate was 0.87%, which indicates that almost all magnetite had been recovered in previous LIMS tests. The manganese in the concentrate was very low (less than 0.20% MnO) however, for the combined middling and concentrate product the manganese increased to 1.08% MnO. The combined LIMS/Mozley concentrate assayed 67.5% Fe,
September 2011
13-4
Alderon Iron Ore Corp.
NI 43-101 Technical Report – PEA of the Kami Iron Ore Project |
|
3.01% SiO2 and 0.90% MnO. The overall iron recovery was 88.6% and the magnetite recovery was estimated at 99.5%.
The following conclusions were derived from Altius testwork.
· The single sample used in testwork is magnetite dominant;
· Quartz is the main gangue mineral and ankerite is the second most abundant gangue mineral;
· Grindability tests indicate that Kami iron ore is in the soft range for coarse grinding but is very hard for finer grinding;
· Iron grade ranging from 63.7% to 68.7% and Fe recoveries ranging from 73.3% to 86.0% were achieved with gravity separation at particle size between +250 µm and +74µm;
· LIMS tests performed on Head sample ground at P80 smaller than 140 µm gave iron grade ranging from 64.3% to 68.7. At coarser grind (P80 of 256 µm), the Fe grade was low at 55.6%. However, Iron recoveries were low for any grind size, ranging from 57.3% to 65.4%;
· From LIMS tails, good gravity separation results were achieved without any regrind.
13.2 PEA Study Metallurgical Testwork
A metallurgical testwork program was developed by BBA Inc. at the early stages of the study, in order to characterize the Kami Property ore body, specifically for the Rose Central and the Mills deposits. The objective of the testwork was to evaluate the ore’s amenability to be processed by gravity separation and/or by magnetic separation in order to produce a commercially acceptable, quality product that would allow for the economical development of the Kami Iron Ore Project. An important part of the testwork consisted of evaluating the Fe liberation granulometry with the objective of achieving a concentrate particle size distribution as coarse as possible (while maintaining an acceptable Fe recovery and grade), in order to provide a wider range of applications and wider marketing flexibility. The testwork results were then used in
September 2011
13-5
Alderon Iron Ore Corp.
NI 43-101 Technical Report – PEA of the Kami Iron Ore Project |
|
defining a conceptual Process Flowsheet which is described later in this section of the Report. A recommended testwork program for subsequent testwork required for the next study phase of this Project is also presented later in this section.
In previous testwork, as described earlier in this section, a composite sample from two boreholes was used for the purpose of characterizing the Kami Ore. The result of this work, albeit limited in scope, indicated that a concentrate of acceptable quality could be achieved at a 35 mesh grind (P80 = 190 microns). In developing the PEA study metallurgical testwork program, consideration was given to these results and testwork was done on ore samples deemed to be more representative of the ore body, in order to validate the aforementioned testwork results.
The test plan was developed and conducted as follows. SGS Minerals Services was the laboratory retained by Alderon to perform the metallurgical testwork.
1. Sample selection was done by Alderon and BBA. In order to expedite testwork, samples were selected from readily available core rejects stored at SGS. The sample selection process and compositing procedures adopted assured that the samples were reasonably representative of the ore body. Sample preparation was done by SGS as part of their testwork mandate.
2. A Head assay was performed on all samples.
3. Samples were ground and screened to produce four size fractions:
a. -35 mesh / +65 mesh (-425/+212 microns)
b. -65 mesh / +200 mesh (-212/+75 microns)
c. -200 mesh / +325 mesh (-75/+45 microns)
d. -325 mesh (-45 microns)
Full assays and distributions were performed for each of these size fractions. The -325 mesh (-45 micron) fraction was not analyzed further.
September 2011
13-6
Alderon Iron Ore Corp.
NI 43-101 Technical Report – PEA of the Kami Iron Ore Project | 
|
4. For each sample and for each of the size fractions, a Heavy Liquid Separation (HLS) test was performed to characterize the ore’s characteristics related to gravity separation.
5. For each sample and for each of the size fractions, a Davis Tube (DT) test was performed to characterize the ore’s characteristics related to magnetic separation.
6. For each sample and for each of the size fractions, a High Definition Mineralogical Analysis using QEMSCAN test was performed to assess mineralogical characteristics of the ore. Elemental deportment, oxide liberation and association of various constituents were determined in this testwork.
7. Optical microscopy to differentiate between magnetite and hematite.
8. Microprobe analysis for the purpose of identifying impurities in the Fe oxides.
9. Once results from the HLS, DT and QEMSCAN were obtained, Wilfley Table (WT) tests were performed on selected samples and particle fractions in order to evaluate how the coarsest fraction would perform with a gravity circuit.
10. The Wilfley Table concentrate, middling and tail for each test was then subjected to a Davis Tube test in order to determine silica and MnO concentrations in the magnetic and non-magnetic portions of each product.
11. QEMSCAN and microprobe analysis was also performed on each of the aforementioned Davis Tube products in order to provide further mineralogical information on each of these specific Wilfley Table products.
Grindability testwork was performed on five samples from two HQ drill cores; one from Rose Central and one from the Rose North deposit which is not part of this study. Composite samples were prepared based on the three distinct mineralization zones described earlier. The grindability testwork performed on each sample was as follows:
September 2011
13-7
Alderon Iron Ore Corp.
NI 43-101 Technical Report – PEA of the Kami Iron Ore Project |
|
1. Drop-Weight Test
2. SAG Mill Comminution Test (SMC)
3. Bond Low Energy Impact Test
4. Bond Rod Mill Work Index
5. Bond Ball Mill Work Index (at 300µm, at 150µm and at 75µm)
The results from this testwork (Davis and Lascelles) were used to develop the preliminary Process Flowsheet as well as preliminary mass and water balance, forming the basis of process design for this study. Preliminary sizing of major process equipment was also developed.
13.2.1 Sample Selection and Preparation
As a first step, BBA and Alderon proceeded to identify samples from readily available core rejects in order to define composite samples deemed representative of the ore body. In reviewing the geology and mineralogy of the Rose Central deposit, it was determined that the ore body can be classified into three distinct zones; a zone consisting mainly of hematite, a zone of mixed hematite and magnetite and a zone of predominantly magnetite. The Mills deposit per se is fairly homogenous consisting mainly of fine magnetite. Composite samples were selected and prepared and are described as follows:
· RC1: Composite sample RC1, prepared from stratigraphic base of iron formation in the Rose Lake Central deposit which consists mainly of hematite with manganese (Mn) in silicate gangue (rhodonite, bustamite) and less than 5% magnetite.
· RC2: Composite sample RC2, prepared from stratigraphic centre of iron formation in the Rose Lake Central deposit which consists of a mixture of magnetite with variable amounts of hematite in interband layers. The amount of magnetite is greater than hematite. The amount of Mn ranges between 0.7% to more than 3%.
September 2011
13-8
Alderon Iron Ore Corp.
NI 43-101 Technical Report – PEA of the Kami Iron Ore Project |
|
· RC3: Composite sample RC3, prepared from stratigraphic top of iron formation in the Rose Lake Central deposit which is composed of mainly magnetite with less than 5% hematite. It contains some Mn in magnetite with the amount of up to 0.7%. Some manganese occurs as an interstitial element in the magnetite.
· RC4: Composite sample RC4 which is a blend of equal weights of RC1, RC2, RC3 to characterize bulk ore behavior.
· Sample M: Composite sample M representing Mills Lake deposit in which magnetite is much higher than hematite. Mn in magnetite is less than 0.7% and hematite is in distinct layers with Mn in silicate gangue (rhodonite, bustamite).
· Sample composites were prepared from half drill core reject samples, having been previously crushed to -10 mesh (-1651 microns). In general, from 500g to 1000g were taken from each bag.
Table 13.2 shows the drillhole number, the number of bags sampled and the combined weight from each bag, for each core. The location along the drill core is also indicated on the table.
Figure 13.2 illustrates the composite sample preparation block diagram.
September 2011
13-9
Alderon Iron Ore Corp.
NI 43-101 Technical Report – PEA of the Kami Iron Ore Project | 
|
Table 13.2: Summary Description of Composite Sample Selection and Preparation
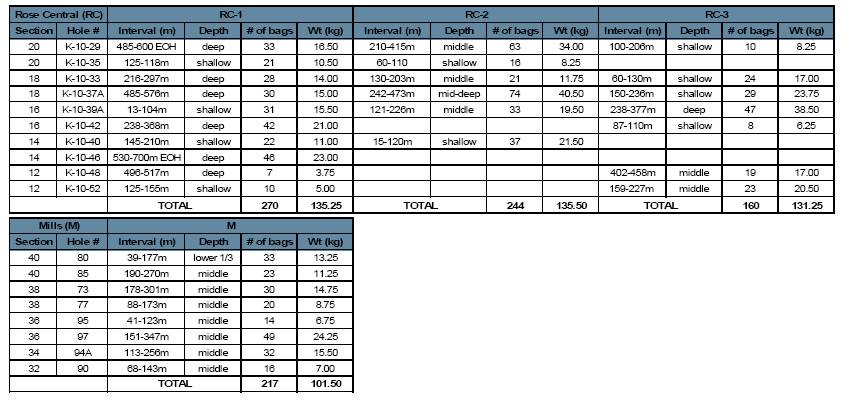
September 2011
13-10
Alderon Iron Ore Corp.
NI 43-101 Technical Report – PEA of the Kami Iron Ore Project | 
|
Figure 13.2: Bags Sampling Flow Diagram at SGS
September 2011
13-11
Alderon Iron Ore Corp.
NI 43-101 Technical Report – PEA of the Kami Iron Ore Project |
|
The aforementioned sample composites were then ground to -35 mesh (-417 microns). An excessive amount of fines was generated (20% to 30% at -45 microns) from both the original core sample crushing and subsequent grinding. This fine fraction was not used in subsequent testwork. Figure 13.3 shows the particle size distribution of ground material. For each sample, a complete assay for each particle fraction was performed.
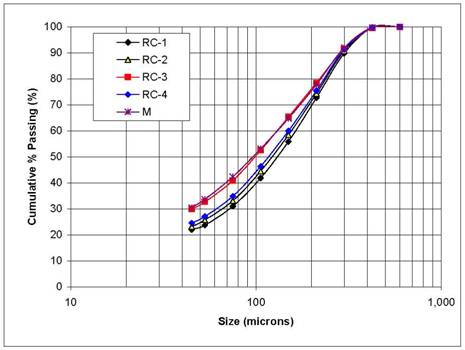
Figure 13.3: Particle Size Distribution of Ground Metallurgical Samples
13.2.2 Head Assays
In general, the Head assays agree with the mineralogical description of the deposit. It is noted, however, that based on the sample Head assays, RC1 is higher in magnetite and RC3 is somewhat higher in hematite than expected. In general the Kami deposit does not point to any issues with regards to sulfur and phosphorus, both these elements being of relatively low to moderate concentration. The Kami ore is however manganese bearing, therefore, due attention needs to be given to manganese behavior during the concentration process. Manganese content is higher in the RC1 ore than in the RC3 ore. Head assays are presented in Table 13.3.
September 2011
13-12
Alderon Iron Ore Corp.
NI 43-101 Technical Report – PEA of the Kami Iron Ore Project |
|
Table 13.3: Sample Head Assays
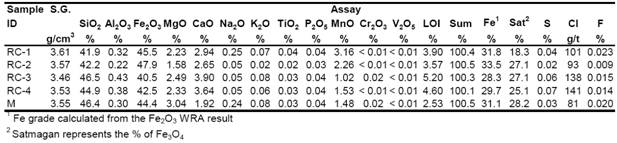
13.2.3 Heavy Liquid Separation and Davis Tube Test Results
Considering that historical metallurgical testwork was limited to only one composite sample from two drill cores and considering that the Rose Central ore deposit is composed of three distinct mineralization zones, the first phase of the test plan was aimed to determine the metallurgical characteristics of each of the three ore types. For each composite sample and for each of the particle size fractions, HLS and DT tests were performed. Results from this baseline characterization would help in defining subsequent testwork. Table 13.4 presents a summary table of HLS and DT test results. The following general observations can be made in analyzing the HSL and DT testwork results:
· In all Head samples, the -75 µm fraction has a higher concentration of Fe, Sat and MnO and a lower concentration of silica than the coarser fractions;
· With the exception of the RC3 coarse sample, total Fe reporting to the sink fraction in the HLS tests is above 90% for all size fractions. Mills and RC3 show the biggest variance in Fe recovery from the coarsest to the finest size samples;
· Although Fe grade improves with finer particle size in the HLS sink fraction, Fe grade is relatively low for all particle sizes. This suggests that some Fe may not be well liberated and, consequently, reports to the sink fraction. However, the high silica levels suggest that heavy silicates may be reporting to the sink fraction. Also, it is observed that MnO generally concentrated in the sink fraction suggesting that some heavy manganese bearing minerals also report to the sink fraction;
September 2011
13-13
Alderon Iron Ore Corp.
NI 43-101 Technical Report – PEA of the Kami Iron Ore Project |
|
· HSL results show good to excellent total Fe and Sat recovery but poor Fe grade. Silica and manganese levels are also very high;
· The DT test results show that, with finer particle size, total Fe recovery generally increases as does Fe grade. Mills results indicate that even at the finer particle size fraction, Fe grade is only in the order of 60%, suggesting that some magnetite is finely disseminated and require better liberation. MnO levels in the DT concentrate seem relatively stable at all particle sizes but are significantly lower than the Head sample. This suggests that a significant proportion on the manganese is liberated from the magnetite;
· DT results show relatively poor total Fe recoveries but excellent magnetite recovery at all size fractions. This is mainly as a result of hematite loss to the DT tails. The DT concentrate Fe grade is poor for the two coarser particle size fractions but drastically improves at the finer -75 µm fraction. This suggests the presence, at various proportions depending on the mineralization zone, of both coarsely liberated magnetite and finely liberated magnetite, in the ore.
For each mineralization zone, Davis Tube tests were also done on the combined float fraction (tails) from HLS tests reground to a K80 of 75 µm. Results are presented in Table 13.5. Both iron and weight recovery were low as well as the concentrate Fe grade. This is explainable by the fact that most of the Fe, in all forms, reported to the HLS sink fraction. Iron in the float fraction is likely to be finely disseminated within gangue minerals.
September 2011
13-14
Alderon Iron Ore Corp.
NI 43-101 Technical Report – PEA of the Kami Iron Ore Project | 
|
Table 13.4: HLS and DT Results Summary Table
September 2011
13-15
Alderon Iron Ore Corp.
NI 43-101 Technical Report – PEA of the Kami Iron Ore Project | 
|
Table 13.5: Combined HLS Floats Davis Tube Concentrate Summary
13.2.4 Mineralogical Analysis (QEMSCAN)
A detailed QEMSCAN and microprobe analysis was performed on four size fractions of the Head samples used for the previously described HLS and Davis Tube tests. The analysis included modals analysis, elemental deportment for iron and manganese, liberation size and association of major mineral components, mineral release curves and grain size distribution curves, Fe grade versus recovery curves by size fraction and mineral distribution by density classification. This section presents a summary of the results.
The assay reconciliation shows that both chemical and QEMSCAN assays are in line with each other. Modals analysis, shown in Table 13.6, shows the mineral composition in each mineralogical zone sample. As expected, the two major minerals are quartz and Fe-oxides. Other minor minerals are amphibole/pyroxene, ankerite, Mn-Fe-Ca carbonates and dolomite (Fe).
September 2011
13-16
Alderon Iron Ore Corp.
NI 43-101 Technical Report – PEA of the Kami Iron Ore Project |
|
Table 13.6: Modals Composition within Samples
Sample | | RC1 | | RC2 | | RC3 | | RC4 | | M |
Mineral Mass (%) | | | | | | | | | | |
Fe-Oxides Total | | 46.4 | | 46.2 | | 40.1 | | 43.0 | | 48.6 |
Magnetite | | 15.7 | | 29.8 | | 26.3 | | 29.2 | | 59.0 |
Hematite | | 30.6 | | 16.4 | | 13.8 | | 16.0 | | 32.4 |
Goethite | | 0.2 | | 0.0 | | 0.0 | | 0.0 | | 0.0 |
Quartz | | 32.1 | | 37.1 | | 34.8 | | 33.7 | | 35.4 |
Amphibole/Pyroxene | | 6.5 | | 5.9 | | 12.9 | | 9.5 | | 7.9 |
Micas/Clays | | 0.4 | | 0.2 | | 0.8 | | 0.4 | | 0.3 |
Other Silicates | | 1.0 | | 0.4 | | 0.5 | | 0.4 | | 1.5 |
Ankerite(Low Mn,Mg,Fe) | | 6.1 | | 4.7 | | 1.8 | | 4.1 | | 0.9 |
Dolomite(Fe) | | 0.7 | | 0.7 | | 6.6 | | 3.2 | | 1.6 |
Mn-Fe-Ca Carbonates | | 5.5 | | 4.4 | | 1.3 | | 4.7 | | 2.7 |
Calcite | | 0.1 | | 0.2 | | 0.4 | | 0.3 | | 0.1 |
Other Carbonates | | 0.2 | | 0.1 | | 0.5 | | 0.3 | | 0.9 |
Apatite | | 0.1 | | 0.1 | | 0.1 | | 0.1 | | 0.1 |
Sulphides | | 0.1 | | 0.0 | | 0.2 | | 0.2 | | 0.0 |
Other | | 0.3 | | 0.1 | | 0.1 | | 0.0 | | 0.1 |
Total | | 100.0 | | 100.0 | | 100.0 | | 100.0 | | 100.0 |
From these results, it is observed that, as expected, there is significantly more hematite in RC1 than in RC2, RC3 and Mills. The hematite/magnetite ratio is 2 for 1 in RC1 and approximately 1 for 2 in other ore types. The differentiation of magnetite, hematite and goethite was determined by optical microscope observations. Also, minor elements, containing non-recoverable iron are much more prevalent in the RC3 mineralization zone than in the others. This is also corroborated by the iron deportment analysis which shows that about 94% of total Fe occurs as Fe-oxide minerals in RC1, RC2 and Mills compared to 87% for RC3. Iron bearing minerals such as amphibole/pyroxene, ankerite and Fe-dolomite contain chemically bonded iron which is lost with the gangue. This therefore suggests that the maximum iron recovery that could be achieved with RC3 ore type is 87%. Figure 13.4 shows the iron deportment for each composite sample.
September 2011
13-17
Alderon Iron Ore Corp.
NI 43-101 Technical Report – PEA of the Kami Iron Ore Project |
|
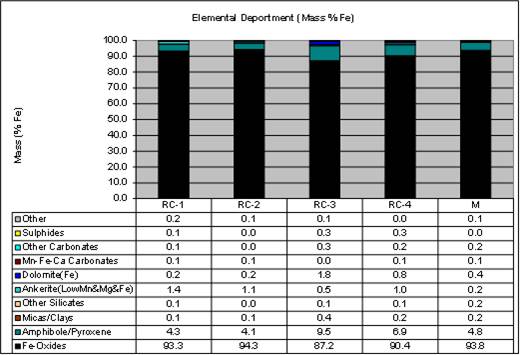
Figure 13.4: Iron Deportment within Samples
Manganese is a deleterious element associated with the Kami ore. Excessive manganese in the concentrate can restrict the marketability of the concentrate. For this reason, it is important to understand the form in which manganese is present and how it can be minimized in the final concentrate. For this reason, a manganese deportment analysis was performed as part of the testwork.
In all four samples, carbonates (Mn-Fe-Ca Carbonates, Dolomite-Fe, Ankerite and others) are the most prevalent manganese bearing minerals, ranging from 61% for RC3 to 89% for RC1. Manganese deportment varies significantly from one mineralization zone to the other; however, the most important difference between the ore types is the amount of manganese chemically bonded to the magnetite. In RC1, only 5.8% of manganese is associated with the magnetite, whereas in RC3 and Mills respectively, 22.5% and 18.9% of the manganese is in magnetite. Therefore, the final concentrate manganese level might vary significantly from one mineralization to the other since it is greatly controlled by the amount of manganese deported to magnetite mineral. Figure 13.5 shows the manganese deportment characteristics of each ore type.
September 2011
13-18
Alderon Iron Ore Corp.
NI 43-101 Technical Report – PEA of the Kami Iron Ore Project |
|
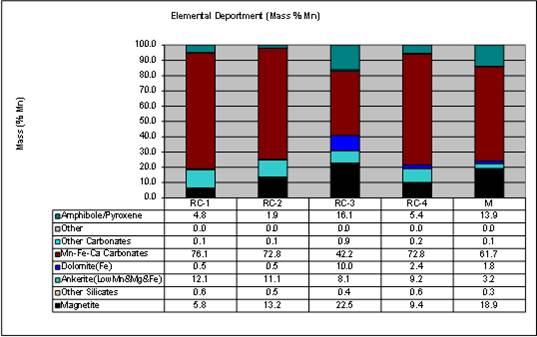
Figure 13.5: Mn Deportment within Samples
Liberation particle sizes of Fe-oxides were estimated from QEMSCAN image analysis. Liberation is characterized using five criteria as indicated in the Figure 13.6.
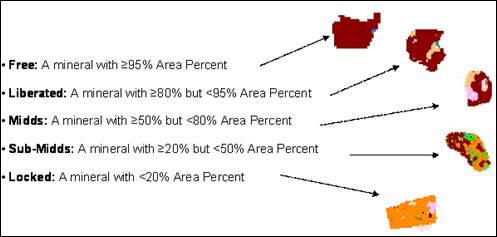
Figure 13.6: Mineral Liberation Size Definition
September 2011
13-19
Alderon Iron Ore Corp.
NI 43-101 Technical Report – PEA of the Kami Iron Ore Project |
|
Fe-oxide liberation was found to be different from one ore type to the other. While RC1 and RC2 showed liberated and free Fe-oxides in the -425 µm/+212 µm fraction to be respectively 87% and 90%, RC3 was found to be only 73%. Liberation increases respectively to 97%, 95% and 93% for the particle size range of -212 µm/+75 µm. Thus, RC3 Fe-oxides liberation size is finer than for RC1 and RC2. Mills Fe-oxide liberation were found to be 64% and 83%, respectively for -425/+212 µm and -212/+75 µm size fractions. Liberation of 90% was achieved only at a particle size of less than 75 µm. Figure 13.7 shows the Fe-oxide liberation curves discussed.
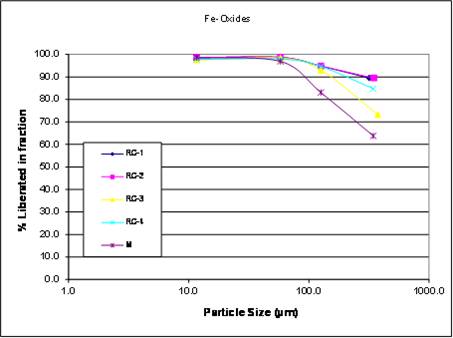
Figure 13.7: Fe-oxide Liberation Curves
Liberation and association analyses done on other minerals showed that unliberated Fe-oxides are mainly associated with silicates. The proportion of Fe-oxides associated with carbonates or carbonates and silicate complexes is slightly higher in RC3 and Mills than in RC1 and RC2. Unliberated carbonates are mainly associated to silicates, but a significant proportion are associated to Fe-oxides or Fe-oxides-carbonate complexes, especially in Mills. It was found that in general, carbonates liberate finer than Fe-oxides, except for RC3 which has similar liberation size. Liberation size of silicates is coarser for all ore types.
September 2011
13-20
Alderon Iron Ore Corp.
NI 43-101 Technical Report – PEA of the Kami Iron Ore Project |
|
13.2.5 Conclusions from the Mineralogical Testwork Results
The initial testwork done by Altius was limited to one composite sample from two drill cores taken from the Rose Central deposit. In this study, a more detailed characterization of the three mineralogical zones found in Rose Central as well as the mineralogical zone in the Mills deposit was performed. The following general conclusions were drawn from the HLS, Davis Tube and the mineralogical testwork done:
· RC1 and RC2 are of similar ore types with comparable gangue composition, similar mineral liberation size, elemental deportment, iron grade, and low sulphur and phosphorous content. The main difference between RC1 and RC2 is the proportion of magnetite and hematite;
· Iron oxides in RC2, RC3 and Mills are mainly magnetite;
· The main gangue minerals are quartz, carbonates and silicates in every mineralization zone;
· RC1, RC2 contain more manganese than RC3 and Mills. The manganese in RC1 deports mainly in carbonates while RC3 and Mills have more manganese in silicates and in the magnetite. The Mn deportment in magnetite is 5.8% and 22.5% respectively for RC1 and RC3;
· Microprobe analysis on all five samples determined that magnetite is the only iron oxide manganese carrier;
· RC3 has significant amount of non-recoverable Fe mainly in the form of silicates and dolomite-Fe. The proportion of non-recoverable iron in RC3 is in the order of 13% compared to approximately 6% for RC1 and RC2;
· Fe-oxide liberation (>90% liberated) size for RC1 and RC2 is over 300 µm. Fe-oxide liberation size for RC3 is in the order of 150 µm while it is less than 100 µm for Mills.
September 2011
13-21
Alderon Iron Ore Corp.
NI 43-101 Technical Report – PEA of the Kami Iron Ore Project | 
|
13.2.6 Wilfley Table Testwork
The HLS, DT and QEMSCAN testwork previously described, served to establish a baseline characterization of the three mineralogical zones in the Rose Central deposit and in the Mills deposit. Understanding the mineralogical differences between the zones will help in understanding the metallurgical behavior of the ore when subjected to various processing steps within a Process Flowsheet. This testwork also helped in defining the scope of further testwork required during the course of this study and subsequent studies.
Following review of the HLS, DT and QEMSCAN results for each of the composite samples and for each particle size fraction, it was decided to proceed with Wilfley Table (WT) tests on the coarse size fraction (-425/+212 micron) for only RC1, RC2, RC3 and RC4 samples. Considering indications that RC3 may contain finer and non-liberated magnetite, WT tests were also done for the intermediate size fraction (-212/+75 micron). Wilfley Table (WT) tests were conducted to evaluate the amenability of the ore to gravity concentration, specifically to concentration using spirals. Considering that the Mills results indicated that iron liberation is achieved at finer particle size, it was decided that for this study, process development would only be done considering the Rose Central mineralization.
Each WT test yielded three products; a WT concentrate, a WT middling and a WT tail. Each of these products was further subjected to a Davis Tube (DT) test, thus each yielding a DT concentrate and a DT tail. Furthermore, a QEMSCAN analysis of each of these DT products was performed. This provided a relatively detailed characterization of each composite sample product from gravity concentration. Table 13.7 provides a general overview of the results.
September 2011
13-22
Alderon Iron Ore Corp.
NI 43-101 Technical Report – PEA of the Kami Iron Ore Project |
|
Table 13.7: Wilfley Table & Davis Tube Test Result Summary
| | Wilfley Table Tests | | DT Tests | |
| | Weight | | Fe (%) | | Sat (%) | | Concentrate | |
| | (%) | | Grade | | Rec | | Grade | | Rec | | Fe(%) | | Fe % Rec | | Weight (%) | |
RC1 -425/+212 | | | | | | | | | | | | | | | | | |
Conc | | 23.9 | | 69.0 | | 54.6 | | 27.5 | | 49.4 | | 69.9 | | 32.4 | | 31.9 | |
Middling | | 14.1 | | 64.3 | | 30.1 | | 29.2 | | 31.0 | | 67.1 | | 36.0 | | 34.2 | |
Tails | | 61.9 | | 7.5 | | 15.3 | | 4.2 | | 19.6 | | 17.3 | | 40.8 | | 20.4 | |
RC2 -425/+212 | | | | | | | | | | | | | | | | | |
Conc | | 28.9 | | 69.1 | | 67.2 | | 48.2 | | 67.5 | | 69.9 | | 57.9 | | 57.3 | |
Middling | | 5.8 | | 61.5 | | 12.0 | | 45.5 | | 12.8 | | 63.5 | | 65.8 | | 62.7 | |
Tails | | 65.3 | | 9.4 | | 20.8 | | 6.2 | | 19.7 | | 15.6 | | 45.1 | | 39.6 | |
RC3 -425/+212 | | | | | | | | | | | | | | | | | |
Conc | | 13.7 | | 69.0 | | 43.4 | | 78.7 | | 57.9 | | 69.9 | | 85.3 | | 83.9 | |
Middling | | 3.6 | | 43.2 | | 7.0 | | 36.0 | | 6.9 | | 49.9 | | 72.0 | | 63.1 | |
Tails | | 82.8 | | 13.0 | | 49.5 | | 7.9 | | 35.2 | | 17.5 | | 63.2 | | 46.6 | |
RC3 -212/+75 | | | | | | | | | | | | | | | | | |
Conc | | 29.1 | | 65.5 | | 66.6 | | 84.3 | | 78.7 | | 68.8 | | 84.7 | | 77.4 | |
Middling | | 8.2 | | 48.1 | | 13.8 | | 52.3 | | 13.8 | | 57.8 | | 81.2 | | 63.9 | |
Tails | | 62.7 | | 8.9 | | 19.6 | | 3.7 | | 7.5 | | 14.3 | | 37.5 | | 23.2 | |
RC4 -425/+212 | | | | | | | | | | | | | | | | | |
Conc | | 14.8 | | 69.7 | | 38.0 | | 50.1 | | 40.0 | | 70.6 | | 56.2 | | 54.9 | |
Middling | | 10.6 | | 66.3 | | 25.7 | | 47.4 | | 27.0 | | 68.0 | | 55.9 | | 54.0 | |
Tails | | 74.6 | | 13.2 | | 36.3 | | 8.2 | | 33.0 | | 20.6 | | 59.7 | | 39.2 | |
Analysis of the WT test results shows that gravity concentration for the ore deposits represented by the RC1 and RC2 composite samples yielded relatively good Fe grade with correspondingly good silica levels (about 2.7%) for the combined WT concentrate plus WT middling. Total Fe recovery was also relatively good for both ore types. It was indicated and expected, based on HLS and DT data for these samples, as previously described, that the finer size fractions should give even better results.
When analyzing the RC3 WT results, it was seen that, for the coarse particle size fraction, a very good Fe grade and silica level was achieved, however, total Fe recovery and weight recovery was found to be very low. Magnetite recovery was much better than hematite recovery however, it should be noted that within the hematite content indicated, non-recoverable Fe in the form of silicates and carbonates is also included. If the middlings were to be included with the concentrate, Fe grade would decrease and silica levels would increase to the point where
September 2011
13-23
Alderon Iron Ore Corp.
NI 43-101 Technical Report – PEA of the Kami Iron Ore Project |
|
the targeted concentrate quality would not be met, therefore middling would need to be directed with the WT tailings.
At the intermediate RC3 particle size fraction, Fe grade, Fe recovery and weight recovery were better than those for the coarser size fraction; however, the silica level was above target. Here again, middling should be directed to the WT tailings and not the WT concentrate. For both coarse and intermediate size fractions, Fe losses to the WT tails are relatively high.
Considering that the Rose Central ore deposit is considerably composed of mineralization zones represented by the RC3 composite sample, testwork results indicate that metallurgical performance could be enhanced by incorporating a WT tailing cobbing step using Low Intensity Magnetic Separation (LIMS) to improve magnetite recovery. The LIMS concentrate would require a regrind step followed by further magnetic separation. Fe lost to the LIMS tails would contain little magnetite, some non-liberated hematite and a significant quantity of non-recoverable Fe, as mentioned earlier. Both the iron deportment analysis derived from QEMSCAN and the optical microscope observation revealed that, in RC1 and RC2, respectively, 76% and 87% of the iron in the tails is in the form of hematite. The iron oxide grains are relatively fine with a P50 of 100 µm. On the other hand, iron in Wilfley tails Davis Tube tails of both size fractions is mostly deported to non-recoverable iron (» 60%). The iron oxide grain size is very fine with a P50 between 25 µm and 50 µm. Iron in the Davis Tube tails of the RC3 WT middling, which also report to the final tail, is mostly hematite (65%) and non-recoverable iron. QEMSCAN analysis on DT Tube test products also revealed that most unliberated iron oxides in WT RC1, RC2 and RC3 middling and tails are associated to silicates and complex minerals. Unliberated iron in RC3 WT middling and tails are mainly associated to carbonates and complex minerals. It was estimated from the metallurgical testwork, and corroborated by the geological characterization of the ore zone represented by the RC3 composite sample, that the non-recoverable Fe is in the order of 12% of the total Fe. In contrast, the ore deposit represented by the RC1 composite sample contains non-recoverable Fe in the order of 3% of total Fe. Incorporation of Davis Tube separation on Wilfley Table concentrate does not give any significant concentrate upgrade or process improvement. Finally, grain size curves of DT concentrates corresponding to regrind mill feed show that iron oxides median grain size are in the order of 90µm.
September 2011
13-24
Alderon Iron Ore Corp.
NI 43-101 Technical Report – PEA of the Kami Iron Ore Project |
|
For each of the samples, manganese concentrates at the WT middling and tails. With the exception of RC3 samples, DT concentrated manganese to the magnetic fraction. This confirmed the association between magnetite and manganese, which was also confirmed by microprobe results showing an average Mn content in magnetite and hematite of 0.58% and 0.04% respectively.
13.2.7 Ore Grindability
Initially, for this study, it was planned that the grindability data from previous testwork be used for the preliminary grinding circuit design. However, during the winter 2011 drilling program, two HQ drill cores, one from Rose North and one from Rose Central, were specifically obtained for grindability tests. Five composite samples were prepared, three from Rose Central representing the three different mineralization zones and two from Rose North representing one mineralization which was deemed to be comparable to RC1 in Rose Central. All samples were assayed and submitted to the following seven standard grindability tests.
· Drop-Weight Test (DWT)
· SAG Mill Comminution Test (SMC)
· Bond Low Energy Impact Test
· Bond Rod Mill Grindability Test
· Bond Ball Mill Grindability Test (at 300 µm)
· Bond Ball Mill Grindability Test (at 150 µm)
· Bond Ball Mill Grindability Test (at 45 µm)
The grindability test results obtained are summarized in Table 13.8 and Table 13.9. These results were used to perform preliminary sizing and power evaluation of the crusher, primary grinding mill and the regrind mill.
September 2011
13-25
Alderon Iron Ore Corp.
NI 43-101 Technical Report – PEA of the Kami Iron Ore Project |
|
Table 13.8: Grindability Test Result Summary
Sample | | Mineralogy | | Rel. Density | | RWI | | CWI | | BWI_(kWh/t) | |
Name | | Corresponding | | DWT | | CWI | | SMC | | (kWh/t) | | (kWh/t) | | 48M | | 100M | | 325M | |
NL09996 | | RC1 | | 3.49 | | 3.9 | | 3.73 | | 5.0 | | 6.43 | | 6.9 | | 12.9 | | 25.6 | |
NL09997 | | RC2 | | 3.47 | | 3.32 | | 3.50 | | 7.8 | | 12.8 | | 6.6 | | 10.1 | | 21.5 | |
NL09998 | | RC3 | | 3.35 | | 3.42 | | 3.37 | | 7.8 | | 9.45 | | 7.1 | | 10.9 | | 22.2 | |
NL09999 | | Rose North- | | 3.42 | | 3.54 | | 3.58 | | 3.4 | | 5.75 | | 6.0 | | 15.8 | | 26.1 | |
NL10000 | | Mainly Hematite | | 3.32 | | 3.18 | | 3.18 | | 3.8 | | 6.88 | | 7.2 | | 16.5 | | 26.3 | |
Table 13.9: JK Tech SMC Test Result Summary
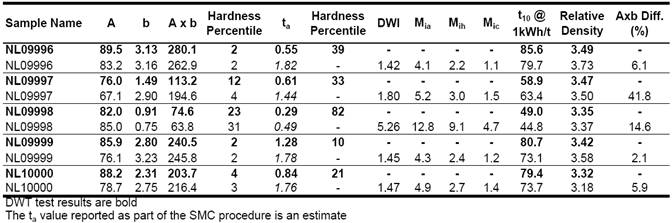
Crusher Work Index (CWI) values are in the normal range of the database for all samples with the exception of NL09997 and NL09998, which are in the higher range. The variability of the results is also relatively high and is taken into account in the design of the crusher. The variation between specimens was from 1.5 to 20 kWh/t with standard deviation ranging from 3.8 to 4.7 kWh/t. To conservatively size the crusher, the maximum Crushing Work Index of 12.8 kWh/t was used for the calculations. The operating Crusher Work Index was calculated to be 0.17 kWh/t. This value was used to estimate crusher motor and power consumption.
The Drop-Weight Test results revealed some evidence of bimodality in the relative density distribution. The consequence of this could be an accumulation of a dense component in the primary mill circulating leading to possible power problems which could result in a loss of throughput. This will be further investigated in the planned Feasibility Study testwork.
The SMC test results were analyzed by JK Tech Pty Ltd. Parameters ‘A’ and ‘b’ had been calibrated with full Drop-Weight Test results. Drop-Weight results were analyzed by Contract
September 2011
13-26
Alderon Iron Ore Corp.
NI 43-101 Technical Report – PEA of the Kami Iron Ore Project |
|
Support Services for JK Tech. The Axb parameters calculated from SMC and Drop-Weight are relatively well correlated for three of the samples. However, samples NL09997 and NL09998 have big differences at respectively 41.8% and 14.6%. This variation will be further investigated during the Feasibility Study. Considering that the Mia value for sample NL09998 is significantly higher than that of the other samples and is not typical of ore bodies in the region, for this study, this result was excluded and considered as an outlier but was highlighted as a potential technical risk.
For primary grinding, it was assumed that a conventional AG mill can be used. AG power calculations were done according to Morrel formulas and methodology which estimates the total operating grinding energy (WT) with Mia and Mib parameters. This equation is used to estimate the required power at the pinion.

The Wa parameter is defined as the power required to grind the ore with an AG mill from the feed size, set to 165 mm, down to 750 µm. The Mia parameters, which correspond to the work index of coarse particle, vary from 4.1 to 5.2 for four of the five samples (excluding sample NL09998 as previously mentioned). For this study, it was assumed that 4.1 is the nominal ore Mia value (average value) and 5.2 is the design value for determining maximum primary mill grinding power required. The Table 13.10 below presents the design Mia values and the resulting Wa values.
Table 13.10: Mia Values and the Resulting Wa Values
| | Mia | | Wa (kWh/t) | |
Average (excludes outlier) | | 4.6 | | 2.5 | |
Design | | 5.2 | | 2.9 | |
The Wb parameter is defined as the power required to grind the ore from 750 µm (22M) to the final product size. It is calculated with the Mib parameter which is the work index of the fine particle. The Mib parameter was estimated with feed and product particle size and Bond Ball Mill Index test parameters measured at 300 µm (48M). The target particle size fed to spirals has been assumed to be 275 µm. Ball mill work index at 300 µm is relatively constant for all samples. The test which has the highest work index was used to calculate Mib. The resulting Wb
September 2011
13-27
Alderon Iron Ore Corp.
NI 43-101 Technical Report – PEA of the Kami Iron Ore Project |
|
is 1.16 kWh/t. The sum of Wb to design or average Wa gives a total operating work indexes (WT) of respectively 3.7 kWh/t and 4.0 kWh/t for nominal and design values. These values serve for sizing the AG mill.
To size the regrind mill, the BWI is required. Table 13.8 presented earlier shows how the BWI increases significantly as the grind product gets finer. For this study, a BWI of 18.5 kWh/t as reported in the Altius testwork was used. This value is consistent with current testwork results. Using the appropriate Morrel equations, the regrind ball mill operating work index was estimated at 7.6 kWh/t. This value was used to size the ball mill motor and to calculate estimated power consumption.
13.3 Process Flowsheet Development
The results from the aforementioned testwork were used to determine a preliminary Process Flowsheet (PFS) for the Kami ore. Considering that;
· the baseline HLS, DT and QEMSCAN testwork indicated that the Mills deposit differs considerably from the Rose Central ore deposit;
· the Mills deposit will likely require a finer grind than the Rose Central deposit;
· the Rose Central deposit is considerably larger than the Mills deposit;
· Laboratories are very busy and testwork had to be limited and prioritized.
It was decided that the PFS for this study would be developed on the Rose Central ore deposit only. In subsequent planned testwork, the Mills deposit will be characterized as to its compatibility with the PFS developed in this study and required modifications to the PFS, if any, will then be determined.
September 2011
13-28
Alderon Iron Ore Corp.
NI 43-101 Technical Report – PEA of the Kami Iron Ore Project |
|
13.3.1 Proposed Process Flowsheet
Taking into consideration the results of the testwork performed during the course of this study, the Process Flowsheet (PFS) presented in the simplified process block diagram in Figure 13.8 was adopted as the base case flowsheet. As can be seen, following crushing and grinding, the first concentration step is gravity concentration using spirals. Spiral tailings are subsequently cobbed to recover magnetite prior to their disposition. The cobbing concentrate is subjected to a regrind step to liberate the magnetite and a further magnetic separation to achieve the targeted Fe grade and silica level. It should be noted that in this study, no testwork was done on the regrind and magnetic plant therefore, several assumptions which will be discussed later, were made for this part of the process.
September 2011
13-29
Alderon Iron Ore Corp.
NI 43-101 Technical Report – PEA of the Kami Iron Ore Project |
|
Figure 13.8: Simplified Process Block Diagram
September 2011
13-30
Alderon Iron Ore Corp.
NI 43-101 Technical Report – PEA of the Kami Iron Ore Project | | 
|
13.3.2 Mass Balance Derived from WT Test Results
The Wilfley Table (WT) test results for each of the composite samples (RC1, RC2 and RC3) described earlier, were used to derive the final mass balance for this study. The following steps for deriving the final mass balance were followed.
1. A mass balance for each composite sample and for each size fraction subjected to WT tests, adjusted to the laboratory sample head assay, was derived. For RC1 and RC2 intermediate size fractions, which were not subjected to WT tests, the mass balances were estimated using the coarse particle size WT results as well as results from the HLS, DT and QEMSCAN tests.
2. Not having the appropriate grindability data available for primary grinding, a hypothetical particle size distribution (PSD) curve was developed for a -35 mesh (-425 micron) assumed grind feed to the spirals. This PSD was developed using BBA experience from its reference project database for an ore having similar grinding requirements. This PSD is represented in Figure 13.9.

Figure 13.9: Hypothetical Spiral Feed PSD Used In Mass Balance Development
September 2011
13-31
Alderon Iron Ore Corp.
NI 43-101 Technical Report – PEA of the Kami Iron Ore Project | |
|
3. Using the PSD curve shown for primary grinding (AG Mill) spiral feed, it was assumed that 40% of the spiral feed was -35/+65 mesh (-425/+212 microns) and 60% of the spiral feed was -65/+200 mesh (-212/+75 microns). A weighted mass balance was then produced for each of the composite samples RC1, RC2 and RC3 adjusted to the laboratory sample Head assay.
4. In order to produce a single mass balance to establish the process design basis, an assumption was made that the three mineralization zones in the Rose Central deposit were weighted according to a proportion of 21% RC1, 36% RC2 and 43% RC3. This assumption was supported by an analysis performed by Alderon using the following methodology:
a. Section-by-section interpretations of RC1, RC2 and RC3 were digitized in mining software (Datamine and Gemcom) based on field and laboratory results for Central Rose ore body.
b. A set of 3-D models were created and named for each zone.
c. The current block model blocks, (used in this study) were tagged based on each zone, by creating another folder within the block model.
d. A tonnage-grade volumetric report was generated based on each subzone (RC1, RC2, RC3) and results were used to derive the aforementioned proportion of each zone.
Although BBA did not validate the aforementioned analysis, BBA is of the opinion that the methodology used to derive these proportions provides a reasonable estimation of the proportions of each subzone.
5. A further adjustment was made to account for fines produced during primary grinding. Spirals lose efficiency in recovering Fe at particle sizes below 100 microns. At particle sizes below 75 microns, Fe recovery drops drastically. In the development of the mass balance, it was assumed that all Fe finer than 75 microns was lost to the spiral tailings. Of course, considering that a spiral tailings cobbing step is included in the adopted PFS, fine magnetite is largely recovered whereas fine hematite is lost to the tailings.
September 2011
13-32
Alderon Iron Ore Corp.
NI 43-101 Technical Report – PEA of the Kami Iron Ore Project | |
|
6. A final adjustment to the mass balance was made and incorporated the following elements:
a. The Head grade was adjusted to correspond to the mine plan Head grade (preliminary optimized pit for Rose Central) for total Fe = 29.9%, Fe in magnetite = 18.4%, silica = 44.7% and MnO = 1.6%. The mine plan also provided a value for Fe in hematite = 8.7%. When reconciling total Fe compared to combined Fe from magnetite and hematite, it was determined that approximately 9.4% of the total iron is in a non-recoverable form (silicates, carbonates and other complexes). In adjusting Head grade to the mine plan, unit recoveries were maintained at the values supported by the testwork results.
b. It is assumed that, following regrind, the magnetic separation plant recovers 90% of the magnetite and that none of the hematite is recovered. This assumption is based on BBA reference projects but will need to be validated with subsequent testwork.
c. This mass balance indicates that of the total concentrate produced, about 78% comes from the spiral circuit and the remaining 22% comes from the mag-plant. This mass balance, derived with all assumptions mentioned, constitutes the design basis carried forward in this study.
d. One important parameter to be determined in subsequent testwork is the regrind PSD required to achieve the targeted mag-plant concentrate Fe grade and silica level. The target mag-plant concentrate Fe grade and silica level was derived by proportionally blending mag-plant concentrate and spiral concentrate to attain the final concentrate quality target for Fe grade and silica content. Based on testwork results, regrind P50 will likely be between 75 microns and 150 microns. Figure 13.10 shows combined PSD curves for blended spiral concentrate and mag-plant concentrate (assumed at P50 of 75 microns) at the approximate proportions of 78% / 22% respectively. The figure also shows concentrate PSD for three of BBA’s reference project database. Reference 1 consists of a specular hematite concentrate liberating at about 20 mesh. Reference 2 is also a specular hematite concentrate liberating at about 35 mesh. Reference 3 represents concentrate from a similar operation producing a spiral concentrate bearing hematite and magnetite for the sinter fines market. No regrind concentrate is included
September 2011
13-33
Alderon Iron Ore Corp.
NI 43-101 Technical Report – PEA of the Kami Iron Ore Project | |
|
in any of the reference projects. As can be observed from the figure, the Kami spiral concentrate PSD is slightly finer than Reference 2. When mag-plant concentrate is combined, the PSD gets significantly finer. For the purpose of this study, it was assumed that regrind will be done at P50 = 75 microns and equipment is sized accordingly. Also, it was assumed that one combined concentrate will be produced.
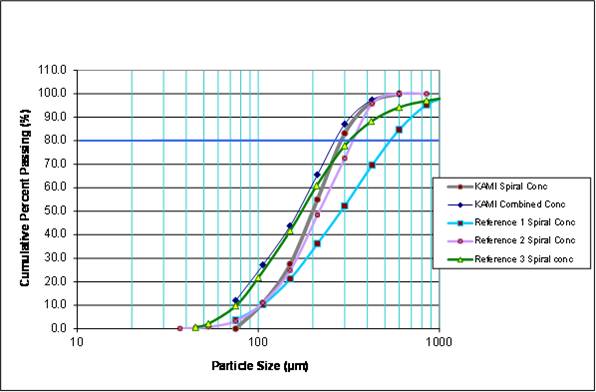
Figure 13.10: Kami PSD Combining Spiral Concentrate and Mag-Plant Concentrate (regrind P50 = 75 microns) Compared to Reference Projects
September 2011
13-34
Alderon Iron Ore Corp.
NI 43-101 Technical Report – PEA of the Kami Iron Ore Project | | 
|
e. In consolidating the testwork results and developing the mass balance for the PFS as described, it was possible to develop a preliminary concentrate analysis as shown in Table 13.11.
Table 13.11: Preliminary Kami Concentrate Analysis
Fe | | Mag | | Hem | | SiO2 | | MnO | | Mn | | Al2O3 | |
65.5 | % | 65.1 | % | 26.3 | % | 4.5 | % | .95 | % | .75 | % | .20 | % |
MgO | | CaO | | TiO2 | | Cr2O3 | | V2O5 | | P2O5 | | S | |
.43 | % | .44 | % | .04 | % | <.01 | % | <.01 | % | <.01 | % | .053 | % |
13.4 Recommended Testwork for Feasibility Study
As part of this study, a comprehensive test plan has been developed in order to obtain more detailed metallurgical and grindability characterization of the ore body permitting to validate the Process Flowsheet developed. Considering that it will be difficult to perform certain testwork at a pilot scale, the proposed test plan is designed to obtain the maximum information from laboratory scale testwork. During the course of the Feasibility Study, semi-pilot testwork may be warranted for certain processing steps. If this proves to be the case, an appropriate test program will be developed and executed prior to final plant design.
The major testwork planned to be performed early in the Feasibility Study is shown in Table 13.12, Figure 13.11 and Figure 13.12, illustrating the block diagram for feasibility testwork.
September 2011
13-35
Alderon Iron Ore Corp.
NI 43-101 Technical Report — PEA of the Kami Iron Ore Project | | 
|
Table 13.12: Feasibility Testwork Program
| | | | Minimum
Sample Weight | | Drill Core
Size | | Number of Tests | |
Test | | | | | | | | RC | | RN | |
1. Grindability - HQ full Drill Core | | kg | | in | | Mills | | RC1 | | RC2 | | RC3 | | Comp | | Total | | RN1 | | RN2 | | RN3 | | Comp | | Total | |
1.1 | | Drop-Weight | | 90 | | 3-4 | | 3 | | 3 | | 3 | | 3 | | | | 9 | | 3 | | 3 | | 3 | | | | 9 | |
1.2 | | SPI | | 10 | | 0.75 | | 3 | | 3 | | 3 | | 3 | | | | 9 | | 3 | | 3 | | 3 | | | | 9 | |
1.3 | | CWI | | 10 | | 3 | | 3 | | 3 | | 3 | | 3 | | | | 9 | | 3 | | 3 | | 3 | | | | 9 | |
1.4 | | RWI | | 15 | | 0.5 | | 3 | | 3 | | 3 | | 3 | | | | 9 | | 3 | | 3 | | 3 | | | | 9 | |
1.5 | | BWI (at 300 um) | | 10 | | 6 mesh | | 3 | | 3 | | 3 | | 3 | | | | 9 | | 3 | | 3 | | 3 | | | | 9 | |
1.6 | | BWI (TBD) | | 10 | | 7 mesh | | 3 | | 3 | | 3 | | 3 | | | | 9 | | 3 | | 3 | | 3 | | | | 9 | |
1.7 | | SAG Design | | 15 | | 2-4 | | 3 | | 3 | | 3 | | 3 | | | | 9 | | 3 | | 3 | | 3 | | | | 9 | |
| | | | | | | | | | | | | | | | | | | | | | | | | | | | | |
2. Test for AG Mill Sizing - HQ Full Drill Core | | | | | | M | | RC1 | | RC2 | | RC3 | | Comp | | Total | | RN1 | | RN2 | | RN3 | | Comp | | Total | |
2.1 | | MacPherson | | 200 | | NQ | | 1 | | 1 | | 1 | | 1 | | 1 | | 4 | | 1 | | 1 | | 1 | | 1 | | 4 | |
| | | | | | | | | | | | | | | | | | | | | | | | | | | | | |
3. Variability Test | | | | | | M | | | | | | RC | | | | | | | | | | RN | | | | | |
3.1 | | SPI | | 10 | | 0.75 | | 30 | | | | | | 50 | | | | | | | | | | 50 | | | | | |
3.2 | | ModBond | | 2 | | 6 mesh | | 30 | | | | | | 50 | | | | | | | | | | 50 | | | | | |
3.3 | | BWI | | 10 | | 6 mesh | | 3 | | | | | | 5 | | | | | | | | | | 5 | | | | | |
| | | | | | | | | | | | | | | | | | | | | | | | | | | |
4. Simulation | | | | | | | | | | | | | | | | | | | | | | | | | | | |
4.1 | | JKSimmet | | NA | | NA | | | | | | | | | | | | 1 | | | | | | | | | | | |
4.2 | | SGS Minovex (CEET) | | NA | | NA | | | | | | | | | | | | 1 | | | | | | | | | | | |
| | | | | | | | | | | | | | | | | | | | | | | | | | | | | |
5. Process Development | | Sample weight per
mineralization | | | | M | | RC1 | | RC2 | | RC3 | | Comp | | Total | | RN1 | | RN2 | | RN3 | | Comp | | Total | |
5.1 | | Sample Preparation | | 40.0 | | -35 mesh | | 1 | | | | | | | | 1 | | 1 | | 1 | | 1 | | 1 | | 1 | | 4 | |
5.2 | | Sample Grinding | | | | | | 1 | | | | | | | | 1 | | 1 | | 1 | | 1 | | 1 | | 1 | | 4 | |
5.3 | | Screening (3 sizes) | | | | | | 3 | | | | | | | | 3 | | 3 | | 3 | | 3 | | 3 | | 3 | | 12 | |
5.4 | | Wilfley Test (3 sizes) | | | | | | 3 | | | | | | | | 3 | | 3 | | 3 | | 3 | | 3 | | 3 | | 12 | |
5.5 | | DT Test | | | | | | 9 | | | | | | | | 9 | | 9 | | 9 | | 9 | | 9 | | 9 | | 36 | |
5.6 | | Sample combined | | | | | | 1 | | | | | | 1 | | 1 | | 2 | | 1 | | 1 | | 1 | | 1 | | 4 | |
September 2011
13-36
Alderon Iron Ore Corp. | 
|
NI 43-101 Technical Report — PEA of the Kami Iron Ore Project |
| | Test | | Minimum
Sample Weight | | Drill Core
Size | | Number of Tests | |
5.7 | | LIMS test-Cobber | | | | | | 1 | | | | | | 1 | | 1 | | 2 | | 1 | | 1 | | 1 | | 1 | | 4 | |
5.8 | | Bench scale rare-earth mag test | | | | | | 1 | | | | | | 1 | | 1 | | 2 | | 1 | | 1 | | 1 | | 1 | | 4 | |
5.9 | | Regrind (3 sizes) | | | | | | 3 | | | | | | 3 | | 3 | | 6 | | 3 | | 3 | | 3 | | 3 | | 12 | |
5.10 | | DT Cleaner | | | | | | 3 | | | | | | 3 | | 3 | | 6 | | 3 | | 3 | | 3 | | 3 | | 12 | |
| | | | | | | | | |
| | Test | | Minimum
Sample | | Drill Core | | | |
| | Flowsheet Pilot Test (generate 100kg | | Weight | | Size | | Number of Tests | |
6. | | combined concentrate) | | Weight per composite sample | | M | | RC1 | | RC2 | | RC3 | | Comp | | Total | | RN1 | | RN2 | | RN3 | | Comp | | Total | |
6.1 | | Sample Preparation | | 300.0 | | -425µm | | 1 | | | | | | | | 1 | | 1 | | | | | | | | 1 | | 1 | |
6.2 | | Rougher Spiral Lock-Cycle Test (Wilfley Table) | | 285.7 | | | | 1 | | | | | | | | 1 | | 1 | | | | | | | | 1 | | 1 | |
6.3 | | Cleaner Spiral Lock-Cycle Test (Wilfley Table) | | 111.9 | | | | 1 | | | | | | | | 1 | | 1 | | | | | | | | 1 | | 1 | |
6.4 | | Recleaner Spiral Lock-Cycle Test (Wilfley Table) | | 91.8 | | | | 1 | | | | | | | | 1 | | 1 | | | | | | | | 1 | | 1 | |
6.5 | | LIMS-Cobber | | 200.0 | | | | 1 | | | | | | | | 1 | | 1 | | | | | | | | 1 | | 1 | |
6.6 | | Regrind | | 80.0 | | | | 1 | | | | | | | | 1 | | 1 | | | | | | | | 1 | | 1 | |
6.7 | | LIMS-Rougher | | 80.0 | | | | 1 | | | | | | | | 1 | | 1 | | | | | | | | 1 | | 1 | |
6.8 | | LIMS-Cleaner | | 80.0 | | | | 1 | | | | | | | | 1 | | 1 | | | | | | | | 1 | | 1 | |
| | | | | | | | | | | | | | | | | | | | | | | | | | | | | |
7. | | Concentrate filtration test | | | | | | M | | RC1 | | RC2 | | RC3 | | Comp | | Total | | RN1 | | RN2 | | RN3 | | Comp | | Total | |
7.1 | | Spiral Concentrate Filtration Rate Vacuum (Table) | | | | | | 1 | | | | | | | | 1 | | 1 | | | | | | | | 1 | | 1 | |
7.2 | | LIMS Concentrate Filtration Rate Vacuum (belt) | | | | | | 1 | | | | | | | | 1 | | 1 | | | | | | | | 1 | | 1 | |
7.3 | | LIMS Concentrate Filtration Rate Vacuum (disc/drum) | | | | | | 1 | | | | | | | | 1 | | 1 | | | | | | | | 1 | | 1 | |
| | | | | | | | | | | | | | | | | | | | | | | | | | | | | |
8. | | Sedimentation Test | | | | | | M | | RC1 | | RC2 | | RC3 | | Comp | | Total | | RN1 | | RN2 | | RN3 | | Comp | | Total | |
8.1 | | Tailings Thickener Sedimentation Tests | | | | | | 1 | | | | | | | | 1 | | 1 | | | | | | | | 1 | | 1 | |
| | | | | | | | | | | | | | | | | | | | | | | | | | | | | |
9. | | Ultimate Tailing Rheology | | | | | | M | | RC1 | | RC2 | | RC3 | | Comp | | Total | | RN1 | | RN2 | | RN3 | | Comp | | Total | |
9.1 | | Tailings Shear Stress; Density & Viscosity | | | | | | 1 | | | | | | | | 1 | | 1 | | | | | | | | 1 | | 1 | |
| | | | | | | | | | | | | | | | | | | | | | | | | | | | | |
10. | | Water Clarification and Treatment | | Sample Weight | | Size | | M | | RC1 | | RC2 | | RC3 | | Comp | | Total | | RN1 | | RN2 | | RN3 | | Comp | | Total | |
10.1 | | Tailing Effluent Ageing | | | | | | 1 | | | | | | | | 1 | | 1 | | | | | | | | 1 | | 1 | |
10.2 | | Water Treatment Test | | | | | | 1 | | | | | | | | 1 | | 1 | | | | | | | | 1 | | 1 | |
September 2011
13-37
Alderon Iron Ore Corp. | 
|
NI 43-101 Technical Report — PEA of the Kami Iron Ore Project |

Figure 13.11: Feasibility Process Development Test Block Diagram
September 2011
13-38
Alderon Iron Ore Corp. | 
|
NI 43-101 Technical Report — PEA of the Kami Iron Ore Project |
Figure 13.12: Feasibility Process Validation Test Block Diagram
September 2011
13-39
Alderon Iron Ore Corp. |
|
NI 43-101 Technical Report — PEA of the Kami Iron Ore Project |
14. MINERAL RESOURCE ESTIMATE
14.1 WGM Mineral Resource Estimate Statement
WGM prepared a Mineral Resource estimate for the Kami Iron Ore Project mineralized zones that have sufficient data to allow for continuity of geology and grades. WGM modeled the Rose Central and Mills Lake deposits but did not include Rose North Zone or other mineralized areas at the time. More field work and confirmation/infill drilling is required before a Mineral Resource estimate can be completed on these other areas. Indicated Mineral Resources are defined as blocks being within 100 m of a drillhole intercept for Mills Lake and within 150 m for Rose Central. Inferred Mineral Resources are interpolated out to a maximum of about 300 m for both deposit areas on the ends/edges and at depth when supporting information from adjacent cross sections was available.
The current drilling pattern is irregular/uneven and certain areas are sparsely drilled, with possibly only one or two holes intersecting the mineralization on a select limb or at depth on some cross sections. Many of the holes did not penetrate the entire thickness of the mineralized zone due to poor drillhole angles; hence the “boundaries” are not well defined in some areas (particularly the dips of the zone and the depth extension). In general, the mineralization shows fairly good continuity on a gross scale, however, the folded nature and complexity of the Rose Central area is not yet completely understood. Additional drilling and a more detailed geological interpretation will be required to unravel the inter-layering or in-folding of waste sedimentary units. A Mineral Resources estimate is provided in Table 14.1.
The classification of Mineral Resources used in this Report conforms to the definitions provided in the final version of NI 43-101, which came into effect on June 30th, 2011. WGM further confirms that, as a result of our classification, we have followed the guidelines adopted by the Council of the Canadian Institute of Mining Metallurgy and Petroleum (“CIM”) Standards. The relevant definitions for the CIM Standards/NI 43-101 are as follows:
September 2011
14-1
Alderon Iron Ore Corp. | 
|
NI 43-101 Technical Report — PEA of the Kami Iron Ore Project |
Table 14.1: Categorized Mineral Resource Estimate for Kami Iron Ore Project (Cutoff of 20% TFe)
Category | | Zone | | Tonnes
(Million) | | Density | | TFe% | | magFe% | | hmFe% | | Mn% | | SiO2% | |
Indicated | | Rose Central Zone - Hematite-rich | | 66.7 | | 3.60 | | 31.4 | | 6.9 | | 23.6 | | 2.88 | | 42.4 | |
| | Rose Central Zone - Magnetite-rich | | 309.4 | | 3.54 | | 29.5 | | 21.1 | | 5.0 | | 1.27 | | 45.4 | |
| | Total Indicated Rose Central Zone | | 376.1 | | 3.55 | | 29.8 | | 18.6 | | 8.3 | | 1.56 | | 44.9 | |
| | | | | | | | | | | | | | | | | |
| | Mills Lake Zone - Hematite-rich | | 12.2 | | 3.68 | | 34.2 | | 2.7 | | 30.7 | | 4.80 | | 35.3 | |
| | Mills Lake Zone - Magnetite-rich | | 93.8 | | 3.56 | | 30.1 | | 24.5 | | 2.8 | | 0.57 | | 47.0 | |
| | Mills Lake Zone - Upper Magnetite-rich | | 8.2 | | 3.55 | | 29.6 | | 23.0 | | 1.3 | | 0.56 | | 45.6 | |
| | Total Indicated Mills Lake Zone | | 114.1 | | 3.57 | | 30.5 | | 22.1 | | 5.7 | | 1.02 | | 45.6 | |
| | | | | | | | | | | | | | | | | |
Inferred | | Rose Central Zone - Hematite-rich | | 10.3 | | 3.60 | | 31.6 | | 7.5 | | 23.9 | | 3.15 | | 41.5 | |
| | Rose Central Zone - Magnetite-rich | | 35.7 | | 3.54 | | 29.3 | | 22.6 | | 3.4 | | 1.16 | | 45.9 | |
| | Total Inferred Rose Central Zone | | 46.0 | | 3.55 | | 29.8 | | 19.2 | | 8.0 | | 1.61 | | 44.9 | |
| | | | | | | | | | | | | | | | | |
| | Mills Lake Zone - Hematite-rich | | 8.3 | | 3.70 | | 34.7 | | 2.6 | | 31.1 | | 4.60 | | 35.5 | |
| | Mills Lake Zone - Magnetite-rich | | 60.4 | | 3.56 | | 30.2 | | 24.8 | | 2.8 | | 0.60 | | 46.7 | |
| | Mills Lake Zone - Upper Magnetite-rich | | 3.3 | | 3.55 | | 29.8 | | 23.7 | | 1.3 | | 0.55 | | 45.5 | |
| | Total Inferred Mills Lake Zone | | 71.9 | | 3.58 | | 30.7 | | 22.2 | | 6.0 | | 1.05 | | 45.4 | |
September 2011
14-2
Alderon Iron Ore Corp. | 
|
NI 43-101 Technical Report — PEA of the Kami Iron Ore Project |
A Mineral Resource is a concentration or occurrence of diamonds, natural, solid, inorganic or fossilized organic material including base and precious metals, coal, and industrial minerals in or on the Earth’s crust in such form and quantity and of such a grade or quality that it has reasonable prospects for economic extraction. The location, quantity, grade, geological characteristics and continuity of a Mineral Resource are known, estimated or interpreted from specific geological evidence and knowledge.
An Inferred Mineral Resource is that part of a Mineral Resource for which quantity and grade or quality can be estimated on the basis of geological evidence and limited sampling and reasonably assumed, but not verified, geological and grade continuity. The estimate is based on limited information and sampling gathered through appropriate techniques from locations such as outcrops, trenches, pits, workings and drillholes.
An Indicated Mineral Resource is that part of a Mineral Resource for which quantity, grade or quality, densities, shape and physical characteristics can be estimated with a level of confidence sufficient enough to allow the appropriate application of technical and economic parameters and to support mine planning and evaluation of the economic viability of the deposit. The estimate is based on detailed and reliable exploration and testing information gathered through appropriate techniques from locations such as outcrops, trenches, pits, workings and drillholes that are spaced closely enough for geological and grade continuity.
A Measured Mineral Resource is that part of a Mineral Resource for which quantity, grade or quality, densities, shape, physical characteristics are so well established that they can be estimated with confidence sufficient enough to allow the appropriate application of technical and economic parameters to support production planning and evaluation of the economic viability of the deposit. The estimate is based on detailed and reliable exploration, sampling and testing information gathered through appropriate techniques from locations such as outcrops, trenches, pits, workings and drillholes that are spaced closely enough to confirm both geological and grade continuity.
September 2011
14-3
Alderon Iron Ore Corp. |
|
NI 43-101 Technical Report — PEA of the Kami Iron Ore Project |
A Mineral Reserve is the economically mineable part of a Measured or Indicated Mineral Resource demonstrated by at least a Preliminary Feasibility Study. This Study must include adequate information on mining, processing, metallurgical, economic and other relevant factors that demonstrate, at the time of reporting, that economic extraction can be justified. A Mineral Reserve includes diluting materials and allowances for losses that may occur when the material is mined.
A Probable Mineral Reserve is the economically mineable part of an Indicated, and in some circumstances a Measured Mineral Resource demonstrated by at least a Preliminary Feasibility Study. This Study must include adequate information on mining, processing, metallurgical, economic, and other relevant factors that demonstrate, at the time of reporting, that economic extraction can be justified.
A Proven Mineral Reserve is the economically mineable part of a Measured Mineral Resource demonstrated by at least a Preliminary Feasibility Study. This Study must include adequate information on mining, processing, metallurgical, economic, and other relevant factors that demonstrate, at the time of reporting, that economic extraction is justified.
Mineral Resource classification is based on certainty and continuity of geology and grades. In most deposits, there are areas where the uncertainty is greater than in others. Most of the time, this is directly related to the drilling density. Areas more densely drilled are usually better known and understood than areas with sparser drilling.
14.2 General Mineral Resource Estimation Procedures
The block model Mineral Resource estimate procedure included:
· validation of digital data in Gemcom Software International Inc.’s (“GemcomTM”) geological software package — the data was transferred to WGM from Alderon in MS Access format and was validated both within Access and Gemcom (once the data was imported);
· generation of cross sections and plans to be used for geological interpretations;
· basic statistical analyses to assess cutoff grades, compositing and cutting (capping) factors, if required;
September 2011
14-4
Alderon Iron Ore Corp. |
|
NI 43-101 Technical Report — PEA of the Kami Iron Ore Project |
· development of 3-D wireframe models for zones with continuity of geology/mineralization, using available geochemical assays for each drillhole sample interval and;
· generation of block models for Mineral Resource estimates for each defined zone and categorizing the results according to NI 43-101 and CIM definitions.
14.3 Database
14.3.1 Drillhole Data
Data used to generate the Mineral Resource estimate originated from a dataset supplied by Alderon technical personnel to WGM. The Gemcom Project was established to hold all the requisite data to be used for any manipulations necessary and for completion of the geological modeling and Mineral Resource estimate.
The Gemcom drillhole database consisted of 107 diamond drillholes; including “duplicated” hole numbers designated with an “A” nomenclature, meaning the hole was re-drilled in whole or in part, due to lost core/bad recovery. A total of 68 drillholes totaling 24,079 m were used for the current Mineral Resource estimate; 48 holes at Rose Central and 20 holes at Mills Lake. These holes were dispersed along the iron mineralization - approximately 1,600 m of strike length and 700 m of width on Rose Central and 1,400 m by 800 m on Mills Lake. The remaining drillholes in the database were located outside the current area of the Mineral Resources; however, many were in close proximity to the main mineralized zone at Rose Central. A number of these holes will undoubtedly be used in future Mineral Resource estimates once additional drilling is completed, hence leading to a better understanding of the structure, geology and mineralization in these areas.
The drillhole database contained geological codes and short descriptions for each unit and sub-unit and assay data for Head and Davis Tube Concentrate analyses, where available. The raw sample intervals (565 for Mills Lake and 2,948 for Rose Central, including “internal waste”) within the mineralized zone ranged from 0.7 m to 8.2 m, averaging 3.1 m for Mills Lake and ranged 0.3 m to 7.6 m, averaging 3.1 m for Rose Central. Approximately 60% of the Head assayed intervals were between 2.8 m and 3.2 m in length for the routine analyses.
September 2011
14-5
Alderon Iron Ore Corp. |
|
NI 43-101 Technical Report — PEA of the Kami Iron Ore Project |
Additional information, including copies of the geological logs, summary reports and internal geological interpretations were supplied to WGM digitally or as hard copies.
14.3.2 Data Validation
Upon receipt of the data, WGM performed the following validation steps:
· checking for location and elevation discrepancies by comparing collar coordinates with the copies of the original drill logs received from the site;
· checking minimum and maximum values for each quality value field and confirming/modifying those outside of expected ranges;
· checking for inconsistency in lithological unit terminology and/or gaps in the lithological code;
· spot checking original assay certificates with information entered in the database and;
· checking gaps, overlaps and out of sequence intervals for both assays and lithology tables.
The database tables as originally supplied contained some errors which were corrected and confirmed by the Client before proceeding with the Mineral Resource estimate. In general, WGM found the database to be in good order, however, was still a work in progress. After the errors that WGM identified were corrected, there were no additional database issues that would have a material impact on the Mineral Resource estimate, so WGM proceeded to use the most updated database supplied by Alderon. However, further checking and additional information (that was still being acquired at the time of WGM’s Report) will likely result in an improved database for future Mineral Resource estimates. In addition, future metallurgical and assay testwork will determine the percentage of recoverable iron comprising the Mineral Resources.
14.3.3 Database Management
The drillhole data were stored in a Gemcom multi-tabled workspace specifically designed to manage collar and interval data. The line work for the geological interpretations and the resulting 3-D wireframes were also stored within the Gemcom Project. The Project database stored cross section and level plan definitions and the block models, such that all data pertaining to the Project are contained within the same Project database.
September 2011
14-6
Alderon Iron Ore Corp. |
|
NI 43-101 Technical Report — PEA of the Kami Iron Ore Project |
14.4 Geological Modeling Procedures
14.4.1 Cross Section Definition
Seven vertical cross sections were defined for Mills Lake deposit and eight for Rose Central for the purpose of Mineral Resource estimation. The holes were drilled on section lines which were spaced 200 m apart for both deposits in the main area of mineralization. The cross sections were oriented perpendicular to the general strike of the deposits. Drillholes on cross sections were variably spaced and with variable dips (and directions) leading to a separation of the mineralized intersections from less than 50 m to more than 250 m apart on adjacent holes. This is due to crisscrossing of holes (on Rose Central) and drilling many holes in a scissor or fan pattern from the same set-up. Most cross sections contained at least three holes and some had as many as 10 holes passing through the mineralized zone due to the variable drilling pattern. However, in both deposits, the closest spaced drilling was near the surface (in the first 150 to 200 m). The deeper mineralization, i.e., below 200 m vertical depth, has been tested by fewer holes and both zones are open at depth. See Figure 7.3 for the locations of the drillholes in the Mineral Resource area and the cross section orientations.
14.4.2 Geological Interpretation and 3-D Wireframe Creation
WGM used Alderon’s internal preliminary geological interpretations from the cross sections as a guide to define the boundaries of the mineralized zones for the Mineral Resource estimate. WGM’s zone interpretations of the mineralization were digitized into Gemcom and each polyline was assigned an appropriate rock type and stored with its section definition. The digitized lines were “snapped” to drillhole intervals to anchor the line which allows for the creation of a true 3-D wireframe that honors the 3-D position of the drillhole interval. Any discrepancies or interpretation differences between Alderon’s original interpretation and WGM’s final interpretations were discussed with Alderon technical personnel and agreed upon before finalizing the interpretation to be used for the Mineral Resource estimate. Mineralized boundaries were digitized from drillhole to drillhole that showed continuity of strike, dip and grade, generally from 100 m to 200 m in extent, and up to a maximum of about 300 m on the ends of the zones and at depth where there was no or little drillhole information, but only if the interpretation was supported by drillhole information on adjacent cross sections.
September 2011
14-7
Alderon Iron Ore Corp. |
|
NI 43-101 Technical Report — PEA of the Kami Iron Ore Project |
WGM modeled the Mills Lake and Rose Central Fe mineralization only, which is Lake Superior-type iron formation consisting of banded sedimentary rocks composed principally of bands of iron oxides, magnetite and hematite within quartz (chert)-rich rock. Other iron mineralization intersected in drillholes outside of these two areas is currently not included in the Mineral Resource estimate; however, many of these holes will be incorporated once additional drilling is completed.
In each deposit, WGM modeled out the larger and more continuous hematite-rich zones/units/beds within the main magnetite body that appeared to have fairly good correlation between holes and through multiple cross sections. In the Mills Lake deposit, the hematite-rich unit was located near the middle of the deposit, whereas in Rose Central, two hematite-rich units were separately modeled; one along or near the basal contact of the main magnetite zone and one closer to the middle of the deposit, which was not as consistent. There appears to be more intermixed hematite and magnetite in this deposit as well. This hematite modeling was not perfect due to the lack of drilling information in some areas and the complex nature of the folding in some areas, however, WGM was of the opinion that it was better to try to model these units out than just combine them with the more abundant magnetite-rich mineralization, as it may become important for determining processing options and costs of the iron-bearing material in future economic studies. The “internal” hematite units that were created as 3-D wireframes were used to “overprint” the geological codes in the block model after the block model was updated with the wireframes for the main magnetite units.
The extensions of the mineralization on the ends and at depth took into account the fact that the drilling pattern was irregular and that a proper grid was not complete; hence several drillholes did not penetrate the entire stratigraphy/zone. The continuity of the mineralization as a whole was quite good, so WGM had no issues with extending the interpretation beyond a 250 m distance in some cases. However, as stated above, supporting data from adjacent sections was required. The 3-D model for Rose Central was continued at depth as long as there was drillhole information, however, this extension was taken into consideration when classifying the Mineral Resources and these areas were given a lower confidence category. Even though the wireframe continued to a maximum depth of -135 m (approximately 750 m vertically below surface and extending 100 m past the deepest drilling), at this time, no Mineral Resources were defined or considered below a 150 m elevation.
September 2011
14-8
Alderon Iron Ore Corp. |
|
NI 43-101 Technical Report — PEA of the Kami Iron Ore Project |
Figure 14.1 to Figure 14.3 show the 3-D geological models to illustrate the above relationships in Mills Lake and Rose Central. Figure 14.4 to Figure 14.7 show typical cross sections through the Mills Lake and Rose Central deposits and illustrate the zone/unit boundaries, TFe% block model and Mineral Resource categorization (see following Section 14.6 for the categorization explanation).
September 2011
14-9
Alderon Iron Ore Corp. | 
|
NI 43-101 Technical Report — PEA of the Kami Iron Ore Project |
Figure 14.1: Mills Lake 3-D Geological Model
September 2011
14-10
Alderon Iron Ore Corp. | 
|
NI 43-101 Technical Report — PEA of the Kami Iron Ore Project |
Figure 14.2: Rose Central 3-D Geological Model — View 1
September 2011
14-11
Alderon Iron Ore Corp. | 
|
NI 43-101 Technical Report — PEA of the Kami Iron Ore Project |
Figure 14.3: Rose Central 3-D Geological Model — View 2
September 2011
14-12
Alderon Iron Ore Corp. | 
|
NI 43-101 Technical Report — PEA of the Kami Iron Ore Project |
Figure 14.4: Rose Central Cross Section 20+00E Showing %TFe Block Grade Model
September 2011
14-13
Alderon Iron Ore Corp. |
|
NI 43-101 Technical Report — PEA of the Kami Iron Ore Project |
Figure 14.5: Rose Central Cross Section 20+00E Showing Mineral Resource Categorization
September 2011
14-14
Alderon Iron Ore Corp. | 
|
NI 43-101 Technical Report — PEA of the Kami Iron Ore Project |
Figure 14.6: Mills Lake Cross Section 36+00S Showing %TFe Block Grade Model
September 2011
14-15
Alderon Iron Ore Corp.
NI 43-101 Technical Report — PEA of the Kami Iron Ore Project | 
|
Figure 14.7: Mills Lake Cross Section 36+00S Showing Mineral Resource Categorization
September 2011
14-16
Alderon Iron Ore Corp.
NI 43-101 Technical Report — PEA of the Kami Iron Ore Project | 
|
14.4.3 Topographic Surface Creation
A wireframed surface or Triangulated Irregular Network (“TIN”) was supplied by Alderon for the topography surface and overburden contacts. The topography wireframe was derived from a gridded digital elevation model created by Mira Geoscience from the 2008 ground gravity survey. Mira downloaded SRTM World Elevation 90 m data and fitted the SRTM data to accurate ground gravity station DGPS elevations in GoCad. The topography wireframe was offset to drillhole overburden/bedrock contacts using Leapfrog3D to create the overburden wireframe and to ensure the overburden did not cross the topography surface where no drillhole information existed.
WGM checked the overburden surface created by Alderon against the drillhole information and found it to be properly created. These surfaces, as supplied to WGM, were used to limit the upper boundary of the geological block model, i.e., the Mineral Resources were defined up to the surface representing the bottom of the overburden. WGM ensured that the Mineral Resource estimate stayed below this overburden surface.
14.5 Statistical Analysis, Compositing, Capping and Specific Gravity
14.5.1 Back-Coding of Rock Code Field
The 3-D wireframes / solids that represented the interpreted mineralized zones were used to back-code a rock code field into the drillhole workspace and these were checked against the logs and the final geological interpretation. Each interval in the original assay table and the WGM generated composite table was assigned a rock code value based on the rock type wireframe that the interval midpoint fell within.
14.5.2 Statistical Analysis and Compositing
In order to carry out the Mineral Resource grade interpolation, a set of equal length composites of 3 m was generated from the raw drillhole intervals, as the original assay intervals were different lengths and required normalization to a consistent length. A 3 m composite length was chosen to ensure that more than one composite would be used for grade interpolation for each
September 2011
14-17
Alderon Iron Ore Corp.
NI 43-101 Technical Report — PEA of the Kami Iron Ore Project |
|
block in the model and 3 m is also close to the average length of the raw assay intervals. Regular down-the-drillhole compositing was used.
Table 14.2 summarizes the statistics of the 3 m composites inside the defined geological wireframe for %TFe_H, %magFe_H and %hmFe_H and Figure 14.8 and Figure 14.9 show example histograms for the %TFe_H for Mills Lake and Rose Central magnetite-rich samples.
Table 14.2: Basic Statistics of 3 m Composites
Element | | Number | | Minimum | | Maximum | | Average | | C.O.V. | |
Mills Lake - %TFe_H (Magnetite(1)) | | 541 | | 6.5 | | 39.3 | | 30.0 | | 0.11 | |
Mills Lake - %TFe_H (Hematite) | | 86 | | 9.6 | | 41.9 | | 33.9 | | 0.11 | |
Mills Lake - %magFe_H (Magnetite(1)) | | 541 | | 0.9 | | 38.7 | | 24.3 | | 0.25 | |
Mills Lake - %magFe_H (Hematite) | | 86 | | 0.1 | | 21.6 | | 3.2 | | 1.54 | |
Mills Lake - %hmFe_H (Magnetite(1)) | | 541 | | 0.0 | | 30.1 | | 3.2 | | 1.46 | |
Mills Lake - %hmFe_H (Hematite) | | 86 | | 7.8 | | 37.9 | | 29.9 | | 0.20 | |
| | | | | | | | | | | |
Rose Central - %TFe_H (Magnetite) | | 2,424 | | 4.7 | | 50.4 | | 28.9 | | 0.21 | |
Rose Central - %TFe_H (Hematite) | | 659 | | 7.4 | | 50.4 | | 31.2 | | 0.16 | |
Rose Central - %magFe_H (Magnetite) | | 2,424 | | 0.1 | | 49.2 | | 20.4 | | 0.42 | |
Rose Central - %magFe_H (Hematite) | | 659 | | 0.1 | | 33.6 | | 6.7 | | 1.22 | |
Rose Central - %hmFe_H (Magnetite(2)) | | 2,168 | | 0 | | 32.5 | | 4.67 | | 1.41 | |
Rose Central - %hmFe_H (Hematite) | | 659 | | 0.0 | | 41.0 | | 23.6 | | 0.39 | |
Notes: 1) Main Magnetite Zone only; 2) Excludes samples with no FeO assays in Lean IF and Internal Waste Units
September 2011
14-18
Alderon Iron Ore Corp.
NI 43-101 Technical Report — PEA of the Kami Iron Ore Project |
|
Figure 14.8: Normal Histogram, %TFe_H — Mills Lake 3 m Magnetite Composites
Figure 14.9: Normal Histogram, %TFe_H — Rose Central 3 m Magnetite Composites
September 2011
14-19
Alderon Iron Ore Corp.
NI 43-101 Technical Report — PEA of the Kami Iron Ore Project | 
|
14.5.3 Grade Capping
The statistical distribution of the %TFe samples showed good normal distributions considering the number of samples available. Grade capping, also sometimes referred to as top cutting, is commonly used in the Mineral Resource estimation process to limit the effect (risk) associated with extremely high assay values, however, considering the nature of the mineralization and the continuity of the zones, WGM determined that capping was not required for either the Mills Lake or Rose Central deposits.
14.5.4 Density / Specific Gravity
Specific gravity is previously discussed in detail in the mineralization section of this Report. For the Mineral Resource estimate, WGM created a variable density model and as typically, the SG varies with the iron grade. SG vs. %TFe for the Kami samples was plotted using the helium gas comparison pycnometer method on sample pulps. Most of the iron formation consists of a mix of magnetite and hematite, however, there are sections which contain very little hematite and are mostly magnetite and vice versa.
Alderon modeled the SG slightly differently than WGM but came up with a very similar relationship to WGM’s. The plot shows that SG by pycnometer results correlate strongly with %TFe on samples. It also illustrates that DGI probe determined density averaged over the same sample intervals, similarly correlate strongly with %TFe.
Since we are of the opinion that there is insignificant difference between the WGM method and the Alderon method, the following WGM formula was used to obtain the density of each block in the model: %TFe x 0.0294 + 2.677. This formula also reflects WGM’s experience with other iron ore deposits that we have modeled and we have found that SG shows excellent correlation with %TFe, as is typical with these types of deposits. Using WGM’s variable density model, a 30% TFe gives a SG of approximately 3.56.
14.6 Block Model Parameters, Grade Interpolation and Categorization of Mineral Resources
September 2011
14-20
Alderon Iron Ore Corp.
NI 43-101 Technical Report — PEA of the Kami Iron Ore Project |
|
14.6.1 General
The Kami Project Mineral Resource estimates were completed using a block modeling method and for the purpose of this study, the grades have been interpolated using an Inverse Distance (“ID”) estimation technique. ID belongs to a distance-weighted interpolation class of methods, similar to Kriging, where the grade of a block is interpolated from several composites within a defined distance range of that block. ID uses the inverse of the distance (to the selected power) between a composite and the block as the weighting factor.
For comparison and cross-checking purposes, the ID2 and ID10 methods, which closely resemble a Nearest Neighbour (“NN”) technique, were used. In the NN method, the grade of a block is estimated by assigning only the grade of the nearest composite to the block. All interpolation methods gave similar results, as the grades were well constrained within the wireframes and the results of the interpolation approximated the average grade of the all the composites used for the estimate. WGM’s experience with similar types of deposits showed that geostatistical methods like Kriging gave very similar results when compared to ID interpolation, therefore, we are of the opinion that ID interpolation is appropriate.
14.6.2 Block Model Setup / Parameters
The block model was created using the Gemcom software package in order to create a grid of regular blocks to estimate tonnes and grades. Two block models were set up for the Kami Project Mineral Resource estimates; one for Mills Lake and one for Rose Central, as they were oriented in different directions along the main strike direction of each deposit. The deposit specific parameters used for the block modeling are summarized below.
· For both Mills Lake and Rose Central, the following block sizes used were:
· Width of columns = 5 m
· Width of rows = 20 m
· Height of blocks = 5 m
The specific parameters for the block models are as follows:
September 2011
14-21
Alderon Iron Ore Corp.
NI 43-101 Technical Report — PEA of the Kami Iron Ore Project |
|
Mills Lake: | | | |
| | | |
Easting coordinate of model bottom left hand corner: | | 634270.00 | |
| | | |
Northing coordinate of model bottom left hand corner: | | 5850120.00 | |
| | | |
Datum elevation of top of model: | | 650.00 m | |
| | | |
Model rotation (anti-clockwise around Origin): | | 30.00 | |
| | | |
Number of columns in model: | | 360 | |
| | | |
Number of rows in model: | | 100 | |
| | | |
Number of levels: | | 100 | |
| | | |
Rose Central: | | | |
| | | |
Easting coordinate of model bottom left hand corner: | | 631700.00 | |
| | | |
Northing coordinate of model bottom left hand corner: | | 5854930.00 | |
| | | |
Datum elevation of top of model: | | 730.00 m | |
| | | |
Model rotation (anti-clockwise around Origin): | | -45.00 | |
| | | |
Number of columns in model: | | 280 | |
| | | |
Number of rows in model: | | 100 | |
| | | |
Number of levels: | | 186 | |
14.6.3 Grade Interpolation
The details of the geology and geometry of the Rose Central mineralized body is quite complex and more drilling is required to get a better understanding of the depth potential, dip and internal detail of the hematite-rich and waste units. However, the gross overall mineralization controls appear to be fairly well understood with the current amount of drilling completed to date. Both deposits have undergone various degrees of folding, but at this stage of exploration, the search ellipse size and orientations for the grade interpolation were kept simple and based on the current geological knowledge. For future Mineral Resource estimates and after more drilling information is available, WGM envisions that due to folding causing orientation/strike complexity and change, different domains will most likely be defined to better control grade distribution along the limbs and to reflect changes in dip/attitude. Alternately, a technique known as unfolding may be applied during the statistical analysis and the grade interpolation; however, this may not be necessary. The following lists the general grade interpolation parameters (Note that the dip orientation of the search ellipse changed for each deposit):
September 2011
14-22
Alderon Iron Ore Corp.
NI 43-101 Technical Report — PEA of the Kami Iron Ore Project |
|
ID Search Ellipsoid:
450 m in the Strike Direction
350 m in the Across Strike Direction
50 m in the Vertical (Dip) Direction
Minimum / Maximum number of composites used to estimate a block: 2 / 10
Maximum number of composites coming from a single hole: 3
Ellipsoidal search strategy was used with rotation about Z,Y,Z:
Mills Lake: 0°, 30°, 0°
Rose Central: 0°, 75°, 0°
The large search ellipse was used in order to inform all the blocks in the block model with grade, however, the classification of the Mineral Resources (see below) was based on drillhole density (or drilling pattern), geological knowledge / interpretation of the geology and WGM’s experience with similar deposits. The %TFe_H grade (interpolated from 3 m composites) was used for the Mineral Resource estimate, however, %SiO2, %Mn, %magFe and %hmFe (calculated) were also interpolated into the grade block model.
The mineralization of economic interest on the Kami Property is oxide facies iron formation, consisting mainly of semi-massive bands, or layers, and disseminations of magnetite and/or specular hematite (specularite) in recrystallized chert and interlayered with bands (beds) of chert with minor carbonate and iron silicates. The oxide iron formation is mostly magnetite-rich, but some submembers contain increased amounts of hematite, either inter-mixed with magnetite or as more discrete bands / beds / layers. WGM is of the opinion that different ratios of hematite to magnetite occur in the different deposits (or parts of the deposits), but this distribution is not yet completely mapped out and understood and should be studied in detail during future work. Davis Tube testwork was also completed on some samples, giving WGM some comparative numbers on our calculated iron in hematite values. Section 7 in this Report gives a full description of the methods that WGM used to calculate %hmFe from %TFe, FeO, Satmagan and Davis Tube results. The final WGM calculated %hmFe values were used in the grade interpolation in the block model.
September 2011
14-23
Alderon Iron Ore Corp.
NI 43-101 Technical Report — PEA of the Kami Iron Ore Project |
|
Gemcom does not use the sub-blocking method for determining the proportion and spatial location of a block that falls partially within a wireframed object. Instead, the system makes use of a percent or partial block model (if it is important to track the different rock type’s proportions in the block — usually if there is more than one important type) or uses a “needling technology” that is similar in concept, but offers greater flexibility and granularity for accurate volumetric calculations. In this case, the block model was to be exported to another software system for pit optimization purposes subsequent to the Mineral Resource estimation and the third party engineering company requested that a percent model (or needling) not be applied. WGM decided to use smaller blocks (20m x 5m x5m) than would be typical for this drillhole spacing and envisioned mining method (large open pit). The blocks were made smaller in all dimensions so the accuracy would not be lost during the Mineral Resource tabulation and so that the narrower hematite-rich zones would not lose resolution. If larger blocks were used, the narrower portions of the hematite-rich zones may not have been properly defined.
14.6.4 Mineral Resource Categorization
Mineral Resource classification is based on certainty and continuity of geology and grades, and this is almost always directly related to the drilling density. Areas more densely drilled are usually better known and understood than areas with sparser drilling, which would be considered to have greater uncertainty and hence, lower confidence.
WGM has abundant experience with similar types of mineralization to the Kami Project; therefore, we used this knowledge to assist us with our categorization of the Mineral Resources. Since the entire drilling grid was not completed to a regular spacing and drillhole pattern, and some holes were not drilled at optimum angles (and in some cases did not penetrate the entire stratigraphy/zone), the mineralization was further extended on the fringes/edges and at depth, particularly in the Rose Central deposit. The continuity of the mineralization in general was quite good, however, internally; the continuity of the hematite-rich beds and some waste units is poorly understood due to lack of drilling and folding/geometric complexity. WGM was of the opinion that extending the geological interpretation beyond the more densely drilled parts of the deposit (again, particularly at Rose Central), was appropriate, as long as there was supporting data from adjacent sections. This extension was taken into consideration when classifying the Mineral Resources, and these areas were given a lower confidence category. In general, this
September 2011
14-24
Alderon Iron Ore Corp.
NI 43-101 Technical Report — PEA of the Kami Iron Ore Project |
|
represented the deeper mineralization. Variograms were also generated along strike and across the deposit in support of these distances. WGM has not classified any of the Mills Lake or Rose Central mineralization as Measured at this stage of exploration.
Because the search ellipses were large enough to ensure that all the blocks in the 3-D model were interpolated with grade, WGM generated a distance model (distance from actual data point in the drillhole to the block centroid) and reported the estimated Mineral Resources by distances which represented the category or classification. WGM chose to use the blocks within the wireframes that had a distance of 100 m or less to be Indicated category and +100 m to be Inferred category for Mills Lake; and 150 m or less for Indicated and +150 m for Inferred for Rose Central. Inferred Mineral Resources are interpolated out to a maximum of about 300 m for both deposit areas on the ends/edges and at depth when supporting information from adjacent cross sections was available. The average distance for the total Indicated Mineral Resources at Mills Lake was approximately 63 m and 144 m for the Inferred; for Rose Central the corresponding distances were 76 m and 192 m. The majority of the deeper mineralization is categorized as Inferred due to the sparse drillhole information below about 250 m from surface, and the maximum depth that the mineralization was taken to is 150 m elevation (approximately 450 m vertically from surface).
Figure 14.10 shows the zone outlines and interpolated %TFe blocks on Level Plan 450 m for Rose Central deposits. An example of WGM’s categorization of the Mineral Resources was shown previously on type cross sections for each zone.
For the Mineral Resource estimate, a cutoff of 20% TFeHead was determined to be appropriate at this stage of the project (Table 14.3). This cutoff was chosen based on a preliminary review of the parameters that would likely determine the economic viability of a large open-pit operation and compares well to similar projects and to projects that are currently at a more advanced stage of study.
Table 14.3 shows the Mineral Resource estimate at various cutoffs for comparison purposes.
Mineral resources that are not mineral reserves do not have demonstrated economic viability.
September 2011
14-25
Alderon Iron Ore Corp.
NI 43-101 Technical Report — PEA of the Kami Iron Ore Project | 
|
Figure 14.10: Rose Central Level Plan 450 m - %TFe Block Grade Model
September 2011
14-26
Alderon Iron Ore Corp.
NI 43-101 Technical Report — PEA of the Kami Iron Ore Project | 
|
Table 14.3: Categorized Mineral Resources by %TFe_H Cutoff Kami Iron Ore Project
Cutoff% | | Tonnes
(million) | | TFe% | | magFe% | | hmFe% | | Mn% | | SiO2% | |
Rose Central Indicated Resources | | | | | | | | | | | | | |
25.0 | | 355.4 | | 30.2 | | 18.7 | | 8.5 | | 1.58 | | 44.5 | |
22.5 | | 372.2 | | 29.9 | | 18.6 | | 8.3 | | 1.56 | | 44.8 | |
20.0 | | 376.1 | | 29.8 | | 18.6 | | 8.3 | | 1.56 | | 44.9 | |
18.0 | | 377.2 | | 29.8 | | 18.5 | | 8.3 | | 1.56 | | 44.9 | |
15.0% | | 378.0 | | 29.7 | | 18.5 | | 8.2 | | 1.56 | | 45.0 | |
| | | | | | | | | | | | | |
Rose Central Inferred Resources | | | | | | | | | | | | | |
25.0 | | 44.9 | | 30.0 | | 19.2 | | 8.1 | | 1.62 | | 44.8 | |
22.5 | | 45.8 | | 29.9 | | 19.2 | | 8.0 | | 1.61 | | 44.9 | |
20.0 | | 46.0 | | 29.8 | | 19.2 | | 8.0 | | 1.61 | | 44.9 | |
18.0 | | 46.0 | | 29.8 | | 19.2 | | 8.0 | | 1.61 | | 44.9 | |
15.0% | | 46.0 | | 29.8 | | 19.2 | | 8.0 | | 1.61 | | 44.9 | |
| | | | | | | | | | | | | |
Mills Lake Indicated Resources | | | | | | | | | | | | | |
25.0 | | 111.6 | | 30.7 | | 22.2 | | 5.8 | | 1.03 | | 45.6 | |
22.5 | | 113.7 | | 30.6 | | 22.1 | | 5.7 | | 1.02 | | 45.6 | |
20.0 | | 114.1 | | 30.5 | | 22.1 | | 5.7 | | 1.02 | | 45.6 | |
18.0 | | 114.2 | | 30.5 | | 22.1 | | 5.7 | | 1.02 | | 45.6 | |
15.0% | | 114.2 | | 30.5 | | 22.1 | | 5.7 | | 1.02 | | 45.6 | |
Mills Lake Inferred Resources | | | | | | | | | | | | | |
25.0 | | 70.8 | | 30.8 | | 22.2 | | 6.1 | | 1.06 | | 45.4 | |
22.5 | | 71.5 | | 30.8 | | 22.2 | | 6.0 | | 1.06 | | 45.4 | |
20.0 | | 71.9 | | 30.7 | | 22.2 | | 6.0 | | 1.05 | | 45.4 | |
18.0 | | 72.0 | | 30.7 | | 22.2 | | 6.0 | | 1.05 | | 45.4 | |
15.0% | | 72.0 | | 30.7 | | 22.2 | | 6.0 | | 1.05 | | 45.4 | |
September 2011
14-27
Alderon Iron Ore Corp.
NI 43-101 Technical Report — PEA of the Kami Iron Ore Project |
|
15. MINERAL RESERVE ESTIMATE
The definitions of “Mineral Resource” and “Mineral Reserve” have been outlined in Section 14.1 of this Report and conform to the definitions adopted by the Canadian Institute of Mining, Metallurgy and Petroleum as the CIM Definition Standards on Mineral Resources and Mineral Reserves.
For studies at the Pre-Feasibility and Feasibility levels, the CIM guidelines require that only material categorized as Measured or Indicated be classified as a reserve. Considering that this present Study is at a Preliminary Economic Assessment level, these guidelines require that all material classified as Measured, Indicated, or Inferred be reported as a Mineral Resource.
In-pit resources are reported in Section 16 of this report.
September 2011
15-1
Alderon Iron Ore Corp.
NI 43-101 Technical Report — PEA of the Kami Iron Ore Project |
|
16. MINING METHOD
16.1 Resource Block Model
The original block models for the Preliminary Economic Assessment for the Kami Iron Ore Project were prepared and provided to BBA by Watts, Griffis and McOuat Ltd (WGM), in the form of text files (.txt), on March 30th, 2010. Two separate models were provided; one for the Rose Central deposit and one for the Mills deposit. The variables contained in the original models are listed in Table 16.1.
Table 16.1: Block Model Items
Model Item Description
Model Item | | Rose Central Model | | Mills Model |
| | | | |
X | | Easting Coordinate | | Easting Coordinate |
| | | | |
Y | | Northing Coordinate | | Northing Coordinate |
| | | | |
Z | | Elevation Coordinate | | Elevation Coordinate |
| | | | |
Density | | Ore: 2.68-3.91 t/m3 Waste: 3.50 t/m3 (Default WGM) Waste : 3.00 t/m3 (Default BBA) OB : 2.00 t/m3 (Default BBA) | | Ore: 3.18-3.79 t/m3 Waste: 3.50 t/m3 (Default WGM) Waste : 3.00 t/m3 (Default BBA) OB : 2.00 t/m3 (Default BBA) |
| | | | |
Rock Code | | Rock Classification Code
(Air, Overburden, Waste, Magnetite, Hematite, Etc.) |
| | |
Distance | | Distance of centroid of block to
closest data (drillhole) point used for classification |
| | |
TFe% | | Total Iron (Fe) Percent |
| | |
SiO2% | | Silica Percent |
| | |
Mn% | | Manganese Percent |
| | |
MagFe% | | Magnetite in Iron (Fe) Percent |
| | |
HemFe% | | Hematite in Iron (Fe) Percent |
September 2011
16-1
Alderon Iron Ore Corp.
NI 43-101 Technical Report — PEA of the Kami Iron Ore Project |
|
The two models received on March 30th, 2011 for Rose Central and Mills did not include a variable for the rock classification (i.e. Measured, Indicated, Inferred). On April 14, 2011, WGM provided two additional text files (.txt), including the rock classifications. BBA took the new information and merged it into the two original block models.
The block models were imported into the MineSight software, into two respective project control files (PCF) (i.e. one for Rose Central and one for Mills), as provided, with no modification to the information provided. The model was checked to ensure the validity and the integrity of the transfer from WGM files into the MineSight program.
Following the confirmation of the validity of the block models, BBA created and coded additional model items as follows:
· Topography Percent (percent of block below topographical surface);
· Overburden Percent (percent of block between topographical and bedrock surface);
· Weighted Recovery (concentrate weight yield);
16.1.1 Model Coordinate System
Both block models prepared and provided by WGM have the same model coordinate system. The block sizes are 5 m (x-coordinate) x 20 m (y-coordinate) x 5 m (z-coordinate). A three dimensional (3-D) representation of the block model at a cut-off grade of 15% total iron percent TFe is shown in Figure 16.1. The example shown is an extraction from the Rose Central Model.
September 2011
16-2
Alderon Iron Ore Corp.
NI 43-101 Technical Report — PEA of the Kami Iron Ore Project |
|
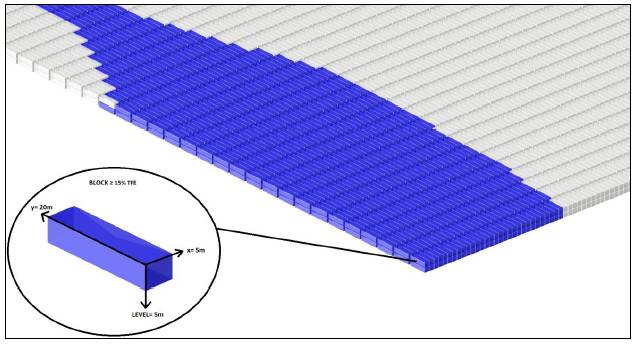
Figure 16.1: Block Model Coordinate System
16.1.2 Model Densities
The block models included the density for ore and waste material. The density for ore ranges from 2.68 - 3.91 t/m3 for Rose Central and from 3.18 - 3.79 t/m3 for Mills. The waste density is constant in both models. BBA has defaulted the waste density as 3.00 t/m3. For the overburden density, BBA assigned a default value of 2.00 t/m3.
16.2 Pit Optimization
Pit optimization was carried out for the Kami Project using the true pit optimizer algorithm Lerchs-Grossman 3-D (“LG 3-D”) in MineSight. The LG 3-D algorithm is based on the graph theory and calculates the net value of each block in the model, i.e. profit minus loss. With all mining costs, processing costs, processing recoveries, weighted recovery values and overall pit slope, the pit optimizer searches for the pit shell with the highest undiscounted cash flow. For this Study, all blocks with rock classifications of Measured, Indicated and Inferred will be included in the economic calculations and in the pit optimization process.
September 2011
16-3
Alderon Iron Ore Corp.
NI 43-101 Technical Report — PEA of the Kami Iron Ore Project |
|
16.2.1 Pit Optimization Parameters
Table 16.2 summarizes the pit optimization parameters used for the Preliminary Economic Assessment. The costs indicated were based on historical data and benchmarking of similar active mining operations in the region, as well as on BBA experience. Concentrate prices were set conservatively for the pit optimization.
The overall pit slope is 48o and falls within the conservative range of the overall pit slopes of active mines in the region. This slope is on average a few degrees shallower than geotechnical recommendations provided by Stantec, in order to allow for operational factors to be incorporated in the engineered pit design, i.e. safety berms, haulage ramps.
Table 16.2: Pit Optimization Parameters
Parameter | | Value | |
Operating Costs | |
Mining Cost (Ore, Waste) | | 2.10 | | $/t mined | |
| | | | | |
Mining Cost (OB) | | 1.05 | | $/t mined | |
| | | | | |
Processing Cost | | 1.95 | | $/t milled | |
| | | | | |
General and Administration (G&A) | | 1.13 | | $/t milled | |
| | | | | |
Sales Revenue | |
Product Price | | 85 | | $CA/ t FeCon | |
| | | | | |
Exchange Rate | | 1.10 | | CAD/USD | |
| |
Indirect Costs | |
Quality Penalties | | 15 | | $/ t FeCon | |
| | | | | |
Port | | 3 | | $/ t FeCon | |
| | | | | |
Rail | | 10 | | $/ t FeCon | |
| | | | | |
Weighted Recovery | | 37 | | % | |
| |
Pit Parameters | |
Pit Slope | | 48 | | Degrees | |
It is important to note that in addition to the aforementioned economic, processing and slope parameters given, there are various limits or constraints that were imposed in order to run the
September 2011
16-4
Alderon Iron Ore Corp.
NI 43-101 Technical Report — PEA of the Kami Iron Ore Project |
|
pit optimizer. The surface and subsurface assumed limits were agreed upon by BBA, Alderon, WGM and Stantec. These limits include:
For Rose Central:
· Surface Limit: 80 m offset from Pike Lake
· Sub-surface Limit: Only blocks above 150 m elevation were considered. This is due to the fact that the deep Magnetite and Hematite zones, which WGM coded in the model, are not included in the resource estimate. These deep units were created by a block created below a 150 m elevation.
For Mills:
· Surface Limit: 80 m offset from Mills Lake
Geotechnical, hydrogeological and hydrological work planned for the Feasibility Study will better define these assumed constraints.
16.2.2 Cut-Off Grade Calculation
The break-even cut-off grade (COG) is used to classify the material within the pit limits as ore or waste. The milling cut-off grade used for the Kami Project was taken at 15% TFe. This cut-off grade is slightly higher than the break-even cut-off grade. This is done in order to maximize the NPV for this Project.
16.2.3 Pit Optimization Results
Using the technical and economic parameters described previously, the LG 3-D algorithm was run and produced optimum pit shells for both the Rose Central deposit, and for the Mills deposit. In Figure 16.2 and Figure 16.3, the two dimensional (2-D) views of the respective pit optimizations can be seen.
September 2011
16-5
Alderon Iron Ore Corp.
NI 43-101 Technical Report — PEA of the Kami Iron Ore Project |
|

Figure 16.2: Rose Central Pit Optimization Plan View
Figure 16.3: Mills Pit Optimization Plan View
September 2011
16-6
Alderon Iron Ore Corp.
NI 43-101 Technical Report — PEA of the Kami Iron Ore Project | 
|
The results of the pit optimizations for Rose Central and Mills for this Study are shown in Table 16.3 and Table 16.4.
Table 16.3: Rose Central Pit Optimization Results
Rose Central - LG Pit Optimization
Total Resource Estimate - (COG 15% TFe%)
| | | | Grades | |
Category | | Ore (kt) | | % TFe | | %SiO2 | | %Mn | | %MagFe | | %HemFe | | Fe Con. (kt) | |
| | | | | | | | | | | | | | | |
Indicated | | 331 502 | | 29.85 | | 44.77 | | 1.61 | | 18.29 | | 8.73 | | 122 656 | |
Inferred | | 33 505 | | 30.01 | | 44.69 | | 1.68 | | 18.65 | | 8.65 | | 12 397 | |
| | | | | | | | | | | | | | | |
Total | | 365 006 | | 29.90 | | 44.74 | | 1.63 | | 18.41 | | 8.71 | | 135 052 | |
Wt. Rec (%) | | 37 | % | | | | | | | | | | | | |
| | Waste (kt) | | | | | | | | | | | | | |
| | | | | | | | | | | | | | | |
Rock | | 740 862 | | | | | | | | | | | | | |
OB | | 48 477 | | | | | | | | | | | | | |
| | | | Total S/R | | | | | | | | | | | |
Stripping | | 789 339 | | 2.16 | | | | | | | | | | | |
Table 16.4: Mills Pit Optimization Results
Mills - LG Pit Optimization
Total Resource Estimate - (COG 15% TFe%)
| | | | Grades | |
Category | | Ore (kt) | | % TFe | | %SiO2 | | %Mn | | %MagFe | | %HemFe | | Fe Con. (kt) | |
| | | | | | | | | | | | | | | |
Indicated | | 74 680 | | 30.55 | | 45.48 | | 1.04 | | 22.57 | | 5.81 | | 27 632 | |
Inferred | | 28 304 | | 30.91 | | 45.19 | | 1.19 | | 22.92 | | 5.99 | | 10 472 | |
| | | | | | | | | | | | | | | |
Total | | 102 996 | | 30.64 | | 45.40 | | 1.08 | | 22.66 | | 5.86 | | 38 109 | |
Wt. Rec (%) | | 37 | % | | | | | | | | | | | | |
| | Waste (kt) | | | | | | | | | | | | | |
Rock | | 93 620 | | | | | | | | | | | | | |
OB | | 16 604 | | | | | | | | | | | | | |
| | | | Total S/R | | | | | | | | | | | |
Stripping | | 110 224 | | 1.07 | | | | | | | | | | | |
September 2011
16-7
Alderon Iron Ore Corp.
NI 43-101 Technical Report — PEA of the Kami Iron Ore Project |
|
16.3 Engineered Pit Design
The detailed mine design is carried out using the LG 3-D optimized pit shell as a base. Operational factors that are required for a mine are added during the engineered pit design phase. These features include a haulage ramp, safety berms, bench face angles, inter-ramp angles, and bench height.
16.3.1 Pit Slope Design Criteria
The preliminary pit design developed in this Study was based on specifications provided by Stantec (Stantec 2011).
The conceptual pit design slopes recommended by Stantec vary depending on the rock type, i.e. Type 1 for massive rock formations and Type 2 for bedded or foliated formations. The conceptual pit design slopes also depend on the orientation of the wall, i.e. hanging wall or foot wall. For this study, BBA has used one constant Bench Face angle, and Inter-ramp angle. The reason being is that not enough information was provided for the localizations of these different rock types and their strata. The design parameters used by BBA for this Study are shown in Table 16.5.
Table 16.5: Pit Design Parameters
Parameters for Design | | Units | |
Single Ramp | | 20 | | M | |
Double Ramp | | 31 | | M | |
Grade | | 10.00 | | % | |
IRA | | 50.00 | | ° | |
BFA | | 75.00 | | ° | |
Approximate Berm Width | | 8.6 | | M | |
Benches | | 5.00 | | M | |
Benching | | (Triple) | | | |
September 2011
16-8
Alderon Iron Ore Corp.
NI 43-101 Technical Report — PEA of the Kami Iron Ore Project |
|
Stantec specifies the use of 14 m benches in their Report, however, since the model block size is based on a 5 m bench height, the detailed mine design was carried out using triple-benching arrangement, i.e. 5 m x 3 benches.
The width of the in-pit haulage ramp measures 31 m to accommodate uninterrupted double lane traffic. The final few benches at the bottom of the pit are designed with a width of 20 m in order to reduce the stripping ratio. The maximum grade used is 10%.
The main difference between the design of the two pits, i.e. Rose Central and Mills, are the design and direction. Rose Central is a larger pit, and travelling throughout is fairly straightforward. Since the Mills pit is narrower, certain ramp design aspects differ from Rose Central. First, the Mills pit incorporates a switchback, whereas Rose Central does not. Furthermore, in order to provide more flexibility and maneuverability in the Mills pit, two bases with separate ramps accessing them were created. The separate ramps join the main ramp at an elevation of 495 m.
16.3.2 Engineered Pit Design Results
Both two dimensional (2-D) and three dimensional (3-D) views of the Rose Central pit and Mills pit are shown in Figure 16.4 and Figure 16.9 respectively. Rose Central pit is shown in various section views (Eastings and Northing) in Figure 16.5 to Figure 16.8 and Mills pit is shown in various section views in Figure 16.9 to Figure 16.13.
September 2011
16-9
Alderon Iron Ore Corp.
NI 43-101 Technical Report — PEA of the Kami Iron Ore Project | 
|
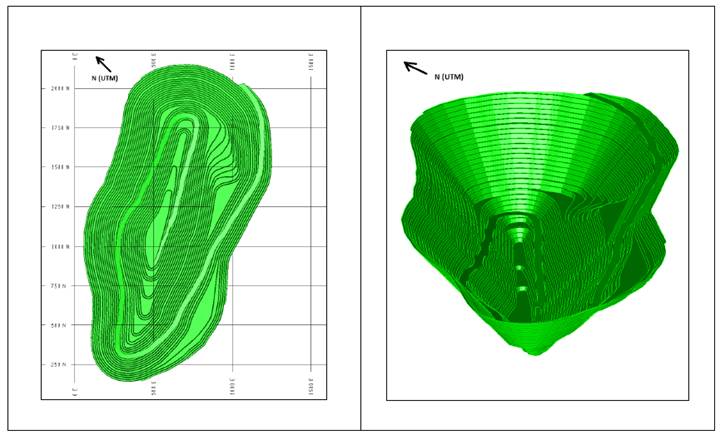
Figure 16.4: Rose Central Engineered Pit Design, Plan View and 3-D View
September 2011
16-10
Alderon Iron Ore Corp.
NI 43-101 Technical Report — PEA of the Kami Iron Ore Project | 
|
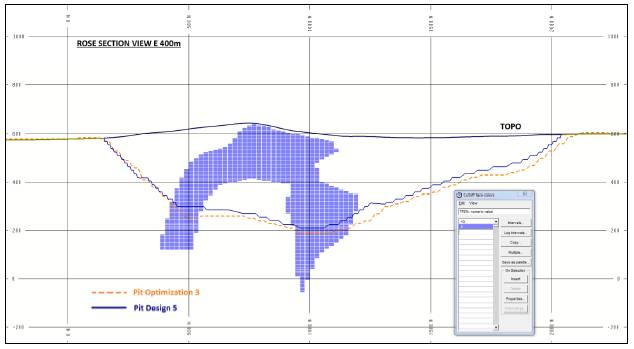
Figure 16.5: Rose Central Pit Section View E 400 m
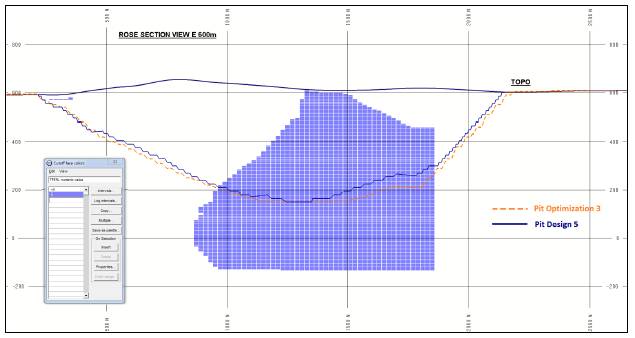
Figure 16.6: Rose Central Pit Section View E 600 m
September 2011
16-11
Alderon Iron Ore Corp.
NI 43-101 Technical Report — PEA of the Kami Iron Ore Project |
|
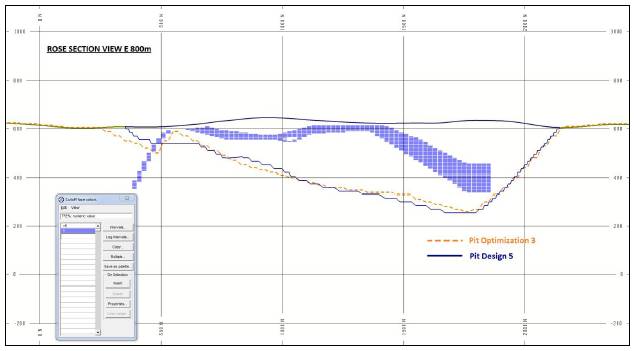
Figure 16.7: Rose Central Pit Section View E 800 m
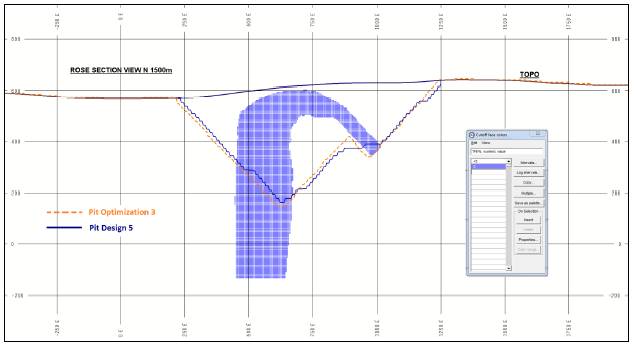
Figure 16.8: Rose Central Pit Section View N 1500 m
September 2011
16-12
Alderon Iron Ore Corp.
NI 43-101 Technical Report — PEA of the Kami Iron Ore Project | 
|
Figure 16.9: Mills Engineered Pit Design, Plan View and 3-D View
September 2011
16-13
Alderon Iron Ore Corp.
NI 43-101 Technical Report — PEA of the Kami Iron Ore Project | | 
|
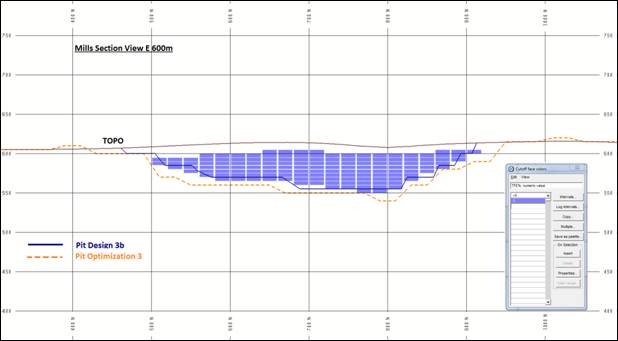
Figure 16.10: Mills Pit Section View E 600 m

Figure 16.11: Mills Pit Section View E 800 m
September 2011
16-14
Alderon Iron Ore Corp.
NI 43-101 Technical Report — PEA of the Kami Iron Ore Project | |
|
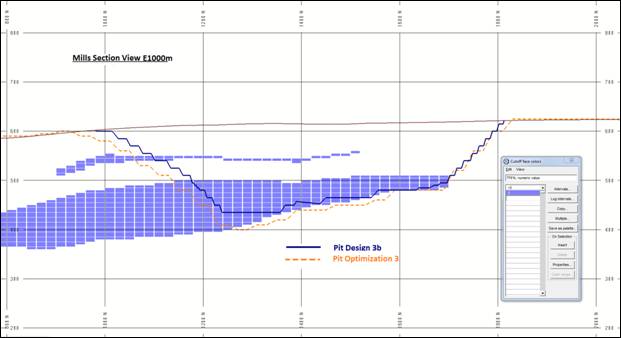
Figure 16.12: Mills Pit Section View E 1000 m

Figure 16.13: Mills Pit Section View N 1500 m
September 2011
16-15
Alderon Iron Ore Corp.
NI 43-101 Technical Report — PEA of the Kami Iron Ore Project | |
|
16.4 In-Pit Resource Estimate
The resources for the engineered pit design are based on the parameters described previously. As discussed in Section 15 of this Report, CIM guidelines require that for a Preliminary Economic Assessment, all material classified as Measured, Indicated, or Inferred shall be reported as an in-pit resource.
The mining resources were calculated for both the Rose Central engineered pit design and the Mills engineered pit design at an in-pit cut-off grade of 15% TFe. The mining resources calculated in the present Study for the Rose Central pit, as presented in Table 16.6, total 335.13 Mt, with an average grade of 29.88 % TFe. The total waste contained in the Rose Central pit is 758.62 Mt, which includes 46.77 Mt of overburden. This results in a stripping ratio of 2.26.
The mining resources calculated for the Mills pit, as presented in Table 16.7, total 89.52 Mt, with an average grade of 30.66 % TFe. The total waste contained in the Mills pit is 92.70 Mt, which includes 14.87 Mt overburden. This results in a stripping ratio of 1.04.
September 2011
16-16
Alderon Iron Ore Corp.
NI 43-101 Technical Report — PEA of the Kami Iron Ore Project | |
|
Table 16.6: Rose Central In-Pit Resource Estimate
Rose Central- Engineered Pit Design
Total Resource Estimate - (COG 15% TFE%)
| | | | Grades | |
Category | | Ore (kt) | | % TFe | | %SiO2 | | %Mn | | %MagFe | | %HemFe | | Fe Con. (kt) | |
Indicated | | 307 755 | | 29.86 | | 44.75 | | 1.63 | | 18.24 | | 8.83 | | 113 869 | |
Inferred | | 27 373 | | 30.03 | | 44.80 | | 1.68 | | 18.49 | | 8.79 | | 10 128 | |
Total | | 335 128 | | 29.88 | | 44.76 | | 1.63 | | 18.26 | | 8.83 | | 123 998 | |
| | Waste (kt) | | Total S/R | | | | | | | | | | | |
Rock | | 711 853 | | | | | | | | | | | | | |
OB | | 46 766 | | | | | | | | | | | | | |
Total Stripping | | 758 619 | | 2.26 | | | | | | | | | | | |
Table 16.7: Mills In-Pit Resource Estimate
Mills - Engineered Pit Design
Total Resource Estimate - (COG 15% TFE%)
| | | | Grades | |
Category | | Ore (kt) | | % Tfe | | %SiO2 | | %MN | | %MGFe | | %HMFe | | Fe Con. (kt) | |
Indicated | | 65 089 | | 30.56 | | 45.32 | | 1.08 | | 22.36 | | 6.07 | | 24 083 | |
Inferred | | 24 435 | | 30.94 | | 45.02 | | 1.24 | | 22.58 | | 6.45 | | 9 041 | |
Total | | 89 523 | | 30.66 | | 45.40 | | 1.08 | | 22.66 | | 5.86 | | 33 124 | |
| | Waste (kt) | | Total S/R | | | | | | | | | | | |
Rock | | 77 834 | | | | | | | | | | | | | |
OB | | 14 869 | | | | | | | | | | | | | |
Total Stripping | | 92 703 | | 1.04 | | | | | | | | | | | |
September 2011
16-17
Alderon Iron Ore Corp.
NI 43-101 Technical Report — PEA of the Kami Iron Ore Project | |
|
16.5 Development of the Mine Plan and Mining Operations
As was outlined in Section 13.2.6 of this study, process development for this Study was based only on the Rose Central ore deposit. Consequently, for this Study, the mine plan and mining operation strategy was developed only for the Rose Central pit.
Table 16.8 presents the tonnages of material moved, by year, for the mining plan developed in this Preliminary Economic Assessment. Material moved is classified as Waste, Overburden (OB) and ore. The annual stripping ratio is also indicated. Totals for the LOM, estimated at 15.3 years, are also presented. The mine plan is developed to support operational requirements for the production of 8.0 Mt/y of concentrate.
September 2011
16-18
Alderon Iron Ore Corp.
NI 43-101 Technical Report — PEA of the Kami Iron Ore Project | | 
|
Table 16.8: Tonnages of Material Moved over the LOM for Production of 8.0 Mt/y of Concentrate
September 2011
16-19
Alderon Iron Ore Corp.
NI 43-101 Technical Report — PEA of the Kami Iron Ore Project | | 
|
16.5.1 Waste and Waste Dumps
Waste rock mined from the Rose Central pit will be dumped at two locations, as indicated on the general site plan presented in Section 18 of this Report. The two locations are designated as the Rose North Dump and the Rose South Dump. For this Study, the maximum waste rock dump elevation was determined in collaboration with Stantec to be 780 m. This height was deemed adequate for the purpose of mine closure and rehabilitation. The design parameters for the waste dumps, as provided by Stantec, are as follows:
· Face angle: 36°
· Overall slope: 30°
· Bench height: 30 m
· Berm width: 10 m
· Maximum elevation 780 m
Based on an average swell factor of 30%, the Rose North Dump has an estimated storage capacity of 442 Mt and the Rose South Dump has an estimated storage capacity of 520 Mt for the footprint indicated. The designated stockpile footprints and profiles provide sufficient capacity for the waste rock generated over the LOM for the Rose Central pit. A more detailed description of the waste rock dump design is provided in Section 20.6.1 of this Report.
Average mine truck travel distance from the Rose Central pit to the North and South dumps are approximately 3.4 km and 4.2 km respectively. These parameters have been used in the selection of mine equipment.
As the top of the Rose Central ore body is relatively deep from the surface, significant pre-production stripping will be required in preparation for mining. Additionally, due to close proximity of the Rose Central deposit to Pike Lake, an arbitrary distance from the lake of 80 m has been assumed, which needs to be validated by a geotechnical study during the Feasibility Study. Sufficient waste rock will be mined during the pre-production period to secure adequate ore access for the production years to follow. Some waste material generated during the pre-production period may be used as construction material; however, this requires further detailed evaluation during the next study phases and as the construction plan is developed.
September 2011
16-20
Alderon Iron Ore Corp.
NI 43-101 Technical Report — PEA of the Kami Iron Ore Project | |
|
16.5.2 Mine Operations and Mining Equipment Requirements and Selection
Mining operations will be conducted 24 hours per day, seven days per week and 365 days per year. Following drilling and blasting, run-of-mine (ROM) ore will be delivered to a primary crusher located approximately 1,000 m to the northeast of the pit.
Requirements for primary mining equipment consisting of drills, haul trucks, loaders and shovels, have been estimated based on haul distance, equipment availability, utilization and overall productivity data. Availability profiles for major equipment have been estimated using Vendor benchmarks, similar projects in BBA’s database as well as operating experience.
The truck fleet consists of Komatsu 930E trucks having a payload capacity of 290 metric tonnes. Up to 29 trucks will be required to support the mine plan and schedule. Operating truck requirements were determined using the appropriate operating time parameters, fill factors, cycle times, and tonnes to be moved per material type. The truck fleet size was calculated using the applicable equipment availability factor and was subsequently rounded to the nearest truck. The truck fleet size on a yearly basis was then smoothed out to better represent an actual operation.
The proposed shovel fleet consists of one Bucyrus 495HD electric cable shovel, one Bucyrus 395HR electrically-driven hydraulic shovel and one Komatsu PC5500 hydraulic backhoe excavator. Annual shovel productivity was determined using the appropriate operating time parameters, fill factors, material properties, and bucket capacities. The shovel fleet chosen is such that all ore is moved by 395HR and that any remaining 395HR capacity is used to move waste or overburden material. Early in the mine life, a PC5500 is assigned to overburden removal and later assist with movement of various materials during main equipment downtimes. The 495HD is selected primarily for waste removal. Overall, the shovel fleet requirements are calculated so as to ensure that the total shovel requirements, in equivalent shovel units, are met.
The primary equipment fleet will have a minimum of one front-end loader with a lifting capacity of 45 t/bucket, (CAT994 or similar), for supplementary loading and stockpile management. The
September 2011
16-21
Alderon Iron Ore Corp.
NI 43-101 Technical Report — PEA of the Kami Iron Ore Project | |
|
flexibility of the loader with its fast response time in replacing a shovel or for a particular blending requirement, justifies its use.
The three drills required are electric, with a capacity to drill 12” diameter blast holes with high pull-down pressure (Bucyrus 49HR or similar).
To carry out the routine road maintenance and various other functions within the mine, the following secondary equipment was selected:
· Track-Dozers: One CAT D-10 with ripper and one CAT D-9 are used to maintain the waste dumps as well as perform the general work within the mine.
· Front-End Loaders: Two CAT 844’s are used for road maintenance, blast hole stemming and snow removal. The units will be complete with quick-release couplings to allow easy changes from one attachment to another. Attachments include a bucket designed for blast hole stemming and a snow removal bucket.
· Graders: Two CAT 16G’s are used to maintain the roads on the entire mine site.
· Water Truck: Two CAT 777F water trucks with a capacity of 20,000 liters will be used for site dust abatement.
To support the mine as well as site maintenance, a fleet of auxiliary equipment has been selected and is included as part of the mining equipment. The complete list of primary, secondary and auxiliary equipment considered in this Study, showing equipment requirements on an annual basis, is presented in Table 16.9. The annual mine truck requirements, based on the mine plan, are shown in Figure 16.14.
A radio communication system will link all the vehicles together and assure that the equipment is effectively managed and truck dispatching is controlled.
September 2011
16-22
Alderon Iron Ore Corp.
NI 43-101 Technical Report — PEA of the Kami Iron Ore Project | | 
|
Table 16.9: Mining Equipment List
September 2011
16-23
Alderon Iron Ore Corp.
NI 43-101 Technical Report — PEA of the Kami Iron Ore Project | | 
|
Figure 16.14: Annual Mine Truck Fleet Requirements
16.6 Drilling and Blasting
Preliminary selection of drilling equipment and drill pattern design takes into consideration the control of damage on final pit walls, minimization of blasting costs and control of material size and distribution. Due to the close proximity of the Rose Central pit to Pike Lake, a good geotechnical monitoring program, pre-split and trim blasting may have to be implemented. The final pit distance from the lake, concept of double or triple benching and final design for pre-split and trim blast patterns, will be based on the geotechnical testing and assessment.
A high energy bulk emulsion explosive with electronics detonators should be used for application in wet or dry conditions with an in-hole density of 1.25 g/cc. The cost advantage and operational simplicity of using only bulk emulsion explosives is based on reduction of explosive plant and requirement of trucks for product mixing.
Drilling and blasting activities should be directed by mine operations personnel who will be responsible for development of drilling and blasting procedures, management of misfires, drill
September 2011
16-24
Alderon Iron Ore Corp.
NI 43-101 Technical Report — PEA of the Kami Iron Ore Project | |
|
site preparation and cleanup and supervision of the explosive provider. The explosive plant, supplying and delivering of explosives in the hole through a project mine life, will be outsourced. Table 16.10 presents the drilling and blasting design parameters used in this Study. These parameters provide the basis for estimating drilling and blasting operating costs.
Table 16.10: Mining Equipment List
16.7 Fuel and Electricity
Fuel consumption for mining equipment operating on diesel fuel was estimated based on benchmark (liters per hour of operation) data for each piece of equipment in the equipment list. Electric power consumption was also estimated based on Vendor data sheets for each piece of equipment operating on electricity. Figure 16.11 and Figure 16.12 present estimates that have been subsequently used for estimating operating costs.
16.8 Manpower Requirements
Manpower requirements for the mine area, as estimated by BBA, are presented in Figure 16.13 and Figure 16.14.
September 2011
16-25
Alderon Iron Ore Corp.
NI 43-101 Technical Report — PEA of the Kami Iron Ore Project | | 
|
Table 16.11: Mining Equipment Estimated Fuel Consumption

Table 16.12: Mining Equipment Estimated Electricity Consumption

September 2011
16-26
Alderon Iron Ore Corp.
NI 43-101 Technical Report — PEA of the Kami Iron Ore Project | | 
|
Table 16.13 Mine Area Hourly Personnel
September 2011
16-27
Alderon Iron Ore Corp.
NI 43-101 Technical Report — PEA of the Kami Iron Ore Project | | 
|
Table 16.14 Mine Area Salaried Personnel and Total Headcount
September 2011
16-28
Alderon Iron Ore Corp.
NI 43-101 Technical Report — PEA of the Kami Iron Ore Project | | 
|
17. RECOVERY METHODS
Section 13 of this Report described the metallurgical testwork and how the results were used to derive the preliminary Process Flowsheet (PFS) and mass balance constituting the basis for determining the recovery method of Fe from the Kami ore to produce an iron ore concentrate. In this section of the Report, a process design basis is established and is used to further develop the PFS mass and water balance and to develop the process design criteria, including the preliminary selection and sizing of major process equipment. It should be noted that equipment sizing is preliminary and is generally based on a combination of the following:
· Testwork results,
· Handbook references,
· BBA’s experience on other projects (reference projects),
· Vendor information.
A general processing plant description of the various areas is provided and some preliminary plant General Arrangement (GA) drawings are developed. This information serves as input information for the development of the capital and Operating Cost Estimates presented later in this Report.
17.1 Process Design Basis
For this Study, Process Design is based on an annual concentrate production capacity target of 8.0 Mt. This is in line with other similar projects recently developed by BBA. As mentioned earlier, laboratory testwork was performed during the course of this Study and results previously presented in Section 13 of this Report, were used to develop the PFS as well as preliminary mass and water balances forming the basis of Process Design. Table 17.1 presents a global balance of nominal and design tonnages for the concentrator plant. These form the basis for establishing process design criteria for determining preliminary major equipment sizing.
September 2011
17-1
Alderon Iron Ore Corp. NI 43-101 Technical Report — PEA of the Kami Iron Ore Project | |
|
Table 17.1: Concentrate Production Target and Nominal and Design Production Rates
PROCESS DESIGN BASIS
| | Annual
(Nominal) | | Minimum | | Nominal | | Design | |
| | M t/y | | t/h | | t/h | | t/h | |
Grinding Capacity (Fresh Feed) | | 21.2 | | 2282 | | 2685 | | 3088 | |
Concentrate Production | | 8.0 | | 863 | | 1015 | | 1167 | |
Tailings Generated | | 13.2 | | 1420 | | 1670 | | 1921 | |
Wt Rec % | | 37.79 | % | | | | | | |
Fe Rec % | | 82.8 | % | | | | | | |
Plant Utilization % | | 90.0 | % | | | | | | |
Head Grade %Fe | | 29.90 | % | | | | | | |
Con Grade %Fe | | 65.50 | % | | | | | | |
Design to Nominal +/-15% | | | | | | |
As mentioned, the annual concentrate production tonnage was fixed at 8.0 Mt. The concentrate Fe grade of 65.5% was also a fixed target and was derived following discussions with Alderon and in consideration of their preliminary marketing study. The targeted final concentrate Fe and SiO2 grade were derived taking into consideration the ore deposit’s metallurgical and mineralogical characteristics. Achieving a higher Fe grade and lower SiO2 levels could be possible, providing a finer regrind is obtained at the magnetic concentration plant.
Concentrator utilization of 90% was based on modern day plant design and performance. The Fe Head grade was derived from the Rose Central deposit block model and optimized pit design. Weight recovery and iron recovery were derived from testwork results and took into consideration an assumed grinding particle size distribution as well as an assumed weighted mix of the three ore zones in the Rose Central deposit, as described in Section 13 of this Report. Table 17.1 shows that to achieve the targeted concentrate production, a total of 21.2 Mt/y of crushed ore must be fed to the grinding circuit. This generates a quantity of tailings in the order of 13.2 Mt/y. For design purpose, a variation of +/-15% from nominal tonnages was considered.
September 2011
17-2
Alderon Iron Ore Corp.
NI 43-101 Technical Report — PEA of the Kami Iron Ore Project | |
|
17.2 Process Flowsheet and Mass and Water Balance
The process block diagram in Figure 13.8 and process design basis presented earlier in this section were used to develop the PFS mass and water balances presented in Figure 17.1 to Figure 17.4 for the processing plant. The balances shown are for nominal conditions and take into consideration plant utilization. These serve as the basis for developing the process design criteria and for developing preliminary major process equipment selection and sizing.
September 2011
17-3
Alderon Iron Ore Corp.
NI 43-101 Technical Report — PEA of the Kami Iron Ore Project | | 
|
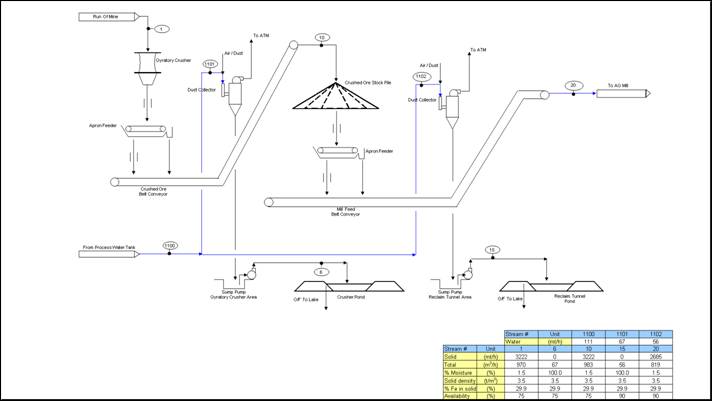
Figure 17.1: Process Flow Diagram Crushing and Crushed Ore Storage
September 2011
17-4
Alderon Iron Ore Corp.
NI 43-101 Technical Report — PEA of the Kami Iron Ore Project | | 
|
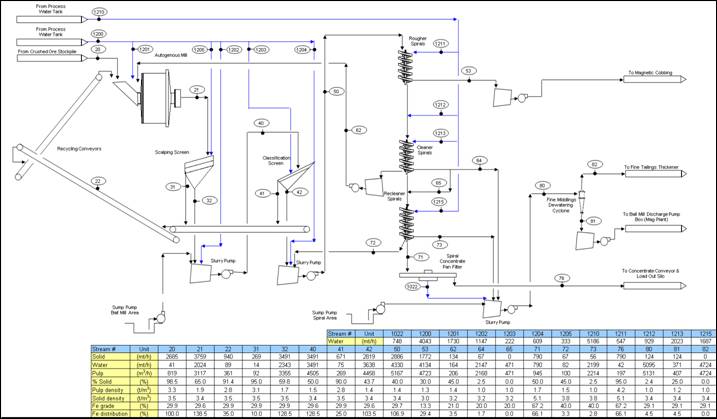
Figure 17.2: Process Flow Diagram Grinding, Screening and Gravity Concentration
September 2011
17-5
Alderon Iron Ore Corp.
NI 43-101 Technical Report — PEA of the Kami Iron Ore Project | 
|
Figure 17.3: Process Flow Diagram Regrind and Magnetic Separation Plant
September 2011
17-6
Alderon Iron Ore Corp.
NI 43-101 Technical Report — PEA of the Kami Iron Ore Project | 
|
Figure 17.4: Process Flow Diagram General Process Water Balance
September 2011
17-7
Alderon Iron Ore Corp.
NI 43-101 Technical Report — PEA of the Kami Iron Ore Project | 
|
17.3 General Process Description and Plant Design
General Process and Plant Design criteria and considerations for the Kami concentrator are based on the following:
· The general location of the crusher, stockpile, concentrator, load-out, tailings disposal area, freshwater source and other infrastructure is shown on the general site plan developed in this Study. The site plan is presented in Figure 18.1;
· Ore is crushed using a single gyratory crusher. Crushed ore is stored in a conventional, uncovered stockpile, reclaimed by apron feeders onto the AG mill feed conveyor;
· Primary grinding is done with one dual-pinion AG mill with a variable speed, active front-end type electric drive;
· Mill discharge is screened using a two-stage screening circuit. Oversize from the primary screens and the secondary “banana” screens is recirculated to the AG mill;
· The flowsheet is based on a three-stage spiral gravity concentrating circuit followed by Low Intensity Magnetic Separation (LIMS) cobbing of the spiral circuit tailings. The LIMS concentrate is reground in a ball mill and further concentrated in a magnetic separation plant for magnetite recovery;
· Concentrate from the spiral circuit, dewatered using pan filters, and concentrate from the magnetic circuit, dewatered using disc filters, are combined and directed to a train load-out silo;
· Dewatered tailings are directed to the tailings pumping system for final disposal to the tailings impoundment area;
· Concentrator operations are based on a 365 days per year operation with an overall plant utilization of 90%;
· In general, there is sufficient redundancy incorporated in the Plant Design to assure the required equipment availability to achieve the targeted plant utilization rate;
· BBA will use general design criteria based on those developed for BBA’s reference projects;
· Major equipment sizing is to be considered preliminary and was estimated by one or more of the following methods;
· Vendor charts using testwork data or flowsheet balances;
· Using scaling factors to adjust from BBA’s reference projects;
September 2011
17-8
Alderon Iron Ore Corp.
NI 43-101 Technical Report — PEA of the Kami Iron Ore Project |
|
· Handbook, theoretical or empirical formulas.
General plant layouts were developed during the course of this Study and were used in estimating capital costs for the facility.
17.4 Ore Crushing, Conveying and Storage
Ore from the mine will be delivered by truck to two dump points at the gyratory crusher building. With the limited ore grindability information available for this Study, it was determined that a single 1,525 mm x 2,260 mm (60” x 89”), 600 kW (800 HP) gyratory crusher would provide the required crushing capacity. According to Supplier’s technical documentation, this crusher model has a capacity ranging between 4100 t/h and 5500 t/h, based on an ore SG of 1.6. This crusher model is the same as the one used in BBA’s reference projects, having similar capacity requirements and ore characteristics. Crusher power calculations using a CWI of 12.7 kWh/t, a F80 of 800 mm and a P80 of 165 mm confirm the crusher selection. The operating Crusher Work Index was estimated at 0.17 kWh/t resulting with an estimated operating power of 560 kW at nominal tonnage.
A hydraulic rock breaker operated from a control panel in the crusher operator’s room is provided adjacent to the crusher to break up and manipulate oversized or improperly positioned rocks. An overhead crane is located in the crusher building to service equipment. This crane can also be used during construction. An auxiliary hoist is installed to handle lighter components. The crusher building is enclosed within a building and provided with a wet scrubber and an air make-up unit. Scrubber effluent, floor wash-down water and drainage will be collected in a sump and pumped to a designated area.
Ore, crushed to -200 mm (8”) in size, will be collected in a surge pocket below the crusher. From the surge pocket, the crushed ore is fed by a 1,830 mm wide by 6,700 mm long (6’ x 22’) apron feeder with a design capacity of 4500 t/h onto the 1,524 mm (60”) wide, fixed speed, crushed ore, belt conveyor. This conveyor discharges onto a transfer/stacking conveyor. The elevated sections of the conveyors are provided with walkways on both sides and are enclosed in an unheated gallery. This conveyor system discharges onto an outside crushed ore stockpile.
September 2011
17-9
Alderon Iron Ore Corp.
NI 43-101 Technical Report — PEA of the Kami Iron Ore Project |
|
The 26,000 tonne live capacity of the stockpile will be sufficient to sustain nine hours of operation. This will allow the crusher to be taken out of service for normal maintenance while maintaining feed to the mill. The total pile capacity will be in the order of 113,000 t, sufficient to maintain an uninterrupted feed to the grinding circuit for up to 46 hours to permit major repairs to be undertaken on the crusher. During this period, ore will be reclaimed from the dead area of the ore stockpile by using loaders.
Ore is withdrawn from the stockpile by two 1,830 mm wide by 7,000 mm long (6’ x 23’) variable-speed apron feeders located inside a heated tunnel. The two apron feeders feed crushed ore onto a 1,524 mm-wide mill feed conveyor at the required rate. The mill feed tonnage is controlled by varying the feeder speed with a signal from the belt weigh scale.
A wet scrubber and air make-up unit is provided in the reclaim tunnel. Scrubber effluent, wash down water and drainage water from the tunnel will be pumped to an appropriate area. The elevated sections of the mill feed conveyor have walkways on both sides and are enclosed within a gallery.
17.5 Grinding and Screening
The Grinding and Screening circuit described here for the Kami facility is similar to the design used in BBA’s reference projects. Certain features have been adjusted based on experience and operations at other facilities.
The ground ore from the AG mill is discharged into a chute distributing the slurry to two primary horizontal screens. From this point, the grinding, screening and the gravity circuit is split into two sections. Design provides that the AG mill can operate at half capacity and discharge onto only one of the two primary screens, thus allowing for operating only one section of the concentrator. This is not intended to be normal operating practice and is only to be used for short periods of time in case of an isolated equipment breakdown.
The oversized fraction from the primary screens is returned to the AG mill by belt conveyor. The passing fraction from the screens is collected in two pump boxes, one for each screen. Each
September 2011
17-10
Alderon Iron Ore Corp.
NI 43-101 Technical Report — PEA of the Kami Iron Ore Project |
|
one of the two primary screen pump boxes is equipped with two single-stage pumps (one operating and one standby). The primary screen undersize fraction is fed to six multi-slope (banana-type) secondary screens. One primary screen pump box feeds three secondary screens. The oversize from the secondary screens is collected on a belt conveyor and directed back to the AG mill feed chute. The secondary screen-passing fraction is collected into two pump boxes, each pump box collecting slurry from three secondary screens.
Each one of the two pump boxes, thus handling half of the total AG mill capacity, is equipped with two single-stage pumps (one operating and one standby). Each of these pumps feeds two primary distributors that provide the feed slurry at the required %-solids to the rougher spirals.
17.5.1 Primary Grinding Mill Sizing
Preliminary sizing of the primary grinding mill was performed using the data available from the SGS grindability testwork described in Section 13 of this Report. As was indicated, the nominal ore grinding energy required was estimated at 3.7 kWh/t. This is considered to represent nominal ore hardness. For design condition, it was assumed that ore hardness of 4.0 kWh/t represents the 75th percentile of the hardness distribution, meaning that 75% of the time, ore grinding energy requirement will be 4.0 kWh/t or less, therefore, 25% of the time ore will require more than 4.0 kWh/t grinding energy. Considering that the nominal production tonnage was defined as 2685 t/h of fresh feed to the grinding mill and the design tonnage was defined as 3088 t/h, the following table defines the power requirement (power at the pinion) envelope for the various operating conditions.
Table 17.2: Power Requirement Envelope for the Various Operating Conditions
Mill Energy at Pinion
| | Production Tonnage | |
Operating Work Index | | 2685 t/h | | 3088 t/h | |
3.7 kWh/t | | 9935 kW | | 11425 kW | |
4.0 kWh/t | | 10740 kW | | 12325 kW | |
For predominant operating conditions, i.e. average energy and average tonnage, the grinding mill must be able to draw 9935 kW at the pinion in order to achieve the required grinding at P100
September 2011
17-11
Alderon Iron Ore Corp.
NI 43-101 Technical Report — PEA of the Kami Iron Ore Project |
|
of 425 µm . Design should provide that the mill should be able to draw 10740 kW in order to grind the harder ore at nominal tonnage. Design should ideally also provide that the mill should be able to draw 11425 kW to allow for operations at design tonnage for average ore hardness. Design should not however be required to support operations at design tonnage combined with hard ore. Thus when ore hardness is such that the mill cannot draw the required power, feed tonnage will be less than the nominal rate.
Testwork indicates that there may be a build-up of hard pebbles in the circuit due to the possible bimodality characteristics of the ore. This needs to be explored further into the next round of grindability tests. A pebble crusher may be required should this condition be prevalent.
Considering the limited grindability and ore hardness data available for the purpose of this Study, it is assumed that one 10.97 m x 6.55 m (36’ x 21’6”) dual-pinion AG mill powered by two 6,338 kW (8,500 hp) motors for a total of 12,676 kW (17,000 hp) will be adequate for primary grinding. Preliminary Vendor data shows that this size mill can draw the required power for nominal tonnage and nominal ore hardness but its upside is limited. The addition of grinding balls may be required to maintain productivity for harder ore or a larger mill may be required. Further detailed development will be required during the Feasibility Study when more grindability data will be available.
17.6 Gravity Spiral Circuit
The gravity concentrating circuit layout is based on a conventional three-stage spiral circuit similar to BBA’s reference projects. As mentioned previously, there are four primary distributors. Each primary distributor has eight orifices, thus feeding eight secondary distributors. Each secondary distributor has 28 orifices feeding 14 double-start rougher spirals.
The number of spirals, as well as the spiral models selected as the basis of design for this Study, is based on BBA’s and Vendor’s experience on other projects. For the rougher spirals, this study is based on using a high-capacity spiral model. This reduces the number of spirals as well as costs. Testwork will be required prior to final design using these spirals on the Kami ore in order to validate performance. The spiral layout is based on a back-to-back arrangement at
September 2011
17-12
Alderon Iron Ore Corp.
NI 43-101 Technical Report — PEA of the Kami Iron Ore Project |
|
the three spiral stages in order to minimize the quantity of launders required. Table 17.3 illustrates the type of spirals as well as the total number of distributors and spirals required at each concentrating stage. The Capital Cost Estimate developed by BBA in this study is based on this configuration.
Table 17.3: Gravity Circuit Summary
Spiral Circuit | | |
Primary distributors (8-way) | | 4 |
Secondary distributors (24-way) | | 32 |
Rougher spiral type | | High Capacity |
Rougher spirals (# of DS spirals) | | 448 |
Number of spiral banks | | 32 (2 X 7) |
Feed Design (t/start) | | 3.5 |
Tertiary distributors (24-way) | | 32 |
Cleaner spiral type | | Conventional |
Cleaner spirals (# of DS spirals) | | 448 |
Number of spiral banks | | 32 (2 X 7) |
Feed (t/start) | | 2.2 |
Recleaner spiral type | | Conventional |
Recleaner spirals (# of DS spirals) | | 448 |
Feed (t/start) | | 2.2 |
The rougher spirals produce two products, a concentrate stream and a tailings stream. The concentrate is collected by a series of launders and directed to the tertiary distributors feeding the cleaner spirals. Dilution water is added in the launders to control %-solids at the cleaner spiral feed. To preserve the functionality of operating each half line independently, the tailings of each half line are collected by a series of launders and directed to its own pump box. Each of the two pump boxes is equipped with two pumps (one operating and one standby). The tailings collected in each of the two pump boxes are pumped to a distribution system at the magnetic separation plant. Design provides that the magnetic separation plant can be bypassed if required by pumping the tailings directly to the tailings dewatering cyclones. This is described later in this section.
September 2011
17-13
Alderon Iron Ore Corp.
NI 43-101 Technical Report — PEA of the Kami Iron Ore Project |
|
The cleaner spirals are fed by the tertiary distributors. The cleaner spirals produce three products. The concentrate is fed directly to the recleaner spirals located immediately below the cleaner spirals. Dilution water is added to the concentrate stream ahead of the recleaner spirals to control feed %-solids. The dilution water comes from the cleaner spiral fine-middling stream and is part of the spiral product box design. A coarse middling stream is collected by a network of launders and is directed by gravity to two pump boxes for pumping back to the AG mill. A fine-middling stream, very low in %-solids, is collected by a network of launders and sent by gravity to two fine-middling pump boxes (one per half line).
The recleaner spirals are fed directly by the cleaner spiral concentrate stream. The recleaner spirals generate three products. The final spiral concentrate is collected by a network of launders and directed by gravity to four 7.3 m diameter (24’) horizontal pan filters. Each filter receives concentrate produced by one-quarter line of spirals. Each pan filter is provided with a scroll discharge and a steam hood for steam injection during the winter months. Steam injection is required to reduce incidence of concentrate freezing in the railcars thus facilitating railcar unloading at the port.
A coarse middling stream from the recleaner spirals is collected by a network of launders and is fed by gravity to the rougher spiral pump boxes. A fine-middling stream is collected and is directed by gravity to the aforementioned fine-middling pump boxes. The fine-middling from the cleaner and the recleaner spirals is collected in the fine-middling pump boxes and pumped to two dewatering cyclone clusters. The overflow of these dewatering cyclones is directed by gravity to the thickener. The cyclone underflow, containing unliberated Fe, is collected in two pump boxes and directed to the magnetic separation plant regrind mill. This dewatering strategy is successfully used in other plants in order to better control the water balance and %-solids in the spiral feed and achieve better metallurgical performance at the spiral circuit.
17.7 Magnetic Concentration Plant
The tailings collected at the two rougher spiral tailings pump boxes are pumped to the magnetic separation plant cobbing LIMS circuit. Each pump box pumps to one 4-way distributor feeding a total of eight LIMS single drum units. The concentrate from the LIMS cobbing drums, constituted
September 2011
17-14
Alderon Iron Ore Corp.
NI 43-101 Technical Report — PEA of the Kami Iron Ore Project |
|
mainly of non-liberated magnetite requiring regrinding and fine liberated magnetite that was not recovered by the spirals, is collected in launders and directed by gravity to the regrind ball mill discharge pump box. The non-magnetic tailings from the LIMS are collected in two pump boxes and pumped to two tailings dewatering cyclone clusters. Due to the volume and pressure anticipated, it is assumed that these pumps are two-stage pumps, again with one operating set of pumps and one standby set of pumps. These tailings, constituted mainly of gangue, also contain unrecoverable Fe units as well as unrecovered fine and non-liberated hematite.
For this Study, it is assumed that regrinding will be done using a ball mill in closed circuit with cyclones. Preliminary sizing of the ball mill was determined assuming a feed particle size distribution (F80) of 266 µm, a mill product size (P80) of 106 µm and using grindability data presented in Section 13 of this Report and Vendor handbook data. The regrind ball mill is 7.0 m dia X 9.6 m L (23’ dia. X 31’ L). Considering that the mill will require power in the order of 7,457 kW (10,000 hp), the mill will have a dual-pinion drive, thus each pinion will be driven by a 3,728 kW (5,000 hp) fixed speed motor.
Slurry from the ball mill discharge, combined with slurry from the cobbing LIMS magnetic concentrate and with slurry from the fine-middling cyclone underflow, is pumped to cyclones designed to produce an overflow at a P50 of 75 microns (the P50 will need to be confirmed with specific testwork planned for the next study phase). The cyclone overflow, now containing liberated magnetite, is fed to a further magnetic separation circuit. The cyclone underflow returns to the ball mill for further regrind.
The aforementioned magnetic separation circuit was sized from Vendor handbook information. For this Study, this circuit is assumed to constitute eight double drum (rougher/cleaner) LIMS units. Each unit is fed by the overflow of a dedicated cyclone. The underflow of each cyclone is directed by launders into a single pump box and pumped to the ball mill feed chute.
The cleaner LIMS concentrate constitutes the final magnetic plant concentrate. It is collected in a pump box and pumped to two disc filters, each of 2.7 m diameter with 12 discs. The filters were sized by an equipment Vendor based on the regrind particle size indicated. Each filter is equipped with a steam hood in order to reduce humidity during the winter months, much the
September 2011
17-15
Alderon Iron Ore Corp.
NI 43-101 Technical Report — PEA of the Kami Iron Ore Project | 
|
same as what is done on the spiral concentrate at the pan filters. The final magnetic plant concentrate from the disc filters is discharged onto a conveyor and directed onto the concentrate collection conveyor where it is combined with the spiral concentrate and directed to the concentrate load-out silo.
The cleaner LIMS non-magnetic tailings are collected by a series of launders and directed by gravity to the two tailings pump boxes where they are combined with the tailings of the cobbing circuit, as discussed previously.
17.8 Consolidated Concentrate and Tailings Production
Table 17.4 shows the proportions of concentrate produced by the spiral circuit and by the magnetic separation plant. This table also shows the proportion of coarse tailings (+100 microns) and fine tailings (-100 microns) generated. The coarse tailings are produced at the tailings dewatering cyclone underflow whereas the fine tailings are produced at the thickener underflow. The table shows annual quantities as well as hourly quantities used for plant design.
September 2011
17-16
Alderon Iron Ore Corp.
NI 43-101 Technical Report — PEA of the Kami Iron Ore Project |
|
Table 17.4: Design Basis Showing Consolidated Concentrate and Tailings Production
PROCESS DESIGN BASIS
| | Annual
(Nominal) | | Minimum | | Nominal | | Design | |
| | M t/y | | t/h | | t/h | | t/h | |
Grinding Capacity
(Fresh Feed) | | 21.2 | | 2282 | | 2685 | | 3088 | |
Concentrate
Production | | 8.0 | | 863 | | 1015 | | 1167 | |
Spiral Concentrate | | 6.2 | | 671 | | 790 | | 908 | |
Mag Plant Concentrate | | 1.8 | | 191 | | 225 | | 258 | |
Tailings
Generated | | 13.2 | | 1420 | | 1670 | | 1921 | |
Coarse Tailings | | 8.0 | | 866 | | 1019 | | 1172 | |
Fine Tailings | | 5.1 | | 554 | | 651 | | 749 | |
Wt Rec % | | 37.79 | % |
Fe Rec % | | 82.8 | % |
Plant Utilization % | | 90.0 | % |
Head Grade %Fe | | 29.90 | % |
Con Grade %Fe | | 65.50 | % |
Design to Nominal +/-15% | |
17.9 Concentrate Conveying and Load-Out
The concentrate discharged from the pan filters and the disc filters is collected on a common 1,067 mm wide (42’’) belt conveyor. This conveyor empties onto the transfer conveyor which normally discharges into the concentrate load-out silo. The load-out silo can be bypassed if required and concentrate can be directed onto an outside emergency stockpile. Concentrate from the outside emergency stockpile is reclaimed as required by loader which dumps into a hopper feeding a 609 mm (24”) wide reclaim conveyor belt and returned onto the load-out conveyor feeding the silo. Concentrate from the load-out silo is loaded into railcars by two silo discharge feeders. Weight in the railcars is controlled by controlling the railcar advancement speed and feeder feed rate with a feedback signal from a rail weigh scale.
September 2011
17-17
Alderon Iron Ore Corp.
NI 43-101 Technical Report — PEA of the Kami Iron Ore Project |
|
17.10 Tailings Dewatering and Pumping to Tailings Pond
As previously mentioned, two pump boxes collect the combined final tailings from the magnetic separation plant. Slurry from each pump box is pumped to a dewatering cyclone cluster. The cyclone underflow is directed into a single tailings collection pump box. Cyclone overflow is directed to the plant thickener. The thickener will be a high rate thickener design, in the order of 46 m in diameter. This will need to be validated by testwork planned in the next study phase. Flocculant and coagulant are added to the thickener feed stream to promote settling and to maintain process water clarity. The clarified thickener overflow stream flows by gravity to the process water tank and constitutes the main source of process water for the plant’s operation.
The underflow from the thickener consists of fine tailings. It is normally pumped to the tailings pump box and combined with the underflow from the dewatering cyclone clusters. This constitutes final plant tailings which are pumped to the tailings pond. Design for this study provides for two tailings pumping lines, one operating and one back-up. For the first two years of operation, it is planned to pump the tailings a distance of 3 km through a single pipeline. In the third year of operation, tailings will be pumped to a distance of up to 5.5 km. Design for tailings line is based on having two, three-stage pumping systems at the concentrator with a 406 mm diameter (16”) rubber lined, Victaulic pipeline. Furthermore, considering the pumping distance, a single-stage booster pump at kilometer 3 is assumed to be required and is included in the design. In order to minimize costs, design provides that the twin pipeline is maintained only to kilometer 3. Beyond kilometer 3, only one booster pump line and pipeline is provided. If the booster pump is not available, operations can continue by temporarily pumping into the tailings pond in a designated area. This needs to be validated in the next study phase once pumping distances and elevations are developed in more detail.
Design provides for the possibility to pump the fine tailings separately from the coarse tailings for spigotting during the summer months, requiring the use of the two tailings pump lines. Spigotting practice is successfully used in many operations as an integral part of their tailings management program.
September 2011
17-18
Alderon Iron Ore Corp.
NI 43-101 Technical Report — PEA of the Kami Iron Ore Project |
|
17.11 General Concentrator Plant Services
General plant services for the concentrator are as follows. In this Study, services have not been specifically quantified but rather estimated based on BBA’s reference projects or developed mass and water balance. Capital costs have been estimated accordingly.
17.11.1 Compressed Air
Compressed air requirements have been assumed similar to BBA’s reference project and capital costs for the compressed air distribution network have been estimated accordingly. For the concentrator, it is assumed that two (one operating and one standby), compressors with a capacity of 2000 scfm each will be required. A desiccant dryer of equivalent capacity is also assumed for supply of instrument air. An emergency compressor with a capacity of 200 scfm is also provided.
17.11.2 Freshwater
Freshwater, used for potable water, gland seal water and cooling water, is pumped from a nearby source at Duley Lake. In this study, BBA assumed the same freshwater requirements and configuration as in its reference projects, and capital costs have been estimated accordingly. Design provides for one operating pump, one standby pump and one emergency pump operating on diesel. The plant fire loop is supplied by this system.
A single freshwater tank, for seal water and for cooling water, is provided in the design, for distribution throughout the concentrator. A low pressure pumping system supplies gland seal water and cooling water. A high pressure pumping system supplies gland seal water to the multi-stage pumps operating at a higher pressure, including the tailings pumps.
September 2011
17-19
Alderon Iron Ore Corp.
NI 43-101 Technical Report — PEA of the Kami Iron Ore Project |
|
17.11.3 Process Water
A guiding principle of the water management program proposed for the Kami operation is to maximize water recirculation and minimize freshwater usage. A preliminary water balance was presented in Figure 17.4 of this section. Plant process water requirements have been estimated and are in line with similar operations and BBA’s reference projects. Design provides an above-ground steel process water tank in proximity to the concentrator building and to the thickener. The main source of process water comes from the thickener overflow. The level in the process water tank is controlled by modulating water reclaim from the tailings pond polishing basin.
Process water distribution is provided by a piping network throughout the plant. Six process water pumps, four operating and two standby are used to provide the required flow and pressure throughout the plant. Process water quality should be adequate for general use, however, a strainer is provided for filtering wash water for the rougher spiral which require a higher level of water quality for trouble-free operation.
17.11.4 Fire Protection
Design provides for a plant-wide fire protection system within the spiral area as well as electrical rooms and other high risk areas. Final design will confirm fire protection in further detail in order to conform to local regulations along with the Insurer’s requirements.
17.11.5 Steam
Steam is used during the winter months for both heating of buildings as well as for drying concentrate in order to reduce humidity for rail transport. An oil-fired steam boiler facility using No. 2 light oil is included in this study design. It is assumed that steam is produced in a central boiler house at the concentrator and distributed throughout. Considering the distance from the concentrator to the crusher, the mine garage and the concentrate load-out, design provides that these areas will have local oil heating systems. An estimate of steam requirements was performed based on BBA’s reference projects. The following table presents an estimate of
September 2011
17-20
Alderon Iron Ore Corp.
NI 43-101 Technical Report — PEA of the Kami Iron Ore Project |
|
steam requirements for the purpose of calculating fuel oil requirements for OPEX estimating, as well as for preliminary design of the boiler facility.
Table 17.5: Kami Steam Requirement Estimate
Steam | | Steam | | #2 Oil | |
Peak | | Consumption | | Consumption | |
lb/h | | thousand lb/y | | liters | |
Kami Steam Requirement Estimate
Annual Concentrate Production 8 000 000 TPY
Concentrator & Crusher Buildings | | 55 035 | | 180 524 | | 5 601 664 | |
Maintenance/Warehouse Offices | | 20 020 | | 63 423 | | 1 968 016 | |
5% | | 3 753 | | 12 197 | | 378 484 | |
Total Heating Load | | 78 807 | | 256 144 | | 7 948 164 | |
Pan filters | | 49 472 | | 62 326 | | 1 933 986 | |
5% | | 2 474 | | 3 116 | | 96 699 | |
Process Load | | 52 000 | | 65 000 | | 2 030 685 | |
Total | | 130 807 | | 321 144 | | 9 978 849 | |
As can be seen, boiler peak capacity is in the order of 130,000 lb/h of steam. Boiler steam generating capacity has been based on peak steam demand. Design provides for three 90,000 lb/h oil-fired boilers, two operating and one standby.
17.12 Process Design Criteria
Table 17.6 presents the general process design criteria for the concentrator. This information is used to develop preliminary sizing of equipment and the major process equipment list.
September 2011
17-21
| | 
|
Alderon Iron Ore Corp. | |
NI 43-101 Technical Report — PEA of the Kami Iron Ore Project | |
Table 17.6: Process Design Criteria
PROCESS DESIGN CRITERIA
KAMI IRON ORE PROJECT PRELIMINARY ECONOMIC ASSESSMENT
Source Data References
A | | Testwork |
B | | Assumed - Based on Experience |
C | | Vendor-Supplier Information |
D | | Calculated |
E | | Process Requirement, Project Internal Design |
F | | Mine Plan |
G | | BBA Reference Projects |
H | | Plant Layout |
Parameter | | Value | | Units | | Source | |
| | | | | | | |
PLANT DESIGN BASIS | | | | | | | |
| | | | | | | |
Plant operating days per week | | 7 | | days | | E | |
Plant operating hour per day | | 24 | | hours | | E | |
Total spiral concentrate production (dry) | | 8.0 | | Mtpy | | E | |
Ore crushed (dry) | | 21.2 | | Mtpy | | A | |
Ore moisture content | | 1.5 | | % | | B | |
Concentrate grade | | 65.5 | | %Fe | | E | |
Fe recovery | | 82.8 | | % | | A | |
Concentrate weight recovery | | 37.8 | | % | | A | |
Ore Specific Gravity | | 3.5 | | kg/m³ | | A | |
Plant Utilization | | 90 | | % | | B | |
Iron in ore | | 29.9 | | % Fe | | F | |
Hematite in ore (including non-recoverable iron) | | 16.5 | | % Fe2O3 | | F | |
Magnetite in ore | | 25.5 | | % Fe3O4 | | F | |
| | | | | | | |
CRUSHING | | | | | | | |
| | | | | | | |
Crusher | | | | | | | |
Number of crusher units | | 1 | | — | | H | |
Type / model of crusher | | Gyratory, 60” x 89” | | — | | C | |
Feed opening | | 1525 | | mm | | C | |
Utilization | | 75 | | % | | B | |
Required power | | 416.0 | | kW | | A | |
Installed power | | 600.0 | | kW | | G | |
Crusher Nominal Feedrate (wet) | | 3 271 | | t/h | | E | |
September 2011
17-22
| |
|
Alderon Iron Ore Corp. | |
NI 43-101 Technical Report — PEA of the Kami Iron Ore Project | |
PROCESS DESIGN CRITERIA
KAMI IRON ORE PROJECT PRELIMINARY ECONOMIC ASSESSMENT
Crushing design capacity - rated (wet) | | 3 762 | | t/h | | E | |
Bond Crushability Work Index | | 12.8 | | kWh/t | | A | |
Operating Work Index | | 0.17 | | kWh/t | | D | |
Feed material size, F100 | | 1220.0 | | mm | | G | |
Feed material size, F80 | | 800.0 | | mm | | G | |
Product size, P100 | | 250.0 | | mm | | G | |
Product size, P80 | | 150.0 | | mm | | G | |
Bulk density crushed ore | | 2.1 | | kg/m³ | | G | |
| | | | | | | |
Crushed Ore Stockpile | | | | | | | |
Crushed Ore Stockpile Live Capacity | | 9.5 | | h | | D | |
Crushed Ore Stockpile Live Capacity | | 26 000 | | t | | G | |
Crushed Ore Stockpile Total Capacity | | 113 000 | | t | | G | |
| | | | | | | |
GRINDING & SCREENING | | | | | | | |
| | | | | | | |
Grinding | | | | | | | |
Fresh feed to mill nominal (dry) | | 2 685 | | t/h | | E | |
Fresh feed to mill design (dry) | | 3 088 | | t/h | | E | |
Utilization required | | 90 | | % | | B | |
Circulating load from screens | | 35 | | % | | G | |
Circulating load from screens (dry) | | 940 | | t/h | | D,G | |
Spiral middling recirculated (dry) | | 134 | | t/h | | D,G | |
Mill type | | Autogenous | | — | | E,G | |
Mill size | | 11.0 Dx6.6 L
(6.02 EGL) | | mxm | | C | |
Number of mills | | 1 | | — | | E,H | |
Autogenous grinding operating work index, nominal | | 3.7 | | kWh/t | | A | |
Autogenous grinding operating work index, design | | 4.0 | | kWh/t | | A | |
Nominal power required | | 9 935 | | kW | | D | |
Design power required | | 11 425 | | kW | | D | |
Installed power | | 12 677 | | kW | | B,C | |
Feed size, F80 | | 165 | | mm | | D,G | |
Mill discharge product size, P80 | | 275 | | µm | | D,G | |
Mill discharge slurry density (solids) | | 65 | | % | | B | |
| | | | | | | |
Scalping Screens | | | | | | | |
Primary screen type | | Horizontal | | — | | B,H | |
Screen size | | 3.67 x 7.32 (12’ x 24’) | | m | | B | |
September 2011
17-23
| |
|
Alderon Iron Ore Corp. | |
NI 43-101 Technical Report — PEA of the Kami Iron Ore Project | |
PROCESS DESIGN CRITERIA
KAMI IRON ORE PROJECT PRELIMINARY ECONOMIC ASSESSMENT
Number of primary screens | | 2 | | — | | G,H | |
Screen opening | | 4.0 | | mm | | G | |
Primary screen feed slurry density (% solid) | | 65.0 | | % | | D | |
Primary screen feed rate - total (dry) | | 3 759 | | t/h | | D | |
Primary screen feed flow rate - total | | 3 117 | | m3/h | | D | |
Screen undersize product, P80 | | 800 | | µm | | D,G | |
Primary screen oversize recycle (dry) | | 10.0 | | % | | B,G | |
Primary screen oversize recycle (dry) | | 269 | | t/h | | D | |
| | | | | | | |
Classification Screens | | | | | | | |
Secondary screen type | | Banana | | — | | G,H | |
Screen size | | 4.28 x 8.66 (14’ x 28’) | | m | | G | |
Number of secondary screens | | 6 | | — | | G,H | |
Screen opening | | 0.850 | | mm | | G | |
Secondary screen feed rate - total (dry) | | 3 491 | | t/h | | D | |
Secondary screen feed slurry density (% solid) | | 50 | | % | | B | |
Secondary screen feed flow rate - total | | 4 505 | | m3/h | | D | |
Screen undersize product, P80 | | 275 | | µm | | D | |
Secondary screen oversize recycle (dry) | | 25.0 | | % | | B | |
Secondary screen oversize recycle (dry) | | 671 | | t/h | | D | |
| | | | | | | |
GRAVITY CONCENTRATION | | | | | | | |
Type | | 3 stage spiral circuit | | | | B | |
Rougher Spirals | | | | | | | |
Nominal Capacity per start (including recirculation,solids) | | 3.5 | | t/h | | G | |
Number double start spirals installed | | 448 | | — | | D,H | |
Double start spirals per bank | | 14 | | — | | D,H | |
Number of banks installed | | 32 | | — | | D,H | |
Rougher Spiral Feed | | | | | | | |
Feed rate - total (dry) | | 2 886 | | t/h | | D | |
Feed rate per spiral start (dry) | | 3.2 | | t/h | | D | |
Slurry density (solids) | | 40.0 | | % | | G | |
| | | | | | | |
Cleaner Spirals | | | | | | | |
Nominal Capacity per start (including recirculation, solids) | | 2.2 | | t/h | | G | |
September 2011
17-24
| |
|
Alderon Iron Ore Corp. | |
NI 43-101 Technical Report — PEA of the Kami Iron Ore Project | |
PROCESS DESIGN CRITERIA
KAMI IRON ORE PROJECT PRELIMINARY ECONOMIC ASSESSMENT
Number double start spirals installed | | 448 | | — | | D,H | |
Double start spirals per bank | | 14 | | — | | D,H | |
Number of banks installed | | 32 | | — | | D,H | |
Cleaner Spiral Feed | | | | | | | |
Feed rate - total (dry) | | 1 115 | | t/h | | D | |
Feed rate per spiral start (dry) | | 1.24 | | t/h | | D | |
Slurry density (solids) | | 40.0 | | % | | G | |
| | | | | | | |
Recleaner Spirals | | | | | | | |
Type | | EDI-WW6 | | — | | G | |
Nominal Capacity per start (including recirculation) | | 2.2 | | t/h | | G | |
Number double start spirals installed | | 448 | | — | | H | |
Double start spirals per bank | | 14 | | — | | D,H | |
Number of banks installed | | 32 | | — | | D,H | |
Recleaner Spiral Feed | | | | | | | |
Feed rate - total (dry) | | 913 | | t/h | | D | |
Feed rate per spiral start (dry) | | 1.0 | | t/h | | D | |
Recleaner Spiral Conc. | | | | | | | |
Concentrate production (dry) | | 790 | | t/h | | D | |
Slurry density (solids) | | 50 | | % | | G | |
Grade | | 67.2 | | %Fe | | A | |
Total Iron Recovery | | 66.1 | | % | | A | |
Weight yield (as % of fresh feed to mill) | | 29.4 | | % | | A | |
Fine Middlings Dewatering Cyclone | | | | | | | |
Cyclone diameter | | 800.0 | | mm | | B | |
Required cut size | | 35.0 | | µm | | E | |
Number of clusters | | 2 | | — | | C,H | |
Number of cyclones per cluster | | 4 (3 operating, 1 spare) | | — | | C,E | |
Cyclone feed | | | | — | | | |
Solids feed rate | | 124 | | t/h | | D | |
Solids d50 | | 35.0 | | µm | | B,C | |
Slurry feed rate | | 5 131 | | m³/h | | D | |
Slurry density (solids) | | 2.4 | | % | | D | |
| | | | | | | |
MAGNETIC SEPARATION | | | | | | | |
| | | | | | | |
Cobbing LIMS | | | | | | | |
Type | | Cobbing LIMS | | — | | B | |
September 2011
17-25
| |
|
Alderon Iron Ore Corp. | |
NI 43-101 Technical Report — PEA of the Kami Iron Ore Project | |
PROCESS DESIGN CRITERIA
KAMI IRON ORE PROJECT PRELIMINARY ECONOMIC ASSESSMENT
Capacity (dry) | | 120 | | t/h·m (drum length) | | C | |
Volumetric Capacity | | 240 | | m3/h·m (drum length) | | C | |
Number of units | | 8 | | — | | D,H | |
Size (diameter x drum length) | | 1 200 x 3 600 | | mm | | C,D | |
Solids feed rate | | 1 772 | | t/h | | D | |
Feed | | | | | | | |
Magnetite | | 9.9 | | % | | A,D | |
Slurry density (solids) | | 30 | | % | | D | |
Flow rate (total) | | 4 723 | | m³/h | | D | |
Flow rate per unit length | | 164 | | m³/h/m of drum | | D | |
Feed size, P80 | | 250 | | µm | | B | |
Regrind Mill Circuit Classification Cyclones | | | | | | | |
Cyclone diameter | | 650 | | mm | | C | |
Required cut size | | 106 | | µm | | A,D | |
Number of clusters | | 8 | | — | | C | |
Number of cyclones per cluster | | 1 (8 operating, 0 spare) | | — | | B | |
Recirculating load to ball mill | | 250 | | % | | D | |
Cyclone feed | | | | — | | | |
Solids feed rate | | 2 806 | | t/h | | D | |
Solids d50 | | 75 | | µm | | D | |
Slurry feed rate | | 2 982 | | m³/h | | D | |
Slurry density (solids) | | 57.3 | | % | | D | |
| | | | | | | |
Regrind Ball Mill | | | | | | | |
Mill type | | Ball mill | | — | | B | |
Mill size (DIA X L) | | 7 X 9.6 EGL | | mxm | | A,C | |
Number of mills | | 1 | | — | | E,H | |
Feed to mill | | 802 | | t/h | | D | |
Recirculating load | | 250 | | % | | B | |
Utilization required | | 90 | | % | | B | |
Bond Work Index, design | | 18.5 | | kWh/t | | A | |
Operating Work Index | | 7.6 | | kWh/t | | A,D | |
Total required power | | 7637.0 | | kW | | C,D | |
September 2011
17-26
| |
|
Alderon Iron Ore Corp. | |
NI 43-101 Technical Report — PEA of the Kami Iron Ore Project | |
PROCESS DESIGN CRITERIA
KAMI IRON ORE PROJECT PRELIMINARY ECONOMIC ASSESSMENT
Total installed power | | 2 X 4100 | | kW | | B,C | |
Feed size, F80 | | 266 | | µm | | B,D | |
Mill discharge product size, P80 | | 106 | | µm | | B | |
Mill discharge slurry density (solids) | | 70 | | % | | B | |
| | | | | | | |
Rougher / Cleaner LIMS | | | | | | | |
Type | | Rougher / Cleaner LIMS | | — | | C,H | |
Capacity (dry) | | 60 | | t/h·m (drum length) | | C | |
Volumetric Capacity | | 130 | | m3/h·m (drum length) | | C | |
Size (diameter x drum length) | | 1 200 x 3 600 Double Drum | | mm | | C,D | |
Number of units | | 8 | | — | | H | |
Feed | | | | | | | |
Solids feed rate | | 802 | | t/h | | D | |
Magnetite | | 25.7 | | % | | B,D | |
Slurry density (solids) | | 25.0 | | % | | G | |
Flow rate (total) | | 1 679 | | m³/h | | D | |
Flow rate per unit length | | 58.3 | | m³/h/m of drum | | D | |
Feed size, P80 | | 106.0 | | µm | | B,D | |
| | | | | | | |
CONCENTRATE DEWATERING AND COLLECTION | | | | | | | |
| | | | | | | |
Spiral Concentrate Pan Filters | | | | | | | |
Filter type | | Horizontal pan filter | | — | | C,G | |
Number of filters | | 4 | | — | | C,G | |
Filter diameter | | 7.3 | | m | | D,H | |
Discharge type | | Scroll | | — | | D,E | |
Total filter feed: | | | | | | | |
Solids feed rate | | 790 | | t/h | | D | |
Slurry density (% solids) | | 50 | | % wt | | D | |
Filter cake moisture | | 5 | | % | | D | |
Steam addition | | Yes | | — | | D | |
September 2011
17-27
| |
|
Alderon Iron Ore Corp. | |
NI 43-101 Technical Report — PEA of the Kami Iron Ore Project | |
PROCESS DESIGN CRITERIA
KAMI IRON ORE PROJECT PRELIMINARY ECONOMIC ASSESSMENT
Mag Plant Concentrate Disc Filters | | | | | | | |
Filter type | | Vertical disc | | — | | B,C | |
Number of filters | | 2 | | — | | C,H | |
Filter diameter | | 2.7 | | m | | C | |
Number of disc per filter | | 12 | | | | C,E | |
Total filter feed: | | | | | | | |
Solids feed rate | | 225 | | t/h | | D | |
Slurry density (% solids) | | 65 | | % wt | | D | |
Filter cake moisture Max | | 8 | | % | | C | |
Steam addition | | Yes | | — | | E,C | |
| | | | | | | |
TAILING DEWATERING AND PUMPING | | | | | | | |
| | | | | | | |
Tailings Dewatering Cyclones | | | | | | C,G | |
Cyclone diameter | | 800 | | mm | | C,G | |
Required cut size | | 106 | | µm | | D,H | |
Number of clusters | | 2 | | — | | D,E | |
Number of cyclones per cluster | | 5 (4 operating, 1 spare) | | — | | | |
Cyclone feed | | | | | | D | |
Solids feed rate | | 1670 | | t/h | | D | |
Solids d50 | | 120 | | µm | | D | |
Slurry feed rate | | 7730 | | m³/h | | D | |
Slurry density (solids) | | 18.9 | | % | | | |
| | | | | | | |
Tailing Thickener (Fine Tailings) | | | | | | C,E | |
Thickener type | | High Rate | | — | | E,H | |
Number of thickeners | | 1 | | — | | B,D | |
Thickener diameter | | 46 | | m | | G | |
Hydraulic capacity at nominal flow | | 7.2 | | m3/m2.h | | G | |
Thickening Capacity | | 0.29 | | t/m2.h | | | |
Thickener feed | | | | — | | D | |
Solids feed rate | | 652 | | t/h | | B,D | |
Solids d80 | | 106 | | µm | | D | |
Specific gravity of solids | | 2.9 | | t/m3 | | D | |
Slurry flow rate | | 10 865 | | m3/h | | D | |
Solids density (% solids) | | 5.8 | | % | | | |
Thickener underflow: | | | | | | D | |
Solids discharge rate | | 652 | | t/h | | D | |
Slurry flow rate | | 1 019 | | m³/h | | B | |
September 2011
17-28
| |
|
Alderon Iron Ore Corp. | |
NI 43-101 Technical Report — PEA of the Kami Iron Ore Project | |
PROCESS DESIGN CRITERIA
KAMI IRON ORE PROJECT PRELIMINARY ECONOMIC ASSESSMENT
Solids density (% solids) | | 45 | | % wt | | | |
Thickener overflow | | | | | | B,E | |
Solids concentration in overflow | | <100 | | ppm | | D | |
Water flow rate | | 9 841 | | m3/h | | | |
| | | | | | | |
Tailing Lines | | | | | | E | |
Number of lines | | 2 (1 operating, 1 stand by) | | — | | G | |
Pipe material | | Steel, rubberlined | | — | | B | |
Line diameter | | 406.4 (16’’) | | mm | | H | |
Principal Line length | | 5.5 | | km | | H | |
Stand-by Line length | | 3 | | km | | C,G | |
| | | | | | | |
CONCENTRATE LOADOUT | | | | | | | |
| | | | | | | |
Concentrate Load-Out Silo | | | | | | | |
Number of silos | | 1 | | — | | E | |
Silo type | | Funnel flow, concrete | | — | | G | |
Silo size | | 13.04 DIA X 33.8 H | | m | | E | |
Concentrate bulk density | | 2647.0 | | kg/m³ | | G | |
Storage capacity (wet) | | 24 000 | | t | | G | |
Storage capacity | | 22.5 | | h | | D | |
17.13 Major Process Equipment List
Table 17.7 presents the major process equipment list used as the basis for developing the Capital Cost Estimate.
September 2011
17-29
| | 
|
Alderon Iron Ore Corp. | |
NI 43-101 Technical Report — PEA of the Kami Iron Ore Project | |
Table 17.7: Major Process Equipment List
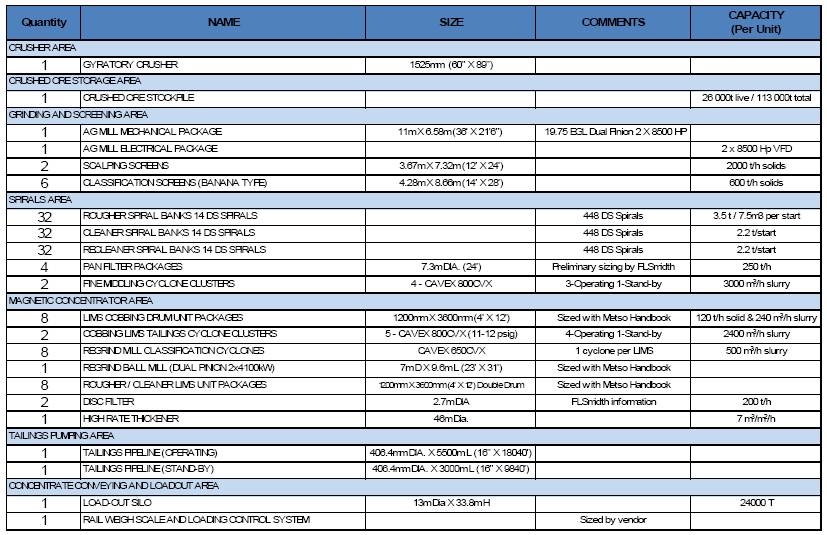
September 2011
17-30
| | 
|
Alderon Iron Ore Corp. | |
NI 43-101 Technical Report — PEA of the Kami Iron Ore Project | |
18. PROJECT INFRASTRUCTURE
This section describes the major infrastructure required to support the Project, both at the Kami site as well as off site and at the Sept-Îles port facility.
18.1 General Kami Site Plot Plan
The general Kami site preliminary plot plan, presented in Figure 18.1 was developed for this Study. The following approach was taken to develop the site plan:
· As a first step, a review of the Property was done by BBA in collaboration with the Alderon exploration team and with Stantec. The known and potential mineralization areas on the Property were identified, and as a rule, site infrastructure was kept outside of the boundaries of the mineralization zones;
· With the block model for the Mills and Rose Central deposits, the optimized pit shell was developed for both pits and was outlined on the site plan;
· In order to minimize impact on the environment and to facilitate permitting, land management areas were identified. These areas were avoided where possible when developing site infrastructure plan;
· Considering that the western portion of the Property contains the principal mineralization zones and that there is a provincial park to the northwest, it was decided that access to the site should be from the northeast, just south of Labrador West. The rail loop and rail spur connecting to the QNSL main line, the access road to the site, as well as the routing of the electric power line connecting to the power grid, are therefore all situated to the northeast of the Property and south of the Elephant Head Management Area. The tailings pond is located in a convenient area taking up much of the southeast area of the Property;
· With the aforementioned areas dedicated to the described functions, the process plant was then located on the site plan. The primary crusher was conveniently and appropriately located in the vicinity of the Rose Central pit, therefore in proximity of the mineralization
September 2011
18-1
| |
|
Alderon Iron Ore Corp. | |
NI 43-101 Technical Report — PEA of the Kami Iron Ore Project | |
zone. The concentrator was located eastwards from the crusher in an area in proximity of the rail loop and the tailings pond. The final location of the concentrator will be determined once geotechnical data is available. The crusher, crushed ore stockpile, and the concentrator are connected by conveyor for transporting the ore. The mine garage and mine service facilities are located in proximity of the crusher and Rose Central pit. The concentrator is connected to the load-out silo also by a conveyor system;
· The Rose Central and Rose North mineral deposits are located directly within the Pike Lake South Management Area. This is the principal land management area impacted by the Project;
· For this Study, waste dumps have been located the closest possible to the Rose Central and Mills pits to optimize the mining operation. The final waste dump footprint and designated areas will be confirmed once exploration is at a more advanced stage;
· For this Study, it is assumed that access to the plant will be by a new access road from the plant to the existing road 503, which is assumed to be adequate to handle normal traffic to the plant;
· For this study, it is assumed that NALCOR will, in the near future, build a 230 kV (or 315 kV) line running along the Bloom Lake railway, and the power line supplying the Kami site will connect to this line as shown on the site plan in Figure 18.1.
September 2011
18-2
| | 
|
Alderon Iron Ore Corp. | |
NI 43-101 Technical Report — PEA of the Kami Iron Ore Project | |
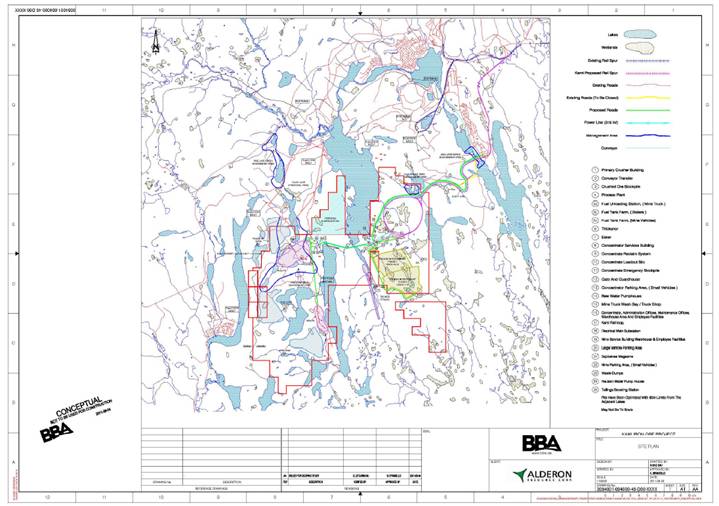
Figure 18.1: Site Plan Kami Iron Ore Project
September 2011
18-3
| | 
|
Alderon Iron Ore Corp. | |
NI 43-101 Technical Report — PEA of the Kami Iron Ore Project | |
The following section provides a descriptive legend to the general site plan presented.
Item | | Reference | | Description and Design Basis |
| | | | |
KAMI Rail Spur | | 

| | · Rail loop is located in the North-East area of the Property. · The rail spur connects to QNSL with a new railway passing south and east of the Town of Wabush. · A short spur from the loop (2 km length) is provided to store fuel tanker cars for fuel unloading. |
| | | | |
Access Road to Property | | 
| | · The access road to the Property will be through a new road replacing the existing starting from 31 St. to Property line (length of 6.2 km, width of 6.8 m). · The access road will be available for traffic to site as well as local traffic accessing private Property. · For safety reasons, the road will avoid crossing the KAMI railway. · It is assumed that road 503 will not need modifications. |
| | | | |
On Site Road Work | | 
| | · On-site road to the concentrator area will be south of Elephant Head Management Area and east of Long Lake from Property line to concentrator (length of 4.7 km, width of 6.8 m). · Road access from the concentrator to the crusher and to the mine services building crosses the narrowest point south of Long Lake (length of 3.8 km, width of 6.8 m). · Road from fuel unloading station to concentrator (length 1.2 km, width of 6.8 m). · Gate, guard house, and truck weigh scale are provided. |
| | | | |
Primary Crusher Building | | 
| | · Primary crusher building is located in proximity of Rose Central pit. · Access roads connect the crusher building to the concentrator and to the mine services building. · A mine road connects Rose Central pit and Mills pit to the crusher. |
September 2011
18-4
| | 
|
Alderon Iron Ore Corp. | |
NI 43-101 Technical Report — PEA of the Kami Iron Ore Project | |
Item | | Reference | | Description and Design Basis |
| | | | |
Crushed Ore Stockpile | | 
| | · Crushed ore stockpile design provides a capacity of about 25,000 t live capacity (110,000 t of total capacity). |
| | | | |
Process Plant | | 
| | · The process plant consists of a concentrator and ancillary process areas including thickener, tailings pumping, boiler house, laboratory, etc. · The process plant is situated east of the narrowest waterway south of Long Lake. · The process plant location was determined in considering a relatively short concentrate conveyor to minimize concentrate heat lost during winter and proximity to the tailings pond in order to minimize capital and operating costs for tailings disposition. |
| | | | |
Crushed Ore Conveyors | | 
| | · Crushed ore is conveyed from crusher to stockpile using two conveyors, one being a stacker conveyor. · Crushed ore is reclaimed from the stockpile and conveyed to the AG mill feed chute. |
| | | | |
Fuel Unloading and Tank Farm | | 
| | · Fuel for the mine trucks and the boilers will be transported by rail from Sept-Îles. · Fuel will be unloaded from an extension of the rail spur into two different unloading and storage tanks (5a) depending on oil type · Storage tanks for the mine truck diesel fuel will have a two week storage capacity consisting of two 700,000 liter reservoirs, one located at the unloading station and one at the mine. · A mine truck fueling station is provided in proximity of the fuel tanks. · Storage tanks for the boilers will have a nominal 10 days storage capacity consisting of two 500,000 liter reservoirs, one located at the unloading station and one at the concentrator in proximity of the boiler house. · Fuel will be transferred from the unloading/storage reservoirs by tanker truck (by contractor) to the boiler house (5b) tanks, or to the mine fueling station (5c). |
September 2011
18-5
| |
|
Alderon Iron Ore Corp. | |
NI 43-101 Technical Report — PEA of the Kami Iron Ore Project | |
Item | | Reference | | Description and Design Basis |
| | | | |
Esker | | 
| | · The Esker located south of Long Lake will provide construction materials for the Project. |
| | | | |
Concentrate Load-Out | | 
| | · Concentrate is conveyed from the concentrator to a load-out silo of 24,000 t capacity. · The silo can be bypassed to an outside concentrate stockpile (in case of railway problems). · A concentrate reclaim system will return concentrate from the outside stockpile to the load-out silo. |
| | | | |
Parking Areas | | 

| | · Parking for employee vehicles and other light service vehicles is provided in proximity of the concentrator building as well as the mine services building. · Parking area for mine trucks and heavy equipment is located in proximity of mine garage. |
| | | | |
Administration, Offices and Employee Facilities | | 
| | · The main administration building and offices are located adjacent to the concentrator. · Employee facilities and plant offices are located at the concentrator and at the mine services building. |
| | | | |
| | 
| | |
| | | | |
Mine Truck Wash Bay and Truck Maintenance Shop | | 
| | · In the first two years of operation only, a temporary sprung structure maintenance garage will be built along with permanent workshop and warehouse. · In the third year of operation, a six-bay mine truck shop, a light vehicle maintenance area, a truck washing station, and tire shop building will be built and will be located ahead of the mine garage. · Warehousing facilities will be located at the concentrator and at the mine services building. · Maintenance shops are located at the concentrator and at the mine services building. · An assay laboratory and core sample storage and preparation area will be provided. |
September 2011
18-6
| |
|
Alderon Iron Ore Corp. | |
NI 43-101 Technical Report — PEA of the Kami Iron Ore Project | |
Item | | Reference | | Description and Design Basis |
| | | | |
Raw Water Pump House | | 
| | · Raw water pump house will be located south of Long Lake. · Length of the water pipeline from the raw water pump house to the concentrator is estimated at 0.46 km. |
| | | | |
Explosives Magazine | | 
| | · Explosives storage is located near the mine and will be managed by contractor. |
| | | | |
Power Transmission Line
and
Electrical Main Substation | | 
| | · 230 (or 315) kV substation is located to the north of concentrator building. · It is assumed that power will be available from Churchill Falls or from Quebec (Section 18.2). · 230 kV power line will follow the KAMI railway. At Wanhanish Lake, the power line will pass west of Labrador West and will connect to the new 230 kV line tying Quebec to Wabush Terminal Station. |
| | | | |
| | 
| | · Assumed a tie-in point as indicated on site plan. · Length of the power line from substation to tie in point is estimated at 13.7 km. |
| | | | |
Waste Piles | | 
| | · Main waste pile for Rose Central pit will be located north of Rose Central pit and south of the Provincial Park within the existing Kami Property line. · An area south of Rose Central pit will also be used. · An area south of Mills pit has been identified for waste rock from Mills. |
| | | | |
Tailings Pond | | 
| | · Tailings pond will be located on the east part of the Property in an area where natural topography facilitates tailings disposal and management (validated at site visit). · Tailings water natural drainage will be from south to north towards the concentrator building. · A polishing pond will collect tailings water to be recycled back to the process water tank. · Tailings pond pipeline is estimated to be 5.5 km with a booster pump provided at kilometer 3. |
September 2011
18-7
| |
|
Alderon Iron Ore Corp. | |
NI 43-101 Technical Report — PEA of the Kami Iron Ore Project | |
Item | | Reference | | Description and Design Basis |
| | | | |
Land Management Areas | | 
| | · Design provides that the Elephant Head Management Area will not be affected by the Project. · Pike Lake South Management Area will be impacted by Rose Central pit. |
| | | | |
Temporary Construction Camp | | | | · Camp and worker facilities will be built in Labrador West, not within the KAMI Property. · Permanent employees will reside in Wabush and Labrador City. |
| | | | |
General | | | | · Communications systems (internal and external) will be provided to support operations and to provide a safe and secure environment. · Sanitary facilities and sewage treatment systems as well as domestic waste disposal are provided according to local conditions and requirements. |
Major building structures will be made of steel with pre-painted steel cladding. Concrete foundations will consist of spread footings, however, a more detailed geotechnical survey will determine if piling will be required. Secondary buildings will be of pre-engineered or prefabricated type when applicable. Temporary buildings and warehousing will be of “sprung structure” type.
Slurry and process water pipelines will generally run above ground although some pipework may be buried.
Design provides for domestic sewage treatment. A sewage treatment unit will be located near the concentrator and a separate one will be located near the mine garage.
Security fencing will be provided but requirements will be established during the next study phase.
September 2011
18-8
| |
|
Alderon Iron Ore Corp. | |
NI 43-101 Technical Report — PEA of the Kami Iron Ore Project | |
18.2 Electricity
Site wide electric power requirements were estimated and a preliminary load list was developed. For the process, the major process equipment list presented in Figure 17.7 was used as a guide. Crushing and grinding power requirements were estimated based on ore grindability data. Power requirements for pumping, conveying, and other process equipment were estimated based on flow rates developed in the mass and water balance as well as from BBA’s reference projects database. Power requirements for the mine were estimated using Vendor specifications for the electric powered equipment selected. Power requirements for infrastructure and service buildings were also estimated from BBA’s reference projects. Table 18.1 presents the site-wide estimated power requirements and annual electrical consumption for the various sectors of the facility. As can be seen, the projected annual electrical consumption is in the order of 451 GWh and the power demand is estimated at 58.3 MW. These results have been used in the operating cost estimate. Furthermore, the load list was used to develop the preliminary electrical Single Line Diagram and to size major electrical equipment and components. The facility power requirements were then used to orient a study conducted by BBA to evaluate the options available for power transmission to the Kami mine site.
Emergency power will be provided by four diesel-powered gensets. Two 1200 kW units will be required for the concentrator, one for the crusher and one for the mine garage and offices.
September 2011
18-9
Alderon Iron Ore Corp.
NI 43-101 Technical Report — PEA of the Kami Iron Ore Project | 
|
Table 18.1: Kami Power Load Calculation
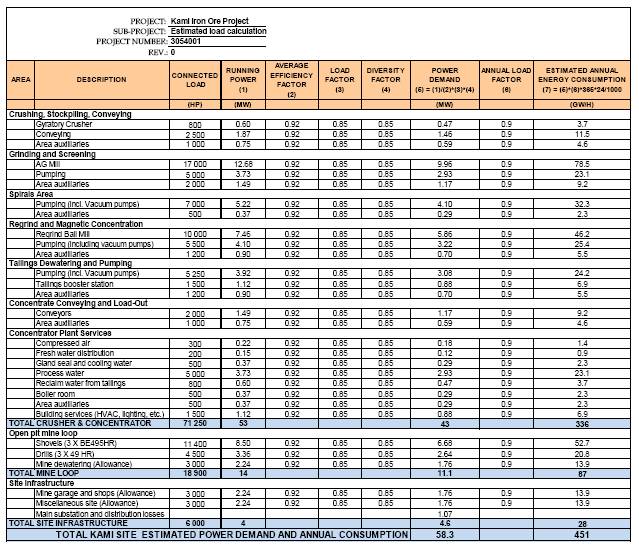
Figure 18.2 presents the preliminary SLD developed for the Kami Project. A list of the major electrical equipment and components for the main substation as well as for the local electrical rooms is also presented on the SLD drawing. This list of major equipment was used in developing the Capital Cost Estimate for the Project.
September 2011
18-10
Alderon Iron Ore Corp.
NI 43-101 Technical Report — PEA of the Kami Iron Ore Project | 
|
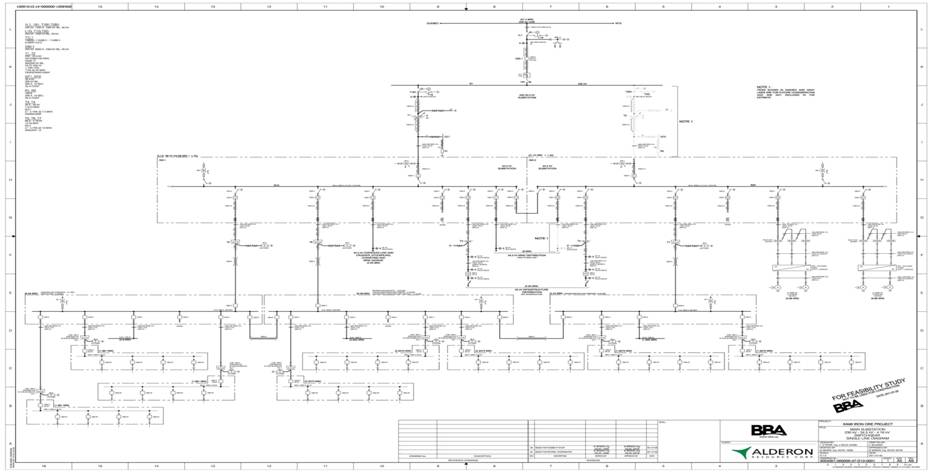
Figure 18.2: Kami Site Wide Electrical Single Line Diagram and Major Electrical Equipment List
September 2011
18-11
Alderon Iron Ore Corp.
NI 43-101 Technical Report — PEA of the Kami Iron Ore Project | 
|
18.2.1 Analysis of Electrical Power Supply Options to the Kami Site
In this Study, it was determined that the Kami mining and concentrating operation will require a power demand in the order of 60 MW. This assumes that winter building heating and concentrate drying is done using oil-fired boilers and not electric boilers for steam production. If electric boilers were to be considered, an additional 35 MW would be required along with an emergency oil-fired boiler. This solution would not be cost effective and is not considered further.
Considering the site plan presented in Figure 18.1, the main substation on the Kami Property would be located approximately 16 km from the Labrador West main substation, i.e. the Wabush Terminal Station (WTS), 230-46 kV. One option would be to pass new 46 kV overhead lines (from the WTS) to the Kami main substation through the designated corridor to provide power to the site. The current situation however is such that the 230 kV Twinco lines cannot provide sufficient power in the peak winter months (three months of the year) and only about 50 MW are available during the nine remaining months.
Alternatively, it is a known fact that both IOC and ArcelorMittal Mines Canada are negotiating with their respective public utility (HQ and NALCOR) for the construction of a 230 kV/315 kV tie line which would pass by the Bloom Lake site and would supply Bloom Lake with sufficient power to allow them to develop the second phase of their Project. Presently, the Bloom Lake site is fed at 34.5 kV from the 315-34.5 kV Normand substation at Mont-Wright. This would give Province of Newfoundland and Labrador the possibility of supplying the Alderon Project through a tap-off at 315 kV (or 230 kV) from this tie line. Based on the corridor for the aforementioned tap-off line as defined on the Kami site plan, this line would run a distance of 13.7 km.
The admissible peak power (400 MW) for the existing WTS 230 kV power system, supplied by two 230 kV transmission lines from Churchill Falls, has already reached the point where some load curtailment at IOC and Wabush Mines during winter is experienced. IOC must then shave its peak load by using its fuel boilers instead of its electric boilers and plan maintenance during periods of peak power demand. As for Wabush Mines, they must use their oil-fired boiler on a continuous basis in order to respect the original contract limited to 54 MW (take or pay).
September 2011
18-12
Alderon Iron Ore Corp.
NI 43-101 Technical Report — PEA of the Kami Iron Ore Project |
|
Furthermore, the power demand for the towns of Wabush and Labrador City has been increasing annually and is expected to continue to do so. Therefore, there is a serious risk that the situation will continue to deteriorate if nothing is done.
The solution to this problem has long been identified i.e., the addition of a third 230 kV line from Churchill Falls over a distance of 207 km requiring an investment in the range of $150M. This investment would not be justifiable for only an added load in the order of 60 MW (as required by Alderon), based on the economic principle of the marginal cost allocation of any power system expansion. However, at Churchill Falls, there is enough available power “Upon Recall” such that the financing of the 230 kV third line is only a problem for Labrador. Whereas Quebec, excluding the provincial jurisdiction prevailing in this matter, will have more than enough capacity to feed temporarily and/or for the long term, this new load from its 315 kV network, presently supplying Mont-Wright. As mentioned, this 315 kV network is in the process of being extended to Bloom Lake for Phase II of their Project as well as for the construction of the planned 315/230 kV tie line which is currently being negotiated between HQ and CFLco (Province of Newfoundland and Labrador). This is planned for 2013.
In light of the above and assuming that the capacity limitation issue at the Wabush terminal will be resolved in time for the Alderon Project, two (2) power supply options are available, namely:
1. A direct tap-off at 230 kV (or 315 kV) off the contemplated 230/315 kV tie line between neighboring networks (HQ and the Province of Newfoundland and Labrador). This option is applicable for site installation at Kami. This option would involve the following:
· Construction of a 230 kV line, 13.7 km long, on wooden poles, equipped with a 795 MCM, ACSR conductor;
· Construction of a 230-34.5 kV main substation at the Kami site, equipped with one 230-34.5 kV, 54/72/90/100 MVA main transformer with +10%/-15% OLTC in the case of a mine and concentrator project. A second transformer should be considered as an operating backup to share the load and mitigate the risk of a transformer failure which could stop production for up to a year in the case where a new transformer is required;
September 2011
18-13
Alderon Iron Ore Corp.
NI 43-101 Technical Report — PEA of the Kami Iron Ore Project |
|
2. The required 60 MW ± 10% load to operate the mine and concentrator, could also conceivably be obtained immediately at 46 kV from the WTS, providing a third 230 kV line from Churchill Falls to Wabush is added, since there is presently no additional power available from the WTS as is, with only two (2) 230 kV lines from Churchill Falls. To do so, a 46 kV line, directly fed from the WTS, having access to the two (2) main 46 kV busses, needs to be built. This option is considered marginal for the required power and is not recommended and would involve the following:
· Construction of two (2) outgoing bays at 46 kV at the WTS, assuming the Province of Newfoundland and Labrador will take over the 230-46 kV step-down transformer and, eventually, the creation of a third 46 kV bus;
· Construction of a 46 kV line, 12 km long, on wooden poles, equipped with a 1033 MCM, ACSR conductor, over insulated as required at 72 kV to take into account the high impedance neutral grounding at 46 kV of the WTS substation;
· Construction of an incoming 46 kV bay at the Alderon substation to have a backup from the existing 46 kV line in Fermont.
According to the preliminary order of magnitude cost estimate for each of the two (2) power supply options for the supply of 60 MW to the Kami Property, the cost of the 230 kV option is about 20% lower as shown in Table 18.2.
September 2011
18-14
Alderon Iron Ore Corp.
NI 43-101 Technical Report — PEA of the Kami Iron Ore Project |
|
Table 18.2: Comparison of Capital Cost of Options
| | Option 230 kV
1 x (230-34.5 kV,
54/72/90/100 MVA transformer) | | Option 46 kV
Two (2) line from the WTS | |
2 x 46 kV bus extension at the WTS | | — | | $ | 1.4M | |
0/H Line (About 14 km) | | $ | 8.4M | | $ | 15.4M | |
Alderon Main Substation | | $ | 12.3M | | $ | 7.2M | |
Total | | $ | 20.7M | | $ | 24.0M | |
Furthermore in the 46 kV option, the Province of Newfoundland and Labrador could request metering at the 46 kV incoming of the WTS, in which case, a present value of $4,000/kW of losses should be added for transportation losses at 46 kV, i.e. approximately $6.4M over 25 years. Depending on the outcome of negotiations with the Province of Newfoundland and Labrador, this additional amount ($6.4M), may apply to this option but would not apply to the 230 kV (315 kV) option.
It should be noted that, for Alderon, the optimum distribution voltage is 34.5 kV rather than 46 kV. However, the 46 kV distribution voltage could be imposed since it is currently used at the WTS. This is why the new 230 kV substation is equipped as required with a 230-34.5 kV transformation instead of 230-46 kV as is now the case at the WTS.
In the 230 kV option, a main electrical substation (230 — 34.5 kV) is necessary with firm power, according to the n-1 criterion. This would require that two main 230 — 34.5 kV, 54/72/90/100 MVA transformers be installed for a combined power of 100 MVA that would provide ample room for future expansion while at the same time mitigating the risk of curtailment of operations due to a transformer failure.
As the severe ice and frost conditions cannot be overlooked in the northern region, it should be noted that the cost of electrical lines is governed not so much by the voltage but rather by the size of the overhead line conductor i.e.:

| , where index 0 corresponds to the reference line. |
September 2011
18-15
Alderon Iron Ore Corp.
NI 43-101 Technical Report — PEA of the Kami Iron Ore Project | 
|
At 230 kV, a load current of 160 A and less would allow for using a very small conductor such as 4/0 ASCR and less. As a minimum, a 795 MCM, ACSR conductor must be considered because of the losses due to the corona effect and radio and TV interferences. However, at 46 kV, the Alderon load current being 800 A, 1033 MCM, ACSR is the optimum selection when considering the cost-plus investment compared to the present ohmic losses over the Project lifecycle, i.e. 25 years. For instance, the cost of the line (46 kV, 1033 MCM), in relation to the reference line at 230 kV, 795 MCM for which the estimated cost in Labrador is $600k/km, would be as follows:
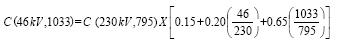

i.e. $624k/km at 46 kV
Alderon could benefit from having access to the backup line at 46 kV in Fermont for a 20 MW capacity. The line originating from the WTS could be used as backup for normal supply of the new Alderon load, and could provide power supply to the site during construction. This 46 kV line was built by QCM in the early 1980s to secure the electric supply of the town of Fermont should normal power supply from the HQ 315-34.5 kV Montagnais/Normand network be unavailable for an extended period of time. Usually, this line is only used by Fermont as a backup. The remainder of the time, the line would be available as a backup for Alderon and especially for planned maintenance activities with regard to the substation and normal line. This would be possible since it is unlikely that its use would coincide with the priority needs of the town of Fermont in winter, when all the power available is required from this 46 kV line (=25 MW) for the backup of the town of Fermont.
The most appropriate power supply option for Alderon is to feed the Kami site at 230 kV. The 46 kV option described would have been adequate if the power demand was in the order of 40 MW, however, at the anticipated 60 MW, it is not recommended. Alderon must ensure that the 60 MW ±10% load anticipated for its Project be available in time for plant startup, which may not be obvious considering the current situation at the WTS and the required investment of $150M (3rd line, 230 kV) to correct the problem. This critical situation has been present for a
September 2011
18-16
Alderon Iron Ore Corp.
NI 43-101 Technical Report — PEA of the Kami Iron Ore Project |
|
number of years at this substation. A Province of Newfoundland and Labrador government decision is required in this matter to develop the full potential of iron ore extraction in the Labrador region. All other possible power supply options will have to be considered to meet the Alderon Project schedule, among which, a temporary supply from the HQ network while the 230 kV Churchill/Wabush third line is being built. Furthermore, the additional capacity obtained for Labrador West with the third transmission line will all be taken by IOC and Alderon. For this reason, Nalcor is currently studying the option of new 315 kV lines from Churchill Falls to Wabush in order to improve the capacity of the WTS and to better serve the optimistic load forecast for the Labrador West area.
At the same time, it is also imperative for Alderon to have access to the existing backup line at 46 kV in Fermont from the Wabush substation (Fermont tie) to ensure the following:
· Supply to the site during construction (a few months only)
· Normal supply backup of Alderon (from 10 to 20 MVA), knowing that this line is only used at full capacity a few days in winter for Fermont backup from the WTS. In all other instances, this line would theoretically be available as backup for Alderon.
18.3 Railway Transportation Options Study
Stassinu-Stantec Limited Partnership (Stantec) was retained by Alderon to undertake the rail transportation component of this Study (Stantec 2011). The study is summarized in this section of the Report.
The Kami Project will require the movement of eight (8) million metric tonnes by year of iron ore concentrate from the Kami mine (near Labrador City) to the Port of Sept-Îles facilities at Pointe Noire, Quebec. Railcars will be loaded at the mine site and moved over a spur line to be constructed by Alderon to meet up with the Quebec, North Shore & Labrador (QNSL) Railway east of Labrador City. QNSL will be used to move the traffic from the Mine Spur junction to Sept-Îles Junction, just north of Sept-Îles, Quebec. The Chemin de Fer Arnaud (CFA) will be utilized to move the traffic from Sept-Îles Junction to the port facilities at Pointe Noire. New
September 2011
18-17
Alderon Iron Ore Corp.
NI 43-101 Technical Report — PEA of the Kami Iron Ore Project |
|
railway infrastructure will need to be constructed by Alderon to connect the mine to the QNSL (referred to as the Mine Spur) and in the vicinity of the port facilities (referred to as the Port Spur). It is assumed that Alderon will not be required to build any interchange tracks and existing QNSL and CFA interchange tracks will be used.
It is assumed that the product will be suitable for shipment in the standard 35-foot open gondola cars typically used in Labrador iron ore rail service. Each train will consist of 240 gondola cars in accordance with standard QNSL train size for new Clients. The car fleet will be equipped to accommodate rotary dumping to unload the cars at Pointe Noire. With a cycle time of 48 to 65 hours, the rail operation will require three train sets of 240 cars, each including spare cars, with the total fleet requirement being 750 cars. Each car will be capable of handling 108 metric tonnes of concentrate. A 240-car train will therefore move 25,900 metric tonnes of concentrate and the requirement to move eight million tonnes annually can be completed with 309 trainloads of product.
The Mine Spur will consist of a single main track along with a loop at the loading facility. A setoff track 2 km in length for diesel fuel delivery will be required at the mine site. Several options for tying into the QNSL railway were analyzed in this Study. The retained option, shown on the site plan in Figure 18.1, will leave the QNSL line at Mile 34 Northerland Subdivision and run in a southerly direction east of the town site of Wabush. Once south of the town site, the line will run south-westerly to the Kami mine site. The retained option does not require interaction with the other local railways (Bloom Lake Railway, Wabush Lake Railway) which are owned by Consolidated Thompson and Wabush Mines.
As mentioned earlier, no interchange yard is assumed to be required at Sept-Îles Junction. The Port Spur at Pointe Noire will consist of two separate components of rail infrastructure. One component is a two-track staging yard to be located adjacent to the existing Consolidated Thompson staging yard within the existing CFA right-of-way. The second component is a loop track to be built primarily on Port of Sept-Îles land in association with the railcar dumper. A total of 9 km of track will be required to complete the Port Spur components.
September 2011
18-18
Alderon Iron Ore Corp.
NI 43-101 Technical Report — PEA of the Kami Iron Ore Project |
|
A railway company will need to be established to construct and operate the Mine Spur. The railway will fall under provincial rail regulation, specifically the Newfoundland Rail Service Act of 2009, administered by the Newfoundland Department of Transportation and Works. An application to the Department of Transportation and Works detailing the design of the railway, its operation plan and proof of insurance will be necessary to obtain a permit to build and operate the Mine Spur. Once constructed, the use of an experienced contract rail service provider to operate the Mine Spur is recommended. The rail operator can provide the management, staffing, locomotive needs, rail traffic control, and track maintenance services to keep the Mine Spur in operation. In order to inspect and maintain the contract operator’s equipment and the gondola car fleet, a rail maintenance garage structure will be required on the mine site. The building will also accommodate the storage space necessary for tools and parts plus office and locker room space for the railway operating employees.
Port Spur trackage will become part of the CFA once constructed and accepted as suitable for operation by CFA. The CFA will provide all necessary operating and maintenance needs to keep the Port Spur functional. No special buildings for the railway are anticipated to be necessary at the port.
Rail haulage contracts will be required between Alderon and QNSL and CFA in order to obtain transportation services. Both QNSL and CFA are federally regulated railways and must abide by the provisions of the Canada Transportation Act. The Act stipulates that federally regulated railways must provide fair market rates to shippers that wish to use the transportation services of the railway. The railways are free to negotiate a contract with the shipper including a confidential rate structure. The contract to be negotiated will set out a monthly or yearly fee for the movement of iron ore concentrate. The railways will include the costs of their infrastructure and equipment upgrade needs for the new traffic in the fee. However, in order to procure certain components at the start of the Project, the railways will require a certain amount of the total value of the contract to be paid up front. In return, a rebate will be applied to the rates for the first one or two years of the contract. The railways have expressed an interest in the Project and are willing to undertake a negotiation process in event the Project moves forward to development.
September 2011
18-19
Alderon Iron Ore Corp.
NI 43-101 Technical Report — PEA of the Kami Iron Ore Project |
|
18.4 Port Facility
Stantec was retained by Alderon to undertake a Preliminary Economic Assessment of the Iron Ore Concentrate Storage and Reclaim Facility proposed for the Port of Sept-Îles lands located at Pointe-Noire. The Preliminary Economic Assessment also served to examine the common user wharf and ship loading facilities as proposed by the Port of Sept-Îles and to determine the limits of construction and land requirements specific to Alderon. The study is summarized in this section of the Report.
The Port of Sept-Îles has provided a drawing indicating two blocks of land that could be developed by Alderon to be used for an iron concentrate storage and load out facility. Block 1 was used to develop raw costing for this Study. Figure 18.3 presents a general site layout indicating the two land blocks considered.
September 2011
18-20
Alderon Iron Ore Corp.
NI 43-101 Technical Report — PEA of the Kami Iron Ore Project | 
|
Figure 18.3: Port Site Plan Showing Land Blocks Considered for the Alderon Port Facility
September 2011
18-21
Alderon Iron Ore Corp.
NI 43-101 Technical Report — PEA of the Kami Iron Ore Project | 
|
Three different equipment layout options were considered for the Block 1 parcel of land. Preliminary Opinions of Probable Costs (OPC) were prepared to demonstrate gross differences in the cost of each option. Option 2 was then selected by the Client for further refinement. All three options involve preparing a block of land that is partially tree covered and partially developed rock quarry. The base elevation proposed for the facility requires the blasting and excavation of approximately 500,000 m3 of rock.
Option 2 is based on building an independent operation controlled by Alderon. This option involves the purchase and construction of the following:
· 1 stacker/reclaimer
· 1 railcar dumper and train positioner
· 1 rail loop to handle 240 ore cars
· 6 conveyors
· Road relocation and 48”Ø water line relocation
· Conveyor structures and maintenance facilities
Option 2 would involve negotiating a land lease and equipment use lease for Port of Sept-Îles lands and ship loader. It would also require right-of-ways or servitude agreements with Cliff Resources, Labrador Iron Mines, and other parties to allow for equipment and personnel access. Figure 18.4 presents a site plan with the proposed facilities general arrangement. The common user ship loading facility which would be owned and operated by the Port of Sept-Îles is also indicated on the aforementioned site plan. This design and general arrangement forms the basis of the Capital Cost Estimate for the port facility.
September 2011
18-22
Alderon Iron Ore Corp.
NI 43-101 Technical Report — PEA of the Kami Iron Ore Project | 
|
Figure 18.4: Port Site Plan Showing Option 2 Proposed General Arrangement
September 2011
18-23
Alderon Iron Ore Corp.
NI 43-101 Technical Report — PEA of the Kami Iron Ore Project | | 
|
18.4.1 Proposed Option Design and Equipment
Based on a 240-car train capacity, each car is loaded to 108.1 t, a total of 309 trains per year would be required to transport the 8.0 Mt/y production from the Kami mine site. These requirements would be satisfied with a one train per day schedule transporting 25,900 t/ train. Modern car dumpers can handle a nominal 90 cars per hour. Accounting for inefficiencies logistics have been developed considering 80 cars per hour. This would require handling capacity for storage at a nominal rate of 8,600 t/h.
The stacker/reclaimer selection will be constrained by the reclaim capacity. The tentative selection of a Sandvik PD-200 has a nominal stack out capacity exceeding requirements. Conveyors ahead of the stacker/reclaimer would have an 1800 mm (72” belt) with 45° idlers with belt speed between 300 and 400 fpm.
The Port of Sept-Îles has tentatively sized the proposed ship loader for the common user facility at 12,000 t/h. The Alderon reclaimer and conveyor system has been designed assuming that this rate will be matched.
Electric power for the port facility will be supplied by Hydro Quebec.
September 2011
18-24
Alderon Iron Ore Corp.
NI 43-101 Technical Report — PEA of the Kami Iron Ore Project | |
|
19. MARKET STUDIES AND CONTRACTS
BBA understands that Alderon is actively promoting the Project and has engaged in discussions with several potential Clients interested in the concentrate which will be produced at the Kami facility. Alderon has also been in discussions with service Suppliers such as QNSL and Cliffs for rail transportation and with the Port of Sept-Îles for loading concentrate into ships. As of the effective date of this Report, Alderon has not entered into any material commercial agreements with any potential Client or Service Supplier.
Alderon has retained the services of Mr. Jan van Veelen, an independent consultant, to perform a market study. The objective of the study was to determine product marketability and sales strategy with an analysis of target markets and potential end-users for the Kami concentrate.
Considering that the Project is at an early study stage and available data is limited to what was supplied by BBA based on preliminary metallurgical testwork, certain assumptions regarding product specifications and production volume as well as logistics had to be made.
Statistical data are from reputable sources, such as UNCTAD, CRU, AME Mineral Economics, Macquarie Research, Hatch Associates, Metal Bulletin, Ferrum Consultants, Platts, Steel Business Briefing and the consultant’s own database.
All costs, prices and other financial information in this section of the Report is in US$ unless otherwise stated.
September 2011
19-1
Alderon Iron Ore Corp.
NI 43-101 Technical Report — PEA of the Kami Iron Ore Project | |
|
19.1 Overview of the Iron Ore Market
The study focused on the global seaborne iron products market based mainly around the two major steel producing regions:
· Eastern Asia (China, Japan, Korea, Taiwan)
· Europe
These two regions import vast quantities of iron ore from remote sources. China alone imports more than 60% of the total seaborne iron ore trade. In 2010 total seaborne trade was just under 1,000 Mt of which China accounted for 620 Mt. Western Europe, once dominant, now imports approximately 140 M/y of iron ore products.
The two major sources of supply are Australia and Brazil. They account for more than 70% of the world’s seaborne trade.
The growth in demand from China has been staggering. The iron ore import for the Chinese steel industry was:
| 110 Mt in 2001 |
| 208 Mt in 2004 |
| 444 Mt in 2008 |
| 620 Mt in 2010 |
The various forecasts anticipate that China will import 1,000 Mt/y by the year 2020. That is, for China alone, an additional 380 Mt/y of iron ore product imports needed in the next eight years.
September 2011
19-2
Alderon Iron Ore Corp.
NI 43-101 Technical Report — PEA of the Kami Iron Ore Project | |
|
19.2 Iron Ore Products and Consumption Trends
The vast majority of iron ore is used in steelmaking, mainly through the blast furnace process. The blast furnace produces pig iron that requires further reduction, mainly in a Basic Oxygen Furnace (BOF), to produce steel. Iron ore products are fed to the blast furnace in one or a combination of three products:
· sinter produced from fines (sinter fines) screen size <6.3mm
· pellets screen size 8mm-20mm, produced mainly from pellet feed, screen size <0.1mm
· lump ore, screen size between 6.3-35mm
The North American market uses high quantities of pellets due to the fact that the local ores have to be beneficiated resulting in a very fine size distribution. This necessitates a pelletizing process to make the very fine product suitable for use in the blast furnace. The North American market is however not part of the seaborne trade as it is almost completely self-sufficient in iron ore and lacks coastal steel plants with the exception of the Burns Harbor facility. The ore trade between Canada and the U.S.A. is not considered part of the seaborne iron ore trade considered in this study.
The European and East Asian markets rely heavily on fines for the production of sinter. Sinter fines or sinter feed account for about 65% of the total ore requirements.
The consumption of lump ore, which can be charged directly into the blast furnace, is limited by the scarcity of good quality supply. Most high quality lump ore deposits have been exhausted both in Australia (Mount Newman and Hamersley) and Brazil (MBR). The lump supplies from Australia are now poorer quality. The biggest lump Supplier is Kumba of the Republic of South Africa with their Sishen lump. Lump ore accounts for about 15% of total seaborne ore traded.
September 2011
19-3
Alderon Iron Ore Corp.
NI 43-101 Technical Report — PEA of the Kami Iron Ore Project | |
|
Table 19.1 presents a breakdown by year as well as a forecast for the various iron ore products for seaborne trade.
Table 19.1: Iron Ore Products Seaborne Trade Trend

Fines are shipped from the producing facility to the recipient steel plant where they are sintered prior to charging into the blast furnace. Lump ore is shipped from the producing facility to the recipient steel plant where they are charged directly into the blast furnace. Pellets are shipped from the producing facility to the recipient steel plant where they are charged directly into the blast furnace. Pellet feed is shipped from the producing facility to a recipient facility where it must be further processed in a pellet plant prior to feeding into the blast furnace. High quality pellets (pellets with low silica and other tramp elements) can also be fed to a reducing process such as a DRI (Direct Reduced Iron) plant and subsequently used as feed for the Electric Arc Furnace (EAF) as a substitute for recycled scrap.
Due to the decreasing quality of the new iron ore deposits in development, a concentration process becomes necessary to produce a saleable product. This requires that the ore from the mine be finely ground in order to liberate the iron oxides from the gangue minerals which consequently results in the production of a finer iron ore product. When the product produced is too fine, it cannot be used in the sintering process and thus requires pelletizing.
Table 19.2 shows crude steel production for selected key areas. These numbers include steel production for both BOF and EAF processing routes. Approximately 65% of the world’s steel is produced via the BOF route which uses blast furnace pig iron as a feed stock. EAF predominantly use scrap as a feed for steelmaking, however, as previously mentioned, DRI is also used. In 2010, DRI production reached 72 Mt (which consumed approximately 110 Mt of pre-reduced pellets). As can be seen from these numbers, China accounts for approximately
September 2011
19-4
Alderon Iron Ore Corp.
NI 43-101 Technical Report — PEA of the Kami Iron Ore Project | |
|
45% of the world’s steel production. Furthermore, China’s steel production has increased at a faster pace than other regions and has shown resilience even during the 2008 financial crisis.
Table 19.2: Iron Ore Products Seaborne Trade Trend
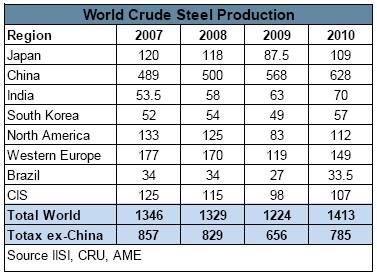
19.3 Iron Ore Pricing System
The pricing mechanism for iron ore has changed dramatically in the last three years. The benchmark system which set prices for a complete year has been replaced by a system based on price indexes and prices are now revised on a quarterly basis. Whereas the benchmark system used for the past 40 years published its prices, the new system is much less transparent and prices for individual ores and contracts between Suppliers and Customers are not public.
Iron ore prices from 1974 to 2002 increased only slightly in nominal value and steadily decreased in real terms. The explosive growth of the Chinese demand has had a considerable effect on ore prices. Supply has not kept up with the growth in demand which meant that in a matter of a few years the low iron ore prices (typically in the order of $20/t US) prevailing during the 70’s, 80’s and 90’s came to an abrupt end. Prices have risen close to $180/t in recent years and are no longer valid for one year but change on a quarterly basis. A spot market for iron ore has developed in this period, which hardly existed before. This has given rise to significant price volatility over relatively short periods of time.
September 2011
19-5
Alderon Iron Ore Corp.
NI 43-101 Technical Report — PEA of the Kami Iron Ore Project | |
|
Under the aforementioned pricing system for iron ore, pricing of individual ores are based on a number of recognized indices published by Metal Bulletin (Iron Ore Index), Steel Business Briefing (TSI) and Platts (IODEX). An index is given for various Fe contents and 58%, 62%, 63.5% being the most common.
Premiums for pellets and for lump ore are calculated and published on an estimated or indicative basis. The index, either one or an average of all three, will form the basis for individual negotiations between the Seller and Buyer. These negotiations will take into account the Fe content of the ore as well as the levels of deleterious elements contained in the ore. As an example, the current premium for each 1% Fe over the index is $5.50/t. For excess moisture, sulphur, silica or any deleterious elements, penalties will be negotiated on a case by case basis.
A price will be agreed on a delivered China basis as all indices are based on Cost and Freight China (CFR-China). The freight will then be equalized to the port of delivery for the individual Buyer in direct negotiations between Buyer and Seller.
The highest prices are commanded by pellets as the cost of agglomeration is already included and they can be used directly in the BF, mostly without screening out the fines. The next highest price is for lump ore as it too can be used directly in the BF but requires screening as it creates fines in handling.
The increasing volume of very fine material or pellet feed will probably lead to a separate price group in iron ore. Historically, the price for pellet feed was discounted by 10-20% from sinter feed to account for the production loss in the sinter plant by the use of pellet feed. As more and more pellet feed comes on the market and less sinter feed is available, the price will find a different value versus sinter feed.
September 2011
19-6
Alderon Iron Ore Corp.
NI 43-101 Technical Report — PEA of the Kami Iron Ore Project | |
|
19.4 Iron Ore Price Forecast
The general consensus is that the demand for iron ore will outstrip supply for a few more years. It is thought that the various expansions and new projects will begin to balance the market starting in 2014 at the earliest. It is doubtful, however, that all the announced projects will make it to the market. The average annual new production from Brazil and Australia in the last seven years has been only 50 Mt/y. A growing shortage of qualified personnel and equipment will obstruct faster growth and are likely to delay many projects. It remains, therefore, uncertain when supply will balance demand.
The various long-term forecasts among financial analysts vary between $40/t (UBS) and $100/t (Citigroup). The forecasts by industry experts such as CRU, AME, Hatch and others typically range between $60/t and $100/t. These prices are loaded on vessel, FOB, at port of origin. The pellet premium for BF pellets over sinter fines is forecast to be approximately $35/t. It is notable that long-term forecasts are being adjusted only upwards by all forecasters as demand keeps outpacing expectations almost continuously. Also, even in the midst of the recent financial crisis, iron ore fines price did not drop below $65/t FOB Brazil destined for Europe.
As previously mentioned, pellet feed fines have been discounted by up to 20% when used in sintering applications. The full value of a pellet feed is however recognized when considered as the ore feed to a pellet plant. Since most pellet plants are at the mine site or at the port of a mine, pellet feed for pellet production has trouble finding consumers in the open market. The Middle East has built and is planning to make further investments in pellet plants mainly for DR pellets. As the production of pellets is energy intensive, it makes sense to produce pellets where energy is relatively cheap. GIIC has committed to build pellet plants in Egypt for both BF and DR pellets. All the iron ore for this region will be imported.
China is the main growth area for pellet feed as it is for all iron ore products. Hatch estimates that China will import an additional 50 Mt/y by 2015 to support the expected growth in pellet production. In 2010, pellet production capacity was 120 Mt/y and is expected to increase to 150 Mt/y by 2013.
September 2011
19-7
Alderon Iron Ore Corp.
NI 43-101 Technical Report — PEA of the Kami Iron Ore Project | | 
|
19.5 Freight
For many years, the freight component was approximately 30% of the CFR price. In recent years, the ocean freight has been as high as $200,000 per day. The cost-per-ton for Brazil-Rotterdam was typically between $5.00/t and $10.00/t pre-2003. It then increased with the boom in iron ore demand to $50.00/t in 2007 which caused a record number of orders for ships that have flooded the market in 2010, 2011 and will only abate after 2012.
This means that for the next four or five years, the competition for cargo to employ available vessel capacity will keep rates very competitive. Rates from Brazil-Rotterdam have fallen from $50.00/t to $7.00/t and spot rates from Brazil to China have fallen from $80.00/t to $20.00/t. In comparison, the difference in spot rates from Brazil-China versus Australia-China has been as high as $60/t and is now (Feb.2011) only $11/t.
Experience shows, however, that the freight market is volatile and a higher than expected growth in iron ore and coal seaborne trade could absorb available vessel capacity at a faster rate than forecast. A longer term forecast of freight rates is very difficult as so many factors influence. In general terms, it seems that the additions to the fleet of Capesize ore carriers will outstrip demand until at least 2014.
19.6 Iron Ore Quality
The quality of concentrate from the Labrador Trough is well known through the products marketed by ArcelorMittal Mines Canada from their Mount Wright facility and by IOCC (Iron Ore Company of Canada) from their Carol Lake facility. Both have sold their concentrate to Europe, Japan and Korea for decades. The Canadian concentrates are mainly used in the sinter plants of steel mills in Europe and Japan.
The benefits of magnetite in iron ore come into play when used in a pellet plant as it saves on fuel, due to the exothermic nature of the chemical reactions with magnetic ore. This is of lesser use in a sinter plant. In China, concentrate is increasingly used as a blending ore to upgrade lower grade domestic and Indian ore fines.
September 2011
19-8
Alderon Iron Ore Corp.
NI 43-101 Technical Report — PEA of the Kami Iron Ore Project | |
|
The chemical analysis for the Kami concentrate, previously presented in Table 13.11, offers mostly positive characteristics having a low concentration of the most typical gangue elements. Silica levels are in line with those for concentrates from Mount Wright (4.5%) and Carol Lake (4.2%). The sulfur level of 0.053% is indicated to be marginally higher than the acceptable limit in Europe which is 0.050%. The Mn level is elevated and exceeds acceptable levels in many BF operations. The expected MnO and S levels of the Alderon concentrate will make this product difficult to market in Europe.
The expected screen size for the Alderon concentrate will likely be D50 at 150 micron according to early work done. This is fine compared to the concentrates from Mount Wright. The Alderon concentrate can be classified as a sinter feed. Further testwork to determine the size distribution of ultra-fine material (<100 micron) will be included in the Feasibility Study.
19.7 Prospects for Alderon Concentrate
The closest market for Alderon concentrate is Western Europe as the North American market is a pellet market and not a fines or concentrate market. The steel mills in Western Europe already use Canadian concentrates from IOCC and AMMC. As already mentioned, these concentrates are considerably coarser than the Alderon expected sizing. The sinter feed market for concentrates is limited to 20% max of the sinter burden due to permeability issues. Discounts to natural sinter feeds will vary by Customer and run typically from 0% to 10% depending on the cleanliness of the concentrate and the other ore used in the blend.
As the sales potential for Europe is limited, it is more relevant to forecast the price for the Chinese market. The most recent forecast by the analysts of CRU and AME for the long-term fines price from Brazil is shown in Table 19.3. As these prices are loaded on vessel at point of origin, an adjustment for freight is warranted for direct comparison.
September 2011
19-9
Alderon Iron Ore Corp.
NI 43-101 Technical Report — PEA of the Kami Iron Ore Project | |
|
Table 19.3: Brazilian Fines Price Forecast
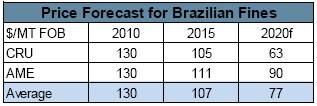
As previously discussed, there is a high probability that supply will not match demand until well beyond 2014, as is currently projected. The forecasted prices are therefore considered to be on the conservative side. Furthermore, over the last five years, long-term price forecasts by all analysts have been regularly adjusted upwards, never downwards. It is therefore very likely that the long-term price will be higher than the $77/t price indicated.
19.8 Conclusions
Considering that:
· The Kami concentrate may contain a higher proportion of fines than what is normally used as a sinter feed;
· The Kami concentrate can be considered as a standard quality concentrate, with normal silica levels, high-end sulfur levels and higher than standard manganese content;
· The Chinese market is the largest consumer of sinter feed material and the fastest growing in demand;
· The Chinese market has the least quality restrictions.
It can be concluded, at this stage of the Project, and based on the information available to date, that the most appropriate marketing strategy for Alderon is to actively explore and pursue commercial opportunities with potential Chinese Customers.
September 2011
19-10
Alderon Iron Ore Corp.
NI 43-101 Technical Report — PEA of the Kami Iron Ore Project | |
|
20. ENVIRONMENTAL STUDIES, PERMITTING AND SOCIAL OR COMMUNITY IMPACT
Stantec was retained by Alderon as the environmental consultant for the Kami Iron Ore Project PEA Study. In their mandate, Stantec performed the following studies:
· Environmental Study (Stantec 2011)
· Tailings Management Study (Stantec 2011)
· Waste Rock Management Study (Stantec 2011)
· Hydrologic Study - Kami Site (Stantec 2011)
· Baseline Hydrogeology Study - Kami Site (Stantec 2011)
· Site Wide Geotechnical Study - Kami Site (Stantec 2011)
· Rehabilitation & Closure Report (Stantec 2011).
This section of the Report provides a general overview of these studies which were conducted for the Kami Project.
20.1 Environmental Setting
20.1.1 Kami Mine Site
There are two types of sensitive or special areas in the vicinity of the Project at the Kami site: a Provincial Park Reserve and a Wetland Stewardship Zone consisting of several management units.
Provincial Park Reserves protect areas with important natural features and landscapes. These areas are part of a provincial initiative to protect representative portions of all the different ecoregions within the province of Newfoundland and Labrador. These areas have no day use or camping facilities. The Duley Lake Provincial Park Reserve is approximately 7 km2 and is located approximately 90 m from the proposed location of the Rose North Waste Rock Disposal Area, 1.1 km from Rose Central pit, and 10 km from Labrador City.
A Wetland Stewardship Zone agreement was signed by the Town of Labrador City and the Newfoundland and Labrador Department of Environment and Conservation in 2005. This
September 2011
20-1
Alderon Iron Ore Corp.
NI 43-101 Technical Report — PEA of the Kami Iron Ore Project | |
|
agreement pledged their commitment to conservation and protection of wetlands within the zone in consultation with the Provincial Wildlife Division. This was formalized in 2010 with the development of a Habitat Conservation Plan. The Plan identifies eight Management Units within the Labrador City Wetland Stewardship Zone. The Town has committed to using the Habitat Conservation Plan as a guide to best management practices in and around the Stewardship Zone and Management Units including use of riparian buffers around all water bodies and marsh areas with the Units (Town of Labrador City and Eastern Habitat Joint Venture 2010). As such, exploration activities in these Management Units are subject to review by the Municipality and Wildlife Division; to date, exploration activities have been approved in accordance with the limitations of working in a Management Unit.
There are a number of basic cottages on the Property along various rivers and lakes.
20.1.2 Pointe Noire Port Facility Site
New railway infrastructure (referred to as the rail loop) will need to be constructed at the vicinity of the Port of Sept-Îles at Pointe Noire, Québec. A concentrate storage and load-out facility will also be required at the Port of Sept-Îles facilities. Currently, Cliffs (Wabush Mines and Bloom Lake Mine) and Iron Ore Company of Canada (IOCC) have operational rail lines as well as port facilities at the Port of Sept-Îles. IOCC also manages the Arnaud Junction.
The proposed rail loop and concentrate storage and load-out facility are located on the Marconi Peninsula in the Gulf of St-Lawrence, approximately 450 m from the shoreline. A small portion of the proposed port spur is located on private land owned by Cliffs. The Port of Sept-Îles has proposed to make federal land available to Alderon within the limits of the Sept-Îles Port Authority. Parts of the proposed port spur and loop and the concentrate storage and load-out facility will therefore occupy public lands.
Baleine Creek, an intermittent watercourse, crosses the Project area and a small intermittent watercourse borders the western side of the Project area.
Two First Nations Reserves of the Uashat mak Mani-Utenam First Nation are located in the Sept-Îles area. The Uashat Reserve is located on the western outskirts of Sept-Îles while the Maliotenam Reserve is located 16 km east of Sept-Îles.
September 2011
20-2
Alderon Iron Ore Corp.
NI 43-101 Technical Report — PEA of the Kami Iron Ore Project | |
|
20.2 Jurisdiction, Applicable Laws and Regulations
The Project components for the Mine site and related infrastructure are wholly located within the Province of Newfoundland and Labrador.
Mining projects in the Province of Newfoundland and Labrador are subject to Environmental Assessment (EA) under the Newfoundland and Labrador Environmental Protection Act, and associated Environmental Assessment Regulations (an undertaking that will be “engaged in the mining, beneficiating and preparing of a mineral as defined in the Mineral Act whether or not these operations are to be performed in conjunction with a mine or at mills that will be operated separately” is required to be registered).
The Project components in the Province of Quebec may be subject to Section 31.1 of the Québec Environment Quality Act, which requires a full environmental impact assessment with possible government public hearings under the BAPE (Bureau des Audiences Publiques sur l’Environnement).
It is anticipated that the Kami Project will be the subject of a Federal Environmental Assessment under section five of the Canadian Environmental Assessment Act including.
The Newfoundland and Labrador Quebec and Federal EA processes are all public.
20.2.1 Newfoundland and Labrador Environmental Assessment Process
The EA process is initiated with a formal registration of the Project, submitted in a prescribed format, to the Newfoundland and Labrador Department of Environment and Conservation. The Registration is made available to the public and to government agencies for review. Based on the review, the Minister decides within 45 days, one of three options:
· an Environmental Preview Report is required;
· an Environmental Impact Statement is required; or
· no further EA is required.
September 2011
20-3
Alderon Iron Ore Corp.
NI 43-101 Technical Report — PEA of the Kami Iron Ore Project | |
|
It is anticipated that an Environmental Impact Statement will be required for the Newfoundland and Labrador component of the Kami Project.
Environmental Preview Report
An EPR is ordered by the Minister when additional information is required to determine the potential for a project to result in significant adverse environmental effects. The Project proponent is responsible to prepare a project-specific EPR, in response to government-issued guidelines. The EPR is available for public and government review. At the completion of the review period, the Minister decides if the EPR is sufficient. If not, the proponent is required to revise and/or amend it. Upon a determination of sufficiency, the Minister will release the project, conditionally release the project, or call for an Environmental Impact Statement.
Environmental Impact Statement
An EIS is required in cases where potential exists for a project to cause significant adverse environmental effects. The project proponent is responsible to prepare a project-specific EIS and associated component studies in response to government-issued guidelines. Field work is typically required for the completion of an EIS. The component studies and EIS are available for public and government review. At the completion of the review period, the Minister decides if the component studies and/or EIS are sufficient. If not, the proponent is required to revise and/or amend them. Upon a determination of sufficiency, Cabinet will release the project, conditionally release the project, or not release the project. Once the project is released from the EA process and prior to project construction, the proponent can proceed to obtain the necessary permits and authorizations. A release from the provincial process is valid for three years.
20.2.2 Quebec Environmental Assessment Process
All documents must be provided in French. The Quebec EA process is initiated when the Project Notice is provided in a prescribed format to the Ministère de l’Environnement, du Développement durable et des Parcs - MDDEP (Department of Sustainable Development, Environment and Parks). Usually, the government will issue its guidelines for the Environmental Impact Assessment (EIA) within three months of receiving the Project Notice. Based on the guidelines, the proponent prepares the EIA in French and provides 30 copies to the MDDEP. The EIA is reviewed for sufficiency, and the proponent will provide any additional information if
September 2011
20-4
Alderon Iron Ore Corp.
NI 43-101 Technical Report — PEA of the Kami Iron Ore Project | |
|
required, before it is made available for public review. The public review is conducted by the Bureau d’Audiences Publiques sur l’Environnement (BAPE). All documents are made public for a 45-day period during which a person, a group or a municipality can request a public hearing from the MDDEP. The Minister determines if a public hearing is warranted, in which case the BAPE organizes public hearings in affected areas. At the completion of the hearings, the BAPE produces a report of its observations and analysis, which is forwarded to the Minister and made available to the public.
In parallel to the public consultation process, the MDDEP will review the EIA and will advise the Minister on the environmental acceptability of the project, as well as recommending any conditions deemed appropriate for its approval. This analysis considers the reasons justifying the project and its anticipated impacts on the biophysical and human settings.
Based on the Report from the BAPE (if required) and the MDDEP review, the Minister of the Environment makes recommendations to government to either authorize the project (with or without modifications and conditions) or reject it. Before implementation of the project, the proponent must submit its plans and specifications to the MDDEP regional office in order to obtain a certificate of authorization under Section 22 of the Environmental Quality Act. Generally, the duration of the process is a maximum of 15 months, excluding the preparation of the EIA itself.
20.2.3 The Federal Environmental Assessment Process
Federally, the Canadian Environmental Assessment Act (CEAA) is triggered if a federal department is required to exercise certain powers or perform certain duties or functions in respect to the project for the purpose of enabling the project. Under Section 5 of CEAA, a federal EA may be required when, in respect of a project, a Federal Authority (FA) proposes to:
· be the proponent;
· make or authorize payment or any other form of financial assistance to a proponent;
· sell, lease or otherwise dispose of land; or;
· issue a permit, or license or other form of approval pursuant to statutory or regulatory provisions identified in the Law List Regulations.
September 2011
20-5
Alderon Iron Ore Corp.
NI 43-101 Technical Report — PEA of the Kami Iron Ore Project | 
|
In the case of a private-sector development such as the Kami Project, the most common “trigger” under CEAA is the Law List Regulations. Federal permits and approvals that may be required for a mine/mill operation include approval to alter, disrupt or destroy fish habitat (HADD) or to alter navigability within navigable waters.
A Comprehensive Study level of EA will be required, pursuant to Section 16 of the Comprehensive Study List Regulation:
“The proposed construction, decommissioning or abandonment of (a) metal mine, other than a gold mine, with an ore production capacity of 3 000 t/d or more”
20.2.4 Law List Triggers for CEAA
There are several potential Law List Triggers that may apply to the Kami Project and information on these triggers is provided below, with the applicable sections of the related Act(s) that may apply to the project.
1. Fisheries Act - The Fisheries Act deals with the proper management and control of the fisheries, the conservation and protection of fish and the protection of fish habitat, and prevention of pollution.
· 35(2) Authorizations by the Minister or under regulations made by the Governor in Council to cause the harmful alteration, disruption or destruction (HADD) of fish habitat in the course of carrying out a work or undertaking.
· 37(2) Ministerial order, subject to regulations or with the approval of the Governor in Council, requiring modifications, additions or restrictions to, or the closing of (the latter always with the approval of the Governor in Council), a work that does or could result in the harmful alteration, disruption or destruction of fish habitat, or the deposit of a deleterious substance.
September 2011
20-6
Alderon Iron Ore Corp.
NI 43-101 Technical Report — PEA of the Kami Iron Ore Project |
|
The Fisheries Act is the most likely Law List Trigger for the Kami Project. This triggers would potentially include any stream crossings for roads and railways that could result in loss of fish habitat (HADD authorization), as well as losses related to any other project activities.
2. Navigable Waters Protection Act - The principal aim of this Act is to ensure unimpeded navigation along navigable waters.
The Law List Triggers apply to works that interfere substantially with navigation, including bridges, booms, dams, and causeways. Consequently, all works requiring an approval under subsection 5(2) (substantial interference with navigation), and all bridges, booms, dams and causeways requiring an approval under subsection 5(3) (no substantial interference to navigation) trigger an environmental assessment under the Law List Regulations.
3. Explosives Act - The Explosives Act governs the manufacture, testing, sale, storage and importation of explosives in Canada. It provides for the issuance of the following licence:
· Section 7(1) (a) Licence issued by the Minister of Natural Resources for an explosives factory (manufacture) and magazine (storage).
20.2.5 Major Projects Management Office
The Major Project Management Office (MPMO) is a Government of Canada organization whose role is to provide overarching project management and accountability for major resource projects in the federal regulatory review process, and to facilitate improvements to the regulatory system for major resource projects. The MPMO, working collaboratively with federal departments and agencies (including the Canadian Environmental Assessment Agency), serves as a single window into the federal regulatory process, and complements the technical discussions between proponents and regulators.
The MPMO provides guidance to project proponents and other stakeholders coordinates project agreements and timelines between federal departments and agencies, and tracks and monitors the progression of major resource projects through the federal regulatory review process.
20-7
Alderon Iron Ore Corp.
NI 43-101 Technical Report — PEA of the Kami Iron Ore Project |
|
A Major Resource Project (MRP) has been defined by the MPMO as:
“a large resource project which is subject to a Comprehensive Study, a panel review, or a large or complex multi-jurisdictional screening, as defined under the Canadian Environmental Assessment Act (CEAA).”
The Kami Project will be subject to a Comprehensive Study, and therefore it will be considered a MRP and will fall under the MPMO jurisdiction. The role and responsibilities of the MPMO have not been clearly defined in Newfoundland and Labrador.
20.3 Environmental Studies
As indicated, a Newfoundland and Labrador EIS, a Quebec EIA, and a federal Comprehensive Study will be required for the Kami Project. As part of these multi-jurisdictional EAs, environmental baseline studies will be required to be completed in 2011 and 2012 in Labrador and Quebec. The environmental studies to be conducted in Labrador include:
· Sound monitoring
· Air quality
· Historic and heritage resources
· Fish and fish habitat baseline studies
· Rare plant surveys
· Ecological land classifications (ELC) including wildlife assemblages and wetlands
· Song birds
· Waterfowl.
Determination of HADD and socio-economic baseline studies will also be undertaken.
The environmental studies to be conducted in Quebec include:
· Air quality
· Soil studies
· Vegetation
· Surface water characterization
· Fish and fish habitat baseline studies
20-8
Alderon Iron Ore Corp.
NI 43-101 Technical Report — PEA of the Kami Iron Ore Project |
|
· Herpetofauna surveys
· Terrestrial mammal surveys
· Songbirds and waterfowl
· Historic resources.
Determination of HADD and socio-economic baseline studies will also be undertaken.
The results of the environmental studies will be used upon which to base the predictions of environmental effects resulting from the Project. During construction and operation, environmental monitoring may be required, depending on the conditions of release issued by governments. Monitoring and follow-up is the proponent’s responsibility and ensures that the project is carried out according to government and ministerial authorizations, to ascertain the accuracy of the environmental effects predicted in the EIS, EIA and Comprehensive Study, and to evaluate the effectiveness of the mitigation measures.
20.4 Environmental Permitting
Following release from the multi-jurisdictional environmental assessment process, the Project will require a number of approvals, permits and authorizations prior to Project initiation. In addition, throughout Project construction and operation, compliance with various standards contained in federal and provincial legislation, regulations and guidelines will be required. Alderon will also be required to comply with any other terms and conditions associated with the release issued by the three jurisdictions. Preliminary lists of permits, approvals and authorizations that may be required for the Project are presented in Table 20.1, Table 20.2, and
Table 20.3. Permits and authorizations will also be required from affected municipalities (e.g., Labrador City).
Table 20.1: Potential Permits, Approvals, and Authorizations (Preliminary) - Newfoundland and Labrador
Permit, Approval or Authorization Activity | | Issuing Agency |
· Release from Environment Assessment Process | | DOEC — Environmental Assessment Division |
· Permit to Occupy Crown Land | | DOEC — Crown Lands Division |
· Permit to Construct a Non-Domestic Well · Water Resources Real-Time Monitoring · Certificate of Environmental Approval to Alter a Body of Water | | DOEC — Water Resources Management Division |
20-9
Alderon Iron Ore Corp.
NI 43-101 Technical Report — PEA of the Kami Iron Ore Project |
|
Permit, Approval or Authorization Activity | | Issuing Agency |
· Culvert Installation · Fording · Stream Modification or Diversion · Other works within 15m of a body of water (site drainage, dewater pits, settling ponds) | | |
· Certificate of Approval for Construction and Operation · Certificate of Approval for Generators · Industrial Processing Works · Approval of MMER Emergency Response Plan · Approval of Waste Management Plan · Approval of Environmental Contingency Plan (Emergency Spill Response) · Approval of Environmental Protection Plan | | DOEC — Pollution Prevention Division |
· Permit to Control Nuisance Animals | | DOEC — Wildlife Division |
· Pesticide Operators License | | DOEC — Pesticides Control Section |
· Blasters Safety Certificate · Magazine License · Approval for Storage & Handling Gasoline and Associated Products · Temporary Fuel Cache · Fuel Tank Registration · Approval for Used Oil Storage Tank System (Oil/Water Separator) · Fire, Life and Safety Program · Certificate of Approval for a Waste Management System | | Government Service Centre (GSC) |
· Approval of Development Plan, Closure Plan, and Financial Security · Mining Lease · Surface Rights Lease · Quarry Development Permit | | Department of Natural Resources (DNR) — Mineral Lands Division |
· Operating Permit to Carry out an Industrial Operation During Forest Fire Season on Crown Land · Permit to Cut Crown Timber · Permit to Burn | | DNR — Forest Resources |
· Approval to Construct and Operate a Railway in Newfoundland and Labrador | | Department of Transportation and Works (DTW) |
| | | | |
Table 20.2: Potential Permits, Approval and Authorizations (Preliminary) - Quebec
Permit, Approval or Authorization Activity | | Issuing Agency |
Environmental Assessment Process | | MDDEP — Direction des évaluations environnementales |
Certificate of Authorization (Section 22 of the Environment Quality Act) | | MDDEP — Direction régionale de la Côte-Nord |
Authorization to modify a wildlife habitat (Section 128.7 of An Act respecting the conservation and development of | | MRNF - Direction de la protection de la faune de la Côte-Nord |
20-10
Alderon Iron Ore Corp.
NI 43-101 Technical Report — PEA of the Kami Iron Ore Project |
|
Permit, Approval or Authorization Activity | | Issuing Agency |
wildlife | | |
Permit to Occupy Crown Land | | Ministère des Ressources naturelles et de la Faune |
Forest Work Permit (for deforestation on crown land) | | Ministère des Ressources naturelles et de la Faune - Unité de gestion des ressources naturelles et de la faune de Sept-Îles, Havre-Saint-Pierre et Anticosti |
Authorization to erect or maintain a construction on the lands of the public domain | | Ministère des Ressources naturelles et de la Faune |
Table 20.3: Potential Permits, Approval and Authorizations (Preliminary) - Canada
Permit, Approval or Authorization Activity | | Issuing Agency |
Authorization for Harmful Alteration, Disruption or Destruction (HADD) of fish habitat | | Fisheries and Oceans Canada (DFO) |
Approval to interfere with navigation | | Transport Canada |
20-11
Alderon Iron Ore Corp.
NI 43-101 Technical Report — PEA of the Kami Iron Ore Project |
|
20.5 Tailings Management
The purpose of this study was to review available information and conduct a reconnaissance site visit in order to provide a concept-level approach for the disposal and management of tailings produced from the iron ore processing plant. The initial stage of the present Study involved a review of general tailings management approaches in an effort to determine the most appropriate approach for the Kami Project. A review of advantages, disadvantages and “show-stopper” issues was completed and documented. The experience of similar northern mining operations was also considered through a review of available documents on general mine waste management approaches being used at other mine sites in the region. The feasibility of each option was evaluated based on technical/operational aspects, economic implications, impacts to physical environment, and on terrestrial and aquatic life.
For the Kami Project, deposition of thickened tailings in an engineered impoundment was deemed the most suitable tailings management approach. This method is the current industry standard, utilizes proven technology and limits the impact of the tailings on surrounding natural water bodies. To supplement the primary tailings management approach, it is recommended that the coarse iron ore tailings stream be considered for use as an aggregate source. The inert sand-sized iron ore tailings may be used as a source of borrow material for site infrastructure such as progressive tailings dam raises and road building.
20.5.1 Tailings Management Facility (TMF) Design Considerations
A TMF, or engineered impoundment, must be designed, operated, closed and rehabilitated to meet or exceed the performance criteria defined in early stages by mine management. To achieve this, it is important to consider not only TMF operations but also the effective closure and rehabilitation of the facility during the design stages. At the preliminary design stage, all appropriate considerations must be highlighted and addressed.
20-12
Alderon Iron Ore Corp.
NI 43-101 Technical Report — PEA of the Kami Iron Ore Project |
|
Environmental Considerations
The impact of a tailings management facility on the immediate and surrounding environment should be assessed at early stages of any mining project. Geochemical characterization of the tailings will indicate their potential for acidic and/or metaliferous drainage during the life of the mine and will influence the selection of appropriate tailings placement and confinement method. Preliminary geochemical characterization can often be done concurrently with metallurgical testwork at the economic feasibility stage. Based on the characterization of the Kami Property and on known conditions at adjacent iron ore projects, neither acidic nor metaliferous tailings are anticipated during or after operations. Total suspended solids (TSS) in the tailings effluent may be an issue. Provisions for the addition of flocculent and prolonged retention time in the tailings sedimentation ponds should be made.
Operational Considerations
The logistics of the TMF should align with those of the rest of the mine site infrastructure. Consideration shall be given to the storage capacity of the site, accessibility of the storage area for equipment (construction, operation and closure), distance and elevation from the mill for tailings transportation, and availability of construction material. Integration of the TMF with the mine plan and schedule will optimize operations.
Processing factors that will impact the TMF include: projected volume and rate of production, project lifespan, tailings physical, chemical and rheological characteristics and process water requirements. Any changes in the process throughout the operation may affect the ultimate output of tailings and/or water requirements and may justify re-evaluation of the proposed TMF.
Economic Considerations
With the life-of-mine approach, consideration shall be given to costs at all stages of the mine including: capital cost, operating/maintenance cost, and rehabilitation and closure costs for the TMF.
Rehabilitation and Closure Considerations
The Newfoundland and Labrador Department of Natural Resources (NLDNR) requires that mining companies develop approved plans and provide financial assurance for the anticipated rehabilitation and closure of all mine site infrastructure. Factors that affect the rehabilitation and
20-13
Alderon Iron Ore Corp.
NI 43-101 Technical Report — PEA of the Kami Iron Ore Project | 
|
closure of a TMF include: long-term geotechnical and geochemical stability of the tailings and associated containment structures, ease of establishing permanent drainage, control of any potential acid/toxic drainage, control of dust, ease of revegetation, and requirements for long-term monitoring and maintenance of the facility.
The key design criteria for the TMF include the following:
· Tailings production rates (m3/hour);
· Geochemical characteristics of the tailings that would affect the selection of tailings management approach;
· Solids content of tailings slurry;
· Annual and life-of-mine tailings production tonnages;
· Capacity of the reclaim water system (m3/hour);
· Rheological characteristics of tailings slurry and drained tailings solids;
· Regulatory compliance targets (e.g., ground water quality, air quality, and rehabilitation and closure requirements).
20.5.2 TMF Design Basis
Based on current estimates provided by BBA, the annual concentrate production tonnage for the Kami Project has been fixed at 8.0 Mt/y. To produce this concentrate, a total of 21.2 Mt/y of crushed ore must be fed to the grinding circuit. This production rate generates a quantity of tailings on the order of 13.2 Mt/y which can be classified into coarse and fine fractions using +/- 100 µm as a classification parameter. It is estimated that 5.1 Mt/y of fine tailings and 8.0 Mt/y of coarse tailings will be generated.
The total tailings production for the Kami Project Rose Central ore deposit (excludes Mills since it is not part of this Study mine plan) has been estimated to be in the order of 210 Mt. Based on preliminary calculations, this quantity corresponds to a total volumetric storage requirement in the order of 90 to 105 million m3. The drained density of the tailings in the impoundment will depend on grain size, specific gravity and discharge/placement method. For the purpose of this study, the specific gravity of the tailings solids has been estimated to be 3.00. A range of void ratios from 0.5 to 0.7 have been estimated based on published values and previous experience.
20-14
Alderon Iron Ore Corp.
NI 43-101 Technical Report — PEA of the Kami Iron Ore Project |
|
It is anticipated that the tailings supernatant will be inert, with negligent metal and chemical levels. Flocculent and coagulant will be used in the thickener.
In consultation between Stantec, BBA and Alderon, the preferred location for the TMF was determined to be in the eastern portion of the claim block, directly south of the proposed plant site and rail loop, as shown on the site plan in Section 18 of this Report. Constraints on the location of the TMF included; planned site infrastructure, location of environmentally protected areas, natural topography and property boundaries. The proposed location of the TMF was chosen for the large available area south of the plant site that is necessary for the chosen subaerial deposition method, for the minimal environmental/wetland impact and for the favorable topography. The gently undulating topography of this site creates natural valleys which shall be exploited for much of the impoundment capacity.
The tailings containment structures will consist of rockfill starter dams/dykes with low- permeability till cores. Progressive raising of the tailings area will be completed by advancing the containment wall upstream using the coarsest fraction of tailings solids. In this upstream raising method, material is moved from the tailings beach and used to construct progressive lifts over the deposited tailings. Based on preliminary estimates, the Tailings Impoundment can be divided into two general regions: 1) the southern region (estimated capacity for Years 1 — 8) and the northern region (estimated capacity for Years 8 — 16). It is recommended that tailings discharge be initiated in the southern region, at the highest elevation and the furthest distance south from the mill. This approach will ensure that tailings drainage will consistently be directed northeastwards, following the natural drainage path of the surrounding topography. Initiating deposition in this southeasterly area will also allow for progressive rehabilitation of the tailings deposit as the discharge point moves north and eastward.
The thickened tailings will be discharged via spigot and allowed to drain naturally via gravity. The resulting tailings beach shall have a low-angle slope towards the north and east, suitable for progressive revegetation as the impoundment fills and discharge progresses northward. Particulate will be removed from the tailings water by conventional gravity sedimentation. A settling “pool” (Tailings Pond) will be maintained within the impoundment area. The overflow from the Tailings Pond will discharge into a Polishing Pond via surface decant for the removal of any particulate carried over from the Tailings Pond.
20-15
Alderon Iron Ore Corp.
NI 43-101 Technical Report — PEA of the Kami Iron Ore Project |
|
The containment dams and diversion dykes will be earthfill structures composed of a low-permeability till core supported by a free draining rockfill shell. The low permeability core will control seepage out of the dam and, where necessary, can maintain water levels in the Tailings Pond area should water quality deficiencies warrant temporary containment. The till core will have side slopes of 2 horizontal to 1 vertical (2H:1V) and a crest width of 6.0 m. The rockfill shell will have an upstream slope of 3H:1V, a downstream slope of 2H:1V and a crest width of 10.0 m.
Figure 20.1 shows a more detailed layout and location of the TMF as well as some design features.
20-16
Alderon Iron Ore Corp.
NI 43-101 Technical Report — PEA of the Kami Iron Ore Project |
|
Figure 20.1: Layout and Location of TMF
September 2011
20-17
Alderon Iron Ore Corp.
NI 43-101 Technical Report — PEA of the Kami Iron Ore Project | 
|
20.6 Waste Rock Management
The purpose of this study was to review available information and conduct a reconnaissance site visit in order to provide a preliminary waste rock management strategy around the mine site. The proposed waste rock dumps are to be located in close proximity to the points of mining in the westernmost claim block in the areas identified on the site plan presented in Section 18 of this Report. The Mills Dump is planned to be situated on the slopes of a topographic knob immediately south of the Mills open pit. The Rose North Dump shall be located along the eastern slopes of the north-south trending hills overlooking Rose Central pit to the northwest, while Rose South Dump is planned for the southern slope of the northeast-southwest trending ridge positioned to the south of Rose Central pit.
An analysis of waste volumes has been made based on the preliminary mine plan completed by BBA. Open-pit mining based on the optimized pit shell for the Rose Central and the Mills deposits is expected to generate on the order of a total of 851 million tonnes of waste rock over the life of the mine as established in this Study. The current estimates of waste rock quantities, as provided by BBA, for the project lifespan, are presented in Table 20.4.
Table 20.4: Estimated Waste Rock Quantities
| | Estimated Total Waste Rock Quantities | |
| | Mass
[tonnes] | | In Situ Volume
[m3] | | Loose Volume
[m3] | |
Mills Pit | | 92,703,000 | | 30,901,000 | | 40,171,300 | |
Rose Central Pit | | 758,619,000 | | 252,873,000 | | 328,734,900 | |
Total | | 851,322,000 | | 283,774,000 | | 368,906,200 | |
Based on experience with other similar iron ore mining operations in the Labrador Trough, it is estimated that the in situ waste rock volume will swell by 30% due to bulking during excavation and dump disposal activities.
20-18
Alderon Iron Ore Corp.
NI 43-101 Technical Report — PEA of the Kami Iron Ore Project |
|
20.6.1 Conceptual Design of Waste Rock Dump
The following conceptual level waste rock dump design parameters have been provided by Stantec to BBA mining group for the mine plan development and economic assessment. These recommendations are based on Stantec’s understanding of the geology, environmental constraints, regulatory requirements, and preliminary engineering analysis. Stability analyses have not been conducted as part of this preliminary exercise.
To permanently store the anticipated volume of waste rock to be produced by the development of the proposed Mills and Rose Central open pits, conventional surface waste rock dumps are proposed, adjacent to the open pits. Three (3) side-hill fill type dumps are proposed in the areas selected, to take advantage of the existing natural topography and provide sufficient capacity as close as practical to the pits. These locations optimize haulage distances and take in consideration the park and provincial boundaries while minimizing impacts to the physical environment, and terrestrial and aquatic life. Dumps are situated to avoid potential mineralization zones; however, all waste rock dump areas will have to be shown to have no potential for Mineral Resources beneath the impacted area through condemnation drilling yet to be completed. The proposed side-hill type waste rock dumps should be “designed for closure” using an ascending benched construction sequence that will integrate progressive rehabilitation activities during operations and maximize stability. Waste rock placement will begin at the toe of the dumps and will proceed in a series of lifts up the side of the valley slope, as the development of the mine and mineral processing dictate.
Based on the available geological data for the Kami Property, review of design parameters at adjacent iron ore properties, and regulatory requirements, it is recommended that dump benches be designed 30 m high by 10 m wide with an inter-bench slope angle slightly less than the expected angle of natural repose of the material (36°), resulting in an overall ultimate side slope of the waste rock dump, from toe to crest, of approximately 30°. To prevent stormwater runoff from eroding the edge of the dump, the top surfaces should be sloped with gradients of about 0.5% to the rear of the dump. Table 20.5 summarizes the waste rock dump design parameters.
20-19
Alderon Iron Ore Corp.
NI 43-101 Technical Report — PEA of the Kami Iron Ore Project |
|
Table 20.5: Waste Rock Dump Design Parameters
Waste Rock Dump Design Parameters
Maximum inter-bench slope angle | | 36° | |
Overall slope angle | | 30° (approximately 1.75H:1V) | |
Bench height | | 30 m | |
Bench width | | 10 m | |
The ascending construction sequence will allow dump development and progressive rehabilitation to be completed in sections, with clearing and grubbing carried out only on the next section when waste is to be placed, and the placement of overburden/organics and revegetation on the bench and slope of the preceding lift as a progressive rehabilitation measure.
The dump locations selected, and configurations recommended, will provide waste rock disposal capacities as listed in Table 20.6. The Mills Dump capacity exceeds the currently anticipated required storage volume and may be used for additional waste rock storage from either pit. Any of the dumps may be expanded if required; however, constraints for the plan dimensions in these areas are particularly stringent at this time until the site development details are advanced, and condemnation drilling and environmental field work is complete, to delineate potential zones of mineralization and protected habitat areas. Opportunity for dump expansion, if additional resources are identified, is further outlined below.
Table 20.6: Estimated Waste Rock Dump Capacities
| | Estimated Waste Rock Dump Capacities |
| | Footprint Area [m2] | | Mass Capacity [t] | | Volume Capacity [m3] |
Mills Dump | | 1,777,826 | | 302,740,093 | | 131,187,374 |
Rose North Dump | | 1,790,469 | | 340,085,262 | | 147,370,280 |
Rose South Dump | | 2,098,643 | | 399,710,568 | | 173,207,913 |
Total | | 5,666,938 | | 1,042,535,923 | | 451,765,567 |
To obtain information for a safe, practical, and economical design, and develop the waste rock dump designs to the feasibility level, further assessment is required. Based on current
20-20
Alderon Iron Ore Corp.
NI 43-101 Technical Report — PEA of the Kami Iron Ore Project |
|
understanding of the project development and site conditions, Stantec proposes the following phased approach for the feasibility-level Waste Rock Management Study:
· Stage 1 — Geotechnical and Hydrogeological Site Investigations
· Stage 2 — Waste Rock Characterization Program
· Stage 3 — Detailed Waste Rock Dump Design
20.7 Site Geotechnical
As part of the geotechnical study, Stantec initiated a desktop study to review available information for the Kami Property. The document review included examining third party literature relevant to the geotechnical site conditions including bedrock geology, surficial geology, hydrogeology, physiography, vegetation, and climate. The experience of similar northern mining operations was considered through a review of available documents on other iron ore mining operations in the Labrador Trough. Existing Kami Project technical documents were also reviewed; however, a detailed examination of core logs from the 2008, 2010 and 2011 exploration programs was outside the scope of this study.
For the purposes of this Study, the Watts, Griffis and McOuat Technical Report on the Kami Property dated February 2010, provided the most relevant information on site conditions, including detailed information on bedrock geology and physiography. However, little site specific surficial geology information is available at this time with only partial coverage provided by provincial surficial geology and aggregate potential mapping.
In general, little geotechnical information exists for the site. No intrusive geotechnical investigation work has been completed to date and there has been limited characterization of engineering properties soils and bedrock completed during the previous exploration programs. The review of available documents on other iron ore mining operations in the Labrador Trough provided limited information on expected geotechnical conditions and design considerations for the planning of foundations and civil works for the Kami Property. Documentation on adjacent iron ore projects was limited to publicly available Technical Reports.
20-21
Alderon Iron Ore Corp.
NI 43-101 Technical Report — PEA of the Kami Iron Ore Project | 
|
The exploitation of iron ore at the Kami Property will require significant infrastructure development across the mine site including roads, rail lines, buildings, tailings dams, ponds, etc., as shown in the site plan in Section 18 of this Report. These infrastructures require site development within three broad areas based on the geographic locations of the Property claim blocks: Western Area, Central Area, and Eastern Area.
Western Area
The proposed Rose Central pit and Mills pit, and associated waste rock dumps, and haul roads will be located in the western area. The area displays a rugged physiography with hills and valleys reflecting the structure of the underlying bedrock, ranging in elevation from 580 to over 700 masl. Bedrock outcrops are noted occasionally along the crests of ridges. Based on an examination of core logs from the 2008, 2010 and 2011 exploration programs, it is understood that thick deposits of overburden on the order of 20 — 50 m occur in lower lying areas representing rock fold depressions.
Hilltops and adjacent slopes are expected to be relatively well drained, while poorer drainage conditions and higher groundwater tables are anticipated in the isolated boggy areas which may pose some difficulties for access route construction. It is anticipated that site grading (cut and fill) requirements for development in this area will be greater due to the variation in topographic relief.
Given the thickness of overburden over the proposed area of the open pits, it is anticipated that significant pre-stripping will be required, along with additional engineering for the stabilization of the overburden slopes and benches.
Under the current waste rock management conceptual design, three (3) conventional surface waste rock dumps are envisioned as being situated in the rolling hills above the open pits. Given the relatively rugged topographic setting and configurations of the proposed waste rock piles, special consideration may be required regarding foundation stability, specifically the potential of sliding along the base. Typically, where sloped foundations are present, additional strategies to manage the risk associated with the foundation stability are recommended. Isolated zones of bog have been also noted in the vicinity of the proposed Mills pit dump. The presence of any such loose or soft soils will influence the preparatory requirements for the foundation.
20-22
Alderon Iron Ore Corp.
NI 43-101 Technical Report — PEA of the Kami Iron Ore Project |
|
Central Area
The central portion of the Property separating the southern extremity of Long Lake and northern portion of Mills Lake is the proposed location of the majority of site infrastructure, including the Primary Crusher Building, Processing Plant, Mine Service Building and the Fuel Unloading and Tank Farm area, Vehicle Maintenance Building, Large Vehicle Parking Area, Thickener, Mine Offices, Maintenance Offices, and Warehouse Area.
This low-lying area has relatively subdued topography that generally slopes towards Long Lake and Waldorf River. Overburden is anticipated to be relatively thick in this area and feature alluvial deposits of finer sands and potentially significant silt contents. A large glacialfluvial esker feature is observed to the south of this area, paralleling Waldorf River.
Preliminary indications from the desktop review and site visit are that from a geotechnical perspective, development of the site for the proposed infrastructure is feasible. However, there are isolated boggy patches and there may be some fine sand and silt fluvial deposits associated with streams in the area, which would present difficulties with workability and construction.
Heavily loaded structures and those with vibratory or machine foundations (Process Plant and Heavy Crusher) would likely be founded on deep foundations (piles). It is anticipated that lightly loaded structures will be founded using shallow soil foundations (conventional slab on grade construction and strip/spread footings) on suitably prepared undisturbed native soil. In areas where fine-grained or undesirably soft deposits are encountered, they would have to be removed and replaced with engineered fill to ensure desired bearing capacities.
20-23
Alderon Iron Ore Corp.
NI 43-101 Technical Report — PEA of the Kami Iron Ore Project |
|
Eastern Area
The northeasternmost claim block (017926M) is the proposed location for the TMF, main electrical substation, concentrate loadout and emergency stockpile and portions of the railway spur, site access road, and electrical transmission line. This area has relatively subdued topography, generally sloping downward to the northwest at an approximate grade of 2 to 12%. There are several creeks/streams noted within the area and numerous muskeg/bog areas of varying sizes.
Based on the widespread occurrence of bogs, ponds, rivers and brooks in this area, it is evident that drainage is poor and groundwater generally occurs at or near the ground surface in low-lying areas. The high groundwater table may pose some difficulties for construction and operation, especially in boggy areas. Areas of muskeg/bog are expected to be compressible and to have fairly low bearing capacities and any development in this area will involve the excavation of these unsuitable soft surficial soils and the importation of fill materials. It is anticipated that the Tailings Impoundment embankments will be best founded on the existing soils underlying the peat/bog deposits.
To validate and refine the geotechnical conceptual model and to complete the Feasibility Study, further assessment is required. Geotechnical field investigations will be required in support of all the proposed mine site developments including buildings, roads, rail lines, electrical transmission lines, tailings dams, ponds, etc. so as to obtain information for a safe, practical, and economical design.
Based on current understanding of the project development and site conditions, Stantec proposes the following phased approach for the feasibility-level geotechnical field program:
· Stage 1 — Geotechnical Field Investigation for Preliminary Planning
· Stage 2 — Geotechnical Field Investigation for Design
· Stage 3 — Aggregate Sourcing Study
20-24
Alderon Iron Ore Corp.
NI 43-101 Technical Report — PEA of the Kami Iron Ore Project |
|
20.8 Baseline Hydrogeology
A hydrogeological study is required to provide input to the geotechnical evaluation and provide information on potential groundwater inflows and other hydrogeological concerns. This assessment included a review of existing information related to the topography, geology and hydrogeology of the area.
There is limited information available on the regional hydrogeology of the area, however, based on a review of geological reports and topographic maps, it appears that the area is characterized by rugged bedrock dominated uplands that have been incised by glacial erosion to form prominent valleys. The Rose Central deposit lies within a northwest orientated drainage system which included Elfie Lake, End Lake, Mid Lake and Rose Lake which drains into Narrow Lake. The sub-drainage basin surrounding the deposit covers an area of approximately 8 km2. The drainage area surrounding the Mills deposit flow predominantly to the east toward Mills Lake and covers an area of approximately 3.8 km2. The flow regime in the area is likely dominated by spring snow melt events, although periodic rainstorms can produce large discharges.
Infiltration of precipitation through the ground surface used to recharge the underlying groundwater flow system is largely limited to the spring and summer period of the year when the ground is not frozen, likely extending from May through to October. The upland bedrock terrain is typically of low permeability and the direction of groundwater flow is radially outward toward the adjacent area of discharge within the streams valleys. Surficial deposits within the valleys and flanks of the upland terrain form local aquifer systems where groundwater discharge provides baseflow to the various streams draining the area.
Based on information from exploration boreholes provided by the site geologist, it is expected that groundwater table will be found to be at, or within a few meters of, ground surface within the valley areas and up to several meters below ground surface along bedrock ridges and topographic highs. The water table is expected to be a subdued reflection of the topographic surface. Regional groundwater flow in the area is assumed to follow topography which would be from the upland areas toward the adjacent valleys. Groundwater is thought to be recharging along the topographic highs and discharging along the stream and brooks in the valleys.
20-25
Alderon Iron Ore Corp.
NI 43-101 Technical Report — PEA of the Kami Iron Ore Project |
|
The overburden has been described as glacial till by the Alderon Geologists and that overburden thickness in the area of the open pits may range from less than 10 m to over 30 m. The types of materials within the till are not known and therefore their anticipated hydrogeological characteristics have not been determined. Bedrock in the area is comprised mainly of sedimentary rock that generally has a characteristically low primary porosity. Therefore, smaller scale fractures and joints would be the important water-bearing structures present in these types of bedrock and would be the main conduits for groundwater flow. The upper layers of bedrock are likely to be more weathered and fractured than the deeper layers of bedrock, but more regularly fractured
The review of available information indicates that there is a limited understanding of the regional hydrogeology surrounding the Rose Central and Mills deposit at the Kami Project site. Relatively thick (10 m to 30 m) overburden deposits have been identified in the area which could, depending on their composition, be a source of significant inflow of groundwater to the proposed open pits. In addition, high permeability overburden deposits could provide a conduit for groundwater flow from adjacent surface water bodies. Therefore, distribution and hydrogeological characteristic of the overburden deposits in the area of the pit should be determined.
Based on the results of investigations in similar geological settings indicating that fracture frequency and hydraulic conductivity generally decrease with depth, it is expected that large scale structural features (i.e., faults) will be the main conduits for groundwater inflow to any subsurface mining operations both at the Rose Central and Mills areas. Therefore, further site investigation work should be carried out to determine the hydraulic properties of these features and the significance they may have on potential mine inflows.
20-26
Alderon Iron Ore Corp.
NI 43-101 Technical Report — PEA of the Kami Iron Ore Project |
|
20.9 Hydrologic Study
As observed from the available GIS maps, the topography of the site is irregular with the presence of several watercourses, lakes and wetlands. This desktop hydrologic study focuses on all waterbodies within the Property, giving particular attention to the Rose Central and Mills pits as well as the tailings area.
Available spatial data includes 5 m and 25 m resolution elevation contours, streams and waterbodies, flow gauging stations, vegetation, roads, railways, project related data, proposed infrastructure, provincial boundaries, land use, and local management areas. These layers were obtained from several sources including Alderon, NRCAN, the ESRI ArcMap database and the Land Management Division of the Government of Newfoundland and Labrador. A description of the surficial geology of Labrador was obtained from the Water Resources Atlas of Newfoundland (1992), which indicates that the proposed mine site area is dominated by the presence of till layer with a maximum thickness of 1.5 m over bedrock. The till consists of a mixture of grain sizes from clay to boulders deposited by glacial action.
Climate normals and Intensity-Duration-Frequency (IDF) curves were obtained from Station 8504175 (Wabush Lake Airport) which is located approximately 12 km to the northeast from the site; this station is operated by Environment Canada. Daily average flows from several stations were obtained from Environment Canada’s national flow database HYDAT. Details of the weather and flow stations are included in Table 20.7.
20-27
Alderon Iron Ore Corp.
NI 43-101 Technical Report — PEA of the Kami Iron Ore Project |
|
Table 20.7: Details of Available Weather and Flow Station Near the Kami Project
STATION
ID | | NAME | | AVAILABLE DATA | | DISTANCE
FROM
PROJECT | | WATERSHED
AREA (KM2)* |
8505174 | | Wabush Lake Airport | | Climate Normals (1971-2000) | | 12 km — NE | | not applicable |
03OA009 | | Harrie River at outlet of Harrie Lake | | Flow (2002-2003) | | 10 km — NE | | not available |
03OA010 | | Flora Creek below Flora Lake | | Flow (2002-2003, 2007-2008) | | 18 km — NE | | 130.69 |
03OA012 | | Luce Brook below Tinto Pond | | Flow (2002-2003, 2007-2008) | | 18 km — N | | 35.17 |
03OA013 | | White River at outlet of White Lake | | Flow (2002-2003) | | 18 km — N | | 3.79 |
03OA014 | | Wabush Lake at Dolomite Road | | Level (2007-2008) | | 16 km — NE | | not available |
*Estimated based on available elevation contours.
The entire Kami Project Property discharges into Wabush Lake in Labrador and contains a complex system of watercourses and lakes within several sub-watersheds. Wabush Lake is located in the upper sections of the Churchill River watershed which ultimately discharges to the Atlantic Ocean.
The Kami Project site was divided into a series of sub-watersheds. A total of seven sub-watersheds were included in the analysis: the Rose Central and Mills pits, the tailings area and three other locations including Long Lake, Mills Lake and Narrow Lake. All sub-watersheds were labeled as SW1 to SW6 and their surface area, perimeter and stream order were determined using GIS tools. The details of all seven sub-watersheds are included in Table 20.8.
Table 20.8: Sub-Watershed Details — Kami Project
CODE | | NAME | | AREA
(KM2) | | PERIMETER
(KM) | | STREAM
ORDER | | ELEVATION AT
HEADWATERS | | ELEVATION AT
EXIT* |
SW1 | | Long Lake | | 184.7 | | 83.34 | | 4 | | 730 | | 550 |
SW2 | | Mills Lake | | 45.8 | | 34.08 | | 3 | | 720 | | 560 |
SW3 | | Narrow Lake | | 29.9 | | 29.8 | | 3 | | 800 | | 550 |
SW4A | | Tailings A | | 10.8 | | 14.5 | | 2 | | 700 | | 560 |
SW4B | | Tailings B | | 3.6 | | 8.3 | | 1 | | 660 | | 560 |
SW5 | | Mills Mine | | 2.4 | | 6.59 | | 2 | | 670 | | 600 |
SW6 | | Rose Central Pit | | 6.7 | | 11.3 | | 1 | | 720 | | 580 |
*Based on elevation contours, elevation in m.a.s.l.
Based on the available elevation contours, the Mills area is relatively flat with elevations ranging from 610 to 625 m.a.s.l. However, a larger variation in elevations is present at the proposed
20-28
Alderon Iron Ore Corp.
NI 43-101 Technical Report — PEA of the Kami Iron Ore Project | 
|
Rose Central pit site ranging from 580 to 670 m.a.s.l. The largest sub-watershed within the Kami Project is SW1 (Long Lake) which also contains sub-watersheds SW2, SW4A, SW4B and SW6, corresponding to Mills Lake, the tailings area and the Rose Central pit, respectively. Sub-watershed SW5 (Mills mine) is contained by sub-watershed SW3 (Narrow Lake) which runs parallel to the Long Lake sub-watershed.
20.9.1 Hydrology
According to the climate normal mentioned previously, the average annual precipitation near the Kami Project site, which includes rainfall and snowfall, amounts to 851.5 mm. Average monthly temperatures range between -22.7°C in January to 13.7°C in July. Additionally, the average monthly snow depths range between 3 cm in October to 92 cm in February with only four months presenting zero snow depths (June to September). A summary of the climate normals is included in Table 20.9.
Table 20.9: Summary of Climate Normals for Wabush Lake Airport
PARAMETER | | JAN | | FEB | | MAR | | APR | | MAY | | JUN | | JUL | | AUG | | SEP | | OCT | | NOV | | DEC | | YEAR | |
Temperature (°C) | | -22.7 | | -20.7 | | -13.5 | | -4.6 | | 3.6 | | 10.3 | | 13.7 | | 12.4 | | 6.8 | | -0.4 | | -8.6 | | -18.6 | | -3.5 | |
Rainfall (mm) | | 0.5 | | 1.6 | | 3.1 | | 11.9 | | 40.4 | | 82.3 | | 111.5 | | 95.4 | | 89.3 | | 36.9 | | 6.8 | | 2.9 | | 482.6 | |
Snowfall (cm) | | 66.4 | | 48.7 | | 64.8 | | 52.5 | | 16.5 | | 2.6 | | 0 | | 0.1 | | 6.8 | | 42 | | 75.3 | | 70.2 | | 445.7 | |
Precipitation (mm) | | 54 | | 41.7 | | 57.4 | | 56.7 | | 55.8 | | 84.8 | | 111.5 | | 95.4 | | 95.8 | | 73.5 | | 68.2 | | 56.8 | | 851.6 | |
Snow depth (cm) | | 74 | | 92 | | 89 | | 59 | | 6 | | 0 | | 0 | | 0 | | 0 | | 3 | | 20 | | 49 | | 33 | |
The available IDF curves from Station 8504175 (1974-2003) are included in Table 20.10. The IDF curves contain rainfall magnitudes associated with different storm durations and return periods. As an example, the rainfall magnitude associated with the 24 hour duration 100 year storm is 67.0 mm. Other magnitudes are also included.
September 2011
20-29
Alderon Iron Ore Corp.
NI 43-101 Technical Report — PEA of the Kami Iron Ore Project |
|
Table 20.10: IDF Rainfall Amounts for Wabush Lake Airport
| | RETURN PERIOD | |
DURATION | | 2 YR | | 5 YR | | 10 YR | | 25 YR | | 50 YR | | 100 YR | |
5 min | | 4.2 | | 6.2 | | 7.5 | | 9.2 | | 10.4 | | 11.7 | |
10 min | | 5.9 | | 8.7 | | 10.5 | | 12.8 | | 14.6 | | 16.3 | |
15 min | | 7.0 | | 10.4 | | 12.6 | | 15.4 | | 17.5 | | 19.6 | |
30 min | | 9.7 | | 14.1 | | 17.0 | | 20.7 | | 23.5 | | 26.2 | |
1 h | | 11.8 | | 17.2 | | 20.8 | | 25.3 | | 28.7 | | 32.0 | |
2 h | | 14.8 | | 20.4 | | 24.1 | | 28.7 | | 32.2 | | 35.6 | |
6 hr | | 20.7 | | 26.5 | | 30.4 | | 35.3 | | 38.9 | | 42.5 | |
12 h | | 27.6 | | 34.5 | | 39.0 | | 44.7 | | 49.0 | | 53.2 | |
24 h | | 34.3 | | 43.1 | | 48.9 | | 56.2 | | 61.6 | | 67.0 | |
A water balance for the Kami Project area was conducted. To facilitate calculations, the software model program Thornpro (Black, 1996) was utilized, which allows for the rapid determination of evapotranspiration (ET), infiltration and runoff based on regional and site specific parameters including the soil and surface cover types, latitude, land use characteristics, hydrologic inputs and climate data. The model program was applied in a single simulation run for the entire area that covers sub-watersheds SW1 and SW3 with a total surface area of 214.6 km2. The results of the water budget calculations are presented in Table 20.11.
September 2011
20-30
Alderon Iron Ore Corp.
NI 43-101 Technical Report — PEA of the Kami Iron Ore Project |
|
Table 20.11: Water Budget Calculations for the Kami Mine Project
| | MONTH (MM) | | YEAR | |
VARIABLE | | Jan | | Feb | | Mar | | Apr | | May | | Jun | | Jul | | Aug | | Sep | | Oct | | Nov | | Dec | | (MM) | |
Precip. | | 54 | | 42 | | 57 | | 57 | | 56 | | 85 | | 112 | | 95 | | 96 | | 74 | | 68 | | 57 | | 852 | |
ET | | 0 | | 0 | | 0 | | 0 | | 46 | | 84 | | 120 | | 101 | | 57 | | 0 | | 0 | | 0 | | 408 | |
Runoff | | 5 | | 3 | | 1 | | 1 | | 38 | | 77 | | 9 | | 1 | | 7 | | 40 | | 20 | | 10 | | 212 | |
Infil. | | 49 | | 39 | | 56 | | 56 | | -28 | | -76 | | -18 | | -7 | | 32 | | 34 | | 48 | | 47 | | 232 | |
According to the water budget calculations for an average year based on climate normals, a total of 408 mm or 48% of the total precipitation evapotranspires, 232 mm or 27% infiltrates and the remaining 212 mm or 25% of the total precipitation runs off the surface.
The daily average flow rates for all sub-watersheds were estimated using the most suitable flow station based on similar catchment area and available record. The results of the method are summarized on Table 20.12.
Table 20.12: Summary of Flow Proration Results for the Kami Mine Project
Watershed | | Proration
Factor by Area | | Minimum Flow
(m3/s) | | Maximum Flow
(m3/s) | | Average (m3/s) | |
Long Lake | | 1.41 | | 0.62 | | 27.28 | | 3.56 | |
Mills Lake | | 1.30 | | 0.19 | | 3.56 | | 0.93 | |
Narrow Lake | | 0.85 | | 0.13 | | 2.33 | | 0.61 | |
Tailings A | | 0.31 | | 0.05 | | 0.84 | | 0.22 | |
Tailings B | | 0.95 | | 0.004 | | 0.28 | | 0.06 | |
Mills Mine | | 0.62 | | 0.002 | | 0.18 | | 0.04 | |
Rose Central Pit | | 1.77 | | 0.01 | | 0.52 | | 0.11 | |
The flow hydrograph for the available record for Long Lake, Mills Lake and Narrow Lake are included in Figure 20.2. The data presented a gap between the years 2004 to 2007 which is represented by straight lines in the graph. The flow hydrographs for Long Lake, Mills Lake and Narrow Lake show seasonal trends during a typical year with the spring freshet normally occurring between May and June and higher flow rates during the summer months when compared to the winter months. The flow hydrographs also show the attenuating influence of the lakes that are capable of storing water during late spring and releasing it gradually during the warmer months.
September 2011
20-31
Alderon Iron Ore Corp.
NI 43-101 Technical Report — PEA of the Kami Iron Ore Project |
|
*Flow rates not available between 2004 to 2007.
Figure 20.2: Flow Hydrograph for Selected Sub-Watersheds
20.9.2 Water Supply and Returns
The larger lakes in the Kami Project site likely have the greatest potential as water supply sources for the project. Therefore, the potential sites for water extraction include the Long and Mills Lakes due to their size and proximity. The approximate surface area of both the Long and Mills Lakes are 1150 Ha and 510 Ha respectively. Currently the actual bathymetry of the lakes is not available and therefore lake volumes were not estimated. Other parameters that were calculated previously in conjunction with lake volumes can be used to estimate their feasibility as water supply sources as soon as project related information including general water requirements and consumptive demand become available.
Mine water returns are an important factor in water supply permitting, and combine to reduce the total water taking estimate. Mine water returns include returns from the water taking and may include dewatering volumes and effluent from mine process water uses. When estimating total required water takings and returns, it is critical to identify the taking source type such as surface water or groundwater, the taking point and the return point. To maintain the water
September 2011
20-32
Alderon Iron Ore Corp.
NI 43-101 Technical Report — PEA of the Kami Iron Ore Project |
|
balance and environmental flows and reduce the “net” taking volume, it is often advisable, especially in surface water environments, to return discharge to the same taking water body.
The assimilative capacity of lakes and watercourses is determined through estimating water quality constituent loading using both flow or volume and water quality. For example, determining the assimilative capacity of a local lake to receive mine site effluent would require an understanding of the lake’s area, bathymetry, volume, internal circulation and water quality for constituents determined to be critical with respect to specific mining operation and local environment. From this information, the first step is usually the development of a mass balance loading model for an approximate effluent mixing zone. The second step is usually the development of a steady state model, often with water quality simulation software and based on the background and effluent information specified in regulatory criteria. Based on the results of these two assessments, relative impacts and assimilative capacity can be determined. If the receiving environment has excess assimilative capacity to account for mine effluent needs, existing uses and potential future uses, further detailed analysis is often not required. However, in cases where assimilative capacity is limited, hydrodynamic and multi-dimensional modeling may be required to determine mitigative measures necessary to reduce environmental impacts to acceptable levels.
Based on the work undertaken in this study, the Long Lake watershed is considered to have the greatest assimilative capacity for mine effluent discharge. However, this must be confirmed by lake bathymetry, volume and water quality information.
In the next study phase, more detailed hydrologic work including computer modeling may be warranted to understand with more accuracy the hydrologic regime within the Kami Project site and its response to large precipitation events for the existing and proposed conditions (i.e. during the operation of the mine). Detailed hydrological and hydraulic modeling would be required as inputs to the design of Tailings Impoundment dams to assess the hazard potential of dam failure as per provincial dam safety requirements and the Canadian Dam Safety Guidelines (CDA, 2007).
September 2011
20-33
Alderon Iron Ore Corp.
NI 43-101 Technical Report — PEA of the Kami Iron Ore Project |
|
20.10 Rehabilitation and Closure Planning
This study has been undertaken to specifically address the requirements outlined under the Mining Act for the Rehabilitation and Closure Plan submission and to develop a specific conceptual Rehabilitation and Closure Plan for the Kami Project. The scope of this Plan is primarily defined by the Guidelines for the preparation of a Rehabilitation and Closure Plan for submission, provided by the Department of Natural Resources of the Province of Newfoundland and Labrador. These guidelines are based on the standards and requirements outlined by the Mining Act of the Province. Where necessary, alternate or additional information is presented, based on the specific project details for this proposed mine development.
Another objective of this study is to provide Alderon with a capital cost estimate for implementing the proposed conceptual Rehabilitation and Closure Plan.
20.10.1 Rehabilitation Planning
Regulation, Design and Implementation
The Rehabilitation and Closure Plan is a provincial requirement of the Newfoundland and Labrador Mining Act, Chapter M-15.1, sections (8), (9) and (10). Under the Mining Act, the “Rehabilitation and Closure Plan” is defined as a plan which describes the process of rehabilitation of a project at any stage of the project up to and including closure. Rehabilitation is defined as measures taken to restore the Property as close as is reasonably possible to its former use or condition or to an alternate use or condition that is considered appropriate and acceptable by the Department of Natural Resources.
There are three stages of rehabilitation activity that occur over the life of a mine:
· Progressive rehabilitation
· Closure rehabilitation
· Post-closure monitoring and treatment.
Progressive rehabilitation is considered to include rehabilitation completed, where possible or practical, throughout the mine operation stage, prior to closure. This would include activities that would contribute to the rehabilitation effort that would otherwise necessarily be carried out upon
September 2011
20-34
Alderon Iron Ore Corp.
NI 43-101 Technical Report — PEA of the Kami Iron Ore Project |
|
cessation of mining operations (closure rehabilitation). In some cases, a crossover between “progressive rehabilitation” activities and operational activities may exist.
Closure rehabilitation includes the measures, remaining after progressive rehabilitation activities, required to restore or reclaim the Property as close as reasonably possible to its post-mining condition. This could include demolition and removal of site infrastructure, revegetation, and any other activities required to achieve the requirements and goals detailed in the Rehabilitation and Closure Plan.
Upon completion of the closure rehabilitation activities, a period of “post-closure monitoring” is then required to ensure that the rehabilitation activities have been successful in achieving the prescribed goals. At this stage of rehabilitation, some treatment requirements may continue until the natural baseline conditions are restored and these conditions would then persist without additional treatment. Once it can be demonstrated that practical rehabilitation of the site has been successful, the site should be closed out or released by the Department of Natural Resources, and the land relinquished to the Crown.
Rehabilitation and Closure Plan Submission and Review
A formal Rehabilitation and Closure Plan is required to obtain approval for project development under the Mining Act. This Plan is required to be submitted with or immediately following the submission of the Project Development Plan and provides the basis for the establishment of the Financial Assurance for the Project. The Mining Act requirements will only be reviewed by NLDNR following release of the Project from Environmental Assessment and the review and approval process can typically take four (4) months to one (1) year.
The Rehabilitation and Closure Plan is directly linked to mine development and operation over the life of a mine and therefore must be considered a “live” document. It is common practice in the industry to review and revise the Rehabilitation and Closure Plan throughout the development and operational stages of the Project. The process of reviewing and updating the Plan commonly occurs on a five year cycle after the start of operations; however the review cycle is typically established on a site by site basis.
September 2011
20-35
Alderon Iron Ore Corp.
NI 43-101 Technical Report — PEA of the Kami Iron Ore Project | 
|
The final review of the Rehabilitation and Closure Plan generally occurs once the mine closure schedule is known (typically 12 months or more before end of mining). This final review forms a “Closure Plan” which defines in detail the actions necessary to achieve the Rehabilitation and Closure objectives and requirements. This Plan utilizes the actual site conditions and knowledge of the operation of the site and can therefore provide specific reference to activities and goals.
20.10.2 Objectives and Scope of the Rehabilitation and Closure Plan
The overall objectives of the Rehabilitation and Closure Plan proposed for the Kami Iron Ore Mine site should include:
· Restoration of the land to as close to natural state as possible;
· Provision of an agreeable habitat for existing wildlife (including fish) in a balanced and maintenance-free ecosystem;
· Creation of a landscape which is compatible with surrounding terrain and land use;
· Mitigation and control to within acceptable levels, the potential sources of pollution, fire risk, and public liability;
· Provide an environment for long term public access.
The Rehabilitation and Closure Plan will outline the mine site development and operational characteristics for the Project and will detail the steps and procedures to be taken to progressively rehabilitate the site during operations and to provide final rehabilitation upon closure of the mine while maintaining the aforementioned rehabilitation objectives. The following list outlines the natural and existing characteristics of the site which provide the basis for the Rehabilitation and Closure Plan design.
Physical and Chemical Stability
The Rehabilitation and Closure Plan will work towards achieving both physical and chemical stability of the entire project area based on a progressive rehabilitation approach, followed by a Comprehensive Closure and Environmental Effects Monitoring (EEM) Program.
The Rehabilitation and Closure Plan will address the physical stability aspect of the site components which remain after operations have ceased. In the case of the Kami site, these
September 2011
20-36
Alderon Iron Ore Corp.
NI 43-101 Technical Report — PEA of the Kami Iron Ore Project |
|
components may include collection/sedimentation pond berms and associated outlet structures and channels; Tailings Impoundment and infrastructure; slopes and high walls associated with the open pits; waste dump slopes; and construction features associated with buildings and site infrastructure. The Plan will consider the deterioration of site components over the long term, by perpetual forces such as precipitation, wind, chemical weathering, and seismic events.
To meet the Rehabilitation and Closure Plan objectives, it is necessary to ensure long term chemical stability of the rehabilitated mine site. The Plan design must contain appropriate methods to ensure that on-site water, drainage, and surface runoff from the site meet acceptable water quality standards. Testing of the mine rock for acid generation potential will be conducted, however it is anticipated that ARD potential is extremely low for this Project.
Natural Aesthetic Requirements
The Project will not occur in a pristine environment; the natural and human environments in the area have been affected by other activities. These existing effects have been considered as part of the baseline environment, and the assessment and evaluation of the cumulative environmental effects of the Project in combination with other projects and activities considers the nature and degree of change from these existing environmental conditions. Visual impact of the mine site is an important consideration. As part of the Rehabilitation and Closure Plan, the primary objective is to return the site as close to pre-mining conditions, as practical, with due consideration to the natural aesthetics that currently exist.
Revegetation and Wildlife
To achieve overall objectives, the Rehabilitation and Closure Plan must ensure that revegetation will be self-sustaining over the long term by being compatible with on-site soil and local climatic conditions. Establishment of vegetation should facilitate the natural recovery of the area for use by local wildlife and will be conducted in areas that were vegetated prior to the initiation of the development program.
Prior to revegetation, the Rehabilitation and Closure Plan will ensure that disturbed areas of the site such as roadways, building areas, storage pads and storage area bases are suitably prepared either by scarification to loosen the soil and/or loosened and covered with a cap of local soils where possible. Concrete structures will be removed or buried under a suitable cover
September 2011
20-37
Alderon Iron Ore Corp.
NI 43-101 Technical Report — PEA of the Kami Iron Ore Project |
|
of local soils to permit vegetation growth. In all cases, the primary objective of revegetation is to stabilize the soil against the erosion forces of both wind and water, and provide a naturally sustainable surface cover.
Water Management
The Rehabilitation and Closure Plan considers water management issues as they relate to:
· Potential control and mitigation of drainage issues from both surface waste materials and mine workings;
· Site drainage and surface run-off from the mine site to control erosion, sedimentation, and the degradation of adjacent water courses.
The overall objective of the water management program is to minimize any potential impact on the site and the down-gradient surface and groundwater system to acceptable guideline levels, without creating the requirement for long term post-closure water treatment.
Air Quality
Following the closure construction activities, only occasional light truck traffic, related to mine closure monitoring activities, will occur on site and are expected to have a negligible impact on local air quality.
September 2011
20-38
Alderon Iron Ore Corp.
NI 43-101 Technical Report — PEA of the Kami Iron Ore Project |
|
Noise Levels
Following Rehabilitation and Closure, noise levels on the mine site will return to ambient background levels.
Long Term Land Use
The Rehabilitation and Closure Plan must consider long term land use for the mine site that is sustainable and compatible with local and regional topography, soil and climatic conditions. Other land use options, such as agricultural, commercial/industrial, and forestry activity are not considered viable at this time.
Final closure planning will be based on the current Canadian Council of Ministers of the Environment (CCME) soil quality guidelines to industrial classification. The surface rights would be returned to the Crown once the lands are rehabilitated and stabilized to the level prescribed in the final Rehabilitation and Closure planning document.
20.10.3 Proposed Approach to Rehabilitation and Closure
The approach to rehabilitation should be to employ advanced progressive and closure rehabilitation techniques through integrated development, operational and closure technology and design. The site design should follow the concept of ‘designing for closure’ for all site structures.
The Project Rehabilitation and Closure Plan will be subject to scheduled reviews and updates as additional or revised information pertaining to rehabilitation and closure activities becomes available through the development stage and during the operational life of the mine.
Strategies and methods, which should be employed to minimize environmental disturbances during construction and operations, are described in the following sections. Steps to promote the overall rehabilitation process should include the following:
· Terrain, soil and vegetation disturbances should be limited to that which is absolutely necessary to complete the work within the defined project boundaries;
September 2011
20-39
Alderon Iron Ore Corp.
NI 43-101 Technical Report — PEA of the Kami Iron Ore Project |
|
· Wherever possible, organic soils, mineral soils, glacial till, and excavated rock should be stockpiled separately and protected for later rehabilitation work;
· Surface disturbances should be stabilized to limit erosion and promote natural re-vegetation;
· Natural revegetation of surface disturbances should be encouraged;
· Alderon should incorporate environmental measures in the contract documents. As such, contract documents should reflect the conditions specified for the construction and operation of the project. Contractors must be bound contractually to comply with the environmental protection standards set by Alderon and be compliant with applicable federal and provincial regulatory requirements.
All aspects of mine development including mine design, infrastructure location and design, and operations planning should be conducted with full consideration of available progressive rehabilitation opportunities and closure rehabilitation requirements. The Project should be planned and designed to minimize the disturbed area of the site, where possible, and to minimize the environmental impact prior to mine operations.
Once the mine advances from the development stage to the operational stage, progressive rehabilitation activities can commence. Progressive rehabilitation opportunities for the site during the operational stage may include:
· Rehabilitation of construction related buildings and laydown areas;
· Grade and revegetate the Tailings Pile;
· Stabilization and revegetation of Waste Dumps;
· Development and implementation of an integrated Waste Management Plan;
· Backfill open pits or sections as they are exhausted of ore;
· Install barricades and signage around the open pits, where applicable;
· Complete revegetation studies and trials.
An environmental monitoring program should be conducted as part of the mining operations and this data should be utilized to evaluate the Progressive Rehabilitation Program on an ongoing
September 2011
20-40
Alderon Iron Ore Corp.
NI 43-101 Technical Report — PEA of the Kami Iron Ore Project |
|
basis. Studies, such as revegetation trials, may be conducted as required over the operational phase of the mine, the results of which would be integrated into ongoing progressive rehabilitation activities and used, if appropriate, in the development of the final closure rehabilitation design.
Typically, the final review and update of the Rehabilitation and Closure Plan is conducted approximately one year prior to the cessation of operations. The final review of the Plan will provide the detailed closure rehabilitation design and procedures to fully reclaim the mine site. This Plan will be developed to a contract ready stage and would include Contract Documents and Drawings, as well as a detailed cost estimate for the work (±15 percent).
20.10.4 Progressive Rehabilitation
Progressive rehabilitation is considered to include rehabilitation completed, where possible or practical, throughout the mine operation stage, prior to closure. This includes activities that contribute to the rehabilitation effort that would otherwise be carried out at mine closure. In some cases a cross-over between “progressive rehabilitation” activities and operational activities may exist.
Progressive rehabilitation opportunities identified for the proposed Kami Iron Ore Mine at the time of writing may include: rehabilitation of construction related buildings and laydown areas; grade and revegetate the Tailings Pile; stabilization and revegetation of Waste Dumps; development and implementation of an integrated Waste Management Plan (WMP); backfill open pits or sections as they are exhausted of ore; install barricades and signage around the open pits, where applicable; and complete revegetation studies and trials. Additional progressive rehabilitation activities may be identified during the design, development, and operational stages of the mine and these will be actively pursued where practical.
September 2011
20-41
Alderon Iron Ore Corp.
NI 43-101 Technical Report — PEA of the Kami Iron Ore Project |
|
20.10.5 Closure Rehabilitation
Closure rehabilitation, carried out once mining operations have ceased, includes all activities required to fully restore or reclaim the Property as close as reasonably possible to its former condition. This would include demolition and removal of site infrastructure, revegetation and all other activities required to achieve the requirements and goals detailed in the Rehabilitation and Closure Plan.
Closure rehabilitation activities should be carried out on the mine site with the general objectives as previously noted. As required in the Mining Act and associated guidelines, the rehabilitation activities are based on the completion of these activities by Alderon and their Contractors. The closure cost estimates developed in this Study are based on the Owner default scenario. In this case, the costing is based on others having to carry out and manage this work and, as outlined in the Mining Act, credit for salvageable materials and equipment is not accounted for; even though these options would be pursued assuming Alderon completes the closure activities. The following list summarizes closure activities that are included in the capital cost estimate developed.
Railway
The rehabilitation and closure of the railway will consist of removing all ties, rails and any Other Track Material (OTM) including: spikes, rail anchors, tie plates, joint bars, track bolts, nuts and spring washers over approximately 20 km of track. The rail bed would be graded and left in place. All cross contour ditching will be filled. Any cross culverts and bridges will be removed and disposed of off-site and the rail line will be assessed for revegetation opportunities where practical.
Roadways
Approximately 20 km of haul roads, site access roads and service roads will be rehabilitated as part of the Closure Plan. The main site access road will remain intact for post-decommissioning activities and emergency situations.
September 2011
20-42
Alderon Iron Ore Corp.
NI 43-101 Technical Report — PEA of the Kami Iron Ore Project | 
|
Infrastructure
Any salvageable equipment would be identified and preserved for salvage, if possible. All affected ground would be incorporated as part of the general site grading and contouring. Wastewater and sewage holding tanks will be pumped of their contents by an appropriate waste disposal contractor and the tanks will be collapsed and removed to an appropriate waste disposal area. Infrastructure items carrying no salvage value will be removed and disposed of off-site where practicable to do so. It is assumed all demolition material will be disposed in Labrador City.
Light Frame Buildings
Light buildings, include buildings fabricated with timber or other light framing materials and excludes the heavy steel structures. Included in this category are mine service buildings and employee facilities, guardhouse, pumphouses, etc. Any concrete associated with the structures will be demolished to approximately 0.3 m below existing grade and disposed of on site at the appropriate locations. All building site areas will be regraded to match the surrounding grades and the surface will be loosened or capped with local soils of a type suitable for natural revegetation.
Steel Structures
The primary crusher, process plant, conveyors, etc. will be salvaged if conditions permit. Any concrete associated with the structures will be treated the same as concrete associated with light framed structures.
Waste Dumps
The proposed Waste Dumps will be designed for closure and benched, with waste placement in tiers starting at the lowest elevation. The dumps are planned to be completed in sections (in plan), with clearing and grubbing carried only on the next section when waste is to be placed. Organic/overburden materials will be used to conduct revegetation trials.
For rehabilitation and closure planning and providing a cost estimate for closure, and in consideration of existing local site conditions and the pending completion of revegetation trials, it is assumed that concentrated revegetation “islands” or areas, located in relatively protected areas, will be the most effective revegetation strategy. This method would concentrate the
September 2011
20-43
Alderon Iron Ore Corp.
NI 43-101 Technical Report — PEA of the Kami Iron Ore Project |
|
limited organic materials and overburden in areas relatively protected from wind and water scour near the toe of the stockpile where the underlying soils (waste rock) would not drain moisture away. These vegetation islands then shed organic materials, primarily in the prevailing wind direction, which will accumulate and provide sufficient base for the same vegetation to spread and cover additional area naturally.
Open Pits
Open pits will be decommissioned through a sequence of events designed for their long-term stability. Flooding of the pit will be allowed to occur naturally from groundwater inflows, snowmelt and rainfall within the pit catchment area. As per engineering specifications, the pit walls will be excavated to a stable slope angle during mining operations. Pit water will be monitored on a regular basis as flooding proceeds. Pit slopes will be graded and contoured above and just below the final water surface for safety and access over portions of the pit perimeter.
Tailings Impoundment
The Tailings Impoundment Area will occupy approximately 3.5 km2. At closure, Alderon will ensure that all Tailings and Polishing Pond areas are contoured, covered and revegetated and any potential drainage areas addressed appropriately.
Fresh and Wash Water Intakes, Wells, and Pipelines
Any pipelines related to freshwater intake, wash water diversion, in-pit pumps, and dewatering systems will be removed. All mechanical equipment (ie. pumps and pipelines) will be salvaged, intake structures will be demolished, and the demolition debris will be removed. The surrounding area will be graded and rehabilitated. All trenches as a result of pipeline removal will be backfilled and contoured to match the existing surrounding grade. Dewatering and groundwater wells will be backfilled and capped in accordance with applicable regulations.
Transmission Line
Approximately 12 km of transmission line and associated infrastructure will be removed and disposed of as part of the rehabilitation and Closure Plan. The areas disturbed by removal of the overhead and underground (where applicable) electrical distribution system will be contoured to match the surrounding grades.
September 2011
20-44
Alderon Iron Ore Corp.
NI 43-101 Technical Report — PEA of the Kami Iron Ore Project |
|
Re-establishment of Site Drainage Patterns
The rehabilitation procedures described will be planned and carried out to ensure the general re-establishment of pre-Alderon development surface runoff patterns and sub-basins.
Salvage and Local Recycle of Materials
In the period leading up to the decommissioning of project facilities and mine closure, the mine operator will evaluate options to identify the potential for recycle and reuse of materials.
20.10.6 Post Closure Monitoring and Treatment
Post closure monitoring and treatment must be conducted to ensure the chemical and physical stability of the rehabilitation work and general site prior to close-out and relinquishment of the land to the Crown. Alderon must complete post closure monitoring in cooperation with the regulatory agencies having authority and following the standards in force at the time.
Development of a detailed post-closure monitoring program is not practical until mine development advances and an operating monitoring program is fully defined or developed. The post-closure monitoring program should follow directly from the operating monitoring program to ensure continuity of data sources and provide historical data for monitoring sites. It is expected that post-closure monitoring would be conducted on a less rigorous (time and number of sites) as site activities cease and the monitoring requirements would reduce or be eliminated.
20.11 Community Relations
Alderon has been engaging five Aboriginal groups with asserted land claims or traditional territories in proximity to the Kami Property: Innu Nation, NunatuKavut Community Council (“NCC”), Uashat mak Mani-Utenam, Matimekush-Lac John and Naskapi Nation of Kawawachikamach.
Alderon began its Aboriginal engagement by negotiating a Memorandum of Understanding (“MOU”) with the Innu Nation which was signed on August 11, 2010. The MOU between the Innu Nation of Labrador and Alderon provides a framework for Alderon and the Innu Nation to work together to establish a long term, mutually beneficial, cooperative and productive
September 2011
20-45
Alderon Iron Ore Corp.
NI 43-101 Technical Report — PEA of the Kami Iron Ore Project |
|
relationship. It also provides the parties with a process for which the Innu Nation can identify and provide Innu Nation businesses and members an opportunity to participate in the exploration activities. During a meeting held in Montreal with Labrador Innu representatives on May 23, 2011, Alderon outlined their exploration program. The Labrador Innu expressed no concern about the exploration activities planned for 2011. On September 27, 2011, Alderon met with representatives of the Innu Nation to advance discussions surrounding the conditions outlined in the MOU.
Consultation efforts with the Québec communities of Uashat mak Mani-Utenam, Matimekush-Lac John, and Naskapi Nation of Kawawachikmach began on January 12, 2011, with each community receiving a letter introducing the Company, providing an overview of its exploration plans including a map, and providing contact information for any questions or concerns they may have related to Alderon’s exploration efforts. These letters were translated into French for the communities of Uashat mak Mani-Utenam and Matimekush-Lac John. In the letter, Alderon extended offers to meet and address any questions or concerns the Québec communities may have, and to provide additional information on Alderon’s 2011 exploration plans with a goal of building respectful relationships. In January 2011, Alderon met at separate occasions with the Chief of Matimekush-Lac John, and a representative from Uashat mak Mani-Utenam, at which time Alderon provided a more detailed overview of Alderon and its exploration efforts of the Property.
In February 2011, additional letters were sent to the Québec Innu communities of Uashat mak Mani-Utenam and Matimekush-Lac John, inviting them to meet with Alderon in Toronto during a conference in March 2011. A meeting was held in Toronto between the Chief, a councilor of Uashat mak Mani-Utenam and a legal representative from the community. At that time there were no concerns raised regarding the exploration component of Alderon’s program. During the meeting, the Chief expressed an interest in negotiating a MOU with Alderon. Alderon forwarded a copy of a draft MOU to the Uashat representatives on March 23, 2011 and there has been ongoing communication between the two parties since then. On May 11, 2011, Alderon met with Uashat mak Mani-Utenam legal counsel and a representative of the community to discuss their concerns with Alderon’s exploration program. Alderon also met with councilors and legal counsel from Uashat on August 16 and September 29, 2011 to discuss the next steps in advancing discussions.
September 2011
20-46
Alderon Iron Ore Corp.
NI 43-101 Technical Report — PEA of the Kami Iron Ore Project |
|
Alderon contacted the President of NCC to meet with company representatives in August 2011. On September 13, 2011, Alderon sent a letter to NCC providing an overview of the Project and reiterating the offer to meet with Alderon representatives. Discussions between Alderon and NCC to arrange a meeting to discuss the Project are ongoing.
Alderon will continue to engage all Aboriginal groups and communicate with stakeholders who have an interest in the Property and Alderon’s activities.
September 2011
20-47
Alderon Iron Ore Corp.
NI 43-101 Technical Report — PEA of the Kami Iron Ore Project |
|
21. CAPITAL AND OPERATING COSTS
The Kami Iron Ore Project scope covered in this Study is based on the construction of a greenfield facility having a nominal annual production capacity of 8 Mt of concentrate. The Capital and Operating Cost Estimates related to the mine, concentrator and Kami site infrastructure have been developed by BBA. Costs related to the railway, port facilities, environmental and Tailings Pond and site Closure Plan have been developed by Stantec. BBA consolidated cost information from all sources. Table 21.1 presents a summary of total estimated initial capital cost for the Project.
Table 21.1: Total Estimated Initial Capital Costs (M$)
The total initial capital cost, including Indirect Costs and contingency was estimated to be in the order of $989M. Mining costs include pre-stripping costs which have been calculated from operating costs and capitalized (estimated at $97.4M). This Capital Cost Estimate is expressed in constant August 2011 Canadian Dollars, with an exchange rate at par with the US Dollar. This estimate table does not include the following items, which were accounted for separately:
· Leased equipment (mining equipment and railcars) estimated value at $259.2M which is included in operating costs;
· The portion of rehabilitation and closure costs required to be disbursed prior to production startup estimated by Stantec to be in the order of $25.5M;
· Sustaining capital (capital expenses incurred in Year 1 of production to the end of mine life) estimated at $198.5M.
September 2011
21-1
Alderon Iron Ore Corp.
NI 43-101 Technical Report — PEA of the Kami Iron Ore Project | 
|
Table 21.2 presents a summary of total estimated average operating costs presented in Canadian Dollars (CAD$) per tonne of concentrate produced. Operating costs were estimated based on the average over the life of the mine. Operating costs include the estimated cost of leased equipment over the life of the lease.
Table 21.2: Total Estimated Average Operating Cost ($/t concentrate)

The total estimated operating costs are in the order of $44.87/t of concentrate produced. These costs include the cost of leasing mining equipment as well as railcars for the life of the lease. The operating costs developed were based on power costs that are in line with local rates and fuel costs that were obtained from a major fuel supplier in the region.
Royalties are not included in the Operating Cost Estimate presented but are treated separately in the economic analysis.
21.1 Basis of Estimate and Assumptions
The Capital Cost Estimate pertaining to the processing areas and Kami site infrastructure within the BBA scope was performed by a professional estimator in BBA’s estimation team. Capital costs for the mine were estimated by BBA’s mining group. Capital costs for the rail, port, Tailings Pond and site rehabilitation and closure costs were developed by Stantec.
September 2011
21-2
Alderon Iron Ore Corp.
NI 43-101 Technical Report — PEA of the Kami Iron Ore Project |
|
21.1.1 Type and Class of Estimate
The present Capital Cost Estimate pertaining to this Study meets Class 4 - Initial (FEL-1) estimate type criteria, which are usually prepared to establish a preliminary Capital Cost Forecast and assess the project’s profitability potential. This will allow management or the project sponsor to obtain authorization for funds for further project definition. As such, this estimate forms the initial “Control Estimate” against which subsequent Cost Estimates developed in the next study and engineering phases will be compared and monitored. The accuracy range for the Capital Cost Estimate and the Operating Cost Estimate developed in this Study is -20%/+30%.
21.1.2 Dates, Currency and Exchange Rates
This Cost Estimate is calculated and presented in August 2011, Canadian Dollars (CAD$). The exchange rate was assumed at $1 CAD = $1 US.
21.1.3 Labour Rates and Labour Productivity Factors
The hourly Crew Rates used in the present estimate were developed by BBA and were based on current applicable Construction Collective Bargaining Agreements and on BBA experience on other projects in the region. Crew Rates include Direct and Indirect components and were developed as “all-in” rates.
Direct rates include a mix of skilled, semi-skilled and unskilled labours for each trade as well as the fringe benefits on top of gross wages. Direct supervision by the Foremen and Surveyors is built in the Direct Costs. The Indirect Cost component consist of allowances for small tools, consumables, supervision by the General Foremen, Management Team, Contractors on site temporary construction facilities, mobilisation / demobilisation, Contractor’s overhead and profit.
The Construction Equipment rates were developed by BBA for each discipline (by speciality), and established, based on the assumption that all hourly workers are unionized.
September 2011
21-3
Alderon Iron Ore Corp.
NI 43-101 Technical Report — PEA of the Kami Iron Ore Project | 
|
Labour productivity factors have been developed for each discipline and applied as a productivity loss factor to the base man-hours developed for each discipline. Winter conditions are expected to dominate from December 1st to March 31st, which is taken into consideration within the aforementioned productivity loss factors.
21.1.4 General Direct Capital Costs
This Capital Cost Estimate is based on the construction of a greenfield facility having a capacity to produce 8 Mt/y of concentrate. The design of the crusher area, the crushed ore stockpile area and the concentrator area has largely been based on BBA’s reference projects. General Arrangement drawings developed in this Study have been used to scale quantities estimated from factors derived from relevant BBA reference projects. Equipment costs have been estimated using recent Vendor prices for major process equipment and labour rates have been estimated as described previously. Related infrastructure has been estimated by BBA based on the site plan developed.
BBA has developed this Capital Cost Estimate on the following assumptions and estimation methodology:
· Mining equipment quantities and costs have been developed by BBA’s mining group based on the mine plan developed in this Study. Equipment costs were estimated from BBA’s recently updated database of Vendor pricing. In order to reduce initial mining equipment costs, it is assumed that Alderon will lease to own certain equipment that is required for pre-production and for Year 1 of operation.
· For this study, it was assumed that the initial installation for servicing mining equipment will be limited to a sprung structure type building, whose cost was estimated by BBA, based on recent experience with similar installations. Sustaining capital includes the installation of a six-bay garage, wash station and tire shop.
· Pre-stripping costs incurred in the pre-production period have been capitalized. This Capital Cost Estimate is based on pre-stripping tonnage as defined in the mine plan and includes costs associated with the mining and hauling of overburden, waste rock and ore.
September 2011
21-4
Alderon Iron Ore Corp.
NI 43-101 Technical Report — PEA of the Kami Iron Ore Project |
|
· The capital cost for the crusher area and the crushed ore stockpile area was estimated based on BBA’s reference project using estimated quantities and updated unit costs. A budget price for the crusher was obtained from a Vendor.
· The capital cost for the concentrator area was estimated based on BBA’s reference projects using estimated quantities for commodities (concrete, steel) and updated unit costs. Major process equipment was sized by BBA and budget prices were obtained from Vendors or from recently updated BBA database.
· Other mechanical equipment, piping, electrical and automation quantities (and sizes if applicable) were taken directly from the BBA reference projects, grouped into distinct packages and factors were applied.
· The concentrate load-out silo and emergency stockpile were estimated based on BBA’s reference project.
· Site electrical includes all infrastructure to connect to the local power grid, to build a new main substation and to distribute electric power to the main site areas. Costs of major electrical components were estimated using BBA’s recently updated internal database.
· It was assumed that the bearing capacity of the soil is in the order of 200 kPa and that no rock drilling or blasting will be required.
· It was assumed that all backfill materials will be available from gravel pits, esker or other sources located within a radius of 10 km.
· Unit costs for commodities such as concrete, structural steel, metal works and architectural finishes were estimated from BBA’s internal database.
September 2011
21-5
Alderon Iron Ore Corp.
NI 43-101 Technical Report — PEA of the Kami Iron Ore Project |
|
21.1.5 Indirect Costs
Indirect Costs for areas under BBA’s responsibility for capital cost estimation were factored by BBA based on experience on other projects as described below. Stantec applied an all-in factor for estimating Indirect Costs for items under their responsibility.
· Costs related to the construction of temporary facilities required during the project construction period comprise of costs incurred for building and maintaining temporary facilities and accesses, which will no longer be required once construction is completed. BBA estimated these costs at 3.5% of Direct Costs.
· Owner’s costs are estimated as a percentage of total Direct Costs. For this Study, BBA used 4%. Owner’s costs include items such as Owner’s team salaries and expenses, insurance, authorization certificates and permits, geotechnical and surveying costs, laboratory testwork, etc.
· Engineering, Procurement, and Construction Management (EPCM) services are estimated at 11.75% of Direct Costs.
· Temporary construction facilities were estimated as 6.35% of Direct Costs.
· Operations of temporary construction facilities are capitalized and were estimated at 4.55% of Direct Costs.
· Cost of sub-consultants and other third parties were estimated at 0.65% of Direct Costs.
· Costs for pre-operational acceptance of mechanical equipment were estimated at 0.5% of Direct Costs.
· Costs for plant mobile equipment used during construction were estimated at 0.45% of Direct Costs.
· Other Indirect Costs and add-ons were estimated at 0.5% of Direct Costs.
September 2011
21-6
Alderon Iron Ore Corp.
NI 43-101 Technical Report — PEA of the Kami Iron Ore Project |
|
· Costs for spare parts, freight, Vendor’s reps and other such items were estimated at 13.5% of equipment value.
21.1.6 Contingency
Contingency provides an allowance to the Capital Cost Estimate for undeveloped details within the Scope of Work covered by the estimate. Contingency is not intended to take into account items such as labour disruptions, weather related impediments, changes in the scope of the Project from what is defined in the study, nor does contingency take into account price escalation or currency fluctuations. A contingency of 20% of the sum of Direct and Indirect Costs has been attributed to the Capital Cost Estimate developed in this Study for areas estimated by BBA.
21.1.7 Exclusions
The following items are not included in this Capital Cost Estimate:
· Inflation and escalation, the estimate is in constant August 2011 Canadian Dollars
· Costs associated with protection against currency fluctuations
· All taxes, duties and levies
· Working capital
· Project financing costs
September 2011
21-7
Alderon Iron Ore Corp.
NI 43-101 Technical Report — PEA of the Kami Iron Ore Project |
|
22. ECONOMIC ANALYSIS
The economic evaluation of the Kami Iron Ore Project was performed using the discounted cash flow model. The capital and operating cost estimates based on the mine plan developed in this Study to produce 8.0 Mt of concentrate annually were used as input to the model. The Internal Rate of Return (IRR) on total investment was calculated based on 100% equity financing. The Net Present Value (NPV), based on discounting rate between 0% and 10%, resulting from the net cash flow generated by the Project was also calculated. The payback period is also indicated as a financial measure. A sensitivity analysis was also performed and presented. The following assumptions were made for the financial analysis:
· A construction period of two years
· A production life of 15.3 years for the Rose Central deposit
· A commodity price of $115/t of concentrate of grading at 65.5% Fe. This price was based on the following:
· Three-year average price of $135/t
· Long-term price forecasted by analysts and producers of $85/t
· Alderon market study
· Production startup in Q4-2015
· All of the concentrate is sold in the same year of production
· No escalation or inflation factor has been taken into account (constant 2011 $)
· Financial analysis excludes working capital
· The financial analysis is carried out on a pre-tax basis
· US Dollar at par with Canadian Dollar
Table 22.1 presents the undiscounted cash flow projection for the Project. BBA assumed that initial capital cost disbursement takes place over a two year period prior to production startup. Production starts in Yr 1.
September 2011
22-1
Alderon Iron Ore Corp.
NI 43-101 Technical Report — PEA of the Kami Iron Ore Project | 
|
Table 22.1: Kami Project Table of Undiscounted Cash Flow
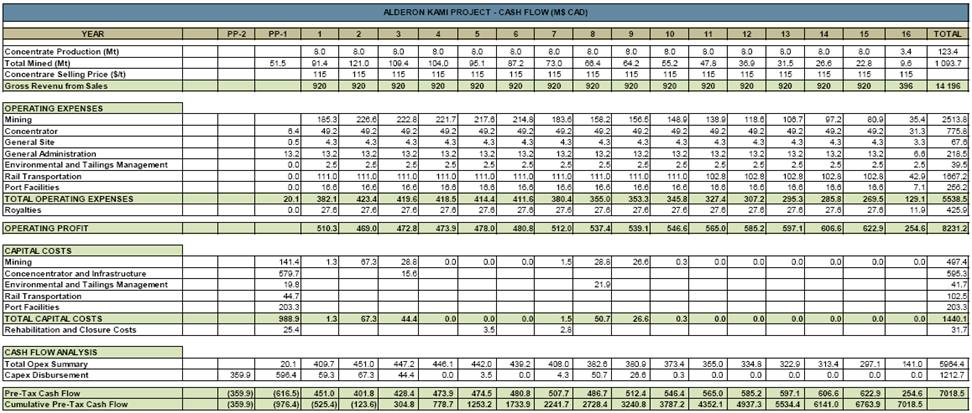
September 2011
22-2
Alderon Iron Ore Corp.
NI 43-101 Technical Report — PEA of the Kami Iron Ore Project | 
|
A discount rate is applied to the cash flow to arrive at a NPV and payback period. The NPV calculation was done at 0%, 5%, 8% and 10%. The Base Case NPV was assumed at a discount rate of 8%. Table 22.2 presents the results of the financial analysis for the Project based on the assumptions and cash flow projections previously presented.
Table 22.2: Financial Analysis Results
Base Case
| | 40.2% | |
IRR | | NPV | | Payback | |
0% | | $ | 7 019 M | | 2.3 yrs | |
5% | | $ | 4 135 M | | 2.5 yrs | |
8% | | $ | 3 066 M | | 2.7 yrs | |
10% | | $ | 2 526 M | | 2.8 yrs | |
As can be seen, the Project is forecasted to provide an IRR of 40.2% (before tax). At the Base Case discount rate of 8%, NPV is $3,066 M. The Payback period is 2.7 years after the start of production.
A Preliminary Economic Assessment is preliminary in nature and includes inferred mineral resources that are considered too speculative geologically to have economic considerations applied to them that would enable them to be categorized as mineral reserves, and there is no certainty that the Preliminary Economic Assessment will be realized.
September 2011
22-3
Alderon Iron Ore Corp.
NI 43-101 Technical Report — PEA of the Kami Iron Ore Project |
|
22.1 Sensitivity Analysis
A sensitivity analysis was done on parameters that are deemed to have the biggest impact on project financial performance. The following sensitivity analysis was performed and results are presented in Table 22.3.
· Base Case CAPEX estimate +/- $100M (about 10% of initial capital cost)
· Base Case Selling Price +/- 25%
· Base Case OPEX estimate +/- $50M per year (about 12% of operating costs)
· Reduced production from 8.0 Mt/y to 7.0 Mt/y assuming a reduction in iron recovery
Figure 22.1 shows a graphical representation of the sensitivity analysis. As is indicated, NPV at an 8% discount rate is more sensitive to a $50M/y variation in operating costs than a $100M variation in initial capital cost. A 25% variation in the commodity selling price however affects NPV to a much greater extent than the aforementioned variation in operating costs and capital costs.
September 2011
22-4
Alderon Iron Ore Corp.
NI 43-101 Technical Report — PEA of the Kami Iron Ore Project | 
|
Table 22.3: Sensitivity Analysis Table
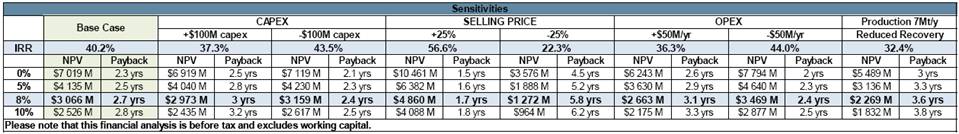
Figure 22.1: Sensitivity Analysis Graph
September 2011
22-5
Alderon Iron Ore Corp.
NI 43-101 Technical Report — PEA of the Kami Iron Ore Project | 
|
22.2 Risk Management
22.2.1 Scope
BBA’s approach to Risk Management in the context of this study is to identify major risks associated with this Project in terms of the following categories:
· Technology and technical risk
· Risk related to meeting the targeted project schedule
· Risk affecting CAPEX
· Risk affecting OPEX
· Risk affecting product quality with potential repercussions on product marketability
Risk Management is a continuous process that is performed over the full life-cycle of a project; therefore, Risk Management is only complete when the project is complete. Consequently, the data and information presented in this Report is a snapshot of the project risk profile as understood on the effective date of this Report. It will be noted that because of the continuous nature of the Risk Management process, many open risk issues exist at this time. A review of the Risk Register will show that not all risks have been fully evaluated nor are they accompanied by well-defined mitigation plans or actions since these are to be updated regularly.
September 2011
22-6
Alderon Iron Ore Corp.
NI 43-101 Technical Report — PEA of the Kami Iron Ore Project |
|
22.2.2 Risk Assessment Methodology
Risk identification is the process of examining the various project areas and each critical process in order to identify and document any associated potential risks. A preliminary Risk Register was compiled by BBA during the early phases of this Preliminary Economic Assessment. A risk review meeting was held in St. John’s, Newfoundland and Labrador on May 11, 2011 with the participation of BBA, Stantec and Alderon. During the course of the study, as new risks were identified by the various parties contributing to this study, they were submitted to BBA and added to the Risk Register. A final review of the Risk Register to be incorporated in the Report was conducted on September 1, 2011.
For this study, risk assessment was conducted on a qualitative basis. The Probability of Occurrence was assessed and qualified on three levels. The Manageability of the risk, which indicates how effectively the risk may be mitigated, was also qualified on three levels. These are indicated in Table 22.4. The consequence associated with the risk was qualified in the Risk Register but only as a description.
Table 22.4: Classification of Occurrence and Manageability
Label | | Probability | | Manageability | |
High | | Likely to Occur | | Direct control with a clear solution | |
Medium | | May Occur | | No control with a solution or Some
control with no clear solution | |
Low | | Unlikely to Occur | | No control and no clear solution | |
From this table, it is understood that a risk with a High Probable Consequence and a Low Manageability should receive a high priority for mitigation activities and resources.
Table 22.5 presents a summary of the risk items identified and the risk category for each risk item.
September 2011
22-7
Alderon Iron Ore Corp.
NI 43-101 Technical Report — PEA of the Kami Iron Ore Project |
|
Table 22.5: Risk Register
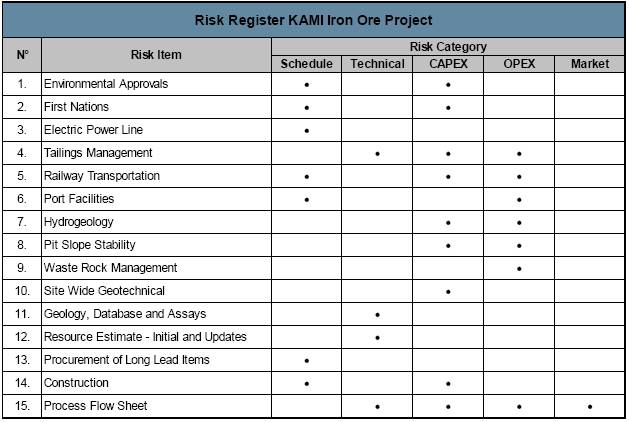
September 2011
22-8
Alderon Iron Ore Corp.
NI 43-101 Technical Report — PEA of the Kami Iron Ore Project |
|
23. ADJACENT PROPERTIES
The northern boundary of the Property is located approximately 6 km south of the Scully Mine of Wabush Mines, owned 100% by Cleveland Cliffs Inc., now Cliffs Natural Resources Inc. (“Cliffs”). The Carol operations owned by Rio Tinto Iron Ore subsidiary IOCC, located north of Labrador City, are approximately 18 km north of the Property. ArcelorMittal Mines Canada Mount Wright facility is located 9 km west of the Property. The Property is also located approximately 10 km southeast of the Bloom Lake Iron Deposit recently purchased by Cliffs. All of these iron mines in the area extract similar iron mineralization as found at the Property, although for each deposit there are some variations in geology and the character of the mineralization.
The following is a brief description of the operations in the area:
Wabush Mines’ Scully Mine has been in operation since 1965. Mining and concentrating takes place in Wabush, while the subsequent stage of pelletizing is done at a plant at Pointe-Noire on the St Lawrence River, west of Sept-Iles, Québec. Since 1967, annual capacity of the Wabush operation has been approximately six million long tonnes of pellets. Strathcona Mineral Services Limited (“Strathcona”) completed a review of the Scully operation in 2006 for the government of Newfoundland and Labrador and much of what is summarized below concerning the Scully operations is taken from Stathcona’s Report. Wabush Mines is the smallest of the three operations in Western Labrador and has always been considered to have less favorable economics because of its lower production rate, ore quality issues because of the manganese content in the ore, significant dewatering requirements in the mining operations, and reliance on a competitor’s railroad (IOCC) for transporting ore to the pellet plant.
The Wabush Mine ore consists dominantly of hematite with minor magnetite. Ore with more than 15% magnetite is excluded from Mineral Reserves because the processing plant cannot handle it. This information has not been independently verified by the QP and the information is not necessarily indicative of mineralization on the Property. Manganese is the main non-iron element affecting the quality of the Wabush pellets, with all other elements generally meeting typical market specifications. O’Leary et al., (1979) has shown the manganese grade in the final
September 2011
23-1
Alderon Iron Ore Corp.
NI 43-101 Technical Report — PEA of the Kami Iron Ore Project |
|
concentrate closely matches the manganese grade in the crude ore, indicating that, on average, about two-thirds of the manganese is being rejected in the concentration process.
Pellets from Wabush Mines with high manganese have to be blended with low-manganese iron ore in order to meet the specifications generally established by the steel producers. Maintaining satisfactory manganese content is therefore the major technical challenge facing Wabush Mines in terms of product quality, which is a challenge not faced by the neighboring operations at IOCC and Mont-Wright. WGM understands that a decision to go ahead with the construction of a manganese treatment plant at Wabush is in process. This development should extend mine life as more high manganese mineralization will become ore and the mines product should presumably be able to garner a higher price.
AMMC is a major North American producer and marketer of a variety of iron ore products consisting of concentrates and several types of pellets. AMMC owns and operates the Mont- Wright Mine and concentrator at Fermont, a pellet plant and adjacent port facilities on the Gulf of St. Lawrence at Port-Cartier, Québec, and the railway, which transports iron ore concentrate to the pelletizing plant and for direct shipping.
The Mont-Wright operation which started production in 1975 consists of a concentrator and several open-pit mines. The iron formation that is mined at Mont-Wright has an average iron content of approximately 30% TFe. The magnetite content is normally less than 5% by weight, however, it may be higher locally, and magnetite must be blended into the mill feed. The level of contaminants (predominantly TiO2, Al2O3, Mn, P, Na2O, K2O) in the iron ore is generally low, but is higher adjacent to the amphibolite-specular hematite contacts. The marketplace considers Mont-Wright concentrate to be purer than the fines being shipped from Australia and Brazil.
The mine has the capacity to produce some 38 million tonnes of feed for the concentrator and about 30 million tonnes of waste per year. The Mont-Wright concentrator has the capacity to produce 16 million tonnes of concentrate annually, assuming a Head grade of 30% Fe. Current production is approximately 13.5 million tonnes of iron ore concentrates per year, from crude ore, with an average Head grade of 28% Fe. Crude Head grade averaged 28.2% Fe between 2001 and 2005 and is forecast to average 28.9% TFe for the 2006 to 2010 year period. The variation in the concentrate tonnage is directly related to yearly sales, which is dependent on
September 2011
23-2
Alderon Iron Ore Corp.
NI 43-101 Technical Report — PEA of the Kami Iron Ore Project |
|
market conditions. During the period from 1961 through 2005, a total of approximately 543 million tonnes of iron ore products were shipped from Port-Cartier. Prior to the start of the Mont-Wright mine, QCM production came from the operations in Gagnon and Fire Lake which used the southern portion of the rail and the shipping facilities at Port-Cartier.
The Lac Hessé, Lac Moiré and Fire Lake deposits occur in this same immediate area and are held by AMMC. In addition, AMMC recently reacquired the magnetite-rich Mont-Reed deposit near Lac Jeannine. Lac Jeannine, at Gagnon was QCM’s first operation in the area, but by April 1977 it had been depleted following production of 130 million tonnes of iron ore concentrate over a 17-year period. The Fire Lake deposit saw limited production from late 1974 into 1984, first by QCM, then by Sidbec-Normines Inc. Recent developments at Fire Lake included the 2006 extraction of approximately 1.3 million tonnes of crude ore for metallurgical and concentrator testing. This program began in June 2006 and was to be completed by year-end.
The Bloom Lake Mine started commercial production in 2010. In 1998, WGM on behalf of QCM, designed and managed an exploration program on the Bloom Lake Property. BBA completed a Conceptual Study for the development of a 5 million t/y mine and concentrator for the deposit in October 2005. In May of 2006, BBA completed a Feasibility Study based on the same parameters. In May of 2007, BBA presented an update of the mining plan, the mine and concentrator infrastructure, the capital and operating costs and a review of the financial analysis for the development of a 7 million t/y operation. In August 2007, Consolidated Thompson stated that almost half of its detailed engineering for mine development had been completed and work was proceeding. In November of 2008, they filed a Feasibility Study available on SEDAR for the project based on 8 Mt/yr of iron concentrate, (Allaire, Palumbo, Live and Scherrer, 2008). This information has not been verified by the QP and the information is not necessarily indicative of mineralization on the Property.
IOCC operates a mine, concentrator and a pelletizing plant in Labrador City, as well as port facilities located in Sept-Îles. The company also operates a 420-kilometre railroad that links the mine to the port. IOCC is the largest iron ore and pellet producer in Canada. In 2005, IOCC celebrated fifty years of operation. Its first operation, in Schefferville, Québec, at Knob Lake, started in 1954 and ceased production in 1982. IOCC’s Carol operations, initially from the Smallwood Mine, opened in 1962. IOCC recently announced its commitment to boost
September 2011
23-3
Alderon Iron Ore Corp.
NI 43-101 Technical Report — PEA of the Kami Iron Ore Project |
|
concentrate output from 17 to 22 million t/y. Additional projects are planned to increase pellet production from 13.0 to 14.5 million t/y.
September 2011
23-4
Alderon Iron Ore Corp.
NI 43-101 Technical Report — PEA of the Kami Iron Ore Project |
|
24. OTHER RELEVANT DATA AND INFORMATION
24.1 Project Implementation and Execution Plan
Upon completion of this Preliminary Economic Assessment, the Project will immediately proceed with the Feasibility Study (FS) phase. Environmental studies have been initiated and the project registration process leading to Alderon obtaining all required permits for construction at all sites as well as for operating the facilities has been defined and is being executed. On-site work including exploration drilling and condemnation, as well as geotechnical drilling, is proceeding as planned.
The preliminary project execution schedule developed in this Study and described herein, covers the period from the start of the FS right to the end of commissioning. The major assumptions driving key milestones in the preliminary project execution schedule are as follows:
· The FS schedule is dependent on the Rose North block model being available by April 30, 2012. The FS is scheduled to be completed by October 2012;
· The environmental permitting process is assumed to begin with project registration initiated with the submission of the Draft Project Description on October 3, 2011. Based on the expected duration of the various regulatory proceedings, it is expected that the permits to allow for start of construction will be issued by November 1, 2013. No site work is anticipated prior to this date. Environmental permitting, expected to last 25 months, constitutes the project execution critical path;
· On site construction at the Kami site is set to start on November 1, 2013 and is based on a construction schedule of 21 months. This is in line with similar projects facing similar challenges. It is assumed that the temporary camp facility for construction workers will be built ahead of time in Labrador West, i.e. off-site;
· To support the construction schedule, EPCM activities need to be executed as follows:
September 2011
24-1
Alderon Iron Ore Corp.
NI 43-101 Technical Report — PEA of the Kami Iron Ore Project |
|
· Detailed engineering is assumed to begin at the end of August 2012, thus before the end of the FS. This is typical of fast-track projects;
· Procurement activities are based on delivery of long lead items, including the grinding mills, spirals and concentrate stacker/reclaimer at the port. It is assumed that the longest lead items are in the order of 18 months.
An analysis of the construction schedule developed for the Project, considering only the Kami site construction and excluding the railway and port facility, allowed for the development of a preliminary manpower curve as shown in Figure 24.1. Figure 24.2 presents the simplified project execution schedule.
Figure 24.1: Preliminary Construction Manpower Curve
September 2011
24-2
Alderon Iron Ore Corp.
NI 43-101 Technical Report — PEA of the Kami Iron Ore Project | 
|
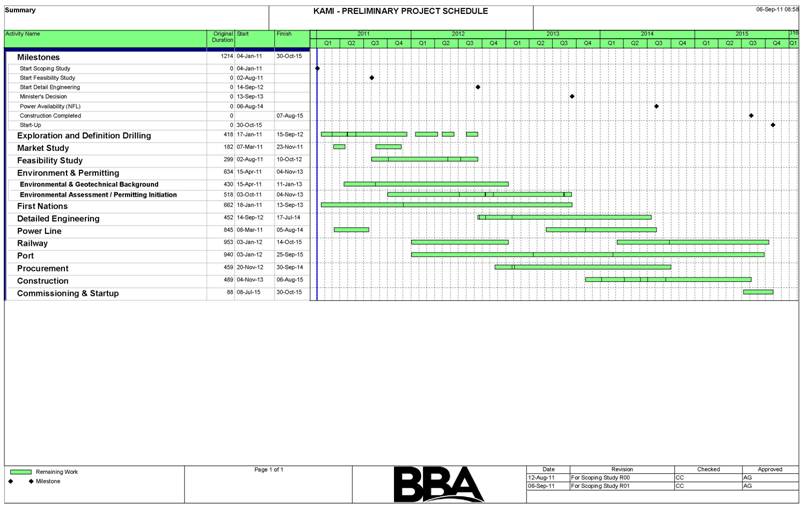
Figure 24.2: Simplified Project Execution Schedule
September 2011
24-3
Alderon Iron Ore Corp.
NI 43-101 Technical Report — PEA of the Kami Iron Ore Project | 
|
25. INTERPRETATION AND CONCLUSION
25.1 Mineral Resources
The most recent Resource Estimate for the Rose Central deposit and the Mills deposit were conducted by WGM and documented in an NI 43-101 Compliant Report dated May 20, 2011 that has been filed on Sedar. The following interpretations and conclusions were drawn by WGM based on results reported in the aforementioned Report.
· Mineralization on the Property comprises meta-taconite typical of the Sokoman/Wabush Formation. Iron formation is mainly magnetite-rich but also includes specular hematite components. At Rose Central, the iron formation is hosted in a series of upright to slightly overturned anticlines and synclines. At Mills, the iron formation consists of a main tabular gently dipping lens and some minor ancillary lenses.
· A substantial deposit of meta-taconite exists on the Property. With the currently available information from the drilling campaigns, WGM prepared a Mineral Resource estimate for the Rose Central and Mills deposits summarized in Table 25.1.
Table 25.1: Categorized Mineral Resource Estimate for Kami Iron Ore Project (Cutoff of 20% TFe)
Category | | Zone | | Tonnes
(Million) | | TFe% | | magFe% | | hmFe% | | Mn% | | SiO2% | |
Indicated | | Rose Central Mills | | 376.1 114.1 | | 29.8
30.5 | | 18.6
22.1 | | 8.3
5.7 | | 1.56
1.02 | | 44.9
45.6 | |
Inferred | | Rose Central Mills | | 46.0
71.9 | | 29.8
30.7 | | 19.2
22.2 | | 8.0
6.0 | | 1.61
1.05 | | 44.9
45.4 | |
· WGM has not classified any of the Kami Project deposits’ mineralization as Measured Mineral Resources at this stage of exploration and did not include Rose North Zone or other mineralized areas in the estimate. More field work and confirmation/infill drilling is required before a Mineral Resource estimate can be completed on these other areas.
· In both Rose Central and Mills deposits, the closest spaced drilling was near the surface (in the first 150 to 200 m) and the extensions of the mineralization on the ends and at depth took into account the fact that the drilling pattern was irregular; hence many drillholes did not
September 2011
25-1
Alderon Iron Ore Corp.
NI 43-101 Technical Report — PEA of the Kami Iron Ore Project |
|
penetrate the entire stratigraphy/zone. The 3-D model for Rose Central was continued at depth as long as there was drillhole information, however, this extension was taken into consideration when classifying the Mineral Resources and these areas were given a lower (Inferred) confidence category with no Mineral Resources defined or considered below the 150 m elevation.
· The details of the geology and geometry of the Rose Central mineralized body is quite complex and more drilling is required to get a better understanding of the depth potential, dip and internal detail of the hematite-rich and waste units. However, the gross overall mineralization controls appear to be fairly well understood with the drilling completed to date. At this stage of exploration, the search ellipse size and orientations for the grade interpolation were kept simple and the same sizes were used for both deposits, but the orientation and dips were changed based on the geological interpretation. After more drilling information is available, WGM envisions that due to folding causing orientation/strike complexity and change, “domaining” will most likely be used to better control grade distribution in future Mineral Resource estimates.
· WGM agrees that all the 2008 and 2010 drillhole collars and preferably the tops of the drillholes be surveyed by gyroscope for location, azimuth and dip.
The block models for Rose Central and Mills deposits were prepared by WGM and provided to BBA to calculate in-pit resources, as indicated in Table 25.2 and Table 25.3 respectively. Mining operations will be based on conventional open pit, drill and blast, load and haul methods.
A Preliminary Economic Assessment is preliminary in nature and includes Inferred Mineral Resources that are considered too speculative geologically to have economic considerations applied to them that would enable them to be categorized as Mineral Reserves, and there is no certainty that the Preliminary Economic Assessment will be realized.
September 2011
25-2
Alderon Iron Ore Corp.
NI 43-101 Technical Report — PEA of the Kami Iron Ore Project |
|
Table 25.2: Rose Central In-Pit Resource Estimate
Rose Central- Engineered Pit Design
Total Resource Estimate - (COG 15% TFE%)
| | | | Grades | |
Category | | Ore (kt) | | % TFe | | %SiO2 | | %Mn | | %MagFe | | %HemFe | | Fe Con. (kt) | |
Indicated | | 307 755 | | 29.86 | | 44.75 | | 1.63 | | 18.24 | | 8.83 | | 113 869 | |
Inferred | | 27 373 | | 30.03 | | 44.80 | | 1.68 | | 18.49 | | 8.79 | | 10 128 | |
Total | | 335 128 | | 29.88 | | 44.76 | | 1.63 | | 18.26 | | 8.83 | | 123 998 | |
| | | | | | | | | | | | | | | |
| | Waste (kt) | | Total S/R | | | | | | | | | | | |
Rock | | 711 853 | | | | | | | | | | | | | |
OB | | 46 766 | | | | | | | | | | | | | |
Total Stripping | | 758 619 | | 2.26 | | | | | | | | | | | |
Table 25.3: Mills In-Pit Resource Estimate
Mills - Engineered Pit Design
Total Resource Estimate - (COG 15% TFE%)
| | | | Grades | |
Category | | Ore (kt) | | % Tfe | | %SiO2 | | %MN | | %MGFe | | %HMFe | | Fe Con. (kt) | |
Indicated | | 65 089 | | 30.56 | | 45.32 | | 1.08 | | 22.36 | | 6.07 | | 24 083 | |
Inferred | | 24 435 | | 30.94 | | 45.02 | | 1.24 | | 22.58 | | 6.45 | | 9 041 | |
Total | | 89 523 | | 30.66 | | 45.40 | | 1.08 | | 22.66 | | 5.86 | | 33 124 | |
| | | | | | | | | | | | | | | |
| | Waste (kt) | | Total S/R | | | | | | | | | | | |
Rock | | 77 834 | | | | | | | | | | | | | |
OB | | 14 869 | | | | | | | | | | | | | |
Total Stripping | | 92 703 | | 1.04 | | | | | | | | | | | |
September 2011
25-3
Alderon Iron Ore Corp.
NI 43-101 Technical Report — PEA of the Kami Iron Ore Project |
|
25.2 Metallurgy and Ore Processing
The Rose Central deposit is characterized by three distinct mineralization zones containing varying degrees of magnetite and hematite. The Mills deposit is relatively uniform with magnetite predominating. Both deposits exhibit varying manganese levels. Manganese is contained in carbonate and silicate gangue minerals and is also chemically bonded within the magnetite. Testwork indicated the liberation size for Mills to be significantly finer than that of the three mineralization zones in Rose Central and it was decided, based on this information and considering that the Mills deposit is significantly smaller than the Rose Central deposit, that process development for this Study be done based only on the Rose Central deposit. The testwork results permitted to develop a preliminary Process Flowsheet based on crushing, grinding and screening, gravity concentration using spirals and cobbing of the gravity tailings for magnetite regrinding and magnetic concentration. Thus a gravity concentrate and a magnetic plant concentrate are produced.
Preliminary grindability testwork was performed but no testwork to indicate particle size distribution from primary grinding was carried out in this Study. A particle size distribution was assumed based on BBA’s experience on ore with a liberation size of 35 mesh.
The metallurgical testwork pointed to the following risk factors:
· The lack of sufficient grindability data regarding the primary grinding product particle size distribution may result in production of fines in excess of what was assumed and reduce total hematite Fe recovery.
· Primary mill power requirements for the production of 8.0 Mt/y of total concentrate were estimated to be at the limit of capacity of 36’ diameter, dual pinion autogenous grinding mills.
· The limited grindability results indicated the possibility of bimodality of the ore which could result a buildup of pebbles in the primary grinding circuit.
The testwork planned in the next study phase is designed to address these issues.
September 2011
25-4
Alderon Iron Ore Corp.
NI 43-101 Technical Report — PEA of the Kami Iron Ore Project |
|
25.3 Environmental Permitting
The process of environmental permitting is relatively well understood and a preliminary schedule outlining the critical steps has been developed in this Study and has been integrated into the preliminary project execution schedule. Environmental permitting is on the project critical path and no construction activities can commence until the required permits and authorizations are obtained.
25.4 Conclusions
Based on the work accomplished and the results obtained in this PEA Study, it is BBA’s opinion that the Project is sufficiently robust to warrant proceeding with a Feasibility Study.
September 2011
25-5
Alderon Iron Ore Corp.
NI 43-101 Technical Report — PEA of the Kami Iron Ore Project |
|
26. RECOMMENDATIONS
The following recommendations are made considering the results of this PEA Study and the project risks identified. The recommendations also take into consideration the degree of detail in information required at the Feasibility Study level.
· Due to the variations in the drilling pattern, separations in the mineralized intersections were anywhere from less than 50 m to more than 250 m apart on adjacent holes. A more regular pattern of drilling should be used going forward, and wherever possible, it should be a priority for the drillhole to pass through the entire mineralized zone. Down dip drilling should also be kept to a minimum;
· WGM modeled out the larger and more continuous hematite-rich zones/units/beds within the main magnetite body that appeared to have fairly good correlation between holes and through multiple cross sections. The Rose Central deposit is more complex structurally and at least two hematite-rich units could be separately modeled. There appears to be more intermixed hematite and magnetite in this deposit as well. It appears that different ratios of hematite to magnetite occur in the different deposits (or parts of the deposits), but this distribution is not yet completely mapped out and understood and should be studied in detail during future work. WGM is of the opinion that it is important to keep these hematite-rich zones separate in future modeling and Mineral Resource estimates, as it may become important for determining processing options and costs of the iron-bearing material in subsequent economic studies;
· The current 3-D wireframe continued to a maximum depth of -135 m (approximately 750 m vertically below surface and extended 100 m past the deepest drilling) at Rose Central. The deeper mineralization, i.e., below 200 m vertical depth, has been tested by few drillholes and both zones are open at depth. A targeted exploration program will most likely increase the Mineral Resources at depth; however, an “economic lower level” or maximum depth of viable extraction should be determined in a subsequent Study;
· The metallurgical testwork proposed should be carried out early in the Feasibility Study;
September 2011
26-1
Alderon Iron Ore Corp.
NI 43-101 Technical Report — PEA of the Kami Iron Ore Project |
|
· Site conditions including geotechnical, hydrogeological and other studies should be conducted, as recommended by Stantec;
· Alderon should proceed, as soon as possible, with environmental permitting beginning with project registration;
· Alderon should continue discussions with stakeholders, including First Nations, in order to develop mutually beneficial accords;
· Alderon should undertake a more detailed and focused market study based on the results indicated in the market study performed during this PEA Study;
· Alderon should begin discussions with rail carriers and the Port of Sept-Îles to secure services and land in the vicinity of the port installations.
BBA recommends that Alderon proceed with the undertaking of a Feasibility Study. The costs for this next Study phase have been estimated and are outlined in Table 26.1. As of the Effective Date of this report, Alderon has already authorized and/or initiated some of the work outlined in the recommendations made.
Table 26.1: Next Study Phase Cost Estimate
Study Phase | | Cost Estimate | |
Exploration Drilling Program (to June 2012) | | $ | 17.3 M | |
Feasibility Study (Kami Site) | | $ | 1.9 M | |
Metallurgical Testwork | | $ | 1.1 M | |
Port and Rail | | $ | 1.1 M | |
Geotech and Pit Slope | | $ | 4.6 M | |
Other Site Studies | | $ | 1.0 M | |
Environmental Studies | | $ | 3.2 M | |
Total | | $ | 30.2 M | |
September 2011
26-2
Alderon Iron Ore Corp.
NI 43-101 Technical Report — PEA of the Kami Iron Ore Project | 
|
27. REFERENCES
Allaire, A., E. Palumbo, P. Live, and R. Scherrer |
2008 | | Technical Report Bloom Lake Project Labrador Trough, Québec Technical Report 43-101 on the feasibility Study for the Bloom Lake Project 8-million tonnes per year of Iron Concentrate prepared for Consolidated Thompson Iron Mines Ltd. and BBA Inc. |
| | |
Avison, A. T., Alcock, P. W., Poisson, P. and Connell, E. |
1984 | | Assessment report on geological, geochemical and geophysical exploration for 1983 submission on Labrador Mining and Exploration Company Limited blocks 4, 8 to 18, 20, 21, 26 to 31, 33, 43, 44, 45, 53, 55, 57, 63, 68, 78, 79, 80, 84 to 87, 92, 94, 95, 96, 100, 103 to 108, 110, 115 to 118, 120 to 125, 127 to 131, 134, 136, 138, 139, 140 and 142 in the Labrador City and Schefferville areas, Labrador, 4 reports. Newfoundland and Labrador Geological Survey, Assessment File LAB/0666, 1984, 520 p. |
| | |
Brown, Dennis, Tom Rivers and Tom Calon |
1992 | | A Structural analysis of a metamorphic fold-thrust belt, northeast Gagnon terrane, Grenville Province, Canadian Journal of Earth Science 29, pp. 1915 - 1927. |
| | |
Crouse, R.A. |
1954 | | Report on the Mills Lake-Dispute Lake area, Labrador, Iron ore Company of Canada, Newfoundland and Labrador Geological Survey Assessment file 23B/0006, 22 p. |
| | |
Davenport, P. H. and Butler, A. J. |
1983 | | Regional geochemical surveys, In Current research, Edited by m. J. Murray, P. D. Saunders, W. D. Boyce and R. V. Gibbons, Newfoundland and Labrador Geological Survey, Report 83~01, pp. 121~125. |
| | |
Davies, T., Lascelles, D. |
Sept 2011 | | “An Investigation into the Grindability and Mineralogical Characteristics of Samples from the Kamistiatusset Deposit”, prepared for Alderon Resource Corp., prepared by SGS Minerals Services, Project 12489-005 — Final Report. |
| | |
Aug 2011 | | “An Investigation into the Gravity and Magnetic Separation Characteristics of Samples from the Kamistiatusset Deposit”, prepared for Alderon Resource Corp., prepared by SGS Minerals Services, Project 12489-002/003/004 — Final Report. |
| | |
Ernst, Richard E. |
2004 | | Ca. 1880 Ma Circum-Superior LIP, May 2004 LIP of the Month, Geological Survey of Canada. |
| | |
September 2011
27-1
Alderon Iron Ore Corp.
NI 43-101 Technical Report — PEA of the Kami Iron Ore Project |
|
Grant, J. M. | | |
1979 | | Drill report on block 57 in the Wabush area, Labrador. Labrador Mining and Exploration Company Limited Iron Ore Company of Canada. Newfoundland and Labrador Geological Survey, Assessment File 23B/14/0121, 1979, 6 p. |
| | |
Gross, G.A. |
1996 | | Lake Superior-type iron-formation: in Geology of Canadian Mineral Deposit Types, (ed.) O.R. Eckstrand, W.D. Sinclair, and R.I. Thorpe; Geological Survey of Canada, Geology of Canada, No. 8, pp. 54-66 (also Geological Society of America, the Geology of North America, v. P-1). |
| | |
1996 | | Stratiform iron: in Geology of Canadian Mineral Deposit Types, (ed.) O.R. Eckstrand, W.D. Sinclair, and R.I. Thorpe; Geological Survey of Canada, Geology of Canada, No. 8, pp. 41-54 (also Geological Society of America, the Geology of North America, v. P-1). |
| | |
1993 | | Industrial and Genetic Models for Iron Ore in Iron-Formations in Geological Survey of Canada, Special Paper 40, pp. 151-170. |
| | |
Gross, G.A., Glazier, W., Kruechi, G., Nichols L., and O’Leary, J. |
1972 | | Iron Ranges of the Labrador Trough and Northern Québec, 24th International Geological Congress, Montreal Québec Canada, Guidebook excursion A55, 66 p. |
| | |
Hird, J.M. |
1960 | | Report on the Wabush iron ore deposits, Michigan College of Mining Technology and Iron Ore Company of Canada, Newfoundland Labrador Geological Survey, Internal Report, 35 p [023B/0033]. |
| | |
Kelly, R. G. and Stubbins, J .B. |
1983 | | Assessment report on topographic mapping program for the Carol project for 1982 submission on lease blocks 22, 22~5 and 22~6 and licence blocks 23, 24, 25, 32, 34 to 38, 41, 42, 60 and 61 in the Labrador City area, Labrador, Iron Ore Company of Canada and Labrador Mining and Exploration Company Limited, Newfoundland and Labrador Geological Survey, Assessment File LAB/0633, 27 p. |
Macdonald, R. D. |
1960 | | Report of operations for 1959 in Labrador, Iron Ore Company of Canada and Labrador Mining and Exploration Company Limited, Newfoundland and Labrador Geological Survey, Assessment File LAB/0263, 14 p. |
| | |
Mathieson, R.D. |
1957 | | Report of exploratory drilling of the Wabush project in the Duley Lake-Mills Lake area, Labrador, iron Ore Company of Canada, Newforundland and Labrador Geological Survey Assessment file 23B/0011. |
September 2011
27-2
Alderon Iron Ore Corp.
NI 43-101 Technical Report — PEA of the Kami Iron Ore Project |
|
McConnell, J. |
1984 | | Reconnaissance and detailed geochemical surveys for base metals in Labrador, Government of Newfoundland and Labrador, Department of Mines and Energy, Mineral Development Division, Report 84~02, 122 p. |
| | |
McKen, A., Wagner, R |
Sept 2009 | | “An Investigation into the Beneficiation Characteristics of One Sample from the Kamistiatusset Deposit”, prepared for Thibault & Associates Inc. on behalf of Altius Resources Inc., prepared by SGS Minerals Services, Project 12209-001 — Final Report |
| | |
Neal, H.E. |
1951 | | Exploration Report on the Wabush Lake-Shabogamo Lake area, Labrador Iron Ore Company of Canada, Newfoundland and Labrador Geological Survey Assessment File 23G/0004, 47 p. |
| | |
O’Leary, R. Cannell and D. Honsberger |
1972 | | Geology of the Scully Mine, CIM Bulletin for January 1972, pp. 25-29. |
| | |
Price, J. B. | | |
1979 | | Report on a ground magnetometer survey on block 24, Labrador, Labrador Mining and Exploration Company Limited, Newfoundland and Labrador Geological Survey, Assessment File 23B/0107. |
| | |
Risto, R., Kociumbas, M., MacFarlane, G. R. |
May 2011 | | “Technical Report and Mineral Resource Estimate on the Kamistiatusset Property Newfoundland and Labrador”, prepared for Alderon Resource Corp. NI 43-101 Technical Report, prepared by Watts, Griffis and McOuat Limited (WGM), Consulting Geologists and Engineers. |
| | |
Rivers, T. and Clarke, M. |
1980 | | Geological map of Flora Lake, Government of Newfoundland and Labrador, Department of Mines and Energy, Mineral Development Division, Map 80~282. |
|
Seymour, Carol, Rod Churchill, Lawrence Winter and Jackie O’Driscoll |
2009 | | First and Fourth Year Assessment Report covering Diamond Drilling, Line Cutting and Ground Geophysical Surveys (Gravity and Total Field Magnetic Field) for map Staked Licences 14957M (1st Yr), 14962M (1st Yr), 14967M (1st Yr), 14968M (1st Yr) and 15037M (4th Yr), Kamistiatusset Property, Western Labrador, NTS 23B14 and 23B15 prepared for Altius Resources Inc. |
| | |
September 2011
27-3
Alderon Iron Ore Corp.
NI 43-101 Technical Report — PEA of the Kami Iron Ore Project |
|
Simpson, H. J., Poisson, P. and McLachlan, C. |
1985 | | Assessment report on geological, geochemical and geophysical exploration for 1985 submission on Labrador Mining and Exploration Company Limited blocks 1, 2, 3, 5, 6, 7, 15, 17, 19, 19~1, 19~ 2, 19~3, 20, 21, 22, 22~4, 22~5, 22~6, 22~9, 22~10, 23 to 38, 41, 42, 51 to 54, 57 to 68, 72 to 76, 82, 84, 85, 86, 88, 89, 90, 92, 99, 101, 102, 111, 112, 116, 118, 121 and 128 in the Labrador City and Schefferville areas, Labrador, 4 volumes, Labrador Mining and Exploration Company Limited, Newfoundland and Labrador Geological Survey, Assessment File LAB/0723, 900 p. |
| | |
Smith, P. J. R., Stubbins, J. B., Avison, A. T., Grant, J .M. and Hallof, P. G. |
1981 | | Assessment report on geological, geochemical, geophysical and diamond drilling exploration for the Carol project for 1981 submission on Labrador Mining and Exploration Company Limited blocks 22 to 42, 22~1 to 22~10, 64~1, 64~2, 51 to 101, 103 to 108, 110, 115 to 118, 120 to 125, 127 to 131 and 133 to 143 in the Wabush, Labrador City and Schefferville areas, western Labrador, 49 reports, Iron Ore Company of Canada (option holder) and Labrador Mining and Exploration Company Limited (owner of property), Newfoundland and Labrador Geological Survey, Assessment File LAB/0600, 777 p. |
| | |
Stubbins, J. B. |
1973 | | Report for the year ending 1972 for the Labrador City and Schefferville area, Labrador, Labrador Mining and Exploration Company Limited, Newfoundland and Labrador Geological Survey, Assessment File LAB/0180. |
| | |
VanVeelen, J. |
Aug 2011 | | “Market Study”, prepared for Alderon Resource Corp., prepared by Jan van Veelen, Consultant — Iron Ore Marketing Strategies |
| | |
Stantec |
May 2011 | | “Environmental Scoping Study, Kami Iron Ore Project”, prepared by Stassinu Stantec Limited Partnership, prepared for Alderon Resource Corp., Final Report, File No. 121510653.200. |
| | |
Aug 2011 | | “Scoping Level Rehabilitation & Closure Report, Kami Iron Ore Project”, prepared by Stassinu Stantec Limited Partnership, prepared for Alderon Resource Corp., Final Report, File No. 121510653.300. |
| | |
Jul 2011 | | “Tailings Management Scoping Study, Kami Iron Ore Project”, prepared by Stassinu Stantec Limited Partnership, prepared for Alderon Resource Corp., Final Report, File No. 121510653.400. |
| | |
Jul 2011 | | “Railway Components Scoping Study, Kami Iron Ore Project”, prepared by Stassinu Stantec Limited Partnership, prepared for Alderon Resource Corp., Final Report, File No. 121510653.500. |
| | |
September 2011
27-4
Alderon Iron Ore Corp.
NI 43-101 Technical Report — PEA of the Kami Iron Ore Project |
|
Stantec |
Aug 2011 | | Iron Ore Concentrate Storage and Load-Out Facility, Proposed Common User Facility, Deep Water Berth, Port of Sept Îles Kami Iron Ore Project, prepared by Stassinu Stantec Limited Partnership, prepared for Alderon Resource Corp., Final Report, File No. 121510653.600. |
| | |
Jun 2011 | | “Baseline Hydrogeology Scoping Study, Kami Iron Ore Project”, prepared by Stassinu Stantec Limited Partnership, prepared for Alderon Resource Corp., Final Report, File No. 121510653.700. |
| | |
Jun 2011 | | 1. “Pit Slope Design Scoping Study, Kami Iron Ore Project”, prepared by Stassinu Stantec Limited Partnership, prepared for Alderon Resource Corp., Final Report, File No. 121510653.800. |
| | |
Jun 2011 | | “Pit Slope Design Scoping Study, Kami Iron Ore Project”, prepared by Stassinu Stantec Limited Partnership, prepared for Alderon Resource Corp., Final Report, File No. 121510653.800. |
| | |
Jul 2011 | | “Waste Rock Management Scoping Study, Kami Iron Ore Project”, prepared by Stassinu Stantec Limited Partnership, prepared for Alderon Resource Corp., Final Report, File No. 121510653.900. |
| | |
Jun 2011 | | “Site Wide Geotechnical Scoping Study, Kami Iron Ore Project”, prepared by Stassinu Stantec Limited Partnership, prepared for Alderon Resource Corp., Final Report, File No. 121510653.905. |
| | |
Jun 2011 | | “Scoping Level Hydrologic Study, Kami Iron Ore Project”, prepared by Stassinu Stantec Limited Partnership, prepared for Alderon Resource Corp., Final Report, File No. 121510653.910. |
September 2011
27-5