TECHNICAL REPORT AND
MINERAL RESOURCE ESTIMATE
ON THE
KAMISTIATUSSET PROPERTY,
NEWFOUNDLAND AND LABRADOR
FOR
ALDERON RESOURCE CORP.
prepared by
Richard W. Risto, M.Sc., P.Geo.,
Senior Associate Geologist
Michael Kociumbas, P.Geo.
Senior Geologist and Vice-President and
and
G. Ross MacFarlane, P.Eng.,
Senior Associate Metallurgical Engineer
May 20, 2011 Toronto, Canada | 
|

TABLE OF CONTENTS
| Page |
| |
1. SUMMARY | 1 |
| |
2. INTRODUCTION AND TERMS OF REFERENCE | 16 |
2.1 | GENERAL | 16 |
2.2 | TERMS OF REFERENCE | 16 |
2.3 | SOURCES OF INFORMATION | 18 |
2.4 | UNITS AND CURRENCY | 18 |
| | |
3. RELIANCE ON OTHER EXPERTS | 21 |
| |
4. PROPERTY DESCRIPTION AND LOCATION | 22 |
4.1 | PROPERTY LOCATION | 22 |
4.2 | PROPERTY DESCRIPTION AND OWNERSHIP | 22 |
4.3 | PROPERTY AGREEMENTS | 26 |
4.4 | PERMITTING | 27 |
4.5 | ENVIRONMENTAL ISSUES | 28 |
4.6 | FIRST NATION ISSUES | 29 |
| | |
5. ACCESS, CLIMATE, LOCAL RESOURCES, INFRASTRUCTURE AND PHYSIOGRAPHY | 31 |
5.1 | ACCESS | 31 |
5.2 | CLIMATE | 31 |
5.3 | PHYSIOGRAPHY | 31 |
5.4 | LOCAL RESOURCES AND INFRASTRUCTURE | 31 |
| | |
6. HISTORY | 33 |
6.1 | GENERAL | 33 |
| | |
7. GEOLOGICAL SETTING | 38 |
7.1 | REGIONAL GEOLOGY | 38 |
7.2 | PROPERTY GEOLOGY | 40 |
| | |
8. DEPOSIT TYPES | 46 |
| |
9. MINERALIZATION | 48 |
| |
10. EXPLORATION | 68 |
10.1 | GENERAL | 68 |
10.2 | ALTIUS EXPLORATION PROGRAMS 2006 - 2009 | 68 |
10.3 | ALDERON’S SUMMER 2010 EXPLORATION PROGRAM | 69 |
ii
TABLE OF CONTENTS
(continued)
| Page |
| |
11. DRILLING | 71 |
11.1 | HISTORIC DRILLING | 71 |
11.2 | ALTIUS 2008 DRILLING PROGRAM | 71 |
11.3 | ALDERON 2010 DRILLING PROGRAM | 73 |
11.4 | WGM COMMENT ON 2008 AND 2010 DRILLING | 78 |
| | |
12. SAMPLING METHOD AND APPROACH | 80 |
12.1 | GENERAL | 80 |
12.2 | 2006 AND 2007 SURFACE SAMPLING PROGRAMS | 80 |
12.3 | 2008 DRILL CORE HANDLING AND LOGGING | 80 |
12.4 | 2008 SAMPLING APPROACH | 81 |
12.5 | 2008 SAMPLING METHOD | 81 |
12.6 | CORE STORAGE | 82 |
12.7 | 2010 DRILL CORE HANDLING AND LOGGING | 82 |
12.8 | SAMPLE SECURITY | 83 |
12.9 | 2010 SAMPLING APPROACH | 83 |
12.10 | 2010 SAMPLING METHOD | 84 |
12.11 | WGM COMMENT ON LOGGING AND SAMPLING | 85 |
| | |
13. SAMPLE PREPARATION, ASSAYING AND SECURITY | 86 |
13.1 | 2008 SAMPLE PREPARATION | 86 |
13.2 | 2010 SAMPLE PREPARATION | 88 |
13.3 | WGM COMMENT ON 2008 AND 2010 SAMPLING AND ASSAYING | 105 |
| | |
14. DATA CORROBORATION | 107 |
| |
15. ADJACENT PROPERTIES | 113 |
| |
16. MINERAL PROCESSING AND METALLURGICAL TESTING | 116 |
16.1 | GENERAL | 116 |
16.2 | CURRENT TESTWORK PROGRAM | 117 |
16.3 | FUTURE TESTING | 117 |
16.4 | TESTWORK RESULTS PRIOR TO 2010 | 118 |
| | |
17. MINERAL RESOURCE AND MINERAL RESERVE ESTIMATES | 124 |
17.1 | WGM MINERAL RESOURCE ESTIMATE STATEMENT | 124 |
17.2 | GENERAL MINERAL RESOURCE ESTIMATION PROCEDURES | 127 |
17.3 | DATABASE | 127 |
17.4 | GEOLOGICAL MODELLING PROCEDURES | 129 |
17.5 | STATISTICAL ANALYSIS, COMPOSITING, CAPPING AND SPECIFIC GRAVITY | 138 |
17.6 | BLOCK MODEL PARAMETERS, GRADE INTERPOLATION AND CATEGORIZATION OF MINERAL RESOURCES | 141 |
iii
TABLE OF CONTENTS
(continued)
| Page |
| |
18. OTHER RELEVANT DATA AND INFORMATION | 149 |
| |
19. INTERPRETATION AND CONCLUSIONS | 150 |
| |
20. RECOMMENDATIONS | 152 |
| |
21. SIGNATURE PAGE | 157 |
| |
CERTIFICATE | 158 |
| |
REFERENCES | 164 |
| |
APPENDIX 1: WGM INDEPENDENT SAMPLING RESULTS | 169 |
LIST OF TABLES |
|
1. | Summary of terms and abbreviations for units | 20 |
2. | Kamistiatusset property in Labrador | 22 |
3. | Kamistiatusset property in Québec | 23 |
4. | Minimum cost of work to be carried out on a Québec claim north of 52° latitude | 26 |
5. | Regional stratigraphic column, Western Labrador Trough | 40 |
6. | Rock/unit coding for Kami property drill core logging | 45 |
7. | Deposit model for Lake Superior type iron formation after Eckstrand (1984) | 47 |
8. | Central Rose Deposit - average composition of rock units from 2008 and 2010 drill core sample assays | 58 |
9. | Mills Lake Deposit - average composition of rock units from 2008 and 2010 drill core sample assays | 59 |
10. | North Rose Zone - average composition of rock units from 2008 and 2010 drill core sample assays | 60 |
11. | Central Rose Deposit - averages for Davis Tube test results by rock type | 64 |
12. | Mills Lake Deposit - averages for Davis Tube test results by rock type | 64 |
13. | Drilling summary — Altius 2008 program | 72 |
14. | 2010 drilling summary by deposit or zone | 73 |
15. | Drilling summary - Alderon 2010 program | 75 |
16. | Sampling and analysis summary, Altius 2008 drill program | 86 |
17. | Certified standard reference materials used for the in-field QA/Qc program, Altius 2008 and Alderon 2010 | 87 |
18. | Sampling and analysis summary, Alderon 2010 drill program | 89 |
19. | Summary for 2008 and 2010 in-field certified reference standards | 96 |
20. | Selected analytical results for Davis Tube tests performed on standard FER-4 | 97 |
iv
TABLE OF CONTENTS
(continued)
| | Page |
| | |
21. | Selected analytical results for Davis Tube tests performed on eight duplicate core samples | 97 |
22. | Performance of SGS-Lakefield certified reference standards %TFe — 2008 and 2010 programs | 101 |
23. | Performance of SGS-Lakefield certified reference standards %FeO — 2008 and 2010 programs | 102 |
24. | Summary of WGM independent second half core sampling | 108 |
25. | Comparison of analytical results WGM independent sample assays versus 2010 and 2008 original sample assays | 109 |
26. | Make-up of metallurgical sample | 118 |
27. | Ore characterization summary | 119 |
28. | Ore characterization details | 120 |
29. | Beneficiation characterization summary | 121 |
30. | Overall metallurgical summary | 123 |
31. | Categorized mineral resource estimate for Kami Iron Ore Project (cutoff of 20% TFe) | 125 |
32. | Basic statistics of 3 m composites | 139 |
33. | Categorized mineral resource estimate for Kami Iron Ore Project (cutoff of 20% TFeHead) | 147 |
34. | Categorized mineral resources by %TFe_H cutoff Kami Iron Ore Project | 148 |
35. | Summary of categorized mineral resource estimate for Kami Iron Ore Project (cutoff of 20% TFe) | 150 |
36. | Proposed budget estimate | 154 |
LIST OF FIGURES
1. | Property Location | 17 |
2. | Land Status Map | 24 |
3. | Regional geology | 39 |
4. | Property Geology | 42 |
5. | Total Magnetic Intensity, Reduced to the Pole, First Vertical Derivative after BGI | 43 |
6. | Terrain Corrected Tzz, Density 2.67 g/cc after BGI | 44 |
7. | Ground magnetic survey with 2008 and 2010 drillhole locations | 51 |
8. | Rose Lake area cross section 20E | 52 |
9. | Rose Lake area cross section 16E | 53 |
10. | Mills Lake Area Cross Section 36+00S | 56 |
11. | Comparison of %magFe determined from Satmagan vs. determined by Davis Tube | 62 |
12. | Bulk density for 0.1 m samples intervals vs. %TFe on routine samples | 65 |
13. | SG by gas comparison pycnometer on pulps vs. %TFe on routine assay samples | 66 |
14. | SG by pycnometer on pulps vs. %TFe for WGM’s independent samples | 67 |
15. | Results for Duplicate ¼ split drill core samples - %TFe_H — 2008 and 2010 Programs | 91 |
16. | Results for Duplicate ¼ split drill core samples - %Fe3O4Satmagan_H — 2008 and 2010 Programs | 91 |
17. | Results for Duplicate ¼ split drill core samples - %FeO_H — 2008 and 2010 Programs | 92 |
18. | Results for Duplicate ¼ split drill core samples - %Mn_H — 2008 and 2010 Programs | 92 |
19. | Results for Duplicate ¼ split drill core samples - %SiO2_H — 2008 and 2010 Programs | 93 |
v
TABLE OF CONTENTS
(continued)
| | Page |
| | |
20. | Results for In-Field Standards for %TFe — 2008 and 2010 Programs | 93 |
21. | Results for In-Field Standards for %SiO2_H — 2008 and 2010 Programs | 94 |
22. | Results for In-Field Standards for %Mn_H — 2008 and 2010 Programs | 94 |
23. | Results for In-Field Standards for %FeO_H — 2010 Program | 95 |
24. | Results for In-Field Standards for %magFe_H — 2010 Program | 95 |
25. | %TFe_H for Preparation Duplicates 2008 and 2010 Results | 98 |
26. | %magFeSat_H for Preparation Duplicates 2008 and 2010 Results | 98 |
27. | %FeO_H for Preparation Duplicates 2008 and 2010 Results | 99 |
28. | %magFeSat_H for Analytical Duplicates 2008 and 2010 Results | 99 |
29. | Performance of SGS-Lakefield Certified Reference Standards - %TFe_H 2010 Program | 100 |
30. | Performance of SGS-Lakefield Certified Reference Standards - %FeO_H 2010 Program | 101 |
31. | %TFe_H at Inspectorate. vs. SGS-Lakefield | 103 |
32. | %FeO_H by HF-H2SO4 digestion at Inspectorate. vs. SGS-Lakefield | 103 |
33. | %magFeSat at Inspectorate vs. SGS-Lakefield | 104 |
34. | %MnO_H at Inspectorate. vs. SGS-Lakefield | 104 |
35. | %SiO2_H at Inspectorate vs. SGS-Lakefield | 105 |
36. | %TFe_H for WGM Independent Sample vs. Alderon or Altius Original Sample | 110 |
37. | %magFe_H (Satmagan) for WGM independent sample vs. Alderon or Altius original sample | 110 |
38. | %FeO_H for WGM Independent Sample vs. Alderon or Altius Original Sample | 111 |
39. | %SiO2_H for WGM Independent Sample vs. Alderon or Altius Original Sample | 111 |
40. | %Mn_H for WGM Independent Sample vs. Alderon or Altius Original Sample | 112 |
41. | Mills Lake 3-D geological model | 131 |
42. | Rose Central 3-D geological model — View 1 | 132 |
43. | Rose Central 3-D geological model — View 2 | 133 |
44. | Rose Central Cross Section 20+00E showing %TFe block grade model | 134 |
45. | Rose Central Cross Section 20+00E showing Mineral Resource categorization | 135 |
46. | Mills Lake Cross Section 36+00S showing %TFe block grade model | 136 |
47. | Mills Lake Cross Section 36+00S showing Mineral Resource categorization | 137 |
48. | Normal histogram, %TFe_H — Mills Lake 3 m Magnetite Composites | 139 |
49. | Normal histogram, %TFe_H — Rose Central 3 m Magnetite Composites | 140 |
50. | Rose Central Level Plan 450 m - %TFe block grade model | 146 |
vi

1. SUMMARY
General and Terms of Reference
Alderon Resource Corp. (“Alderon��) acquired a 100% interest in the Kamistiatusset iron ore Property (the “Property” or “Kami”) on December 6, 2010 from Altius Minerals Corporation (“Altius”). The purchase is subject to a 3% gross sales royalty. The Property is located approximately 10 km from the town of Wabush in Western Labrador and is approximately 6 km south from the Wabush Mines mining lease owned by Cliffs Natural Resources Inc. The Property straddles the Québec-Labrador provincial border, but the majority of it is in Labrador. Altius initiated exploration of the Property in 2006 and completed geological mapping, geophysical surveys and in 2008, a diamond drilling program comprising 25 drillholes aggregating 6,129.5 m. Alderon in 2010 acquired further claims, performed an airborne gravity survey and initiated a drilling program in the Rose Central and Mills Lake areas aimed at acquiring sufficient data to allow for the estimation of Mineral Resources. This program comprised 82 drillholes aggregating 25,749 m.
Watts, Griffis and McOuat Limited (“WGM”) was retained by Alderon to prepare a National Instrument 43-101 (“NI 43-101”) compliant Technical Report and Mineral Resource estimate documenting geology, mineralization, exploration drilling, with emphasis on reviewing assaying and QA/QC results. The classification of Mineral Resources used in this report conforms to the definitions provided in National Instrument 43-101 and the guidelines adopted by the Council of the Canadian Institute of Mining Metallurgy and Petroleum (“CIM”) Standards. WGM estimated Mineral Resources in the Rose Central and Mills Lake Deposits as summarized in the following table:
Categorized Mineral Resource Estimate for
Kami Iron Ore Project (Cutoff of 20% TFe)
Category | | Zone | | Tonnes
(Million) | | TFe% | | magFe% | | hmFe% | | Mn% | | SiO2% | |
Indicated | | Rose Central | | 376.1 | | 29.8 | | 18.6 | | 8.3 | | 1.56 | | 44.9 | |
| | Mills Lake | | 114.1 | | 30.5 | | 22.1 | | 5.7 | | 1.02 | | 45.6 | |
| | | | | | | | | | | | | | | |
Inferred | | Rose Central | | 46.0 | | 29.8 | | 19.2 | | 8.0 | | 1.61 | | 44.9 | |
| | Mills Lake | | 71.9 | | 30.7 | | 22.2 | | 6.0 | | 1.05 | | 45.4 | |
This report makes recommendations and provides guidelines for subsequent work.
The preparation of this report was authorized by Mr. Mark J. Morabito, President and CEO of Alderon Resource Corp. on October 21, 2010.
1
Property
The Property in Labrador comprises three map-staked license (305 claims) covering 7,625 hectares. The Property in Québec, consists of five map-staked licenses covering a nominal area of 125 hectares.
Previous Work
The earliest geological reconnaissance in the southern extension of the Labrador Trough within the Grenville Province was by prospectors in 1914 in search of gold. Several parties visited the area between 1914 and 1933. J.E. Gill, in 1933 first recognized the metamorphosed iron formation in the vicinity of Wabush Lake. In 1937, the first geological map and report was published for the area. A few years later, the Labrador Mining and Exploration Co. Ltd. (“LM&E”) launched a program to evaluate the iron formation.
In 1949, interest in the Carol Lake area by LM&E was renewed and geological mapping was carried out in the Duley Lake - Wabush Lake area. Concentrations of magnetite and specularite were found in many places west of Duley Lake and Wabush Lake. The material was considered to be of economic significance, as the metallurgical tests indicated that it could be concentrated. In 1951, nearly all of the concession held by LM&E within the Labrador Trough was flown with an airborne magnetometer. This survey showed the known deposits to be more extensive than apparent from surface mapping and suggested further iron formation potential in drift-covered areas. In 1953, a program of geological mapping in the Mills Lake - Dispute Lake area was conducted by the Iron Ore Company of Canada (“IOCC”). In 1957, an area to the west of Duley Lake was remapped and test drilled by IOCC to determine areas for beneficiating ore. The Mills No.1 Zone was outlined by six drillholes. IOCC continued mapping and evaluation of the deposits lying west of Wabush Lake through 1959.
In 1972, an extensive helicopter magnetic and electromagnetic survey for LM&E covering the Labrador City area was carried out. In 1979, a ground magnetometer survey was conducted on Block No. 24 (part of the Property) and two diamond drillholes were completed.
In 1981 and 1982, an air photography and topographic mapping program was completed by IOCC to re-photograph the mining areas and the survey was extended to cover all the lease and licence blocks in the Labrador City area. In 2001, IOCC staked a considerable portion of the iron formation in the Labrador City area, with the Kamistiatusset area being the southern extent of the company’s focus. The Kamistiatusset area and the area north of the Property was recommended as a high priority target by SRK Consulting Ltd. as part of the 2001, IOCC work report, however, no work was reported for the area.
2
Geology and Mineralization
The Property is situated in the highly metamorphosed and deformed metasedimentary sequence of the Grenville Province, Gagnon terrane of the Labrador Trough (the “Trough”). The Trough is comprised of a sequence of Proterozoic sedimentary rocks, including iron formation, volcanic rocks and mafic intrusions. Trough rocks in the Grenville Province are highly metamorphosed and complexly folded. Iron deposits in the Gagnon terrane, Grenville part of the Trough, include those on the Property and Lac Jeannine, Fire Lake, Mont-Wright, Mont-Reed, and Bloom Lake in the Manicouagan-Fermont area and the Luce, Humphrey and Scully deposits in the Wabush-Labrador City area. The high-grade metamorphism of the Grenville Province is responsible for recrystallization of both iron oxides and silica in primary iron formation, producing coarse-grained sugary quartz, magnetite, and specular hematite schist or gneiss (meta-taconites) that are of improved quality for concentration and processing.
The Property is underlain by folded sequences of the Ferriman Group (previously Knob Lake Group) or Gagnon Group containing Wabush/Sokoman Formation iron formation and underlying and overlying units. The stratigraphic sequence varies in different parts of the Property. Altius’ exploration was focussed on three parts of the Property known as the Mills Lake, Rose Lake and the Mart Lake areas. Alderon’s 2010 drilling was focussed on the Rose Central and Mills Lake Deposits.
The iron formation on the Property is the Lake Superior-type. Lake Superior-type iron formation consists of banded sedimentary rocks composed principally of bands of iron oxides, magnetite and hematite within quartz (chert)-rich rock with variable amounts of silicate, carbonate and sulphide lithofacies. Such iron formations have been the principal sources of iron throughout the world (Gross, 1996). Mineralization of economic interest on the Property is oxide facies iron formation. The oxide iron formation (“OIF”) consists mainly of semi-massive bands, or layers, and disseminations of magnetite and/or specular hematite (specularite) in recrystallized chert and interlayered with bands (beds) of chert with minor carbonate and iron silicates. Where iron silicates exceed iron oxides mineralization is Silicate Iron Formation (“SIF”) or where carbonate is also prevalent Silicate-Carbonate iron Formation (“SCIF”). SIF and variants consist mainly of amphiboles and chert, often associated with carbonate and contains magnetite or specularite in minor amounts. Grunerite is a prominent member of the silicate iron assemblage on the Property. The OIF assemblage on the Property is mostly magnetite-rich but includes hematite-rich units as well as lean oxide iron formation and SIF and SCIF variants. Some sub-members contain increased amounts of hematite (specularite) associate with rhodonite (a manganese silicate).
3
In the Mills Lake area, the iron formation consist of a gently east dipping tabular main zone with several parallel ancillary zones. The iron formation in the Rose and Mart Lakes area consist of a series of corrugated gently plunging, northeast-southwest oriented sub-parallel upright to slightly overturned anticlines and synclines. Thickness of oxide and silicate-carbonate iron formation varies widely but is indicated to be up to about 300 m on fold limbs in the Rose Central Deposit.
Exploration and Drilling
All recent exploration and drilling on the Property were completed either by Altius or Alderon. Altius’ reconnaissance mapping and rock sampling commenced during the summer of 2006 and was completed during the 2007 field season. In 2007 its exploration program also included a high resolution helicopter airborne magnetic survey and linecutting. The results of the 2007 program were positive and the airborne magnetic survey effectively highlighted the extent of the iron formation. Following the 2007 program, Altius acquired additional property.
Altius’ 2008 exploration program on the Property consisted of rock sampling, linecutting, a ground gravity and magnetic survey, a high resolution satellite imagery survey, an integrated 3D geological and geophysical inversion model and 6,129.49 m of diamond drilling in 27 holes (two abandoned holes which were re-drilled). The drilling program was designed to test three known iron ore occurrences that were targeted through geological mapping and geophysics, namely; Mills Lake, Mart Lake and Rose Lake. Drilling confirmed the presence of iron oxide-rich iron formation and was successful in extending the occurrences along strike and at depth.
Alderon commenced their 2010 drill program on the Property on June 1. It was focussed on the Rose Central and Mills Lake Deposits but a few drillholes were targeted on the North Rose and South West Rose Zones (“SW Rose”). An airborne gravity and magnetic survey covering all of the Property in Newfoundland and Labrador was also completed by Bell Geospace Inc.
The drill program on the Rose Central Deposit comprised 51 drillholes aggregating 18,928 m. Drilling was completed along grid lines 200 m apart, filling in between and extending Altius’ 2008 drilling pattern. Distance between holes varied. The holes covered an approximate NE-SW strike length of 1.5 km and tested mineralization to a depth of approximately 500 m. Four drillholes were drilled to test the North Rose Zone and several Central Rose drillholes also tested the North Rose Zone at depth to allow for a preliminary assessment. Ten holes aggregating 1,441 m were targeted on the SW Rose Zone. On the Mills Lake Deposit, 16 holes were drilled aggregating 4,121 m over a N-S strike length of 1.2 km on cross sections
4
200 m apart. The gently dipping iron formation was tested to a depth of approximately 300 m.
DGI Geoscience Inc. (“DGI”) in support of the drilling program performed borehole surveying of many of the accessible drillholes including Altius’ 2008 drillholes. DGI carried out down-hole attitude surveys using a north seeking gyro, determined in-situ physical properties including rock density and using an optical televiewer acquired rock/structure orientation information.
Logging, Sampling and Assaying
Core logging for both Altius’ and Alderon’s programs included descriptive logging and Rock Quality Designation (“RQD”), specific gravity, magnetic susceptibility measurements and core photography.
Sample intervals were determined on a geological basis, as selected by the drill geologist during logging, and marked out on the drill core. Core was sampled systematically with sample lengths ranging from 1 to 5 m. All rock estimated to contain abundant iron oxide was sampled.
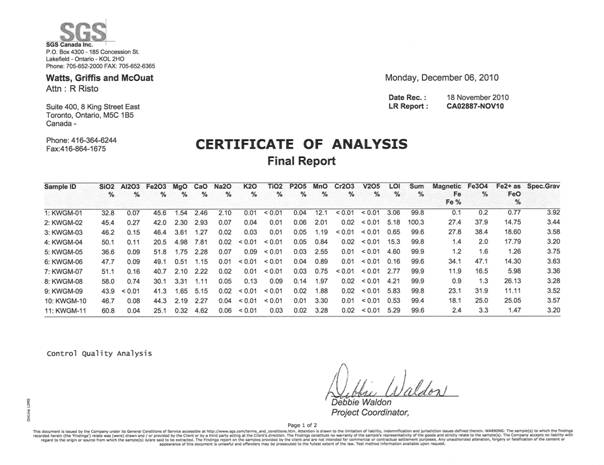
Samples for both of Alderon’s and Altius’ programs were shipped to SGS-Lakefield Minerals Services’, (“SGS-Lakefield”) Lakefield, Ontario facility for sample preparation and assay.
For Altius’ 2008 program all samples were routinely analyzed for major element oxides by XRF, FeO by titration and magnetic iron or magnetite by Satmagan. A group of 14 samples were also analysed for S. In-field QA/QC included the insertion into the sample stream of Blanks, quarter core Duplicates and Certified Reference Standards.
Alderon’s 2010 assay protocol for drill core samples again included determination of major elements at SGS-Lakefield by whole rock X-Ray Florescence (“XRF”) lithium metaborate fusion. FeO was determined in selected samples by H2SO4/HF acid digest-potassium dichromate titration and magnetic iron and/or magnetite was determined by Satmagan. Davis Tube tests were performed on selected samples and for selected samples FeO, by titration was determined in Davis Tube tails. Alderon also completed XRF and Satmagan re-assaying of a selection of Altius’ 2008 samples for the purposes of ensuring inter-program data integrity. In-field QA/QC included the use of ¼ core duplicates, Blanks and Certified Reference Standards inserted into the sample stream going to the lab. Inspectorate’s Vancouver laboratory (“Inspectorate”) was used as a Secondary assay lab to complete Check Assaying on a selection of samples previously assayed by SGS-Lakefield.
5
Data Corroboration
WGM Senior Associate Geologist Richard Risto, P.Geo., visited the Property twice in 2010 while Alderon’s drilling program was in progress. The initial visit was to initiate the project review process. Mr. Risto reviewed drilling completed to date, proposed drilling strategy, deposit interpretation, logging and sampling procedures and visited the Property to see previous drilling sites and drilling in progress. Mr. Risto reviewed with the project manager the details of the planned work program, including the company’s analytical and testing protocols to facilitate the planned Mineral Resource estimation.
The November site visit was made as the completion of the drilling program was pending. The purpose of this site visit was to review new data and ongoing drilling plans and for the collection of independent samples. Mr. Risto reviewed drilling completed to date, proposed drilling strategy for the remainder of the program, discussed deposit interpretation, collected independent drill core samples and again visited the Property to check drilling site locations.
In October, 2009, WGM Senior Geologist, David Power-Fardy, P.Geo., accompanied by BCL representative, Mr. Stewart Wallis, P.Geo., and Altius representative Ms. Carol Seymour, Geologist, completed a site visit to the project. WGM independently collected 15 samples from 2008 drillholes and these samples were sent to SGS-Lakefield for analysis.
Adjacent Properties
The northern boundary of the Property is located approximately 6 km south of the Scully Mine of Wabush Mines, owned 100% by Cliffs Natural Resources Inc. (“Cliffs”). The Carol operations (Luce & Humphrey Mines) owned by Rio Tinto Iron Ore, a subsidiary IOCC, is located north of Labrador City, approximately 18 km north of the Property. QCM’s Mont-Wright Iron Mine, owned by Arcelor-Mittal Steel is located 9 km west of the Property. The Property is also located approximately 10 km southeast of the Bloom Lake Iron Deposit. Consolidated Thompson Iron Mines Ltd. commenced commercial production on the Bloom Lake Deposit in 2010. In January 2011 Cliffs agreed to buy Consolidated Thompson. All of these iron mines in the area extract similar iron mineralization as found on the Property, although for each deposit, there are variations in geology and character of mineralization.
Mineral Processing and Metallurgical Testing
Preliminary metallurgical testwork on the Kami deposit was completed by Altius Resources in 2009 on a sample composited from two drillholes. This work demonstrated that a concentrate of acceptable quality could be produced. In conjunction with assay of the drill core from the 2010 drill program, over 3,000 Davis Tube tests were completed which serves both as an indicator of magnetite content, as well as the potential recovery and concentrate grade from the application of LIMS in commercial processing of the deposits. WGM is aware
6
that further metallurgical testwork has been completed since 2009 but has not been provided with any of these results for review, other than the Davis Tube test results which formed a part of the drill core sample “assay” program, as this work is currently ongoing at the time of writing this report. WGM has been provided with a scope of current work that is ongoing and the scope of the next phase of testwork that is planned.
The indicated presence of manganese in the Kami deposits will require careful consideration in the process development work to ensure the selected flowsheet can maintain market specifications on the mineralization that is ultimately included in the project Mineral Resources/Reserves. As specifications for iron ore concentrates became more stringent, tolerable levels of manganese have been reduced. Potential strategies for managing manganese levels to meet the specifications of the world iron ore market include more selectively mining, ore blending and further treatment of concentrates.
Mineral Resource Estimates
WGM has prepared a Mineral Resource estimate for the Kami Iron Ore Project mineralized areas that have sufficient data to allow for continuity of geology and grades. WGM modelled the Rose Central and Mills Lake deposits, but did not include the Rose North Zone or other mineralized areas at this time. More field work and confirmation/infill drilling is required before a Mineral Resource estimate can be completed on these other areas.
The classification of Mineral Resources used in this report conforms with the definitions provided in National Instrument 43-101 and the guidelines adopted by the Council of the Canadian Institute of Mining Metallurgy and Petroleum (“CIM”) Standards. WGM generated a distance block model and reported the estimated Mineral Resources by distances which represented the category or classification. The current drilling pattern is irregular / uneven and certain areas are sparsely drilled, with possibly only one or two holes intersecting the mineralization on a select limb or at depth on some cross sections. Many of the holes did not penetrate the entire width of the mineralized zone due to poor drillhole angles hence the “boundaries” are not well defined in some areas (particularly the dips of the zone and the depth extension). In general, the mineralization shows fairly good continuity on a gross scale, however, the folded nature and complexity of the Rose Central area is not yet completely understood.
WGM has abundant experience with similar types of mineralization to the Kami Project deposits and we used this knowledge to assist us with our categorization of the Mineral Resources. Within the interpreted 3-D wireframe, Indicated Mineral Resources are defined as blocks being within 100 m of a drillhole intercept for Mills Lake and within 150 m for Rose Central. Inferred Mineral Resources are interpolated out to a maximum of about 300 m for
7
both deposit areas on the ends/edges and at depth when supporting information from adjacent cross sections was available. WGM has not classified any of the Kami Project deposits mineralization as Measured at this stage of exploration. A summary of the Mineral Resources is provided in the table below.
Categorized Mineral Resource Estimate For
Kami Iron Ore Project (Cutoff Of 20% TFe)
Category | | Zone | | Tonnes
(Million) | | Density | | TFe% | | magFe% | | hmFe% | | Mn% | | SiO2% | |
Indicated | | Rose Central Zone - Hematite-rich | | 66.7 | | 3.60 | | 31.4 | | 6.9 | | 23.6 | | 2.88 | | 42.4 | |
| | Rose Central Zone - Magnetite-rich | | 309.4 | | 3.54 | | 29.5 | | 21.1 | | 5.0 | | 1.27 | | 45.4 | |
| | Total Indicated Rose Central Zone | | 376.1 | | 3.55 | | 29.8 | | 18.6 | | 8.3 | | 1.56 | | 44.9 | |
| | | | | | | | | | | | | | | | | |
| | Mills Lake Zone - Hematite-rich | | 12.2 | | 3.68 | | 34.2 | | 2.7 | | 30.7 | | 4.80 | | 35.3 | |
| | Mills Lake Zone - Magnetite-rich | | 93.8 | | 3.56 | | 30.1 | | 24.5 | | 2.8 | | 0.57 | | 47.0 | |
| | Mills Lake Zone - Upper Magnetite-rich | | 8.2 | | 3.55 | | 29.6 | | 23.0 | | 1.3 | | 0.56 | | 45.6 | |
| | Total Indicated Mills Lake Zone | | 114.1 | | 3.57 | | 30.5 | | 22.1 | | 5.7 | | 1.02 | | 45.6 | |
| | | | | | | | | | | | | | | | | |
Inferred | | Rose Central Zone - Hematite-rich | | 10.3 | | 3.60 | | 31.6 | | 7.5 | | 23.9 | | 3.15 | | 41.5 | |
| | Rose Central Zone - Magnetite-rich | | 35.7 | | 3.54 | | 29.3 | | 22.6 | | 3.4 | | 1.16 | | 45.9 | |
| | Total Inferred Rose Central Zone | | 46.0 | | 3.55 | | 29.8 | | 19.2 | | 8.0 | | 1.61 | | 44.9 | |
| | | | | | | | | | | | | | | | | |
| | Mills Lake Zone - Hematite-rich | | 8.3 | | 3.70 | | 34.7 | | 2.6 | | 31.1 | | 4.60 | | 35.5 | |
| | Mills Lake Zone - Magnetite-rich | | 60.4 | | 3.56 | | 30.2 | | 24.8 | | 2.8 | | 0.60 | | 46.7 | |
| | Mills Lake Zone - Upper Magnetite-rich | | 3.3 | | 3.55 | | 29.8 | | 23.7 | | 1.3 | | 0.55 | | 45.5 | |
| | Total Inferred Mills Lake Zone | | 71.9 | | 3.58 | | 30.7 | | 22.2 | | 6.0 | | 1.05 | | 45.4 | |
A cutoff of 20% TFe_H was determined to be appropriate at this stage of the project and was chosen based on a preliminary review of the parameters that would likely determine the economic viability of a large open pit operation and compares well to similar projects and to projects that are currently at a more advanced stage of study.
The data used to generate the Mineral Resource estimate was supplied to WGM by Alderon technical personnel. The Gemcom drillhole database consisted of 107 diamond drillholes; including “duplicated” hole numbers designated with an “A” nomenclature, meaning the hole was re-drilled in whole or in part, due to lost core/bad recovery. A total of 68 drillholes totaling 24,079 m were used for the current Mineral Resource estimate; 48 holes at Rose Central and 20 holes at Mills Lake. These holes were dispersed along the iron mineralization - approximately 1,600 m of strike length and 700 m of width on Rose Central and 1,400 m by 800 m on Mills Lake. The database tables as originally supplied to WGM contained some errors and these were corrected and confirmed by the client before proceeding with the Mineral Resource estimate. In general, WGM found the database to be in good order, but it was still a work in progress. After the errors that WGM identified were corrected, there were no additional database issues that would have a material impact on the Mineral Resource estimate, so WGM proceeded to use the most up to date database supplied by Alderon.
8
For the current Mineral Resource estimate, the holes were drilled on section lines which were spaced 200 m apart for both deposits in the main area of mineralization. Drillholes on cross sections were variably spaced and with variable dips (and directions) leading to mineralized intersections at from anywhere from less than 50 m to more than 250 m apart from each other on adjacent holes. Most cross sections contained at least three holes and some has as many as 10 holes passing through the mineralized zone due to the variable drilling pattern, however, in both deposits the closest spaced drilling was near the surface (in the first 150 to 200 m). The deeper mineralization, i.e., below 200 m vertical depth, has been tested by fewer holes and both zones are open at depth. WGM’s zone interpretations of the mineralization were digitized into Gemcom and each polyline was ‘snapped’ to drillhole intervals allow for the creation of a true 3-D wireframe. Mineralized boundaries were digitized from drillhole to drillhole that showed continuity of strike, dip and grade, generally from 100 m to 200 m in extent, and up to a maximum of about 300 m on the ends of the zones and at depth where there was no/little drillhole information, but only if the interpretation was supported by drillhole information on adjacent cross sections.
In each deposit, WGM modelled out the larger and more continuous hematite-rich zones/units/beds within the main magnetite body that appeared to have fairly good correlation between holes and through multiple cross sections. In the Mills Lake Deposit, the hematite-rich unit was located near the middle of the deposit, whereas in Rose Central, two hematite-rich units were separately modelled; one along/near the basal contact of the main magnetite zone and one closer to the middle of the deposit, which was not as consistent. There appears to be more intermixed hematite and magnetite in this deposit, as well. WGM was of the opinion that it was better to try to model these units out than just combine them with the more abundant magnetite-rich mineralization, as it may become important for determining processing options and costs of the iron-bearing material in future economic studies. The present metallurgical study by BBA that is underway is based on several composites selected by Alderon and BBA to reflect the relationship between the magnetite: hematite ratio and Mn in magnetite.
The extensions of the mineralization on the ends and at depth took into account the fact that the drilling pattern was irregular and that a proper grid was not complete; hence many drillholes did not penetrate the entire stratigraphy/zone. The 3-D model for Rose Central was continued at depth as long as there was drillhole information, however, this extension was taken into consideration when classifying the Mineral Resources and these areas were given a lower confidence category. Even though the wireframe continued to a maximum depth of -135 m (approximately 750 m vertically below surface and extending 100 m past the deepest drilling), at this time, no Mineral Resources were defined/considered below 150 m elevation.
9
The mineralization of economic interest on the Kami Property is oxide facies iron formation, consisting mainly of semi-massive bands, or layers, and disseminations of magnetite and/or specular hematite (specularite) in recrystallized chert and interlayered with bands (beds) of chert with minor carbonate and iron silicates. The oxide iron formation is mostly magnetite-rich, but some sub-members contain increased amounts of hematite, either inter-mixed with magnetite or as more discrete bands / beds / layers. WGM is of the opinion that different ratios of hematite to magnetite occur in the different deposits (or parts of the deposits), but this distribution is not yet completely mapped out and understood and should be studied in detail during future work. WGM calculated %hmFe from %TFe, FeO, Satmagan and Davis Tube results. The final WGM calculated %hmFe values were used in the grade interpolation in the block model.
The Mineral Resource estimate was completed using a block modelling method and for the purpose of this study, the grades have been interpolated using an Inverse Distance estimation technique with a set of equal length (3 m) composites generated from the raw drillhole intervals. A 3 m composite length was chosen to ensure that more than one composite would be used for grade interpolation for each block in the model and 3 m is also close to the average length of the raw assay intervals. The grades were well constrained within the wireframes, and the results of the interpolation approximated the average grade of the all the composites used for the estimate.
WGM created a variable density model to estimate tonnage. Most of the iron formation consists of a mix of magnetite and hematite, but there are sections that contain very little hematite and are mostly magnetite, and vice versa. The SG results returned by pycnometer measurements correlate strongly with %TFe on samples and the DGI probe determined density averaged over the same sample intervals similarly correlate strongly with %TFe. Using WGM’s variable density model, a 30% TFe gives a SG of approximately 3.56.
The details of the geology and geometry of the Rose Central mineralized body is quite complex and more drilling is required to get a better understanding of the depth potential, dip and internal detail of the hematite-rich and waste units. However, the gross overall mineralization controls appear to be fairly well understood with the current amount of drilling completed to date. Both deposits have undergone various degrees of folding, but at this stage of exploration, the search ellipse size and orientations for the grade interpolation were kept simple and based on the current geological knowledge; the ellipses sizes were kept the same for both deposits, but the orientation and dips changed based on the geological interpretation. For future Mineral Resource estimates and after more drilling information is available, WGM envisions that due to folding causing orientation/strike complexity and change, different
10

domains will most likely be defined to better control grade distribution along the limbs and to reflect changes in dip/attitude. Alternately, a technique known as unfolding may be applied during the statistical analysis and the grade interpolation.
Conclusions and Recommendations
Based on WGM’s review of the available information for the Kami Iron Ore Project, we offer the following conclusions:
· Mineralization on the Property comprises meta-taconite typical of the Sokoman/Wabush Formation. Iron formation is mainly magnetite-rich but also includes a hematite (specularite component). At Rose Central the iron formation is hosted in a series of upright to slightly overturned anticlines and synclines. At Mills Lake the iron formation consists of a main tabular gently dipping lens and some minor ancillary lenses;
· A substantial deposit of meta-taconite exists on the Property. With the currently available information from the drilling campaigns, WGM prepared a Mineral Resource estimate for the Rose Central and Mills Lake deposits using a cutoff of 20% TFe_H, as summarized below:
Categorized Mineral Resource Estimate for
Kami Iron Ore Project (Cutoff of 20% Tfe)
Category | | Zone | | Tonnes
(Million) | | TFe% | | magFe% | | hmFe% | | Mn% | | SiO2% | |
Indicated | | Rose Central | | 376.1 | | 29.8 | | 18.6 | | 8.3 | | 1.56 | | 44.9 | |
| | Mills Lake | | 114.1 | | 30.5 | | 22.1 | | 5.7 | | 1.02 | | 45.6 | |
| | | | | | | | | | | | | | | |
Inferred | | Rose Central | | 46.0 | | 29.8 | | 19.2 | | 8.0 | | 1.61 | | 44.9 | |
| | Mills Lake | | 71.9 | | 30.7 | | 22.2 | | 6.0 | | 1.05 | | 45.4 | |
· WGM has not classified any of the Kami Project deposits mineralization as Measured Mineral Resources at this stage of exploration and we did not include Rose North Zone or other mineralized areas for the estimate. More field work and confirmation/infill drilling needs to be done before a Mineral Resource estimate can be completed on these other areas;
· In both Rose Central and Mills Lake deposits, the closest spaced drilling was near the surface (in the first 150 to 200 m) and the extensions of the mineralization on the ends and at depth took into account the fact that the drilling pattern was irregular; hence many drillholes did not penetrate the entire stratigraphy/zone. The 3-D model for Rose Central was continued at depth as long as there was drillhole information, however, this extension was taken into consideration when classifying the Mineral Resources and these areas were
11
given a lower (Inferred) confidence category; no Mineral Resources were defined/considered below 150 m elevation;
· The details of the geology and geometry of the Rose Central mineralized body is quite complex and more drilling is required to get a better understanding of the depth potential, dip and internal detail of the hematite-rich and waste units. However, the gross overall mineralization controls appear to be fairly well understood with the current amount of drilling completed to date. At this stage of exploration, the search ellipse size and orientations for the grade interpolation were kept simple and the same sizes were used for both deposits, but the orientation and dips changed based on the geological interpretation. After more drilling information is available, WGM envisions that due to folding causing orientation/strike complexity and change, “domaining” will most likely be used to better control grade distribution in future Mineral Resource estimates.
· WGM agrees that all the 2008 and 2010 drillhole collars and preferably the tops of the drillholes be surveyed by gyroscope for location, azimuth and dip;
· In WGM’s opinion, the results of the current process development work will guide the need to submit possible variations in the mineralogy to further bench scale testing to establish grade and recovery factors to support Mineral Reserve estimates, as well as the scale of the pilot operation that may be required to support a final feasibility. WGM anticipates that areas of the deposit with higher concentrations of manganese will require particular attention in support of Mineral Reserve estimates where it may be necessary to confirm that the manganese levels in the concentrates produced from these areas can be maintained at or below market requirements;
· It is worthy of note that the Mn in the Kami deposits occur in different minerals and hence may not have the same concentration issues as at the Scully operation; and
· It may be possible to reduce the manganese in the product by selective mining and blending or inclusion of a manganese reduction plant.
12
Based on WGM’s review of the available information for the Kami Iron Ore Project, we offer the following principal recommendations:
· Due to the variations in the drilling pattern, separations in the mineralized intersections were anywhere from less than 50 m to more than 250 m apart on adjacent holes. A more regular pattern of drilling should be used going forward, and wherever possible, it should be a priority for the drillhole to pass through the entire mineralized zone. Down dip drilling should also be kept to a minimum;
· WGM modelled out the larger and more continuous hematite-rich zones/units/beds within the main magnetite body that appeared to have fairly good correlation between holes and through multiple cross sections. The Rose Central deposit is more complex structurally and at least two hematite-rich units could be separately modelled at this time; there appears to be more intermixed hematite and magnetite in this deposit, as well. It appears that different ratios of hematite to magnetite occur in the different deposits (or parts of the deposits), but this distribution is not yet completely mapped out and understood and should be studied in detail during future work. WGM is of the opinion that it is important to keep these hematite-rich zones separate in future modelling and Mineral Resource estimates, as it may become important for determining processing options and costs of the iron-bearing material in subsequent economic studies;
· The current 3-D wireframe continued to a maximum depth of -135 m (approximately 750 m vertically below surface and extended 100 m past the deepest drilling) at Rose Central. The deeper mineralization, i.e., below 200 m vertical depth, has been tested by few drillholes and both zones are open at depth. A targeted exploration program will most likely increase the Mineral Resources at depth, however, an “economic lower level” or maximum depth of viable extraction should be determined in a subsequent Preliminary Assessment;
· Based on the current geological interpretation and perceived structural complexity, WGM is of the opinion that the Rose Central mineralized body will require more infill drilling than Mills Lake to get a better understanding of the internal complexity of the hematite-rich zones and waste units and the depth potential / dip of the mineralization. Both deposits have undergone various degrees of folding, and after more drilling is completed, the search ellipse sizes and orientations for the grade interpolation will undoubtedly need to be adjusted based on new knowledge and more detailed information. For future Mineral Resource estimates, WGM envisions that due to a better understanding of the geological complexity based on additional information, different domains will most likely be defined to better control grade distribution along the limbs and to reflect changes in
13
dip/attitude; alternately, a technique known as unfolding may be applied during the statistical analysis and the grade interpolation;
· In addition, future metallurgical testwork and analysis will determine the percentage of recoverable iron comprising the Mineral Resources;
· Future metallurgical testwork must consider the results of the current testwork which are not yet available. Additional exploration drilling, as well as geological interpretation updates, may necessitate further bench scale testing on any possible variations in mineralogy from that already identified. Initiation of larger scale testing before exploration and future Mineral Resource estimates are complete could risk making incorrect conclusions on flowsheet development and process design parameters. It is important that representative samples of the mineralization are selected for the next phase of testwork and that its scope is based on a complete knowledge of the deposits to be mined.
· Alderon has developed a program and budget to advance the Project and complete an updated NI 43-101 compliant Mineral Resource estimate. WGM agrees the program and budget is reasonable. The estimated cost breakdown for the program is presented below.
Additional recommendations are listed in the Recommendations section of the report.
14
Proposed Budget Estimate
Description | | Cost
(C$) | | Total Cost
(C$) | |
2010-2011 Winter Drilling Program — 4,200 m drilling completed Sample analysis and testwork in Progress | | | | | |
Drilling | | C$ | 1,000,000 | | | |
Sampling | | 424,000 | | | |
Salaries | | 164,625 | | | |
Accommodations & meals | | 110,400 | | | |
Field office costs | | 77,800 | | | |
43-101 update | | 75,000 | | | |
Travel | | 27,500 | | | |
Contingency (15%) | | 281,899 | | | |
Subtotal 2010-2011 Winter Drilling program in Progress | | | | C$ | 2,161,224 | |
| | | | | |
2011 Summer Drilling Program — Approximately 32,000 m | | | | | |
Drilling | | C$ | 6,600,000 | | | |
Sampling | | 1,155,000 | | | |
Borehole Geophysics | | 650,000 | | | |
Salaries | | 700,000 | | | |
Accommodations & meals | | 263,000 | | | |
Field office costs | | 312,000 | | | |
43-101 update | | 100,000 | | | |
Reclamation costs | | 50,000 | | | |
Travel | | 70,000 | | | |
Contingency (20%) | | 1,980,000 | | | |
Subtotal 2011 Summer Drilling Program | | | | C$ | 11,880,000 | |
| | | | | |
2012 Winter Drilling Program — Approximately 8,000 m | | | | | |
Drilling | | C$ | 1,600,000 | | | |
Sampling | | 550,000 | | | |
Borehole Geophysics | | 240,000 | | | |
Salaries | | 190,000 | | | |
Accommodations & meals | | 150,000 | | | |
Field office costs | | 100,000 | | | |
43-101 update | | 75,000 | | | |
Reclamation costs | | 10,000 | | | |
Travel | | 32,000 | | | |
Contingency (20%) | | 589,400 | | | |
Subtotal 2012 Winter Drilling Program | | | | C$ | 3,536,400 | |
| | | | | |
Scoping Study - BBA/Stantec | | | | C$ | 650,000 | |
Metallurgical testing — BBA/SGS (completed — results pending) | | | | 250,000 | |
Feasibility study — BBA/Stantec (includes $1.4 million for additional metallurgical testwork) | | | | 5,400,000 | |
Environmental Field sampling | | | | 2,200,000 | |
| | | | | |
GRAND TOTAL | | | | C$ | 26,077,624 | |
15
2. INTRODUCTION AND TERMS OF REFERENCE
2.1 GENERAL
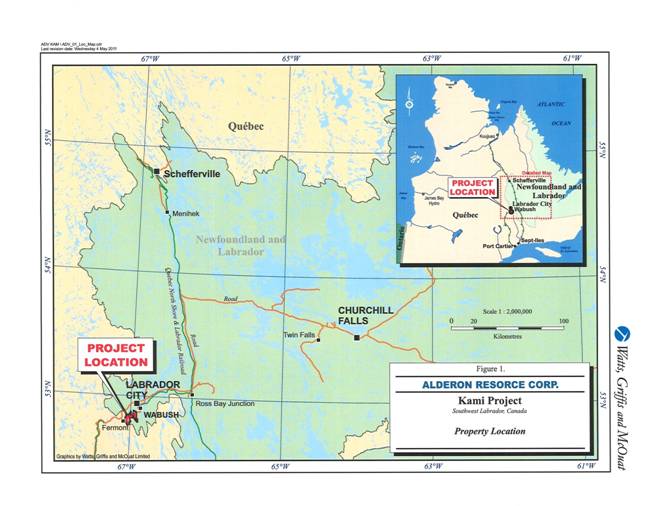
Alderon Resource Corp. (“Alderon”) acquired a 100% interest in the iron ore Kamistiatusset Property (the “Property” or “Kami”), or Kami Project, on December 6, 2010 from Altius Minerals Corporation (“Altius”), subject to a 3% gross sales royalty. The Property as shown in Figure 1 is located approximately 10 km from the town of Wabush, Western Labrador and is approximately 6 km south from the Wabush Mines mining lease. The Property straddles the Québec-Labrador provincial border, but the majority of it is in Labrador. Altius initiated exploration of the Property in 2006 and has completed field work including prospecting, confirmatory geological mapping, gravity and airborne magnetic surveys and in 2008, a drilling program aggregating 6,029.5 m in 27 drillholes. Some historical exploration results are available, but these appear to be of limited value. After Alderon acquired the option to acquire the Property it expanded the property by acquiring more licences in Newfoundland and Labrador and in 2010 initiated a drilling program aimed at acquiring sufficient information to allow for the estimation of Mineral Resources on the Central Rose and Mills Lake deposits. Alderon, in 2010 drilled a total of 82 drillholes, including re-drills, aggregating 25,896 m. Most of this was on the Central Rose and Mills Lake Deposits. It also completed an airborne magnetic and gravity survey.
2.2 TERMS OF REFERENCE
Watts, Griffis and McOuat Limited (“WGM”) was retained by Alderon to prepare a National Instrument 43-101 (“NI 43-101”) compliant Technical Report and Mineral Resource estimates for the Rose Central and Mills Lake Deposits. The classification of Mineral Resources used in this report conforms to the definitions provided in National Instrument 43-101 and the guidelines adopted by the Council of the Canadian Institute of Mining Metallurgy and Petroleum (“CIM”) Standards.
This technical report is copyright protected; the copyright is vested in WGM, and this report or any part thereof may not be reproduced in any form or by any means whatsoever without the written permission of Watts, Griffis and McOuat Limited. Furthermore, WGM permits the report to be used as a basis for project financings and for filing on SEDAR. Part or all of the report may be reproduced by Alderon in any subsequent reports, with the prior consent of WGM.
16
Figure 1. Property Location
17
The preparation of this report was authorized by Mr. Mark J. Morabito, President and CEO of Alderon Resource Corp. on October 21, 2010.
2.3 SOURCES OF INFORMATION
Much of the material used to prepare this report has been provided by Alderon and its predecessor Altius. This data, as well as including the latest results for the 2010 drilling program, also included assessment reports completed for Altius, and filed with the Department of Natural Resources Government of Newfoundland and Labrador to document its 2006, 2007, 2008 and 2009 exploration programs. These assessment filings often contain reports by contractors to Altius or Alderon including geophysical contractors. Other sources of historic exploration and general geological information include the Ministère des Resources Naturelle et Fauna du Québec (“MNRF”) and the Geological Survey of Canada. WGM completed an earlier NI 43-101 report concerning the property titled: “Technical Report on the Kamistiatusset Property, Newfoundland and Labrador for 0860132 B.C. LTD. and Alderon Resource Corp.” dated February 12, 2010. WGM reviewed the documents available, corroborated a number of details concerning the Property and deposit geology.
Additional information was sourced from WGM files.
WGM Senior Associate Geologist, Mr. Richard Risto, P.Geo., QP visited the Property in August and November 2010 and reviewed Alderon’s’ program results with Alderon Chief Geologist Mr. Edward Lyons, P.Geo. (BC), géo (QC) and Doris Fox, P.Geo., Kami Project Manager, EGM Exploration Group Management Corp. (an Alderon associate company). Mr. Risto collected independent drill core samples during the November site visit. WGM also visited the Property in 2009 during Altius’ ownership to review Altius’ drill program. Co-authors of this report, Mr. Michael Kociumbas, P.Geo., Senior Geologist and Vice-President., QP and WGM Senior Associate Metallurgical Engineer G. Ross MacFarlane, P.Eng., QP, have not visited the Property.
A complete list of the material reviewed is found in the “References” section of this report.
2.4 UNITS AND CURRENCY
Metric units are used throughout this report unless specified otherwise and all dollar amounts are quoted in Canadian currency (“C$”). Historical data and some government map data are generally in Imperial units. WGM has converted the necessary data for inclusion in this report, although Imperial units are often provided for clearer reference to historical data.
18
Alderon’s 2010 and Altius’ 2006, 2007 and 2008 surface and drill core samples were analysed by X-Ray Florescence (“XRF”) methods on metaborate discs by SGS Minerals Services (“SGS-Lakefield”) at its Lakefield, Ontario facility. Iron results on SGS-Lakefield certificates of analysis are reported in the form of Fe2O3 and are total iron. Total Iron (“TFe”) refers to the total iron in a sample. TFe is calculated from Fe2O3 by dividing the Fe2O3 wt% value by 1.4295. TFe assays are often completed on both Head and Crude samples of rock and also on the concentrates produced from the rock. In this report %TFe Head or %TFe_H refers to the percent total iron in a Head or Crude sample. Similarly %SiO2_H represents silica in the Head or Crude sample.
Alderon and Altius’ drill program sample assaying, in addition to using chemical assays, also included determining magnetic iron, or the magnetite content of samples using the Satmagan method (Satmagan is an acronym for Saturation Magnetization Analyzer). Satmagan refers to an electromagnetic method to estimate the magnetite content of a sample. These assays are expressed as %Fe3O4 or as %magnetite (“Mt”) or %magFe. Magnetic iron (“magFe) is calculated by multiplying the %Fe3O4 value by 0.7236. Similarly hematitic iron or the iron in hematite (%hmFe) is estimated, accepting certain assumptions, by calculation from %TFe, %magFe and %FeO derived from Head and/or Davis Tube results.
Altius also completed a bench scale metallurgical testwork program on one composite sample from the Property in 2009. This testwork included the preparation of Davis Tube concentrates (“DTCs”) for drillhole samples. Davis Tube tests on individual routine drill program samples were also a component of Alderon’s sample assaying program. The Davis Tube provides an alternative method to Satmagan for estimating the magnetic iron content of a sample. Davis Tube refers to the equipment and a procedure that produces a mineral concentrate high in magnetic iron by separating that portion of the sample that is magnetic from the portion that is non-magnetic, following sample comminution. Percent Davis Tube Weight Recovery (“%DTWR”) refers to the weight percent of the sample concentrated in the magnetic fraction using the Davis Tube procedure. The result is approximately the same as percent magnetite in the crude sample, but degree of liberation of the magnetite is an issue. Davis Tube concentrates are also assayed for iron and other oxides expressed in weight percent. %Fe_DTC and %SiO2_DTC refer respectively to the iron and silica content in Davis Tube concentrates and a number of other elements are often expressed in this same way. The %magnetic iron in the Crude sample can be estimated by multiplying the %DTWR figure by the %Fe in the Davis Tube concentrate. Total Iron Recovery (“TFe Recovery” or Rec’y) is the %TFe units recovered in the concentrate compared to the TFe in the Crude sample.
19
Other whole rock analysis results for samples are expressed in weight percent (“Wt%”). Table 1 documents several of the commonly used abbreviations and acronyms in the text of this report.
TABLE 1.
SUMMARY OF TERMS AND ABBREVIATIONS FOR UNITS
Abbreviation | | Term |
% or Wt% | | Weight Percent |
Head or Crude or H | | Non-concentrated material |
TFe | | Total Iron |
SFe | | Soluble iron |
Fe | | Iron; SFe and TFe |
DT, DTC or C | | Davis Tube, Davis Tube Concentrate, Concentrate |
%DTWR | | % Davis Tube Weight Recovery |
%Wt Recovery | | General term for weight recovery |
TFe Recovery or Rec’y | | %TFe units recovered compared to TFe units in Head |
20

3. RELIANCE ON OTHER EXPERTS
WGM prepared this study using the resource materials, reports and documents as noted in the text and “References” at the end of this report.
WGM has not independently verified the legal title to the Property. We are relying on public documents and information provided by Alderon for the descriptions of title and status of the Property agreements.
Drill core and surface rock samples collected by Alderon and Altius were submitted by Alderon and Altius to SGS-Lakefield which is an accredited laboratory. Although WGM has reviewed the assay results generated by SGS-Lakefield and believes they are generally accurate, WGM is relying on SGS-Lakefield as an independent expert.
We have also not carried out any independent geological surveys of the Property, but did complete site visits in October 2009, August 2010 and November 2010 to view first-hand the Property site, view 2008 and 2010 drill core, collect samples from the drill core and to review historic exploration and development work. These samples were collected and assayed independently of Alderon and Altius to validate their results. We have relied for our geological descriptions and program results solely on the basis of historic reports, notes and communications with Alderon and Altius.
21
4. PROPERTY DESCRIPTION AND LOCATION
4.1 PROPERTY LOCATION
The Property is located in western Labrador and eastern Québec and straddles the interprovincial boundary. It is approximately 10 km southwest from the town of Wabush, Newfoundland and Labrador and immediately adjacent (east) of the town of Fermont in Québec. The Property perimeter is approximately 6 km southwest from the Wabush Mines mining lease. The Property in Labrador consists of two non-contiguous blocks and spans an area that extends about 12 km east-west and 13 km north-south in NTS map areas 23B/14 and 15 and centred at approximately 52°49’N latitude and 67°02’W longitude.
4.2 PROPERTY DESCRIPTION AND OWNERSHIP
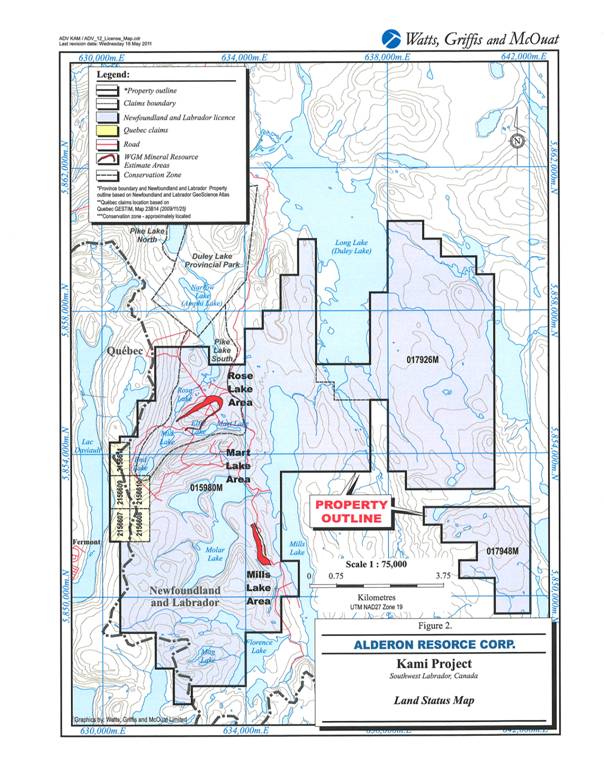
The Property is mainly located in Labrador, but also a group of contiguous licences is held in Québec. According to the claim system registries of both the Government of Newfoundland and Labrador and Québec the Property in Newfoundland and Labrador and Québec is registered to Alderon Resource Corp. The total area of the Property is nominally 7,750 ha but some of the claims in Labrador and Québec overlap slightly. The Property in Labrador comprises three map-staked licences, namely 015980M, 017926M and 017948M totalling 305 claim units covering 7,625 hectares. License, 015980M issued in 2009, replaced licenses 014957M, 014962M, 014967M, 014968M and 015037M. Licenses 017926M and 017948M were added to the Property in 2010. Surface rights on the acquired lands are held by the provincial governments, but may be subject to First Nations Rights. Table 2 provides details of the current mineral land holdings in Labrador.
TABLE 2.
KAMISTIATUSSET PROPERTY IN LABRADOR
Licence | | Claims | | Area (ha) | | NTS Areas | | Issuance Date | | Renewal Date | | Report Date | |
015980M | | 191 | | 4,775 | | 23B14 23B15 | | Dec 29, 2004 | | Dec 29, 2014 | | February 28, 2011 | |
017926M | | 92 | | 2,300 | | 23B15 | | Aug 30, 2010 | | Aug 30, 2015 | | October 31, 2011 | |
017948M | | 22 | | 550 | | 23B15 | | Sep 10, 2010 | | Sep 10, 2015 | | November 09, 2011 | |
Total | | 305 | | 7,625 | | | | | | | | | |
The Property in Québec consists of five map-staked licenses covering a nominal area of 125.46 ha. Table 3 provides details of the mineral land holdings in Québec.
22
TABLE 3.
KAMISTIATUSSET PROPERTY IN QUÉBEC
Licence | | Area
(ha) | | NTS Areas | | Registration
Date | | Expiry
Date | | Designation
Date | | Work Necessary
for Renewal($) | | Required Fees
for Renewal($) | |
CDC2156611 | | 25.03 | | 23B14 | | May 29, 2008 | | May 28, 2012 | | Mar 27, 2008 | | 400.00 | | 96.00 | |
CDC2156609 | | 45.31 | | 23B14 | | May 29, 2008 | | May 28, 2012 | | Mar 27, 2008 | | 450.00 | | 107.00 | |
CDC2156607 | | 49.4 | | 23B14 | | May 29, 2008 | | May 28, 2012 | | Mar 27, 2008 | | 450.00 | | 107.00 | |
CDC2156610 | | 3.50 | | 23B14 | | May 29, 2008 | | May 28, 2012 | | Mar 27, 2008 | | 16.00 | | 26.00 | |
CDC2156608 | | 4.22 | | 23B14 | | May 29, 2008 | | May 28, 2012 | | Mar 27, 2008 | | 160.00 | | 26.00 | |
Total | | 125.46 | | | | | | | | | | | | | |
The Property land holdings are depicted on Figure 2.
The Property has not been legally surveyed, but the claims and licences both in Québec and Labrador were map-staked and are defined by UTM coordinates, so the Property location is accurate.
In Labrador, a mineral exploration licence is issued for a term of five years. However, a mineral exploration licence may be held for a maximum of twenty years provided the required annual assessment work is completed and reported upon and the mineral exploration licence is renewed every five years. The minimum annual assessment work required to be done on a licence are:
$200/claim in the first year
$250/claim in the second year
$300/claim in the third year
$350/claim in the fourth year
$400/claim in the fifth year
$600/claim/year for years six to ten, inclusive
$900/claim/year for years eleven to fifteen, inclusive
$1,200/claim/year for years sixteen to twenty, inclusive.
The renewal fees are:
for Year five $25/claim
for Year ten $50/claim
for Year fifteen $100/claim.
The minimum annual assessment work must be completed on or before the anniversary date. The assessment report must then be submitted within 60 days after the anniversary date.
License 015980M is now in its 7th year. The license was renewed December 29, 2009 with a fee payment of $4,775.00. Total expenditures on the 191 claims to date accepted by the Department of Mines and Energy total $2,296,535.83. Government records show that a Work
23
Figure 2. Land Status Map
24
Report for the 5th year was accepted on March 02, 2010. To maintain the Property in good standing, through December 29, 2019, a total of $171,900 of acceptable work expenditures are required. No Work Reports have to date been filed for the two new licenses. Government records indicate that to maintain the licenses in good standing a total of $18,400.00 needs to be expended on license 017926M by August 30, 2011 and a total of $4,400.00 is required on license 017948M by September 10, 2011.
In Québec, the term of a claim is two years from the day the claim is registered, and the claim can be renewed indefinitely providing the holder meets all the conditions set out in the Mining Act, including the obligation to invest a minimum amount required in exploration work determined by regulation. The Act includes provisions to allow any amount disbursed to perform work in excess of the prescribed requirements to be applied to subsequent terms of the claim.
The claim holder may renew title for a two year period by:
· submitting an application for renewal prior to the claim expiry date; and
· paying the required fees, which vary according to the surface area of the claim, its location, and the date the application is received. If renewal application is received 60 days prior to the claim expiry date, the regular fees apply; if it is received within 60 days of the claim (prior to expiry date) expiry date, the fees are doubled; and submitting an assessment work report and the work declaration form at least 60 days before the claim expiry date. If the remittance of these documents is made during the 60 days prior to the expiry date, a penalty fee of $100 per claim is applied for the late submission.
Alderon’s Québec claims range in size from approximately 3 ha to 50 ha and fees for renewal vary with claim size (see Table 3). If renewals are late, then late fees apply. If the required work was not performed or was insufficient to cover the minimums required, then the claim holder may pay a sum equivalent to the minimum cost of work that should have been performed. Assessment work requirements escalate with renewal term and all fees are subject to revision (Table 4). After a claim’s 6th term, which would be at the end of its 12th year of validity, assessment costs are static. All of Alderon’s Québec claims have been renewed once so all are in their second term. WGM understands from Alderon that the claims were renewed by payment in lieu of work and Québec government records indicate no Work Reports are registered. Table 3 (shown previously) indicates that the required expenditures for renewal for the five claims vary depending on surface area, but all require filing by early 2012.
25
TABLE 4.
MINIMUM COST OF WORK TO BE CARRIED OUT
ON A QUÉBEC CLAIM NORTH OF 52° LATITUDE
| | Area of Claim | |
Term | | Less than 25 ha | | 25 to 45 Ha | | Over 45 Ha | |
1 | | 48 | | $ | 120 | | $ | 135 | |
2 | | 160 | | $ | 400 | | $ | 450 | |
3 | | 320 | | $ | 800 | | $ | 900 | |
4 | | 480 | | $ | 1,200 | | $ | 1,350 | |
5 | | 640 | | $ | 1,600 | | $ | 1,800 | |
6 | | 750 | | $ | 1,800 | | $ | 1,800 | |
7 and over | | 1,000 | | $ | 2,500 | | $ | 2,500 | |
4.3 PROPERTY AGREEMENTS
On November 2, 2009, 0860132 B.C. Ltd. (“Privco”) entered into an option agreement (the “Altius Option Agreement”) pursuant to which Privco, or an approved assignee of Privco, had the exclusive right and option (the “Option”) to acquire a 100% title and interest in the Property, subject to the terms and conditions of the Altius Option Agreement. In order to exercise the Option, Privco was required to (i) assign its interest in the Altius Option Agreement to a company acceptable to Altius, acting reasonably, that has its shares listed on the Toronto Stock Exchange or the TSX Venture Exchange (“Pubco”); (ii) fund exploration expenditures on the Property of at least $1,000,000 in the first year, and cumulative expenditures in the first two years of at least $5 million; and (iii) issue to Altius, after the satisfaction of certain financing conditions, shares of Pubco such that upon issuance Altius would own 50% of Pubco’s issued capital, on a fully diluted basis. In order to exercise the Option, Pubco was required to have first raised not less than $5,000,000 in capital.
Altius retained a 100% interest in the Property until such time as Privco satisfied all of the conditions to exercise the Option. Privco had until November 2, 2011 to satisfy such conditions and exercise the Option. Upon exercise, Altius was required to transfer its 100% interest in the Property to Pubco and retained a 3% gross sales royalty, in addition to the equity stake in Pubco described above.
The Altius Option Agreement also included a right of first refusal. With certain exceptions, any proposed sale by Altius or its affiliates of interests or rights in any claims, permits or other property interests located in the same western Labrador iron ore mining district as the Property and described in the Altius Option Agreement must first be offered to Privco (or Pubco on the assignment) at the same price and terms.
Subsequently, Alderon was identified as “Pubco” and Privco satisfied the first condition of the Altius Option Agreement on December 15, 2009, when it entered into a share exchange
26
agreement (the “Share Exchange Agreement”) whereby Alderon would acquire all of the issued and outstanding shares of Privco from Mr. Morabito in consideration of issuing 5,000,000 shares of Alderon to Mr. Morabito. Also on December 15, 2009 Alderon, Privco and Altius entered into an assignment agreement pursuant to which Alderon assumed the rights and obligations of Privco and Pubco under the Altius Option Agreement.
On January 15, 2010, Altius, Privco and Alderon amended the terms of the Altius Option Agreement to provide that upon the completion of a private placement by Alderon in February 2010, all financing conditions set forth in the Altius Option Agreement would have been satisfied. The amendment also clarified the calculation and number of Alderon common shares to be issued to Altius to achieve the ownership of 50% (fully diluted) of the issued and outstanding common shares of Alderon as of the specified date.
On March 3, 2010, Alderon completed the acquisition of Privco pursuant to the terms of the Share Exchange Agreement and acquired all of the outstanding common shares of Privco. In consideration, Alderon issued 5,000,000 common shares from treasury to Mr. Morabito.
On December 8, 2010 Altius announced in a press release that Alderon had earned a 100% interest in the Property. In order to complete the exercise of the Option, Alderon issued an aggregate of 32,285,006 common shares from its treasury to Altius. Altius retains a 3% gross sales royalty relating to any potential future mining operations.
WGM understands that there are no other third part agreements concerning the Property except for a Memorandum of Understanding (“MOU”) signed with the Innu Nation of Labrador dated August 11, 2010. This agreement is summarized in Section 4.6.
4.4 PERMITTING
Alderon, for its summer 2010 program, acquired a provincial exploration permit (E100083) from the government of Newfoundland and Labrador that covered drilling, geophysics and land access including a fording permit for five crossings. It also was granted a municipal letter of permission from the town of Labrador City. This permit (No. 10-284) noted that the land is zoned Mining Reserve Rural and mineral exploration is a permitted use in this zone. This permit allowed for exploration and a fuel cache subject to certain conditions outlined in a letter dated June 10, 2010. The Labrador City permit specifies the need to respect wetlands and minimise waterfowl habitat disturbance. Alderon also was issued a permit allowing cutting of 300 cords of wood.
27
The provincial exploration permit, the municipal letter of permission and the water use license were renewed to provide for the 2011 winter program.
All exploration work was conducted in Newfoundland and Labrador so no permits were required from Québec.
4.5 ENVIRONMENTAL ISSUES
The Property is located immediately to the south of Duley Lake Provincial Park and partially is common with an area designated as the Pike Lake South Conservation Zone. The conservation zones, also referred to as a wetlands management units, were the outcome of the Wetlands Stewardship Agreement entered into by the Town of Labrador City and the Province of Newfoundland and Labrador in 2005. The stewardship agreement is a formal commitment to honour the goals of the wetland conservation plan within specific management units. A wetland management unit is an environmentally sensitive area or a protected area, and is a significant wetland identified as important to waterfowl during nesting, brood-raising, feeding and/or staging. As such, exploration activities in these areas are subject to the additional approval of both the municipality and the Province of Newfoundland and Labrador and work is approved in accordance with the limitations of working in a conservation zone.
WGM is also aware that there are a number of basic cottages on the Property along various rivers and lakes. Any mining operation will impact these buildings, the Pike Lake South Conservation Zone and recreational facilities and will also have to be dealt with.
Tailings disposal will also be an issue for the Ministry of Fisheries and Oceans, Government of Canada.
Neither Alderon nor Altius have conducted any environmental studies to date on the Property. WGM understands that during the next phase of work in the summer of 2011, flora, fauna and baseline water quality surveys will be initiated. Stassinu Stantec Limited Partnership (“Stantec”) has been engaged by Alderon to conduct these environmental studies.
28
4.6 FIRST NATION ISSUES
WGM understands from data provided by Alderon that there are three Aboriginal groups: the Innu Nation of Labrador, the Innu Takuaikan Uashat Mak Mani-Utenam of Sept-Îles and the Matimeskush-Lac John of Schefferville that have unresolved land claims in the area of the Property.
Alderon signed a Memorandum of Understanding (“MOU”) with the Innu Nation of Labrador on August 11, 2010 and also has consulted the Québec Innu communities of Matimekush-Lac John, Uashat Mak Mani-Utenam and the Naskapi Nation of Kawawachikamach in January 2011.
WGM understands that the MOU between the Innu Nation of Labrador and Alderon provides a framework for Alderon and the Innu Nation to work together to establish a long term, mutually beneficial, cooperative and productive relationship during the exploration phase of the Property. The MOU provides the parties with a process for which the Innu Nation can identify and provide Innu Nation businesses and members an opportunity to participate in the exploration activities of the Property. The MOU is only for the exploration phase of the Property and outlines, should the Property proceed to advanced exploration, that Alderon shall at that time negotiate a participation agreement with the Innu Nation.
Consultation efforts with the Québec communities of Uashat mak Mani-Utenam, Matimekush-Lac John, and Naskapi Nation of Kawawachikmach began on January 12, 2011 with each community chief receiving a letter from Alderon’s President and CEO, Mark Morabito, introducing himself, the Property and the company. The letters, which included a map outlining Alderon’s project area, provided background information along with contact and exploration program information. In the letter, Alderon extended offers to meet and address any questions or concerns the Québec communities may have, and to provide additional information on Alderon’s 2011 exploration plans with a goal of building respectful relationships. In January, via phone, follow-up contacts were made and separate meetings with the Chief of Matimekosh-Lac John, and a representative from Uashat Mak Mani-Utenam in Montreal were scheduled. Doris Fox, Alderon’s project manager in Labrador, flew to Montreal to provide a more detailed overview of Alderon and its exploration efforts on the Property.
Additional letters were sent to the Quebec Innu communities inviting them to meet with Alderon in Toronto. A meeting was held in Toronto during the PDAC between the Chief and a councillor of Uashat mark Mani-Utenam and their legal representative, Ken Brophy, Alderon’s Director of Aboriginal and Community Affairs, and Mark Morabito. According to
29
Alderon, this meeting was well received and the Chief indicated that he was happy to have initiated dialogue so early in Alderon’s exploration program. A meeting scheduled to take place between Alderon and the Innu Nation of Labrador during the PDAC was cancelled due to the inability of Innu Nation representatives to make it to Toronto.
Ongoing communications continue between Alderon and all the First Nations who have claimed traditional territory in the area of the Property.
30

5. ACCESS, CLIMATE, LOCAL RESOURCES, INFRASTRUCTURE
AND PHYSIOGRAPHY
5.1 ACCESS
The Property is accessible from Labrador City/Wabush, Newfoundland via 4x4 vehicle roads. All-Terrain Vehicle (“ATV”) trails enable access to the remainder of the Property. Wabush is serviced daily by commercial airline form Sept-Îles, Montreal and Québec City and also by flights from points east.
5.2 CLIMATE
The climate in the region is typical of north-central Québec/Western Labrador. Winters are harsh, lasting about six to seven months, with heavy snow from December through April. Summers are generally cool and wet; however, extended day-light enhances the summer work-day period. Early and late-winter conditions are acceptable for ground geophysical surveys and drilling operations.
5.3 PHYSIOGRAPHY
The Property is characterized by gently rolling hills and valleys that trend northeast-southwest to the north of Molar Lake and trend north-south to the west of Molar Lake reflecting the structure of the underlying geology. Elevations range from 590 m to 700 m.
The Property area drains east or north into Duley Lake. A part of the Property drains north into the Duley Lake Provincial Park before draining into Duley Lake.
In the central Property area, forest fires have helped to expose outcrops; the remainder of the Property has poor outcrop exposure (see Figure 1). The cover predominantly consists of various coniferous and deciduous trees with alder growth over burnt areas.
5.4 LOCAL RESOURCES AND INFRASTRUCTURE
The Property is adjacent to the two towns of Labrador City, 2006 population 7,240 and Wabush, population 1,739. Together these two towns are known as Labrador West. Labrador City was founded in the 1960s to accommodate the employees of the Iron Ore Company of Canada. A qualified work force is located within the general area due to the operating mines and long history of exploration in this region.
31
Although low cost power from a major hydroelectric development at Churchill Falls to the east is currently transmitted into the region for the existing mine operations, the current availability of additional electric power on the existing infrastructure in the region is limited, therefore Alderon has already begun discussions with local utilities to secure electric power for the project. A study is currently being done to evaluate various options for supplying power to the site. The Kami site is also located in proximity to other key services and infrastructure. The project will include a rail loop and a connection to the QNS&L railway for transportation of product to a port. Fresh water sources on the site are plentiful, although the plan is to maximize recycling and minimize dependence on fresh water. A preliminary site plan, being developed as part of the ongoing Scoping Study, indicates that there are enough barren areas on the site to permit permanent storage of waste rock, as well as tailings.
32
6. HISTORY
6.1 GENERAL
A summary of the historical work is presented below. WGM believes the historical descriptions presented are generally accurate, but WGM has not independently verified the data.
The earliest geological reconnaissance in the southern extension of the Labrador Trough within the Grenville Province was by prospectors in 1914 in the search for gold. Several parties visited the area between 1914 and 1933, but it was not until 1937 that the first geological map and report was published by Gill et al., 1937 (Rivers, 1980).
The metamorphosed iron formation in the vicinity of Wabush Lake was first recognized by Dr. J.E. Gill in 1933. A few years later, the Labrador Mining and Exploration Co. Ltd. (“LM&E”) evaluated the iron formation, but decided it was too lean for immediate consideration (Gross et al., 1972).
In 1949, interest in the Carol Lake area by LM&E was renewed and geological mapping was carried out in the Duley Lake - Wabush Lake area by H.E. Neal for IOCC. The work was done on a scale of 1”= 1/2 mi. and covered an area approximately 8 km wide by 40 km long from Mills Lake northward to the middle of Wabush Lake. This work formed part of the systematic mapping and prospecting carried on by LM&E on their concession.
Concentrations of magnetite and specularite were found in many places west of Duley Lake and Wabush Lake during the course of Neal’s geological mapping. Broad exposures of this enrichment, up to 1.2 km long, assayed from 35 to 54% Fe and 17 to 45% SiO2. Ten enriched zones of major dimensions were located and six of these were roughly mapped on a scale of 1” = 200 ft. Seventy-four samples were sent to Burnt Creek for analysis. Two bulk samples, each about 68 kg, were taken for ore dressing tests. One was sent to the Hibbing Research Laboratory, the other to the Bureau of Mines, Ottawa. The material was considered to be of economic significance, as the metallurgical tests indicated that it could be concentrated.
Geological mapping on a scale of 1”= 1/2 mi was carried out by H.E. Neal in the Wabush Lake - Shabogamo Lake area in 1950. Neal (1951) also reported numerous occurrences of pyrolusite and psilomelane (botryoidal goethite being frequently associated with the manganese) within the iron formation and quartzite.
33
Mills No. 1 was one of the iron deposits discovered in 1950 and was sampled and described at that time. A narrow irregular band of pyrolusite was reported to extend for 457 m within a friable magnetite-hematite iron formation located 914 m southwest of the prominent point on the west side of Mills Lake (Neal, 1951).
In 1951, nearly all of the concession held by LM&E within the Labrador Trough was flown with an airborne magnetometer. This survey showed the known deposits to be more extensive than apparent from surface mapping and suggested further ore zones in drift-covered areas (Hird, 1960).
In 1953, a program of geological mapping in the Mills Lake - Dispute Lake area was conducted by R.A. Crouse of IOCC. Crouse (1954) considered the possibility of beneficiating ores within the iron formation and all high magnetic anomalies and bands of magnetite-specularite iron formation were mapped in considerable detail. Occurrences of friable magnetite-specularite gneiss, containing enough iron oxides to be considered as beneficiating ore, were found in several places west of Duley Lake and northwest of Canning Lake. Representative samples assayed 18.55 to 43.23% Fe and 26.66 to 71.78% SiO2 (Crouse, 1954). Seven zones of this material were located in the area. Three of these (one of which was Mills No. 1 Deposit) were mapped on a scale of 1”=200 ft. On two of these occurrences, dip needle lines were surveyed at 122 m (400 ft) intervals. Forty-two samples were sent to the Burnt Creek Laboratory for analysis. Three samples were sent to Hibbing, Minnesota for magnetic testing (Crouse, 1954). Crouse (1954) reported that at Mills No. 1 the ore was traced for a distance of 488 m along strike, with the minimum width being 107 m.
In 1957, an area of 86.2 km2 to the west of Duley Lake was remapped on a scale of 1”= 1,000 ft and test drilled by IOCC to determine areas for beneficiating ore. Dip needle surveying served as a guide in determining the locations of iron formation in drift-covered areas. According to Hird (1960), 272 holes for a total of 7,985 m (26,200 ft) were drilled during the 1957 program (approximately 66 holes are located on the Property). Mathieson (1957) reported that there were no new deposits found as a result of the drilling, however, definite limits were established for the iron formation found during previous geological mapping. Three zones of “ore” were outlined, which included Mills No. 1, and an area of 19.1 km2 was blocked out as the total area to be retained (Mathieson, 1957). According to Mathieson (1957), the Mills No.1 zone was outlined by six drillholes and found to have a maximum length of 3,048 m (10,000 ft) and a maximum width of 610 m (2,000 ft). Mathieson (1957) describes mineralization to be composed of specularite with varying amounts of magnetite grading on average 32.1% Fe. A search by Altius for the logs and/or core from the 1957 LM&E drilling program has not been successful. From local sources, it is known that all holes drilled in this area were of small diameter and very shallow (~30 m).
34
Early in 1959, a decision was made by IOCC to proceed with a project designed to open up and produce from the ore bodies lying to the west of Wabush Lake and a major program of construction, development drilling and ore testing was started in the Wabush area (Macdonald, 1960). Geological mapping (1”=1,000 ft) and magnetic profiling were conducted by R. Nincheri of LM&E in the Duley - Mills Lake area that year. Zones of potential beneficiating ores were located to the southwest of Mills Lake (Nincheri, 1959).
In 1972, an extensive airborne electromagnetic survey covered 2,150 km2 of territory, and entailed 2,736 line km of flying in the Labrador City area. The area covered extended from the southern extremity of Kissing Lake to north of Sawbill Lake, and from approximately the Québec-Labrador border on the west to the major drainage system, through Duley, Wabush and Shabogamo Lakes on the east. The survey was done by Sander Geophysics Ltd. (for LM&E) using a helicopter equipped with a NPM-4 magnetometer, a fluxgate magnetometer, a modified Sander EM-3 electromagnetic system employing a single coil receiver, and a VLF unit (Stubbins, 1973).
In 1972 to 1973, an airborne magnetic survey was conducted over the area by Survair Ltd., Geoterrex Ltd., Lockwood Survey Corporation Ltd. for the Geological Survey of Canada (GSC, 1975).
In 1977, geological mapping was initiated by T. Rivers of the Newfoundland Department of Mines and Energy within the Grenville Province covering the Wabush-Labrador City area. This work was part of the program of 1:50,000 scale mapping and reassessment of the mineral potential of the Labrador Trough by the Newfoundland Department of Mines and Energy. Mapping was continued by Rivers in western Labrador from 1978 to 1980. As part of an experimental geochemical exploration program in Labrador by LM&E in 1978, many of the lakes in the Labrador City area were sampled both for lake-bottom sediments and for lake-water (Stubbins, 1978). Lake sediment samples were sent to Barringer Research Ltd., Toronto, Ontario, for a multi-element analysis (Stubbins, 1978). Water samples were tested at Labrador City for acidity before being acidified for shipment. Some samples were also shipped to Barringer analysis and some were analysed in the Sept-Îles laboratory of IOCC. A sample portion was also sent to the Hibbing Minnesota laboratory of Learch Brothers for additional analysis (Stubbins, 1978). On Block No. 24 (part of the Property), only one site was sampled. The sediment assay results indicated the sample to be statistically ‘anomalous’ in phosphorous. None of the water samples were defined as anomalous (Stubbins, 1978). Stubbins (1978) concluded that the samples as a group are widely scattered and it is difficult to draw any firm conclusion from the results. He added that further study might indicate that it is worthwhile to take more samples.
35
In 1979, a ground magnetometer survey was conducted on Block No. 24 (part of the Property). A total of four lines having a combined length of 3,500 m were surveyed on this block (Price, 1979). The standard interval between successive magnetometer readings was 20 m. Occasionally, over magnetically ‘quiet’ terrain, this interval was increased. Whenever an abrupt change in magnetic intensity was encountered, intermediate stations were surveyed. According to Price (1979), the magnetometer profiles and observations of rare outcrops confirm that oxide facies iron formation occurs on Block No. 24 (in the Mills No. 1 area of the Property). Also in 1979, one diamond drillhole was drilled by LM&E near the north end of Elfie Lake on the Property. The hole (No. 57-1) was drilled vertically to a depth of 28 m (Grant, 1979) and did not encounter the iron oxide facies of interest. In 1983, LM&E collared a 51 m deep (168 ft) diamond drillhole 137 m north of Elfie Lake (DDH No. 57-83-1). The drillhole encountered metamorphosed iron formation from 17 m to a depth of 51 m; of this, only 2 m was oxide facies. Core recovery was very poor (20%) (Avison et al., 1984).
In 1981 and 1982, an air photography and topographic mapping program was completed by IOCC to re-photograph the mining areas as part of its program to convert to the metric system. Two scales of photography (1:10,000 and 1:20,000) were flown and new topographic maps (1:2,000 scale) were made from these photos. The photography was extended to cover all the lease and licence blocks in the Labrador City area (Smith et al. 1981; Kelly and Stubbins, 1983).
A lake sediment and water reconnaissance survey was undertaken by the GSC, in conjunction with the Newfoundland Department of Mines and Energy, over about one-half (134,000 km2) of Labrador during the summers of 1977 and 1978. The survey was designed to provide the exploration industry with data on bedrock composition and to identify metaliferous areas as large scale prospecting targets (McConnell, 1984). Sampling continued in 1982 in south-western Labrador. Waters and sediments from lakes over an area of about 50,000 km2 were sampled at an average density of one sample per 13 km2. Lake sediment samples were analysed for U, Cu, Pb, Zn, Co, Ni, Ag, Mo, Mn, Fe, F, As, Hg and L.O.I. In addition, U, F and pH were determined on the water samples (Davenport and Butler, 1983).
During 1985, field work by C. McLachlan of LM&E was concentrated on the northern part of Block No. 24. A pace and compass grid was established near Molar Lake. Cross lines were put in at 152 m (500 ft) intervals. The grid was used to tie in the sample sites and a systematic radiometric survey was performed. There were four soil samples and six rock samples (one analysed) collected (Simpson et al., 1985). A possible source of dolomite as an additive for the IOCC’s pellet plant was examined near Molar Lake. Simpson concluded from visual examination that the dolomite was high in silica.
36
In 2001, IOCC staked a considerable portion of the iron formation in the Labrador City area, with the Kamistiatusset area being in the southern extent of the company’s focus. Extensive geophysical testing was conducted over the area using airborne methods. The Kamistiatusset area and the area north of the Property was recommended as a high priority target by SRK Consulting Ltd. as part of the 2001 IOCC work report (GSNL open file LAB1369), however, no work was reported for the area.
In 2004, Altius staked 20 claims comprising licence 10501M, and in the spring of 2006 staked another 38 claims to the north comprising licence 11927M. In 2008, it conducted a drilling program. Altius’ programs and results are discussed under Exploration and Drilling sections of the report along with Alderon’s recent program and results.
37
7. GEOLOGICAL SETTING
7.1 REGIONAL GEOLOGY
The Property is situated in the highly metamorphosed and deformed metasedimentary sequence of the Grenville Province, Gagnon terrane of the Labrador Trough (“Trough”), adjacent to and underlain by Archean basement gneiss (Figure 3).
The Trough, otherwise known as the Labrador-Québec Fold Belt, extends for more than 1,000 km along the eastern margin of the Superior Craton from Ungava Bay to Lake Pletipi, Québec. The belt is about 100 km wide in its central part and narrows considerably to the north and south. The Trough itself is a component of the circum-Superior belt (Ernst, 2004) that surrounds the Archean Superior craton which includes the iron deposits of Minnesota and Michigan. Iron formation deposits occur throughout the Labrador Trough over much of its length.
The Trough is comprised of a sequence of Proterozoic sedimentary rocks, including iron formation, volcanic rocks and mafic intrusions. The southern part of the Trough is crossed by the Grenville Front representing a metamorphic fold-thrust belt in which Archean basement and Early Proterozoic platformal cover were thrust north-westwards across the southern portion of the southern margin of the North American Craton during the 1,000 Ma Grenvillian orogeny (Brown, Rivers, and Callon, 1992). Trough rocks in the Grenville Province are highly metamorphosed and complexly folded. Iron deposits in the Gagnon terrane, (the Grenville part of the Trough), include those on the Property and Lac Jeannine, Fire Lake, Mont-Wright, Mont-Reed, and Bloom Lake in the Manicouagan-Fermont area and the Luce, Humphrey and Scully deposits in the Wabush-Labrador City area. The high-grade metamorphism of the Grenville Province is responsible for recrystallization of both iron oxides and silica in primary iron formation, producing coarse-grained sugary quartz, magnetite, and specular hematite schist or gneiss (meta-taconites) that are of improved quality for concentration and processing.
North of the Grenville Front, the Trough rocks in the Churchill Province have been only subject to greenschist or sub-greenschist grade metamorphism and the principal iron formation unit is known as the Sokoman Formation. The Sokoman Formation is underlain by the Wishart Formation (quartzite),) and the Attikamagen Group including the Denault Formation (dolomite) and the Dolly/Fleming Formations (shale). In the Grenville part of the Trough, where the Property is located, these same Proterozoic units can be identified, but are more metamorphosed and deformed. In the Grenville portion of the Trough, the Sokoman
38
Figure 3. Regional geology
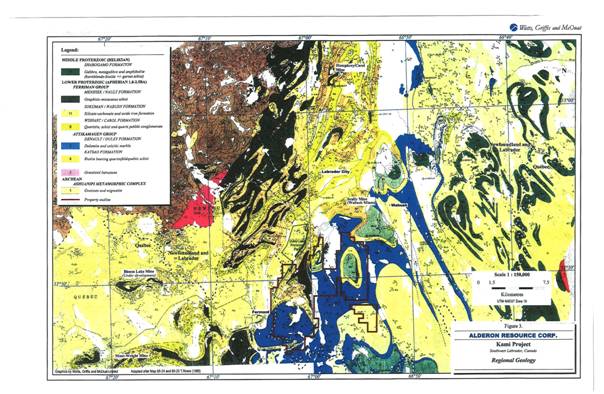
39
rocks are known as the Wabush Formation, the Wishart as the Carol Formation (Wabush area) or Wapusakatoo Formation (Gagnon area), the Denault as the Duley Formation and the Fleming as the Katsao Formation. The recent synthesis by Clark and Wares (2005) develops modern lithotectonic and metallogenic models of the Trough north of the Grenville Front. In practice, both sets of nomenclature for the rock formations are often used. Alderon and Altius have used the Menihek, Sokoman, Wishart, Denault, and Attikamagen nomenclature throughout their reports to name rock units on the Property, and WGM, to minimize confusion in this report, has elected to also use these same rock unit names, but often gives reference to the other name (in brackets). The regional stratigraphy is summarized in Table 5.
TABLE 5.
REGIONAL STRATIGRAPHIC COLUMN, WESTERN LABRADOR TROUGH
Description
MIDDLE PROTEROZOIC – Helikian
Shabogamo Mafic Intrusives -Gabbro, Diabase
Monzonite-granodiorite
Intrusive Contact
PALEOPROTEROZOIC – Aphebian
Ferriman Group | |
Nault Formation (Menihek Formation) | Graphitic, chloritic and micaceous schist |
Wabush Formation (Sokoman Formation iron formation) | Quartz, magnetite-specularite-silicate-carbonate iron formation |
Carol Formation (Wishart Formation) | Quartzite, quartz-muscovite-garnet schist |
Unconformity? – locally transitional contact?
Attikamagen Group | |
Duley Formation (Denault Formation) | Meta-dolomite and calcite marble |
Katsao Formation (Fleming/Dolly Formations) | Quartz-biotite-feldspar schist and gneiss |
Unconformity
ARCHEAN
Ashuanipi Complex | Granitic and Granodioritic gneiss and mafic intrusives |
Note: The names in brackets provide reference to the equivalent units in the Churchill Province part of the Trough.
7.2 PROPERTY GEOLOGY
7.2.1 GENERAL
The most comprehensive mapping of this area was done by T. Rivers as part of his Labrador Trough mapping program of the mid-1980s. Several maps of the area were produced, with the most applicable to this area being Maps 85-25 and 85-24 (1:100,000) covering National Topographic System Sheet 23B/14. Figure 4, Property Geology, is based mainly on River’s
40

work with modifications made by Alderon and Altius through mapping, drilling and interpretation of geophysical survey results including the 2010 airborne gravity survey shown on Figures 5 and 6.
The Property is underlain by folded sequences of the Ferriman Group containing Sokoman (Wabush) Formation iron formation and associated lithologies. The stratigraphic sequence varies in different parts of the Property. Altius’ exploration was focussed on three parts of the Property known as the Mills Lake, Rose Lake and the Mart Lake areas. Alderon’s drilling was focussed on the Rose Lake and Mills Lake areas. On some parts of the Property, the Sokoman (Wabush) is directly underlain by Denault (Duley) Formation dolomite and the Wishart (Carol) Formation quartzite is missing. In other places, both the dolomite and quartzite units are present.
Alderon interprets the Property to include two iron oxide hosting basins juxtaposed by thrust faulting. The principal basin, here named the Wabush Basin, contains the majority of the known iron oxide deposits on the Property. Its trend continues NNE from the Rose Lake area 9 km to the Wabush Mine and beyond the town of Wabush. The second basin, called the “Mills Lake Basin”, lies south of the Elfie Lake Thrust Fault and extends southwards, parallel with the west shore of Mills Lake. Each basin has characteristic lithological assemblages and iron formation variants.
7.2.2 EAST OF MILLS LAKE
The portion of the Property east of the western shore of Mills Lake is dominated by gently dipping (15°-20°E) Denault Fm marble with quartz bands paralleling crude foliation. This block is interpreted as being thrust from the east onto the two basin complexes above. The marble outcrops across the 8 km width of licenses 017926M and 0179948M with consistent east dips. The thickness exposed suggests that several thrust faults may have repeated the Denault Fm stratigraphy. On license 017948M, large blocks of Wishart quartzite were observed surrounding an elevated plateau that may be an infolded syncline of Sokoman Fm. Another area on license 017926M, interpreted by Rivers (1985), as a syncline with Sokoman and Menihek Fms in the core did not show any airborne magnetic or gravity anomalies. More field evaluation is required to understand these features as part of future project development.
Table 6 presents the lithological codes used by Alderon for its 2010 drill core logging. Alderon initiated its 2010 program by re-logging Altius’ drill core and replaced Altius’ previous lithological codes with its codes. Amphibolite dikes and sills cut through all other
41
Figure 4. Property Geology
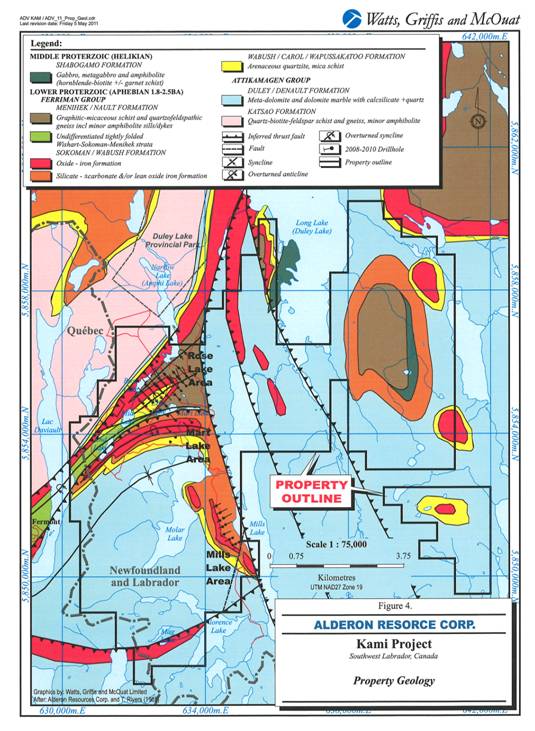
42
Figure 5. Total Magnetic Intensity, Reduced to the Pole, First Vertical Derivative after BGI
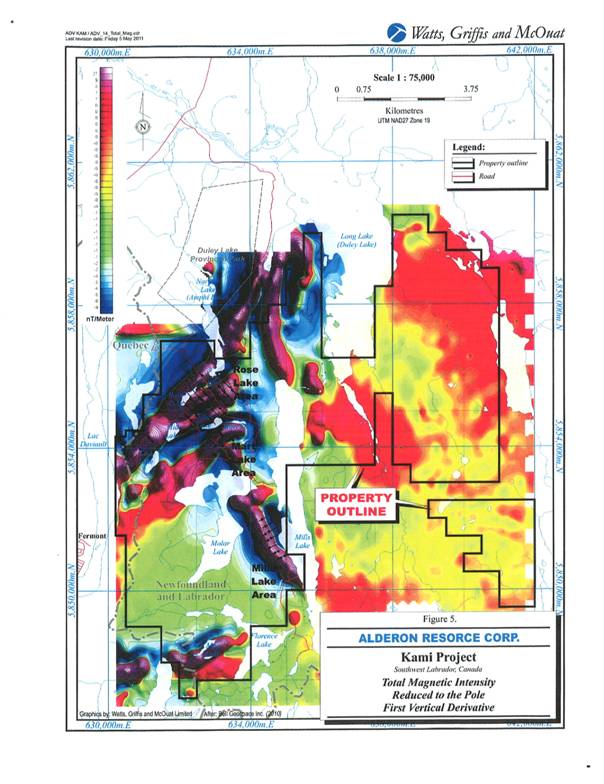
43
Figure 6. Terrain Corrected Tzz, Density 2.67 g/cc after BGI
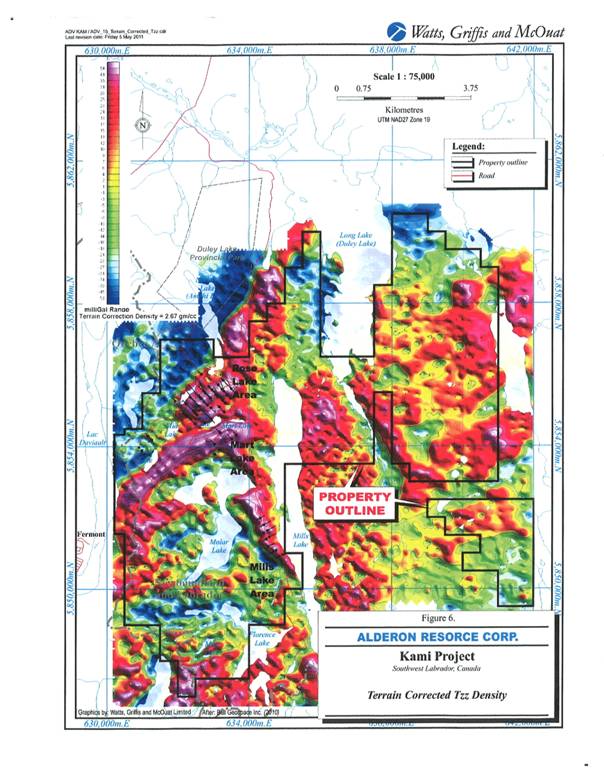
44
rock units, but are particularly common in the Menihek Formation schists and are a consideration as they may negatively impact the chemistry of iron concentrates made from mineralization containing these rocks that may be difficult to exclude during mining.
TABLE 6.
ROCK/UNIT CODING FOR KAMI PROPERTY DRILL CORE LOGGING
Lithology Code | | Description | | Formal Unit Name | | Facies |
NR | | Not Recorded | | MISC | | MISC |
LOST | �� | Lost core | | MISC | | MISC |
OB | | Overburden | | MISC | | MISC |
EOH | | End of Hole Marker | | MISC | | MISC |
QV | | quartz vein with variable accessory minerals | | Post-Iron Fm dyke/sill | | Intrusive |
B_MS_SCH | | biotite-muscovite quartz schist , often w/ Fe-sulfides | | Menihek Fm | | Menihek Fm |
GF_B_MS_SCH | | graphitic biotite-muscovite quartz schist , often w/ Fe-sulfides | | Menihek Fm | | Menihek Fm |
GF_SCH | | graphitic biotite-quartz schist | | Menihek Fm | | Menihek Fm |
MS_B_SCH | | muscovite-biotite quartz schist | | Menihek Fm | | Menihek Fm |
MS_SCH | | muscovite-quartz schist | | Menihek Fm | | Menihek Fm |
HBG_GN-Menihek | | hornblende-biotite-garnet gneiss (+ coronite) | | Menihek Fm | | Menihek Fm |
HBG_GN | | hornblende-biotite-garnet gneiss (+ coronite) | | Sokoman Fm | | Menihek Fm |
CIF | | carbonate >50% IF | | Sokoman Fm | | IF-Carbonate |
MCIF | | magnetite >20% + carbonate IF | | Sokoman Fm | | IF-Carbonate |
LMCIF | | magnetite 10-20% + carbonate IF | | Sokoman Fm | | IF-Carbonate |
CSIF | | carbonate > 50% + silicate iron formation | | Sokoman Fm | | IF-Silicate |
HIF | | hematite >20%-quartzite (minor marble, Ca/Fe silicates) | | Sokoman Fm | | IF-Main |
HMIF | | hematite>magnetite-quartzite [MT+HM>20%] (minor marble, Ca/Fe silicates) | | Sokoman Fm | | IF-Main |
HMCIF | | hematite+magnetite >20% carbonate silicate iron formation | | Sokoman Fm | | IF-Carbonate |
HMSIF | | hematite>magnetite> 20%; silicate >50% iron formation | | Sokoman Fm | | IF-Silicate |
HSIF | | hematite >20% silicate >50% iron formation | | Sokoman Fm | | IF-Silicate |
LHIF | | hematite 10-20% + quartz (minor marble, Ca/Fe silicates) | | Sokoman Fm | | IF-Main |
LHMIF | | hematite>magnetite (HM+MT 10-20%) quartzite (minor marble, Ca/Fe silicates) | | Sokoman Fm | | IF-Main |
LMCSIF | | magnetite (10-20%) carbonate silicate iron formation | | Sokoman Fm | | IF-Carbonate |
LMIF | | magnetite(10-20%)-quartzite (minor marble, Ca/Fe-silicates) | | Sokoman Fm | | IF-Main |
LMHIF | | magnetite>hematite(10-20%)+quartz (minor marble, Ca/Fe-silicates) | | Sokoman Fm | | IF-Main |
LMQCIF | | magnetite (10-20%) quartz carbonate silicate iron formation | | Sokoman Fm | | IF-Carbonate |
LMQSIF | | magnetite (10-20%) quartz silicate iron formation | | Sokoman Fm | | IF-Silicate |
LMSIF | | magnetite (10-20%) silicate iron formation | | Sokoman Fm | | IF-Silicate |
MHIF | | magnetite>hematite [MT+HM>20%]-quartzite w/minor marble, Ca/Fe silicates | | Sokoman Fm | | IF-Main |
MIF | | magnetite>20%-quartzite (minor marble, Ca/Fe-silicates) | | Sokoman Fm | | IF-Main |
MCSIF | | magnetite>20% carbonate silicate iron formation | | Sokoman Fm | | IF-Carbonate |
MHSIF | | magnetite>hematite> 20%; silicate >50% iron formation | | Sokoman Fm | | IF-Silicate |
MSIF | | magnetite >20% silicate iron formation | | Sokoman Fm | | IF-Silicate |
QCIF | | Quartz (50-90 qz)% carbonate iron formation | | Sokoman Fm | | IF-Carbonate |
QCSIF | | Quartz (50-90 qz)% carbonate silicate iron formation | | Sokoman Fm | | IF-Carbonate |
QSIF | | Quartz (50-90% qz) + Ca-Fe silicates, + minor Fe oxides | | Sokoman Fm | | IF-Silicate |
SIF | | Fe-Ca silicates >50% w/ qzt, marble, + minor Fe oxide | | Sokoman Fm | | IF-Silicate |
QZT | | quartzite( >90% qz + mica, carbonate, other) | | Wishart Fm | | Wishart Fm |
CARB_QZ_SCH | | carbonate (dolomite,calcite) + qz variable micas schist | | Wishart Fm | | Wishart Fm |
QZ_MS_B_CC_SCH | | high quartz w/muscovite>biotite w/calcite schist | | Wishart Fm | | Wishart Fm |
QZ_MS_B_SCH | | high quartz w/muscovite>biotite schist | | Wishart Fm | | Wishart Fm |
QZT-MS | | quartzite w/ muscovite; can range to 20% mica | | Wishart Fm | | Wishart Fm |
MB | | Duley Fm (Denault Fm) — marble (CT+ DL)>75% w/Ca-silicate, minor Fe oxides | | Attikamagen Gp | | Attikamagen Gp |
45
8. DEPOSIT TYPES
The iron formation on the Property is iron formation of the Lake Superior-type. Lake Superior-type iron formation consists of banded sedimentary rocks composed principally of bands of iron oxides, magnetite and hematite within quartz (chert)-rich rock with variable amounts of silicate, carbonate and sulphide lithofacies. Such iron formations have been the principal sources of iron throughout the world (Gross, 1996). Table 7, after Eckstrand, editor (1984), presents the salient characteristics of the Lake Superior-type iron deposit model.
Lithofacies that are not highly metamorphosed or altered by weathering and are fine grained are referred to as taconite.
Metamorphosed taconites are known as meta-taconite or itabirite (particularly if hematite-rich). The iron deposits in the Grenville part of the Labrador Trough in the vicinity of Wabush and Mont-Wright, operated by IOCC (Rio Tinto), ArcelorMittal and Cliffs Natural Resources (“Cliffs”) (Wabush Mine) are meta-taconite. The Bloom Lake iron deposit acquired with the recent purchase of Consolidated Thompson by Cliffs is also a meta-taconite. The iron formation on the Property is similarly Lake Superior-type meta-taconite.
For non-supergene-enriched iron formation to be mined economically, oxide iron content must be sufficiently high but also the iron oxides must be amenable to concentration (beneficiation) and the concentrates produced must be low in deleterious elements such as silica, aluminum, phosphorus, manganese, sulphur and alkalis. For bulk mining, the silicate and carbonate lithofacies and other rock types interbedded within the iron formation must be sufficiently segregated from the iron oxides. Folding can be important for repeating iron formation and concentrating iron formation beds to create economic concentrations of iron.
46
TABLE 7.
DEPOSIT MODEL FOR LAKE SUPERIOR TYPE IRON FORMATION
AFTER ECKSTRAND (1984)
Commodities | | Fe (Mn) |
Examples:
Canadian - Foreign | | Knob Lake, Wabush Lake and Mont-Wright areas, Que. and Lab. - Mesabi Range, Minnesota; Marquette Range, Michigan; Minas Gerais area, Brazil. |
| | |
Importance | | Canada: the major source of iron.
World: the major source of iron. |
| | |
Typical Grade, Tonnage | | Up to billions of tonnes, at grades ranging from 15 to 45% Fe, averaging 30% Fe. |
| | |
Geological Setting | | Continental shelves and slopes possibly contemporaneous with offshore volcanic ridges. Principal development in middle Precambrian shelf sequences marginal to Archean cratons. |
| | |
Host Rocks or Mineralized Rocks | | Iron formations consist mainly of iron- and silica-rich beds; common varieties are taconite, itabirite, banded hematite quartzite, and jaspilite; composed of oxide, silicate and carbonate facies and may also include sulphide facies. Commonly intercalated with other shelf sediments: black |
| | |
Associated Rocks | | Bedded chert and chert breccia, dolomite, stromatolitic dolomite and chert, black shale, argillite, siltstone, quartzite, conglomerate, redbeds, tuff, lava, volcaniclastic rocks; metamorphic equivalents. |
| | |
Form of Deposit, Distribution of Ore Minerals | | Mineable deposits are sedimentary beds with cumulative thickness typically from 30 to 150 m and strike length of several kilometres. In many deposits, repetition of beds caused by isoclinal folding or thrust faulting has produced widths that are economically mineable. Ore mineral distribution is largely determined by primary sedimentary deposition. Granular and oolitic textures common. |
| | |
Minerals: Principal Ore Minerals
- Associated Minerals | | Magnetite, hematite, goethite, pyrolusite, manganite, hollandite.
- Finely laminated chert, quartz, Fe-silicates, Fe-carbonates and Fe-sulphides; primary or. metamorphic derivatives |
| | |
Age, Host Rocks | | Precambrian, predominantly early Proterozoic (2.4 to 1.9 Ga). |
| | |
Age, Ore | | Syngenetic, same age as host rocks. In Canada, major deformation during Hudsonian and, in places, Grenvillian orogenies produced mineable thicknesses of iron formation. |
| | |
Genetic Model | | A preferred model invokes chemical, collodial and possibly biochemical precipitates of iron and silica in euxinic to oxidizing environments, derived from hydrothermal effusive sources related to fracture systems and offshore volcanic activity. Deposition may be distal from effusive centres and hot spring activity. Other models derive silica and iron from deeply weathered land masses, or by leaching from euxinic sediments. Sedimentary reworking of beds is common. The greater development of Lake Superior-type iron formation in early Proterozoic time has been considered by some to be related to increased atmospheric oxygen content, resulting from biological evolution. |
| | |
Ore Controls, Guides to Exploration | | 1. Distribution of iron formation is reasonably well known from aeromagnetic surveys. 2. Oxide facies is the most important, economically, of the iron formation facies. 3. Thick primary sections of iron formation are desirable. 4. Repetition of favourable beds by folding or faulting may be an essential factor in generating widths that are mineable (30 to 150 m). . 5. Metamorphism increases grain size, improves metallurgical recovery. 6. Metamorphic mineral assemblages reflect the mineralogy of primary sedimentary facies. 7. Basin analysis and sedimentation modelling indicate controls for facies development, and help define location and distribution of different iron formation facies. |
| | |
Author | | G.A. Gross |
47
9. MINERALIZATION
Mineralization of economic interest on the Property is oxide facies iron formation. The oxide iron formation (“OIF”) consists mainly of semi-massive bands, or layers, and disseminations of magnetite and/or specular hematite (specularite) in recrystallized chert and interlayered with bands (beds) of chert with carbonate and iron silicates. Where magnetite or hematite represent minor component of the rock comprised mainly of chert the rock is lean iron formation. Where silicate or carbonate becomes more prevalent than magnetite and/or hematite then the rock is silicate iron formation (“SIF”) and or silicate-carbonate iron formation and its variants. SIF consists mainly of amphibole and chert, often associated with carbonate and contains magnetite or specularite in minor amounts. The dominant amphibole on the Kami Property is grunerite. Where carbonate becomes more prevalent the rock is named silicate-carbonate or carbonate-silicate iron formation but in practice infinite variations exist between the OIF and silicate-carbonate iron formation composition end members (see Table 6). SIF and its variants and lean iron formation are also often interbedded with OIF.
The OIF on the Property is mostly magnetite-rich and some sub-members contain increased amounts of hematite (specularite). At both Rose Central and at Mills Lake, bright pink rhodonite, which is a manganese silicate, is preferentially associated with hematite-rich OIF facies. Bustamite, a calcium manganese silicate, is also said to be present. There may also be other manganese species present which perhaps have been identified during recent metallurgical testwork, but these results have not yet been finalized and made available to WGM for review.
9.1 WABUSH BASIN – ROSE DEPOSITS
The Wabush Basin on the Property contains (from south to north) the South Rose/Elfie Lake Deposit, the Rose Central Deposit and the North Rose Deposit. These deposits represent different parts of a series of gently plunging NNE-SSW upright to slightly overturned anticlines and synclines. The airborne geophysics anomalies and Rivers’, (1985) maps show the linear trend of this fold system continuing NNE from western end of the North Rose Deposit toward Long (Duley) Lake. The Wabush Mine Deposit lies across the lake where the structure opens into a broad open anticline perhaps dipping ENE under Little Wabush Lake.
The stratigraphy in the Rose area ranges from the Archean granite gneiss, north of the Rose syncline, up to the Menihek Formation mica schist. The contact between the Archean basement and the Denault marble is not exposed, nor has not been drilled to date. The Rose anticline exposes the Wishart Formation quartzite and drillholes also pass into Denault marble in the anticline core. The contact relationship between the two units appears gradational with increasing quartz at the base of the Wishart. The Wishart includes muscovite + biotite-rich
48
schist and variations in quartzite textures. It appears more variable than the large quartzite exposures near Labrador City.
The upper contact of the Wishart Formation is abrupt. The base of the overlying iron formation often starts with a narrow layer of Fe-silicate—rich iron formation. Alderon’s exploration team correlates this member with the Ruth Fm. Locally this is called the Basal Iron Silicate Unit (Wabush Mines terminology). The thickness of this sub-unit ranges 0 to 15 m.
The Sokoman Formation in the Rose Lake area includes three iron-oxide rich stratigraphic domains or zones separated by two thin low-grade units. This is similar to the sequence observed at the Wabush Mine. At Rose Lake, the low grade units, composed of quartz, Fe-carbonate plus Fe-silicates and minor Fe oxides, are thinner and more erratically distributed than at the Wabush Mine. The three oxide divisions or domains in a gross sense are mineralogically distinct.
The lower stratigraphic level typically has substantially higher specular hematite to magnetite ratio; magnetite content can be minimal to almost absent. The principal gangue mineral is quartz with a little carbonate or Fe-silicate. Crystalline rhodonite and bustamite are locally common. Occasionally, magnetite can be observed replacing the hematite as crystalline clusters to 2 cm with rhodonite coronas. This is interpreted as indicating a broad reduction in Fe oxidation during the peak of metamorphism. The Mn-silicates appear to be cleanly crystallised with little entrainment of Fe oxides.
The middle domain typically is comprised of a series of OIF units where hematite exceeds magnetite, interlayered with units where magnetite exceeds hematite. The mineralization is somewhat enriched in manganese. Gangue minerals include quartz, Fe-carbonate, and modest amounts of Fe-silicate.
The upper domain typically has a much higher magnetite:hematite ratio than the other levels, with hematite being uncommon in any quantity. Upwards, this domain grades into assemblages containing less Fe oxide with increasing amounts of Fe-silicate and Fe-carbonate. Magnetite-rich mineralization typically contains less than 0.5% Mn.
The uppermost part of the Sokoman is principally non-oxide facies. The contact with the overlying Menihek Fm is a diachronous transition of interlayered Sokoman chemical sediments and Menihek flysch mud. The contact may locally be tightly folded or faulted by post-metamorphic movement parallel with the foliation, but many of the contacts between the
49
two formations are delicately preserved and appear to be “one-way”, not folded stratigraphy. It is probable that all three contact controls are in play.
The Wabush Basin in the southern part of the Property is bounded to the south by a major SSE-trending thrust fault along Elfie Lake and on its north and west margins by a steeply dipping contact between the Sokoman Formation-Wishart Formation assemblage and the Archean granite gneiss basement. This contact is apparently drag-folded along a NNE trend toward the Wabush Mine. The eastern edge of the assemblage appears to be defined by a late fault (probably a thrust from the east).
Figure 7 shows the drilling areas and deposit with reference to ground magnetics. Figures 8 and 9 are respectively Cross Sections 20E and 16E on the Rose Central Deposit, 400 m apart along strike. Both cross sections from north to south show the North Rose, Rose Central and South Rose zones or deposits. The magnetic profile from the ground magnetic survey shows peaks that correlate with magnetite-hematite mineralization intersected in the drillholes. Each of these zones are interpreted as limbs of a series of NE-SW trending, upright to slightly overturned, shallow NE plunging anticlines and synclines but structural stacking may also play a role. Cross Section 20E, 400 m NE of Section 16E, is down plunge of Section 16E. On Section 20E, the anticlinal hinge of the South Rose-Central Rose is mapped out by drilling, but on Section 16E this hinge zone has been eroded away (would be above ground surface) and only the SE and NW limbs, which are respectively the South Rose and Central Rose Deposits are present. On both cross sections, it can be seen that Wishart Formation quartzites form the core of the fold (intersected towards the bottoms of drillholes K-10-09, K-08-18, K-10-30 and K-10-35 on Section 20E) and Menihek Formations mica - graphitic schists are the stratigraphic hanging wall above the Sokoman Formation iron formation (mid part of K-08-24, upper portions of K-10-42 on Section 16E and upper parts of K-10-18, K-10-29, K-10-35, K-10-27, K-10-30 K-10-69A etc. on Section 20E). On Section 16E two holes (K-10-51 and K-10-66) are shown partially testing the North Rose Zone. The North Rose Zone is not part of the current Mineral Resource estimate and was the main focus of Alderon’s 2011 winter drill program (results are pending).
The true width of the Central Rose Deposit as shown by the interpretation is in the order of 220 m wide however, as shown, widths of mineralization rapidly attenuate through the hinge into the South Rose Zone or limb and there is no consistent relationship between drillhole intersection length and true width. There is also likely another narrow highly attenuated, perhaps tightly folded limb of Sokoman between the main Central Rose Zone and the North Rose Zone. The entire Rose system also appears to attenuate along strike to the SSW. WGM believes it likely that considerable second order and third order parasitic folding is also most
50

Figure 7. Ground magnetic survey with 2008 and 2010 drillhole locations
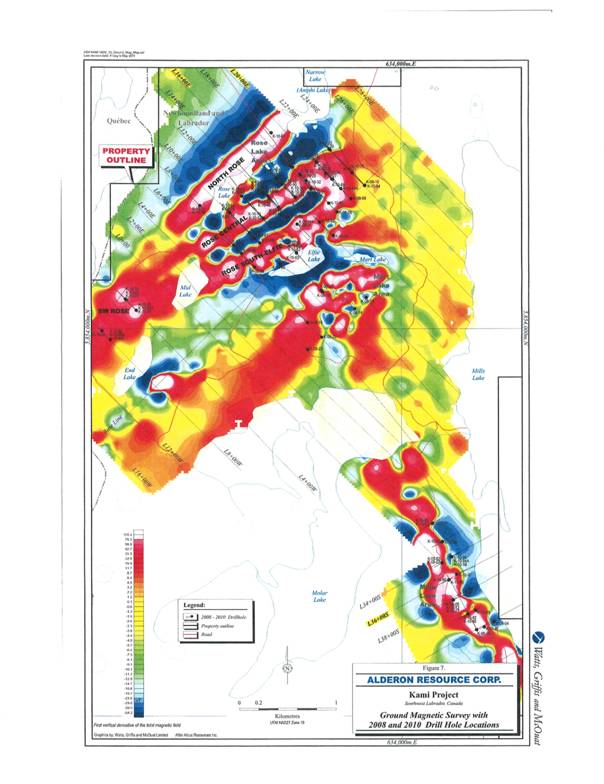
51
Figure 8. Rose Lake area cross section 20E
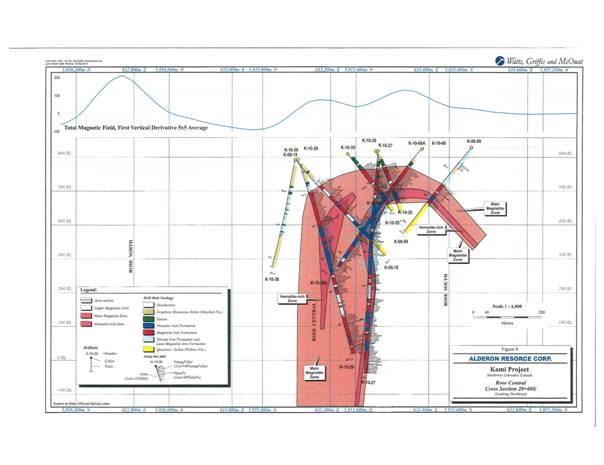
52
Figure 9. Rose Lake area cross section 16E
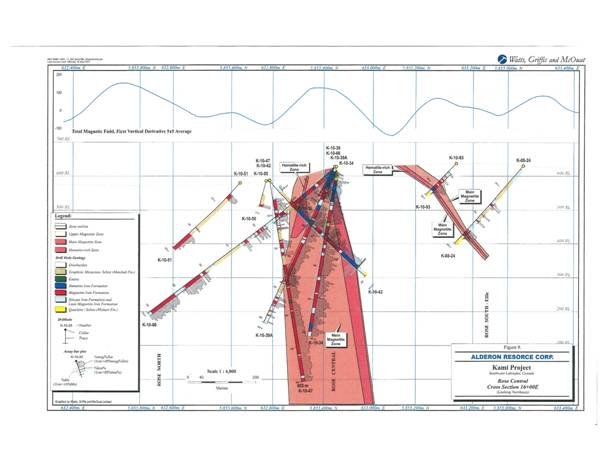
53
likely present and is largely responsible for difficulties in tracing narrow layers of SIF, CSIF (variants) and magnetite and hematite-dominant OIF from drillhole intersection to intersection. Such folding would also, in WGM’s opinion, be the main reason for the interlayering between Menihek-Sokoman-Wishart and even Denault formations, but as aforementioned, the relative importance of possible structural stacking also remains unresolved.
On both cross sections, the aforementioned interzone stratigraphy of the Central Rose Zone is apparent. On Section 16E, a hematite-rich layer is obvious on the structural hanging wall (towards the bottom of drillhole K-10-42 and upper most parts of drillholes K-10-34, K-10-39A and K-10-66). Clearly, core logged as hematite-dominant as completed by Alderon’s exploration crew correlates well with estimated %hmFe calculated from assays. It also can be seen that this hematite dominant mineralization is enriched in manganese. In addition to the prominent hematite-rich layer near the stratigraphic base, there are other layers of hematite-rich OIF throughout the zone alternating with magnetite-rich, lean oxide and SIF and variants but these are less prominent and difficult to trace. This difficulty in tracing individual iron formation variants from hole to hole is probably explained by the fact that these other layers are relatively thin. Because they are thinner, the aforementioned second and third order folding has been more effective in shifting them in position and causing them to thicken and thin. The prevalence of down-dip drilling also makes interpretation more difficult.
In the main body of the Central Rose Zone, as shown on Figures 8 and 9, manganese decreases in concentration from stratigraphic bottom towards the stratigraphic top and hematite also decreases in prevalence as magnetite-rich OIF becomes dominant.
9.2 MILLS LAKE BASIN — MILLS LAKE AND MART LAKE DEPOSITS
The Mills Lake Basin is developed south of the Wabush Basin. It is considered to be a separate basin because the amount and distribution of non-oxide facies iron formation is different from the Wabush Basin package at Rose and Wabush Mine. Drilling on Section 16E shows the two basin assemblages juxtaposed by the Elfie Lake Thrust Fault.
The oldest lithology in the Mills Lake area is the Denault marble. It forms the core of the syncline in outcrop. The contact with the overlying Wishart is transitional to sharp. The Wishart is predominantly quartzite with lenses of micaceous schist, especially towards the upper contact with the Sokoman Formation. The base of the Sokoman is marked by the discontinuous occurrence of a basal silicate iron formation that ranges from nil to 20 m true thickness that Alderon correlates to the Ruth Formation.
54
The lower part of the Sokoman is Fe-carbonate-quartz facies IF with scattered zones of disseminated magnetite. The OIF facies forms two coherent lenses traced over 1,400 m on the Mills Lake Deposit and similarly south of Mart Lake, drilled in 2008 (Seymour et al. 2009). In the Mills Lake Deposit, the lower oxide unit is 30-130 m true thickness and the upper one more diffuse and generally less than 25 m thick. In the Mart Zone, the two oxide layers are less than 30 m thick. They are separated by 20 to 50 m of carbonate facies IF. Above the upper oxide lens, more carbonate facies, greater than 50 m thick, caps the exposed stratigraphy. Alderon reports that the carbonate facies units often show zones of Fe-silicates which they interpret as being derived from a decarbonation process during metamorphism leading to replacement textures indicating that, at least in the Mills Lake area, the origin of Fe-silicates is principally metamorphic and not primary. Disseminated magnetite is a common accessory with the Fe-silicates, but isn’t economically significant at this low level of replacement.
The lower oxide facies at the Mills Lake Deposit, similar to the Rose situation, has three levels or stratigraphic domains: a lower magnetite dominant domain, a specular hematite with rhodonite domain, and an upper magnetite domain. The two magnetite dominant domains show different amounts of manganese in magnetite-OIF with the upper portion being low in manganese and the lower one having moderate manganese enrichment. In the Mart Zone, a similar pattern is apparent, but the two magnetite-dominant OIF domains are more widely separated stratigraphically, are generally thinner, have lower Fe-oxide grade and the hematite member is less well developed.
Figure 10 is Cross Section 36+00S through the Mills Lake Deposit showing the lower and wider lenses of iron formation intersected by three drillholes K-10-95, K-10-96 and K-10-97. The narrower upper lens is intersected only in the top of drillhole K-10-97. Also apparent is the narrow hematite dominant layer which occurs three quarters of the distance towards the top of the lower lens and divides the lower lens into three parts with a magnetic OIF dominant bottom and top. Similar to Rose Central mineralization, the core logging of various facies correlates well with hematitic Fe (%hmFe) calculated from assays. Again, similar to Rose, manganese is significantly higher in hematite-rich OIF than the magnetite-rich OIF.
The Mills Lake Basin outcrop is controlled by an ENE trending asymmetrical open syncline overturned from the SSE with a steeper north limb and shallow-dipping (18°E) east-facing limb. The fold plunges moderately to the ENE. The Mills Lake Basin is fault-bounded. The northern limit of the basin is the Elfie Lake Thrust Fault pushed from the SSE where it rides over the Wabush Basin package. The east limit is an (interpreted) thrust fault from the east that pushes Denault marble over the Sokoman Formation. The SSE fault appears to be the older of the two.
55
Figure 10. Mills Lake Area Cross Section 36+00S
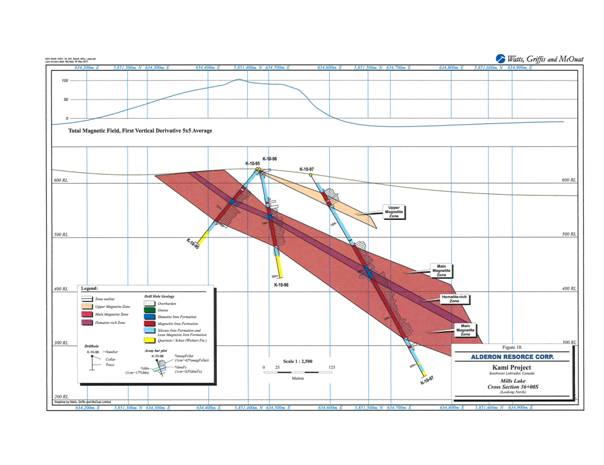
56
The details of the basin dimensions are unknown. It may be relatively small, extending only to Fermont, or it may include the Mont-Wright Deposit and several smaller iron deposits west of Fermont.
9.3 MINERALIZATION BY ROCK TYPE AND SPECIFIC GRAVITY
Tables 8 to 10 provides average composition of rock types derived from drill core sample assays for the Rose Central, Mills Lake and North Rose Deposits. In these tables, the estimates of %Fe in the form of hematite (%hmFe) have been made by WGM using several different methods depending on the type of assay and testwork data available. The precedence for calculation method follows the order in which the methods are described. For all cases the distribution of Fe++ and Fe+++ to magnetite was done assuming the iron in magnetite is 33.3% Fe++ and 66.6% Fe+++. The estimation method also assumes all iron in silicates, carbonates and sulphides is Fe++ and there are no other iron oxide species present in mineralization other than hematite and magnetite. This latter assumption is generally believed to be true for the Rose Central and Mills Lake Deposits, but not true for the Rose North Zone where extensive deep weathering has resulted in extensive limonite, ±goethite and hematite after magnetite. However, to WGM’s knowledge, no detailed mineralogical studies for any of the mineralization have been completed. TFe was determined by XRF in all Head or Crude samples, and for most samples FeO and magFe were determined by Satmagan. Hematitic Fe, where Satmagan and FeO_H assays are available was estimated by subtracting the iron in magnetite (determined from Satmagan) and the iron from the FeO analysis, in excess of what can be attributed to the iron in the magnetite, from %TFe, and then restating this excess iron as hematite, as below:
%hmFe = %TFe - (Fe+++ (computed from Satmagan) + Fe++ (computed from FeO))
In practice, %otherFe was computed as the first step in the calculation and %hmFe = %TFe - (%magFe+%otherFe), where %otherFe is assumed to represent the Fe in sulphides, carbonates and/or silicates is the iron represented by Fe++ from FeO_H that is not in magnetite. Where Fe++ from magnetite exceeds Fe++ from %FeO_H, negative values accrue. These negative values are often small, less than 2% and represent minor, but reasonably acceptable assay inaccuracy in either FeO_H or Satmagan results. These negative values are replaced with zero in the process of completing the calculations. Where the negative values are greater than 2%, significant assay error for either Satmagan determinations or FeO_H are indicated and there are some samples in this category.
57

TABLE 8.
CENTRAL ROSE DEPOSIT - AVERAGE COMPOSITION OF ROCK UNITS FROM 2008 AND 2010 DRILL CORE SAMPLE ASSAYS
RockType | | HBG_GN | | HIF | | HMIF | | HMSIF | | HSIF | | MHIF | | MHSIF | | MIF | | MSIF | | MCIF | | LHIF | | LHMIF | | LMCIF | | LMHIF | | LMHSIF | | LMIF | | LMQCIF | | LMQSIF | | LMSIF | | CIF | | CSIF | | QCIF | | QCSIF | | QSIF | | QV | | SIF | | Qtz Schist
(Wishart) | | Menihek | |
Count_XRF | | 31 | | 336 | | 404 | | 2 | | 4 | | 480 | | 15 | | 1943 | | 164 | | 3 | | 6 | | 2 | | 1 | | 17 | | 5 | | 148 | | 19 | | 3 | | 97 | | 8 | | 45 | | 102 | | 24 | | 109 | | 4 | | 136 | | 46 | | 137 | |
Avg %TFe_H | | 15.13 | | 30.78 | | 31.61 | | 31.65 | | 32.38 | | 30.75 | | 30.22 | | 29.11 | | 31.76 | | 27.07 | | 20.79 | | 21.47 | | 29.24 | | 20.48 | | 26.91 | | 22.34 | | 13.29 | | 24.53 | | 26.51 | | 16.48 | | 14.69 | | 13.59 | | 12.24 | | 17.30 | | 2.86 | | 24.31 | | 8.15 | | 8.85 | |
Avg FeO_H | | 13.34 | | 1.12 | | 5.80 | | 18.89 | | 6.07 | | 9.26 | | 12.50 | | 16.04 | | 22.25 | | | | 14.83 | | 3.03 | | | | 23.11 | | 19.25 | | 17.97 | | | | | | 23.55 | | | | 15.56 | | 16.06 | | 13.16 | | 20.70 | | 2.68 | | 27.24 | | 6.08 | | 8.89 | |
Avg %hmFe | | 1.53 | | 29.24 | | 20.80 | | 11.10 | | 28.03 | | 10.06 | | 5.93 | | 1.42 | | 1.76 | | | | 10.27 | | 11.90 | | | | 5.23 | | 6.32 | | 1.39 | | | | | | 1.36 | | 7.70 | | 1.35 | | 0.60 | | 1.39 | | 0.97 | | 0.00 | | 1.35 | | 2.35 | | 0.48 | |
Avg %magFeSat | | 2.25 | | 0.83 | | 9.91 | | 8.75 | | 0.78 | | 19.77 | | 18.77 | | 23.68 | | 18.10 | | 10.23 | | 0.98 | | 8.60 | | 7.10 | | 5.82 | | 6.96 | | 9.76 | | 4.18 | | 2.90 | | 8.59 | | 2.19 | | 1.75 | | 1.81 | | 0.92 | | 1.99 | | 2.03 | | 2.24 | | 2.23 | | 1.46 | |
Avg %SiO2_H | | 47.42 | | 42.17 | | 43.73 | | 46.95 | | 32.90 | | 44.82 | | 44.77 | | 46.04 | | 42.38 | | 48.57 | | 55.63 | | 57.55 | | 26.90 | | 56.39 | | 50.58 | | 52.68 | | 65.97 | | 45.10 | | 45.66 | | 48.99 | | 54.70 | | 55.26 | | 50.84 | | 55.49 | | 93.18 | | 46.57 | | 70.45 | | 57.85 | |
Avg %Al2O3_H | | 11.35 | | 0.18 | | 0.20 | | 0.89 | | 0.12 | | 0.27 | | 0.22 | | 0.35 | | 0.29 | | 0.84 | | 0.80 | | 0.28 | | 0.29 | | 0.26 | | 0.46 | | 0.59 | | 0.17 | | 0.13 | | 0.50 | | 1.79 | | 1.59 | | 1.32 | | 12.35 | | 1.17 | | 0.61 | | 1.37 | | 4.18 | | 10.72 | |
Avg %TiO2_H | | 1.33 | | 0.01 | | 0.01 | | 0.08 | | 0.01 | | 0.03 | | 0.02 | | 0.03 | | 0.03 | | 0.05 | | 0.04 | | 0.01 | | 0.01 | | 0.02 | | 0.03 | | 0.04 | | 0.01 | | 0.01 | | 0.05 | | 0.12 | | 0.08 | | 0.06 | | 1.32 | | 0.08 | | 0.02 | | 0.16 | | 0.18 | | 0.62 | |
Avg %MgO_H | | 5.25 | | 2.18 | | 1.70 | | 3.83 | | 2.51 | | 1.82 | | 2.01 | | 2.46 | | 2.32 | | 2.95 | | 1.06 | | 2.70 | | 5.87 | | 1.72 | | 3.00 | | 3.51 | | 2.53 | | 4.97 | | 3.90 | | 4.97 | | 4.38 | | 4.42 | | 4.68 | | 4.07 | | 0.44 | | 4.75 | | 2.29 | | 3.19 | |
Avg %CaO_H | | 5.06 | | 2.58 | | 2.64 | | 1.19 | | 3.26 | | 2.96 | | 3.29 | | 3.52 | | 3.47 | | 3.82 | | 0.73 | | 1.84 | | 4.06 | | 2.75 | | 2.05 | | 4.00 | | 4.43 | | 6.10 | | 4.05 | | 7.43 | | 6.85 | | 6.97 | | 4.51 | | 5.51 | | 0.38 | | 4.19 | | 3.24 | | 2.54 | |
Avg %MnH | | 0.57 | | 3.50 | | 1.77 | | 1.56 | | 7.16 | | 1.55 | | 1.55 | | 0.96 | | 1.16 | | 0.25 | | 1.26 | | 2.14 | | 2.97 | | 3.61 | | 1.05 | | 0.63 | | 0.83 | | 0.10 | | 1.27 | | 0.70 | | 0.43 | | 0.59 | | 0.31 | | 0.58 | | 0.29 | | 1.22 | | 0.60 | | 0.17 | |
Avg %Na2O_H | | 1.40 | | 0.34 | | 0.04 | | 0.05 | | 0.55 | | 0.06 | | 0.02 | | 0.07 | | 0.05 | | 0.03 | | 0.04 | | 0.03 | | 0.04 | | 0.06 | | 0.03 | | 0.06 | | 0.03 | | 0.03 | | 0.04 | | 0.10 | | 0.12 | | 0.18 | | 1.51 | | 0.12 | | 0.03 | | 0.10 | | 0.21 | | 1.12 | |
Avg %K2O_H | | 1.38 | | 0.06 | | 0.03 | | 0.08 | | 0.01 | | 0.04 | | 0.03 | | 0.05 | | 0.02 | | 0.17 | | 0.14 | | 0.02 | | 0.01 | | 0.06 | | 0.04 | | 0.12 | | 0.01 | | 0.01 | | 0.09 | | 0.58 | | 0.34 | | 0.31 | | 1.76 | | 0.23 | | 0.05 | | 0.20 | | 1.65 | | 2.78 | |
Avg %P2O5_H | | 0.27 | | 0.02 | | 0.02 | | 0.07 | | 0.03 | | 0.03 | | 0.03 | | 0.04 | | 0.04 | | 0.05 | | 0.11 | | 0.03 | | 0.08 | | 0.02 | | 0.03 | | 0.05 | | 0.01 | | 0.02 | | 0.06 | | 0.08 | | 0.06 | | 0.05 | | 0.29 | | 0.05 | | 0.02 | | 0.09 | | 0.11 | | 0.23 | |
AvgOfLOI | | 3.84 | | 3.65 | | 4.06 | | -0.52 | | 4.40 | | 3.93 | | 4.14 | | 4.46 | | 4.47 | | 4.22 | | 9.98 | | 3.75 | | 17.40 | | 4.58 | | 3.68 | | 5.99 | | 6.83 | | 9.06 | | 5.90 | | 11.09 | | 9.33 | | 10.54 | | 4.21 | | 7.39 | | 0.92 | | 5.78 | | 4.59 | | 6.88 | |
CountOfS_ | | 0.00 | | 0.00 | | 0.00 | | 0.00 | | 0.00 | | 0.00 | | 0.00 | | 14.00 | | 0.00 | | 0.00 | | 0.00 | | 0.00 | | 0.00 | | 0.00 | | 0.00 | | 0.00 | | 0.00 | | 0.00 | | 0.00 | | 0.00 | | 0.00 | | 0.00 | | 0.00 | | 0.00 | | 0.00 | | 0.00 | | 0.00 | | 0.00 | |
AvgOfS_ | | | | | | | | | | | | | | | | 1.08 | | | | | | | | | | | | | | | | | | | | | | | | | | | | | | | | | | | | | | | | | |
CountOfSG_Pyc | | 0 | | 2 | | 0 | | 0 | | 0 | | 0 | | 0 | | 12 | | 2 | | 0 | | 0 | | 0 | | 0 | | 0 | | 0 | | 1 | | 0 | | 0 | | 1 | | 2 | | 1 | | 4 | | 0 | | 0 | | 0 | | 3 | | 1 | | 4 | |
AvgOfSG_Pyc | | | | 3.79 | | | | | | | | | | | | 3.53 | | 3.62 | | | | | | | | | | | | | | 3.04 | | | | | | 3.56 | | 3.22 | | 2.94 | | 3.33 | | | | | | | | 3.63 | | 3.46 | | 2.91 | |
Total Samples assayed by XRF represented in this table is 4292; 1 sample not shown in table coded as Overburden.
Assay values below detection limit have been adjusted to 0.5 x DL before averages calculated;
Codes for some rock types such as Menihek and Wishart are grouped;
Averages reported here for magFe are calculated only from Satmagan method. Some samples also had Davis Tube tests;
hmFe (hematitic Fe) estimated using TFe, Satmagan and FeO and Davis Tube results as described in text of report and estimates are based on certain assumptions;
Shaded cells generally represent mineralization that has sufficient oxide Fe components to be of economic importance.
58

TABLE 9.
MILLS LAKE DEPOSIT - AVERAGE COMPOSITION OF ROCK UNITS FROM 2008 AND 2010 DRILL CORE SAMPLE ASSAYS
RockType | | HIF | | HMIF | | HSIF | | MHIF | | MIF | | MSIF | | LMIF | | LMSIF | | CSIF | | QCIF | | QCSIF | | QSIF | | SIF | | Qtz Schist
(Wishart) | | Carbonate
(Denault) | |
Count_XRF | | 42 | | 16 | | 4 | | 115 | | 393 | | 1 | | 14 | | 1 | | 10 | | 56 | | 4 | | 50 | | 42 | | 10 | | 10 | |
Avg %TFe_H | | 33.34 | | 34.80 | | 33.75 | | 30.14 | | 29.91 | | 38.19 | | 26.30 | | 28.89 | | 19.72 | | 20.41 | | 7.04 | | 24.20 | | 25.72 | | 5.47 | | 2.31 | |
Avg FeO_H | | 1.37 | | 4.44 | | 2.34 | | 9.46 | | 15.77 | | 32.69 | | 22.59 | | 27.48 | | 24.41 | | 24.49 | | 6.56 | | 28.74 | | 30.20 | | 4.44 | | 3.52 | |
Avg %hmFe | | 31.79 | | 23.76 | | 29.83 | | 9.54 | | 0.90 | | 0.30 | | 0.69 | | 0.20 | | 0.01 | | 0.11 | | 0.75 | | 0.16 | | 0.26 | | 9.13 | | 0.00 | |
Avg %magFeSat | | 0.74 | | 10.61 | | 3.15 | | 19.81 | | 25.43 | | 18.75 | | 12.12 | | 10.90 | | 1.34 | | 2.10 | | 1.80 | | 2.96 | | 3.23 | | 0.30 | | 0.30 | |
Avg %SiO2_H | | 35.46 | | 37.42 | | 35.80 | | 48.04 | | 46.38 | | 39.00 | | 43.94 | | 37.60 | | 37.77 | | 42.57 | | 46.30 | | 43.22 | | 43.61 | | 31.67 | | 22.47 | |
Avg %Al2O3_H | | 0.45 | | 0.44 | | 0.35 | | 0.27 | | 0.40 | | 0.10 | | 0.67 | | 0.36 | | 0.24 | | 0.33 | | 11.85 | | 0.35 | | 0.91 | | 5.23 | | 1.44 | |
Avg %TiO2_H | | 0.03 | | 0.02 | | 0.01 | | 0.02 | | 0.02 | | 0.01 | | 0.03 | | 0.03 | | 0.02 | | 0.02 | | 0.58 | | 0.02 | | 0.07 | | 0.21 | | 0.06 | |
Avg %MgO_H | | 1.99 | | 1.81 | | 1.40 | | 3.19 | | 3.18 | | 2.42 | | 3.99 | | 4.63 | | 6.50 | | 5.66 | | 8.09 | | 5.32 | | 4.99 | | 10.18 | | 13.73 | |
Avg %CaO_H | | 2.06 | | 1.81 | | 1.49 | | 2.00 | | 2.75 | | 3.07 | | 4.90 | | 5.46 | | 10.10 | | 7.80 | | 7.39 | | 6.12 | | 4.51 | | 17.06 | | 23.74 | |
Avg %Mn_H | | 5.10 | | 3.10 | | 5.42 | | 0.37 | | 0.65 | | 0.26 | | 0.68 | | 1.20 | | 0.71 | | 0.83 | | 0.19 | | 0.73 | | 1.07 | | 0.29 | | 0.14 | |
Avg %Na2O_H | | 1.19 | | 0.30 | | 0.80 | | 0.14 | | 0.12 | | 0.02 | | 0.14 | | 0.03 | | 0.01 | | 0.03 | | 3.91 | | 0.06 | | 0.03 | | 0.19 | | 0.15 | |
Avg %K2O_H | | 0.08 | | 0.08 | | 0.07 | | 0.06 | | 0.10 | | 0.01 | | 0.10 | | 0.06 | | 0.04 | | 0.04 | | 1.85 | | 0.05 | | 0.16 | | 2.19 | | 0.52 | |
Avg %P2O5_H | | 0.04 | | 0.06 | | 0.04 | | 0.03 | | 0.04 | | 0.06 | | 0.05 | | 0.05 | | 0.04 | | 0.04 | | 0.19 | | 0.04 | | 0.09 | | 0.11 | | 0.13 | |
Avg %LOI | | 4.12 | | 4.12 | | 4.82 | | 2.66 | | 3.32 | | 0.31 | | 7.74 | | 9.15 | | 15.79 | | 13.00 | | 9.00 | | 9.27 | | 7.10 | | 24.34 | | 33.58 | |
Count %S_H | | 0 | | 0 | | 0 | | 0 | | 0 | | 0 | | 0 | | 0 | | 0 | | 0 | | 0 | | 0 | | 0 | | 0 | | 0 | |
Avg %S_H | | | | | | | | | | | | | | | | | | | | | | | | | | | | | | | |
Count %SG_Pyc | | 0 | | 0 | | 0 | | 0 | | 0 | | 0 | | 0 | | 0 | | 0 | | 0 | | 0 | | 0 | | 0 | | 0 | | 0 | |
Avg SG_Pyc | | | | | | | | | | | | | | | | | | | | | | | | | | | | | | | |
Total Samples assayed by XRF represented in this table is 768;
Codes for some rock types such as Wishart are grouped;
Averages reported here for magFe are calculated only from Satmagan method. Some samples also had Davis Tube tests.
Shaded cells generally represent mineralization that has sufficient oxide Fe components to be of economic importance.
59

TABLE 10.
NORTH ROSE ZONE - AVERAGE COMPOSITION OF ROCK UNITS FROM 2008 AND 2010 DRILL CORE SAMPLE ASSAYS
RockType | | HBG_GN | | HIF | | HMIF | | MHIF | | MIF | | MCIF | | MSIF | | LHIF | | LMIF | | LMQCIF | | LMQSIF | | LMSIF | | QCIF | | QCSIF | | QSIF | | SIF | | CIF | | CSIF | | Menihek | |
Count_XRF | | 1 | | 75 | | 71 | | 43 | | 68 | | 5 | | 1 | | 1 | | 4 | | 3 | | 4 | | 2 | | 17 | | 1 | | 7 | | 2 | | 5 | | 1 | | 10 | |
Avg %TFe_H | | 20.63 | | 33.69 | | 32.86 | | 31.48 | | 26.59 | | 23.98 | | 27.49 | | 9.51 | | 34.34 | | 22.01 | | 23.97 | | 27.59 | | 17.03 | | 7.20 | | 21.71 | | 21.47 | | 17.74 | | 16.79 | | 5.82 | |
Avg FeO_H | | | | 0.53 | | 3.44 | | 9.18 | | 19.93 | | | | | | 0.10 | | 26.23 | | | | | | | | 19.05 | | | | | | | | | | 13.58 | | 7.18 | |
Avg %hmFe | | | | 32.12 | | 23.84 | | 11.79 | | 0.80 | | | | | | 8.90 | | 0.90 | | | | | | | | 1.63 | | 0.00 | | | | | | | | 5.20 | | 1.30 | |
Avg %magFeSat | | 1.00 | | 1.47 | | 8.88 | | 18.31 | | 20.82 | | 10.98 | | 6.80 | | 0.60 | | 5.00 | | 3.50 | | 1.43 | | 2.55 | | 1.69 | | 0.60 | | 0.38 | | 1.40 | | 0.49 | | 1.50 | | 0.30 | |
Avg %SiO2_H | | 52.90 | | 48.93 | | 50.20 | | 49.65 | | 48.39 | | 46.72 | | 49.90 | | 85.30 | | 40.33 | | 40.57 | | 47.33 | | 51.25 | | 53.19 | | 60.90 | | 45.46 | | 47.65 | | 45.96 | | 54.10 | | 62.37 | |
Avg %Al2O3_H | | 5.57 | | 0.12 | | 0.17 | | 0.22 | | 0.42 | | 0.27 | | 1.71 | | 0.17 | | 1.33 | | 0.19 | | 0.27 | | 1.15 | | 0.47 | | 13.20 | | 0.14 | | 0.09 | | 0.21 | | 3.58 | | 12.79 | |
Avg %TiO2_H | | 0.27 | | 0.01 | | 0.01 | | 0.01 | | 0.02 | | 0.01 | | 0.21 | | 0.01 | | 0.14 | | 0.01 | | 0.01 | | 0.08 | | 0.02 | | 0.56 | | 0.01 | | 0.01 | | 0.01 | | 0.20 | | 0.66 | |
Avg %MgO_H | | 2.78 | | 0.06 | | 0.43 | | 1.04 | | 2.96 | | 4.08 | | 4.06 | | 0.03 | | 0.40 | | 5.72 | | 5.15 | | 3.38 | | 3.87 | | 2.57 | | 5.88 | | 5.42 | | 5.34 | | 2.62 | | 2.28 | |
Avg %CaO_H | | 2.61 | | 0.03 | | 0.23 | | 0.97 | | 3.55 | | 4.77 | | 3.58 | | 0.01 | | 0.18 | | 7.09 | | 5.24 | | 2.57 | | 5.86 | | 2.03 | | 6.41 | | 5.74 | | 7.61 | | 3.41 | | 1.51 | |
Avg %Mn_H | | 0.62 | | 1.02 | | 0.73 | | 0.62 | | 0.58 | | 0.64 | | 0.67 | | 0.65 | | 0.75 | | 0.43 | | 0.20 | | 0.79 | | 0.26 | | 0.22 | | 0.23 | | 0.32 | | 0.35 | | 0.33 | | 0.11 | |
Avg %Na2O_H | | 0.02 | | 0.05 | | 0.02 | | 0.04 | | 0.07 | | 0.03 | | 0.09 | | 0.02 | | 0.03 | | 0.03 | | 0.01 | | 0.02 | | 0.04 | | 1.18 | | 0.02 | | 0.01 | | 0.01 | | 0.26 | | 1.44 | |
Avg %K2O_H | | 0.81 | | 0.02 | | 0.01 | | 0.02 | | 0.05 | | 0.02 | | 0.01 | | 0.01 | | 0.10 | | 0.01 | | 0.03 | | 0.11 | | 0.08 | | 3.12 | | 0.01 | | 0.01 | | 0.02 | | 1.04 | | 3.30 | |
Avg %P2O5_H | | 0.17 | | 0.04 | | 0.02 | | 0.02 | | 0.03 | | 0.01 | | 0.08 | | 0.02 | | 0.11 | | 0.01 | | 0.02 | | 0.08 | | 0.02 | | 0.19 | | 0.01 | | 0.01 | | 0.01 | | 0.10 | | 0.24 | |
Avg %LOI | | 2.76 | | 1.33 | | 1.02 | | 2.08 | | 5.54 | | 9.15 | | 0.17 | | 0.81 | | 7.62 | | 14.50 | | 6.71 | | 0.04 | | 11.66 | | 4.33 | | 10.84 | | 9.85 | | 14.76 | | 9.11 | | 5.84 | |
Count %S_H | | 0.00 | | 0.00 | | 0.00 | | 0.00 | | 0.00 | | 0.00 | | 0.00 | | 0.00 | | 0.00 | | 0.00 | | 0.00 | | 0.00 | | 0.00 | | 0.00 | | 0.00 | | 0.00 | | 0.00 | | 0.00 | | 0.00 | |
Avg %S_H | | | | | | | | | | | | | | | | | | | | | | | | | | | | | | | | | | | | | | | |
Count %SG_Pyc | | 0 | | 0 | | 0 | | 0 | | 0 | | 0 | | 0 | | 0 | | 0 | | 0 | | 0 | | 0 | | 0 | | 0 | | 0 | | 0 | | 0 | | 0 | | 0 | |
Total Samples assayed by XRF represented in this table is 322; 1 sample not shown in table is coded as Overburden..
Codes for some rock types such as Menihek are grouped;
Averages reported here for magFe are calculated only from Satmagan method. Some samples also had Davis Tube tests;
Considerable deep weathering of North Rose Zone of Mineralization and lost core. Assay averages therefore may not be representative
60

Not all 2010 samples of OIF containing significant hematite were assayed for FeO_H or had magFe determined by Satmagan. The samples that did not have FeO_H and/or Satmagan testwork often had Davis Tube tests completed. Where Davis Tube tests were completed, the tails from these Davis Tube tests (“DTT”) were generally assayed for FeO.
Where Davis Tube weight recoveries were available for magnetic concentrates and Davis Tube tails had been assayed for FeO, then %hmFe was estimated as follows:
%hmFe = %TFe-(magFeDT+%otherFeDT), where %otherFeDT = weight of Davis Tube tail/Davis Tube feed weight x %Fe++_DTT
Some 2010 samples had Davis Tube tests completed, but there was insufficient magnetic concentrate for assay by XRF. These samples were mostly HIF and variants, or SIF or variants. For these samples no %DTWR could be calculated and consequently no %magFe from Davis Tube could be calculated. Some of these samples did however have FeO on DTT completed. Where Satmagan determinations of %magFe and FeO on DTT were available, but no %magFe from DT, WGM estimated %hmFe as follows:
%hmFe = %TFe-(magFeSat - %otherFeDT).
Figure 11 is a plot of all samples, 2,837 in total, that had both Satmagan determinations of %magFe and sufficient assay data to allow for %magFe to be computed from Davis Tube results. These samples are mostly OIF, but also include carbonate and silicate IF and even amphibolite gneiss (HBG_GN). The results show that both methods for computing magFe produce very similar results with no significant bias. Clearly sample pulverization, 80% passing 70 microns, has resulted in a high degree of magnetite liberation. Hence, the latter two methods for estimation of %hmFe, where the only difference is whether magnetic Fe is computed from Satmagan or Davis Tube results, should in general produce very similar results.
For some OIF samples, %hmFe cannot be calculated because the necessary assay data is not available. Most of these samples were logged as low in hematite, i.e., magnetite-rich OIF or SIF, and the requisite assays to allow for the calculation of %hmFe were not completed because hematite contents were very low and not significant. Many samples of carbonate and silicate IF were also not assayed completely because they were judged as containing insignificant magnetite or hematite.
61
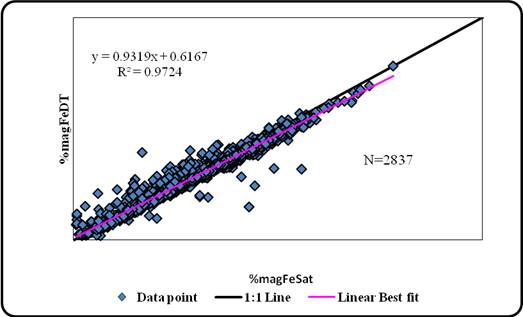
Figure 11. Comparison of %magFe determined from Satmagan vs. determined by Davis Tube
WGM believes it would be useful to be able to compare hematitic Fe estimates computed from assays completed on Crude or Heads, i.e. FeO_H, versus those computed on the basis of FeO data from DTT and Davis Tube product weight distributions. There are few sample results currently available to allow this comparison to be performed and where the necessary results are available, the samples are all very low in hematite content so inference from the results are not very meaningful. WGM has recommended that Alderon proceed with having the necessary assays and testwork completed on a selection of samples so a meaningful comparison of the methods for estimating hematitic iron can be compared. WGM understands that this assay and testwork is in progress.
For OIF, the sums of %hmFe and %magFe approach %TFe (see Table 10). The difference between the sum of %hmFe and %magFe and %TFe for OIF samples can be due to minor amounts of iron in silicates and or carbonates, i.e. “otherFe” or also due to the assays for individual iron components (%TFe, %FeO_H or magFe from Satmagan) not being absolutely accurate. The estimates for %hmFe generally appear to be accurate ±2%. For silicate and carbonate IF lithologies the sum of %hmFe and %magFe is often significantly less than %TFe. The “missing iron” is probably mostly in grunerite, which on the Property is a common iron silicate in IF and/or iron carbonates. Not much of the “otherFe” is likely in sulphides because sulphur levels in mineralization are generally low.
62
There are a small percentage of samples that from the assay data appear to be misclassified in terms of lithology code. This misclassification may be due to errors in logging or sample sequencing, i.e., sample mix-up problems in the field or in the lab, or could have resulted from acceptable logging misclassification. Acceptable misclassification by lithology code can occur due to samples containing more than one rock type. This can occur and be acceptable, because of the minimum requisite sample length constraints.
The results in Tables 8, 9 and 10 shows that logging is generally in agreement with rock composition. Samples logged and coded as magnetite-rich are indicated by assay results to contain more magnetic Fe than samples logged as hematite-rich or carbonate and silicate IF. Samples coded as hematite-rich contain more hematitic Fe. At both Rose and Mills, hematite-rich samples contain higher levels of manganese. Carbonate IF samples are generally higher in CaO. Mafic intrusive rocks (HBG-GN) contain higher levels of TiO2, Al2O3 and Mg than IF. Quartz Schists (which WGM has regrouped from Alderon individual lithology field codes to facilitate simplification for reporting in Tables 9 to 10) which generally represent Wishart Formation are high in SiO2 and Al2O3, as are Menihek Formation samples. Denault Formation samples are high in CaO and MgO as this rock is marble or dolomitic marble.
Over 3,000 Davis Tube tests were completed on 2010 drilling program samples (see Section 13). Most of these were completed on Rose Central with 2,929 tests completed. On Mills Lake mineralization 167 tests were completed. Davis Tube magnetic concentrates were generally assayed for major elements by XRF. For some samples Davis Tube tails were analysed for FeO. For a proportion of these samples, particularly hematite-rich samples no XRF analysis on products was possible because the magnetic concentrate produced was too small non-existent.
Preliminary results for the Davis Tube tests results for the Rose Central and Mills Lake Deposits are summarized in Tables 11 and 12. As expected high iron recoveries were achieved for magnetite-rich samples and lower recoveries for hematite-rich samples. Iron concentrations in magnetic concentrates are generally high at 67 to 70% and silica values generally range from 2 to 4%. Manganese in magnetic concentrates is weakly to moderately correlated with manganese in Head samples but patterns are irregular.
63
TABLE 11.
CENTRAL ROSE DEPOSIT - AVERAGES FOR DAVIS TUBE TEST RESULTS BY ROCK TYPE
RockType | | HBG_GN | | MHIF | | MHSIF | | MIF | | MSIF | | MCIF | | HIF | | HMIF | | HMSIF | | HSIF | | LHMIF | | LMHIF | | LMHSIF | |
Count of Samples | | 2 | | 389 | | 4 | | 1464 | | 108 | | 2 | | 34 | | 353 | | 2 | | 1 | | 2 | | 16 | | 5 | |
Avg %Fe_H | | 21.62 | | 30.59 | | 32.67 | | 29.28 | | 32.28 | | 27.00 | | 29.51 | | 31.73 | | 31.66 | | 26.16 | | 21.48 | | 20.47 | | 26.92 | |
Avg %MagFeSat | | 7.70 | | 19.55 | | 13.28 | | 23.76 | | 18.46 | | 12.15 | | 4.51 | | 10.57 | | 8.75 | | 2.50 | | 8.60 | | 5.69 | | 6.96 | |
Avg %SiO2_H | | 47.00 | | 45.54 | | 41.58 | | 45.81 | | 41.63 | | 48.80 | | 48.34 | | 44.34 | | 46.95 | | 47.10 | | 57.55 | | 56.60 | | 50.58 | |
Avg %Mn_H | | 0.62 | | 1.50 | | 1.13 | | 1.00 | | 1.17 | | 0.08 | | 1.01 | | 1.67 | | 1.56 | | 1.56 | | 2.14 | | 3.80 | | 1.05 | |
Avg %P2O5_H | | 0.09 | | 0.03 | | 0.04 | | 0.03 | | 0.04 | | 0.03 | | 0.02 | | 0.02 | | 0.07 | | 0.02 | | 0.03 | | 0.02 | | 0.03 | |
Avg %FeO_H | | | | 3.33 | | 25.15 | | 8.14 | | 20.45 | | | | 1.48 | | 1.63 | | | | | | 2.33 | | 9.39 | | 26.89 | |
Avg %DTWR | | 10.73 | | 27.13 | | 19.35 | | 32.68 | | 25.72 | | 16.58 | | 6.27 | | 15.26 | | 11.21 | | 3.09 | | 11.62 | | 7.96 | | 12.57 | |
Avg %Fe_DTC | | 68.83 | | 68.98 | | 68.32 | | 69.53 | | 68.35 | | 68.90 | | 69.81 | | 68.59 | | 69.11 | | 67.57 | | 68.62 | | 65.05 | | 65.96 | |
Avg %SiO2_DTC | | 2.64 | | 2.23 | | 3.76 | | 2.19 | | 3.51 | | 3.47 | | 1.98 | | 2.53 | | 3.04 | | 4.49 | | 2.80 | | 5.40 | | 6.49 | |
Avg %Mn_DTC | | 0.12 | | 1.03 | | 0.20 | | 0.37 | | 0.21 | | 0.03 | | 0.64 | | 1.23 | | 0.16 | | 0.23 | | 1.27 | | 2.68 | | 0.18 | |
Avg %P2O5_DTC | | 0.01 | | 0.01 | | 0.01 | | 0.01 | | 0.01 | | 0.01 | | 0.01 | | 0.01 | | 0.01 | | 0.01 | | 0.01 | | 0.01 | | 0.02 | |
Avg %MagFe_DT | | 7.40 | | 18.76 | | 13.30 | | 22.73 | | 17.63 | | 11.46 | | 4.51 | | 10.51 | | 7.73 | | 2.09 | | 8.06 | | 5.14 | | 8.29 | |
Avg %FeRec’y | | 32.82 | | 61.08 | | 41.30 | | 76.86 | | 54.08 | | 42.52 | | 16.70 | | 33.58 | | 24.36 | | 7.99 | | 34.07 | | 30.65 | | 31.32 | |
| | LMIF | | LMQCIF | | LMSIF | | CIF | | CSIF | | QCIF | | QCSIF | | QSIF | | QV | | SIF | | Qtz Schist
(Wishart) | | Menihek | |
Count of Samples | | 88 | | 1 | | 58 | | 1 | | 7 | | 15 | | 1 | | 6 | | 1 | | 21 | | 9 | | 5 | |
Avg %Fe_H | | 24.13 | | 18.05 | | 27.88 | | 20.15 | | 16.02 | | 11.26 | | 7.21 | | 22.69 | | 5.22 | | 27.31 | | 13.55 | | 21.64 | |
Avg %MagFeSat | | 11.83 | | 2.70 | | 9.97 | | 12.50 | | 5.33 | | 4.90 | | 0.60 | | 4.73 | | 5.30 | | 4.40 | | 6.80 | | 13.68 | |
Avg %SiO2_H | | 50.73 | | 39.70 | | 44.08 | | 56.60 | | 61.13 | | 63.55 | | 60.90 | | 46.05 | | 86.80 | | 45.49 | | 69.20 | | 53.52 | |
Avg %Mn_H | | 0.71 | | 0.49 | | 1.19 | | 1.67 | | 0.89 | | 1.32 | | 0.22 | | 1.11 | | 0.90 | | 1.32 | | 1.59 | | 0.51 | |
Avg %P2O5_H | | 0.06 | | 0.01 | | 0.04 | | 0.02 | | 0.03 | | 0.03 | | 0.19 | | 0.03 | | 0.01 | | 0.07 | | 0.02 | | 0.06 | |
Avg %FeO_H | | 17.02 | | | | 24.54 | | 1.63 | | 22.98 | | 7.66 | | 8.62 | | 25.68 | | 1.54 | | 32.88 | | 5.22 | | | |
Avg %DTWR | | 16.97 | | 3.61 | | 14.12 | | 16.35 | | 6.56 | | 7.69 | | 0.70 | | 6.13 | | 6.25 | | 6.37 | | 9.50 | | 19.19 | |
Avg %Fe_DTC | | 67.98 | | 61.90 | | 67.20 | | 69.94 | | 68.32 | | 67.90 | | | | 67.36 | | 71.34 | | 64.69 | | 65.80 | | 65.69 | |
Avg %SiO2_DTC | | 3.75 | | 8.24 | | 4.65 | | 1.20 | | 3.96 | | 4.15 | | | | 3.94 | | 1.61 | | 6.68 | | 5.88 | | 4.41 | |
Avg %Mn_DTC | | 0.26 | | 0.14 | | 0.18 | | 0.88 | | 0.15 | | 0.47 | | | | 0.16 | | 0.49 | | 0.22 | | 1.06 | | 0.19 | |
Avg %P2O5_DTC | | 0.02 | | 0.01 | | 0.01 | | 0.01 | | 0.01 | | 0.01 | | 0.19 | | 0.01 | | 0.01 | | 0.05 | | 0.01 | | 0.03 | |
Avg %MagFe_DT | | 11.61 | | 2.24 | | 9.55 | | 11.44 | | 4.47 | | 5.57 | | | | 4.15 | | 4.46 | | 4.13 | | 6.24 | | 13.18 | |
Avg %FeRec’y | | 48.86 | | 12.40 | | 34.14 | | 56.75 | | 29.51 | | 58.34 | | | | 18.68 | | 85.38 | | 15.24 | | 54.54 | | 55.01 | |
Shaded cells generally represent mineralization that has sufficient oxide Fe components to be of economic importance but details will vary
TABLE 12.
MILLS LAKE DEPOSIT - AVERAGES FOR DAVIS TUBE TEST RESULTS BY ROCK TYPE
RockType | | MIF | | MHIF | | HMIF | | LMIF | | HSIF | | SIF | | QSIF | |
Count of Samples | | 117 | | 35 | | 3 | | 5 | | 1 | | 4 | | 2 | |
Avg %Fe_H | | 30.52 | | 31.12 | | 36.54 | | 26.62 | | 33.37 | | 28.14 | | 27.84 | |
Avg %MagFeSat | | 26.32 | | 22.19 | | 13.77 | | 10.76 | | 9.60 | | 5.03 | | 5.45 | |
Avg %SiO2_H | | 47.19 | | 46.97 | | 31.30 | | 46.22 | | 40.80 | | 41.43 | | 34.70 | |
Avg %Mn_H | | 0.55 | | 0.30 | | 7.42 | | 0.60 | | 2.35 | | 0.84 | | 0.61 | |
Avg %P2O5_H | | 0.04 | | 0.03 | | 0.03 | | 0.05 | | 0.04 | | 0.09 | | 0.02 | |
Avg %FeO_H | | | | | | | | | | | | | | | |
Avg %DTWR | | 37.47 | | 31.62 | | 18.86 | | 14.44 | | 12.19 | | 7.26 | | 6.92 | |
Avg %Fe_DTC | | 68.19 | | 68.33 | | 66.10 | | 67.87 | | 68.34 | | 63.68 | | 68.51 | |
Avg %SiO2_DTC | | 4.54 | | 4.51 | | 1.67 | | 4.75 | | 1.02 | | 7.50 | | 3.22 | |
Avg %Mn_DTC | | 0.24 | | 0.19 | | 5.08 | | 0.10 | | 3.20 | | 0.18 | | 0.08 | |
Avg %P2O5_DTC | | 0.01 | | 0.01 | | 0.01 | | 0.01 | | 0.01 | | 0.07 | | 0.01 | |
Avg %MagFe_DT | | 25.50 | | 21.59 | | 12.56 | | 9.81 | | 8.33 | | 4.64 | | 4.75 | |
Avg %FeRec’y | | 83.15 | | 69.02 | | 33.27 | | 38.06 | | 24.96 | | 16.23 | | 17.03 | |
Shaded cells generally represent mineralization that has sufficient oxide Fe components to be of economic importance but details will vary
64
For its 2010 program, Alderon completed bulk density determination on 175, 0.1 m length half split core samples for the purposes of calibrating the down-hole density probe data, (see Section 13). The samples tested spanned a number of rock types. The bulk densities were determined at SGS-Lakefield using the weigh-in-water/weigh-in-air method. These 0.1 m samples represent the upper 0.1 m intervals of routine assay samples that are generally 3 m to 4 m long. There are no XRF WR assays for these specific 0.1 m samples as only the routine sample intervals, of which the 0.1 m samples were a part, were assayed. Figure 12 shows that bulk densities for these 0.1 m samples correlate poorly with the %TFe from assays on the longer interval routine samples of which they were a part. This poor correlation is not unexpected by WGM since mineralization is rarely consistent over entire sample intervals. Note: Although there were 175 wet bulk density determinations, more than one result for the 0.1 m samples can match with a routine sample interval.
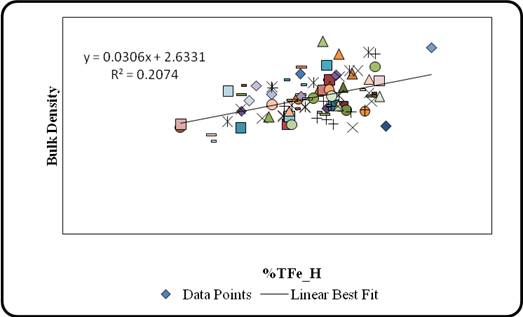
Figure 12. Bulk density for 0.1 m samples intervals vs. %TFe on routine samples
Alderon also completed SG determinations on the pulps from 33 routine samples at SGS-Lakefield using the gas comparison pycnometer method. The SG results for these samples versus XRF WR %TFe results are shown on Figure 13. The plot also shows the results of DGI Geosciences Inc. (“DGI”) down-hole density results (see Section 11.3.2). This plot shows that SG by pycnometer results correlate strongly with %TFe. It also illustrates that probe determined density averaged over the same sample intervals similarly correlate strongly with both %TFe from assay and with pycnometer determined density.
65
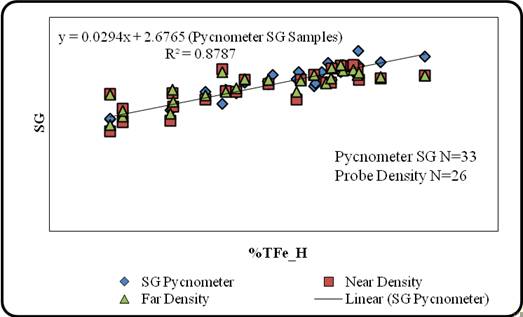
Figure 13. SG by gas comparison pycnometer on pulps vs. %TFe on routine assay samples
WGM’s experience is that there is invariably a strong positive correlation between SG and/or density and %TFe assays for fresh unweathered / unleached OIF. This occurs because OIF generally has a very simple mineralogy consisting predominantly of hematite and/or magnetite and quartz. Because the iron oxide component is much denser than the quartz and the OIF mineralogy is simple, the Fe concentration of a sample provides an excellent measure of the amount of magnetite and/or hematite present in the sample and hence the density of the sample. Invariably, the relationship between %TFe and SG is much the same from one deposit to the next. Pycnometer determined SG on pulps is not the ideal method for proving the SG to %TFe relationship because any porosity in samples could lead to misleading results. However, where bulk density and pulp density or SG have been determined on fresh unweathered OIF samples, WGM has found that results will be very comparable.
Figure 14 is a plot showing helium comparison pycnometer SG results for WGM’s 26 samples it collected from Alderon and Altius drill core during site visits in 2009 and 2010 (see Section 15). Also shown are DGI’s density results from down-hole probe averaged over the same Tos and Froms as the WGM sample intervals. Pycnometer SG and %TFe correlate well and the Best Fit relationship line is similar to that shown on Figure 13 for Alderon’s 33 SG pycnometer results and similar to that for other iron deposits WGM has reviewed. However, the probe densities do not correlate well with either the pycnometer SG or iron assays.
WGM believes the discrepancy between the relationships shown on Figures 13 and 14 may be due to poor correlation between sample Tos and Froms from sampling, logging and the core meterage blocks and the probe depth indexing. WGM understands that Alderon has been
66
aware of discrepancies between the depth of drillholes as indicated by the drillers and the DGI probe data. WGM further understands that the consensus of opinion is that the driller’s core meterage block errors were not always detected and corrected by Alderon’s geotechnical crew. Consequently, the depth indexing for DGI’s probe does not correspond exactly with Tos and Froms from logging and sampling. On Figure 13, probe density, pycnometer SG and %TFe correlate well because special effort was made to correct the indexing errors.
For the Mineral Resource estimate, WGM has chosen for its modeling to use the relationship between pycnometer SG and %TFe to mitigate the depth indexing issue.
Figure 14. SG by pycnometer on pulps vs. %TFe for WGM’s independent samples
WGM recommends that Alderon complete pycnometer pulp SG and bulk density determinations on whole routine assay sample intervals and compare results to confirm that pycnometer SG and bulk density measurements generate similar results and correlate strongly with %TFe. WGM further recommends that Alderon strengthen its core handling, logging and sampling routines in order to locate and fix core block meterage errors before logging and sampling is completed. The positive consequence of finding and fixing these errors would be to make the probe densities more valuable. WGM would argue however, that for fresh unweathered OIF, probe densities provide little to no advantage over estimating rock density from assay results. However, where rocks are weathered and leached, probe densities would have a distinct advantage.
67
10. EXPLORATION
10.1 GENERAL
Historic exploration is summarized under the History section of the report. Altius’ initial exploration was in 2006 culminating in a diamond drilling program in 2008. Alderon acquired the Property in December 2010 and conducted its first exploration program in the summer of 2010.
10.2 ALTIUS EXPLORATION PROGRAMS 2006 - 2009
Reconnaissance mapping and rock sampling commenced during the summer of 2006 and was completed during the 2007 field season. Ten 2006 samples of outcrop and boulders were assayed at SGS-Lakefield for major elements. Grab samples yielded iron values typical of oxide facies iron formation. Further outcrop sampling was completed during the 2008 program. A total of 63 rock samples were collected, 29 of which were for chemical analysis while the remaining were collected for physical properties testing. The 2007 samples were sent to Activation Laboratories in Ancaster Ontario and assayed for major elements, FeO and total sulphur. Nine rock samples from the Mills Lake area returned Fe values ranging from 9.7% Fe to 43.6% Fe and manganese values ranging from 0.43% Mn to 13.87% Mn. From the Molar Lake area, five rock samples were collected yielding 13.7% Fe to 23.6% Fe and 0.1% to 0.69% Mn. From the Elfie Lake area, two grab samples were collected that respectively returned assay results of 25.9% Fe and 0.95% Mn and 17.9% Fe and 1.07% Mn. From the Mart Lake area, one sample was collected that yielded 16.3% Fe and 0.15% Mn. From the Rose Lake area, a few outcrops over a strike length of approximately 430 m were grab sampled. Values ranged from 5.6% Fe with 9.73% Mn from a sample near the iron formation – Wishart Formation contact to 29.7% Fe with 1.05% Mn from a magnetite-specularite sample of iron formation.
Altius’ 2007 exploration program also included a high resolution helicopter airborne magnetic survey carried out by McPhar Geosurveys Ltd. The purpose of the airborne survey was to acquire high resolution magnetic data to map the magnetic anomalies and geophysical characteristics of the geology. The survey covered one block. Flight lines were oriented northwest-southeast at a spacing of 100 m. Tie-lines were oriented northeast-southwest at a spacing of 1,000 m. A total of 905 line km of data were acquired. Data acquisition utilized precision differential GPS positioning. The rock samples collected from the Property and sent for physical properties testing were to support interpretation of the airborne magnetic survey results.
68
The results of the 2007 exploration program were positive with rock samples returning favourable iron values and the airborne magnetic survey effectively highlighting the extent of the iron formation. Following the 2007 exploration program, licences 013935M, 013937M, 010501M, 011927M, 012853M and 012854M were grouped to form licence 15037M and licenses 14957M, 14962M, 14967M and 14968M were staked.
The 2008 exploration program on the Property consisted of physical properties testing of the rock samples collected in 2007, linecutting, a ground gravity and magnetic survey carried out by Geosig of Saint Foy, Québec, a high resolution satellite imagery survey (Quickbird), an integrated 3D geological and geophysical inversion model and 6,129.49 m of diamond drilling in 25 holes. The drilling program was designed to test three known iron ore occurrences on the Property (namely Mills Lake, Mart Lake and Rose Lake) that were targeted through geological mapping and geophysics.
The ground gravity and total field magnetic surveys were conducted along 69.8 km of cut grid lines spaced from 200 m to 400 m apart oriented northwest-southeast. Gravity surveying and high resolution positional data were collected at 25 m intervals. The magnetic survey stations were spaced at 12.5 m along the lines.
Mira Geoscience (“Mira”) was contracted to create a 3D geological and geophysical inversion model of the Property. Mira was provided with the geological cross sections, airborne and ground geophysics data and the physical rock properties from each of the different lithologies. The 3D geological and geophysical model was completed to help with target definition and drillhole planning.
Drilling confirmed the presence of iron oxide-rich iron formation at the three iron occurrences and was successful in extending the occurrences along strike and at depth. Drilling was also fundamental in testing stratigraphy and structure to help refine the geological and structural models for each area to aid in drillhole targeting.
10.3 ALDERON’S SUMMER 2010 EXPLORATION PROGRAM
The 2010 exploration program started on June 1, 2010 and finished December 1. The program consisted mainly of a drilling program, described under Drilling (Section 11.0), but also included an airborne geophysical survey covering the three licenses Alderon holds in Newfoundland and Labrador (see Figures 5 and 6) and the re-logging and lithology re-coding of Altius’ 2008 drill core. The airborne geophysical survey consisted of 1,079 line km of gravity and magnetic surveying covering a 130 km2 area.
69
The geophysical survey measuring the gradient of the gravity field and magnetics was carried out by Bell Geospace Inc. (“BGI”) of Houston, Texas and flown over the Property from November 8th through November 11th, 2010 onboard a Cessna Grand Caravan. The crew and equipment were stationed in Wabush. The survey was flown in a north-south direction with perpendicular tie lines. Eighty five survey lines and 13 tie lines were flown. The survey lines were 100 m apart on the western side of the survey area, and 300 m apart on the eastern side. The tie lines were 1,000 m apart. The survey lines vary from 10.3 to 12.4 km in length, and the tie lines varied in length from 5.5 to 11.7 km.
The survey plan defines a flight path that maintains a constant distance from the ground for the entire length of each survey line. However, it is not always possible to maintain the constant clearance because of variations in terrain relief. Ground clearance does not vary greatly in this survey due to the lack of severe terrain features and ground clearance ranged from 60 to 187 m.
Magnetic data was acquired with a cesium vapour sensor. A radar altimeter system is deployed to measure the distance between the airplane and the ground. Along with the plane’s altitude acquired via GPS, radar altimetry data is used to produce a digital elevation model (“DEM”). The full Tensor Gravity Gradiometry (Air FTG) system contains three Gravity Gradient Instruments (“GGI”s), each consisting of two opposing pairs of accelerometers arranged on a rotating disc.
Processing of the gravity data includes line levelling, terrain correction and noise reduction. Measured free air and terrain corrected maps for each of the six-tensor components are provided.
Minimal data correction is required for magnetics. The majority of erroneous data is removed by the compensation process that corrects the data for the effects of the aircraft as heading and position changes relative to the magnetic field. A base magnetometer was also used to record and remove the daily variations in the magnetic field due to regional factors. A lag correction is applied to correct for the distance between the mag sensor and the GPS antennae. The lag correction is computed based on speed and distance to accurately shift the magnetic data to the GPS reference point and ensure that lines flown in opposite directions are not biased by the distance between the sensor and antennae. The Earth’s Field is calculated and removed. Only minor line adjustments are required to remove any remnant errors that are apparent at line intersections. The data is then ready for reduction to the magnetic pole to approximate the anomaly directly over the causative body, and other derivative calculations to accentuate the anomalies.
70

11. DRILLING
11.1 HISTORIC DRILLING
In 1957, IOCC re-mapped an area of 86.2 km2 to the west of Duley Lake on a scale of 1”= 1,000 ft and test drilled shallow holes throughout the area through overburden cover to determine areas underlain by iron formation. Dip needle surveying served as a guide for determining the locations of iron formation in drift-covered areas.
According to Hird (1960), 272 holes aggregating a total of 7,985 m (26,200 ft) were drilled during IOCC’s 1957 program. Approximately 66 of these holes were located on the Property. Mathieson (1957) reported that there were no new deposits found as a result of the drilling, however, definite limits were established for the iron formation outcrops found during previous geological mapping.
In 1979, one diamond drill hole was drilled by LM&E near the north end of Elfie Lake. The hole (No. 57-1) was drilled vertically to a depth of 28 m (Grant, 1979) and did not encounter oxide iron formation. In 1983, as reported by Avison et al., 1984, LM&E collared a 51 m deep (168 ft) diamond drill hole 137 m north of Elfie lake (DDH No. 57-83-1). The drillhole encountered iron formation from 17 m to a depth of 51 m. Of this however, only 2 m was oxide facies. Core recovery was very poor, (20%).
11.2 ALTIUS 2008 DRILLING PROGRAM
11.2.1 GENERAL
Altius’ 2008 drilling program consisted of 27 holes totalling 6,129.5 m (including two abandoned holes which were re-drilled) testing the Mills Lake, Mart Lake and Rose Lake iron occurrences (see Figure 4). Descriptions of mineralization and estimated true widths are discussed under Mineralization. Drillhole locations and collar information are given in Table 13. Drilling was carried out between June and October by Lantech Drilling Services of Dieppe, New Brunswick using a Marooka mounted JKS300 drill rig. A second, larger drill rig was added to the program in September to help complete the program before freeze-up. The second rig was a skid mounted LDS1000 towed by a Caterpillar D6H dozer. Both drills were equipped for drilling BTW sized core. Drilling took place on a two shifts per day basis, 20 hours per day, 7 days per week. The remaining four hours was taken up with travel to and from the drill site and shift change.
71
TABLE 13.
DRILLING SUMMARY — ALTIUS 2008 PROGRAM
HoleID | | Zone | | Easting | | Northing | | Elev | | Azimuth | | Dip | | Length
(m) | | Start
Date | | Finish Date | |
K-08-01 | | Central Rose | | 633067.65 | | 5855447.72 | | 615.13 | | 315 | | -45 | | 274.0 | | 06-Jun-08 | | 16-Jun-08 | |
K-08-02 | | Mills Lake | | 634415.60 | | 5851576.78 | | 635.49 | | 240 | | -50 | | 145.2 | | 19-Jun-08 | | 25-Jun-08 | |
K-08-03 | | Mills Lake | | 634416.25 | | 5851576.01 | | 635.32 | | 240 | | -90 | | 186.0 | | 24-Jun-08 | | 28-Jun-08 | |
K-08-04 | | Mills Lake | | 634949.99 | | 5850966.76 | | 588.34 | | 240 | | -50 | | 98.0 | | 30-Jun-08 | | 04-Jul-08 | |
K-08-05 | | Mills Lake | | 634770.00 | | 5850885.00 | | 611.00 | | 240 | | -90 | | 57.0 | | 05-Jul-08 | | 07-Jul-08 | |
K-08-06 | | Mills Lake | | 634531.11 | | 5851191.13 | | 627.57 | | 240 | | -51 | | 170.0 | | 08-Jul-08 | | 11-Jul-08 | |
K-08-07 | | Mills Lake | | 634316.26 | | 5851987.22 | | 620.57 | | 240 | | -51 | | 178.0 | | 12-Jul-08 | | 18-Jul-08 | |
K-08-08 | | Central Rose | | 633337.00 | | 5855208.22 | | 626.87 | | 315 | | -50 | | 241.0 | | 20-Jul-08 | | 28-Jul-08 | |
K-08-09 | | Central Rose | | 633479.77 | | 5855345.66 | | 628.62 | | 315 | | -51 | | 316.0 | | 28-Jul-08 | | 02-Aug-08 | |
K-08-10 | | Central Rose | | 633621.14 | | 5855480.71 | | 637.14 | | 315 | | -50 | | 316.0 | | 02-Aug-08 | | 10-Aug-08 | |
K-08-11 | | Central Rose | | 632925.43 | | 5855079.84 | | 644.68 | | 135 | | -50 | | 38.4 | | 11-Aug-08 | | 12-Aug-08 | |
K-08-11A | | Central Rose | | 632925.43 | | 5855079.84 | | 644.68 | | 135 | | -50 | | 280.0 | | 12-Aug-08 | | 23-Aug-08 | |
K-08-12 | | Central Rose | | 632585.30 | | 5855406.53 | | 585.99 | | 135 | | -50 | | 427.7 | | 28-Aug-08 | | 10-Sep-08 | |
K-08-13 | | Elfie | | 633636.56 | | 5854321.44 | | 686.76 | | 315 | | -50 | | 192.4 | | 04-Sep-08 | | 08-Sep-08 | |
K-08-14 | | Elfie | | 633515.52 | | 5854204.53 | | 684.88 | | 315 | | -50 | | 281.0 | | 08-Sep-08 | | 15-Sep-08 | |
K-08-15 | | Central Rose | | 632228.99 | | 5855196.57 | | 576.98 | | 135 | | -50 | | 316.0 | | 10-Sep-08 | | 17-Sep-08 | |
K-08-16 | | Elfie | | 633184.61 | | 5854381.98 | | 677.22 | | 315 | | -90 | | 351.0 | | 16-Sep-08 | | 25-Sep-08 | |
K-08-17 | | North Rose | | 632226.54 | | 5855198.68 | | 576.46 | | 315 | | -50 | | 208.0 | | 16-Sep-08 | | 21-Sep-08 | |
K-08-18 | | Central Rose | | 633123.23 | | 5855723.46 | | 592.26 | | 135 | | -50 | | 386.0 | | 22-Sep-08 | | 30-Sep-08 | |
K-08-19 | | Elfie | | 633030.76 | | 5854062.66 | | 685.77 | | 315 | | -50 | | 334.8 | | 24-Sep-08 | | 04-Oct-08 | |
K-08-20 | | Central Rose | | 633266.33 | | 5855847.56 | | 601.40 | | 135 | | -50 | | 441.0 | | 30-Sep-08 | | 09-Oct-08 | |
K-08-21 | | Elfie | | 633173.74 | | 5854394.69 | | 679.25 | | 315 | | -50 | | 331.0 | | 04-Oct-08 | | 11-Oct-08 | |
K-08-22 | | Elfie | | 633177.18 | | 5853911.07 | | 658.72 | | 315 | | -50 | | 75.0 | | 11-Oct-08 | | 15-Oct-08 | |
K-08-23 | | Elfie | | 633033.21 | | 5853783.48 | | 645.60 | | 315 | | -50 | | 64.0 | | 15-Oct-08 | | 17-Oct-08 | |
K-08-24 | | Central Rose | | 633296.58 | | 5854963.20 | | 630.36 | | 315 | | -50 | | 305.0 | | 01-Oct-18 | | 24-Oct-08 | |
Total 25 drillholes | | | | | | | | | | | | 6,009 m | | | | | |
| |
Notes: | Coordinates are NAD 27 Zone 19N. |
| List excludes two drillholes that were abandoned at shallow depth; Total contract drilling was 27 drillholes aggregating 6,129.5 m |
| | | | | | | | | | | | | | | | | | | | |
11.2.2 2008 DRILL HOLE COLLARS AND DOWN-HOLE SURVEYING
Drillhole collars were spotted prior to drilling by chaining in the locations from the closest grid line picket. Drilling azimuths were established by lining up the drill by sight on the cut grid lines. Drill inclinations were established using a compass on the drill head.
Once a drillhole was finished, the drill geologist placed a fluorescent orange picket next to the collar labelled with the collar information on an aluminum tag. The X, Y and Z coordinates for these collar markers were surveyed using hand-held GPS. Generally, casing was left in the ground where holes were successful in reaching bedrock.
Down-hole surveys were systematically performed by the driller every 50 m using a Flexit instrument. Azimuth, inclination and magnetic field data were recorded by the driller in a survey book kept at the drill. A copy of the page is taken from the book, placed in a plastic zip lock bag and placed in the core box and the test was recorded by the geologist.
72
11.3 ALDERON 2010 DRILLING PROGRAM
11.3.1 GENERAL
The 2010 drill program consisted of 25,895 m NQ diamond drilling. The objective of the program was to delineate an Inferred iron oxide Mineral Resource of 400-500 MT on two areas: the Rose Central and Mills Lake Deposits. The drilling included testing the North Rose Lake Zone, the SW Rose Lake Zone and the Elfie Lake/South Rose Zone. The 2010 program included: borehole geophysics on many of the 2008 and 2010 holes, detailed 3D, DGPS surveying of 2008 and 2010 drillhole collars, and logging and sampling of drill core including the re-logging of 2008 drillholes.
Landdrill International Ltd. (“Landdrill”) based in Notre-Dame-du Nord, QC, was the drill contractor for the entire campaign. Throughout the campaign, between three and five diamond drill rigs were operating. Some rigs were brought in for special purposes, like a heli-supported drill for several holes on North Rose and a track-mounted drill to access an area with a restricted access permit. A total of 82 holes were collared, but only 72 holes were drilled to the desired depths, with the remaining holes being lost during casing or before reaching their target depth because of broken casing, detached rods, bad ground, etc. Table 14 provides a summary of 2010 drilling by target zone.
TABLE 14.
2010 DRILLING SUMMARY BY DEPOSIT OR ZONE
Deposit or Zone | | Metres | | Number of Holes | |
Central Rose | | 18,928 | | 51 | |
Mills Target | | 4,124 | | 16 | |
North Rose | | 1,419 | | 5 | |
SW Rose | | 1,424 | | 10 | |
Total | | 25,895 | | 82 | |
Several Central Rose Lake drillholes also tested the North Rose Zone at depth, allowing for a preliminary evaluation.
The drill campaign consisted of three continuous and at times simultaneous phases of exploration:
1. The drilling began on the NE extent of the Central Rose Lake trend (L22E) and progressed SW along the established 200 m spaced NW-SE oriented grid lines to section L8E. Each section was drilled and interpreted with the interpretation extrapolated and integrated into previous sections.
73
2. Towards the middle of the program, drilling expanded to test the North Rose and SW Rose Zones, also following 200 m spaced lines. This expansion was done by increasing the number of drills on the Property to allow focus to continue on the Central Rose Zone. The North Rose and SW Rose zones were difficult to test due to the topography, thick overburden and swampy terrain.
3. The last phase of exploration focussed on the Mills Lake Deposit and utilized two drills (one heli-supported, the other self-propelled track driven) over eight weeks.
Drilling on the SW Rose Zone was limited to two cross sections. Drilling was difficult due to a combination of thick overburden (37-65 m vertical depth) with deep saprolitic weathering. Core recovery ranged from adequate to very poor. The weathering decreased at depths below 170 vertical m, but most holes did not achieve that depth. Drilling on this target was suspended due to poor production.
Drilling on the North Rose Zone was limited to two sites due to accessibility. The terrain overlying this target is swampy lowland surrounding a shallow lake. Several holes testing the Central Rose Deposit were extended to test the deeper portions of this North Zone and indicate this zone requires additional drilling and may significantly contribute to the overall Rose Lake tonnage. This target is best tested during a winter program when the area is frozen and more readily accessible.
Core recovery was generally very good throughout the drilling focussed on the Central Rose and Mills Lake Deposits and is not a factor the Mineral Resource estimate. Core recovery is often poor for the drilling on the North Rose Zone due to intensive weathering along fault systems, but neither the SW Rose, nor the North Rose Zones form part of the present Mineral Resource estimate.
The holes drilled in 2010 are listed in Table 15.
11.3.2 2010 DRILL HOLE COLLARS AND DOWN-HOLE ATTITUDE SURVEYING
Prior to drilling the drillhole collars were spotted with a hand-held GPS. The drilling azimuths for inclined drillholes were established by lining up the drill on fore-sight and/or back-sight pickets previously aligned along the desired azimuth, parallel with the previously surveyed grid lines. Drill inclinations were established with a protractor fixed on the drill head. When a hole was completed, a post was placed in the collar of the hole. This post was
74
TABLE 15.
DRILLING SUMMARY - ALDERON 2010 PROGRAM
HoleID | | Zone | | Easting | | Northing | | Elevation | | Azimuth | | Dip | | Length (m) | |
K-10-25 | | Central Rose | | 633256.60 | | 5855857.71 | | 599.08 | | 315 | | -80 | | 458.0 | |
K-10-26 | | Central Rose | | 633125.79 | | 5855726.77 | | 592.09 | | 315 | | -80 | | 323.0 | |
K-10-27 | | Central Rose | | 633289.60 | | 5855546.10 | | 618.62 | | 315 | | -80 | | 658.0 | |
K-10-28 | | Central Rose | | 632953.41 | | 5855598.73 | | 586.60 | | 135 | | -80 | | 623.0 | |
K-10-29 | | Central Rose | | 633130.62 | | 5855720.79 | | 593.11 | | 135 | | -67 | | 597.0 | |
K-10-30 | | Central Rose | | 633282.92 | | 5855548.61 | | 617.64 | | 135 | | -65 | | 191.0 | |
K-10-31 | | Central Rose | | 633070.47 | | 5855443.85 | | 615.23 | | 135 | | -45 | | 38.0 | |
K-10-32 | | Central Rose | | 633020.24 | | 5855531.56 | | 600.74 | | 135 | | -50 | | 211.0 | |
K-10-33 | | Central Rose | | 632962.75 | | 5855589.26 | | 588.67 | | 135 | | -45 | | 366.0 | |
K-10-34 | | Central Rose | | 632910.22 | | 5855357.10 | | 627.82 | | 315 | | -80 | | 507.0 | |
K-10-35 | | Central Rose | | 633224.15 | | 5855607.02 | | 609.68 | | 135 | | -50 | | 212.0 | |
K-10-36 | | Central Rose | | 632861.04 | | 5855685.18 | | 576.37 | | 135 | | -50 | | 40.0 | |
K-10-37 | | Central Rose | | 632879.09 | | 5855671.03 | | 577.85 | | 135 | | -45 | | 60.0 | |
K-10-37A | | Central Rose | | 632879.09 | | 5855671.03 | | 577.85 | | 135 | | -50 | | 609.0 | |
K-10-38 | | Central Rose | | 632580.32 | | 5855412.79 | | 585.06 | | 135 | | -70 | | 440.5 | |
K-10-39 | | Central Rose | | 632906.62 | | 5855360.91 | | 627.77 | | 315 | | -60 | | 97.6 | |
K-10-39A | | Central Rose | | 632906.62 | | 5855360.91 | | 627.77 | | 315 | | -60 | | 505.0 | |
K-10-40 | | Central Rose | | 632635.36 | | 5855351.75 | | 601.20 | | 135 | | -45 | | 314.0 | |
K-10-41 | | Central Rose | | 632732.47 | | 5855254.03 | | 635.21 | | 135 | | -75 | | 141.1 | |
K-10-42 | | Central Rose | | 632770.11 | | 5855496.45 | | 587.43 | | 135 | | -55 | | 401.8 | |
K-10-43 | | Central Rose | | 632620.00 | | 5855375.00 | | 595.00 | | 135 | | -60 | | 183.0 | |
K-10-44 | | Central Rose | | 632732.36 | | 5855254.97 | | 635.02 | | 315 | | -80 | | 140.6 | |
K-10-45 | | Central Rose | | 632578.54 | | 5855414.90 | | 584.93 | | 135 | | -80 | | 528.0 | |
K-10-46 | | Central Rose | | 632638.66 | | 5855348.62 | | 601.43 | | 135 | | -65 | | 704.0 | |
K-10-47 | | Central Rose | | 632770.73 | | 5855495.83 | | 587.67 | | 135 | | -82 | | 603.0 | |
K-10-48 | | Central Rose | | 632348.62 | | 5855372.82 | | 574.94 | | 135 | | -45 | | 596.2 | |
K-10-49 | | North Rose | | 632638.57 | | 5855347.04 | | 601.50 | | 315 | | -45 | | 672.0 | |
K-10-50 | | Central Rose | | 632763.92 | | 5855503.72 | | 586.12 | | 315 | | -75 | | 77.0 | |
K-10-51 | | Central Rose | | 632711.77 | | 5855560.20 | | 580.37 | | 315 | | -50 | | 278.0 | |
K-10-52 | | Central Rose | | 632575.59 | | 5855143.64 | | 667.44 | | 315 | | -70 | | 524.0 | |
K-10-53 | | Central Rose | | 632348.22 | | 5855373.24 | | 574.71 | | 135 | | -60 | | 449.0 | |
K-10-54 | | North Rose | | 632220.20 | | 5855205.78 | | 575.46 | | 315 | | -45 | | 196.0 | |
K-10-55 | | Central Rose | | 632536.01 | | 5854887.03 | | 619.66 | | 315 | | -50 | | 558.0 | |
K-10-56 | | Central Rose | | 632429.35 | | 5854993.94 | | 631.63 | | 315 | | -50 | | 324.0 | |
K-10-57 | | Central Rose | | 632266.76 | | 5854864.00 | | 607.24 | | 315 | | -55 | | 362.3 | |
K-10-58 | | Central Rose | | 632347.54 | | 5854779.14 | | 593.11 | | 315 | | -50 | | 65.0 | |
K-10-59 | | Central Rose | | 632482.96 | | 5854635.70 | | 608.11 | | 315 | | -50 | | 569.0 | |
K-10-60 | | Central Rose | | 632750.47 | | 5854669.00 | | 612.90 | | 315 | | -55 | | 131.0 | |
K-10-61 | | Central Rose | | 632483.84 | | 5854938.39 | | 625.87 | | 315 | | -50 | | 377.0 | |
K-10-62 | | Central Rose | | 632918.67 | | 5854785.02 | | 616.90 | | 315 | | -80 | | 24.0 | |
K-10-62A | | Central Rose | | 632918.67 | | 5854785.02 | | 616.90 | | 315 | | -80 | | 235.0 | |
K-10-63 | | Central Rose | | 632917.94 | | 5854785.70 | | 617.04 | | 315 | | -45 | | 292.0 | |
K-10-64 | | Central Rose | | 632830.68 | | 5855159.57 | | 643.90 | | 315 | | -60 | | 518.0 | |
K-10-65 | | SW Rose | | 631158.40 | | 5854298.28 | | 627.34 | | 315 | | -80 | | 150.0 | |
K-10-66 | | Central Rose | | 632905.20 | | 5855359.14 | | 627.53 | | 315 | | -45 | | 708.0 | |
K-10-67 | | North Rose | | 632657.00 | | 5856024.00 | | 571.00 | | 315 | | -45 | | 165.0 | |
K-10-68 | | Central Rose | | 632918.50 | | 5854780.99 | | 616.82 | | 135 | | -45 | | 234.0 | |
K-10-69 | | Central Rose | | 633377.00 | | 5855449.00 | | 625.00 | | 315 | | -45 | | 159.0 | |
K-10-69A | | Central Rose | | 633390.40 | | 5855437.25 | | 625.72 | | 315 | | -45 | | 720.0 | |
K-10-70 | | Central Rose | | 632574.10 | | 5855140.86 | | 667.58 | | 315 | | -45 | | 788.6 | |
K-10-71 | | Central Rose | | 633488.66 | | 5855616.04 | | 629.91 | | 315 | | -50 | | 141.0 | |
K-10-72 | | SW Rose | | 631157.56 | | 5854299.23 | | 627.34 | | 315 | | -45 | | 174.0 | |
K-10-73 | | Mills Lake | | 634530.34 | | 5851192.50 | | 627.63 | | 60 | | -50 | | 349.0 | |
K-10-74 | | North Rose | | 631917.24 | | 5855274.61 | | 578.83 | | 315 | | -45 | | 201.0 | |
K-10-75 | | SW Rose | | 631150.41 | | 5854304.61 | | 628.32 | | 135 | | -45 | | 94.5 | |
K-10-76 | | Central Rose | | 633490.27 | | 5855614.38 | | 630.16 | | 315 | | -50 | | 357.0 | |
K-10-77 | | Mills Lake | | 634529.29 | | 5851191.87 | | 627.50 | | 60 | | -80 | | 236.0 | |
K-10-78 | | North Rose | | 631917.92 | | 5855273.99 | | 578.66 | | 315 | | -70 | | 185.0 | |
K-10-79 | | SW Rose | | 631264.02 | | 5854188.32 | | 613.58 | | 315 | | -45 | | 147.0 | |
K-10-80 | | Mills Lake | | 634679.03 | | 5851048.95 | | 613.85 | | 240 | | -45 | | 218.0 | |
K-10-81 | | SW Rose | | 631263.26 | | 5854189.12 | | 613.61 | | 315 | | -80 | | 10.0 | |
K-10-81A | | SW Rose | | 631263.26 | | 5854189.12 | | 613.61 | | 315 | | -80 | | 384.4 | |
K-10-82 | | Mills Lake | | 634680.49 | | 5851049.67 | | 613.65 | | 240 | | -80 | | 230.0 | |
K-10-83 | | Central Rose | | 633251.10 | | 5855298.41 | | 625.31 | | 315 | | -45 | | 664.0 | |
K-10-84 | | Central Rose | | 633622.65 | | 5855483.39 | | 637.19 | | 315 | | -45 | | 696.0 | |
K-10-85 | | Mills Lake | | 634761.70 | | 5851086.30 | | 607.22 | | 60 | | -80 | | 317.0 | |
K-10-86 | | SW Rose | | 630992.00 | | 5853883.00 | | 623.00 | | 315 | | -80 | | 66.0 | |
K-10-86A | | SW Rose | | 630992.00 | | 5853883.00 | | 620.00 | | 315 | | -75 | | 69.0 | |
K-10-86B | | SW Rose | | 630992.00 | | 5853883.00 | | 623.00 | | 315 | | -85 | | 155.0 | |
K-10-87 | | Mills Lake | | 634848.86 | | 5850914.17 | | 601.61 | | 240 | | -75 | | 81.7 | |
K-10-88 | | SW Rose | | 630907.00 | | 5853975.00 | | 625.00 | | 315 | | -70 | | 174.0 | |
K-10-89 | | Mills Lake | | 634317.16 | | 5851987.84 | | 620.64 | | 240 | | -70 | | 248.0 | |
K-10-90 | | Mills Lake | | 634414.46 | | 5851794.15 | | 617.98 | | 240 | | -50 | | 185.0 | |
K-10-91 | | Mills Lake | | 634318.94 | | 5851988.48 | | 620.67 | | 60 | | -60 | | 284.0 | |
K-10-92 | | Mills Lake | | 634421.37 | | 5851798.60 | | 617.17 | | 60 | | -55 | | 408.0 | |
K-10-93 | | Central Rose | | 633156.97 | | 5855102.13 | | 637.20 | | 315 | | -45 | | 129.0 | |
K-10-94 | | Mills Lake | | 634505.00 | | 5851643.00 | | 618.00 | | 60 | | -80 | | 20.0 | |
K-10-94A | | Mills Lake | | 634516.21 | | 5851639.37 | | 616.16 | | 60 | | -75 | | 309.0 | |
K-10-95 | | Mills Lake | | 634485.21 | | 5851399.88 | | 626.19 | | 240 | | -50 | | 177.0 | |
K-10-96 | | Mills Lake | | 634488.71 | | 5851401.57 | | 625.79 | | 60 | | -80 | | 204.0 | |
K-10-97 | | Mills Lake | | 634565.41 | | 5851459.00 | | 615.05 | | 60 | | -60 | | 427.0 | |
K-10-98 | | Mills Lake | | 634516.63 | | 5851639.64 | | 616.27 | | 60 | | -55 | | 431.0 | |
Total | | 82 drillholes | | | | | | | | | | | | 25,895 m | |
Notes: Coordinates are NAD 27, UTM Zone 19N.
75
temporarily surveyed with a hand-held GPS. Subsequently, at the end of the drilling campaign, the X, Y and Z-coordinates of all the new drillholes and the 2008 drillholes were precisely DGPS surveyed using dual frequency receivers in real Time Kinematic Mode by the land surveyor firm N.E. Parrott Surveyors (“Parrott”) of Labrador City, NL and tied into the federal geodesic benchmark.
Most of the 2008 and 2010 collars were identified and surveyed during the first (October 23 to 27) or second (December 5) surveying campaign. Two collars, K-08-05 and K-10-43 could not be located.
Downhole tests were done with a North Seeking Gyroscope instrument by DGI as part of the borehole geophysics program immediately after the termination of the drillhole while the drill rig was still on site.
The down-hole attitude surveys were performed with the rods inside the borehole to prevent the borehole from collapsing, thus minimizing risk to the equipment. Boreholes drilled in 2008 (K-08 designation) only had casing shots completed to eliminate the risk of open-hole logging.
A series of boreholes, including K-08-20, K-10-25, K-10-27, K-10-30 and K-10-35 were revisited later in the program. These boreholes were now open holes and only casing shots were repeated to minimize risk to the gyro. These results were compared to the previous measurements and repeated within the error range of the instrument.
During the program it was detected that the azimuth information produced by the gyro, did not match the planned azimuths of the boreholes. Parrot was hired by DGI to provide corroboration to either the planned or measured azimuths of the boreholes and Parrot during its December 5 visit surveyed the azimuths of 24 drillholes. These results were received in early November 2010. The Parrot azimuths for 20 of the 24 drillholes correlated most closely with the planned azimuths. For four drillholes (K-10-60, K-10-25, K-10-96 and K-10-94A) the planned azimuths departed from the Parrot azimuths by more than 5 degrees. As a result DGI recommended that the gyro instrument be immediately removed from the field for problem diagnosis at the manufacturer’s facility.
A sensor was replaced and extensive calibration checks were performed at the manufacturer’s facility with DGI’s Vice President Operations in attendance. The calibration checks demonstrated a high degree of repeatability and accuracy for the instrument. Once tests were completed to the satisfaction of the manufacturer and DGI, the gyro was returned to the Kami project.
76
A thorough review of all calibration data, QA/QC tests, and repeat field measurements compared to the Parrot collar surveys and planned drill azimuths indicated that the gyro information should be treated as relative. That is, prior to having repairs completed by the manufacturer the instrument measured the correct relative change in azimuth down hole, but not the correct absolute azimuth. This is the same method as used for normal gyro data. The relative accuracy of the instrument throughout the duration of the project is supported by the manufacturer.
Alderon elected to use the planned azimuths as the collar azimuths of all of the 2008 and 2010 drillholes and adjust the DGI gyro down-hole azimuths to the planned collar azimuths. These corrections were also applied to the OTV structure data to compute orientations for the picked structures.
11.3.3 GEOPHYSICAL DOWN-HOLE SURVEYING
DGI employed a multi-parameter digital logging system designed by Mount Sopris Instrument Co. and along with gyroscopic down-hole drillhole attitude surveying included, natural gamma, poly electric, magnetic susceptibility, calliper, and optical televiewer (“OTV”) instrumentation.
The Poly Gamma probe measures variations in the presence of natural radioactivity. Changes in natural radioactivity are typically related to concentrations of uranium, thorium and potassium. Data acquired from this parameter is useful in identifying lithological changes.
The Poly-Electric probe measures: normal resistivity, spontaneous potential (“SP”), single-point resistivity (“SPR”), fluid resistivity, fluid temperature and natural gamma radiation. Resistivity measurements can be used to identify lithology changes, often resulting from changes in porosity. Fluid resistivity measurements are often used to correct the resistivity measurements of the rock from the influence of drilling mud and borehole fluid, and can also be indicative of borehole fractures. Temperature contrast data can identify zones of water movement through borehole fractures and faults relative to static water in the borehole column.
The Magnetic Susceptibility probe delineates lithology by analyzing changes in the presence of magnetic minerals. Magnetic susceptibility data can illustrate lithological changes and degree of homogeneity, and can be indicative of alteration zones. The magnetic susceptibility probe is stabilized in the borehole fluid prior to calibration checks and the start of the survey
77
runs. Calibration checks are performed before the deployment run and after the retrieval run using two points of known magnetic susceptibility. Susceptibility data was used in conjunction with assay data to develop an equation converting magnetic susceptibility (CGS units) to a % magnetite content value estimate.
The Optical Televiewer provides a detailed visualization of the borehole by capturing a high-resolution image of the borehole wall with precise depth control. The OTV captures a high-resolution 360º image perpendicular to the plane of the probe and borehole. This allows borehole bedding and fractures to be inspected by a direct camera angle. This 360° high-resolution image can be used to identify, measure and orient bedding, folding, faulting and lithological changes in the borehole. The use of a gyro provides the relative orientation data to correct the image and feature orientation. 2D and 3D projections of this data provide a variety of interpretive options for analysis.
The OTV data is reported as True Azimuth and as True Dip. It should be noted that Azimuth True for the feature is the azimuth of the dip direction rather than the strike of the feature. The strike azimuth for a feature is 90° from the value reported in the True Azimuth data column.
Sixty-nine boreholes were surveyed during this project with various probes. Once a final data set was completed, a statistical characterization was performed using the physical properties data.
11.4 WGM COMMENT ON 2008 AND 2010 DRILLING
Altius’ 2008 and Alderon’s 2010 drilling programs were generally well run. In 2008, drillhole collars were surveyed using hand-held GPS. Fortunately, casings were left in the ground so the collars could be resurveyed at a later date. As part of the 2010 program, Alderon resurveyed all of Altius’ collars using DGPS except for two that could not be located.
In 2008, downhole surveying was done using a Flexit instrument. This instrument determines azimuths based on a magnetic compass. Altius ignored azimuth readings from the instrument and utilized only the inclination information from the survey. WGM agrees that this was acceptable practice. Alderon attempted gyro surveys of the collars of many of these holes as part of the 2010 program, however, it was later concluded that the gyro azimuths were not accurate. The 2008 drillholes consequently only have inclination data, and no azimuth information and the collar and down-hole azimuths used in the drillhole database are taken to be the planned azimuths for the drillholes or gyro azimuths for the hole tops adjusted to planned collar azimuths.
78
Alderon suspected early on in the 2010 program that the gyro azimuths were biased. DGI and investigations by the probe manufacturer concluded that there was a sensor malfunction in the probe. The result of this sensor problem was that drillhole azimuths were inaccurate, but were precise. Consequently, down-hole azimuths and changes in azimuth for the 2008 and 2010 drillholes were adjusted to planned collar azimuths which are likely mostly accurate within two to three degrees. Unfortunately, weather and logistical problems prevented resurveying of holes with the probe once it was repaired.
In the summer of 2011, Alderon plans to re-survey as many drillhole collars as possible for location and azimuth. WGM agrees this is the best approach. The assumption of drillhole azimuth based on planned collar azimuth, rather than actual accurate measured azimuths, will likely have a minor affect on geological interpretation and the Mineral Resource estimate, but considering that this is an initial resource estimate and more drillholes are required to fully delineate mineralization, WGM is of the opinion that any adverse effect of inaccurate azimuth is small.
Drillhole orientation relative to rock structure varies from nearly perpendicular to dip to almost down dip and the rocks and mineralization are folded. Accordingly, the relationship between true widths and drillhole intersection length also varies considerably from hole to hole, or even within a hole. WGM encourages Alderon, as much as possible, to avoid drilling down dip.
WGM also suggests that it label drillhole collars immediately after drill dismount.
WGM has not completed a thorough review of all the down-hole geophysical information as Alderon has also not yet completed its review.
79

12. SAMPLING METHOD AND APPROACH
12.1 GENERAL
The description and discussions herein for sampling are for the programs conducted from 2006 to 2010 by Altius and Alderon and are derived mostly from reports and protocol documents completed by or for Altius and Alderon and direct observations by WGM during its site visit.
12.2 2006 AND 2007 SURFACE SAMPLING PROGRAMS
The 2006 program completed on the Property consisted of reconnaissance prospecting and sampling. Ten surface grab samples from outcrop were collected and sent to SGS-Lakefield for XRF WR analysis and determination of magnetite by Satmagan. Details of results are reported in Way, Churchill and Seymour, 2007.
Altius’ 2007 program also included a prospecting and sampling component. A total of 63 samples were collected. Twenty-nine of these were sent to Activation Laboratories in Ancaster, Ontario for determination of major oxides, FeO total, S, LOI and H2O+. The others were collected for physical properties testing at Morris. Morris determined density and magnetic susceptibility. Results for this program are reported Seymour, Churchill and Winter, 2008.
Sample and analysis results for the 2006 and 2007 programs were used only for geological mapping purposes and were not used for the Mineral Resource estimate.
12.3 2008 DRILL CORE HANDLING AND LOGGING
Core was removed from the core tube by the driller’s helper at the drill and placed into core trays labelled with hole and box number. Once the tray was filled (approximately 4 to 4.5 m per box) it was secured at both ends, labelled and set aside. Core was picked up at the drill site by Altius personal each day. Core was transported from the drill site to a truck road using all terrain vehicles and a trailer. Core was then transferred to an Altius truck and transported directly to Altius’ secure core facility in Labrador City. A geologist was always on site at the core facility to receive the core deliveries. Core boxes were then checked for proper labelling and correct positioning of tags. The end of box interval was measured and marked on the end of each tray with an orange china marker. Box numbers, intervals and Hole ID were recorded on a spreadsheet and recorded on aluminum tags which were subsequently stapled to the tray
80
ends for proper cataloguing. All core was photographed, both wet and dry, in groups of four trays by a geotechnician or geologist.
Rock quality designation (“RQD”), specific gravity and magnetic susceptibility measurements were completed for each drillhole and recorded on spreadsheets. A measurement of specific gravity was obtained from each lithological unit in each drillhole by selecting short pieces of whole or split core and weighing each in air and in water. Magnetic susceptibility was measured using a magnetic susceptibility KT-9 Kappameter distributed by Exploranium G.S. Limited by taking one measurement every metre as an approximation of magnetic susceptibility.
A geologist logs the core and records the data on logging sheets. All geological and geotechnical information was recorded digitally at the end of each day.
12.4 2008 SAMPLING APPROACH
Sample intervals were determined on a geological basis, as selected by the drill geologist during logging, and marked out on the drill core with a china marker during descriptive logging.
Core was first aligned in a consistent foliation direction. Iron formation was sampled systematically at 5 m sample intervals where possible, except where lithological contacts are less than 5 m.
All rock estimated to contain abundant iron oxide was sampled. In addition, two 3-m samples on either side of all “ore grade” iron formation were taken, where possible, to bracket all “ore grade” iron formation sequences.
12.5 2008 SAMPLING METHOD
The geologist marked the sample intervals with a red china marker and placed lines perpendicular to the core axis at the beginning and end of sample intervals. The geologist also marked a line along the top of the core, parallel to the core axis, to indicate to the sampling geotechnician where the core should be sawn in half.
Three-part sample tickets, with unique sequential numbers, were used to number and label samples for assay. One tag contains information about the sample (such as date, hole ID, interval and description) and is kept in the sample log book. A second tag is stapled into the core box at the beginning of the sample interval. The third tag is stapled into the plastic poly
81
bags containing that sample for assay. Sample numbers and intervals were entered into a digital spreadsheet.
Core was sawn in half using a rock saw at the Altius core facility by an Altius geotechnician. One half of the core comprising the sample is placed into the labelled sample bags and stapled closed immediately after the sample is inserted. The remaining half of the split core is returned to the core tray and inserted in its original order and orientation and retained for future reference. Where duplicate samples were required, quarter samples were taken sawn. Each sample is then secured within plastic pails labelled with the sample number. Lids were secured on the pails and the pails were then taped closed for extra security. The buckets were placed onto pallets where they were subsequently shrink-wrapped and also secured with plastic straps for loading onto transport trucks for shipment to SGS-Lakefield.
12.6 CORE STORAGE
After core logging and sampling were completed, core trays containing the reference half or quarter-split core and the archive sections of whole core were stacked on timber and rebar core racks at the Labrador City core facility.
12.7 2010 DRILL CORE HANDLING AND LOGGING
Core logging was conducted by several geologists, including Elsa Hernandez-Lyons, William Strain, Bryan Sparrow (“GIT-PEGNL”) and supervised by Edward Lyons, a member of the Association of Professional Engineers and Geoscientists of British Columbia (“APEGBC”), the professional Engineers and Geoscientists of Newfoundland and Labrador (“PEGNL”), and the Ordre des Géologues du Québec (“OGQ”). Mr. Lyons and Ms. Hernandez-Lyons have recent experience on similar deposits in the Fermont, Fire Lake district.
After the core was placed in the core trays, the geologists checked the core for meterage blocks and continuity of core pieces. The geotechnical logging was done by measuring the core for recovery and rock quality designation (“RQD”). This logging was done on a drill run block to block basis, generally at nominal three metre intervals. Core recovery and rock quality data were measured for all holes. Drill core recovery in most cases was close to 100% with virtually every run 3 m. The RQD was generally higher than 92%. Lower values were observed and measured for the first 3 to 5 m of some holes where the core is slightly broken and occasionally slightly weathered. Near fault shears, RDQ dropped somewhat, but was rarely below 65% and this mainly occurs in the schistose stratigraphic hanging wall Menihek Formation, rather than in the iron formation.
82
The core was logged for lithology, structure, and mineralization with data entered directly into laptop computers using MSAccess forms developed by Alderon geomatics staff. Attention was directed at evaluating the percent content of iron oxides as well as the major constituent gangue components of the iron formation using a quaternary diagram developed by Mr. Lyons. Drillhole locations, sample tables, and geotechnical tables were created in MSAccess separately and are able to be merged with the geological tables at will.
Prior to sample cutting, the core was photographed wet and dry. Generally, each photo includes five core boxes. A small white dry-erase board with a label is placed at the top of each photo and provides the drillhole number, box numbers and from-to in metres for the group of trays. The core box was labelled with an aluminum tag containing the drillhole number, box number and from-to in metres stapled on their left (starting) end. Library samples approximately 0.1 m long of whole core were commonly taken from most drill holes to represent each lithological unit intersected. Once the core logging and the sampling mark-up was completed, the boxes were stacked in core racks inside the core facility. After sampling, the core trays containing the remaining half core and the un-split parts of the drillholes were stored in sequence on pallets in a locked semi-heated warehouse located in the Wabush Industrial Park. The warehouse contains the entire core from Altius’ 2008 and Alderon’s 2010 drilling campaigns.
12.8 SAMPLE SECURITY
The core was brought in twice daily at shift changes to Alderon’s core facility in a building in Labrador City, NL to reduce the possibility of access by the public near the drill staging area southwest of Labrador City. Public access to the core facility was restricted by signage and generally closed doors. Only Alderon or its contractor’s employees were allowed to handle core boxes or to visit the logging or sampling areas inside the facility. Split core samples were packed in sealed steel drums and strapped onto wood pallets. The pallets were picked up at the core facility with a fork-lift and loaded into a closed van and carried by TST Transport to SGS- Lakefield, via Baie-Comeau, Québec and Montréal.
12.9 2010 SAMPLING APPROACH
The 2010 sampling approach was similar to the 2008 approach with most samples taken to start and stop at the meterage blocks, at 3.0 m intervals, with variation in sample limits adaptable to changes in lithology and mineralization. Samples were therefore generally 3.0 m long and minimum sample length was set at 1.0 m. Zones of unusual gangue, like Mn-mineralization, or abnormally high carbonate were treated as separate lithologies for sampling.
83
The bracket or shoulder sampling of all “ore grade” mineralization by low grade or waste material was promoted. The protocol developed for the program also stated that silicate and silicate iron formation intervals in the zones of oxide iron formation should generally all be sampled unless exceeding 20 m in intersection length. In the abnormal case, where core lengths for these waste intervals were greater than 20 m, then only the low/nil grade waste intervals marginal to OIF were to be sampled as bracket samples.
In-field Quality Control materials consisting of Blanks, Certified Reference Standards or quarter core Duplicates were inserted into the sample stream with a routine sequential sample numbers at a frequency of one per 10 routine samples. The Duplicates were located in the sample number sequence within 9 samples of the location of its corresponding “Original”. The Duplicates accordingly do not necessarily directly follow their corresponding Original.
12.10 2010 SAMPLING METHOD
Similar to 2008 practice, 2010 practice entailed the use of three tag sample books. Geologists were encouraged to try to use continuous sequences of sample numbers. The geologists were instructed to mark the Quality Control (“QC”) sample identifiers in the sample books prior to starting any sampling.
The sample intervals and sample identifiers are marked by the geologist onto the core with an arrow, with an indelible pen or wax marker. The sample limits and sample identifiers are also marked on the core tray.
The book-retained sample tags are marked with the sampling date, drillhole number, the From and To of the sample and the sample type (sawn half core, Blank, Duplicate or Standard) and if Standard, then also record the identity of the Standard. The first detachable ticket recording the From and To of the sample was stapled into the core tray at the start of the sample interval. QC sample tags were are also stapled into the core tray at proper location. Quarter core Duplicates were flagged with flagging tape to alert the core cutters.
The core cutters saw the samples coaxially, as indicated by the markings and then place both halves of the core back into the core tray in original order. The sampling technicians complete the sampling procedure which involves bagging the samples.
The second detachable sample tags are placed in the plastic sample bags. These tags do not record sample location. As an extra precaution against damage, the sample number on these tags was covered over with small piece of clear packing tape. The sample identifiers were
84
also marked with indelible marker on the sample bags. The bags are then closed with a cable tie or stapled and placed in numerical order in the sampling area to facilitate shipping. The samplers inserted the samples designated as Field Blanks before shipping.
Samples are checked and loaded into pails or barrels for shipping. Pails or barrels are individually labelled with laboratory address and the samples in each shipping container are recorded.
12.11 WGM COMMENT ON LOGGING AND SAMPLING
WGM examined sections of Altius’ 2008 drill core during its October 2009 site visit and Alderon’s 2010 drill core during its site visits in July and November 2010 and found the core for both campaigns in good order. The drill logs have also been reviewed and WGM agrees they are comprehensive and generally are of excellent quality. Core descriptions in the logs were found to match the drill core.
During WGM’s site visits, sample tickets in the trays were checked and confirmed that they were located as reported in the drill logs.
A drill core sampling approach using 1 m to 5 m long samples respecting lithological contacts is acceptable practice. WGM is unaware of any drilling, sampling or recovery factors that could materially impact the accuracy and reliability of the results. WGM agrees that the Library samples do not materially impact assay reliability and/or accuracy.
85
13. SAMPLE PREPARATION, ASSAYING AND SECURITY
13.1 2008 SAMPLE PREPARATION
In-lab sample preparation was performed by SGS-Lakefield at its Lakefield, Ontario facility. SGS is an accredited laboratory meeting the requirements of ISO 9001 and ISO 17025. Samples were crushed to 9 mesh (2 mm) and 500 g of riffle split sample was pulverized to 200 mesh (75 µm).
13.1.1 2008 SAMPLE ASSAYING
All of Altius’ drill core samples were subject to a standard analysis routine including whole rock analysis (“WR”), by lithium metaborate fusion XRF, FeO by H2SO4/HF acid digest-potassium dichromate titration, and magnetic Fe and Fe3O4 by Satmagan. Neither the Satmagan nor the FeO determinations were completed on all in-field QA/QC materials. A group of 14 samples were analysed for S by LECO with sample selection based on visual observation of sulphides in the drill core. A total of 676 samples, including in-field QC materials, were sent for assay. Sample and analysis statistics are summarized in Table 16.
TABLE 16.
SAMPLING AND ANALYSIS SUMMARY, ALTIUS 2008 DRILL PROGRAM
Sample Classification | | Analysis | | Number | |
Routine | | XRF WR and Satmagan | | 613 | |
S | | S | | 14 | |
In-Field Blank | | XRF WR and Satmagan | | 19 | |
In-Field ¼ Core Duplicate | | XRF WR and Satmagan | | 24 | |
In-Field Standards (TBD-1, SCH-1) | | XRF WR and Satmagan | | 20 | |
SGS-Lakefield Preparation Duplicate | | | | 7 | |
SGS-Lakefield Replicates Analytical Duplicates | | | | 22 | |
SGS-Lakefield Certified Standards and Blanks | | variable | | | |
13.1.2 2008 QUALITY ASSURANCE AND QUALITY CONTROL
Altius conducted an in-field QA/QC program during initial core sampling. SGS-Lakefield also conducted its own in-lab internal QA/QC program. Samples and analysis for both these programs are summarized in Table 16.
In the field, Standard, Blanks and Duplicate samples were inserted alternately every 10th sample. The material used for Blank was a relatively pure quartzite and was obtained from a quarry outside of Labrador City. Duplicate samples were collected by quarter sawing the
86
predetermined sample intervals and using ¼ core for the Duplicate sample, ¼ for the regular samples, and the remaining half core was returned to the core tray for reference. The Certified Standard Reference materials used were CANMET’s TBD-1 and SCH-1, CANMET’s FER-4 was used when the TBD-1 material was exhausted in the later half of the program. This material was pre-packaged in paper envelopes and, as required, a sachet was placed in a regular sample bag and given a routine sequential project sample number. Certified and provisional values for iron and selected other elements for these two standards are listed in Table 17. The table also lists the certified reference values for the Standard FER-1 which was used by Alderon during its 2010 program.
TABLE 17.
CERTIFIED STANDARD REFERENCE MATERIALS USED FOR
THE IN-FIELD QA/QC PROGRAM, ALTIUS 2008 and Alderon 2010
Standard | | | | Certified Values | |
ID | | Material | | %Fe | | %FeO | | %SiO2 | | %Mn | | %P | | %S | |
SCH-1 | | Schefferville Hematite IF | | 60.73 | | NA | | 8.087 | | 0.777 | | 0.054 | | 0.007 | |
TDB-1 | | Saskatchewan - Diabase - | | 10.4 | | NA | | 50.2 | | 0.1577 | | 0.08 | | 0.03 | |
FER-4 | | Sherman Mine Ontario — cherty magnetite IF | | 27.96 | | 15.54 | | 50.07 | | 0.147 | | 0.057 | | 0.11 | |
The 19, 2008 drilling campaign field Blanks all returned low values.
Results for %TFe and %Fe3O4Satmagan, FeO, MnO and SiO2 for analysis of Duplicate ¼ drill core samples for both the 2008 and 2010 programs are shown in Section 13.2.3 along with results for 2010 program samples. The results generally indicate that Original and Duplicate assays correlate strongly. There are a few outliers that may represent errors made in the field or in the lab, but generally the results indicate that assays are precise and minimal sampling mix-ups prevail.
The results for the 2008 program Certified Reference Standards are shown in Section 13.2.3 along with results for Alderon’s 2010 samples. In general, the Standards performed well as indicated by the clustering of results and the concentration averages which are close to the certified reference values summarized in Tables 17 and 18. The Standards were not however assayed for FeO, or had Satmagan determinations completed. Albeit, such analysis would not have generated a lot of information, as both of the Standards used for the 2008 program contained little magnetite.
SGS-Lakefield’s in-laboratory QA/QC program consisted of assays on Preparation Duplicates which it calls Replicates and Analytical Duplicates which are re-assays of same pulps. These re-assays, SGS-Lakefield refers to as Duplicates on its Certificates of Analysis. Preparation Duplicates are second pulps made by splitting off a second portion from a coarse reject. SGS-Lakefield prepared and assayed Preparation Duplicates and Preparation Blanks at a rate
87
of one every 50 to 70 routine samples. Analytical Duplicates, which involved a new fusion and disc, were prepared and assayed at a frequency of one sample every 20 to 25 routine samples.
Results for Preparation Duplicates (Replicates) and Analytical Duplicates for the 2008 program for selected elements are shown on Figures 25 to 27 along with results from the 2010 program.
13.2 2010 SAMPLE PREPARATION
The Primary laboratory for Alderon’s 2010 exploration program was again SGS-Lakefield. Sample preparation for assay included crushing the samples to 75% passing 2 mm. A 250 g (approximate) sub-sample was then riffled out and pulverized in a ring and puck pulverizer to 80% passing 200 mesh. Standard SGS-Lakefield QA/QC procedures applied. These included crushing and pulverizing screen tests at 50 sample intervals. Davis Tube tests were also performed on selected samples. The material for the David Tube tests was riffled out directly from the pulverised Head samples.
13.2.1 2010 SAMPLE ASSAYING
Alderon’s 2010 drill core sample assay protocol was similar to the 2008 protocol with WR analysis for major oxides by lithium metaborate fusion XRF requested for all samples and magnetic Fe or Fe3O4 determined by Satmagan. For a proportion, but not all samples, FeO was determined by H2SO4/HF acid digest - potassium dichromate titration. Generally where FeO on Heads was not completed, Davis Tube tests were performed. Sample selection criteria for Davis Tube testwork included magnetite by Satmagan greater than 5%, or hematite visually observed by the core logging geologists. Where Davis Tube tests were completed, Davis Tube magnetic concentrates were generally analysed by XRF for WR major elements. During the first half of the program, FeO was also determined in Davis Tube tails. Alderon made this switch in methodology because it believed Davis Tube tails were being overwashed.
In addition to the “routine” assaying 175, 0.1 m samples of half split core samples were sent to SGS-Lakefield for bulk density determination by the weighing-in-water/weighing-in-air method. The purpose of this work was to provide rock density for different rock types and types of mineralization to calibrate DGI’s down-hole density probe. These samples were taken from the upper 0.1 m long intervals of routine assay sample intervals each generally 3 m to 4 m long. After SGS-Lakefield completed the bulk density tests these core pieces were returned to the field, so they could be replaced back into the original core trays. In addition to
88
the bulk density testwork, 33 sample pulps had SG determined by the gas comparison pycnometer method.
Alderon also cut 58 new samples from 2008 drill core that had not been previously sampled and assayed.
Additional determinations of FeO_H on samples where FeO was not originally requested and additional Davis Tube testwork are in progress. The purpose of this work is to provide the data necessary to enable a comparison of methods for estimating %hmFe. Additional assaying was done as part of the QA/QC program and more details concerning the QA/QC program are described in Section 13.2.3
A total of 5,527 samples, including new assays from 2008 drill core and including in-field QC materials were sent for assay. Sample and analysis statistics are summarized in Table 18.
TABLE 18.
SAMPLING AND ANALYSIS SUMMARY, ALDERON 2010 DRILL PROGRAM
Sample Classification | | Analysis | | Number | |
Routine (2010 program drillholes — excluding 58 samples from 2008 drill core) | | XRF WR | | 4,944 | |
| | Satmagan | | 4,943 | |
| | FeO_H | | 2,552 | |
| | | | | |
Davis Tube Tests (includes field inserted QA/QC materials) | | Weight recovery | | 3,242 | |
| | XRF_DTC | | 2,992 | |
| | FeO_DTT | | 1,761 | |
| | | | | |
Assaying and sampling of previously un-sampled 2008 core intervals | | XRF WR and Satmagan | | 58 | |
| | FeO_H | | 41 | |
| | | | | |
Re-assay of 2008 pulps | | XRF WR and Satmagan | | 595 | |
| | | | | |
In-Field Blank | | XRF WR and Satmagan | | 179 | |
| | FeO_H | | 82 | |
| | | | | |
In-Field 1/2 Core Duplicate | | XRF WR and Satmagan | | 167 | |
| | FeO_H | | | |
| | | | | |
In-Field Standards (STD A=FER-4, STD B= SCH-1) | | XRF WR and Satmagan | | 185 | |
| | | | | |
Secondary lab (Inspectorate) Check Assaying | | XRF WR | | 287 | |
| | FeO_H by HCL-H2SO3 | | 287 | |
| | FeO_H by HF-H2SO4 | | 85 | |
| | Satmagan | | 287 | |
SGS-Lakefield Preparation Duplicate | | Variable —see text | | | |
SGS-Lakefield Replicates Analytical Duplicates | | Variable —see text | | | |
SGS-Lakefield Certified Standards and Blanks | | Variable —see text | | | |
89

13.2.3 2010 QUALITY ASSURANCE AND QUALITY CONTROL
The 2010, QA/QC program, similar to the 2008 program, included components conducted by Alderon that were initiated during core sampling in the field and also components operated by SGS-Lakefield’s as part of its own internal QA/QC program. Samples and analysis for both these components are summarized in Table 18. Alderon’s program included in-field components involving the insertion of Blanks, Duplicates and Standards into the sample stream going to SGS-Lakefield, plus the re-assaying of a selection of 2008 program pulps and the Check Assaying of a selection of pulps at a Secondary laboratory. Inspectorate, located in Vancouver, B.C. was the Secondary Laboratory for the program. Inspectorate holds a number of international accreditations, including ISO 17025.
Alderon In-field QA/QC
In the field, Standard, Blanks and Duplicate samples were inserted into the sample stream alternately every 10th sample. The Certified Standard Reference materials used were CANMET’s TBD-1 changed later to FER-4 and SCH-1. This material was pre-packaged in ziploc bags and, as required, a sachet was placed in a regular sample bag and given a routine sequential project sample number. The certified and provisional values for iron and selected other elements for SCH-1 and FER-1 are listed previously in Table 17.
Duplicate samples were collected by quarter sawing the predetermined sample intervals and using ¼ core for the Duplicate sample, and ¼ for the regular samples with the remaining half core returned to the core tray for reference. The material used for Blanks was the same material used for the 2008 program being crushed quartzite located from local outcrops.
In addition to the in-field insertion of Blanks, Duplicates and Standards, a selection of Altius sample pulps originally assayed as part of the 2008 program were retrieved from storage and re-assayed. Initial results from this re-assaying raised some issues concerning Satmagan results for several samples and more assaying to address these issues involving preparation of new pulps from 2008 program rejects is in progress. At time of writing, the project database holds new WR and Satmagan results for 595, 2008 sample pulps, however, none of these re-assays have been used for the Mineral Resource estimate.
Alderon maintained active monitoring of field-QA/QC results as they were received and undertook re-assaying when assay or sample irregularities were observed. A tracking table was used to track QA/QC issues. WGM recommends that Alderon develop a written protocol specifying the criteria for identifying and selecting questionable sample results (QA/QC-failures) and the steps to be taken to when dealing with questionable sample results.
90
SGS-Lakefield’s internal QA/QC for the 2010 program was similar to its practice in 2008 including screen tests for crushing and pulverizing, Preparation Duplicates, Preparation Blanks, Analytical Duplicates, and Blanks and Standards.
Figures 15 to 19 present assay results for selected elements for 2008 and 2010 core Duplicates.
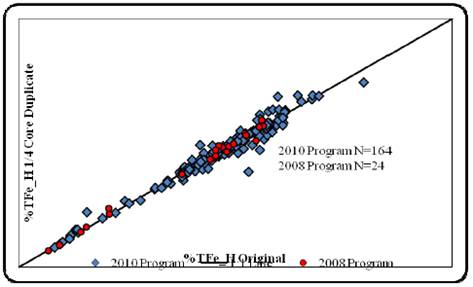
Figure 15. Results for Duplicate ¼ split drill core samples - %TFe_H — 2008 and 2010 Programs
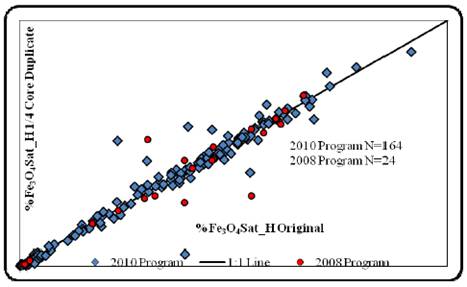
Figure 16. Results for Duplicate ¼ split drill core samples - %Fe3O4Satmagan_H — 2008 and 2010 Programs
91
Figure 17. Results for Duplicate ¼ split drill core samples - %FeO_H — 2008 and 2010 Programs
Figure 18. Results for Duplicate ¼ split drill core samples - %Mn_H — 2008 and 2010 Programs
92
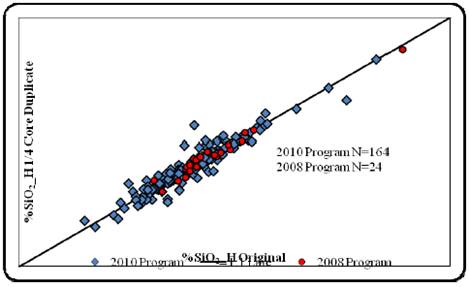
Figure 19. Results for Duplicate ¼ split drill core samples - %SiO2_H — 2008 and 2010 Programs
Generally Duplicate and Original results are strongly correlated. A few outliers can be identified.
Results for field-inserted Certified Reference Standards are shown on Figures 20 to 24. On these plots assay values are plotted against certificate date. Table 19 compares assay results for the Standards against their certified values where available.
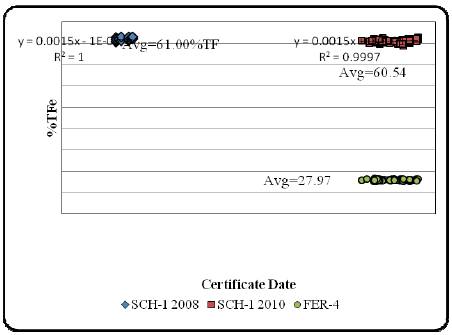
Figure 20. Results for In-Field Standards for %TFe — 2008 and 2010 Programs
93
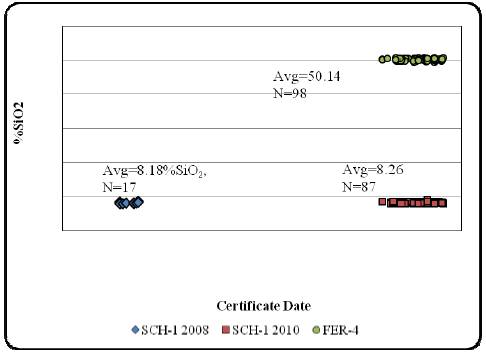
Figure 21. Results for In-Field Standards for %SiO2_H — 2008 and 2010 Programs
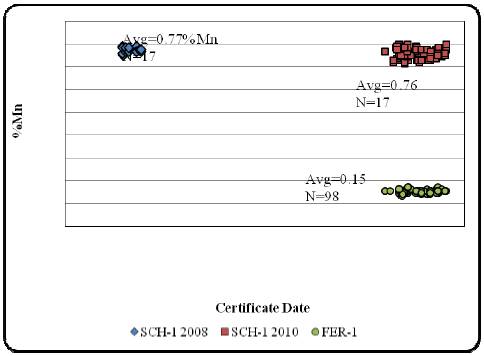
Figure 22. Results for In-Field Standards for %Mn_H — 2008 and 2010 Programs
94
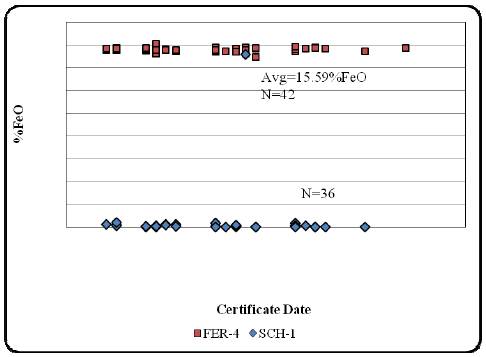
Figure 23. Results for In-Field Standards for %FeO_H — 2010 Program
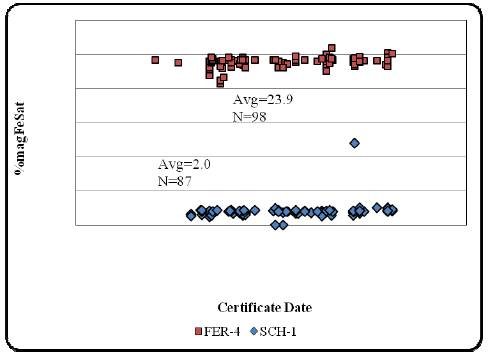
Figure 24. Results for In-Field Standards for %magFe_H — 2010 Program
95
TABLE 19.
SUMMARY FOR 2008 AND 2010 IN-FIELD CERTIFIED REFERENCE STANDARDS
| | | | %TFe | | %SiO2 | | %Mn | | %FeO | | %magFe | |
SCH-1 | | Certified Value | | 60.73 | | 8.087 | | 0.777 | | | | | |
2008 | | Average | | 61.00 | | 8.18 | | 0.77 | | | | | |
2010 | | Average | | 60.54 | | 8.26 | | 0.76 | | | | 2.0 | |
| | | | | | | | | | | | | |
FER-4 | | Certified Value | | 27.96 | | 50.07 | | 0.147 | | 15.54 | | | |
2010 | | Average | | 27.97 | | 50.14 | | 0.15 | | 15.59 | | 23.9 | |
The results indicate that the Certified Reference Standards performed well for both the 2008 and 2010 programs. The averages for the Standards assayed at SGS-Lakefield are very close to the Certified Reference values and the charts show that most assays are closely clustered along a constant value line. There are albeit, occasionally assays that indicate either a Standard was misidentified in the field or mixed-up in the lab, i.e., one sample is identified as SCH-1 on Figure 23 for FeO_H, but possibly it is FER-4 based on its assay value. Another example is one sample shown on Figure 24 for magFe that reports the wrong value according to Alderon’s sample and assay database.
The estimates of %hmFe used for the Mineral Resource estimate were computed from analytical results from analysis of Head samples, but also from Davis Tube testwork results depending on what type of analytical data was available for any particular sample (see Section 9.3). QA/QC for the Davis Tube tests and assays of their products is consequently also important.
Davis Tube tests were completed on six samples of CANMET’s FER-4 Certified Reference Standard that was inserted into the sample stream in the field. Only one sample of SCH-1 had a Davis Tube test completed. There were eight field ¼ core Duplicates where Davis Tube tests were performed, but complete analysis of Davis Tube products were not performed on every one of these Duplicate samples.
Table 20 summarises results for the six samples for Standard FER-4 on which Davis Tube tests were completed. The results for Head analysis listed in the table are also a component of the results shown on Figures 20 to 24 for the performance of Certified Reference Standards. The magFe results listed for Satmagan and DT are also a component of Figure 11. For these six samples, %DTWR ranges from 33% to 37% and Fe_DTC ranges from nearly 63% to nearly 68%. Three of these samples report SiO2 in DTCs ranging from 5% to 6%, while for the other three instances of FER-4, SiO2 concentrations are approximately 10%. In WGM’s opinion, these results for silica are curious. The %DTWR appears reasonable but WGM’s expectation would be that the %TFe assays for the DTCs would be more closely clustered. WGM recommends that Alderon conduct a further review and ascertain any implications.
96
TABLE 20.
SELECTED ANALYTICAL RESULTS FOR DAVIS TUBE TESTS PERFORMED ON STANDARD FER-4
Sample | | %TFe_H | | %SiO2_H | | %Mn_H | | %magFeS
at | | %magFe
DT | | %DTWR | | %Fe_
DTC | | %FeO_
DTT | | %SiO2_D
TC | | %Mn_DT
C | |
NL00503 | | 27.6 | | 49.90 | | 0.15 | | 23.60 | | 22.02 | | 33.03 | | 66.66 | | 7.87 | | 5.53 | | 0.03 | |
NL00905 | | 27.9 | | 50.10 | | 0.15 | | 24.00 | | 23.28 | | 36.82 | | 63.23 | | 7.97 | | 10.30 | | 0.04 | |
NL00902 | | 28.0 | | 50.20 | | 0.15 | | 24.20 | | 23.41 | | 37.23 | | 62.88 | | 7.24 | | 9.96 | | 0.05 | |
NL00031 | | 27.8 | | 50.10 | | 0.15 | | 24.00 | | 22.10 | | 32.84 | | 67.29 | | 7.18 | | 5.86 | | 0.03 | |
NL00603 | | 27.6 | | 50.00 | | 0.15 | | 23.00 | | 23.44 | | 36.95 | | 63.44 | | 7.20 | | 10.10 | | 0.03 | |
NL00170 | | 27.7 | | 50.00 | | 0.15 | | 22.80 | | 23.50 | | 34.63 | | 67.85 | | 7.55 | | 5.44 | | 0.02 | |
Results for the eight core Duplicates are listed in Table 21. Values of %DTWR for corresponding samples (one pair of samples NL00452, NL00453 excepted) are generally close together. %TFe, %SiO2 and %Mn in DTCs and FeO in DTT for corresponding samples are also generally similar indicating excellent quality data.
TABLE 21.
SELECTED ANALYTICAL RESULTS FOR DAVIS TUBE TESTS PERFORMED ON EIGHT DUPLICATE CORE SAMPLES
Sample | | RkType | | %TFe | | Mag
FeSat | | %FeO_
H | | %SiO2_
H | | %Mn_
H | | %DTWR | | %Fe_
DTC | | %SiO2_
DTC | | %Mn_
DTT | | %magFe_
DT | | %FeO_
DTT | |
NL00320 | | MHIF | | 29.5 | | 17.2 | | | | 40.20 | | 1.49 | | 21.7 | | 69.2 | | 0.83 | | 1.12 | | 15.0 | | 1.95 | |
NL00321 | | MHIF | | 32.4 | | 16.6 | | | | 33.00 | | 1.70 | | 22.1 | | 69.0 | | 0.90 | | 1.13 | | 15.3 | | 1.76 | |
| | | | | | | | | | | | | | | | | | | | | | | | | |
NL00903 | | HIF | | 34.3 | | 0.5 | | | | 33.20 | | 3.52 | | 0.0 | | | | | | | | 0.0 | | 0.32 | |
NL00350 | | HIF | | 35.8 | | 0.7 | | | | 31.20 | | 3.91 | | 0.0 | | | | | | | | 0.0 | | 0.31 | |
| | | | | | | | | | | | | | | | | | | | | | | | | |
NL00453 | | MIF | | 41.6 | | 39.9 | | | | 34.30 | | 1.10 | | 57.6 | | 70.6 | | 1.01 | | 0.42 | | 40.7 | | 5.12 | |
NL00452 | | MIF | | 38.7 | | 36.5 | | | | 37.80 | | 1.17 | | 47.6 | | 70.6 | | 1.12 | | 0.40 | | 33.6 | | 5.00 | |
| | | | | | | | | | | | | | | | | | | | | | | | | |
NL00483 | | HIF | | 31.8 | | 0.1 | | | | 28.60 | | 7.47 | | 0.0 | | | | | | | | 0.0 | | 1.71 | |
NL00482 | | HIF | | 31.6 | | 0.1 | | | | 29.80 | | 7.38 | | 0.0 | | | | | | | | 0.0 | | 1.70 | |
| | | | | | | | | | | | | | | | | | | | | | | | | |
NL00513 | | MHIF | | 26.9 | | 17.5 | | | | 46.80 | | 1.50 | | 24.0 | | 69.9 | | 1.16 | | 0.68 | | 16.8 | | 2.60 | |
NL00512 | | MHIF | | 26.4 | | 18.2 | | | | 46.90 | | 1.52 | | 25.2 | | 69.9 | | 1.17 | | 0.7 | | 17.6 | | 2.43 | |
| | | | | | | | | | | | | | | | | | | | | | | | | |
NL00045 | | MIF | | 21.9 | | 19.3 | | | | 47.20 | | 0.50 | | 25.7 | | 70.6 | | 0.86 | | 0.07 | | 18.1 | | 5.05 | |
NL00044 | | MIF | | 22.6 | | 19.6 | | | | 47.10 | | 0.50 | | 26.3 | | 69.9 | | 1.04 | | 0.07 | | 18.4 | | 4.80 | |
| | | | | | | | | | | | | | | | | | | | | | | | | |
NL00793 | | MIF | | 29.2 | | 25.8 | | | | 49.20 | | 0.46 | | 36.5 | | 68.9 | | 2.65 | | 0.29 | | 25.2 | | 4.91 | |
NL00792 | | MIF | | 29.4 | | 26.4 | | | | 48.70 | | 0.46 | | 35.9 | | 68.9 | | 2.24 | | 0.29 | | 24.8 | | 4.59 | |
| | | | | | | | | | | | | | | | | | | | | | | | | |
NL02089 | | HMIF | | 36.3 | | 2.8 | | | | 45.60 | | 1.32 | | 3.9 | | 67.7 | | 4.94 | | 1.1 | | 2.6 | | | |
NL02088 | | HMIF | | 36.7 | | 2.1 | | 0.005 | | 45.10 | | 1.23 | | 2.8 | | | | | | | | | | | |
SGS-Lakefield Primary Laboratory QA/QC
As aforementioned (Section 3.1.3) SGS-Lakefield is an accredited laboratory and operates its own internal QA/QC program involving Preparation Duplicates (Replicates), Analytical Duplicates, Preparation and Analytical Blanks and Certified Reference Standards.
Results for the Preparation Duplicates for TFe_H, magFe_Sat and FeO_H are shown on Figures 25 to 27.
97
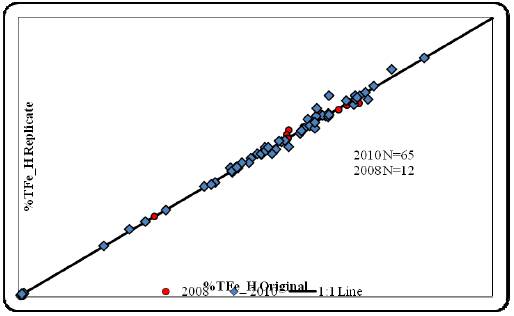
Figure 25. %TFe_H for Preparation Duplicates 2008 and 2010 Results
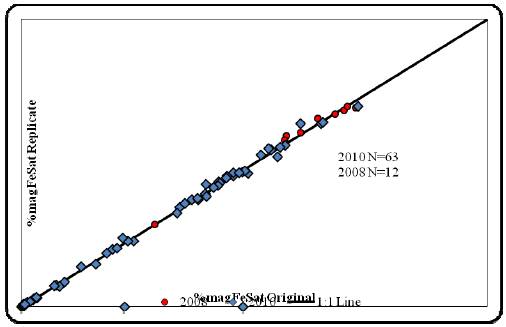
Figure 26. %magFeSat_H for Preparation Duplicates 2008 and 2010 Results
98
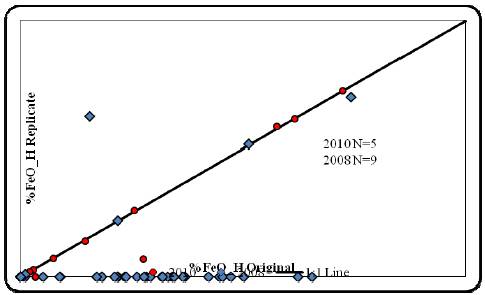
Figure 27. %FeO_H for Preparation Duplicates 2008 and 2010 Results
For most samples the assay results are strongly positively correlated. The chart for FeO_H (see Figure 27) illustrates that for an occasional determination, random irregularities can occur, probably due to sample mix-up in the lab or during reporting the results.
Assay results for Analytical Duplicates in terms of %magFeSat (Figure 28), are strongly correlated except for one 2008 sample where an error has obviously occurred. Assays for Analytical Duplicates are as expected more strongly correlated than for Preparation Duplicates, as Preparation Duplicates include both sub-sampling and analytical variance.
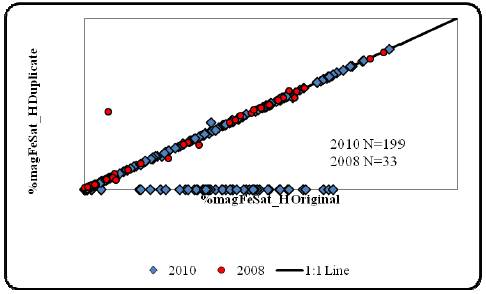
Figure 28. %magFeSat_H for Analytical Duplicates 2008 and 2010 Results
99

SGS-Lakefield’s Analytical Blanks, (N=137) for the 2008 and 2010 programs all returned assays of less than 0.01%TFe. Preparation Blanks generally returned approximately 5%TFe, although there were a few higher values indicating some occasional carryover iron during sample preparation.
Figures 29 and 30 show the results for the Certified Reference Standards SGS-Lakefield used during Alderon’s 2010 program to monitor and control Head assays for TFe and FeO_H. Similar plots can be constructed to illustrate the behaviour of all other analytes. Table 22 summarizes %TFe results for all Certified Reference Standards used for both the 2008 and 2010 programs.
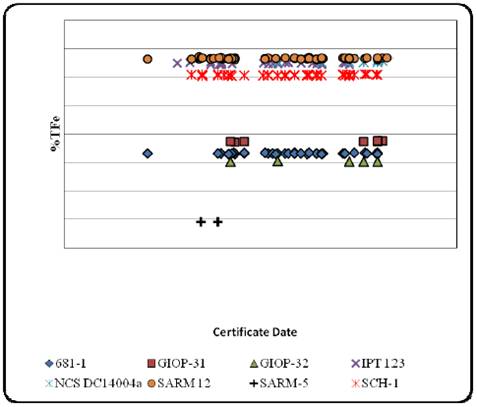
Figure 29. Performance of SGS-Lakefield Certified Reference Standards - %TFe_H 2010 Program
100
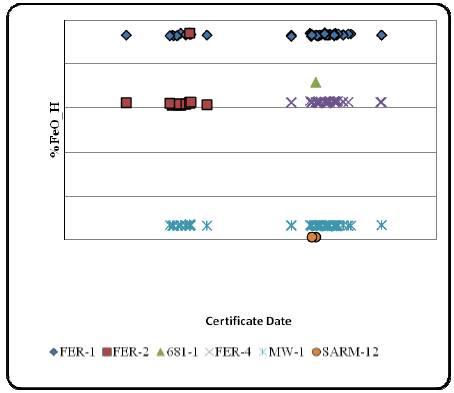
Figure 30. Performance of SGS-Lakefield Certified Reference Standards - %FeO_H 2010 Program
TABLE 22.
PERFORMANCE OF SGS-LAKEFIELD CERTIFIED REFERENCE STANDARDS
%TFE — 2008 AND 2010 PROGRAMS
STD_ID | | %TFe (%)
Certified
Value | | Number
Samples | | %TFe
Avg | | %TFe
Min | | %TFe
Min | | Material | | Provider |
676-1 | | 39.76 | | 2 | | 39.73 | | 39.73 | | 39.73 | | Iron ore Sinter | | LGC Standards |
680-1 | | 59.98 | | 1 | | 59.81 | | 59.81 | | 59.81 | | Iron Ore | | LGC Standards |
681-1 | | 33.21 | | 43 | | 33.23 | | 32.88 | | 33.51 | | Iron Ore Powder | | LGC Standards |
879-1 | | 18.97 | | 2 | | 18.68 | | 18.61 | | 18.75 | | Basic Slag | | LGC Standards |
BCS-313/1 | | | | 2 | | 0.02 | | 0.01 | | 0.02 | | | | |
BCS-369 | | 7.2 | | 2 | | 7.21 | | 7.21 | | 7.21 | | | | |
GBW03114 | | 0.33 | | 1 | | 0.34 | | 0.34 | | 0.34 | | Silica sand | | Beijing International standard material |
GIOP-31 | | 37.4 | | 9 | | 37.49 | | 37.29 | | 37.64 | | Iron Ore | | GEOSTATS PTY LTD |
GIOP-32 | | 30.2 | | 5 | | 30.33 | | 30.22 | | 30.50 | | Iron Ore | | GEOSTATS PTY LTD |
IPT 123 | | 65.1 | | 27 | | 65.00 | | 64.57 | | 65.55 | | Iron ore Pellet | | Instituto de Pesquisas Tecnologicas |
IPT 51 | | 0.83 | | 2 | | 0.84 | | 0.83 | | 0.84 | | Burnt refractory | | Instituto de Pesquisas Tecnologicas |
IPT 72 | | 0.06 | | 3 | | 0.06 | | 0.06 | | 0.06 | | Soda Feldspar | | Instituto de Pesquisas Tecnologicas |
MW-1 | | 66.08 | | 0 | | | | | | | | Specularite Iron ore | | Canmet |
NBS-69b | | | | 1 | | 4.90 | | 4.90 | | 4.90 | | | | |
NCS DC14004a | | 65.58 | | 7 | | 65.56 | | 65.34 | | 66.04 | | Iron ore Pellet | | China National Center for Iron and Steel |
SARM-12 | | 66.6 | | 70 | | 66.64 | | 66.18 | | 67.23 | | Magnetite Ore | | Mintek |
SARM-5 | | 8.84 | | 2 | | 9.02 | | 9.02 | | 9.02 | | Pyroxinite | | Mintek |
SCH-1 | | 60.73 | | 44 | | 60.75 | | 60.37 | | 61.07 | | Hematite iron ore | | Canmet |
SY4 | | 4.34 | | 4 | | 4.35 | | 4.32 | | 4.41 | | Diorite Gneiss | | Canmet |
101
Figure 30 and Table 23 show results for one sample labelled FER-2 that returned an assay value for FeO that is out of line with expectations. WGM recommends that Alderon investigate to determine if the error is due to a mis-entry in the assay database or a lab error.
TABLE 23.
PERFORMANCE OF SGS-LAKEFIELD CERTIFIED REFERENCE STANDARDS
%FeO — 2008 AND 2010 PROGRAMS
STD_ID | | %FeO (%)
Certified
Value | | Numb
Samples | | %FeO_H
Avg | | %FeO_H
Min | | %FeO_H
Min | | Material | | Provider |
681-1 | | | | 1 | | 17.90 | | 17.9 | | 17.9 | | Iron Ore Powder | | LGC Standards |
FER-1 | | 23.34 | | 59 | | 23.32 | | 23.16 | | 23.56 | | Iron Formation | | CANMET |
FER-2 | | 15.24 | | 17 | | 15.90 | | 15.26 | | 23.48 | | Iron Formation | | CANMET |
FER-4 | | 15.54 | | 45 | | 15.64 | | 15.48 | | 15.79 | | Iron Formation | | CANMET |
GIOP-31 | | | | 1 | | 27.60 | | 27.6 | | 27.6 | | Iron Ore | | GEOSTATS PTY LTD |
MW-1 | | 1.75 | | 57 | | 1.70 | | 1.62 | | 1.79 | | Specularite Iron ore | | CANMET |
SARM-12 | | | | 2 | | 0.37 | | 0.36 | | 0.38 | | Magnetite Ore | | Mintek |
During its 2010 program, Alderon requested SGS-Lakefield to supplement its internal QA/QC protocol to help ensure improved quality of iron assays. These measures included:
· checking magnetic iron from Satmagan against %TFe and in the case where the magFe exceeded the TFe, repeat the Satmagan determination; and
· where Davis Tube tests and Satmagan were both completed, check Satmagan results against the Davis Tube results and repeat determinations as required to mitigate any discrepancy.
This modified protocol was not established until part way through the 2010 assay program, but should have lead to improved quality of data, particularly helping to mitigate random Satmagan errors. Certainly there are occasional samples in the assay database where %FeO_H, %TFe and/or %magFeSat are out of balance and can be readily spotted where re-assaying might result in better quality data.
Secondary Laboratory — Inspectorate Check Assay Program
Two hundred and eighty-seven pulps from eight different Alderon drillholes representing different lithology and mineralization were forwarded to Inspectorate Labs, Vancouver in January 2011.
102
Analysis for WR by XRF, S, FeO by potassium dichromate titration and Satmagan were completed. Initially, the FeO analysis was completed using a HCL-H2SO4 digestion. Subsequently, a selection of samples was re analysed using a HF-H2SO4 digestion. The HF- H2SO4 digestion is similar to SGS-Lakefield’s digestion and is required in order to break down silicates so near total Fe can be measured. Figures 31 to 35 show Inspectorate assays versus SGS-Lakefield’s original results for corresponding samples.
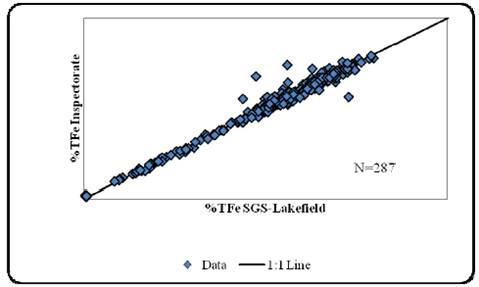
Figure 31. %TFe_H at Inspectorate. vs. SGS-Lakefield
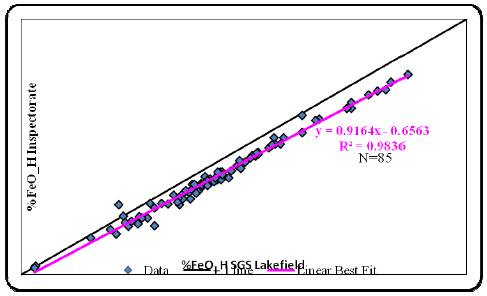
Figure 32. %FeO_H by HF-H2SO4 digestion at Inspectorate. vs. SGS-Lakefield
103
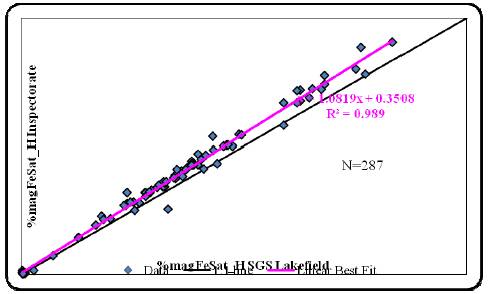
Figure 33. %magFeSat at Inspectorate vs. SGS-Lakefield
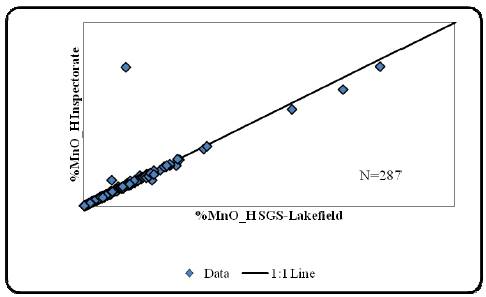
Figure 34. %MnO_H at Inspectorate. vs. SGS-Lakefield
104
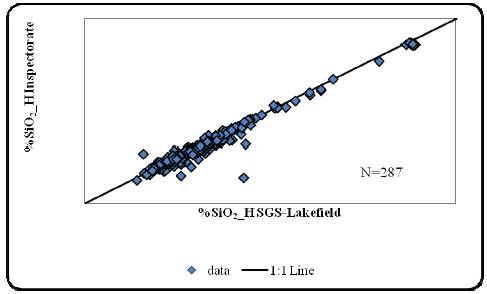
Figure 35. %SiO2_H at Inspectorate vs. SGS-Lakefield
The WR Check Assaying results indicate that SGS-Lakefield’s assays of TFe, SiO2 and MnO are reliable and unbiased. The FeO results from Inspectorate are strongly positively correlated with original SGS-Lakefield results, but are biased slightly lower. The Satmagan determinations completed at Inspectorate are also highly correlated with original SGS-Lakefield results, but are systematically biased slightly higher. If Inspectorate’s Satmagan and FeO results are more accurate than SGS-Lakefield’s it would mean that estimates of %magFe for the Mineral Resource estimate are perhaps very slightly low. Assuming Inspectorate’s FeO and Satmagans are more correct than SGS-Lakefield’s, then estimated %hmFe probably would not change much because Inspectorate’s results are both higher in magnetic Fe and lower in FeO.
The samples at Inspectorate were also assayed for S and only a few samples from the project have been previously assayed for S. The new S results confirm that mineralization is generally low in S, but there are occasional intervals with S at levels of 1% to 3%. WGM recommends that Alderon check these samples against drill logs and, if required, against archived drill core to confirm, if possible the presence of sulphides in these sample intervals.
13.3 WGM COMMENT ON 2008 AND 2010 SAMPLING AND ASSAYING
Alderon’s programs included credible sampling, assaying and QA/QC components that helped to assure quality exploration data. Its programs included the re-logging of Altius’ 2008 core and the re-assaying of a selection of Altius’ samples. QA/QC protocols for both Altius’ and Alderon’s programs included in-field insertion of Standards, Duplicates and Certified Reference Standards. In addition, Alderon supplemented these with Secondary
105
Laboratory Check assaying and the close monitoring of returned assay results and re-assayed of samples where quality control issues were raised.
Some errors in logging, sampling and assaying are identifiable from results returned, but WGM has not identified any material errors that delegitimize logging, sampling and/or assaying results and believes program results are of sufficient quality to support the Mineral Resource estimate.
In WGM’s opinion, areas for improvement include developing more awareness towards:
· Identifying drillers core block meterage errors during logging and reconciling down-hole probe depths with drillers hole depths prior to detailed logging and sampling being undertaken;
· More attention to drillhole planning so drillholes better cross cut zones of mineralization;
· Simplifying the assay protocol so that basic determinations are completed on all samples;
· Simplifying the database in terms of the number of data tables by combining related data in the same tables, i.e., combining Davis Tube results (mass recoveries and concentrate analysis) in one table and combining in-lab QA/QC results with assays for routine sample;
· Avoiding repetitive data in assay tables such as certificate dates that can be more simply and better derived from separate tables through table joins;
· Still more aggressive identification and follow-up of QA/QC issues including monitoring of in-lab QA/QC results; and
· Filing retained core on core racks rather than stacking, so logged and sampled core is more readily accessible for review and checking.
106
14. DATA CORROBORATION
WGM Senior Associate Geologist, Richard Risto, P.Geo., visited the Property twice in 2010 while Alderon’s drilling program was in progress. The first visit was completed August 3 to August 6 and the second from November 1 to November 3, 2010. This initial visit was to initiate the project review process. Alderon’s Chief Geologist, Mr. Edward Lyons, P.Geo. (BC), géo (QC), P.Geo. (NL) and Doris Fox, P.Geo., Kami Project Manager, EGM Exploration Group Management Corp. (an Alderon associate company) were hosts for the visit. Mr. Risto reviewed drilling completed to date, proposed drilling strategy, deposit interpretation, logging and sampling procedures and visited the Property to see previous drilling sites and drilling in progress. Mr. Risto reviewed with the project manager the details of the planned work program, including the company’s analytical and testing protocols to facilitate the planned Mineral Resource estimate.
The November site visit was made as the completion of the drilling program was pending with approximately 3,000 m remaining to be drilled. The purpose of this site visit was to review new data and ongoing drilling plans and for the collection of independent samples. ADR Chief Geologist, Mr. Edward Lyons, was again host for the visit. Mr. Risto reviewed drilling completed to date, proposed drilling strategy for the remainder of the program, discussed deposit interpretation, collected independent drill core samples and again visited the Property to check drilling sites.
In October, 2009, WGM Senior Geologist, David Power-Fardy, P.Geo., accompanied by BCL representative, Mr. Stewart Wallis, P.Geo., and Altius representative Ms. Carol Seymour, Geologist, completed a site visit to the project. Drill core was reviewed at Altius’ core storage facility in Wabush on October 6 and again on October 8. Facilitated by helicopter, Mr. Power-Fardy, Mr. Wallis and Ms. Seymour visited the Property on October 7. WGM independently collected 15 samples from 2008 drillholes and these samples were sent to SGS-Lakefield for analysis.
On checking the drill sites during its July 2010 Site Visit, WGM found that the drill collars were not labelled so it was not possible to be certain of individual drillhole identity. WGM recommended that collars be labelled when the drills dismount or very shortly afterwards. During its November 2010 Site Visit, WGM found that the collars were now labelled and capped. WGM validated drillhole locations in the field using a hand-held GPS and checked casing inclinations. Mr. Risto found that his Eastings and Northings closely matched those in Alderon’s database within a few metres and dips closely matched database dips to within ±3o. WGM also validated logging and sampling procedures. Check logging and checking sample
107
locations in core trays validated Alderon’s logging and sampling. As a component of the work plan, towards the Mineral Resource estimate (Section 17), WGM checked a random selection of assays in Alderon’s database versus SGS-Lakefield analytical certificates. During this process, some omissions and errors were identified which were communicated to Alderon and these errors and omissions were fixed. The assay Quality and Control section of the report (Section 13.3) was completed by WGM independently of Alderon based on data provided by Alderon. WGM also independently completed the calculations leading to the estimates of %hmFe used in the Mineral Resource estimate and formulated the SG model.
Table 24 lists locations for WGM’s eleven independent samples collected in 2010, as well as the samples collected from Altius’ drill core during WGM’s 2009 Site Visit. Table 25 provides the analytical results for all of the 2010 and 2009 WGM independent samples and the corresponding Alderon and Altius assay results for the original samples. The Alderon and WGM 2010 samples represent different halves of the split core. WGM’s 2009 samples were quarter core samples. Figures 36 to 40 illustrate the results graphically.
TABLE 24.
SUMMARY OF WGM INDEPENDENT SECOND HALF CORE SAMPLING
WGM ID | | Sample_ID | | Drillhole_ID | | From (m) | | To (m) | | Lith Code |
KWGM-01 | | NL03634 | | K-10-83 | | 306.60 | | 310.00 | | HIF |
KWGM-02 | | NL04545 | | K-10-83 | | 592.00 | | 595.00 | | MIF |
KWGM-03 | | NL04231 | | K-10-85 | | 230.00 | | 233.00 | | MIF |
KWGM-04 | | NL03537 | | K-10-85 | | 44.00 | | 47.00 | | QCIF |
KWGM-05 | | NL04229 | | K-10-85 | | 224.00 | | 227.00 | | HIF |
KWGM-06 | | NL04133 | | K-10-84 | | 333.00 | | 336.00 | | MIF |
KWGM-07 | | NL04974 | | K-10-81A | | 308.00 | | 310.00 | | MHIF |
KWGM-08 | | NL01407 | | K-10-37A | | 591.00 | | 594.00 | | SIF |
KWGM-09 | | NL00530 | | K-10-27 | | 652.00 | | 655.00 | | MIF |
KWGM-10 | | NL02404 | | K-10-63 | | 14.00 | | 16.00 | | MIF |
KWGM-11 | | NL02965 | | K-10-46 | | 42.50 | | 44.60 | | HMIF |
| | | | | | | | | | |
2663 | | 2016 | | K-08-01 | | 74.40 | | 79.40 | | MHIF |
2664 | | 2148 | | K-08-07 | | 33.00 | | 36.40 | | MIF |
2665 | | 2372 | | K-08-13 | | 75.10 | | 78.00 | | MIF |
2666 | | 4510 | | K-08-19 | | 69.23 | | 71.64 | | MIF |
2667 | | 4592 | | K-08-21 | | 36.91 | | 39.60 | | MIF |
2668 | | 2440 | | K-08-16 | | 306.75 | | 311.66 | | MIF |
2669 | | 2121 | | K-08-06 | | 117.00 | | 122.00 | | MIF |
2670 | | 2078 | | K-08-02 | | 85.65 | | 90.65 | | MIF |
2671 | | 2383 | | K-08-15 | | 115.23 | | 116.23 | | MIF |
2672 | | 4614 | | K-08-24 | | 247.50 | | 249.62 | | MIF |
2673 | | 4534 | | K-08-20 | | 216.95 | | 221.95 | | MIF |
2674 | | 4580 | | K-08-20 | | 400.27 | | 402.89 | | MIF |
2675 | | 2139 | | K-08-08 | | 88.95 | | 93.95 | | MIF |
2676 | | 2003 | | K-08-01 | | 14.20 | | 16.60 | | MIF |
2677 | | 2495 | | K-08-18 | | 286.32 | | 291.32 | | HIF |
108
TABLE 25.
COMPARISON OF ANALYTICAL RESULTS
WGM INDEPENDENT SAMPLE ASSAYS VERSUS 2010 AND 2008 ORIGINAL SAMPLE ASSAYS
Sample
ID | | TFe
(%) | | magFe
(%) | | FeO
(%) | | SiO2
(%) | | TiO2
(%) | | Al2O3
(%) | | MgO
(%) | | CaO
(%) | | Na2O
(%) | | K2O
(%) | | Mn
(%) | | P2O5
(%) | | S
(%) | | SG | |
NL03634 | | 32.17 | | 0.05 | | 0.72 | | 32.20 | | 0.01 | | 0.03 | | 1.46 | | 2.46 | | 1.98 | | 0.01 | | 9.14 | | 0.04 | | | | | |
KWGM-01 | | 31.89 | | 0.10 | | 0.77 | | 32.80 | | 0.01 | | 0.07 | | 1.54 | | 2.46 | | 2.10 | | 0.01 | | 9.37 | | 0.04 | | | | 3.92 | |
| | | | | | | | | | | | | | | | | | | | | | | | | | | | | |
NL04545 | | 33.01 | | 30.10 | | 16.78 | | 38.60 | | 0.01 | | 0.28 | | 2.43 | | 3.21 | | 0.06 | | 0.02 | | 1.84 | | 0.06 | | | | | |
KWGM-02 | | 29.38 | | 27.40 | | 14.75 | | 45.40 | | 0.01 | | 0.27 | | 2.30 | | 2.93 | | 0.07 | | 0.04 | | 1.56 | | 0.06 | | | | 3.44 | |
| | | | | | | | | | | | | | | | | | | | | | | | | | | | | |
NL04231 | | 33.08 | | 27.40 | | 18.96 | | 45.30 | | 0.01 | | 0.15 | | 3.55 | | 1.50 | | 0.01 | | 0.03 | | 0.94 | | 0.05 | | | | | |
KWGM-03 | | 32.45 | | 27.80 | | 18.60 | | 46.20 | | 0.01 | | 0.15 | | 3.61 | | 1.27 | | 0.02 | | 0.03 | | 0.92 | | 0.05 | | | | 3.58 | |
| | | | | | | | | | | | | | | | | | | | | | | | | | | | | |
NL03537 | | 15.53 | | 1.50 | | 19.07 | | 46.20 | | 0.01 | | 0.17 | | 5.44 | | 8.14 | | 0.02 | | 0.01 | | 0.72 | | 0.06 | | | | | |
KWGM-04 | | 14.34 | | 1.40 | | 17.79 | | 50.10 | | 0.01 | | 0.11 | | 4.98 | | 7.81 | | 0.02 | | 0.01 | | 0.65 | | 0.05 | | | | 3.20 | |
| | | | | | | | | | | | | | | | | | | | | | | | | | | | | |
NL04229 | | 36.79 | | 0.60 | | 1.18 | | 36.30 | | 0.02 | | 0.12 | | 1.82 | | 2.36 | | 0.05 | | 0.09 | | 2.08 | | 0.03 | | | | | |
KWGM-05 | | 36.23 | | 1.20 | | 1.26 | | 36.60 | | 0.01 | | 0.09 | | 1.75 | | 2.28 | | 0.07 | | 0.09 | | 1.98 | | 0.03 | | | | 3.75 | |
| | | | | | | | | | | | | | | | | | | | | | | | | | | | | |
NL04133 | | 33.71 | | 32.60 | | 13.80 | | 49.40 | | 0.01 | | 0.10 | | 0.56 | | 1.17 | | 0.01 | | 0.01 | | 0.68 | | 0.03 | | | | | |
KWGM-06 | | 34.34 | | 34.10 | | 14.30 | | 47.70 | | 0.01 | | 0.09 | | 0.51 | | 1.15 | | 0.01 | | 0.01 | | 0.69 | | 0.04 | | | | 3.63 | |
| | | | | | | | | | | | | | | | | | | | | | | | | | | | | |
NL04974 | | 29.94 | | 12.20 | | 5.97 | | 48.60 | | 0.01 | | 0.16 | | 2.04 | | 2.20 | | 0.03 | | 0.02 | | 0.59 | | 0.03 | | | | | |
KWGM-07 | | 28.47 | | 11.90 | | 5.98 | | 51.10 | | 0.01 | | 0.16 | | 2.10 | | 2.22 | | 0.02 | | 0.01 | | 0.58 | | 0.03 | | | | 3.36 | |
| | | | | | | | | | | | | | | | | | | | | | | | | | | | | |
NL01407 | | 23.57 | | 1.10 | | | | 50.90 | | 0.10 | | 0.90 | | 3.50 | | 1.46 | | 0.04 | | 0.13 | | 1.79 | | 0.17 | | | | | |
KWGM-08 | | 21.05 | | 0.90 | | 26.13 | | 58.00 | | 0.09 | | 0.74 | | 3.31 | | 1.11 | | 0.05 | | 0.13 | | 1.53 | | 0.14 | | | | 3.28 | |
| | | | | | | | | | | | | | | | | | | | | | | | | | | | | |
NL00530 | | 28.96 | | 23.50 | | | | 42.60 | | 0.01 | | 0.05 | | 1.78 | | 5.58 | | 0.01 | | 0.01 | | 1.61 | | 0.02 | | | | | |
KWGM-09 | | 28.89 | | 23.10 | | 11.11 | | 43.90 | | 0.01 | | 0.01 | | 1.65 | | 5.15 | | 0.02 | | 0.01 | | 1.46 | | 0.02 | | | | 3.52 | |
| | | | | | | | | | | | | | | | | | | | | | | | | | | | | |
NL02404 | | 31.06 | | 18.40 | | 24.68 | | 46.10 | | 0.01 | | 0.10 | | 2.19 | | 2.32 | | 0.05 | | 0.01 | | 2.62 | | 0.02 | | | | | |
KWGM-10 | | 30.99 | | 18.10 | | 25.05 | | 46.70 | | 0.01 | | 0.08 | | 2.19 | | 2.27 | | 0.04 | | 0.01 | | 2.56 | | 0.01 | | | | 3.57 | |
| | | | | | | | | | | | | | | | | | | | | | | | | | | | | |
NL02965 | | 18.26 | | 2.20 | | | | 58.20 | | 0.04 | | 0.11 | | 0.41 | | 5.47 | | 0.04 | | 0.01 | | 2.88 | | 0.02 | | | | | |
KWGM-11 | | 17.56 | | 2.40 | | 1.47 | | 60.80 | | 0.03 | | 0.04 | | 0.32 | | 4.62 | | 0.06 | | 0.01 | | 2.54 | | 0.02 | | | | 3.20 | |
| | | | | | | | | | | | | | | | | | | | | | | | | | | | | |
02016 | | 36.93 | | 28.00 | | 11.90 | | 36.50 | | 0.01 | | 0.08 | | 1.35 | | 3.79 | | 0.01 | | 0.01 | | 1.19 | | 0.02 | | | | | |
2663 | | 36.16 | | 27.20 | | 11.96 | | 37.30 | | 0.01 | | 0.06 | | 1.34 | | 3.85 | | 0.01 | | 0.01 | | 1.15 | | 0.02 | | 0.01 | | 3.60 | |
| | | | | | | | | | | | | | | | | | | | | | | | | | | | | |
02148 | | 29.10 | | 15.00 | | 25.30 | | 42.80 | | 0.03 | | 0.27 | | 4.00 | | 3.59 | | 0.03 | | 0.04 | | 1.12 | | 0.06 | | | | | |
2664 | | 32.17 | | 22.50 | | 22.99 | | 42.40 | | 0.02 | | 0.26 | | 2.66 | | 2.60 | | 0.03 | | 0.03 | | 1.05 | | 0.05 | | 0.01 | | 3.51 | |
| | | | | | | | | | | | | | | | | | | | | | | | | | | | | |
02372 | | 24.27 | | 22.70 | | 13.05 | | 48.30 | | 0.01 | | 0.12 | | 2.98 | | 5.42 | | 0.10 | | 0.01 | | 0.26 | | 0.03 | | | | | |
2665 | | 24.06 | | 22.00 | | 12.99 | | 48.80 | | 0.01 | | 0.14 | | 3.07 | | 5.48 | | 0.02 | | 0.01 | | 0.23 | | 0.02 | | 0.18 | | 3.19 | |
| | | | | | | | | | | | | | | | | | | | | | | | | | | | | |
04510 | | 25.81 | | 21.90 | | 10.48 | | 48.60 | | 0.01 | | 0.02 | | 2.81 | | 5.27 | | 0.01 | | 0.01 | | 0.22 | | 0.01 | | | | | |
2666 | | 26.65 | | 21.40 | | 10.70 | | 46.60 | | 0.01 | | 0.01 | | 2.81 | | 5.62 | | 0.10 | | 0.01 | | 0.22 | | 0.01 | | 0.01 | | 3.30 | |
| | | | | | | | | | | | | | | | | | | | | | | | | | | | | |
04592 | | 28.26 | | 26.80 | | 14.53 | | 43.40 | | 0.01 | | 0.02 | | 2.35 | | 5.54 | | 0.01 | | 0.01 | | 0.88 | | 0.02 | | | | | |
2667 | | 28.82 | | 27.90 | | 14.49 | | 44.80 | | 0.01 | | 0.01 | | 2.21 | | 4.91 | | 0.01 | | 0.01 | | 0.78 | | 0.01 | | 0.01 | | 3.37 | |
| | | | | | | | | | | | | | | | | | | | | | | | | | | | | |
02440 | | 40.15 | | 40.30 | | 17.73 | | 37.90 | | 0.01 | | 0.18 | | 1.63 | | 1.96 | | 0.07 | | 0.03 | | 0.39 | | 0.04 | | | | | |
2668 | | 40.99 | | 41.10 | | 18.61 | | 35.80 | | 0.01 | | 0.37 | | 1.79 | | 2.20 | | 0.02 | | 0.03 | | 0.42 | | 0.03 | | 0.01 | | 3.70 | |
| | | | | | | | | | | | | | | | | | | | | | | | | | | | | |
02121 | | 32.03 | | 32.00 | | 12.13 | | 46.20 | | 0.02 | | 0.22 | | 3.37 | | 1.31 | | 0.01 | | 0.12 | | 0.74 | | 0.05 | | | | | |
2669 | | 32.94 | | 33.00 | | 14.79 | | 45.60 | | 0.01 | | 0.23 | | 3.35 | | 1.32 | | 0.02 | | 0.13 | | 0.70 | | 0.05 | | 0.01 | | 3.52 | |
| | | | | | | | | | | | | | | | | | | | | | | | | | | | | |
02078 | | 28.40 | | 27.00 | | 14.58 | | 45.60 | | 0.10 | | 1.96 | | 3.61 | | 2.38 | | 0.43 | | 0.48 | | 0.53 | | 0.07 | | | | | |
2670 | | 28.75 | | 27.00 | | 14.67 | | 46.40 | | 0.08 | | 1.71 | | 3.52 | | 2.39 | | 0.34 | | 0.42 | | 0.52 | | 0.08 | | 0.04 | | 3.37 | |
| | | | | | | | | | | | | | | | | | | | | | | | | | | | | |
02383 | | 33.08 | | 29.00 | | 19.23 | | 43.10 | | 0.01 | | 0.18 | | 3.16 | | 2.32 | | 0.07 | | 0.03 | | 0.74 | | 0.04 | | | | | |
2671 | | 30.99 | | 26.40 | | 18.31 | | 46.30 | | 0.01 | | 0.17 | | 3.20 | | 2.30 | | 0.01 | | 0.03 | | 0.72 | | 0.03 | | 0.01 | | 3.42 | |
| | | | | | | | | | | | | | | | | | | | | | | | | | | | | |
04614 | | 32.31 | | 25.90 | | 17.64 | | 40.70 | | 0.06 | | 0.97 | | 1.61 | | 4.19 | | 0.01 | | 0.02 | | 0.72 | | 0.06 | | | | | |
2672 | | 30.92 | | 26.40 | | 15.70 | | 44.80 | | 0.02 | | 0.31 | | 1.50 | | 4.18 | | 0.01 | | 0.01 | | 0.63 | | 0.05 | | 1.77 | | 3.38 | |
| | | | | | | | | | | | | | | | | | | | | | | | | | | | | |
04534 | | 36.30 | | 36.20 | | 15.24 | | 38.50 | | 0.02 | | 0.14 | | 2.34 | | 2.85 | | 0.01 | | 0.02 | | 1.86 | | 0.05 | | | | | |
2673 | | 35.46 | | 36.10 | | 14.70 | | 39.10 | | 0.01 | | 0.15 | | 2.35 | | 2.73 | | 0.13 | | 0.02 | | 1.77 | | 0.04 | | 0.01 | | 3.56 | |
| | | | | | | | | | | | | | | | | | | | | | | | | | | | | |
04580 | | 33.57 | | 31.60 | | 15.87 | | 45.90 | | 0.02 | | 0.26 | | 2.85 | | 1.26 | | 0.01 | | 0.05 | | 0.87 | | 0.05 | | | | | |
2674 | | 32.24 | | 30.80 | | 15.26 | | 46.60 | | 0.02 | | 0.29 | | 2.86 | | 1.30 | | 0.01 | | 0.05 | | 0.81 | | 0.05 | | 0.01 | | 3.39 | |
| | | | | | | | | | | | | | | | | | | | | | | | | | | | | |
02139 | | 21.75 | | 22.00 | | 10.78 | | 52.70 | | 0.01 | | 0.09 | | 2.59 | | 5.00 | | 0.01 | | 0.02 | | 1.57 | | 0.03 | | | | | |
2675 | | 25.60 | | 25.60 | | 11.95 | | 49.10 | | 0.01 | | 0.07 | | 2.29 | | 4.43 | | 0.01 | | 0.01 | | 1.56 | | 0.03 | | 0.01 | | 3.30 | |
| | | | | | | | | | | | | | | | | | | | | | | | | | | | | |
02003 | | 31.41 | | 31.00 | | 15.02 | | 41.40 | | 0.01 | | 0.14 | | 3.40 | | 0.50 | | 0.01 | | 0.01 | | 4.9 | | 0.04 | | | | | |
2676 | | 32.17 | | 31.90 | | 15.42 | | 41.40 | | 0.01 | | 0.12 | | 3.33 | | 0.50 | | 0.01 | | 0.01 | | 4.57 | | 0.03 | | 0.02 | | 3.59 | |
| | | | | | | | | | | | | | | | | | | | | | | | | | | | | |
02495 | | 27.42 | | 0.40 | | 0.76 | | 48.60 | | 0.03 | | 0.47 | | 3.08 | | 2.53 | | 0.01 | | 0.29 | | 0.96 | | 0.03 | | | | | |
2677 | | 27.21 | | 0.50 | | 0.62 | | 50.00 | | 0.02 | | 0.42 | | 2.98 | | 2.59 | | 0.07 | | 0.25 | | 0.96 | | 0.03 | | 0.02 | | 3.35 | |
Notes: Alderon and Altius samples and results are shaded.
WGM 2008 samples were quarter core; 2010 samples were half split core.
109

Draft Kami Report, May19, 2011
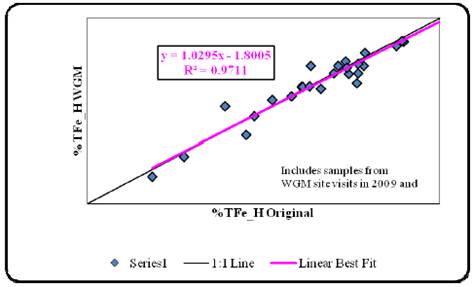
Figure 36. %TFe_H for WGM Independent Sample vs. Alderon or Altius Original Sample
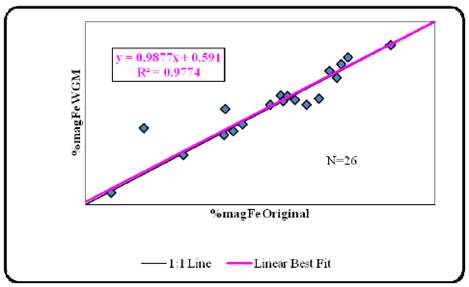
Figure 37. %magFe_H (Satmagan) for WGM Independent Sample vs. Alderon or Altius Original Sample
110
Draft Kami Report, May19, 2011
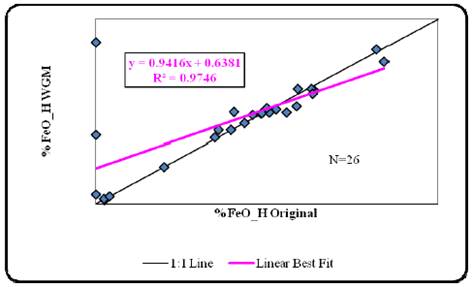
Figure 38. %FeO_H for WGM Independent Sample vs. Alderon or Altius Original Sample
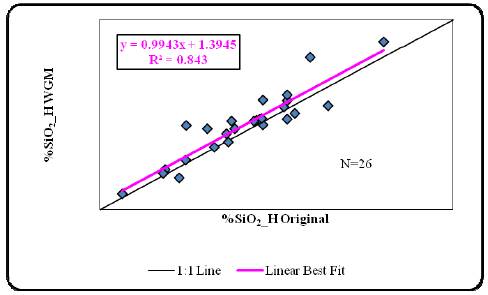
Figure 39. %SiO2_H for WGM Independent Sample vs. Alderon or Altius Original Sample
111
Draft Kami Report, May19, 2011
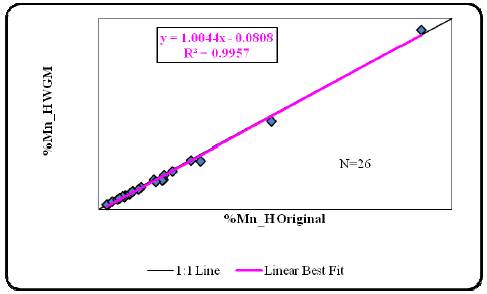
Figure 40. %Mn_H for WGM Independent Sample vs. Alderon or Altius Original Sample
Assay results for WGM Independent samples and corresponding Alderon sample are generally strongly correlated indicating generally reliable and precise assays and the minimal probability of any sample mix-ups in the field or in the lab. Two samples, KWGM-02 and KWGM-08, reported SiO2 assays that diverge noticeably from Alderon Original values but assays for other components in these same two samples are generally within 1% to 2% of each other. Similarly, %magFeSat for WGM’s 2009 sample 2664 and corresponding Altius sample 02148 shows more variance than might be expected, but other assay components are within a close range. WGM concludes Alderon and Altius sampling and assaying is generally reliable.
Results for SG are given in the Section 9 Mineralization of this report.
112
Draft Kami Report, May19, 2011
15. ADJACENT PROPERTIES
The northern boundary of the Property is located approximately 6 km south of the Scully Mine of Wabush Mines, owned 100% by Arcelor-Mittal Steel’s Canadian subsidiary Dofasco. Dofasco purchased all outstanding interest in the operation from Stelco and Cleveland Cliffs Inc., now Cliffs Natural Resources Inc. (“Cliffs”), in September 2007. The Carol operations (Humphrey Mine) owned by Rio Tinto Iron Ore subsidiary IOCC located north of Labrador City is approximately 18 km north of the Property. QCM’s Mont-Wright Iron Mine, also owned by Arcelor-Mittal Steel is located 9 km west of the Property. QCM has been renamed ArcelorMittal Mines of Canada (“AMMC”). The Property is also located approximately 10 km southeast of the Bloom Lake Iron Deposit recently purchased by Cliffs. All of these iron mines in the area extract similar iron mineralization as found at the Property, although for each deposit there are some variations in geology and the character of the mineralization.
The following is a brief description of the operations in the area:
Wabush Mines’ Scully Mine has been in operations since 1965. Mining and concentrating takes place in Wabush, while the subsequent stage of pelletizing is done at a plant at Pointe Noire on the St Lawrence River west of Sept-Iles, Québec. Since 1967, annual capacity of the Wabush operation has been approximately six million long tons of pellets. Strathcona Mineral Services Limited (“Strathcona”) completed a review of the Scully operation in 2006 for the government of Newfoundland and Labrador and much of what is summarized below concerning the Scully operations is taken from Stathcona’s report. Wabush Mines is the smallest of the three operations in the Western Labrador and has always been considered to have less favourable economics because of its lower production rate, ore quality issues because of the manganese content in the ore, significant de-watering requirements in the mining operations, and reliance on a competitor’s railroad (IOCC) for transporting ore to the pellet plant.
The Wabush Mine ore consists dominantly of hematite with minor magnetite. Ore with more than 15% magnetite is excluded from Mineral Reserves because the processing plant can’t handle it. This information has not been independently verified by the QP and the information is not necessarily indicative of mineralization on the Property. Manganese is the main non-iron element affecting the quality of the Wabush pellets, with all other elements generally meeting typical market specifications. O’Leary et al., (1979) has shown the manganese grade in the final concentrate closely matches the manganese grade in the crude ore, indicating that, on average, about two-thirds of the manganese is being rejected in the concentration process.
113
Draft Kami Report, May19, 2011
Pellets from Wabush Mines with high manganese have to be blended with low-manganese iron ore in order to meet the specifications generally established by the steel producers. Maintaining satisfactory manganese content is therefore the major technical challenge facing Wabush Mines in terms of product quality, which is a challenge not faced by the neighbouring operations at IOCC and Mont-Wright. WGM understands that a decision to go ahead with the construction of a manganese treatment plant at Wabush is in process. This development should extend mine life as more high manganese mineralization will become ore and the mines product should presumably be able to garner a higher price.
AMMC is a major North American producer and marketer of a variety of iron ore products consisting of concentrates and several types of pellets. AMMC owns and operates the Mont-Wright Mine and concentrator at Fermont, a pellet plant and adjacent port facilities on the Gulf of St. Lawrence at Port-Cartier, Québec and the railway, which transports iron ore concentrate to the pelletizing plant and for direct shipping.
The Mont-Wright operation consists of several open pit mines and a concentrator, which started production in 1975. The iron formation that is mined at Mont-Wright has an average iron content of approximately 30% TFe. The magnetite content is normally less than 5% by weight, however, it may be higher locally, and magnetite must be blended into the mill feed. The level of contaminants (predominantly TiO2, Al2O3, Mn, P, Na2O, K2O) in the iron ore is generally low, but is higher adjacent to the amphibolite-specular hematite contacts. The marketplace considers Mont-Wright concentrate purer than the fines being shipped from Australia and Brazil.
The mine has the capacity to produce some 38 million tonnes of feed for the concentrator and about 30 million tonnes of waste per year. The Mont-Wright concentrator has the capacity to produce 16 million tonnes of concentrate annually, assuming a Head grade of 30% Fe. Current production is approximately 13.5 million tonnes of iron ore concentrates per year, from crude ore with an average Head grade of 28% Fe. Crude Head grade averaged 28.2% Fe between 2001 and 2005 and is forecast to average 28.9% TFe for the 2006 to 2010-year period. The variation in the concentrate tonnage is directly related to yearly sales, which are dependent on market conditions. During the period from 1961 through 2005, a total of approximately 543 million tonnes of iron ore products was shipped from Port-Cartier. Prior to the start of the Mont-Wright mine, QCM production came from the operations in Gagnon and Fire Lake which used the southern portion of the rail and the shipping facilities at Port-Cartier.
114
Draft Kami Report, May19, 2011
The Lac Hessé, Lac Moiré and Fire Lake deposits occur in this same immediate area and are held by AMMC. In addition, AMMC recently re-acquired the magnetite-rich Mont-Reed deposit near Lac Jeannine. Lac Jeannine, at Gagnon, was QCM’s first operation in the area, but by April 1977 it had been depleted following production of 130 million tonnes of iron ore concentrate over a 17-year period. The Fire Lake Deposit saw limited production from late-1974 into 1984, first by QCM, then by Sidbec-Normines Inc. Recent developments at Fire Lake included the 2006 extraction of approximately 1.3 million tonnes of crude ore for metallurgical and concentrator testing. This program began in June 2006 and was to be completed before the end of the year.
The Bloom Lake Mine started commercial production in 2010. In 1998, WGM on behalf of QCM, designed and managed an exploration program on the Bloom Lake Property. Breton, Banville and Associates (“BBA”) completed a Conceptual Study for the development of 5 million t/y mine and concentrator for the deposit in October 2005. In May 2006, BBA completed a feasibility study based on the same parameters. In May 2007, BBA presented an update of the mining plan, the mine and concentrator infrastructure, the capital and operating costs and a review of the financial analysis for the development of a 7 million t/y operation. In August 2007, Consolidated Thomson stated that almost half of its detailed engineering for mine development had been completed and work was proceeding. In November 2008 it filed a feasibility study available on SEDAR for the project based on 8 Mt/yr of iron concentrate, (Allaire, Palumbo, Live and Scherrer, 2008). This information has not been verified by the QP and the information is not necessarily indicative of mineralization on the Property.
IOCC operates a mine, concentrator and a pelletizing plant in Labrador City, as well as port facilities located in Sept-Îles. The company also operates a 420-kilometre railroad that links the mine to the port. IOCC is the largest iron ore and pellet producer in Canada. In 2005, it celebrated 50 years of operation. Its first operation, in Schefferville, Québec at Knob Lake started in 1954 and ceased production in 1982. IOCC’s Carol operations, initially from the Smallwood Mine, opened in 1962. IOCC recently announced its commitment to boost concentrate output from 17 to 22 million t/y. Additional projects are planned to increase pellet production from 13.0 to 14.5 million t/y.
115

Draft Kami Report, May19, 2011
16. MINERAL PROCESSING AND METALLURGICAL TESTING
16.1 GENERAL
Preliminary metallurgical testwork on the Kami deposit was completed by Altius Resources in 2009 on a sample composited from two drillholes. This work demonstrated that a concentrate of acceptable quality could be produced. In conjunction with assay of the drill core from the 2010 drill program, over 3,000 Davis Tube tests were completed which serves both as an indicator of magnetite content, as well as the potential recovery and concentrate grade from the application of LIMS in commercial processing of the deposits. The Davis Tube tests were completed at a grind of P80 of 200 mesh, which appears to be finer than the deposits may require to produce saleable concentrates.
WGM is aware that further metallurgical testwork has been completed since 2009 but has not been provided with any of these results for review, other than the Davis Tube test results which formed a part of the drill core sample “assay” program, as this work is currently ongoing at the time of writing this report. WGM has been provided with a scope of current work that is ongoing and the scope of the next phase of testwork that is planned. A summary of the current scope of the testwork is provided below and WGM recommends that these results require a thorough review in conjunction with the Mineral Resource estimate prior to committing to the second phase of metallurgical testwork. There is significant exploration drilling, as well as infill drilling of the deposits, that has yet to be completed that may influence the sample material and further bench scale testing that may be required.
The indicated presence of manganese in the Kami deposits will require careful consideration in the process development work to ensure the selected flowsheet can maintain market specifications on the mineralization that is ultimately included in the project Mineral Resources/Reserves. As specifications for iron ore concentrates became more stringent, tolerable levels of manganese have been reduced. Potential strategies for managing manganese levels to meet the specifications of the world iron ore market include more selectively mining, ore blending and further treatment of concentrates.
It is worthy of note that the Mn in the Kami deposits occur in different minerals and hence may not have the same concentration issues as at the Scully operation.
116
Draft Kami Report, May19, 2011
16.2 CURRENT TESTWORK PROGRAM
In preparation for a scoping study on the Kami deposits, a program of metallurgical testwork has been developed by BBA and initiated using assay rejects from the diamond drilling program. No results of this work have been made available to WGM as the work is still ongoing. Preliminary bench scale testwork will be carried out to establish the metallurgical response of recognized variations in the mineralization. To support this testwork, five samples have been composited based on variations in the mineralogy and particularly magnetite and hematite, as well as manganese. Four of the samples are from the Rose Lake Deposit, with one sample high in magnetite, one sample high in hematite, one sample a mixture of magnetite and hematite, and one sample a composite of the first three from the Rose Lake Deposit. A fifth sample has been composited from the adjacent Mills Lake Deposit.
Following grinding to 100% passing 35 mesh, the four composite samples will be subjected to an analysis of weight distribution by screen fraction at 35, 65, 200, and 325 mesh, with full head analysis, QEMSCAN analysis, heavy liquid separation, and magnetic and gravity separation testing on each of the size fractions. Manganese will be tracked in the various concentrates produced in the comparative testing. The results of this work will be considered in selecting the process flowsheet (and variations) for further larger scale testwork.
16.3 FUTURE TESTING
Based on the results of the current testwork, a process flowsheet will be proposed and a program of larger scale testing on half core will be carried out. Although there is an extensive second phase of metallurgical testing proposed by BBA with a defined scope, WGM recommends that a full review of the current test results is required prior to committing to the next phase. These results will require careful consideration in estimation of the Kami Mineral Resource. Depending on the deportment of manganese in the concentration process, portions of the deposit may have to be excluded from the resources, however a marketing study will need to be completed before this can be determined.
In WGM’s opinion, the results of the current process development work will guide the need to submit possible variations in the mineralogy to further bench scale testing to establish grade and recovery factors to support Mineral Reserve estimates, as well as the scale of the pilot operation that may be required to support a final feasibility. WGM anticipates that areas of the deposit with higher concentrations of manganese will require particular attention in support of Mineral Reserve estimates where it may be necessary to confirm that the
117
Draft Kami Report, May19, 2011
manganese levels in the concentrates produced from these areas can be maintained at or below market requirements.
In the Labrador West area, there are four other iron ore deposits in commercial production with many similarities to the Kami deposits which will be useful references in deciding the scope of future testing and pilot plant requirements necessary to support Project feasibility. It is possible that marketing considerations, evaluation of pelletizing, characterization of products, and potential off-take agreements as part of Project financing will be a significant consideration for a pilot plant operation.
This work would include communition tests to establish the ore work indices, gravity and magnetic concentration and characterization of concentrates and tailings for preliminary process design criteria.
16.4 TESTWORK RESULTS PRIOR TO 2010
One testwork program completed at SGS-Lakefield has been conducted on mineralization from the Property. This program was completed for Altius in 2009 based on a design prepared by Mrs. Stephanie m. Scott from Thibault and Associates Inc. (“Thibault”) for bench-scale testing of a single bulk sample. The test program was directed by Mrs. Scott. Mr. Richard Wagner, in his capacity as a qualified person, as defined by NI-43-101, reviewed the final report.
The metallurgical sample was a composite made from routine sample intervals from drill holes K-08-01 and K-08-18 (Table 26). These intervals of magnetite-rich iron formation, with lower specularite, were selected by Altius as reasonably representative of the overall deposit mineralization. Most of the routine assay sample intervals were 3.0 m. The assay rejects from the routine samples were combined providing a total composite weight of approximately 250 kg.
TABLE 26.
MAKE-UP OF METALLURGICAL SAMPLE
Hole_ID | | From (m) | | To (m) | | Width (m) | |
K-08-18 | | 161.0 | | 222.0 | | 61.0 | |
K-08-01 | | 99.4 | | 162.9 | | 63.5 | |
Total | | | | | | 124.5 | |
The sample was submitted for a detailed ore characterization including head assays, mineralogy, preliminary grindability and beneficiation testwork. A sample representing the magnetite-rich ore zone was subjected to low-intensity magnetic separation (“LIMS”) and
118
Draft Kami Report, May19, 2011
gravity separation. SGS-Lakefield completed a report that presents the test results and provides a recommendation for a conceptual flowsheet.
The complete characterization and analysis for the sample are summarized in Tables 27 and 28.
The Head grade of the bulk sample at 44.3% Fe2O3 (30.98% TFe) compares closely with the average of all OIF classified drill core samples at 30.67%TFe. The Head of 1.60% MnO (1.25% Mn) is close to the average Mn content of OIF as calculated at 1.28% Mn based on all OIF classified Altius 2008 drillhole samples.
TABLE 27.
ORE CHARACTERIZATION SUMMARY
Head Assays | | % | | Mineral Abundance | | Head Assays |
Fe | | | 31.0 | | Magnetite | | 26.4 |
SiO2 | | | 43.0 | | Hematite | | 19.9 |
S | | | 0.01 | | Quartz | | 37.6 |
Fe3O4 | | | 26.4 | | Ankerite (Low Mn and Mg and Fe) | | 6.3 |
Mag Fe | | | 19.1 | | Dolomite(Fe) | | 4.8 |
Mag Rec Fe | | | 61.7 | | Amphibole/Pyroxene | | 2.4 |
Grindability | | | kWh/t | | Mn-Fe-Ca Carbonates | | 1.6 |
RWI | | | 5.75 | | Fe Deportment | | % |
BWI | | | 18.5 | | Fe Oxides | | 96.7 |
119
Draft Kami Report, May19, 2011
TABLE 28.
ORE CHARACTERIZATION DETAILS
XRF Whole-Rock Analysis | | ICP-Scan | | Rare-Earth Scan | |
Element | | Unit | | Assay | | Element | | Unit | | Assay | | Element | | Unit | | Assay | |
SiO2 | | % | | 43.0 | | | Ag | | g/t | | | < 2 | | Ce | | g/t | | | | 9.5 | |
Al2O3 | | % | | 0.11 | | | As | | g/t | | | < 30 | | Dy | | g/t | | | < | 1 | |
Fe2O3 | | % | | 44.3 | | | Ba | | g/t | | | 59 | | Er | | g/t | | | < | 0.8 | |
MgO | | % | | 1.78 | | | Be | | g/t | | | 1 | | Eu | | g/t | | | < | 0.6 | |
CaO | | % | | 3.88 | | | Bi | | g/t | | | < 20 | | Gd | | g/t | | | | 1.0 | |
Na2O | | % | | < 0.01 | | | Ca | | g/t | | | 28000 | | Ho | | g/t | | | < | 0.4 | |
K2O | | % | | 0.01 | | | Cd | | g/t | | | < 2 | | La | | g/t | | | | 4.3 | |
TiO2 | | % | | < 0.01 | | | Co | | g/t | | | < 30 | | Lu | | g/t | | | < | 0.6 | |
P2O5 | | % | | 0.03 | | | Cr | | g/t | | | 73 | | Nd | | g/t | | | | 4 | |
MnO | | % | | 1.60 | | | Cu | | g/t | | | 13 | | Pr | | g/t | | | | 0.9 | |
Cr2O3 | | % | | 0.01 | | | K | | g/t | | | 150 | | Sc | | g/t | | | < | 2 | |
V2O5 | | % | | < 0.01 | | | Li | | g/t | | | < 10 | | Sm | | g/t | | | < | 0.8 | |
LOI | | % | | 5.15 | | | Mg | | g/t | | | 9700 | | Tb | | g/t | | | < | 0.6 | |
Sum | | % | | 99.9 | | | Mn | | g/t | | | 12000 | | Th | | g/t | | | < | 0.6 | |
Fe | | % | | 31.0 | | | Mo | | g/t | | | < 5 | | Tm | | g/t | | | < | 0.8 | |
| | | | | | | Na | | g/t | | | 59 | | U | | g/t | | | < | 0.4 | |
Satmagan | | | Ni | | g/t | | | < 20 | | Y | | g/t | | | | 6.7 | |
Element | | Unit | | Assay | | | Pb | | g/t | | | < 60 | | Yb | | g/t | | | | 0.5 | |
Fe3O4 | | % | | 26.4 | | | Sb | | g/t | | | < 10 | | | | | | | | | |
Mag Fe | | % | | 19.1 | | | Se | | g/t | | | < 30 | | Other Analyses | |
Rec Fe | | % | | 61.7 | | | Sn | | g/t | | | < 20 | | Element | | Unit | | Assay | |
| | | | | | | Sr | | g/t | | | 15 | | S | | % | | 0.01 | |
Moisture content | | | Ti | | g/t | | | 34 | | F | | % | | 0.005 | |
Wet | | Dry | | % | | | Tl | | g/t | | | < 30 | | Cl | | g/t | | 49 | |
9933.3 | | 9926.7 | | 0.1 | | | V | | g/t | | | 7 | | S.G. | | g/cm3 | | 3.49 | |
| | | | | | | Zn | | g/t | | | < 40 | | | | | | | |
As aforementioned, the Head assayed 31% Fe and 43% SiO2. A high proportion of the TFe (about 97%) in the sample was present in coarse-grained Fe-oxides (magnetite and hematite), which constitutes 46% of the total mineral assemblage, with the balance distributed into various non-opaque gangue minerals. The magnetite grade measured 26.4% (mineralogy and Satmagan), corresponding to a ‘magnetically recoverable Fe proportion of about 62%’. Hematite was also present in a slightly lower proportion (19.9%), which can be recovered through gravity separation given the relative coarse grained nature of the mineralization. Iron oxide liberation was good over the entire size range which facilitates the recovery of high grade concentrates.
The Bond rod mill and ball mill grindability tests measured 5.8 and 18.5 kWh/t, respectively. The large variation between the two indices is not common in ore testing, but is similar to the results on the Bloom Lake Deposit. This will not cause any particular problem in grinding, but primary grinding will require low energy and secondary grinding will require more.
120
Draft Kami Report, May19, 2011
The sample was submitted for a preliminary beneficiation program which included Davis Tube and Mozley testing on various sizes; followed by wet drum LIMS confirmation. The test results are summarized in Table 29. Mozley testing on various sizes was also performed on the tailings produced from the best LIMS test. The best results were produced on sample material with a P80 of 78 microns (200 mesh) which achieved 61.7% Fe recovery at final LIMS concentrate grade of 69.0% TFe and 3.32% SiO2 with a weight recovery of 40.7%. Testing showed that size reduction below a P80 of 78 microns generally produced poorer results.
The Mozley results performed on a sample prepared at 65 mesh (P80 of 201 microns), achieved weight recoveries of 39.4% and TFe recoveries of 83.3%, with final TFe and SiO2 grades of 65.5% and 2.67%, respectively.
TABLE 29.
BENEFICIATION CHARACTERIZATION SUMMARY
| | Concentrate Grade (%) | | Recovery (%) | |
| | SiO2 | | TFe | | Sat | | Weight | | SiO2 | | TFe | | Sat | |
LIMS only | | 3.32 | | 69.0 | | 99.8 | | 28.5 | | 2.23 | | 61.7 | | 97.1 | |
Mozley only | | 2.67 | | 65.5 | | 59.2 | | 39.4 | | 2.49 | | 83.3 | | 86.8 | |
LIMS+Mozley | | 3.01 | | 67.5 | | 70.1 | | 40.7 | | 2.81 | | 88.6 | | 99.5 | |
The test combining LIMS and Mozley separations on the LIMS tailings achieved the best overall performance with weight and TFe recoveries of 40.7% and 88.6%, respectively, at final TFe and SiO2 grades of 67.5% and 3.01%, respectively as shown in Table 30. This result was a slight improvement in weight yield and 5.3% increase in TFe recovery over the Mozley only result on material with a P80 of 200 microns (65 mesh) which would result in considerably less grinding energy and the associated cost.
The normal range for manganese in pellet and concentrates from North and South America is 0.08% to 0.20% MnO (0.06 to 0.16% Mn) making the combined LIMS and gravity concentrate produced in this test program at 0.90% MnO (0.69% Mn) higher than “competitive products” in this market place. According to Alderon, the acceptable range may be higher than this normal North and South American range depending on the country the product is being sold into with values ranging from 0.5 % to 1.0% MnO (0.4 to 0.8% Mn), placing the combined test program product at the high end of the acceptable range. This however must be confirmed during the marketing study in progress. Wabush Mines has historically marketed much higher manganese content product and shows that a market acceptable product can be produced from high Mn mineralization.
121
Draft Kami Report, May19, 2011
The metallurgical testwork results performed on the one bulk sample from the Property indicates that manganese levels in concentrates from the Property may be higher than normal for iron concentrate levels and will be at a competitive disadvantage to other products currently sold on the world market with lower Mn levels. However, the limited work done to date suggests manganese levels will be significantly lower than for concentrates and pellets produced from Scully ores at Wabush Mines.
Specifications by the steel industry on the maximum permissible manganese content in pellets have restricted mining to ore units at Wabush that have less than 2% Mn, which after concentrating results in similar manganese content in the pellet product. As much as 60% of the production from Wabush Mines, with its high-manganese pellets, has recently been sold in China, as the traditional North American markets are no longer as receptive to this quality of product. China remains a strong and expanding iron market.
With the indicated average manganese content of the mineralization on the Kami Property being considerably lower than that of the Scully Mine, it is WGM’s opinion that it may be possible to reduce the manganese in the product by selective mining and blending or inclusion of a manganese reduction plant. Based on preliminary indications from ongoing testwork, Alderon believes that the distribution and occurrence of Mn in the Rose Central Deposit can be mitigated by simple blending of mill feed to result in an acceptable market product.
122
Draft Kami Report, May19, 2011 | | 
|
TABLE 30.
OVERALL METALLURGICAL SUMMARY
Grind Time: | 41 Minutes |
K80: | 78 Microns |
| | Weight | | | | | | | | | | | | | | | | Grade Retained, % | | | | | | | | | | | | | | | | | |
Sample | | % | | SiO2 | | Al2O3 | | Fe2O3 | | MgO | | CaO | | Na2O | | K2O | | TiO2 | | P2O5 | | MnO | | Cr2O3 | | V2O5 | | LOI | | Sum | | S | | Fe | | Mn | | Sat | |
LIMS Conc | | 28.5 | | 3.32 | | 0.08 | | 98.6 | | 0.23 | | 0.17 | | 0.02 | | 0.01 | | 0.02 | | 0.01 | | 0.82 | | 0.02 | | <0.01 | | -2.86 | | 100.4 | | 0.01 | | 69.0 | | 0.635 | | 99.8 | |
Gravity Conc* | | 12.2 | | 2.29 | | 0.14 | | 91.8 | | 0.89 | | 1.54 | | 0.01 | | 0.01 | | 0.03 | | 0.05 | | 1.08 | | — | | — | | — | | — | | 0.06 | | 64.2 | | 0.836 | | 0.87 | |
Combined Fe Conc. | | 40.7 | | 3.01 | | 0.1 | | 96.6 | | 0.43 | | 0.58 | | 0.02 | | 0.01 | | 0.02 | | 0.02 | | 0.90 | | — | | — | | — | | — | | 0.02 | | 67.5 | | 0.697 | | 70.1 | |
Gravity Tailings | | 59.3 | | 71.6 | | 0.23 | | 8.53 | | 2.59 | | 5.91 | | 0.03 | | 0.04 | | 0.01 | | 0.03 | | 1.95 | | — | | — | | — | | — | | 0.02 | | 5.96 | | 1.510 | | 0.26 | |
Calc. Head | | 100 | | 43.6 | | 0.18 | | 44.4 | | 1.71 | | 3.74 | | 0.03 | | 0.03 | | 0.02 | | 0.03 | | 1.52 | | — | | — | | — | | — | | 0.02 | | 31.1 | | 1.177 | | 28.7 | |
Direct Head | | — | | 43 | | 0.11 | | 44.3 | | 1.78 | | 3.88 | | <0.01 | | 0.01 | | <0.01 | | 0.03 | | 1.60 | | 0.01 | | <0.01 | | 5.15 | | 99.9 | | 0.01 | | 31 | | 1.239 | | 26.4 | |
*Represent the concentrate point on the grade-recovery curve with less than 4% SiO2 and >63% Fe
| | Weight | | | | | | | | | | | | | | | | Distribution, % | | | | | | | | | | | | | | | |
Sample | | % | | SiO2 | | Al2O3 | | Fe2O3 | | MgO | | CaO | | Na2O | | K2O | | TiO2 | | P2O5 | | MnO | | Cr2O3 | | V2O5 | | LOI | | Sum | | S | | Fe | | Sat | |
LIMS Conc | | 28.5 | | 2.17 | | 13.0 | | 63.3 | | 3.84 | | 1.3 | | 20.7 | | 10.4 | | 37.3 | | 10.1 | | 15.4 | | — | | — | | — | | — | | 13 | | 63.3 | | 99.1 | |
Gravity Conc* | | 12.2 | | 0.64 | | 9.94 | | 25.3 | | 6.4 | | 5.05 | | 5.77 | | 5.81 | | 22.6 | | 20.6 | | 8.65 | | — | | — | | — | | — | | 33.1 | | 25.3 | | 0.37 | |
Combined Fe Conc. | | 40.7 | | 2.81 | | 22.9 | | 88.6 | | 10.2 | | 6.35 | | 26.4 | | 16.2 | | 59.9 | | 30.7 | | 24 | | — | | — | | — | | — | | 46.1 | | 88.6 | | 99.5 | |
Gravity Tailings | | 59.3 | | 97.2 | | 77.1 | | 11.4 | | 89.8 | | 93.7 | | 73.6 | | 83.8 | | 40.1 | | 69.3 | | 76 | | — | | — | | — | | — | | 53.9 | | 11.4 | | 0.54 | |
Calc. Head | | 100 | | 100 | | 100 | | 100 | | 100 | | 100 | | 100 | | 100 | | 100 | | 100 | | 100 | | — | | — | | — | | — | | 100 | | 100 | | 100 | |
*Represent the concentrate point on the grade-recovery curve with less than 4% SiO2 and >63% Fe
123

17. MINERAL RESOURCE AND MINERAL RESERVE ESTIMATES
17.1 WGM MINERAL RESOURCE ESTIMATE STATEMENT
WGM has prepared a Mineral Resource estimate for the Kami Iron Ore Project mineralized zones that have sufficient data to allow for continuity of geology and grades. WGM modelled the Rose Central and Mills Lake deposits, but did not include Rose North Zone or other mineralized areas at this time. More field work and confirmation/infill drilling is required before a Mineral Resource estimate can be completed on these other areas. Indicated Mineral Resources are defined as blocks being within 100 m of a drillhole intercept for Mills Lake and within 150 m for Rose Central. Inferred Mineral Resources are interpolated out to a maximum of about 300 m for both deposit areas on the ends/edges and at depth when supporting information from adjacent cross sections was available.
The current drilling pattern is irregular / uneven and certain areas are sparsely drilled, with possibly only one or two holes intersecting the mineralization on a select limb or at depth on some cross sections. Many of the holes did not penetrate the entire thickness of the mineralized zone due to poor drillhole angles hence the “boundaries” are not well defined in some areas (particularly the dips of the zone and the depth extension). In general, the mineralization shows fairly good continuity on a gross scale, however, the folded nature and complexity of the Rose Central area is not yet completely understood. Additional drilling and a more detailed geological interpretation will be required to unravel the inter-layering or in-folding of waste sedimentary units. A Mineral Resources estimate is provided in Table 31.
The classification of Mineral Resources used in this report conforms with the definitions provided in the final version of NI 43-101, which came into effect on February 1, 2001, as revised on December 11, 2005. WGM further confirms that, in arriving at our classification, we have followed the guidelines adopted by the Council of the Canadian Institute of Mining Metallurgy and Petroleum (“CIM”) Standards. The relevant definitions for the CIM Standards/NI 43-101 are as follows:
A Mineral Resource is a concentration or occurrence of diamonds, natural, solid, inorganic or fossilized organic material including base and precious metals, coal, and industrial minerals in or on the Earth’s crust in such form and quantity and of such a grade or quality that it has reasonable prospects for economic extraction. The location, quantity, grade, geological characteristics and continuity of a Mineral Resource are known, estimated or interpreted from specific geological evidence and knowledge.
124
TABLE 31.
CATEGORIZED MINERAL RESOURCE ESTIMATE FOR
KAMI IRON ORE PROJECT (CUTOFF OF 20% TFe)
Category | | Zone | | Tonnes
(Million) | | Density | | TFe% | | magFe% | | hmFe% | | Mn% | | SiO2% | |
Indicated | | Rose Central Zone - Hematite-rich | | 66.7 | | 3.60 | | 31.4 | | 6.9 | | 23.6 | | 2.88 | | 42.4 | |
| | Rose Central Zone - Magnetite-rich | | 309.4 | | 3.54 | | 29.5 | | 21.1 | | 5.0 | | 1.27 | | 45.4 | |
| | Total Indicated Rose Central Zone | | 376.1 | | 3.55 | | 29.8 | | 18.6 | | 8.3 | | 1.56 | | 44.9 | |
| | | | | | | | | | | | | | | | | |
| | Mills Lake Zone - Hematite-rich | | 12.2 | | 3.68 | | 34.2 | | 2.7 | | 30.7 | | 4.80 | | 35.3 | |
| | Mills Lake Zone - Magnetite-rich | | 93.8 | | 3.56 | | 30.1 | | 24.5 | | 2.8 | | 0.57 | | 47.0 | |
| | Mills Lake Zone - Upper Magnetite-rich | | 8.2 | | 3.55 | | 29.6 | | 23.0 | | 1.3 | | 0.56 | | 45.6 | |
| | Total Indicated Mills Lake Zone | | 114.1 | | 3.57 | | 30.5 | | 22.1 | | 5.7 | | 1.02 | | 45.6 | |
| | | | | | | | | | | | | | | | | |
Inferred | | Rose Central Zone - Hematite-rich | | 10.3 | | 3.60 | | 31.6 | | 7.5 | | 23.9 | | 3.15 | | 41.5 | |
| | Rose Central Zone - Magnetite-rich | | 35.7 | | 3.54 | | 29.3 | | 22.6 | | 3.4 | | 1.16 | | 45.9 | |
| | Total Inferred Rose Central Zone | | 46.0 | | 3.55 | | 29.8 | | 19.2 | | 8.0 | | 1.61 | | 44.9 | |
| | | | | | | | | | | | | | | | | |
| | Mills Lake Zone - Hematite-rich | | 8.3 | | 3.70 | | 34.7 | | 2.6 | | 31.1 | | 4.60 | | 35.5 | |
| | Mills Lake Zone - Magnetite-rich | | 60.4 | | 3.56 | | 30.2 | | 24.8 | | 2.8 | | 0.60 | | 46.7 | |
| | Mills Lake Zone - Upper Magnetite-rich | | 3.3 | | 3.55 | | 29.8 | | 23.7 | | 1.3 | | 0.55 | | 45.5 | |
| | Total Inferred Mills Lake Zone | | 71.9 | | 3.58 | | 30.7 | | 22.2 | | 6.0 | | 1.05 | | 45.4 | |
125
An Inferred Mineral Resource is that part of a Mineral Resource for which quantity and grade or quality can be estimated on the basis of geological evidence and limited sampling and reasonably assumed, but not verified, geological and grade continuity. The estimate is based on limited information and sampling gathered through appropriate techniques from locations such as outcrops, trenches, pits, workings and drillholes.
An Indicated Mineral Resource is that part of a Mineral Resource for which quantity, grade or quality, densities, shape and physical characteristics, can be estimated with a level of confidence sufficient to allow the appropriate application of technical and economic parameters, to support mine planning and evaluation of the economic viability of the deposit. The estimate is based on detailed and reliable exploration and testing information gathered through appropriate techniques from locations such as outcrops, trenches, pits, workings and drillholes that are spaced closely enough for geological and grade continuity to be reasonably assumed.
A Measured Mineral Resource is that part of a Mineral Resource for which quantity, grade or quality, densities, shape, physical characteristics are so well established that they can be estimated with confidence sufficient to allow the appropriate application of technical and economic parameters, to support production planning and evaluation of the economic viability of the deposit. The estimate is based on detailed and reliable exploration, sampling and testing information gathered through appropriate techniques from locations such as outcrops, trenches, pits, workings and drillholes that are spaced closely enough to confirm both geological and grade continuity.
A Mineral Reserve is the economically mineable part of a Measured or Indicated Mineral Resource demonstrated by at least a Preliminary Feasibility Study. This Study must include adequate information on mining, processing, metallurgical, economic and other relevant factors that demonstrate, at the time of reporting, that economic extraction can be justified. A Mineral Reserve includes diluting materials and allowances for losses that may occur when the material is mined.
A Probable Mineral Reserve is the economically mineable part of an Indicated, and in some circumstances a Measured Mineral Resource demonstrated by at least a Preliminary Feasibility Study. This Study must include adequate information on mining, processing, metallurgical, economic, and other relevant factors that demonstrate, at the time of reporting, that economic extraction can be justified.
A Proven Mineral Reserve is the economically mineable part of a Measured Mineral Resource demonstrated by at least a Preliminary Feasibility Study. This Study must include adequate information on mining, processing, metallurgical, economic, and other relevant factors that demonstrate, at the time of reporting, that economic extraction is justified.
Mineral Resource classification is based on certainty and continuity of geology and grades. In most deposits, there are areas where the uncertainty is greater than in others. The majority of the time, this is directly related to the drilling density. Areas more densely drilled are usually better known and understood than areas with sparser drilling.
126
17.2 GENERAL MINERAL RESOURCE ESTIMATION PROCEDURES
The block model Mineral Resource estimate procedure included:
· validation of digital data in Gemcom Software International Inc.’s (“GemcomTM”) geological software package — the data was transferred to WGM from Alderon in MSAccess format and was validated both within Access and Gemcom (once the data was imported);
· generation of cross sections and plans to be used for geological interpretations;
· basic statistical analyses to assess cutoff grades, compositing and cutting (capping) factors, if required;
· development of 3-D wireframe models for zones with continuity of geology/mineralization, using available geochemical assays for each drillhole sample interval; and
· generation of block models for Mineral Resource estimates for each defined zone and categorizing the results according to NI 43-101 and CIM definitions.
17.3 DATABASE
17.3.1 DRILLHOLE DATA
Data used to generate the Mineral Resource estimate originated from a dataset supplied by Alderon technical personnel to WGM. The Gemcom Project was established to hold all the requisite data to be used for any manipulations necessary and for completion of the geological modelling and Mineral Resource estimate.
The Gemcom drillhole database consisted of 107 diamond drillholes; including “duplicated” hole numbers designated with an “A” nomenclature, meaning the hole was re-drilled in whole or in part, due to lost core/bad recovery. A total of 68 drillholes totaling 24,079 m were used for the current Mineral Resource estimate; 48 holes at Rose Central and 20 holes at Mills Lake. These holes were dispersed along the iron mineralization - approximately 1,600 m of strike length and 700 m of width on Rose Central and 1,400 m by 800 m on Mills Lake. The remaining drillholes in the database were located outside the current area of the Mineral Resources, but many were in close proximity to the main mineralized zone at Rose Central. A number of these holes will undoubtedly be used in future Mineral Resource estimates once additional drilling is completed leading to a better understanding of the structure, geology and mineralization in these areas.
The drillhole database contained geological codes and short descriptions for each unit and sub-unit and assay data for Head and Davis Tube Concentrate analyses, where available (as
127
summarized in Section 9 of this report). The raw sample intervals (565 for Mills Lake and 2,948 for Rose Central, including “internal waste”) within the mineralized zone ranged from 0.7 m to 8.2 m, averaging 3.1 m for Mills Lake and ranged 0.3 m to 7.6 m, averaging 3.1 m for Rose Central. Approximately 60% of the Head assayed intervals were between 2.8 m and 3.2 m in length for the routine analyses.
Additional information, including copies of the geological logs, summary reports and internal geological interpretations were supplied to WGM digitally or as hard copies.
17.3.2 DATA VALIDATION
Upon receipt of the data, WGM performed the following validation steps:
· checking for location and elevation discrepancies by comparing collar coordinates with the copies of the original drill logs received from the site;
· checking minimum and maximum values for each quality value field and confirming/modifying those outside of expected ranges;
· checking for inconsistency in lithological unit terminology and/or gaps in the lithological code;
· spot checking original assay certificates with information entered in the database; and
· checking gaps, overlaps and out of sequence intervals for both assays and lithology tables.
The database tables as originally supplied contained some errors and these were corrected and confirmed by the client before proceeding with the Mineral Resource estimate. In general, WGM found the database to be in good order, but was still a work in progress. After the errors that WGM identified were corrected, there were no additional database issues that would have a material impact on the Mineral Resource estimate, so WGM proceeded to use the most up to date database supplied by Alderon. However, further checking and additional information (that was still being acquired at the time of WGM’s report) will likely result in an improved database for future Mineral Resource estimates. In addition, future metallurgical and assay testwork will determine the percentage of recoverable iron comprising the Mineral Resources.
17.3.3 DATABASE MANAGEMENT
The drillhole data were stored in a Gemcom multi-tabled workspace specifically designed to manage collar and interval data. The line work for the geological interpretations and the resultant 3-D wireframes were also stored within the Gemcom Project. The Project database
128
stored cross section and level plan definitions and the block models, such that all data pertaining to the Project are contained within the same Project database.
17.4 GEOLOGICAL MODELLING PROCEDURES
17.4.1 CROSS SECTION DEFINITION
Seven vertical cross sections were defined for Mills Lake Deposit and eight for Rose Central for the purpose of Mineral Resource estimation. The holes were drilled on section lines which were spaced 200 m apart for both deposits in the main area of mineralization. The cross sections were oriented perpendicular to the general strike of the deposits. Drillholes on cross sections were variably spaced and with variable dips (and directions) leading to a separation of the mineralized intersections from less than 50 m to more than 250 m apart on adjacent holes. This is due to crisscrossing of holes (on Rose Central) and drilling many holes in a scissor or fan pattern from the same set-up. Most cross sections contained at least three holes and some had as many as 10 holes passing through the mineralized zone due to the variable drilling pattern. However, in both deposits the closest spaced drilling was near the surface (in the first 150 to 200 m). The deeper mineralization, i.e., below 200 m vertical depth, has been tested by fewer holes and both zones are open at depth. See Figures 5 to 7 for the locations of the drillholes in the Mineral Resource area and the cross section orientations.
17.4.2 GEOLOGICAL INTERPRETATION AND 3-D WIREFRAME CREATION
WGM used Alderon’s internal preliminary geological interpretations from the cross sections as a guide to define the boundaries of the mineralized zones for the Mineral Resource estimate. WGM’s zone interpretations of the mineralization were digitized into Gemcom and each polyline was assigned an appropriate rock type and stored with its section definition. The digitized lines were ‘snapped’ to drillhole intervals to anchor the line which allows for the creation of a true 3-D wireframe that honours the 3-D position of the drillhole interval. Any discrepancies or interpretation differences between Alderon’s original interpretation and WGM’s final interpretations were discussed with Alderon technical personnel and agreed upon before finalizing the interpretation to be used for the Mineral Resource estimate. Mineralized boundaries were digitized from drillhole to drillhole that showed continuity of strike, dip and grade, generally from 100 m to 200 m in extent, and up to a maximum of about 300 m on the ends of the zones and at depth where there was no/little drillhole information, but only if the interpretation was supported by drillhole information on adjacent cross sections.
WGM modelled the Mills Lake and Rose Central Fe mineralization only, which is Lake Superior-type iron formation consisting of banded sedimentary rocks composed principally of
129
bands of iron oxides, magnetite and hematite within quartz (chert)-rich rock. Other iron mineralization intersected in drillholes outside of these two areas is currently not included in the Mineral Resource estimate, but many of these holes will be incorporated once additional drilling is completed.
In each deposit, WGM modelled out the larger and more continuous hematite-rich zones/units/beds within the main magnetite body that appeared to have fairly good correlation between holes and through multiple cross sections. In the Mills Lake deposit, the hematite-rich unit was located near the middle of the deposit, whereas in Rose Central, two hematite-rich units were separately modelled; one along/near the basal contact of the main magnetite zone and one closer to the middle of the deposit, which was not as consistent. There appears to be more intermixed hematite and magnetite in this deposit, as well. This hematite modeling was not perfect due to the lack of drilling information in some areas and the complex nature of the folding in some areas, but WGM was of the opinion that it was better to try to model these units out than just combine them with the more abundant magnetite-rich mineralization, as it may become important for determining processing options and costs of the iron-bearing material in future economic studies. The “internal” hematite units that were created as 3-D wireframes were used to “overprint” the geological codes in the block model after the block model was updated with the wireframes for the main magnetite units.
The extensions of the mineralization on the ends and at depth took into account the fact that the drilling pattern was irregular and that a proper grid was not complete; hence many drillholes did not penetrate the entire stratigraphy/zone. The continuity of the mineralization as a whole was quite good, so WGM had no issues with extending the interpretation beyond 250 m distance in some cases, but as stated above, there needed to be supporting data from adjacent sections. The 3-D model for Rose Central was continued at depth as long as there was drillhole information, however, this extension was taken into consideration when classifying the Mineral Resources and these areas were given a lower confidence category. Even though the wireframe continued to a maximum depth of -135 m (approximately 750 m vertically below surface and extending 100 m past the deepest drilling), at this time, no Mineral Resources were defined/considered below 150 m elevation.
Figures 41 to 43 shows the 3-D geological models to illustrate the above relationships in Mills Lake and Rose Central. Figures 44 and 47 show typical cross sections through the Mills Lake and Rose Central deposits and illustrate the zone/unit boundaries, TFe% block model and Mineral Resource categorization (see Section 17.6 for a detailed explanation).
130
Figure 41. Mills Lake 3-D geological model
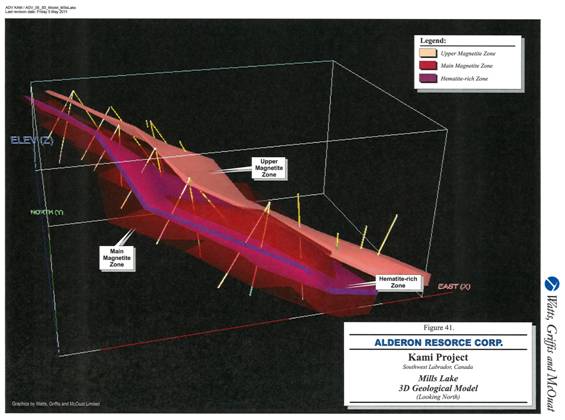
131
Figure 42. Rose Central 3-D geological model – View 1
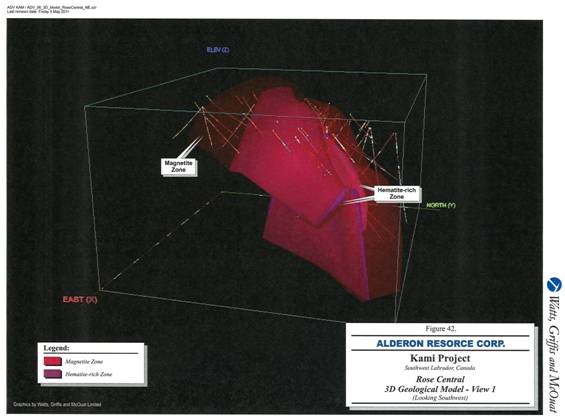
132
Figure 43. Rose Central 3-D geological model – View 2

133

Figure 44. Rose Central Cross Section 20+00E showing %TFe block grade model
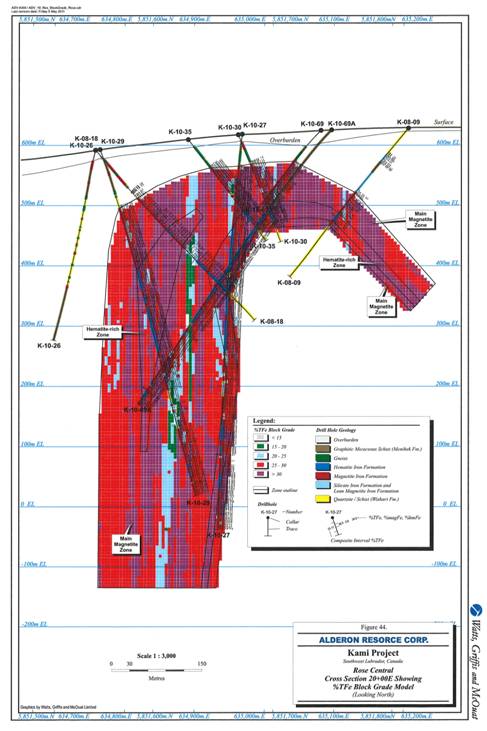
134
Figure 45. Rose Central Cross Section 20+00E showing Mineral Resource categorization
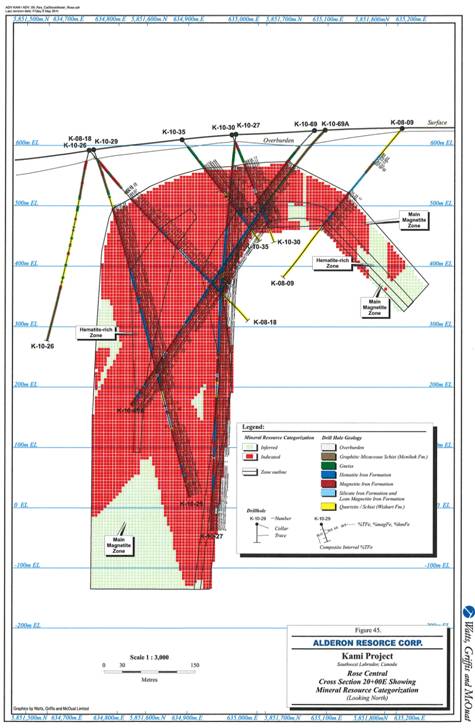
135
Figure 46. Mills Lake Cross Section 36+00S showing %TFe block grade model
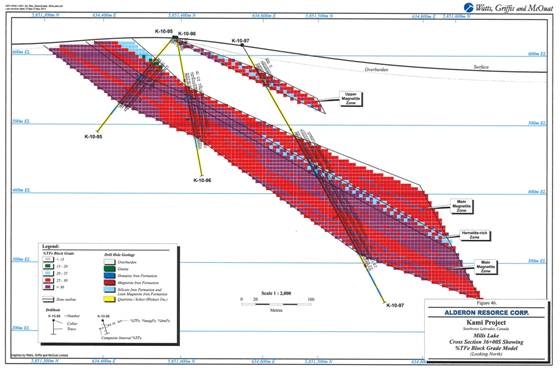
136
Figure 47. Mills Lake Cross Section 36+00S showing Mineral Resource categorization
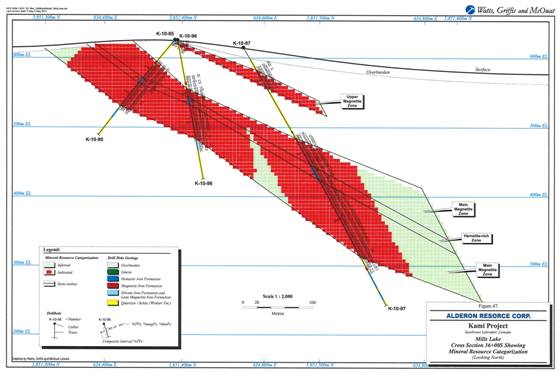
137
17.4.3 TOPOGRAPHIC SURFACE CREATION
A wireframed surface or triangulated irregular network (“TIN”) was supplied by Alderon for the topography surface and overburden contacts. The topography wireframe was derived from a gridded digital elevation model created by Mira Geoscience from the 2008 ground gravity survey. Mira downloaded SRTM World Elevation 90 m data and fitted the SRTM data to accurate ground gravity station DGPS elevations in GoCad. The topography wireframe was offset to drillhole overburden/bedrock contacts using Leapfrog3D to create the overburden wireframe and to ensure the overburden did not cross the topography surface where no drillhole information existed.
WGM checked the overburden surface created by Alderon against the drillhole information and found it to be properly created. These surfaces, as supplied to WGM, were used to limit the upper boundary of the geological block model, i.e., the Mineral Resources were defined up to the surface representing the bottom of the overburden. WGM ensured that the Mineral Resource estimate stayed below this overburden surface.
17.5 STATISTICAL ANALYSIS, COMPOSITING, CAPPING AND SPECIFIC GRAVITY
17.5.1 BACK-CODING OF ROCK CODE FIELD
The 3-D wireframes / solids that represented the interpreted mineralized zones were used to back-code a rock code field into the drillhole workspace, and these were checked against the logs and the final geological interpretation. Each interval in the original assay table and the WGM generated composite table was assigned a rock code value based on the rock type wireframe that the interval midpoint fell within.
17.5.2 STATISTICAL ANALYSIS AND COMPOSITING
In order to carry out the Mineral Resource grade interpolation, a set of equal length composites of 3 m was generated from the raw drillhole intervals, as the original assay intervals were different lengths and required normalization to a consistent length. A 3 m composite length was chosen to ensure that more than one composite would be used for grade interpolation for each block in the model and 3 m is also close to the average length of the raw assay intervals. Regular down-the-drillhole compositing was used.
138
Table 32 summarizes the statistics of the 3 m composites inside the defined geological wireframe for %TFe_H, %magFe_H and %hmFe_H and Figures 48 and 49 show example histograms for the %TFe_H for Mills Lake and Rose Central magnetite-rich samples.
TABLE 32.
BASIC STATISTICS OF 3 m COMPOSITES
Element | | Number | | Minimum | | Maximum | | Average | | C.O.V. | |
Mills Lake - %TFe_H (Magnetite(1)) | | 541 | | 6.5 | | 39.3 | | 30.0 | | 0.11 | |
Mills Lake - %TFe_H (Hematite) | | 86 | | 9.6 | | 41.9 | | 33.9 | | 0.11 | |
Mills Lake - %magFe_H (Magnetite(1)) | | 541 | | 0.9 | | 38.7 | | 24.3 | | 0.25 | |
Mills Lake - %magFe_H (Hematite) | | 86 | | 0.1 | | 21.6 | | 3.2 | | 1.54 | |
Mills Lake - %hmFe_H (Magnetite(1)) | | 541 | | 0.0 | | 30.1 | | 3.2 | | 1.46 | |
Mills Lake - %hmFe_H (Hematite) | | 86 | | 7.8 | | 37.9 | | 29.9 | | 0.20 | |
| | | | | | | | | | | |
Rose Central - %TFe_H (Magnetite) | | 2,424 | | 4.7 | | 50.4 | | 28.9 | | 0.21 | |
Rose Central - %TFe_H (Hematite) | | 659 | | 7.4 | | 50.4 | | 31.2 | | 0.16 | |
Rose Central - %magFe_H (Magnetite) | | 2,424 | | 0.1 | | 49.2 | | 20.4 | | 0.42 | |
Rose Central - %magFe_H (Hematite) | | 659 | | 0.1 | | 33.6 | | 6.7 | | 1.22 | |
Rose Central - %hmFe_H (Magnetite(2)) | | 2,168 | | 0 | | 32.5 | | 4.67 | | 1.41 | |
Rose Central - %hmFe_H (Hematite) | | 659 | | 0.0 | | 41.0 | | 23.6 | | 0.39 | |
Notes: (1) Main Magnetite Zone only; (2) Excludes samples with no FeO assays in Lean IF and Internal Waste Units
Figure 48. Normal histogram, %TFe_H — Mills Lake 3 m Magnetite Composites
139

Figure 49. Normal histogram, %TFe_H — Rose Central 3 m Magnetite Composites
17.5.3 GRADE CAPPING
The statistical distribution of the %TFe samples showed good normal distributions considering the number of samples available. Grade capping, also sometimes referred to as top cutting, is commonly used in the Mineral Resource estimation process to limit the effect (risk) associated with extremely high assay values, but considering the nature of the mineralization and the continuity of the zones, WGM determined that capping was not required for the either the Mills Lake or Rose Central deposits.
17.5.4 DENSITY/SPECIFIC GRAVITY
Specific gravity is discussed in detail in Section 9 (Mineralization) of this report. For the Mineral Resource estimate, WGM created a variable density model, as typically the SG varies with the iron grade. Figure 13 (shown previously) illustrates a plot of SG vs. %TFe for the Kami samples using the helium gas comparison pycnometer method on sample pulps. Most of the iron formation consists of a mix of magnetite and hematite, but there are sections that contain very little hematite and are mostly magnetite, and vice versa.
140
Alderon modelled the SG slightly differently than WGM, but came up with a very similar relationship to WGM’s. This plot, see Figure 13, shows that SG by pycnometer results correlate strongly with %TFe on samples. It also illustrates that DGI probe determined density averaged over the same sample intervals similarly correlate strongly with %TFe.
Since we are of the opinion that there is insignificant difference between the WGM method and the Alderon method, the following WGM formula was used to obtain the density of each block in the model: %TFe x 0.0294 + 2.677. This formula also reflects WGM’s experience with other iron ore deposits that we have modelled and we have found that SG shows excellent correlation with %TFe, as is typical with these types of deposits. Using WGM’s variable density model, a 30% TFe gives a SG of approximately 3.56.
17.6 BLOCK MODEL PARAMETERS, GRADE INTERPOLATION AND CATEGORIZATION OF MINERAL RESOURCES
17.6.1 GENERAL
The Kami Project Mineral Resource estimates were completed using a block modelling method and for the purpose of this study, the grades have been interpolated using an Inverse Distance (“ID”) estimation technique. ID belongs to a distance-weighted interpolation class of methods, similar to Kriging, where the grade of a block is interpolated from several composites within a defined distance range of that block. ID uses the inverse of the distance (to the selected power) between a composite and the block as the weighting factor.
For comparison and cross checking purposes, the ID2 and ID10 methods, which closely resembles a Nearest Neighbour (“NN”) technique, was used. In the NN method, the grade of a block is estimated by assigning only the grade of the nearest composite to the block. All interpolation methods gave similar results, as the grades were well constrained within the wireframes, and the results of the interpolation approximated the average grade of the all the composites used for the estimate. WGM’s experience with similar types of deposits showed that geostatistical methods, like Kriging, gave very similar results when compared to ID interpolation, therefore we are of the opinion that ID interpolation is appropriate.
141
17.6.2 BLOCK MODEL SETUP / PARAMETERS
The block model was created using the Gemcom software package to create a grid of regular blocks to estimate tonnes and grades. Two block models were set-up for the Kami Project Mineral Resource estimates; one for Mills Lake and one for Rose Central, as they were oriented in different directions along the main strike direction of each deposit. The deposit specific parameters used for the block modelling are summarized below.
For both Mills Lake and Rose Central, the block sizes used were:
Width of columns = 5 m
Width of rows = 20 m
Height of blocks = 5 m
The specific parameters for the block models are as follows:
Mills Lake:
Easting coordinate of model bottom left hand corner: | | 634270.00 |
Northing coordinate of model bottom left hand corner: | | 5850120.00 |
Datum elevation of top of model: | | 650.00 m |
Model rotation (anti-clockwise around Origin): | | 30.00 |
Number of columns in model: | | 360 |
Number of rows in model: | | 100 |
Number of levels: | | 100 |
Rose Central:
Easting coordinate of model bottom left hand corner: | | 631700.00 |
Northing coordinate of model bottom left hand corner: | | 5854930.00 |
Datum elevation of top of model: | | 730.00 m |
Model rotation (anti-clockwise around Origin): | | -45.00 |
Number of columns in model: | | 280 |
Number of rows in model: | | 100 |
Number of levels: | | 186 |
17.6.3 GRADE INTERPOLATION
The details of the geology and geometry of the Rose Central mineralized body is quite complex and more drilling is required to get a better understanding of the depth potential, dip and internal detail of the hematite-rich and waste units. However, the gross overall mineralization controls appear to be fairly well understood with the current amount of drilling completed to date. Both deposits have undergone various degrees of folding, but at this stage of exploration, the search ellipse size and orientations for the grade interpolation were kept simple and based on the current geological knowledge. For future Mineral Resource estimates and after more drilling
142
information is available, WGM envisions that due to folding causing orientation/strike complexity and change, different domains will most likely be defined to better control grade distribution along the limbs and to reflect changes in dip/attitude. Alternately, a technique known as unfolding may be applied during the statistical analysis and the grade interpolation, however, this may not be necessary. The following lists the general grade interpolation parameters (Note that the dip orientation of the search ellipse changed for each deposit):
ID Search Ellipsoid:
450 m in the Strike Direction
350 m in the Across Strike Direction
50 m in the Vertical (Dip) Direction
Minimum / Maximum number of composites used to estimate a block: 2 / 10
Maximum number of composites coming from a single hole: 3
Ellipsoidal search strategy was used with rotation about Z,Y,Z:
Mills Lake: 0°, 30°, 0°
Rose Central: 0°, 75°, 0°
The large search ellipse was used in order to inform all the blocks in the block model with grade, however, the classification of the Mineral Resources (see below) was based on drillhole density (or drilling pattern), geological knowledge / interpretation of the geology and WGM’s experience with similar deposits. The %TFe_H grade (interpolated from 3 m composites) was used for the Mineral Resource estimate, however, %SiO2, %Mn, %magFe and %hmFe (calculated).
The mineralization of economic interest on the Kami Property is oxide facies iron formation, consisting mainly of semi-massive bands, or layers, and disseminations of magnetite and/or specular hematite (specularite) in recrystallized chert and interlayered with bands (beds) of chert with minor carbonate and iron silicates. The oxide iron formation is mostly magnetite-rich, but some sub-members contain increased amounts of hematite, either inter-mixed with magnetite or as more discrete bands / beds / layers. WGM is of the opinion that different ratios of hematite to magnetite occur in the different deposits (or parts of the deposits), but this distribution is not yet completely mapped out and understood and should be studied in detail during future work. Some Davis Tube testwork was also completed on some samples, giving WGM some comparative numbers to our calculated iron in hematite values. Section 9 in this report gives a full description of the methods that WGM used to calculate %hmFe from %TFe, FeO, Satmagan and Davis Tube results. The final WGM calculated %hmFe values were used in the grade interpolation in the block model.
Gemcom does not use the sub-blocking method for determining the proportion and spatial location of a block that falls partially within a wireframed object. Instead, the system makes use
143

of a percent or partial block model (if it is important to track the different rock type’s proportions in the block — usually if there is more than one important type) or uses a “needling technology” that is similar in concept, but offers greater flexibility and granularity for accurate volumetric calculations. In this case, the block model was to be exported to another software system for pit optimization purposes subsequent to the Mineral Resource estimation and the third party engineering company requested that a percent model (or needling) not be applied. WGM decided to use smaller blocks (20m x 5m x5m) than would be typical for this drillhole spacing and envisioned mining method (large open pit). The blocks were made smaller in all dimensions so accuracy would not be lost during the Mineral Resource tabulation and so that the narrower hematite-rich zones would not lose resolution. If larger blocks were used, the narrower portions of the hematite-rich zones may not have been properly defined.
17.6.4 MINERAL RESOURCE CATEGORIZATION
Mineral Resource classification is based on certainty and continuity of geology and grades, and this is almost always directly related to the drilling density. Areas more densely drilled are usually better known and understood than areas with sparser drilling, which would be considered to have greater uncertainty, and hence lower confidence.
WGM has abundant experience with similar types of mineralization to the Kami Project, therefore, we used this knowledge to assist us with our categorization of the Mineral Resources. Since the entire drilling grid was not completed to a regular spacing and drillhole pattern, and some holes were not drilled at optimum angles (and in some cases did not penetrate the entire stratigraphy/zone), the mineralization was further extended on the fringes/edges and at depth, particularly in the Rose Central deposit. The continuity of the mineralization in general was quite good, but internally the continuity of the hematite-rich beds and some waste units is poorly understood due to lack of drilling and folding/geometric complexity. WGM was of the opinion that extending the geological interpretation beyond the more densely drilled parts of the deposit (again, particularly at Rose Central), was appropriate as long as there was supporting data from adjacent sections. This extension was taken into consideration when classifying the Mineral Resources and these areas were given a lower confidence category; in general, this represented the deeper mineralization. Variograms were also generated along strike and across the deposit in support of these distances. WGM has not classified any of the Mills Lake or Rose Central mineralization as Measured at this stage of exploration.
Because the search ellipses were large enough to ensure that all the blocks in the 3-D model were interpolated with grade, WGM generated a distance model (distance from actual data point in the drillhole to the block centroid) and reported the estimated Mineral Resources by distances which represented the category or classification. WGM chose to use the blocks within the wireframes
144
that had a distance of 100 m or less to be Indicated category and +100 m to be Inferred category for Mills Lake; and 150 m or less for Indicated and +150 m for Inferred for Rose Central. Inferred Mineral Resources are interpolated out to a maximum of about 300 m for both deposit areas on the ends/edges and at depth when supporting information from adjacent cross sections was available. The average distance for the total Indicated Mineral Resources at Mills Lake was approximately 63 m and 144 m for the Inferred; for Rose Central the corresponding distances were 76 m and 192 m. The majority of the deeper mineralization is categorized as Inferred to due the sparse drillhole information below about 250 m from surface, and the maximum depth that the mineralization was taken to is 150 m elevation (approximately 450 m vertically from surface).
Figure 50 show the zone outlines and interpolated %TFe blocks on Level Plan 450 m for Rose Central deposits. An example of WGM’s categorization of the Mineral Resources was shown previously on Figures 45 and 46.
For the Mineral Resource estimate, a cutoff of 20% TFeHead was determined to be appropriate at this stage of the project (Table 33). This cutoff was chosen based on a preliminary review of the parameters that would likely determine the economic viability of a large open pit operation and compares well to similar projects and to projects that are currently at a more advanced stage of study.
Table 34 shows the Mineral Resource estimate at various cutoffs for comparison purposes.
145
Figure 50. Rose Central Level Plan 450 m - %TFe block grade model
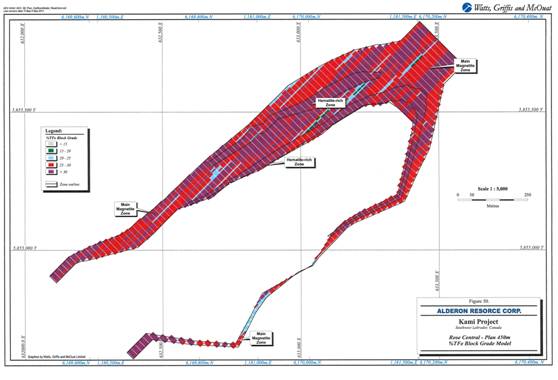
146
TABLE 33.
CATEGORIZED MINERAL RESOURCE ESTIMATE FOR
KAMI IRON ORE PROJECT (CUTOFF OF 20% TFeHead)
Category | | Zone | | Tonnes
(Million) | | Density | | TFe% | | magFe% | | hmFe% | | Mn% | | SiO2% | |
Indicated | | Rose Central Zone - Hematite-rich | | 66.7 | | 3.60 | | 31.4 | | 6.9 | | 23.6 | | 2.88 | | 42.4 | |
| | Rose Central Zone - Magnetite-rich | | 309.4 | | 3.54 | | 29.5 | | 21.1 | | 5.0 | | 1.27 | | 45.4 | |
| | Total Indicated Rose Central Zone | | 376.1 | | 3.55 | | 29.8 | | 18.6 | | 8.3 | | 1.56 | | 44.9 | |
| | | | | | | | | | | | | | | | | |
| | Mills Lake Zone - Hematite-rich | | 12.2 | | 3.68 | | 34.2 | | 2.7 | | 30.7 | | 4.80 | | 35.3 | |
| | Mills Lake Zone - Magnetite-rich | | 93.8 | | 3.56 | | 30.1 | | 24.5 | | 2.8 | | 0.57 | | 47.0 | |
| | Mills Lake Zone - Upper Magnetite-rich | | 8.2 | | 3.55 | | 29.6 | | 23.0 | | 1.3 | | 0.56 | | 45.6 | |
| | Total Indicated Mills Lake Zone | | 114.1 | | 3.57 | | 30.5 | | 22.1 | | 5.7 | | 1.02 | | 45.6 | |
| | | | | | | | | | | | | | | | | |
Inferred | | Rose Central Zone - Hematite-rich | | 10.3 | | 3.60 | | 31.6 | | 7.5 | | 23.9 | | 3.15 | | 41.5 | |
| | Rose Central Zone - Magnetite-rich | | 35.7 | | 3.54 | | 29.3 | | 22.6 | | 3.4 | | 1.16 | | 45.9 | |
| | Total Inferred Rose Central Zone | | 46.0 | | 3.55 | | 29.8 | | 19.2 | | 8.0 | | 1.61 | | 44.9 | |
| | | | | | | | | | | | | | | | | |
| | Mills Lake Zone - Hematite-rich | | 8.3 | | 3.70 | | 34.7 | | 2.6 | | 31.1 | | 4.60 | | 35.5 | |
| | Mills Lake Zone - Magnetite-rich | | 60.4 | | 3.56 | | 30.2 | | 24.8 | | 2.8 | | 0.60 | | 46.7 | |
| | Mills Lake Zone - Upper Magnetite-rich | | 3.3 | | 3.55 | | 29.8 | | 23.7 | | 1.3 | | 0.55 | | 45.5 | |
| | Total Inferred Mills Lake Zone | | 71.9 | | 3.58 | | 30.7 | | 22.2 | | 6.0 | | 1.05 | | 45.4 | |
147
TABLE 34.
CATEGORIZED MINERAL RESOURCES BY %TFe_H CUTOFF
KAMI IRON ORE PROJECT
Cutoff % | | Tonnes
(million) | | TFe% | | magFe% | | hmFe% | | Mn% | | SiO2% | |
| | | | | | | | | | | | | |
Rose Central Indicated Resources | | | | | | | | | |
25.0 | | 355.4 | | 30.2 | | 18.7 | | 8.5 | | 1.58 | | 44.5 | |
22.5 | | 372.2 | | 29.9 | | 18.6 | | 8.3 | | 1.56 | | 44.8 | |
20.0 | | 376.1 | | 29.8 | | 18.6 | | 8.3 | | 1.56 | | 44.9 | |
18.0 | | 377.2 | | 29.8 | | 18.5 | | 8.3 | | 1.56 | | 44.9 | |
15.0% | | 378.0 | | 29.7 | | 18.5 | | 8.2 | | 1.56 | | 45.0 | |
| | | | | | | | | | | | | |
Rose Central Inferred Resources | | | | | | | | | |
25.0 | | 44.9 | | 30.0 | | 19.2 | | 8.1 | | 1.62 | | 44.8 | |
22.5 | | 45.8 | | 29.9 | | 19.2 | | 8.0 | | 1.61 | | 44.9 | |
20.0 | | 46.0 | | 29.8 | | 19.2 | | 8.0 | | 1.61 | | 44.9 | |
18.0 | | 46.0 | | 29.8 | | 19.2 | | 8.0 | | 1.61 | | 44.9 | |
15.0% | | 46.0 | | 29.8 | | 19.2 | | 8.0 | | 1.61 | | 44.9 | |
| | | | | | | | | | | | | |
Mills Lake Indicated Resources | | | | | | | | | |
25.0 | | 111.6 | | 30.7 | | 22.2 | | 5.8 | | 1.03 | | 45.6 | |
22.5 | | 113.7 | | 30.6 | | 22.1 | | 5.7 | | 1.02 | | 45.6 | |
20.0 | | 114.1 | | 30.5 | | 22.1 | | 5.7 | | 1.02 | | 45.6 | |
18.0 | | 114.2 | | 30.5 | | 22.1 | | 5.7 | | 1.02 | | 45.6 | |
15.0% | | 114.2 | | 30.5 | | 22.1 | | 5.7 | | 1.02 | | 45.6 | |
| | | | | | | | | |
Mills Lake Inferred Resources | | | | | | | | | |
25.0 | | 70.8 | | 30.8 | | 22.2 | | 6.1 | | 1.06 | | 45.4 | |
22.5 | | 71.5 | | 30.8 | | 22.2 | | 6.0 | | 1.06 | | 45.4 | |
20.0 | | 71.9 | | 30.7 | | 22.2 | | 6.0 | | 1.05 | | 45.4 | |
18.0 | | 72.0 | | 30.7 | | 22.2 | | 6.0 | | 1.05 | | 45.4 | |
15.0% | | 72.0 | | 30.7 | | 22.2 | | 6.0 | | 1.05 | | 45.4 | |
148

18. OTHER RELEVANT DATA AND INFORMATION
WGM is unaware of any other available pertinent technical information concerning the Property.
149
19. INTERPRETATION AND CONCLUSIONS
Based on WGM’s review of the available information for the Kami Iron Ore Project, we offer the following conclusions:
· Mineralization on the Property comprises meta-taconite typical of the Sokoman/Wabush Formation. Iron formation is mainly magnetite-rich but also includes specular hematite components. At Rose Central the iron formation is hosted in a series of upright to slightly overturned anticlines and synclines. At Mills Lake the iron formation consists of a main tabular gently dipping lens and some minor ancillary lenses;
· A substantial deposit of meta-taconite exists on the Property. With the currently available information from the drilling campaigns, WGM prepared a Mineral Resource estimate for the Rose Central and Mills Lake deposits using a cutoff of 20% TFe_H (Table 35);
TABLE 35.
SUMMARY OF CATEGORIZED MINERAL RESOURCE ESTIMATE FOR
KAMI IRON ORE PROJECT (CUTOFF OF 20% TFE)
Category | | Zone | | Tonnes
(Million) | | TFe% | | magFe% | | hmFe% | | Mn% | | SiO2% | |
Indicated | | Rose Central | | 376.1 | | 29.8 | | 18.6 | | 8.3 | | 1.56 | | 44.9 | |
| | Mills Lake | | 114.1 | | 30.5 | | 22.1 | | 5.7 | | 1.02 | | 45.6 | |
| | | | | | | | | | | | | | | |
Inferred | | Rose Central | | 46.0 | | 29.8 | | 19.2 | | 8.0 | | 1.61 | | 44.9 | |
| | Mills Lake | | 71.9 | | 30.7 | | 22.2 | | 6.0 | | 1.05 | | 45.4 | |
· WGM has not classified any of the Kami Project deposits’ mineralization as Measured Mineral Resources at this stage of exploration and we did not include Rose North Zone or other mineralized areas for the estimate. More field work and confirmation/infill drilling is required before a Mineral Resource estimate can be completed on these other areas;
· In both Rose Central and Mills Lake deposits, the closest spaced drilling was near the surface (in the first 150 to 200 m) and the extensions of the mineralization on the ends and at depth took into account the fact that the drilling pattern was irregular; hence many drillholes did not penetrate the entire stratigraphy/zone. The 3-D model for Rose Central was continued at depth as long as there was drillhole information, however, this extension was taken into consideration when classifying the Mineral Resources and these areas were given a lower (Inferred) confidence category with no Mineral Resources defined or considered below 150 m elevation;
150
· The details of the geology and geometry of the Rose Central mineralized body is quite complex and more drilling is required to get a better understanding of the depth potential, dip and internal detail of the hematite-rich and waste units. However, the gross overall mineralization controls appear to be fairly well understood with the drilling completed to date. At this stage of exploration, the search ellipse size and orientations for the grade interpolation were kept simple and the same sizes were used for both deposits, but the orientation and dips were changed based on the geological interpretation. After more drilling information is available, WGM envisions that due to folding causing orientation/strike complexity and change, “domaining” will most likely be used to better control grade distribution in future Mineral Resource estimates;
· WGM agrees that all the 2008 and 2010 drillhole collars and preferably the tops of the drillholes be surveyed by gyroscope for location, azimuth and dip;
· In WGM’s opinion, the results of the current process development work will guide the need to submit possible variations in the mineralogy to further bench scale testing to establish grade and recovery factors to support Mineral Reserve estimates, as well as the scale of the pilot operation that may be required to support a final feasibility. WGM anticipates that areas of the deposit with higher concentrations of manganese will require particular attention in support of Mineral Reserve estimates where it may be necessary to confirm that the manganese levels in the concentrates produced from these areas can be maintained at or below market requirements;
· It is worthy of note that the Mn in the Kami deposits occur in different minerals and hence may not have the same concentration issues as at the Scully operation; and
· It may be possible to reduce the manganese in the product by selective mining and blending or inclusion of a manganese reduction plant.
151
20. RECOMMENDATIONS
Based on WGM’s review of the available information for the Kami Iron Ore Project, we offer the following recommendations:
· Due to the variable drilling pattern, mineralized intersections were separated from less than 50 m to more than 250 m from each other on adjacent holes. A more regular pattern of drilling should be used going forward, and wherever possible, it should be a priority for the drillhole to pass through the entire mineralized zone. Down dip drilling should also be kept to a minimum;
· WGM modelled out the larger and more continuous hematite-rich zones/units/beds within the main magnetite body that appeared to have fairly good correlation between holes and through multiple cross sections. The Rose Central deposit is more complex structurally and at least two hematite-rich units could be separately modelled at this time, and there appears to be more intermixed hematite and magnetite in this deposit, as well. It appears that different ratios of hematite to magnetite occur in the different deposits (or parts of the deposits), but this distribution is not yet completely mapped out and understood and should be studied in detail during future work. WGM is of the opinion that it is important to keep these hematite-rich zones separate in future modelling and Mineral Resource estimates, as it may become important for determining processing options and costs of the iron-bearing material in subsequent economic studies;
· The current 3-D wireframe continued to a maximum depth of -135 m (approximately 750 m vertically below surface and extended 100 m past the deepest drilling) at Rose Central. The deeper mineralization, i.e., below 200 m vertical depth, has been tested by limited drilling and both zones are open at depth. A targeted exploration program will most likely increase the Mineral Resources at depth, however, an “economic lower level” or maximum depth of viable extraction should be determined in a subsequent Preliminary Assessment;
· Based on the current geological interpretation and perceived structural complexity, WGM is of the opinion that the Rose Central mineralized body will require more infill drilling than Mills Lake to get a more complete understanding of the internal complexity of the hematite-rich zones, the waste units and the depth potential / dip of the mineralization. Both deposits have undergone various degrees of folding, and after more drilling is completed, the search ellipse sizes and orientations for the grade interpolation will undoubtedly need to be adjusted based on new knowledge and more detailed information.
152
For future Mineral Resource estimates, WGM envisions that a better understanding of the geological complexity based on additional information, will provide for definition of different domains to better control grade distribution along the limbs and to reflect changes in dip/attitude. Alternately, a technique known as unfolding may be applied during the statistical analysis and the grade interpolation;
· In addition, when metallurgical testwork results become available this will determine the percentage of recoverable iron comprising the Mineral Resources;
· Future metallurgical testwork must consider the results of the current testwork which are not yet available. Additional exploration drilling, as well as geological interpretation updates, may necessitate further bench scale testing on any possible variations in mineralogy from that already identified. Initiation of larger scale testing before exploration and future Mineral Resource estimates are complete could risk making incorrect conclusions on flowsheet development and process design parameters. It is important that representative samples of the mineralization are selected for the next phase of testwork and that its scope is based on a complete knowledge of the deposits to be mined; and
· Alderon has developed a program and budget to advance the Project and complete an updated NI 43-101 compliant Mineral Resource estimate, and is described in detail below. WGM agrees the program and budget are reasonable. The estimated cost breakdown for the program is presented in Table 36.
The 2010-2011 winter drill program is essentially completed in the field but sample processing and reporting has not yet been completed. The program consisted of 4,200 m of drilling. The drilling was focussed primarily on the North Rose Zone. The summer 2011 program is in the final planning stages and will be launched approximately June 1. Planned drilling for this program totals 32,000 m with infill on Rose Central (16,000 m); infill on Mills Lake (5,000 m); condemnation drilling (2,000 m); exploration drilling (7,000 m); and geotech drilling (2,000 m). The exploration component is focussed on Mart Ridge, south of Rose Central, and several magnetic anomalies near the north end of the Kami concessions believed to be folded sections of the Wabush Basin Sokoman Formation.
153
TABLE 36.
PROPOSED BUDGET ESTIMATE
Description | | Cost
(C$) | | Total Cost
(C$) | |
2010-2011 Winter Drilling Program — 4,200 m drilling completed Sample analysis and testwork in Progress | | | | | | | |
Drilling | | C$ | 1,000,000 | | | | |
Sampling | | | 424,000 | | | | |
Salaries | | | 164,625 | | | | |
Accommodations & meals | | | 110,400 | | | | |
Field office costs | | | 77,800 | | | | |
43-101 update | | | 75,000 | | | | |
Travel | | | 27,500 | | | | |
Contingency (15%) | | | 281,899 | | | | |
Subtotal 2010-2011 Winter Drilling program in Progress | | | | | C$ | 2,161,224 | |
| | | | | | | |
2011 Summer Drilling Program — Approximately 32,000 m | | | | | | | |
Drilling | | C$ | 6,600,000 | | | | |
Sampling | | | 1,155,000 | | | | |
Borehole Geophysics | | | 650,000 | | | | |
Salaries | | | 700,000 | | | | |
Accommodations & meals | | | 263,000 | | | | |
Field office costs | | | 312,000 | | | | |
43-101 update | | | 100,000 | | | | |
Reclamation costs | | | 50,000 | | | | |
Travel | | | 70,000 | | | | |
Contingency (20%) | | | 1,980,000 | | | | |
Subtotal 2011 Summer Drilling Program | | | | | C$ | 11,880,000 | |
| | | | | | | |
2012 Winter Drilling Program — Approximately 8,000 m | | | | | | | |
Drilling | | C$ | 1,600,000 | | | | |
Sampling | | | 550,000 | | | | |
Borehole Geophysics | | | 240,000 | | | | |
Salaries | | | 190,000 | | | | |
Accommodations & meals | | | 150,000 | | | | |
Field office costs | | | 100,000 | | | | |
43-101 update | | | 75,000 | | | | |
Reclamation costs | | | 10,000 | | | | |
Travel | | | 32,000 | | | | |
Contingency (20%) | | | 589,400 | | | | |
Subtotal 2012 Winter Drilling Program | | | | | C$ | 3,536,400 | |
| | | | | | | |
Scoping Study - BBA/Stantec | | | | | C$ | 650,000 | |
Metallurgical testing — BBA/SGS (completed — results pending) | | | | | | 250,000 | |
Feasibility study — BBA/Stantec (includes $1.4 million for additional metallurgical testwork) | | | | | | 5,400,000 | |
Environmental Field sampling | | | | | | 2,200,000 | |
| | | | | | | |
GRAND TOTAL | | | | | C$ | 26,077,624 | |
154
The optimised drillhole planning on Rose Central and Mills have not yet been completed so the following description of the program is general in nature:
· The Rose Central infill drilling will be completed on 100-m cross sections between the existing cross sections, as well as fill-in holes on the sections drilled in 2010 to carry the Mineral Resource to the 150 m elevation (450 m below notional surface ay approximately 600 m elevation). These holes will be drilled mainly SE to NW;
· At Mills Lake, a similar program will follow to infill on existing sections and drill the 100-m cross sections between the existing sections. No drilling will be completed under Mills Lake;
· Condemnation drilling sites will be selected by Stantec at proposed locations of the mill/plant site. There are three weak magnetic/gravity targets on the eastern boundary of the claims staked in 2010 which will be tested with several short (150 m or less) holes. There is no strong expectation of significant oxide iron formation, but this is required for permitting purposes. These latter holes have already been included in the permit application, but not the Stantec drillholes;
· The Mart Ridge, which lies on the north limit of the Mills Lake Basin, repeatedly shows magnetic and gravity anomalies. The Mart drilling by Altius in 2008 intersected two OIF zones similar to what was observed in Mills Lake this year, but the intervals are generally 25-30 m and grade 22-26% Fe in oxides at some depth. It is possible that the zone increases to the SW. No drillholes have presently been spotted, since this drilling will be carried out after the Mills Lake infill and condemnation programs are completed; and
· Some HQ drilling for whole core grindability tests is also being considered.
Additional recommendations per Drilling Supervision, Core Handling, Sampling and Assaying are listed below in no particular order:
· Expend more effort in the field during the logging process to check and minimise errors in depth of holes and depth indexing caused by meterage block errors;
· Logging geologists should make regular visits to drills to liaise with drillers about progress and problems;
· Picket and label drillhole collars in the field as soon as possible after drills dismount;
· Store core on racks rather than in stacks to facilitate ready access for checking and review of logging and sampling;
155
· Simplify the assay protocol so that all samples have basic assays completed — such as WR XRF, FeO_H and Satmagan;
· Apply more aggressive QA/QC monitoring and action program including monitoring of Primary Lab QA/QC;
· Process more in-Field-inserted Standards through the DT testwork; and
· Process a number of samples of varying hematite content through both the DT testwork and routine assay protocol, (WR, FeO_H and Satmagan) so a comparison of methods for estimating %hmFe can be completed.
Additional recommendations per Drillhole, Sampling and Assay database are as follows:
· Include drilling dates in Collar Table;
· Combine Tables for routine samples with Primary Assay data tables. Perhaps combine current Davis Tube FeO Table with DT Concentrate analysis. This would reduce basic assay tables from six tables to two tables. Combine the laboratory QA/QC data with routine assay data and add analytical sequence index to promote evaluation of assay failures;
· Create a Table that provides basic information on all Standards used including Standard ID, Identity of the provider, and lists the certified values for the significant elements in the Standard;
· In the QA/QC tables, the identity of the Standards needs to be standalone. Currently, for Standards the “Sample” field includes additional information other that the Standard’s identity which makes it difficult to group by Standard ID. The Sample field should be the same format as the Standard ID field of the Standards Table; and
· Leave the Certificate dates out of the assay tables. Link these tables through the Certificate ID to the date information. This would make it simpler to keep the date information up to date. For instance, the database version that WGM used does not include Certificate dates for the 2008 data. Also, we suggest that a check be made of the Certificate date information. It does not appear to be accurate for all Certificates.
156

21. SIGNATURE PAGE
This report entitled “Technical Report on Mineral Resource Estimate on the Kamistiatusset Property, Newfoundland and Labrador for Alderon Resource Corp.”, was prepared and signed by the following authors:
Dated effective as of May 20, 2011.
signed by | | signed by |
“ Richard W. Risto ” | | “ Michael Kociumbas ” |
| | |
| | |
| | |
Richard W. Risto, M.Sc., P.Geo.,
Senior Associate Geologist | | Michael Kociumbas, P.Geo.
Senior Geologist and Vice-President |
signed by | | |
“ G. Ross MacFarlane ” | | |
| | |
| | |
| | |
G. Ross MacFarlane, P.Eng., | | |
Senior Associate Metallurgical Engineer | | |
157
CERTIFICATE
To Accompany the Report Entitled
“Technical Report on Mineral Resource Estimate on the Kamistiatusset Property, Newfoundland and Labrador for Alderon Resource Corp.” dated May 20, 2011
I, Richard W. Risto, do hereby certify that:
1. I reside at 22 Northridge Ave, Toronto, Ontario, Canada, M4J 4P2.
2. I am a graduate from the Brock University, St. Catherines, Ontario with an Honours B.Sc. Degree in Geology (1977), Queens University, Kingston, Ontario with a M.Sc. Degree in Mineral Exploration (1983), and I have practised my profession for over 20 years.
3. I am a member of the Association of Professional Geoscientists of Ontario (Membership Number 276).
4. I am a Senior Associate Geologist with Watts, Griffis and McOuat Limited, a firm of consulting engineers and geologists, which has been authorized to practice professional engineering by Professional Engineers Ontario since 1969, and professional geoscience by the Association of Professional Geoscientists of Ontario.
5. I am an independent Qualified Person for the purposes of NI 43-101 and have extensive experience with iron deposits, a variety of other deposit types and the preparation of technical reports.
6. I visited the Property August 3 to August 6 and November 1 to November 3, 2010.
7. I have no personal knowledge as of the date of this certificate of any material fact or change, which is not reflected in this report.
8. I am solely responsible for Sections 2 to 13, and 15. With co-authors Michael Kociumbas and G. Ross MacFarlane I am jointly responsible for Sections 1 and 18 to 20.
9. This report was prepared for Alderon Resource Corp., in part by Richard Risto, Michael Kociumbas, Ross MacFarlane and WGM. It is based almost exclusively on data that were provided to the authors by Altius Minerals Corporation and Alderon Resource Corp .
10. Neither I, nor any affiliated entity of mine, is at present, under an agreement, arrangement or understanding or expects to become, an insider, associate, affiliated entity or employee of Alderon Resource Corp., or any associated or affiliated entities.
158
11. Neither I, nor any affiliated entity of mine own, directly or indirectly, nor expect to receive, any interest in the properties or securities of Alderon Resource Corp., or any associated or affiliated companies.
12. Neither I, nor any affiliated entity of mine, have earned the majority of our income during the preceding three years from Alderon Resource Corp., or any associated or affiliated companies.
13. I have read NI 43-101 and Form 43-101F1 and have prepared the technical report in compliance with NI 43-101 and Form 43-101F1; and have prepared the report in conformity with generally accepted Canadian mining industry practice, and as of the date of the certificate, to the best of my knowledge, information and belief, the technical report contains all scientific and technical information that is required to be disclosed to make the technical report not misleading.
| signed by |
| “ Richard W. Risto ” |
| |
| Richard W. Risto, M.Sc., P.Geo. |
| May 20, 2011 |
159
CERTIFICATE
To Accompany the Report Entitled
“Technical Report on Mineral Resource Estimate on the Kamistiatusset Property, Newfoundland and Labrador for Alderon Resource Corp.” dated May 20, 2011
I, Michael W. Kociumbas, do hereby certify that:
1. I reside at 420 Searles Court, Mississauga, Ontario, Canada, L5R 2C6.
2. I am a graduate from the University of Waterloo, Waterloo, Ontario with an Honours B.Sc. Degree in Applied Earth Sciences, Geology Option (1985), and I have practised my profession continuously since that time.
3. I am a member of the Association of Professional Geoscientists of Ontario (Membership Number 0417).
4. I am a Senior Geologist and Vice-President with Watts, Griffis and McOuat Limited, a firm of consulting geologists and engineers, which has been authorized to practice professional engineering by Professional Engineers Ontario since 1969, and professional geoscience by the Association of Professional Geoscientists of Ontario.
5. I am an independent Qualified Person for the purposes of NI 43-101 and have experience with base metal deposits, Mineral Resource estimation techniques and the preparation of technical reports.
6. I did not visit the Property.
7. I have no personal knowledge as of the date of this certificate of any material fact or change, which is not reflected in this report.
8. I am solely responsible for Section 17. With co-authors Richard Risto and G. Ross MacFarlane, I am jointly responsible for Sections 1 and 18 to 20.
9. This report was prepared for Alderon Resource Corp., in part by Richard Risto, Michael Kociumbas, Ross MacFarlane and WGM. It is based almost exclusively on data that were provided to the authors by Altius Minerals Corporation and Alderon Resource Corp.
10. Neither I, nor any affiliated entity of mine, is at present, under an agreement, arrangement or understanding or expects to become, an insider, associate, affiliated entity or employee of Alderon Resource Corp., or any associated or affiliated entities.
160
11. Neither I, nor any affiliated entity of mine own, directly or indirectly, nor expect to receive, any interest in the properties or securities of Alderon Resource Corp., or any associated or affiliated companies.
12. Neither I, nor any affiliated entity of mine, have earned the majority of our income during the preceding three years from Alderon Resource Corp., or any associated or affiliated companies.
13. I have read NI 43-101 and Form 43-101F1 and have prepared the technical report in compliance with NI 43-101 and Form 43-101F1; and have prepared the report in conformity with generally accepted Canadian mining industry practice, and as of the date of the certificate, to the best of my knowledge, information and belief, the technical report contains all scientific and technical information that is required to be disclosed to make the technical report not misleading.
| signed by |
| “ Michael Kociumbas ” |
| |
| Michael Kociumbas, P.Geo. |
| May 20, 2011 |
161
CERTIFICATE
To Accompany the Report Entitled
“Technical Report on Mineral Resource Estimate on the Kamistiatusset Property, Newfoundland and Labrador for Alderon Resource Corp.” dated May 20, 2011
I, G. Ross MacFarlane, do hereby certify that:
1. I reside at 1302 Woodgrove Place, Oakville, Ontario, Canada, L6M 1V5.
2. I am a graduate of the Technical University of Nova Scotia, Halifax, Nova Scotia, with a Bachelor of Engineering, Mining with Metallurgy Option in 1973 and have practiced my profession since that time.
3. I am a member of the Association of Professional Engineers Ontario (Registration Number 28062503).
4. I am a Senior Associate Metallurgical Engineer with Watts, Griffis and McOuat Limited, a firm of consulting engineers and geologists, which has been authorized to practice professional engineering by Professional Engineers Ontario since 1969, and professional geoscience by the Association of Professional Geoscientists of Ontario.
5. I have more than 35 years of experience in the operation, evaluation, and design of mining and milling operations.
6. I am an independent Qualified Person for the purposes of NI 43-101 and have knowledge of and experience with iron ore operations including mining, concentrating, and pelletizing.
7. I have not visited the Property.
8. I have no personal knowledge as of the date of this certificate of any material fact or change, which is not reflected in this report.
9. I am solely responsible for Section 16, and jointly responsible with co-authors Richard Risto and Michael Kociumbas for Sections 1, 18 to 20.
10. This report was prepared for Alderon Resource Corp., in part by Richard Risto, Michael Kociumbas, Ross MacFarlane and WGM. It is based almost exclusively on data that were provided to the authors by Altius Minerals Corporation and Alderon Resource Corp.
11. Neither I, nor any affiliated entity of mine, is at present, under an agreement, arrangement or understanding or expects to become, an insider, associate, affiliated entity or employee of Alderon Resource Corp., or any associated or affiliated entities.
162
12. Neither I, nor any affiliated entity of mine own, directly or indirectly, nor expect to receive, any interest in the properties or securities of Alderon Resource Corp., or any associated or affiliated companies.
13. Neither I, nor any affiliated entity of mine, have earned the majority of our income during the preceding three years from Alderon Resource Corp., or any associated or affiliated companies.
14. I have read NI 43-101 and Form 43-101F1 and have prepared the technical report in compliance with NI 43-101 and Form 43-101F1; and have prepared the report in conformity with generally accepted Canadian mining industry practice, and as of the date of the certificate, to the best of my knowledge, information and belief, the technical report contains all scientific and technical information that is required to be disclosed to make the technical report not misleading.
| signed by |
| “ G. Ross MacFarlane ” |
| |
| |
| Ross MacFarlane, B.Eng., P.Eng. |
| May 20, 2011 |
163

REFERENCES
Allaire, A., E. Palumbo, P. Live, and R. Scherrer
2008 Technical Report Bloom Lake Project Labrador Trough, Québec Technical Report 43-101 on the feasibility Study for the Bloom Lake Project 8-million tonnes per year of Iron Concentrate prepared for Consolidated Thompson Iron Mines Ltd. and BBA Inc.
Avison, A. T., Alcock, P. W., Poisson, P. and Connell, E.
1984 Assessment report on geological, geochemical and geophysical exploration for 1983 submission on Labrador Mining and Exploration Company Limited blocks 4, 8 to 18, 20, 21, 26 to 31, 33, 43, 44, 45, 53, 55, 57, 63, 68, 78, 79, 80, 84 to 87, 92, 94, 95, 96, 100, 103 to 108, 110, 115 to 118, 120 to 125, 127 to 131, 134, 136, 138, 139, 140 and 142 in the Labrador City and Schefferville areas, Labrador, 4 reports. Newfoundland and Labrador Geological Survey, Assessment File LAB/0666, 1984, 520 p.
Brown, Dennis, Tom Rivers and Tom Calon
1992 A Structural analysis of a metamorphic fold-thrust belt, northeast Gagnon terrane, Grenville Province, Canadian Journal of Earth Science 29, pp. 1915-1927.
Clark, Thomas and Robert Wares
2006 Lithotectonic and Metallogenic Synthesis of the New Québec Orogen (Labrador Trough), Géologie Québec publication: 2005-01
Cotnoir, Alain
2001 Exploration Assessment report of Sublicenced Blocks Licences 24 to 42; Mining Leases 10-B22-1, 12-B22-2, 13-B22-3, 14-B22-4, 16-B22-6, 17-B22-7, 18-B22-8, 19-B22-9, 20-B22-10, 22-B64-1, 22-B64-2, 114-224M, 116-224M, 125-223M, 132-223M, 6695M, 22-B64-1, 22-B64-2; and Map Staked Licence 7782M to 7803M. NAD 27; Zone 19; NTS: 22B/14, 22B/15, 22G/1-22G/3, 22G/7-22G/10 January-December 2001 Volume 1, Iron Ore Company of Canada Resource Assessment Program Labrador City, Newfoundland —Labrador.
Crouse, R.A.
1954 Report on the Mills Lake-Dispute Lake area, Labrador, Iron ore Company of Canada, Newfoundland and Labrador Geological Survey Assessment file 23B/0006, 22 p.
Davenport, P. H. and Butler, A. J.
1983 Regional geochemical surveys, In Current research, Edited by m. J. Murray, P. D. Saunders, W. D. Boyce and R. V. Gibbons, Newfoundland and Labrador Geological Survey, Report 83~01, pp. 121~125.
164
Ernst, Richard E.
2004 Ca. 1880 Ma Circum-Superior LIP, May 2004 LIP of the Month, Geological Survey of Canada.
Farquharson, G., and Thalenhorst, H.
2006 Wabush Mines Review of Scully Mine Reserves fro Department of Natural Resources Government of Newfoundland and Labrador, Strathcona Mineral Services Limited, 23 p.
Geological Survey of Canada
1975 Lac Virot, Newfoundland — Québec. Geophysical Series Map 6006G, 1975. Geolfile 023B/14/0056.
Grant, J. M.
1979 Drill report on block 57 in the Wabush area, Labrador. Labrador Mining and Exploration Company Limited Iron Ore Company of Canada. Newfoundland and Labrador Geological Survey, Assessment File 23B/14/0121, 1979, 6 p.
Gross, G.A.
1996 Lake Superior-type iron-formation: in Geology of Canadian Mineral Deposit Types, (ed.) O.R. Eckstrand, W.D. Sinclair, and R.I. Thorpe; Geological Survey of Canada, Geology of Canada, No. 8, pp. 54-66 (also Geological Society of America, the Geology of North America, v. P-1).
1996 Stratiform iron: in Geology of Canadian Mineral Deposit Types, (ed.) O.R. Eckstrand, W.D. Sinclair, and R.I. Thorpe; Geological Survey of Canada, Geology of Canada, No. 8, pp. 41-54 (also Geological Society of America, the Geology of North America, v. P-1).
1993 Industrial and Genetic Models for Iron Ore in Iron-Formations in Geological Survey of Canada, Special Paper 40, pp. 151-170.
Gross, G.A., Glazier, W., Kruechi, G., Nichols L., and O’Leary, J.
1972 Iron Ranges of the Labrador Trough and Northern Québec, 24th International Geological Congress, Montreal Québec Canada, Guidebook excursion A55, 66 p.
Hird, J.M.
1960 Report on the Wabush iron ore deposits, Michigan College of Mining Technology and Iron Ore Company of Canada, Newfoundland Labrador Geological Survey, Internal Report, 35 p [023B/0033].
James, H.L.
1954 Sedimentary Facies of Iron Formation; Economic Geology, v. 9, pp. 251-266.
165
Kelly, R. G. and Stubbins, J .B.
1983 Assessment report on topographic mapping program for the Carol project for 1982 submission on lease blocks 22, 22~5 and 22~6 and licence blocks 23, 24, 25, 32, 34 to 38, 41, 42, 60 and 61 in the Labrador City area, Labrador, Iron Ore Company of Canada and Labrador Mining and Exploration Company Limited, Newfoundland and Labrador Geological Survey, Assessment File LAB/0633, 27 p.
Klein, Cornelis, Jr.
1966 Mineralogy and Petrology of the Metamorphosed Wabush Iron Formation, Southwestern Labrador, Journal of Petrology 7, Part 2, pp. 246-305.
Macdonald, R. D.
1960 Report of operations for 1959 in Labrador, Iron Ore Company of Canada and Labrador Mining and Exploration Company Limited, Newfoundland and Labrador Geological Survey, Assessment File LAB/0263, 14 p.
McConnell, J.
1984 Reconnaissance and detailed geochemical surveys for base metals in Labrador, Government of Newfoundland and Labrador, Department of Mines and Energy, Mineral Development Division, Report 84~02, 122 p.
Mathieson, R.D.
1957 Report of exploratory drilling of the Wabush project in the Duley Lake-Mills Lake area, Labrador, iron Ore Company of Canada, Newforundland and Labrador Geological Survey Assessment file 23B/0011.
Neal, H.E.
1951 Exploration Report on the Wabush Lake-Shabogamo Lake area, Labrador Iron Ore Company of Canada, Newfoundland and Labrador Geological Survey Assessment File 23G/0004, 47 p.
Nincheri, R.
1959 Geological and geophysical report of the Duley Mills Lake area, Labrador, Labrador Mining and Exploration Company Limited, Newfoundland and Labrador Geological Survey, Assessment File 23G/0047, 28 p.
O’Leary, R. Cannell and D. Honsberger
1972 Geology of the Scully Mine, CIM Bulletin for January 1972, pp. 25-29.
Price, J. B.
1979 Report on a ground magnetometer survey on block 24, Labrador, Labrador Mining and Exploration Company Limited, Newfoundland and Labrador Geological Survey, Assessment File 23B/0107.
166
Ramsey Way, Rod Churchill and Carol Seymour
2007 First Year Assessment Report for map Staked Licences 11927M, 12853M, and 12854M and Second Year Assessment Report for 10501M covering Compilation and reconnaissance Geological Investigations (Mills Lake Property, Western Labrador) Newfoundland and Labrador, NTS 23B14 and 23B15 a report prepared for Altius Resources Inc.
Rivers, T.
1985 Geology Map of the Lac Virot Area, Labrador~Québec (parts of 23G and 23B) 1:100,000, Geological Survey of Canada under the Canada-Newfoundland cooperative mineral program (1982~1984), Department of Mines and Energy, Government of Newfoundland and Labrador, Map 85~25.
Rivers, T. and Clarke, M.
1980 Geological map of Flora Lake, Government of Newfoundland and Labrador, Department of Mines and Energy, Mineral Development Division, Map 80~282.
Seymour, Carol, Rod Churchill and Lawrence Winter
2008 First, Second and Third Year Assessment Report Covering Reconnaissance Geological Mapping, Prospecting, Airborne Geophysics, Line Cutting and Geochemistry for Map Staked Licences 10501M, 11927M, 12853M, 12854M, 13935M, and 13937M (Kamistiatusset Property, Western Labrador) Newfoundland and Labrador, NTS 23B14 and 23B15 prepared for Altius Resources Inc.
Seymour, Carol, Rod Churchill, Lawrence Winter and Jackie O’Driscoll
2009 First and Fourth Year Assessment Report covering Diamond Drilling, Line Cutting and Ground Geophysical Surveys (Gravity and Total Field Magnetic Field) for map Staked Licences 14957M (1st Yr), 14962M (1st Yr), 14967M (1st Yr), 14968M (1st Yr) and 15037M (4th Yr), Kamistiatusset Property, Western Labrador, NTS 23B14 and 23B15 prepared for Altius Resources Inc.
Simpson, H. J., Poisson, P. and McLachlan, C.
1985 Assessment report on geological, geochemical and geophysical exploration for 1985 submission on Labrador Mining and Exploration Company Limited blocks 1, 2, 3, 5, 6, 7, 15, 17, 19, 19~1, 19~ 2, 19~3, 20, 21, 22, 22~4, 22~5, 22~6, 22~9, 22~10, 23 to 38, 41, 42, 51 to 54, 57 to 68, 72 to 76, 82, 84, 85, 86, 88, 89, 90, 92, 99, 101, 102, 111, 112, 116, 118, 121 and 128 in the Labrador City and Schefferville areas, Labrador, 4 volumes, Labrador Mining and Exploration Company Limited, Newfoundland and Labrador Geological Survey, Assessment File LAB/0723, 900 p.
167
Smith, P. J. R., Stubbins, J. B., Avison, A. T., Grant, J .M. and Hallof, P. G.
1981 Assessment report on geological, geochemical, geophysical and diamond drilling exploration for the Carol project for 1981 submission on Labrador Mining and Exploration Company Limited blocks 22 to 42, 22~1 to 22~10, 64~1, 64~2, 51 to 101, 103 to 108, 110, 115 to 118, 120 to 125, 127 to 131 and 133 to 143 in the Wabush, Labrador City and Schefferville areas, western Labrador, 49 reports, Iron Ore Company of Canada (option holder) and Labrador Mining and Exploration Company Limited (owner of property), Newfoundland and Labrador Geological Survey, Assessment File LAB/0600, 777 p.
Stubbins, J. B.
1973 Report for the year ending 1972 for the Labrador City and Schefferville area, Labrador, Labrador Mining and Exploration Company Limited, Newfoundland and Labrador Geological Survey, Assessment File LAB/0180.
1978 Report on geochemical sampling and other work in the Wabush Lake area, Labrador, Iron Ore Company of Canada and Labrador Mining and Exploration Company Limited.
Way, Ramsey, Rod Churchill and Carol Seymour
2007 First year assessment report for map staked licences 11927M, 12853M and 12854M and Second year assessment report for 10501M covering compilation and reconnaissance geological investigations (Mills Lake Property, Western Labrador) Newfoundland and Labrador, NTS 23B14 and 23B15 prepared for Altius Resources Inc.
Watts, Griffis and McOuat Limited
Feb 2010 Technical Report on the Kamistiatusset Property, Newfoundland and Labrador for 0860132 B.C. Ltd. and Alderon Resource Corp., prepared by Richard W. Risto, David Power-Fardy and G. Ross MacFarlane.
168
APPENDIX 1:
WGM INDEPENDENT SAMPLING RESULTS
169